Embed Size (px)
Citation preview
2014 Reset RIN – Basis of Preparation
i
SA Power Networks
2014 Reset RIN
www.sapowernetworks.com.au
RIN Sch2 - Basis of Preparation (RIN templates 2.3, 2.4, 3.4, 3.5, 3.6)
30 October 2014
SUPPORTING DOCUMENT 32.4
2014 Reset RIN – Basis of Preparation
i
Document Control Version No Date Description
1.0 27/10/2014 First issue
2014 Reset RIN – Basis of Preparation
ii
Contents Document Control.................................................................................................................................... i
Contents .................................................................................................................................................. ii
Glossary ................................................................................................................................................... 1
1 Tab 2.3 – Augex Project Data ........................................................................................................ 3
1.1 General .................................................................................................................................... 3
1.2 Reason for Estimate (if applicable) ......................................................................................... 3
1.3 Reason for Confidentiality (if applicable) ................................................................................ 3
1.4 Assumptions ............................................................................................................................ 3
1.5 Methodology ........................................................................................................................... 3
1.6 Additional Comments ............................................................................................................. 6
2 Table 2.4.1 – Augex Model Inputs – Sub-transmission Lines ..................................................... 17
2.1 General .................................................................................................................................. 17
2.2 Reason for Estimate .............................................................................................................. 17
2.3 Reason for Confidentiality (if applicable) .............................................................................. 18
2.4 Assumptions .......................................................................................................................... 18
2.5 Methodology ......................................................................................................................... 18
2.6 Additional Comments ........................................................................................................... 19
3 Table 2.4.2 – Augex Model Inputs – High Voltage Feeders ........................................................ 21
3.1 General .................................................................................................................................. 21
3.2 Reason for Estimate .............................................................................................................. 21
3.3 Reason for Confidentiality .................................................................................................... 21
3.4 Assumptions .......................................................................................................................... 21
3.5 Methodology ......................................................................................................................... 21
3.6 Additional Comments ........................................................................................................... 22
4 Table 2.4.3 – Augex Model Inputs –Sub-transmission Substations, Sub-transmission Switching Stations and Zone Substations .............................................................................................................. 23
4.1 General .................................................................................................................................. 23
4.2 Reason for Estimate (if applicable) ....................................................................................... 23
4.3 Reason for Confidentiality (if applicable) .............................................................................. 23
4.4 Assumptions .......................................................................................................................... 23
4.5 Methodology ......................................................................................................................... 24
4.6 Additional Comments ........................................................................................................... 24
5 Table 2.4.4 – Augex Model Inputs - Distribution Substations .................................................... 25
5.1 General .................................................................................................................................. 25
5.2 Reason for Estimate (if applicable) ....................................................................................... 25
5.3 Reason for Confidentiality (if applicable) .............................................................................. 25
5.4 Assumptions .......................................................................................................................... 25
2014 Reset RIN – Basis of Preparation
iii
5.5 Methodology ......................................................................................................................... 25
5.6 Additional Comments ........................................................................................................... 26
6 Table 2.4.5 – Augex Model – Segment Data ............................................................................... 27
6.1 General .................................................................................................................................. 27
6.2 Reason for Estimate (if applicable) ....................................................................................... 27
6.3 Assumptions .......................................................................................................................... 27
6.4 Methodology ......................................................................................................................... 28
6.5 Additional Comments ........................................................................................................... 29
7 Table 2.4.6 – Capex and Net Capacity added by segment group ............................................... 37
7.1 General .................................................................................................................................. 37
7.2 Reason for Estimate (if applicable) ....................................................................................... 37
7.3 Reason for Confidentiality (if applicable) .............................................................................. 37
7.4 Assumptions .......................................................................................................................... 37
7.5 Methodology ......................................................................................................................... 38
7.6 Additional Comments ........................................................................................................... 42
7.7 Unmodelled Augmentation.................................................................................................. 42
8 Table 3.4.3.1 & 3.4.3.3 – Annual system maximum demand characteristics at the zone substation level – MW & MVA measure ............................................................................................... 45
8.1 General .................................................................................................................................. 45
8.2 Reason for Estimate (if applicable) ....................................................................................... 45
8.3 Reason for Confidentiality (if applicable) .............................................................................. 45
8.4 Assumptions .......................................................................................................................... 45
8.5 Methodology ......................................................................................................................... 45
8.6 Additional Comments ........................................................................................................... 46
9 Table 3.4.3.2 & 3.4.3.4 – Annual system maximum demand characteristics at the transmission connection point level – MW & MVA measure .................................................................................... 47
9.1 General .................................................................................................................................. 47
9.2 Reason for Estimate (if applicable) ....................................................................................... 47
9.3 Reason for Confidentiality (if applicable) .............................................................................. 47
9.4 Assumptions .......................................................................................................................... 47
9.5 Methodology ......................................................................................................................... 47
9.6 Additional Comments ........................................................................................................... 47
10 Table 3.4.3.5 – Power Factor Conversion between MVA and MW ............................................ 49
10.1 General .................................................................................................................................. 49
10.2 Reason for Estimate (if applicable) ....................................................................................... 49
10.3 Reason for Confidentiality (if applicable) .............................................................................. 49
10.4 Assumptions .......................................................................................................................... 49
10.5 Methodology ......................................................................................................................... 50
2014 Reset RIN – Basis of Preparation
iv
10.6 Additional Comments ........................................................................................................... 51
11 Table 3.5.1.3 – Estimated overhead network weighted average MVA capacity by voltage class – DPA0301 – DPA0313 .......................................................................................................................... 52
11.1 General .................................................................................................................................. 52
11.2 Reason for Estimate (if applicable) ....................................................................................... 52
11.3 Reason for Confidentiality (if applicable) .............................................................................. 52
11.4 Assumptions .......................................................................................................................... 52
11.5 Methodology ......................................................................................................................... 52
11.6 Additional Comments ........................................................................................................... 53
12 Table 3.5.1.4 – Estimated underground network weighted average MVA capacity by voltage class – DPA0401 – DPA0413 ................................................................................................................. 55
12.1 General .................................................................................................................................. 55
12.2 Reason for Estimate (if applicable) ....................................................................................... 55
12.3 Reason for Confidentiality (if applicable) .............................................................................. 55
12.4 Assumptions .......................................................................................................................... 55
12.5 Methodology ......................................................................................................................... 56
12.6 Additional Comments ........................................................................................................... 57
13 Table 3.5.2.1 – Distribution Transformer Total Capacity (DPA0501 & DPA0503) ...................... 58
13.1 General .................................................................................................................................. 58
13.2 Reason for Estimate (if applicable) ....................................................................................... 58
13.3 Reason for Confidentiality (if applicable) .............................................................................. 58
13.4 Assumptions .......................................................................................................................... 58
13.5 Methodology ......................................................................................................................... 58
13.6 Additional Comments ........................................................................................................... 59
14 Table 3.5.2.2 – Zone Substation Transformer Capacity (DPA0601 – DPA0605) ......................... 60
14.1 General .................................................................................................................................. 60
14.2 Reason for Estimate (if applicable) ....................................................................................... 60
14.3 Reason for Confidentiality (if applicable) .............................................................................. 60
14.4 Assumptions .......................................................................................................................... 60
14.5 Methodology ......................................................................................................................... 61
14.6 Additional Comments ........................................................................................................... 61
15 Table 3.6.4 – Capacity Utilisation ............................................................................................... 62
15.1 General .................................................................................................................................. 62
15.2 Reason for Estimate (if applicable) ....................................................................................... 62
15.3 Reason for Confidentiality (if applicable) .............................................................................. 62
15.4 Assumptions .......................................................................................................................... 62
15.5 Methodology ......................................................................................................................... 62
15.6 Additional Comments ........................................................................................................... 62

2014 Reset RIN – Basis of Preparation
v
2014 Reset RIN – Basis of Preparation
Page 1
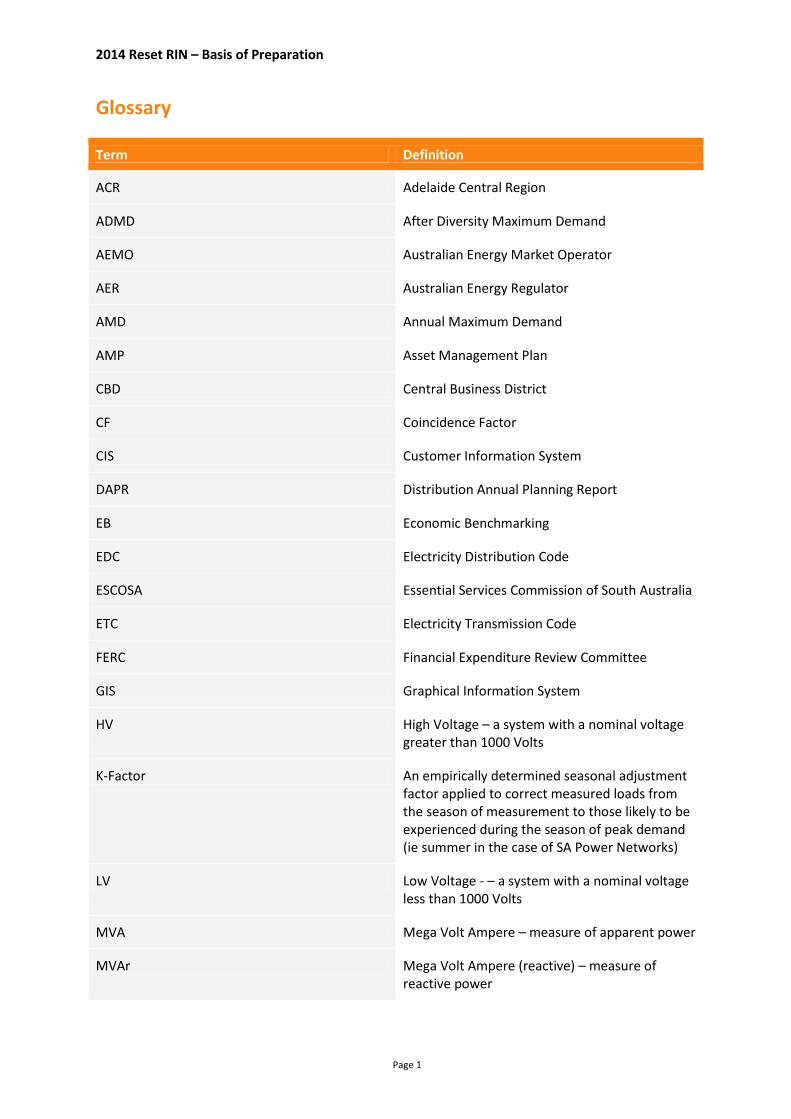
Glossary
Term Definition
ACR Adelaide Central Region
ADMD After Diversity Maximum Demand
AEMO Australian Energy Market Operator
AER Australian Energy Regulator
AMD Annual Maximum Demand
AMP Asset Management Plan
CBD Central Business District
CF Coincidence Factor
CIS Customer Information System
DAPR Distribution Annual Planning Report
EB Economic Benchmarking
EDC Electricity Distribution Code
ESCOSA Essential Services Commission of South Australia
ETC Electricity Transmission Code
FERC Financial Expenditure Review Committee
GIS Graphical Information System
HV High Voltage – a system with a nominal voltage greater than 1000 Volts
K-Factor An empirically determined seasonal adjustment factor applied to correct measured loads from the season of measurement to those likely to be experienced during the season of peak demand (ie summer in the case of SA Power Networks)
LV Low Voltage - – a system with a nominal voltage less than 1000 Volts
MVA Mega Volt Ampere – measure of apparent power
MVAr Mega Volt Ampere (reactive) – measure of reactive power
2014 Reset RIN – Basis of Preparation
Page 2
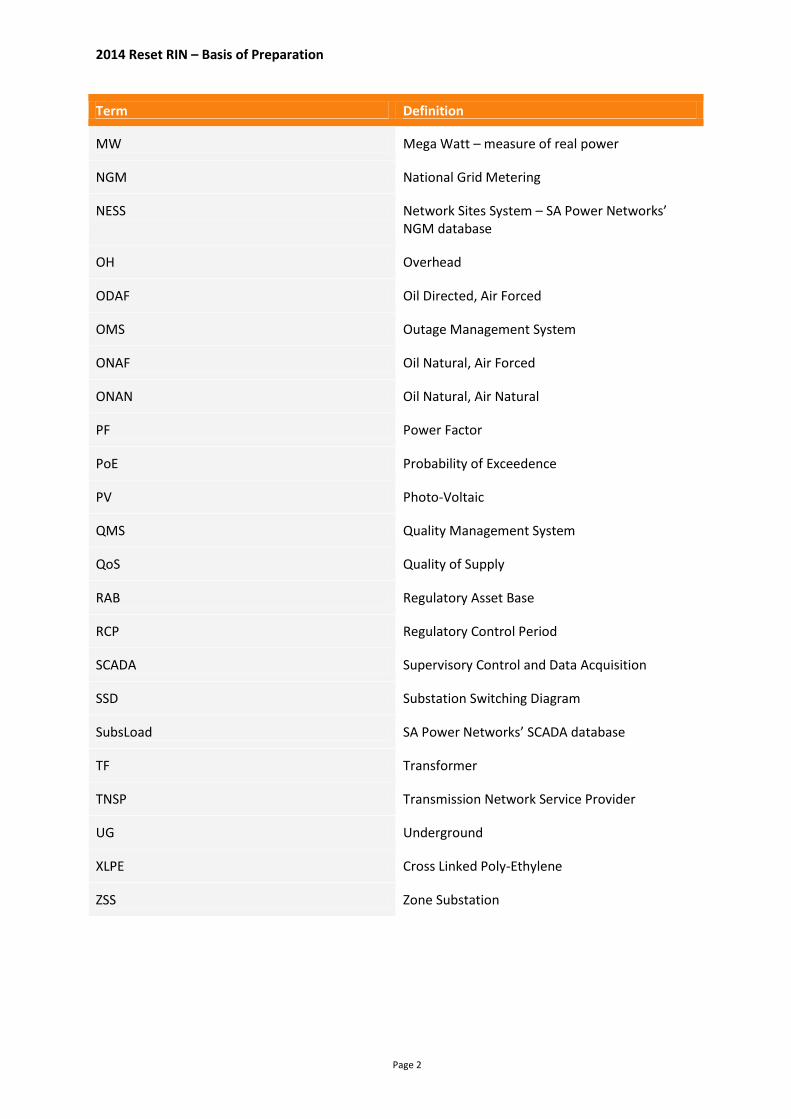
Term Definition
MW Mega Watt – measure of real power
NGM National Grid Metering
NESS Network Sites System – SA Power Networks’ NGM database
OH Overhead
ODAF Oil Directed, Air Forced
OMS Outage Management System
ONAF Oil Natural, Air Forced
ONAN Oil Natural, Air Natural
PF Power Factor
PoE Probability of Exceedence
PV Photo-Voltaic
QMS Quality Management System
QoS Quality of Supply
RAB Regulatory Asset Base
RCP Regulatory Control Period
SCADA Supervisory Control and Data Acquisition
SSD Substation Switching Diagram
SubsLoad SA Power Networks’ SCADA database
TF Transformer
TNSP Transmission Network Service Provider
UG Underground
XLPE Cross Linked Poly-Ethylene
ZSS Zone Substation

2014 Reset RIN – Basis of Preparation
Page 3
1 Tab 2.3 – Augex Project Data
1.1 General
RIN Section Compliance: Schedule 2, Appendix E – Section 6 Data Type: Financial and volume data Data Source: Asset Management Plans 1.1.01 & 2.1.03, Network Planning Department’s Capex Register. Data Quality: Estimated Confidentiality: Non-confidential Confidentiality Category: Not Applicable
1.2 Reason for Estimate (if applicable)
Financial and volume data for projects are currently in estimate stage and have yet to be incurred.
1.3 Reason for Confidentiality (if applicable)
Not Applicable.
1.4 Assumptions
The assumptions used to populate Augex tab 2.3 are listed below. 1. Project costs and quantities reported in table 2.3.1 and 2.3.2 are derived from building block
estimates only. 2. Building block estimates for projects were used to prepare the costs contained in AMP 1.1.01
and various other justifying documents forming the Reset submission. 3. Costs and quantities for distribution substations are based on historical trends. 4. All model costs were in $2012/13, inclusive of overheads prior to escalation to $2014/15 and
overhead removal. 5. All projects are based on standard SA Power Networks design and building standards.
1.5 Methodology
The methodology used to populate the tables in Augex tab 2.3 are listed by table below.
Table 2.3.1
1. Forecast projects were identified from those scheduled to commence and/or be completed in the forecast period as detailed in the AMP 1.1.01.
2. Materials quantities were obtained from project building block estimates.
3. Costs were obtained from the latest estimating cost library.
4. A model was created to prepare the project estimates for inputting into table 2.3.1. The model used project data for those projects identified as exceeding the $5 million materiality threshold and which involved works at one of the substation categories.
5. For most projects, material costs were derived by matching the quantity of each specific category of plant item listed against each project and multiplying these by the value of these items within SA Power Networks’ period contracts with the relevant material supplier. Costs for transformers, switchgear and other plant and equipment were allocated to their respective cells in the table.
The nature of SA Power Networks’ unit costs is such that we are unable to separately identify civil work costs from other material or installation costs. As such we have entered a zero value within these cells.

2014 Reset RIN – Basis of Preparation
Page 4
Installation labour costs have been allocated based on the difference between the listed materials and the total project cost and can include labour, civil works, feeders and other costs.
6. For some projects (eg Evanston Gardens, Baroota, Myponga-Square Water Hole and Port Noarlunga-Aldinga) a 30/70 percentage split between materials and labour was applied to the total project cost to estimate other plant costs. Other costs were estimated as per 5 above.
7. Substation rating information have been updated to reflect after post project ratings.
8. Volume data have been determined from the items listed in the project estimates and the type of modular installation being proposed.
9. Non-material projects (forecast) is the sum of the direct costs of those substation projects that either close during the period or have expenditure within the forecast period and close in the regulatory period following.
10. Data placed in to Table 2.3.1.
Table 2.3.2
1. Forecast projects were identified from those scheduled to commence and/or complete in the forecast period as detailed in the AMP 1.1.01.
2. Materials quantities were obtained from project building block estimates.
3. Costs were obtained from the latest estimating cost library.
4. A model was created to prepare the project estimates for inputting into table 2.3.2. The model used project data for those projects identified as exceeding the $5 million materiality threshold and which involved works on sub-transmission lines.
5. For most projects, materials costs were derived by matching the specific plant item listed against each project to a matching cost in the cost library. Costs for Poles, conductor, cable and other plant and equipment were allocated to their respective cells in the table based on an assumed number of poles per route km of line and historic material costs for poles, conductors and cables. SA Power Networks is unable to specifically identify civil work costs and have entered a zero value in these cells. The installation labour costs represent the difference between the listed materials and the total project cost and can include labour, civil, feeder and other costs.
6. For some projects (Myponga-Square Water Hole and Port Noarlunga-Aldinga) a 30/70 percentage split between materials and labour was applied to the total project cost to estimate other plant costs. Other costs were estimated as 5 above.
7. Volume data have been determined from the items listed in the project estimates and proposed routes.
8. Non-material projects (forecast) is the sum of the direct costs of sub-transmission line projects that either close during the period or have expenditure within the forecast period and close in the regulatory period following.
9. Data placed in to Table 2.3.2
Table 2.3.3.1 HV Feeders - Volumes
1. Forecast HV Feeder projects were identified from the AMP 1.1.01 and are those scheduled to incur expenditure within the forecast period.
2. A model was created to extract volume metrics (kms) from the quantities used in the identified project estimates into the appropriate categories for input into table 2.3.3.1. HV Feeder projects were tagged as over or under the threshold, overhead or underground and new feeders or upgrade projects.
2014 Reset RIN – Basis of Preparation
Page 5
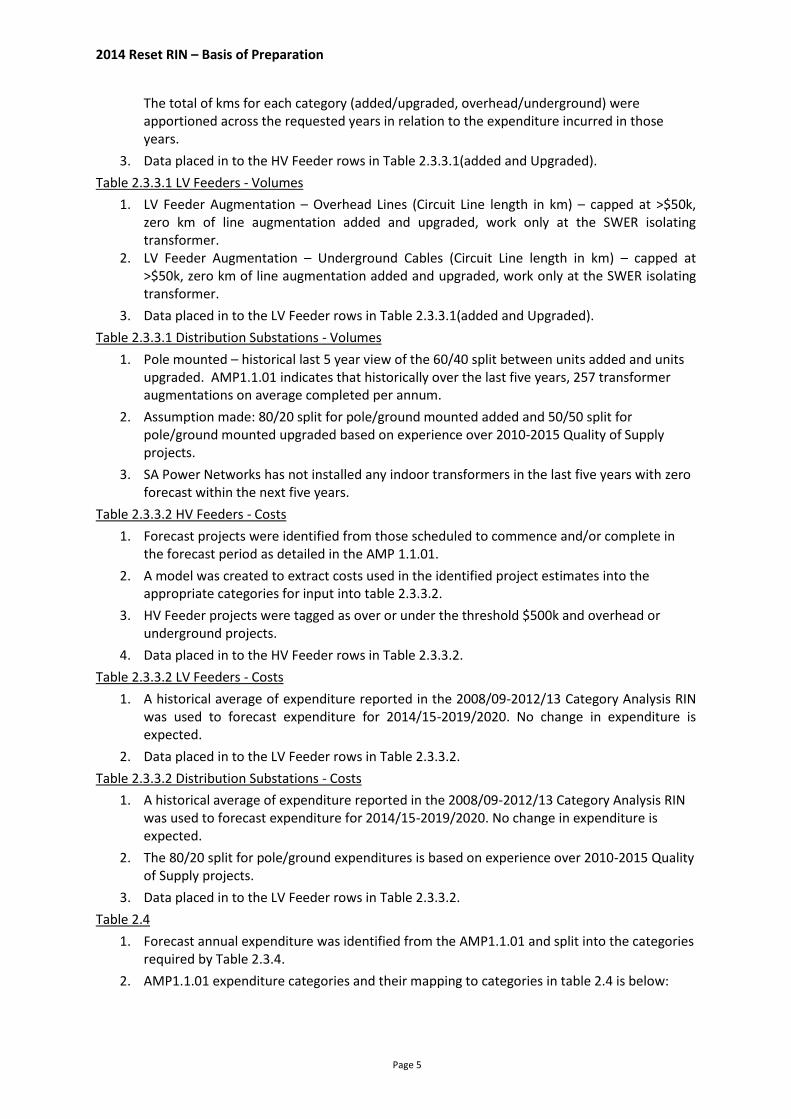
The total of kms for each category (added/upgraded, overhead/underground) were apportioned across the requested years in relation to the expenditure incurred in those years.
3. Data placed in to the HV Feeder rows in Table 2.3.3.1(added and Upgraded).
Table 2.3.3.1 LV Feeders - Volumes
1. LV Feeder Augmentation – Overhead Lines (Circuit Line length in km) – capped at >$50k, zero km of line augmentation added and upgraded, work only at the SWER isolating transformer.
2. LV Feeder Augmentation – Underground Cables (Circuit Line length in km) – capped at >$50k, zero km of line augmentation added and upgraded, work only at the SWER isolating transformer.
3. Data placed in to the LV Feeder rows in Table 2.3.3.1(added and Upgraded).
Table 2.3.3.1 Distribution Substations - Volumes
1. Pole mounted – historical last 5 year view of the 60/40 split between units added and units upgraded. AMP1.1.01 indicates that historically over the last five years, 257 transformer augmentations on average completed per annum.
2. Assumption made: 80/20 split for pole/ground mounted added and 50/50 split for pole/ground mounted upgraded based on experience over 2010-2015 Quality of Supply projects.
3. SA Power Networks has not installed any indoor transformers in the last five years with zero forecast within the next five years.
Table 2.3.3.2 HV Feeders - Costs
1. Forecast projects were identified from those scheduled to commence and/or complete in the forecast period as detailed in the AMP 1.1.01.
2. A model was created to extract costs used in the identified project estimates into the appropriate categories for input into table 2.3.3.2.
3. HV Feeder projects were tagged as over or under the threshold $500k and overhead or underground projects.
4. Data placed in to the HV Feeder rows in Table 2.3.3.2.
Table 2.3.3.2 LV Feeders - Costs
1. A historical average of expenditure reported in the 2008/09-2012/13 Category Analysis RIN was used to forecast expenditure for 2014/15-2019/2020. No change in expenditure is expected.
2. Data placed in to the LV Feeder rows in Table 2.3.3.2.
Table 2.3.3.2 Distribution Substations - Costs
1. A historical average of expenditure reported in the 2008/09-2012/13 Category Analysis RIN was used to forecast expenditure for 2014/15-2019/2020. No change in expenditure is expected.
2. The 80/20 split for pole/ground expenditures is based on experience over 2010-2015 Quality of Supply projects.
3. Data placed in to the LV Feeder rows in Table 2.3.3.2.
Table 2.4
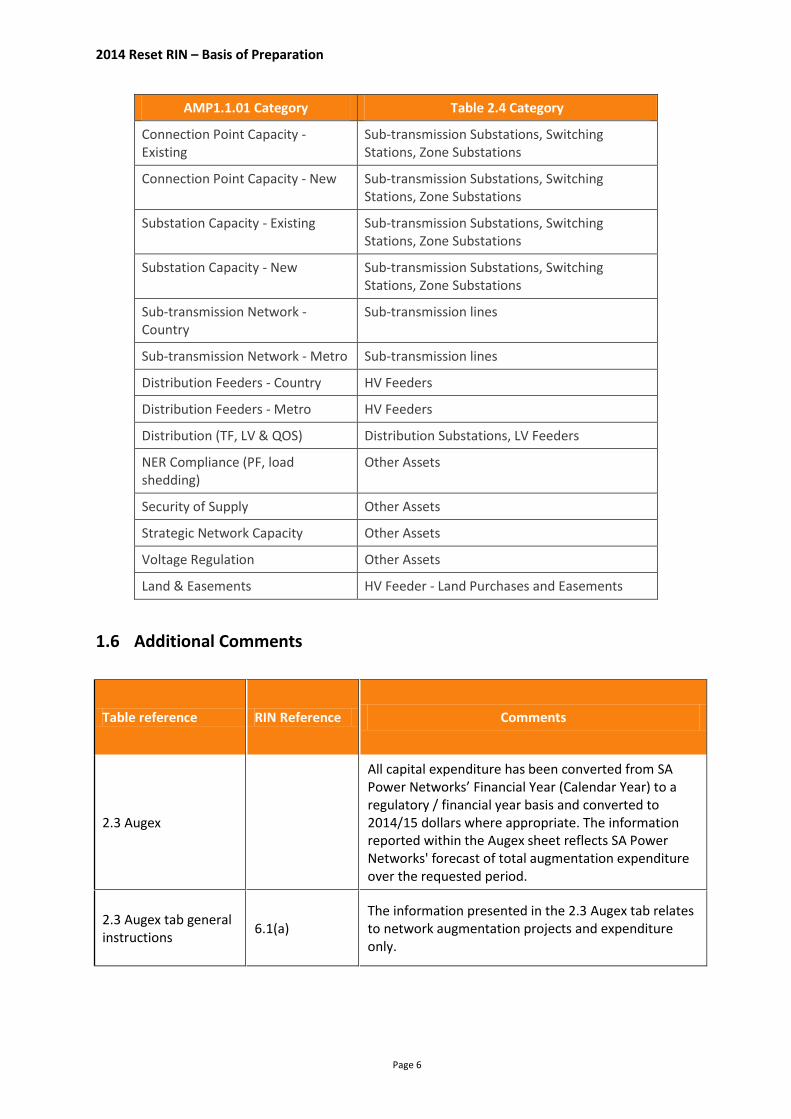
1. Forecast annual expenditure was identified from the AMP1.1.01 and split into the categories required by Table 2.3.4.
2. AMP1.1.01 expenditure categories and their mapping to categories in table 2.4 is below:
2014 Reset RIN – Basis of Preparation
Page 6
AMP1.1.01 Category Table 2.4 Category
Connection Point Capacity - Existing
Sub-transmission Substations, Switching Stations, Zone Substations
Connection Point Capacity - New Sub-transmission Substations, Switching Stations, Zone Substations
Substation Capacity - Existing Sub-transmission Substations, Switching Stations, Zone Substations
Substation Capacity - New Sub-transmission Substations, Switching Stations, Zone Substations
Sub-transmission Network - Country
Sub-transmission lines
Sub-transmission Network - Metro Sub-transmission lines
Distribution Feeders - Country HV Feeders
Distribution Feeders - Metro HV Feeders
Distribution (TF, LV & QOS) Distribution Substations, LV Feeders
NER Compliance (PF, load shedding)
Other Assets
Security of Supply Other Assets
Strategic Network Capacity Other Assets
Voltage Regulation Other Assets
Land & Easements HV Feeder - Land Purchases and Easements
1.6 Additional Comments
Table reference RIN Reference Comments
2.3 Augex
All capital expenditure has been converted from SA Power Networks’ Financial Year (Calendar Year) to a regulatory / financial year basis and converted to 2014/15 dollars where appropriate. The information reported within the Augex sheet reflects SA Power Networks' forecast of total augmentation expenditure over the requested period.
2.3 Augex tab general instructions
6.1(a) The information presented in the 2.3 Augex tab relates to network augmentation projects and expenditure only.
2014 Reset RIN – Basis of Preparation
Page 7
Table reference RIN Reference Comments
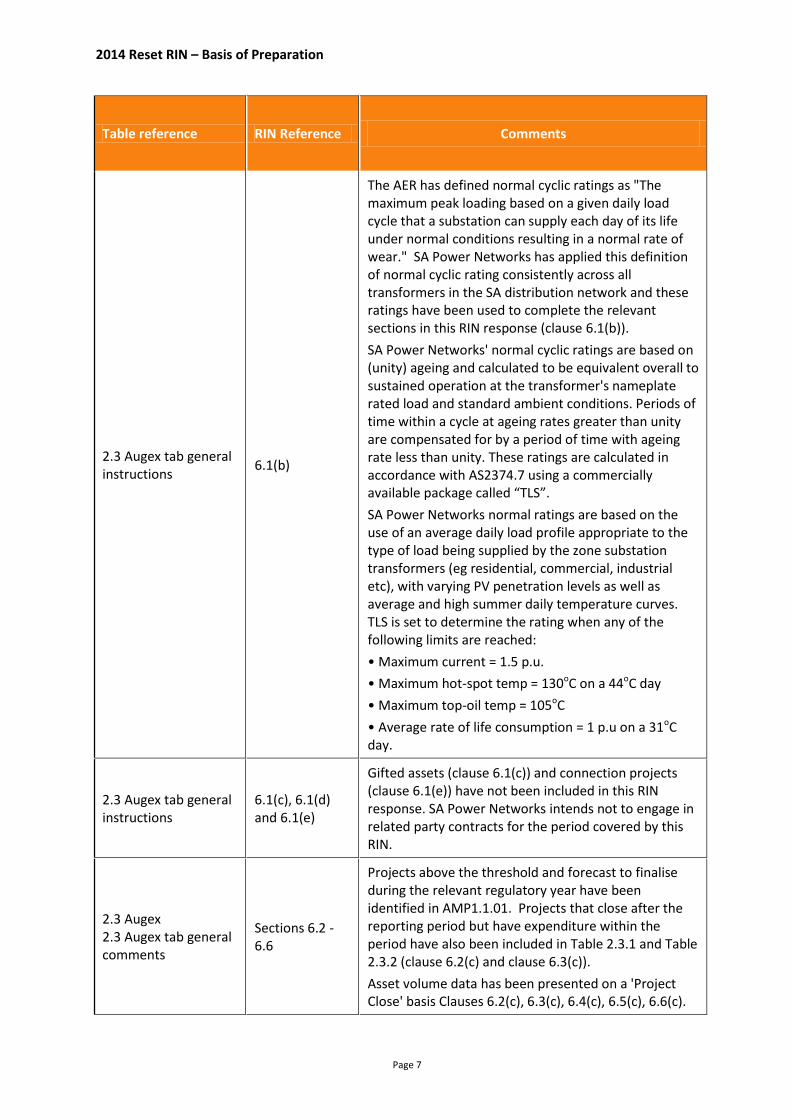
2.3 Augex tab general instructions
6.1(b)
The AER has defined normal cyclic ratings as "The maximum peak loading based on a given daily load cycle that a substation can supply each day of its life under normal conditions resulting in a normal rate of wear." SA Power Networks has applied this definition of normal cyclic rating consistently across all transformers in the SA distribution network and these ratings have been used to complete the relevant sections in this RIN response (clause 6.1(b)).
SA Power Networks' normal cyclic ratings are based on (unity) ageing and calculated to be equivalent overall to sustained operation at the transformer's nameplate rated load and standard ambient conditions. Periods of time within a cycle at ageing rates greater than unity are compensated for by a period of time with ageing rate less than unity. These ratings are calculated in accordance with AS2374.7 using a commercially available package called “TLS”.
SA Power Networks normal ratings are based on the use of an average daily load profile appropriate to the type of load being supplied by the zone substation transformers (eg residential, commercial, industrial etc), with varying PV penetration levels as well as average and high summer daily temperature curves. TLS is set to determine the rating when any of the following limits are reached:
• Maximum current = 1.5 p.u.
• Maximum hot-spot temp = 130oC on a 44oC day
• Maximum top-oil temp = 105oC
• Average rate of life consumption = 1 p.u on a 31oC day.
2.3 Augex tab general instructions
6.1(c), 6.1(d) and 6.1(e)
Gifted assets (clause 6.1(c)) and connection projects (clause 6.1(e)) have not been included in this RIN response. SA Power Networks intends not to engage in related party contracts for the period covered by this RIN.
2.3 Augex 2.3 Augex tab general comments
Sections 6.2 - 6.6
Projects above the threshold and forecast to finalise during the relevant regulatory year have been identified in AMP1.1.01. Projects that close after the reporting period but have expenditure within the period have also been included in Table 2.3.1 and Table 2.3.2 (clause 6.2(c) and clause 6.3(c)).
Asset volume data has been presented on a 'Project Close' basis Clauses 6.2(c), 6.3(c), 6.4(c), 6.5(c), 6.6(c).
2014 Reset RIN – Basis of Preparation
Page 8
Table reference RIN Reference Comments
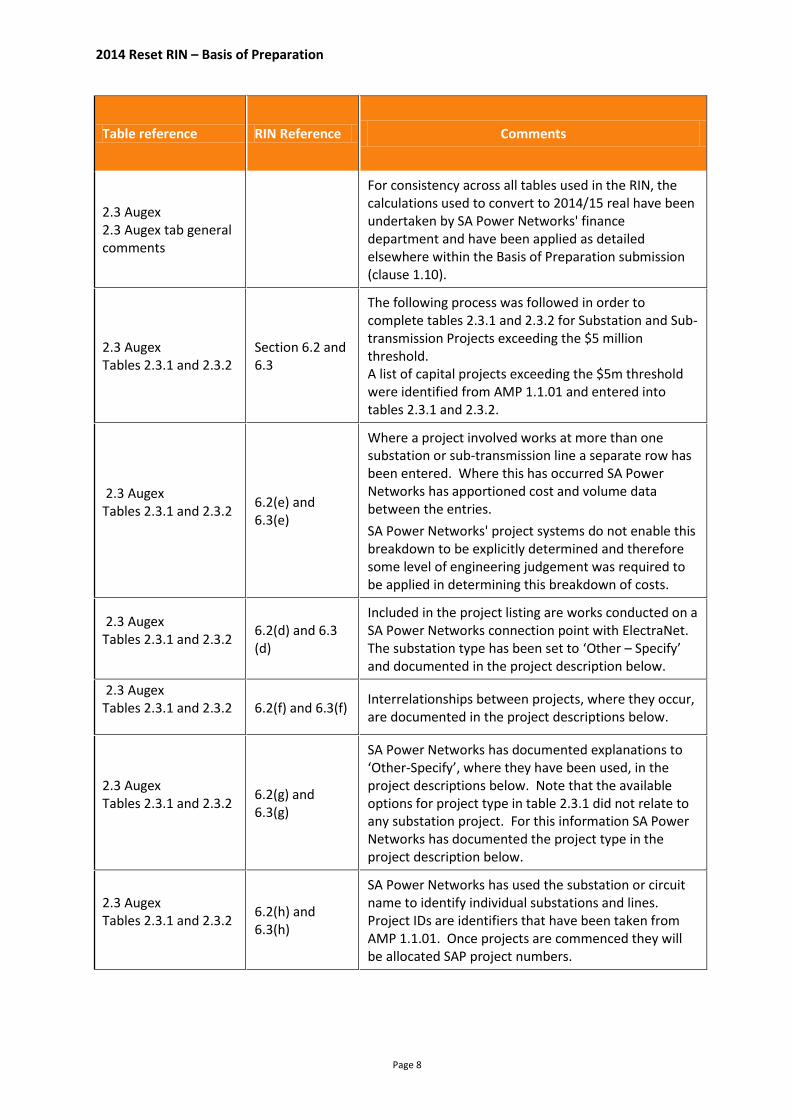
2.3 Augex 2.3 Augex tab general comments
For consistency across all tables used in the RIN, the calculations used to convert to 2014/15 real have been undertaken by SA Power Networks' finance department and have been applied as detailed elsewhere within the Basis of Preparation submission (clause 1.10).
2.3 Augex Tables 2.3.1 and 2.3.2
Section 6.2 and 6.3
The following process was followed in order to complete tables 2.3.1 and 2.3.2 for Substation and Sub-transmission Projects exceeding the $5 million threshold. A list of capital projects exceeding the $5m threshold were identified from AMP 1.1.01 and entered into tables 2.3.1 and 2.3.2.
2.3 Augex Tables 2.3.1 and 2.3.2
6.2(e) and 6.3(e)
Where a project involved works at more than one substation or sub-transmission line a separate row has been entered. Where this has occurred SA Power Networks has apportioned cost and volume data between the entries.
SA Power Networks' project systems do not enable this breakdown to be explicitly determined and therefore some level of engineering judgement was required to be applied in determining this breakdown of costs.
2.3 Augex Tables 2.3.1 and 2.3.2
6.2(d) and 6.3 (d)
Included in the project listing are works conducted on a SA Power Networks connection point with ElectraNet. The substation type has been set to ‘Other – Specify’ and documented in the project description below.
2.3 Augex Tables 2.3.1 and 2.3.2
6.2(f) and 6.3(f) Interrelationships between projects, where they occur, are documented in the project descriptions below.
2.3 Augex Tables 2.3.1 and 2.3.2
6.2(g) and 6.3(g)
SA Power Networks has documented explanations to ‘Other-Specify’, where they have been used, in the project descriptions below. Note that the available options for project type in table 2.3.1 did not relate to any substation project. For this information SA Power Networks has documented the project type in the project description below.
2.3 Augex Tables 2.3.1 and 2.3.2
6.2(h) and 6.3(h)
SA Power Networks has used the substation or circuit name to identify individual substations and lines. Project IDs are identifiers that have been taken from AMP 1.1.01. Once projects are commenced they will be allocated SAP project numbers.
2014 Reset RIN – Basis of Preparation
Page 9
Table reference RIN Reference Comments
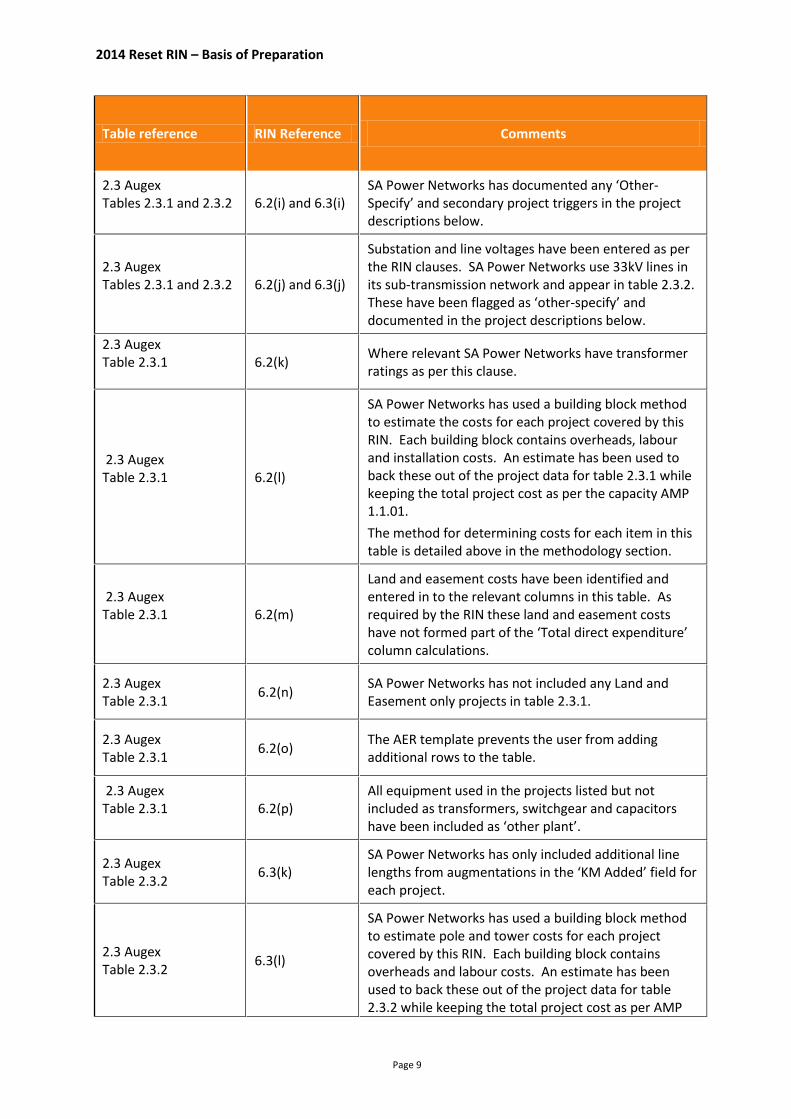
2.3 Augex Tables 2.3.1 and 2.3.2
6.2(i) and 6.3(i) SA Power Networks has documented any ‘Other-Specify’ and secondary project triggers in the project descriptions below.
2.3 Augex Tables 2.3.1 and 2.3.2
6.2(j) and 6.3(j)
Substation and line voltages have been entered as per the RIN clauses. SA Power Networks use 33kV lines in its sub-transmission network and appear in table 2.3.2. These have been flagged as ‘other-specify’ and documented in the project descriptions below.
2.3 Augex Table 2.3.1
6.2(k) Where relevant SA Power Networks have transformer ratings as per this clause.
2.3 Augex Table 2.3.1
6.2(l)
SA Power Networks has used a building block method to estimate the costs for each project covered by this RIN. Each building block contains overheads, labour and installation costs. An estimate has been used to back these out of the project data for table 2.3.1 while keeping the total project cost as per the capacity AMP 1.1.01.
The method for determining costs for each item in this table is detailed above in the methodology section.
2.3 Augex Table 2.3.1
6.2(m)
Land and easement costs have been identified and entered in to the relevant columns in this table. As required by the RIN these land and easement costs have not formed part of the ‘Total direct expenditure’ column calculations.
2.3 Augex Table 2.3.1
6.2(n) SA Power Networks has not included any Land and Easement only projects in table 2.3.1.
2.3 Augex Table 2.3.1
6.2(o) The AER template prevents the user from adding additional rows to the table.
2.3 Augex Table 2.3.1
6.2(p) All equipment used in the projects listed but not included as transformers, switchgear and capacitors have been included as ‘other plant’.
2.3 Augex Table 2.3.2
6.3(k) SA Power Networks has only included additional line lengths from augmentations in the ‘KM Added’ field for each project.
2.3 Augex Table 2.3.2
6.3(l)
SA Power Networks has used a building block method to estimate pole and tower costs for each project covered by this RIN. Each building block contains overheads and labour costs. An estimate has been used to back these out of the project data for table 2.3.2 while keeping the total project cost as per AMP
2014 Reset RIN – Basis of Preparation
Page 10
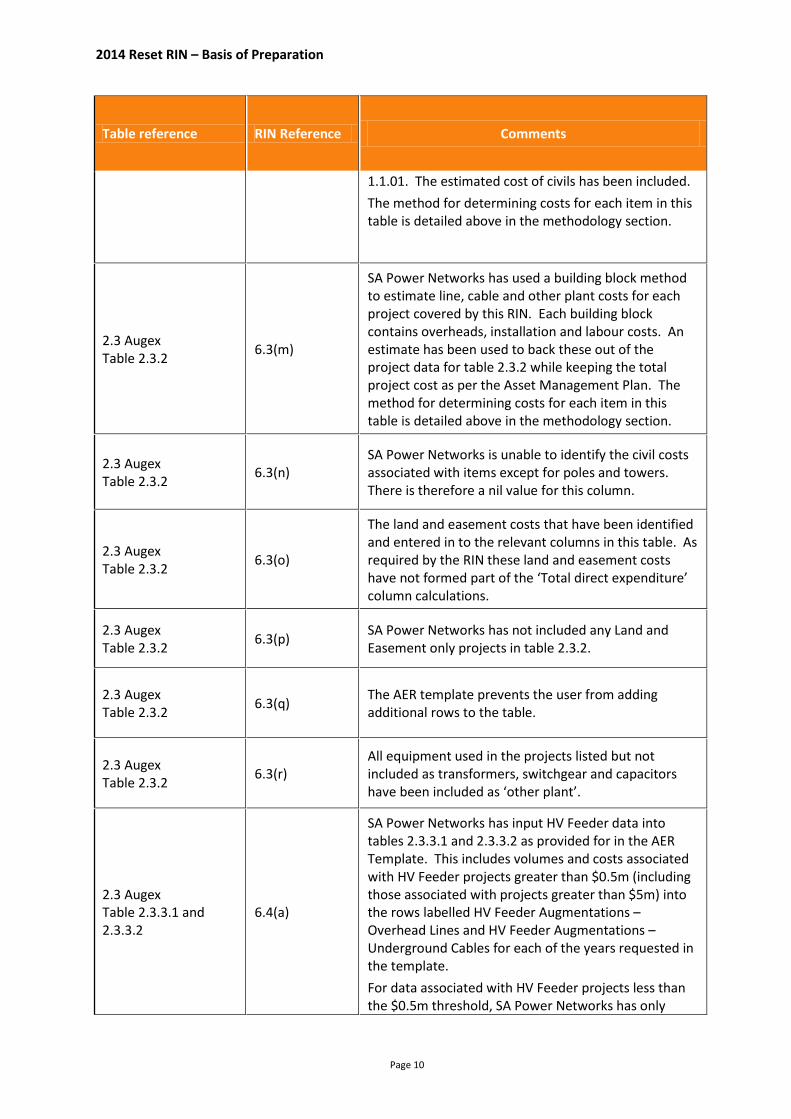
Table reference RIN Reference Comments
1.1.01. The estimated cost of civils has been included.
The method for determining costs for each item in this table is detailed above in the methodology section.
2.3 Augex Table 2.3.2
6.3(m)
SA Power Networks has used a building block method to estimate line, cable and other plant costs for each project covered by this RIN. Each building block contains overheads, installation and labour costs. An estimate has been used to back these out of the project data for table 2.3.2 while keeping the total project cost as per the Asset Management Plan. The method for determining costs for each item in this table is detailed above in the methodology section.
2.3 Augex Table 2.3.2
6.3(n) SA Power Networks is unable to identify the civil costs associated with items except for poles and towers. There is therefore a nil value for this column.
2.3 Augex Table 2.3.2
6.3(o)
The land and easement costs that have been identified and entered in to the relevant columns in this table. As required by the RIN these land and easement costs have not formed part of the ‘Total direct expenditure’ column calculations.
2.3 Augex Table 2.3.2
6.3(p) SA Power Networks has not included any Land and Easement only projects in table 2.3.2.
2.3 Augex Table 2.3.2
6.3(q) The AER template prevents the user from adding additional rows to the table.
2.3 Augex Table 2.3.2
6.3(r) All equipment used in the projects listed but not included as transformers, switchgear and capacitors have been included as ‘other plant’.
2.3 Augex Table 2.3.3.1 and 2.3.3.2
6.4(a)
SA Power Networks has input HV Feeder data into tables 2.3.3.1 and 2.3.3.2 as provided for in the AER Template. This includes volumes and costs associated with HV Feeder projects greater than $0.5m (including those associated with projects greater than $5m) into the rows labelled HV Feeder Augmentations – Overhead Lines and HV Feeder Augmentations – Underground Cables for each of the years requested in the template.
For data associated with HV Feeder projects less than the $0.5m threshold, SA Power Networks has only
2014 Reset RIN – Basis of Preparation
Page 11
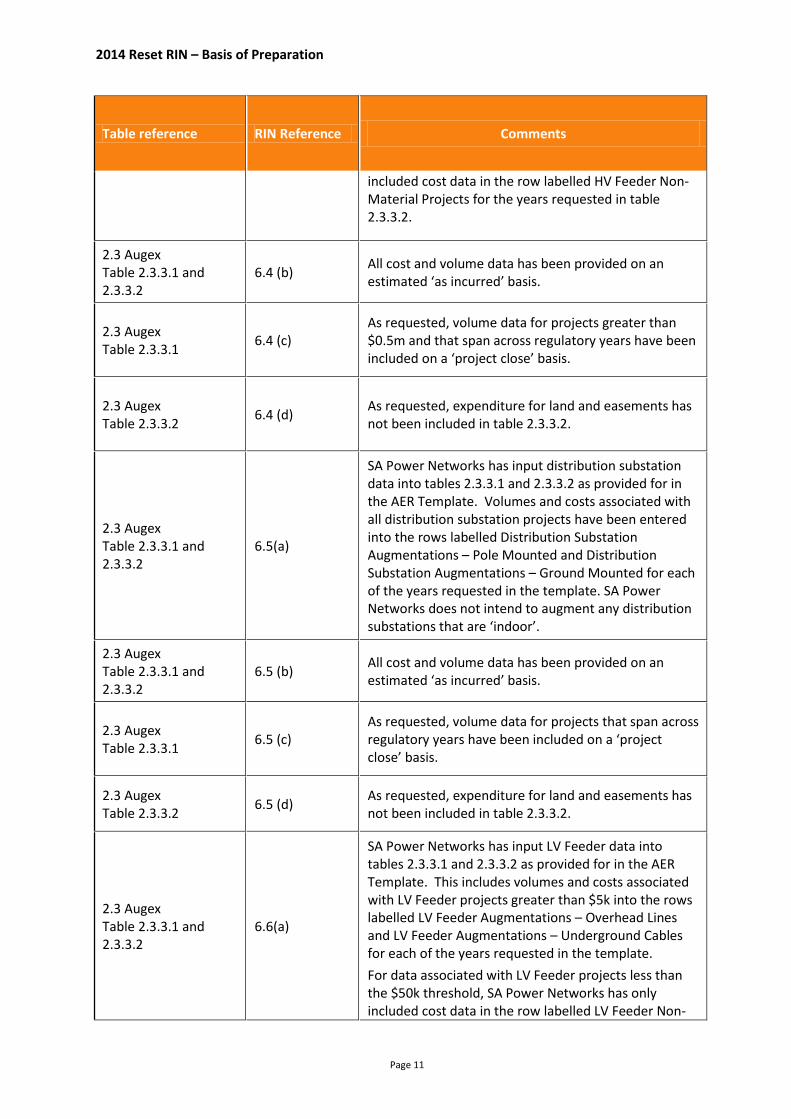
Table reference RIN Reference Comments
included cost data in the row labelled HV Feeder Non-Material Projects for the years requested in table 2.3.3.2.
2.3 Augex Table 2.3.3.1 and 2.3.3.2
6.4 (b) All cost and volume data has been provided on an estimated ‘as incurred’ basis.
2.3 Augex Table 2.3.3.1
6.4 (c) As requested, volume data for projects greater than $0.5m and that span across regulatory years have been included on a ‘project close’ basis.
2.3 Augex Table 2.3.3.2
6.4 (d) As requested, expenditure for land and easements has not been included in table 2.3.3.2.
2.3 Augex Table 2.3.3.1 and 2.3.3.2
6.5(a)
SA Power Networks has input distribution substation data into tables 2.3.3.1 and 2.3.3.2 as provided for in the AER Template. Volumes and costs associated with all distribution substation projects have been entered into the rows labelled Distribution Substation Augmentations – Pole Mounted and Distribution Substation Augmentations – Ground Mounted for each of the years requested in the template. SA Power Networks does not intend to augment any distribution substations that are ‘indoor’.
2.3 Augex Table 2.3.3.1 and 2.3.3.2
6.5 (b) All cost and volume data has been provided on an estimated ‘as incurred’ basis.
2.3 Augex Table 2.3.3.1
6.5 (c) As requested, volume data for projects that span across regulatory years have been included on a ‘project close’ basis.
2.3 Augex Table 2.3.3.2
6.5 (d) As requested, expenditure for land and easements has not been included in table 2.3.3.2.
2.3 Augex Table 2.3.3.1 and 2.3.3.2
6.6(a)
SA Power Networks has input LV Feeder data into tables 2.3.3.1 and 2.3.3.2 as provided for in the AER Template. This includes volumes and costs associated with LV Feeder projects greater than $5k into the rows labelled LV Feeder Augmentations – Overhead Lines and LV Feeder Augmentations – Underground Cables for each of the years requested in the template.
For data associated with LV Feeder projects less than the $50k threshold, SA Power Networks has only included cost data in the row labelled LV Feeder Non-
2014 Reset RIN – Basis of Preparation
Page 12
Table reference RIN Reference Comments
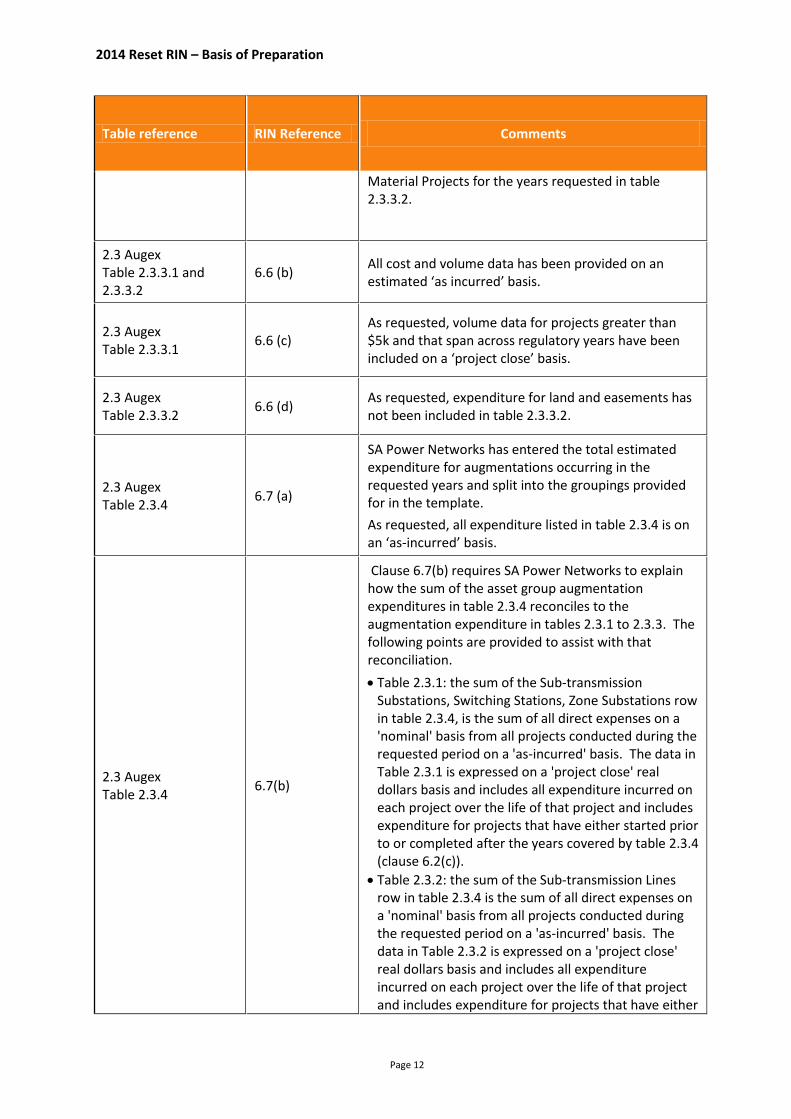
Material Projects for the years requested in table 2.3.3.2.
2.3 Augex Table 2.3.3.1 and 2.3.3.2
6.6 (b) All cost and volume data has been provided on an estimated ‘as incurred’ basis.
2.3 Augex Table 2.3.3.1
6.6 (c) As requested, volume data for projects greater than $5k and that span across regulatory years have been included on a ‘project close’ basis.
2.3 Augex Table 2.3.3.2
6.6 (d) As requested, expenditure for land and easements has not been included in table 2.3.3.2.
2.3 Augex Table 2.3.4
6.7 (a)
SA Power Networks has entered the total estimated expenditure for augmentations occurring in the requested years and split into the groupings provided for in the template.
As requested, all expenditure listed in table 2.3.4 is on an ‘as-incurred’ basis.
2.3 Augex Table 2.3.4
6.7(b)
Clause 6.7(b) requires SA Power Networks to explain how the sum of the asset group augmentation expenditures in table 2.3.4 reconciles to the augmentation expenditure in tables 2.3.1 to 2.3.3. The following points are provided to assist with that reconciliation.
Table 2.3.1: the sum of the Sub-transmission Substations, Switching Stations, Zone Substations row in table 2.3.4, is the sum of all direct expenses on a 'nominal' basis from all projects conducted during the requested period on a 'as-incurred' basis. The data in Table 2.3.1 is expressed on a 'project close' real dollars basis and includes all expenditure incurred on each project over the life of that project and includes expenditure for projects that have either started prior to or completed after the years covered by table 2.3.4 (clause 6.2(c)).
Table 2.3.2: the sum of the Sub-transmission Lines row in table 2.3.4 is the sum of all direct expenses on a 'nominal' basis from all projects conducted during the requested period on a 'as-incurred' basis. The data in Table 2.3.2 is expressed on a 'project close' real dollars basis and includes all expenditure incurred on each project over the life of that project and includes expenditure for projects that have either
2014 Reset RIN – Basis of Preparation
Page 13
Table reference RIN Reference Comments
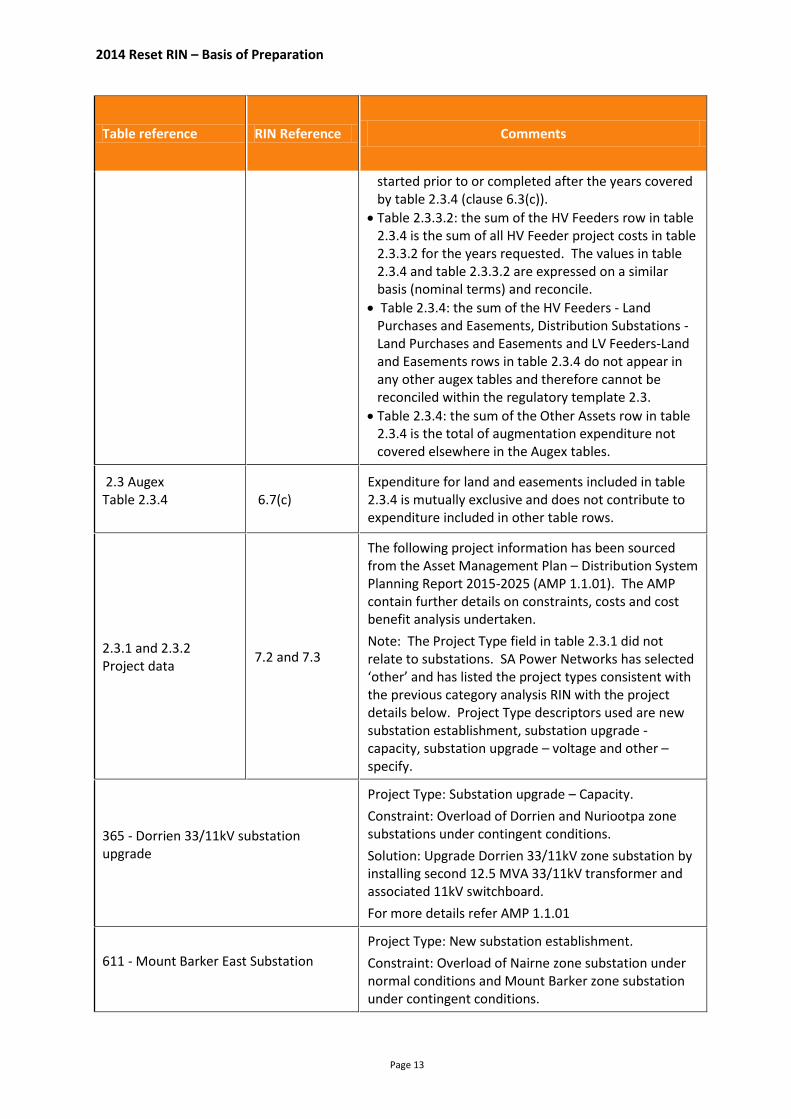
started prior to or completed after the years covered by table 2.3.4 (clause 6.3(c)).
Table 2.3.3.2: the sum of the HV Feeders row in table 2.3.4 is the sum of all HV Feeder project costs in table 2.3.3.2 for the years requested. The values in table 2.3.4 and table 2.3.3.2 are expressed on a similar basis (nominal terms) and reconcile.
Table 2.3.4: the sum of the HV Feeders - Land Purchases and Easements, Distribution Substations - Land Purchases and Easements and LV Feeders-Land and Easements rows in table 2.3.4 do not appear in any other augex tables and therefore cannot be reconciled within the regulatory template 2.3.
Table 2.3.4: the sum of the Other Assets row in table 2.3.4 is the total of augmentation expenditure not covered elsewhere in the Augex tables.
2.3 Augex Table 2.3.4
6.7(c) Expenditure for land and easements included in table 2.3.4 is mutually exclusive and does not contribute to expenditure included in other table rows.
2.3.1 and 2.3.2 Project data
7.2 and 7.3
The following project information has been sourced from the Asset Management Plan – Distribution System Planning Report 2015-2025 (AMP 1.1.01). The AMP contain further details on constraints, costs and cost benefit analysis undertaken.
Note: The Project Type field in table 2.3.1 did not relate to substations. SA Power Networks has selected ‘other’ and has listed the project types consistent with the previous category analysis RIN with the project details below. Project Type descriptors used are new substation establishment, substation upgrade - capacity, substation upgrade – voltage and other – specify.
365 - Dorrien 33/11kV substation upgrade
Project Type: Substation upgrade – Capacity.
Constraint: Overload of Dorrien and Nuriootpa zone substations under contingent conditions.
Solution: Upgrade Dorrien 33/11kV zone substation by installing second 12.5 MVA 33/11kV transformer and associated 11kV switchboard.
For more details refer AMP 1.1.01
611 - Mount Barker East Substation
Project Type: New substation establishment.
Constraint: Overload of Nairne zone substation under normal conditions and Mount Barker zone substation under contingent conditions.
2014 Reset RIN – Basis of Preparation
Page 14
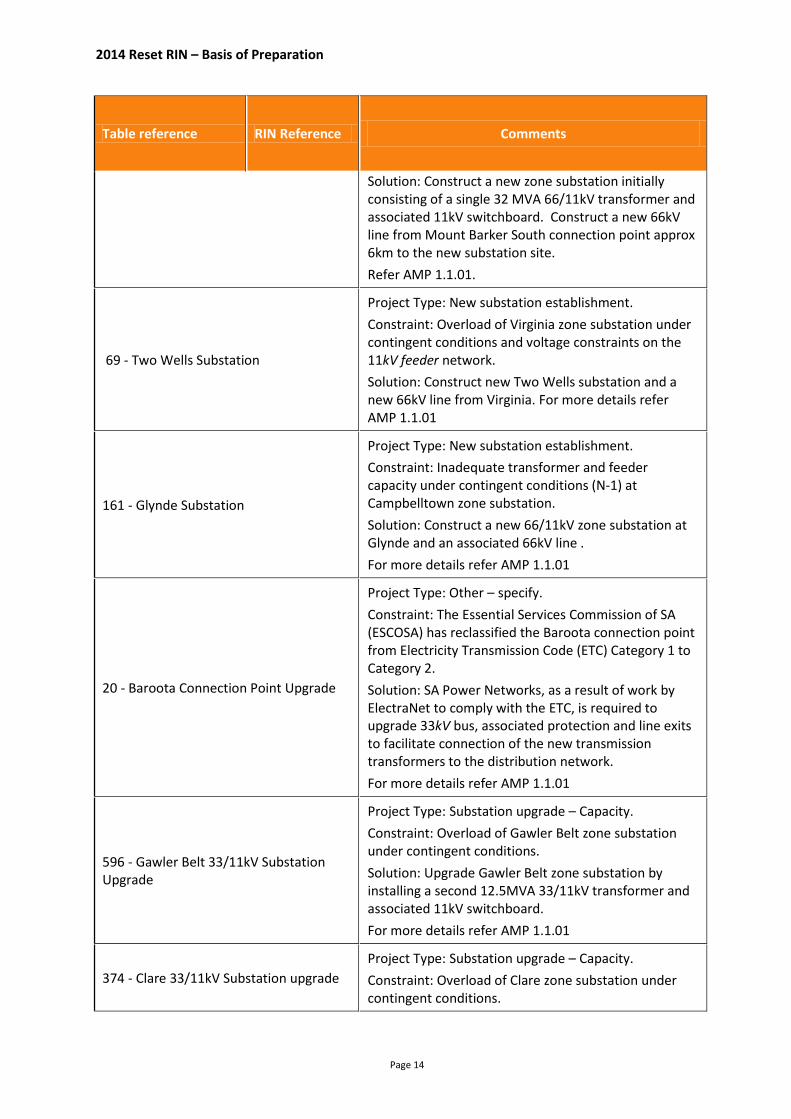
Table reference RIN Reference Comments
Solution: Construct a new zone substation initially consisting of a single 32 MVA 66/11kV transformer and associated 11kV switchboard. Construct a new 66kV line from Mount Barker South connection point approx 6km to the new substation site.
Refer AMP 1.1.01.
69 - Two Wells Substation
Project Type: New substation establishment.
Constraint: Overload of Virginia zone substation under contingent conditions and voltage constraints on the 11kV feeder network.
Solution: Construct new Two Wells substation and a new 66kV line from Virginia. For more details refer AMP 1.1.01
161 - Glynde Substation
Project Type: New substation establishment.
Constraint: Inadequate transformer and feeder capacity under contingent conditions (N-1) at Campbelltown zone substation.
Solution: Construct a new 66/11kV zone substation at Glynde and an associated 66kV line .
For more details refer AMP 1.1.01
20 - Baroota Connection Point Upgrade
Project Type: Other – specify.
Constraint: The Essential Services Commission of SA (ESCOSA) has reclassified the Baroota connection point from Electricity Transmission Code (ETC) Category 1 to Category 2.
Solution: SA Power Networks, as a result of work by ElectraNet to comply with the ETC, is required to upgrade 33kV bus, associated protection and line exits to facilitate connection of the new transmission transformers to the distribution network.
For more details refer AMP 1.1.01
596 - Gawler Belt 33/11kV Substation Upgrade
Project Type: Substation upgrade – Capacity.
Constraint: Overload of Gawler Belt zone substation under contingent conditions.
Solution: Upgrade Gawler Belt zone substation by installing a second 12.5MVA 33/11kV transformer and associated 11kV switchboard.
For more details refer AMP 1.1.01
374 - Clare 33/11kV Substation upgrade
Project Type: Substation upgrade – Capacity.
Constraint: Overload of Clare zone substation under contingent conditions.
2014 Reset RIN – Basis of Preparation
Page 15
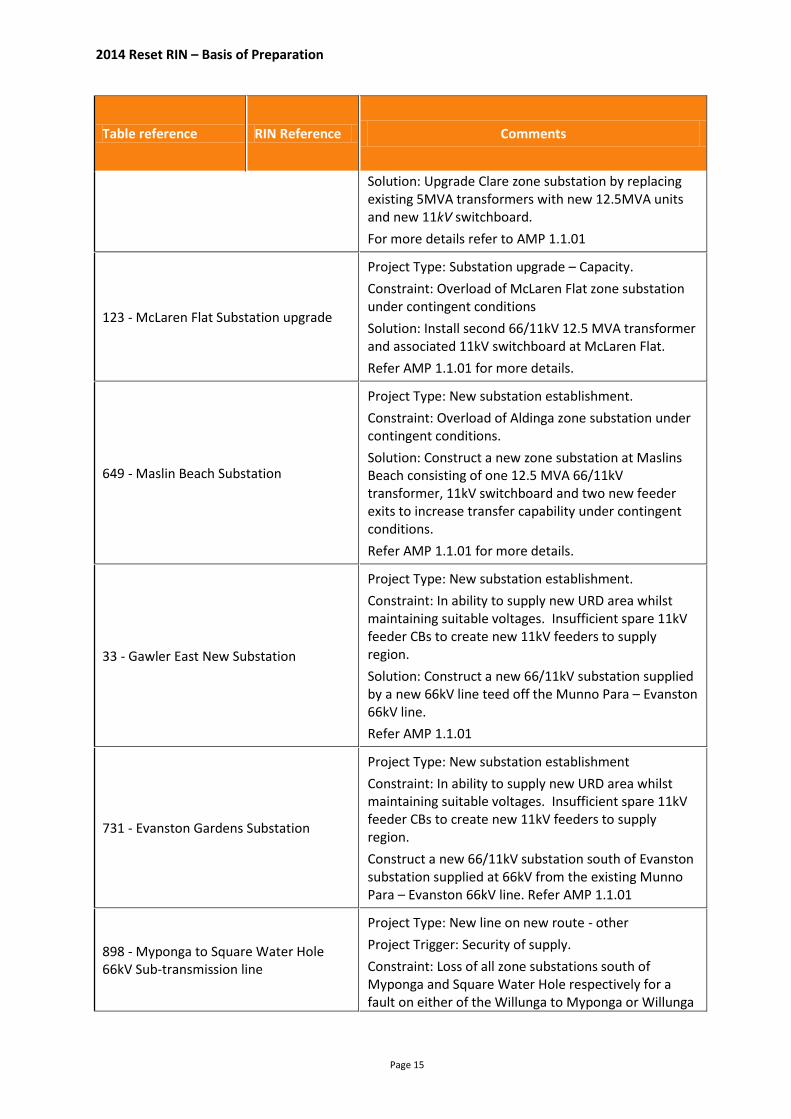
Table reference RIN Reference Comments
Solution: Upgrade Clare zone substation by replacing existing 5MVA transformers with new 12.5MVA units and new 11kV switchboard.
For more details refer to AMP 1.1.01
123 - McLaren Flat Substation upgrade
Project Type: Substation upgrade – Capacity.
Constraint: Overload of McLaren Flat zone substation under contingent conditions
Solution: Install second 66/11kV 12.5 MVA transformer and associated 11kV switchboard at McLaren Flat.
Refer AMP 1.1.01 for more details.
649 - Maslin Beach Substation
Project Type: New substation establishment.
Constraint: Overload of Aldinga zone substation under contingent conditions.
Solution: Construct a new zone substation at Maslins Beach consisting of one 12.5 MVA 66/11kV transformer, 11kV switchboard and two new feeder exits to increase transfer capability under contingent conditions.
Refer AMP 1.1.01 for more details.
33 - Gawler East New Substation
Project Type: New substation establishment.
Constraint: In ability to supply new URD area whilst maintaining suitable voltages. Insufficient spare 11kV feeder CBs to create new 11kV feeders to supply region.
Solution: Construct a new 66/11kV substation supplied by a new 66kV line teed off the Munno Para – Evanston 66kV line.
Refer AMP 1.1.01
731 - Evanston Gardens Substation
Project Type: New substation establishment
Constraint: In ability to supply new URD area whilst maintaining suitable voltages. Insufficient spare 11kV feeder CBs to create new 11kV feeders to supply region.
Construct a new 66/11kV substation south of Evanston substation supplied at 66kV from the existing Munno Para – Evanston 66kV line. Refer AMP 1.1.01
898 - Myponga to Square Water Hole 66kV Sub-transmission line
Project Type: New line on new route - other
Project Trigger: Security of supply.
Constraint: Loss of all zone substations south of Myponga and Square Water Hole respectively for a fault on either of the Willunga to Myponga or Willunga
2014 Reset RIN – Basis of Preparation
Page 16
Table reference RIN Reference Comments
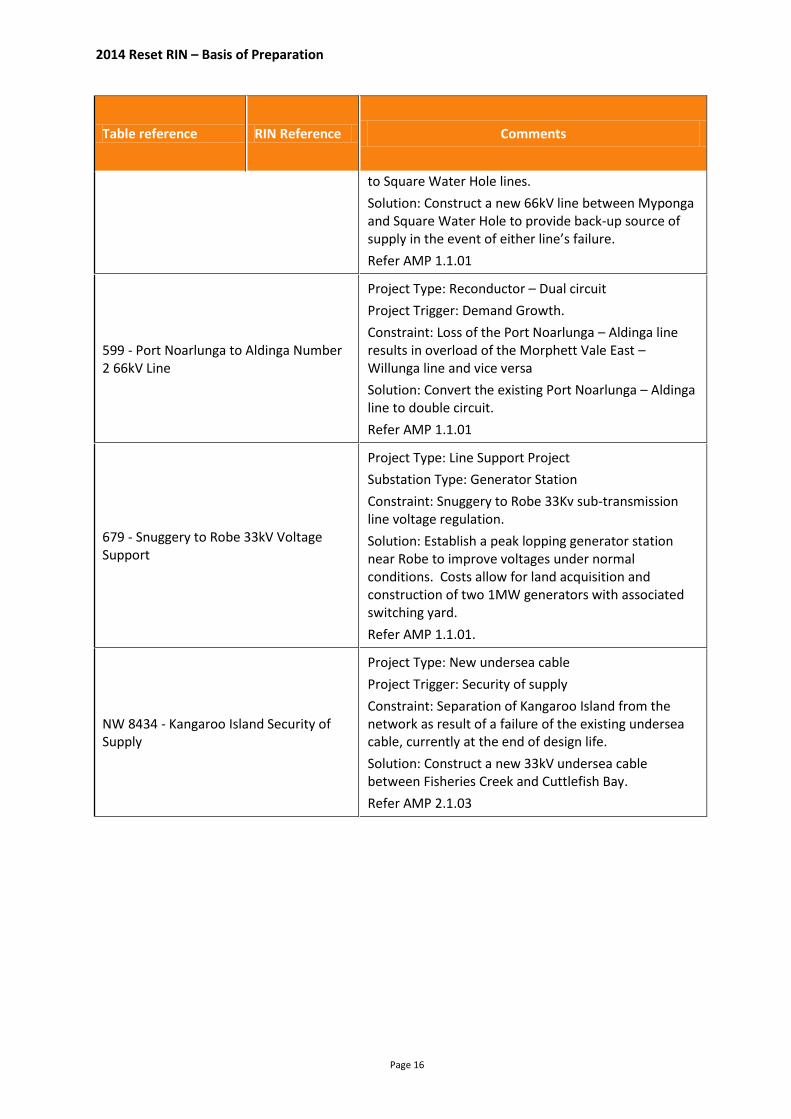
to Square Water Hole lines.
Solution: Construct a new 66kV line between Myponga and Square Water Hole to provide back-up source of supply in the event of either line’s failure.
Refer AMP 1.1.01
599 - Port Noarlunga to Aldinga Number 2 66kV Line
Project Type: Reconductor – Dual circuit
Project Trigger: Demand Growth.
Constraint: Loss of the Port Noarlunga – Aldinga line results in overload of the Morphett Vale East – Willunga line and vice versa
Solution: Convert the existing Port Noarlunga – Aldinga line to double circuit.
Refer AMP 1.1.01
679 - Snuggery to Robe 33kV Voltage Support
Project Type: Line Support Project
Substation Type: Generator Station
Constraint: Snuggery to Robe 33Kv sub-transmission line voltage regulation.
Solution: Establish a peak lopping generator station near Robe to improve voltages under normal conditions. Costs allow for land acquisition and construction of two 1MW generators with associated switching yard.
Refer AMP 1.1.01.
NW 8434 - Kangaroo Island Security of Supply
Project Type: New undersea cable
Project Trigger: Security of supply
Constraint: Separation of Kangaroo Island from the network as result of a failure of the existing undersea cable, currently at the end of design life.
Solution: Construct a new 33kV undersea cable between Fisheries Creek and Cuttlefish Bay.
Refer AMP 2.1.03
2014 Reset RIN – Basis of Preparation
Page 17
2 Table 2.4.1 – Augex Model Inputs – Sub-transmission Lines
2.1 General
RIN Section Compliance: Schedule 2, Appendix E – Section 7.2 Data Type: Non-Financial Data Source: Load Forecast / PSS/E Model Data Quality: Estimated Confidentiality: Partially Confidential Confidentiality Category: Personal information
2.2 Reason for Estimate
66kV sub-transmission lines SA Power Networks does not prepare 50% PoE weather corrected data for the purposes of planning its 66kV sub-transmission lines. Consequently, flows in meshed lines have been estimated using a network model scaled to the 50% PoE weather corrected connection point regional loads. Flows in radial lines have been estimated based on the 50% PoE loading of the single zone substation that the line supports. See methodology section for details. 33kV sub-transmission lines SA Power Networks does not prepare 50% PoE weather corrected data for its 33kV sub-transmission lines. Consequently, these have been estimated using peak SCADA data recorded for the summer 2013-14 and summer 2009-10 periods, where available. SCADA is unavailable on many country 33kV line segments servicing small zone substations. Consequently these have been estimated taking into account:
Upstream flows;
Available information on zone substation demand;
Quantity and location of direct connect 33/0.4 kV customers and small 33/11kV pole top zone substation transformers.
Where Amps are available from SCADA readings, but voltage readings are not available, then MW and MVA has been calculated using our best estimates of voltage and power factor based on:
Upstream values;
Nature of connected customers;
Consistency with measured values on other parts of the line or similar lines;
Nominal system values – eg a nominal operating voltage such as 33kV; and
The PF of the upstream connection point. Forecast growth rate SA Power Networks does NOT determine growth rates for its sub-transmission lines as the load in a line is not linearly dependent on the customer load connected to that line. Consequently, SA Power Networks is unable to comply with the AER’s request in section 7.2 (d) (i) and (ii) for a forecast maximum demand growth rate for sub-transmission lines as this information is not available. The relevant column within the RIN template has instead been populated with a homogenised growth rate dependent on the upstream connection point’s forecast 50% PoE growth between the years 2017/18 and 2019/20. The 2017/18 start year was chosen to avoid complications arising from forecast changes in demand from large individual customers and planned transfers of substations between connection points. It is important to recognise that this figure cannot be used to forecast actual demand in any sub-transmission line during the 2014-2020 period as this figure ignores:
2014 Reset RIN – Basis of Preparation
Page 18
Differences in diversity between zone substations;
Individual zone substation growth rates;
Non linear voltage effects;
Non linear sub-transmission line and transformer losses.
2.3 Reason for Confidentiality (if applicable)
Some data has been marked as confidential to preserve the privacy of individual direct connect customers, radially supplied by certain sub-transmission lines.
2.4 Assumptions
Sub-transmission line ratings 1. 66kV and 33kV sub-transmission lines are rated in accordance with QMS Procedure 638 -
Current Ratings for Overhead Conductors, Underground Cables and Busbars. Meshed 66kV sub-transmission lines 1. That peak flows on a meshed line occur at times of the region / meshed connection point
peak. That is to say, the individual diversity between zone substations is not material to the size of the flows between zone substations.
2. That changes in reactive power (VAr) flows in the network are not material to the MVA loading of a meshed line. These changes occur through operational changes in voltage levels maintained by ElectraNet at the connection point 66kV buses and by the switching in and out of large capacitor banks;
3. That differences in zone substation diversity between the 10%PoE and 50% PoE cases are not material. See section on methodology for details.
33kV sub-transmission lines 1. Where actual measured values are not available for MW and MVA but Amp readings are, the
voltage and power factor to enable the conversion of Amps to MVA and MW have assumed nominal values of 33kV for the voltage and the power factor measured at the upstream connection point transformers.
2. That the diversity between zone substations fed from the same 33kV line is limited; that is that all zone substations in the same geographical area peak at about the same time and that this corresponds to the peak recorded for the sub-transmission line supplying them. This allows load on a line to be allocated proportionally to the zone substation forecast.
2.5 Methodology
For each of the two periods (ie historic and future) the following steps were taken Ratings and line lengths 1. Extract the rating and lengths of each line (meshed and radial) from the respective line
databases that were current at the time of the summer in question. These databases are the master records used for by the Network Planning Department for planning purposes.
2. Ratings contained within these databases have been calculated according to Procedure 638. 3. Compare 2009/10 and 2013/14 records for differences including the creation or alteration in
configuration, line lengths and ratings. 4. Identify the cause of each difference identified. 5. Populate the table 2.4.1 with the determined information. Flows in 66kV sub-transmission lines 11. Scale each metro region within the PSS/E model of the network used for planning purposes for
the summer of interest to the 50% PoE weather adjusted loads.
2014 Reset RIN – Basis of Preparation
Page 19
12. Modify the status of transmission system connected or embedded generators to reflect ‘likely’ 50% PoE generation levels.
13. Modify the status of capacitor banks to achieve (where possible) the smallest positive reactive (VAr) inflow to the region as a whole and preferably at each connection point.
14. Rescale each metro region to match the 50% PoE weather adjusted loads to account for variations caused by changes in losses due to steps 2 and 3 above.
15. Manually enter the MVA and MW loads produced by the PSS/E model for each meshed sub-transmission line under ‘N’ conditions into table 2.4.1 of the RIN.
16. Compare model loads with the 50% PoE values for each zone substation supported by a radial line. Where different, enter the zone substation’s 50% PoE forecast load within the RIN.
Flows in 33kV sub-transmission lines 1. At each connection point exit, identify the time and date of the sub-transmission line’s peak
MW or Amp flow using recorded half hourly SCADA values, where these exist. 2. Convert any Amp readings to MW and MVA using either actual or estimated bus voltages and
estimated power factors. 3. Allocate flows along line according to actual recorded zone substation loads (where available),
the density of direct connect 33/0.4 kV customers and expected values of zone substation loads.
4. Note that the same basis of allocation has been applied to the 2009/10 values and the 2013/14 values for those lines where the network architecture is common to both sets of years.
5. Check the reasonableness of these estimates by comparing all MVAr and MW flows positive towards the end of line and similar sized zone substations having similar sized flows.
6. Compare 2009/10 and 2013/14 values for significant differences and explain cause. For instance the introduction of a new connection point changing network flows.
7. Manually enter line flows into table 2.4.1. Forecast growth percentage 1. Calculate the homogenised forecast growth rate for each connection point using the Non Co-
Incident, Reconciled 50% PoE forecast values for the period between 2017/18 and 2019/20. 2. Apply this rate to all sub-transmission lines originating from that connection point.
2.6 Additional Comments
New Lines A new line is may represent a line constructed directly between two zone substations or teed off an existing line to create a new three ended line. Where a line has been converted from a two ended line to a three ended line during the period, the former two ended line has been marked as non existent by changing its length, ratings and flows to zeros in 2013/14 and new lines with the revised origin / destination added. Three and Four ended Lines Three and four ended lines are split into two ended segments by identifying one point in the line as a “Tee” point. For instance a line between zone substations A, B and C would appear as three segments:
A to Tee
B to Tee
C to Tee. Note that the point “Tee” is not a substation and will therefore not appear in table 2.4.3. Voltage level

2014 Reset RIN – Basis of Preparation
Page 20
SA Power Networks has historically used 33kV as a sub-transmission voltage both within and outside of the Adelaide metropolitan area. Consequently, the RIN instruction that sub-transmission lines are only to be considered as being those with an operating voltage “higher than 33kV” has been ignored. This is consistent with our treatment within other RIN submissions and the NER definition of sub-transmission. Line Flow Comparisons When examining the data provided within Table 2.4.1, it is important that the AER does not simply compare line flows in 2009/10 to those in 2013/14 and draw conclusions regarding possible augmentation needs. Reduced or increased line flows, particularly within the meshed networks can change markedly through the introduction of new lines, changes is generation patterns or permanent load transfers. In addition, the sub-transmission networks are planned against a 10% PoE demand rather than 50% PoE which again can be affected by the different generation patterns at these differing PoE levels while the meshed network is planned based on line flows under contingent conditions (ie N-1) rather than normal conditions (ie N) as provided within table 2.4.1 of the RIN.
2014 Reset RIN – Basis of Preparation
Page 21
3 Table 2.4.2 – Augex Model Inputs – High Voltage Feeders
3.1 General
RIN Section Compliance: Schedule 2, Appendix E – Section 7.3 Data Type: Non-Financial Data Source: GIS Click here to enter text. Data Quality: Estimated Confidentiality: Partially Confidential Confidentiality Category: Personal information
3.2 Reason for Estimate
Route line lengths are based on GIS extractions from 30 June 2014 and 30 April 2010 respectively. Retrospective GIS data was not available for 30 June 2010. Weather corrected 50% PoE maximum demand for 2013/14 and 2009/10 is based on historic values where the absence of SCADA or other demand logging equipment has lead to the availability of limited records. Retrospective thermal ratings directly reflect the 2013/14 values.
3.3 Reason for Confidentiality
Several feeders are dedicated to a specific customer who could be readily identified from the information provided.
3.4 Assumptions
1. For double banked feeders (ie two feeder exits supplied from a common CB), where only the total length of both feeders was available (ie identified with the same feeder ID prefix), the total length was equally apportioned to each feeder. If one of the feeders did not exist in a given year it was assigned a zero length.
2. Where actual demand data was only available in Amps, the MW and MVA values have been determined assuming nominal voltage and using the power factor of the originating zone substation at the time of peak demand and the reactive power (MVAr), adjusted to negate the affect of capacitor banks at the zone substation level, where installed. The power factor of the upstream connection point was used if a value for the zone substation was not available.
3. Where operational ratings are greater than thermal ratings, SA Power Networks generally uses the lower of the two.
4. Normal conditions for operating HV Feeders and other networks segments are described in QMS Procedure 630.
5. The average forecast growth rate of dedicated single customer feeders between 2013/14 and 2019/20 has been assumed to be zero as any demand increase would be subject to negotiation with the customer concerned.
6. All dedicated single customer feeders used only for backup of another primary dedicated feeder have been excluded from the reported values.
3.5 Methodology
Below is a summary of the steps used to compile the information on the SA Power Networks’ HV feeders into the form specified within the RIN.
2014 Reset RIN – Basis of Preparation
Page 22
1. Each feeder ID was extracted directly from SA Power Networks’ internal feeder forecasts (consisting of three regional zones: country, metropolitan and CBD). The originating substation for each feeder was also obtained from here.
2. An extract from GIS as of 30 June 2014 provided the feeder classification (ie urban, rural short etc) and nominal voltage directly. A summation of each feeder’s underground cable and overhead conductor lengths, also contained within the GIS extraction, provided the 2013/14 route feeder length. Note the above assumption applicable to some double banked CBD feeders.
3. The same process using a GIS extraction from 30 April 2010 was used to provide the 2009/10 route line length. Again, note the assumption applicable to some double banked CBD feeders.
4. The 2013/14 “operational” rating (in MVA, as specified in the RIN) was calculated using the feeder’s normal Ampere rating determined in accordance with SA Power Networks’ Procedures 630 and 638 for the applicable regional zone. The same “operational” rating was used for 2009/10. These Ampere ratings were converted to MVA based on the feeder’s nominal voltage.
5. The 2013/14 thermal rating (in MVA, as specified in the RIN) was calculated using the individual Ampere rating and nominal voltage from the aforementioned feeder forecasts. For more details on the calculation of HV feeder ratings refer to QMS Procedure 638.
6. The calculated 2013/14 thermal rating was reused for the 2009/10 value if during this period the rating had been updated without any infrastructure change. Such instances arose where updated data was obtained (eg conductor or design temperature data) which altered the rating previously determined. Alternatively, the rating was obtained from the Ampere rating in SA Power Networks’ 2010 internal feeder forecast.
7. For sites where SCADA is available, actual recorded Ampere values (ie raw, unadjusted), were used to calculate the 2013/14 and 2009/10 maximum demand. In the absence of SCADA, the 2013/14 maximum demand was populated using the 50% PoE forecast. The 2009/10 forecast consisted of only peak Ampere values, consequently, the 2009/10 maximum demand was calculated by scaling the 2013/14 actual demand by the 50% PoE forecast to obtain a ratio of actual to 50% PoE which was then applied to the 2009/10 actual values to arrive at a 50% PoE value in 2009/10 for the originating zone substation.
8. The average forecast growth rate of the originating zone substation for the 2013/14 to 2019/20 period provided by SA Power Networks’ load forecasting tool was applied to each feeder emanating from the relevant zone substation with the exception of those feeders dedicated to specific customers.
9. Any feeder that did not exist in 2009/10 was blacked out in accordance with the RIN notice.
3.6 Additional Comments
Feeder Demand Comparisons When examining the historic feeder demands provided within Table 2.4.2, caution should be exercised by the AER in arriving at any conclusions regarding demand trends through the direct comparison of historic demand levels. Reduced or increased feeder demands, can change markedly between periods through the introduction of new feeders, permanent load transfers, the introduction or operation of embedded generation and PV generation.
2014 Reset RIN – Basis of Preparation
Page 23
4 Table 2.4.3 – Augex Model Inputs –Sub-transmission Substations, Sub-transmission Switching Stations and Zone Substations
4.1 General
RIN Section Compliance: Schedule 2, Appendix E – Section 7.4 Data Type: Non-Financial Data Source: Substation Load v Capacity Databases Data Quality: Estimated Confidentiality: Partially Confidential Confidentiality Category: Personal information
4.2 Reason for Estimate (if applicable)
Substation weather corrected 50% PoE maximum demands for 2009/10 for those substations where SCADA does not exist are based on forecast values derived from temporary logging equipment installed at the site on a rotational basis. Retrospective and predicted substation growth rates have been estimated using the respective upstream connection point for those sites where SCADA does not exist.
4.3 Reason for Confidentiality (if applicable)
Several zone substations are dedicated to customers whose identities are apparent from the information provided or essential services are supplied where network security could be jeopardised with the release of the included information.
4.4 Assumptions
1. The substation ID format is consistent with those contained in Table 5.4 of this RIN and previous RIN submissions.
2. The normal cyclic ratings of SA Power Networks’ substation transformers are determined according with QMS Procedure 634.
3. In accordance with SA Power Networks’ planning criteria (QMS Procedure 630), the substation’s normal cyclic rating is equal to the total TF normal cyclic rating unless limited by switchgear or cables / connections between the TFs and the switchgear. The ratings provided account for those substations where the load is not shared equally by the transformers and is not simply the arithmetic sum of the individual transformer capacities.
4. Where actual data was only available in Amperes, the MVA and MW demands have been determined using the power factor of the upstream connection point and assuming nominal voltage.
5. For sites without SCADA, the 50% PoE and maximum demand (MD) forecasts have been derived from temporary logging equipment installed at the site on a rotational basis. In the absence of a 2009/10 50% PoE forecast, the 2013/14 MD was interpolated using the growth of the upstream connection point over this period to arrive at a value for 2009/10. Where the connection point data could not be used then a zero growth rate was assumed.
6. A specific TF ONAN nameplate rating was included (if available) and different to the ONAF/ODAF nameplate rating.
7. The growth rate of the upstream connection point was used for substations where there was no 50% PoE forecast available for 2009/10.
2014 Reset RIN – Basis of Preparation
Page 24
8. The average forecast growth rate of single customer dedicated substations between 2013/14 and 2019/20 has been assumed to be zero. Any demand increase requiring zone substation augmentation would be undertaken following negotiation with the relevant customer.
9. For consistency and comparability with the DAPR, all substations consisting of transformers with different nameplate ratings (including ONAN) are reported as the product of the number of transformers and the lowest individual transformer rating.
4.5 Methodology
The following process was used to compile the summary of SA Power Networks’ substations into the format required by the RIN template. 1. The following attributes were extracted directly from SA Power Networks’ 2013/14 Substation
Load v Capacity records and represent values as of 30 June 2014:
Substation ID;
Primary and secondary voltage;
Number of transformers;
In service TF nameplate rating;
Total TF normal cyclic rating and substation normal cyclic rating; and
N-1 emergency rating. 2. The 50% PoE weather corrected 2013/14 and 2009/10 maximum demands (MVA and MW)
were acquired from the SA Power Networks’ load forecasting tool for all SCADA enabled substations. For all other (non SCADA) sites, the 50% PoE forecast (MVA) from the 2013/14 Substation Load v Capacity records was used as described in assumption (5) above.
3. The Substation Load v Capacity records from 2009/10 directly provided the other required data as at 30 June 2010:
Number of transformers;
In service TF nameplate rating;
Total TF normal cyclic rating and substation normal cyclic rating; and
N-1 emergency rating. 4. The TF ONAN nameplate rating was determined directly from SA Power Networks’ internal
transformer database (as of 30 June 2014 and 30 June 2010 respectively) if satisfying the assumed criteria.
5. The area classification primarily supplied by each substation is as previously supplied in table 2.4.2.
6. The average 50% PoE growth rate for period between 2013/14 and 2019/20 as provided in the load forecast tool was used for each substation, excluding dedicated customer zone substations.
7. Any substation that did not exist in 2009/10 was blacked out in accordance with RIN Notice.
4.6 Additional Comments
Substation Demand Comparisons When examining the historic substation demands provided within Table 2.4.3, caution should be exercised by the AER in arriving at any conclusions regarding demand trends through the direct comparison of historic demand levels. Reduced or increased substation demands, can change markedly between periods through the introduction of new feeders, permanent load transfers, introduction or operation of embedded generation, PV generation and the introduction or operation of capacitor banks.
2014 Reset RIN – Basis of Preparation
Page 25
5 Table 2.4.4 – Augex Model Inputs - Distribution Substations
5.1 General
RIN Section Compliance: Schedule 2, Appendix E – Section 7.5 Data Type: Non-Financial Data Source: OMS / GIS, SAP Data Quality: Actual and Estimated Confidentiality: Non-confidential Confidentiality Category: Not Applicable
5.2 Reason for Estimate (if applicable)
1. Actual transformer test values are used where available. 2. Transformer utilisation values are estimated based on the product of the actual number of
customers supplied by each distribution transformer and the estimated ADMD, for each transformer based on location or customer type.
3. Recorded load values have been scaled a multiplying factor, (K-Factor), to estimate the peak transformer demand.
4. All ADMD values are estimated.
5.3 Reason for Confidentiality (if applicable)
Not applicable
5.4 Assumptions
1. SA Power Networks have assumed that the AER has requested the aggregate of the ratings in the utilisation bands provided. As such MVA have been provided.
2. All distribution transformer ratings and subsequent utilisation values have been based on nameplate ratings. SA Power Networks does not keep cyclic ratings for distribution transformers and therefore uses nameplate ratings as the most accurate data available. Transformer installations are too geographically diverse to rely on cyclic ratings calculated from test data.
3. On average, SA Power Networks tests over 1,400 transformers per year. Augmentations are considered by applying test results to the distribution transformer planning criteria (100% (nameplate rating) for ground mounted transformers and 130% nameplate for pole mounted transformers). Refer to Distribution System Planning Report (AMP 1.1.01) for details on the planning criteria & ratings applied for distribution transformers.
4. The average After Diversity Maximum Demand (ADMD) for residential customers of 3kVA has been calculated from transformer test results, taking into account factors such as PV generation contribution at peak demand times.
5. Data for 2009-10 has been estimated from the 2013-14 data and the estimated MVA added during the period 2009-10 to 20013-14.
6. All distribution transformers supplying single customers have been excluded from the analysis as any load increase on these assets should be subject to negotiations between SA Power Networks and the customer.
7. No change in the demand for distribution transformers in the current period in the forecast period.
5.5 Methodology
2013-14 Transformer Population Aggregate of the normal cyclic ratings of all individual distribution substations in the distribution substation category that were within the categorised utilisation bands:
2014 Reset RIN – Basis of Preparation
Page 26
1. Allocate distribution transformers in 2013-14 obtained from SA Power Networks’ OMS/GIS and
SAP databases into distribution substation categories (ie CBD, urban, rural short etc) and remove all distribution substations supplying only one customer (or less).
2. Sort the data by transformer type (ie pole or pad-mounted). 3. Calculate the normal transformer loading (kVA) based on the product of number of customers
connected to TF x ADMD per customer. 4. Transformer testing records were consulted to use actual loading data multiplied by a K-Factor,
where test data was available. 5. Where the ADMD (based on measurements) was not known, an ADMD of 3kVA per customer
was assumed. 6. Each transformer’s utilisation was then determined by dividing the transformer’s calculated
load by its nameplate rating. 7. The transformers were then sorted from (low to high) by utilisation level and segmented into
utilisation bands of 20% increments from 0% to 200%. 8. The nameplate rating (kVA) of each transformer within each utilisation band was summated
and entered against the relevant utilisation band within table 2.4.4 of the RIN. 2009-10 Transformer Population Aggregate of the normal cyclic ratings of all individual distribution substations in the distribution substation category that were within the categorised utilisation bands:
1. Commencing with the data as at 2013-14, calculate the proportion of each network segments aggregate MVA over the total aggregated MVA for poles and pad transformers.
2. Apportion the MVA added for the period 2009-10 to 2012-13 for poles and pads and subtract from the 2013-14 network segment data.
3. Calculate the proportion of MVA per utilisation band in each network segment and apply to the 2009-10 network segment totals in 2 above.
Aggregate of the normal cyclic ratings of all individual distribution substations in the distribution substation category 1. The aggregated nameplate capacities (kVA) in each asset category (ie CBD, urban etc) were
summated to arrive at the total installed capacity (MVA) for that distribution substation category.
Average per annum growth rate in annual substation maximum demand (50% PoE) from 2013-14 to 2019-20 1. The AEMO forecast at the State wide level is for the growth rate to be flat (ie the combination
of all transformer area growth rates (positive, zero and negative) aggregate to a zero growth rate for the next 20 years).
2. As such, in order for the Augex model to produce sensible results, SA Power Networks assumed the smallest positive growth rate of 0.1% per annum for all distribution substation assets.
3. Data provided is an average of the HV Feeder growth rates for the applicable network segment.
5.6 Additional Comments
Not Applicable
2014 Reset RIN – Basis of Preparation
Page 27
6 Table 2.4.5 – Augex Model – Segment Data
6.1 General
RIN Section Compliance: Schedule 2, Appendix E – Section 7.6 Data Type: Non-Financial Data Source: Augex Model, Historical demand forecasts, other tables in RIN 2.4 Data Quality: Estimated Confidentiality: Non-confidential Confidentiality Category: Not Applicable
6.2 Reason for Estimate (if applicable)
Segment Data in table 2.4.5 is estimated due to the nature of the aggregation of the network segments, the averaging used and the manipulation of data to fit the Augex model’s inherent assumptions, particularly those related to the ability to specify a “utilisation threshold” value at which augmentations should occur and the model’s inability to cater for zero growth rates. The source for many parameters used in table 2.4.5 are based on forecast demand and future asset ratings.
6.3 Assumptions
Assumptions used in preparation of the parameters in table 2.4.5
Historical Segment Data
1. No definition of “Historic” data exists. SA Power Networks’ assumption here is that historical data represents the previous 5 year period.
2. A change in the rating of an element within a given network segment is assumed to represent an augmentation. For instance, a change in the nameplate rating of a zone substation over the period indicates that some form of augmentation has taken place to increase capacity.
3. Where a change in an asset’s rating occurs, it is assumed that demand has equalled or exceeded the relevant utilisation threshold for that network element. Therefore, any increase in the rating has been taken as the amount of additional capacity installed over the immediate demand at that point in time.
4. The utilisation constraint point will be the maximum utilisation over the period. The assumption here is that utilisation will increase over time until a point at which an augmentation takes place. After augmentation, the utilisation will decrease, then increase over time until it reaches that utilisation point where augmentation is again required. Where SA Power Networks has performed load transfers to momentarily defer overloads prior to augmentation, the highest utilisation recorded prior to the augmentation has been used in determining the utilisation threshold.
5. Where SA Power Networks planning criteria does not use a 50% PoE forecast for augmentation, the utilisation mean has been adjusted to approximate a 10% PoE
Forecast Segment Data
1. In general, historical utilisation threshold parameters cannot be used for forecast augmentation modelling as SA Power Networks has revised its planning criteria based on the adoption of 10% and 50% PoE demand forecasting methodology. Refer AMP 1.1.01 for further details.
2. It is assumed that demand will equal or exceed the relevant utilisation threshold for a network element prior to any network augmentation. Therefore, the increase in the rating of a network element is taken as the amount of additional capacity installed over the immediate demand at that point in time.
3. SA Power Networks’ planning criteria uses a combination of 10% PoE and 50% PoE forecasts under N and N-1 scenarios with varying levels of risk (measured in MVA) and requirements for restoration times (refer AMP 1.1.01 section 2.4). Augmentation trigger points therefore vary for
2014 Reset RIN – Basis of Preparation
Page 28
those elements within a network segment and aggregation into broad network segments under a 50% PoE is therefore approximate. Determination of constraint timing and planning for augmentation will involve the comparison of individual network elements against that element’s particular load according to the planning criteria.
4. SA Power Networks has used the forecast demand and ratings data from Reset RIN tab 2.4 (tables 2.4.1 to 2.4.4) to construct the forecast segment parameters.
5. SA Power Networks’ planning criteria represents the utilisation threshold at which a network element requires augmentation. The use of a small standard deviation ensures that relevant thresholds are not breached and capacity is added when required.
6.4 Methodology
Historical Segment Data
Refer to 6.3 Assumptions above.
1. Average unit cost of augmentation for the network segment for the next regulatory control period. Note: SA Power Networks has assumed that the Historical average unit cost should reflect historical costs per MVA and not the forecast costs per MVA as it is labelled.
a. The average unit cost for each segment group is sourced from the historic values contained within table 2.4.6. Historic unit cost data for each AER segment group has been calculated from the capex spend and MVA added for those NSP-initiated and capacity related augmentations over the 2013-2015 period.
b. The average unit cost for each segment group has then been applied to each network segment in that group.
2. Capacity Factor for the period
The Capacity Factor defines the amount of additional capacity that is added to the relevant network segment1 at time of augmentation.
For each element in each network segment:
a. Obtain the normal summer rating (or name plate rating) of the element in the segment over the period 2009-2013.
b. Calculate the change in the rating over the period.
c. Calculate the capacity factor, as a percentage, as the absolute amount of the change to the rating over the period. That is, the amount of the change over the existing rating for the period.
d. Calculate the mean capacity factor for the network segment.
3. Mean value of the utilisation threshold for the period
The utilisation threshold defines the utilisation limit when augmentation must occur2.
For each element in each network segment:
a. Where a network element has been identified as augmented in 2 above, obtain the utilisation of that network element in the year prior to augmentation.
b. Calculate the mean utilisation for the network segment.
c. Apply a multiplier to approximate the network segment utilisation mean under a 50%PoE demand forecast.
4. Standard deviation of the utilisation threshold for the period
For each element in each network segment:
1 AER augmentation model handbook p.21 2 ibid
2014 Reset RIN – Basis of Preparation
Page 29
a. Where a network element has been identified as augmented in 2 above, obtain the utilisation of that network element just prior to augmentation.
b. Calculate the standard deviation of the network segment using the STDEV function within Excel.
Forecast Segment Data
Refer to 6.3 Assumptions above.
1. The average unit cost of augmentation for each network segment for the next regulatory control period
a. The average unit cost for each segment group is sourced from table 2.4.6. Forecast unit cost data for each AER segment group has been calculated from the forecast capex spend and MVA capacity added for NSP-initiated capacity related augmentations over the 2015-16 to 2019-2020 period.
b. The average unit cost for each segment group has then been applied to each network segment in that group.
2. Capacity Factor for the period
a. Capacity factors for each network element have been calculated by averaging the standard increase in capacity due to typical augmentation projects. For instance, if the standard pole top transformer sizes in service are 100, 200 and 315 kVA and on augmentation they would typically be replaced with 200, 315 or a second transformer at 200 kVA, then the average capacity factor for that network segment for planning purposes would be 1.58. Capacity factors provided for the forecast model represent average increments in the standard sizes of major equipment used to plan an augmentation to a network element.
3. Mean value of the utilisation threshold for the period
a. SA Power Networks has approximated what the standard planning parameters for utilisation thresholds would be under a 50% PoE forecast for all network segments. These parameters have been added to table 2.4.5. It should be noted that SA Power Networks uses the 10% PoE forecast in planning its connection point substations, sub-transmission lines and zone substations under normal conditions.
4. Standard deviation of the utilisation threshold for the period
a. SA Power Networks has selected a standard deviation of 0.1% to best represent that the utilisation threshold values submitted are the trigger points and actual threshold for augmentation of the relevant network segment. For the applicable planning criteria please refer to Section 2.4 of AMP 1.1.01.
6.5 Additional Comments
Table reference
RIN reference
Comments
2.4 Augex model
7.6(a) SA Power Networks has entered a row for each network segment and completed table with the required parameters.
7.6 (b)-(i) SA Power Networks has defined network segments based on the guidance document AER augmentation model handbook, November 2013. The network segments chosen represent broad categories of substations, lines and distribution substations to ensure large number of samples and to match, as close as possible, the group
2014 Reset RIN – Basis of Preparation
Page 30
Table reference
RIN reference
Comments
segments provided by the AER. The network segments are:
Sub-transmission lines – radial;
Sub-transmission lines – meshed;
Sub-transmission lines – CBD;
Sub-transmission substations (ie 66/33kV);
Zone substations – Urban;
Zone substations – Rural;
Distribution Feeders – CBD;
Distribution Feeders – Urban
Distribution Feeders – Short Rural;
Distribution Feeders – Long Rural;
Distribution Substations – CBD;
Distribution Substations – Urban Pole;
Distribution Substations – Urban Pad;
Distribution Substations – Short Rural;
Distribution Substations – Long Rural.
Sub-transmission Lines – Radial These assets reside within the AER’s segment group of Sub-transmission lines. Sub-transmission Lines – Radial are bounded by sub-transmission and zone substations. Country 66kV and 33kV sub-transmission lines are predominantly radial systems, designed to carry normal loads under 10% PoE conditions. They are not designed to provide N-1 backup as most lines are radial in nature and consist of overhead construction, with a repair time generally of up to 12 to 24 hours. Radial sub-transmission lines differ in their topology, loading, length and planning criteria from other sub-transmission lines so a separate network segment was created to capture the differences. The Planning criteria applied to radial sub-transmission lines are: Scenario: N Forecast basis: 10%PoE Outages: Supplies may be interrupted for a single line outage, but all should be restorable, at 10% PoE demand, within 12 hours. May be achieved by repair, or transfer of load to adjoining substations, without causing any other line or transformer to be loaded above emergency rating (contingency plans to be prepared if line contains cable, with preparatory work if required). Consideration will be given to the construction of a second line when the load exceeds 30 MVA according to the 10% PoE forecast or where the performance of a RIT-D indicates a positive net market benefit of the de-radialisation.
Sub-transmission lines – Meshed
2014 Reset RIN – Basis of Preparation
Page 31
Table reference
RIN reference
Comments
These assets reside within the AER’s segment group of Sub-transmission lines. Meshed sub-transmission lines are typically located in metropolitan Adelaide. The metropolitan 66kV sub-transmission network consists of four islanded 66kV meshed systems that distribute the customer demand from ElectraNet’s connection points to metropolitan zone substations. Rural meshed 66 and 33kV sub-transmission lines are planned to the N-1 standard as per the metropolitan area. Meshed sub-transmission lines differ in their topology, loading, length and planning criteria from radial sub-transmission lines in their planning methodology. As such, a separate network segment was created to capture the differences. The Planning criteria applied to meshed subtransmission lines are: Scenario: N Forecast basis: 10% PoE Outages: No supplies interrupted for a single line outage at 10% PoE demand (excludes substations teed off a line and substations without line circuit breakers). And Scenario: N-1 Forecast Basis: 10% PoE Outages: No sub-transmission line loaded above emergency rating and no transmission connection point transformer above normal rating, as a consequence of a line fault.
Sub-transmission Lines – CBD These assets reside within the AER’s segment group of Sub-transmission lines. The Adelaide Central Region (ACR) was created by ESCOSA under the ETC to define the area containing the Adelaide CBD (it should be noted that the area defined as CBD for the purposes of reliability reporting differs from that of the ACR). From a sub-transmission perspective, this region is not independently planned as it is contained within the larger Metro East region. However, it is categorised separately at connection point level according to the ETC as its importance to the State warrants separation. The planning criteria for these lines are: Scenario: N Forecast basis: 10% PoE Outages: No supplies interrupted for a single line outage at 10% PoE demand. And Scenario: N-1 Forecast basis: 10% PoE Outages: No sub-transmission line loaded above emergency rating and no
2014 Reset RIN – Basis of Preparation
Page 32
Table reference
RIN reference
Comments
transmission connection point transformer above normal rating, as a consequence.
Sub-transmission and zone substations AER segment group is Sub-transmission substations. SA Power Networks in accordance with the RIN’s definitions has defined sub-transmission substations as those operating at 66/33 kV. Bulk supply points (aka connection points) with the transmission system have been omitted. Zone substations – Urban (AER segment group is zone substations) typically supply metropolitan Adelaide or regional centres while zone substations – rural (AER segment group is zone substations) supply other areas. Separate network segments were created to match the AER segment groups and to reflect the differences between rural and metropolitan Adelaide zone substations. For those substations supplying the CBD, the planning criteria are: Scenario: N Forecast basis: 10% PoE Outages: No supplies interrupted for a single transformer outage at 10% PoE demand. And Scenario: N-1 Forecast basis: 10% PoE Outages: No other transformer loaded above emergency rating as a consequence.
For other sub-transmission substations and zone substations, the planning criteria depends on the type of customers and the size of the load serviced. The planning criteria for specific major zone substations are: Scenario: N Forecast basis: 10% PoE Outages: No supplies interrupted for a single transformer outage at 50% PoE demand. And Scenario: N-1 Forecast basis: 10% PoE Outages: No other transformer loaded above emergency rating as a consequence. The planning criteria for substations supplying major industrial customers or critical commercial load regions, or where supply cannot be restored within 12 hours and substations where the
2014 Reset RIN – Basis of Preparation
Page 33
Table reference
RIN reference
Comments
mobile substation can’t be used are: Scenario: N Forecast basis: 10% PoE And Scenario N-1 (including feeder transfers) Forecast basis: 50% PoE Outages: Supplies may be interrupted for a single transformer outage, but all should be restorable following transfer of load to adjoining substations, at 50% PoE demand, without causing any equipment to be loaded above emergency rating.
The planning criteria for all other zone substations are: Scenario: N Forecast basis: 10% PoE And Scenario N-1 (including feeder transfers and allowing a 3MVA risk margin) Forecast basis: 50% PoE Outages: Supplies may be interrupted for a single transformer outage, but all should be restorable following transfer of load to adjoining substations and installation of a mobile substation, at 50% PoE, without causing any equipment to be loaded above emergency rating. Full supply to be restored within 24 hours.
Distribution Feeders – CBD AER segment Group is distribution feeders - CBD. The service area for distribution feeders – CBD is the Adelaide Central Region as defined in the ETC. Feeders supplying the CBD are operated at 11kV. The network segments that bound distribution feeders – CBD are zone substations – urban and CBD based sub-transmission substations. A separate network segment was selected to match the AER segment group. The planning criteria are: Scenario: N Forecast basis: 10% PoE And Scenario: N-1 (continuous) Forecast basis: 10% PoE Outage: No supplies interrupted for a single transformer outage at 10% PoE demand. No other transformer loaded above emergency rating as a consequence.
2014 Reset RIN – Basis of Preparation
Page 34
Table reference
RIN reference
Comments
Distribution Feeders – Urban AER segment Group is distribution feeders – urban. Urban feeders typically supply metropolitan Adelaide. The network segments that bound distribution feeders – urban are zone substations – urban. A separate network segment was selected to match the AER segment group. Their planning criteria are: Scenario: N Forecast basis: 50% PoE And Scenario: N-1 (including feeder transfers) Forecast basis: 50% PoE Outage: Supplies may be interrupted for a single feeder outage, but all should be restorable following transfer of load to adjoining substations, at 50% PoE demand, without causing any equipment to be loaded above emergency rating.
Distribution Feeders – Rural (short and long) AER segment Group is distribution feeders – Short Rural and distribution feeders – long rural. The network segments that bound distribution feeders – rural (short and long) are zone substations – urban. A separate network segment was selected to match the AER segment group. For distribution feeders (both rural short and rural long) the planning criteria are: Scenario: N Forecast basis: 50% PoE And Scenario: N-1 (including feeder transfers) Forecast basis: 50% PoE Outage: Supplies may be interrupted for a single feeder outage, but all should be restorable following transfer of loads (where available) to adjoining substations at 50% PoE, without causing any equipment to be loaded above emergency rating. Full supply to be restored generally within 12 hours.
Distribution Substations Distribution substations convert the voltage from HV to LV and may be connected to SA Power Networks’ network at 33kV, 19kV, 11kV or 7.6kV. The secondary voltage of the distribution substation may be either 400V (three-phase), 460V (single phase) or 230V (single-phase) and can supply either single customers or a low-voltage mains system from which multiple customers may be connected. Mostly the networks are selected to match the AER segment groups
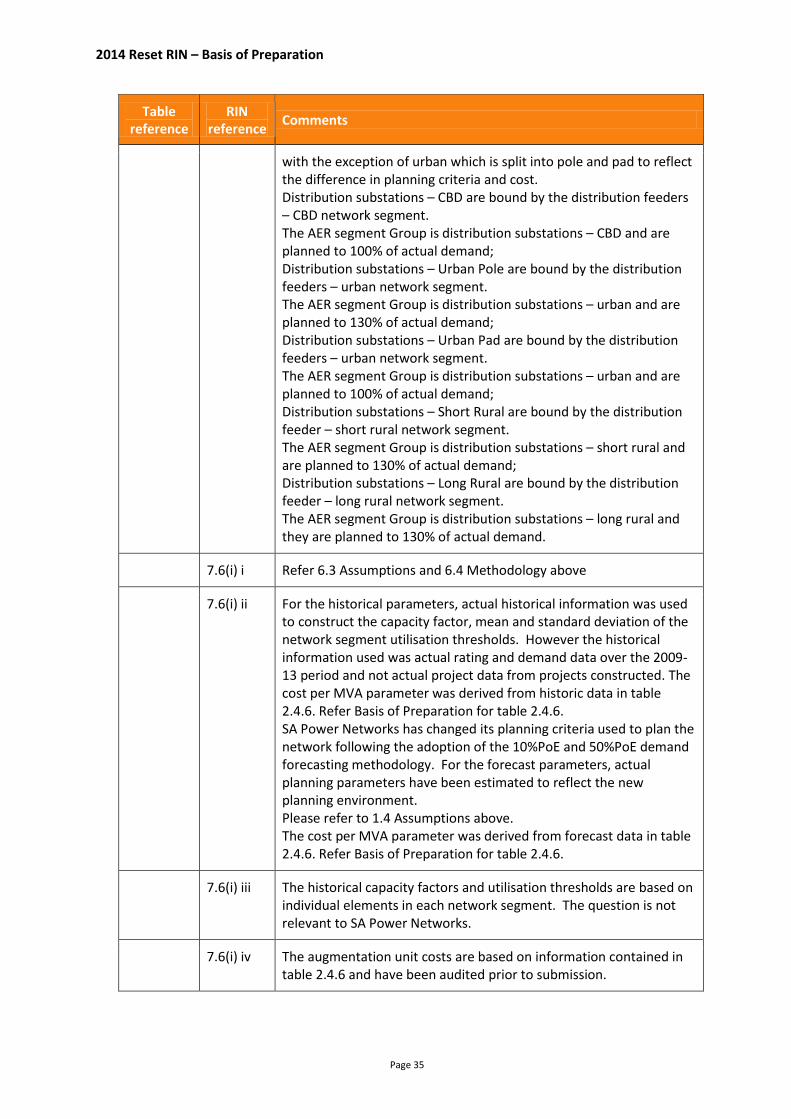
2014 Reset RIN – Basis of Preparation
Page 35
Table reference
RIN reference
Comments
with the exception of urban which is split into pole and pad to reflect the difference in planning criteria and cost. Distribution substations – CBD are bound by the distribution feeders – CBD network segment. The AER segment Group is distribution substations – CBD and are planned to 100% of actual demand; Distribution substations – Urban Pole are bound by the distribution feeders – urban network segment. The AER segment Group is distribution substations – urban and are planned to 130% of actual demand; Distribution substations – Urban Pad are bound by the distribution feeders – urban network segment. The AER segment Group is distribution substations – urban and are planned to 100% of actual demand; Distribution substations – Short Rural are bound by the distribution feeder – short rural network segment. The AER segment Group is distribution substations – short rural and are planned to 130% of actual demand; Distribution substations – Long Rural are bound by the distribution feeder – long rural network segment. The AER segment Group is distribution substations – long rural and they are planned to 130% of actual demand.
7.6(i) i Refer 6.3 Assumptions and 6.4 Methodology above
7.6(i) ii For the historical parameters, actual historical information was used to construct the capacity factor, mean and standard deviation of the network segment utilisation thresholds. However the historical information used was actual rating and demand data over the 2009-13 period and not actual project data from projects constructed. The cost per MVA parameter was derived from historic data in table 2.4.6. Refer Basis of Preparation for table 2.4.6. SA Power Networks has changed its planning criteria used to plan the network following the adoption of the 10%PoE and 50%PoE demand forecasting methodology. For the forecast parameters, actual planning parameters have been estimated to reflect the new planning environment. Please refer to 1.4 Assumptions above. The cost per MVA parameter was derived from forecast data in table 2.4.6. Refer Basis of Preparation for table 2.4.6.
7.6(i) iii The historical capacity factors and utilisation thresholds are based on individual elements in each network segment. The question is not relevant to SA Power Networks.
7.6(i) iv The augmentation unit costs are based on information contained in table 2.4.6 and have been audited prior to submission.

2014 Reset RIN – Basis of Preparation
Page 36
Table reference
RIN reference
Comments
7.6(j) i-iii Refer 1.3 Methodology and 1.4 Assumptions above
7.6(j) iv No comment.
7.6(j) v Historic rating, demand and augmentation information has been used to calculate the parameters for the historic section of table 2.4.5 and have been audited. As new planning criteria have been implemented, the forecast parameters have been estimated to reflect the new planning environment.
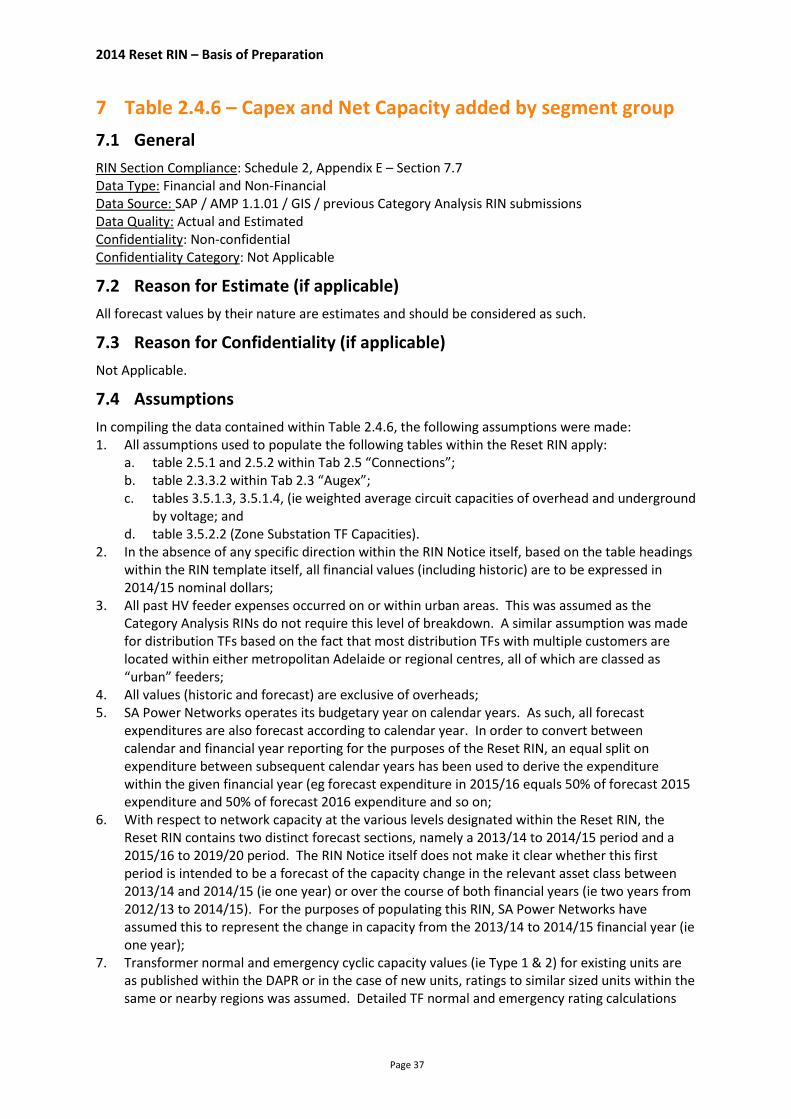
2014 Reset RIN – Basis of Preparation
Page 37
7 Table 2.4.6 – Capex and Net Capacity added by segment group
7.1 General
RIN Section Compliance: Schedule 2, Appendix E – Section 7.7 Data Type: Financial and Non-Financial Data Source: SAP / AMP 1.1.01 / GIS / previous Category Analysis RIN submissions Data Quality: Actual and Estimated Confidentiality: Non-confidential Confidentiality Category: Not Applicable
7.2 Reason for Estimate (if applicable)
All forecast values by their nature are estimates and should be considered as such.
7.3 Reason for Confidentiality (if applicable)
Not Applicable.
7.4 Assumptions
In compiling the data contained within Table 2.4.6, the following assumptions were made: 1. All assumptions used to populate the following tables within the Reset RIN apply:
a. table 2.5.1 and 2.5.2 within Tab 2.5 “Connections”; b. table 2.3.3.2 within Tab 2.3 “Augex”; c. tables 3.5.1.3, 3.5.1.4, (ie weighted average circuit capacities of overhead and underground
by voltage; and d. table 3.5.2.2 (Zone Substation TF Capacities).
2. In the absence of any specific direction within the RIN Notice itself, based on the table headings within the RIN template itself, all financial values (including historic) are to be expressed in 2014/15 nominal dollars;
3. All past HV feeder expenses occurred on or within urban areas. This was assumed as the Category Analysis RINs do not require this level of breakdown. A similar assumption was made for distribution TFs based on the fact that most distribution TFs with multiple customers are located within either metropolitan Adelaide or regional centres, all of which are classed as “urban” feeders;
4. All values (historic and forecast) are exclusive of overheads; 5. SA Power Networks operates its budgetary year on calendar years. As such, all forecast
expenditures are also forecast according to calendar year. In order to convert between calendar and financial year reporting for the purposes of the Reset RIN, an equal split on expenditure between subsequent calendar years has been used to derive the expenditure within the given financial year (eg forecast expenditure in 2015/16 equals 50% of forecast 2015 expenditure and 50% of forecast 2016 expenditure and so on;
6. With respect to network capacity at the various levels designated within the Reset RIN, the Reset RIN contains two distinct forecast sections, namely a 2013/14 to 2014/15 period and a 2015/16 to 2019/20 period. The RIN Notice itself does not make it clear whether this first period is intended to be a forecast of the capacity change in the relevant asset class between 2013/14 and 2014/15 (ie one year) or over the course of both financial years (ie two years from 2012/13 to 2014/15). For the purposes of populating this RIN, SA Power Networks have assumed this to represent the change in capacity from the 2013/14 to 2014/15 financial year (ie one year);
7. Transformer normal and emergency cyclic capacity values (ie Type 1 & 2) for existing units are as published within the DAPR or in the case of new units, ratings to similar sized units within the same or nearby regions was assumed. Detailed TF normal and emergency rating calculations
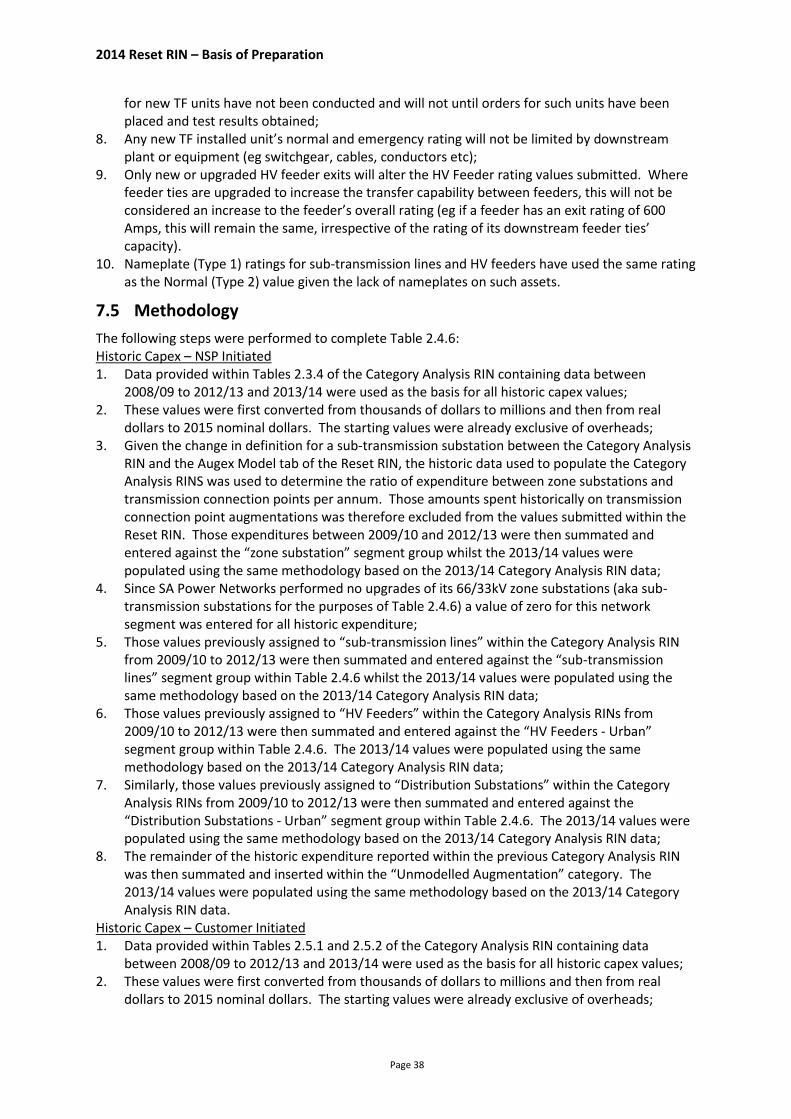
2014 Reset RIN – Basis of Preparation
Page 38
for new TF units have not been conducted and will not until orders for such units have been placed and test results obtained;
8. Any new TF installed unit’s normal and emergency rating will not be limited by downstream plant or equipment (eg switchgear, cables, conductors etc);
9. Only new or upgraded HV feeder exits will alter the HV Feeder rating values submitted. Where feeder ties are upgraded to increase the transfer capability between feeders, this will not be considered an increase to the feeder’s overall rating (eg if a feeder has an exit rating of 600 Amps, this will remain the same, irrespective of the rating of its downstream feeder ties’ capacity).
10. Nameplate (Type 1) ratings for sub-transmission lines and HV feeders have used the same rating as the Normal (Type 2) value given the lack of nameplates on such assets.
7.5 Methodology
The following steps were performed to complete Table 2.4.6: Historic Capex – NSP Initiated 1. Data provided within Tables 2.3.4 of the Category Analysis RIN containing data between
2008/09 to 2012/13 and 2013/14 were used as the basis for all historic capex values; 2. These values were first converted from thousands of dollars to millions and then from real
dollars to 2015 nominal dollars. The starting values were already exclusive of overheads; 3. Given the change in definition for a sub-transmission substation between the Category Analysis
RIN and the Augex Model tab of the Reset RIN, the historic data used to populate the Category Analysis RINS was used to determine the ratio of expenditure between zone substations and transmission connection points per annum. Those amounts spent historically on transmission connection point augmentations was therefore excluded from the values submitted within the Reset RIN. Those expenditures between 2009/10 and 2012/13 were then summated and entered against the “zone substation” segment group whilst the 2013/14 values were populated using the same methodology based on the 2013/14 Category Analysis RIN data;
4. Since SA Power Networks performed no upgrades of its 66/33kV zone substations (aka sub-transmission substations for the purposes of Table 2.4.6) a value of zero for this network segment was entered for all historic expenditure;
5. Those values previously assigned to “sub-transmission lines” within the Category Analysis RIN from 2009/10 to 2012/13 were then summated and entered against the “sub-transmission lines” segment group within Table 2.4.6 whilst the 2013/14 values were populated using the same methodology based on the 2013/14 Category Analysis RIN data;
6. Those values previously assigned to “HV Feeders” within the Category Analysis RINs from 2009/10 to 2012/13 were then summated and entered against the “HV Feeders - Urban” segment group within Table 2.4.6. The 2013/14 values were populated using the same methodology based on the 2013/14 Category Analysis RIN data;
7. Similarly, those values previously assigned to “Distribution Substations” within the Category Analysis RINs from 2009/10 to 2012/13 were then summated and entered against the “Distribution Substations - Urban” segment group within Table 2.4.6. The 2013/14 values were populated using the same methodology based on the 2013/14 Category Analysis RIN data;
8. The remainder of the historic expenditure reported within the previous Category Analysis RIN was then summated and inserted within the “Unmodelled Augmentation” category. The 2013/14 values were populated using the same methodology based on the 2013/14 Category Analysis RIN data.
Historic Capex – Customer Initiated 1. Data provided within Tables 2.5.1 and 2.5.2 of the Category Analysis RIN containing data
between 2008/09 to 2012/13 and 2013/14 were used as the basis for all historic capex values; 2. These values were first converted from thousands of dollars to millions and then from real
dollars to 2015 nominal dollars. The starting values were already exclusive of overheads;
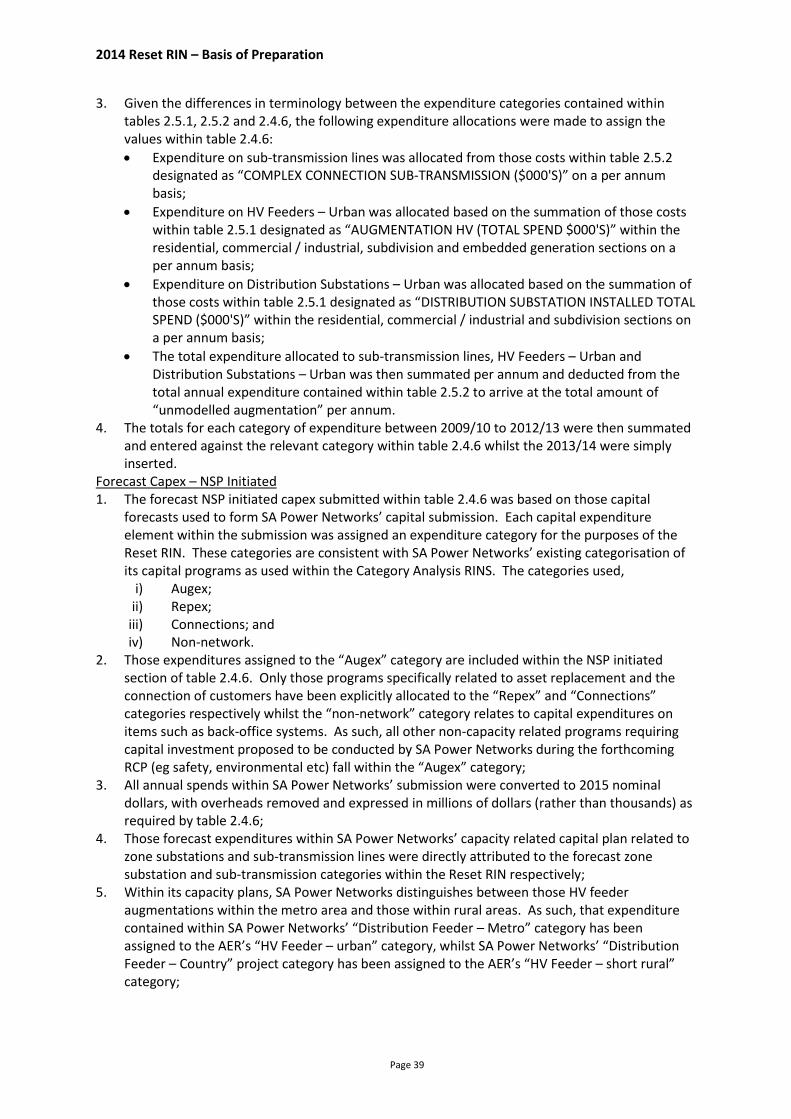
2014 Reset RIN – Basis of Preparation
Page 39
3. Given the differences in terminology between the expenditure categories contained within tables 2.5.1, 2.5.2 and 2.4.6, the following expenditure allocations were made to assign the values within table 2.4.6:
Expenditure on sub-transmission lines was allocated from those costs within table 2.5.2 designated as “COMPLEX CONNECTION SUB-TRANSMISSION ($000'S)” on a per annum basis;
Expenditure on HV Feeders – Urban was allocated based on the summation of those costs within table 2.5.1 designated as “AUGMENTATION HV (TOTAL SPEND $000'S)” within the residential, commercial / industrial, subdivision and embedded generation sections on a per annum basis;
Expenditure on Distribution Substations – Urban was allocated based on the summation of those costs within table 2.5.1 designated as “DISTRIBUTION SUBSTATION INSTALLED TOTAL SPEND ($000'S)” within the residential, commercial / industrial and subdivision sections on a per annum basis;
The total expenditure allocated to sub-transmission lines, HV Feeders – Urban and Distribution Substations – Urban was then summated per annum and deducted from the total annual expenditure contained within table 2.5.2 to arrive at the total amount of “unmodelled augmentation” per annum.
4. The totals for each category of expenditure between 2009/10 to 2012/13 were then summated and entered against the relevant category within table 2.4.6 whilst the 2013/14 were simply inserted.
Forecast Capex – NSP Initiated 1. The forecast NSP initiated capex submitted within table 2.4.6 was based on those capital
forecasts used to form SA Power Networks’ capital submission. Each capital expenditure element within the submission was assigned an expenditure category for the purposes of the Reset RIN. These categories are consistent with SA Power Networks’ existing categorisation of its capital programs as used within the Category Analysis RINS. The categories used,
i) Augex; ii) Repex;
iii) Connections; and iv) Non-network.
2. Those expenditures assigned to the “Augex” category are included within the NSP initiated section of table 2.4.6. Only those programs specifically related to asset replacement and the connection of customers have been explicitly allocated to the “Repex” and “Connections” categories respectively whilst the “non-network” category relates to capital expenditures on items such as back-office systems. As such, all other non-capacity related programs requiring capital investment proposed to be conducted by SA Power Networks during the forthcoming RCP (eg safety, environmental etc) fall within the “Augex” category;
3. All annual spends within SA Power Networks’ submission were converted to 2015 nominal dollars, with overheads removed and expressed in millions of dollars (rather than thousands) as required by table 2.4.6;
4. Those forecast expenditures within SA Power Networks’ capacity related capital plan related to zone substations and sub-transmission lines were directly attributed to the forecast zone substation and sub-transmission categories within the Reset RIN respectively;
5. Within its capacity plans, SA Power Networks distinguishes between those HV feeder augmentations within the metro area and those within rural areas. As such, that expenditure contained within SA Power Networks’ “Distribution Feeder – Metro” category has been assigned to the AER’s “HV Feeder – urban” category, whilst SA Power Networks’ “Distribution Feeder – Country” project category has been assigned to the AER’s “HV Feeder – short rural” category;
2014 Reset RIN – Basis of Preparation
Page 40
6. All forecast expenditure related to augmentation of the LV network and distribution transformers to resolve or prevent QoS issues has been assigned to the AER’s “Distribution Substations – urban” category as such issues typically only occur on those distribution substations which supply multiple customers. Such distribution substations only typically occur in areas deemed “urban” (ie metropolitan Adelaide or regional centres);
7. All other “Augex” expenditure, not directly attributable to SA Power Networks’ capacity plan as detailed within AMP1.1.01 has been inserted within the “Unmodelled augmentation” category.
8. In forecasting expenditure in the 2014/15 financial year, the latest 2014 expenditure forecasts and the 2015 budget submission have been used. Whilst not yet approved by SA Power Networks’ Board, the 2015 budget submission has been reviewed and approved for submission to the Board by the FERC.
Forecast Capex – Customer Initiated 1. Data provided within Tables 2.5.1 and 2.5.2 of the Reset RIN containing data between 20014/15
and 2015/16 to 2019/20 was used as the basis for all forecast capex values pertaining to customer initiated augmentation;
2. The forecast values were first converted from thousands of dollars to millions and then from real dollars to 2015 nominal dollars. The starting values were already exclusive of overheads;
3. Given the differences in terminology between the expenditure categories contained within tables 2.5.1, 2.5.2 and 2.4.6, the following expenditure allocations were made to assign the values within table 2.4.6:
Expenditure on sub-transmission lines was allocated from those costs within table 2.5.2 designated as “COMPLEX CONNECTION SUB-TRANSMISSION ($000'S)” on a per annum basis;
Expenditure on HV Feeders – Urban was allocated based on the summation of those costs within table 2.5.1 designated as “AUGMENTATION HV (TOTAL SPEND $000'S)” within the residential, commercial / industrial, subdivision and embedded generation sections on a per annum basis;
Expenditure on Distribution Substations – Urban was allocated based on the summation of those costs within table 2.5.1 designated as “DISTRIBUTION SUBSTATION INSTALLED TOTAL SPEND ($000'S)” within the residential, commercial / industrial, subdivision and embedded generation sections on a per annum basis;
The total expenditure allocated to sub-transmission lines, HV Feeders – Urban and Distribution Substations – Urban was then summated per annum and deducted from the total annual expenditure contained within table 2.5.2 to arrive at the total amount of “unmodelled augmentation” per annum.
4. The totals for each category of expenditure between 2015/16 to 2019/20 were then summated and entered against the relevant category within table 2.4.6 whilst the 2014/15 were estimated based on the latest 2014 expenditure forecasts and the 2015 budget submission.
Total Capex 1. For each category of expenditure and in the absence of any clarifying statements within the RIN
Notice to the contrary, the total capital expenditure in each financial year was taken to be the sum of the submitted NSP initiated and customer initiated capital expenditure. This summation therefore excludes and expenditure attributed as “non-network” related capital expenditure.
Net Capacity Added – NSP Initiated 1. For sub-transmission lines, in populating tables 3.5.13 and 5.3.1.4, SA Power Networks was
required to forecast both the annual changes in capacity and network length either due to line up-rating (ie same conductor, but altered design temperature) or the construction of new circuits in accordance with the timing of its capacity plans. As such, SA Power Networks used this analysis to determine the annual change in capacity of its metropolitan area meshed 66kV networks, radial country 66kV networks and 33kV country networks. The capacity in these three networks was then summated to arrive at the annual capacity change value submitted.
2014 Reset RIN – Basis of Preparation
Page 41
Where forecast augmentations involved the use of hybrid construction using both overhead and underground systems, the capacity added value submitted, represented the lower of the two systems (eg should a new line be proposed consisting of an overhead component rated at 136 MVA and an underground section with a rating of 137 MVA, the overall capacity added was 136 MVA rather than 273 MVA). It should also be noted that the stated capacity increases in the sub-transmission network includes the additional capacity attributable to a single security of supply driven project. Whilst the additional capacity of this new line is reflected in the capacity changes, its expenditure is contained within the “Unmodelled augmentation” category since its need is not demand driven.
2. For zone substation TF capacity, table 3.5.2.2 of the RIN required SA Power Networks to forecast the zone substation transformer capacity changes on an annual basis. This analysis provided the ability to determine the annual change in zone substation TF capacity given that where an upgrade was forecast to occur, the existing TF units were removed and replaced with larger units while additional units added the full capacity of the new TF unit(s). The values therefore submitted within table 2.4.6 represent the change in TF capacity from any given year to the subsequent financial year as indicated within DOPSD0602 and DOPSD0603 within table 3.5.2.2. Where 66/33kV TF are proposed to be replaced (ie Stage 1 TF – DOPSD0601), these capacity changes are represented within the sub-transmission substation capacity values.
3. With respect to HV Feeder capacity alterations, no augmentation of CBD feeders is proposed within the forecast period. Where such augmentations are required, they are generally customer funded and therefore do not represent a capital expenditure by SA Power Networks.
4. As stated earlier, the only investment on HV feeders has been considered within the “urban” and “rural short” categories. As such, the “rural long” category has been completed with zero values. In order to ascertain the change in capacity across the “urban” and “rural short” feeder networks, an analysis of all proposed projects which would see either the upgrade of an existing feeder exit or the creation of a new feeder exit was undertaken. It should be noted, whilst the cost of any new feeder associated with the upgrade or creation of a new zone substation is contained within the “zone substation” category’s costs, the capacity change reflects those feeder capacity changes proposed. Whilst several projects exist to increase the capacity of ties between HV feeders, this will not increase the rating of the affected feeder’s zone substation exit capacity.
5. With respect to Distribution Substations, the capacity change values submitted are based on an analysis of those distribution TFs changed or added by the QoS group between 2010 and 2013. As stated above, the forecast financial values submitted within this category reflect those historically spent by the QoS group and are therefore forecast to continue. On average over this period, the QoS group has increased the distribution substation capacity by 33.8 MVA per annum. Therefore, the forecast change in distribution substation capacity over the five year RCP equates to five times this average annual value. As previously indicated, this increase has been attributed against the “urban” classification as the vast majority of distribution substations augmented during the present period have been multiple customer transformers located within urban areas.
Net Capacity Added – Customer Initiated 1. For sub-transmission lines, the forecast capacity increases between 2013/14 and 2014/15 has
been based on known projects whilst the forecast data between 2015/16 – 2019/20 is based on the capacity which would be added for an existing speculative connection enquiry.
2. For zone substations, the change in capacity between 2013/14 and 2014/15 is due to a single project which is in progress. Given the demand growth at a system level is flat and assuming those zone substation augmentations forecast within the capacity portion of the Reset submission are approved, adequate capacity should exist within the zone substations to facilitate customer connection activities over the course of the RCP. Should a large customer
2014 Reset RIN – Basis of Preparation
Page 42
require the construction of a dedicated zone substation, these are likely to become un-regulated assets and therefore have no impact on the RAB.
3. For HV Feeders, all values assigned to the 2013/14 to 2014/15 period are based on the rating changes due to existing projects. Within this period, six new urban feeders have or are planned to be constructed, while two short rural feeders have been constructed. With respect to the 2015/16 – 2019/20 period, the capacity changes are based on the historic average number of new feeders constructed. Therefore, two new urban feeders per annum for a total of 10, two new rural short feeders and four CBD feeders have been considered over the RCP. The ratings of these assets have assumed the use of standard feeder cable exits for each scenario, namely three single core 630mm2 Aluminium XLPE cable in urban areas, three single core 300mm2 Aluminium XLPE cable in rural areas and a single three core, 240mm2 Copper XLPE cable within the CBD. All ratings have assumed installation in ducts, double point bonding of the cable’s sheath conductors to earth and a trefoil touching arrangement (in the case of the single core cables).
4. For the Distribution Substations, all capacity changes forecast within table 2.5.1 have been allocated against the urban category.
Total Capacity 1. For each segment group and in the absence of any clarifying statements within the RIN Notice
to the contrary, the total capacity added in each financial year was taken to be the sum of the submitted NSP initiated and customer initiated capacity increase.
7.6 Additional Comments
Caution should be exercised in using this table to attempt to determine a cost per unit of capacity added due to the various assumptions made, such as the inclusion of capacity changes due to projects contained within the “Unmodelled augmentation” category.
7.7 Unmodelled Augmentation
Unmodelled augmentation is all augmentation expenditure that is not related to peak demand capacity. This has been summarised in the attached spreadsheet “ Augmentation Expenditure Project List”, which lists all the augmentation expenditure by project type, references supporting documents and where included in both RIN tables 2.3.5 and 2.4.6. Unmodelled augmentation includes the following expenditure which we have classified as “capacity” but is not related to peak demand or is specifically excluded by RIN instructions for 2.4.6:
Connection Point Capacity: Upgrade/new Transmission connection point substations, refer AMP 1.1.01;
Strategic Network Capacity: NER compliance, voltage regulation & Network Planning, refer AMP 1.1.01;
Land: land and easements for future substations and lines, refer AMP 1.1.01;
LV Two Way Network (QoS): projects to enable connection of PV generation and meet QoS standards, refer AMP 1.1.01;
Supply Security: improve network security where passes market benefits test of RIT-D, refer AMP 1.1.01;
Substation Standards Digital Optimisation: introduction of new technology to increase long term efficiency, refer to business case; and
Flexible Load Management: load control to improve network efficiency and utilisation, refer to Flexible Load Strategy.

2014 Reset RIN – Basis of Preparation
Page 43
Unmodelled augmentation also includes the following expenditure which we have classified as “reliability, environmental, safety or strategic” but is not related to peak demand:
Reliability: o Existing Network Protection Management: continuation program for Protection
systems management to maintain network performance, refer to AMP 3.2.14; o Emergency Response Plant: continuation program for minor upgrades to emergency
response plant to maintain performance, e.g. mobile substations & generators, based on historical;
o Reliability Management Plan: continuation of annual plan to maintain network performance, refer to AMP 2.1.01;
o Air Conditioning Relay rooms: continuation of annual plan to add air conditioning to relay rooms to prevent premature failure of electronic equipment, refer to AMP 3.2.14;
o Network Hardening: refer to business case Hardening the Network; o Low Reliability Feeders: refer to business case Low Reliability Feeders; o Remote Communities: refer to business case Microgrid trial; o Remote Communities Hardening: refer to business case on Poorly Served
Communities.
Environmental: o Environmental Management – Lines: continuation programs, refer to AMP 4.1.03; o Oil Containment Substations: continuation of program to manage the substation
high risk oil spill environmental sites, refer to AMP 4.1.01; o Environmental Management Subs (noise abatement): continuation of program to
manage high risk noise level sites, refer to AMP 4.1.05; o Mannum Town Substation: manage a major oil contamination site, refer to AMP
4.1.06.
Safety: o Substation lighting: continuation program to manage high safety risk after hours
access to substations, refer to AMP 4.1.01; o Substation security & fencing: continuation program to manage substation high
public safety risk, refer to AMP 5.1.03; o CBD Fault level control: completion of project to manage CBD 11kV high fault levels-
risk to public safety, refer to AMP 2.1.07; o Substation Infrastructure – earth grids: continuation of program to manage
substation high safety risk during short circuit faults, refer to AMP 4.1.01; o Undergrounding for road safety: program to underground assets in high risk
locations for public safety; o Bushfire Mitigation:
Reclosers to SCADA: continuation of high bushfire risk program to manage reclosers at bushfire boundaries, refer to Bushfire Mitigation Program Business case and Bushfire Risk Reduction Strategy report;
Install Ground Fault Neutraliser: program to reduce risk of fire starts in high bushfire risk areas by reduction ground fault current to near zero, refer to Bushfire Mitigation Program Business case and Bushfire Risk Reduction Strategy report;
Replace rod gaps and current limiting arcing horns: program to reduce risk of fire starts in high bushfire risk areas by reduction in locations for same,

2014 Reset RIN – Basis of Preparation
Page 44
refer to Bushfire Mitigation Program Business case and Bushfire Risk Reduction Strategy report;
Metered Mains: program to manage risk in high bushfire risk areas of customer mains, refer to AMP 3.1.08 & Bushfire Risk Reduction Strategy report;
Backup Protection: continuation of program to achieve NER compliance in high bushfire risk region to ensure adequate backup protection, refer to AMP 3.2.14;
Undergrounding for bushfire safety: program based on wiliness for customer to pay survey regarding undergrounding prioritised high risk assets in high bushfire risk regions, refer to Bushfire Mitigation Program Business case and Bushfire Risk Reduction Strategy report.
Strategic: o NER Compliance:
Protection Critical Clearing Times (CCT): Fix where primary protection does not meet stability CCTs, refer AMP 3.2.14;
Load Shedding: Comply with AEMO & OTR directions to modify underfrequency load shedding plant – historical;
Power Quality Monitoring: Deploying comms to subset of 3 phase smart ready meters to monitor Quality of Supply on suspect LV networks (two way network impact), refer to Tariff and Metering Business case;
o Kangaroo Island 2nd undersea cable: project to add 2nd undersea cable to KI to secure supply for KI, refer to AMP 2.1.03;
o Network Control: 33kV SCADA controlled switches: continuation of program to ensure
effective load management for ADMS, refer to AMP 2.1.02; 11 & 19kV SCADA controlled switches: continuation of program to ensure
effective load management for ADMS, refer to AMP 2.1.02; SCADA to remaining zone substations: continuation of program to provide
SCADA visibility for network optimisation and operations, refer to AMP 2.1.02;
o Power Line Environment Committee: continuation of legislated program to underground assets at locations determined by the PLEC committee – funding specified by legislation.
2014 Reset RIN – Basis of Preparation
Page 45
8 Table 3.4.3.1 & 3.4.3.3 – Annual system maximum demand characteristics at the zone substation level – MW & MVA measure
8.1 General
RIN Section Compliance: Schedule 1 – Section 16.8. Data Type: Non-Financial Data Source: Load Forecast, SCADA Data Quality: Estimated Confidentiality: Non-confidential Confidentiality Category: Not Applicable
8.2 Reason for Estimate (if applicable)
By virtue of the fact that the data provided is a forecast, all data is therefore estimated.
8.3 Reason for Confidentiality (if applicable)
Not Applicable
8.4 Assumptions
The following assumptions were made in preparing the data provided: 1. As per Section Error! Reference source not found. relating to Table 5.4; and 2. The “non-coincident” and “coincident” raw system actual MW and MVA demands (ie
DOPSD0101, DOPSD0104, DOPSD0201 and DOPSD0204 respectively) were not populated as all data is forecast, therefore raw actual values do not exist.
8.5 Methodology
The following steps were undertaken to derive the non-coincident and coincident 10 and 50 PoE, MW and MVA demand values at the zone substation level: 1. The reconciled non-coincident, zone substation 10 and 50 PoE forecast’s MW values for each
forecast year from 2014/15 to 2019/20 contained within Table 5.4 were summated to arrive at the values submitted within field DOPSD102 and DOPSD0103 respectively. This summation excluded those substations categorised within Table 3.5.2.2 as “Stage 2” transformations to avoid double counting of loads at both a Stage 1 and Stage 2 level. Similarly, those loads supplied through unregulated TF assets were also excluded from the summations.
2. Similarly, the reconciled coincident, zone substation 10 and 50 PoE forecast’s MW values for each forecast year from 2014/15 to 2019/20 contained within Table 5.4 were summated to arrive at the values submitted within field DOPSD105 and DOPSD0106 respectively.
3. All non-coincident and coincident MVAr forecast values at the 10 and 50 PoE level for a given year were separately summated. Again, this summation excluded those substations categorised within DPA0602 of Table 3.5.2.2 as “Stage 2” transformations to avoid double counting of loads at both a Stage 1 and Stage 2 level as well as those loads supplied by unregulated zone substation transformer assets.
4. The resultant MW and MVAr totals were then converted to the non-coincident and coincident MVA value using the formula;
5. The calculated non-coincident and coincident MVA values for each year at 10 and 50 PoE were
then entered within DOPSD0202, DOPSD0203, DOPSD0205 and DOPSD0206 respectively.
2014 Reset RIN – Basis of Preparation
Page 46
8.6 Additional Comments
1. Calculation of the zone substation’s total non-coincident and coincident MVA should not simply be as a result of a summation of the constituent zone substation’s MVA values at any given time as these are vector quantities rather than scalar values and therefore should be determined by adding their rectangular components (ie MW and MVAr) and then converting these sums to MVA. For example, consider two loads constituted by 3 MW + j 4 MVAr and 4 MW + j 3 MVAr respectively. Individually, both have a total load of 5 MVA. If simply added, we would obtain a total MVA value of 10 MVA, however, if added vectorially, these two loads summate to 9.89 MVA (ie MVA= √((3+4)2+ (4+3)2=9.89)). Whilst not a major difference in this example, over multiple summations of greater value, this can result in a significant variation from the true value.
2. It should also be noted that particularly in country areas, SA Power Networks’ 33kV sub-transmission lines contain direct connected 33/0.4V distribution transformers and 33/19kV SWER Isolating transformers. As such, not all load seen at the transmission connection points passes through a zone substation before reaching the customer. Similarly, SA Power Networks have some major customers who are connected directly at the transmission connection point’s 33kV bus or who take supply at 66kV or are supplied through unregulated zone substation transformers, further increasing the difference between the load seen by the transmission connection point and the regulated zone substation assets at times of peak system demand.
3. Given SA Power Networks do have some stage 1 and stage 2 transformations within its network, in order to avoid double counting these loads, those “stage 2” substation’s loads have been excluded from the totals entered within the RIN. For example consider a 66/33kV substation with a measured load of 14 MW in 2012/13. If the 33kV line emanating from this substation then supplies 33/11kV substations with loads of 8MW, 4MW and 2MW, inclusion of these loads within the totals would suggest the existence of 28MW of load rather than the 14MW which actually exists.
4. When comparing the coincident zone substation MVA values to the corresponding coincident connection point MVA summation values, it should be noted that the MVAr load seen by the connection points is less than that seen by the zone substations due to the impact of capacitor banks installed at the sub-transmission (ie 33 and 66kV) level. At present, SA Power Networks has 15 MVAr of capacitors installed at 33kV and 1,142 MVAr installed at 66kV level which are switched in and out of service via supervisory control at the direction of ElectraNet’s System Control.
2014 Reset RIN – Basis of Preparation
Page 47
9 Table 3.4.3.2 & 3.4.3.4 – Annual system maximum demand characteristics at the transmission connection point level – MW & MVA measure
9.1 General
RIN Section Compliance: Schedule 1 – Section 16.8 Data Type: Non-Financial Data Source: Load Forecast, SCADA Data Quality: Estimated Confidentiality: Non-confidential Confidentiality Category: Not Applicable
9.2 Reason for Estimate (if applicable)
By virtue of the fact that the data provided is a forecast, all data is therefore estimated.
9.3 Reason for Confidentiality (if applicable)
Not Applicable
9.4 Assumptions
The following assumptions were made in preparing the data provided: 1. As per Section Error! Reference source not found. relating to Table 5.4; and 2. The “non-coincident” and “coincident” raw system actual MW and MVA demands (ie
DOPSD0107, DOPSD0110, DOPSD0207 and DOPSD0210 respectively) were not populated as all data is forecast, therefore raw actual values do not exist.
9.5 Methodology
The following steps were undertaken to derive the non-coincident and coincident 10 and 50 PoE, MW and MVA demand values at the connection point level: 1. The reconciled non-coincident, connection point substation 10 and 50 PoE forecast’s MW
values for each forecast year from 2014/15 to 2019/20 contained within Table 5.4 were summated to arrive at the values submitted within field DOPSD108 and DOPSD0109 respectively.
2. Similarly, the reconciled coincident, connection point 10 and 50 PoE forecast’s MW values for each forecast year from 2014/15 to 2019/20 contained within Table 5.4 were summated to arrive at the values submitted within field DOPSD111 and DOPSD0112 respectively.
3. All corresponding non-coincident and coincident MVAr forecast values for a given year were separately summated.
4. The resultant MW and MVAr totals were then converted to the non-coincident and coincident MVA value using the formula;
5. The calculated non-coincident and coincident MVA values for each year at 10 and 50 PoE were
then entered within DOPSD0208, DOPSD0209, DOPSD0211 and DOPSD0212 respectively.
9.6 Additional Comments
1. Calculation of the connection point substation’s total non-coincident and coincident MVA should not simply be as a result of a summation of the constituent connection point substation’s MVA values at any given time as these are vector quantities rather than scalar values and therefore should be determined by adding their rectangular components (ie MW and MVAr) and then converting these sums to MVA.

2014 Reset RIN – Basis of Preparation
Page 48
For example, consider two loads constituted by 3 MW + j 4 MVAr and 4 MW + j 3 MVAr respectively. Individually, both have a total load of 5 MVA. If simply added, we would obtain a total MVA value of 10 MVA, however, if added vectorially, these two loads summate to 9.89 MVA (ie MVA= √((3+4)2+ (4+3)2=9.89)). Whilst not a major difference in this example, over multiple summations of greater value, this can result in a significant variation from the true value.
2014 Reset RIN – Basis of Preparation
Page 49
10 Table 3.4.3.5 – Power Factor Conversion between MVA and MW
10.1 General
RIN Section Compliance: Schedule 1 – Section 16.8 Data Type: Non-Financial Data Source: Load Forecast Click here to enter text. Data Quality: Estimated Confidentiality: Partially Confidential Confidentiality Category: Personal information
10.2 Reason for Estimate (if applicable)
All values submitted are based on load forecast demands and therefore must be considered as estimates. Given that SA Power Networks does not individually SCADA monitor its distribution transformers, it has been assumed that the value for these parameters will be equivalent to that of the combined 11 and 7.6kV networks from which the vast majority of SA Power Networks’ distribution transformers are supplied, with the MVAr values corrected for the removal of any 11 or 7.6kV capacitor banks. Similarly, SA Power Networks does not individually SCADA monitor its SWER systems, it has been assumed that the value for these parameters will be equivalent to the “corrected” values of the 33kV networks from which the vast majority of SA Power Networks’ SWER systems are supplied with the MVAr values corrected for the removal of any 33kV capacitor banks.
10.3 Reason for Confidentiality (if applicable)
SA Power Networks only has one customer supplied at 6.6kV. This data therefore only relates to this single customer which must remain confidential.
10.4 Assumptions
The following assumptions have been made in preparing the data submitted: DOPSD0301 - Average overall network power factor 1. The non coincident 10 PoE, MW and MVA values at the connection point level have been used
as these represent the average PF seen by the TNSP’s network at the time of each connection point’s peak.
DOPSD0302 - Average power factor conversion for low voltage 1. Given the lack of metering at LV level, all distribution transformers have been assumed to be
connected to the 11 & 7.6kV networks. Whilst there are distribution transformers directly connected to the 33kV and SWER networks (largely supplied from the 33kV sub-transmission network), it is not anticipated that these customer’s PF values will vary greatly (if at all) from the vast majority of those customers supplied by the LV networks primarily supplied by both the 11 and 7.6kV networks.
DOPSD0305 and DOPSD0306 - Average power factor conversion for 7.6 kV and 11kV 1. Calculated values at 11 and 7.6kVdo not represent customer’s PF levels as they are
compensated for by SA Power Networks owned capacitor banks installed across the network. They therefore represent PF values as effectively seen by the upstream network and substation’s transformers.
DOPSD0307 - Average power factor conversion for SWER 1. Given the lack of metering at SWER level, all SWER systems have been assumed to be
connected to the 33kV network. Whilst there are a few SWER systems supplied from 11kV
2014 Reset RIN – Basis of Preparation
Page 50
feeders (ie 11/19kV), it is not anticipated that the customer’s connected to these systems will have different PF values (if at all) to those supplied primarily by the 33kV network.
DOPSD0309 & DOPSD0311- Average power factor conversion for 33 kV and 66kV 1. Calculated values do not represent customer’s PF levels as they are compensated for by SA
Power Networks’ and ElectraNet’s capacitor banks installed across the network. They therefore represent PF values as effectively seen by the upstream transmission network and substation’s transformers.
10.5 Methodology
The following methodology was used to calculate the PF values at the respective levels of the network: DOPSD0301 - Average overall network power factor 1. Given this is intended to represent the average PF of the entire network, the non-coincident 10
PoE connection point values in DOPSD0108 have been divided by those contained in DOPSD0208 to arrive at the values entered within DOPSD0301 of the RIN.
DOPSD0302 - Average power factor conversion for low voltage 1. Given this value is intended to represent the average PF of the entire LV network and the
majority of SA Power Networks’ distribution transformers are supplied by the 11 and 7.6kV networks, the non-coincident 10 PoE MW and MVAr values for all 11 and 7.6kV zone substations have been summated according to each substation’s secondary voltage (eg 11and 7.6kV) to provide a summated value of the MW and MVAr supplied by the 11kV and 7.6kV networks.
2. The final MVAr value was then adjusted to remove the effect of any 11kV or 7.6kV capacitor banks in each year as these reduce the MVArs measured at the 11 and 7.6kV terminals of the zone substation’s transformers.
3. The summated MW and “adjusted” MVAr values at 11 and 7.6kV were then converted to MVA using Pythagoras’ Theorem. The MW sum was then divided by the result of the MVA calculation to arrive at the average LV PF value per annum entered within DOPSD0302 of the RIN.
DOPSD0303 - Average power factor conversion for 3.3kV 1. SA Power Networks separately summated the MW and MVAr values for all zone substations
with a secondary voltage of 3.3kV. These summated values were then converted to MVA using Pythagoras’ Theorem with the summated MW value being divided by the calculated MVA value. The result was then entered into the RIN for each respective year.
DOPSD0304 - Average power factor conversion for 6.6kV 1. SA Power Networks separately summated the MW and MVAr values for all zone substations
with a secondary voltage of 6.6kV. These summated values were then converted to MVA using Pythagoras’ Theorem with the summated MW value being divided by the calculated MVA value. The result was then entered into the RIN for each respective year.
DOPSD0305 - Average power factor conversion for 7.6kV 1. SA Power Networks summated the MW and MVAr values for all zone substations with a
secondary voltage of 7.6kV. These summated values were then converted to MVA using Pythagoras’ Theorem with the summated MW value being divided by the calculated MVA value. The result was then entered into the RIN for each respective year.
DOPSD0306 - Average power factor conversion for 11kV 1. SA Power Networks summated the MW and MVAr values for all zone substations with a
secondary voltage of 11kV. These summated values were then converted to MVA using Pythagoras’ Theorem with the summated MW value being divided by the calculated MVA value. The result was then entered into the RIN for each respective year.
DOPSD0307 - Average power factor conversion for SWER
2014 Reset RIN – Basis of Preparation
Page 51
1 This section are intended to represent the average PF of the SWER network, the MW and MVAr values used to generate the values contained in DOPSD0102 and DOPSD0202 have been added according to each substation’s secondary voltage (ie 33kV) to provide a summated value of the MW and MVAr supplied by the 33kV network.
2 The final MVAr value has then been adjusted to remove the effect of any 33kV capacitor banks in each year as these reduce the MVArs seen at the 33kV terminals of the zone substation transformers.
3 The summated MW and adjusted MVAr values at 33kV have then been converted to MVA using Pythagoras’ Theorem. The MW sum was then divided by the result of this MVA calculation to arrive at the average SWER PF value per annum entered within DOPSD0307 of the RIN.
DOPSD0308 - Average power factor conversion for 22kV 1 Not applicable. Voltage not operated by SA Power Networks. DOPSD0309 - Average power factor conversion for 33kV 1 In order to determine the PF of the 33kV network, SA Power Networks separately summated
the MW and MVAr values for all zone substations and connection points with a secondary voltage of 33kV.
2 These summated values were then converted to MVA using Pythagoras’ Theorem. 3 The summated MW value was then divided by the calculated MVA value. The result was then
entered into DOPSD0309 of the RIN for each respective year. DOPSD0310 - Average power factor conversion for 44kV 1 Not applicable. Voltage not operated by SA Power Networks. DOPSD0311 - Average power factor conversion for 66kV 1 In order to determine the PF of the 66kV network, SA Power Networks separately summated
the MW and MVAr values for all zone substations and connection points with a secondary voltage of 66kV.
2 These summated values were then converted to MVA using Pythagoras’ Theorem. 3 The summated MW value was then divided by the calculated MVA value. The result was then
entered into DOPSD0311 of the RIN for each respective year. DOPSD0312 - Average power factor conversion for 110kV 1 Not applicable. Voltage not operated by SA Power Networks. DOPSD0313 - Average power factor conversion for 132kV 1 Not applicable. Voltage not operated by SA Power Networks DOPSD0314 - Average power factor conversion for 220kV 1 Not applicable. Voltage not operated by SA Power Networks
10.6 Additional Comments
All customers supplied at 6.6kV and 3.3kV are supplied from dedicated zone substation transformers with all secondary cable / overhead connection assets being owned by the customer (eg cables). As such, SA Power Networks does not operate any 6.6 or 3.3kV feeders, hence the reason these voltages are not contained within Tables 3.5.1.1, 3.5.1.2, 3.5.1.3 or 3.5.1.4.
2014 Reset RIN – Basis of Preparation
Page 52
11 Table 3.5.1.3 – Estimated overhead network weighted average MVA capacity by voltage class – DPA0301 – DPA0313
11.1 General
RIN Section Compliance: Schedule 1 – Section 16.8 Data Type: Non-Financial Data Source: GIS, Network Planning Sub-transmission Line records, QMS Procedure 638. Data Quality: Estimated Confidentiality: Non-confidential Confidentiality Category: Not Applicable
11.2 Reason for Estimate (if applicable)
All values are forecast based on AER approval of regulatory Reset proposal augmentations.
11.3 Reason for Confidentiality (if applicable)
Not Applicable.
11.4 Assumptions
In compiling the data contained within this table, the following assumptions were made: 1. All new overhead 11kV and 7.6kV conductors forecast to be constructed will be spurs off the
feeder backbone and therefore would be constructed using 7/4.75 AAAC/1120 conductor (Moon) designed for operation at 75oC, in order to achieve SA Power Networks’ standard normal and emergency ratings for feeder spur construction.
2. Forecasts of future 11 and 7.6kV lengths provided in Table 3.5.1.1 are accurate. 3. Due to the length of, nature and forecasts of the length of the LV network, no alteration in the
overall MVA per km value will be achieved during the RCP. 4. Where network augmentation is forecast to occur, 5. Irrespective of the capacity of the overhead conductors used to construct SA Power Networks’
SWER networks, their capacity is limited to the largest SWER Isolating TF to prevent both overloading of the TF and also to ensure adequate protection co-ordination with upstream protection devices.
6. All augmentations contained within SA Power Networks’ Regulatory Rest submission for the 2015-20 RCP are approved by the AER and implemented as presently proposed by SA Power Networks.
7. Augmentations of the relevant network occur such that the asset will be commissioned and therefore first available for service in November of the last year of construction (in the case where construction is planned to occur over multiple years). As a result, such assets will not be reflected within the values submitted until the financial year beginning with the final year of construction (eg for 2017 projects, these augmentations will first be reflected in the 2017/18 financial year).
8. Final sub-transmission routes are not altered (and subsequently lengths) from those proposed within SA Power Networks’ submission.
9. For new sub-transmission lines or augmentation of existing lines, where an overhead solution has been submitted, SA Power Networks are not forced to revert to an underground solution.
10. All MVA capacity values are based on the asset’s “normal” rating according to SA Power Networks’ QMS Procedure 638.
11.5 Methodology
The following steps were undertaken to compile the data submitted:
2014 Reset RIN – Basis of Preparation
Page 53
1. For all operating voltages, the starting basis was the MVA.km, route length (in km) and MVA per km capacity for each voltage’s overhead network according to those values supplied within the 2013/14 EB RIN.
For 33kV and 66kV (ie DPA0307 and 309 respectively), 1. Those forecast augmentations of the 33kV and 66kV sub-transmission network (both new lines
and upgrades) according to the capacity submission (refer AMP 1.1.01) were added to the previous year’s MVA.km and route length values.
2. Given that the timing of each proposed augmentation of the sub-transmission network (ie 33kV and 66kV) is relatively well known, as is the augmentation required (ie conductor type, length), those proposed augmentations of existing and the addition of new sub-transmission lines was made to the 2013/14 EB RIN data in the relevant year of augmentation by multiplying the revised or additional circuit’s MVA normal capacity by the route length of the line concerned and adding this to the previous year’s value to arrive at the relevant year’s MVA.km value.
3. Equally, where the proposed augmentation will see the creation of a new sub-transmission line, the route length of this line is added to the previous year’s route length for the relevant voltage. Obviously, where the proposed augmentation involves the thermal up-rating of an existing line or the upgrading of an existing line’s conductor, whilst the rating of the line and subsequently its MVA.km value will increase, its route length will not.
4. The forecast weighted average MVA per km value for each year within the RCP is determined by dividing the relevant year’s MVA.km value by the total route length of the relevant voltage’s circuits.
For 7.6kV and 11kV (ie DPA0303 and 304 respectively), 1. As stated within the assumptions section, all new 7.6 and 11kV conductor was assumed to be
suitable for operation within the feeder’s backbone. This assumption possibly over-inflates the capacity values submitted, but therefore represent the maximum possible value. Equally, the length of overhead conductor to be added on a per annum basis was based on the annual change in those forecast values submitted within Table 3.5.1.1.
2. The MVA capacity of the nominal backbone conductor chosen was multiplied by the incremental increase in the nominal voltage’s length per annum to arrive at a MVA.km increase from the previous year’s value.
3. Similarly, the route length of conductor was added to the previous year’s value to arrive at the respective voltage’s total length in km.
4. Each year’s MVA.km value was then divided by the total route length for each voltage to arrive at the final MVA per km value.
For SWER and LV (ie DPA0301 and 305 respectively), as stated within the assumptions section: 1. the capacity of SA Power Networks’ SWER systems has been limited to 0.2 MVA per km. 2. given the dynamic nature of and forecast continued reduction in the route length of the
overhead LV network (refer Table 3.5.1.1), the forecast capacity of this network has been assumed to remain constant over the RCP. This assumption would seem reasonable given both the length of the existing overhead LV network and given that it is equally likely that both low and high capacity LV assets will be replaced or removed in favour of underground networks. Equally, where LV overhead network augmentation may occur due to QoS enquiries, these will increase the capacity of the localised LV network rather than diminish it. The AER should note that this area is in a high state of flux with respect to QoS enquiries due to the continued penetration of solar PV and the subsequent “high voltage” enquiries these systems generate.
11.6 Additional Comments
The following variable codes within Table 3.1.5.3 were not submitted either due to these voltages not being operated by SA Power Networks or where operated by SA Power Networks at these voltages, they directly supply HV customers from the ZSS and therefore SA Power Networks does not operate any overhead assets at this voltage:

2014 Reset RIN – Basis of Preparation
Page 54
1. DPA0302 – 6.6kV (no overhead assets owned by SA Power Networks); 2. DPA0306 – 22kV (not operated by SA Power Networks); 3. DPA0308 – 44kV (not operated by SA Power Networks); 4. DPA0310 – 110kV (not operated by SA Power Networks); 5. DPA0311 – 132kV (not operated by SA Power Networks); 6. DPA0312 – 220kV (not operated by SA Power Networks); 7. DPA0313 – Other (no overhead assets owned by SA Power Networks).
2014 Reset RIN – Basis of Preparation
Page 55
12 Table 3.5.1.4 – Estimated underground network weighted average MVA capacity by voltage class – DPA0401 – DPA0413
12.1 General
RIN Section Compliance: Schedule 1 – Section 16.8 Data Type: Non-Financial Data Source: GIS, Network Planning Sub-transmission Line records, QMS Procedure 638. Data Quality: Estimated Confidentiality: Non-confidential Confidentiality Category: Not Applicable
12.2 Reason for Estimate (if applicable)
All values are forecast based on AER approval of regulatory Reset proposal augmentations.
12.3 Reason for Confidentiality (if applicable)
Not Applicable.
12.4 Assumptions
In compiling the data contained within this table, the following assumptions were made: 1. All new underground 11kV and 7.6kV cables forecast to be constructed would form spurs off
the existing feeder backbone and therefore would be constructed using 95mm2 Al XLPE, installed in horizontally spaced ducts and utilising single point bonding of the cable’s sheath conductors. This configuration provides the standard normal and emergency ratings for feeder spur construction.
2. Forecasts of future 11 and 7.6kV lengths provided in Table 3.5.1.2 are accurate. 3. Due to the length of, standardised nature of those cables used and forecasts of the length of the
underground LV network, no alteration in the overall MVA per km value will be achieved during the RCP.
Where network augmentation (at a particular nominal voltage) is forecast to occur, 1. Irrespective of the capacity of the underground cables used to construct SA Power Networks’
SWER networks, their capacity is limited to the largest SWER Isolating TF to prevent both overloading of the TF and also to ensure adequate protection co-ordination with upstream protection devices.
2. All augmentations contained within SA Power Networks’ Regulatory Reset submission for the 2015-20 RCP are approved by the AER and implemented as presently proposed by SA Power Networks.
3. Augmentations of the relevant network occur such that the asset will be commissioned and therefore first available for service in November of the last year of construction (in the case where construction is planned to occur over multiple years). As a result, such assets will not be reflected within the values submitted until the financial year beginning with the final year of construction (eg for 2017 projects, these augmentations will first be reflected in the 2017/18 financial year).
4. Final sub-transmission routes are not altered (and subsequently lengths) from those proposed within SA Power Networks’ Reset submission.
5. For new sub-transmission lines or augmentation of existing lines, where an overhead solution has been submitted, SA Power Networks are not forced to revert to an underground solution.
6. All MVA capacity values are based on the underground asset’s “normal” rating according to SA Power Networks’ QMS Procedure 638 or site specific calculation (as applicable).
2014 Reset RIN – Basis of Preparation
Page 56
12.5 Methodology
The following steps were undertaken to compile the data submitted: 1. For all operating voltages, the starting basis was the MVA.km, route length (in km) and MVA per
km capacity for each voltage’s underground network according to those values supplied within the 2013/14 EB RIN.
For 33kV and 66kV (ie DPA0409 and 410 respectively), 1. Those forecast augmentations of the 33kV and 66kV sub-transmission network (both new lines
and upgrades) according to the capacity submission (refer AMP 1.1.01) were added to the previous year’s MVA.km and route length values.
2. Given that the timing of each proposed augmentation of the sub-transmission network (ie 33kV and 66kV) is relatively well known, as is the augmentation required (ie cable type, length), those proposed augmentations of existing and the addition of new sub-transmission lines was made to the 2013/14 EB RIN data in the relevant year of augmentation by multiplying the revised or additional circuit’s MVA normal capacity by the route length of the line concerned and adding this to the previous year’s value to arrive at the relevant year’s MVA.km value.
3. Equally, where the proposed augmentation will see the creation of a new sub-transmission line, the route length of this line is added to the previous year’s route length for the relevant voltage. Obviously, where the proposed augmentation involves the upgrading of an existing line’s cable, whilst the rating of the line and subsequently its MVA.km value will increase, its route length will not.
4. The forecast weighted average MVA per km value for each year within the RCP is determined by dividing the relevant year’s MVA.km value by the total route length of the relevant voltage’s circuits.
For 7.6kV and 11kV (ie DPA0304 and 305 respectively), 1. As stated within the assumptions section, all new 7.6 and 11kV cable was assumed to be
suitable for operation within the feeder’s backbone. This assumption possibly over-inflates the capacity values submitted, but therefore represent the maximum possible value. Equally, the length of cable to be added on a per annum basis was based on the annual change in those forecast values submitted within Table 3.5.1.2.
2. The MVA capacity of the nominal backbone cable chosen was multiplied by the incremental increase in the nominal voltage’s length per annum to arrive at a MVA.km increase from the previous year’s value.
3. Similarly, the route length of cable was added to the previous year’s value to arrive at the respective voltage’s total length in km.
4. Each year’s MVA.km value was then divided by the total route length for each voltage to arrive at the final MVA per km value.
For SWER and LV (ie DPA0406 and 401 respectively), as stated within the assumptions section: 1. the capacity of SA Power Networks’ SWER systems has been limited to 0.2 MVA per km. 2. given the dynamic nature of and forecast continued increase in the route length of the
underground LV network (refer Table 3.5.1.2), the forecast capacity of this network has been assumed to remain constant over the RCP. This assumption would seem reasonable given both the length of the existing underground LV network (ie large quantities at reduced capacities would need to be added to reduce the overall MVA per km value) and given that it is equally likely that all new LV assets will conform to today’s capacity requirements. Equally, where LV underground network augmentation may occur due to QoS enquiries, these will increase the capacity of the localised underground LV network rather than diminish it. The AER should note that this area is in a high state of flux with respect to QoS enquiries due to the continued penetration of solar PV and the subsequent “high voltage” enquiries these systems generate.

2014 Reset RIN – Basis of Preparation
Page 57
12.6 Additional Comments
The following variable codes within Table 3.1.5.4 were not submitted either due to these voltages not being operated by SA Power Networks or where operated by SA Power Networks at these voltages, they directly supply HV customers from the ZSS and therefore SA Power Networks does not operate any underground assets at this voltage: 1. DPA0402 – 5kV (not operated by SA Power Networks); 2. DPA0403 – 6.6kV (no underground assets owned by SA Power Networks); 3. DPA0407 – 12.7kV (not operated by SA Power Networks); 4. DPA0408 – 22kV (not operated by SA Power Networks); 5. DPA0411 – 110kV (not operated by SA Power Networks); 6. DPA0412 – 132kV (not operated by SA Power Networks); 7. DPA0413 – Other (no underground assets owned by SA Power Networks).
2014 Reset RIN – Basis of Preparation
Page 58
13 Table 3.5.2.1 – Distribution Transformer Total Capacity (DPA0501 & DPA0503)
13.1 General
RIN Section Compliance: Schedule 1 – Section 16.8 Data Type: Non-Financial Data Source: GIS Data Quality: Estimated Confidentiality: Non-confidential Confidentiality Category: Not Applicable
13.2 Reason for Estimate (if applicable)
Values provided are based on forecast QoS and customer connection based upgrades and installations based on historic levels of augmentation. Forecasted work may vary due to situations not within the control of SA Power Networks, for example: sustained periods of extreme hot weather.
13.3 Reason for Confidentiality (if applicable)
Not applicable
13.4 Assumptions
In compiling the data contained within this table, the following assumptions have been made: 1. The existing installed distribution substation transformer capacities contained within SA Power
Networks’ GIS (and as submitted within the 2013/14 EB RIN) are correct; 2. The capacity increases in distribution substations due to QoS is based on historic levels and will
remain the same; 3. Forecast distribution substation capacity increases have been taken from the data contained
within table 2.5.1. Any assumptions used in preparing this data will also apply to this table’s data;
4. All transformer ratings based on nameplate rating.
13.5 Methodology
1. The forecast changes in distribution substation changes consist of two components: i) a NSP initiated component; and
ii) a customer initiated component. 2. The NSP initiated component is based on an analysis of those distribution substation TFs
changed or added by the QoS group between 2010 and 2013. 3. Over the 2010 – 2013 period, on average, the QoS group has increased the distribution
substation capacity by 33.8 MVA per annum. This was determined by analysing the QoS group’s internal project tracking database. Amongst other things, this database records the project name, nature of the work performed (eg TF upgrade, infill TF install, load balancing etc) together with the existing and revised distribution substation TF rating.
4. Using this data, the total distribution capacity change per annum was determined between 2010 and 2013 and then averaged to arrive at the average annual change in distribution substation capacity.
5. Given the QoS group’s expectation is to maintain historic levels of expenditure and therefore historic levels of augmentation, this average level of distribution substation transformer capacity increase is expected to remain the same over the subsequent RCP. As a consequence, analysis of the historic augmentations undertaken by this group should be considered a
2014 Reset RIN – Basis of Preparation
Page 59
reasonable basis for the augmentation forecasts. As such, this average value was used for the NSP initiated component of the forecast distribution substation capacity change.
6. The level of distribution substation augmentation attributable to customer connections was sourced from that information provided within table 2.5.1 of the RIN and was a result of the summation of the “Distribution substation installed (MVA added)” fields within the “Residential”, “Commericial / Industrial” and “Subdivision” categories.
7. The total annual installed distribution substation capacity was then the result of adding the incremental annual forecast increase to the values submitted within the 2013/14 EB RIN and each subsequent forecast year to the previous forecast year’s value. These values were then populated against DPA0501 within the Reset RIN.
8. The cold standby distribution substation capacity value represents SA Power Networks’ best estimate of the number and range of transformer capacities across all distribution network operating voltages required to maintain adequate emergency spare stock levels. The value of 140 MVA submitted is comparable to that of 156.8 MVA submitted within the 2013/14 EB RIN. This value was then entered within field DPA0503 within table 3.5.2.
13.6 Additional Comments
1. Year on year variation on the total amount of major construction work carried out by Quality of Supply can be effected by sustained extreme weather conditions 2. Annual target of new installations can be affected by workforce capability limitations.
2014 Reset RIN – Basis of Preparation
Page 60
14 Table 3.5.2.2 – Zone Substation Transformer Capacity (DPA0601 – DPA0605)
14.1 General
RIN Section Compliance: Schedule 1 - Section 16.8 Data Type: Non-Financial Data Source: SAP Click here to enter text. Data Quality: Estimated Confidentiality: Non-confidential Confidentiality Category: Not Applicable
14.2 Reason for Estimate (if applicable)
Values provided are based on forecast capacity based upgrades and installations. Timing of augmentation is based on present demand versus capacity forecasts.
14.3 Reason for Confidentiality (if applicable)
Not applicable.
14.4 Assumptions
1. Any proposed asset replacement project involving the replacement of an existing TF(s) will be with on a "like for like" basis and will therefore not increase the installed capacity of the ZSS's TF capacity across the network.
2. Where a new or upgraded TF is proposed to be installed in a given calendar year, SA Power Networks have assumed that its capacity will not be available until the November of the final construction year. Therefore, the capacity values submitted are reflected in the subsequent financial year's installed capacity values (eg a TF upgrade planned for implementation in 2017 will be reflected in the 2017/18 financial year's capacity values as opposed to the 2016/17 financial year).
3. No increase in the installed TF capacity at a ZSS level has been allowed for due to the unplanned failure of a TF where the failed unit is unable to be replaced with an identical unit, but rather SA Power Networks’ modern equivalent standard or spare unit (eg failure of an existing 10 MVA nameplate 66/11kV or 33/11kV TF will be replaced with a 12.5MVA TF).
4. In order to maintain consistency and comparability with previous EB RIN submissions, all TF capacities (at each voltage reporting level), are based on the highest in service nameplate rating for the given TF according to its operating voltage (ie dual ratio transformers will have differing ratings depending on the secondary voltage they are set to operate at). In the case of cold standby units, if the TF has forced cooling, the nameplate rating reported is the ONAF rather than ONAN nameplate rating. Nameplate ratings have historically been provided rather than normal rating as those normal ratings applied by SA Power Networks are subject to change due to re-calculation of rating due to changes in rating parameters (eg consideration of impact of PV on demand profile curve) or to reflect unbalanced sharing of transformers. The highest nameplate value according to the TF’s operating voltage has been used where fans exist and according to operating voltage
5. All TFs owned by SA Power Networks but which are deemed unregulated assets have been excluded from the reported values.
6. Those TFs reported as being "cold standby" include TFs which are: i) installed, but de-energised (ie traditional cold standby);
ii) installed, energised, but not on load (ie hot standby); iii) mobile units for use by SA Power Networks under contingent conditions or during ZSS
augmentation;
2014 Reset RIN – Basis of Preparation
Page 61
iv) not installed and held as system spares; and v) not installed, but held in stores awaiting future installation (either as part of a planned
network upgrade or new customer installation). 7. Those TF units removed as part of either a substation upgrade or TF replacement will not be
returned to stores for re-deployment elsewhere (ie will be scrapped) and therefore, will not impact upon the "cold standby capacity" values reported.
14.5 Methodology
1. Starting with the installed TF nameplate capacities submitted within the 2013/14 Economic Benchmarking (EB) RIN, those capacity driven augmentations involving the upgrading or addition of further TFs at existing zone substation sites, or the installation of TFs at new zone substation sites, were added to the baseline TF installed capacity portfolio based on the proposed year of commissioning and as stated within the assumptions section above.
2. Each TF according to its ZSS, was assigned a "classification code" (S1, S2, P or C) to indicate whether they were "Stage 1", "Stage2", "Primary" or "Cold Standby" TFs respectively, based on their position and function within the network.
3. A summation of the capacity of those TFs within each classification in each forecast year was then performed using the “SUMIF” function within MS Excel, to arrive at the forecast summated TF capacity according to the classifications specified within the RIN.
14.6 Additional Comments
Not Applicable
2014 Reset RIN – Basis of Preparation
Page 62
15 Table 3.6.4 – Capacity Utilisation
15.1 General
RIN Section Compliance: Schedule 1 – Section 16.8 Data Type: Non-Financial Data Source: DOPSD0202 and DPA0604 Click here to enter text. Data Quality: Estimated Confidentiality: Non-confidential Confidentiality Category: Not Applicable
15.2 Reason for Estimate (if applicable)
All values contained within variables DOPSD0202 and DPA0604 used to derive these values are estimated.
15.3 Reason for Confidentiality (if applicable)
Not Applicable.
15.4 Assumptions
The following assumptions were made in deriving the values submitted: 1. The value provided within DOPSD0202 excludes the loads seen by the second step
transformations to avoid double counting of the loads seen by the first and second step transformations. As an exercise, SA Power Networks re-calculated the utilisation values which would have been seen had the installed capacity of these loads had been excluded and found that on average, the utilisation values would have increased by 1.2% per annum.
15.5 Methodology
The values submitted were calculated according to the following process: 1. The utilisation values were calculated based on the value held in DOPSD0202 (Non–coincident
10% PoE Maximum Demand in MVA) divided by the value held in DPA0604 which represent the summation of DPA0601 (ie first step transformation capacity), DPA0602 (ie second step transformation capacity), DPA0603 (ie single step transformation capacity) and DPA0605 (ie cold standby capacity).
2. The resultant values were then converted to percent.
15.6 Additional Comments
Not Applicable.


