Embed Size (px)
Citation preview

April 2017
Company Presentation
Vietcombank

2
111 441 39
Color scheme
226 50 50
190 223 149
144 133 130
223 178 53
189 123 87
141 198 63
39 103 59
Highlight Color
226 50 50
Key Message
190 191 193
1. Vietcombank overview
2. Vietnam's banking landscape
3. Key company highlights
4. Growth strategy and targets
5. Recent financial performance
6. Annexes
Agenda

1. Vietcombank overview
4
111 441 39
Color scheme
226 50 50
190 223 149
144 133 130
223 178 53
189 123 87
141 198 63
39 103 59
Highlight Color
226 50 50
Key Message
190 191 193
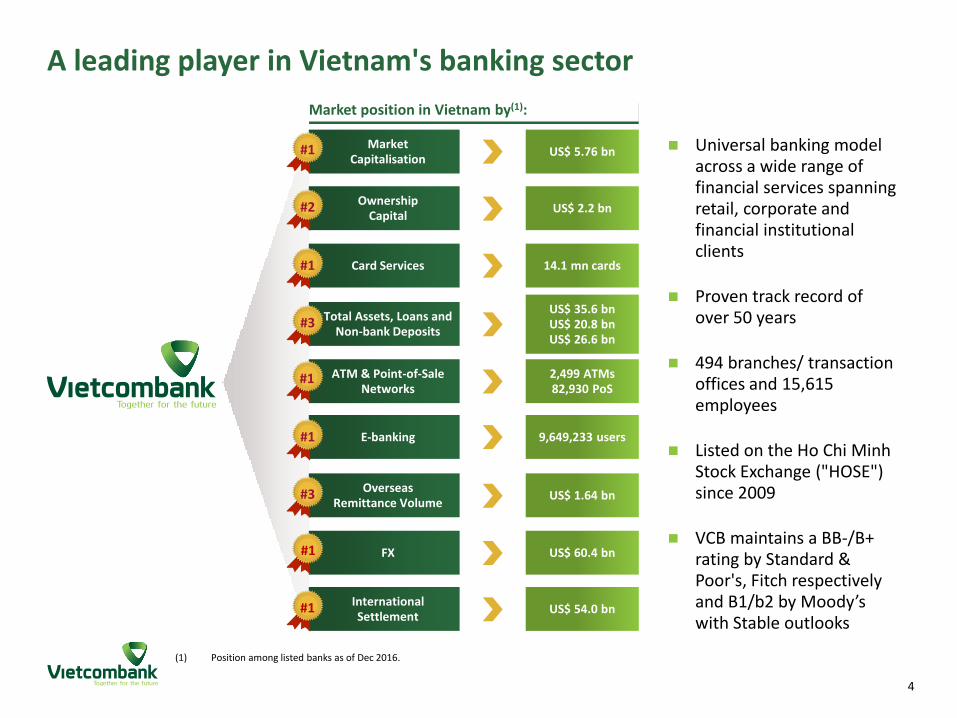
A leading player in Vietnam's banking sector
Universal banking model across a wide range of financial services spanning retail, corporate and financial institutional clients
Proven track record of over 50 years
494 branches/ transaction offices and 15,615 employees
Listed on the Ho Chi Minh Stock Exchange ("HOSE") since 2009
VCB maintains a BB-/B+ rating by Standard & Poor's, Fitch respectively and B1/b2 by Moody’s with Stable outlooks
Market position in Vietnam by(1):
Market Capitalisation US$ 5.76 bn #1
Card Services 14.1 mn cards #1
ATM & Point-of-Sale Networks
2,499 ATMs 82,930 PoS
#1
FX US$ 60.4 bn #1
International Settlement
US$ 54.0 bn #1
E-banking 9,649,233 users #1
Ownership Capital
US$ 2.2 bn #2
Total Assets, Loans and Non-bank Deposits
US$ 35.6 bn US$ 20.8 bn US$ 26.6 bn
#3
Overseas Remittance Volume
US$ 1.64 bn #3
(1) Position among listed banks as of Dec 2016.

5
111 441 39
Color scheme
226 50 50
190 223 149
144 133 130
223 178 53
189 123 87
141 198 63
39 103 59
Highlight Color
226 50 50
Key Message
190 191 193
Strong heritage and track record of achievements
Corporate milestones Key shareholders
1990 Changed to Universal
Commercial Bank
2007-2008 IPO & became
JSCB
2009 Listed in HCM Stock Exchange
2011 Entered a strategic
partner relationship with Mizuho
Corporate Bank Ltd.
1963 Established
(SOCB)
Today Most favorite
bank-brand name
Major awards
Best Local Bank in Vietnam 2008-2013
Most Favorite Bank in Vietnam 2013
Ranked # 485 among the world’s top 1000 banks
Best Trade Bank in Vietnam 2008-2013
500 Strongest Banks in Asian Pacific 2016
Best Listed Company in Vietnam 2013-2016
SBV, 77.11%
Mizuho, 15.00%
Foreign investor,
5.85%
Domestic investor,
2.04%
Note: SOCB refers to State Owned Commercial Bank and JSCB refers to Joint Stock Commercial Bank.
Best Cash Management Bank in Vietnam 2015
Best Bank in Vietnam 2016

6
111 441 39
Color scheme
226 50 50
190 223 149
144 133 130
223 178 53
189 123 87
141 198 63
39 103 59
Highlight Color
226 50 50
Key Message
190 191 193
VCB Tower 198 (70%)
VCB – Bonday –Benthanh
(52%)
VCB – Bonday (16%)
Corporate structure
Vietcombank Group
Vietcombank
Financial Services Subsidiaries and Affiliates Non-Financial Services
Subsidiaries and Affiliates
Commercial Banking Investment Banking Other Financial Services Insurance
Equity Investments in Joint-Stock Banks
Vietcombank Securities (VCBS)
(100%)
Vietcombank Fund Management (VCBF)
(51%)
Vietcombank Leasing (VCBL)
(100%)
Vietnam Finance Co. (Vinafico HK)
(100%)
VCB Cardif Life Insurance
(45%)
Real Estate
Government of Vietnam (77.1%)
VCB Money (87.5%)
Domestic Subsidiaries Joint Ventures Foreign Subsidiaries
Mizuho Bank Ltd (15.0%)
Public investors (7.9%)

2. Vietnam's banking landscape

8
111 441 39
Color scheme
226 50 50
190 223 149
144 133 130
223 178 53
189 123 87
141 198 63
39 103 59
Highlight Color
226 50 50
Key Message
190 191 193
1,006.4 948.7 787.9
333.3 256.3
BIDV Vietinbank Vietcombank Sacombank MilitaryCommercial
Bank
(VND tn)
The largest listed banks by assets (2016)
Market share by lending & deposit (2016)
Strong, double digit growth in credit and deposits
Large number of banks (98); market share dominated by SOCBs with ~50% of the industry assets, 52% lending and 46% deposit
Industry restructuring plan commenced with bank consolidation and credit control enhancement
High growth potential
− Only 35% of country's population currently has a personal bank account
− Favorable demographics with growing levels of urbanization, young population & rising income
Overview
Vietnam's banking sector today
Total credit and deposits
Deposit Lending
SOCB 51.9%
Top 5 JSCB
15.6%
Others 32.5% SOCB
45.8%
Top 5 JSCB
13.5%
Others 40.7%
Note: JSCB refers to Joint Stock Commercial Bank and SOCB refers to State Owned Commercial Bank.
2011 2012 2013 2014 2015 2016
Credit Deposits
(VND tn)

3. Key company highlights

10
111 441 39
Color scheme
226 50 50
190 223 149
144 133 130
223 178 53
189 123 87
141 198 63
39 103 59
Highlight Color
226 50 50
Key Message
190 191 193
Key company highlights
Growing loan portfolio with increasing retail component
Favorable macroeconomic environment in Vietnam
Strong brand positioning driving robust deposit growth
Extensive branch / ATM network supported by strong investment in technology
Leading product platform for trade financing and credit card services
High asset quality and strong capital base
Consistently strong profitability and market performance
Experienced management team and Board with deep industry expertise
3
1
2
6
5
4
7
8

11
111 441 39
Color scheme
226 50 50
190 223 149
144 133 130
223 178 53
189 123 87
141 198 63
39 103 59
Highlight Color
226 50 50
Key Message
190 191 193
Growing FX reserves Stabilizing inflation rate
Positive trade balance Strong GDP growth
Favorable macroeconomic environment in Vietnam 1
–
2.00%
4.00%
6.00%
8.00%
2012 2013 2014 2015 2016 2017E
Vietnam Thailand Malaysia
Indonesia India Philippines
(%) Expected to reach 6.7% growth in 2017, one of the highest in Emerging Markets
114.6 132.1
150.2 162.4
175.9
114.3 131.3
148.0 165.6 173.3
2012 2013 2014 2015 2016
Export Import
(USD bn)
25.6 25.9
34.2 38.0
41.0
2012 2013 2014 2015 2016
(USD bn)
Source: EIU, IMF, General Statistics Office of Vietnam.
6.8% 6.0%
1.8% 0.6%
4.7% 4.5%
2012 2013 2014 2015 2016 2017E
(YoY increase in consumer price)
Significant decline in inflation rate

12
111 441 39
Color scheme
226 50 50
190 223 149
144 133 130
223 178 53
189 123 87
141 198 63
39 103 59
Highlight Color
226 50 50
Key Message
190 191 193
26.9 33.0 33.6
36.1 39.4
45.5 46.9
29.6
36.0
44.7 45.1 46.1
54.5 55.9
2.4% 1.1%
3.4%
5.0%
4.4% 4.6% 4.2%
2010 2011 2012 2013 2014 2015 2016
Revenue Expenditure Budget deficit (excl. principal payment)
(USD bn)
Current account balance
Public debt and national external debt (as a % of GDP) Government revenues, expenditures and budget deficit
Favorable macroeconomic environment in Vietnam (cont’d) 1
Prudent government finances have resulted in steady revenue increases and manageable fiscal deficits
Source: MOF, SBV Note: Government revenues and expenditures are converted from VND to USD using an exchange rate of VND 22,159.
52 50 51 55
60 62 63
39 39 37 37 40 43 44
2010 2011 2012 2013 2014 2015 2016
Public debt to GDP National external debt to GDP
(%) Public and external debt levels are projected to remain within a government mandated cap of below 65% of GDP
(4.3)
0.2
9.3 7.7 9.0
0.9 4.5
2010 2011 2012 2013 2014 2015 2016
(USD bn) Current account surpluses in the last few years have benefited from strengthening remittances
Current account as a % of GDP
as a % of GDP
(3.8%) 4.9% 0.2% 5.9% 4.5% 0.5% 3.0%

13
111 441 39
Color scheme
226 50 50
190 223 149
144 133 130
223 178 53
189 123 87
141 198 63
39 103 59
Highlight Color
226 50 50
Key Message
190 191 193
Deposit breakdown by term Customer deposit
Customer deposits are the largest source of total funding, accounting for ~75%
Growing market share (~10%) on the back of strong nationwide brand recognition and loyalty
2016 deposit balance: ~VND 590.5 tn, up 17.8% compared with 2015; recorded 21.1% CAGR between 2011 – 2016
Deposit structure:
Advantages of low cost funding resources: Demand deposits account for ~28%
37.3% corporates and 62.7% retail (individuals and SMEs)
VND-denominated deposits account for ~80%
Strong brand positioning driving robust deposit growth 2
227.0 285.4
332.2
422.2
501.2
590.5
2011 2012 2013 2014 2015 2016
(VND tn)
63.4% 59.0% 50.7% 47.6% 46.0% 43.1%
9.7% 16.0% 22.0% 24.9% 24.8% 28.9%
26.9% 25.0% 27.3% 27.5% 29.2% 28.0%
2011 2012 2013 2014 2015 2016
Term deposits (12M and below) Term deposits (above 12M)
Current accounts
(%)

14
111 441 39
Color scheme
226 50 50
190 223 149
144 133 130
223 178 53
189 123 87
141 198 63
39 103 59
Highlight Color
226 50 50
Key Message
190 191 193
Lending breakdown by clients Total loans
Growing loan portfolio with a focused approach to increase loans to retail banking
− Long and medium term loans account for 44% of total loans
− Domestic currency loans account for 83% of total loans
− ~50% of the total loans are collateralized
Market share: ~9%
2016: Total loans: ~VND 460.8 tn, increased 18.9% against 2015; recorded 17.1% CAGR between 2011 – 2016
2016 NPL ratio: 1.51%
2016 total provision fund: VND 8.1 tn
3 Growing loan portfolio with increasing retail component
209.4 241.2
274.3 323.3
387.7
2011 2012 2013 2014 2015 2016
(VND tn)
460.8
Note: Criteria for lending breakdown by clients (corporates vs SMEs) has been amended from 2015 onwards and reflected accordingly.
77.0% 74.3% 72.7% 69.5% 72.4% 65.2%
13.0% 13.7% 13.7% 14.5% 7.9% 9.6%
10.0% 12.0% 13.6% 16.0% 19.7% 25.3%
2011 2012 2013 2014 2015 2016
Corporates SME Individual

15
111 441 39
Color scheme
226 50 50
190 223 149
144 133 130
223 178 53
189 123 87
141 198 63
39 103 59
Highlight Color
226 50 50
Key Message
190 191 193
Short-term 56.4%
Medium-term 11.7%
Long-term 31.9% Current, 96.78%
Special mentioned,
1.72%
Sub-standard, 0.29%
Doubtful, 0.29%
Loss, 0.92%
By term By loan group By sector
Diversified loan portfolio with a focus on high-growth sectors with good credit quality
Lending breakdown (2016)
Construction 5.5%
Electricity, gas, water
processing & supplying
6.2%
Processing, manufacturing
30.6%
Transportation, logistics,
communication 5.8%
Trading & services 25.5%
Others 26.4%
3
Note: Lending breakdown by sector as at 31 Dec 2016, audited F.S.

16
111 441 39
Color scheme
226 50 50
190 223 149
144 133 130
223 178 53
189 123 87
141 198 63
39 103 59
Highlight Color
226 50 50
Key Message
190 191 193
Earning assets breakdown (2016) Total assets
High asset quality and strong capital base
Balances with SBV 2.3% Placements
with & loans to other
banks 19.7%
Loans & advances to customers
59.9%
Investment in securities
18.2%
(%)
4
FY ended 31 December 2011A 2012A 2013A 2014A 2015A 2016A
Loans to deposits 92.25% 84.51% 82.56% 76.58% 77.36% 78.04%
Loan loss reserve coverage (Provision/NPL) 125.13% 91.07% 86.29% 94.43% 120.63% 117.12%
NPL ratio 2.03% 2.40% 2.73% 2.31% 1.84% 1.51%
CAR 11.13% 14.83% 13.37% 11.61% 11.04% 11.13%
Credit Cost 1.80% 1.47% 1.37% 1.53% 1.71% 1.51%
VND 770 tn 366.7 414.5 469.0
577.0 674.4
787.9
2011 2012 2013 2014 2015 2016
(VND tn)

17
111 441 39
Color scheme
226 50 50
190 223 149
144 133 130
223 178 53
189 123 87
141 198 63
39 103 59
Highlight Color
226 50 50
Key Message
190 191 193
Export-import settlement volume Leading position in Trade Financing (TF) and International Settlement
− Market share: ~15.5% in TF
− Solid customer-base include country’s top importers & exporters
− Extensive correspondent network includes ~2,000 banks all over the world
Domestic Settlement (VCB Money)
− The first and leading e-banking platform in Vietnam
− Clearing center in Vietnam for foreign currencies
FX Transactions and Derivatives
− Leader in Vietnam’s foreign exchange market
− Overall profit from FX contribute to ~7.4% of total operating income
Leading platform for trade financing and cross-border business needs
5
Market share in total international settlement
22.6% 19.8% 18.4% 18.7% 17.6%
14.3% 16.1% 14.1% 13.2% 13.6% 15.8%
16.7%
2011 2012 2013 2014 2015 2016
Export Import
FX transaction volumes
34.6 42.2 45.2
62.1 59.8 60.4
2011 2012 2013 2014 2015 2016
(USD bn)
14.6 15.2 15.5 19.1
22.2 25.1
18.0 16.4 17.7 20.7 22.5 28.9
2011 2012 2013 2014 2015 2016
Export Import
(USD bn)

18
111 441 39
Color scheme
226 50 50
190 223 149
144 133 130
223 178 53
189 123 87
141 198 63
39 103 59
Highlight Color
226 50 50
Key Message
190 191 193
Credit Card payment volume Vietcombank is the No.1 bank in Vietnam for bank cards
− 30% market share by number of credit cards (issuing bank)
− 14% market share by number of debit card
− 44% market share by credit card payments volume
Strategic partners in Vietnam for international card organizations (Visa, Master, Amex, JCB, Diner’s Club, China Union Pay)
Largest ATM network with 2,499 ATMs and 82,930 Points of Sale nationwide
Leading platform for credit card services and products 5
Number of ATM&POS Number of cards
973 1,185
1,503 1,760
2,104
3,165
2011 2012 2013 2014 2015 2016
(USD mn)
884
8,892
654 1,058
10,339
786 1,279
11,948
910
International debit Domestic debit Credit
2014 2015 2016
(‘000 cards)
1,700 1,835 1,917 2,127 2,346 2,499
22,000 32,178
42,238
55,576
69,347
82,930
2011 2012 2013 2014 2015 2016
ATMs POS

19
111 441 39
Color scheme
226 50 50
190 223 149
144 133 130
223 178 53
189 123 87
141 198 63
39 103 59
Highlight Color
226 50 50
Key Message
190 191 193
Extensive branch / ATM network supported by strong investment in technology
…supported by a digital platform Nationwide coverage and presence…
6
As of 2016,
In 2016, Vietcombank has opened 5 branches and 25 transaction offices
Vietcombank aims to open approximately 5-10 branches and 15-20 transaction offices each year
50 Cities covered
101 Branches
393 Transaction
offices
2,499 ATMs
New e-banking customers (additions only)* (‘000)
Developed a wide range of products and services that are distributed through digital channels
Services include:
− VCB I-B@nking
− VCB SMS B@nking
− Mobile B@nking
− VCB Home B@nking
− VCB Cyber Bill Payment
− VCB Global Trade
23.9
Represents VCB branch
1,195 1,568
2,050 2,118
2013 2014 2015 2016
* Figures are non-cumulative

20
111 441 39
Color scheme
226 50 50
190 223 149
144 133 130
223 178 53
189 123 87
141 198 63
39 103 59
Highlight Color
226 50 50
Key Message
190 191 193
Cost to income ratios Operating income structure (2016)
Consistently strong profitability
Services 8.5%
Interest, 74.5%
FX 7.4%
Investment 0.3%
Other 9.3%
(%)
VND 24,880 bn
7
FY ended 31 December 2011A 2012A 2013A 2014A 2015A 2016A
Net interest margin 3.48% 2.99% 2.62% 2.40% 2.57% 2.64%
Non-interest income/Operating Income 26.47% 27.45% 30.47% 31.96% 27.11% 25.53%
Pre-Provision Operating Profit/Equity 37.15% 25.84% 22.07% 24.36% 29.20% 32.12%
ROAA 1.24% 1.13% 0.99% 0.88% 0.85% 0.93%
ROAE 17.00% 12.54% 10.39% 10.66% 12.03% 14.70%
30%
40%
50%
60%
70%
80%
90%
2011 2012 2013 2014 2015 2016
VCB ACB Sacombank Vietinbank BIDV
(%)

21
111 441 39
Color scheme
226 50 50
190 223 149
144 133 130
223 178 53
189 123 87
141 198 63
39 103 59
Highlight Color
226 50 50
Key Message
190 191 193
Sector leading share price performance
Source: FactSet, Bloomberg as of 30 Dec 2016. *All prices are adjusted prices
2014 – 2016 YTD share price performance
7
Number of shares: 3,597,768,575
Last closed price (30/12/2016): 35,450 VND*
VWAP in the most recent 3 months: 36,404 VND
52-week high / low: 41,800 / 28,000 VND
All shares are listed on the HOSE
EPS (4Q 2016 LTM): 1,566 VND
P/B (30/12/2016)= 2.66
P/E (30/12/2016) = 22.64
Transaction volume of foreign investors
− 2014: 27.3 million shares
− 2015: 2.85 million shares
− 2016 : 4.43 million shares
Shares information
0
50
100
150
200
250
VCB BID CTG MBB STB EIB ACB

22
111 441 39
Color scheme
226 50 50
190 223 149
144 133 130
223 178 53
189 123 87
141 198 63
39 103 59
Highlight Color
226 50 50
Key Message
190 191 193
Dao Hao Deputy CEO
Pham Thanh Ha Deputy CEO
Pham Manh Thang Deputy CEO
Truong Thi Thuy Nga Deputy CEO
Phung Nguyen Hai Yen Chief Accountant
* Also serves as member of the Board of Directors.
Truong Le Hien Head Of Supervisory Board
Do Thi Mai Huong Member of Supervisory Board
La Thi Hong Minh Member of Supervisory Board
Vu Thi Bich Van Member of Supervisory Board
Pham Quang Dung* Chief Executive Officer
Dao Minh Tuan Deputy CEO
Nguyen Danh Luong* Deputy CEO
Yutaka Abe* Deputy CEO
Nguyen Thi Kim Oanh Deputy CEO
Dinh Thi Thai Deputy CEO
Supervisory Board
Experienced management team and BoD with deep industry expertise
Mr. Nghiem Xuan Thanh, Chairman of Board of Directors, has been with VCB since 2013 and has a banking career spanning over 25 years in various banks in Vietnam and in the State Bank of Vietnam. Before being appointed the Chairman, Mr. Thanh was member of the Board of Directors and concurrently the CEO of VCB.
Mr. Pham Quang Dung, Chief Executive Officer, has been with VCB since 1994 and has over 20 years of banking and finance experience in Vietnam. Before being appointed the CEO, he held various positions in VCB, including member of the Board of Directors and the Deputy CEO
Chairman and CEO profile
8
Nguyen Manh Hung Member of the BoD
Nguyen Thi Dung Member of the BoD
Le Thi Hoa Member of the BoD
Board of Directors
Nghiem Xuan Thanh Chairman of the BoD
Pham Quang Dung
Nguyen Danh Luong
Yutaka Abe
Board of Management

4. Growth strategy and targets

24
111 441 39
Color scheme
226 50 50
190 223 149
144 133 130
223 178 53
189 123 87
141 198 63
39 103 59
Highlight Color
226 50 50
Key Message
190 191 193
To become number 1 bank in Vietnam, ranking among 300 biggest financial groups in the world,
underpinned by global best practices
V. Best local Bank in Risk management
III. Number 1 by customer satisfaction
IV. Best local bank in human resource quality
II. The local most profitable bank with ROE ~15%
I. Top 1 Retail and Top 2 Wholesale
Deposits:
60% retail
40% wholesales
Loans:
50% retails (40%
individual)
50% wholesales
ROE ~13-15%
ROA ~ 1%
Most
convenient
products and
services
Best
customer
services
Highest
Return for
Customers
Highest labor
productivity
Highest EES
Pioneer in
applying
standard
Basel II by
2018 and
advanced
Basel II by
2020
Vision 2020 & Strategy

25
111 441 39
Color scheme
226 50 50
190 223 149
144 133 130
223 178 53
189 123 87
141 198 63
39 103 59
Highlight Color
226 50 50
Key Message
190 191 193
VCB Tower 198 (70%)
VCB – Bonday –Benthanh
(52%)
VCB – Bonday (16%)
Targeted corporate structure
Vietcombank Group Vietcombank Holdings
Financial Services Subsidiaries and Affiliates Non-Financial Services Subsidiaries and
Affiliates
Vietcombank Securities (VCBS)
(100%)
Vietcombank Fund Management (VCBF)
(51%)
Vietcombank Leasing (VCBL)
(100%)
Vietnam Finance Co. (Vinafico HK)
(100%)
VCB Cardif Life Insurance
(45%)
VCB Money (87.5%)
Domestic Subsidiaries Joint Ventures Foreign Subsidiaries
Target businesses which VCB plans to invest in sometime in the near future
Commercial Banking Investment Banking Other Financial
Services Insurance Real Estate Others
Equity Investments in Joint-Stock Banks
Vietcombank Commercial Bank
(100%)
Consumer Finance
VCB Training Centre
AMC Domestic Money
Transfer

26
111 441 39
Color scheme
226 50 50
190 223 149
144 133 130
223 178 53
189 123 87
141 198 63
39 103 59
Highlight Color
226 50 50
Key Message
190 191 193
Key strategic initiatives
Centralize organizational structure
Standardize branch’s operation model
Accelerate transformation projects (Credit TOM, Basel II, MIS, KPIs, ALM-FTP-MPA, etc)
Enhancement of corporate governance
Develop customer base, maintain wholesale banking position and focus more on retail customers
Diversify products and income structure, increase portion of non-interest income
Improve operating cost management
Business expansion
Increase chartered capital
Capital raising
27
111 441 39
Color scheme
226 50 50
190 223 149
144 133 130
223 178 53
189 123 87
141 198 63
39 103 59
Highlight Color
226 50 50
Key Message
190 191 193
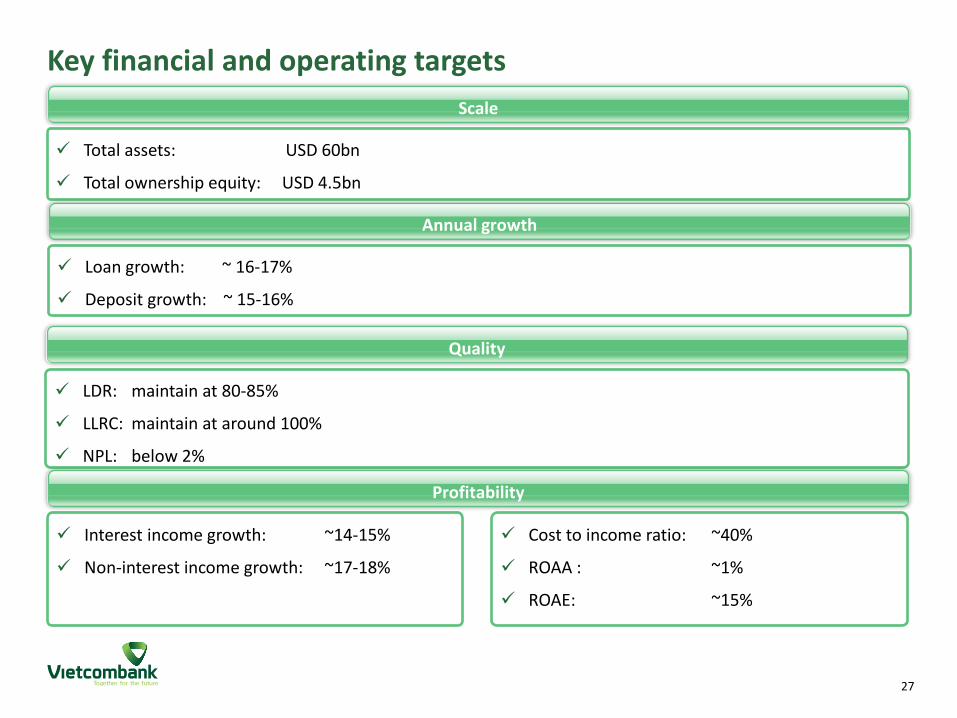
Key financial and operating targets
Total assets: USD 60bn
Total ownership equity: USD 4.5bn
Scale
LDR: maintain at 80-85%
LLRC: maintain at around 100%
NPL: below 2%
Quality
Interest income growth: ~14-15%
Non-interest income growth: ~17-18%
Profitability
Loan growth: ~ 16-17%
Deposit growth: ~ 15-16%
Annual growth
Cost to income ratio: ~40%
ROAA : ~1%
ROAE: ~15%

5. 2016 financial performance

29
111 441 39
Color scheme
226 50 50
190 223 149
144 133 130
223 178 53
189 123 87
141 198 63
39 103 59
Highlight Color
226 50 50
Key Message
190 191 193
Capitalization Gross loans and total deposits
2016 results summary – Balance sheet
241.2 274.3
323.3
387.7
460.8
285.4 332.2
422.2
501.2
590.4
84.5% 82.6% 76.6% 77.4%
78.0%
2012 2013 2014 2015 2016
Gross loans Total deposits Loans-to-deposits ratio
(VND tn)
42.4 43.3 45.0 47.9
13.1%
11.6% 11.0% 11.1%
2013 2014 2015 2016
Shareholders' equity Total CAR
(VND tn)
As of 31 Dec 2016, total deposits and total loans increased by 17.8% and 18.9% respectively against 31 Dec 2015
VCB continues to pursue quality lending opportunities, focusing on high growth sectors and retail accounts. Gross loans increased
18.9% from 31 Dec 2015 to reach VND 460.8 tn as of 31 Dec 16, resulting in a 68 bps increase in LDR in the same period
VCB remains adequately capitalized and is in a position to pursue attractive growth opportunities
30
111 441 39
Color scheme
226 50 50
190 223 149
144 133 130
223 178 53
189 123 87
141 198 63
39 103 59
Highlight Color
226 50 50
Key Message
190 191 193
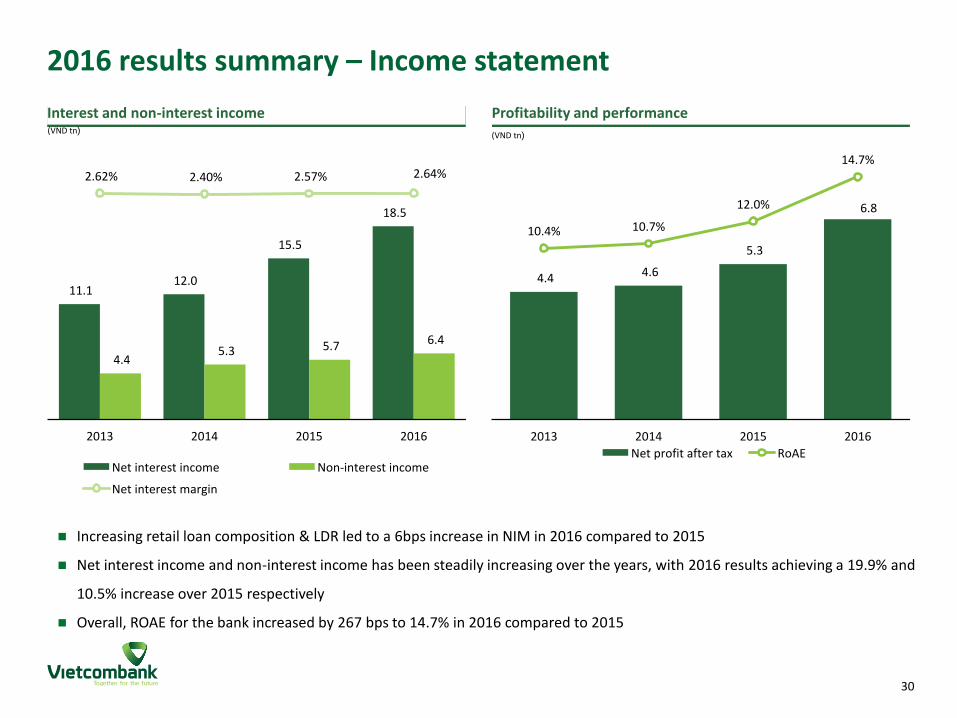
Profitability and performance Interest and non-interest income
2016 results summary – Income statement
11.1 12.0
15.5
18.5
4.4 5.3 5.7 6.4
2.62% 2.40% 2.57% 2.64%
2013 2014 2015 2016
Net interest income Non-interest income
Net interest margin
(VND tn)
4.4 4.6
5.3
6.8
10.4% 10.7%
12.0%
14.7%
2013 2014 2015 2016
Net profit after tax RoAE
(VND tn)
Increasing retail loan composition & LDR led to a 6bps increase in NIM in 2016 compared to 2015
Net interest income and non-interest income has been steadily increasing over the years, with 2016 results achieving a 19.9% and
10.5% increase over 2015 respectively
Overall, ROAE for the bank increased by 267 bps to 14.7% in 2016 compared to 2015

31
111 441 39
Color scheme
226 50 50
190 223 149
144 133 130
223 178 53
189 123 87
141 198 63
39 103 59
Highlight Color
226 50 50
Key Message
190 191 193
2016 Performance vs AGM’s targets & 2017 tentative targets
Key targets 2015 2016 Growth (%) 2016 target Growth (%) 2017 tentative
growth (%)
Total assets (VND bn)
674,395 787,907 16.83% ~765,000 13.50% 11%
Gross customer loans (VND bn)
387,723 460,808 18.85% ~453,000 17.00% 15%
Customer deposits (VND bn)
501,163 590,451 17.82% ~576,000 15.00% 14%
PBT
(VND bn) 6,827 8,523 24.84% ~7,500 10% 8%
NPL ratio 1.84% 1.51% <2.0% <2%

6. Annexes

33
111 441 39
Color scheme
226 50 50
190 223 149
144 133 130
223 178 53
189 123 87
141 198 63
39 103 59
Highlight Color
226 50 50
Key Message
190 191 193
Organisational structure
BOD
Controllers Committee
Internal Audit, Operation Supervisory
Internal Inspectorate Credit Committee, ALCO, ...
Wholesale Business Group
Treasury & Trading Group
Retail Business Group
Risk Management
Operational Group
Financial Group
CEO & Senior Management
Supporting Departments
H.O Dept., Branches, ....
Shareholders’ General Meeting
Risk Committee, Nomination Committee, ...

34
111 441 39
Color scheme
226 50 50
190 223 149
144 133 130
223 178 53
189 123 87
141 198 63
39 103 59
Highlight Color
226 50 50
Key Message
190 191 193
Total investments by type (2016)
Total investments - VND 5,376bn (USD 245m) as of 31 Dec 2016
3 Wholly – Owned Subsidiaries: VCBS, VCBL & VFC
JVs and Partnerships: VCBF, Vietcombank Tower, VCB Money (TN Monex), VCB-Bonday-Ben Thanh, Vietcombank Cardif Life Insurance, etc
Equity Investments: MB, PJICO, etc
VCBS, VCBF & VCB Investment Management Dept. – core components to upgrade to IB
Equity investments overview
Total investments by sectors (2016)
Banking 38.94%
Finance & securities
32.5%
Insurance 6.29%
Real estate, infrastructure
11.52%
Others 10.85%
(%)
Wholly owned 32.00%
JVs & partnership
15.38%
Equity investments
52.63%
(%)

35
111 441 39
Color scheme
226 50 50
190 223 149
144 133 130
223 178 53
189 123 87
141 198 63
39 103 59
Highlight Color
226 50 50
Key Message
190 191 193
Historical balance sheet
(Figures in VND bn)
FY ended 31 Dec 2011A 2012A 2013A 2014A 2015A 2016A
Cash and cash equivalents 5,394 5,627 6,060 8,323 8,519 9,692
Balances with SBV 10,617 15,732 24,844 13,267 19,715 17,382
Current accounts, deposits and placements with banks 105,005 65,713 91,737 146,077 131,527 151,846
Investments in securities 30,274 79,042 64,795 77,246 117,523 136,005
Loans to customers 209,417 241,167 274,314 323,338 387,723 460,808
Provision for credit losses -5,328 -5,278 -6,451 -7,084 (8,610) (8,124)
Equity investment 2,618 3,021 3,042 3,546 3,557 3,628
Net fixed assets 2,606 3,660 4,086 4,465 5,039 5,639
Other assets 6,119 5,804 6,568 7,818 9,400 11,031
Total Assets 366,722 414,488 468,994 576,996 674,394 787,907
Current accounts of banks and payables to SBV 38,866 24,806 32,622 54,093 41,480 54,151
Borrowings from SBV and term deposits from banks 47,962 34,066 44,044 43,238 72,135 72,238
Customers deposits 227,017 285,382 332,246 422,204 501,163 590,451
Valuable papers issued 2,071 2,028 2,014 2,209 2,479 10,286
Debt securities issued and other borrowed funds 12 5 - 75 - -
Other liabilities 22,012 26,502 15,532 11,704 11,966 12,678
Total Liabilities 337,940 372,790 426,458 533,523 629,222 739,805
Minority Interest 143 152 150 148 165 144
Chartered capital 19,698 23,174 23,174 26,650 26,650 35,978
Other capital 1,040 9,247 9,247 5,921 5,940 213
Retained earnings and reserves 7,900 9,126 9,965 10,754 12,417 11,768
Total Shareholders’ Equity 28,638 41,547 42,386 43,325 45,007 47,958
Source: VCB Consolidated Financial Statement.

36
111 441 39
Color scheme
226 50 50
190 223 149
144 133 130
223 178 53
189 123 87
141 198 63
39 103 59
Highlight Color
226 50 50
Key Message
190 191 193
Historical balance sheet (cont’d)
(Figures in USD m)
FY ended 31 Dec 2011A 2012A 2013A 2014A 2015A 2016A
Cash and cash equivalents 259 270 288 392 389 437
Balances with SBV 510 755 1,181 624 901 784
Current accounts, deposits and placements with banks 5,042 3,155 4,361 6,876 6,009 6,853
Investments in securities 1,454 3,795 3,080 3,636 5,369 6,138
Loans to customers 10,055 11,579 13,040 15,220 17,712 20,796
Provision for credit losses -256 -253 -307 (333) (393) (367)
Equity investment 126 145 145 167 162 164
Net fixed assets 125 176 194 210 230 254
Other assets 294 279 312 368 429 498
Total Assets 17,607 19,901 22,295 27,159 30,808 35,557
Current accounts of banks and payables to SBV 1,866 1,191 1,551 2,546 1,895 2,444
Borrowings from SBV and term deposits from banks 2,303 1,636 2,094 2,035 3,295 3,260
Customers deposits 10,900 13,702 15,794 19,873 22,895 26,646
Valuable papers issued 99 97 96 104 113 464
Debt securities issued and other borrowed funds 1 0 - 4 - -
Other liabilities 452 437 453 551 547 572
Total Liabilities 16,225 17,898 20,273 25,113 28,745 33,386
Minority Interest 7 7 7 7 8 6
Chartered capital 946 1,113 1,102 1,254 1,217 1,624
Other capital 50 444 440 279 271 10
Retained earnings and reserves 379 438 474 506 567 531
Total Shareholders’ Equity 1,375 1,995 2,015 2,039 2,056 2,164
Source: VCB Consolidated Financial Statement. Note: Exchange rate (USD/ VND) was taken from the State Bank of Vietnam at the end of period/year

37
111 441 39
Color scheme
226 50 50
190 223 149
144 133 130
223 178 53
189 123 87
141 198 63
39 103 59
Highlight Color
226 50 50
Key Message
190 191 193
Historical income statement
(Figures in VND bn)
FY ended 31 Dec 2011A 2012A 2013A 2014A 2015A 2016A
Interest income 33,574 31,940 28,590 28,222 31,361 37,713
Interest expenses (22,420) (20,793) (17,516) (16,214) (15,908) (19,185)
Net interest income 11,154 11,147 11,074 12,009 15,453 18,528
Service fee income 1,979 2,031 2,454 2,912 3,557 4,326
Service charges (688) (862) (1,126) (1,396) (1,685) (2,220)
Net fee income 1,291 1,169 1,328 1,517 1,873 2,107
Foreign exchange gain, net 1,180 1,488 1,427 1,345 1,573 1,850
Net gain on securities 18 284 183 419 350 406
Investment income (loss) 1,003 469 562 211 48 72
Other non-interest income 226 525 934 1,785 1,905 1,917
Non-interest income 3,718 3,935 4,434 5,277 5,749 6,352
Operating income 14,872 15,082 15,508 17,286 21,202 24,880
Operating expenses (5,700) (6,013) (6,244) (6,850) (8,306) (9,950)
Operating profit (pre-provision) 9,172 9,069 9,264 10,436 12,895 14,929
Provisions (net of reversals) (3,474) (3,303) (3,520) (4,591) (6,068) (6,406)
Profit before taxes 5,698 5,766 5,744 5,845 6,827 8,523
Income tax expense (1,480) (1,343) (1,365) (1,258) (1,495) (1,672)
Minority interest (21) (24) (20) (19) (18) (19)
Net profit /loss 4,197 4,399 4,359 4,568 5,314 6,832
Source: VCB Consolidated Financial Statement.

38
111 441 39
Color scheme
226 50 50
190 223 149
144 133 130
223 178 53
189 123 87
141 198 63
39 103 59
Highlight Color
226 50 50
Key Message
190 191 193
(Figures in USD m)
FY ended 31 Dec 2011A 2012A 2013A 2014A 2015A 2016A
Interest income 1,608 1,532 1,358 1,328 1,433 1,702
Interest expenses (1,074) (997) (832) (763) (727) (866)
Net interest income 534 535 526 565 706 836
Service fee income 95 97 117 137 163 195
Service charges (33) (41) (53) (66) (77) (100)
Net fee income 62 56 63 71 86 95
Foreign exchange gain, net 57 71 68 63 72 83
Net gain on securities 1 14 9 20 16 18
Investment income (loss) 48 22 27 10 2 3
Other non-interest income 11 25 44 84 87 87
Non-interest income 178 189 211 248 263 287
Operating income 712 723 736 814 969 1,123
Operating expenses (273) (288) (297) (322) (379) (449)
Operating profit (pre-provision) 439 435 440 491 589 674
Provisions (net of reversals) (166) (158) (167) (216) (277) (289)
Profit before taxes 273 277 273 275 312 385
Income tax expense (71) (64) (65) (59) (68) (75)
Minority interest (1) (1) (1) (1) (1) (1)
Net profit /loss 201 211 207 215 243 308
Historical income statement (cont’d)
Source: VCB Consolidated Financial Statement. Note: Exchange rate (USD/ VND) was taken from the State Bank of Vietnam at the end of period/year

39
111 441 39
Color scheme
226 50 50
190 223 149
144 133 130
223 178 53
189 123 87
141 198 63
39 103 59
Highlight Color
226 50 50
Key Message
190 191 193
Important notice: This presentation does not constitute a prospectus or form part of any offer or invitation to sell or issue, or any solicitation of any offer to purchase
or subscribe for, or any offer to underwrite or otherwise acquire any shares in VCB or any other securities, nor shall they or any part of them nor the fact of their distribution or communication form the basis of, or be relied on in connection with, any contract, commitment or investment decision in relation thereto.
Some of the statements contained in this presentation that are not historical facts are statements of future expectations with respect to the financial conditions, results of operations and businesses, and related plans and objectives. Forward looking information is based on management's current views and assumptions including, but not limited to, prevailing economic and market conditions. These statements involve known and unknown risks and uncertainties that could cause actual results, performance or events to differ materially from those in the statements as originally made. Such statements are not, and should not be construed as a representation as to future performance of Vietcombank. It should be noted that the actual performance of Vietcombank may vary significantly from such targets.
This presentation is to provide general [public] information and analysis on Vietcombank for those who qualify as a “professional securities investor” as defined in the Securities Law 2006. Such investors should use information, analysis, comment in this presentation as a reference source only. This presentation and any meeting where this presentation is made are for the purpose of providing information and do not intend to advertise VCB or VCB stock or to advice readers to buy or sell VCB stock or any other securities. No representation or warranty, express or implied, is made concerning, and no reliance should be placed on, the accuracy, fairness, or completeness of this Presentation. Vietcombank takes no responsibility with regard to the accuracy or completeness of any information contained here. Viewpoint and analysis in the report can be changed without notification.
The presentation is a property of Vietcombank and under copyright protection. Infringement of copy, change and reprint of the report without permission of Vietcombank is illegal. Vietcombank owns the copyright on this documentation.
IR Team:
Mr. Le Hoang Tung (David) - Tel: +84-4-3 9343137 Ext 2079, Email: [email protected]
Ms. Hoang Le Trang (Page) - Tel: +84-4-3 9343137 Ext 1509, Email: [email protected]
Mr. Duong Duc Hieu (Charlie) - Tel: +84-4-3 9343137 Ext 1828, Email: [email protected]
Ms. La Cam Anh (Emily) - Tel: +84-4-3 9343137 Ext 1834, Email: [email protected]
Mr. Le Viet Anh (David Jr.) - Tel: +84-4-3 9343137 Ext 1530, Email: [email protected]
Ms. Nguyen Mai Huong (Jane) - Tel: +84-4-3 9343137 Ext 1834, Email: [email protected]