Embed Size (px)
Citation preview
20
20
AN
NU
AL R
EP
OR
T S
PIN
MA
ST
ER
CO
RP.
2020 ANNUAL REPORTSPIN MASTER CORP.
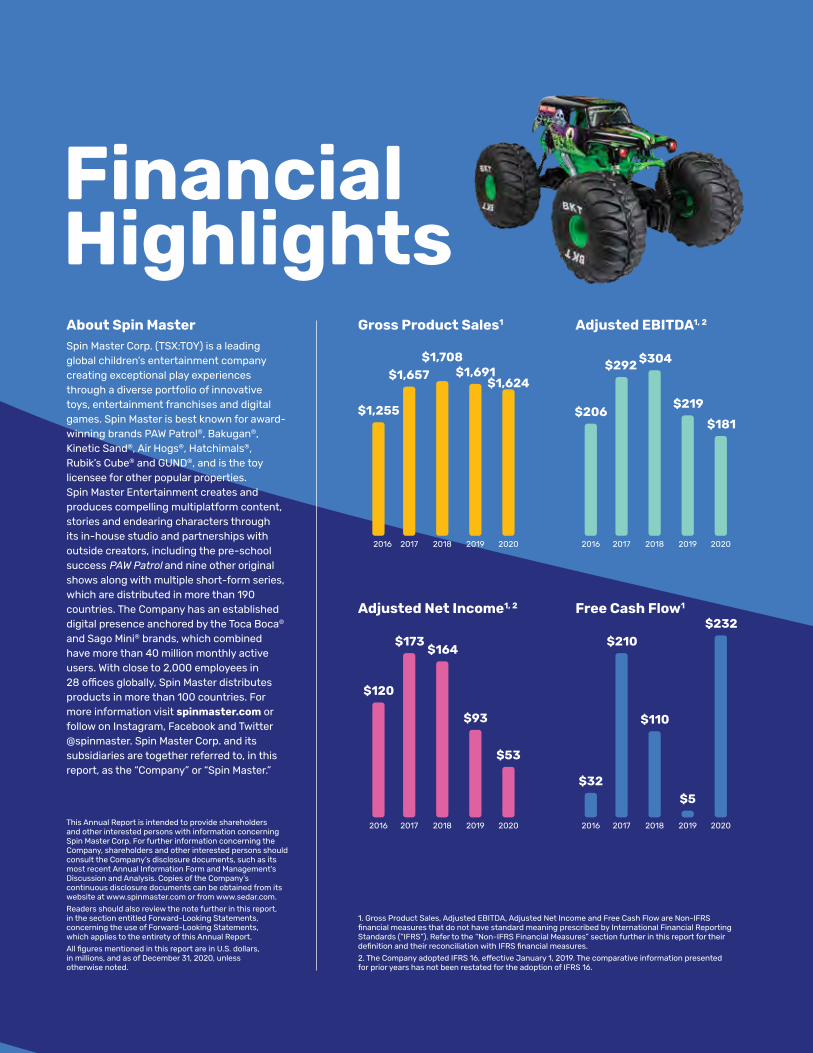
Financial HighlightsAbout Spin MasterSpin Master Corp. (TSX:TOY) is a leading global children’s entertainment company creating exceptional play experiences through a diverse portfolio of innovative toys, entertainment franchises and digital games. Spin Master is best known for award-winning brands PAW Patrol®, Bakugan®, Kinetic Sand®, Air Hogs®, Hatchimals®, Rubik’s Cube® and GUND®, and is the toy licensee for other popular properties. Spin Master Entertainment creates and produces compelling multiplatform content, stories and endearing characters through its in-house studio and partnerships with outside creators, including the pre-school success PAW Patrol and nine other original shows along with multiple short-form series, which are distributed in more than 190 countries. The Company has an established digital presence anchored by the Toca Boca® and Sago Mini® brands, which combined have more than 40 million monthly active users. With close to 2,000 employees in 28 offices globally, Spin Master distributes products in more than 100 countries. For more information visit spinmaster.com or follow on Instagram, Facebook and Twitter @spinmaster. Spin Master Corp. and its subsidiaries are together referred to, in this report, as the “Company” or “Spin Master.”
This Annual Report is intended to provide shareholders and other interested persons with information concerning Spin Master Corp. For further information concerning the Company, shareholders and other interested persons should consult the Company’s disclosure documents, such as its most recent Annual Information Form and Management’s Discussion and Analysis. Copies of the Company’s continuous disclosure documents can be obtained from its website at www.spinmaster.com or from www.sedar.com.
Readers should also review the note further in this report, in the section entitled Forward-Looking Statements, concerning the use of Forward-Looking Statements, which applies to the entirety of this Annual Report.
All figures mentioned in this report are in U.S. dollars, in millions, and as of December 31, 2020, unless otherwise noted.
Gross Product Sales1
$1,255
2016
$1,657$1,708
$1,691$1,624
2017 2018 2019 2020
$206
2016
$292 $304
$219
$181
2017 2018 2019 2020
$120
2016
$173$164
$93
$53
2017 2018 2019 2020
$32
2016
$210
$110
$5
$232
2017 2018 2019 2020
Adjusted EBITDA1, 2
$1,255
2016
$1,657$1,708
$1,691$1,624
2017 2018 2019 2020
$206
2016
$292 $304
$219
$181
2017 2018 2019 2020
$120
2016
$173$164
$93
$53
2017 2018 2019 2020
$32
2016
$210
$110
$5
$232
2017 2018 2019 2020
Adjusted Net Income1, 2
$1,255
2016
$1,657$1,708
$1,691$1,624
2017 2018 2019 2020
$206
2016
$292 $304
$219
$181
2017 2018 2019 2020
$120
2016
$173$164
$93
$53
2017 2018 2019 2020
$32
2016
$210
$110
$5
$232
2017 2018 2019 2020
Free Cash Flow1
$1,255
2016
$1,657$1,708
$1,691$1,624
2017 2018 2019 2020
$206
2016
$292 $304
$219
$181
2017 2018 2019 2020
$120
2016
$173$164
$93
$53
2017 2018 2019 2020
$32
2016
$210
$110
$5
$232
2017 2018 2019 2020
1. Gross Product Sales, Adjusted EBITDA, Adjusted Net Income and Free Cash Flow are Non-IFRS financial measures that do not have standard meaning prescribed by International Financial Reporting Standards (“IFRS”). Refer to the “Non-IFRS Financial Measures” section further in this report for their definition and their reconciliation with IFRS financial measures.
2. The Company adopted IFRS 16, effective January 1, 2019. The comparative information presented for prior years has not been restated for the adoption of IFRS 16.
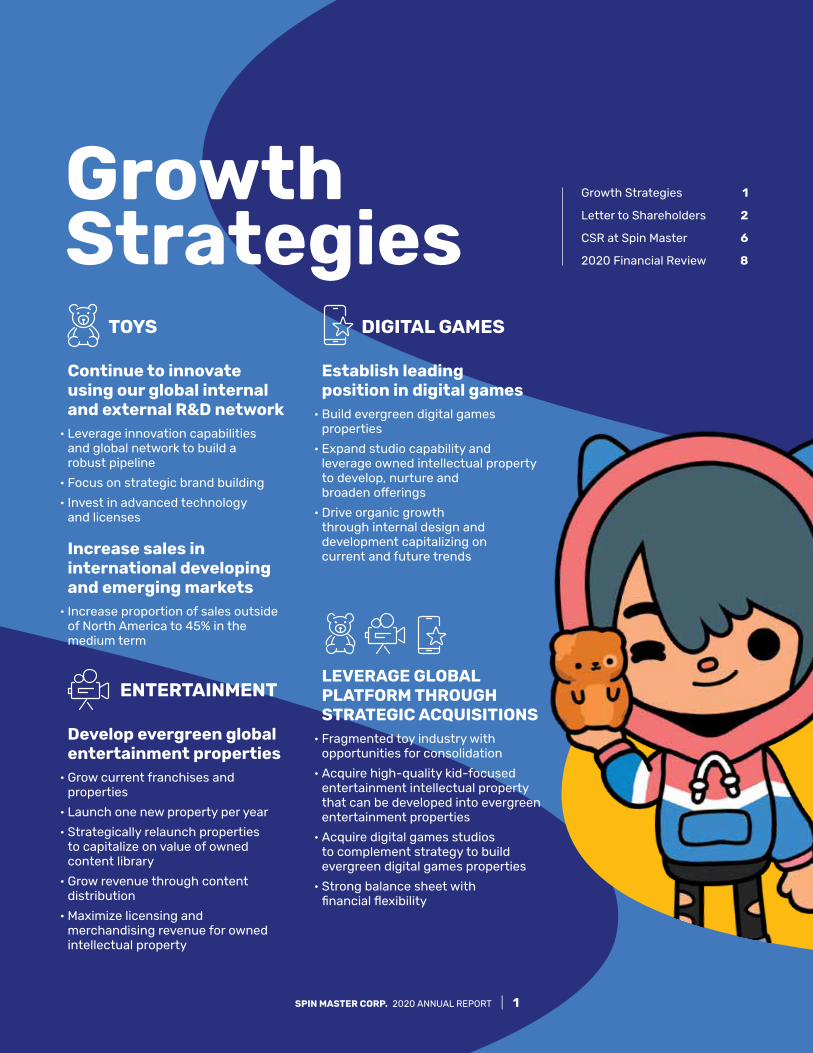
Growth Strategies
TOYS
Continue to innovate using our global internal and external R&D network
• Leverage innovation capabilities and global network to build a robust pipeline
• Focus on strategic brand building
• Invest in advanced technology and licenses
Increase sales in international developing and emerging markets
• Increase proportion of sales outside of North America to 45% in the medium term
ENTERTAINMENT
Develop evergreen global entertainment properties
• Grow current franchises and properties
• Launch one new property per year
• Strategically relaunch properties to capitalize on value of owned content library
• Grow revenue through content distribution
• Maximize licensing and merchandising revenue for owned intellectual property
DIGITAL GAMES
Establish leading position in digital games
• Build evergreen digital games properties
• Expand studio capability and leverage owned intellectual property to develop, nurture and broaden offerings
• Drive organic growth through internal design and development capitalizing on current and future trends
LEVERAGE GLOBAL PLATFORM THROUGH STRATEGIC ACQUISITIONS
• Fragmented toy industry with opportunities for consolidation
• Acquire high-quality kid-focused entertainment intellectual property that can be developed into evergreen entertainment properties
• Acquire digital games studios to complement strategy to build evergreen digital games properties
• Strong balance sheet with financial flexibility
Growth Strategies 1
Letter to Shareholders 2
CSR at Spin Master 6
2020 Financial Review 8
SPIN MASTER CORP. 2020 ANNUAL REPORT | 1

Letter to ShareholdersFellow shareholders,2020 saw us adapt to a shifting and evolving landscape, focused on driving operational improvements globally, while also navigating through the complexities of a global pandemic. At the outset of the year, we committed to resolving the operational challenges we faced in 2019. We are pleased to say that we achieved our goal through significantly improved focus and execution in every function across Spin Master globally. We set ambitious objectives and we followed through with meaningful results to return stability to our supply chain and strengthen the platform for growth.
We’re extremely proud of how our team rallied to adjust to the various waves of the pandemic. From mobilizing to meet fluid production timelines, to resolving supply chain issues and to driving continued innovation in product development, our team rose to the challenge. Our commitment to collaboration and partnerships has shone during a time where many of our team members were working remotely. Together, we’ve been able to provide magical moments and imaginative experiences through our toys, entertainment and digital games for kids around the world, at a time when connecting with family has never been more important.
The circumstances surrounding the pandemic have triggered consumer behaviour shifts, some of which will be long lasting. The shift to ecommerce, as consumer shopping habits evolved towards online shopping, had an impact on our business. In those markets where we sell directly, we recorded over 30% of our sales through ecommerce channels. The acceleration of digital adoption across the board from shopping preferences to consumption habits required us to remain agile and flexible to
best serve customers and consumers wherever they shopped.
Our performance this year reflects our commitment to, and the power of, a diversified portfolio of brands, entertainment franchises and digital games. We reported Gross Product Sales1 of $1.62 billion and total revenue of $1.57 billion. We continued to significantly strengthen our balance sheet, exiting 2020 with the strongest net cash position in our history of just over $320 million, after generating over $232 million in Free Cash Flow1 resulting from a significant reduction in our net working capital.
We remediated the operational issues we experienced in Q4 2019 and ended 2020 with strong operational momentum. We used the remediation process as an opportunity to build a continuous improvement mindset, which is now embedded in our organization globally. We will continue to improve our systems and processes in 2021. Our solid financial position, together with the achievement of our operational improvement initiatives, sets a very solid foundation for growth for 2021 and beyond.
1. Gross Product Sales, Adjusted EBITDA, Adjusted Net Income and Free Cash Flow are Non-IFRS financial measures that do not have standard meaning prescribed by International Financial Reporting Standards (“IFRS”). Refer to the “Non-IFRS Financial Measures” section further in this report for their definition and their reconciliation with IFRS financial measures.
SPIN MASTER CORP. 2020 ANNUAL REPORT | 2
“Founded over 26 years ago, Spin Master has grown from a single, item-driven business to a leading global children’s entertainment company. With a clear vision for the future, an exceptional leadership team in place, a solid global operating platform and three thriving creative centres encompassing toys, entertainment and digital games leveraged to deliver the most imaginative experiences for kids and families around the world, we are poised for the next stage of our growth.
Growth strategies During 2020, we advanced key initiatives within our growth strategies:
• Innovate using our global internal and external research and development network
• Increase international sales in developed and emerging markets
• Develop evergreen global entertainment franchises and establish a leading position in digital games
• Leverage the Company’s global platform through strategic acquisitions
These strategies continue to drive our long-term growth and we are intensely focused on our efforts to continue to progress in each.
InnovationTOYSAt its core, Spin Master values open-mindedness, innovation, collaboration and partnership; values that are reflected in the development of our toys and products. Building on our deep understanding of play, our Internal Advanced Concepts Team of inventors, designers and engineers, in collaboration with a powerful, global network of external inventors, review thousands of product ideas annually to unearth new ideas and develop imaginative toys and games. While we are best known for our own award-winning brands such as PAW Patrol®, Bakugan®, Kinetic Sand®, Air Hogs®, Hatchimals® and GUND®, we are also constantly inventing and bringing new, innovative toys to the market.
In 2020, we again demonstrated our ability to break through with new items with many of our toys landing on retailer
top-toy lists globally, and receiving numerous toy industry accolades. In North America, we received eight top-selling toy awards including the Kinetic Sand® brand Sandisfying Set™, which was the top-selling toy in the Arts & Crafts super category and the PAW Patrol Dino Patroller™ vehicle, which won the Preschool Toy of the Year Award from The Toy Association. In Europe, we received three top-selling NPD toy awards and in Canada we received two. The sustainability of our innovation is achieved, in part, from our rolling 36-month brand innovation pipeline, which we regularly review to identify opportunities to commercialize innovation, capitalize on growing trends, fill gaps in our product categories, meet growth targets and diversify our product offering.
Our continued focus on innovation and diversification within our portfolio of brands and products across all 11 categories of the toy industry was evident in 2020. Our global point of sale (POS) purchases increased 9%, in line with the industry’s 10%. Global POS, excluding the U.S., increased 9% compared to 4% for the industry. This highlights the strength of our international platform and the strong results we achieved of more than double the industry’s growth. Most of our international growth came from Europe, where we performed very strongly.
We continue to attract highly sought-after toy licenses. In 2020, we introduced new products within our current toy lines, including the Monster Jam® and DC Comics Batman® franchises. We also announced several new toy licensing
agreements, including the Warner Bros. Consumer Products’ Wizarding World™, FELD Entertainment Inc.’s Supercross™ and Riot Games’ League of Legends® franchises, all of which have products scheduled to launch in Fall 2021. Being entrusted with these leading global franchises gives us the opportunity to develop innovative toys for kids and fans everywhere.
ENTERTAINMENT For the past few years, we observed the changing consumer content consumption patterns and have mobilized an established multiplatform approach to content production within our entertainment creative centre to stay ahead of the curve. Telling stories and creating engaging and endearing characters that resonate with kids around the world is important to us regardless of what screen they are watching. Our commitment to storytelling is working. PAW Patrol, currently in its eighth season, continues to be the number one pre-school show. Fans around the globe responded with excitement as we announced Spin Master’s feature film debut with PAW Patrol: The Movie™. The animated feature film, including a cast of star-studded voice and music talent, is scheduled to debut August 2021, in association with Nickelodeon Movies and distributed by Paramount Pictures.
We also launched our first-ever straight-to-streaming series with the Netflix original Mighty Express™. Mighty Express is built on an evergreen and timeless foundation with a contemporary approach, which infuses the show with action, humour and a cast of characters that are diverse in
Letter to Shareholders
SPIN MASTER CORP. 2020 ANNUAL REPORT | 3SPIN MASTER CORP. 2020 ANNUAL REPORT | 3
personality, experience and appearance. We’ve taken a multifaceted approach to the content creation for Mighty Express that includes a YouTube destination with short-form content, music videos and character bios as well as a mobile app to further engage kids where they are. Spin Master has retained the rights to the distribution of the series outside of SVOD, including licensing of consumer products and a toy line set to launch soon.
While we currently have 10 original shows and multiple short-form series airing or streaming in more than 190 countries in 30 languages, the development team within the entertainment creative centre is constantly searching for fresh stories and ideas that will captivate children and families alike. While the PAW Patrol movie is our first feature film, we have other film concepts in development and are currently developing our original series slate well into 2023.
DIGITAL GAMES Mobile device gaming is the fastest growing segment of the video game industry, and 67% of all games are now played on mobile devices, with 94% of all kids aged 2-12 playing digital games on mobile devices. Playing digital games has become an integral part of children’s lives and this trend only further intensified during the pandemic, with children finding solace in digital games, using virtual worlds to meet up with friends and “hang out” virtually.
We are focused on delivering “play as a service,” brought to life through our leading digital brands, Toca Boca® and Sago Mini®. We put kids first by creating expansive and open-ended digital playgrounds while also providing a safe and secure place for them to explore, learn and express themselves. This past year our digital games revenue nearly tripled, driven by significant growth in the Toca Life World™ platform. Monthly active users (MAU) for Toca Boca digital games climbed to more than 40 million. Sago Mini digital games
had over 242,000 subscribers at the end of 2020, up from 119,000 at the end of 2019.
In addition to growing our base of users in 2020, we were also focused on launching new products. Launches in 2020 included Sago Mini School™, a subscription-based learning app geared to kids aged 3-5, which provides parents with an educational and engaging tool. The go-live in April was well-timed given many parents have had to perform double duty as both educator and parent during the pandemic. In 2020, we launched Sago Mini subscription boxes, monthly make-and-play kits that bring quality, creative play right to consumers’ doors.
We’re developing the Toca Boca and Sago Mini brands into cross-category franchises that have a strong presence in both the physical and digital worlds. Leveraging the deep connection kids have with these popular characters, we’re bringing them from the digital world to real life. Our teams at Toca Boca are currently developing its first multiplayer game, Toca Days™, which is expected to go-live during Q4 2021. In 2021, building on the success of the Sago Mini subscription boxes, we will introduce Toca Life Boxes™, celebrating the power of play with creative, do-it-yourself activities full of fun and silliness.
International expansion Despite the challenges posed internationally due to the rolling retail closures, we kept pace with toy industry gains internationally. In 2020, our Gross Product Sales1 in international markets remained consistent year over year, representing approximately 39% of Gross Product Sales.1 We believe our international platform remains under-leveraged and provides us with a very meaningful growth opportunity in the future. We are making solid progress toward our goal of increasing our Gross Product Sales1 in international markets to 45% of our Gross Product Sales.1
We continue to invest in converting specific markets to direct distribution
where it provides a competitive advantage and stronger sales potential. In 2020, we moved to a direct distribution model in Turkey and we plan to selectively convert further third-party distributor markets to direct sales where it makes sense strategically for us to do so.
Acquisitions While Spin Master has grown its business organically on many fronts, we’ve also built an aggressive acquisition strategy to further diversify our product offerings. With 22 acquisitions completed, we’ve demonstrated an ability to successfully identify, integrate and grow businesses through acquisition. More importantly, we have become a trusted steward to legacy brands, and, in turn, these acquisitions have enhanced our overall growth and profitability.
Our financial flexibility, made possible by our strong balance sheet and free cash flow generation, positions Spin Master to continue to supplement organic growth with strategic acquisitions. In October 2020, we announced our intention to acquire Rubik’s Brand Limited, owner of the iconic Rubik’s Cube™, and subsequently closed the transaction in January 2021. We are excited for the opportunity to put our innovation on the entire Rubik’s portfolio and expand distribution through our global footprint. The acquisition of Rubik’s Cube further strengthens our presence in the Games & Puzzles category and gives us a platform for further innovation and global leverage. We’ve been expanding our leading position within this category through acquisitions of new titles and innovative partnerships and collaborations for some time. The Games & Puzzles category was one of the fastest growing super categories in 2020, with families spending more quality time at home with their loved ones.
We’re always on the lookout for accretive M&A opportunities that complement our organic growth strategy, and we continue to apply a disciplined approach to assessing
Letter to Shareholders
1. Gross Product Sales, Adjusted EBITDA, Adjusted Net Income and Free Cash Flow are Non-IFRS financial measures that do not have standard meaning prescribed by International Financial Reporting Standards (“IFRS”). Refer to the “Non-IFRS Financial Measures” section further in this report for their definition and their reconciliation with IFRS financial measures.
SPIN MASTER CORP. 2020 ANNUAL REPORT | 4
all opportunities. We’re increasingly focused on the entertainment and digital games areas for M&A opportunities. Given our growth in the digital games creative centre, our potential M&A universe has expanded dramatically.
Corporate social responsibilitySpin Master brings kids and families together through the timeless magic of play. As we continue to grow our business, we seek to be an inclusive employer, enhance the communities in which we operate and minimize our environmental impacts. Our CSR strategy is grounded in four key areas: our people, our community, our environment and our products.
This past year, we accelerated and adapted our CSR programs in response to the pandemic, putting efforts behind immediate needs, while also laying the foundation for the future. First and foremost, we introduced supplemental programs to support our team during this challenging time. We also responded to the early need for personal protective equipment for front-line health workers, producing and donating more than 450,000 face shields, made from our Hedbanz™ game, to hospitals, shelters and long-term care facilities. Finally, recognizing the need for imagination and inspiration has never been greater, we increased the number of in-kind donations for children, distributing more than 460,000 toys globally. We also progressed against our environmental targets by participating in carbon emissions offsets. In 2020, we funded two projects through Carbonfund, offsetting 10,000 metric tonnes of carbon. Our goal in 2021 is to offset 100% of our self-generated carbon.
More details regarding our CSR commitments and progress in 2020 can be found in our annual CSR report.
Looking ahead At the end of 2020, we appointed Max Rangel as Spin Master’s new Global President, and he will assume the position of CEO in April 2021. Max is a seasoned executive who has successfully led global
businesses generating growth across multiple consumer packaged goods categories. He is an effective people leader with a well-established ability to unlock the potential of teams to boost organizational capability. From April, we, as co-founders, will continue to drive the long-term vision and strategy for Spin Master in our roles on the Board of Directors. We will also continue to be actively involved in areas of the business we are passionate about, including external partnerships and M&A. Ronnen will maintain involvement in the creative process for entertainment and oversight of the digital games creative centres and Anton will provide guidance on Spin Master’s talent and culture globally.
As we look to the balance of 2021, our team is fully aligned and we remain deeply committed to disciplined cost management, operational efficiency and productivity gains, as we set the foundation for a return to further growth and margin improvement. We will capitalize on the momentum we developed in 2020, leveraging the significant improvements in our operations to propel us forward. We will continue making investments to drive long-term operational excellence while we continue to seek operating leverage. We are confident in our strategy and have aligned our leadership structure to accelerate our growth. With a clear vision for the future, an
exceptional leadership team in place, a solid operating platform and three thriving creative centres encompassing toys, entertainment and digital games, we are poised for the next stage of our growth. We continue to believe in our long-term financial framework and that at its core, our formula for innovation and growth across toys, entertainment and digital games is stronger than ever.
On behalf of the Board of Directors and management, we want to thank our talented team members for their incredible efforts in 2020 and to thank you for your continued support of Spin Master.
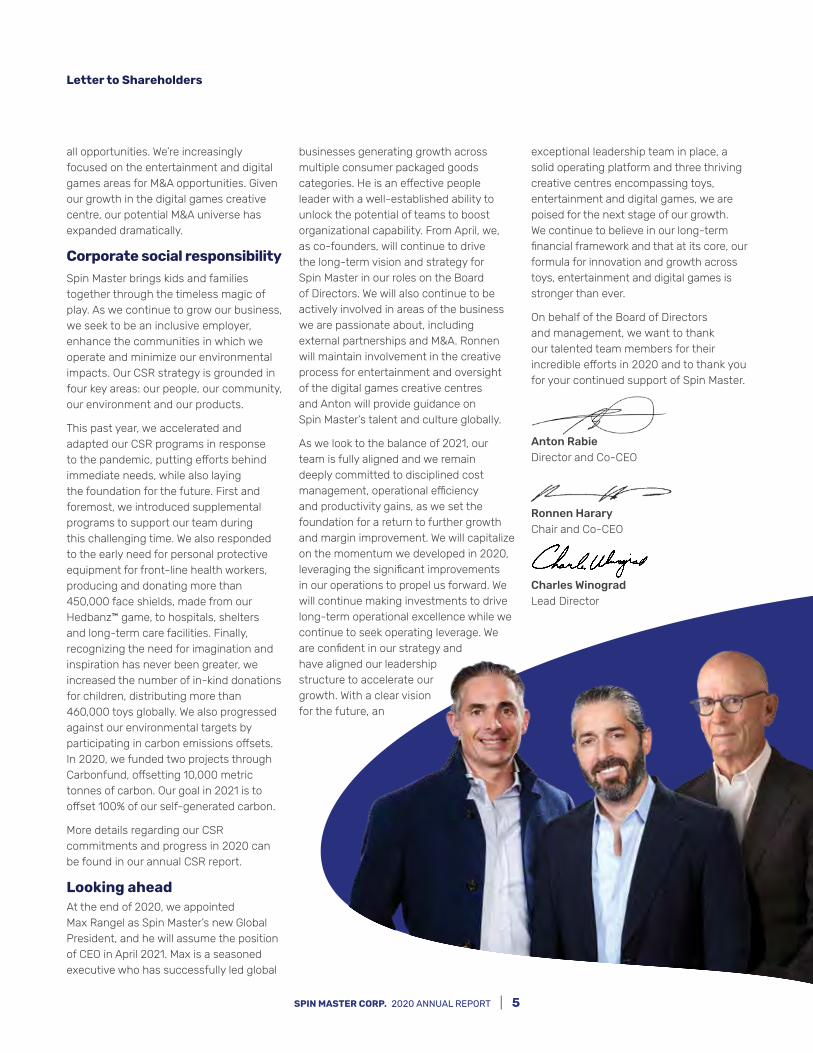
Anton Rabie Director and Co-CEO
Ronnen Harary Chair and Co-CEO
Charles Winograd Lead Director
Letter to Shareholders
SPIN MASTER CORP. 2020 ANNUAL REPORT | 5SPIN MASTER CORP. 2020 ANNUAL REPORT | 5

CSR at Spin Master
CSR Vision
Spin Master brings kids and families together through the timeless magic of play. We seek to be an inclusive employer, enhance the communities we operate in and minimize our environmental impacts.
274M Toys and games produced in 2020.
These are a few highlights from our 2020 Corporate Social Responsibility Report. To learn more about our CSR commitments and progress, visit our website for the full report. www.spinmaster.com/en-US/corporate/corporate-social-responsibility
SPIN MASTER CORP. 2020 ANNUAL REPORT | 6
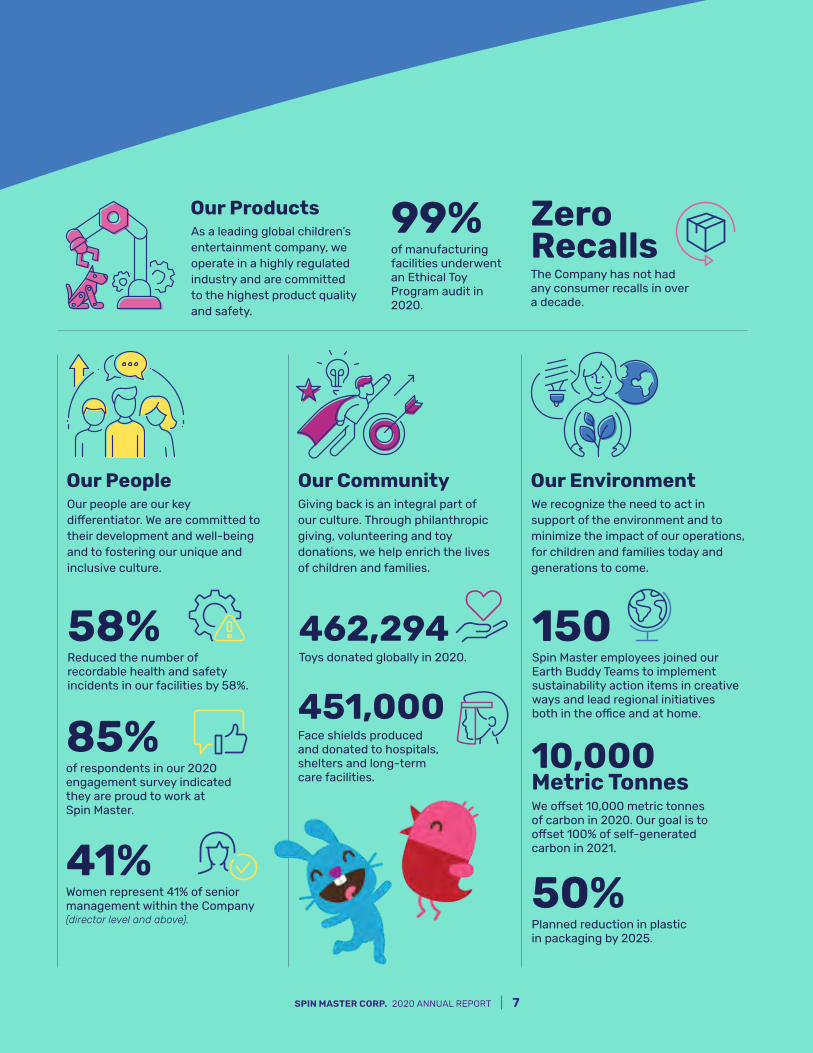
Our ProductsAs a leading global children’s entertainment company, we operate in a highly regulated industry and are committed to the highest product quality and safety.
99%of manufacturing facilities underwent an Ethical Toy Program audit in 2020.
Zero RecallsThe Company has not had any consumer recalls in over a decade.
Our PeopleOur people are our key differentiator. We are committed to their development and well-being and to fostering our unique and inclusive culture.
58%Reduced the number of recordable health and safety incidents in our facilities by 58%.
85%of respondents in our 2020 engagement survey indicated they are proud to work at Spin Master.
41%Women represent 41% of senior management within the Company (director level and above).
Our CommunityGiving back is an integral part of our culture. Through philanthropic giving, volunteering and toy donations, we help enrich the lives of children and families.
462,294 Toys donated globally in 2020.
451,000 Face shields produced and donated to hospitals, shelters and long-term care facilities.
Our EnvironmentWe recognize the need to act in support of the environment and to minimize the impact of our operations, for children and families today and generations to come.
150 Spin Master employees joined our Earth Buddy Teams to implement sustainability action items in creative ways and lead regional initiatives both in the office and at home.
10,000 Metric TonnesWe offset 10,000 metric tonnes of carbon in 2020. Our goal is to offset 100% of self-generated carbon in 2021.
50% Planned reduction in plastic in packaging by 2025.
SPIN MASTER CORP. 2020 ANNUAL REPORT | 7SPIN MASTER CORP. 2020 ANNUAL REPORT | 7
2020 Financial Review
Management’s Discussion and Analysis of Financial Results
Independent Auditor’s Report
Consolidated Statements of Financial Position
Consolidated Statements of Earnings and Comprehensive Income
Consolidated Statements of Changes in Shareholders’ Equity
Consolidated Statements of Cash Flows
Notes to the Consolidated Financial Statements
SPIN MASTER CORP. 2020 ANNUAL REPORT | 8
March 1, 2021
SPIN MASTER CORP.
MANAGEMENT’S DISCUSSION AND ANALYSIS OF FINANCIAL RESULTS
For the three months and year ended December 31, 2020
INTRODUCTION
The following Management’s Discussion and Analysis (“MD&A”) for Spin Master Corp. (“Spin Master” or the “Company”) is dated March 1, 2021 and provides information concerning the Company’s financial condition, financial performance and cash flows for the year ended December 31, 2020 and the three months ended December 31, 2020, (“fourth quarter”, “the quarter”, “Q4”). This MD&A should be read in conjunction with the Company’s audited consolidated financial statements and accompanying notes (“financial statements”) for the year ended December 31, 2020 and its Annual Information Form ("AIF"). Additional information relating to the Company can be found under the Company's profile on SEDAR at www.sedar.com.
Some of the information contained in this MD&A contains forward‑looking statements that are based on assumptions and involve risks and uncertainties. See the “Forward‑Looking Statements”, “Financial Risk Management” and “Risks Relating to Spin Master’s Business” sections of this MD&A for a discussion of the uncertainties, risks and assumptions associated with those statements. Actual results may differ materially from those discussed in the forward‑looking statements as a result of various factors, including those described in the “Risks Relating to Spin Master’s Business” section and elsewhere in this MD&A.
BASIS OF PRESENTATION
The financial statements of the Company have been prepared in accordance with International Financial Reporting Standards (“IFRS”). However, certain financial measures contained in this MD&A are non-IFRS measures and are discussed further in the “Non-IFRS Financial Measures” section of this MD&A. Effective December 31, 2019, all financial information is presented in millions of United States dollars ("$", "dollars" and "US$") and has been rounded to the nearest hundred thousand, except per share amounts and where otherwise indicated. Certain totals, subtotals and percentages throughout this MD&A may not reconcile due to rounding. The impact of these rounding adjustments do not have a material effect on the Company's MD&A.
BUSINESS OVERVIEW
Spin Master is a leading global children’s entertainment company creating exceptional play experiences through a diverse portfolio of innovative toys, entertainment franchises and digital games. Spin Master is best known for award-winning brands PAW Patrol, Bakugan, Kinetic Sand, Air Hogs, Hatchimals, Rubik's Cube and GUND and is the toy licensee for other popular properties. Spin Master's entertainment team creates and produces compelling multiplatform content, stories and endearing characters through its in-house studio and partnerships with outside creators, including the pre-school success PAW Patrol and 9 other original shows along with multiple short-form series, which are distributed in more than 190 countries. The Company has an established digital games presence, anchored by the Toca Boca and Sago Mini brands, which combined have more than 40 million monthly active users. With close to 2,000 employees in 28 offices globally, Spin Master distributes products in more than 100 countries.
Spin Master’s principal strategies to drive the Company's continued growth include:
• Innovate using our global internal and external research and development network;
• Developing evergreen global entertainment franchises and digital games;
• Increasing international sales in developed and emerging markets; and
• Leveraging the Company's global platform through strategic acquisitions.
Spin Master's organic growth strategy is centered around the Company's 36-month brand innovation pipeline. This pipeline is fed by internal innovation and multiple touch points with inventors, licensors, consumers and
1
potential acquisitions, traditional and innovative entertainment contact and digital toys. These touch points strengthen consumers' attachments to Spin Master's brands and franchises and are the engine of long-term growth.
Spin Master continues to expand into content for traditional television, video-on-demand, subscription video-on-demand, in addition to other short-form and long-form content, including movies, across a variety of distribution channels. In addition, the Company will continue its focus on direct-to-consumer initiatives as consumer purchasing trends in the retail landscape evolve.
Spin Master’s business comprises three geographic segments: North America, comprised of the United States ("U.S.") and Canada; Europe, comprised of the United Kingdom, France, Italy, the Netherlands, Germany, Austria, Switzerland, Belgium, Luxembourg, Slovakia, Hungary, Romania, Czech Republic, Poland, Turkey, Russia and Greece; and the Rest of World, primarily comprised of Hong Kong, China, Vietnam, India, Australia, New Zealand, Japan and Mexico and all other areas of the world serviced by Spin Master’s third party distribution network. The Company remains focused on its long-term goal of more than 45% of sales outside of the North America segment.
Spin Master’s diversified portfolio of toys, games and products is organized into five product categories: (1) Activities, Games & Puzzles and Plush; (2) Boys Action and Construction; (3) Outdoor; (4) Pre-School and Girls and (5) Remote Control and Interactive Characters. Effective January 1, 2021, Spin Master has simplified its product categories to align with the Company's product offerings going forward (see Addendum for additional information).
Seasonality factors cause the Company's operating results to fluctuate significantly from quarter to quarter. A majority of the Company’s annual sales occur during the third and fourth quarters of the Company’s fiscal year with a significant portion of its net income earned and cash flows generated during the same period.
COVID-19 PANDEMIC UPDATE
In March 2020, the World Health Organization declared the outbreak of COVID-19 as a global pandemic. The crisis related to COVID-19 is unprecedented and has had an impact on the Company's employees, customers and suppliers.
Supply Chain
When COVID-19 first emerged early in the first quarter of 2020, it directly affected Spin Master’s third party manufacturing capacity in China, which comprises between 60% to 65% of the Company's manufacturing capacity, in addition to third party manufacturing in Vietnam, Mexico and India. Capacity progressively improved through the first quarter such that by the end of the quarter it had largely returned to normal levels. Following the first quarter, Spin Master did not experience any material disruption to its manufacturing as a result of COVID-19.
The Company continues to closely monitor the changing global environment to enable immediate actions to be taken to ensure customer order fulfillment is achieved across the various markets.
Demand
The pandemic spread to customer markets globally late in the first quarter of 2020 and continued through the rest of the year. Due to government-imposed restrictions and the closure of many retail locations during certain parts of the year, the pandemic resulted in significant reductions in retail consumer traffic in most countries globally, including some of Spin Master’s largest markets. This put additional pressure on the Company's business, driving disruption in customer behaviour and consumer demand. Although many retail locations re-opened globally during the third quarter with the exception of some small specialty stores mainly in North America, they were forced to close again during the fourth quarter. As a result, retail consumer traffic continues to be impacted in markets with government-imposed restrictions. Online and e-commerce channels continue to remain active in most countries.
2
Liquidity
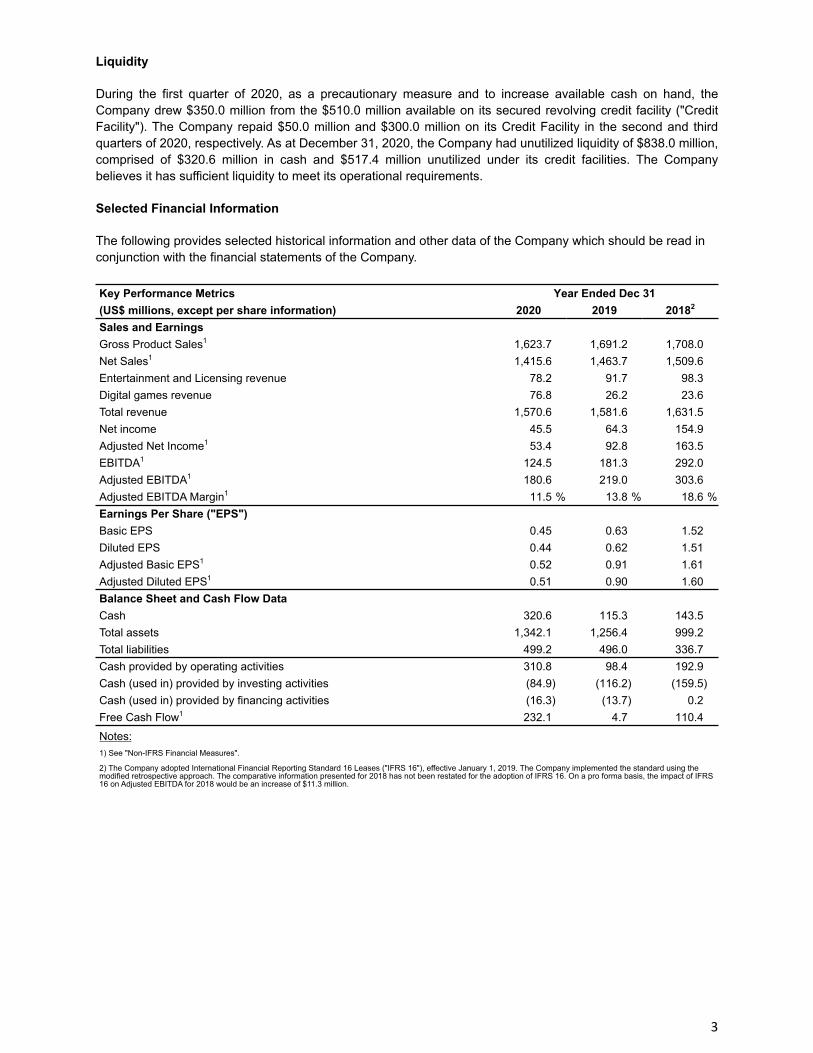
During the first quarter of 2020, as a precautionary measure and to increase available cash on hand, the Company drew $350.0 million from the $510.0 million available on its secured revolving credit facility ("Credit Facility"). The Company repaid $50.0 million and $300.0 million on its Credit Facility in the second and third quarters of 2020, respectively. As at December 31, 2020, the Company had unutilized liquidity of $838.0 million, comprised of $320.6 million in cash and $517.4 million unutilized under its credit facilities. The Company believes it has sufficient liquidity to meet its operational requirements.
Selected Financial Information
The following provides selected historical information and other data of the Company which should be read in conjunction with the financial statements of the Company.
Key Performance Metrics Year Ended Dec 31(US$ millions, except per share information) 2020 2019 20182
Sales and EarningsGross Product Sales1 1,623.7 1,691.2 1,708.0 Net Sales1 1,415.6 1,463.7 1,509.6 Entertainment and Licensing revenue 78.2 91.7 98.3 Digital games revenue 76.8 26.2 23.6 Total revenue 1,570.6 1,581.6 1,631.5 Net income 45.5 64.3 154.9 Adjusted Net Income1 53.4 92.8 163.5 EBITDA1 124.5 181.3 292.0 Adjusted EBITDA1 180.6 219.0 303.6 Adjusted EBITDA Margin1 11.5 % 13.8 % 18.6 %Earnings Per Share ("EPS")Basic EPS 0.45 0.63 1.52 Diluted EPS 0.44 0.62 1.51 Adjusted Basic EPS1 0.52 0.91 1.61 Adjusted Diluted EPS1 0.51 0.90 1.60 Balance Sheet and Cash Flow DataCash 320.6 115.3 143.5 Total assets 1,342.1 1,256.4 999.2 Total liabilities 499.2 496.0 336.7 Cash provided by operating activities 310.8 98.4 192.9 Cash (used in) provided by investing activities (84.9) (116.2) (159.5) Cash (used in) provided by financing activities (16.3) (13.7) 0.2 Free Cash Flow1 232.1 4.7 110.4
Notes:1) See "Non-IFRS Financial Measures".
2) The Company adopted International Financial Reporting Standard 16 Leases ("IFRS 16"), effective January 1, 2019. The Company implemented the standard using the modified retrospective approach. The comparative information presented for 2018 has not been restated for the adoption of IFRS 16. On a pro forma basis, the impact of IFRS 16 on Adjusted EBITDA for 2018 would be an increase of $11.3 million.
3
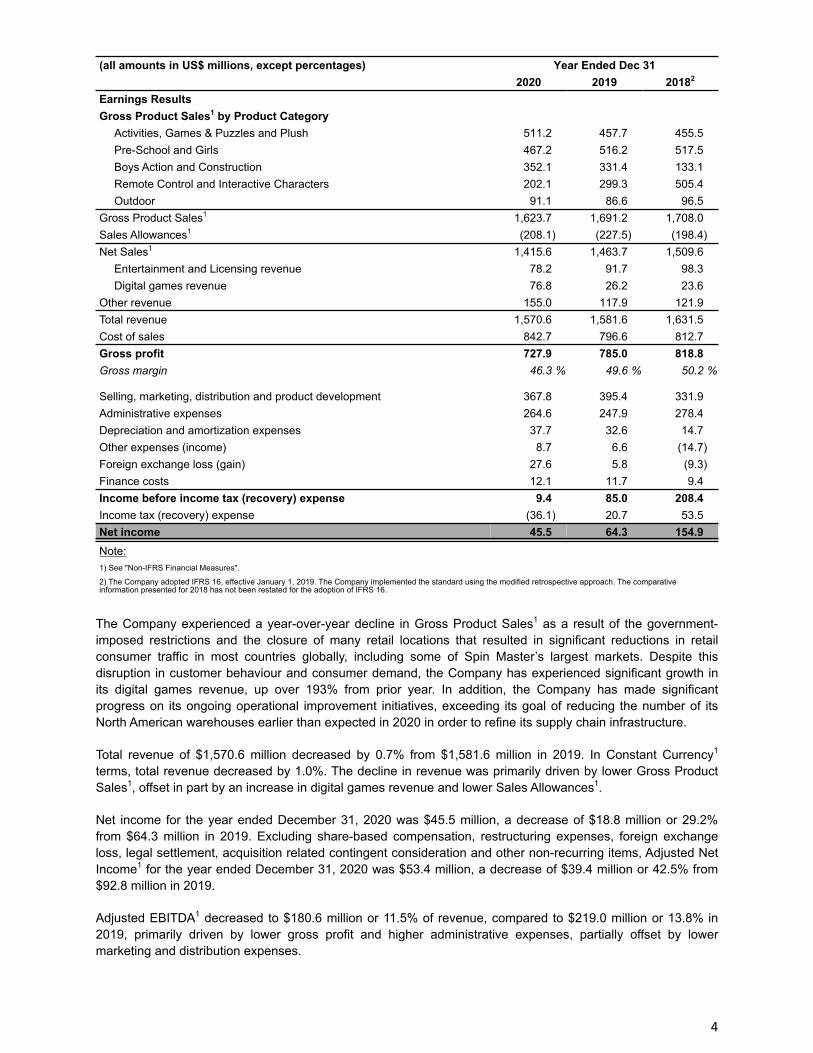
(all amounts in US$ millions, except percentages) Year Ended Dec 312020 2019 20182
Earnings ResultsGross Product Sales1 by Product Category
Activities, Games & Puzzles and Plush 511.2 457.7 455.5 Pre-School and Girls 467.2 516.2 517.5 Boys Action and Construction 352.1 331.4 133.1 Remote Control and Interactive Characters 202.1 299.3 505.4 Outdoor 91.1 86.6 96.5
Gross Product Sales1 1,623.7 1,691.2 1,708.0 Sales Allowances1 (208.1) (227.5) (198.4) Net Sales1 1,415.6 1,463.7 1,509.6
Entertainment and Licensing revenue 78.2 91.7 98.3 Digital games revenue 76.8 26.2 23.6
Other revenue 155.0 117.9 121.9 Total revenue 1,570.6 1,581.6 1,631.5 Cost of sales 842.7 796.6 812.7 Gross profit 727.9 785.0 818.8 Gross margin 46.3 % 49.6 % 50.2 %
Selling, marketing, distribution and product development 367.8 395.4 331.9 Administrative expenses 264.6 247.9 278.4 Depreciation and amortization expenses 37.7 32.6 14.7 Other expenses (income) 8.7 6.6 (14.7) Foreign exchange loss (gain) 27.6 5.8 (9.3) Finance costs 12.1 11.7 9.4 Income before income tax (recovery) expense 9.4 85.0 208.4 Income tax (recovery) expense (36.1) 20.7 53.5 Net income 45.5 64.3 154.9 Note:1) See "Non-IFRS Financial Measures".
2) The Company adopted IFRS 16, effective January 1, 2019. The Company implemented the standard using the modified retrospective approach. The comparative information presented for 2018 has not been restated for the adoption of IFRS 16.
The Company experienced a year-over-year decline in Gross Product Sales1 as a result of the government-imposed restrictions and the closure of many retail locations that resulted in significant reductions in retail consumer traffic in most countries globally, including some of Spin Master’s largest markets. Despite this disruption in customer behaviour and consumer demand, the Company has experienced significant growth in its digital games revenue, up over 193% from prior year. In addition, the Company has made significant progress on its ongoing operational improvement initiatives, exceeding its goal of reducing the number of its North American warehouses earlier than expected in 2020 in order to refine its supply chain infrastructure.
Total revenue of $1,570.6 million decreased by 0.7% from $1,581.6 million in 2019. In Constant Currency1 terms, total revenue decreased by 1.0%. The decline in revenue was primarily driven by lower Gross Product Sales1, offset in part by an increase in digital games revenue and lower Sales Allowances1.
Net income for the year ended December 31, 2020 was $45.5 million, a decrease of $18.8 million or 29.2% from $64.3 million in 2019. Excluding share-based compensation, restructuring expenses, foreign exchange loss, legal settlement, acquisition related contingent consideration and other non-recurring items, Adjusted Net Income1 for the year ended December 31, 2020 was $53.4 million, a decrease of $39.4 million or 42.5% from $92.8 million in 2019.
Adjusted EBITDA1 decreased to $180.6 million or 11.5% of revenue, compared to $219.0 million or 13.8% in 2019, primarily driven by lower gross profit and higher administrative expenses, partially offset by lower marketing and distribution expenses.
4
Gross Product Sales1 have decreased from $1,708.0 million in 2018 to $1,623.7 million in 2020. Over the same period, total revenue has decreased from $1,631.5 million to $1,570.6 million. However, over the past 10 years, the Company’s Gross Product Sales1 have grown at a 5.9% compound annual growth rate.
FINANCIAL PERFORMANCE
For the three months and year ended December 31, 2020 compared to the three months and year ended December 31, 2019:
Consolidated Results
The following tables provide a summary of Spin Master’s consolidated results for the three months and year ended December 31, 2020 and 2019:
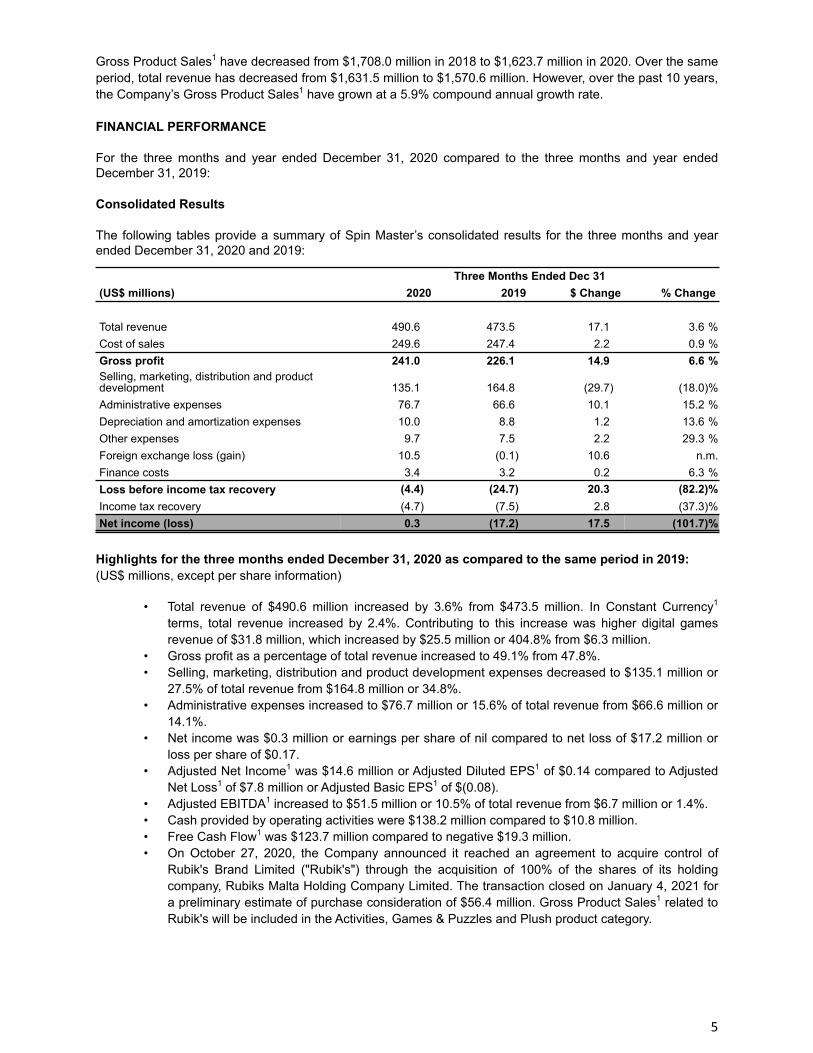
Three Months Ended Dec 31(US$ millions) 2020 2019 $ Change % Change
Total revenue 490.6 473.5 17.1 3.6 %Cost of sales 249.6 247.4 2.2 0.9 %Gross profit 241.0 226.1 14.9 6.6 %Selling, marketing, distribution and product development 135.1 164.8 (29.7) (18.0) %Administrative expenses 76.7 66.6 10.1 15.2 %Depreciation and amortization expenses 10.0 8.8 1.2 13.6 %Other expenses 9.7 7.5 2.2 29.3 %Foreign exchange loss (gain) 10.5 (0.1) 10.6 n.m.Finance costs 3.4 3.2 0.2 6.3 %Loss before income tax recovery (4.4) (24.7) 20.3 (82.2) %Income tax recovery (4.7) (7.5) 2.8 (37.3) %Net income (loss) 0.3 (17.2) 17.5 (101.7) %
Highlights for the three months ended December 31, 2020 as compared to the same period in 2019:(US$ millions, except per share information)
• Total revenue of $490.6 million increased by 3.6% from $473.5 million. In Constant Currency1 terms, total revenue increased by 2.4%. Contributing to this increase was higher digital games revenue of $31.8 million, which increased by $25.5 million or 404.8% from $6.3 million.
• Gross profit as a percentage of total revenue increased to 49.1% from 47.8%.• Selling, marketing, distribution and product development expenses decreased to $135.1 million or
27.5% of total revenue from $164.8 million or 34.8%. • Administrative expenses increased to $76.7 million or 15.6% of total revenue from $66.6 million or
14.1%.• Net income was $0.3 million or earnings per share of nil compared to net loss of $17.2 million or
loss per share of $0.17.• Adjusted Net Income1 was $14.6 million or Adjusted Diluted EPS1 of $0.14 compared to Adjusted
Net Loss1 of $7.8 million or Adjusted Basic EPS1 of $(0.08).• Adjusted EBITDA1 increased to $51.5 million or 10.5% of total revenue from $6.7 million or 1.4%.• Cash provided by operating activities were $138.2 million compared to $10.8 million.• Free Cash Flow1 was $123.7 million compared to negative $19.3 million. • On October 27, 2020, the Company announced it reached an agreement to acquire control of
Rubik's Brand Limited ("Rubik's") through the acquisition of 100% of the shares of its holding company, Rubiks Malta Holding Company Limited. The transaction closed on January 4, 2021 for a preliminary estimate of purchase consideration of $56.4 million. Gross Product Sales1 related to Rubik's will be included in the Activities, Games & Puzzles and Plush product category.
5
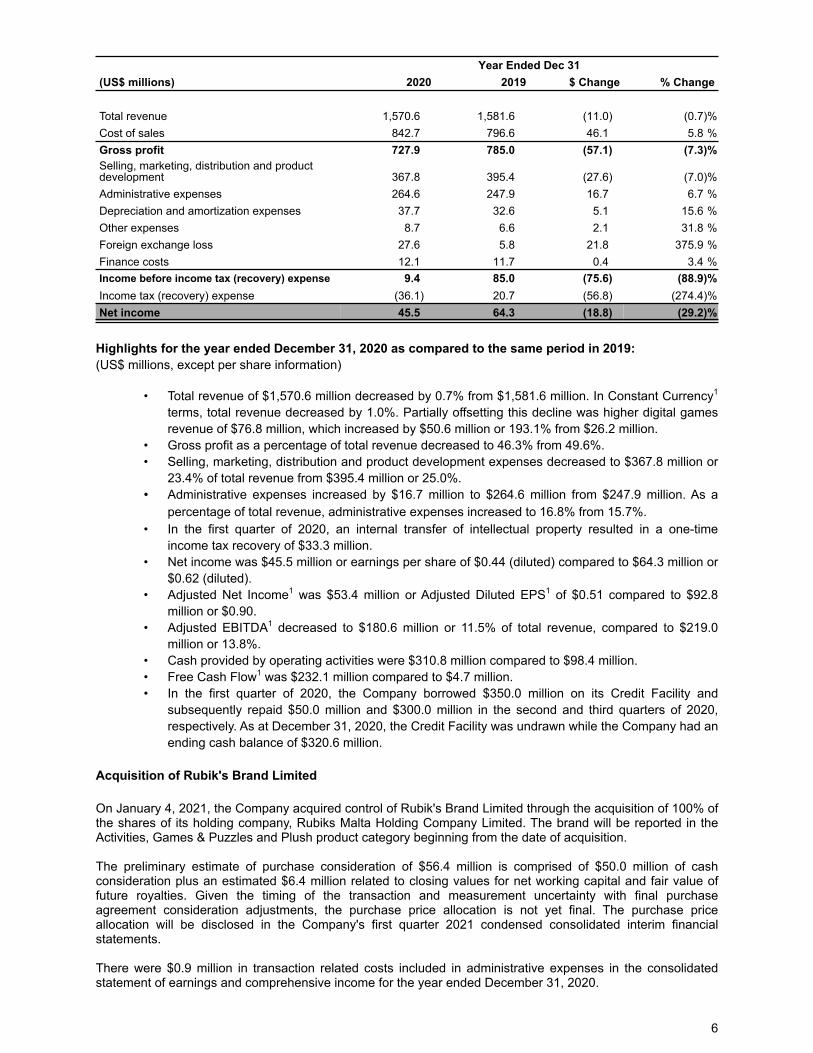
Year Ended Dec 31(US$ millions) 2020 2019 $ Change % Change
Total revenue 1,570.6 1,581.6 (11.0) (0.7) %Cost of sales 842.7 796.6 46.1 5.8 %Gross profit 727.9 785.0 (57.1) (7.3) %Selling, marketing, distribution and product development 367.8 395.4 (27.6) (7.0) %Administrative expenses 264.6 247.9 16.7 6.7 %Depreciation and amortization expenses 37.7 32.6 5.1 15.6 %Other expenses 8.7 6.6 2.1 31.8 %Foreign exchange loss 27.6 5.8 21.8 375.9 %Finance costs 12.1 11.7 0.4 3.4 %Income before income tax (recovery) expense 9.4 85.0 (75.6) (88.9) %Income tax (recovery) expense (36.1) 20.7 (56.8) (274.4) %Net income 45.5 64.3 (18.8) (29.2) %
Highlights for the year ended December 31, 2020 as compared to the same period in 2019:(US$ millions, except per share information)
• Total revenue of $1,570.6 million decreased by 0.7% from $1,581.6 million. In Constant Currency1 terms, total revenue decreased by 1.0%. Partially offsetting this decline was higher digital games revenue of $76.8 million, which increased by $50.6 million or 193.1% from $26.2 million.
• Gross profit as a percentage of total revenue decreased to 46.3% from 49.6%.• Selling, marketing, distribution and product development expenses decreased to $367.8 million or
23.4% of total revenue from $395.4 million or 25.0%. • Administrative expenses increased by $16.7 million to $264.6 million from $247.9 million. As a
percentage of total revenue, administrative expenses increased to 16.8% from 15.7%. • In the first quarter of 2020, an internal transfer of intellectual property resulted in a one-time
income tax recovery of $33.3 million.• Net income was $45.5 million or earnings per share of $0.44 (diluted) compared to $64.3 million or
$0.62 (diluted).• Adjusted Net Income1 was $53.4 million or Adjusted Diluted EPS1 of $0.51 compared to $92.8
million or $0.90. • Adjusted EBITDA1 decreased to $180.6 million or 11.5% of total revenue, compared to $219.0
million or 13.8%.• Cash provided by operating activities were $310.8 million compared to $98.4 million.• Free Cash Flow1 was $232.1 million compared to $4.7 million.• In the first quarter of 2020, the Company borrowed $350.0 million on its Credit Facility and
subsequently repaid $50.0 million and $300.0 million in the second and third quarters of 2020, respectively. As at December 31, 2020, the Credit Facility was undrawn while the Company had an ending cash balance of $320.6 million.
Acquisition of Rubik's Brand Limited
On January 4, 2021, the Company acquired control of Rubik's Brand Limited through the acquisition of 100% of the shares of its holding company, Rubiks Malta Holding Company Limited. The brand will be reported in the Activities, Games & Puzzles and Plush product category beginning from the date of acquisition.
The preliminary estimate of purchase consideration of $56.4 million is comprised of $50.0 million of cash consideration plus an estimated $6.4 million related to closing values for net working capital and fair value of future royalties. Given the timing of the transaction and measurement uncertainty with final purchase agreement consideration adjustments, the purchase price allocation is not yet final. The purchase price allocation will be disclosed in the Company's first quarter 2021 condensed consolidated interim financial statements.
There were $0.9 million in transaction related costs included in administrative expenses in the consolidated statement of earnings and comprehensive income for the year ended December 31, 2020.
6
Revenue
For the three months ended December 31, 2020 as compared to the same period in 2019:
The following table provides a summary of Spin Master’s revenue by product category for the three months ended December 31, 2020 and 2019:
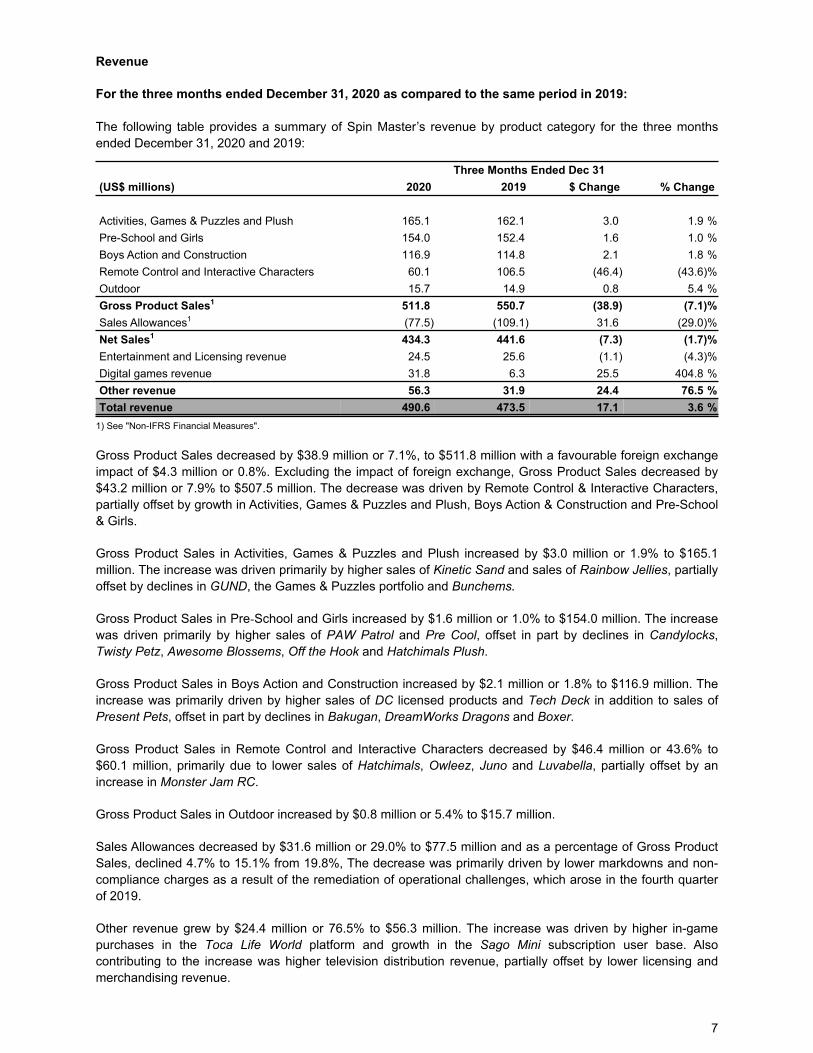
Three Months Ended Dec 31(US$ millions) 2020 2019 $ Change % Change
Activities, Games & Puzzles and Plush 165.1 162.1 3.0 1.9 %Pre-School and Girls 154.0 152.4 1.6 1.0 %Boys Action and Construction 116.9 114.8 2.1 1.8 %Remote Control and Interactive Characters 60.1 106.5 (46.4) (43.6) %Outdoor 15.7 14.9 0.8 5.4 %Gross Product Sales1 511.8 550.7 (38.9) (7.1) %Sales Allowances1 (77.5) (109.1) 31.6 (29.0) %Net Sales1 434.3 441.6 (7.3) (1.7) %Entertainment and Licensing revenue 24.5 25.6 (1.1) (4.3) %Digital games revenue 31.8 6.3 25.5 404.8 %Other revenue 56.3 31.9 24.4 76.5 %Total revenue 490.6 473.5 17.1 3.6 %
1) See "Non-IFRS Financial Measures".
Gross Product Sales decreased by $38.9 million or 7.1%, to $511.8 million with a favourable foreign exchange impact of $4.3 million or 0.8%. Excluding the impact of foreign exchange, Gross Product Sales decreased by $43.2 million or 7.9% to $507.5 million. The decrease was driven by Remote Control & Interactive Characters, partially offset by growth in Activities, Games & Puzzles and Plush, Boys Action & Construction and Pre-School & Girls.
Gross Product Sales in Activities, Games & Puzzles and Plush increased by $3.0 million or 1.9% to $165.1 million. The increase was driven primarily by higher sales of Kinetic Sand and sales of Rainbow Jellies, partially offset by declines in GUND, the Games & Puzzles portfolio and Bunchems.
Gross Product Sales in Pre‑School and Girls increased by $1.6 million or 1.0% to $154.0 million. The increase was driven primarily by higher sales of PAW Patrol and Pre Cool, offset in part by declines in Candylocks, Twisty Petz, Awesome Blossems, Off the Hook and Hatchimals Plush.
Gross Product Sales in Boys Action and Construction increased by $2.1 million or 1.8% to $116.9 million. The increase was primarily driven by higher sales of DC licensed products and Tech Deck in addition to sales of Present Pets, offset in part by declines in Bakugan, DreamWorks Dragons and Boxer.
Gross Product Sales in Remote Control and Interactive Characters decreased by $46.4 million or 43.6% to $60.1 million, primarily due to lower sales of Hatchimals, Owleez, Juno and Luvabella, partially offset by an increase in Monster Jam RC.
Gross Product Sales in Outdoor increased by $0.8 million or 5.4% to $15.7 million.
Sales Allowances decreased by $31.6 million or 29.0% to $77.5 million and as a percentage of Gross Product Sales, declined 4.7% to 15.1% from 19.8%, The decrease was primarily driven by lower markdowns and non-compliance charges as a result of the remediation of operational challenges, which arose in the fourth quarter of 2019.
Other revenue grew by $24.4 million or 76.5% to $56.3 million. The increase was driven by higher in-game purchases in the Toca Life World platform and growth in the Sago Mini subscription user base. Also contributing to the increase was higher television distribution revenue, partially offset by lower licensing and merchandising revenue.
7
The following table provides a summary of Spin Master’s Gross Product Sales by geographic segment for the three months ended December 31, 2020 and 2019:
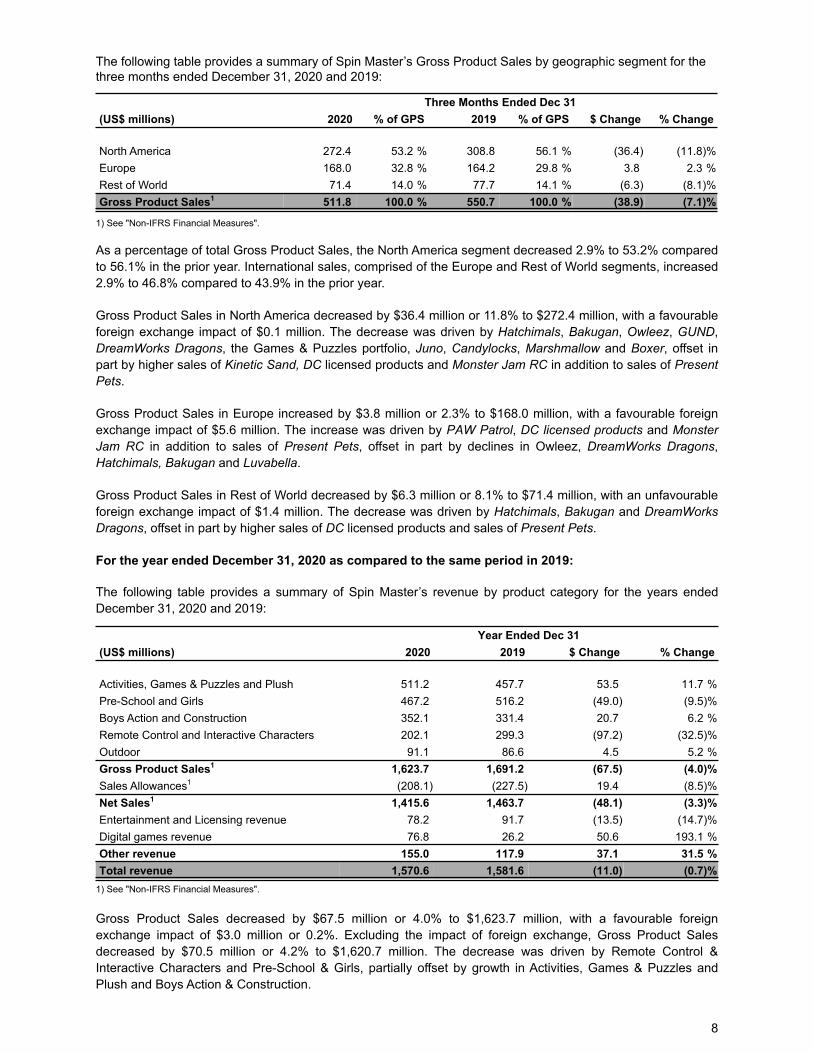
Three Months Ended Dec 31(US$ millions) 2020 % of GPS 2019 % of GPS $ Change % Change
North America 272.4 53.2 % 308.8 56.1 % (36.4) (11.8) %Europe 168.0 32.8 % 164.2 29.8 % 3.8 2.3 %Rest of World 71.4 14.0 % 77.7 14.1 % (6.3) (8.1) %Gross Product Sales1 511.8 100.0 % 550.7 100.0 % (38.9) (7.1) %
1) See "Non-IFRS Financial Measures".
As a percentage of total Gross Product Sales, the North America segment decreased 2.9% to 53.2% compared to 56.1% in the prior year. International sales, comprised of the Europe and Rest of World segments, increased 2.9% to 46.8% compared to 43.9% in the prior year.
Gross Product Sales in North America decreased by $36.4 million or 11.8% to $272.4 million, with a favourable foreign exchange impact of $0.1 million. The decrease was driven by Hatchimals, Bakugan, Owleez, GUND, DreamWorks Dragons, the Games & Puzzles portfolio, Juno, Candylocks, Marshmallow and Boxer, offset in part by higher sales of Kinetic Sand, DC licensed products and Monster Jam RC in addition to sales of Present Pets.
Gross Product Sales in Europe increased by $3.8 million or 2.3% to $168.0 million, with a favourable foreign exchange impact of $5.6 million. The increase was driven by PAW Patrol, DC licensed products and Monster Jam RC in addition to sales of Present Pets, offset in part by declines in Owleez, DreamWorks Dragons, Hatchimals, Bakugan and Luvabella.
Gross Product Sales in Rest of World decreased by $6.3 million or 8.1% to $71.4 million, with an unfavourable foreign exchange impact of $1.4 million. The decrease was driven by Hatchimals, Bakugan and DreamWorks Dragons, offset in part by higher sales of DC licensed products and sales of Present Pets.
For the year ended December 31, 2020 as compared to the same period in 2019:
The following table provides a summary of Spin Master’s revenue by product category for the years ended December 31, 2020 and 2019:
Year Ended Dec 31(US$ millions) 2020 2019 $ Change % Change
Activities, Games & Puzzles and Plush 511.2 457.7 53.5 11.7 %Pre-School and Girls 467.2 516.2 (49.0) (9.5) %Boys Action and Construction 352.1 331.4 20.7 6.2 %Remote Control and Interactive Characters 202.1 299.3 (97.2) (32.5) %Outdoor 91.1 86.6 4.5 5.2 %Gross Product Sales1 1,623.7 1,691.2 (67.5) (4.0) %Sales Allowances1 (208.1) (227.5) 19.4 (8.5) %Net Sales1 1,415.6 1,463.7 (48.1) (3.3) %Entertainment and Licensing revenue 78.2 91.7 (13.5) (14.7) %Digital games revenue 76.8 26.2 50.6 193.1 %Other revenue 155.0 117.9 37.1 31.5 %Total revenue 1,570.6 1,581.6 (11.0) (0.7) %
1) See "Non-IFRS Financial Measures".
Gross Product Sales decreased by $67.5 million or 4.0% to $1,623.7 million, with a favourable foreign exchange impact of $3.0 million or 0.2%. Excluding the impact of foreign exchange, Gross Product Sales decreased by $70.5 million or 4.2% to $1,620.7 million. The decrease was driven by Remote Control & Interactive Characters and Pre-School & Girls, partially offset by growth in Activities, Games & Puzzles and Plush and Boys Action & Construction.
8
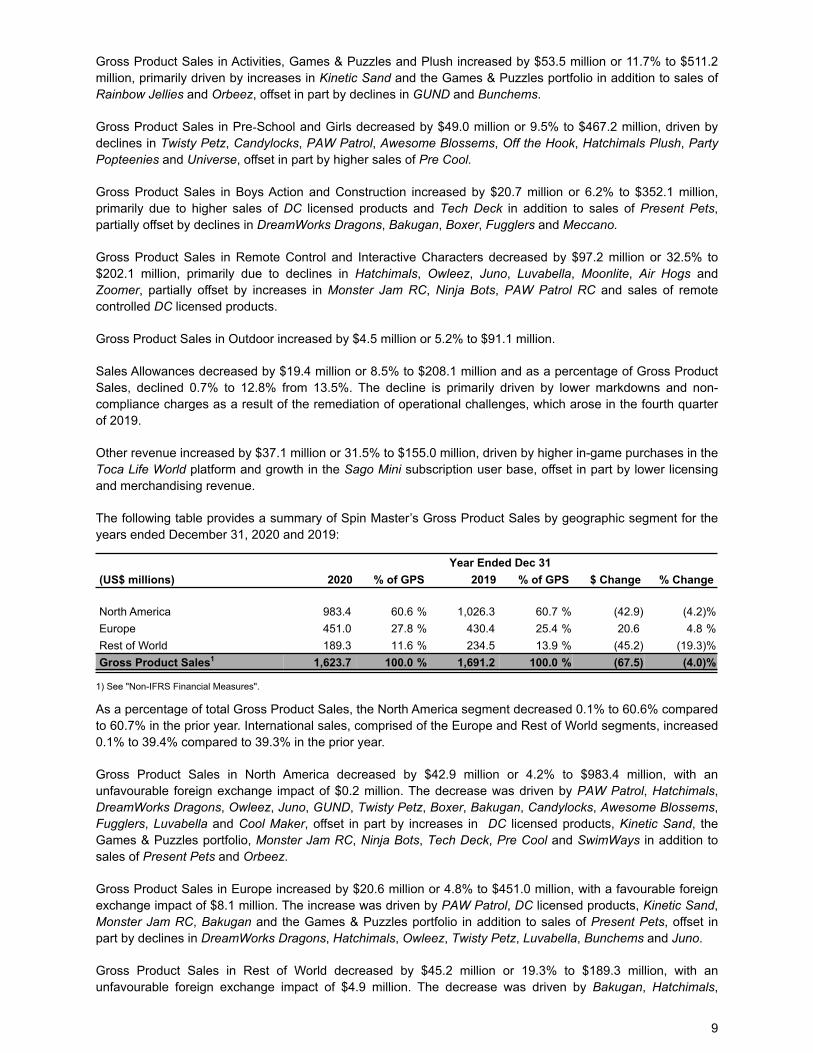
Gross Product Sales in Activities, Games & Puzzles and Plush increased by $53.5 million or 11.7% to $511.2 million, primarily driven by increases in Kinetic Sand and the Games & Puzzles portfolio in addition to sales of Rainbow Jellies and Orbeez, offset in part by declines in GUND and Bunchems.
Gross Product Sales in Pre‑School and Girls decreased by $49.0 million or 9.5% to $467.2 million, driven by declines in Twisty Petz, Candylocks, PAW Patrol, Awesome Blossems, Off the Hook, Hatchimals Plush, Party Popteenies and Universe, offset in part by higher sales of Pre Cool.
Gross Product Sales in Boys Action and Construction increased by $20.7 million or 6.2% to $352.1 million, primarily due to higher sales of DC licensed products and Tech Deck in addition to sales of Present Pets, partially offset by declines in DreamWorks Dragons, Bakugan, Boxer, Fugglers and Meccano.
Gross Product Sales in Remote Control and Interactive Characters decreased by $97.2 million or 32.5% to $202.1 million, primarily due to declines in Hatchimals, Owleez, Juno, Luvabella, Moonlite, Air Hogs and Zoomer, partially offset by increases in Monster Jam RC, Ninja Bots, PAW Patrol RC and sales of remote controlled DC licensed products.
Gross Product Sales in Outdoor increased by $4.5 million or 5.2% to $91.1 million.
Sales Allowances decreased by $19.4 million or 8.5% to $208.1 million and as a percentage of Gross Product Sales, declined 0.7% to 12.8% from 13.5%. The decline is primarily driven by lower markdowns and non-compliance charges as a result of the remediation of operational challenges, which arose in the fourth quarter of 2019.
Other revenue increased by $37.1 million or 31.5% to $155.0 million, driven by higher in-game purchases in the Toca Life World platform and growth in the Sago Mini subscription user base, offset in part by lower licensing and merchandising revenue.
The following table provides a summary of Spin Master’s Gross Product Sales by geographic segment for the years ended December 31, 2020 and 2019:
Year Ended Dec 31(US$ millions) 2020 % of GPS 2019 % of GPS $ Change % Change
North America 983.4 60.6 % 1,026.3 60.7 % (42.9) (4.2) %Europe 451.0 27.8 % 430.4 25.4 % 20.6 4.8 %Rest of World 189.3 11.6 % 234.5 13.9 % (45.2) (19.3) %Gross Product Sales1 1,623.7 100.0 % 1,691.2 100.0 % (67.5) (4.0) %
1) See "Non-IFRS Financial Measures".
As a percentage of total Gross Product Sales, the North America segment decreased 0.1% to 60.6% compared to 60.7% in the prior year. International sales, comprised of the Europe and Rest of World segments, increased 0.1% to 39.4% compared to 39.3% in the prior year.
Gross Product Sales in North America decreased by $42.9 million or 4.2% to $983.4 million, with an unfavourable foreign exchange impact of $0.2 million. The decrease was driven by PAW Patrol, Hatchimals, DreamWorks Dragons, Owleez, Juno, GUND, Twisty Petz, Boxer, Bakugan, Candylocks, Awesome Blossems, Fugglers, Luvabella and Cool Maker, offset in part by increases in DC licensed products, Kinetic Sand, the Games & Puzzles portfolio, Monster Jam RC, Ninja Bots, Tech Deck, Pre Cool and SwimWays in addition to sales of Present Pets and Orbeez.
Gross Product Sales in Europe increased by $20.6 million or 4.8% to $451.0 million, with a favourable foreign exchange impact of $8.1 million. The increase was driven by PAW Patrol, DC licensed products, Kinetic Sand, Monster Jam RC, Bakugan and the Games & Puzzles portfolio in addition to sales of Present Pets, offset in part by declines in DreamWorks Dragons, Hatchimals, Owleez, Twisty Petz, Luvabella, Bunchems and Juno.
Gross Product Sales in Rest of World decreased by $45.2 million or 19.3% to $189.3 million, with an unfavourable foreign exchange impact of $4.9 million. The decrease was driven by Bakugan, Hatchimals,
9
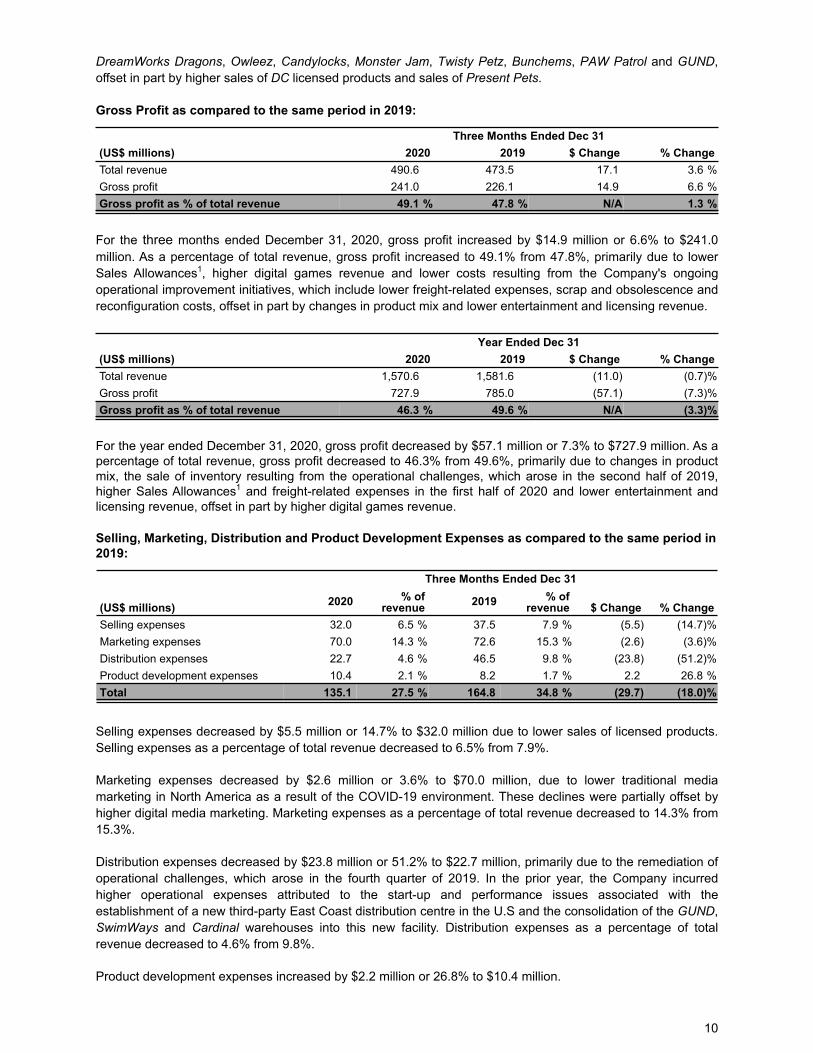
DreamWorks Dragons, Owleez, Candylocks, Monster Jam, Twisty Petz, Bunchems, PAW Patrol and GUND, offset in part by higher sales of DC licensed products and sales of Present Pets.
Gross Profit as compared to the same period in 2019:
Three Months Ended Dec 31(US$ millions) 2020 2019 $ Change % ChangeTotal revenue 490.6 473.5 17.1 3.6 %Gross profit 241.0 226.1 14.9 6.6 %Gross profit as % of total revenue 49.1 % 47.8 % N/A 1.3 %
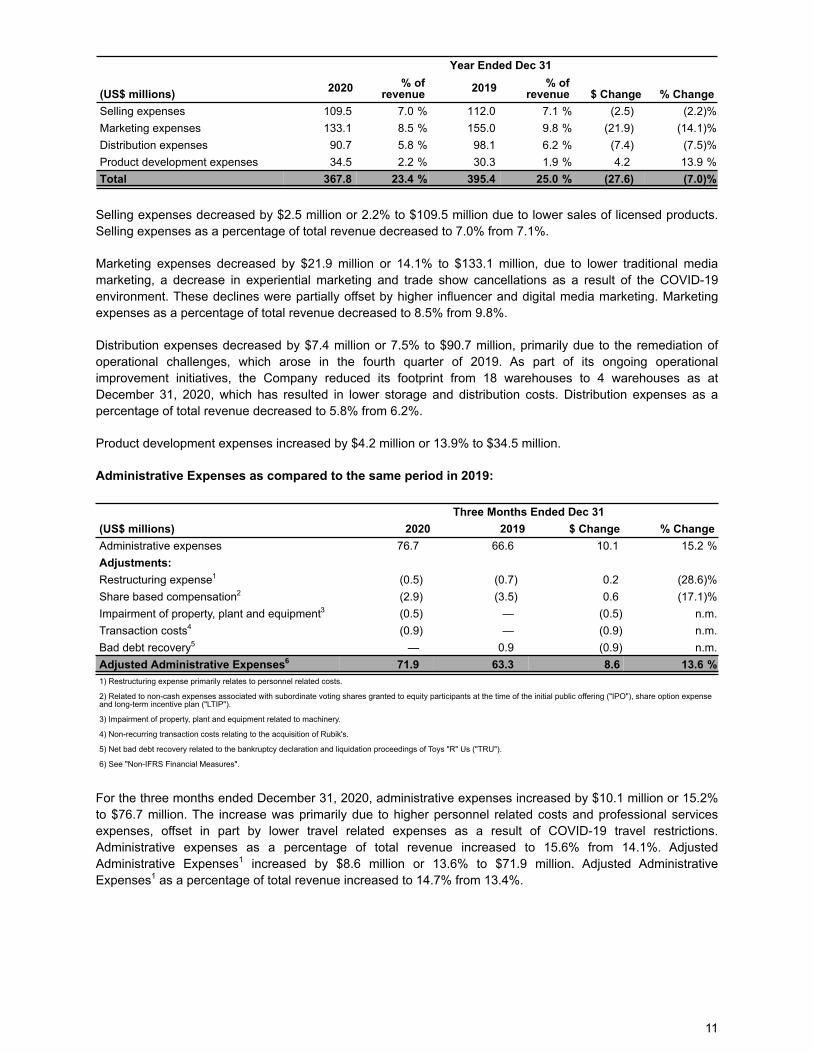
For the three months ended December 31, 2020, gross profit increased by $14.9 million or 6.6% to $241.0 million. As a percentage of total revenue, gross profit increased to 49.1% from 47.8%, primarily due to lower Sales Allowances1, higher digital games revenue and lower costs resulting from the Company's ongoing operational improvement initiatives, which include lower freight-related expenses, scrap and obsolescence and reconfiguration costs, offset in part by changes in product mix and lower entertainment and licensing revenue.
Year Ended Dec 31(US$ millions) 2020 2019 $ Change % ChangeTotal revenue 1,570.6 1,581.6 (11.0) (0.7) %Gross profit 727.9 785.0 (57.1) (7.3) %Gross profit as % of total revenue 46.3 % 49.6 % N/A (3.3) %
For the year ended December 31, 2020, gross profit decreased by $57.1 million or 7.3% to $727.9 million. As a percentage of total revenue, gross profit decreased to 46.3% from 49.6%, primarily due to changes in product mix, the sale of inventory resulting from the operational challenges, which arose in the second half of 2019, higher Sales Allowances1 and freight-related expenses in the first half of 2020 and lower entertainment and licensing revenue, offset in part by higher digital games revenue.
Selling, Marketing, Distribution and Product Development Expenses as compared to the same period in 2019:
Three Months Ended Dec 31
(US$ millions) 2020 % of revenue 2019 % of
revenue $ Change % ChangeSelling expenses 32.0 6.5 % 37.5 7.9 % (5.5) (14.7) %Marketing expenses 70.0 14.3 % 72.6 15.3 % (2.6) (3.6) %Distribution expenses 22.7 4.6 % 46.5 9.8 % (23.8) (51.2) %Product development expenses 10.4 2.1 % 8.2 1.7 % 2.2 26.8 %Total 135.1 27.5 % 164.8 34.8 % (29.7) (18.0) %
Selling expenses decreased by $5.5 million or 14.7% to $32.0 million due to lower sales of licensed products. Selling expenses as a percentage of total revenue decreased to 6.5% from 7.9%.
Marketing expenses decreased by $2.6 million or 3.6% to $70.0 million, due to lower traditional media marketing in North America as a result of the COVID-19 environment. These declines were partially offset by higher digital media marketing. Marketing expenses as a percentage of total revenue decreased to 14.3% from 15.3%.
Distribution expenses decreased by $23.8 million or 51.2% to $22.7 million, primarily due to the remediation of operational challenges, which arose in the fourth quarter of 2019. In the prior year, the Company incurred higher operational expenses attributed to the start-up and performance issues associated with the establishment of a new third-party East Coast distribution centre in the U.S and the consolidation of the GUND, SwimWays and Cardinal warehouses into this new facility. Distribution expenses as a percentage of total revenue decreased to 4.6% from 9.8%.
Product development expenses increased by $2.2 million or 26.8% to $10.4 million.
10
Year Ended Dec 31
(US$ millions) 2020 % of revenue 2019 % of
revenue $ Change % ChangeSelling expenses 109.5 7.0 % 112.0 7.1 % (2.5) (2.2) %Marketing expenses 133.1 8.5 % 155.0 9.8 % (21.9) (14.1) %Distribution expenses 90.7 5.8 % 98.1 6.2 % (7.4) (7.5) %Product development expenses 34.5 2.2 % 30.3 1.9 % 4.2 13.9 %Total 367.8 23.4 % 395.4 25.0 % (27.6) (7.0) %
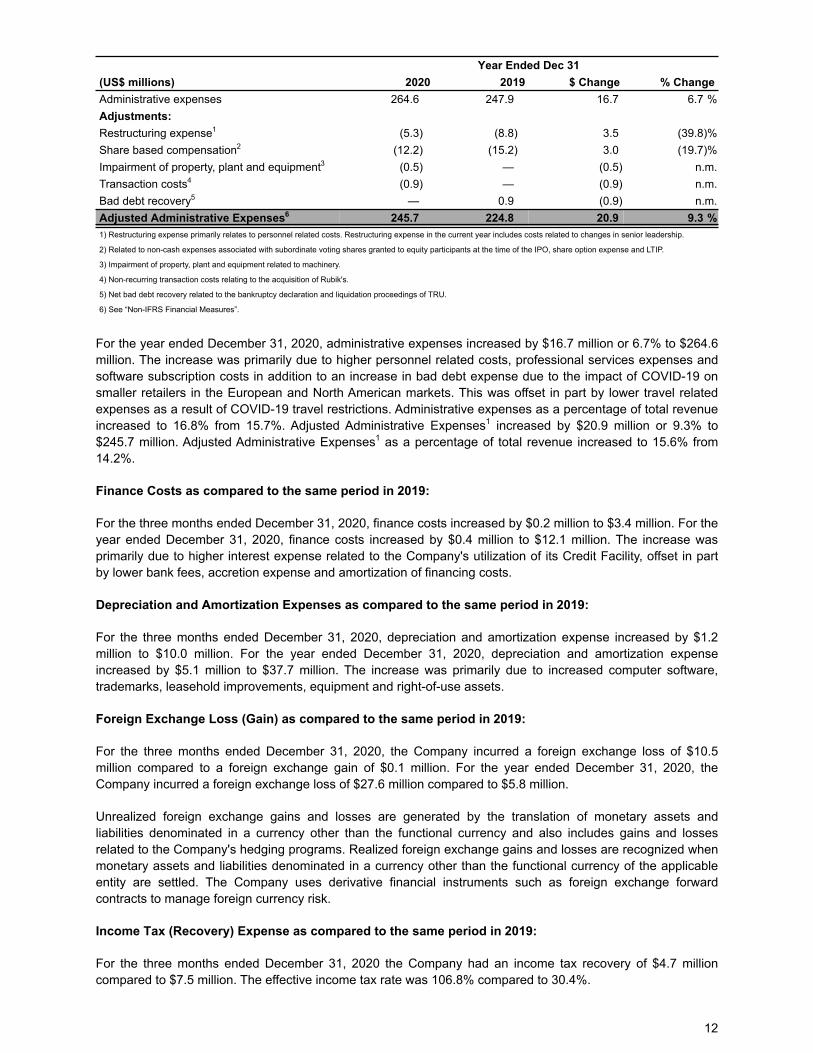
Selling expenses decreased by $2.5 million or 2.2% to $109.5 million due to lower sales of licensed products. Selling expenses as a percentage of total revenue decreased to 7.0% from 7.1%.
Marketing expenses decreased by $21.9 million or 14.1% to $133.1 million, due to lower traditional media marketing, a decrease in experiential marketing and trade show cancellations as a result of the COVID-19 environment. These declines were partially offset by higher influencer and digital media marketing. Marketing expenses as a percentage of total revenue decreased to 8.5% from 9.8%.
Distribution expenses decreased by $7.4 million or 7.5% to $90.7 million, primarily due to the remediation of operational challenges, which arose in the fourth quarter of 2019. As part of its ongoing operational improvement initiatives, the Company reduced its footprint from 18 warehouses to 4 warehouses as at December 31, 2020, which has resulted in lower storage and distribution costs. Distribution expenses as a percentage of total revenue decreased to 5.8% from 6.2%.
Product development expenses increased by $4.2 million or 13.9% to $34.5 million.
Administrative Expenses as compared to the same period in 2019:
Three Months Ended Dec 31(US$ millions) 2020 2019 $ Change % ChangeAdministrative expenses 76.7 66.6 10.1 15.2 %Adjustments:Restructuring expense1 (0.5) (0.7) 0.2 (28.6) %Share based compensation2 (2.9) (3.5) 0.6 (17.1) %Impairment of property, plant and equipment3 (0.5) — (0.5) n.m.Transaction costs4 (0.9) — (0.9) n.m.Bad debt recovery5 — 0.9 (0.9) n.m.Adjusted Administrative Expenses6 71.9 63.3 8.6 13.6 %1) Restructuring expense primarily relates to personnel related costs.
2) Related to non-cash expenses associated with subordinate voting shares granted to equity participants at the time of the initial public offering ("IPO"), share option expense and long-term incentive plan ("LTIP").
3) Impairment of property, plant and equipment related to machinery.
4) Non-recurring transaction costs relating to the acquisition of Rubik's.
5) Net bad debt recovery related to the bankruptcy declaration and liquidation proceedings of Toys "R" Us ("TRU").
6) See "Non-IFRS Financial Measures".
For the three months ended December 31, 2020, administrative expenses increased by $10.1 million or 15.2% to $76.7 million. The increase was primarily due to higher personnel related costs and professional services expenses, offset in part by lower travel related expenses as a result of COVID-19 travel restrictions. Administrative expenses as a percentage of total revenue increased to 15.6% from 14.1%. Adjusted Administrative Expenses1 increased by $8.6 million or 13.6% to $71.9 million. Adjusted Administrative Expenses1 as a percentage of total revenue increased to 14.7% from 13.4%.
11
Year Ended Dec 31(US$ millions) 2020 2019 $ Change % ChangeAdministrative expenses 264.6 247.9 16.7 6.7 %Adjustments:Restructuring expense1 (5.3) (8.8) 3.5 (39.8) %Share based compensation2 (12.2) (15.2) 3.0 (19.7) %Impairment of property, plant and equipment3 (0.5) — (0.5) n.m.Transaction costs4 (0.9) — (0.9) n.m.Bad debt recovery5 — 0.9 (0.9) n.m.Adjusted Administrative Expenses6 245.7 224.8 20.9 9.3 %1) Restructuring expense primarily relates to personnel related costs. Restructuring expense in the current year includes costs related to changes in senior leadership.
2) Related to non-cash expenses associated with subordinate voting shares granted to equity participants at the time of the IPO, share option expense and LTIP.
3) Impairment of property, plant and equipment related to machinery.
4) Non-recurring transaction costs relating to the acquisition of Rubik's.
5) Net bad debt recovery related to the bankruptcy declaration and liquidation proceedings of TRU.
6) See “Non-IFRS Financial Measures”.
For the year ended December 31, 2020, administrative expenses increased by $16.7 million or 6.7% to $264.6 million. The increase was primarily due to higher personnel related costs, professional services expenses and software subscription costs in addition to an increase in bad debt expense due to the impact of COVID-19 on smaller retailers in the European and North American markets. This was offset in part by lower travel related expenses as a result of COVID-19 travel restrictions. Administrative expenses as a percentage of total revenue increased to 16.8% from 15.7%. Adjusted Administrative Expenses1 increased by $20.9 million or 9.3% to $245.7 million. Adjusted Administrative Expenses1 as a percentage of total revenue increased to 15.6% from 14.2%.
Finance Costs as compared to the same period in 2019:
For the three months ended December 31, 2020, finance costs increased by $0.2 million to $3.4 million. For the year ended December 31, 2020, finance costs increased by $0.4 million to $12.1 million. The increase was primarily due to higher interest expense related to the Company's utilization of its Credit Facility, offset in part by lower bank fees, accretion expense and amortization of financing costs.
Depreciation and Amortization Expenses as compared to the same period in 2019:
For the three months ended December 31, 2020, depreciation and amortization expense increased by $1.2 million to $10.0 million. For the year ended December 31, 2020, depreciation and amortization expense increased by $5.1 million to $37.7 million. The increase was primarily due to increased computer software, trademarks, leasehold improvements, equipment and right-of-use assets.
Foreign Exchange Loss (Gain) as compared to the same period in 2019:
For the three months ended December 31, 2020, the Company incurred a foreign exchange loss of $10.5 million compared to a foreign exchange gain of $0.1 million. For the year ended December 31, 2020, the Company incurred a foreign exchange loss of $27.6 million compared to $5.8 million.
Unrealized foreign exchange gains and losses are generated by the translation of monetary assets and liabilities denominated in a currency other than the functional currency and also includes gains and losses related to the Company's hedging programs. Realized foreign exchange gains and losses are recognized when monetary assets and liabilities denominated in a currency other than the functional currency of the applicable entity are settled. The Company uses derivative financial instruments such as foreign exchange forward contracts to manage foreign currency risk.
Income Tax (Recovery) Expense as compared to the same period in 2019:
For the three months ended December 31, 2020 the Company had an income tax recovery of $4.7 million compared to $7.5 million. The effective income tax rate was 106.8% compared to 30.4%.
12
For the year ended December 31, 2020 the Company had an income tax recovery of $36.1 million compared to an income tax expense of $20.7 million. An internal transfer of intellectual property resulted in a one-time income tax recovery of $33.3 million or 354.2% on the effective tax rate for the year ended December 31, 2020. Excluding the one-time income tax recovery, the effective income tax rate was (29.8)% compared to 24.4%. The change in the effective income tax rate was primarily driven by different tax rates of subsidiaries operating in other jurisdictions.
Net Income (Loss) as compared to the same period in 2019:
Net income for the three months ended December 31, 2020 was $0.3 million, an increase of $17.5 million from net loss of $17.2 million. Excluding share-based compensation, restructuring expense, foreign exchange loss (gain), legal settlement, acquisition related contingent consideration and other non-recurring items, Adjusted Net Income1 for the three months ended December 31, 2020 was $14.6 million, an increase of $22.4 million from Adjusted Net Loss1 of $7.8 million.
Net income for the year ended December 31, 2020 was $45.5 million, a decrease of $18.8 million from $64.3 million. Excluding share-based compensation, restructuring expense, foreign exchange loss, legal settlement, acquisition related contingent consideration, a one-time income tax recovery and other non-recurring items, Adjusted Net Income1 for the year ended December 31, 2020 was $53.4 million, a decrease of $39.4 million from $92.8 million.
OUTLOOK
Spin Master continues to focus on driving long-term growth. Its principle strategies are to:
• Innovate using our global internal and external research and development network;• Increase international sales in developed and emerging markets;• Develop evergreen global entertainment franchises;• Establish a leading position in digital games; and• Leverage the Company's global platform through strategic acquisitions.
The Company expects 2021 Gross Product Sales1 to increase low to mid single digits compared to 2020. The seasonality of Gross Product Sales1 for 2021 is expected to be approximately 32-34% in the first half of 2021 and 66-68% in the second half of 2021.
On a full year basis, the Company expects 2021 total revenue to increase mid to high single digits compared to 2020. The Company expects 2021 Adjusted EBITDA Margin1 to be in the mid to high teens, significantly improved over 2020.
13
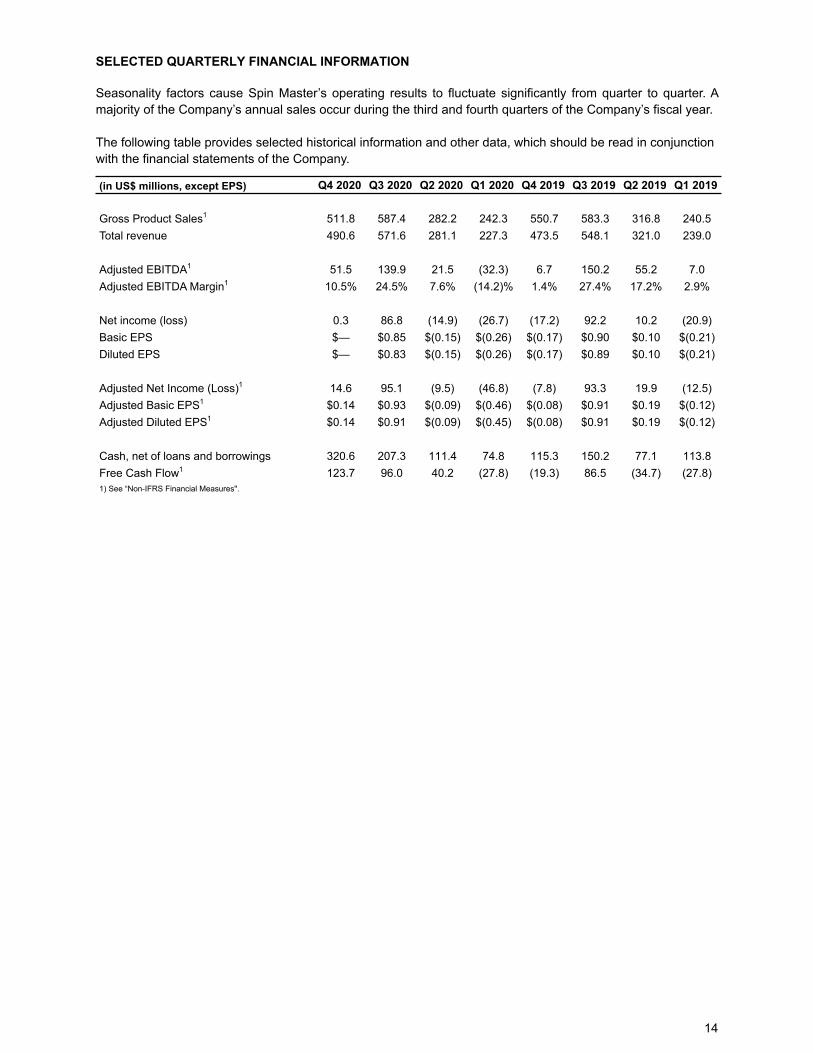
SELECTED QUARTERLY FINANCIAL INFORMATION
Seasonality factors cause Spin Master’s operating results to fluctuate significantly from quarter to quarter. A majority of the Company’s annual sales occur during the third and fourth quarters of the Company’s fiscal year.
The following table provides selected historical information and other data, which should be read in conjunction with the financial statements of the Company.
(in US$ millions, except EPS) Q4 2020 Q3 2020 Q2 2020 Q1 2020 Q4 2019 Q3 2019 Q2 2019 Q1 2019
Gross Product Sales1 511.8 587.4 282.2 242.3 550.7 583.3 316.8 240.5Total revenue 490.6 571.6 281.1 227.3 473.5 548.1 321.0 239.0
Adjusted EBITDA1 51.5 139.9 21.5 (32.3) 6.7 150.2 55.2 7.0Adjusted EBITDA Margin1 10.5% 24.5% 7.6% (14.2)% 1.4% 27.4% 17.2% 2.9%
Net income (loss) 0.3 86.8 (14.9) (26.7) (17.2) 92.2 10.2 (20.9)Basic EPS $— $0.85 $(0.15) $(0.26) $(0.17) $0.90 $0.10 $(0.21)Diluted EPS $— $0.83 $(0.15) $(0.26) $(0.17) $0.89 $0.10 $(0.21)
Adjusted Net Income (Loss)1 14.6 95.1 (9.5) (46.8) (7.8) 93.3 19.9 (12.5)Adjusted Basic EPS1 $0.14 $0.93 $(0.09) $(0.46) $(0.08) $0.91 $0.19 $(0.12)Adjusted Diluted EPS1 $0.14 $0.91 $(0.09) $(0.45) $(0.08) $0.91 $0.19 $(0.12)
Cash, net of loans and borrowings 320.6 207.3 111.4 74.8 115.3 150.2 77.1 113.8Free Cash Flow1 123.7 96.0 40.2 (27.8) (19.3) 86.5 (34.7) (27.8)1) See “Non-IFRS Financial Measures".
14
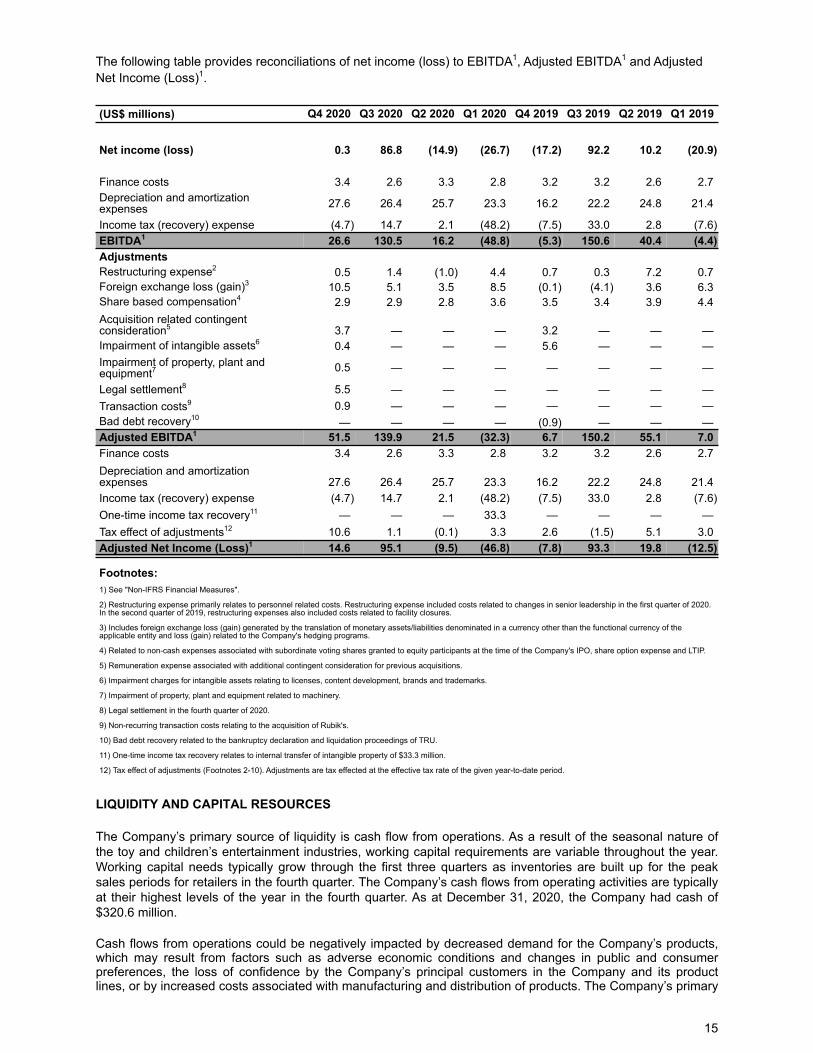
The following table provides reconciliations of net income (loss) to EBITDA1, Adjusted EBITDA1 and Adjusted Net Income (Loss)1.
(US$ millions) Q4 2020 Q3 2020 Q2 2020 Q1 2020 Q4 2019 Q3 2019 Q2 2019 Q1 2019
Net income (loss) 0.3 86.8 (14.9) (26.7) (17.2) 92.2 10.2 (20.9)
Finance costs 3.4 2.6 3.3 2.8 3.2 3.2 2.6 2.7 Depreciation and amortization expenses 27.6 26.4 25.7 23.3 16.2 22.2 24.8 21.4
Income tax (recovery) expense (4.7) 14.7 2.1 (48.2) (7.5) 33.0 2.8 (7.6) EBITDA1 26.6 130.5 16.2 (48.8) (5.3) 150.6 40.4 (4.4) AdjustmentsRestructuring expense2 0.5 1.4 (1.0) 4.4 0.7 0.3 7.2 0.7 Foreign exchange loss (gain)3 10.5 5.1 3.5 8.5 (0.1) (4.1) 3.6 6.3 Share based compensation4 2.9 2.9 2.8 3.6 3.5 3.4 3.9 4.4 Acquisition related contingent consideration5 3.7 — — — 3.2 — — — Impairment of intangible assets6 0.4 — — — 5.6 — — — Impairment of property, plant and equipment7 0.5 — — — — — — —
Legal settlement8 5.5 — — — — — — — Transaction costs9 0.9 — — — — — — — Bad debt recovery10 — — — — (0.9) — — — Adjusted EBITDA1 51.5 139.9 21.5 (32.3) 6.7 150.2 55.1 7.0 Finance costs 3.4 2.6 3.3 2.8 3.2 3.2 2.6 2.7 Depreciation and amortization expenses 27.6 26.4 25.7 23.3 16.2 22.2 24.8 21.4 Income tax (recovery) expense (4.7) 14.7 2.1 (48.2) (7.5) 33.0 2.8 (7.6) One-time income tax recovery11 — — — 33.3 — — — — Tax effect of adjustments12 10.6 1.1 (0.1) 3.3 2.6 (1.5) 5.1 3.0 Adjusted Net Income (Loss)1 14.6 95.1 (9.5) (46.8) (7.8) 93.3 19.8 (12.5)
Footnotes:1) See "Non-IFRS Financial Measures".
2) Restructuring expense primarily relates to personnel related costs. Restructuring expense included costs related to changes in senior leadership in the first quarter of 2020. In the second quarter of 2019, restructuring expenses also included costs related to facility closures.
3) Includes foreign exchange loss (gain) generated by the translation of monetary assets/liabilities denominated in a currency other than the functional currency of the applicable entity and loss (gain) related to the Company's hedging programs.
4) Related to non-cash expenses associated with subordinate voting shares granted to equity participants at the time of the Company's IPO, share option expense and LTIP.
5) Remuneration expense associated with additional contingent consideration for previous acquisitions.
6) Impairment charges for intangible assets relating to licenses, content development, brands and trademarks.
7) Impairment of property, plant and equipment related to machinery.
8) Legal settlement in the fourth quarter of 2020.
9) Non-recurring transaction costs relating to the acquisition of Rubik's.
10) Bad debt recovery related to the bankruptcy declaration and liquidation proceedings of TRU.
11) One-time income tax recovery relates to internal transfer of intangible property of $33.3 million.
12) Tax effect of adjustments (Footnotes 2-10). Adjustments are tax effected at the effective tax rate of the given year-to-date period.
LIQUIDITY AND CAPITAL RESOURCES
The Company’s primary source of liquidity is cash flow from operations. As a result of the seasonal nature of the toy and children’s entertainment industries, working capital requirements are variable throughout the year. Working capital needs typically grow through the first three quarters as inventories are built up for the peak sales periods for retailers in the fourth quarter. The Company’s cash flows from operating activities are typically at their highest levels of the year in the fourth quarter. As at December 31, 2020, the Company had cash of $320.6 million.
Cash flows from operations could be negatively impacted by decreased demand for the Company’s products, which may result from factors such as adverse economic conditions and changes in public and consumer preferences, the loss of confidence by the Company’s principal customers in the Company and its product lines, or by increased costs associated with manufacturing and distribution of products. The Company’s primary
15
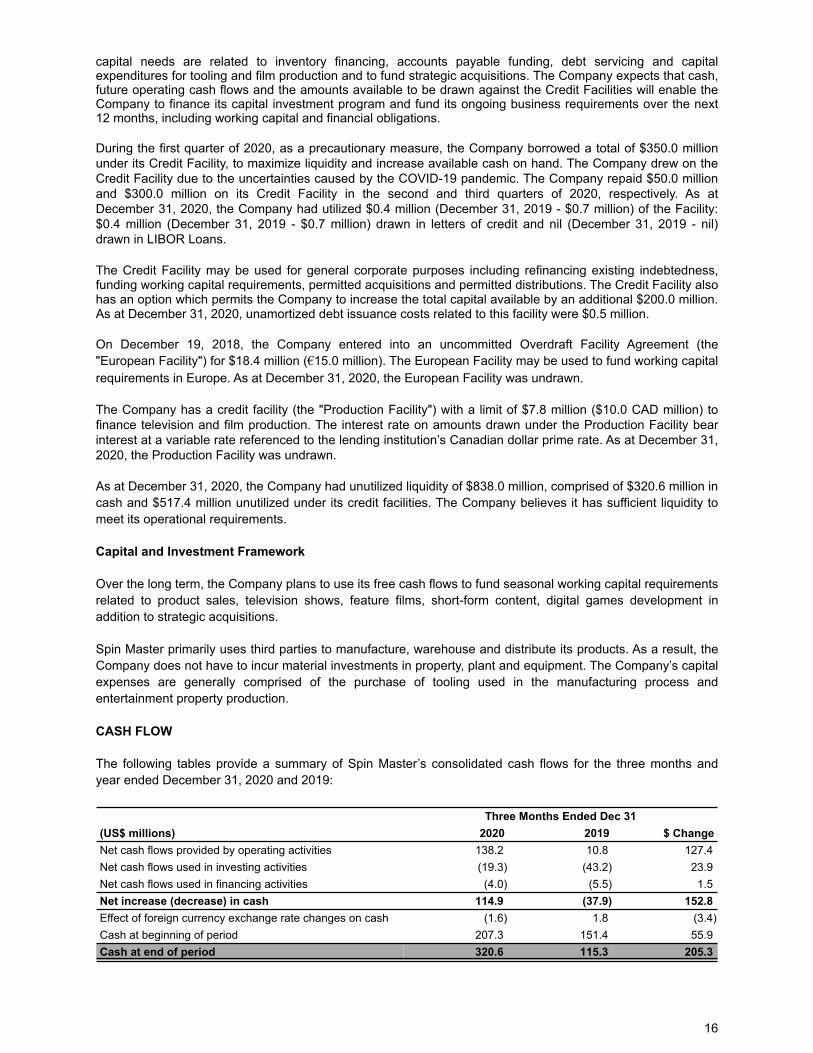
capital needs are related to inventory financing, accounts payable funding, debt servicing and capital expenditures for tooling and film production and to fund strategic acquisitions. The Company expects that cash, future operating cash flows and the amounts available to be drawn against the Credit Facilities will enable the Company to finance its capital investment program and fund its ongoing business requirements over the next 12 months, including working capital and financial obligations.
During the first quarter of 2020, as a precautionary measure, the Company borrowed a total of $350.0 million under its Credit Facility, to maximize liquidity and increase available cash on hand. The Company drew on the Credit Facility due to the uncertainties caused by the COVID-19 pandemic. The Company repaid $50.0 million and $300.0 million on its Credit Facility in the second and third quarters of 2020, respectively. As at December 31, 2020, the Company had utilized $0.4 million (December 31, 2019 - $0.7 million) of the Facility: $0.4 million (December 31, 2019 - $0.7 million) drawn in letters of credit and nil (December 31, 2019 - nil) drawn in LIBOR Loans.
The Credit Facility may be used for general corporate purposes including refinancing existing indebtedness, funding working capital requirements, permitted acquisitions and permitted distributions. The Credit Facility also has an option which permits the Company to increase the total capital available by an additional $200.0 million. As at December 31, 2020, unamortized debt issuance costs related to this facility were $0.5 million.
On December 19, 2018, the Company entered into an uncommitted Overdraft Facility Agreement (the "European Facility") for $18.4 million (€15.0 million). The European Facility may be used to fund working capital requirements in Europe. As at December 31, 2020, the European Facility was undrawn.
The Company has a credit facility (the "Production Facility") with a limit of $7.8 million ($10.0 CAD million) to finance television and film production. The interest rate on amounts drawn under the Production Facility bear interest at a variable rate referenced to the lending institution’s Canadian dollar prime rate. As at December 31, 2020, the Production Facility was undrawn.
As at December 31, 2020, the Company had unutilized liquidity of $838.0 million, comprised of $320.6 million in cash and $517.4 million unutilized under its credit facilities. The Company believes it has sufficient liquidity to meet its operational requirements.
Capital and Investment Framework
Over the long term, the Company plans to use its free cash flows to fund seasonal working capital requirements related to product sales, television shows, feature films, short-form content, digital games development in addition to strategic acquisitions.
Spin Master primarily uses third parties to manufacture, warehouse and distribute its products. As a result, the Company does not have to incur material investments in property, plant and equipment. The Company’s capital expenses are generally comprised of the purchase of tooling used in the manufacturing process and entertainment property production.
CASH FLOW
The following tables provide a summary of Spin Master’s consolidated cash flows for the three months and year ended December 31, 2020 and 2019:
Three Months Ended Dec 31(US$ millions) 2020 2019 $ ChangeNet cash flows provided by operating activities 138.2 10.8 127.4 Net cash flows used in investing activities (19.3) (43.2) 23.9 Net cash flows used in financing activities (4.0) (5.5) 1.5 Net increase (decrease) in cash 114.9 (37.9) 152.8 Effect of foreign currency exchange rate changes on cash (1.6) 1.8 (3.4) Cash at beginning of period 207.3 151.4 55.9 Cash at end of period 320.6 115.3 205.3
16
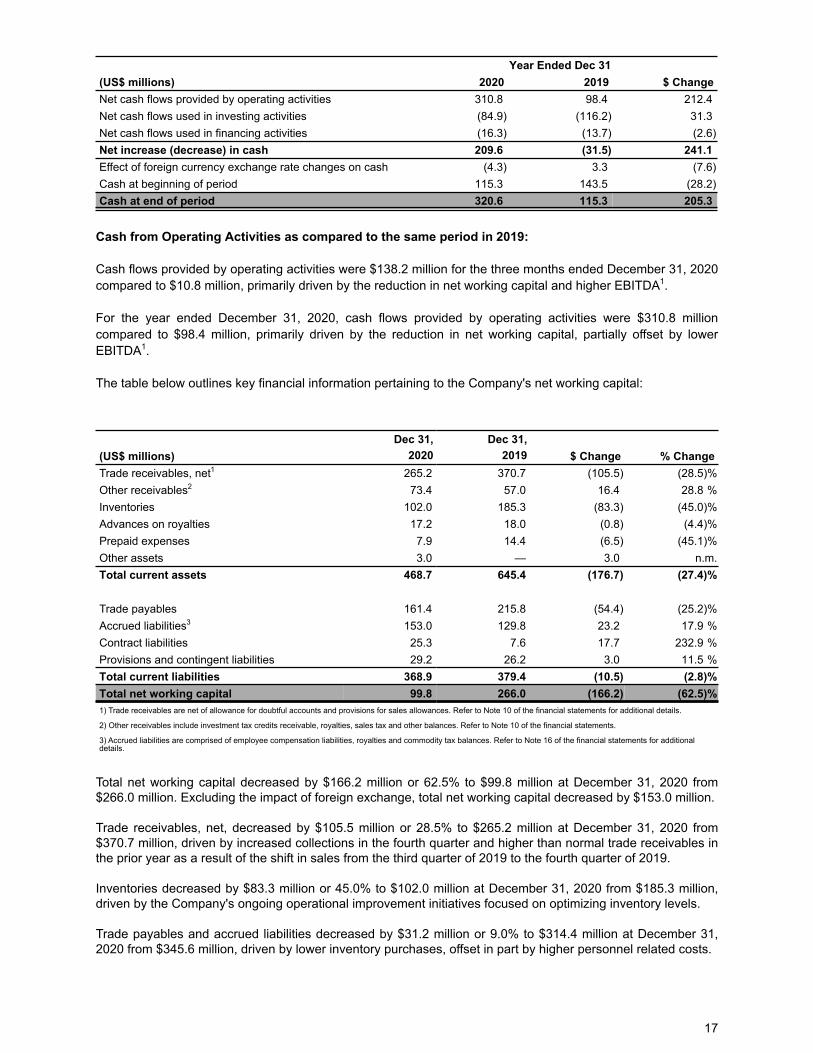
Year Ended Dec 31(US$ millions) 2020 2019 $ ChangeNet cash flows provided by operating activities 310.8 98.4 212.4 Net cash flows used in investing activities (84.9) (116.2) 31.3 Net cash flows used in financing activities (16.3) (13.7) (2.6) Net increase (decrease) in cash 209.6 (31.5) 241.1 Effect of foreign currency exchange rate changes on cash (4.3) 3.3 (7.6) Cash at beginning of period 115.3 143.5 (28.2) Cash at end of period 320.6 115.3 205.3
Cash from Operating Activities as compared to the same period in 2019:
Cash flows provided by operating activities were $138.2 million for the three months ended December 31, 2020 compared to $10.8 million, primarily driven by the reduction in net working capital and higher EBITDA1.
For the year ended December 31, 2020, cash flows provided by operating activities were $310.8 million compared to $98.4 million, primarily driven by the reduction in net working capital, partially offset by lower EBITDA1.
The table below outlines key financial information pertaining to the Company's net working capital:
Dec 31, Dec 31,$ Change % Change(US$ millions) 2020 2019
Trade receivables, net1 265.2 370.7 (105.5) (28.5) %Other receivables2 73.4 57.0 16.4 28.8 %Inventories 102.0 185.3 (83.3) (45.0) %Advances on royalties 17.2 18.0 (0.8) (4.4) %Prepaid expenses 7.9 14.4 (6.5) (45.1) %Other assets 3.0 — 3.0 n.m.Total current assets 468.7 645.4 (176.7) (27.4) %
Trade payables 161.4 215.8 (54.4) (25.2) %Accrued liabilities3 153.0 129.8 23.2 17.9 %Contract liabilities 25.3 7.6 17.7 232.9 %Provisions and contingent liabilities 29.2 26.2 3.0 11.5 %Total current liabilities 368.9 379.4 (10.5) (2.8) %Total net working capital 99.8 266.0 (166.2) (62.5) %1) Trade receivables are net of allowance for doubtful accounts and provisions for sales allowances. Refer to Note 10 of the financial statements for additional details.
2) Other receivables include investment tax credits receivable, royalties, sales tax and other balances. Refer to Note 10 of the financial statements.
3) Accrued liabilities are comprised of employee compensation liabilities, royalties and commodity tax balances. Refer to Note 16 of the financial statements for additional details.
Total net working capital decreased by $166.2 million or 62.5% to $99.8 million at December 31, 2020 from $266.0 million. Excluding the impact of foreign exchange, total net working capital decreased by $153.0 million.
Trade receivables, net, decreased by $105.5 million or 28.5% to $265.2 million at December 31, 2020 from $370.7 million, driven by increased collections in the fourth quarter and higher than normal trade receivables in the prior year as a result of the shift in sales from the third quarter of 2019 to the fourth quarter of 2019.
Inventories decreased by $83.3 million or 45.0% to $102.0 million at December 31, 2020 from $185.3 million, driven by the Company's ongoing operational improvement initiatives focused on optimizing inventory levels.
Trade payables and accrued liabilities decreased by $31.2 million or 9.0% to $314.4 million at December 31, 2020 from $345.6 million, driven by lower inventory purchases, offset in part by higher personnel related costs.
17
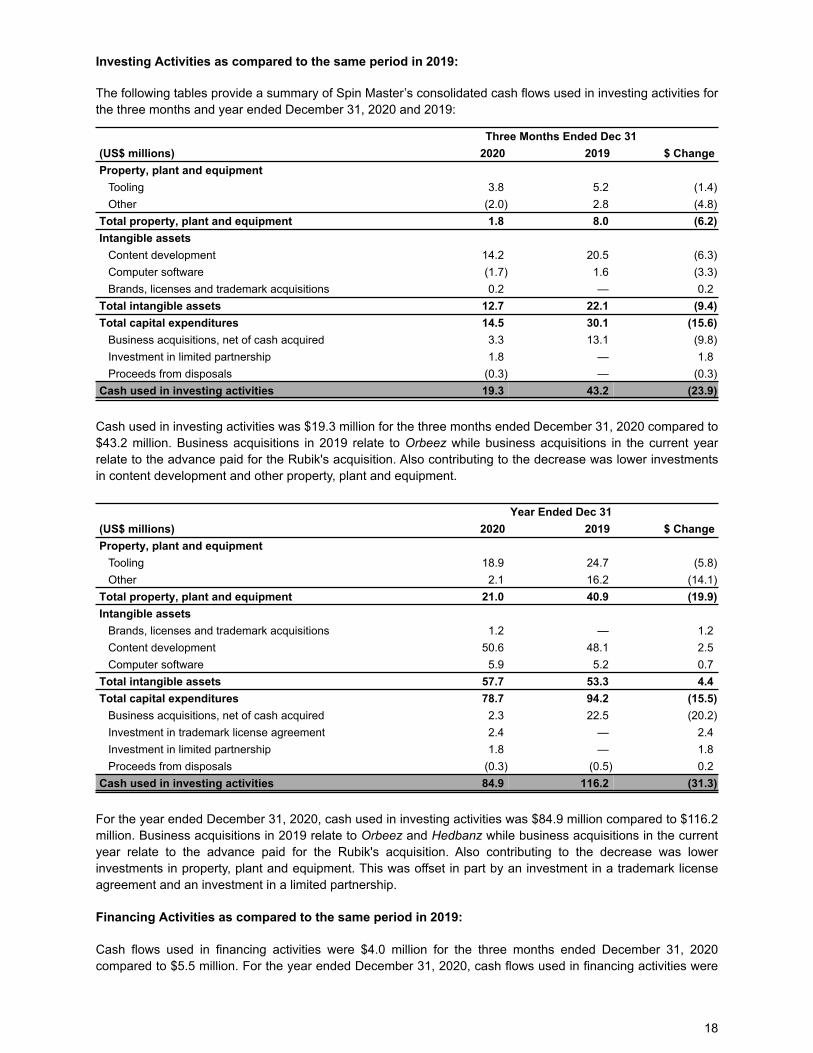
Investing Activities as compared to the same period in 2019:
The following tables provide a summary of Spin Master’s consolidated cash flows used in investing activities for the three months and year ended December 31, 2020 and 2019:
Three Months Ended Dec 31(US$ millions) 2020 2019 $ ChangeProperty, plant and equipment
Tooling 3.8 5.2 (1.4) Other (2.0) 2.8 (4.8)
Total property, plant and equipment 1.8 8.0 (6.2) Intangible assets
Content development 14.2 20.5 (6.3) Computer software (1.7) 1.6 (3.3) Brands, licenses and trademark acquisitions 0.2 — 0.2
Total intangible assets 12.7 22.1 (9.4) Total capital expenditures 14.5 30.1 (15.6)
Business acquisitions, net of cash acquired 3.3 13.1 (9.8) Investment in limited partnership 1.8 — 1.8 Proceeds from disposals (0.3) — (0.3)
Cash used in investing activities 19.3 43.2 (23.9)
Cash used in investing activities was $19.3 million for the three months ended December 31, 2020 compared to $43.2 million. Business acquisitions in 2019 relate to Orbeez while business acquisitions in the current year relate to the advance paid for the Rubik's acquisition. Also contributing to the decrease was lower investments in content development and other property, plant and equipment.
Year Ended Dec 31(US$ millions) 2020 2019 $ ChangeProperty, plant and equipment
Tooling 18.9 24.7 (5.8) Other 2.1 16.2 (14.1)
Total property, plant and equipment 21.0 40.9 (19.9) Intangible assets
Brands, licenses and trademark acquisitions 1.2 — 1.2 Content development 50.6 48.1 2.5 Computer software 5.9 5.2 0.7
Total intangible assets 57.7 53.3 4.4 Total capital expenditures 78.7 94.2 (15.5)
Business acquisitions, net of cash acquired 2.3 22.5 (20.2) Investment in trademark license agreement 2.4 — 2.4 Investment in limited partnership 1.8 — 1.8 Proceeds from disposals (0.3) (0.5) 0.2
Cash used in investing activities 84.9 116.2 (31.3)
For the year ended December 31, 2020, cash used in investing activities was $84.9 million compared to $116.2 million. Business acquisitions in 2019 relate to Orbeez and Hedbanz while business acquisitions in the current year relate to the advance paid for the Rubik's acquisition. Also contributing to the decrease was lower investments in property, plant and equipment. This was offset in part by an investment in a trademark license agreement and an investment in a limited partnership.
Financing Activities as compared to the same period in 2019:
Cash flows used in financing activities were $4.0 million for the three months ended December 31, 2020 compared to $5.5 million. For the year ended December 31, 2020, cash flows used in financing activities were
18
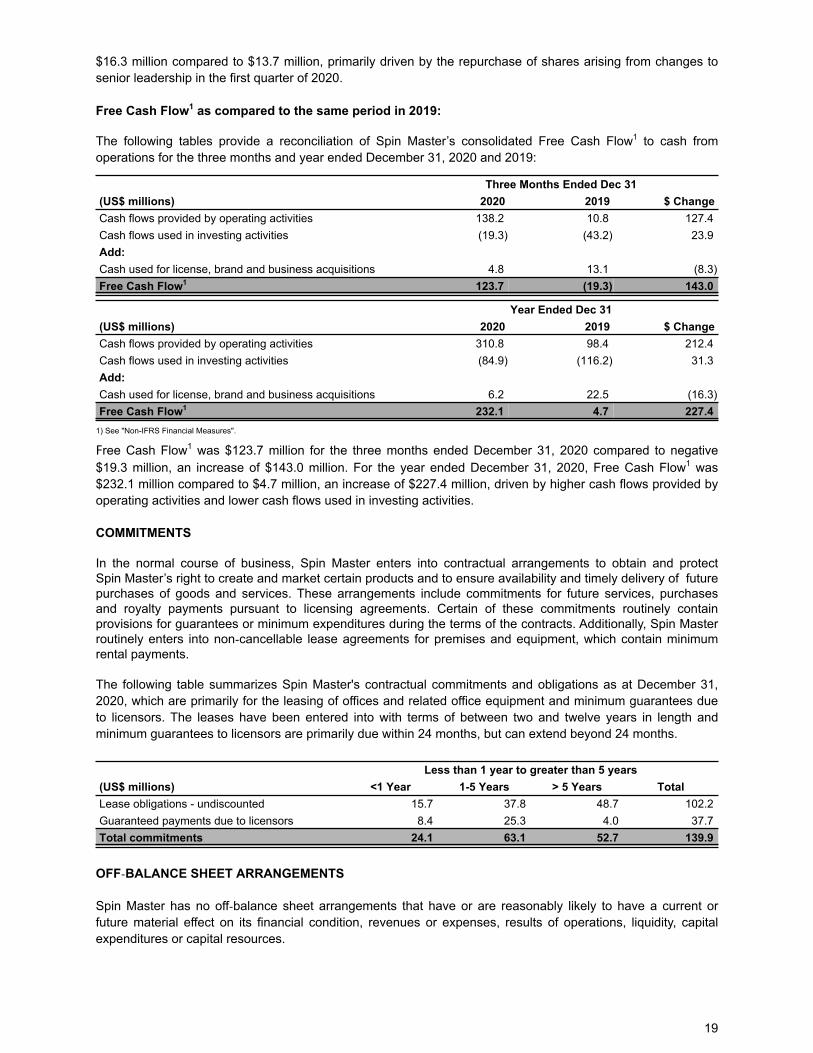
$16.3 million compared to $13.7 million, primarily driven by the repurchase of shares arising from changes to senior leadership in the first quarter of 2020.
Free Cash Flow1 as compared to the same period in 2019:
The following tables provide a reconciliation of Spin Master’s consolidated Free Cash Flow1 to cash from operations for the three months and year ended December 31, 2020 and 2019:
Three Months Ended Dec 31(US$ millions) 2020 2019 $ ChangeCash flows provided by operating activities 138.2 10.8 127.4 Cash flows used in investing activities (19.3) (43.2) 23.9 Add:Cash used for license, brand and business acquisitions 4.8 13.1 (8.3) Free Cash Flow1 123.7 (19.3) 143.0
Year Ended Dec 31(US$ millions) 2020 2019 $ ChangeCash flows provided by operating activities 310.8 98.4 212.4 Cash flows used in investing activities (84.9) (116.2) 31.3 Add:Cash used for license, brand and business acquisitions 6.2 22.5 (16.3) Free Cash Flow1 232.1 4.7 227.4
1) See "Non-IFRS Financial Measures".
Free Cash Flow1 was $123.7 million for the three months ended December 31, 2020 compared to negative $19.3 million, an increase of $143.0 million. For the year ended December 31, 2020, Free Cash Flow1 was $232.1 million compared to $4.7 million, an increase of $227.4 million, driven by higher cash flows provided by operating activities and lower cash flows used in investing activities.
COMMITMENTS
In the normal course of business, Spin Master enters into contractual arrangements to obtain and protect Spin Master’s right to create and market certain products and to ensure availability and timely delivery of future purchases of goods and services. These arrangements include commitments for future services, purchases and royalty payments pursuant to licensing agreements. Certain of these commitments routinely contain provisions for guarantees or minimum expenditures during the terms of the contracts. Additionally, Spin Master routinely enters into non‑cancellable lease agreements for premises and equipment, which contain minimum rental payments.
The following table summarizes Spin Master's contractual commitments and obligations as at December 31, 2020, which are primarily for the leasing of offices and related office equipment and minimum guarantees due to licensors. The leases have been entered into with terms of between two and twelve years in length and minimum guarantees to licensors are primarily due within 24 months, but can extend beyond 24 months.
Less than 1 year to greater than 5 years(US$ millions) <1 Year 1-5 Years > 5 Years TotalLease obligations - undiscounted 15.7 37.8 48.7 102.2 Guaranteed payments due to licensors 8.4 25.3 4.0 37.7 Total commitments 24.1 63.1 52.7 139.9
OFF‑BALANCE SHEET ARRANGEMENTS
Spin Master has no off‑balance sheet arrangements that have or are reasonably likely to have a current or future material effect on its financial condition, revenues or expenses, results of operations, liquidity, capital expenditures or capital resources.
19
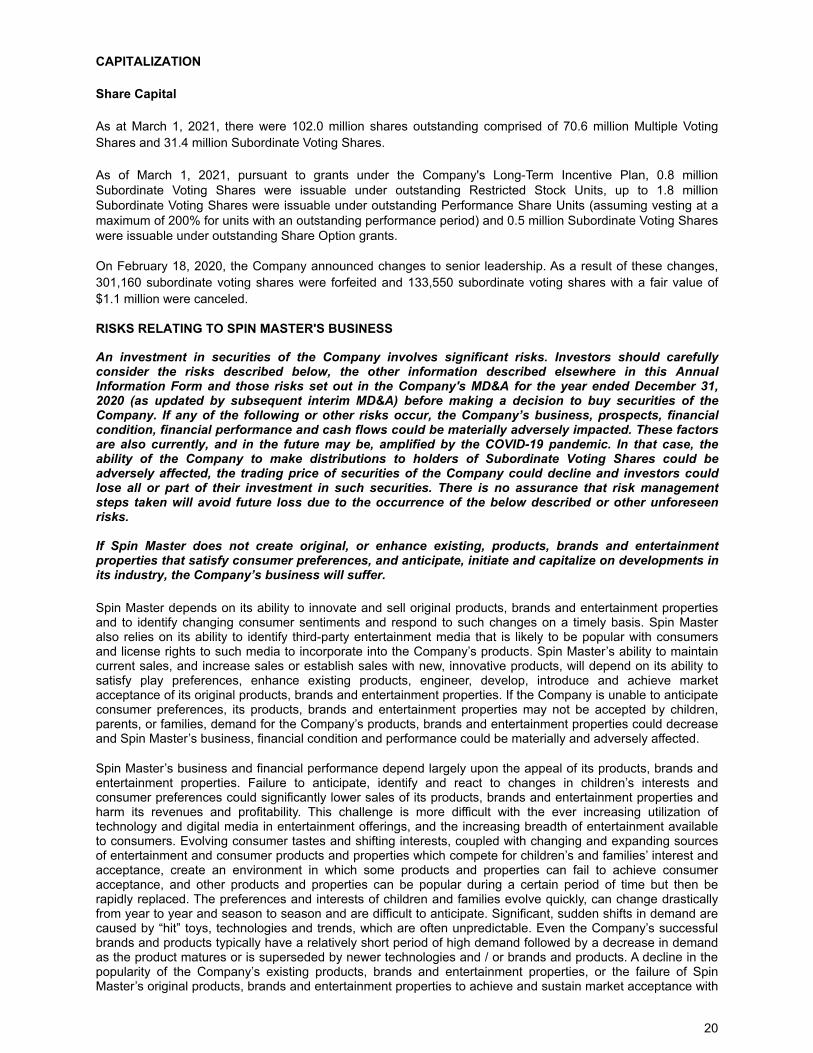
CAPITALIZATION
Share Capital
As at March 1, 2021, there were 102.0 million shares outstanding comprised of 70.6 million Multiple Voting Shares and 31.4 million Subordinate Voting Shares.
As of March 1, 2021, pursuant to grants under the Company's Long-Term Incentive Plan, 0.8 million Subordinate Voting Shares were issuable under outstanding Restricted Stock Units, up to 1.8 million Subordinate Voting Shares were issuable under outstanding Performance Share Units (assuming vesting at a maximum of 200% for units with an outstanding performance period) and 0.5 million Subordinate Voting Shares were issuable under outstanding Share Option grants.
On February 18, 2020, the Company announced changes to senior leadership. As a result of these changes, 301,160 subordinate voting shares were forfeited and 133,550 subordinate voting shares with a fair value of $1.1 million were canceled.
RISKS RELATING TO SPIN MASTER'S BUSINESS
An investment in securities of the Company involves significant risks. Investors should carefully consider the risks described below, the other information described elsewhere in this Annual Information Form and those risks set out in the Company's MD&A for the year ended December 31, 2020 (as updated by subsequent interim MD&A) before making a decision to buy securities of the Company. If any of the following or other risks occur, the Company’s business, prospects, financial condition, financial performance and cash flows could be materially adversely impacted. These factors are also currently, and in the future may be, amplified by the COVID-19 pandemic. In that case, the ability of the Company to make distributions to holders of Subordinate Voting Shares could be adversely affected, the trading price of securities of the Company could decline and investors could lose all or part of their investment in such securities. There is no assurance that risk management steps taken will avoid future loss due to the occurrence of the below described or other unforeseen risks.
If Spin Master does not create original, or enhance existing, products, brands and entertainment properties that satisfy consumer preferences, and anticipate, initiate and capitalize on developments in its industry, the Company’s business will suffer.
Spin Master depends on its ability to innovate and sell original products, brands and entertainment properties and to identify changing consumer sentiments and respond to such changes on a timely basis. Spin Master also relies on its ability to identify third-party entertainment media that is likely to be popular with consumers and license rights to such media to incorporate into the Company’s products. Spin Master’s ability to maintain current sales, and increase sales or establish sales with new, innovative products, will depend on its ability to satisfy play preferences, enhance existing products, engineer, develop, introduce and achieve market acceptance of its original products, brands and entertainment properties. If the Company is unable to anticipate consumer preferences, its products, brands and entertainment properties may not be accepted by children, parents, or families, demand for the Company’s products, brands and entertainment properties could decrease and Spin Master’s business, financial condition and performance could be materially and adversely affected.
Spin Master’s business and financial performance depend largely upon the appeal of its products, brands and entertainment properties. Failure to anticipate, identify and react to changes in children’s interests and consumer preferences could significantly lower sales of its products, brands and entertainment properties and harm its revenues and profitability. This challenge is more difficult with the ever increasing utilization of technology and digital media in entertainment offerings, and the increasing breadth of entertainment available to consumers. Evolving consumer tastes and shifting interests, coupled with changing and expanding sources of entertainment and consumer products and properties which compete for children’s and families’ interest and acceptance, create an environment in which some products and properties can fail to achieve consumer acceptance, and other products and properties can be popular during a certain period of time but then be rapidly replaced. The preferences and interests of children and families evolve quickly, can change drastically from year to year and season to season and are difficult to anticipate. Significant, sudden shifts in demand are caused by “hit” toys, technologies and trends, which are often unpredictable. Even the Company’s successful brands and products typically have a relatively short period of high demand followed by a decrease in demand as the product matures or is superseded by newer technologies and / or brands and products. A decline in the popularity of the Company’s existing products, brands and entertainment properties, or the failure of Spin Master’s original products, brands and entertainment properties to achieve and sustain market acceptance with
20
retailers and consumers, could significantly lower the Company’s revenues and operating margins, which would harm Spin Master’s business, financial condition and performance.
The industries in which Spin Master operates are highly competitive and the Company’s inability to compete effectively may materially and adversely impact its business, financial condition and performance.
Spin Master operates in industries characterized by intense competition. The Company competes domestically and internationally with numerous large and small companies that develop, market and sell analog toys and games, products which combine analog and digital play, digital gaming products, and other entertainment and consumer products, as well as with retailers who offer such products under their own private labels often at lower prices. The growing importance of digital media, and the heightened connection between digital media and consumer interest, has further increased the ability for new participants to enter Spin Master’s markets, and has broadened the array of companies Spin Master competes with which can become a significant source of competition for the Company in a very short period of time. In addition to existing customers, low barriers to entry enable new competitors to quickly establish themselves with only a single popular product. New participants with a popular product idea or property can gain access to consumers and become a significant source of competition for the Company. Spin Master’s competitors’ products may achieve greater market acceptance than the Company’s products and, in doing so, may potentially reduce the demand for the Company’s products, brands or properties. Spin Master’s competitors have obtained and are likely to continue to obtain licenses that overlap with the Company’s licenses with respect to products, geographic areas and markets. Spin Master may not be able to obtain adequate shelf space in retail stores to support or expand its brands or products, and the Company may not be able to continue to compete effectively against current and future competitors. These existing and new competitors may be able to respond more rapidly than Spin Master to changes in consumer preferences. Spin Master’s competitors’ products may achieve greater market acceptance than the Company’s products and potentially reduce demand for the Company’s products, lower its revenues and lower its profitability.
Spin Master also faces competition in the entertainment industry. Some of the Company’s competitors in the content market have interests in multiple media businesses which are often vertically integrated. Spin Master’s ability to compete in this market depends on a number of factors, including its ability to develop high quality and popular entertainment content, adapt to new technologies and distribution platforms and achieve widespread distribution.
Some of Spin Master’s competitors have longer operating histories, significantly greater financial, marketing and other resources, greater economies of scale, more long-standing brands and products and greater name recognition. The Company may be unable to compete with them in the future. If Spin Master fails to compete, its business, financial condition and performance could be materially and adversely affected.
Spin Master’s failure to market or advertise products could have a material adverse effect on the Company’s business, financial condition and performance.
Spin Master’s products are marketed worldwide through a diverse spectrum of advertising and promotional programs. The Company’s ability to sell products is largely dependent upon the success of these programs. If Spin Master does not market its products, sales could decline or if media or other advertising or promotional costs increase, Spin Master’s costs could increase, which could have a material adverse effect on the Company’s business, financial condition and performance. Additionally, loss of television or media support related to any of the Company’s products may decrease the number of products it sells and harm its business, financial condition and performance.
Failure to protect or enforce Spin Master’s IP rights and claims by third parties that the Company is infringing their IP rights could materially and adversely affect Spin Master’s business, financial condition and performance.
Spin Master relies on a combination of patents, copyrights, trademarks, trade secrets, confidentiality provisions and licensing arrangements to establish and protect its IP and proprietary rights. Contractual arrangements and other steps the Company has taken to protect its IP may not prevent misappropriation of its IP or deter independent third-party development of similar products. The steps Spin Master has taken may not prevent unauthorized use of its IP, particularly in foreign countries where the Company does not hold patents or trademarks or where the laws may not protect its IP as fully as in North America. Some of Spin Master’s products and product features have limited IP protection, and, as a consequence, the Company may not have the legal right to prevent others from reverse engineering or otherwise copying and using these features in competitive products. Monitoring the unauthorized use of the Company’s IP is costly, and any dispute or other
21
litigation, regardless of the outcome, may be costly and time consuming and may divert the Company’s resources.
Additionally, Spin Master has registered various domain names relating to some of its brands and products. If the Company fails to maintain these registrations, or if a third party acquires domain names similar to the Company’s and engages in a business that may be confusing to the Company’s users and customers, Spin Master’s revenues may decline and it may incur additional expenses in maintaining its brands.
Spin Master periodically receives claims of infringement or otherwise becomes aware of potentially relevant patents, copyrights, trademarks or other IP rights held by other parties. Responding to any infringement claim, regardless of its validity, may be costly and time-consuming and may divert the Company’s resources. If Spin Master or its licensors are found to be infringing on the IP rights of any third-party, Spin Master or its licensors may be required to obtain a license to use those rights, which may not be obtainable on reasonable terms, if at all. The Company also may be subject to significant damages or injunctions against the development and sale of some of its products or against the use of a trademark or copyright in the sale of some of its products. Spin Master’s insurance does not cover all types of IP claims and insurance levels for covered claims may not be adequate to indemnify the Company against all liability, which could materially and adversely harm its business, financial condition and performance.
Spin Master licenses IP rights from third-party owners. Failure of such owners to properly maintain or enforce the IP underlying such licenses could have a material adverse effect on the Company’s business, financial condition and performance. The Company’s licensors may also seek to terminate Spin Master’s license.
Spin Master is a party to a number of licenses that give the Company rights to third-party IP that is necessary or useful to the Company’s business. Spin Master’s success will depend in part on the ability of its licensors to obtain, maintain and enforce its licensed IP, in particular, those IP rights to which the Company has secured exclusive rights. Without protection for the IP Spin Master licenses, other companies might be able to offer substantially identical products for sale, which could have a material adverse effect on the Company’s business, financial condition and performance.
One or more of the Company’s licensors may allege that Spin Master has breached its license agreement with them, and accordingly seek to terminate Spin Master’s license. If successful, this could result in the Company’s loss of the right to use the licensed IP, which could adversely affect the Company’s ability to commercialize its technologies, products or services, as well as have a material adverse effect on its business, financial condition and performance.
The COVID-19 pandemic and actions taken by governments, businesses, and individuals in response to it could adversely affect Spin Master’s business, financial position, sales, and results of operations.
The global COVID-19 pandemic and the actions taken by governments, businesses, and individuals in response to it have resulted in significant global economic disruption, including, but not limited to, temporary business closures, reduced retail traffic, volatility in financial markets, restrictions on travel, and safer-at-home protocols. Such disruptions in the markets in which Spin Master, its employees, consumers, customers, partners, licensees, licensors, suppliers, and manufacturers operate, can have, and at times in the past have had, a significant negative impact on Spin Master’s business, financial position, sales, and results of operations. Negative impacts may result from, among other things:
• declines in net sales as a result of retail store closures (including specialty retailers), limited reopening, evolving stay-at-home protocols, and limitations on the capacity of e-commerce in certain markets;
• disruptions to the design, development, manufacturing, and/or distribution operations of Spin Master and/or its third-party suppliers resulting in limitations on Spin Master’s ability to design, develop, manufacture, and distribute products effectively, efficiently, and in a timely manner;
• delays in entertainment content releases from our licensors, or changes in release plans, that can adversely impact sales of the Company’s products;
• disruptions or restrictions on the ability of Spin Master’s employees, suppliers, and manufacturers to work effectively, including due to illness, quarantines, government actions, and facility closures or other similar restrictions;
• increased operational risks, including increased risks of accounts receivable collection, insolvency of retailers (particularly specialty retailers), delays in payment, and negotiations with third parties over payment terms or the ability to perform under certain contracts or licenses; and
• any currently unforeseen effects of COVID-19.
22
Any one of these factors, or a combination thereof, could impact Spin Master’s ability to meet demand for its products. To the extent any of these disruptions become prolonged or recur, particularly during seasonally high periods of production or distribution, Spin Master’s ability to meet demand may be materially impacted.
Since mid-March 2020, the majority of Spin Master’s workforce has been working remotely. While reopening of some of the Company’s offices has begun on a limited basis, Spin Master continues to actively develop a plan to safely bring additional personnel back to its offices, which will be based on need and governmental, health, and safety guidelines. The Company regularly communicates and engages with its employees to minimize the disruption and stress of working remotely, provide flexibility and ensure that our employees are getting access to information and accommodations as the Company plans for a successful and safe re-entry to the workplace.
The impact of the COVID-19 pandemic continues to be fluid and uncertain, making it difficult to forecast the ultimate impact it could have on Spin Master’s future operations. If Spin Master’s business experiences prolonged occurrence of adverse public health conditions due to COVID-19 or other similar public health incidents, Spin Master’s business, financial position, sales, and results of operations could be materially impacted.
Spin Master may not be able to sustain or manage its growth strategy, which may prevent the Company from increasing its net revenues.
Historically, Spin Master has experienced growth in its product lines which at times has been rapid. The Company’s growth strategy calls for it to continuously develop and diversify its business by introducing original products, innovating and refining its existing product lines and expanding into international markets, entering into additional license agreements, and acquiring other companies, which will place additional demands upon the Company’s management, operational capacity and financial resources and systems. The increased demand upon management may necessitate Spin Master’s recruitment and retention of qualified personnel. This can be particularly difficult when unexpected, significant, sudden shifts in demand are caused by “hit” toys and trends. There can be no assurance that the Company will be able to recruit and retain qualified personnel or expand and manage its operations effectively and profitably. Implementation of Spin Master’s growth strategy is subject to risks beyond its control, including competition, market acceptance of original products, changes in economic conditions, its ability to obtain or renew licenses on commercially reasonable terms and its ability to finance increased levels of accounts receivable and inventory necessary to support its sales growth, if any. Accordingly, there can be no assurance that the Company’s growth strategy will be successful or that it will be able to achieve its targeted future sales growth. The lack of success in the Company’s growth strategy may have a material and adverse effect on its business, financial condition and performance.
Spin Master’s dependence on third-party manufacturers, distributors, distribution centres and logistics service providers presents risks to the Company’s business and exposes it to risks associated with international operations.
A majority of Spin Master’s products are manufactured by third-party manufacturers, most of which are located in Asia and primarily in China, and transported, stored and distributed by third parties on its behalf. The Company’s operations could be adversely affected if the Company lost its relationship with any of its third-party service providers, or if there was any material failure, inadequacy or interruption resulting from its third-party service providers due to factors beyond the Company’s control. Although Spin Master’s external sources of manufacturing and its distribution centres and logistics service providers can be shifted over a period of time to alternative sources, should such changes be necessary, the Company’s operations could be disrupted, potentially for a significant period of time, while alternative sources were secured, and significant capital investments could be required to remediate the problem.
Given that the majority of Spin Master’s products are manufactured by third-party manufacturers, public health crises, such as the COVID-19 pandemic, and other factors affecting social and economic activity where our manufacturers are located may affect the movement of people and products into and from those locations to the Company’s major markets, including North America and Europe. Public health crises, such as the COVID-19 pandemic, impacting the Company’s third-party manufacturers, distributors, distribution centres and logistics service providers had and can have a significant negative impact on Spin Master’s business.
As a result of Spin Master’s dependence on third-party manufacturers, any difficulties encountered by one of the Company’s third-party manufacturers that results in production delays, cost overruns or the inability to fulfill its orders on a timely basis, including political disruptions, labour difficulties and other factors beyond the Company’s control, could adversely affect the Company’s ability to deliver its products to its customers, which in turn could harm the Company’s reputation and adversely affect its business, financial condition and performance. Similarly, Spin Master relies on third-party distribution centres and logistics service providers to transport its products to the markets in which they are sold and on third-party distributors to distribute those
23
products within those markets. Any disruption affecting the ability of the Company’s third-party service providers to timely deliver or distribute its products to its customers could cause delays in product sales, cause customers to cancel orders, have a material adverse effect on Spin Master’s revenue and profitability, and harm its reputation.
Spin Master’s significant use of third-party manufacturers outside of North America also exposes the Company to risks, including:
• currency fluctuations;• limitations on the repatriation of capital;• potential challenges to the Company’s transfer pricing determinations and other aspects of its cross-
border transactions which may impact income tax expense;• political instability, civil unrest and economic instability;• greater difficulty enforcing IP rights and weaker laws protecting such rights;• requirements to comply with different laws in varying jurisdictions, which laws may dictate that certain
practices that are acceptable in some jurisdictions are not acceptable in others, and changes in governmental policies;
• natural disasters and greater difficulty and expense in recovering from them;• difficulties in moving materials and products from one country to another, including port congestion,
strikes and other transportation delays and interruptions;• difficulties in controlling the quality of raw materials and components used to manufacture the
Company’s products, which may lead to public health and other concerns regarding its products;• changes in international labour costs, labour strikes, disruptions or lock-outs; and• the imposition of tariffs or other protectionist measures, or the breakdown of trade relations.
Due to Spin Master’s reliance on international sourcing of manufacturing, its business, financial condition and performance could be significantly and materially harmed if any of the risks described above were to occur.
Spin Master requires its third-party manufacturers and distributors to comply with Spin Master’s code of conduct, which is designed to prevent products manufactured by or for the Company from being produced under inhumane or exploitive conditions. Spin Master’s code of conduct addresses a number of issues, including work hours and compensation, health and safety, and abuse and discrimination. In addition, the Company requires that its products supplied by third-party manufacturers or distributors be produced or distributed in compliance with all applicable laws and regulations, including consumer and product safety laws in the markets where those products are sold. The Company has the right, both directly and through the use of outside monitors, to monitor compliance by its third-party manufacturers and distributors with Spin Master’s code of conduct and other manufacturing requirements. In addition, the Company conducts quality assurance testing on its products, including products manufactured or distributed for the Company by third parties. Notwithstanding these requirements and Spin Master’s monitoring and testing of compliance with them, there remains the risk that one or more of the Company’s third-party manufacturers or distributors will not comply with Spin Master’s requirements and that Spin Master will not immediately discover such non-compliance. Any failure of the Company’s third-party manufacturers or distributors to comply with labour, consumer, product safety or other applicable requirements in manufacturing or distributing products for the Company could result in damage to Spin Master’s reputation, harm sales of its products and potentially create liability for Spin Master and its business, financial condition and performance could be materially and adversely impacted.
Disruptions in Spin Master’s manufacturing operations or supply chain due to political instability, civil unrest or public health crisis have adversely affected and could further adversely affect Spin Master’s business, financial position, sales, and results of operations.
The Company owns, operates and manages manufacturing facilities and utilizes third-party manufacturers and suppliers in China, as well as in Vietnam, India, Mexico, France and the U.S. The risk of political instability and civil unrest in certain of these countries, which could temporarily or permanently damage the manufacturing operations of the Company or its third-party manufacturers. Outbreaks of communicable diseases have also been known to occur in certain of these countries and around the world. For example, the COVID-19 pandemic began in Wuhan, Hubei Province, China, resulting in a global pandemic caused supply chain interruptions for Spin Master, its suppliers and customers that contributed to lower net sales in the first half of 2020 and may cause lower net sales to the extent they remain issues in the future. Other disruptions from public health crises such as these result from, among other things, workers contracting diseases, restrictions on factory openings, restrictions on travel, restrictions on shipping and shopping, and the closure of critical infrastructure. The design, development, manufacture, distribution and sale of the Company’s products has suffered and could further suffer if a significant number of the Company’s employees or the employees of its third-party manufacturers, their suppliers, or of businesses where the Company’s products are sold, contract communicable diseases such as these, or if the Company, the Company’s third-party manufacturers, or their
24
suppliers are adversely affected by other impacts of such diseases. In addition, the contingency plans the Company has developed to help mitigate the impact of disruptions in its operations, have not and may not prevent its business, financial position, sales, and results of operations from being adversely affected by a significant disruption to its operations, suppliers or demand for the Company’s products.
Spin Master’s business is seasonal and therefore its annual financial performance depends, in large part, on its sales relating to the holiday season. As retailers become more efficient in their control of inventory levels and give shorter lead times for production, failures to predict demand and possible transportation, production or other disruptions during peak demand times may affect the Company’s ability to deliver products in time to meet retailer demands.
Seasonality factors cause Spin Master’s operating results to fluctuate significantly from quarter to quarter. A majority of the Company’s sales occur during the third and fourth quarters, with a majority of retail sales occurring during the period from September through December in anticipation of the holiday season. Generally, the first quarter is the period of lowest shipments and revenues in the toy industry and therefore, the least profitable because of certain fixed costs. This seasonality has increased over time, as retailers become more efficient in their control of inventory levels through inventory management techniques. Further, ecommerce continues to grow significantly and accounts for a higher portion of the ultimate sales of the Company’s products to consumers. Ecommerce retailers tend to hold less inventory and take inventory closer to the time of sale to consumers than traditional retailers. Spin Master’s failure to predict levels of consumer demand surrounding the holiday season may result in under-producing popular products and overproducing underperforming items, which, in either case, would adversely affect the Company’s business, financial condition and performance. Spin Master’s results of operations may also fluctuate as a result of factors such as the timing of new products or new products that its competitors introduce in the marketplace, the advertising activities of its competitors and the emergence of new market entrants. In addition, due to the seasonal nature of Spin Master’s business, the Company would be materially and adversely impacted, in a manner disproportionate to the impact on a company with sales spread more evenly throughout the year, by unforeseen events, such as public health crises and pandemics, terrorist attacks, adverse weather conditions or economic shocks that harm the retail environment or consumer buying patterns during the Company’s key selling season, or by events such as strikes, port delays or supply chain interruptions, that interfere with the manufacture or shipment of goods during critical months leading up to the peak purchasing season.
If Spin Master fails to meet transportation schedules, it could damage the Company’s relationships with retailers, increase the Company’s distribution and logistics costs or cause sales opportunities to be delayed or lost. In order to be able to deliver its merchandise on a timely basis, Spin Master needs to maintain adequate inventory levels of the desired products. If the Company’s inventory forecasting and production planning processes result in Spin Master manufacturing inventory in excess of the levels demanded by its customers, the Company could be required to record inventory write-downs for excess and obsolete inventory, which could materially and adversely affect the Company’s financial performance. If the inventory of Spin Master products held by its retailers is too high, they may not place or may reduce orders for additional products, which could unfavourably impact the Company’s future sales and materially and adversely affect its financial performance.
Uncertainty and adverse changes in general economic conditions may negatively affect consumer spending, which could have a material adverse effect on Spin Master’s revenue and profitability.
Current and future conditions in the economy have an inherent degree of uncertainty. As a result, it is difficult to estimate the level of growth or contraction for the economy as a whole. It is even more challenging to estimate growth or contraction in various parts, sectors and regions of the economy, including the many different markets in which Spin Master participates. The Company’s budgeting and forecasting are dependent upon estimates of demand for its products and growth or contraction in the markets it serves. Economic uncertainty complicates reliable estimation of future income and expenditures. Adverse changes may occur as a result of weakening global economic conditions, tightening of consumer credit, falling consumer confidence, increasing unemployment, declining stock markets or other factors affecting economic conditions generally. These changes may negatively affect demand for Spin Master’s products, increase exposure to retailers with whom it does business, increase the cost and decrease the availability of financing to fund Spin Master’s working capital needs, or increase costs associated with manufacturing and distributing products, any of which could have a material and adverse effect on the Company’s revenue and profitability.
Consumer spending habits, including spending on Spin Master products, are affected by, among other things, prevailing economic conditions, levels of employment, fuel prices, salaries and wages, the availability of consumer credit, foreclosures, bankruptcies, falling home prices, consumer confidence and consumer perception of economic conditions. A general economic slowdown in Canada, the U.S. and other parts of the world could decrease demand for the Company’s products which would adversely affect its revenue; an uncertain economic outlook may adversely affect consumer spending habits and customer traffic, which may
25
result in lower revenue. A prolonged global economic downturn could have a material negative impact on the Company’s business, financial condition and performance.
In addition to experiencing potentially lower revenues during times of economic difficulty, in an effort to maintain sales during such times, Spin Master may need to reduce the price of its products, increase promotional spending and/or sales allowances, offer incentives or take other steps to encourage retailer and consumer purchase of its products. Those steps may lower the Company’s net revenues or increase its costs, thereby decreasing its operating margins and lowering its profitability. These challenges can be exacerbated if customers accumulate excess retail inventories over time due to their purchases of Spin Master’s products exceeding sales of those products to ultimate consumers. It can then take the Company significant time, working with retailers, to reduce those excess retail inventories, and in the interim its sales of new products can be negatively impacted.
Spin Master’s sales are concentrated with a small number of retailers that do not make long-term purchase commitments. Consequently, economic difficulties or changes in the purchasing strategies and patterns of those retailers could have a material adverse effect on the Company’s business, financial condition and performance.
A small number of retailers account for a large proportion of Spin Master’s total sales. In 2020, the three largest customers collectively accounted for approximately 50.3% of the Company’s Gross Product Sales. This concentration means that if one or more of Spin Master’s major customers were to experience difficulties in fulfilling their obligations to the Company, cease doing business with the Company, significantly reduce the amount of their purchases from the Company, return substantial amounts of Spin Master’s products, favour its competitors or new entrants or increase their competition with Spin Master by expanding their private label product lines, or seek material financial contributions from the Company towards price reductions at the retail level, the Company’s business, financial condition and performance could suffer. The COVID-19 pandemic has resulted in an increased reliance on Spin Master’s largest customers due to forced or voluntary store closures by its specialty retail customers. In addition, increased concentration among Spin Master’s customers could also negatively impact its ability to negotiate higher sales prices for its products, could result in lower margins and could reduce the number of products the Company would otherwise be able to bring to market. Retailers do not make any long-term commitments to the Company regarding purchase volumes and make all purchases by delivering one-time purchase orders. Any customer could reduce its overall purchases of the Company’s products, reduce the number and variety of the Company’s products that it carries and the shelf space allotted for Spin Master’s products, or otherwise seek to materially change the terms of their business relationship with Spin Master at any time. Any such change could significantly harm the Company’s business, financial condition and performance. Similarly, liquidity problems at one or more of the Company’s key customers could expose the Company to losses from bad debts and negatively impact its business, financial condition and performance. Spin Master’s sales to retailers are typically made on credit without collateral. There is a risk that customers will not pay, or that payment will be delayed, because of bankruptcy or other factors beyond Spin Master’s control, which could increase its exposure to losses from bad debts and increase its cost of sales. In addition, if these or other retailers were to cease doing business as a result of bankruptcy, or significantly reduce the number of stores they operate, it could have a material adverse effect on the Company’s business, financial condition and performance. Spin Master’s credit insurance may not cover all types of claims against customers and insurance levels for covered claims may not be adequate to indemnify the Company against all liability, which could materially and adversely harm the Company’s business, financial condition and performance.
Failure to maintain existing relationships, or to develop new relationships, with inventors and entertainment content collaborators could have a material adverse effect on Spin Master’s business, financial condition and performance.
Spin Master’s relationships with inventors are a critical aspect of the Company’s product development. A significant portion of Spin Master’s product ideas have been sourced from inventors and developed by the Company. If Spin Master fails to maintain existing relationships or to develop new relationships within the inventor community or if the Company experiences an adverse change in the perception of the Company by inventors, Spin Master may receive fewer product concepts from inventors. This would adversely impact Spin Master’s ability to introduce new, innovative brands and products, which in turn would materially and adversely harm its business, financial condition and performance.
Spin Master’s relationships with entertainment collaborators, including writers, content developers, broadcasters and directors, are a critical aspect of the Company’s development of its entertainment properties, brands and content. A portion of Spin Master’s entertainment properties, brands and content have been sourced from external collaborators. If Spin Master fails to maintain existing relationships or to develop new relationships with entertainment collaborators or if the Company experiences an adverse change in the perception of the Company by these entertainment collaborators, Spin Master may receive fewer concepts.
26
This would adversely impact Spin Master’s ability to introduce new entertainment properties, brands and content, which in turn would materially and adversely harm its business, financial condition and performance.
Failure to leverage Spin Master’s portfolio of franchises effectively across entertainment and media platforms, maintain relationships with key television and motion picture studios, and entertainment and media companies could have a material adverse effect on the Company’s business, financial condition and performance.
Complementing Spin Master’s product offerings with entertainment and media initiatives is an integral part of the Company’s growth strategy. Spin Master invests in interactive media and other entertainment initiatives, extending the Company’s brands across multiple platforms. Establishing and maintaining relationships with key broadcasters and motion picture studios, and entertainment and media companies are critical to the successful execution of these initiatives. The Company’s failure to execute effectively on these initiatives could result in its inability to recoup its investment and harm the related toy brands employed in these initiatives. Such failures could have a material adverse effect on the Company’s business, financial condition and performance.
Risks Related to the Entertainment Industry.
The entertainment industry involves a substantial degree of risk. Acceptance of children’s entertainment programming represents a response not only to the production’s artistic components, but also the quality and acceptance of other competing programs released into the marketplace at or near the same time, the availability of alternative forms of children’s entertainment and leisure time activities, general economic conditions, public tastes generally and other intangible factors, all of which could change rapidly or without notice and cannot be predicted with certainty. There is a risk that some or all of Spin Master’s programming will not be purchased or accepted by the public generally, resulting in a portion of costs not being recouped or anticipated direct and indirect profits not being realized, which could have a material and adverse effect on the Company’s business, financial condition and performance. There can be no assurance that revenue from existing or future programming will replace loss of revenue associated with the cancellation or unsuccessful commercialization of any particular production or that Spin Master’s entertainment programming will generate product sales.
The business of producing and distributing television programs is highly competitive. There are numerous suppliers of entertainment content and Spin Master faces intense competition with other producers and distributors, many of whom are substantially larger and have greater resources. Further, vertical integration of the television broadcast industry worldwide and the creation and expansion of new networks, which create a substantial portion of their own programming, has decreased access for programs produced by third-party production companies. The Company competes with other television production companies for ideas and storylines created by third parties as well as for access to animation studios, writers, producers, actors, directors and other personnel required for a production. Spin Master may not be successful in any of these efforts which could have a material and adverse effect on its business, financial condition and performance.
Spin Master also faces competition from both regulated and unregulated players using existing or new technologies and from illegal services. The rapid deployment of new technologies, services and products have reduced the traditional lines between internet and broadcast services and further expanded the competitive landscape. The Company may also be affected by changes in customer discretionary spending patterns, which in turn are dependent on consumer confidence, disposable consumer income and general economic conditions. New or alternative media technologies and business models, such as video-on-demand, subscription-video-on-demand, high-definition television, personal video recorders, mobile television, internet protocol television, over-the-top internet-based video entertainment services, connected televisions, virtual multichannel programming distributors, audio streaming platforms, podcasting and direct-to-home satellite compete for audiences. As well, mobile devices like smartphones and tablets allow consumers to access content anywhere, anytime and are creating consumer demand for mobile, portable or free content. These technologies and business models may increase audience fragmentation. Technological developments may also disrupt traditional distribution platforms by enabling content owners to provide content directly to consumers, thus bypassing traditional content aggregators.
Distributors’ decisions regarding the timing of release and promotional support of Spin Master’s television programs are important in determining the success of these programs. The Company does not ultimately control the timing and manner in which its distributors distribute the Company’s television programs. Any decision by those distributors not to distribute or promote one of Spin Master’s television programs or to promote competitors’ programs to a greater extent than they promote Spin Master’s programs could have a material and adverse effect on the Company’s business, financial condition and performance.
27
Production of film and television programs requires a significant amount of capital. Unforeseen events such as labour disputes, changes related to technology, special effects or other aspects of production, shortage of necessary equipment, or other unforeseen events affecting aspects of production may cause cost overruns and delay or frustrate completion of a production. Although Spin Master has historically completed its productions within budget, there can be no assurance that it will continue to do so. The Company currently maintains insurance policies covering certain of these risks. There can be no assurance that any overrun resulting from any occurrence will be adequately covered or that such insurance and completion bonds will continue to be available or, if available on terms acceptable to Spin Master. In the event of substantial budget overruns, there can be no assurance that such costs will be recouped, which could have a material and adverse effect on the Company’s business, financial condition and performance.
Financial risks exist in productions relating to tax credits. There can be no assurance that industry funding assistance programs and government tax credits which Spin Master may access in Canada and internationally from time to time, including those sponsored by various European, Australian and Canadian governmental agencies, will not be reduced, amended or eliminated or that Spin Master’s production projects will continue to qualify for them. Any change in the policies of those countries in connection with their incentive programs could have a material and adverse effect on the Company’s business, financial condition and performance.
International sales are subject to various risks and failure to implement the international growth strategy could have a material adverse effect on the Company’s business, financial condition and performance.
Spin Master currently relies on international sales of its products and expects to do so to a greater extent in the future as it continues to expand its business. The Company believes that its revenue and financial performance will depend in part upon its ability to increase sales in international markets. Implementation of Spin Master’s international growth strategy is subject to risks beyond its control, and accordingly, there can be no assurance that the Company’s international growth strategy will be successful. The lack of success in the Company’s international growth strategy may have a material and adverse effect on its business, financial condition and performance.
International sales are subject to various risks, including: exposure to currency fluctuations; political and economic instability; increased difficulty of administering business; and the need to comply with a wide variety of international and domestic laws and regulatory requirements. There are a number of risks inherent in the Company’s international activities, including: unexpected changes in Canadian, U.S. or other governmental policies concerning the import and export of goods; services and technology and other regulatory requirements; tariffs and other trade barriers; costs and risks of localizing products for foreign languages; longer accounts receivable payment cycles; limits on repatriation of earnings; the burdens of complying with a wide variety of non-Canadian or U.S. laws; and difficulties supervising and managing local personnel. The financial stability of non-Canadian or U.S. markets could also affect Spin Master’s international sales. In addition, international income may be subject to taxation by more than one jurisdiction, which could also have a material adverse effect on the Company’s financial performance. Such factors may have a material adverse effect on the Company’s revenues and expenses related to international sales and, consequently, business, financial condition and performance.
An increasing portion of Spin Master’s business may come from new and emerging markets, and growing business in new and emerging markets presents additional challenges which could have a material adverse effect on the Company’s business, financial condition and performance.
Spin Master expects an increasing portion of its revenues to come from new and emerging markets, including China and Russia. Operating in new and emerging markets, each with its own unique consumer preferences and business climates, presents additional challenges that Spin Master must meet. In addition, sales and operations in new and emerging markets are subject to other risks associated with international operations. Such risks include, but are not limited to: complications in complying with different laws in varying jurisdictions; dealing with changes in governmental policies and the evolution of laws and regulations that impact Spin Master’s product offerings and related enforcement; difficulties understanding the retail climate, consumer trends, local customs and competitive conditions in foreign markets, which may be quite different from Canada and the U.S.; difficulties in moving materials and products from one country to another, including port congestion, strikes and other transportation delays and interruptions; potential challenges to Spin Master’s transfer pricing determinations and other aspects of its cross border transactions; and the impact of tariffs, quotas, or other protectionist measures. Spin Master’s business, financial condition and performance could be harmed if any of the risks described above are not appropriately managed, or if the Company is otherwise unsuccessful in managing its new and emerging market business.
28
Product recalls, post-manufacture repairs of Spin Master’s products, product liability claims, absence or cost of insurance, and associated costs could harm the Company’s reputation, which could have a material adverse effect on the Company’s business, financial condition and performance.
Spin Master is subject to regulation by Health Canada, the U.S. Consumer Product Safety Commission and regulatory authorities and by similar consumer protection regulatory authorities in other countries in which Spin Master sells its products. These regulatory bodies have the authority to remove from the market, products that are found to be defective and present a substantial hazard or risk of serious injury or death. The Company has experienced, and may in the future experience, issues in relation to products that result in recalls, delays, withdrawals, or post-manufacture repairs or replacements of products.
Individuals have asserted claims, and may in the future assert claims, that they have sustained injuries from the Company’s products, and Spin Master may be subject to lawsuits relating to these claims. There is a risk that these claims or liabilities may exceed, or fall outside of the scope of, Spin Master’s insurance coverage as Spin Master does not maintain separate product recall insurance. The Company has recorded, and in the future may record, charges and incremental costs relating to recalls, withdrawals or replacements of its products, based on the Company’s most recent estimates of retailer inventory returns, consumer product replacement costs, associated legal and other professional fees, and costs associated with advertising and administration of product recalls. As these current and expected future charges are based on estimates, they may increase as a result of numerous factors, many of which are beyond Spin Master’s control, including the amount of products that may be returned by consumers and retailers, the number and type of legal, regulatory, or legislative proceedings relating to product recalls, withdrawals or replacements or product safety proceedings in Canada, the U.S. and elsewhere that may involve the Company, as well as regulatory or judicial orders or decrees in Canada, the U.S. and elsewhere that may require the Company to take certain actions in connection with product recalls.
Moreover, Spin Master may be unable to obtain adequate liability insurance in the future. Any of these issues could result in damage to the Company’s reputation, diversion of development and management resources, reduced sales, and increased costs and could cause the Company’s licensors to terminate or not renew its licenses, any of which could materially and adversely harm its business, financial condition and performance. Product recalls, withdrawals, or replacements may also increase the competition that Spin Master faces. Some competitors may attempt to differentiate themselves by claiming that their products are produced in a manner or geographic area that is insulated from the issues that preceded recalls, withdrawals or replacements of Spin Master’s products. In addition, to the extent that the Company’s competitors choose not to implement enhanced safety and testing protocols comparable to those that the Company and its third-party manufacturers have adopted, such competitors could enjoy a cost advantage that could enable them to offer products at lower prices than Spin Master.
Additionally, product recalls relating to Spin Master’s competitors’ products, post-manufacture repairs of their products and product liability claims against the Company’s competitors may indirectly impact the Company’s product sales even if its products are not subject to the same recalls, repairs or claims.
Unfavourable resolution of litigation matters and disputes, including those arising from recalls, withdrawals or replacements of Spin Master’s products, could have a material adverse effect on the Company’s business, financial condition and performance.
Spin Master is involved from time to time in litigation and disputes, including those arising from recalls, withdrawals or replacements of its products. Since outcomes of regulatory investigations, litigation and arbitration disputes are inherently difficult to predict, there is the risk that an unfavourable outcome in any of these matters could negatively affect the Company’s business, financial condition and performance. Regardless of the outcome, litigation may result in substantial costs and expenses to Spin Master and significantly divert the attention of its management. The Company may not be able to prevail in, or achieve a favourable settlement of, pending litigation. In addition to pending litigation, future litigation, government proceedings, labour disputes or environmental matters could lead to increased costs or interruption of the Company’s normal business operations.
Failure to implement new initiatives or meet product introduction schedules could have a material adverse effect on Spin Master’s business, financial condition and performance.
Spin Master has undertaken, and in the future may undertake, initiatives to increase its efficiency, reduce its costs, improve the execution of its core business, globalize and extend its brands, develop or extend entertainment properties, leverage new trends, create new brands or franchises, offer new innovative products and technologies, enhance product safety, develop its employees, improve productivity, simplify processes, maintain customer service levels, drive sales growth, capitalize on its scale advantage and improve its supply
29
chain. These initiatives involve investment of capital and complex decision-making, as well as extensive and intensive execution, and these initiatives may not succeed or there may be a delay in the anticipated timing of the launch of new initiatives. In addition, Spin Master may anticipate introducing a specific product, product line or brand at a certain time in the future. There is no guarantee that Spin Master will be able to manufacture, source and ship new or continuing products in a timely manner and on a cost-effective basis. The risk is also exacerbated by the increasing sophistication of many of the products the Company is designing, and the brands being developed in terms of combining digital and analog technologies and providing greater innovation and product differentiation. Unforeseen delays or difficulties in the development process or significant increases in the planned cost of development for new products may cause the introduction date for products to be later than anticipated or, in some situations, may cause a product or new product introduction to be discontinued. Failure to implement any of these initiatives, or the delay of the anticipated launch, or the failure of any of these initiatives or launches to produce the results anticipated by management, could have a material adverse effect on the Company’s business, financial condition and performance.
A reduction or interruption in the delivery of raw materials, parts and components from Spin Master’s suppliers or a significant increase in the price of supplies could negatively impact the Company’s profit margins or result in lower sales.
Spin Master’s ability to meet customer demand depends in part on its ability to obtain timely and adequate delivery of materials, parts and components from Spin Master’s suppliers. The Company has experienced shortages in the past, including shortages of raw materials and components, and may encounter these problems in the future. A reduction or interruption in supplies, whether resulting from more stringent regulatory requirements, disruptions in transportation, port delays, labour strikes, lockouts, an outbreak of a severe public health crisis, severe weather due to climate change or otherwise, the occurrence of threat of wars or other conflicts, or a significant increase in the price of one or more supplies, such as fuel and resin (which is a petroleum-based product), could have a material adverse effect on the Company’s business, financial condition and performance. Cost increases, whether resulting from shortages of materials or rising costs of materials, transportation, services or labour, could impact the profit margins on the sale of Spin Master’s products. Due to market conditions, timing of pricing decisions and other factors, the Company may not be able to offset any of these increased costs by adjusting the prices of its products. Increases in prices of the Company’s products could result in lower sales and have a material adverse effect on its financial condition and performance.
Spin Master may not realize the full benefit of its licenses if the licensed material has less market appeal than expected and licenses may not be profitable to the Company if sales revenue from the licensed products are not sufficient to support the minimum guaranteed royalties.
An integral part of Spin Master’s business involves obtaining licenses to produce products utilizing various entertainment brands and content. As a licensee of entertainment-based properties, the Company has no guarantee that a particular brand or property will translate into a successful toy, entertainment brand or other product. Additionally, a successful brand may not continue to be successful or maintain a high level of sales. If Spin Master produces a line of products based on entertainment-based properties, the success of the entertainment series has a critical impact on the level of consumer interest in the associated products being offered by the Company. Spin Master relies on the efforts of third parties, such as licensors, film studios, content producers and distribution channels with whom the Company works, with respect to development of content and timing of media development, release dates and the ultimate consumer interest in and success of these media efforts. Spin Master does not fully control when or if any particular project will be developed or released, and the Company’s licensors, media partners or other third parties may change their plans with respect to projects and release dates or cancel development all together. Lack of control can make it difficult for the Company to successfully develop and market products in conjunction with such entertainment projects, given the lengthy lead times involved in product development and successful marketing efforts. Any delay or cancellation of planned product development work, releases, or media support may decrease the number of products sold by the Company, which could harm its business. If any production or entertainment releases are delayed, due to the COVID-19 pandemic or otherwise, it could adversely affect the Company’s business, financial condition and performance.
The license agreements into which the Company enters usually require it to pay minimum royalty guarantees that may be substantial, and in some cases may be greater than the amount it earns from sales of the licensed brands. This could result in write-offs of significant amounts, which in turn could materially and adversely impact the Company’s financial condition and performance. Acquiring or renewing licenses may require the payment of minimum guaranteed royalties that Spin Master considers to be too high to be profitable, which may result in losing licenses it currently holds when they become renewable under their terms, or missing business opportunities for new licenses. If the Company is unable to acquire or maintain successful licenses on advantageous terms, its business, financial condition and performance may be materially and adversely impacted.
30
Spin Master’s operating procedures and product requirements are subject to change and may increase costs, which may materially and adversely affect its relationship with vendors and make it more difficult for it to produce, purchase and deliver products on a timely basis to meet market demands. Future conditions may require the Company to adopt further changes that may increase its costs and adversely affect the Company’s relationship with vendors.
Spin Master’s operating procedures and requirements for both its own manufacturing facilities and vendors, which are regularly monitored and which are subject to change, including by implementing enhanced testing requirements and standards, impose additional costs on both Spin Master and the vendors from whom it purchases products. These changes may also delay delivery of the Company’s products. Additionally, changes in industry wide product safety guidelines may affect the Company’s ability to sell its inventory and may negatively impact its business. Spin Master’s relationship with existing vendors may be adversely affected as a result of these changes, making it more dependent on a smaller number of vendors. Some vendors may choose not to continue to do business with the Company or not to accommodate the Company’s needs to the extent that they have done so in the past. Due to the seasonal nature of Spin Master’s business and the demands of its customers for deliveries with short lead times, Spin Master depends upon the cooperation of its vendors to meet market demand for its products in a timely manner. Existing and future events may require the Company to impose additional requirements on its vendors that may adversely affect the Company’s relationships with those vendors and its ability to meet market demand in a timely manner which may in turn have a material and adverse effect on the Company’s business, financial condition and performance.
Spin Master may engage in acquisitions, mergers, or dispositions, which may affect the profit, revenues, profit margins or other aspects of its business. Spin Master may not realize the anticipated benefits of future acquisitions, mergers or dispositions to the degree anticipated, or such transactions could have a material adverse impact on the Company’s business, financial condition and performance.
Acquisitions have been a part of Spin Master’s growth and have enabled it to further broaden and diversify its product offerings. The Company expects that in the future it will further expand its operations, brands, and product offerings through the acquisition of additional businesses, products or technologies. However, the Company may not be able to identify suitable acquisition targets or merger partners and the Company’s ability to efficiently integrate large acquisitions may be limited by its lack of experience with them. If Spin Master is able to identify suitable targets or merger partners, it may not be able to acquire these targets on acceptable terms or agree to terms with merger partners. Also, Spin Master may not be able to integrate or profitably manage acquired businesses and may experience substantial expenses, delays or other operational or financial problems associated with the integration of acquired businesses. The Company may also face substantial expenses, delays or other operational or financial problems if it is unable to sustain the distribution channels and other relationships currently in place at an acquired business. The businesses, products, brands or properties the Company acquires may not achieve or maintain popularity with consumers, and other anticipated benefits may not be realized immediately or at all. Further, integration of an acquired business may divert the attention of the Company’s management from its core business. In cases where Spin Master acquires businesses that have key individuals, Spin Master cannot be certain that those persons will continue to work for it after the acquisition or that they will continue to develop popular and profitable products. Loss of such individuals could materially and adversely affect the value of businesses that the Company acquires.
Acquisitions also entail numerous other risks, including but not limited to:
• unanticipated costs and legal liabilities;• adverse effects on the Company’s existing business relationships with its suppliers and customers;• risk of entering markets in which the Company has limited or no prior experience;• amortizing any acquired intangible assets; and• difficulties in maintaining uniform standards, procedures, controls and policies.
Some or all of the foregoing risks could have a material adverse effect on Spin Master’s business, financial condition and performance. In addition, any businesses, products or technologies the Company may acquire may not achieve anticipated revenues or income and the Company may not be able to achieve cost savings and other benefits that it would hope to achieve with an acquisition.
Acquisitions could also consume a substantial portion of Spin Master’s available cash, could result in incurring substantial debt which may not be available on favourable terms, and could result in the Company assuming contingent liabilities. In addition, if the business, product or technologies the Company acquires are unsuccessful it would likely result in the incurrence of a write-down of such acquired assets, that could
31
adversely affect Spin Master’s financial performance. The Company’s failure to manage its acquisition strategy could have a material adverse effect on its business, financial condition and performance.
Consistent with Spin Master’s past practice and in the normal course, the Company may have outstanding non-binding letters of intent and / or conditional agreements or may otherwise be engaged in discussions with respect to possible acquisitions which may or may not be material. However, there can be no assurance that any of these letters, agreements and / or discussions will result in an acquisition and, if they do, what the final terms or timing of any acquisition would be.
If Spin Master fails to maintain an effective system of internal controls, Spin Master may not be able to report its financial results or prevent fraud, which could harm the Company’s financial performance and may cause investors to lose confidence in it.
Spin Master must maintain effective internal financial controls for it to provide reliable and accurate financial reports. The Company’s compliance with the internal control reporting requirements will depend on the effectiveness of its financial reporting and data systems and controls. Spin Master expects these systems and controls to become increasingly complex to the extent that its business grows, including through acquisitions. To effectively manage such growth, the Company will need to continue to improve its operational, financial and management controls and its reporting systems and procedures. These measures may not ensure that Spin Master designs, implements and maintains adequate controls over its financial processes and reporting in the future. Any failure to implement required new or improved controls, or difficulties encountered in their implementation or operation, could harm the Company’s financial performance or cause it to fail to meet its financial reporting obligations. Inferior internal controls could also cause investors to lose confidence in the Company’s reported financial information, which could have a material and adverse effect on the trading price of its stock and its access to capital.
Spin Master is subject to tax and regulatory compliance in all the jurisdictions in which it operates and may be subject to audits from time to time that could result in the assessment of additional taxes, interest and penalties.
Spin Master conducts business globally and is subject to tax and regulatory compliance in the jurisdictions in which it operates. These include those related to collection and payment of value added taxes at appropriate rates and the appropriate application of value added taxes to each of the Company’s products, those designed to ensure that appropriate levels of customs duties are assessed on the importation of its products, as well as transfer pricing and other tax regulations designed to ensure that its intercompany transactions are consummated at prices that have not been manipulated to produce a desired tax result, that appropriate levels of income are reported as earned and that it is taxed appropriately on such transactions. International transfer pricing is a subjective area of taxation and generally involves a significant degree of judgment.
Spin Master may be subject to audits that are at various levels of review, assessment or appeal in a number of jurisdictions involving various aspects of value added taxes, customs duties, transfer pricing, income taxes, withholding taxes, sales and use and other taxes and related interest and penalties in material amounts. The taxation authorities in the jurisdictions where the Company carries on business could challenge the Company’s transfer pricing policies. In some circumstances, additional taxes, interest and penalties may be assessed and deposits required to be paid in order to challenge the assessments. When applicable, the Company reserves in the consolidated financial statements an amount that it believes represents the most likely outcome of the resolution of disputes, but if it is incorrect in its assessment, it may have to pay a different amount which could potentially be material. Ultimate resolution of these matters can take several years, and the outcome is uncertain. If the taxing authorities in any of the jurisdictions in which the Company operates were to successfully challenge its transfer pricing practices or its positions regarding the payment of income taxes, customs duties, value added taxes, withholding taxes, sales and use, and other taxes, it could become subject to higher taxes and its revenue and earnings could be adversely affected.
Significant changes in currency exchange rates could have a material adverse effect on Spin Master’s business, financial condition and performance.
Spin Master’s global operations means business is transacted in many different currencies and financial performance and cash flows are subject to changes in currency exchange rates and regulations. As the Company’s financial results are reported in U.S. dollars, changes in the exchange rate between the U.S. dollar, Canadian dollar, Pound Sterling, Peso and the Euro may have an adverse effect / beneficial impact on the Company’s U.S. dollar results. Furthermore, potential significant revaluation of the Chinese yuan, which may result in an increase in the cost of producing products in China, could negatively affect Spin Master’s business. Government action may restrict the Company’s ability to transfer capital across borders and may also impact the fluctuation of currencies in the countries where the Company conducts business or has invested capital.
32
Significant changes in currency exchange rates and reductions in Spin Master’s ability to transfer capital across borders could have a material adverse effect on its business, financial condition and performance. Currency fluctuations may also adversely affect the Company’s financial performance when it repatriates the funds it receives from these sales or other sources.
Spin Master is subject to various laws and government regulations, which, if violated, could subject Spin Master to sanctions or third-party litigation or, if changed, could lead to increased costs, changes in the Company’s effective tax rate or the interruption of normal business operations that would negatively impact the Company’s business, financial condition and performance.
Spin Master operates in a highly regulated environment in the U.S., Canada and international markets, including its products and the importation and exportation of its products. These policies or regulations may include accounting standards, taxation requirements (including changes in applicable income tax rates, new tax laws, and revised tax law interpretations), product safety and other safety standards, trade restrictions, duties and tariffs (including international trade laws and regulations, export controls, and economic sanctions), and regulations regarding currency and financial matters, anticorruption standards, environmental matters, advertising directed toward children, product content, and privacy and data protection, as well as other administrative and regulatory restrictions. The breakdown of trade relations between the U.S. and a foreign country in which Spin Master has significant manufacturing facilities or other operations, could adversely affect Spin Master’s business, financial condition and results of operations. For example, a change in trade status between the U.S. and a foreign country could result in a substantial increase in the import duty of toys manufactured in that foreign country and imported into the U.S. The U.S. has commenced certain trade actions, including imposing increased tariffs on certain goods imported into the U.S. from China, which has resulted in retaliatory tariffs by China. Any increased trade barriers or restrictions on global trade imposed by the U.S., or further retaliatory trade measures taken by China or other countries in response, could adversely affect Spin Master’s business, financial condition and performance. Given the recent change in the U.S. presidential administration, Spin Master faces uncertainty with respect to U.S. trade policy going forward.
In addition, changes in laws or regulations may lead to increased costs, changes in the Company’s effective tax rate, or the interruption of normal business operations that would materially and adversely impact its business, financial condition and performance. The Company believes that it takes all necessary steps to comply with these laws and regulations, but Spin Master cannot be certain that it is in full compliance or will be in the future. Failure to comply could result in sanctions or delays that could have a negative impact on the Company’s business, financial condition and performance.
Spin Master relies extensively on information technology in its operations, and any material failure in design, inadequacy, interruption, or security breach of that technology could have a material adverse impact on the Company’s business, financial condition and performance.
Spin Master relies extensively on various information technology systems and software applications across its operations to manage many aspects of the business, including product development, management of its supply chain, sale and delivery of its products, financial reporting, collection and storage of data, and various other processes and transactions. Many of these systems are managed by third-party service providers. The Company is critically dependent on the integrity, security and consistent operations of these systems and related back-up systems. These systems are subject to damage or interruption from power outages, computer and telecommunications failures, computer viruses, malware and other security breaches, catastrophic events such as hurricanes, fires, floods, earthquakes, tornadoes, acts of war or terrorism and usage errors by employees or partners. The efficient operation and successful growth of Spin Master’s business depends on these information systems, including its ability to operate them effectively and to select and implement appropriate upgrades or new technologies and systems and adequate disaster recovery systems successfully. The failure of the information systems design, to perform as designed or Spin Master’s failure to implement and operate them effectively could disrupt the Company’s business, require significant capital investments to remediate a problem or subject the Company to liability and could have a material adverse effect on its business, financial condition and performance.
Spin Master’s business could be significantly harmed if its electronic data is compromised.
Spin Master maintains significant amounts of data electronically in locations around the world. This data relates to all aspects of the Company’s business and also contains certain customer and consumer data. The Company maintains systems and processes designed to protect this data, but notwithstanding such protective measures, there is a risk of intrusion or tampering that could compromise the integrity and privacy of this data. In addition, Spin Master provides confidential and proprietary information to its third-party business partners in certain cases where doing so is necessary to conduct the Company’s business. While Spin Master obtains assurances from those parties that they have systems and processes in place to protect such data, and where
33
applicable, that they will take steps to assure the protections of such data by third parties, nonetheless those partners may also be subject to data intrusion or otherwise compromise the protection of such data. While Spin Master and its third-party business partners maintain systems for preventing and detecting a breach of their respective information technology systems, Spin Master and those third parties may be unaware that a breach has occurred, may be unable to detect an ongoing breach or may be delayed in detecting a breach. Spin Master has exposure to similar security risks faced by other large companies that have data stored on their information technology systems. To its knowledge, Spin Master has not experienced any material breach of its cybersecurity systems. If Spin Master’s or any third-party service providers’ systems fail to operate effectively or are damaged, destroyed, or shut down, or there are problems with transitioning to upgraded or replacement systems, or there are security breaches in these systems, any of the aforementioned could occur as a result of natural disasters, software or equipment failures, telecommunications failures, loss or theft of equipment, acts of terrorism, circumvention of security systems, or other cyber-attacks, Spin Master could experience delays or decreases in sales, and reduced efficiency of its operations. Any compromise of the confidential data of Spin Master’s customers, its consumers or itself, or failure to prevent or mitigate the loss of this data could disrupt Spin Master’s operations, damage its reputation, violate applicable laws and regulations and subject the Company to additional costs and liabilities and have a material and adverse impact on its business, financial condition and performance.
The challenge of continuously developing and offering products and entertainment experiences that are sought after by children is compounded by the sophistication of today’s children and the increasing array of technology and entertainment offerings available to them.
Children are increasingly utilizing electronic offerings such as computers, tablet devices and mobile phones and they are expanding their interests to a wider array of innovative, technology-driven entertainment products and digital and social media offerings at younger and younger ages. Spin Master’s products and digital games compete with the offerings of consumer electronics companies, gaming, digital media and social media companies. To meet this challenge, the Company is designing and marketing products and digital games which incorporate increasing technology, seek to combine digital and analog play, and capitalize on evolving play patterns and increased consumption of digital and social media. With the increasing array of competitive entertainment offerings, there is no guarantee that:
• any of Spin Master’s products, brands or entertainment properties will achieve popularity or continue to be popular;
• any property for which Spin Master has a significant license will achieve or sustain popularity;• any new products or product lines Spin Master introduces, or entertainment content that it creates, will
be considered interesting to consumers and achieve an adequate market acceptance; or• any product’s life cycle or sales quantities will be sufficient to permit Spin Master to profitably recover
the development, manufacturing, marketing, royalties (including royalty advances and guarantees) and other costs of producing, marketing and selling the product.
An increasing portion of Spin Master’s business may come from technologically advanced or sophisticated digital and smart technology products, which present additional challenges compared to more traditional toys and games.
Spin Master expects that children will continue to be interested in product offerings incorporating sophisticated technology, such as video games, consumer electronics and social and digital media, at younger and younger ages. Spin Master also expects that parents will seek to enhance child development and learning through digital technologies and analog and technology-based play.
In addition to the risks associated with Spin Master’s more traditional products, sophisticated digital and smart technology products face certain additional risks. Costs associated with designing, developing and producing digital games and technologically advanced or sophisticated products tend to be higher than for many of Spin Master’s more traditional products. Heavy competition in consumer electronics and entertainment products and difficult economic conditions may increase the risk of Spin Master not achieving sales sufficient to recover the increased costs associated with these products. Designing, developing and producing sophisticated digital and smart technology products requires different competencies and may follow longer timelines than traditional toys and games, and any delays in the design, development or production of these products could have a significant impact on Spin Master’s ability to successfully offer such products. In addition, the pace of change in product offerings and consumer tastes in the video games, consumer electronics and social and digital media areas is potentially even greater than for Spin Master’s more traditional products. This pace of change means that the window in which a technologically advanced or sophisticated product can achieve and maintain consumer interest may be shorter than traditional toys and games. These products may also present data security and data privacy risks and be subject to certain laws, government policies or regulations not applicable to more
34
traditional products, such as the U.S. Children’s Online Privacy Protection Act of 1998, the EU General Data Protection Regulation and the California Consumer Protection Act.
The production and sale of private-label toys by the retailers with which Spin Master does business may result in lower purchases of the Spin Master’s branded products by those customers.
In recent years, retailers have been increasing the development of their own private-label products that directly compete with the products of their other suppliers, including children’s entertainment companies. Some of the retailers with whom Spin Master does business sell private-label toys designed, manufactured and branded by the retailers themselves. The Company’s customers may sell their private-label toys at prices lower than comparable toys sold by the Company, and, particularly in the event of strong sales of private-label toys, may elect to reduce their purchases of Spin Master’s branded products. In some cases, retailers who sell these private-label toys are larger than Spin Master and have substantially more resources. An increase in the sale of private-label product by retailers could have a material adverse effect on the Company’s business, financial condition and performance.
Spin Master’s success depends on key personnel and without them the Company may be unable to maintain and expand its business.
Spin Master’s future success depends on the continued contribution of key personnel, including, executives, designers, inventors, technical, sales, marketing and in the entertainment and digital creative centres. The loss of services of any of the Company’s key personnel could harm its business. Recruiting and retaining skilled personnel is costly and highly competitive around the world. If the Company fails to retain, hire, train and integrate qualified employees and contractors, it may not be able to maintain and expand its business.
Natural disasters or other catastrophic events out of Spin Master’s control may damage its operations, facilities or those of its contractors and could materially and adversely affect the Company’s business, financial condition and performance.
A catastrophic event where Spin Master has operations, offices or manufacturing facilities, such as an earthquake, tsunami, flood, typhoon, fire or other natural or manmade disaster, terrorist attacks, wars and other conflicts, or an outbreak of a public health pandemic could disrupt the Company’s operations or those of its contractors and impair production or distribution of its products, damage inventory, interrupt critical functions, or otherwise affect its business negatively, and could materially and adversely affect the Company’s business, financial condition and performance.
Increases in interest rates, the lack of availability of credit and Spin Master’s inability to meet the debt covenant coverage requirements in its credit facility could negatively impact the Company’s ability to conduct its business operations.
Increases in interest rates, both domestically and internationally, could negatively affect Spin Master’s cost of financing its operations and investments. Adverse credit market conditions could limit the Company’s ability to refinance its existing credit facility and raise additional debt that may be needed to fund the Company’s operations. Additionally, Spin Master’s ability to issue or borrow long-term debt and obtain seasonal financing or pay dividends could be adversely affected by factors such as an inability to meet certain debt covenant requirements and ratios. In the past, the Company’s business has required and will continue to require capital expenditures and available resources to finance acquisitions. Accordingly, Spin Master’s ability to maintain its current credit facility and its ability to issue or borrow long-term debt and raise seasonal financing are critical for the success of Spin Master’s business. The Company’s ability to conduct operations could be materially and adversely impacted should these or other adverse conditions affect the Company’s sources of liquidity.
Negative publicity and product reviews may negatively impact Spin Master’s business, financial condition and performance.
There has been a marked increase in the use of social media platforms and similar channels, including weblogs (blogs), social media websites and other forms of Internet-based communications that provide individuals with access to a broad audience of consumers and other interested persons. The availability and impact of information on social media platforms is virtually immediate and the accuracy of such information is not independently verified. The opportunity for dissemination of information, including inaccurate information, is seemingly limitless and readily available. Information concerning Spin Master or one or more of its products or employees may be posted on such platforms at any time. Information posted may be adverse to Spin Master’s interests or may be inaccurate, each of which may harm the Company’s reputation and business. The harm may be immediate without affording Spin Master an opportunity for redress or correction. Ultimately, the risks
35
associated with any such negative publicity or incorrect information cannot be completely eliminated or mitigated and may materially and adversely impact its business, financial condition and performance.
System failures related to the websites that support Spin Master’s internet-related products, applications, services and associated websites could harm the Company’s business.
The websites, applications and services associated with Spin Master’s internet-related products depend upon the reliable performance of their technological infrastructure. Customers could be inconvenienced and the Company’s business may suffer if demand for access to those websites, applications or services exceeds their capacity. Any significant disruption to, or malfunction by, those websites or services, particularly malfunctions related to transaction processing, on those associated websites could result in a loss of potential or existing customers and sales.
Although Spin Master’s systems have been designed to function in the event of outages or catastrophic occurrences, they remain vulnerable to damage or interruption from earthquakes, floods, fires, power loss, telecommunication failures, terrorist attacks, computer viruses, computer denial-of-service attacks, and other events. Some of the Company’s systems are not fully redundant, and its disaster recovery planning is not sufficient for all eventualities. Spin Master’s systems are also subject to break-ins, sabotage, and intentional acts of vandalism. Despite any precautions the Company may take, the occurrence of a natural disaster or other unanticipated problems at the Company’s hosting facilities could result in lengthy interruptions in its services. Spin Master does not carry business interruption insurance sufficient to compensate it for losses that may result from interruptions in its service as a result of system failures. Any unplanned disruption of the Company’s systems could result in material and adverse financial impact on its business, financial condition and performance.
FINANCIAL RISK MANAGEMENT
The Company is exposed to risks of varying degrees of significance which could affect its ability to achieve its strategic objectives for growth. The main objectives of the Company’s risk management process are to ensure that risks are properly identified and that the capital base is adequate in relation to these risks. The principal financial risks to which the Company is exposed are described below.
Foreign currency risk
Due to the nature of the Company’s international operations, it is exposed to foreign currency risk driven by fluctuations in foreign exchange rates. Risk arises because the value of monetary assets, liabilities, revenues and expenditures arising from transactions denominated in foreign currencies may vary due to changes in foreign exchange rates (“transaction exposures”) and because the non-U.S. dollar denominated financial statements of the Company’s subsidiaries may vary on translation into the U.S. dollar presentation currency (“translation exposures”). These exposures could impact the Company’s earnings and cash flows.
The Company uses derivative financial instruments such as foreign exchange forward contracts to manage foreign currency risk.
Interest rate risk
Interest rate risk is the risk that the Company’s financial assets and liabilities will increase or decrease in value due to a change in interest rates. The Company is exposed to interest rate risk as its loan facility bears interest at a variable rate.
Credit risk and Customer Concentration
The Company is dependent on three main retailers with respect to product sales for the majority of its products. These three customers accounted for 50.3% and 48.0% of consolidated Gross Product Sales1 for the years ended December 31, 2020 and 2019 respectively.
As the Company usually grants credit to customers on an unsecured basis, credit risk arises from the possibility that customers may experience financial difficulty and may be unable to fulfill their financial obligations.
36
This risk is managed through the establishment of credit limits and payment terms based on an evaluation of the customer’s financial performance, ability to generate cash, financing availability, and liquidity status. These factors are reviewed at least annually, with more frequent reviews performed as necessary.
In addition, the Company uses a variety of financial arrangements to ensure collectability of trade receivables, including requiring letters of credit, supplier financing programs, cash in advance of shipment and purchase of insurance on trade customer receivables, when available.
RELATED PARTY TRANSACTIONS
The Company periodically engages the services of a law firm whose managing partner is also a member of the Company’s Board of Directors. During the year ended December 31, 2020, the fees for services rendered were approximately $1.6 million (2019 - $0.5 million).
CRITICAL ACCOUNTING ESTIMATES
The Company’s significant accounting policies are described in Note 2 of the Company's audited consolidated financial statements and accompanying notes, which have been prepared in accordance with IFRS. The preparation of financial statements requires management to make estimates, assumptions and judgments that affect the reported amounts of assets and liabilities, related disclosures and the reported amounts of revenues and expenses during the periods covered by the financial statements. Refer to Note 3 of the Company's audited consolidated financial statements for additional information.
The Company has identified the following accounting policies under which significant judgments, estimates and assumptions are made, where actual results may differ from these estimates under different assumptions and conditions and which may materially affect financial results or the financial position in future periods.
Determination of cash‑generating units
A cash‑generating unit ("CGU") is defined as the smallest identifiable group of assets that generates cash inflows that are largely independent of the cash inflows from other assets or groups of assets. Determining the impact of impairment requires significant judgment in identifying which assets or groups of assets constitute CGUs of the Company.
Functional currency
Transactions in foreign currencies are translated to the respective functional currencies of Company entities at foreign exchange rates at the dates of the transactions. Monetary assets and liabilities denominated in foreign currencies at the reporting date are retranslated to the functional currency at the exchange rate at that date.
Determining the appropriate functional currencies for entities in the Company requires analysis of various factors, including the currencies and country‑specific factors that mainly influence sales prices, and the currencies that mainly influence labour, materials, and other costs of providing goods or services.
Useful life of property, plant and equipment and intangible assets with finite useful lives
The Company employs significant estimates to determine the estimated useful lives of property, plant and equipment and intangible assets with finite useful lives, considering industry trends such as technological advancements, past experience, expected use and review of asset lives.
Components of an item of property, plant and equipment may have different useful lives. The Company makes estimates when determining depreciation methods, depreciation rates and asset useful lives, which requires taking into account industry trends and company-specific factors. The Company reviews depreciation methods, useful lives and residual values annually or when circumstances change and adjusts its depreciation methods and assumptions prospectively.
37
Impairment testing of goodwill and indefinite life intangible assets
Goodwill and indefinite life intangible assets are assessed for impairment at least annually, and whenever there is an indication that the asset may be impaired. The Company determines the fair value of its CGU groupings and indefinite life intangible assets using discounted cash flow models corroborated by other valuation techniques. The process of determining these fair values requires the Company to make estimates and assumptions of a long-term nature regarding discount rates, projected revenues, royalty rates and margins, as applicable, derived from past experience, actual operating results and budgets. These estimates and assumptions may change in the future due to uncertain competitive and economic market conditions or changes in business strategies.
Provision for inventories
Inventories are stated at the lower of cost and estimated net realizable value. The Company estimates net realizable value as the amount at which inventories are expected to be sold, taking into consideration fluctuations in retail prices due to seasonality less estimated costs necessary to make the sale. Inventories are written down to net realizable value when the cost of inventories is estimated to be unrecoverable due to obsolescence, damage or declining selling prices.
Sales allowances
A sales allowance is established to reflect amounts for programs which can be contractual or discretionary by nature, and can include negotiated discounts, customer audits, defective products and refund of costs incurred by customers to sell the Company’s products. Contractual allowances are fixed and determinable at the time of sale and are recorded at the time of sales as a reduction to revenue. Discretionary allowances can vary depending on the future outcomes such as customer sales volume, inventory position, product performance at retail, historical performance, market conditions and other considerations. The Company may adjust its estimate of sales allowances when facts and circumstances used in the estimation process change.
Income and other taxes
The calculation of current and deferred income taxes requires the Company to make estimates and assumptions and to exercise judgment regarding the carrying values of assets and liabilities which are subject to accounting estimates inherent in those balances, the interpretation of income tax legislation across various jurisdictions, expectations about future operating results, the timing of reversal of temporary differences and possible audits of income tax filings by tax authorities.
Changes or differences in underlying estimates or assumptions may result in changes to the current or deferred income tax balances on the consolidated statements of financial position and income tax (recovery) expense on the consolidated statements of earnings and comprehensive income.
All income, capital and commodity tax filings are subject to audits and reassessments. Changes in interpretations or judgments may result in a change in the Company’s income, capital or commodity tax provisions in the future. The amount of such a change cannot be reasonably estimated.
FINANCIAL INSTRUMENTS
The Company uses derivative financial instruments such as foreign exchange forward contracts to manage foreign currency risk.
As at December 31, 2020, the Company is committed under outstanding foreign exchange contracts representing a total net purchase commitment of approximately $11.3 million in US$ (2019 - $15.8 million). These foreign exchange contracts have maturity dates varying from January to December 2021. The fair value of these contracts at December 31, 2020 results in an unrealized loss of $7.2 million included in accrued liabilities and an unrealized gain of $3.7 million included in other receivables (2019 - $0.5 million included in accrued liabilities). In 2020, realized losses on the Company’s matured hedges were $2.6 million (2019 - realized gains of $0.6 million) and is included in the consolidated statement of earnings and comprehensive income.
38
DISCLOSURE CONTROLS AND PROCEDURES
The Co-Chief Executive Officers and the Chief Financial Officer (the “Certifying Officers”) have designed, or caused to be designed under their supervision, Disclosure Controls and Procedures (“DC&P”) to provide reasonable assurance that (i) material information relating to the Company is made known to them by others, particularly during the period in which the annual filings are being prepared; and (ii) information required to be disclosed by the Company in its annual filings, interim filings or other reports filed or submitted by it under securities legislation is recorded, processed, summarized and reported within the time periods specified in securities legislation. The Certifying Officers have evaluated, or caused to be evaluated under their supervision, the effectiveness of the Company’s DC&P as at December 31, 2020 and have concluded that the Company's DC&P was effective as at December 31, 2020.
INTERNAL CONTROL OVER FINANCIAL REPORTING
The Certifying Officers have also designed, or caused to be designed under their supervision, Internal Control over Financial Reporting (“ICFR”) to provide reasonable assurance regarding the reliability of financial reporting and the preparation of financial statements for external purposes prepared in accordance with IFRS. The Certifying Officers have used the Internal Control – Integrated Framework (2013 COSO Framework) issued by the Committee of Sponsoring Organizations of the Treadway Commission (“COSO”) to design the Company’s ICFR. The Certifying Officers have evaluated, or caused to be evaluated under their supervision, the effectiveness of the Company’s ICFR as at December 31, 2020 and have concluded that the Company's ICFR was effective as at December 31, 2020.
There have been no changes in the Company’s ICFR during the year ended December 31, 2020 which have materially affected, or are reasonably likely to materially affect, the Company’s ICFR and its disclosure controls and procedures.
LIMITATIONS OF AN INTERNAL CONTROL SYSTEM
The Co-Chief Executive Officers and the Chief Financial Officer believe that any Disclosure Controls and Procedures or ICFR, no matter how well designed and operated, can provide only reasonable, not absolute, assurance that the objectives of the control system are met and that all control issues, including instances of fraud, if any, within the Company have been prevented or detected. Further, the design of a control system must reflect the fact that there are resource constraints, and the benefits of controls must be considered relative to their costs. The design of any system of control is also based in part upon certain assumptions about the likelihood of future events, and there can be no assurance that any design will succeed in achieving its stated goals under all potential (future) conditions.
NON-IFRS FINANCIAL MEASURES
In addition to using financial measures prescribed under IFRS, references are made in this MD&A to “EBITDA”, “Adjusted EBITDA”, “Adjusted EBITDA Margin”, “Adjusted Net Income (Loss)”, “Free Cash Flow”, “Gross Product Sales”, “Constant Currency”, “Sales Allowances”, "Net Sales" and "Adjusted Administrative Expenses" which are non-IFRS financial measures. Non-IFRS financial measures do not have any standardized meaning prescribed by IFRS and are therefore unlikely to be comparable to similar measures presented by other issuers.
EBITDA is calculated as net earnings before finance costs, income tax expense and depreciation and amortization.
Adjusted EBITDA is calculated as EBITDA excluding adjustments that do not necessarily reflect the Company’s underlying financial performance. These adjustments include restructuring expenses, foreign exchange gains or losses, share based compensation expenses, acquisition related contingent consideration, impairment of intangible assets, impairment of property, plant and equipment, legal settlement, transaction costs, bad debt recovery and expense and fair market value adjustments to acquired inventories. Adjusted EBITDA is used by management as a measure of the Company’s profitability.
Adjusted EBITDA Margin is calculated as Adjusted EBITDA divided by Revenue. Management uses Adjusted EBITDA Margin to evaluate the Company’s performance compared to internal targets and to benchmark its performance against key competitors.
39
Adjusted Net Income (Loss) is calculated as net income (loss) excluding adjustments, as defined above, in addition to a one-time income tax recovery and the corresponding impact these items have on income tax expense. Management uses Adjusted Net Income (Loss) to measure the underlying financial performance of the business on a consistent basis over time.
Adjusted Basic EPS is calculated by dividing Adjusted Net Income (Loss) by the weighted average number of shares outstanding during the period. Adjusted Diluted EPS is calculated by dividing Adjusted Net Income (Loss) by the weighted average number of common shares outstanding, assuming the conversion of all dilutive securities were exercised during the period.
Constant Currency represents Revenue and Gross Product Sales results that are presented excluding the impact from changes in foreign currency exchange rates. The current period and prior period results for entities reporting in currencies other than the US dollar are translated using consistent exchange rates, rather than using the actual exchange rate in effect during the respective periods. The difference between the current period and prior period results using the consistent exchange rates reflects the changes in the underlying performance results, excluding the impact from fluctuations in foreign currency exchange rates.
Free Cash Flow is calculated as cash flows provided by/used in operating activities reduced by cash flows used in investing activities and adding back cash used in license, brand and business acquisitions. Management uses the Free Cash Flow metric to analyze the cash flow being generated by the Company’s business. Prior year comparative information has been updated to conform with the current disclosure.
Gross Product Sales represent sales of the Company’s products to customers, excluding the impact of Sales Allowances. As Sales Allowances are generally not associated with individual products, the Company uses changes in Gross Product Sales to provide meaningful comparisons across product category and geographical segment results to highlight trends in Spin Master’s business. For a reconciliation of Gross Product Sales to Revenue, please see the revenue table for the three months and year ended December 31, 2020 as compared to the same period in 2019 in this MD&A.
Sales Allowances represent marketing and sales credits requested by customers relating to factors such as cooperative advertising, contractual discounts, negotiated discounts, customer audits, volume rebates, defective products and costs incurred by customers to sell the Company’s products and are recorded as a reduction to Gross Product Sales. Management uses Sales Allowances to identify and compare the cost of doing business with individual retailers, different geographic markets and amongst various distribution channels.
Net Sales represents Gross Product Sales less Sales Allowances. Management uses Net Sales to evaluate the Company’s total net revenue generating capacity compared to internal targets and as a measure of Company performance.
Adjusted Administrative Expenses is calculated as administrative expenses adjusted for restructuring expenses, share based compensation expenses, impairment of property, plant and equipment, transaction costs and bad debt recovery. Please see the Adjusted Administrative Expenses table for the three months and year ended December 31, 2020 as compared to the same period in 2019 in this MD&A.
Management believes the non-IFRS measures defined above are important supplemental measures of operating performance and highlight trends in the core business that may not otherwise be apparent when relying solely on IFRS financial measures. Management believes that these measures allow for assessment of the Company’s operating performance and financial condition on a basis that is more consistent and comparable between reporting periods. The Company believes that lenders, securities analysts, investors and other interested parties frequently use these non-IFRS financial measures in the evaluation of issuers.
40
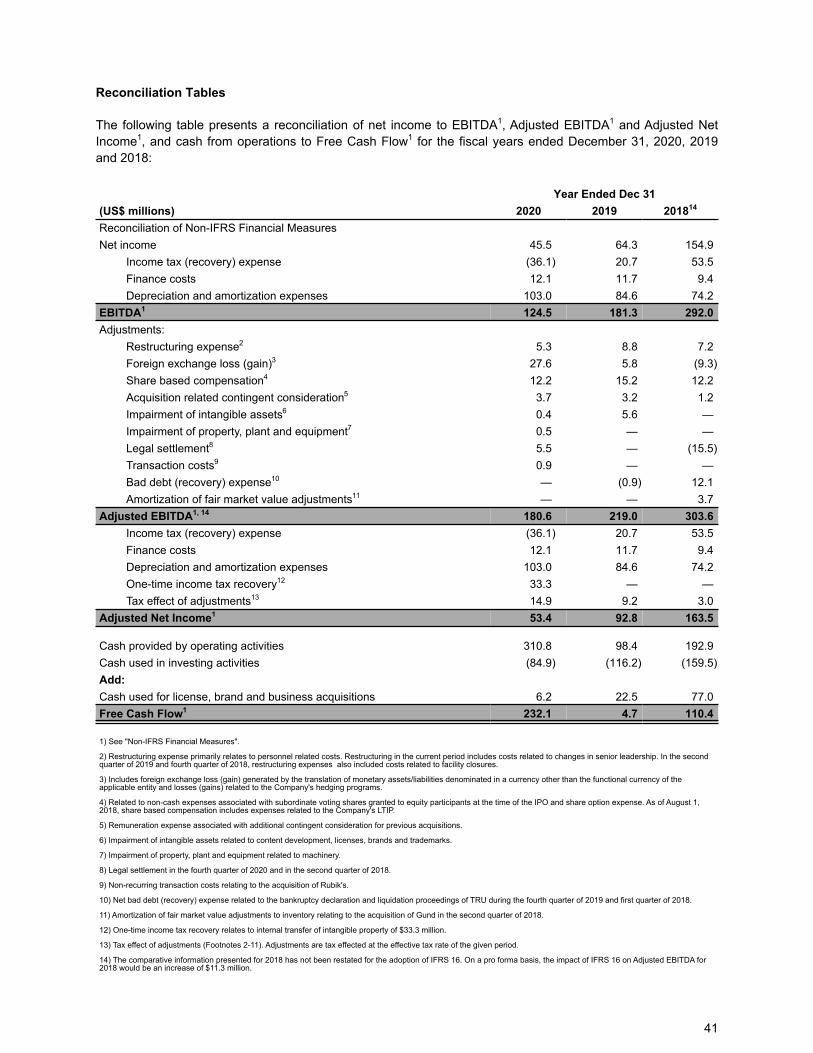
Reconciliation Tables
The following table presents a reconciliation of net income to EBITDA1, Adjusted EBITDA1 and Adjusted Net Income1, and cash from operations to Free Cash Flow1 for the fiscal years ended December 31, 2020, 2019 and 2018:
Year Ended Dec 31(US$ millions) 2020 2019 201814
Reconciliation of Non-IFRS Financial MeasuresNet income 45.5 64.3 154.9
Income tax (recovery) expense (36.1) 20.7 53.5 Finance costs 12.1 11.7 9.4 Depreciation and amortization expenses 103.0 84.6 74.2
EBITDA1 124.5 181.3 292.0 Adjustments:
Restructuring expense2 5.3 8.8 7.2 Foreign exchange loss (gain)3 27.6 5.8 (9.3) Share based compensation4 12.2 15.2 12.2 Acquisition related contingent consideration5 3.7 3.2 1.2 Impairment of intangible assets6 0.4 5.6 — Impairment of property, plant and equipment7 0.5 — — Legal settlement8 5.5 — (15.5) Transaction costs9 0.9 — — Bad debt (recovery) expense10 — (0.9) 12.1 Amortization of fair market value adjustments11 — — 3.7
Adjusted EBITDA1, 14 180.6 219.0 303.6 Income tax (recovery) expense (36.1) 20.7 53.5 Finance costs 12.1 11.7 9.4 Depreciation and amortization expenses 103.0 84.6 74.2 One-time income tax recovery12 33.3 — — Tax effect of adjustments13 14.9 9.2 3.0
Adjusted Net Income1 53.4 92.8 163.5
Cash provided by operating activities 310.8 98.4 192.9 Cash used in investing activities (84.9) (116.2) (159.5) Add:Cash used for license, brand and business acquisitions 6.2 22.5 77.0 Free Cash Flow1 232.1 4.7 110.4
1) See "Non-IFRS Financial Measures".
2) Restructuring expense primarily relates to personnel related costs. Restructuring in the current period includes costs related to changes in senior leadership. In the second quarter of 2019 and fourth quarter of 2018, restructuring expenses also included costs related to facility closures.
3) Includes foreign exchange loss (gain) generated by the translation of monetary assets/liabilities denominated in a currency other than the functional currency of the applicable entity and losses (gains) related to the Company's hedging programs.
4) Related to non-cash expenses associated with subordinate voting shares granted to equity participants at the time of the IPO and share option expense. As of August 1, 2018, share based compensation includes expenses related to the Company's LTIP.
5) Remuneration expense associated with additional contingent consideration for previous acquisitions.
6) Impairment of intangible assets related to content development, licenses, brands and trademarks.
7) Impairment of property, plant and equipment related to machinery.
8) Legal settlement in the fourth quarter of 2020 and in the second quarter of 2018.
9) Non-recurring transaction costs relating to the acquisition of Rubik's.
10) Net bad debt (recovery) expense related to the bankruptcy declaration and liquidation proceedings of TRU during the fourth quarter of 2019 and first quarter of 2018.
11) Amortization of fair market value adjustments to inventory relating to the acquisition of Gund in the second quarter of 2018.
12) One-time income tax recovery relates to internal transfer of intangible property of $33.3 million.
13) Tax effect of adjustments (Footnotes 2-11). Adjustments are tax effected at the effective tax rate of the given period.
14) The comparative information presented for 2018 has not been restated for the adoption of IFRS 16. On a pro forma basis, the impact of IFRS 16 on Adjusted EBITDA for 2018 would be an increase of $11.3 million.
41
FORWARD‑LOOKING STATEMENTS
Certain statements, other than statements of historical fact, contained in this MD&A constitute “forward-looking information” within the meaning of certain securities laws, including the Securities Act (Ontario), and are based on expectations, estimates and projections as of the date on which the statements are made in this MD&A. The words “plans”, “expects”, “projected”, “estimated”, “forecasts”, “anticipates”, “indicative”, “intend”, “guidance”, “outlook”, “potential”, “prospects”, “seek”, “strategy”, “targets” or “believes”, or variations of such words and phrases or statements that certain future conditions, actions, events or results “will”, “may”, “could”, “would”, “should”, “might” or “can”, or negative versions thereof, “be taken”, “occur”, “continue” or “be achieved”, and other similar expressions, identify statements containing forward-looking information. Statements of forward-looking information in this MD&A include, without limitation, statements with respect to: the Company’s outlook for 2021 (see “Outlook”); future growth expectations in 2021 and beyond; financial position, cash flows and financial performance; drivers for such growth; the resolution of logistics problems; the program to achieve operational efficiencies supports the growth of the Company's global platform; the successful execution of its strategies for growth; the impacts of the COVID-19 pandemic on the Company; and consumer demand and the seasonality of financial results and performance.
Forward-looking statements are necessarily based upon management’s perceptions of historical trends, current conditions and expected future developments, as well as a number of specific factors and assumptions that, while considered reasonable by management as of the date on which the statements are made in this MD&A, are inherently subject to significant business, economic and competitive uncertainties and contingencies which could result in the forward-looking statements ultimately being incorrect. In addition to any factors and assumptions set forth above in this MD&A, the material factors and assumptions used to develop the forward-looking information include, but are not limited to: the ability of factories to manufacture products, including labour size and allocation, tooling, raw material and component availability, ability to shift between product mix, and customer acceptance of delayed delivery dates; that the program designed to gain operational efficiencies will achieve the desired results; the expanded use of advanced technology, robotics and innovation the Company applies to its products will have a level of success consistent with its past experiences; the Company will continue to successfully secure broader licenses from third parties for major entertainment properties consistent with past practices; the expansion of sales and marketing offices in new markets will increase the sales of products in that territory; the Company will be able to successfully identify and integrate strategic acquisition opportunities; the Company will be able to maintain its distribution capabilities; the Company will be able to leverage its global platform to grow sales from acquired brands; the Company will be able to recognize and capitalize on opportunities earlier than its competitors; the Company will be able to continue to build and maintain strong, collaborative relationships; the Company will maintain its status as a preferred collaborator; the culture and business structure of the Company will support its growth; the current business strategies of the Company will continue to be desirable on an international platform; the Company will be able to expand its portfolio of owned branded intellectual property and successfully license it to third parties; use of advanced technology and robotics in the Company’s products will expand; access of entertainment content on mobile platforms will expand; fragmentation of the market will continue to create acquisition opportunities; the Company will be able to maintain its relationships with its employees, suppliers and retailers; the Company will continue to attract qualified personnel to support its development requirements; and the Company's key personnel will continue to be involved in the Company products and entertainment properties will be launched as scheduled and that the risk factors noted in this MD&A, collectively, do not have a material impact on the Company.
By its nature, forward-looking information is subject to inherent risks and uncertainties that may be general or specific and which give rise to the possibility that expectations, forecasts, predictions, projections or conclusions will not prove to be accurate, that assumptions may not be correct and that objectives, strategic goals and priorities will not be achieved. Known and unknown risk factors, many of which are beyond the control of the Company, could cause actual results to differ materially from the forward-looking information in this MD&A. Such risks and uncertainties include, without limitation, the magnitude and length of economic disruption as a result of the COVID-19 pandemic; and the factors discussed in the Company's disclosure materials, including the Annual MD&A and the Company's most recent AIF, filed with the securities regulatory authorities in Canada and available under the Company's profile on SEDAR (www.sedar.com). These risk factors are not intended to represent a complete list of the factors that could affect the Company and investors are cautioned to consider these and other factors, uncertainties and potential events carefully and not to put undue reliance on forward-looking statements.
There can be no assurance that forward-looking statements will prove to be accurate, as actual results and future events could differ materially from those anticipated in such statements. Forward-looking statements are provided for the purpose of providing information about management’s expectations and plans relating to the
42

future. The Company disclaims any intention or obligation to update or revise any forward-looking statements whether as a result of new information, future events or otherwise, or to explain any material difference between subsequent actual events and such forward-looking statements, except to the extent required by applicable law.
43
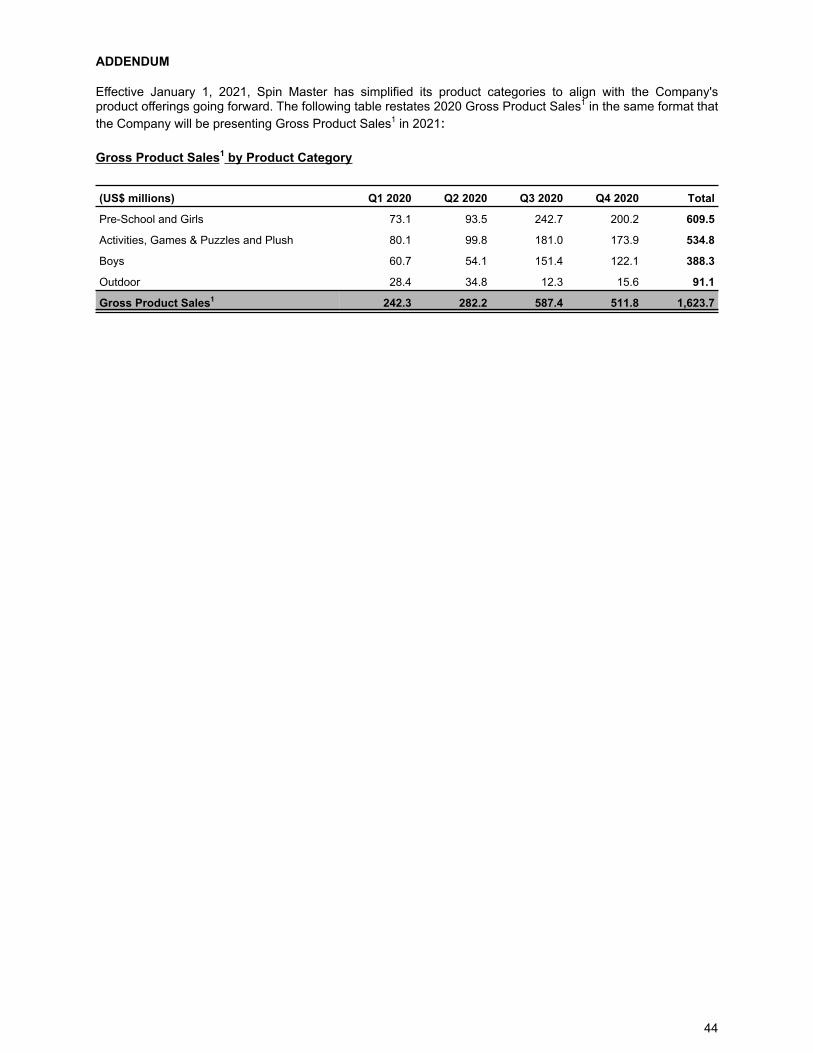
ADDENDUM
Effective January 1, 2021, Spin Master has simplified its product categories to align with the Company's product offerings going forward. The following table restates 2020 Gross Product Sales1 in the same format that the Company will be presenting Gross Product Sales1 in 2021:
Gross Product Sales1 by Product Category
(US$ millions) Q1 2020 Q2 2020 Q3 2020 Q4 2020 Total
Pre-School and Girls 73.1 93.5 242.7 200.2 609.5
Activities, Games & Puzzles and Plush 80.1 99.8 181.0 173.9 534.8
Boys 60.7 54.1 151.4 122.1 388.3
Outdoor 28.4 34.8 12.3 15.6 91.1
Gross Product Sales1 242.3 282.2 587.4 511.8 1,623.7
44
Spin Master Corp.Annual consolidated financial statements
For the years ended December 31, 2020 and December 31, 2019
Deloitte LLP Bay Adelaide East 8 Adelaide Street West Suite 200 Toronto ON M5H 0A9 Canada Tel: 416-601-6150 Fax: 416-601-6151 www.deloitte.ca
Independent Auditor’s Report
To the Shareholders of Spin Master Corp.
Opinion We have audited the consolidated financial statements of Spin Master Corp. (the “Company”), which comprise the consolidated statements of financial position as at December 31, 2020 and 2019, and the consolidated statements of earnings and comprehensive income, consolidated statements of changes in shareholders’ equity and consolidated statements of cash flows for the years then ended, and notes to the consolidated financial statements, including a summary of significant accounting policies (collectively referred to as the “financial statements”).
In our opinion, the accompanying financial statements present fairly, in all material respects, the financial position of the Company as at December 31, 2020 and 2019, and its financial performance and its cash flows for the years then ended in accordance with International Financial Reporting Standards (“IFRS”).
Basis for Opinion We conducted our audit in accordance with Canadian generally accepted auditing standards (“Canadian GAAS”). Our responsibilities under those standards are further described in the Auditor’s Responsibilities for the Audit of the Financial Statements section of our report. We are independent of the Company in accordance with the ethical requirements that are relevant to our audit of the financial statements in Canada, and we have fulfilled our other ethical responsibilities in accordance with these requirements. We believe that the audit evidence we have obtained is sufficient and appropriate to provide a basis for our opinion.
Key Audit Matter A key audit matter is a matter that, in our professional judgment, was of most significance in our audit of the financial statements for the year ended December 31, 2020. This matter was addressed in the context of our audit of the financial statements as a whole, and in forming our opinion thereon, and we do not provide a separate opinion on this matter.
Provisions for sales allowances - Refer to Notes 2F, 3D and 10 to the financial statements Key Audit Matter Description The Company routinely enters into arrangements with its customers to provide sales incentives, support customer promotional activities and provide compensation for defective merchandise. Such arrangements are considered variable consideration for revenue recognition purposes, and the Company uses the expected value method to quantify the variable consideration. A sales allowance is established to reflect amounts for programs which can be contractual or discretionary by nature. Contractual allowances are fixed and determinable at the time of sale, which do not require management to make significant judgments. The determination of the provisions for discretionary sales allowances are impacted by various current and forward-looking factors including customer sales volumes, channel inventory positions, product performance at retail, historical performance, market conditions and other considerations.
Given the significant judgments made by management to estimate the provisions for discretionary sales allowances, performing audit procedures to evaluate their reasonableness required a high degree of auditor judgment and an increased extent of audit effort.
How the Key Audit Matter Was Addressed in the Audit Our audit procedures related to the determination of the provisions for discretionary sales allowances included the following procedures, among others:
• Evaluated management’s methods around the development of the provisions for discretionary sales allowances.
• Evaluated the reasonableness of the assumptions used by management to develop the provisions for discretionary sales allowances, including assessing the completeness and appropriateness of information considered by management.
• Tested the underlying inputs used in the determination of the provisions for discretionary sales allowances.
• Assessed management’s historical ability to estimate the provisions for discretionary sales allowances by comparing the prior year estimated amounts to actual allowances utilized in the current year.
• Evaluated the reasonableness of the provisions for discretionary sales allowances by comparing a sample to the actual results of transactions occurring after year end.
Other Information Management is responsible for the other information. The other information comprises: • Management’s Discussion and Analysis
• The information, other than the financial statements and our auditor’s report thereon, in the Annual Report
Our opinion on the financial statements does not cover the other information and we do not and will not express any form of assurance conclusion thereon. In connection with our audit of the financial statements, our responsibility is to read the other information identified above and, in doing so, consider whether the other information is materially inconsistent with the financial statements or our knowledge obtained in the audit, or otherwise appears to be materially misstated.
We obtained Management’s Discussion and Analysis prior to the date of this auditor’s report. If, based on the work we have performed on this other information, we conclude that there is a material misstatement of this other information, we are required to report that fact in this auditor’s report. We have nothing to report in this regard.
The Annual Report is expected to be made available to us after the date of the auditor’s report. If, based on the work we will perform on this other information, we conclude that there is a material misstatement of this other information, we are required to report that fact to those charged with governance.
Responsibilities of Management and Those Charged with Governance for the Financial Statements Management is responsible for the preparation and fair presentation of the financial statements in accordance with IFRS, and for such internal control as management determines is necessary to enable the preparation of financial statements that are free from material misstatement, whether due to fraud or error.
In preparing the financial statements, management is responsible for assessing the Company’s ability to continue as a going concern, disclosing, as applicable, matters related to going concern and using the going concern basis of accounting unless management either intends to liquidate the Company or to cease operations, or has no realistic alternative but to do so.
Those charged with governance are responsible for overseeing the Company’s financial reporting process.
Auditor’s Responsibilities for the Audit of the Financial Statements Our objectives are to obtain reasonable assurance about whether the financial statements as a whole are free from material misstatement, whether due to fraud or error, and to issue an auditor’s report that includes our opinion. Reasonable assurance is a high level of assurance, but is not a guarantee that an audit conducted in accordance with Canadian GAAS will always detect a material misstatement when it exists. Misstatements can arise from fraud or error and are considered material if, individually or in the aggregate, they could reasonably be expected to influence the economic decisions of users taken on the basis of these financial statements.
As part of an audit in accordance with Canadian GAAS, we exercise professional judgment and maintain professional skepticism throughout the audit. We also:
• Identify and assess the risks of material misstatement of the financial statements, whether due to fraud or error, design and perform audit procedures responsive to those risks, and obtain audit evidence that is sufficient and appropriate to provide a basis for our opinion. The risk of not detecting a material misstatement resulting from fraud is higher than for one resulting from error, as fraud may involve collusion, forgery, intentional omissions, misrepresentations, or the override of internal control.
• Obtain an understanding of internal control relevant to the audit in order to design audit procedures that are appropriate in the circumstances, but not for the purpose of expressing an opinion on the effectiveness of the Company’s internal control.
• Evaluate the appropriateness of accounting policies used and the reasonableness of accounting estimates and related disclosures made by management.
• Conclude on the appropriateness of management’s use of the going concern basis of accounting and, based on the audit evidence obtained, whether a material uncertainty exists related to events or conditions that may cast significant doubt on the Company’s ability to continue as a going concern. If we conclude that a material uncertainty exists, we are required to draw attention in our auditor’s report to the related disclosures in the financial statements or, if such disclosures are inadequate, to modify our opinion. Our conclusions are based on the audit evidence obtained up to the date of our auditor’s report. However, future events or conditions may cause the Company to cease to continue as a going concern.
• Evaluate the overall presentation, structure and content of the financial statements, including the disclosures, and whether the financial statements represent the underlying transactions and events in a manner that achieves fair presentation.
• Obtain sufficient appropriate audit evidence regarding the financial information of the entities or business activities within the Company to express an opinion on the financial statements. We are responsible for the direction, supervision and performance of the group audit. We remain solely responsible for our audit opinion.
We communicate with those charged with governance regarding, among other matters, the planned scope and timing of the audit and significant audit findings, including any significant deficiencies in internal control that we identify during our audit.
We also provide those charged with governance with a statement that we have complied with relevant ethical requirements regarding independence, and to communicate with them all relationships and other matters that may reasonably be thought to bear on our independence, and where applicable, related safeguards.
From the matters communicated with those charged with governance, we determine those matters that were of most significance in the audit of the financial statements of the current period and are therefore the key audit matters. We describe these matters in our auditor's report unless law or regulation precludes public disclosure about the matter or when, in extremely rare circumstances, we determine that a matter should not be communicated in our report because the adverse consequences of doing so would reasonably be expected to outweigh the public interest benefits of such communication.
The engagement partner on the audit resulting in this independent auditor’s report is Steve Lawrenson.
Chartered Professional Accountants Licensed Public Accountants March 1, 2021
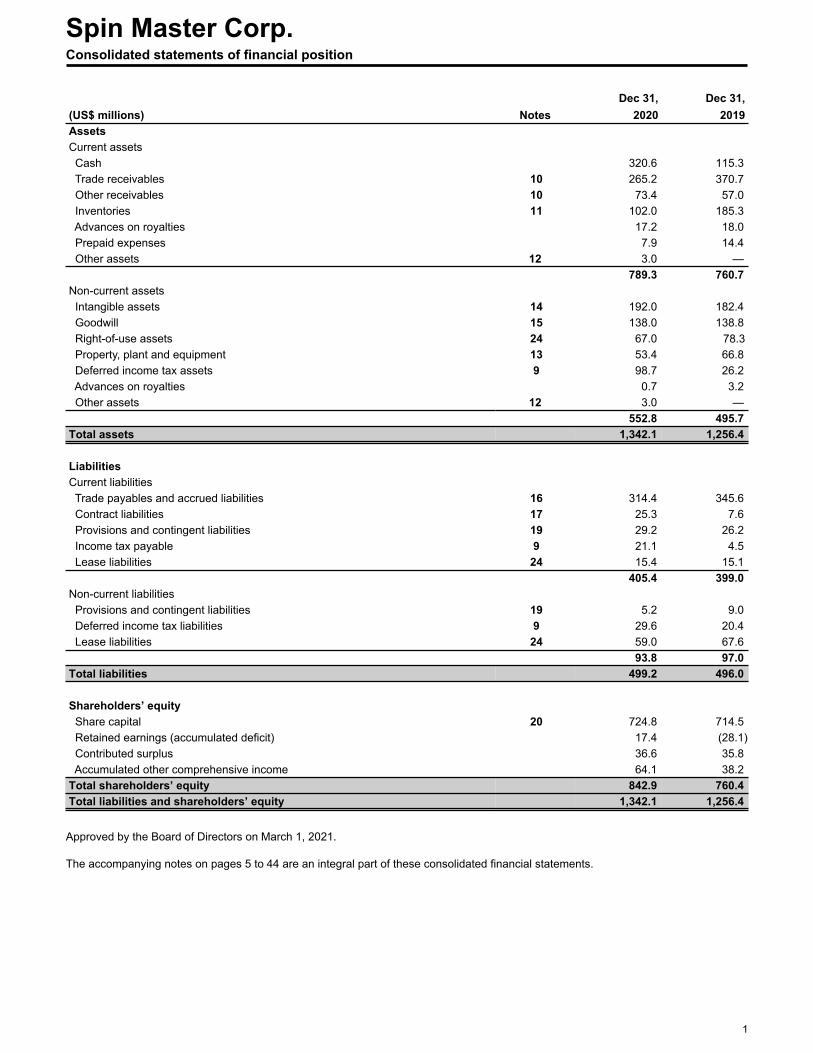
Dec 31, Dec 31,(US$ millions) Notes 2020 2019Assets Current assets Cash 320.6 115.3 Trade receivables 10 265.2 370.7 Other receivables 10 73.4 57.0 Inventories 11 102.0 185.3 Advances on royalties 17.2 18.0 Prepaid expenses 7.9 14.4 Other assets 12 3.0 —
789.3 760.7 Non-current assets Intangible assets 14 192.0 182.4 Goodwill 15 138.0 138.8 Right-of-use assets 24 67.0 78.3 Property, plant and equipment 13 53.4 66.8 Deferred income tax assets 9 98.7 26.2 Advances on royalties 0.7 3.2 Other assets 12 3.0 —
552.8 495.7 Total assets 1,342.1 1,256.4 Liabilities Current liabilities Trade payables and accrued liabilities 16 314.4 345.6 Contract liabilities 17 25.3 7.6 Provisions and contingent liabilities 19 29.2 26.2 Income tax payable 9 21.1 4.5 Lease liabilities 24 15.4 15.1
405.4 399.0 Non-current liabilities Provisions and contingent liabilities 19 5.2 9.0 Deferred income tax liabilities 9 29.6 20.4 Lease liabilities 24 59.0 67.6
93.8 97.0 Total liabilities 499.2 496.0 Shareholders’ equity Share capital 20 724.8 714.5 Retained earnings (accumulated deficit) 17.4 (28.1) Contributed surplus 36.6 35.8 Accumulated other comprehensive income 64.1 38.2 Total shareholders’ equity 842.9 760.4 Total liabilities and shareholders’ equity 1,342.1 1,256.4
Approved by the Board of Directors on March 1, 2021.
The accompanying notes on pages 5 to 44 are an integral part of these consolidated financial statements.
Spin Master Corp.Consolidated statements of financial position
1
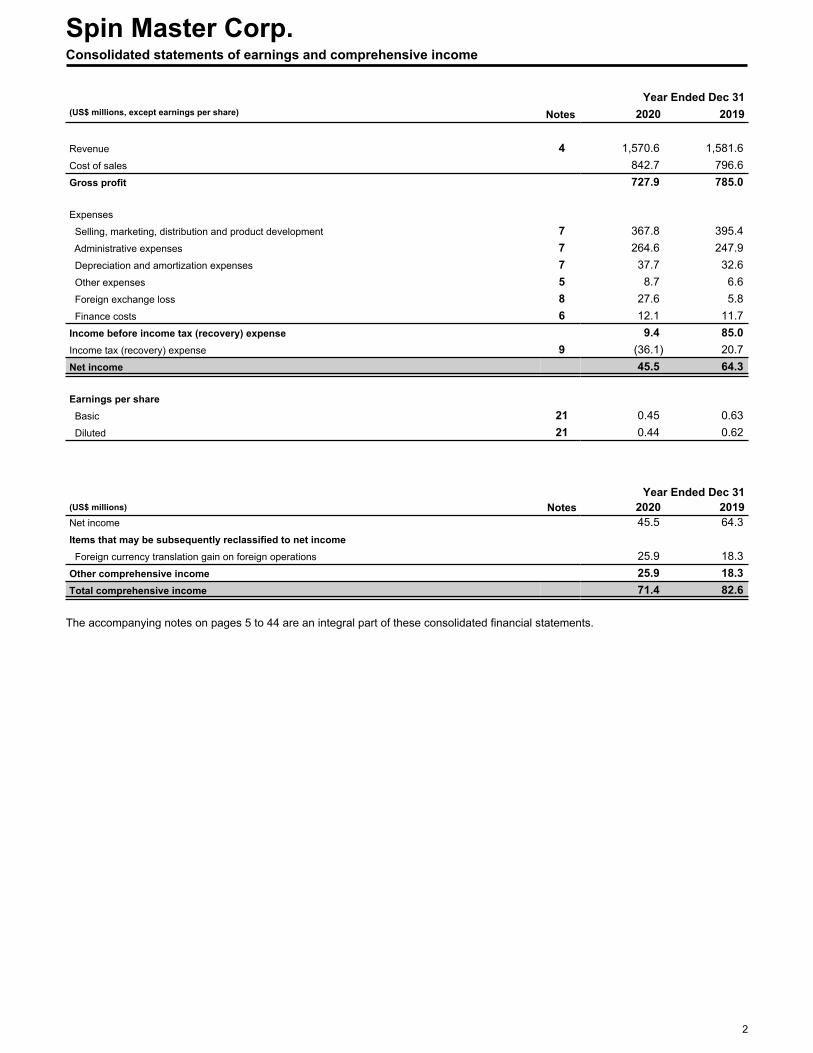
Year Ended Dec 31(US$ millions, except earnings per share) Notes 2020 2019
Revenue 4 1,570.6 1,581.6 Cost of sales 842.7 796.6 Gross profit 727.9 785.0
Expenses
Selling, marketing, distribution and product development 7 367.8 395.4 Administrative expenses 7 264.6 247.9 Depreciation and amortization expenses 7 37.7 32.6 Other expenses 5 8.7 6.6 Foreign exchange loss 8 27.6 5.8 Finance costs 6 12.1 11.7 Income before income tax (recovery) expense 9.4 85.0 Income tax (recovery) expense 9 (36.1) 20.7 Net income 45.5 64.3
Earnings per share Basic 21 0.45 0.63 Diluted 21 0.44 0.62
Year Ended Dec 31(US$ millions) Notes 2020 2019Net income 45.5 64.3 Items that may be subsequently reclassified to net income Foreign currency translation gain on foreign operations 25.9 18.3 Other comprehensive income 25.9 18.3 Total comprehensive income 71.4 82.6
The accompanying notes on pages 5 to 44 are an integral part of these consolidated financial statements.
Spin Master Corp.Consolidated statements of earnings and comprehensive income
2
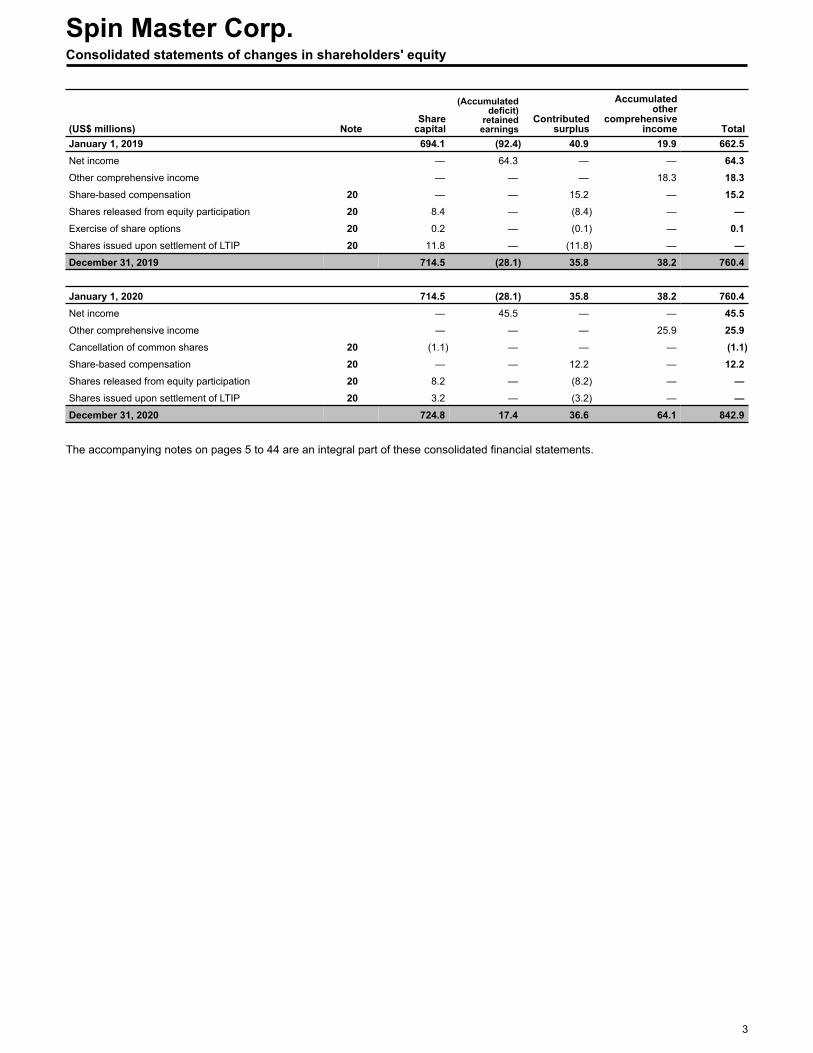
(US$ millions) NoteShare
capital
(Accumulated deficit)
retained earnings
Contributed surplus
Accumulated other
comprehensive income Total
January 1, 2019 694.1 (92.4) 40.9 19.9 662.5 Net income — 64.3 — — 64.3 Other comprehensive income — — — 18.3 18.3 Share-based compensation 20 — — 15.2 — 15.2 Shares released from equity participation 20 8.4 — (8.4) — — Exercise of share options 20 0.2 — (0.1) — 0.1 Shares issued upon settlement of LTIP 20 11.8 — (11.8) — — December 31, 2019 714.5 (28.1) 35.8 38.2 760.4
January 1, 2020 714.5 (28.1) 35.8 38.2 760.4 Net income — 45.5 — — 45.5 Other comprehensive income — — — 25.9 25.9 Cancellation of common shares 20 (1.1) — — — (1.1) Share-based compensation 20 — — 12.2 — 12.2 Shares released from equity participation 20 8.2 — (8.2) — — Shares issued upon settlement of LTIP 20 3.2 — (3.2) — — December 31, 2020 724.8 17.4 36.6 64.1 842.9
The accompanying notes on pages 5 to 44 are an integral part of these consolidated financial statements.
Spin Master Corp.Consolidated statements of changes in shareholders' equity
3
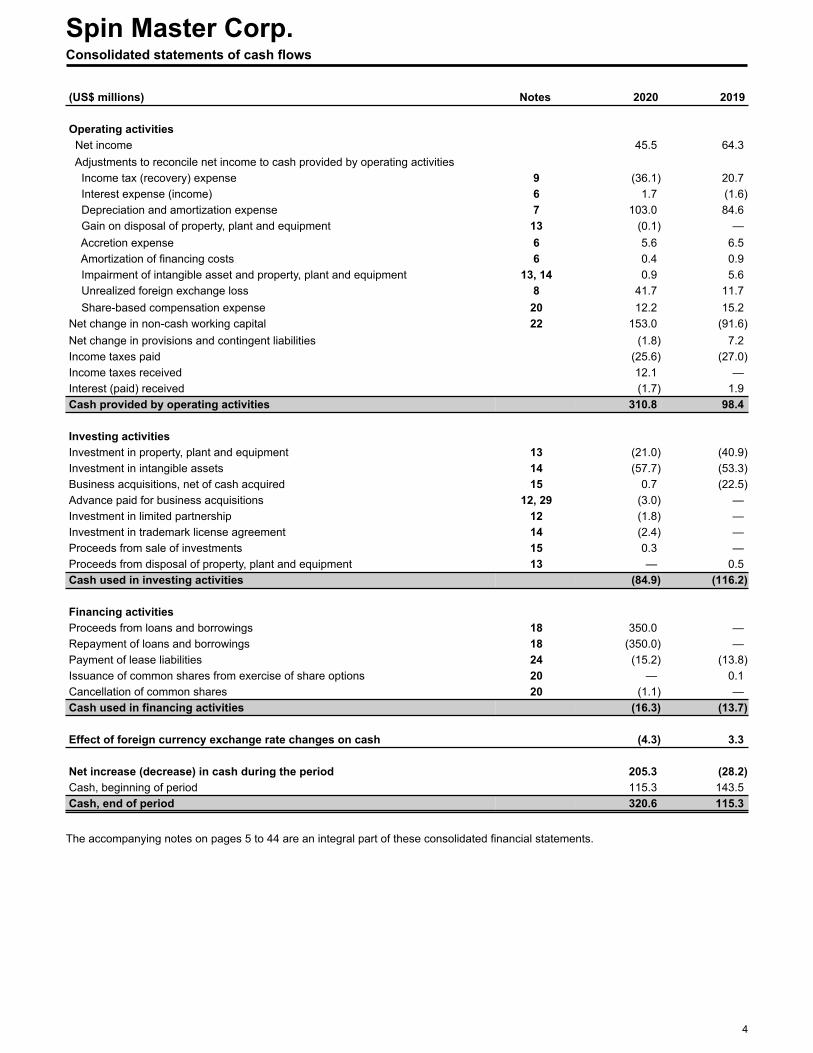
(US$ millions) Notes 2020 2019
Operating activities Net income 45.5 64.3 Adjustments to reconcile net income to cash provided by operating activities
Income tax (recovery) expense 9 (36.1) 20.7 Interest expense (income) 6 1.7 (1.6) Depreciation and amortization expense 7 103.0 84.6 Gain on disposal of property, plant and equipment 13 (0.1) — Accretion expense 6 5.6 6.5 Amortization of financing costs 6 0.4 0.9 Impairment of intangible asset and property, plant and equipment 13, 14 0.9 5.6 Unrealized foreign exchange loss 8 41.7 11.7 Share-based compensation expense 20 12.2 15.2 Net change in non-cash working capital 22 153.0 (91.6) Net change in provisions and contingent liabilities (1.8) 7.2 Income taxes paid (25.6) (27.0) Income taxes received 12.1 — Interest (paid) received (1.7) 1.9 Cash provided by operating activities 310.8 98.4
Investing activitiesInvestment in property, plant and equipment 13 (21.0) (40.9) Investment in intangible assets 14 (57.7) (53.3) Business acquisitions, net of cash acquired 15 0.7 (22.5) Advance paid for business acquisitions 12, 29 (3.0) — Investment in limited partnership 12 (1.8) — Investment in trademark license agreement 14 (2.4) — Proceeds from sale of investments 15 0.3 — Proceeds from disposal of property, plant and equipment 13 — 0.5 Cash used in investing activities (84.9) (116.2)
Financing activitiesProceeds from loans and borrowings 18 350.0 — Repayment of loans and borrowings 18 (350.0) — Payment of lease liabilities 24 (15.2) (13.8) Issuance of common shares from exercise of share options 20 — 0.1 Cancellation of common shares 20 (1.1) — Cash used in financing activities (16.3) (13.7)
Effect of foreign currency exchange rate changes on cash (4.3) 3.3
Net increase (decrease) in cash during the period 205.3 (28.2) Cash, beginning of period 115.3 143.5 Cash, end of period 320.6 115.3
The accompanying notes on pages 5 to 44 are an integral part of these consolidated financial statements.
Spin Master Corp.Consolidated statements of cash flows
4
1. Description of business
Spin Master Corp., was incorporated on June 9, 2004, under the laws of the Province of Ontario, Canada and is a global children’s entertainment company creating exceptional play experiences through a diverse portfolio of innovative toys, entertainment franchises and digital games. Spin Master Corp. creates, designs, manufactures, licenses and markets a diversified portfolio of toys, games and products, creates and produces multiplatform content, stories and characters in both original shows along with short-form series and creates digital games and apps. Its registered office is located at 225 King Street West, Suite 200, Toronto, Canada, M5V 3M2. Spin Master Corp. and its subsidiaries are together referred to, in these consolidated financial statements, as the “Company” or “Spin Master”.
The Company has three reportable operating segments: North America, Europe and Rest of World (see Note 28).
2. Summary of significant accounting policies
(A) Statement of compliance and basis of preparation and measurement
The consolidated financial statements have been prepared in accordance with International Financial Reporting Standards (“IFRS”) as issued by the International Accounting Standards Board ("IASB") with interpretations of the International Financial Reporting Interpretations Committee ("IFRIC").
All financial information is presented in millions of United States dollars ("US$") and has been rounded to the nearest hundred thousand, except as otherwise indicated.
These consolidated financial statements were approved and authorized for issuance by the Board of Directors on March 1, 2021.
The consolidated financial statements have been prepared on the historical cost basis except for certain financial instruments that are measured at fair value, as explained in the accounting policies below. Historical cost is measured on the fair value of the consideration provided in exchange for goods and services.
(B) Application of new and revised IFRS
IFRS 16 Leases
The Company has adopted the IFRS 16 "Leases" amendment related to COVID-19 Rent Concessions effective June 1, 2020. The amendment provides lessees with a practical expedient that relieves a lessee from assessing whether a COVID-19-related rent concession is a lease modification.
The Company, as a lessee, has elected to apply the practical expedient to all eligible contracts and has accounted for rent concessions occurring as a direct consequence of COVID-19 as if they were not lease modifications. The forgiveness of lease payments is accounted for as a variable lease payment and that part of the lease liability is derecognized. For deferrals of lease payments, interest continues to be recognized on the lease liability and the liability is reduced once payments are made to the lessor.
The Company has applied the amendment and has recognized an impact for the year ended December 31, 2020 in its lease liabilities on the balance sheet of $0.1 million related to rent forgiveness and $1.0 million related to rent deferrals.
IFRS 3 Business Combinations
The IASB published amendments to IFRS 3 "Business Combinations". The amendment clarifies the definition of a business and outputs. The amendment also adds guidance that determines if substantive processes have been acquired or if an acquired set of activities and assets is a business. The amendments are effective for fiscal years beginning on or after January 1, 2020. The Company has adopted these changes to IFRS 3 for the year ended December 31, 2020.
Spin Master Corp.Consolidated financial statements for the years ended December 31, 2020 and December 31, 2019
5
2. Summary of significant accounting policies (continued)
(C) Basis of preparation
The consolidated financial statements incorporate the financial statement accounts of the Company and entities controlled by the Company and its subsidiaries (the “Group”). Control is achieved when the Company:
• has power over the investee;• is exposed, or has rights, to variable returns from its involvement with the investee; and • has the ability to use its power to affect its returns.
The Company reassesses whether or not it controls an investee if facts and circumstances indicate that there are changes to one or more of the three elements of control listed above.
Consolidation of a subsidiary begins when the Company obtains control over the subsidiary and ceases when the Company loses control of the subsidiary. Specifically, income and expenses of a subsidiary acquired or disposed of during the year are included in the consolidated statement of earnings and comprehensive income from the date the Company gains control until the date when the Company ceases to control the subsidiary.
All intragroup assets and liabilities, equity, income, expenses and cash flows relating to transactions between members of the Group are eliminated in full on consolidation.
In March 2020, the World Health Organization declared the outbreak of COVID-19 as a global pandemic, which has resulted in governments worldwide enacting emergency measures to combat the spread of the pandemic. These measures have caused disruption to businesses globally resulting in an economic slowdown which has impacted the demand for the Company’s products.
The Company’s financial performance in 2020 was impacted by the supply chain disruption in the first half of 2020 and the reduction in customer demand due to COVID-19. As a result of the dynamic nature of these circumstances, it is not possible to reliably estimate the length and severity of the pandemic and the impact on the financial results of the Company.
During the first quarter of 2020, due to the uncertainties caused by the COVID-19 pandemic and as a precautionary measure, the Company borrowed a total of $350.0 million under its credit facility, to maximize liquidity and increase available cash on hand. The Company repaid $50.0 million and $300.0 million in the second and third quarters of 2020, respectively.
The Company has assessed the significant accounting judgments and estimates in preparing the Company’s consolidated financial statements for the year ended December 31, 2020.
(D) Business combinations
Acquisitions of businesses are accounted for using the acquisition method. The consideration transferred in a business combination is measured at fair value, which is calculated as the sum of the acquisition-date fair values of the assets transferred by the Company, liabilities incurred by the Company to the former owners of the acquiree and the equity interests issued by the Company in exchange for control of the acquiree. Acquisition-related costs are recognized in profit or loss as incurred.
When the consideration transferred by the Group in a business combination includes assets or liabilities resulting from a contingent consideration arrangement, the contingent consideration is measured at its acquisition-date fair value and included as part of the consideration transferred in a business combination. Changes in the fair value of the contingent consideration that qualify as measurement period adjustments are adjusted retrospectively, with corresponding adjustment against goodwill. Measurement period adjustments are adjustments that arise from additional information obtained during the “measurement period” (which cannot exceed one year from the acquisition date) about facts and circumstances that existed at the acquisition date.
Spin Master Corp.Consolidated financial statements for the years ended December 31, 2020 and December 31, 2019
6
2. Summary of significant accounting policies (continued)
(D) Business combinations (continued)
All other subsequent changes in the fair value of contingent consideration classified as an asset or liability are accounted for in accordance with the relevant policy. Contingent consideration that is classified as equity is not remeasured and its subsequent settlement is accounted for within equity. Other contingent consideration is remeasured to fair value at subsequent reporting dates with changes in fair value recognized in profit or loss. There has been no changes in the fair value of contingent consideration classified as equity.
If the initial accounting for a business combination is incomplete by the end of the reporting period in which the combination occurs, the Group reports provisional amounts for the items for which the accounting is incomplete. Those provisional amounts are adjusted during the measurement period (see above), or additional assets or liabilities are recognized, to reflect new information obtained about facts and circumstances that existed at the acquisition date that, if known would have affected the amounts recognized at that time.
At the acquisition date, the identifiable assets acquired and the liabilities assumed are recognized at their fair value.
Goodwill arising on an acquisition of a business is carried at cost as established at the date of acquisition of the business less accumulated impairment losses, if any. Goodwill is measured as the excess of the sum of the consideration transferred, over the net of the acquisition-date amounts of the identifiable assets acquired and the liabilities assumed. For the purposes of impairment testing, goodwill is allocated to each of the Company’s cash generating units ("CGUs") (or groups of CGUs) that are expected to benefit from the combination.
(E) Goodwill
A CGU to which goodwill has been allocated is tested for impairment annually, or more frequently when there is an indication that the unit may be impaired. If the recoverable amount of the CGU is less than its carrying amount, the impairment loss is allocated first to reduce the carrying amount of any goodwill allocated to the unit and then to the other assets of the unit pro-rata based on the carrying amount of each asset in the unit.
Any impairment loss for goodwill is recognized directly in profit or loss, and an impairment loss recognized for goodwill is not reversed in subsequent periods. On disposal of the relevant CGU, the attributed amount of goodwill is included in the determination of the profit or loss on disposal.
(F) Revenue recognition
Sale of Goods
The majority of the Company’s revenue is derived from the sales of toys and related products to retail customers and distributors in domestic and international markets. Revenue is recognized at an amount that reflects the consideration to which an entity expects to be entitled in exchange for transferring goods or services to a customer.
The Company recognizes revenue when control of the goods has transferred, which is determined by respective shipping terms and certain additional considerations. Invoices are generally issued at the time of delivery (which is when the Company has satisfied its performance obligations under the arrangement). As such, a receivable is recognized as the consideration is unconditional and only the passage of time is required before payment is due.
The Company does not have performance obligations subsequent to delivery of the sale of goods to customers and revenues from sale of goods are recognized upon the passing of control to the customer.
The Company routinely enters into arrangements with its customers to provide sales incentives, support customer promotion and provides allowances for returns and defective merchandise. Such programs are based primarily on purchases, customer performance of specified promotional activities and other specified factors, which are not necessarily stipulated in the customer's contract.
Revenue represents the amount of consideration to which the Company expects to be entitled to through the sale of goods excluding sales tax and after the application of the variable consideration constraint. Variable consideration includes estimates for defective products, sales allowances and returns by customers made based on certain judgments, contractual terms and conditions and historical data. The Company uses the expected value method to quantify the variable consideration. The Company monitors periodic results against historical data and makes any adjustments to both sales discounts and returns accruals as required. Note 3 - Significant accounting judgments and estimates outlines additional details on sales allowances.
Spin Master Corp.Consolidated financial statements for the years ended December 31, 2020 and December 31, 2019
7
2. Significant accounting policies (continued)
(F) Revenue recognition (continued)
Entertainment and Licensing revenue
Television distribution sales, which are generated by the use of the Company's brands and other intellectual property through the production of television and streaming programming for licensing to third parties, are recognized in accordance with the relevant agreements. The license agreement is assessed as either providing the customer with a 'right-to-use' or 'right-to-access' license and the applicable revenue is recognized at a point-in-time or over time based on the classification determined. The license to distribute television and streaming programming grants a right to use the Company's brands and other intellectual property. The licensee pays a fixed fee for the license of the produced content. Revenue is recognized upon delivery of the television or streaming programming and is measured based on the consideration to which the Company expects to be entitled to upon delivery. There are no future performance obligations associated with the delivery of the programs.
For entertainment and licensing revenues that are generated by the use of the Company’s brands and other intellectual property, the license is assessed as either providing the customer with a ‘right-to-use’ or ‘right-to-access’ license and revenue is recognized at a point-in-time or over time based on the classifications determined. Judgment is required in determining the appropriate classification. The license of the Company’s brands provide access to the intellectual property over the term of the license and is considered a right-to-access license of intellectual property. The Company records sales-based or usage-based royalty revenues for right-to-access licenses upon occurrence of the licensees’ subsequent sale or usage.
Customer advances on contracts, licensing and/or television distribution, are recorded in contract liabilities until all of the foregoing revenue recognition conditions have been met. This does not give rise to a significant financing component as the timing difference between when the customer advances are recorded and the revenue recognition conditions being fulfilled are protective for both parties of a contract, to protect against failure of completion of some of their obligations under the contract.
Digital games
The Company develops digital applications ("apps") which are hosted by third-party platform providers. The Company controls all aspects of the apps delivered to the end user. The third-party platform providers are providing the service of hosting and administrating receipt from the end users. The Company has determined that it is the principal in the arrangement and revenues are recorded in other revenue on a gross basis. The fees charged by the third-party platform providers are recorded within cost of sales. Revenue associated with the sale of apps is recognized when control is transferred. This condition is typically met when the end-user purchases and downloads the app from the third-party. The end users can make in-app purchases and the Company recognizes revenue at the time of sale. The Company has no additional performance obligations other than the delivery of apps to the third-party platform providers.
Disaggregation of revenue
The Company disaggregates its revenues from contracts with customers by geographic segment: North America, Europe and Rest of World. The Company further disaggregates revenues by product category: Activities, Games & Puzzles and Plush, Remote Control and Interactive Characters, Boys Action and Construction, Pre-School and Girls and Outdoor. The Company believes these collectively depict how the nature, amount, timing and uncertainty of revenue and cash flows are affected by economic factors. See Note 28 Segment information for further information.
Spin Master Corp.Consolidated financial statements for the years ended December 31, 2020 and December 31, 2019
8
2. Significant accounting policies (continued)
(G) Leases
The Company assesses whether a contract is or contains a lease, at inception of a contract. The Company recognizes a right-of-use asset and a corresponding lease liability with respect to all lease agreements in which it is the lessee, except for short-term leases (defined as leases with a lease term of 12 months or less) and leases of low value assets. For these leases, the Company recognizes the leases as an operating expense on a straight-line basis over the term of the lease unless another systematic basis is more representative of the time pattern in which economic benefits from the leased assets are assumed.
Lease liability
The lease liability is initially measured at the present value of the lease payments that are not paid at the commencement date, discounted by using the rate implicit in the lease. If this rate cannot be readily determined, the Company uses its incremental borrowing rate. The incremental borrowing rate is defined as the rate of interest that the Company would have to pay to borrow over a similar term and with a similar security the funds necessary to obtain an asset of a similar value to the right-of-use asset in a similar economic environment.
Lease payments included in the measurement of the lease liability comprise:
• fixed lease payments (including in-substance fixed payments), less any lease incentives receivable;• variable lease payments that depend on an index or rate, initially measured using the index or rate at the
commencement date;• the amount expected to be payable by the lessee under residual value guarantees;• the exercise of purchase options, if the lessee is reasonably certain to exercise the options; and• payments of penalties for terminating the lease, if the lease term reflects the exercise of an option to terminate
the lease.
The lease liability is subsequently measured by increasing the carrying amount to reflect interest on the lease liability (using the effective interest method) and by reducing the carrying amount to reflect the lease payments made.
The Company remeasures the lease liability (and makes a corresponding adjustment to the related right-of-use asset) whenever:
• the lease term has changed or there is a change in the assessment of exercise of a purchase option, in which case the lease liability is remeasured by discounting the revised lease payments using a revised discount rate;
• the lease payments change due to changes in an index or rate or a change in expected payment under a guaranteed residual value, in which cases the lease liability is remeasured by discounting the revised lease payments using the initial discount rate (unless the lease payments change is due to a change in a floating interest rate, in which case a revised discount rate is used); and
• a lease contract is modified and the lease modification is not accounted for as a separate lease, in which case the lease liability is remeasured by discounting the revised lease payments using a revised discount rate.
Right-of-use asset
The right-of-use assets comprise the initial measurement of the corresponding lease liability, lease payments made at or before the commencement day and any initial direct costs. They are subsequently measured at cost less accumulated depreciation and impairment losses.
Right-of-use assets are depreciated over the shorter period of lease term and useful life of the underlying asset. If a lease transfers ownership of the underlying asset or the cost of the right-of-use asset reflects that the Company expects to exercise a purchase option, the related right-of-use asset is depreciated over the useful life of the underlying asset. The depreciation starts at the commencement date of the lease.
The Company applies IAS 36 Impairment of Assets to determine whether a right-of-use asset is impaired.
Variable rents that do not depend on an index or rate are not included in the measurement of the lease liability and the right-of-use asset. The related payments are recognized as an expense in the period in which the event or condition that triggers those payments occurs and are included in administrative expenses in the consolidated statement of earnings and comprehensive income.
Spin Master Corp.Consolidated financial statements for the years ended December 31, 2020 and December 31, 2019
9
2. Significant accounting policies (continued)
(G) Leases (continued)
As a practical expedient, IFRS 16 permits a lessee not to separate non-lease components and instead account for any lease and associated non-lease components as a single arrangement. The Company has elected to use this practical expedient.
(H) Foreign currencies
The Company reports its financial results in US$; however, the functional currency of the Company is the Canadian dollar.
The assets and liabilities of foreign operations that have a functional currency different from that of the Company are translated into the Company’s functional currency of Canadian dollars using exchange rates prevailing at the end of each reporting period. Income and expense items are translated at the average exchange rates for the period, unless exchange rates fluctuate significantly during that period, in which case the exchange rates at the dates of the transactions are used. Exchange differences arising, if any, are recognized in the foreign currency translation adjustment as part of other comprehensive income.
In preparing the financial statements of each individual Group entity, transactions in currencies other than the Group entity’s functional currency are recognized at the rates of exchange prevailing at the dates of the transactions. At the end of each reporting period, monetary items denominated in foreign currencies are retranslated at the rates prevailing at that date. Non-monetary items carried at fair value that are denominated in foreign currencies are retranslated at the rates prevailing when the fair value was determined. Non-monetary items that are measured in terms of historical cost in a foreign currency are translated using the exchange rate at the date of the transaction. The resulting foreign currency exchange gains or losses are recognized in profit or loss.
For the purposes of presenting these consolidated financial statements, the assets and liabilities of the Group’s foreign operations are translated into US$ using exchange rates prevailing at the end of each reporting period. Income and expense items are translated in the same manner as above with exchange differences impacting other comprehensive income and accumulated in equity.
At December 31, 2020 and 2019, the functional currencies of the Groups subsidiaries included the Canadian dollar, the Euro, the Great Britain pound sterling, the Hong Kong dollar, the Mexican peso, the Chinese yuan, the Vietnamese dong, the Japanese yen, the Swedish krona, the Australian dollar, the Indian rupee, the Polish zloty, and the Russian ruble.
(I) Earnings per share
Basic earnings per share (“EPS”) is calculated by dividing net income by the weighted average number of shares outstanding during the period. Diluted earnings per share is calculated by dividing net income by the weighted average number of common shares outstanding, assuming the conversion of all dilutive securities were exercised during the period. Securities refer to all outstanding share options, Restricted Stock Units ("RSUs") and Performance Share Units ("PSUs").
(J) Income taxes
Income tax expense or recovery represents the sum of the taxes currently payable or receivable and deferred taxes.
Current tax
For each entity in the Group, the tax currently payable is based on taxable income for the year. Taxable income differs from “income before income tax expense (recovery)” as reported on the consolidated statement of earnings and comprehensive income because of items of income or expense that are taxable or deductible in other years and items that are never taxable or deductible. The Company’s current tax expense or recovery is calculated using income tax rates that have been enacted or substantively enacted by the end of the reporting period.
Spin Master Corp.Consolidated financial statements for the years ended December 31, 2020 and December 31, 2019
10
2. Significant accounting policies (continued)
(J) Income taxes (continued)
Deferred tax
Deferred tax is recognized on temporary differences between the carrying amount of assets and liabilities in the consolidated financial statements and the corresponding tax basis used in the computation of taxable income. Deferred tax liabilities are recognized for taxable temporary differences. Deferred tax assets are recognized for deductible temporary differences to the extent that it is probable that taxable profits will be available against which those deductible temporary differences can be utilized.
Deferred tax assets and liabilities are not recognized if the temporary difference arises from the initial recognition (other than a business combination) of assets and liabilities in a transaction that does not affect either taxable income or net income before income taxes. In addition, deferred tax liabilities are not recognized if the temporary difference arises from the initial recognition of goodwill.
The carrying amount of deferred tax assets is reviewed at the end of each reporting period and reduced to the extent that it is no longer probable that sufficient taxable income will be available to allow all or part of the asset to be recovered.
Deferred tax liabilities and assets are measured at the income tax rates that are expected to apply in the period in which the liability is expected to be settled or the asset realized, based on income tax rates (and income tax laws) that have been enacted or substantively enacted at the end of the reporting period, reflecting the tax consequences that would follow from the manner in which the Company expects, at the end of the reporting period, to recover or settle the carrying amount of its assets and liabilities.
Current and deferred tax for the period
Current and deferred tax expense or recovery are recognized in profit or loss, except when they relate to items that are recognized in other comprehensive income or directly in equity, in which case the current and deferred tax expenses are also recognized in other comprehensive income or directly in equity, respectively. Where current deferred taxes arises from the initial accounting for a business combination, the tax effect is included in the accounting for the business combination.
(K) Cash
Cash is net of outstanding bank overdrafts, if applicable.
(L) Property, plant and equipment
Property, plant and equipment are stated at cost, net of accumulated depreciation and accumulated impairment losses, if any.
Depreciation is recognized so as to depreciate the cost or valuation of assets less their residual values over their useful lives, using the straight-line method or declining balance method. Repairs and maintenance costs are recognized in profit or loss as incurred.
The estimated useful lives, residual values and depreciation method are reviewed at the end of each reporting period, with the effect of any changes in estimate accounted for on a prospective basis.
The following are the estimated useful lives for the major classes of property, plant and equipment:
Land Not depreciated
Buildings 30 years
Moulds, dies and tools 2 years
Office equipment 3 years
Leasehold improvements Lesser of lease term or 5 years
Computer hardware 3 years
Machinery and equipment 30% declining balance
An item of property, plant and equipment is derecognized upon disposal or when no future economic benefits are expected to arise from the continued use of the asset. Any gain or loss arising on the disposal or retirement of an item of property, plant and equipment is determined as the difference between the sales proceeds and the carrying amounts of the asset and is recognized in profit or loss.
Spin Master Corp.Consolidated financial statements for the years ended December 31, 2020 and December 31, 2019
11
2. Significant accounting policies (continued)
(M) Intangible assets
The following are the estimated useful lives for the major classes of intangible assets:
Brands Indefinite
Trademarks and licenses 5 years
Customer lists 5 years
Intellectual property ("IP") 10 years
App and content development 1-5 years
Computer software 1-5 years
Intangible assets acquired separately in an asset acquisition
Intangible assets with finite useful lives that are acquired separately are carried at cost less accumulated amortization and accumulated impairment losses, if any.
Amortization is recognized on a straight-line basis over the estimated useful life of the intangible assets. The estimated useful life and amortization method are reviewed at the end of each reporting period, with the effect of any changes in estimate being accounted for on a prospective basis.
Intangible assets with indefinite useful lives, such as brands that are acquired separately are carried at cost less accumulated impairment losses.
Intangible assets acquired in a business combination
Intangible assets acquired in a business combination and recognized separately from goodwill are initially recognized at their fair values at the acquisition date (which is regarded as their initial cost).
Subsequent to initial recognition, intangible assets acquired in business combinations are reported at cost less accumulated amortization if applicable and accumulated impairment losses, on the same basis as intangible assets that are acquired separately.
Internally-generated intangible assets - research and development expenditures
Expenditures on research activities are recognized as incurred. An internally-generated intangible asset arising from development (or from the development phase of an internal project) is recognized only if all of the following have been demonstrated:
• the technical feasibility of completing the intangible asset so that it will be available for use or sale;• the intention to complete the intangible asset for use or sale;• the ability to use or sell the intangible asset;• how the intangible asset will generate probable future economic benefits;• the availability of adequate technical, financial and other resources to complete the development and to use or
sell the intangible asset; and• the ability to measure reliably the expenditure attributable to the intangible asset during its development.
The amount initially recognized for internally-generated intangible assets is the sum of the expenditure incurred from the date when the intangible asset first meets the recognition criteria listed above. Where no internally-generated intangible asset can be recognized, development expenditures are recognized in profit or loss in the period in which they are incurred.
Subsequent to initial recognition, internally-generated intangible assets are reported at cost less accumulated amortization and accumulated impairment losses, on the same basis as intangible assets that are acquired separately.
Spin Master Corp.Consolidated financial statements for the years ended December 31, 2020 and December 31, 2019
12
2. Significant accounting policies (continued)
(M) Intangible assets (continued)
Television production assets
Television production assets are a component of intangible assets and are recorded at cost as content development. The Company has access to government programs, including tax credits that are designed to assist film and television production and distribution in Canada. The federal and provincial tax credits are not recognized until there is reasonable assurance that the Company will comply with the conditions attached to them and that the tax credits will be received. Capitalized costs net of expected federal and provincial tax credits are charged to amortization expense as completed episodes are delivered on a pro-rata basis over the total number of episodes for the season.
Contract liabilities related to television production assets arises as a result of consideration received in advance of the Company fulfilling its obligations.
Impairment of tangible and intangible assets other than goodwill
At the end of each reporting period, the Company reviews the carrying amounts of its tangible and intangible assets to determine whether there is any indication of impairment. If any such indication exists, the recoverable amount of the asset is estimated in order to determine the extent of the impairment loss (if any).
When it is not possible to estimate the recoverable amount of an individual asset, the Company estimates the recoverable amount of the CGU to which the asset belongs. When a reasonable and consistent basis of allocation can be identified, corporate assets are also allocated to individual CGUs, otherwise, they are allocated to the smallest group of CGUs for which a reasonable and consistent allocation basis can be identified. Intangible assets with indefinite useful lives or that are not yet available for use are tested for impairment at least annually and whenever there is an indication that the asset may be impaired.
Recoverable amount is the higher of fair value less costs of disposal and value in use. In assessing value in use, the estimated future cash flows are discounted to their present value using a pre-tax discount rate that reflects current market assessments of the time value of money and the risks specific to the asset for which the estimates of future cash flows have not been adjusted.
If the recoverable amount of an asset (or CGU) is estimated to be less than its carrying amount, the carrying amount of the asset (or CGU) is reduced to its recoverable amount. An impairment loss equal to the difference between the carrying and recorded amounts is recognized immediately in profit or loss.
When an impairment loss subsequently reverses, the carrying amount of the asset (or CGU) is increased to the revised estimate of its recoverable amount, provided that the increased carrying amount does not exceed the carrying amount that would have been determined had no impairment loss been recognized for the asset (or CGU) in prior years. A reversal of an impairment loss is recognized immediately in profit or loss.
(N) Advances on royalties
The Company enters into license agreements with inventors and licensors for the use of their intellectual properties in its products. These agreements may call for payment in advance of minimum guaranteed amounts. Amounts paid in advance are initially recorded as an asset and subsequently expensed to net income or loss as revenue from the related products is recognized. If all or a portion of an advance does not appear to be recoverable through future use of the rights obtained under license, the non-recoverable portion is expensed immediately in profit or loss.
(O) Inventories
Inventories are stated at the lower of cost and net realizable value. Cost is determined by the first-in, first-out method. Cost includes the purchase price and other costs, such as import duties, taxes and transportation costs. Trade discounts and rebates are deducted from the purchase price. Net realizable value represents the estimated selling price for inventories in the ordinary course of business, less all estimated costs of completion and costs necessary to make the sale. Reserves for excess and obsolete inventory are based upon quantities on hand, projected volumes from demand forecast and net realizable value. The impact of changes in inventory reserves is reflected in cost of sales.
Spin Master Corp.Consolidated financial statements for the years ended December 31, 2020 and December 31, 2019
13
2. Significant accounting policies (continued)
(P) Provisions and contingent liabilities
A provision is a liability of uncertain timing or amount. Provisions are recognized when the Company has a present legal or constructive obligation as a result of past events, it is probable that an outflow of resources will be required to settle the obligation and if the amount can be reliably estimated. Provisions are measured at the present value of the amount expected to be required to settle the obligation and are re-measured each reporting date.
Contingent consideration
Where the Company is committed to pay royalties on sales of acquired brands, the future royalty obligation is based on the Company’s estimate of the related brands future sales, discounted for the timing of expected payments.
Provision for defectives
Defectives refer to when the end consumer returns defective goods to the Company’s customers. Customers without a fixed allowance for defectives are eligible for a credit for the cost of the product if returned as defective by the end consumer. The estimate of defectives is made based on the class and nature of the product and is recorded as a reduction to revenue in the consolidated statement of earnings and comprehensive income.
Supplier obligations
Supplier obligations represent the estimated compensation to be paid to suppliers for lower than expected volumes purchased, resulting in the supplier having excess raw material and finished goods inventories. While payments are not contractually required, the Company regularly compensates suppliers to maintain supplier relationships, which represents a constructive obligation due to past practices. The supplier obligation is based on an estimate of the cost of the supplier’s excess raw material and finished goods inventory.
(Q) Share-based payments
As part of the Company’s Initial Public Offering (the “Initial Offering”), employees were granted subordinate voting shares through equity participation arrangements. The Initial Offering price multiplied by the number of shares that an employee was entitled to receive is recognized as an expense in administrative expenses, with a corresponding increase in contributed surplus over the vesting period, at the end of which, the employees become unconditionally entitled to the shares. The amount expensed is adjusted for forfeitures as required.
The Company has one share option plan for key employees, which forms part of their long-term incentive compensation plan. Under the plan, the exercise price of each option equals the market price of the Company’s shares on the date of grant and the options have a maximum term of ten years. Options vest between zero and four years.
The equity based compensation plan providing for the issuance of securities from treasury under which the grants will be made by the Company. Under the long-term incentive plan ("LTIP"), the Board may at its discretion from time to time, grant share options, share units (in the form of RSUs and PSUs), Stock Appreciation Rights ("SARs"), restricted stock and any other equity based awards. These awards may be settled in shares at the option of the Company. LTIP liabilities are recorded in shareholders equity and not marked to market.
(R) Financial instruments
Financial assets and financial liabilities are recognized when the Company becomes a party to the contractual provisions of the respective instrument.
Financial assets and financial liabilities are initially measured at fair value. Transaction costs that are directly attributable to the acquisition or issue of financial assets and financial liabilities (other than financial assets and financial liabilities at fair value through profit or loss) are included in the initial carrying value of the related instrument and are amortized using the effective interest method. Transaction costs directly attributable to the acquisition of financial assets or financial liabilities at fair value through profit or loss are recognized immediately in profit or loss.
Spin Master Corp.Consolidated financial statements for the years ended December 31, 2020 and December 31, 2019
14
2. Significant accounting policies (continued)
(R) Financial instruments (continued)
Fair value estimates are made at the consolidated statement of financial position date based on relevant market information and information about the financial instrument. All financial instruments are classified into either: fair value through profit or loss (“FVTPL”) or amortized cost.
The Company has made the following classifications:
Cash Amortized cost
Trade and other receivables Amortized cost
Other long-term assets Amortized cost
Investment in a limited partnership FVTPL
Trade payables and other liabilities Amortized cost
Loans and borrowings Amortized cost
Interest payable Amortized cost
Other long-term liabilities Amortized cost
Foreign exchange forward contracts FVTPL
(S) Financial assets
The classification of financial assets depends on the nature and purpose of the financial assets and is determined at the time of initial recognition.
Financial assets at FVTPL
Financial assets are classified as FVTPL when the financial asset is either held for trading or it is designated as FVTPL. A financial asset is classified as held for trading if:
• it has been acquired principally for the purpose of selling it in the near term;• on initial recognition it is part of a portfolio of identified financial instruments that the Company manages
together and has a recent actual pattern of short-term profit-taking; or • it is a derivative that is not designated and effective as a hedging instrument.
Financial assets at amortized cost
Financial assets at amortized cost are non-derivative financial assets which are held within a business model whose objective is to hold assets to collect contractual cash flows and whose contractual terms give rise on specified dates to cash flows that are solely payments of principal and interest on the principal amount outstanding. A financial asset (unless it is a trade receivable without a significant financing component that is initially measured at the transaction price) is initially measured at fair value plus, for an item not at FVTPL, transaction costs that are directly attributable to its acquisition. Subsequent to initial recognition, financial assets are measured at amortized cost using the effective interest method, less any impairment.
Impairment of financial assets
Financial assets, other than those classified as FVTPL, are assessed for indicators of impairment at the end of each reporting period. Financial assets are considered to be impaired when there is objective evidence that, as a result of one or more events that occurred after the initial recognition of the financial asset, the estimated future cash flows of the investment have been decreased.
The carrying amount of the financial asset is reduced by the impairment loss directly for all financial assets with the exception of trade receivables, where the carrying amount is reduced through the use of an allowance account.
When a trade receivable is considered uncollectible, it is written off against the allowance account. Subsequent recoveries of amounts previously written off are offset against the allowance account. Changes in the carrying amount of the allowance account are recognized in profit or loss. Loss allowances are based on the lifetime expected credit losses that result from all possible default events over the expected life of the trade receivable, using the simplified approach.
Spin Master Corp.Consolidated financial statements for the years ended December 31, 2020 and December 31, 2019
15
2. Significant accounting policies (continued)
(T) Financial liabilities and equity instruments
For financial assets measured at amortized cost, if, in a subsequent period, the amount of the impairment loss decreases and the decrease can be related objectively to an event occurring after the impairment was recognized, the previously recognized impairment loss is reversed through profit or loss to the extent that the carrying amount of the investment at the date the impairment is reversed does not exceed what the amortized cost would have been had the impairment not been recognized.
Classification as debt or equity
Debt and equity instruments issued by the Company are classified as either financial liabilities or as equity in accordance with the substance of the contractual arrangements and the definitions of a financial liability and an equity instrument.
Equity instruments
An equity instrument is any contract that evidences a residual interest in the assets of an entity after deducting all of its liabilities. Equity instruments issued by the Company are recognized as the proceeds received, net of direct issue costs.
Other financial liabilities
Other financial liabilities (including loans and borrowings and trade payables and other liabilities) are initially measured at fair value, net of transaction costs. Subsequently, other financial liabilities are measured at amortized cost using the effective interest method.
The effective interest method is a method of calculating the amortized cost of a financial liability and of allocating interest expense over the relevant period. The effective interest rate is the rate that exactly discounts estimated future cash payments (including all fees and points paid or received that form an integral part of the effective interest rate, transaction costs and other premiums or discounts) through the expected life of the financial liability, or (where appropriate) a shorter period, to the net carrying amount on initial recognition.
(U) Derivative financial instruments
The Company enters into foreign exchange forward contracts to manage its exposure to foreign exchange rate risks.
Derivatives are initially recognized at fair value at the date the derivative contracts are entered into and are subsequently re-measured at their fair value at the end of each reporting period. The resulting gain or loss is recognized in profit or loss.
(V) Fair value hierarchy and liquidity risk disclosure
Fair value measurements are classified using a fair value hierarchy that reflects the significance of inputs used in making the measurements. The fair value hierarchy has the following levels:
• Level 1 - valuation based on quoted prices (unadjusted) in active markets for identical assets or liabilities;• Level 2 - valuation techniques based on inputs other than quoted prices included in Level 1 that are observable
for the asset or liability, either directly (i.e. as prices) or indirectly (i.e. derived from prices); and• Level 3 - valuation techniques using inputs for the asset or liability that are not based on observable market
data (unobservable inputs).
The fair value of short-term financial instruments approximates their carrying amounts due to the relatively short period to maturity. These include cash, trade and other receivables, as well as trade payables and other liabilities and provisions. Fair value amounts represent point-in-time estimates and may not reflect fair value in the future.
Spin Master Corp.Consolidated financial statements for the years ended December 31, 2020 and December 31, 2019
16
2. Significant accounting policies (continued)
(W) Accounting standards issued but not yet adopted
IAS 1 Presentation of Financial Statements
The IASB published amendments to IAS 1 "Presentation of Financial Statements". The amendments clarify the requirements for classifying liabilities as current or non-current. In particular, they specify the conditions which exist at the end of the reporting period will be used to determine if a right to defer settlement of a liability exists, and clarify the situations that are considered settlement of a liability. The amendments are effective for fiscal years beginning on or after January 1, 2023 and are applicable retrospectively. The Company is currently assessing these changes and their potential impact on the Company's financial statements.
IAS 37 Provisions, Contingent Liabilities and Contingent Assets
The IASB published amendments to IAS 37 "Provisions, Contingent Liabilities and Contingent Assets". The amendments specify that the cost of fulfilling a contract consists of both incremental costs of fulfilling the contract and an allocation of other costs that relate directly to fulfilling contracts. The amendments are effective for fiscal years beginning on or after January 1, 2022. The Company is currently assessing these changes and their potential impact on the Company's financial statements.
3. Significant accounting judgments and estimates
In the application of the Company’s accounting policies, management is required to make judgments, estimates and assumptions about the carrying amounts of assets and liabilities that are not readily apparent from other sources. As these estimates and associated assumptions are based on historical experience and other factors that are considered to be relevant, actual results may differ. The estimates and underlying assumptions are reviewed on an ongoing basis. Adjustments are recognized in the period in which the estimate is modified if the change affects only that period, or in the period the estimate is modified and future periods if the revision affects both current and future periods.
Critical judgments in applying accounting policies
The Company has identified the following judgments, apart from estimates, which management has made in the process of applying the Company’s accounting policies and which have the most significant effect on the amounts recognized in the consolidated financial statements.
(A) Determination of CGUs
A CGU is defined as the smallest identifiable group of assets that generates cash inflows that are largely independent of the cash inflows from other assets or groups of assets. Determining the impact of impairment requires significant judgment in identifying which assets or groups of assets are CGUs of the Company.
(B) Functional currency
Transactions in foreign currencies are translated to the respective functional currencies of Group entities at exchange rates as of the dates the transactions occur. Monetary assets and liabilities denominated in foreign currencies at the reporting date are retranslated to the functional currency at the exchange rate at that date.
Determining the appropriate functional currencies for entities in the Group requires analysis of various factors, including the currencies and country-specific factors that mainly influence sales prices, and the currencies that mainly influence labour, materials and other costs of providing goods or services.
Significant estimates and assumptions
The Company has identified the following accounting policies under which significant judgments, estimates and assumptions are made, where actual results may differ from these estimates under different assumptions and conditions, and which may materially affect the Company's financial results or financial position in future periods.
(A) Useful life of property, plant and equipment and intangible assets with finite useful lives
The Company employs significant estimates to determine useful lives of property, plant and equipment and intangible assets with finite useful lives, considering industry trends such as technological advancements, past experience, expected use and review of asset lives.
Spin Master Corp.Consolidated financial statements for the years ended December 31, 2020 and December 31, 2019
17
3. Significant accounting judgments and estimates (continued)
Components of an item of property, plant and equipment may have different useful lives. The Company makes estimates when determining depreciation methods, depreciation rates and useful lives, which require taking into account industry trends and company-specific factors. The Company reviews depreciation methods, useful lives and residual values annually or when circumstances change and adjusts, if necessary, its depreciation methods and assumptions prospectively.
(B) Impairment testing of goodwill and indefinite life intangible assets
Goodwill and indefinite life intangible assets are assessed for impairment at least annually, and whenever there is an indication of impairment. The Company determines the fair value of its CGU groupings and indefinite life intangible assets using discounted cash flow models corroborated by other valuation techniques.
The process of determining these fair values requires the Company to make estimates and assumptions of a long-term nature regarding discount rates, projected revenues, royalty rates and margins derived from past experience, actual operating results and budgets. These estimates and assumptions may change in the future due to uncertain competitive and economic market conditions or changes in business strategies.
(C) Provision for inventories
Inventories are stated at the lower of cost and estimated net realizable value. The Company estimates net realizable value as the amount at which inventories are expected to be sold, taking into consideration fluctuations in retail prices due to seasonality less estimated costs required to sell. Inventories are written down to net realizable value when the cost of inventories is estimated to be unrecoverable due to obsolescence, damage or declining selling prices.
(D) Sales allowances
A sales allowance is established to reflect amounts for programs which can be contractual or discretionary by nature, and can include negotiated discounts, customer audits, defective products and refund of costs incurred by customers to sell the Company’s products. Contractual allowances are fixed and determinable at the time of sale and are recorded at the time of sale as a reduction to revenue. Discretionary allowances can vary depending on future outcomes such as customer sales volume, inventory position, product performance at retail, historical performance, market conditions and other considerations. The Company may adjust its estimate of sales allowances when facts and circumstances used in the estimation process change.
(E) Income and other taxes
The calculation of current and deferred income taxes requires the Company to make estimates and assumptions and to exercise judgment regarding the carrying values of assets and liabilities which are subject to accounting estimates inherent in those balances, the interpretation of income tax legislation across various jurisdictions, expectations about future operating results, the timing of reversal of temporary differences and possible audits of income tax filings by tax authorities.
Changes or differences in underlying estimates or assumptions may result in changes to the current or deferred income tax balances on the consolidated statements of financial position, a charge or credit to income tax expense in the consolidated statement of earnings and comprehensive income and may result in cash payments or receipts. All income, capital and commodity tax filings are subject to audits and reassessments. Changes in interpretations or judgments may result in a change in the Company’s income, capital or commodity tax provisions in the future. The amount of such a change cannot be reliably estimated.
Spin Master Corp.Consolidated financial statements for the years ended December 31, 2020 and December 31, 2019
18
4. Revenue
The Company earns revenue from the following primary sources:
a. Sales of toys and related products;b. Entertainment and Licensing revenue; andc. Digital games revenue.
Year Ended Dec 31(US$ millions) 2020 2019Revenue from sale of goods 1,415.6 1,463.7 Entertainment and Licensing revenue 78.2 91.7 Digital games revenue 76.8 26.2 Revenue 1,570.6 1,581.6
5. Other expenses
Year Ended Dec 31(US$ millions) Notes 2020 2019Impairment of non-current assets 13, 14 0.9 5.6 Other 7.8 1.0 Other expenses 8.7 6.6
The Company agreed to a legal settlement of $5.5 million included in other expenses in the consolidated statement of earnings and comprehensive income for the year ended December 31, 2020. The legal settlement was recorded in accrued liabilities and paid subsequent to December 31, 2020.
Other includes $3.7 million in contingent consideration related to previous acquisitions (see Note 19) (2019 - $4.3 million).
6. Finance costs Year Ended Dec 31
(US$ millions) 2020 2019Bank fees 4.4 5.9 Accretion expense - lease liabilities 4.6 4.8 Accretion expense - other 1.0 1.7 Amortization of financing costs 0.4 0.9 Interest expense (income) 1.7 (1.6) Finance costs 12.1 11.7
7. Expenses
Included within expenses are the following: selling, marketing, distribution and product development expenses; administrative expenses, which include employee benefit expenses, property and operations and professional fees; and depreciation and amortization expenses.
Selling, marketing, distribution and product development expenses
Year Ended Dec 31(US$ millions) 2020 2019
Selling 109.5 112.0 Marketing 133.1 155.0
Distribution 90.7 98.1
Product development 34.5 30.3 Selling, marketing, distribution and product development expenses 367.8 395.4
Spin Master Corp.Consolidated financial statements for the years ended December 31, 2020 and December 31, 2019
19
7. Expenses (continued)
Administrative expenses
Year Ended Dec 31(US$ millions) 2020 2019
Employee compensation and benefits 184.5 172.1
Professional services 26.9 22.8
Property and operations 17.2 27.6
Technology 13.7 12.2
Recruiting and training 8.0 6.9
Bad debts 3.3 0.2
Other taxes 3.2 2.3
Restructuring — 2.7
Other 7.8 1.1
Administrative expenses 264.6 247.9
Employee compensation and benefits
Year Ended Dec 31(US$ millions) 2020 2019
Salaries, wages and bonuses 5.8 5.6
Employee benefits 1.2 0.9
Employee compensation and benefits expenses in cost of sales 7.0 6.5 Salaries, wages and bonuses 144.3 130.5
Share-based compensation 12.2 15.2
Restructuring expense 5.3 6.1
Employee benefits 22.7 20.3
Employee compensation and benefits in administrative expenses 184.5 172.1
Employee compensation and benefits 191.5 178.6
Depreciation and amortization expenses
Year Ended Dec 31(US$ millions) 2020 2019Property, plant and equipmentMoulds, dies and tools, included in cost of sales 23.6 20.9 Equipment 4.2 3.4 Land and leasehold improvements 6.3 5.8 Computer hardware 1.6 1.4
35.7 31.5
Intangible assetsTrademarks, licenses, IP & customer lists - definite 7.7 6.8 Content development, included in cost of sales 38.6 28.8 App development, included in cost of sales 3.1 2.3 Computer software 4.6 2.2
54.0 40.1
Right-of-use assets 13.3 13.0
Depreciation and amortization expenses 103.0 84.6
Spin Master Corp.Consolidated financial statements for the years ended December 31, 2020 and December 31, 2019
20
8. Foreign exchange loss
For the year ended December 31, 2020, the Company incurred a foreign exchange loss (net of gains) of $27.6 million (2019 - $5.8 million).
(US$ millions) 2020 2019Unrealized foreign exchange losses 41.7 11.7 Realized foreign exchange gains (14.1) (5.9) Foreign exchange loss 27.6 5.8
Unrealized foreign exchange gains and losses are generated by the translation of monetary assets and liabilities denominated in a currency other than the functional currency and also includes gains and losses related to the Company's hedging programs. Realized foreign exchange gains and losses are recognized when monetary assets and liabilities denominated in a currency other than the functional currency of the applicable entity are settled. The Company uses derivative financial instruments such as foreign exchange forward contracts to manage foreign currency risk (see Note 27).
9. Income tax
The income tax (recovery) expense recognized in the consolidated statement of earnings and comprehensive income comprise of the following:
(US$ millions) 2020 2019Current income tax expense 27.4 22.9 Deferred income tax recovery (63.5) (2.2) Income tax (recovery) expense (36.1) 20.7
The income tax (recovery) expense is calculated as follows:
(US$ millions) 2020 2019Income before income tax (recovery) expense 9.4 85.0
Income tax expense at Canadian statutory tax rate of 26.5% (2019 - 26.5%) 2.5 26.5 % 22.5 26.5 %Effect of:
Different tax rates of subsidiaries operating in other jurisdictions (5.0) (53.1) % (4.2) (5.0) %Unused tax losses and tax attributes not recognized as deferred tax assets 1.7 18.1 % 1.5 1.8 %(Income) expenses not (taxable) deductible in determining taxable income (0.3) (3.2) % 0.5 0.6 %Recognition of previously unrecognized tax losses and other deferred tax assets — — % (0.4) (0.5) %Internal transfer of intangible property (33.3) (354.2) % — — %Other (1.7) (18.1) % 0.8 1.0 %
Income tax (recovery) expense (36.1) (384.0) % 20.7 24.4 %
The tax rates used for the reconciliations above are the Canadian statutory tax rates of the parent payable by corporate entities in the Group, on taxable profits under tax laws in the respective jurisdictions in which the Company operates.
Current tax assets and liabilities
As at December 31, 2020, the Company had an income tax payable of $21.1 million (2019 - $4.5 million).
Deferred income tax balances
The following is the analysis of deferred income tax assets and liabilities presented in the consolidated statements of financial position:
(US$ millions) 2020 2019Deferred income tax assets 98.7 26.2 Deferred income tax liabilities (29.6) (20.4) Net deferred income tax assets 69.1 5.8
Spin Master Corp.Consolidated financial statements for the years ended December 31, 2020 and December 31, 2019
21
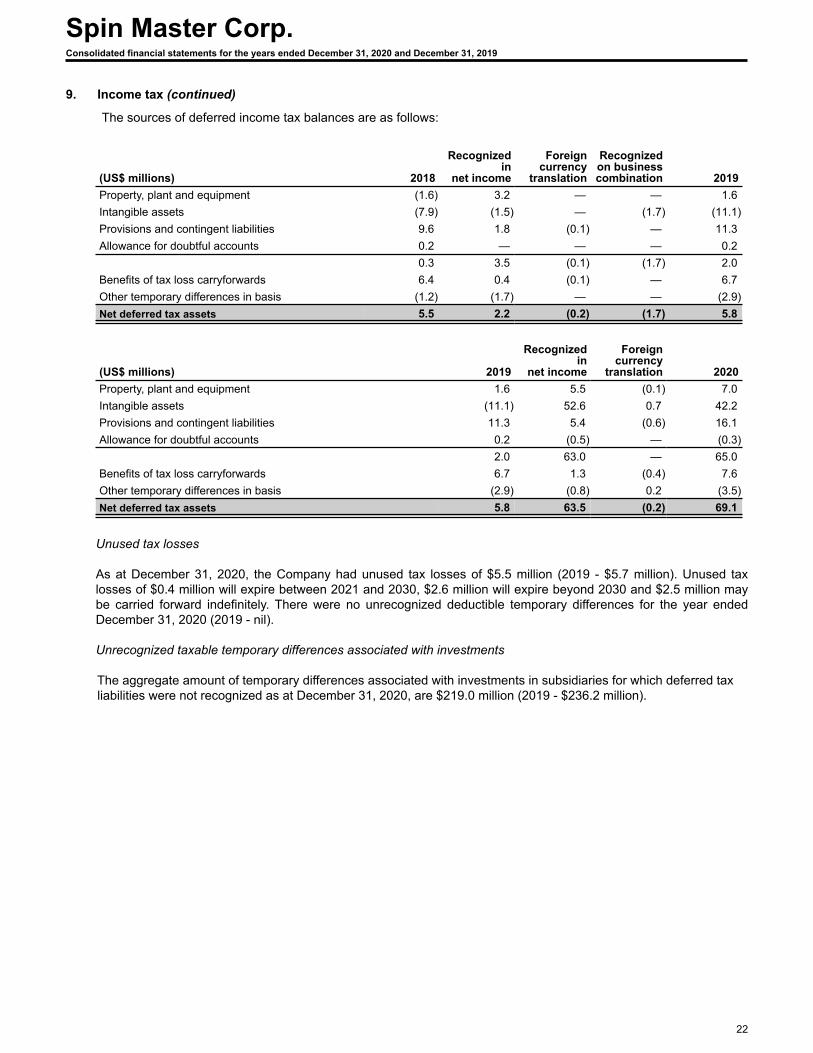
9. Income tax (continued)
The sources of deferred income tax balances are as follows:
(US$ millions) 2018
Recognized in
net income
Foreign currency
translation
Recognized on business combination 2019
Property, plant and equipment (1.6) 3.2 — — 1.6 Intangible assets (7.9) (1.5) — (1.7) (11.1) Provisions and contingent liabilities 9.6 1.8 (0.1) — 11.3 Allowance for doubtful accounts 0.2 — — — 0.2
0.3 3.5 (0.1) (1.7) 2.0 Benefits of tax loss carryforwards 6.4 0.4 (0.1) — 6.7 Other temporary differences in basis (1.2) (1.7) — — (2.9) Net deferred tax assets 5.5 2.2 (0.2) (1.7) 5.8
(US$ millions) 2019
Recognized in
net income
Foreign currency
translation 2020Property, plant and equipment 1.6 5.5 (0.1) 7.0 Intangible assets (11.1) 52.6 0.7 42.2 Provisions and contingent liabilities 11.3 5.4 (0.6) 16.1 Allowance for doubtful accounts 0.2 (0.5) — (0.3)
2.0 63.0 — 65.0 Benefits of tax loss carryforwards 6.7 1.3 (0.4) 7.6 Other temporary differences in basis (2.9) (0.8) 0.2 (3.5) Net deferred tax assets 5.8 63.5 (0.2) 69.1
Unused tax losses
As at December 31, 2020, the Company had unused tax losses of $5.5 million (2019 - $5.7 million). Unused tax losses of $0.4 million will expire between 2021 and 2030, $2.6 million will expire beyond 2030 and $2.5 million may be carried forward indefinitely. There were no unrecognized deductible temporary differences for the year ended December 31, 2020 (2019 - nil).
Unrecognized taxable temporary differences associated with investments
The aggregate amount of temporary differences associated with investments in subsidiaries for which deferred tax liabilities were not recognized as at December 31, 2020, are $219.0 million (2019 - $236.2 million).
Spin Master Corp.Consolidated financial statements for the years ended December 31, 2020 and December 31, 2019
22
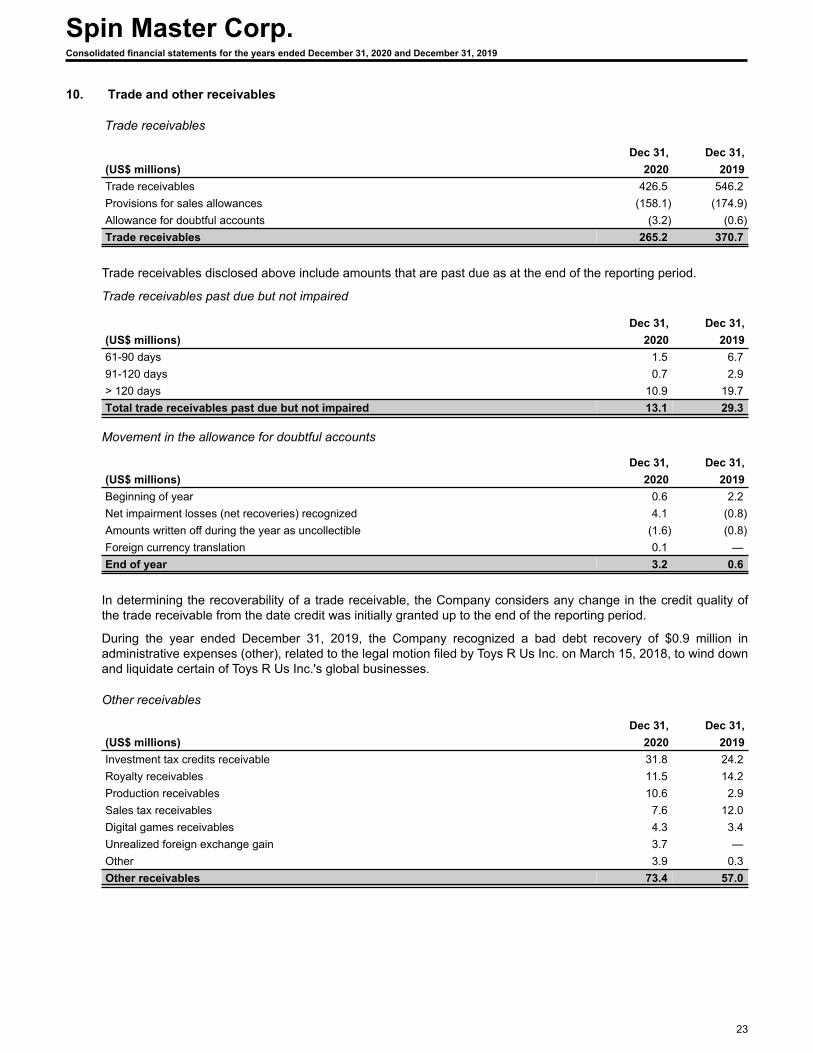
10. Trade and other receivables
Trade receivables
Dec 31, Dec 31,(US$ millions) 2020 2019Trade receivables 426.5 546.2 Provisions for sales allowances (158.1) (174.9) Allowance for doubtful accounts (3.2) (0.6) Trade receivables 265.2 370.7
Trade receivables disclosed above include amounts that are past due as at the end of the reporting period.
Trade receivables past due but not impaired
Dec 31, Dec 31,(US$ millions) 2020 201961-90 days 1.5 6.7 91-120 days 0.7 2.9 > 120 days 10.9 19.7 Total trade receivables past due but not impaired 13.1 29.3
Movement in the allowance for doubtful accounts
Dec 31, Dec 31,(US$ millions) 2020 2019Beginning of year 0.6 2.2 Net impairment losses (net recoveries) recognized 4.1 (0.8) Amounts written off during the year as uncollectible (1.6) (0.8) Foreign currency translation 0.1 — End of year 3.2 0.6
In determining the recoverability of a trade receivable, the Company considers any change in the credit quality of the trade receivable from the date credit was initially granted up to the end of the reporting period.
During the year ended December 31, 2019, the Company recognized a bad debt recovery of $0.9 million in administrative expenses (other), related to the legal motion filed by Toys R Us Inc. on March 15, 2018, to wind down and liquidate certain of Toys R Us Inc.'s global businesses.
Other receivables
Dec 31, Dec 31,(US$ millions) 2020 2019Investment tax credits receivable 31.8 24.2 Royalty receivables 11.5 14.2 Production receivables 10.6 2.9 Sales tax receivables 7.6 12.0 Digital games receivables 4.3 3.4 Unrealized foreign exchange gain 3.7 — Other 3.9 0.3 Other receivables 73.4 57.0
Spin Master Corp.Consolidated financial statements for the years ended December 31, 2020 and December 31, 2019
23
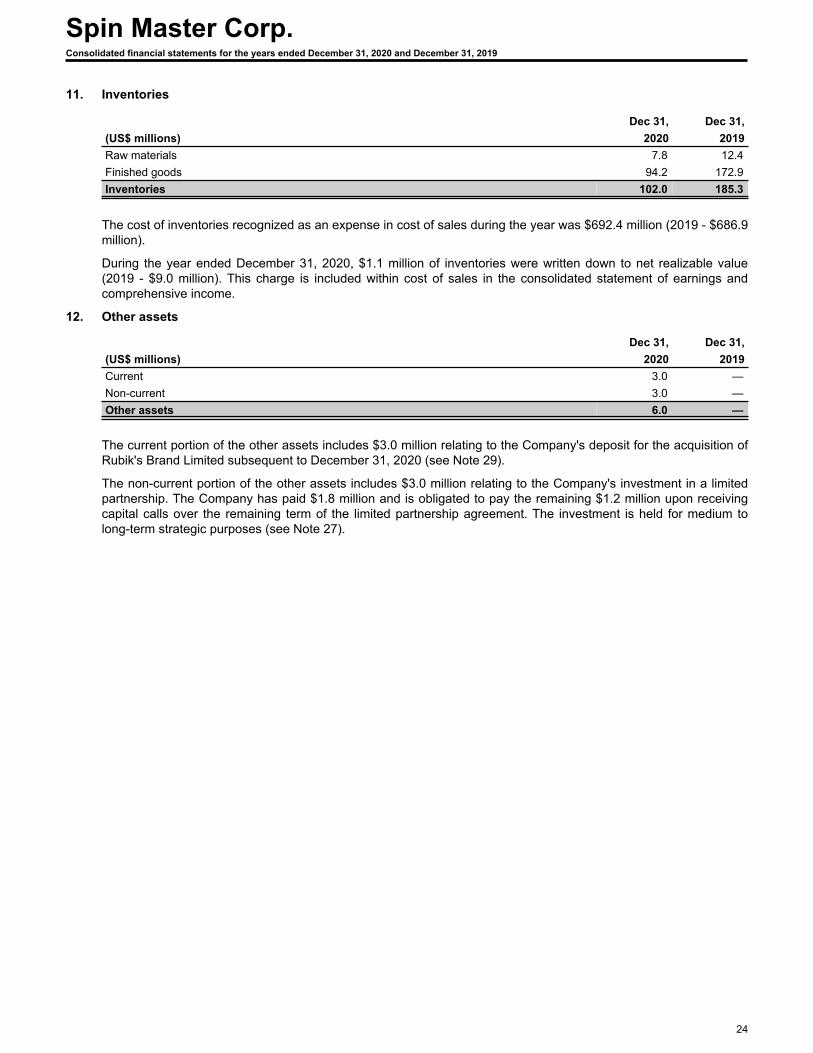
11. Inventories
Dec 31, Dec 31,(US$ millions) 2020 2019Raw materials 7.8 12.4 Finished goods 94.2 172.9 Inventories 102.0 185.3
The cost of inventories recognized as an expense in cost of sales during the year was $692.4 million (2019 - $686.9 million).
During the year ended December 31, 2020, $1.1 million of inventories were written down to net realizable value (2019 - $9.0 million). This charge is included within cost of sales in the consolidated statement of earnings and comprehensive income.
12. Other assets
Dec 31, Dec 31,(US$ millions) 2020 2019Current 3.0 — Non-current 3.0 — Other assets 6.0 —
The current portion of the other assets includes $3.0 million relating to the Company's deposit for the acquisition of Rubik's Brand Limited subsequent to December 31, 2020 (see Note 29).
The non-current portion of the other assets includes $3.0 million relating to the Company's investment in a limited partnership. The Company has paid $1.8 million and is obligated to pay the remaining $1.2 million upon receiving capital calls over the remaining term of the limited partnership agreement. The investment is held for medium to long-term strategic purposes (see Note 27).
Spin Master Corp.Consolidated financial statements for the years ended December 31, 2020 and December 31, 2019
24
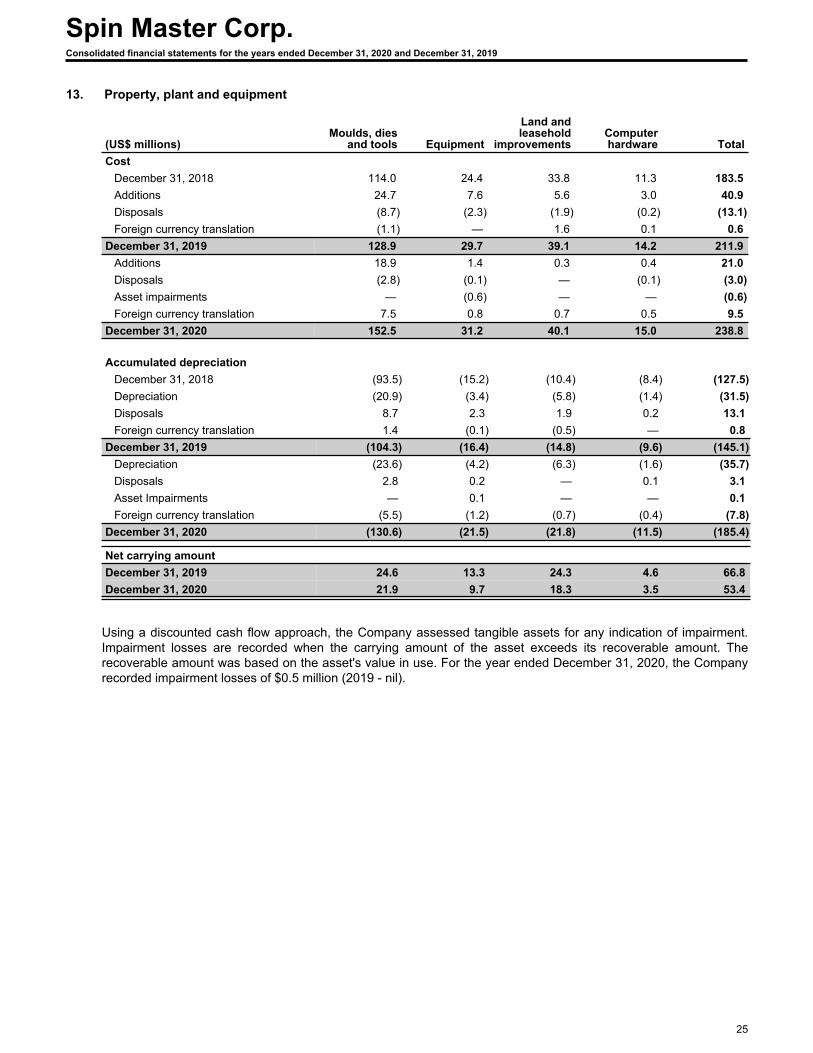
13. Property, plant and equipment
(US$ millions)Moulds, dies
and tools Equipment
Land and leasehold
improvementsComputer hardware Total
CostDecember 31, 2018 114.0 24.4 33.8 11.3 183.5 Additions 24.7 7.6 5.6 3.0 40.9 Disposals (8.7) (2.3) (1.9) (0.2) (13.1) Foreign currency translation (1.1) — 1.6 0.1 0.6
December 31, 2019 128.9 29.7 39.1 14.2 211.9 Additions 18.9 1.4 0.3 0.4 21.0 Disposals (2.8) (0.1) — (0.1) (3.0) Asset impairments — (0.6) — — (0.6) Foreign currency translation 7.5 0.8 0.7 0.5 9.5
December 31, 2020 152.5 31.2 40.1 15.0 238.8
Accumulated depreciationDecember 31, 2018 (93.5) (15.2) (10.4) (8.4) (127.5) Depreciation (20.9) (3.4) (5.8) (1.4) (31.5) Disposals 8.7 2.3 1.9 0.2 13.1 Foreign currency translation 1.4 (0.1) (0.5) — 0.8
December 31, 2019 (104.3) (16.4) (14.8) (9.6) (145.1) Depreciation (23.6) (4.2) (6.3) (1.6) (35.7) Disposals 2.8 0.2 — 0.1 3.1 Asset Impairments — 0.1 — — 0.1 Foreign currency translation (5.5) (1.2) (0.7) (0.4) (7.8)
December 31, 2020 (130.6) (21.5) (21.8) (11.5) (185.4)
Net carrying amountDecember 31, 2019 24.6 13.3 24.3 4.6 66.8 December 31, 2020 21.9 9.7 18.3 3.5 53.4
Using a discounted cash flow approach, the Company assessed tangible assets for any indication of impairment. Impairment losses are recorded when the carrying amount of the asset exceeds its recoverable amount. The recoverable amount was based on the asset's value in use. For the year ended December 31, 2020, the Company recorded impairment losses of $0.5 million (2019 - nil).
Spin Master Corp.Consolidated financial statements for the years ended December 31, 2020 and December 31, 2019
25
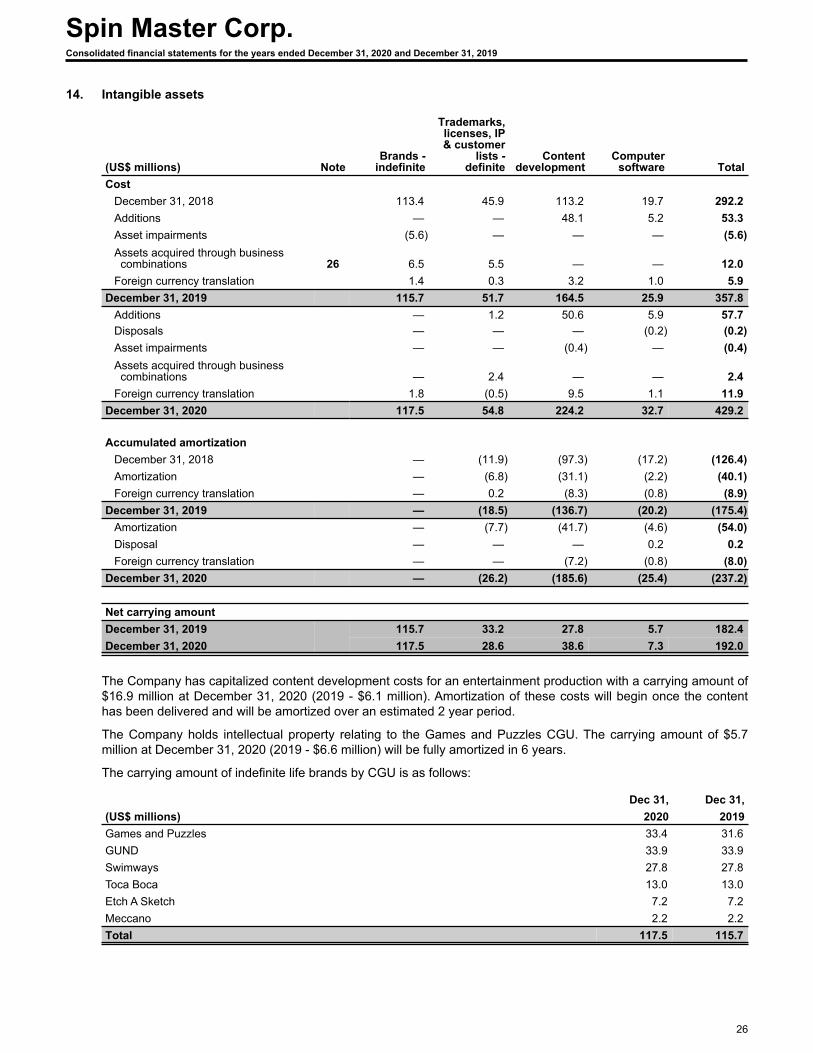
14. Intangible assets
(US$ millions) NoteBrands -
indefinite
Trademarks, licenses, IP & customer
lists - definite
Content development
Computer software Total
CostDecember 31, 2018 113.4 45.9 113.2 19.7 292.2 Additions — — 48.1 5.2 53.3 Asset impairments (5.6) — — — (5.6) Assets acquired through business combinations 26 6.5 5.5 — — 12.0 Foreign currency translation 1.4 0.3 3.2 1.0 5.9
December 31, 2019 115.7 51.7 164.5 25.9 357.8 Additions — 1.2 50.6 5.9 57.7 Disposals — — — (0.2) (0.2) Asset impairments — — (0.4) — (0.4) Assets acquired through business combinations — 2.4 — — 2.4 Foreign currency translation 1.8 (0.5) 9.5 1.1 11.9
December 31, 2020 117.5 54.8 224.2 32.7 429.2
Accumulated amortizationDecember 31, 2018 — (11.9) (97.3) (17.2) (126.4) Amortization — (6.8) (31.1) (2.2) (40.1) Foreign currency translation — 0.2 (8.3) (0.8) (8.9)
December 31, 2019 — (18.5) (136.7) (20.2) (175.4) Amortization — (7.7) (41.7) (4.6) (54.0) Disposal — — — 0.2 0.2 Foreign currency translation — — (7.2) (0.8) (8.0)
December 31, 2020 — (26.2) (185.6) (25.4) (237.2)
Net carrying amountDecember 31, 2019 115.7 33.2 27.8 5.7 182.4 December 31, 2020 117.5 28.6 38.6 7.3 192.0
The Company has capitalized content development costs for an entertainment production with a carrying amount of $16.9 million at December 31, 2020 (2019 - $6.1 million). Amortization of these costs will begin once the content has been delivered and will be amortized over an estimated 2 year period.
The Company holds intellectual property relating to the Games and Puzzles CGU. The carrying amount of $5.7 million at December 31, 2020 (2019 - $6.6 million) will be fully amortized in 6 years.
The carrying amount of indefinite life brands by CGU is as follows:
Dec 31, Dec 31,(US$ millions) 2020 2019Games and Puzzles 33.4 31.6 GUND 33.9 33.9 Swimways 27.8 27.8 Toca Boca 13.0 13.0 Etch A Sketch 7.2 7.2 Meccano 2.2 2.2 Total 117.5 115.7
Spin Master Corp.Consolidated financial statements for the years ended December 31, 2020 and December 31, 2019
26
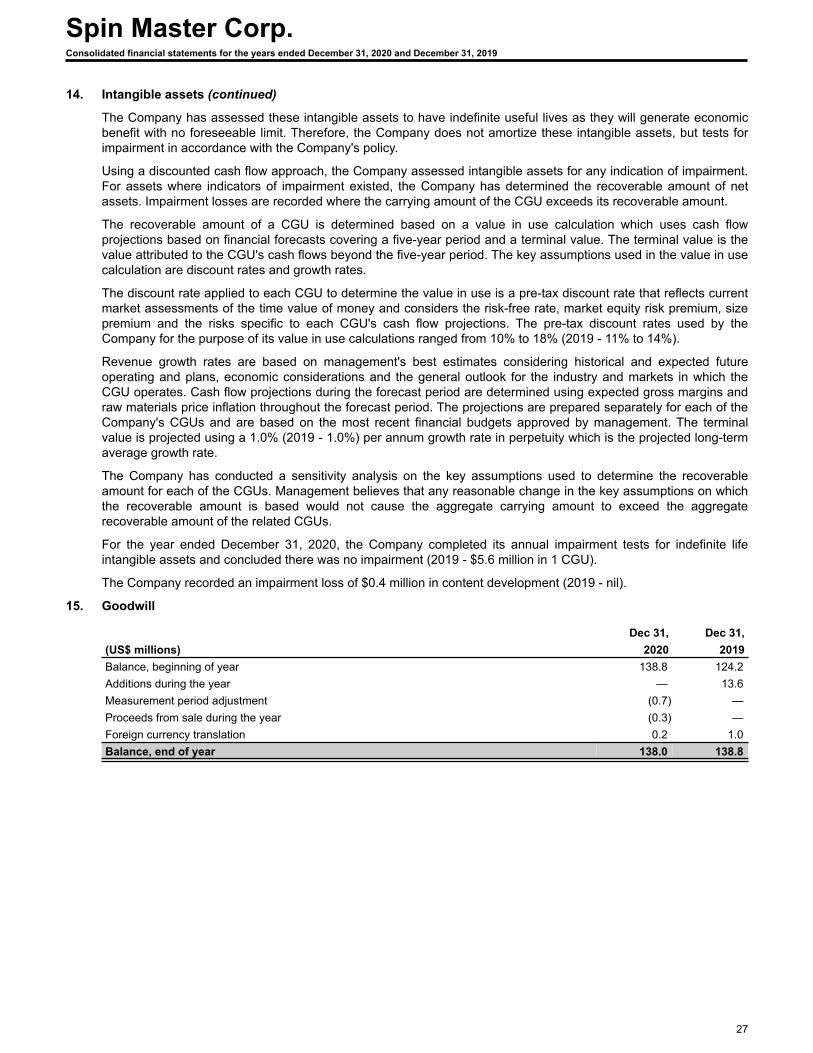
14. Intangible assets (continued)
The Company has assessed these intangible assets to have indefinite useful lives as they will generate economic benefit with no foreseeable limit. Therefore, the Company does not amortize these intangible assets, but tests for impairment in accordance with the Company's policy.
Using a discounted cash flow approach, the Company assessed intangible assets for any indication of impairment. For assets where indicators of impairment existed, the Company has determined the recoverable amount of net assets. Impairment losses are recorded where the carrying amount of the CGU exceeds its recoverable amount.
The recoverable amount of a CGU is determined based on a value in use calculation which uses cash flow projections based on financial forecasts covering a five-year period and a terminal value. The terminal value is the value attributed to the CGU's cash flows beyond the five-year period. The key assumptions used in the value in use calculation are discount rates and growth rates.
The discount rate applied to each CGU to determine the value in use is a pre-tax discount rate that reflects current market assessments of the time value of money and considers the risk-free rate, market equity risk premium, size premium and the risks specific to each CGU's cash flow projections. The pre-tax discount rates used by the Company for the purpose of its value in use calculations ranged from 10% to 18% (2019 - 11% to 14%).
Revenue growth rates are based on management's best estimates considering historical and expected future operating and plans, economic considerations and the general outlook for the industry and markets in which the CGU operates. Cash flow projections during the forecast period are determined using expected gross margins and raw materials price inflation throughout the forecast period. The projections are prepared separately for each of the Company's CGUs and are based on the most recent financial budgets approved by management. The terminal value is projected using a 1.0% (2019 - 1.0%) per annum growth rate in perpetuity which is the projected long-term average growth rate.
The Company has conducted a sensitivity analysis on the key assumptions used to determine the recoverable amount for each of the CGUs. Management believes that any reasonable change in the key assumptions on which the recoverable amount is based would not cause the aggregate carrying amount to exceed the aggregate recoverable amount of the related CGUs.
For the year ended December 31, 2020, the Company completed its annual impairment tests for indefinite life intangible assets and concluded there was no impairment (2019 - $5.6 million in 1 CGU).
The Company recorded an impairment loss of $0.4 million in content development (2019 - nil).
15. Goodwill
Dec 31, Dec 31,(US$ millions) 2020 2019Balance, beginning of year 138.8 124.2 Additions during the year — 13.6 Measurement period adjustment (0.7) — Proceeds from sale during the year (0.3) — Foreign currency translation 0.2 1.0 Balance, end of year 138.0 138.8
Spin Master Corp.Consolidated financial statements for the years ended December 31, 2020 and December 31, 2019
27
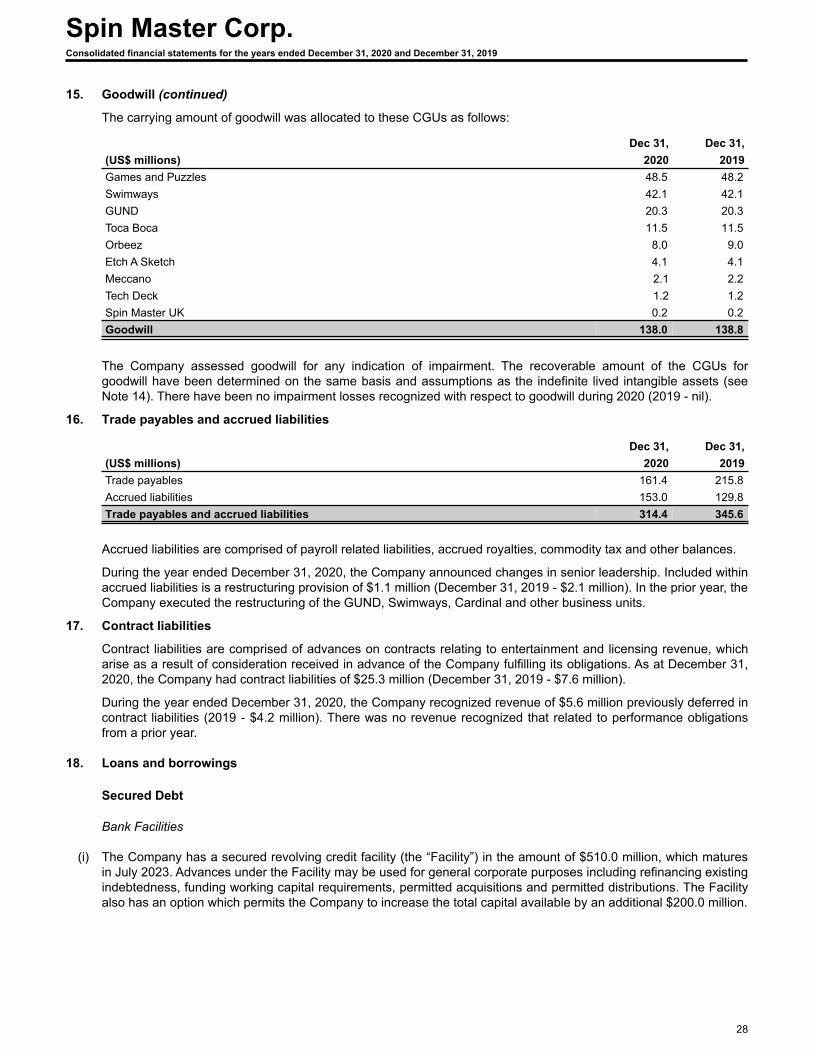
15. Goodwill (continued)
The carrying amount of goodwill was allocated to these CGUs as follows:
Dec 31, Dec 31,(US$ millions) 2020 2019Games and Puzzles 48.5 48.2 Swimways 42.1 42.1 GUND 20.3 20.3 Toca Boca 11.5 11.5 Orbeez 8.0 9.0 Etch A Sketch 4.1 4.1 Meccano 2.1 2.2 Tech Deck 1.2 1.2 Spin Master UK 0.2 0.2 Goodwill 138.0 138.8
The Company assessed goodwill for any indication of impairment. The recoverable amount of the CGUs for goodwill have been determined on the same basis and assumptions as the indefinite lived intangible assets (see Note 14). There have been no impairment losses recognized with respect to goodwill during 2020 (2019 - nil).
16. Trade payables and accrued liabilities
Dec 31, Dec 31,(US$ millions) 2020 2019Trade payables 161.4 215.8 Accrued liabilities 153.0 129.8 Trade payables and accrued liabilities 314.4 345.6
Accrued liabilities are comprised of payroll related liabilities, accrued royalties, commodity tax and other balances.
During the year ended December 31, 2020, the Company announced changes in senior leadership. Included within accrued liabilities is a restructuring provision of $1.1 million (December 31, 2019 - $2.1 million). In the prior year, the Company executed the restructuring of the GUND, Swimways, Cardinal and other business units.
17. Contract liabilities
Contract liabilities are comprised of advances on contracts relating to entertainment and licensing revenue, which arise as a result of consideration received in advance of the Company fulfilling its obligations. As at December 31, 2020, the Company had contract liabilities of $25.3 million (December 31, 2019 - $7.6 million).
During the year ended December 31, 2020, the Company recognized revenue of $5.6 million previously deferred in contract liabilities (2019 - $4.2 million). There was no revenue recognized that related to performance obligations from a prior year.
18. Loans and borrowings
Secured Debt
Bank Facilities
(i) The Company has a secured revolving credit facility (the “Facility”) in the amount of $510.0 million, which matures in July 2023. Advances under the Facility may be used for general corporate purposes including refinancing existing indebtedness, funding working capital requirements, permitted acquisitions and permitted distributions. The Facility also has an option which permits the Company to increase the total capital available by an additional $200.0 million.
Spin Master Corp.Consolidated financial statements for the years ended December 31, 2020 and December 31, 2019
28
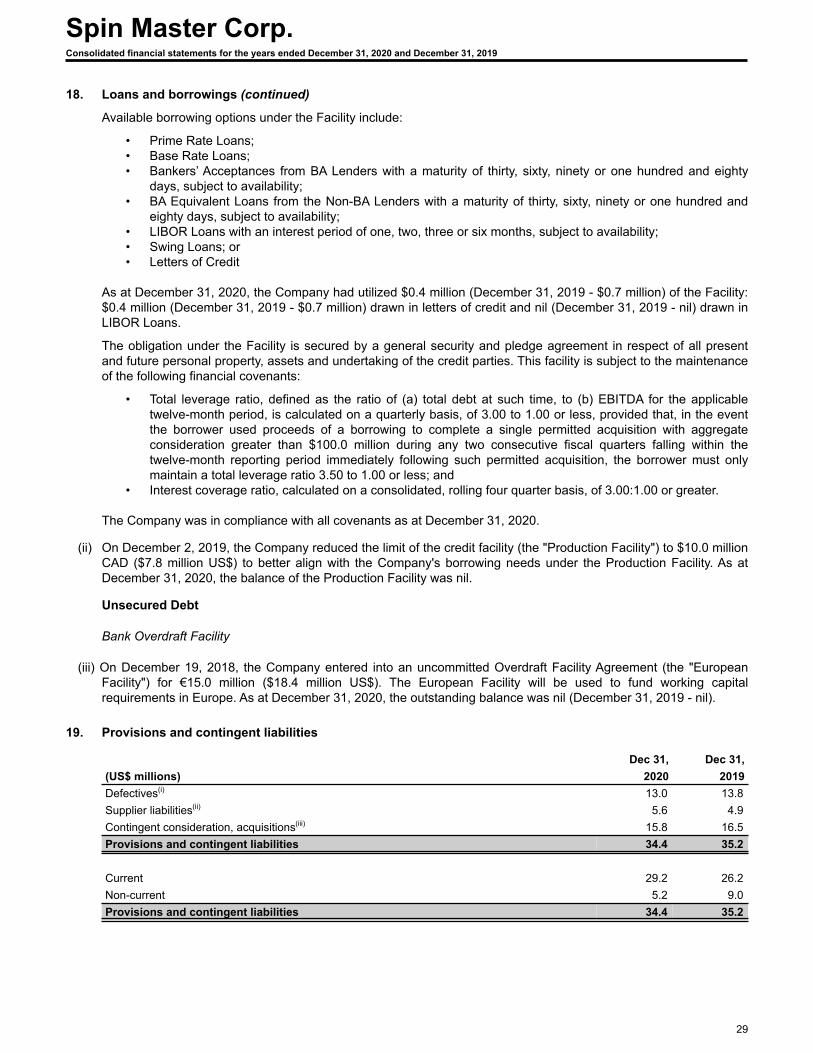
18. Loans and borrowings (continued)
Available borrowing options under the Facility include:
• Prime Rate Loans;• Base Rate Loans;• Bankers’ Acceptances from BA Lenders with a maturity of thirty, sixty, ninety or one hundred and eighty
days, subject to availability;• BA Equivalent Loans from the Non-BA Lenders with a maturity of thirty, sixty, ninety or one hundred and
eighty days, subject to availability; • LIBOR Loans with an interest period of one, two, three or six months, subject to availability;• Swing Loans; or• Letters of Credit
As at December 31, 2020, the Company had utilized $0.4 million (December 31, 2019 - $0.7 million) of the Facility: $0.4 million (December 31, 2019 - $0.7 million) drawn in letters of credit and nil (December 31, 2019 - nil) drawn in LIBOR Loans.
The obligation under the Facility is secured by a general security and pledge agreement in respect of all present and future personal property, assets and undertaking of the credit parties. This facility is subject to the maintenance of the following financial covenants:
• Total leverage ratio, defined as the ratio of (a) total debt at such time, to (b) EBITDA for the applicable twelve-month period, is calculated on a quarterly basis, of 3.00 to 1.00 or less, provided that, in the event the borrower used proceeds of a borrowing to complete a single permitted acquisition with aggregate consideration greater than $100.0 million during any two consecutive fiscal quarters falling within the twelve-month reporting period immediately following such permitted acquisition, the borrower must only maintain a total leverage ratio 3.50 to 1.00 or less; and
• Interest coverage ratio, calculated on a consolidated, rolling four quarter basis, of 3.00:1.00 or greater.
The Company was in compliance with all covenants as at December 31, 2020.
(ii) On December 2, 2019, the Company reduced the limit of the credit facility (the "Production Facility") to $10.0 million CAD ($7.8 million US$) to better align with the Company's borrowing needs under the Production Facility. As at December 31, 2020, the balance of the Production Facility was nil.
Unsecured Debt
Bank Overdraft Facility
(iii) On December 19, 2018, the Company entered into an uncommitted Overdraft Facility Agreement (the "European Facility") for €15.0 million ($18.4 million US$). The European Facility will be used to fund working capital requirements in Europe. As at December 31, 2020, the outstanding balance was nil (December 31, 2019 - nil).
19. Provisions and contingent liabilities
Dec 31, Dec 31,(US$ millions) 2020 2019Defectives(i) 13.0 13.8 Supplier liabilities(ii) 5.6 4.9 Contingent consideration, acquisitions(iii) 15.8 16.5 Provisions and contingent liabilities 34.4 35.2
Current 29.2 26.2 Non-current 5.2 9.0 Provisions and contingent liabilities 34.4 35.2
Spin Master Corp.Consolidated financial statements for the years ended December 31, 2020 and December 31, 2019
29
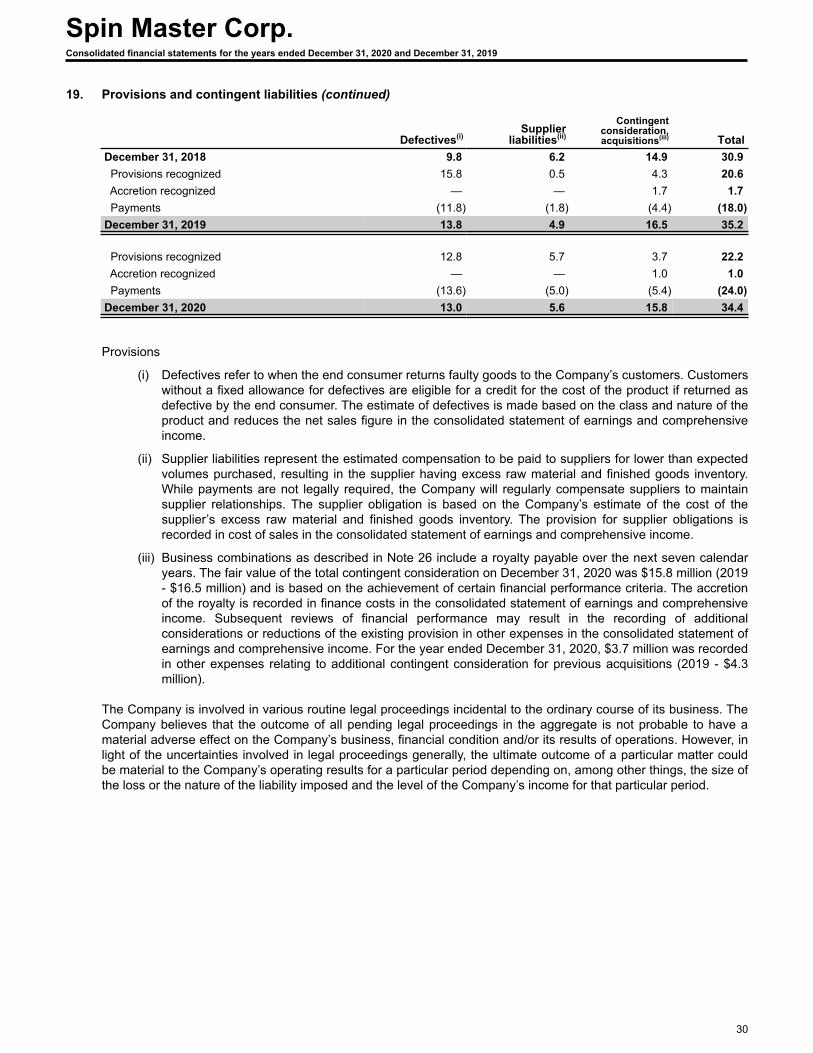
19. Provisions and contingent liabilities (continued)
Supplierliabilities(ii)
Contingent consideration, acquisitions(iii)Defectives(i) Total
December 31, 2018 9.8 6.2 14.9 30.9 Provisions recognized 15.8 0.5 4.3 20.6 Accretion recognized — — 1.7 1.7 Payments (11.8) (1.8) (4.4) (18.0) December 31, 2019 13.8 4.9 16.5 35.2
Provisions recognized 12.8 5.7 3.7 22.2 Accretion recognized — — 1.0 1.0 Payments (13.6) (5.0) (5.4) (24.0) December 31, 2020 13.0 5.6 15.8 34.4
Provisions
(i) Defectives refer to when the end consumer returns faulty goods to the Company’s customers. Customers without a fixed allowance for defectives are eligible for a credit for the cost of the product if returned as defective by the end consumer. The estimate of defectives is made based on the class and nature of the product and reduces the net sales figure in the consolidated statement of earnings and comprehensive income.
(ii) Supplier liabilities represent the estimated compensation to be paid to suppliers for lower than expected volumes purchased, resulting in the supplier having excess raw material and finished goods inventory. While payments are not legally required, the Company will regularly compensate suppliers to maintain supplier relationships. The supplier obligation is based on the Company’s estimate of the cost of the supplier’s excess raw material and finished goods inventory. The provision for supplier obligations is recorded in cost of sales in the consolidated statement of earnings and comprehensive income.
(iii) Business combinations as described in Note 26 include a royalty payable over the next seven calendar years. The fair value of the total contingent consideration on December 31, 2020 was $15.8 million (2019 - $16.5 million) and is based on the achievement of certain financial performance criteria. The accretion of the royalty is recorded in finance costs in the consolidated statement of earnings and comprehensive income. Subsequent reviews of financial performance may result in the recording of additional considerations or reductions of the existing provision in other expenses in the consolidated statement of earnings and comprehensive income. For the year ended December 31, 2020, $3.7 million was recorded in other expenses relating to additional contingent consideration for previous acquisitions (2019 - $4.3 million).
The Company is involved in various routine legal proceedings incidental to the ordinary course of its business. The Company believes that the outcome of all pending legal proceedings in the aggregate is not probable to have a material adverse effect on the Company’s business, financial condition and/or its results of operations. However, in light of the uncertainties involved in legal proceedings generally, the ultimate outcome of a particular matter could be material to the Company’s operating results for a particular period depending on, among other things, the size of the loss or the nature of the liability imposed and the level of the Company’s income for that particular period.
Spin Master Corp.Consolidated financial statements for the years ended December 31, 2020 and December 31, 2019
30
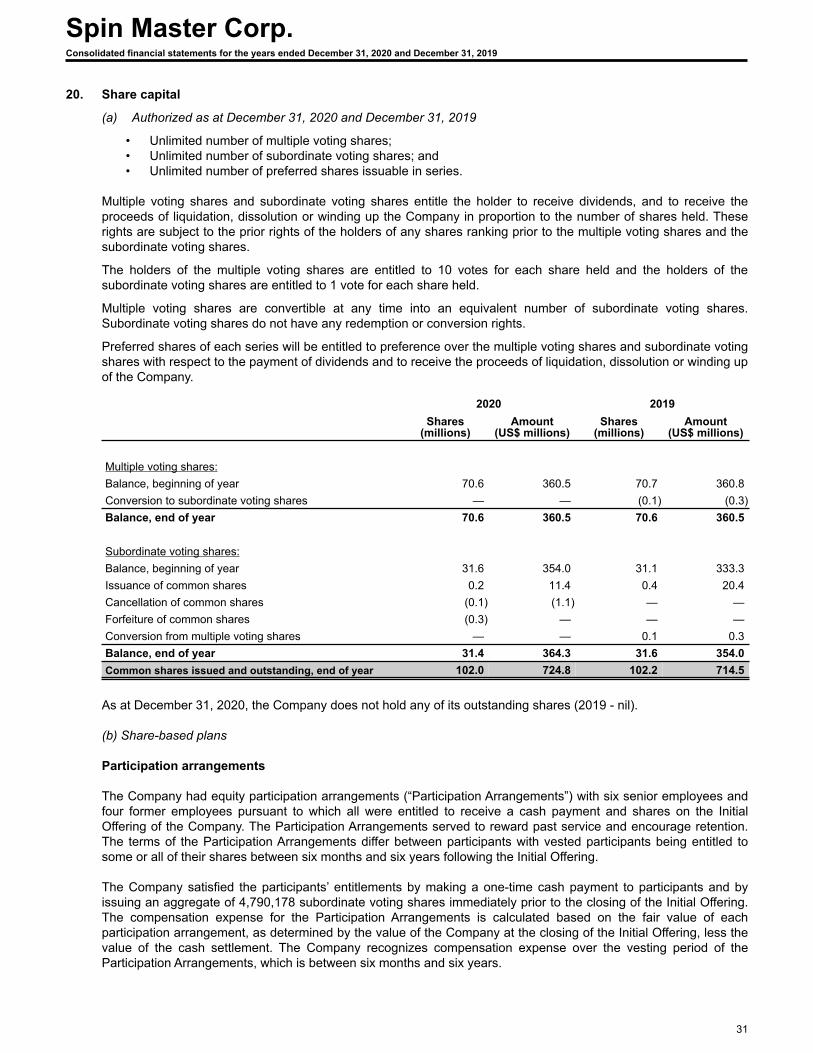
20. Share capital
(a) Authorized as at December 31, 2020 and December 31, 2019
• Unlimited number of multiple voting shares;• Unlimited number of subordinate voting shares; and • Unlimited number of preferred shares issuable in series.
Multiple voting shares and subordinate voting shares entitle the holder to receive dividends, and to receive the proceeds of liquidation, dissolution or winding up the Company in proportion to the number of shares held. These rights are subject to the prior rights of the holders of any shares ranking prior to the multiple voting shares and the subordinate voting shares.
The holders of the multiple voting shares are entitled to 10 votes for each share held and the holders of the subordinate voting shares are entitled to 1 vote for each share held.
Multiple voting shares are convertible at any time into an equivalent number of subordinate voting shares. Subordinate voting shares do not have any redemption or conversion rights.
Preferred shares of each series will be entitled to preference over the multiple voting shares and subordinate voting shares with respect to the payment of dividends and to receive the proceeds of liquidation, dissolution or winding up of the Company.
2020 2019Shares
(millions)Amount
(US$ millions)Shares
(millions)Amount
(US$ millions)
Multiple voting shares:Balance, beginning of year 70.6 360.5 70.7 360.8 Conversion to subordinate voting shares — — (0.1) (0.3) Balance, end of year 70.6 360.5 70.6 360.5
Subordinate voting shares:Balance, beginning of year 31.6 354.0 31.1 333.3 Issuance of common shares 0.2 11.4 0.4 20.4 Cancellation of common shares (0.1) (1.1) — — Forfeiture of common shares (0.3) — — — Conversion from multiple voting shares — — 0.1 0.3 Balance, end of year 31.4 364.3 31.6 354.0 Common shares issued and outstanding, end of year 102.0 724.8 102.2 714.5
As at December 31, 2020, the Company does not hold any of its outstanding shares (2019 - nil).
(b) Share-based plans
Participation arrangements
The Company had equity participation arrangements (“Participation Arrangements”) with six senior employees and four former employees pursuant to which all were entitled to receive a cash payment and shares on the Initial Offering of the Company. The Participation Arrangements served to reward past service and encourage retention. The terms of the Participation Arrangements differ between participants with vested participants being entitled to some or all of their shares between six months and six years following the Initial Offering.
The Company satisfied the participants’ entitlements by making a one-time cash payment to participants and by issuing an aggregate of 4,790,178 subordinate voting shares immediately prior to the closing of the Initial Offering. The compensation expense for the Participation Arrangements is calculated based on the fair value of each participation arrangement, as determined by the value of the Company at the closing of the Initial Offering, less the value of the cash settlement. The Company recognizes compensation expense over the vesting period of the Participation Arrangements, which is between six months and six years.
Spin Master Corp.Consolidated financial statements for the years ended December 31, 2020 and December 31, 2019
31
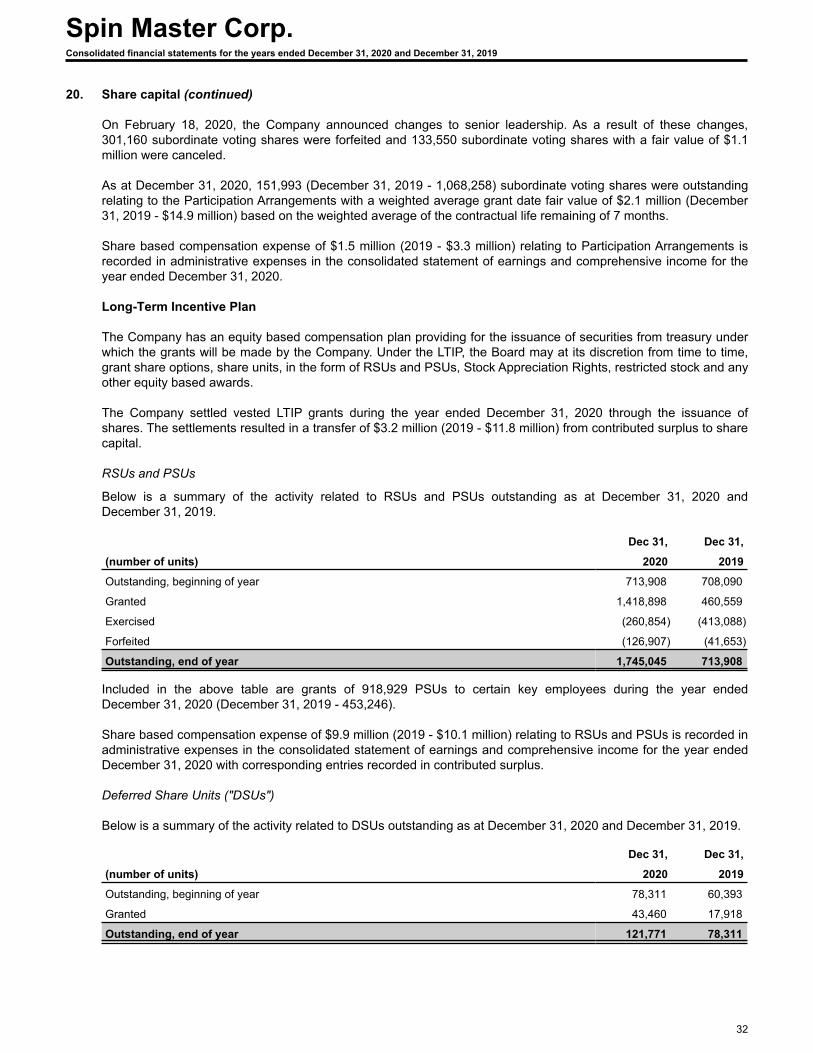
20. Share capital (continued)
On February 18, 2020, the Company announced changes to senior leadership. As a result of these changes, 301,160 subordinate voting shares were forfeited and 133,550 subordinate voting shares with a fair value of $1.1 million were canceled.
As at December 31, 2020, 151,993 (December 31, 2019 - 1,068,258) subordinate voting shares were outstanding relating to the Participation Arrangements with a weighted average grant date fair value of $2.1 million (December 31, 2019 - $14.9 million) based on the weighted average of the contractual life remaining of 7 months.
Share based compensation expense of $1.5 million (2019 - $3.3 million) relating to Participation Arrangements is recorded in administrative expenses in the consolidated statement of earnings and comprehensive income for the year ended December 31, 2020.
Long-Term Incentive Plan
The Company has an equity based compensation plan providing for the issuance of securities from treasury under which the grants will be made by the Company. Under the LTIP, the Board may at its discretion from time to time, grant share options, share units, in the form of RSUs and PSUs, Stock Appreciation Rights, restricted stock and any other equity based awards.
The Company settled vested LTIP grants during the year ended December 31, 2020 through the issuance of shares. The settlements resulted in a transfer of $3.2 million (2019 - $11.8 million) from contributed surplus to share capital.
RSUs and PSUs
Below is a summary of the activity related to RSUs and PSUs outstanding as at December 31, 2020 and December 31, 2019.
Dec 31, Dec 31,
(number of units) 2020 2019
Outstanding, beginning of year 713,908 708,090
Granted 1,418,898 460,559
Exercised (260,854) (413,088)
Forfeited (126,907) (41,653)
Outstanding, end of year 1,745,045 713,908
Included in the above table are grants of 918,929 PSUs to certain key employees during the year ended December 31, 2020 (December 31, 2019 - 453,246).
Share based compensation expense of $9.9 million (2019 - $10.1 million) relating to RSUs and PSUs is recorded in administrative expenses in the consolidated statement of earnings and comprehensive income for the year ended December 31, 2020 with corresponding entries recorded in contributed surplus.
Deferred Share Units ("DSUs")
Below is a summary of the activity related to DSUs outstanding as at December 31, 2020 and December 31, 2019.
Dec 31, Dec 31,
(number of units) 2020 2019
Outstanding, beginning of year 78,311 60,393
Granted 43,460 17,918
Outstanding, end of year 121,771 78,311
Spin Master Corp.Consolidated financial statements for the years ended December 31, 2020 and December 31, 2019
32
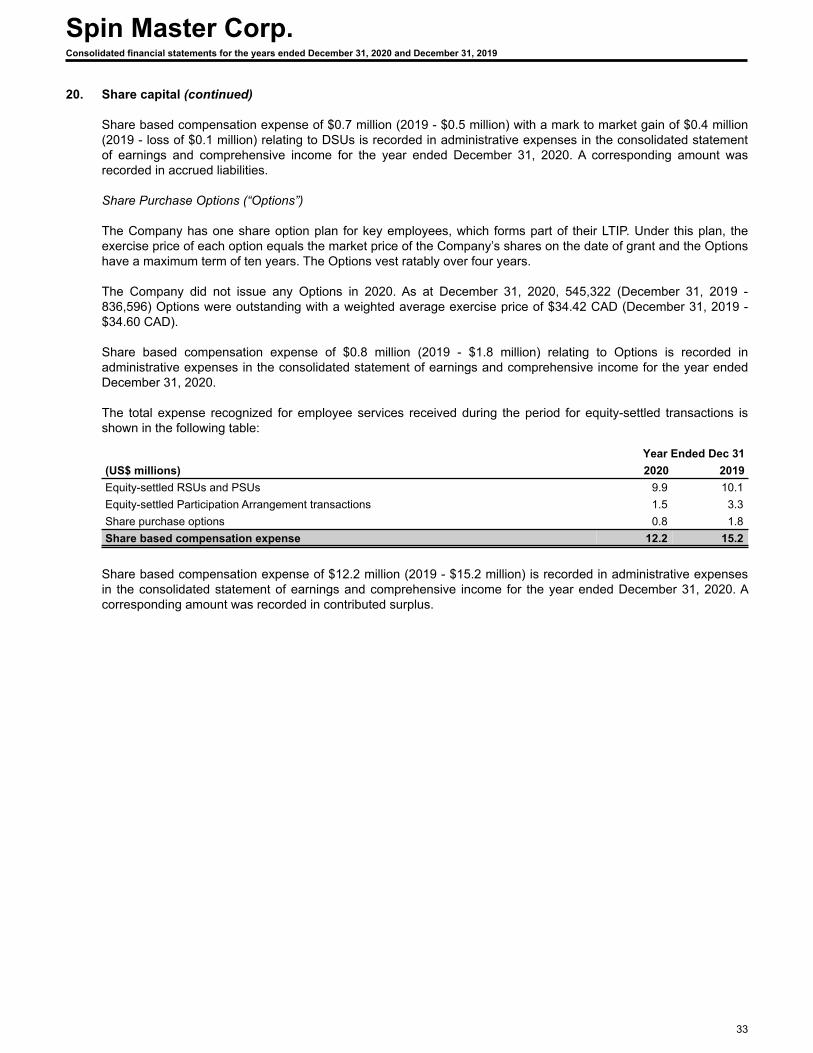
20. Share capital (continued)
Share based compensation expense of $0.7 million (2019 - $0.5 million) with a mark to market gain of $0.4 million (2019 - loss of $0.1 million) relating to DSUs is recorded in administrative expenses in the consolidated statement of earnings and comprehensive income for the year ended December 31, 2020. A corresponding amount was recorded in accrued liabilities.
Share Purchase Options (“Options”)
The Company has one share option plan for key employees, which forms part of their LTIP. Under this plan, the exercise price of each option equals the market price of the Company’s shares on the date of grant and the Options have a maximum term of ten years. The Options vest ratably over four years.
The Company did not issue any Options in 2020. As at December 31, 2020, 545,322 (December 31, 2019 - 836,596) Options were outstanding with a weighted average exercise price of $34.42 CAD (December 31, 2019 - $34.60 CAD).
Share based compensation expense of $0.8 million (2019 - $1.8 million) relating to Options is recorded in administrative expenses in the consolidated statement of earnings and comprehensive income for the year ended December 31, 2020.
The total expense recognized for employee services received during the period for equity-settled transactions is shown in the following table:
Year Ended Dec 31(US$ millions) 2020 2019Equity-settled RSUs and PSUs 9.9 10.1 Equity-settled Participation Arrangement transactions 1.5 3.3 Share purchase options 0.8 1.8 Share based compensation expense 12.2 15.2
Share based compensation expense of $12.2 million (2019 - $15.2 million) is recorded in administrative expenses in the consolidated statement of earnings and comprehensive income for the year ended December 31, 2020. A corresponding amount was recorded in contributed surplus.
Spin Master Corp.Consolidated financial statements for the years ended December 31, 2020 and December 31, 2019
33
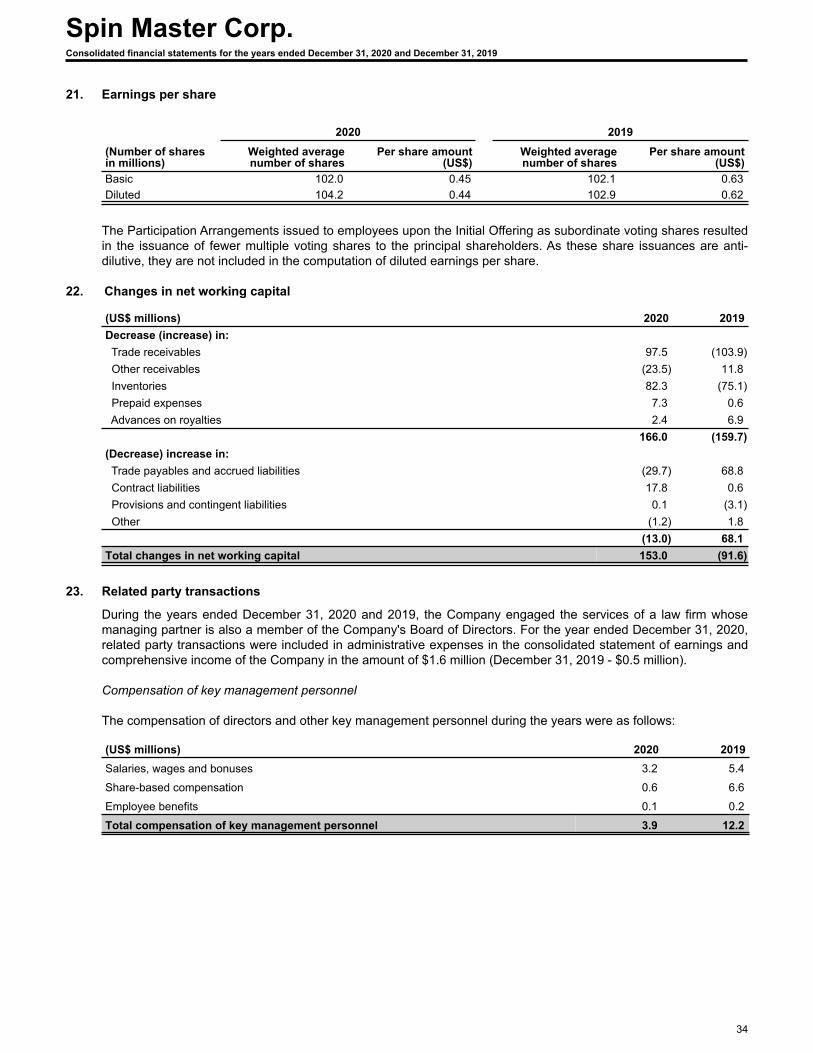
21. Earnings per share
2020 2019(Number of shares in millions)
Weighted average number of shares
Per share amount (US$)
Weighted average number of shares
Per share amount (US$)
Basic 102.0 0.45 102.1 0.63 Diluted 104.2 0.44 102.9 0.62
The Participation Arrangements issued to employees upon the Initial Offering as subordinate voting shares resulted in the issuance of fewer multiple voting shares to the principal shareholders. As these share issuances are anti-dilutive, they are not included in the computation of diluted earnings per share.
22. Changes in net working capital
(US$ millions) 2020 2019Decrease (increase) in: Trade receivables 97.5 (103.9) Other receivables (23.5) 11.8 Inventories 82.3 (75.1) Prepaid expenses 7.3 0.6 Advances on royalties 2.4 6.9
166.0 (159.7) (Decrease) increase in: Trade payables and accrued liabilities (29.7) 68.8 Contract liabilities 17.8 0.6 Provisions and contingent liabilities 0.1 (3.1) Other (1.2) 1.8
(13.0) 68.1 Total changes in net working capital 153.0 (91.6)
23. Related party transactions
During the years ended December 31, 2020 and 2019, the Company engaged the services of a law firm whose managing partner is also a member of the Company's Board of Directors. For the year ended December 31, 2020, related party transactions were included in administrative expenses in the consolidated statement of earnings and comprehensive income of the Company in the amount of $1.6 million (December 31, 2019 - $0.5 million).
Compensation of key management personnel
The compensation of directors and other key management personnel during the years were as follows:
(US$ millions) 2020 2019Salaries, wages and bonuses 3.2 5.4
Share-based compensation 0.6 6.6
Employee benefits 0.1 0.2
Total compensation of key management personnel 3.9 12.2
Spin Master Corp.Consolidated financial statements for the years ended December 31, 2020 and December 31, 2019
34
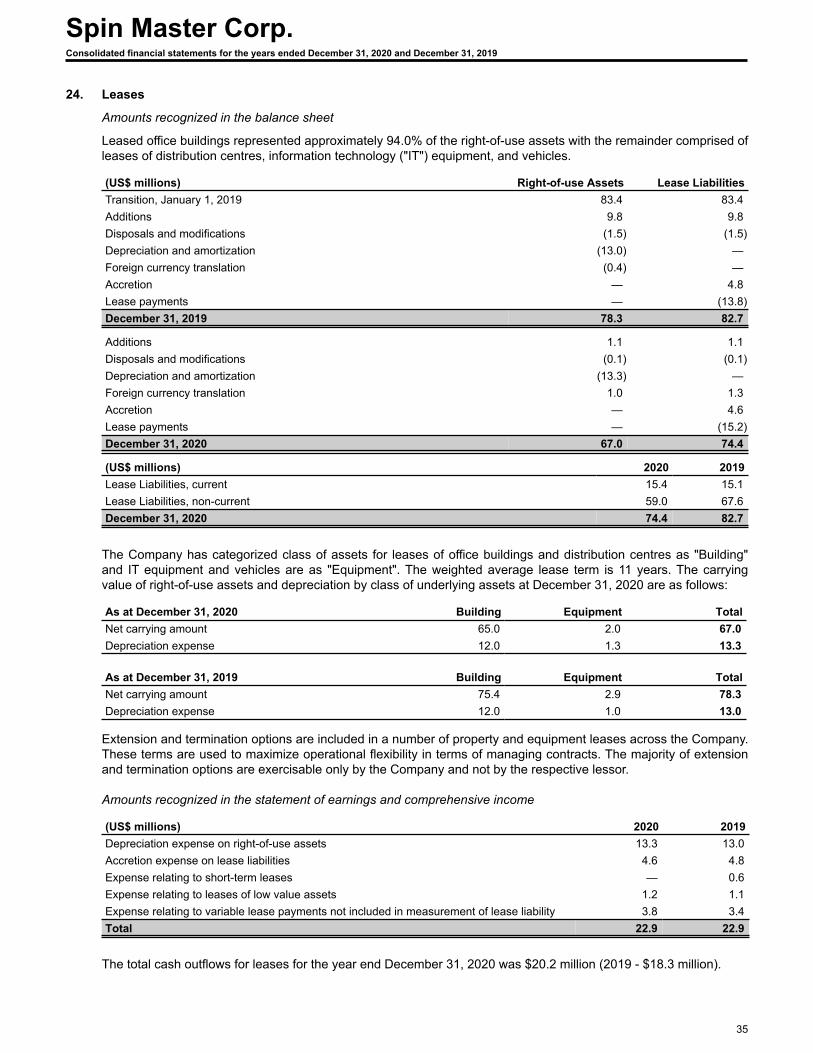
24. Leases
Amounts recognized in the balance sheet
Leased office buildings represented approximately 94.0% of the right-of-use assets with the remainder comprised of leases of distribution centres, information technology ("IT") equipment, and vehicles.
(US$ millions) Right-of-use Assets Lease LiabilitiesTransition, January 1, 2019 83.4 83.4 Additions 9.8 9.8 Disposals and modifications (1.5) (1.5) Depreciation and amortization (13.0) — Foreign currency translation (0.4) — Accretion — 4.8 Lease payments — (13.8) December 31, 2019 78.3 82.7
Additions 1.1 1.1 Disposals and modifications (0.1) (0.1) Depreciation and amortization (13.3) — Foreign currency translation 1.0 1.3 Accretion — 4.6 Lease payments — (15.2) December 31, 2020 67.0 74.4
(US$ millions) 2020 2019Lease Liabilities, current 15.4 15.1 Lease Liabilities, non-current 59.0 67.6 December 31, 2020 74.4 82.7
The Company has categorized class of assets for leases of office buildings and distribution centres as "Building" and IT equipment and vehicles are as "Equipment". The weighted average lease term is 11 years. The carrying value of right-of-use assets and depreciation by class of underlying assets at December 31, 2020 are as follows:
As at December 31, 2020 Building Equipment TotalNet carrying amount 65.0 2.0 67.0 Depreciation expense 12.0 1.3 13.3
As at December 31, 2019 Building Equipment TotalNet carrying amount 75.4 2.9 78.3 Depreciation expense 12.0 1.0 13.0
Extension and termination options are included in a number of property and equipment leases across the Company. These terms are used to maximize operational flexibility in terms of managing contracts. The majority of extension and termination options are exercisable only by the Company and not by the respective lessor.
Amounts recognized in the statement of earnings and comprehensive income
(US$ millions) 2020 2019Depreciation expense on right-of-use assets 13.3 13.0 Accretion expense on lease liabilities 4.6 4.8 Expense relating to short-term leases — 0.6 Expense relating to leases of low value assets 1.2 1.1 Expense relating to variable lease payments not included in measurement of lease liability 3.8 3.4 Total 22.9 22.9
The total cash outflows for leases for the year end December 31, 2020 was $20.2 million (2019 - $18.3 million).
Spin Master Corp.Consolidated financial statements for the years ended December 31, 2020 and December 31, 2019
35
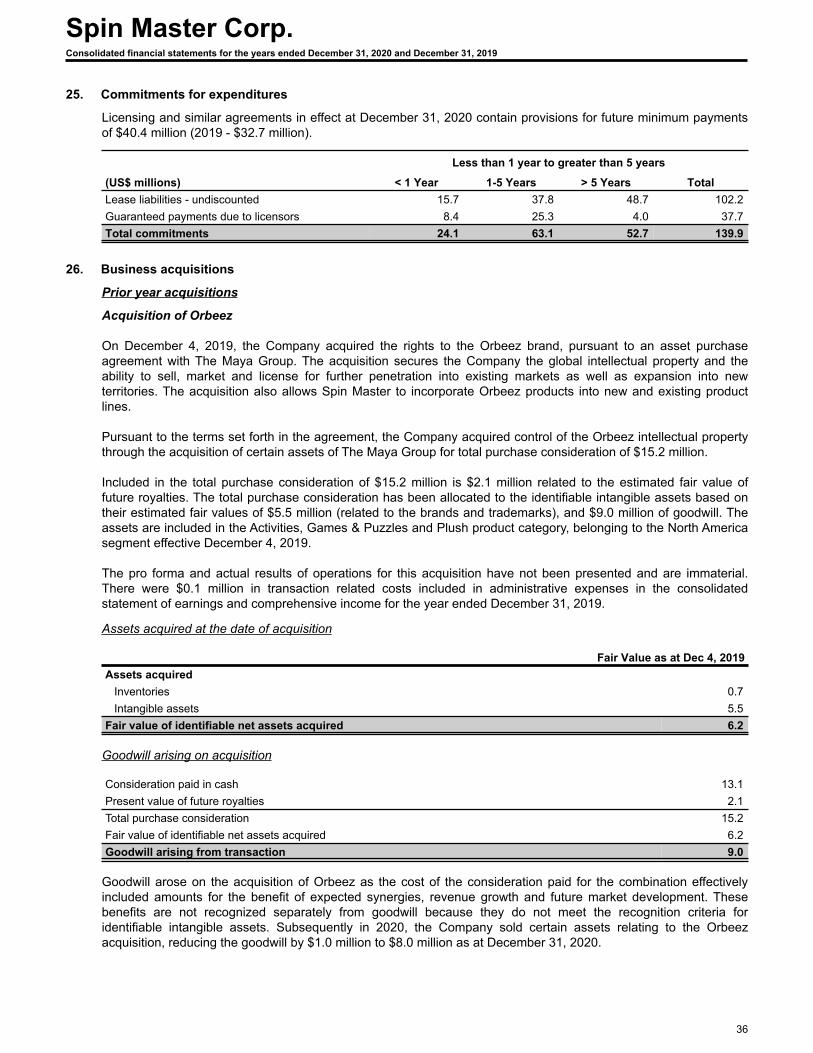
25. Commitments for expenditures
Licensing and similar agreements in effect at December 31, 2020 contain provisions for future minimum payments of $40.4 million (2019 - $32.7 million).
Less than 1 year to greater than 5 years
(US$ millions) < 1 Year 1-5 Years > 5 Years TotalLease liabilities - undiscounted 15.7 37.8 48.7 102.2 Guaranteed payments due to licensors 8.4 25.3 4.0 37.7 Total commitments 24.1 63.1 52.7 139.9
26. Business acquisitions
Prior year acquisitions
Acquisition of Orbeez
On December 4, 2019, the Company acquired the rights to the Orbeez brand, pursuant to an asset purchase agreement with The Maya Group. The acquisition secures the Company the global intellectual property and the ability to sell, market and license for further penetration into existing markets as well as expansion into new territories. The acquisition also allows Spin Master to incorporate Orbeez products into new and existing product lines.
Pursuant to the terms set forth in the agreement, the Company acquired control of the Orbeez intellectual property through the acquisition of certain assets of The Maya Group for total purchase consideration of $15.2 million.
Included in the total purchase consideration of $15.2 million is $2.1 million related to the estimated fair value of future royalties. The total purchase consideration has been allocated to the identifiable intangible assets based on their estimated fair values of $5.5 million (related to the brands and trademarks), and $9.0 million of goodwill. The assets are included in the Activities, Games & Puzzles and Plush product category, belonging to the North America segment effective December 4, 2019.
The pro forma and actual results of operations for this acquisition have not been presented and are immaterial. There were $0.1 million in transaction related costs included in administrative expenses in the consolidated statement of earnings and comprehensive income for the year ended December 31, 2019.
Assets acquired at the date of acquisition
Fair Value as at Dec 4, 2019Assets acquired
Inventories 0.7 Intangible assets 5.5
Fair value of identifiable net assets acquired 6.2
Goodwill arising on acquisition
Consideration paid in cash 13.1 Present value of future royalties 2.1 Total purchase consideration 15.2 Fair value of identifiable net assets acquired 6.2 Goodwill arising from transaction 9.0
Goodwill arose on the acquisition of Orbeez as the cost of the consideration paid for the combination effectively included amounts for the benefit of expected synergies, revenue growth and future market development. These benefits are not recognized separately from goodwill because they do not meet the recognition criteria for identifiable intangible assets. Subsequently in 2020, the Company sold certain assets relating to the Orbeez acquisition, reducing the goodwill by $1.0 million to $8.0 million as at December 31, 2020.
Spin Master Corp.Consolidated financial statements for the years ended December 31, 2020 and December 31, 2019
36
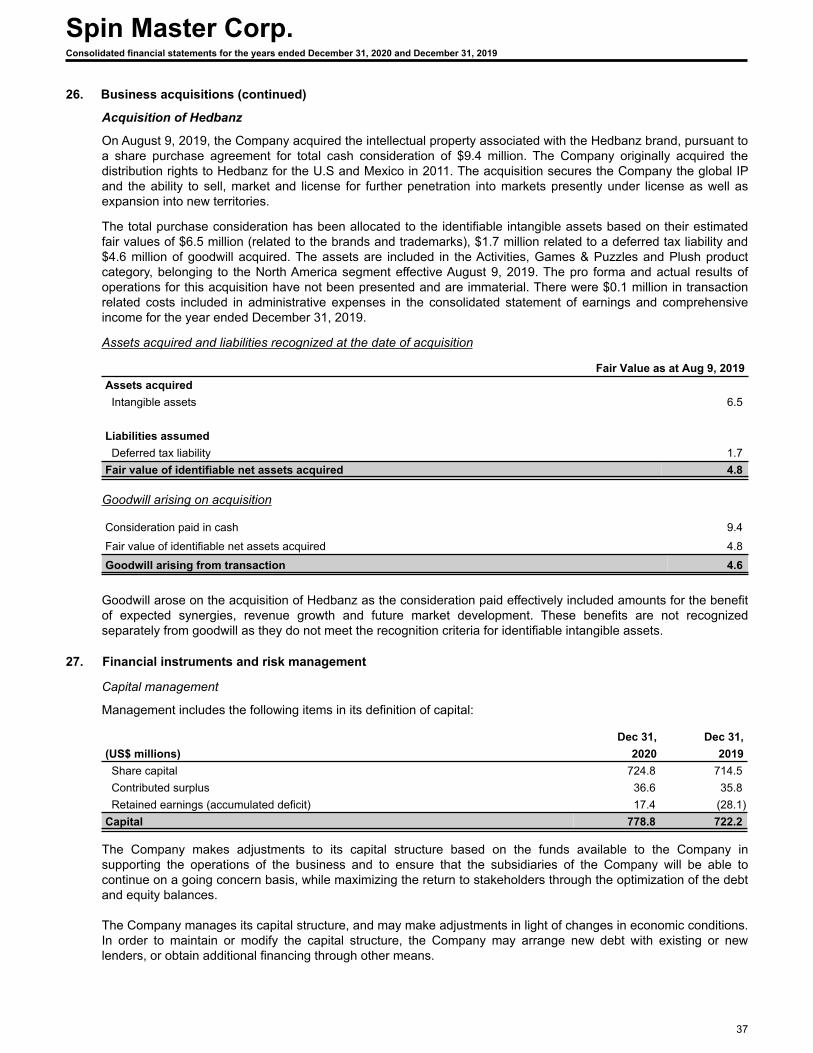
26. Business acquisitions (continued)
Acquisition of Hedbanz
On August 9, 2019, the Company acquired the intellectual property associated with the Hedbanz brand, pursuant to a share purchase agreement for total cash consideration of $9.4 million. The Company originally acquired the distribution rights to Hedbanz for the U.S and Mexico in 2011. The acquisition secures the Company the global IP and the ability to sell, market and license for further penetration into markets presently under license as well as expansion into new territories.
The total purchase consideration has been allocated to the identifiable intangible assets based on their estimated fair values of $6.5 million (related to the brands and trademarks), $1.7 million related to a deferred tax liability and $4.6 million of goodwill acquired. The assets are included in the Activities, Games & Puzzles and Plush product category, belonging to the North America segment effective August 9, 2019. The pro forma and actual results of operations for this acquisition have not been presented and are immaterial. There were $0.1 million in transaction related costs included in administrative expenses in the consolidated statement of earnings and comprehensive income for the year ended December 31, 2019.
Assets acquired and liabilities recognized at the date of acquisition
Fair Value as at Aug 9, 2019Assets acquired Intangible assets 6.5
Liabilities assumed Deferred tax liability 1.7 Fair value of identifiable net assets acquired 4.8
Goodwill arising on acquisition
Consideration paid in cash 9.4
Fair value of identifiable net assets acquired 4.8
Goodwill arising from transaction 4.6
Goodwill arose on the acquisition of Hedbanz as the consideration paid effectively included amounts for the benefit of expected synergies, revenue growth and future market development. These benefits are not recognized separately from goodwill as they do not meet the recognition criteria for identifiable intangible assets.
27. Financial instruments and risk management
Capital management
Management includes the following items in its definition of capital:
Dec 31, Dec 31,(US$ millions) 2020 2019 Share capital 724.8 714.5 Contributed surplus 36.6 35.8 Retained earnings (accumulated deficit) 17.4 (28.1) Capital 778.8 722.2
The Company makes adjustments to its capital structure based on the funds available to the Company in supporting the operations of the business and to ensure that the subsidiaries of the Company will be able to continue on a going concern basis, while maximizing the return to stakeholders through the optimization of the debt and equity balances.
The Company manages its capital structure, and may make adjustments in light of changes in economic conditions. In order to maintain or modify the capital structure, the Company may arrange new debt with existing or new lenders, or obtain additional financing through other means.
Spin Master Corp.Consolidated financial statements for the years ended December 31, 2020 and December 31, 2019
37
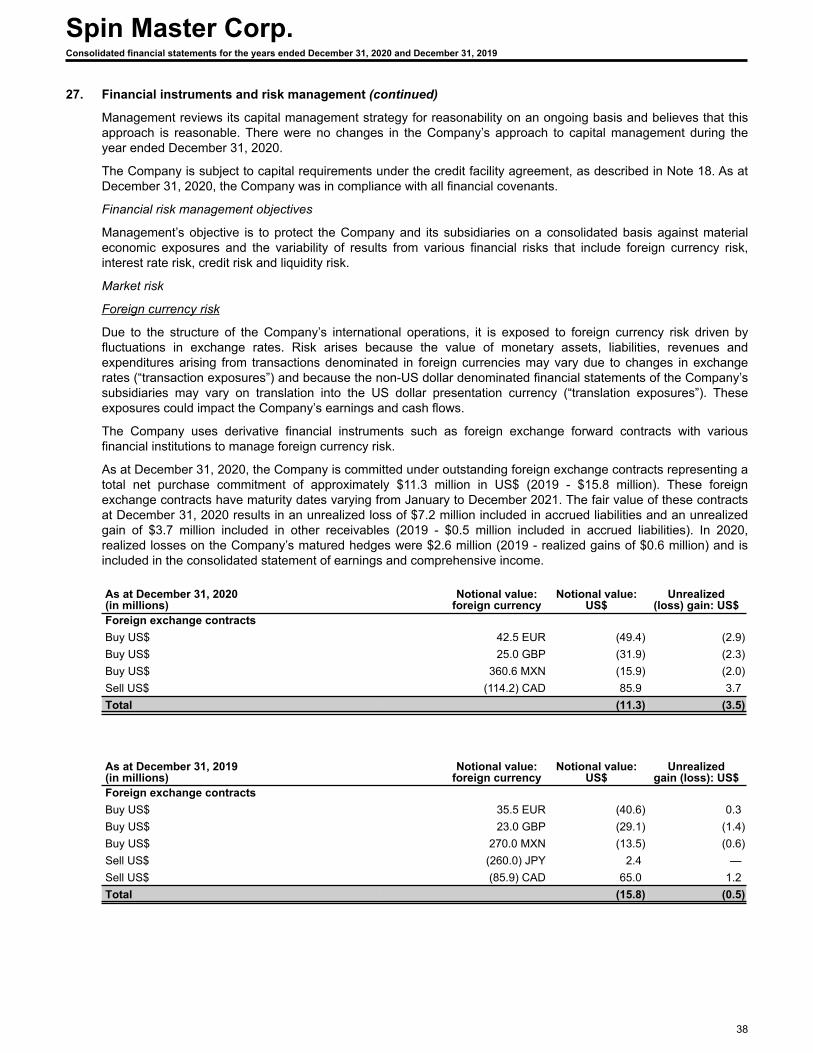
27. Financial instruments and risk management (continued)
Management reviews its capital management strategy for reasonability on an ongoing basis and believes that this approach is reasonable. There were no changes in the Company’s approach to capital management during the year ended December 31, 2020.
The Company is subject to capital requirements under the credit facility agreement, as described in Note 18. As at December 31, 2020, the Company was in compliance with all financial covenants.
Financial risk management objectives
Management’s objective is to protect the Company and its subsidiaries on a consolidated basis against material economic exposures and the variability of results from various financial risks that include foreign currency risk, interest rate risk, credit risk and liquidity risk.
Market risk
Foreign currency risk
Due to the structure of the Company’s international operations, it is exposed to foreign currency risk driven by fluctuations in exchange rates. Risk arises because the value of monetary assets, liabilities, revenues and expenditures arising from transactions denominated in foreign currencies may vary due to changes in exchange rates (“transaction exposures”) and because the non-US dollar denominated financial statements of the Company’s subsidiaries may vary on translation into the US dollar presentation currency (“translation exposures”). These exposures could impact the Company’s earnings and cash flows.
The Company uses derivative financial instruments such as foreign exchange forward contracts with various financial institutions to manage foreign currency risk.
As at December 31, 2020, the Company is committed under outstanding foreign exchange contracts representing a total net purchase commitment of approximately $11.3 million in US$ (2019 - $15.8 million). These foreign exchange contracts have maturity dates varying from January to December 2021. The fair value of these contracts at December 31, 2020 results in an unrealized loss of $7.2 million included in accrued liabilities and an unrealized gain of $3.7 million included in other receivables (2019 - $0.5 million included in accrued liabilities). In 2020, realized losses on the Company’s matured hedges were $2.6 million (2019 - realized gains of $0.6 million) and is included in the consolidated statement of earnings and comprehensive income.
As at December 31, 2020(in millions)
Notional value: foreign currency
Notional value: US$
Unrealized (loss) gain: US$
Foreign exchange contractsBuy US$ 42.5 EUR (49.4) (2.9) Buy US$ 25.0 GBP (31.9) (2.3) Buy US$ 360.6 MXN (15.9) (2.0) Sell US$ (114.2) CAD 85.9 3.7 Total (11.3) (3.5)
As at December 31, 2019(in millions)
Notional value: foreign currency
Notional value: US$
Unrealized gain (loss): US$
Foreign exchange contractsBuy US$ 35.5 EUR (40.6) 0.3 Buy US$ 23.0 GBP (29.1) (1.4) Buy US$ 270.0 MXN (13.5) (0.6) Sell US$ (260.0) JPY 2.4 — Sell US$ (85.9) CAD 65.0 1.2 Total (15.8) (0.5)
Spin Master Corp.Consolidated financial statements for the years ended December 31, 2020 and December 31, 2019
38
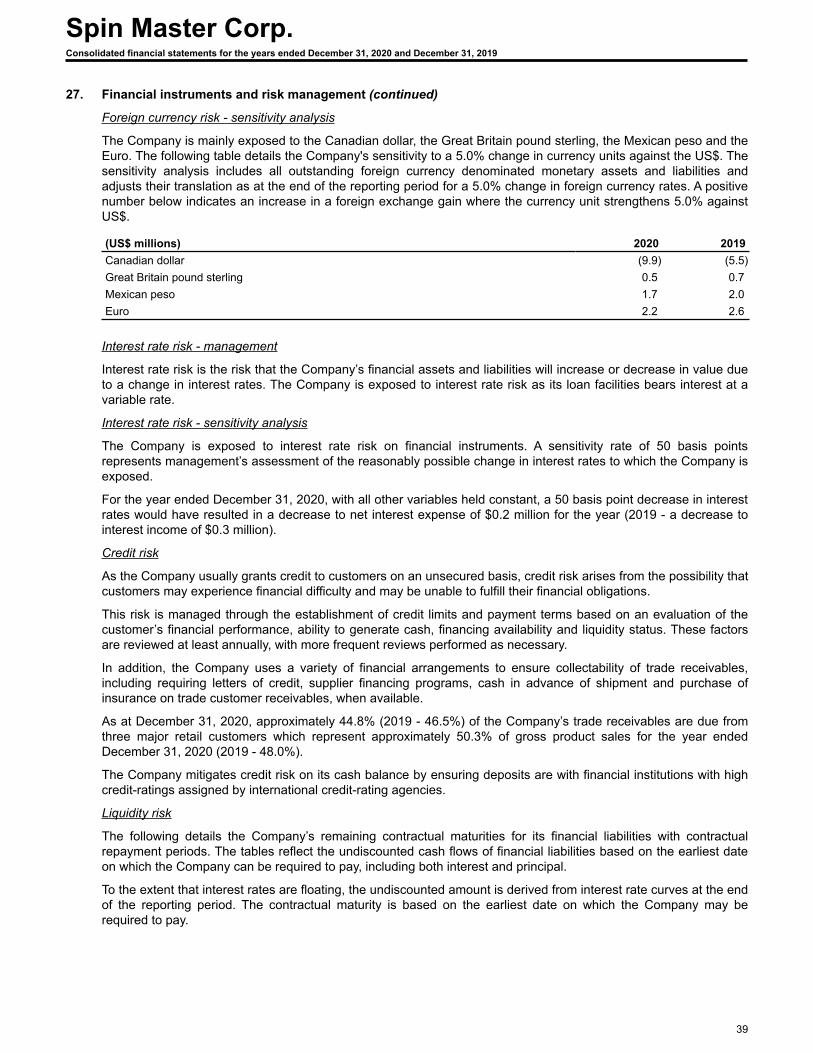
27. Financial instruments and risk management (continued)
Foreign currency risk - sensitivity analysis
The Company is mainly exposed to the Canadian dollar, the Great Britain pound sterling, the Mexican peso and the Euro. The following table details the Company's sensitivity to a 5.0% change in currency units against the US$. The sensitivity analysis includes all outstanding foreign currency denominated monetary assets and liabilities and adjusts their translation as at the end of the reporting period for a 5.0% change in foreign currency rates. A positive number below indicates an increase in a foreign exchange gain where the currency unit strengthens 5.0% against US$.
(US$ millions) 2020 2019Canadian dollar (9.9) (5.5) Great Britain pound sterling 0.5 0.7 Mexican peso 1.7 2.0 Euro 2.2 2.6
Interest rate risk - management
Interest rate risk is the risk that the Company’s financial assets and liabilities will increase or decrease in value due to a change in interest rates. The Company is exposed to interest rate risk as its loan facilities bears interest at a variable rate.
Interest rate risk - sensitivity analysis
The Company is exposed to interest rate risk on financial instruments. A sensitivity rate of 50 basis points represents management’s assessment of the reasonably possible change in interest rates to which the Company is exposed.
For the year ended December 31, 2020, with all other variables held constant, a 50 basis point decrease in interest rates would have resulted in a decrease to net interest expense of $0.2 million for the year (2019 - a decrease to interest income of $0.3 million).
Credit risk
As the Company usually grants credit to customers on an unsecured basis, credit risk arises from the possibility that customers may experience financial difficulty and may be unable to fulfill their financial obligations.
This risk is managed through the establishment of credit limits and payment terms based on an evaluation of the customer’s financial performance, ability to generate cash, financing availability and liquidity status. These factors are reviewed at least annually, with more frequent reviews performed as necessary.
In addition, the Company uses a variety of financial arrangements to ensure collectability of trade receivables, including requiring letters of credit, supplier financing programs, cash in advance of shipment and purchase of insurance on trade customer receivables, when available.
As at December 31, 2020, approximately 44.8% (2019 - 46.5%) of the Company’s trade receivables are due from three major retail customers which represent approximately 50.3% of gross product sales for the year ended December 31, 2020 (2019 - 48.0%).
The Company mitigates credit risk on its cash balance by ensuring deposits are with financial institutions with high credit-ratings assigned by international credit-rating agencies.
Liquidity risk
The following details the Company’s remaining contractual maturities for its financial liabilities with contractual repayment periods. The tables reflect the undiscounted cash flows of financial liabilities based on the earliest date on which the Company can be required to pay, including both interest and principal.
To the extent that interest rates are floating, the undiscounted amount is derived from interest rate curves at the end of the reporting period. The contractual maturity is based on the earliest date on which the Company may be required to pay.
Spin Master Corp.Consolidated financial statements for the years ended December 31, 2020 and December 31, 2019
39
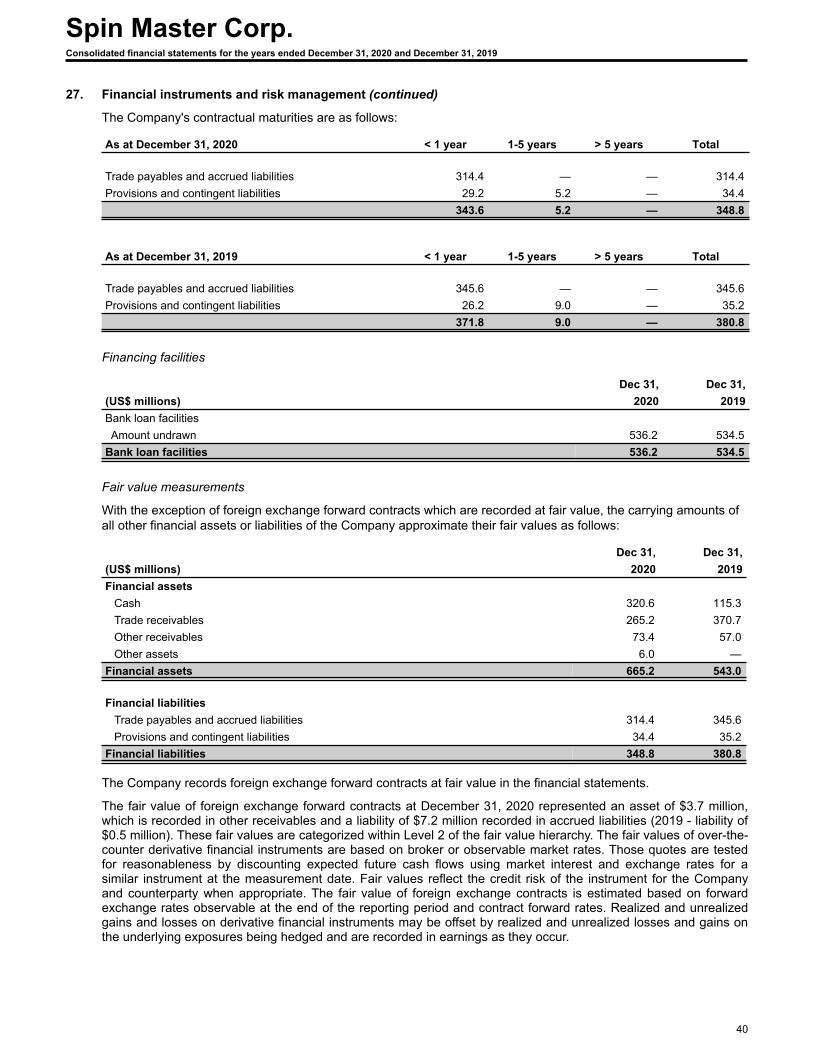
27. Financial instruments and risk management (continued)
The Company's contractual maturities are as follows:
As at December 31, 2020 < 1 year 1-5 years > 5 years Total
Trade payables and accrued liabilities 314.4 — — 314.4 Provisions and contingent liabilities 29.2 5.2 — 34.4
343.6 5.2 — 348.8
As at December 31, 2019 < 1 year 1-5 years > 5 years Total
Trade payables and accrued liabilities 345.6 — — 345.6 Provisions and contingent liabilities 26.2 9.0 — 35.2
371.8 9.0 — 380.8
Financing facilities
Dec 31, Dec 31,(US$ millions) 2020 2019Bank loan facilities Amount undrawn 536.2 534.5 Bank loan facilities 536.2 534.5
Fair value measurements
With the exception of foreign exchange forward contracts which are recorded at fair value, the carrying amounts of all other financial assets or liabilities of the Company approximate their fair values as follows:
Dec 31, Dec 31,(US$ millions) 2020 2019Financial assets
Cash 320.6 115.3 Trade receivables 265.2 370.7 Other receivables 73.4 57.0 Other assets 6.0 —
Financial assets 665.2 543.0
Financial liabilitiesTrade payables and accrued liabilities 314.4 345.6 Provisions and contingent liabilities 34.4 35.2
Financial liabilities 348.8 380.8
The Company records foreign exchange forward contracts at fair value in the financial statements.
The fair value of foreign exchange forward contracts at December 31, 2020 represented an asset of $3.7 million, which is recorded in other receivables and a liability of $7.2 million recorded in accrued liabilities (2019 - liability of $0.5 million). These fair values are categorized within Level 2 of the fair value hierarchy. The fair values of over-the-counter derivative financial instruments are based on broker or observable market rates. Those quotes are tested for reasonableness by discounting expected future cash flows using market interest and exchange rates for a similar instrument at the measurement date. Fair values reflect the credit risk of the instrument for the Company and counterparty when appropriate. The fair value of foreign exchange contracts is estimated based on forward exchange rates observable at the end of the reporting period and contract forward rates. Realized and unrealized gains and losses on derivative financial instruments may be offset by realized and unrealized losses and gains on the underlying exposures being hedged and are recorded in earnings as they occur.
Spin Master Corp.Consolidated financial statements for the years ended December 31, 2020 and December 31, 2019
40
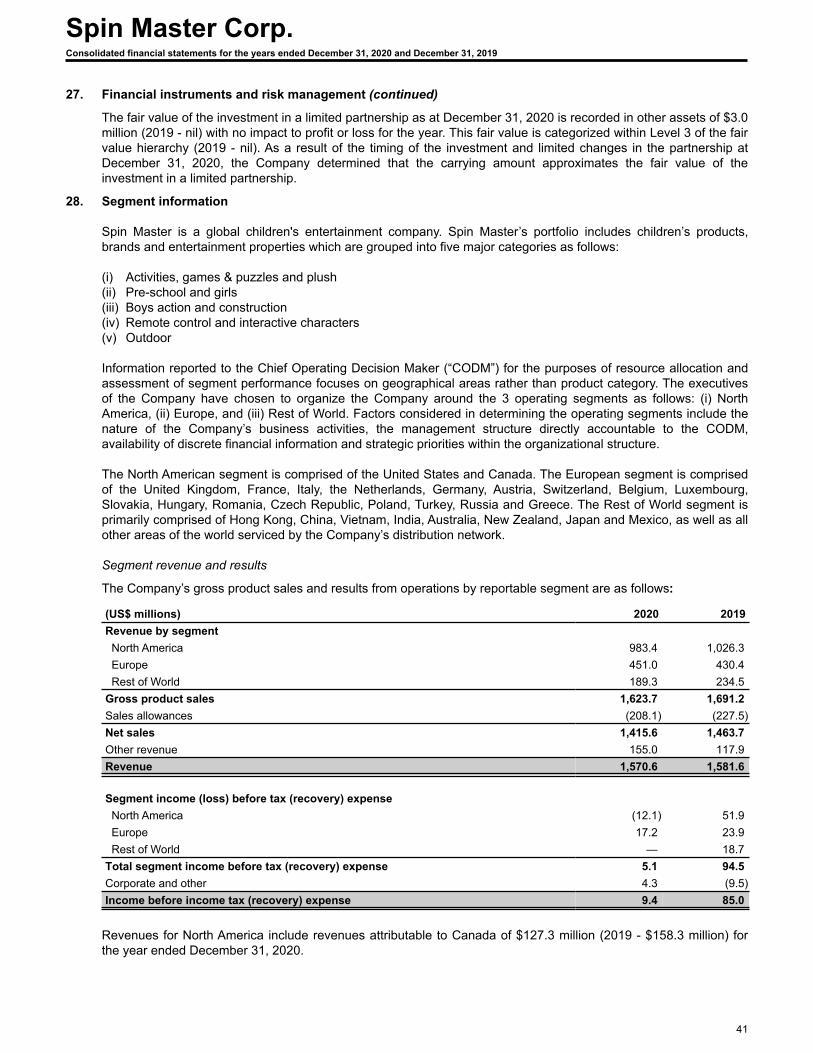
27. Financial instruments and risk management (continued)
The fair value of the investment in a limited partnership as at December 31, 2020 is recorded in other assets of $3.0 million (2019 - nil) with no impact to profit or loss for the year. This fair value is categorized within Level 3 of the fair value hierarchy (2019 - nil). As a result of the timing of the investment and limited changes in the partnership at December 31, 2020, the Company determined that the carrying amount approximates the fair value of the investment in a limited partnership.
28. Segment information
Spin Master is a global children's entertainment company. Spin Master’s portfolio includes children’s products, brands and entertainment properties which are grouped into five major categories as follows:
(i) Activities, games & puzzles and plush(ii) Pre-school and girls(iii) Boys action and construction(iv) Remote control and interactive characters(v) Outdoor
Information reported to the Chief Operating Decision Maker (“CODM”) for the purposes of resource allocation and assessment of segment performance focuses on geographical areas rather than product category. The executives of the Company have chosen to organize the Company around the 3 operating segments as follows: (i) North America, (ii) Europe, and (iii) Rest of World. Factors considered in determining the operating segments include the nature of the Company’s business activities, the management structure directly accountable to the CODM, availability of discrete financial information and strategic priorities within the organizational structure.
The North American segment is comprised of the United States and Canada. The European segment is comprised of the United Kingdom, France, Italy, the Netherlands, Germany, Austria, Switzerland, Belgium, Luxembourg, Slovakia, Hungary, Romania, Czech Republic, Poland, Turkey, Russia and Greece. The Rest of World segment is primarily comprised of Hong Kong, China, Vietnam, India, Australia, New Zealand, Japan and Mexico, as well as all other areas of the world serviced by the Company’s distribution network.
Segment revenue and results
The Company’s gross product sales and results from operations by reportable segment are as follows:
(US$ millions) 2020 2019Revenue by segment North America 983.4 1,026.3 Europe 451.0 430.4 Rest of World 189.3 234.5 Gross product sales 1,623.7 1,691.2 Sales allowances (208.1) (227.5) Net sales 1,415.6 1,463.7 Other revenue 155.0 117.9 Revenue 1,570.6 1,581.6
Segment income (loss) before tax (recovery) expense North America (12.1) 51.9 Europe 17.2 23.9 Rest of World — 18.7 Total segment income before tax (recovery) expense 5.1 94.5 Corporate and other 4.3 (9.5) Income before income tax (recovery) expense 9.4 85.0
Revenues for North America include revenues attributable to Canada of $127.3 million (2019 - $158.3 million) for the year ended December 31, 2020.
Spin Master Corp.Consolidated financial statements for the years ended December 31, 2020 and December 31, 2019
41
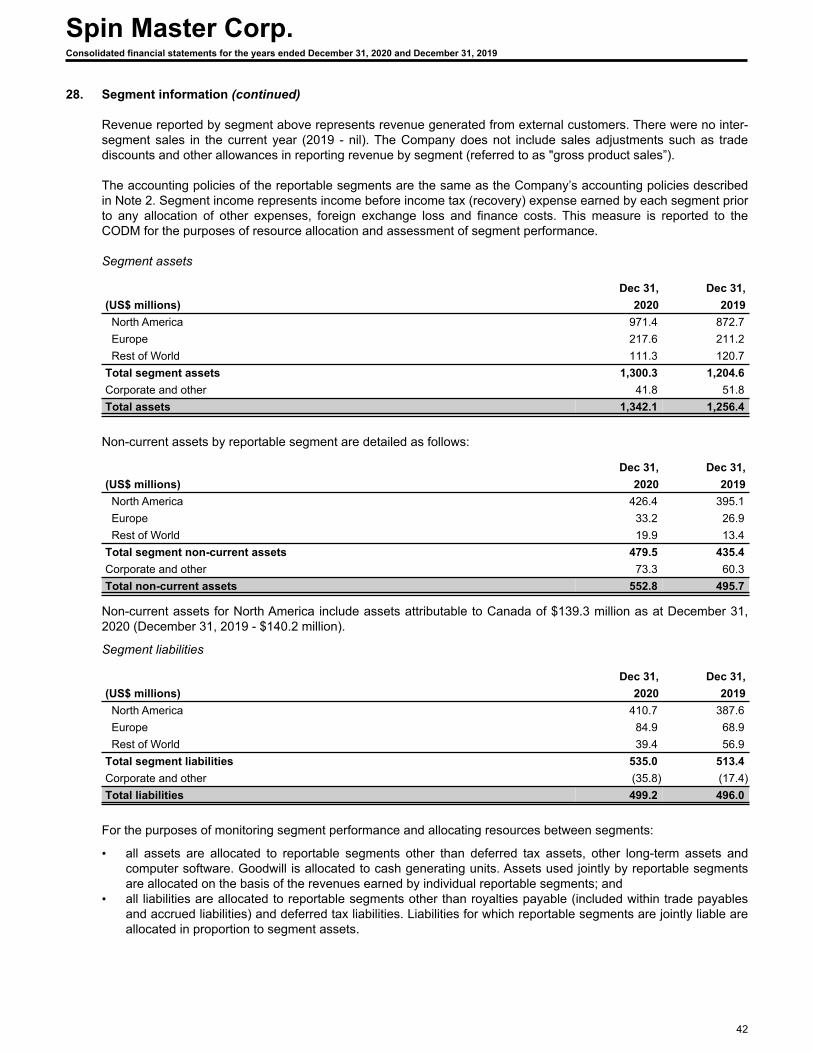
28. Segment information (continued)
Revenue reported by segment above represents revenue generated from external customers. There were no inter-segment sales in the current year (2019 - nil). The Company does not include sales adjustments such as trade discounts and other allowances in reporting revenue by segment (referred to as "gross product sales”).
The accounting policies of the reportable segments are the same as the Company’s accounting policies described in Note 2. Segment income represents income before income tax (recovery) expense earned by each segment prior to any allocation of other expenses, foreign exchange loss and finance costs. This measure is reported to the CODM for the purposes of resource allocation and assessment of segment performance.
Segment assets
Dec 31, Dec 31,(US$ millions) 2020 2019 North America 971.4 872.7 Europe 217.6 211.2 Rest of World 111.3 120.7 Total segment assets 1,300.3 1,204.6 Corporate and other 41.8 51.8 Total assets 1,342.1 1,256.4
Non-current assets by reportable segment are detailed as follows:
Dec 31, Dec 31,(US$ millions) 2020 2019 North America 426.4 395.1 Europe 33.2 26.9 Rest of World 19.9 13.4 Total segment non-current assets 479.5 435.4 Corporate and other 73.3 60.3 Total non-current assets 552.8 495.7
Non-current assets for North America include assets attributable to Canada of $139.3 million as at December 31, 2020 (December 31, 2019 - $140.2 million).
Segment liabilities
Dec 31, Dec 31,(US$ millions) 2020 2019 North America 410.7 387.6 Europe 84.9 68.9 Rest of World 39.4 56.9 Total segment liabilities 535.0 513.4 Corporate and other (35.8) (17.4) Total liabilities 499.2 496.0
For the purposes of monitoring segment performance and allocating resources between segments:
• all assets are allocated to reportable segments other than deferred tax assets, other long-term assets and computer software. Goodwill is allocated to cash generating units. Assets used jointly by reportable segments are allocated on the basis of the revenues earned by individual reportable segments; and
• all liabilities are allocated to reportable segments other than royalties payable (included within trade payables and accrued liabilities) and deferred tax liabilities. Liabilities for which reportable segments are jointly liable are allocated in proportion to segment assets.
Spin Master Corp.Consolidated financial statements for the years ended December 31, 2020 and December 31, 2019
42
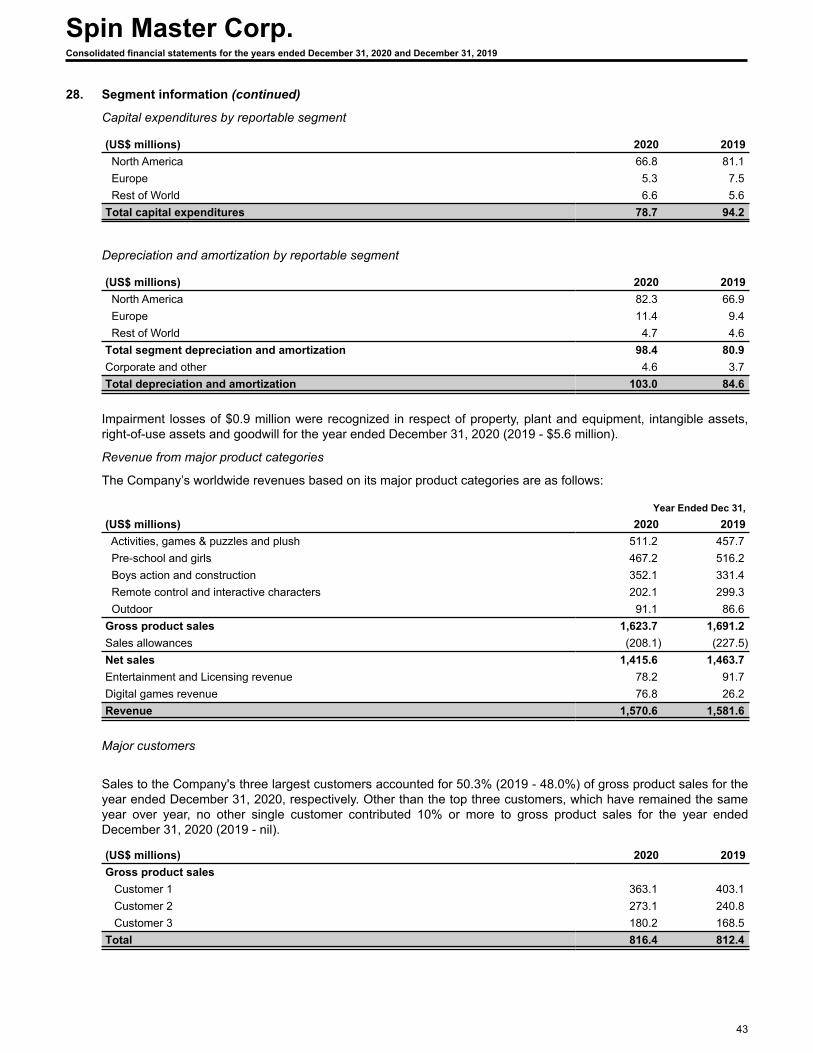
28. Segment information (continued)
Capital expenditures by reportable segment
(US$ millions) 2020 2019 North America 66.8 81.1 Europe 5.3 7.5 Rest of World 6.6 5.6 Total capital expenditures 78.7 94.2
Depreciation and amortization by reportable segment
(US$ millions) 2020 2019 North America 82.3 66.9 Europe 11.4 9.4 Rest of World 4.7 4.6 Total segment depreciation and amortization 98.4 80.9 Corporate and other 4.6 3.7 Total depreciation and amortization 103.0 84.6
Impairment losses of $0.9 million were recognized in respect of property, plant and equipment, intangible assets, right-of-use assets and goodwill for the year ended December 31, 2020 (2019 - $5.6 million).
Revenue from major product categories
The Company’s worldwide revenues based on its major product categories are as follows:
Year Ended Dec 31,(US$ millions) 2020 2019 Activities, games & puzzles and plush 511.2 457.7 Pre-school and girls 467.2 516.2 Boys action and construction 352.1 331.4 Remote control and interactive characters 202.1 299.3 Outdoor 91.1 86.6 Gross product sales 1,623.7 1,691.2 Sales allowances (208.1) (227.5) Net sales 1,415.6 1,463.7 Entertainment and Licensing revenue 78.2 91.7 Digital games revenue 76.8 26.2 Revenue 1,570.6 1,581.6
Major customers
Sales to the Company's three largest customers accounted for 50.3% (2019 - 48.0%) of gross product sales for the year ended December 31, 2020, respectively. Other than the top three customers, which have remained the same year over year, no other single customer contributed 10% or more to gross product sales for the year ended December 31, 2020 (2019 - nil).
(US$ millions) 2020 2019Gross product sales
Customer 1 363.1 403.1 Customer 2 273.1 240.8 Customer 3 180.2 168.5
Total 816.4 812.4
Spin Master Corp.Consolidated financial statements for the years ended December 31, 2020 and December 31, 2019
43
29. Subsequent event
Acquisition of Rubik's Brand Limited
On January 4, 2021, the Company acquired control of Rubik's Brand Limited through the acquisition of 100% of the shares of its holding company, Rubiks Malta Holding Company Limited. The brand will be reported in the Activities, Games & Puzzles and Plush product category beginning from the date of acquisition.
The preliminary estimate of purchase consideration of $56.4 million is comprised of $50.0 million of cash consideration plus an estimated $6.4 million related to closing values for net working capital and fair value of future royalties. Given the timing of the transaction and measurement uncertainty with final purchase agreement consideration adjustments, the purchase price allocation is not yet final. The purchase price allocation will be disclosed in the Company's first quarter 2021 condensed consolidated interim financial statements.
There were $0.9 million in transaction related costs included in administrative expenses in the consolidated statement of earnings and comprehensive income for the year ended December 31, 2020.
30. Prior year comparatives
Certain prior year comparatives have been reclassified to conform with current year presentation.
Spin Master Corp.Consolidated financial statements for the years ended December 31, 2020 and December 31, 2019
44

Corporate DirectoryBoard of DirectorsAnton RabieChairman, Co-Founder & Co-Chief Executive Officer
Ronnen HararyDirector, Co-Founder & Co-Chief Executive Officer
Jeffrey I. CohenNon-Executive Director
Reggie Fils-AiméNon-Executive Director
Kevin Glass Non-Executive Director
Dina R. Howell Non-Executive Director
Christina MillerNon-Executive Director
Todd TappinNon-Executive Director
Ben VaradiDirector, Executive Vice President & Chief Creative Officer
Charles WinogradLead Director
Senior ManagementAnton RabieChairman, Co-Founder & Co-Chief Executive Officer
Ronnen HararyDirector, Co-Founder & Co-Chief Executive Officer
Ben VaradiDirector, Executive Vice President & Chief Creative Officer
Max RangelGlobal President
Mark L. SegalExecutive Vice President & Chief Financial Officer
Chris BeardallPresident, Toys
Jennifer DodgePresident, Entertainment
Fredrick LovingPresident, Digital Games
Adam BederExecutive Vice President, Strategic Partnership & Franchise Development
Paul Blom Executive Vice President, Global Operations & Technology
Tara DeakinExecutive Vice President & Chief People Officer
Christopher HarrsExecutive Vice President & General Counsel, Corporate Secretary
Laura HendersonExecutive Vice President, Marketing
Ben DermerSenior Vice President, Creative Development
Head Office 225 King Street West, Suite 200
Toronto, ON M5V 3M2
Tel. (416) 364-6002
Fax (416) 364-5097
www.spinmaster.com
Toronto Stock Exchange ListingTrading symbol: TOY
Securities listed: Subordinate Voting Shares
Auditor Deloitte LLP
8 Adelaide Street West, Suite 200
Toronto, ON M5H 0A9
Transfer Agent & Registrar Computershare Investor Services Inc.
100 University Avenue, 8th Floor
Toronto, ON M5J 2Y1
Legal Counsel Torkin Manes LLP
1500 – 151 Yonge Street
Toronto, ON M5C 2W7
Annual Meeting of ShareholdersMay 6, 2021
Investor Contact InformationEmail: [email protected]
The trademarks contained in this report are owned by Spin Master Corp. or by its subsidiaries. Trademarks that are not owned by Spin Master Corp. are used with permission.

Spin Master Corp.
225 King Street West, Suite 200, Toronto, ON M5V 3M2Tel. (416) 364-6002 Fax (416) 364-5097
spinmaster.com
20
20
AN
NU
AL R
EP
OR
T S
PIN
MA
ST
ER
CO
RP.

20
20
AN
NU
AL R
EP
OR
T S
PIN
MA
ST
ER
CO
RP.


