Embed Size (px)
Citation preview

KA
PE
TE
CH
NO
LOG
IES
PLC
An
nu
Al R
ep
oR
t An
d A
cc
ou
nts
2018
GROWING OPPORTUNITIES
ANNUAL REPORT AND ACCOUNTS 2018
KAPE TECHNOLOGIES PLCANNUAL REPORT ANd ACCOUNTS 2018
IntRoductIon
Who we are
Kape is a privacy first cybersecurity company focused on helping consumers around the world have better experience and protection in their digital life.
Our focus
The Group utilises its proprietary digital distribution technology to optimise its reach and create a superb user experience.
01KAPE TECHNOLOGIES PLCANNUAL REPORT ANd ACCOUNTS 2018
CORPORATEGOVERNANCE
STRATEGICREPORT FINANCIAL
STATEMENTS
Digital marketing expertise
Kape offers products which provide online security, privacy and an optimal online experience.
Our vision
Kape’s vision is to provide online autonomy for a secure and accessible personal digital life.
Financial highlights Operational highlights
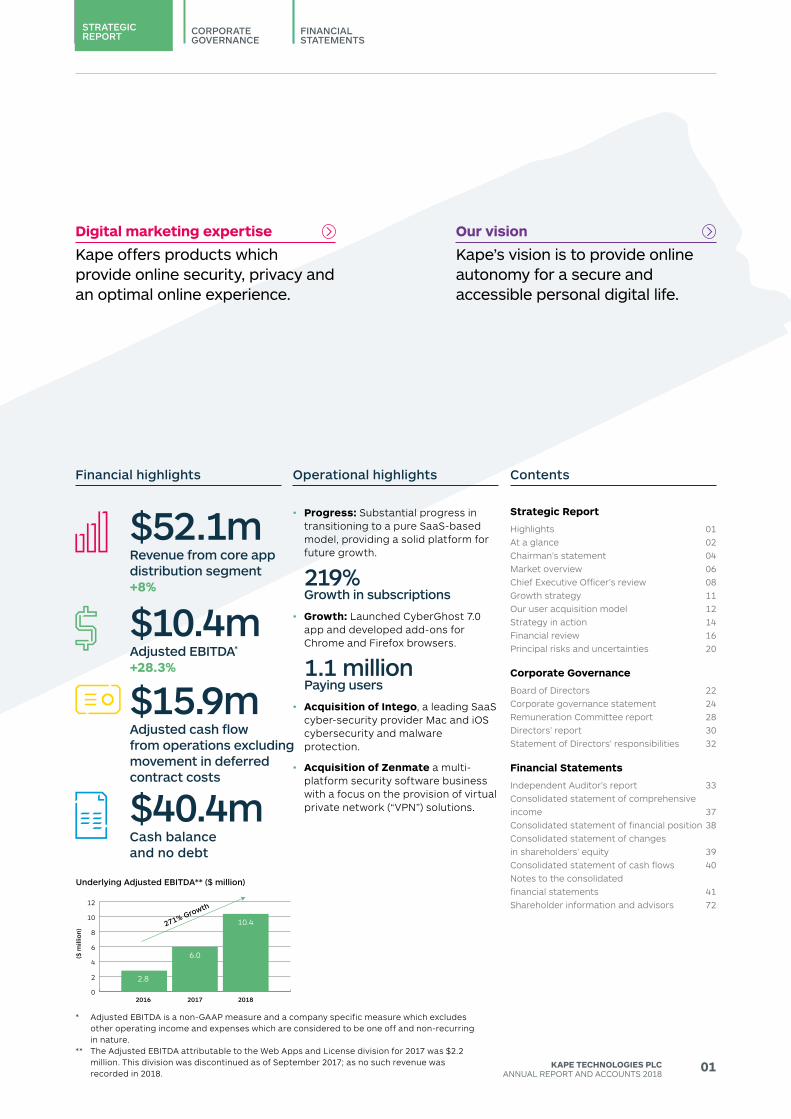
$10.4mAdjusted EBITDA*
+28.3%
$52.1mRevenue from core app distribution segment+8%
$40.4mCash balance and no debt
$15.9mAdjusted cash flow from operations excluding movement in deferred contract costs
• Progress: Substantial progress intransitioning to a pure SaaS-basedmodel, providing a solid platform forfuture growth.
219%Growth in subscriptions
• Growth: Launched CyberGhost 7.0app and developed add-ons forChrome and Firefox browsers.
1.1 millionPaying users
• Acquisition of Intego, a leading SaaScyber-security provider Mac and iOScybersecurity and malwareprotection.
• Acquisition of Zenmate a multi-platform security software businesswith a focus on the provision of virtualprivate network (“VPN”) solutions.
Contents
Strategic Report
Highlights 01At a glance 02Chairman’s statement 04Market overview 06Chief Executive Officer’s review 08Growth strategy 11Our user acquisition model 12Strategy in action 14Financial review 16Principal risks and uncertainties 20
Corporate Governance
Board of directors 22Corporate governance statement 24Remuneration Committee report 28directors’ report 30Statement of directors’ responsibilities 32
Financial Statements
Independent Auditor’s report 33Consolidated statement of comprehensive income 37Consolidated statement of financial position 38Consolidated statement of changes in shareholders’ equity 39Consolidated statement of cash flows 40Notes to the consolidated financial statements 41Shareholder information and advisors 72
0
2
4
6
8
10
12
2016
Underlying Adjusted EBITDA** ($ million)
($ m
illio
n)
2017
271% Growth
2018
2.8
6.0
10.4
* Adjusted EBITdA is a non-GAAP measure and a company specific measure which excludes other operating income and expenses which are considered to be one off and non-recurring in nature.
** The Adjusted EBITdA attributable to the Web Apps and License division for 2017 was $2.2 million. This division was discontinued as of September 2017; as no such revenue was recorded in 2018.
02 KAPE TECHNOLOGIES PLCANNUAL REPORT ANd ACCOUNTS 2018
At A GlAnce
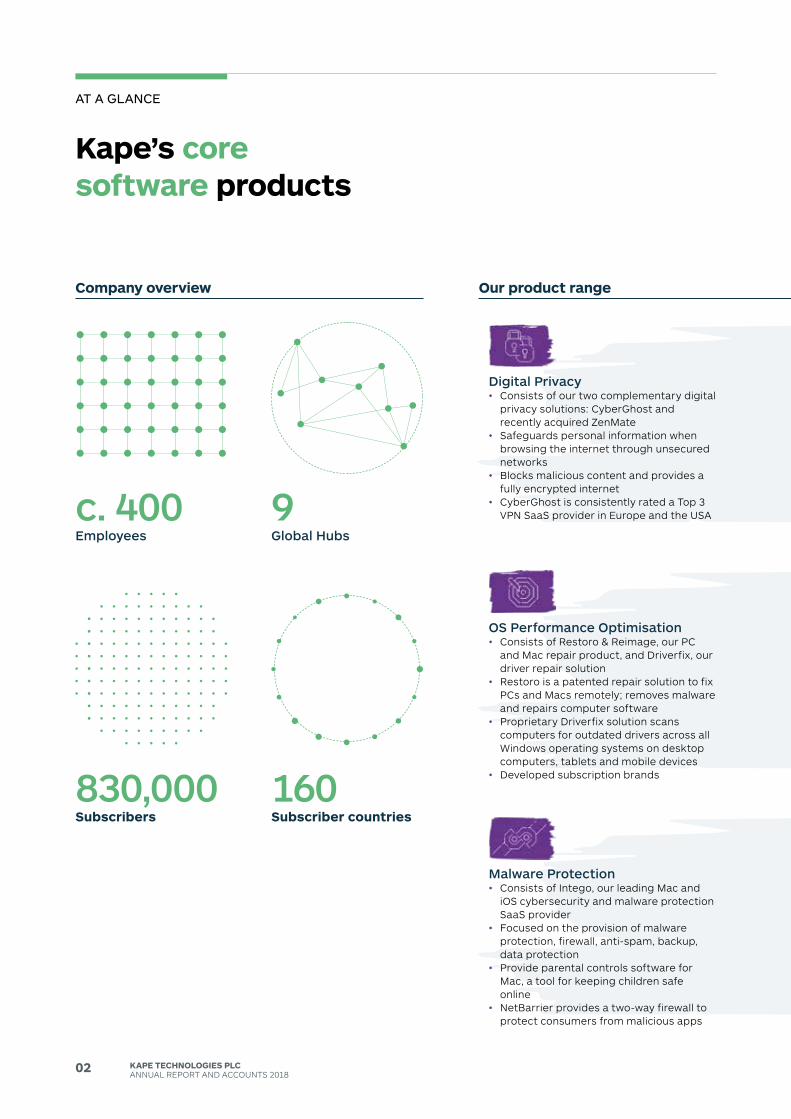
Kape’s core software products
Digital Privacy• Consists of our two complementary digital
privacy solutions: CyberGhost andrecently acquired ZenMate
• Safeguards personal information whenbrowsing the internet through unsecurednetworks
• Blocks malicious content and provides afully encrypted internet
• CyberGhost is consistently rated a Top 3VPN SaaS provider in Europe and the USA
Malware Protection• Consists of Intego, our leading Mac and
iOS cybersecurity and malware protectionSaaS provider
• Focused on the provision of malwareprotection, firewall, anti-spam, backup,data protection
• Provide parental controls software forMac, a tool for keeping children safeonline
• NetBarrier provides a two-way firewall toprotect consumers from malicious apps
OS Performance Optimisation• Consists of Restoro & Reimage, our PC
and Mac repair product, and driverfix, ourdriver repair solution
• Restoro is a patented repair solution to fixPCs and Macs remotely; removes malwareand repairs computer software
• Proprietary driverfix solution scanscomputers for outdated drivers across allWindows operating systems on desktopcomputers, tablets and mobile devices
• developed subscription brands
Company overview
9Global Hubs
c. 400Employees
160Subscriber countries
830,000Subscribers
Our product range

03KAPE TECHNOLOGIES PLCANNUAL REPORT ANd ACCOUNTS 2018
CORPORATEGOVERNANCE
STRATEGICREPORT FINANCIAL
STATEMENTS
Our product range
04 KAPE TECHNOLOGIES PLCANNUAL REPORT ANd ACCOUNTS 2018
1 Cybersecurity Market by Solution, Markets & Markets, September 2018 2 The Cybersecurity Market Report, by Cybersecurity Ventures, March 2018
cHAIRMAn’s stAteMent
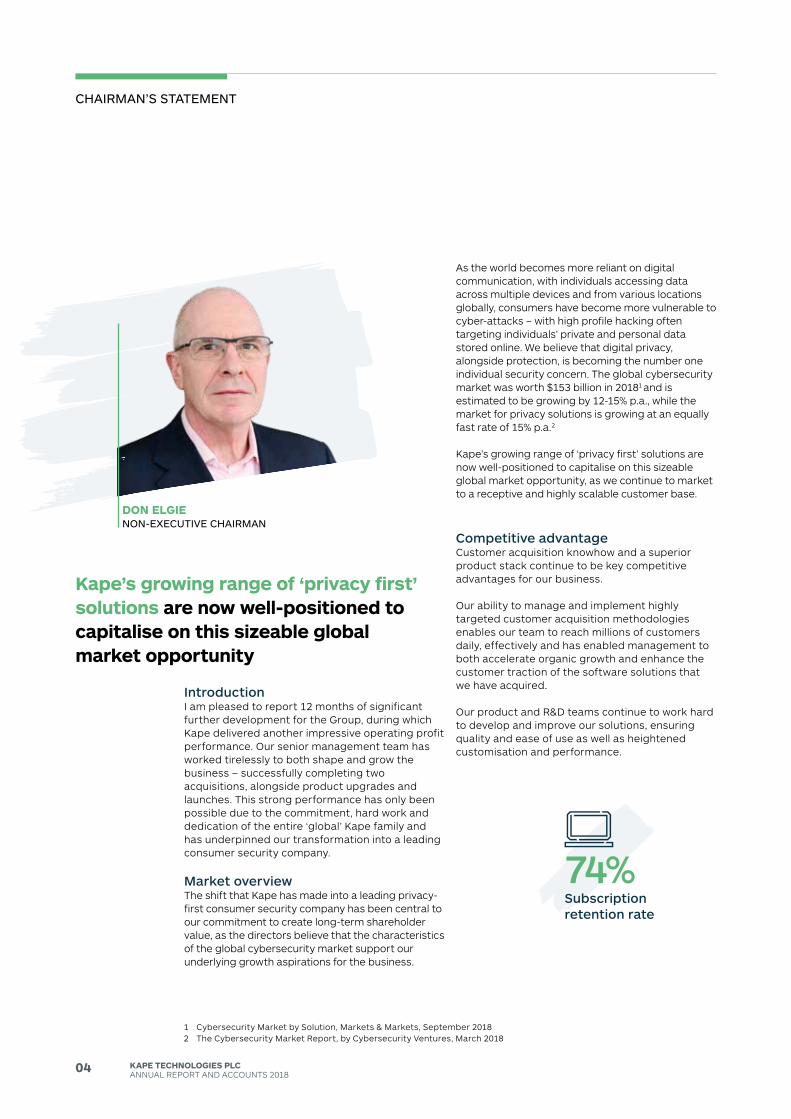
DON ELGIEnon-eXecutIVe cHAIRMAn
As the world becomes more reliant on digital communication, with individuals accessing data across multiple devices and from various locations globally, consumers have become more vulnerable to cyber-attacks – with high profile hacking often targeting individuals’ private and personal data stored online. We believe that digital privacy, alongside protection, is becoming the number one individual security concern. The global cybersecurity market was worth $153 billion in 20181 and is estimated to be growing by 12-15% p.a., while the market for privacy solutions is growing at an equally fast rate of 15% p.a.2
Kape’s growing range of ‘privacy first’ solutions are now well-positioned to capitalise on this sizeable global market opportunity, as we continue to market to a receptive and highly scalable customer base.
Competitive advantage Customer acquisition knowhow and a superior product stack continue to be key competitive advantages for our business. Our ability to manage and implement highly targeted customer acquisition methodologies enables our team to reach millions of customers daily, effectively and has enabled management to both accelerate organic growth and enhance the customer traction of the software solutions that we have acquired.
Our product and R&d teams continue to work hard to develop and improve our solutions, ensuring quality and ease of use as well as heightened customisation and performance.
IntroductionI am pleased to report 12 months of significant further development for the Group, during which Kape delivered another impressive operating profit performance. Our senior management team has worked tirelessly to both shape and grow the business – successfully completing two acquisitions, alongside product upgrades and launches. This strong performance has only been possible due to the commitment, hard work and dedication of the entire ‘global’ Kape family and has underpinned our transformation into a leading consumer security company.
Market overview The shift that Kape has made into a leading privacy-first consumer security company has been central to our commitment to create long-term shareholder value, as the directors believe that the characteristics of the global cybersecurity market support our underlying growth aspirations for the business.
Kape’s growing range of ‘privacy first’ solutions are now well-positioned to capitalise on this sizeable global market opportunity
74%Subscription retention rate
05KAPE TECHNOLOGIES PLCANNUAL REPORT ANd ACCOUNTS 2018
CORPORATEGOVERNANCE
STRATEGICREPORT FINANCIAL
STATEMENTS
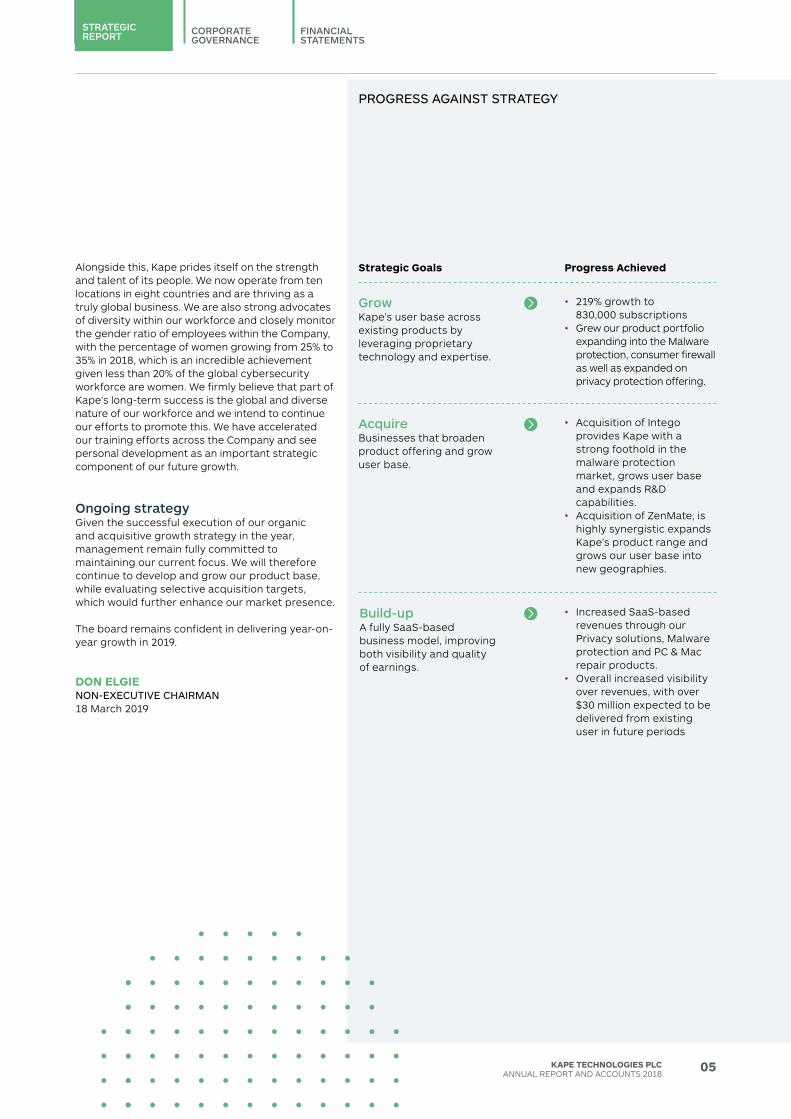
GrowKape’s user base across existing products by leveraging proprietary technology and expertise.
AcquireBusinesses that broaden product offering and grow user base.
Build-upA fully SaaS-based business model, improving both visibility and quality of earnings.
Alongside this, Kape prides itself on the strength and talent of its people. We now operate from ten locations in eight countries and are thriving as a truly global business. We are also strong advocates of diversity within our workforce and closely monitor the gender ratio of employees within the Company, with the percentage of women growing from 25% to 35% in 2018, which is an incredible achievement given less than 20% of the global cybersecurity workforce are women. We firmly believe that part of Kape’s long-term success is the global and diverse nature of our workforce and we intend to continue our efforts to promote this. We have accelerated our training efforts across the Company and see personal development as an important strategic component of our future growth.
Ongoing strategyGiven the successful execution of our organic and acquisitive growth strategy in the year, management remain fully committed to maintaining our current focus. We will therefore continue to develop and grow our product base, while evaluating selective acquisition targets, which would further enhance our market presence.
The board remains confident in delivering year-on-year growth in 2019.
DON ELGIEnon-eXecutIVe cHAIRMAn18 March 2019
pRoGRess AGAInst stRAteGY
Strategic Goals Progress Achieved
• 219% growth to830,000 subscriptions
• Grew our product portfolio expanding into the Malware protection, consumer firewall as well as expanded on privacy protection offering.
• Acquisition of Integoprovides Kape with astrong foothold in themalware protectionmarket, grows user baseand expands R&dcapabilities.
• Acquisition of ZenMate, ishighly synergistic expandsKape’s product range andgrows our user base intonew geographies.
• Increased SaaS-basedrevenues through ourPrivacy solutions, Malwareprotection and PC & Macrepair products.
• Overall increased visibilityover revenues, with over$30 million expected to bedelivered from existinguser in future periods
06 KAPE TECHNOLOGIES PLCANNUAL REPORT ANd ACCOUNTS 2018
MARKet oVeRVIeW
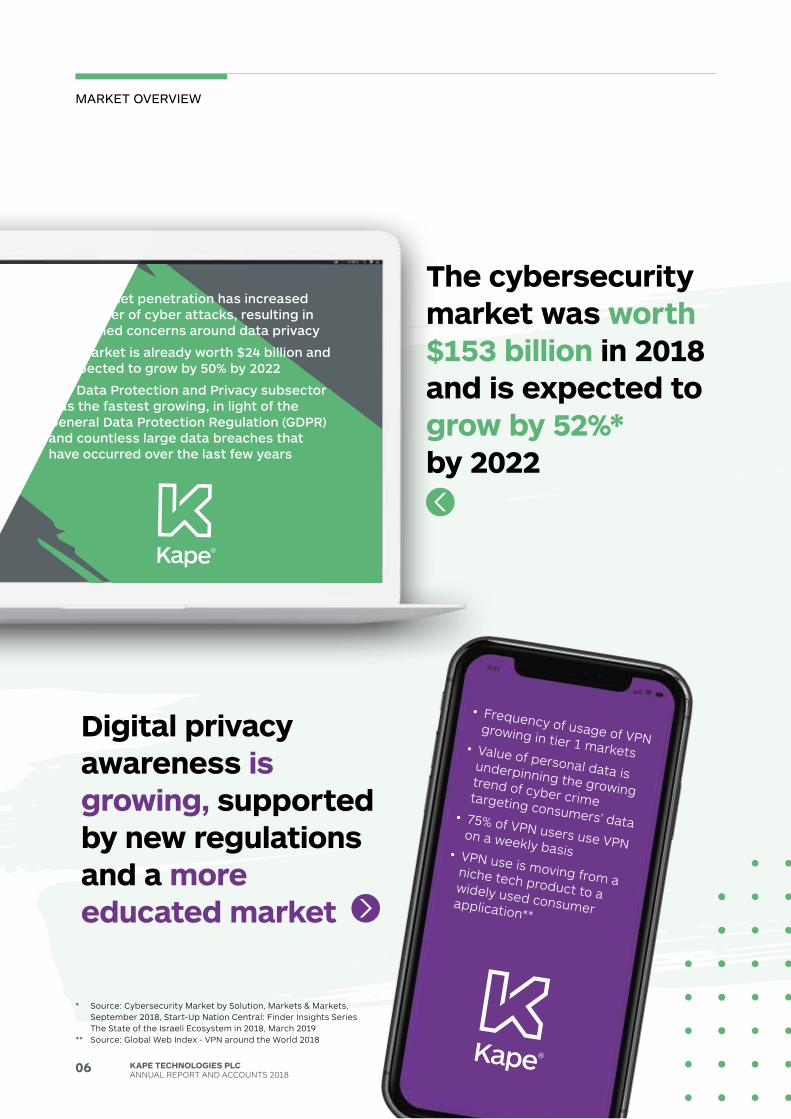
The cybersecurity market was worth $153 billion in 2018 and is expected to grow by 52%* by 2022
Digital privacy awareness is growing, supported by new regulations and a more educated market
• High internet penetration has increased the number of cyber attacks, resulting in heightened concerns around data privacy
• VPN market is already worth $24 billion and is expected to grow by 50% by 2022
• The Data Protection and Privacy subsector was the fastest growing, in light of the General Data Protection Regulation (GDPR) and countless large data breaches that have occurred over the last few years
• Frequency of usage of VPN growing in tier 1 markets• Value of personal data is
underpinning the growing trend of cyber crime targeting consumers’ data• 75% of VPN users use VPN
on a weekly basis• VPN use is moving from a niche tech product to a widely used consumer application**
* Source: Cybersecurity Market by Solution, Markets & Markets, September 2018, Start-Up Nation Central: Finder Insights Series The State of the Israeli Ecosystem in 2018, March 2019
** Source: Global Web Index - VPN around the World 2018
07KAPE TECHNOLOGIES PLCANNUAL REPORT ANd ACCOUNTS 2018
CORPORATEGOVERNANCE
STRATEGICREPORT FINANCIAL
STATEMENTS
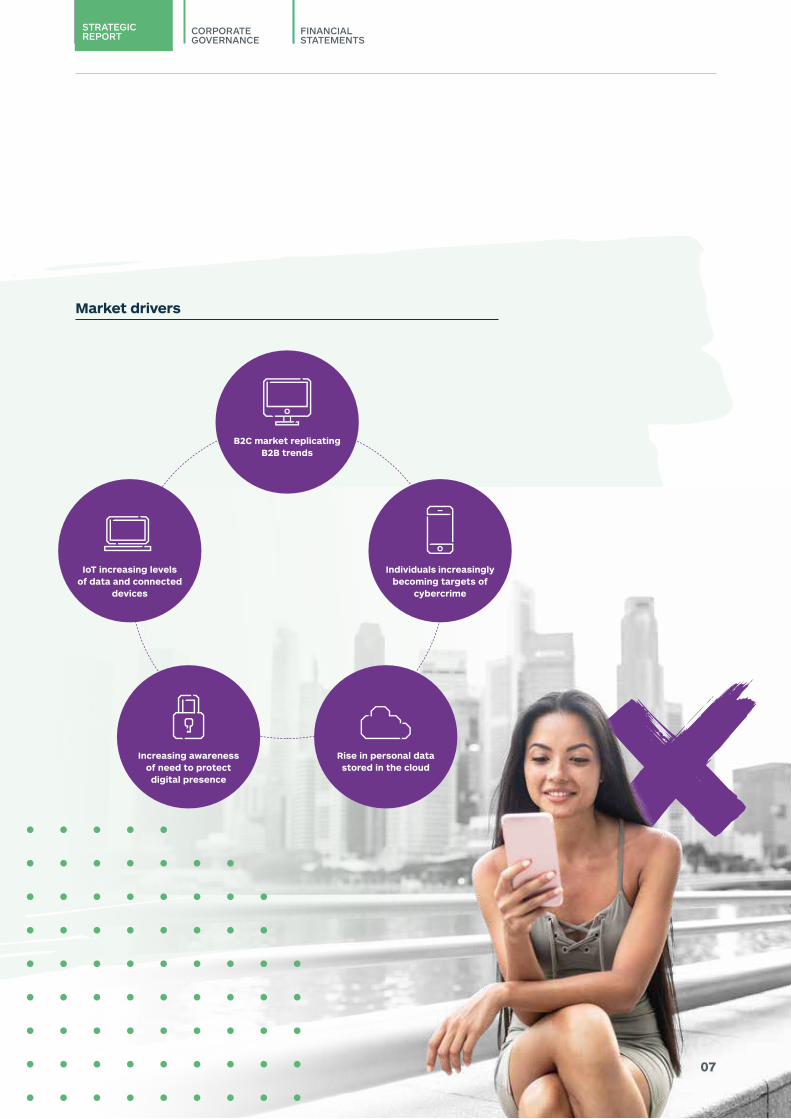
Market drivers
B2C market replicating B2B trends
Increasing awareness of need to protect digital presence
Rise in personal datastored in the cloud
IoT increasing levels of data and connected
devices
Individuals increasinglybecoming targets of
cybercrime
08 KAPE TECHNOLOGIES PLCANNUAL REPORT ANd ACCOUNTS 2018
cHIeF eXecutIVe oFFIceR’s ReVIeW
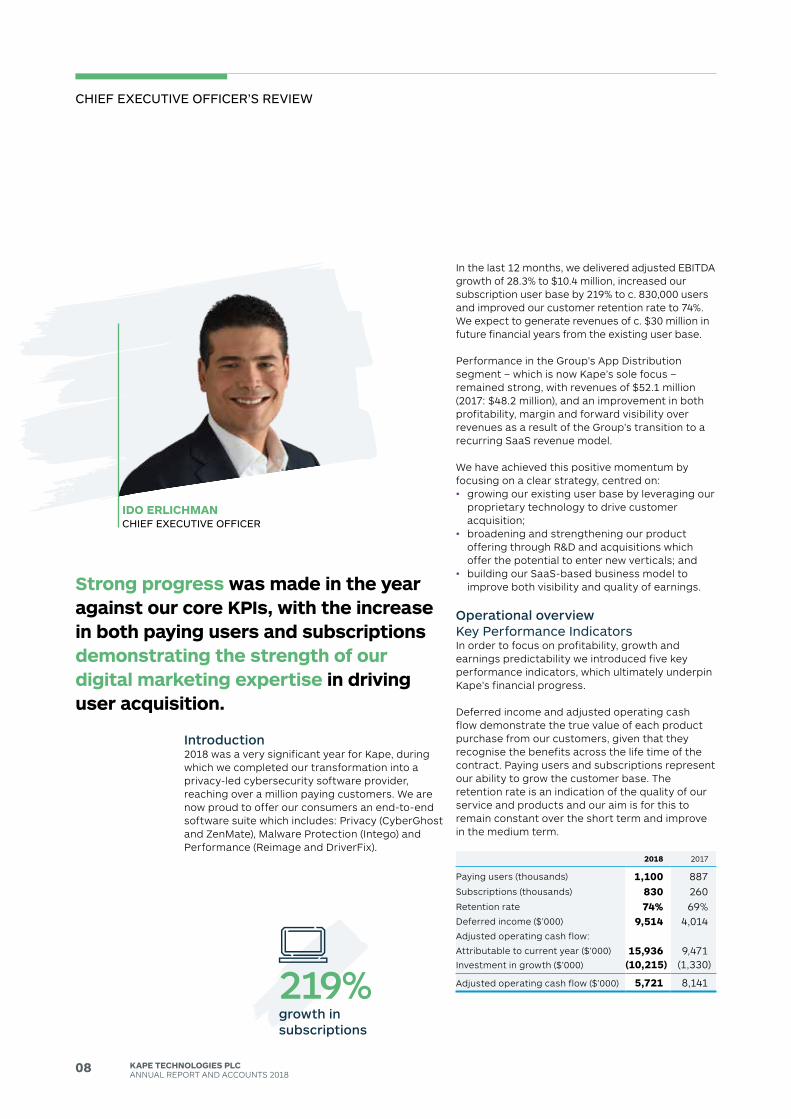
IDO ERLICHMANcHIeF eXecutIVe oFFIceR
In the last 12 months, we delivered adjusted EBITdA growth of 28.3% to $10.4 million, increased our subscription user base by 219% to c. 830,000 users and improved our customer retention rate to 74%. We expect to generate revenues of c. $30 million in future financial years from the existing user base.
Performance in the Group’s App distribution segment – which is now Kape’s sole focus – remained strong, with revenues of $52.1 million (2017: $48.2 million), and an improvement in both profitability, margin and forward visibility over revenues as a result of the Group’s transition to a recurring SaaS revenue model.
We have achieved this positive momentum by focusing on a clear strategy, centred on: • growing our existing user base by leveraging our
proprietary technology to drive customer acquisition;
• broadening and strengthening our product offering through R&d and acquisitions which offer the potential to enter new verticals; and
• building our SaaS-based business model to improve both visibility and quality of earnings.
Operational overviewKey performance IndicatorsIn order to focus on profitability, growth and earnings predictability we introduced five key performance indicators, which ultimately underpin Kape’s financial progress.
deferred income and adjusted operating cash flow demonstrate the true value of each product purchase from our customers, given that they recognise the benefits across the life time of the contract. Paying users and subscriptions represent our ability to grow the customer base. The retention rate is an indication of the quality of our service and products and our aim is for this to remain constant over the short term and improve in the medium term.
2018 2017
Paying users (thousands) 1,100 887Subscriptions (thousands) 830 260Retention rate 74% 69%deferred income ($’000) 9,514 4,014Adjusted operating cash flow:
Attributable to current year ($’000) 15,936 9,471Investment in growth ($’000) (10,215) (1,330)
Adjusted operating cash flow ($’000) 5,721 8,141
Introduction2018 was a very significant year for Kape, during which we completed our transformation into a privacy-led cybersecurity software provider, reaching over a million paying customers. We are now proud to offer our consumers an end-to-end software suite which includes: Privacy (CyberGhost and ZenMate), Malware Protection (Intego) and Performance (Reimage and driverFix).
Strong progress was made in the year against our core KPIs, with the increase in both paying users and subscriptions demonstrating the strength of our digital marketing expertise in driving user acquisition.
219%growth in subscriptions
09KAPE TECHNOLOGIES PLCANNUAL REPORT ANd ACCOUNTS 2018
CORPORATEGOVERNANCE
STRATEGICREPORT FINANCIAL
STATEMENTS
also integrated Intego’s R&d, marketing and product teams into Kape, which further benefit from the economies of scale of the enlarged group. We also expect to release new malware protection products in the coming months.
In October 2018, Kape acquired ZenMate, a multi-platform security software business with a focus on the provision of privacy solutions, for a total consideration of $5.6 million. ZenMate is a highly complementary solution to CyberGhost, Kape’s existing VPN solution. This synergistic infrastructure allows Kape to leverage the products’ strengths and create an improved product for users worldwide coupled with substantial cost savings. In addition, with ZenMate’s highly regarded web firewall and its Safesearch application, Kape is now able to provide a broader software suite to protect our customers’ digital lives. As part of its integration, Kape implemented an extensive restructuring of ZenMate, which has been completed in less than two months, ahead of management’s expectations. As a result, in this short time we have been able to bring ZenMate to profitability. ZenMate is anticipated to be EBITdA enhancing from Q1 2019.
Prior to being acquired, both businesses’ marketing activities were primarily organic, presenting a clear opportunity for the implementation of Kape’s digital marketing expertise to drive user acquisition and enhance profit margin. The benefits of this implementation are anticipated to begin to be realised in 2019.
Strong progress was made in the year against our core KPIs, with the increase in both paying users and subscriptions demonstrating the strength of our digital marketing expertise in driving user acquisition. Additionally, the increase in our retention rate to 74% is particularly pleasing, and now compares favourably against the wider B2C cybersecurity industry. Clearly, the most important improvement is in visibility of revenues, and we expect to deliver $30 million revenue from existing users in future periods (dec 2017: $8 million). This is a key metric for the Group, as it reflects our customers’ satisfaction, in addition to providing quality, highly visible earnings for the Company moving forward. In 2018, the Company remained highly cash generative. As stated in our growth ambitions we enhanced the investment in growth, primarily in user acquisition.
divestment of Media division and re-brandduring 2018, we completed our transition to solely focus on the delivery of cybersecurity solutions following the divestment of Kape’s Media division, announced in July 2018, to Ecom Online Ltd. As consideration, Kape will receive a 50% share of EBITdA from the Media division for the next five years following the sale. This divestment resulted in an anticipated decrease in revenues for the year and is aligned to the Company’s strategy to focus on the development and growth of its owned cybersecurity assets. In March 2018, we rebranded to Kape Technologies Group plc to better reflect the ongoing activities of the business.
Acquisitions and integration In-line with our strategy laid out at the beginning of the year, we were able to successfully execute on two earnings enhancing acquisitions in 2018, both of which form part of Kape’s approach to acquire select businesses to add complementary products and additional users.
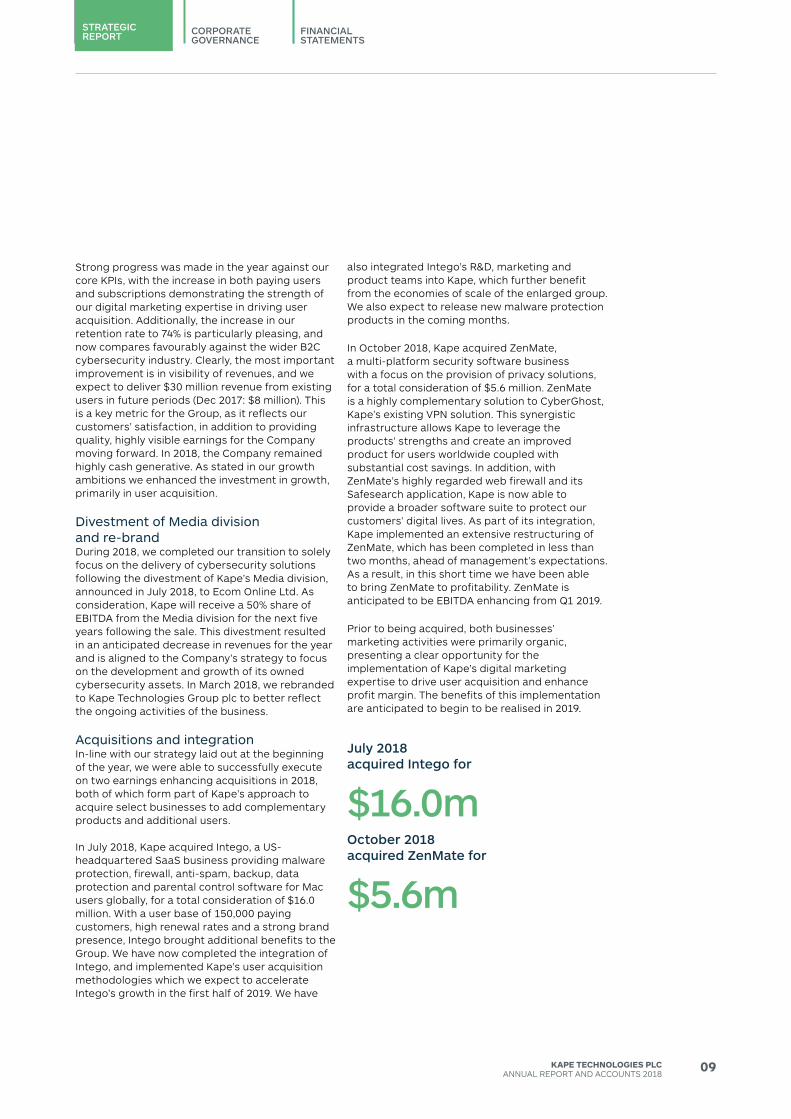
In July 2018, Kape acquired Intego, a US-headquartered SaaS business providing malware protection, firewall, anti-spam, backup, data protection and parental control software for Mac users globally, for a total consideration of $16.0 million. With a user base of 150,000 paying customers, high renewal rates and a strong brand presence, Intego brought additional benefits to the Group. We have now completed the integration of Intego, and implemented Kape’s user acquisition methodologies which we expect to accelerate Intego’s growth in the first half of 2019. We have
July 2018 acquired Intego for
$16.0mOctober 2018 acquired ZenMate for
$5.6m
10 KAPE TECHNOLOGIES PLCANNUAL REPORT ANd ACCOUNTS 2018
3 Best VPN, January 2019; VPN Mentor 2019, Comparitech June 20184 Size of the virtual private network (VPN) market worldwide from 2016
to 2022 (in billion U.S. dollars), Statista 2019.
cHIeF eXecutIVe oFFIceR’s ReVIeW
OutlookThe underlying trends in digital privacy and cybersecurity continue to broaden Kape’s addressable VPN market to $36 billion by 20224 with demand for privacy solutions anticipated to continue growing 15% annually, underpinning the ongoing demand for our products. Management are confident that not only does a sizable opportunity exist to add further products to Kape’s portfolio through future acquisitions, but there is also substantial potential within Kape’s existing product portfolio and user base to further invest in organic initiatives.
We continue to improve and expand our product offering to best serve our customers globally and will continue to evaluate select acquisition opportunities to broaden and deepen our reach.
IDO ERLICHMANcHIeF eXecutIVe oFFIceR18 March 2019
organic growthduring the year, we saw accelerated growth in CyberGhost, as we increased user acquisition through the application of our digital marketing technologies and expertise. We have seen positive results in CyberGhost’s user acquisition on desktop and mobile; and expect enhanced growth and profitability to be delivered in 2019. In 2018, CyberGhost was one of the top performing VPN solutions globally – ranking in the top three in the US, France, Germany and the UK by industry reviewers.3
In our Performance vertical (ReImage and driverfix), focus has been on transitioning to a subscription-based model and implementing new product marketing initiatives ahead of the launch of two major updates for our driver and computer repair solutions. We are extremely pleased with the results of the transition to a subscription model, which we expect to improve profitability moving forward.
product development We accelerated our R&d efforts in the year and we now have 68 employees globally who are top-tier experts in their field. Our focus has been on: • investment in the next generation infrastructure; • development of new products and updates to
existing solutions; and• implementation of proprietary cross-product
business intelligence and marketing tools.
Specifically, we released the most comprehensive update to our CyberGhost product to-date with the launch of the CyberGhost 7.0 app across Apple and Android devices, following an increase in mobile subscribers, as individuals look to safeguard their mobile devices. Kape also launched a Google Chrome and Mozilla Firefox plug-in based on a distributed computing platform and operating system, which enables greater freedom on the internet. We have seen significant traction across these products, demonstrating our standing at the forefront of the privacy technology sector.
11KAPE TECHNOLOGIES PLCANNUAL REPORT ANd ACCOUNTS 2018
CORPORATEGOVERNANCE
STRATEGICREPORT FINANCIAL
STATEMENTS
GRoWtH stRAteGY
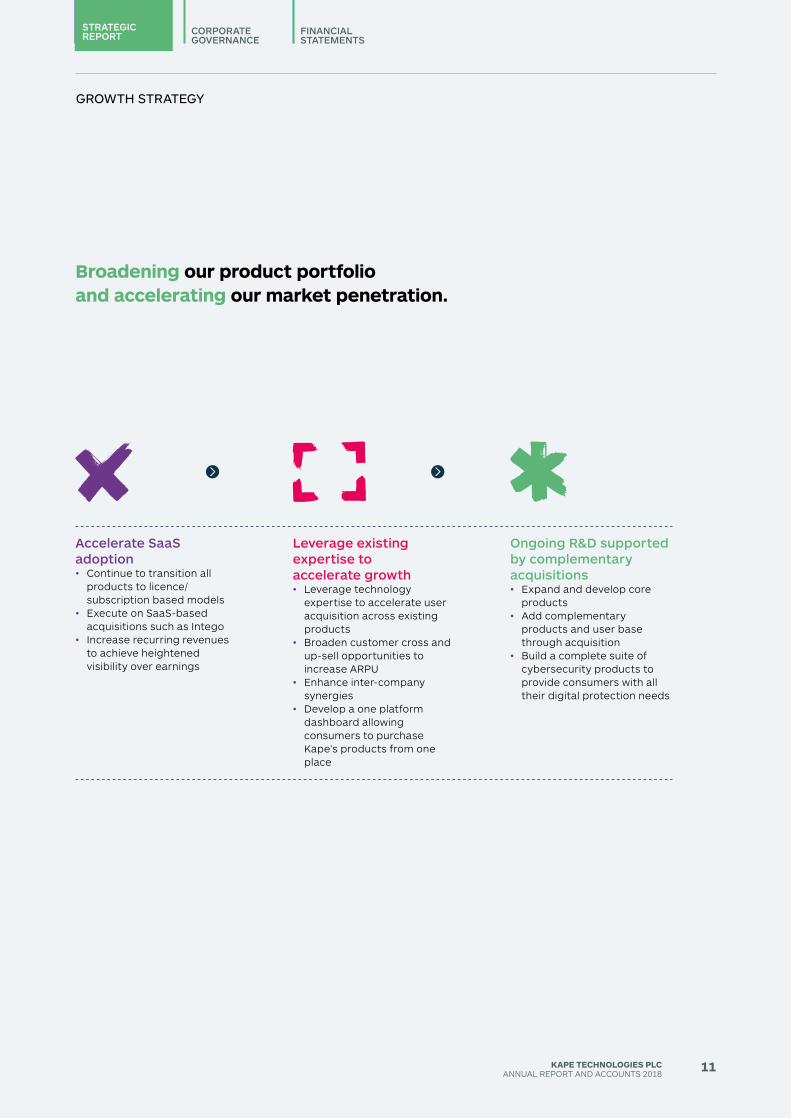
Broadening our product portfolio and accelerating our market penetration.
Ongoing R&D supported by complementary acquisitions• Expand and develop core
products • Add complementary
products and user base through acquisition
• Build a complete suite of cybersecurity products to provide consumers with all their digital protection needs
Leverage existing expertise to accelerate growth• Leverage technology
expertise to accelerate user acquisition across existing products
• Broaden customer cross and up-sell opportunities to increase ARPU
• Enhance inter-company synergies
• develop a one platform dashboard allowing consumers to purchase Kape’s products from one place
Accelerate SaaSadoption• Continue to transition all
products to licence/subscription based models
• Execute on SaaS-based acquisitions such as Intego
• Increase recurring revenues to achieve heightened visibility over earnings
12 KAPE TECHNOLOGIES PLCANNUAL REPORT ANd ACCOUNTS 2018
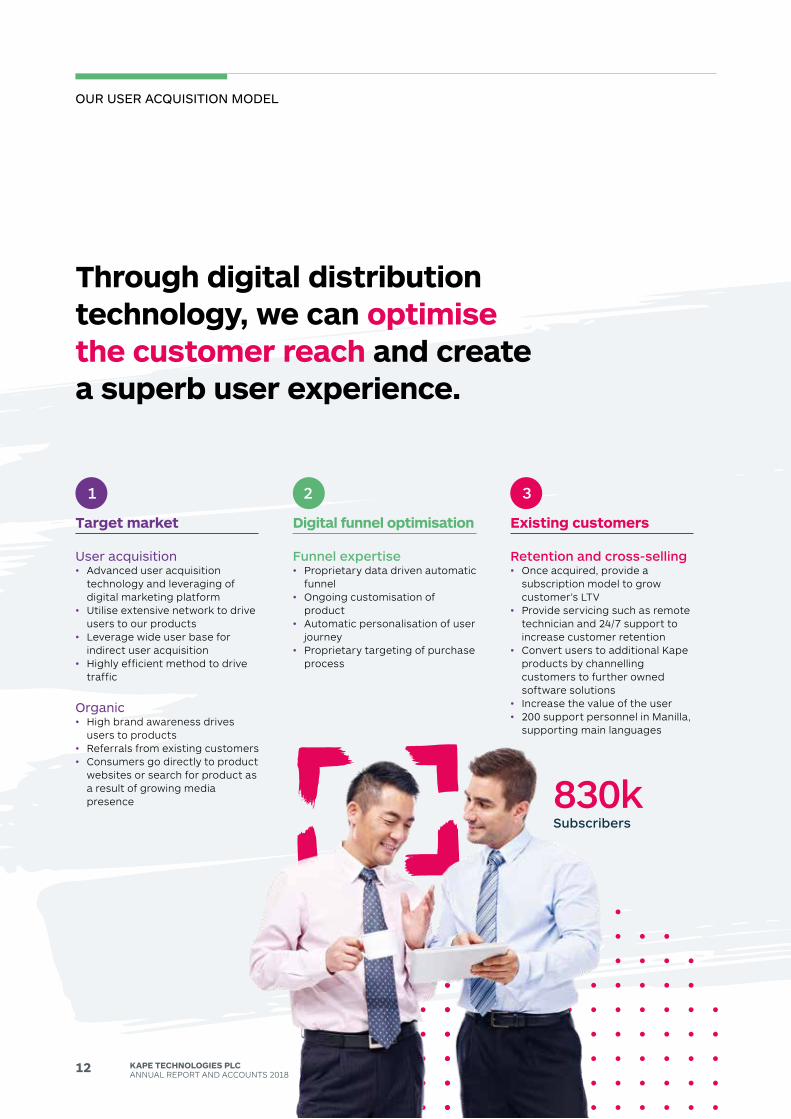
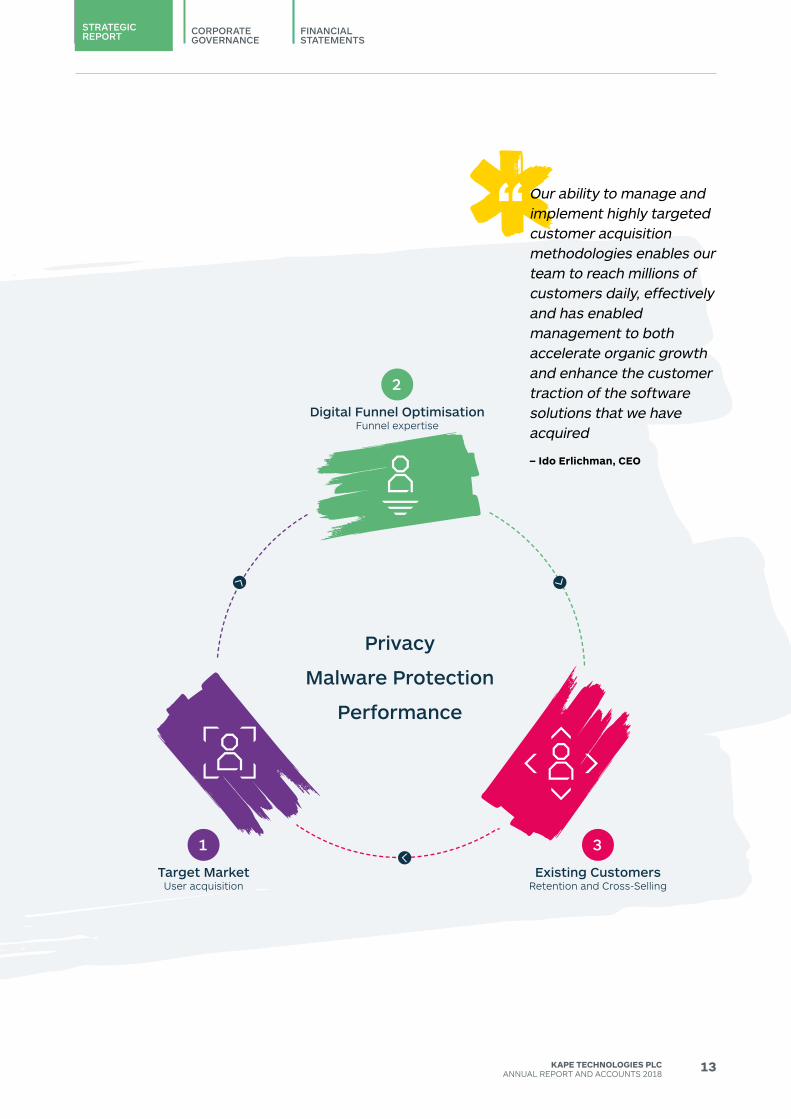
ouR useR AcQuIsItIon Model
user acquisition• Advanced user acquisition
technology and leveraging of digital marketing platform
• Utilise extensive network to drive users to our products
• Leverage wide user base for indirect user acquisition
• Highly efficient method to drive traffic
organic• High brand awareness drives
users to products• Referrals from existing customers• Consumers go directly to product
websites or search for product as a result of growing media presence
Funnel expertise• Proprietary data driven automatic
funnel• Ongoing customisation of
product• Automatic personalisation of user
journey• Proprietary targeting of purchase
process
Retention and cross-selling• Once acquired, provide a
subscription model to grow customer’s LTV
• Provide servicing such as remote technician and 24/7 support to increase customer retention
• Convert users to additional Kape products by channelling customers to further owned software solutions
• Increase the value of the user• 200 support personnel in Manilla,
supporting main languages
Through digital distribution technology, we can optimise the customer reach and create a superb user experience.
Digital funnel optimisationTarget market Existing customers
1 2 3
830kSubscribers
13KAPE TECHNOLOGIES PLCANNUAL REPORT ANd ACCOUNTS 2018
CORPORATEGOVERNANCE
STRATEGICREPORT FINANCIAL
STATEMENTS
Privacy
Malware Protection
Performance
our ability to manage and implement highly targeted customer acquisition methodologies enables our team to reach millions of customers daily, effectively and has enabled management to both accelerate organic growth and enhance the customer traction of the software solutions that we have acquired
– Ido Erlichman, CEO
2
Digital Funnel OptimisationFunnel expertise
1
Target MarketUser acquisition
3
Existing CustomersRetention and Cross-Selling
14 KAPE TECHNOLOGIES PLCANNUAL REPORT ANd ACCOUNTS 2018
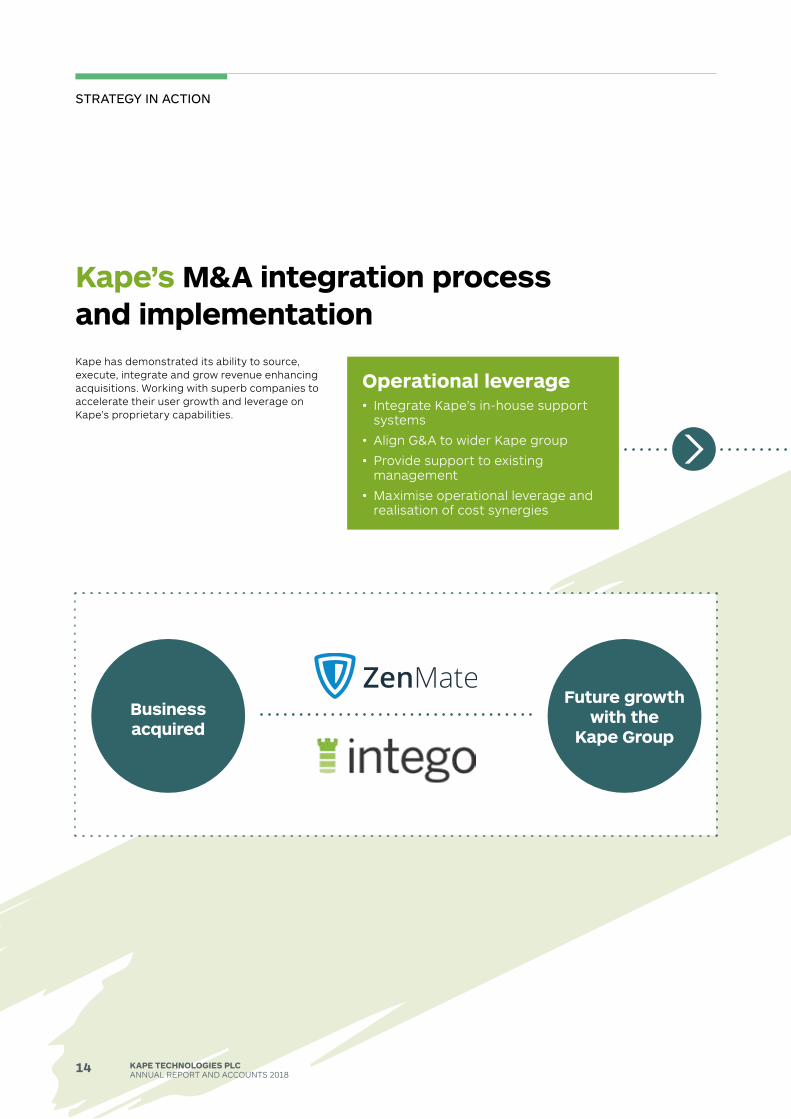
stRAteGY In ActIon
Kape’s M&A integration process and implementation Kape has demonstrated its ability to source, execute, integrate and grow revenue enhancing acquisitions. Working with superb companies to accelerate their user growth and leverage on Kape’s proprietary capabilities.
Operational leverage• Integrate Kape’s in-house support
systems
• Align G&A to wider Kape group
• Provide support to existing management
• Maximise operational leverage and realisation of cost synergies
Business acquired
Future growth with the
Kape Group
15KAPE TECHNOLOGIES PLCANNUAL REPORT ANd ACCOUNTS 2018
CORPORATEGOVERNANCE
STRATEGICREPORT FINANCIAL
STATEMENTS
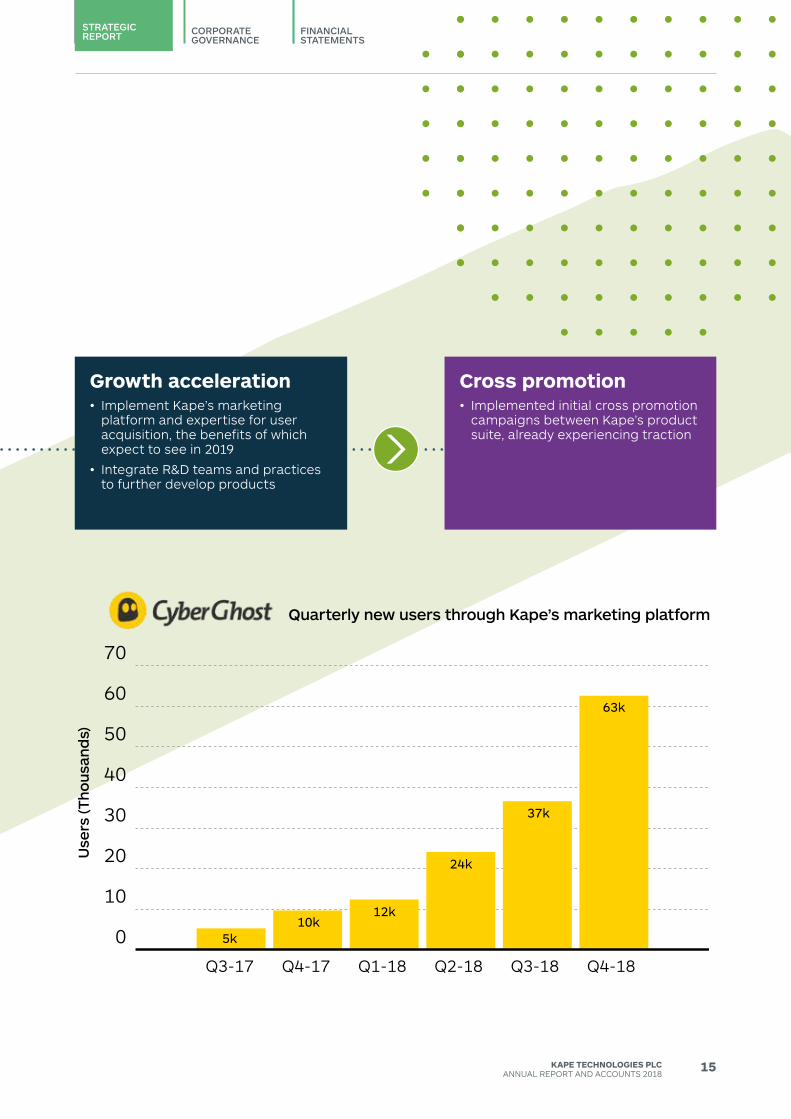
Growth acceleration• Implement Kape’s marketing
platform and expertise for user acquisition, the benefits of which expect to see in 2019
• Integrate R&d teams and practices to further develop products
Cross promotion• Implemented initial cross promotion
campaigns between Kape’s product suite, already experiencing traction
Quarterly new users through Kape’s marketing platform
Use
rs (T
hous
and
s)
0
10
20
30
40
50
60
70
Q3-17
5k10k
12k
24k
37k
63k
Q4-17 Q1-18 Q2-18 Q3-18 Q4-18
16 KAPE TECHNOLOGIES PLCANNUAL REPORT ANd ACCOUNTS 2018
cHIeF FInAncIAl oFFIceR’s ReVIeW
MORAN LAUFERcHIeF FInAncIAl oFFIceR
expensed in future periods as it attributable to future revenue from subscriptions and is recognised over the expected life time of the users in accordance with IFRS 15 (2017: $1.3 million). When excluding this investment, adjusted cash conversion from operations was $15.9 million, which represents cash conversion of 151%. The Group’s balance sheet remains strong with cash of $40.4 million at 31 december 2018 (31 december 2017: $69.5 million) and no debt after cash outflow for investing and financing activities of $32.0 million, that comprise mainly of the acquisitions of Intego and ZenMate and a special dividend payment.
On 24 July 2018, the Group acquired 100% of the share capital of Neutral Holdings Inc, trading as Intego, for a total consideration of $16.0 million. Intego is a leading Mac and IOS cybersecurity and malware protection SaaS business. Intego is focused on the provision of malware protection, firewall, anti-spam, backup, data protection and parental controls software for Mac. In the year to 31 december 2017, Intego generated profit before tax of $1.3 million.
On 16 October 2018, the Group acquired 100% of the share capital of ZenGuard GMBH trading as ZenMate, a multi-platform security software business with a focus on the provision of virtual private network solutions. The total consideration for the acquisition was $5.6 million (€4.8 million) in cash, funded from Kape’s internal cash resources, which was satisfied on closing of the acquisition. As part of the acquisition, Kape initiated a restructuring plan which was intended to downsize ZenMate’s staff and reduce operational costs.
Segment result
Revenue Segment result
2018$’000
2017$’000
2018$’000
2017$’000
App distribution 52,060 48,226 25,690 17,207Web Apps and license - 2,376 - 2,376
Revenue 52,060 50,602 25,690 19,583
The segment result has been calculated using revenue less costs directly attributable to that segment. Cost of sales comprises payment processing fees and infrastructure costs of the group’s VPN products. direct sales and marketing costs are user acquisition costs.
Overview Revenue from continued operations for the year to 31 december 2018 increased by 3% to $52.1 million (2017: $50.6 million). Adjusted EBITdA from continued operations increased by 28.4% to $10.4 million (2017: $8.1 million) with the increase in Adjusted EBITdA driven by the strong performance of Kape’s core App distribution activity, with an increase of 8% in revenues, 49.3% in segment results and 73.3% in underlying adjusted EBITdA. In July 2018, Kape divested its Media division to a third party, Ecom online Ltd, and is now considered a discontinued operation.
Kape remains a cash generative business, with cash generated from continued operations after adjusting for one-off non-recurring items in 2018 of $5.7 million (2017: $8.1 million). This represents adjusted cash conversion of 55% (2017: 101%). Cash flow from operations includes $10.2 of million investment in user acquisitions growth that will be
Strong performance of Kape’s core App Distribution activity, with an increase of 8% in revenues, 49.3% in segment results and 73.3% in underlying adjusted EBITDA
17KAPE TECHNOLOGIES PLCANNUAL REPORT ANd ACCOUNTS 2018
CORPORATEGOVERNANCE
STRATEGICREPORT FINANCIAL
STATEMENTS
49.3%App distribution margin
App Distribution
2018$’000
2017$’000
Revenue 52,060 48,226Cost of sales (5,605) (4,572)direct sales and marketing costs (20,765) (26,447)
Segment result 25,690 17,207
Segment margin (%) 49.3 35.7
during the period, the App distribution segment has seen continued growth with an 8.0% increase in revenue to $52.1 million (2017: $48.2 million) and a 49.3% increase in segment result to $25.7 million (2017: $17.2 million). The segment margin has significantly improved to 49.3% (2017: 35.7%). Following their acquisition, Intego contributed $2.6 million and ZenMate contributed $0.4 million to the segment result. Excluding acquisitions, the segment results has increased by 30.2% to $22.4 million in 2018.
Adjusted EBITDA from continued operationsAdjusted EBITdA from continued operations for the year to 31 december 2018 was $10.4 million (2017: $8.1 million). Adjusted EBITdA is a non-GAAP company specific measure which is considered to be a key performance indicator of the Group’s financial performance. It excludes share based payment charges and expenses which are considered to be one-off and non-recurring in nature and are excluded from the following analysis:
2018$’000
2017$’000
Revenue 52,060 50,602Cost of sales (5,605) (4,572)direct sales and marketing costs (20,765) (26,447)
Segment result 25,690 19,583
Indirect sales and marketing costs (6,398) (3,657)Research and development costs (1,389) (535)Management, general and administrative cost (7,529) (7,306)
Adjusted EBITDA 10,374 8,085
1 Adjusted EBITdA is a company specific measure which is calculated as operating loss before depreciation, amortisation, exceptional and non-recurring costs, employee share-based payment charges and charge of repurchase of employee options which are considered to be one off and non-recurring in nature as set out in note 4. The directors believe that this provides a better understanding of the underlying trading performance of the business.
Operating profitA reconciliation of Adjusted EBITdA to operating profit is provided as follows:
2018$’000
2017$’000
Adjusted EBITDA 10,374 8,085
Employee share-based payment charge (1,490) (303)
Charge for repurchase of employee options - (3,176)
Exceptional and non-recurring costs (1,441) (796)depreciation and amortisation (3,800) (2,376)
Operating profit 3,643 1,434
Exceptional and non-recurring costs in 2018 comprised non-recurring staff costs of $0.5 million (2017: $0.3 million), mainly due to payments made to employees that were option holders in parallel to the special dividend paid in June, $0.8 million for professional services for acquisitions (2017: $0.3 million) and $0.1 million related to an onerous lease contract (H1 2017: Nil).
Profit/(Loss) before tax from continuing operationsProfit before tax from continuing operations was $3.3 million (2017: $1.3 million).
Profit from continuing operationsProfit from continuing operations was $2.2 million (2017: $0.2 million). The tax charge derives mainly from group subsidiaries’ residual profits. The Group recognises a deferred tax asset of $0.2 million (2017: Nil) in respect of tax losses accumulated in previous years.
18 KAPE TECHNOLOGIES PLCANNUAL REPORT ANd ACCOUNTS 2018
cHIeF FInAncIAl oFFIceR’s ReVIeW
Discontinued operationsOn 26 July 2018, the Group sold the Media division to Ecom Online Ltd. This sale is in-line with the Company’s strategy to focus on the development and distribution of its own cybersecurity products. As consideration, the Group will receive a 50% share of EBITdA from the Media division for the five years following the sale. The Company recognised a loss from the sale as calculated below:
Consideration received or receivable:2018
$’000
Fair value of contingent consideration 1,257
Total consideration 1,257
Carry amount of net assets sold (4,498)Non-controlling interest 989
Loss on sale (2,252)
The financial performance and cash flow information presented are for the period ended 26 July 2018 and the year ended 31 december 2017.
2018$’000
2017$’000
Revenue 4,185 15,781Share of results of equity accounted associates – (40)Expenses (4,501) (19,895)
Loss before income tax (316) (4,154)Income tax income/ (expenses) (166) 636
Loss after income tax of discontinued operation (482) (3,518)Loss on sale of the Media division (2,252) –
Loss from discontinued operation (2,734) (3,518)
Net cash outflow from operating activities (336) (603)Net cash outflow from investing activities (341) (175)Net cash flow from financing activities – –
Net decrease in cash generated by the Media division (677) (778)
Cash flow 2018
$’0002017
$’000
Cash flow from operations 3,695 6,533
Exceptional and non-recurring payments 1,441 1,005
Net cash flow from discontinued operating activities 336 603Net cash paid due to restructuring plan 249 (796)
Adjusted cash flow from operations 5,721 8,141
% of Adjusted EBITDA 55% 101%
Cash flow from operations was $3.7 million (2017: $6.5 million). Adjusted cash flows from operations, after adding back payments that are one off in nature was $5.7 million (2017: $8.1 million). This represents a cash conversion of 55% of Adjusted EBITdA (2017: 101%). Cash flow from operations includes $10.2 million investment in user acquisitions growth that will be expensed in future periods as it attributable to future revenue from subscriptions and therefore is recognised over the expected life time of the users in accordance with IFRS 15 (2017: $1.3 million). When excluding this investment adjusted cash conversion from operations is $15.9 million (2017: $9.5 million) which represents cash conversion of 151% (2017: 115%).
Tax paid net of refunds in the period was $0.5 million (2017: $0.1 million).
Cash spent in the period on capital expenditure of $2.5 million (2017: $2 million) mainly comprises capitalised development costs and purchase of fixed assets. Net cash paid for acquisitions in the period totalled $20.8 million (2017: $5.3 million), of which the Company paid $15.5 million in relation to the acquisition of Neural Holdings Inc and $5.3 million related to the acquisition of ZenGuard GMBH. Net cash outflow for sold operations in the period amounted to $0.3 million in relation to the disposal of the Media division to a third party in July 2018. As a result, net cash outflow from investing activities was $23.6 million (2017: $7.4 million).
In June 2018, the Company paid a special dividend in the amount of $6.8 million representing 3.55 pence per share. In November 2017, the Company repurchased 3.8 million share options from CyberGhost’s founder for a total consideration of $3.8 million, out of which $1.9 million was paid in 2017 and the rest in eight equal quarterly instalments. during 2018 $0.9 million in payments were made for the repurchase. during 2018 the Company paid $1.1 million of lease related payments that were recorded as part of the financing activities following the adoption of IFRS 16. Employee option exercises resulted in cash receipts of $0.4 million during 2018. As a result, net cash outflow from financing activities was $8.4 million (2017: $1.5 million).
19KAPE TECHNOLOGIES PLCANNUAL REPORT ANd ACCOUNTS 2018
CORPORATEGOVERNANCE
STRATEGICREPORT FINANCIAL
STATEMENTS
Financial positionAt 31 december 2018, the Company had cash of $40.4 million (31 december 2017: $69.5 million), net assets of $73.0 million (31 december 2017: $79.4 million) and was debt free. At 31 december 2018, trade receivables and contract assets were $3.6 million (31 december 2017: $8.5 million) which represented 13 days outstanding, (31 december 2017: 42 days). The decrease in Trade receivables is mainly due to the sale of the media division
Early adoption of IFRS 16From 1 January, 2018, the Company adopted IFRS 16, which specifies how to recognise, measure, present and disclose leases. The Company has not restated comparatives for the 2017 reporting period.
On initial application, the Group recognised lease liabilities in relation to leases which had previously been classified as ‘operating leases’ under the principles of IAS 17 Leases. If the Company had chosen not to early adopt IFRS 16, the Company net profits from continuing operations would have been $2.3 million.
The recognised right-of-use assets and lease liabilities are specified below:
Right-of-Use AssetsReal estate
leases$’000
Vehicles$’000
Total$’000
At 1 January 2018 1,331 77 1,408Additions 1,265 – 1,265Additions through business combination 305 – 305Amortisation (1,181) (28) (1,209)
At 31 december 2018 1,720 49 1,769
Lease liabilitiesReal estate
leases$’000
Vehicles$’000
Total$’000
At 1 January 2018 1,331 77 1,408Additions 1,265 – 1,265Additions through business combination 305 – 305Interest expense 82 11 93Lease payments (1,058) (29) (1,087)Interest expense (62) (3) (65)
At 31 december 2018 1,863 56 1,919
MORAN LAUFERcHIeF FInAncIAl oFFIceR18 March 2019
$40.4mCash at 31 December 2018
20 KAPE TECHNOLOGIES PLCANNUAL REPORT ANd ACCOUNTS 2018
pRIncIpAl RIsKs And unceRtAIntIes
There are a number of potential risks and uncertainties that could have a material impact on the Group’s long-term performance and could cause results to differ materially from expected and historical results. The risks to which the business is exposed are set out below:
Risks Background Mitigating controls
Regulatory, legislative or self-regulatory developments regarding internet privacy matters could adversely affect the Group’s ability to conduct its business.
Large and established internet, Antivirus and technology companies may be able to significantly impair the Group’s ability to operate.
International regulatory bodies are increasingly focused on online privacy issues and user data protection. In particular, GdPR was approved by the European Union (EU) and takes effect from May 2018. It intends to strengthen and unify data protection for all individuals within the EU. It also addresses the export of personal data outside the EU. The GdPR aims primarily to give control back to citizens and residents over their personal data and to simplify the regulatory environment for international business by unifying the regulation within the EU.
Large and established internet, Antivirus and technology companies such as Symantec Corporation, Amazon.com, Inc. (“Amazon”), AOL, Inc., Apple, eBay Inc., Facebook, Inc. (“Facebook”), Google and Microsoft, may have the power to significantly change the very nature of the app-distribution and internet display advertising marketplace. These changes could materially disadvantage the Group. For example, Amazon, Apple, Facebook, Google and Microsoft have substantial resources and control a significant share of widely adopted industry platforms such as web browsers, mobile operating systems and advertising exchanges and networks. Changes to their web browsers, mobile operating systems, platforms, exchanges, networks or other products or services could be significantly harmful to the Group’s business. Such companies could also seek to replicate all or parts of the Group’s business.
• All the information that the Group obtains regarding users and their profiling is information that may correspond to a particular person, account or profile, but does not identify, allow contact or enable Kape to locate the person to whom such information pertains. As a consequence, the Group is not regulated by any regulator or subject to any regulatory approval for its day-to-day operations.
• Whilst not externally regulated, the Group adheres to a strict set of controls with its partners. Partners, developers, publishers and advertisers are required to comply with these contractually imposed controls, which have been jointly created by the Group and its legal advisers.
• The Group actively monitors the developments of the large and established internet, Antivirus and technology companies to identify any threats that may impair the Group’s ability to operate.
21KAPE TECHNOLOGIES PLCANNUAL REPORT ANd ACCOUNTS 2018
CORPORATEGOVERNANCE
STRATEGICREPORT FINANCIAL
STATEMENTS
Mitigating controls
• The Group invests in research and development resources to ensure that the Group’s technology platforms are continually enhanced through evolution and innovation.
• The Group also invests in acquisitions to expand its technology platforms and adapt to the rapidly changing technology environment.
• The Group outsources hosting services, holding minimal server infrastructure itself. This allows the Group to flex and grow its operations efficiently.
• Kape uses third party content distribution network services in order to offload traffic served directly from its own infrastructure and minimise network latency.
• The Group uses advisers to review its tax position and ensure compliance with local tax legislation.
Risks Background
If the Group fails to innovate and respond effectively to rapidly changing technology, the Group’s solution may become less competitive or obsolete.
Failures in the Group’s IT systems and infrastructure supporting its solution could significantly disrupt its operations and cause it to lose clients.
The Group is a multinational organisation faced with increasingly complex tax issues in many jurisdictions, and it could be obliged to pay additional taxes in various jurisdictions as a result of new taxes, laws or interpretation, including sales taxes, which may negatively affect its business.
To remain competitive, the Group’s future success will depend on its ability to continuously enhance and improve its solutions to meet client needs, add functionality to its product portfolio and address technological advancements.
In addition to the optimal performance of the Kape Engine, the Group’s business relies on the continued and uninterrupted performance of its software and hardware infrastructures. Sustained or repeated system failures of its software and hardware infrastructures, which interrupt its ability to deliver its software products and services or advertisements quickly and accurately, could significantly reduce the attractiveness of its solution to advertiser clients and publishers, reduce its revenue and affect its reputation.
As a multinational organisation, operating in multiple jurisdictions such as the Isle of Man, Cyprus, Israel, Romania, Germany, Untied States and the United Kingdom, the Group may be subject to taxation in several jurisdictions around the world with increasingly complex tax laws, the application of which can be uncertain. The amount of taxes it pays in these jurisdictions could increase substantially as a result of changes in the applicable tax principles, including increased tax rates, new tax laws or revised interpretations of existing tax laws and precedents, which could have a material adverse effect on its liquidity and results of operations.
22 KAPE TECHNOLOGIES PLCANNUAL REPORT ANd ACCOUNTS 2018
BoARd oF dIRectoRs
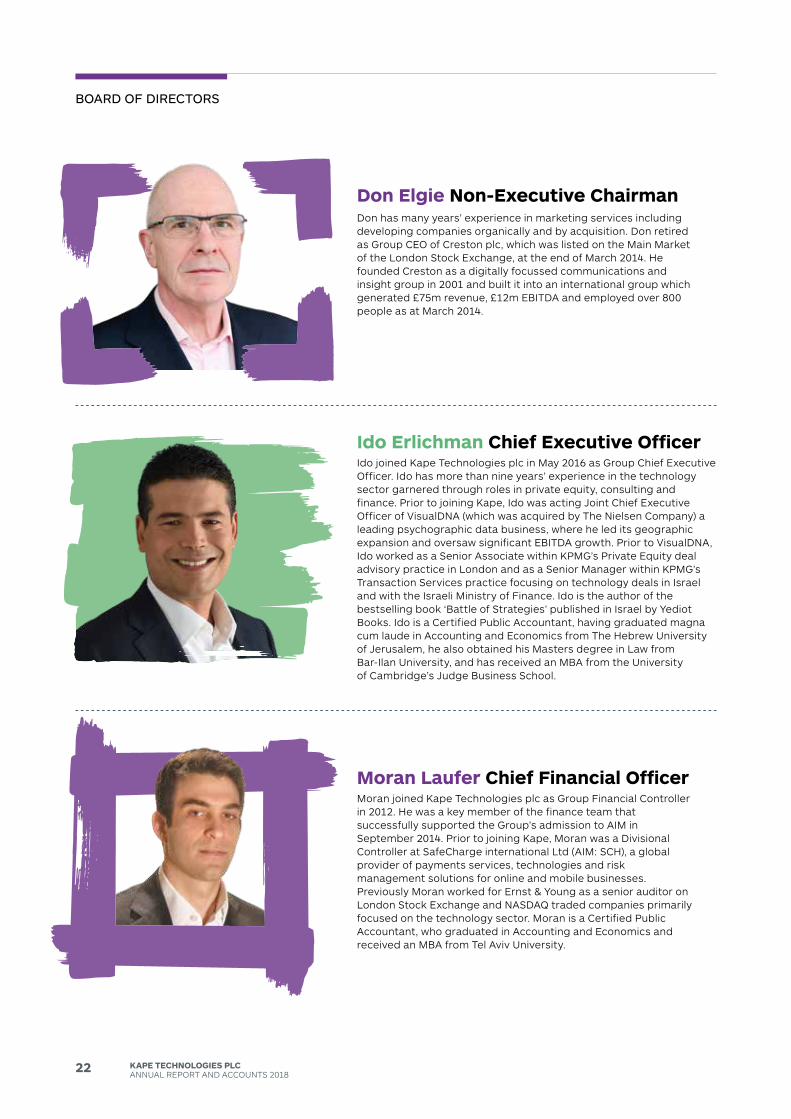
don has many years’ experience in marketing services including developing companies organically and by acquisition. don retired as Group CEO of Creston plc, which was listed on the Main Market of the London Stock Exchange, at the end of March 2014. He founded Creston as a digitally focussed communications and insight group in 2001 and built it into an international group which generated £75m revenue, £12m EBITdA and employed over 800 people as at March 2014.
Don Elgie Non-Executive Chairman
Ido joined Kape Technologies plc in May 2016 as Group Chief Executive Officer. Ido has more than nine years’ experience in the technology sector garnered through roles in private equity, consulting and finance. Prior to joining Kape, Ido was acting Joint Chief Executive Officer of VisualdNA (which was acquired by The Nielsen Company) a leading psychographic data business, where he led its geographic expansion and oversaw significant EBITdA growth. Prior to VisualdNA, Ido worked as a Senior Associate within KPMG’s Private Equity deal advisory practice in London and as a Senior Manager within KPMG’s Transaction Services practice focusing on technology deals in Israel and with the Israeli Ministry of Finance. Ido is the author of the bestselling book ‘Battle of Strategies’ published in Israel by Yediot Books. Ido is a Certified Public Accountant, having graduated magna cum laude in Accounting and Economics from The Hebrew University of Jerusalem, he also obtained his Masters degree in Law from Bar-Ilan University, and has received an MBA from the University of Cambridge’s Judge Business School.
Ido Erlichman Chief Executive Officer
Moran joined Kape Technologies plc as Group Financial Controller in 2012. He was a key member of the finance team that successfully supported the Group’s admission to AIM in September 2014. Prior to joining Kape, Moran was a divisional Controller at SafeCharge international Ltd (AIM: SCH), a global provider of payments services, technologies and risk management solutions for online and mobile businesses. Previously Moran worked for Ernst & Young as a senior auditor on London Stock Exchange and NASdAQ traded companies primarily focused on the technology sector. Moran is a Certified Public Accountant, who graduated in Accounting and Economics and received an MBA from Tel Aviv University.
Moran Laufer Chief Financial Officer
23KAPE TECHNOLOGIES PLCANNUAL REPORT ANd ACCOUNTS 2018
STRATEGICREPORT
CORPORATEGOVERNANCE FINANCIAL
STATEMENTS
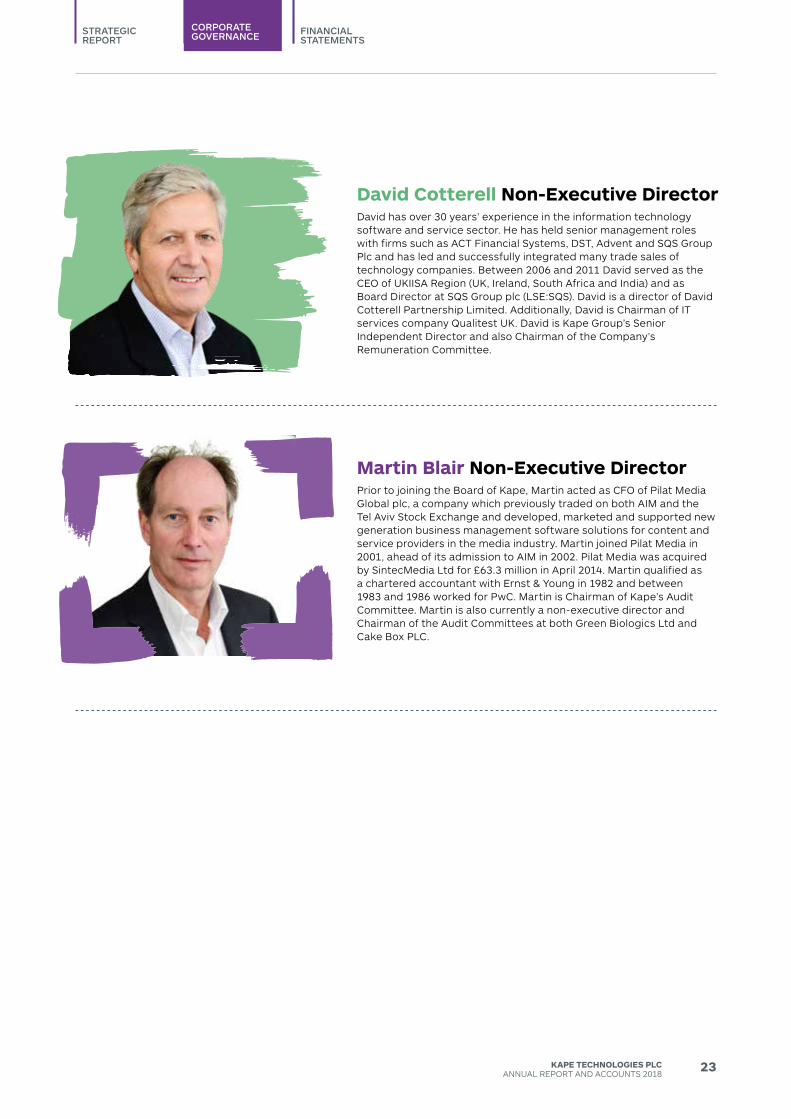
david has over 30 years’ experience in the information technology software and service sector. He has held senior management roles with firms such as ACT Financial Systems, dST, Advent and SQS Group Plc and has led and successfully integrated many trade sales of technology companies. Between 2006 and 2011 david served as the CEO of UKIISA Region (UK, Ireland, South Africa and India) and as Board director at SQS Group plc (LSE:SQS). david is a director of david Cotterell Partnership Limited. Additionally, david is Chairman of IT services company Qualitest UK. david is Kape Group’s Senior Independent director and also Chairman of the Company’s Remuneration Committee.
David Cotterell Non-Executive Director
Prior to joining the Board of Kape, Martin acted as CFO of Pilat Media Global plc, a company which previously traded on both AIM and the Tel Aviv Stock Exchange and developed, marketed and supported new generation business management software solutions for content and service providers in the media industry. Martin joined Pilat Media in 2001, ahead of its admission to AIM in 2002. Pilat Media was acquired by SintecMedia Ltd for £63.3 million in April 2014. Martin qualified as a chartered accountant with Ernst & Young in 1982 and between 1983 and 1986 worked for PwC. Martin is Chairman of Kape’s Audit Committee. Martin is also currently a non-executive director and Chairman of the Audit Committees at both Green Biologics Ltd and Cake Box PLC.
Martin Blair Non-Executive Director
24 KAPE TECHNOLOGIES PLCANNUAL REPORT ANd ACCOUNTS 2018
coRpoRAte GoVeRnAnce
and where appropriate, other members of the senior management team meet regularly with investors (including institutional shareholders) and analysts to actively build the relationship, provide them with updates on the Group’s business and to obtain feedback regarding the market’s expectations for the Group. Shareholders also have access to current information on the Company through its website http://investors.kape.com/, and via its financial PR advisor and the Chief Financial Officer who is available to answer investor relations queries.
3. take into account wider stakeholder and social responsibilities and their implications for long-term successThe Group is aware of its corporate social responsibilities and the need to maintain working relationships across a range of stakeholder groups. The Group’s operations and working methodologies take account of the requirement to balance the needs of all of these stakeholder groups while maintaining focus on the Board’s primary responsibility to promote the success of the Group for the benefit of members as a whole. Our employees are the key to our success and therefore regular meetings are held with staff to ensure that the strategic vision of the Group is realised and to provide a forum for employees to engage in open and confidential dialogue and ensure successful two-way communication with agreement on goals, targets and aspirations of employees and the Group. In addition, the Group is in the process of setting up formal arrangements to facilitate whistleblowing. These feedback processes help to ensure that the Group can respond to new issues and opportunities that arise to further the success of employees and the Group. In addition, there are a range of processes and systems in place with other stakeholders to ensure that there is close oversight and contact with key stakeholders. These relationships are addressed at regular Board meetings.
4. embed effective risk management, considering both opportunities and threats, throughout the organisationThe Board is responsible for the systems of risk management and internal control and for reviewing their effectiveness. The internal controls are designed to manage rather than eliminate risk and provide reasonable but not absolute assurance against material misstatement or loss. Through the activities of the Audit Committee, the scope and effectiveness of these internal controls is reviewed annually, identifying key financial and non-financial risks, risk control measures and the implementation status of risk control measures. The review was presented to the Audit Committee by the Chief Financial Officer. A summary of the principal risks and uncertainties facing the Group, as well as mitigating controls, are set out on pages 20 and 21. All material contracts are required to be reviewed and signed by a senior director of the Company and reviewed by our General Counsel. Whilst not externally regulated, the Group adheres to a strict set of controls with its partners. Partners, developers, publishers and advertisers are required to comply with these contractually imposed controls, which have been jointly created by the Group and its legal advisers.
OverviewOn 8 March 2018, the LSE issued revised rules for AIM-listed companies, within which was a requirement (Rule 26) for AIM companies to apply a recognised corporate governance code from 28 September 2018. Taking account of this, the Board has adopted the Quoted Company Alliance’s (QCA) Corporate Governance Code for Small and Mid-Size Quoted Companies (“QCA Code”). The principal means of communicating our application of the Code are this annual report and our website (http://investors.kape.com/corporate-governance). As Chairman, I am the custodian of the corporate governance approach adopted by the Board to ensure that the Company has the right people, strategy and culture to deliver success in the medium to long term. Since adopting the QCA Code I have led the Company’s application of its ten principles to ensure that the Company’s strategy is linked to and supported by its governance arrangements. The remainder of this statement sets out the Company’s application of the Code including, where appropriate, cross references to other sections of the annual report.
1. establish a strategy and business model which promote long-term value for shareholdersThe strategy and business operations of the Group are set out in the Chairman’s Statement on pages 4 and 5 and the Chief Executive Officer’s Review on pages 8 to 10. The Group’s strategy and business model and amendments thereto, are developed by the Chief Executive Officer and the senior management team, and approved by the Board. The management team, led by the Chief Executive Officer, is responsible for implementing the strategy and managing the business at an operational level.
The Group’s overall strategic objective is to become the leading next generation providers of consumer cybersecurity products.
The Group continues to grow and develop its product portfolio in the growing cybersecurity market, with a renewed focus in consumer cybersecurity. The Group deploys its financial and other resources towards developing R&d internally, growing its product offering through organic growth and acquisitions and strengthening its SaaS business.
The Board believes that this approach will continue deliver significant long-term value for shareholders through a strong share performance and against the Group’s key performance indicators. The Board also believes that remaining admitted to trading on AIM is of long-term value to shareholders as it offers a combination of access to capital markets, flexibility to make acquisitions, incentives and rewards to management through share schemes, and a regulatory environment appropriate to the size of the Company.
2. seek to understand and meet shareholder needs and expectationsThe Group seeks to maintain a regular dialogue with both existing and potential new shareholders in order to communicate the Group/Company’s strategy and progress and to understand the expectations and needs of shareholders. Beyond the Annual General Meeting, the Chairman, Chief Executive Officer and Chief Financial Officer
25KAPE TECHNOLOGIES PLCANNUAL REPORT ANd ACCOUNTS 2018
STRATEGICREPORT
CORPORATEGOVERNANCE FINANCIAL
STATEMENTS
A comprehensive budgeting process is completed once a year and is reviewed and approved by the Board. Actual results are monitored on a weekly and monthly basis and compared to the yearly budget. In addition, the Group performs quarterly reforecasts for expected performance over the remainder of the financial period. These cover profits, cash flows, capital expenditure and balance sheets. The Group maintains appropriate insurance cover in respect of actions taken against the directors because of their roles, as well as against material loss or claims against the Group. The insured amounts and type of cover are reviewed periodically. The Board has ultimate responsibility for the Group’s system of internal control and for reviewing its effectiveness. However, any such system of internal control can provide only reasonable, but not absolute, assurance against material misstatement or loss. The Board considers that the internal controls in place are appropriate for the size, complexity and risk profile of the Group.
5. Maintain the board as a well-functioning, balanced team led by the chairThe Board currently comprises three Non-Executive directors (one of whom also acts as Senior Independent director) and two Executive directors. The directors’ biographies are set out on pages 22 and 23. The Board is satisfied that it has a suitable balance between independence on the one hand, and knowledge of the Company on the other, to enable it to discharge its duties and responsibilities effectively. The Board considers, after careful review, the Non-Executive directors to be independent of management and free of any relationship which could materially interfere with the exercise of their independent judgment. The Board is responsible for the overall strategy and direction of the Group. It provides robust leadership of the Company within a framework of effective controls which enables risk to be assessed and managed. The Board, in setting the Company’s aims, ensures that the necessary financial and human resources are in place to meet its objectives. It regularly reviews management performance on a yearly basis and upholds the Company’s values and standards so that its obligations to shareholders and others are understood and met. The Board is supplied with information in a timely manner to enable it to discharge its duties. The Board also reviews arrangements under which employees can raise concerns in confidence about possible improprieties in matters of financial reporting or other areas. The Board meets at regular scheduled intervals ten times a year and follows a formal agenda. It also meets as and when required. during 2018, all the directors attended all the board meetings. No one individual has unfettered powers of decision. The directors may take independent professional advice at the Group’s expense. The Non-Executive directors normally do not have any day-to-day involvement in the running of the business but are responsible for scrutinising the performance of management in meeting agreed goals and objectives and monitoring the reporting of performance. All Board members are considered to be able to allocate sufficient time to the Company to discharge their responsibilities as directors effectively with a minimum of 45 days a year dedicated to fulfil their roles.
6. ensure that between them the directors have the necessary up-to-date experience, skills and capabilitiesThe Board considers that all of the Non-Executive directors are of sufficient competence and calibre to add strength and objectivity to its activities. The directors’ biographies are set out on pages 22 and 23. The Board considers that the combination of the complementary skills and experience of its Board members provides it with an appropriate balance of sector, financial and public markets skills. The composition of the Board is reviewed regularly to ensure that it has the necessary breadth and depth of skills to support the ongoing development of the Group. The Chairman has a clear and distinct responsibility for running the Board whilst the executive responsibility for running the Company’s business was delegated to the Chief Executive Officer.
7. evaluate board performance based on clear and relevant objectives, seeking continuous improvementBoard and Committee meetings are scheduled in advance for each calendar year. Additional meetings are arranged as necessary.
The Chairman assesses the individual contributions of each member of the Board to ensure that: • their contribution is relevant and effective;• that they are committed; • understand the business and its strategy;• where relevant, they have maintained their independence
8. promote a corporate culture that is based on ethical values and behavioursThe Board seeks to maintain the highest standards of integrity and probity in the conduct of the Group’s operations. These values are enshrined in written policies and working practices adopted by all employees in the Group. We strive to create an agile, creative and openminded culture to support our success in a constantly evolving market where time to market and outside of the box thinking is essential for success. We promote cross company discussions as well as encourage involvement of employees in proposing new and innovative project initiatives we do that through cross company activities as well as regular subject based meetings.
The board believes that diversity is a key to future success of our business we have put an effort on monitoring and improving the gender ratio in the company, and we are pleased to report that the percentage of women in the company has gone up from 25% to 35% in the last year, as we firmly believe that part of the company success is the global and diverse nature of our workforce and we intend to continue our effort to promote diversity.
9. Maintain governance structures and processes that are fit for purpose and support good decision-making by the boardOur corporate governance structures and processes are summarised and discussed under the heading Corporate Governance on pages 24 to 26.
26 KAPE TECHNOLOGIES PLCANNUAL REPORT ANd ACCOUNTS 2018
10. communicate how the company is governed and is performing by maintaining a dialogue with shareholders and other relevant stakeholdersIn addition to the activities summarised under the QCA Code principle, “Seek to understand and meet shareholder needs and expectations” the Company provides information for investors on its website, arranges Investor meetings and maintains contact with institutional shareholders and fund managers. The Company’s joint-brokers provide independent feedback to the Board on market views and produce regular research notes on the Company. This enables the Board to understand the concerns of shareholders and the wider investment community.
Role of the BoardThe Board is responsible for the overall strategy and direction of the Group. It provides robust leadership of the Company within a framework of effective controls which enables risk to be assessed and managed. The Board in setting the Company’s aims, ensures that the necessary financial and human resources are in place to meet its objectives. It regularly reviews management performance and upholds the Company’s values and standards so that its obligations to shareholders and others are understood and met.
The Board is supplied with information in a quality form and in a timely manner to enable it to discharge its duties. The Board also reviews arrangements under which employees can raise concerns in confidence about possible improprieties in matters of financial reporting or other areas.
Division of responsibilitiesduring 2018, the Chairman, donald (don) Elgie had a clear and distinctive responsibility of running the Board whilst the executive responsibility of running the Company’s business was delegated to the Chief Executive Officer, Ido Erlichman.
As at 31 december 2018, the Board comprised five directors, three of whom were Non-Executive directors.
The Non-Executive directors normally do not have any day-to-day involvement in the running of the business but are responsible for scrutinizing the performance of management in meeting agreed goals and objectives and monitoring the reporting of performance. All Board members are considered to be able to allocate sufficient time to the Company to discharge their responsibilities as directors effectively.
The Board meets at regular scheduled intervals and follows a formal agenda; it also meets as and when required. No one individual has unfettered powers of decision. The directors may take independent professional advice at the Group’s expense.
Board committeesThe Group has an Audit Committee, a Nominations Committee, and a Remuneration Committee, each consisting of three Non-Executive directors. Each committee has written terms of delegated responsibilities which will be available for review at the end of the Annual General Meeting for 2018 and are available for review in the Investor Relations section of the Group’s website www.Kape.com. The Board and its committees are considered to have an appropriate balance of skills, experience, independence, and knowledge of the Company to enable them to discharge their respective duties and responsibilities effectively.
Remuneration committeeThe Remuneration Committee is comprised of david Cotterell (Chair of the Committee), don Elgie and Martin Blair, all of whom are Non-Executive directors. It is responsible for making recommendations to the Board on remuneration policy as applied to the Company’s Executive directors. The Remuneration Committee also considers grants of options under the company’s share option schemes. The policy of the Remuneration Committee is to grant share options to employees as part of a remuneration package to motivate them to contribute to the growth of the Group over the medium to long term.
The Chief Executive may, at the Remuneration Committee’s invitation, attend meetings except where his own remuneration is discussed. The Remuneration Committee met twice during the past financial year. The Remuneration Committee’s terms of reference, which can be found on the Company’s website www.Kape.com, are reviewed on an annual basis and updated as required.
The Remuneration Committee Report, which includes details of directors’ remuneration, pension entitlements and director’s interests, together with information on service contracts, is set out on pages 28 and 29.
Audit committeeThe Audit Committee is comprised of Martin Blair (Chair of the Committee), david Cotterell and don Elgie, all of whom are Non-Executive directors.
The Committee meets at least twice a year and at other times as agreed between the members of the Committee. In 2018 the Committee met 4 times. Executive directors and the Group’s auditors may be invited to attend all or part of any meetings. The Committee also meets with the Group’s external auditors without the presence of the Executive directors.
The Committee terms of reference, which can be found on the Company’s website www.Kape.com, are reviewed on an annual basis and updated as required.
Risk management and internal controlsduring the year, the Audit Committee has reviewed the scope and effectiveness of systems to identify and address financial and non-financial risks. The review identified the key risks, risk control measures and the implementation status of the risk control measures. The report was presented to the Committee by the Chief Financial Officer.
coRpoRAte GoVeRnAnce CONTINUEd
27KAPE TECHNOLOGIES PLCANNUAL REPORT ANd ACCOUNTS 2018
STRATEGICREPORT
CORPORATEGOVERNANCE FINANCIAL
STATEMENTS
Audit of the Group’s annual report financial statementsIn advance of the audit of the Group’s annual report and financial statements the Audit Committee reviewed the plans as presented by the Group’s external auditor, BdO LLP. The plan set out the proposed scope of work, audit approach, materiality and identified areas of audit risk.
The Audit Committee also reviewed the annual report and financial statements along with the audit findings report presented by BdO LLP.
Auditor independenceThe Audit Committee monitors the independence of the Group’s external auditor. during the year BdO LLP provided the Group with the following non-audit services:
• Taxation compliance services; and• Taxation advisory services.
The Audit Committee considered the threats to the independence of BdO LLP created by the provision of the non-audit services and concluded that sufficient safeguards were in place.
BdO was appointed as auditor of the Group for the year ended 31 december 2013. The Audit Committee will keep under review, in consultation with major shareholders, the decision as to whether to conduct a tender in respect of the audit in line with the recommendations of the Financial Reporting Council.
Nominations committeeThe Nominations Committee is comprised of don Elgie (Chair of the Committee), Martin Blair and david Cotterell, all of whom are independent Non-Executive directors. The Committee meets when appropriate and considers the composition of the Board, retirements and appointments of additional and replacement directors and makes appropriate recommendations to the Board. The objective of the Committee is to review the composition of the Board and to plan for its progressive refreshing, with regard to balance and structure. The Committee is responsible for:
• Reviewing the structure of the Board;• Evaluating the balance of skills, knowledge, experience and
diversity of the Board;• Advising the Board on any areas where further recruitment
may be appropriate; and• Succession planning for key executives at Board level
and below.
Where necessary and appropriate, recruitment consultants are used to assist the Committee in delivering its objectives and responsibilities. The Committee leads the process for the identification and selection of new directors and makes recommendations to the Board in respect of such appointments. The Committee also makes recommendations to the Board on membership of its committees. The Committee terms of reference, which can be found on the Company’s website www.Kape.com, are reviewed on an annual basis and updated as required.
28 KAPE TECHNOLOGIES PLCANNUAL REPORT ANd ACCOUNTS 2018
The Remuneration Committee (for the purpose of the Remuneration Committee report “the Committee”) is comprised of david Cotterell (Chair of the Committee), don Elgie and Martin Blair all of whom are Non-Executive directors.
The directors (other than alternate directors) shall be entitled to receive by way of fees for their services as directors (in addition to fees paid for employment or executive services) such sum as the Board may from time to time determine, provided that such amount shall not exceed in aggregate £500,000 per annum or such greater sum as the Company in general meeting shall from time to time determine by ordinary resolution. Any fees payable shall be distinct from any salary, remuneration or other amounts payable to a director.
Each director is entitled to be repaid all reasonable travelling, hotel and other expenses properly incurred by him in or about the performance of his duties as a director, including any expenses incurred in attending meetings of the Board or any committee of the Board or general meetings or separate meetings of the holders of any class of shares or of debentures of the Company.
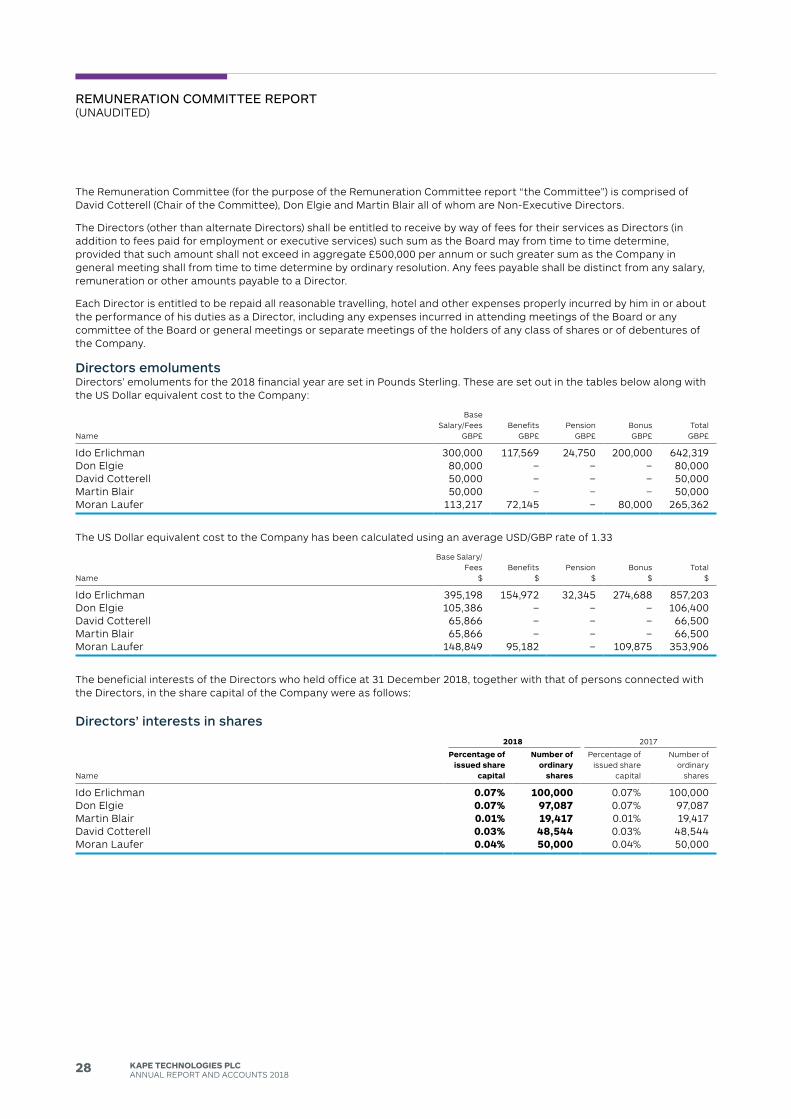
Directors emolumentsdirectors’ emoluments for the 2018 financial year are set in Pounds Sterling. These are set out in the tables below along with the US dollar equivalent cost to the Company:
Name
Base Salary/Fees
GBP£Benefits
GBP£Pension
GBP£BonusGBP£
TotalGBP£
Ido Erlichman 300,000 117,569 24,750 200,000 642,319don Elgie 80,000 – – – 80,000david Cotterell 50,000 – – – 50,000Martin Blair 50,000 – – – 50,000Moran Laufer 113,217 72,145 – 80,000 265,362
The US dollar equivalent cost to the Company has been calculated using an average USd/GBP rate of 1.33
Name
Base Salary/Fees
$Benefits
$Pension
$Bonus
$Total
$
Ido Erlichman 395,198 154,972 32,345 274,688 857,203don Elgie 105,386 – – – 106,400david Cotterell 65,866 – – – 66,500Martin Blair 65,866 – – – 66,500Moran Laufer 148,849 95,182 – 109,875 353,906
The beneficial interests of the directors who held office at 31 december 2018, together with that of persons connected with the directors, in the share capital of the Company were as follows:
Directors’ interests in shares2018 2017
Name
Percentage of issued share
capital
Number of ordinary
shares
Percentage of issued share
capital
Number of ordinary
shares
Ido Erlichman 0.07% 100,000 0.07% 100,000don Elgie 0.07% 97,087 0.07% 97,087Martin Blair 0.01% 19,417 0.01% 19,417david Cotterell 0.03% 48,544 0.03% 48,544Moran Laufer 0.04% 50,000 0.04% 50,000
ReMuneRAtIon coMMIttee RepoRt(UNAUdITEd)
29KAPE TECHNOLOGIES PLCANNUAL REPORT ANd ACCOUNTS 2018
STRATEGICREPORT
CORPORATEGOVERNANCE FINANCIAL
STATEMENTS
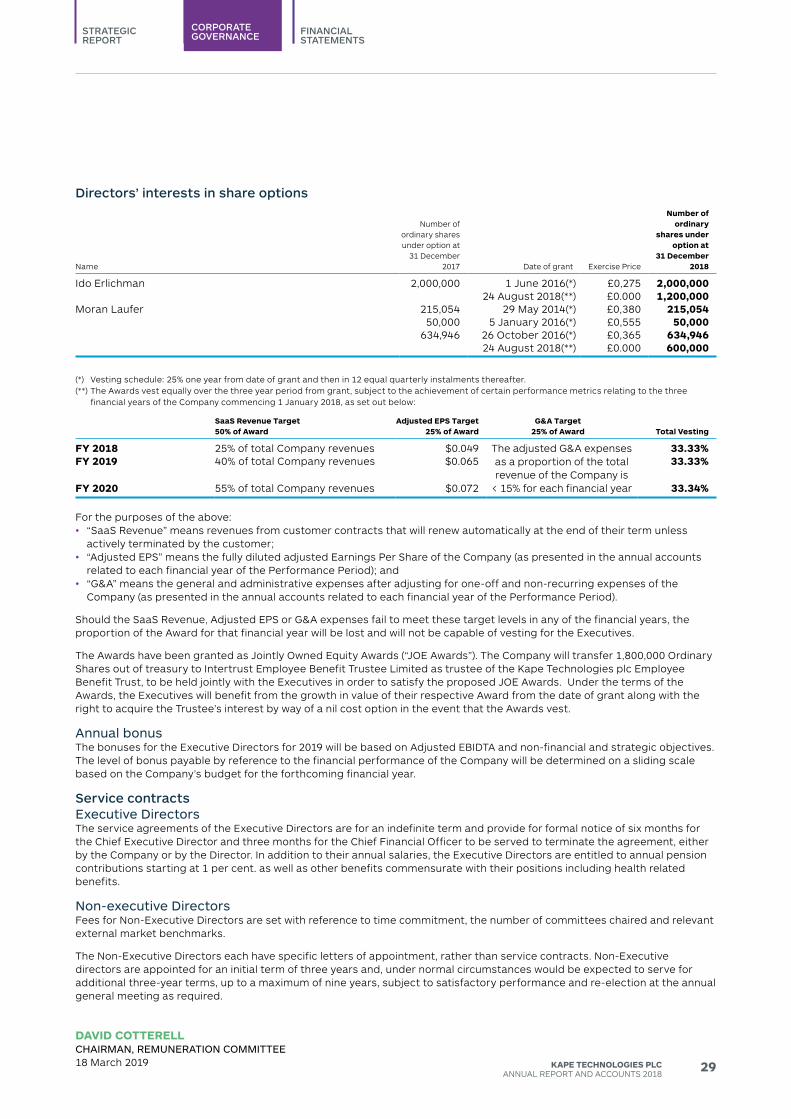
Directors’ interests in share options
Name
Number of ordinary shares under option at
31 december 2017 date of grant Exercise Price
Number of ordinary
shares under option at
31 December 2018
Ido Erlichman 2,000,000 1 June 2016(*) £0,275 2,000,00024 August 2018(**) £0.000 1,200,000
Moran Laufer 215,054 29 May 2014(*) £0,380 215,05450,000 5 January 2016(*) £0,555 50,000
634,946 26 October 2016(*) £0,365 634,94624 August 2018(**) £0.000 600,000
(*) Vesting schedule: 25% one year from date of grant and then in 12 equal quarterly instalments thereafter.(**) The Awards vest equally over the three year period from grant, subject to the achievement of certain performance metrics relating to the three
financial years of the Company commencing 1 January 2018, as set out below:
SaaS Revenue Target50% of Award
Adjusted EPS Target25% of Award
G&A Target25% of Award Total Vesting
FY 2018 25% of total Company revenues $0.049 The adjusted G&A expenses as a proportion of the total revenue of the Company is
< 15% for each financial year
33.33%FY 2019 40% of total Company revenues $0.065 33.33%
FY 2020 55% of total Company revenues $0.072 33.34%
For the purposes of the above:• “SaaS Revenue” means revenues from customer contracts that will renew automatically at the end of their term unless
actively terminated by the customer;• “Adjusted EPS” means the fully diluted adjusted Earnings Per Share of the Company (as presented in the annual accounts
related to each financial year of the Performance Period); and• “G&A” means the general and administrative expenses after adjusting for one-off and non-recurring expenses of the
Company (as presented in the annual accounts related to each financial year of the Performance Period).
Should the SaaS Revenue, Adjusted EPS or G&A expenses fail to meet these target levels in any of the financial years, the proportion of the Award for that financial year will be lost and will not be capable of vesting for the Executives.
The Awards have been granted as Jointly Owned Equity Awards (“JOE Awards”). The Company will transfer 1,800,000 Ordinary Shares out of treasury to Intertrust Employee Benefit Trustee Limited as trustee of the Kape Technologies plc Employee Benefit Trust, to be held jointly with the Executives in order to satisfy the proposed JOE Awards. Under the terms of the Awards, the Executives will benefit from the growth in value of their respective Award from the date of grant along with the right to acquire the Trustee’s interest by way of a nil cost option in the event that the Awards vest.
Annual bonusThe bonuses for the Executive directors for 2019 will be based on Adjusted EBIdTA and non-financial and strategic objectives. The level of bonus payable by reference to the financial performance of the Company will be determined on a sliding scale based on the Company’s budget for the forthcoming financial year.
Service contractsexecutive directorsThe service agreements of the Executive directors are for an indefinite term and provide for formal notice of six months for the Chief Executive director and three months for the Chief Financial Officer to be served to terminate the agreement, either by the Company or by the director. In addition to their annual salaries, the Executive directors are entitled to annual pension contributions starting at 1 per cent. as well as other benefits commensurate with their positions including health related benefits.
non-executive directorsFees for Non-Executive directors are set with reference to time commitment, the number of committees chaired and relevant external market benchmarks.
The Non-Executive directors each have specific letters of appointment, rather than service contracts. Non-Executive directors are appointed for an initial term of three years and, under normal circumstances would be expected to serve for additional three-year terms, up to a maximum of nine years, subject to satisfactory performance and re-election at the annual general meeting as required.
DAVID COTTERELLcHAIRMAn, ReMuneRAtIon coMMIttee18 March 2019
30 KAPE TECHNOLOGIES PLCANNUAL REPORT ANd ACCOUNTS 2018
The directors present their annual report on the affairs of the Group, together with the financial statements and independent auditor’s report for the year ended 31 december 2018. The Corporate Governance Statement set out on pages 14 to 16 forms part of this report.
The Company’s full name is Kape Technologies plc, domiciled in the Isle of Man with company number 011402V. Kape Technologies plc is a public listed company, listed on the AIM market of the London Stock Exchange (“AIM”).
Principal activityKape develops and distributes a variety of digital products in the online security space. The Company utilises its proprietary digital distribution technology to optimise its reach and distribute its software products to consumer. The Company offers products which provide online security, privacy and optimisation tools for the consumer system. A detailed overview of the Group’s activities is set out on pages 2 to 13.
Review of business and future developmentsdetails of the Group’s performance during the year under review and expected future developments are set out in the Chairman and Chief executive officer statements on pages 4 to 10. A description of the principal risks and uncertainties facing the Group is set out on pages 20 to 21.
DividendsOn 14 March 2018, The Board has declared the payment of a special dividend of 4.93 US$ cents per share being a total payout of $7 million (2016: nil), which was paid to shareholders on the register as at 25 May 2018. No additional dividend were declared in 2018.
DirectorsThe directors who served during the period were as follows:Ido Erlichman Activedonald (don) Elgie Activedavid Cotterell ActiveMartin Blair ActiveMoran Laufer Active
Re-election of DirectorsThe Articles of Association require that at each Annual General Meeting one third of the directors (excluding any director who has been appointed by the Board since the previous Annual General Meeting) or, if their number is not an integral multiple of three, the number nearest to one third but not exceeding one third shall retire from office (but so that if there are fewer than three directors who are subject to retirement by rotation one shall retire).
Any director who is not required to retire by rotation but who has been in office for three years or more since his appointment or his last re appointment or who would have held office at not less than three consecutive Annual General Meetings of the Company without retiring shall retire from office.
Appointment of a DirectorThe Articles of Association require that any director appointed by the Board shall, unless appointed at such meeting, hold office only until the dissolution of the Annual General Meeting of the Company next following such appointment.
Directors’ responsibility statementThe statement of directors’ responsibility is set out on page 32.
Directors’ indemnitiesThe directors have been granted an indemnity from the Company to the extent permitted by law in respect of liabilities incurred as a result of their office which remains in force at the date of this report.
Employee policiesAt the 31 december 2018, the Group employed 344 people, (31 december 2017: 128 people). The Group is committed to attracting and retaining personnel with the requisite technical skills and experience to implement its growth strategy and maintain its position in the competitive industry in which it operates. Kape therefore places significant emphasis on ensuring that it has a strong recruitment team as well as appropriate remuneration and bonus policies which are set by reference to appropriate objectives and include share based incentive schemes, details of which are set out in note 17 to the financial statements.
Financial instrumentsThe Group does not currently use derivative financial instruments. A summary of the Group’s financial instruments, changes in share capital and related disclosures are set out in notes 14 and 16 to the financial statements. The Group has no material exposure to price, liquidity, or cash flow risk that would impact its objectives.
Capital structureUnder the IOM Companies Act, the Company is not required to have an authorised share capital. The Ordinary Shares in issue at 31 december 2018 have been created pursuant to the BVI Companies Act and the articles of association of the Company in place prior to the re-domiciliation of the Company from the BVI to the IOM on 13 August 2014 and are ordinary shares of USd 0.0001 par value.
details of the issued share capital as at 31 december 2018 of 148,496,073 ordinary shares of USd 0.0001 par value, together with details of the movements in the Company’s issued share capital during the year are shown in note 14 to the financial statements. The Company has one class of ordinary shares, which carry no right to fixed income. Each share carries the right to one vote at general meetings of the Company.
dIRectoRs’ RepoRt
31KAPE TECHNOLOGIES PLCANNUAL REPORT ANd ACCOUNTS 2018
STRATEGICREPORT
CORPORATEGOVERNANCE FINANCIAL
STATEMENTS
There are no specific restrictions on the size of a holding nor on the transfer of shares, which are both governed by the general provisions of the Articles of Association and prevailing legislation. Save as provided by the terms of certain lock-in agreements entered into between the Company, the directors and certain shareholders, the directors are not aware of any agreements between holders of the Company’s shares that may result in restrictions on the transfer of securities or on voting rights.
As at 31 december 2018 the Company held 4,476,153 shares in treasury and 1,800,000 are held by Intertrust Employee Benefit Trustee Limited as trustee of the Kape Technologies plc Employee Benefit Trust. No other shares in the capital of the Company are held by or on behalf of the Company or by any of the Company’s subsidiaries.
details of employee share schemes are set out in note 17 to the financial statements.
Related party transactionsdetails of all related party transactions are set out in note 22 to the financial statements.
Research and developmentThe Group maintains an integrated global research and development team which has a staff of 68 (2017: 44). In the opinion of the directors, continuity of investment in this area is essential for the maintenance of the Group’s market position and for future growth. The amount of research and development costs capitalised in the year was $2,289,000 (2017: $1,432,000).
Going concernThe directors, having considered the Group’s resources financially and the associated risks with doing business in the current economic climate, believe the Group is capable of successfully managing these risks. The Board has reviewed the cash flow forecast and business plan as provided by management which includes the rate of revenue growth, margins and cost control. As such, the directors are satisfied that the Group has adequate resources to continue in operational existence for the foreseeable future. Accordingly, they continue to adopt the going concern basis in preparing these financial statements.
Annual general meetingThe annual general meeting for 2019 will be held on Tuesday, 07 May 2019 at 12 noon. The notice convening the annual general meeting for this year, and an explanation of the items of non-routine business are set out in the circular that accompanies the Annual Report.
AuditorA resolution to reappoint BdO LLP as the Company’s auditor will be proposed at the 2018 Annual General Meeting.
Each of the persons who are directors at the date of approval of this annual report confirms that:
• So far as the director is aware, there is no relevant audit information of which the Company’s auditor is unaware; and
• The director has taken all the steps that he ought to have taken as a director in order to make himself aware of any relevant audit information and to establish that the Company’s auditor is aware of that information.
Signed on behalf of the Board by:
DON ELGIEnon-eXecutIVe cHAIRMAn 18 March 2019
32 KAPE TECHNOLOGIES PLCANNUAL REPORT ANd ACCOUNTS 2018
The directors are responsible for preparing the Annual Report and the financial statements in accordance with applicable law and regulations.
Isle of Man company law does not require the directors to prepare financial statements for each financial year, however the group is required to do so to satisfy the requirements of the AIM Rules for Companies. Under company law, when preparing the financial statements, the directors are required to prepare the group financial statements in accordance with an appropriate set of generally accepted accounting principles or practice. The directors have elected to use International Financial Reporting Standards (IFRSs) as issued by the IASB.
Under Company law the directors must not approve the accounts unless they are satisfied that they give a true and fair view of the state of affairs of the Company and of the profit or loss of the Company for that period.
In preparing these financial statements, International Accounting Standard 1 (revised) requires that directors:
• Properly select and apply accounting policies; • Present information, including accounting policies, in a
manner that provides relevant, reliable, comparable and understandable information;
• Provide additional disclosures when compliance with the specific requirements in IFRSs are insufficient to enable users to understand the impact of particular transactions, other events and conditions on the entity’s financial position and financial performance; and
• Make an assessment of the Company’s ability to continue as a going concern.
The directors are responsible for keeping adequate accounting records that correctly explain the transactions of the Company, enable the financial position of the Company to be determined with reasonable accuracy at any time and allow financial statements to be prepared. They are also responsible for safeguarding the assets of the Company and hence for taking reasonable steps for the prevention and detection of fraud and other irregularities.
The directors are responsible for the maintenance and integrity of the corporate and financial information included on the Company’s website. The directors’ responsibility also extends to the continued integrity of the financial statements contained therein.
Signed on behalf of the Board by:
DON ELGIEnon-eXecutIVe cHAIRMAn 18 March 2019
dIRectoRs’ ResponsIBIlItY stAteMent
CORPORATEGOVERNANCE
STRATEGICREPORT
FINANCIALSTATEMENTS
33KAPE TECHNOLOGIES PLCANNUAL REPORT ANd ACCOUNTS 2018
OpinionWe have audited the financial statements of Kape Technologies Plc for the year ended 31 december 2018 which comprise consolidated statement of comprehensive income, the consolidated statement of changes in equity, the consolidated statement of financial position, the consolidated cash flow statement and notes to the financial statements, including a summary of significant accounting policies.
The financial reporting framework that has been applied in the preparation of the financial statements is applicable law and International Financial Reporting Standards (IFRSs) as issued by the International Accounting Standards Board (IASB).
In our opinion:
• the financial statements give a true and fair view of the state of the affairs as at 31 december 2018 and of the group’s loss for the year then ended;
• the group financial statements have been properly prepared in accordance with IFRSs as issued by the IASB;
• the financial statements have been prepared in accordance with the requirements of the Isle of Man Companies Act 2006.
Basis for opinionWe conducted our audit in accordance with International Standards on Auditing (UK) (ISAs (UK)) and applicable law. Our responsibilities under those standards are further described in the Auditor’s responsibilities for the audit of the financial statements section of our report. We are independent of the group in accordance with the ethical requirements that are relevant to our audit of the financial statements in the UK, including the FRC’s Ethical Standard as applied to listed entities, and we have fulfilled our other ethical responsibilities in accordance with these requirements. We believe that the audit evidence we have obtained is sufficient and appropriate to provide a basis for our opinion.
Conclusions relating to going concernWe have nothing to report in respect of the following matters in relation to which the ISAs (UK) require us to report to you where:
• the directors’ use of the going concern basis of accounting in the preparation of the financial statements is not appropriate; or
• the directors have not disclosed in the financial statements any identified material uncertainties that may cast significant doubt about the group’s or the parent company’s ability to continue to adopt the going concern basis of accounting for a period of at least twelve months from the date when the financial statements are authorised for issue.
Key audit mattersKey audit matters are those matters that, in our professional judgment, were of most significance in our audit of the financial statements of the current period and include the most significant assessed risks of material misstatement (whether or not due to fraud) we identified, including those which had the greatest effect on: the overall audit strategy, the allocation of resources in the audit; and directing the efforts of the engagement team. These matters were addressed in the context of our audit of the financial statements as a whole, and in forming our opinion thereon, and we do not provide a separate opinion on these matters.
Key audit matter How we addressed the matter in our audit
Revenue recognitionThe group has a number of revenue streams for which the accounting must be individually considered. due to the different nature of agreements entered into by the group, and the fact that revenue is recognised both at a point in time and over a period of time, there is a key risk of material misstatement arising from both the recognition of revenue around the year end (cut-off) and the revenue recognition policy itself, as detailed in note 2 to these financial statements.
In accordance with accounting standards, costs that are directly incremental to obtaining a contract are eligible to be recognised as an asset, provided the entity expects to recover the costs. A material deferred contract cost asset has been capitalised in respect of costs incurred to obtain and fulfil contracts. There is judgement surrounding costs meeting the capitalisation criteria and a risk that this balance is overstated.
We assessed whether the revenue recognition policies adopted by the Group comply with relevant accounting standards.
We tested revenue through substantive procedures, including confirmation of cash receipts through to bank statement over all material revenue streams.
We performed cut-off procedures including recalculations of contract liabilities around the year-end in order to get comfort over subscription revenues, noting that both newly acquired entities have subscription based revenue.
We reviewed the capitalised customer acquisition costs against the accounting standard requirements to check the costs met the criteria for recognition. The length of time over which costs are amortised is based upon management’s estimate of average customer lifetime, which exceeds the licence length. discussions were held with management and reviews of historic customer purchasing trends were undertaken. A recalculation was also performed over the amortisation charge recognised in the year.
Independent AudItoR’s RepoRt to tHe MeMBeRs oF KApe tecHnoloGIes plc
34 KAPE TECHNOLOGIES PLCANNUAL REPORT ANd ACCOUNTS 2018
Independent AudItoR’s RepoRt to tHe MeMBeRs oF KApe tecHnoloGIes plc CONTINUEd
Key audit matter How we addressed the matter in our audit
Business combinationsSee accounting policy in note 2, and the intangibles assets note (note 9) and the business combinations note (note 20) on page 66 respectively.
There are risks present as a result of management’s requirement to make significant judgements in assessing the fair values of consideration and of the assets and liabilities acquired. Management have engaged external valuations experts to undertake the purchase price allocation exercise required.
The two acquisitions resulted in the group holding, on consolidation, goodwill and intangible assets of $19.96m and $7.43m respectively.
With input from our valuations team, we challenged the assumptions underpinning the significant judgements and estimates used by management in the assessment of the fair values of the assets and liabilities acquired and consideration paid including; reviewing underlying cash flow projections and comparing against post-year end, royalty rates, discount rates applied and the long term growth rates.
Our testing focused on both material and more judgmental fair value adjustments that were recorded. Particular adjustments we tested were:
Intangible assets – the directors obtained external valuations for the acquired intangible assets. Utilising our own valuations expertise, we evaluated the valuation methodologies used for each type of asset and used these to check that the methodology used by the directors was appropriate and consistent with market practice. We also examined thekey assumptions used as inputs to the valuation models to assess whether these were consistent with our understanding of the businesses acquired, their historical performance and the markets in which they operate. These assumptions included revenue and profit forecasts, discount rates, customer attrition rates, technology obsolescence rates and royalty rates.
We examined and satisfied ourselves with the methodology and tax rates used to calculate the associated deferred tax liabilities arising from the creation of intangible assets. This involved reference to the tax jurisdictions in which the group operates, levels of business in those jurisdictions and the manner in which profits are expected to be repatriated and taxed.
Adoption of IFRS 16: LeasesThe Group have elected to early adopt IFRS 16 – Leases effective 1 January 2018, as detailed in notes 2 and 23 to the financial statements.
The new standard sets out the principles for the recognition, measurement, presentation and disclosure of leases. It requires lessees to bring all leases within the scope of IFRS 16 on balance sheet with an asset shown for the right of use and a liability shown for the discounted amount of future payments.
There is a risk associated with the accounting in respect of IFRS 16, as a result of the judgements and inputs required within the calculation including determining the incremental borrowing rate, noting that the asset and corresponding liability are material to the Group at year-end.
We assessed whether the lease policy adopted by the Group complies with accounting standards. The relevant IFRS is International Financial Reporting Standard 16 Leases.
Our procedures included the following:
• Obtaining copies of lease agreements to assess the key terms included and verify the inputs to the calculation.
• Checking that any practical expedients taken are in line with those allowed by the standard.
• Reviewing the financial statement disclosures against the disclosure requirements of the standard.
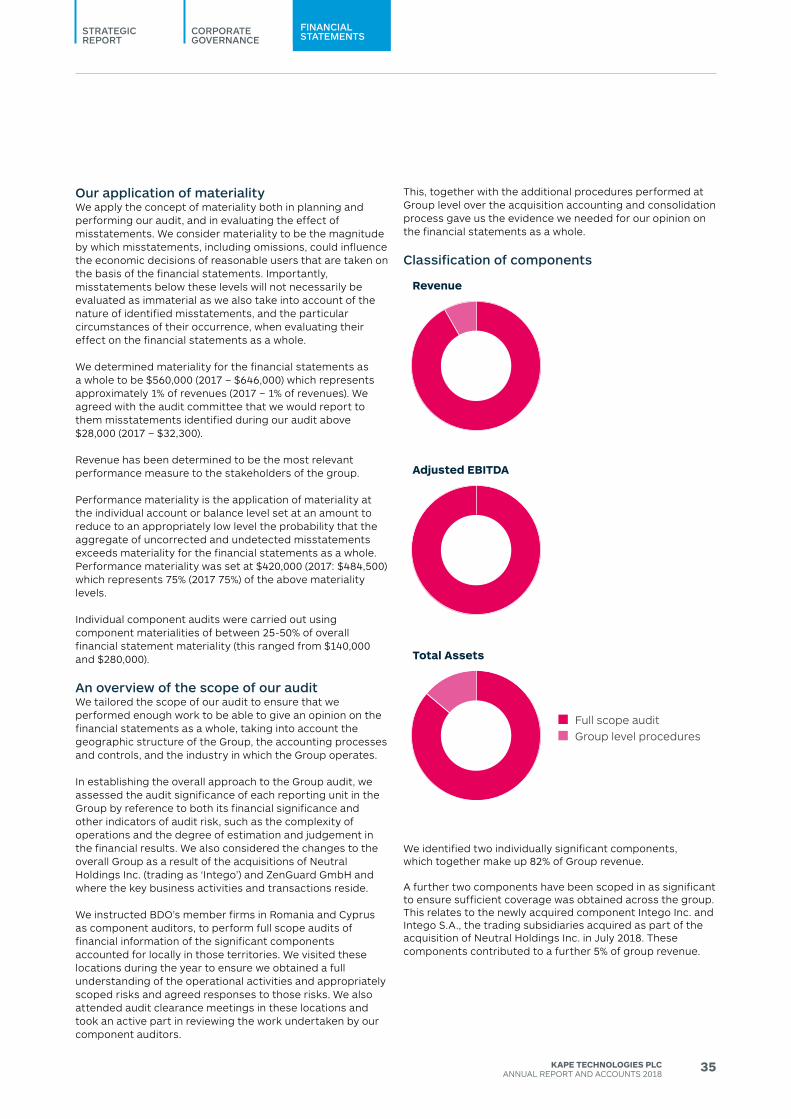
CORPORATEGOVERNANCE
STRATEGICREPORT
FINANCIALSTATEMENTS
35KAPE TECHNOLOGIES PLCANNUAL REPORT ANd ACCOUNTS 2018
Our application of materialityWe apply the concept of materiality both in planning and performing our audit, and in evaluating the effect of misstatements. We consider materiality to be the magnitude by which misstatements, including omissions, could influence the economic decisions of reasonable users that are taken on the basis of the financial statements. Importantly, misstatements below these levels will not necessarily be evaluated as immaterial as we also take into account of the nature of identified misstatements, and the particular circumstances of their occurrence, when evaluating their effect on the financial statements as a whole.
We determined materiality for the financial statements as a whole to be $560,000 (2017 – $646,000) which represents approximately 1% of revenues (2017 – 1% of revenues). We agreed with the audit committee that we would report to them misstatements identified during our audit above $28,000 (2017 – $32,300).
Revenue has been determined to be the most relevant performance measure to the stakeholders of the group.
Performance materiality is the application of materiality at the individual account or balance level set at an amount to reduce to an appropriately low level the probability that the aggregate of uncorrected and undetected misstatements exceeds materiality for the financial statements as a whole. Performance materiality was set at $420,000 (2017: $484,500) which represents 75% (2017 75%) of the above materiality levels.
Individual component audits were carried out using component materialities of between 25-50% of overall financial statement materiality (this ranged from $140,000 and $280,000).
An overview of the scope of our auditWe tailored the scope of our audit to ensure that we performed enough work to be able to give an opinion on the financial statements as a whole, taking into account the geographic structure of the Group, the accounting processes and controls, and the industry in which the Group operates.
In establishing the overall approach to the Group audit, we assessed the audit significance of each reporting unit in the Group by reference to both its financial significance and other indicators of audit risk, such as the complexity of operations and the degree of estimation and judgement in the financial results. We also considered the changes to the overall Group as a result of the acquisitions of Neutral Holdings Inc. (trading as ‘Intego’) and ZenGuard GmbH and where the key business activities and transactions reside.
We instructed BdO’s member firms in Romania and Cyprus as component auditors, to perform full scope audits of financial information of the significant components accounted for locally in those territories. We visited these locations during the year to ensure we obtained a full understanding of the operational activities and appropriately scoped risks and agreed responses to those risks. We also attended audit clearance meetings in these locations and took an active part in reviewing the work undertaken by our component auditors.
This, together with the additional procedures performed at Group level over the acquisition accounting and consolidation process gave us the evidence we needed for our opinion on the financial statements as a whole.
Classification of components
Revenue
Full scope auditGroup level procedures
Adjusted EBITDA
Total Assets
We identified two individually significant components, which together make up 82% of Group revenue.
A further two components have been scoped in as significant to ensure sufficient coverage was obtained across the group. This relates to the newly acquired component Intego Inc. and Intego S.A., the trading subsidiaries acquired as part of the acquisition of Neutral Holdings Inc. in July 2018. These components contributed to a further 5% of group revenue.
36 KAPE TECHNOLOGIES PLCAnnuAl RepoRt And Accounts 2018
INDEPENDENT AUDITOR’S REPORT TO THE MEMBERS OF KAPE TECHNOLOGIES PLC contInued
the remaining components not subject to full scope audit have been reviewed for group reporting purposes, using analytic procedures to corroborate the conclusions reached that there are no significant risks of material misstatement of the aggregated financial information of those components.
Other informationthe directors are responsible for the other information. the other information comprises the information included in the annual report and accounts, other than the financial statements and our auditor’s report thereon. our opinion on the financial statements does not cover the other information and, except to the extent otherwise explicitly stated in our report, we do not express any form of assurance conclusion thereon.
In connection with our audit of the financial statements, our responsibility is to read the other information and, in doing so, consider whether the other information is materially inconsistent with the financial statements or our knowledge obtained in the audit or otherwise appears to be materially misstated. If we identify such material inconsistencies or apparent material misstatements, we are required to determine whether there is a material misstatement in the financial statements or a material misstatement of the other information. If, based on the work we have performed, we conclude that there is a material misstatement of this other information, we are required to report that fact. We have nothing to report in this regard.
Responsibilities of directorsAs explained more fully in the directors’ responsibilities statement set out on page 32, the directors are responsible for the preparation of the financial statements and for being satisfied that they give a true and fair view, and for such internal control as the directors determine is necessary to enable the preparation of financial statements that are free from material misstatement, whether due to fraud or error.
In preparing the financial statements, the directors are responsible for assessing the group’s and the parent company’s ability to continue as a going concern, disclosing, as applicable, matters related to going concern and using the going concern basis of accounting unless the directors either intend to liquidate the group or the parent company or to cease operations, or have no realistic alternative but to do so.
Auditor’s responsibilities for the audit of the financial statementsour objectives are to obtain reasonable assurance about whether the financial statements as a whole are free from material misstatement, whether due to fraud or error, and to issue an auditor’s report that includes our opinion. Reasonable assurance is a high level of assurance but is not a guarantee that an audit conducted in accordance with IsAs (uK) will always detect a material misstatement when it exists.
Misstatements can arise from fraud or error and are considered material if, individually or in the aggregate, they could reasonably be expected to influence the economic decisions of users taken on the basis of these financial statements.
A further description of our responsibilities for the audit of the financial statements is located on the Financial Reporting council’s website at: www.frc.org.uk/auditorsresponsibilities. this description forms part of our auditor’s report.
Use of our reportthis report is made solely to the company’s directors, as a body, in accordance with the terms of our engagement letter dated 29 november 2018. our audit work has been undertaken so that we might state to the company’s directors those matters we are required to state to them in an auditor’s report and for no other purpose. to the fullest extent permitted by law, we do not accept or assume responsibility to anyone other than the company and the company’s directors as a body, for our audit work, for this report, or for the opinions we have formed.
Iain Henderson (senior statutory Auditor)For and on behalf of BDO LLP, Chartered Accountantslondon, uK18 March 2019
Bdo llp is a limited liability partnership registered in england and Wales (with registered number oc305127).
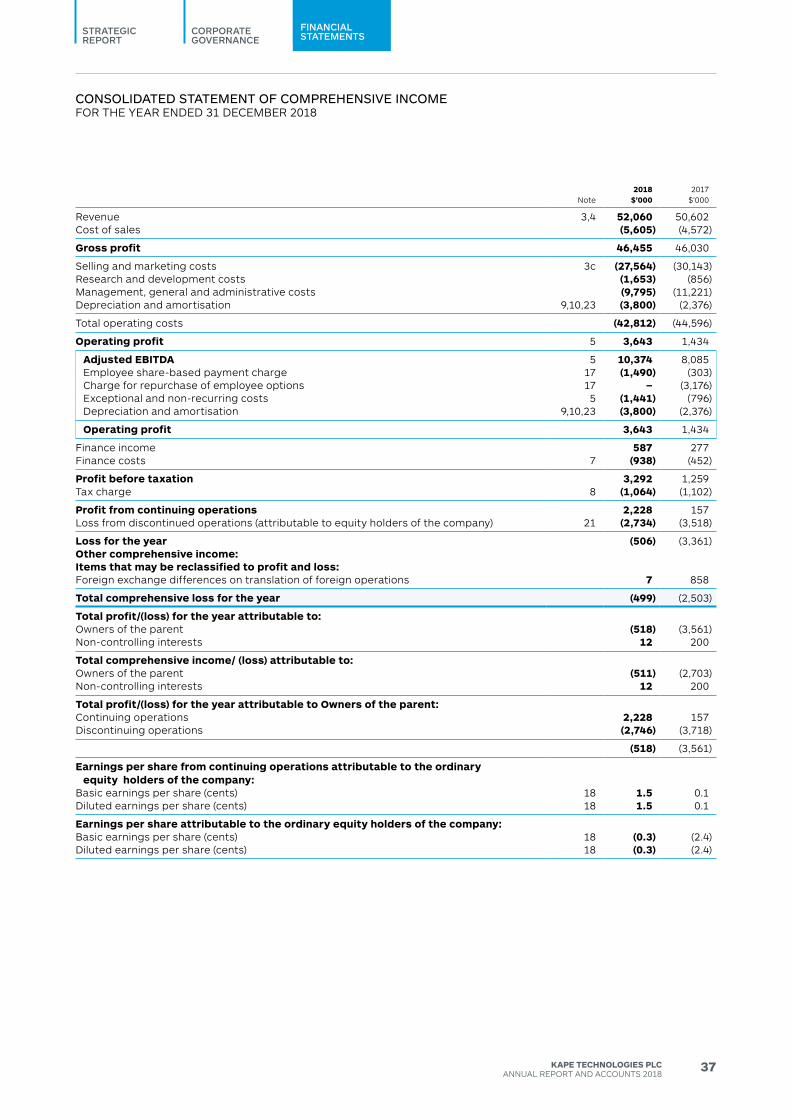
CORPORATEGOVERNANCE
STRATEGICREPORT
FINANCIALSTATEMENTS
37KAPE TECHNOLOGIES PLCANNUAL REPORT ANd ACCOUNTS 2018
consolIdAted stAteMent oF coMpReHensIVe IncoMeFOR THE YEAR ENdEd 31 dECEMBER 2018
Note2018
$’0002017
$’000
Revenue 3,4 52,060 50,602Cost of sales (5,605) (4,572)
Gross profit 46,455 46,030
Selling and marketing costs 3c (27,564) (30,143)Research and development costs (1,653) (856)Management, general and administrative costs (9,795) (11,221)depreciation and amortisation 9,10,23 (3,800) (2,376)
Total operating costs (42,812) (44,596)
Operating profit 5 3,643 1,434
Adjusted EBITDA 5 10,374 8,085Employee share-based payment charge 17 (1,490) (303)Charge for repurchase of employee options 17 – (3,176)Exceptional and non-recurring costs 5 (1,441) (796)depreciation and amortisation 9,10,23 (3,800) (2,376)
Operating profit 3,643 1,434
Finance income 587 277Finance costs 7 (938) (452)
Profit before taxation 3,292 1,259Tax charge 8 (1,064) (1,102)
Profit from continuing operations 2,228 157Loss from discontinued operations (attributable to equity holders of the company) 21 (2,734) (3,518)
Loss for the year (506) (3,361)Other comprehensive income: Items that may be reclassified to profit and loss:Foreign exchange differences on translation of foreign operations 7 858
Total comprehensive loss for the year (499) (2,503)
Total profit/(loss) for the year attributable to:Owners of the parent (518) (3,561)Non-controlling interests 12 200
Total comprehensive income/ (loss) attributable to:Owners of the parent (511) (2,703)Non-controlling interests 12 200
Total profit/(loss) for the year attributable to Owners of the parent:Continuing operations 2,228 157discontinuing operations (2,746) (3,718)
(518) (3,561)
Earnings per share from continuing operations attributable to the ordinary equity holders of the company:
Basic earnings per share (cents) 18 1.5 0.1diluted earnings per share (cents) 18 1.5 0.1
Earnings per share attributable to the ordinary equity holders of the company: Basic earnings per share (cents) 18 (0.3) (2.4)diluted earnings per share (cents) 18 (0.3) (2.4)
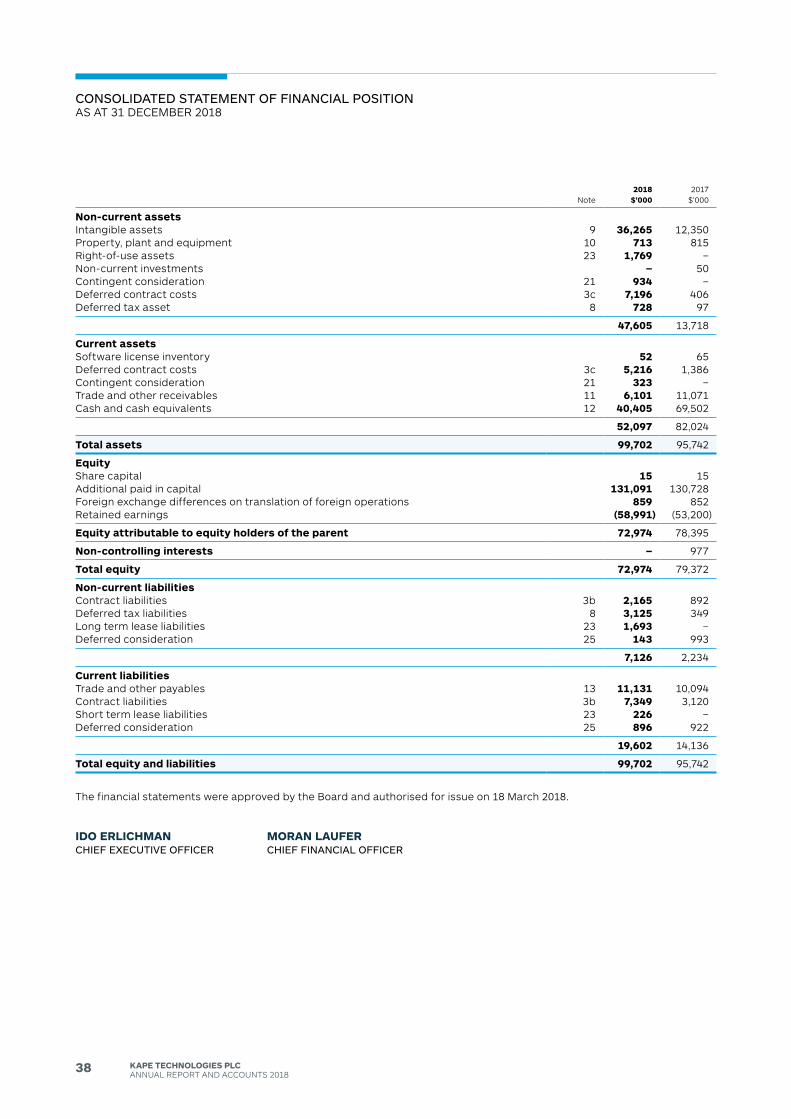
38 KAPE TECHNOLOGIES PLCANNUAL REPORT ANd ACCOUNTS 2018
consolIdAted stAteMent oF FInAncIAl posItIonAS AT 31 dECEMBER 2018
Note2018
$’0002017
$’000
Non-current assetsIntangible assets 9 36,265 12,350Property, plant and equipment 10 713 815Right-of-use assets 23 1,769 –Non-current investments – 50Contingent consideration 21 934 –deferred contract costs 3c 7,196 406deferred tax asset 8 728 97
47,605 13,718
Current assetsSoftware license inventory 52 65deferred contract costs 3c 5,216 1,386Contingent consideration 21 323 –Trade and other receivables 11 6,101 11,071Cash and cash equivalents 12 40,405 69,502
52,097 82,024
Total assets 99,702 95,742
EquityShare capital 15 15Additional paid in capital 131,091 130,728Foreign exchange differences on translation of foreign operations 859 852Retained earnings (58,991) (53,200)
Equity attributable to equity holders of the parent 72,974 78,395
Non-controlling interests – 977
Total equity 72,974 79,372
Non-current liabilitiesContract liabilities 3b 2,165 892deferred tax liabilities 8 3,125 349Long term lease liabilities 23 1,693 –deferred consideration 25 143 993
7,126 2,234
Current liabilitiesTrade and other payables 13 11,131 10,094Contract liabilities 3b 7,349 3,120Short term lease liabilities 23 226 –deferred consideration 25 896 922
19,602 14,136
Total equity and liabilities 99,702 95,742
The financial statements were approved by the Board and authorised for issue on 18 March 2018.
IDO ERLICHMAN MORAN LAUFERcHIeF eXecutIVe oFFIceR cHIeF FInAncIAl oFFIceR
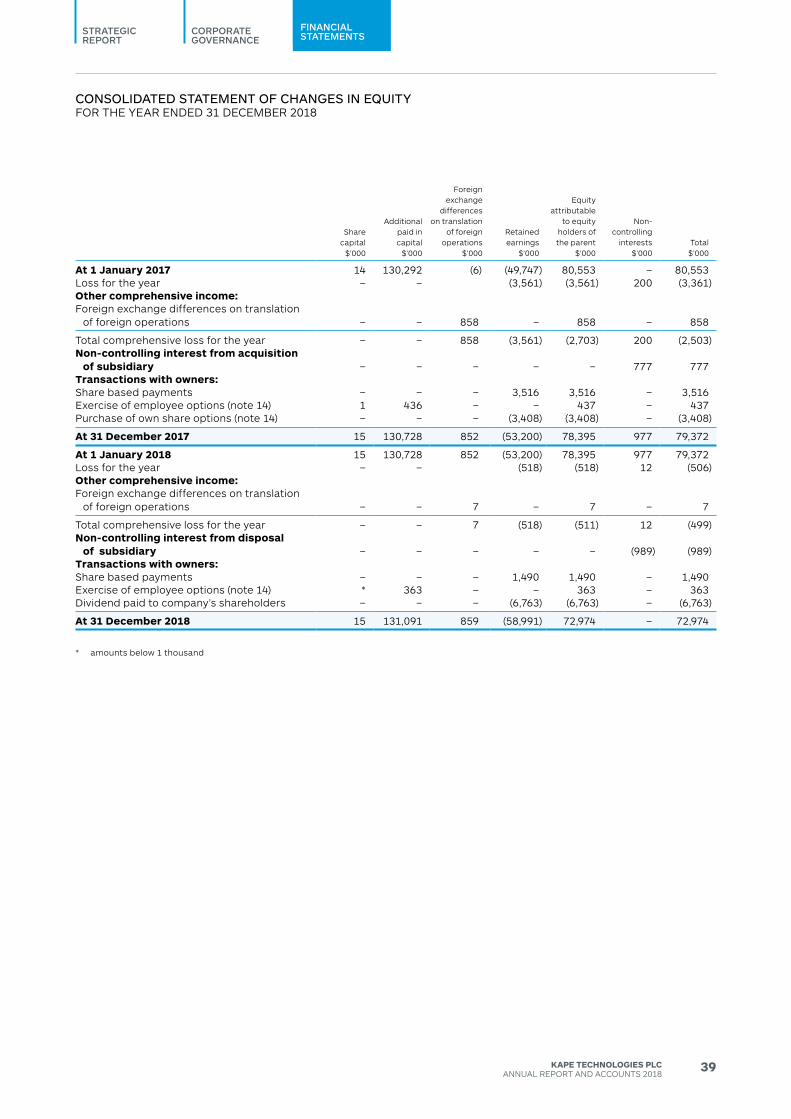
CORPORATEGOVERNANCE
STRATEGICREPORT
FINANCIALSTATEMENTS
39KAPE TECHNOLOGIES PLCANNUAL REPORT ANd ACCOUNTS 2018
consolIdAted stAteMent oF cHAnGes In eQuItYFOR THE YEAR ENdEd 31 dECEMBER 2018
Sharecapital
$’000
Additional paid in capital
$’000
Foreign exchange
differences on translation
of foreign operations
$’000
Retained earnings
$’000
Equity attributable
to equity holders of the parent
$’000
Non-controlling
interests$’000
Total $’000
At 1 January 2017 14 130,292 (6) (49,747) 80,553 – 80,553Loss for the year – – (3,561) (3,561) 200 (3,361)Other comprehensive income:Foreign exchange differences on translation
of foreign operations – – 858 – 858 – 858
Total comprehensive loss for the year – – 858 (3,561) (2,703) 200 (2,503)Non-controlling interest from acquisition
of subsidiary – – – – – 777 777Transactions with owners:Share based payments – – – 3,516 3,516 – 3,516Exercise of employee options (note 14) 1 436 – – 437 – 437Purchase of own share options (note 14) – – – (3,408) (3,408) – (3,408)
At 31 December 2017 15 130,728 852 (53,200) 78,395 977 79,372
At 1 January 2018 15 130,728 852 (53,200) 78,395 977 79,372Loss for the year – – (518) (518) 12 (506)Other comprehensive income:Foreign exchange differences on translation
of foreign operations – – 7 – 7 – 7
Total comprehensive loss for the year – – 7 (518) (511) 12 (499)Non-controlling interest from disposal
of subsidiary – – – – – (989) (989)Transactions with owners:Share based payments – – – 1,490 1,490 – 1,490Exercise of employee options (note 14) * 363 – – 363 – 363dividend paid to company’s shareholders – – – (6,763) (6,763) – (6,763)
At 31 December 2018 15 131,091 859 (58,991) 72,974 – 72,974
* amounts below 1 thousand
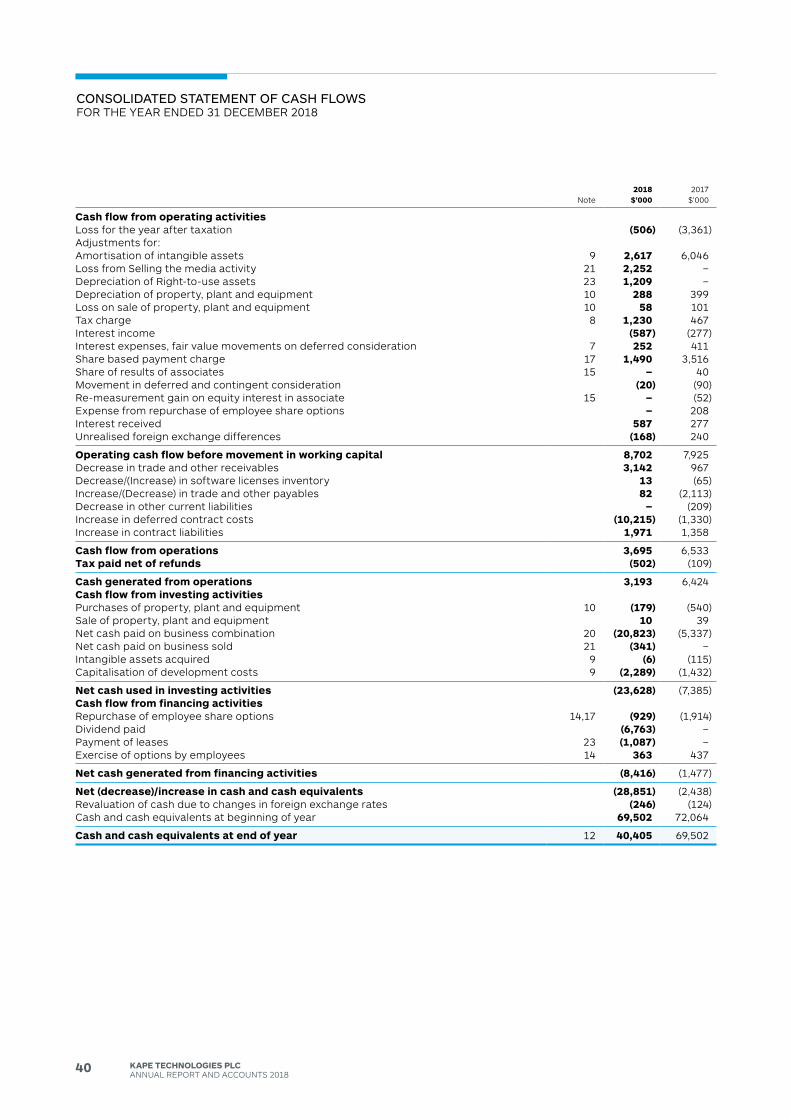
40 KAPE TECHNOLOGIES PLCANNUAL REPORT ANd ACCOUNTS 2018
consolIdAted stAteMent oF cAsH FloWs FOR THE YEAR ENdEd 31 dECEMBER 2018
Note2018
$’0002017
$’000
Cash flow from operating activitiesLoss for the year after taxation (506) (3,361)Adjustments for:Amortisation of intangible assets 9 2,617 6,046Loss from Selling the media activity 21 2,252 –depreciation of Right-to-use assets 23 1,209 –depreciation of property, plant and equipment 10 288 399Loss on sale of property, plant and equipment 10 58 101Tax charge 8 1,230 467Interest income (587) (277)Interest expenses, fair value movements on deferred consideration 7 252 411Share based payment charge 17 1,490 3,516Share of results of associates 15 – 40Movement in deferred and contingent consideration (20) (90)Re-measurement gain on equity interest in associate 15 – (52)Expense from repurchase of employee share options – 208Interest received 587 277Unrealised foreign exchange differences (168) 240
Operating cash flow before movement in working capital 8,702 7,925decrease in trade and other receivables 3,142 967decrease/(Increase) in software licenses inventory 13 (65)Increase/(decrease) in trade and other payables 82 (2,113)decrease in other current liabilities – (209)Increase in deferred contract costs (10,215) (1,330)Increase in contract liabilities 1,971 1,358
Cash flow from operations 3,695 6,533Tax paid net of refunds (502) (109)
Cash generated from operations 3,193 6,424Cash flow from investing activitiesPurchases of property, plant and equipment 10 (179) (540)Sale of property, plant and equipment 10 39Net cash paid on business combination 20 (20,823) (5,337)Net cash paid on business sold 21 (341) –Intangible assets acquired 9 (6) (115)Capitalisation of development costs 9 (2,289) (1,432)
Net cash used in investing activities (23,628) (7,385)Cash flow from financing activitiesRepurchase of employee share options 14,17 (929) (1,914)dividend paid (6,763) –Payment of leases 23 (1,087) –Exercise of options by employees 14 363 437
Net cash generated from financing activities (8,416) (1,477)
Net (decrease)/increase in cash and cash equivalents (28,851) (2,438)Revaluation of cash due to changes in foreign exchange rates (246) (124)Cash and cash equivalents at beginning of year 69,502 72,064
Cash and cash equivalents at end of year 12 40,405 69,502
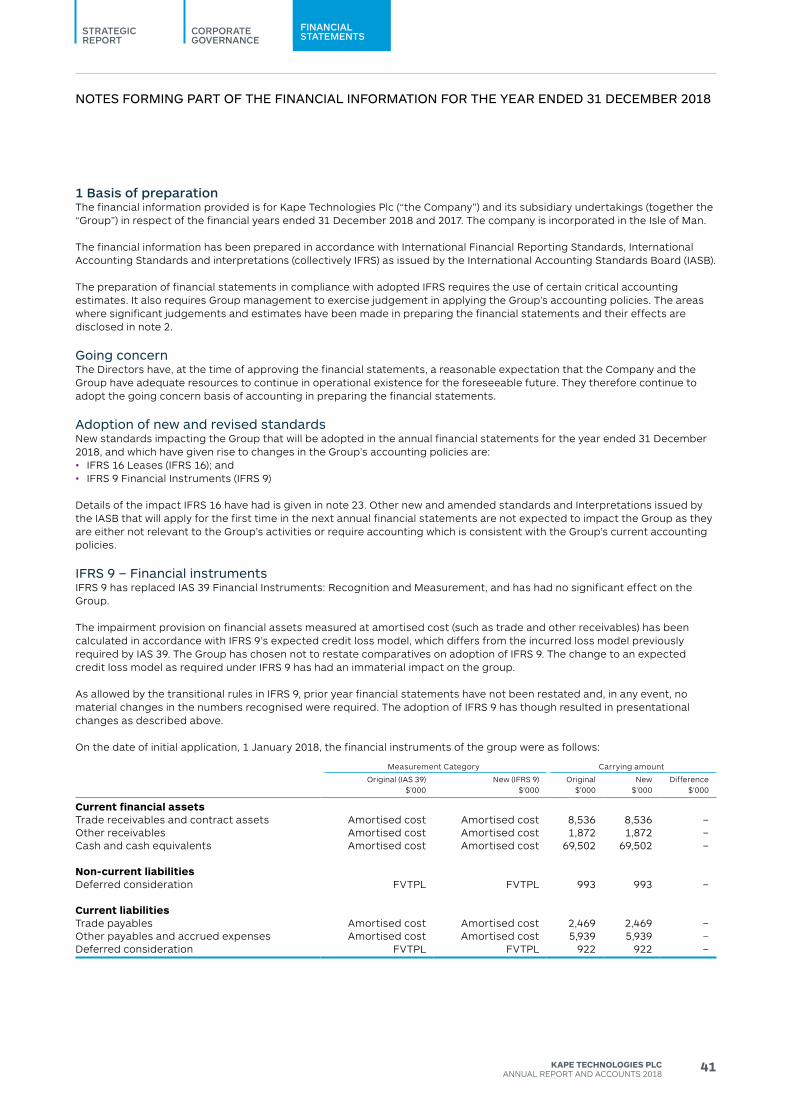
CORPORATEGOVERNANCE
STRATEGICREPORT
FINANCIALSTATEMENTS
41KAPE TECHNOLOGIES PLCANNUAL REPORT ANd ACCOUNTS 2018
notes FoRMInG pARt oF tHe FInAncIAl InFoRMAtIon FoR tHe YeAR ended 31 deceMBeR 2018
1 Basis of preparationThe financial information provided is for Kape Technologies Plc (“the Company”) and its subsidiary undertakings (together the “Group”) in respect of the financial years ended 31 december 2018 and 2017. The company is incorporated in the Isle of Man.
The financial information has been prepared in accordance with International Financial Reporting Standards, International Accounting Standards and interpretations (collectively IFRS) as issued by the International Accounting Standards Board (IASB).
The preparation of financial statements in compliance with adopted IFRS requires the use of certain critical accounting estimates. It also requires Group management to exercise judgement in applying the Group’s accounting policies. The areas where significant judgements and estimates have been made in preparing the financial statements and their effects are disclosed in note 2.
Going concernThe directors have, at the time of approving the financial statements, a reasonable expectation that the Company and the Group have adequate resources to continue in operational existence for the foreseeable future. They therefore continue to adopt the going concern basis of accounting in preparing the financial statements.
Adoption of new and revised standardsNew standards impacting the Group that will be adopted in the annual financial statements for the year ended 31 december 2018, and which have given rise to changes in the Group’s accounting policies are: • IFRS 16 Leases (IFRS 16); and• IFRS 9 Financial Instruments (IFRS 9)
details of the impact IFRS 16 have had is given in note 23. Other new and amended standards and Interpretations issued by the IASB that will apply for the first time in the next annual financial statements are not expected to impact the Group as they are either not relevant to the Group’s activities or require accounting which is consistent with the Group’s current accounting policies.
IFRs 9 – Financial instrumentsIFRS 9 has replaced IAS 39 Financial Instruments: Recognition and Measurement, and has had no significant effect on the Group.
The impairment provision on financial assets measured at amortised cost (such as trade and other receivables) has been calculated in accordance with IFRS 9’s expected credit loss model, which differs from the incurred loss model previously required by IAS 39. The Group has chosen not to restate comparatives on adoption of IFRS 9. The change to an expected credit loss model as required under IFRS 9 has had an immaterial impact on the group.
As allowed by the transitional rules in IFRS 9, prior year financial statements have not been restated and, in any event, no material changes in the numbers recognised were required. The adoption of IFRS 9 has though resulted in presentational changes as described above.
On the date of initial application, 1 January 2018, the financial instruments of the group were as follows:
Measurement Category Carrying amount
Original (IAS 39) $’000
New (IFRS 9)$’000
Original$’000
New$’000
difference$’000
Current financial assetsTrade receivables and contract assets Amortised cost Amortised cost 8,536 8,536 –Other receivables Amortised cost Amortised cost 1,872 1,872 –Cash and cash equivalents Amortised cost Amortised cost 69,502 69,502 –
Non-current liabilitiesdeferred consideration FVTPL FVTPL 993 993 –
Current liabilities Trade payables Amortised cost Amortised cost 2,469 2,469 –Other payables and accrued expenses Amortised cost Amortised cost 5,939 5,939 –deferred consideration FVTPL FVTPL 922 922 –
42 KAPE TECHNOLOGIES PLCANNUAL REPORT ANd ACCOUNTS 2018
notes to tHe consolIdAted FInAncIAl stAteMents CONTINUEd
1 Basis of preparation continuednew standards, interpretations and amendments not yet effective IFRIC 23 ‘Uncertainty over Income Tax Positions’ is effective for annual periods beginning on or after 1 January 2019. IFRIC 23 clarifies how to recognise and measure current and deferred income tax assets and liabilities when there is uncertainty over income tax treatments. When there is uncertainty over income tax treatments. IFRIC 23 is not expected to have a significant impact on the amounts recognised in the Group’s consolidated financial statements.
The Group does not expect any other standards issued by the IASB, but not yet effective, to have a material impact on the Group.
2 Significant accounting policiesBasis of consolidationThe Group consolidated financial statements comprise the financial statements of the parent company Kape Technologies Plc and the financial statements of the subsidiaries as shown in note 19 of the consolidated financial statements.
The financial statements of all the Group companies are prepared using uniform accounting policies. All transactions and balances between Group companies have been eliminated on consolidation.
Business combinations and goodwillAcquisitions of businesses not under common control are accounted for using the acquisition method. The consideration transferred in a business combination is measured at fair value, which is calculated as the sum of the acquisition date fair values of the assets transferred by the Group, liabilities incurred by the Group to the former owners of the acquiree and the equity interests issued by the Group in exchange for control of the acquiree. Acquisition related costs are recognised in profit or loss as incurred.
Contingent consideration that is classified as an asset or a liability is initially recognised at fair value and subsequently at fair value thorough profit and loss in accordance with IFRS 9 as appropriate.
At the acquisition date, the identifiable assets acquired and the liabilities assumed are recognised at their fair value at the acquisition date.
Goodwill is measured as the excess of the sum of the consideration transferred and the fair value of the acquirer’s previously held equity interest in the acquiree (if any) over the net of the acquisition date amounts of the identifiable assets acquired and the liabilities assumed.
common control transactionsCommon control transactions have been accounted for using merger accounting.
Under merger accounting, the assets and liabilities of both entities are recorded at book value, not fair value (although adjustments are made to achieve uniform accounting policies), intangible assets and contingent liabilities are recognised only to the extent that they were recognised by the legal acquiree in accordance within applicable IFRS, no goodwill is recognised, any expenses of the combination are written off immediately to the income statement and comparative amounts, if applicable, are restated as if the combination had taken place at the beginning of the earliest accounting period presented.
The result is that the merged groups are treated as if they had been combined throughout the current and comparative accounting periods.
non-controlling InterestsFor business combinations, the Group initially recognises any non-controlling interest in the acquiree at the non-controlling interest’s proportionate share of the acquiree’s net assets.
The total comprehensive income of non-wholly owned subsidiaries is attributed to owners of the parent and to the non-controlling interests in proportion to their relative ownership interests.
Foreign currencies(a) Presentational currencyItems included in the Group’s financial statements are measured using the currency of the primary economic environment in which each entity of the group operates (the “functional currency”). The financial statements are presented in United States dollars ($000).
CORPORATEGOVERNANCE
STRATEGICREPORT
FINANCIALSTATEMENTS
43KAPE TECHNOLOGIES PLCANNUAL REPORT ANd ACCOUNTS 2018
(b) Transactions and balancesForeign currency transactions are translated into the functional currency using the exchange rates prevailing at the dates of the transactions. Foreign exchange gains and losses resulting from the settlement of such transactions and from the translation at year end exchange rates of monetary assets and liabilities denominated in foreign currencies are recognised in profit or loss. Exchange rates gains and losses are recognised net within Finance cost.
(c) ConsolidationThe functional currency of the Company, and the presentation currency for the consolidated financial statements is United States dollars. For the purpose of the consolidated financial statements, the assets and liabilities of the Group’s foreign operations with a functional currency other than United States dollars are translated into United States dollars using exchange rates prevailing on the reporting date. Income and expense items (including comparatives) are translated at the exchange rates at the dates of the transactions. Exchange differences arising, if any, are recognised within other comprehensive income.
Effective March 31, 2018, the functional currency of one of the Company’s subsidiaries, CyberGhost SRL, has changed to US dollar (“USd” or “$”) from Romanian Lei (“Lei”). The change was following an assessment by company’s management that found that the USd is the primary currency of the economic environment in which the subsidiary operates. The exchange rate at that date was Lei 1= $0.2646.
Goodwill and fair value adjustments arising on the acquisition of a foreign operation are treated as assets and liabilities of the foreign operation and translated at the closing rate.
AssociatesWhere the Group has the power to participate in (but not control) the financial and operating policy decisions of another entity, it is classified as an associate. Associates are initially recognised in the consolidated statement of financial position at cost. Subsequently associates are accounted for using the equity method, where the Group’s share of post-acquisition profits and losses and other comprehensive income is recognised in the consolidated statement of profit and loss and other comprehensive income (except for losses in excess of the Group’s investment in the associate unless there is an obligation to make good those losses).
Revenue recognitionRevenue is measured based on the consideration specified in a contract with customer and excludes amounts collected on behalf of third parties. The company recognises revenue when it transfers control over a product or service to a customer.
sales from App distribution The majority of the Group revenue is derived from sales of products to customers in a B2C model. Transaction price been determined by the fixed price of each product which may be changed according to management decision.
• The CyberGhost, Zenmate, VirusBarrier and ContentBarriar products are SaaS products which contain one performance obligation that is satisfied over time. Since the service is being provided evenly across the contract period, revenue is recognised on a straight-line basis. All payments from customers are received upfront. Some of these contracts’ term are greater than one year, mostly for 24 and 36 months. The Company determined that the upfront payments are for reasons other than providing a financing benefit to the Company and thus there are no significant financing components in its contracts. The following factors were considered in the analysis:
• The intent of the payment terms that require all payments in advance is to preserve the customers, and to make it economically unlikely for them to stop using the Company’s services.1. The company has no need for financing and it charges its customers with an upfront payment, since otherwise it would
incur high administration costs related to renewals and collection of payments. 2. An upfront payment of the entire consideration is in accordance with the typical payment terms in the industry.
• The Reimage PC and driverAgent products contain three performance obligations: one-time repair, unlimited use of the repair software for one year and technical support for one year. Revenue for performing the one-time repair obligation is recognised at the time of the sale. For the unlimited use package, customers benefit from the use of the repair software and technical support for one year, revenues are recognised in line with the pattern of usage of the products and technical support, which is substantially within the first 30 days of the 12 months period.
• Revenue from the sale of Intego Mac Washing Machine, NetBarrier and Backup products is recognised at the time of the sale as the customer is able to use the products independently without any additional resources of the company.
• The Company also offers its products for sale as a bundle. For software bundles, the company allocates revenue to each of the performance obligations based on their relative standalone selling price. The stand- alone selling prices are determined based on the prices charged to customers who acquire software packages individually.
In respect of the App distribution CGU, customers are provided with a 30-60 day refund period in which they can receive a full refund. Historical experience and information post year end allows management to estimate the value of products that will be returned which are not material to the group and a refund liability has therefore not been recognised.
44 KAPE TECHNOLOGIES PLCANNUAL REPORT ANd ACCOUNTS 2018
notes to tHe consolIdAted FInAncIAl stAteMents CONTINUEd
2 Significant accounting policies continuedsales from advertisingThe Company provides advertisers with the ability to manage and monetize publishers’ inventory and manage advertisers’ campaigns. These services represent one performance obligation and are recognised in the accounting period in which the services are rendered based on clicks/ views/ impression as detailed below.
The determination of whether revenue should be reported on a gross or net basis is based on an assessment of whether the Company controls the specified services before the transfer to its customers. In determining this, the Company follows the accounting guidance for principal-agent considerations. This determination involves judgment and is based on an evaluation of the terms of each arrangement. The Company determined that it is the principal in these transactions and therefore revenue is recognised on a gross basis since it is primarily responsible for fulfilling of the services. The Company also bears inventory risk as it pays the majority of publishers according to cost per mille impressions (CPM( but charges the payment from the customer according to cost per acquisition (CPA)/ cost per click (CPC)/dCPC/ or cost per install (CPI). Stated differently, an impression can be purchased from a publisher with no corresponding sale to an advertiser if the final user does not click on the advertisement delivered. Moreover, The Company has the discretion in establishing the prices.
sales from Ajillion – Ad-exchangeThe Company provides ad-exchange services which allow the Company’s partners to seamlessly buy and sell from each other through a real time bidding process. Revenue is recognised in the accounting period in which the services are rendered.
In this case, the Company determined that it is acting as an agent and therefore revenue is recognised on a net basis. While the Company is primarily responsible for the connectivity services, it does not bear inventory risk nor has discretion in establishing the prices. The customer chooses the inventory to purchase on a real-time basis, the amount spent on the campaign is determined by the customer through a real-time bidding process and the amount earned by the Company is based on a fixed percentage.
sales from license of web apps platformThe company licenses its web apps platform to customers on a SaaS basis. The benefits simultaneously provided to and consumed by the customers therefore revenues were recognised on a straight line bases over the period of the contract.
costs to obtain and fulfil a contractAccording to IFRS 15, Incremental costs of obtaining a contract are those costs that the entity would not have incurred if the contract had not been obtained (for example, sales commissions). Incremental costs of obtaining a contract with a customer are recognised as assets if they are recoverable. The Company recognise an asset in relation to marketing costs to obtain a contract. The costs include fees paid to marketing partners on behalf of subscription sales of Cyberghost or Reimage to customers referred by the partners. The company believes that the costs are recoverable as the proceeds from the customer over the expected relationship period exceed the costs to obtain the contract. The asset is amortised on a systematic basis over the expected customer relationship period including expected contract renewals by customers. The expected customer relationship period is an estimation, which is based on historical renewal data.
In addition, the company recognised an asset for fulfilment costs that are considered directly attributable in fulfilling a contract. The fulfilment costs comprised of processing fees paid to third party processing service providers. This asset is amortised on a systematic basis over the contract period.
Assets recognised from the costs to obtain or fulfill a contract are subject to impairment testing. An impairment loss should be recognised in profit or loss to the extent that the carrying amount of an asset exceeds:a. The remaining amount of consideration that the entity expects to receive in exchange for the goods or services to which
the asset relates, lessb. The costs that relate directly to providing those goods or services and that have not been recognised as expenses.
Intangible assets Amortisation for all classes of intangible assets is included within amortisation and depreciation costs in the income statement.
(a) Externally acquired intangible assets Externally acquired intangible assets comprise intellectual property (“IP”), customer lists, trademarks and internet domains. All such intangible assets are stated at cost less any accumulated amortisation and any accumulated impairment losses. Amortisation of these intangible assets is calculated using the straight-line method over their useful economic lives.
Where intangible assets are acquired as part of a business combination they are recorded initially at their fair value.
The useful economic life of IP, customer lists and trademarks is 3 to 11 years.
CORPORATEGOVERNANCE
STRATEGICREPORT
FINANCIALSTATEMENTS
45KAPE TECHNOLOGIES PLCANNUAL REPORT ANd ACCOUNTS 2018
Internet domains are generally considered to have an indefinite useful economic life. They are purchased due to the marketability of the related domain name, are not specific to a particular product, brand, market or service and therefore are not expected to diminish in value or use as a function of time.
An intangible asset is derecognised on disposal, or when no future economic benefits are expected from use or disposal. Gains or losses arising from derecognition of an intangible asset, measured as the difference between the net disposal proceeds and the carrying amount of the asset, are recognised in profit or loss when the asset is derecognised.
(b) Internally generated intangible assets (development costs)An internally-generated intangible asset arising from the Group’s e-business development is recognised only if all of the following conditions are met:• The technical feasibility of completing the intangible asset so that it will be available for use or sale;• The intention to complete the intangible asset and use or sell it;• It is probable that the asset created will generate future economic benefits; and• The development cost of the asset can be measured reliably.
Internally-generated intangible assets are amortised on a straight-line basis over their estimated useful lives, which is 2 to 3 years. Amortisation commences when the asset is available for use.
Where no internally-generated intangible asset can be recognised, development expenditure is charged to profit or loss in the period in which it is incurred.
An intangible asset is derecognised on disposal, or when no future economic benefits are expected from use or disposal. Gains or losses arising from derecognition of an intangible asset, measured as the difference between the net disposal proceeds and the carrying amount of the asset are recognised in profit or loss when the asset is derecognised.
(c) GoodwillGoodwill is initially recognised as an asset at cost and is subsequently measured at cost less any accumulated impairment losses. The Group tests goodwill annually for impairment, or more frequently if there are indicators that goodwill might be impaired.
property, plant and equipmentProperty, plant and equipment are stated at historical cost less accumulated depreciation and any accumulated impairment losses.
depreciation is calculated on the straight-line method so as to write off the cost of each asset to its residual value over its estimated useful life. The annual depreciation rates used are as follows:• Computer equipment: 2-3 years• Furniture, fixtures and office equipment: 6 -15 years• Leasehold improvements: 10 years or the term of the lease if shorter• Cars: 4 years
The assets residual values and useful lives are reviewed and adjusted, if appropriate, at each reporting date.
Expenditure for repairs and maintenance of property, plant and equipment is charged to profit or loss in the year in which it is incurred.
An item of property, plant and equipment is derecognised upon disposal or when no future economic benefits are expected to arise from the continued use of the asset. Any gain or loss arising on the disposal or retirement of an item of property, plant and equipment is determined as the difference between the sales proceeds and the carrying amount of the asset and is recognised in profit or loss.
Impairment of property, plant and equipment and internally generated intangible assetsAssets that have an indefinite useful life are not subject to depreciation or amortisation and are tested annually for impairment. Assets that are subject to depreciation or amortisation are reviewed for impairment whenever events or changes in circumstances indicate that the carrying amount may not be recoverable. An impairment loss is recognised for the amount by which the asset’s carrying amount exceeds its recoverable amount. The recoverable amount is the higher of an asset’s fair value less costs to sell and value in use. For the purposes of assessing impairment, assets are grouped at the lowest levels for which there are separately identifiable cash flows (cash generating units).
cash and cash equivalentsFor the purpose of the consolidated cash flow statement, cash and cash equivalents comprise cash at bank and short-term bank deposits.
46 KAPE TECHNOLOGIES PLCANNUAL REPORT ANd ACCOUNTS 2018
notes to tHe consolIdAted FInAncIAl stAteMents CONTINUEd
2 Significant accounting policies continuedFinancial assets(a) ClassificationFrom 1 January 2018, the Group classifies its financial assets in the following measurement categories:• Those to measured subsequently at fair value (either through OCI or through profit or loss), and • Those to be measured at amortised cost.
The classification depends on the Group’s business model for managing the financial assets and the contractual terms of the cash flows. For assets measured at fair value, gains and losses will either be recorded in profit or loss or OCI.
The Group’s financial assets are trade receivables, other receivables and cash and cash equivalents. These assets are held within a business model whose objective is to collect contractual cash flows, and give rise on specified dates to cash flows that are solely payments of principal and interest on the principal amount outstanding. As such, they are classified as measured at amortised cost.
(b) Recognition and derecognition Regular way purchases and sales of financial assets are recognised on trade-date, the date which the Group commits to purchase or sell the asset. Financial assets are derecognised when the rights to receive cash flows from the financial assets have expired or have been transferred and the Group has transferred substantially all risks and rewards of ownership.
(c) MeasurementAt initial recognition, the Group measures a financial asset at its fair value plus, in the case of a financial asset not at fair value through profit or loss (FVTPL), transaction costs that are directly attributable to the acquisition of the financial asset. Transaction costs of financial assets carried at FVTPL are expenses in profit or loss. Changes in the fair value of financial assets at FVTPL are recognised in the statement of comprehensive.
Financially assets measured at amortised cost arise principally through the provision of services to customers (e.g. trade receivables), but also incorporate other types of contractual monetary asset. They are initially recognised at fair value plus transaction costs that are directly attributable to their acquisition or issue and are subsequently carried at amortised cost using the effective interest rate method, less provision for impairment.
Trade receivables are amounts due from customers for goods sold or services performed in the ordinary course of business. They are generally due for settlement within 365 days and therefore are all classified as current. Trade receivables are recognised initially at the amount of consideration that is unconditional. The group holds the trade receivables with the objective to collect the contractual cash flows and therefore measures them subsequently at amortised cost using the effective interest method.
due to the short-term nature of the current receivables, their carrying amount is considered to be the same as their fair value.Other receivables consist of amounts generally arising from transactions outside the usual operating activities of the group. due to the short-term nature of the other current receivables, their carrying amount is considered to be the same as their fair value.
(d) ImpairmentThe group applies the IFRS 9 simplified approach to measuring expected credit losses which uses a lifetime expected loss allowance for all trade receivables.
the following policy was applied before the adoption of IFRs 9:The Group has applied IFRS9 retrospectively but has elected not to restate comparative information. As a result, the comparative information provided continues to be accounted for in accordance with the Group’s previous accounting policy.
Trade receivables are measured at initial recognition at fair value and are subsequently measured at amortised cost using the effective interest rate method. Appropriate allowances for estimated irrecoverable amounts are recognised in profit or loss when there is objective evidence that the asset is impaired. The allowance recognised is measured as the difference between the asset’s carrying amount and the present value of estimated future cash flows discounted at the effective interest rate computed at initial recognition.
Financial liabilitiesTrade payables and other short-term monetary liabilities are initially recognised at fair value and subsequently carried at amortised cost using the effective interest method.
current and deferred taxIncome tax expense represents the sum of the tax currently payable and deferred tax.
CORPORATEGOVERNANCE
STRATEGICREPORT
FINANCIALSTATEMENTS
47KAPE TECHNOLOGIES PLCANNUAL REPORT ANd ACCOUNTS 2018
current taxCurrent tax liabilities and assets are measured at the amount expected to be paid to or recovered from the taxation authorities, using the tax rates and laws that have been enacted, or substantively enacted, by the reporting date.
deferred taxdeferred tax is provided in full, using the liability method, on temporary differences arising between the tax bases of assets and liabilities and their carrying amounts in the financial statements.
deferred tax assets are recognised to the extent that it is probable that future taxable profit will be available against which the temporary differences can be utilised. deferred tax is calculated at the tax rates that are expected to apply in the period when the liability is settled or the asset realised, based on tax rates that have been enacted or substantively enacted by the period end date, and is not discounted.
deferred tax assets and liabilities are offset when there is a legally enforceable right to set off current tax assets against current tax liabilities and when the deferred taxes relate to the same fiscal authority.
operating leasesThe implementation of IFRS 16 replaced the existing guidance in IAS 17 – “Leases” (hereafter – “IAS 17”). The standard sets out the principles for the recognition, measurement, presentation and disclosure of leases, and has a material impact mainly on the accounting treatment applied by the lessee in a lease transaction.
Until the 2018 financial year, leases were classified as either finance or operating leases. Payments made under operating leases (net of any incentives received from the lessor) were charged to profit or loss on a straight-line basis over the period of the lease.
IFRS 16 changes the existing guidance in IAS 17 and requires lessees to recognise a lease liability that reflects future lease payments and a “right-of-use asset” in all lease contracts within scope, with no distinction between financing and capital leases. IFRS 16 exempts lessees in short-term leases or the when underlying asset has a low value.
The Company has elected to apply the practical expedient not to recognise right-of-use assets and lease liabilities for leases of low-value assets only. The lease payments associated with these leases is recognised as an expense on a straight-line basis over the lease term.
IFRS 16 substantially carries forward the lessor accounting requirements in IAS 17. Accordingly, a lessor continues to classify its leases as operating leases or finance leases, and to account for those two types of leases differently.
IFRS 16 also changes the definition of a “lease” and the manner of assessing whether a contract contains a lease. At inception of a contract, the Company assesses whether a contract is, or contains, a lease based on whether the contract conveys the right to control the use of an identified asset for a period of time in exchange for consideration.
The Company has elected to apply the practical expedient to account for each lease component and any non-lease components as a single lease component.
The Company recognises a right-of-use asset and a lease liability at the lease commencement date.
The lease liability is initially measured at the present value of the following lease payments:• Fixed payments• Variable payments that are based on index or rate• The exercise price of an extension or purchase option if reasonably certain to be exercised • Payment of penalties for terminating the lease, if relevant
The lease payments are discounted using the interest rate implicit in the lease or, if that rate cannot be readily determined, the Company’s incremental borrowing rate. The Company uses its incremental borrowing rate as the discount rate.
The right-of-use asset is initially measured based on the initial amount of the lease liability adjusted for any lease payments made at or before the commencement date, plus any initial direct costs incurred and an estimate of costs to dismantle and remove the underlying asset or to restore the underlying asset or the site on which it is located, less any lease incentives received. The assets are depreciated to the earlier of the end of the useful life of the right-of-use asset or the lease term using the straight-line method. The lease term includes periods covered by an option to extend if the Company is reasonably certain to exercise that option. In addition, the right-of-use asset is periodically reduced by impairment losses, if any, and adjusted for certain remeasurements of the lease liability.
48 KAPE TECHNOLOGIES PLCANNUAL REPORT ANd ACCOUNTS 2018
notes to tHe consolIdAted FInAncIAl stAteMents CONTINUEd
2 Significant accounting policies continuedoperating leases continuedThe lease liability is measured at amortized cost using the effective interest method. It is remeasured when there is a change in future lease payments arising from a change in an index or rate, if there is a change in the Company’s estimate of the amount expected to be payable. When the lease liability is remeasured in this way, a corresponding adjustment is made to the carrying amount of the right-of-use asset, or is recorded in profit or loss if the carrying amount of the right-of-use asset has been reduced to zero.
the following policy was applied before the adoption of IFRs 16:Leases where a significant portion of the risks and rewards of ownership are retained by the lessor are classified as operating leases. Payments made under operating leases are charged to profit or loss on a straight-line basis over the period of the lease.
share-based paymentsKape operates equity-settled, share-based compensation plans, under which the entity receives services from employees as consideration for Kape equity instruments (options). The fair value of the options and share awards is recognised as an employee benefit expense. The total amount to be expensed over the vesting period is determined by reference to the fair value of the options granted, excluding the impact of any non-market vesting conditions (for example, Recurring Revenue and Earning Per Share targets). Non-market vesting conditions are included in assumptions about the number of options that are expected to vest.
At each balance sheet date, the entity revises its estimates of the number of options that are expected to vest. It recognises the impact of the revision of original estimates, if any, in the income statement, with a corresponding adjustment to equity. The proceeds received net of any directly attributable transaction costs are credited to share capital (par value) and share premium when the options are exercised.
Cancellation or settlement is accounted for as an acceleration of the vesting period, and therefore the amount that otherwise would have been recognised for services received over the remainder of the vesting period is recognised immediately. Repurchase of cancelled or settled share based compensation plan, is accounted for as a deduction from equity, except to the extent that the payment exceeds the fair value of the equity instruments granted, measured at purchase date. Such excess is accounted as expense.
share capitalOrdinary shares are classified as equity. The difference between the fair value of the consideration received by the Group and the nominal value of the share capital being issued is classified as additional paid in capital.
critical accounting estimates and judgementsThe preparation of consolidated financial statements under IFRS requires the Group to make estimates and judgments that affect the application of policies and reported amounts. Estimates and judgments are continually evaluated and are based on historical experience and other factors including expectations of future events that are believed to be reasonable under the circumstances. Actual results may differ from these estimates.
The following accounting policies cover areas that the directors consider require estimates and assumptions which have a significant risk of causing a material adjustment to the carrying amount of assets and liabilities within the next financial year:
(a) Capitalisation of development expensesResearch and development costs which create identifiable assets and are expected to generate future economic benefits are capitalised, and the remainder is expensed to income statement. This requires the Group to perform judgements in apportioning costs to identifiable assets and making judgements about which assets are expected to give rise to future economic benefits.
(b) Presentation of net revenuesThe Group makes judgements in assessing whether it has acted as a principal or agent in transactions for selling and acquiring advertising media space, and therefore whether it reports its revenues gross or net respectively. The Group assesses a number of criteria in making these judgements, including the party, who is responsible for price setting and credit risk of the transaction, the losses the Group would suffer for non-delivery of service as well as the perceived and contractual relationship between the media publisher and seller or ad network.
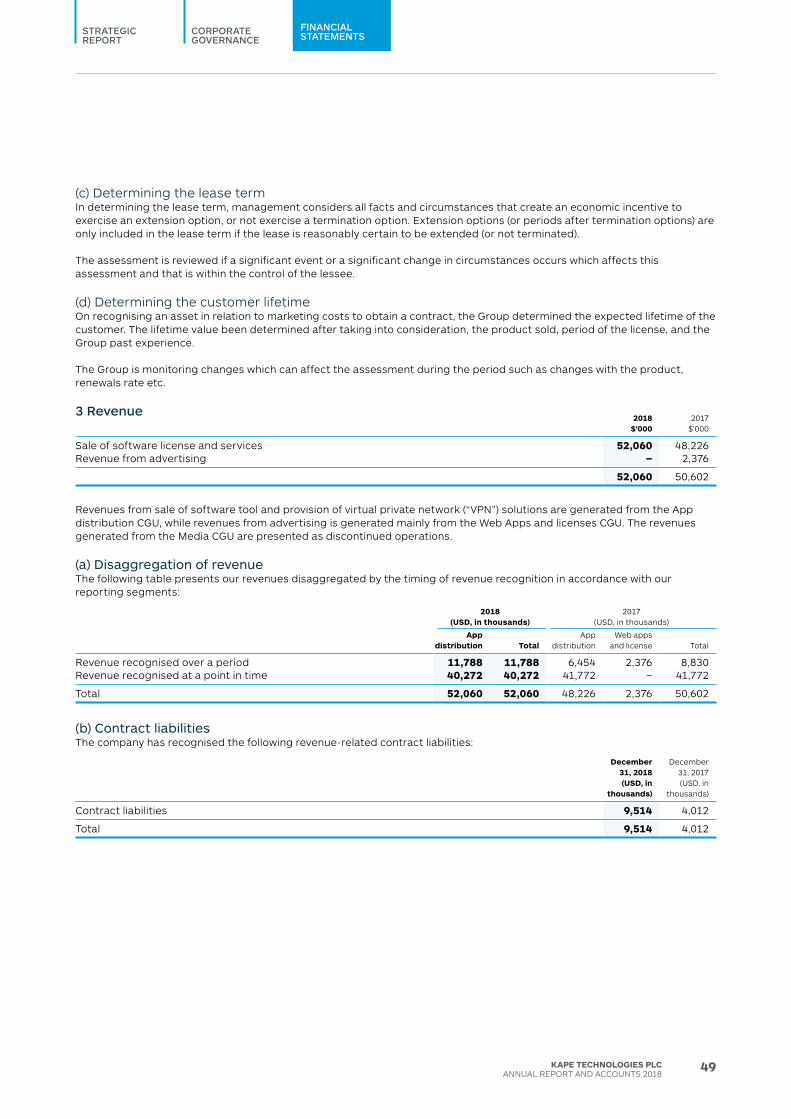
CORPORATEGOVERNANCE
STRATEGICREPORT
FINANCIALSTATEMENTS
49KAPE TECHNOLOGIES PLCANNUAL REPORT ANd ACCOUNTS 2018
(c) determining the lease termIn determining the lease term, management considers all facts and circumstances that create an economic incentive to exercise an extension option, or not exercise a termination option. Extension options (or periods after termination options) are only included in the lease term if the lease is reasonably certain to be extended (or not terminated).
The assessment is reviewed if a significant event or a significant change in circumstances occurs which affects this assessment and that is within the control of the lessee.
(d) determining the customer lifetime On recognising an asset in relation to marketing costs to obtain a contract, the Group determined the expected lifetime of the customer. The lifetime value been determined after taking into consideration, the product sold, period of the license, and the Group past experience.
The Group is monitoring changes which can affect the assessment during the period such as changes with the product, renewals rate etc.
3 Revenue2018
$’0002017
$’000
Sale of software license and services 52,060 48,226Revenue from advertising – 2,376
52,060 50,602
Revenues from sale of software tool and provision of virtual private network (“VPN”) solutions are generated from the App distribution CGU, while revenues from advertising is generated mainly from the Web Apps and licenses CGU. The revenues generated from the Media CGU are presented as discontinued operations.
(a) disaggregation of revenueThe following table presents our revenues disaggregated by the timing of revenue recognition in accordance with our reporting segments:
2018 (USD, in thousands)
2017 (USd, in thousands)
App distribution Total
App distribution
Web apps and license Total
Revenue recognised over a period 11,788 11,788 6,454 2,376 8,830Revenue recognised at a point in time 40,272 40,272 41,772 – 41,772
Total 52,060 52,060 48,226 2,376 50,602
(b) contract liabilitiesThe company has recognised the following revenue-related contract liabilities:
December 31, 2018 (USD, in
thousands)
december 31, 2017 (USd, in
thousands)
Contract liabilities 9,514 4,012
Total 9,514 4,012
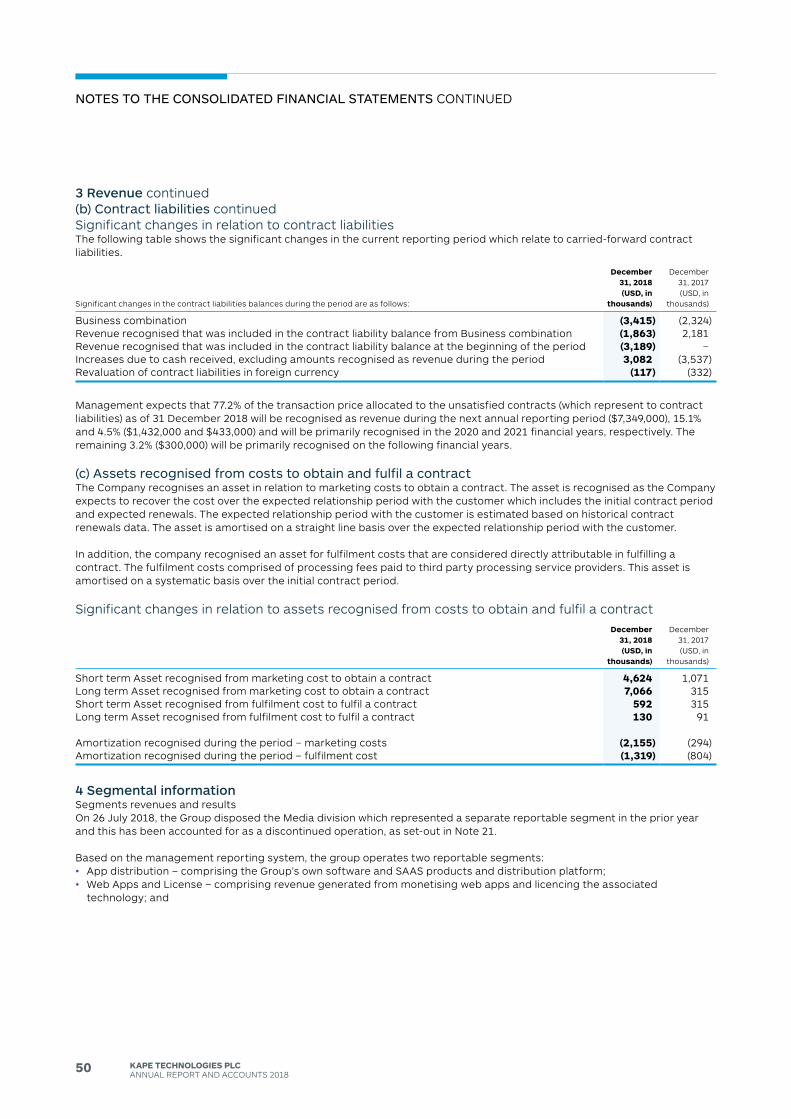
50 KAPE TECHNOLOGIES PLCANNUAL REPORT ANd ACCOUNTS 2018
notes to tHe consolIdAted FInAncIAl stAteMents CONTINUEd
3 Revenue continued(b) contract liabilities continuedSignificant changes in relation to contract liabilitiesThe following table shows the significant changes in the current reporting period which relate to carried-forward contract liabilities.
Significant changes in the contract liabilities balances during the period are as follows:
December 31, 2018 (USD, in
thousands)
december 31, 2017 (USd, in
thousands)
Business combination (3,415) (2,324)Revenue recognised that was included in the contract liability balance from Business combination (1,863) 2,181Revenue recognised that was included in the contract liability balance at the beginning of the period (3,189) –Increases due to cash received, excluding amounts recognised as revenue during the period 3,082 (3,537)Revaluation of contract liabilities in foreign currency (117) (332)
Management expects that 77.2% of the transaction price allocated to the unsatisfied contracts (which represent to contract liabilities) as of 31 december 2018 will be recognised as revenue during the next annual reporting period ($7,349,000), 15.1% and 4.5% ($1,432,000 and $433,000) and will be primarily recognised in the 2020 and 2021 financial years, respectively. The remaining 3.2% ($300,000) will be primarily recognised on the following financial years.
(c) Assets recognised from costs to obtain and fulfil a contractThe Company recognises an asset in relation to marketing costs to obtain a contract. The asset is recognised as the Company expects to recover the cost over the expected relationship period with the customer which includes the initial contract period and expected renewals. The expected relationship period with the customer is estimated based on historical contract renewals data. The asset is amortised on a straight line basis over the expected relationship period with the customer.
In addition, the company recognised an asset for fulfilment costs that are considered directly attributable in fulfilling a contract. The fulfilment costs comprised of processing fees paid to third party processing service providers. This asset is amortised on a systematic basis over the initial contract period.
Significant changes in relation to assets recognised from costs to obtain and fulfil a contractDecember
31, 2018 (USD, in
thousands)
december 31, 2017 (USd, in
thousands)
Short term Asset recognised from marketing cost to obtain a contract 4,624 1,071Long term Asset recognised from marketing cost to obtain a contract 7,066 315Short term Asset recognised from fulfilment cost to fulfil a contract 592 315Long term Asset recognised from fulfilment cost to fulfil a contract 130 91
Amortization recognised during the period – marketing costs (2,155) (294)Amortization recognised during the period – fulfilment cost (1,319) (804)
4 Segmental informationSegments revenues and resultsOn 26 July 2018, the Group disposed the Media division which represented a separate reportable segment in the prior year and this has been accounted for as a discontinued operation, as set-out in Note 21.
Based on the management reporting system, the group operates two reportable segments:• App distribution – comprising the Group’s own software and SAAS products and distribution platform;• Web Apps and License – comprising revenue generated from monetising web apps and licencing the associated
technology; and
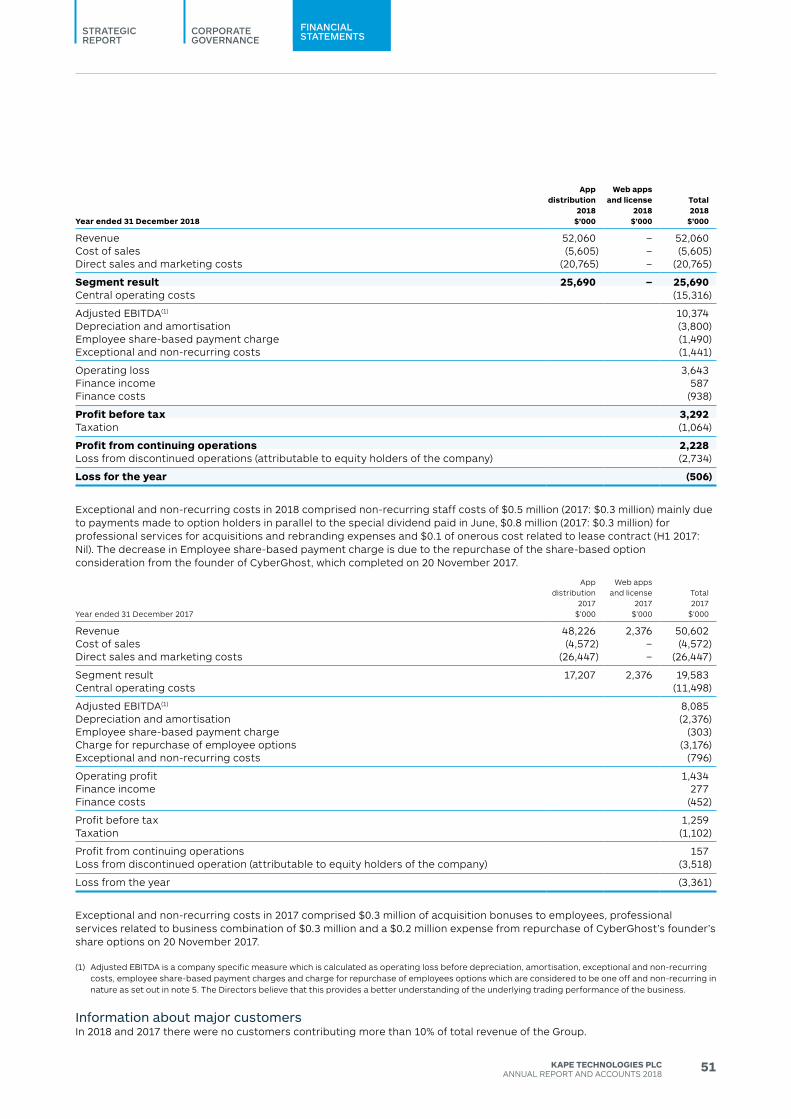
CORPORATEGOVERNANCE
STRATEGICREPORT
FINANCIALSTATEMENTS
51KAPE TECHNOLOGIES PLCANNUAL REPORT ANd ACCOUNTS 2018
Year ended 31 December 2018
App distribution
2018$’000
Web apps and license
2018$’000
Total2018
$’000
Revenue 52,060 – 52,060 Cost of sales (5,605) – (5,605)direct sales and marketing costs (20,765) – (20,765)
Segment result 25,690 – 25,690Central operating costs (15,316)
Adjusted EBITdA(1) 10,374depreciation and amortisation (3,800)Employee share-based payment charge (1,490)Exceptional and non-recurring costs (1,441)
Operating loss 3,643Finance income 587 Finance costs (938)
Profit before tax 3,292Taxation (1,064)
Profit from continuing operations 2,228Loss from discontinued operations (attributable to equity holders of the company) (2,734)
Loss for the year (506)
Exceptional and non-recurring costs in 2018 comprised non-recurring staff costs of $0.5 million (2017: $0.3 million) mainly due to payments made to option holders in parallel to the special dividend paid in June, $0.8 million (2017: $0.3 million) for professional services for acquisitions and rebranding expenses and $0.1 of onerous cost related to lease contract (H1 2017: Nil). The decrease in Employee share-based payment charge is due to the repurchase of the share-based option consideration from the founder of CyberGhost, which completed on 20 November 2017.
Year ended 31 december 2017
App distribution
2017$’000
Web apps and license
2017$’000
Total2017
$’000
Revenue 48,226 2,376 50,602Cost of sales (4,572) – (4,572)direct sales and marketing costs (26,447) – (26,447)
Segment result 17,207 2,376 19,583Central operating costs (11,498)
Adjusted EBITdA(1) 8,085depreciation and amortisation (2,376)Employee share-based payment charge (303)Charge for repurchase of employee options (3,176)Exceptional and non-recurring costs (796)
Operating profit 1,434Finance income 277Finance costs (452)
Profit before tax 1,259Taxation (1,102)
Profit from continuing operations 157Loss from discontinued operation (attributable to equity holders of the company) (3,518)
Loss from the year (3,361)
Exceptional and non-recurring costs in 2017 comprised $0.3 million of acquisition bonuses to employees, professional services related to business combination of $0.3 million and a $0.2 million expense from repurchase of CyberGhost’s founder’s share options on 20 November 2017.
(1) Adjusted EBITdA is a company specific measure which is calculated as operating loss before depreciation, amortisation, exceptional and non-recurring costs, employee share-based payment charges and charge for repurchase of employees options which are considered to be one off and non-recurring in nature as set out in note 5. The directors believe that this provides a better understanding of the underlying trading performance of the business.
Information about major customersIn 2018 and 2017 there were no customers contributing more than 10% of total revenue of the Group.
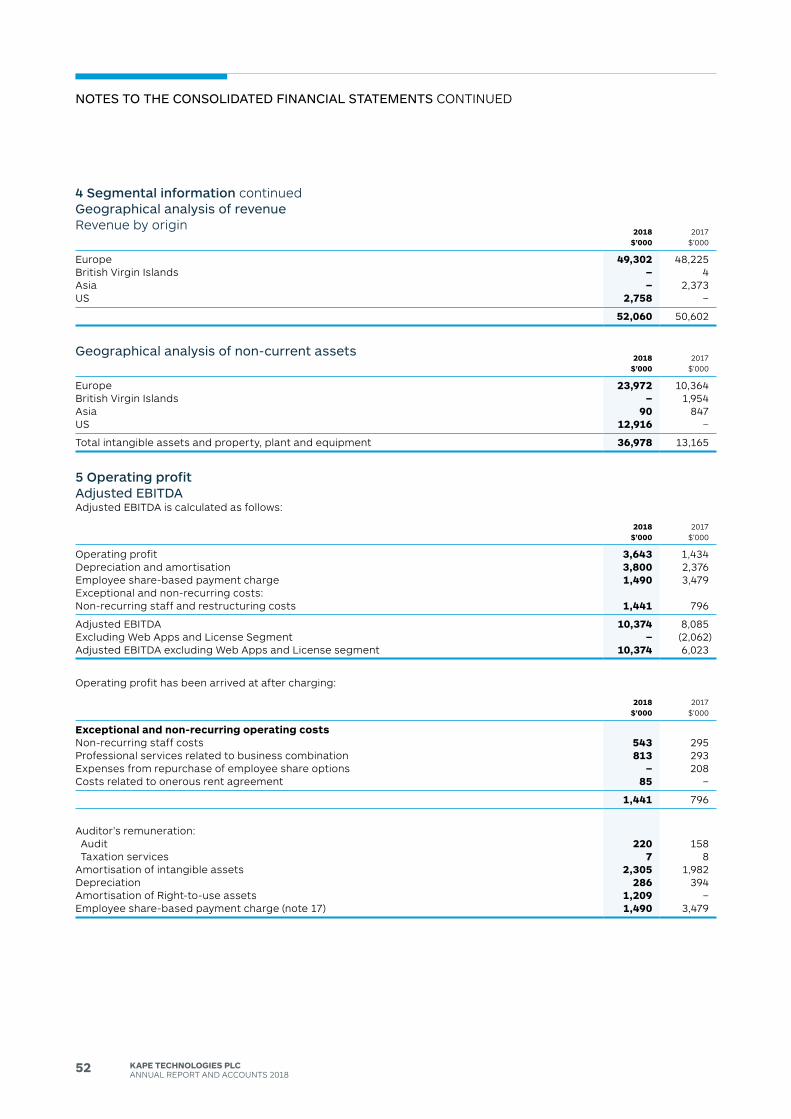
52 KAPE TECHNOLOGIES PLCANNUAL REPORT ANd ACCOUNTS 2018
notes to tHe consolIdAted FInAncIAl stAteMents CONTINUEd
4 Segmental information continuedGeographical analysis of revenueRevenue by origin
2018$’000
2017$’000
Europe 49,302 48,225British Virgin Islands – 4Asia – 2,373US 2,758 –
52,060 50,602
Geographical analysis of non-current assets2018
$’0002017
$’000
Europe 23,972 10,364British Virgin Islands – 1,954Asia 90 847US 12,916 –
Total intangible assets and property, plant and equipment 36,978 13,165
5 Operating profitAdjusted eBItdAAdjusted EBITdA is calculated as follows:
2018$’000
2017$’000
Operating profit 3,643 1,434depreciation and amortisation 3,800 2,376Employee share-based payment charge 1,490 3,479Exceptional and non-recurring costs:Non-recurring staff and restructuring costs 1,441 796
Adjusted EBITdA 10,374 8,085Excluding Web Apps and License Segment – (2,062)Adjusted EBITdA excluding Web Apps and License segment 10,374 6,023
Operating profit has been arrived at after charging:
2018$’000
2017$’000
Exceptional and non-recurring operating costsNon-recurring staff costs 543 295Professional services related to business combination 813 293Expenses from repurchase of employee share options – 208Costs related to onerous rent agreement 85 –
1,441 796
Auditor’s remuneration: Audit 220 158 Taxation services 7 8Amortisation of intangible assets 2,305 1,982depreciation 286 394Amortisation of Right-to-use assets 1,209 –Employee share-based payment charge (note 17) 1,490 3,479
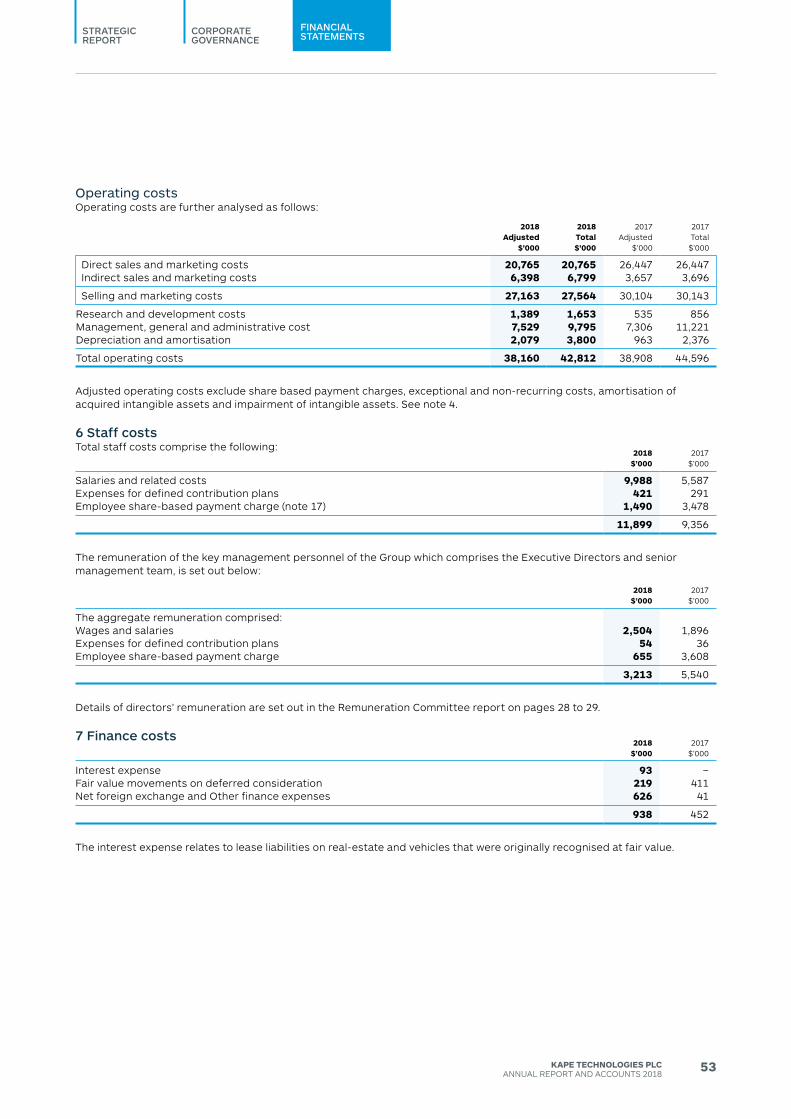
CORPORATEGOVERNANCE
STRATEGICREPORT
FINANCIALSTATEMENTS
53KAPE TECHNOLOGIES PLCANNUAL REPORT ANd ACCOUNTS 2018
operating costsOperating costs are further analysed as follows:
2018Adjusted
$’000
2018Total$’000
2017Adjusted
$’000
2017Total$’000
direct sales and marketing costs 20,765 20,765 26,447 26,447 Indirect sales and marketing costs 6,398 6,799 3,657 3,696
Selling and marketing costs 27,163 27,564 30,104 30,143
Research and development costs 1,389 1,653 535 856Management, general and administrative cost 7,529 9,795 7,306 11,221depreciation and amortisation 2,079 3,800 963 2,376
Total operating costs 38,160 42,812 38,908 44,596
Adjusted operating costs exclude share based payment charges, exceptional and non-recurring costs, amortisation of acquired intangible assets and impairment of intangible assets. See note 4.
6 Staff costsTotal staff costs comprise the following:
2018$’000
2017 $’000
Salaries and related costs 9,988 5,587Expenses for defined contribution plans 421 291Employee share-based payment charge (note 17) 1,490 3,478
11,899 9,356
The remuneration of the key management personnel of the Group which comprises the Executive directors and senior management team, is set out below:
2018 $’000
2017 $’000
The aggregate remuneration comprised:Wages and salaries 2,504 1,896Expenses for defined contribution plans 54 36Employee share-based payment charge 655 3,608
3,213 5,540
details of directors’ remuneration are set out in the Remuneration Committee report on pages 28 to 29.
7 Finance costs2018
$’0002017
$’000
Interest expense 93 –Fair value movements on deferred consideration 219 411Net foreign exchange and Other finance expenses 626 41
938 452
The interest expense relates to lease liabilities on real-estate and vehicles that were originally recognised at fair value.
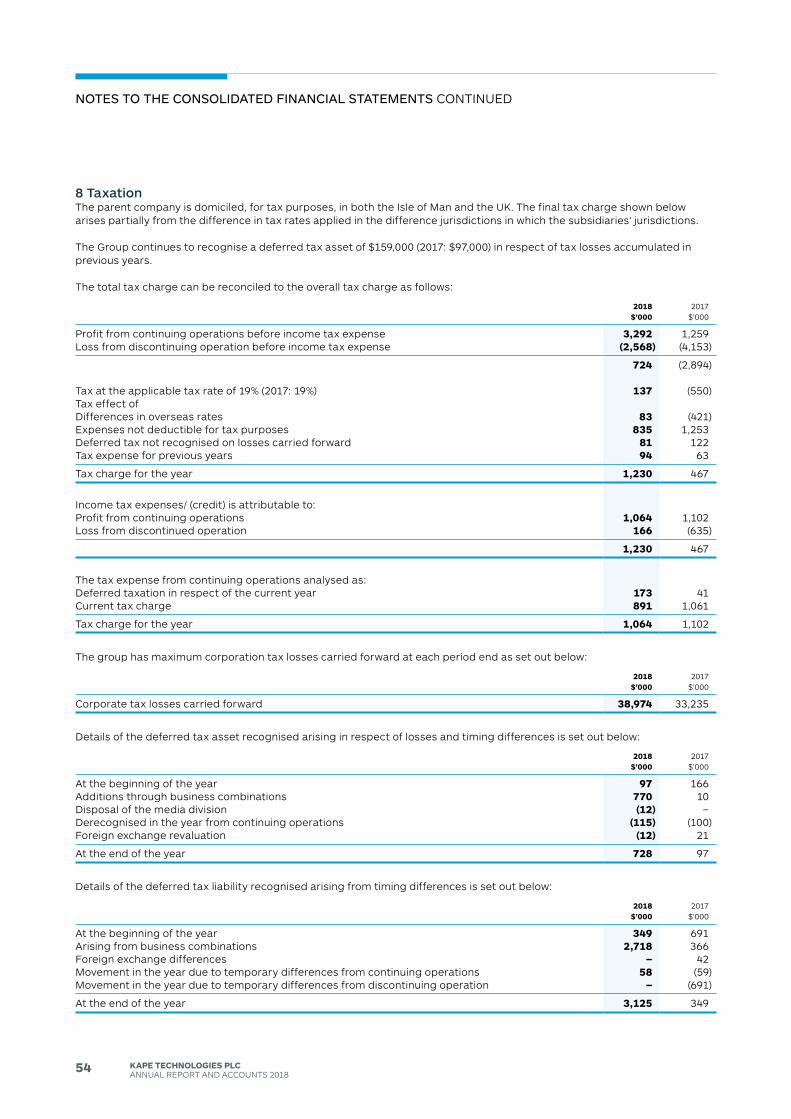
54 KAPE TECHNOLOGIES PLCANNUAL REPORT ANd ACCOUNTS 2018
notes to tHe consolIdAted FInAncIAl stAteMents CONTINUEd
8 TaxationThe parent company is domiciled, for tax purposes, in both the Isle of Man and the UK. The final tax charge shown below arises partially from the difference in tax rates applied in the difference jurisdictions in which the subsidiaries’ jurisdictions.
The Group continues to recognise a deferred tax asset of $159,000 (2017: $97,000) in respect of tax losses accumulated in previous years.
The total tax charge can be reconciled to the overall tax charge as follows:
2018$’000
2017 $’000
Profit from continuing operations before income tax expense 3,292 1,259Loss from discontinuing operation before income tax expense (2,568) (4,153)
724 (2,894)
Tax at the applicable tax rate of 19% (2017: 19%) 137 (550)Tax effect ofdifferences in overseas rates 83 (421)Expenses not deductible for tax purposes 835 1,253deferred tax not recognised on losses carried forward 81 122Tax expense for previous years 94 63
Tax charge for the year 1,230 467
Income tax expenses/ (credit) is attributable to:Profit from continuing operations 1,064 1,102Loss from discontinued operation 166 (635)
1,230 467
The tax expense from continuing operations analysed as:deferred taxation in respect of the current year 173 41Current tax charge 891 1,061
Tax charge for the year 1,064 1,102
The group has maximum corporation tax losses carried forward at each period end as set out below:
2018 $’000
2017 $’000
Corporate tax losses carried forward 38,974 33,235
details of the deferred tax asset recognised arising in respect of losses and timing differences is set out below:
2018 $’000
2017 $’000
At the beginning of the year 97 166Additions through business combinations 770 10disposal of the media division (12) –derecognised in the year from continuing operations (115) (100)Foreign exchange revaluation (12) 21
At the end of the year 728 97
details of the deferred tax liability recognised arising from timing differences is set out below:
2018 $’000
2017 $’000
At the beginning of the year 349 691Arising from business combinations 2,718 366Foreign exchange differences – 42Movement in the year due to temporary differences from continuing operations 58 (59)Movement in the year due to temporary differences from discontinuing operation – (691)
At the end of the year 3,125 349
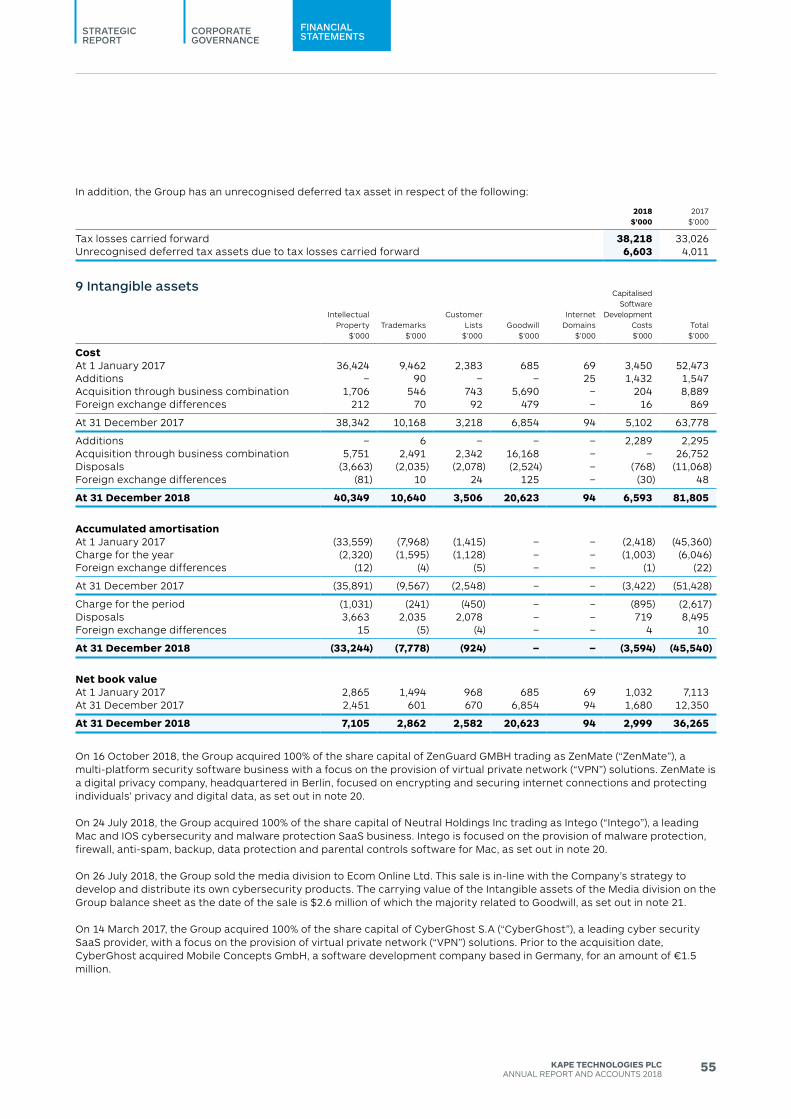
CORPORATEGOVERNANCE
STRATEGICREPORT
FINANCIALSTATEMENTS
55KAPE TECHNOLOGIES PLCANNUAL REPORT ANd ACCOUNTS 2018
In addition, the Group has an unrecognised deferred tax asset in respect of the following:
2018 $’000
2017 $’000
Tax losses carried forward 38,218 33,026Unrecognised deferred tax assets due to tax losses carried forward 6,603 4,011
9 Intangible assets
Intellectual Property
$’000Trademarks
$’000
Customer Lists
$’000Goodwill
$’000
Internet domains
$’000
Capitalised Software
developmentCosts$’000
Total$’000
CostAt 1 January 2017 36,424 9,462 2,383 685 69 3,450 52,473Additions – 90 – – 25 1,432 1,547Acquisition through business combination 1,706 546 743 5,690 – 204 8,889Foreign exchange differences 212 70 92 479 – 16 869
At 31 december 2017 38,342 10,168 3,218 6,854 94 5,102 63,778
Additions – 6 – – – 2,289 2,295Acquisition through business combination 5,751 2,491 2,342 16,168 – – 26,752disposals (3,663) (2,035) (2,078) (2,524) – (768) (11,068)Foreign exchange differences (81) 10 24 125 – (30) 48
At 31 December 2018 40,349 10,640 3,506 20,623 94 6,593 81,805
Accumulated amortisationAt 1 January 2017 (33,559) (7,968) (1,415) – – (2,418) (45,360)Charge for the year (2,320) (1,595) (1,128) – – (1,003) (6,046)Foreign exchange differences (12) (4) (5) – – (1) (22)
At 31 december 2017 (35,891) (9,567) (2,548) – – (3,422) (51,428)
Charge for the period (1,031) (241) (450) – – (895) (2,617)disposals 3,663 2,035 2,078 – – 719 8,495Foreign exchange differences 15 (5) (4) – – 4 10
At 31 December 2018 (33,244) (7,778) (924) – – (3,594) (45,540)
Net book valueAt 1 January 2017 2,865 1,494 968 685 69 1,032 7,113At 31 december 2017 2,451 601 670 6,854 94 1,680 12,350
At 31 December 2018 7,105 2,862 2,582 20,623 94 2,999 36,265
On 16 October 2018, the Group acquired 100% of the share capital of ZenGuard GMBH trading as ZenMate (“ZenMate”), a multi-platform security software business with a focus on the provision of virtual private network (“VPN”) solutions. ZenMate is a digital privacy company, headquartered in Berlin, focused on encrypting and securing internet connections and protecting individuals’ privacy and digital data, as set out in note 20.
On 24 July 2018, the Group acquired 100% of the share capital of Neutral Holdings Inc trading as Intego (“Intego”), a leading Mac and IOS cybersecurity and malware protection SaaS business. Intego is focused on the provision of malware protection, firewall, anti-spam, backup, data protection and parental controls software for Mac, as set out in note 20.
On 26 July 2018, the Group sold the media division to Ecom Online Ltd. This sale is in-line with the Company’s strategy to develop and distribute its own cybersecurity products. The carrying value of the Intangible assets of the Media division on the Group balance sheet as the date of the sale is $2.6 million of which the majority related to Goodwill, as set out in note 21.
On 14 March 2017, the Group acquired 100% of the share capital of CyberGhost S.A (“CyberGhost”), a leading cyber security SaaS provider, with a focus on the provision of virtual private network (“VPN”) solutions. Prior to the acquisition date, CyberGhost acquired Mobile Concepts GmbH, a software development company based in Germany, for an amount of €1.5 million.
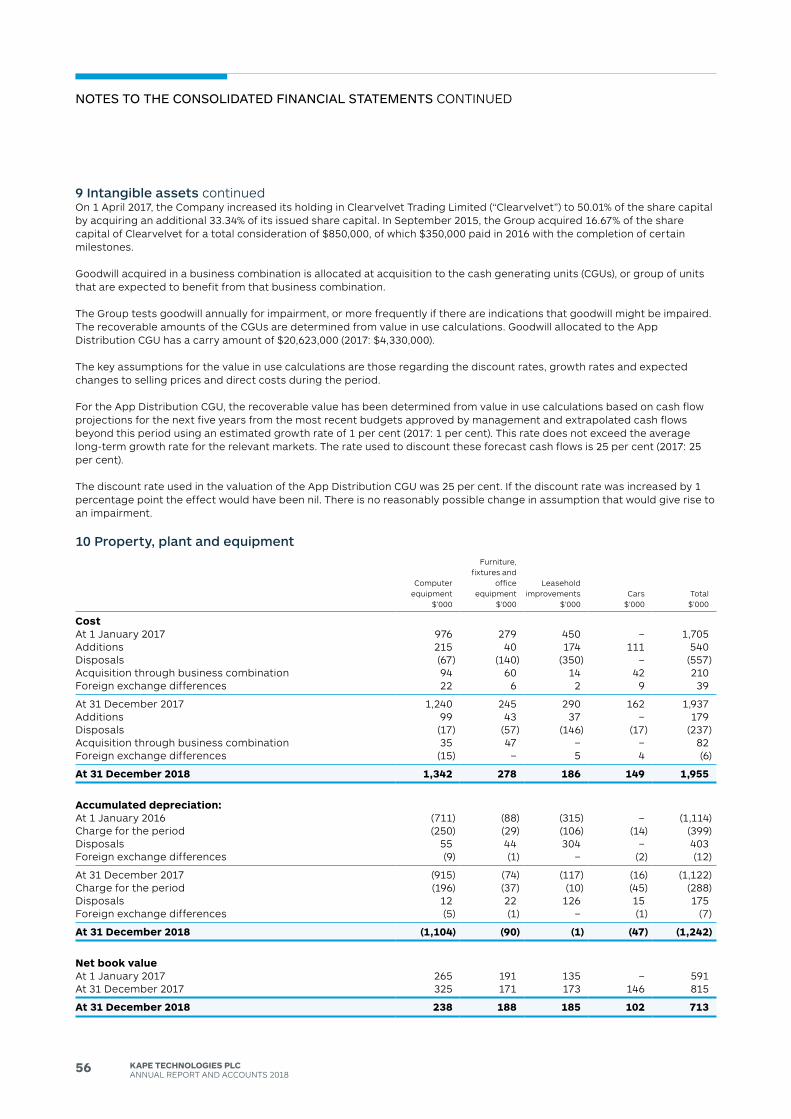
56 KAPE TECHNOLOGIES PLCANNUAL REPORT ANd ACCOUNTS 2018
notes to tHe consolIdAted FInAncIAl stAteMents CONTINUEd
9 Intangible assets continuedOn 1 April 2017, the Company increased its holding in Clearvelvet Trading Limited (“Clearvelvet”) to 50.01% of the share capital by acquiring an additional 33.34% of its issued share capital. In September 2015, the Group acquired 16.67% of the share capital of Clearvelvet for a total consideration of $850,000, of which $350,000 paid in 2016 with the completion of certain milestones.
Goodwill acquired in a business combination is allocated at acquisition to the cash generating units (CGUs), or group of units that are expected to benefit from that business combination.
The Group tests goodwill annually for impairment, or more frequently if there are indications that goodwill might be impaired. The recoverable amounts of the CGUs are determined from value in use calculations. Goodwill allocated to the App distribution CGU has a carry amount of $20,623,000 (2017: $4,330,000).
The key assumptions for the value in use calculations are those regarding the discount rates, growth rates and expected changes to selling prices and direct costs during the period.
For the App distribution CGU, the recoverable value has been determined from value in use calculations based on cash flow projections for the next five years from the most recent budgets approved by management and extrapolated cash flows beyond this period using an estimated growth rate of 1 per cent (2017: 1 per cent). This rate does not exceed the average long-term growth rate for the relevant markets. The rate used to discount these forecast cash flows is 25 per cent (2017: 25 per cent).
The discount rate used in the valuation of the App distribution CGU was 25 per cent. If the discount rate was increased by 1 percentage point the effect would have been nil. There is no reasonably possible change in assumption that would give rise to an impairment.
10 Property, plant and equipment
Computer equipment
$’000
Furniture, fixtures and
office equipment
$’000
Leasehold improvements
$’000Cars
$’000Total$’000
CostAt 1 January 2017 976 279 450 – 1,705Additions 215 40 174 111 540disposals (67) (140) (350) – (557)Acquisition through business combination 94 60 14 42 210Foreign exchange differences 22 6 2 9 39
At 31 december 2017 1,240 245 290 162 1,937Additions 99 43 37 – 179disposals (17) (57) (146) (17) (237)Acquisition through business combination 35 47 – – 82Foreign exchange differences (15) – 5 4 (6)
At 31 December 2018 1,342 278 186 149 1,955
Accumulated depreciation:At 1 January 2016 (711) (88) (315) – (1,114)Charge for the period (250) (29) (106) (14) (399)disposals 55 44 304 – 403Foreign exchange differences (9) (1) – (2) (12)
At 31 december 2017 (915) (74) (117) (16) (1,122)Charge for the period (196) (37) (10) (45) (288)disposals 12 22 126 15 175Foreign exchange differences (5) (1) – (1) (7)
At 31 December 2018 (1,104) (90) (1) (47) (1,242)
Net book valueAt 1 January 2017 265 191 135 – 591At 31 december 2017 325 171 173 146 815
At 31 December 2018 238 188 185 102 713
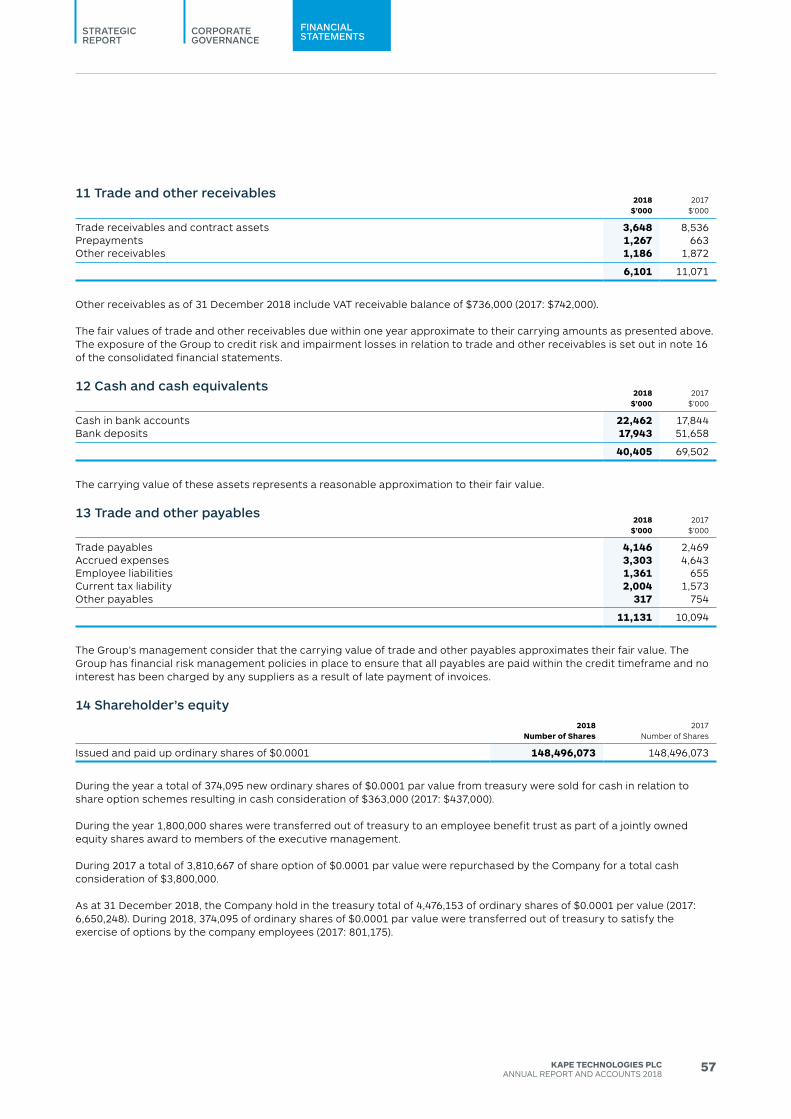
CORPORATEGOVERNANCE
STRATEGICREPORT
FINANCIALSTATEMENTS
57KAPE TECHNOLOGIES PLCANNUAL REPORT ANd ACCOUNTS 2018
11 Trade and other receivables2018
$’0002017
$’000
Trade receivables and contract assets 3,648 8,536Prepayments 1,267 663Other receivables 1,186 1,872
6,101 11,071
Other receivables as of 31 december 2018 include VAT receivable balance of $736,000 (2017: $742,000).
The fair values of trade and other receivables due within one year approximate to their carrying amounts as presented above. The exposure of the Group to credit risk and impairment losses in relation to trade and other receivables is set out in note 16 of the consolidated financial statements.
12 Cash and cash equivalents2018
$’0002017
$’000
Cash in bank accounts 22,462 17,844Bank deposits 17,943 51,658
40,405 69,502
The carrying value of these assets represents a reasonable approximation to their fair value.
13 Trade and other payables2018
$’0002017
$’000
Trade payables 4,146 2,469Accrued expenses 3,303 4,643Employee liabilities 1,361 655Current tax liability 2,004 1,573Other payables 317 754
11,131 10,094
The Group’s management consider that the carrying value of trade and other payables approximates their fair value. The Group has financial risk management policies in place to ensure that all payables are paid within the credit timeframe and no interest has been charged by any suppliers as a result of late payment of invoices.
14 Shareholder’s equity2018
Number of Shares2017
Number of Shares
Issued and paid up ordinary shares of $0.0001 148,496,073 148,496,073
during the year a total of 374,095 new ordinary shares of $0.0001 par value from treasury were sold for cash in relation to share option schemes resulting in cash consideration of $363,000 (2017: $437,000).
during the year 1,800,000 shares were transferred out of treasury to an employee benefit trust as part of a jointly owned equity shares award to members of the executive management.
during 2017 a total of 3,810,667 of share option of $0.0001 par value were repurchased by the Company for a total cash consideration of $3,800,000.
As at 31 december 2018, the Company hold in the treasury total of 4,476,153 of ordinary shares of $0.0001 per value (2017: 6,650,248). during 2018, 374,095 of ordinary shares of $0.0001 par value were transferred out of treasury to satisfy the exercise of options by the company employees (2017: 801,175).
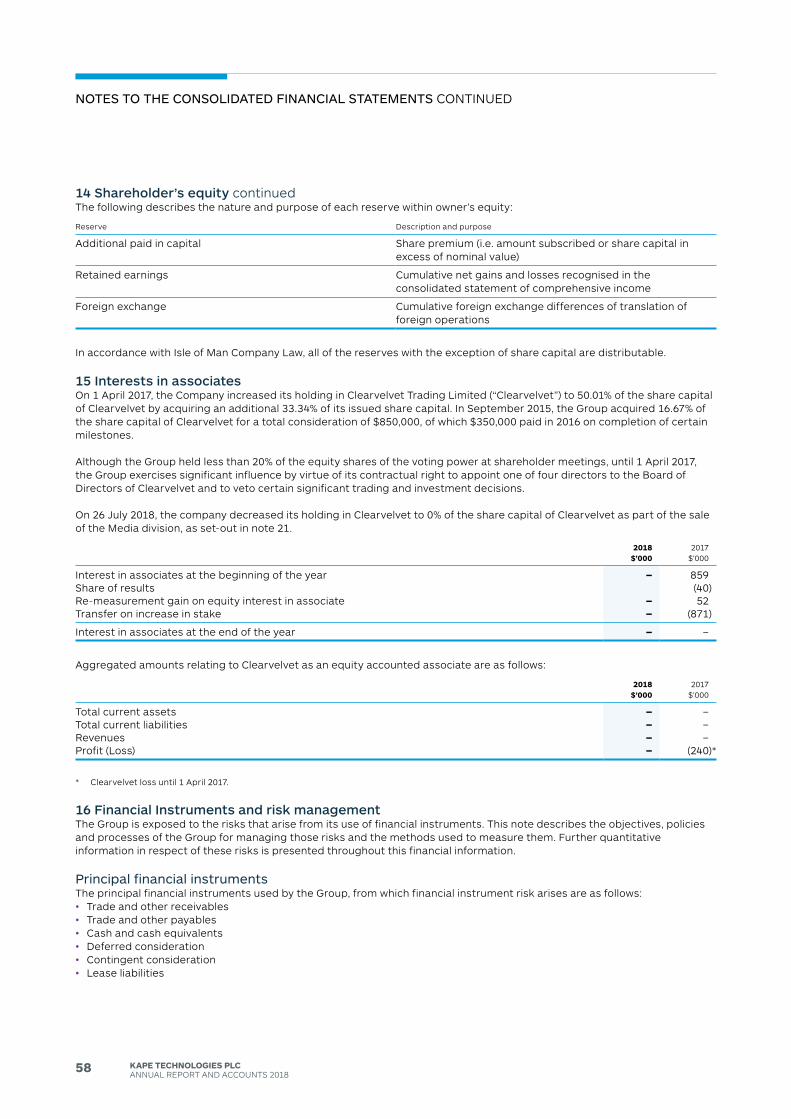
58 KAPE TECHNOLOGIES PLCANNUAL REPORT ANd ACCOUNTS 2018
14 Shareholder’s equity continuedThe following describes the nature and purpose of each reserve within owner’s equity:
Reserve description and purpose
Additional paid in capital Share premium (i.e. amount subscribed or share capital in excess of nominal value)
Retained earnings Cumulative net gains and losses recognised in the consolidated statement of comprehensive income
Foreign exchange Cumulative foreign exchange differences of translation of foreign operations
In accordance with Isle of Man Company Law, all of the reserves with the exception of share capital are distributable.
15 Interests in associatesOn 1 April 2017, the Company increased its holding in Clearvelvet Trading Limited (“Clearvelvet”) to 50.01% of the share capital of Clearvelvet by acquiring an additional 33.34% of its issued share capital. In September 2015, the Group acquired 16.67% of the share capital of Clearvelvet for a total consideration of $850,000, of which $350,000 paid in 2016 on completion of certain milestones.
Although the Group held less than 20% of the equity shares of the voting power at shareholder meetings, until 1 April 2017, the Group exercises significant influence by virtue of its contractual right to appoint one of four directors to the Board of directors of Clearvelvet and to veto certain significant trading and investment decisions.
On 26 July 2018, the company decreased its holding in Clearvelvet to 0% of the share capital of Clearvelvet as part of the sale of the Media division, as set-out in note 21.
2018 $’000
2017 $’000
Interest in associates at the beginning of the year – 859Share of results (40)Re-measurement gain on equity interest in associate – 52Transfer on increase in stake – (871)
Interest in associates at the end of the year – –
Aggregated amounts relating to Clearvelvet as an equity accounted associate are as follows:
2018 $’000
2017 $’000
Total current assets – –Total current liabilities – –Revenues – –Profit (Loss) – (240)*
* Clearvelvet loss until 1 April 2017.
16 Financial Instruments and risk managementThe Group is exposed to the risks that arise from its use of financial instruments. This note describes the objectives, policies and processes of the Group for managing those risks and the methods used to measure them. Further quantitative information in respect of these risks is presented throughout this financial information.
principal financial instrumentsThe principal financial instruments used by the Group, from which financial instrument risk arises are as follows:• Trade and other receivables• Trade and other payables• Cash and cash equivalents• deferred consideration• Contingent consideration • Lease liabilities
notes to tHe consolIdAted FInAncIAl stAteMents CONTINUEd
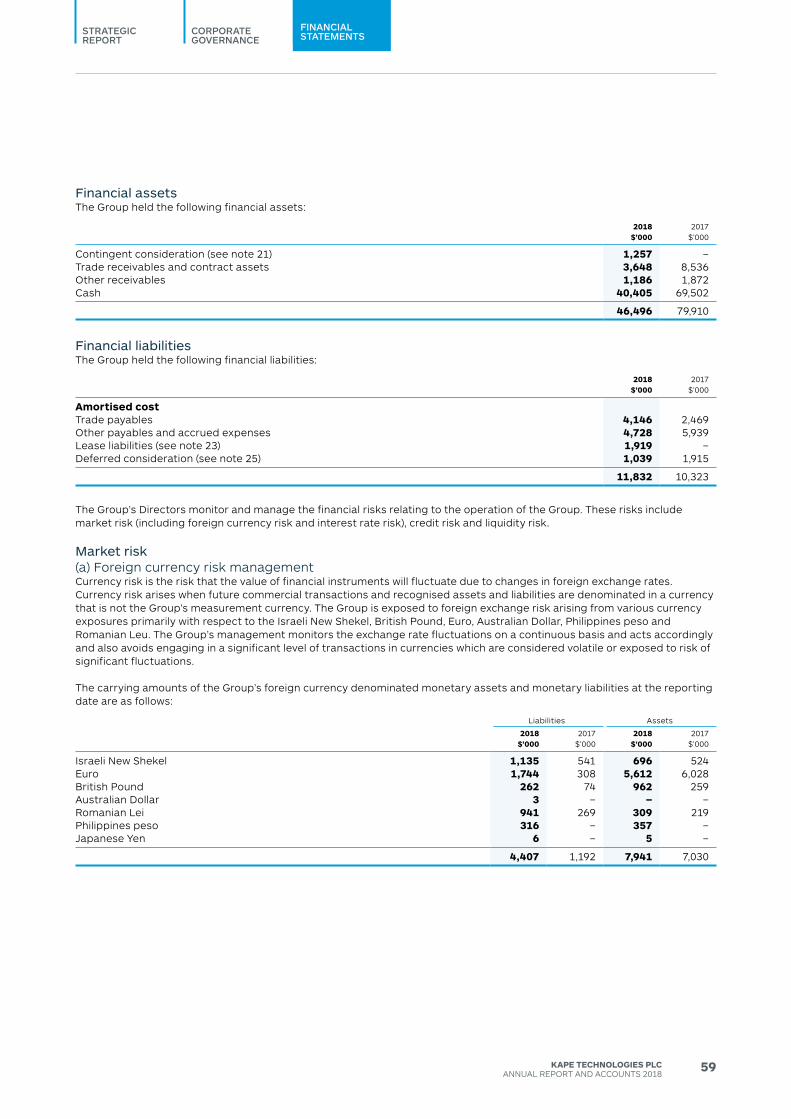
CORPORATEGOVERNANCE
STRATEGICREPORT
FINANCIALSTATEMENTS
59KAPE TECHNOLOGIES PLCANNUAL REPORT ANd ACCOUNTS 2018
Financial assetsThe Group held the following financial assets:
2018 $’000
2017 $’000
Contingent consideration (see note 21) 1,257 –Trade receivables and contract assets 3,648 8,536Other receivables 1,186 1,872Cash 40,405 69,502
46,496 79,910
Financial liabilitiesThe Group held the following financial liabilities:
2018 $’000
2017 $’000
Amortised costTrade payables 4,146 2,469Other payables and accrued expenses 4,728 5,939Lease liabilities (see note 23) 1,919 –deferred consideration (see note 25) 1,039 1,915
11,832 10,323
The Group’s directors monitor and manage the financial risks relating to the operation of the Group. These risks include market risk (including foreign currency risk and interest rate risk), credit risk and liquidity risk.
Market risk(a) Foreign currency risk managementCurrency risk is the risk that the value of financial instruments will fluctuate due to changes in foreign exchange rates. Currency risk arises when future commercial transactions and recognised assets and liabilities are denominated in a currency that is not the Group’s measurement currency. The Group is exposed to foreign exchange risk arising from various currency exposures primarily with respect to the Israeli New Shekel, British Pound, Euro, Australian dollar, Philippines peso and Romanian Leu. The Group’s management monitors the exchange rate fluctuations on a continuous basis and acts accordingly and also avoids engaging in a significant level of transactions in currencies which are considered volatile or exposed to risk of significant fluctuations.
The carrying amounts of the Group’s foreign currency denominated monetary assets and monetary liabilities at the reporting date are as follows:
Liabilities Assets
2018 $’000
2017 $’000
2018 $’000
2017 $’000
Israeli New Shekel 1,135 541 696 524Euro 1,744 308 5,612 6,028British Pound 262 74 962 259Australian dollar 3 – – –Romanian Lei 941 269 309 219Philippines peso 316 – 357 –Japanese Yen 6 – 5 –
4,407 1,192 7,941 7,030
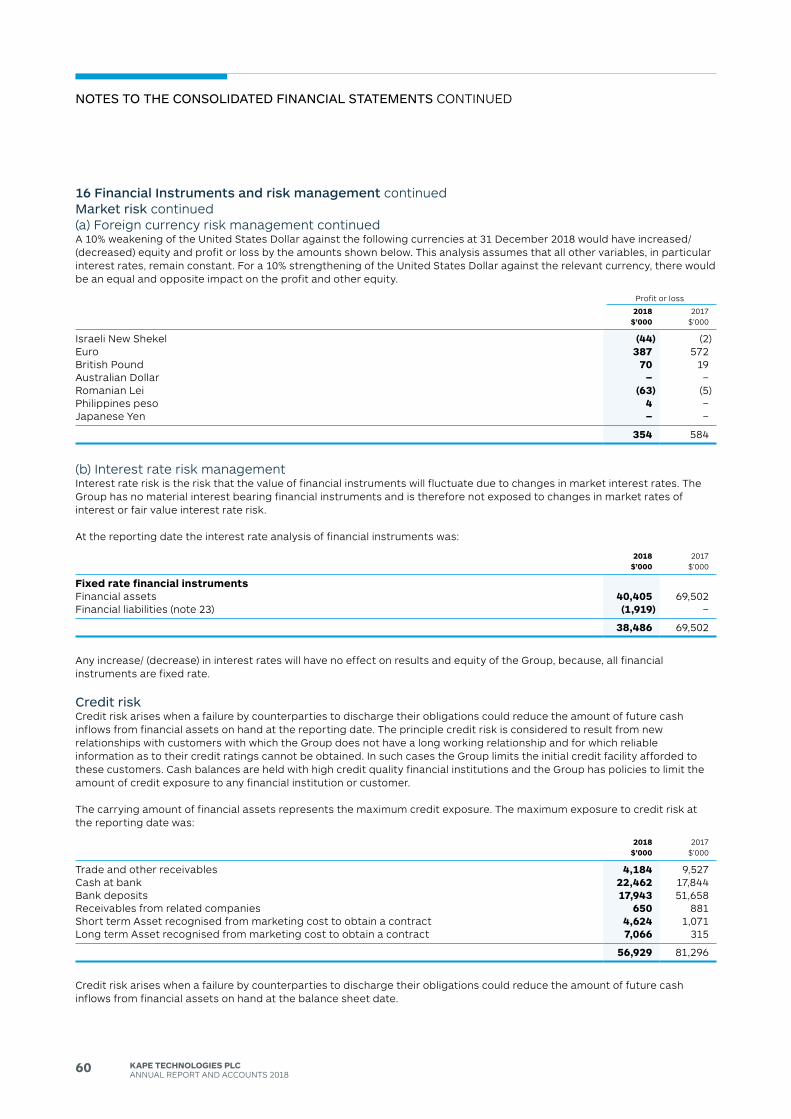
60 KAPE TECHNOLOGIES PLCANNUAL REPORT ANd ACCOUNTS 2018
16 Financial Instruments and risk management continuedMarket risk continued(a) Foreign currency risk management continuedA 10% weakening of the United States dollar against the following currencies at 31 december 2018 would have increased/ (decreased) equity and profit or loss by the amounts shown below. This analysis assumes that all other variables, in particular interest rates, remain constant. For a 10% strengthening of the United States dollar against the relevant currency, there would be an equal and opposite impact on the profit and other equity.
Profit or loss
2018 $’000
2017 $’000
Israeli New Shekel (44) (2)Euro 387 572British Pound 70 19Australian dollar – –Romanian Lei (63) (5)Philippines peso 4 –Japanese Yen – –
354 584
(b) Interest rate risk managementInterest rate risk is the risk that the value of financial instruments will fluctuate due to changes in market interest rates. The Group has no material interest bearing financial instruments and is therefore not exposed to changes in market rates of interest or fair value interest rate risk.
At the reporting date the interest rate analysis of financial instruments was:
2018 $’000
2017 $’000
Fixed rate financial instrumentsFinancial assets 40,405 69,502Financial liabilities (note 23) (1,919) –
38,486 69,502
Any increase/ (decrease) in interest rates will have no effect on results and equity of the Group, because, all financial instruments are fixed rate.
credit riskCredit risk arises when a failure by counterparties to discharge their obligations could reduce the amount of future cash inflows from financial assets on hand at the reporting date. The principle credit risk is considered to result from new relationships with customers with which the Group does not have a long working relationship and for which reliable information as to their credit ratings cannot be obtained. In such cases the Group limits the initial credit facility afforded to these customers. Cash balances are held with high credit quality financial institutions and the Group has policies to limit the amount of credit exposure to any financial institution or customer.
The carrying amount of financial assets represents the maximum credit exposure. The maximum exposure to credit risk at the reporting date was:
2018 $’000
2017 $’000
Trade and other receivables 4,184 9,527Cash at bank 22,462 17,844Bank deposits 17,943 51,658Receivables from related companies 650 881Short term Asset recognised from marketing cost to obtain a contract 4,624 1,071Long term Asset recognised from marketing cost to obtain a contract 7,066 315
56,929 81,296
Credit risk arises when a failure by counterparties to discharge their obligations could reduce the amount of future cash inflows from financial assets on hand at the balance sheet date.
notes to tHe consolIdAted FInAncIAl stAteMents CONTINUEd
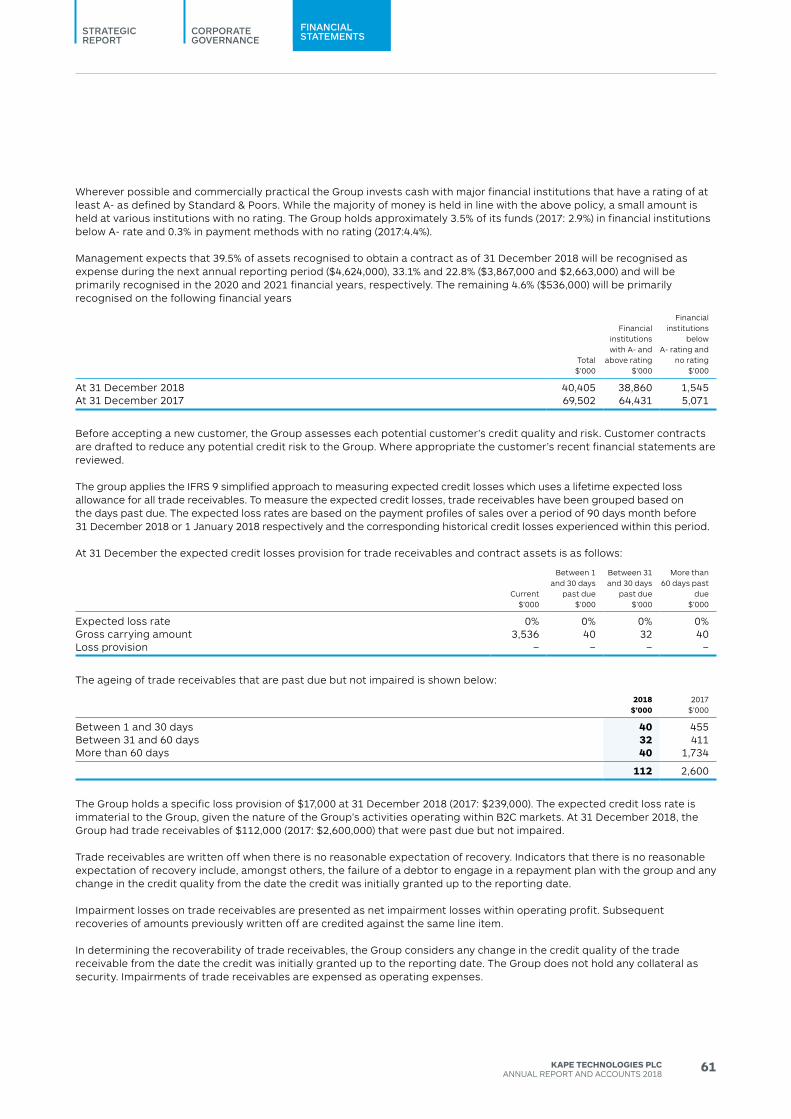
CORPORATEGOVERNANCE
STRATEGICREPORT
FINANCIALSTATEMENTS
61KAPE TECHNOLOGIES PLCANNUAL REPORT ANd ACCOUNTS 2018
Wherever possible and commercially practical the Group invests cash with major financial institutions that have a rating of at least A- as defined by Standard & Poors. While the majority of money is held in line with the above policy, a small amount is held at various institutions with no rating. The Group holds approximately 3.5% of its funds (2017: 2.9%) in financial institutions below A- rate and 0.3% in payment methods with no rating (2017:4.4%).
Management expects that 39.5% of assets recognised to obtain a contract as of 31 december 2018 will be recognised as expense during the next annual reporting period ($4,624,000), 33.1% and 22.8% ($3,867,000 and $2,663,000) and will be primarily recognised in the 2020 and 2021 financial years, respectively. The remaining 4.6% ($536,000) will be primarily recognised on the following financial years
Total $’000
Financial institutions with A- and
above rating $’000
Financial institutions
below A- rating and
no rating $’000
At 31 december 2018 40,405 38,860 1,545At 31 december 2017 69,502 64,431 5,071
Before accepting a new customer, the Group assesses each potential customer’s credit quality and risk. Customer contracts are drafted to reduce any potential credit risk to the Group. Where appropriate the customer’s recent financial statements are reviewed.
The group applies the IFRS 9 simplified approach to measuring expected credit losses which uses a lifetime expected loss allowance for all trade receivables. To measure the expected credit losses, trade receivables have been grouped based on the days past due. The expected loss rates are based on the payment profiles of sales over a period of 90 days month before 31 december 2018 or 1 January 2018 respectively and the corresponding historical credit losses experienced within this period.
At 31 december the expected credit losses provision for trade receivables and contract assets is as follows:
Current $’000
Between 1 and 30 days
past due $’000
Between 31 and 30 days
past due $’000
More than 60 days past
due $’000
Expected loss rate 0% 0% 0% 0%Gross carrying amount 3,536 40 32 40Loss provision – – – –
The ageing of trade receivables that are past due but not impaired is shown below:
2018 $’000
2017 $’000
Between 1 and 30 days 40 455Between 31 and 60 days 32 411More than 60 days 40 1,734
112 2,600
The Group holds a specific loss provision of $17,000 at 31 december 2018 (2017: $239,000). The expected credit loss rate is immaterial to the Group, given the nature of the Group’s activities operating within B2C markets. At 31 december 2018, the Group had trade receivables of $112,000 (2017: $2,600,000) that were past due but not impaired.
Trade receivables are written off when there is no reasonable expectation of recovery. Indicators that there is no reasonable expectation of recovery include, amongst others, the failure of a debtor to engage in a repayment plan with the group and any change in the credit quality from the date the credit was initially granted up to the reporting date.
Impairment losses on trade receivables are presented as net impairment losses within operating profit. Subsequent recoveries of amounts previously written off are credited against the same line item.
In determining the recoverability of trade receivables, the Group considers any change in the credit quality of the trade receivable from the date the credit was initially granted up to the reporting date. The Group does not hold any collateral as security. Impairments of trade receivables are expensed as operating expenses.
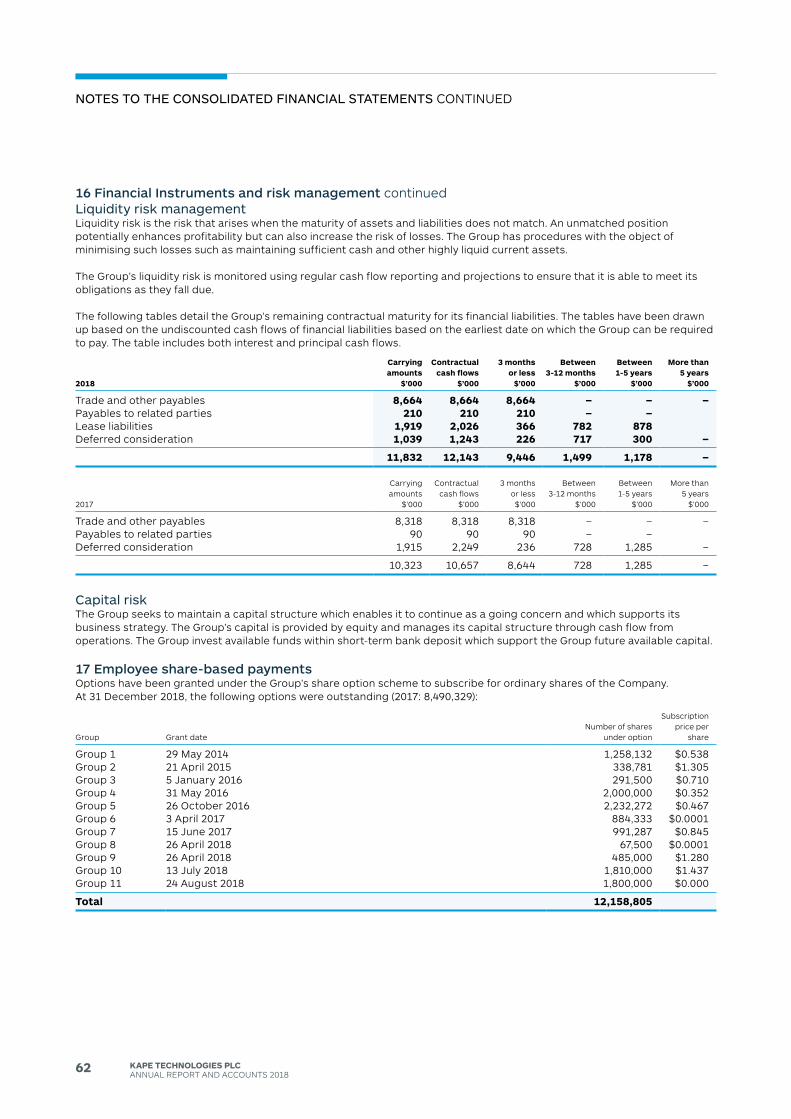
62 KAPE TECHNOLOGIES PLCANNUAL REPORT ANd ACCOUNTS 2018
16 Financial Instruments and risk management continuedliquidity risk managementLiquidity risk is the risk that arises when the maturity of assets and liabilities does not match. An unmatched position potentially enhances profitability but can also increase the risk of losses. The Group has procedures with the object of minimising such losses such as maintaining sufficient cash and other highly liquid current assets.
The Group’s liquidity risk is monitored using regular cash flow reporting and projections to ensure that it is able to meet its obligations as they fall due.
The following tables detail the Group’s remaining contractual maturity for its financial liabilities. The tables have been drawn up based on the undiscounted cash flows of financial liabilities based on the earliest date on which the Group can be required to pay. The table includes both interest and principal cash flows.
2018
Carrying amounts
$’000
Contractual cash flows
$’000
3 months or less
$’000
Between 3-12 months
$’000
Between 1-5 years
$’000
More than 5 years
$’000
Trade and other payables 8,664 8,664 8,664 – – –Payables to related parties 210 210 210 – –Lease liabilities 1,919 2,026 366 782 878deferred consideration 1,039 1,243 226 717 300 –
11,832 12,143 9,446 1,499 1,178 –
2017
Carrying amounts
$’000
Contractual cash flows
$’000
3 months or less$’000
Between 3-12 months
$’000
Between 1-5 years
$’000
More than 5 years
$’000
Trade and other payables 8,318 8,318 8,318 – – –Payables to related parties 90 90 90 – –deferred consideration 1,915 2,249 236 728 1,285 –
10,323 10,657 8,644 728 1,285 –
capital riskThe Group seeks to maintain a capital structure which enables it to continue as a going concern and which supports its business strategy. The Group’s capital is provided by equity and manages its capital structure through cash flow from operations. The Group invest available funds within short-term bank deposit which support the Group future available capital.
17 Employee share-based paymentsOptions have been granted under the Group’s share option scheme to subscribe for ordinary shares of the Company. At 31 december 2018, the following options were outstanding (2017: 8,490,329):
Group Grant dateNumber of shares
under option
Subscription price per
share
Group 1 29 May 2014 1,258,132 $0.538Group 2 21 April 2015 338,781 $1.305Group 3 5 January 2016 291,500 $0.710Group 4 31 May 2016 2,000,000 $0.352Group 5 26 October 2016 2,232,272 $0.467Group 6 3 April 2017 884,333 $0.0001Group 7 15 June 2017 991,287 $0.845Group 8 26 April 2018 67,500 $0.0001Group 9 26 April 2018 485,000 $1.280Group 10 13 July 2018 1,810,000 $1.437Group 11 24 August 2018 1,800,000 $0.000
Total 12,158,805
notes to tHe consolIdAted FInAncIAl stAteMents CONTINUEd
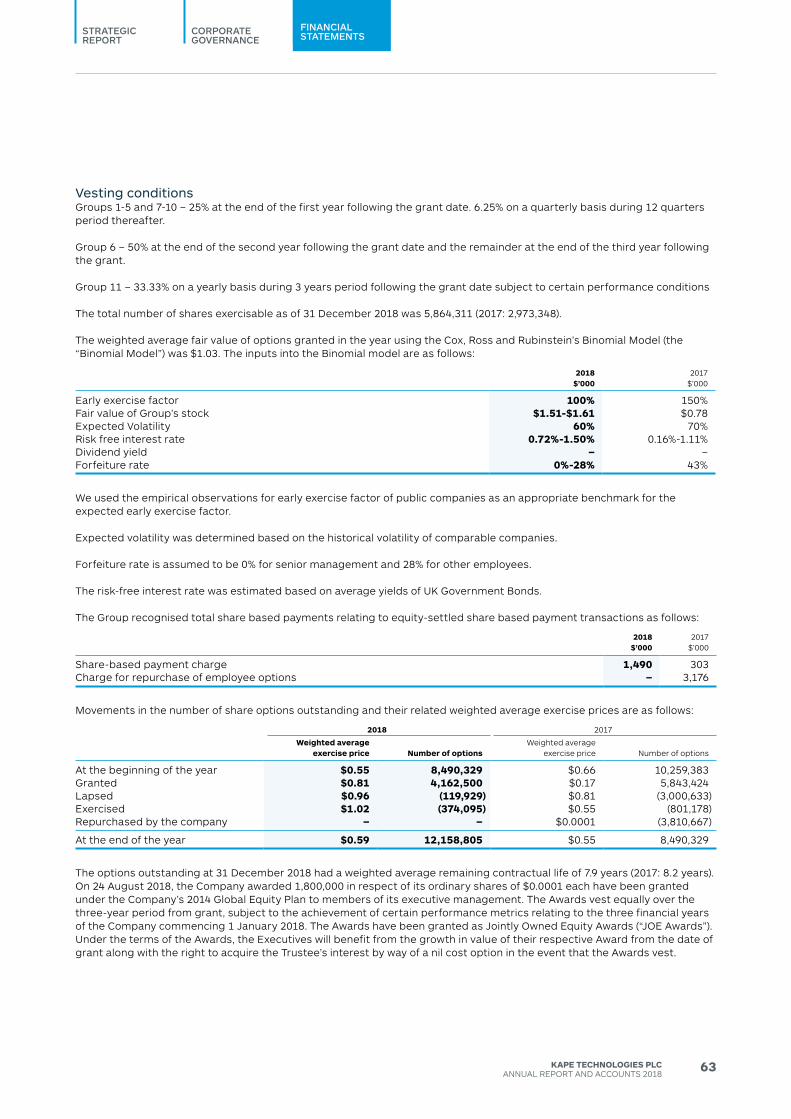
CORPORATEGOVERNANCE
STRATEGICREPORT
FINANCIALSTATEMENTS
63KAPE TECHNOLOGIES PLCANNUAL REPORT ANd ACCOUNTS 2018
Vesting conditionsGroups 1-5 and 7-10 – 25% at the end of the first year following the grant date. 6.25% on a quarterly basis during 12 quarters period thereafter.
Group 6 – 50% at the end of the second year following the grant date and the remainder at the end of the third year following the grant.
Group 11 – 33.33% on a yearly basis during 3 years period following the grant date subject to certain performance conditions
The total number of shares exercisable as of 31 december 2018 was 5,864,311 (2017: 2,973,348).
The weighted average fair value of options granted in the year using the Cox, Ross and Rubinstein’s Binomial Model (the “Binomial Model”) was $1.03. The inputs into the Binomial model are as follows:
2018 $’000
2017 $’000
Early exercise factor 100% 150%Fair value of Group’s stock $1.51-$1.61 $0.78Expected Volatility 60% 70%Risk free interest rate 0.72%-1.50% 0.16%-1.11%dividend yield – –Forfeiture rate 0%-28% 43%
We used the empirical observations for early exercise factor of public companies as an appropriate benchmark for the expected early exercise factor.
Expected volatility was determined based on the historical volatility of comparable companies.
Forfeiture rate is assumed to be 0% for senior management and 28% for other employees.
The risk-free interest rate was estimated based on average yields of UK Government Bonds.
The Group recognised total share based payments relating to equity-settled share based payment transactions as follows:
2018 $’000
2017 $’000
Share-based payment charge 1,490 303Charge for repurchase of employee options – 3,176
Movements in the number of share options outstanding and their related weighted average exercise prices are as follows:
2018 2017
Weighted average exercise price Number of options
Weighted average exercise price Number of options
At the beginning of the year $0.55 8,490,329 $0.66 10,259,383Granted $0.81 4,162,500 $0.17 5,843,424Lapsed $0.96 (119,929) $0.81 (3,000,633)Exercised $1.02 (374,095) $0.55 (801,178)Repurchased by the company – – $0.0001 (3,810,667)
At the end of the year $0.59 12,158,805 $0.55 8,490,329
The options outstanding at 31 december 2018 had a weighted average remaining contractual life of 7.9 years (2017: 8.2 years).On 24 August 2018, the Company awarded 1,800,000 in respect of its ordinary shares of $0.0001 each have been granted under the Company’s 2014 Global Equity Plan to members of its executive management. The Awards vest equally over the three-year period from grant, subject to the achievement of certain performance metrics relating to the three financial years of the Company commencing 1 January 2018. The Awards have been granted as Jointly Owned Equity Awards (“JOE Awards”). Under the terms of the Awards, the Executives will benefit from the growth in value of their respective Award from the date of grant along with the right to acquire the Trustee’s interest by way of a nil cost option in the event that the Awards vest.
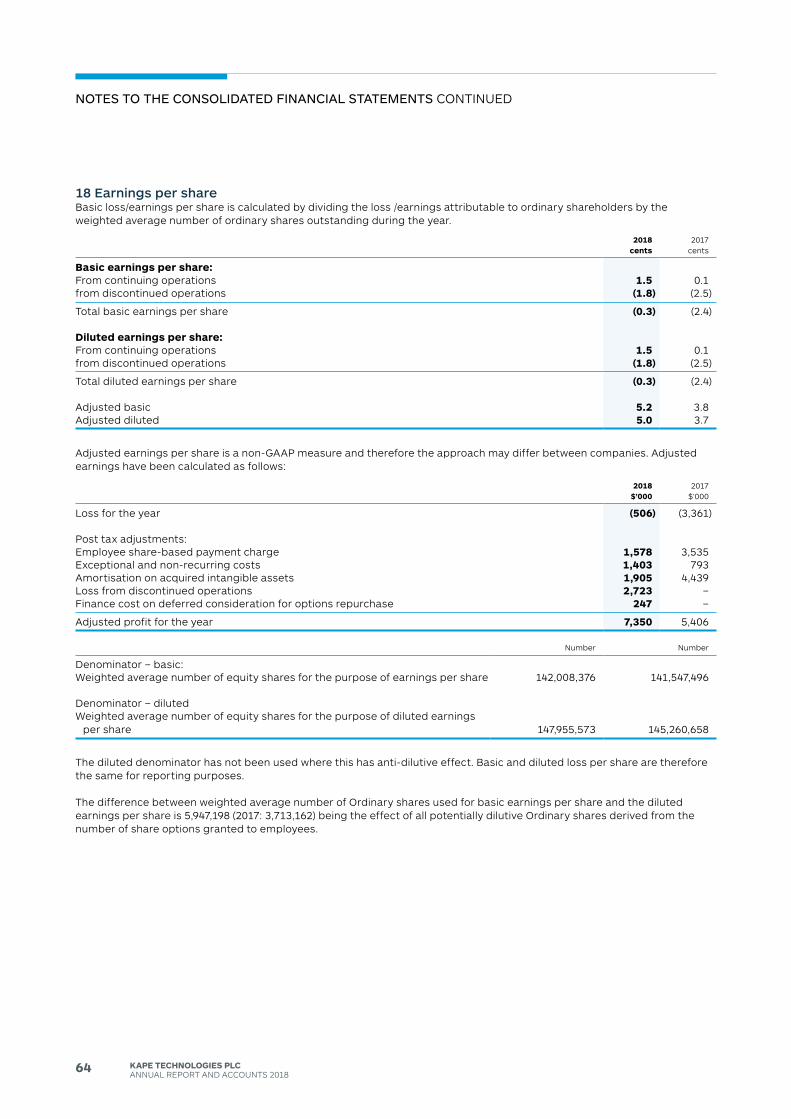
64 KAPE TECHNOLOGIES PLCANNUAL REPORT ANd ACCOUNTS 2018
18 Earnings per shareBasic loss/earnings per share is calculated by dividing the loss /earnings attributable to ordinary shareholders by the weighted average number of ordinary shares outstanding during the year.
2018 cents
2017 cents
Basic earnings per share: From continuing operations 1.5 0.1from discontinued operations (1.8) (2.5)
Total basic earnings per share (0.3) (2.4)
Diluted earnings per share: From continuing operations 1.5 0.1from discontinued operations (1.8) (2.5)
Total diluted earnings per share (0.3) (2.4)
Adjusted basic 5.2 3.8Adjusted diluted 5.0 3.7
Adjusted earnings per share is a non-GAAP measure and therefore the approach may differ between companies. Adjusted earnings have been calculated as follows:
2018 $’000
2017 $’000
Loss for the year (506) (3,361)
Post tax adjustments:Employee share-based payment charge 1,578 3,535Exceptional and non-recurring costs 1,403 793Amortisation on acquired intangible assets 1,905 4,439Loss from discontinued operations 2,723 –Finance cost on deferred consideration for options repurchase 247 –
Adjusted profit for the year 7,350 5,406
Number Number
denominator – basic:Weighted average number of equity shares for the purpose of earnings per share 142,008,376 141,547,496
denominator – dilutedWeighted average number of equity shares for the purpose of diluted earnings
per share 147,955,573 145,260,658
The diluted denominator has not been used where this has anti-dilutive effect. Basic and diluted loss per share are therefore the same for reporting purposes.
The difference between weighted average number of Ordinary shares used for basic earnings per share and the diluted earnings per share is 5,947,198 (2017: 3,713,162) being the effect of all potentially dilutive Ordinary shares derived from the number of share options granted to employees.
notes to tHe consolIdAted FInAncIAl stAteMents CONTINUEd
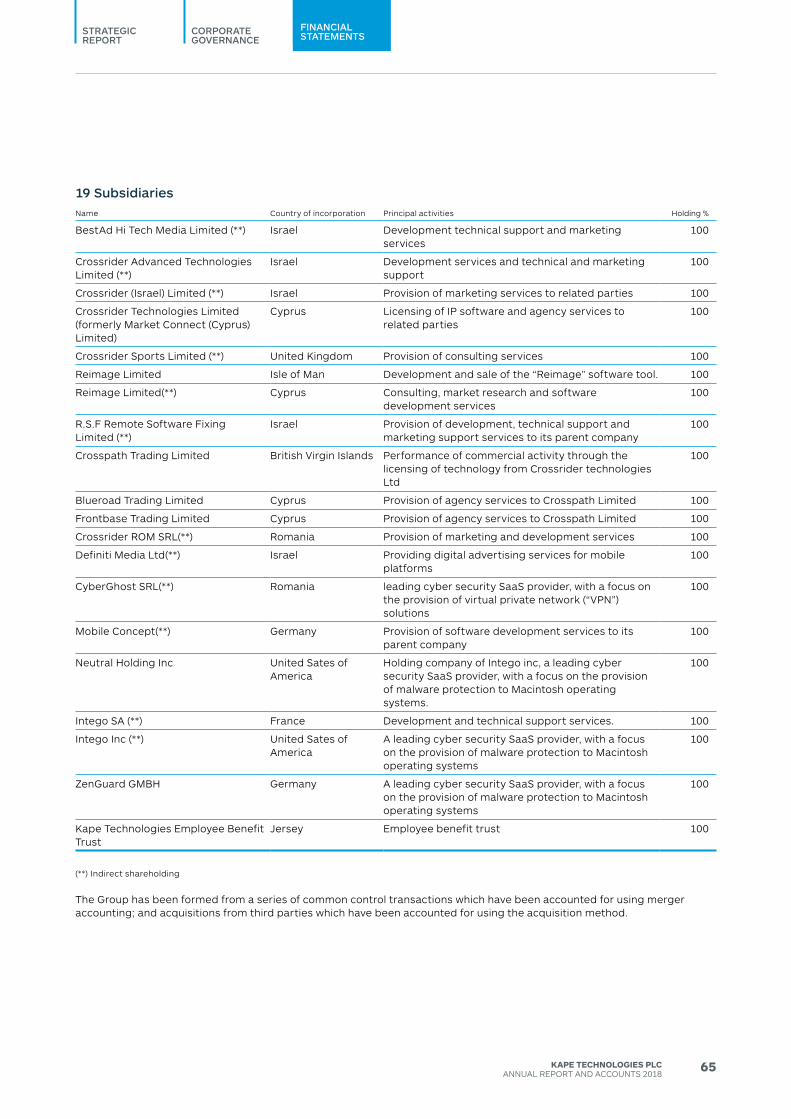
CORPORATEGOVERNANCE
STRATEGICREPORT
FINANCIALSTATEMENTS
65KAPE TECHNOLOGIES PLCANNUAL REPORT ANd ACCOUNTS 2018
19 SubsidiariesName Country of incorporation Principal activities Holding %
BestAd Hi Tech Media Limited (**) Israel development technical support and marketing services
100
Crossrider Advanced Technologies Limited (**)
Israel development services and technical and marketing support
100
Crossrider (Israel) Limited (**) Israel Provision of marketing services to related parties 100
Crossrider Technologies Limited (formerly Market Connect (Cyprus) Limited)
Cyprus Licensing of IP software and agency services to related parties
100
Crossrider Sports Limited (**) United Kingdom Provision of consulting services 100
Reimage Limited Isle of Man development and sale of the “Reimage” software tool. 100
Reimage Limited(**) Cyprus Consulting, market research and software development services
100
R.S.F Remote Software Fixing Limited (**)
Israel Provision of development, technical support and marketing support services to its parent company
100
Crosspath Trading Limited British Virgin Islands Performance of commercial activity through the licensing of technology from Crossrider technologies Ltd
100
Blueroad Trading Limited Cyprus Provision of agency services to Crosspath Limited 100
Frontbase Trading Limited Cyprus Provision of agency services to Crosspath Limited 100
Crossrider ROM SRL(**) Romania Provision of marketing and development services 100
definiti Media Ltd(**) Israel Providing digital advertising services for mobile platforms
100
CyberGhost SRL(**) Romania leading cyber security SaaS provider, with a focus on the provision of virtual private network (“VPN”) solutions
100
Mobile Concept(**) Germany Provision of software development services to its parent company
100
Neutral Holding Inc United Sates of America
Holding company of Intego inc, a leading cyber security SaaS provider, with a focus on the provision of malware protection to Macintosh operating systems.
100
Intego SA (**) France development and technical support services. 100
Intego Inc (**) United Sates of America
A leading cyber security SaaS provider, with a focus on the provision of malware protection to Macintosh operating systems
100
ZenGuard GMBH Germany A leading cyber security SaaS provider, with a focus on the provision of malware protection to Macintosh operating systems
100
Kape Technologies Employee Benefit Trust
Jersey Employee benefit trust 100
(**) Indirect shareholding
The Group has been formed from a series of common control transactions which have been accounted for using merger accounting; and acquisitions from third parties which have been accounted for using the acquisition method.
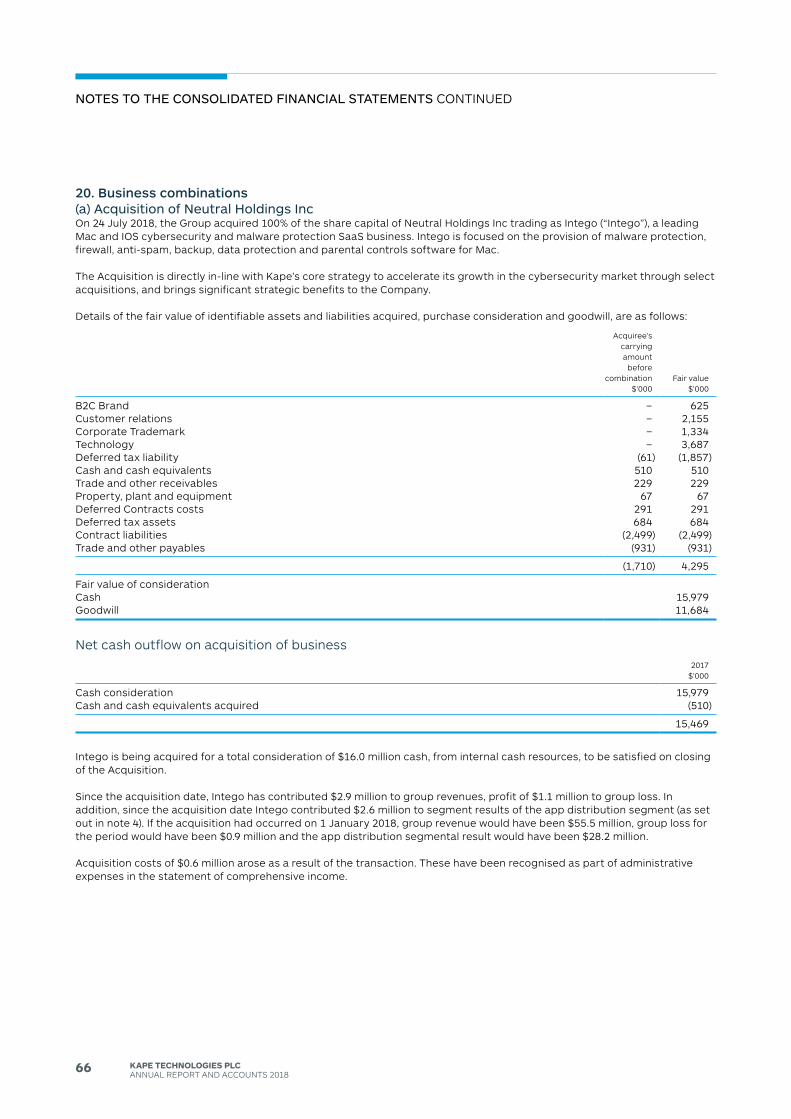
66 KAPE TECHNOLOGIES PLCANNUAL REPORT ANd ACCOUNTS 2018
20. Business combinations (a) Acquisition of neutral Holdings IncOn 24 July 2018, the Group acquired 100% of the share capital of Neutral Holdings Inc trading as Intego (“Intego”), a leading Mac and IOS cybersecurity and malware protection SaaS business. Intego is focused on the provision of malware protection, firewall, anti-spam, backup, data protection and parental controls software for Mac.
The Acquisition is directly in-line with Kape’s core strategy to accelerate its growth in the cybersecurity market through select acquisitions, and brings significant strategic benefits to the Company.
details of the fair value of identifiable assets and liabilities acquired, purchase consideration and goodwill, are as follows:
Acquiree’s carrying amount
before combination
$’000Fair value
$’000
B2C Brand – 625Customer relations – 2,155Corporate Trademark – 1,334Technology – 3,687deferred tax liability (61) (1,857)Cash and cash equivalents 510 510Trade and other receivables 229 229Property, plant and equipment 67 67deferred Contracts costs 291 291deferred tax assets 684 684Contract liabilities (2,499) (2,499)Trade and other payables (931) (931)
(1,710) 4,295
Fair value of considerationCash 15,979Goodwill 11,684
Net cash outflow on acquisition of business2017
$’000
Cash consideration 15,979Cash and cash equivalents acquired (510)
15,469
Intego is being acquired for a total consideration of $16.0 million cash, from internal cash resources, to be satisfied on closing of the Acquisition.
Since the acquisition date, Intego has contributed $2.9 million to group revenues, profit of $1.1 million to group loss. In addition, since the acquisition date Intego contributed $2.6 million to segment results of the app distribution segment (as set out in note 4). If the acquisition had occurred on 1 January 2018, group revenue would have been $55.5 million, group loss for the period would have been $0.9 million and the app distribution segmental result would have been $28.2 million.
Acquisition costs of $0.6 million arose as a result of the transaction. These have been recognised as part of administrative expenses in the statement of comprehensive income.
notes to tHe consolIdAted FInAncIAl stAteMents CONTINUEd
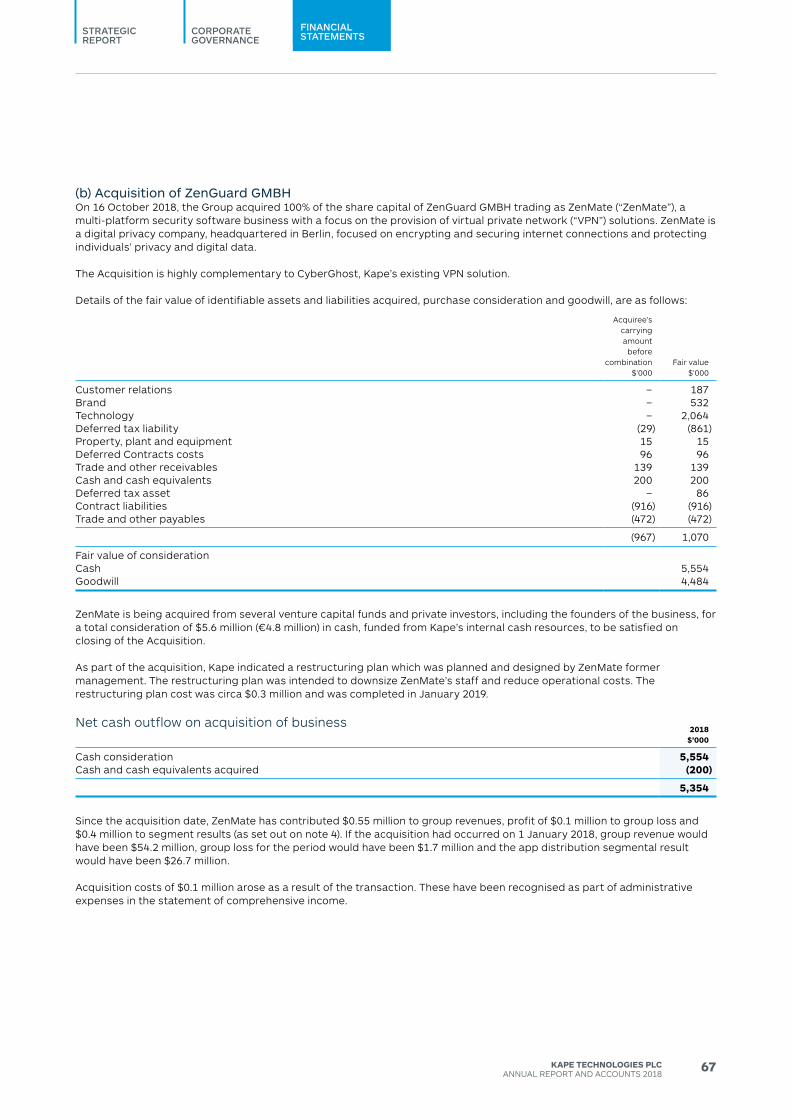
CORPORATEGOVERNANCE
STRATEGICREPORT
FINANCIALSTATEMENTS
67KAPE TECHNOLOGIES PLCANNUAL REPORT ANd ACCOUNTS 2018
(b) Acquisition of ZenGuard GMBHOn 16 October 2018, the Group acquired 100% of the share capital of ZenGuard GMBH trading as ZenMate (“ZenMate”), a multi-platform security software business with a focus on the provision of virtual private network (“VPN”) solutions. ZenMate is a digital privacy company, headquartered in Berlin, focused on encrypting and securing internet connections and protecting individuals’ privacy and digital data.
The Acquisition is highly complementary to CyberGhost, Kape’s existing VPN solution.
details of the fair value of identifiable assets and liabilities acquired, purchase consideration and goodwill, are as follows:
Acquiree’s carrying amount
before combination
$’000Fair value
$’000
Customer relations – 187Brand – 532Technology – 2,064deferred tax liability (29) (861)Property, plant and equipment 15 15deferred Contracts costs 96 96Trade and other receivables 139 139Cash and cash equivalents 200 200deferred tax asset – 86Contract liabilities (916) (916)Trade and other payables (472) (472)
(967) 1,070
Fair value of considerationCash 5,554Goodwill 4,484
ZenMate is being acquired from several venture capital funds and private investors, including the founders of the business, for a total consideration of $5.6 million (€4.8 million) in cash, funded from Kape’s internal cash resources, to be satisfied on closing of the Acquisition.
As part of the acquisition, Kape indicated a restructuring plan which was planned and designed by ZenMate former management. The restructuring plan was intended to downsize ZenMate’s staff and reduce operational costs. The restructuring plan cost was circa $0.3 million and was completed in January 2019.
Net cash outflow on acquisition of business2018
$’000
Cash consideration 5,554Cash and cash equivalents acquired (200)
5,354
Since the acquisition date, ZenMate has contributed $0.55 million to group revenues, profit of $0.1 million to group loss and $0.4 million to segment results (as set out on note 4). If the acquisition had occurred on 1 January 2018, group revenue would have been $54.2 million, group loss for the period would have been $1.7 million and the app distribution segmental result would have been $26.7 million.
Acquisition costs of $0.1 million arose as a result of the transaction. These have been recognised as part of administrative expenses in the statement of comprehensive income.
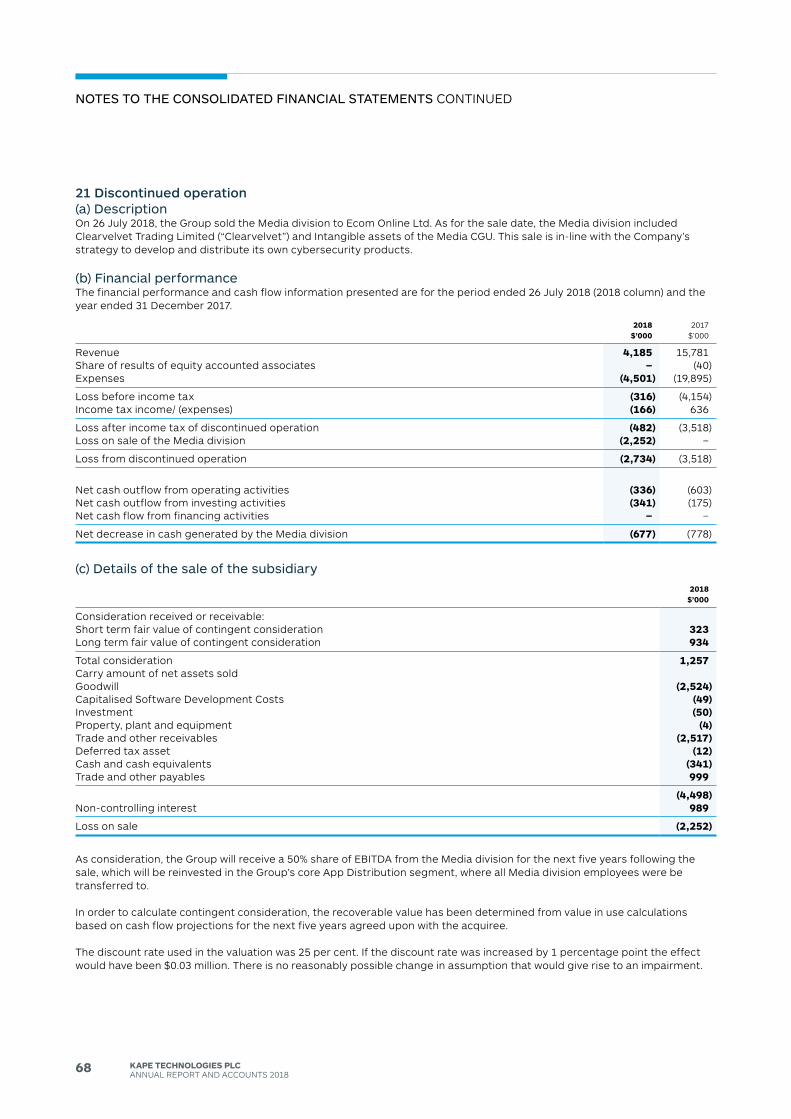
68 KAPE TECHNOLOGIES PLCANNUAL REPORT ANd ACCOUNTS 2018
21 Discontinued operation(a) descriptionOn 26 July 2018, the Group sold the Media division to Ecom Online Ltd. As for the sale date, the Media division included Clearvelvet Trading Limited (“Clearvelvet”) and Intangible assets of the Media CGU. This sale is in-line with the Company’s strategy to develop and distribute its own cybersecurity products.
(b) Financial performanceThe financial performance and cash flow information presented are for the period ended 26 July 2018 (2018 column) and the year ended 31 december 2017.
2018 $’000
2017 $’000
Revenue 4,185 15,781Share of results of equity accounted associates – (40)Expenses (4,501) (19,895)
Loss before income tax (316) (4,154)Income tax income/ (expenses) (166) 636
Loss after income tax of discontinued operation (482) (3,518)Loss on sale of the Media division (2,252) –
Loss from discontinued operation (2,734) (3,518)
Net cash outflow from operating activities (336) (603)Net cash outflow from investing activities (341) (175)Net cash flow from financing activities – –
Net decrease in cash generated by the Media division (677) (778)
(c) details of the sale of the subsidiary2018
$’000
Consideration received or receivable:Short term fair value of contingent consideration 323Long term fair value of contingent consideration 934
Total consideration 1,257Carry amount of net assets soldGoodwill (2,524)Capitalised Software development Costs (49)Investment (50)Property, plant and equipment (4)Trade and other receivables (2,517)deferred tax asset (12)Cash and cash equivalents (341)Trade and other payables 999
(4,498)Non-controlling interest 989
Loss on sale (2,252)
As consideration, the Group will receive a 50% share of EBITdA from the Media division for the next five years following the sale, which will be reinvested in the Group’s core App distribution segment, where all Media division employees were be transferred to.
In order to calculate contingent consideration, the recoverable value has been determined from value in use calculations based on cash flow projections for the next five years agreed upon with the acquiree.
The discount rate used in the valuation was 25 per cent. If the discount rate was increased by 1 percentage point the effect would have been $0.03 million. There is no reasonably possible change in assumption that would give rise to an impairment.
notes to tHe consolIdAted FInAncIAl stAteMents CONTINUEd
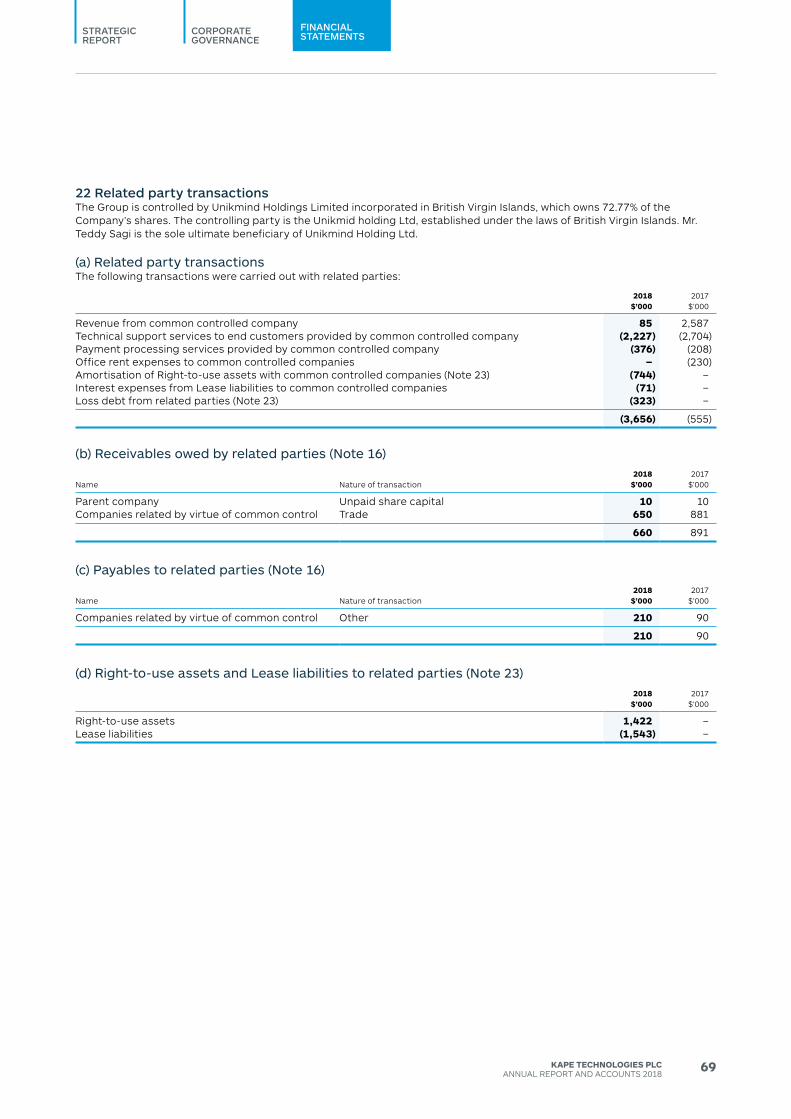
CORPORATEGOVERNANCE
STRATEGICREPORT
FINANCIALSTATEMENTS
69KAPE TECHNOLOGIES PLCANNUAL REPORT ANd ACCOUNTS 2018
22 Related party transactionsThe Group is controlled by Unikmind Holdings Limited incorporated in British Virgin Islands, which owns 72.77% of the Company’s shares. The controlling party is the Unikmid holding Ltd, established under the laws of British Virgin Islands. Mr. Teddy Sagi is the sole ultimate beneficiary of Unikmind Holding Ltd.
(a) Related party transactionsThe following transactions were carried out with related parties:
2018 $’000
2017 $’000
Revenue from common controlled company 85 2,587Technical support services to end customers provided by common controlled company (2,227) (2,704)Payment processing services provided by common controlled company (376) (208)Office rent expenses to common controlled companies – (230)Amortisation of Right-to-use assets with common controlled companies (Note 23) (744) –Interest expenses from Lease liabilities to common controlled companies (71) –Loss debt from related parties (Note 23) (323) –
(3,656) (555)
(b) Receivables owed by related parties (note 16)
Name Nature of transaction2018
$’0002017
$’000
Parent company Unpaid share capital 10 10Companies related by virtue of common control Trade 650 881
660 891
(c) payables to related parties (note 16)
Name Nature of transaction2018
$’0002017
$’000
Companies related by virtue of common control Other 210 90
210 90
(d) Right-to-use assets and lease liabilities to related parties (note 23)2018
$’0002017
$’000
Right-to-use assets 1,422 –Lease liabilities (1,543) –
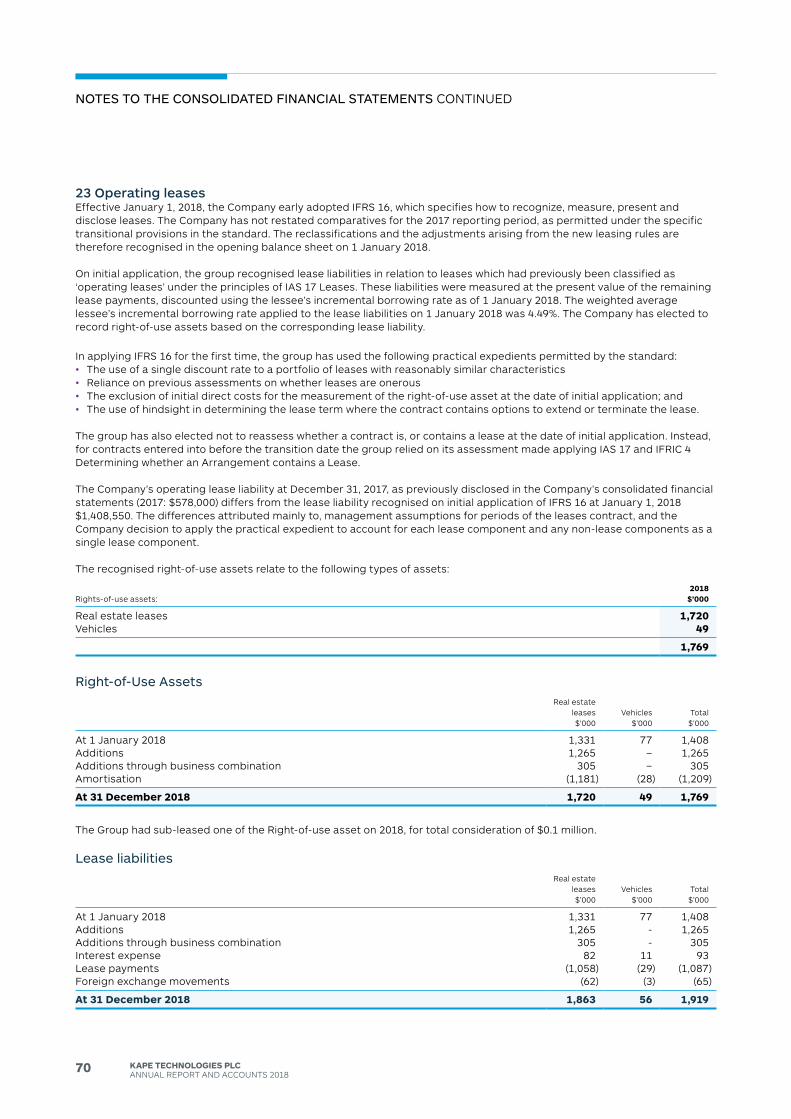
70 KAPE TECHNOLOGIES PLCANNUAL REPORT ANd ACCOUNTS 2018
23 Operating leasesEffective January 1, 2018, the Company early adopted IFRS 16, which specifies how to recognize, measure, present and disclose leases. The Company has not restated comparatives for the 2017 reporting period, as permitted under the specific transitional provisions in the standard. The reclassifications and the adjustments arising from the new leasing rules are therefore recognised in the opening balance sheet on 1 January 2018.
On initial application, the group recognised lease liabilities in relation to leases which had previously been classified as ‘operating leases’ under the principles of IAS 17 Leases. These liabilities were measured at the present value of the remaining lease payments, discounted using the lessee’s incremental borrowing rate as of 1 January 2018. The weighted average lessee’s incremental borrowing rate applied to the lease liabilities on 1 January 2018 was 4.49%. The Company has elected to record right-of-use assets based on the corresponding lease liability.
In applying IFRS 16 for the first time, the group has used the following practical expedients permitted by the standard: • The use of a single discount rate to a portfolio of leases with reasonably similar characteristics • Reliance on previous assessments on whether leases are onerous • The exclusion of initial direct costs for the measurement of the right-of-use asset at the date of initial application; and• The use of hindsight in determining the lease term where the contract contains options to extend or terminate the lease.
The group has also elected not to reassess whether a contract is, or contains a lease at the date of initial application. Instead, for contracts entered into before the transition date the group relied on its assessment made applying IAS 17 and IFRIC 4 determining whether an Arrangement contains a Lease.
The Company’s operating lease liability at december 31, 2017, as previously disclosed in the Company’s consolidated financial statements (2017: $578,000) differs from the lease liability recognised on initial application of IFRS 16 at January 1, 2018 $1,408,550. The differences attributed mainly to, management assumptions for periods of the leases contract, and the Company decision to apply the practical expedient to account for each lease component and any non-lease components as a single lease component.
The recognised right-of-use assets relate to the following types of assets:
Rights-of-use assets:2018
$’000
Real estate leases 1,720Vehicles 49
1,769
Right-of-use AssetsReal estate
leases$’000
Vehicles$’000
Total$’000
At 1 January 2018 1,331 77 1,408Additions 1,265 – 1,265Additions through business combination 305 – 305Amortisation (1,181) (28) (1,209)
At 31 December 2018 1,720 49 1,769
The Group had sub-leased one of the Right-of-use asset on 2018, for total consideration of $0.1 million.
lease liabilitiesReal estate
leases $’000
Vehicles $’000
Total $’000
At 1 January 2018 1,331 77 1,408Additions 1,265 - 1,265Additions through business combination 305 - 305Interest expense 82 11 93Lease payments (1,058) (29) (1,087)Foreign exchange movements (62) (3) (65)
At 31 December 2018 1,863 56 1,919
notes to tHe consolIdAted FInAncIAl stAteMents CONTINUEd
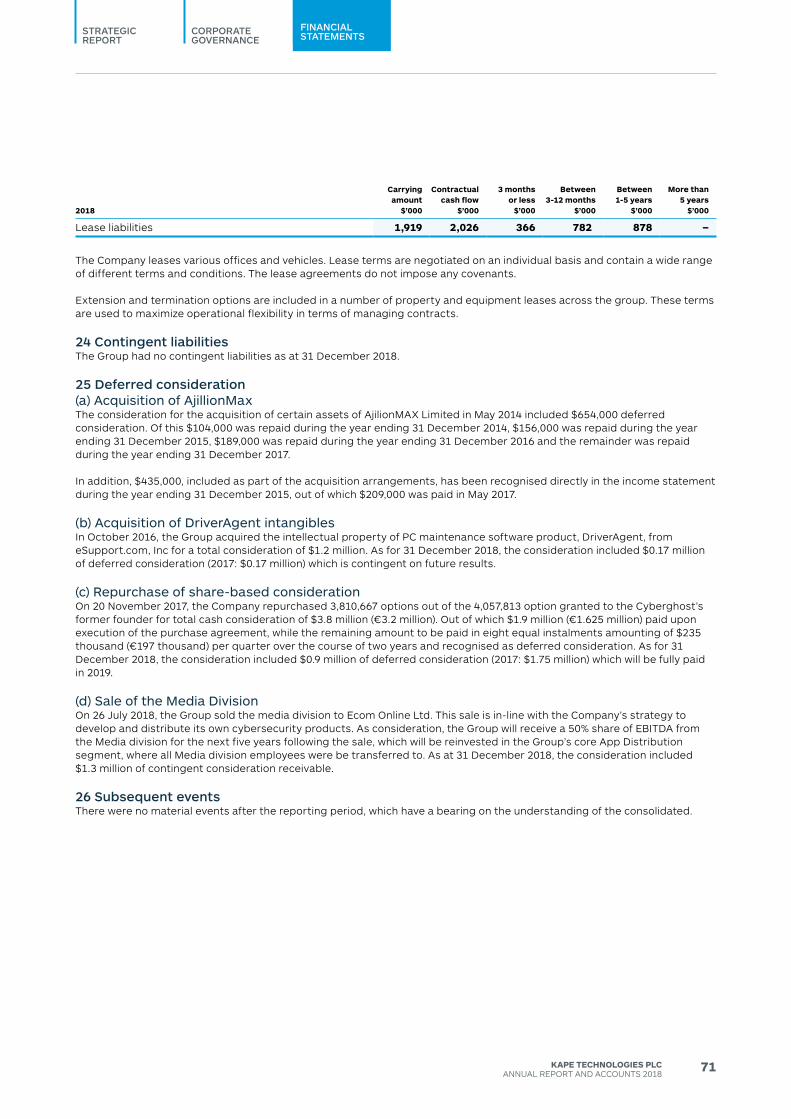
CORPORATEGOVERNANCE
STRATEGICREPORT
FINANCIALSTATEMENTS
71KAPE TECHNOLOGIES PLCANNUAL REPORT ANd ACCOUNTS 2018
2018
Carrying amount
$’000
Contractual cash flow
$’000
3 months or less
$’000
Between 3-12 months
$’000
Between 1-5 years
$’000
More than 5 years
$’000
Lease liabilities 1,919 2,026 366 782 878 –
The Company leases various offices and vehicles. Lease terms are negotiated on an individual basis and contain a wide range of different terms and conditions. The lease agreements do not impose any covenants.
Extension and termination options are included in a number of property and equipment leases across the group. These terms are used to maximize operational flexibility in terms of managing contracts.
24 Contingent liabilitiesThe Group had no contingent liabilities as at 31 december 2018.
25 Deferred consideration(a) Acquisition of AjillionMaxThe consideration for the acquisition of certain assets of AjilionMAX Limited in May 2014 included $654,000 deferred consideration. Of this $104,000 was repaid during the year ending 31 december 2014, $156,000 was repaid during the year ending 31 december 2015, $189,000 was repaid during the year ending 31 december 2016 and the remainder was repaid during the year ending 31 december 2017.
In addition, $435,000, included as part of the acquisition arrangements, has been recognised directly in the income statement during the year ending 31 december 2015, out of which $209,000 was paid in May 2017.
(b) Acquisition of driverAgent intangiblesIn October 2016, the Group acquired the intellectual property of PC maintenance software product, driverAgent, from eSupport.com, Inc for a total consideration of $1.2 million. As for 31 december 2018, the consideration included $0.17 million of deferred consideration (2017: $0.17 million) which is contingent on future results.
(c) Repurchase of share-based consideration On 20 November 2017, the Company repurchased 3,810,667 options out of the 4,057,813 option granted to the Cyberghost’s former founder for total cash consideration of $3.8 million (€3.2 million). Out of which $1.9 million (€1.625 million) paid upon execution of the purchase agreement, while the remaining amount to be paid in eight equal instalments amounting of $235 thousand (€197 thousand) per quarter over the course of two years and recognised as deferred consideration. As for 31 december 2018, the consideration included $0.9 million of deferred consideration (2017: $1.75 million) which will be fully paid in 2019.
(d) sale of the Media divisionOn 26 July 2018, the Group sold the media division to Ecom Online Ltd. This sale is in-line with the Company’s strategy to develop and distribute its own cybersecurity products. As consideration, the Group will receive a 50% share of EBITdA from the Media division for the next five years following the sale, which will be reinvested in the Group’s core App distribution segment, where all Media division employees were be transferred to. As at 31 december 2018, the consideration included $1.3 million of contingent consideration receivable.
26 Subsequent eventsThere were no material events after the reporting period, which have a bearing on the understanding of the consolidated.
72 KAPE TECHNOLOGIES PLCANNUAL REPORT ANd ACCOUNTS 2018
sHAReHoldeR InFoRMAtIon And AdVIsoRs
Shareholder information, including financial results, news and information on products and services, can be found at www.kape.com.
Independent Auditor BdO LLP55 Baker StreetLondon W1U 7EU
Nominated Advisor and Broker Shore Capital & Corporate LimitedBond Street House14 Clifford StreetLondon W1S 4JU
Investor Relations Vigo Communications180 PiccadillyLondon W1J 9HF
Registered OfficeSovereign House4 Christian RoaddouglasIsle of Man IM1 2Sd
Corporate Legal AdvisorsMorrison Foerster CityPointOne Ropemaker StreetLondon, United Kingdom EC2Y 9AW
Joint BrokerNplus1 Singer Advisory LLP1 Bartholomew LaneLondon EC2N 2AXUnited Kingdom
RegistrarsComputershare Investor Services (Jersey) LimitedQueensway HouseHilgrove StreetSt HelierJersey JE1 1ES
Stock exchangesThe Company’s ordinary shares are listed on the AIM market of the London Stock Exchange under the symbol “KAPE”. The Company does not maintain listings on any other stock exchanges.


KA
PE
TE
CH
NO
LOG
IES
PLC
An
nu
Al R
ep
oR
t An
d A
cc
ou
nts
2018
Kape Technologies plcLABS Atrium Stables MarketChalk Farm RoadLondon NW1 8AHTel: +44 (0) 203 355 7926Email: [email protected]


