Embed Size (px)
Citation preview
2 0 2 0 CALABARZ O N RE GI O NAL DEV ELO P ME NT
RE P O RT


2020 Regional Development Report i
Foreword
HON. HERMILANDO I. MANDANAS
RDC Chairperson
The CALABARZON Regional Development Report (RDR) is an annual
assessment report of the CALABARZON Regional Development Plan
2017-2022. The RDR tracks the Region’s socio-economic performance against
the annual targets of the Plan. It highlights the role of government policies,
programs and projects in meeting the development targets and outcomes
contained in the Results Matrices of the RDP in 2020.
Likewise, the Sustainable Development Goal Report is now incorporated in the
2020 RDR as a distinct chapter, wherein it measures the performance of SDG
indicators against their annual targets in the RDP.
This Report will serve as guide for the RDC in policy formulation, investment
programming, budget review and other developmental interventions for the
Region. Likewise, it will also guide the government agencies and LGUs to align
their resources in addressing the impacts of Taal Volcano Eruption, typhoons,
and COVID-19 pandemic.
The RDR also acknowledges the contributions and efforts of the national
government agencies, regional line agencies, state universities and colleges, local
government units, private sector, and civil society organizations in achieving the
goals in the RDP, and the Region’s vision to be a highly liveable and globally
competitive industrial region.
ii 2020 Regional Development Report
TA B L E O F C O N T E N T S
Page No.
Foreword i
Table of Contents ii
List of Tables iv
List of Figures ix
List of Acronyms xi
Executive Summary xvii
Chapter 1: Facilitating Transition, Implementing Change 1
Chapter 2: Global and Regional Trends and Prospects 5
Chapter 3: Overlay of Economic Growth, Demographic Trends and Physical
Characteristics
9
Chapter 4: Regional Development Plan 2017-2022 Framework and Headline
Targets
15
Chapter 5: Ensuring People-Centered, Clean and Efficient Governance 19
Chapter 6: Pursuing Swift and Fair Administration of Justice 27
Chapter 7: Promoting Philippine Culture and Values 35
Chapter 8: Expanding Economic Opportunities in Agriculture, Forestry and
Fisheries
41
Chapter 9: Expanding Economic Opportunities in Industry and Services 53
Chapter 10: Accelerating Human Capital Development 67
Chapter 11: Reducing Vulnerability of Individual and Families 81
Chapter 12: Building Safe and Secure Communities 97
Chapter 13: Reaching for the Demographic Dividend 101
Chapter 14: Vigorously Advancing Science, Technology and Innovation 113
Chapter 15: Ensuring Sound Macroeconomic Policy 127
2020 Regional Development Report iii
Chapter 16: Leveling the Playing Field 141
Chapter 17: Attaining Just and Lasting Peace 149
Chapter 18: Ensuring Regional Security, Public Order and Safety 153
Chapter 19: Accelerating Infrastructure Development 157
Chapter 20: Ensuring Ecological Integrity, Clean and Healthy Environment 179
Chapter 21: Ensuring Safe, Orderly and Regular Migration
Chapter 22: Sustainable Development Goals
199
203
Chapter 23: Plan Implementation and Monitoring 233
Annexes A to Q
235
Credits 295
iv 2020 Regional Development Report
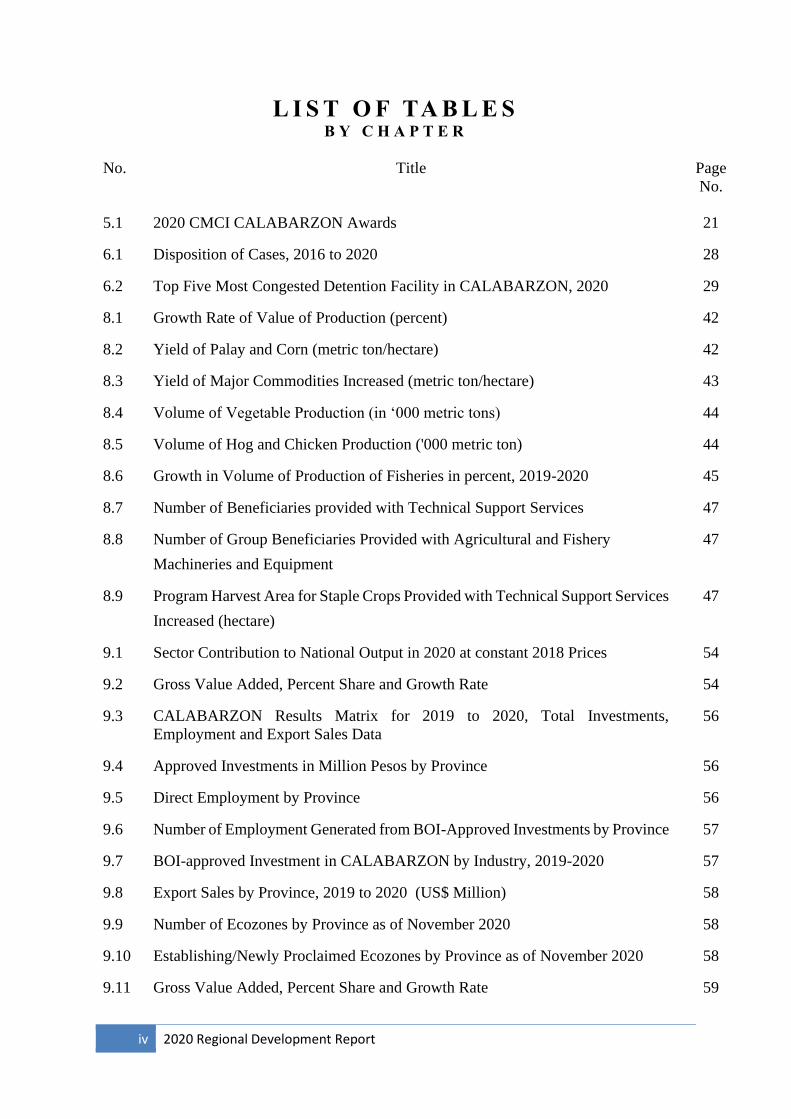
L I S T O F TA B L E S B Y C H A P T E R
No. Title Page
No.
5.1 2020 CMCI CALABARZON Awards 21
6.1 Disposition of Cases, 2016 to 2020 28
6.2 Top Five Most Congested Detention Facility in CALABARZON, 2020 29
8.1 Growth Rate of Value of Production (percent) 42
8.2 Yield of Palay and Corn (metric ton/hectare) 42
8.3 Yield of Major Commodities Increased (metric ton/hectare) 43
8.4 Volume of Vegetable Production (in ‘000 metric tons) 44
8.5 Volume of Hog and Chicken Production ('000 metric ton) 44
8.6 Growth in Volume of Production of Fisheries in percent, 2019-2020 45
8.7 Number of Beneficiaries provided with Technical Support Services 47
8.8 Number of Group Beneficiaries Provided with Agricultural and Fishery
Machineries and Equipment
47
8.9 Program Harvest Area for Staple Crops Provided with Technical Support Services
Increased (hectare)
47
9.1 Sector Contribution to National Output in 2020 at constant 2018 Prices 54
9.2 Gross Value Added, Percent Share and Growth Rate 54
9.3 CALABARZON Results Matrix for 2019 to 2020, Total Investments,
Employment and Export Sales Data
56
9.4 Approved Investments in Million Pesos by Province 56
9.5 Direct Employment by Province 56
9.6 Number of Employment Generated from BOI-Approved Investments by Province 57
9.7 BOI-approved Investment in CALABARZON by Industry, 2019-2020 57
9.8 Export Sales by Province, 2019 to 2020 (US$ Million) 58
9.9 Number of Ecozones by Province as of November 2020 58
9.10 Establishing/Newly Proclaimed Ecozones by Province as of November 2020 58
9.11 Gross Value Added, Percent Share and Growth Rate 59
2020 Regional Development Report v
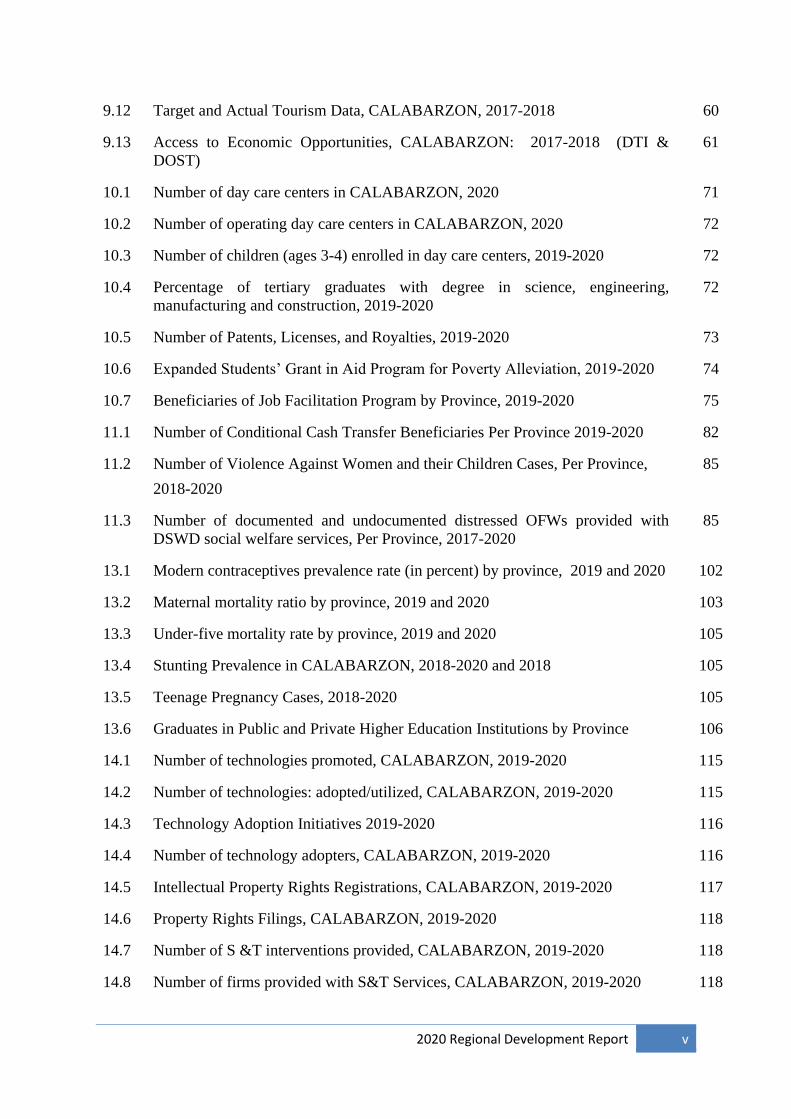
9.12 Target and Actual Tourism Data, CALABARZON, 2017-2018 60
9.13 Access to Economic Opportunities, CALABARZON: 2017-2018 (DTI &
DOST)
61
10.1 Number of day care centers in CALABARZON, 2020 71
10.2 Number of operating day care centers in CALABARZON, 2020 72
10.3 Number of children (ages 3-4) enrolled in day care centers, 2019-2020 72
10.4 Percentage of tertiary graduates with degree in science, engineering,
manufacturing and construction, 2019-2020
72
10.5 Number of Patents, Licenses, and Royalties, 2019-2020 73
10.6 Expanded Students’ Grant in Aid Program for Poverty Alleviation, 2019-2020 74
10.7 Beneficiaries of Job Facilitation Program by Province, 2019-2020 75
11.1 Number of Conditional Cash Transfer Beneficiaries Per Province 2019-2020 82
11.2 Number of Violence Against Women and their Children Cases, Per Province,
2018-2020
85
11.3 Number of documented and undocumented distressed OFWs provided with
DSWD social welfare services, Per Province, 2017-2020
85
13.1 Modern contraceptives prevalence rate (in percent) by province, 2019 and 2020 102
13.2 Maternal mortality ratio by province, 2019 and 2020 103
13.3 Under-five mortality rate by province, 2019 and 2020 105
13.4 Stunting Prevalence in CALABARZON, 2018-2020 and 2018 105
13.5 Teenage Pregnancy Cases, 2018-2020 105
13.6 Graduates in Public and Private Higher Education Institutions by Province 106
14.1 Number of technologies promoted, CALABARZON, 2019-2020 115
14.2 Number of technologies: adopted/utilized, CALABARZON, 2019-2020 115
14.3 Technology Adoption Initiatives 2019-2020 116
14.4 Number of technology adopters, CALABARZON, 2019-2020 116
14.5 Intellectual Property Rights Registrations, CALABARZON, 2019-2020 117
14.6 Property Rights Filings, CALABARZON, 2019-2020 118
14.7 Number of S &T interventions provided, CALABARZON, 2019-2020 118
14.8 Number of firms provided with S&T Services, CALABARZON, 2019-2020 118
vi 2020 Regional Development Report
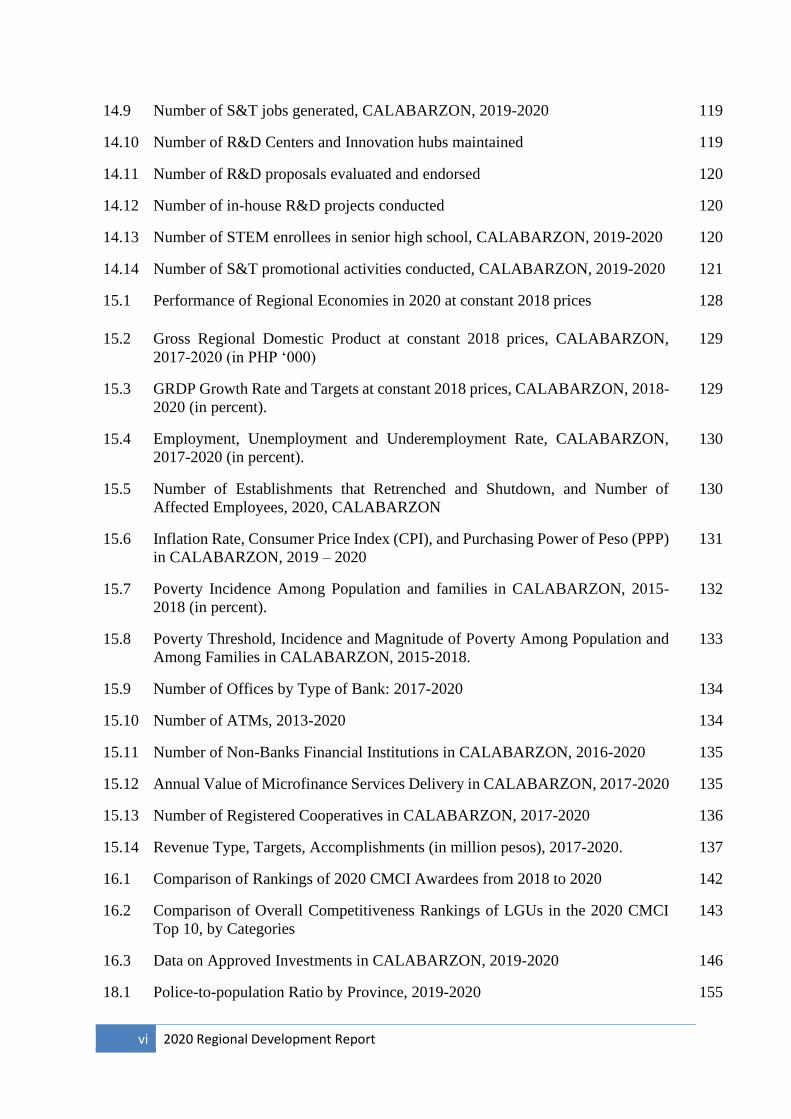
14.9 Number of S&T jobs generated, CALABARZON, 2019-2020 119
14.10 Number of R&D Centers and Innovation hubs maintained 119
14.11 Number of R&D proposals evaluated and endorsed 120
14.12 Number of in-house R&D projects conducted 120
14.13 Number of STEM enrollees in senior high school, CALABARZON, 2019-2020 120
14.14 Number of S&T promotional activities conducted, CALABARZON, 2019-2020 121
15.1 Performance of Regional Economies in 2020 at constant 2018 prices 128
15.2 Gross Regional Domestic Product at constant 2018 prices, CALABARZON,
2017-2020 (in PHP ‘000)
129
15.3 GRDP Growth Rate and Targets at constant 2018 prices, CALABARZON, 2018-
2020 (in percent).
129
15.4 Employment, Unemployment and Underemployment Rate, CALABARZON,
2017-2020 (in percent).
130
15.5 Number of Establishments that Retrenched and Shutdown, and Number of
Affected Employees, 2020, CALABARZON
130
15.6 Inflation Rate, Consumer Price Index (CPI), and Purchasing Power of Peso (PPP)
in CALABARZON, 2019 – 2020
131
15.7 Poverty Incidence Among Population and families in CALABARZON, 2015-
2018 (in percent).
132
15.8 Poverty Threshold, Incidence and Magnitude of Poverty Among Population and
Among Families in CALABARZON, 2015-2018.
133
15.9 Number of Offices by Type of Bank: 2017-2020 134
15.10 Number of ATMs, 2013-2020 134
15.11 Number of Non-Banks Financial Institutions in CALABARZON, 2016-2020 135
15.12 Annual Value of Microfinance Services Delivery in CALABARZON, 2017-2020 135
15.13 Number of Registered Cooperatives in CALABARZON, 2017-2020 136
15.14 Revenue Type, Targets, Accomplishments (in million pesos), 2017-2020. 137
16.1 Comparison of Rankings of 2020 CMCI Awardees from 2018 to 2020 142
16.2 Comparison of Overall Competitiveness Rankings of LGUs in the 2020 CMCI
Top 10, by Categories
143
16.3 Data on Approved Investments in CALABARZON, 2019-2020 146
18.1 Police-to-population Ratio by Province, 2019-2020 155
2020 Regional Development Report vii
19.1 Length of national roads, bridges and widened roads in CALABARZON in 2020. 158
19.2 Throughput of Batangas and Lucena Ports in 2019 and 2020 160
19.3 Performance of Irrigated Areas (in hectares), 2016 to 2020 161
19.4 Ratio of actual irrigated area, and cropping intensity, 2016 to 2020 161
19.5 Access to sanitation and safe water supply, 2016 to 2020 162
19.6 Level three water supply system in CALABARZON 163
19.7 Sitio Electrification, 2019-2020 163
19.8 Household Electrification, 2019-2020 163
19.9 Household Electrification by Province, 2020 164
19.10 Luzon Grid Power Plant Capacity, 2020 164
19.11 Number of powered-up sites with free Wi-Fi internet access and PoP established
in CALABARZON, 2018-2020
165
19.12 Education Facilities Results Matrix, 2016-2020 166
19.13 Health Facilities Results Matrix, 2015-2020 167
19.14 Number of Evacuation Centers by Province, 2018 168
19.15 Sanitary Landfills Monitored in CALABARZON, 2016-2020 168
19.16 Volume of desludged and/or treated septage in Water Districts CALABARZON,
2016-2020
169
19.17 List of ongoing and proposed major transport projects 170
20.1 Indicators, targets, and accomplishment for forest cover changes and forestland
management in CALABARZON, 2017-2020
180
20.2 List of protected areas in CALABARZON 181
20.3 Indicators, targets, and accomplishments for the terrestrial and coastal and marine
protected areas in CALABARZON, 2017-2020
182
20.4 Indicators, targets, and accomplishments for inland/wetlands and caves in
CALABARZON, 2017-2020
183
20.5 Indicators, targets, and accomplishments for land in CALABARZON, 2017-2020 184
20.6 Indicator, targets, and accomplishments for LAMS in CALABARZON, 2017-
2020
184
20.7 Indicators, targets, and accomplishments for resource-based industries in
CALABARZON, 2017-2020
186
20.8 Ambient air quality in three urban areas of CALABARZON from 2017 to 2020 187
viii 2020 Regional Development Report
20.9 Water quality of priority river systems in CALABARZON. 187
20.10 Water quality in 10 sampling stations along Manila Bay 189
20.11 Water quality sampling stations in selected recreational water bodies in
CALABARZON
190
20.12 Average BOD level of Laguna Lake from 2017 to 2020 190
20.13 Total Sanitary Landfills in CALABARZON as of June 2019 191
20.14 10-year Solid Waste Management Plan Compliance in CALABARZON 192
20.15 Status of Solid Waste Management in CALABARZON 192
2020 Regional Development Report ix
L I S T O F F I G U R E S B Y C H A P T E R
No. Title Page No.
1.1 The RDP Within the Context of the Long-Term Development Plan 2
4.1 CALABARZON RDP 2017-2022 Overall Strategic Framework 15
5.1 Strategic Framework towards Ensuring People-centered, Clean, and
Efficient Governance
19
6.1 Strategic Framework on the Swift and Fair Administration of Justice 27
6.2 Crude Mortality Rate 29
7.1 Strategic Framework to Promote Philippine Culture and Values 35
8.1 Strategic Framework to Expand Economic Opportunities in Agriculture,
Forestry, and Fisheries
41
9.1 Strategic Framework to Expand Economic Opportunities in
Industry and Services
53
10.1 Strategic Framework to Accelerate Human Capital Development 67
10.2 Mortality rates in CALABARZON, 2019-2020 68
10.3 Proportion of faculty members with Master’s and Doctorate Degree, 2020 74
11.1 Strategic Framework to Reduce Vulnerability of Individuals and Families 81
11.2 Number of Child Labor Victims Assisted, 2019-2020 83
11.3 Number of Poor Senior Citizens Covered by Social Pension, Per Province,
2017-2020
84
11.4 Area distributed under CARP, 2019-2020 86
11.5 DAR Number of Holders of Emancipation Patents and Certificates of
Land Ownership, 2020
87
11.6 Percentage of Population Covered by Philhealth Insurance, 2018-2020 89
11.7 Percentage covered by Philhealth, 2018-2020 89
12.1 Strategic Framework for Building Safe and Secure Communities 97
13.1 Strategic Framework to Reach for the Demographic Dividend 101
14.1 Strategic Framework to Advance Science, Technology and Innovation 113
15.1 Framework to Ensure Sound Macroeconomic Policy 127
16.1 Strategic Framework for Leveling the Playing Field 141
x 2020 Regional Development Report
17.1 Strategic Framework for Attaining Just and Lasting Peace 149
17.2 Number of CTG Violent Activities in CALABARZON 150
17.3 Number of CTG Non-violent Activities in CALABARZON 150
18.1 Strategic Framework for Ensuring Regional Security, Public Order
and Safety
153
19.1 Strategic Framework for Accelerating Infrastructure Development 157
20.1 Strategic Framework to Ensure Ecological Integrity, Clean and Healthy
Environment
179
20.2 Map of Environmental Quality Monitoring Stations 191
21.1 Strategic Framework to Ensure Safe, Orderly and Regular Migration 199
2020 Regional Development Report xi
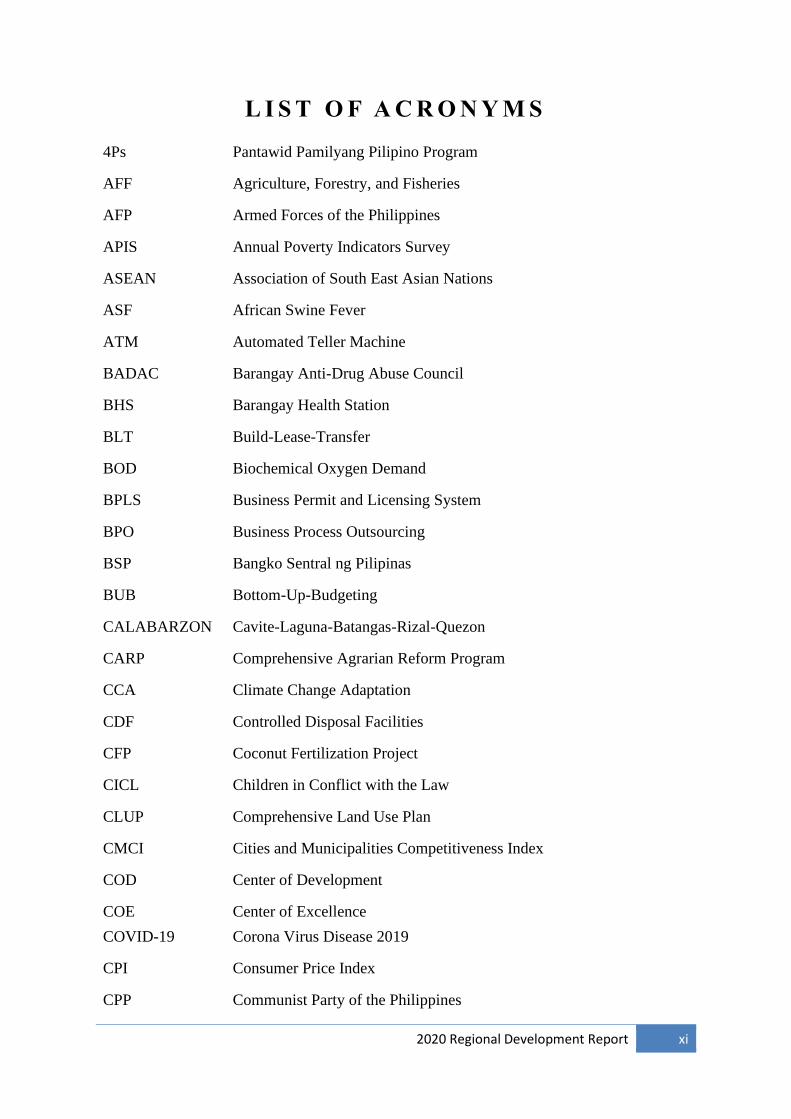
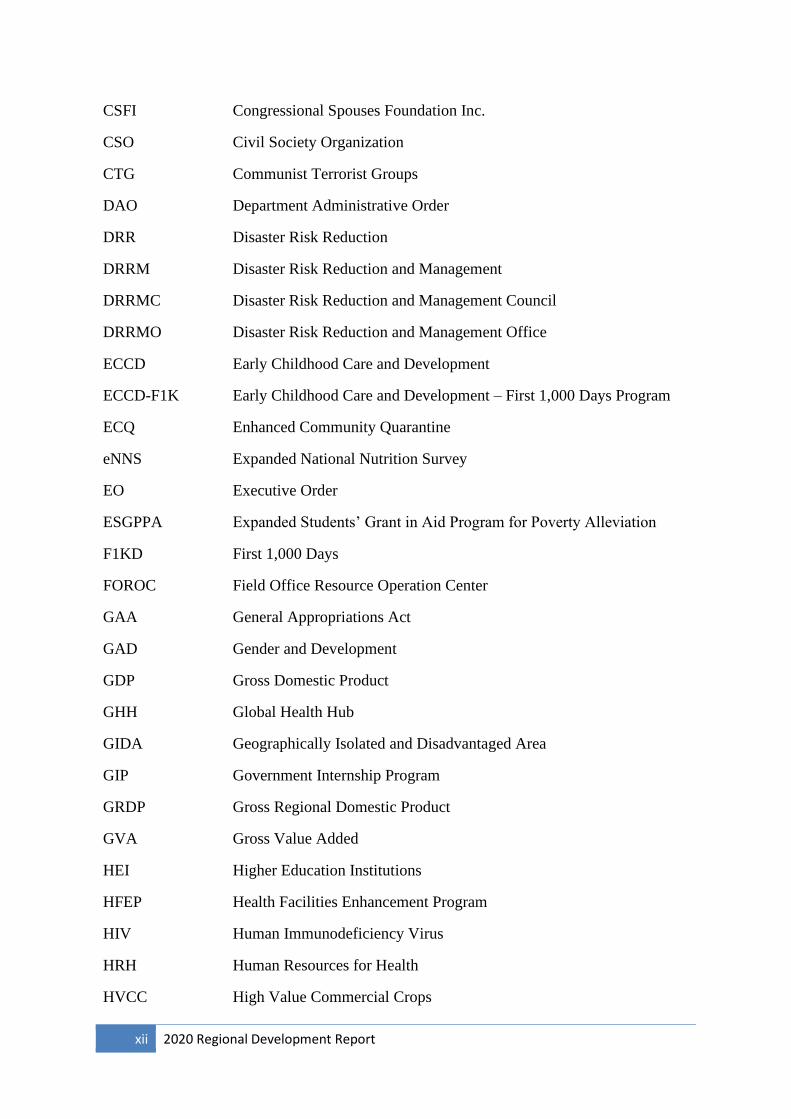
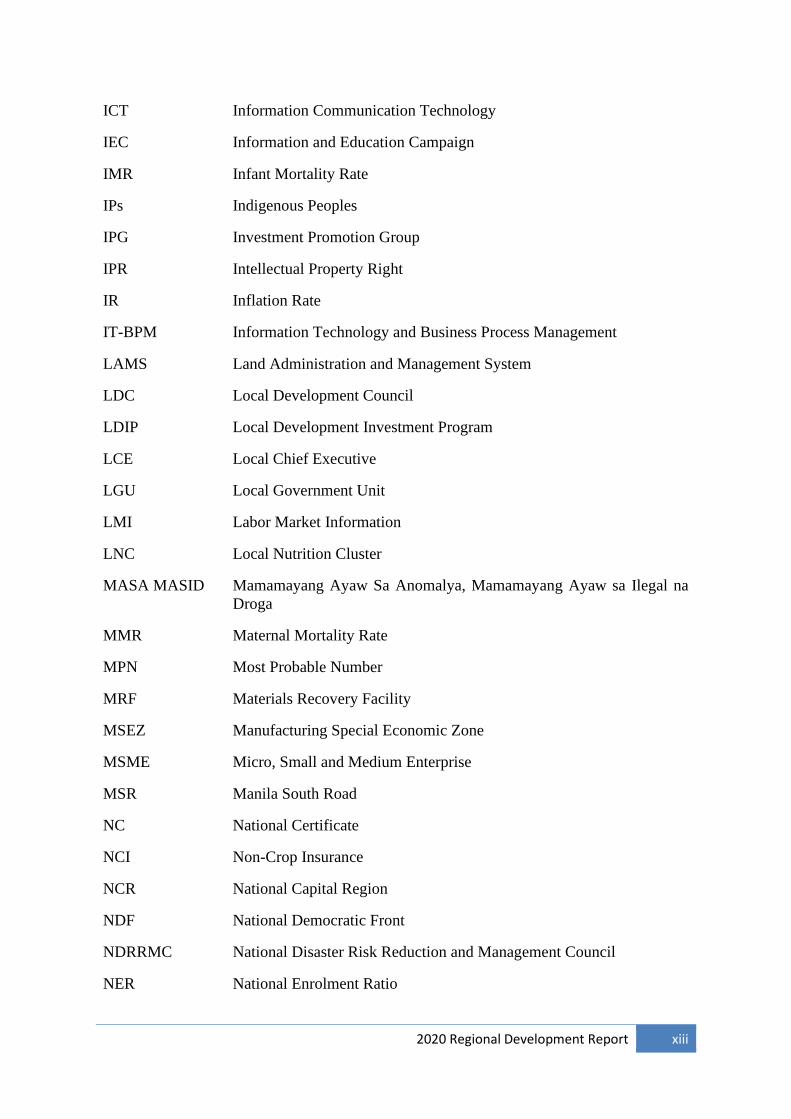
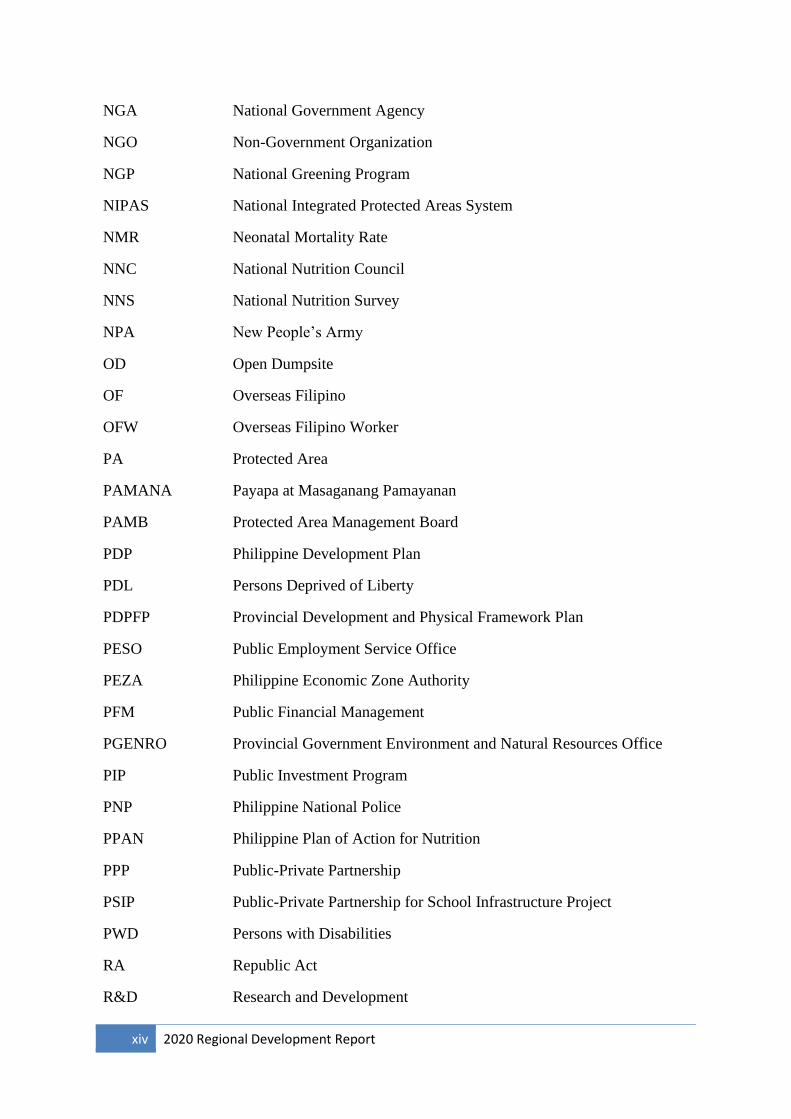
L I S T O F A C R O N Y M S
4Ps Pantawid Pamilyang Pilipino Program
AFF Agriculture, Forestry, and Fisheries
AFP Armed Forces of the Philippines
APIS Annual Poverty Indicators Survey
ASEAN Association of South East Asian Nations
ASF African Swine Fever
ATM Automated Teller Machine
BADAC Barangay Anti-Drug Abuse Council
BHS Barangay Health Station
BLT Build-Lease-Transfer
BOD Biochemical Oxygen Demand
BPLS Business Permit and Licensing System
BPO Business Process Outsourcing
BSP Bangko Sentral ng Pilipinas
BUB Bottom-Up-Budgeting
CALABARZON Cavite-Laguna-Batangas-Rizal-Quezon
CARP Comprehensive Agrarian Reform Program
CCA Climate Change Adaptation
CDF Controlled Disposal Facilities
CFP Coconut Fertilization Project
CICL Children in Conflict with the Law
CLUP Comprehensive Land Use Plan
CMCI Cities and Municipalities Competitiveness Index
COD Center of Development
COE
COVID-19
Center of Excellence
Corona Virus Disease 2019
CPI Consumer Price Index
CPP Communist Party of the Philippines
xii 2020 Regional Development Report
CSFI Congressional Spouses Foundation Inc.
CSO Civil Society Organization
CTG Communist Terrorist Groups
DAO Department Administrative Order
DRR Disaster Risk Reduction
DRRM Disaster Risk Reduction and Management
DRRMC Disaster Risk Reduction and Management Council
DRRMO Disaster Risk Reduction and Management Office
ECCD Early Childhood Care and Development
ECCD-F1K Early Childhood Care and Development – First 1,000 Days Program
ECQ Enhanced Community Quarantine
eNNS Expanded National Nutrition Survey
EO Executive Order
ESGPPA Expanded Students’ Grant in Aid Program for Poverty Alleviation
F1KD First 1,000 Days
FOROC Field Office Resource Operation Center
GAA General Appropriations Act
GAD Gender and Development
GDP Gross Domestic Product
GHH Global Health Hub
GIDA Geographically Isolated and Disadvantaged Area
GIP Government Internship Program
GRDP Gross Regional Domestic Product
GVA Gross Value Added
HEI Higher Education Institutions
HFEP Health Facilities Enhancement Program
HIV Human Immunodeficiency Virus
HRH Human Resources for Health
HVCC High Value Commercial Crops
2020 Regional Development Report xiii
ICT Information Communication Technology
IEC Information and Education Campaign
IMR Infant Mortality Rate
IPs Indigenous Peoples
IPG Investment Promotion Group
IPR Intellectual Property Right
IR Inflation Rate
IT-BPM Information Technology and Business Process Management
LAMS Land Administration and Management System
LDC Local Development Council
LDIP Local Development Investment Program
LCE Local Chief Executive
LGU Local Government Unit
LMI Labor Market Information
LNC Local Nutrition Cluster
MASA MASID Mamamayang Ayaw Sa Anomalya, Mamamayang Ayaw sa Ilegal na
Droga
MMR Maternal Mortality Rate
MPN Most Probable Number
MRF Materials Recovery Facility
MSEZ Manufacturing Special Economic Zone
MSME Micro, Small and Medium Enterprise
MSR Manila South Road
NC National Certificate
NCI Non-Crop Insurance
NCR National Capital Region
NDF National Democratic Front
NDRRMC National Disaster Risk Reduction and Management Council
NER National Enrolment Ratio
xiv 2020 Regional Development Report
NGA National Government Agency
NGO Non-Government Organization
NGP National Greening Program
NIPAS National Integrated Protected Areas System
NMR Neonatal Mortality Rate
NNC National Nutrition Council
NNS National Nutrition Survey
NPA New People’s Army
OD Open Dumpsite
OF Overseas Filipino
OFW Overseas Filipino Worker
PA Protected Area
PAMANA Payapa at Masaganang Pamayanan
PAMB Protected Area Management Board
PDP Philippine Development Plan
PDL Persons Deprived of Liberty
PDPFP Provincial Development and Physical Framework Plan
PESO Public Employment Service Office
PEZA Philippine Economic Zone Authority
PFM Public Financial Management
PGENRO Provincial Government Environment and Natural Resources Office
PIP Public Investment Program
PNP Philippine National Police
PPAN Philippine Plan of Action for Nutrition
PPP Public-Private Partnership
PSIP Public-Private Partnership for School Infrastructure Project
PWD Persons with Disabilities
RA Republic Act
R&D Research and Development
2020 Regional Development Report xv
RCEF Rice Competitiveness Enhancement Fund
RCSP Re-tooled Community Support Program
RDC Regional Development Council
RDIP Regional Development Investment Program
RDP Regional Development Plan
RDR Regional Development Report
R/P/C/MDRRMC Regional/Provincial/City/Municipal Disaster
Risk Reduction and Management Council
RLA Regional Line Agency
RNC Regional Nutrition Cluster
ROLL-IT Roads Leveraging Linkages for Industry and Trade
RPAN Regional Plan of Action for Nutrition
RT-PCR Reverse Transcription Polymerase Chain Reaction
RHU Rural Health Units
RTF-ELCAC Regional Task Force to End Local Communist Armed Conflict
SCP Save the Children Philippines
SDG Sustainable Development Goal
SETUP Small Enterprise Technology Upgrading Program
SGLG Seal of Good Local Governance
SHS Senior High School
SLP Sustainable Livelihood Program
SOLCOM Southern Luzon Command
SPES Special Program for the Employment of Students
STP Sewage Treatment Plant
SUC State University and College
SWM Solid Waste Management
TB Tuberculosis
TIP Term Insurance Packages
TUPAD Tulong Panghanap Buhay sa Ating Disadvantaged/Displaced Workers
TVET Technical Vocational Education and Training
xvi 2020 Regional Development Report
TVPL Taal Volcano Protected Landscape
TWG Technical Working Group
U5MR Under-Five Morality Rate
UHC Universal Health Care
WQMA Water Quality Management Area
WSP Water Service Providers
xvii 2020 Regional Development Report
EXECUTIVE SUMMARY
In 2020, the economy of CALABARZON contracted by negative 10.5 percent in contrast
to its 4.6 percent growth in 2019. The contraction in the regional economy was mainly due
to the impacts of the COVID-19 pandemic and Taal Volcano Eruption. The biggest decline
in performance came from the industry sector at negative 12.5 percent followed by services
at negative 8.6 percent, and agriculture, forestry, and fishing at negative 6.6 percent.
Employment and unemployment targets were not achieved in 2020 as employment rate
declined to 88.4 percent from 93.9 percent in 2019. Meanwhile, unemployment rate rose to
11.6 percent in 2020 from 6.1 percent in 2019.
CALABARZON’s upward economic growth from 2015 to 2019 translated to a better
quality of life of residents in 2019. The anti-poverty efforts of the Region have reflected in
the reduction of poverty incidence among population in 2018. However, poverty incidence
in the Region would likely increase in the next survey in 2021 due to the impacts of
COVID-19 pandemic and natural calamities in 2020 to the vulnerable population.
Inflation rate increased by 0.2 percentage point from 2.6 percent in 2019. This was higher
than the national average of 2.6 percent but within the regional target of lower than 5
percent. The increase in food prices can be attributed to the adverse impact of calamities
and pandemic in 2020 that affected the production, supply and mobility of goods.
On the social aspect, mortality rate decreased from 3 percent in 2019 to 2.47 percent in
2020, and kept below the target of 5.0 percent due to improved provision and better quality
of health programs and services to prevent and treat diseases. While an improved
performance is observed in terms of overall mortality rate in the Region, infant mortality
rate increased from 10.44 percent in 2019 to 11.38 percent in 2020. Due to community
quarantine restrictions, there were limitations on the mobility of sick children and adults.
For education, no data was available due to community quarantine restrictions and face-to-
face class suspensions brought on by the pandemic.
For infrastructure development, existing national roads in fair and good conditions have
increased from 50.4 percent to 65.0 percent. On the other hand, the improvement of Sangley
Airport has been completed and 232 WiFi Access Points were activated in the rural health
units and hospitals. Implementation schedules of infrastructure projects were also affected
by the restrictions brought by the pandemic.
On peace and order, the number of barangays affected by internal armed conflict decreased
from 21 barangays in 2019 to 8 barangays in 2020. The continuous implementation of the
whole-of-nation approach towards peace and development contributed to the improvement
of the peace situation.
Environmental quality was maintained with the 43,156 hectares of forestland under
effective management and 1,086 hectares of mangrove plantations were maintained and
protected in 2020.

Chapter 1: FACILITATING TRANSITION, IMPLEMENTING CHANGE 1
Chapter 1
Facilitating Transition, Implementing
Change
The 2020 Regional Development Report (RDR) presents the annual assessment of the
socioeconomic performance of the region based on the targets in the Results Matrices of the
CALABARZON Regional Development Plan Midterm Update (RDP) 2017-2022. The RDR
highlights the annual accomplishments of the key sectors namely: the macroeconomy; industry
and services; agriculture and fisheries; infrastructure; social; peace and security; governance;
environment; and migration and development. In addition, the 2020 RDR includes the region’s
accomplishment in contribution to the achievement of the 2030 Sustainable Development
Goals. The challenges as well as strategies to address the development issues were identified
while keeping an eye on the trends, prospects, and opportunities of each sector. The RDR is a
tool for policy-makers and development planners for the identification and implementation of
appropriate development interventions for the region.
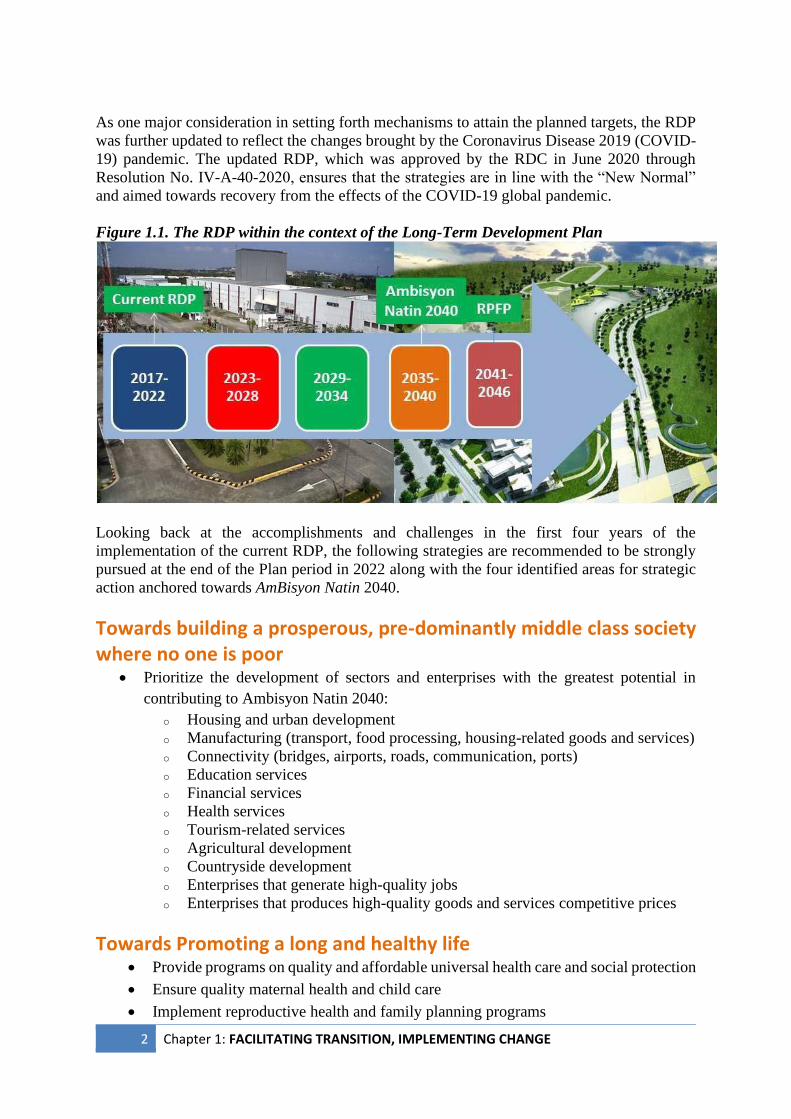
The Long View
The Updated CALABARZON RDP 2017-2022 continuously supports the plans and strategies
set forth by the Philippine Development Plan (PDP) 2017-2022 which gives the direction and
the overall development framework for the country.
The RDP and the PDP are both anchored on the long-term vision for the country –
AmBisyon Natin 2040 which states that “By 2040, the Philippines shall be a prosperous,
predominantly middle-class society where no one is poor; our people shall live long and healthy
lives, be smart and innovative, and shall live in a high-trust society.” In addition, the RDP will
serve as a tool to build on the Region’s promise to become the most livable industrial Region
in the country where no one is poor. Meanwhile, the Updated Regional Physical Framework
Plan 2017-2046 espouses the spatial dimension of the Updated RDP through its vision that
“CALABARZON is a region of vibrant economic diversity and vitality with progressive, well-
planned town clusters inhabited by God-loving people enjoying globally competitive, balanced
and resilient ecosystems”. These Plans lay down a solid foundation for a more inclusive
growth, a society that we can trust and an economy that is at par with the emerging economies
of the world (Figure 1.1).
To achieve the PDP and the RDP outcomes, a whole of government approach, complemented
by the private sector and civil society organizations, are needed. At the regional level, the
collective action for the implementation of the CALABARZON RDP 2017-2022 was set by
the Regional Development Council when it approved the updated Plan in December 2019
through Resolution No. IV-A-136-2019. All sectoral, thematic, and agency plans at the
regional level, and the plans of the LGUs must be consistent and aligned with the targets and
strategies in the RDP. Continuity and sustainability of development initiatives throughout the
planning period are expected, while taking into account the region’s performance as contained
in the RDR.
2 Chapter 1: FACILITATING TRANSITION, IMPLEMENTING CHANGE
As one major consideration in setting forth mechanisms to attain the planned targets, the RDP
was further updated to reflect the changes brought by the Coronavirus Disease 2019 (COVID-
19) pandemic. The updated RDP, which was approved by the RDC in June 2020 through
Resolution No. IV-A-40-2020, ensures that the strategies are in line with the “New Normal”
and aimed towards recovery from the effects of the COVID-19 global pandemic.
Figure 1.1. The RDP within the context of the Long-Term Development Plan
Looking back at the accomplishments and challenges in the first four years of the
implementation of the current RDP, the following strategies are recommended to be strongly
pursued at the end of the Plan period in 2022 along with the four identified areas for strategic
action anchored towards AmBisyon Natin 2040.
Towards building a prosperous, pre-dominantly middle class society where no one is poor
• Prioritize the development of sectors and enterprises with the greatest potential in
contributing to Ambisyon Natin 2040:
o Housing and urban development
o Manufacturing (transport, food processing, housing-related goods and services)
o Connectivity (bridges, airports, roads, communication, ports)
o Education services
o Financial services
o Health services
o Tourism-related services
o Agricultural development
o Countryside development
o Enterprises that generate high-quality jobs
o Enterprises that produces high-quality goods and services competitive prices
Towards Promoting a long and healthy life • Provide programs on quality and affordable universal health care and social protection
• Ensure quality maternal health and child care
• Implement reproductive health and family planning programs
Chapter 1: FACILITATING TRANSITION, IMPLEMENTING CHANGE 3
• Encourage development of healthy lifestyles through malnutrition programs and
facilities
• Ensure natural resources and environment management
Towards becoming smarter and more innovative people
• Upgrade skills to rapidly changing technology and work requirements
• Continue K to 12 Program to provide foundation for a smarter society
• Pursue innovative products and ideas with strong intellectual property rights
framework
• Implement massive Research and Development programs
Towards building a high-trust society
• Ensure people-centered, effective, and accountable governance
• Deliver public goods and services at all levels of government efficiently
• Encourage political and electoral reforms to promote competition and inclusiveness
in the political system in place
• Pursue peace agenda for armed conflict threatened areas
• Promote social and cultural awareness, and development of deep appreciation of the
Filipino nation

4 Chapter 1: FACILITATING TRANSITION, IMPLEMENTING CHANGE
Chapter 2: GLOBAL AND REGIONAL TRENDS AND PROSPECTS 5
Chapter 2
Global and Regional Trends
and Prospects
CALABARZON remains to be one of the top investment destinations in the country because
of its proximity to the National Capital Region (NCR). It is the hub of the manufacturing
industries, with abundant agricultural produce and raw materials, and a large labor force. The
Region has the second highest total approved foreign investments in 2020 amounting to
PHP35billion, with NCR being first with PHP40.38 billion. The total amount of foreign
investments in the country in 2020 was PHP112.12 billion.
The total foreign investment decreased compared to the previous year’s total foreign
investment of PHP390.11 billion. The main cause of this decrease is the COVID-19 Pandemic
which greatly affected the business climate all over the world. The pandemic greatly disrupted
global supply chains and caused restrictions that greatly affected the economy.
Economic
The CALABARZON economy contracted by -10.5 percent in 2020, indicating the significant
effects of the COVID-19 pandemic and the Taal Volcano Eruption. This contraction in the
Region’s economy is a reflection of the contraction of its sectors particularly the industry sector
which accounts for 49.4 percent of the Region’s economic output.
The economic growth can be recovered and sustained by generating more investments from
global and high-value firms that will provide more quality employment and create competitive
products and services for the international and domestic markets. As such, the conduct of
various investment promotion activities is being spearheaded by Investment Promotion Group
of the RDC which include the formulation and adoption of the RDC-approved
CALABARZON Investment Priority Areas 2019-2020, conduct of investment missions and
fora, and dissemination of promotional materials, among others.
The Build, Build, Build Program will help boost the CALABARZON’s declining construction
subsector since major projects will be implemented in the region. Opening of new roads, bypass
roads, and construction of roads for interregional connectivity especially along the Pacific
Coast will bring more investments and create jobs while ensuring connectivity and improved
public service accessibility. Improvement of international and inter-regional connectivity
which includes internet connectivity will reduce logistics costs, leading to higher productivity
and stronger regional economy. This will greatly facilitate and help the economy recover from
the losses due to the pandemic.
Political
The proposed shift to a federal government is one of the priorities of the National Government.
In 2018, the Office of the President released Memorandum Circular No. 62 which creates the
Inter-Agency Task Force on Federalism and Constitutional Reform. The proposed charter
mandates that the form and structure of the government will be that of a presidential-bicameral-
6 Chapter 2: GLOBAL AND REGIONAL TRENDS AND PROSPECTS
federal system, develop a two-party system where the state shall subsidize the political parties,
automatic release of national taxes to local governments or federated regions, and extension in
the term of elected officials. The shift to a federal government would require substantial
financial costs from the government to fully capacitate the regional and local levels of
bureaucracy to take on the central government offices’ functions. Thus, a phased approach to
federalism would help ensure that the shift in government would not disrupt the economic
growth of the country.
Even as federalism is being pursued by some, the LGUs are expected to exercise more
autonomy with more devolution of basic services.
The Supreme Court on its July 3, 2018 decision ordered to automatically release the shares of
LGUs in the national taxes pursuant to the schedule provided by the Local Government Code,
including the collections of the Bureau of Customs. The SC decision will help fund the
devolved basic services on health, agriculture, education, disaster management, peace and
order, and safety. The additional share is expected to be released to the LGUs in 2022.
While peace negotiations are still uncertain, the national and local governments will continue
to implement a comprehensive peace and development program to neutralize security threats
and encourage more rebel returnees to become productive members of society. In
CALABARZON, the RDC has conducted several community outreach activities in insurgency
areas to make government services more accessible. To further promote peace and ensure the
safety in the National Task Force to End Local Communist Armed Conflict initiative the
Barangay Development Program helps in delivering development programs to conflict ridden
areas.
Social and Demographic
Being the most populous region at 14.4 million people and having a 14 percent share in the
youth labor force population of the country, the Region can benefit most out of the demographic
dividend with the appropriate health and education strategies for children and youth to improve
human capital.
On health, the full implementation of the Responsible Parenthood and Reproductive Health
(RPRH) Law, adolescent and youth health programs, first 1000 days and promotion of healthy
lifestyle can address the problems on increasing cases of teenage pregnancy, high fertility rate,
malnutrition, and obesity. To ensure the provision of adequate health and nutrition services to
all pregnant women and children during their early days of development (i.e. newly-born up to
24 months), Republic Act No. 11148, or the Kalusugan at Nutrisyon ng Mag-Nanay Act was
signed into law on November 29, 2018. The law was spurred by the success of Quezon
Province’s First 1000 Days of Life Program which aims to reduce malnutrition, maternal, and
neonatal mortality in the province.
Another major concern on health that has greatly affect the development of the Region and the
country is the COVID-19 pandemic. But with the advent of creating effective vaccines the
outlook on this front is positive. With the ongoing roll out of vaccines in the country at 1.4
percent, herd immunity is expected to be achieved by 2023 (Source). The health sector should
still have precautions in place and be ready for mutations of COVID-19 to avoid transmission
and increase in cases.
Chapter 2: GLOBAL AND REGIONAL TRENDS AND PROSPECTS 7
The COVID-19 pandemic also greatly affected education and employment. To mitigate the
effects of the pandemic and avoid prolonged unemployment, employment opportunities and
alternative livelihood programs will be provided to the affected workers. Distance Learning
System for the students will also be adopted and continued. Support critical infrastructures and
services will be established to adapt to the “new normal”. Trends in overseas migration and in-
migration to CALABARZON may also change to avoid the spread of the pandemic. Another
factor to be considered is the implementation of the Balik Probinsya Program that will further
decentralize NCR and may increase the population in the region.
Technological
The Fourth Industrial Revolution (FIRe) or Industry 4.0 refers to the currently emerging
revolution in technology based on the fusion of radical advances in knowledge across a wide
range of scientific domains. Iconic examples are advances in artificial intelligence,
neuroscience, robotics, internet of things, nanotechnology, quantum computers, genetics bio-
engineering, among others.
FIRe will create new products, production methods, business process and other cost-reducing,
quality-improving and lifestyle-changing methods. It will also bring about massive job changes
that will be favorable to workers that have strong scientific and quantitative skills and those
who are highly trainable and adaptable. However, it will be disadvantageous to workers whose
jobs can be automated such as unskilled assembly line jobs and routine jobs.
For the country and the region to be responsive to Industry 4.0, reforms in the education sector,
research and development, and technology need to be prioritized and provided the necessary
investments. Among these strategies include achieving universal completion of quality K to 12
education, ensuring that young and future workers are highly trainable and flexible, and
enabling current workers’ to acquire new competencies for regular updating and upgrading of
skills (i.e. lifelong learning).
With FIRe, it is also imperative for the Philippines’ Information and Technology and Business
Process Management (IT-BPM) industry to evolve and remain competitive. This involves
strengthening human resource capability and maximizing use of technology in new, emerging
and more complex sectors in the industry such as animation and game development, health
information management, and IT and software development.
With the Internet of Things (the interconnection via the Internet of gadgets/devices),
technology and devices will be used in new different ways for business and everyday lives.
Addressing the COVID-19 Pandemic, online processes and services are now more essential to
our everyday life. In order to improve and continue operations of business and the economy,
ICT will be improved to support the economy and the government.
Environmental
The major weather disturbances or disaster that affected the region in 2020 was the Taal
Volcano Eruption (TVE) in January and the Typhoons Quinta, Rolly and Ulysses at the last
qaurter of the year. The TVE affected 12 municipalities and 3 cities in the provinces of
Batangas and Cavite. The eruption, adversely affected about 131,123 families and damaged
8 Chapter 2: GLOBAL AND REGIONAL TRENDS AND PROSPECTS
houses, public buildings, establishments, and roads. The consecutive typhoons that devastated
the region resulted to loss of lives and extensive damages to property across the five provinces.
To recover from the devastating effect of this weather disturbances and the global pandemic.
The CALABARZON Rehabilitation and Recovery Committee prepared three Rehabilitation
and Recovery Programs (RRP) for the TVE, COVID-19 and Typhoons in 2020. These RRPs
will provide strategic interventions for the rehabilitation and recovery of affected communities
in the region. The RRPs also identifies key programs, projects and activities needed to restore
damaged properties and rebuild the lives of affected people while improving their livelihood
and increasing the level of resilience of all communities.
The adoption and implementation of the Philippine Water Supply and Sanitation Masterplan
(PWSSMP) will not only help ensure adequate water supply in the future but also improve
water quality in the region including sources of water such as rivers, lakes and coastal areas.
At the regional level, the CALABARZON Flood Risk Assessment Study is being prepared to
address issues caused by flooding. The study will serve as a basis or framework in preparing
local and regional flood control policies, studies and projects all over the Region.
On solid waste management, the PWSSMP identified putting up of sanitary landfills for highly
urbanized and cluster of municipalities as well as technologies on sanitation. As a devolved
function, local governments need to come up with their approved solid waste management
plans and to allocate funds for waste management or pollution reduction programs and projects.
Chapter 3: OVERLAY OF ECONOMIC GROWTH, DEMOGRAPHIC TRENDS AND PHYSICAL CHARACTERISTICS
9
Chapter 3
Overlay of Economic Growth,
Demographic Trends and
Physical Characteristics
The distribution of population over a geographical location reflects the economic structure of
a region. Regions with established and large cities coupled with increasing population tend to
develop at a faster rate. To maximize the opportunities of increasing population and economic
activities, the CALABARZON RDP 2017-2022 adopts the National Spatial Strategy (NSS)
which provides the basis for policies to complement population and economic growth
involving the core strategies of regional agglomeration, connectivity, and vulnerability
reduction.
Accomplishments
Population and economic growth CALABARZON has the largest population among regions with more than 16 million people
based on the July 2020 estimates. With an annual growth rate of 2.58 percent, the Region’s
population is expected to double by 2042.
On the economic side, CALABARZON’s GRDP growth target of 5.7 to 7.2 percent for 2020
was not met. The Region’s GRDP contracted by 10.5 percent in 2020 from a growth of 4.5
percent in 2019 due to the impact of the COVID-19 pandemic and Taal Volcano Eruption. This
was the second recorded contraction since 2009 wherein the regional economy contracted by
0.8 percent. The industry sector recorded the highest contraction at 12.5 percent followed by
the service sector at 8.6 percent, and the agriculture, fisheries, and forestry sector at 6.6 percent.
It is also notable that the CALABARZON had the second largest contraction after Central
Luzon at 13.9 percent (details in Chapter 15).
Inflation rate increased by 0.2 percentage point from 2.6 percent in 2019 to 2.8 percent in 2020
which is still within the regional target of lower than 5 percent. Consumer price index (CPI)
also rose from 118.3 in 2019 to 121.6 in 2020 due to the increase in prices of all commodity
groups. As the inflation rate and the CPI increases, the purchasing power of peso declined from
PHP0.85 in 2019 to PHP0.82 in 2020 (details in Chapter 15).
Effect on poverty situation. In 2018, CALABARZON recorded a poverty incidence of 7.1
percent, that is 5.1 percentage points lower than the poverty incidence in 2015 at 12.2 percent.
Likewise, poverty incidence among families improved with the reduction of 4.1 percentage
points from 9.1 percent in 2015 to 5.0 percent in 2018. However, with the COVID-19 pandemic
it is expected that poverty incidence would be higher in the next survey period in 2021, possibly
negating public and private sector efforts in reducing poverty in the Region. Hence, there is a
need to provide timely, adequate and appropriate assistance to vulnerable groups to mitigate
10 Chapter 3: OVERLAY OF ECONOMIC GROWTH, DEMOGRAPHIC TRENDS AND PHYSICAL CHARACTERISTICS
the negative effects of the pandemic on people’s income and livelihood and to sustains the
region’s progress towards reducing poverty (details in Chapter 15).
Agglomeration and urban efficiency Regional agglomeration aims to decongest Metro Manila by promoting scale and
agglomeration economies in the regional and sub-regional center has benefited the
CALABARZON with various economic zones. As of 2020, the Region has a total of 57
operating ecozones and 21 newly proclaimed ecozones such as manufacturing, IT parks and
centers, agro-industrial and tourism mostly located in the provinces of Laguna, Batangas and
Cavite (details in Chapter 9). However, with regional agglomeration, the Region is confronted
with the problems of overcrowding and congestion which may contributed to the increasing
cases of COVID-19. To prevent these diseconomies of agglomeration, the Region should
improve the living environment in urban centers, increase green and open spaces, improve
infrastructure and service delivery, among others.
To promote urban efficiency, the provinces created the Comprehensive Development Plan
Technical Assistance Committee (CDP-TAC) to strengthen the relationship of the province
with its component cities and municipalities as partners in local development. The CDP-TAC
will ensure plan complementation and augmentation between the Provincial Development and
Physical Framework Plans (PDPFPs) and Provincial Development Investment Programs of the
provinces and the CDPs of component cities and municipalities. This initiative will also
promote vertical and horizontal linkages of plans and rural-urban linkages (details in Chapters
7 and 16).
CALABARZON Region continues to perform well in improving efficiency and effectiveness
in delivering government services and in creating a conducive environment for local
development as measured by the 2020 Cities and Municipalities Competitiveness Index
(CMCI) ranking. As evident in the 2020 CMCI rankings wherein CALABARZON Region
received 21 out of 111 awards, the most among regions. Also, the percentage of cities and
municipalities with improved CMCI ranking increased to 61.27 percent in 2020 from 59
percent in 2019. However, some LGUs failed to retain their 2019 rankings hence, the decrease
of total number of LGU awardees from 15 in 2019 to 12 in 2020 (details in Chapters 5
and 16).
Regional connectivity Connectivity strategy aims to improve the linkages among settlements and key production
areas by connecting rural areas to growth centers or strengthening urban-rural linkages by
increasing redundancy of transportation routes, communication, and other infrastructure
facilities.
From 2019 to 2020, the transportation sector focused on developing new road networks such
as bypass and diversion roads and widening of existing national roads into at least four lanes.
At present, there are 25 ongoing bypass and diversion road projects which are expected to
decongest traffic in urban areas of CALABARZON. In addition, the length of permanent
bridges along national roads increased to 19,855.8 lineal meters in 2020 from 18,575.17 lineal
Chapter 3: OVERLAY OF ECONOMIC GROWTH, DEMOGRAPHIC TRENDS AND PHYSICAL CHARACTERISTICS
11
meters in 2019. On the other hand, the length of expressways and railways did not increase as
the implementation of these projects was affected by COVID-19 pandemic restrictions.
In terms of water transport, the expansion project in Batangas Port which aims to upgrade the
passenger terminal and berthing facilities was already completed in December 2020. The
improved port facility can now accommodate an estimated 4,000 passengers.
On the other hand, the Sangley Development Project Airport in Cavite was completed in
October 10, 2020. The airport can serve as an alternate gateway for general aviation operations
of Ninoy Aquino International Airport (NAIA)
In terms of communication, the Region has established 34 Technology Empowerment for
Education, Employment, Entrepreneurship and Economic Development (Tech4ED) centers
and activated Wifi access points of 232 for rural health units and hospitals, 240 for LGUs and
state universities and colleges, and 124 for other public spaces (details in Chapter 19).
Vulnerability reduction Vulnerability reduction efforts will be integrated with regional agglomeration and connectivity
to develop disaster and climate resilient infrastructure and facilities to reduce vulnerabilities to
the impacts of disaster and climate change.
To reduce vulnerability of individual and families in environmental and natural risks, the
Region focused on improving the disaster-related capabilities of LGUs. Among the activities
conducted are the review of 76 Local Disaster Risk Reduction and Management (DRRM)
Plans, provision of technical assistance on DRRM and on the preparation of DRRM Annual
Plans and Budget (details in Chapter 11).
Mainstreaming disaster risk reduction and climate change mitigation measures in local
development planning has been the priority of the Region towards reducing vulnerabilities and
strengthening resilience. As of 2020, 68 out of 142 LGUs have approved or updated
Comprehensive Land Use Plans. However, LGUs provided with CLUP assistance declined
from 67 in 2019 to 23 in 2020 due to the challenges brought by the pandemic and the shift of
LGU priorities to address the pandemic. Meanwhile, all five provinces in the Region are
currently preparing their Provincial Development and Physical Framework Plan 2021-2030
(details in Chapter 12).
Strategy In achieving the development goals of the Region, the National Spatial Strategy was adopted
in the RDP. The NSS’ core strategies include regional agglomeration, connectivity, and
vulnerability reduction. The Regional agglomeration promotes concentration, with proper
health and sanitation standards, and maximizes the benefits of scale and agglomeration of
economies, while connectivity aims to connect production areas to settlement and market areas.
Vulnerability reduction is about ensuring the safety of the population to various hazards and
control settlements in hazard prone areas.
12 Chapter 3: OVERLAY OF ECONOMIC GROWTH, DEMOGRAPHIC TRENDS AND PHYSICAL CHARACTERISTICS
Moving Forward
Agglomeration and urban efficiency
With the COVID-19 pandemic, the spatial strategy needs to be revisited to integrate health
hazards in land use and settlements development as well as promote the development of more
growth centers outside Metro Manila. Network of settlements shall also be pursued to promote
agglomeration and redistribution of urban growth. The CALABARZON Regional Balik
Probinsya, Bagong Pag-Asa (BP2) Action Plan will guide the region in planning,
implementing, and monitoring programs and projects to achieve the program’s objectives on
countryside development and improved quality in rural areas. Through the implementation of
the BP2 Program key strategies such as the promotion of local industries and the development
of productive and resilient agriculture value-chain, the Region will be able to create a high-
trust, socially cohesive, vibrant, resilient, and sustainable communities.
A paradigm shift in land use and urban design will also be considered to develop more open,
green and public spaces, improve air quality and access to clean water and sanitation, ensure
efficient public transport and safe bicycle and pedestrian networks, and protect the biodiversity,
among others.
To recover and regain the growth momentum before the pandemic, the industry and services
sector will focus efforts on sustainable economic activities and address the impact of reduced
production capacities and disruption in supply chains such as virtual job fairs, and automated
systems and processes to enhance ease of doing business. The implementation of the Corporate
Recovery and Tax Incentives for Enterprises Act law will help business establishments to
recover through gradually lowering the corporate income tax from 30 percent to 25 percent.
There is also a need to sustain and improve competitiveness and CMCI ranking of more LGUs
in the Region. Thus, there will be continuous orientations and trainings on the CMCI to Local
Chief Executives and key LGU personnel.
Connectivity
With the increasing population and the current issues brought by COVID-19 pandemic, the
Region will continue to promote the development of multi-modal transport system and further
develop the internal and external linkages to other Regions to increase efficiency and support
the economy’s recovery. Under the new normal environment, the transportation sector would
need to redesign facilities for public transportation to meet the new health standards and other
requirements to ensure public health is protected. Among the proposed measures to improve
public transportation are the development of contactless payment and systems and strengthened
health screening and contact tracing.
CALABARZON will support the completion of the Follow-Up Survey on the Roadmap for
Transport Infrastructure Development for the Greater Capital Region which aims to guide in
prioritizing the projects in the transport investment program of NCR and its neighboring
regions including CALABARZON. The Region will also continue to implement the of priority
projects and activities in the CALABARZON Traffic Management Plan 2017-2022 to address
traffic problems.
Chapter 3: OVERLAY OF ECONOMIC GROWTH, DEMOGRAPHIC TRENDS AND PHYSICAL CHARACTERISTICS
13
Port facilities will be continuously developed and improved to ensure efficient and safe
transport of people and goods to the islands, encourage more locators, and optimize port
utilization. This will also create economic opportunities for the Region and aid in decongesting
the container terminals in Manila.
On the other hand, the proposal to develop the Sangley Airport into a 1,500-hectare
international airport was deferred.
Meanwhile, the Region will continue to intensify its efforts to bring up new innovations in ICT
and increase usage of internet services in partnership with the private sector.
Vulnerability reduction
Implementation of disaster-resilient projects and vulnerability reduction measures shall also be
intensified. The LGUs in coordination with DPWH, OCD and DILG shall prioritize the
construction of disaster resilient evacuation centers outside the high-risk area. Evacuation
centers should be equipped with basic utilities such as separate toilets, bath, kitchen, solid and
liquid waste management infrastructures, and access to green spaces to promote the evacuees’
social well-being. There is also a need to expand trainings on DRRM and investments in
innovative DRR-CCA technologies and systems to minimize the effects of man-made and
natural hazards.
Moreover, the lack of or insufficient accurate and updated data on housing remains a
fundamental issue that needs to be resolved immediately for better targeting and monitoring of
accomplishment in terms of building safe and secure communities. The DHSUD is expected to
develop a database on all housing-related data, specifically to have a profile of informal settler
families in waterways and hazard-prone areas.

14 Chapter 3: OVERLAY OF ECONOMIC GROWTH, DEMOGRAPHIC TRENDS AND PHYSICAL CHARACTERISTICS
Chapter 4: REGIONAL DEVELOPMENT PLAN 2017-2022 FRAMEWORK AND HEADLINE TARGETS
15
Chapter 4
Regional Development Plan 2017-2022
Framework and Headline Targets
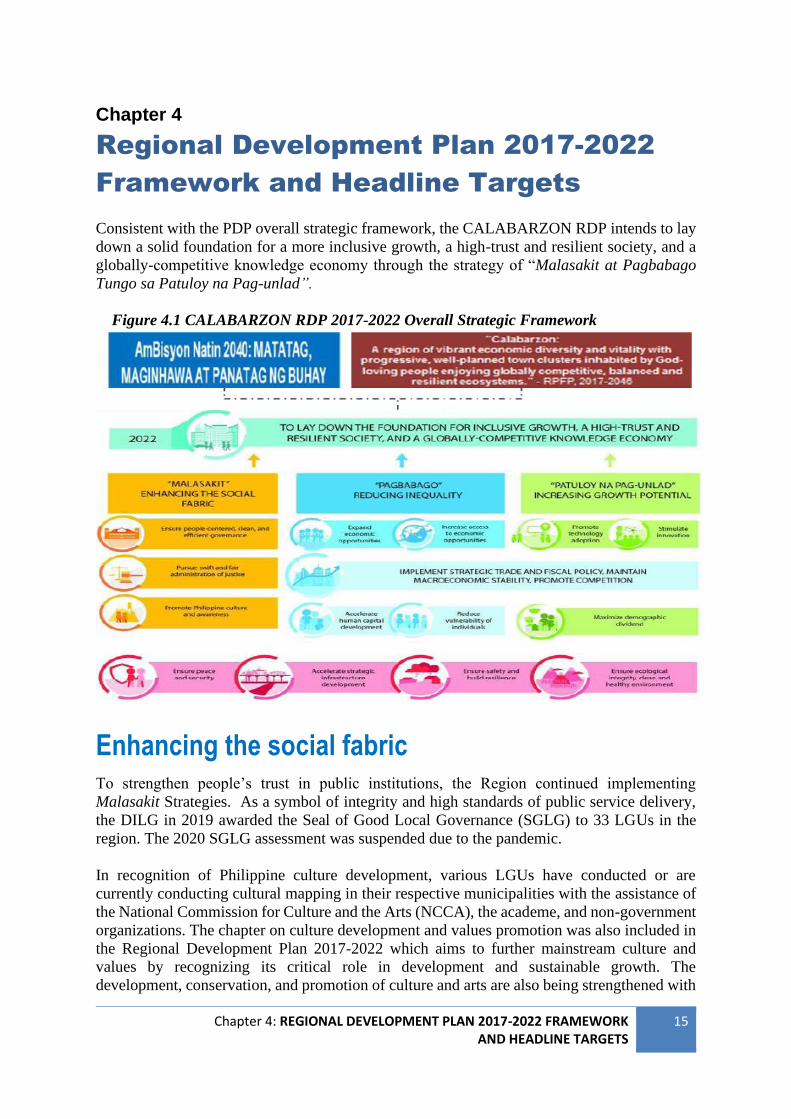
Consistent with the PDP overall strategic framework, the CALABARZON RDP intends to lay
down a solid foundation for a more inclusive growth, a high-trust and resilient society, and a
globally-competitive knowledge economy through the strategy of “Malasakit at Pagbabago
Tungo sa Patuloy na Pag-unlad”.
Figure 4.1 CALABARZON RDP 2017-2022 Overall Strategic Framework
Enhancing the social fabric
To strengthen people’s trust in public institutions, the Region continued implementing
Malasakit Strategies. As a symbol of integrity and high standards of public service delivery,
the DILG in 2019 awarded the Seal of Good Local Governance (SGLG) to 33 LGUs in the
region. The 2020 SGLG assessment was suspended due to the pandemic.
In recognition of Philippine culture development, various LGUs have conducted or are
currently conducting cultural mapping in their respective municipalities with the assistance of
the National Commission for Culture and the Arts (NCCA), the academe, and non-government
organizations. The chapter on culture development and values promotion was also included in
the Regional Development Plan 2017-2022 which aims to further mainstream culture and
values by recognizing its critical role in development and sustainable growth. The
development, conservation, and promotion of culture and arts are also being strengthened with
16 Chapter 4: REGIONAL DEVELOPMENT PLAN 2017-2022 FRAMEWORK AND HEADLINE TARGETS
the establishment of more local culture and arts council. Relatedly, the DILG’s SGLG included
indicators on Essential Areas, Tourism, Culture and the Arts, Cultural Heritage Promotion and
Conservation to ensure the integration of culture in the local plans and programs.
Reducing inequality
The Strategy of Pagbabago aims to reduce inequality by expanding economic opportunities
and increasing access to these opportunities especially for the marginalized sector. The
government continued to provide agriculture and fishery inputs and machineries to farmers and
fisherfolks to increase their productivity. To complement this, various technical, credit and
insurance assistance were also provided to improve their livelihood. To support the creation
and expansion of MSMEs, more Negosyo Centers have been established by DTI in
collaboration with LGUs. DOST also provided technological support through their Small-
Enterprise Technology Upgrading Program.
To bring the government programs and services closer to lagging and conflict-affected areas,
the Yakap Bayan: Community Mobilization and Support Program initiated a number of
activities such as community outreach, medical and dental missions, community-based drug
rehabilitation and food for work programs, among others.
Increasing potential growth
To recover the Region’s economic growth in the long-term, strategies on increasing the growth
potential through innovation and advancing technology are being pursued especially with the
stronger reliance of the world with ICT brought on by the “new normal”. This includes science
and technology interventions such as grants-in-aid community-based projects, trainings,
technology forums, and testing and calibration services, among others. To stimulate innovation,
more innovations centers will be established in collaboration with state colleges in universities
in the region where the facilities will be housed. Increasing the number of adopters of new
technology will lead to an increase in number of commercialized local products and improved
productivity.
Enabling and supportive economic environment
With the decline of the economic development in country and the region, there is a need for a
stronger effort by the government and the private sector in generating more investments and
quality employment. Aggressive promotion and marketing programs will be pursued to attract
more foreign direct investments especially those that would bring in new technologies.
Meanwhile, mitigating measures need to be effective with the ongoing implementation of the
TRAIN Package 2. To make the country’s business environment more engaging and conducive
to local and foreign investors, the ease of doing business will continue to be enhanced by the
whole bureaucracy through the implementation of Republic Act No. 11032 or the Ease of
Doing Business and Efficient Government Service Delivery Act.
Chapter 4: REGIONAL DEVELOPMENT PLAN 2017-2022 FRAMEWORK AND HEADLINE TARGETS
17
Foundations for sustainable development
In support to the CALABARZON Spatial Strategy, the RDP identifies strategies to balance
economic growth and ecological integrity. DPWH has implemented various transportation
projects in 2020 such as the construction of bypass and diversion roads and flood control
projects to mitigate or minimize the effects of natural calamities i.e., flooding incidences in the
low-lying areas in the region.
Several masterplans have been completed or will be formulated to provide a blueprint for the
development of water resources, drainage and transport systems in the country and in
CALABARZON. These are the Philippine Water Supply and Sanitation Masterplan,
CALABARZON Flood Risk Assessment Study and the Philippine Transportation System
Master Plan. The adoption and implementation of these masterplans are crucial for the
sustained growth and development of the region.
In order to preserve public order, and safety in the region the programs and projects aligned
with the following RDP outcomes will be pursued; a) to reduce all forms of criminality; b)
ensuring public safety; and c) protect the welfare and well-being of all Filipinos overseas. By
having order and a secure community in the region this will help as a foundation of economic
growth.

18 Chapter 4: REGIONAL DEVELOPMENT PLAN 2017-2022 FRAMEWORK AND HEADLINE TARGETS
Chapter 5: ENSURING PEOPLE-CENTERED, CLEAN AND EFFICIENT GOVERNANCE 19
Chapter 5
Ensuring People-Centered, Clean and
Efficient Governance
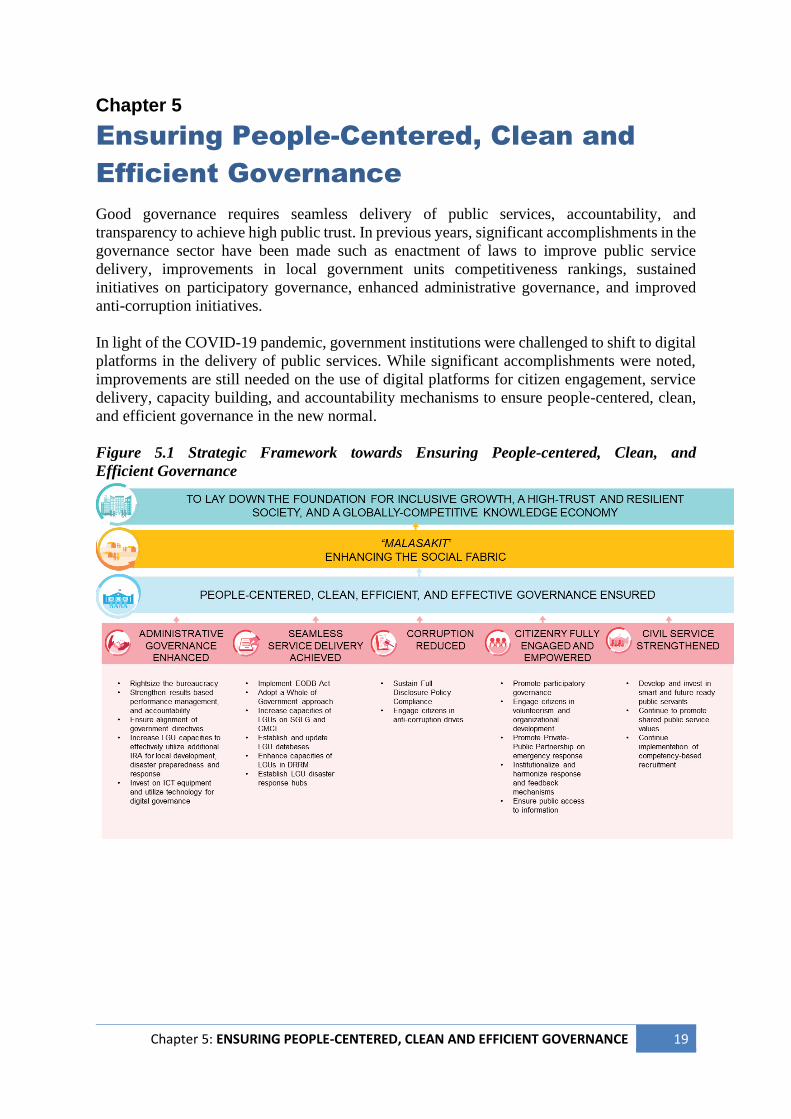
Good governance requires seamless delivery of public services, accountability, and
transparency to achieve high public trust. In previous years, significant accomplishments in the
governance sector have been made such as enactment of laws to improve public service
delivery, improvements in local government units competitiveness rankings, sustained
initiatives on participatory governance, enhanced administrative governance, and improved
anti-corruption initiatives.
In light of the COVID-19 pandemic, government institutions were challenged to shift to digital
platforms in the delivery of public services. While significant accomplishments were noted,
improvements are still needed on the use of digital platforms for citizen engagement, service
delivery, capacity building, and accountability mechanisms to ensure people-centered, clean,
and efficient governance in the new normal.
Figure 5.1 Strategic Framework towards Ensuring People-centered, Clean, and
Efficient Governance
20 Chapter 5: ENSURING PEOPLE-CENTERED, CLEAN AND EFFICIENT GOVERNANCE
Accomplishments
Empowering and engaging with citizenry
Full representation of civil society organizations to the local development councils. The
representation of civil society organizations (CSO) in the local development councils (LDCs)
is being monitored as one of the indicators in the Seal of Good Local Governance (SGLG).
However, this was not monitored in 2020 due to the deferment of the SGLG assessment.
Nonetheless, the LGUs in CALABARZON continue to meet the requirements for NGO
representation of CSOs in all LDCs which is being facilitated through capability development
trainings to LGUs in strengthening participation of CSOs.
Related to this, in 2020, the Sanguniang Panlalawigan of Quezon Province duly accredited 22
CSOs which resulted to increased public sector involvement in the activities in the Province.
Their accredited CSO were able to participate in their various committees such as the Provincial
Gender and Development Committee, the Provincial Committee on Migration and
Development, the Provincial Council Against Human Trafficking, Child Pornography and
Violence Against Women and their Children, among others.
Institutionalization of Citizen Participatory Audit (CPA) in all LGUs and agencies. The
Commission on Audit introduced the CPA in 2012 to provide a mechanism for collectively
answering questions regarding government’s efficient and effective use of public funds. The
CPA is a priority program founded on the premise that public accountability can prosper only
with the involvement of vigilant citizens. All matters and activities in connection with the said
program are specifically spearheaded and undertaken through the supervision of the Director
of the Project Management Office of the Commission.
All agencies are fully compliant with the transparency seal. To enhance transparency and
enforce accountability, the National Budget Circular No. 542 dated August 29, 2012 and as
prescribed all national government agencies (NGAs) to maintain a transparency seal on their
official websites. In 2019, a total of 68 NGAs, 8 local water districts, and 12 government-
owned and controlled corporations in CALABARZON complied with the requirements of the
Transparency Seal as validated by the DBM. The Compliance for FY 2020 is currently being
validated by the DBM-Office of the Chief Information Officer.1
Complete LGU compliance to full disclosure policy. Since 2016, all LGUs in the Region
were compliant with the Full Disclosure Policy through portal posting and posting in
conspicuous places. This ensures that the public is well informed on government policies and
performance on public goods and services delivery. The LGU compliance to the Full
Disclosure Policy was facilitated with the implementation of DILG Management System,
strong coordinating mechanisms with concerned partner agencies/Local Governance Regional
Resource Center members, and regular monitoring of compliance through the SGLG wherein
the Full Disclosure Policy compliance is one of the indicators.
1 Figures were sourced from the national data that is currently grouped into three: a) national government agency;
b) government-owned and controlled corporations; and c) local water districts. The regional data was determined
by identifying which among these agencies have regional offices and/or are within the CALABARZON.
Chapter 5: ENSURING PEOPLE-CENTERED, CLEAN AND EFFICIENT GOVERNANCE 21
Monitoring of LGUs’ feedback mechanism sustained. Gathering citizen’s feedback is
required for all government agencies to get the public’s satisfaction level on government
service. The DILG adopted the Citizen Satisfaction Index Survey (CSIS) as a tool in assessing
the effectiveness of local government’s basic public services. Since 2019, all cities in the region
already implemented the CSIS. However, for municipalities and provinces, the CSIS was not
included as the targets vary depending on the current needs and demands which is determined
by the DILG Central Office. Thus, this was not included in the 2020 commitment from the
DILG Central Office Nonetheless, new targets may also arise in accordance with the
Mandanas-Garcia Ruling.
Achieving seamless service delivery
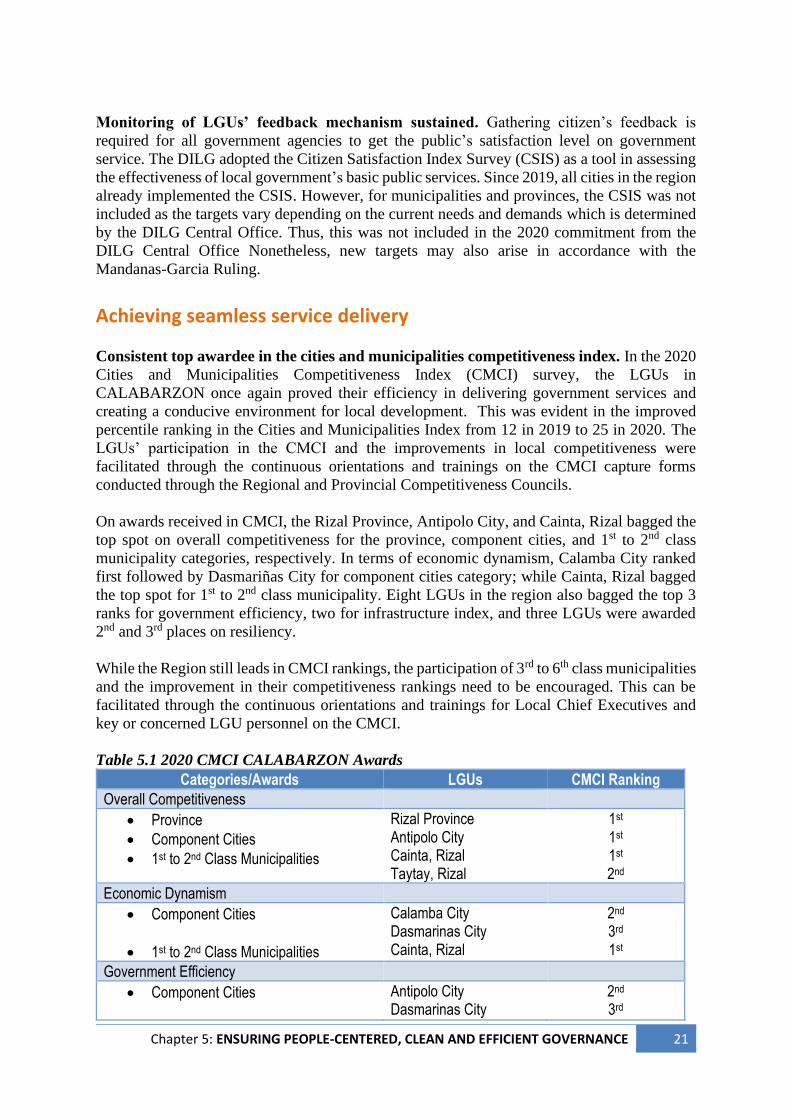
Consistent top awardee in the cities and municipalities competitiveness index. In the 2020
Cities and Municipalities Competitiveness Index (CMCI) survey, the LGUs in
CALABARZON once again proved their efficiency in delivering government services and
creating a conducive environment for local development. This was evident in the improved
percentile ranking in the Cities and Municipalities Index from 12 in 2019 to 25 in 2020. The
LGUs’ participation in the CMCI and the improvements in local competitiveness were
facilitated through the continuous orientations and trainings on the CMCI capture forms
conducted through the Regional and Provincial Competitiveness Councils.
On awards received in CMCI, the Rizal Province, Antipolo City, and Cainta, Rizal bagged the
top spot on overall competitiveness for the province, component cities, and 1st to 2nd class
municipality categories, respectively. In terms of economic dynamism, Calamba City ranked
first followed by Dasmariñas City for component cities category; while Cainta, Rizal bagged
the top spot for 1st to 2nd class municipality. Eight LGUs in the region also bagged the top 3
ranks for government efficiency, two for infrastructure index, and three LGUs were awarded
2nd and 3rd places on resiliency.
While the Region still leads in CMCI rankings, the participation of 3rd to 6th class municipalities
and the improvement in their competitiveness rankings need to be encouraged. This can be
facilitated through the continuous orientations and trainings for Local Chief Executives and
key or concerned LGU personnel on the CMCI.
Table 5.1 2020 CMCI CALABARZON Awards
Categories/Awards LGUs CMCI Ranking
Overall Competitiveness
• Province
• Component Cities
• 1st to 2nd Class Municipalities
Rizal Province Antipolo City Cainta, Rizal Taytay, Rizal
1st
1st 1st 2nd
Economic Dynamism
• Component Cities
• 1st to 2nd Class Municipalities
Calamba City Dasmarinas City Cainta, Rizal
2nd 3rd
1st
Government Efficiency
• Component Cities
Antipolo City Dasmarinas City
2nd 3rd
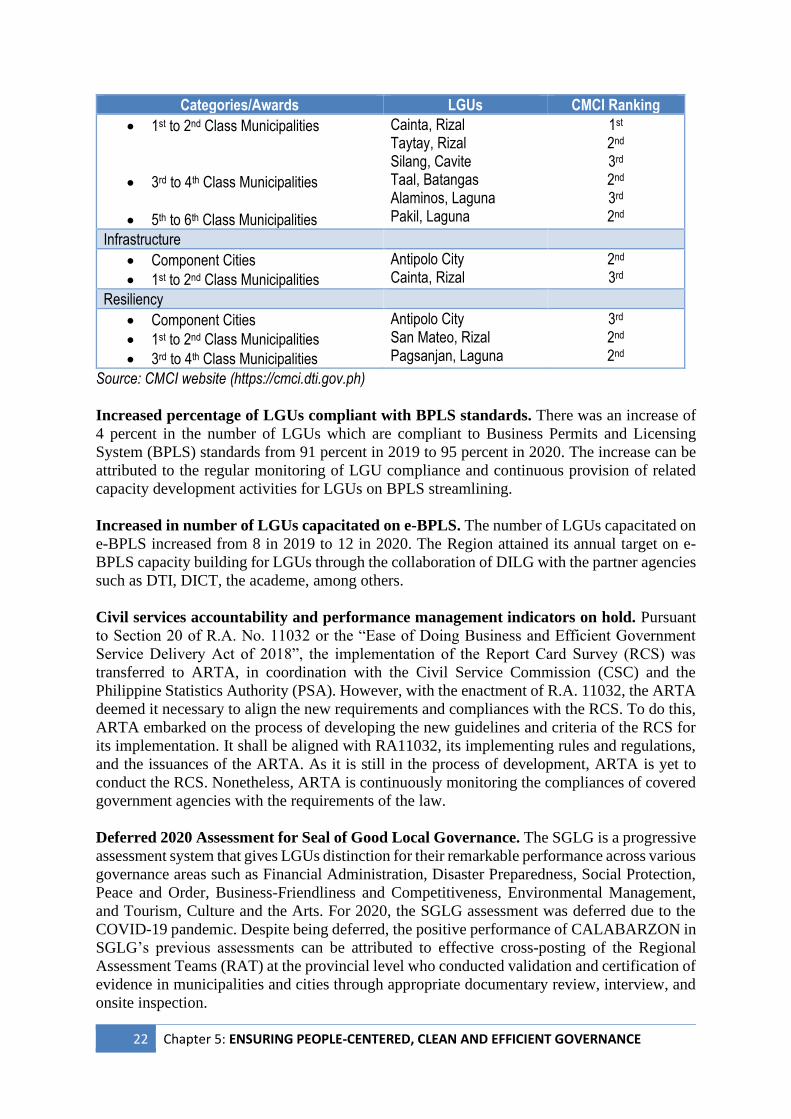
22 Chapter 5: ENSURING PEOPLE-CENTERED, CLEAN AND EFFICIENT GOVERNANCE
Categories/Awards LGUs CMCI Ranking
• 1st to 2nd Class Municipalities
• 3rd to 4th Class Municipalities
• 5th to 6th Class Municipalities
Cainta, Rizal Taytay, Rizal Silang, Cavite Taal, Batangas Alaminos, Laguna Pakil, Laguna
1st 2nd 3rd
2nd 3rd
2nd
Infrastructure
• Component Cities
• 1st to 2nd Class Municipalities
Antipolo City Cainta, Rizal
2nd
3rd
Resiliency
• Component Cities
• 1st to 2nd Class Municipalities
• 3rd to 4th Class Municipalities
Antipolo City San Mateo, Rizal Pagsanjan, Laguna
3rd 2nd 2nd
Source: CMCI website (https://cmci.dti.gov.ph)
Increased percentage of LGUs compliant with BPLS standards. There was an increase of
4 percent in the number of LGUs which are compliant to Business Permits and Licensing
System (BPLS) standards from 91 percent in 2019 to 95 percent in 2020. The increase can be
attributed to the regular monitoring of LGU compliance and continuous provision of related
capacity development activities for LGUs on BPLS streamlining.
Increased in number of LGUs capacitated on e-BPLS. The number of LGUs capacitated on
e-BPLS increased from 8 in 2019 to 12 in 2020. The Region attained its annual target on e-
BPLS capacity building for LGUs through the collaboration of DILG with the partner agencies
such as DTI, DICT, the academe, among others.
Civil services accountability and performance management indicators on hold. Pursuant
to Section 20 of R.A. No. 11032 or the “Ease of Doing Business and Efficient Government
Service Delivery Act of 2018”, the implementation of the Report Card Survey (RCS) was
transferred to ARTA, in coordination with the Civil Service Commission (CSC) and the
Philippine Statistics Authority (PSA). However, with the enactment of R.A. 11032, the ARTA
deemed it necessary to align the new requirements and compliances with the RCS. To do this,
ARTA embarked on the process of developing the new guidelines and criteria of the RCS for
its implementation. It shall be aligned with RA11032, its implementing rules and regulations,
and the issuances of the ARTA. As it is still in the process of development, ARTA is yet to
conduct the RCS. Nonetheless, ARTA is continuously monitoring the compliances of covered
government agencies with the requirements of the law.
Deferred 2020 Assessment for Seal of Good Local Governance. The SGLG is a progressive
assessment system that gives LGUs distinction for their remarkable performance across various
governance areas such as Financial Administration, Disaster Preparedness, Social Protection,
Peace and Order, Business-Friendliness and Competitiveness, Environmental Management,
and Tourism, Culture and the Arts. For 2020, the SGLG assessment was deferred due to the
COVID-19 pandemic. Despite being deferred, the positive performance of CALABARZON in
SGLG’s previous assessments can be attributed to effective cross-posting of the Regional
Assessment Teams (RAT) at the provincial level who conducted validation and certification of
evidence in municipalities and cities through appropriate documentary review, interview, and
onsite inspection.
Chapter 5: ENSURING PEOPLE-CENTERED, CLEAN AND EFFICIENT GOVERNANCE 23
Enhancing administrative governance
Increased in LGUs compliant with public financial management standards. In 2020, 94
percent of LGUs in CALABARZON were compliant with the assessed Public Financial
Management (PFM) systems, higher than the 79 percent compliance in 2019. This may be
attributed to the increased appreciation of LGUs on the importance of an open and orderly PFM
system in improving its service delivery and fund management. Moreover, technical assistance
was constantly provided by the DBM to the LGUs.
Retained proportion of LGUs adopting PFM improvement measures2. The Region fell
short of its target to annually increase the proportion of LGUs adopting PFM improvement
measures with the number of LGUs retained at 135 from 2019 to 2020. While the LGUs
acknowledge the importance of an organized PFM system, some have re-prioritized their PFM
improvement measures to respond to the COVID-19 pandemic.
Improving anti-corruption initiatives
Decreased COA findings with cash shortages forwarded to the Ombudsman for filing of
appropriate charges. In 2020, no cash examination report (CERs) was referred to the
Ombudsman. The two CERs that were reviewed by CALABARZON in 2019 were returned
to the concerned audit team leaders for further revisions. The decrease in the cases involving
cash shortages may be attributed to the strict monitoring of government agencies by their
respective auditors.
LGUs compliant to Anti-Red Tape Act. Similar to agency Anti-Red Tape Act indicators,
data for LGU compliance is also on hold while new requirements and compliances with the
RCS are still in process.
Moving Forward
Institutionalization of legal frameworks such as RA 11032, known as the Ease of Doing
Business and Efficient Government Service Delivery Act of 2018 and the R.A. No. 11055,
otherwise known as the Philippine Identification System Act, will streamline processes and
increase access to government services. Moreover, the shift to digital platforms and
government initiatives to automate processes will also improve the delivery of public services.
With the increase in internal revenue allotment of LGUs and the LGUs’ role as primary
responders and frontline service providers, their readiness, institutional capacity, and
leadership will play a significant role in delivering essential and devolved public services. This
necessitates building LGU capabilities and preparation of systems to implement the Supreme
Court Ruling in the Mandanas-Garcia Case.
2 LGUs adopting PFM improvement measures are those that adopted their PFM Improvement Plan through a
Sanggunian Resolution and are annually submitting monitoring reports to the DBM. On the other hand, LGUs
compliant to PFM Standards are those that have conducted their PFM assessment and submitted PFM documents
as required by the DBM.
24 Chapter 5: ENSURING PEOPLE-CENTERED, CLEAN AND EFFICIENT GOVERNANCE
In light of the COVID-19 pandemic, necessary measures must be in place to adapt to the new
normal such as compliance to minimum health and safety protocols, and adoption of alternative
work arrangements. With the shift to digital platforms, the government must strengthen its
initiative to address security concerns such as cybercrimes and cyberattacks, as well as fake
news and misinformation.
Moreover, the pandemic also necessitates governance sector reforms such as the review of
Voter’s Registration Act and the integration of new election protocols on automation and online
system for voter registration, and enhancement of voting measures for vulnerable groups like
senior citizens, persons with disabilities, and indigenous peoples.
The sector also needs to make adjustments on the use of digital platforms for citizen
engagement, service delivery, capacity building, and accountability mechanisms to ensure
people-centered, clean, and efficient governance in the new normal.
Recommendations
Challenges Recommended Strategies Implementing Agency
Limited technical capacity and human resource constraints of LGUs to effectively and efficiently deliver devolved services
Finalize the agency devolution transition plans and wide dissemination to LGUs Fast-track roll out of capacity development programs/activities for LGUs on planning, investment programming, budgeting, implementation, and monitoring Assist LGUs in finalizing major local plans such as CLUP, CDP, LDIP, Local Shelter Plan, among others
DILG. DHSUD, NEDA & all concerned
agencies
Sustaining/Improvement of competitiveness and CMCI ranking of more LGUs
Continue the conduct of orientation on CMCI forms Strengthen the Provincial Competitiveness Council Conduct an in-depth analysis on CMCI rankings of LGUs
LGUs, PCC, RCC
Increase LGUs’ compliance to PFM standards
Conduct continuous or regular orientation/trainings (through the use of technology) to LGUs on PFM processes, standards/requirements Provide PFM orientation to LCEs together with local finance committees, especially those newly-elected, on the importance and objectives of PFM
DBM, DILG, LGUs
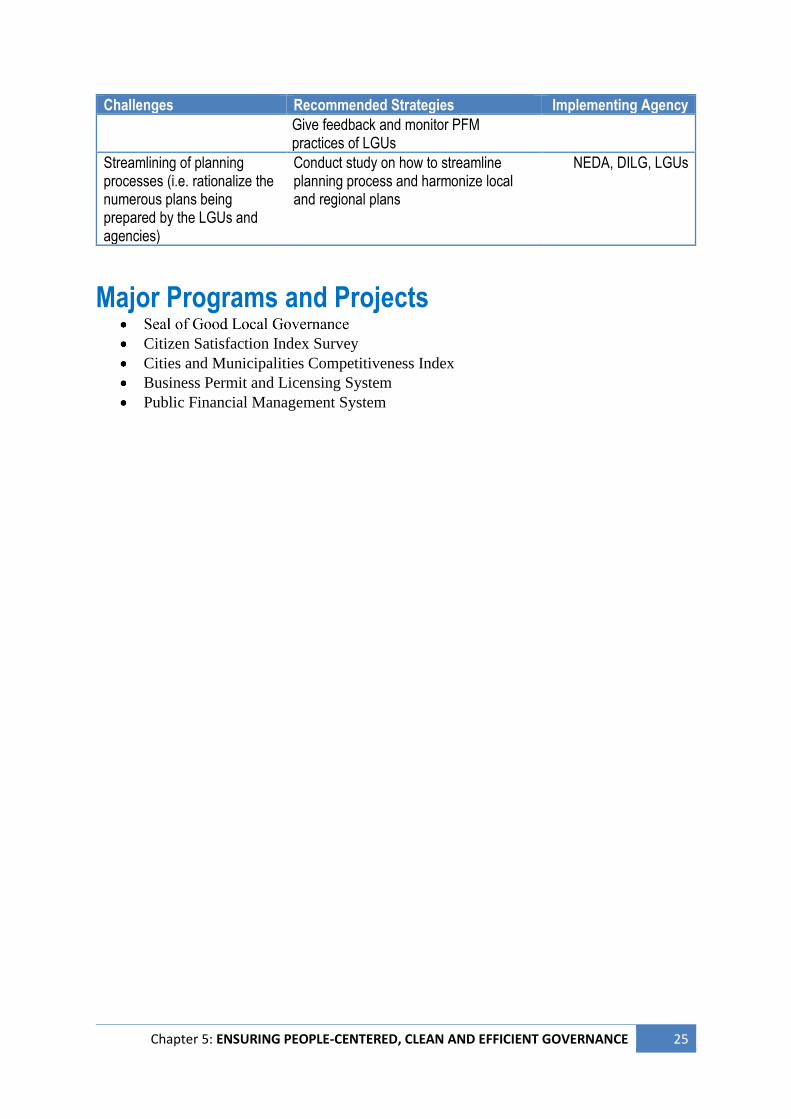
Chapter 5: ENSURING PEOPLE-CENTERED, CLEAN AND EFFICIENT GOVERNANCE 25
Challenges Recommended Strategies Implementing Agency
Give feedback and monitor PFM practices of LGUs
Streamlining of planning processes (i.e. rationalize the numerous plans being prepared by the LGUs and agencies)
Conduct study on how to streamline planning process and harmonize local and regional plans
NEDA, DILG, LGUs
Major Programs and Projects
Citizen Satisfaction Index Survey
Cities and Municipalities Competitiveness Index
Business Permit and Licensing System
Public Financial Management System

26 Chapter 5: ENSURING PEOPLE-CENTERED, CLEAN AND EFFICIENT GOVERNANCE
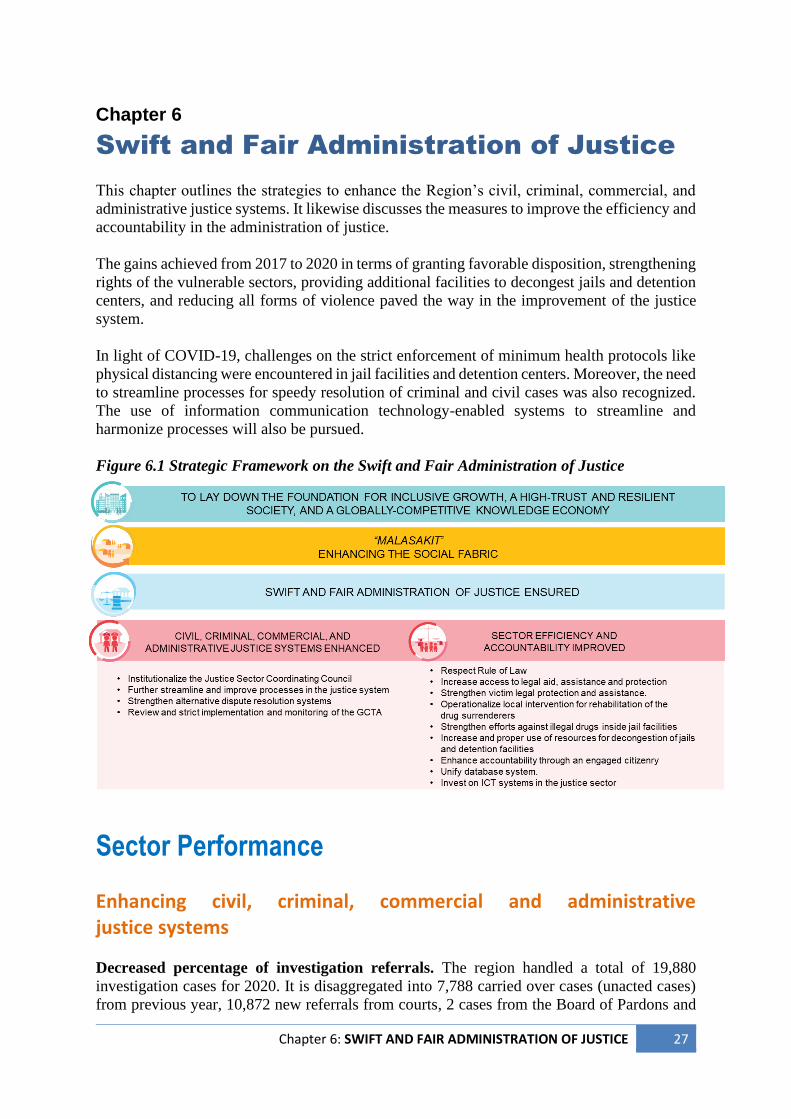
Chapter 6: SWIFT AND FAIR ADMINISTRATION OF JUSTICE 27
Chapter 6
Swift and Fair Administration of Justice
This chapter outlines the strategies to enhance the Region’s civil, criminal, commercial, and
administrative justice systems. It likewise discusses the measures to improve the efficiency and
accountability in the administration of justice.
The gains achieved from 2017 to 2020 in terms of granting favorable disposition, strengthening
rights of the vulnerable sectors, providing additional facilities to decongest jails and detention
centers, and reducing all forms of violence paved the way in the improvement of the justice
system.
In light of COVID-19, challenges on the strict enforcement of minimum health protocols like
physical distancing were encountered in jail facilities and detention centers. Moreover, the need
to streamline processes for speedy resolution of criminal and civil cases was also recognized.
The use of information communication technology-enabled systems to streamline and
harmonize processes will also be pursued.
Figure 6.1 Strategic Framework on the Swift and Fair Administration of Justice
Sector Performance Enhancing civil, criminal, commercial and administrative justice systems
Decreased percentage of investigation referrals. The region handled a total of 19,880
investigation cases for 2020. It is disaggregated into 7,788 carried over cases (unacted cases)
from previous year, 10,872 new referrals from courts, 2 cases from the Board of Pardons and
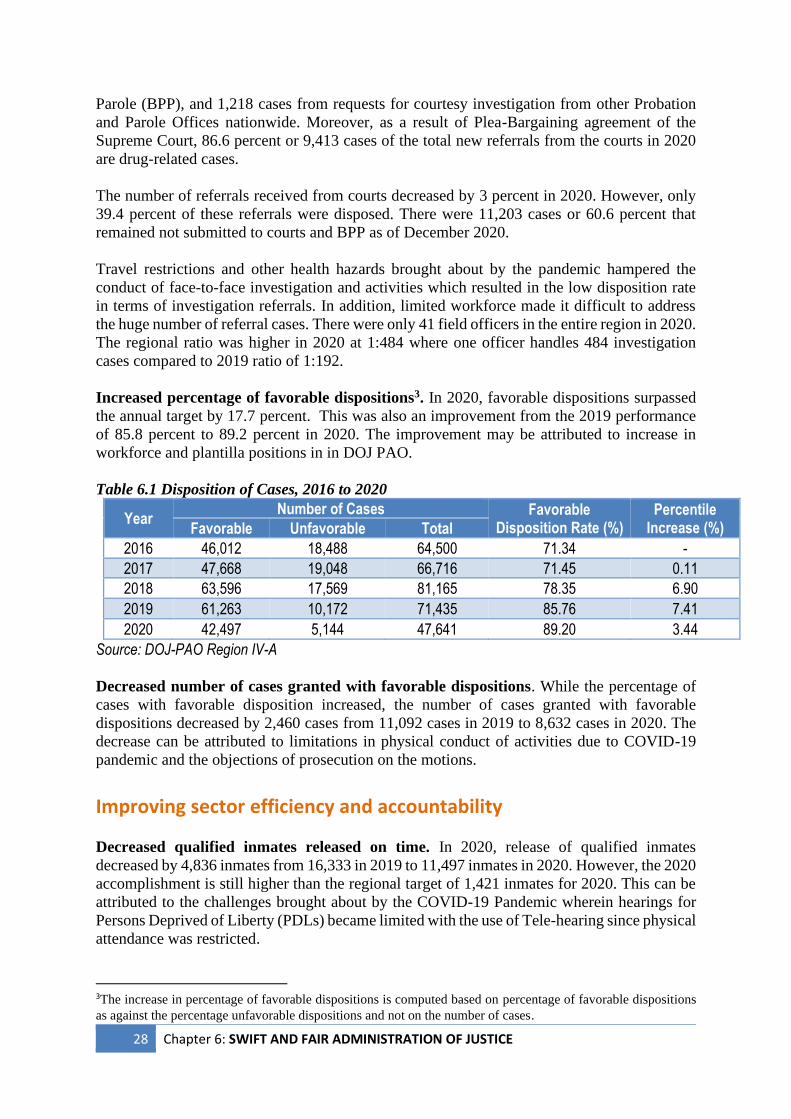
28 Chapter 6: SWIFT AND FAIR ADMINISTRATION OF JUSTICE
Parole (BPP), and 1,218 cases from requests for courtesy investigation from other Probation
and Parole Offices nationwide. Moreover, as a result of Plea-Bargaining agreement of the
Supreme Court, 86.6 percent or 9,413 cases of the total new referrals from the courts in 2020
are drug-related cases.
The number of referrals received from courts decreased by 3 percent in 2020. However, only
39.4 percent of these referrals were disposed. There were 11,203 cases or 60.6 percent that
remained not submitted to courts and BPP as of December 2020.
Travel restrictions and other health hazards brought about by the pandemic hampered the
conduct of face-to-face investigation and activities which resulted in the low disposition rate
in terms of investigation referrals. In addition, limited workforce made it difficult to address
the huge number of referral cases. There were only 41 field officers in the entire region in 2020.
The regional ratio was higher in 2020 at 1:484 where one officer handles 484 investigation
cases compared to 2019 ratio of 1:192.
Increased percentage of favorable dispositions3. In 2020, favorable dispositions surpassed
the annual target by 17.7 percent. This was also an improvement from the 2019 performance
of 85.8 percent to 89.2 percent in 2020. The improvement may be attributed to increase in
workforce and plantilla positions in in DOJ PAO.
Table 6.1 Disposition of Cases, 2016 to 2020
Year Number of Cases Favorable
Disposition Rate (%) Percentile
Increase (%) Favorable Unfavorable Total
2016 46,012 18,488 64,500 71.34 -
2017 47,668 19,048 66,716 71.45 0.11
2018 63,596 17,569 81,165 78.35 6.90
2019 61,263 10,172 71,435 85.76 7.41
2020 42,497 5,144 47,641 89.20 3.44
Source: DOJ-PAO Region IV-A
Decreased number of cases granted with favorable dispositions. While the percentage of
cases with favorable disposition increased, the number of cases granted with favorable
dispositions decreased by 2,460 cases from 11,092 cases in 2019 to 8,632 cases in 2020. The
decrease can be attributed to limitations in physical conduct of activities due to COVID-19
pandemic and the objections of prosecution on the motions.
Improving sector efficiency and accountability
Decreased qualified inmates released on time. In 2020, release of qualified inmates
decreased by 4,836 inmates from 16,333 in 2019 to 11,497 inmates in 2020. However, the 2020
accomplishment is still higher than the regional target of 1,421 inmates for 2020. This can be
attributed to the challenges brought about by the COVID-19 Pandemic wherein hearings for
Persons Deprived of Liberty (PDLs) became limited with the use of Tele-hearing since physical
attendance was restricted.
3The increase in percentage of favorable dispositions is computed based on percentage of favorable dispositions
as against the percentage unfavorable dispositions and not on the number of cases.
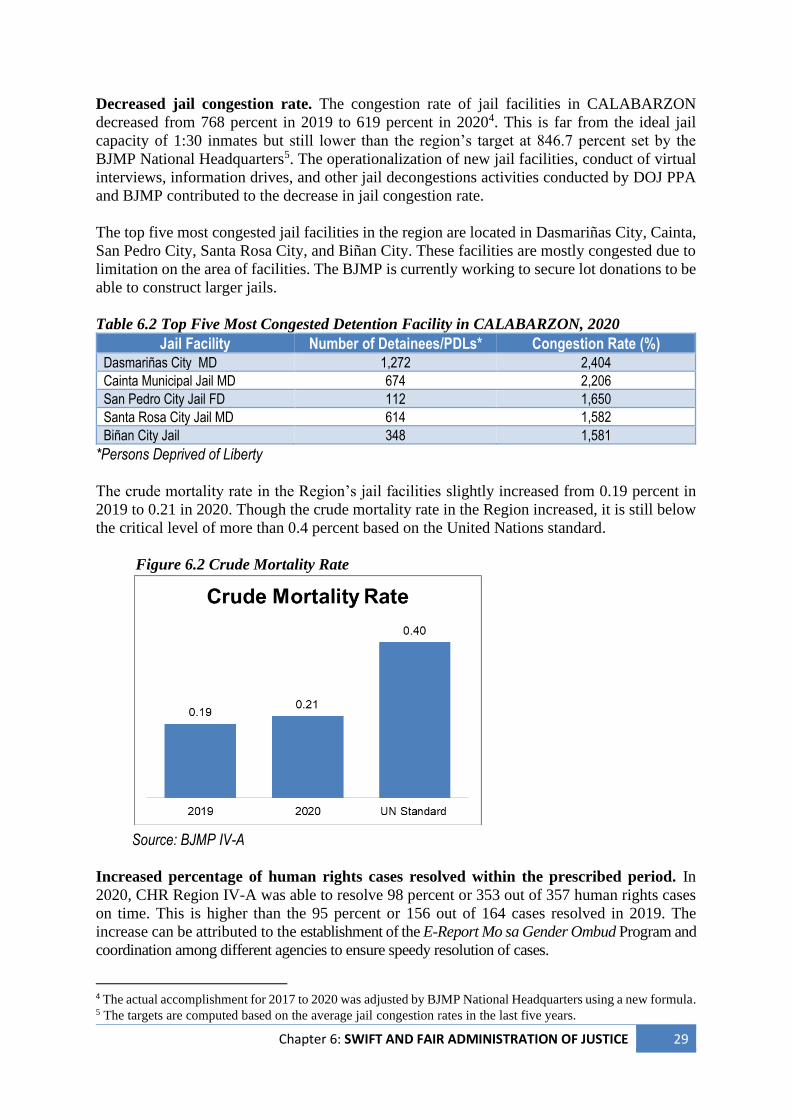
Chapter 6: SWIFT AND FAIR ADMINISTRATION OF JUSTICE 29
Decreased jail congestion rate. The congestion rate of jail facilities in CALABARZON
decreased from 768 percent in 2019 to 619 percent in 20204. This is far from the ideal jail
capacity of 1:30 inmates but still lower than the region’s target at 846.7 percent set by the
BJMP National Headquarters5. The operationalization of new jail facilities, conduct of virtual
interviews, information drives, and other jail decongestions activities conducted by DOJ PPA
and BJMP contributed to the decrease in jail congestion rate.
The top five most congested jail facilities in the region are located in Dasmariñas City, Cainta,
San Pedro City, Santa Rosa City, and Biñan City. These facilities are mostly congested due to
limitation on the area of facilities. The BJMP is currently working to secure lot donations to be
able to construct larger jails.
Table 6.2 Top Five Most Congested Detention Facility in CALABARZON, 2020
Jail Facility Number of Detainees/PDLs* Congestion Rate (%) Dasmariñas City MD 1,272 2,404 Cainta Municipal Jail MD 674 2,206 San Pedro City Jail FD 112 1,650 Santa Rosa City Jail MD 614 1,582 Biñan City Jail 348 1,581
*Persons Deprived of Liberty
The crude mortality rate in the Region’s jail facilities slightly increased from 0.19 percent in
2019 to 0.21 in 2020. Though the crude mortality rate in the Region increased, it is still below
the critical level of more than 0.4 percent based on the United Nations standard.
Figure 6.2 Crude Mortality Rate
Source: BJMP IV-A
Increased percentage of human rights cases resolved within the prescribed period. In
2020, CHR Region IV-A was able to resolve 98 percent or 353 out of 357 human rights cases
on time. This is higher than the 95 percent or 156 out of 164 cases resolved in 2019. The
increase can be attributed to the establishment of the E-Report Mo sa Gender Ombud Program and
coordination among different agencies to ensure speedy resolution of cases.
4 The actual accomplishment for 2017 to 2020 was adjusted by BJMP National Headquarters using a new formula. 5 The targets are computed based on the average jail congestion rates in the last five years.
30 Chapter 6: SWIFT AND FAIR ADMINISTRATION OF JUSTICE
Decrease in reoffending rate among convicted offenders. There was a decrease in the
reoffending rate among probationers, Juvenile in Conflict with the Law (JICL) and parolees
and pardonees from 0.41 percent or 40 clients out of 9,581 convicted offenders in 2019 to 0.33
percent or 44 clients out of 13,284 convicted offenders in 2020. The commitment and
dedication of DOJ PPA workforce in delivering services and activities to beneficiaries
contributed to the performance as well as the support of LGUs, agencies, and other
stakeholders.
Decreased rate of probationers, parolees, pardonees and CICL compliant to the terms
and conditions of probation or parole. A total of 13,284 probationers, parolees/pardonees
and Children in Conflict with the Law (CICLs) were supervised in 2020. Out of 13,284, only
11,325 or 92.78 percent has been compliant6 with the terms and conditions, a decrease of 6.2
percent from 2019 compliance rate of 98.99 percent. The decrease in their participation can be
attributed to the effects of pandemic such as limited mobility and suspension of face-to-face
interactions and other group activities.
Nonetheless, despite mobility restrictions due to COVID-19, continuous monitoring and
supervision were conducted following safety protocols by the 19 DOJ PPA field offices in the
region. The activities were facilitated through proper coordination with different Barangays for
the conduct of community service, use of social media and other online modes of
communications, and assistance of Volunteer Probation Assistants (VPAs).
Requests for free legal assistance/representation acted upon. All requests for free legal
assistance were acted upon within three working days from the date of requests from 2019 to
2020.
In 2020, the Quezon Province was able to provide legal representation for 16 active cases filed
in court, rendered legal counseling and advice to 321 clients, issued 529 opinions and
recommendations on local ordinances and resolutions, conducted 6 legal seminars to a total of
620 participants, reviewed 147 contract and 30 executive orders, circulars and issuances, and
developed 25 plans and strategies concerning the legal aspect of programs and projects of the
Provincial Government. All these were made possible through the availability of able and
competent legal officers and support staff, and institutionalized process for review of
documents.
Achieving Sustainable Development Goal (SDG) on just, peaceful, and inclusive societies.
In line with SDG Goal 16 which is to promote just, peaceful and inclusive societies, countries
are encouraged to promote the rule of law at the national and international levels, and ensure
equal access to justice for all. One of SDG 16’s target is to significantly reduce all forms of
violence and related death rates everywhere. In the region, the number of homicide and murder
cases as well as index crime rate went down in 2020 (See Chapter 18: Ensuring Security, Public
Order, and Safety).
Moreover, the number of reported gender-based violence cases including technology related-
violence against women and their children (e-VAW), and abuse cases for women and children
increased from 2019 to 2020. (See Chapter 22: Sustainable Development Goals).
6 The term compliance refers to the clients’ participation in various office-initiated activities and other intervention
geared towards their rehabilitation.
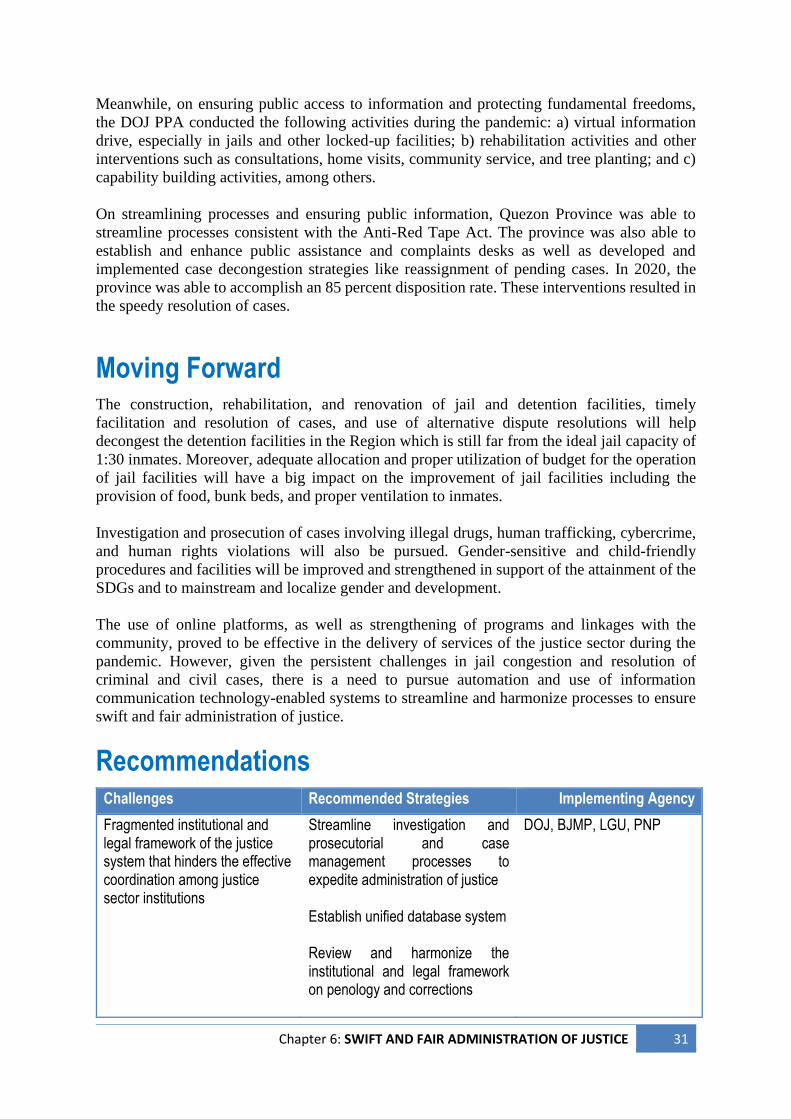
Chapter 6: SWIFT AND FAIR ADMINISTRATION OF JUSTICE 31
Meanwhile, on ensuring public access to information and protecting fundamental freedoms,
the DOJ PPA conducted the following activities during the pandemic: a) virtual information
drive, especially in jails and other locked-up facilities; b) rehabilitation activities and other
interventions such as consultations, home visits, community service, and tree planting; and c)
capability building activities, among others.
On streamlining processes and ensuring public information, Quezon Province was able to
streamline processes consistent with the Anti-Red Tape Act. The province was also able to
establish and enhance public assistance and complaints desks as well as developed and
implemented case decongestion strategies like reassignment of pending cases. In 2020, the
province was able to accomplish an 85 percent disposition rate. These interventions resulted in
the speedy resolution of cases.
Moving Forward The construction, rehabilitation, and renovation of jail and detention facilities, timely
facilitation and resolution of cases, and use of alternative dispute resolutions will help
decongest the detention facilities in the Region which is still far from the ideal jail capacity of
1:30 inmates. Moreover, adequate allocation and proper utilization of budget for the operation
of jail facilities will have a big impact on the improvement of jail facilities including the
provision of food, bunk beds, and proper ventilation to inmates.
Investigation and prosecution of cases involving illegal drugs, human trafficking, cybercrime,
and human rights violations will also be pursued. Gender-sensitive and child-friendly
procedures and facilities will be improved and strengthened in support of the attainment of the
SDGs and to mainstream and localize gender and development.
The use of online platforms, as well as strengthening of programs and linkages with the
community, proved to be effective in the delivery of services of the justice sector during the
pandemic. However, given the persistent challenges in jail congestion and resolution of
criminal and civil cases, there is a need to pursue automation and use of information
communication technology-enabled systems to streamline and harmonize processes to ensure
swift and fair administration of justice.
Recommendations Challenges Recommended Strategies Implementing Agency
Fragmented institutional and legal framework of the justice system that hinders the effective coordination among justice sector institutions
Streamline investigation and prosecutorial and case management processes to expedite administration of justice Establish unified database system Review and harmonize the institutional and legal framework on penology and corrections
DOJ, BJMP, LGU, PNP
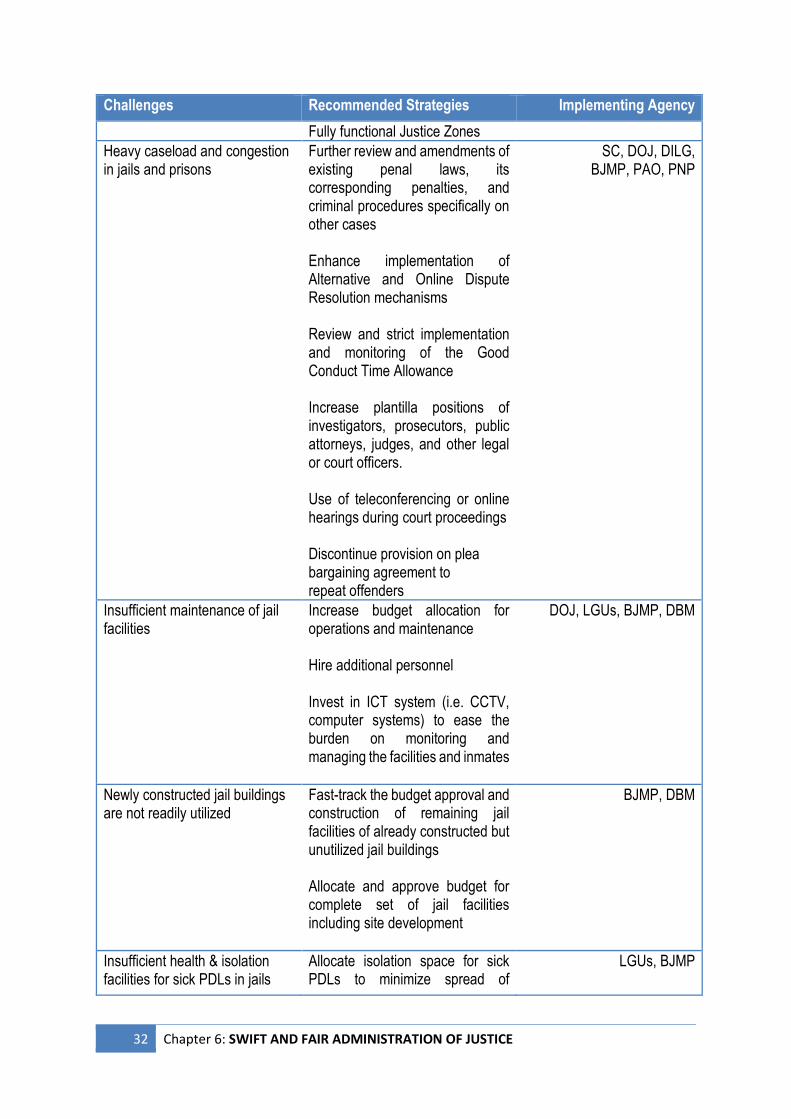
32 Chapter 6: SWIFT AND FAIR ADMINISTRATION OF JUSTICE
Challenges Recommended Strategies Implementing Agency
Fully functional Justice Zones
Heavy caseload and congestion in jails and prisons
Further review and amendments of existing penal laws, its corresponding penalties, and criminal procedures specifically on other cases Enhance implementation of Alternative and Online Dispute Resolution mechanisms Review and strict implementation and monitoring of the Good Conduct Time Allowance Increase plantilla positions of investigators, prosecutors, public attorneys, judges, and other legal or court officers. Use of teleconferencing or online hearings during court proceedings Discontinue provision on plea bargaining agreement to repeat offenders
SC, DOJ, DILG, BJMP, PAO, PNP
Insufficient maintenance of jail facilities
Increase budget allocation for operations and maintenance Hire additional personnel Invest in ICT system (i.e. CCTV, computer systems) to ease the burden on monitoring and managing the facilities and inmates
DOJ, LGUs, BJMP, DBM
Newly constructed jail buildings are not readily utilized
Fast-track the budget approval and construction of remaining jail facilities of already constructed but unutilized jail buildings Allocate and approve budget for complete set of jail facilities including site development
BJMP, DBM
Insufficient health & isolation facilities for sick PDLs in jails
Allocate isolation space for sick PDLs to minimize spread of
LGUs, BJMP
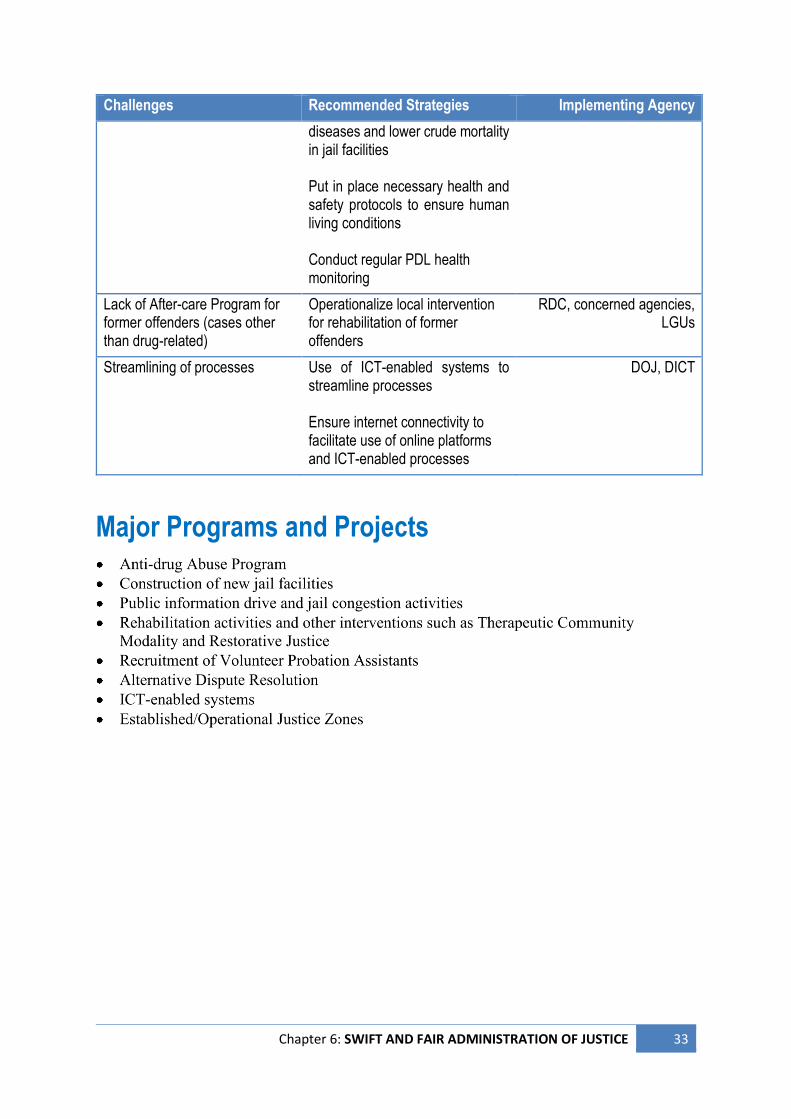
Chapter 6: SWIFT AND FAIR ADMINISTRATION OF JUSTICE 33
Challenges Recommended Strategies Implementing Agency
diseases and lower crude mortality in jail facilities Put in place necessary health and safety protocols to ensure human living conditions Conduct regular PDL health monitoring
Lack of After-care Program for former offenders (cases other than drug-related)
Operationalize local intervention for rehabilitation of former offenders
RDC, concerned agencies, LGUs
Streamlining of processes Use of ICT-enabled systems to streamline processes Ensure internet connectivity to facilitate use of online platforms and ICT-enabled processes
DOJ, DICT
Major Programs and Projects

34 Chapter 6: SWIFT AND FAIR ADMINISTRATION OF JUSTICE
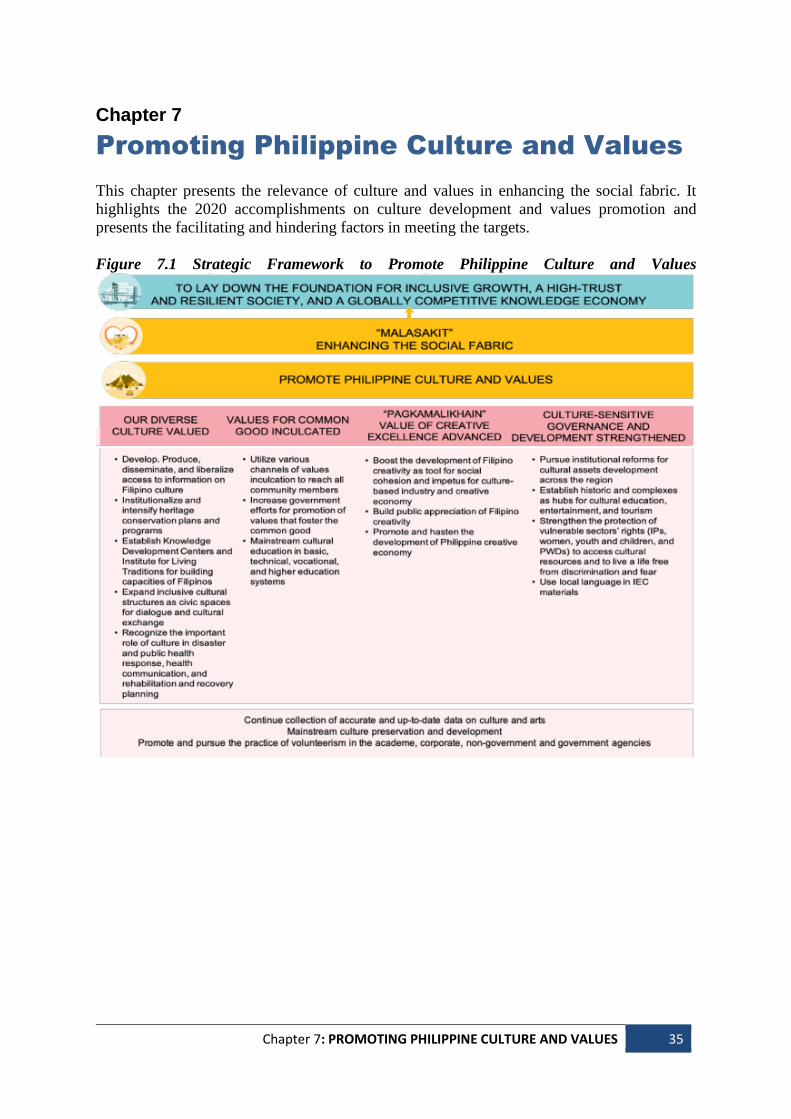
Chapter 7: PROMOTING PHILIPPINE CULTURE AND VALUES 35
Chapter 7
Promoting Philippine Culture and Values
This chapter presents the relevance of culture and values in enhancing the social fabric. It
highlights the 2020 accomplishments on culture development and values promotion and
presents the facilitating and hindering factors in meeting the targets.
Figure 7.1 Strategic Framework to Promote Philippine Culture and Values
36 Chapter 7: PROMOTING PHILIPPINE CULTURE AND VALUES
Accomplishments
Philippine culture and values promoted
Culture components included in development plans. The inclusion of the chapter on culture
development and values promotion in the CALABARZON RDP 2017-2022 contributed to the
mainstreaming of culture and values by recognizing its critical roles in development towards
inclusive and sustainable growth. The midterm updating of the plan in 2019 facilitated the
monitoring of the Region’s accomplishments in culture development and values promotion.
Strategies and policy recommendations served as guide to enhance and support the programs
of national government agencies and local government units in culture development and values
promotion up to present.
In 2020, the National Commission on Culture and Arts (NCCA) started developing the Culture
Response and Resiliency Plan (CRRP). As input to CRRP, NCCA conducted a rapid
assessment survey and stakeholder consultation in June to December 2020 to determine the
impact of the COVID-19 pandemic in the culture and arts sector. Island consultations were also
conducted in November to December 2020 to identify challenges and opportunities for the
sector.
Culture development was also integrated in the Provincial Development Plans of Batangas,
Cavite, and Laguna. The Province of Laguna has mainstreamed culture development in their
Provincial Tourism Development Plans.
As of 2020, there are 52 updated comprehensive development plans (CDPs) which integrated
culture development as compared to 54 CDPs in 2019. This is due to the outdated CDPs of two
municipalities in 2020. The CDP-Technical Assessment Committee ensured that culture and
arts were incorporated in the plans. The inclusion of culture and arts sub-area in the SGLG “all-
in” assessment criteria also contributed to the mainstreaming of culture and arts development
and related activities at the local level. The “all-in” criteria were implemented since 2019.
On the other hand, as of December 2020, there were 68 Comprehensive Land Use Plans that
were updated which have mainstreamed culture and arts as compared to 61 in 2019. The
creation of tourism, history, culture and arts councils, and the involvement of civil society
organizations in the preparation and review of the plan facilitated the integration of culture
development.
Our diverse cultures valued
IKSPs documented. Indigenous Knowledge System and Practices (IKSP) are local knowledge
developed over centuries of experimentation and are passed orally from generation to
generation. It was found to be an important catalyst to sustainable development due to their
direct connection to resource management and conservation. The NCCA documented one
IKSP for 2020, in addition to the three National Commission on Indigenous People’s (NCIP)
documented in 2019. The IKSP documented was Tuloy Po! Taka ng Paete, a video
Chapter 7: PROMOTING PHILIPPINE CULTURE AND VALUES 37
documentation featuring the traditional practice of taka or paper mache making in Paete,
Laguna.
Number of schools of living tradition increased. In 2020, NCCA is supporting one School
of Living Tradition (SLT) in Tanay Rizal. The SLT is located in the community of the
Dumagat Remontado in Brgy. Cuyambay, Tanay, Rizal. The SLT is focused on the teaching
of traditional weaving and “Bolos” Dumagat language.
Inculcating values that foster the common good. Understanding Filipino values is key in
defining and making sense of people’s social and behavioral patterns, and strengthening
common identity towards national and regional goals. NCCA completed the study to identify
the core and sectoral Filipino values. Results of the national study identified 19 core values.
The following are the top five core values of the CALABARZON Region: 1) health and
wellness; 2) family; 3) education; 4) work and livelihood; and 5) self.
Cities and municipalities with cultural mapping increased. Cultural mapping is a tool to
document and identify tangible and intangible assets in the community. The number of LGUs
with cultural mapping increased to 16 in 2020 from 7 in 2019. Of the 16 LGUs, Santa Rosa
City, Biñan City, and Imus City have already submitted their local culture profiles to NCCA.
Meanwhile, the LGUs with ongoing cultural mapping project are: 1) San Pablo City; 2)
Calamba City; 3) Tanauan City; 4) Infanta, Quezon; 5) Real, Quezon; 6) Rodriguez, Rizal; 7)
Tanay, Rizal; 8) Pitogo, Quezon; 9) Alaminos, Laguna; 10) Lipa City; 11) Maragondon,
Cavite; 12) Tagkawayan, Quezon; and 13) Pililla, Rizal. The increase can be attributed to the
technical assistance provided by the NCCA on the conduct of cultural mapping and the capacity
building for the cultural mapping teams.
Number of local festivities increased. Festivities are events which are celebrated by a
community and center some characteristic aspect of that community and its religion or culture.
In 2020, local festivities in Cavite, Laguna, and Batangas decreased due to COVID-19
community quarantine restrictions, while Rizal only featured their cultural activities and
festivities through online via Rizal Province’s Facebook Page. For Batangas Province, the
eruption of the Taal Volcano hampered the celebration local festivities. The different
e-festivities are part of the annual festivals of LGUs in cooperation with culture and arts
councils, civil society organizations, private sectors, and academe.
Pagkamalikhain values of creative excellence advanced Established arts organizations and councils increased. Total number of local culture and
arts council and arts organization in the provinces remained at 82 from 2019 to 2020. LGUs
need to establish and maintain a local culture and arts council and arts organization that would
facilitate formulation of programs, and recommend development and sustainability of local
culture and arts.
Cultural sites identified. As of 2020, there are 432 identified cultural sites in the region from
387 in 2019. The increase was due to the additional cultural sites declared in the Province of
Laguna. The identification of cultural sites adds character and distinctiveness to an area
while heritage is an essential element in creating a 'sense of place' for a community. Data on
cultural sites can also be used in policy recommendation and community planning and
development.
38 Chapter 7: PROMOTING PHILIPPINE CULTURE AND VALUES
Arts academies and schools established. There were five additional arts academies and
schools which implemented a special curriculum for the arts established in 2020 compared to
three in 2019. These are: a) Batangas Province High School for Culture and Arts; b) Calamba
City School for the Arts; c) Regional Lead School for the Arts in Angono, Rizal; d) Jose Rizal
Memorial School in Calamba City; and e) Batangas City High School for the Arts. The
establishment of arts academies and schools will aid in the improvement and popularization of
Filipino culture. Inclusion of culture and arts in the school curriculum, capacity building and
training of teaching personnel and enhancement of the learning materials will encourage the
youth to enroll in cultural and arts programs and attend in cultural activities.
Culture-sensitive public governance and development strengthened
Formal agreements for cultural initiatives created. There were six agreements entered into
by the NCCA in 2020 in support to the cultural initiatives in the region. NCCA approved grants
for the projects on Bulihan NHS E-Librarywith Bulihan National High School and
establishment of Mauban Studies Center in LGU Mauban, Quezon. It also entered into
agreements with the following LGUs for the conduct of Cultural Mapping Activities: a) Tanay,
Rizal; b) Rodriguez, Rizal; c) Infanta, Quezon; and d) San Pablo City. Other on-going and
proposed cultural initiatives of NCCA in 2020 included Likmuan, which is the third phase of
implementation of Intangible Cultural Heritage Program. It entails the publication of a
compendium of lesson exemplars adapting authentic appropriate and culture-based intangible
cultural knowledge which are aligned with the competencies of the Department of Education
for basic education program.
Two film showing activities were conducted in 2020- the PELIKULTURA and the Bernardo
Carpio. PELIKULTURA is the CALABARZON Film Festival that aimed to continuously
provide venue for networking and film exhibition for Region IV-A’s budding and experienced
filmmakers to continue filmmaking endeavors. The film festival was conducted in the
University of the Philippines Los Baños. Meanwhile, the Bernardo Carpio is an animated short
film in Rizal Province premiered in November 2020 which aimed to regain current generation’s
interest in its own culture and heritage by giving a modern update through animated film. It
also intends to reach schools and communities through school tour animation and film
workshops.
On November 17, 2020, the NCCA in collaboration with CALABARZON Regional
Development Council conducted a Webinar on Filipino Culture and Values entitled, "A Culture
that Heals: NCCA-RDC Webinar on Filipino Culture and Values in Time of Pandemic.” The
activity was attended by LGUs, SUCs, and RLAs.
Number of required municipalities, cities, and provinces with Indigenous Peoples
Mandatory Representation (IPMR) increased. The IP mandatory representation will provide
support in sustaining the constitution and operations of the Indigenous Peoples Consultative
Body at the barangay, municipal, city, and provincial levels. In 2020, there were six additional
IPMR with Certificates of Affirmation. As per NCIP guidelines, the IPMR has a term of three
years and shall be in line with the Local Gabay. The 12 IPMRs in 2019 will end their term in
2021-2022.
Awarding and incentives system for cultural initiatives established. For 2020, the LGUs
with institutionalized awarding and incentive system for cultural initiatives remained the same
as in 2019. These are the Province of Batangas with the Batangas Culture and Arts Council
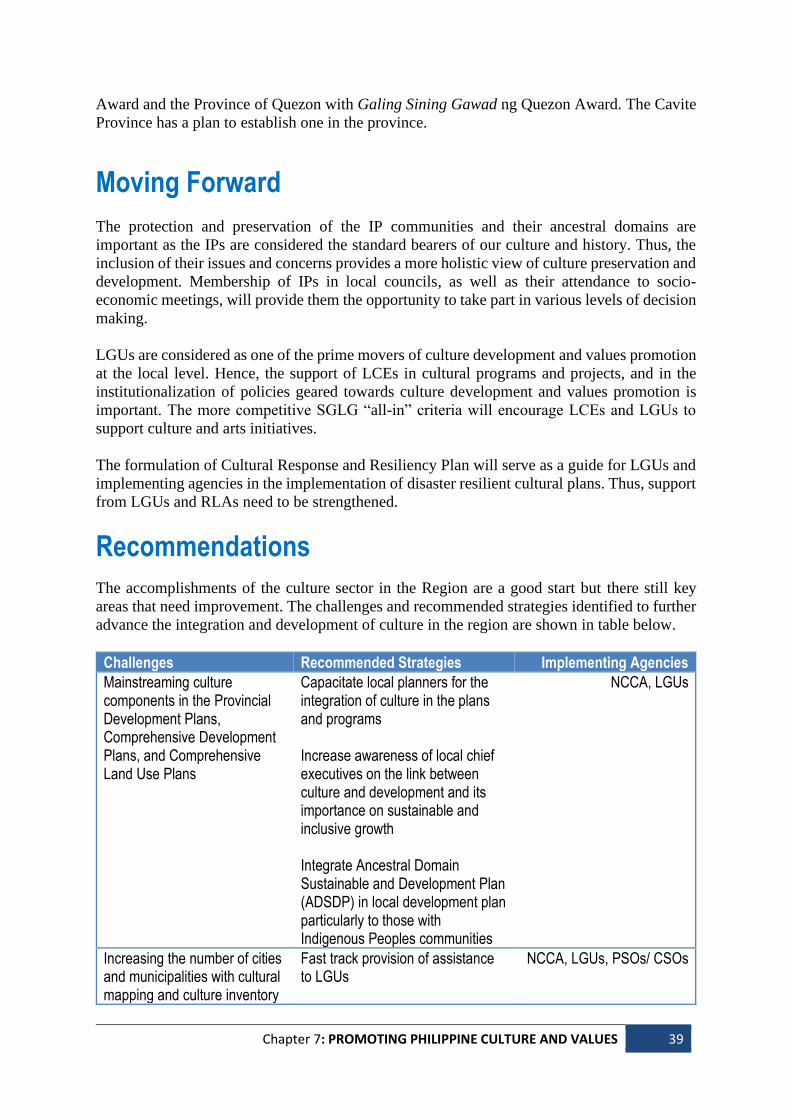
Chapter 7: PROMOTING PHILIPPINE CULTURE AND VALUES 39
Award and the Province of Quezon with Galing Sining Gawad ng Quezon Award. The Cavite
Province has a plan to establish one in the province.
Moving Forward
The protection and preservation of the IP communities and their ancestral domains are
important as the IPs are considered the standard bearers of our culture and history. Thus, the
inclusion of their issues and concerns provides a more holistic view of culture preservation and
development. Membership of IPs in local councils, as well as their attendance to socio-
economic meetings, will provide them the opportunity to take part in various levels of decision
making.
LGUs are considered as one of the prime movers of culture development and values promotion
at the local level. Hence, the support of LCEs in cultural programs and projects, and in the
institutionalization of policies geared towards culture development and values promotion is
important. The more competitive SGLG “all-in” criteria will encourage LCEs and LGUs to
support culture and arts initiatives.
The formulation of Cultural Response and Resiliency Plan will serve as a guide for LGUs and
implementing agencies in the implementation of disaster resilient cultural plans. Thus, support
from LGUs and RLAs need to be strengthened.
Recommendations
The accomplishments of the culture sector in the Region are a good start but there still key
areas that need improvement. The challenges and recommended strategies identified to further
advance the integration and development of culture in the region are shown in table below.
Challenges Recommended Strategies Implementing Agencies
Mainstreaming culture components in the Provincial Development Plans, Comprehensive Development Plans, and Comprehensive Land Use Plans
Capacitate local planners for the integration of culture in the plans and programs Increase awareness of local chief executives on the link between culture and development and its importance on sustainable and inclusive growth Integrate Ancestral Domain Sustainable and Development Plan (ADSDP) in local development plan particularly to those with Indigenous Peoples communities
NCCA, LGUs
Increasing the number of cities and municipalities with cultural mapping and culture inventory
Fast track provision of assistance to LGUs
NCCA, LGUs, PSOs/ CSOs
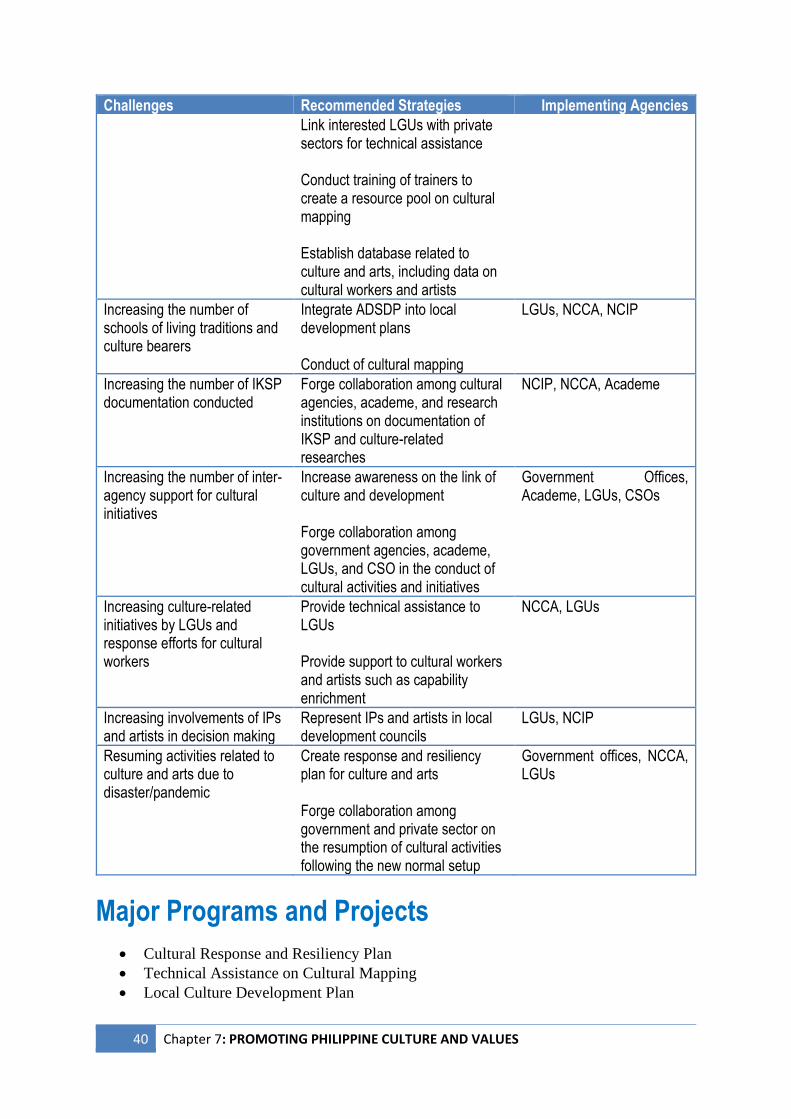
40 Chapter 7: PROMOTING PHILIPPINE CULTURE AND VALUES
Challenges Recommended Strategies Implementing Agencies
Link interested LGUs with private sectors for technical assistance Conduct training of trainers to create a resource pool on cultural mapping Establish database related to culture and arts, including data on cultural workers and artists
Increasing the number of schools of living traditions and culture bearers
Integrate ADSDP into local development plans Conduct of cultural mapping
LGUs, NCCA, NCIP
Increasing the number of IKSP documentation conducted
Forge collaboration among cultural agencies, academe, and research institutions on documentation of IKSP and culture-related researches
NCIP, NCCA, Academe
Increasing the number of inter-agency support for cultural initiatives
Increase awareness on the link of culture and development Forge collaboration among government agencies, academe, LGUs, and CSO in the conduct of cultural activities and initiatives
Government Offices, Academe, LGUs, CSOs
Increasing culture-related initiatives by LGUs and response efforts for cultural workers
Provide technical assistance to LGUs Provide support to cultural workers and artists such as capability enrichment
NCCA, LGUs
Increasing involvements of IPs and artists in decision making
Represent IPs and artists in local development councils
LGUs, NCIP
Resuming activities related to culture and arts due to disaster/pandemic
Create response and resiliency plan for culture and arts Forge collaboration among government and private sector on the resumption of cultural activities following the new normal setup
Government offices, NCCA, LGUs
Major Programs and Projects
• Cultural Response and Resiliency Plan
• Technical Assistance on Cultural Mapping
• Local Culture Development Plan
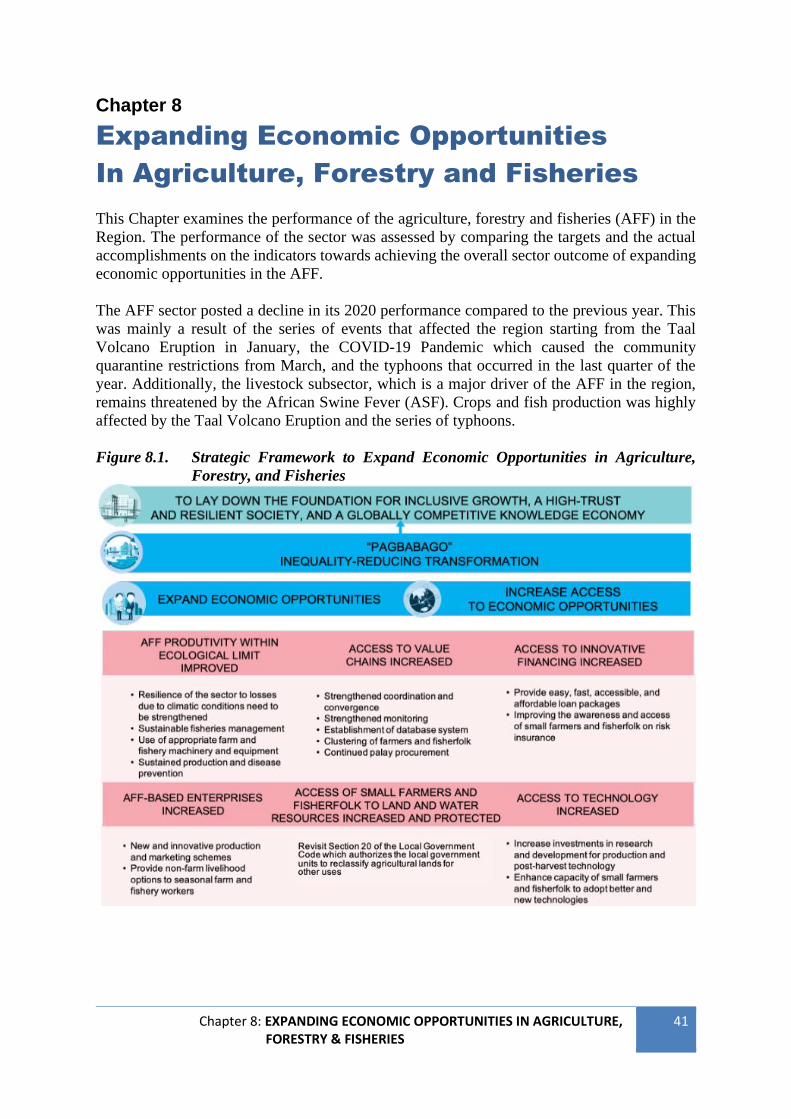
Chapter 8: EXPANDING ECONOMIC OPPORTUNITIES IN AGRICULTURE, FORESTRY & FISHERIES
41
Chapter 8
Expanding Economic Opportunities
In Agriculture, Forestry and Fisheries
This Chapter examines the performance of the agriculture, forestry and fisheries (AFF) in the
Region. The performance of the sector was assessed by comparing the targets and the actual
accomplishments on the indicators towards achieving the overall sector outcome of expanding
economic opportunities in the AFF.
The AFF sector posted a decline in its 2020 performance compared to the previous year. This
was mainly a result of the series of events that affected the region starting from the Taal
Volcano Eruption in January, the COVID-19 Pandemic which caused the community
quarantine restrictions from March, and the typhoons that occurred in the last quarter of the
year. Additionally, the livestock subsector, which is a major driver of the AFF in the region,
remains threatened by the African Swine Fever (ASF). Crops and fish production was highly
affected by the Taal Volcano Eruption and the series of typhoons.
Figure 8.1. Strategic Framework to Expand Economic Opportunities in Agriculture,
Forestry, and Fisheries
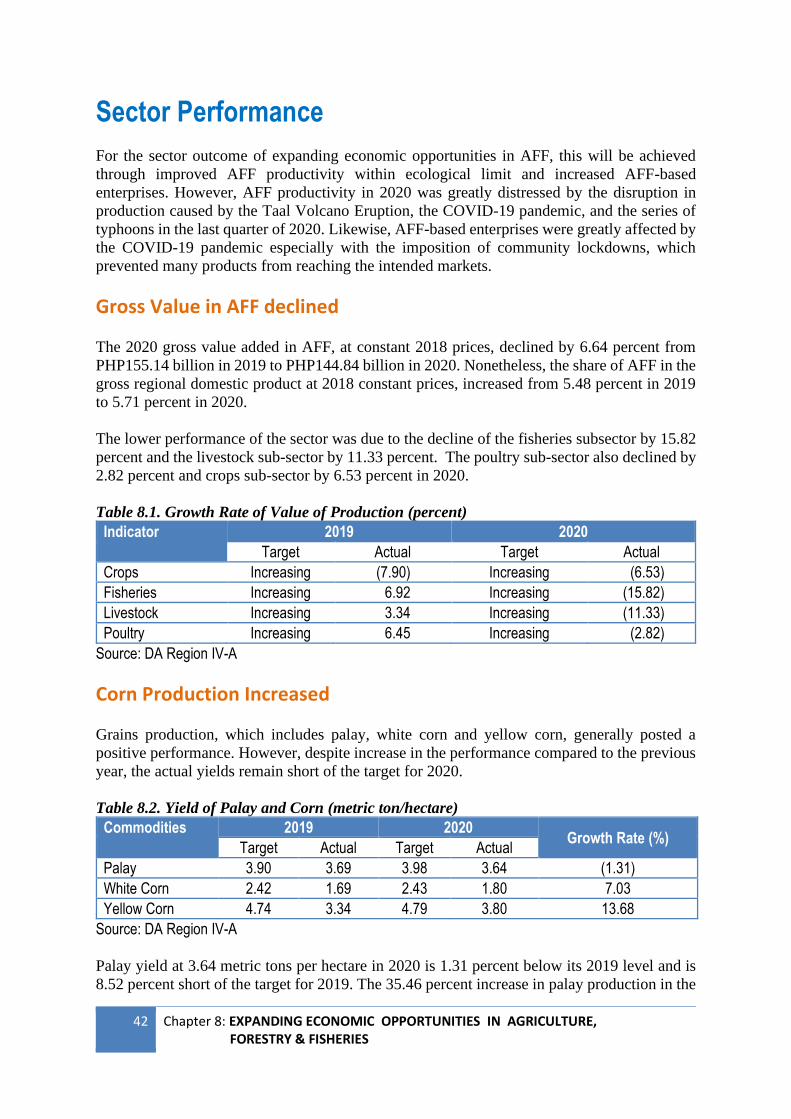
42 Chapter 8: EXPANDING ECONOMIC OPPORTUNITIES IN AGRICULTURE, FORESTRY & FISHERIES
Sector Performance
For the sector outcome of expanding economic opportunities in AFF, this will be achieved
through improved AFF productivity within ecological limit and increased AFF-based
enterprises. However, AFF productivity in 2020 was greatly distressed by the disruption in
production caused by the Taal Volcano Eruption, the COVID-19 pandemic, and the series of
typhoons in the last quarter of 2020. Likewise, AFF-based enterprises were greatly affected by
the COVID-19 pandemic especially with the imposition of community lockdowns, which
prevented many products from reaching the intended markets.
Gross Value in AFF declined
The 2020 gross value added in AFF, at constant 2018 prices, declined by 6.64 percent from
PHP155.14 billion in 2019 to PHP144.84 billion in 2020. Nonetheless, the share of AFF in the
gross regional domestic product at 2018 constant prices, increased from 5.48 percent in 2019
to 5.71 percent in 2020.
The lower performance of the sector was due to the decline of the fisheries subsector by 15.82
percent and the livestock sub-sector by 11.33 percent. The poultry sub-sector also declined by
2.82 percent and crops sub-sector by 6.53 percent in 2020.
Table 8.1. Growth Rate of Value of Production (percent)
Indicator 2019 2020
Target Actual Target Actual
Crops Increasing (7.90) Increasing (6.53)
Fisheries Increasing 6.92 Increasing (15.82)
Livestock Increasing 3.34 Increasing (11.33)
Poultry Increasing 6.45 Increasing (2.82)
Source: DA Region IV-A
Corn Production Increased
Grains production, which includes palay, white corn and yellow corn, generally posted a
positive performance. However, despite increase in the performance compared to the previous
year, the actual yields remain short of the target for 2020.
Table 8.2. Yield of Palay and Corn (metric ton/hectare)
Commodities 2019 2020 Growth Rate (%)
Target Actual Target Actual
Palay 3.90 3.69 3.98 3.64 (1.31)
White Corn 2.42 1.69 2.43 1.80 7.03
Yellow Corn 4.74 3.34 4.79 3.80 13.68
Source: DA Region IV-A
Palay yield at 3.64 metric tons per hectare in 2020 is 1.31 percent below its 2019 level and is
8.52 percent short of the target for 2019. The 35.46 percent increase in palay production in the
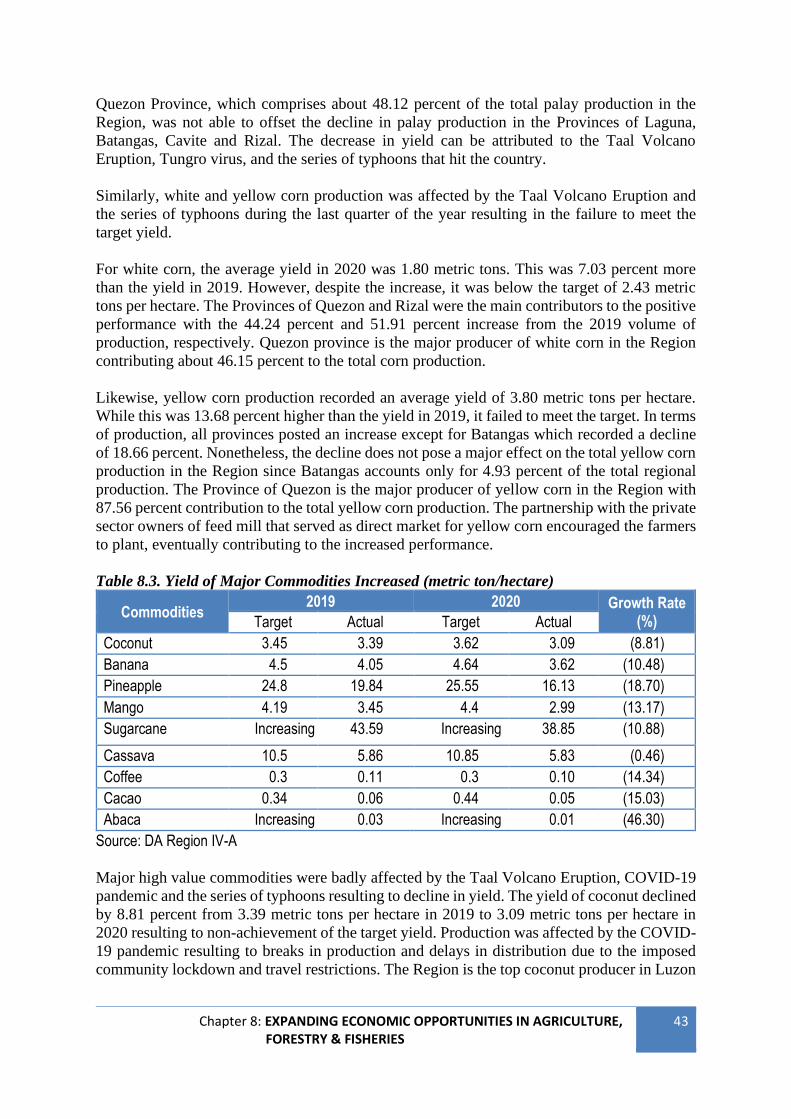
Chapter 8: EXPANDING ECONOMIC OPPORTUNITIES IN AGRICULTURE, FORESTRY & FISHERIES
43
Quezon Province, which comprises about 48.12 percent of the total palay production in the
Region, was not able to offset the decline in palay production in the Provinces of Laguna,
Batangas, Cavite and Rizal. The decrease in yield can be attributed to the Taal Volcano
Eruption, Tungro virus, and the series of typhoons that hit the country.
Similarly, white and yellow corn production was affected by the Taal Volcano Eruption and
the series of typhoons during the last quarter of the year resulting in the failure to meet the
target yield.
For white corn, the average yield in 2020 was 1.80 metric tons. This was 7.03 percent more
than the yield in 2019. However, despite the increase, it was below the target of 2.43 metric
tons per hectare. The Provinces of Quezon and Rizal were the main contributors to the positive
performance with the 44.24 percent and 51.91 percent increase from the 2019 volume of
production, respectively. Quezon province is the major producer of white corn in the Region
contributing about 46.15 percent to the total corn production.
Likewise, yellow corn production recorded an average yield of 3.80 metric tons per hectare.
While this was 13.68 percent higher than the yield in 2019, it failed to meet the target. In terms
of production, all provinces posted an increase except for Batangas which recorded a decline
of 18.66 percent. Nonetheless, the decline does not pose a major effect on the total yellow corn
production in the Region since Batangas accounts only for 4.93 percent of the total regional
production. The Province of Quezon is the major producer of yellow corn in the Region with
87.56 percent contribution to the total yellow corn production. The partnership with the private
sector owners of feed mill that served as direct market for yellow corn encouraged the farmers
to plant, eventually contributing to the increased performance.
Table 8.3. Yield of Major Commodities Increased (metric ton/hectare)
Commodities 2019 2020 Growth Rate
(%) Target Actual Target Actual
Coconut 3.45 3.39 3.62 3.09 (8.81)
Banana 4.5 4.05 4.64 3.62 (10.48)
Pineapple 24.8 19.84 25.55 16.13 (18.70)
Mango 4.19 3.45 4.4 2.99 (13.17)
Sugarcane Increasing 43.59 Increasing 38.85 (10.88)
Cassava 10.5 5.86 10.85 5.83 (0.46)
Coffee 0.3 0.11 0.3 0.10 (14.34)
Cacao 0.34 0.06 0.44 0.05 (15.03)
Abaca Increasing 0.03 Increasing 0.01 (46.30)
Source: DA Region IV-A
Major high value commodities were badly affected by the Taal Volcano Eruption, COVID-19
pandemic and the series of typhoons resulting to decline in yield. The yield of coconut declined
by 8.81 percent from 3.39 metric tons per hectare in 2019 to 3.09 metric tons per hectare in
2020 resulting to non-achievement of the target yield. Production was affected by the COVID-
19 pandemic resulting to breaks in production and delays in distribution due to the imposed
community lockdown and travel restrictions. The Region is the top coconut producer in Luzon
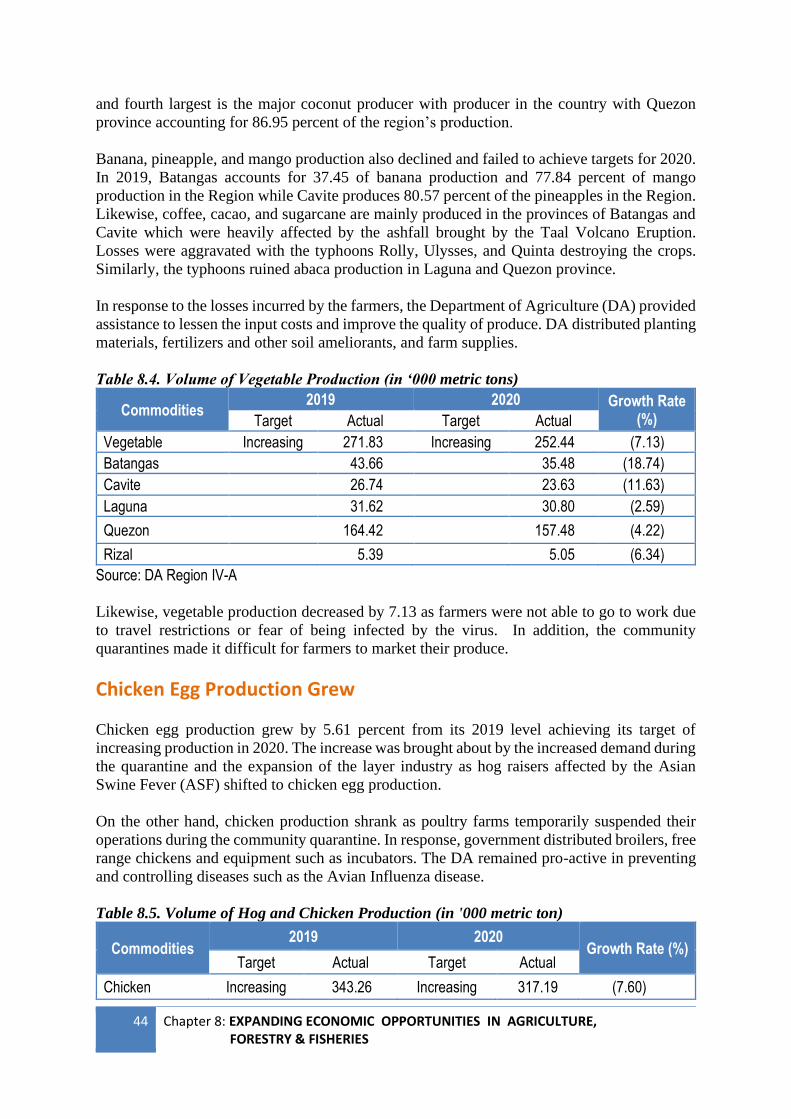
44 Chapter 8: EXPANDING ECONOMIC OPPORTUNITIES IN AGRICULTURE, FORESTRY & FISHERIES
and fourth largest is the major coconut producer with producer in the country with Quezon
province accounting for 86.95 percent of the region’s production.
Banana, pineapple, and mango production also declined and failed to achieve targets for 2020.
In 2019, Batangas accounts for 37.45 of banana production and 77.84 percent of mango
production in the Region while Cavite produces 80.57 percent of the pineapples in the Region.
Likewise, coffee, cacao, and sugarcane are mainly produced in the provinces of Batangas and
Cavite which were heavily affected by the ashfall brought by the Taal Volcano Eruption.
Losses were aggravated with the typhoons Rolly, Ulysses, and Quinta destroying the crops.
Similarly, the typhoons ruined abaca production in Laguna and Quezon province.
In response to the losses incurred by the farmers, the Department of Agriculture (DA) provided
assistance to lessen the input costs and improve the quality of produce. DA distributed planting
materials, fertilizers and other soil ameliorants, and farm supplies.
Table 8.4. Volume of Vegetable Production (in ‘000 metric tons)
Commodities 2019 2020 Growth Rate
(%) Target Actual Target Actual
Vegetable Increasing 271.83 Increasing 252.44 (7.13)
Batangas 43.66 35.48 (18.74)
Cavite 26.74 23.63 (11.63)
Laguna 31.62 30.80 (2.59)
Quezon 164.42 157.48 (4.22)
Rizal 5.39 5.05 (6.34)
Source: DA Region IV-A
Likewise, vegetable production decreased by 7.13 as farmers were not able to go to work due
to travel restrictions or fear of being infected by the virus. In addition, the community
quarantines made it difficult for farmers to market their produce.
Chicken Egg Production Grew
Chicken egg production grew by 5.61 percent from its 2019 level achieving its target of
increasing production in 2020. The increase was brought about by the increased demand during
the quarantine and the expansion of the layer industry as hog raisers affected by the Asian
Swine Fever (ASF) shifted to chicken egg production.
On the other hand, chicken production shrank as poultry farms temporarily suspended their
operations during the community quarantine. In response, government distributed broilers, free
range chickens and equipment such as incubators. The DA remained pro-active in preventing
and controlling diseases such as the Avian Influenza disease.
Table 8.5. Volume of Hog and Chicken Production (in '000 metric ton)
Commodities 2019 2020
Growth Rate (%) Target Actual Target Actual
Chicken Increasing 343.26 Increasing 317.19 (7.60)
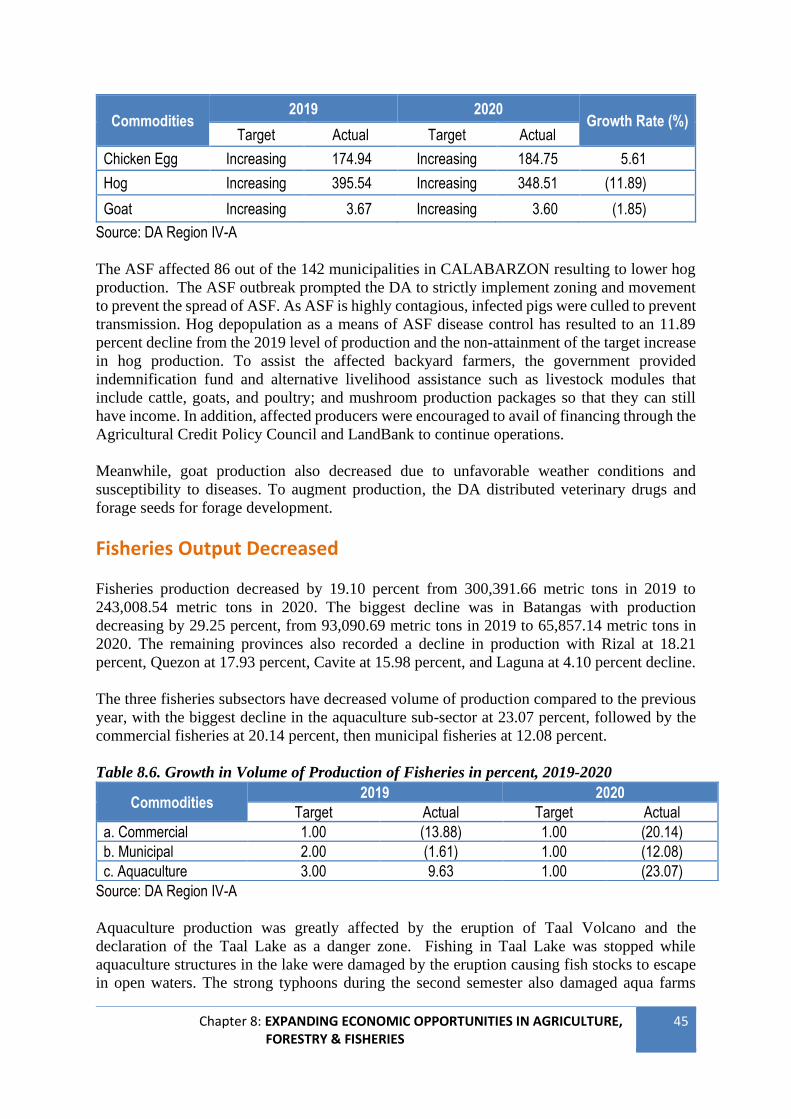
Chapter 8: EXPANDING ECONOMIC OPPORTUNITIES IN AGRICULTURE, FORESTRY & FISHERIES
45
Commodities 2019 2020
Growth Rate (%) Target Actual Target Actual
Chicken Egg Increasing 174.94 Increasing 184.75 5.61
Hog Increasing 395.54 Increasing 348.51 (11.89)
Goat Increasing 3.67 Increasing 3.60 (1.85)
Source: DA Region IV-A
The ASF affected 86 out of the 142 municipalities in CALABARZON resulting to lower hog
production. The ASF outbreak prompted the DA to strictly implement zoning and movement
to prevent the spread of ASF. As ASF is highly contagious, infected pigs were culled to prevent
transmission. Hog depopulation as a means of ASF disease control has resulted to an 11.89
percent decline from the 2019 level of production and the non-attainment of the target increase
in hog production. To assist the affected backyard farmers, the government provided
indemnification fund and alternative livelihood assistance such as livestock modules that
include cattle, goats, and poultry; and mushroom production packages so that they can still
have income. In addition, affected producers were encouraged to avail of financing through the
Agricultural Credit Policy Council and LandBank to continue operations.
Meanwhile, goat production also decreased due to unfavorable weather conditions and
susceptibility to diseases. To augment production, the DA distributed veterinary drugs and
forage seeds for forage development.
Fisheries Output Decreased
Fisheries production decreased by 19.10 percent from 300,391.66 metric tons in 2019 to
243,008.54 metric tons in 2020. The biggest decline was in Batangas with production
decreasing by 29.25 percent, from 93,090.69 metric tons in 2019 to 65,857.14 metric tons in
2020. The remaining provinces also recorded a decline in production with Rizal at 18.21
percent, Quezon at 17.93 percent, Cavite at 15.98 percent, and Laguna at 4.10 percent decline.
The three fisheries subsectors have decreased volume of production compared to the previous
year, with the biggest decline in the aquaculture sub-sector at 23.07 percent, followed by the
commercial fisheries at 20.14 percent, then municipal fisheries at 12.08 percent.
Table 8.6. Growth in Volume of Production of Fisheries in percent, 2019-2020
Source: DA Region IV-A
Aquaculture production was greatly affected by the eruption of Taal Volcano and the
declaration of the Taal Lake as a danger zone. Fishing in Taal Lake was stopped while
aquaculture structures in the lake were damaged by the eruption causing fish stocks to escape
in open waters. The strong typhoons during the second semester also damaged aqua farms
Commodities 2019 2020
Target Actual Target Actual
a. Commercial 1.00 (13.88) 1.00 (20.14)
b. Municipal 2.00 (1.61) 1.00 (12.08)
c. Aquaculture 3.00 9.63 1.00 (23.07)
46 Chapter 8: EXPANDING ECONOMIC OPPORTUNITIES IN AGRICULTURE, FORESTRY & FISHERIES
resulting to losses in stocks. However, fish stocks from aqua farms were dispersed in other
bodies of water so that they can be caught by municipal fishermen.
The production of commercial fisheries, or fishing done in offshore waters using fishing vessels
of more than three gross, have also decreased mainly in Quezon province at 27.16 percent
reduction in catch. There were also recorded decline in the provinces of Batangas and Cavite
at 2.82 and 4.11 percent, respectively. The intensified enforcement of fishery law limited the
fishing of commercial fishers in the municipal waters which contributed to the drop in
commercial fisheries production. In addition, the strict quarantine protocols in the different
localities due to the COVID-19 pandemic limited the movement of some crews in commercial
fisheries.
Similarly, the volume of municipal fisheries or those fishing done in inland and coastal areas
with or without the use of a fishing boat of up to three gross tons have declined in 2020. The
highest decline recorded was in Quezon Province at 22.05 percent, followed by the Rizal and
Batangas Provinces at 19.80 and 19.47 percent, respectively. There was also an observed
decline in Cavite Province at 4.25 percent reduction from the 2019 level. On the other hand,
Laguna Province posted an increase in production of about 0.64 percent. The decline in
municipal fisheries production was due to the frequent occurrence of typhoons and gale
warnings which prohibited municipal fishermen from fishing. The COVID-19 pandemic has
also affected municipal fishing as municipal fishers have limited movement given the stricter
quarantine protocols and there are few buyers of fish and fish products which prompted
fisherfolks to limit their operation for own food consumption. While inland municipal
fishermen were reported to have higher catch during the onslaught of typhoons Quinta, Rolly
and Ulysses during the last quarter of 2020 due to escapement of fishes from cages and pens,
these were not properly noted in the official reports.
In terms of priority fishery commodities, tiger prawns and white shrimp production have
increased by 34.45 and 48.39 percent, respectively. On the other hand, while total bangus
production declined, production in the provinces of Cavite, Laguna, and Quezon have increased
from 2019 level. However, despite the positive performance of these commodities, the
increases in production were not sufficient to meet the target production for 2020.
Ecological Limit Maintained
Production forest which includes tree plantation and non-timber forest products must be
increased to ensure that productivity enhancements will be attained within the ecological limit
and will sustain benefits. The area within production forest, for tree plantation and non-timber
forest products, is equivalent to 1,430 hectares and 4,340 hectares, respectively. The area is the
same since 2018 considering that the region has no more target for tree plantation starting 2019,
and Rattan and Bamboo planting in 2020.
Technical Support Services Increased
Technical support services provided to livestock producers group beneficiaries and fisherfolks
in 2020 increased by 79.37 and 59.28 percent, respectively. The increase in services resulted
to the attainment of the target for 2020. Production support services in fisheries include input
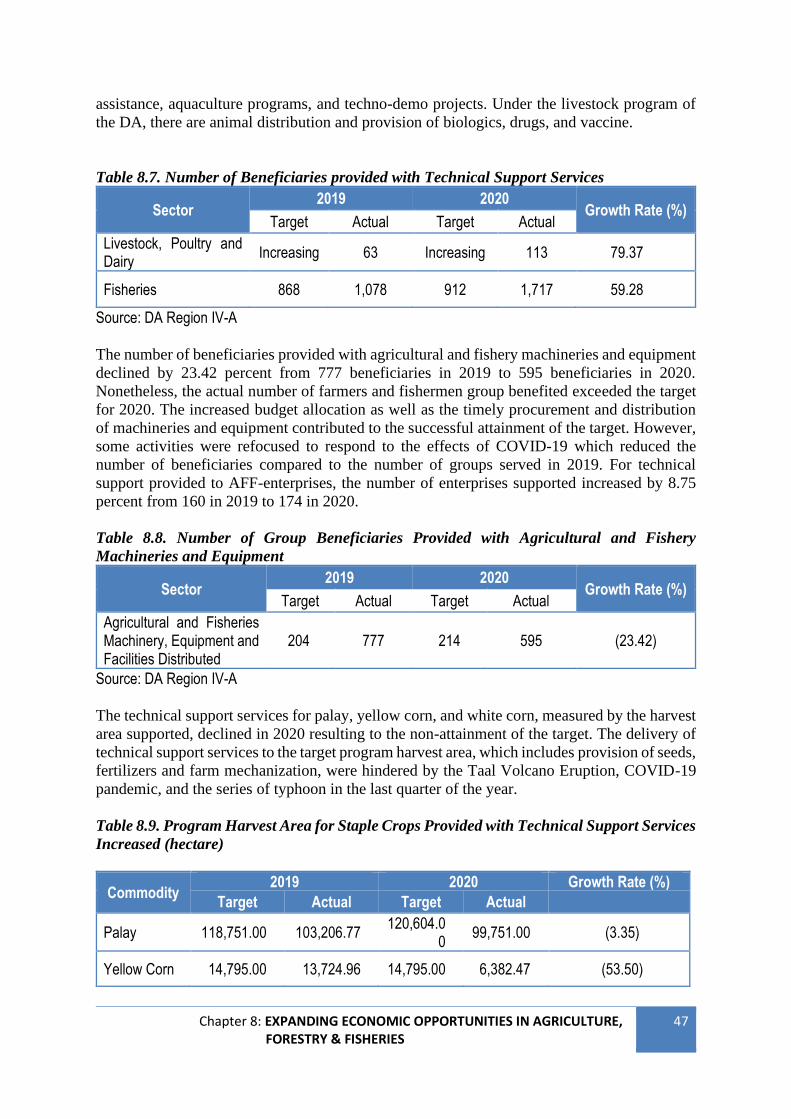
Chapter 8: EXPANDING ECONOMIC OPPORTUNITIES IN AGRICULTURE, FORESTRY & FISHERIES
47
assistance, aquaculture programs, and techno-demo projects. Under the livestock program of
the DA, there are animal distribution and provision of biologics, drugs, and vaccine.
Table 8.7. Number of Beneficiaries provided with Technical Support Services
Sector 2019 2020
Growth Rate (%) Target Actual Target Actual
Livestock, Poultry and Dairy
Increasing 63 Increasing 113 79.37
Fisheries 868 1,078 912 1,717 59.28
Source: DA Region IV-A
The number of beneficiaries provided with agricultural and fishery machineries and equipment
declined by 23.42 percent from 777 beneficiaries in 2019 to 595 beneficiaries in 2020.
Nonetheless, the actual number of farmers and fishermen group benefited exceeded the target
for 2020. The increased budget allocation as well as the timely procurement and distribution
of machineries and equipment contributed to the successful attainment of the target. However,
some activities were refocused to respond to the effects of COVID-19 which reduced the
number of beneficiaries compared to the number of groups served in 2019. For technical
support provided to AFF-enterprises, the number of enterprises supported increased by 8.75
percent from 160 in 2019 to 174 in 2020.
Table 8.8. Number of Group Beneficiaries Provided with Agricultural and Fishery
Machineries and Equipment
Sector 2019 2020
Growth Rate (%) Target Actual Target Actual
Agricultural and Fisheries Machinery, Equipment and Facilities Distributed
204 777 214 595 (23.42)
Source: DA Region IV-A
The technical support services for palay, yellow corn, and white corn, measured by the harvest
area supported, declined in 2020 resulting to the non-attainment of the target. The delivery of
technical support services to the target program harvest area, which includes provision of seeds,
fertilizers and farm mechanization, were hindered by the Taal Volcano Eruption, COVID-19
pandemic, and the series of typhoon in the last quarter of the year.
Table 8.9. Program Harvest Area for Staple Crops Provided with Technical Support Services
Increased (hectare)
Commodity 2019 2020 Growth Rate (%)
Target Actual Target Actual
Palay 118,751.00 103,206.77 120,604.0
0 99,751.00 (3.35)
Yellow Corn 14,795.00 13,724.96 14,795.00 6,382.47 (53.50)
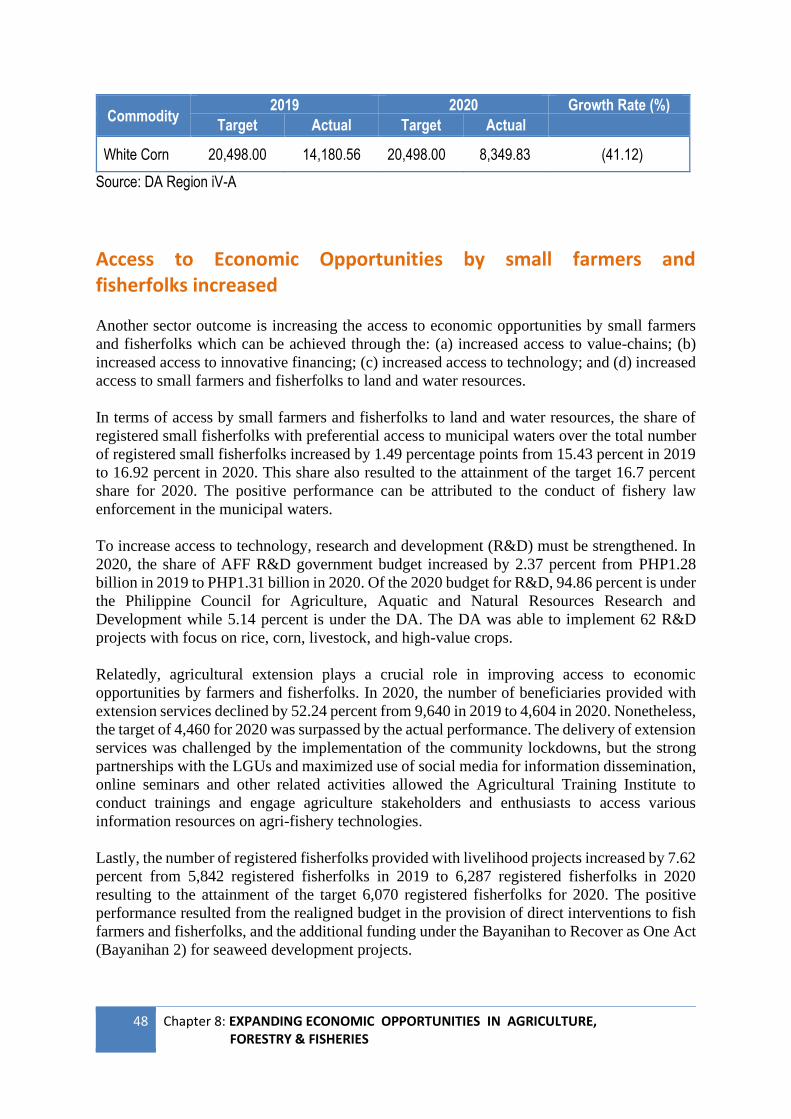
48 Chapter 8: EXPANDING ECONOMIC OPPORTUNITIES IN AGRICULTURE, FORESTRY & FISHERIES
Commodity 2019 2020 Growth Rate (%)
Target Actual Target Actual
White Corn 20,498.00 14,180.56 20,498.00 8,349.83 (41.12)
Source: DA Region iV-A
Access to Economic Opportunities by small farmers and fisherfolks increased
Another sector outcome is increasing the access to economic opportunities by small farmers
and fisherfolks which can be achieved through the: (a) increased access to value-chains; (b)
increased access to innovative financing; (c) increased access to technology; and (d) increased
access to small farmers and fisherfolks to land and water resources.
In terms of access by small farmers and fisherfolks to land and water resources, the share of
registered small fisherfolks with preferential access to municipal waters over the total number
of registered small fisherfolks increased by 1.49 percentage points from 15.43 percent in 2019
to 16.92 percent in 2020. This share also resulted to the attainment of the target 16.7 percent
share for 2020. The positive performance can be attributed to the conduct of fishery law
enforcement in the municipal waters.
To increase access to technology, research and development (R&D) must be strengthened. In
2020, the share of AFF R&D government budget increased by 2.37 percent from PHP1.28
billion in 2019 to PHP1.31 billion in 2020. Of the 2020 budget for R&D, 94.86 percent is under
the Philippine Council for Agriculture, Aquatic and Natural Resources Research and
Development while 5.14 percent is under the DA. The DA was able to implement 62 R&D
projects with focus on rice, corn, livestock, and high-value crops.
Relatedly, agricultural extension plays a crucial role in improving access to economic
opportunities by farmers and fisherfolks. In 2020, the number of beneficiaries provided with
extension services declined by 52.24 percent from 9,640 in 2019 to 4,604 in 2020. Nonetheless,
the target of 4,460 for 2020 was surpassed by the actual performance. The delivery of extension
services was challenged by the implementation of the community lockdowns, but the strong
partnerships with the LGUs and maximized use of social media for information dissemination,
online seminars and other related activities allowed the Agricultural Training Institute to
conduct trainings and engage agriculture stakeholders and enthusiasts to access various
information resources on agri-fishery technologies.
Lastly, the number of registered fisherfolks provided with livelihood projects increased by 7.62
percent from 5,842 registered fisherfolks in 2019 to 6,287 registered fisherfolks in 2020
resulting to the attainment of the target 6,070 registered fisherfolks for 2020. The positive
performance resulted from the realigned budget in the provision of direct interventions to fish
farmers and fisherfolks, and the additional funding under the Bayanihan to Recover as One Act
(Bayanihan 2) for seaweed development projects.
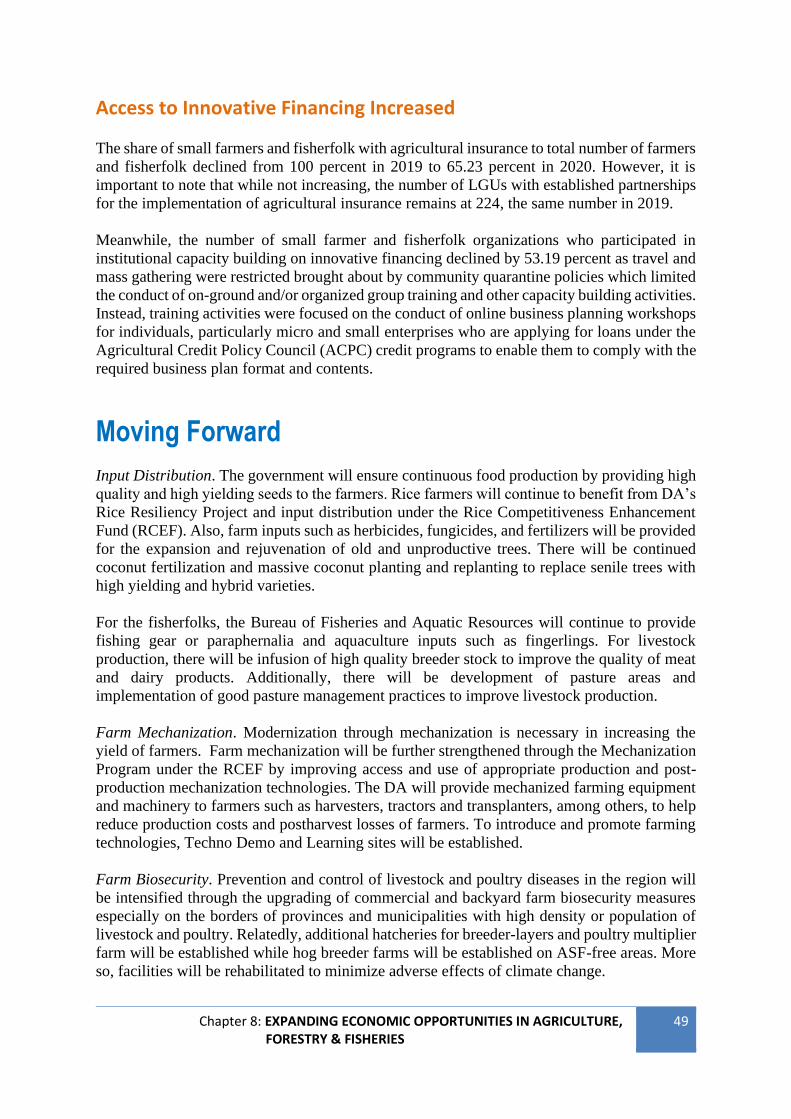
Chapter 8: EXPANDING ECONOMIC OPPORTUNITIES IN AGRICULTURE, FORESTRY & FISHERIES
49
Access to Innovative Financing Increased
The share of small farmers and fisherfolk with agricultural insurance to total number of farmers
and fisherfolk declined from 100 percent in 2019 to 65.23 percent in 2020. However, it is
important to note that while not increasing, the number of LGUs with established partnerships
for the implementation of agricultural insurance remains at 224, the same number in 2019.
Meanwhile, the number of small farmer and fisherfolk organizations who participated in
institutional capacity building on innovative financing declined by 53.19 percent as travel and
mass gathering were restricted brought about by community quarantine policies which limited
the conduct of on-ground and/or organized group training and other capacity building activities.
Instead, training activities were focused on the conduct of online business planning workshops
for individuals, particularly micro and small enterprises who are applying for loans under the
Agricultural Credit Policy Council (ACPC) credit programs to enable them to comply with the
required business plan format and contents.
Moving Forward
Input Distribution. The government will ensure continuous food production by providing high
quality and high yielding seeds to the farmers. Rice farmers will continue to benefit from DA’s
Rice Resiliency Project and input distribution under the Rice Competitiveness Enhancement
Fund (RCEF). Also, farm inputs such as herbicides, fungicides, and fertilizers will be provided
for the expansion and rejuvenation of old and unproductive trees. There will be continued
coconut fertilization and massive coconut planting and replanting to replace senile trees with
high yielding and hybrid varieties.
For the fisherfolks, the Bureau of Fisheries and Aquatic Resources will continue to provide
fishing gear or paraphernalia and aquaculture inputs such as fingerlings. For livestock
production, there will be infusion of high quality breeder stock to improve the quality of meat
and dairy products. Additionally, there will be development of pasture areas and
implementation of good pasture management practices to improve livestock production.
Farm Mechanization. Modernization through mechanization is necessary in increasing the
yield of farmers. Farm mechanization will be further strengthened through the Mechanization
Program under the RCEF by improving access and use of appropriate production and post-
production mechanization technologies. The DA will provide mechanized farming equipment
and machinery to farmers such as harvesters, tractors and transplanters, among others, to help
reduce production costs and postharvest losses of farmers. To introduce and promote farming
technologies, Techno Demo and Learning sites will be established.
Farm Biosecurity. Prevention and control of livestock and poultry diseases in the region will
be intensified through the upgrading of commercial and backyard farm biosecurity measures
especially on the borders of provinces and municipalities with high density or population of
livestock and poultry. Relatedly, additional hatcheries for breeder-layers and poultry multiplier
farm will be established while hog breeder farms will be established on ASF-free areas. More
so, facilities will be rehabilitated to minimize adverse effects of climate change.
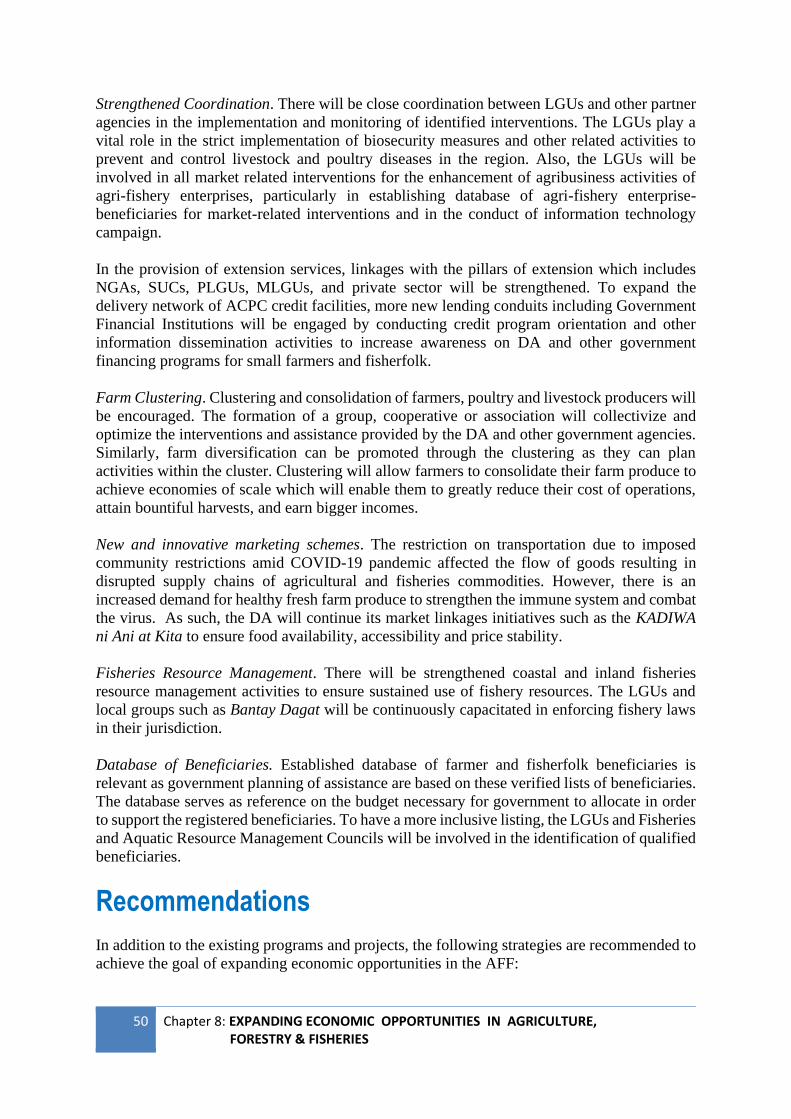
50 Chapter 8: EXPANDING ECONOMIC OPPORTUNITIES IN AGRICULTURE, FORESTRY & FISHERIES
Strengthened Coordination. There will be close coordination between LGUs and other partner
agencies in the implementation and monitoring of identified interventions. The LGUs play a
vital role in the strict implementation of biosecurity measures and other related activities to
prevent and control livestock and poultry diseases in the region. Also, the LGUs will be
involved in all market related interventions for the enhancement of agribusiness activities of
agri-fishery enterprises, particularly in establishing database of agri-fishery enterprise-
beneficiaries for market-related interventions and in the conduct of information technology
campaign.
In the provision of extension services, linkages with the pillars of extension which includes
NGAs, SUCs, PLGUs, MLGUs, and private sector will be strengthened. To expand the
delivery network of ACPC credit facilities, more new lending conduits including Government
Financial Institutions will be engaged by conducting credit program orientation and other
information dissemination activities to increase awareness on DA and other government
financing programs for small farmers and fisherfolk.
Farm Clustering. Clustering and consolidation of farmers, poultry and livestock producers will
be encouraged. The formation of a group, cooperative or association will collectivize and
optimize the interventions and assistance provided by the DA and other government agencies.
Similarly, farm diversification can be promoted through the clustering as they can plan
activities within the cluster. Clustering will allow farmers to consolidate their farm produce to
achieve economies of scale which will enable them to greatly reduce their cost of operations,
attain bountiful harvests, and earn bigger incomes.
New and innovative marketing schemes. The restriction on transportation due to imposed
community restrictions amid COVID-19 pandemic affected the flow of goods resulting in
disrupted supply chains of agricultural and fisheries commodities. However, there is an
increased demand for healthy fresh farm produce to strengthen the immune system and combat
the virus. As such, the DA will continue its market linkages initiatives such as the KADIWA
ni Ani at Kita to ensure food availability, accessibility and price stability.
Fisheries Resource Management. There will be strengthened coastal and inland fisheries
resource management activities to ensure sustained use of fishery resources. The LGUs and
local groups such as Bantay Dagat will be continuously capacitated in enforcing fishery laws
in their jurisdiction.
Database of Beneficiaries. Established database of farmer and fisherfolk beneficiaries is
relevant as government planning of assistance are based on these verified lists of beneficiaries.
The database serves as reference on the budget necessary for government to allocate in order
to support the registered beneficiaries. To have a more inclusive listing, the LGUs and Fisheries
and Aquatic Resource Management Councils will be involved in the identification of qualified
beneficiaries.
Recommendations
In addition to the existing programs and projects, the following strategies are recommended to
achieve the goal of expanding economic opportunities in the AFF:
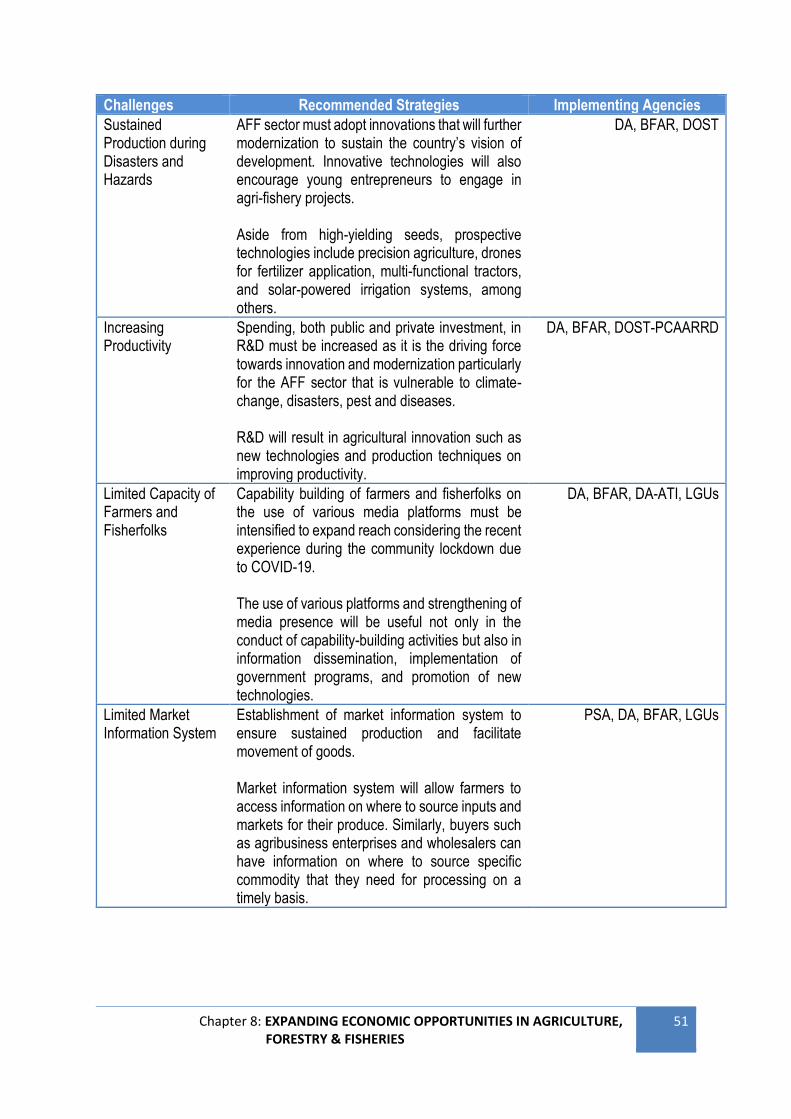
Chapter 8: EXPANDING ECONOMIC OPPORTUNITIES IN AGRICULTURE, FORESTRY & FISHERIES
51
Challenges Recommended Strategies Implementing Agencies
Sustained Production during Disasters and Hazards
AFF sector must adopt innovations that will further modernization to sustain the country’s vision of development. Innovative technologies will also encourage young entrepreneurs to engage in agri-fishery projects. Aside from high-yielding seeds, prospective technologies include precision agriculture, drones for fertilizer application, multi-functional tractors, and solar-powered irrigation systems, among others.
DA, BFAR, DOST
Increasing Productivity
Spending, both public and private investment, in R&D must be increased as it is the driving force towards innovation and modernization particularly for the AFF sector that is vulnerable to climate-change, disasters, pest and diseases. R&D will result in agricultural innovation such as new technologies and production techniques on improving productivity.
DA, BFAR, DOST-PCAARRD
Limited Capacity of Farmers and Fisherfolks
Capability building of farmers and fisherfolks on the use of various media platforms must be intensified to expand reach considering the recent experience during the community lockdown due to COVID-19. The use of various platforms and strengthening of media presence will be useful not only in the conduct of capability-building activities but also in information dissemination, implementation of government programs, and promotion of new technologies.
DA, BFAR, DA-ATI, LGUs
Limited Market Information System
Establishment of market information system to ensure sustained production and facilitate movement of goods. Market information system will allow farmers to access information on where to source inputs and markets for their produce. Similarly, buyers such as agribusiness enterprises and wholesalers can have information on where to source specific commodity that they need for processing on a timely basis.
PSA, DA, BFAR, LGUs
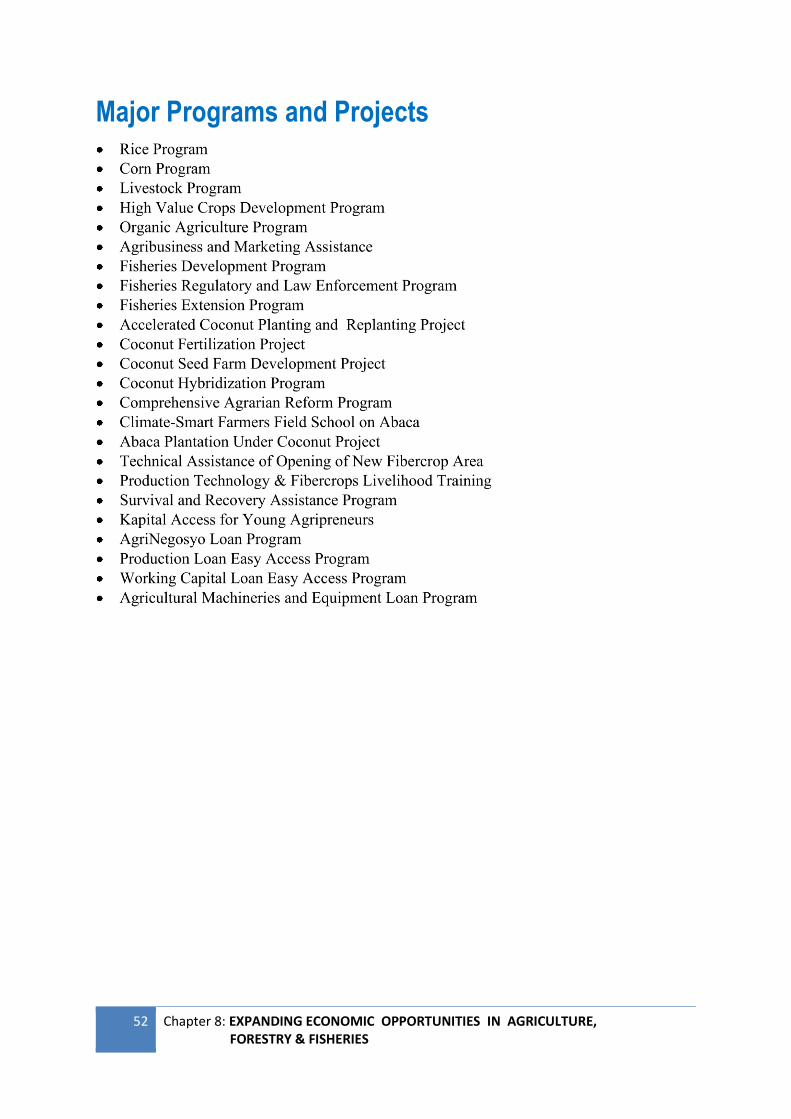
52 Chapter 8: EXPANDING ECONOMIC OPPORTUNITIES IN AGRICULTURE, FORESTRY & FISHERIES
Major Programs and Projects
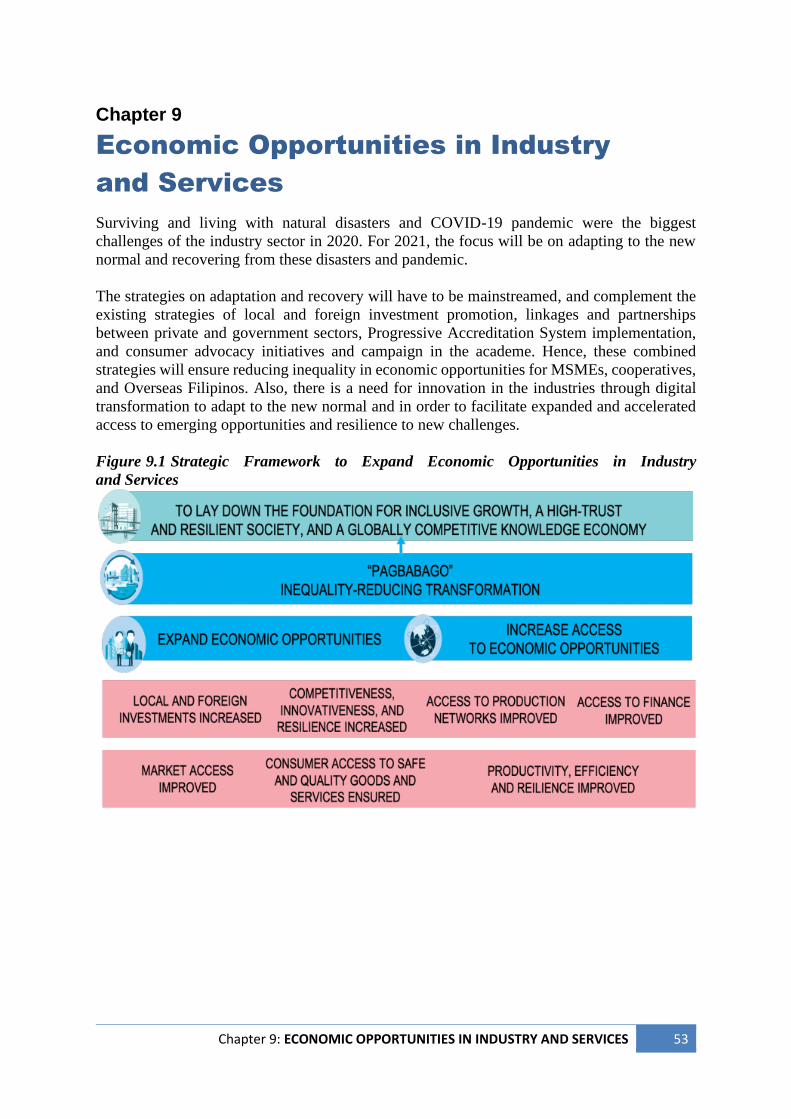
Chapter 9: ECONOMIC OPPORTUNITIES IN INDUSTRY AND SERVICES 53
Chapter 9
Economic Opportunities in Industry
and Services
Surviving and living with natural disasters and COVID-19 pandemic were the biggest
challenges of the industry sector in 2020. For 2021, the focus will be on adapting to the new
normal and recovering from these disasters and pandemic.
The strategies on adaptation and recovery will have to be mainstreamed, and complement the
existing strategies of local and foreign investment promotion, linkages and partnerships
between private and government sectors, Progressive Accreditation System implementation,
and consumer advocacy initiatives and campaign in the academe. Hence, these combined
strategies will ensure reducing inequality in economic opportunities for MSMEs, cooperatives,
and Overseas Filipinos. Also, there is a need for innovation in the industries through digital
transformation to adapt to the new normal and in order to facilitate expanded and accelerated
access to emerging opportunities and resilience to new challenges.
Figure 9.1 Strategic Framework to Expand Economic Opportunities in Industry
and Services
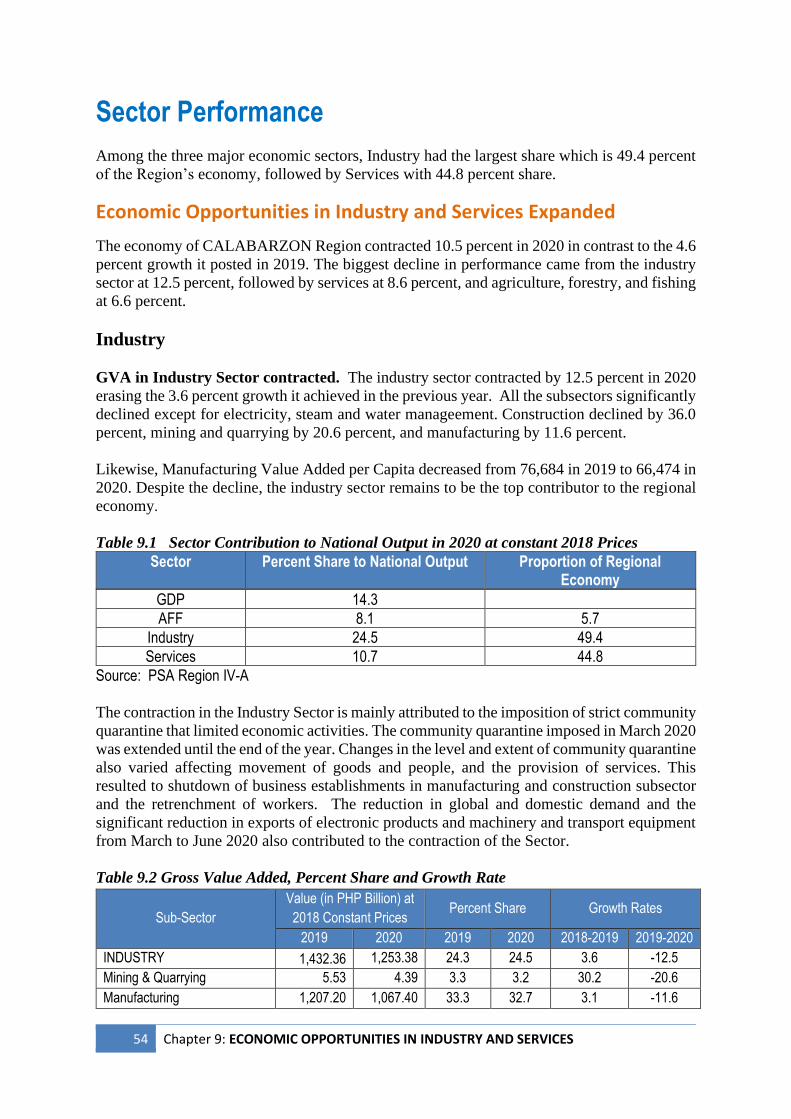
54 Chapter 9: ECONOMIC OPPORTUNITIES IN INDUSTRY AND SERVICES
Sector Performance
Among the three major economic sectors, Industry had the largest share which is 49.4 percent
of the Region’s economy, followed by Services with 44.8 percent share.
Economic Opportunities in Industry and Services Expanded
The economy of CALABARZON Region contracted 10.5 percent in 2020 in contrast to the 4.6
percent growth it posted in 2019. The biggest decline in performance came from the industry
sector at 12.5 percent, followed by services at 8.6 percent, and agriculture, forestry, and fishing
at 6.6 percent.
Industry
GVA in Industry Sector contracted. The industry sector contracted by 12.5 percent in 2020
erasing the 3.6 percent growth it achieved in the previous year. All the subsectors significantly
declined except for electricity, steam and water manageement. Construction declined by 36.0
percent, mining and quarrying by 20.6 percent, and manufacturing by 11.6 percent.
Likewise, Manufacturing Value Added per Capita decreased from 76,684 in 2019 to 66,474 in
2020. Despite the decline, the industry sector remains to be the top contributor to the regional
economy.
Table 9.1 Sector Contribution to National Output in 2020 at constant 2018 Prices
Sector Percent Share to National Output Proportion of Regional Economy
GDP 14.3
AFF 8.1 5.7
Industry 24.5 49.4
Services 10.7 44.8
Source: PSA Region IV-A
The contraction in the Industry Sector is mainly attributed to the imposition of strict community
quarantine that limited economic activities. The community quarantine imposed in March 2020
was extended until the end of the year. Changes in the level and extent of community quarantine
also varied affecting movement of goods and people, and the provision of services. This
resulted to shutdown of business establishments in manufacturing and construction subsector
and the retrenchment of workers. The reduction in global and domestic demand and the
significant reduction in exports of electronic products and machinery and transport equipment
from March to June 2020 also contributed to the contraction of the Sector.
Table 9.2 Gross Value Added, Percent Share and Growth Rate
Sub-Sector
Value (in PHP Billion) at
2018 Constant Prices Percent Share Growth Rates
2019 2020 2019 2020 2018-2019 2019-2020
INDUSTRY 1,432.36 1,253.38 24.3 24.5 3.6 -12.5
Mining & Quarrying 5.53 4.39 3.3 3.2 30.2 -20.6
Manufacturing 1,207.20 1,067.40 33.3 32.7 3.1 -11.6
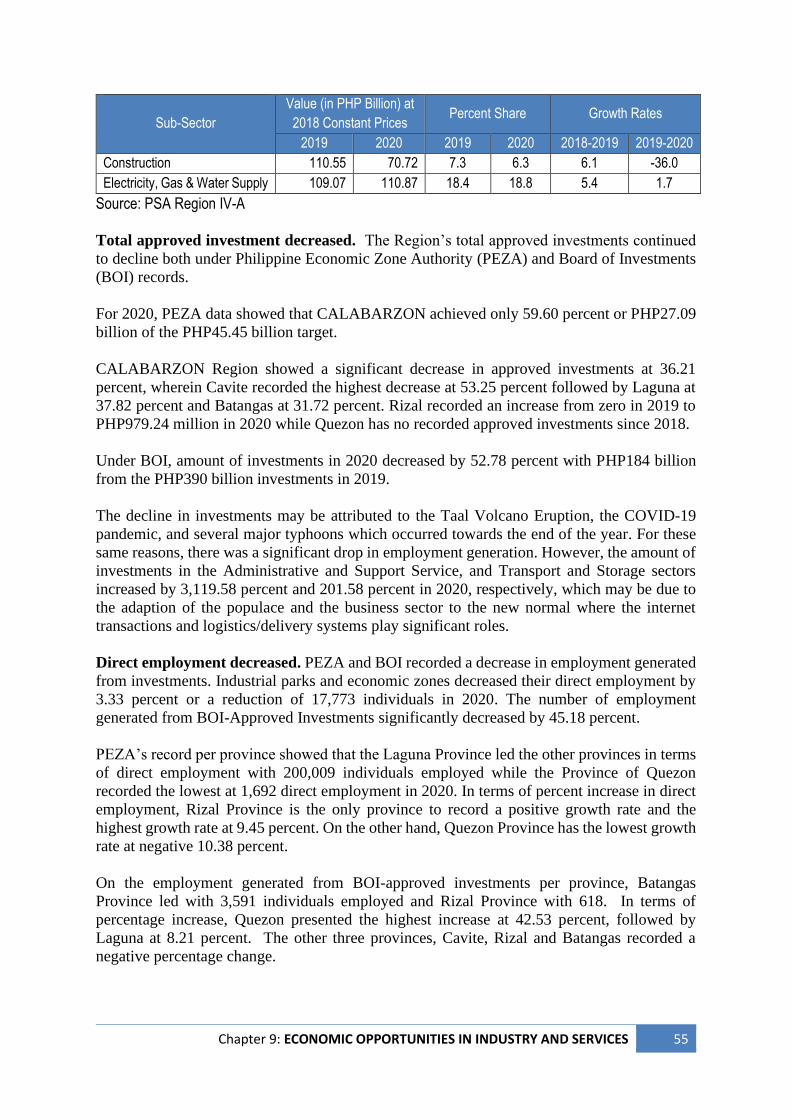
Chapter 9: ECONOMIC OPPORTUNITIES IN INDUSTRY AND SERVICES 55
Sub-Sector
Value (in PHP Billion) at
2018 Constant Prices Percent Share Growth Rates
2019 2020 2019 2020 2018-2019 2019-2020
Construction 110.55 70.72 7.3 6.3 6.1 -36.0
Electricity, Gas & Water Supply 109.07 110.87 18.4 18.8 5.4 1.7
Source: PSA Region IV-A
Total approved investment decreased. The Region’s total approved investments continued
to decline both under Philippine Economic Zone Authority (PEZA) and Board of Investments
(BOI) records.
For 2020, PEZA data showed that CALABARZON achieved only 59.60 percent or PHP27.09
billion of the PHP45.45 billion target.
CALABARZON Region showed a significant decrease in approved investments at 36.21
percent, wherein Cavite recorded the highest decrease at 53.25 percent followed by Laguna at
37.82 percent and Batangas at 31.72 percent. Rizal recorded an increase from zero in 2019 to
PHP979.24 million in 2020 while Quezon has no recorded approved investments since 2018.
Under BOI, amount of investments in 2020 decreased by 52.78 percent with PHP184 billion
from the PHP390 billion investments in 2019.
The decline in investments may be attributed to the Taal Volcano Eruption, the COVID-19
pandemic, and several major typhoons which occurred towards the end of the year. For these
same reasons, there was a significant drop in employment generation. However, the amount of
investments in the Administrative and Support Service, and Transport and Storage sectors
increased by 3,119.58 percent and 201.58 percent in 2020, respectively, which may be due to
the adaption of the populace and the business sector to the new normal where the internet
transactions and logistics/delivery systems play significant roles.
Direct employment decreased. PEZA and BOI recorded a decrease in employment generated
from investments. Industrial parks and economic zones decreased their direct employment by
3.33 percent or a reduction of 17,773 individuals in 2020. The number of employment
generated from BOI-Approved Investments significantly decreased by 45.18 percent.
PEZA’s record per province showed that the Laguna Province led the other provinces in terms
of direct employment with 200,009 individuals employed while the Province of Quezon
recorded the lowest at 1,692 direct employment in 2020. In terms of percent increase in direct
employment, Rizal Province is the only province to record a positive growth rate and the
highest growth rate at 9.45 percent. On the other hand, Quezon Province has the lowest growth
rate at negative 10.38 percent.
On the employment generated from BOI-approved investments per province, Batangas
Province led with 3,591 individuals employed and Rizal Province with 618. In terms of
percentage increase, Quezon presented the highest increase at 42.53 percent, followed by
Laguna at 8.21 percent. The other three provinces, Cavite, Rizal and Batangas recorded a
negative percentage change.
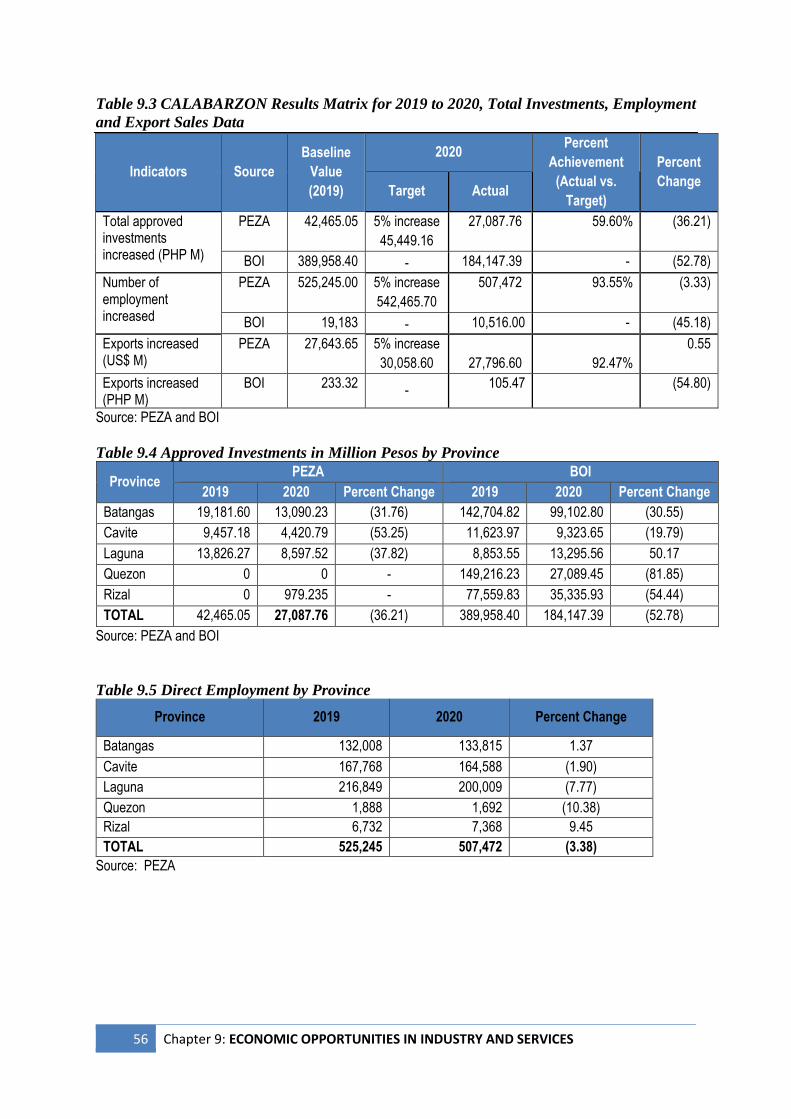
56 Chapter 9: ECONOMIC OPPORTUNITIES IN INDUSTRY AND SERVICES
Table 9.3 CALABARZON Results Matrix for 2019 to 2020, Total Investments, Employment
and Export Sales Data
Indicators Source
Baseline
Value
(2019)
2020 Percent
Achievement
(Actual vs.
Target)
Percent
Change Target Actual
Total approved investments increased (PHP M)
PEZA 42,465.05 5% increase
45,449.16
27,087.76 59.60% (36.21)
BOI 389,958.40 - 184,147.39 - (52.78)
Number of employment increased
PEZA 525,245.00 5% increase
542,465.70
507,472 93.55% (3.33)
BOI 19,183 - 10,516.00 - (45.18)
Exports increased (US$ M)
PEZA 27,643.65 5% increase
30,058.60
27,796.60
92.47%
0.55
Exports increased (PHP M)
BOI 233.32 -
105.47 (54.80)
Source: PEZA and BOI
Table 9.4 Approved Investments in Million Pesos by Province
Province PEZA BOI
2019 2020 Percent Change 2019 2020 Percent Change
Batangas 19,181.60 13,090.23 (31.76) 142,704.82 99,102.80 (30.55)
Cavite 9,457.18 4,420.79 (53.25) 11,623.97 9,323.65 (19.79)
Laguna 13,826.27 8,597.52 (37.82) 8,853.55 13,295.56 50.17
Quezon 0 0 - 149,216.23 27,089.45 (81.85)
Rizal 0 979.235 - 77,559.83 35,335.93 (54.44)
TOTAL 42,465.05 27,087.76 (36.21) 389,958.40 184,147.39 (52.78)
Source: PEZA and BOI
Table 9.5 Direct Employment by Province
Province 2019 2020 Percent Change
Batangas 132,008 133,815 1.37
Cavite 167,768 164,588 (1.90)
Laguna 216,849 200,009 (7.77)
Quezon 1,888 1,692 (10.38)
Rizal 6,732 7,368 9.45
TOTAL 525,245 507,472 (3.38)
Source: PEZA
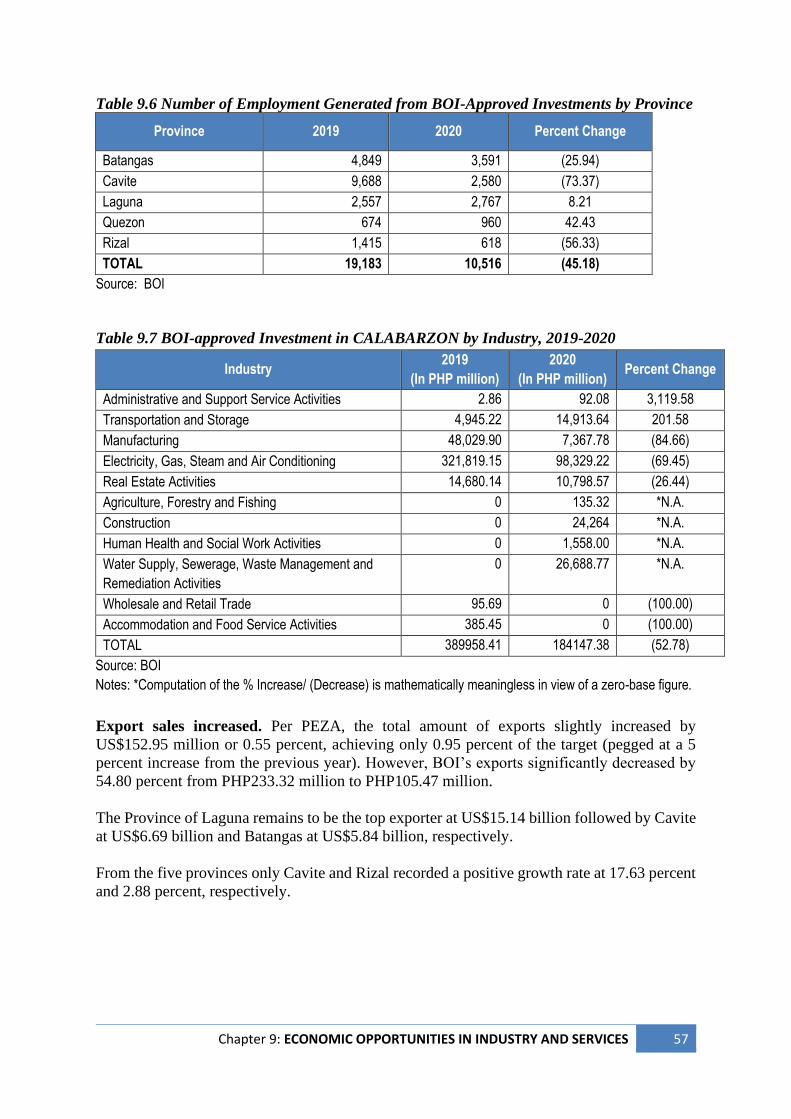
Chapter 9: ECONOMIC OPPORTUNITIES IN INDUSTRY AND SERVICES 57
Table 9.6 Number of Employment Generated from BOI-Approved Investments by Province
Province 2019 2020 Percent Change
Batangas 4,849 3,591 (25.94)
Cavite 9,688 2,580 (73.37)
Laguna 2,557 2,767 8.21
Quezon 674 960 42.43
Rizal 1,415 618 (56.33)
TOTAL 19,183 10,516 (45.18)
Source: BOI
Table 9.7 BOI-approved Investment in CALABARZON by Industry, 2019-2020
Industry 2019
(In PHP million)
2020
(In PHP million) Percent Change
Administrative and Support Service Activities 2.86 92.08 3,119.58
Transportation and Storage 4,945.22 14,913.64 201.58
Manufacturing 48,029.90 7,367.78 (84.66)
Electricity, Gas, Steam and Air Conditioning 321,819.15 98,329.22 (69.45)
Real Estate Activities 14,680.14 10,798.57 (26.44)
Agriculture, Forestry and Fishing 0 135.32 *N.A.
Construction 0 24,264 *N.A.
Human Health and Social Work Activities 0 1,558.00 *N.A.
Water Supply, Sewerage, Waste Management and
Remediation Activities
0 26,688.77 *N.A.
Wholesale and Retail Trade 95.69 0 (100.00)
Accommodation and Food Service Activities 385.45 0 (100.00)
TOTAL 389958.41 184147.38 (52.78)
Source: BOI
Notes: *Computation of the % Increase/ (Decrease) is mathematically meaningless in view of a zero-base figure.
Export sales increased. Per PEZA, the total amount of exports slightly increased by
US$152.95 million or 0.55 percent, achieving only 0.95 percent of the target (pegged at a 5
percent increase from the previous year). However, BOI’s exports significantly decreased by
54.80 percent from PHP233.32 million to PHP105.47 million.
The Province of Laguna remains to be the top exporter at US$15.14 billion followed by Cavite
at US$6.69 billion and Batangas at US$5.84 billion, respectively.
From the five provinces only Cavite and Rizal recorded a positive growth rate at 17.63 percent
and 2.88 percent, respectively.
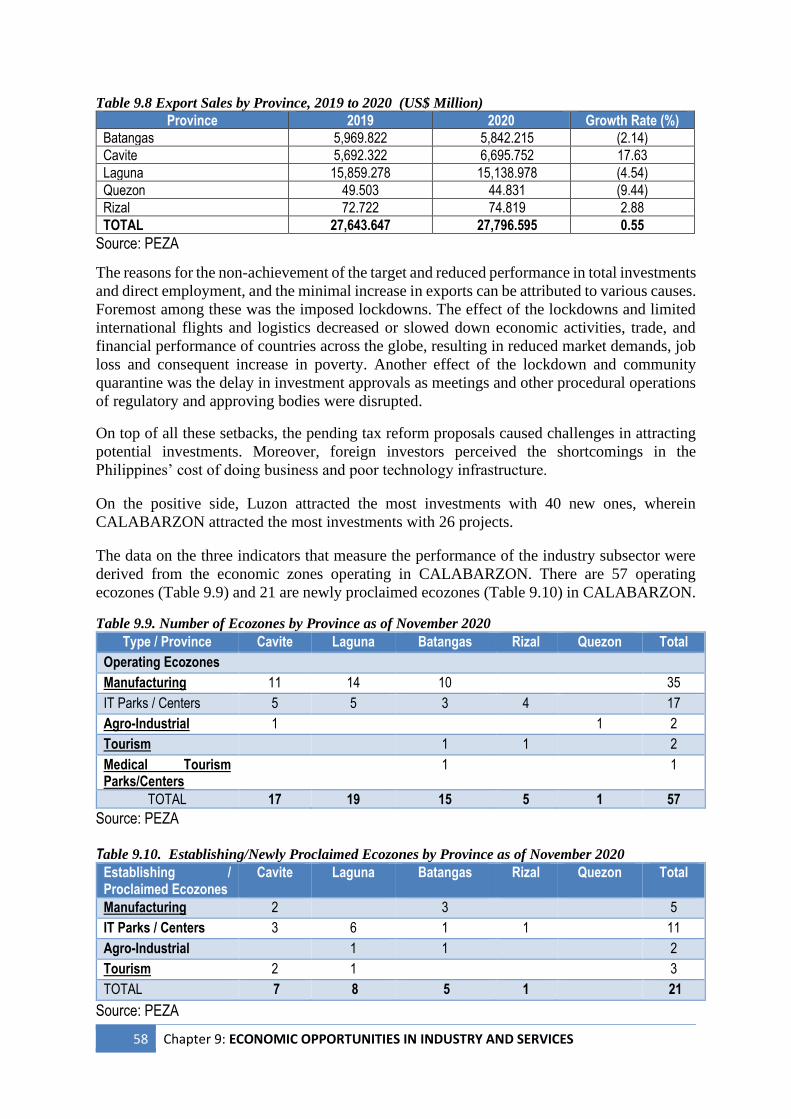
58 Chapter 9: ECONOMIC OPPORTUNITIES IN INDUSTRY AND SERVICES
Table 9.8 Export Sales by Province, 2019 to 2020 (US$ Million)
Province 2019 2020 Growth Rate (%)
Batangas 5,969.822 5,842.215 (2.14)
Cavite 5,692.322 6,695.752 17.63
Laguna 15,859.278 15,138.978 (4.54)
Quezon 49.503 44.831 (9.44)
Rizal 72.722 74.819 2.88
TOTAL 27,643.647 27,796.595 0.55
Source: PEZA
The reasons for the non-achievement of the target and reduced performance in total investments
and direct employment, and the minimal increase in exports can be attributed to various causes.
Foremost among these was the imposed lockdowns. The effect of the lockdowns and limited
international flights and logistics decreased or slowed down economic activities, trade, and
financial performance of countries across the globe, resulting in reduced market demands, job
loss and consequent increase in poverty. Another effect of the lockdown and community
quarantine was the delay in investment approvals as meetings and other procedural operations
of regulatory and approving bodies were disrupted.
On top of all these setbacks, the pending tax reform proposals caused challenges in attracting
potential investments. Moreover, foreign investors perceived the shortcomings in the
Philippines’ cost of doing business and poor technology infrastructure.
On the positive side, Luzon attracted the most investments with 40 new ones, wherein
CALABARZON attracted the most investments with 26 projects.
The data on the three indicators that measure the performance of the industry subsector were
derived from the economic zones operating in CALABARZON. There are 57 operating
ecozones (Table 9.9) and 21 are newly proclaimed ecozones (Table 9.10) in CALABARZON.
Table 9.9. Number of Ecozones by Province as of November 2020
Type / Province Cavite Laguna Batangas Rizal Quezon Total
Operating Ecozones
Manufacturing 11 14 10 35
IT Parks / Centers 5 5 3 4 17
Agro-Industrial 1 1 2
Tourism 1 1 2
Medical Tourism Parks/Centers
1 1
TOTAL 17 19 15 5 1 57
Source: PEZA Table 9.10. Establishing/Newly Proclaimed Ecozones by Province as of November 2020
Establishing / Proclaimed Ecozones
Cavite Laguna Batangas Rizal Quezon Total
Manufacturing 2 3 5
IT Parks / Centers 3 6 1 1 11
Agro-Industrial 1 1 2
Tourism 2 1 3
TOTAL 7 8 5 1 21
Source: PEZA
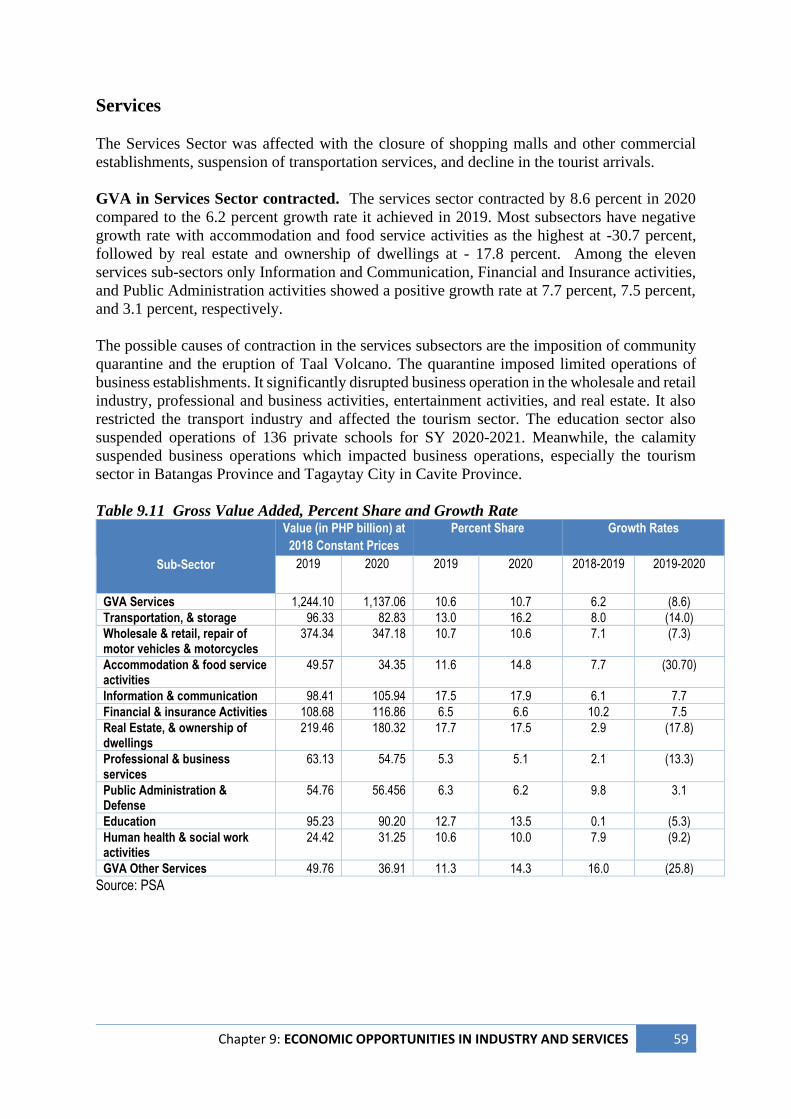
Chapter 9: ECONOMIC OPPORTUNITIES IN INDUSTRY AND SERVICES 59
Services The Services Sector was affected with the closure of shopping malls and other commercial
establishments, suspension of transportation services, and decline in the tourist arrivals.
GVA in Services Sector contracted. The services sector contracted by 8.6 percent in 2020
compared to the 6.2 percent growth rate it achieved in 2019. Most subsectors have negative
growth rate with accommodation and food service activities as the highest at -30.7 percent,
followed by real estate and ownership of dwellings at - 17.8 percent. Among the eleven
services sub-sectors only Information and Communication, Financial and Insurance activities,
and Public Administration activities showed a positive growth rate at 7.7 percent, 7.5 percent,
and 3.1 percent, respectively.
The possible causes of contraction in the services subsectors are the imposition of community
quarantine and the eruption of Taal Volcano. The quarantine imposed limited operations of
business establishments. It significantly disrupted business operation in the wholesale and retail
industry, professional and business activities, entertainment activities, and real estate. It also
restricted the transport industry and affected the tourism sector. The education sector also
suspended operations of 136 private schools for SY 2020-2021. Meanwhile, the calamity
suspended business operations which impacted business operations, especially the tourism
sector in Batangas Province and Tagaytay City in Cavite Province.
Table 9.11 Gross Value Added, Percent Share and Growth Rate
Sub-Sector
Value (in PHP billion) at
2018 Constant Prices
Percent Share Growth Rates
2019 2020 2019 2020 2018-2019 2019-2020
GVA Services 1,244.10 1,137.06 10.6 10.7 6.2 (8.6)
Transportation, & storage 96.33 82.83 13.0 16.2 8.0 (14.0)
Wholesale & retail, repair of motor vehicles & motorcycles
374.34 347.18 10.7 10.6 7.1 (7.3)
Accommodation & food service activities
49.57 34.35 11.6 14.8 7.7 (30.70)
Information & communication 98.41 105.94 17.5 17.9 6.1 7.7
Financial & insurance Activities 108.68 116.86 6.5 6.6 10.2 7.5
Real Estate, & ownership of dwellings
219.46 180.32 17.7 17.5 2.9 (17.8)
Professional & business services
63.13 54.75 5.3 5.1 2.1 (13.3)
Public Administration & Defense
54.76 56.456 6.3 6.2 9.8 3.1
Education 95.23 90.20 12.7 13.5 0.1 (5.3)
Human health & social work activities
24.42 31.25 10.6 10.0 7.9 (9.2)
GVA Other Services 49.76 36.91 11.3 14.3 16.0 (25.8)
Source: PSA
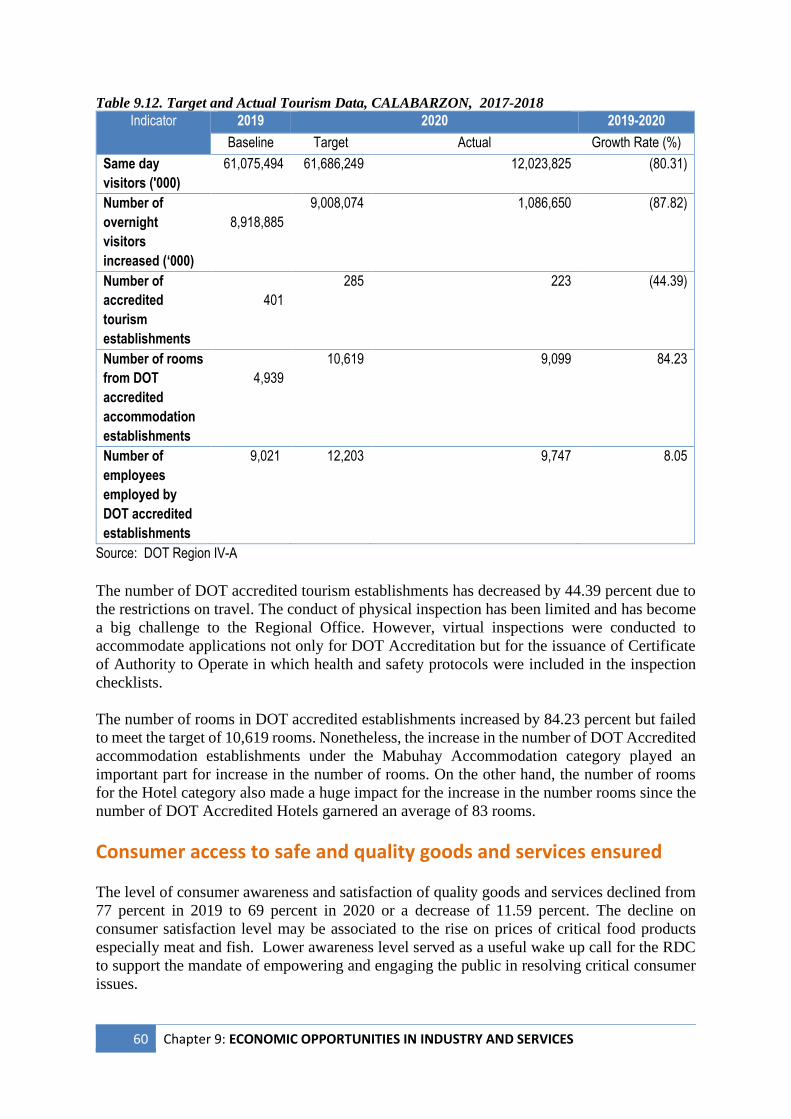
60 Chapter 9: ECONOMIC OPPORTUNITIES IN INDUSTRY AND SERVICES
Table 9.12. Target and Actual Tourism Data, CALABARZON, 2017-2018
Indicator 2019 2020 2019-2020
Baseline Target Actual Growth Rate (%)
Same day
visitors ('000)
61,075,494 61,686,249 12,023,825 (80.31)
Number of
overnight
visitors
increased (‘000)
8,918,885
9,008,074 1,086,650 (87.82)
Number of
accredited
tourism
establishments
401
285 223 (44.39)
Number of rooms
from DOT
accredited
accommodation
establishments
4,939
10,619 9,099 84.23
Number of
employees
employed by
DOT accredited
establishments
9,021 12,203 9,747 8.05
Source: DOT Region IV-A
The number of DOT accredited tourism establishments has decreased by 44.39 percent due to
the restrictions on travel. The conduct of physical inspection has been limited and has become
a big challenge to the Regional Office. However, virtual inspections were conducted to
accommodate applications not only for DOT Accreditation but for the issuance of Certificate
of Authority to Operate in which health and safety protocols were included in the inspection
checklists.
The number of rooms in DOT accredited establishments increased by 84.23 percent but failed
to meet the target of 10,619 rooms. Nonetheless, the increase in the number of DOT Accredited
accommodation establishments under the Mabuhay Accommodation category played an
important part for increase in the number of rooms. On the other hand, the number of rooms
for the Hotel category also made a huge impact for the increase in the number rooms since the
number of DOT Accredited Hotels garnered an average of 83 rooms.
Consumer access to safe and quality goods and services ensured
The level of consumer awareness and satisfaction of quality goods and services declined from
77 percent in 2019 to 69 percent in 2020 or a decrease of 11.59 percent. The decline on
consumer satisfaction level may be associated to the rise on prices of critical food products
especially meat and fish. Lower awareness level served as a useful wake up call for the RDC
to support the mandate of empowering and engaging the public in resolving critical consumer
issues.
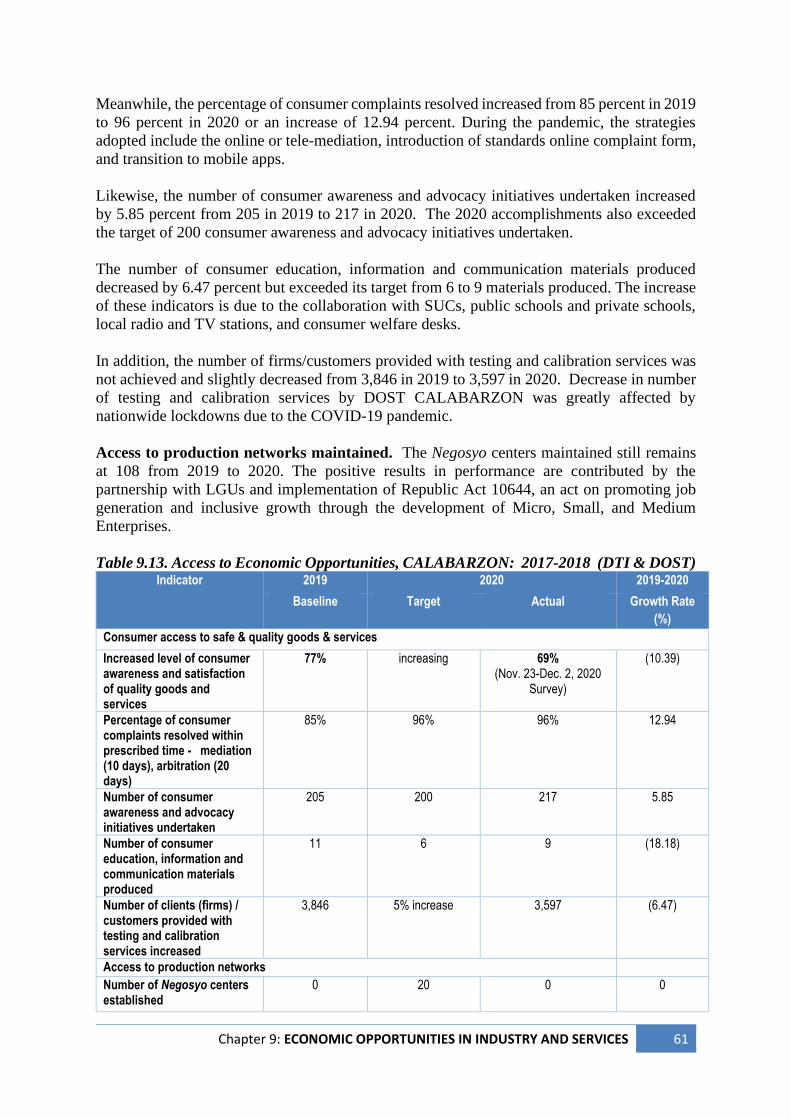
Chapter 9: ECONOMIC OPPORTUNITIES IN INDUSTRY AND SERVICES 61
Meanwhile, the percentage of consumer complaints resolved increased from 85 percent in 2019
to 96 percent in 2020 or an increase of 12.94 percent. During the pandemic, the strategies
adopted include the online or tele-mediation, introduction of standards online complaint form,
and transition to mobile apps.
Likewise, the number of consumer awareness and advocacy initiatives undertaken increased
by 5.85 percent from 205 in 2019 to 217 in 2020. The 2020 accomplishments also exceeded
the target of 200 consumer awareness and advocacy initiatives undertaken.
The number of consumer education, information and communication materials produced
decreased by 6.47 percent but exceeded its target from 6 to 9 materials produced. The increase
of these indicators is due to the collaboration with SUCs, public schools and private schools,
local radio and TV stations, and consumer welfare desks.
In addition, the number of firms/customers provided with testing and calibration services was
not achieved and slightly decreased from 3,846 in 2019 to 3,597 in 2020. Decrease in number
of testing and calibration services by DOST CALABARZON was greatly affected by
nationwide lockdowns due to the COVID-19 pandemic.
Access to production networks maintained. The Negosyo centers maintained still remains
at 108 from 2019 to 2020. The positive results in performance are contributed by the
partnership with LGUs and implementation of Republic Act 10644, an act on promoting job
generation and inclusive growth through the development of Micro, Small, and Medium
Enterprises.
Table 9.13. Access to Economic Opportunities, CALABARZON: 2017-2018 (DTI & DOST) Indicator 2019 2020 2019-2020
Baseline Target Actual Growth Rate
(%)
Consumer access to safe & quality goods & services
Increased level of consumer awareness and satisfaction of quality goods and services
77% increasing 69% (Nov. 23-Dec. 2, 2020
Survey)
(10.39)
Percentage of consumer complaints resolved within prescribed time - mediation (10 days), arbitration (20 days)
85% 96% 96% 12.94
Number of consumer awareness and advocacy initiatives undertaken
205 200 217 5.85
Number of consumer education, information and communication materials produced
11 6 9 (18.18)
Number of clients (firms) / customers provided with testing and calibration services increased
3,846 5% increase 3,597 (6.47)
Access to production networks
Number of Negosyo centers established
0 20 0 0
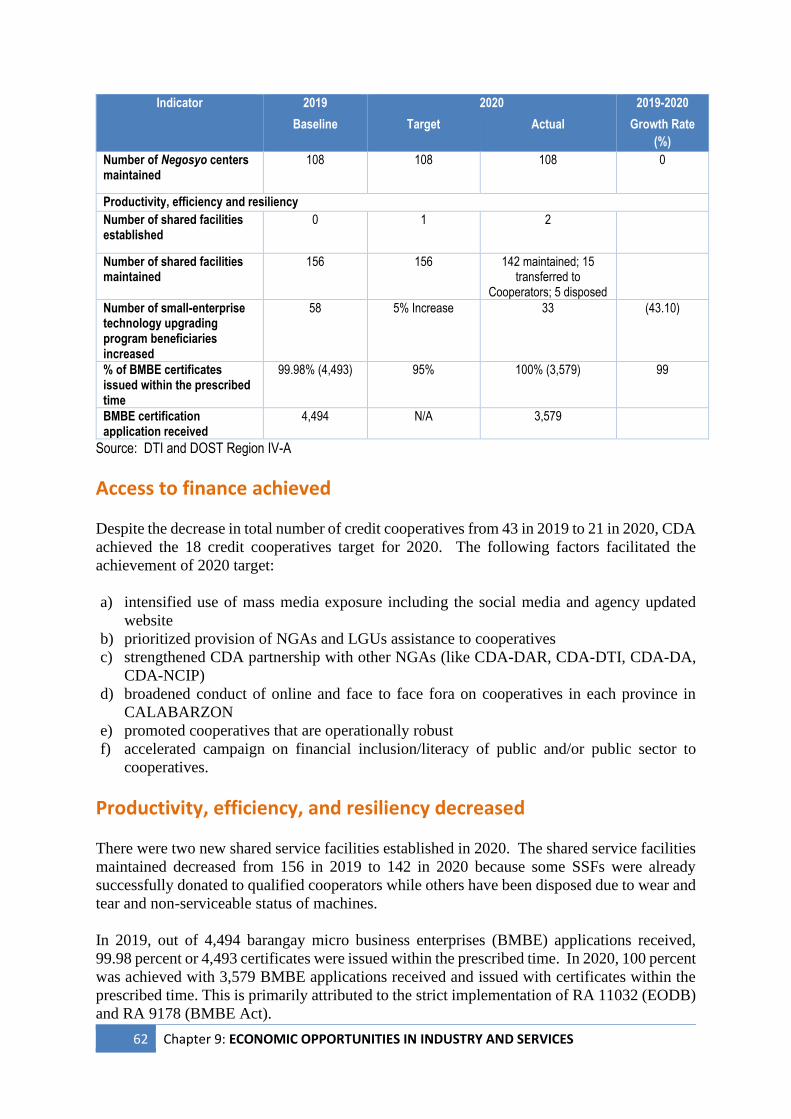
62 Chapter 9: ECONOMIC OPPORTUNITIES IN INDUSTRY AND SERVICES
Indicator 2019 2020 2019-2020
Baseline Target Actual Growth Rate
(%)
Number of Negosyo centers maintained
108 108 108 0
Productivity, efficiency and resiliency
Number of shared facilities established
0 1 2
Number of shared facilities maintained
156 156 142 maintained; 15 transferred to
Cooperators; 5 disposed
Number of small-enterprise technology upgrading program beneficiaries increased
58 5% Increase 33 (43.10)
% of BMBE certificates issued within the prescribed time
99.98% (4,493) 95%
100% (3,579) 99
BMBE certification application received
4,494 N/A 3,579
Source: DTI and DOST Region IV-A
Access to finance achieved
Despite the decrease in total number of credit cooperatives from 43 in 2019 to 21 in 2020, CDA
achieved the 18 credit cooperatives target for 2020. The following factors facilitated the
achievement of 2020 target:
a) intensified use of mass media exposure including the social media and agency updated
website
b) prioritized provision of NGAs and LGUs assistance to cooperatives
c) strengthened CDA partnership with other NGAs (like CDA-DAR, CDA-DTI, CDA-DA,
CDA-NCIP)
d) broadened conduct of online and face to face fora on cooperatives in each province in
CALABARZON
e) promoted cooperatives that are operationally robust
f) accelerated campaign on financial inclusion/literacy of public and/or public sector to
cooperatives.
Productivity, efficiency, and resiliency decreased
There were two new shared service facilities established in 2020. The shared service facilities
maintained decreased from 156 in 2019 to 142 in 2020 because some SSFs were already
successfully donated to qualified cooperators while others have been disposed due to wear and
tear and non-serviceable status of machines.
In 2019, out of 4,494 barangay micro business enterprises (BMBE) applications received,
99.98 percent or 4,493 certificates were issued within the prescribed time. In 2020, 100 percent
was achieved with 3,579 BMBE applications received and issued with certificates within the
prescribed time. This is primarily attributed to the strict implementation of RA 11032 (EODB)
and RA 9178 (BMBE Act).
Chapter 9: ECONOMIC OPPORTUNITIES IN INDUSTRY AND SERVICES 63
The number of Small-Enterprise Technology Upgrading Program (SETUP) beneficiaries
decreased from 58 in 2019 to 33 in 2020. Only 33 proposals funded as of December 30, 2020
amounting to PHP55.90 Million (firm release only) was reported at the end of the year.
Decrease in number of SETUP beneficiaries was due to Taal Volcano Eruption, COVID-19
pandemic, and lockdowns in CALABARZON within 2nd to 3rd Quarter of 2020. Another
constraining factor is the difficulty in the assessment of MSMEs/firms due to stricter
implementation of IATF and business owners to conduct technology needs assessment and
field operations to fast track the development of project proposals for funding assistance
(innovation-enabling fund). Also, the lack of consumer demand tests businesses’ financial
capacity to keep their enterprise afloat, together with trying to support their workforce.
Moving Forward
The disruption in economic activities as a result of temporary closure and suspension of
production activities arising from the COVID-19 pandemic, including the huge number of
displaced workers, limited consumer spending, and travel restrictions, are among the biggest
challenges that the Region has to overcome. To recover and regain the growth momentum
before the pandemic, the Industry and Services sector will focus on sustainable economic
activities and address the impact of reduced production capacities and disruption in supply
chains.
One of the major activities that may help to increase employment is the PEZA’s DOLLAR
program. It is a virtual job fair to inform the public of the jobs available in various ecozones.
The Cavite Economic Zone held its virtual launching of the online job skills training.
Also, as a response to the restrictions imposed by the pandemic and community quarantines,
PEZA adapted automated systems and processes to enhance the ease of doing business in
economic zones. These systems include online payment methods accessible to applicant
investors or current locators in ecozones.
Another great opportunity for the CALABARZON is the Manufacturing Plant Expansion
Project of Yamaha Motor Philippines, Inc. at Lima Technology Center, Special Economic Zone
in Batangas Province. It is seen to create additional jobs and will contribute to the economic
recovery not only for the CALABARZON but for the Philippines. Yamaha Motors aims to
expand business operations in CALABARZON, consistent with its plan to achieve the highest
growth in the motorcycle industry among ASEAN countries.
Likewise, the Corporate Recovery and Tax Incentives for Enterprises Law will gradually lower
the corporate income tax from 30 percent to 25 percent and streamline the government’s fiscal
incentives for investments both covering foreign and domestic enterprises to help business
establishments recover and expand.
The various programs of DTI such as MSME Development Program, Industry Development
Program, Consumer Protection Program and Consumer Education & Advocacy Program will
continue to support the MSMEs. In addition to these programs, DTI unveiled the country’s
Artificial Intelligence Roadmap to increase productivity and competitiveness. Furthermore,
close collaboration of government agencies should be sustained. CALABARZON should
continue to pursue skills retooling programs, implement flexible and blended training
arrangements for displaced/affected workers, and scale-up manufacturing technologies for
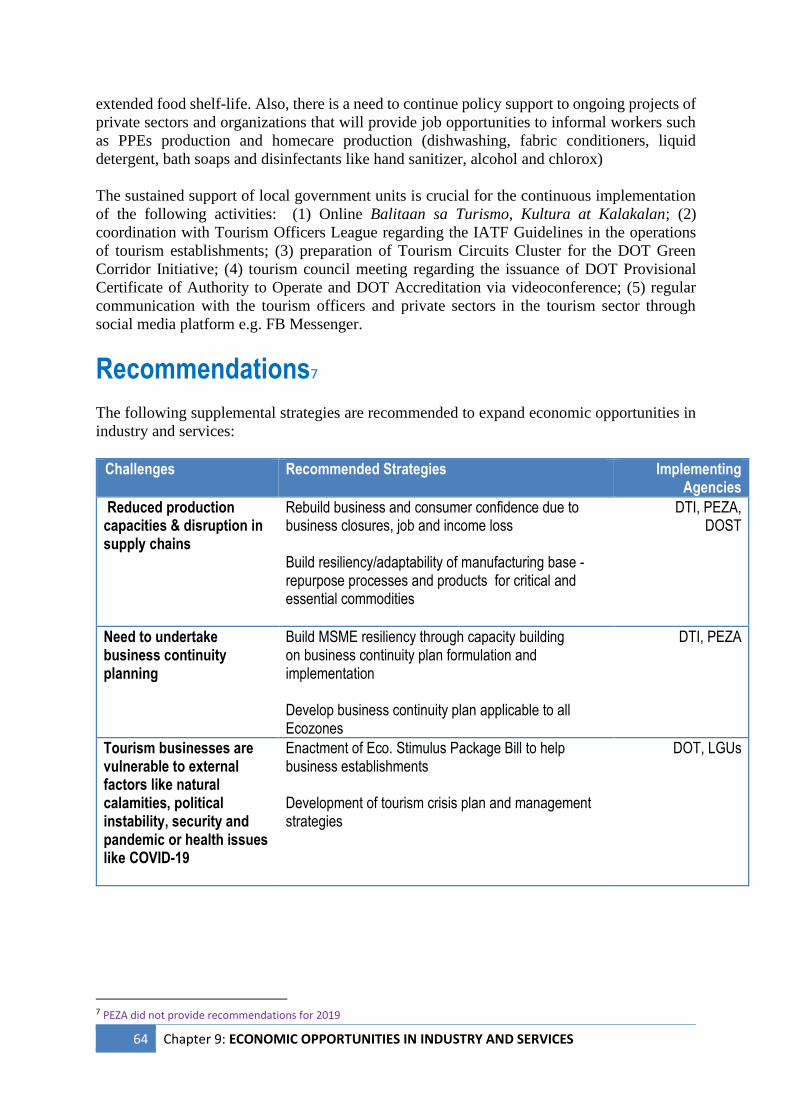
64 Chapter 9: ECONOMIC OPPORTUNITIES IN INDUSTRY AND SERVICES
extended food shelf-life. Also, there is a need to continue policy support to ongoing projects of
private sectors and organizations that will provide job opportunities to informal workers such
as PPEs production and homecare production (dishwashing, fabric conditioners, liquid
detergent, bath soaps and disinfectants like hand sanitizer, alcohol and chlorox)
The sustained support of local government units is crucial for the continuous implementation
of the following activities: (1) Online Balitaan sa Turismo, Kultura at Kalakalan; (2)
coordination with Tourism Officers League regarding the IATF Guidelines in the operations
of tourism establishments; (3) preparation of Tourism Circuits Cluster for the DOT Green
Corridor Initiative; (4) tourism council meeting regarding the issuance of DOT Provisional
Certificate of Authority to Operate and DOT Accreditation via videoconference; (5) regular
communication with the tourism officers and private sectors in the tourism sector through
social media platform e.g. FB Messenger.
Recommendations7 The following supplemental strategies are recommended to expand economic opportunities in
industry and services:
Challenges Recommended Strategies Implementing Agencies
Reduced production capacities & disruption in supply chains
Rebuild business and consumer confidence due to business closures, job and income loss
Build resiliency/adaptability of manufacturing base - repurpose processes and products for critical and essential commodities
DTI, PEZA, DOST
Need to undertake business continuity planning
Build MSME resiliency through capacity building on business continuity plan formulation and implementation Develop business continuity plan applicable to all Ecozones
DTI, PEZA
Tourism businesses are vulnerable to external factors like natural calamities, political instability, security and pandemic or health issues like COVID-19
Enactment of Eco. Stimulus Package Bill to help business establishments Development of tourism crisis plan and management strategies
DOT, LGUs
7 PEZA did not provide recommendations for 2019
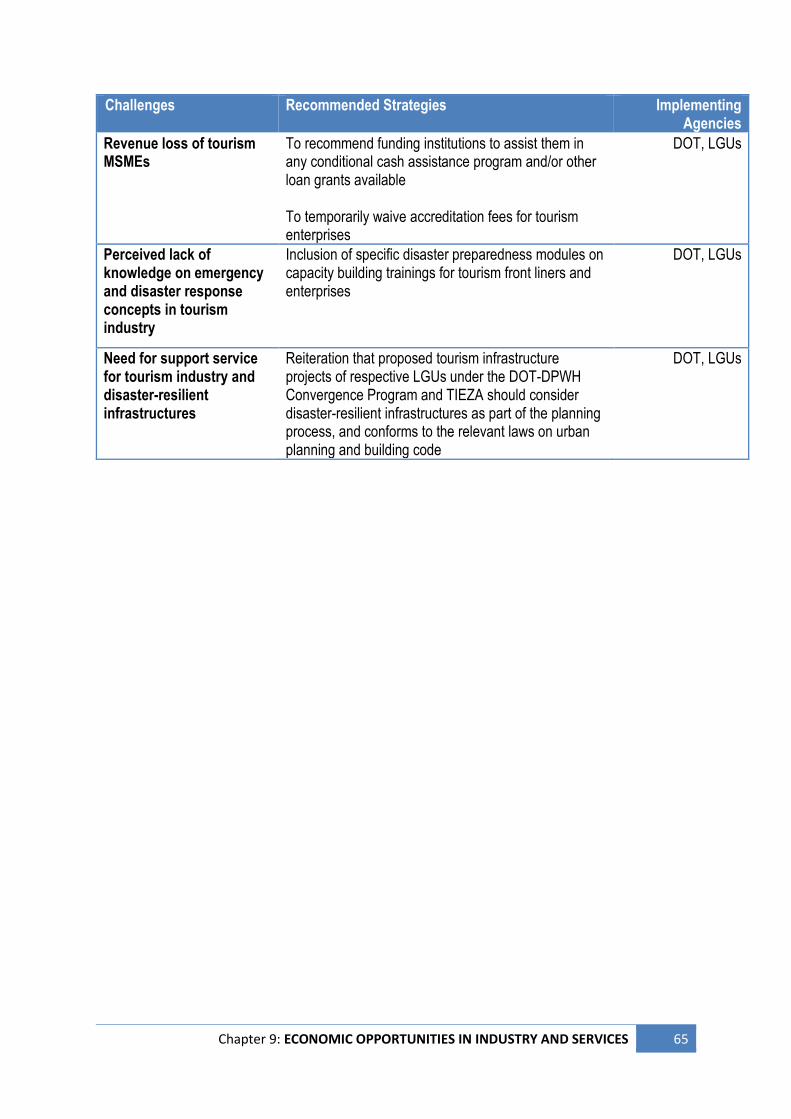
Chapter 9: ECONOMIC OPPORTUNITIES IN INDUSTRY AND SERVICES 65
Challenges Recommended Strategies Implementing Agencies
Revenue loss of tourism MSMEs
To recommend funding institutions to assist them in any conditional cash assistance program and/or other loan grants available To temporarily waive accreditation fees for tourism enterprises
DOT, LGUs
Perceived lack of knowledge on emergency and disaster response concepts in tourism industry
Inclusion of specific disaster preparedness modules on capacity building trainings for tourism front liners and enterprises
DOT, LGUs
Need for support service for tourism industry and disaster-resilient infrastructures
Reiteration that proposed tourism infrastructure projects of respective LGUs under the DOT-DPWH Convergence Program and TIEZA should consider disaster-resilient infrastructures as part of the planning process, and conforms to the relevant laws on urban planning and building code
DOT, LGUs

66 Chapter 9: ECONOMIC OPPORTUNITIES IN INDUSTRY AND SERVICES
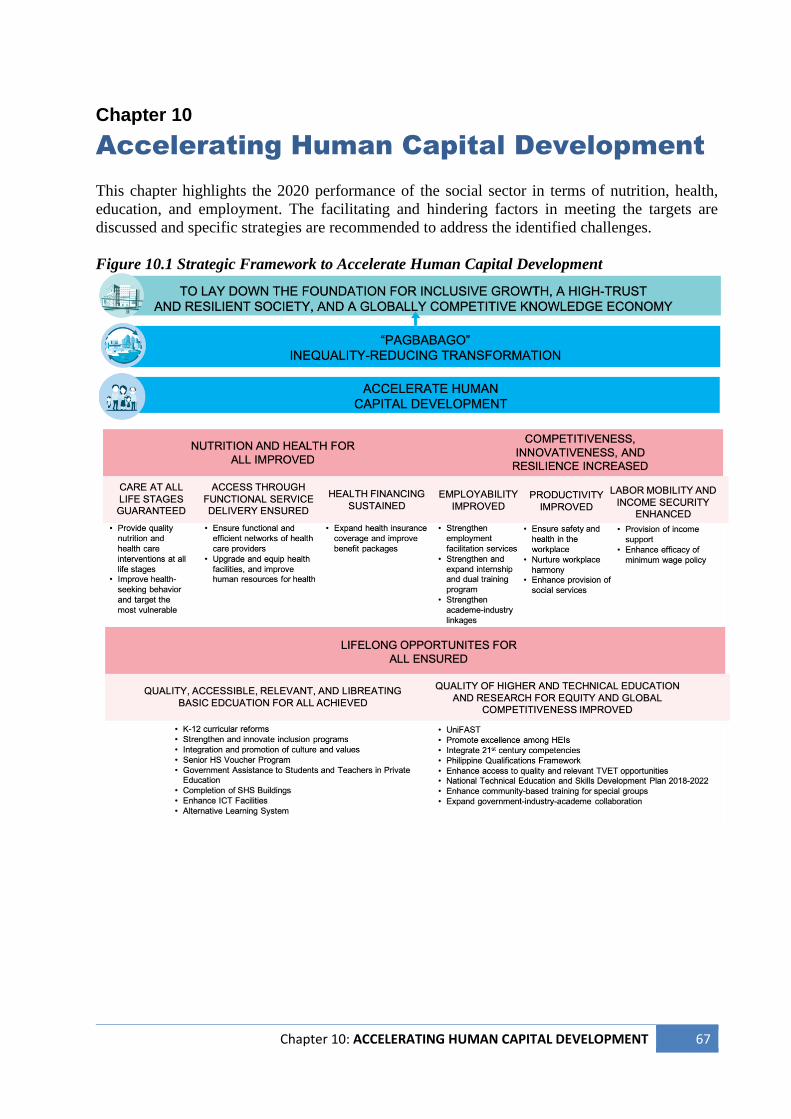
Chapter 10: ACCELERATING HUMAN CAPITAL DEVELOPMENT 67
Chapter 10
Accelerating Human Capital Development
This chapter highlights the 2020 performance of the social sector in terms of nutrition, health,
education, and employment. The facilitating and hindering factors in meeting the targets are
discussed and specific strategies are recommended to address the identified challenges.
Figure 10.1 Strategic Framework to Accelerate Human Capital Development
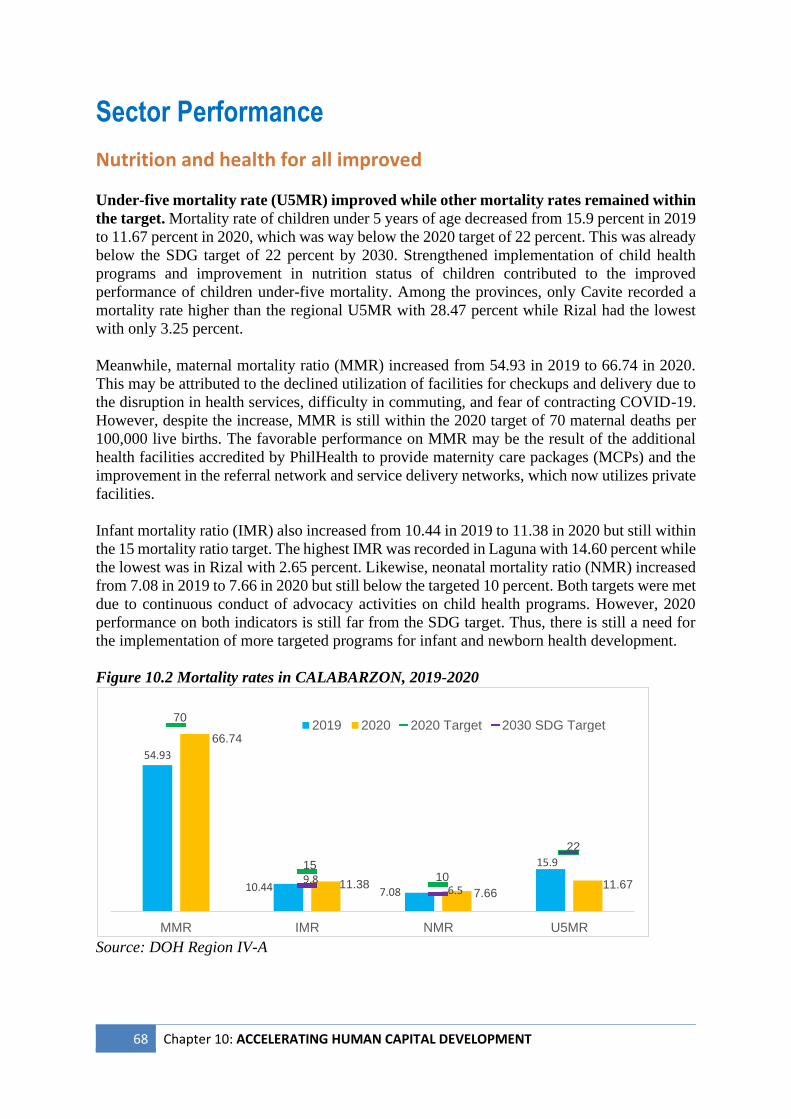
68 Chapter 10: ACCELERATING HUMAN CAPITAL DEVELOPMENT
Sector Performance
Nutrition and health for all improved
Under-five mortality rate (U5MR) improved while other mortality rates remained within
the target. Mortality rate of children under 5 years of age decreased from 15.9 percent in 2019
to 11.67 percent in 2020, which was way below the 2020 target of 22 percent. This was already
below the SDG target of 22 percent by 2030. Strengthened implementation of child health
programs and improvement in nutrition status of children contributed to the improved
performance of children under-five mortality. Among the provinces, only Cavite recorded a
mortality rate higher than the regional U5MR with 28.47 percent while Rizal had the lowest
with only 3.25 percent.
Meanwhile, maternal mortality ratio (MMR) increased from 54.93 in 2019 to 66.74 in 2020.
This may be attributed to the declined utilization of facilities for checkups and delivery due to
the disruption in health services, difficulty in commuting, and fear of contracting COVID-19.
However, despite the increase, MMR is still within the 2020 target of 70 maternal deaths per
100,000 live births. The favorable performance on MMR may be the result of the additional
health facilities accredited by PhilHealth to provide maternity care packages (MCPs) and the
improvement in the referral network and service delivery networks, which now utilizes private
facilities.
Infant mortality ratio (IMR) also increased from 10.44 in 2019 to 11.38 in 2020 but still within
the 15 mortality ratio target. The highest IMR was recorded in Laguna with 14.60 percent while
the lowest was in Rizal with 2.65 percent. Likewise, neonatal mortality ratio (NMR) increased
from 7.08 in 2019 to 7.66 in 2020 but still below the targeted 10 percent. Both targets were met
due to continuous conduct of advocacy activities on child health programs. However, 2020
performance on both indicators is still far from the SDG target. Thus, there is still a need for
the implementation of more targeted programs for infant and newborn health development.
Figure 10.2 Mortality rates in CALABARZON, 2019-2020
Source: DOH Region IV-A
70 2019 2020 2020 Target 2030 SDG Target
66.74
54.93
22
10.44
15 9.8
15.9
11.38 7.08
10 6.5 7.66
11.67
MMR IMR NMR U5MR
Chapter 10: ACCELERATING HUMAN CAPITAL DEVELOPMENT 69
CALABARZON remained malaria-free. No cases of malaria were recorded in the Region
due to the sustained efforts of the provinces of Laguna, Rizal and Quezon in eliminating
malaria.
New Human Immunodeficiency Virus (HIV) and tuberculosis cases decreased. New HIV
cases decreased by 743 from 2,114 in 2019 to only 1,372 in 2020. This is consistent with the
Sustainable Development Goal (SDG) target of decreasing HIV incidence. The positive
performance was attributed to the increased number of testing sites, hubs, and clinics for HIV,
as well as increased awareness on the safe practices to prevent the virus. Among the provinces,
Rizal recorded the highest increase in cases with 63 new cases while Cavite had the most
number of new cases with 469.
Meanwhile, tuberculosis cases also decreased from 500 in 2019 to 266 in 2020. However, the
recorded few cases may not be an indicator of positive performance according to the
Department of Health as it may be a direct effect of COVID-19, especially on a critical disease
prevention and control program like tuberculosis.
Drug cases with completed treatment improved. Drug cases that completed treatment
increased from 94 percent in 2019 to 100 percent in 2020. The strong support of the government
and engagement of stakeholders from all sectors accounted for the high completion rate.
Proportion of deliveries attended by skilled personnel increased as births delivered in
health facilities decreased. The proportion of births attended by skilled health personnel
reached 114.6718 percent, exceeding the target rate of 96 percent. The 2020 accomplishment
for deliveries attended by skilled personnel was 19.68 and 18.67 percentage points higher than
the previous year’s accomplishment and the 2020 target, respectively. On the other hand,
deliveries in health facilities decreased from 94.39 to only 92.11 in 2020, but still within the
91 percent target. This may also be an effect of the COVID-19 pandemic as less individuals go
to hospitals and health facilities due to fear of contracting the virus. Limited access to transport
services may have also affected deliveries in health facilities during implementation of
enhanced community quarantine. Overall, the increase in number of accredited facilities
providing MCPs, upgraded health facilities and birthing homes, and creation of local
ordinances requiring the local government units to support maternal care contributed to the
positive results.
This is also consistent with the recorded percentage of pregnant women with 4 or more prenatal
visits and percentage of women with at least 2 postpartum visits. From 50.22 in 2019,
percentage of women with 4 or more prenatal visits decreased to 15.08 in 2020 while
percentage of women with at least 2 postpartum visits declined from 58.21 in 2019 to only
20.35 in 2020.
Health manpower to population ratio improved but ratio for medical doctors is still below
standard. Nurses to population ratio significantly improved from the ratio in previous years to
2020’s 1:3,427, which is way lower than the targeted 1:20,000. Furthermore, midwives to
population ratio was recorded at 1:4,064, a steep decline from 2019 at 1:14,410 and within the
standard 1:5,000. The lower ratios may be attributed to mass hiring of health care professionals
to address the demand for health care services arising from COVID-19 pandemic.
8 Due to under targeting of population; partial data only, final data still to be provided by DOH
70 Chapter 10: ACCELERATING HUMAN CAPITAL DEVELOPMENT
Meanwhile, doctor to population ratio improved at 1:28,552 in 2020 from 1:76,622 in 2019.
However, doctors to population ratio has yet to meet the standard 1:20,000, indicating the need
for more medical doctors.
Percentage of immunized one-year-old children decreased and still below target. The
percentage of one-year-old children that are fully immunized decreased by 40.50 percentage
points from 73.96 percent in 2019 to only 36.79 percent in 2020. Consequently, the targeted
95 percent immunized one-year-old children was not met due to loss of confidence and trust
among parents on the vaccines under the immunization program brought about by the
Dengvaxia controversy. In addition, inadequacy of staff, disruptions in health services, and
quarantine restrictions may have contributed to the poor performance.
Malnutrition in the Region is still a priority concern. Underweight, wasting, and stunting
among preschool children under five years old remain as regional concerns.
Stunting or pagkabansot is when a child has a low height for his/her age, usually due to
malnutrition (starting from the womb until two years of age), repeated infections, and/or poor
psychosocial stimulation. This is attributed to insufficient nutritious foods, long periods of
hunger due to poor socioeconomic conditions, and inadequate health and nutrition maintenance
during the first 1,000 days (F1KD) of life (i.e., from conception up to two years old of age of
the child). The first 1,000 days is considered the “golden window of opportunity” for a child
as nutrition, social, and psychosocial deficiency during this period will have irreversible side
effects on the physical and cognitive ability of a child.
Wasting, on the other hand, can be observed by seeing a very low weight-for-height ratio of a
child. It often indicates recent and severe weight loss, although it can also persist for a long
time. It usually occurs when a person has inadequate consumption of quality and quantity of
food, and/or they have had frequent or prolonged illnesses.
Unfortunately, official data or trends in the prevalence of underweight, wasting, and stunting
are unavailable from 2017 to 2020. National and regional results of the Expanded National
Nutrition Survey (eNNS) will be out by 2022. Even though there are already provincial results,
for 2018, the results only pertain for the Province of Laguna, while results for 2019 only refer
to the Provinces of Rizal and Quezon.
Physical and mental development will suffer when a child is experiencing malnutrition
especially if it persists. Malnutrition results to insufficient energy and low mental awareness to
perform satisfactorily in school. Studies have shown that failure of children to attain optimal
growth due to malnutrition is associated with high risk for impaired cognitive development,
poor school performance, and lower earnings in adulthood. (Save the Children Philippines,
2015)
Aside from physical development, proper nutrition in the first 1,000 days is critical to the
cognitive development of every child. A study from Global Health Hub (2016) comparing brain
scans of a healthy child and stunted child, showed that the latter portrays 40 percent less brain
mass particularly in the temporal lobe. Hence, cognitive functions were affected.
Proper nutrition in the F1KD of a child produces a positive impact in personal health and
development as well as productivity and family health later in adult life. Well-nourished
children in the first 1,000 days are 10 times more likely to overcome life-threatening diseases,
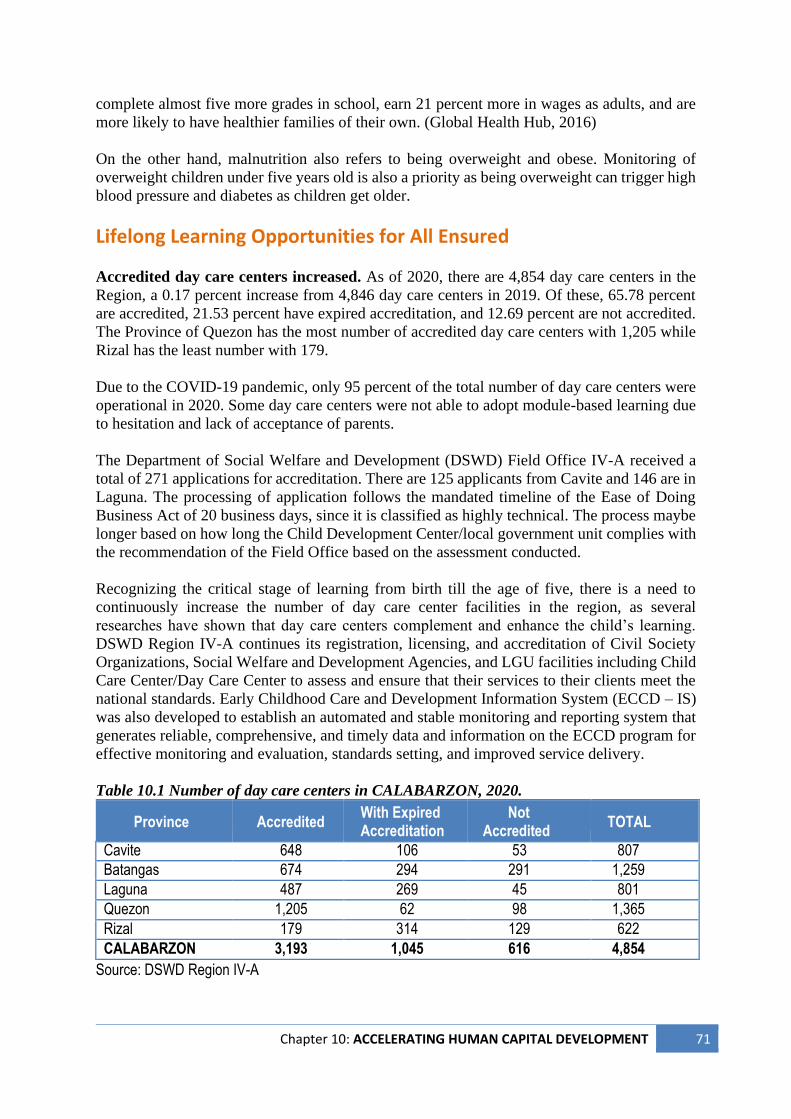
Chapter 10: ACCELERATING HUMAN CAPITAL DEVELOPMENT 71
complete almost five more grades in school, earn 21 percent more in wages as adults, and are
more likely to have healthier families of their own. (Global Health Hub, 2016)
On the other hand, malnutrition also refers to being overweight and obese. Monitoring of
overweight children under five years old is also a priority as being overweight can trigger high
blood pressure and diabetes as children get older.
Lifelong Learning Opportunities for All Ensured
Accredited day care centers increased. As of 2020, there are 4,854 day care centers in the
Region, a 0.17 percent increase from 4,846 day care centers in 2019. Of these, 65.78 percent
are accredited, 21.53 percent have expired accreditation, and 12.69 percent are not accredited.
The Province of Quezon has the most number of accredited day care centers with 1,205 while
Rizal has the least number with 179.
Due to the COVID-19 pandemic, only 95 percent of the total number of day care centers were
operational in 2020. Some day care centers were not able to adopt module-based learning due
to hesitation and lack of acceptance of parents.
The Department of Social Welfare and Development (DSWD) Field Office IV-A received a
total of 271 applications for accreditation. There are 125 applicants from Cavite and 146 are in
Laguna. The processing of application follows the mandated timeline of the Ease of Doing
Business Act of 20 business days, since it is classified as highly technical. The process maybe
longer based on how long the Child Development Center/local government unit complies with
the recommendation of the Field Office based on the assessment conducted.
Recognizing the critical stage of learning from birth till the age of five, there is a need to
continuously increase the number of day care center facilities in the region, as several
researches have shown that day care centers complement and enhance the child’s learning.
DSWD Region IV-A continues its registration, licensing, and accreditation of Civil Society
Organizations, Social Welfare and Development Agencies, and LGU facilities including Child
Care Center/Day Care Center to assess and ensure that their services to their clients meet the
national standards. Early Childhood Care and Development Information System (ECCD – IS)
was also developed to establish an automated and stable monitoring and reporting system that
generates reliable, comprehensive, and timely data and information on the ECCD program for
effective monitoring and evaluation, standards setting, and improved service delivery.
Table 10.1 Number of day care centers in CALABARZON, 2020.
Province Accredited With Expired Accreditation
Not Accredited
TOTAL
Cavite 648 106 53 807
Batangas 674 294 291 1,259
Laguna 487 269 45 801
Quezon 1,205 62 98 1,365
Rizal 179 314 129 622
CALABARZON 3,193 1,045 616 4,854
Source: DSWD Region IV-A
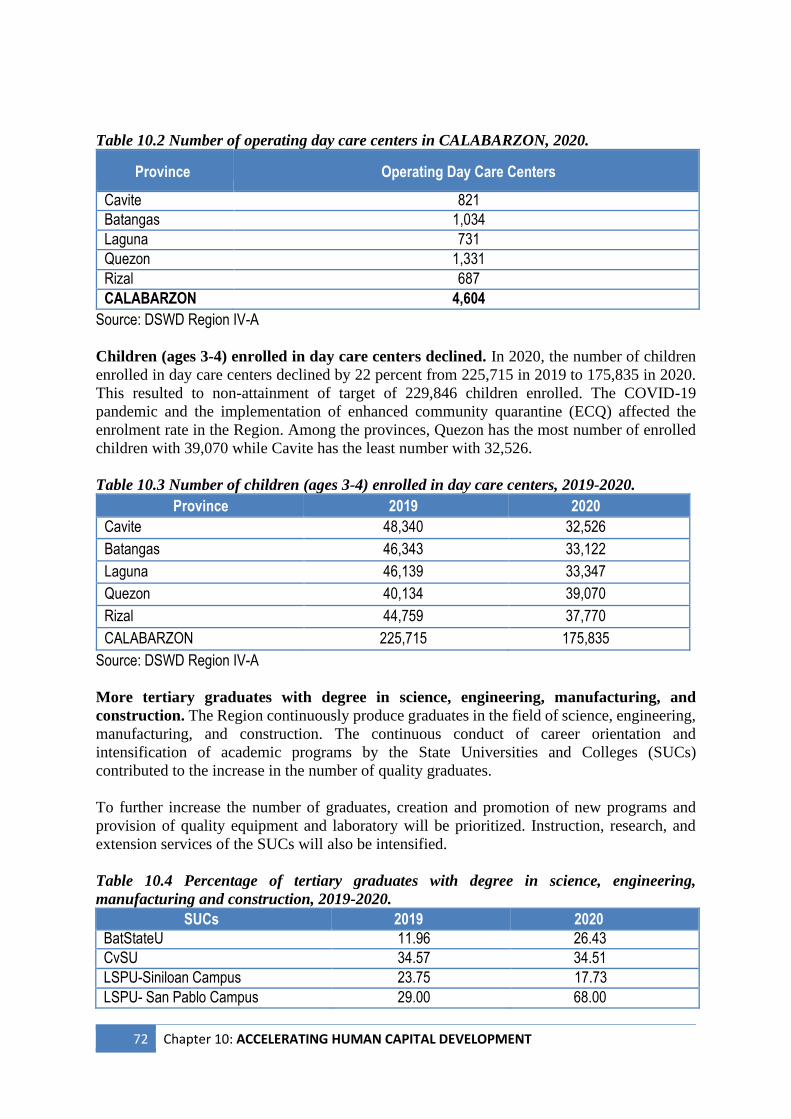
72 Chapter 10: ACCELERATING HUMAN CAPITAL DEVELOPMENT
Table 10.2 Number of operating day care centers in CALABARZON, 2020.
Province Operating Day Care Centers
Cavite 821
Batangas 1,034
Laguna 731
Quezon 1,331
Rizal 687
CALABARZON 4,604
Source: DSWD Region IV-A Children (ages 3-4) enrolled in day care centers declined. In 2020, the number of children
enrolled in day care centers declined by 22 percent from 225,715 in 2019 to 175,835 in 2020.
This resulted to non-attainment of target of 229,846 children enrolled. The COVID-19
pandemic and the implementation of enhanced community quarantine (ECQ) affected the
enrolment rate in the Region. Among the provinces, Quezon has the most number of enrolled
children with 39,070 while Cavite has the least number with 32,526.
Table 10.3 Number of children (ages 3-4) enrolled in day care centers, 2019-2020.
Province 2019 2020
Cavite 48,340 32,526
Batangas 46,343 33,122
Laguna 46,139 33,347
Quezon 40,134 39,070
Rizal 44,759 37,770
CALABARZON 225,715 175,835
Source: DSWD Region IV-A
More tertiary graduates with degree in science, engineering, manufacturing, and
construction. The Region continuously produce graduates in the field of science, engineering,
manufacturing, and construction. The continuous conduct of career orientation and
intensification of academic programs by the State Universities and Colleges (SUCs)
contributed to the increase in the number of quality graduates.
To further increase the number of graduates, creation and promotion of new programs and
provision of quality equipment and laboratory will be prioritized. Instruction, research, and
extension services of the SUCs will also be intensified.
Table 10.4 Percentage of tertiary graduates with degree in science, engineering,
manufacturing and construction, 2019-2020.
SUCs 2019 2020
BatStateU 11.96 26.43
CvSU 34.57 34.51
LSPU-Siniloan Campus 23.75 17.73
LSPU- San Pablo Campus 29.00 68.00
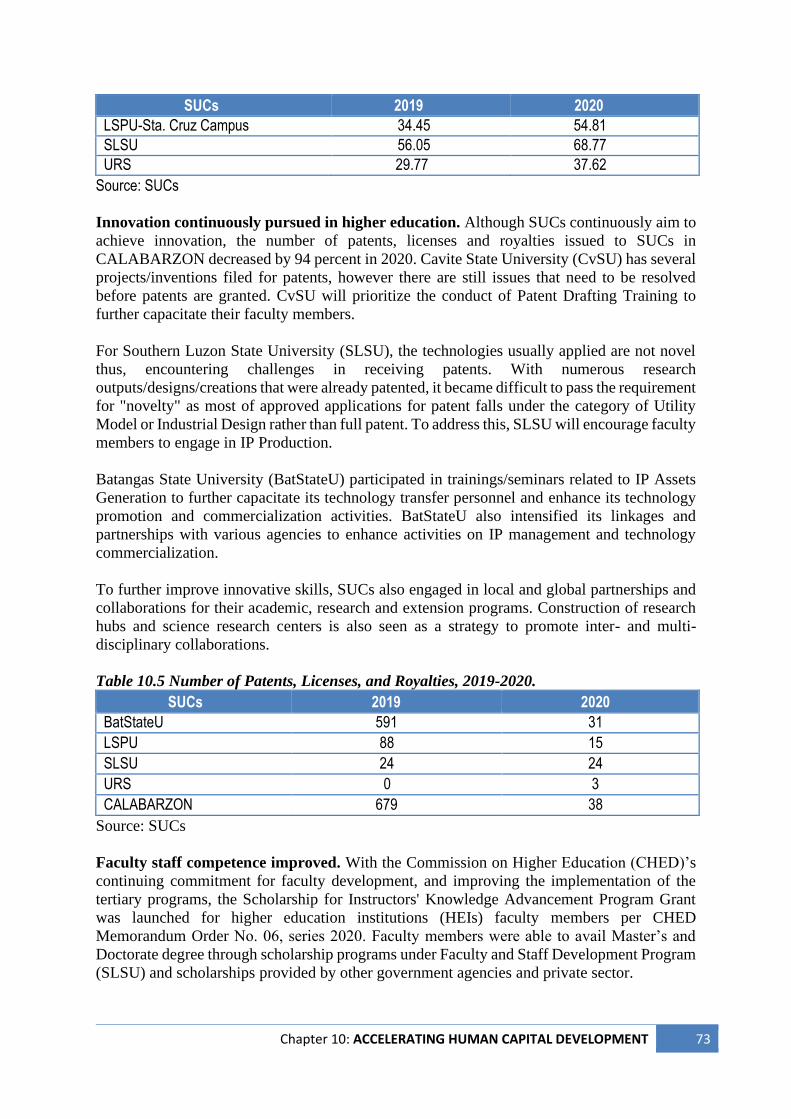
Chapter 10: ACCELERATING HUMAN CAPITAL DEVELOPMENT 73
SUCs 2019 2020
LSPU-Sta. Cruz Campus 34.45 54.81
SLSU 56.05 68.77
URS 29.77 37.62
Source: SUCs Innovation continuously pursued in higher education. Although SUCs continuously aim to
achieve innovation, the number of patents, licenses and royalties issued to SUCs in
CALABARZON decreased by 94 percent in 2020. Cavite State University (CvSU) has several
projects/inventions filed for patents, however there are still issues that need to be resolved
before patents are granted. CvSU will prioritize the conduct of Patent Drafting Training to
further capacitate their faculty members.
For Southern Luzon State University (SLSU), the technologies usually applied are not novel
thus, encountering challenges in receiving patents. With numerous research
outputs/designs/creations that were already patented, it became difficult to pass the requirement
for "novelty" as most of approved applications for patent falls under the category of Utility
Model or Industrial Design rather than full patent. To address this, SLSU will encourage faculty
members to engage in IP Production.
Batangas State University (BatStateU) participated in trainings/seminars related to IP Assets
Generation to further capacitate its technology transfer personnel and enhance its technology
promotion and commercialization activities. BatStateU also intensified its linkages and
partnerships with various agencies to enhance activities on IP management and technology
commercialization.
To further improve innovative skills, SUCs also engaged in local and global partnerships and
collaborations for their academic, research and extension programs. Construction of research
hubs and science research centers is also seen as a strategy to promote inter- and multi-
disciplinary collaborations.
Table 10.5 Number of Patents, Licenses, and Royalties, 2019-2020.
SUCs 2019 2020
BatStateU 591 31
LSPU 88 15
SLSU 24 24
URS 0 3
CALABARZON 679 38
Source: SUCs
Faculty staff competence improved. With the Commission on Higher Education (CHED)’s
continuing commitment for faculty development, and improving the implementation of the
tertiary programs, the Scholarship for Instructors' Knowledge Advancement Program Grant
was launched for higher education institutions (HEIs) faculty members per CHED
Memorandum Order No. 06, series 2020. Faculty members were able to avail Master’s and
Doctorate degree through scholarship programs under Faculty and Staff Development Program
(SLSU) and scholarships provided by other government agencies and private sector.
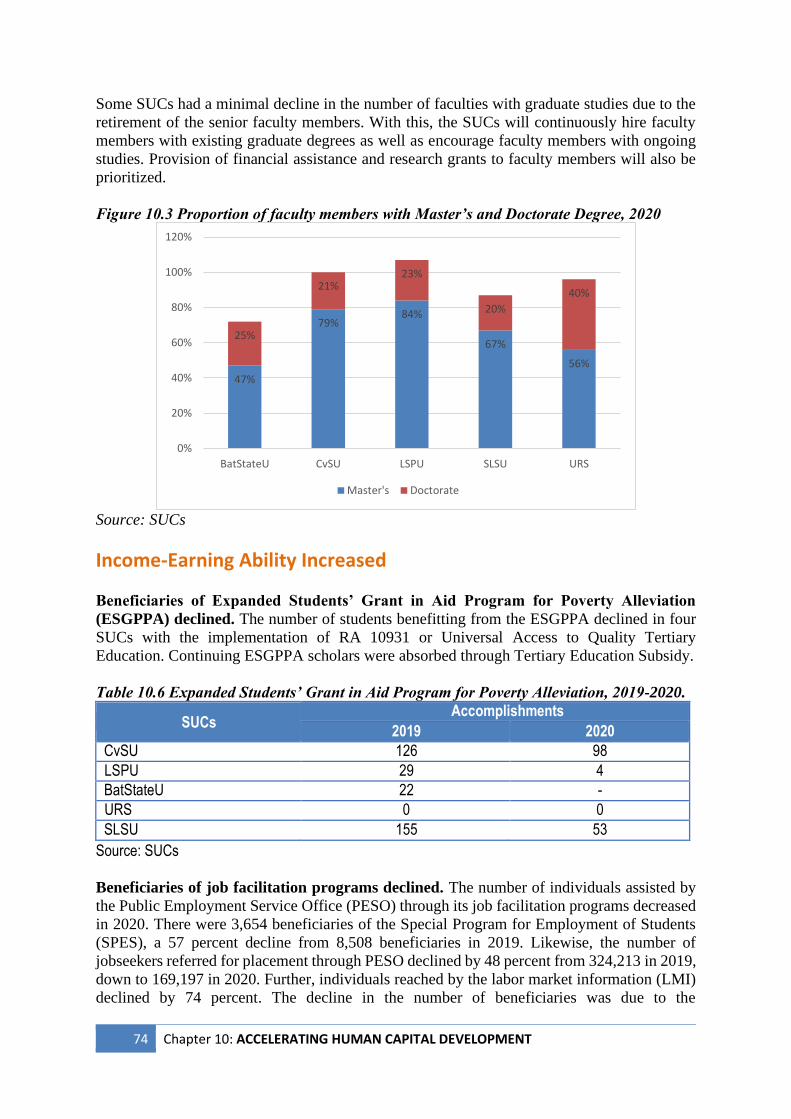
74 Chapter 10: ACCELERATING HUMAN CAPITAL DEVELOPMENT
Some SUCs had a minimal decline in the number of faculties with graduate studies due to the
retirement of the senior faculty members. With this, the SUCs will continuously hire faculty
members with existing graduate degrees as well as encourage faculty members with ongoing
studies. Provision of financial assistance and research grants to faculty members will also be
prioritized. Figure 10.3 Proportion of faculty members with Master’s and Doctorate Degree, 2020
Source: SUCs
Income-Earning Ability Increased
Beneficiaries of Expanded Students’ Grant in Aid Program for Poverty Alleviation
(ESGPPA) declined. The number of students benefitting from the ESGPPA declined in four
SUCs with the implementation of RA 10931 or Universal Access to Quality Tertiary
Education. Continuing ESGPPA scholars were absorbed through Tertiary Education Subsidy.
Table 10.6 Expanded Students’ Grant in Aid Program for Poverty Alleviation, 2019-2020.
SUCs Accomplishments
2019 2020
CvSU 126 98
LSPU 29 4
BatStateU 22 -
URS 0 0
SLSU 155 53
Source: SUCs
Beneficiaries of job facilitation programs declined. The number of individuals assisted by
the Public Employment Service Office (PESO) through its job facilitation programs decreased
in 2020. There were 3,654 beneficiaries of the Special Program for Employment of Students
(SPES), a 57 percent decline from 8,508 beneficiaries in 2019. Likewise, the number of
jobseekers referred for placement through PESO declined by 48 percent from 324,213 in 2019,
down to 169,197 in 2020. Further, individuals reached by the labor market information (LMI)
declined by 74 percent. The decline in the number of beneficiaries was due to the
47%
79%84%
67%
56%
25%
21%23%
20%
40%
0%
20%
40%
60%
80%
100%
120%
BatStateU CvSU LSPU SLSU URS
Master's Doctorate
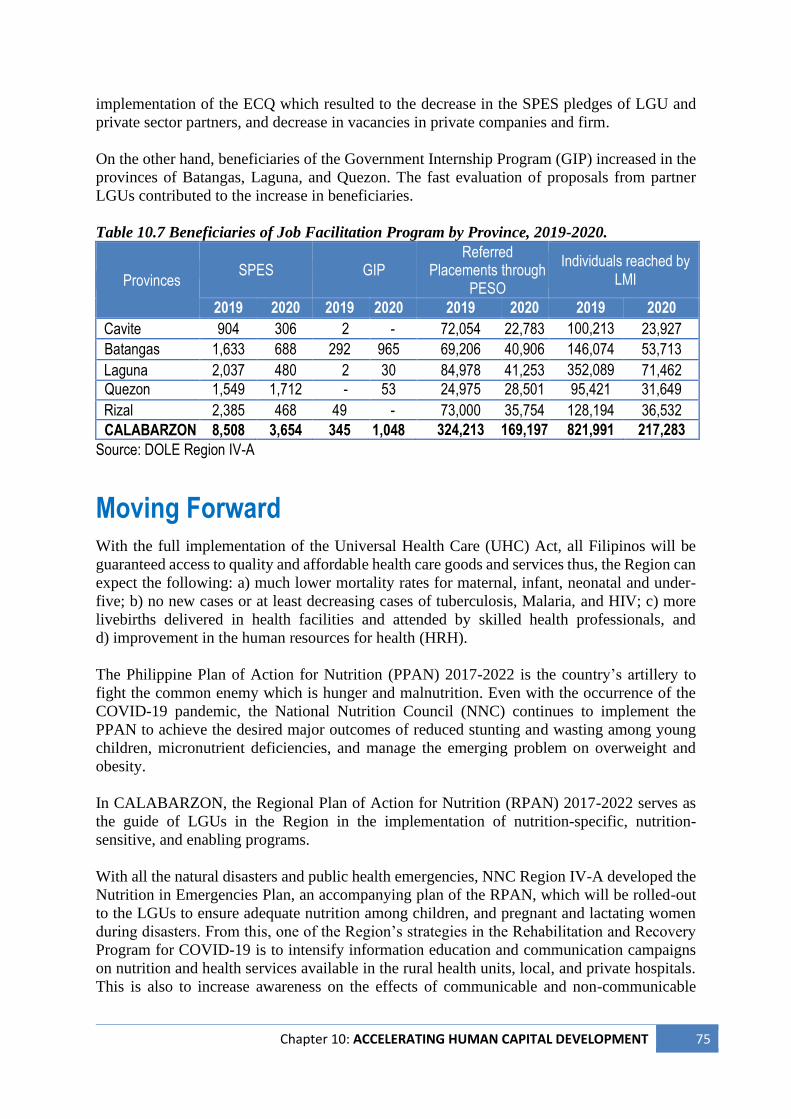
Chapter 10: ACCELERATING HUMAN CAPITAL DEVELOPMENT 75
implementation of the ECQ which resulted to the decrease in the SPES pledges of LGU and
private sector partners, and decrease in vacancies in private companies and firm.
On the other hand, beneficiaries of the Government Internship Program (GIP) increased in the
provinces of Batangas, Laguna, and Quezon. The fast evaluation of proposals from partner
LGUs contributed to the increase in beneficiaries.
Table 10.7 Beneficiaries of Job Facilitation Program by Province, 2019-2020.
Provinces SPES GIP
Referred Placements through
PESO
Individuals reached by LMI
2019 2020 2019 2020 2019 2020 2019 2020
Cavite 904 306 2 - 72,054 22,783 100,213 23,927
Batangas 1,633 688 292 965 69,206 40,906 146,074 53,713
Laguna 2,037 480 2 30 84,978 41,253 352,089 71,462
Quezon 1,549 1,712 - 53 24,975 28,501 95,421 31,649
Rizal 2,385 468 49 - 73,000 35,754 128,194 36,532
CALABARZON 8,508 3,654 345 1,048 324,213 169,197 821,991 217,283
Source: DOLE Region IV-A
Moving Forward
With the full implementation of the Universal Health Care (UHC) Act, all Filipinos will be
guaranteed access to quality and affordable health care goods and services thus, the Region can
expect the following: a) much lower mortality rates for maternal, infant, neonatal and under-
five; b) no new cases or at least decreasing cases of tuberculosis, Malaria, and HIV; c) more
livebirths delivered in health facilities and attended by skilled health professionals, and
d) improvement in the human resources for health (HRH).
The Philippine Plan of Action for Nutrition (PPAN) 2017-2022 is the country’s artillery to
fight the common enemy which is hunger and malnutrition. Even with the occurrence of the
COVID-19 pandemic, the National Nutrition Council (NNC) continues to implement the
PPAN to achieve the desired major outcomes of reduced stunting and wasting among young
children, micronutrient deficiencies, and manage the emerging problem on overweight and
obesity.
In CALABARZON, the Regional Plan of Action for Nutrition (RPAN) 2017-2022 serves as
the guide of LGUs in the Region in the implementation of nutrition-specific, nutrition-
sensitive, and enabling programs.
With all the natural disasters and public health emergencies, NNC Region IV-A developed the
Nutrition in Emergencies Plan, an accompanying plan of the RPAN, which will be rolled-out
to the LGUs to ensure adequate nutrition among children, and pregnant and lactating women
during disasters. From this, one of the Region’s strategies in the Rehabilitation and Recovery
Program for COVID-19 is to intensify information education and communication campaigns
on nutrition and health services available in the rural health units, local, and private hospitals.
This is also to increase awareness on the effects of communicable and non-communicable
76 Chapter 10: ACCELERATING HUMAN CAPITAL DEVELOPMENT
diseases to improve health-seeking behavior targeting the most vulnerable as well as intensify
promotion of general health care.
Also, the Regional Nutrition Cluster (RNC) and Local Nutrition Clusters do multi-strategic and
coordinated efforts (e.g. creation and adoption of Nutrition Advisories in disaster-stricken
areas, provision of nutritious food pack relief goods and vitamin supplements, physical check-
up in evacuation areas, among others) in order to mitigate acute malnutrition among children
and pregnant women evacuees and for those communities/localities in the Region affected by
disasters like typhoons. It does help in combating especially acute malnutrition when
coordination and harmonization of activities are also done with the private sector by gathering
more essential resources i.e. funds to procure food packs, medicines, and vitamin supplements
during relief operations.
A long-term solution against malnutrition, especially to counter stunting, is the implementation
of the ECCD – F1KD Program. With this program, the LGUs will strengthen their health and
nutrition programs for the nutritionally-at-risk pregnant and lactating women, and teenage
mothers, women of reproductive age adolescent girls, and 0-24 months old children. In
CALABARZON, even before the approval of the Kalusugan at Nutrisyon ng Mag-Nanay Act
(Republic Act [RA] No. 11148), NNC Region IV- A released a total of PHP27.9 million to
implement PPAs supporting the first 1,000 days program and another PHP20 million for the
Dietary Supplementation Program for Pregnant and Lactating Women.
Furthermore, the National/Regional Dietary Supplementation Program dubbed as “Tutok
Kainan” aims to supplement the diets of nutritionally vulnerable groups, particularly pregnant
women and infants 6-23 months old in food-insecure households, and wasted school children,
especially those from very poor households.
The RNC continues to provide technical assistance through trainings, seminars or workshops,
study visits, and dialogues with LGUs and other stakeholders that may help to strengthen the
stakeholders’ capacities in performing their duties. The LGUs are on the forefront in mitigating
acute and chronic malnutrition in their respective jurisdictions. Thus, LGUs include nutrition-
related program, projects, and activities in their local development plans and investment
programs.
One of the growing concerns in the Region is the increasing cases of adolescent pregnancy,
especially during the implementation of lockdowns and quarantine restrictions. Even before
the pandemic, the declaration of adolescent pregnancy as a National Social Emergency
prompted the CALABARZON Regional Development Council to prepare an action plan to
address the issue. The action plan includes the establishment of a database, creation of peer
counselling mechanisms, and information dissemination to increase awareness on the
repercussions of adolescent pregnancy.
Mental health is another growing priority due to the increasing concern for emotional,
psychological, and social well-being of an individual which can influence the individual’s
actions and future. As an intervention, there is a proposal to create a Regional Mental Health
Council that will support the sustainability and continuity of the mental health program by
creating policies on patient referrals which will engage every health care providers starting
from barangay health stations up to hospitals.
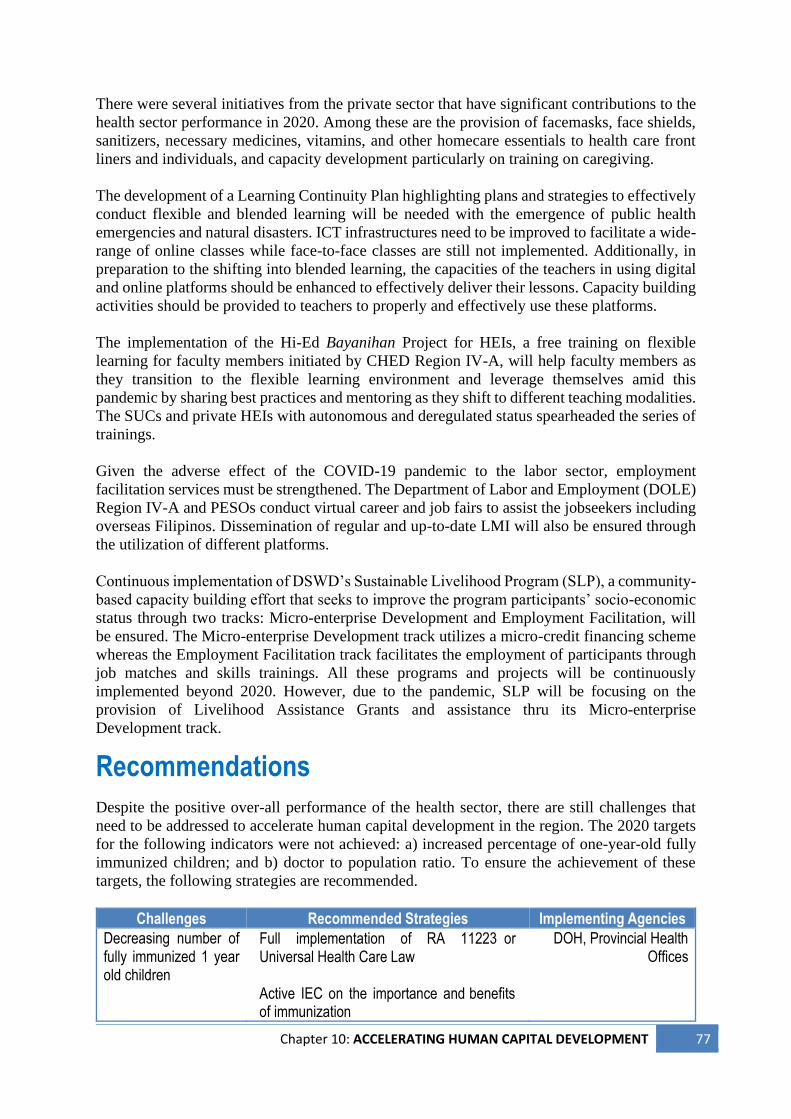
Chapter 10: ACCELERATING HUMAN CAPITAL DEVELOPMENT 77
There were several initiatives from the private sector that have significant contributions to the
health sector performance in 2020. Among these are the provision of facemasks, face shields,
sanitizers, necessary medicines, vitamins, and other homecare essentials to health care front
liners and individuals, and capacity development particularly on training on caregiving.
The development of a Learning Continuity Plan highlighting plans and strategies to effectively
conduct flexible and blended learning will be needed with the emergence of public health
emergencies and natural disasters. ICT infrastructures need to be improved to facilitate a wide-
range of online classes while face-to-face classes are still not implemented. Additionally, in
preparation to the shifting into blended learning, the capacities of the teachers in using digital
and online platforms should be enhanced to effectively deliver their lessons. Capacity building
activities should be provided to teachers to properly and effectively use these platforms.
The implementation of the Hi-Ed Bayanihan Project for HEIs, a free training on flexible
learning for faculty members initiated by CHED Region IV-A, will help faculty members as
they transition to the flexible learning environment and leverage themselves amid this
pandemic by sharing best practices and mentoring as they shift to different teaching modalities.
The SUCs and private HEIs with autonomous and deregulated status spearheaded the series of
trainings.
Given the adverse effect of the COVID-19 pandemic to the labor sector, employment
facilitation services must be strengthened. The Department of Labor and Employment (DOLE)
Region IV-A and PESOs conduct virtual career and job fairs to assist the jobseekers including
overseas Filipinos. Dissemination of regular and up-to-date LMI will also be ensured through
the utilization of different platforms.
Continuous implementation of DSWD’s Sustainable Livelihood Program (SLP), a community-
based capacity building effort that seeks to improve the program participants’ socio-economic
status through two tracks: Micro-enterprise Development and Employment Facilitation, will
be ensured. The Micro-enterprise Development track utilizes a micro-credit financing scheme
whereas the Employment Facilitation track facilitates the employment of participants through
job matches and skills trainings. All these programs and projects will be continuously
implemented beyond 2020. However, due to the pandemic, SLP will be focusing on the
provision of Livelihood Assistance Grants and assistance thru its Micro-enterprise
Development track.
Recommendations
Despite the positive over-all performance of the health sector, there are still challenges that
need to be addressed to accelerate human capital development in the region. The 2020 targets
for the following indicators were not achieved: a) increased percentage of one-year-old fully
immunized children; and b) doctor to population ratio. To ensure the achievement of these
targets, the following strategies are recommended.
Challenges Recommended Strategies Implementing Agencies
Decreasing number of fully immunized 1 year old children
Full implementation of RA 11223 or Universal Health Care Law Active IEC on the importance and benefits of immunization
DOH, Provincial Health Offices
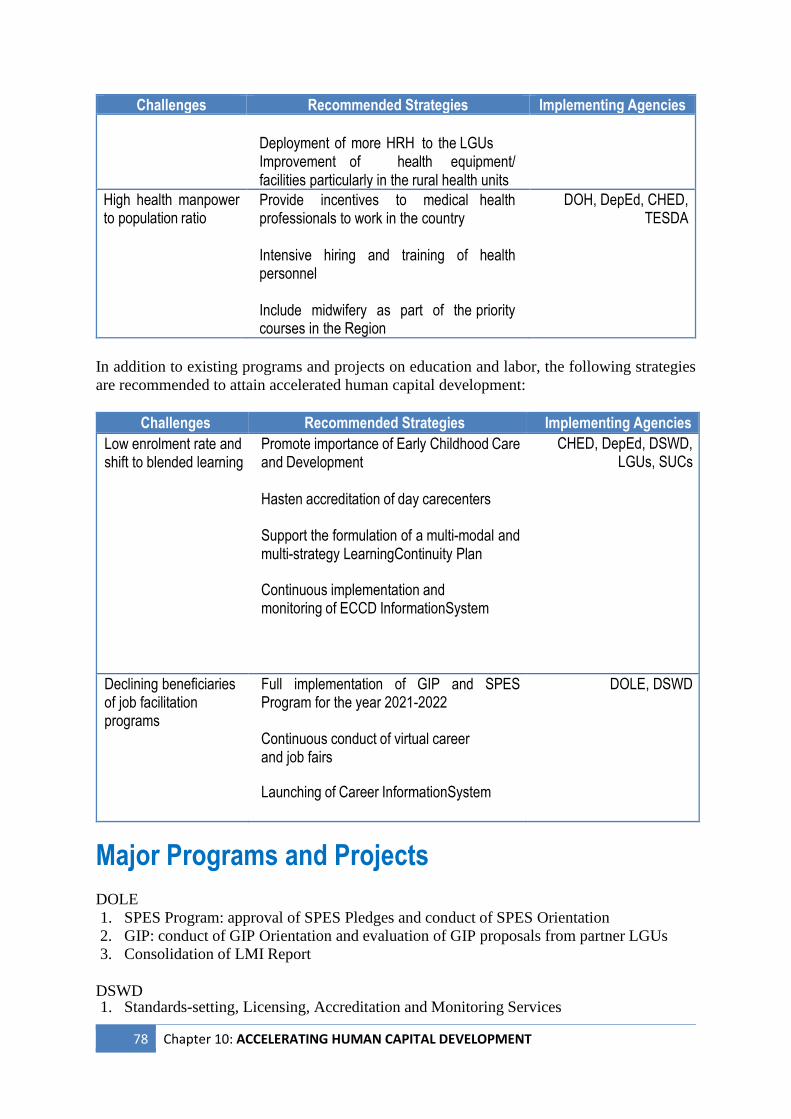
78 Chapter 10: ACCELERATING HUMAN CAPITAL DEVELOPMENT
Challenges Recommended Strategies Implementing Agencies
Deployment of more HRH to the LGUs Improvement of health equipment/ facilities particularly in the rural health units
High health manpower to population ratio
Provide incentives to medical health professionals to work in the country Intensive hiring and training of health personnel Include midwifery as part of the priority courses in the Region
DOH, DepEd, CHED, TESDA
In addition to existing programs and projects on education and labor, the following strategies
are recommended to attain accelerated human capital development:
Challenges Recommended Strategies Implementing Agencies
Low enrolment rate and shift to blended learning
Promote importance of Early Childhood Care and Development
Hasten accreditation of day care centers
Support the formulation of a multi- modal and multi-strategy Learning Continuity Plan
Continuous implementation and monitoring of ECCD Information System
CHED, DepEd, DSWD, LGUs, SUCs
Declining beneficiaries of job facilitation programs
Full implementation of GIP and SPES Program for the year 2021-2022
Continuous conduct of virtual career and job fairs
Launching of Career Information System
DOLE, DSWD
Major Programs and Projects
DOLE
1. SPES Program: approval of SPES Pledges and conduct of SPES Orientation
2. GIP: conduct of GIP Orientation and evaluation of GIP proposals from partner LGUs
3. Consolidation of LMI Report
DSWD 1. Standards-setting, Licensing, Accreditation and Monitoring Services
Chapter 10: ACCELERATING HUMAN CAPITAL DEVELOPMENT 79
2. Sustainable Livelihood Program Batangas State University 1. Conduct of and Participation to Training/Seminar related to IP Assets Generation
(Patent Searching, Patent Drafting, etc.)
Cavite State University
1. Academe-Industry Linkages
2. Internationalization efforts
3. Conduct of Patent Drafting Training
4. Development of modern and sophisticated infrastructure projects to supplement academic
and research endeavors
Luzon State Polytechnic University
1. Mobile E-Learning Laboratory for LSPU Students
2. Conduct of Project Unity in LSPU Against COVID-19 (in collaboration with the Gender
and Development Office)
3. Conduct of timely webinar on Addressing Work-Related Issues of Educators
4. Conduct of mental health awareness
5. Conduct of extension services and training activities (face to face and online) even during
the time of pandemic
Southern Luzon State University
1. Conduct of: a) Career Information; b) Career Symposium; c) Job Fair; and
d) Personal/Academic/Career Counseling
2. Academe-Industry Linkages
3. Continuous Professional Development
4. Faculty and Staff Development Program
5. IP Management Echo Seminar
6. Protecting University IP for Commercialization

80 Chapter 10: ACCELERATING HUMAN CAPITAL DEVELOPMENT
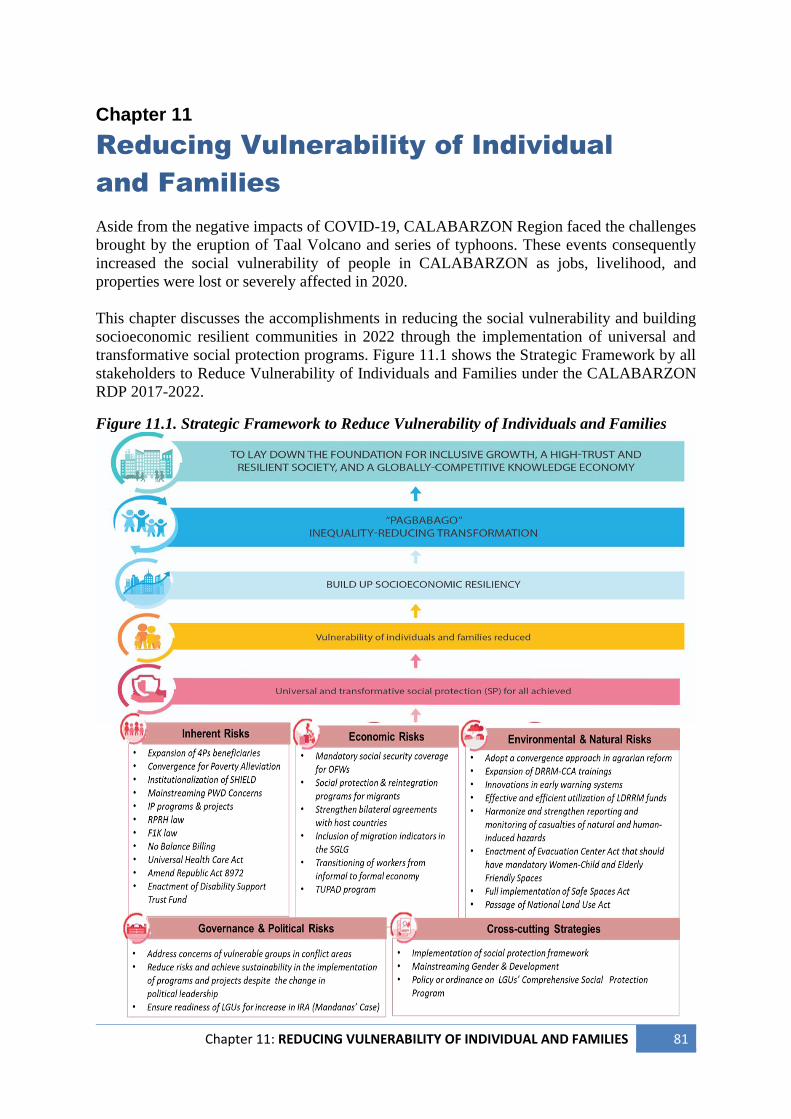
Chapter 11: REDUCING VULNERABILITY OF INDIVIDUAL AND FAMILIES 81
Chapter 11
Reducing Vulnerability of Individual
and Families
Aside from the negative impacts of COVID-19, CALABARZON Region faced the challenges
brought by the eruption of Taal Volcano and series of typhoons. These events consequently
increased the social vulnerability of people in CALABARZON as jobs, livelihood, and
properties were lost or severely affected in 2020.
This chapter discusses the accomplishments in reducing the social vulnerability and building
socioeconomic resilient communities in 2022 through the implementation of universal and
transformative social protection programs. Figure 11.1 shows the Strategic Framework by all
stakeholders to Reduce Vulnerability of Individuals and Families under the CALABARZON
RDP 2017-2022.
Figure 11.1. Strategic Framework to Reduce Vulnerability of Individuals and Families
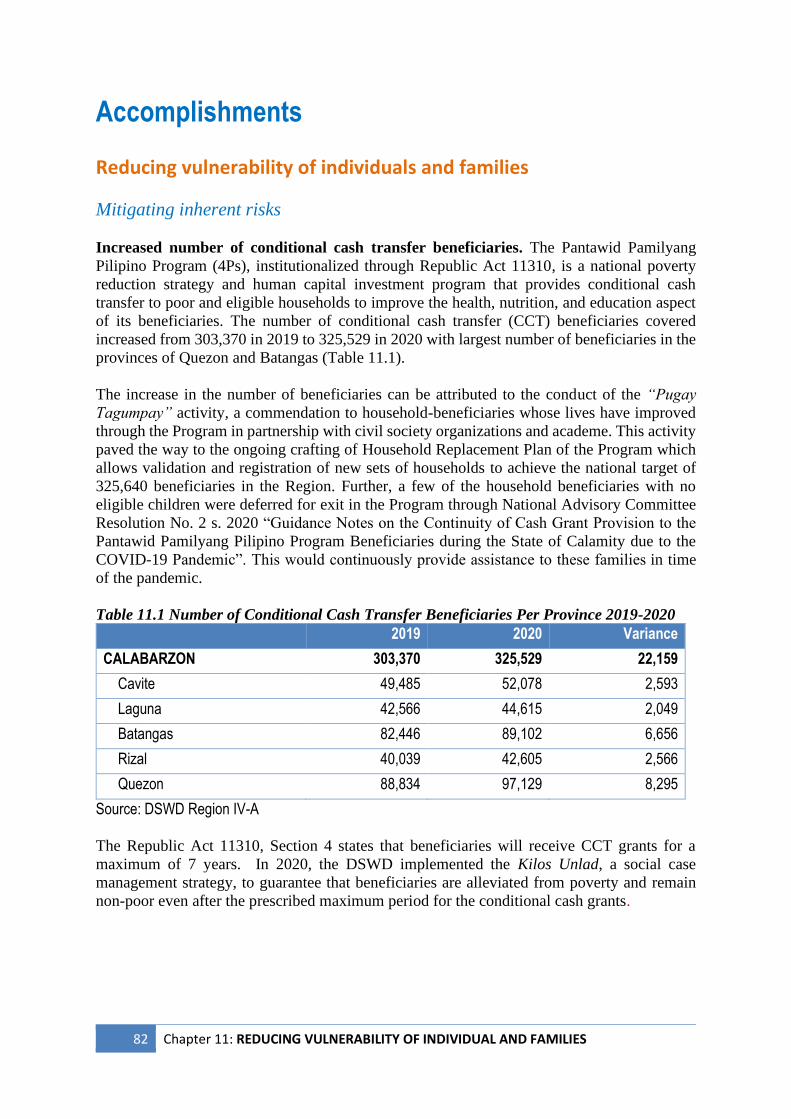
82 Chapter 11: REDUCING VULNERABILITY OF INDIVIDUAL AND FAMILIES
Accomplishments
Reducing vulnerability of individuals and families
Mitigating inherent risks
Increased number of conditional cash transfer beneficiaries. The Pantawid Pamilyang
Pilipino Program (4Ps), institutionalized through Republic Act 11310, is a national poverty
reduction strategy and human capital investment program that provides conditional cash
transfer to poor and eligible households to improve the health, nutrition, and education aspect
of its beneficiaries. The number of conditional cash transfer (CCT) beneficiaries covered
increased from 303,370 in 2019 to 325,529 in 2020 with largest number of beneficiaries in the
provinces of Quezon and Batangas (Table 11.1).
The increase in the number of beneficiaries can be attributed to the conduct of the “Pugay
Tagumpay” activity, a commendation to household-beneficiaries whose lives have improved
through the Program in partnership with civil society organizations and academe. This activity
paved the way to the ongoing crafting of Household Replacement Plan of the Program which
allows validation and registration of new sets of households to achieve the national target of
325,640 beneficiaries in the Region. Further, a few of the household beneficiaries with no
eligible children were deferred for exit in the Program through National Advisory Committee
Resolution No. 2 s. 2020 “Guidance Notes on the Continuity of Cash Grant Provision to the
Pantawid Pamilyang Pilipino Program Beneficiaries during the State of Calamity due to the
COVID-19 Pandemic”. This would continuously provide assistance to these families in time
of the pandemic.
Table 11.1 Number of Conditional Cash Transfer Beneficiaries Per Province 2019-2020
2019 2020 Variance
CALABARZON 303,370 325,529 22,159
Cavite 49,485 52,078 2,593
Laguna 42,566 44,615 2,049
Batangas 82,446 89,102 6,656
Rizal 40,039 42,605 2,566
Quezon 88,834 97,129 8,295
Source: DSWD Region IV-A
The Republic Act 11310, Section 4 states that beneficiaries will receive CCT grants for a
maximum of 7 years. In 2020, the DSWD implemented the Kilos Unlad, a social case
management strategy, to guarantee that beneficiaries are alleviated from poverty and remain
non-poor even after the prescribed maximum period for the conditional cash grants.
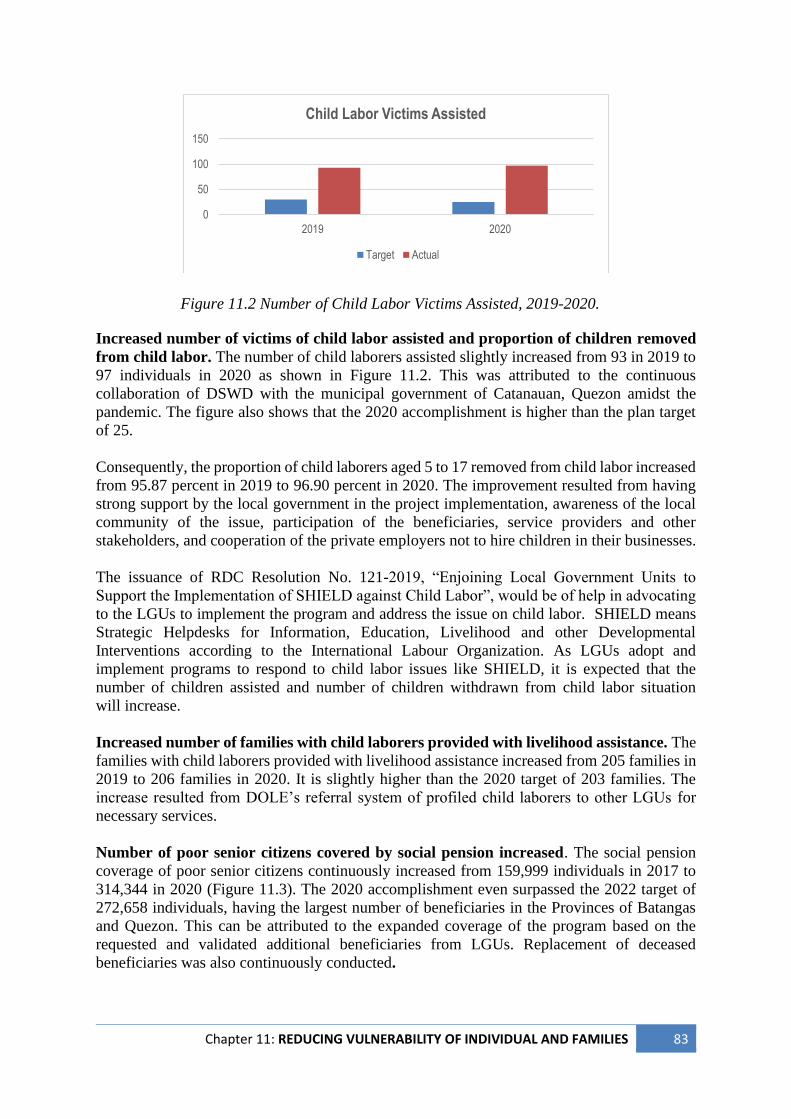
Chapter 11: REDUCING VULNERABILITY OF INDIVIDUAL AND FAMILIES 83
Increased number of victims of child labor assisted and proportion of children removed
from child labor. The number of child laborers assisted slightly increased from 93 in 2019 to
97 individuals in 2020 as shown in Figure 11.2. This was attributed to the continuous
collaboration of DSWD with the municipal government of Catanauan, Quezon amidst the
pandemic. The figure also shows that the 2020 accomplishment is higher than the plan target
of 25.
Consequently, the proportion of child laborers aged 5 to 17 removed from child labor increased
from 95.87 percent in 2019 to 96.90 percent in 2020. The improvement resulted from having
strong support by the local government in the project implementation, awareness of the local
community of the issue, participation of the beneficiaries, service providers and other
stakeholders, and cooperation of the private employers not to hire children in their businesses.
The issuance of RDC Resolution No. 121-2019, “Enjoining Local Government Units to
Support the Implementation of SHIELD against Child Labor”, would be of help in advocating
to the LGUs to implement the program and address the issue on child labor. SHIELD means
Strategic Helpdesks for Information, Education, Livelihood and other Developmental
Interventions according to the International Labour Organization. As LGUs adopt and
implement programs to respond to child labor issues like SHIELD, it is expected that the
number of children assisted and number of children withdrawn from child labor situation
will increase.
Increased number of families with child laborers provided with livelihood assistance. The
families with child laborers provided with livelihood assistance increased from 205 families in
2019 to 206 families in 2020. It is slightly higher than the 2020 target of 203 families. The
increase resulted from DOLE’s referral system of profiled child laborers to other LGUs for
necessary services.
Number of poor senior citizens covered by social pension increased. The social pension
coverage of poor senior citizens continuously increased from 159,999 individuals in 2017 to
314,344 in 2020 (Figure 11.3). The 2020 accomplishment even surpassed the 2022 target of
272,658 individuals, having the largest number of beneficiaries in the Provinces of Batangas
and Quezon. This can be attributed to the expanded coverage of the program based on the
requested and validated additional beneficiaries from LGUs. Replacement of deceased
beneficiaries was also continuously conducted.
0
50
100
150
2019 2020
Child Labor Victims Assisted
Target Actual
Figure 11.2 Number of Child Labor Victims Assisted, 2019-2020.
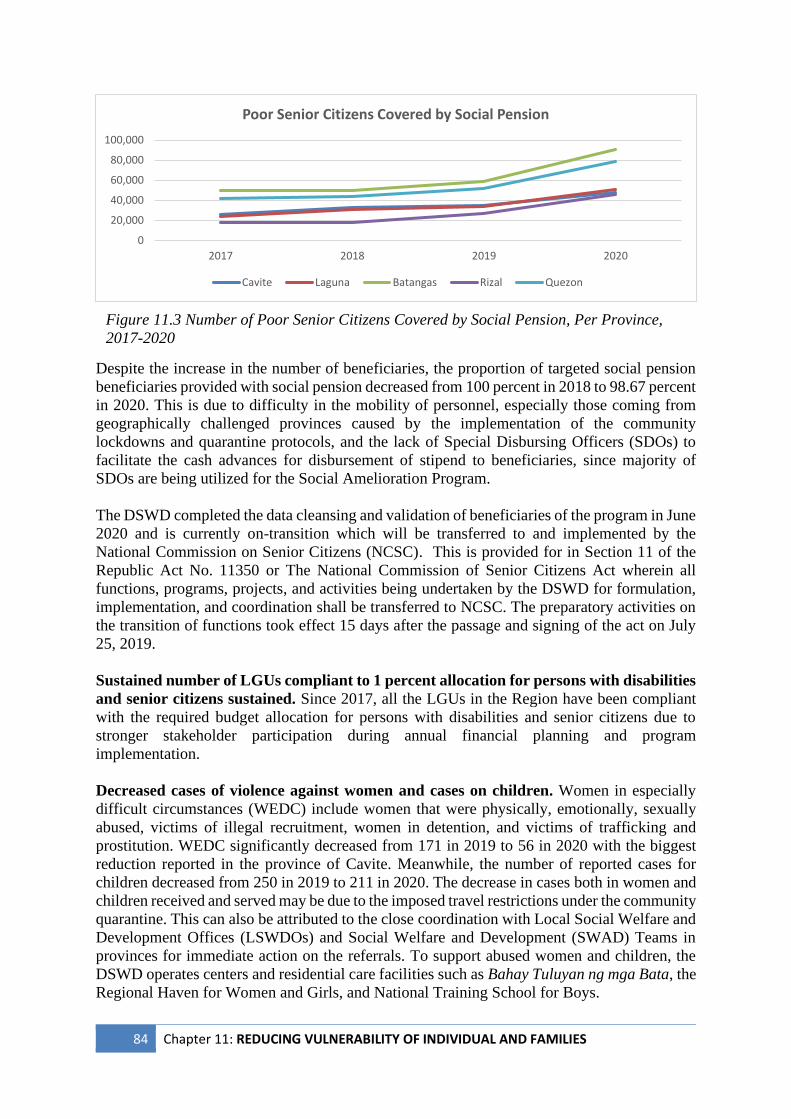
84 Chapter 11: REDUCING VULNERABILITY OF INDIVIDUAL AND FAMILIES
Figure 11.3 Number of Poor Senior Citizens Covered by Social Pension, Per Province,
2017-2020
Despite the increase in the number of beneficiaries, the proportion of targeted social pension
beneficiaries provided with social pension decreased from 100 percent in 2018 to 98.67 percent
in 2020. This is due to difficulty in the mobility of personnel, especially those coming from
geographically challenged provinces caused by the implementation of the community
lockdowns and quarantine protocols, and the lack of Special Disbursing Officers (SDOs) to
facilitate the cash advances for disbursement of stipend to beneficiaries, since majority of
SDOs are being utilized for the Social Amelioration Program.
The DSWD completed the data cleansing and validation of beneficiaries of the program in June
2020 and is currently on-transition which will be transferred to and implemented by the
National Commission on Senior Citizens (NCSC). This is provided for in Section 11 of the
Republic Act No. 11350 or The National Commission of Senior Citizens Act wherein all
functions, programs, projects, and activities being undertaken by the DSWD for formulation,
implementation, and coordination shall be transferred to NCSC. The preparatory activities on
the transition of functions took effect 15 days after the passage and signing of the act on July
25, 2019.
Sustained number of LGUs compliant to 1 percent allocation for persons with disabilities
and senior citizens sustained. Since 2017, all the LGUs in the Region have been compliant
with the required budget allocation for persons with disabilities and senior citizens due to
stronger stakeholder participation during annual financial planning and program
implementation.
Decreased cases of violence against women and cases on children. Women in especially
difficult circumstances (WEDC) include women that were physically, emotionally, sexually
abused, victims of illegal recruitment, women in detention, and victims of trafficking and
prostitution. WEDC significantly decreased from 171 in 2019 to 56 in 2020 with the biggest
reduction reported in the province of Cavite. Meanwhile, the number of reported cases for
children decreased from 250 in 2019 to 211 in 2020. The decrease in cases both in women and
children received and served may be due to the imposed travel restrictions under the community
quarantine. This can also be attributed to the close coordination with Local Social Welfare and
Development Offices (LSWDOs) and Social Welfare and Development (SWAD) Teams in
provinces for immediate action on the referrals. To support abused women and children, the
DSWD operates centers and residential care facilities such as Bahay Tuluyan ng mga Bata, the
Regional Haven for Women and Girls, and National Training School for Boys.
0
20,000
40,000
60,000
80,000
100,000
2017 2018 2019 2020
Poor Senior Citizens Covered by Social Pension
Cavite Laguna Batangas Rizal Quezon
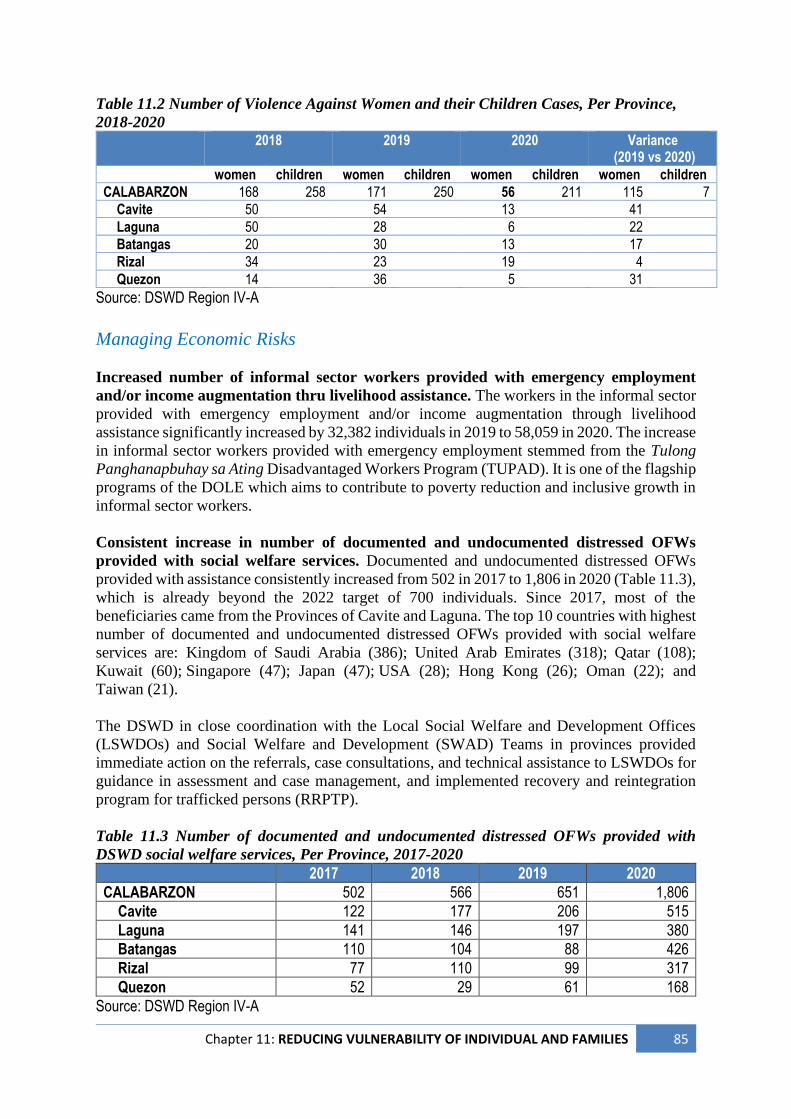
Chapter 11: REDUCING VULNERABILITY OF INDIVIDUAL AND FAMILIES 85
Table 11.2 Number of Violence Against Women and their Children Cases, Per Province,
2018-2020
2018 2019 2020 Variance (2019 vs 2020)
women children women children women children women children
CALABARZON 168 258 171 250 56 211 115 7
Cavite 50 54 13 41
Laguna 50 28 6 22
Batangas 20 30 13 17
Rizal 34 23 19 4
Quezon 14 36 5 31
Source: DSWD Region IV-A
Managing Economic Risks
Increased number of informal sector workers provided with emergency employment
and/or income augmentation thru livelihood assistance. The workers in the informal sector
provided with emergency employment and/or income augmentation through livelihood
assistance significantly increased by 32,382 individuals in 2019 to 58,059 in 2020. The increase
in informal sector workers provided with emergency employment stemmed from the Tulong
Panghanapbuhay sa Ating Disadvantaged Workers Program (TUPAD). It is one of the flagship
programs of the DOLE which aims to contribute to poverty reduction and inclusive growth in
informal sector workers.
Consistent increase in number of documented and undocumented distressed OFWs
provided with social welfare services. Documented and undocumented distressed OFWs
provided with assistance consistently increased from 502 in 2017 to 1,806 in 2020 (Table 11.3),
which is already beyond the 2022 target of 700 individuals. Since 2017, most of the
beneficiaries came from the Provinces of Cavite and Laguna. The top 10 countries with highest
number of documented and undocumented distressed OFWs provided with social welfare
services are: Kingdom of Saudi Arabia (386); United Arab Emirates (318); Qatar (108);
Kuwait (60); Singapore (47); Japan (47); USA (28); Hong Kong (26); Oman (22); and
Taiwan (21).
The DSWD in close coordination with the Local Social Welfare and Development Offices
(LSWDOs) and Social Welfare and Development (SWAD) Teams in provinces provided
immediate action on the referrals, case consultations, and technical assistance to LSWDOs for
guidance in assessment and case management, and implemented recovery and reintegration
program for trafficked persons (RRPTP).
Table 11.3 Number of documented and undocumented distressed OFWs provided with
DSWD social welfare services, Per Province, 2017-2020
2017 2018 2019 2020
CALABARZON 502 566 651 1,806
Cavite 122 177 206 515
Laguna 141 146 197 380
Batangas 110 104 88 426
Rizal 77 110 99 317
Quezon 52 29 61 168
Source: DSWD Region IV-A
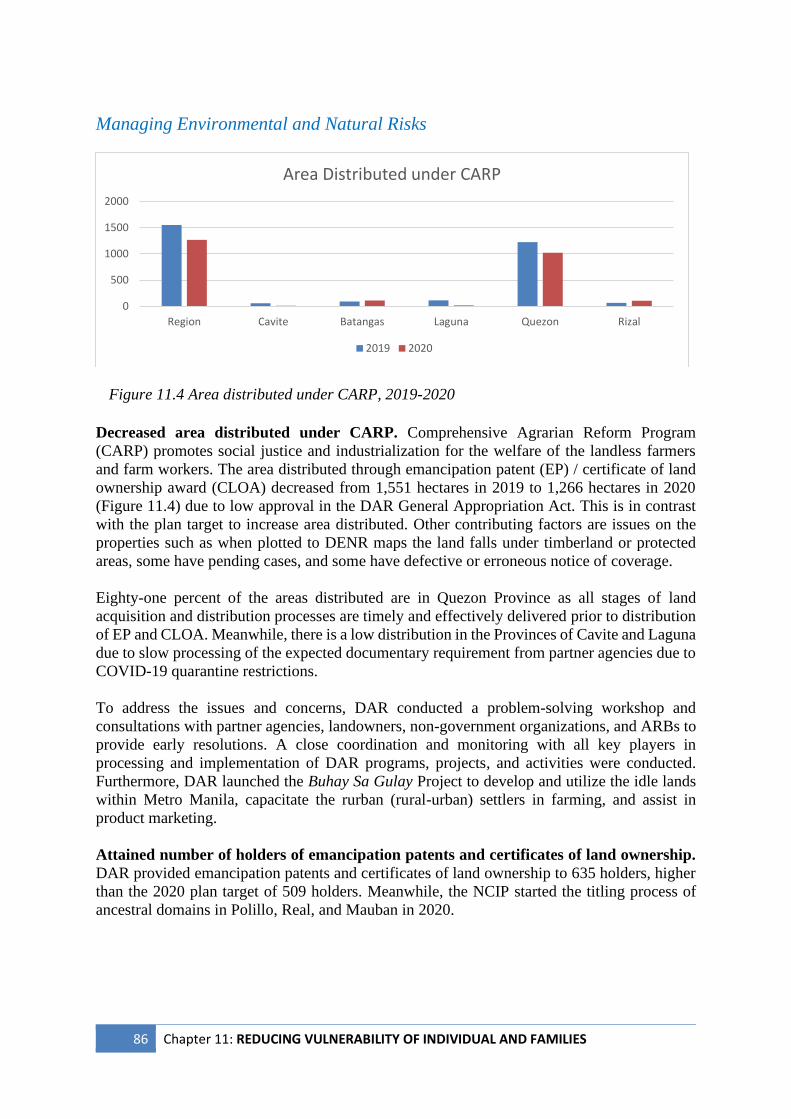
86 Chapter 11: REDUCING VULNERABILITY OF INDIVIDUAL AND FAMILIES
Managing Environmental and Natural Risks
Decreased area distributed under CARP. Comprehensive Agrarian Reform Program
(CARP) promotes social justice and industrialization for the welfare of the landless farmers
and farm workers. The area distributed through emancipation patent (EP) / certificate of land
ownership award (CLOA) decreased from 1,551 hectares in 2019 to 1,266 hectares in 2020
(Figure 11.4) due to low approval in the DAR General Appropriation Act. This is in contrast
with the plan target to increase area distributed. Other contributing factors are issues on the
properties such as when plotted to DENR maps the land falls under timberland or protected
areas, some have pending cases, and some have defective or erroneous notice of coverage.
Eighty-one percent of the areas distributed are in Quezon Province as all stages of land
acquisition and distribution processes are timely and effectively delivered prior to distribution
of EP and CLOA. Meanwhile, there is a low distribution in the Provinces of Cavite and Laguna
due to slow processing of the expected documentary requirement from partner agencies due to
COVID-19 quarantine restrictions.
To address the issues and concerns, DAR conducted a problem-solving workshop and
consultations with partner agencies, landowners, non-government organizations, and ARBs to
provide early resolutions. A close coordination and monitoring with all key players in
processing and implementation of DAR programs, projects, and activities were conducted.
Furthermore, DAR launched the Buhay Sa Gulay Project to develop and utilize the idle lands
within Metro Manila, capacitate the rurban (rural-urban) settlers in farming, and assist in
product marketing.
Attained number of holders of emancipation patents and certificates of land ownership.
DAR provided emancipation patents and certificates of land ownership to 635 holders, higher
than the 2020 plan target of 509 holders. Meanwhile, the NCIP started the titling process of
ancestral domains in Polillo, Real, and Mauban in 2020.
0
500
1000
1500
2000
Region Cavite Batangas Laguna Quezon Rizal
Area Distributed under CARP
2019 2020
Figure 11.4 Area distributed under CARP, 2019-2020
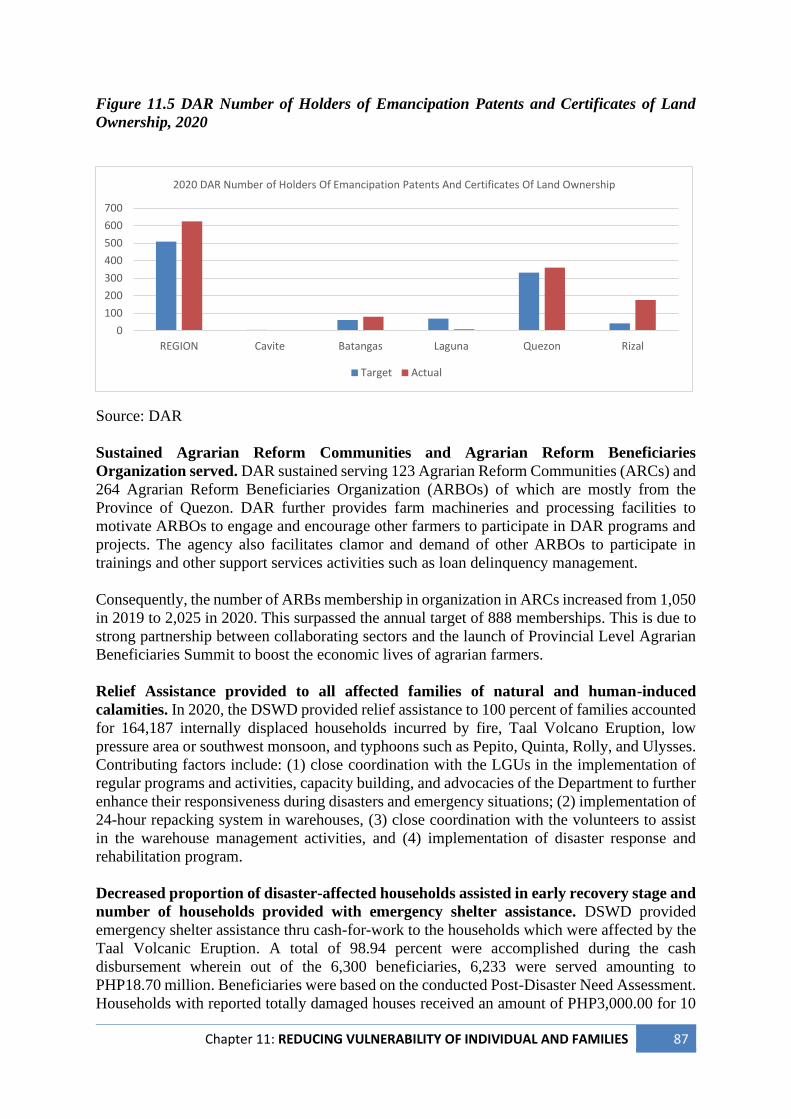
Chapter 11: REDUCING VULNERABILITY OF INDIVIDUAL AND FAMILIES 87
Figure 11.5 DAR Number of Holders of Emancipation Patents and Certificates of Land
Ownership, 2020
Source: DAR
Sustained Agrarian Reform Communities and Agrarian Reform Beneficiaries
Organization served. DAR sustained serving 123 Agrarian Reform Communities (ARCs) and
264 Agrarian Reform Beneficiaries Organization (ARBOs) of which are mostly from the
Province of Quezon. DAR further provides farm machineries and processing facilities to
motivate ARBOs to engage and encourage other farmers to participate in DAR programs and
projects. The agency also facilitates clamor and demand of other ARBOs to participate in
trainings and other support services activities such as loan delinquency management.
Consequently, the number of ARBs membership in organization in ARCs increased from 1,050
in 2019 to 2,025 in 2020. This surpassed the annual target of 888 memberships. This is due to
strong partnership between collaborating sectors and the launch of Provincial Level Agrarian
Beneficiaries Summit to boost the economic lives of agrarian farmers.
Relief Assistance provided to all affected families of natural and human-induced
calamities. In 2020, the DSWD provided relief assistance to 100 percent of families accounted
for 164,187 internally displaced households incurred by fire, Taal Volcano Eruption, low
pressure area or southwest monsoon, and typhoons such as Pepito, Quinta, Rolly, and Ulysses.
Contributing factors include: (1) close coordination with the LGUs in the implementation of
regular programs and activities, capacity building, and advocacies of the Department to further
enhance their responsiveness during disasters and emergency situations; (2) implementation of
24-hour repacking system in warehouses, (3) close coordination with the volunteers to assist
in the warehouse management activities, and (4) implementation of disaster response and
rehabilitation program.
Decreased proportion of disaster-affected households assisted in early recovery stage and
number of households provided with emergency shelter assistance. DSWD provided
emergency shelter assistance thru cash-for-work to the households which were affected by the
Taal Volcanic Eruption. A total of 98.94 percent were accomplished during the cash
disbursement wherein out of the 6,300 beneficiaries, 6,233 were served amounting to
PHP18.70 million. Beneficiaries were based on the conducted Post-Disaster Need Assessment.
Households with reported totally damaged houses received an amount of PHP3,000.00 for 10
0
100
200
300
400
500
600
700
REGION Cavite Batangas Laguna Quezon Rizal
2020 DAR Number of Holders Of Emancipation Patents And Certificates Of Land Ownership
Target Actual
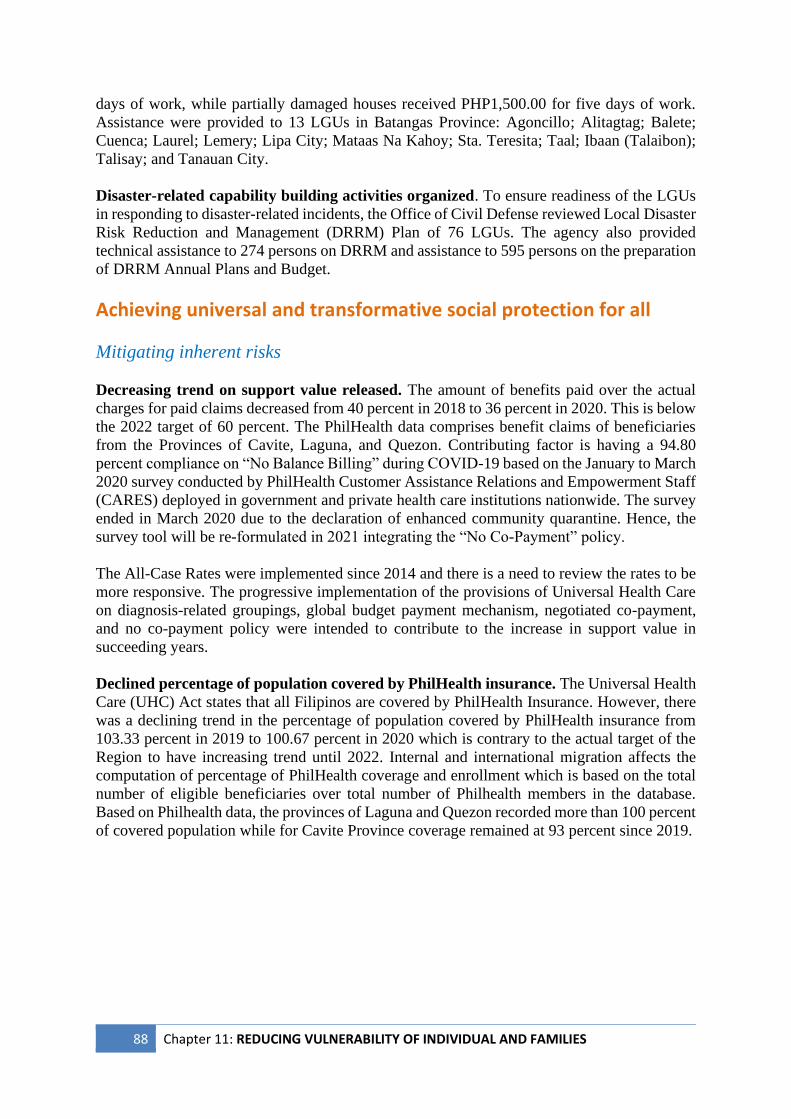
88 Chapter 11: REDUCING VULNERABILITY OF INDIVIDUAL AND FAMILIES
days of work, while partially damaged houses received PHP1,500.00 for five days of work.
Assistance were provided to 13 LGUs in Batangas Province: Agoncillo; Alitagtag; Balete;
Cuenca; Laurel; Lemery; Lipa City; Mataas Na Kahoy; Sta. Teresita; Taal; Ibaan (Talaibon);
Talisay; and Tanauan City.
Disaster-related capability building activities organized. To ensure readiness of the LGUs
in responding to disaster-related incidents, the Office of Civil Defense reviewed Local Disaster
Risk Reduction and Management (DRRM) Plan of 76 LGUs. The agency also provided
technical assistance to 274 persons on DRRM and assistance to 595 persons on the preparation
of DRRM Annual Plans and Budget.
Achieving universal and transformative social protection for all
Mitigating inherent risks
Decreasing trend on support value released. The amount of benefits paid over the actual
charges for paid claims decreased from 40 percent in 2018 to 36 percent in 2020. This is below
the 2022 target of 60 percent. The PhilHealth data comprises benefit claims of beneficiaries
from the Provinces of Cavite, Laguna, and Quezon. Contributing factor is having a 94.80
percent compliance on “No Balance Billing” during COVID-19 based on the January to March
2020 survey conducted by PhilHealth Customer Assistance Relations and Empowerment Staff
(CARES) deployed in government and private health care institutions nationwide. The survey
ended in March 2020 due to the declaration of enhanced community quarantine. Hence, the
survey tool will be re-formulated in 2021 integrating the “No Co-Payment” policy.
The All-Case Rates were implemented since 2014 and there is a need to review the rates to be
more responsive. The progressive implementation of the provisions of Universal Health Care
on diagnosis-related groupings, global budget payment mechanism, negotiated co-payment,
and no co-payment policy were intended to contribute to the increase in support value in
succeeding years.
Declined percentage of population covered by PhilHealth insurance. The Universal Health
Care (UHC) Act states that all Filipinos are covered by PhilHealth Insurance. However, there
was a declining trend in the percentage of population covered by PhilHealth insurance from
103.33 percent in 2019 to 100.67 percent in 2020 which is contrary to the actual target of the
Region to have increasing trend until 2022. Internal and international migration affects the
computation of percentage of PhilHealth coverage and enrollment which is based on the total
number of eligible beneficiaries over total number of Philhealth members in the database.
Based on Philhealth data, the provinces of Laguna and Quezon recorded more than 100 percent
of covered population while for Cavite Province coverage remained at 93 percent since 2019.
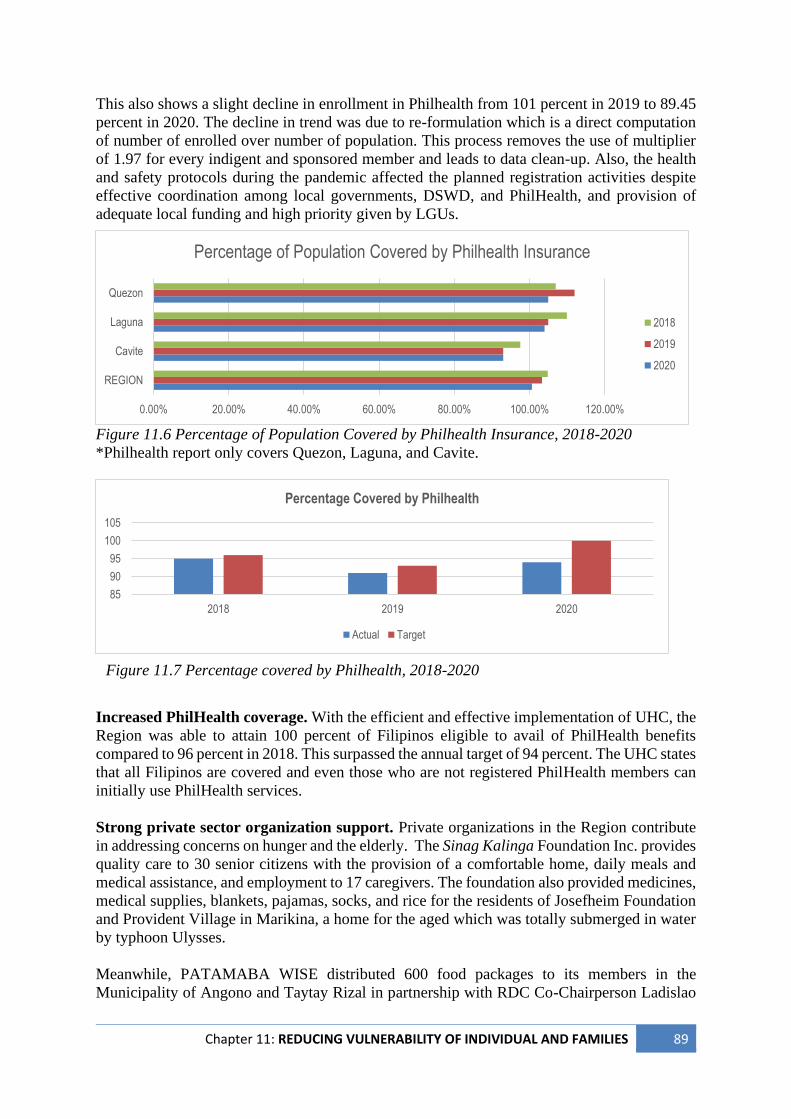
Chapter 11: REDUCING VULNERABILITY OF INDIVIDUAL AND FAMILIES 89
This also shows a slight decline in enrollment in Philhealth from 101 percent in 2019 to 89.45
percent in 2020. The decline in trend was due to re-formulation which is a direct computation
of number of enrolled over number of population. This process removes the use of multiplier
of 1.97 for every indigent and sponsored member and leads to data clean-up. Also, the health
and safety protocols during the pandemic affected the planned registration activities despite
effective coordination among local governments, DSWD, and PhilHealth, and provision of
adequate local funding and high priority given by LGUs.
Figure 11.6 Percentage of Population Covered by Philhealth Insurance, 2018-2020
*Philhealth report only covers Quezon, Laguna, and Cavite.
Increased PhilHealth coverage. With the efficient and effective implementation of UHC, the
Region was able to attain 100 percent of Filipinos eligible to avail of PhilHealth benefits
compared to 96 percent in 2018. This surpassed the annual target of 94 percent. The UHC states
that all Filipinos are covered and even those who are not registered PhilHealth members can
initially use PhilHealth services.
Strong private sector organization support. Private organizations in the Region contribute
in addressing concerns on hunger and the elderly. The Sinag Kalinga Foundation Inc. provides
quality care to 30 senior citizens with the provision of a comfortable home, daily meals and
medical assistance, and employment to 17 caregivers. The foundation also provided medicines,
medical supplies, blankets, pajamas, socks, and rice for the residents of Josefheim Foundation
and Provident Village in Marikina, a home for the aged which was totally submerged in water
by typhoon Ulysses.
Meanwhile, PATAMABA WISE distributed 600 food packages to its members in the
Municipality of Angono and Taytay Rizal in partnership with RDC Co-Chairperson Ladislao
85
90
95
100
105
2018 2019 2020
Percentage Covered by Philhealth
Actual Target
Figure 11.7 Percentage covered by Philhealth, 2018-2020
0.00% 20.00% 40.00% 60.00% 80.00% 100.00% 120.00%
REGION
Cavite
Laguna
Quezon
Percentage of Population Covered by Philhealth Insurance
2018
2019
2020
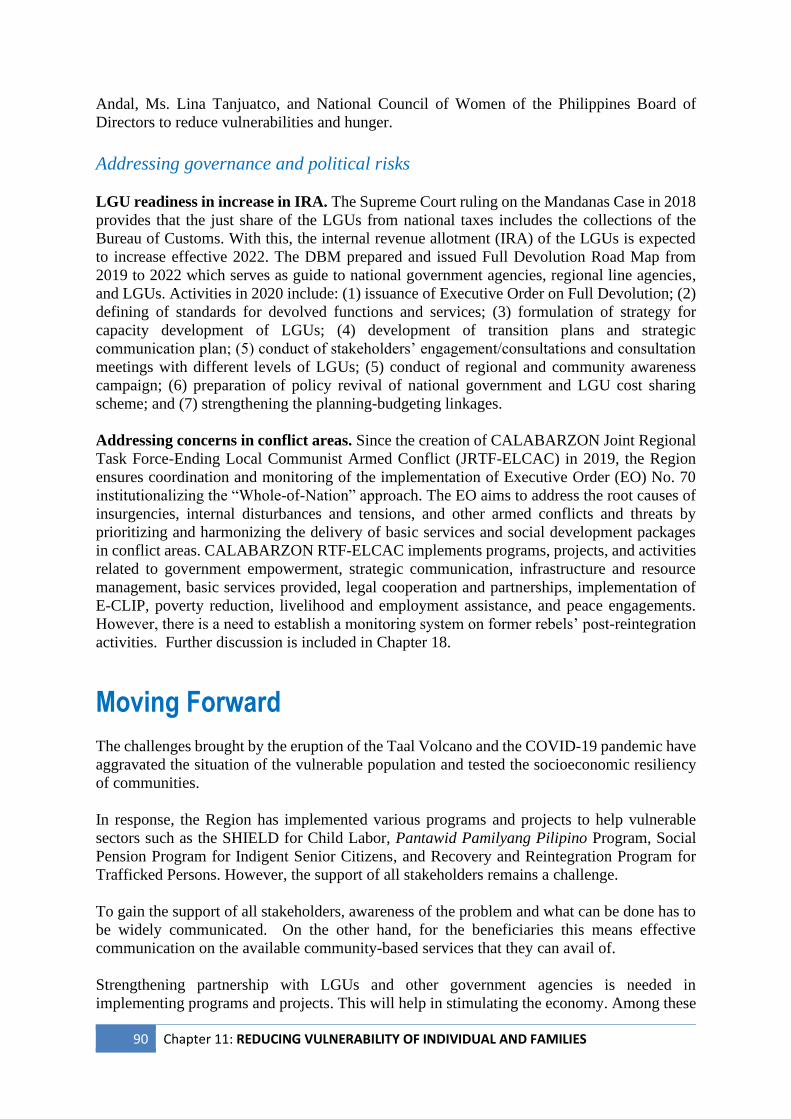
90 Chapter 11: REDUCING VULNERABILITY OF INDIVIDUAL AND FAMILIES
Andal, Ms. Lina Tanjuatco, and National Council of Women of the Philippines Board of
Directors to reduce vulnerabilities and hunger.
Addressing governance and political risks
LGU readiness in increase in IRA. The Supreme Court ruling on the Mandanas Case in 2018
provides that the just share of the LGUs from national taxes includes the collections of the
Bureau of Customs. With this, the internal revenue allotment (IRA) of the LGUs is expected
to increase effective 2022. The DBM prepared and issued Full Devolution Road Map from
2019 to 2022 which serves as guide to national government agencies, regional line agencies,
and LGUs. Activities in 2020 include: (1) issuance of Executive Order on Full Devolution; (2)
defining of standards for devolved functions and services; (3) formulation of strategy for
capacity development of LGUs; (4) development of transition plans and strategic
communication plan; (5) conduct of stakeholders’ engagement/consultations and consultation
meetings with different levels of LGUs; (5) conduct of regional and community awareness
campaign; (6) preparation of policy revival of national government and LGU cost sharing
scheme; and (7) strengthening the planning-budgeting linkages.
Addressing concerns in conflict areas. Since the creation of CALABARZON Joint Regional
Task Force-Ending Local Communist Armed Conflict (JRTF-ELCAC) in 2019, the Region
ensures coordination and monitoring of the implementation of Executive Order (EO) No. 70
institutionalizing the “Whole-of-Nation” approach. The EO aims to address the root causes of
insurgencies, internal disturbances and tensions, and other armed conflicts and threats by
prioritizing and harmonizing the delivery of basic services and social development packages
in conflict areas. CALABARZON RTF-ELCAC implements programs, projects, and activities
related to government empowerment, strategic communication, infrastructure and resource
management, basic services provided, legal cooperation and partnerships, implementation of
E-CLIP, poverty reduction, livelihood and employment assistance, and peace engagements.
However, there is a need to establish a monitoring system on former rebels’ post-reintegration
activities. Further discussion is included in Chapter 18.
Moving Forward
The challenges brought by the eruption of the Taal Volcano and the COVID-19 pandemic have
aggravated the situation of the vulnerable population and tested the socioeconomic resiliency
of communities.
In response, the Region has implemented various programs and projects to help vulnerable
sectors such as the SHIELD for Child Labor, Pantawid Pamilyang Pilipino Program, Social
Pension Program for Indigent Senior Citizens, and Recovery and Reintegration Program for
Trafficked Persons. However, the support of all stakeholders remains a challenge.
To gain the support of all stakeholders, awareness of the problem and what can be done has to
be widely communicated. On the other hand, for the beneficiaries this means effective
communication on the available community-based services that they can avail of.
Strengthening partnership with LGUs and other government agencies is needed in
implementing programs and projects. This will help in stimulating the economy. Among these
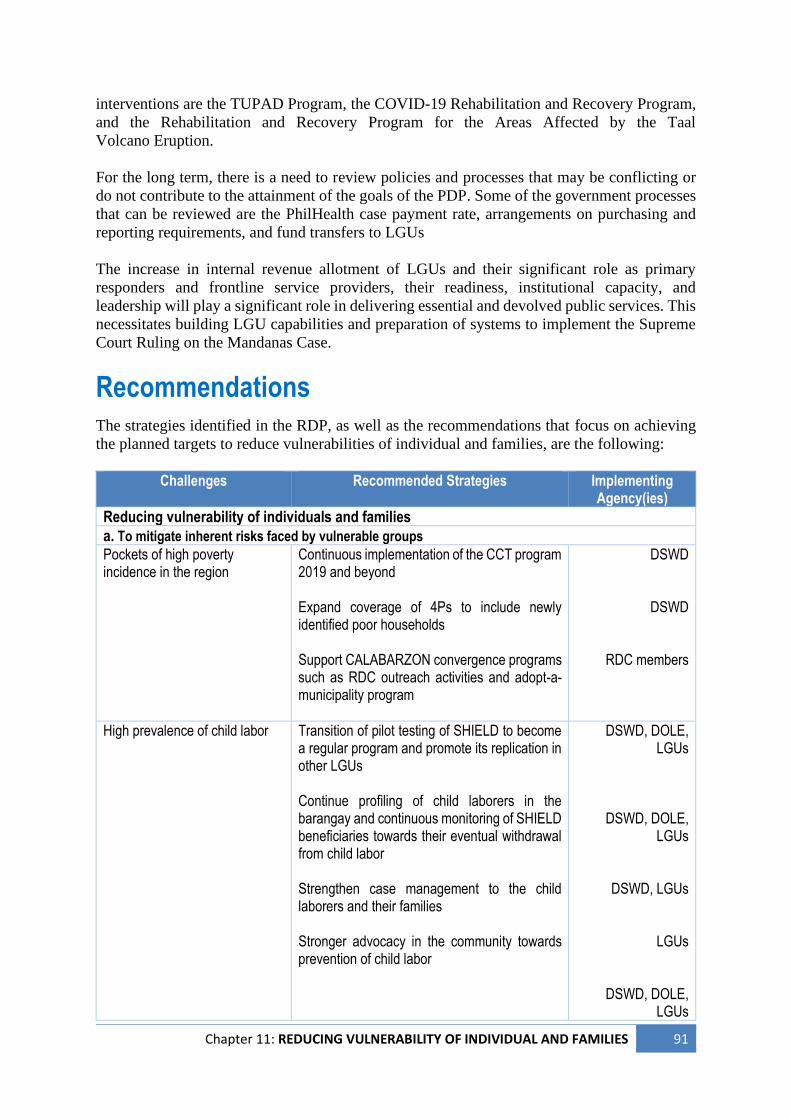
Chapter 11: REDUCING VULNERABILITY OF INDIVIDUAL AND FAMILIES 91
interventions are the TUPAD Program, the COVID-19 Rehabilitation and Recovery Program,
and the Rehabilitation and Recovery Program for the Areas Affected by the Taal
Volcano Eruption.
For the long term, there is a need to review policies and processes that may be conflicting or
do not contribute to the attainment of the goals of the PDP. Some of the government processes
that can be reviewed are the PhilHealth case payment rate, arrangements on purchasing and
reporting requirements, and fund transfers to LGUs
The increase in internal revenue allotment of LGUs and their significant role as primary
responders and frontline service providers, their readiness, institutional capacity, and
leadership will play a significant role in delivering essential and devolved public services. This
necessitates building LGU capabilities and preparation of systems to implement the Supreme
Court Ruling on the Mandanas Case.
Recommendations
The strategies identified in the RDP, as well as the recommendations that focus on achieving
the planned targets to reduce vulnerabilities of individual and families, are the following:
Challenges Recommended Strategies Implementing Agency(ies)
Reducing vulnerability of individuals and families
a. To mitigate inherent risks faced by vulnerable groups
Pockets of high poverty incidence in the region
Continuous implementation of the CCT program 2019 and beyond Expand coverage of 4Ps to include newly identified poor households Support CALABARZON convergence programs such as RDC outreach activities and adopt-a-municipality program
DSWD
DSWD
RDC members
High prevalence of child labor Transition of pilot testing of SHIELD to become a regular program and promote its replication in other LGUs Continue profiling of child laborers in the barangay and continuous monitoring of SHIELD beneficiaries towards their eventual withdrawal from child labor Strengthen case management to the child laborers and their families Stronger advocacy in the community towards prevention of child labor
DSWD, DOLE, LGUs
DSWD, DOLE, LGUs
DSWD, LGUs
LGUs
DSWD, DOLE, LGUs
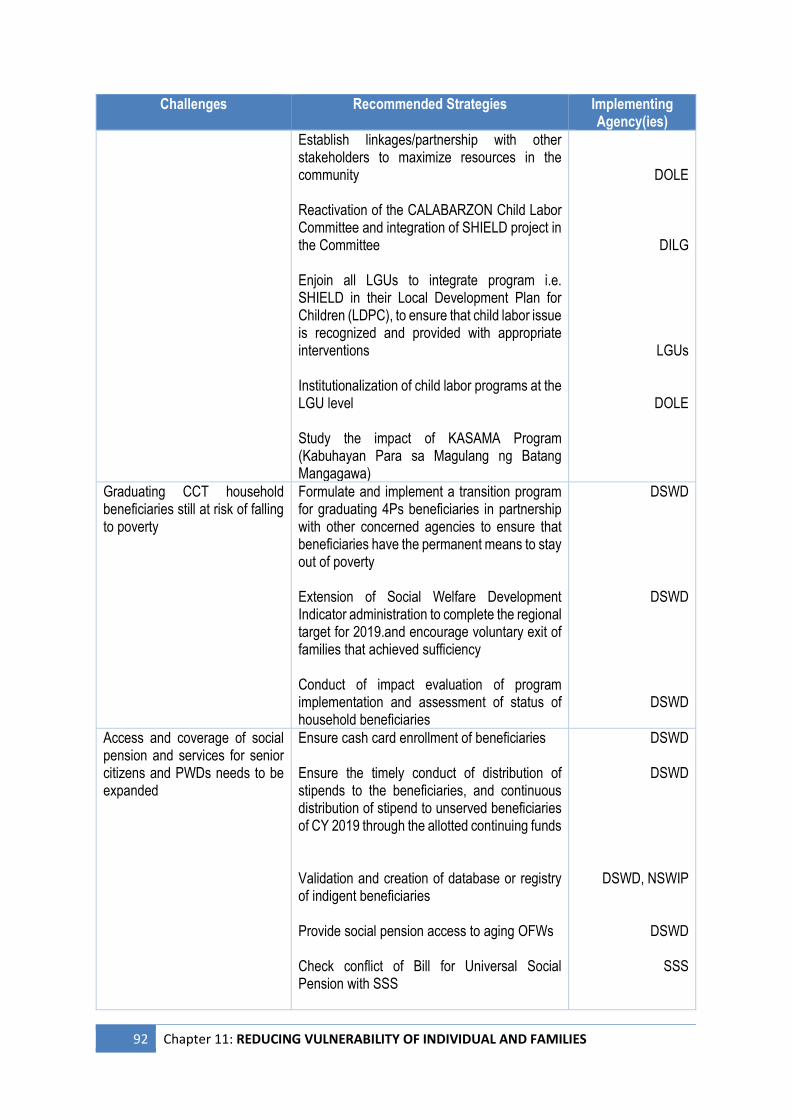
92 Chapter 11: REDUCING VULNERABILITY OF INDIVIDUAL AND FAMILIES
Challenges Recommended Strategies Implementing Agency(ies)
Establish linkages/partnership with other stakeholders to maximize resources in the community Reactivation of the CALABARZON Child Labor Committee and integration of SHIELD project in the Committee Enjoin all LGUs to integrate program i.e. SHIELD in their Local Development Plan for Children (LDPC), to ensure that child labor issue is recognized and provided with appropriate interventions Institutionalization of child labor programs at the LGU level Study the impact of KASAMA Program (Kabuhayan Para sa Magulang ng Batang Mangagawa)
DOLE
DILG
LGUs
DOLE
Graduating CCT household beneficiaries still at risk of falling to poverty
Formulate and implement a transition program for graduating 4Ps beneficiaries in partnership with other concerned agencies to ensure that beneficiaries have the permanent means to stay out of poverty Extension of Social Welfare Development Indicator administration to complete the regional target for 2019.and encourage voluntary exit of families that achieved sufficiency Conduct of impact evaluation of program implementation and assessment of status of household beneficiaries
DSWD
DSWD
DSWD
Access and coverage of social pension and services for senior citizens and PWDs needs to be expanded
Ensure cash card enrollment of beneficiaries Ensure the timely conduct of distribution of stipends to the beneficiaries, and continuous distribution of stipend to unserved beneficiaries of CY 2019 through the allotted continuing funds Validation and creation of database or registry of indigent beneficiaries Provide social pension access to aging OFWs Check conflict of Bill for Universal Social Pension with SSS
DSWD
DSWD
DSWD, NSWIP
DSWD
SSS
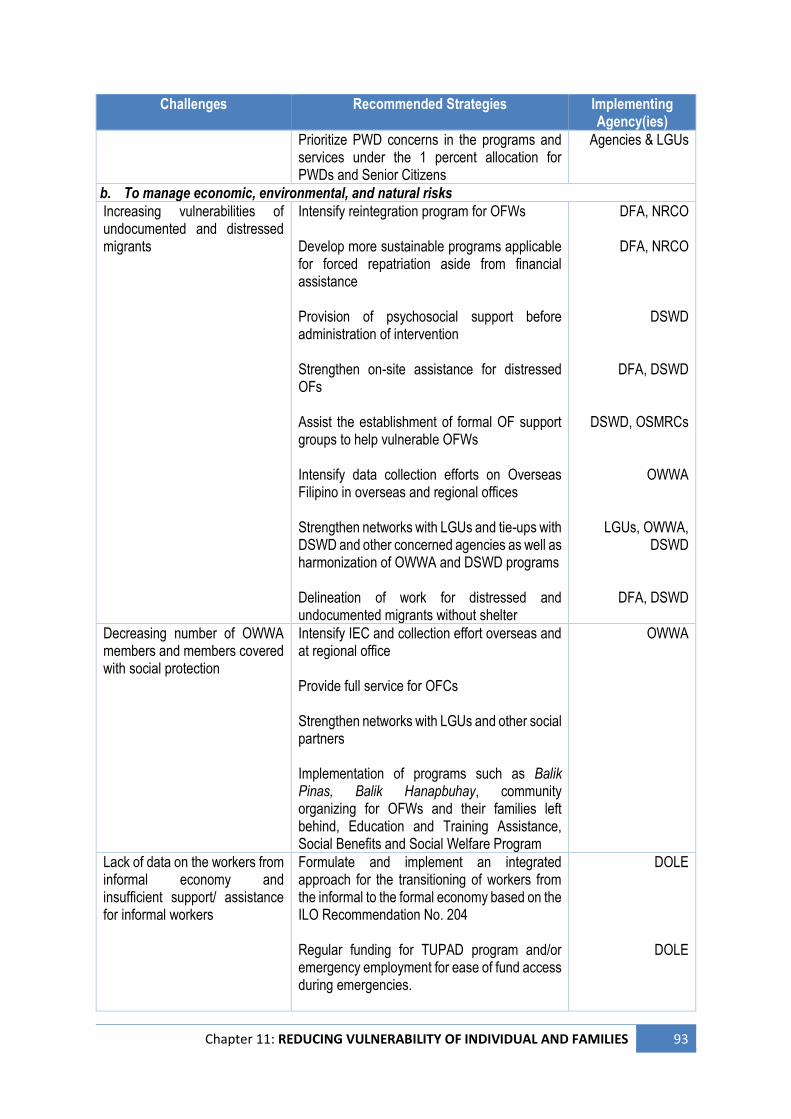
Chapter 11: REDUCING VULNERABILITY OF INDIVIDUAL AND FAMILIES 93
Challenges Recommended Strategies Implementing Agency(ies)
Prioritize PWD concerns in the programs and services under the 1 percent allocation for PWDs and Senior Citizens
Agencies & LGUs
b. To manage economic, environmental, and natural risks
Increasing vulnerabilities of undocumented and distressed migrants
Intensify reintegration program for OFWs Develop more sustainable programs applicable for forced repatriation aside from financial assistance Provision of psychosocial support before administration of intervention Strengthen on-site assistance for distressed OFs Assist the establishment of formal OF support groups to help vulnerable OFWs Intensify data collection efforts on Overseas Filipino in overseas and regional offices Strengthen networks with LGUs and tie-ups with DSWD and other concerned agencies as well as harmonization of OWWA and DSWD programs Delineation of work for distressed and undocumented migrants without shelter
DFA, NRCO
DFA, NRCO
DSWD
DFA, DSWD
DSWD, OSMRCs
OWWA
LGUs, OWWA, DSWD
DFA, DSWD
Decreasing number of OWWA members and members covered with social protection
Intensify IEC and collection effort overseas and at regional office Provide full service for OFCs Strengthen networks with LGUs and other social partners Implementation of programs such as Balik Pinas, Balik Hanapbuhay, community organizing for OFWs and their families left behind, Education and Training Assistance, Social Benefits and Social Welfare Program
OWWA
Lack of data on the workers from informal economy and insufficient support/ assistance for informal workers
Formulate and implement an integrated approach for the transitioning of workers from the informal to the formal economy based on the ILO Recommendation No. 204 Regular funding for TUPAD program and/or emergency employment for ease of fund access during emergencies.
DOLE
DOLE
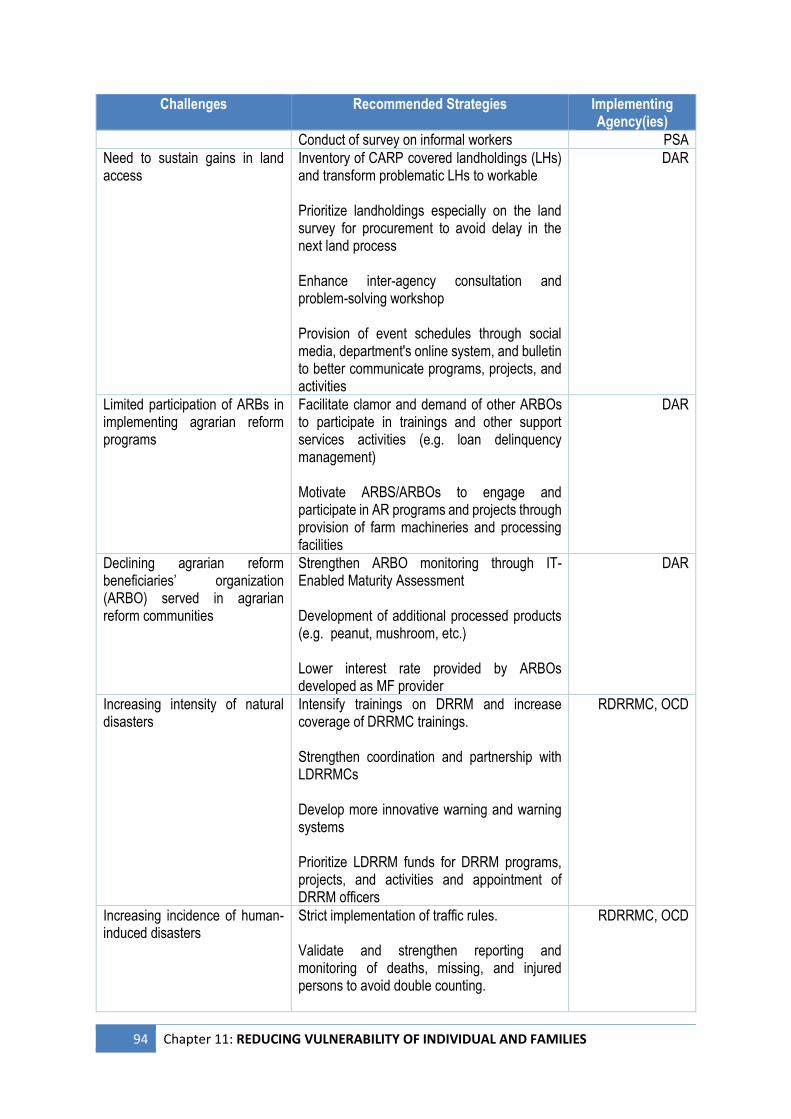
94 Chapter 11: REDUCING VULNERABILITY OF INDIVIDUAL AND FAMILIES
Challenges Recommended Strategies Implementing Agency(ies)
Conduct of survey on informal workers PSA
Need to sustain gains in land access
Inventory of CARP covered landholdings (LHs) and transform problematic LHs to workable Prioritize landholdings especially on the land survey for procurement to avoid delay in the next land process Enhance inter-agency consultation and problem-solving workshop Provision of event schedules through social media, department's online system, and bulletin to better communicate programs, projects, and activities
DAR
Limited participation of ARBs in implementing agrarian reform programs
Facilitate clamor and demand of other ARBOs to participate in trainings and other support services activities (e.g. loan delinquency management) Motivate ARBS/ARBOs to engage and participate in AR programs and projects through provision of farm machineries and processing facilities
DAR
Declining agrarian reform beneficiaries’ organization (ARBO) served in agrarian reform communities
Strengthen ARBO monitoring through IT-Enabled Maturity Assessment Development of additional processed products (e.g. peanut, mushroom, etc.) Lower interest rate provided by ARBOs developed as MF provider
DAR
Increasing intensity of natural disasters
Intensify trainings on DRRM and increase coverage of DRRMC trainings. Strengthen coordination and partnership with LDRRMCs Develop more innovative warning and warning systems Prioritize LDRRM funds for DRRM programs, projects, and activities and appointment of DRRM officers
RDRRMC, OCD
Increasing incidence of human-induced disasters
Strict implementation of traffic rules. Validate and strengthen reporting and monitoring of deaths, missing, and injured persons to avoid double counting.
RDRRMC, OCD
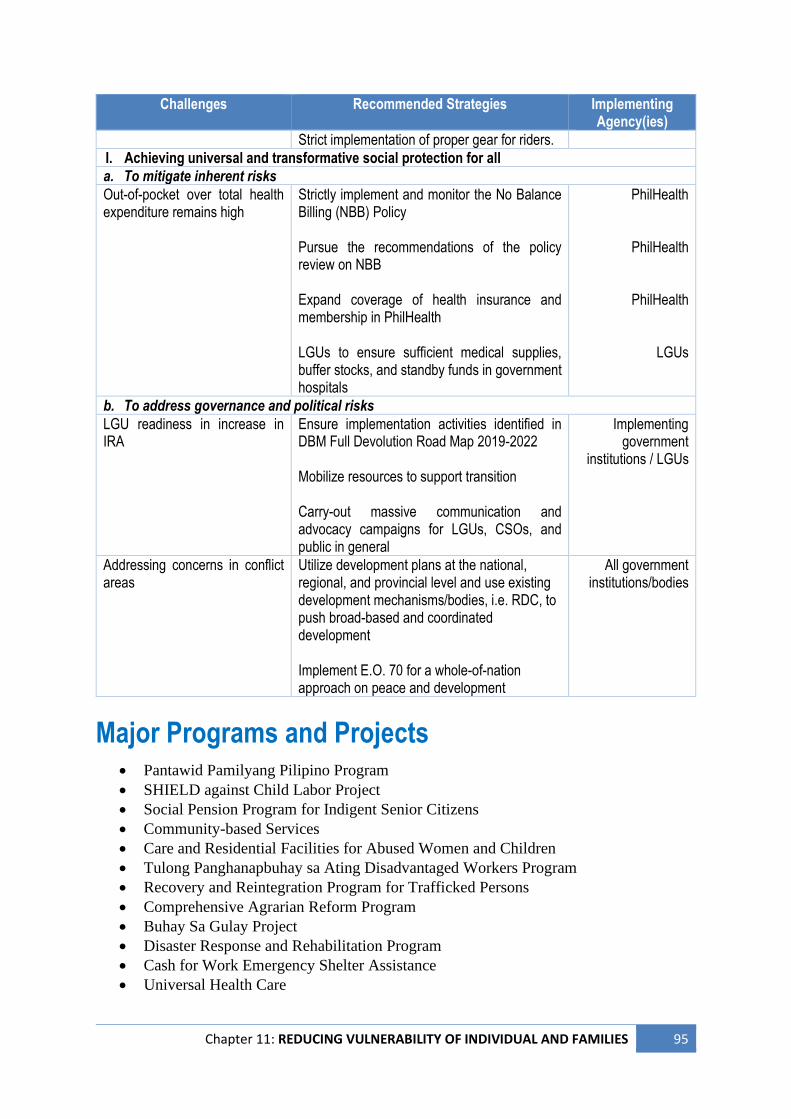
Chapter 11: REDUCING VULNERABILITY OF INDIVIDUAL AND FAMILIES 95
Challenges Recommended Strategies Implementing Agency(ies)
Strict implementation of proper gear for riders.
I. Achieving universal and transformative social protection for all
a. To mitigate inherent risks
Out-of-pocket over total health expenditure remains high
Strictly implement and monitor the No Balance Billing (NBB) Policy Pursue the recommendations of the policy review on NBB Expand coverage of health insurance and membership in PhilHealth LGUs to ensure sufficient medical supplies, buffer stocks, and standby funds in government hospitals
PhilHealth
PhilHealth
PhilHealth
LGUs
b. To address governance and political risks
LGU readiness in increase in IRA
Ensure implementation activities identified in DBM Full Devolution Road Map 2019-2022 Mobilize resources to support transition Carry-out massive communication and advocacy campaigns for LGUs, CSOs, and public in general
Implementing government
institutions / LGUs
Addressing concerns in conflict areas
Utilize development plans at the national, regional, and provincial level and use existing development mechanisms/bodies, i.e. RDC, to push broad-based and coordinated development Implement E.O. 70 for a whole-of-nation approach on peace and development
All government institutions/bodies
Major Programs and Projects • Pantawid Pamilyang Pilipino Program
• SHIELD against Child Labor Project
• Social Pension Program for Indigent Senior Citizens
• Community-based Services
• Care and Residential Facilities for Abused Women and Children
• Tulong Panghanapbuhay sa Ating Disadvantaged Workers Program
• Recovery and Reintegration Program for Trafficked Persons
• Comprehensive Agrarian Reform Program
• Buhay Sa Gulay Project
• Disaster Response and Rehabilitation Program
• Cash for Work Emergency Shelter Assistance
• Universal Health Care
96 Chapter 11: REDUCING VULNERABILITY OF INDIVIDUAL AND FAMILIES
• Sinag Kalinga Foundation and PATAMABA WISE initiative on shelter, medical
assistance, employment and food packages
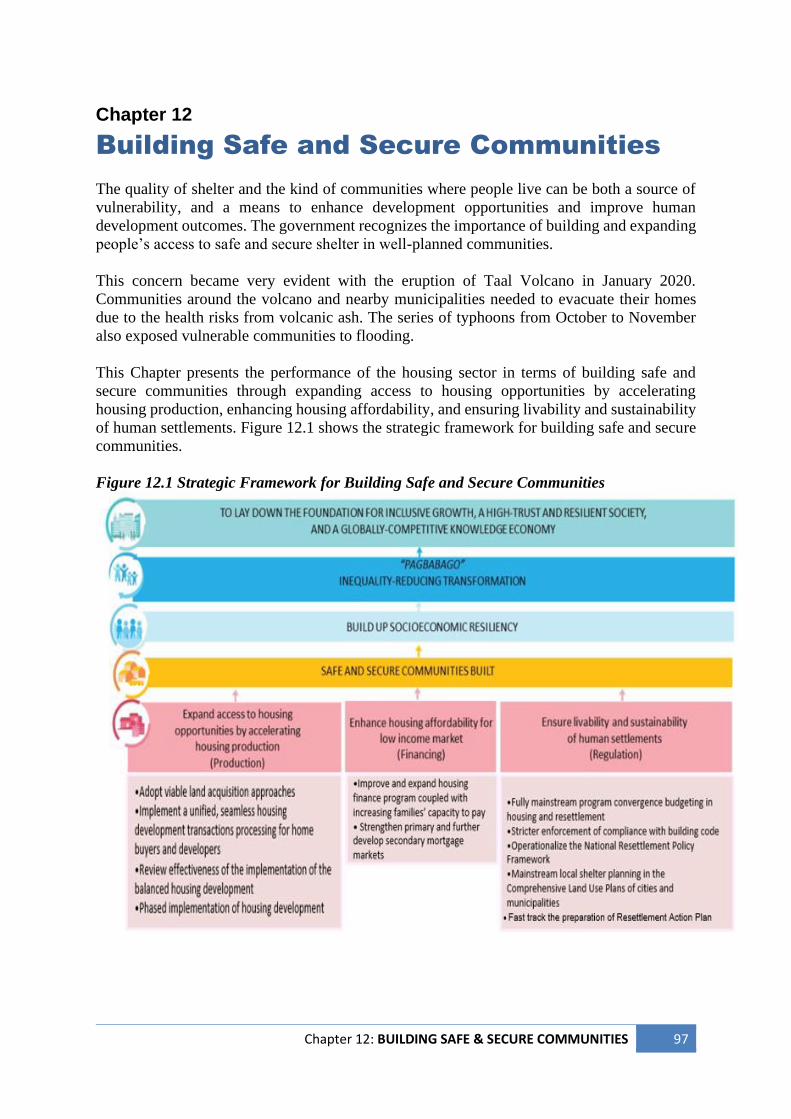
Chapter 12: BUILDING SAFE & SECURE COMMUNITIES 97
Chapter 12
Building Safe and Secure Communities
The quality of shelter and the kind of communities where people live can be both a source of
vulnerability, and a means to enhance development opportunities and improve human
development outcomes. The government recognizes the importance of building and expanding
people’s access to safe and secure shelter in well-planned communities.
This concern became very evident with the eruption of Taal Volcano in January 2020.
Communities around the volcano and nearby municipalities needed to evacuate their homes
due to the health risks from volcanic ash. The series of typhoons from October to November
also exposed vulnerable communities to flooding.
This Chapter presents the performance of the housing sector in terms of building safe and
secure communities through expanding access to housing opportunities by accelerating
housing production, enhancing housing affordability, and ensuring livability and sustainability
of human settlements. Figure 12.1 shows the strategic framework for building safe and secure
communities.
Figure 12.1 Strategic Framework for Building Safe and Secure Communities
98 Chapter 12: BUILDING SAFE & SECURE COMMUNITIES
Accomplishments
Direct Housing Assistance
Direct housing assistance refers to direct provision of housing units or housing loans for
informal settlers, community mortgage, and end-user home financing.
Home Development Mutual Fund takeouts declined. The Home Development Mutual Fund
(HDMF), more popularly known as the Pag-IBIG Fund, takeouts (socialized housing, low cost,
medium cost and open market) declined from 11,940 in 2019 to 8,018 in 2020. The HDMF
takeouts is declining in the past two years. This can be attributed to the limitations brought by
the COVID-19 pandemic further resulting to the incapacity of members to avail. This is also
due to shutdowns of businesses during the implementation of enhanced community
quarantines.
On the number of socialized housing units delivered, 1,594 socialized housing units were
delivered in 2020. This is lower compared to the 3,407 units delivered in 2019. The decline
can be attributed to the halt of construction activities due to COVID-19 quarantine restrictions
and lockdowns.
Indirect Housing Assistance
Indirect housing assistance includes provision of guaranty cover for investment and credits to
housing, issuance of license to sell, provision of technical assistance for the preparation of
Comprehensive Land Use Plans (CLUPs), and securitization of housing loan receivables.
LGUs provided CLUP assistance increased/declined. LGUs provided with technical
assistance in the preparation of their CLUPs continue to increase from 35 in 2017, 50 in 2018,
67 in 2019, and to 23 in 2020. The decline can be associated to the challenges brought by the
pandemic as face-to-face sessions were limited and there were difficulties in the conduct of on-
line sessions. LGU priorities were also shifted to pandemic response. The decrease in CLUP
assistance may also be attributed to prior years of accomplishments of LGUs who have already
updated their respective CLUPs. The need to enhance the CLUPs by including disaster risk
reduction and climate change mitigation measures as well as its inclusion as one of the
requirements for the Seal of Good Local Governance increased the demand for assistance in
CLUP preparation.
Livability and Sustainability
Effects of Taal Volcano Eruption. The damage in the housing sector was estimated at PHP2.7
billion. A total of 4,476 houses were damaged which valued at PHP111.35 million. The total
amount needed for recovery is estimated at PHP5.17 billion. The Municipalities of Agoncillo,
San Nicolas, Laurel, Lemery, and Taal suffered significant damage in the housing sector.
The Department of Human Settlements and Development (DSHUD) noted the
recommendations to address the Taal Volcano Eruption on the housing sector which is on the
following: 1) Prioritization of families residing in the volcano island for relocation or
resettlement; 2) DSHUD, National Housing Authority, and Social Housing Finance
Chapter 12: BUILDING SAFE & SECURE COMMUNITIES 99
Corporation to provide safe relocation sites; and 3) LGUs and national government to
appropriate permanent evacuation centers to avoid using school buildings as evacuation centers
(Taal Volcanic Eruption Rehabilitation and Recovery Plan).
Secured Communities. President Rodrigo Roa Duterte signed Executive Order No. 70 which
recognizes the need to reframe and refocus government policy in achieving inclusive and
sustainable peace which will contribute in achieving secured communities. The
CALABARZON Regional Task Force to End Local Communist Armed Conflict (RTF-
ELCAC) under its Peace, Law Enforcement and Development Support Cluster to continue
clearing conflict-affected barangays and facilitate the return of former rebels to society. Former
rebels under the Enhanced Comprehensive Local Integration Program receive benefits such as
housing units and other livelihood assistance for them to be fully reintegrated in the
communities.
Moving Forward
The lack or insufficient accurate and updated data on housing remains a fundamental issue that
needs to be resolved immediately for better planning, targeting and monitoring of
accomplishments in terms of building safe and secure communities. Getting the accurate
number of informal settler families (ISF) is one of the key elements to have a successful
housing program.
The DHSUD is expected to develop a database on all housing-related data, specifically to have
a profile of ISFs in waterways and hazard-prone areas. The DHSUD can also intensify
provision of technical assistance on the formulation of Local Shelter Plans for all cities and
rapidly urbanizing municipalities and promote the adoption of the National Urban
Development and Housing Framework (NUDHF) 2017-2022 and National Resettlement
Framework by including supportive policies, programs, and projects in sectoral plans, and local
development and investment plans. The reinstatement of the Sub-Committee on Housing will
enable housing agencies and other partners to discuss and device strategies to address housing
sector concerns, and monitor implementation of the NUDHF.
The Region needs to fast track the establishment of a housing database to account for the total
housing unit requirement of the Region taking into account the households living in slum
communities and hazard zones, households coming from Metro Manila and other regions and
new households, among others.
The eruption of Taal Volcano and series of typhoons in 2020 have exposed vulnerable
communities. Mainstreaming disaster risk reduction and climate change adaptation in selecting
new settlements should be practiced by all implementing offices.
The continuation of Building Adequate, Livable, Affordable and Inclusive or BALAI Filipino
Communities Program would further strengthen partnership among key shelter agencies and
housing developers to narrow down the housing backlog.
Lastly before the COVID-19, CALABARZON has become a primary destination for real estate
investment, with most developers aggressively expanding their portfolios across the Region.
The provinces of Laguna, Cavite and Rizal are immediate neighbors to the metropolis and
among the most populous provinces in the country. Improved connectivity and cheaper real
100 Chapter 12: BUILDING SAFE & SECURE COMMUNITIES
estate options have attracted Metro Manila’s workers to reside in these provinces. Additionally,
given high rates of industrialization of the southern corridor, employment opportunities,
higher-income households, and in-migration from other regions have created robust demand
for affordable housing.
The pandemic will still to hamper government operations and initiatives, and private sector
investments as lockdowns continue. The COVID-19 pandemic is still a top priority to be
addressed to achieve safer communities and for the Region to again be the primary destination
in real estate and housing.
Recommendations
Challenges Recommended Strategies Implementing Agency
Lack of accurate data on housing i.e. profile of ISFs, no. of families living in hazard prone areas, no. of families affected by government project, consolidated housing programs/project accomplishments (regional, provincial breakdown), etc.
Provide fund for establishment of centralized database on housing Further enhance coordination among KSAs and their branches
DHSUD and KSAs
Only few LGUs have approved Local Shelter Plan (LSP).
Intensify provision of technical assistance on the formulation of LSP Mainstream LSP components in the CLUP to decrease no. of plans being prepared by LGUs
DHSUD & DILG
Low accomplishment due to delays in the submission of requirements and processing of documents and funds
Streamline requirements for housing projects
DHSUD & KSAs
Changes in the LGU administration contributes to the delays in housing project requirements
Strengthen partnership /collaboration with LGUs
DHSUD, DILG, KSAs & LGUs
Major Programs and Projects • Housing Projects
• Home and Short-Term Loans
• Community Mortgage Program
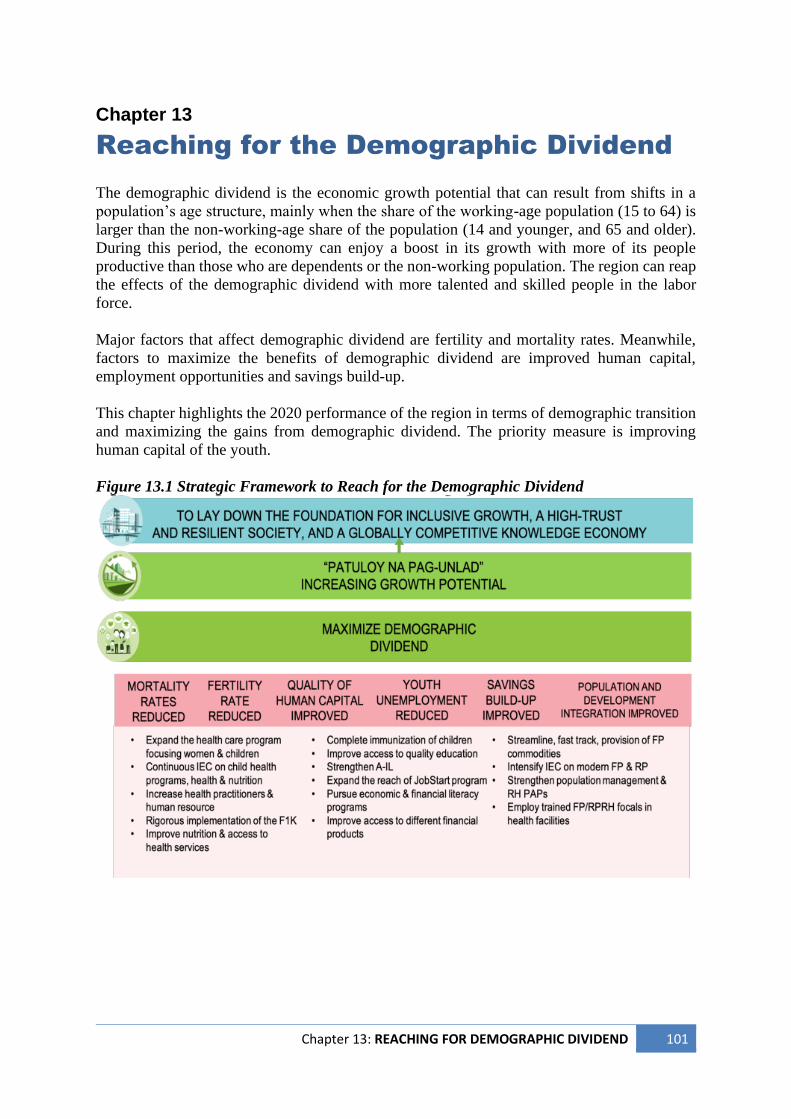
Chapter 13: REACHING FOR DEMOGRAPHIC DIVIDEND 101
Chapter 13
Reaching for the Demographic Dividend
The demographic dividend is the economic growth potential that can result from shifts in a
population’s age structure, mainly when the share of the working-age population (15 to 64) is
larger than the non-working-age share of the population (14 and younger, and 65 and older).
During this period, the economy can enjoy a boost in its growth with more of its people
productive than those who are dependents or the non-working population. The region can reap
the effects of the demographic dividend with more talented and skilled people in the labor
force.
Major factors that affect demographic dividend are fertility and mortality rates. Meanwhile,
factors to maximize the benefits of demographic dividend are improved human capital,
employment opportunities and savings build-up.
This chapter highlights the 2020 performance of the region in terms of demographic transition
and maximizing the gains from demographic dividend. The priority measure is improving
human capital of the youth.
Figure 13.1 Strategic Framework to Reach for the Demographic Dividend
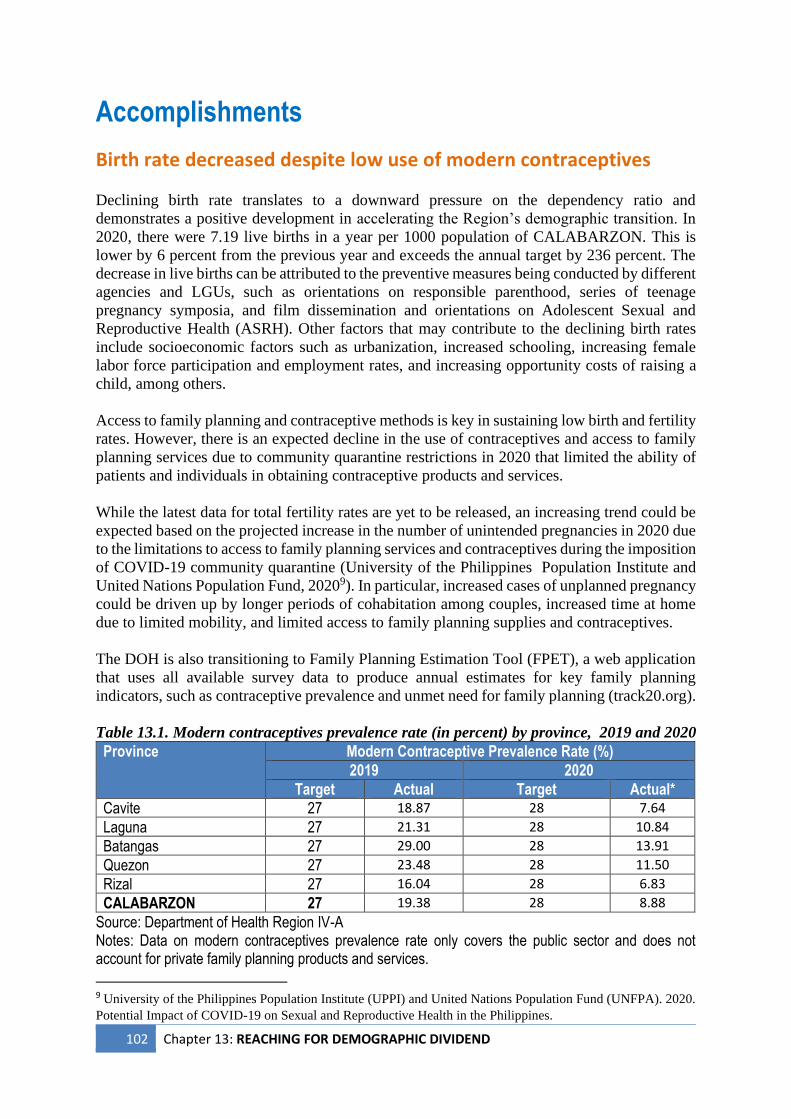
102 Chapter 13: REACHING FOR DEMOGRAPHIC DIVIDEND
Accomplishments
Birth rate decreased despite low use of modern contraceptives
Declining birth rate translates to a downward pressure on the dependency ratio and
demonstrates a positive development in accelerating the Region’s demographic transition. In
2020, there were 7.19 live births in a year per 1000 population of CALABARZON. This is
lower by 6 percent from the previous year and exceeds the annual target by 236 percent. The
decrease in live births can be attributed to the preventive measures being conducted by different
agencies and LGUs, such as orientations on responsible parenthood, series of teenage
pregnancy symposia, and film dissemination and orientations on Adolescent Sexual and
Reproductive Health (ASRH). Other factors that may contribute to the declining birth rates
include socioeconomic factors such as urbanization, increased schooling, increasing female
labor force participation and employment rates, and increasing opportunity costs of raising a
child, among others.
Access to family planning and contraceptive methods is key in sustaining low birth and fertility
rates. However, there is an expected decline in the use of contraceptives and access to family
planning services due to community quarantine restrictions in 2020 that limited the ability of
patients and individuals in obtaining contraceptive products and services.
While the latest data for total fertility rates are yet to be released, an increasing trend could be
expected based on the projected increase in the number of unintended pregnancies in 2020 due
to the limitations to access to family planning services and contraceptives during the imposition
of COVID-19 community quarantine (University of the Philippines Population Institute and
United Nations Population Fund, 20209). In particular, increased cases of unplanned pregnancy
could be driven up by longer periods of cohabitation among couples, increased time at home
due to limited mobility, and limited access to family planning supplies and contraceptives.
The DOH is also transitioning to Family Planning Estimation Tool (FPET), a web application
that uses all available survey data to produce annual estimates for key family planning
indicators, such as contraceptive prevalence and unmet need for family planning (track20.org).
Table 13.1. Modern contraceptives prevalence rate (in percent) by province, 2019 and 2020
Province Modern Contraceptive Prevalence Rate (%)
2019 2020
Target Actual Target Actual*
Cavite 27 18.87 28 7.64
Laguna 27 21.31 28 10.84
Batangas 27 29.00 28 13.91
Quezon 27 23.48 28 11.50
Rizal 27 16.04 28 6.83
CALABARZON 27 19.38 28 8.88
Source: Department of Health Region IV-A Notes: Data on modern contraceptives prevalence rate only covers the public sector and does not account for private family planning products and services.
9 University of the Philippines Population Institute (UPPI) and United Nations Population Fund (UNFPA). 2020.
Potential Impact of COVID-19 on Sexual and Reproductive Health in the Philippines.
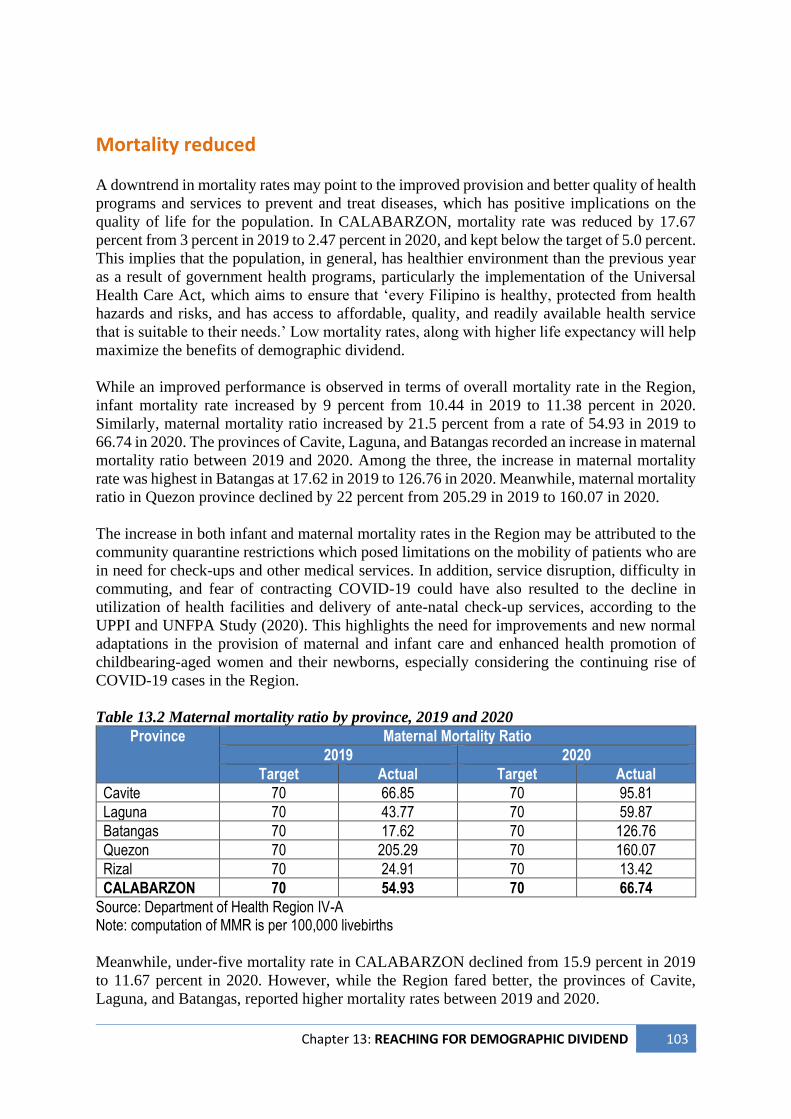
Chapter 13: REACHING FOR DEMOGRAPHIC DIVIDEND 103
Mortality reduced
A downtrend in mortality rates may point to the improved provision and better quality of health
programs and services to prevent and treat diseases, which has positive implications on the
quality of life for the population. In CALABARZON, mortality rate was reduced by 17.67
percent from 3 percent in 2019 to 2.47 percent in 2020, and kept below the target of 5.0 percent.
This implies that the population, in general, has healthier environment than the previous year
as a result of government health programs, particularly the implementation of the Universal
Health Care Act, which aims to ensure that ‘every Filipino is healthy, protected from health
hazards and risks, and has access to affordable, quality, and readily available health service
that is suitable to their needs.’ Low mortality rates, along with higher life expectancy will help
maximize the benefits of demographic dividend.
While an improved performance is observed in terms of overall mortality rate in the Region,
infant mortality rate increased by 9 percent from 10.44 in 2019 to 11.38 percent in 2020.
Similarly, maternal mortality ratio increased by 21.5 percent from a rate of 54.93 in 2019 to
66.74 in 2020. The provinces of Cavite, Laguna, and Batangas recorded an increase in maternal
mortality ratio between 2019 and 2020. Among the three, the increase in maternal mortality
rate was highest in Batangas at 17.62 in 2019 to 126.76 in 2020. Meanwhile, maternal mortality
ratio in Quezon province declined by 22 percent from 205.29 in 2019 to 160.07 in 2020.
The increase in both infant and maternal mortality rates in the Region may be attributed to the
community quarantine restrictions which posed limitations on the mobility of patients who are
in need for check-ups and other medical services. In addition, service disruption, difficulty in
commuting, and fear of contracting COVID-19 could have also resulted to the decline in
utilization of health facilities and delivery of ante-natal check-up services, according to the
UPPI and UNFPA Study (2020). This highlights the need for improvements and new normal
adaptations in the provision of maternal and infant care and enhanced health promotion of
childbearing-aged women and their newborns, especially considering the continuing rise of
COVID-19 cases in the Region.
Table 13.2 Maternal mortality ratio by province, 2019 and 2020
Province Maternal Mortality Ratio
2019 2020
Target Actual Target Actual
Cavite 70 66.85 70 95.81
Laguna 70 43.77 70 59.87
Batangas 70 17.62 70 126.76
Quezon 70 205.29 70 160.07
Rizal 70 24.91 70 13.42
CALABARZON 70 54.93 70 66.74
Source: Department of Health Region IV-A Note: computation of MMR is per 100,000 livebirths
Meanwhile, under-five mortality rate in CALABARZON declined from 15.9 percent in 2019
to 11.67 percent in 2020. However, while the Region fared better, the provinces of Cavite,
Laguna, and Batangas, reported higher mortality rates between 2019 and 2020.
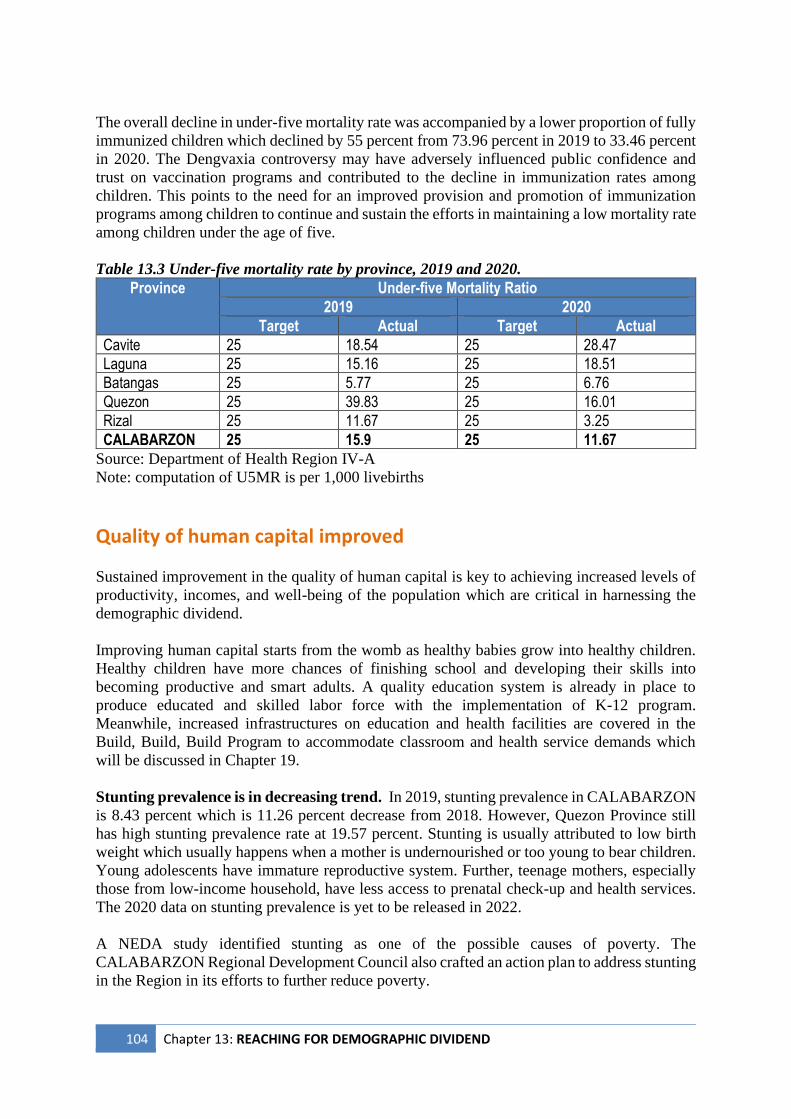
104 Chapter 13: REACHING FOR DEMOGRAPHIC DIVIDEND
The overall decline in under-five mortality rate was accompanied by a lower proportion of fully
immunized children which declined by 55 percent from 73.96 percent in 2019 to 33.46 percent
in 2020. The Dengvaxia controversy may have adversely influenced public confidence and
trust on vaccination programs and contributed to the decline in immunization rates among
children. This points to the need for an improved provision and promotion of immunization
programs among children to continue and sustain the efforts in maintaining a low mortality rate
among children under the age of five.
Table 13.3 Under-five mortality rate by province, 2019 and 2020.
Province Under-five Mortality Ratio
2019 2020
Target Actual Target Actual
Cavite 25 18.54 25 28.47
Laguna 25 15.16 25 18.51
Batangas 25 5.77 25 6.76
Quezon 25 39.83 25 16.01
Rizal 25 11.67 25 3.25
CALABARZON 25 15.9 25 11.67
Source: Department of Health Region IV-A
Note: computation of U5MR is per 1,000 livebirths
Quality of human capital improved
Sustained improvement in the quality of human capital is key to achieving increased levels of
productivity, incomes, and well-being of the population which are critical in harnessing the
demographic dividend.
Improving human capital starts from the womb as healthy babies grow into healthy children.
Healthy children have more chances of finishing school and developing their skills into
becoming productive and smart adults. A quality education system is already in place to
produce educated and skilled labor force with the implementation of K-12 program.
Meanwhile, increased infrastructures on education and health facilities are covered in the
Build, Build, Build Program to accommodate classroom and health service demands which
will be discussed in Chapter 19.
Stunting prevalence is in decreasing trend. In 2019, stunting prevalence in CALABARZON
is 8.43 percent which is 11.26 percent decrease from 2018. However, Quezon Province still
has high stunting prevalence rate at 19.57 percent. Stunting is usually attributed to low birth
weight which usually happens when a mother is undernourished or too young to bear children.
Young adolescents have immature reproductive system. Further, teenage mothers, especially
those from low-income household, have less access to prenatal check-up and health services.
The 2020 data on stunting prevalence is yet to be released in 2022.
A NEDA study identified stunting as one of the possible causes of poverty. The
CALABARZON Regional Development Council also crafted an action plan to address stunting
in the Region in its efforts to further reduce poverty.
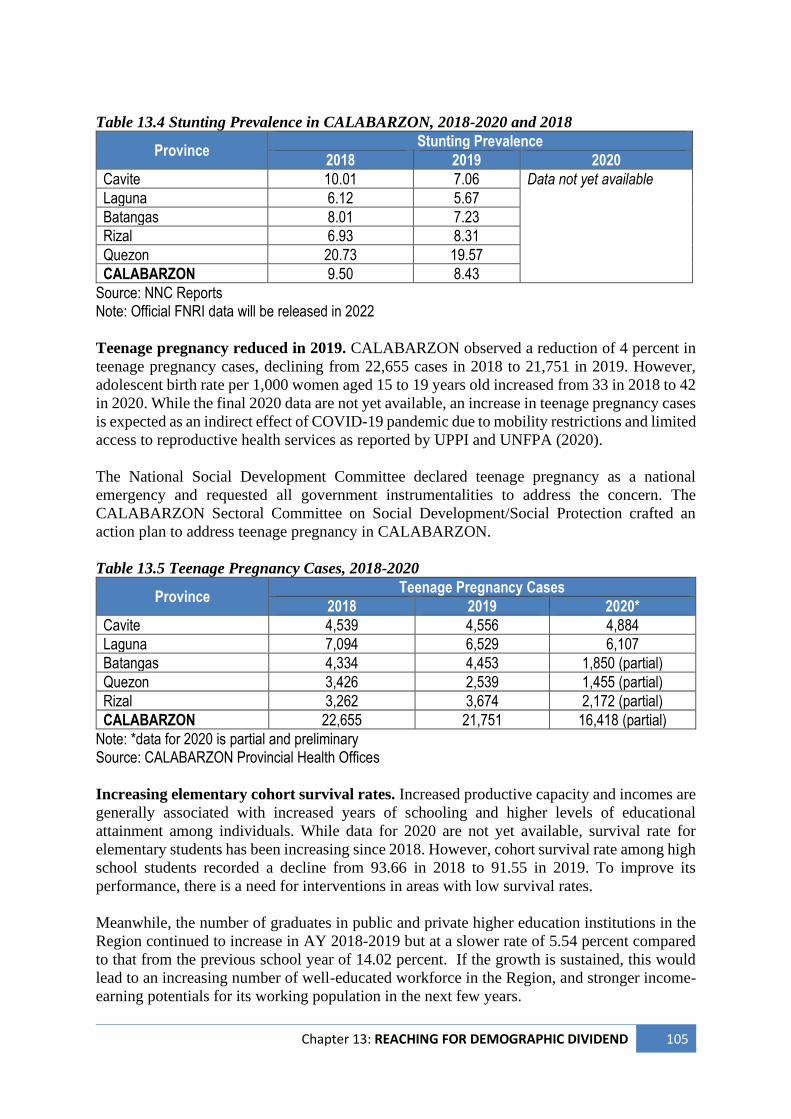
Chapter 13: REACHING FOR DEMOGRAPHIC DIVIDEND 105
Table 13.4 Stunting Prevalence in CALABARZON, 2018-2020 and 2018
Province Stunting Prevalence
2018 2019 2020
Cavite 10.01 7.06 Data not yet available Laguna 6.12 5.67
Batangas 8.01 7.23
Rizal 6.93 8.31
Quezon 20.73 19.57
CALABARZON 9.50 8.43
Source: NNC Reports Note: Official FNRI data will be released in 2022
Teenage pregnancy reduced in 2019. CALABARZON observed a reduction of 4 percent in
teenage pregnancy cases, declining from 22,655 cases in 2018 to 21,751 in 2019. However,
adolescent birth rate per 1,000 women aged 15 to 19 years old increased from 33 in 2018 to 42
in 2020. While the final 2020 data are not yet available, an increase in teenage pregnancy cases
is expected as an indirect effect of COVID-19 pandemic due to mobility restrictions and limited
access to reproductive health services as reported by UPPI and UNFPA (2020).
The National Social Development Committee declared teenage pregnancy as a national
emergency and requested all government instrumentalities to address the concern. The
CALABARZON Sectoral Committee on Social Development/Social Protection crafted an
action plan to address teenage pregnancy in CALABARZON.
Table 13.5 Teenage Pregnancy Cases, 2018-2020
Province Teenage Pregnancy Cases
2018 2019 2020*
Cavite 4,539 4,556 4,884
Laguna 7,094 6,529 6,107
Batangas 4,334 4,453 1,850 (partial)
Quezon 3,426 2,539 1,455 (partial)
Rizal 3,262 3,674 2,172 (partial)
CALABARZON 22,655 21,751 16,418 (partial)
Note: *data for 2020 is partial and preliminary Source: CALABARZON Provincial Health Offices
Increasing elementary cohort survival rates. Increased productive capacity and incomes are
generally associated with increased years of schooling and higher levels of educational
attainment among individuals. While data for 2020 are not yet available, survival rate for
elementary students has been increasing since 2018. However, cohort survival rate among high
school students recorded a decline from 93.66 in 2018 to 91.55 in 2019. To improve its
performance, there is a need for interventions in areas with low survival rates.
Meanwhile, the number of graduates in public and private higher education institutions in the
Region continued to increase in AY 2018-2019 but at a slower rate of 5.54 percent compared
to that from the previous school year of 14.02 percent. If the growth is sustained, this would
lead to an increasing number of well-educated workforce in the Region, and stronger income-
earning potentials for its working population in the next few years.
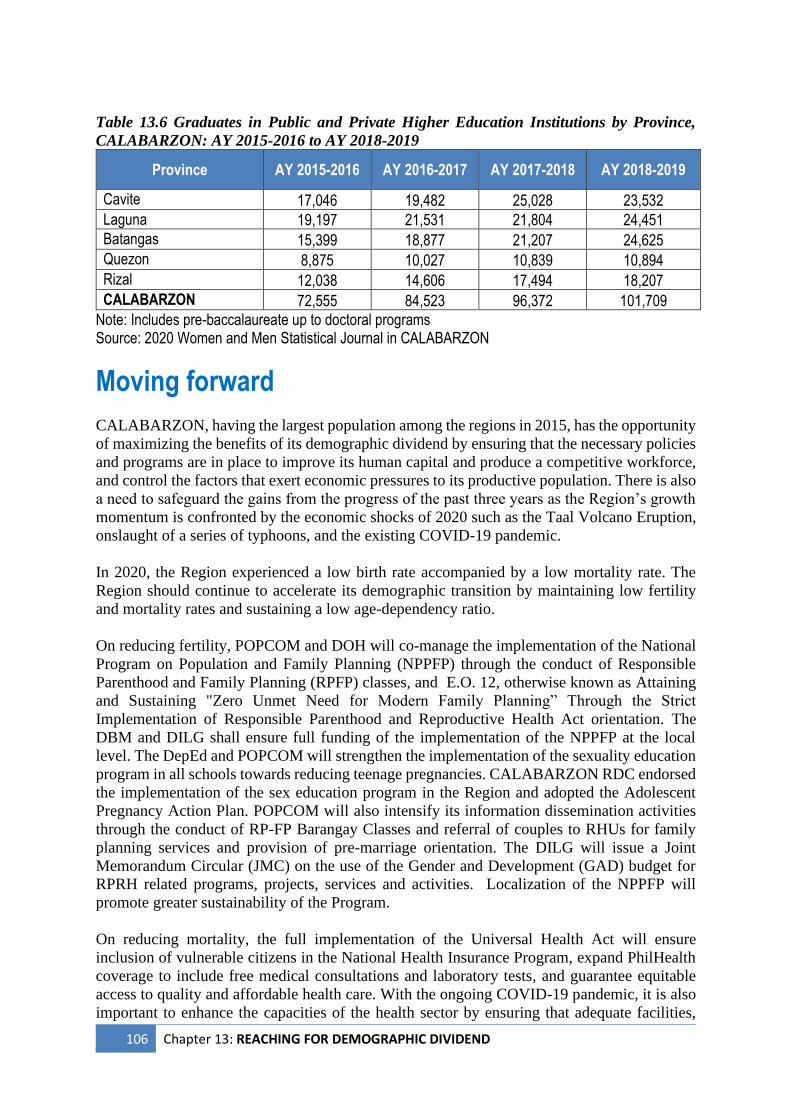
106 Chapter 13: REACHING FOR DEMOGRAPHIC DIVIDEND
Table 13.6 Graduates in Public and Private Higher Education Institutions by Province,
CALABARZON: AY 2015-2016 to AY 2018-2019
Province AY 2015-2016 AY 2016-2017 AY 2017-2018 AY 2018-2019
Cavite 17,046 19,482 25,028 23,532
Laguna 19,197 21,531 21,804 24,451
Batangas 15,399 18,877 21,207 24,625
Quezon 8,875 10,027 10,839 10,894
Rizal 12,038 14,606 17,494 18,207
CALABARZON 72,555 84,523 96,372 101,709
Note: Includes pre-baccalaureate up to doctoral programs Source: 2020 Women and Men Statistical Journal in CALABARZON
Moving forward
CALABARZON, having the largest population among the regions in 2015, has the opportunity
of maximizing the benefits of its demographic dividend by ensuring that the necessary policies
and programs are in place to improve its human capital and produce a competitive workforce,
and control the factors that exert economic pressures to its productive population. There is also
a need to safeguard the gains from the progress of the past three years as the Region’s growth
momentum is confronted by the economic shocks of 2020 such as the Taal Volcano Eruption,
onslaught of a series of typhoons, and the existing COVID-19 pandemic.
In 2020, the Region experienced a low birth rate accompanied by a low mortality rate. The
Region should continue to accelerate its demographic transition by maintaining low fertility
and mortality rates and sustaining a low age-dependency ratio.
On reducing fertility, POPCOM and DOH will co-manage the implementation of the National
Program on Population and Family Planning (NPPFP) through the conduct of Responsible
Parenthood and Family Planning (RPFP) classes, and E.O. 12, otherwise known as Attaining
and Sustaining "Zero Unmet Need for Modern Family Planning” Through the Strict
Implementation of Responsible Parenthood and Reproductive Health Act orientation. The
DBM and DILG shall ensure full funding of the implementation of the NPPFP at the local
level. The DepEd and POPCOM will strengthen the implementation of the sexuality education
program in all schools towards reducing teenage pregnancies. CALABARZON RDC endorsed
the implementation of the sex education program in the Region and adopted the Adolescent
Pregnancy Action Plan. POPCOM will also intensify its information dissemination activities
through the conduct of RP-FP Barangay Classes and referral of couples to RHUs for family
planning services and provision of pre-marriage orientation. The DILG will issue a Joint
Memorandum Circular (JMC) on the use of the Gender and Development (GAD) budget for
RPRH related programs, projects, services and activities. Localization of the NPPFP will
promote greater sustainability of the Program.
On reducing mortality, the full implementation of the Universal Health Act will ensure
inclusion of vulnerable citizens in the National Health Insurance Program, expand PhilHealth
coverage to include free medical consultations and laboratory tests, and guarantee equitable
access to quality and affordable health care. With the ongoing COVID-19 pandemic, it is also
important to enhance the capacities of the health sector by ensuring that adequate facilities,
Chapter 13: REACHING FOR DEMOGRAPHIC DIVIDEND 107
infrastructures, and workforce are available across the provinces. Given the health risks posed
by the COVID-19 pandemic, the timely and effective implementation of the COVID-19
vaccination program is key in maintaining a low mortality rate in the Region.
On human capital formation, the improved provision of education and health programs and
services among the youth may result to a social multiplier effect, particularly through higher
labor force participation and higher incomes, lower incidence of unwanted and unplanned
pregnancies, and higher productive capacities due to improved health resulting to increased
capabilities of the working-age population in providing better education and health to their
children. On improving the welfare of the youth, the implementation of the First 1000 Days
Act will help produce healthy children and reduce incidence of stunting. There is also a need
to reduce out of school children and youths (OSCYs) in CALABARZON and establish regular
collection of regional data to allow the timely monitoring of its progress. LGUs and concerned
regional line agencies should collaborate to emphasize the importance of education to OSCYs
especially to girls and women. Free tuition fees on government schools will encourage more
enrollment.
Moreover, CALABARZON should maximize the gains from its demographic dividend by
creating economic opportunities for the working class not only for employment but also for
entrepreneurship. Financial literacy should be increased to enhance the capability of the
population to save enough money for their retirement.
Current challenges on the objective of reaching for the demographic dividend are the: a)
increasing use of modern contraceptives; b) decreasing infant and maternal mortality rates and
sustaining low under-five mortality rate; c) reducing the incidence of teenage pregnancy; d)
maintaining low birth and fertility rates considering the limited access to family planning
services during the pandemic; and e) reducing OSCYs.
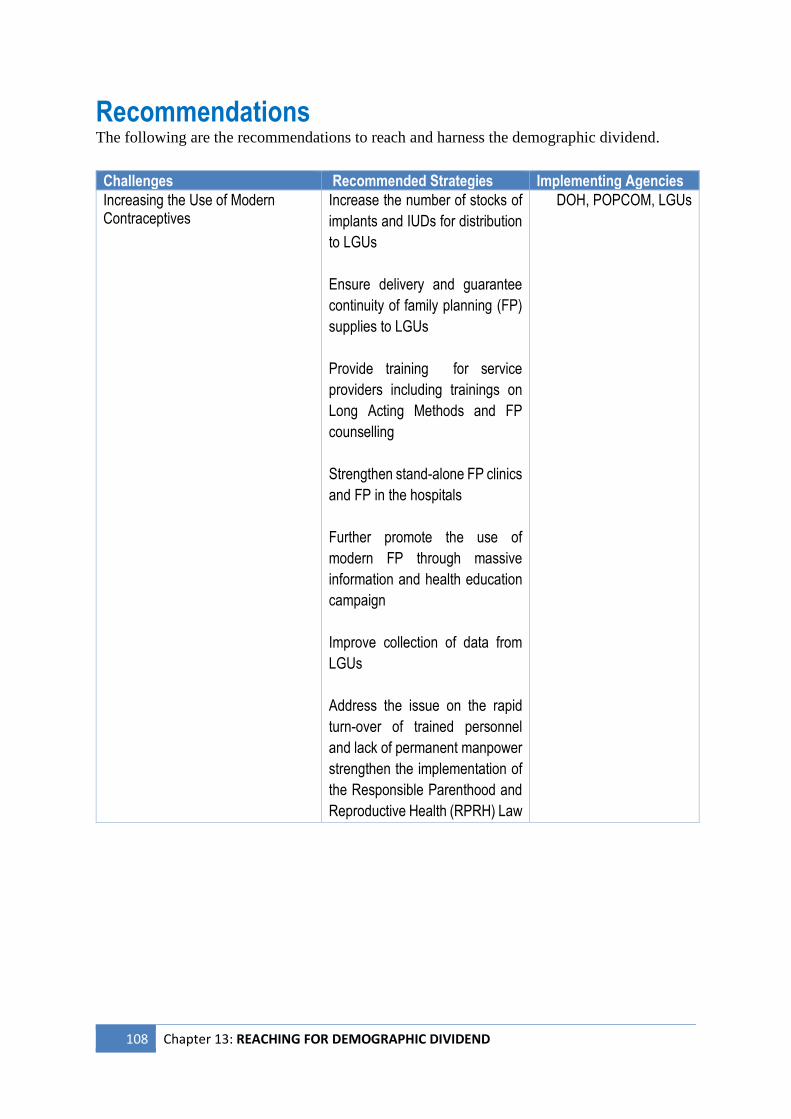
108 Chapter 13: REACHING FOR DEMOGRAPHIC DIVIDEND
Recommendations
The following are the recommendations to reach and harness the demographic dividend.
Challenges Recommended Strategies Implementing Agencies
Increasing the Use of Modern Contraceptives
Increase the number of stocks of
implants and IUDs for distribution
to LGUs
Ensure delivery and guarantee
continuity of family planning (FP)
supplies to LGUs
Provide training for service
providers including trainings on
Long Acting Methods and FP
counselling
Strengthen stand-alone FP clinics
and FP in the hospitals
Further promote the use of
modern FP through massive
information and health education
campaign
Improve collection of data from
LGUs
Address the issue on the rapid
turn-over of trained personnel
and lack of permanent manpower
strengthen the implementation of
the Responsible Parenthood and
Reproductive Health (RPRH) Law
DOH, POPCOM, LGUs
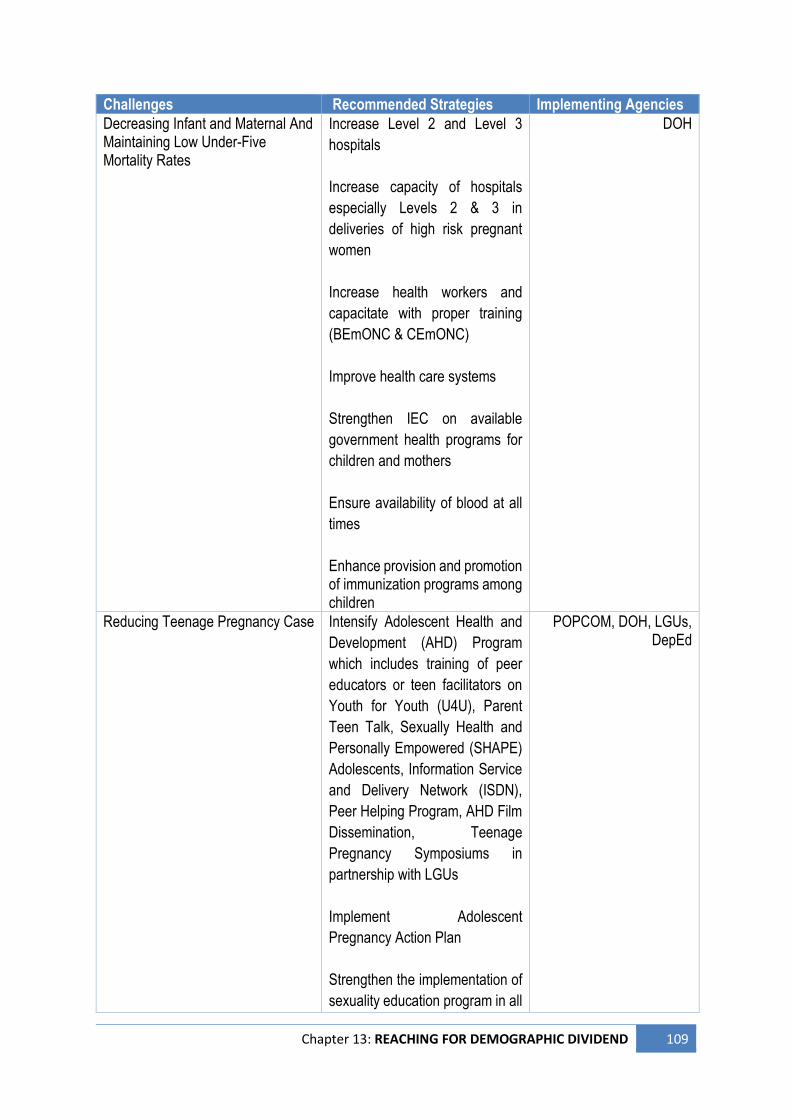
Chapter 13: REACHING FOR DEMOGRAPHIC DIVIDEND 109
Challenges Recommended Strategies Implementing Agencies
Decreasing Infant and Maternal And Maintaining Low Under-Five Mortality Rates
Increase Level 2 and Level 3
hospitals
Increase capacity of hospitals
especially Levels 2 & 3 in
deliveries of high risk pregnant
women
Increase health workers and
capacitate with proper training
(BEmONC & CEmONC)
Improve health care systems
Strengthen IEC on available
government health programs for
children and mothers
Ensure availability of blood at all
times
Enhance provision and promotion of immunization programs among children
DOH
Reducing Teenage Pregnancy Case Intensify Adolescent Health and
Development (AHD) Program
which includes training of peer
educators or teen facilitators on
Youth for Youth (U4U), Parent
Teen Talk, Sexually Health and
Personally Empowered (SHAPE)
Adolescents, Information Service
and Delivery Network (ISDN),
Peer Helping Program, AHD Film
Dissemination, Teenage
Pregnancy Symposiums in
partnership with LGUs
Implement Adolescent
Pregnancy Action Plan
Strengthen the implementation of
sexuality education program in all
POPCOM, DOH, LGUs, DepEd
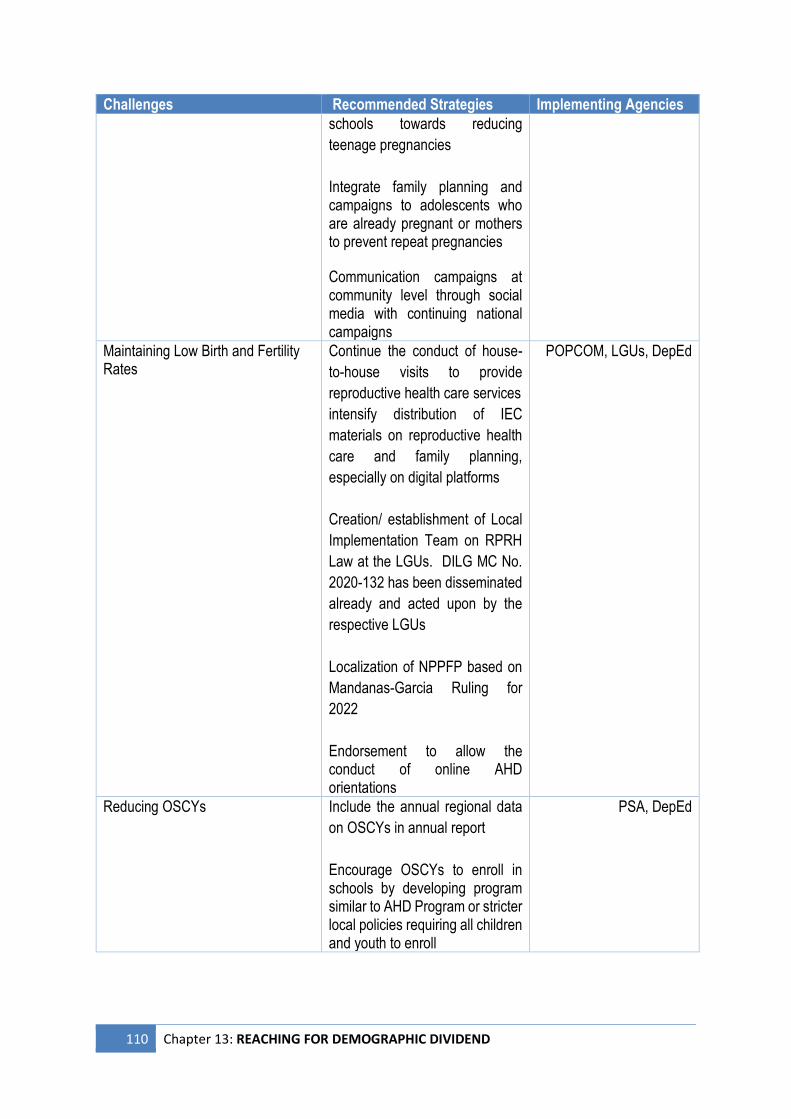
110 Chapter 13: REACHING FOR DEMOGRAPHIC DIVIDEND
Challenges Recommended Strategies Implementing Agencies
schools towards reducing
teenage pregnancies
Integrate family planning and campaigns to adolescents who are already pregnant or mothers to prevent repeat pregnancies
Communication campaigns at community level through social media with continuing national campaigns
Maintaining Low Birth and Fertility Rates
Continue the conduct of house-
to-house visits to provide
reproductive health care services
intensify distribution of IEC
materials on reproductive health
care and family planning,
especially on digital platforms
Creation/ establishment of Local
Implementation Team on RPRH
Law at the LGUs. DILG MC No.
2020-132 has been disseminated
already and acted upon by the
respective LGUs
Localization of NPPFP based on
Mandanas-Garcia Ruling for
2022
Endorsement to allow the conduct of online AHD orientations
POPCOM, LGUs, DepEd
Reducing OSCYs Include the annual regional data
on OSCYs in annual report
Encourage OSCYs to enroll in schools by developing program similar to AHD Program or stricter local policies requiring all children and youth to enroll
PSA, DepEd
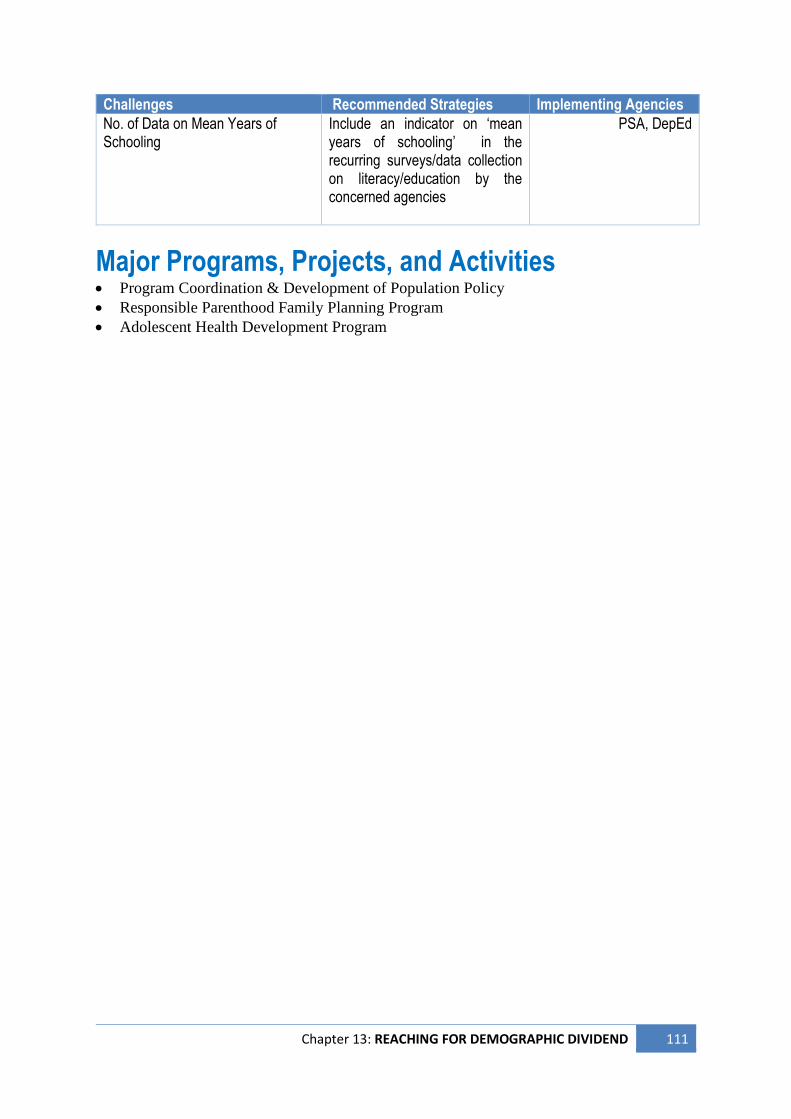
Chapter 13: REACHING FOR DEMOGRAPHIC DIVIDEND 111
Challenges Recommended Strategies Implementing Agencies
No. of Data on Mean Years of Schooling
Include an indicator on ‘mean years of schooling’ in the recurring surveys/data collection on literacy/education by the concerned agencies
PSA, DepEd
Major Programs, Projects, and Activities • Program Coordination & Development of Population Policy
• Responsible Parenthood Family Planning Program
• Adolescent Health Development Program

112 Chapter 13: REACHING FOR DEMOGRAPHIC DIVIDEND
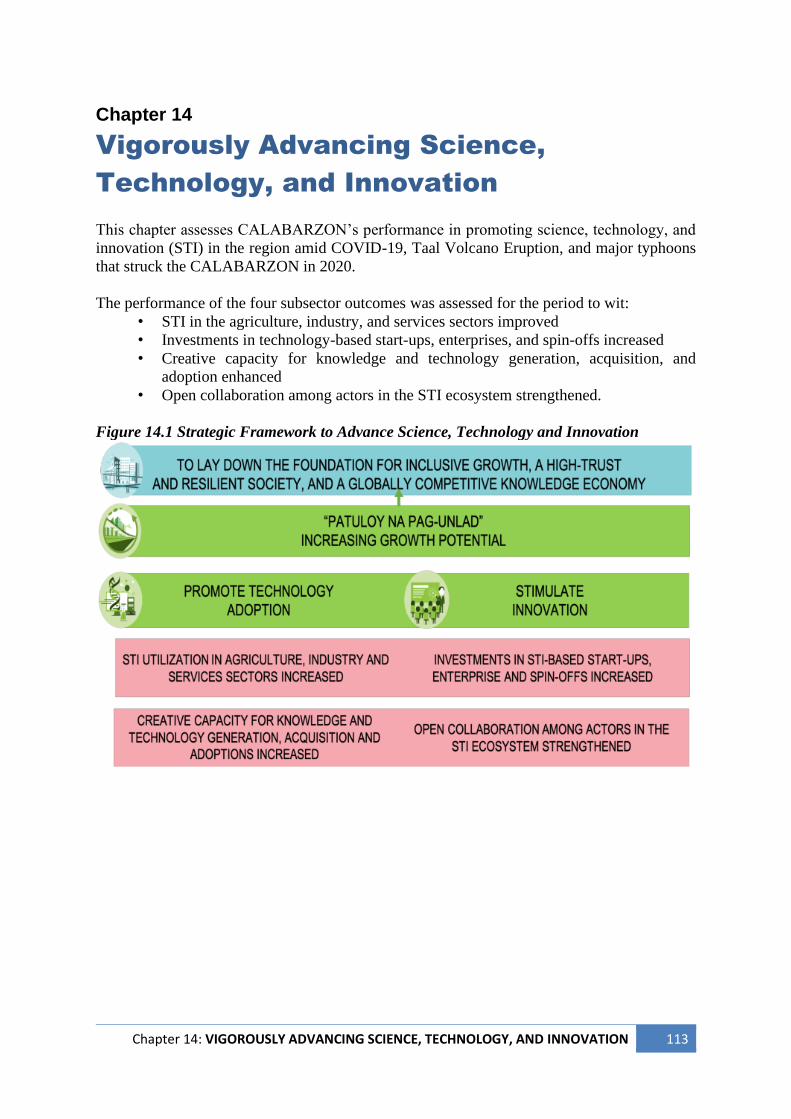
Chapter 14: VIGOROUSLY ADVANCING SCIENCE, TECHNOLOGY, AND INNOVATION 113
Chapter 14
Vigorously Advancing Science,
Technology, and Innovation
This chapter assesses CALABARZON’s performance in promoting science, technology, and
innovation (STI) in the region amid COVID-19, Taal Volcano Eruption, and major typhoons
that struck the CALABARZON in 2020.
The performance of the four subsector outcomes was assessed for the period to wit:
• STI in the agriculture, industry, and services sectors improved
• Investments in technology-based start-ups, enterprises, and spin-offs increased
• Creative capacity for knowledge and technology generation, acquisition, and
adoption enhanced
• Open collaboration among actors in the STI ecosystem strengthened.
Figure 14.1 Strategic Framework to Advance Science, Technology and Innovation
114 Chapter 14: VIGOROUSLY ADVANCING SCIENCE, TECHNOLOGY, AND INNOVATION
Sector Performance
Promote and accelerate technology adoption
STI utilization in the agriculture, industry, and services sectors increased
Technology
The onset of COVID-19 in 2020 led to the promotion and dissemination of STI in
CALABARZON through online platforms which has increased from 2019. This resulted to
reaching more technology adopters which aims to improve the productivity of agriculture,
industry, and services sectors.
Number of Promoted Technologies Increased. There was an increase of 53.94 percent in the
number of technologies promoted, from 165 in 2019 to 254 in 2020 (Table 14.1). The increase
may be attributed to DOST’s various promotional activities on diverse and locally developed
R&D outputs through different strategies like deployment, transfer agreements, promotion, and
commercialization services. One strategy, for example, is the incorporation of technology
interventions in major programs like Community Empowerment thru Science and Technology
(CEST), Small Enterprise Technology Upgrading Program (SETUP), Science and Technology
Academic and Research-Based Openly Operated KioskS (STARBOOKS), and Grants-in-Aid
Community-Based Projects (GIA-CBP). The enhanced programs are geared towards
promoting and transfer of the following notable technologies to target communities:
• ASTI - Automated Rain Gauge (ARG), Automated Weather Station,
• Local Government Unit Information Dissemination System
• MAPUA Automatic Identification System for Fiberglass Rescue Boat
• BatStateU Tsunami Early Warning System (TEWS)
• FNRI Enhanced Nutribun,
• FNRI Complementary Food (Rice-Monggo Crunchies)
• RxBOX Telehealth Device
• Biotek-M
• GenAmplify Corona Virus 2019 (COVID-19) RT PCR Detection Kit
• ITDI Biogas Digester
• FPRDI Easy-to-Ignite Charcoal
• FPRDI Handmade Paper Making
• ITDI Salt Production and Iodization
• FNRI Tubig Talino
• FPRDI Water Hyacinth Dryer
• ITDI Cacao Processing Eqpt.
• PTRI Handloom Weaving
• FNRI Iron Fortified RiceITDI Bioreactor
• ITDI Technology on Calamansi Processing RTD Juice Drinks and Concentrates
The consistent and on-time use of online training platforms and social media in promoting
technologies also contributed to the increase. Moreover, DOST and its agencies continue to
mobilize the involvement and participation of other national government agencies, local
government units (LGUs), academe, and media in DOST-led programs and projects.
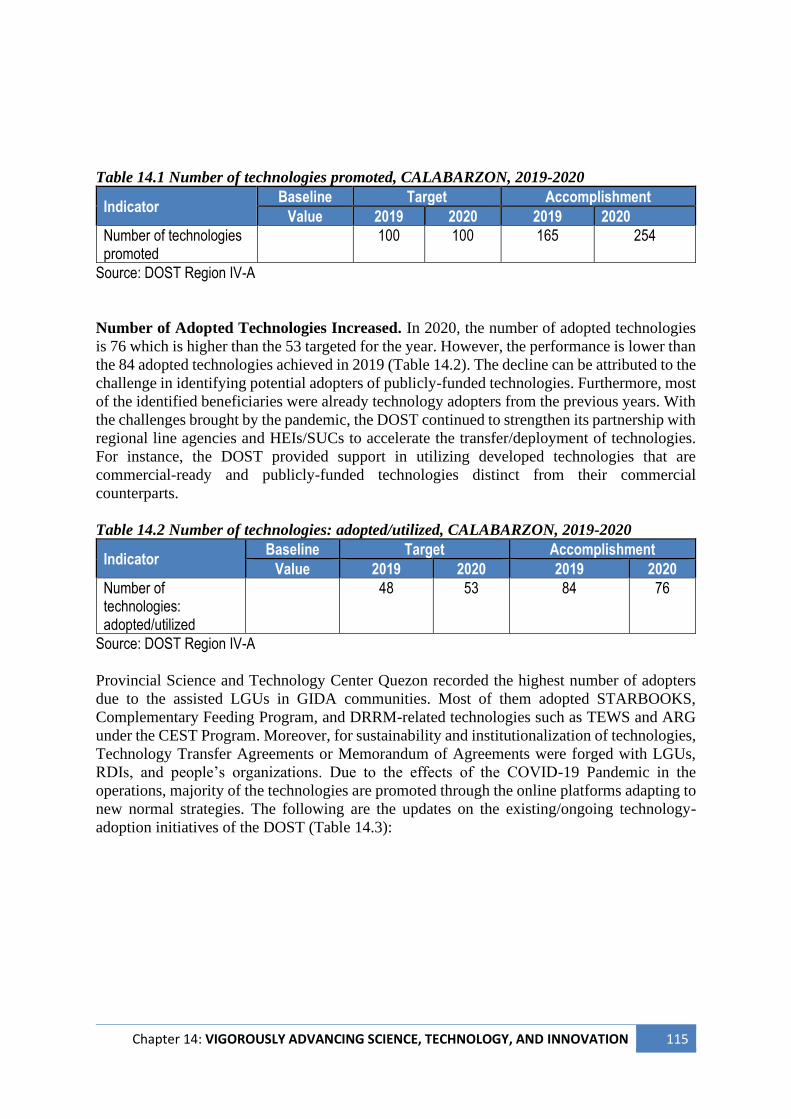
Chapter 14: VIGOROUSLY ADVANCING SCIENCE, TECHNOLOGY, AND INNOVATION 115
Table 14.1 Number of technologies promoted, CALABARZON, 2019-2020
Indicator Baseline Target Accomplishment
Value 2019 2020 2019 2020
Number of technologies promoted
100 100 165 254
Source: DOST Region IV-A
Number of Adopted Technologies Increased. In 2020, the number of adopted technologies
is 76 which is higher than the 53 targeted for the year. However, the performance is lower than
the 84 adopted technologies achieved in 2019 (Table 14.2). The decline can be attributed to the
challenge in identifying potential adopters of publicly-funded technologies. Furthermore, most
of the identified beneficiaries were already technology adopters from the previous years. With
the challenges brought by the pandemic, the DOST continued to strengthen its partnership with
regional line agencies and HEIs/SUCs to accelerate the transfer/deployment of technologies.
For instance, the DOST provided support in utilizing developed technologies that are
commercial-ready and publicly-funded technologies distinct from their commercial
counterparts.
Table 14.2 Number of technologies: adopted/utilized, CALABARZON, 2019-2020
Indicator Baseline Target Accomplishment
Value 2019 2020 2019 2020
Number of technologies: adopted/utilized
48 53 84 76
Source: DOST Region IV-A
Provincial Science and Technology Center Quezon recorded the highest number of adopters
due to the assisted LGUs in GIDA communities. Most of them adopted STARBOOKS,
Complementary Feeding Program, and DRRM-related technologies such as TEWS and ARG
under the CEST Program. Moreover, for sustainability and institutionalization of technologies,
Technology Transfer Agreements or Memorandum of Agreements were forged with LGUs,
RDIs, and people’s organizations. Due to the effects of the COVID-19 Pandemic in the
operations, majority of the technologies are promoted through the online platforms adapting to
new normal strategies. The following are the updates on the existing/ongoing technology-
adoption initiatives of the DOST (Table 14.3):
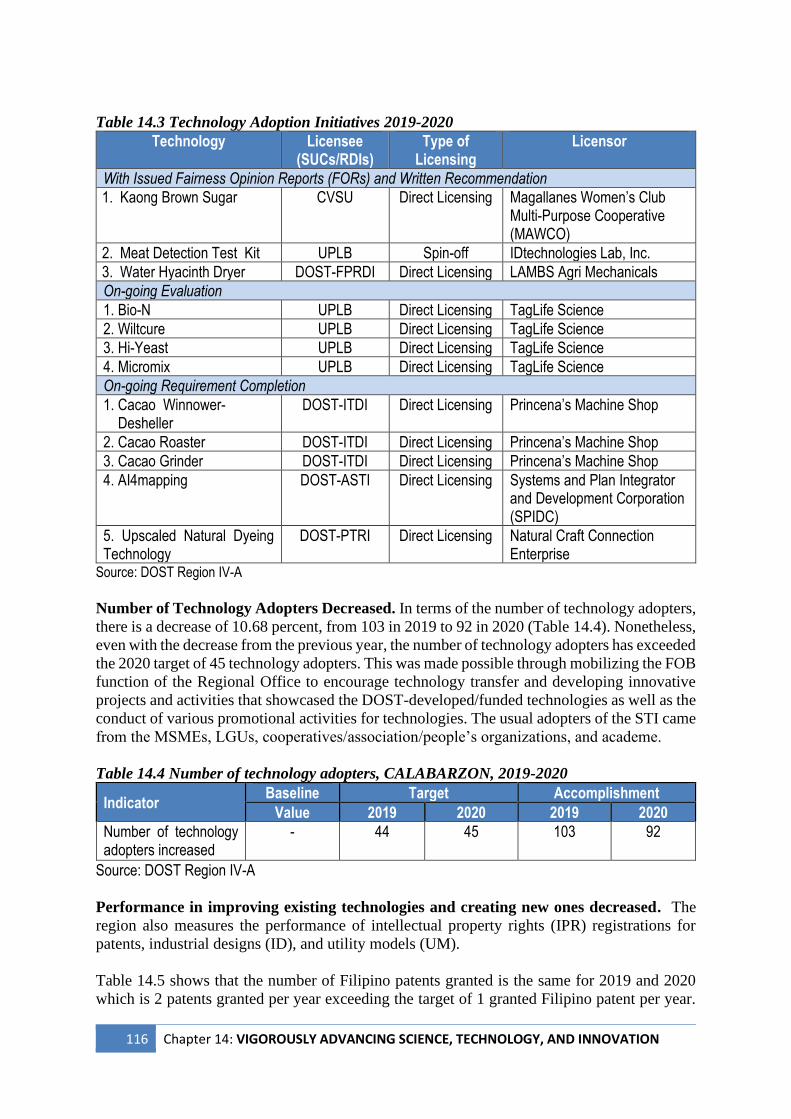
116 Chapter 14: VIGOROUSLY ADVANCING SCIENCE, TECHNOLOGY, AND INNOVATION
Table 14.3 Technology Adoption Initiatives 2019-2020
Technology Licensee (SUCs/RDIs)
Type of Licensing
Licensor
With Issued Fairness Opinion Reports (FORs) and Written Recommendation
1. Kaong Brown Sugar CVSU Direct Licensing Magallanes Women’s Club Multi-Purpose Cooperative (MAWCO)
2. Meat Detection Test Kit UPLB Spin-off IDtechnologies Lab, Inc.
3. Water Hyacinth Dryer DOST-FPRDI Direct Licensing LAMBS Agri Mechanicals
On-going Evaluation
1. Bio-N UPLB Direct Licensing TagLife Science
2. Wiltcure UPLB Direct Licensing TagLife Science
3. Hi-Yeast UPLB Direct Licensing TagLife Science
4. Micromix UPLB Direct Licensing TagLife Science
On-going Requirement Completion
1. Cacao Winnower- Desheller
DOST-ITDI Direct Licensing Princena’s Machine Shop
2. Cacao Roaster DOST-ITDI Direct Licensing Princena’s Machine Shop
3. Cacao Grinder DOST-ITDI Direct Licensing Princena’s Machine Shop
4. AI4mapping DOST-ASTI Direct Licensing Systems and Plan Integrator and Development Corporation (SPIDC)
5. Upscaled Natural Dyeing Technology
DOST-PTRI Direct Licensing Natural Craft Connection Enterprise
Source: DOST Region IV-A
Number of Technology Adopters Decreased. In terms of the number of technology adopters,
there is a decrease of 10.68 percent, from 103 in 2019 to 92 in 2020 (Table 14.4). Nonetheless,
even with the decrease from the previous year, the number of technology adopters has exceeded
the 2020 target of 45 technology adopters. This was made possible through mobilizing the FOB
function of the Regional Office to encourage technology transfer and developing innovative
projects and activities that showcased the DOST-developed/funded technologies as well as the
conduct of various promotional activities for technologies. The usual adopters of the STI came
from the MSMEs, LGUs, cooperatives/association/people’s organizations, and academe.
Table 14.4 Number of technology adopters, CALABARZON, 2019-2020
Indicator Baseline Target Accomplishment
Value 2019 2020 2019 2020
Number of technology adopters increased
- 44 45 103 92
Source: DOST Region IV-A
Performance in improving existing technologies and creating new ones decreased. The
region also measures the performance of intellectual property rights (IPR) registrations for
patents, industrial designs (ID), and utility models (UM).
Table 14.5 shows that the number of Filipino patents granted is the same for 2019 and 2020
which is 2 patents granted per year exceeding the target of 1 granted Filipino patent per year.
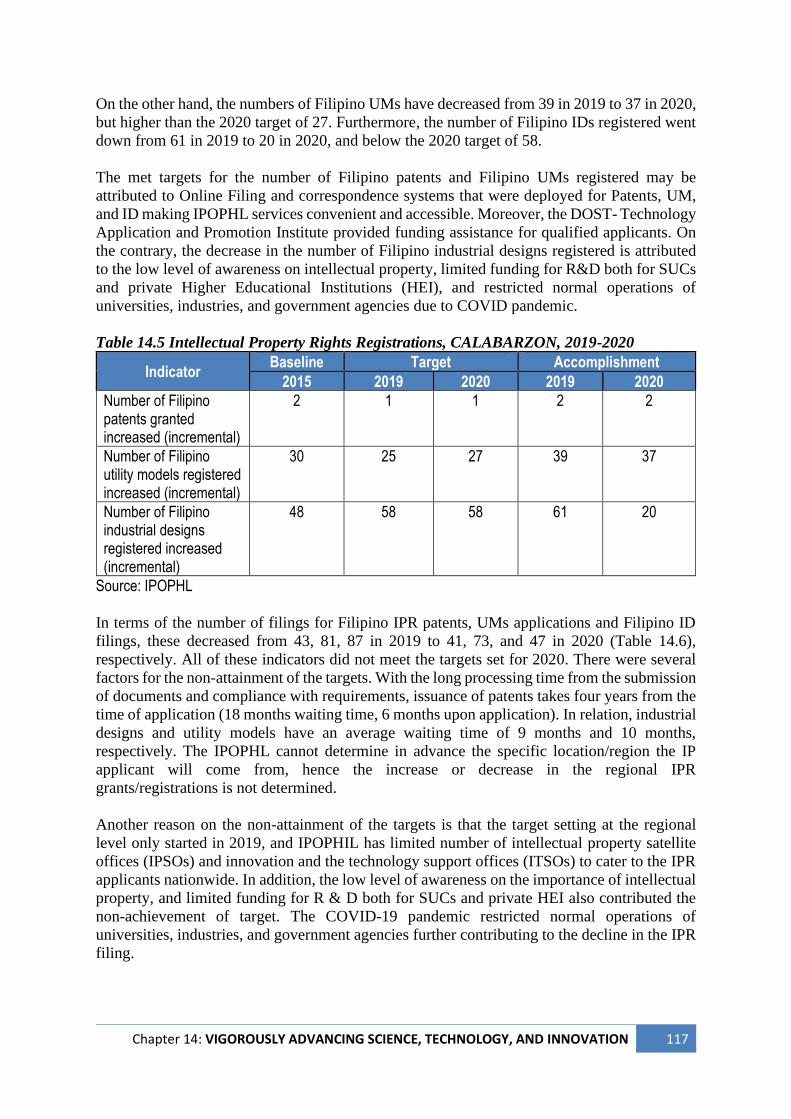
Chapter 14: VIGOROUSLY ADVANCING SCIENCE, TECHNOLOGY, AND INNOVATION 117
On the other hand, the numbers of Filipino UMs have decreased from 39 in 2019 to 37 in 2020,
but higher than the 2020 target of 27. Furthermore, the number of Filipino IDs registered went
down from 61 in 2019 to 20 in 2020, and below the 2020 target of 58.
The met targets for the number of Filipino patents and Filipino UMs registered may be
attributed to Online Filing and correspondence systems that were deployed for Patents, UM,
and ID making IPOPHL services convenient and accessible. Moreover, the DOST- Technology
Application and Promotion Institute provided funding assistance for qualified applicants. On
the contrary, the decrease in the number of Filipino industrial designs registered is attributed
to the low level of awareness on intellectual property, limited funding for R&D both for SUCs
and private Higher Educational Institutions (HEI), and restricted normal operations of
universities, industries, and government agencies due to COVID pandemic.
Table 14.5 Intellectual Property Rights Registrations, CALABARZON, 2019-2020
Indicator Baseline Target Accomplishment
2015 2019 2020 2019 2020
Number of Filipino patents granted increased (incremental)
2 1 1 2 2
Number of Filipino utility models registered increased (incremental)
30 25 27 39 37
Number of Filipino industrial designs registered increased (incremental)
48 58 58 61 20
Source: IPOPHL
In terms of the number of filings for Filipino IPR patents, UMs applications and Filipino ID
filings, these decreased from 43, 81, 87 in 2019 to 41, 73, and 47 in 2020 (Table 14.6),
respectively. All of these indicators did not meet the targets set for 2020. There were several
factors for the non-attainment of the targets. With the long processing time from the submission
of documents and compliance with requirements, issuance of patents takes four years from the
time of application (18 months waiting time, 6 months upon application). In relation, industrial
designs and utility models have an average waiting time of 9 months and 10 months,
respectively. The IPOPHL cannot determine in advance the specific location/region the IP
applicant will come from, hence the increase or decrease in the regional IPR
grants/registrations is not determined.
Another reason on the non-attainment of the targets is that the target setting at the regional
level only started in 2019, and IPOPHIL has limited number of intellectual property satellite
offices (IPSOs) and innovation and the technology support offices (ITSOs) to cater to the IPR
applicants nationwide. In addition, the low level of awareness on the importance of intellectual
property, and limited funding for R & D both for SUCs and private HEI also contributed the
non-achievement of target. The COVID-19 pandemic restricted normal operations of
universities, industries, and government agencies further contributing to the decline in the IPR
filing.
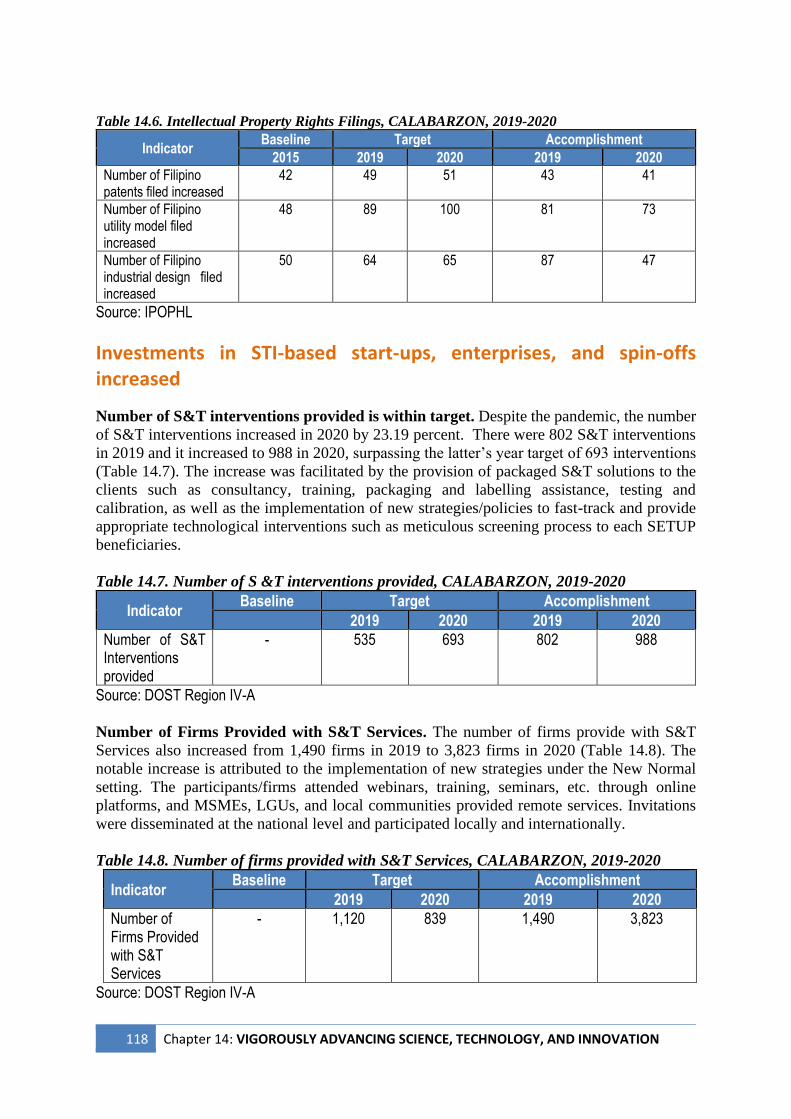
118 Chapter 14: VIGOROUSLY ADVANCING SCIENCE, TECHNOLOGY, AND INNOVATION
Table 14.6. Intellectual Property Rights Filings, CALABARZON, 2019-2020
Indicator Baseline Target Accomplishment
2015 2019 2020 2019 2020
Number of Filipino patents filed increased
42 49 51 43 41
Number of Filipino utility model filed increased
48 89 100 81 73
Number of Filipino industrial design filed increased
50 64 65 87 47
Source: IPOPHL
Investments in STI-based start-ups, enterprises, and spin-offs increased
Number of S&T interventions provided is within target. Despite the pandemic, the number
of S&T interventions increased in 2020 by 23.19 percent. There were 802 S&T interventions
in 2019 and it increased to 988 in 2020, surpassing the latter’s year target of 693 interventions
(Table 14.7). The increase was facilitated by the provision of packaged S&T solutions to the
clients such as consultancy, training, packaging and labelling assistance, testing and
calibration, as well as the implementation of new strategies/policies to fast-track and provide
appropriate technological interventions such as meticulous screening process to each SETUP
beneficiaries.
Table 14.7. Number of S &T interventions provided, CALABARZON, 2019-2020
Indicator Baseline Target Accomplishment
2019 2020 2019 2020
Number of S&T Interventions provided
- 535 693 802 988
Source: DOST Region IV-A Number of Firms Provided with S&T Services. The number of firms provide with S&T
Services also increased from 1,490 firms in 2019 to 3,823 firms in 2020 (Table 14.8). The
notable increase is attributed to the implementation of new strategies under the New Normal
setting. The participants/firms attended webinars, training, seminars, etc. through online
platforms, and MSMEs, LGUs, and local communities provided remote services. Invitations
were disseminated at the national level and participated locally and internationally.
Table 14.8. Number of firms provided with S&T Services, CALABARZON, 2019-2020
Indicator Baseline Target Accomplishment
2019 2020 2019 2020
Number of Firms Provided with S&T Services
- 1,120 839 1,490 3,823
Source: DOST Region IV-A
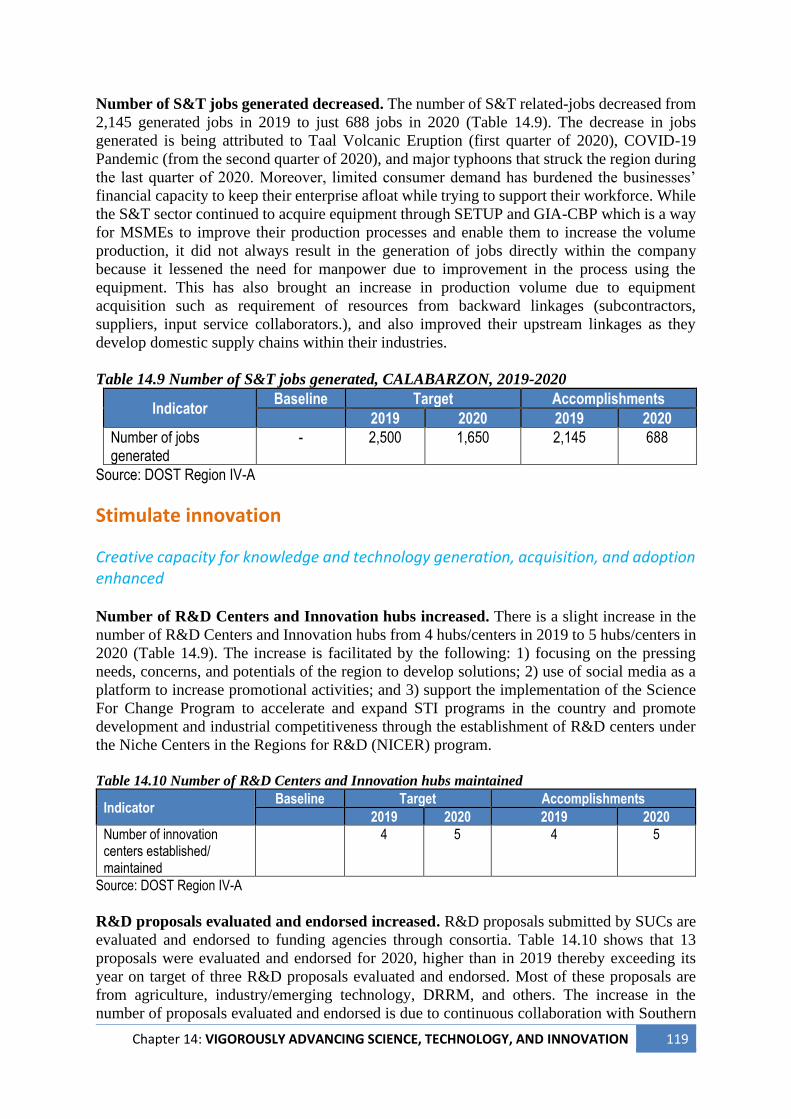
Chapter 14: VIGOROUSLY ADVANCING SCIENCE, TECHNOLOGY, AND INNOVATION 119
Number of S&T jobs generated decreased. The number of S&T related-jobs decreased from
2,145 generated jobs in 2019 to just 688 jobs in 2020 (Table 14.9). The decrease in jobs
generated is being attributed to Taal Volcanic Eruption (first quarter of 2020), COVID-19
Pandemic (from the second quarter of 2020), and major typhoons that struck the region during
the last quarter of 2020. Moreover, limited consumer demand has burdened the businesses’
financial capacity to keep their enterprise afloat while trying to support their workforce. While
the S&T sector continued to acquire equipment through SETUP and GIA-CBP which is a way
for MSMEs to improve their production processes and enable them to increase the volume
production, it did not always result in the generation of jobs directly within the company
because it lessened the need for manpower due to improvement in the process using the
equipment. This has also brought an increase in production volume due to equipment
acquisition such as requirement of resources from backward linkages (subcontractors,
suppliers, input service collaborators.), and also improved their upstream linkages as they
develop domestic supply chains within their industries.
Table 14.9 Number of S&T jobs generated, CALABARZON, 2019-2020
Indicator Baseline Target Accomplishments
2019 2020 2019 2020
Number of jobs generated
- 2,500 1,650 2,145 688
Source: DOST Region IV-A
Stimulate innovation
Creative capacity for knowledge and technology generation, acquisition, and adoption enhanced Number of R&D Centers and Innovation hubs increased. There is a slight increase in the
number of R&D Centers and Innovation hubs from 4 hubs/centers in 2019 to 5 hubs/centers in
2020 (Table 14.9). The increase is facilitated by the following: 1) focusing on the pressing
needs, concerns, and potentials of the region to develop solutions; 2) use of social media as a
platform to increase promotional activities; and 3) support the implementation of the Science
For Change Program to accelerate and expand STI programs in the country and promote
development and industrial competitiveness through the establishment of R&D centers under
the Niche Centers in the Regions for R&D (NICER) program.
Table 14.10 Number of R&D Centers and Innovation hubs maintained
Indicator Baseline Target Accomplishments
2019 2020 2019 2020
Number of innovation centers established/ maintained
4 5 4 5
Source: DOST Region IV-A
R&D proposals evaluated and endorsed increased. R&D proposals submitted by SUCs are
evaluated and endorsed to funding agencies through consortia. Table 14.10 shows that 13
proposals were evaluated and endorsed for 2020, higher than in 2019 thereby exceeding its
year on target of three R&D proposals evaluated and endorsed. Most of these proposals are
from agriculture, industry/emerging technology, DRRM, and others. The increase in the
number of proposals evaluated and endorsed is due to continuous collaboration with Southern
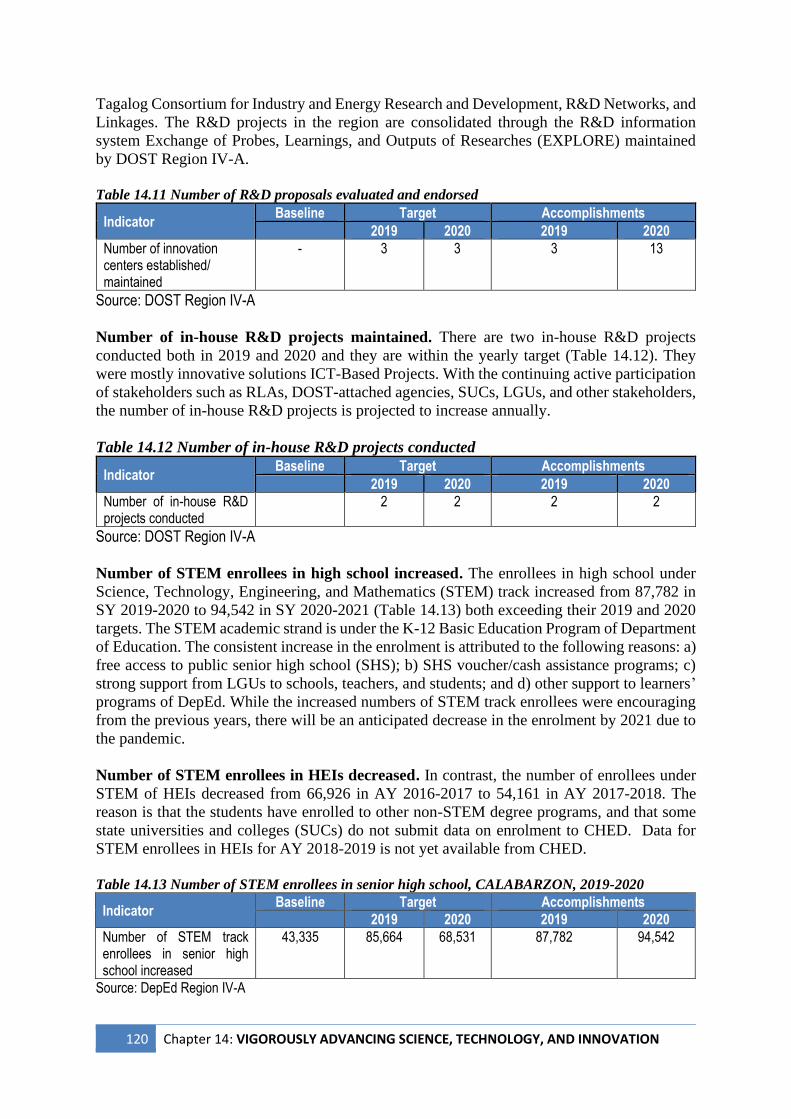
120 Chapter 14: VIGOROUSLY ADVANCING SCIENCE, TECHNOLOGY, AND INNOVATION
Tagalog Consortium for Industry and Energy Research and Development, R&D Networks, and
Linkages. The R&D projects in the region are consolidated through the R&D information
system Exchange of Probes, Learnings, and Outputs of Researches (EXPLORE) maintained
by DOST Region IV-A.
Table 14.11 Number of R&D proposals evaluated and endorsed
Indicator Baseline Target Accomplishments
2019 2020 2019 2020
Number of innovation centers established/ maintained
- 3 3 3 13
Source: DOST Region IV-A
Number of in-house R&D projects maintained. There are two in-house R&D projects
conducted both in 2019 and 2020 and they are within the yearly target (Table 14.12). They
were mostly innovative solutions ICT-Based Projects. With the continuing active participation
of stakeholders such as RLAs, DOST-attached agencies, SUCs, LGUs, and other stakeholders,
the number of in-house R&D projects is projected to increase annually.
Table 14.12 Number of in-house R&D projects conducted
Indicator Baseline Target Accomplishments
2019 2020 2019 2020
Number of in-house R&D projects conducted
2 2 2 2
Source: DOST Region IV-A
Number of STEM enrollees in high school increased. The enrollees in high school under
Science, Technology, Engineering, and Mathematics (STEM) track increased from 87,782 in
SY 2019-2020 to 94,542 in SY 2020-2021 (Table 14.13) both exceeding their 2019 and 2020
targets. The STEM academic strand is under the K-12 Basic Education Program of Department
of Education. The consistent increase in the enrolment is attributed to the following reasons: a)
free access to public senior high school (SHS); b) SHS voucher/cash assistance programs; c)
strong support from LGUs to schools, teachers, and students; and d) other support to learners’
programs of DepEd. While the increased numbers of STEM track enrollees were encouraging
from the previous years, there will be an anticipated decrease in the enrolment by 2021 due to
the pandemic.
Number of STEM enrollees in HEIs decreased. In contrast, the number of enrollees under
STEM of HEIs decreased from 66,926 in AY 2016-2017 to 54,161 in AY 2017-2018. The
reason is that the students have enrolled to other non-STEM degree programs, and that some
state universities and colleges (SUCs) do not submit data on enrolment to CHED. Data for
STEM enrollees in HEIs for AY 2018-2019 is not yet available from CHED.
Table 14.13 Number of STEM enrollees in senior high school, CALABARZON, 2019-2020
Indicator Baseline Target Accomplishments
2019 2020 2019 2020
Number of STEM track enrollees in senior high school increased
43,335 85,664 68,531 87,782 94,542
Source: DepEd Region IV-A
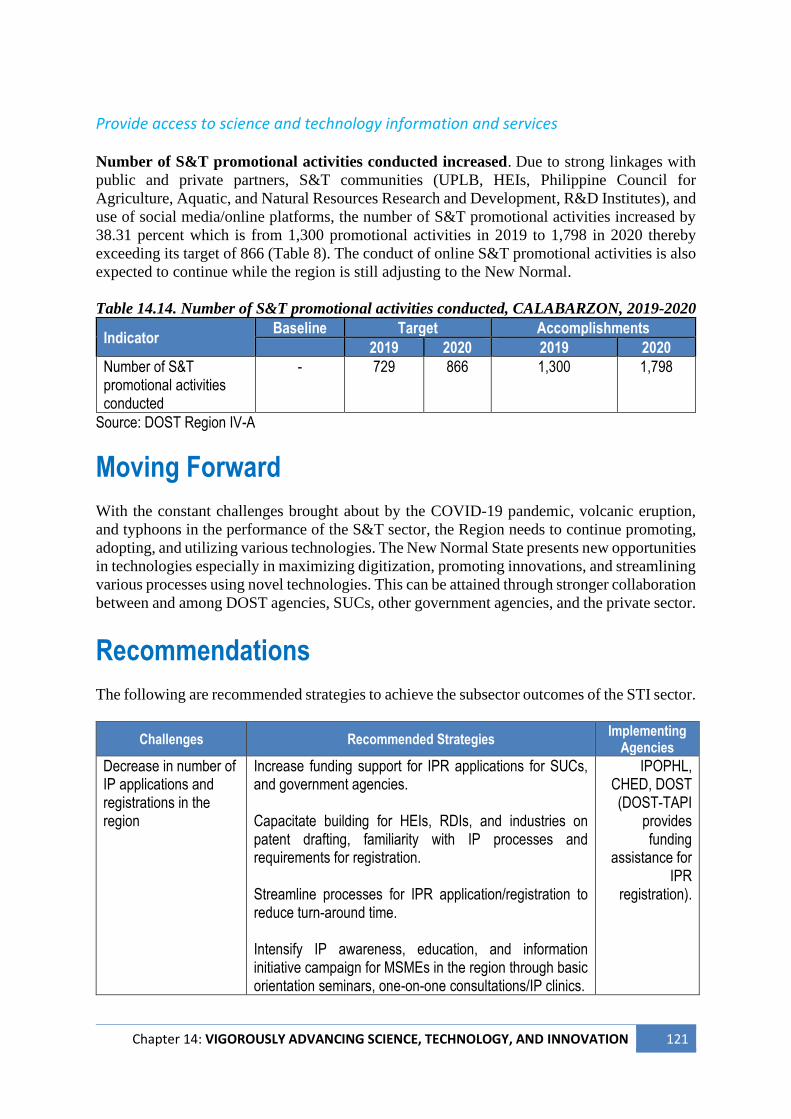
Chapter 14: VIGOROUSLY ADVANCING SCIENCE, TECHNOLOGY, AND INNOVATION 121
Provide access to science and technology information and services
Number of S&T promotional activities conducted increased. Due to strong linkages with
public and private partners, S&T communities (UPLB, HEIs, Philippine Council for
Agriculture, Aquatic, and Natural Resources Research and Development, R&D Institutes), and
use of social media/online platforms, the number of S&T promotional activities increased by
38.31 percent which is from 1,300 promotional activities in 2019 to 1,798 in 2020 thereby
exceeding its target of 866 (Table 8). The conduct of online S&T promotional activities is also
expected to continue while the region is still adjusting to the New Normal.
Table 14.14. Number of S&T promotional activities conducted, CALABARZON, 2019-2020
Indicator Baseline Target Accomplishments
2019 2020 2019 2020
Number of S&T promotional activities conducted
- 729 866 1,300 1,798
Source: DOST Region IV-A
Moving Forward
With the constant challenges brought about by the COVID-19 pandemic, volcanic eruption,
and typhoons in the performance of the S&T sector, the Region needs to continue promoting,
adopting, and utilizing various technologies. The New Normal State presents new opportunities
in technologies especially in maximizing digitization, promoting innovations, and streamlining
various processes using novel technologies. This can be attained through stronger collaboration
between and among DOST agencies, SUCs, other government agencies, and the private sector.
Recommendations
The following are recommended strategies to achieve the subsector outcomes of the STI sector.
Challenges Recommended Strategies Implementing
Agencies
Decrease in number of IP applications and registrations in the region
Increase funding support for IPR applications for SUCs, and government agencies.
Capacitate building for HEIs, RDIs, and industries on patent drafting, familiarity with IP processes and requirements for registration.
Streamline processes for IPR application/registration to reduce turn-around time. Intensify IP awareness, education, and information initiative campaign for MSMEs in the region through basic orientation seminars, one-on-one consultations/IP clinics.
IPOPHL, CHED, DOST (DOST-TAPI
provides funding
assistance for IPR
registration).
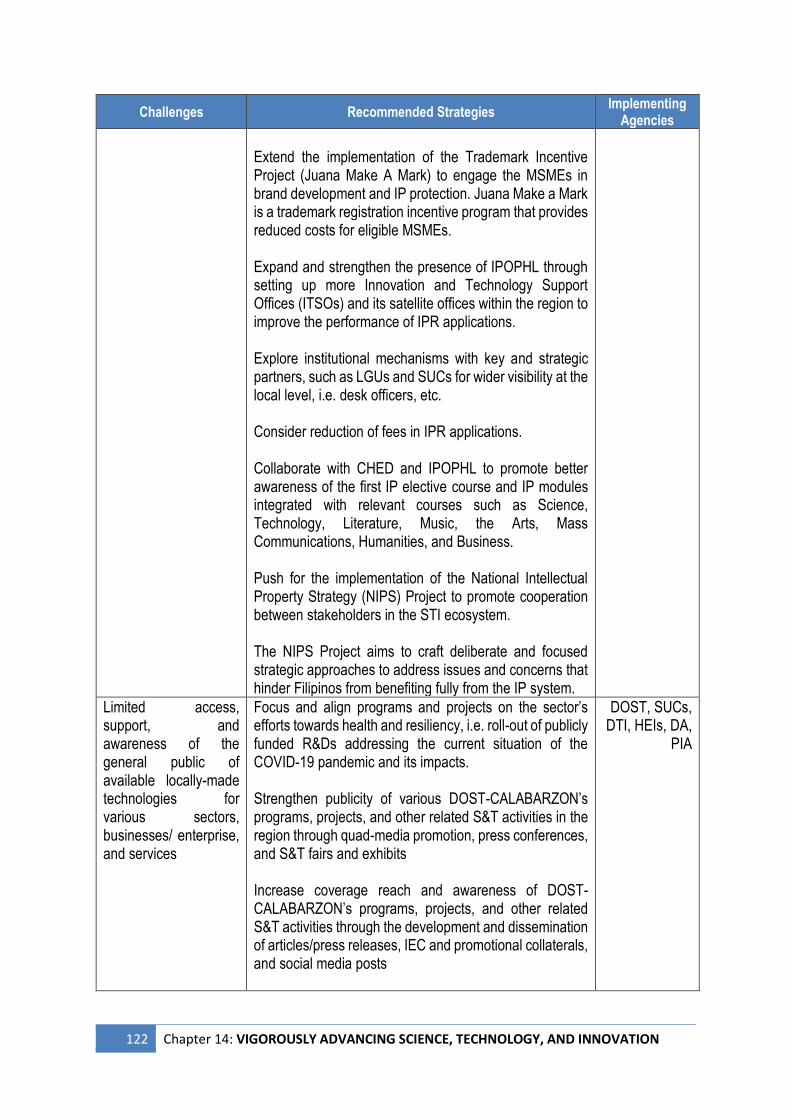
122 Chapter 14: VIGOROUSLY ADVANCING SCIENCE, TECHNOLOGY, AND INNOVATION
Challenges Recommended Strategies Implementing
Agencies
Extend the implementation of the Trademark Incentive Project (Juana Make A Mark) to engage the MSMEs in brand development and IP protection. Juana Make a Mark is a trademark registration incentive program that provides reduced costs for eligible MSMEs.
Expand and strengthen the presence of IPOPHL through setting up more Innovation and Technology Support Offices (ITSOs) and its satellite offices within the region to improve the performance of IPR applications.
Explore institutional mechanisms with key and strategic partners, such as LGUs and SUCs for wider visibility at the local level, i.e. desk officers, etc.
Consider reduction of fees in IPR applications.
Collaborate with CHED and IPOPHL to promote better awareness of the first IP elective course and IP modules integrated with relevant courses such as Science, Technology, Literature, Music, the Arts, Mass Communications, Humanities, and Business.
Push for the implementation of the National Intellectual Property Strategy (NIPS) Project to promote cooperation between stakeholders in the STI ecosystem.
The NIPS Project aims to craft deliberate and focused strategic approaches to address issues and concerns that hinder Filipinos from benefiting fully from the IP system.
Limited access, support, and awareness of the general public of available locally-made technologies for various sectors, businesses/ enterprise, and services
Focus and align programs and projects on the sector’s efforts towards health and resiliency, i.e. roll-out of publicly funded R&Ds addressing the current situation of the COVID-19 pandemic and its impacts.
Strengthen publicity of various DOST-CALABARZON’s programs, projects, and other related S&T activities in the region through quad-media promotion, press conferences, and S&T fairs and exhibits
Increase coverage reach and awareness of DOST-CALABARZON’s programs, projects, and other related S&T activities through the development and dissemination of articles/press releases, IEC and promotional collaterals, and social media posts
DOST, SUCs, DTI, HEIs, DA,
PIA
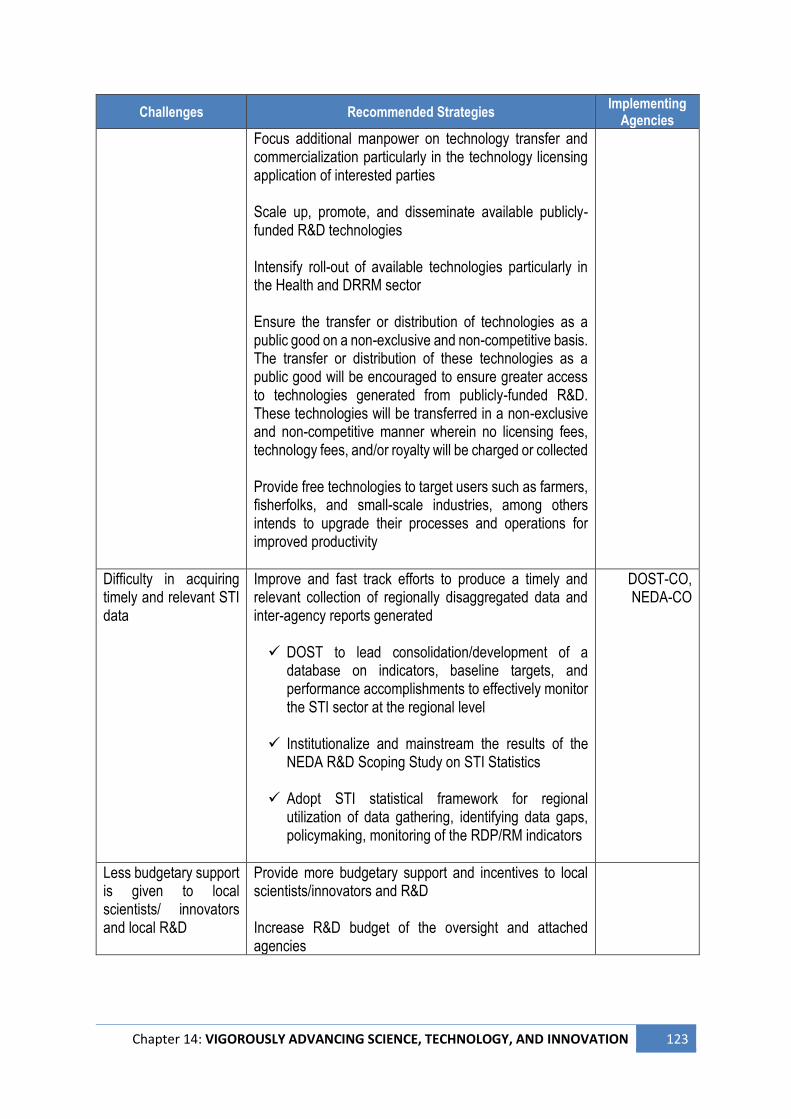
Chapter 14: VIGOROUSLY ADVANCING SCIENCE, TECHNOLOGY, AND INNOVATION 123
Challenges Recommended Strategies Implementing
Agencies
Focus additional manpower on technology transfer and commercialization particularly in the technology licensing application of interested parties
Scale up, promote, and disseminate available publicly-funded R&D technologies
Intensify roll-out of available technologies particularly in the Health and DRRM sector
Ensure the transfer or distribution of technologies as a public good on a non-exclusive and non-competitive basis. The transfer or distribution of these technologies as a public good will be encouraged to ensure greater access to technologies generated from publicly-funded R&D. These technologies will be transferred in a non-exclusive and non-competitive manner wherein no licensing fees, technology fees, and/or royalty will be charged or collected
Provide free technologies to target users such as farmers, fisherfolks, and small-scale industries, among others intends to upgrade their processes and operations for improved productivity
Difficulty in acquiring timely and relevant STI data
Improve and fast track efforts to produce a timely and relevant collection of regionally disaggregated data and inter-agency reports generated ✓ DOST to lead consolidation/development of a
database on indicators, baseline targets, and performance accomplishments to effectively monitor the STI sector at the regional level
✓ Institutionalize and mainstream the results of the NEDA R&D Scoping Study on STI Statistics
✓ Adopt STI statistical framework for regional utilization of data gathering, identifying data gaps, policymaking, monitoring of the RDP/RM indicators
DOST-CO, NEDA-CO
Less budgetary support is given to local scientists/ innovators and local R&D
Provide more budgetary support and incentives to local scientists/innovators and R&D
Increase R&D budget of the oversight and attached agencies
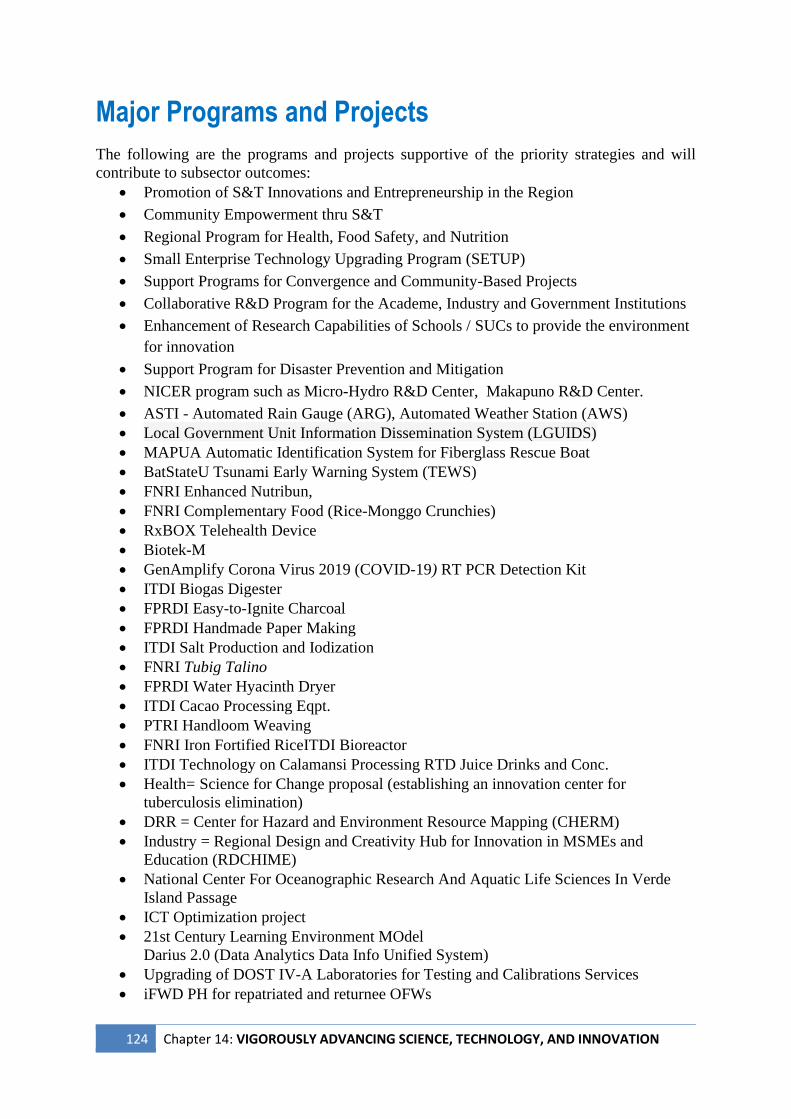
124 Chapter 14: VIGOROUSLY ADVANCING SCIENCE, TECHNOLOGY, AND INNOVATION
Major Programs and Projects
The following are the programs and projects supportive of the priority strategies and will
contribute to subsector outcomes:
• Promotion of S&T Innovations and Entrepreneurship in the Region
• Community Empowerment thru S&T
• Regional Program for Health, Food Safety, and Nutrition
• Small Enterprise Technology Upgrading Program (SETUP)
• Support Programs for Convergence and Community-Based Projects
• Collaborative R&D Program for the Academe, Industry and Government Institutions
• Enhancement of Research Capabilities of Schools / SUCs to provide the environment
for innovation
• Support Program for Disaster Prevention and Mitigation
• NICER program such as Micro-Hydro R&D Center, Makapuno R&D Center.
• ASTI - Automated Rain Gauge (ARG), Automated Weather Station (AWS)
• Local Government Unit Information Dissemination System (LGUIDS)
• MAPUA Automatic Identification System for Fiberglass Rescue Boat
• BatStateU Tsunami Early Warning System (TEWS)
• FNRI Enhanced Nutribun,
• FNRI Complementary Food (Rice-Monggo Crunchies)
• RxBOX Telehealth Device
• Biotek-M
• GenAmplify Corona Virus 2019 (COVID-19) RT PCR Detection Kit
• ITDI Biogas Digester
• FPRDI Easy-to-Ignite Charcoal
• FPRDI Handmade Paper Making
• ITDI Salt Production and Iodization
• FNRI Tubig Talino
• FPRDI Water Hyacinth Dryer
• ITDI Cacao Processing Eqpt.
• PTRI Handloom Weaving
• FNRI Iron Fortified RiceITDI Bioreactor
• ITDI Technology on Calamansi Processing RTD Juice Drinks and Conc.
• Health= Science for Change proposal (establishing an innovation center for
tuberculosis elimination)
• DRR = Center for Hazard and Environment Resource Mapping (CHERM)
• Industry = Regional Design and Creativity Hub for Innovation in MSMEs and
Education (RDCHIME)
• National Center For Oceanographic Research And Aquatic Life Sciences In Verde
Island Passage
• ICT Optimization project
• 21st Century Learning Environment MOdel
Darius 2.0 (Data Analytics Data Info Unified System)
• Upgrading of DOST IV-A Laboratories for Testing and Calibrations Services
• iFWD PH for repatriated and returnee OFWs
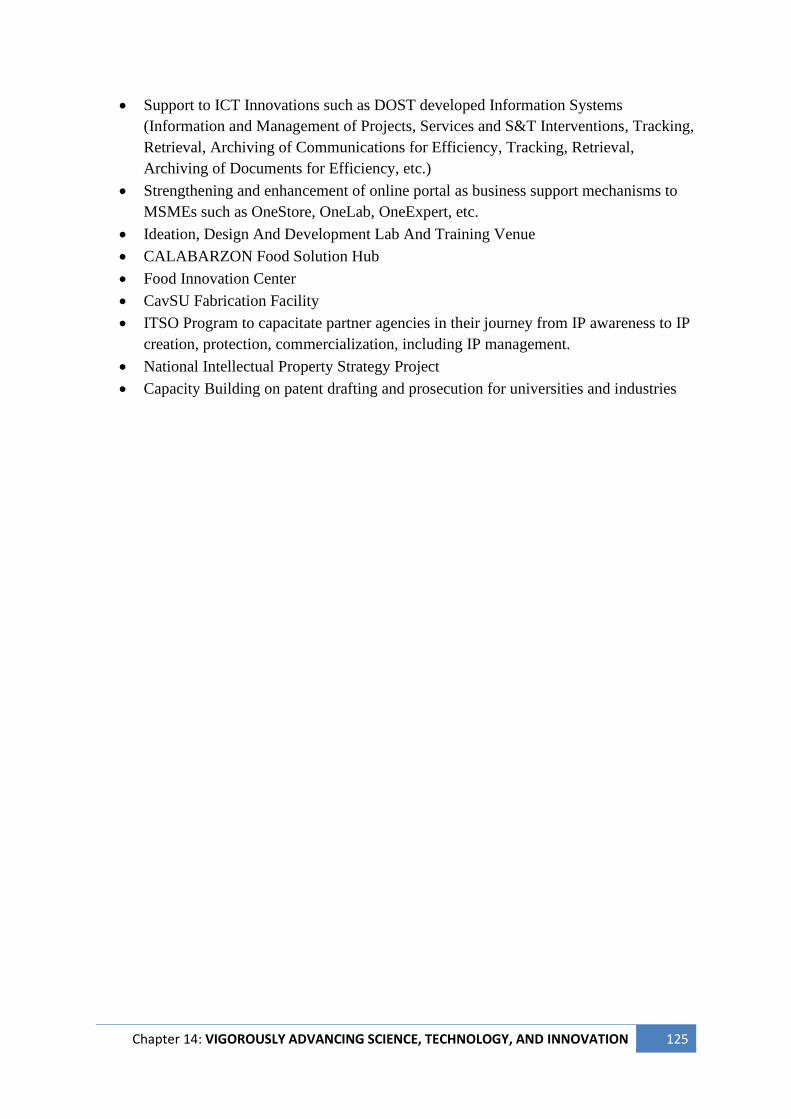
Chapter 14: VIGOROUSLY ADVANCING SCIENCE, TECHNOLOGY, AND INNOVATION 125
• Support to ICT Innovations such as DOST developed Information Systems
(Information and Management of Projects, Services and S&T Interventions, Tracking,
Retrieval, Archiving of Communications for Efficiency, Tracking, Retrieval,
Archiving of Documents for Efficiency, etc.)
• Strengthening and enhancement of online portal as business support mechanisms to
MSMEs such as OneStore, OneLab, OneExpert, etc.
• Ideation, Design And Development Lab And Training Venue
• CALABARZON Food Solution Hub
• Food Innovation Center
• CavSU Fabrication Facility
• ITSO Program to capacitate partner agencies in their journey from IP awareness to IP
creation, protection, commercialization, including IP management.
• National Intellectual Property Strategy Project
• Capacity Building on patent drafting and prosecution for universities and industries

126 Chapter 14: VIGOROUSLY ADVANCING SCIENCE, TECHNOLOGY, AND INNOVATION
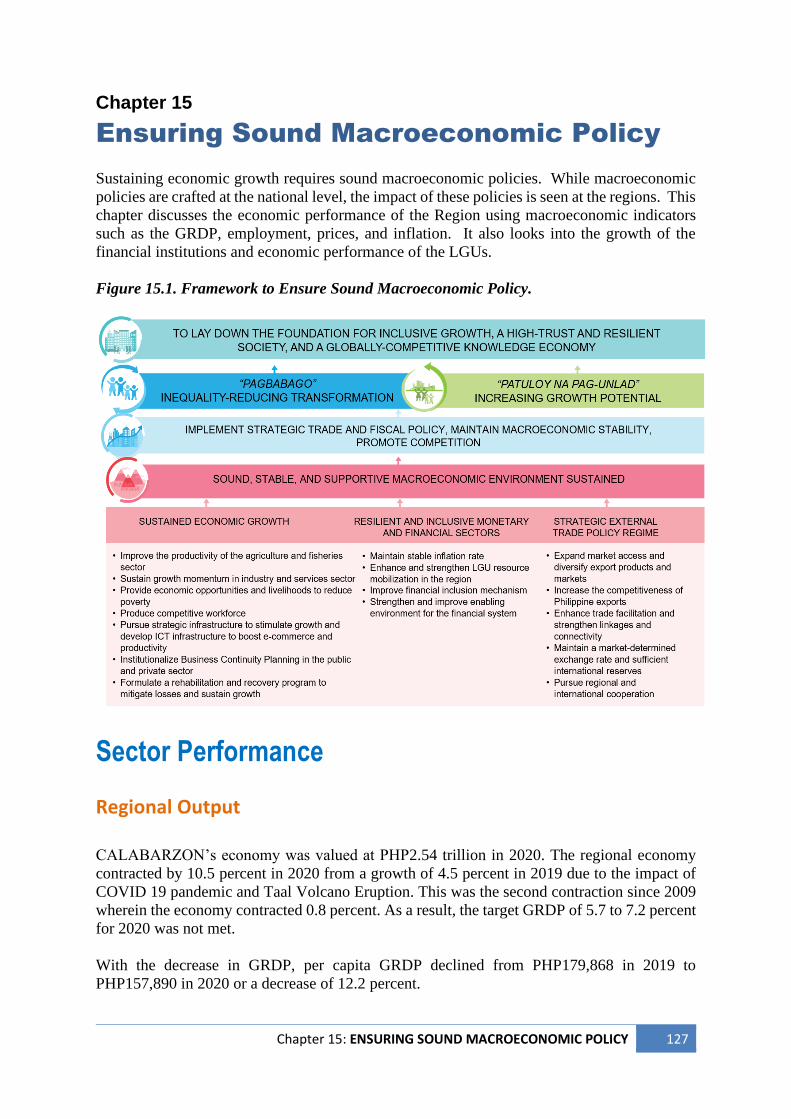
Chapter 15: ENSURING SOUND MACROECONOMIC POLICY 127
Chapter 15
Ensuring Sound Macroeconomic Policy
Sustaining economic growth requires sound macroeconomic policies. While macroeconomic
policies are crafted at the national level, the impact of these policies is seen at the regions. This
chapter discusses the economic performance of the Region using macroeconomic indicators
such as the GRDP, employment, prices, and inflation. It also looks into the growth of the
financial institutions and economic performance of the LGUs.
Figure 15.1. Framework to Ensure Sound Macroeconomic Policy.
Sector Performance Regional Output CALABARZON’s economy was valued at PHP2.54 trillion in 2020. The regional economy
contracted by 10.5 percent in 2020 from a growth of 4.5 percent in 2019 due to the impact of
COVID 19 pandemic and Taal Volcano Eruption. This was the second contraction since 2009
wherein the economy contracted 0.8 percent. As a result, the target GRDP of 5.7 to 7.2 percent
for 2020 was not met.
With the decrease in GRDP, per capita GRDP declined from PHP179,868 in 2019 to
PHP157,890 in 2020 or a decrease of 12.2 percent.
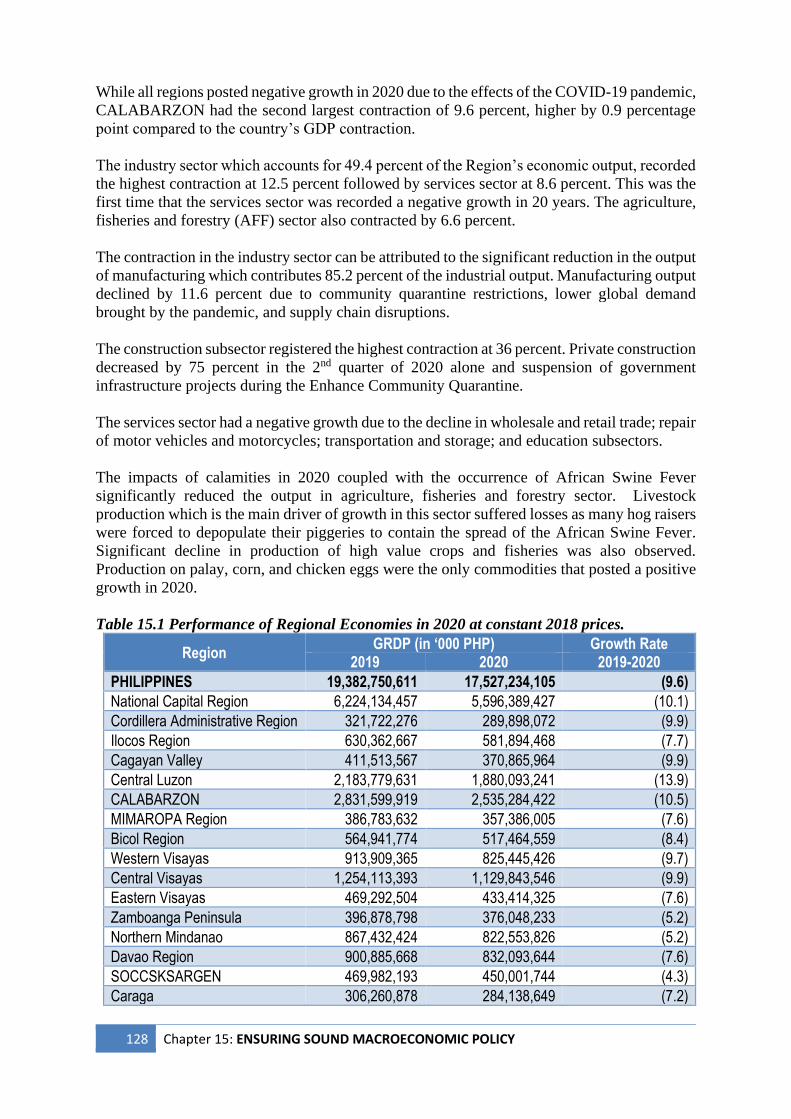
128 Chapter 15: ENSURING SOUND MACROECONOMIC POLICY
While all regions posted negative growth in 2020 due to the effects of the COVID-19 pandemic,
CALABARZON had the second largest contraction of 9.6 percent, higher by 0.9 percentage
point compared to the country’s GDP contraction.
The industry sector which accounts for 49.4 percent of the Region’s economic output, recorded
the highest contraction at 12.5 percent followed by services sector at 8.6 percent. This was the
first time that the services sector was recorded a negative growth in 20 years. The agriculture,
fisheries and forestry (AFF) sector also contracted by 6.6 percent.
The contraction in the industry sector can be attributed to the significant reduction in the output
of manufacturing which contributes 85.2 percent of the industrial output. Manufacturing output
declined by 11.6 percent due to community quarantine restrictions, lower global demand
brought by the pandemic, and supply chain disruptions.
The construction subsector registered the highest contraction at 36 percent. Private construction
decreased by 75 percent in the 2nd quarter of 2020 alone and suspension of government
infrastructure projects during the Enhance Community Quarantine.
The services sector had a negative growth due to the decline in wholesale and retail trade; repair
of motor vehicles and motorcycles; transportation and storage; and education subsectors.
The impacts of calamities in 2020 coupled with the occurrence of African Swine Fever
significantly reduced the output in agriculture, fisheries and forestry sector. Livestock
production which is the main driver of growth in this sector suffered losses as many hog raisers
were forced to depopulate their piggeries to contain the spread of the African Swine Fever.
Significant decline in production of high value crops and fisheries was also observed.
Production on palay, corn, and chicken eggs were the only commodities that posted a positive
growth in 2020.
Table 15.1 Performance of Regional Economies in 2020 at constant 2018 prices.
Region GRDP (in ‘000 PHP) Growth Rate
2019 2020 2019-2020
PHILIPPINES 19,382,750,611 17,527,234,105 (9.6)
National Capital Region 6,224,134,457 5,596,389,427 (10.1)
Cordillera Administrative Region 321,722,276 289,898,072 (9.9)
Ilocos Region 630,362,667 581,894,468 (7.7)
Cagayan Valley 411,513,567 370,865,964 (9.9)
Central Luzon 2,183,779,631 1,880,093,241 (13.9)
CALABARZON 2,831,599,919 2,535,284,422 (10.5)
MIMAROPA Region 386,783,632 357,386,005 (7.6)
Bicol Region 564,941,774 517,464,559 (8.4)
Western Visayas 913,909,365 825,445,426 (9.7)
Central Visayas 1,254,113,393 1,129,843,546 (9.9)
Eastern Visayas 469,292,504 433,414,325 (7.6)
Zamboanga Peninsula 396,878,798 376,048,233 (5.2)
Northern Mindanao 867,432,424 822,553,826 (5.2)
Davao Region 900,885,668 832,093,644 (7.6)
SOCCSKSARGEN 469,982,193 450,001,744 (4.3)
Caraga 306,260,878 284,138,649 (7.2)
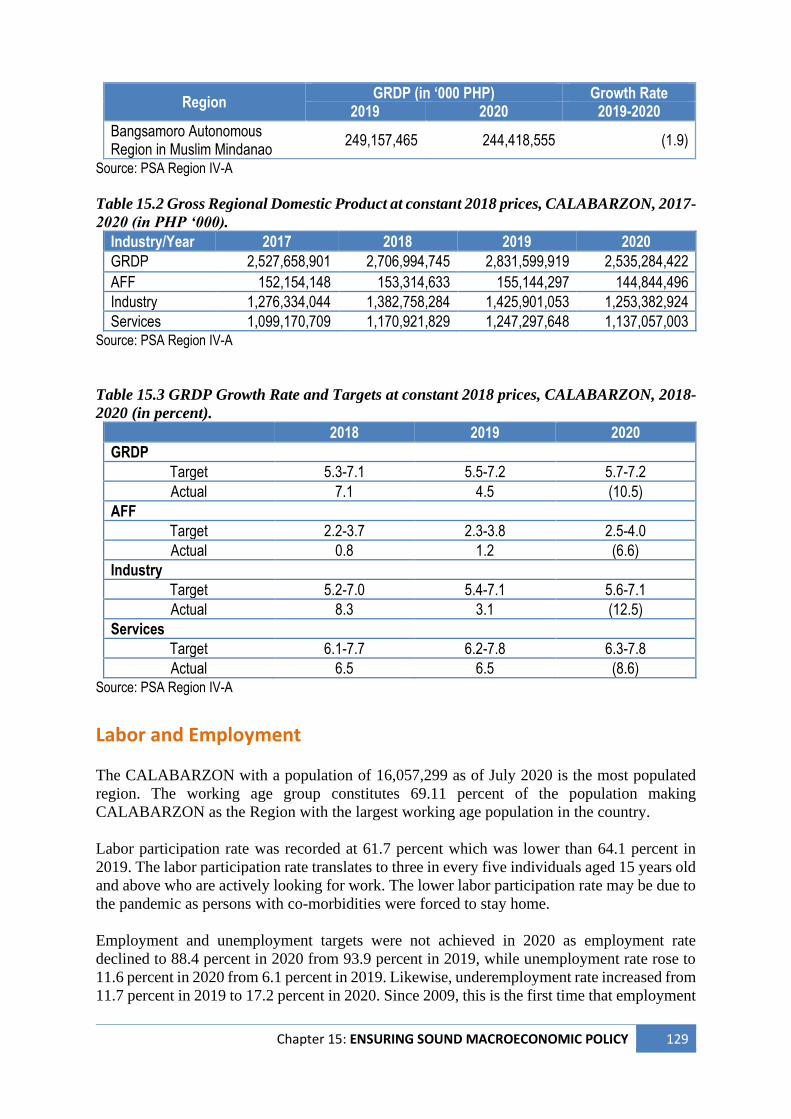
Chapter 15: ENSURING SOUND MACROECONOMIC POLICY 129
Region GRDP (in ‘000 PHP) Growth Rate
2019 2020 2019-2020
Bangsamoro Autonomous Region in Muslim Mindanao
249,157,465 244,418,555 (1.9)
Source: PSA Region IV-A
Table 15.2 Gross Regional Domestic Product at constant 2018 prices, CALABARZON, 2017-
2020 (in PHP ‘000).
Industry/Year 2017 2018 2019 2020
GRDP 2,527,658,901 2,706,994,745 2,831,599,919 2,535,284,422
AFF 152,154,148 153,314,633 155,144,297 144,844,496
Industry 1,276,334,044 1,382,758,284 1,425,901,053 1,253,382,924
Services 1,099,170,709 1,170,921,829 1,247,297,648 1,137,057,003 Source: PSA Region IV-A
Table 15.3 GRDP Growth Rate and Targets at constant 2018 prices, CALABARZON, 2018-
2020 (in percent).
2018 2019 2020
GRDP
Target 5.3-7.1 5.5-7.2 5.7-7.2
Actual 7.1 4.5 (10.5)
AFF
Target 2.2-3.7 2.3-3.8 2.5-4.0
Actual 0.8 1.2 (6.6)
Industry
Target 5.2-7.0 5.4-7.1 5.6-7.1
Actual 8.3 3.1 (12.5)
Services
Target 6.1-7.7 6.2-7.8 6.3-7.8
Actual 6.5 6.5 (8.6) Source: PSA Region IV-A
Labor and Employment
The CALABARZON with a population of 16,057,299 as of July 2020 is the most populated
region. The working age group constitutes 69.11 percent of the population making
CALABARZON as the Region with the largest working age population in the country.
Labor participation rate was recorded at 61.7 percent which was lower than 64.1 percent in
2019. The labor participation rate translates to three in every five individuals aged 15 years old
and above who are actively looking for work. The lower labor participation rate may be due to
the pandemic as persons with co-morbidities were forced to stay home.
Employment and unemployment targets were not achieved in 2020 as employment rate
declined to 88.4 percent in 2020 from 93.9 percent in 2019, while unemployment rate rose to
11.6 percent in 2020 from 6.1 percent in 2019. Likewise, underemployment rate increased from
11.7 percent in 2019 to 17.2 percent in 2020. Since 2009, this is the first time that employment
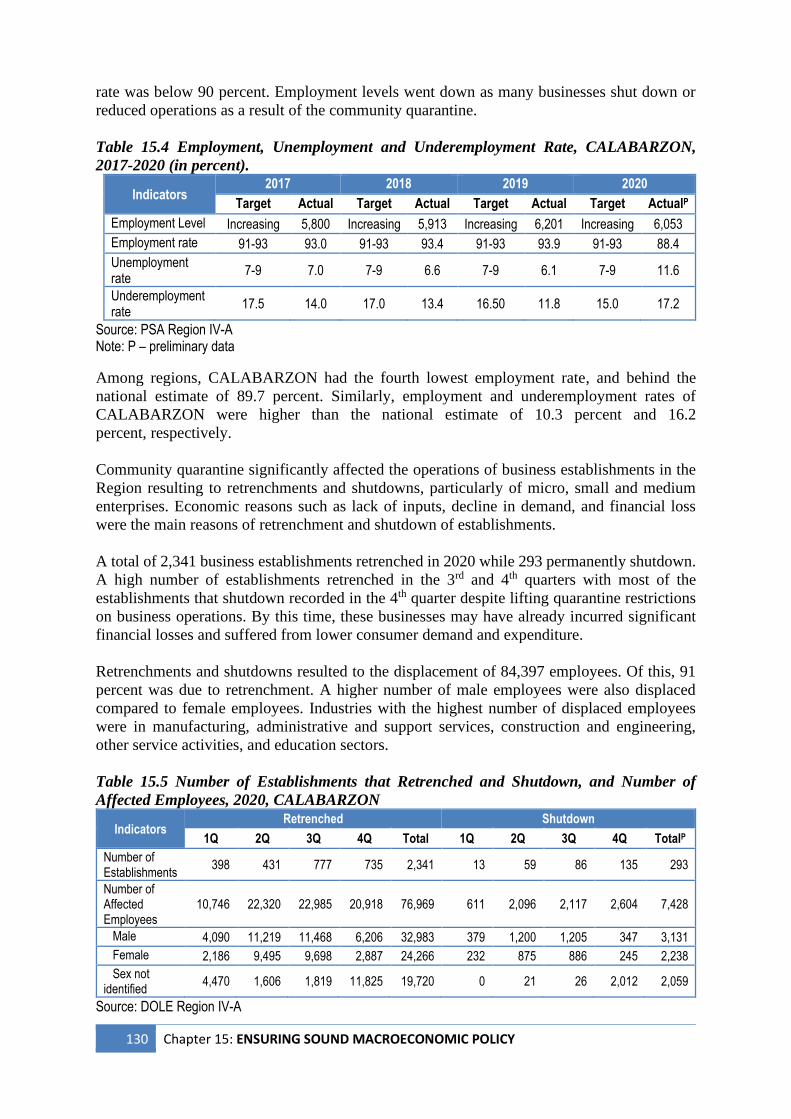
130 Chapter 15: ENSURING SOUND MACROECONOMIC POLICY
rate was below 90 percent. Employment levels went down as many businesses shut down or
reduced operations as a result of the community quarantine.
Table 15.4 Employment, Unemployment and Underemployment Rate, CALABARZON,
2017-2020 (in percent).
Indicators 2017 2018 2019 2020
Target Actual Target Actual Target Actual Target ActualP
Employment Level Increasing 5,800 Increasing 5,913 Increasing 6,201 Increasing 6,053
Employment rate 91-93 93.0 91-93 93.4 91-93 93.9 91-93 88.4
Unemployment rate
7-9 7.0 7-9 6.6 7-9 6.1 7-9 11.6
Underemployment rate
17.5 14.0 17.0 13.4 16.50 11.8 15.0 17.2
Source: PSA Region IV-A Note: P – preliminary data
Among regions, CALABARZON had the fourth lowest employment rate, and behind the
national estimate of 89.7 percent. Similarly, employment and underemployment rates of
CALABARZON were higher than the national estimate of 10.3 percent and 16.2
percent, respectively.
Community quarantine significantly affected the operations of business establishments in the
Region resulting to retrenchments and shutdowns, particularly of micro, small and medium
enterprises. Economic reasons such as lack of inputs, decline in demand, and financial loss
were the main reasons of retrenchment and shutdown of establishments.
A total of 2,341 business establishments retrenched in 2020 while 293 permanently shutdown.
A high number of establishments retrenched in the 3rd and 4th quarters with most of the
establishments that shutdown recorded in the 4th quarter despite lifting quarantine restrictions
on business operations. By this time, these businesses may have already incurred significant
financial losses and suffered from lower consumer demand and expenditure.
Retrenchments and shutdowns resulted to the displacement of 84,397 employees. Of this, 91
percent was due to retrenchment. A higher number of male employees were also displaced
compared to female employees. Industries with the highest number of displaced employees
were in manufacturing, administrative and support services, construction and engineering,
other service activities, and education sectors.
Table 15.5 Number of Establishments that Retrenched and Shutdown, and Number of
Affected Employees, 2020, CALABARZON
Indicators Retrenched Shutdown
1Q 2Q 3Q 4Q Total 1Q 2Q 3Q 4Q TotalP
Number of Establishments
398 431 777 735 2,341 13 59 86 135 293
Number of Affected Employees
10,746 22,320 22,985 20,918 76,969 611 2,096 2,117 2,604 7,428
Male 4,090 11,219 11,468 6,206 32,983 379 1,200 1,205 347 3,131
Female 2,186 9,495 9,698 2,887 24,266 232 875 886 245 2,238
Sex not identified
4,470 1,606 1,819 11,825 19,720 0 21 26 2,012 2,059
Source: DOLE Region IV-A
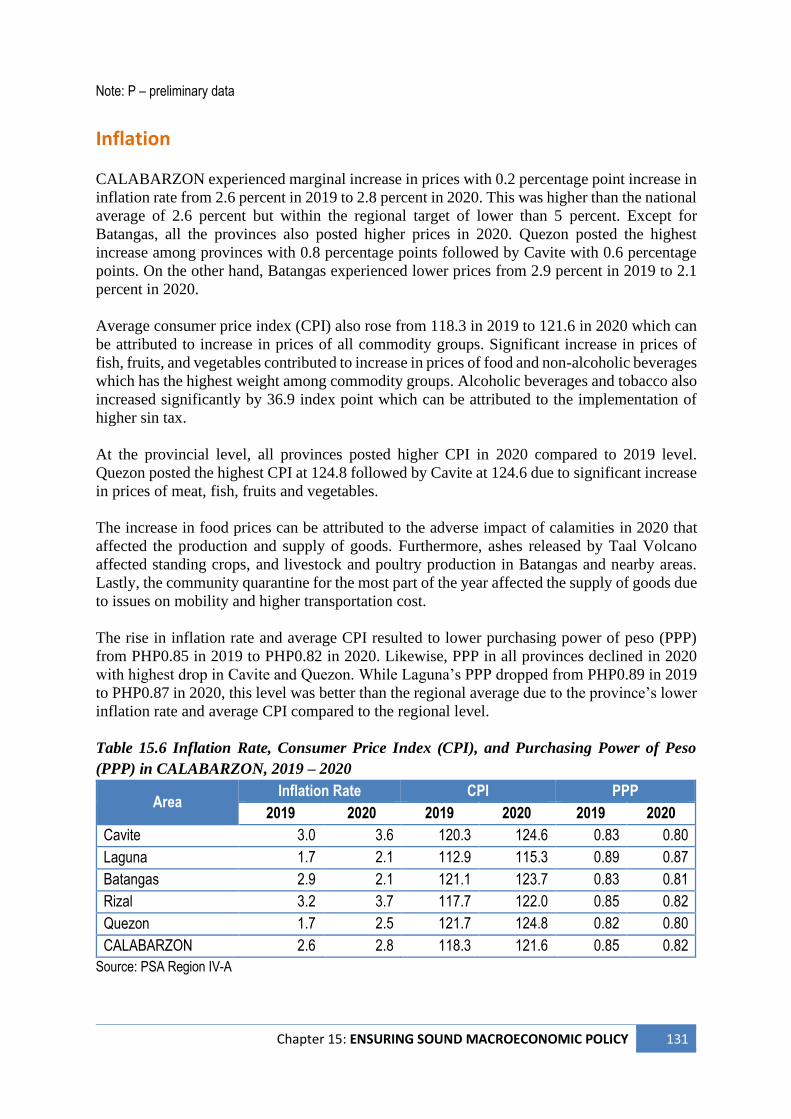
Chapter 15: ENSURING SOUND MACROECONOMIC POLICY 131
Note: P – preliminary data
Inflation
CALABARZON experienced marginal increase in prices with 0.2 percentage point increase in
inflation rate from 2.6 percent in 2019 to 2.8 percent in 2020. This was higher than the national
average of 2.6 percent but within the regional target of lower than 5 percent. Except for
Batangas, all the provinces also posted higher prices in 2020. Quezon posted the highest
increase among provinces with 0.8 percentage points followed by Cavite with 0.6 percentage
points. On the other hand, Batangas experienced lower prices from 2.9 percent in 2019 to 2.1
percent in 2020.
Average consumer price index (CPI) also rose from 118.3 in 2019 to 121.6 in 2020 which can
be attributed to increase in prices of all commodity groups. Significant increase in prices of
fish, fruits, and vegetables contributed to increase in prices of food and non-alcoholic beverages
which has the highest weight among commodity groups. Alcoholic beverages and tobacco also
increased significantly by 36.9 index point which can be attributed to the implementation of
higher sin tax.
At the provincial level, all provinces posted higher CPI in 2020 compared to 2019 level.
Quezon posted the highest CPI at 124.8 followed by Cavite at 124.6 due to significant increase
in prices of meat, fish, fruits and vegetables.
The increase in food prices can be attributed to the adverse impact of calamities in 2020 that
affected the production and supply of goods. Furthermore, ashes released by Taal Volcano
affected standing crops, and livestock and poultry production in Batangas and nearby areas.
Lastly, the community quarantine for the most part of the year affected the supply of goods due
to issues on mobility and higher transportation cost.
The rise in inflation rate and average CPI resulted to lower purchasing power of peso (PPP)
from PHP0.85 in 2019 to PHP0.82 in 2020. Likewise, PPP in all provinces declined in 2020
with highest drop in Cavite and Quezon. While Laguna’s PPP dropped from PHP0.89 in 2019
to PHP0.87 in 2020, this level was better than the regional average due to the province’s lower
inflation rate and average CPI compared to the regional level.
Table 15.6 Inflation Rate, Consumer Price Index (CPI), and Purchasing Power of Peso
(PPP) in CALABARZON, 2019 – 2020
Area Inflation Rate CPI PPP
2019 2020 2019 2020 2019 2020
Cavite 3.0 3.6 120.3 124.6 0.83 0.80
Laguna 1.7 2.1 112.9 115.3 0.89 0.87
Batangas 2.9 2.1 121.1 123.7 0.83 0.81
Rizal 3.2 3.7 117.7 122.0 0.85 0.82
Quezon 1.7 2.5 121.7 124.8 0.82 0.80
CALABARZON 2.6 2.8 118.3 121.6 0.85 0.82
Source: PSA Region IV-A
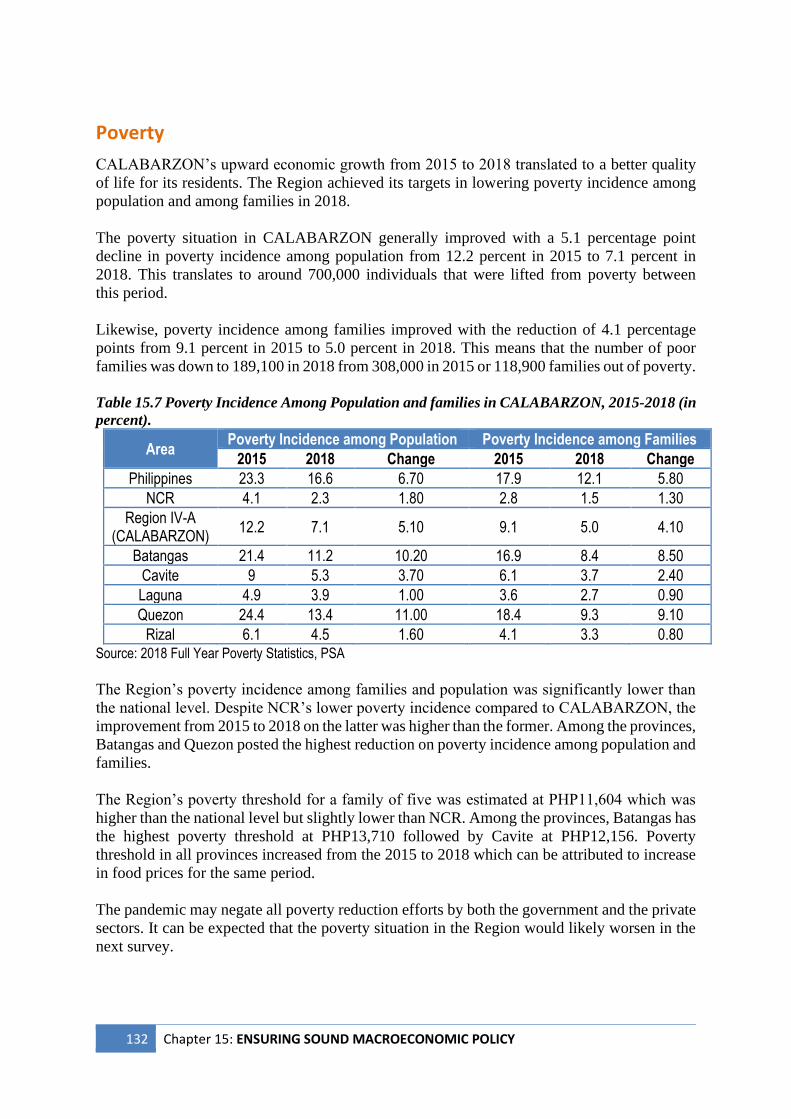
132 Chapter 15: ENSURING SOUND MACROECONOMIC POLICY
Poverty
CALABARZON’s upward economic growth from 2015 to 2018 translated to a better quality
of life for its residents. The Region achieved its targets in lowering poverty incidence among
population and among families in 2018.
The poverty situation in CALABARZON generally improved with a 5.1 percentage point
decline in poverty incidence among population from 12.2 percent in 2015 to 7.1 percent in
2018. This translates to around 700,000 individuals that were lifted from poverty between
this period.
Likewise, poverty incidence among families improved with the reduction of 4.1 percentage
points from 9.1 percent in 2015 to 5.0 percent in 2018. This means that the number of poor
families was down to 189,100 in 2018 from 308,000 in 2015 or 118,900 families out of poverty.
Table 15.7 Poverty Incidence Among Population and families in CALABARZON, 2015-2018 (in
percent).
Area Poverty Incidence among Population Poverty Incidence among Families
2015 2018 Change 2015 2018 Change
Philippines 23.3 16.6 6.70 17.9 12.1 5.80
NCR 4.1 2.3 1.80 2.8 1.5 1.30
Region IV-A (CALABARZON)
12.2 7.1 5.10 9.1 5.0 4.10
Batangas 21.4 11.2 10.20 16.9 8.4 8.50
Cavite 9 5.3 3.70 6.1 3.7 2.40
Laguna 4.9 3.9 1.00 3.6 2.7 0.90
Quezon 24.4 13.4 11.00 18.4 9.3 9.10
Rizal 6.1 4.5 1.60 4.1 3.3 0.80 Source: 2018 Full Year Poverty Statistics, PSA
The Region’s poverty incidence among families and population was significantly lower than
the national level. Despite NCR’s lower poverty incidence compared to CALABARZON, the
improvement from 2015 to 2018 on the latter was higher than the former. Among the provinces,
Batangas and Quezon posted the highest reduction on poverty incidence among population and
families.
The Region’s poverty threshold for a family of five was estimated at PHP11,604 which was
higher than the national level but slightly lower than NCR. Among the provinces, Batangas has
the highest poverty threshold at PHP13,710 followed by Cavite at PHP12,156. Poverty
threshold in all provinces increased from the 2015 to 2018 which can be attributed to increase
in food prices for the same period.
The pandemic may negate all poverty reduction efforts by both the government and the private
sectors. It can be expected that the poverty situation in the Region would likely worsen in the
next survey.
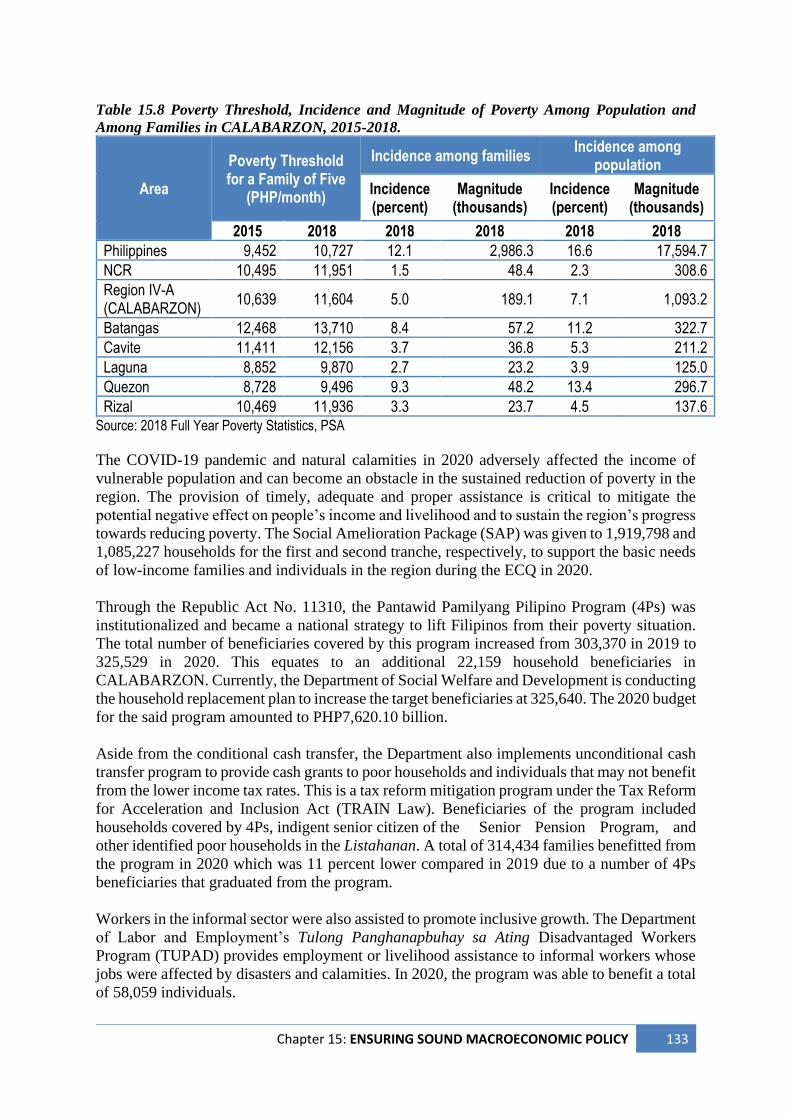
Chapter 15: ENSURING SOUND MACROECONOMIC POLICY 133
Table 15.8 Poverty Threshold, Incidence and Magnitude of Poverty Among Population and
Among Families in CALABARZON, 2015-2018.
Area
Poverty Threshold for a Family of Five
(PHP/month)
Incidence among families Incidence among
population
Incidence (percent)
Magnitude (thousands)
Incidence (percent)
Magnitude (thousands)
2015 2018 2018 2018 2018 2018
Philippines 9,452 10,727 12.1 2,986.3 16.6 17,594.7
NCR 10,495 11,951 1.5 48.4 2.3 308.6
Region IV-A (CALABARZON)
10,639 11,604 5.0 189.1 7.1 1,093.2
Batangas 12,468 13,710 8.4 57.2 11.2 322.7
Cavite 11,411 12,156 3.7 36.8 5.3 211.2
Laguna 8,852 9,870 2.7 23.2 3.9 125.0
Quezon 8,728 9,496 9.3 48.2 13.4 296.7
Rizal 10,469 11,936 3.3 23.7 4.5 137.6 Source: 2018 Full Year Poverty Statistics, PSA
The COVID-19 pandemic and natural calamities in 2020 adversely affected the income of
vulnerable population and can become an obstacle in the sustained reduction of poverty in the
region. The provision of timely, adequate and proper assistance is critical to mitigate the
potential negative effect on people’s income and livelihood and to sustain the region’s progress
towards reducing poverty. The Social Amelioration Package (SAP) was given to 1,919,798 and
1,085,227 households for the first and second tranche, respectively, to support the basic needs
of low-income families and individuals in the region during the ECQ in 2020.
Through the Republic Act No. 11310, the Pantawid Pamilyang Pilipino Program (4Ps) was
institutionalized and became a national strategy to lift Filipinos from their poverty situation.
The total number of beneficiaries covered by this program increased from 303,370 in 2019 to
325,529 in 2020. This equates to an additional 22,159 household beneficiaries in
CALABARZON. Currently, the Department of Social Welfare and Development is conducting
the household replacement plan to increase the target beneficiaries at 325,640. The 2020 budget
for the said program amounted to PHP7,620.10 billion.
Aside from the conditional cash transfer, the Department also implements unconditional cash
transfer program to provide cash grants to poor households and individuals that may not benefit
from the lower income tax rates. This is a tax reform mitigation program under the Tax Reform
for Acceleration and Inclusion Act (TRAIN Law). Beneficiaries of the program included
households covered by 4Ps, indigent senior citizen of the Senior Pension Program, and
other identified poor households in the Listahanan. A total of 314,434 families benefitted from
the program in 2020 which was 11 percent lower compared in 2019 due to a number of 4Ps
beneficiaries that graduated from the program.
Workers in the informal sector were also assisted to promote inclusive growth. The Department
of Labor and Employment’s Tulong Panghanapbuhay sa Ating Disadvantaged Workers
Program (TUPAD) provides employment or livelihood assistance to informal workers whose
jobs were affected by disasters and calamities. In 2020, the program was able to benefit a total
of 58,059 individuals.
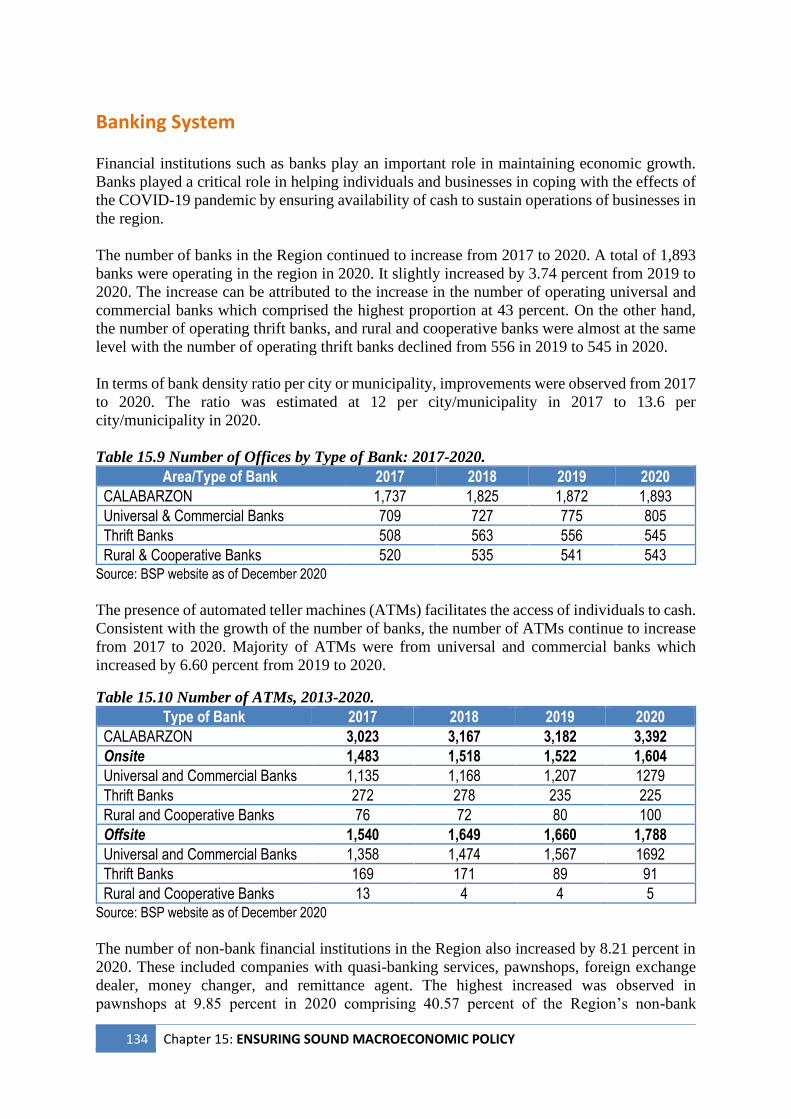
134 Chapter 15: ENSURING SOUND MACROECONOMIC POLICY
Banking System Financial institutions such as banks play an important role in maintaining economic growth.
Banks played a critical role in helping individuals and businesses in coping with the effects of
the COVID-19 pandemic by ensuring availability of cash to sustain operations of businesses in
the region.
The number of banks in the Region continued to increase from 2017 to 2020. A total of 1,893
banks were operating in the region in 2020. It slightly increased by 3.74 percent from 2019 to
2020. The increase can be attributed to the increase in the number of operating universal and
commercial banks which comprised the highest proportion at 43 percent. On the other hand,
the number of operating thrift banks, and rural and cooperative banks were almost at the same
level with the number of operating thrift banks declined from 556 in 2019 to 545 in 2020.
In terms of bank density ratio per city or municipality, improvements were observed from 2017
to 2020. The ratio was estimated at 12 per city/municipality in 2017 to 13.6 per
city/municipality in 2020.
Table 15.9 Number of Offices by Type of Bank: 2017-2020.
Area/Type of Bank 2017 2018 2019 2020
CALABARZON 1,737 1,825 1,872 1,893
Universal & Commercial Banks 709 727 775 805
Thrift Banks 508 563 556 545
Rural & Cooperative Banks 520 535 541 543 Source: BSP website as of December 2020
The presence of automated teller machines (ATMs) facilitates the access of individuals to cash.
Consistent with the growth of the number of banks, the number of ATMs continue to increase
from 2017 to 2020. Majority of ATMs were from universal and commercial banks which
increased by 6.60 percent from 2019 to 2020.
Table 15.10 Number of ATMs, 2013-2020.
Type of Bank 2017 2018 2019 2020
CALABARZON 3,023 3,167 3,182 3,392
Onsite 1,483 1,518 1,522 1,604
Universal and Commercial Banks 1,135 1,168 1,207 1279
Thrift Banks 272 278 235 225
Rural and Cooperative Banks 76 72 80 100
Offsite 1,540 1,649 1,660 1,788
Universal and Commercial Banks 1,358 1,474 1,567 1692
Thrift Banks 169 171 89 91
Rural and Cooperative Banks 13 4 4 5 Source: BSP website as of December 2020
The number of non-bank financial institutions in the Region also increased by 8.21 percent in
2020. These included companies with quasi-banking services, pawnshops, foreign exchange
dealer, money changer, and remittance agent. The highest increased was observed in
pawnshops at 9.85 percent in 2020 comprising 40.57 percent of the Region’s non-bank
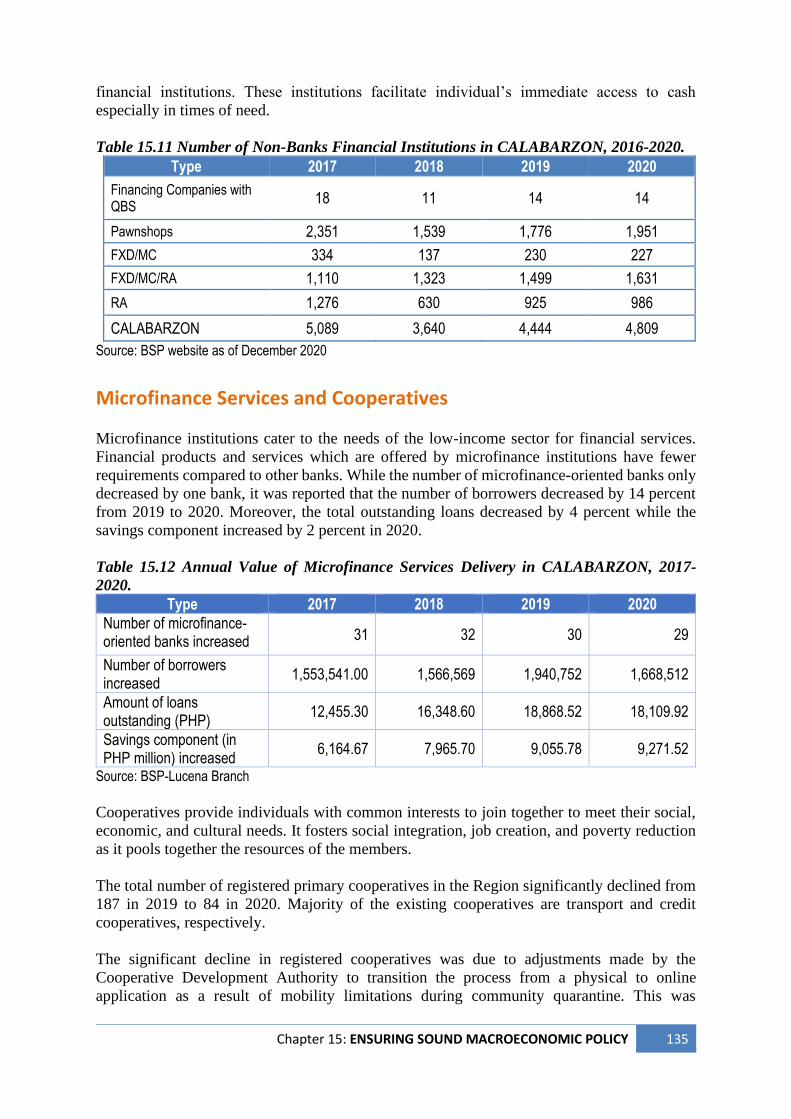
Chapter 15: ENSURING SOUND MACROECONOMIC POLICY 135
financial institutions. These institutions facilitate individual’s immediate access to cash
especially in times of need.
Table 15.11 Number of Non-Banks Financial Institutions in CALABARZON, 2016-2020.
Type 2017 2018 2019 2020
Financing Companies with QBS
18 11 14 14
Pawnshops 2,351 1,539 1,776 1,951
FXD/MC 334 137 230 227
FXD/MC/RA 1,110 1,323 1,499 1,631
RA 1,276 630 925 986
CALABARZON 5,089 3,640 4,444 4,809
Source: BSP website as of December 2020
Microfinance Services and Cooperatives
Microfinance institutions cater to the needs of the low-income sector for financial services.
Financial products and services which are offered by microfinance institutions have fewer
requirements compared to other banks. While the number of microfinance-oriented banks only
decreased by one bank, it was reported that the number of borrowers decreased by 14 percent
from 2019 to 2020. Moreover, the total outstanding loans decreased by 4 percent while the
savings component increased by 2 percent in 2020.
Table 15.12 Annual Value of Microfinance Services Delivery in CALABARZON, 2017-
2020.
Type 2017 2018 2019 2020
Number of microfinance-oriented banks increased 31 32 30 29
Number of borrowers increased
1,553,541.00 1,566,569 1,940,752 1,668,512
Amount of loans outstanding (PHP)
12,455.30 16,348.60 18,868.52 18,109.92
Savings component (in PHP million) increased
6,164.67 7,965.70 9,055.78 9,271.52
Source: BSP-Lucena Branch
Cooperatives provide individuals with common interests to join together to meet their social,
economic, and cultural needs. It fosters social integration, job creation, and poverty reduction
as it pools together the resources of the members.
The total number of registered primary cooperatives in the Region significantly declined from
187 in 2019 to 84 in 2020. Majority of the existing cooperatives are transport and credit
cooperatives, respectively.
The significant decline in registered cooperatives was due to adjustments made by the
Cooperative Development Authority to transition the process from a physical to online
application as a result of mobility limitations during community quarantine. This was
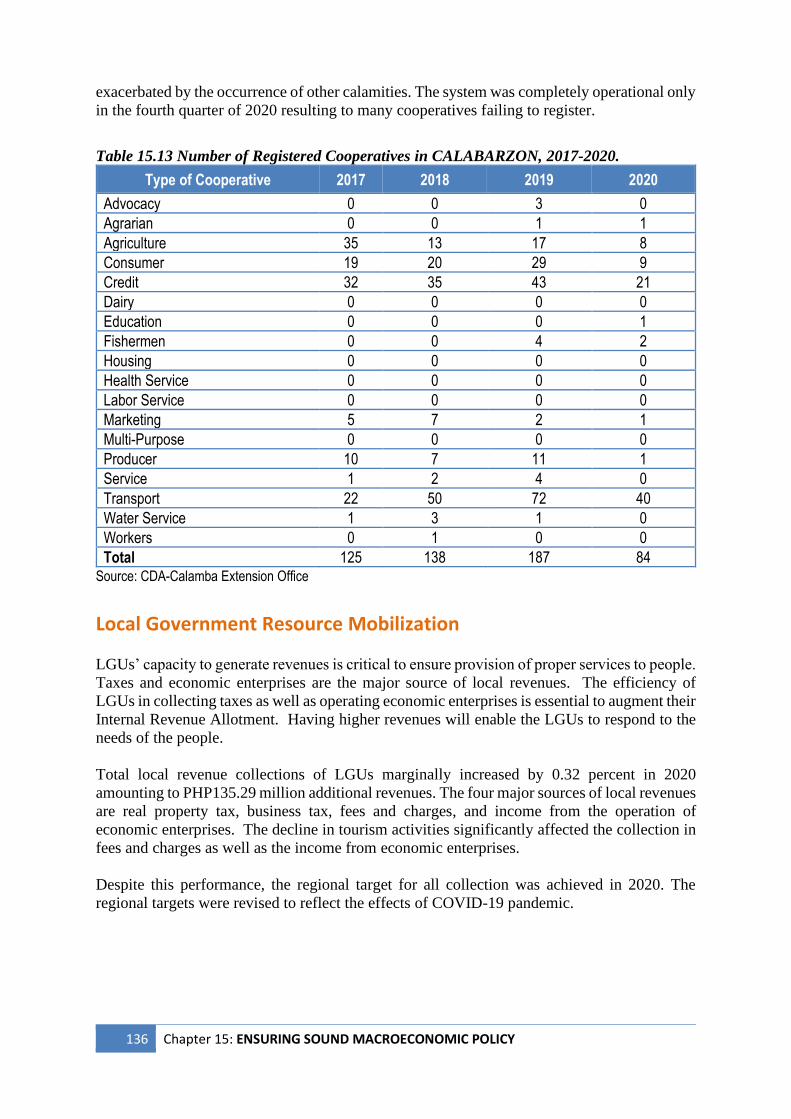
136 Chapter 15: ENSURING SOUND MACROECONOMIC POLICY
exacerbated by the occurrence of other calamities. The system was completely operational only
in the fourth quarter of 2020 resulting to many cooperatives failing to register.
Table 15.13 Number of Registered Cooperatives in CALABARZON, 2017-2020.
Type of Cooperative 2017 2018 2019 2020
Advocacy 0 0 3 0
Agrarian 0 0 1 1
Agriculture 35 13 17 8
Consumer 19 20 29 9
Credit 32 35 43 21
Dairy 0 0 0 0
Education 0 0 0 1
Fishermen 0 0 4 2
Housing 0 0 0 0
Health Service 0 0 0 0
Labor Service 0 0 0 0
Marketing 5 7 2 1
Multi-Purpose 0 0 0 0
Producer 10 7 11 1
Service 1 2 4 0
Transport 22 50 72 40
Water Service 1 3 1 0
Workers 0 1 0 0
Total 125 138 187 84 Source: CDA-Calamba Extension Office
Local Government Resource Mobilization
LGUs’ capacity to generate revenues is critical to ensure provision of proper services to people.
Taxes and economic enterprises are the major source of local revenues. The efficiency of
LGUs in collecting taxes as well as operating economic enterprises is essential to augment their
Internal Revenue Allotment. Having higher revenues will enable the LGUs to respond to the
needs of the people.
Total local revenue collections of LGUs marginally increased by 0.32 percent in 2020
amounting to PHP135.29 million additional revenues. The four major sources of local revenues
are real property tax, business tax, fees and charges, and income from the operation of
economic enterprises. The decline in tourism activities significantly affected the collection in
fees and charges as well as the income from economic enterprises.
Despite this performance, the regional target for all collection was achieved in 2020. The
regional targets were revised to reflect the effects of COVID-19 pandemic.
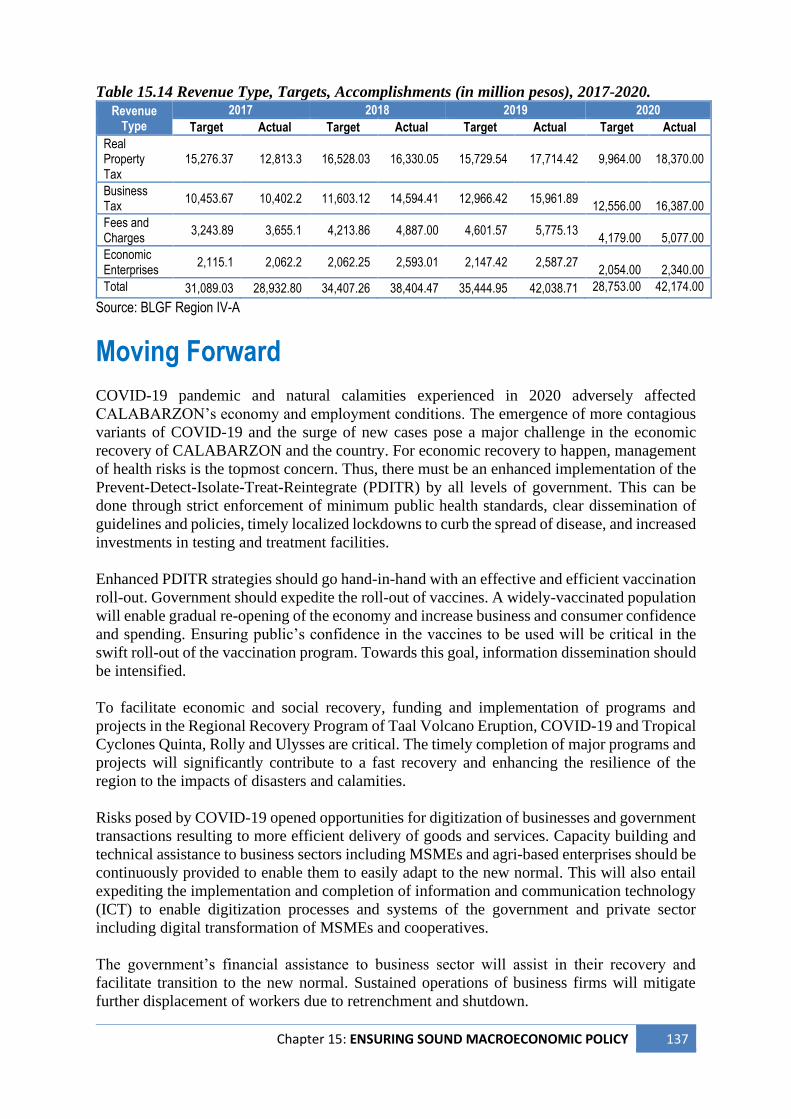
Chapter 15: ENSURING SOUND MACROECONOMIC POLICY 137
Table 15.14 Revenue Type, Targets, Accomplishments (in million pesos), 2017-2020.
Revenue Type
2017 2018 2019 2020
Target Actual Target Actual Target Actual Target Actual
Real Property Tax
15,276.37 12,813.3 16,528.03 16,330.05 15,729.54 17,714.42
9,964.00
18,370.00
Business Tax
10,453.67 10,402.2 11,603.12 14,594.41 12,966.42 15,961.89
12,556.00
16,387.00
Fees and Charges
3,243.89 3,655.1 4,213.86 4,887.00 4,601.57 5,775.13
4,179.00
5,077.00
Economic Enterprises
2,115.1 2,062.2 2,062.25 2,593.01 2,147.42 2,587.27
2,054.00
2,340.00
Total 31,089.03 28,932.80 34,407.26 38,404.47 35,444.95 42,038.71 28,753.00 42,174.00
Source: BLGF Region IV-A
Moving Forward
COVID-19 pandemic and natural calamities experienced in 2020 adversely affected
CALABARZON’s economy and employment conditions. The emergence of more contagious
variants of COVID-19 and the surge of new cases pose a major challenge in the economic
recovery of CALABARZON and the country. For economic recovery to happen, management
of health risks is the topmost concern. Thus, there must be an enhanced implementation of the
Prevent-Detect-Isolate-Treat-Reintegrate (PDITR) by all levels of government. This can be
done through strict enforcement of minimum public health standards, clear dissemination of
guidelines and policies, timely localized lockdowns to curb the spread of disease, and increased
investments in testing and treatment facilities.
Enhanced PDITR strategies should go hand-in-hand with an effective and efficient vaccination
roll-out. Government should expedite the roll-out of vaccines. A widely-vaccinated population
will enable gradual re-opening of the economy and increase business and consumer confidence
and spending. Ensuring public’s confidence in the vaccines to be used will be critical in the
swift roll-out of the vaccination program. Towards this goal, information dissemination should
be intensified.
To facilitate economic and social recovery, funding and implementation of programs and
projects in the Regional Recovery Program of Taal Volcano Eruption, COVID-19 and Tropical
Cyclones Quinta, Rolly and Ulysses are critical. The timely completion of major programs and
projects will significantly contribute to a fast recovery and enhancing the resilience of the
region to the impacts of disasters and calamities.
Risks posed by COVID-19 opened opportunities for digitization of businesses and government
transactions resulting to more efficient delivery of goods and services. Capacity building and
technical assistance to business sectors including MSMEs and agri-based enterprises should be
continuously provided to enable them to easily adapt to the new normal. This will also entail
expediting the implementation and completion of information and communication technology
(ICT) to enable digitization processes and systems of the government and private sector
including digital transformation of MSMEs and cooperatives.
The government’s financial assistance to business sector will assist in their recovery and
facilitate transition to the new normal. Sustained operations of business firms will mitigate
further displacement of workers due to retrenchment and shutdown.
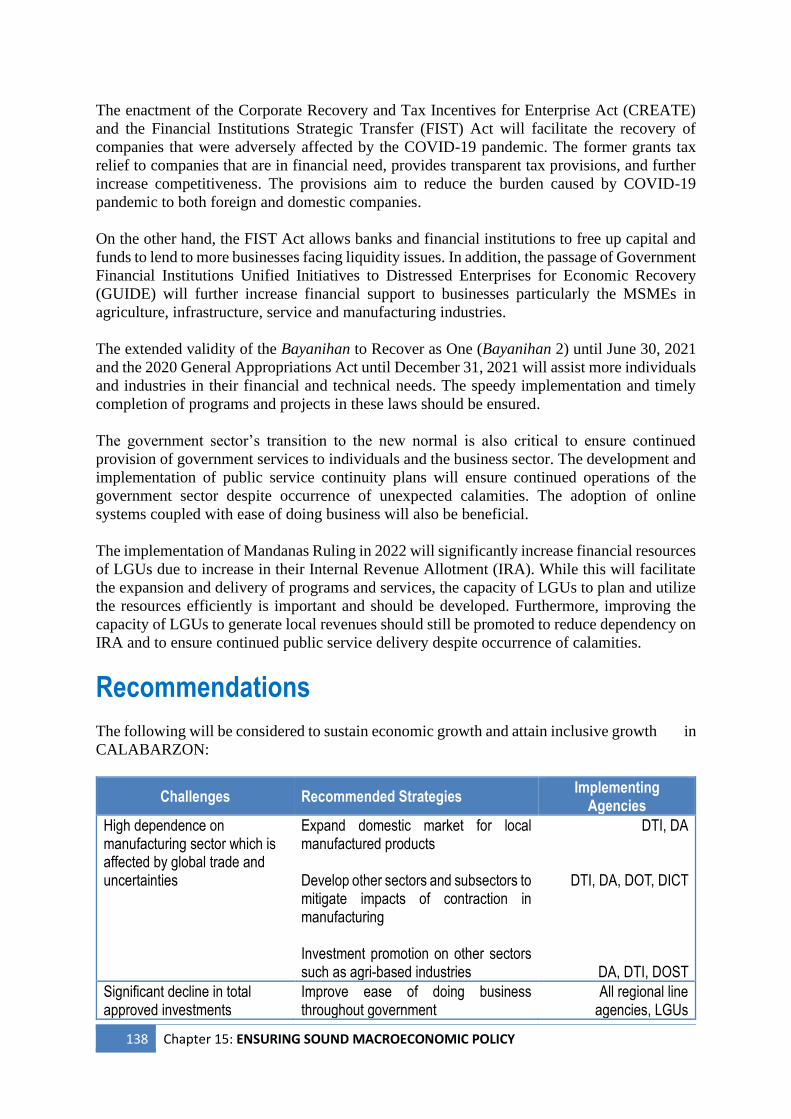
138 Chapter 15: ENSURING SOUND MACROECONOMIC POLICY
The enactment of the Corporate Recovery and Tax Incentives for Enterprise Act (CREATE)
and the Financial Institutions Strategic Transfer (FIST) Act will facilitate the recovery of
companies that were adversely affected by the COVID-19 pandemic. The former grants tax
relief to companies that are in financial need, provides transparent tax provisions, and further
increase competitiveness. The provisions aim to reduce the burden caused by COVID-19
pandemic to both foreign and domestic companies.
On the other hand, the FIST Act allows banks and financial institutions to free up capital and
funds to lend to more businesses facing liquidity issues. In addition, the passage of Government
Financial Institutions Unified Initiatives to Distressed Enterprises for Economic Recovery
(GUIDE) will further increase financial support to businesses particularly the MSMEs in
agriculture, infrastructure, service and manufacturing industries.
The extended validity of the Bayanihan to Recover as One (Bayanihan 2) until June 30, 2021
and the 2020 General Appropriations Act until December 31, 2021 will assist more individuals
and industries in their financial and technical needs. The speedy implementation and timely
completion of programs and projects in these laws should be ensured.
The government sector’s transition to the new normal is also critical to ensure continued
provision of government services to individuals and the business sector. The development and
implementation of public service continuity plans will ensure continued operations of the
government sector despite occurrence of unexpected calamities. The adoption of online
systems coupled with ease of doing business will also be beneficial.
The implementation of Mandanas Ruling in 2022 will significantly increase financial resources
of LGUs due to increase in their Internal Revenue Allotment (IRA). While this will facilitate
the expansion and delivery of programs and services, the capacity of LGUs to plan and utilize
the resources efficiently is important and should be developed. Furthermore, improving the
capacity of LGUs to generate local revenues should still be promoted to reduce dependency on
IRA and to ensure continued public service delivery despite occurrence of calamities.
Recommendations
The following will be considered to sustain economic growth and attain inclusive growth in
CALABARZON:
Challenges Recommended Strategies Implementing
Agencies
High dependence on manufacturing sector which is affected by global trade and uncertainties
Expand domestic market for local manufactured products Develop other sectors and subsectors to mitigate impacts of contraction in manufacturing Investment promotion on other sectors such as agri-based industries
DTI, DA
DTI, DA, DOT, DICT
DA, DTI, DOST
Significant decline in total approved investments
Improve ease of doing business throughout government
All regional line agencies, LGUs
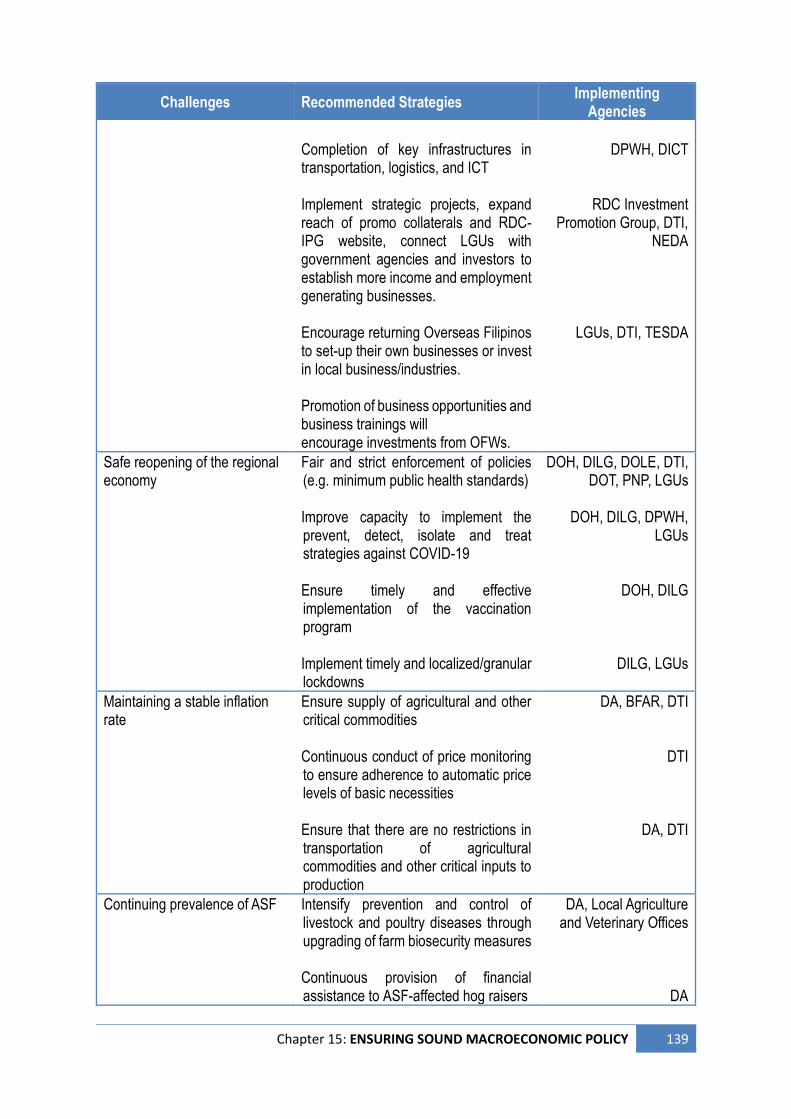
Chapter 15: ENSURING SOUND MACROECONOMIC POLICY 139
Challenges Recommended Strategies Implementing
Agencies
Completion of key infrastructures in transportation, logistics, and ICT Implement strategic projects, expand reach of promo collaterals and RDC-IPG website, connect LGUs with government agencies and investors to establish more income and employment generating businesses. Encourage returning Overseas Filipinos to set-up their own businesses or invest in local business/industries. Promotion of business opportunities and business trainings will encourage investments from OFWs.
DPWH, DICT
RDC Investment Promotion Group, DTI,
NEDA
LGUs, DTI, TESDA
Safe reopening of the regional economy
Fair and strict enforcement of policies (e.g. minimum public health standards) Improve capacity to implement the prevent, detect, isolate and treat strategies against COVID-19 Ensure timely and effective implementation of the vaccination program Implement timely and localized/granular lockdowns
DOH, DILG, DOLE, DTI, DOT, PNP, LGUs
DOH, DILG, DPWH,
LGUs
DOH, DILG
DILG, LGUs
Maintaining a stable inflation rate
Ensure supply of agricultural and other critical commodities Continuous conduct of price monitoring to ensure adherence to automatic price levels of basic necessities Ensure that there are no restrictions in transportation of agricultural commodities and other critical inputs to production
DA, BFAR, DTI
DTI
DA, DTI
Continuing prevalence of ASF Intensify prevention and control of livestock and poultry diseases through upgrading of farm biosecurity measures Continuous provision of financial assistance to ASF-affected hog raisers
DA, Local Agriculture and Veterinary Offices
DA
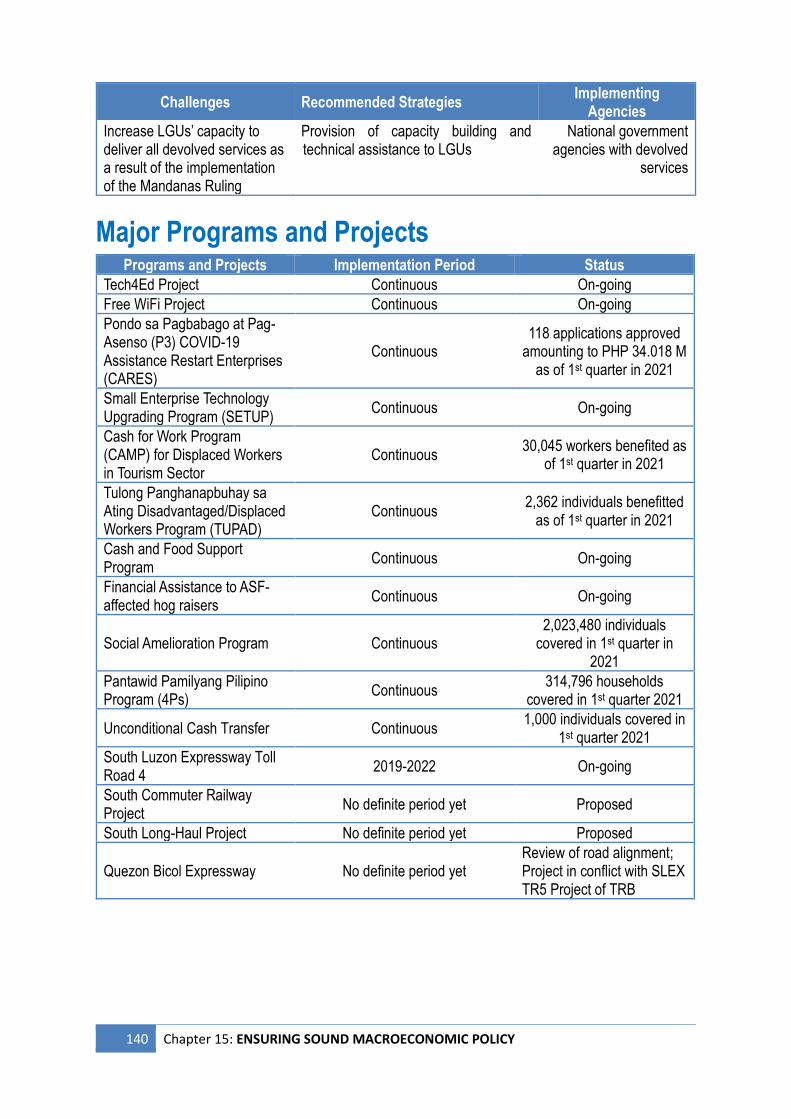
140 Chapter 15: ENSURING SOUND MACROECONOMIC POLICY
Challenges Recommended Strategies Implementing
Agencies
Increase LGUs’ capacity to deliver all devolved services as a result of the implementation of the Mandanas Ruling
Provision of capacity building and technical assistance to LGUs
National government agencies with devolved
services
Major Programs and Projects
Programs and Projects Implementation Period Status
Tech4Ed Project Continuous On-going
Free WiFi Project Continuous On-going
Pondo sa Pagbabago at Pag-Asenso (P3) COVID-19 Assistance Restart Enterprises (CARES)
Continuous 118 applications approved
amounting to PHP 34.018 M as of 1st quarter in 2021
Small Enterprise Technology Upgrading Program (SETUP)
Continuous On-going
Cash for Work Program (CAMP) for Displaced Workers in Tourism Sector
Continuous 30,045 workers benefited as
of 1st quarter in 2021
Tulong Panghanapbuhay sa Ating Disadvantaged/Displaced Workers Program (TUPAD)
Continuous 2,362 individuals benefitted
as of 1st quarter in 2021
Cash and Food Support Program
Continuous On-going
Financial Assistance to ASF-affected hog raisers
Continuous On-going
Social Amelioration Program Continuous 2,023,480 individuals
covered in 1st quarter in 2021
Pantawid Pamilyang Pilipino Program (4Ps)
Continuous 314,796 households
covered in 1st quarter 2021
Unconditional Cash Transfer Continuous 1,000 individuals covered in
1st quarter 2021
South Luzon Expressway Toll Road 4
2019-2022 On-going
South Commuter Railway Project
No definite period yet Proposed
South Long-Haul Project No definite period yet Proposed
Quezon Bicol Expressway No definite period yet Review of road alignment; Project in conflict with SLEX TR5 Project of TRB
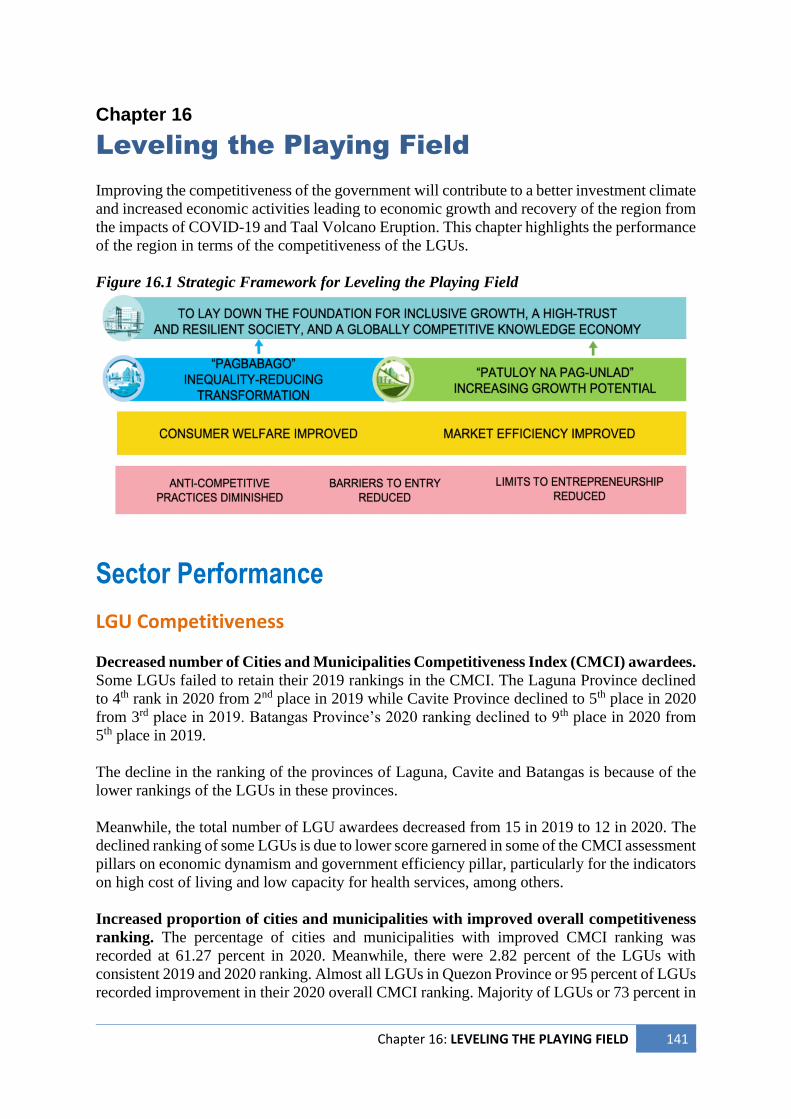
Chapter 16: LEVELING THE PLAYING FIELD 141
Chapter 16
Leveling the Playing Field
Improving the competitiveness of the government will contribute to a better investment climate
and increased economic activities leading to economic growth and recovery of the region from
the impacts of COVID-19 and Taal Volcano Eruption. This chapter highlights the performance
of the region in terms of the competitiveness of the LGUs.
Figure 16.1 Strategic Framework for Leveling the Playing Field
Sector Performance
LGU Competitiveness
Decreased number of Cities and Municipalities Competitiveness Index (CMCI) awardees.
Some LGUs failed to retain their 2019 rankings in the CMCI. The Laguna Province declined
to 4th rank in 2020 from 2nd place in 2019 while Cavite Province declined to 5th place in 2020
from 3rd place in 2019. Batangas Province’s 2020 ranking declined to 9th place in 2020 from
5th place in 2019.
The decline in the ranking of the provinces of Laguna, Cavite and Batangas is because of the
lower rankings of the LGUs in these provinces.
Meanwhile, the total number of LGU awardees decreased from 15 in 2019 to 12 in 2020. The
declined ranking of some LGUs is due to lower score garnered in some of the CMCI assessment
pillars on economic dynamism and government efficiency pillar, particularly for the indicators
on high cost of living and low capacity for health services, among others.
Increased proportion of cities and municipalities with improved overall competitiveness
ranking. The percentage of cities and municipalities with improved CMCI ranking was
recorded at 61.27 percent in 2020. Meanwhile, there were 2.82 percent of the LGUs with
consistent 2019 and 2020 ranking. Almost all LGUs in Quezon Province or 95 percent of LGUs
recorded improvement in their 2020 overall CMCI ranking. Majority of LGUs or 73 percent in
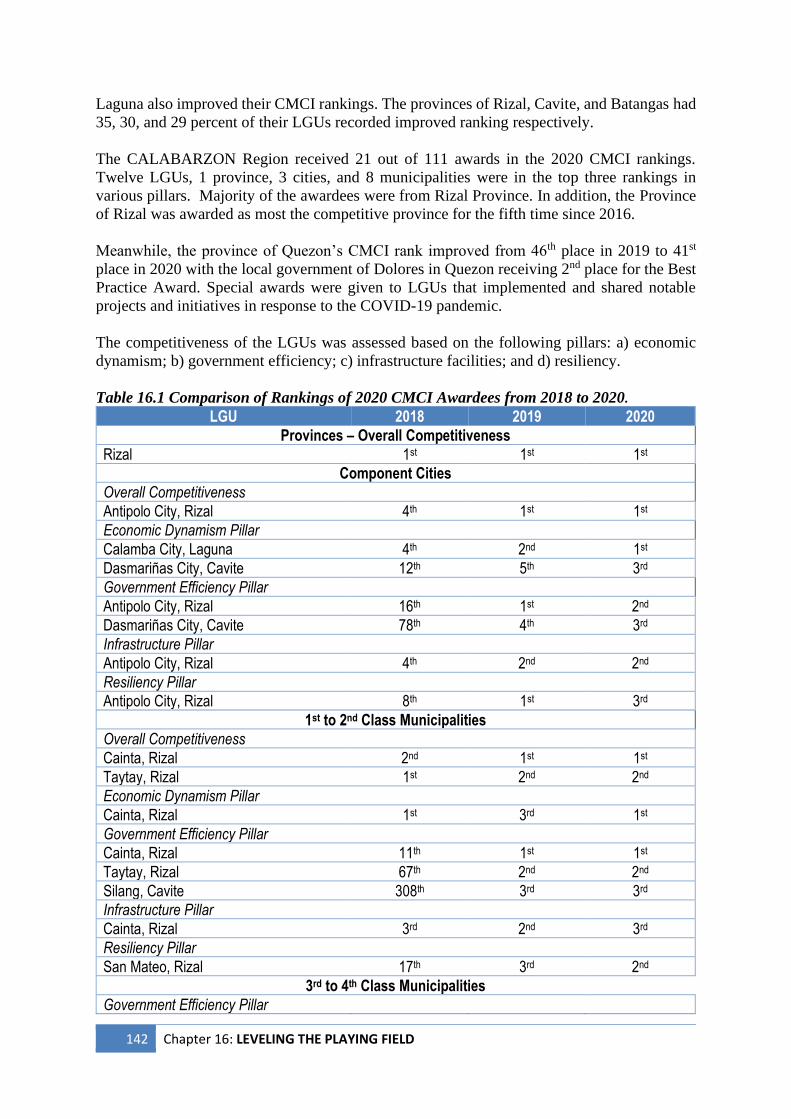
142 Chapter 16: LEVELING THE PLAYING FIELD
Laguna also improved their CMCI rankings. The provinces of Rizal, Cavite, and Batangas had
35, 30, and 29 percent of their LGUs recorded improved ranking respectively.
The CALABARZON Region received 21 out of 111 awards in the 2020 CMCI rankings.
Twelve LGUs, 1 province, 3 cities, and 8 municipalities were in the top three rankings in
various pillars. Majority of the awardees were from Rizal Province. In addition, the Province
of Rizal was awarded as most the competitive province for the fifth time since 2016.
Meanwhile, the province of Quezon’s CMCI rank improved from 46th place in 2019 to 41st
place in 2020 with the local government of Dolores in Quezon receiving 2nd place for the Best
Practice Award. Special awards were given to LGUs that implemented and shared notable
projects and initiatives in response to the COVID-19 pandemic.
The competitiveness of the LGUs was assessed based on the following pillars: a) economic
dynamism; b) government efficiency; c) infrastructure facilities; and d) resiliency.
Table 16.1 Comparison of Rankings of 2020 CMCI Awardees from 2018 to 2020.
LGU 2018 2019 2020
Provinces – Overall Competitiveness
Rizal 1st 1st 1st
Component Cities
Overall Competitiveness
Antipolo City, Rizal 4th 1st 1st
Economic Dynamism Pillar
Calamba City, Laguna 4th 2nd 1st
Dasmariñas City, Cavite 12th 5th 3rd
Government Efficiency Pillar
Antipolo City, Rizal 16th 1st 2nd
Dasmariñas City, Cavite 78th 4th 3rd
Infrastructure Pillar
Antipolo City, Rizal 4th 2nd 2nd
Resiliency Pillar
Antipolo City, Rizal 8th 1st 3rd
1st to 2nd Class Municipalities
Overall Competitiveness
Cainta, Rizal 2nd 1st 1st
Taytay, Rizal 1st 2nd 2nd
Economic Dynamism Pillar
Cainta, Rizal 1st 3rd 1st
Government Efficiency Pillar
Cainta, Rizal 11th 1st 1st
Taytay, Rizal 67th 2nd 2nd
Silang, Cavite 308th 3rd 3rd
Infrastructure Pillar
Cainta, Rizal 3rd 2nd 3rd
Resiliency Pillar
San Mateo, Rizal 17th 3rd 2nd
3rd to 4th Class Municipalities
Government Efficiency Pillar
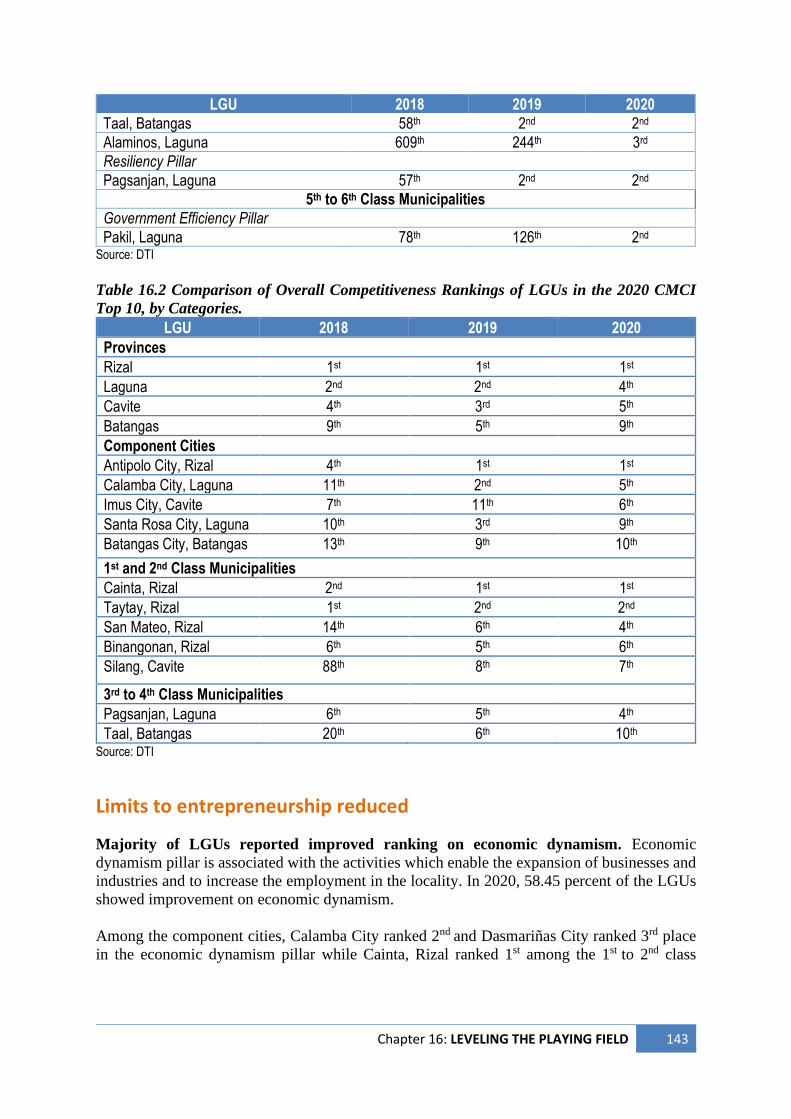
Chapter 16: LEVELING THE PLAYING FIELD 143
LGU 2018 2019 2020
Taal, Batangas 58th 2nd 2nd
Alaminos, Laguna 609th 244th 3rd
Resiliency Pillar
Pagsanjan, Laguna 57th 2nd 2nd
5th to 6th Class Municipalities
Government Efficiency Pillar
Pakil, Laguna 78th 126th 2nd Source: DTI
Table 16.2 Comparison of Overall Competitiveness Rankings of LGUs in the 2020 CMCI
Top 10, by Categories.
LGU 2018 2019 2020
Provinces
Rizal 1st 1st 1st
Laguna 2nd 2nd 4th
Cavite 4th 3rd 5th
Batangas 9th 5th 9th
Component Cities
Antipolo City, Rizal 4th 1st 1st
Calamba City, Laguna 11th 2nd 5th
Imus City, Cavite 7th 11th 6th
Santa Rosa City, Laguna 10th 3rd 9th
Batangas City, Batangas 13th 9th 10th
1st and 2nd Class Municipalities
Cainta, Rizal 2nd 1st 1st
Taytay, Rizal 1st 2nd 2nd
San Mateo, Rizal 14th 6th 4th
Binangonan, Rizal 6th 5th 6th
Silang, Cavite 88th 8th 7th
3rd to 4th Class Municipalities
Pagsanjan, Laguna 6th 5th 4th
Taal, Batangas 20th 6th 10th Source: DTI
Limits to entrepreneurship reduced
Majority of LGUs reported improved ranking on economic dynamism. Economic
dynamism pillar is associated with the activities which enable the expansion of businesses and
industries and to increase the employment in the locality. In 2020, 58.45 percent of the LGUs
showed improvement on economic dynamism.
Among the component cities, Calamba City ranked 2nd and Dasmariñas City ranked 3rd place
in the economic dynamism pillar while Cainta, Rizal ranked 1st among the 1st to 2nd class
144 Chapter 16: LEVELING THE PLAYING FIELD
municipalities category. Below are some of the indicators used to assess the LGUs’
competitiveness under this pillar10:
Total capitalization of new business. The City of Santa Rosa, Laguna recorded the largest total
capitalization of new business amounting to PHP12.58 billion while Tayabas City recorded the
smallest total capitalization amounting to PHP55,147. Among the municipalities, Cainta, Rizal
has the largest total capitalization amounting to PHP7.72 billion.
Number of approved occupancy permit. General Trias City approved 8,409 occupancy permits,
the highest in the region. On the other hand, Cavite City approved 72 occupancy permits which
is the lowest among the component cities. In terms of the approved permits among the
municipalities, Tanza, Cavite recorded the highest at 6,825 permits.
Local inflation rate. Slower increase in prices of commodities was recorded in the region as
the inflation rate decreased to 2.6 percent in 2019 from 4.8 percent in 2018. All the provinces
recorded an improved year-on-year inflation rate. The Provinces of Laguna and Quezon had
the lowest inflation rate at 1.7 percent while Rizal Province recorded the highest inflation rate
at 3.2 percent. Moreover, decrease in the inflation rate in Quezon Province was recorded at 4.2
percentage points, year-on-year.
Most LGUs recorded improved ranking on government efficiency. Government efficiency
refers to the quality of government services provided to its stakeholders and to the quality of
government support to monitor the compliance to the standards and directives in ensuring
conducive business environment and attracting investors. Continuous improvement in the
delivery of government services was implemented in the region as 66.90 percent of the LGUs
improved their rankings on government efficiency. Furthermore, most of the top performing
LGUs on government efficiency pillar are from the CALABARZON Region. A total of 4.23
percent of the LGUs recorded consistent ranking in 2019 and 2020.
Antipolo City ranked 2nd while Dasmariñas City 3rd on government efficiency among the
component cities. For the 1st to 2nd class municipalities category, Cainta ranked 1st, Taytay was
2nd, and Silang was 3rd. Meanwhile, Taal, Batangas and Alaminos, Laguna ranked 2nd and 3rd,
respectively, among the 3rd to 4th class municipalities. Pakil, Laguna was also awarded the 2nd
place for the 5th to 6th class municipalities. Below are some indicators used to assess the
efficiency of the LGUs11:
Presence of Comprehensive Development Plan (CDP). Only 59 out of 142 or 41.5 percent of
the LGUs have updated their CDPs while 69 LGUs are updating their CDPs in 2019.
Presence of Local Investment and Incentives Code (LIIC) and local executive order. All cities
in CALABARZON have formulated their LIIC. However, only 65.04 percent of municipalities
have their LIIC. To support the implementation of the LIIC, all cities in the Region passed a
local executive order to set up an investment promotion unit. On the other hand, 75.61 percent
of the municipalities passed an ordinance on the implementation of LIIC.
Automation of business permits and licensing systems (BPLS). All cities and 85 municipalities
in the region have automated their BPLS.
10 Batangas State University (2021). 2020 CMCI Appraisal Report 11 Batangas State University (2021). 2020 CMCI Appraisal Report
Chapter 16: LEVELING THE PLAYING FIELD 145
Majority of LGUs recorded improved ranking on infrastructure pillar. Adequate and
reliable infrastructure is essential for the delivery of services, support to economic activities,
and productivity and competitiveness of LGUs. In 2020, a total of 60.56 percent of the total
LGUs in the region recorded improved ranking in the infrastructure pillar. There were only five
LGUs with consistent ranking in this pillar.
Antipolo City ranked 2nd while Cainta, Rizal ranked 3rd place for the 1st to 2nd class
municipalities on infrastructure. To assess the competitiveness of the LGUs in the
infrastructure pillar, the 2019 data were used for the following indicators12: Daily average hours of water services at Central Business District. Water services which
include water supply and sanitation are considered as the most important basic services in the
communities. Nineteen cities and 105 municipalities in the region have a 24-hour average daily
water services. Water services in Trece Martires City in Cavite is accessible for 17 hours per
day, on the average.
Percentage of households with water services. All households in ten cities in the region have
access to water services. Among the cities with no universal household water coverage,
households in Tayabas City have the lowest access to water services which was recorded at
72.45 percent. For the municipalities, all the households in 19 municipalities have access to
water services.
Daily average hours of electricity services at Central Business District. All cities and 120
municipalities have electricity services for 24 hours per day, on the average. The municipalities
that do not have 24-hour electricity services are Jomalig in Quezon, Rosario in Cavite, and
Tingloy in Batangas.
Percentage of households with electricity services. All households in 12 cities and 27
municipalities were provided with electric services.
Number of internet service providers. Santa Rosa City has the most number of internet service
providers with eight internet service providers while the cities of General Trias and Tayabas
have the lowest with only one internet service provider. Among the municipalities, Angono,
Rizal has the greatest number of internet providers with 11. The municipalities of Patnanungan,
Quezon and San Nicolas, Batangas do not have any internet service providers.
More than half of LGUs reported improved ranking on resiliency pillar. Local
governments play an important role in ensuring a conducive environment for businesses to
sustain profits and create more jobs. Thus, LGUs must be resilient, reduce the negative effects
and recover quickly from the impacts brought about by hazards. In 2020, 50.70 percent of the
LGUs improved their rankings in the resiliency pillar compared to the previous year while 2.82
percent of LGUs maintained their 2019 ranking in 2020.
Among the component cities, Antipolo City ranked 3rd in terms of resiliency while
municipalities of San Mateo in Rizal and Pagsanjan in Laguna also ranked 2nd for the 1st to 2nd
12 Batangas State University (2021). 2020 CMCI Appraisal Report
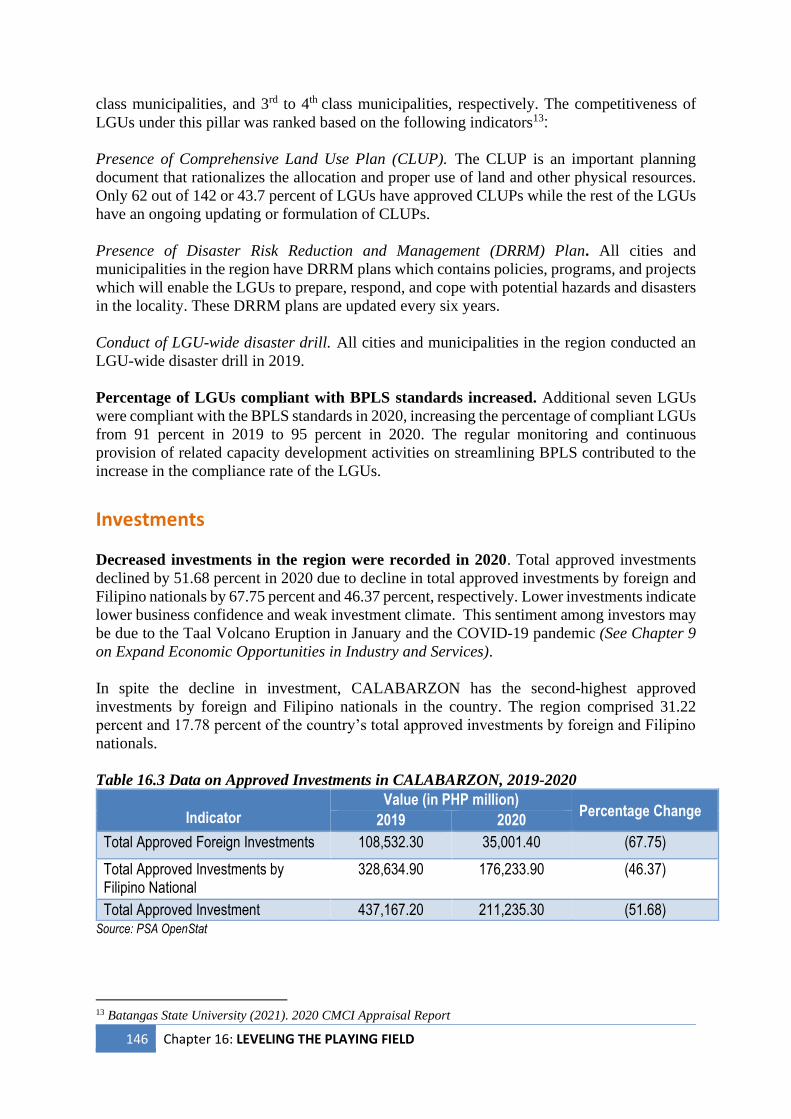
146 Chapter 16: LEVELING THE PLAYING FIELD
class municipalities, and 3rd to 4th class municipalities, respectively. The competitiveness of
LGUs under this pillar was ranked based on the following indicators13: Presence of Comprehensive Land Use Plan (CLUP). The CLUP is an important planning
document that rationalizes the allocation and proper use of land and other physical resources.
Only 62 out of 142 or 43.7 percent of LGUs have approved CLUPs while the rest of the LGUs
have an ongoing updating or formulation of CLUPs.
Presence of Disaster Risk Reduction and Management (DRRM) Plan. All cities and
municipalities in the region have DRRM plans which contains policies, programs, and projects
which will enable the LGUs to prepare, respond, and cope with potential hazards and disasters
in the locality. These DRRM plans are updated every six years.
Conduct of LGU-wide disaster drill. All cities and municipalities in the region conducted an
LGU-wide disaster drill in 2019.
Percentage of LGUs compliant with BPLS standards increased. Additional seven LGUs
were compliant with the BPLS standards in 2020, increasing the percentage of compliant LGUs
from 91 percent in 2019 to 95 percent in 2020. The regular monitoring and continuous
provision of related capacity development activities on streamlining BPLS contributed to the
increase in the compliance rate of the LGUs.
Investments
Decreased investments in the region were recorded in 2020. Total approved investments
declined by 51.68 percent in 2020 due to decline in total approved investments by foreign and
Filipino nationals by 67.75 percent and 46.37 percent, respectively. Lower investments indicate
lower business confidence and weak investment climate. This sentiment among investors may
be due to the Taal Volcano Eruption in January and the COVID-19 pandemic (See Chapter 9
on Expand Economic Opportunities in Industry and Services).
In spite the decline in investment, CALABARZON has the second-highest approved
investments by foreign and Filipino nationals in the country. The region comprised 31.22
percent and 17.78 percent of the country’s total approved investments by foreign and Filipino
nationals.
Table 16.3 Data on Approved Investments in CALABARZON, 2019-2020
Indicator Value (in PHP million)
Percentage Change 2019 2020
Total Approved Foreign Investments 108,532.30 35,001.40 (67.75)
Total Approved Investments by Filipino National
328,634.90 176,233.90 (46.37)
Total Approved Investment 437,167.20 211,235.30 (51.68) Source: PSA OpenStat
13 Batangas State University (2021). 2020 CMCI Appraisal Report
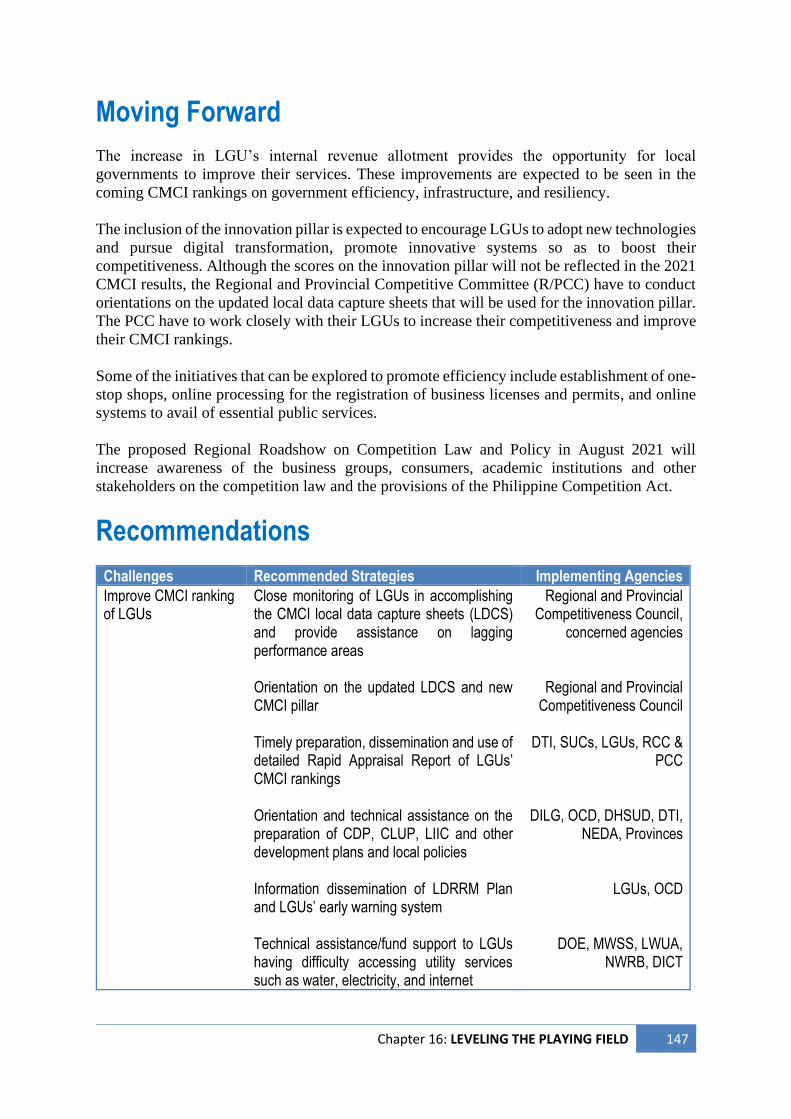
Chapter 16: LEVELING THE PLAYING FIELD 147
Moving Forward
The increase in LGU’s internal revenue allotment provides the opportunity for local
governments to improve their services. These improvements are expected to be seen in the
coming CMCI rankings on government efficiency, infrastructure, and resiliency.
The inclusion of the innovation pillar is expected to encourage LGUs to adopt new technologies
and pursue digital transformation, promote innovative systems so as to boost their
competitiveness. Although the scores on the innovation pillar will not be reflected in the 2021
CMCI results, the Regional and Provincial Competitive Committee (R/PCC) have to conduct
orientations on the updated local data capture sheets that will be used for the innovation pillar.
The PCC have to work closely with their LGUs to increase their competitiveness and improve
their CMCI rankings.
Some of the initiatives that can be explored to promote efficiency include establishment of one-
stop shops, online processing for the registration of business licenses and permits, and online
systems to avail of essential public services.
The proposed Regional Roadshow on Competition Law and Policy in August 2021 will
increase awareness of the business groups, consumers, academic institutions and other
stakeholders on the competition law and the provisions of the Philippine Competition Act.
Recommendations
Challenges Recommended Strategies Implementing Agencies
Improve CMCI ranking of LGUs
Close monitoring of LGUs in accomplishing the CMCI local data capture sheets (LDCS) and provide assistance on lagging performance areas Orientation on the updated LDCS and new CMCI pillar Timely preparation, dissemination and use of detailed Rapid Appraisal Report of LGUs’ CMCI rankings Orientation and technical assistance on the preparation of CDP, CLUP, LIIC and other development plans and local policies Information dissemination of LDRRM Plan and LGUs’ early warning system Technical assistance/fund support to LGUs having difficulty accessing utility services such as water, electricity, and internet
Regional and Provincial Competitiveness Council,
concerned agencies
Regional and Provincial Competitiveness Council
DTI, SUCs, LGUs, RCC &
PCC
DILG, OCD, DHSUD, DTI, NEDA, Provinces
LGUs, OCD
DOE, MWSS, LWUA, NWRB, DICT
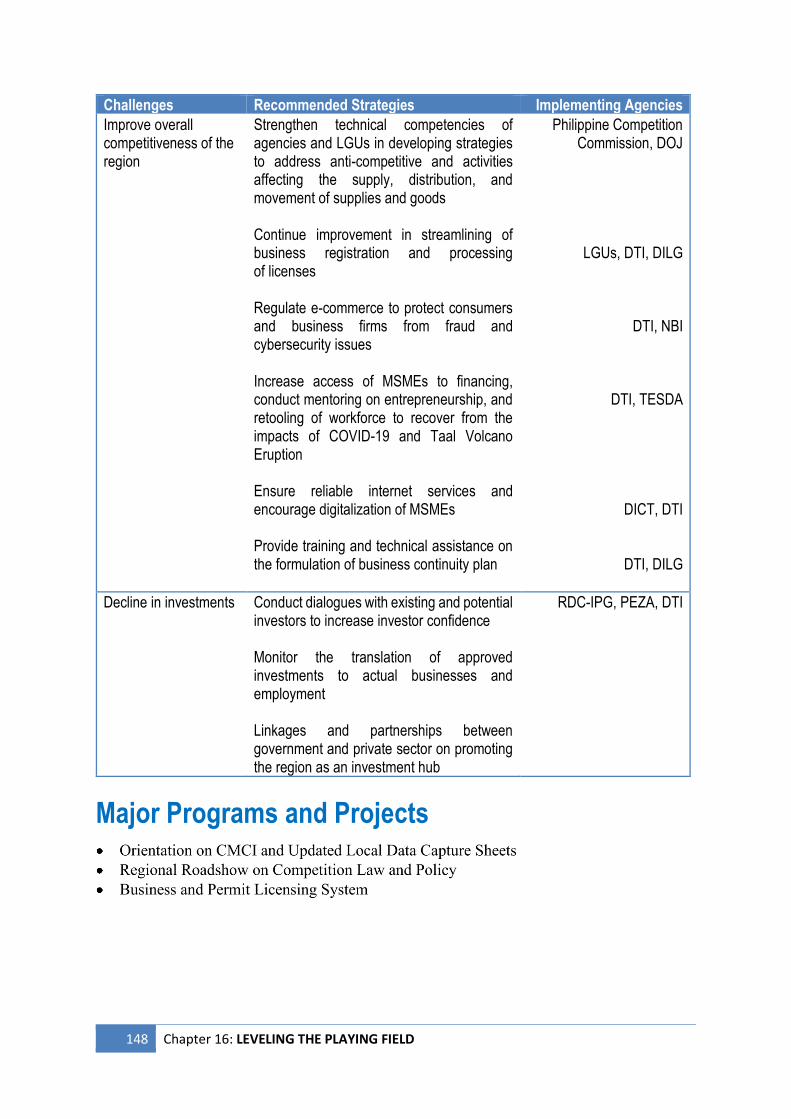
148 Chapter 16: LEVELING THE PLAYING FIELD
Challenges Recommended Strategies Implementing Agencies
Improve overall competitiveness of the region
Strengthen technical competencies of agencies and LGUs in developing strategies to address anti-competitive and activities affecting the supply, distribution, and movement of supplies and goods Continue improvement in streamlining of business registration and processing of licenses Regulate e-commerce to protect consumers and business firms from fraud and cybersecurity issues Increase access of MSMEs to financing, conduct mentoring on entrepreneurship, and retooling of workforce to recover from the impacts of COVID-19 and Taal Volcano Eruption Ensure reliable internet services and encourage digitalization of MSMEs Provide training and technical assistance on the formulation of business continuity plan
Philippine Competition Commission, DOJ
LGUs, DTI, DILG
DTI, NBI
DTI, TESDA
DICT, DTI
DTI, DILG
Decline in investments
Conduct dialogues with existing and potential investors to increase investor confidence Monitor the translation of approved investments to actual businesses and employment Linkages and partnerships between government and private sector on promoting the region as an investment hub
RDC-IPG, PEZA, DTI
Major Programs and Projects
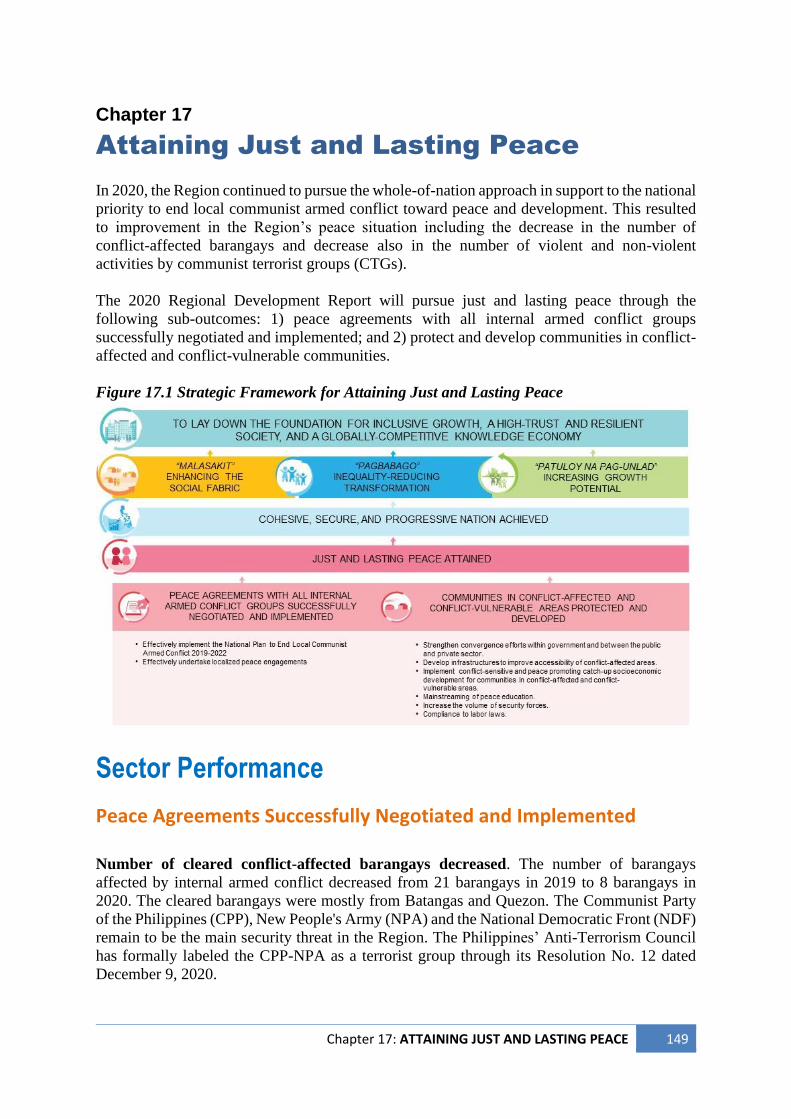
Chapter 17: ATTAINING JUST AND LASTING PEACE 149
Chapter 17
Attaining Just and Lasting Peace
In 2020, the Region continued to pursue the whole-of-nation approach in support to the national
priority to end local communist armed conflict toward peace and development. This resulted
to improvement in the Region’s peace situation including the decrease in the number of
conflict-affected barangays and decrease also in the number of violent and non-violent
activities by communist terrorist groups (CTGs).
The 2020 Regional Development Report will pursue just and lasting peace through the
following sub-outcomes: 1) peace agreements with all internal armed conflict groups
successfully negotiated and implemented; and 2) protect and develop communities in conflict-
affected and conflict-vulnerable communities.
Figure 17.1 Strategic Framework for Attaining Just and Lasting Peace
Sector Performance
Peace Agreements Successfully Negotiated and Implemented Number of cleared conflict-affected barangays decreased. The number of barangays
affected by internal armed conflict decreased from 21 barangays in 2019 to 8 barangays in
2020. The cleared barangays were mostly from Batangas and Quezon. The Communist Party
of the Philippines (CPP), New People's Army (NPA) and the National Democratic Front (NDF)
remain to be the main security threat in the Region. The Philippines’ Anti-Terrorism Council
has formally labeled the CPP-NPA as a terrorist group through its Resolution No. 12 dated
December 9, 2020.
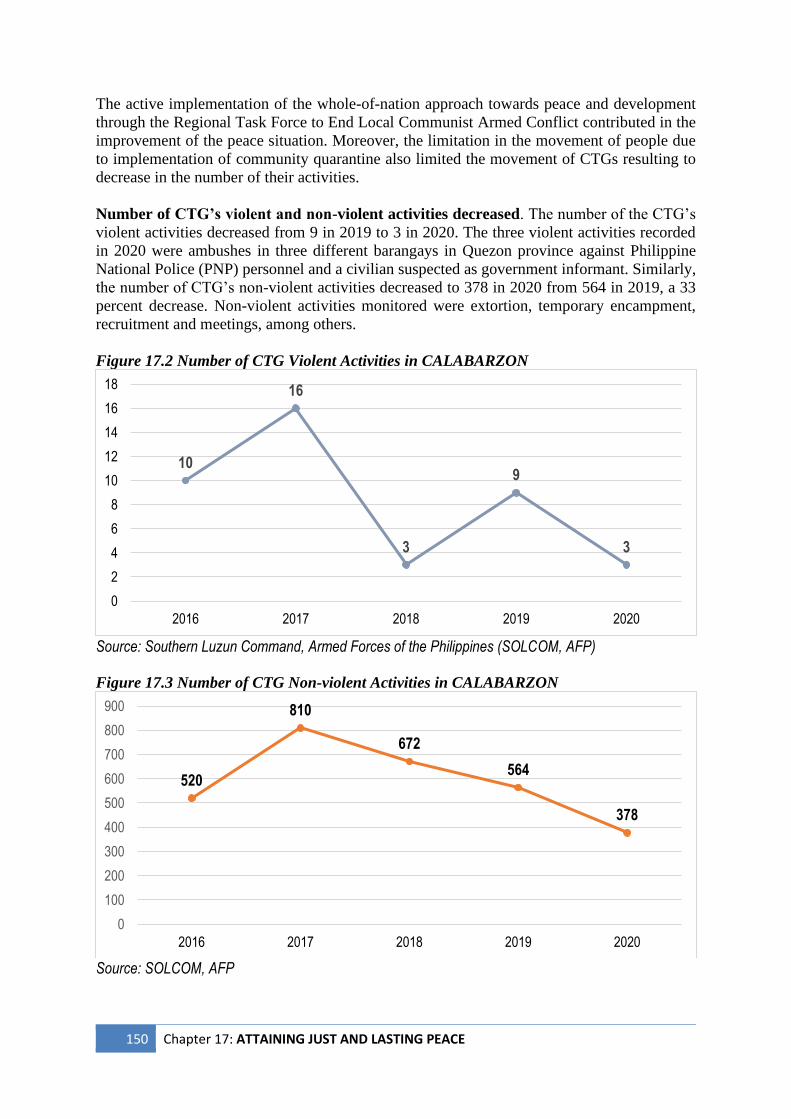
150 Chapter 17: ATTAINING JUST AND LASTING PEACE
The active implementation of the whole-of-nation approach towards peace and development
through the Regional Task Force to End Local Communist Armed Conflict contributed in the
improvement of the peace situation. Moreover, the limitation in the movement of people due
to implementation of community quarantine also limited the movement of CTGs resulting to
decrease in the number of their activities.
Number of CTG’s violent and non-violent activities decreased. The number of the CTG’s
violent activities decreased from 9 in 2019 to 3 in 2020. The three violent activities recorded
in 2020 were ambushes in three different barangays in Quezon province against Philippine
National Police (PNP) personnel and a civilian suspected as government informant. Similarly,
the number of CTG’s non-violent activities decreased to 378 in 2020 from 564 in 2019, a 33
percent decrease. Non-violent activities monitored were extortion, temporary encampment,
recruitment and meetings, among others.
Figure 17.2 Number of CTG Violent Activities in CALABARZON
Source: Southern Luzun Command, Armed Forces of the Philippines (SOLCOM, AFP)
Figure 17.3 Number of CTG Non-violent Activities in CALABARZON
Source: SOLCOM, AFP
10
16
3
9
3
0
2
4
6
8
10
12
14
16
18
2016 2017 2018 2019 2020
520
810
672
564
378
0
100
200
300
400
500
600
700
800
900
2016 2017 2018 2019 2020
Chapter 17: ATTAINING JUST AND LASTING PEACE 151
CPP-NPA manpower through surrender decreased. There was a decrease in the number of
rebels surrendering to the government from 90 in 2019 to 41 in 2020. Consequently, the number
of surrendered firearms also decreased from 38 in 2019 to 31 in 2020. Mobility restrictions
from the implementation of community quarantines limited the conduct of local peace
dialogues. This affected the government’s efforts to reach out and entice more rebels to return
to the fold of law through programs such as the Retooled Community Support Program and the
Enhanced Comprehensive Local Integration Program.
Communities in Conflict-affected and Conflict-vulnerable Areas Protected and Developed Net enrolment rate in primary education increased (in conflict-affected areas). On
education, the net enrolment rate in secondary schools in conflict-affected areas increased from
86.38 percent in SY 2018-2019 to 87.85 percent in SY 2019-2020 due to the conduct of child
mapping, early registration, and other school-based programs. These activities also contributed
to the improvement of the net enrolment rate in primary schools in conflict-affected areas, from
97.36 percent in SY 2018-2019 to 98.23 in SY 2019-2020. The negative effect of the COVID-
19 pandemic on enrollment is expected to be felt in the SY 2020-2021.
PAMANA projects implemented in conflict affected barangays. On addressing root causes
of insurgency, the Region continues to implement its peace development projects through the
Payapa at Masaganang Pamayanan or PAMANA program being managed by the Office of
the Presidential Adviser on the Peace Process. Among the PAMANA in 2020 were the
construction of day care centers and water supply systems, and electrification through solar
power in selected barangays in the provinces of Batangas, Rizal, and Quezon.
Moving Forward In 2020, movement of CTGs were hampered by the implementation of community quarantine.
As mobility restrictions gradually ease, it is expected that they will intensify their activities to
increase their strength and funds to support their activities.
The Region will continue the whole-of-government approach to counter and end the local
communist armed conflict. This will include coordination with task forces from other regions
to share information and best practices. Aside from government, the Region will also actively
seek active participation of stakeholders from academe, religious, business, and other relevant
sectors. The peace and development of conflict-affect barangays shall be prioritized through
programs and projects to address poverty and other root causes of insurgency.
The PAMANA program by the Office of the Presidential Adviser on the Peace Process and the
Re-tooled Community Support Program (RCSP) of the DILG will continue to be implemented
in the region. Aside from the provision of projects to improve access of conflict-affected and
conflict-vulnerable areas to socio-economic interventions, the PAMANA program also
capacitates communities in addressing peace-related issues. It also capacitates government
agencies and LGUs on conflict-sensitive, peace-promoting, culture-sensitive and gender-
sensitive approaches to human rights promotion and development. The RCSP, on the other
hand, empowers communities by allowing them to identify their peace and development-
related issues and address those issues through convergence approach up to barangay level and
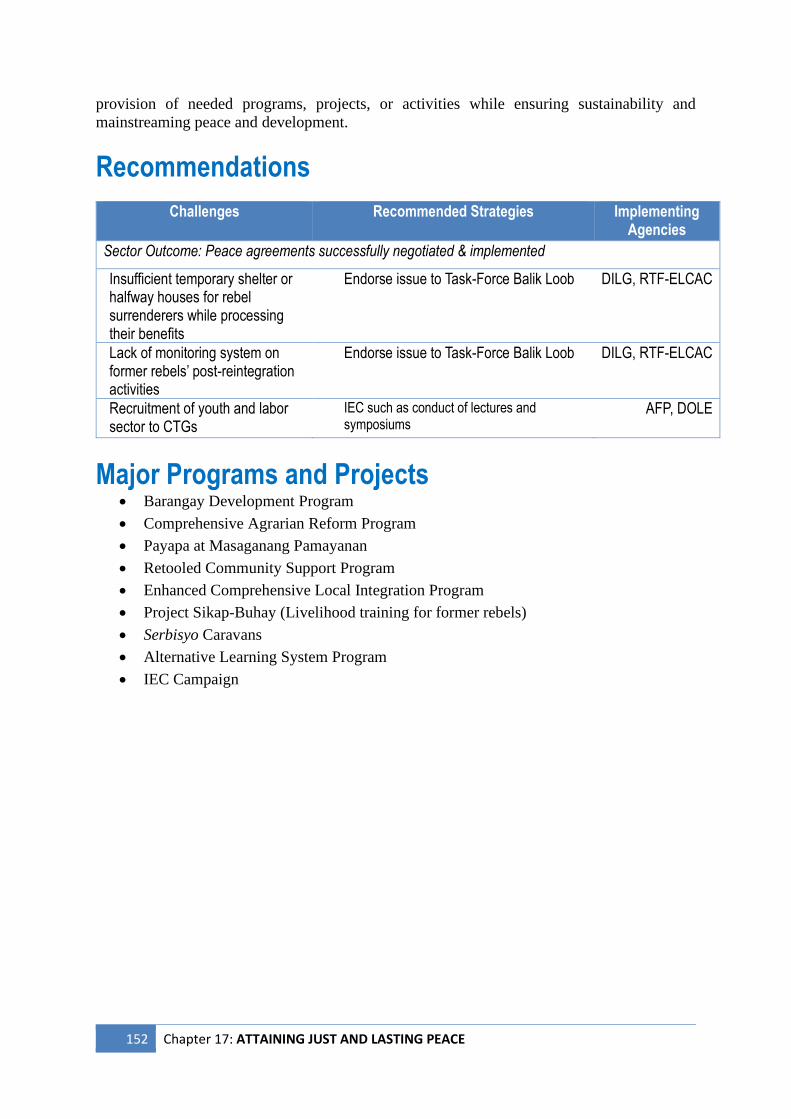
152 Chapter 17: ATTAINING JUST AND LASTING PEACE
provision of needed programs, projects, or activities while ensuring sustainability and
mainstreaming peace and development.
Recommendations
Challenges Recommended Strategies Implementing Agencies
Sector Outcome: Peace agreements successfully negotiated & implemented
Insufficient temporary shelter or halfway houses for rebel surrenderers while processing their benefits
Endorse issue to Task-Force Balik Loob DILG, RTF-ELCAC
Lack of monitoring system on former rebels’ post-reintegration activities
Endorse issue to Task-Force Balik Loob DILG, RTF-ELCAC
Recruitment of youth and labor sector to CTGs
IEC such as conduct of lectures and symposiums
AFP, DOLE
Major Programs and Projects • Barangay Development Program
• Comprehensive Agrarian Reform Program
• Payapa at Masaganang Pamayanan
• Retooled Community Support Program
• Enhanced Comprehensive Local Integration Program
• Project Sikap-Buhay (Livelihood training for former rebels)
• Serbisyo Caravans
• Alternative Learning System Program
• IEC Campaign
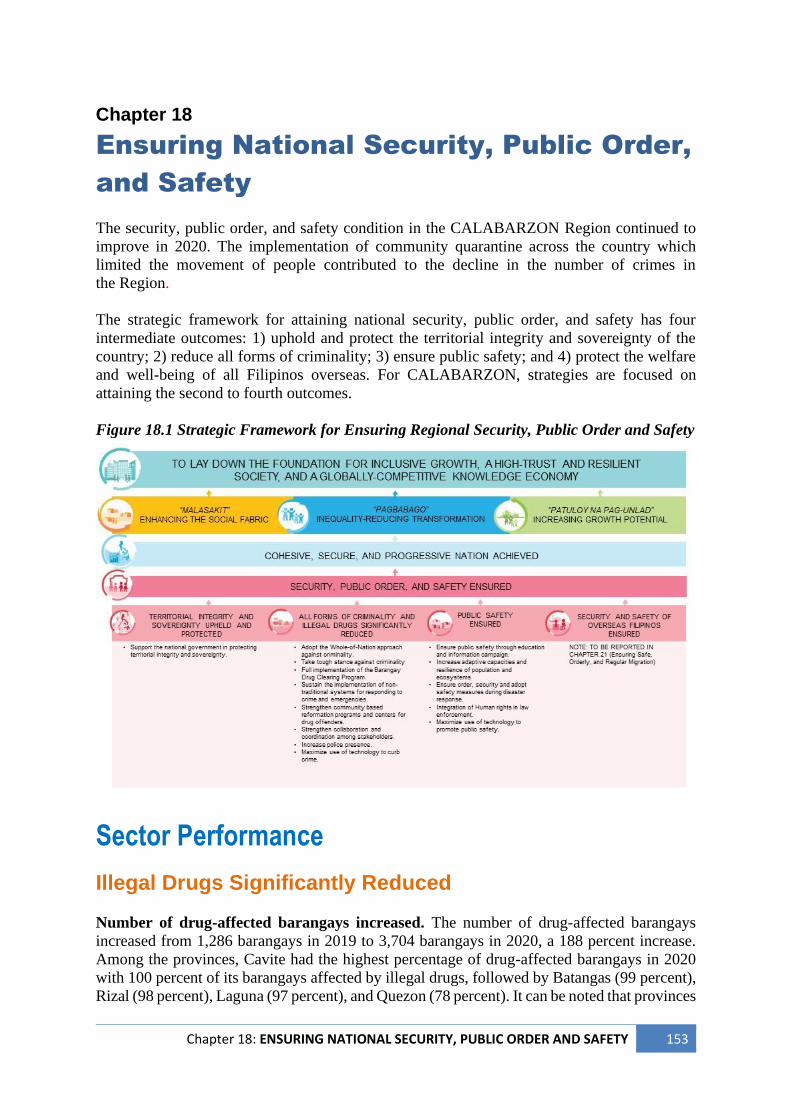
Chapter 18: ENSURING NATIONAL SECURITY, PUBLIC ORDER AND SAFETY 153
Chapter 18
Ensuring National Security, Public Order,
and Safety
The security, public order, and safety condition in the CALABARZON Region continued to
improve in 2020. The implementation of community quarantine across the country which
limited the movement of people contributed to the decline in the number of crimes in
the Region.
The strategic framework for attaining national security, public order, and safety has four
intermediate outcomes: 1) uphold and protect the territorial integrity and sovereignty of the
country; 2) reduce all forms of criminality; 3) ensure public safety; and 4) protect the welfare
and well-being of all Filipinos overseas. For CALABARZON, strategies are focused on
attaining the second to fourth outcomes.
Figure 18.1 Strategic Framework for Ensuring Regional Security, Public Order and Safety
Sector Performance
Illegal Drugs Significantly Reduced Number of drug-affected barangays increased. The number of drug-affected barangays
increased from 1,286 barangays in 2019 to 3,704 barangays in 2020, a 188 percent increase.
Among the provinces, Cavite had the highest percentage of drug-affected barangays in 2020
with 100 percent of its barangays affected by illegal drugs, followed by Batangas (99 percent),
Rizal (98 percent), Laguna (97 percent), and Quezon (78 percent). It can be noted that provinces
154 Chapter 18: ENSURING NATIONAL SECURITY, PUBLIC ORDER AND SAFETY
near Metro Manila have a higher percentage of drug-affected barangays. Coordination gaps
between security agencies, local government units and barangay workers in identifying and
locating drug personalities may have contributed to the increase in the number of drug-affected
barangays.
Nevertheless, a total of 2,255 barangays were cleared from illegal drugs in 2020, a 9 percent
increase from 2,071 barangays cleared in 2019. The establishment of Barangay Anti-Drug
Abuse Councils and the conduct of barangay drug clearing operations contributed to the
increase in the number of drug cleared barangays.
All Forms of Criminality Significantly Reduced Monthly index crime rate reduced. The average monthly index crime rate in 2020 decreased
to 2.48 percent from 3.74 percent in 2019. This means that there were around 2.48 index crime
incidents per month for every 100,000 people. Index crimes involve crimes against persons and
crimes against property. Crimes against persons include murder, homicide, physical injury, and
rape while crimes against property are robbery, theft, carnapping/carjacking, and cattle rustling.
The decrease in the monthly crime rate may be attributed to the intensified police operations
such as conduct of anti-illegal drug operations and serving warrants of arrest to drug
personalities.
Homicide victims and murder cases reduced. The number of homicide victims dropped to
108 in 2020 from 176 in 2019. Similarly, the number of murder cases decreased from 851 in
2019 to 675 in 2020. The implementation of community quarantine across the country which
limited the movement of people and the number of people on the streets contributed to the
decline in the number of crimes in the Region.
Average monthly non-index crime rate (AMNICR) reduced. Following the trend in reduced
crime rates, the average monthly non-index crime rate slightly decreased from 22.48 percent
in 2019 to 22.47 percent in 2020. Non-index crimes pertain to violations of special laws such
as illegal logging or local ordinances. The reduction in the AMNICR is a result of the
implementation of community quarantines which restricted mobility and heightened police
visibility in checkpoints and public areas.
Crime clearance efficiency (CCE) and crime solution efficiency (CSE) rate improved. The
crime solution efficiency rate improved from 81.17 percent in 2019 to 86.12 percent in 2020.
Consequently, crime clearance efficiency increased to 94.9 percent in 2020 from 94.21 percent
in 2019. The improvement in crime solution and crime clearance efficiency may be attributed
to the continuous monitoring and resolution of cases. The improved CCE and CSE may be
attributed to the continuous conduct of follow-up operations by investigators coupled with the
consistent and close monitoring of directives resulting in the identification and arrest of
suspects.
Public Safety Ensured Police to population ratio improved. The police to population ratio improved from 1
policeman to 1,402 citizens in 2019 to 1:1,379 in 2020. However, in spite of the improvement,
the national standard of 1:500 police-to-population ratio was not yet met. Cavite province had
the lowest police ratio at 1:1,688 while Laguna province had the highest at 1:1,064.
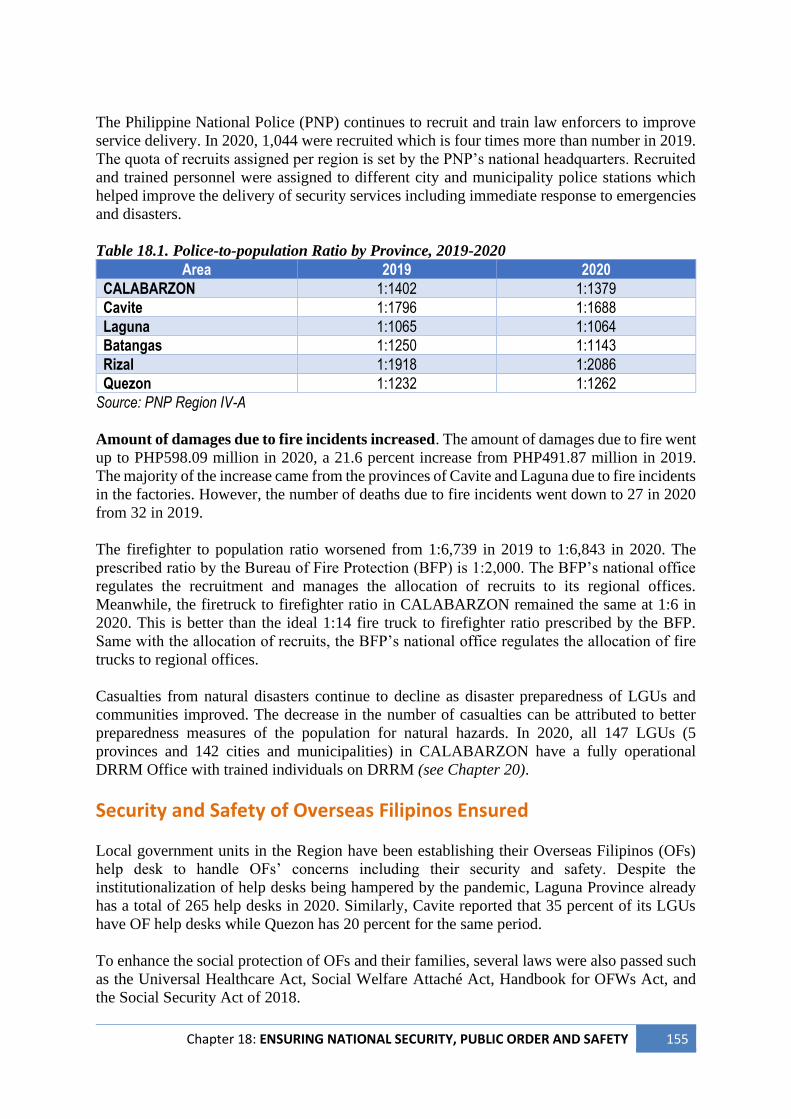
Chapter 18: ENSURING NATIONAL SECURITY, PUBLIC ORDER AND SAFETY 155
The Philippine National Police (PNP) continues to recruit and train law enforcers to improve
service delivery. In 2020, 1,044 were recruited which is four times more than number in 2019.
The quota of recruits assigned per region is set by the PNP’s national headquarters. Recruited
and trained personnel were assigned to different city and municipality police stations which
helped improve the delivery of security services including immediate response to emergencies
and disasters.
Table 18.1. Police-to-population Ratio by Province, 2019-2020
Area 2019 2020
CALABARZON 1:1402 1:1379
Cavite 1:1796 1:1688
Laguna 1:1065 1:1064
Batangas 1:1250 1:1143
Rizal 1:1918 1:2086
Quezon 1:1232 1:1262
Source: PNP Region IV-A
Amount of damages due to fire incidents increased. The amount of damages due to fire went
up to PHP598.09 million in 2020, a 21.6 percent increase from PHP491.87 million in 2019.
The majority of the increase came from the provinces of Cavite and Laguna due to fire incidents
in the factories. However, the number of deaths due to fire incidents went down to 27 in 2020
from 32 in 2019.
The firefighter to population ratio worsened from 1:6,739 in 2019 to 1:6,843 in 2020. The
prescribed ratio by the Bureau of Fire Protection (BFP) is 1:2,000. The BFP’s national office
regulates the recruitment and manages the allocation of recruits to its regional offices.
Meanwhile, the firetruck to firefighter ratio in CALABARZON remained the same at 1:6 in
2020. This is better than the ideal 1:14 fire truck to firefighter ratio prescribed by the BFP.
Same with the allocation of recruits, the BFP’s national office regulates the allocation of fire
trucks to regional offices.
Casualties from natural disasters continue to decline as disaster preparedness of LGUs and
communities improved. The decrease in the number of casualties can be attributed to better
preparedness measures of the population for natural hazards. In 2020, all 147 LGUs (5
provinces and 142 cities and municipalities) in CALABARZON have a fully operational
DRRM Office with trained individuals on DRRM (see Chapter 20).
Security and Safety of Overseas Filipinos Ensured Local government units in the Region have been establishing their Overseas Filipinos (OFs)
help desk to handle OFs’ concerns including their security and safety. Despite the
institutionalization of help desks being hampered by the pandemic, Laguna Province already
has a total of 265 help desks in 2020. Similarly, Cavite reported that 35 percent of its LGUs
have OF help desks while Quezon has 20 percent for the same period.
To enhance the social protection of OFs and their families, several laws were also passed such
as the Universal Healthcare Act, Social Welfare Attaché Act, Handbook for OFWs Act, and
the Social Security Act of 2018.
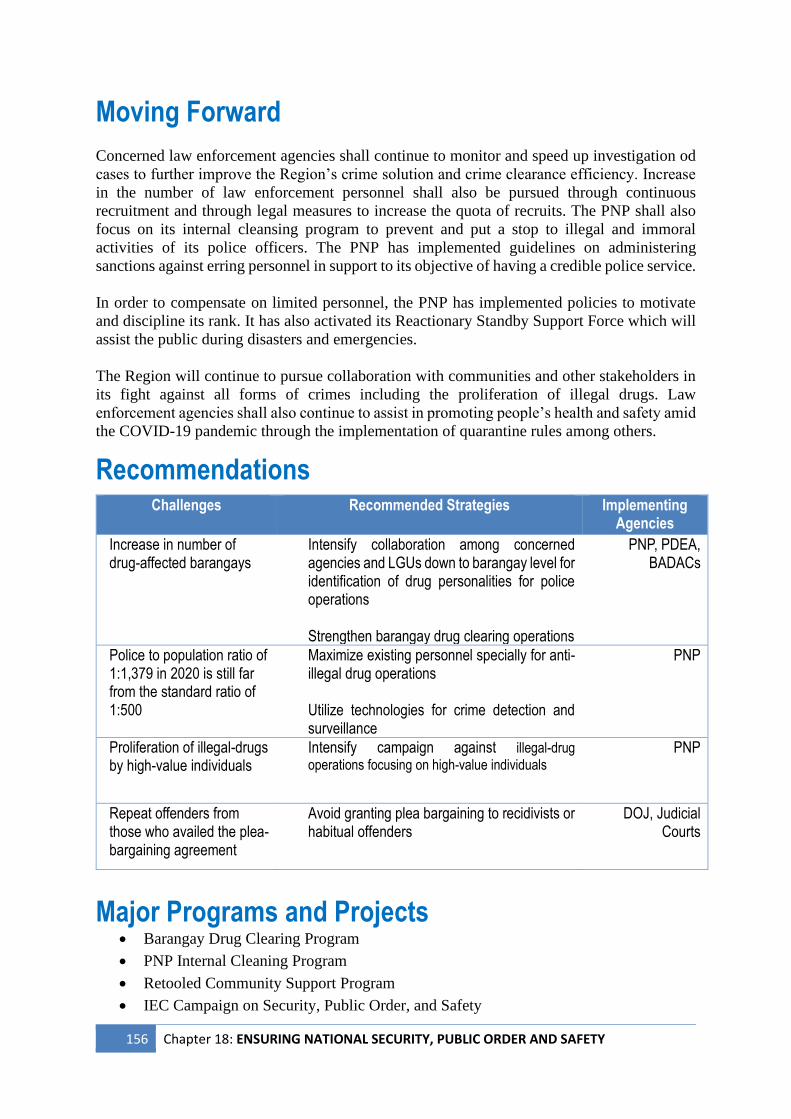
156 Chapter 18: ENSURING NATIONAL SECURITY, PUBLIC ORDER AND SAFETY
Moving Forward
Concerned law enforcement agencies shall continue to monitor and speed up investigation od
cases to further improve the Region’s crime solution and crime clearance efficiency. Increase
in the number of law enforcement personnel shall also be pursued through continuous
recruitment and through legal measures to increase the quota of recruits. The PNP shall also
focus on its internal cleansing program to prevent and put a stop to illegal and immoral
activities of its police officers. The PNP has implemented guidelines on administering
sanctions against erring personnel in support to its objective of having a credible police service.
In order to compensate on limited personnel, the PNP has implemented policies to motivate
and discipline its rank. It has also activated its Reactionary Standby Support Force which will
assist the public during disasters and emergencies.
The Region will continue to pursue collaboration with communities and other stakeholders in
its fight against all forms of crimes including the proliferation of illegal drugs. Law
enforcement agencies shall also continue to assist in promoting people’s health and safety amid
the COVID-19 pandemic through the implementation of quarantine rules among others.
Recommendations
Challenges Recommended Strategies Implementing Agencies
Increase in number of drug-affected barangays
Intensify collaboration among concerned agencies and LGUs down to barangay level for identification of drug personalities for police operations Strengthen barangay drug clearing operations
PNP, PDEA, BADACs
Police to population ratio of 1:1,379 in 2020 is still far from the standard ratio of 1:500
Maximize existing personnel specially for anti-illegal drug operations Utilize technologies for crime detection and surveillance
PNP
Proliferation of illegal-drugs by high-value individuals
Intensify campaign against illegal-drug operations focusing on high-value individuals
PNP
Repeat offenders from those who availed the plea-bargaining agreement
Avoid granting plea bargaining to recidivists or habitual offenders
DOJ, Judicial Courts
Major Programs and Projects • Barangay Drug Clearing Program
• PNP Internal Cleaning Program
• Retooled Community Support Program
• IEC Campaign on Security, Public Order, and Safety
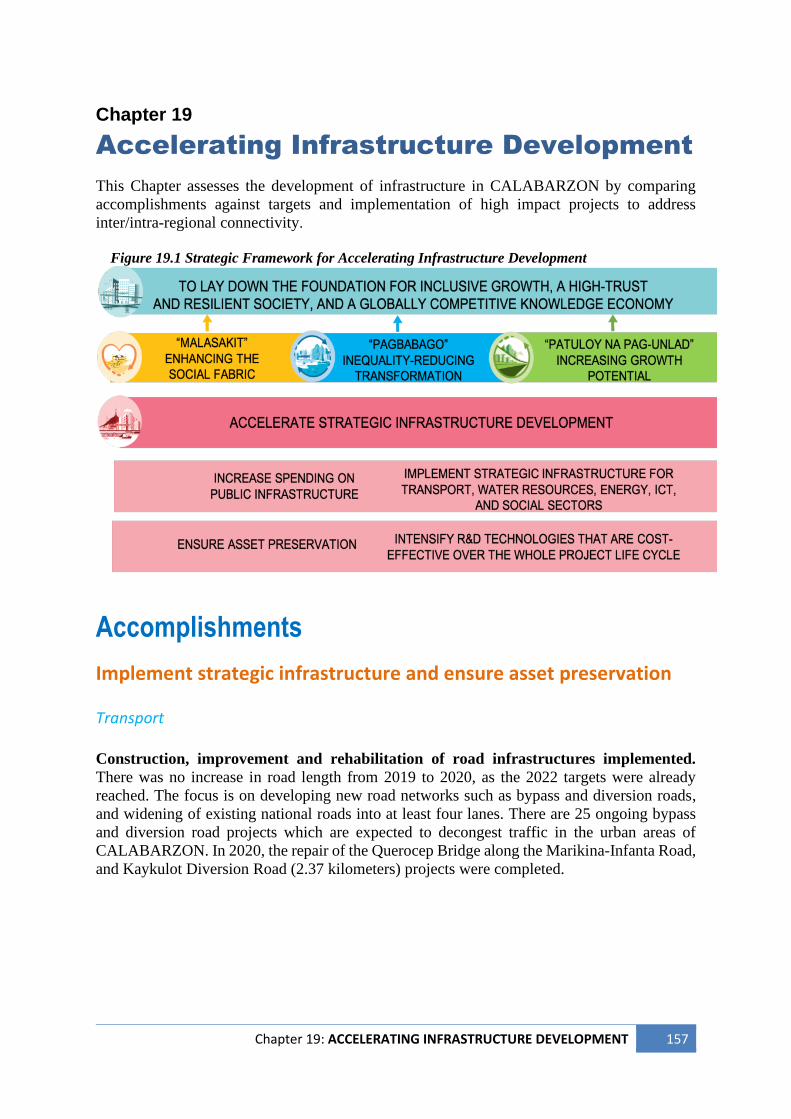
Chapter 19: ACCELERATING INFRASTRUCTURE DEVELOPMENT 157
Chapter 19
Accelerating Infrastructure Development
This Chapter assesses the development of infrastructure in CALABARZON by comparing
accomplishments against targets and implementation of high impact projects to address
inter/intra-regional connectivity.
Figure 19.1 Strategic Framework for Accelerating Infrastructure Development
Accomplishments
Implement strategic infrastructure and ensure asset preservation Transport Construction, improvement and rehabilitation of road infrastructures implemented.
There was no increase in road length from 2019 to 2020, as the 2022 targets were already
reached. The focus is on developing new road networks such as bypass and diversion roads,
and widening of existing national roads into at least four lanes. There are 25 ongoing bypass
and diversion road projects which are expected to decongest traffic in the urban areas of
CALABARZON. In 2020, the repair of the Querocep Bridge along the Marikina-Infanta Road,
and Kaykulot Diversion Road (2.37 kilometers) projects were completed.
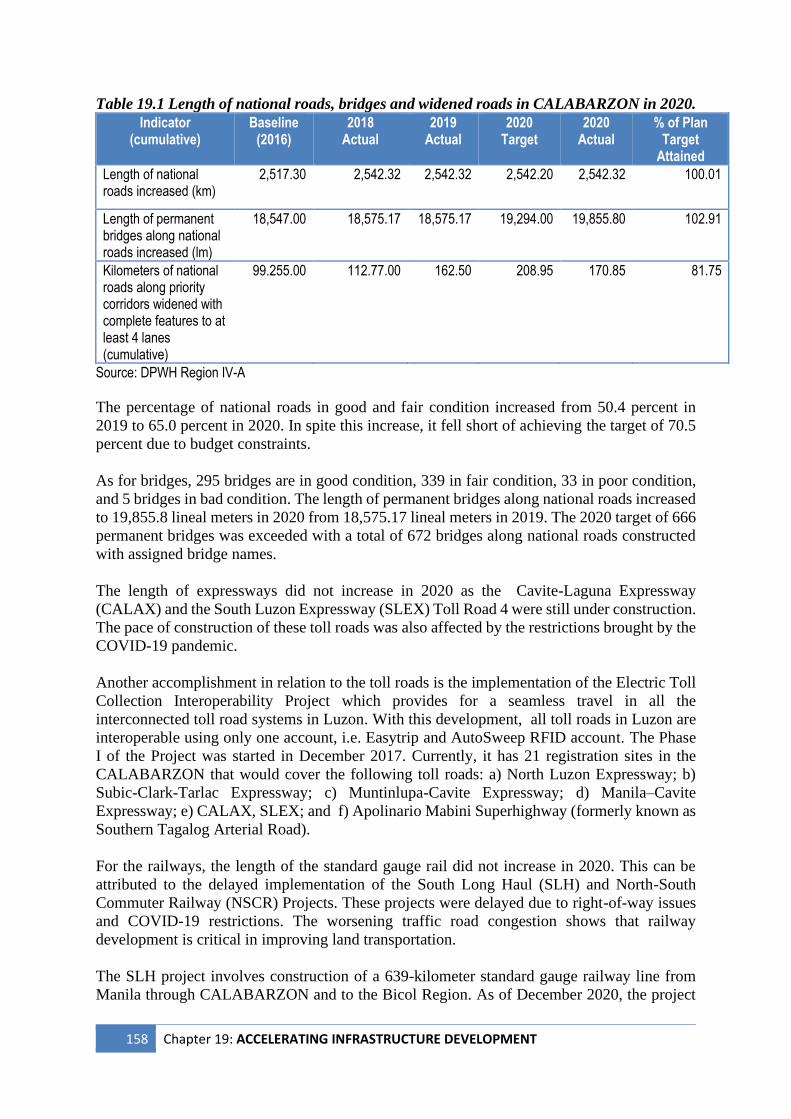
158 Chapter 19: ACCELERATING INFRASTRUCTURE DEVELOPMENT
Table 19.1 Length of national roads, bridges and widened roads in CALABARZON in 2020.
Indicator (cumulative)
Baseline (2016)
2018 Actual
2019 Actual
2020 Target
2020 Actual
% of Plan Target
Attained
Length of national roads increased (km)
2,517.30 2,542.32 2,542.32 2,542.20 2,542.32 100.01
Length of permanent bridges along national roads increased (lm)
18,547.00 18,575.17 18,575.17 19,294.00 19,855.80 102.91
Kilometers of national roads along priority corridors widened with complete features to at least 4 lanes (cumulative)
99.255.00 112.77.00 162.50 208.95 170.85 81.75
Source: DPWH Region IV-A
The percentage of national roads in good and fair condition increased from 50.4 percent in
2019 to 65.0 percent in 2020. In spite this increase, it fell short of achieving the target of 70.5
percent due to budget constraints.
As for bridges, 295 bridges are in good condition, 339 in fair condition, 33 in poor condition,
and 5 bridges in bad condition. The length of permanent bridges along national roads increased
to 19,855.8 lineal meters in 2020 from 18,575.17 lineal meters in 2019. The 2020 target of 666
permanent bridges was exceeded with a total of 672 bridges along national roads constructed
with assigned bridge names.
The length of expressways did not increase in 2020 as the Cavite-Laguna Expressway
(CALAX) and the South Luzon Expressway (SLEX) Toll Road 4 were still under construction.
The pace of construction of these toll roads was also affected by the restrictions brought by the
COVID-19 pandemic.
Another accomplishment in relation to the toll roads is the implementation of the Electric Toll
Collection Interoperability Project which provides for a seamless travel in all the
interconnected toll road systems in Luzon. With this development, all toll roads in Luzon are
interoperable using only one account, i.e. Easytrip and AutoSweep RFID account. The Phase
I of the Project was started in December 2017. Currently, it has 21 registration sites in the
CALABARZON that would cover the following toll roads: a) North Luzon Expressway; b)
Subic-Clark-Tarlac Expressway; c) Muntinlupa-Cavite Expressway; d) Manila–Cavite
Expressway; e) CALAX, SLEX; and f) Apolinario Mabini Superhighway (formerly known as
Southern Tagalog Arterial Road).
For the railways, the length of the standard gauge rail did not increase in 2020. This can be
attributed to the delayed implementation of the South Long Haul (SLH) and North-South
Commuter Railway (NSCR) Projects. These projects were delayed due to right-of-way issues
and COVID-19 restrictions. The worsening traffic road congestion shows that railway
development is critical in improving land transportation.
The SLH project involves construction of a 639-kilometer standard gauge railway line from
Manila through CALABARZON and to the Bicol Region. As of December 2020, the project
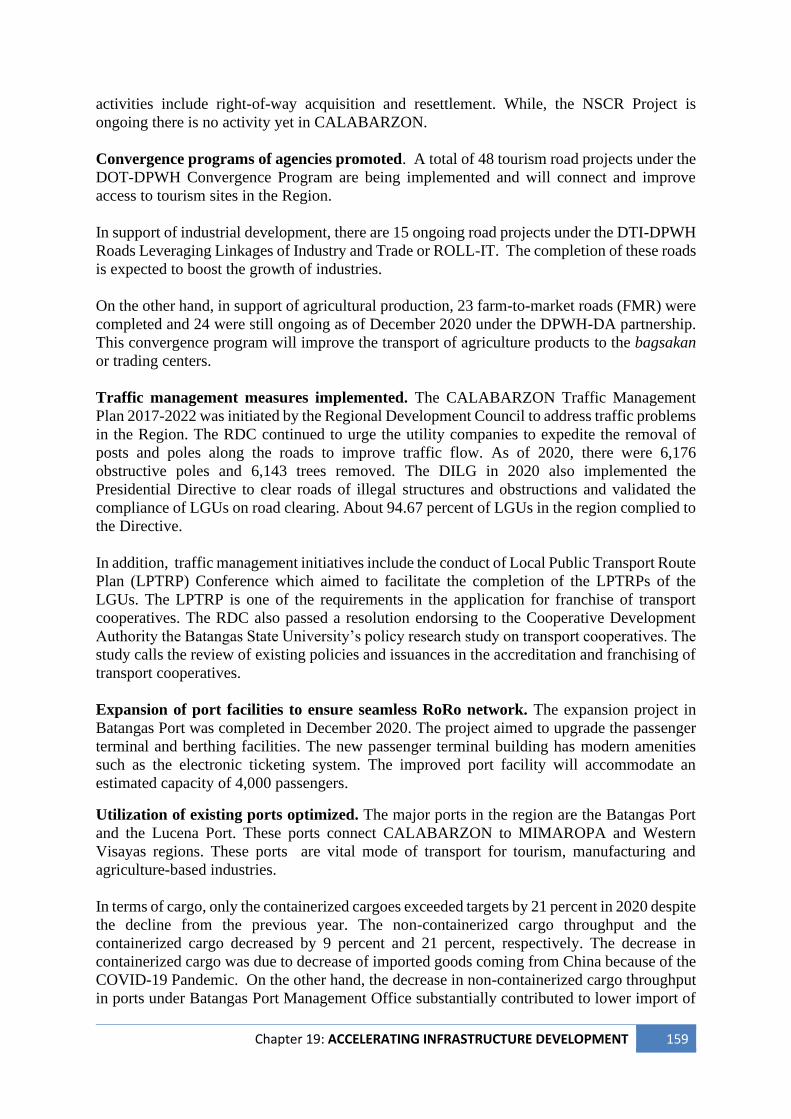
Chapter 19: ACCELERATING INFRASTRUCTURE DEVELOPMENT 159
activities include right-of-way acquisition and resettlement. While, the NSCR Project is
ongoing there is no activity yet in CALABARZON.
Convergence programs of agencies promoted. A total of 48 tourism road projects under the
DOT-DPWH Convergence Program are being implemented and will connect and improve
access to tourism sites in the Region.
In support of industrial development, there are 15 ongoing road projects under the DTI-DPWH
Roads Leveraging Linkages of Industry and Trade or ROLL-IT. The completion of these roads
is expected to boost the growth of industries.
On the other hand, in support of agricultural production, 23 farm-to-market roads (FMR) were
completed and 24 were still ongoing as of December 2020 under the DPWH-DA partnership.
This convergence program will improve the transport of agriculture products to the bagsakan
or trading centers.
Traffic management measures implemented. The CALABARZON Traffic Management
Plan 2017-2022 was initiated by the Regional Development Council to address traffic problems
in the Region. The RDC continued to urge the utility companies to expedite the removal of
posts and poles along the roads to improve traffic flow. As of 2020, there were 6,176
obstructive poles and 6,143 trees removed. The DILG in 2020 also implemented the
Presidential Directive to clear roads of illegal structures and obstructions and validated the
compliance of LGUs on road clearing. About 94.67 percent of LGUs in the region complied to
the Directive.
In addition, traffic management initiatives include the conduct of Local Public Transport Route
Plan (LPTRP) Conference which aimed to facilitate the completion of the LPTRPs of the
LGUs. The LPTRP is one of the requirements in the application for franchise of transport
cooperatives. The RDC also passed a resolution endorsing to the Cooperative Development
Authority the Batangas State University’s policy research study on transport cooperatives. The
study calls the review of existing policies and issuances in the accreditation and franchising of
transport cooperatives.
Expansion of port facilities to ensure seamless RoRo network. The expansion project in
Batangas Port was completed in December 2020. The project aimed to upgrade the passenger
terminal and berthing facilities. The new passenger terminal building has modern amenities
such as the electronic ticketing system. The improved port facility will accommodate an
estimated capacity of 4,000 passengers.
Utilization of existing ports optimized. The major ports in the region are the Batangas Port
and the Lucena Port. These ports connect CALABARZON to MIMAROPA and Western
Visayas regions. These ports are vital mode of transport for tourism, manufacturing and
agriculture-based industries.
In terms of cargo, only the containerized cargoes exceeded targets by 21 percent in 2020 despite
the decline from the previous year. The non-containerized cargo throughput and the
containerized cargo decreased by 9 percent and 21 percent, respectively. The decrease in
containerized cargo was due to decrease of imported goods coming from China because of the
COVID-19 Pandemic. On the other hand, the decrease in non-containerized cargo throughput
in ports under Batangas Port Management Office substantially contributed to lower import of
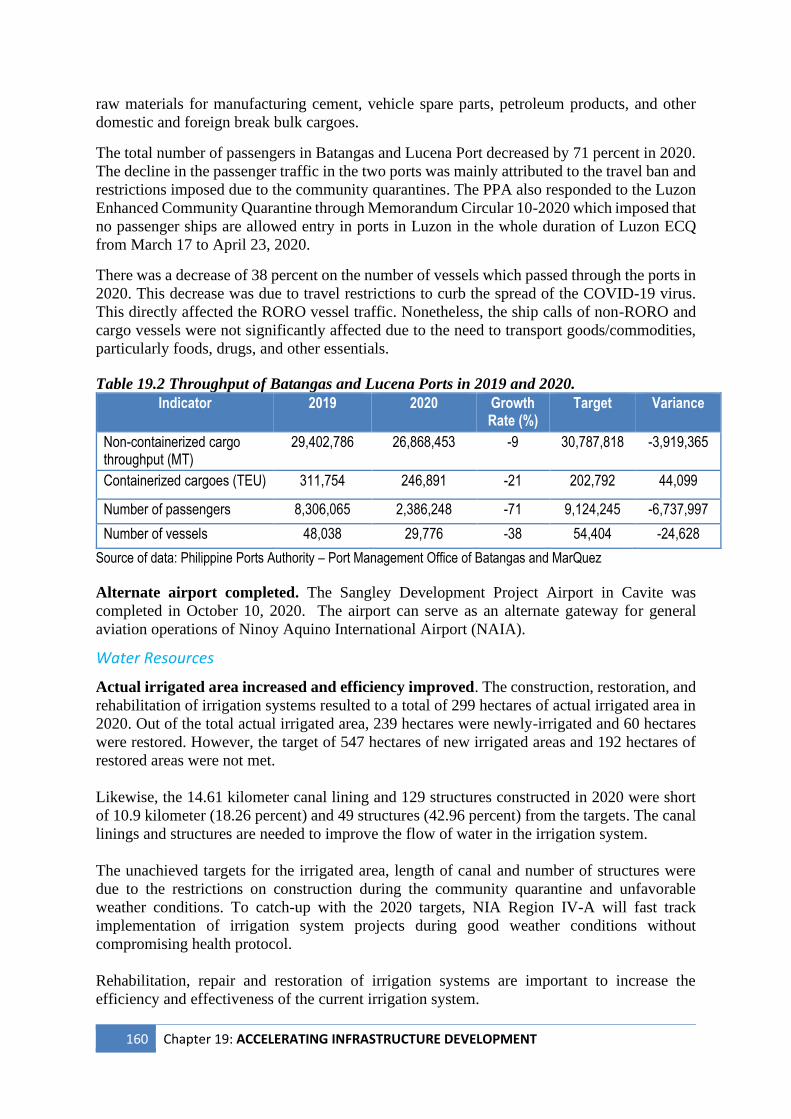
160 Chapter 19: ACCELERATING INFRASTRUCTURE DEVELOPMENT
raw materials for manufacturing cement, vehicle spare parts, petroleum products, and other
domestic and foreign break bulk cargoes.
The total number of passengers in Batangas and Lucena Port decreased by 71 percent in 2020.
The decline in the passenger traffic in the two ports was mainly attributed to the travel ban and
restrictions imposed due to the community quarantines. The PPA also responded to the Luzon
Enhanced Community Quarantine through Memorandum Circular 10-2020 which imposed that
no passenger ships are allowed entry in ports in Luzon in the whole duration of Luzon ECQ
from March 17 to April 23, 2020.
There was a decrease of 38 percent on the number of vessels which passed through the ports in
2020. This decrease was due to travel restrictions to curb the spread of the COVID-19 virus.
This directly affected the RORO vessel traffic. Nonetheless, the ship calls of non-RORO and
cargo vessels were not significantly affected due to the need to transport goods/commodities,
particularly foods, drugs, and other essentials.
Table 19.2 Throughput of Batangas and Lucena Ports in 2019 and 2020.
Indicator 2019 2020 Growth Rate (%)
Target Variance
Non-containerized cargo throughput (MT)
29,402,786 26,868,453 -9 30,787,818 -3,919,365
Containerized cargoes (TEU) 311,754 246,891 -21 202,792 44,099
Number of passengers 8,306,065 2,386,248 -71 9,124,245 -6,737,997
Number of vessels 48,038 29,776 -38 54,404 -24,628
Source of data: Philippine Ports Authority – Port Management Office of Batangas and MarQuez
Alternate airport completed. The Sangley Development Project Airport in Cavite was
completed in October 10, 2020. The airport can serve as an alternate gateway for general
aviation operations of Ninoy Aquino International Airport (NAIA).
Water Resources
Actual irrigated area increased and efficiency improved. The construction, restoration, and
rehabilitation of irrigation systems resulted to a total of 299 hectares of actual irrigated area in
2020. Out of the total actual irrigated area, 239 hectares were newly-irrigated and 60 hectares
were restored. However, the target of 547 hectares of new irrigated areas and 192 hectares of
restored areas were not met.
Likewise, the 14.61 kilometer canal lining and 129 structures constructed in 2020 were short
of 10.9 kilometer (18.26 percent) and 49 structures (42.96 percent) from the targets. The canal
linings and structures are needed to improve the flow of water in the irrigation system.
The unachieved targets for the irrigated area, length of canal and number of structures were
due to the restrictions on construction during the community quarantine and unfavorable
weather conditions. To catch-up with the 2020 targets, NIA Region IV-A will fast track
implementation of irrigation system projects during good weather conditions without
compromising health protocol.
Rehabilitation, repair and restoration of irrigation systems are important to increase the
efficiency and effectiveness of the current irrigation system.
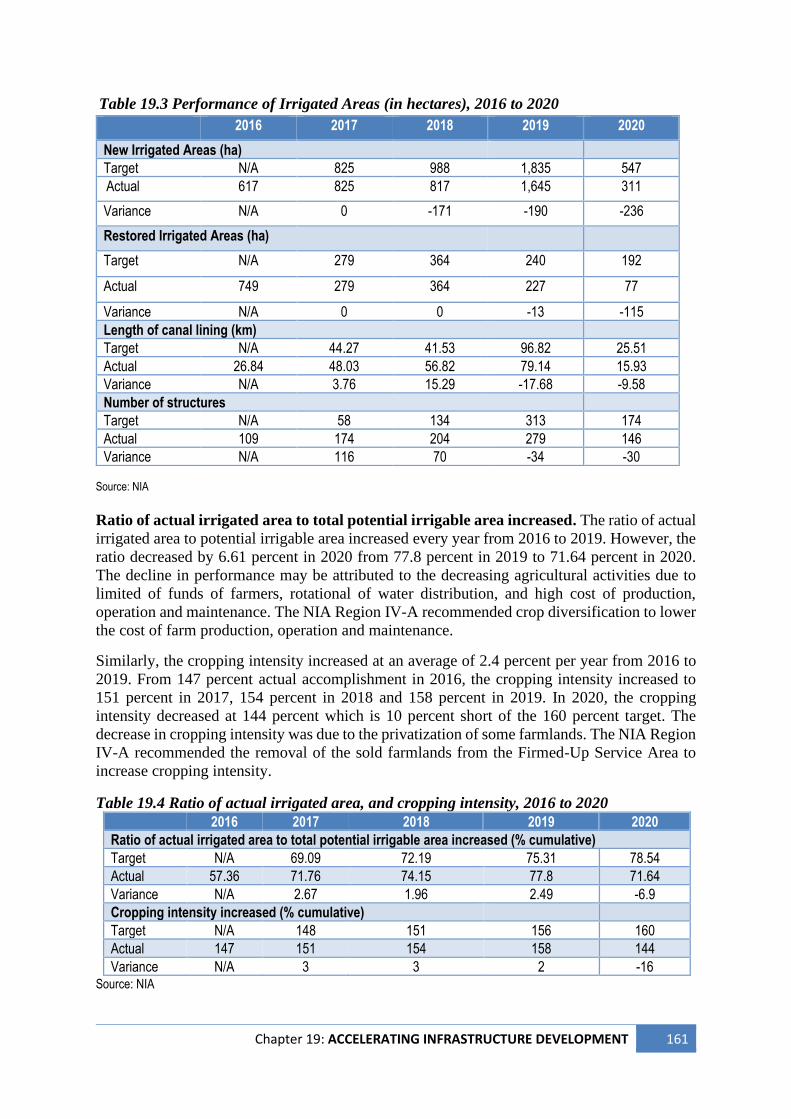
Chapter 19: ACCELERATING INFRASTRUCTURE DEVELOPMENT 161
Table 19.3 Performance of Irrigated Areas (in hectares), 2016 to 2020
Source: NIA
Ratio of actual irrigated area to total potential irrigable area increased. The ratio of actual
irrigated area to potential irrigable area increased every year from 2016 to 2019. However, the
ratio decreased by 6.61 percent in 2020 from 77.8 percent in 2019 to 71.64 percent in 2020.
The decline in performance may be attributed to the decreasing agricultural activities due to
limited of funds of farmers, rotational of water distribution, and high cost of production,
operation and maintenance. The NIA Region IV-A recommended crop diversification to lower
the cost of farm production, operation and maintenance.
Similarly, the cropping intensity increased at an average of 2.4 percent per year from 2016 to
2019. From 147 percent actual accomplishment in 2016, the cropping intensity increased to
151 percent in 2017, 154 percent in 2018 and 158 percent in 2019. In 2020, the cropping
intensity decreased at 144 percent which is 10 percent short of the 160 percent target. The
decrease in cropping intensity was due to the privatization of some farmlands. The NIA Region
IV-A recommended the removal of the sold farmlands from the Firmed-Up Service Area to
increase cropping intensity.
Table 19.4 Ratio of actual irrigated area, and cropping intensity, 2016 to 2020
2016 2017 2018 2019 2020
Ratio of actual irrigated area to total potential irrigable area increased (% cumulative)
Target N/A 69.09 72.19 75.31 78.54
Actual 57.36 71.76 74.15 77.8 71.64
Variance N/A 2.67 1.96 2.49 -6.9
Cropping intensity increased (% cumulative)
Target N/A 148 151 156 160
Actual 147 151 154 158 144
Variance N/A 3 3 2 -16 Source: NIA
2016 2017 2018 2019 2020
New Irrigated Areas (ha)
Target N/A 825 988 1,835 547
Actual 617 825 817 1,645 311
Variance N/A 0 -171 -190 -236
Restored Irrigated Areas (ha)
Target N/A 279 364 240 192
Actual 749 279 364 227 77
Variance N/A 0 0 -13 -115
Length of canal lining (km)
Target N/A 44.27 41.53 96.82 25.51
Actual 26.84 48.03 56.82 79.14 15.93
Variance N/A 3.76 15.29 -17.68 -9.58
Number of structures
Target N/A 58 134 313 174
Actual 109 174 204 279 146
Variance N/A 116 70 -34 -30
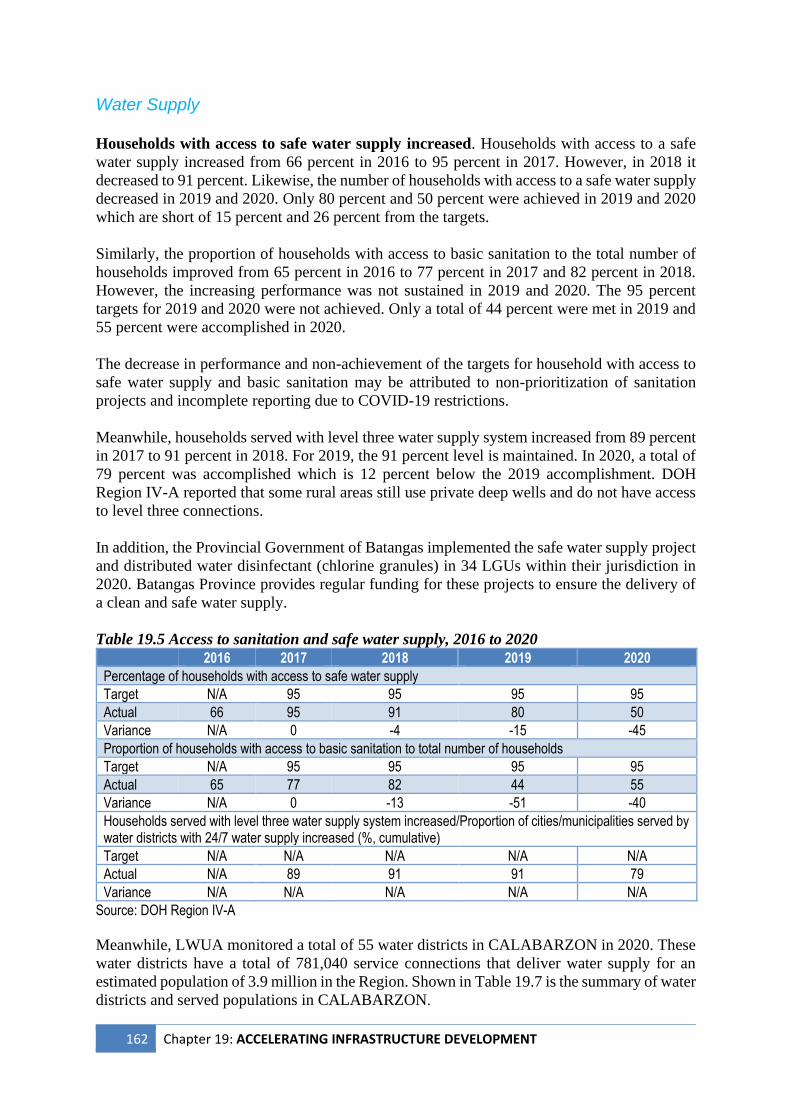
162 Chapter 19: ACCELERATING INFRASTRUCTURE DEVELOPMENT
Water Supply Households with access to safe water supply increased. Households with access to a safe
water supply increased from 66 percent in 2016 to 95 percent in 2017. However, in 2018 it
decreased to 91 percent. Likewise, the number of households with access to a safe water supply
decreased in 2019 and 2020. Only 80 percent and 50 percent were achieved in 2019 and 2020
which are short of 15 percent and 26 percent from the targets.
Similarly, the proportion of households with access to basic sanitation to the total number of
households improved from 65 percent in 2016 to 77 percent in 2017 and 82 percent in 2018.
However, the increasing performance was not sustained in 2019 and 2020. The 95 percent
targets for 2019 and 2020 were not achieved. Only a total of 44 percent were met in 2019 and
55 percent were accomplished in 2020.
The decrease in performance and non-achievement of the targets for household with access to
safe water supply and basic sanitation may be attributed to non-prioritization of sanitation
projects and incomplete reporting due to COVID-19 restrictions.
Meanwhile, households served with level three water supply system increased from 89 percent
in 2017 to 91 percent in 2018. For 2019, the 91 percent level is maintained. In 2020, a total of
79 percent was accomplished which is 12 percent below the 2019 accomplishment. DOH
Region IV-A reported that some rural areas still use private deep wells and do not have access
to level three connections.
In addition, the Provincial Government of Batangas implemented the safe water supply project
and distributed water disinfectant (chlorine granules) in 34 LGUs within their jurisdiction in
2020. Batangas Province provides regular funding for these projects to ensure the delivery of
a clean and safe water supply.
Table 19.5 Access to sanitation and safe water supply, 2016 to 2020
2016 2017 2018 2019 2020
Percentage of households with access to safe water supply
Target N/A 95 95 95 95
Actual 66 95 91 80 50
Variance N/A 0 -4 -15 -45
Proportion of households with access to basic sanitation to total number of households
Target N/A 95 95 95 95
Actual 65 77 82 44 55
Variance N/A 0 -13 -51 -40
Households served with level three water supply system increased/Proportion of cities/municipalities served by water districts with 24/7 water supply increased (%, cumulative)
Target N/A N/A N/A N/A N/A
Actual N/A 89 91 91 79
Variance N/A N/A N/A N/A N/A
Source: DOH Region IV-A
Meanwhile, LWUA monitored a total of 55 water districts in CALABARZON in 2020. These
water districts have a total of 781,040 service connections that deliver water supply for an
estimated population of 3.9 million in the Region. Shown in Table 19.7 is the summary of water
districts and served populations in CALABARZON.
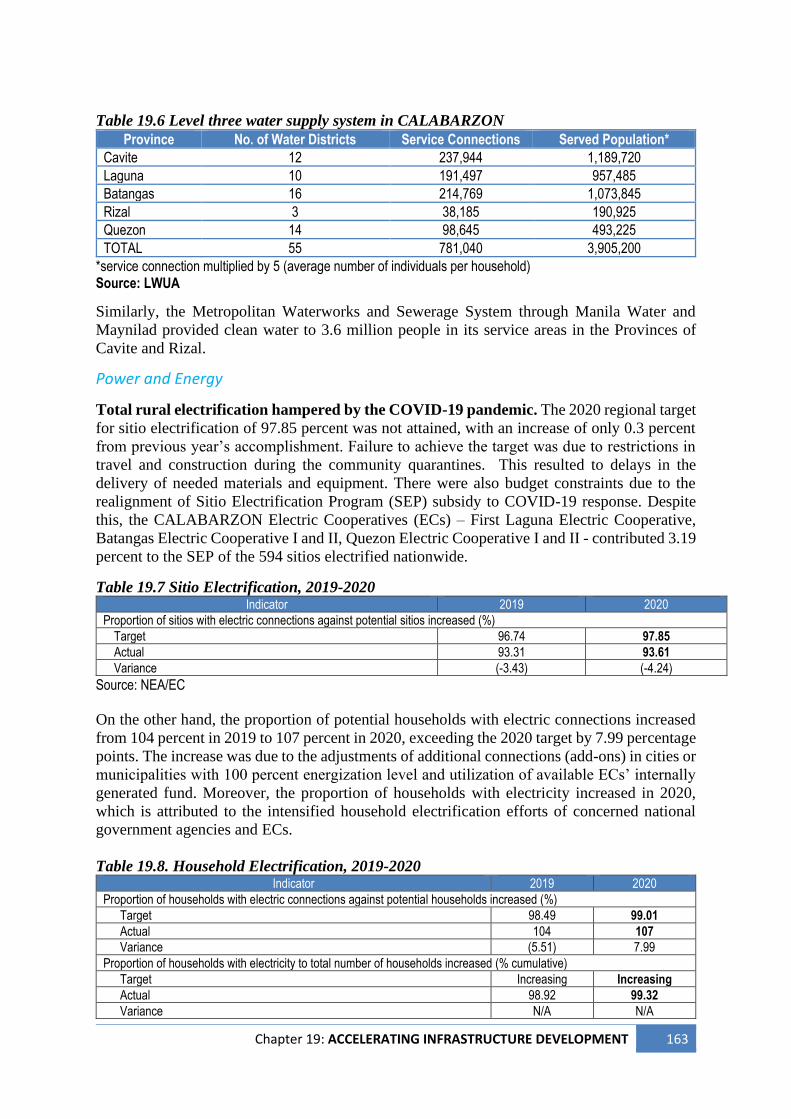
Chapter 19: ACCELERATING INFRASTRUCTURE DEVELOPMENT 163
Table 19.6 Level three water supply system in CALABARZON
Province No. of Water Districts Service Connections Served Population*
Cavite 12 237,944 1,189,720
Laguna 10 191,497 957,485
Batangas 16 214,769 1,073,845
Rizal 3 38,185 190,925
Quezon 14 98,645 493,225
TOTAL 55 781,040 3,905,200
*service connection multiplied by 5 (average number of individuals per household) Source: LWUA
Similarly, the Metropolitan Waterworks and Sewerage System through Manila Water and
Maynilad provided clean water to 3.6 million people in its service areas in the Provinces of
Cavite and Rizal.
Power and Energy
Total rural electrification hampered by the COVID-19 pandemic. The 2020 regional target
for sitio electrification of 97.85 percent was not attained, with an increase of only 0.3 percent
from previous year’s accomplishment. Failure to achieve the target was due to restrictions in
travel and construction during the community quarantines. This resulted to delays in the
delivery of needed materials and equipment. There were also budget constraints due to the
realignment of Sitio Electrification Program (SEP) subsidy to COVID-19 response. Despite
this, the CALABARZON Electric Cooperatives (ECs) – First Laguna Electric Cooperative,
Batangas Electric Cooperative I and II, Quezon Electric Cooperative I and II - contributed 3.19
percent to the SEP of the 594 sitios electrified nationwide.
Table 19.7 Sitio Electrification, 2019-2020 Indicator 2019 2020
Proportion of sitios with electric connections against potential sitios increased (%) Target 96.74 97.85 Actual 93.31 93.61 Variance (-3.43) (-4.24)
Source: NEA/EC
On the other hand, the proportion of potential households with electric connections increased
from 104 percent in 2019 to 107 percent in 2020, exceeding the 2020 target by 7.99 percentage
points. The increase was due to the adjustments of additional connections (add-ons) in cities or
municipalities with 100 percent energization level and utilization of available ECs’ internally
generated fund. Moreover, the proportion of households with electricity increased in 2020,
which is attributed to the intensified household electrification efforts of concerned national
government agencies and ECs.
Table 19.8. Household Electrification, 2019-2020 Indicator 2019 2020
Proportion of households with electric connections against potential households increased (%) Target 98.49 99.01 Actual 104 107 Variance (5.51) 7.99
Proportion of households with electricity to total number of households increased (% cumulative) Target Increasing Increasing Actual 98.92 99.32 Variance N/A N/A
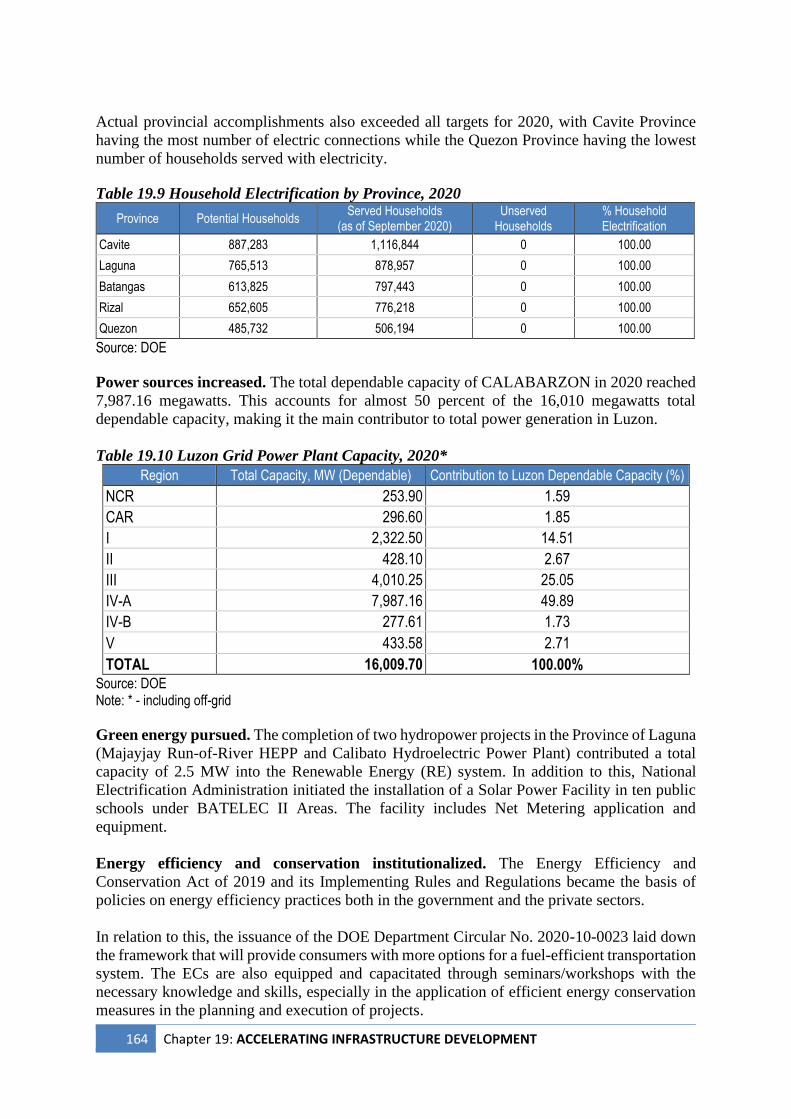
164 Chapter 19: ACCELERATING INFRASTRUCTURE DEVELOPMENT
Actual provincial accomplishments also exceeded all targets for 2020, with Cavite Province
having the most number of electric connections while the Quezon Province having the lowest
number of households served with electricity.
Table 19.9 Household Electrification by Province, 2020
Province Potential Households Served Households
(as of September 2020) Unserved
Households % Household Electrification
Cavite 887,283 1,116,844 0 100.00
Laguna 765,513 878,957 0 100.00
Batangas 613,825 797,443 0 100.00
Rizal 652,605 776,218 0 100.00
Quezon 485,732 506,194 0 100.00
Source: DOE
Power sources increased. The total dependable capacity of CALABARZON in 2020 reached
7,987.16 megawatts. This accounts for almost 50 percent of the 16,010 megawatts total
dependable capacity, making it the main contributor to total power generation in Luzon.
Table 19.10 Luzon Grid Power Plant Capacity, 2020*
Region Total Capacity, MW (Dependable) Contribution to Luzon Dependable Capacity (%)
NCR 253.90 1.59
CAR 296.60 1.85
I 2,322.50 14.51
II 428.10 2.67
III 4,010.25 25.05
IV-A 7,987.16 49.89
IV-B 277.61 1.73
V 433.58 2.71
TOTAL 16,009.70 100.00% Source: DOE Note: * - including off-grid
Green energy pursued. The completion of two hydropower projects in the Province of Laguna
(Majayjay Run-of-River HEPP and Calibato Hydroelectric Power Plant) contributed a total
capacity of 2.5 MW into the Renewable Energy (RE) system. In addition to this, National
Electrification Administration initiated the installation of a Solar Power Facility in ten public
schools under BATELEC II Areas. The facility includes Net Metering application and
equipment.
Energy efficiency and conservation institutionalized. The Energy Efficiency and
Conservation Act of 2019 and its Implementing Rules and Regulations became the basis of
policies on energy efficiency practices both in the government and the private sectors.
In relation to this, the issuance of the DOE Department Circular No. 2020-10-0023 laid down
the framework that will provide consumers with more options for a fuel-efficient transportation
system. The ECs are also equipped and capacitated through seminars/workshops with the
necessary knowledge and skills, especially in the application of efficient energy conservation
measures in the planning and execution of projects.
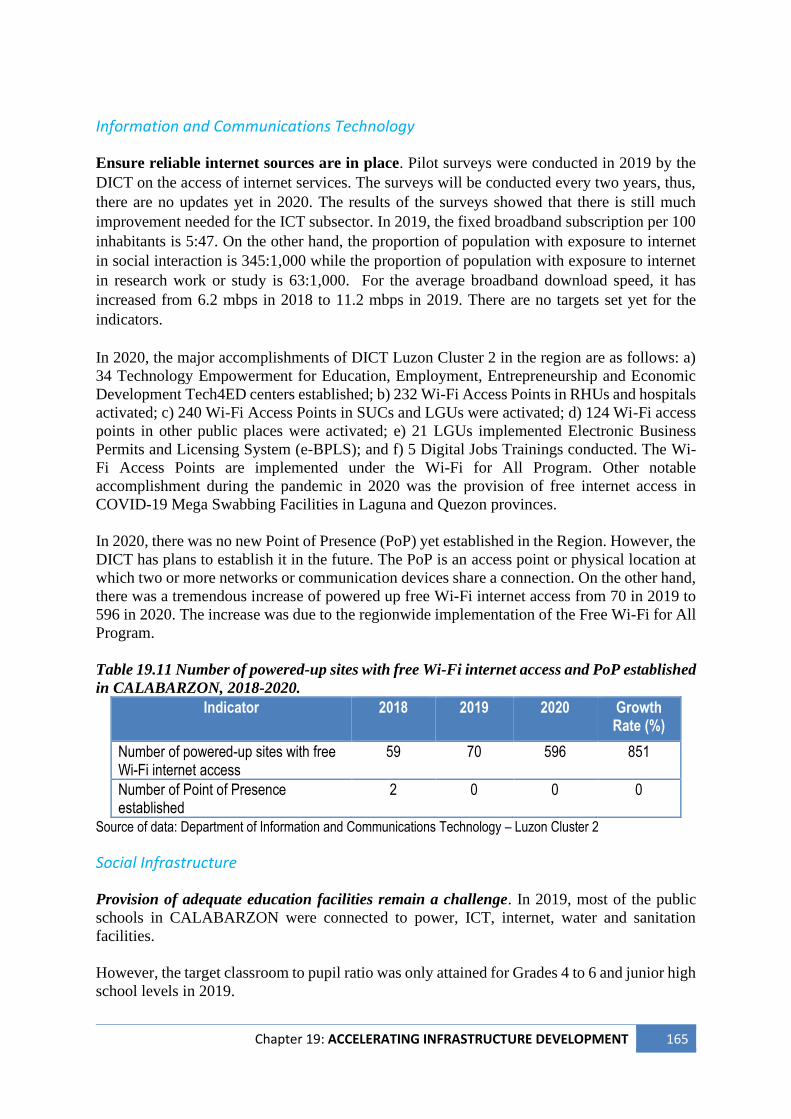
Chapter 19: ACCELERATING INFRASTRUCTURE DEVELOPMENT 165
Information and Communications Technology
Ensure reliable internet sources are in place. Pilot surveys were conducted in 2019 by the
DICT on the access of internet services. The surveys will be conducted every two years, thus,
there are no updates yet in 2020. The results of the surveys showed that there is still much
improvement needed for the ICT subsector. In 2019, the fixed broadband subscription per 100
inhabitants is 5:47. On the other hand, the proportion of population with exposure to internet
in social interaction is 345:1,000 while the proportion of population with exposure to internet
in research work or study is 63:1,000. For the average broadband download speed, it has
increased from 6.2 mbps in 2018 to 11.2 mbps in 2019. There are no targets set yet for the
indicators.
In 2020, the major accomplishments of DICT Luzon Cluster 2 in the region are as follows: a)
34 Technology Empowerment for Education, Employment, Entrepreneurship and Economic
Development Tech4ED centers established; b) 232 Wi-Fi Access Points in RHUs and hospitals
activated; c) 240 Wi-Fi Access Points in SUCs and LGUs were activated; d) 124 Wi-Fi access
points in other public places were activated; e) 21 LGUs implemented Electronic Business
Permits and Licensing System (e-BPLS); and f) 5 Digital Jobs Trainings conducted. The Wi-
Fi Access Points are implemented under the Wi-Fi for All Program. Other notable
accomplishment during the pandemic in 2020 was the provision of free internet access in
COVID-19 Mega Swabbing Facilities in Laguna and Quezon provinces.
In 2020, there was no new Point of Presence (PoP) yet established in the Region. However, the
DICT has plans to establish it in the future. The PoP is an access point or physical location at
which two or more networks or communication devices share a connection. On the other hand,
there was a tremendous increase of powered up free Wi-Fi internet access from 70 in 2019 to
596 in 2020. The increase was due to the regionwide implementation of the Free Wi-Fi for All
Program.
Table 19.11 Number of powered-up sites with free Wi-Fi internet access and PoP established
in CALABARZON, 2018-2020.
Indicator 2018 2019 2020 Growth Rate (%)
Number of powered-up sites with free Wi-Fi internet access
59 70 596 851
Number of Point of Presence established
2 0 0 0
Source of data: Department of Information and Communications Technology – Luzon Cluster 2
Social Infrastructure
Provision of adequate education facilities remain a challenge. In 2019, most of the public
schools in CALABARZON were connected to power, ICT, internet, water and sanitation
facilities.
However, the target classroom to pupil ratio was only attained for Grades 4 to 6 and junior high
school levels in 2019.
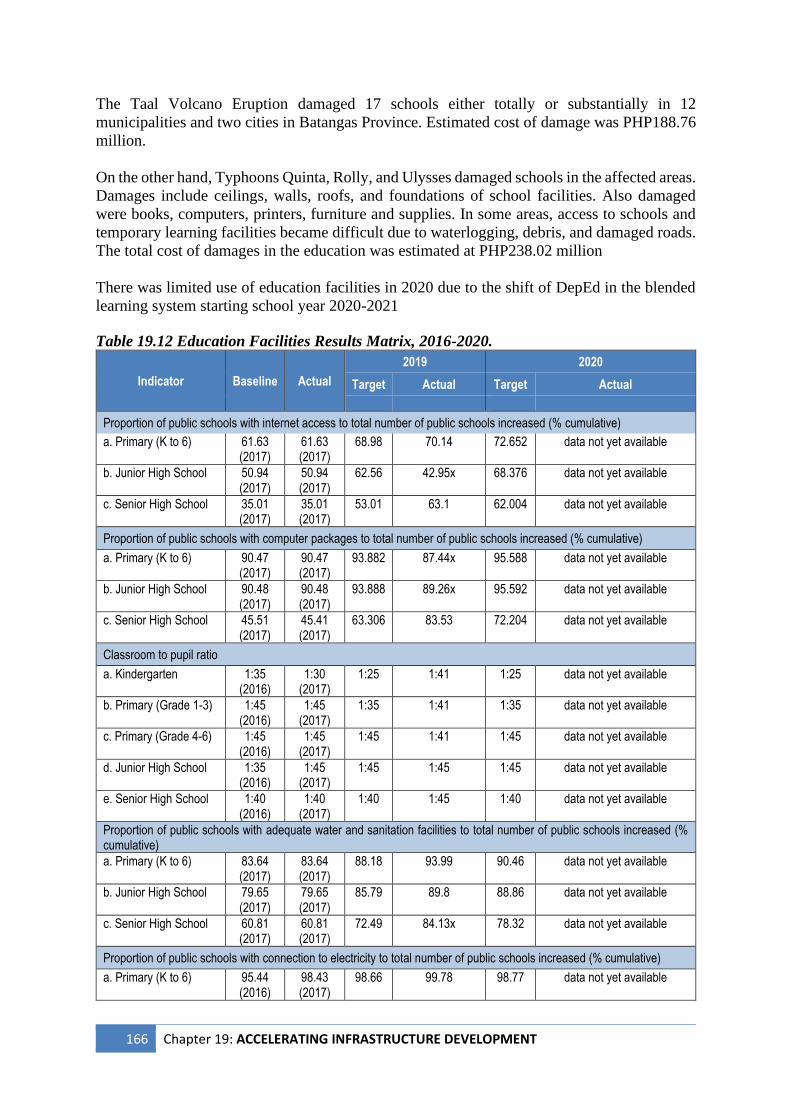
166 Chapter 19: ACCELERATING INFRASTRUCTURE DEVELOPMENT
The Taal Volcano Eruption damaged 17 schools either totally or substantially in 12
municipalities and two cities in Batangas Province. Estimated cost of damage was PHP188.76
million.
On the other hand, Typhoons Quinta, Rolly, and Ulysses damaged schools in the affected areas.
Damages include ceilings, walls, roofs, and foundations of school facilities. Also damaged
were books, computers, printers, furniture and supplies. In some areas, access to schools and
temporary learning facilities became difficult due to waterlogging, debris, and damaged roads.
The total cost of damages in the education was estimated at PHP238.02 million
There was limited use of education facilities in 2020 due to the shift of DepEd in the blended
learning system starting school year 2020-2021 Table 19.12 Education Facilities Results Matrix, 2016-2020.
Indicator Baseline Actual
2019 2020
Target Actual Target Actual
Proportion of public schools with internet access to total number of public schools increased (% cumulative)
a. Primary (K to 6) 61.63 (2017)
61.63 (2017)
68.98 70.14 72.652 data not yet available
b. Junior High School 50.94 (2017)
50.94 (2017)
62.56 42.95x 68.376 data not yet available
c. Senior High School 35.01 (2017)
35.01 (2017)
53.01 63.1 62.004 data not yet available
Proportion of public schools with computer packages to total number of public schools increased (% cumulative)
a. Primary (K to 6) 90.47 (2017)
90.47 (2017)
93.882 87.44x 95.588 data not yet available
b. Junior High School 90.48 (2017)
90.48 (2017)
93.888 89.26x 95.592 data not yet available
c. Senior High School 45.51 (2017)
45.41 (2017)
63.306 83.53 72.204 data not yet available
Classroom to pupil ratio
a. Kindergarten 1:35 (2016)
1:30 (2017)
1:25 1:41 1:25 data not yet available
b. Primary (Grade 1-3) 1:45 (2016)
1:45 (2017)
1:35 1:41 1:35 data not yet available
c. Primary (Grade 4-6) 1:45 (2016)
1:45 (2017)
1:45 1:41 1:45 data not yet available
d. Junior High School 1:35 (2016)
1:45 (2017)
1:45 1:45 1:45 data not yet available
e. Senior High School 1:40 (2016)
1:40 (2017)
1:40 1:45 1:40 data not yet available
Proportion of public schools with adequate water and sanitation facilities to total number of public schools increased (% cumulative)
a. Primary (K to 6) 83.64 (2017)
83.64 (2017)
88.18 93.99 90.46 data not yet available
b. Junior High School 79.65 (2017)
79.65 (2017)
85.79 89.8 88.86 data not yet available
c. Senior High School 60.81 (2017)
60.81 (2017)
72.49 84.13x 78.32 data not yet available
Proportion of public schools with connection to electricity to total number of public schools increased (% cumulative)
a. Primary (K to 6) 95.44 (2016)
98.43 (2017)
98.66 99.78 98.77 data not yet available
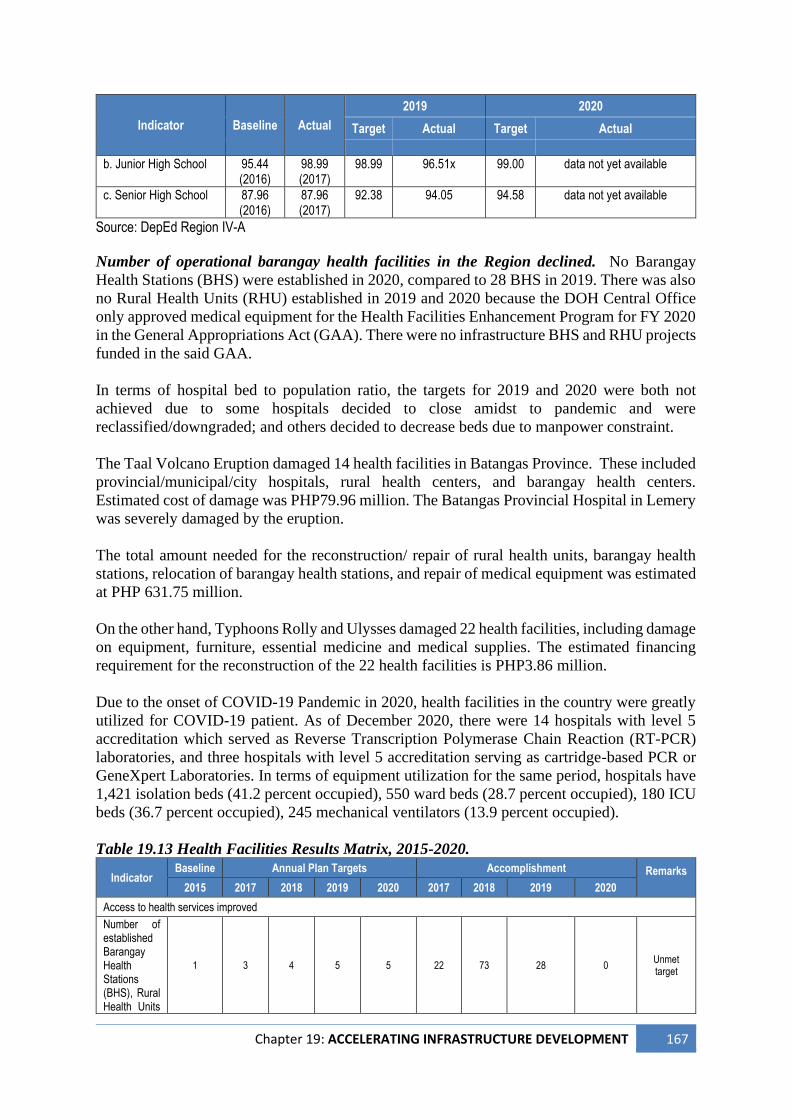
Chapter 19: ACCELERATING INFRASTRUCTURE DEVELOPMENT 167
Indicator Baseline Actual
2019 2020
Target Actual Target Actual
b. Junior High School 95.44 (2016)
98.99 (2017)
98.99 96.51x 99.00 data not yet available
c. Senior High School 87.96 (2016)
87.96 (2017)
92.38 94.05 94.58 data not yet available
Source: DepEd Region IV-A
Number of operational barangay health facilities in the Region declined. No Barangay
Health Stations (BHS) were established in 2020, compared to 28 BHS in 2019. There was also
no Rural Health Units (RHU) established in 2019 and 2020 because the DOH Central Office
only approved medical equipment for the Health Facilities Enhancement Program for FY 2020
in the General Appropriations Act (GAA). There were no infrastructure BHS and RHU projects
funded in the said GAA.
In terms of hospital bed to population ratio, the targets for 2019 and 2020 were both not
achieved due to some hospitals decided to close amidst to pandemic and were
reclassified/downgraded; and others decided to decrease beds due to manpower constraint.
The Taal Volcano Eruption damaged 14 health facilities in Batangas Province. These included
provincial/municipal/city hospitals, rural health centers, and barangay health centers.
Estimated cost of damage was PHP79.96 million. The Batangas Provincial Hospital in Lemery
was severely damaged by the eruption.
The total amount needed for the reconstruction/ repair of rural health units, barangay health
stations, relocation of barangay health stations, and repair of medical equipment was estimated
at PHP 631.75 million.
On the other hand, Typhoons Rolly and Ulysses damaged 22 health facilities, including damage
on equipment, furniture, essential medicine and medical supplies. The estimated financing
requirement for the reconstruction of the 22 health facilities is PHP3.86 million.
Due to the onset of COVID-19 Pandemic in 2020, health facilities in the country were greatly
utilized for COVID-19 patient. As of December 2020, there were 14 hospitals with level 5
accreditation which served as Reverse Transcription Polymerase Chain Reaction (RT-PCR)
laboratories, and three hospitals with level 5 accreditation serving as cartridge-based PCR or
GeneXpert Laboratories. In terms of equipment utilization for the same period, hospitals have
1,421 isolation beds (41.2 percent occupied), 550 ward beds (28.7 percent occupied), 180 ICU
beds (36.7 percent occupied), 245 mechanical ventilators (13.9 percent occupied).
Table 19.13 Health Facilities Results Matrix, 2015-2020.
Indicator Baseline Annual Plan Targets Accomplishment Remarks
2015 2017 2018 2019 2020 2017 2018 2019 2020
Access to health services improved
Number of established Barangay Health Stations (BHS), Rural Health Units
1 3 4 5 5 22 73 28 0 Unmet target
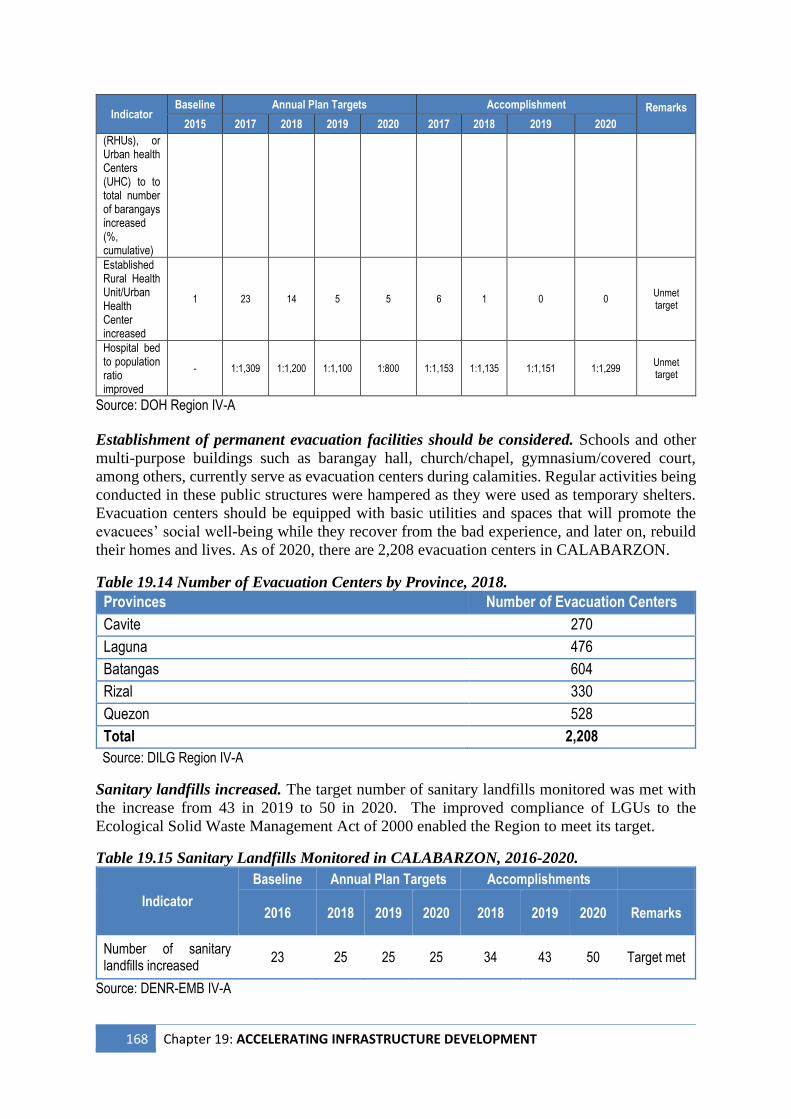
168 Chapter 19: ACCELERATING INFRASTRUCTURE DEVELOPMENT
Indicator Baseline Annual Plan Targets Accomplishment Remarks
2015 2017 2018 2019 2020 2017 2018 2019 2020
(RHUs), or Urban health Centers (UHC) to to total number of barangays increased (%, cumulative)
Established Rural Health Unit/Urban Health Center increased
1 23 14 5 5 6 1 0 0 Unmet target
Hospital bed to population ratio improved
- 1:1,309 1:1,200 1:1,100 1:800 1:1,153 1:1,135 1:1,151 1:1,299 Unmet target
Source: DOH Region IV-A
Establishment of permanent evacuation facilities should be considered. Schools and other
multi-purpose buildings such as barangay hall, church/chapel, gymnasium/covered court,
among others, currently serve as evacuation centers during calamities. Regular activities being
conducted in these public structures were hampered as they were used as temporary shelters.
Evacuation centers should be equipped with basic utilities and spaces that will promote the
evacuees’ social well-being while they recover from the bad experience, and later on, rebuild
their homes and lives. As of 2020, there are 2,208 evacuation centers in CALABARZON.
Table 19.14 Number of Evacuation Centers by Province, 2018.
Provinces Number of Evacuation Centers
Cavite 270
Laguna 476
Batangas 604
Rizal 330
Quezon 528
Total 2,208
Source: DILG Region IV-A
Sanitary landfills increased. The target number of sanitary landfills monitored was met with
the increase from 43 in 2019 to 50 in 2020. The improved compliance of LGUs to the
Ecological Solid Waste Management Act of 2000 enabled the Region to meet its target.
Table 19.15 Sanitary Landfills Monitored in CALABARZON, 2016-2020.
Indicator
Baseline Annual Plan Targets Accomplishments
2016 2018 2019 2020 2018 2019 2020 Remarks
Number of sanitary landfills increased
23 25 25 25 34 43 50 Target met
Source: DENR-EMB IV-A
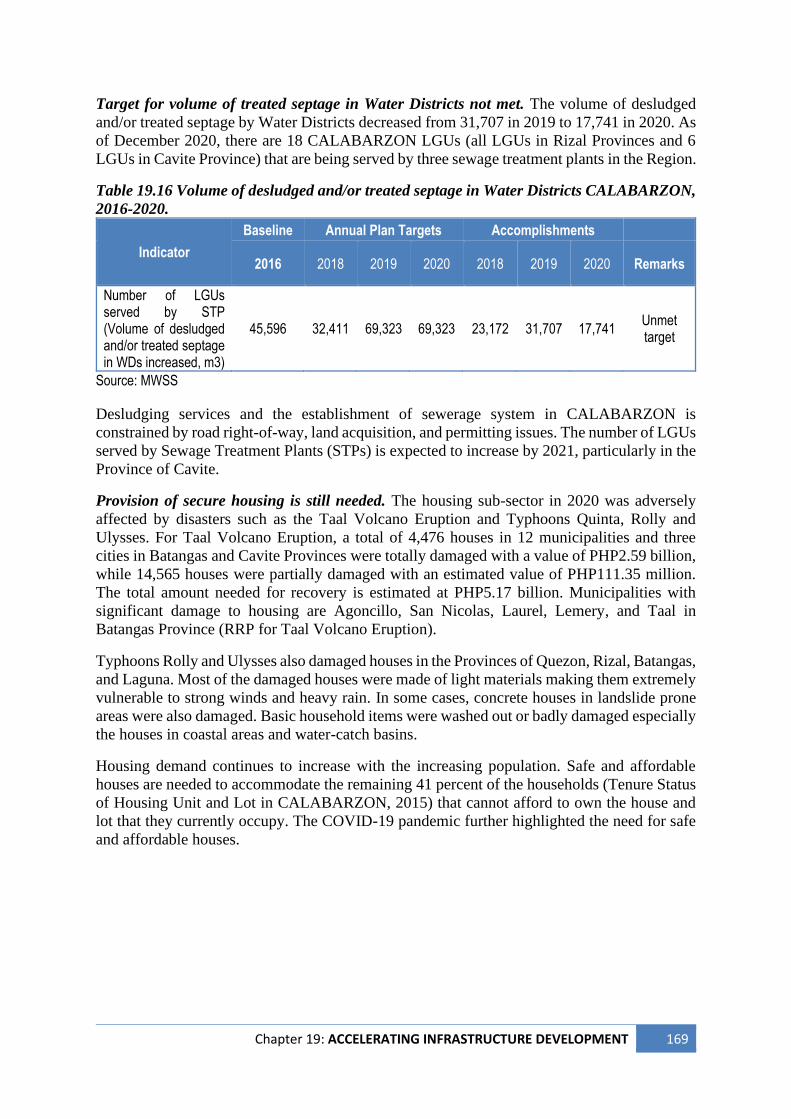
Chapter 19: ACCELERATING INFRASTRUCTURE DEVELOPMENT 169
Target for volume of treated septage in Water Districts not met. The volume of desludged
and/or treated septage by Water Districts decreased from 31,707 in 2019 to 17,741 in 2020. As
of December 2020, there are 18 CALABARZON LGUs (all LGUs in Rizal Provinces and 6
LGUs in Cavite Province) that are being served by three sewage treatment plants in the Region.
Table 19.16 Volume of desludged and/or treated septage in Water Districts CALABARZON,
2016-2020.
Indicator
Baseline Annual Plan Targets Accomplishments
2016 2018 2019 2020 2018 2019 2020 Remarks
Number of LGUs served by STP (Volume of desludged and/or treated septage in WDs increased, m3)
45,596 32,411 69,323 69,323 23,172 31,707 17,741 Unmet target
Source: MWSS
Desludging services and the establishment of sewerage system in CALABARZON is
constrained by road right-of-way, land acquisition, and permitting issues. The number of LGUs
served by Sewage Treatment Plants (STPs) is expected to increase by 2021, particularly in the
Province of Cavite.
Provision of secure housing is still needed. The housing sub-sector in 2020 was adversely
affected by disasters such as the Taal Volcano Eruption and Typhoons Quinta, Rolly and
Ulysses. For Taal Volcano Eruption, a total of 4,476 houses in 12 municipalities and three
cities in Batangas and Cavite Provinces were totally damaged with a value of PHP2.59 billion,
while 14,565 houses were partially damaged with an estimated value of PHP111.35 million.
The total amount needed for recovery is estimated at PHP5.17 billion. Municipalities with
significant damage to housing are Agoncillo, San Nicolas, Laurel, Lemery, and Taal in
Batangas Province (RRP for Taal Volcano Eruption).
Typhoons Rolly and Ulysses also damaged houses in the Provinces of Quezon, Rizal, Batangas,
and Laguna. Most of the damaged houses were made of light materials making them extremely
vulnerable to strong winds and heavy rain. In some cases, concrete houses in landslide prone
areas were also damaged. Basic household items were washed out or badly damaged especially
the houses in coastal areas and water-catch basins.
Housing demand continues to increase with the increasing population. Safe and affordable
houses are needed to accommodate the remaining 41 percent of the households (Tenure Status
of Housing Unit and Lot in CALABARZON, 2015) that cannot afford to own the house and
lot that they currently occupy. The COVID-19 pandemic further highlighted the need for safe
and affordable houses.
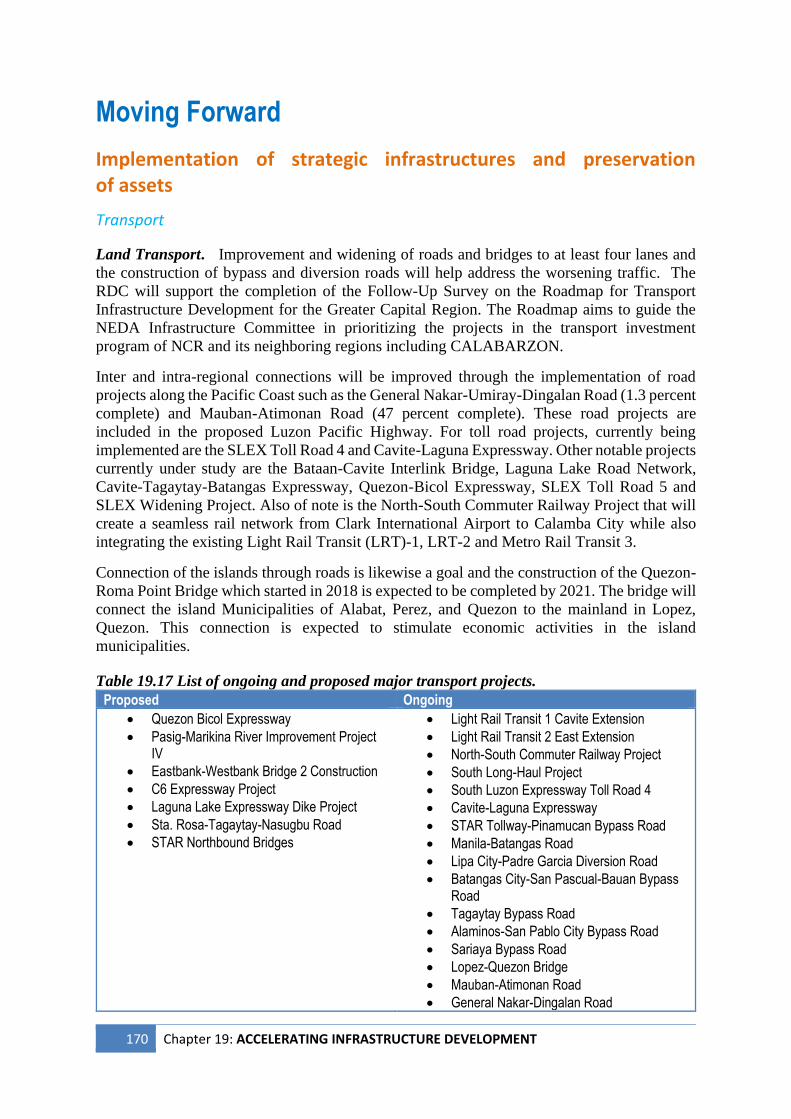
170 Chapter 19: ACCELERATING INFRASTRUCTURE DEVELOPMENT
Moving Forward
Implementation of strategic infrastructures and preservation of assets
Transport
Land Transport. Improvement and widening of roads and bridges to at least four lanes and
the construction of bypass and diversion roads will help address the worsening traffic. The
RDC will support the completion of the Follow-Up Survey on the Roadmap for Transport
Infrastructure Development for the Greater Capital Region. The Roadmap aims to guide the
NEDA Infrastructure Committee in prioritizing the projects in the transport investment
program of NCR and its neighboring regions including CALABARZON.
Inter and intra-regional connections will be improved through the implementation of road
projects along the Pacific Coast such as the General Nakar-Umiray-Dingalan Road (1.3 percent
complete) and Mauban-Atimonan Road (47 percent complete). These road projects are
included in the proposed Luzon Pacific Highway. For toll road projects, currently being
implemented are the SLEX Toll Road 4 and Cavite-Laguna Expressway. Other notable projects
currently under study are the Bataan-Cavite Interlink Bridge, Laguna Lake Road Network,
Cavite-Tagaytay-Batangas Expressway, Quezon-Bicol Expressway, SLEX Toll Road 5 and
SLEX Widening Project. Also of note is the North-South Commuter Railway Project that will
create a seamless rail network from Clark International Airport to Calamba City while also
integrating the existing Light Rail Transit (LRT)-1, LRT-2 and Metro Rail Transit 3.
Connection of the islands through roads is likewise a goal and the construction of the Quezon-
Roma Point Bridge which started in 2018 is expected to be completed by 2021. The bridge will
connect the island Municipalities of Alabat, Perez, and Quezon to the mainland in Lopez,
Quezon. This connection is expected to stimulate economic activities in the island
municipalities.
Table 19.17 List of ongoing and proposed major transport projects.
Proposed Ongoing
• Quezon Bicol Expressway
• Pasig-Marikina River Improvement Project IV
• Eastbank-Westbank Bridge 2 Construction
• C6 Expressway Project
• Laguna Lake Expressway Dike Project
• Sta. Rosa-Tagaytay-Nasugbu Road
• STAR Northbound Bridges
• Light Rail Transit 1 Cavite Extension
• Light Rail Transit 2 East Extension
• North-South Commuter Railway Project
• South Long-Haul Project
• South Luzon Expressway Toll Road 4
• Cavite-Laguna Expressway
• STAR Tollway-Pinamucan Bypass Road
• Manila-Batangas Road
• Lipa City-Padre Garcia Diversion Road
• Batangas City-San Pascual-Bauan Bypass Road
• Tagaytay Bypass Road
• Alaminos-San Pablo City Bypass Road
• Sariaya Bypass Road
• Lopez-Quezon Bridge
• Mauban-Atimonan Road
• General Nakar-Dingalan Road
Chapter 19: ACCELERATING INFRASTRUCTURE DEVELOPMENT 171
Implementation of priority projects and activities in the CALABARZON Traffic Management
Plan will be continued. Coordination with different regional agencies involved in traffic
management and LGUs will be intensified to implement programs, projects, rules and
regulations to address traffic problems. This will also include the development of a module for
conduct of the Road Safety Advocacy Training of Trainers which will produce road safety
advocates in the Region. These advocates will train drivers of public utility vehicles,
motorcycle and truck, and the general public on road safety in order to reduce road crashes in
the Region. Monitoring of major priority projects will be conducted to ensure timely
completion of projects.
Water Transport. The improvement in the port facilities will ensure efficient and safe transport
of people and goods to the islands. The DOTr’s Social Ports Development Program covers the
ongoing rehabilitation and improvement of the following ports: Tingloy Port in Batangas;
Punta Port in Unisan, Quezon; and Quezon Port. The Calasumanga Port and Bonbon Port in
Panukulan, Quezon are also proposed for improvement and rehabilitation.
Improvements of port facilities such as additional berthing facilities will encourage more
locators and optimize port utilization. This will create economic opportunities for the Region
and aid in decongesting the container terminals in Manila. Furthermore, in response to the call
for a less physical contact in various transactions, PPA will continue to digitize the services
such as the provision of online booking features.
MARINA Region IV also proposes a creation of separate offices for CALABARZON and
MIMAROPA Regions. The separation of the jurisdiction for the two regions will further
provide a better venue in addressing specific concerns in the two regions.
Air Transport. Sangley Airport is being eyed as a future alternative airport of Ninoy Aquino
International Airport. The Province of Cavite proposed the development of 1,500-hectare
Sangley International Airport. The proposed airport will feature four runways and a terminal
that can accommodate 100 million passengers annually. (However, the Provincial Government
of Cavite deferred the implementation of the project in January 2021.)
Water Resources Water resources play an important role in promoting sustainable socio-economic development.
However, as the population grows the water demand for drinking and economic activities
increases. It is much crucial now because of the increased need to access safe water for
sanitation and hygiene to combat the COVID-19 pandemic. Also, water supply is expected to
be negatively affected by climate change. Hence, it is imperative to strengthen water security
through implementation of climate change resilient water systems, community-based water
supply and sanitation projects, and water-efficient irrigation systems. These interventions
would ensure the availability of accessible, clean and affordable water supply
Irrigation. In 2021, NIA Region IV-A will continue to implement small irrigation projects,
expand existing communal irrigation systems, establish additional ground pump irrigation
systems and restore/repair existing national and communal irrigation systems including climate
change adaptation works. These projects will help increase the irrigable areas and agricultural
production in the Region.
172 Chapter 19: ACCELERATING INFRASTRUCTURE DEVELOPMENT
The NIA Region IV-A will also fast-track the implementation of two high-impact irrigation
projects in the Region. These are the Quipot Irrigation Project and the Macalelon Small
Reservoir Irrigation Project. The Quipot Irrigation Project will irrigate about 2,800 hectares of
agricultural lands in Tiaong, Candelaria, San Antonio and Sariaya in Quezon Province and San
Juan and Rosario in Batangas Province. The Macalelon Small Reservoir Irrigation Project will
irrigate about 830 hectares of agricultural lands in 10 barangays in Macalelon, Quezon. The
Quipot Irrigation and Macalelon Small Reservoir Irrigation Projects will be completed in 2021
and 2023, respectively.
Similarly, the feasibility study for the Ilangin-River-Alabat Small Reservoir Irrigation Project
and detailed engineering design for the Lopez Small Reservoir Irrigation Project are ongoing.
These projects expected to contribute to the improvement of the irrigation system in the Region.
At the national level, the implementation of the National Irrigation Masterplan 2020-2030 is
ongoing. The Master Plan provides guidelines in the development and prioritization of
irrigation projects, formulation of institutional strategies, and investment programming.
Water Supply
MWSS will fast-track the implementation New Centennial Water Source – Kaliwa Dam
Project (NCWS-KDP). The NCWS-KDP will serve as an additional water source that will
reduce the total dependency on Angat Dam Reservoir and will address the growing demand for
water in Metro Manila including the neighboring areas in Cavite and Rizal. The Project is
located in Barangay Pagsangahan in General Nakar and Barangay Magsaysay in Infanta,
Quezon. It involves the construction of a 60-meter high dam (with an initial supply of 600
million liters per day or MLD) and a 27.7-kilometer raw water conveyance tunnel with a
capacity of 2,400 MLD. The construction activities of Kaliwa Dam Project started in December
2020 and is expected to be completed in June 2025.
Meanwhile, MWSS will prepare an Integrated Community Development Plan involving
Municipalities of General Nakar, Infanta, Tanay, Teresa, and Morong to ensure sustainable
water supply and environmental protection in the area
Moreover, MWSS identified the Kanan Dam Project as an additional source of water. The
Project is still in its evaluation stage and will be constructed in General Nakar, Quezon.
Likewise, LWUA will continue to implement water source development, system expansion,
and water resources exploration and development projects to assist and sustain the provision
of safe and sufficient house water connections in the Region.
Energy Electrification. With the issuance of a DOE circular rationalizing the Energy Regulations (ER)
1-94 Regional Share Fund to prioritize response to the COVID-19 pandemic, there is a need to
fast-track implementation of the remaining energy projects, particularly on electrification. The
DOE-DILG Joint Memorandum Circular 2020-01 or the LGU Energy Code will guide the
LGUs in the facilitation of energy project implementation.
A total of 52 projects in Quezon Province was funded under the 2020 SEP and is expected to
be implemented within the first three quarters of 2021. Relatedly, a total of PHP190 million
was allocated to the five provinces under the Energy Regulation 1-94 for COVID-19 response
Chapter 19: ACCELERATING INFRASTRUCTURE DEVELOPMENT 173
in 2020. As of December 2020, PHP176,233,961.00 or 93 percent of the allocation was
downloaded to the five provinces to augment their COVID-19 budgets.
Resilient energy sector. The adoption of the construction/rehabilitation standards through
Energy Resiliency Policy and the enactment of policies under the Anti-Obstruction of Power
Lines Act will ensure uninterrupted delivery of energy supply and services, especially during
times of emergencies and disasters.
The pursuit for clean energy in the region will also allow for diversification of available energy
sources and will mitigate effects of unexpected disruptions in conventional energy sources. The
results of the Feasibility Study for the Subsidized Sitio Electrification Program (SSEP), which
primarily aims to establish a mini-grid system with RE source, will provide valuable insights
and open new opportunities for sitios serviced by QUEZELCO II.
ICT Infrastructure Enhanced Internet Connectivity. The DICT will continue and further intensify its efforts in
bringing the following innovative programs and projects closer to the people: a) Free Wi-Fi for
All; b) Digital Jobs Training; c) Digital Cities 2025; d) Digital Governance Award; e)
(TECH4ED); f) e-BPLS; g) Government Network (GovNet); h) Philippine National Public
Key Infrastructure (PNPKI); and i) ICT Literacy and Competency Development Bureau
(ILCDB). The government will continue to partner with the private sector in the provision of
ICT infrastructures and services. With the limited face to face activities due to the pandemic,
new innovations in ICT are expected to be introduced, and usage of internet services will
further increase.
Social Infrastructure Construction of disaster-resilient social infrastructures and effective infrastructure audit will
greatly contribute to safe delivery of services to the public.
Education. The continued implementation of DepEd’s convergence programs such as the
School Building Program and the Last Mile Schools Project will address gaps in the provision
of quality and inclusive education, especially during this pandemic period when the students
are on a blended learning scheme. The construction of support infrastructures such as access
roads will also maximize the utility of schools and classrooms located in geographically
isolated and conflict-affected areas (GIDAS).
The DepEd and DPWH should ensure the continued implementation of the repair,
rehabilitation and reconstruction of damaged education facilities projects included in the RRPs
for Taal Volcano Eruption and Areas Affected by Typhoons Quinta, Rolly and Ulysses, and
for these facilities to be more disaster resilient.
Health. With the ongoing challenges brought about by the COVID-19 pandemic, the LGUs
will also ensure that adequate isolation and quarantine facilities are available in their areas to
cater to their the affected population. Bigger budget should be allocated to DOH for the
construction and upgrading of health facilities and equipment. More testing laboratories,
quarantine and isolation facilities should be accredited and established, through the
convergence of DOH, DOST, LGUs and the private sector.
174 Chapter 19: ACCELERATING INFRASTRUCTURE DEVELOPMENT
Access to health facilities will improve with the completion of the remaining and pending
projects under the Health Facilities Enhancement Program (HFEP). DOH should ensure the
continued implementation of the repair, rehabilitation and reconstruction of damaged health
facilities projects included in the RRPs for Taal Volcano Eruption and Areas Affected by
Typhoons Quinta, Rolly and Ulysses, and for these facilities to be more disaster resilient and
be utilized for COVID-19 response.
Policies and investment programs of LGUs will be guided by the Philippine Health Facilities
Development Plan 2017-2022 and the Universal Health Care Law, especially in the provision
of manpower and health workers who will be responsible in the operation of facilities
completed under DOH’s HFPEP. The passage of the Priority Health Infrastructure Bill will
further strengthen public health infrastructures, enabling more local health facilities that will
cater to the basic needs of the community. This will also provide another source of funding for
the establishment of accredited-specialty medical centers and laboratories which will be needed
in the case of health emergencies.
Housing and Settlements. The LGUs in coordination with DPWH, OCD, and DILG should
prioritize the construction of disaster resilient evacuation centers outside the high-risk area with
full features such as separate toilets, bath, kitchen and solid and liquid waste management
infrastructures. These evacuation centers must be able to accommodate the affected population
within the high-risk areas to avoid using schools as evacuation centers and disrupt the
education-related activities/services. The evacuation centers will also be multi-functional and
should comply to the technical standard guidelines with water, sanitation, and hygiene facilities
including community kitchens. The use of education facilities as evacuation centers should be
minimized to avoid disruption of classes since some disasters last for more than 15 days.
With the collaboration of NHA and the LGUs, housing resettlement sites need to be provided
with basic infrastructure services, such as roads, water supply, electricity, and sanitation. These
resettlement sites should be accessible and livable for the displaced families such as those
living on the high-risk areas. For families returning to their homes in the high-risk areas,
restoring and improving basic infrastructure services is important to return normalcy and
enhance their living condition. Prior to the construction of settlements, concerned LGUs must
identify and assure availability of safe and accessible sites for construction before project
implementation.
Conduct infrastructure-related research and development
Research areas on the transportation system, water resource and security, flood control, power
generation, ICT and social infrastructures is being be encouraged by the RDC. The SUCs in
the Region can assist in the conduct of research which can aid in the decision-making process
related to the infrastructure sector.
Recommendations
The following supplemental strategies are recommended to accelerate infrastructure
development:
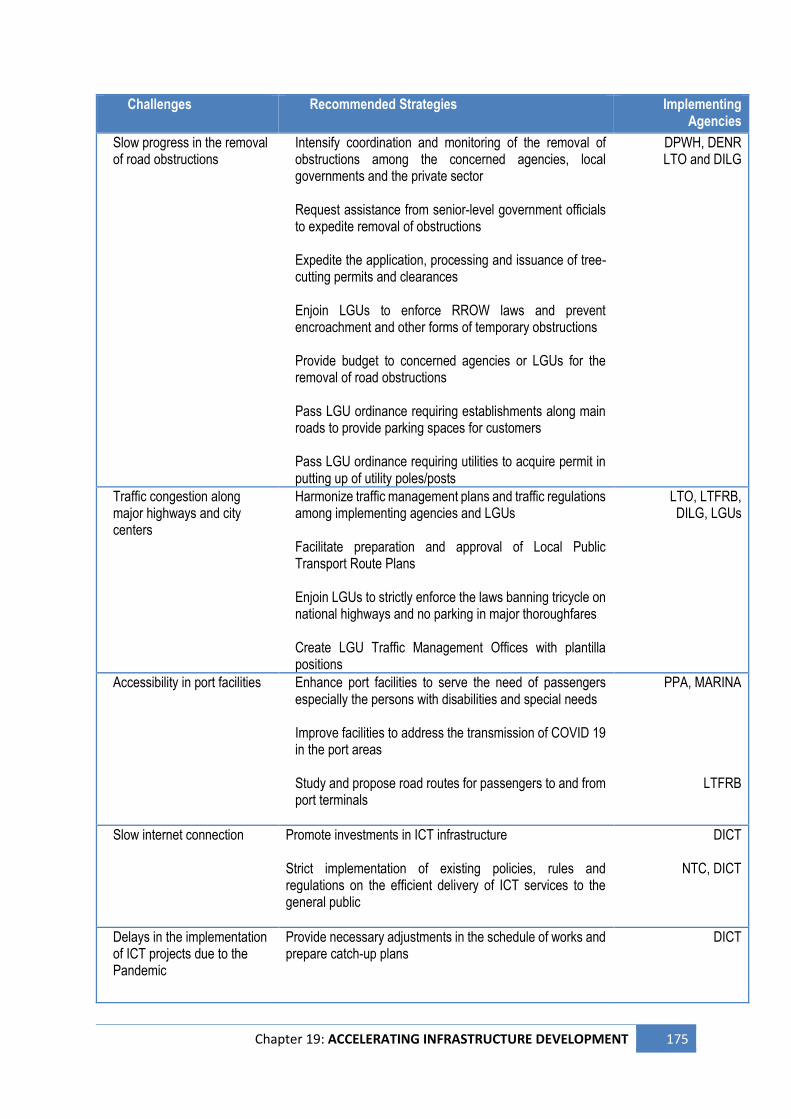
Chapter 19: ACCELERATING INFRASTRUCTURE DEVELOPMENT 175
Challenges Recommended Strategies Implementing Agencies
Slow progress in the removal of road obstructions
Intensify coordination and monitoring of the removal of obstructions among the concerned agencies, local governments and the private sector Request assistance from senior-level government officials to expedite removal of obstructions Expedite the application, processing and issuance of tree-cutting permits and clearances Enjoin LGUs to enforce RROW laws and prevent encroachment and other forms of temporary obstructions Provide budget to concerned agencies or LGUs for the removal of road obstructions Pass LGU ordinance requiring establishments along main roads to provide parking spaces for customers Pass LGU ordinance requiring utilities to acquire permit in putting up of utility poles/posts
DPWH, DENR LTO and DILG
Traffic congestion along major highways and city centers
Harmonize traffic management plans and traffic regulations among implementing agencies and LGUs Facilitate preparation and approval of Local Public Transport Route Plans Enjoin LGUs to strictly enforce the laws banning tricycle on national highways and no parking in major thoroughfares Create LGU Traffic Management Offices with plantilla positions
LTO, LTFRB, DILG, LGUs
Accessibility in port facilities Enhance port facilities to serve the need of passengers especially the persons with disabilities and special needs Improve facilities to address the transmission of COVID 19 in the port areas Study and propose road routes for passengers to and from port terminals
PPA, MARINA
LTFRB
Slow internet connection Promote investments in ICT infrastructure Strict implementation of existing policies, rules and regulations on the efficient delivery of ICT services to the general public
DICT
NTC, DICT
Delays in the implementation of ICT projects due to the Pandemic
Provide necessary adjustments in the schedule of works and prepare catch-up plans
DICT
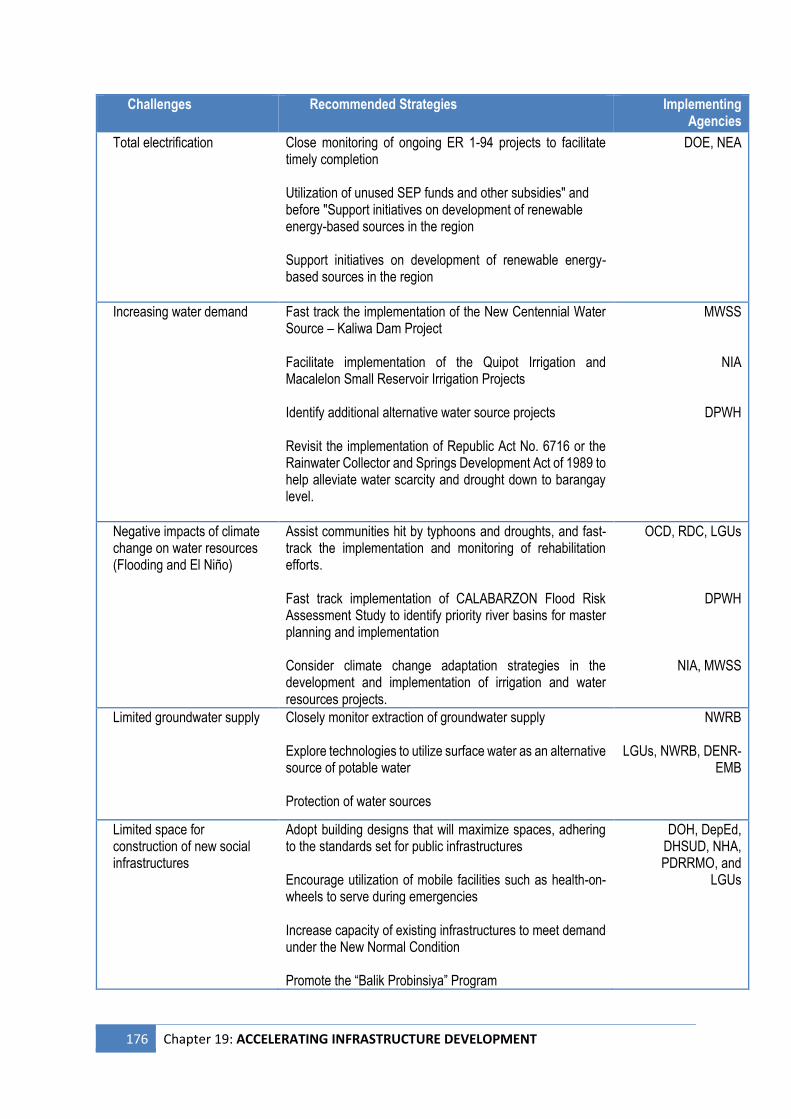
176 Chapter 19: ACCELERATING INFRASTRUCTURE DEVELOPMENT
Challenges Recommended Strategies Implementing Agencies
Total electrification Close monitoring of ongoing ER 1-94 projects to facilitate timely completion Utilization of unused SEP funds and other subsidies" and before "Support initiatives on development of renewable energy-based sources in the region Support initiatives on development of renewable energy-based sources in the region
DOE, NEA
Increasing water demand Fast track the implementation of the New Centennial Water Source – Kaliwa Dam Project Facilitate implementation of the Quipot Irrigation and Macalelon Small Reservoir Irrigation Projects
Identify additional alternative water source projects Revisit the implementation of Republic Act No. 6716 or the Rainwater Collector and Springs Development Act of 1989 to help alleviate water scarcity and drought down to barangay level.
MWSS
NIA
DPWH
Negative impacts of climate change on water resources (Flooding and El Niño)
Assist communities hit by typhoons and droughts, and fast-track the implementation and monitoring of rehabilitation efforts. Fast track implementation of CALABARZON Flood Risk Assessment Study to identify priority river basins for master planning and implementation Consider climate change adaptation strategies in the development and implementation of irrigation and water resources projects.
OCD, RDC, LGUs
DPWH
NIA, MWSS
Limited groundwater supply Closely monitor extraction of groundwater supply Explore technologies to utilize surface water as an alternative source of potable water Protection of water sources
NWRB LGUs, NWRB, DENR-
EMB
Limited space for construction of new social infrastructures
Adopt building designs that will maximize spaces, adhering to the standards set for public infrastructures Encourage utilization of mobile facilities such as health-on-wheels to serve during emergencies Increase capacity of existing infrastructures to meet demand under the New Normal Condition Promote the “Balik Probinsiya” Program
DOH, DepEd, DHSUD, NHA, PDRRMO, and
LGUs
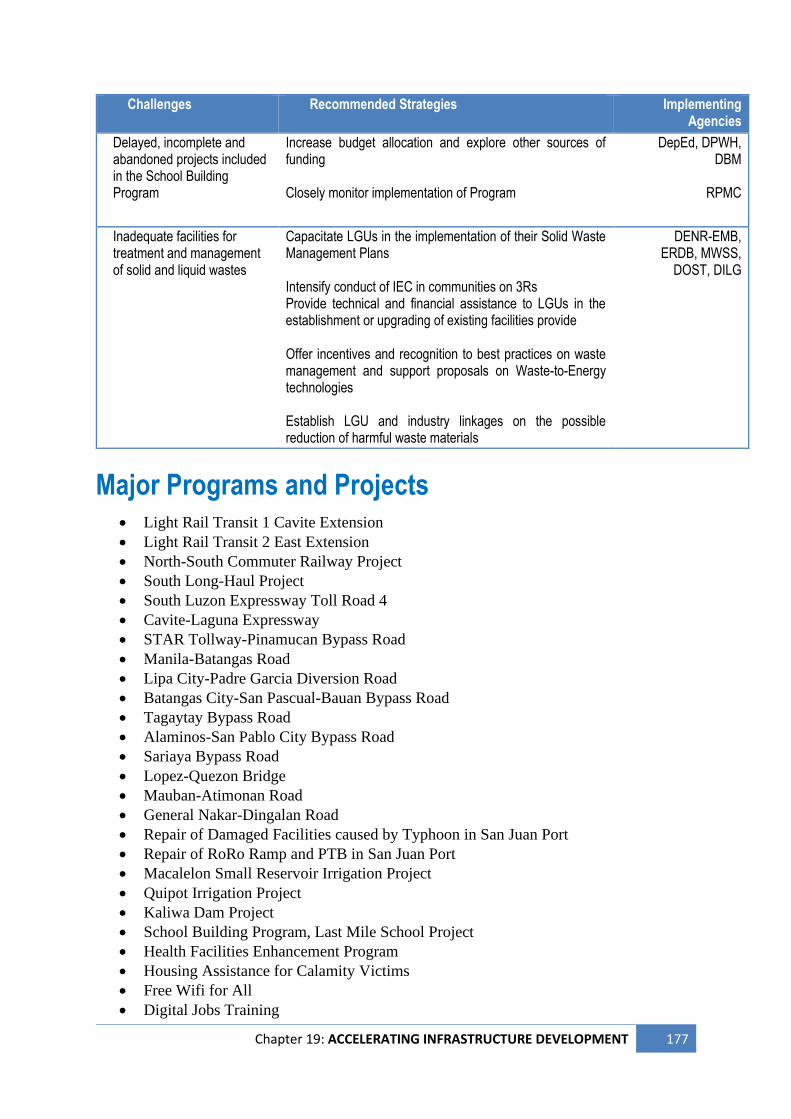
Chapter 19: ACCELERATING INFRASTRUCTURE DEVELOPMENT 177
Challenges Recommended Strategies Implementing Agencies
Delayed, incomplete and abandoned projects included in the School Building Program
Increase budget allocation and explore other sources of funding Closely monitor implementation of Program
DepEd, DPWH, DBM
RPMC
Inadequate facilities for treatment and management of solid and liquid wastes
Capacitate LGUs in the implementation of their Solid Waste Management Plans Intensify conduct of IEC in communities on 3Rs Provide technical and financial assistance to LGUs in the establishment or upgrading of existing facilities provide Offer incentives and recognition to best practices on waste management and support proposals on Waste-to-Energy technologies Establish LGU and industry linkages on the possible reduction of harmful waste materials
DENR-EMB, ERDB, MWSS,
DOST, DILG
Major Programs and Projects • Light Rail Transit 1 Cavite Extension
• Light Rail Transit 2 East Extension
• North-South Commuter Railway Project
• South Long-Haul Project
• South Luzon Expressway Toll Road 4
• Cavite-Laguna Expressway
• STAR Tollway-Pinamucan Bypass Road
• Manila-Batangas Road
• Lipa City-Padre Garcia Diversion Road
• Batangas City-San Pascual-Bauan Bypass Road
• Tagaytay Bypass Road
• Alaminos-San Pablo City Bypass Road
• Sariaya Bypass Road
• Lopez-Quezon Bridge
• Mauban-Atimonan Road
• General Nakar-Dingalan Road
• Repair of Damaged Facilities caused by Typhoon in San Juan Port
• Repair of RoRo Ramp and PTB in San Juan Port
• Macalelon Small Reservoir Irrigation Project
• Quipot Irrigation Project
• Kaliwa Dam Project
• School Building Program, Last Mile School Project
• Health Facilities Enhancement Program
• Housing Assistance for Calamity Victims
• Free Wifi for All
• Digital Jobs Training
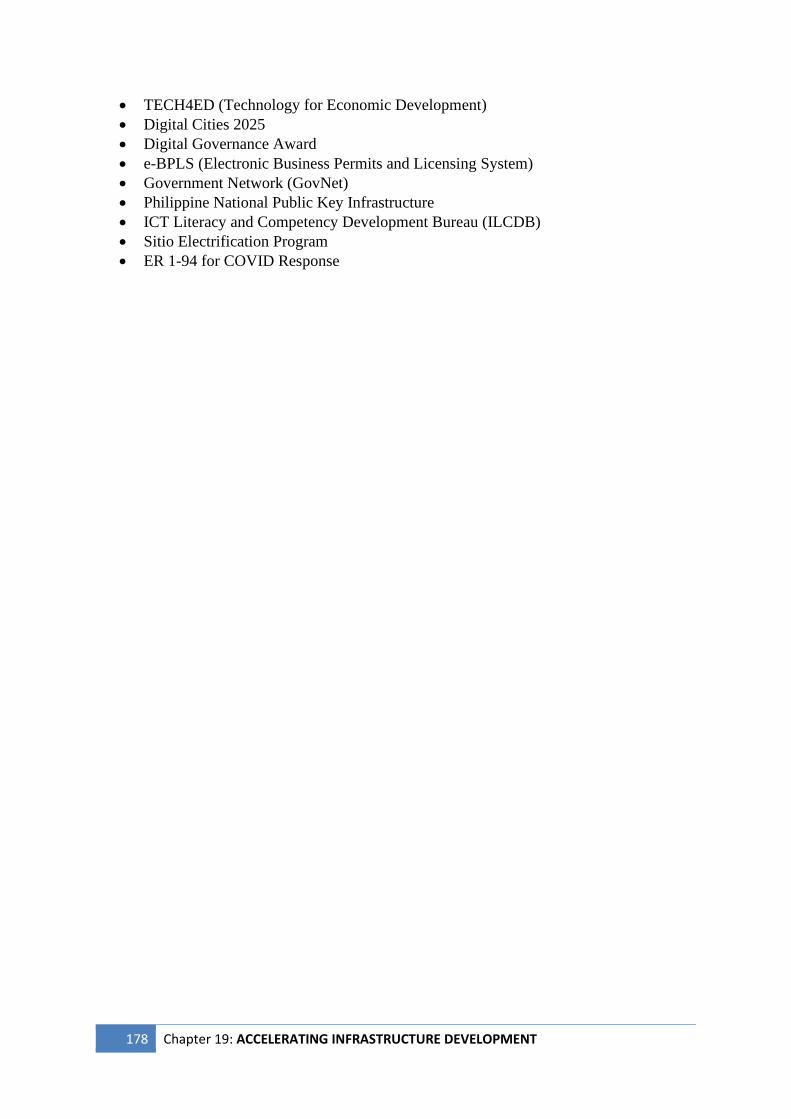
178 Chapter 19: ACCELERATING INFRASTRUCTURE DEVELOPMENT
• TECH4ED (Technology for Economic Development)
• Digital Cities 2025
• Digital Governance Award
• e-BPLS (Electronic Business Permits and Licensing System)
• Government Network (GovNet)
• Philippine National Public Key Infrastructure
• ICT Literacy and Competency Development Bureau (ILCDB)
• Sitio Electrification Program
• ER 1-94 for COVID Response
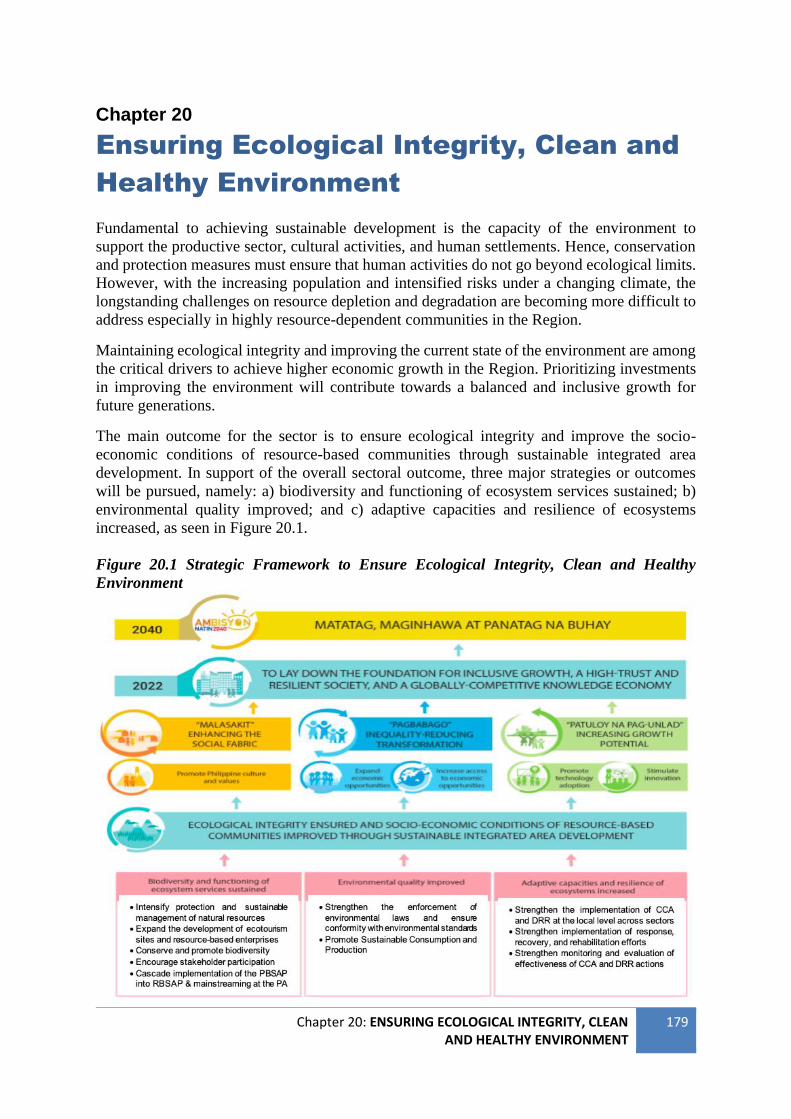
Chapter 20: ENSURING ECOLOGICAL INTEGRITY, CLEAN AND HEALTHY ENVIRONMENT
179
Chapter 20
Ensuring Ecological Integrity, Clean and
Healthy Environment
Fundamental to achieving sustainable development is the capacity of the environment to
support the productive sector, cultural activities, and human settlements. Hence, conservation
and protection measures must ensure that human activities do not go beyond ecological limits.
However, with the increasing population and intensified risks under a changing climate, the
longstanding challenges on resource depletion and degradation are becoming more difficult to
address especially in highly resource-dependent communities in the Region.
Maintaining ecological integrity and improving the current state of the environment are among
the critical drivers to achieve higher economic growth in the Region. Prioritizing investments
in improving the environment will contribute towards a balanced and inclusive growth for
future generations.
The main outcome for the sector is to ensure ecological integrity and improve the socio-
economic conditions of resource-based communities through sustainable integrated area
development. In support of the overall sectoral outcome, three major strategies or outcomes
will be pursued, namely: a) biodiversity and functioning of ecosystem services sustained; b)
environmental quality improved; and c) adaptive capacities and resilience of ecosystems
increased, as seen in Figure 20.1.
Figure 20.1 Strategic Framework to Ensure Ecological Integrity, Clean and Healthy
Environment
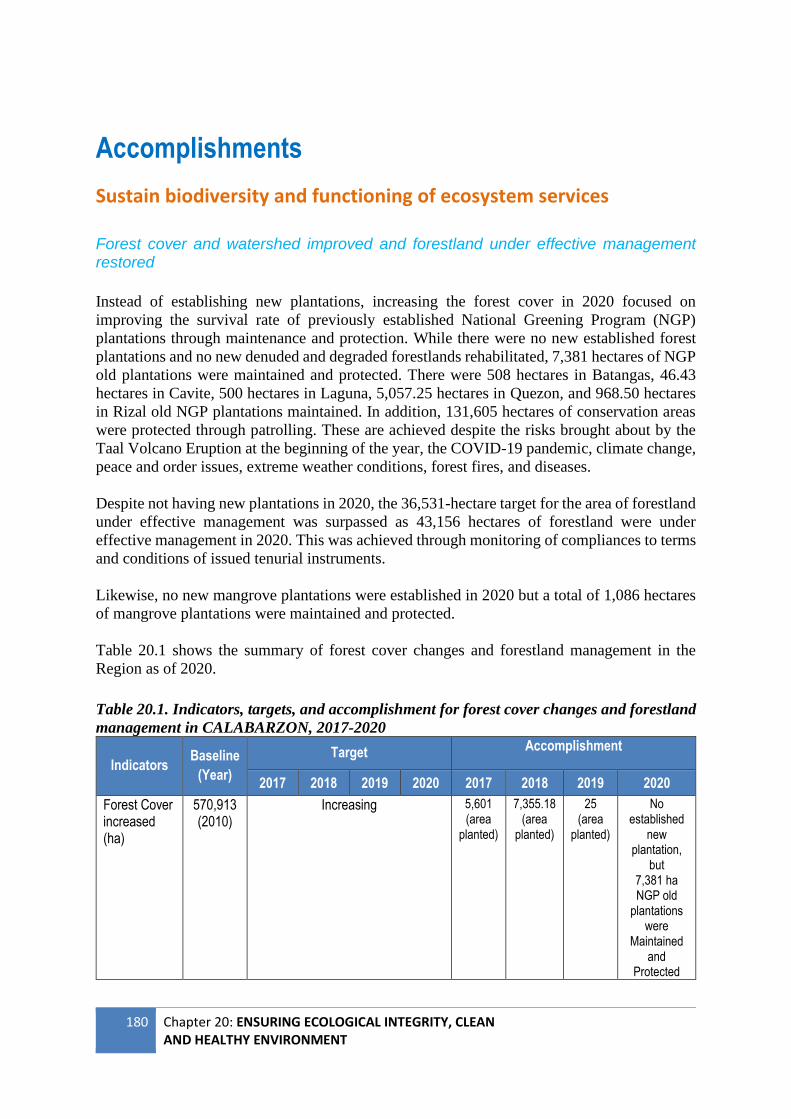
180 Chapter 20: ENSURING ECOLOGICAL INTEGRITY, CLEAN AND HEALTHY ENVIRONMENT
Accomplishments
Sustain biodiversity and functioning of ecosystem services Forest cover and watershed improved and forestland under effective management restored
Instead of establishing new plantations, increasing the forest cover in 2020 focused on
improving the survival rate of previously established National Greening Program (NGP)
plantations through maintenance and protection. While there were no new established forest
plantations and no new denuded and degraded forestlands rehabilitated, 7,381 hectares of NGP
old plantations were maintained and protected. There were 508 hectares in Batangas, 46.43
hectares in Cavite, 500 hectares in Laguna, 5,057.25 hectares in Quezon, and 968.50 hectares
in Rizal old NGP plantations maintained. In addition, 131,605 hectares of conservation areas
were protected through patrolling. These are achieved despite the risks brought about by the
Taal Volcano Eruption at the beginning of the year, the COVID-19 pandemic, climate change,
peace and order issues, extreme weather conditions, forest fires, and diseases.
Despite not having new plantations in 2020, the 36,531-hectare target for the area of forestland
under effective management was surpassed as 43,156 hectares of forestland were under
effective management in 2020. This was achieved through monitoring of compliances to terms
and conditions of issued tenurial instruments.
Likewise, no new mangrove plantations were established in 2020 but a total of 1,086 hectares
of mangrove plantations were maintained and protected.
Table 20.1 shows the summary of forest cover changes and forestland management in the
Region as of 2020.
Table 20.1. Indicators, targets, and accomplishment for forest cover changes and forestland
management in CALABARZON, 2017-2020
Indicators Baseline
(Year)
Target Accomplishment
2017 2018 2019 2020 2017 2018 2019 2020
Forest Cover increased (ha)
570,913 (2010)
Increasing 5,601 (area
planted)
7,355.18 (area
planted)
25 (area
planted)
No established
new plantation,
but 7,381 ha NGP old
plantations were
Maintained and
Protected
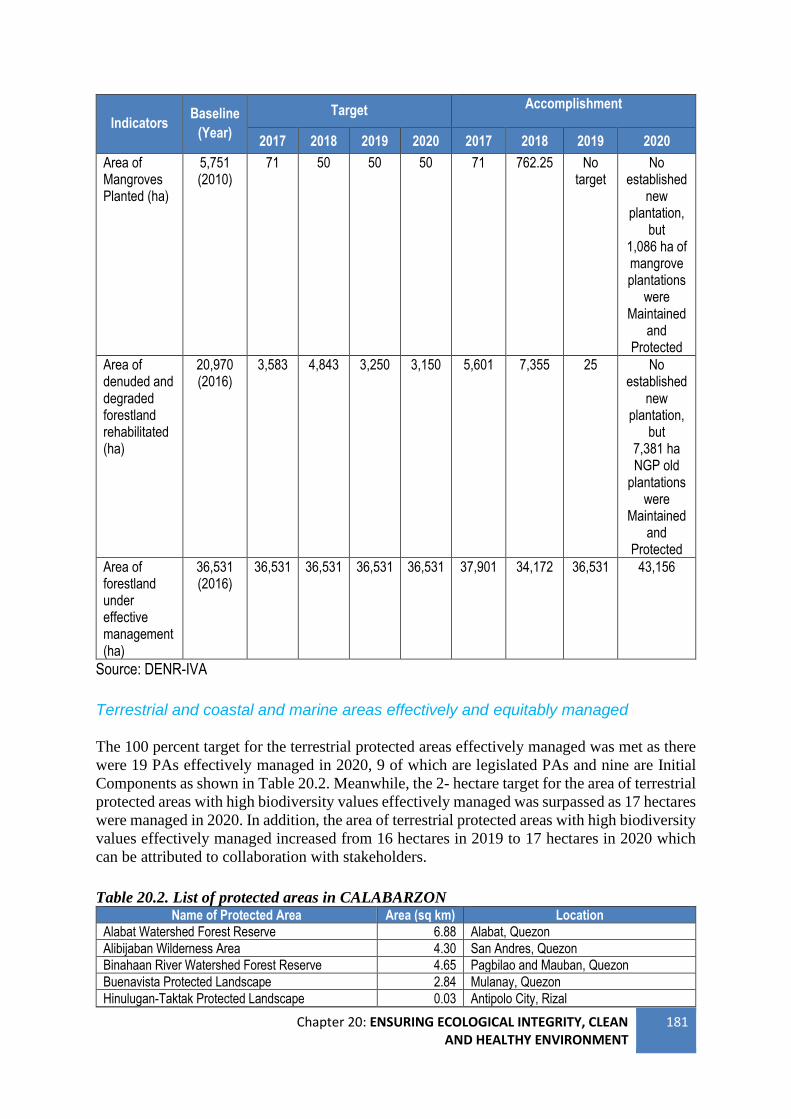
Chapter 20: ENSURING ECOLOGICAL INTEGRITY, CLEAN AND HEALTHY ENVIRONMENT
181
Indicators Baseline
(Year)
Target Accomplishment
2017 2018 2019 2020 2017 2018 2019 2020
Area of Mangroves Planted (ha)
5,751 (2010)
71 50 50 50 71 762.25 No target
No established
new plantation,
but 1,086 ha of mangrove plantations
were Maintained
and Protected
Area of denuded and degraded forestland rehabilitated (ha)
20,970 (2016)
3,583 4,843 3,250 3,150 5,601 7,355 25 No established
new plantation,
but 7,381 ha NGP old
plantations were
Maintained and
Protected
Area of forestland under effective management (ha)
36,531 (2016)
36,531 36,531 36,531 36,531 37,901 34,172 36,531 43,156
Source: DENR-IVA
Terrestrial and coastal and marine areas effectively and equitably managed The 100 percent target for the terrestrial protected areas effectively managed was met as there
were 19 PAs effectively managed in 2020, 9 of which are legislated PAs and nine are Initial
Components as shown in Table 20.2. Meanwhile, the 2- hectare target for the area of terrestrial
protected areas with high biodiversity values effectively managed was surpassed as 17 hectares
were managed in 2020. In addition, the area of terrestrial protected areas with high biodiversity
values effectively managed increased from 16 hectares in 2019 to 17 hectares in 2020 which
can be attributed to collaboration with stakeholders.
Table 20.2. List of protected areas in CALABARZON Name of Protected Area Area (sq km) Location
Alabat Watershed Forest Reserve 6.88 Alabat, Quezon
Alibijaban Wilderness Area 4.30 San Andres, Quezon
Binahaan River Watershed Forest Reserve 4.65 Pagbilao and Mauban, Quezon
Buenavista Protected Landscape 2.84 Mulanay, Quezon
Hinulugan-Taktak Protected Landscape 0.03 Antipolo City, Rizal
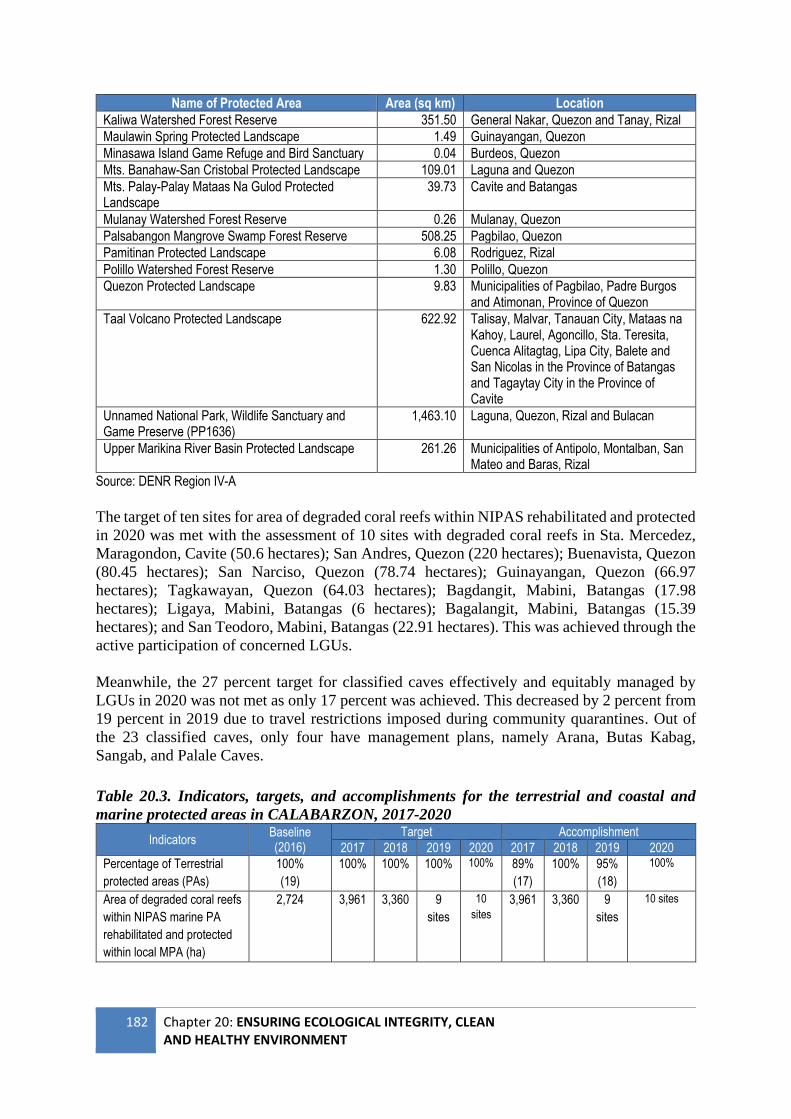
182 Chapter 20: ENSURING ECOLOGICAL INTEGRITY, CLEAN AND HEALTHY ENVIRONMENT
Name of Protected Area Area (sq km) Location
Kaliwa Watershed Forest Reserve 351.50 General Nakar, Quezon and Tanay, Rizal
Maulawin Spring Protected Landscape 1.49 Guinayangan, Quezon
Minasawa Island Game Refuge and Bird Sanctuary 0.04 Burdeos, Quezon
Mts. Banahaw-San Cristobal Protected Landscape 109.01 Laguna and Quezon
Mts. Palay-Palay Mataas Na Gulod Protected Landscape
39.73 Cavite and Batangas
Mulanay Watershed Forest Reserve 0.26 Mulanay, Quezon
Palsabangon Mangrove Swamp Forest Reserve 508.25 Pagbilao, Quezon
Pamitinan Protected Landscape 6.08 Rodriguez, Rizal
Polillo Watershed Forest Reserve 1.30 Polillo, Quezon
Quezon Protected Landscape 9.83 Municipalities of Pagbilao, Padre Burgos and Atimonan, Province of Quezon
Taal Volcano Protected Landscape 622.92 Talisay, Malvar, Tanauan City, Mataas na Kahoy, Laurel, Agoncillo, Sta. Teresita, Cuenca Alitagtag, Lipa City, Balete and San Nicolas in the Province of Batangas and Tagaytay City in the Province of Cavite
Unnamed National Park, Wildlife Sanctuary and Game Preserve (PP1636)
1,463.10 Laguna, Quezon, Rizal and Bulacan
Upper Marikina River Basin Protected Landscape 261.26 Municipalities of Antipolo, Montalban, San Mateo and Baras, Rizal
Source: DENR Region IV-A
The target of ten sites for area of degraded coral reefs within NIPAS rehabilitated and protected
in 2020 was met with the assessment of 10 sites with degraded coral reefs in Sta. Mercedez,
Maragondon, Cavite (50.6 hectares); San Andres, Quezon (220 hectares); Buenavista, Quezon
(80.45 hectares); San Narciso, Quezon (78.74 hectares); Guinayangan, Quezon (66.97
hectares); Tagkawayan, Quezon (64.03 hectares); Bagdangit, Mabini, Batangas (17.98
hectares); Ligaya, Mabini, Batangas (6 hectares); Bagalangit, Mabini, Batangas (15.39
hectares); and San Teodoro, Mabini, Batangas (22.91 hectares). This was achieved through the
active participation of concerned LGUs.
Meanwhile, the 27 percent target for classified caves effectively and equitably managed by
LGUs in 2020 was not met as only 17 percent was achieved. This decreased by 2 percent from
19 percent in 2019 due to travel restrictions imposed during community quarantines. Out of
the 23 classified caves, only four have management plans, namely Arana, Butas Kabag,
Sangab, and Palale Caves.
Table 20.3. Indicators, targets, and accomplishments for the terrestrial and coastal and
marine protected areas in CALABARZON, 2017-2020
Indicators Baseline (2016)
Target Accomplishment
2017 2018 2019 2020 2017 2018 2019 2020
Percentage of Terrestrial
protected areas (PAs)
100%
(19)
100% 100% 100% 100% 89%
(17)
100% 95%
(18)
100%
Area of degraded coral reefs
within NIPAS marine PA
rehabilitated and protected
within local MPA (ha)
2,724 3,961 3,360 9
sites
10
sites 3,961 3,360 9
sites
10 sites
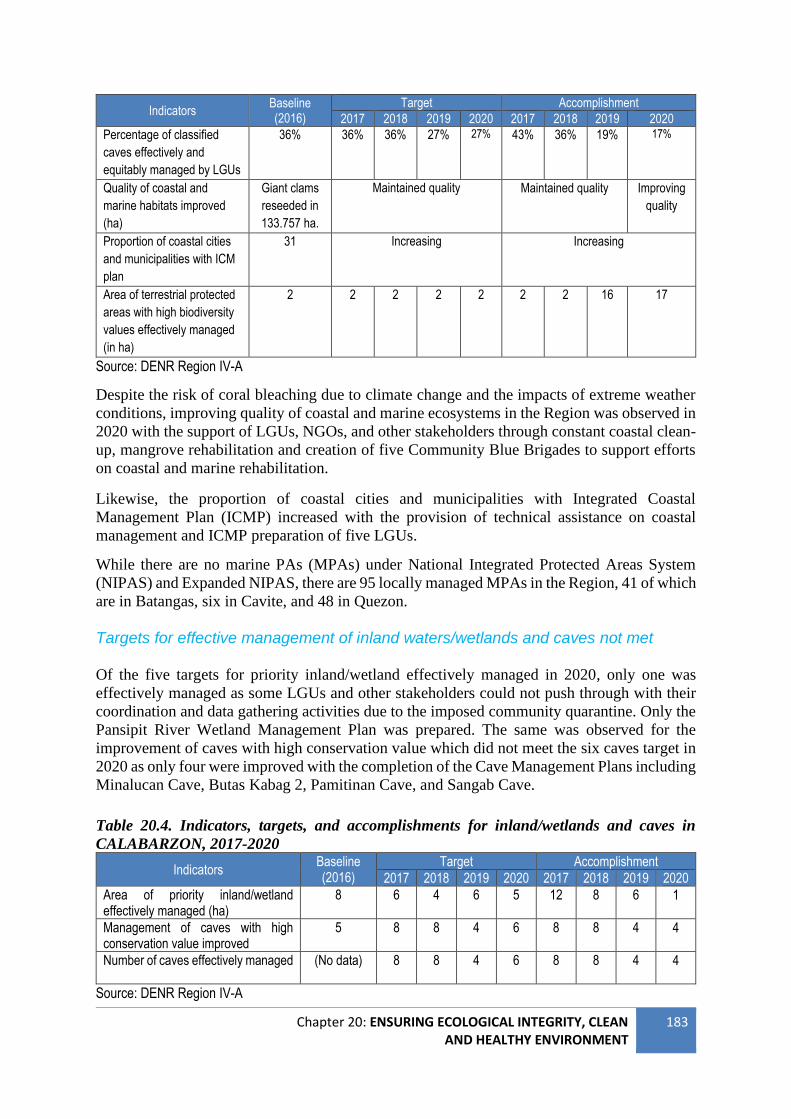
Chapter 20: ENSURING ECOLOGICAL INTEGRITY, CLEAN AND HEALTHY ENVIRONMENT
183
Indicators Baseline (2016)
Target Accomplishment
2017 2018 2019 2020 2017 2018 2019 2020
Percentage of classified
caves effectively and
equitably managed by LGUs
36% 36% 36% 27% 27% 43% 36% 19% 17%
Quality of coastal and
marine habitats improved
(ha)
Giant clams
reseeded in
133.757 ha.
Maintained quality Maintained quality Improving
quality
Proportion of coastal cities
and municipalities with ICM
plan
31 Increasing Increasing
Area of terrestrial protected
areas with high biodiversity
values effectively managed
(in ha)
2 2 2 2 2 2 2 16 17
Source: DENR Region IV-A
Despite the risk of coral bleaching due to climate change and the impacts of extreme weather
conditions, improving quality of coastal and marine ecosystems in the Region was observed in
2020 with the support of LGUs, NGOs, and other stakeholders through constant coastal clean-
up, mangrove rehabilitation and creation of five Community Blue Brigades to support efforts
on coastal and marine rehabilitation.
Likewise, the proportion of coastal cities and municipalities with Integrated Coastal
Management Plan (ICMP) increased with the provision of technical assistance on coastal
management and ICMP preparation of five LGUs.
While there are no marine PAs (MPAs) under National Integrated Protected Areas System
(NIPAS) and Expanded NIPAS, there are 95 locally managed MPAs in the Region, 41 of which
are in Batangas, six in Cavite, and 48 in Quezon.
Targets for effective management of inland waters/wetlands and caves not met Of the five targets for priority inland/wetland effectively managed in 2020, only one was
effectively managed as some LGUs and other stakeholders could not push through with their
coordination and data gathering activities due to the imposed community quarantine. Only the
Pansipit River Wetland Management Plan was prepared. The same was observed for the
improvement of caves with high conservation value which did not meet the six caves target in
2020 as only four were improved with the completion of the Cave Management Plans including
Minalucan Cave, Butas Kabag 2, Pamitinan Cave, and Sangab Cave.
Table 20.4. Indicators, targets, and accomplishments for inland/wetlands and caves in
CALABARZON, 2017-2020
Indicators Baseline (2016)
Target Accomplishment
2017 2018 2019 2020 2017 2018 2019 2020
Area of priority inland/wetland effectively managed (ha)
8 6 4 6 5 12 8 6 1
Management of caves with high conservation value improved
5 8 8 4 6 8 8 4 4
Number of caves effectively managed (No data) 8 8 4 6 8 8 4 4
Source: DENR Region IV-A
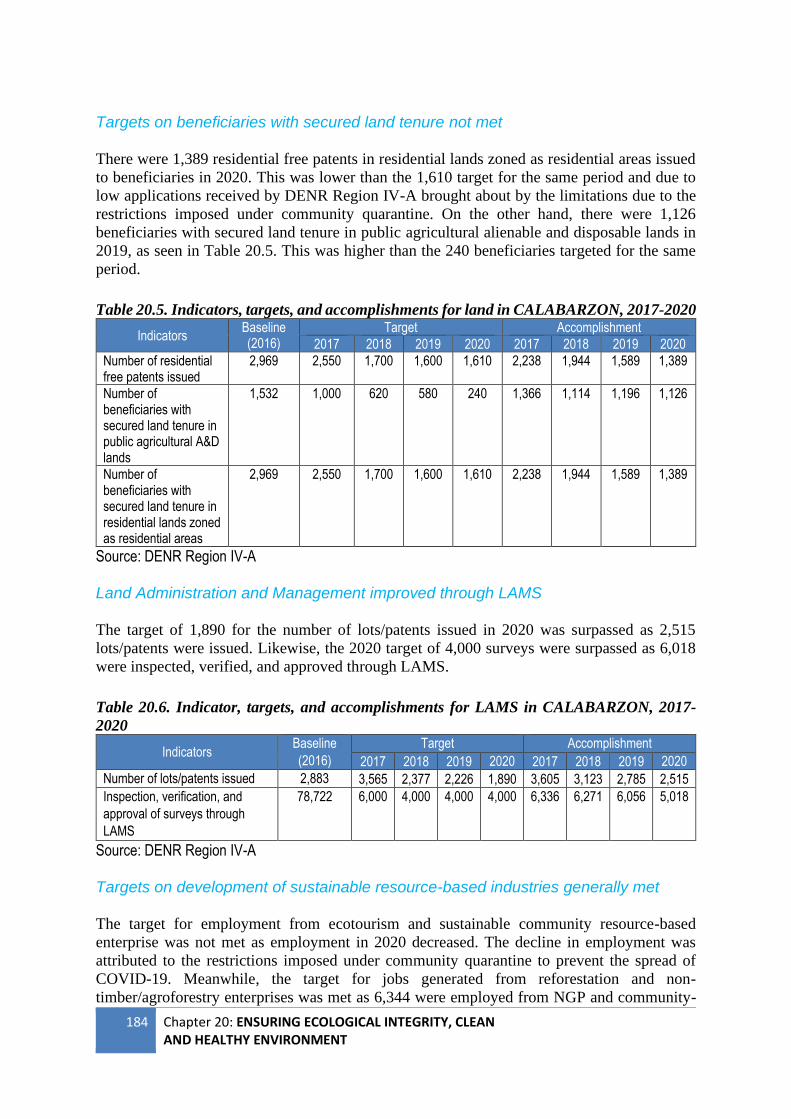
184 Chapter 20: ENSURING ECOLOGICAL INTEGRITY, CLEAN AND HEALTHY ENVIRONMENT
Targets on beneficiaries with secured land tenure not met There were 1,389 residential free patents in residential lands zoned as residential areas issued
to beneficiaries in 2020. This was lower than the 1,610 target for the same period and due to
low applications received by DENR Region IV-A brought about by the limitations due to the
restrictions imposed under community quarantine. On the other hand, there were 1,126
beneficiaries with secured land tenure in public agricultural alienable and disposable lands in
2019, as seen in Table 20.5. This was higher than the 240 beneficiaries targeted for the same
period.
Table 20.5. Indicators, targets, and accomplishments for land in CALABARZON, 2017-2020
Indicators Baseline (2016)
Target Accomplishment
2017 2018 2019 2020 2017 2018 2019 2020
Number of residential free patents issued
2,969 2,550 1,700 1,600 1,610 2,238 1,944 1,589 1,389
Number of beneficiaries with secured land tenure in public agricultural A&D lands
1,532 1,000 620 580 240 1,366 1,114 1,196 1,126
Number of beneficiaries with secured land tenure in residential lands zoned as residential areas
2,969 2,550 1,700 1,600 1,610 2,238 1,944 1,589 1,389
Source: DENR Region IV-A Land Administration and Management improved through LAMS The target of 1,890 for the number of lots/patents issued in 2020 was surpassed as 2,515
lots/patents were issued. Likewise, the 2020 target of 4,000 surveys were surpassed as 6,018
were inspected, verified, and approved through LAMS.
Table 20.6. Indicator, targets, and accomplishments for LAMS in CALABARZON, 2017-
2020
Indicators Baseline
(2016)
Target Accomplishment
2017 2018 2019 2020 2017 2018 2019 2020
Number of lots/patents issued 2,883 3,565 2,377 2,226 1,890 3,605 3,123 2,785 2,515
Inspection, verification, and
approval of surveys through
LAMS
78,722 6,000 4,000 4,000 4,000 6,336 6,271 6,056 5,018
Source: DENR Region IV-A Targets on development of sustainable resource-based industries generally met The target for employment from ecotourism and sustainable community resource-based
enterprise was not met as employment in 2020 decreased. The decline in employment was
attributed to the restrictions imposed under community quarantine to prevent the spread of
COVID-19. Meanwhile, the target for jobs generated from reforestation and non-
timber/agroforestry enterprises was met as 6,344 were employed from NGP and community-
Chapter 20: ENSURING ECOLOGICAL INTEGRITY, CLEAN AND HEALTHY ENVIRONMENT
185
based forest management in 2020. This was achieved through the successful collaboration of
government and people’s organizations. The same is observed with the number of biodiversity-
friendly enterprises recognized as the number increased from 12 in 2019 to 13 in 2020 with the
addition of Fish Processing: Production and Marketing of Surimi Paste Project of the Samahan
ng Mandaragat sa Sulok Fisher Association which focuses on surimi production in Lumaniang,
Lian, Batangas.
The development of 22 protected areas into ecotourism sites targeted for 2020 was not met as
only 18 PAs were developed into ecotourism sites. This achievement, nonetheless, was possible
through the active participation of POs and LGUs and the implementation of the
management plan.
Meanwhile, the 10 target Key Biodiversity Areas (KBAs) that serve as ecotourism destinations
was achieved in 2020. Out of 24 KBAs in CALABARZON, the following were developed into
ecotourism areas: Mt. Makiling Forest Reserve; Mts. Banahaw San Cristobal Protected
Landscape; Mts. Palay Palay Mataas na Gulod Protected Landscape; Quezon Protected
Landscape; Taal Volcano Protected Landscape; Southwest Alabat Island; Northwest Alabat
Island; Lalaguna Marsh; Alibijaban Wilderness Area; and Maulawin Spring
Protected Landscape.
The area of the agroforestry system adopted in 2020, however, did not meet the 2,865-hectare
target as only 135 hectares were adopted. This includes the 50-hectare coffee-based
agroforestry plantation in Laguna, the 35-hectare agroforestry plantation project in Quezon,
and the 50-hectare agroforestry plantation with working animals project in Quezon. In addition,
590 hectares of NGP plantations planted with assorted agroforestry species and 153 hectares
of plantation of assorted fruit trees were maintained and protected.
Meanwhile, the income generated from foreshore areas increased to PHP235,214,773.61 in
2020 from PHP138,910,233.28 in 2019 due to the intensified collection of fees and penalties
to foreshore permitees. An increase was also observed in Integrated Protected Area Fund as
PHP27,512,727 was collected in 2020 from 8,051,260.09 in 2019 which can be attributed
primarily to the agreement with private entities for project development. Maintenance of
facilities within the PAs and the assistance provided by the LGUs and stakeholders in the
development of ecotourism products within the PAs also contributed to the achievement of
the target.
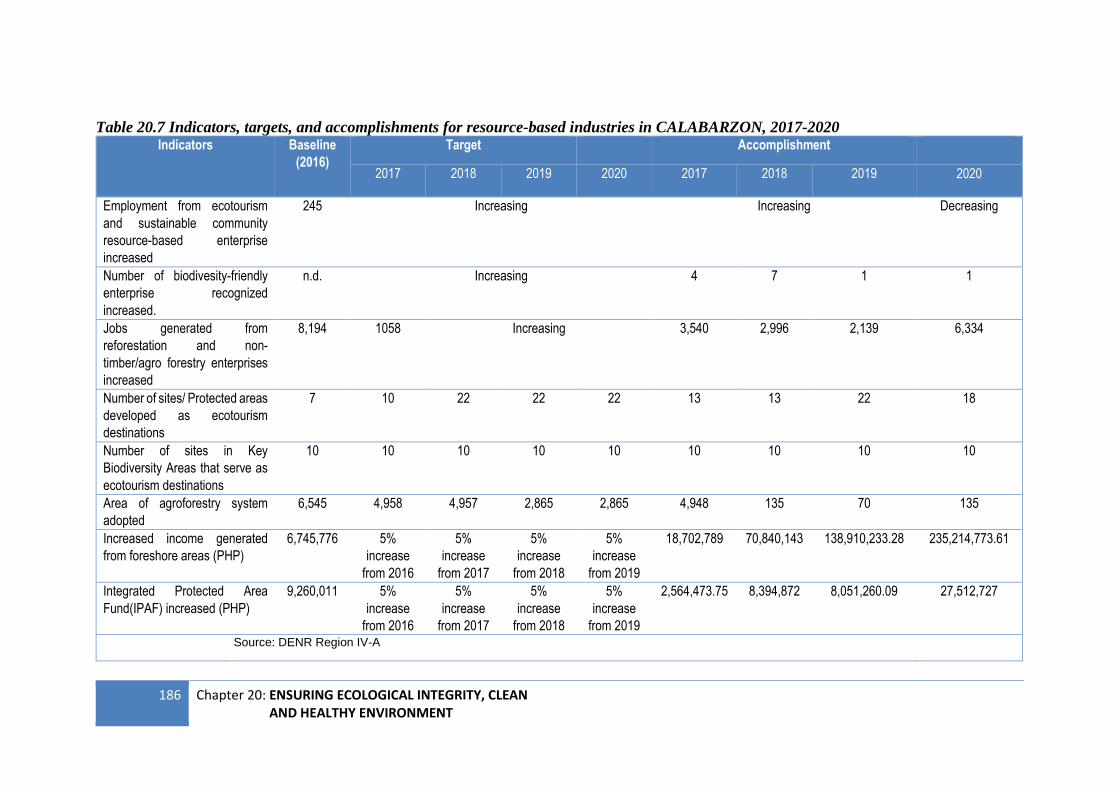
186 Chapter 20: ENSURING ECOLOGICAL INTEGRITY, CLEAN AND HEALTHY ENVIRONMENT
Table 20.7 Indicators, targets, and accomplishments for resource-based industries in CALABARZON, 2017-2020 Indicators Baseline
(2016)
Target Accomplishment
2017 2018 2019 2020 2017 2018 2019 2020
Employment from ecotourism
and sustainable community
resource-based enterprise
increased
245 Increasing Increasing Decreasing
Number of biodivesity-friendly
enterprise recognized
increased.
n.d. Increasing 4 7 1 1
Jobs generated from
reforestation and non-
timber/agro forestry enterprises
increased
8,194 1058 Increasing 3,540 2,996 2,139 6,334
Number of sites/ Protected areas
developed as ecotourism
destinations
7 10 22 22 22 13 13 22 18
Number of sites in Key
Biodiversity Areas that serve as
ecotourism destinations
10 10 10 10 10 10 10 10 10
Area of agroforestry system
adopted
6,545 4,958 4,957 2,865 2,865 4,948 135 70 135
Increased income generated
from foreshore areas (PHP)
6,745,776 5%
increase
from 2016
5%
increase
from 2017
5%
increase
from 2018
5%
increase
from 2019
18,702,789 70,840,143 138,910,233.28 235,214,773.61
Integrated Protected Area
Fund(IPAF) increased (PHP)
9,260,011 5%
increase
from 2016
5%
increase
from 2017
5%
increase
from 2018
5%
increase
from 2019
2,564,473.75 8,394,872 8,051,260.09 27,512,727
Source: DENR Region IV-A
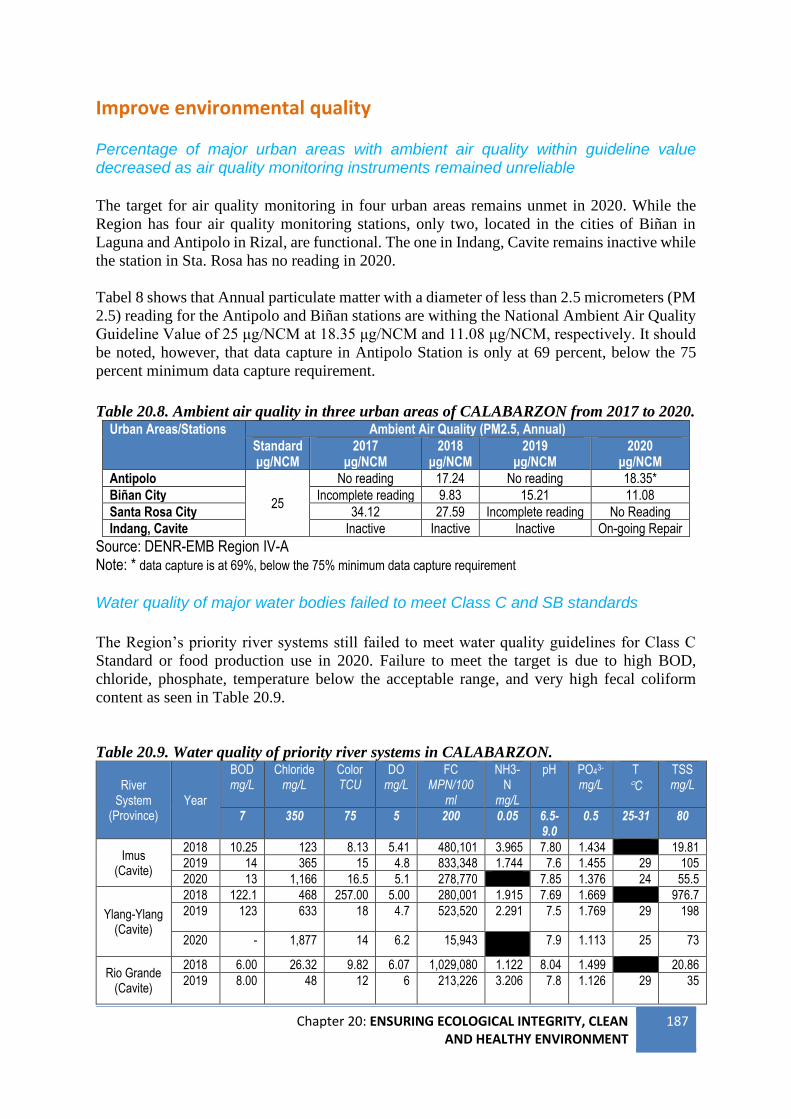
Chapter 20: ENSURING ECOLOGICAL INTEGRITY, CLEAN AND HEALTHY ENVIRONMENT
187
Improve environmental quality Percentage of major urban areas with ambient air quality within guideline value decreased as air quality monitoring instruments remained unreliable The target for air quality monitoring in four urban areas remains unmet in 2020. While the
Region has four air quality monitoring stations, only two, located in the cities of Biñan in
Laguna and Antipolo in Rizal, are functional. The one in Indang, Cavite remains inactive while
the station in Sta. Rosa has no reading in 2020.
Tabel 8 shows that Annual particulate matter with a diameter of less than 2.5 micrometers (PM
2.5) reading for the Antipolo and Biñan stations are withing the National Ambient Air Quality
Guideline Value of 25 μg/NCM at 18.35 μg/NCM and 11.08 μg/NCM, respectively. It should
be noted, however, that data capture in Antipolo Station is only at 69 percent, below the 75
percent minimum data capture requirement.
Table 20.8. Ambient air quality in three urban areas of CALABARZON from 2017 to 2020. Urban Areas/Stations Ambient Air Quality (PM2.5, Annual)
Standard μg/NCM
2017 μg/NCM
2018 μg/NCM
2019 μg/NCM
2020 μg/NCM
Antipolo
25
No reading 17.24 No reading 18.35*
Biñan City Incomplete reading 9.83 15.21 11.08
Santa Rosa City 34.12 27.59 Incomplete reading No Reading
Indang, Cavite Inactive Inactive Inactive On-going Repair
Source: DENR-EMB Region IV-A Note: * data capture is at 69%, below the 75% minimum data capture requirement
Water quality of major water bodies failed to meet Class C and SB standards
The Region’s priority river systems still failed to meet water quality guidelines for Class C
Standard or food production use in 2020. Failure to meet the target is due to high BOD,
chloride, phosphate, temperature below the acceptable range, and very high fecal coliform
content as seen in Table 20.9.
Table 20.9. Water quality of priority river systems in CALABARZON.
River System
(Province) Year
BOD mg/L
Chloride mg/L
Color TCU
DO mg/L
FC MPN/100
ml
NH3-N
mg/L
pH PO43- mg/L
T
C
TSS mg/L
7 350 75 5 200 0.05 6.5-9.0
0.5 25-31 80
Imus (Cavite)
2018 10.25 123 8.13 5.41 480,101 3.965 7.80 1.434 19.81
2019 14 365 15 4.8 833,348 1.744 7.6 1.455 29 105
2020 13 1,166 16.5 5.1 278,770 7.85 1.376 24 55.5
Ylang-Ylang (Cavite)
2018 122.1 468 257.00 5.00 280,001 1.915 7.69 1.669 976.7
2019 123 633 18 4.7 523,520 2.291 7.5 1.769 29 198
2020 - 1,877 14 6.2 15,943 7.9 1.113 25 73
Rio Grande (Cavite)
2018 6.00 26.32 9.82 6.07 1,029,080 1.122 8.04 1.499 20.86
2019 8.00 48 12 6 213,226 3.206 7.8 1.126 29 35
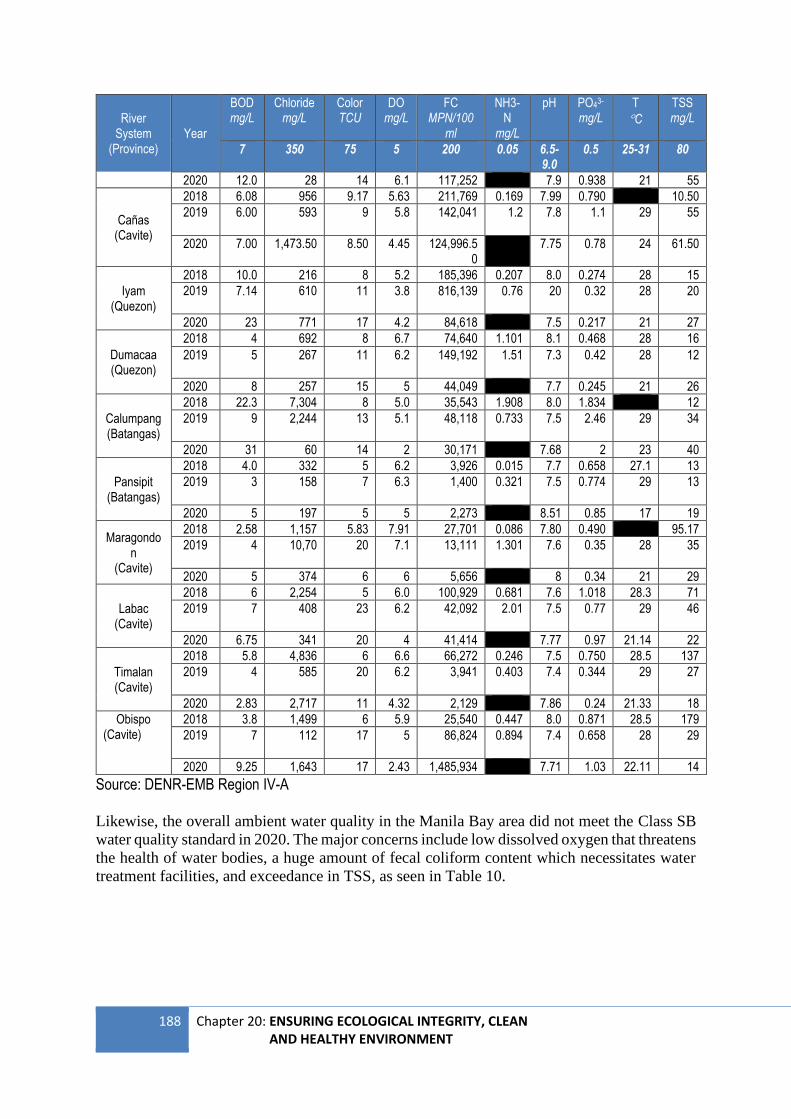
188 Chapter 20: ENSURING ECOLOGICAL INTEGRITY, CLEAN AND HEALTHY ENVIRONMENT
River System
(Province) Year
BOD mg/L
Chloride mg/L
Color TCU
DO mg/L
FC MPN/100
ml
NH3-N
mg/L
pH PO43- mg/L
T
C
TSS mg/L
7 350 75 5 200 0.05 6.5-9.0
0.5 25-31 80
2020 12.0 28 14 6.1 117,252 7.9 0.938 21 55
Cañas (Cavite)
2018 6.08 956 9.17 5.63 211,769 0.169 7.99 0.790 10.50
2019 6.00 593 9 5.8 142,041 1.2 7.8 1.1 29 55
2020 7.00 1,473.50 8.50 4.45 124,996.50
7.75 0.78 24 61.50
Iyam (Quezon)
2018 10.0 216 8 5.2 185,396 0.207 8.0 0.274 28 15
2019 7.14 610 11 3.8 816,139 0.76 20 0.32 28 20
2020 23 771 17 4.2 84,618 7.5 0.217 21 27
Dumacaa (Quezon)
2018 4 692 8 6.7 74,640 1.101 8.1 0.468 28 16
2019 5 267 11 6.2 149,192 1.51 7.3 0.42 28 12
2020 8 257 15 5 44,049 7.7 0.245 21 26
Calumpang (Batangas)
2018 22.3 7,304 8 5.0 35,543 1.908 8.0 1.834 12
2019 9 2,244 13 5.1 48,118 0.733 7.5 2.46 29 34
2020 31 60 14 2 30,171 7.68 2 23 40
Pansipit (Batangas)
2018 4.0 332 5 6.2 3,926 0.015 7.7 0.658 27.1 13
2019 3 158 7 6.3 1,400 0.321 7.5 0.774 29 13
2020 5 197 5 5 2,273 8.51 0.85 17 19
Maragondon
(Cavite)
2018 2.58 1,157 5.83 7.91 27,701 0.086 7.80 0.490 95.17
2019 4 10,70 20 7.1 13,111 1.301 7.6 0.35 28 35
2020 5 374 6 6 5,656 8 0.34 21 29
Labac (Cavite)
2018 6 2,254 5 6.0 100,929 0.681 7.6 1.018 28.3 71
2019 7 408 23 6.2 42,092 2.01 7.5 0.77 29 46
2020 6.75 341 20 4 41,414 7.77 0.97 21.14 22
Timalan (Cavite)
2018 5.8 4,836 6 6.6 66,272 0.246 7.5 0.750 28.5 137
2019 4 585 20 6.2 3,941 0.403 7.4 0.344 29 27
2020 2.83 2,717 11 4.32 2,129 7.86 0.24 21.33 18
Obispo (Cavite)
2018 3.8 1,499 6 5.9 25,540 0.447 8.0 0.871 28.5 179
2019 7 112 17 5 86,824 0.894 7.4 0.658 28 29
2020 9.25 1,643 17 2.43 1,485,934 7.71 1.03 22.11 14
Source: DENR-EMB Region IV-A
Likewise, the overall ambient water quality in the Manila Bay area did not meet the Class SB
water quality standard in 2020. The major concerns include low dissolved oxygen that threatens
the health of water bodies, a huge amount of fecal coliform content which necessitates water
treatment facilities, and exceedance in TSS, as seen in Table 10.
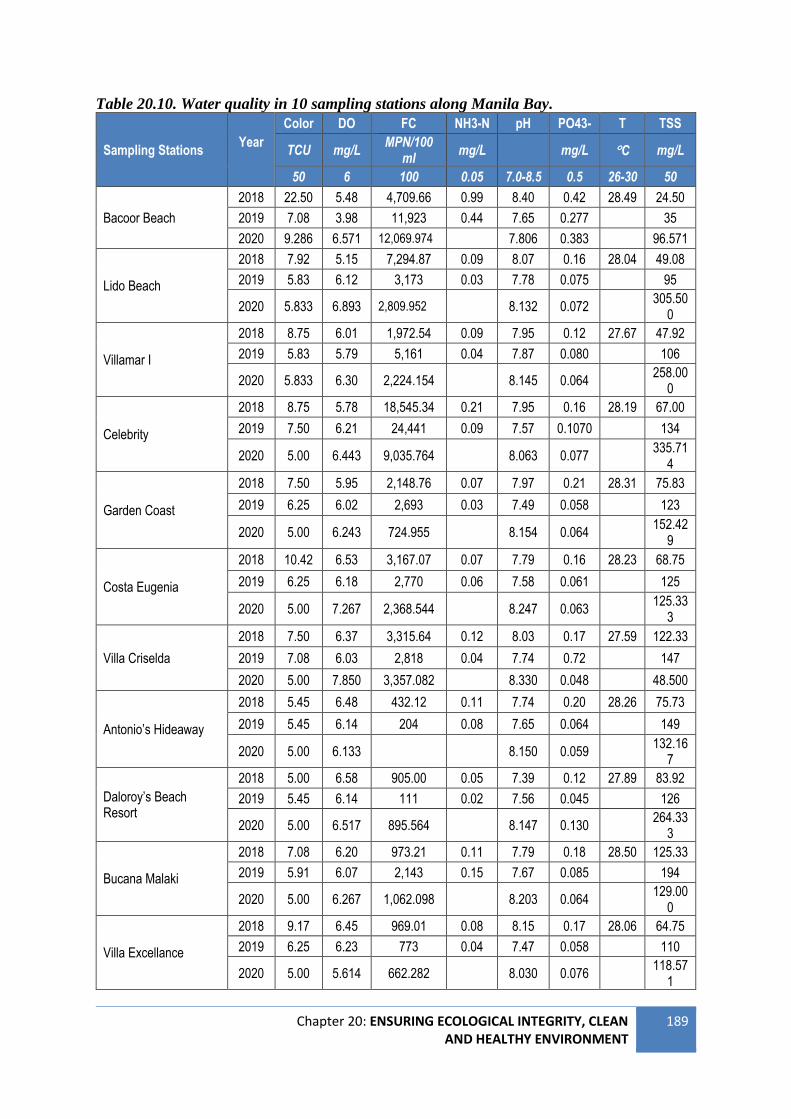
Chapter 20: ENSURING ECOLOGICAL INTEGRITY, CLEAN AND HEALTHY ENVIRONMENT
189
Table 20.10. Water quality in 10 sampling stations along Manila Bay.
Sampling Stations Year
Color DO FC NH3-N pH PO43- T TSS
TCU mg/L MPN/100
ml mg/L mg/L C mg/L
50 6 100 0.05 7.0-8.5 0.5 26-30 50
Bacoor Beach
2018 22.50 5.48 4,709.66 0.99 8.40 0.42 28.49 24.50
2019 7.08 3.98 11,923 0.44 7.65 0.277 35
2020 9.286 6.571 12,069.974 7.806 0.383 96.571
Lido Beach
2018 7.92 5.15 7,294.87 0.09 8.07 0.16 28.04 49.08
2019 5.83 6.12 3,173 0.03 7.78 0.075 95
2020 5.833 6.893 2,809.952 8.132 0.072 305.50
0
Villamar I
2018 8.75 6.01 1,972.54 0.09 7.95 0.12 27.67 47.92
2019 5.83 5.79 5,161 0.04 7.87 0.080 106
2020 5.833 6.30 2,224.154 8.145 0.064 258.00
0
Celebrity
2018 8.75 5.78 18,545.34 0.21 7.95 0.16 28.19 67.00
2019 7.50 6.21 24,441 0.09 7.57 0.1070 134
2020 5.00 6.443 9,035.764 8.063 0.077 335.71
4
Garden Coast
2018 7.50 5.95 2,148.76 0.07 7.97 0.21 28.31 75.83
2019 6.25 6.02 2,693 0.03 7.49 0.058 123
2020 5.00 6.243 724.955 8.154 0.064 152.42
9
Costa Eugenia
2018 10.42 6.53 3,167.07 0.07 7.79 0.16 28.23 68.75
2019 6.25 6.18 2,770 0.06 7.58 0.061 125
2020 5.00 7.267 2,368.544 8.247 0.063 125.33
3
Villa Criselda
2018 7.50 6.37 3,315.64 0.12 8.03 0.17 27.59 122.33
2019 7.08 6.03 2,818 0.04 7.74 0.72 147
2020 5.00 7.850 3,357.082 8.330 0.048 48.500
Antonio’s Hideaway
2018 5.45 6.48 432.12 0.11 7.74 0.20 28.26 75.73
2019 5.45 6.14 204 0.08 7.65 0.064 149
2020 5.00 6.133 8.150 0.059 132.16
7
Daloroy’s Beach Resort
2018 5.00 6.58 905.00 0.05 7.39 0.12 27.89 83.92
2019 5.45 6.14 111 0.02 7.56 0.045 126
2020 5.00 6.517 895.564 8.147 0.130 264.33
3
Bucana Malaki
2018 7.08 6.20 973.21 0.11 7.79 0.18 28.50 125.33
2019 5.91 6.07 2,143 0.15 7.67 0.085 194
2020 5.00 6.267 1,062.098 8.203 0.064 129.00
0
Villa Excellance
2018 9.17 6.45 969.01 0.08 8.15 0.17 28.06 64.75
2019 6.25 6.23 773 0.04 7.47 0.058 110
2020 5.00 5.614 662.282 8.030 0.076 118.57
1
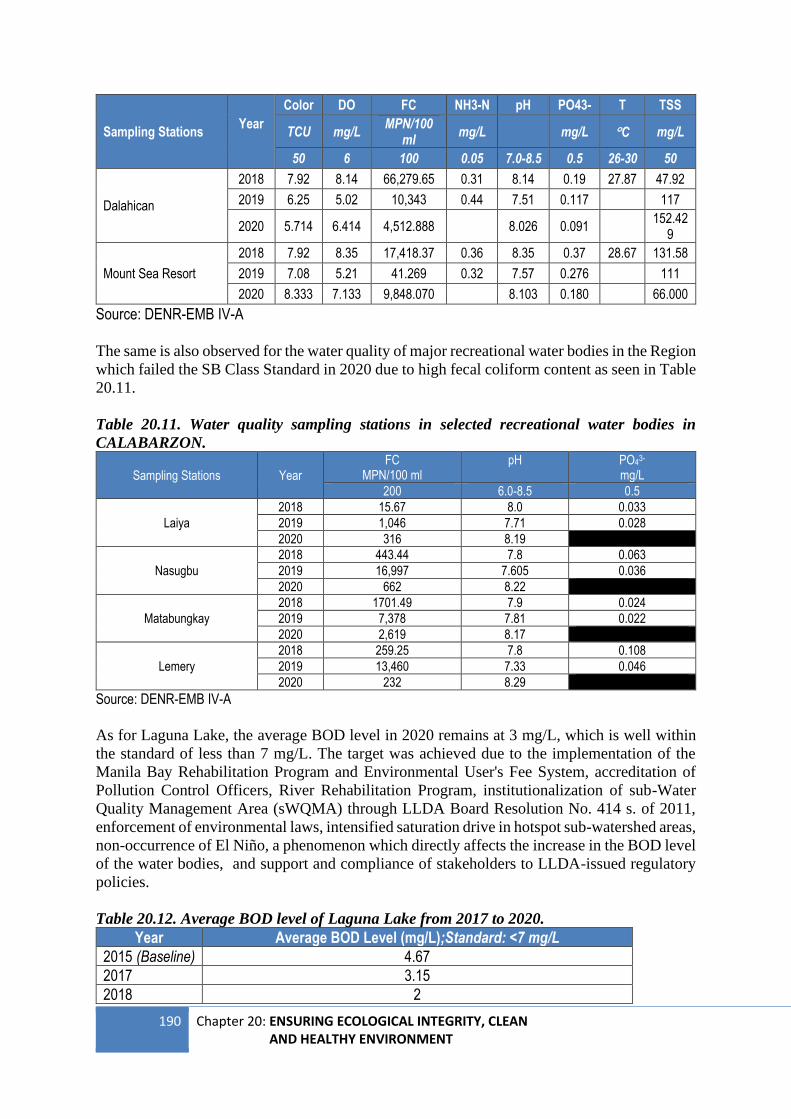
190 Chapter 20: ENSURING ECOLOGICAL INTEGRITY, CLEAN AND HEALTHY ENVIRONMENT
Sampling Stations Year
Color DO FC NH3-N pH PO43- T TSS
TCU mg/L MPN/100
ml mg/L mg/L C mg/L
50 6 100 0.05 7.0-8.5 0.5 26-30 50
Dalahican
2018 7.92 8.14 66,279.65 0.31 8.14 0.19 27.87 47.92
2019 6.25 5.02 10,343 0.44 7.51 0.117 117
2020 5.714 6.414 4,512.888 8.026 0.091 152.42
9
Mount Sea Resort
2018 7.92 8.35 17,418.37 0.36 8.35 0.37 28.67 131.58
2019 7.08 5.21 41.269 0.32 7.57 0.276 111
2020 8.333 7.133 9,848.070 8.103 0.180 66.000
Source: DENR-EMB IV-A The same is also observed for the water quality of major recreational water bodies in the Region
which failed the SB Class Standard in 2020 due to high fecal coliform content as seen in Table
20.11.
Table 20.11. Water quality sampling stations in selected recreational water bodies in
CALABARZON.
Sampling Stations Year FC
MPN/100 ml pH PO43-
mg/L
200 6.0-8.5 0.5
Laiya
2018 15.67 8.0 0.033
2019 1,046 7.71 0.028
2020 316 8.19
Nasugbu
2018 443.44 7.8 0.063
2019 16,997 7.605 0.036
2020 662 8.22
Matabungkay
2018 1701.49 7.9 0.024
2019 7,378 7.81 0.022
2020 2,619 8.17
Lemery
2018 259.25 7.8 0.108
2019 13,460 7.33 0.046
2020 232 8.29
Source: DENR-EMB IV-A
As for Laguna Lake, the average BOD level in 2020 remains at 3 mg/L, which is well within
the standard of less than 7 mg/L. The target was achieved due to the implementation of the
Manila Bay Rehabilitation Program and Environmental User's Fee System, accreditation of
Pollution Control Officers, River Rehabilitation Program, institutionalization of sub-Water
Quality Management Area (sWQMA) through LLDA Board Resolution No. 414 s. of 2011,
enforcement of environmental laws, intensified saturation drive in hotspot sub-watershed areas,
non-occurrence of El Niño, a phenomenon which directly affects the increase in the BOD level
of the water bodies, and support and compliance of stakeholders to LLDA-issued regulatory
policies.
Table 20.12. Average BOD level of Laguna Lake from 2017 to 2020.
Year Average BOD Level (mg/L);Standard: <7 mg/L
2015 (Baseline) 4.67
2017 3.15
2018 2
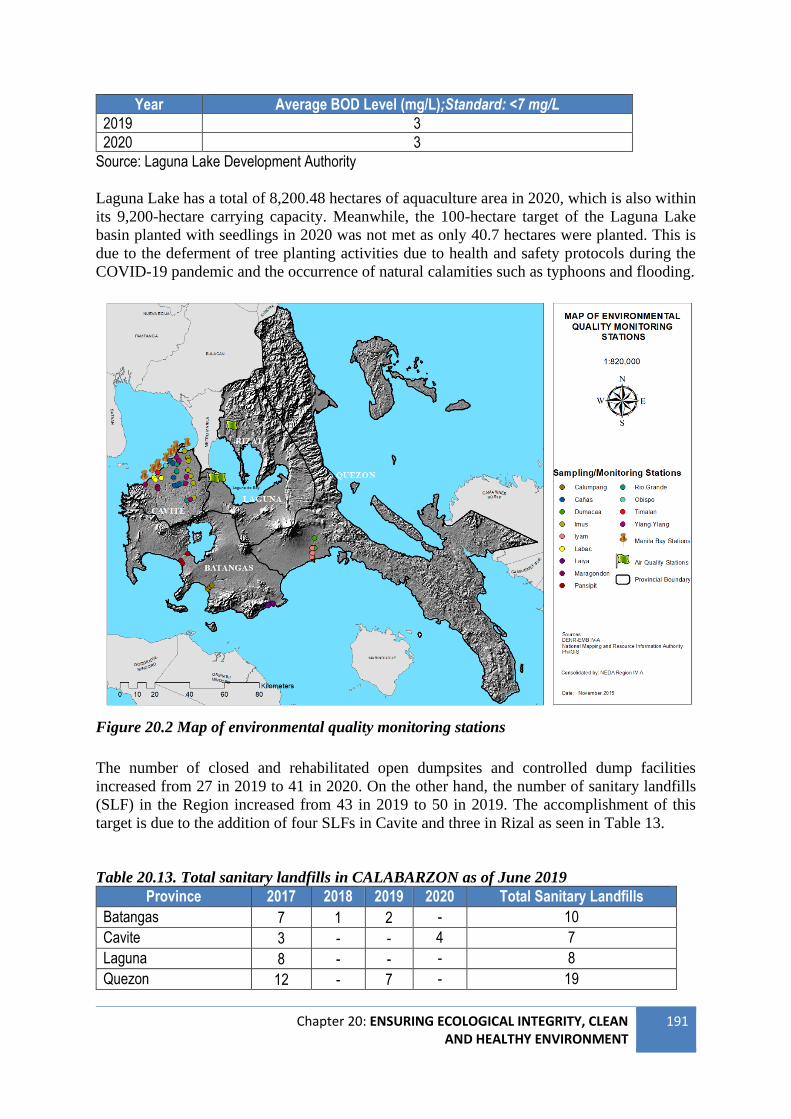
Chapter 20: ENSURING ECOLOGICAL INTEGRITY, CLEAN AND HEALTHY ENVIRONMENT
191
Year Average BOD Level (mg/L);Standard: <7 mg/L
2019 3
2020 3
Source: Laguna Lake Development Authority Laguna Lake has a total of 8,200.48 hectares of aquaculture area in 2020, which is also within
its 9,200-hectare carrying capacity. Meanwhile, the 100-hectare target of the Laguna Lake
basin planted with seedlings in 2020 was not met as only 40.7 hectares were planted. This is
due to the deferment of tree planting activities due to health and safety protocols during the
COVID-19 pandemic and the occurrence of natural calamities such as typhoons and flooding.
Figure 20.2 Map of environmental quality monitoring stations
The number of closed and rehabilitated open dumpsites and controlled dump facilities
increased from 27 in 2019 to 41 in 2020. On the other hand, the number of sanitary landfills
(SLF) in the Region increased from 43 in 2019 to 50 in 2019. The accomplishment of this
target is due to the addition of four SLFs in Cavite and three in Rizal as seen in Table 13.
Table 20.13. Total sanitary landfills in CALABARZON as of June 2019
Province 2017 2018 2019 2020 Total Sanitary Landfills
Batangas 7 1 2 - 10
Cavite 3 - - 4 7
Laguna 8 - - - 8
Quezon 12 - 7 - 19
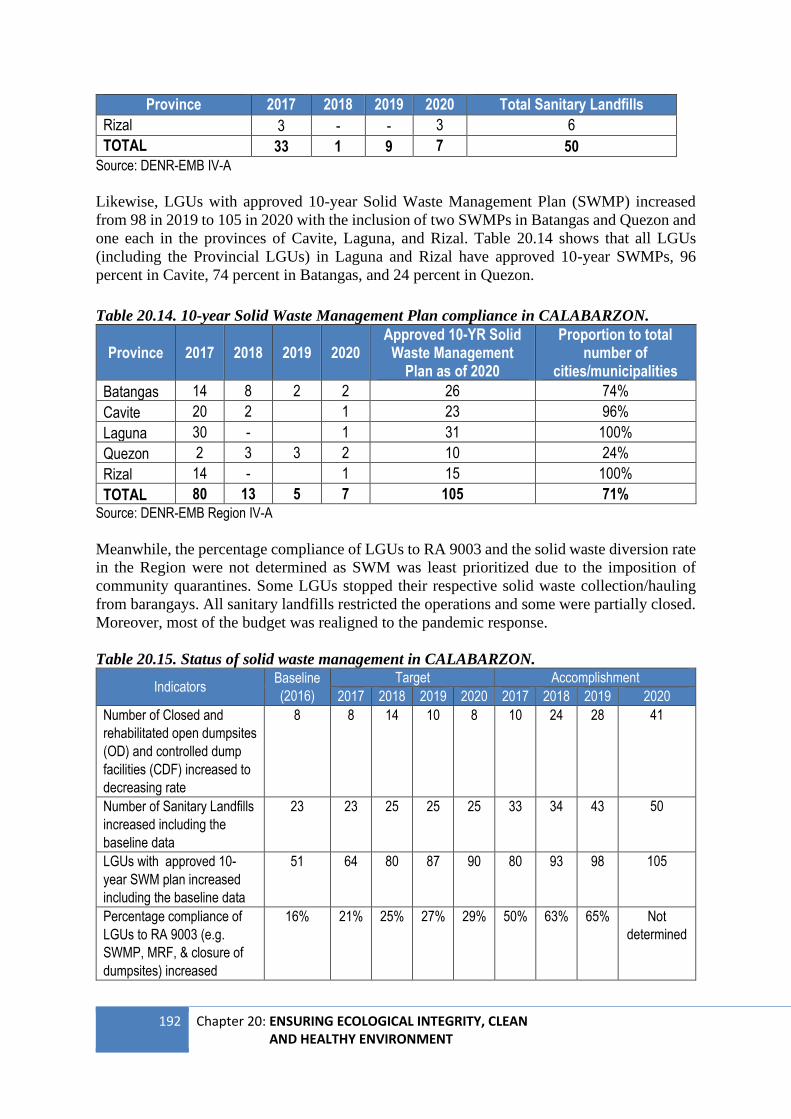
192 Chapter 20: ENSURING ECOLOGICAL INTEGRITY, CLEAN AND HEALTHY ENVIRONMENT
Province 2017 2018 2019 2020 Total Sanitary Landfills
Rizal 3 - - 3 6
TOTAL 33 1 9 7 50 Source: DENR-EMB IV-A
Likewise, LGUs with approved 10-year Solid Waste Management Plan (SWMP) increased
from 98 in 2019 to 105 in 2020 with the inclusion of two SWMPs in Batangas and Quezon and
one each in the provinces of Cavite, Laguna, and Rizal. Table 20.14 shows that all LGUs
(including the Provincial LGUs) in Laguna and Rizal have approved 10-year SWMPs, 96
percent in Cavite, 74 percent in Batangas, and 24 percent in Quezon.
Table 20.14. 10-year Solid Waste Management Plan compliance in CALABARZON.
Province 2017 2018 2019 2020 Approved 10-YR Solid
Waste Management Plan as of 2020
Proportion to total number of
cities/municipalities
Batangas 14 8 2 2 26 74%
Cavite 20 2 1 23 96%
Laguna 30 - 1 31 100%
Quezon 2 3 3 2 10 24%
Rizal 14 - 1 15 100%
TOTAL 80 13 5 7 105 71% Source: DENR-EMB Region IV-A
Meanwhile, the percentage compliance of LGUs to RA 9003 and the solid waste diversion rate
in the Region were not determined as SWM was least prioritized due to the imposition of
community quarantines. Some LGUs stopped their respective solid waste collection/hauling
from barangays. All sanitary landfills restricted the operations and some were partially closed.
Moreover, most of the budget was realigned to the pandemic response.
Table 20.15. Status of solid waste management in CALABARZON.
Indicators Baseline
(2016)
Target Accomplishment
2017 2018 2019 2020 2017 2018 2019 2020
Number of Closed and
rehabilitated open dumpsites
(OD) and controlled dump
facilities (CDF) increased to
decreasing rate
8 8 14 10 8 10 24 28 41
Number of Sanitary Landfills
increased including the
baseline data
23 23 25 25 25 33 34 43 50
LGUs with approved 10-
year SWM plan increased
including the baseline data
51 64 80 87 90 80 93 98 105
Percentage compliance of
LGUs to RA 9003 (e.g.
SWMP, MRF, & closure of
dumpsites) increased
16% 21% 25% 27% 29% 50% 63% 65% Not
determined
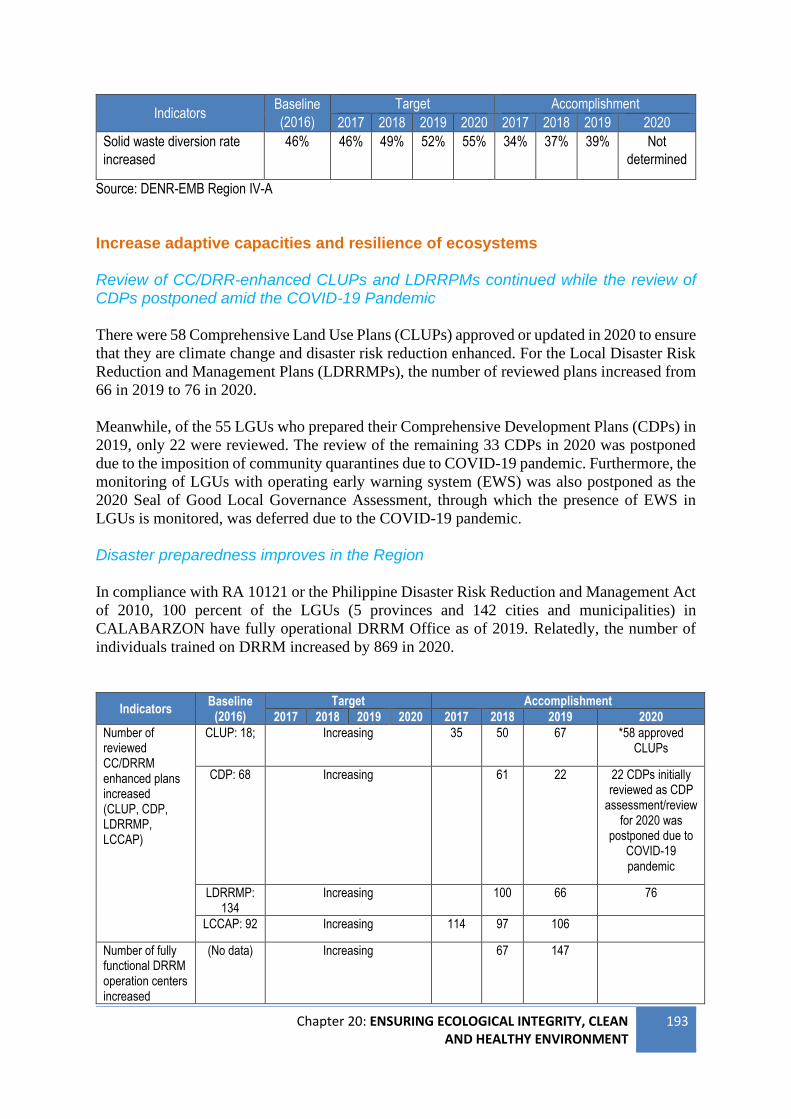
Chapter 20: ENSURING ECOLOGICAL INTEGRITY, CLEAN AND HEALTHY ENVIRONMENT
193
Indicators Baseline
(2016)
Target Accomplishment
2017 2018 2019 2020 2017 2018 2019 2020
Solid waste diversion rate
increased
46% 46% 49% 52% 55% 34% 37% 39% Not
determined
Source: DENR-EMB Region IV-A
Increase adaptive capacities and resilience of ecosystems Review of CC/DRR-enhanced CLUPs and LDRRPMs continued while the review of CDPs postponed amid the COVID-19 Pandemic There were 58 Comprehensive Land Use Plans (CLUPs) approved or updated in 2020 to ensure
that they are climate change and disaster risk reduction enhanced. For the Local Disaster Risk
Reduction and Management Plans (LDRRMPs), the number of reviewed plans increased from
66 in 2019 to 76 in 2020.
Meanwhile, of the 55 LGUs who prepared their Comprehensive Development Plans (CDPs) in
2019, only 22 were reviewed. The review of the remaining 33 CDPs in 2020 was postponed
due to the imposition of community quarantines due to COVID-19 pandemic. Furthermore, the
monitoring of LGUs with operating early warning system (EWS) was also postponed as the
2020 Seal of Good Local Governance Assessment, through which the presence of EWS in
LGUs is monitored, was deferred due to the COVID-19 pandemic.
Disaster preparedness improves in the Region In compliance with RA 10121 or the Philippine Disaster Risk Reduction and Management Act
of 2010, 100 percent of the LGUs (5 provinces and 142 cities and municipalities) in
CALABARZON have fully operational DRRM Office as of 2019. Relatedly, the number of
individuals trained on DRRM increased by 869 in 2020.
Indicators Baseline
(2016)
Target Accomplishment
2017 2018 2019 2020 2017 2018 2019 2020
Number of reviewed CC/DRRM enhanced plans increased (CLUP, CDP, LDRRMP, LCCAP)
CLUP: 18; Increasing 35 50 67 *58 approved CLUPs
CDP: 68 Increasing 61 22 22 CDPs initially reviewed as CDP
assessment/review for 2020 was
postponed due to COVID-19 pandemic
LDRRMP: 134
Increasing 100 66 76
LCCAP: 92 Increasing 114 97 106
Number of fully functional DRRM operation centers increased
(No data) Increasing 67 147
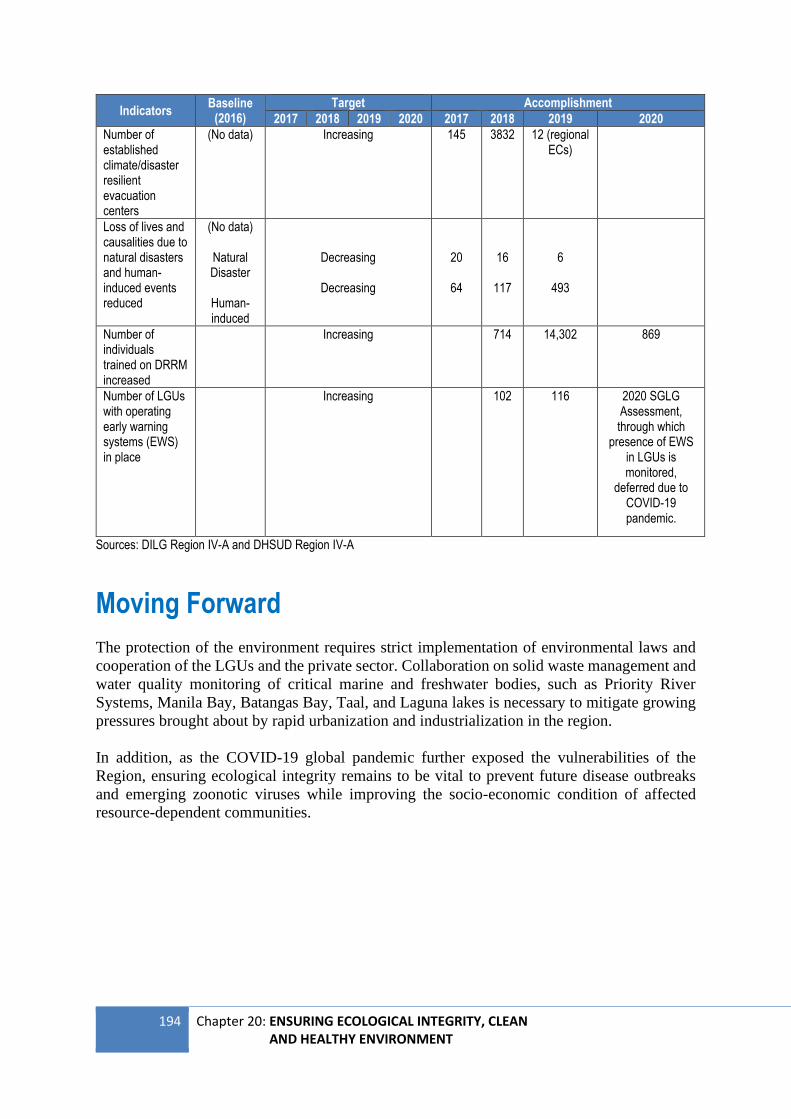
194 Chapter 20: ENSURING ECOLOGICAL INTEGRITY, CLEAN AND HEALTHY ENVIRONMENT
Indicators Baseline
(2016) Target Accomplishment
2017 2018 2019 2020 2017 2018 2019 2020
Number of established climate/disaster resilient evacuation centers
(No data) Increasing 145 3832 12 (regional ECs)
Loss of lives and causalities due to natural disasters and human-induced events reduced
(No data)
Natural Disaster
Human-induced
Decreasing
Decreasing
20
64
16
117
6
493
Number of individuals trained on DRRM increased
Increasing 714 14,302 869
Number of LGUs with operating early warning systems (EWS) in place
Increasing 102 116 2020 SGLG Assessment, through which
presence of EWS in LGUs is monitored,
deferred due to COVID-19 pandemic.
Sources: DILG Region IV-A and DHSUD Region IV-A
Moving Forward
The protection of the environment requires strict implementation of environmental laws and
cooperation of the LGUs and the private sector. Collaboration on solid waste management and
water quality monitoring of critical marine and freshwater bodies, such as Priority River
Systems, Manila Bay, Batangas Bay, Taal, and Laguna lakes is necessary to mitigate growing
pressures brought about by rapid urbanization and industrialization in the region.
In addition, as the COVID-19 global pandemic further exposed the vulnerabilities of the
Region, ensuring ecological integrity remains to be vital to prevent future disease outbreaks
and emerging zoonotic viruses while improving the socio-economic condition of affected
resource-dependent communities.
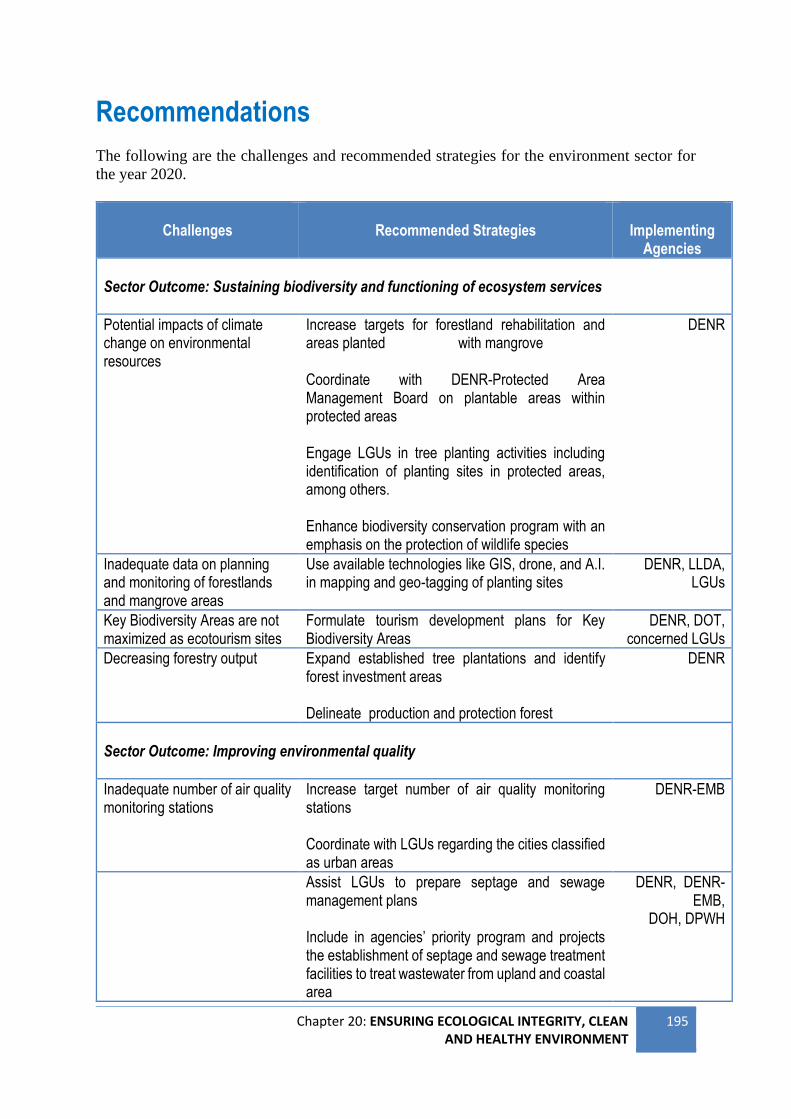
Chapter 20: ENSURING ECOLOGICAL INTEGRITY, CLEAN AND HEALTHY ENVIRONMENT
195
Recommendations
The following are the challenges and recommended strategies for the environment sector for
the year 2020.
Challenges
Recommended Strategies
Implementing
Agencies
Sector Outcome: Sustaining biodiversity and functioning of ecosystem services
Potential impacts of climate change on environmental resources
Increase targets for forestland rehabilitation and areas planted with mangrove Coordinate with DENR-Protected Area Management Board on plantable areas within protected areas Engage LGUs in tree planting activities including identification of planting sites in protected areas, among others. Enhance biodiversity conservation program with an emphasis on the protection of wildlife species
DENR
Inadequate data on planning and monitoring of forestlands and mangrove areas
Use available technologies like GIS, drone, and A.I. in mapping and geo-tagging of planting sites
DENR, LLDA, LGUs
Key Biodiversity Areas are not maximized as ecotourism sites
Formulate tourism development plans for Key Biodiversity Areas
DENR, DOT, concerned LGUs
Decreasing forestry output Expand established tree plantations and identify forest investment areas Delineate production and protection forest
DENR
Sector Outcome: Improving environmental quality
Inadequate number of air quality monitoring stations
Increase target number of air quality monitoring stations Coordinate with LGUs regarding the cities classified as urban areas
DENR-EMB
Assist LGUs to prepare septage and sewage management plans Include in agencies’ priority program and projects the establishment of septage and sewage treatment facilities to treat wastewater from upland and coastal area
DENR, DENR-EMB,
DOH, DPWH
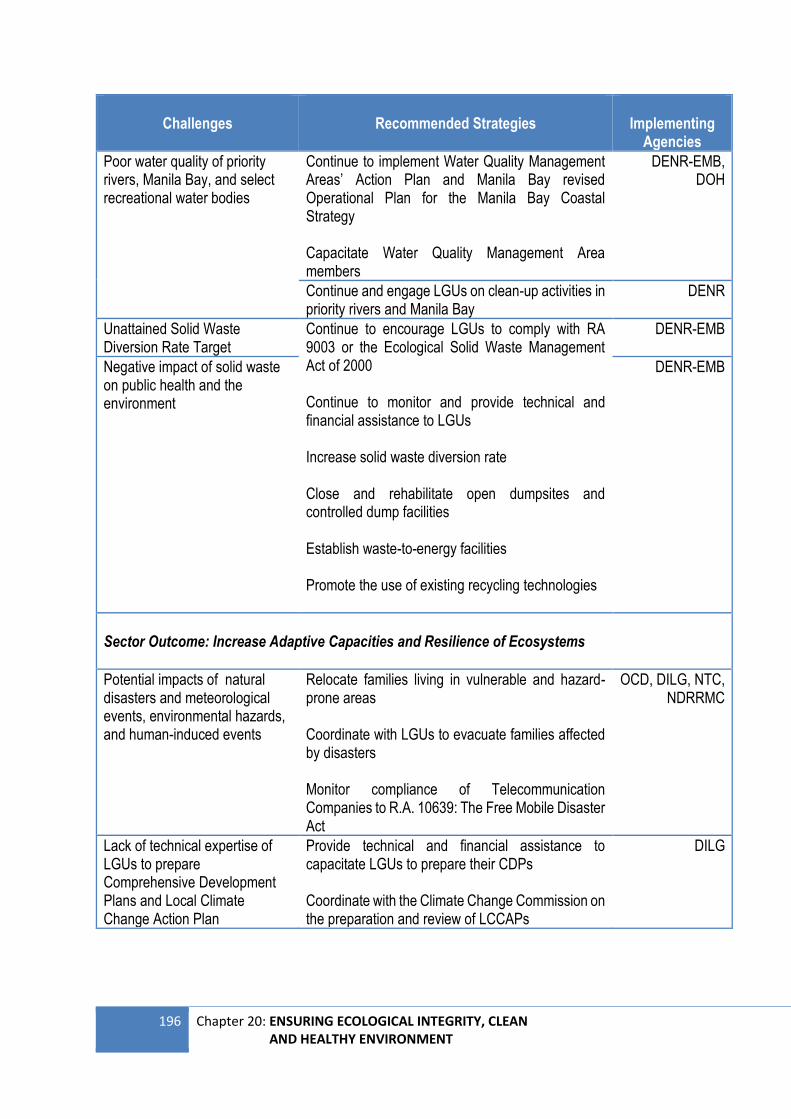
196 Chapter 20: ENSURING ECOLOGICAL INTEGRITY, CLEAN AND HEALTHY ENVIRONMENT
Challenges
Recommended Strategies
Implementing
Agencies
Poor water quality of priority rivers, Manila Bay, and select recreational water bodies
Continue to implement Water Quality Management Areas’ Action Plan and Manila Bay revised Operational Plan for the Manila Bay Coastal Strategy Capacitate Water Quality Management Area members
DENR-EMB, DOH
Continue and engage LGUs on clean-up activities in priority rivers and Manila Bay
DENR
Unattained Solid Waste Diversion Rate Target
Continue to encourage LGUs to comply with RA 9003 or the Ecological Solid Waste Management Act of 2000 Continue to monitor and provide technical and financial assistance to LGUs Increase solid waste diversion rate Close and rehabilitate open dumpsites and controlled dump facilities Establish waste-to-energy facilities Promote the use of existing recycling technologies
DENR-EMB
Negative impact of solid waste on public health and the environment
DENR-EMB
Sector Outcome: Increase Adaptive Capacities and Resilience of Ecosystems
Potential impacts of natural disasters and meteorological events, environmental hazards, and human-induced events
Relocate families living in vulnerable and hazard-prone areas Coordinate with LGUs to evacuate families affected by disasters Monitor compliance of Telecommunication Companies to R.A. 10639: The Free Mobile Disaster Act
OCD, DILG, NTC, NDRRMC
Lack of technical expertise of LGUs to prepare Comprehensive Development Plans and Local Climate Change Action Plan
Provide technical and financial assistance to capacitate LGUs to prepare their CDPs Coordinate with the Climate Change Commission on the preparation and review of LCCAPs
DILG
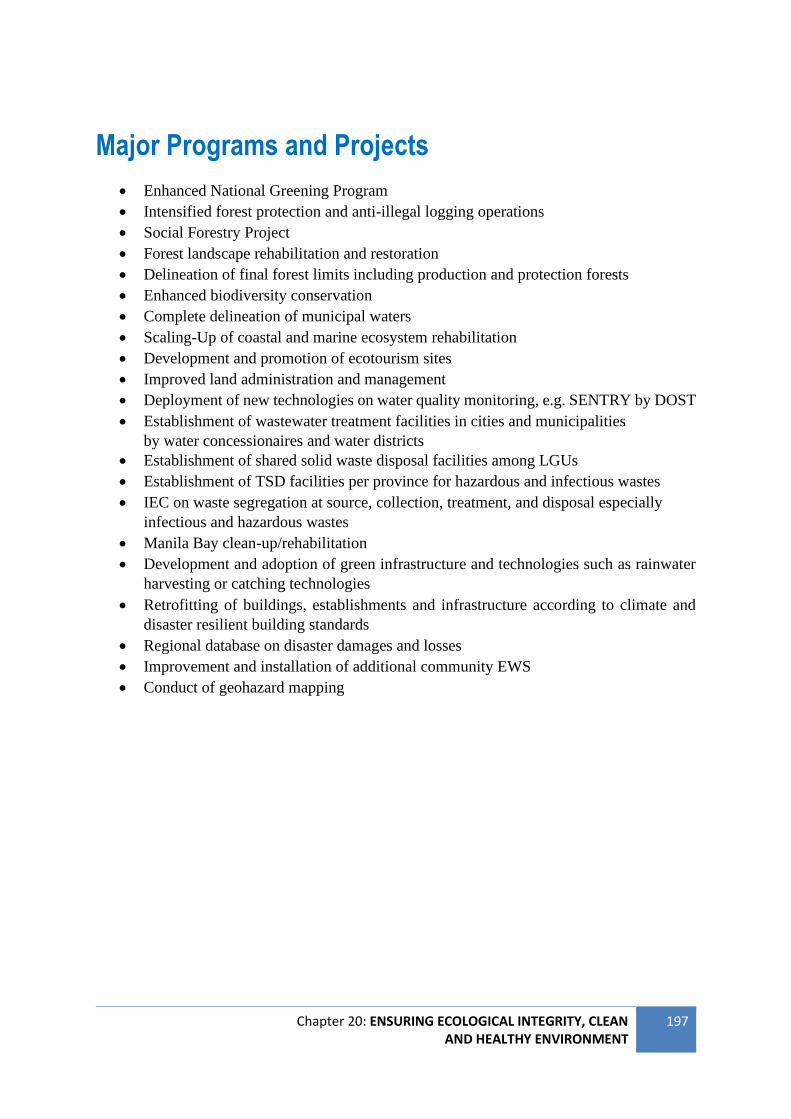
Chapter 20: ENSURING ECOLOGICAL INTEGRITY, CLEAN AND HEALTHY ENVIRONMENT
197
Major Programs and Projects
• Enhanced National Greening Program
• Intensified forest protection and anti-illegal logging operations
• Social Forestry Project
• Forest landscape rehabilitation and restoration
• Delineation of final forest limits including production and protection forests
• Enhanced biodiversity conservation
• Complete delineation of municipal waters
• Scaling-Up of coastal and marine ecosystem rehabilitation
• Development and promotion of ecotourism sites
• Improved land administration and management
• Deployment of new technologies on water quality monitoring, e.g. SENTRY by DOST
• Establishment of wastewater treatment facilities in cities and municipalities
by water concessionaires and water districts
• Establishment of shared solid waste disposal facilities among LGUs
• Establishment of TSD facilities per province for hazardous and infectious wastes
• IEC on waste segregation at source, collection, treatment, and disposal especially
infectious and hazardous wastes
• Manila Bay clean-up/rehabilitation
• Development and adoption of green infrastructure and technologies such as rainwater
harvesting or catching technologies
• Retrofitting of buildings, establishments and infrastructure according to climate and
disaster resilient building standards
• Regional database on disaster damages and losses
• Improvement and installation of additional community EWS
• Conduct of geohazard mapping

198 Chapter 20: ENSURING ECOLOGICAL INTEGRITY, CLEAN AND HEALTHY ENVIRONMENT
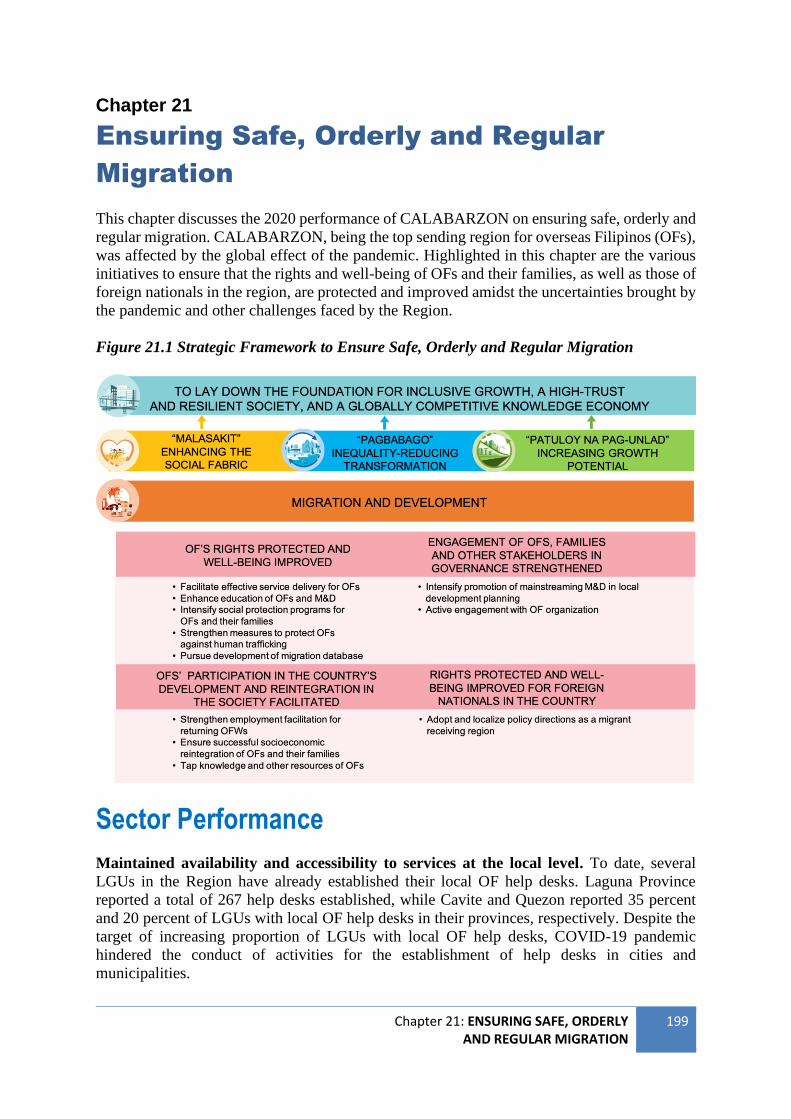
Chapter 21: ENSURING SAFE, ORDERLY AND REGULAR MIGRATION
199
Chapter 21
Ensuring Safe, Orderly and Regular
Migration
This chapter discusses the 2020 performance of CALABARZON on ensuring safe, orderly and
regular migration. CALABARZON, being the top sending region for overseas Filipinos (OFs),
was affected by the global effect of the pandemic. Highlighted in this chapter are the various
initiatives to ensure that the rights and well-being of OFs and their families, as well as those of
foreign nationals in the region, are protected and improved amidst the uncertainties brought by
the pandemic and other challenges faced by the Region.
Figure 21.1 Strategic Framework to Ensure Safe, Orderly and Regular Migration
Sector Performance
Maintained availability and accessibility to services at the local level. To date, several
LGUs in the Region have already established their local OF help desks. Laguna Province
reported a total of 267 help desks established, while Cavite and Quezon reported 35 percent
and 20 percent of LGUs with local OF help desks in their provinces, respectively. Despite the
target of increasing proportion of LGUs with local OF help desks, COVID-19 pandemic
hindered the conduct of activities for the establishment of help desks in cities and
municipalities.
200 Chapter 21: ENSURING SAFE, ORDERLY AND REGULAR MIGRATION
Meanwhile, Cavite Province was able to create another Committee on Migration and
Development (CMD) at the local level, bringing the number of local CMDs in the province to
three while Laguna Province reported a total of two local CMDs created. These local CMDs
were created in addition to the existing provincial CMDs in the region. However, the creation
of local CMDs was affected by the constraints brought by the current pandemic.
Also in 2020, the CALABARZON CMD initiated the creation of the CALABARZON Service
Map to provide relevant information to OFs and their families, and ensure their successful
reintegration in the community. Lists of available services were provided by the Overseas
Workers Welfare Administration, Department of Agriculture, Department of Trade and
Industry, Technical Education and Skills Development Authority, Department of Science and
Technology, Department of Social Welfare and Development, provincial CMDs (PCMDs),
Laguna State Polytechnic University, University of Rizal System, and the Commission of
Filipinos Overseas. The service map was disseminated to provinces through their One Stop
Migration Resource Centers (OSMRCs) and was proposed to be uploaded in the websites of
the Regional Development Council and M&D Academy, as well as, in the different
BalinkBayan portals of LGUs.
During the onset of the pandemic, CALABARZON CMD, through the technical working group
(TWG) on reintegration, also created a service map for reintegration of repatriated OFs. While
Atikha, in partnership with the Overseas Workers Welfare Administration and Philippine
National Volunteer Services Coordinating Agency, launched the Balikabayanihan Campaign
with the purpose of providing displaced and repatriated OF workers with sustainable and
livelihood opportunities in the country. With this program, the TWG on reintegration
spearheaded the identification and implementation of the priority projects in the region.
Strengthened representation of OFs in the community. From the previous year’s 48
federations, three federations were created in 2020, increasing the number of OF federations in
the Region to 51. Of the three newly created federations, two are in Laguna Province while one
is in Quezon Province. Despite the increased number of federations and meeting the target of
creating more OF federations, PCMDs were still greatly affected by the prohibition of
conducting face to face activities which is critical in forming the federations.
Continued capacity development for OFs through PCMDs and OSMRCs. Cavite Province
reported a decline on the number of beneficiaries of Financial Literacy and Family and Income
Management Training from 174 in 2019 to only 19 in 2020. This was mainly due to the
limitations brought by the pandemic. The same was true for Quezon Province with 240
beneficiaries in 2019 to only 120 in 2020, while Laguna had none for 2020.
Laguna Province also reported a decline in number of beneficiaries of Reintegration
Planning/Financial Planning and Investment Counseling from previous year’s 53 to only 26 in
2020, which was again due to the prohibition of face-to-face activities. However, Cavite
Province reported a slight increase from 60 in 2019 to 63 in 2020 due to introduction of
additional program and activities such as assistance on online selling.
Chapter 21: ENSURING SAFE, ORDERLY AND REGULAR MIGRATION
201
The University of Rizal System led the conduct of a 3-phase capacity building on Starting a
Business for OFWs and Families, as part of the implementation of Balikabayanihan, which
started in October 2020 and will be completed in June 2021. The activity assisted returning
OFs in different parts of the country in starting their business and contribute to their successful
reintegration. The capacity building included discussions on criteria to consider in venturing in
a business, mentoring from the business plan preparation to actual business establishment and
ensuring business sustainability.
PCMDs were also able to provide assistance to COVID-19 displaced and repatriated OFWs
such as financial and transportation assistance, farm inputs and other assistance on investments,
conduct of webinars, and counselling sessions.
Sustained savings and investments of OFs. St. Jude Cooperative in Quezon Province was
able to have an increase in investment by 27 percent and savings by 51 percent. Likewise,
Laguna Province was able to increase the amount of savings and investment mobilized by OFs
from PHP20,000 in 2019 to PHP80,000 in 2020. These may be attributed to the strengthened
capability building and continuous counselling of PCMDs and OSMRCs.
On the other hand, number of investment and market place conducted dropped from 10 in 2019
to only five in 2020 in Quezon Province while Laguna Province was able to conduct one in
2020 from none in the previous year. Further, there were five OF enterprises that were set-up
in 2020 in Quezon Province.
Moving Forward
Several laws were passed to enhance the social protection of OFs and their families, such as,
the Universal Healthcare Act, Social Welfare Attaché Act, Handbook for OFWs Act and the
Social Security Act of 2018. However, one of the persisting challenges in migration and
development is still the lack of an updated database. A more updated and comprehensive
database can be expected to be available among LGUs in the future with the adoption of the
Community-Based Monitoring System (CBMS) by more LGUs through the CBMS Act.
Nonetheless, the issue on non-availability of data on foreign nationals in the region continues
to persist and calls for mechanisms to improve immigration policy and management.
On the limited OF help desks in the LGUs, fast tracking the approval of OFW Help Desk Act
can help increase the number of available help desks for OFs in the region as the act requires
all LGUs to create and establish an OFW Family Help Desk in their offices to provide
assistance in addressing concerns of OFs and their families. Help desks also include provision
of business counselling and livelihood assistance. Further, the DILG issued a memorandum
circular to all regional and field offices to establish a DILG OFW Desk and designate an officer
in every region, province, highly urbanized and independent component city. The circular was
issued to create help desks particularly for returning OFs that were affected by COVID-19.
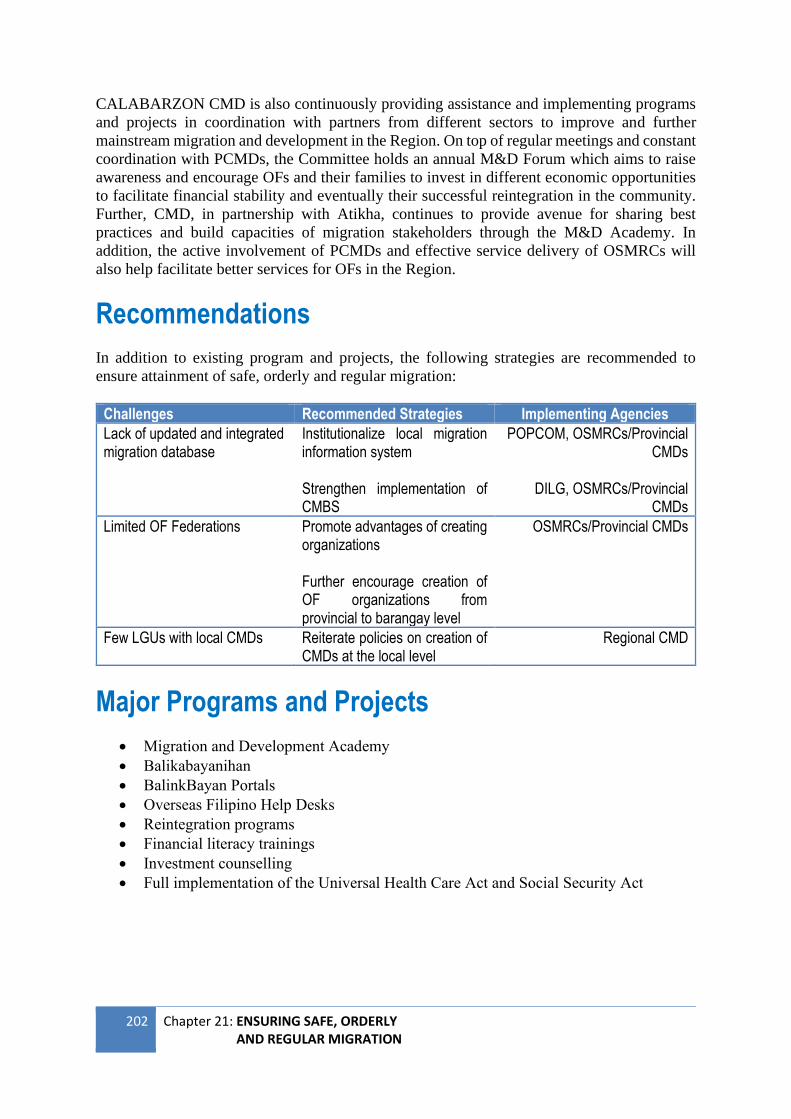
202 Chapter 21: ENSURING SAFE, ORDERLY AND REGULAR MIGRATION
CALABARZON CMD is also continuously providing assistance and implementing programs
and projects in coordination with partners from different sectors to improve and further
mainstream migration and development in the Region. On top of regular meetings and constant
coordination with PCMDs, the Committee holds an annual M&D Forum which aims to raise
awareness and encourage OFs and their families to invest in different economic opportunities
to facilitate financial stability and eventually their successful reintegration in the community.
Further, CMD, in partnership with Atikha, continues to provide avenue for sharing best
practices and build capacities of migration stakeholders through the M&D Academy. In
addition, the active involvement of PCMDs and effective service delivery of OSMRCs will
also help facilitate better services for OFs in the Region.
Recommendations
In addition to existing program and projects, the following strategies are recommended to
ensure attainment of safe, orderly and regular migration:
Challenges Recommended Strategies Implementing Agencies
Lack of updated and integrated migration database
Institutionalize local migration information system Strengthen implementation of CMBS
POPCOM, OSMRCs/Provincial CMDs
DILG, OSMRCs/Provincial
CMDs
Limited OF Federations Promote advantages of creating organizations Further encourage creation of OF organizations from provincial to barangay level
OSMRCs/Provincial CMDs
Few LGUs with local CMDs Reiterate policies on creation of CMDs at the local level
Regional CMD
Major Programs and Projects
• Migration and Development Academy
• Balikabayanihan
• BalinkBayan Portals
• Overseas Filipino Help Desks
• Reintegration programs
• Financial literacy trainings
• Investment counselling
• Full implementation of the Universal Health Care Act and Social Security Act
Chapter 22: SUSTAINABLE DEVELOPMENT GOALS
203
Chapter 22
Sustainable Development Goals
Summary of Accomplishments Six SDG indicators (4 percent) out of the 164 indicators already met their 2030 SDG targets
from 2017-2020, while 6 percent of the indicator (7 indicators) achieved at least 50 percent of
the set targets, and 7 percent (11 indicators) achieved at least 75 percent of the set targets.
Based on the assessment of the actual performance of the SDG indicators, the CALABARZON
Region is still likely to attain the goals on reduction of poverty incidence, good health and well-
being, quality education, sustainable marine resources and terrestrial ecosystems, global
partnerships, and peace, justice, accountable and inclusive institutions. On the other hand, more interventions are needed to attain the 2030 targets on zero hunger,
gender equality, clean water and sanitation, affordable and clean energy, decent work and
economic growth, sustainable, industry, innovation, infrastructure, reduction of inequality
within and among countries, sustainable cities and communities, responsible consumption,
climate action.
Goal 1. End poverty in all its forms everywhere (No Poverty)
Goal 1 aims to achieve the following:
● eradicate extreme poverty for all people everywhere
● reduce at least half the proportion of men and women of all ages living in poverty in all
its dimensions according to national definitions
● ensure that all men and women, in particular the poor and the vulnerable, have equal
rights to economic resources, as well as access to basic services, ownership and control
over land and other forms of property, inheritance, natural resources, appropriate new
technology and financial services.
The following 24 indicators support Goal 1:
1. Poverty incidence by population
2. Poverty incidence by families
3. Poverty incidence for basic sectors
4. Proportion of national budget for direct poverty reduction program to the
national budget
5. Subsistence incidence by population
6. Subsistence incidence by families
7. Proportion of population below the international poverty line, by sex, age, employment
status and geographical location
204 Chapter 22: SUSTAINABLE DEVELOPMENT GOALS
8. Proportion of employed population aged 15 to 24 years old living below the
international poverty line of US$1.90 per day
9. Proportion of employed population aged 25 years old and over living below the
international poverty line of US$1.90 per day
10. Proportion of population living below the national poverty line, by sex
11. Proportion of population living below the national poverty line, by age group
12. Proportion of population living below the national poverty line, by employment status
13. Proportion of population living below the national poverty line, by basic sectors
14. Proportion of population living below the national poverty line, by
geographical location
15. Proportion of population living below the national poverty line, by province (PSA
proposed proxy indicator for proportion of population living below the national poverty
line, by geographical location)
16. Pregnant women with 4 or more prenatal visits
17. Percentage of women ages 15-49 with live birth delivery who were assisted by skilled
health personnel
18. Pregnant women with at least 2 postpartum visits
19. Percentage of population that visited a health facility or sought advice or treatment
20. Net enrolment rate
21. Proportion of families with owned or owner-like possession of housing units
22. Proportion of families with access to secure tenure
23. Sum of total grants and non-debt-creating inflows directly allocated to poverty
reduction programmes as a proportion of GDP·
24. Households served with level three water supply system increased
Based on the latest data, the indicator on poverty incidence for basic sectors has reduced and
attained its 2030 target in 2018. Meanwhile, 12 (50 percent) of the 24 indicators are on track
in meeting their targets. These include the poverty incidence among population and among
families reduced, subsistence incidence by population and families reduced, proportion of
population living below the national poverty line (by age group, employment status, basic
sectors, geographical location, and province), percentage of women ages 15-49 with a live birth
delivery who were assisted by skilled health personnel, and net enrolment rate. On the other
hand, the indicators on pregnant women with four or more prenatal visits and pregnant women
with at least 2 postpartum visits are behind target. seven indicators have no data available, and
two indicators have no targets. The summary of indicators for Goal 1 is in Annex A.
Poverty Incidence14
Indicators on poverty incidence among population and families both exceeded their 2018
targets of 7.1 percent and 5.1 percent, respectively. On the other hand, the 2030 targets on the
reduction on poverty incidence among population basic sectors – women, children, youth,
senior citizens - were all attained in 2018. For the proportion of population below the poverty
line, the Province of Quezon registered the highest in the Region.
Poverty also reduced among population subgroups which suggested inclusivity in the poverty
reduction efforts of the Region. The proportion of female population in the Region living below
14 Next survey in 2021
Chapter 22: SUSTAINABLE DEVELOPMENT GOALS
205
the national poverty line is decreasing, recorded at 7.2 percent in 2018. The declining trend
was also noted across age groups, employment status, basic sectors, geographical location, and
in the five provinces. The Province of Quezon registered the highest in population living below
poverty line. The three indicators on the proportion of population below the international
poverty line have no available data.
The indicator on the proportion of national budget for direct poverty reduction program to the
national budget has no available data since the report is being generated at the national level.
Data and proxy indicator are not available for the percentage of population that visited a health
facility or sought advice or treatment in the 30 days preceding the survey.
The COVID-19 pandemic and the natural calamities experienced in 2020 adversely affected
the income of vulnerable population and may affect the attainment of poverty reduction in the
Region in the succeeding years.
Health and Nutrition
There are still no 2030 and 2020 targets identified for health indicators. In 2020, pregnant
women with four or more prenatal visits was 15.08 percent and pregnant women with at least
two postpartum was 20.35 percent. These are declined performance of 35.14 percent and 37.86
percent, respectively, from 2019. The decline in prenatal visits were affected by restrictions
brought by the pandemic.
Education
For education, the latest data are in 2019. Enrolment for elementary school increased from
2018 to 2019, but slightly below the 98.60 percent target in 2019. Both levels are close to
meeting its 2030 targets.
However, kindergarten and senior high school enrolment rate are still quite far from meeting
its 2030 SDG targets. Net enrolment target for kindergarten was not achieved in 2019 with the
strict implementation of age cut-off in kindergarten and the implementation of enhanced
community quarantine due to COVID-19 pandemic. Enrolment in senior high school also
decreased in 2019 thus, not achieving its target.
Housing
For housing, there is no available data yet in 2020. For the latest data in 2019, only 62.3 percent
of the 3.876 million families in CALABARZON owned or had owner-like possession of the
house and lot they occupied (2019 Annual Poverty Indicators Survey) which is still far behind
of the 2030 SDG target of universal land ownership.
Water Supply
The households served with level three water supply system in the region has incomplete data
at 79 percent in 2020. The collection of complete data was affected by the restrictions brought
206 Chapter 22: SUSTAINABLE DEVELOPMENT GOALS
by the pandemic. In 2019, 91 percent of the households were already served with level three
water supply. The SDG target for this indicator is 100 percent globally by 2030.
With the challenges experienced in 2020, the following strategies, programs and projects are
essential to sustain the Region’s progress in reducing poverty:
● Social Amelioration Package
● Pantawid Pamilyang Pilipino Program
● Unconditional Cash Transfer Program
● Kapit-Bisig Laban sa Kahirapan-Comprehensive and Integrated Delivery of Social
Services - National Community-Driven Development Program
● Sustainable Livelihood Program’s Micro Enterprise Development Track
● Community Based Monitoring System and the National Identification System for
improved profiling and targeting of poverty alleviation programs
● Universal Health Care
● Strengthen interventions to increase enrolment for kindergarten and senior high school
such as policy reiteration on kindergarten cut-off age, and campaign on Senior High
School Program to increase transition and participation rate.
● Review and expand housing finance program , and provide livelihood to increase
families’ capacity to pay.
● Expand level 3 potable water supply system
Goal 2. End hunger, achieve food security and improved nutrition and promote sustainable agriculture (Zero Hunger)
Goal 2 aims to achieve the following:
● end hunger and ensure access by all people, in particular the poor and people in
vulnerable situations, including infants, to safe, nutritious and sufficient food all year
round
● end all forms of malnutrition, including achieving, by 2025, the internationally agreed
targets on stunting and wasting in children under 5 years of age, and address the
nutritional needs of adolescent girls, pregnant and lactating women and older persons.
The following seven indicators support Goal 2:
1. Proportion of HH with per capita intake below 100% dietary energy requirement
2. Prevalence of stunting among children under 5 years old
3. Prevalence of malnutrition for children under 5 years old (wasting)
4. Prevalence of malnutrition for children under 5 years old (overweight)
5. Proportion of the population with Vitamin A Deficient
6. Proportion of the population with anemia
7. Prevalence of exclusively breastfed children 0 to 6 months old.
All seven indicators have no regional data for 2020. On the provincial data, Laguna Province
already met its 2030 target on reducing the prevalence of stunting. Other provincial data are
not yet available. The summary of indicators for Goal 2 is in Annex B.
Chapter 22: SUSTAINABLE DEVELOPMENT GOALS
207
Underweight, wasting, and stunting among preschool children under five years old remain as
regional concerns. Unfortunately, there is no official data or trends in the prevalence of
underweight, wasting, and stunting from 2017 to 2020. National and regional results of the
Expanded National Nutrition Survey (eNNS) will be out by 2022. Even though there are
already provincial results, for 2018, the results only pertain for the Province of Laguna, while
results for 2019 only refer to the Provinces of Rizal and Quezon.
Likewise, indicators on prevalence of anemia and vitamin A deficiency also do not have its
regional data for 2020 while data on prevalence of exclusively breastfed 0 to 6 months old is
still to be finalized.
The Region will continue the following strategies and programs in support to Goal 2:
• strict monitoring and persisting the implementation of the ECCD-F1K Program by the
RDC in all LGUs in which the Program will continuously provide proper health and
nutrition care for a pregnant mother and her child from conception up to two years old;
• implementation of the National/Regional Dietary Supplementation Program dubbed as
“Tutok Kainan” to supplement the diets of nutritionally vulnerable groups, particularly
pregnant women and infants 6-23 months old in food-insecure households, wasted
school children especially those from very poor households, and currently those
affected by disasters like typhoons and the COVID-19 pandemic.
Goal 3. Ensure healthy lives and promote well-being for all at all ages (Good Health and Well-being) Goal 3 aims to achieve the following:
● reduce the global maternal mortality ratio to less than 70 per 100,000 live births
● end preventable deaths of newborns and children under 5 years of age
● end the epidemics of AIDS, tuberculosis, malaria and neglected tropical diseases and
combat hepatitis, water-borne diseases and other communicable diseases
● reduce by one third premature mortality from non-communicable diseases
● strengthen the prevention and treatment of substance abuse
● halve the number of global deaths and injuries from road traffic accidents
● ensure universal access to sexual and reproductive health-care services
● achieve universal health coverage
● substantially reduce the number of deaths and illnesses from hazardous chemicals and
air, water and soil pollution and contamination.
The following 23 indicators support Goal 3:
1. Neonatal mortality rate
2. Infant mortality rate
3. Under-5 mortality rate
208 Chapter 22: SUSTAINABLE DEVELOPMENT GOALS
4. Premature mortality attributed to cardiovascular disease, cancer, diabetes, and
chronic respiratory diseases
a. Mortality attributed to cardiovascular disease
b. Mortality rate attributed to cancer
c. Mortality rate attributed to diabetes
d. Mortality rate attributed to chronic respiratory disease
5. Tuberculosis incidence
6. Malaria prevalence
7. Number of newly diagnosed HIV cases
8. Modern contraceptive prevalence rate
9. Proportion of fully immunized children
10. Proportion of births attended by skilled health personnel
11. Proportion of births delivered in a health facility
12. Percentage of drug abuse cases or users who completed treatment
13. Mortality rate attributed to unintentional poisoning
14. Prevalence of tobacco use (10-19.9 years old)
15. Prevalence of current tobacco use (20 years old and up)
16. percentage of public health facilities properly stocked with essential medicines
17. Percentage of out-of-pocket expenditure over total health expenditure
18. Percentage of population covered by PhilHealth insurance
19. Proportion of women of reproductive age (aged 15-49 years) who have their need
for family planning satisfied [provided] with modern methods
20. Reduced proportion of adolescents who have begun child rearing
21. Harmful use of alcohol, defined according to the national context as alcohol per
capita consumption (aged 15 years and older) within a calendar year in liters of
pure alcohol
22. Age-standardized prevalence of current tobacco use among persons aged 15 years
and older
23. Percentage of all women and currently married women ages 15-49 who have ever
used any contraceptive methods.
Based on the 2020 latest data, the indicator on under-5 mortality rate decreased already attained
the 2030 target in 2020, while seven indicators (30 percent) are on track in meeting the targets.
These are the neonatal and infant mortality rates, tuberculosis incidence, malaria prevalence,
among others, while the indicator on modern contraceptive prevalence rate was way behind the
2030 target. On the other hand, four indicators (17 percent) have no targets and seven indicators
(30 percent) have no data. The summary of indicators for Goal 3 is in Annex C.
Aside from meeting the 2030 target in 2019, under five mortality rate continued to report
positive performance, declining from 15.9 in 2019 to only 11.67 in 2020. Neonatal mortality,
while only behind by 1.16 percentage points into meeting its 2030 target, showed a slight
increase from 2019 to 2020. The same is true for infant mortality rate which reported a 0.94
percentage point increase.
For malaria prevalence in the region, it was maintained at 0, already meeting the 2030 target
of Malaria-free CALABARZON. Further, the 2030 target of decreasing number of newly
diagnosed HIV infections was also met this year with a reported decrease in HIV infections
from 2,114 to 1,372. The decrease was attributed to the increased number of testing sites, hubs,
and clinics for HIV, as well as increased awareness on the virus.
Chapter 22: SUSTAINABLE DEVELOPMENT GOALS
209
On the other hand, modern contraceptive prevalence rate further declined by 10.5 percentage
points in 2020. This accomplishment is way behind the 100 percent target by 2030. Thus, the
need in intensifying campaigns on the use of modern contraceptives and strengthening targeted
beneficiaries of the programs to increase the use of modern contraceptives such the Responsible
Parenthood Family Planning Program (RPFP) and Adolescent Health Development (AHD)
Program.
Data for 2020 showed that out-of-pocket expenditure measured by Philhealth as percentage of
support value or the encoded actual hospital charges over paid amount for paid claims was at
36 percent is lower than the baseline data of 70.75 percent in 2017. This was also below the
43.47 percent target by 2030, attained through compliance on “No Balance Billing”. However,
the progressive implementation of the provisions of Universal Health Care on diagnosis related
groupings, global budget payment mechanism, negotiated co-payment, and no co-payment
policy were intended to contribute to the increase in support value in succeeding years.
In terms of health insurance coverage, the Region attained both the annual target and the SDG
target at 100 percent. For 2020, it even exceeded the target at 100.67 percent. The excess in
100 percent accomplishment can be attributed to migration of members in Laguna and Quezon.
This positive performance is expected to be sustained given the full implementation of the
Universal Health Care Act and the continuous database clean-up and validation of PhilHealth
to come up with a credible and reliable database.
The Region is optimistic in meeting the 2030 targets as supported by the following strategies,
programs, and projects:
● intensify campaigns on use of modern contraceptives
● strengthen implementation of RPFP and AHD
● strengthen implementation of No Balance Billing
● continue database clean-up and validation of PHIC to have credible and reliable
member/beneficiary database.
Goal 4. Ensure inclusive and equitable quality education and promote lifelong learning opportunities for all (Quality Education)
The Goal aims to achieve the following:
● ensure that all girls and boys complete their free, equitable and quality primary and
secondary education
● ensure that all girls and boys have access to quality early childhood development, care
and pre-primary education
● ensure equal access for all women and men to affordable and quality technical,
vocational and tertiary education, including university
● substantially increase the number of youth and adults who have relevant skills
● eliminate gender disparities in education and ensure equal access to all levels of
education and vocational training for the vulnerable
210 Chapter 22: SUSTAINABLE DEVELOPMENT GOALS
● ensure that all youth and a substantial proportion of adults, both men and women,
achieve literacy and numeracy.
The following 22 indicators support Goal 4:
1. Completion rate
2. Cohort survival rate
3. Drop-out or school leavers rate
4. Proportion of schools with access to electricity
5. Proportion of public schools with internet access to total number of public schools
6. Proportion of public schools with computer packages to total number of public schools
7. Proportion of schools with adapted infrastructure and materials for students with
disabilities
8. Proportion of schools with single-sex basic sanitation facilities
9. Proportion of public schools with adequate water and sanitation facilities to total
number of public schools
10. Proportion of population with exposure to internet
11. Gender parity index of students attending formal education
12. Cities to municipalities index of students attending formal education
13. Functional literacy skills
14. Number of children enrolled in day care centers
15. Mean percentage score in national achievement test (NAT)
16. Participation rate of youth and adults in formal and non-formal education
17. Passing rate in licensure exam
18. Certification of TVET graduates
19. Number of TVET trainers trained
20. Proportion of faculty members with graduate studies
21. Percentage of population in a given age group achieving at least a fixed level of proficiency
(functional numeracy skills)
22. Percentage of population in a given age group achieving at least a fixed level of proficiency
basic literacy skills).
Majority of the indicators have the latest available data in 2019. Based on the 2019 data, the
Region is on track in attaining the goal of a quality education for all by 2030. In terms of
achieving the annual target, 14 (64 percent) of the 22 indicators met their targets, one indicator
(5 percent) did not meet their targets, while 7 indicators (32 percent) have no available data
and targets. Among the indicators that are on track in meeting the 2030 targets are completion
rate, cohort survival rate, drop-out rate, gender parity index, functional literacy rate, and
proportion of schools with access to electricity, internet, computer packages, and water and
sanitation facilities. The summary of indicators for Goal 4 is in Annex D.
Universal Primary and Secondary Education
Data on cohort survival rate in elementary level showed improvement from 2017 to 2019 and
exceeded the 2019 target by 0.09 percentage points. Cohort survival rate in secondary level
declined in 2019 and target was not achieved thus, a need to put more focus on areas with low
survival rate.
Chapter 22: SUSTAINABLE DEVELOPMENT GOALS
211
Completion rate also declined in 2019 by 0.35 percentage points and 3.1 percentage points for
elementary and junior high school, respectively. Despite the decline, completion rate in both
levels were still above 90 percent in 2019. The completion rate of the junior high school
exceeded its target, but for elementary missed 0.32 percentage points. The Region is on track
in achieving the 2030 universal targets on cohort survival rate and completion rate for
both levels.
On drop-out rate, this slightly increased but the target for elementary and junior high school
were both met. The Region is also on track in achieving the zero drop-out rate for elementary,
but the 2019 junior high school drop-out data has expanded the gap with the 2030 target.
The results of the National Achievement Test (NAT) for school year 2017-2018 showed below
average performance on learners across three grade levels (Grade 6, 10, 12). On the area of
Mathematics, only 29.91 percent of Grade 12 learners who took the NAT achieved a near
proficiency level. While the percentage is higher for Grade 6 and Grade 10 learners, it was only
at 39.29 percent at best. The same performance for science is also evident with 30.86 percent,
37.32 percent, and 31.95 percent of learners in Grade 6, Grade 10, and Grade 12 meeting the
near proficiency level. Performance in English is also below average with 45.20 percent (Grade
10) being the highest.
With a target of 85 percent of learners achieving near proficiency level in 2030, much needs to
be done in basic education to improve proficiency of learners in the three learning areas.
Relevant Skills for Decent Work On the certification of TVET graduates improved, the latest data was in 2018 at 98 percent
exceeding its target of 85 percent. Likewise, the proportion of faculty members who acquired
Master’s and doctorate degrees in 2019 were at 47.46 percent and 25.14 percent, respectively,
which achieved the increasing targets.
There was an increase in the functional literacy rate based on the latest data in 2019 as reported
by PSA. On the other hand, there was a slight decrease in the percentage of population who
achieved basic literacy skills in the same year. Data is still unavailable for the percentage of
population in a given age group who achieved functional numeracy skills.
Gender Equality and Inclusion
Male and female learners attending basic education in its latest data in 2019 were almost the
same proportion in kindergarten and elementary as shown by the gender parity index. However,
these data showed that higher number of the female population are able to reach secondary and
tertiary education compared to the male population.
Universal Literacy
The number of children enrolled in day care is 175,835 in 2020, which is a decline of 22 percent
from 2019 data. This resulted to non-achievement of target of 229,846 enrolees in 2020. The
decline in the number of enrolees indicated an increase in gap with the 2030 universal target,
212 Chapter 22: SUSTAINABLE DEVELOPMENT GOALS
with only 63.81 percent met. The restrictions due to the pandemic have affected the enrolment
rate in the Region.
Access to Internet and Critical Facilities for Public Schools
Indicators on access to internet and critical facilities have latest data in 2019. The proportion
of population in the Region with exposure to internet was recorded at 596 per 1000 population.
The proportion of public schools with internet access to total number of public schools in
elementary was 70.14 percent while in junior high school it was 42.95 percent. The 2019 target
exceeded for elementary, but target for junior high school was behind by 19.61 percentage
points. Accomplishment for senior high school, although reduced by 10.28 percentage points
in 2019, it was still on track with the target of 53.01 percent. The indicators for elementary and
senior high school have already attained 70 percent of SDG targets.
The proportion of public schools with computer packages to total number of public schools in
elementary, junior high school and senior high school have achieved 87.44 percent, 89.26
percent, and 83.53 percent, respectively. Only the target for senior high school has been
achieved. The 2030 SDG target for these indicators is 100 percent.
The proportion of public schools with connection to electricity to total number of public
schools for primary school and senior high school was 99.78 percent while the senior high was
94.05 percent. Only the target for junior high school was not achieved, missing a 2.48
percentage points. In terms of SDG target, all levels were able to attain more than 90 percent
of the 100 percent target for 2030.
The proportion of schools with adapted infrastructure and materials for students with
disabilities was 72.28 percent and the proportion of public schools with access to single-sex
basic sanitation facilities was 67.70 percent in 2019. No SDG target was specified for these
indicators but in terms of 2019 targets, both indicators have attained their respective targets.
The proportion of public schools with adequate water and sanitation facilities to total number
of public schools was 93.99 percent in 2019, a 9.59 percent increase from 2018. For the junior
and senior high schools, the improved to 89.80 percent and 84.13 percent in 2019, respectively.
increased from 84.68 percent to 89.80 percent and 73.17 percent to 84.13 percent, respectively.
All levels have achieved their 2019 targets. The 2030 SDG target for these indicators is
100 percent.
Targets and accomplishments for the cities to municipalities index, a proxy indicator to rural
to urban index, are still unavailable for all levels (except tertiary education).
The following strategies support Goal 4:
● strengthen early childhood care and development
● decongest curriculum
● improve teacher competencies
● construction of more educational facilities and laboratories
● expand access of schools to internet and critical facilities
● continue school building program.
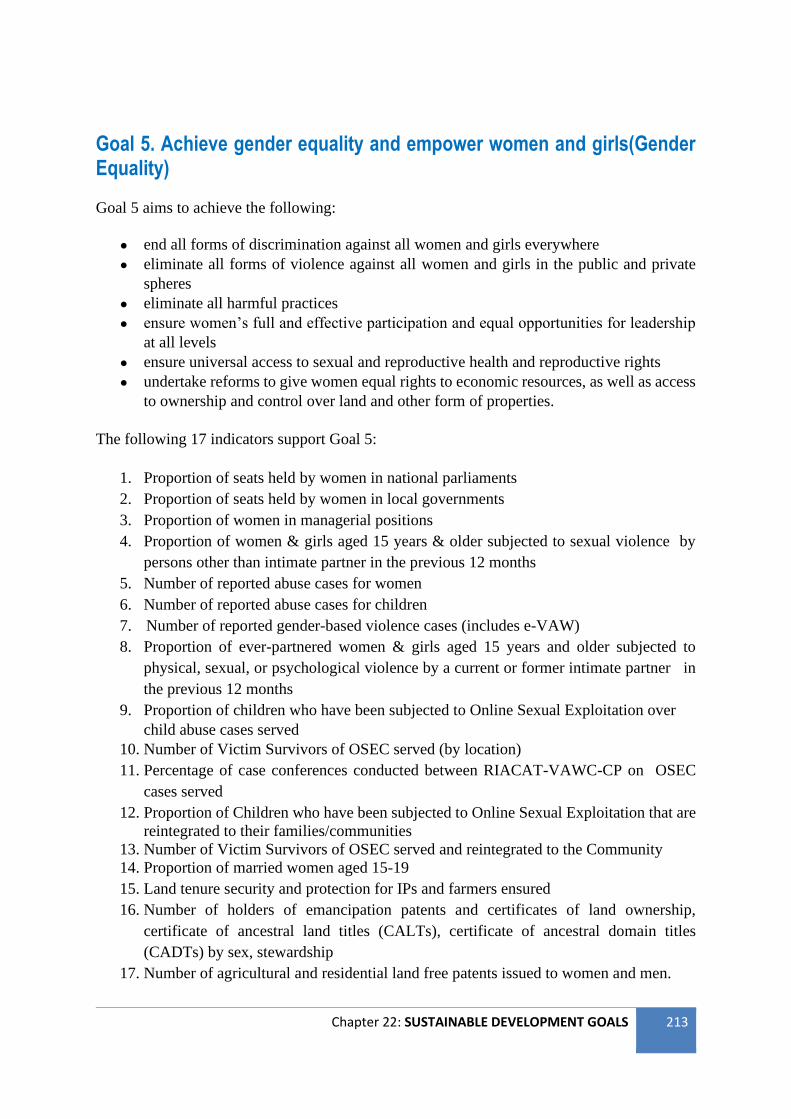
Chapter 22: SUSTAINABLE DEVELOPMENT GOALS
213
Goal 5. Achieve gender equality and empower women and girls(Gender Equality)
Goal 5 aims to achieve the following:
● end all forms of discrimination against all women and girls everywhere
● eliminate all forms of violence against all women and girls in the public and private
spheres
● eliminate all harmful practices
● ensure women’s full and effective participation and equal opportunities for leadership
at all levels
● ensure universal access to sexual and reproductive health and reproductive rights
● undertake reforms to give women equal rights to economic resources, as well as access
to ownership and control over land and other form of properties.
The following 17 indicators support Goal 5:
1. Proportion of seats held by women in national parliaments
2. Proportion of seats held by women in local governments
3. Proportion of women in managerial positions
4. Proportion of women & girls aged 15 years & older subjected to sexual violence by
persons other than intimate partner in the previous 12 months
5. Number of reported abuse cases for women
6. Number of reported abuse cases for children
7. Number of reported gender-based violence cases (includes e-VAW)
8. Proportion of ever-partnered women & girls aged 15 years and older subjected to
physical, sexual, or psychological violence by a current or former intimate partner in
the previous 12 months
9. Proportion of children who have been subjected to Online Sexual Exploitation over
child abuse cases served
10. Number of Victim Survivors of OSEC served (by location)
11. Percentage of case conferences conducted between RIACAT-VAWC-CP on OSEC
cases served
12. Proportion of Children who have been subjected to Online Sexual Exploitation that are
reintegrated to their families/communities
13. Number of Victim Survivors of OSEC served and reintegrated to the Community
14. Proportion of married women aged 15-19
15. Land tenure security and protection for IPs and farmers ensured
16. Number of holders of emancipation patents and certificates of land ownership,
certificate of ancestral land titles (CALTs), certificate of ancestral domain titles
(CADTs) by sex, stewardship
17. Number of agricultural and residential land free patents issued to women and men.
214 Chapter 22: SUSTAINABLE DEVELOPMENT GOALS
Based on the latest data in 2019 and 2020 data, three indicators (18 percent) are on track on
meeting their targets, such as the proportion of children who have been subjected to online
sexual exploitation, number of victim survivors of OSEC served (by location), percentage of
case conferences conducted between RIACAT-VAWC-CP on OSEC cases served, and the
number of holders of emancipation patents and certificates of land ownership, certificate of
ancestral land titles. On the other hand, nine indicators (50 percent) did not meet their annual
targets and five indicators (28 percent) have no targets. The summary of indicators for Goal 5
is in Annex E.
Women Participation
In 2019 latest data, women’s full and effective participation and equal opportunities for
leadership at all levels of decision-making in political, economic and public life, the proportion
of seats held by women in the national parliament particularly those who serve in the House of
Representatives and in local government units accounted to 39.3 percent and 22.8 percent,
respectively. On the other hand, the proportion of women in managerial positions showed a
decreasing trend from 49.03 percent in 2016 to 48.3 percent in 2019. No target was provided
for the three indicators.
Gender Equality On achieving gender equality goals, the Region initiated the harmonization of VAWC data
from PNP, CHR, and DSWD. However, the Philippine Commission on Women, as the
Secretariat of the Inter-Agency Council for VAWC (IACVAWC) at the national level reported
that a similar initiative is currently being finalized. The Regional Gender and Development
Committee and the Regional Inter-Agency Council for VAWC agreed to wait for the standard
intake forms and policy on VAWC data harmonization from IACVAWC. The standard forms
are targeted to be finalized in 2021.
The number of cases assisted by DSWD on violence against women decreased from 171 in
2019 to 56 in 2020, while child abuse cases slightly declined from 250 to 211 from 2019 to
2020. These data are dependent on reported cases to the DSWD and may not capture other data
from the PNP and CHR. A consolidated reporting and database system is still being discussed
at the national level.
Based on PNP’s data, most of the women who suffered physical violence from their partners
were from poor families. Drinking liquor was one of the main causes of fights among partners.
Moreover, it was observed than an increase in poverty leads to an increase among partners. On
the other hand, decrease in the number of reported sexual violence can be attributed to the
imposed quarantine restrictions which did not allow selected groups to go outside their homes.
In terms of psychological violence, majority of the recorded cases were done through
verbal abuse.
On eliminating harmful practices such as child pornography, the Region reinforce elimination
of harmful practices in 2020 by increasing awareness of regional stakeholders and communities
through conduct of various trainings and webinars on Online Safety and Online Sexual
Chapter 22: SUSTAINABLE DEVELOPMENT GOALS
215
Exploitation of Children (OSEC), distribution of 15,812 information, education and
communication materials, and conduct of case conferences between Regional Inter-Agency
Committee Against Trafficking, Child Pornography, Violence Against Women and their
Children (RIACAT-CP-VAWC).
In spite of this, the Region still needs to push strategies to totally achieve its target such as
conduct of training on Standard Training Module for Online Safety and OSEC, Psychosocial
and Therapeutic Module for OSEC, and reintegration programs of victims to their families
and communities.
Moreover, gender equality performance in the economic sector is measured by the number of
agricultural and residential land free patents issued to women and men. The latest data shows
that the land free patents issued to women and men increased by 1,234 and 1,281 in 2020,
respectively. This brings the total of agricultural and residential land free patents issued to
women and men from 2017 to 2020 to 4,094 and 4,192, respectively. While a notable increase
in the issuance of land free patents was observed for both women and men since 2017, it is
worth noting that the gap between the agricultural and residential land free patents issued to
women and men increased from 51 in 2019 to 98 in 2020. This widening of the gap is attributed
to the 1,281 increase in land free patents that were issued to men compared to 1,234 issued
to women.
Sex-disaggregated data on land tenure security and protection for IPs and farmers ensured is
not applicable since data provided by DAR is expressed in unit hectares. For the indicator on
the number of holders of emancipation patents and certificates of land ownership, CALTs, sex-
disaggregated data is also unavailable. Meanwhile, there is no data from NCIP on the number
of holders of certificate of ancestral domain titles (CADTs).
With these accomplishments, the Region is optimistic in meeting the 2030 targets because of
following strategies:
● implement interventions to ensure successful reintegration of victim-survivors
● IEC, advocacy campaigns and trainings
● provide financial support, legal assistance and referrals
● issuance of human rights policy advisories
● conduct of community-based dialogues
● provision of community-based services
● provision of services to residential and center-based clients
● fast-track resolution of Agrarian Law cases
● increase issuance of land free patents.
Goal 6. Ensure availability and sustainable management of water and sanitation for all (Clean Water and Sanitation)
The Goal aims to achieve the following:
● improve water quality
216 Chapter 22: SUSTAINABLE DEVELOPMENT GOALS
● substantially increase water-use efficiency across all sectors and ensure sustainable
withdrawals and supply of freshwater
● implement integrated water resources management at all levels
● expand international cooperation and capacity-building support to developing countries
in water- and sanitation-related activities and programs
● support and strengthen the participation of local communities in improving water and
sanitation management.
The following seven indicators support Goal 6:
1. Volume of wastewater treated from industries
2. Percentage of priority water bodies within water quality guidelines increased in terms
of dissolved oxygen and biochemical oxygen demand
3. Level of water stress in terms of freshwater withdrawal as a proportion of available
freshwater resources
4. Percentage of implementation of programs and projects identified in the Integrated
River Basin Master Plans (IRBMP)
5. Proportion of local administrative units with established and operational policies and
procedures for participation of local communities in water and sanitation management
6. Number of functional water, sanitation, and hygiene (WASH) councils/ committees in
LGUs
7. Number of local WASH ordinances strengthening WASH governance in the
communities.
For 2020, five out of the seven SDG 6 indicators have available data, where only one indicator
has a target but was not achieved. On the other hand, two indicators have no data. The summary
of indicators for Goal 6 is in Annex F.
The percentage of priority water bodies within water quality guidelines increased in terms of
dissolved oxygen (DO) and biochemical oxygen demand (BOD) which is targeted to be both
100 percent in 2019. Generally, the water quality of priority water bodies in the Region, in
terms of DO and BOD, worsened in 2020 as only 54 percent of the Region’s priority water
bodies including Manila Bay, Laguna Lake, and major river systems have DO above the 5mg/L
standard for freshwater bodies and 6mg/L for saltwater bodies. Meanwhile, only 54 percent of
the Region’s priority freshwater bodies have BOD within the 7mg/L standard as of 2020.
Additional information on the quality of priority water bodies can be found in Chapter 20 of
the 2020 RDR.
While there is an observed decline in water quality of priority water bodies in the Region, data
on the percentage of implementation of programs and projects identified in the Integrated River
Basin Master Plans (IRBMs), measured in terms of the percentage of major river basins with
updated IRBM, shows that 67 percent or 2 out of 3 major river basins in the Region have
updated IRBMP (i.e. Marikina River Basin and Malaking Ilog and Iyam-Dumacaa). Moreover,
50 percent of the River Basins have established River Basin Organizations. With the ongoing
formulation of the Pasig-Laguna de Bay River Basin Master Plan, the 2030 SDG Goal 6 targets
can be optimistically expected.
In terms of wastewater treatment, the volume of industrial wastewater treated increased from
9,779,708.56 cubic m/day in 2019 to 14,530,548 cubic m/day in 2020. There is no available
target for the said indicator.
Chapter 22: SUSTAINABLE DEVELOPMENT GOALS
217
Meanwhile, the level of water stress in the region is measured by the freshwater withdrawal as
a proportion of available freshwater resources which is at 64 percent in 2020. Further, the
proportion of local administrative units with established and operational policies and
procedures for participation of local communities in water and sanitation management is at
around 84 percent in 2020 or 124 out of 147 (including the 5 provinces) LGUs in the Region.
However, for the number of functional WASH councils/committees in LGUs and the number
of local WASH ordinances strengthening WASH governance in the communities, no regular
monitoring mechanism as reports may be available directly from LGUs especially considering
the impending devolution of functions/programs to LGUs (e.g. water infrastructure programs
given the Mandanas-Garcia Ruling).
.
The following strategies support Goal 6:
● encourage civil society, private sector, indigenous and local communities participation
in natural resources management
● strengthen environmental law enforcement and ensuring conformity with
environmental standards
● intensify protection and sustainable management of forest, watershed, coastal and
marine, and land through the adoption of the ridge-to-reef approach.
Goal 7. Ensure access to affordable, reliable, sustainable and modern energy for all (Affordable and Clean Energy) Goal 7 aims to achieve the following:
● ensure universal access to affordable, reliable and modern energy services
● increase substantially the share of renewable energy in the global energy mix
● double the global rate of improvement in energy efficiency.
Four indicators support Goal 7:
1. Proportion of households with electricity to total number of households
2. Share of clean energy in the Total Primary Energy Supply
3. Renewable energy share in the total primary energy supply – proxy indicator
4. Energy intensity measured in terms of primary energy and GDP.
Based on the 2020 data, indicator 1 is on track in meeting its target, while the regional data for
the other three indicators are still being generated and processed by the responsible agencies
and is expected to be available by the second half of 2021. Data from the Department of Energy
showed that the 100 percent target in 2030 for household electrification can be achieved earlier.
The summary of indicators for Goal 7 is in Annex G.
The proportion of households with electricity to total number of households is 99.32 percent in
2020 which is almost close to attaining the 100 percent target for 2030 SDG. Data for other
indicators in the energy sector are available at the national level only. The disaggregation of
data at the regional level is still in progress, and there is a need to conduct regular sectoral
218 Chapter 22: SUSTAINABLE DEVELOPMENT GOALS
demand surveys such as the Household Energy Consumption Survey (HECS) to be able to
generate reliable national and regional data for energy sector analysis. Likewise, the energy
intensity measured in terms of primary energy and GDP has national data only based on the
Rebased 2018 National Accounts as of April 20, 2020.
The following strategies support Goal 7:
● continued electrification and renewable energy programs
● promotion of energy efficiency, conservation and alternative fuel technologies
● intensification of IEC
● adoption of alternative fuels for transportation and other purposes.
Goal 8. Promote sustained, inclusive and sustainable economic growth, full and productive employment and decent work for all (Decent Work and Economic Growth) The Goal aims to achieve the following:
● sustain per capita economic growth in accordance with national circumstances
● achieve higher levels of economic productivity through diversification, technological
upgrading and innovation
● achieve full and productive employment and decent work for all women and men,
including for young people and persons with disabilities, and equal pay for work of
equal value
● substantially reduce the proportion of youth not in employment, education or training
● protect labour rights and promote safe and secure working environments for
all workers.
The following 11 indicators support Goal 8:
1. Annual Growth Rate of real GRDP per capita
2. Annual Growth rate of real GRDP per employment
3. Unemployment rate, by age
4. Unemployment rate by sex
5. Number of bank branches per 100,000 adults
6. Number of commercial bank branches per 100,000 adults
7. Number of automated teller machines (ATMs) per 100,000 adults
8. Proportion of adults (15 years and older) with basic deposit accounts
9. Tourism direct GVA as a proportion of total GDP and in growth rate
10. Proportion of employed in tourism out of total employed
11. Frequency rates of fatal and non-fatal occupational injuries.
Based on the 2020/ data, the indicator on unemployment rate is behind its annual target. Five
indicators have no targets, four indicators have no available data yet while one indicator is not
measured at the regional level. The summary of indicators for Goal 8 is in Annex H.
Chapter 22: SUSTAINABLE DEVELOPMENT GOALS
219
The significant contraction on regional outputs affected the growth of real GRDP per capita.
From a slight increase of 2.3 percent in 2019, it decreased by 12.2 percent in 2020.
Unemployment rate rose from 6.1 percent in 2019 to 11.6 percent in 2020. The declined
performance was due to impacts of the pandemic.
Presence of bank branches per 100,000 adults indicates the level of accessibility of banking
institutions in the Region. Bank to population ratio in the Region remained the same at 17.4
between 2016 and 2019 latest data. Meanwhile, the number of commercial bank branches
marginally decreased from 7.3 in 2018 to 7.2 in 2019.
Meanwhile, accessibility of basic financial services as indicated by the ratio of Automated
Teller Machines (ATMs) to population slightly decreased from 29.8 in 2016 to 29.7 in 2019.
The marginal growth in the number of physical bank branches and the decline in number of
ATMs may be attributed to the increasing digitalization of physical financial network in the
country. The digitization initiatives in the financial system as embodied in the three-year
Digital Payments Transformation Roadmap and the National Payment Systems Act may also
affect the setting of targets for these indicators and is still subject to validation with the BSP
Central Office.
The proportion of adults (15 years and older) with basic deposit accounts was proposed as a
proxy indicator for the proportion of adults (15 years and older) with an account at a bank or
other or other financial institution or with a mobile-money-service provider. Data on these are
not yet collected at the regional level but may be considered for future monitoring.
Tourism and Employment
The attainment of decent work and economic growth in the Region is measured based on the
performance of three indicators, namely: i) tourism direct GVA as a proportion of total GDP
and in growth rate; ii) proportion of employed in tourism out of total employed; and iii)
frequency rates of fatal and non-fatal occupational injuries. However, performance-related data
for all three indicators are not yet available from the concerned agency as of the reporting
period.
On the other hand, the overall employment in the region grew in number, especially in Laguna
Province and at a faster pace in Rizal Province for the year 2019.
The following strategies support Goal 8:
● timely implementation of and completion of rehabilitation and recovery programs
● expedite implementation of programs and projects in Bayanihan II and the extended
General Appropriations Act 2020
● strengthen development of ICT infrastructures and boost the use of digital technology
to better adapt to the new normal to support economic recovery
● promote innovation, R&D and regional competitiveness of industries including micro,
small and medium enterprises (MSMEs) and cooperatives
● strengthen the capacity of domestic financial institutions and encourage to expand
access to banking, insurance and financial services
● increase access to credit among MSMEs, farmers, and other low-income sectors
220 Chapter 22: SUSTAINABLE DEVELOPMENT GOALS
● continuous assistance to MSMEs and start-ups and promotion of integrated
livelihood programs
● strengthen existing programs on conduct of job fairs and local recruitment activities,
and PESO job facilitation activities
● update and upgrade of the provision of job trainings to equip the workforce with the
necessary skills to adapt to the increasing dependence of global economies to
digital platforms.
Goal 9. Build resilient infrastructure, promote inclusive and sustainable industrialization and foster innovation (Industry, Innovation and Infrastructure)
Goal 9 aims to achieve the following:
● develop quality, reliable, sustainable and resilient infrastructure
● promote inclusive and sustainable industrialization
● enhance scientific research, upgrade the technological capabilities of industrial sectors
in all countries, in particular developing countries.
The following eight indicators support Goal 9:
1. Non-containerized cargoes
2. Containerized cargoes
3. Passengers transported by sea
4. No. of ship calls
5. Passenger trips via rail
6. Manufacturing value added as a proportion of GDP and per capita
7. Manufacturing employment as a proportion of total employment
8. Research and development expenditure as a proportion of GDP.
Based on the 2020/latest data, only the indicator on containerized cargo increased is on track
in meeting its target, while five indicators are behind targets. On the other hand, two indicators
have no data. The summary of indicators for Goal 9 is in Annex I.
Transport
The containerized cargoes in 2020 is 246,891 TEU which is 21.74 percent greater than its
target. On the other hand, the number of passengers transported by sea is 2,386,248 which is
only 26.15 percent only of its target. Likewise, the non-containerized cargo throughput is
26,868,453.00 metric tons which is only 87.26 percent of its target. For rail transport, the latest
data is 12,521,477 passenger trips via rail (in Metro Manila) in 2019. There is no data available
for the indicators on the number of international and domestic ship calls increased, a proxy
indicator. These indicators are for reporting purposes only in the 2030 SDG.
Chapter 22: SUSTAINABLE DEVELOPMENT GOALS
221
Manufacturing
The industry sector contracted by 12.5 percent in 2020 in contrast with the 3.6 percent growth
it achieved in the previous year. All the subsectors significantly declined except for electricity,
steam and water management. Construction declined by 36.0 percent, mining and quarrying by
20.6 percent, and manufacturing by 11.6 percent.
Related to industry sector, the manufacturing value added per capita decreased by 13.31 percent
from 75, 684 in 2019 to 66,474 in 2020. Despite the decline, the industry sector remains to be
the top contributor to the regional economy.
Research and Development
For research and development expenditures (RDE) as a proportion of GRDP, the latest
available data in 2015 was 3.794 billion which is 0.18 percent of the GRDP. This is greater
than the national RDE share of 0.16 percent.
The following strategies support Goal 9:
● promote inclusive business environment
● invest in R&D & open innovation platform
● intensify industry skills training to enhance the standard of service provided
● sustain increase in manufacturing sub-sector
● accelerate the expansion & development of economic zones
● encourage businesses to reconfigure/change product offerings to include essentials
● provide more budgetary support & incentives to local scientists/innovators and R&D
● increase R&D budget of the oversight and attached agencies
● expand and improve transport facilities.
Goal 10. Reduce Inequality within and among Countries (Reduce Inequalities) Goal 10 aims to achieve the following:
● progressively achieve and sustain income growth of the bottom 40 per cent of the
population at a rate higher than the national average
● empower and promote the social, economic and political inclusion of all
● adopt policies, especially fiscal, wage and social protection policies, and progressively
achieve greater equality
● improve the regulation and monitoring of global financial markets and institutions and
strengthen the implementation of such regulations
● ensure enhanced representation and voice for developing countries in decision-making
in global international economic and financial institutions.
222 Chapter 22: SUSTAINABLE DEVELOPMENT GOALS
The following four indicators support Goal 10:
1. Growth rates of household income per capita among the bottom 40 per cent of the
population and the total population
2. Proportion of people living below 50 percent of median income, by age
3. Volume of InstaPay Transfers (in million)
4. Volume of retail e-payments (% over total payments).
The data for the first two indicators are not yet released. The proposed proxy indicators for the
third and fourth indicators are not yet collected at the regional level. The summary of indicators
for Goal 10 is in Annex J.
The regional data on the growth rates of household income per capita among the bottom 40
percent of the population, and the total population and the proportion of people living below
50 percent of median income by age which be generated from the Family Income and
Expenditure Survey are still for submission by the Philippine Statistics Authority.
On the financial success indicators, the Bangko Sentral ng Pilipinas proposed two proxy
indicators, namely, volume of InstaPay Transfers (in million) and volume of retail e-payments
(%over total payments) for future reporting and monitoring since data on these are not yet
collected at the regional level.
Goal 11. Make cities and human settlements inclusive, safe, resilient and sustainable (Sustainable Cities and Communities) The Goal aims to achieve the following:
● significantly reduce the number of deaths and the number of people affected and
substantially decrease the direct economic losses relative to global gross domestic
product caused by disasters
● reduce the adverse per capita environmental impact of cities, including by paying
special attention to air quality and municipal and other waste management
● substantially increase the number of cities and human settlements adopting and
implementing integrated policies and plans towards inclusion, resource efficiency,
mitigation and adaptation to climate change, and resilience to disasters.
The following five indicators support Goal 11:
1. Proportion of urban population who are informal settlers
2. Number of deaths, missing persons, and directly affected persons attributed to
disasters
3. Death rate due to road traffic injuries
4. Proportion of local governments that adopt and implement national disaster risk
reduction strategies
5. Ambient air quality in highly urbanized and other urban major centers within the
National Ambient Air Quality Guideline Values.
Chapter 22: SUSTAINABLE DEVELOPMENT GOALS
223
Based on the latest data, none of these indicators met their targets. One indicator (number of
deaths, missing persons, and directly affected persons attributed to disasters) is behind its
target, two indicators have no targets and two indicators have no data. The summary of
indicators for Goal 11 is in Annex K.
Informal Settlers
In terms of proportion of urban population who are informal settlers, this was estimated at 2.5
percent based on the latest available data in 2015. More recent data on this indicator is expected
to be available with the conduct of the 2020 Census of Population. The DHSUD is expected to
develop a database on all housing related data including informal settler families. On the other
hand, the local government units, through the assistance of DHSUD, will fast track the
preparation of their Local Shelter Plan to adequately meet the current and future housing needs
of their area. There is also a need for other interventions such as policies or programs providing
funds for the mandatory increase in housing budget and housing stock to adequately meet
current and future housing needs.
Moreover, data showed that the Region is yet to achieve its annual and 2030 SDG target of
zero casualty both for natural and human-induced disasters.
Air Quality
The inclusiveness, safety, resiliency, and sustainability of cities and human settlements is also
measured by the percentage of highly urbanized and other major urban centers in the region
with ambient air quality within the National Ambient Air Quality Guideline Values
(NAAQGV). The NAAQGV ambient air quality is 25 μg/NCM for atmospheric particulate
matter with a diameter of less than 2.5 micrometers (PM 2.5). By 2030, the goal is that 100
percent of the major urban centers in the region have air quality within the 25 μg/NCM
NAAQGV for PM 2.5. As of 2020, the ambient air quality of 50 percent of the major urban
centers in the region is within the standard. However, data capture for one station is below the
75 percent minimum data capture requirement. This increase from 25 percent in 2019 may be
attributed to the sudden reduction of industrial activities and drop in road transport.
Following are the strategies to meet the 2030 targets:
● fast track the preparation of Local Shelter Plan to adequately meet the current and future
housing needs
● implement policies or programs that will provide funds for the mandatory increase in
housing budget and housing stock to adequately meet current and future housing needs
● provide interventions to prevent incidence of deaths and missing persons during
calamities
● cities and major urban areas need to hasten their PPAs to enhance air quality in their
locality
● strengthen environmental law enforcement and ensure conformity with environmental
standards.
224 Chapter 22: SUSTAINABLE DEVELOPMENT GOALS
Goal 12. Ensure sustainable consumption and production patterns (Responsible Consumption)
Goal 12 aims to achieve an environmentally sound management of chemicals and all wastes
throughout their life cycle, and significantly reduce their release to air, water and soil in order
to minimize their adverse impacts on human health and the environment.
Ensuring sustainable consumption and production patterns are measured by the hazardous
waste generated per capita and the proportion of hazardous waste treated. However, in the
Region, this is measured by the hazardous waste generated per firm and the proportion of
hazardous waste treated in the region. No target was identified for this indicator.
Estimated hazardous waste generated per firm increased from 4.40 metric tons (MT) in 2019
to 7.55 MT in 2020 and the proportion of hazardous waste treated at 0.46 MT in 2019 to 2.18
MT in 2020. The summary of indicators for Goal 12 is in Annex L.
This performance will be further improved by strengthening environmental law enforcement
and ensuring conformity with environmental standards.
Goal 13. Take urgent action to combat climate change and its impacts (Climate Action) The Goal aims to achieve the following:
● strengthen resilience and adaptive capacity to climate-related hazards and natural
disasters in all countries
● integrate climate change measures into national policies, strategies and planning.
Goal 13 puts emphasis on the urgent need to take action to combat climate change and its
impacts. Climate change adaptation measures were already integrated into local plans and
policies such as Local Climate Change Action Plan and Comprehensive Land Use Plan, among
others. However, only thirty-nine (27.46 percent) out of 142 LGUs in the Region have
enhanced DRR-CCA CLUPs as of 2019. Majority of LGUs in the Region have yet to
mainstream DRR-CCA in their land use plans.
Currently, only one proxy indicator, percentage of LGUs that prepares LCCAP and DRR-CCA
enhanced, was identified to assess this goal. See Annex M.
Goal 14. Conserve and sustainably use the oceans, seas and marine resources for sustainable development (Life Below Water)
The Goal aims to achieve that by 2020, conserve at least 10 per cent of coastal and marine
areas, consistent with national and international law and based on the best available
scientific information.
Chapter 22: SUSTAINABLE DEVELOPMENT GOALS
225
There is only one indicator (see Annex N) under this goal which is the coverage of protected
areas in relation to marine areas, with proxy indicator in the region. The said indicator is on
track on meeting its target.
The target of 65 marine protected areas (MPAs) and island PAs under NIPAS being managed
in the Region is surpassed as 95 were managed in 2020. The increase may be attributed to the
inclusion of local MPAs, and fish sanctuaries and reserve.
The following strategies support Goal 14:
● intensify protection and sustainable management of forest, watershed, coastal and
marine, and land through the adoption of the ridge-to-reef approach
● promote and conserve biodiversity by:
○ protecting threatened and endemic species
○ preventing, controlling, and eradicating invasive species
○ conducting scientific studies and regular monitoring of biodiversity population
and habitats
○ conducting orientations in schools, local communities, and tourists on
environmental protection awareness
● encourage civil society, private sector, indigenous and local community participation
in natural resources management; and
● cascade/mainstream the Philippine Biodiversity Strategy Action Plan and Regional
Biodiversity Strategy Action Plan implementation at the PA level.
Goal 15. Protect, restore and promote sustainable use of terrestrial ecosystems, sustainably manage forests, combat desertification, and halt and reverse land degradation and halt biodiversity loss (Life on Land) Goal 15 aims to achieve the following:
● ensure the conservation, restoration and sustainable use of terrestrial and inland
freshwater ecosystems and their services
● promote the implementation of sustainable management of all types of forests
● combat desertification, restore degraded land and soil
● take urgent and significant action to reduce the degradation of natural habitats, halt the
loss of biodiversity
● promote fair and equitable sharing of the benefits arising from the utilization of
genetic resources and promote appropriate access to such resources
● take an urgent action to end poaching and trafficking of protected species of flora and
fauna and address both demand and supply of illegal wildlife products
● integrate ecosystem and biodiversity values into national and local planning,
development processes, poverty reduction strategies and accounts
● Mobilize and significantly increase financial resources from all sources to conserve
and sustainably use biodiversity and ecosystems, and sustainable forest management.
The following eight indicators support Goal 15:
226 Chapter 22: SUSTAINABLE DEVELOPMENT GOALS
1. Forest area as a proportion of total land area
2. Proportion of important sites for terrestrial and freshwater biodiversity that are covered
by protected areas
3. Progress towards sustainable forest management
4. Forest Cover Change (from close to open forest)
5. Red List Index
6. Proportion of traded wildlife that was poached or illicitly trafficked
7. Progress towards national targets established in accordance with Aichi Biodiversity
Target 2 of the Strategic Plan for Biodiversity 2011-2020
8. Official development assistance and public expenditure on conservation and
sustainable use of biodiversity and ecosystems.
Based on 2020 data, four indicators either met or surpassed their targets, such as the Progress
towards sustainable forest management, Proportion of traded wildlife that was poached or
illicitly trafficked, Progress towards national targets established in accordance with Aichi
Biodiversity Target 2 of the Strategic Plan for Biodiversity 2011-2020, and Official
development assistance and public expenditure on conservation and sustainable use of
biodiversity and ecosystems. On the other hand, one indicator did not meet the 2020 target
while three indicators have no targets with one having no data. The summary of indicators for
Goal 15 is in Annex O. The recommended strategies to achieve this goal are the same with
Goal 14.
As of 2015, the forest cover in the Region is 267.845 hectares or 16.5 percent of the total land
area in the Region. Given that data on forest cover is dependent on the land cover data, which
is expected to be released in 2021 to 2022, the forest cover data remains the same since 2015.
The same goes with the forest cover change which is due for reporting once the National
Mapping and Resource Information Authority releases new land cover data sometime in 2021
to 2022. Accomplishment for proportion of forest cover to the total land area is already more
than half of the 2030 target of 28.5 percent.
The proportion of critical sites for terrestrial and freshwater biodiversity that are covered by
protected areas is measured in the Region using the percent coverage of protected areas under
the NIPAS in relation to terrestrial areas including caves and inland wetland (total land area)
which has no data in 2020 and the number of E-NIPAS initial components assessed which is
at 4 in 2020 as follows: Kaliwa Watershed Forest Reserve, Alibijaban Wilderness Area, Alabat
Watershed Forest Reserve, and Binahaan River Watershed Forest Reserve.
Progress towards sustainable forest management in the Region is measured as the percentage
of open-access/untenured lands of the public domain placed under appropriate management
arrangement/tenure which is targeted at 5 percent in 2020. This was surpassed as 8.5 percent
open access/untenured lands of the public domain were placed under appropriate management
arrangement/tenure.
In lieu of the data for the Red List Index, the number of stations monitored under the
Biodiversity Monitoring Systems and Biodiversity Assessment Monitoring Systems is
measured in the Region. In 2020, the 23 target was not met as only 17 protected areas (PAs) in
the Region were monitored.
Chapter 22: SUSTAINABLE DEVELOPMENT GOALS
227
For the proportion of traded wildlife that was poached or illicitly trafficked, the number of
wildlife permittees monitored is used in measuring the indicator. In 2020, the 307 target was
surpassed as 438 wildlife permittees were monitored. This figure also increased from 287
in 2019.
In measuring the progress towards national targets established in accordance with Aichi
Biodiversity Target 2 of the Strategic Plan for Biodiversity 2011-2020 in the Region, three
proxy indicators were used in 2020. First is the amount of revenue collected from ecotourism-
related operations within PAs which increased from 2019 at PHP1,103,000.00 to
PHP27,512,727.00 in 2020. Second is the percentage of PAs with ecotourism management
plan implemented, which remains at 100 percent of the nine legislated PAs in 2020. Last is the
percentage of caves with management plans implemented which is targeted at 25 percent of 28
caves. This target was surpassed as 31percent of 28 caves have implemented management
plans.
Meanwhile, the official development assistance and public expenditure on conservation and
sustainable use of biodiversity and ecosystems in the Region is measured by the percentage of
budget allocation for biodiversity conservation. The 16.8 percent target in 2020 was met which
increased from 16.6 percent in 2019.
Goal 16. Promote Peaceful and Inclusive Societies for Sustainable Development, Provide Access to Justice for All, and Build Effective, Accountable and Inclusive Institutions at All Levels Goal 16 aims to achieve the following:
● significantly reduce all forms of violence and related death rates, and corruption
and bribery ● develop effective, accountable and transparent institutions at all levels ● ensure responsive, inclusive, participatory and representative decision-making at
all levels ● broaden and strengthen the participation of developing countries in the institutions of
global governance ● provide legal identity for all, including birth registration ● ensure public access to information, and protect fundamental freedoms ● strengthen relevant national institutions, including through international cooperation,
for building capacity at all levels.
The following 11 indicators support Goal 16:
1. Number of homicide victims
2. Number of murder cases
3. Average monthly index crime rate
4. Ensure public access to information, and protect fundamental freedoms, in accordance
with national legislation and international agreements
a. number of barangay legal outreach and visitations beneficiaries/assisted
228 Chapter 22: SUSTAINABLE DEVELOPMENT GOALS
b. number of jail visitation beneficiaries/assisted (documentary and represented in
court)
c. number of legal aid information/dissemination conducted
5. Strengthen relevant national institutions, including through international cooperation,
for building capacity at all levels, in particular in developing countries, for preventing
violence and combatting terrorism and crime
a. number of activities conducted to prevent violence and combat terrorism and
crime
b. number of institutions providing capability building activities to prevent
violence and combat terrorism and crime
6. Existence of independent regional or local human rights institutions in compliance with
the Paris Principles
7. Proportion of persons who had at least one contact with a public official and who paid
a bribe to a public official, or were asked for a bribe by those public officials during the
previous 12 months
8. Percentage of families that were asked to give bribe or grease money by a government
official with whom they transacted (%)
a. availing of social services
b. payment of taxes and duties
c. securing registry documents and licenses
d. any service
9. Primary government expenditures as a proportion of original approved budget
10. Proportions of positions (by sex, age, persons with disabilities and population groups)
in public institutions (national and local legislatures, public service, and judiciary)
compared to national distributions increased (%)
11. Proportion of children under 5 years of age whose births have been registered with a
civil authority, by age.
Based on the 2020 data, six indicators were able to meet the annual target set such as the
number of homicide victims, number of murder crimes, average monthly index crime rate,
proportion of government expenditures as a proportion of original approved budget, and
ensuring public access to information, and protect fundamental freedoms, in accordance with
national legislation and international agreements. On other hand, two indicators have no
targets, and four indicators have incomplete/no data.
On ensuring public access to information, and protect fundamental freedoms, in accordance
with national legislation and international agreements, it can be noted that compared to 2019
performance, the region recorded a decreased number of Barangay legal outreach and
visitations beneficiaries assisted, and number of legal aid information
dissemination conducted.
The number of beneficiaries assisted during Barangay legal outreach decreased by almost half
from 16,684 beneficiaries in 2019 to 9,863 in 2020. However, the accomplishment for 2020
still surpassed its 2020 target of 6,868. The 2020 target was revised considering the COVID-
19 pandemic and its safety protocols.
Chapter 22: SUSTAINABLE DEVELOPMENT GOALS
229
Pursuant to its Constitutional mandate, CHR IV-A also conducted 36 jail visits in 2019 and 51
jail visits in 2020. Most of the jail visits in 2020 were conducted online because of travel and
health restrictions.
Furthermore, the number of legal aid information dissemination conducted decreased from
1,692 in 2019 to 1,078 in 2020. However, the 2020 accomplishment still surpassed its 2020
target of 891. The decrease in information dissemination was due to constraints brought about
by COVID-19 pandemic.
However, strengthened women, children, LGBTI, PWD, and IP’s rights protection were also
noted in 2020. The assisted and investigated cases related to women and children’s rights
increased in 2020. CHR IV-A assisted 463 women, 117 children, 3 LGBTIs, 22 PWDs and 5
indigenous Peoples (IPs) in 2020.
Out of the 463 docketed women-related cases, 457 were gender-related or gender-based
violence. The common nature of cases docketed were on rape, VAWC and economic and social
rights, particularly on unfair exclusion from SAP beneficiaries, vis-à-vis the COVID-
19 pandemic.
Meanwhile, the common nature of cases involving child victims includes rape, child abuse,
and violation of RA 9262. It can be noted that rape and child abuse significantly increased from
2019 to 2020. This can be attributed to vulnerabilities exacerbated by the pandemic where
victims are being locked down in the same space with their abusers.
On strengthening relevant national institutions for building capacity at all levels on preventing
violence and combatting terrorism and crime, it can be noted that there is an increased number
of activities conducted to prevent violence and combat terrorism and crime and number of local
task force on Ending Local Communist Armed Conflict.
The number of activities conducted to prevent violence and combat terrorism and crimes in the
region is continuously increasing and are being sustained through the Regional Task Force on
Ending Local Communist Armed Conflict (RTF-ELCAC) and Provincial ELCACs. Among
the activities regularly conducted include Serbisyo Caravan, regular dialogues with the
concerned agencies, LGUs, and communities, Re-Tooled Community Support Program to
promote peace and address the root causes of insurgency, and the PAMANA program.
From one RTF-ELCAC established in 2019, additional five provincial task forces were
established in the region in 2020. The functionality and sustained activities of established
ELCAC task forces can be attributed to cooperation between and among members of the
regional task force and membership and active participation of CSOs in the regional and
provincial ELCAC.
On existence of independent regional or local human rights institutions in compliance with the
Paris Principles, the Commission on Human Rights (CHR) is an independent National Human
Rights Institution (NHRI) created under the 1987 Philippine Constitution, established on 05
May 1987 by virtue of Executive Order No. 163. CHR is an “A” accredited NHRI, fully
complying with the Paris Principles adopted by the United Nations General Assembly in
1995.The Commission is mandated to conduct investigations on human rights violations
against marginalized and vulnerable sectors of the society, involving civil and political rights.
230 Chapter 22: SUSTAINABLE DEVELOPMENT GOALS
It has presence in all the sixteen administrative regions. Its Regional Office IV-A is located in
San Pablo City, Laguna.
On building effective, accountable and inclusive institutions, it was reported that since 2016,
the region was able to sustain the primary government expenditures as a proportion of the
original approved budget at 100 percent. However, this reflects only the data from the
decentralized agencies like DOH, DPWH, DepEd, TESDA, CHED, and State Universities and
Colleges in the region. The baseline data in 2016 is more than 100 percent because it represents
the additional fund releases to the agencies, from Special Purpose Fund such as Pension
Gratuity Fund, Miscellaneous Personnel Benefit Funds, and other deficiency in Personnel
Services, among others.
Meanwhile, the proportion of children under 5 years of age whose births have been registered
with a civil authority has been decreasing such that it decreased from 87.7 percent in 2016 to
83 percent in 2019. This is alarming given that the SDG target is to have at least 99.5 percent
of children under 5 years old had their births registered by 2024.
Along with these accomplishments, the Region is pursuing the following strategies to attain
the 2030 targets:
● conduct of barangay legal outreach and visitations
● provision of jail visitation, documentary assistance and court representation services
● provision of legal aid information and dissemination services
Goal 17. Strengthen the means of implementation and revitalize the Global Partnership for Sustainable Development (Partnership for the Goals)
Goal 17 aims to achieve the following:
● strengthen domestic resource mobilization, including through international support to
developing countries
● developed countries to implement fully their official development assistance
commitments
● assist developing countries in attaining long-term debt sustainability
● enhance North-South, South-South and triangular regional and international
cooperation on and access to science, technology and innovation and enhance
knowledge-sharing on mutually agreed terms
● enhance international support for implementing effective and targeted capacity-
building in developing countries
● build on existing initiatives to develop measurements of progress on sustainable
development that complement gross domestic product, and support statistical
capacity-building in developing countries.
The following 12 indicators support Goal 17:
1. Total tax revenues as a proportion of GRDP
2. Total LGU revenues as a proportion of GRDP
Chapter 22: SUSTAINABLE DEVELOPMENT GOALS
231
3. Percentage of LGU budgets funded by local sources
4. Proportion of LGU authorized appropriations funded by total LGU revenues
5. Net official development assistance, total and to least developed countries, as a
proportion of the Organization for Economic Cooperation and Development (OECD)
Development Assistance Committee donors’ gross national income (GNI)
6. Volume of remittances (in United States dollars) as a proportion of total GDP
7. Number of LGUs that have local statistical legislation that complies with the
Fundamental Principles of Official Statistics
8. Number of regional statistical activities that are fully funded and under implementation
9. Average broadband download speed increased
10. Proportion of population exposure to internet in social interaction
11. Proportion of population with exposure to internet in research work/study
12. Fixed Internet broadband subscriptions per 100 inhabitants.
Based on the 2020/latest data, indicators number 9 to 11, which refers to internet connections,
are still far from attaining its 2030 targets. On the other hand, seven indicators have no data on
annual targets while five indicators have no data. The summary of indicators for Goal 17 is in
Annex Q.
Revenues and Taxes
Government revenues from the collection of taxes fell by 5 percent between 2017 and 2018 but
was able to recover in 2019 with 16 percent growth. The improvement during the period can
be attributed to the increase in salary rates of public employees, payment of deficiency taxes
resulting from audit efforts, intensive monitoring of taxpayers under the Taxpayer Account
Management Program, and the implementation of the Tax Amnesty Act, otherwise known as
the Republic Act No. 11213. As to proportion of GRDP, total revenue from tax collections
increased from 2.29 percent in 2018 to 2.51 percent in 2019.
The proportion of LGU budget funded by local sources declined from 45 percent in 2019 to 40
percent in 2020 which can be attributed to the disruption in local economic activities due to the
imposition of community quarantines. Local revenue sources include real property tax,
business tax, fees and charges, and economic enterprises.
The number of regional statistical activities that are fully funded and under implementation of
PSA went down from 45 in 2019 to 43 in 2020. The decrease can be attributed to restrictions
brought by the pandemic.
Meanwhile, the number LGUs that have local statistical legislation that complies with the
fundamental principles of official statistics is not yet monitored in the region as PSA still needs
to complete the orientation on the fundamental principles for LGUs. The timeline and
implementation plan for the conduct of the orientation is still being discussed.
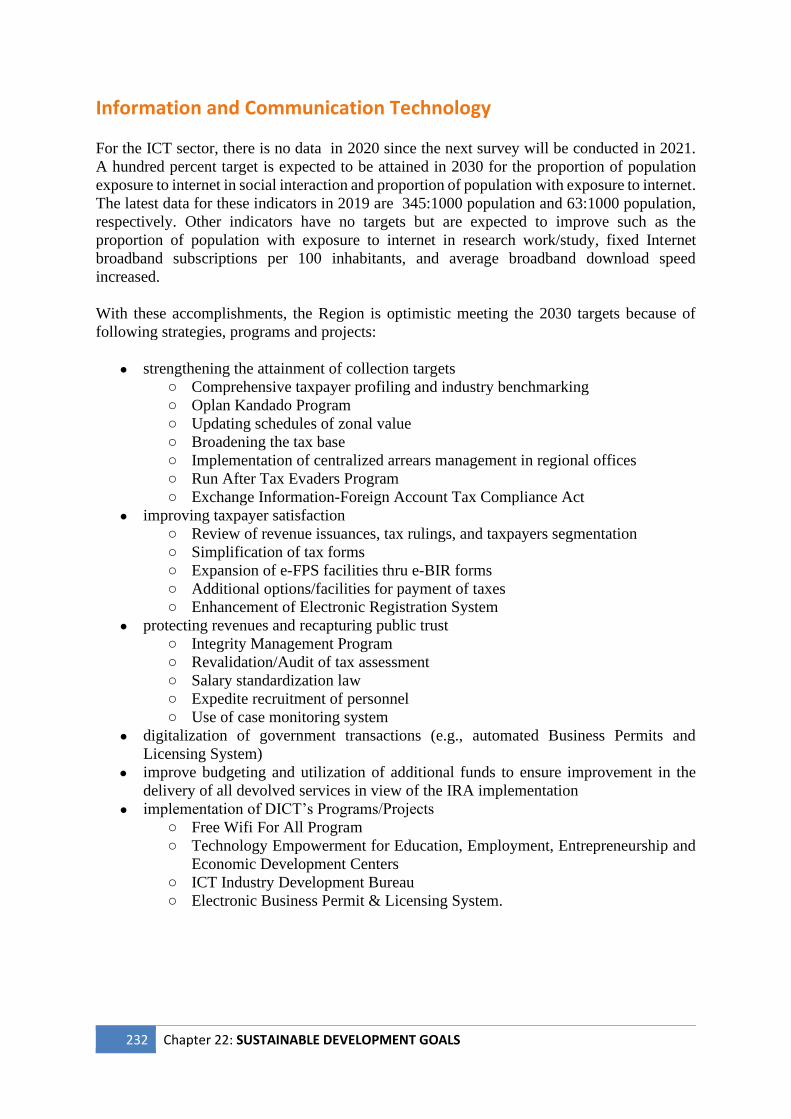
232 Chapter 22: SUSTAINABLE DEVELOPMENT GOALS
Information and Communication Technology
For the ICT sector, there is no data in 2020 since the next survey will be conducted in 2021.
A hundred percent target is expected to be attained in 2030 for the proportion of population
exposure to internet in social interaction and proportion of population with exposure to internet.
The latest data for these indicators in 2019 are 345:1000 population and 63:1000 population,
respectively. Other indicators have no targets but are expected to improve such as the
proportion of population with exposure to internet in research work/study, fixed Internet
broadband subscriptions per 100 inhabitants, and average broadband download speed
increased.
With these accomplishments, the Region is optimistic meeting the 2030 targets because of
following strategies, programs and projects:
● strengthening the attainment of collection targets
○ Comprehensive taxpayer profiling and industry benchmarking
○ Oplan Kandado Program
○ Updating schedules of zonal value
○ Broadening the tax base
○ Implementation of centralized arrears management in regional offices
○ Run After Tax Evaders Program
○ Exchange Information-Foreign Account Tax Compliance Act
● improving taxpayer satisfaction
○ Review of revenue issuances, tax rulings, and taxpayers segmentation
○ Simplification of tax forms
○ Expansion of e-FPS facilities thru e-BIR forms
○ Additional options/facilities for payment of taxes
○ Enhancement of Electronic Registration System
● protecting revenues and recapturing public trust
○ Integrity Management Program
○ Revalidation/Audit of tax assessment
○ Salary standardization law
○ Expedite recruitment of personnel
○ Use of case monitoring system
● digitalization of government transactions (e.g., automated Business Permits and
Licensing System)
● improve budgeting and utilization of additional funds to ensure improvement in the
delivery of all devolved services in view of the IRA implementation
● implementation of DICT’s Programs/Projects
○ Free Wifi For All Program
○ Technology Empowerment for Education, Employment, Entrepreneurship and
Economic Development Centers
○ ICT Industry Development Bureau
○ Electronic Business Permit & Licensing System.
Chapter 23: REGIONAL DEVELOPMENT PLAN 2017-2022 IMPLEMENTATION AND MONITORING
233
Chapter 23
Regional Development Plan 2017-2022
Implementation and Monitoring
The implementation of the CALABARZON RDP 2017-2022 is a concerted effort among the
RLAs, GOCCs, SUCs, LGUs, private sector and civil society organizations. The attainment of
the development goals of the Plan depends on the close coordination among these development
actors. The NEDA Regional Office IV-A monitors and shepherds the implementation of the
RDP with guidance from the RDC. The RDR serves as the annual measure of the Plan’s
accomplishments vis-à-vis with its development goals and targets. For 2020, the RDR reported
the accomplishments for the year in comparison with the accomplishments of previous year.
The RDP 2017-2022 was updated to address the challenges brought by the Taal Volcano
Eruption and the COVID- 19 Pandemic. The RDC approved the inclusion of 162 new programs
and projects in the RDIP amounting to PHP8.93 billion for implementation in 2020. These
programs and projects will contribute to the achievement of goals and targets of the Plan. The
RDIP also serves as a basis in the RDC review and endorsement of RLA, SUCs and GOCC
budgets. The total FY 2020 budget endorsed by RDC to the central offices of the RLAs,
governing boards of GOCCs, CHED and DBM amounted to PHP138.998 billion.
On monitoring, the RPMC regularly conducted committee meetings and field inspections of
major ongoing programs/projects to ensure their efficient and effective implementation.
Problem-solving sessions were proactively conducted to resolve program/project bottlenecks
at the onset. The Local Project Monitoring Committees were likewise involved in monitoring
and facilitation activities considering their first-hand knowledge of the programs/projects on
the ground.
To gain support for the RDP and Ambisyon 2040, advocacy activities were conducted for the
awareness of CALABARZON stakeholders on the Plan, country’s vision, and admiration of
the Filipino people which is Matatag, Panatag at Maginhawang Pamumuhay.

234 2020 Regional Development Report
Chapter 23: REGIONAL DEVELOPMENT PLAN 2017-2022 IMPLEMENTATION AND MONITORING
235
ANNEXES A TO Q
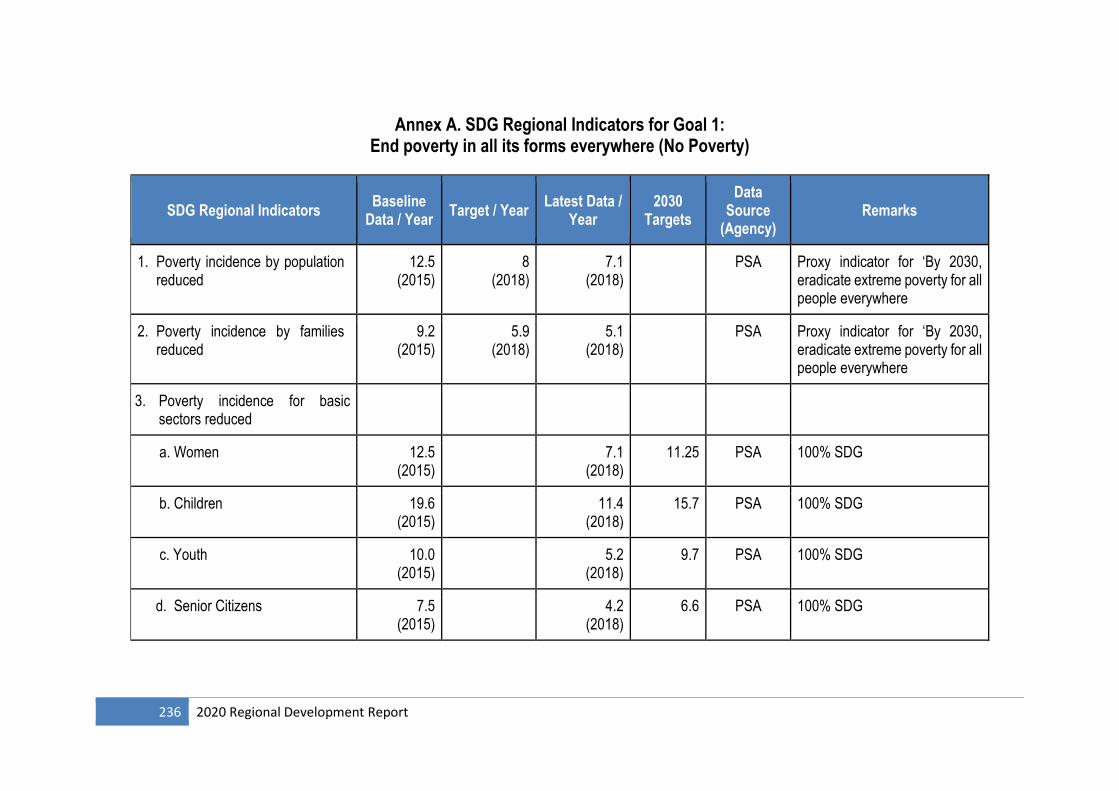
236 2020 Regional Development Report
Annex A. SDG Regional Indicators for Goal 1: End poverty in all its forms everywhere (No Poverty)
SDG Regional Indicators Baseline
Data / Year Target / Year
Latest Data / Year
2030 Targets
Data Source
(Agency) Remarks
1. Poverty incidence by population reduced
12.5 (2015)
8 (2018)
7.1 (2018)
PSA Proxy indicator for ‘By 2030, eradicate extreme poverty for all people everywhere
2. Poverty incidence by families reduced
9.2 (2015)
5.9 (2018)
5.1 (2018)
PSA Proxy indicator for ‘By 2030, eradicate extreme poverty for all people everywhere
3. Poverty incidence for basic sectors reduced
a. Women 12.5 (2015)
7.1 (2018)
11.25 PSA 100% SDG
b. Children 19.6 (2015)
11.4 (2018)
15.7 PSA 100% SDG
c. Youth 10.0 (2015)
5.2 (2018)
9.7 PSA 100% SDG
d. Senior Citizens 7.5 (2015)
4.2 (2018)
6.6 PSA 100% SDG
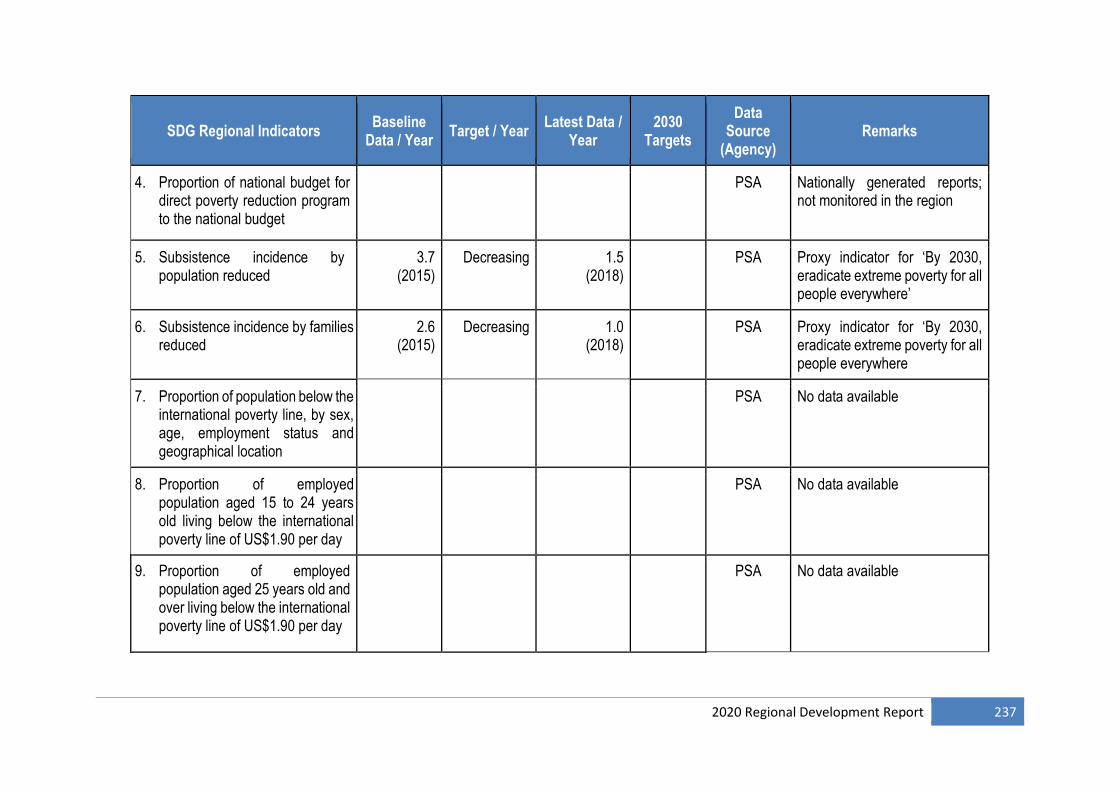
2020 Regional Development Report 237
SDG Regional Indicators Baseline
Data / Year Target / Year
Latest Data / Year
2030 Targets
Data Source
(Agency) Remarks
4. Proportion of national budget for direct poverty reduction program to the national budget
PSA Nationally generated reports; not monitored in the region
5. Subsistence incidence by population reduced
3.7 (2015)
Decreasing
1.5 (2018)
PSA Proxy indicator for ‘By 2030, eradicate extreme poverty for all people everywhere’
6. Subsistence incidence by families reduced
2.6 (2015)
Decreasing
1.0 (2018)
PSA Proxy indicator for ‘By 2030, eradicate extreme poverty for all people everywhere
7. Proportion of population below the international poverty line, by sex, age, employment status and geographical location
PSA No data available
8. Proportion of employed population aged 15 to 24 years old living below the international poverty line of US$1.90 per day
PSA No data available
9. Proportion of employed population aged 25 years old and over living below the international poverty line of US$1.90 per day
PSA
No data available
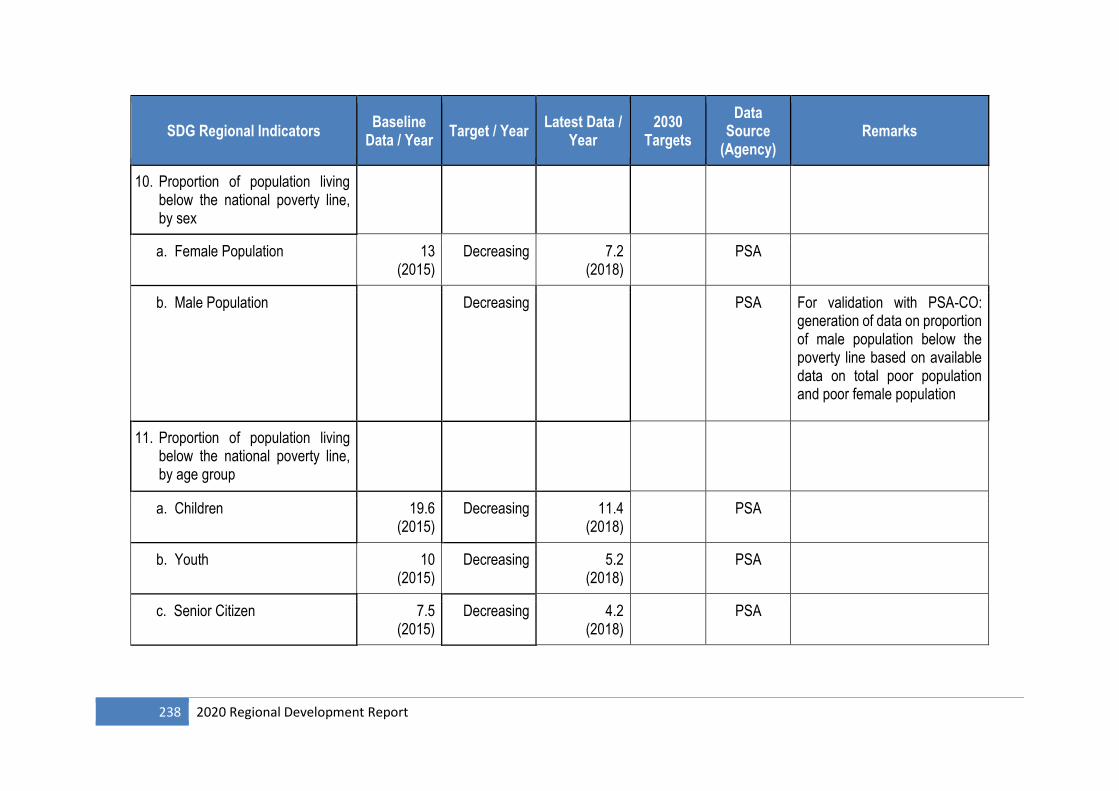
238 2020 Regional Development Report
SDG Regional Indicators Baseline
Data / Year Target / Year
Latest Data / Year
2030 Targets
Data Source
(Agency) Remarks
10. Proportion of population living below the national poverty line, by sex
a. Female Population 13 (2015)
Decreasing
7.2 (2018)
PSA
b. Male Population Decreasing PSA For validation with PSA-CO: generation of data on proportion of male population below the poverty line based on available data on total poor population and poor female population
11. Proportion of population living below the national poverty line, by age group
a. Children 19.6 (2015)
Decreasing 11.4 (2018)
PSA
b. Youth 10 (2015)
Decreasing 5.2 (2018)
PSA
c. Senior Citizen 7.5 (2015)
Decreasing 4.2 (2018)
PSA
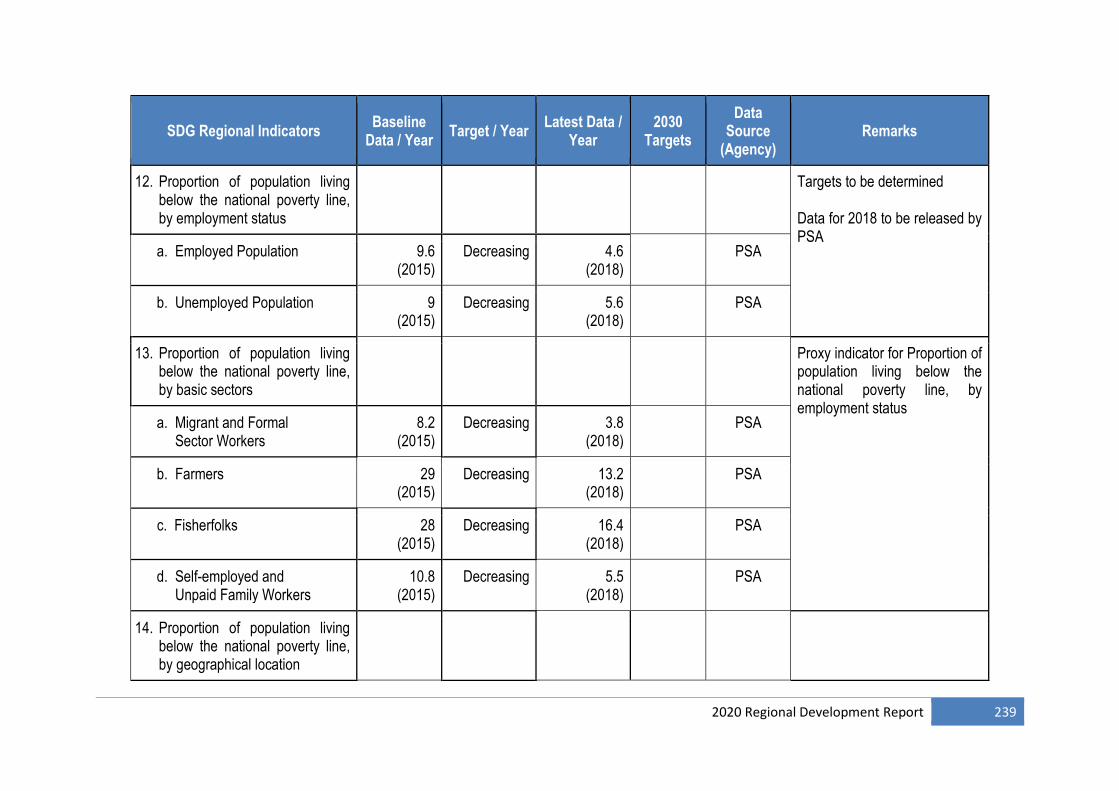
2020 Regional Development Report 239
SDG Regional Indicators Baseline
Data / Year Target / Year
Latest Data / Year
2030 Targets
Data Source
(Agency) Remarks
12. Proportion of population living below the national poverty line, by employment status
Targets to be determined Data for 2018 to be released by PSA
a. Employed Population 9.6 (2015)
Decreasing 4.6 (2018)
PSA
b. Unemployed Population 9 (2015)
Decreasing 5.6 (2018)
PSA
13. Proportion of population living below the national poverty line, by basic sectors
Proxy indicator for Proportion of population living below the national poverty line, by employment status a. Migrant and Formal
Sector Workers 8.2
(2015) Decreasing 3.8
(2018) PSA
b. Farmers 29 (2015)
Decreasing 13.2 (2018)
PSA
c. Fisherfolks 28 (2015)
Decreasing 16.4 (2018)
PSA
d. Self-employed and Unpaid Family Workers
10.8 (2015)
Decreasing 5.5 (2018)
PSA
14. Proportion of population living below the national poverty line, by geographical location
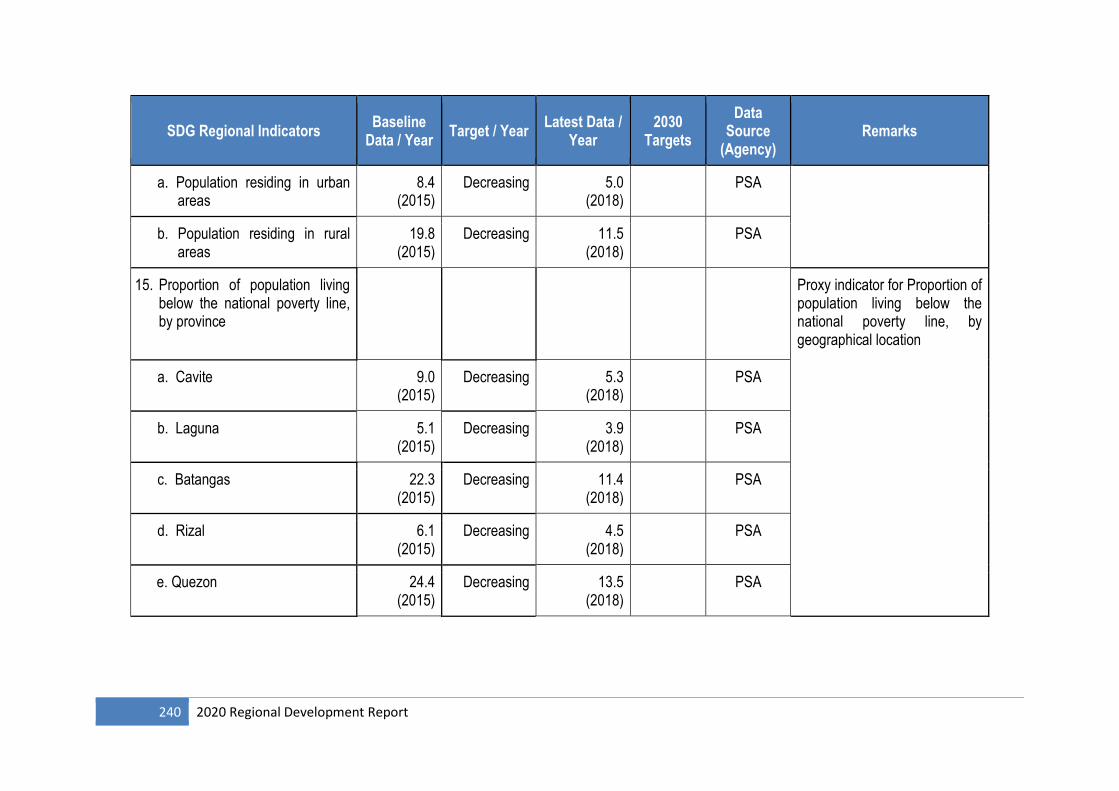
240 2020 Regional Development Report
SDG Regional Indicators Baseline
Data / Year Target / Year
Latest Data / Year
2030 Targets
Data Source
(Agency) Remarks
a. Population residing in urban areas
8.4 (2015)
Decreasing 5.0 (2018)
PSA
b. Population residing in rural areas
19.8 (2015)
Decreasing 11.5 (2018)
PSA
15. Proportion of population living below the national poverty line, by province
Proxy indicator for Proportion of population living below the national poverty line, by geographical location
a. Cavite 9.0 (2015)
Decreasing 5.3 (2018)
PSA
b. Laguna 5.1 (2015)
Decreasing 3.9 (2018)
PSA
c. Batangas 22.3 (2015)
Decreasing 11.4 (2018)
PSA
d. Rizal 6.1 (2015)
Decreasing 4.5 (2018)
PSA
e. Quezon 24.4 (2015)
Decreasing 13.5 (2018)
PSA
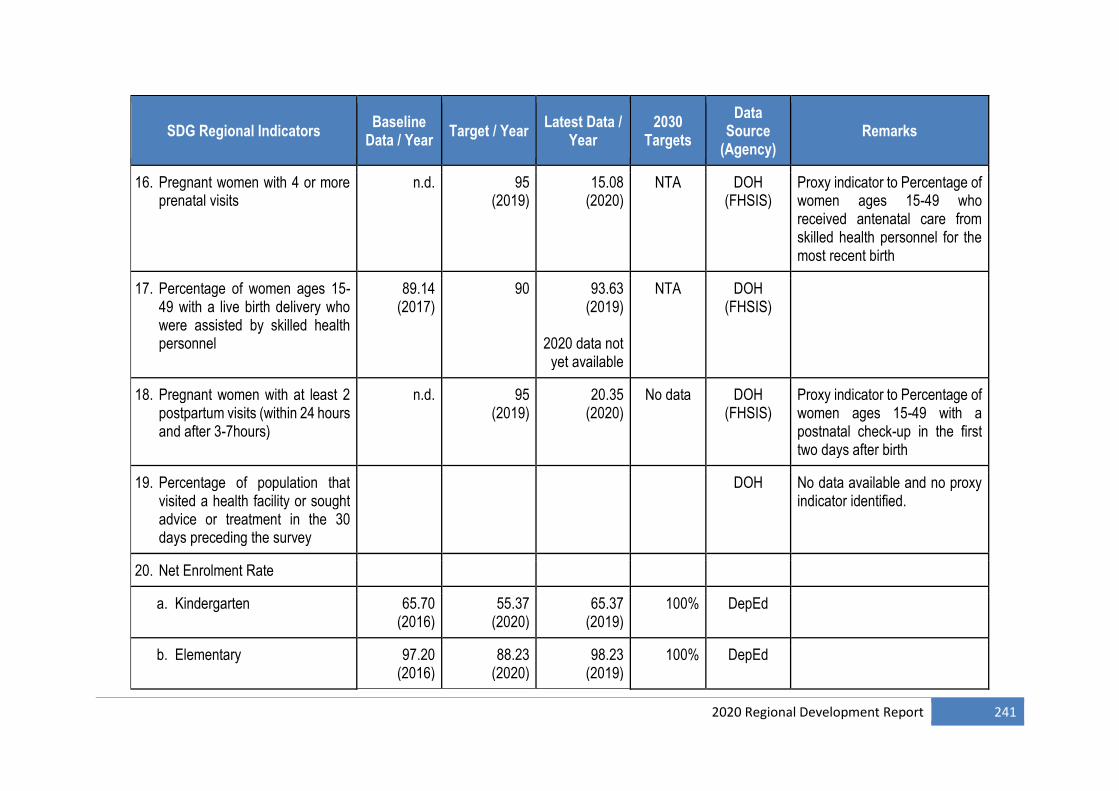
2020 Regional Development Report 241
SDG Regional Indicators Baseline
Data / Year Target / Year
Latest Data / Year
2030 Targets
Data Source
(Agency) Remarks
16. Pregnant women with 4 or more prenatal visits
n.d. 95 (2019)
15.08 (2020)
NTA DOH (FHSIS)
Proxy indicator to Percentage of women ages 15-49 who received antenatal care from skilled health personnel for the most recent birth
17. Percentage of women ages 15-49 with a live birth delivery who were assisted by skilled health personnel
89.14 (2017)
90 93.63 (2019)
2020 data not
yet available
NTA DOH (FHSIS)
18. Pregnant women with at least 2 postpartum visits (within 24 hours and after 3-7hours)
n.d. 95 (2019)
20.35 (2020)
No data DOH (FHSIS)
Proxy indicator to Percentage of women ages 15-49 with a postnatal check-up in the first two days after birth
19. Percentage of population that visited a health facility or sought advice or treatment in the 30 days preceding the survey
DOH No data available and no proxy indicator identified.
20. Net Enrolment Rate
a. Kindergarten 65.70 (2016)
55.37 (2020)
65.37 (2019)
100% DepEd
b. Elementary 97.20 (2016)
88.23 (2020)
98.23 (2019)
100% DepEd
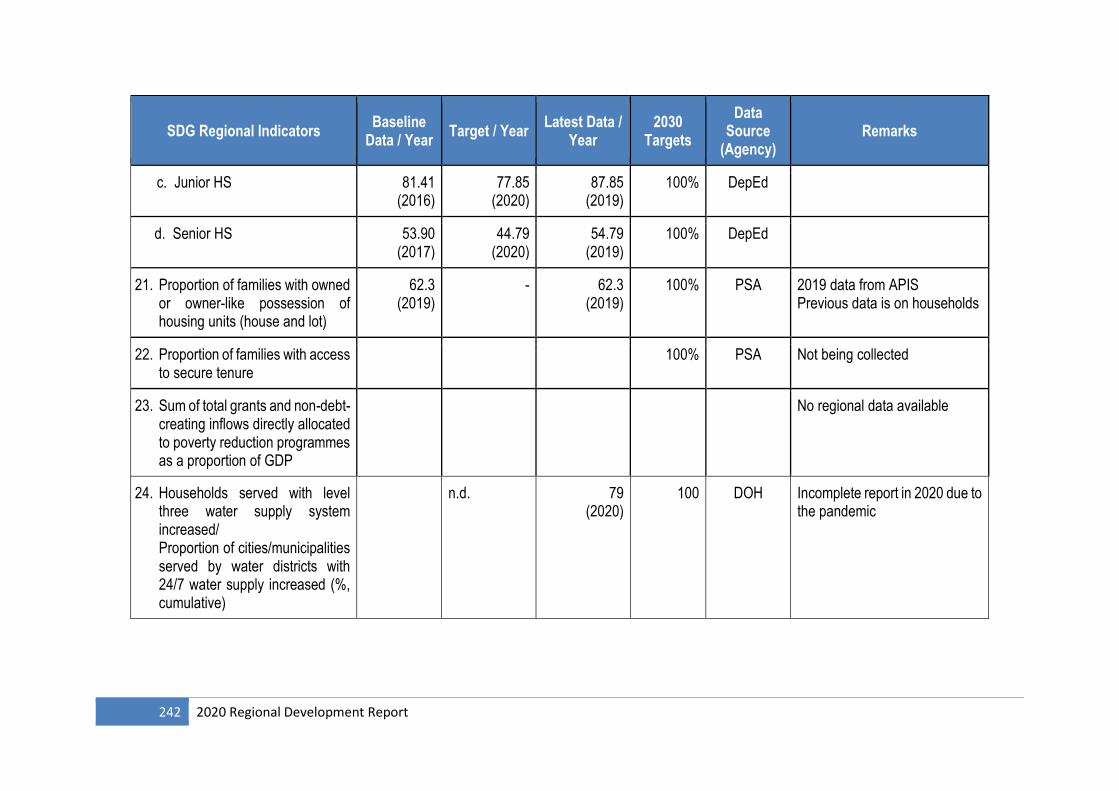
242 2020 Regional Development Report
SDG Regional Indicators Baseline
Data / Year Target / Year
Latest Data / Year
2030 Targets
Data Source
(Agency) Remarks
c. Junior HS 81.41 (2016)
77.85 (2020)
87.85 (2019)
100% DepEd
d. Senior HS 53.90 (2017)
44.79 (2020)
54.79 (2019)
100% DepEd
21. Proportion of families with owned or owner-like possession of housing units (house and lot)
62.3 (2019)
- 62.3 (2019)
100% PSA 2019 data from APIS Previous data is on households
22. Proportion of families with access to secure tenure
100% PSA Not being collected
23. Sum of total grants and non-debt-creating inflows directly allocated to poverty reduction programmes as a proportion of GDP
No regional data available
24. Households served with level three water supply system increased/ Proportion of cities/municipalities served by water districts with 24/7 water supply increased (%, cumulative)
n.d. 79 (2020)
100 DOH Incomplete report in 2020 due to the pandemic
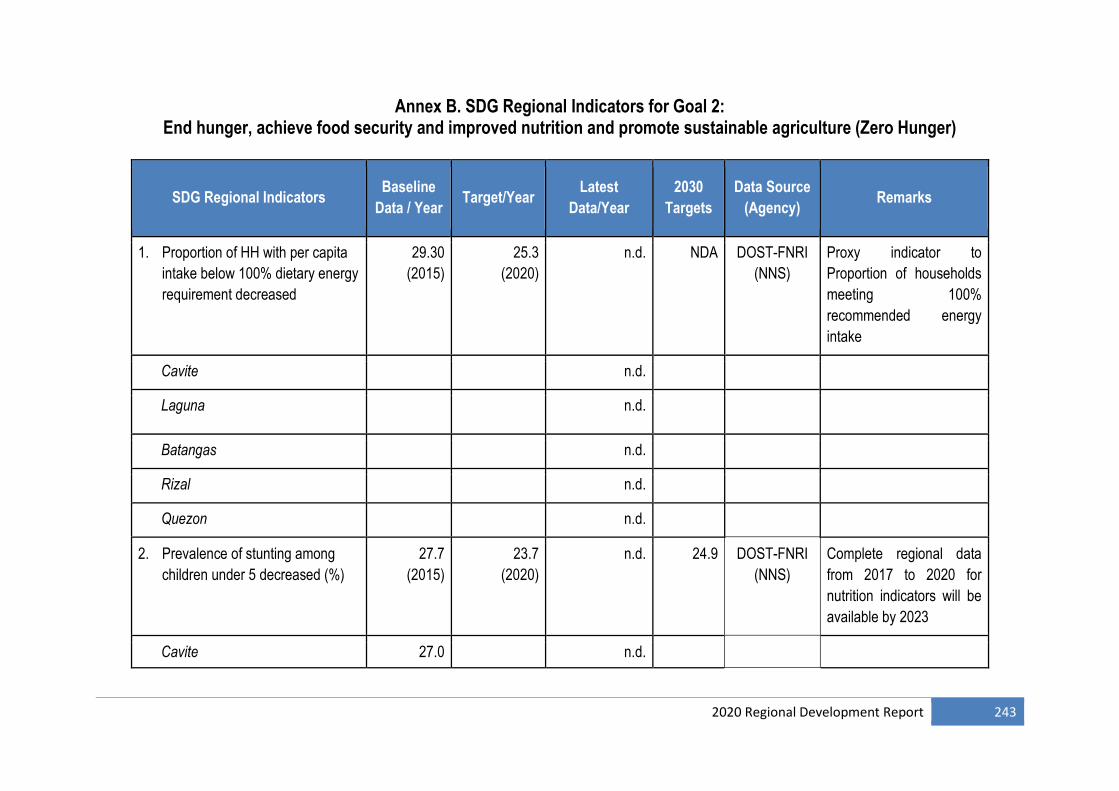
2020 Regional Development Report 243
Annex B. SDG Regional Indicators for Goal 2: End hunger, achieve food security and improved nutrition and promote sustainable agriculture (Zero Hunger)
SDG Regional Indicators Baseline
Data / Year Target/Year
Latest
Data/Year
2030
Targets
Data Source
(Agency) Remarks
1. Proportion of HH with per capita
intake below 100% dietary energy
requirement decreased
29.30
(2015)
25.3
(2020)
n.d. NDA DOST-FNRI
(NNS)
Proxy indicator to
Proportion of households
meeting 100%
recommended energy
intake
Cavite n.d.
Laguna n.d.
Batangas n.d.
Rizal n.d.
Quezon n.d.
2. Prevalence of stunting among
children under 5 decreased (%)
27.7
(2015)
23.7
(2020)
n.d. 24.9 DOST-FNRI
(NNS)
Complete regional data
from 2017 to 2020 for
nutrition indicators will be
available by 2023
Cavite 27.0 n.d.
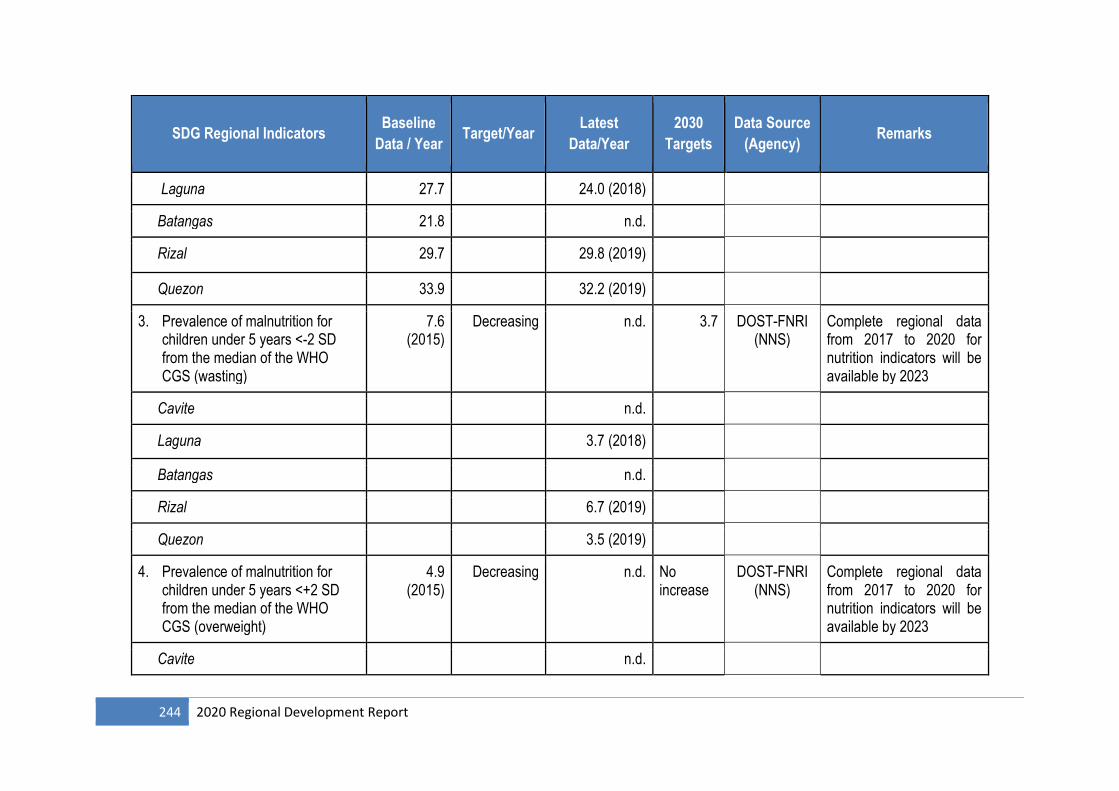
244 2020 Regional Development Report
SDG Regional Indicators Baseline
Data / Year Target/Year
Latest
Data/Year
2030
Targets
Data Source
(Agency) Remarks
Laguna 27.7 24.0 (2018)
Batangas 21.8 n.d.
Rizal 29.7 29.8 (2019)
Quezon 33.9 32.2 (2019)
3. Prevalence of malnutrition for children under 5 years <-2 SD from the median of the WHO CGS (wasting)
7.6 (2015)
Decreasing n.d. 3.7 DOST-FNRI (NNS)
Complete regional data from 2017 to 2020 for nutrition indicators will be available by 2023
Cavite n.d.
Laguna 3.7 (2018)
Batangas n.d.
Rizal 6.7 (2019)
Quezon 3.5 (2019)
4. Prevalence of malnutrition for children under 5 years <+2 SD from the median of the WHO CGS (overweight)
4.9 (2015)
Decreasing n.d. No increase
DOST-FNRI (NNS)
Complete regional data from 2017 to 2020 for nutrition indicators will be available by 2023
Cavite n.d.
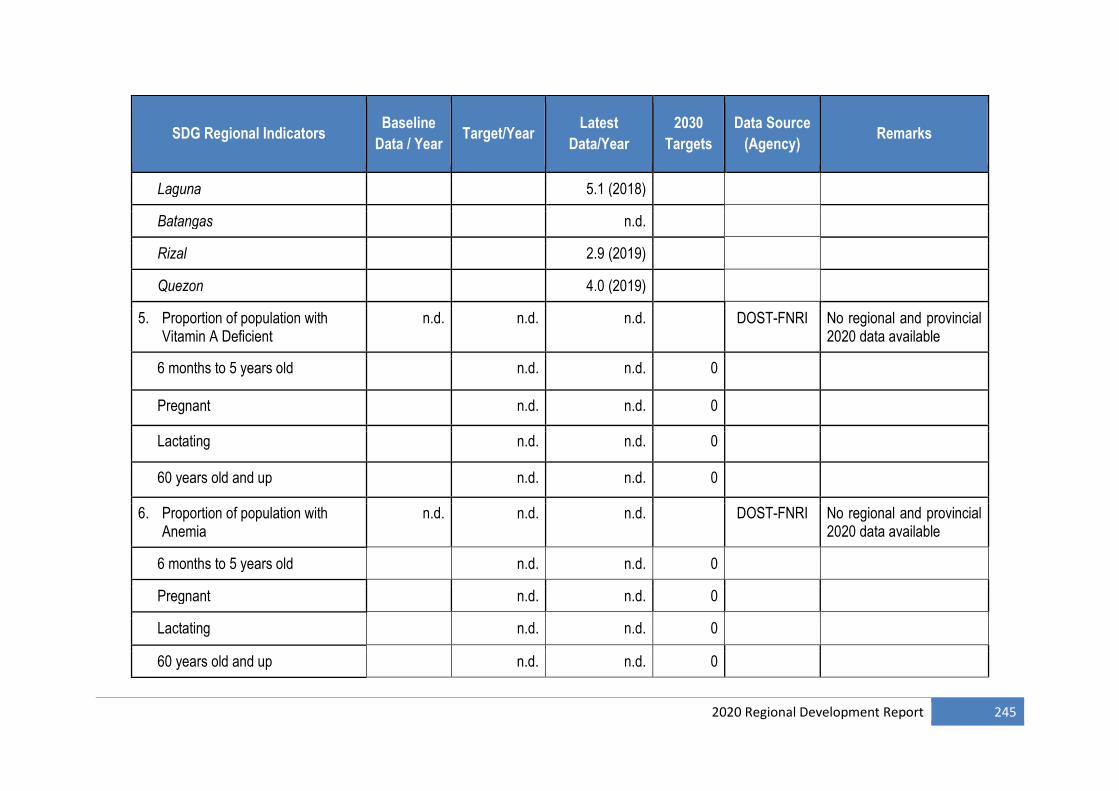
2020 Regional Development Report 245
SDG Regional Indicators Baseline
Data / Year Target/Year
Latest
Data/Year
2030
Targets
Data Source
(Agency) Remarks
Laguna 5.1 (2018)
Batangas n.d.
Rizal 2.9 (2019)
Quezon 4.0 (2019)
5. Proportion of population with Vitamin A Deficient
n.d. n.d. n.d. DOST-FNRI No regional and provincial 2020 data available
6 months to 5 years old n.d. n.d. 0
Pregnant n.d. n.d. 0
Lactating n.d. n.d. 0
60 years old and up n.d. n.d. 0
6. Proportion of population with Anemia
n.d. n.d. n.d. DOST-FNRI No regional and provincial 2020 data available
6 months to 5 years old n.d. n.d. 0
Pregnant n.d. n.d. 0
Lactating n.d. n.d. 0
60 years old and up n.d. n.d. 0
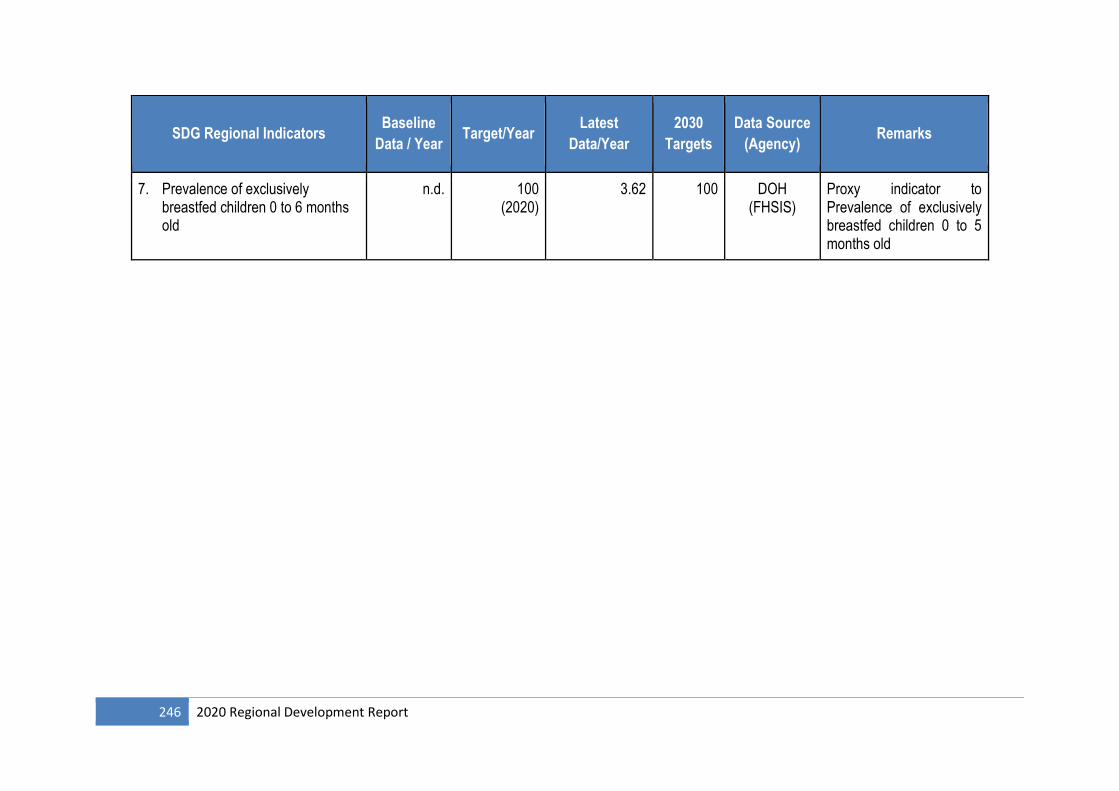
246 2020 Regional Development Report
SDG Regional Indicators Baseline
Data / Year Target/Year
Latest
Data/Year
2030
Targets
Data Source
(Agency) Remarks
7. Prevalence of exclusively breastfed children 0 to 6 months old
n.d. 100 (2020)
3.62 100 DOH (FHSIS)
Proxy indicator to Prevalence of exclusively breastfed children 0 to 5 months old
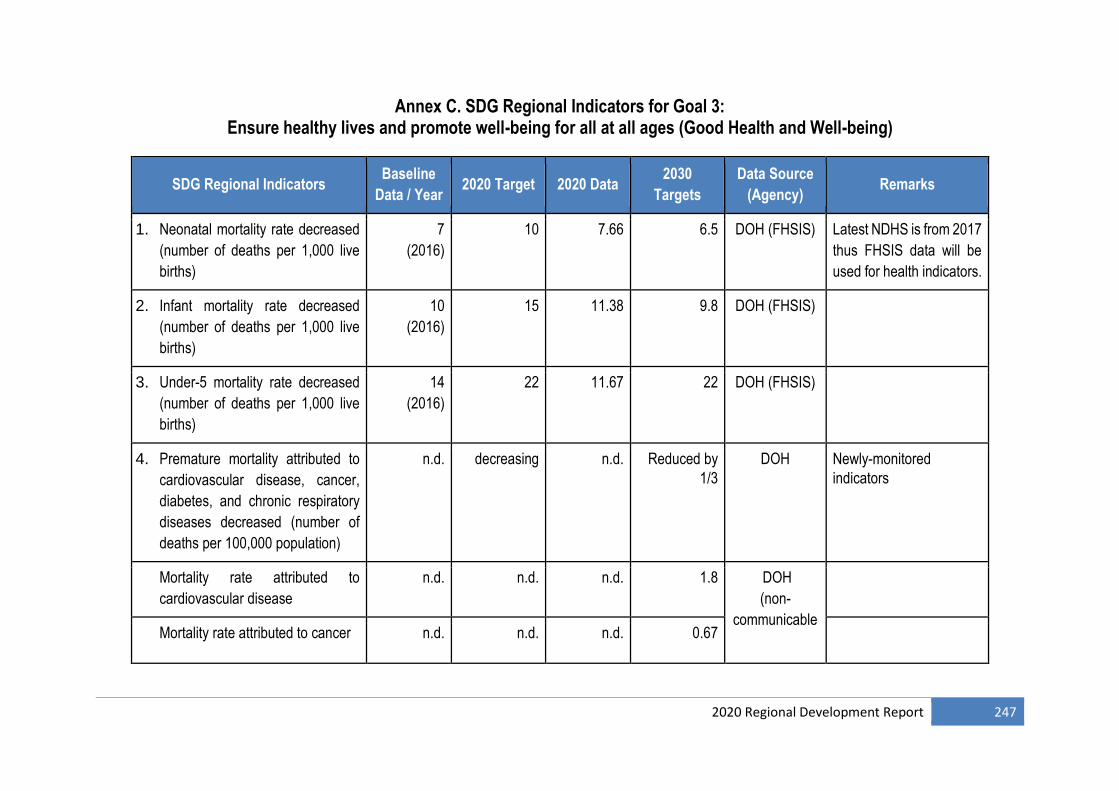
2020 Regional Development Report 247
Annex C. SDG Regional Indicators for Goal 3: Ensure healthy lives and promote well-being for all at all ages (Good Health and Well-being)
SDG Regional Indicators Baseline
Data / Year 2020 Target 2020 Data
2030
Targets
Data Source
(Agency) Remarks
1. Neonatal mortality rate decreased
(number of deaths per 1,000 live
births)
7
(2016)
10 7.66 6.5 DOH (FHSIS) Latest NDHS is from 2017
thus FHSIS data will be
used for health indicators.
2. Infant mortality rate decreased
(number of deaths per 1,000 live
births)
10
(2016)
15 11.38 9.8 DOH (FHSIS)
3. Under-5 mortality rate decreased
(number of deaths per 1,000 live
births)
14
(2016)
22 11.67 22 DOH (FHSIS)
4. Premature mortality attributed to
cardiovascular disease, cancer,
diabetes, and chronic respiratory
diseases decreased (number of
deaths per 100,000 population)
n.d. decreasing n.d. Reduced by
1/3
DOH Newly-monitored
indicators
Mortality rate attributed to
cardiovascular disease
n.d. n.d. n.d.
1.8 DOH
(non-
communicable
Mortality rate attributed to cancer n.d. n.d. n.d. 0.67
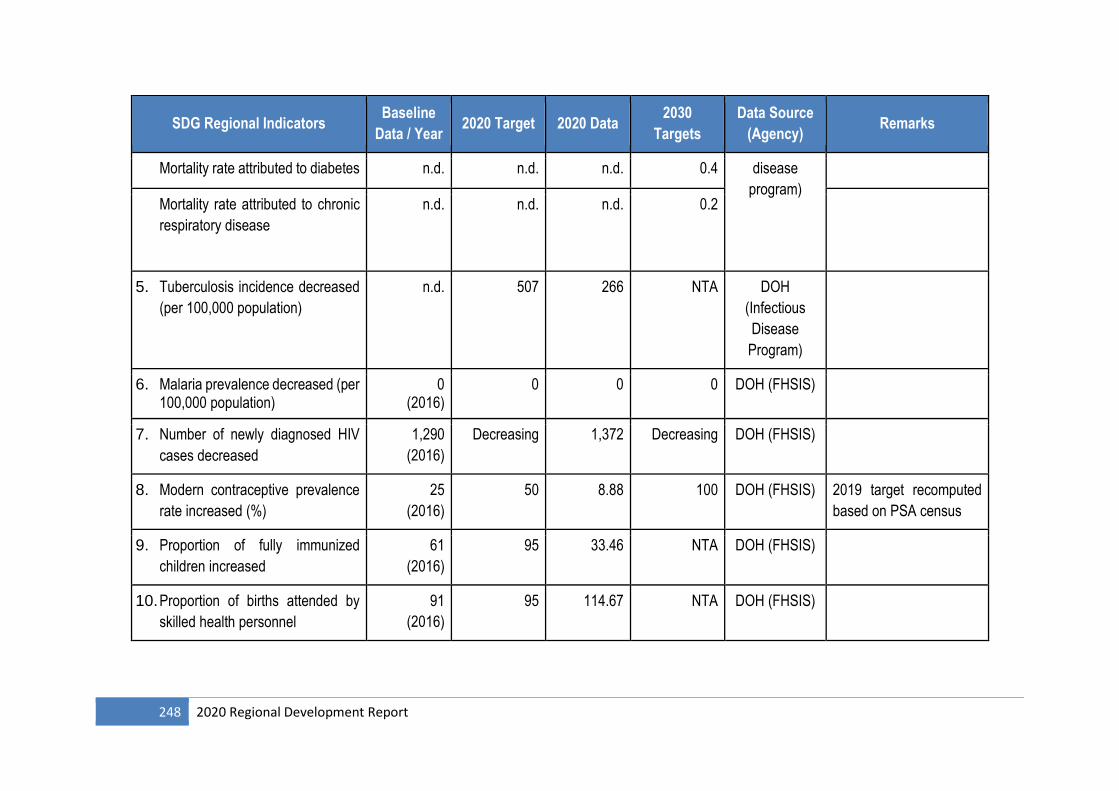
248 2020 Regional Development Report
SDG Regional Indicators Baseline
Data / Year 2020 Target 2020 Data
2030
Targets
Data Source
(Agency) Remarks
Mortality rate attributed to diabetes n.d. n.d. n.d. 0.4 disease
program)
Mortality rate attributed to chronic
respiratory disease
n.d. n.d. n.d. 0.2
5. Tuberculosis incidence decreased
(per 100,000 population)
n.d. 507 266 NTA DOH
(Infectious
Disease
Program)
6. Malaria prevalence decreased (per 100,000 population)
0 (2016)
0 0 0 DOH (FHSIS)
7. Number of newly diagnosed HIV
cases decreased
1,290
(2016)
Decreasing 1,372 Decreasing DOH (FHSIS)
8. Modern contraceptive prevalence
rate increased (%)
25
(2016)
50 8.88 100 DOH (FHSIS) 2019 target recomputed
based on PSA census
9. Proportion of fully immunized
children increased
61
(2016)
95 33.46 NTA DOH (FHSIS)
10. Proportion of births attended by
skilled health personnel
91
(2016)
95 114.67 NTA DOH (FHSIS)
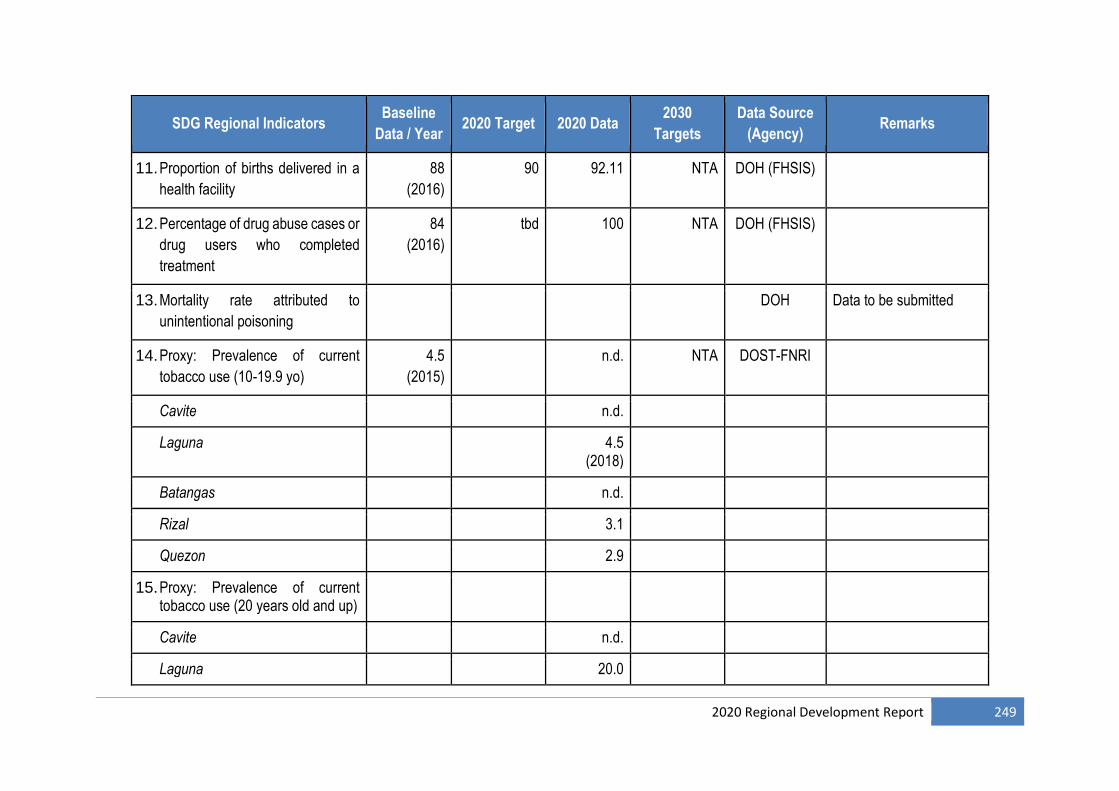
2020 Regional Development Report 249
SDG Regional Indicators Baseline
Data / Year 2020 Target 2020 Data
2030
Targets
Data Source
(Agency) Remarks
11. Proportion of births delivered in a
health facility
88
(2016)
90 92.11 NTA DOH (FHSIS)
12. Percentage of drug abuse cases or
drug users who completed
treatment
84
(2016)
tbd 100 NTA DOH (FHSIS)
13. Mortality rate attributed to
unintentional poisoning
DOH Data to be submitted
14. Proxy: Prevalence of current
tobacco use (10-19.9 yo)
4.5
(2015)
n.d. NTA DOST-FNRI
Cavite n.d.
Laguna 4.5 (2018)
Batangas n.d.
Rizal 3.1
Quezon 2.9
15. Proxy: Prevalence of current tobacco use (20 years old and up)
Cavite n.d.
Laguna 20.0
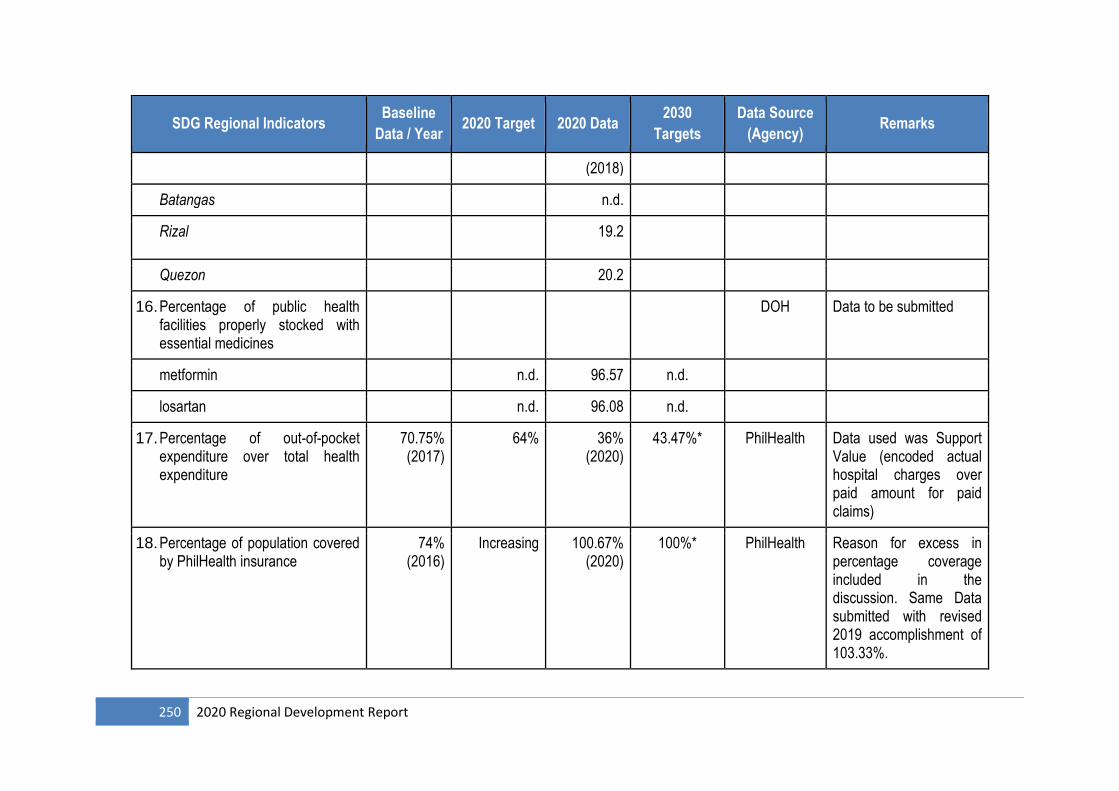
250 2020 Regional Development Report
SDG Regional Indicators Baseline
Data / Year 2020 Target 2020 Data
2030
Targets
Data Source
(Agency) Remarks
(2018)
Batangas n.d.
Rizal 19.2
Quezon 20.2
16. Percentage of public health facilities properly stocked with essential medicines
DOH Data to be submitted
metformin n.d. 96.57 n.d.
losartan n.d. 96.08 n.d.
17. Percentage of out-of-pocket expenditure over total health expenditure
70.75% (2017)
64%
36% (2020)
43.47%* PhilHealth Data used was Support Value (encoded actual hospital charges over paid amount for paid claims)
18. Percentage of population covered by PhilHealth insurance
74% (2016)
Increasing 100.67% (2020)
100%* PhilHealth Reason for excess in percentage coverage included in the discussion. Same Data submitted with revised 2019 accomplishment of 103.33%.
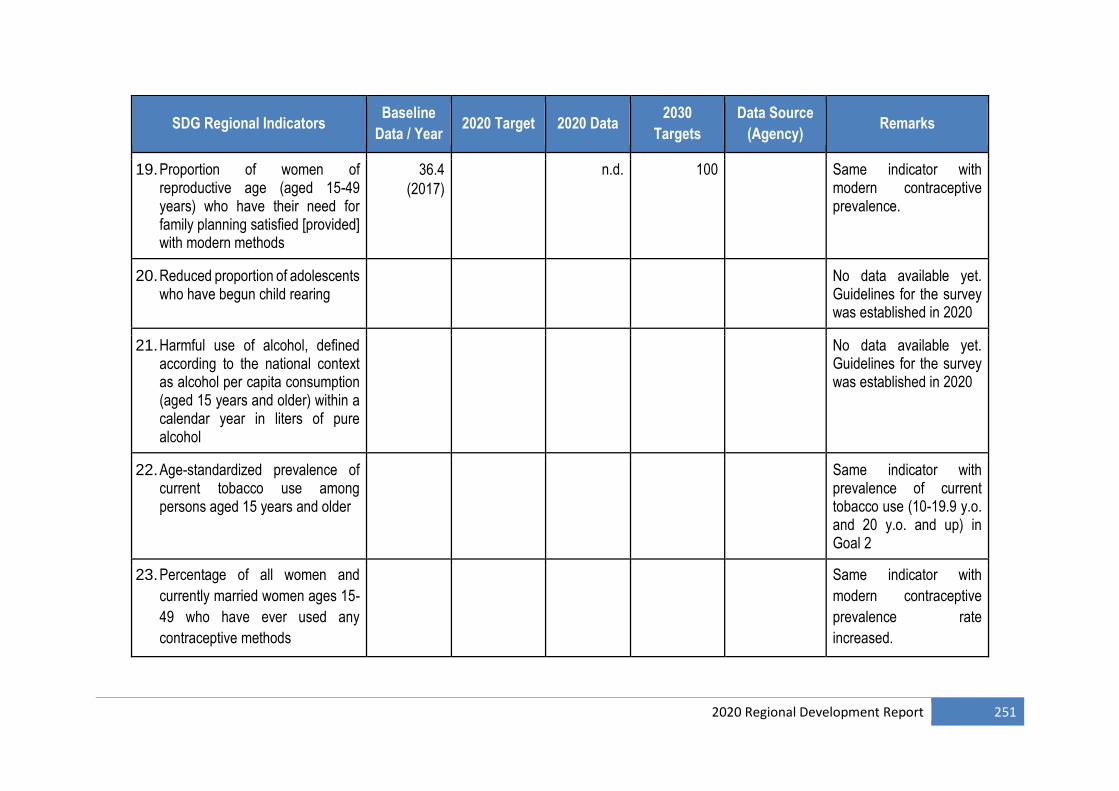
2020 Regional Development Report 251
SDG Regional Indicators Baseline
Data / Year 2020 Target 2020 Data
2030
Targets
Data Source
(Agency) Remarks
19. Proportion of women of reproductive age (aged 15-49 years) who have their need for family planning satisfied [provided] with modern methods
36.4
(2017)
n.d. 100 Same indicator with modern contraceptive prevalence.
20. Reduced proportion of adolescents who have begun child rearing
No data available yet. Guidelines for the survey was established in 2020
21. Harmful use of alcohol, defined according to the national context as alcohol per capita consumption (aged 15 years and older) within a calendar year in liters of pure alcohol
No data available yet. Guidelines for the survey was established in 2020
22. Age-standardized prevalence of current tobacco use among persons aged 15 years and older
Same indicator with prevalence of current tobacco use (10-19.9 y.o. and 20 y.o. and up) in Goal 2
23. Percentage of all women and
currently married women ages 15-
49 who have ever used any
contraceptive methods
Same indicator with
modern contraceptive
prevalence rate
increased.
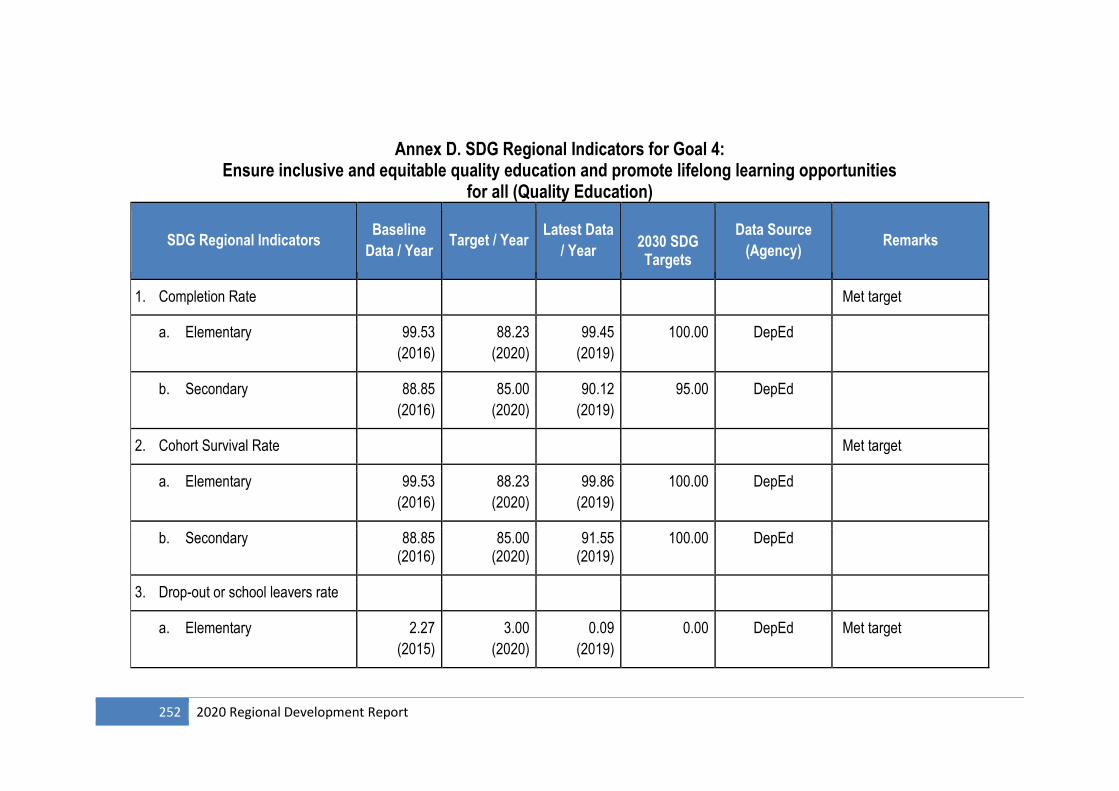
252 2020 Regional Development Report
Annex D. SDG Regional Indicators for Goal 4: Ensure inclusive and equitable quality education and promote lifelong learning opportunities
for all (Quality Education)
SDG Regional Indicators Baseline
Data / Year Target / Year
Latest Data
/ Year
2030 SDG Targets
Data Source
(Agency) Remarks
1. Completion Rate Met target
a. Elementary 99.53
(2016)
88.23
(2020)
99.45
(2019)
100.00 DepEd
b. Secondary 88.85
(2016)
85.00
(2020)
90.12
(2019)
95.00 DepEd
2. Cohort Survival Rate Met target
a. Elementary 99.53
(2016)
88.23
(2020)
99.86
(2019)
100.00 DepEd
b. Secondary 88.85 (2016)
85.00 (2020)
91.55 (2019)
100.00 DepEd
3. Drop-out or school leavers rate
a. Elementary 2.27
(2015)
3.00
(2020)
0.09
(2019)
0.00 DepEd Met target
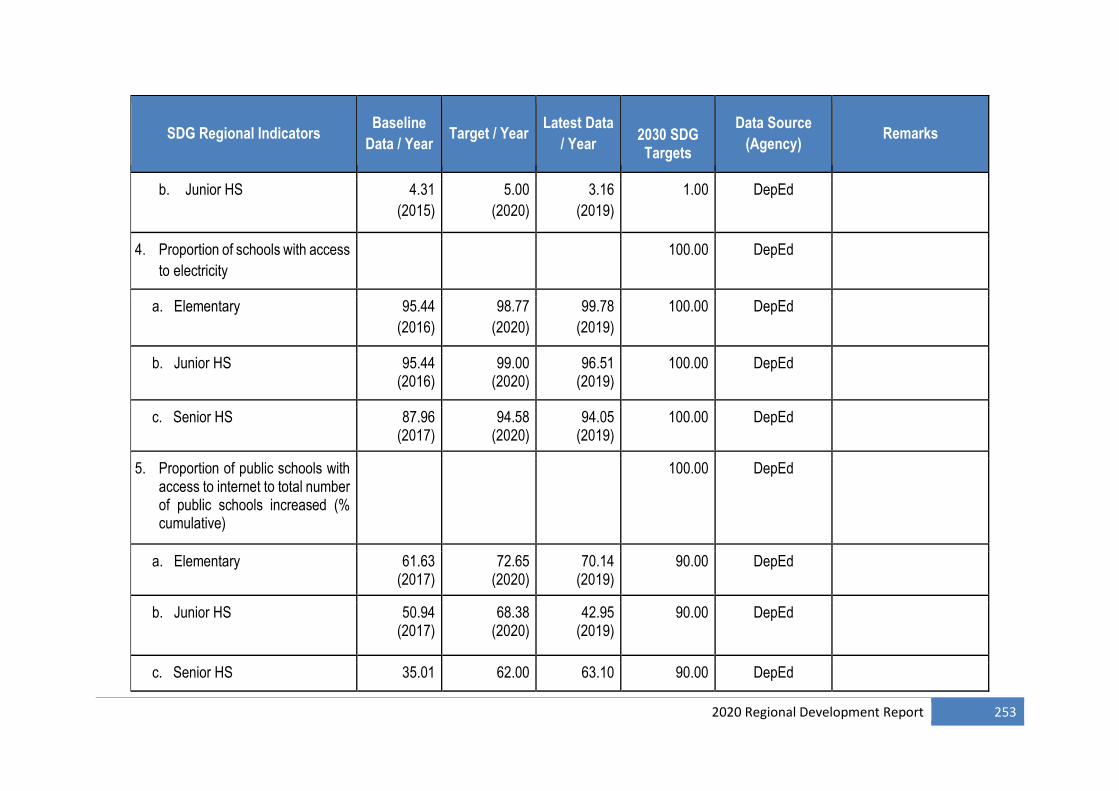
2020 Regional Development Report 253
SDG Regional Indicators Baseline
Data / Year Target / Year
Latest Data
/ Year
2030 SDG Targets
Data Source
(Agency) Remarks
b. Junior HS 4.31
(2015)
5.00
(2020)
3.16
(2019)
1.00 DepEd
4. Proportion of schools with access
to electricity
100.00 DepEd
a. Elementary 95.44
(2016)
98.77
(2020)
99.78
(2019)
100.00 DepEd
b. Junior HS 95.44 (2016)
99.00 (2020)
96.51 (2019)
100.00 DepEd
c. Senior HS 87.96 (2017)
94.58 (2020)
94.05 (2019)
100.00 DepEd
5. Proportion of public schools with access to internet to total number of public schools increased (% cumulative)
100.00 DepEd
a. Elementary 61.63 (2017)
72.65 (2020)
70.14 (2019)
90.00 DepEd
b. Junior HS 50.94 (2017)
68.38 (2020)
42.95 (2019)
90.00 DepEd
c. Senior HS 35.01 62.00 63.10 90.00 DepEd
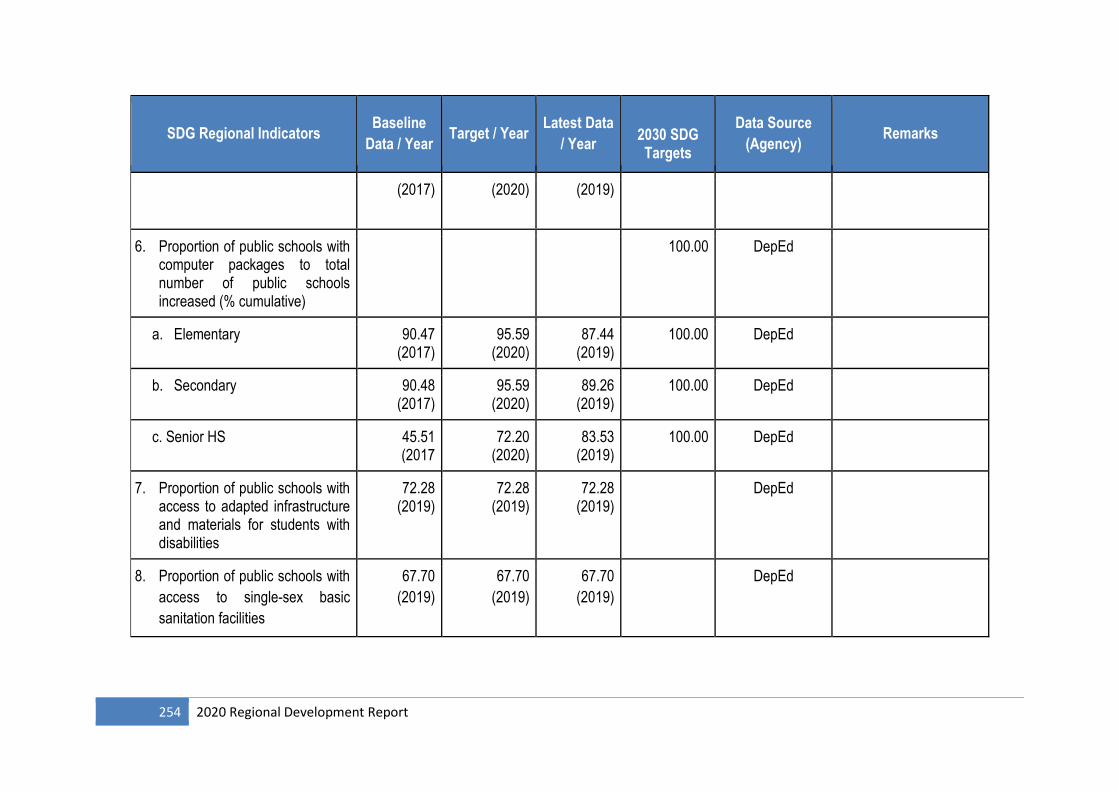
254 2020 Regional Development Report
SDG Regional Indicators Baseline
Data / Year Target / Year
Latest Data
/ Year
2030 SDG Targets
Data Source
(Agency) Remarks
(2017) (2020)
(2019)
6. Proportion of public schools with computer packages to total number of public schools increased (% cumulative)
100.00 DepEd
a. Elementary 90.47 (2017)
95.59 (2020)
87.44 (2019)
100.00 DepEd
b. Secondary 90.48 (2017)
95.59 (2020)
89.26 (2019)
100.00
DepEd
c. Senior HS 45.51 (2017
72.20 (2020)
83.53 (2019)
100.00 DepEd
7. Proportion of public schools with access to adapted infrastructure and materials for students with disabilities
72.28 (2019)
72.28 (2019)
72.28 (2019)
DepEd
8. Proportion of public schools with
access to single-sex basic
sanitation facilities
67.70
(2019)
67.70
(2019)
67.70
(2019)
DepEd
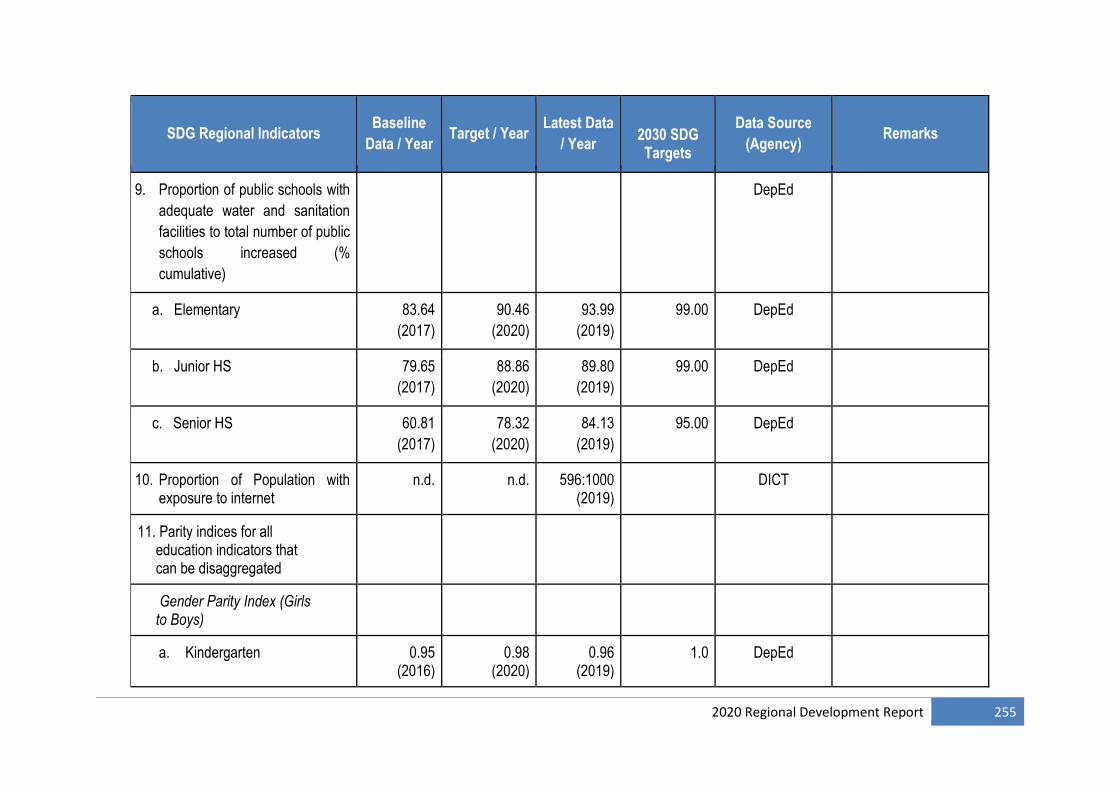
2020 Regional Development Report 255
SDG Regional Indicators Baseline
Data / Year Target / Year
Latest Data
/ Year
2030 SDG Targets
Data Source
(Agency) Remarks
9. Proportion of public schools with
adequate water and sanitation
facilities to total number of public
schools increased (%
cumulative)
DepEd
a. Elementary 83.64
(2017)
90.46
(2020)
93.99
(2019)
99.00 DepEd
b. Junior HS 79.65
(2017)
88.86
(2020)
89.80
(2019)
99.00 DepEd
c. Senior HS 60.81
(2017)
78.32
(2020)
84.13
(2019)
95.00 DepEd
10. Proportion of Population with exposure to internet
n.d. n.d. 596:1000 (2019)
DICT
11. Parity indices for all education indicators that can be disaggregated
Gender Parity Index (Girls to Boys)
a. Kindergarten 0.95 (2016)
0.98 (2020)
0.96 (2019)
1.0 DepEd
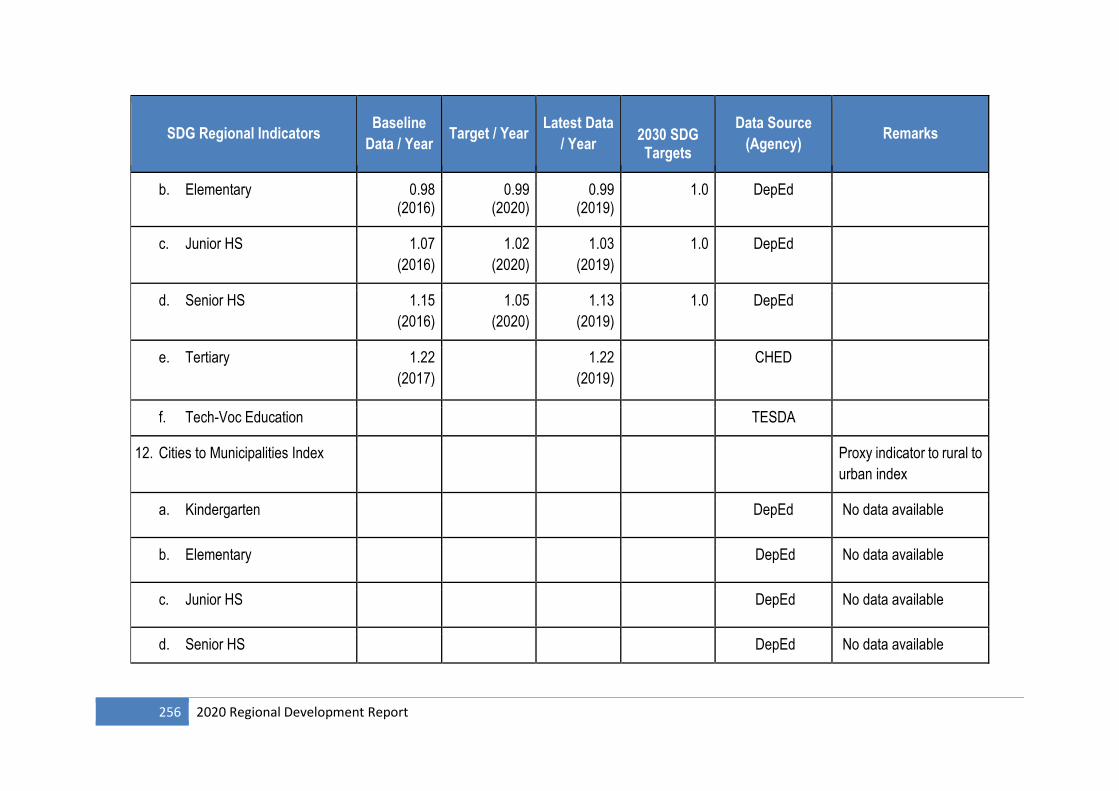
256 2020 Regional Development Report
SDG Regional Indicators Baseline
Data / Year Target / Year
Latest Data
/ Year
2030 SDG Targets
Data Source
(Agency) Remarks
b. Elementary 0.98 (2016)
0.99 (2020)
0.99 (2019)
1.0 DepEd
c. Junior HS 1.07
(2016)
1.02
(2020)
1.03
(2019)
1.0 DepEd
d. Senior HS 1.15
(2016)
1.05
(2020)
1.13
(2019)
1.0 DepEd
e. Tertiary 1.22
(2017)
1.22
(2019)
CHED
f. Tech-Voc Education TESDA
12. Cities to Municipalities Index Proxy indicator to rural to
urban index
a. Kindergarten DepEd No data available
b. Elementary DepEd No data available
c. Junior HS DepEd No data available
d. Senior HS DepEd No data available
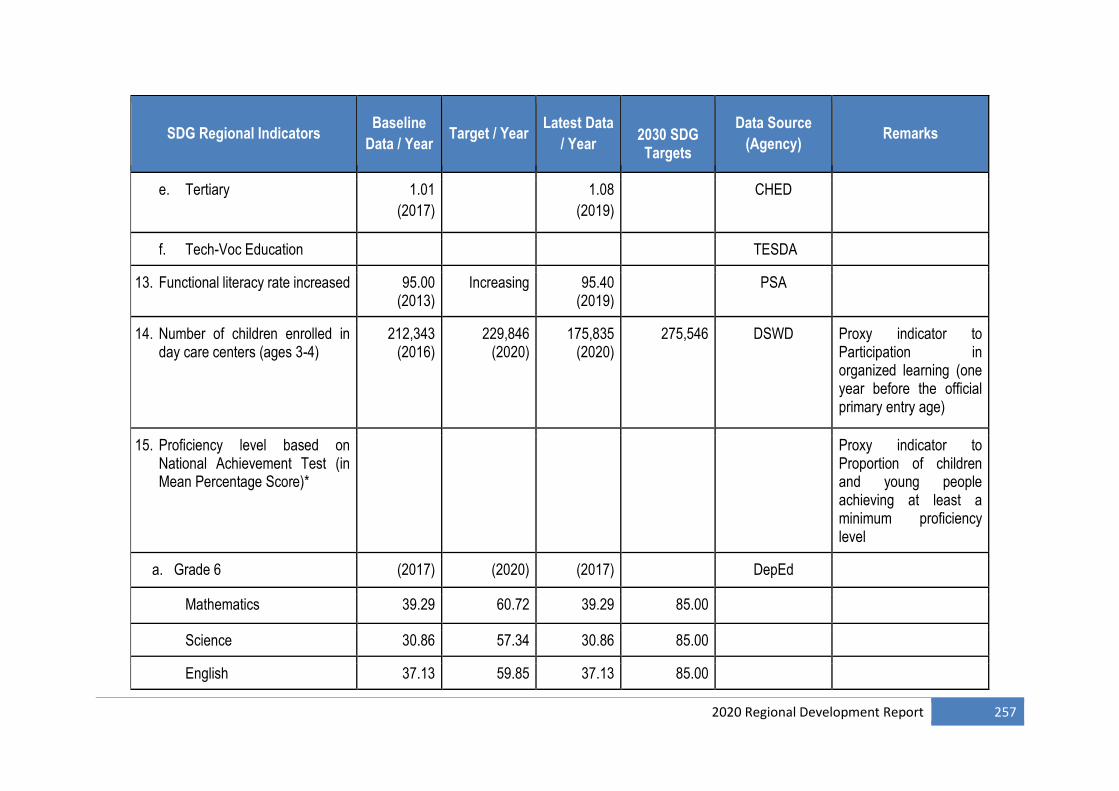
2020 Regional Development Report 257
SDG Regional Indicators Baseline
Data / Year Target / Year
Latest Data
/ Year
2030 SDG Targets
Data Source
(Agency) Remarks
e. Tertiary 1.01
(2017)
1.08
(2019)
CHED
f. Tech-Voc Education TESDA
13. Functional literacy rate increased 95.00 (2013)
Increasing 95.40 (2019)
PSA
14. Number of children enrolled in day care centers (ages 3-4)
212,343 (2016)
229,846 (2020)
175,835 (2020)
275,546
DSWD Proxy indicator to Participation in organized learning (one year before the official primary entry age)
15. Proficiency level based on National Achievement Test (in Mean Percentage Score)*
Proxy indicator to Proportion of children and young people achieving at least a minimum proficiency level
a. Grade 6 (2017) (2020) (2017) DepEd
Mathematics 39.29 60.72 39.29 85.00
Science 30.86 57.34 30.86 85.00
English 37.13 59.85 37.13 85.00
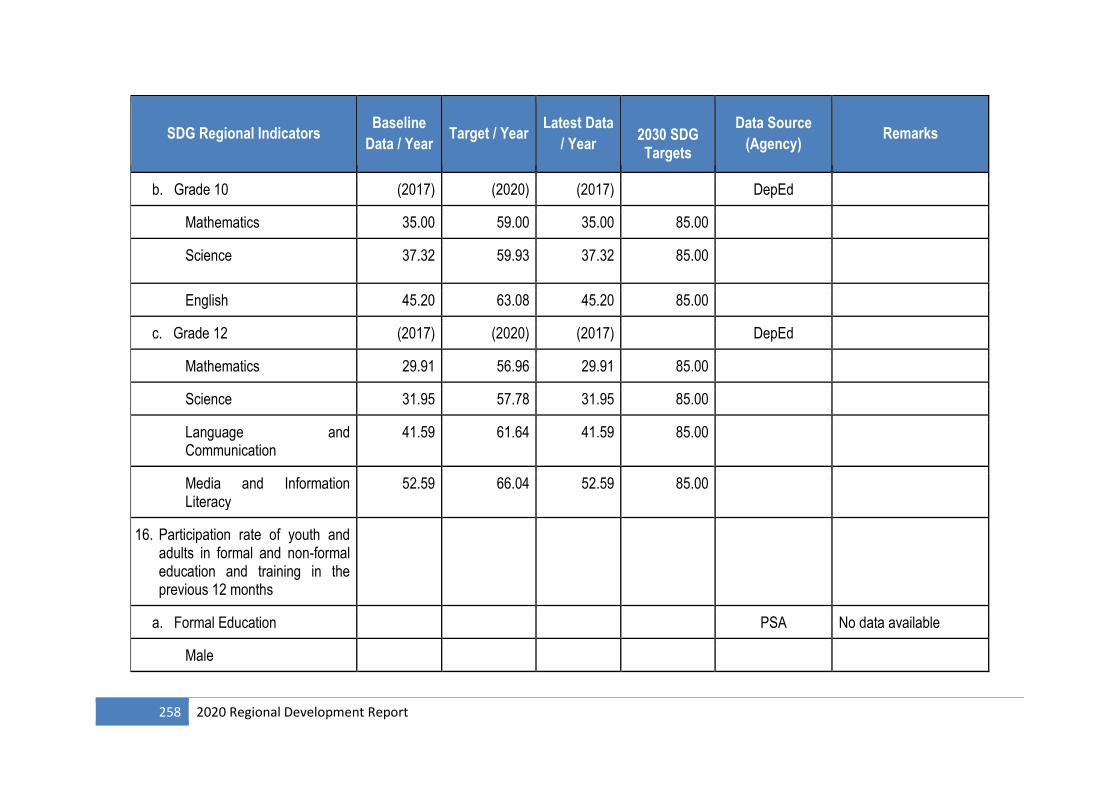
258 2020 Regional Development Report
SDG Regional Indicators Baseline
Data / Year Target / Year
Latest Data
/ Year
2030 SDG Targets
Data Source
(Agency) Remarks
b. Grade 10 (2017) (2020) (2017) DepEd
Mathematics 35.00 59.00 35.00 85.00
Science 37.32 59.93 37.32 85.00
English 45.20 63.08 45.20 85.00
c. Grade 12 (2017) (2020) (2017) DepEd
Mathematics 29.91 56.96 29.91 85.00
Science 31.95 57.78 31.95 85.00
Language and Communication
41.59 61.64 41.59 85.00
Media and Information Literacy
52.59 66.04 52.59 85.00
16. Participation rate of youth and adults in formal and non-formal education and training in the previous 12 months
a. Formal Education PSA No data available
Male
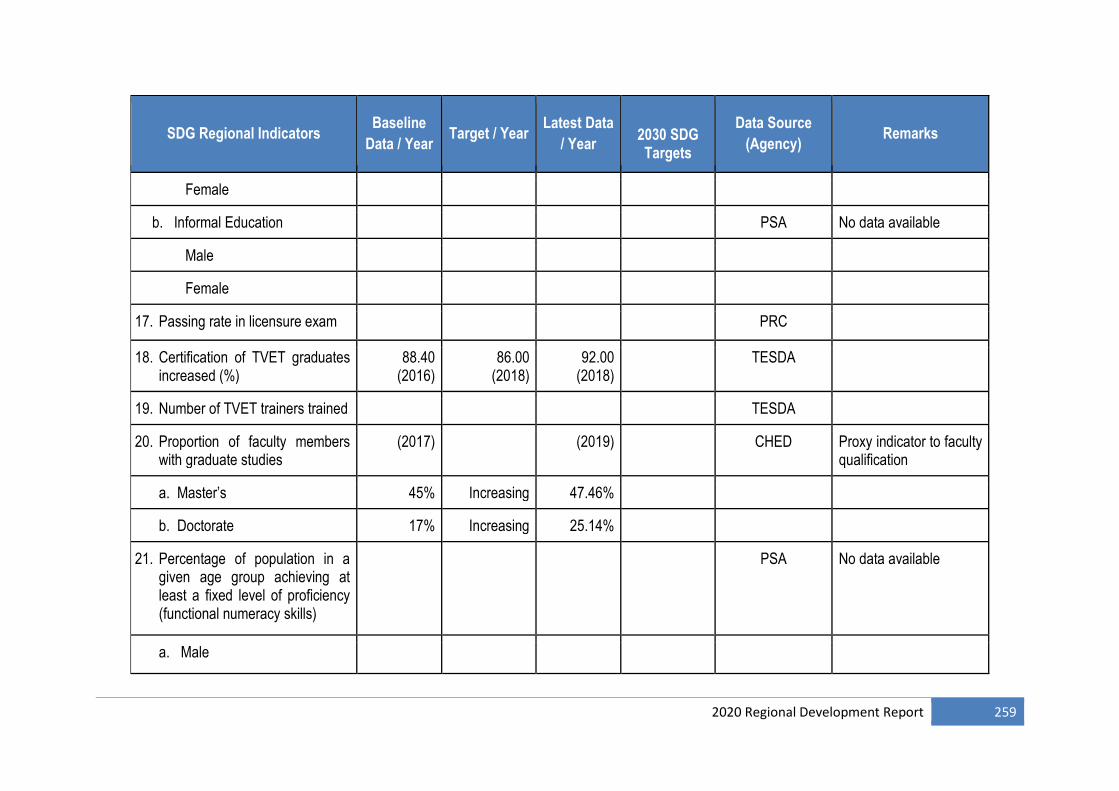
2020 Regional Development Report 259
SDG Regional Indicators Baseline
Data / Year Target / Year
Latest Data
/ Year
2030 SDG Targets
Data Source
(Agency) Remarks
Female
b. Informal Education PSA No data available
Male
Female
17. Passing rate in licensure exam PRC
18. Certification of TVET graduates increased (%)
88.40 (2016)
86.00 (2018)
92.00 (2018)
TESDA
19. Number of TVET trainers trained TESDA
20. Proportion of faculty members with graduate studies
(2017) (2019) CHED Proxy indicator to faculty qualification
a. Master’s 45% Increasing 47.46%
b. Doctorate 17% Increasing 25.14%
21. Percentage of population in a given age group achieving at least a fixed level of proficiency (functional numeracy skills)
PSA No data available
a. Male
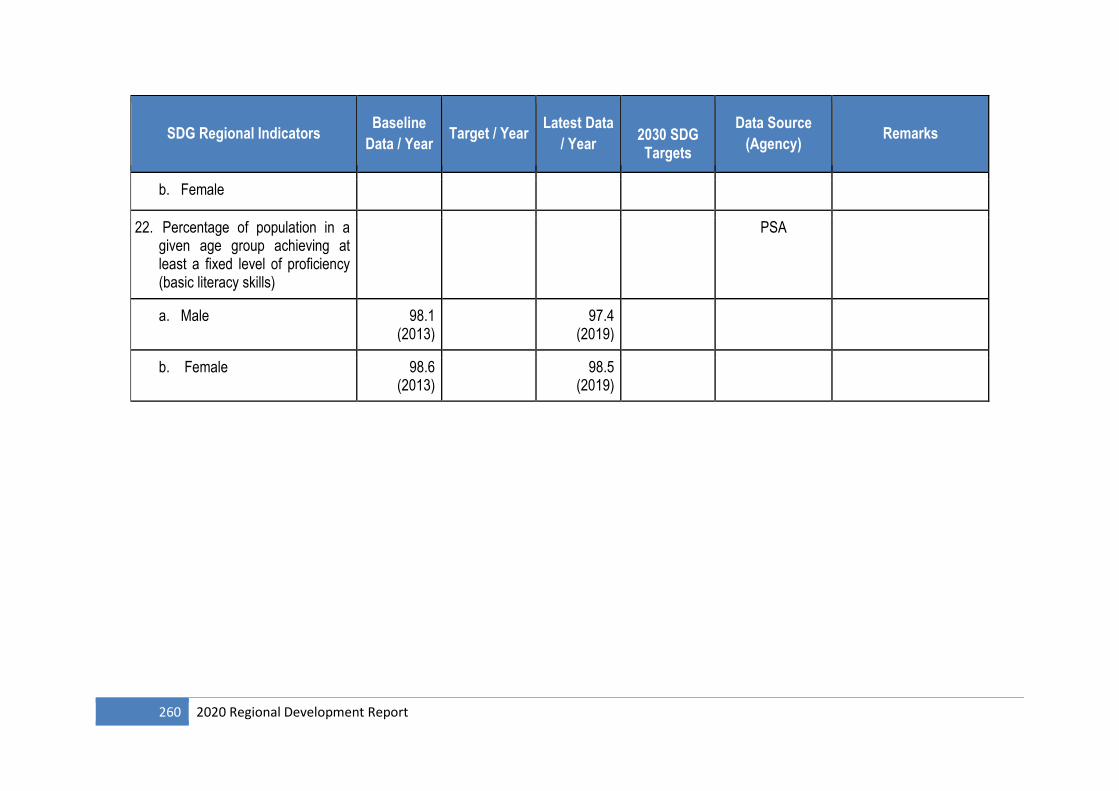
260 2020 Regional Development Report
SDG Regional Indicators Baseline
Data / Year Target / Year
Latest Data
/ Year
2030 SDG Targets
Data Source
(Agency) Remarks
b. Female
22. Percentage of population in a given age group achieving at least a fixed level of proficiency (basic literacy skills)
PSA
a. Male 98.1 (2013)
97.4 (2019)
b. Female 98.6 (2013)
98.5 (2019)
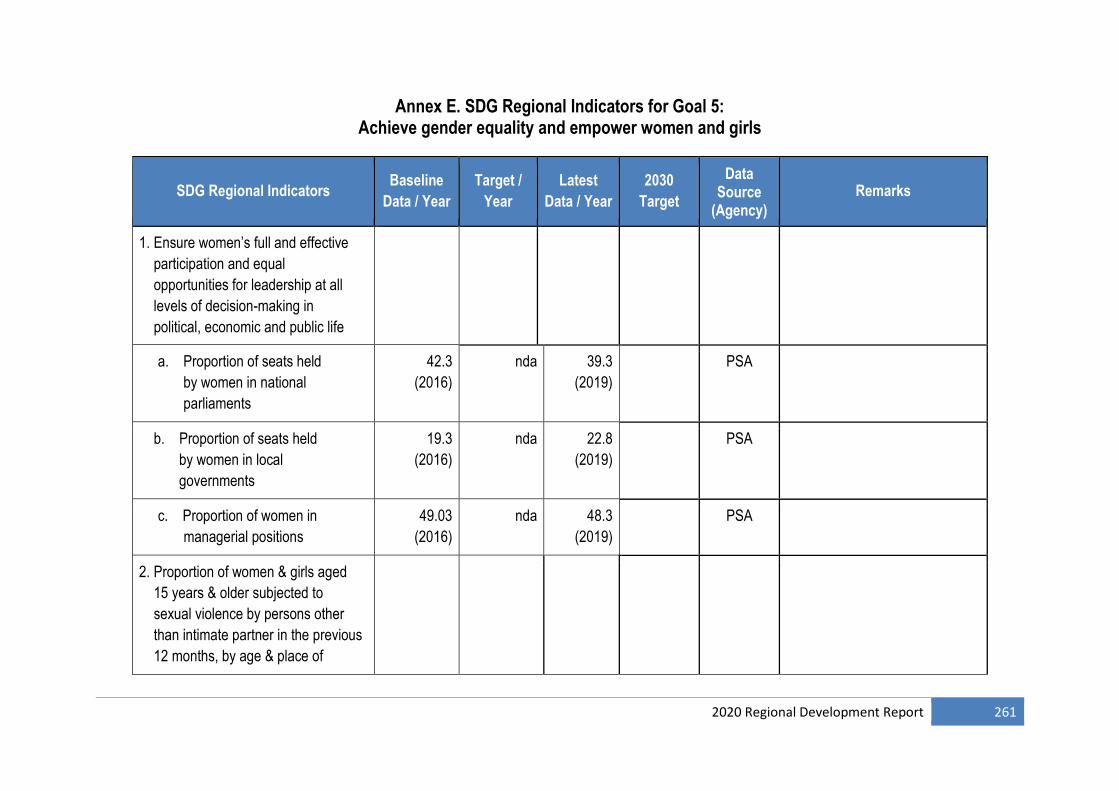
2020 Regional Development Report 261
Annex E. SDG Regional Indicators for Goal 5: Achieve gender equality and empower women and girls
SDG Regional Indicators Baseline
Data / Year
Target /
Year
Latest
Data / Year
2030
Target
Data Source
(Agency)
Remarks
1. Ensure women’s full and effective
participation and equal
opportunities for leadership at all
levels of decision-making in
political, economic and public life
a. Proportion of seats held
by women in national
parliaments
42.3
(2016)
nda
39.3
(2019)
PSA
b. Proportion of seats held
by women in local
governments
19.3
(2016)
nda
22.8
(2019)
PSA
c. Proportion of women in
managerial positions
49.03
(2016)
nda
48.3
(2019)
PSA
2. Proportion of women & girls aged
15 years & older subjected to
sexual violence by persons other
than intimate partner in the previous
12 months, by age & place of
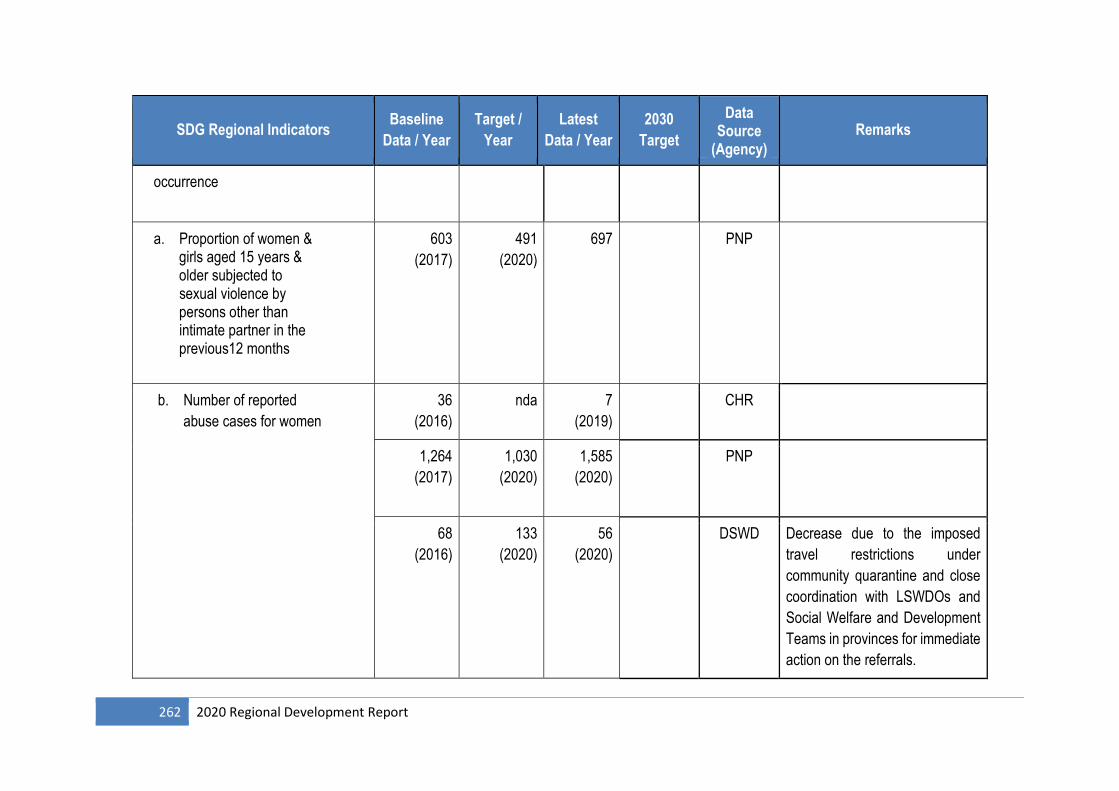
262 2020 Regional Development Report
SDG Regional Indicators Baseline
Data / Year
Target /
Year
Latest
Data / Year
2030
Target
Data Source
(Agency)
Remarks
occurrence
a. Proportion of women & girls aged 15 years & older subjected to sexual violence by persons other than intimate partner in the previous12 months
603
(2017)
491
(2020)
697
(
2
0
2
0
)
PNP
b. Number of reported
abuse cases for women
36
(2016)
nda
7
(2019)
CHR
1,264
(2017)
1,030
(2020)
1,585
(2020)
PNP
68
(2016)
133
(2020)
56
(2020)
DSWD Decrease due to the imposed
travel restrictions under
community quarantine and close
coordination with LSWDOs and
Social Welfare and Development
Teams in provinces for immediate
action on the referrals.
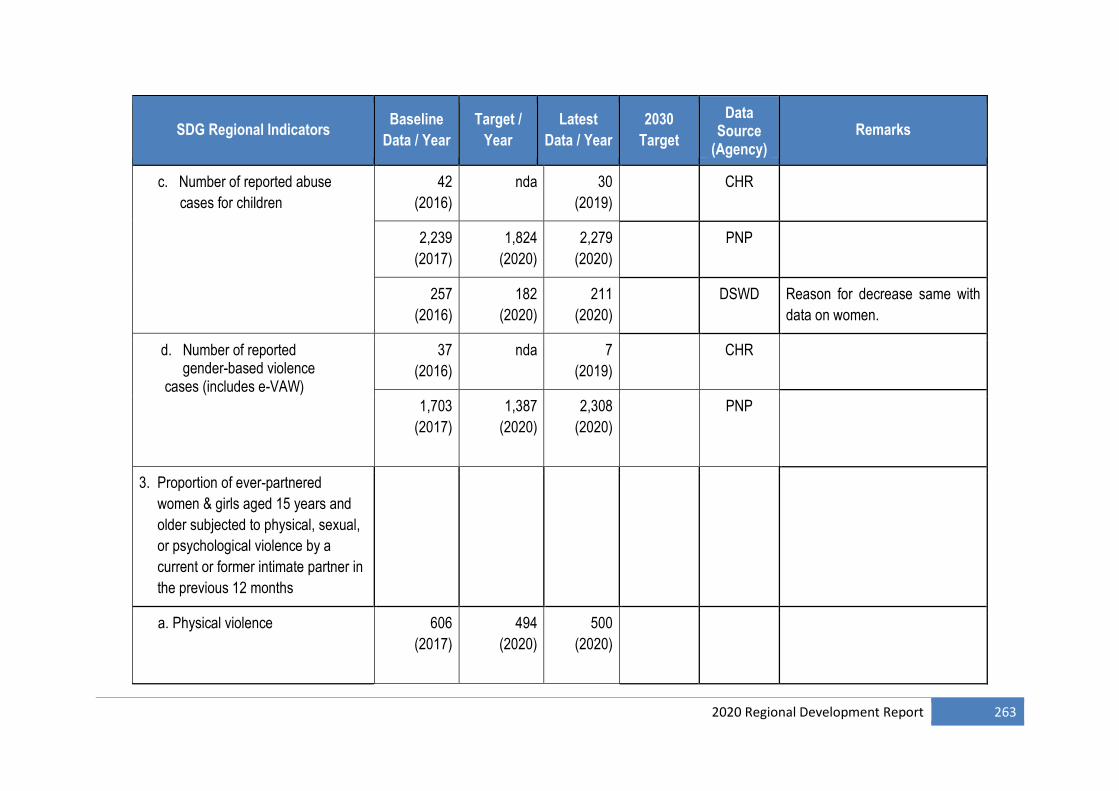
2020 Regional Development Report 263
SDG Regional Indicators Baseline
Data / Year
Target /
Year
Latest
Data / Year
2030
Target
Data Source
(Agency)
Remarks
c. Number of reported abuse
cases for children
42
(2016)
nda
30
(2019)
CHR
2,239
(2017)
1,824
(2020)
2,279
(2020)
PNP
257
(2016)
182
(2020)
211
(2020)
DSWD Reason for decrease same with
data on women.
d. Number of reported gender-based violence cases (includes e-VAW)
37
(2016)
nda
7
(2019)
CHR
1,703
(2017)
1,387
(2020)
2,308
(2020)
PNP
3. Proportion of ever-partnered
women & girls aged 15 years and
older subjected to physical, sexual,
or psychological violence by a
current or former intimate partner in
the previous 12 months
a. Physical violence 606
(2017)
494
(2020)
500
(2020)
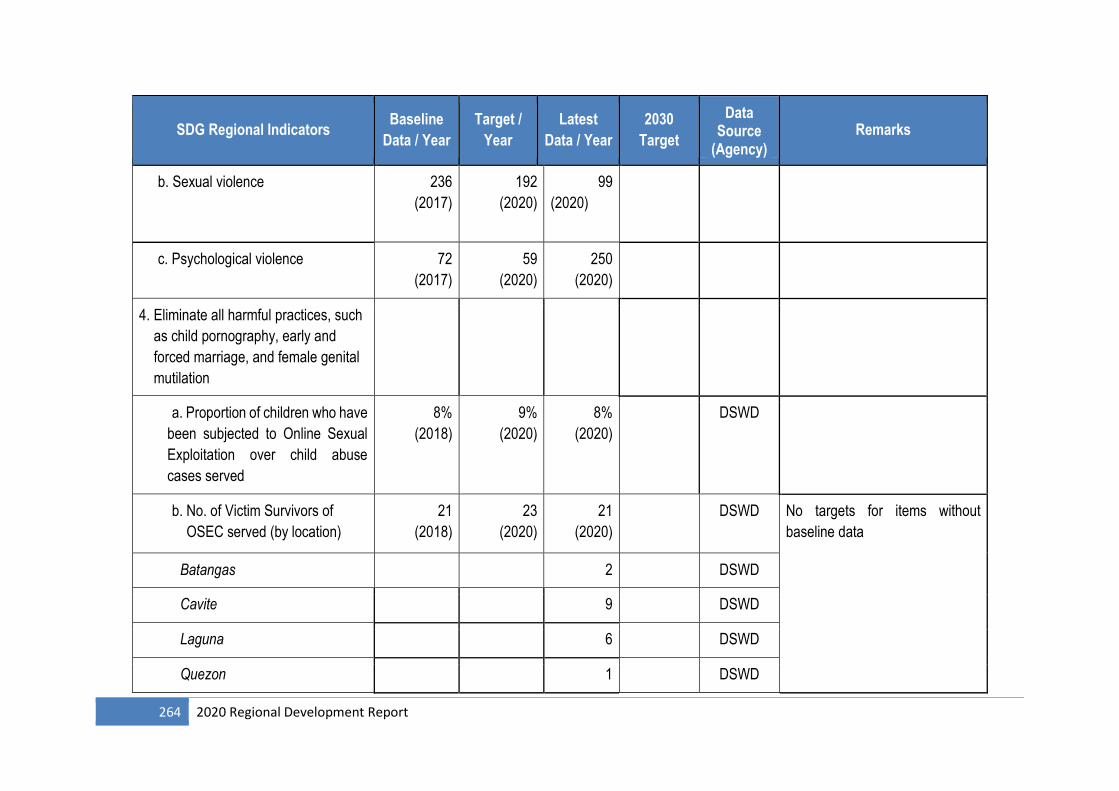
264 2020 Regional Development Report
SDG Regional Indicators Baseline
Data / Year
Target /
Year
Latest
Data / Year
2030
Target
Data Source
(Agency)
Remarks
b. Sexual violence 236
(2017)
192
(2020)
99
(2020)
c. Psychological violence 72
(2017)
59
(2020)
250
(2020)
4. Eliminate all harmful practices, such
as child pornography, early and
forced marriage, and female genital
mutilation
a. Proportion of children who have
been subjected to Online Sexual
Exploitation over child abuse
cases served
8%
(2018)
9%
(2020)
8%
(2020)
DSWD
b. No. of Victim Survivors of
OSEC served (by location)
21
(2018)
23
(2020)
21
(2020)
DSWD No targets for items without
baseline data
Batangas 2 DSWD
Cavite 9 DSWD
Laguna 6 DSWD
Quezon 1 DSWD
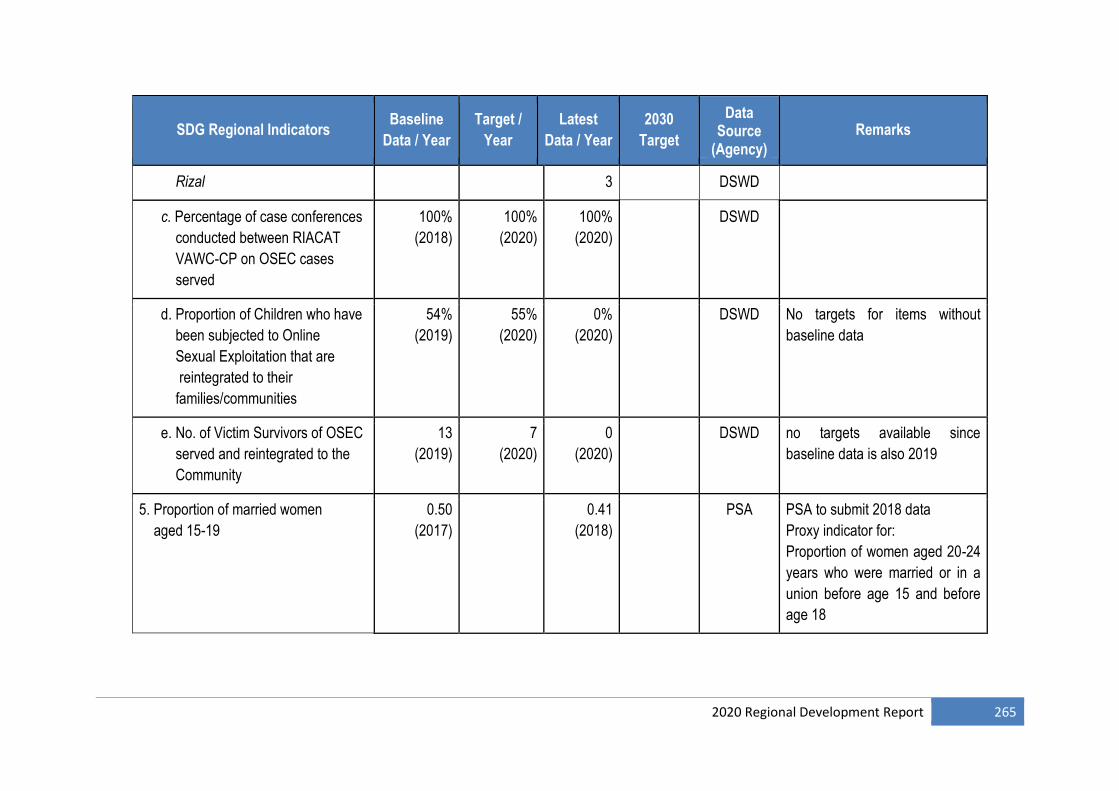
2020 Regional Development Report 265
SDG Regional Indicators Baseline
Data / Year
Target /
Year
Latest
Data / Year
2030
Target
Data Source
(Agency)
Remarks
Rizal 3 DSWD
c. Percentage of case conferences
conducted between RIACAT
VAWC-CP on OSEC cases
served
100%
(2018)
100%
(2020)
100%
(2020)
DSWD
d. Proportion of Children who have
been subjected to Online
Sexual Exploitation that are
reintegrated to their
families/communities
54%
(2019)
55%
(2020)
0%
(2020)
DSWD No targets for items without
baseline data
e. No. of Victim Survivors of OSEC
served and reintegrated to the
Community
13
(2019)
7
(2020)
0
(2020)
DSWD no targets available since
baseline data is also 2019
5. Proportion of married women
aged 15-19
0.50
(2017)
0.41
(2018)
PSA PSA to submit 2018 data
Proxy indicator for:
Proportion of women aged 20-24
years who were married or in a
union before age 15 and before
age 18
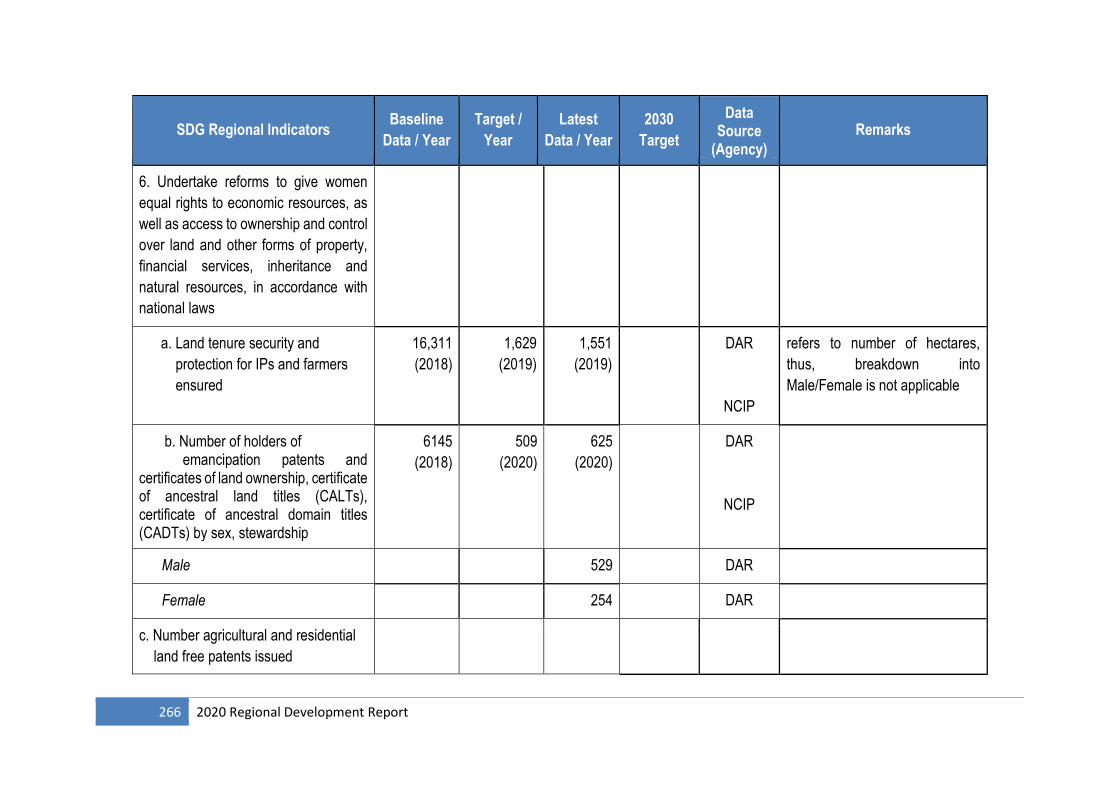
266 2020 Regional Development Report
SDG Regional Indicators Baseline
Data / Year
Target /
Year
Latest
Data / Year
2030
Target
Data Source
(Agency)
Remarks
6. Undertake reforms to give women
equal rights to economic resources, as
well as access to ownership and control
over land and other forms of property,
financial services, inheritance and
natural resources, in accordance with
national laws
a. Land tenure security and
protection for IPs and farmers
ensured
16,311
(2018)
1,629
(2019)
1,551
(2019)
DAR
NCIP
refers to number of hectares,
thus, breakdown into
Male/Female is not applicable
b. Number of holders of emancipation patents and certificates of land ownership, certificate of ancestral land titles (CALTs), certificate of ancestral domain titles (CADTs) by sex, stewardship
6145
(2018)
509
(2020)
625
(2020)
DAR
NCIP
Male 529 DAR
Female 254 DAR
c. Number agricultural and residential
land free patents issued
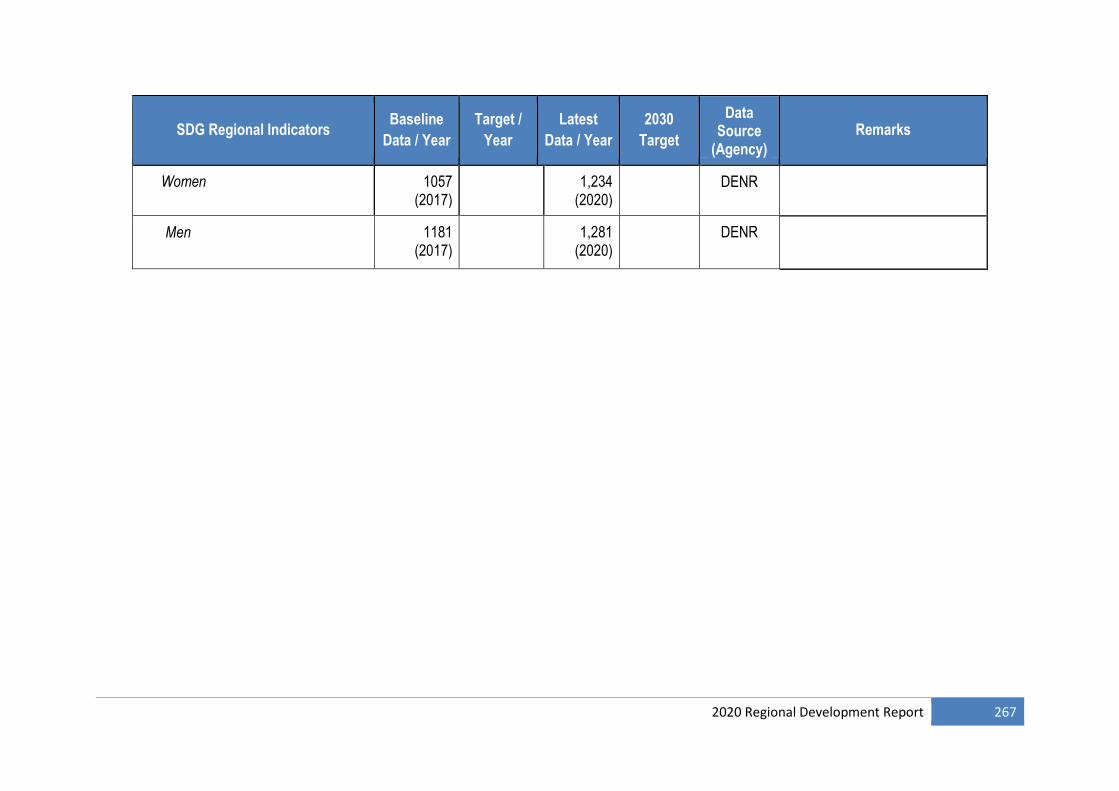
2020 Regional Development Report 267
SDG Regional Indicators Baseline
Data / Year
Target /
Year
Latest
Data / Year
2030
Target
Data Source
(Agency)
Remarks
Women 1057 (2017)
1,234 (2020)
DENR
Men 1181 (2017)
1,281 (2020)
DENR
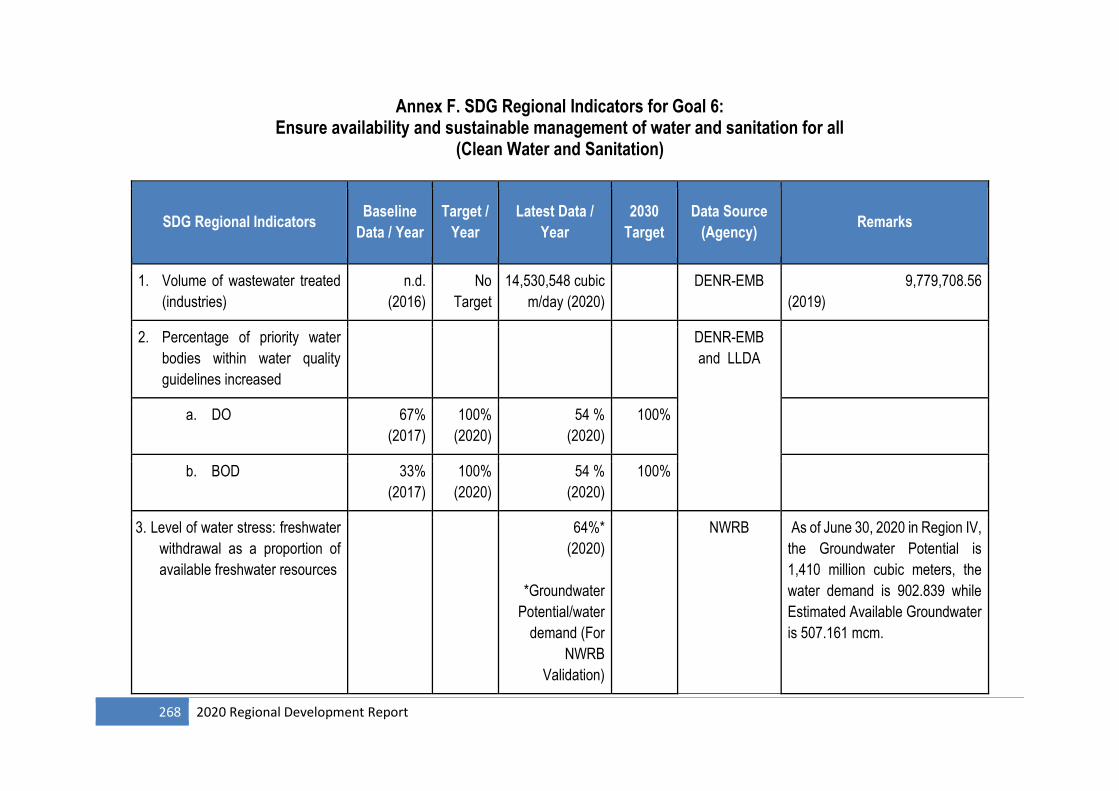
268 2020 Regional Development Report
Annex F. SDG Regional Indicators for Goal 6: Ensure availability and sustainable management of water and sanitation for all
(Clean Water and Sanitation)
SDG Regional Indicators Baseline
Data / Year
Target /
Year
Latest Data /
Year
2030
Target
Data Source
(Agency) Remarks
1. Volume of wastewater treated
(industries)
n.d.
(2016)
No
Target
14,530,548 cubic
m/day (2020)
DENR-EMB 9,779,708.56
(2019)
2. Percentage of priority water
bodies within water quality
guidelines increased
DENR-EMB
and LLDA
a. DO 67%
(2017)
100%
(2020)
54 %
(2020)
100%
b. BOD 33%
(2017)
100%
(2020)
54 %
(2020)
100%
3. Level of water stress: freshwater
withdrawal as a proportion of
available freshwater resources
64%*
(2020)
*Groundwater
Potential/water
demand (For
NWRB
Validation)
NWRB As of June 30, 2020 in Region IV,
the Groundwater Potential is
1,410 million cubic meters, the
water demand is 902.839 while
Estimated Available Groundwater
is 507.161 mcm.
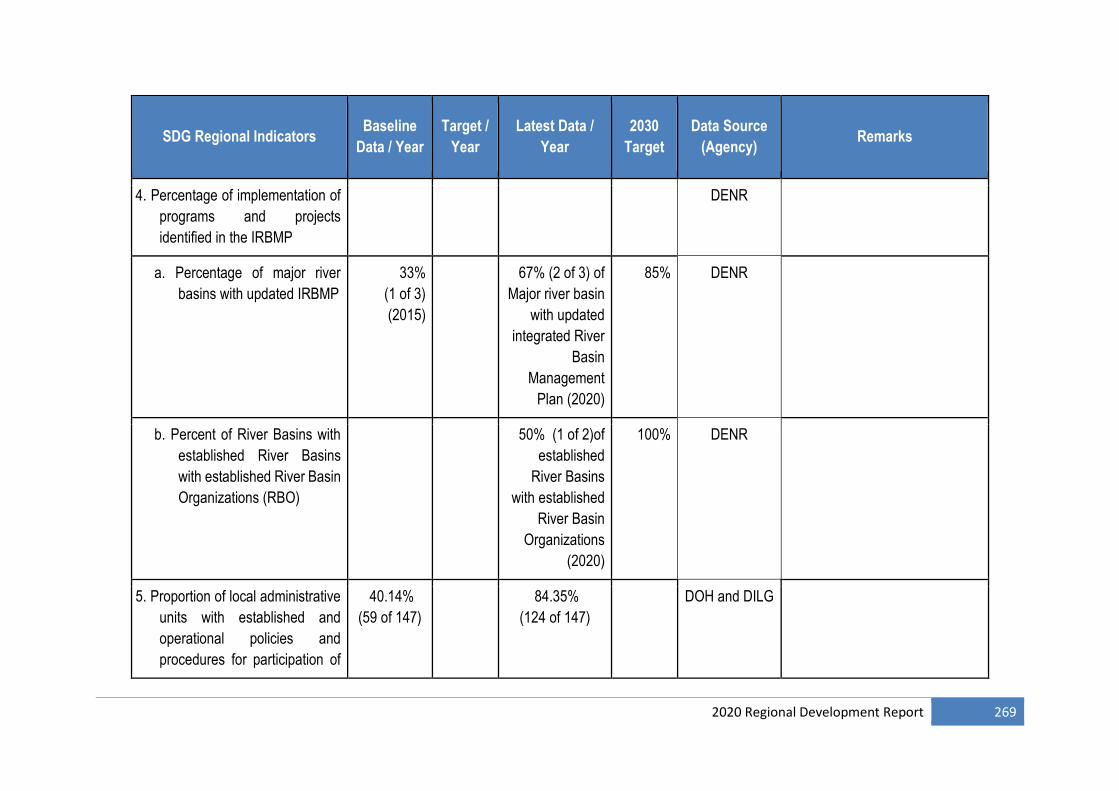
2020 Regional Development Report 269
SDG Regional Indicators Baseline
Data / Year
Target /
Year
Latest Data /
Year
2030
Target
Data Source
(Agency) Remarks
4. Percentage of implementation of
programs and projects
identified in the IRBMP
DENR
a. Percentage of major river
basins with updated IRBMP
33%
(1 of 3)
(2015)
67% (2 of 3) of
Major river basin
with updated
integrated River
Basin
Management
Plan (2020)
85% DENR
b. Percent of River Basins with
established River Basins
with established River Basin
Organizations (RBO)
50% (1 of 2)of
established
River Basins
with established
River Basin
Organizations
(2020)
100% DENR
5. Proportion of local administrative
units with established and
operational policies and
procedures for participation of
40.14%
(59 of 147)
84.35%
(124 of 147)
DOH and DILG
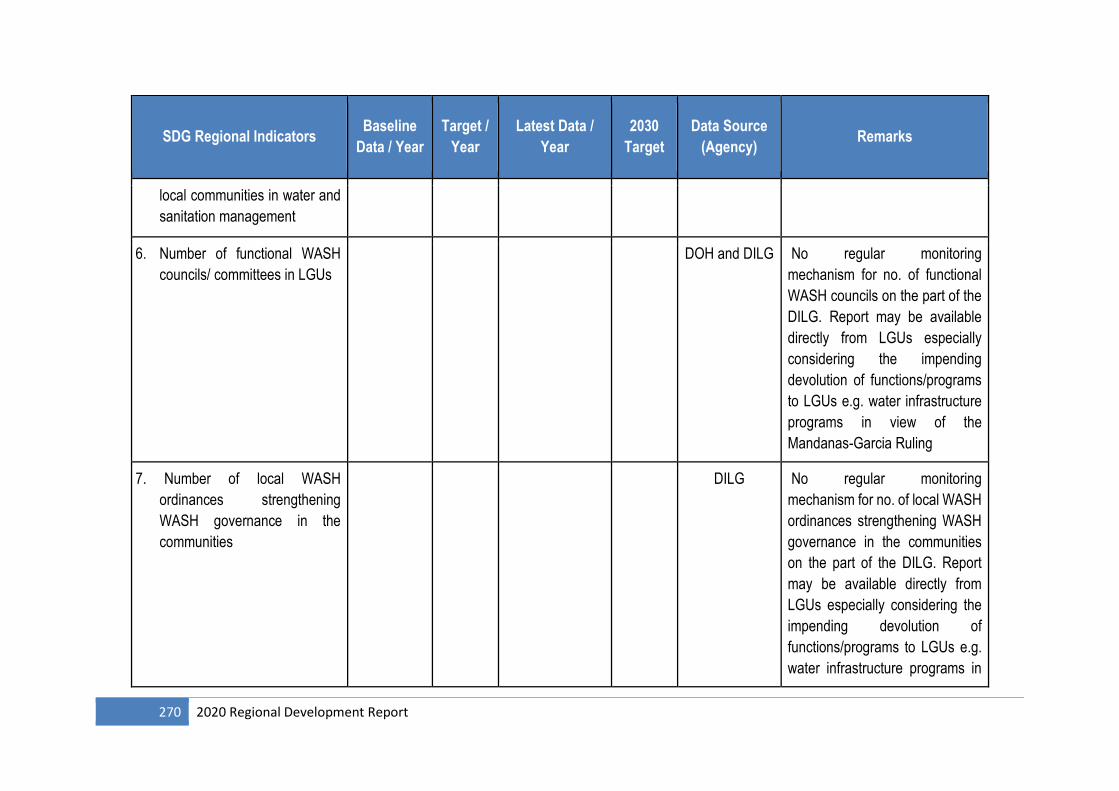
270 2020 Regional Development Report
SDG Regional Indicators Baseline
Data / Year
Target /
Year
Latest Data /
Year
2030
Target
Data Source
(Agency) Remarks
local communities in water and
sanitation management
6. Number of functional WASH
councils/ committees in LGUs
DOH and DILG No regular monitoring
mechanism for no. of functional
WASH councils on the part of the
DILG. Report may be available
directly from LGUs especially
considering the impending
devolution of functions/programs
to LGUs e.g. water infrastructure
programs in view of the
Mandanas-Garcia Ruling
7. Number of local WASH
ordinances strengthening
WASH governance in the
communities
DILG No regular monitoring
mechanism for no. of local WASH
ordinances strengthening WASH
governance in the communities
on the part of the DILG. Report
may be available directly from
LGUs especially considering the
impending devolution of
functions/programs to LGUs e.g.
water infrastructure programs in
2020 Regional Development Report 271
SDG Regional Indicators Baseline
Data / Year
Target /
Year
Latest Data /
Year
2030
Target
Data Source
(Agency) Remarks
view of the Mandanas-Garcia
Ruling
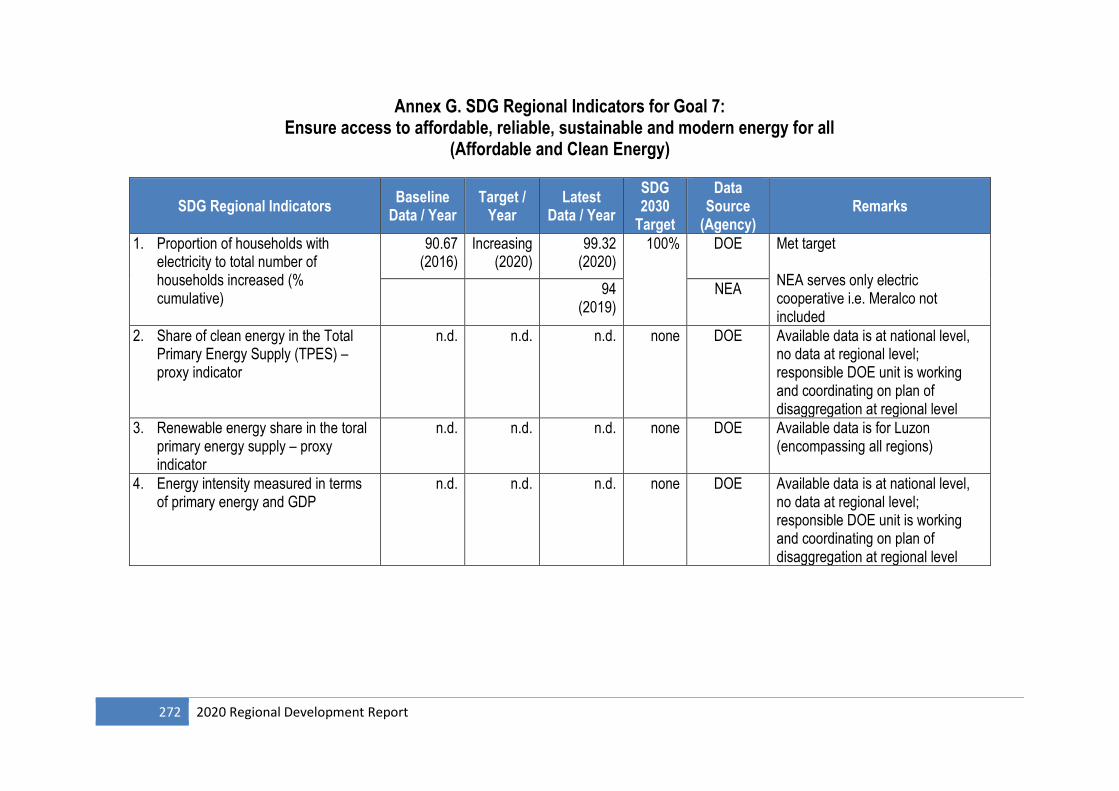
272 2020 Regional Development Report
Annex G. SDG Regional Indicators for Goal 7: Ensure access to affordable, reliable, sustainable and modern energy for all
(Affordable and Clean Energy)
SDG Regional Indicators Baseline
Data / Year Target /
Year Latest
Data / Year
SDG 2030
Target
Data Source
(Agency) Remarks
1. Proportion of households with electricity to total number of households increased (% cumulative)
90.67 (2016)
Increasing (2020)
99.32 (2020)
100% DOE
Met target NEA serves only electric cooperative i.e. Meralco not included
94 (2019)
NEA
2. Share of clean energy in the Total Primary Energy Supply (TPES) – proxy indicator
n.d.
n.d. n.d. none DOE Available data is at national level, no data at regional level; responsible DOE unit is working and coordinating on plan of disaggregation at regional level
3. Renewable energy share in the toral primary energy supply – proxy indicator
n.d. n.d. n.d. none DOE Available data is for Luzon (encompassing all regions)
4. Energy intensity measured in terms of primary energy and GDP
n.d. n.d. n.d. none DOE Available data is at national level, no data at regional level; responsible DOE unit is working and coordinating on plan of disaggregation at regional level
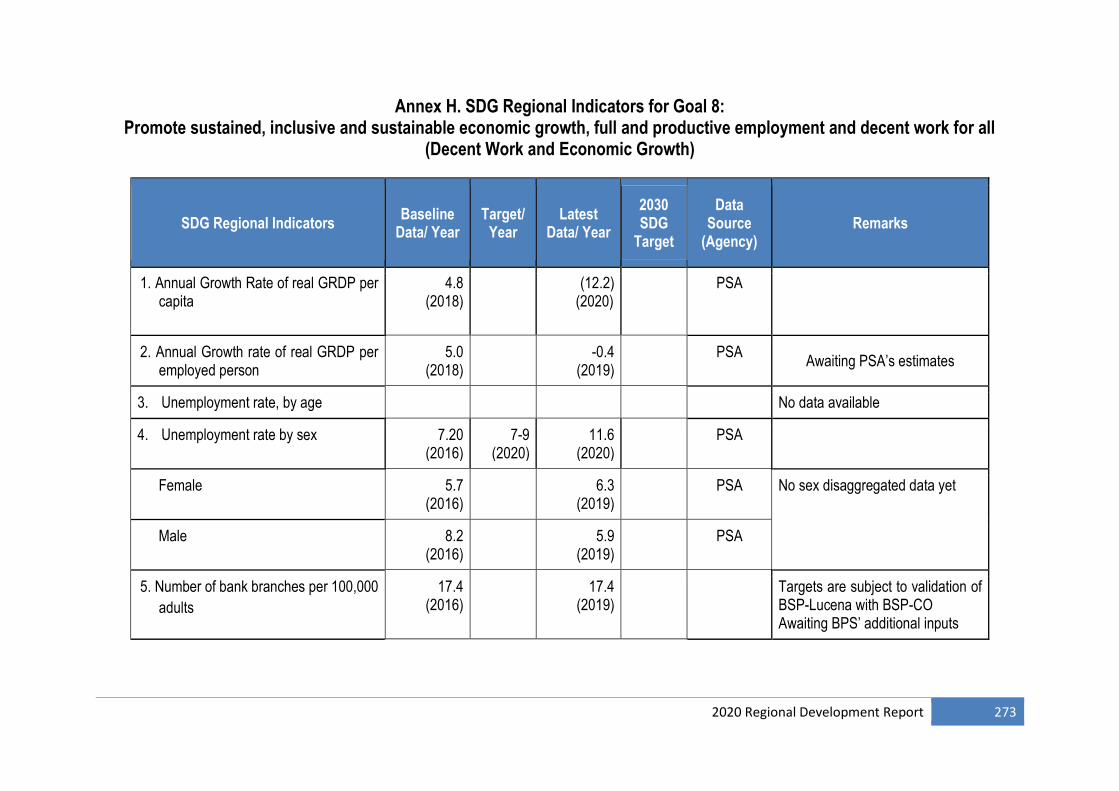
2020 Regional Development Report 273
Annex H. SDG Regional Indicators for Goal 8: Promote sustained, inclusive and sustainable economic growth, full and productive employment and decent work for all
(Decent Work and Economic Growth)
SDG Regional Indicators Baseline
Data/ Year Target/
Year Latest
Data/ Year
2030 SDG
Target
Data Source
(Agency) Remarks
1. Annual Growth Rate of real GRDP per capita
4.8 (2018)
(12.2) (2020)
PSA
2. Annual Growth rate of real GRDP per employed person
5.0 (2018)
-0.4 (2019)
PSA Awaiting PSA’s estimates
3. Unemployment rate, by age No data available
4. Unemployment rate by sex 7.20 (2016)
7-9 (2020)
11.6 (2020)
PSA
Female 5.7 (2016)
6.3 (2019)
PSA No sex disaggregated data yet
Male 8.2 (2016)
5.9 (2019)
PSA
5. Number of bank branches per 100,000
adults
17.4 (2016)
17.4 (2019)
Targets are subject to validation of BSP-Lucena with BSP-CO Awaiting BPS’ additional inputs
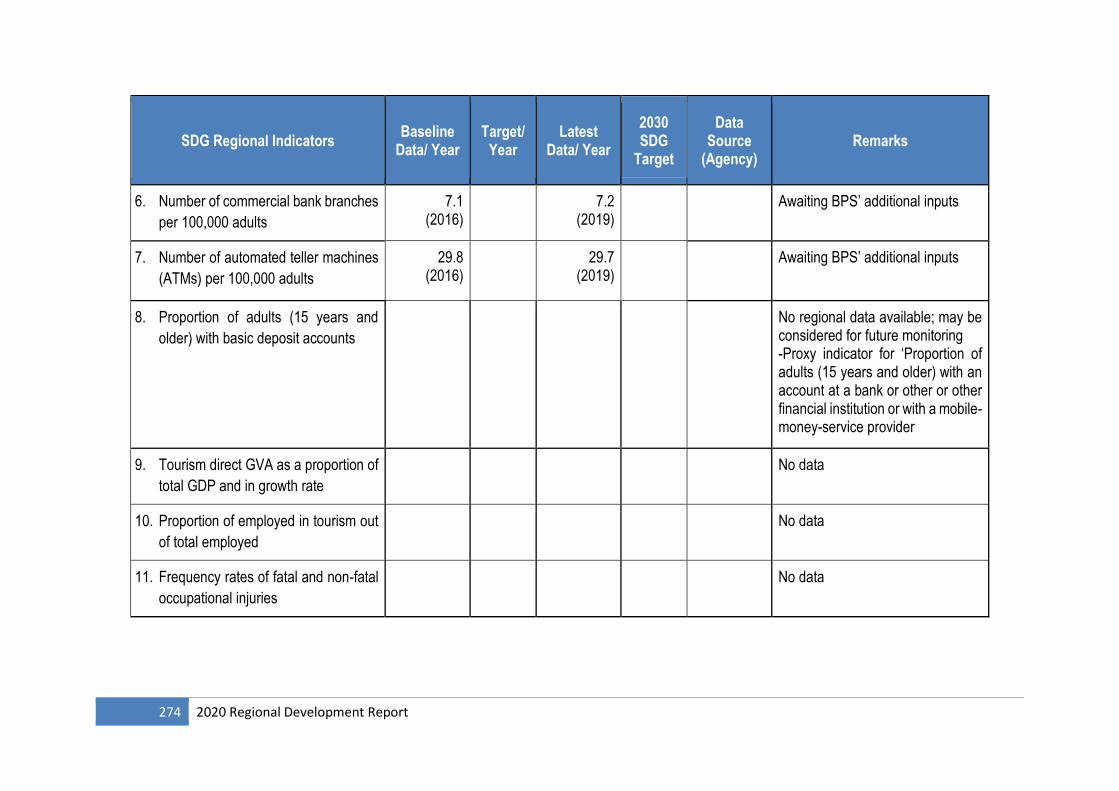
274 2020 Regional Development Report
SDG Regional Indicators Baseline
Data/ Year Target/
Year Latest
Data/ Year
2030 SDG
Target
Data Source
(Agency) Remarks
6. Number of commercial bank branches
per 100,000 adults
7.1 (2016)
7.2 (2019)
Awaiting BPS’ additional inputs
7. Number of automated teller machines
(ATMs) per 100,000 adults
29.8 (2016)
29.7 (2019)
Awaiting BPS’ additional inputs
8. Proportion of adults (15 years and
older) with basic deposit accounts
No regional data available; may be considered for future monitoring -Proxy indicator for ‘Proportion of adults (15 years and older) with an account at a bank or other or other financial institution or with a mobile-money-service provider
9. Tourism direct GVA as a proportion of
total GDP and in growth rate
No data
10. Proportion of employed in tourism out
of total employed
No data
11. Frequency rates of fatal and non-fatal
occupational injuries
No data
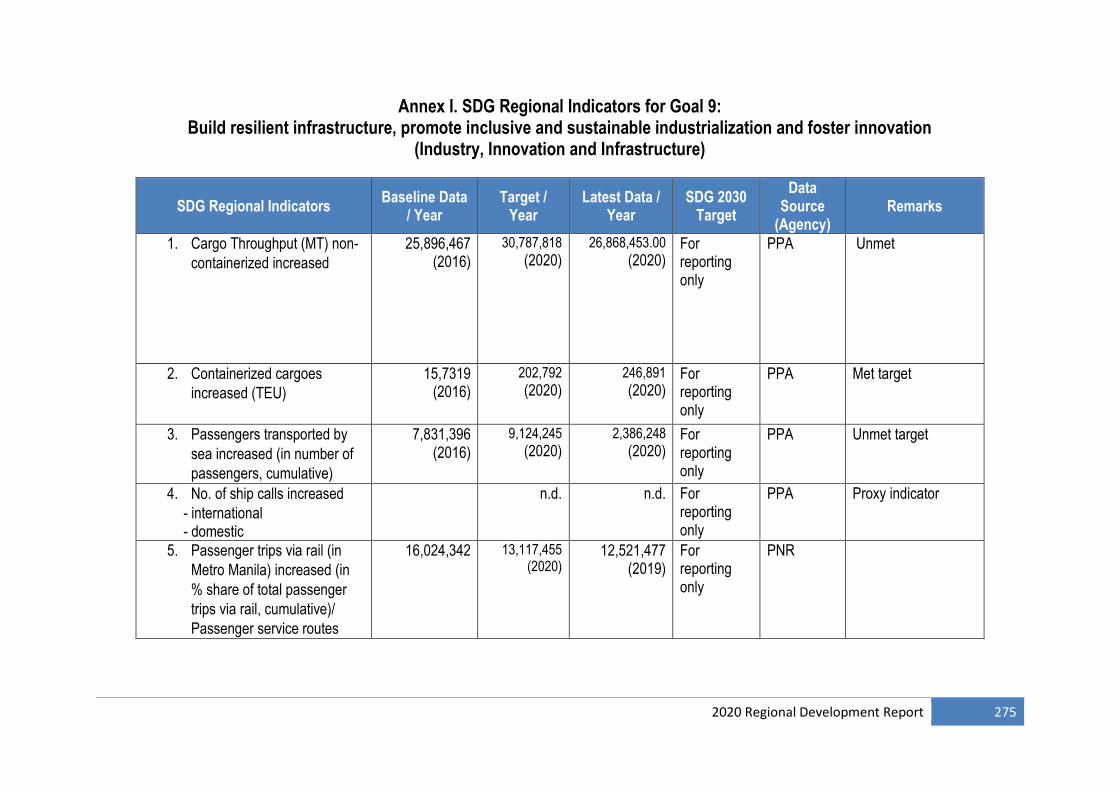
2020 Regional Development Report 275
Annex I. SDG Regional Indicators for Goal 9: Build resilient infrastructure, promote inclusive and sustainable industrialization and foster innovation
(Industry, Innovation and Infrastructure)
SDG Regional Indicators Baseline Data
/ Year Target /
Year Latest Data /
Year SDG 2030
Target
Data Source
(Agency) Remarks
1. Cargo Throughput (MT) non-
containerized increased
25,896,467 (2016)
30,787,818 (2020)
26,868,453.00 (2020)
For reporting only
PPA
Unmet
2. Containerized cargoes
increased (TEU)
15,7319 (2016)
202,792 (2020)
246,891 (2020)
For reporting only
PPA Met target
3. Passengers transported by
sea increased (in number of
passengers, cumulative)
7,831,396 (2016)
9,124,245 (2020)
2,386,248 (2020)
For reporting only
PPA Unmet target
4. No. of ship calls increased
- international - domestic
n.d. n.d. For reporting only
PPA Proxy indicator
5. Passenger trips via rail (in
Metro Manila) increased (in
% share of total passenger
trips via rail, cumulative)/
Passenger service routes
16,024,342 13,117,455 (2020)
12,521,477 (2019)
For reporting only
PNR
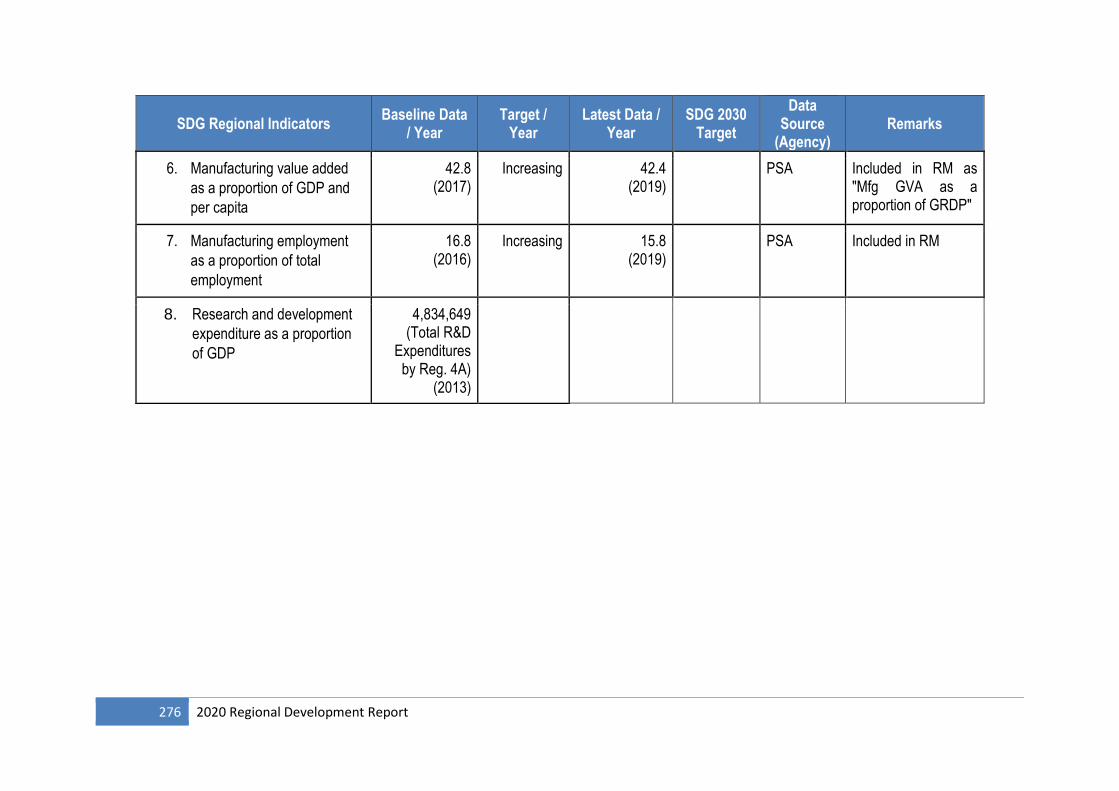
276 2020 Regional Development Report
SDG Regional Indicators Baseline Data
/ Year Target /
Year Latest Data /
Year SDG 2030
Target
Data Source
(Agency) Remarks
6. Manufacturing value added
as a proportion of GDP and
per capita
42.8 (2017)
Increasing 42.4 (2019)
PSA Included in RM as "Mfg GVA as a proportion of GRDP"
7. Manufacturing employment
as a proportion of total
employment
16.8 (2016)
Increasing 15.8 (2019)
PSA Included in RM
8. Research and development
expenditure as a proportion
of GDP
4,834,649 (Total R&D
Expenditures by Reg. 4A)
(2013)
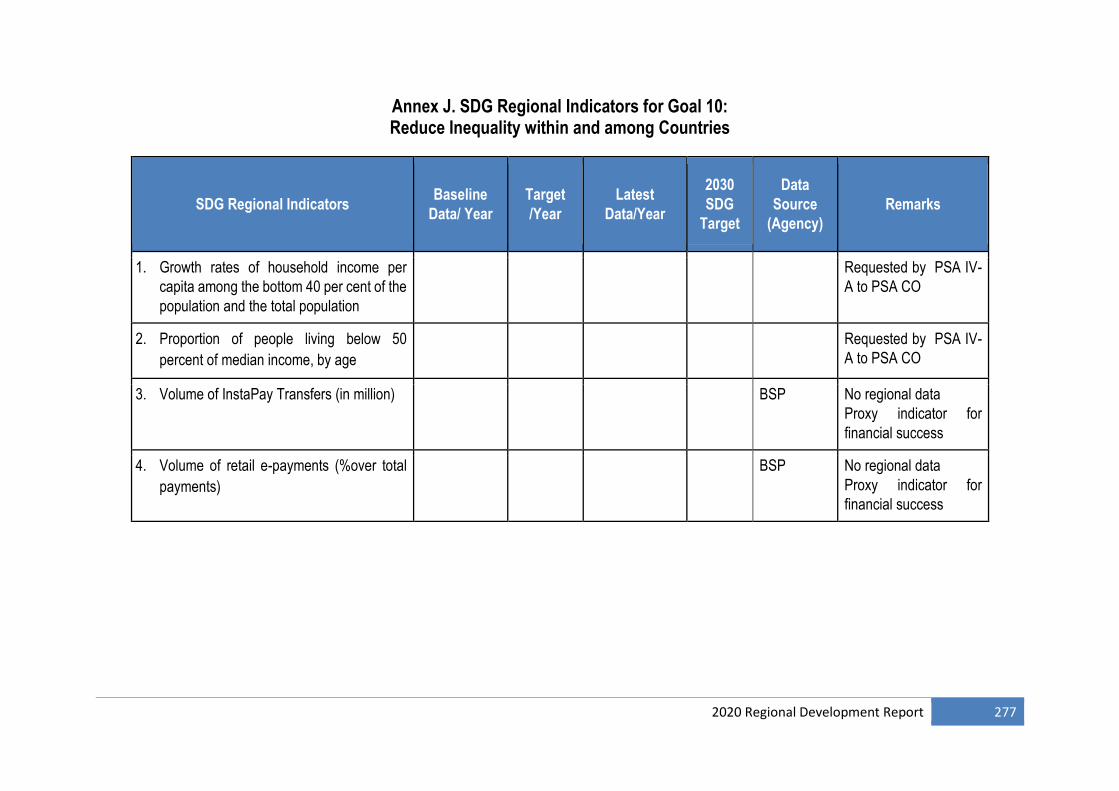
2020 Regional Development Report 277
Annex J. SDG Regional Indicators for Goal 10: Reduce Inequality within and among Countries
SDG Regional Indicators Baseline
Data/ Year
Target
/Year
Latest
Data/Year
2030
SDG
Target
Data
Source
(Agency)
Remarks
1. Growth rates of household income per
capita among the bottom 40 per cent of the
population and the total population
Requested by PSA IV-
A to PSA CO
2. Proportion of people living below 50
percent of median income, by age
Requested by PSA IV-
A to PSA CO
3. Volume of InstaPay Transfers (in million) BSP No regional data
Proxy indicator for
financial success
4. Volume of retail e-payments (%over total
payments)
BSP No regional data
Proxy indicator for
financial success
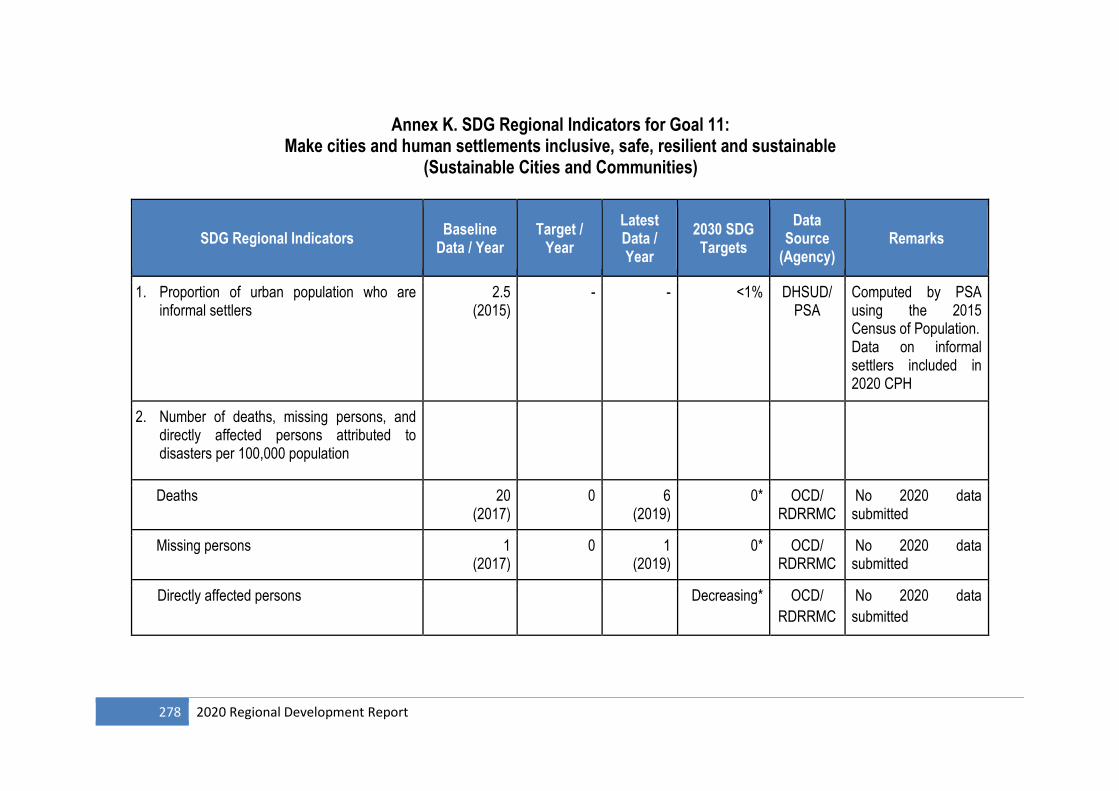
278 2020 Regional Development Report
Annex K. SDG Regional Indicators for Goal 11: Make cities and human settlements inclusive, safe, resilient and sustainable
(Sustainable Cities and Communities)
SDG Regional Indicators Baseline
Data / Year Target /
Year
Latest Data / Year
2030 SDG Targets
Data Source
(Agency) Remarks
1. Proportion of urban population who are informal settlers
2.5 (2015)
- - <1% DHSUD/ PSA
Computed by PSA using the 2015 Census of Population. Data on informal settlers included in 2020 CPH
2. Number of deaths, missing persons, and directly affected persons attributed to disasters per 100,000 population
Deaths 20 (2017)
0
6 (2019)
0* OCD/ RDRRMC
No 2020 data submitted
Missing persons 1 (2017)
0
1 (2019)
0* OCD/ RDRRMC
No 2020 data submitted
Directly affected persons Decreasing* OCD/
RDRRMC
No 2020 data
submitted
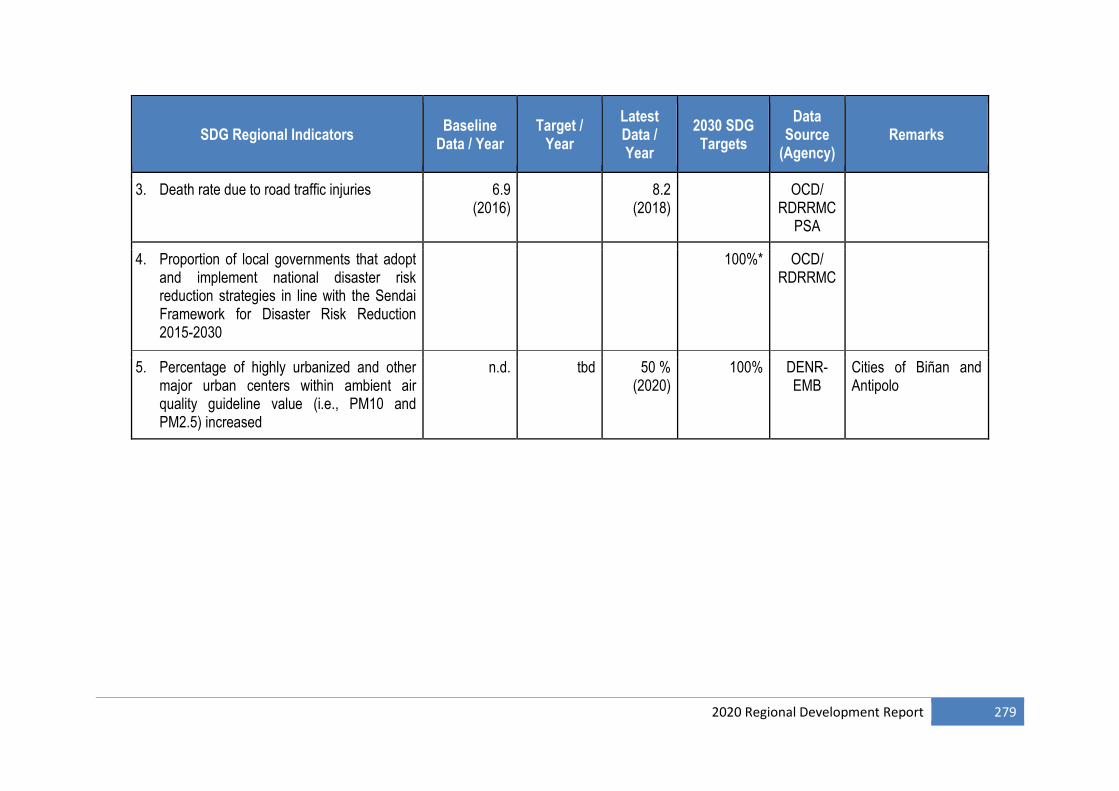
2020 Regional Development Report 279
SDG Regional Indicators Baseline
Data / Year Target /
Year
Latest Data / Year
2030 SDG Targets
Data Source
(Agency) Remarks
3. Death rate due to road traffic injuries 6.9 (2016)
8.2 (2018)
OCD/ RDRRMC
PSA
4. Proportion of local governments that adopt and implement national disaster risk reduction strategies in line with the Sendai Framework for Disaster Risk Reduction 2015-2030
100%* OCD/ RDRRMC
5. Percentage of highly urbanized and other major urban centers within ambient air quality guideline value (i.e., PM10 and PM2.5) increased
n.d. tbd 50 % (2020)
100% DENR-EMB
Cities of Biñan and Antipolo
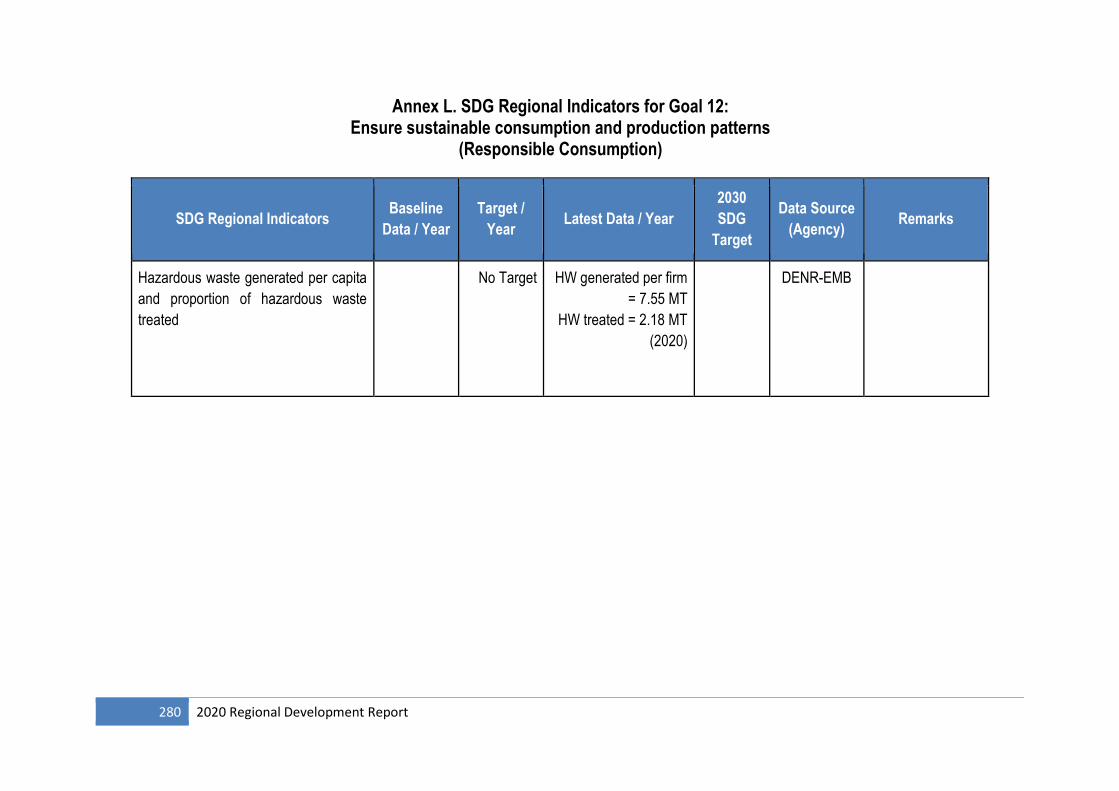
280 2020 Regional Development Report
Annex L. SDG Regional Indicators for Goal 12: Ensure sustainable consumption and production patterns
(Responsible Consumption)
SDG Regional Indicators Baseline
Data / Year
Target /
Year Latest Data / Year
2030
SDG
Target
Data Source
(Agency) Remarks
Hazardous waste generated per capita
and proportion of hazardous waste
treated
No Target
HW generated per firm
= 7.55 MT
HW treated = 2.18 MT
(2020)
DENR-EMB
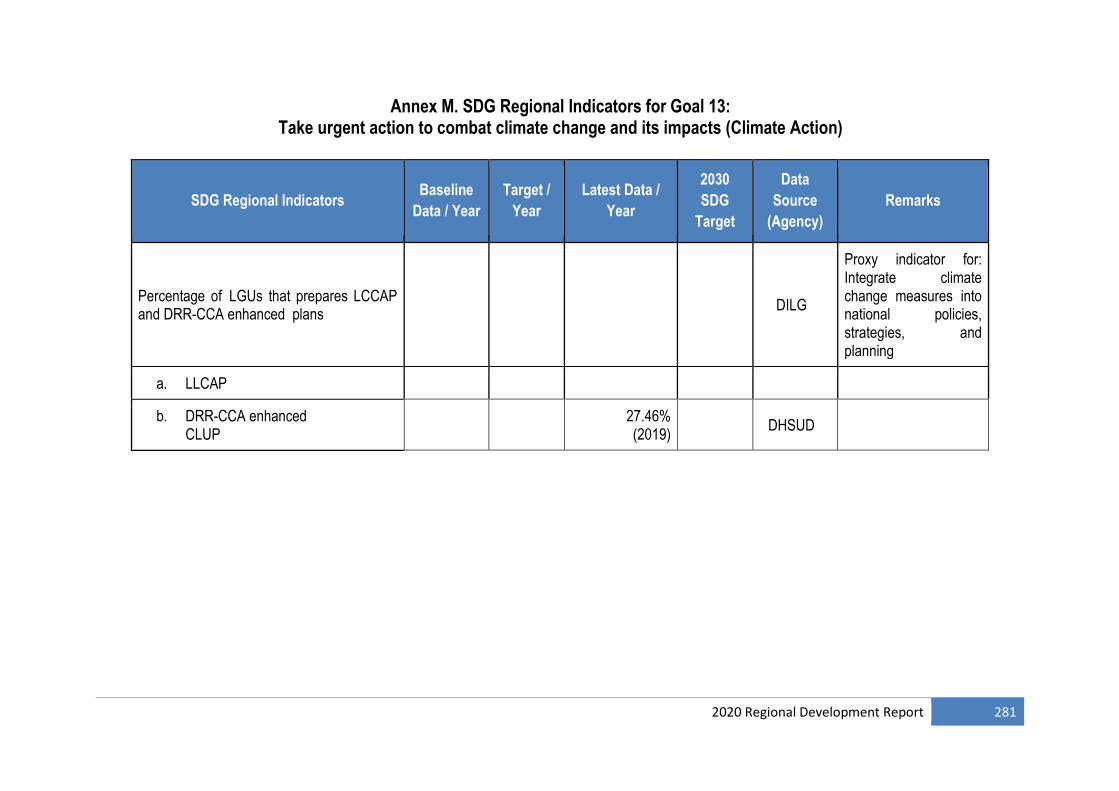
2020 Regional Development Report 281
Annex M. SDG Regional Indicators for Goal 13: Take urgent action to combat climate change and its impacts (Climate Action)
SDG Regional Indicators Baseline
Data / Year
Target /
Year
Latest Data /
Year
2030
SDG
Target
Data
Source
(Agency)
Remarks
Percentage of LGUs that prepares LCCAP and DRR-CCA enhanced plans
DILG
Proxy indicator for: Integrate climate change measures into national policies, strategies, and planning
a. LLCAP
b. DRR-CCA enhanced CLUP
27.46% (2019)
DHSUD
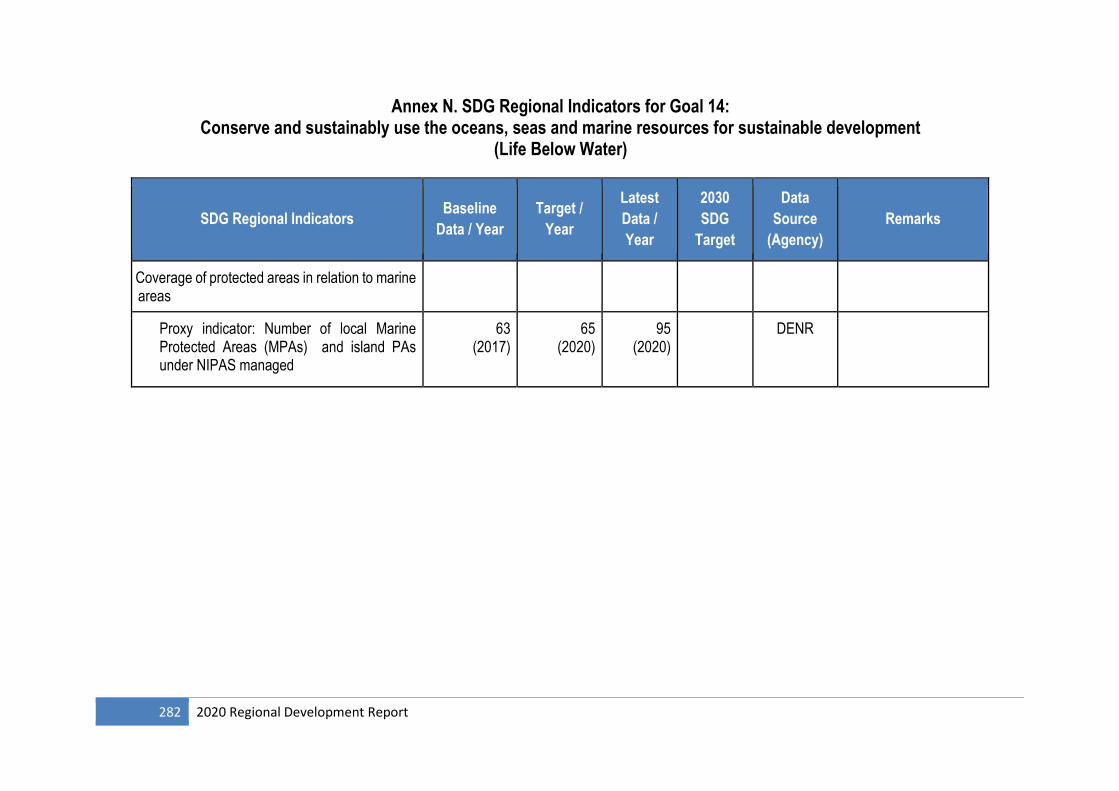
282 2020 Regional Development Report
Annex N. SDG Regional Indicators for Goal 14: Conserve and sustainably use the oceans, seas and marine resources for sustainable development
(Life Below Water)
SDG Regional Indicators Baseline
Data / Year
Target /
Year
Latest
Data /
Year
2030
SDG
Target
Data
Source
(Agency)
Remarks
Coverage of protected areas in relation to marine areas
Proxy indicator: Number of local Marine Protected Areas (MPAs) and island PAs under NIPAS managed
63 (2017)
65 (2020)
95 (2020)
DENR
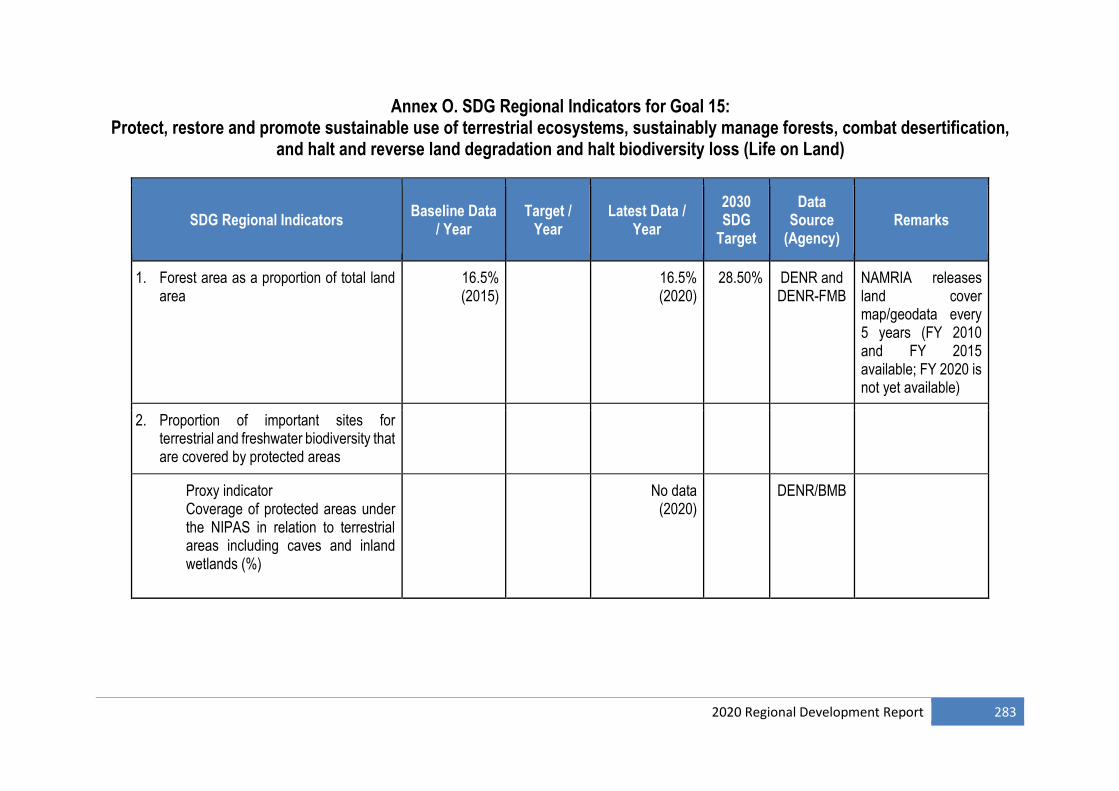
2020 Regional Development Report 283
Annex O. SDG Regional Indicators for Goal 15: Protect, restore and promote sustainable use of terrestrial ecosystems, sustainably manage forests, combat desertification,
and halt and reverse land degradation and halt biodiversity loss (Life on Land)
SDG Regional Indicators Baseline Data
/ Year Target /
Year Latest Data /
Year
2030 SDG
Target
Data Source
(Agency) Remarks
1. Forest area as a proportion of total land area
16.5% (2015)
16.5% (2020)
28.50% DENR and DENR-FMB
NAMRIA releases land cover map/geodata every 5 years (FY 2010 and FY 2015 available; FY 2020 is not yet available)
2. Proportion of important sites for terrestrial and freshwater biodiversity that are covered by protected areas
Proxy indicator Coverage of protected areas under the NIPAS in relation to terrestrial areas including caves and inland wetlands (%)
No data (2020)
DENR/BMB
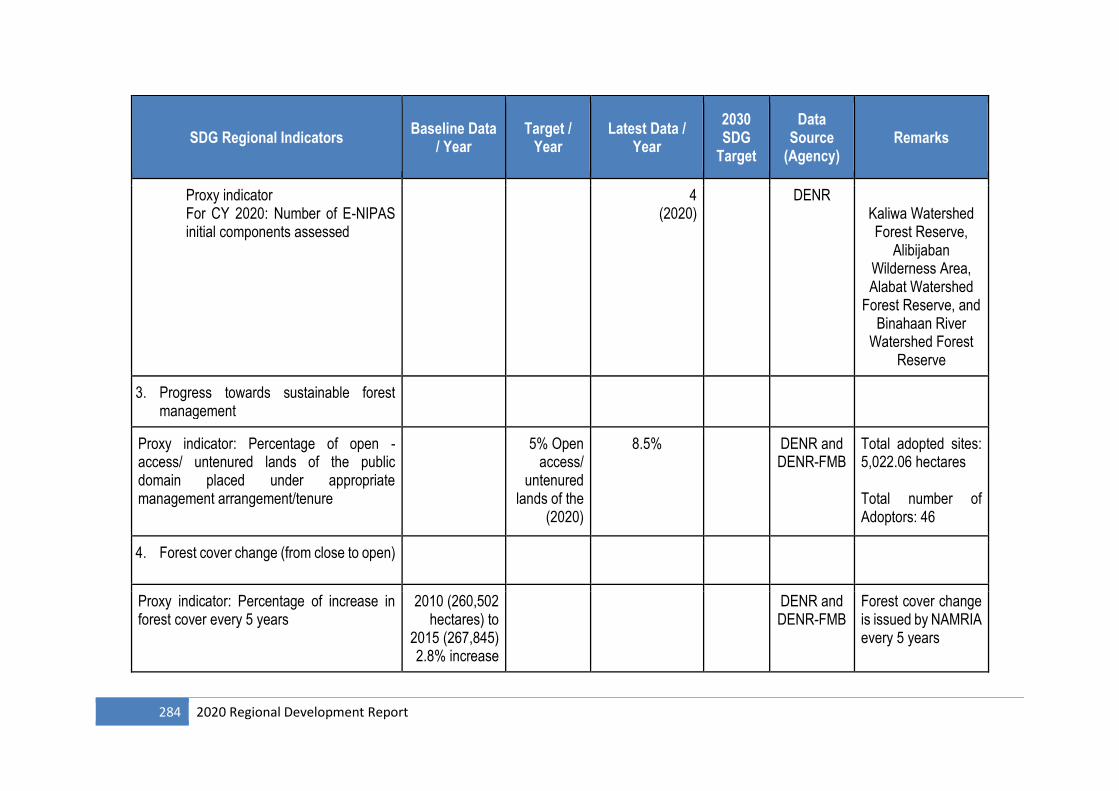
284 2020 Regional Development Report
SDG Regional Indicators Baseline Data
/ Year Target /
Year Latest Data /
Year
2030 SDG
Target
Data Source
(Agency) Remarks
Proxy indicator For CY 2020: Number of E-NIPAS initial components assessed
4 (2020)
DENR Kaliwa Watershed Forest Reserve,
Alibijaban Wilderness Area, Alabat Watershed
Forest Reserve, and Binahaan River
Watershed Forest Reserve
3. Progress towards sustainable forest management
Proxy indicator: Percentage of open - access/ untenured lands of the public domain placed under appropriate management arrangement/tenure
5% Open access/
untenured lands of the
(2020)
8.5% DENR and DENR-FMB
Total adopted sites: 5,022.06 hectares Total number of Adoptors: 46
4. Forest cover change (from close to open)
Proxy indicator: Percentage of increase in forest cover every 5 years
2010 (260,502 hectares) to
2015 (267,845) 2.8% increase
DENR and DENR-FMB
Forest cover change is issued by NAMRIA every 5 years
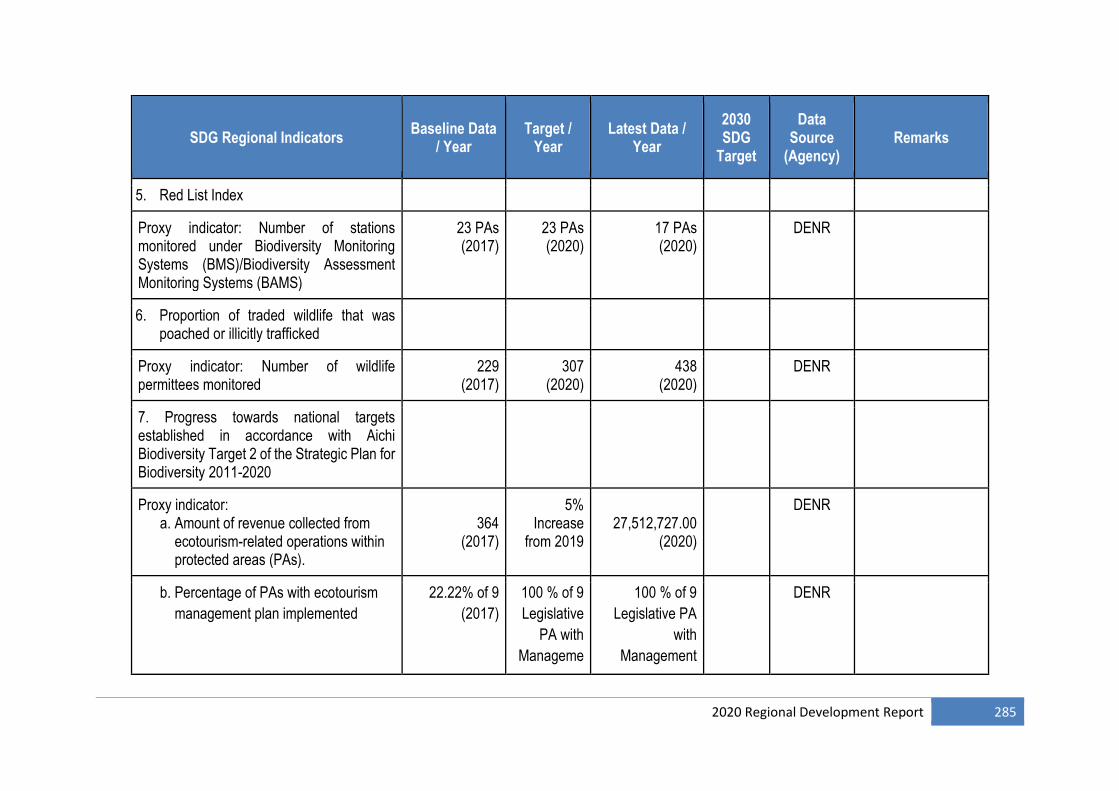
2020 Regional Development Report 285
SDG Regional Indicators Baseline Data
/ Year Target /
Year Latest Data /
Year
2030 SDG
Target
Data Source
(Agency) Remarks
5. Red List Index
Proxy indicator: Number of stations monitored under Biodiversity Monitoring Systems (BMS)/Biodiversity Assessment Monitoring Systems (BAMS)
23 PAs (2017)
23 PAs (2020)
17 PAs (2020)
DENR
6. Proportion of traded wildlife that was poached or illicitly trafficked
Proxy indicator: Number of wildlife permittees monitored
229 (2017)
307 (2020)
438 (2020)
DENR
7. Progress towards national targets established in accordance with Aichi Biodiversity Target 2 of the Strategic Plan for Biodiversity 2011-2020
Proxy indicator: a. Amount of revenue collected from ecotourism-related operations within protected areas (PAs).
364
(2017)
5% Increase
from 2019
27,512,727.00
(2020)
DENR
b. Percentage of PAs with ecotourism
management plan implemented
22.22% of 9
(2017)
100 % of 9
Legislative
PA with
Manageme
100 % of 9
Legislative PA
with
Management
DENR
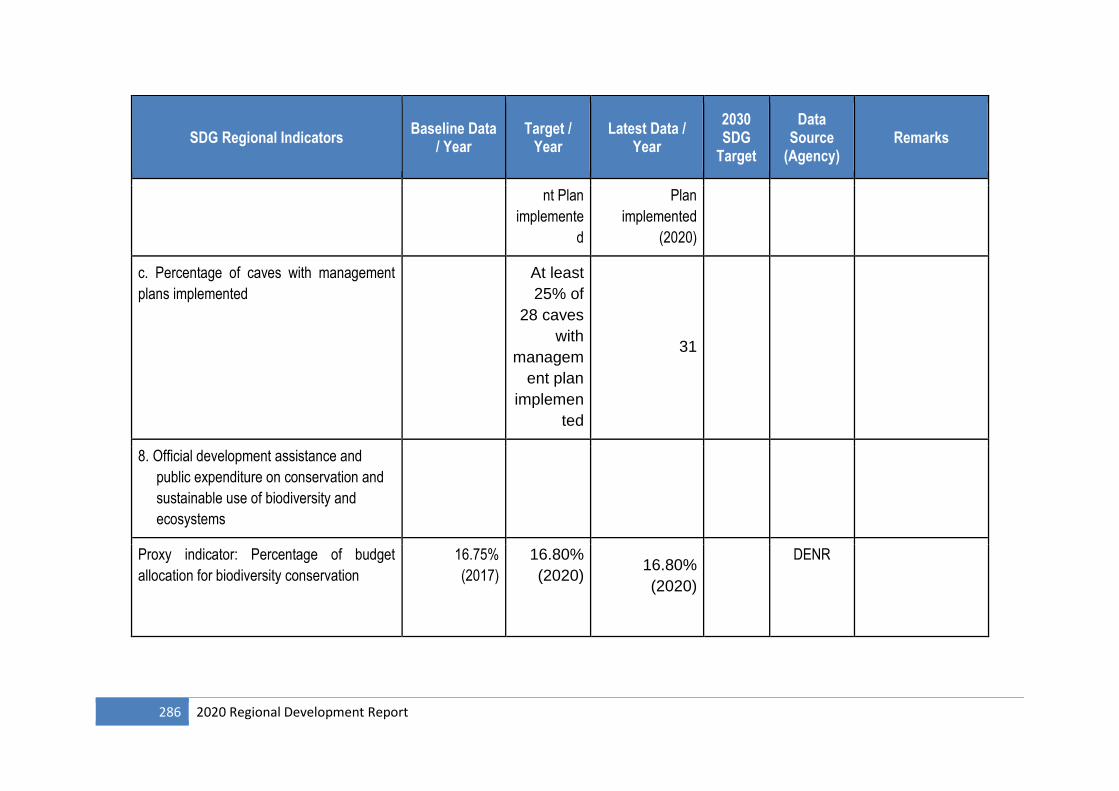
286 2020 Regional Development Report
SDG Regional Indicators Baseline Data
/ Year Target /
Year Latest Data /
Year
2030 SDG
Target
Data Source
(Agency) Remarks
nt Plan
implemente
d
Plan
implemented
(2020)
c. Percentage of caves with management
plans implemented
At least
25% of
28 caves
with
managem
ent plan
implemen
ted
31
8. Official development assistance and
public expenditure on conservation and
sustainable use of biodiversity and
ecosystems
Proxy indicator: Percentage of budget
allocation for biodiversity conservation
16.75%
(2017)
16.80%
(2020)
16.80%
(2020)
DENR
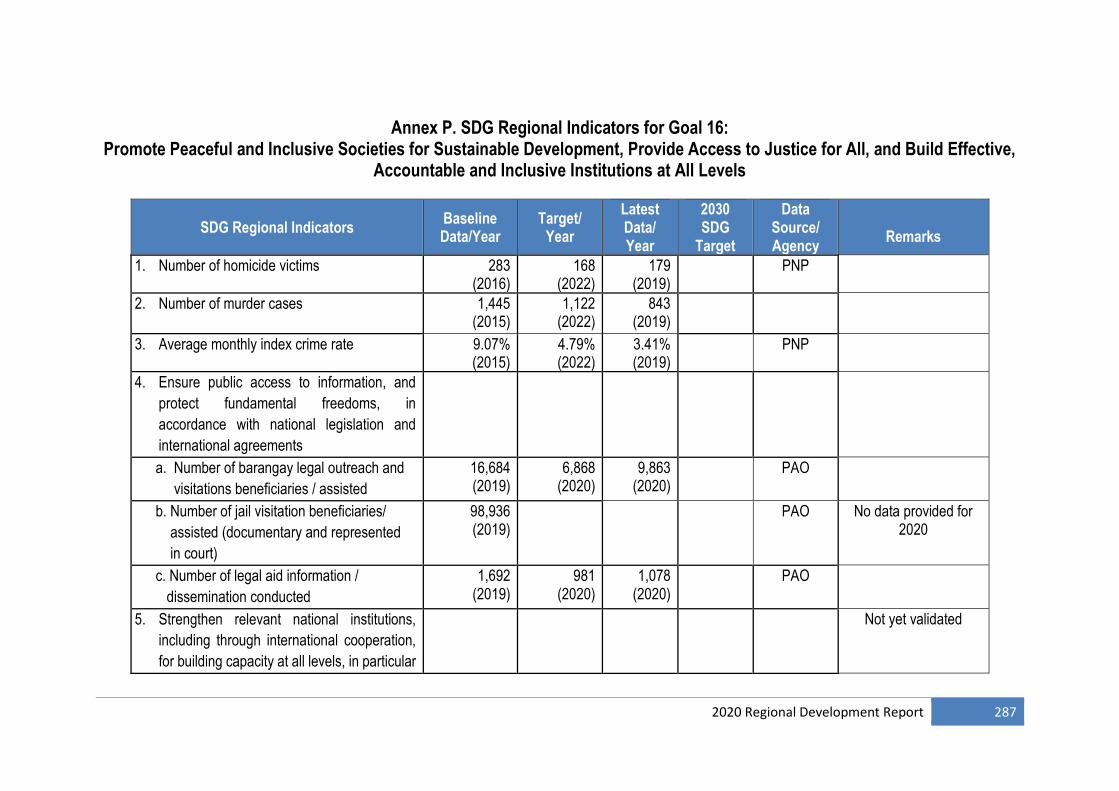
2020 Regional Development Report 287
Annex P. SDG Regional Indicators for Goal 16:
Promote Peaceful and Inclusive Societies for Sustainable Development, Provide Access to Justice for All, and Build Effective, Accountable and Inclusive Institutions at All Levels
SDG Regional Indicators Baseline Data/Year
Target/ Year
Latest Data/ Year
2030 SDG
Target
Data Source/ Agency
Remarks
1. Number of homicide victims 283 (2016)
168 (2022)
179 (2019)
PNP
2. Number of murder cases
1,445 (2015)
1,122 (2022)
843 (2019)
3. Average monthly index crime rate 9.07% (2015)
4.79% (2022)
3.41% (2019)
PNP
4. Ensure public access to information, and
protect fundamental freedoms, in
accordance with national legislation and
international agreements
a. Number of barangay legal outreach and
visitations beneficiaries / assisted
16,684 (2019)
6,868 (2020)
9,863 (2020)
PAO
b. Number of jail visitation beneficiaries/
assisted (documentary and represented
in court)
98,936 (2019)
PAO No data provided for 2020
c. Number of legal aid information /
dissemination conducted
1,692 (2019)
981 (2020)
1,078 (2020)
PAO
5. Strengthen relevant national institutions,
including through international cooperation,
for building capacity at all levels, in particular
Not yet validated
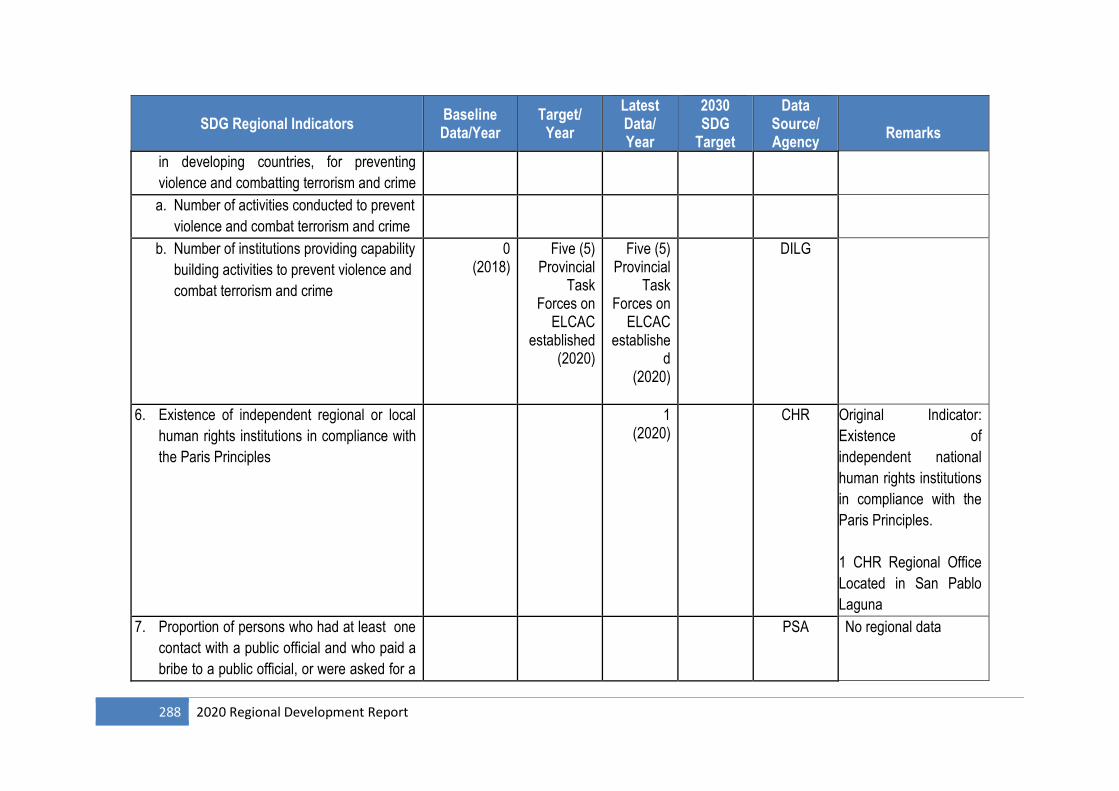
288 2020 Regional Development Report
SDG Regional Indicators Baseline Data/Year
Target/ Year
Latest Data/ Year
2030 SDG
Target
Data Source/ Agency
Remarks
in developing countries, for preventing
violence and combatting terrorism and crime
a. Number of activities conducted to prevent
violence and combat terrorism and crime
b. Number of institutions providing capability
building activities to prevent violence and
combat terrorism and crime
0 (2018)
Five (5) Provincial
Task Forces on
ELCAC established
(2020)
Five (5) Provincial
Task Forces on
ELCAC establishe
d (2020)
DILG
6. Existence of independent regional or local
human rights institutions in compliance with
the Paris Principles
1 (2020)
CHR Original Indicator:
Existence of
independent national
human rights institutions
in compliance with the
Paris Principles.
1 CHR Regional Office
Located in San Pablo
Laguna
7. Proportion of persons who had at least one
contact with a public official and who paid a
bribe to a public official, or were asked for a
PSA No regional data
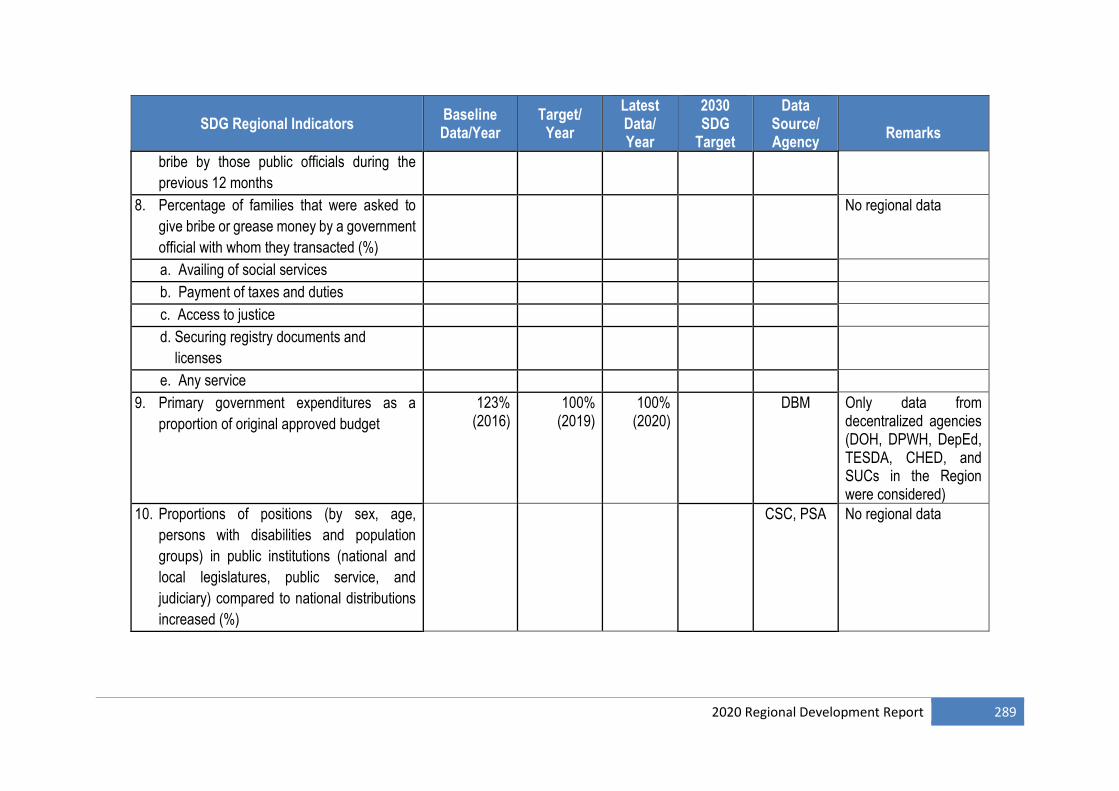
2020 Regional Development Report 289
SDG Regional Indicators Baseline Data/Year
Target/ Year
Latest Data/ Year
2030 SDG
Target
Data Source/ Agency
Remarks
bribe by those public officials during the
previous 12 months
8. Percentage of families that were asked to
give bribe or grease money by a government
official with whom they transacted (%)
No regional data
a. Availing of social services
b. Payment of taxes and duties
c. Access to justice
d. Securing registry documents and
licenses
e. Any service
9. Primary government expenditures as a
proportion of original approved budget
123% (2016)
100% (2019)
100% (2020)
DBM Only data from decentralized agencies (DOH, DPWH, DepEd, TESDA, CHED, and SUCs in the Region were considered)
10. Proportions of positions (by sex, age,
persons with disabilities and population
groups) in public institutions (national and
local legislatures, public service, and
judiciary) compared to national distributions
increased (%)
CSC, PSA No regional data
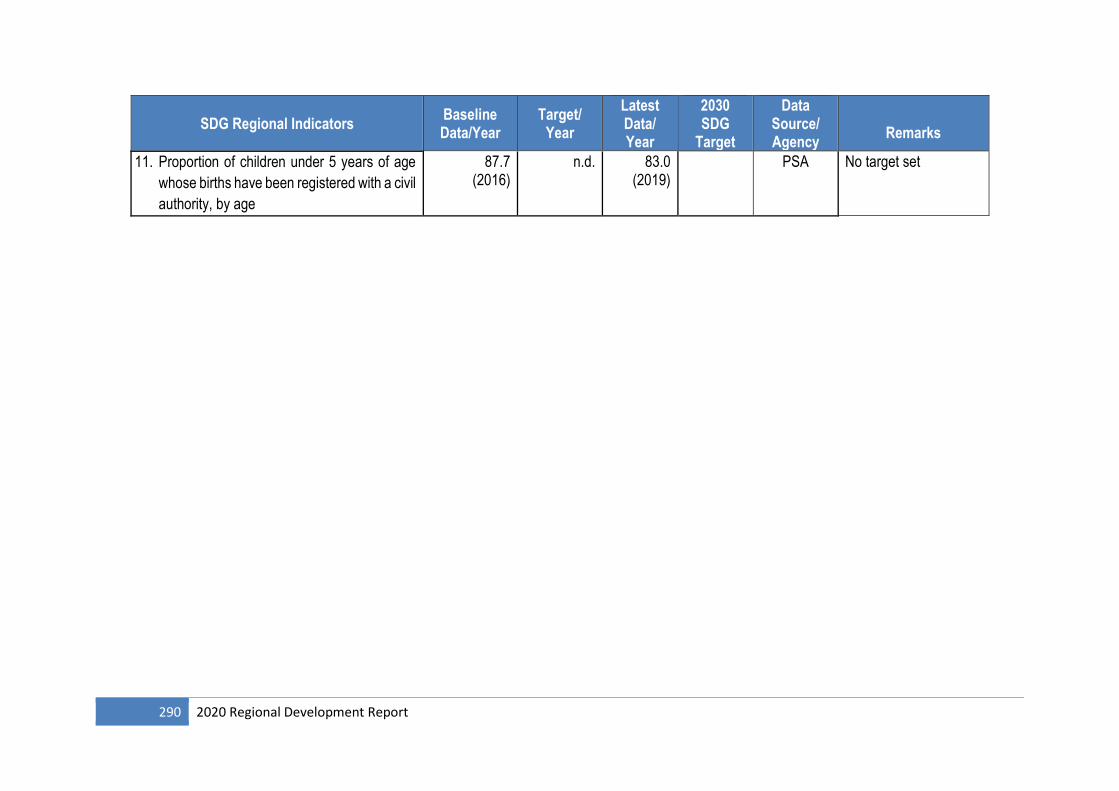
290 2020 Regional Development Report
SDG Regional Indicators Baseline Data/Year
Target/ Year
Latest Data/ Year
2030 SDG
Target
Data Source/ Agency
Remarks
11. Proportion of children under 5 years of age
whose births have been registered with a civil
authority, by age
87.7 (2016)
n.d. 83.0 (2019)
PSA No target set
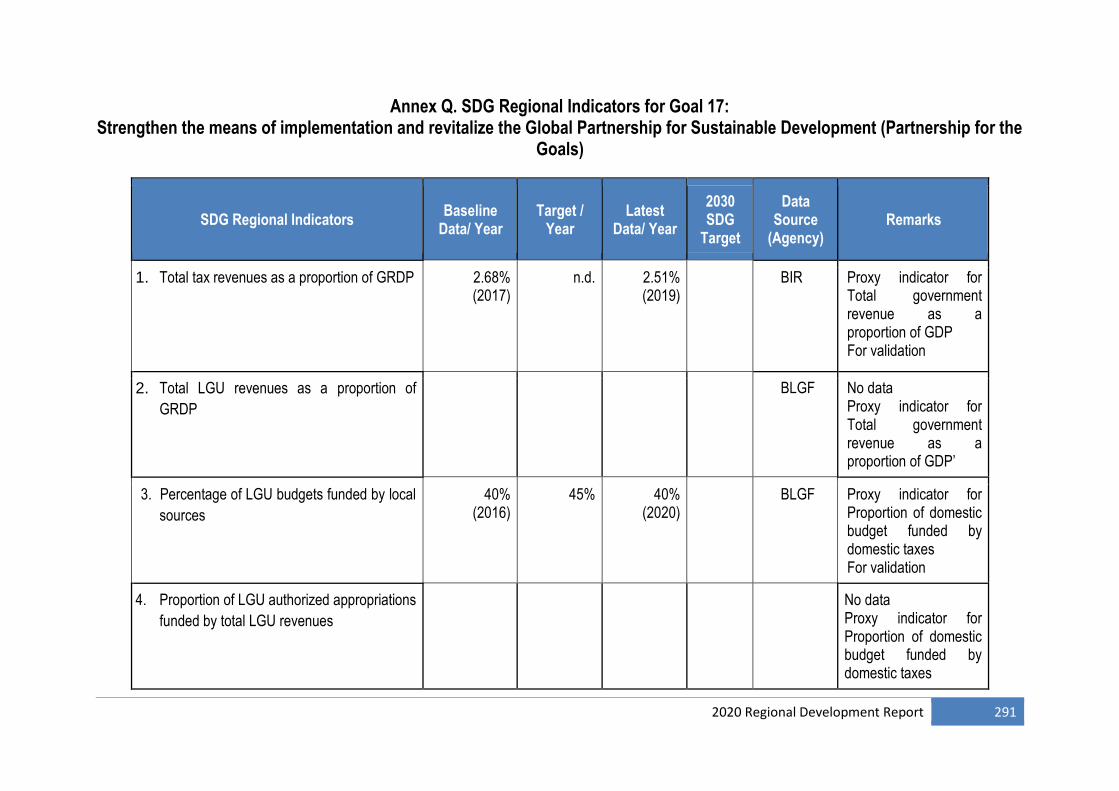
2020 Regional Development Report 291
Annex Q. SDG Regional Indicators for Goal 17: Strengthen the means of implementation and revitalize the Global Partnership for Sustainable Development (Partnership for the
Goals)
SDG Regional Indicators Baseline
Data/ Year Target /
Year Latest
Data/ Year
2030 SDG
Target
Data Source
(Agency) Remarks
1. Total tax revenues as a proportion of GRDP 2.68% (2017)
n.d.
2.51% (2019)
BIR Proxy indicator for Total government revenue as a proportion of GDP For validation
2. Total LGU revenues as a proportion of
GRDP
BLGF No data Proxy indicator for Total government revenue as a proportion of GDP’
3. Percentage of LGU budgets funded by local
sources
40% (2016)
45%
40% (2020)
BLGF Proxy indicator for Proportion of domestic budget funded by domestic taxes For validation
4. Proportion of LGU authorized appropriations
funded by total LGU revenues
No data Proxy indicator for Proportion of domestic budget funded by domestic taxes
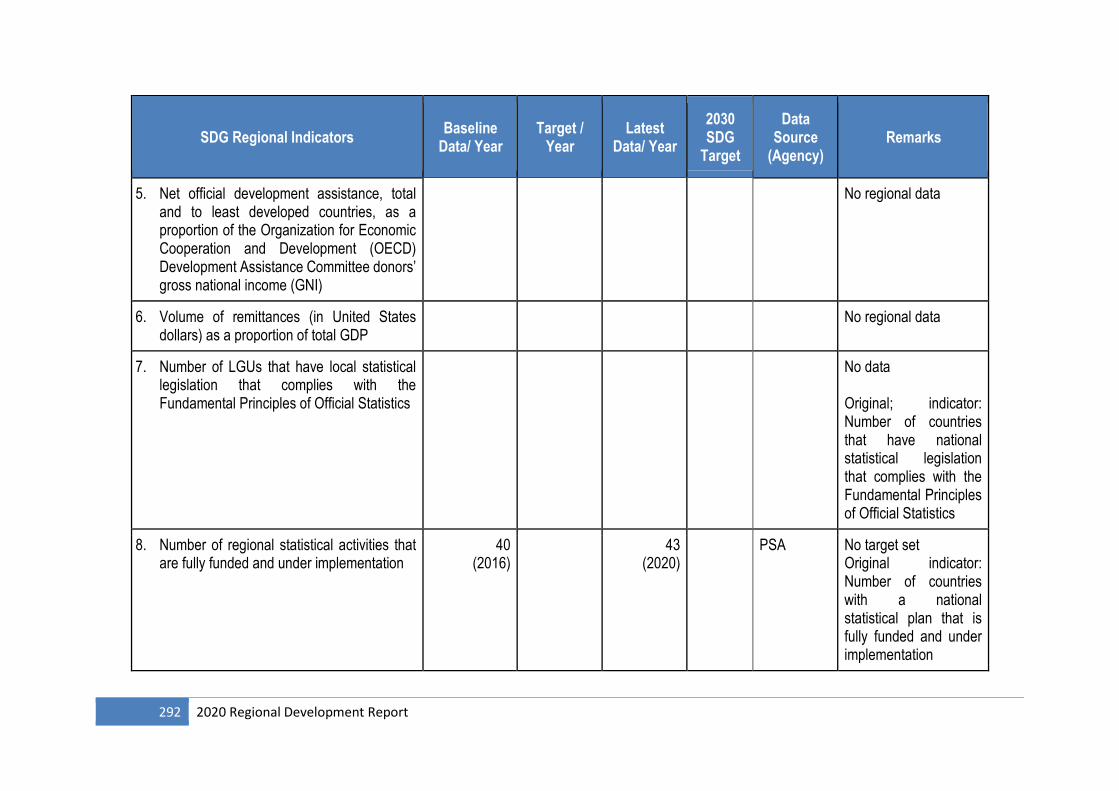
292 2020 Regional Development Report
SDG Regional Indicators Baseline
Data/ Year Target /
Year Latest
Data/ Year
2030 SDG
Target
Data Source
(Agency) Remarks
5. Net official development assistance, total and to least developed countries, as a proportion of the Organization for Economic Cooperation and Development (OECD) Development Assistance Committee donors’ gross national income (GNI)
No regional data
6. Volume of remittances (in United States dollars) as a proportion of total GDP
No regional data
7. Number of LGUs that have local statistical legislation that complies with the Fundamental Principles of Official Statistics
No data Original; indicator: Number of countries that have national statistical legislation that complies with the Fundamental Principles of Official Statistics
8. Number of regional statistical activities that are fully funded and under implementation
40 (2016)
43 (2020)
PSA No target set Original indicator: Number of countries with a national statistical plan that is fully funded and under implementation
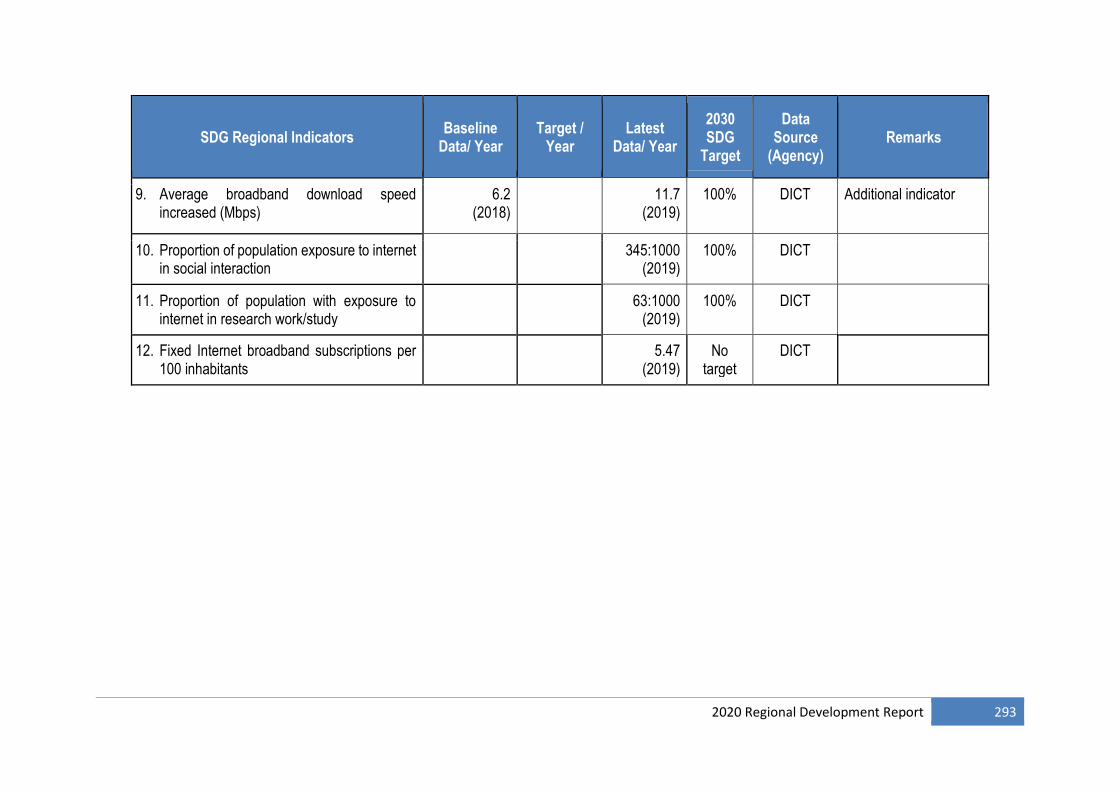
2020 Regional Development Report 293
SDG Regional Indicators Baseline
Data/ Year Target /
Year Latest
Data/ Year
2030 SDG
Target
Data Source
(Agency) Remarks
9. Average broadband download speed increased (Mbps)
6.2 (2018)
11.7 (2019)
100% DICT Additional indicator
10. Proportion of population exposure to internet in social interaction
345:1000 (2019)
100% DICT
11. Proportion of population with exposure to internet in research work/study
63:1000 (2019)
100% DICT
12. Fixed Internet broadband subscriptions per 100 inhabitants
5.47 (2019)
No target
DICT
294 2020 Regional Development Report
2020 Regional Development Report 295
Credits
ARTA Anti-Red Tape Authority
BatStateU Batangas State University
BFP Bureau of Fire Protection
BLGF Bureau of Local Government and Finance
BJMP Bureau of Jail Management and Penology
BSP Bangko Sentral ng Pilipinas
CDA Cooperative Development Authority
CHED Commission on Higher Education
CHR Commission on Human Rights
COA Commission on Audit
CSC Civil Service Commission
CvSU Cavite State University
DA Department of Agriculture
DA-ATI Department of Agriculture - Agricultural Training Institute
DA-ACPC Department of Agriculture - Agricultural Credit Policy Council
DA-BFAR Department of Agriculture - Bureau of Fisheries and Aquatic Resources
DA-PCA Department of Agriculture - Philippine Coconut Authority
DA-PCIC Department of Agriculture - Philippine Crop Insurance Corporation
DA-PhilFIDA Department of Agriculture - Philippine Fiber Industry Development Authority
DAP Development Academy of the Philippines
DAR Department of Agrarian Reform
DBM Department of Budget and Management
DBP Development Bank of the Philippines
DENR Department of Environment and Natural Resources
DENR-EMB Department of Environment and Natural Resources - Environment Management
Bureau
DENR-FMB Department of Environment and Natural Resources - Forest Management
Bureau
296 2020 Regional Development Report
DepEd Department of Education
DHSUD Department of Human Settlements and Urban Development
DILG Department of Interior and Local Government
DOE Department of Energy
DOH Department of Health
DOH-CHD Center for Health Development
DOJ-PAO Department of Justice – Public Attorney’s Office
DOJ-PPA Department of Justice – Parole and Probation Administration
DOLE Department of Labor and Employment
DOST Department of Science and Technology
DOST-FNRI DOST – Food and Nutrition Research Institute
DOST-
PCAARRD
Department of Science and Technology – Philippine Council for Agriculture,
Aquatic, and Natural Resources Research and Development
DOT Department of Tourism
DOTr Department of Transportation
DPWH Department of Public Works and Highways
DSWD Department of Social Welfare and Development
DTI Department of Trade and Industry
GHH Global Health Hub
HDMF Home Development Mutual Fund
HGC Home Guaranty Corporation
IBPAP IT and Business Process Association of the Philippines
IPOPHL Intellectual Property Office of the Philippines
LBP Landbank of the Philippines
LLDA Laguna Lake Development Authority
LSPU Laguna State Polytechnic University
LTO Land Transportation Office
LWUA Local Water Utilities Administration
MWSS Metropolitan Waterworks and Sewerage System
2020 Regional Development Report 297
NCCA National Commission for Culture and the Arts
NCIP National Commission on Indigenous Peoples
NEDA National Economic and Development Authority
NHMFC National Home Mortgage Finance Corporation
NIA National Irrigation Administration
NNC National Nutrition Council
NWRB National Water Resource Board
OCD Office of Civil Defense
OPAPP Office of the Presidential Adviser on the Peace Process
OWWA Overseas Workers Welfare Administration
PATAMABA
WISE
PATAMABA – Workers in the Informal Sector Enterprise
PCA Philippine Coconut Authority
PDEA Philippine Drug Enforcement Agency
PEZA Philippine Economic Zone Authority
PHIC Philippine Health Insurance Corporation
PNP Philippine National Police
PNR Philippine National Railways
POEA Philippine Overseas Employment Administration
POPCOM Commission on Population and Development
PPA Philippine Ports Authority (Batangas and Marquez)
PSA Philippine Statistics Authority
RDC-PSRs Regional Development Council – Private Sector Representatives
SCP Save the Children Philippines
SKFI Sinag Kalinga Foundation, Inc.
SHFC Social Housing Finance Corporation
SLSU Southern Luzon State University
SOLCOM, AFP Southern Luzon Command, Armed Forces of the Philippines
TESDA Technical Education and Skills Development Authority
298 2020 Regional Development Report
TRB Toll Regulatory Board
URS University of Rizal System
LGUs Local Government Units
Cavite Province
Laguna Province
Batangas Province
Rizal Province
Quezon Province
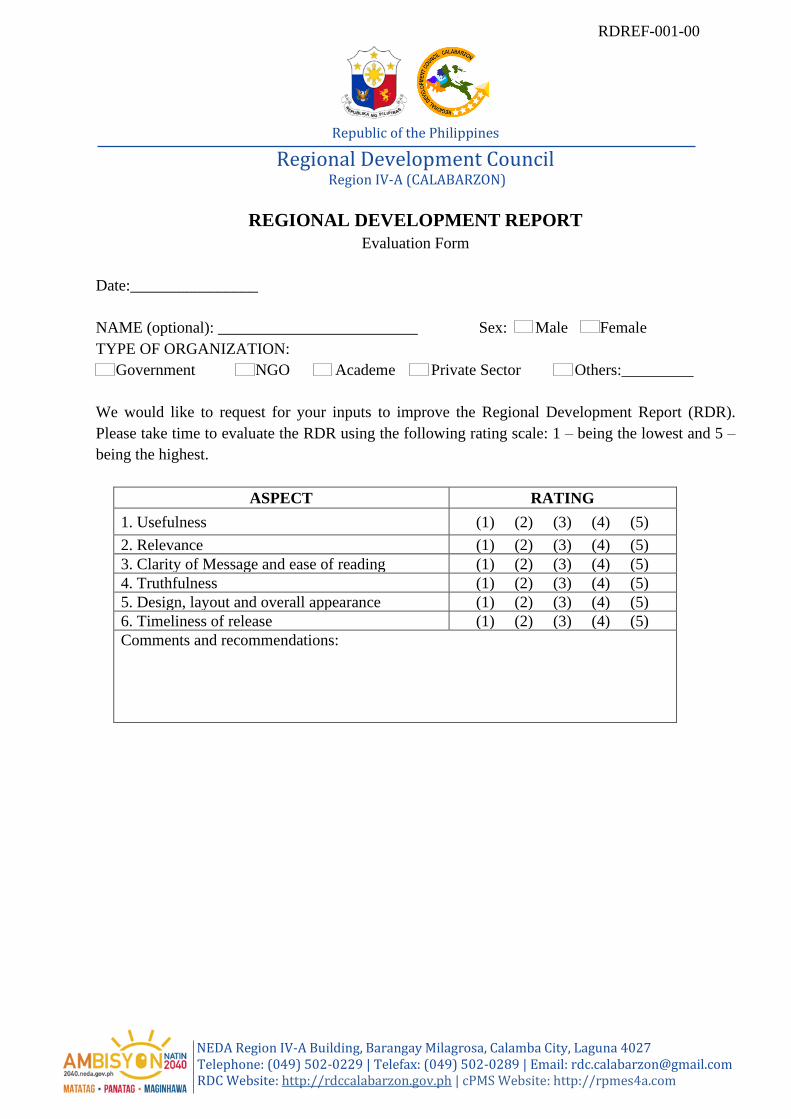
Republic of the Philippines
Regional Development Council Region IV-A (CALABARZON)
NEDA Region IV-A Building, Barangay Milagrosa, Calamba City, Laguna 4027 Telephone: (049) 502-0229 | Telefax: (049) 502-0289 | Email: [email protected] RDC Website: http://rdccalabarzon.gov.ph | cPMS Website: http://rpmes4a.com
RDREF-001-00
REGIONAL DEVELOPMENT REPORT
Evaluation Form
Date:________________
NAME (optional): _________________________ Sex: Male Female
TYPE OF ORGANIZATION:
Government NGO Academe Private Sector Others:_________
We would like to request for your inputs to improve the Regional Development Report (RDR).
Please take time to evaluate the RDR using the following rating scale: 1 – being the lowest and 5 –
being the highest.
ASPECT RATING
1. Usefulness (1) (2) (3) (4) (5)
2. Relevance (1) (2) (3) (4) (5)
3. Clarity of Message and ease of reading (1) (2) (3) (4) (5)
4. Truthfulness (1) (2) (3) (4) (5)
5. Design, layout and overall appearance (1) (2) (3) (4) (5)
6. Timeliness of release (1) (2) (3) (4) (5)
Comments and recommendations: