Embed Size (px)
Citation preview

3D crustal structure in the neotectonic basin
of the Gulf of Saronikos (Greece)
G. Drakatosa,T, V. Karastathisa, J. Makrisb,1, J. Papouliac,2, G. Stavrakakisa
aNational Observatory of Athens, Institute of Geodynamics, P.O. Box 20048, GR 118 10 Athens, GreecebGEOPRO GmbH, St. Annenufer 2, 20457, Hamburg, Germany
cHellenic Center of Marine Research, Institute of Oceanography, P.O. Box 712, 19013 Anavissos, Attiki, Greece
Received 18 March 2003; accepted 9 February 2005
Available online 29 March 2005
Abstract
An on-/offshore seismic network consisting of 36 three-component stand-alone digital stations was deployed in the area of
the Saronikos Gulf, in the vicinity of Athens (Greece), in the fall of 2001. In the present study, from an initial set of more than
1000 micro-earthquakes, 374 were selected and 6666 P- and S-wave arrivals were inverted, based on a 3D linearized
tomography algorithm, in order to determine the 3D velocity structure of the region.
The resulting 3D velocity distribution, in agreement to the micro-seismicity distribution, reflects the Saronikos structure
down to a depth of 12 km. So, the neotectonic basin of the Saronikos Gulf is divided in two parts by a central platform, which
implies the existence of a NNE–SSW-trending rupture zone. This zone is probably the offshore extension of a large thrust belt
dominating the adjacent onshore areas. Due to their different structure, the two basins are dominated by different velocity values
in comparison to the central platform.
The western part is characterised by higher seismic activity than the eastern one. Furthermore, the western Saronikos Gulf is
divided in a northern and a southern part by a well-defined rupture zone trending E–W. This seems to be the extension of the
Corinthiakos Gulf fault zone. At the depth of 17 km, the velocity increases considerably and the crustal thickness is restricted
down to 20 km. This dunexpectedT low thickness in the region of Saronikos Gulf seems to be the result of the extensional stress
field, which dominates the region, as well as of the emergence of the mantle material along the volcanic arc, which clearly
appears at the depth of 12 km. Yet the lack of deep events and, hence, the poor resolution below the depth of 17 km does not
support a definite conclusion about the crust–mantle boundary in this region.
D 2005 Elsevier B.V. All rights reserved.
Keywords: Velocity structure; Tomography; Saronikos Gulf; Greece
0040-1951/$ - see front matter D 2005 Elsevier B.V. All rights reserved.
doi:10.1016/j.tecto.2005.02.004
T Corresponding author. Tel.: +30 10 3490164; fax: +30 10 3490180.
E-mail addresses: [email protected] (G. Drakatos), [email protected] (J. Makris), [email protected] (J. Papoulia).1 Tel.: +49 40 30399576; fax: +49 40 30399578.2 Tel.: +30 22910 76370; fax: +30 22910 76323.
Tectonophysics 400 (2005) 55–65
www.elsevier.com/locate/tecto

1. Introduction
The Saronikos Gulf is situated in the northwestern
part of the Hellenic volcanic arc, between the Pliocene
volcano of Aegina and the Pleistocene volcanoes of
Methana and Sousaki (Fig. 1). The area is in generally
characterised by low seismicity. However, at its north-
ern and western borders, strong historical as well as
recent earthquakes have occurred (Fig. 1), all associ-
ated with a roughly N–S extensional tectonic field. In
the vicinity of the Saronikos Gulf, the existence of the
highly populated Attiki region and particularly the city
of Athens gives to the seismicity of the area a major
significance, from the social and economic point of
view (see also Papadopoulos et al., 2000).
During the instrumental observation period of
Greece, in the broader area of Athens and particularly
in the Saronikos Gulf area, no considerable seismic
activity had been recorded prior to the event of
September 7, 1999 (Ms=5.9). Therefore, it is not
surprising that no systematic micro-seismicity study
has been carried out in the past. After the event of 1999,
the need of mapping the active faults in the Attiki
offshore area was reconsidered. Specifically, the
understanding of the active deformation of the Sar-
onikos Gulf area is a must in order to estimate the
seismic potential and seismic hazard of the Attiki
region. The acquisition of a local velocity model is also
judged essential for understanding the seismogenic
processes.
The 2D crustal structure of the Saronikos–eastern
Corinthiakos basins was investigated in the past,
suggesting an intense crustal thinning below the
volcanic area of the Saronikos Gulf (Makris et al.,
2004a). Following the passive seismic observations of
the fall of 2001, a 3Dactive seismic experimentwas also
conducted, the results of which are under evaluation
(Makris, personal communication). Some work has
been also done in the adjacent onshore area of Attiki,
after September 7, 1999 earthquake, with 3D passive
seismic tomography based on local seismological net-
works (Drakatos et al., 2002). The existing information
Fig. 1. A simplified tectonic map of the study region is shown. The black lines represent faults, whereas the black broken line represents the
thrust belt zone dominating Attiki region. The diamonds represent the historical earthquakes from 450 B.C. to 1900 (MN6.0, after Papadopoulos
et al., 2000). The stars show the epicentre distribution from 1901 to 1964 (MN5.0, after Makropoulos et al., 1989; Papazachos and Papazachou,
1997). The black circles show the epicentre distribution from 1965 to 2000 (MN6.0, Monthly Bulletins of Institute of Geodynamics, NOA).
G. Drakatos et al. / Tectonophysics 400 (2005) 55–6556

for the velocity structure, provided by large-scale
regional passive seismic tomography studies for the
wholeGreek territory, is not of the required resolution to
be effectively used for a detailed study of the active
deformation (e.g., Spakman, 1986; Spakman et al.,
1988; Drakatos and Drakopoulos, 1991; Ligdas and
Main, 1991; Papazachos et al., 1995;Alessandrini et al.,
1997; Drakatos et al., 1997).
The aim of the present study is to derive the 3D
velocity structure of the Saronikos Gulf area, based
on the recorded micro-seismic activity during the
field experiment of 2001, that involved the instal-
lation of eight ocean bottom seismographs (OBS)
and 28 stand-alone land stations (Fig. 2). Both
marine and land stations were three-component
digital stations, used in the above passive experi-
ment the SEDIS III seismic recorder of GeoPro,
Hamburg (Makris and Moeller, 1990).
2. Regional geological and tectonic setting
The proposed geodynamic models for the con-
struction of the Aegean neotectonic basins consider, in
general, a tensional regime with the formation of
tectonic grabens by normal faulting in the back-arc
area of the Hellenic trench (McKenzie, 1978; Dewey
and Sengor, 1979; Le Pichon and Angelier, 1979;
Brooks et al., 1988). Within this process, the
Saronikos Gulf lies along the Hellenic volcanic arc,
within the Pliocene volcano of Aegina and the
Pleistocene volcanoes of Methana and Sousaki
(Papanikolaou et al., 1988). It is divided into a
western and an eastern part by a very shallow N–S-
trending platform, part of which emerges at the islands
of Methana, Angistri, Aegina and Salamina (Fig. 1).
To the west, the Gulf includes two basins, the WNW–
ESE-oriented Epidaurus basin to the south, with a
depth greater than 400 m and the E–W-oriented
Megara basin to the north, which is relatively shallow
(less than 250 m). The WNW–ESE marginal faults of
the Epidaurus basin in the southwest have about 350
m of throw and create a rather symmetric tectonic
graben with significant volcanic intrusions within its
eastern part. The Megara basin is a graben formed by
E–W to ENE–WSW marginal faults having a throw of
400–500 m (Papanikolaou et al., 1988).
In the eastern Saronikos Gulf, NW–SE faults with
relatively smaller throw control the alternation of
basins and plateaux of the sea bottom morphology.
Fig. 2. The distribution of the on-/offshore seismic network is shown (Makris et al., 2004b).
G. Drakatos et al. / Tectonophysics 400 (2005) 55–65 57

Judging by the fault displacements and sediment
distribution, we concluded that the western part is
obviously much more active than the eastern one. The
presence of recent volcanoes in the central part leads
to an even more complicated structure and it separates
the active western part from the relatively inactive
eastern one.
The onshore areas of Attiki (as mapped and
published in the 1:50,000 scale geological maps of
the Institute of Geology and Mineral Exploration of
Greece, IGME, 1989) belong to an autochthonous
metamorphic basement of Palaeozoic–Mesozoic age.
It consists of marbles and schists (Papanastassiou et
al., 2000), with remnants of a tectonic cover identified
in the same localities. A major tectonic boundary,
trending ENE, separates the mountains of Penteli and
Himmitos to the southeast, from the mountains of
Parnis and Aegaleo to the northwest (broken line, Fig.
1). Normal faults along the Parnis Mountain are
considered as the eastward extension of the Corin-
thiakos Gulf fault system of almost E–W orientation.
3. Data–method–modelling
More than 1000 micro-earthquakes were recorded
during the passive seismic experiment of 2001
(Makris et al., 2004b). Four hundred forty five (445)
earthquakes (0.3bMLb3.8) were determined in the
investigated region (37.48N–38.28N, 22.88E–24.28E),recorded at least at five stations. The locations of the
hypocenters were obtained using the HYPOINVERSE
software (Klein, 1989), which allows the application
of spatially varying local velocity models for the
hypocenter location. Magnitudes were defined by the
coda length of the seismograms, calibrated by using
earthquakes also recorded by the Seismograph Net-
work of the National Observatory of Athens. As far as
the magnitude estimates are concerned, a mean
function from four stations having similar site
response was derived, and this was applied to the full
temporary network. More details about RMS, ERH,
ERZ, magnitude and depth distribution are given in
Makris et al., 2004b.
The inverse problem of three-dimensional local
earthquake tomography is formulated as a linear
approximation of a non-linear function (Pavlis and
Booker, 1983). Solutions are generally obtained by
linearization with respect to a reference earth model
(Aki and Lee, 1976; Nolet, 1978). The solutions
obtained and the reliability estimates depend thus on
the initial velocity model. Unrealistic initial condi-
tions may result in artefacts of significant amplitude.
The used tomography technique was initially
introduced by Thurber (1983) and further developed
by Eberhart-Phillips (1986, 1990). The method
performs an iterative simultaneous inversion for 3D
velocity structure and hypocenter parameters using
travel time residuals from local earthquakes. The
velocity of the medium is parameterised by assigning
velocity values at the intersections of a non-uniform,
three-dimensional grid. The spacing within the grid is
selected in such a way as to have enough ray paths
near each grid point so that its velocity may be
adequately resolved. The spacing does not need to be
uniform throughout the study area. The velocity for a
point along a ray path and the velocity partial
derivatives are computed by linear interpolation
between the surrounding grid points. Thus, the
velocity solution will show progressive changes in
velocity rather than the sharp discontinuities shown in
typical wide-angle reflection models or block-type
parameterisations. The ray-tracing technique used is
the bART+Pseudo-bendingQ (Approximate Ray Trac-
ing, proposed by Thurber, 1983).
As far as the modelling stage is concerned, we set
the grid of the nodes at the specified area from
37.408N to 38.208N and 22.808E–24.208E. The nodesare well distributed in seven horizontal layers (slices)
at depths of 1, 3.5, 7, 12, 17, 22 and 30 km,
respectively. Each layer includes 12 nodes in the E–
W direction and 9 nodes in the N–S direction. The
distance between two consequent nodes varies from
10 km to 20 km in both directions. In order to
constrain better the 3D inversion, initially based on
the velocity model (Table 1) proposed by Makris et al.
(2004a), we used the Vp and Vs models shown in
Table 2. Vp values between two consequent nodes
Table 1
Velocity model in Saronikos Gulf (Makris et al., 2004a)
Velocity (km/s) Depth (km)
4.70 0.0
5.70 3.0
6.80 7.0
8.10 17.0
G. Drakatos et al. / Tectonophysics 400 (2005) 55–6558
were computed by linear interpolation. From the
initial set of earthquakes, 374 events were selected
(1.6bMb2.6), which gave a good coverage distribu-
tion. Some of the events were located outside the
modelled area. The inclusion of earthquakes and/or
stations outside the modelled area generally improves
the ray path distribution within it. In order to optimize
the best depth determination, we included in the
relocation process not only P- but also S-wave
arrivals. In total, 6666 arrivals (3402 P-wave and
3264 S-wave readings) were considered. The data set
has been inverted five times to get a stable solution.
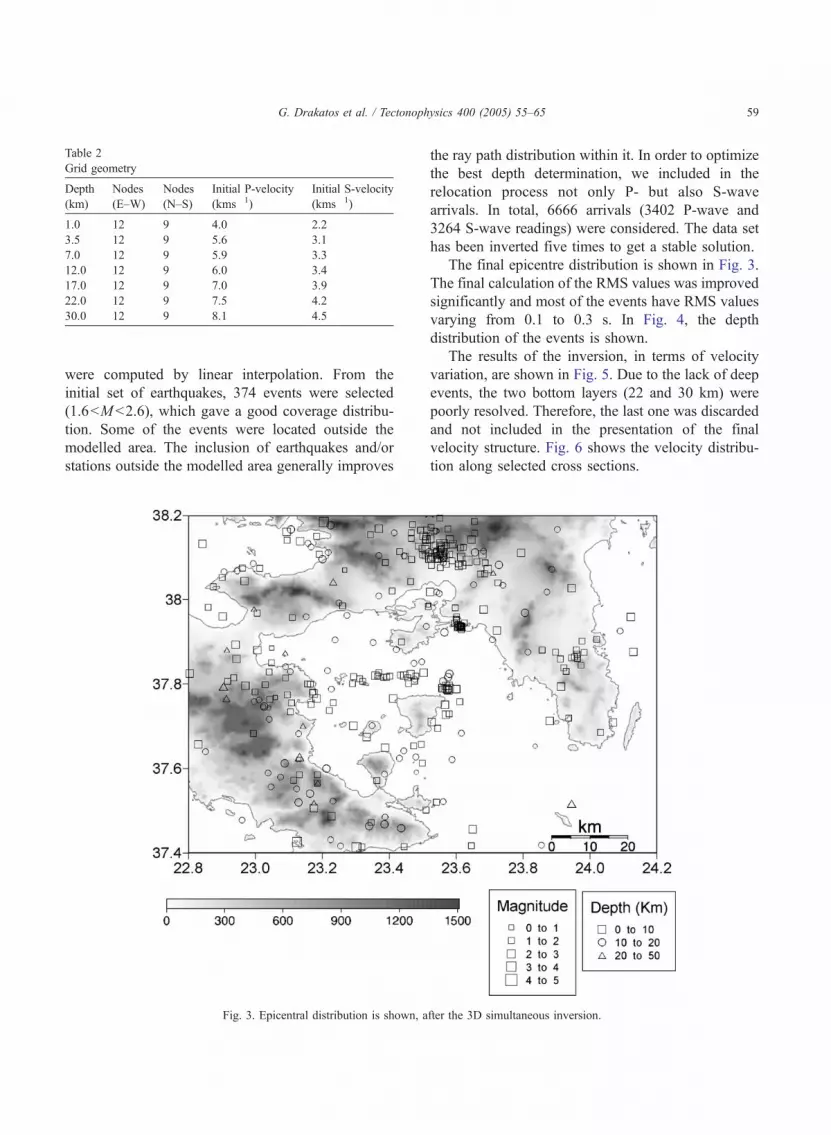
The final epicentre distribution is shown in Fig. 3.
The final calculation of the RMS values was improved
significantly and most of the events have RMS values
varying from 0.1 to 0.3 s. In Fig. 4, the depth
distribution of the events is shown.
The results of the inversion, in terms of velocity
variation, are shown in Fig. 5. Due to the lack of deep
events, the two bottom layers (22 and 30 km) were
poorly resolved. Therefore, the last one was discarded
and not included in the presentation of the final
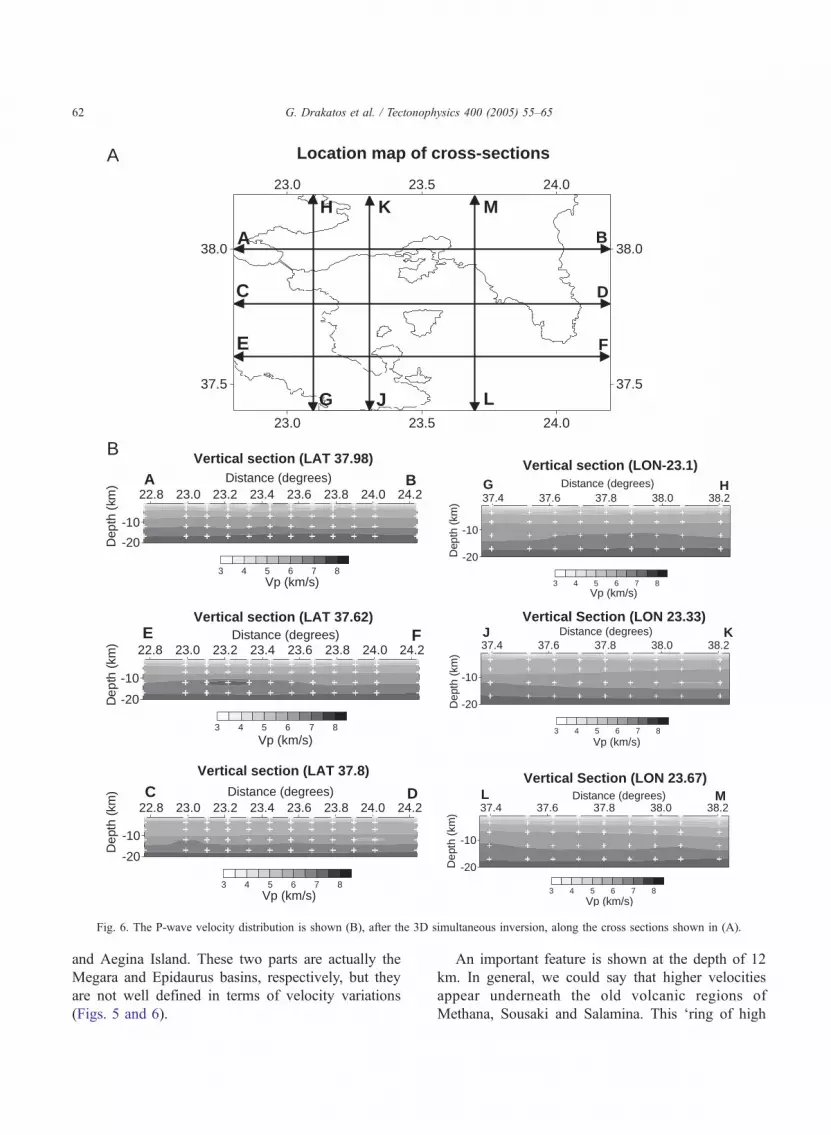
velocity structure. Fig. 6 shows the velocity distribu-
tion along selected cross sections.
Fig. 3. Epicentral distribution is shown, after the 3D simultaneous inversion.
Table 2
Grid geometry
Depth
(km)
Nodes
(E–W)
Nodes
(N–S)
Initial P-velocity
(kms�1)
Initial S-velocity
(kms�1)
1.0 12 9 4.0 2.2
3.5 12 9 5.6 3.1
7.0 12 9 5.9 3.3
12.0 12 9 6.0 3.4
17.0 12 9 7.0 3.9
22.0 12 9 7.5 4.2
30.0 12 9 8.1 4.5
G. Drakatos et al. / Tectonophysics 400 (2005) 55–65 59

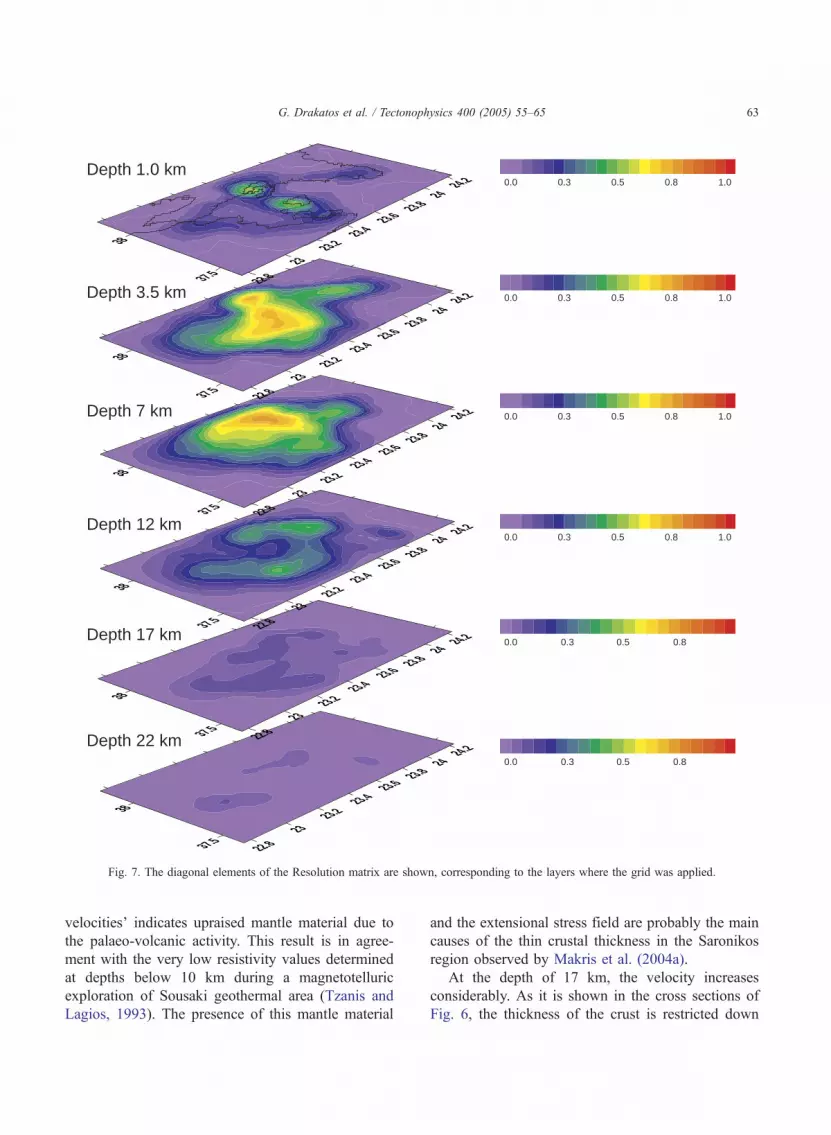
Several parameters, such as the number of hits at
each block, the sum of derivatives, etc., can be used
to verify the reliability and stability of the solution.
The resolution and, hence, the reliability and the
stability of the solution strongly depend on the
degree of intersection of crossing rays. For the latter,
a dense station network of homogeneous distribution
over the area under investigation is usually required.
In Fig. 7, we present the resolution matrix of the
diagonal elements. It is obvious that the solution we
obtained is stable for the major part of the velocity
model.
4. Discussion and conclusions
The micro-seismicity study of the Saronikos Gulf
in 2001 (Makris et al., 2004b) produced reliable and
accurately located seismic data because of the
homogeneous and densely spaced on-/offshore seis-
mic array. A 3D seismic passive tomography based on
this data set evaluated for the first time the 3D
velocity model for the complete Saronikos area of
60�60 km2. As the first evaluation showed (Makris et
al., 2004b), the microearthquake activity is associated
with the tectonic regime rather than the volcanic
activity of the area. The relocation of the foci after the
simultaneous inversion was improved and exhibits
now an RMS of 0.1–0.3 s. This, however, had no
significant influence on the results already published
in 2004, where the main active faults were located
north of the Aegina island striking E–W and continu-
ing onshore west Peloponnese and to the east of
Aegina striking NNE–SSW (see Fig. 3). From west to
east, the micro-seismicity is restricted along a narrow
zone trending NNE–SSW (Aegina and Salamina
islands) that divides the Saronikos in two regions
(Figs. 1 and 3). The shallow micro-seismicity under-
lines the existence of a shallow platform, part of
which emerges at the islands of Methana, Angistri,
Aegina and Salamina (Papanikolaou et al., 1988).
This feature, as obtained from the velocity structure,
seems to continued up to the depth of 12 km (Figs. 5
and 6). This is probably an offshore continuation of
the thrust belt, which is dominant in the Attiki region
(Fig. 1). This result is also supported by the onshore
epicentre distribution of the aftershock sequence of
the September 7, 1999 earthquake, which was
restricted to the west of the thrust belt (Papanastassiou
et al., 2000; Drakatos et al., 2002; Pavlides et al.,
Fig. 4. A 3D view of the depth distribution is shown.
G. Drakatos et al. / Tectonophysics 400 (2005) 55–6560

2002). This could explain the similarity of the
seismotectonic regime of western Saronikos to that
of the Corinthiakos Gulf, while the eastern Saronikos
has a more simple structure.
The western Saronikos Gulf is divided in two parts,
a northern and a southern one, by a well-defined
seismic zone of E–W direction (Fig. 3), which is
shown between the northeastern part of Peloponnisos
Fig. 5. The P-wave velocity distribution is shown, after the 3D simultaneous inversion. Depth denotes the layer (slice), where the grid nodes
(white crosses) were applied.
G. Drakatos et al. / Tectonophysics 400 (2005) 55–65 61
and Aegina Island. These two parts are actually the
Megara and Epidaurus basins, respectively, but they
are not well defined in terms of velocity variations
(Figs. 5 and 6).
An important feature is shown at the depth of 12
km. In general, we could say that higher velocities
appear underneath the old volcanic regions of
Methana, Sousaki and Salamina. This dring of high
23.0 23.5 24.0
23.0 23.5 24.0
37.5
38.0
37.5
38.0
Location map of cross-sections
A B
E F
DC
G
H
J
K
L
M
37.4 37.6 37.8 38.0 38.2
-20
-10
3 4 5 6 7 8
Vertical Section (LON 23.67)
Dep
th(k
m)
Distance (degrees)L M
Vp (km/s)
22.8 23.0 23.2 23.4 23.6 23.8 24.0 24.2
-20
-10
3 4 5 6 7 8
Vertical section (LAT 37.8)
C D
Vp (km/s)
Distance (degrees)
Dep
th(k
m)
22.8 23.0 23.2 23.4 23.6 23.8 24.0 24.2
-20
-10
3 4 5 6 7 8
Vertical section (LAT 37.98)
A B
Vp (km/s)
Distance (degrees)
Dep
th(k
m)
22.8 23.0 23.2 23.4 23.6 23.8 24.0 24.2
-20
-10
3 4 5 6 7 8
Vertical section (LAT 37.62)E F
Vp (km/s)
Distance (degrees)
Dep
th(k
m)
37.4 37.6 37.8 38.0 38.2
-20
-10
3 4 5 6 7 8
Vertical section (LON-23.1)G H
Dep
th(k
m)
Distance (degrees)
Vp (km/s)
37.4 37.6 37.8 38.0 38.2
-20
-10
3 4 5 6 7 8
Vertical Section (LON 23.33)
Dep
th(k
m)
Distance (degrees)J K
Vp (km/s)
A
B
Fig. 6. The P-wave velocity distribution is shown (B), after the 3D simultaneous inversion, along the cross sections shown in (A).
G. Drakatos et al. / Tectonophysics 400 (2005) 55–6562
velocitiesT indicates upraised mantle material due to
the palaeo-volcanic activity. This result is in agree-
ment with the very low resistivity values determined
at depths below 10 km during a magnetotelluric
exploration of Sousaki geothermal area (Tzanis and
Lagios, 1993). The presence of this mantle material
and the extensional stress field are probably the main
causes of the thin crustal thickness in the Saronikos
region observed by Makris et al. (2004a).
At the depth of 17 km, the velocity increases
considerably. As it is shown in the cross sections of
Fig. 6, the thickness of the crust is restricted down
0.0 0.3 0.5 0.8
0.0 0.3 0.5 0.8
0.0 0.3 0.5 0.8 1.0
0.0 0.3 0.5 0.8 1.0
0.0 0.3 0.5 0.8 1.0
0.0 0.3 0.5 0.8 1.0Depth 1.0 km
Depth 3.5 km
Depth 7 km
Depth 12 km
Depth 17 km
Depth 22 km
22.823
23.223.4
23.6 23.824 24.2
37.5
38
22.823
23.223.4
23.6 23.824 24.2
37.5
38
22.823
23.223.4
23.6 23.824 24.2
37.5
38
22.823
23.223.4
23.6 23.824 24.2
37.5
38
22.823
23.223.4
23.6 23.824
24.2
37.5
38
22.823
23.223.4
23.6 23.824 24.2
37.5
38
Fig. 7. The diagonal elements of the Resolution matrix are shown, corresponding to the layers where the grid was applied.
G. Drakatos et al. / Tectonophysics 400 (2005) 55–65 63

to 20 km. Despite the slight influence of the initial
velocity model in the results of the tomography, the
low thickness in the region of Saronikos Gulf is
also supported by active seismic observations. This
could be the result of the extensional stress field,
which dominates in the region at present, as well as
of the intrusion of mantle material in the volcanic
arc.
Acknowledgements
The authors are grateful to Dr. F. Haslinger and Dr.
C. Chiarabba for their constructive comments and
suggestions. This study was partially supported by the
Earthquake Planning and Protection Organisation and
the General Secretariat for Research and Technology
of Greece.
References
Aki, K., Lee, W.H.K., 1976. Determination of three-dimensional
velocity anomalies under a seismic array using first P arrival
times from local earthquakes: 1. A homogeneous initial model.
J. Geophys. Res. 81, 4381–4399.
Alessandrini, B., Beranzoli, L., Drakatos, G., Falcone, C., Kar-
antonis, G., Mele, F., Stavrakakis, G., 1997. Back arc basins and
P-wave crustal velocity in the Ionian and Aegean regions.
Geophys. Res. Lett. 24 (5), 527–530.
Brooks, M., Clews, J.E., Melis, N.S., Underhill, J.R., 1988.
Structural development of Neogene basins in western Greece.
Basin Res. 1, 129–138.
Dewey, J.F., Sengor, C.A.M., 1979. Aegean and surrounding
regions: complex multiplate and continuum tectonics in a
convergent zone. Bull. Geol. Soc. Am. 90, 84–92.
Drakatos, G., Drakopoulos, J., 1991. 3-D velocity structure beneath
the crust and upper mantle of the Aegean Sea region. Pure Appl.
Geophys. 135, 401–420.
Drakatos, G., Karantonis, G., Stavrakakis, G., 1997. P-wave crustal
tomography of Greece with the use of an accurate two-point ray
tracer. Ann. Geofis. XL (1), 25–36.
Drakatos, G., Melis, N., Papanastassiou, D., Karastathis, V.,
Papadopoulos, G., Stavrakakis, G., 2002. 3-D velocity structure
from inversion of local eartquake data in Attiki (Central Greece)
region. Nat. Hazards 27, N1–N2.
Eberhart-Philips, D., 1986. Three-dimensional velocity structure in
Northern California coast ranges from inversion of local
earthquake arrival times. Bull. Seismol. Soc. Am. 76 (4),
1025–1052.
Eberhart-Philips, D., 1990. Three-dimensional P and S velocity
structure in the Coalinga region, California. J. Geophys. Res. 95,
15343–15363.
Institute of Geology and Mineral Exploration, 1989. Geological
Map of Greece (scale 1:50,000).
Klein, F., 1989. User’s Guide to HYPOINVERSE, a program for
VAX computers to solve for earthquake locations and magni-
tudes. U.S. Geol. Surv., Open-File Rep., 89–314.
Le Pichon, X., Angelier, J., 1979. The Hellenic arc and trench
system: a key to the neotectonic evolution of the eastern
Mediterranean region. Tectonophysics 60, 1–42.
Ligdas, C.N., Main, I.G., 1991. On the resolving power of
tomographic images in the Aegean area. Geophys. J. Int. 107,
197–203.
Makris, J., Moeller, L., 1990. An Ocean Bottom Seismograph for
general use. Technical requirements and applications. In:
Hoefeld, J., Mitzlaff, A., Polomsky, S. (Eds.), Proc. Symp.
bEurope and the SeaQ, Hamburg.
Makris, J., Papoulia, J., Ilinski, D., Karastathis, V., 2004a. Crustal
study of the Saronikos–Corinthiakos basins from wide aperture
seismic data: intense crustal thinning below the Saronikos basin.
X Conference of the Hellenic geological society, Thessaloniki,
Greece. Abstracts.
Makris, J., Papoulia, J., Drakatos, G., 2004b. Tectonic deformation
and microseismicity of the Saronikos Gulf, central Greece.
BSSA 94 (3), 920–929.
Makropoulos, K., Drakopoulos, J., Latoussakis, J., 1989. A revised
and extended earthquake catalog for Greece since 1900.
Geophys. J. Int. 98, 391–394.
McKenzie, D.P., 1978. Active tectonics of the Alpine–Himalayan
belt: the Aegean sea and surrounding regions. Geophys. J. R.
Astrol. Soc. 55, 217–254.
Nolet, G., 1978. Simultaneous inversion of seismic data. Geophys.
J. Roy. Astron. Soc. 55, 679–691.
Papadopoulos, G.A., Drakatos, G., Papanastassiou, D., Kalogeras,
I., Stavrakakis, G., 2000. Preliminary results about the
catastrophic earthquake of 7 September 1999 in Athens. Greece
Seismol. Res. Lett. 17 (3), 318–329.
Papanastassiou, D., Stavrakakis, G., Drakatos, G., Papadopoulos,
G., 2000. The Athens, September 7, 1999, Ms=5.9, earth-
quake: first results on the focal properties of the main shock
and the aftershock sequence. Ann. Geol. Pays Hellen. 38 (B),
73–88.
Papanikolaou, D., Lykousis, V., Chronis, G., Pavlakis, P., 1988. A
comparative study of neotectonic basins across the Hellenic arc:
the Messiniakos, Argolicos, Saronikos and Southern Evoikos
Gulfs. Basin Res. N1, 167–176.
Papazachos, B.C., Papazachou, K., 1997. The Earthquakes of
Greece. Zitti Publ., Thessaloniki, p. 304.
Papazachos, C.B., Hatzidimitriou, P.M., Panagiotopoulos, D.G.,
Tsokas, G.N., 1995. Tomography of the crust and upper mantle
in south-east Europe. J. Geophys. Res. 100 (B7), 1242–12405.
Pavlides, S.B., Papadopoulos, G., Ganas, A., 2002. The fault that
caused the Athens September 1999 Ms=5.9 earthquake: field
observations. Nat. Hazards 27, N1–N2.
Pavlis, G.L., Booker, J., 1983. A study of importance on non-
linearity in the in the inversion of earthquake arrival time data
for velocity structure. J. Geophys. Res. 88, 5047–5055.
Spakman, W., 1986. Subduction beneath Eurasia in connection with
the Mesozoic Tethys. Geol. Mijnbow 65, 145–153.
G. Drakatos et al. / Tectonophysics 400 (2005) 55–6564

Spakman, W., Wortel, M.J.R., Vlaar, N.J., 1988. The Hellenic
subduction zone: a tomographic image and its dynamic
implications. Geophys. Res. Lett. 15, 60–63.
Thurber, C.H., 1983. Earthquake locations and three-dimensional
structure in the Coyote Lake area, Central California. J.
Geophys. Res. 88, 8226–8236.
Tzanis, A., Lagios, E., 1993. Magnetotelluric exploration of Sousaki
geothermal prospect, Corinth Prefecture, Greece: the first
results. Proc. 2nd Congress of the Hell. Geophys. Un., 5–7
May 1993, Florina (Greece) 2–3, 229–243.
G. Drakatos et al. / Tectonophysics 400 (2005) 55–65 65


