Embed Size (px)
Citation preview

Full Terms & Conditions of access and use can be found athttp://www.tandfonline.com/action/journalInformation?journalCode=uemj20
Download by: [73.11.63.112] Date: 10 December 2015, At: 00:13
Engineering Management Journal
ISSN: 1042-9247 (Print) 2377-0643 (Online) Journal homepage: http://www.tandfonline.com/loi/uemj20
A Conceptual Map of the Lean Nomenclature:Comparing Expert Classification to the LeanLiterature
Waleed K. Mirdad & Chinweike I. Eseonu
To cite this article: Waleed K. Mirdad & Chinweike I. Eseonu (2015) A Conceptual Map of theLean Nomenclature: Comparing Expert Classification to the Lean Literature, EngineeringManagement Journal, 27:4, 188-202, DOI: 10.1080/10429247.2015.1082068
To link to this article: http://dx.doi.org/10.1080/10429247.2015.1082068
Published online: 08 Dec 2015.
Submit your article to this journal
View related articles
View Crossmark data

A Conceptual Map of the Lean Nomenclature: Comparing ExpertClassification to the Lean Literature
Waleed K. Mirdad, Oregon State University & King Abdulaziz UniversityChinweike I. Eseonu, Oregon State University
Abstract: Although the implementation of lean can yieldimprovements in organizational performance, the literature sug-gests that most organizations are unable to effectively sustain theresults from lean implementation efforts. The lack of clarityrelated to lean concepts may be a cause of unsuccessful imple-mentation. In this work, we seek to clarify conceptual ambiguityin the lean nomenclature. Using an extensive literature review,we document lean principles, practices, and performance mea-sures. Results from a survey of lean experts were used to inves-tigate the relationship between lean principles and practices.Findings from the literature and from the expert survey weresynthesized to develop a visual representation of the leannomenclature. This conceptual map is intended to aid practi-tioners by increasing clarity of important lean concepts andthus, the probability of successful implementation.
Keywords: Lean Concepts, Lean Performance, Lean Imple-mentation, Lean Measures, Lean Context, and LeanFramework
EMJ Focus Areas: Continuous Improvement, OperationsManagement, Organizational and Performance Assessment,Strategic Management
The lean improvement approach seeks to maximize cus-tomer value through an iterative system of ContinuousImprovement and Employee Involvement in improve-
ment projects. Toyota used lean process management to com-bine the advantages of craft manufacturing with those of massmanufacturing, while adding new concepts, such as Just-in-Timeand Zero Inventory, to generate the Toyota Production System(TPS) (Womack, Jones, & Roos, 1990), widely considered as thebenchmark for lean success.
The literature contains many definitions of lean success. Inthis article, lean success is defined as achieving and sustaininglean benefits and a culture of continuous improvement, beyondinitial implementation outcomes. Successful lean implementa-tions increase value, as perceived by customers, while improvingorganizational profitability and employee citizenship behavior(Karim & Arif-Uz-Zaman, 2013). However, relatively few orga-nizations achieve successful lean implementation. For instance,only 26% of lean projects were successful in U.S. manufacturingcompanies (n = 10,000 companies representing 22 manufactur-ing sectors) (Blanchard, 2007; Pay, 2008). Prior studies alsofound that truly lean jobs constitute only 2% of jobs in U.S.manufacturing (Sheridan, 2000) and in the automotive industry(Liker, 2006). Other researchers have reported similar findingsin the U.K. (see Baker, 2002; Bhasin, 2008; Gupta & Kundra,2012), suggesting that the challenge of sustaining improvementsachieved with lean is not unique to the U.S.
The literature identifies a number of factors that affect leanimplementation, including lean behaviors (Emiliani, 1998), leanleadership and culture (Worley & Doolen, 2006), and the natureand quality of continuous improvement training (Wiseman,Eseonu, & Doolen, 2014). Lean adopters often select inappropri-ate lean strategies (Anvari, Ismail, & Hojjati, 2011), use thewrong tool to solve problems (Pavnaskar, Gershenson, &Jambekar, 2003), rely solely on financial measures (Bhasin,2008), or lack synchronization between lean goals and actualpractices (Karim & Arif-Uz-Zaman, 2013).
It is often the case that managers who seek to implement aneffective lean culture lack a complete or consistent understand-ing of lean concepts (Anand & Kodali, 2009; Mohanty, Yadav, &Jain, 2007). Thus, there is a need to clarify the lean nomencla-ture, including principles, practices, and performance measures,in an easily accessible format that removes ambiguity in order tofacilitate successful implementation (Pavnaskar et al., 2003).
The focus of this article is on addressing the apparent lackof conceptual clarity that is characteristic of maturing fields ofresearch, such as lean process management. Specifically, a con-ceptual map is used to define lean principles and practices anddepict relationships between them. A conceptual map is “adiagram that depicts suggested relationships between concepts”(Hager & Corbin, 1997, p. 163). Exhibit 1 illustrates the stepstaken in this research to create the conceptual map.
The next section provides an explanation of lean concepts,including the principles, practices, and performance measuresassociated with lean implementation. The third section describesthe process used to develop and validate the lean conceptual map.The final section provides conclusions, identifies limitations of thisstudy, and includes suggested areas for future research.
Background and Relevant LiteratureLean manufacturing was initially created to be applied in theautomotive industry (Womack et al., 1990). Successful imple-mentation and outcomes at companies like Toyota led to thespread of lean practices across other industries (Anand &Kodali, 2009). In the mining industry, Dunstan, Lavin, andSandford (2006) found that lean resulted in reduced absentee-ism, from 3.4 to 1.8%, and savings of $2 million (Dunstan et al.,2006). In steel processing, Dhandapani, Potter, and Naim (2004)found that lean resulted in lead time reduction by 50%. Similarbenefits have also been documented in other industries, such asaerospace (Parry & Turner, 2006) and electronics manufacturing(Doolen & Hacker, 2005).
Lean is broadly associated with higher and faster through-put, better product quality, and on-time delivery of finishedgoods (Eswaramoorthi, Kathiresan, Prasad, & Mohanram,2010; Goyal & Deshmukh, 1992). The literature also identifiescommon benefits of lean that include better product quality,reduced inventory levels, customer satisfaction, shorter lead
Refereed Research Manuscript. Accepted by Associate Editor Wiljeana Glover.
188 Engineering Management Journal Vol. 27 No. 4 December 2015
Dow
nloa
ded
by [7
3.11
.63.
112]
at 0
0:13
10
Dec
embe
r 201
5

time, lower cost of quality, and overall improvements in com-petitive advantage (Fullerton & McWatters, 2001; MacDuffie,Sethuraman, & Fisher, 1996; Shah & Ward, 2003).
Given the lean benefits documented in the literature, it is ofconcern that these benefits are not consistently realized due to therate of lean implementation failure (Blanchard, 2007; Gupta &Kundra, 2012). Womack et al. (1990) argue that system-widelean implementation is necessary for successful lean implementa-tion. In support of this position, Anvari, Zulkifli, Yusuff, Ismail,andHojjati (2011) identify incomplete or incorrect lean implemen-tation strategies as a primary driver of the high rate of lean imple-mentation failure.
The risk of failed implementation will persist without clar-ification of the lean nomenclature. The lean nomenclatureincludes principles, practices/tools/techniques, and performancemeasures associated with lean. The apparent lack of agreementon lean nomenclature in the literature remains an obstacle tostandard conceptualization of lean, and, by extension, successfullean implementation. Several authors give different definitions oflean, along with differing descriptions of lean principles, prac-tices, and performance measures. In this article, a survey of leanexperts is used to develop a map of the lean nomenclatureobtained from the literature. This map includes classificationof the nomenclature into three categories—principle, practice/tool/technique, or performance measure—and clarification ofthe relationships across each category. Findings from the litera-ture and a survey of lean experts are used to develop a visualconceptual map to guide those involved with lean transforma-tion. As a foundation for this research, the next section containsa discussion of lean principles.
Lean PrinciplesNicholas (2011) defines lean principles as a set of beliefs andassumptions that drive operational decisions and determineactions about products and processes. Specifically, principlesare fundamental rules that manage proper implementation andoperation in a lean process. One must note that these definitionshinge on a system of beliefs and assumptions. In essence, the testof true lean process improvement is the organizational cultureand principles that undergird change. To this end, Womack,Jones, and Roos (1990) identified five key principles for achiev-ing a lean production system:
1. Specify Value: Identify what customers want (and/or arewilling to financially support);
2. Identify the Value Stream: Identify activities that, whenperformed correctly, satisfy customer wants (activities thatprovide value);
3. Flow: Create continuous, interruption-free work processesacross value-adding activities;
4. Pull: Produce only in response to customer demand;5. Continuous Improvement: Generate, test, and implement
process refinements in an ongoing drive for perfection.
Principles are operationalized through a set of practices,which are activities aimed at improving an organization (Dean& Bowen, 1994; Karlsson & Åhlström, 1997). FollowingWomack and Jones (2003), Karlsson and Åhlström (1996) iden-tified nine lean principles (Elimination of Waste, ContinuousImprovement, Zero Defects, Just-in-Time, Pull Instead of Push,Multifunctional Teams, Decentralized Responsibilities, Inte-grated Functions, and Vertical Information Systems). Thereafter,Sánchez and Pérez (2001) built on this work by designing achecklist of 36 indicators that measure lean performance. Sán-chez and Pérez (2001) also added Supplier Integration to theprinciples defined by Karlsson and Åhlström (1996).
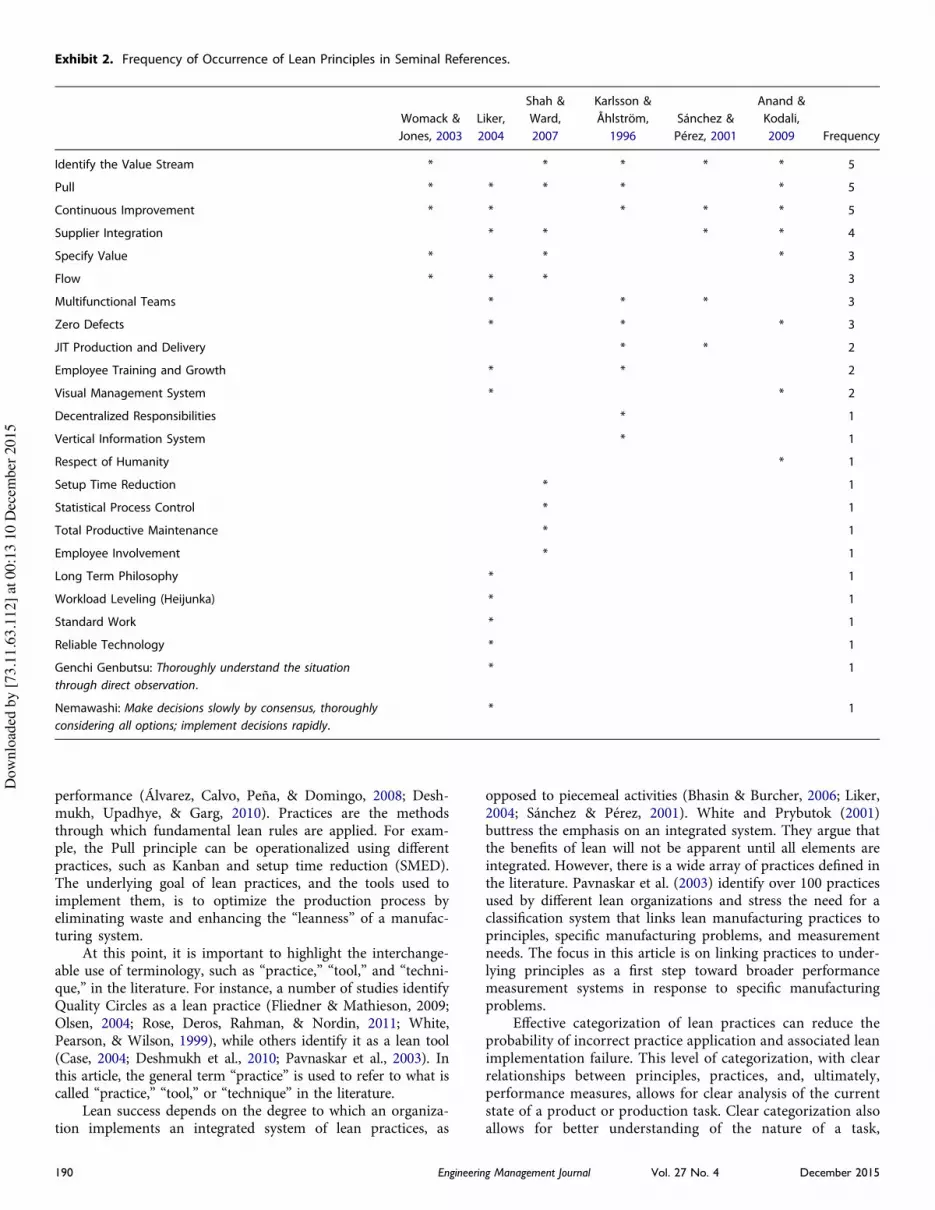
More recently, Anand and Kodali (2009) questioned thebasis of the lean principles defined by Karlsson and Ahlström,arguing against inclusion of Multifunctional Teams, InformationSystems, and Decentralization, due, in part, to the potential forconfusion with other improvement approaches, such as TotalQuality Management and Six Sigma. Anand and Kodali proposedthe following principles as replacements: Respect for Humanity,Visual Management System, Customer Focus, and Supplier Inte-gration. Other authors have published variations of these lists oflean principles. As an example of seminal works, Liker (2004)culminated two decades of research at a Toyota facility by pub-lishing key principles that drive the practices of the ToyotaProduction System and the management of Toyota. Closer tooperationalization, Shah and Ward (2007) presented 10 opera-tional factors that represent ten dimensions of a lean system.Exhibit 2 summarizes the lean principles identified by Liker(2004), Shah and Ward (2007), and other seminal works. Selec-tion of seminal works was based on the number of citations andinitiation of new ideas or approaches to lean implementation.
The five principles identified by Womack and Jones (1990,2003), in addition to Supplier Integration, MultifunctionalTeams, and Zero Defects, represent approximately 60% of theprinciples identified in the review of the literature. However, thelack of agreement in the lean nomenclature extends beyondidentification of lean principles. There are also apparent varia-tions in classification of lean principles, practices/tools/techni-ques, and performance measures. For instance, Anand andKodali (2009) and Liker (2004) consider Visual ManagementSystem (VMS) as a lean principle, while other researchers iden-tify VMS as a lean practice (e.g., Black, 2007; Fliedner & Mathie-son, 2009; Gupta & Kundra, 2012; Mejabi, 2003). The variabilityin specification of the lean nomenclature propagates confusionamong practitioners who seek to adopt lean principles withintheir organizations. Practices are the tangible mechanisms usedto operationalize and implement principles. The following sec-tion describes the lack of agreement in classification of leanpractices in the literature.
Lean PracticesLean principles are implemented by applying lean practicesand performance measures to improve process flow and overall
Exhibit 1. Research Approach in this Work.
Engineering Management Journal Vol. 27 No. 4 December 2015 189
Dow
nloa
ded
by [7
3.11
.63.
112]
at 0
0:13
10
Dec
embe
r 201
5
performance (Álvarez, Calvo, Peña, & Domingo, 2008; Desh-mukh, Upadhye, & Garg, 2010). Practices are the methodsthrough which fundamental lean rules are applied. For exam-ple, the Pull principle can be operationalized using differentpractices, such as Kanban and setup time reduction (SMED).The underlying goal of lean practices, and the tools used toimplement them, is to optimize the production process byeliminating waste and enhancing the “leanness” of a manufac-turing system.
At this point, it is important to highlight the interchange-able use of terminology, such as “practice,” “tool,” and “techni-que,” in the literature. For instance, a number of studies identifyQuality Circles as a lean practice (Fliedner & Mathieson, 2009;Olsen, 2004; Rose, Deros, Rahman, & Nordin, 2011; White,Pearson, & Wilson, 1999), while others identify it as a lean tool(Case, 2004; Deshmukh et al., 2010; Pavnaskar et al., 2003). Inthis article, the general term “practice” is used to refer to what iscalled “practice,” “tool,” or “technique” in the literature.
Lean success depends on the degree to which an organiza-tion implements an integrated system of lean practices, as
opposed to piecemeal activities (Bhasin & Burcher, 2006; Liker,2004; Sánchez & Pérez, 2001). White and Prybutok (2001)buttress the emphasis on an integrated system. They argue thatthe benefits of lean will not be apparent until all elements areintegrated. However, there is a wide array of practices defined inthe literature. Pavnaskar et al. (2003) identify over 100 practicesused by different lean organizations and stress the need for aclassification system that links lean manufacturing practices toprinciples, specific manufacturing problems, and measurementneeds. The focus in this article is on linking practices to under-lying principles as a first step toward broader performancemeasurement systems in response to specific manufacturingproblems.
Effective categorization of lean practices can reduce theprobability of incorrect practice application and associated leanimplementation failure. This level of categorization, with clearrelationships between principles, practices, and, ultimately,performance measures, allows for clear analysis of the currentstate of a product or production task. Clear categorization alsoallows for better understanding of the nature of a task,
Exhibit 2. Frequency of Occurrence of Lean Principles in Seminal References.
Womack &Jones, 2003
Liker,2004
Shah &Ward,2007
Karlsson &Åhlström,1996
Sánchez &Pérez, 2001
Anand &Kodali,2009 Frequency
Identify the Value Stream * * * * * 5
Pull * * * * * 5
Continuous Improvement * * * * * 5
Supplier Integration * * * * 4
Specify Value * * * 3
Flow * * * 3
Multifunctional Teams * * * 3
Zero Defects * * * 3
JIT Production and Delivery * * 2
Employee Training and Growth * * 2
Visual Management System * * 2
Decentralized Responsibilities * 1
Vertical Information System * 1
Respect of Humanity * 1
Setup Time Reduction * 1
Statistical Process Control * 1
Total Productive Maintenance * 1
Employee Involvement * 1
Long Term Philosophy * 1
Workload Leveling (Heijunka) * 1
Standard Work * 1
Reliable Technology * 1
Genchi Genbutsu: Thoroughly understand the situationthrough direct observation.
* 1
Nemawashi: Make decisions slowly by consensus, thoroughlyconsidering all options; implement decisions rapidly.
* 1
190 Engineering Management Journal Vol. 27 No. 4 December 2015
Dow
nloa
ded
by [7
3.11
.63.
112]
at 0
0:13
10
Dec
embe
r 201
5

including the resources needed, resources allocated, and theextent to which lean practices are being effectively applied(Pavnaskar et al., 2003).
Based on the literature review conducted in this study, 200lean practices were extracted from 22 different studies. Thiswealth of un-categorized lean approaches could, in fact,increase the probability of mistakenly applying the wronglean practice in attempts to resolve a problem. Due to spaceconstraints, the most frequently cited lean practices from theliterature are displayed in Exhibit 3. However, these practicesare explored and analyzed in more depth throughout thisarticle.
Performance measures are an important means of incenti-vizing process transformation. To this end, lean performancemeasures are required to help organizations and managers effec-tively diagnose areas in need of improvement. There remains aneed to relate lean practices to lean principles and to regularlymeasure performance to assess the effectiveness of practicesimplemented with the intent of improving performance of theintegrated lean(er) system.
Lean Performance MeasuresNeely, Gregory, and Platts (1995) define a performance mea-sure as a metric used to quantify the efficiency and/or effec-tiveness of an action. Surveys are a common method in theliterature of assessing “leanness” of an organization and evalu-ating overall success in becoming lean. Most surveys measurethe adoption and level of implementation of lean principles(Doolen & Hacker, 2005; Soriano-Meier & Forrester, 2002;Upton, 1998). Other studies have created quantitative modelsto reduce the effect of respondent bias. These quantitativemodels calculate indexes that represent lean adoption byusing techniques, such as simulation (Detty & Yingling, 2000;Lummus, 1995), fuzzy logic (Bayou & De Korvin, 2008; Beh-rouzi & Wong, 2011), or linear programming (Wan & Chen,2008).
The literature identifies a variety of methods, includingspecific performance measures, used to assess success in leanmanufacturing. Resulting from the literature review for thiswork, 250 different lean performance measures were identified,with the most frequently cited shown in Exhibit 4. Althoughonly the most frequently-cited practices and performance
measures are shown in Exhibits 3 and 4, respectively, a morecomplete list of practices and performance measures will beexplored and developed throughout this article. The followingsection outlines the methodology used for data collection andanalysis.
MethodologyThe researchers used a literature review and survey of lean expertsto identify lean principles, practices, and performance measuresand to map connections between each of the three categories(principles, practices, and performance measures). An extensivereview of the lean literature was used to identify papers that definelean principles, practices, and performance measures. First, paperswere identified using the following search terms in EBSCO: leanconcepts, lean performance, lean implementation, lean measures,lean context, and lean framework. Second, the researchers identi-fied the most relevant papers by using online academic citationindexing and search services, such as theWeb of Science. TheWebof Science was used to conduct an analysis of the citations for eachpaper, including identifying the number of citations of each paper.Finally, Google Scholar was used to validate the number of citationslisted in the Web of Science and to identify any new relatedpublications. Google Scholar often includes more citation countsand papers than the Web of Science, which helped ensure that norelevant works were ignored.
Sample SelectionTo strengthen validity of the initial conceptual map presented inExhibit 5, the research team invited 156 lean experts to evaluateinformation from the literature used to generate the map. Theinformation evaluated in the expert survey refers to the content,categories (principles, practices/tools/techniques, and performance
Exhibit 4. Most Frequently-Cited Lean Performance Measures fromthe Literature.
Performance Measures Frequency
Setup Time 21
Scrap and Rework Costs 15
Amount of Finished Goods Inventory 14
Supplier or Delivery Lead Time 14
Percentage of Products Delivered on Time 12
Throughput Time or Manufacturing Lead Time 12
Percentage of Employees Affected by Problem Induced LineStoppages (per occurrence and per specified period)
10
Labour Productivity 8
Work in Process (WIP) Inventory 8
Pull Ratio (proportion of stations that use Pull) 8
Frequency of Preventive Maintenance 7
Manufacturing Cost per Unit 7
Number of Kanbans 7
Percentage of Employee Suggestions that have beenImplemented (measure of openness to employee input)
7
Unscheduled Downtime Ratio (proportion of downtimeevents that are unexpected)
7
Exhibit 3. Most Cited Lean Practices From the Literature.
Practice Frequency
Total Productive Maintenance 19
Setup Time Reduction (SMED) 19
Cellular Manufacturing 13
Kanban 13
Standard Work 10
Small Lot Sizes 10
Poka Yoke (Mistake Proofing) 10
5 S 9
Total Quality Management 9
Quality Circles 8
Engineering Management Journal Vol. 27 No. 4 December 2015 191
Dow
nloa
ded
by [7
3.11
.63.
112]
at 0
0:13
10
Dec
embe
r 201
5

measures), and relationships between categories in the conceptualmap. The survey was designed using the Qualtrics web-basedsurvey software. Invitations to participate in the study were elec-tronically sent to each of the 156 lean experts. To incentivizeresponse, the research team offered participants the chance towin an Amazon Kindle. Each participant was entered into thecompetition using his or her email address. The researchers alsopromised to share aggregate results. Participants were asked torespond online by using a web link provided in the e-mail.
Lean experts invited to participate in the survey wereselected using two methods. The first method was evaluationof Curriculum Vitaes (CVs) of academic experts who hadauthored at least one peer-reviewed journal paper related tolean manufacturing; the research team reviewed each CV toensure a research and publication history in lean manufacturing.The second method was the invitation of attendees in a trackfocused on lean at the 2013 International Annual Conference ofthe American Society for Engineering Management. Attendeeswere invited to participate after a presentation of the initialconceptual map by the authors. Given the nature of researchconferences in which attendees participate in sessions based onresearch, or passing, interest, it is possible that individualsrecruited through the second method had variable familiarityand experience with lean research and practice. Individualsrecruited using the second method were asked to invite indivi-duals in their network who might be more conversant with leanto participate in the survey. For instance, graduate students wereasked to pass the survey on to their advisors, and a departmenthead was invited to pass the survey on to faculty conducting leanresearch at his university.
Survey DesignA total of 200 practices and 250 performance measures wereidentified from the literature review. Microsoft Excel Spread-sheets were used to compile and filter the lean practices andperformance measures based on the number of times eachpractice was mentioned in the literature. The compilation andfiltering process was repeated for lean performance measures.
Due to the large number of practices and performance measures,only the most frequently cited practices and measures were usedin this work. For this research, an item (i.e., a principle, practice,or performance measure) was selected from the literature for thedevelopment of the lean nomenclature if it was mentioned infour or more of the selected papers used in the literature review.This selection process resulted in a more focused list of 32practices and 55 performance measures. Items were then orga-nized into a high-level conceptual map (Exhibit 5), based on thelean principles specified by Womack and Jones (1990, 2003)(Specify Value, Identify the Value Stream, Pull, Flow, andContinuous Improvement). The goal of the conceptual map isto clarify the lean nomenclature based on the relationshipbetween each principle and practice, and between each princi-ple and performance measure, in a manner that facilitatesselection of a practice or performance measure. It is importantto note that the preliminary conceptual map is based on asso-ciation with lean principles, and not association between prac-tices and performance measures.
Expert participants were primarily individuals from theacademic field. Forty-nine experts responded to the survey,representing a 31% response rate. The survey was designed toallow use of data provided from incomplete surveys. Forinstance, information provided by participants who onlyresponded to the section on lean principles remains useful forpopulating the lean conceptual map through their evaluation ofthe principles within the initial conceptual map.
Categorization of Lean PrinciplesIn the first categorization task, respondents were presented with alist of the 25 items in Exhibit 3, all of which had been presented inthe literature as a lean principle. Each expert was asked to classifyeach item into one of three categories: “lean principle,” “leanpractice,” and “not related to lean.” Definitions of items wereprovided to ensure clarity and consistency of terms, as well asreliability of results. A list of these definitions is available at http://research.engr.oregonstate.edu/pigroup/biblio/lean-terms. Results
Exhibit 5. An Overview of Initial Lean Conceptual Map.
192 Engineering Management Journal Vol. 27 No. 4 December 2015
Dow
nloa
ded
by [7
3.11
.63.
112]
at 0
0:13
10
Dec
embe
r 201
5

from the first categorization task were then used to identify anexpert-defined list of lean principles (see Exhibit 6). The expert-defined list is the basis for the final conceptual map at the end ofthis article. “Identify the Value Stream” is absent from the expert-defined list of principles, because 62% of respondents classifiedValue Stream Specification (Identify the Value Stream) as apractice.
To complete the second categorization task, each expert waspresented with a summary of the items s/he had classified as a “leanpractice” in the first categorization task. Each expert was then askedto list any additional practices s/he felt was missing based onprevious experience with lean. Performance measures were notincluded in the survey questions. In the third categorization task,each expert was asked to match each practice on their complete listof practices (including any they added in the second categorizationtask) to any corresponding lean principles. The results from thismatching in the third categorization task were used as input tocreate a revised conceptual map, which is discussed later in thisarticle. Through this process, the research team identified six leanprinciples and 48 lean practices. These expert-defined principlesare the basis of the revised conceptual map discussed later. Thefollowing section contains an explanation of the process throughwhich each practice was associated with a lean principle.
After data were collected and analyzed from the survey of leanexperts, the results were used to evaluate overall classification ofitems from the literature and to identify items for which there wasvariation in perceptions across lean experts. The results werecategorized into four groups: lean principles (Group 1), lean prac-tices/tools/techniques (Group 2), difficult to categorize (Group 3),and not related to lean (Group 4). None of the items in Exhibit 2received 100% agreement on classification by the experts. Thus, theresearchers developed the logic in the flow chart shown in Exhibit 7to categorize the lean nomenclature based on responses to thesurvey of lean experts.
For example, Specify Value is considered a lean principle by71% of the experts, a lean practice by 25%, and not related to leanby 4%. As a result, Specify Value is categorized as a lean principlebecause 71% is greater than the sum of 25% and 4%. However, it isdifficult to categorize Employee Training and Growth because thehighest percentage is 48% (lean practice), which is lower than thesum of 15% (lean principle) and 37% (not related to lean).
The first group in Exhibit 8 (Pull, Continuous Improve-ment, Specify Value, Flow, Zero Defects, and Respect ofHumanity) represents lean principles based on the classificationby the lean experts who participated in this survey. Surveyrespondents’ views differed from the literature that identifiesIdentify the Value Stream, Supplier Integration, and Multifunc-tional Teams as lean principles. This might be due to the
association of the process of defining the value stream with theValue Stream Mapping practice, which is subordinate to theSpecify Value principle.
Supplier Integration is a practice used to achieve Flow and,by extension, Pull Systems. Finally, the creation of Multifunc-tional Teams increases awareness of operations beyond an indi-vidual’s workspace. Teams of this nature can improveorganizational resilience through shared knowledge and createa climate in which individuals have sufficient knowledge andcross-functional skill to support Continuous Improvement.Exhibit 8 contains the classification of lean nomenclaturebased on responses to the survey of lean experts.
The results in Exhibit 8 are of interest because the leannomenclature included in the survey had been presented in theliterature as lean principles (Exhibit 2). However, the lean expertsclassified only six of these as lean principles (Exhibit 8, Group 1).Six items were difficult to categorize because of the high level ofdisagreement between lean experts (Exhibit 8, Group 3). For exam-ple, Long Term Philosophy is considered a lean principle by 44% ofthe experts, but considered as not related to lean by 48% of theexperts surveyed. While a Long Term Philosophy is an importantcultural trait for a successful and sustained Continuous Improve-ment mindset in the face of declining productivity, it does notdirectly address the underlying issues of waste reduction andvalue optimization in ways that are substantially different fromexisting principles.
For instance, the Continuous Improvement mindset empha-sizes improving employee skills, which might be challenging inperiods of economic downturn, but could improve organizationalresilience by empowering employees to prepare mitigation strate-gies for the next such period of economic downturn. In addition,the Specify Value principle also addresses the need for a Long TermPhilosophy through what a number of organizations call “truenorth” goals. True north goals can help decision-makers focus onlong-term value creation when faced with challenges that mightotherwise lead to reactionary behavior.
Exhibit 8, Group 2 includes 10 items that the survey respon-dents classified as lean practices. Total Productive Maintenanceis considered a practice by 93% of the experts; this represents thehighest level of agreement within the group. Employee Involve-ment is considered a practice by 52%, the lowest level in thegroup. Exhibit 8, Group 4 includes two items grouped as notrelated to lean (Vertical Information System and Reliable Tech-nology). This is an interesting finding because Karlsson andÅhlström (1996) consider Vertical Information System a leanprinciple, which they define as the principle of providing timelyinformation continuously and directly to all stakeholders andemployees in the production line.
Following categorization of the lean nomenclature based onexpert surveys, the next step was to compare responses to theliterature to validate responses and investigate discrepancies.Exhibit 9 highlights the disparity, and apparent disagreement,in conceptual understanding of lean and related nomenclaturebased on the comparison between survey responses and pub-lished literature. For instance, the literature lists Identify theValue Stream, Supplier Integration, and Multifunctional Teamsas lean principles, while the lean experts do not support thisclassification. Respect of Humanity is also considered a leanprinciple by 60.7% of the lean experts who participated in thesurvey. As shown in Exhibit 9, this designation has weak supportin the papers reviewed for this study. A simple majority—50%cutoff—was used to determine expert agreement on lean
Exhibit 6. Expert-defined List of Lean Principles.
Lean Principles
Pull
Continuous Improvement
Specify Value
Flow
Zero Defects
Respect of Humanity
Engineering Management Journal Vol. 27 No. 4 December 2015 193
Dow
nloa
ded
by [7
3.11
.63.
112]
at 0
0:13
10
Dec
embe
r 201
5

Exhibit 7. Criteria Used to Categorize the Lean Nomenclature.
Exhibit 8. Categorization of Lean Nomenclature from Survey of Lean Experts.
194 Engineering Management Journal Vol. 27 No. 4 December 2015
Dow
nloa
ded
by [7
3.11
.63.
112]
at 0
0:13
10
Dec
embe
r 201
5

principle classification. The following section describes themethod used to categorize lean practices.
Categorization of Lean PracticesThe data in this step were obtained from the categorization tasksin the expert survey in which the 49 respondents matchedpractices to principles. The items initially presented in thesurvey were created using lean practices obtained from theliterature. The items from Groups 2 and 3 in Exhibit 8 werethen added to the practices identified from the literature. Thisresulted in 48 lean practices, which were examined further inthis article. The goal was to categorize each lean practice under asuitable lean principle. Because the items in Group 4 were
classified as “not related to lean,” these items were removedfrom the revised lean conceptual map in Exhibit 11.
Exhibit 10 shows results from the categorization task com-pleted by the expert survey respondents for a randomly-selectedgroup of practices. Due to space constraints, Exhibit 10 does notinclude the entire group of practices considered in this work.Each cell in the table represents the percentage of experts whocategorized practice X under principle Y, given that the expertselected Y as a principle. For example, the Quality Circlespractice has a 22.2% of association with the Pull principlebecause 22.2% of the experts who selected Pull as a principlecategorized Quality Circles as a practice that supports the Pullprinciple.
Exhibit 10. Sample of Relationships between Lean Principles and Practices Based on Survey Responses.
Principles
PullContinuousImprovement Specify Value Flow Zero Defects
Respectof
Humanity
Level of Expert Agreement (Standardized Percentage)
Exam
ples
ofPractices
Quality Circles 22.2% 66.7% 33.3% 30.8% 87.5% 72.7%
(25.4%) (76.2%) (38.1%) (35.2%) (100%) (83.1%)
Self-directed Teams 16.8% 61.1% 25.0% 23.1% 75.0% 54.6%
(22.7%) (81.5%) (33.3%) (30.8%) (100%) (72.7%)
Small Lot Sizes 61.1% 27.9% 16.7% 53.9% 62.5% 9.1%
(97.9%) (44.4%) (26.7%) (86.2%) (100%) (14.6%)
Customer Relationship Management 11.1% 38.9% 66.7% 0.0% 37.5% 27.3%
(16.7%) (58.3%) (100%) (0.0%) (56.3%) (40.9%)
Value Stream Mapping 55.6% 44.4% 50% 53.9% 62.5% 9.1%
(88.9%) (71.1%) (80.0%) (86.2%) (100%) (14.6%)
JIT Production and Delivery 38.9% 16.7% 16.7% 30.8% 12.5% 9.1%
(100%) (42.9%) (42.9%) (79.1%) (32.1%) (23.4%)
Exhibit 9. A Comparison of the Definition of “Lean Principle” by the Literature and Lean Experts.
Lean principles outlinedin the literature
Level of expert agreementwith the literature on thelist of lean principles
Womack &Jones, 2003
Liker,2004
Shah &Ward, 2007
Karlsson &Åhlström, 1996
Sánchez &Pérez, 2001
Anand &Kodali, 2009 Frequency
Identify the Value Stream 37.9% * * * * * 5
Pull 72.4% * * * * * 5
ContinuousImprovement
79.3% * * * * * 5
Supplier Integration 28.6% * * * * 4
Specify Value 71.4% * * * 3
Flow 85.2% * * * 3
Multifunctional Teams 21.4% * * * 3
Zero Defects 53.6% * * * 3
Respect of Humanity 60.7% * 1
Engineering Management Journal Vol. 27 No. 4 December 2015 195
Dow
nloa
ded
by [7
3.11
.63.
112]
at 0
0:13
10
Dec
embe
r 201
5

Next, the researchers calculated standardized percentagesfor each principle-practice pairing by applying the followingformula:
Standardized percentage ¼ current percentage
" 100Maximum percentage for each practice
:(1)
For example, from Exhibit 10, given the practice of Self-directed Teams, 16.7% of experts identified this practice assupporting the Pull principle. Moreover, 61% state that theSelf-directed Teams practice supports Continuous Improve-ment, 25% argue it supports the Specify Value principle, 75%state it supports Zero Defects, and 54.6% state it supports theRespect of Humanity principle. This case illustrates the possibi-lity that respondents could select more than one principle thatthey felt a given practice supported. The maximum of thesepercentages, 75%, can then be used to calculate the standardizedpercentage for Self-directed Teams as a practice in support ofthe Pull principle.
0:17" 100:75
¼ 22:7%:
Next, the researchers categorized each practice as supporting aprinciple if the standardized percentage for the practice-princi-ple pairing was greater than 80%. A practice did not support aprinciple if the associated practice-principle standardized per-centage was below 80%. For example, the Small Lot Sizes prac-tice supports the Pull (97.9%), Flow (86.2%), and Zero Defects(100%) principles. This high threshold attempts to address someof the issues of respondent experience due to the second methodof recruiting participants.
Finally, the researchers validated the categorization obtainedfrom the analysis of survey data, with categorizations obtainedfrom review of the lean literature. In this step, only two practices(Mixed Model Production and Group Technology) show dis-agreement with the classification in the literature based on Exhi-bit 10. Where there was disagreement with the literature, thepractices were re-categorized based on the literature.
Results and DiscussionExhibit 11 represents a summary of the final categorization oflean practices under the six lean principles in a final conceptualmap. The lean principles used were those defined from theexpert survey (as shown in Exhibit 6): Pull, ContinuousImprovement, Specify Value, Zero Defects, Flow, and Respectof Humanity.
The aim of this conceptual map is to provide an overview ofthe lean nomenclature in a manner that enhances conceptualagreement through visual means and facilitates implementation.It is important to note the number of dotted lines that extendfrom each principle. These lines lead to sets of practices that areshared across two or more lean principles. For example, severalpractices, such as U-shaped Cells, JIT Delivery by Supplier, JITProduction and Delivery, and Setup Time Reduction, are com-mon to the Flow and Pull principles.
Appendix 1 contains a matrix view of the conceptual mapfrom Exhibit 11. While the matrix view provides a simplifiedmapping of practices to principles, the map in Exhibit 11 ispreferable because the map supports the long-term drive forconceptual clarity about the extent to which lean principles are
intertwined. This interconnectedness occurs because severalpractices are shared by multiple principles. For example, theValue Stream Mapping practice is shared by Flow, Pull, ZeroDefects, and Specify Value principles, highlighting the high-impact role of this practice. This finding reinforces prescriptionsby Bhasin and Burcher (2006), Liker (2004), and Sánchez andPérez (2001) to implement all, or most, of the lean practices toensure successful implementation. The map in Exhibit 11 alsohighlights shared (or high-impact) practices, which address anumber of lean principles and provide useful starting points inlow resource situations.
As an improvement approach, lean represents an inte-grated socio-technical system directed by a set of principlesand practices (Mehta & Shah, 2005; Shah & Ward, 2007).Partial implementation (or, implementation of single practicesor a sub-set of practices) is a common challenge with leanimplementation attempts. A common error occurs when orga-nizations deem themselves lean after adopting a few practices,such as 5S or Value Stream Mapping. These practices areuseful, but the underlying cultural change is of higher impor-tance. Consequently, the lean conceptual map provides a usefulvisual map of the lean landscape in an attempt to clarifynomenclature and demonstrate relationships between principlesand practices.
Exhibit 11 depicts the lean improvement approach as acomplex, intertwined improvement process. During expert clas-sification of practices as supporting specific principles, the PokaYoke (Mistake Proofing) practice saw the highest level of agree-ment in its classification as supporting Zero Defects—100%. Anumber of other practices are shared among more than oneprinciple. For example, according to lean experts, the practiceof Quality Circles supports Continuous Improvement (66.7%),Zero Defects (87.5%), and Respect of Humanity (72.7%).
Additionally, Respect of Humanity is one of the uniquefeatures that differentiate lean manufacturing from traditional(mass production) manufacturing systems. The work methodsin mass manufacturing are traditionally monotonous, occur innoisy environments, and do not improve skills, as tasks arelargely repetitive. On the other hand, lean manufacturingfocuses on multi-skilled workers at all levels in the organization.
The Zero Defects principle is the most intertwined. Asshown in Exhibit 11, Zero Defects shares four practices withthe Flow principle (Autonomation, Lead Time Reduction, SmallLot Sizes, and Value Stream Mapping), three practices with Pull(Standard Work, Small Lot Sizes, and Value Stream Mapping),three practices with Respect of Humanity (Quality Circles, Self-directed Teams, and Employee Training and Growth Initiatives),and two practices with Specify Value (Value Stream Mappingand Customer Requirements Analysis). The importance of theZero Defects principle explains the relationship between leanconcepts and those of other improvement programs, such as SixSigma (Franco, Marins, & Silva, n.d.; Timans, Antony, Ahaus, &Van Solingen, 2011) and Total Quality Management.
Conclusions and Future WorkThe aim of this study was to clarify conceptual ambiguity in thelean nomenclature. In support of this aim, this article provides avisual representation of the lean nomenclature in the form of aconceptual map in Exhibit 11. While the map provides a neces-sary first step towards clarification, the results would bestrengthened through a larger sample of experts, inclusion ofperformance measures in the conceptual map, and in the list of
196 Engineering Management Journal Vol. 27 No. 4 December 2015
Dow
nloa
ded
by [7
3.11
.63.
112]
at 0
0:13
10
Dec
embe
r 201
5

lean terms evaluated by experts in the survey. The list of leanterms used in this work included only lean principles andpractices. The results would also be strengthened by considera-tion of practical scenarios in which the conceptual map could beused to guide lean implementation. The focus on practicalapplication is in response to the finding by Wiseman et al.(2014) that training success is closely related to the trainee’sability to apply, and to see the positive effect of, new approachesor skills on his or her work tasks beyond the initial period oflean implementation.
The conceptual map in Exhibit 11 suggests that there arehigh-impact lean practices, the focus on which could addressseveral lean principles simultaneously. It is often the case thatpractices are an easier means of introducing lean principles, so a5S project might be used to train a team of nurses on theimportance and value of visual workspace and flow.
Survey respondents selected Identify the Value Stream as alean practice. The similarity of this item to the Value StreamMapping (VSM) practice highlights the need for strategies thatdifferentiate both concepts—VSM as a practice and ValueStream Specification (Identify the Value Stream) as a principle.Future work should consider the effect of VSM practice on leanconceptualization and culture change. It is possible that effectiveValue Stream Mapping and analysis helps a wider range ofparticipants visualize the entire system, identify value, andexplore strategies for continuous improvement.
The experiences of survey respondents, while relevant inlight of their experience with researching lean processimprovement, do not fully represent the range of experienceacross the possible pool of lean experts. In future work,the research design could be improved with morerestrictive selection criteria to avoid the potential pitfalls of
recruitment through the research conference session on leanmanufacturing.
Future work should also consider determinants of lean fail-ure that have not been addressed here. The focus of this workhas been on the fundamental lack of clarity in the lean nomen-clature among researchers and practitioners. Other importantfactors that hinder the implementation of lean, such as cultureand leadership support, are opportunities for extending thisresearch. The individual determinants of cultural change, per-formance measures that reinforce the culture of lean, and stra-tegies for evaluating lean performance in advance of long-termresults or failed implementation, are additional areas forresearch aimed at improving successful lean implementation.
The next steps in this work include analysis of lean imple-mentation processes to evaluate the effectiveness of the concep-tual map, the extension of the conceptual map to includeperformance measures as part of a larger lean strategy map,and a focus on the cultural drivers of successful lean implemen-tation at the organizational and individual levels of analysis.
Future work will also use analysis of lean implementation toinvestigate the strength of practice-to-principle relationships.The analysis will include investigation of the causal relationshipsbetween lean principles. A look at causal relationships providesan indication of logical implementation procedures in responseto the “where do I start?” question.
Implications for Engineering ManagersThe conceptual map derived from this research could reduce theprobability of failed lean implementation due to misunderstand-ing of lean, which poses a significant challenge to lean imple-mentation (Sarhan & Fox, 2013). In addition to improvingunderstanding of the relationship between lean principles and
Exhibit 11. Lean Conceptual Map.
Engineering Management Journal Vol. 27 No. 4 December 2015 197
Dow
nloa
ded
by [7
3.11
.63.
112]
at 0
0:13
10
Dec
embe
r 201
5

practices, this article highlights the existence of high-impactpractices that an engineering manager can apply in pursuit ofmore than one lean principle in the attempt to increase buy-inamong employees by demonstrating small wins.
Clear, common nomenclature in the conceptual map (Exhibit11) provides a standard means of communicating with existingand new team members, explaining cause-and-effect relation-ships, and can guide task responsibility assignments. An engi-neering manager in charge of lean implementation can alsoincrease buy-in from team members if s/he is able to clearlyexplain how proposed changes affect tasks performed by anemployee. This explanation extends to the ability to effectivelyshow how the tasks performed by an employee impact the largerorganization. The conceptual map provides a tool for engineer-ing managers to increase knowledge, understanding, and use ofappropriate lean practices in pursuit of desired lean principles.
An engineering manager might be tempted to assume thatlean concepts are intuitive and easily grasped. Consequently,s/he might offer little or no training before lean implementation.This research and related literature suggest that long-term pro-cess improvement success requires collective vision and under-standing of the lean concepts being implemented. This approachof collective training, planning, and implementation, is applic-able for engineering managers who lead kaizen event teams (seeFarris, Van Aken, Doolen, & Worley, 2009), innovation and newproduct development environments (see Russell & Tippett,2008), in teams that assess the effectiveness of design tools (seeFarris, Van Aken, Letens, Ellis, & Boyland, 2007), and inattempts to manage efficient and effective Continuous Improve-ment training (see Wiseman et al., 2014). In these instances, theengineering manager can use the conceptual map as a tool forlean orientation.
Good engineers are often promoted to management posi-tions irrespective of training in personnel and process manage-ment. The engineering management literature can provide easilyaccessible tools that reduce wasted time and effort and increasethe chances of successful initiatives by engineering managers.This article has provided a clear link between cause (practice)and effect (desired lean principles) to enable engineering man-agers to effectively design and lead lean transformation efforts.
ReferencesÁlvarez, R., Calvo, R., Peña, M. M., & Domingo, R. (2008).
Redesigning an assembly line through lean manufacturingtools. The International Journal of Advanced ManufacturingTechnology, 43(9–10), 949–958.
Anand, G., & Kodali, R. (2009). Development of a frameworkfor lean manufacturing systems. International Journal ofServices and Operations Management, 5(5), 687–716.
Anvari, A., Ismail, Y., & Hojjati, S. M. H. (2011). A study on totalquality management and lean manufacturing: Through leanthinking approach. World Applied Sciences Journal, 12(9), 11.
Anvari, A. R., Zulkifli, N., Yusuff, R. M., Ismail, Y., & Hojjati, S. M.H. (2011). A proposed dynamic model for a lean roadmap.African Journal of Business Management, 5(16), 6727–6737.
Baker, P. (2002). Why is lean so far off? Works Management, 55(10), 26.
Bayou, M. E., & De Korvin, A. (2008). Measuring the leanness ofmanufacturing systems—A case study of Ford Motor Com-pany and general motors. Journal of Engineering and Tech-nology Management, 25(4), 287–304.
Behrouzi, F., & Wong, K. Y. (2011). Lean performance evalua-tion of manufacturing systems: A dynamic and innovativeapproach. Procedia Computer Science, 3, 388–395.
Bhasin, S. (2008). Lean and performance measurement. Journalof Manufacturing Technology Management, 19(5), 670–684.
Bhasin, S., & Burcher, P. (2006). Lean viewed as a philosophy.Journal of Manufacturing Technology Management, 17(1),56–72.
Black, J. T. (2007). Design rules for implementing the ToyotaProduction System. International Journal of ProductionResearch, 45(16), 3639–3664.
Blanchard, D. (2007). Census of U.S. manufacturers—Leangreen and low cost. Industry Week. Retrieved fromhttp://www.industryweek.com/articles/census_of_us_manufacturers__lean_green_and_low_cost_15009.aspx
Case, S. (2004). The validation of classification scheme for leanmanufacturing tools. Houghton, MI: Michigan Technologi-cal University.
Dean, J. W., & Bowen, D. E. (1994). Management theory andtotal quality: Improving research and practice through the-ory development. Academy of Management Review, 19(3),392–418.
Deshmukh, S. G., Upadhye, N., & Garg, S. (2010). Lean manu-facturing for sustainable development. Global Business andManagement Research: An International Journal, 2, 125.
Detty, R., & Yingling, J. (2000). Quantifying benefits of conver-sion to lean manufacturing with discrete event simulation:A case study. International Journal of Production Research,38(2), 429–445.
Dhandapani, V., Potter, A., & Naim, M. (2004). Applying leanthinking: A case study of an Indian steel plant. InternationalJournal of Logistics, 7(3), 239–250.
Doolen, T. L., & Hacker, M. E. (2005). A review of lean assess-ment in organizations: An exploratory study of lean prac-tices by electronics manufacturers. Journal ofManufacturing Systems, 24(1), 55–67.
Dunstan, K., Lavin, B., & Sandford, R. (2006). The application oflean manufacturing in a mining environment. Paper pre-sented at the International Mine Management Conference,Melbourne, Australia, (pp. 145–154).
Emiliani, M. L. (1998). Lean behaviors. Management Decision,36(9), 615–631.
Eswaramoorthi, M., Kathiresan, G. R., Prasad, P. S. S., &Mohanram, P. V. (2010). A survey on lean practices inIndian machine tool industries. The International Journalof Advanced Manufacturing Technology, 52(9–12), 1091–1101.
Farris, J., Van Aken, E., Letens, G., Ellis, K., & Boyland, J. (2007).A structured approach for assessing the effectiveness ofengineering design tools in new product development. Engi-neering Management Journal, 19(2), 31–39.
Farris, J. A., Van Aken, E. M., Doolen, T. L., & Worley, J. (2009).Critical success factors for human resource outcomes inKaizen events: An empirical study. International Journal ofProduction Economics, 117(1), 42–65.
Franco, P. C., Marins, F. A. S., & Silva, M. B. (n.d.). The keysuccess factors in choosing and conducting a lean six sigmaproject. Retrieved from http://www.pomsmeetings.org/Con-fProceedings/015/FullPapers/015-0738.pdf
Fullerton, R. R., & McWatters, C. S. (2001). The productionperformance benefits from JIT implementation. Journal ofOperations Management, 19(1), 81–96.
198 Engineering Management Journal Vol. 27 No. 4 December 2015
Dow
nloa
ded
by [7
3.11
.63.
112]
at 0
0:13
10
Dec
embe
r 201
5

Goyal, S. K., & Deshmukh, S. G. (1992). A critique of theliterature on just-in-time manufacturing. International Jour-nal of Operations & Production Management, 12(1), 18–28.
Gupta, A., & Kundra, T. (2012). A review of designing machinetool for leanness. Sadhana, 37(2), 241–259. Retrieved fromhttp://www.ias.ac.in/sadhana/Pdf2012Apr/241.pdf
Hager, P. J., & Corbin, N. C. (1997). Designing & delivering:Scientific, technical, and managerial presentations. NewYork: John Wiley & Sons.
Karim, A., & Arif-Uz-Zaman, K. (2013). A methodology foreffective implementation of lean strategies and its perfor-mance evaluation in manufacturing organizations. BusinessProcess Management Journal, 19(1), 169–196.
Karlsson, C., & Åhlström, P. (1996). Assessing changes towardslean production. International Journal of Operations & Pro-duction Management, 16(2), 24–41.
Karlsson, C., & Åhlström, P. (1997). A lean and global smallerfirm? International Journal of Operations & ProductionManagement, 17(10), 940–952.
Liker, J. (2006). re:“lean adoption”, [email protected], e-mail toBhasin, S. [email protected], 27.
Liker, J. K. (2004). The Toyota Way: 14 Management Principlesfrom the World’s Greatest Manufacturer. New York:McGraw-Hill.
Lummus, R. R. (1995). A simulation analysis of sequencingalternatives for JIT lines using Kanbans. Journal of Opera-tions Management, 13(3), 183–191.
MacDuffie, J. P., Sethuraman, K., & Fisher, M. L. (1996). Productvariety and manufacturing performance: Evidence from theinternational automotive assembly plant study. Manage-ment Science, 42(3), 350–369.
Mehta, V., & Shah, H. (2005). Characteristics of a work organi-zation from a lean perspective. Engineering ManagementJournal, 17(2), 14–20.
Mejabi, O. O. (2003). Framework for a lean manufacturingplanning system. International Journal of ManufacturingTechnology and Management, 5(5–6), 563–578.
Mohanty, R. P., Yadav, O. P., & Jain, R. (2007). Implementationof lean manufacturing principles in auto industry. TheXIMB Journal of Management, 1, 1–32.
Neely, A., Gregory, M., & Platts, K. (1995). Performance mea-surement system design: A literature review and researchagenda. International Journal of Operations & ProductionManagement, 15(4), 80–116.
Nicholas, J. M. (2011). Lean production for competitive advan-tage. New York: Taylor and Francis.
Olsen, E. O. (2004). Lean manufacturing management: Therelationship between practice and firm level financial perfor-mance. The Ohio State University. Retrieved from http://etd.ohiolink.edu/send-pdf.cgi/Olsen%20Eric.pdf?osu1086113492
Parry, G. C., & Turner, C. E. (2006). Application of lean visualprocess management tools. Production Planning & Control,17(1), 77–86.
Pavnaskar, S. J., Gershenson, J. K., & Jambekar, A. B. (2003).Classification scheme for lean manufacturing tools. Interna-tional Journal of Production Research, 41(13), 3075–3090.
Pay, R. (2008). Everybody’s jumping on the lean bandwagon,but many are being taken for a ride. Industry Week.Retrieved from http://www.industryweek.com/articles/everybodys_jumping_on_the_lean_bandwagon_but_ma-ny_are_being_taken_for_a_ride_15881.aspx
Rose, A. M. N., Deros, B. M., Rahman, M. N. A., & Nordin, N.(2011). Lean manufacturing best practices in SMEs. In Pro-ceedings of the (2011) International Conference on IndustrialEngineering and Operations Management, Kuala Lumpur,Malaysia, (pp. 22–24)
Ross, A. (2003). Lean is not enough [lean manufacturing].Manufacturing Engineer, 82(4), 14.
Russell, R. K., & Tippett, D. D. (2008). Critical success factorsfor the fuzzy front end of innovation in the medicaldevice industry. Engineering Management Journal, 20(3),36–43.
Sánchez, A. M., & Pérez, M. P. (2001). Lean indicators andmanufacturing strategies. International Journal of Opera-tions & Production Management, 21(11), 1433–1452.
Sarhan, S., & Fox, A. (2013). Barriers to implementing leanconstruction in the UK construction industry. The Built &Human Environment Review, 6, 1–17.
Shah, R., & Ward, P. T. (2003). Lean manufacturing: Context,practice bundles, and performance. Journal of OperationsManagement, 21(2), 129–149.
Shah, R., & Ward, P. T. (2007). Defining and developing mea-sures of lean production. Journal of Operations Manage-ment, 25(4), 785–805.
Sheridan, J. H. (2000). Growing with lean manufacturing:Lean manufacturing carries a long learning curve, but aPittsburgh-based firm intends to spawn a cadre of com-panies dedicated to the philosophy. Industry Week, 249(16), 32–39.
Soriano-Meier, H., & Forrester, P. L. (2002). A model for eval-uating the degree of leanness of manufacturing firms. Inte-grated Manufacturing Systems, 13(2), 104–109.
Timans, W., Antony, J., Ahaus, K., & Van Solingen, R. (2011).Implementation of lean six sigma in small- and medium-sized manufacturing enterprises in the Netherlands.Journal of the Operational Research Society, 63(3),339–353.
Upton, D. (1998). Just-in-time and performance measurementsystems. International Journal of Operations & ProductionManagement, 18(11), 1101–1110.
Wan, H., & Chen, F. (2008). A leanness measure of manu-facturing systems for quantifying impacts of lean initia-tives. International Journal of Production Research, 46(23), 6567–6584.
White, R., Pearson, J. N., & Wilson, J. R. (1999). JIT manufac-turing: A survey of implementations in small and large USmanufacturers. Management Science, 45(1), 1–15.
White, R., & Prybutok, V. (2001). The relationship between JITpractices and type of production system. Omega, 29(2),113–124.
Wiseman, L., Eseonu, C., & Doolen, T. (2014). A framework forthe pre-emptive evaluation of continuous improvementtraining effectiveness and efficiency. Journal of EnterpriseTransformation, 4(3), 251–271.
Womack, J. P., & Jones, D. T. (2003). Lean thinking: Banishwaste and create wealth in your corporation. New York: FreePress.
Womack, J. P., Jones, D. T., & Roos, D. (1990). The machinethat changed the world. New York: Free Press.
Worley, J. M., & Doolen, T. L. (2006). The role of commu-nication and management support in a lean manufactur-ing implementation. Management Decision, 44(2),228–245.
Engineering Management Journal Vol. 27 No. 4 December 2015 199
Dow
nloa
ded
by [7
3.11
.63.
112]
at 0
0:13
10
Dec
embe
r 201
5

About the AuthorsWaleed K. Mirdad is a research assistant and PhD Student inthe School of Mechanical, Industrial, and Manufacturing Engi-neering at Oregon State University. A member of the ProcessImprovement Group, Waleed conducts research on lean con-ceptualization with a focus on lean education strategies anddiffusion of the lean mindset. Waleed received a B.S in IndustrialEngineering from King Abdul Aziz University in Saudi Arabiaand an MS in Industrial Engineering from Oregon State Uni-versity. He has experience in lean manufacturing implementa-tion from the SRMCO Company in Saudi Arabia.
Chinweike I. Eseonu is an assistant professor in the Schoolof Mechanical, Industrial, and Manufacturing Engineering atOregon State University. He leads research in the ProcessImprovement Group on diffusion of innovations, with a
focus on identifying mechanisms through which engineeringmanagers can control the spread of technology, processimprovement changes, policy, and other innovations. Hereceived a BASc in Mechanical Engineering from the Univer-sity of Ottawa, an MS in Engineering Management from theUniversity of Minnesota-Duluth, and a PhD in Systems andEngineering Management from Texas Tech University. Heserves as a member of the Board for the IIE Society forEngineering and Management Systems, as chair of the Aca-demic Research Track at the 2015 IIE Engineering Lean SixSigma Conference, and is a member of ASEM, ASEE, andNSBE.
Contact: Waleed K. Mirdad, School of Mechanical, Industrial,and Manufacturing Engineering, 204 Rogers Hall, Oregon StateUniversity, Corvallis, OR 97330; [email protected]
Appendix 1. Conceptual Map (Matrix View).
Practices Principles Performance Measures
Customer RelationshipManagement
Specify Value Lead Time to Customer
Customer Requirements Analysis Rate of Customer Returns
Quality Function Deployment(QFD)
Customer Satisfaction Index
Supplier Integration Percentage of Defective Products Shipped to Customer
Frequency of Customer Feedback on Quality and Delivery Performance
Degree to which Customers are Actively Involved in Current and Future Product OfferingDecisions
Frequency of Contact with Customers
Frequency of Customer Interaction with the Marketing Department on Current and FutureDemand Information
Average Number of Suppliers for the Most Important Parts (measure of exposure to waste due tovariation)
Percentage of Products Delivered on Time
Pay for Skills and Performance Respect ofHumanity
Percentage of Employees who Work in Teams
Safety Improvement Ratio of Indirect Labor to Direct Labor
Multifunctional Teams Number and Percentage of Tasks Performed by Teams
Employee Training and GrowthInitiatives
Labor Productivity (per specified period)
Employee Involvement Amount of Training (hours) Given to Employees (per specified period)
Quality Circles Employee Turnover Rate
Self-directed Teams Percentage of Implemented Suggestions per Employee (measure of openness to employee input)
Employee Training and Growth
5S Zero Defects Scrap and Rework Costs (per specified period)
Andon Boards Percentage of Parts Reworked (per specified period)
Supplier Development Percentage of Inspections Carried out by Autonomous Defect Control Systems
Supplier Feedback andRelationships
Percentage of Manufacturing Processes in Statistical Control (snapshot and per specified period)
Poka Yoke (Mistake Proofing) Percentage of First Pass Yield
200 Engineering Management Journal Vol. 27 No. 4 December 2015
Dow
nloa
ded
by [7
3.11
.63.
112]
at 0
0:13
10
Dec
embe
r 201
5

Appendix 1. Conceptual Map (Matrix View). (continued)
Practices Principles Performance Measures
Complementary Quality andProductivity Program
Percentage of Employees Affected by Problem Induced Line Stoppages (per occurrence and perspecified period)
Root Cause Analysis Percentage of Information Continuously Displayed in Dedicated Spaces in the Production Flow orDiscussed in Meetings
Visual Management System Information Timeliness (time to notification of all intended recipients)
Standard Work
Statistical Process Control Percentage of Procedures for which Standard Work Instructions have been Developed
Total Productive Maintenance The Frequency at which Information is Given to Employees (managerial interaction)
Autonomation Frequency of Preventive Maintenance
Lead Time Reduction Unscheduled Downtime Ratio (proportion of downtime events that are unexpected)
Small Lot Sizes Amount of Finished Goods Inventory
Value Stream Mapping Amount of Raw Material Inventory
Quality Circles Total Productive Floor Space
Self-directed Teams Work in Process (WIP) Inventory
Employee Training and Growth Frequency and Distance of Part Transportation
Customer Requirements Analysis Non Value Added Time (per specified period)
Line Balancing Flow Takt Time
Focused Factory Percentage of Products Classified into Groups with Similar Processing Requirements
Cellular Manufacturing Percentage of Machines Grouped Together to Produce Families of Products
Workload Leveling (Heijunka)
Group Technology Throughput Time or Manufacturing Lead Time
Autonomation Setup Time
Lead Time Reduction Percentage of Reduction in the Level of Workload Variability
Value Stream Mapping Batch Size
Setup Time Reduction (SMED) Number of Mixed Models Lines
U-shaped Cells Supplier or Delivery Lead Time
JIT Delivery by Suppliers
JIT Production and Delivery
Small Lot Sizes
Mixed Model Production
Kanban Pull Number of Kanbans
Standard Work Level of Standardization (ratio of standard operations and regulations)
Value Stream Mapping Pull Ratio (proportion of stations that use Pull)
Supplier Integration Frequency at which Production is Pulled by the Shipment of Finished Goods
Setup Time Reduction Station Pull Ratio (proportion of stations that rely on Kanban systems from immediate upstreamstation)
U-shaped Cells Length (years) of Relationship with a Supplier
JIT Delivery by Suppliers
JIT Production and Delivery
Small Lot Sizes
Mixed Model Production
Top Management Commitment ContinuousImprovement
Percentage of Employee Suggestions that have been Implemented
(measure of openness toemployee input)
Engineering Management Journal Vol. 27 No. 4 December 2015 201
Dow
nloa
ded
by [7
3.11
.63.
112]
at 0
0:13
10
Dec
embe
r 201
5

Appendix 1. Conceptual Map (Matrix View). (continued)
Practices Principles Performance Measures
Long Term Philosophy Number of Kaizen Events (per specified period)
Genchi Genbutsu Rate and Level of Capacity Increase at Current Facilities
Nemawashi Extent to which Supervision is Performed by Teams (ratio of team membership rotation andnumber of supervisory tasks performed by team members)
Concurrent Engineering Number of Hierarchical Levels in the Manufacturing Organization
Design for Manufacturability Time to Market for New Products
New Process, Equipment, andTechnology Innovation
Rate of New Technology Development (including failed attempts)
202 Engineering Management Journal Vol. 27 No. 4 December 2015
Dow
nloa
ded
by [7
3.11
.63.
112]
at 0
0:13
10
Dec
embe
r 201
5


