Embed Size (px)
Citation preview

A Dataflow Language for Scriptable Debugging∗
Guillaume Marceau, Gregory H. Cooper, Shriram Krishnamurthi, Steven P. Reiss
Department of Computer Science
Brown University
115 Waterman Street, Providence, RI 02912, USA
{gmarceau, greg, sk, spr}@cs.brown.edu
Abstract
Debugging is a laborious, manual activity that often
involves the repetition of common operations. Ideally,
users should be able to describe these repetitious opera-
tions as little programs. Debuggers should therefore be
programmable, or scriptable. The operating environment
of these scripts, however, imposes interesting design chal-
lenges on the programming language in which these scripts
will be written.
This paper presents our design of a language for script-
ing debuggers. The language offers powerful primitives that
can precisely and concisely capture many important debug-
ging and comprehension metaphors. The paper also de-
scribes a debugger for the Java language built in accor-
dance with these principles. We have implemented this de-
bugger to run alongside the Java Virtual Machine. The pa-
per includes concrete examples of applying this debugger to
programs.
1. Introduction
Debugging is a laborious part of the software develop-
ment process. Its unpleasantness is exacerbated by many
contemporary debuggers, which offer only primitive capa-
bilities. Indeed, even with the growing sophistication of vi-
sual programming environments, the underlying debugging
tools remain fairly primitive.
Debugging is a complex activity because there is often
a good deal of knowledge about a program that is not ex-
plicitly represented in its execution. For instance, imagine
a programmer trying to debug a large data structure that ap-
pears not to satisfy an invariant. He might set a breakpoint,
examine a value, compare it against some others and, not
finding a problem, resume execution, perhaps repeating this
process dozens of times. This is both time-consuming and
∗This research was partially supported by NSF grant CCR-0305949.
dull; furthermore, a momentary lapse of concentration may
cause him to miss the bug entirely.
The heart of automated software engineering lies in iden-
tifying such repetitive human activities during software con-
struction and applying computational power to ameliorate
them. For debuggers, one effective way of eliminating rep-
etition is to make them scriptable, so users can capture
common patterns and reuse them in the future. The prob-
lem then becomes one of designing effective languages for
scripting debuggers.
Debugging scripts must easily capture the programmer’s
intent and simplify the burdensome aspects of the activity.
To do this, they must meet several criteria. First, they must
match the temporal, event-oriented view that programmers
have of the debugging process. Second, they must be pow-
erful enough to interact with and monitor a program’s ex-
ecution. Third, they should be written in a language that
is sufficiently expressive that the act of scripting does not
become onerous. Finally, the scripting language must be
practical: users should, for instance, be able to construct
program-specific methods of analyzing and comprehending
data. This calls for a library of I/O and other primitives
more commonly found in general-purpose languages than
in typical domain-specific languages.
In this paper, we present the design and implementation
of an interactive, scriptable debugger for Java. Our debug-
ger communicates with a Java Virtual Machine to pause and
resume execution, query the values of variables, and dy-
namically change the debugging scripts. These scripts are
written in a highly expressive functional language with sup-
port for stateful operations. The language has a dataflow
evaluation semantics, which is a natural fit for receiving
events from external entities, such as programs running in
a debugger. In addition, the language has access to a large
collection of practical libraries, and evaluates in an interac-
tive programming environment, DrScheme.
c l a s s D i j k s t r a S o l v e r {
p u b l i c HashMap b a c k t r a c e = new HashMap ( ) ;
p r i v a t e P r i o r i t y Q u e u e q = new P r i o r i t y Q u e u e ( ) ;
p u b l i c D i j k s t r a S o l v e r ( D i r e c t e d G r a p h graph ,
Node s o u r c e ) {s o u r c e . weigh t = 0 . 0 ;
q . addAl l ( g raph . ge tNodes ( ) ) ;
whi le ( ! q . isEmpty ( ) ) {Node node = ( Node ) q . e x t r a c t M i n ( ) ;
L i s t s u c c e s s o r s = graph . ge tSuccsOf ( node ) ;
f o r ( I t e r a t o r s u c c I t = s u c c e s s o r s . i t e r a t o r ( ) ;
s u c c I t . hasNext ( ) ; )
r e l a x ( node , ( Node ) s u c c I t . n e x t ( ) ) ;
}System . o u t . p r i n t l n ( ” R e s u l t b a c k t r a c e :\ n” +
b a c k t r a c e . keySet ( ) ) ;
}
p u b l i c vo id r e l a x ( Node o r i g i n , Node d e s t ) {double c a n d i d a t e W e i g h t =
o r i g i n . weigh t + o r i g i n . d i s t a n c e T o ( d e s t ) ;
i f ( c a n d i d a t e W e i g h t < d e s t . weigh t ) {d e s t . weigh t = c a n d i d a t e W e i g h t ;
b a c k t r a c e . p u t ( d e s t , o r i g i n ) ;
}}
}
Figure 1. Dijkstra’s Algorithm Implementation
2. A Motivating Example
Figure 1 shows a Java transcription of Dijkstra’s algo-
rithm, as presented in Introduction to Algorithms [9]. Recall
that Dijkstra’s algorithm computes the shortest path from a
source node to all the other nodes in a graph. It is similar
to breadth-first search, except that it enqueues the nodes ac-
cording to the total distance necessary to reach them, rather
than by the number of steps. The length of the shortest path
to a node (so far) is stored in the weight field, which is ini-
tialized to the floating point infinity. The algorithm relies on
the fact that the shortest-path estimate for the node with the
smallest weight is provably optimal. Accordingly, the al-
gorithm removes that node from the pool (via extractMin),
then uses this optimal path to improve the shortest path es-
timate of adjacent nodes (via relax). The algorithm makes
use of a priority queue, which we also implemented.
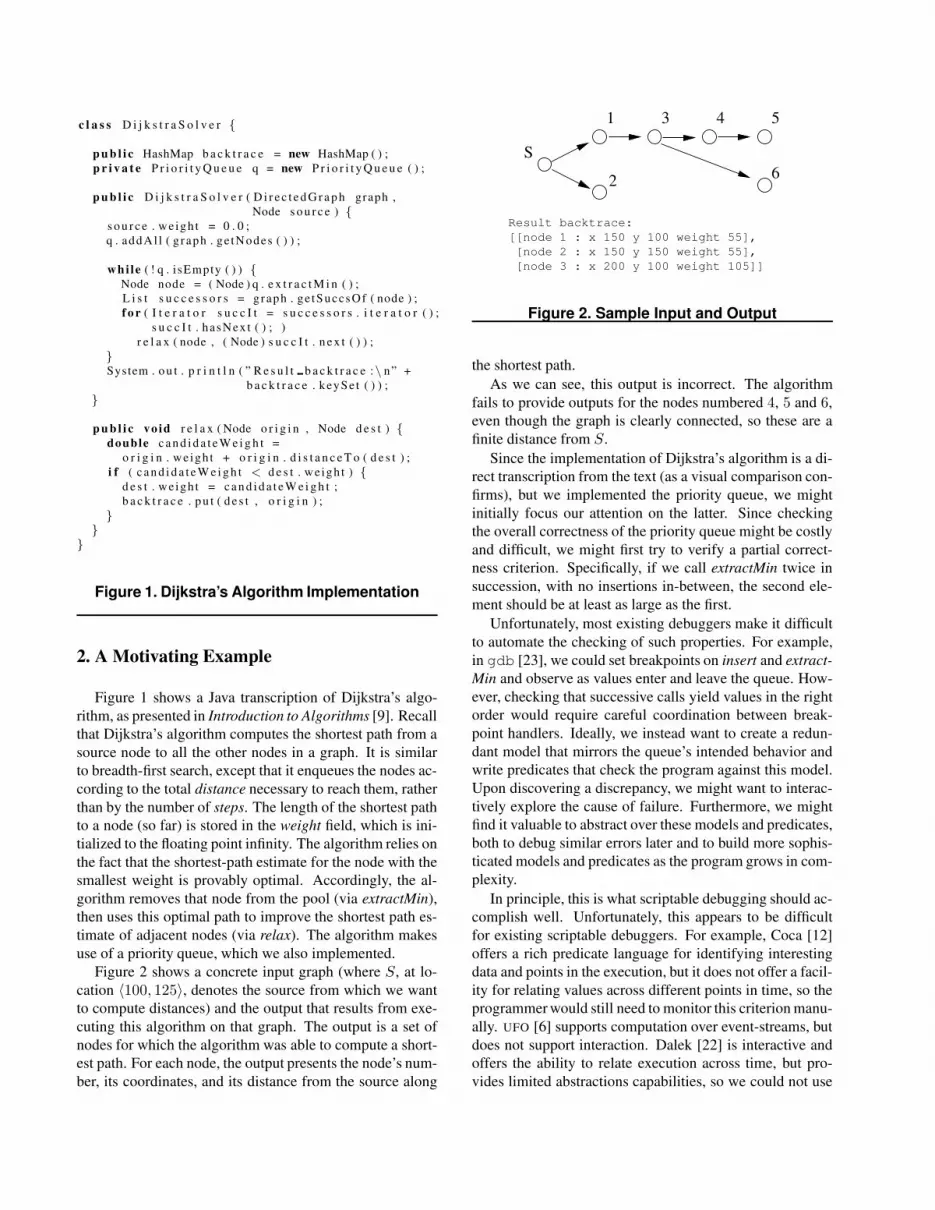
Figure 2 shows a concrete input graph (where S, at lo-
cation 〈100, 125〉, denotes the source from which we want
to compute distances) and the output that results from exe-
cuting this algorithm on that graph. The output is a set of
nodes for which the algorithm was able to compute a short-
est path. For each node, the output presents the node’s num-
ber, its coordinates, and its distance from the source along
2
41 5
6
3
S
Result backtrace:
[[node 1 : x 150 y 100 weight 55],
[node 2 : x 150 y 150 weight 55],
[node 3 : x 200 y 100 weight 105]]
Figure 2. Sample Input and Output
the shortest path.
As we can see, this output is incorrect. The algorithm
fails to provide outputs for the nodes numbered 4, 5 and 6,
even though the graph is clearly connected, so these are a
finite distance from S.
Since the implementation of Dijkstra’s algorithm is a di-
rect transcription from the text (as a visual comparison con-
firms), but we implemented the priority queue, we might
initially focus our attention on the latter. Since checking
the overall correctness of the priority queue might be costly
and difficult, we might first try to verify a partial correct-
ness criterion. Specifically, if we call extractMin twice in
succession, with no insertions in-between, the second ele-
ment should be at least as large as the first.
Unfortunately, most existing debuggers make it difficult
to automate the checking of such properties. For example,
in gdb [23], we could set breakpoints on insert and extract-
Min and observe as values enter and leave the queue. How-
ever, checking that successive calls yield values in the right
order would require careful coordination between break-
point handlers. Ideally, we instead want to create a redun-
dant model that mirrors the queue’s intended behavior and
write predicates that check the program against this model.
Upon discovering a discrepancy, we might want to interac-
tively explore the cause of failure. Furthermore, we might
find it valuable to abstract over these models and predicates,
both to debug similar errors later and to build more sophis-
ticated models and predicates as the program grows in com-
plexity.
In principle, this is what scriptable debugging should ac-
complish well. Unfortunately, this appears to be difficult
for existing scriptable debuggers. For example, Coca [12]
offers a rich predicate language for identifying interesting
data and points in the execution, but it does not offer a facil-
ity for relating values across different points in time, so the
programmer would still need to monitor this criterion manu-
ally. UFO [6] supports computation over event-streams, but
does not support interaction. Dalek [22] is interactive and
offers the ability to relate execution across time, but pro-
vides limited abstractions capabilities, so we could not use

it to build the predicates described in this paper. In general,
existing scriptable debuggers appear to be insufficient for
our needs; we discuss them in more detail in section 9.
In this paper we present a new language and infrastruc-
ture that address the weaknesses found in existing debug-
gers. In section 3, we describe the goals and observations
that have guided our work, and in section 4, we introduce
the dataflow language FrTime, on top of which we have
built our debugger scripting language. We return to our ex-
ample in section 5 and describe the use of our language to
isolate the problem.
3. Desiderata
We believe that users fundamentally view debugging as
a temporal activity with the running program generating a
stream of events (entering and exiting methods, setting val-
ues, and so on). They use constructs such as breakpoints
to make these events manifest and to gain control of exe-
cution, at which point they can inspect and set values be-
fore again relinquishing control to the target program. To
be maximally useful and minimally intrusive, a scriptable
debugger should view the debugging process just as users
do, but make it easy to automate tedious activities.
Concretely, the scripting language must satisfy several
important design goals.
1. While debuggers offer some set of built-in commands,
users often need to define problem-specific commands.
In the preceding example, we wanted to check the
order of elements extracted from a queue; for other
programs, we can imagine commands such as “ver-
ify that this tree is balanced”. While obviously a de-
bugger should not offer commands customized to spe-
cific programs, it should provide a powerful enough
language for programmers to capture these operations
easily. Doing so often requires a rich set of primitives
that can model sophisticated data, for instance to track
the invariants of a program’s data.
2. Programs often contain implicit invariants. Validat-
ing these invariants requires maintaining auxiliary data
structures strictly for the purpose of monitoring and
debugging. In our example, although Dijkstra’s al-
gorithm depends on nodes being visited in order of
weight, there is no data structure in the program that
completely captures the ordered list of nodes (a pri-
ority heap satisfies only a weaker ordering relation).
Lacking a good debugging framework, the developer
who wants to monitor monotonicity therefore needs
to introduce explicit data structures into the source.
These data structures may change the space- and time-
complexity of the program, so they must be disabled
during normal execution. All these demands compli-
cate maintenance and program comprehension. Ide-
ally, a debugger should support the representation of
such invariants outside the program’s source. (In re-
lated work, we explain why approaches like contracts
and aspects [5] are insufficient.)
3. Debugging is often a process of generating and falsi-
fying hypotheses. Programmers must therefore have a
convenient way to generate new hypotheses while run-
ning a program. A technique that involves modifying
the program’s source and/or requires static compilation
is highly disruptive to this exploratory process. In that
respect aspects, contracts and unit testing frameworks
are not appropriate for debugging tasks.
4. Since the target program is a source of events and de-
bugging is an event-oriented activity, the scripting lan-
guage must be designed to act as a recipient of events.
In contrast, traditional programming languages are de-
signed for writing programs that are “in control”—i.e.,
they determine the primary flow of execution. This
poses a challenge for programming language design.
5. As a pragmatic matter, debuggers should have con-
venient access to the rich I/O facilities provided by
modern consoles so they can, for instance, imple-
ment problem-specific interfaces. Domain-specific
languages that are built in isolation invariably provide
only limited support for such activities. In contrast, the
existence of rich programming libraries is important
for the widespread adoption of a debugging language.
To accomplish these goals, a debugging language must
address a conflict central to all language design: balancing
the provision of powerful abstractions with restrictions that
enable efficient processing. Most of the prior work (see sec-
tion 9) has tended toward the latter, while this paper begins
with a general-purpose language, so as to explore the space
of expression more thoroughly. This results in some loss of
machine-level efficiency, but may greatly compensate for it
by saving users’ time. Furthermore, the functional style we
adopt creates opportunities for many traditional compiler
optimizations.
4. The FrTime Programming Language
Instead of implementing our debugging language from
scratch, we have built it atop the language FrTime—a
dataflow language (with Lisp-inspired syntax) that supports
stateful operations and provides a library of data struc-
tures and primitives for most common programming activ-
ities [8]. The language is inspired by work on Functional
Reactive Programming [13], whose motivation is to allow
declarative expression of reactive systems.

Figure 3. Screenshots of FrTime in Action
The motivation for FrTime is easy to explain with a sim-
ple example. Most programming languages have a library
primitive for accessing the current time. A variable that
holds the response from this primitive is, however, assigned
only when the primitive returns; the value becomes out-
dated as execution continues, unless the program explicitly
performs operations to keep the value current. In contrast,
FrTime provides built-in support for time-varying values,
called behaviors, that automatically update with the passage
of time. For instance, the expression seconds is a built-in
behavior whose value updates every second in lockstep with
the system clock.
Any expression that uses a time-varying value itself be-
comes time-varying. For instance, the expression (even?
seconds) recomputes every time the value of seconds up-
dates (i.e., every second), alternating between the values
true and false. The implementation of FrTime is responsi-
ble for automatically tracking dependencies between prim-
itive signals and expressions that depend on them, ordering
these dependencies, forcing fresh computation, and propa-
gating values whenever signals change. Behaviors can take
value undefined, which acts as a bottom. Any operation ap-
plied to undefined also returns undefined.
FrTime offers run-time support through the DrScheme
programming environment [14]. Figure 3 shows the same
DrScheme session, displaying several FrTime expressions,
(define c (start-vm "DijkstraTest"))
(define queue (jclass c PriorityQueue))
(define inserts
(trace ((queue . jdot . add) . jloc . entry)
(bind (item) (item . jdot . weight))))
(define removes
(trace ((queue . jdot . extractMin) . jloc . exit)
(bind (result) (result . jdot . weight))))
(define violations
(not-in-order (merge-e removes (inserts . -=> . ’reset))))
(define latest-violation (hold false violations))
(define (nv)
(set-running! (hold true (violations . -=> . false))))
Figure 4. Monitoring the Priority Queue
captured twenty-five seconds apart. The DrScheme prompt
recognizes behaviors and automatically updates the display
of their values as they change over time. In addition, the
rich libraries of DrScheme are available for FrTime, and are
automatically lifted to the time domain, so they recompute
when their arguments update.
In addition to behaviors, FrTime also has events.
Whereas behaviors have a value at any point in time, events
are discrete: for instance, the event key-strokes is an in-
finite stream that yields a new value every time a key is
pressed. FrTime provides a set of functional combina-
tors that process event-streams; for instance, hold converts
event-streams into behaviors by consuming an event-stream
and returning a behavior whose value is always the most re-
cent value in the stream. Thus, (hold ’none-yet key-strokes)
is a behavior whose value is initially the symbol ’none-yet
and, from the first keystroke onwards, the value of the last
key pressed.
The interested reader can learn more about the language
from a companion paper [8] or by experimenting with the
implementation [1].
5. Debugging the Motivating Example
We are now ready to return to our example from sec-
tion 2. As we explained previously, our implementation
of Dijkstra’s algorithm employs a priority queue coded by
us. In addition, we noted that our implementation of Dijk-
straSolver is a direct transcription of the pseudocode in the
book. We hypothesized that the bug might be in the imple-
mentation of the priority queue, and that we should there-
fore monitor its behavior. Recall that the partial correctness
property we wanted to verify was that consecutive pairs of

(define (not-in-order e)
(filter-e
(match-lambda
[(’reset ) false]
[( ’reset) false]
[(previous current) (> previous current)])
(history-e e 2)))
Figure 5. The Monitoring Primitive
elements extracted from the queue are in non-decreasing or-
der.
Figure 4 presents a debugging script that detects viola-
tions of this property. In the script, the variable c is bound
to a debugging session for DijkstraTest, a class that exer-
cises the implementation of Dijkstra’s algorithm. The invo-
cation of start-vm initiates the execution of the Java Virtual
Machine (JVM) on this class, and immediately suspends its
execution pending further instruction.
The expression (jclass c PriorityQueue) creates a FrTime
proxy for the PriorityQueue class in Java. Since Java dy-
namically loads classes on demand, this proxy is a time
varying value: its value is undefined at first, and stays so
until the class is loaded into the JVM. The operator jclass
treats its second argument specially: PriorityQueue is not a
variable reference, but simply the name of the target class.
In Lisp terminology, jclass is a special form. So are jdot
(which returns the value of a field), jloc (which selects a lo-
cation within a method) and jval (which returns a variable’s
value in the running program).
Next, we install tracing around the methods add and
extractMin of the priority queue. A tracepoint is a Fr-
Time event-stream specifically designed for debugging: the
stream contains a new value every time the Java program’s
execution reaches the location marked by the tracepoint.
Concretely, the expression
(define inserts
(trace ((queue . jdot . add) . jloc . entry)
(bind (item) (item . jdot . weight))))
installs a tracepoint at the entry of the add method of
queue.1 The tracepoint binds the FrTime identifier item
to the variable of the same name in that method.2 The
body of the tracepoint extracts the weight field from this
item. The identifier inserts is therefore bound to a FrTime
event-stream consisting of the weights of all nodes inserted
into the priority queue. The identifier removes is corre-
spondingly bound to the weights of nodes removed from
1Here and in the rest of this paper, we use the infix notation supported
by FrTime: (x . op . y) is the same as (op x y) in traditional Lisp syntax.2Because tracepoints bind by name, rather than by argument position,
the code is more robust to small changes in argument order and count.
the queue by extractMin.
We initially want to perform a lightweight check that de-
termines whether consecutive removes (not separated by an
insert) are non-decreasing. To do this, we merge the two
event-streams, inserts and removes. Since we are only in-
terested in consecutive, uninterrupted removals, the moni-
tor resets upon each insertion. The following FrTime code
uses the combinator -=> to map the values in the inserts
stream to the constant ’reset, which indicates that the mon-
itor should reset:
(merge-e removes (inserts . -=> . ’reset))
The result of this expression is a single event-stream whose
events are in the order they are encountered in the program.
The insert events have been mapped to the constant, while
the remove events are represented by the weight of the node.
This stream is passed to the core monitoring primitive,
not-in-order, shown in figure 5. This uses history-e to ex-
tract the two most recent values from the stream and pro-
cesses each pair in turn. It filters out those pairs that do not
exhibit erroneous behavior, namely when one of the events
is a ’reset or when both events reflect extracted weights that
are in the right order. The result is a stream consisting of
pairs of weights where the weightier node is extracted first,
violating the desired order. We call this stream violations.
The FrTime identifier latest-violation is bound to a be-
havior that captures the last violation (using the FrTime
combinator hold). If the priority queue works properly,
this behavior will retain its initial value, false. If it ever
changes, we want to pause the JVM so that we can examine
the context of the violation. To do this, we use the primitive
set-running!, which consumes a boolean behavior; the JVM
pauses whenever this behavior’s value is false, and runs
otherwise. Since we anticipate wanting to observe numer-
ous violations, we define the (concisely named) abstraction
nv, which tells the JVM to run until the next violation oc-
curs.
At the interactive prompt, we type (nv). Soon afterward,
the JVM stops, and we query the value of latest-violation:
> (nv)
short pause
> latest-violation
(+inf.0 55.90169943749474)
This output indicates that the queue has yielded nodes
whose weights are out of order. This confirms our suspi-
cion that the problem somehow involves the priority queue.
Continuing Exploration Interactively
To identify the problem precisely, we need to refine our
model of the priority queue. Specifically, we would like

(define inserters
(inserts . ==> . insert-in-model))
(define removers
(removes . ==> . remove-from-model))
(define model
(accum-b (merge-e inserters removers)
(convert-queue-to-list (here . jval . q))))
Figure 6. The Redundant Model
to monitor the queue’s complete black-box behavior, which
might provide insight into the actual error.
With the JVM paused, we enter the code in figure 6 to the
running FrTime session. This code duplicates the priority
queue’s implementation using a sorted list. While slower, it
provides redundancy by implementing the same data struc-
ture through an entirely different technique, which should
help identify the true cause of the error.3
The value inserters is bound to an event-stream of Fr-
Time procedures that insert the values added to the priority
queue into the FrTime model (==> applies a given proce-
dure to each value that occurs in an event-stream); similarly,
removers is bound to a stream of procedures that remove
values from the queue. The code
(accum-b (merge-e inserters removers)
(convert-queue-to-list (here . jval . q)))
merges the two streams of procedures using merge-e, and
uses accum-b to apply the procedures to the initial value of
the model. accum-b accumulates the result as it proceeds,
resulting in an updated model that reflects the application
of all the procedures in order. accum-b returns a behav-
ior that reflects the model after each transformation. We
must initialize the model to the current content of the queue.
The predefined behavior here is bound to the top-most stack
frame of the main thread, from which jval extracts the cur-
rent binding of the variable q. The user-defined procedure
convert-queue-to-list (elided here for brevity) converts q’s
internal representation to a list.
Having installed this code and initialized the model, we
resume execution with nv. At the next violation, we inter-
actively apply operations to compare the queue’s content
against its FrTime model (the list). We find that the queue’s
elements are not in sorted order while those in the model
are. More revealingly, the queue’s elements are not the same
as those in the model. A little further study shows that the
bug is in our usage of the priority queue: we have failed
to account for the fact that the assignment to dest.weight
3Since the property we are monitoring depends only on the nodes’
weights, not their identities, the model avoids potential ordering discrep-
ancies between equally-weighted nodes.
in relax (figure 1) updates the weights of nodes already in
the queue. Because the queue is not sensitive to these up-
dates, what it returns is no longer the smallest element in
the queue.
On further reading, we trace the error to a subtle detail
in the description of Dijkstra’s algorithm in Cormen, et al.’s
book [9, page 530]. The book permits the use of a binary
heap (which is how we implemented the priority queue) for
sparse graphs, but subsequently amends the pseudocode to
say that the assignment to dest.weight must explicitly in-
voke a key-decrement operation. Our error, therefore, was
not in the implementation of the heap, but in using the
(faster) binary heap implementation without satisfying its
(stronger) contract.
6. Reflections on the Example
While progressing through the example, we encounter
several properties mentioned in the desiderata that make Fr-
Time a good substrate for scripted debugging. We review
them here, point by point.
1. The DrScheme environment allows the user to keep
and reuse abstractions across interactive sessions. For
instance, to monitor the priority queue, we define pro-
cedures such as not-in-order and convert-queue-to-
list. Such abstractions, which manipulate program data
structures in a custom fashion, may be useful in finding
and fixing similar bugs in the future. They can even be-
come part of the program’s distribution, assisting other
users and developers. In general, debugging scripts
can capture some of the ontology embedded (but not
always explicated) in the program.
2. We discover the bug by monitoring an invariant not
explicitly represented in the program. Specifically, we
keep a sorted list that mirrors the priority queue, and
we observe that its behavior does not match the expec-
tations of Dijkstra’s algorithm. However, the list uses
a linear time insertion procedure, which eliminates the
performance benefit of the (logarithmic time) priority
queue. Fortunately, by expressing this instrumentation
as a debugging script, we cleanly separate it from the
program’s own code, and hence we incur the perfor-
mance penalty only while debugging.
3. The interactive console of DrScheme, in which FrTime
programs run, enables users to combine scripting with
traditional interactive debugging. In the example, we
first probe the priority queue at a coarse level, which
narrows the scope of the bug. We then extend our
script to monitor the queue in greater detail. This abil-
ity to explore interactively saves the programmer from

having to restart the program and manually recreate the
conditions of the error.
4. The dataflow semantics of FrTime makes it well suited
to act as a recipient of events and to keep models in a
consistent state, even as the script is growing. During
the execution of the Dijkstra solver, FrTime automati-
cally propagates information from the variables inserts
and removes to their dependents, the violations vari-
able and the set-running! directive. Also, when we add
the variable model, FrTime keeps it synchronized with
violations without any change to the previous code.
5. The libraries of FrTime are rich enough to communi-
cate with external entities. The programmer also has
access to the programming constructs of DrScheme
(higher-order functions, objects, modules, pattern-
matching, etc.), which have rigorously defined seman-
tics, in contrast to the ad-hoc constructs that populate
many scripting languages. Further, since FrTime has
access to all the libraries in DrScheme [14], it can gen-
erate visual displays and so on, as we will see in sec-
tion 8.
Finally, FrTime’s support for both state (such as hash tables)
and time (such as clocks) make it easy to efficiently and
concisely capture various temporal monitoring concepts.
For instance, by exploiting both hash-tables and the clock,
we can implement a statistical profiler in under a dozen lines
of code.
7. Implementation
The Java standard provides a language-independent de-
bugging protocol called the Java Debug Wire Protocol
(JDWP), designed to enable the construction of out-of-
process debuggers. Typically, the out-of-process debug-
ger connects to the JVM running the program via a TCP/IP
stream. We adapt a JDWP client implementation in Ruby [2]
by compiling its machine-readable description of JDWP
packets into FrTime encoders and decoders.
Our debugger supports a subset of the event language
defined by the JDWP. The main primitive we support is
trace, which creates a FrTime event-stream whose occur-
rences represent points of execution that reach a location of
interest. Locations are identified by a method and a line off-
set from the start of that method, as specified by the JDWP.
A trace expression instructs the debugger to install a
breakpoint at the given location in the JVM. When execu-
tion reaches the breakpoint, the virtual machine suspends all
threads and sends a message to the debugger. The debugger
queries the values of all variables listed in the bind clause
and evaluates the expression in an environment containing
these bindings. The body of the bind can use additional
primitives for inspecting the stacks of threads and for ex-
tracting values from their frames, such as jval.
The value resulting from the evaluation of the bind
clause appears on the FrTime event-stream. This value au-
tomatically propagates to all expressions that refer to the
trace statement, directly or indirectly, in accordance with
FrTime’s dataflow semantics. After all consumers have fin-
ished processing the event, the debugger commands the vir-
tual machine to resume. This provides synchronization be-
tween the debugging script and the debugged program.
Performance
We analyze the performance of the Dijkstra’s algorithm
monitor shown in figures 4 and 5. This example has a high
breakpoint density (approximately 500 events per millisec-
ond), so the time spent monitoring dominates the overall
computation. In general, the impact of monitoring depends
heavily on breakpoint density, and on the amount of pro-
cessing performed by each breakpoint.
We measure the running time of the the Dijkstra’s al-
gorithm monitor shown in figures 4 and 5. Excluding the
JVM startup time, it takes 3 minutes 42 seconds to moni-
tor one million heap operations (either add or extractMin),
which represents 2.217 milliseconds per operation. We par-
tition this time into four parts: First, the virtual machine
executes the call to either add or extractMin (0.002 mil-
liseconds per operation). Second, the JDWP transmits the
context information and FrTime decodes it (0.783 millisec-
onds per operation). Third, FrTime schedules the recompu-
tation according to dataflow dependencies between program
values (0.581 milliseconds per operation). Fourth, FrTime
evaluates the script which monitors the partial correctness
property, in figure 4 (0.851 milliseconds per operation).
According to these measurements, nearly one-third of
the debugging time is devoted to JDWP encoding and de-
coding and to the context-switch. This is consistent with
the penalty we might expect for using an out-of-process de-
bugger. The time spent in FrTime can, of course, be arbi-
trary, depending on the complexity of the monitoring and
debugging script. Obviously, the debugger is not yet effi-
cient enough for intensive monitoring; we discuss this issue
briefly in section 10. A two millisecond response time is,
however, negligible when using the debugger in an interac-
tive mode.
All time measurements are for a 1.8GHz AMD Athlon
XP processor running Sun’s JVM version 1.4 for Linux.
8. Example: Minimum Spanning Trees
Because our scriptable debugger has the full power of
FrTime, users can take advantage of existing libraries to
help them understand programs. For example, the FrTime

Figure 7. Spanning trees computed correctly
(left), without detecting cycles (middle), andwithout sorting edges (right)
animation library allows specification of time-varying im-
ages (i.e., image behaviors) that respond to events. Since
our debugger generates events by tracing program execu-
tion, users can visualize program behavior by appropriately
connecting these events to the animation library.
An intuitive visual representation can be an effective way
of gaining insight into a program’s (mis)behavior. More-
over, many programs lend themselves to natural visualiza-
tions. For example, we consider problem of computing the
Minimum Spanning Tree (MST) for a collection of points in
the plane.
A simple greedy algorithm for the MST works by pro-
cessing the edges in order of increasing length, taking each
edge if and only if it does not introduce a cycle. Though the
algorithm is straightforward, the programmer might forget
to do something important, such as checking for cycles or
first sorting the edges by length.
The programmer could write code to isolate the source
of such errors, but a simple visualization of the program’s
output is much more telling. In Figure 7, we show visualiza-
tions of three versions of an MST program. On the left, we
show the correct MST, in the middle, an edge set computed
without cycle detection, and on the right, what happens if
we forget to sort the edges.
In Figure 8, we show the debugging script that imple-
ments this visualization. Its salient elements are:
tree-start-event occurs each time the program begins com-
puting a new MST, yielding an empty edge list
tree-edge-event occurs each time the algorithm takes a
new edge, adding the new edge to the list
tree builds a model of the tree by accumulating transforma-
tions from these event-streams, starting with an empty
tree
display-lines displays the current tree
Though we have not shown the implementation of the
MST algorithm, one important characteristic is that it does
not maintain the set of edges it has taken: it only accumu-
lates the cost of the edges and keeps track of which vertices
(define tree-start-event
(trace ((tsp . jdot . mst) . jloc . entry)
(bind () (lambda (prev) empty))))
(define tree-edge-event
(trace ((tsp . jdot . mst) . jloc . 80)
(bind (e)
(lambda (prev)
(cons (make-edge (e . jdot . v1)
(e . jdot . v2))
prev)))))
(define tree
(accum-b (merge-e tree-start-event
tree-edge-event)
empty))
(display-lines tree)
Figure 8. Recording MST Edges
are reachable from each other. In building an explicit model
of the tree, our script highlights an important capability of
our debugging system—it can capture information about the
program’s state that is not available from the program’s own
data structures. To implement the same functionality with-
out a scriptable debugger, the user would need to amend the
program to make it store this extra information.
9. Related Work
There are two main branches of research that relate to
our work and from which we have drawn inspiration. We
describe these in turn: first, programmable debugging, and
second, program monitoring and instrumentation.
Dalek [22] is a scripted debugger built atop gdb that
generates events corresponding to points in the program’s
execution. Each event is associated with a callback proce-
dure that can, in turn, generate other events, thus simulating
a dataflow style of evaluation. When the propagation stabi-
lizes, Dalek resumes program execution.
Our debugger has several important features not present
in Dalek. A key difference that a user would notice is
that we rely on FrTime to automatically construct the graph
of dataflow dependencies, whereas in Dalek, the program-
mer must construct this manually. Dalek’s events are not
first-class values, so programmers must hard-wire events to
scripts, and therefore cannot easily create reusable debug-
ging operations such as not-in-order.
In Dalek, each event handler can suspend or resume the
execution of the target program, but these can contradict
each other. Dalek applies a fixed rule to arbitrate these con-
flicts. In contrast, we let authors use set-running! to cre-
ate flexible, application-specific rules (for instance, by us-
ing and, or and richer connectives in the expression that

guards execution). Indeed, using a behavior as the guard
expression highlights the power of using FrTime as the base
language for the debugger, since we can easily reconstruct
Dalek’s policy in our debugger. This design addresses an
important concern raised in an analysis of Dalek by Craw-
ford, et al. [10].
The Acid debugger [24] provides the ability to respond to
breakpoint commands and step commands with small pro-
grams written in a debugging script language very close to
C. Deet [16] provides a scripting language based on Tcl/Tk
along with a variety of the graphical facilities. Dispel [18]
defines its own ad-hoc language. Generalized path expres-
sions [7] specify break conditions as regular repressions
applied to event traces. The regular expressions are aug-
mented with predicate that can check for base-value re-
lations. In these projects, the programmer must respond
to events through callbacks, and there is no notion of a
dataflow evaluation mechanism. Each retains the inspection
and control mechanism of command-prompt debuggers.
DUEL [15] extends gdb with an interpreter for a lan-
guage intended to be a superset of C. It provides several
constructs, such as list comprehensions and generators, for
inspecting large data structures interactively. They do not,
however, address how to control the target program or how
to respond to events generated during the execution.
The Coca debugger by Ducasse [12] offers a conditional
breakpoint language based on Prolog. Coca uses the back-
tracking evaluation mechanism of Prolog to identify poten-
tially problematic control and data configurations during the
execution, and brings these to the user’s attention. As such,
Prolog predicates serve as both the conditional breakpoint
language and the data-matching language. However, since
each predicate application happens in isolation from the
other, there is no way to accumulate a model of the execu-
tion as it happens through time, such as constructing a trace
history or building an explicit representation of an MST (as
we have done in this paper).
Like Coca, on-the-fly query-based debugging [19, 20]
enables users to interactively select heap objects. The ob-
jects are specified using a SQL-like language evaluated us-
ing an efficient on-line algorithm. It does not offer a sophis-
ticated scripting mechanism. Like Coca, this approach does
not support relating data between points in time.
Parasight [4] allows users to insert C code at tracepoint
locations. The C code is compiled and inserted into the run-
ning target program’s process in a way that has minimal per-
formance impact. The inserted code must, however, adopt a
callback-style to respond to events. While adapting the run-
ning program has performance benefits, it also complicates
the process of using more expressive languages to perform
monitoring and debugging (and indeed, Parasight does not
tackle this issue at all, using the same language for both the
target program and the scripts).
Alamo [17], like Parasight, instruments binary objects
with in-process C code. While the scripts do not take
the shape of callbacks, they must manually implement a
programming pattern that simulates a coroutine (which is
handled automatically in FrTime by the evaluation mecha-
nism). The UFO debugger [6] extends Alamo with a rich
pattern-matching syntax over events in term of grammatical
elements in the target language. While our debugger of-
fers a rich, general-purpose language for processing event-
streams, they efficiently handle a special case, namely list
comprehension followed by folding.
There are several projects for monitoring program exe-
cution, as Dias and Richardson’s taxonomy describes [11].
Monitors differ from debuggers by virtue of not being inter-
active, and most do not provide scripting facilities. Instead,
many of these systems have better explored the trade-offs
between expressiveness, conciseness and efficiency in the
specification of interesting events. Our debugger simply re-
lies on the powerful abstractions of FrTime to filter events,
but at the cost of efficiency.
We have argued that the debugging code should remain
outside the program’s source code, to avoid complicating
maintenance and introducing time- and space-complexity
penalties. The debugging script is thus a classic “con-
cern” that warrants separation from the core program. We
could use aspect-like mechanisms [5] to express this sep-
aration. However, using them for our purposes would not
be straightforward. Most implementations of aspect mech-
anisms rely on static compilation, which makes it impossi-
ble to change the set of debugging tasks on-the-fly. More
importantly, they force the debugging script and main pro-
gram to be in the same language, making it difficult to use
more expressive languages for scripting. We therefore view
these mechanisms as orthogonal to our work, and as possi-
ble routes for implementing our debugging language.
Contracts [21] also capture invariants, but they too suf-
fer from the need for static compilation. In addition, data
structures sometimes obey a stronger contract in a specific
context than they do normally. For instance, in our run-
ning example, priority heaps permit keys to change, which
means there is no a priori order on a key’s values. As we
saw, however, Dijkstra’s algorithm initializes keys to ∞ and
decreases them monotonically; importantly, failure to do so
results in an error. The topicality of the contract means it
should not be associated with the priority heap in general.
Finally, unit testing frameworks provide a mechanism
for checking that output from a function matches the ex-
pected answer. With respect to debugging, unit testing suf-
fers from the same limitations as contracts. Namely, they
operate statically and only along interface lines.

10. Conclusion and Future Work
We have presented the design and implementation of a
scriptable, interactive debugger for Java, and shown several
instances of its application. The scripting language has suf-
ficient library support to permit construction of a wide va-
riety of applications including monitors and visualizations,
and is powerful enough to make these concise to express.
Along the way, we have demonstrated that our debugger can
provide program-specific views of rich data, and can easily
monitor implicit invariants.
The most important direction for future work is to im-
prove the debugger’s performance. As we have seen, some
of this overhead is directly attributable to having an out-of-
core debugger. We intend to incorporate some of the opti-
mizations discussed in related work to reduce this overhead,
and will also consider compilation strategies that generate
Java code that can be inlined directly using binary adapta-
tion and other instrumentation methods.
Our scripting language is different enough in semantics
from Java to engender several impedance mismatches, such
as difference in datatypes and invocation semantics. The
Silk [3] project has investigated these issues in the interac-
tion between Scheme and Java. We intend to incorporate
some of their lessons into our debugger.
Finally, we will link the debugging script more closely
with the target program. Concretely, a user should be able to
construct a FrTime behavior that tracks changes to a field in
the JVM. Also, users should be able to receive an event for
each single execution step within a given scope. This will
make FrTime an even more natural language for expressing
monitoring and debugging activities.
11. Acknowledgements
Thanks to the anonymous reviewers for helping improve
the quality of our presentation. We also thank Manos Re-
nieris, Philip Klein and Kathryn Doiron for their comments.
References
[1] Homepage of FrTime. http://www.cs.brown.edu/
people/greg/.
[2] The Ruby JDWP project. http://rubyforge.org/
projects/rubyjdwp/.
[3] K. Anderson, T. J. Hickey, and P. Norvig. Silk: A play-
ful combination of Scheme and Java. In Proceedings of the
Workshop on Scheme and Functional Programming, pages
13–22, 2000.
[4] Z. Aral and I. Gertner. High-level debugging in Parasight.
In Proceedings of the ACM SIGPLAN and SIGOPS Work-
shop on Parallel and Distributed Debugging, pages 151–
162. ACM Press, 1988.
[5] Aspect oriented programming (article series). Commun.
ACM, 44(10), Oct. 2001.
[6] M. Auguston, C. Jeffery, and S. Underwood. A framework
for automatic debugging. In Automated Software Engineer-
ing, 2002.
[7] B. Bruegge and P. Hibbard. Generalized path expressions:
A high level debugging mechanism. In Proceedings of
the ACM SIGSOFT/SIGPLAN Software Engineering Sym-
posium on High-level Debugging, pages 34–44, 1983.
[8] G. H. Cooper and S. Krishnamurthi. FrTime: Functional
reactive programming in PLT Scheme. Technical Report cs-
03-20, Brown University, 2003.
[9] T. H. Cormen, C. E. Leiserson, and R. L. Rivest. Introduc-
tion to Algorithms. McGraw-Hill, 1997.
[10] R. H. Crawford, R. A. Olsson, W. W. Ho, and C. E. Wee.
Semantic issues in the design of languages for debugging. In
Proceedings of the International Conference on Computer
Languages, 1992.
[11] M. de Sousa Dias and D. J. Richardson. Issues on software
monitoring. Technical report, ICS, 2002.
[12] M. Ducasse. Coca: an automated debugger for C. In Pro-
ceedings of the 21st International Conference on Software
Engineering, pages 504–513, 1999.
[13] C. Elliott and P. Hudak. Functional reactive animation. In
Proceedings of the International Conference on Functional
Programming, pages 263–277, 1997.
[14] R. B. Findler, J. Clements, C. Flanagan, M. Flatt, S. Krish-
namurthi, P. Steckler, and M. Felleisen. DrScheme: A pro-
gramming environment for Scheme. Journal of Functional
Programming, 12(2):159–182, 2002.
[15] M. Golan and D. R. Hanson. DUEL - a very high-level de-
bugging language. In Proceedings of the USENIX Annual
Technical Conference, pages 107–118, Winter 1993.
[16] D. R. Hanson and J. L. Kom. A simple and extensible graph-
ical debugger. In Proceedings of the USENIX Annual Tech-
nical Conference, pages 183–174, 1997.
[17] C. Jeffery, W. Zhou, K. Templer, and M. Brazell. A
lightweight architecture for program execution monitoring.
In SIGPLAN Notices, volume 33, 1998.
[18] M. S. Johnson. Dispel: A run-time debugging language.
Computer Languages, 6:79–94, 1981.
[19] R. Lencevicius. On-the-fly query-based debugging with ex-
amples. In Proceedings of the Fourth International Work-
shop on Automated Debugging, 2000.
[20] R. Lencevicius, U. Holzle, and A. K. Singh. Dynamic query-
based debugging of object-oriented programs. Automated
Software Engineering, 10(1):39–74, 2003.
[21] B. Meyer. Eiffel: The Language. Prentice-Hall, 1992.
[22] R. A. Olsson, R. H. Crawford, and W. W. Ho. Dalek: A
GNU, improved programmable debugger. In Proceedings of
the Usenix Technical Conference, pages 221–232, 1990.
[23] R. M. Stallman. GDB Manual (The GNU Source-Level De-
bugger). Free Software Foundation, Cambridge, MA, third
edition, January 1989.
[24] P. Winterbottom. Acid, a debugger built from a language. In
Proceedings of the USENIX Annual Technical Conference,
pages 211–222, January 1994.


