Embed Size (px)
Citation preview
November 22, 2017 | Ilya Zhukov
Mit
glie
d d
er
Helm
holt
z-G
em
ein
schaft
Debugging and performance analysis tools
Vectorization and portable programming using OpenCL – Debugging and performance analysis tools 2
Outline
Debugging Performance analysis: introduction Performance analysis tools
■ Score-P/CUBE■ Vampir■ AMD CodeXL■ nvvp■ Intel Vtune■ Intel Advisor
Tools overview Hands-on
Vectorization and portable programming using OpenCL – Debugging and performance analysis tools 3
Debugging OpenCL 1.1
Top tip:■ Write data to a global buffer from within the kernel
result[ get_global_id(0) ] = … ;■ Copy back to the host and print out from there or debug as a
normal serial application■ Works with any OpenCL device and platform
Vectorization and portable programming using OpenCL – Debugging and performance analysis tools 4
Debugging OpenCL
Check your error messages!■ If you enable Exceptions in C++ as we have here, make sure you
print out the errors. Don’t forget, use the err_code.c from the tutorial to print out errors as strings
(instead of numbers), or check in the cl.h file in the include directory of your OpenCL provider for error messages
Check your work-group sizes and indexing
Vectorization and portable programming using OpenCL – Debugging and performance analysis tools 5
Debugging OpenCL – using GDB
Can also use GDB to debug your programs on the CPU■ This will also leverage the memory system
■ Might catch illegal memory dereferences more accurately■ But it does behave differently to accelerator devices so bugs may show
up in different ways As with debugging, compile your C or C++ programs with the –g flag
Vectorization and portable programming using OpenCL – Debugging and performance analysis tools 6
Using GDB with AMD
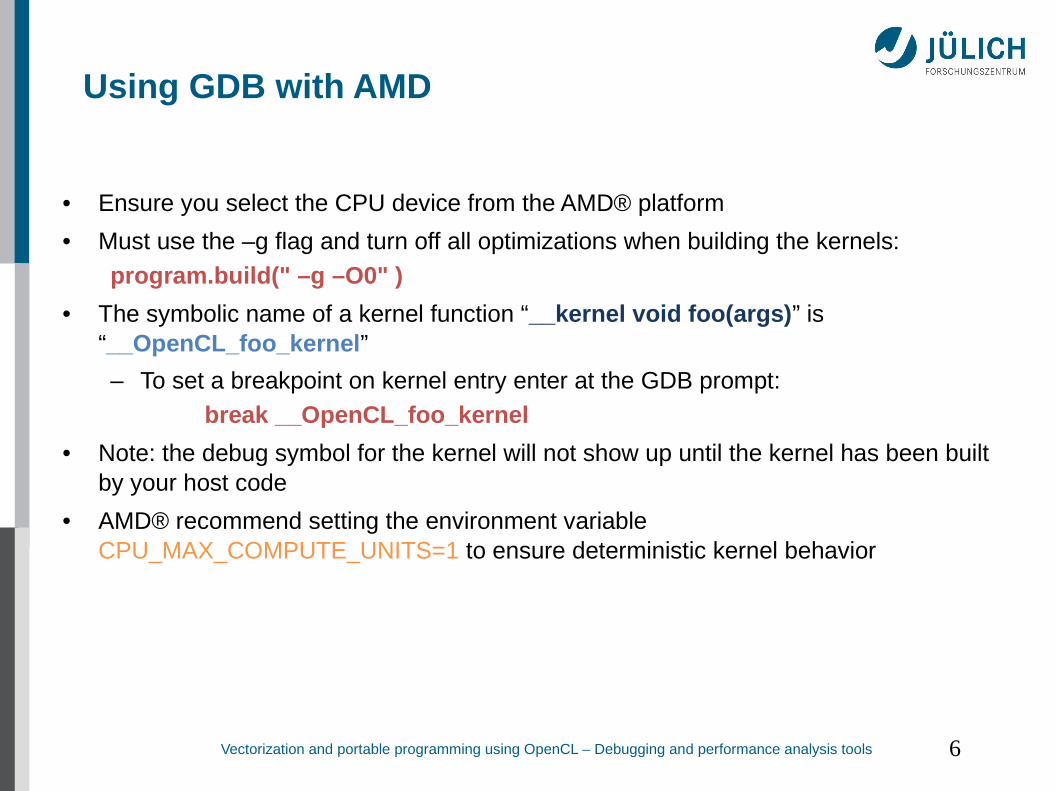
• Ensure you select the CPU device from the AMD® platform
• Must use the –g flag and turn off all optimizations when building the kernels:
program.build(" –g –O0" )
• The symbolic name of a kernel function “__kernel void foo(args)” is “__OpenCL_foo_kernel”
– To set a breakpoint on kernel entry enter at the GDB prompt:
break __OpenCL_foo_kernel
• Note: the debug symbol for the kernel will not show up until the kernel has been built by your host code
• AMD® recommend setting the environment variable CPU_MAX_COMPUTE_UNITS=1 to ensure deterministic kernel behavior
Vectorization and portable programming using OpenCL – Debugging and performance analysis tools 7
Using GDB with Intel
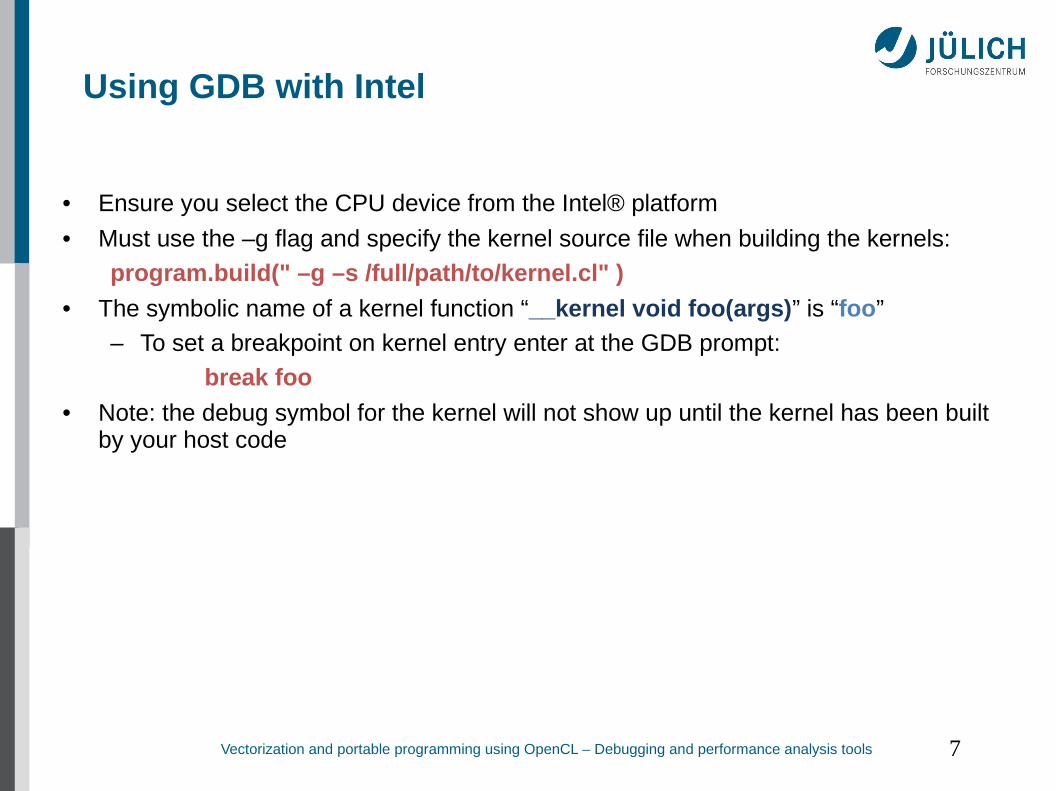
• Ensure you select the CPU device from the Intel® platform
• Must use the –g flag and specify the kernel source file when building the kernels:
program.build(" –g –s /full/path/to/kernel.cl" )
• The symbolic name of a kernel function “__kernel void foo(args)” is “foo”
– To set a breakpoint on kernel entry enter at the GDB prompt:
break foo
• Note: the debug symbol for the kernel will not show up until the kernel has been built by your host code
Vectorization and portable programming using OpenCL – Debugging and performance analysis tools 8
Debugging OpenCL – using GDB
use n to move to the next line of execution use s to step into the function if you reach a segmentation fault, backtrace lists the previous few execution
frames■ type frame 5 to examine the 5th frame
use print varname to output the current value of a variable
Vectorization and portable programming using OpenCL – Debugging and performance analysis tools 9
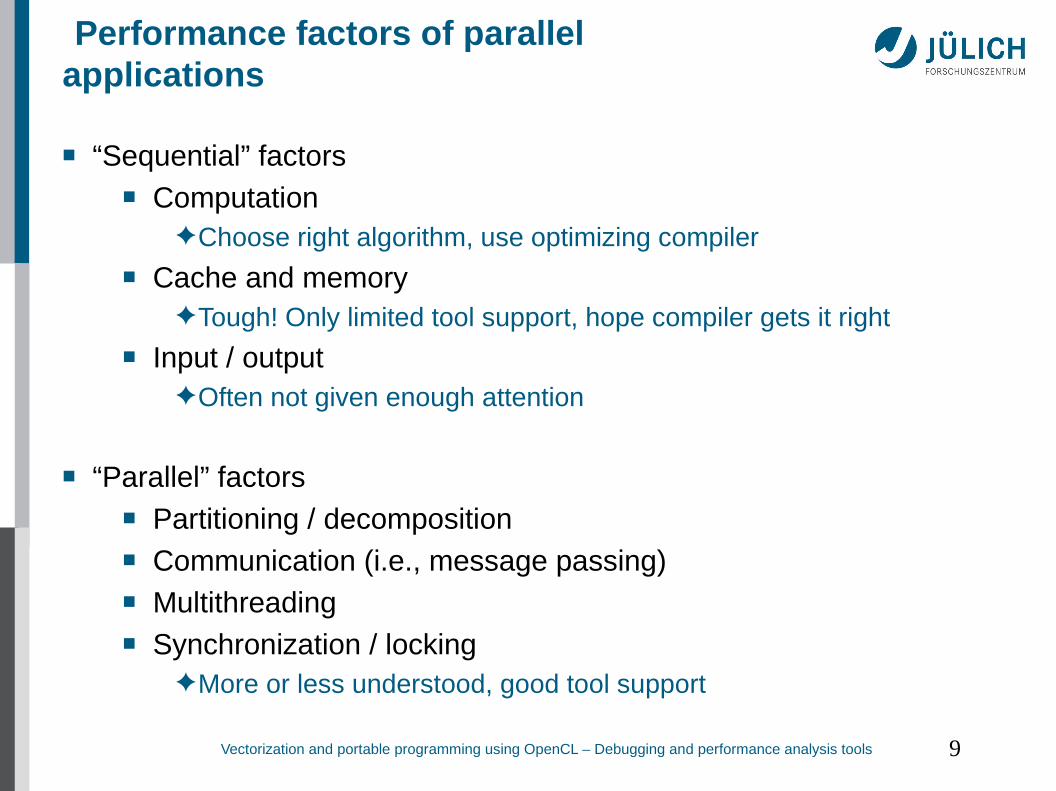
Performance factors of parallel applications
■ “Sequential” factors■ Computation
Choose right algorithm, use optimizing compiler
■ Cache and memoryTough! Only limited tool support, hope compiler gets it right
■ Input / outputOften not given enough attention
■ “Parallel” factors■ Partitioning / decomposition■ Communication (i.e., message passing)■ Multithreading■ Synchronization / locking
More or less understood, good tool support
Vectorization and portable programming using OpenCL – Debugging and performance analysis tools 10
Tuning basics
■ Successful engineering is a combination of■ The right algorithms and libraries■ Compiler flags and directives■ Thinking !!!
■ Measurement is better than guessing■ To determine performance bottlenecks■ To compare alternatives■ To validate tuning decisions and optimizations
After each step!
Vectorization and portable programming using OpenCL – Debugging and performance analysis tools 11
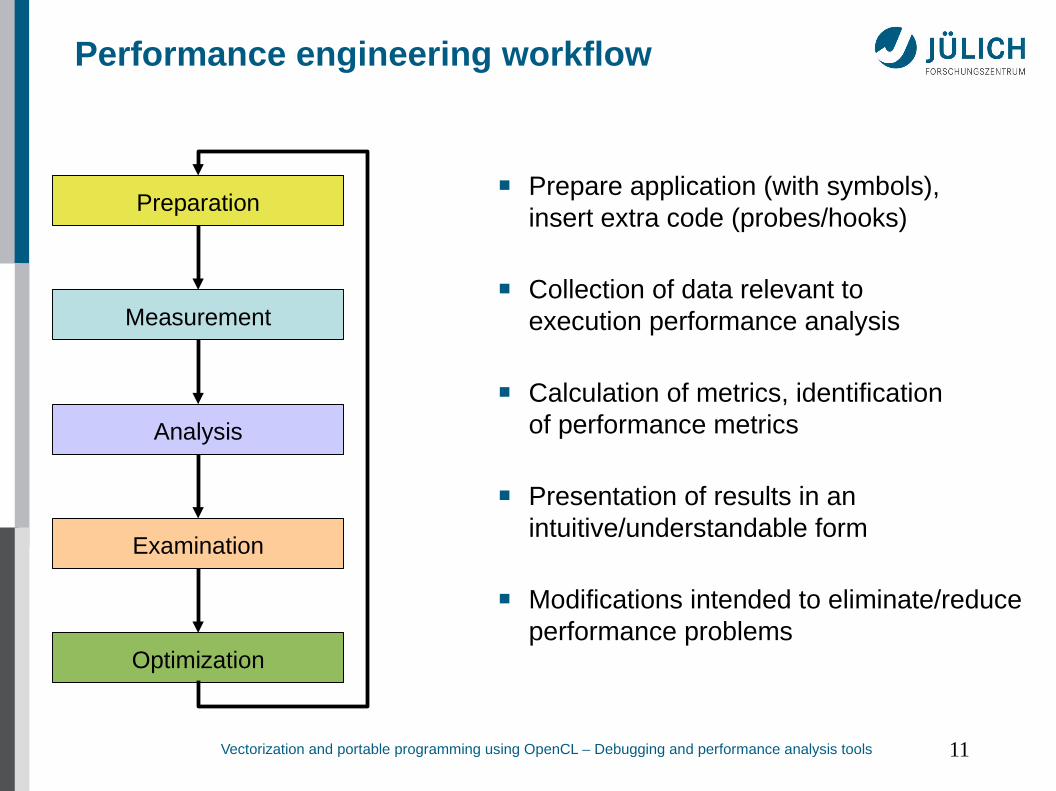
Performance engineering workflow
■ Prepare application (with symbols),insert extra code (probes/hooks)
■ Collection of data relevant toexecution performance analysis
■ Calculation of metrics, identificationof performance metrics
■ Presentation of results in an intuitive/understandable form
■ Modifications intended to eliminate/reduce performance problems
Preparation
Measurement
Analysis
Examination
Optimization
Vectorization and portable programming using OpenCL – Debugging and performance analysis tools 12
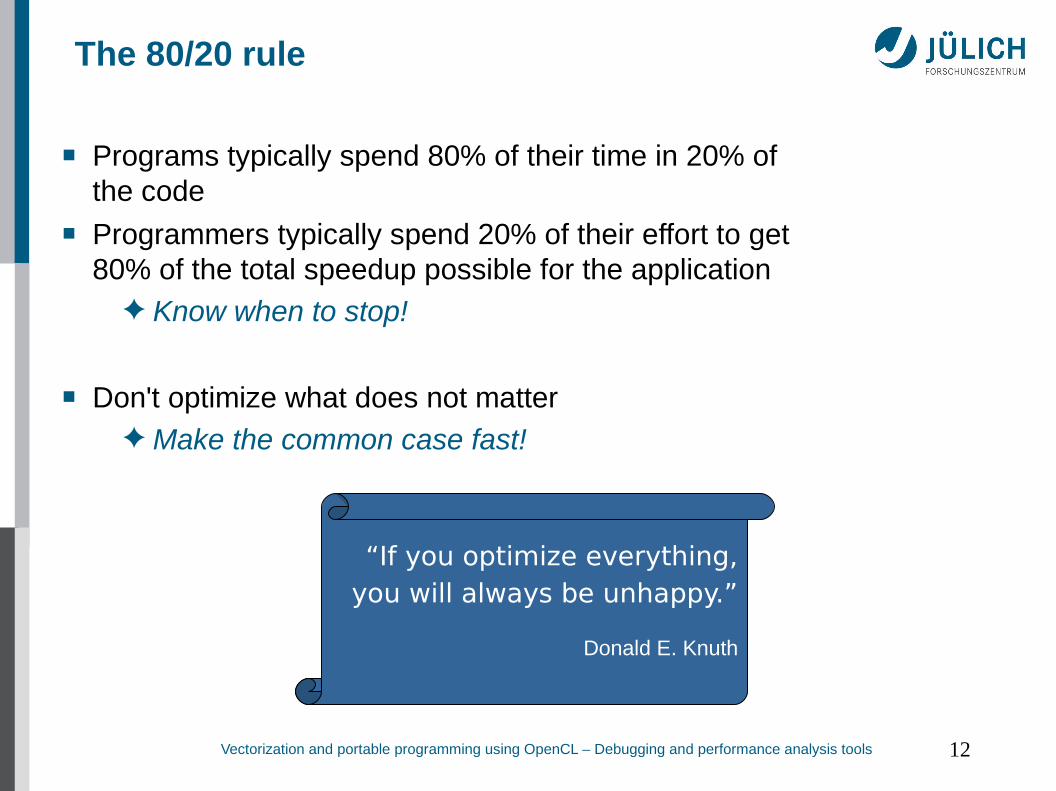
The 80/20 rule
■ Programs typically spend 80% of their time in 20% ofthe code
■ Programmers typically spend 20% of their effort to get80% of the total speedup possible for the application
Know when to stop!
■ Don't optimize what does not matter Make the common case fast!
“If you optimize everything,you will always be unhappy.”
Donald E. Knuth
Vectorization and portable programming using OpenCL – Debugging and performance analysis tools 13
Classification of measurement techniques
■ How are performance measurements triggered?■ Sampling■ Code instrumentation
■ How is performance data recorded?■ Profiling / Runtime summarization■ Tracing
■ How is performance data analyzed?■ Online■ Post mortem
Vectorization and portable programming using OpenCL – Debugging and performance analysis tools 14
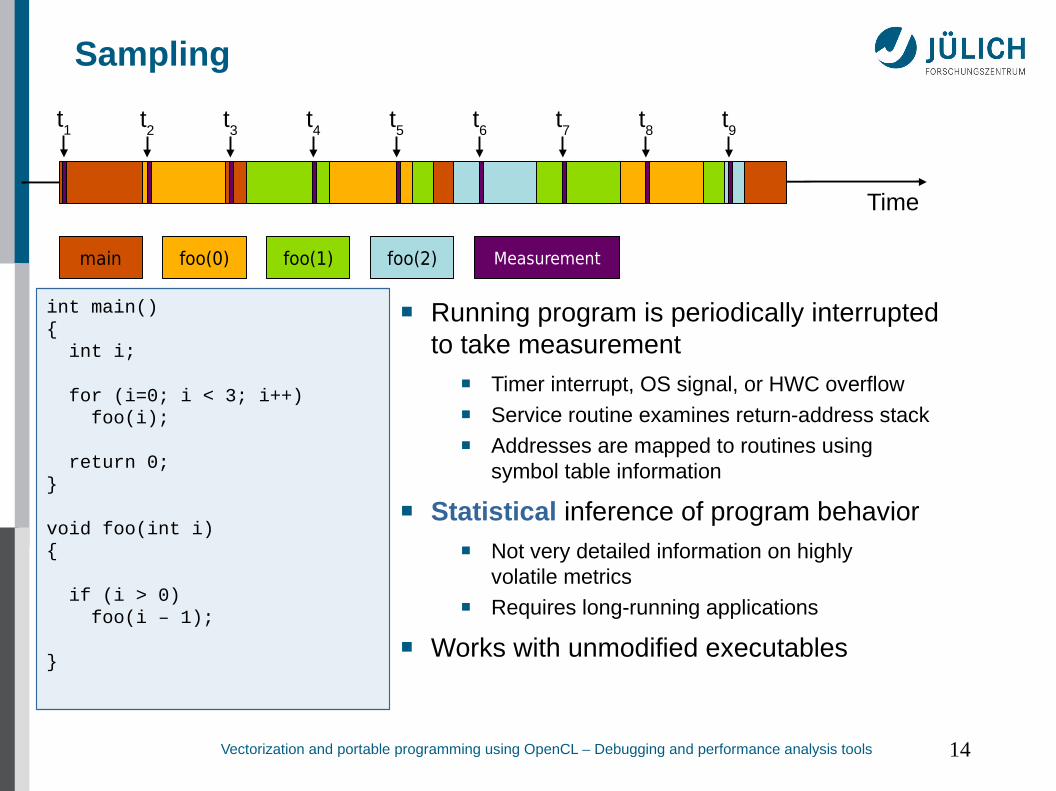
Sampling
■ Running program is periodically interruptedto take measurement
■ Timer interrupt, OS signal, or HWC overflow■ Service routine examines return-address stack■ Addresses are mapped to routines using
symbol table information
■ Statistical inference of program behavior■ Not very detailed information on highly
volatile metrics■ Requires long-running applications
■ Works with unmodified executables
Time
main foo(0) foo(1) foo(2)
int main(){ int i;
for (i=0; i < 3; i++) foo(i);
return 0;}
void foo(int i){
if (i > 0) foo(i – 1);
}
Measurement
t9
t7
t6
t5
t4
t1 t
2t3
t8
Vectorization and portable programming using OpenCL – Debugging and performance analysis tools 15
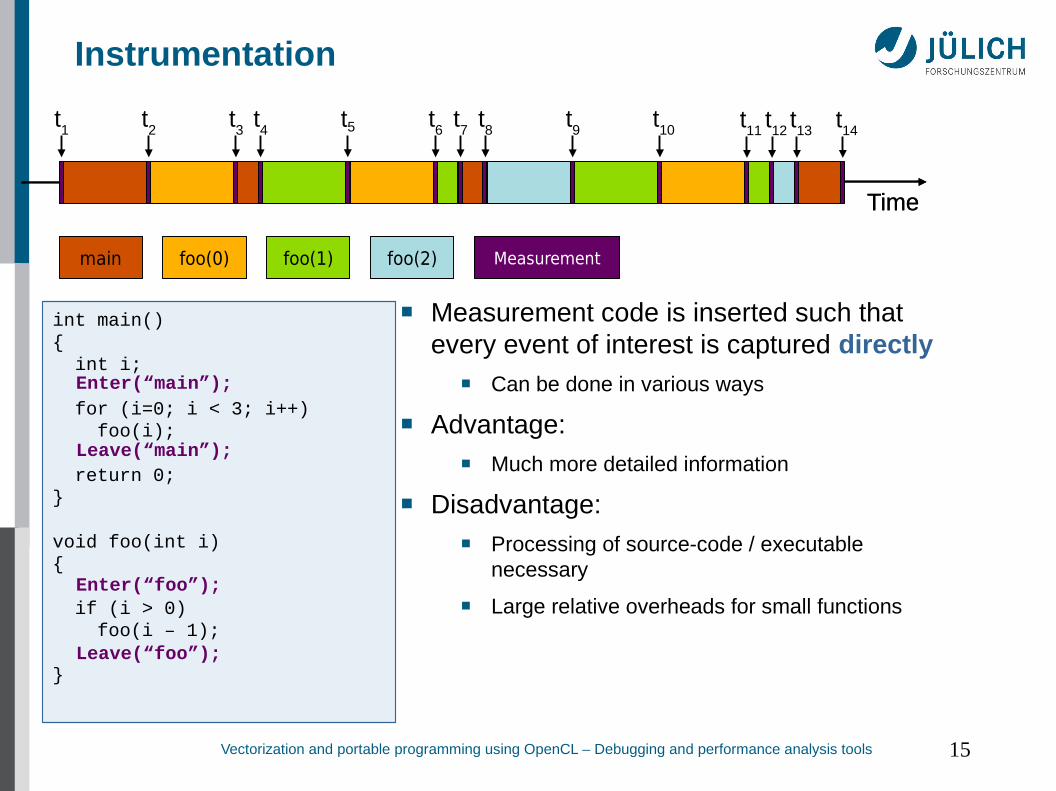
Instrumentation
Time
Measurement
■ Measurement code is inserted such thatevery event of interest is captured directly
■ Can be done in various ways
■ Advantage:■ Much more detailed information
■ Disadvantage:■ Processing of source-code / executable
necessary
■ Large relative overheads for small functions
int main(){ int i;
for (i=0; i < 3; i++) foo(i);
return 0;}
void foo(int i){
if (i > 0) foo(i – 1);
}
Time
t1
t2
t3
t4
t5 t6
t7
t8
t9
t10 t
11t12
t13
t14
main foo(0) foo(1) foo(2)
Enter(“main”);
Leave(“main”);
Enter(“foo”);
Leave(“foo”);
Vectorization and portable programming using OpenCL – Debugging and performance analysis tools 16
Instrumentation techniques
■ Static instrumentation■ Program is instrumented prior to execution
■ Dynamic instrumentation■ Program is instrumented at runtime
■ Code is inserted■ Manually■ Automatically
■ By a preprocessor / source-to-source translation tool■ By a compiler■ By linking against a pre-instrumented library / runtime system■ By binary-rewrite / dynamic instrumentation tool
Vectorization and portable programming using OpenCL – Debugging and performance analysis tools 17
Critical issues
■ Accuracy■ Intrusion overhead
■ Measurement itself needs time and thus lowers performance
■ Perturbation■ Measurement alters program behaviour■ E.g., memory access pattern
■ Accuracy of timers & counters■ Granularity
■ How many measurements?■ How much information / processing during each measurement?
Tradeoff: Accuracy vs. Expressiveness of data
Vectorization and portable programming using OpenCL – Debugging and performance analysis tools 18
Profiling / Runtime summarization
■ Recording of aggregated information■ Total, maximum, minimum, …
■ For measurements■ Time■ Counts
■ Function calls■ Bytes transferred■ Hardware counters
■ Over program and system entities■ Functions, call sites, basic blocks, loops, …■ Processes, threads
Profile = summarization of events over execution interval
Vectorization and portable programming using OpenCL – Debugging and performance analysis tools 19
Tracing
■ Recording information about significant points (events) during execution of the program
■ Enter / leave of a region (function, loop, …)■ Send / receive a message, …
■ Save information in event record■ Timestamp, location, event type■ Plus event-specific information (e.g., communicator,
sender / receiver, …)■ Abstract execution model on level of defined events
Event trace = Chronologically ordered sequence ofevent records
Vectorization and portable programming using OpenCL – Debugging and performance analysis tools 20
Tracing vs. Profiling
■ Tracing advantages
■ Event traces preserve the temporal and spatial relationships among individual events ( context)
■ Allows reconstruction of dynamic application behaviour on any required level of abstraction
■ Most general measurement technique■ Profile data can be reconstructed from event traces
■ Disadvantages
■ Traces can very quickly become extremely large■ Writing events to file at runtime causes perturbation■ Writing tracing software is complicated
■ Event buffering, clock synchronization, ...
Vectorization and portable programming using OpenCL – Debugging and performance analysis tools 21
Score-P
Instrumentation & measurement infrastructure Developed by a consortium of performance
tool groups
Latest generation measurement system of Scalasca 2.x Vampir TAU Periscope
Common data formats improve tool interoperability http://www.score-p.org/
Vectorization and portable programming using OpenCL – Debugging and performance analysis tools 22
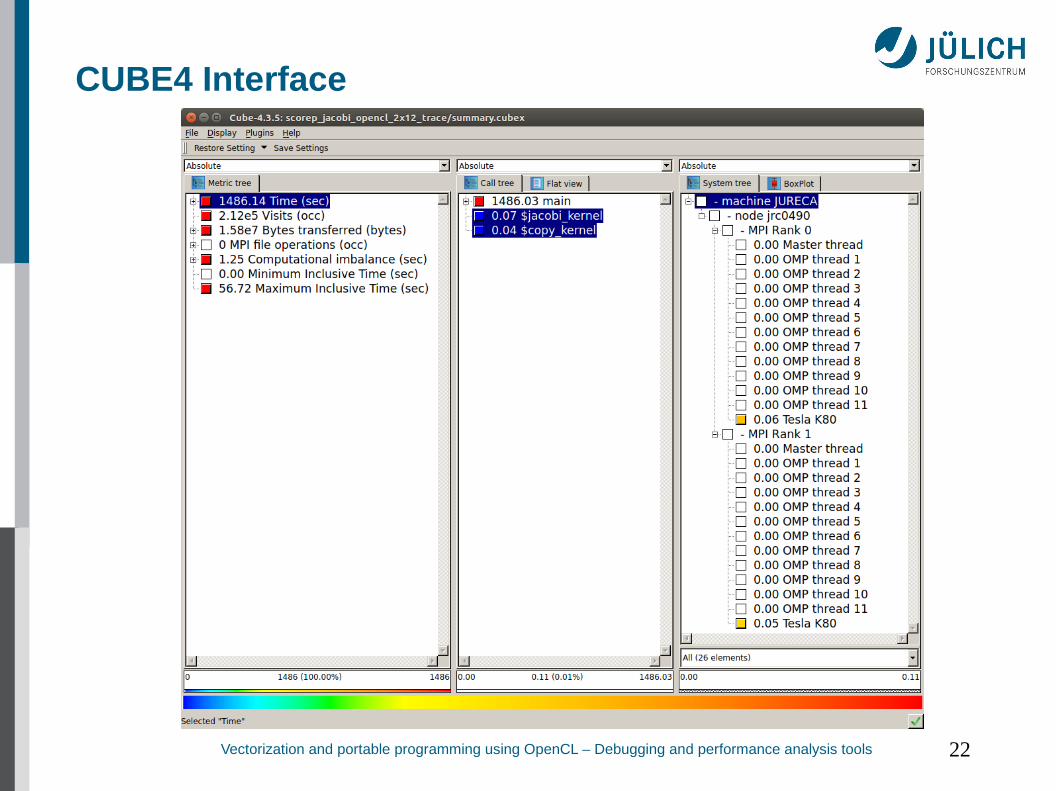
CUBE4 Interface
Vectorization and portable programming using OpenCL – Debugging and performance analysis tools 23
Vampir
Visualization of dynamicsof complex parallel processes
Requires two components■ Monitor/Collector (Score-P)■ Charts/Browser (Vampir)
Typical questions that Vampir helps to answer:■ What happens in my application execution during a given time in
a given process or thread?■ How do the communication patterns of my application execute on
a real system?■ Are there any imbalances in computation, I/O or memory usage
and how do they affect the parallel execution of my application?
Vectorization and portable programming using OpenCL – Debugging and performance analysis tools 24
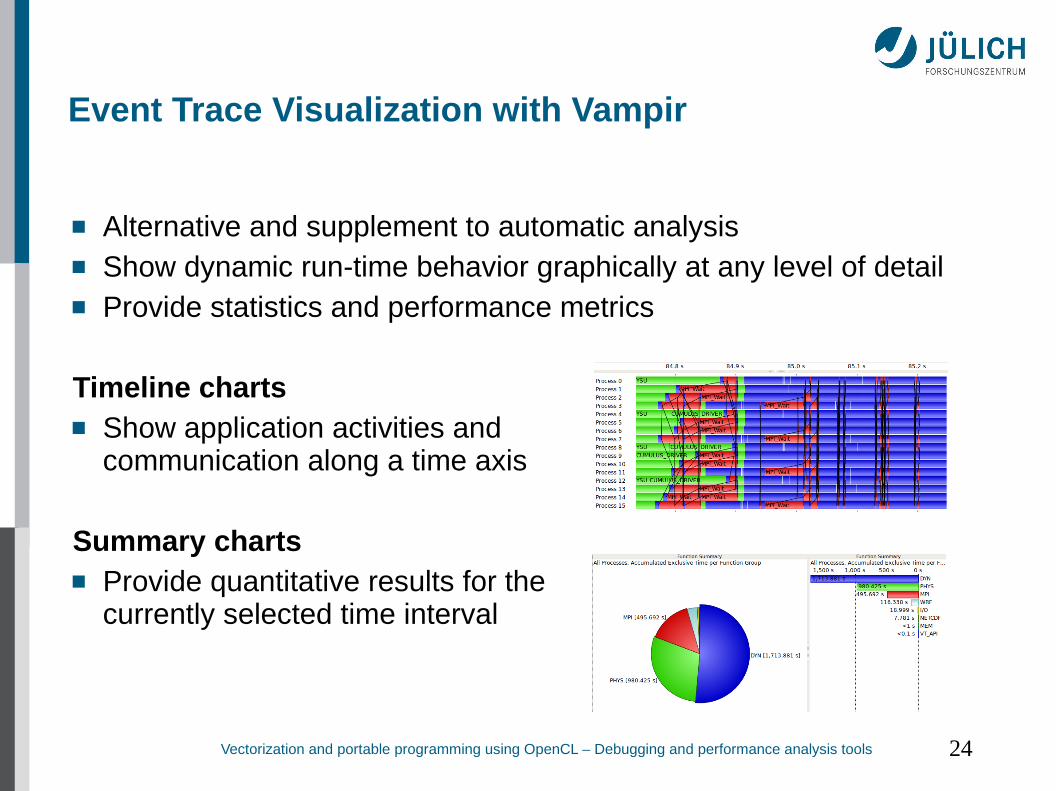
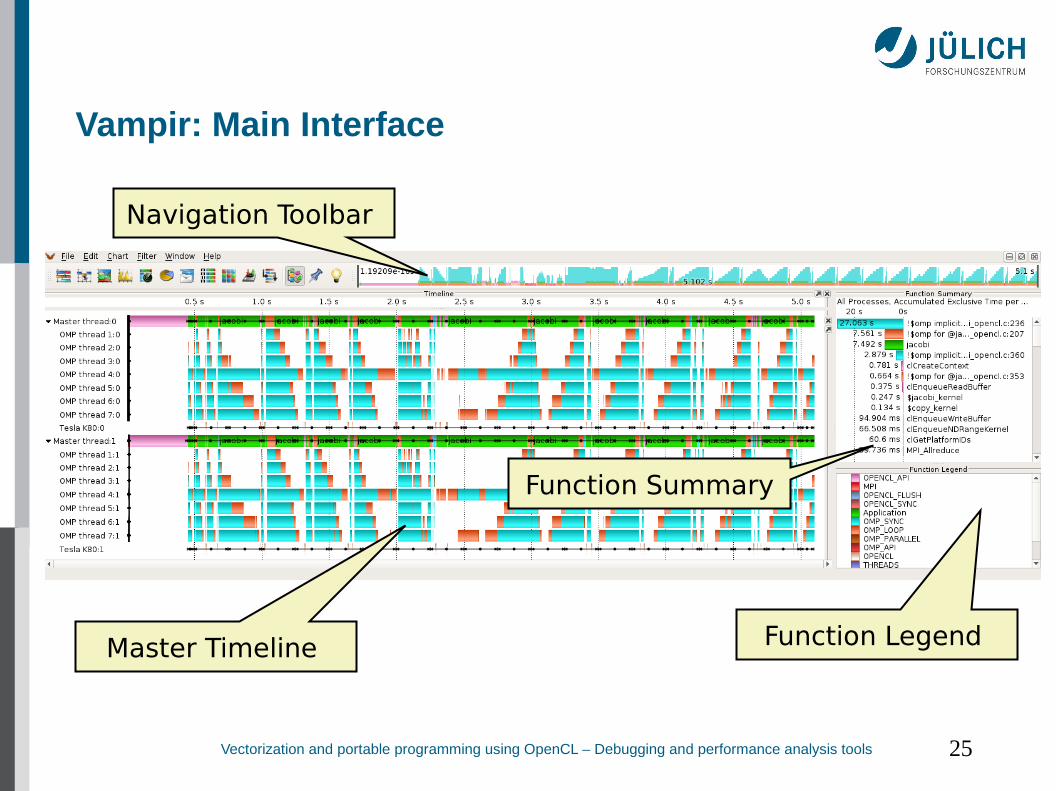
Event Trace Visualization with Vampir
Alternative and supplement to automatic analysis Show dynamic run-time behavior graphically at any level of detail Provide statistics and performance metrics
Timeline charts Show application activities and
communication along a time axis
Summary charts Provide quantitative results for the
currently selected time interval
Vectorization and portable programming using OpenCL – Debugging and performance analysis tools 25
Vampir: Main Interface
Master Timeline
Navigation Toolbar
Function Legend
Function Summary
Vectorization and portable programming using OpenCL – Debugging and performance analysis tools 26
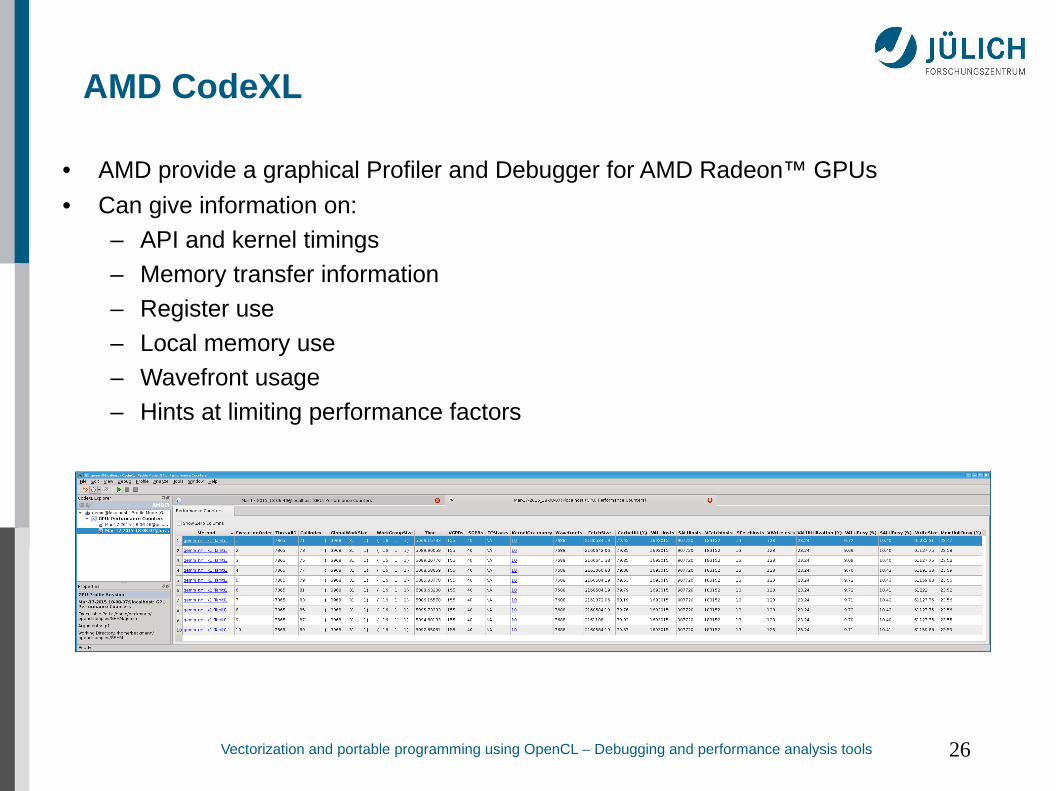
AMD CodeXL
• AMD provide a graphical Profiler and Debugger for AMD Radeon™ GPUs
• Can give information on:
– API and kernel timings
– Memory transfer information
– Register use
– Local memory use
– Wavefront usage
– Hints at limiting performance factors
Vectorization and portable programming using OpenCL – Debugging and performance analysis tools 27
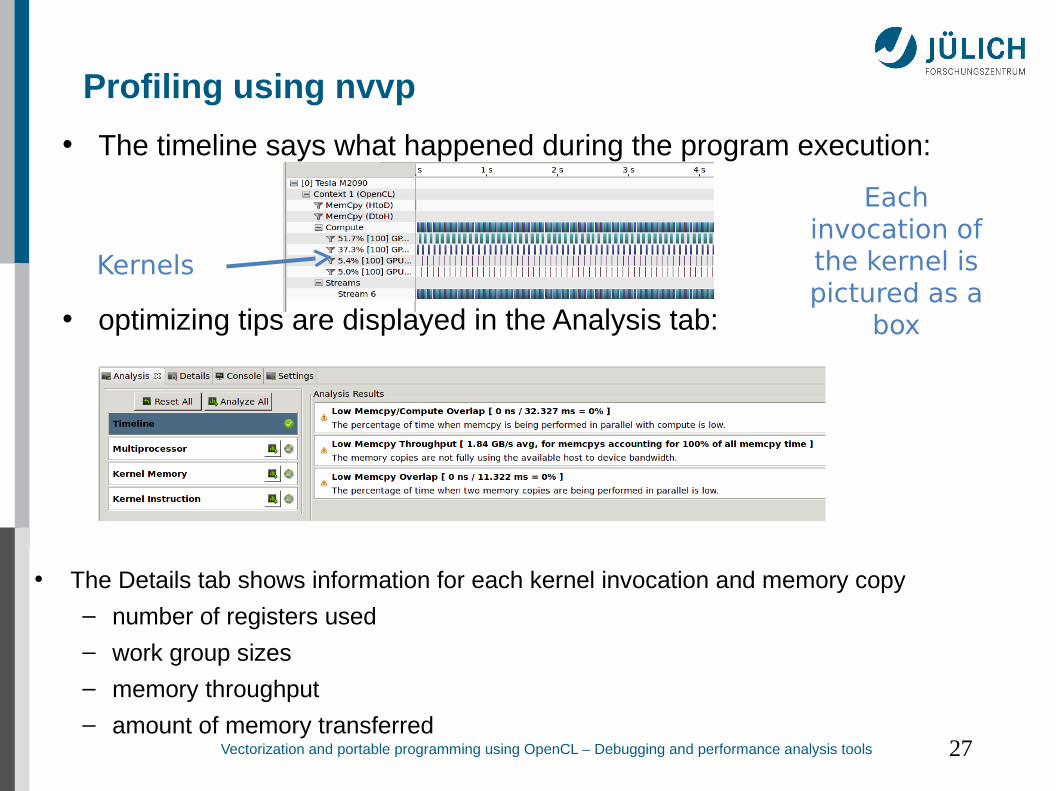
Profiling using nvvp
• The timeline says what happened during the program execution:
• optimizing tips are displayed in the Analysis tab:
Kernels
Each invocation of the kernel is pictured as a
box
• The Details tab shows information for each kernel invocation and memory copy
– number of registers used
– work group sizes
– memory throughput
– amount of memory transferred
Vectorization and portable programming using OpenCL – Debugging and performance analysis tools 28
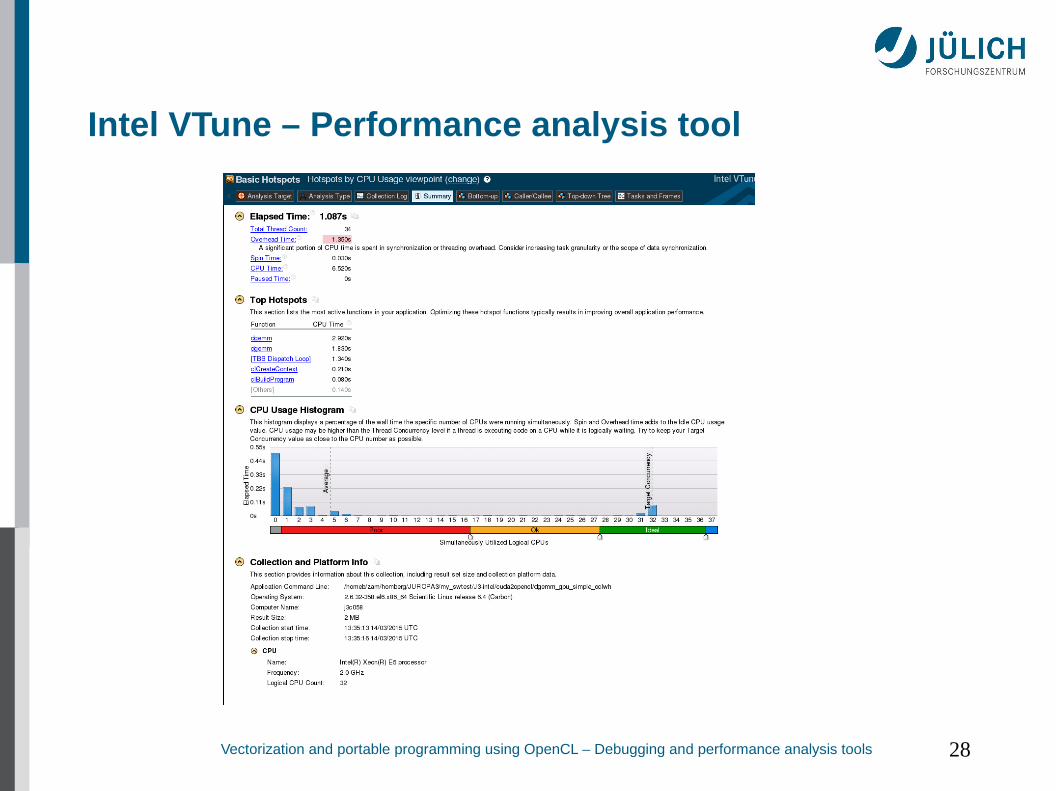
Intel VTune – Performance analysis tool
Vectorization and portable programming using OpenCL – Debugging and performance analysis tools 29
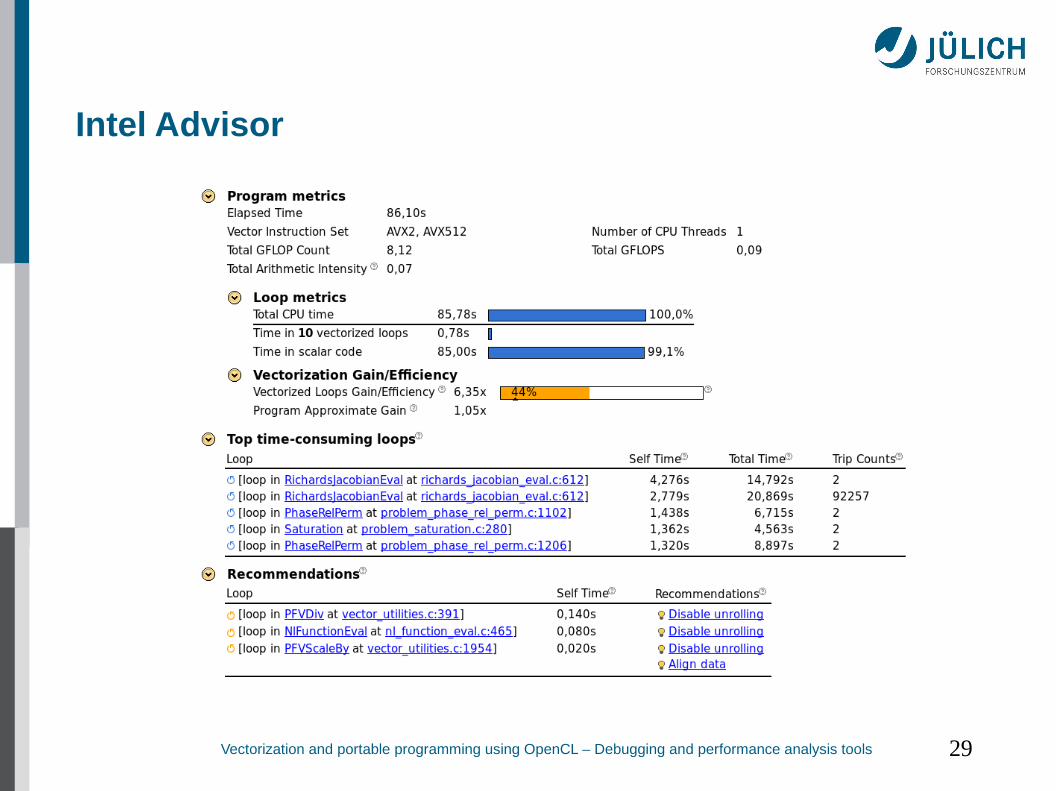
Intel Advisor
Vectorization and portable programming using OpenCL – Debugging and performance analysis tools 30
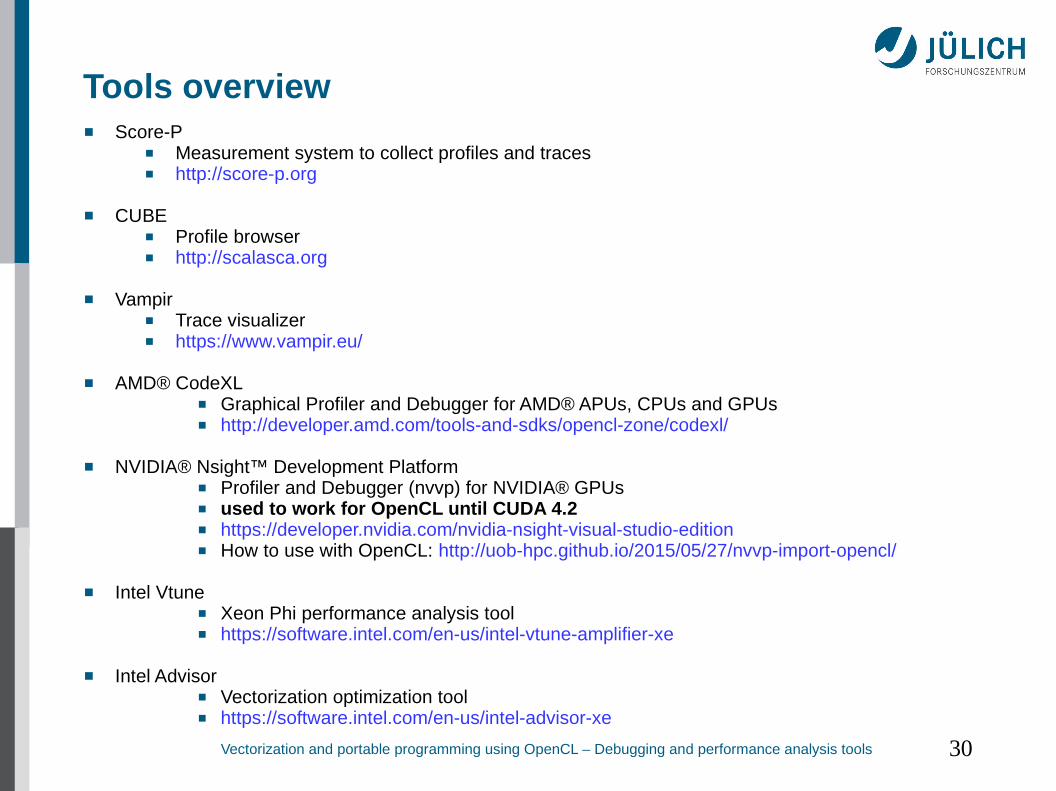
Tools overview Score-P
■ Measurement system to collect profiles and traces■ http://score-p.org
CUBE■ Profile browser■ http://scalasca.org
Vampir■ Trace visualizer■ https://www.vampir.eu/
AMD® CodeXL■ Graphical Profiler and Debugger for AMD® APUs, CPUs and GPUs■ http://developer.amd.com/tools-and-sdks/opencl-zone/codexl/
NVIDIA® Nsight™ Development Platform■ Profiler and Debugger (nvvp) for NVIDIA® GPUs■ used to work for OpenCL until CUDA 4.2■ https://developer.nvidia.com/nvidia-nsight-visual-studio-edition■ How to use with OpenCL: http://uob-hpc.github.io/2015/05/27/nvvp-import-opencl/
Intel Vtune■ Xeon Phi performance analysis tool■ https://software.intel.com/en-us/intel-vtune-amplifier-xe
Intel Advisor■ Vectorization optimization tool ■ https://software.intel.com/en-us/intel-advisor-xe
Vectorization and portable programming using OpenCL – Debugging and performance analysis tools 31
Questions? Ask!
JSC support
VI-HPS tuning workshops
http://www.vi-hps.org/training/tw
Apply for free POP performance audit
https://pop-coe.eu/request-service-form
Vectorization and portable programming using OpenCL – Debugging and performance analysis tools 32
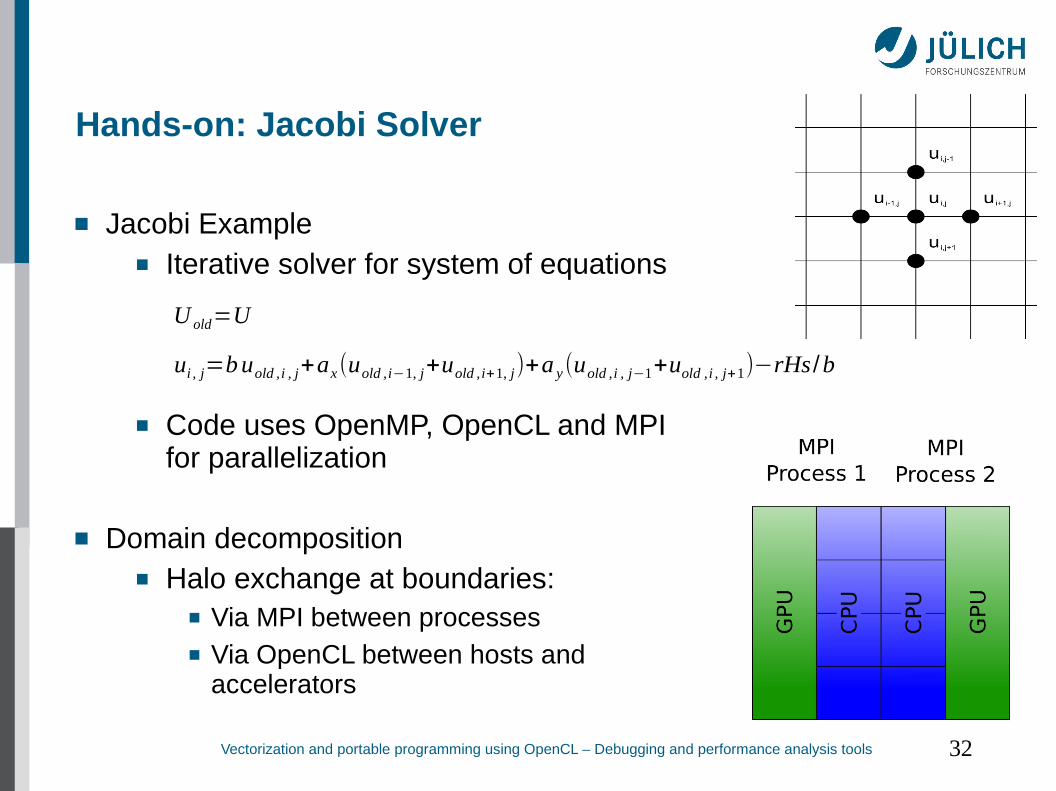
Hands-on: Jacobi Solver
Jacobi Example■ Iterative solver for system of equations
■ Code uses OpenMP, OpenCL and MPI for parallelization
Domain decomposition■ Halo exchange at boundaries:
■ Via MPI between processes■ Via OpenCL between hosts and
accelerators
U old=U
ui , j=buold ,i , j+ax(uold ,i−1, j+uold ,i+1, j)+a y(uold ,i , j−1+uold ,i , j+1)−rHs /b
Vectorization and portable programming using OpenCL – Debugging and performance analysis tools 33
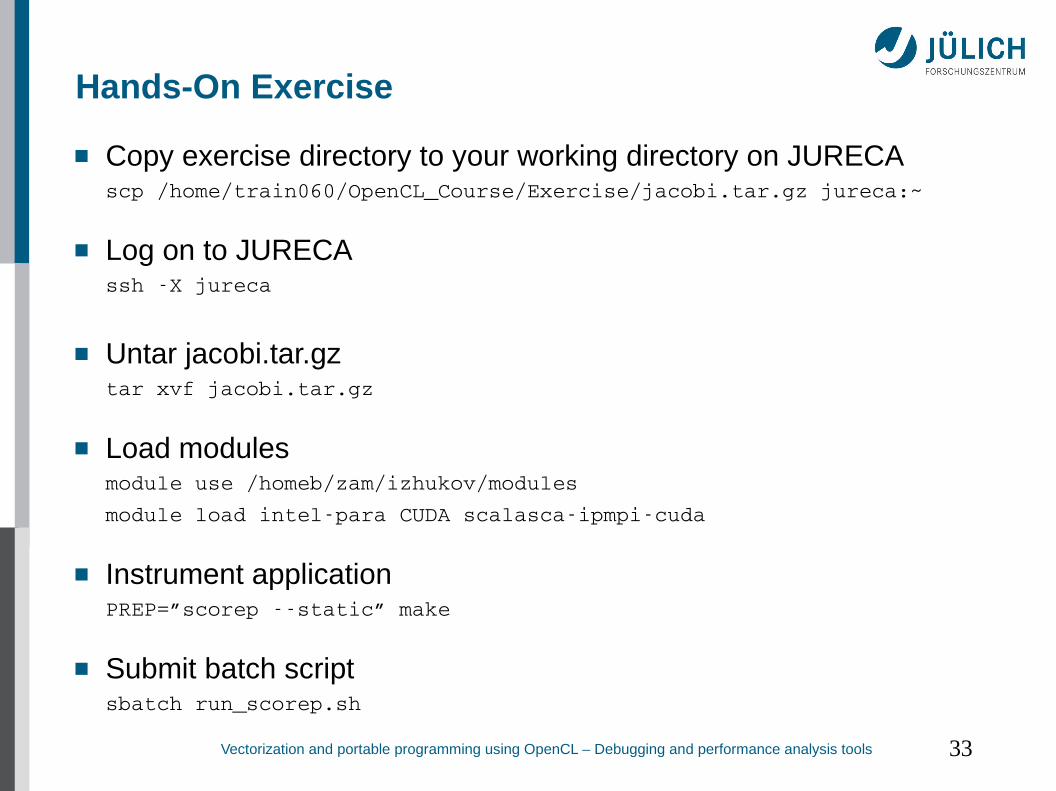
Hands-On Exercise
Copy exercise directory to your working directory on JURECAscp /home/train060/OpenCL_Course/Exercise/jacobi.tar.gz jureca:~
Log on to JURECAssh X jureca
Untar jacobi.tar.gztar xvf jacobi.tar.gz
Load modulesmodule use /homeb/zam/izhukov/modules
module load intelpara CUDA scalascaipmpicuda
Instrument applicationPREP=”scorep static” make
Submit batch scriptsbatch run_scorep.sh
Vectorization and portable programming using OpenCL – Debugging and performance analysis tools 34
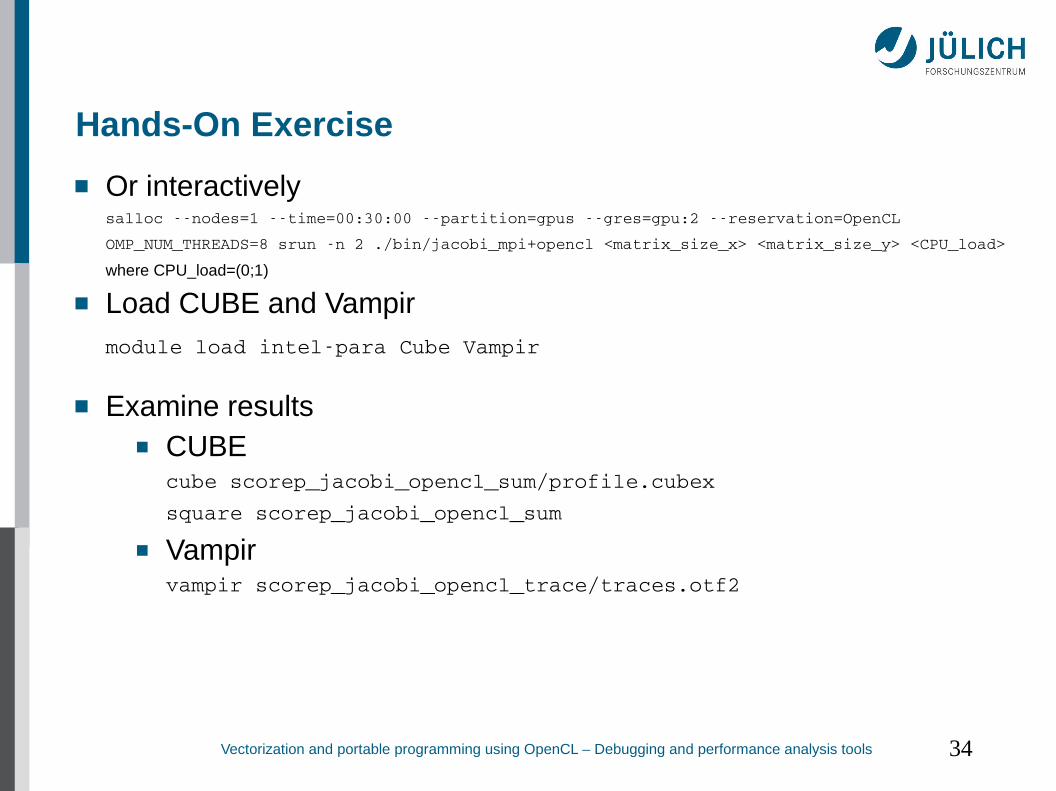
Hands-On Exercise
Or interactivelysalloc nodes=1 time=00:30:00 partition=gpus gres=gpu:2 reservation=OpenCL
OMP_NUM_THREADS=8 srun n 2 ./bin/jacobi_mpi+opencl <matrix_size_x> <matrix_size_y> <CPU_load>
where CPU_load=(0;1)
Load CUBE and Vampirmodule load intelpara Cube Vampir
Examine results■ CUBE
cube scorep_jacobi_opencl_sum/profile.cubex
square scorep_jacobi_opencl_sum
■ Vampirvampir scorep_jacobi_opencl_trace/traces.otf2


