Embed Size (px)
Citation preview
HAL Id: halshs-03452523https://halshs.archives-ouvertes.fr/halshs-03452523
Submitted on 26 Nov 2021
HAL is a multi-disciplinary open accessarchive for the deposit and dissemination of sci-entific research documents, whether they are pub-lished or not. The documents may come fromteaching and research institutions in France orabroad, or from public or private research centers.
L’archive ouverte pluridisciplinaire HAL, estdestinée au dépôt et à la diffusion de documentsscientifiques de niveau recherche, publiés ou non,émanant des établissements d’enseignement et derecherche français ou étrangers, des laboratoirespublics ou privés.
A Geographical Contribution on Interurban PassengerRail Transportation in the United States
Matthieu Schorung
To cite this version:Matthieu Schorung. A Geographical Contribution on Interurban Passenger Rail Transportation inthe United States. [Research Report] Université gustave eiffel. 2021. �halshs-03452523�
1
Matthieu SCHORUNG PhD in Geography and Urban Planning (2019)
Postdoctoral Researcher, Gustave Eiffel University (France)
A GEOGRAPHICAL CONTRIBUTION ON
INTERURBAN PASSENGER RAIL
TRANSPORTATION IN THE UNITED
STATES
POSITION PAPER November 2021
BASED ON A DISSERTATION IN TRANSPORT GEOGRAPHY AND URBAN
PLANNING (DEFENDED IN JULY 2019)
2
Author: Matthieu Schorung PhD in Geography and Urban Planning (Paris-Est University, France) Dissertation under the supervision of Professor Pierre Zembri (defended in July 2019) entitled ‘Passenger Rail Transportation in the United States Between Institutional Conflicts, Process of Territorialization and Metropolitan Anchorage’ Current position: Postdoctoral Researcher, Research Chair Logistics City Gustave Eiffel University (Marne-la-Vallée, France) Email : [email protected] Funding of the report: Gustave Eiffel University Special Grant to Individual Projects (BQR – Bonus Qualité Recherche) 14-20 boulevard Newton, Cité Descartes, Champs-sur-Marne 77420 Champs-sur-Marne Host Research Unit: Research Unit LVMT Laboratoire Ville Mobilité Transport Gustave Eiffel University 6-8 avenue Blaise Pascal, Cité Descartes, Champs-sur-Marne 77455 Marne-la-Vallée cedex 2 Translation and proofreading: LINC Languages OÜ John Crisp Harju maakond, Lasnamäe linnaosa, Sepapaja tn 6 15551 Tallinn Estonie
3
ABSTRACT OF THE COMPLETE DISSERTATION
The complete dissertation (in French) can be found and downloaded here: https://hal.archives-ouvertes.fr/tel-02197401v2
The subject of this research is intercity passenger rail transportation in the United States, approached from two perspectives: Amtrak’s traditional rail services and high-speed rail projects. The aim is to understand the workings of public rail transportation policies, what they contain, and how they are developed and pursued by the different actors. The originality of the research lies in its multiscale approach, with a constant back-and-forth between the different scales of analysis, and in its use of several case studies to analyze the territorialization of intercity rail transportation policies.
Research question
This research, which explores policy trends in passenger rail transportation in the US, seeks to provide answers to two main questions. The first concerns the adoption or readoption of the rail mode by the players in the transportation sector. How do the Federal government, the individual States, and Amtrak construct and implement their rail policies? What are perceived to be the political, economic, and territorial priorities of rail transportation within the overall context of transportation in the United States? How do the different actors perceive the institutional conflicts around the train, whether rooted in financial and legislative factors, or in political practices. The second concerns territorial embeddedness and the territorialization of rail policies in a context where the individual states and local actors develop their own practices and their own forms of public action based on political and economic considerations that have little to do with the federal level. What are the factors that foster and hinder the emergence of new rail policies? What is being done to develop the connections and the necessary coordination between intercity rail projects, regional and urban transportation networks, and mass transit development policy? How do local actors and transit operators view the metropolitan dimension of rail projects in the form of stations and station districts?
Hypotheses
The first hypothesis advanced is that the emergence of high-speed rail (HSR) policy is driven by coalitions of public and/or private actors and not underpinned by national policy. Our argument is based on three factors. First, the difficulties of progressing a new federal rail policy inherent in the structure of the US rail network (centrality of freight, largely private ownership of existing infrastructure, formation of more and more bottlenecks in the big metropolitan regions, Amtrak’s institutional and financial weakness). Then the partial failure of the Obama administration’s initiative in favor of high-speed rail despite the unprecedented allocation of funds for this mode of transportation. Finally, the fact that the renewal of US rail policies entails a more significant delegation of powers on transportation to the states and the regional/metropolitan authorities (in particular the Metropolitan Planning Organizations) in order to circumvent political obstacles at the federal level.
The second hypothesis is that a political paradigm shift is contributing to the emergence and implementation of policies favorable to passenger rail transportation. The argument is that there has been a change in thinking about transportation policies and that economic, territorial, and environmental reasons (growing freeway congestion, future airport congestion, need for policies in favor of public transit and zero-carbon mobilities, global greenhouse gas reduction strategy, etc.) are being advanced to legitimize and justify new rail projects and the big investments associated with them.
The third hypothesis concerns the emergence of a new policy in favor of high-speed rail. High-speed rail in the US is being implemented under a new development model, which represents a move away from speed as a central objective and the traditional goal of building a dedicated high-speed rail network, to the detriment of the existing network and financial and economic balances. By analyzing the business model and geographical context of the train, this research shows that high-speed rail is only appropriate
4
in a small number of “megaregional” or “megalopolitan” corridors. The development of public policies or private strategies for high-speed rail in the US reflects conditions that vary from one region to another, and is based – deliberately or by default – on a passenger rail network that includes European and Asian style high-speed corridors (California, Northeast corridor), and on “higher-speed” corridors that use upgraded existing infrastructures (Cascades, Florida, Midwest corridors). As well as a hybrid concept of technical corridors and the coexistence of different rail services, this new policy is also founded on the importance of regionalized strategies. The other countries with high-speed rail – though with undeniable internal differences – have implemented a unified, uniform, top-down vision, primarily with central government backing, of spatial development and planning through high-speed lines. In the US, the federal government’s powers in transportation are limited to safety and the Interstate highways, or to special investment, while Amtrak has insufficient resources to take on the private freight companies. States, on the other hand, have extensive powers in this sphere but have to accommodate a galaxy of local actors, which also have input into transportation and planning policies. And more recently, private players independent of any public strategy have declared an interest or have become involved in developing rail projects (Florida, Texas, Midwest). This distinctive political and institutional setup is complex – a complexity reinforced by administrative overlap and local government fragmentation in the US – and encourages the development of new strategies appropriate to the regional context, which preclude the uniform practices, goals, and instruments favored at federal level.
The final hypothesis is that since the revival of rail in the US depends on a small number of corridors, what is needed is network integration and an intermodal approach in rail policies. The construction of a new high-speed line or the upgrading of an existing line entail three imperatives that apply to all areas and to all parties: (1) interconnection of the intercity network with the existing regional and urban networks in order to enhance the performance and efficiency of the transportation system; (2) the application of an integrative multi- and inter-modal vision through the coordination of the different practices of the different operators and the construction or renovation of multimodal interchange hubs; (3) specific attention to the metropolitan embeddedness of intercity rail corridors through a restored emphasis on stations. The station, as a symbol of the material and territorial dimension of rail transportation, and as an urban “object”, is undergoing a threefold political reappropriation: as an element of metropolitan centrality; as a starting point for an urban regeneration plan; and in the development of better coordination between urban planning and services through the role of station districts.
Thesis plan
After covering the main legislative stages relating to the introduction of high-speed rail and summarizing the Obama administration’s initiative, the aim of this first part of this thesis is to analyze the main projects underway in the US – including private projects – at their different stages of preparation and development.
The second part largely focuses on political and institutional conflicts. The aim is to analyze federal rail policy through the different transportation acts and the Amtrak reforms, and to compare it with federal support for other transportation modes. Our goal is also to study the federal government attempts to introduce a national strategy for the development of passenger rail transportation (National Rail Plan). The growing role of the states in rail policy since the PRIIA and FAST Acts, and the support for Amtrak, occupy a large proportion of this institutional and political component of the thesis. In addition, even though the existing Metropolitan Planning Organizations (MPO) have no powers with respect to intercity rail transportation, it is interesting to explore the extent to which this institutional layer is taking on the challenges of passenger rail. The aim of this part of the thesis is to cover the interplay between the institutional actors in passenger rail, Amtrak and high-speed rail projects. This section prompts us to consider the points of political, institutional, and financial gridlock that prevent the development of Amtrak and of an ambitious rail policy. This leads us to look at Amtrak’s business model, and that of high-speed rail in the USA. Indeed, the competition from air transportation (for long-haul routes, and increasingly medium- and short-distance travel), and from buses, raises questions about the pertinence of such projects in these geographic conditions. This third stage will therefore focus on four subjects: analysis of Amtrak’s business model (with examples from several lines); analysis of the presumed
5
business model for high-speed rail (based on the examples of the NEC and the Californian project); an exploration of the relevance of high-speed rail in the United States (competition between rail, air, and road); and finally the role of tourism in ongoing rail projects (example of Brightline).
Finally, the third part of the thesis looks at the territorialization of rail policies through the prism of several case studies that reveal the role of local institutional and non-institutional actors and of strategies of integration with urban networks to promote eco-mobility and alternatives to road and airport congestion. Three case studies are considered: the Cascades corridor (Seattle-Portland), the North Californian corridor (San Francisco-San Jose), the new private All Aboard Florida rail project (Miami-Orlando). These case studies will provide an entry into the analysis of the network-territory couplet, and into the examination of stations and station districts. America is seeing a proliferation of projects that involve the renovation of central stations and the construction of multimodal hubs, as well as projects that place stations at the heart of larger urban development programs.
Findings of the thesis
The first hypothesis concerned the emergence of a high-speed rail policy propelled by a coalition of public and/or private actors, rather than by a national high-speed rail development strategy. Our analyses confirmed this hypothesis. In a political climate marked by recurrent tensions and polemics over the influence and role of the federal government, the introduction of any federally instigated scheme is compromised. The emergence of more and more private projects reflects the current situation of passenger rail in the United States, caught between technological, scientific, and political emulation and major financial obstacles. After a significant turnabout in 2009, marked by the passing of several acts and the implementation of an unprecedented funding program founded on a collaboration between the federal and states levels, the federal administration’s rail policy seems to have applied the brakes since 2011. The Obama administration’s top-down initiative changed the geography of US rail, but on too modest scale. It provided support for high-speed rail projects in California and in the Northeast, and for modernization of the existing network in other corridors (Cascade, Midwest, California), but failed to propose or impose a uniform nationwide vision. Rail projects are therefore sustained by coalitions of increasingly cooperating actors. The analysis demonstrates the emergence of a bottom-up approach to projects, notably apparent in the Californian HSR project and in the modernization of the Cascades corridor. This process has even gone to the extreme with the proliferation of private rail projects that stress their independence from government, be it in decision-making, governance, or funding. This seems definitively to preclude any attempt to establish a national framework for high-speed rail, like those found elsewhere in the world, regardless of party-political considerations, i.e. the traditionally greater enthusiasm of the Democratic Party for large-scale federal investment.
The second hypothesis was that a political paradigm shift is contributing to the emergence and implementation of pro-passenger rail policies. This analysis was initially conducted at both national and state levels, with an emphasis on the arguments and guidelines in the strategic planning documents, whether for transportation or urban and regional planning. The dissemination of these arguments and recommendations coincides with a broad movement in favor of developing sustainable mobilities. Two conclusions emerge: first, the development of uniform arguments and recommendations to encourage new rail policies, emphasizing the structuring effects and economic role of high-speed rail, congestion reduction, modal shift; second, a tangible though uneven pro-rail position among public actors at all levels. However, this change of paradigm is limited by three factors that we identified through this research:
- gaps in the technical and administrative culture of rail – since high-speed rail is still an innovative technology in the US, it is hard for the institutional actors to acquire a grasp of the issues. This cultural gap is apparent both in the development of the business models of the different projects (market analysis, modal distribution, supply/demand analysis, changes in resulting footfall or modal shift, etc.) and also in the belief, still strong among public actors at all levels, in the structuring effects of a transportation infrastructure;
- the second factor is institutional and political. For the last few decades, the frameworks of public action for the federal government and for many states have been shaped by and for the development of the
6
private car and the expressway system (lasting and earmarked sources of finance, consistent political backing for expressways, legislative and even constitutional prohibition on the use of existing funding streams for anything other than the expressway sector, absence of specific programs and targeted and stable funding for intercity passenger rail transportation, at both federal and states level);
- finally, a sharp disconnect between the formal political undertakings, present in both the grey literature and in rhetoric, and the reality of what the different actors can do with regard to transportation. While all of them recognize the environmental and economic need to encourage a modal shift from the private car to transit and to support rail, the current structure of powers relating to intercity rail transportation, Amtrak’s institutional isolation, and the sharp division between this intercity mode and the other modes in public policies, mean that in reality the territorial players – beginning with the MPO/RTPO, the counties, the municipalities – have little real capacity to support a large-scale rail project. Their role is limited, in terms of powers, to urban planning with respect to stations and to the interconnections between the different transit networks at city or metropolitan scale. Nonetheless, despite the varying interpretations of local officials, significant convergences in viewpoints and recommendations are emerging. The public transportation and planning authorities are becoming committed to the challenge of backing new rail projects within their own sphere of institutional and geographic influence.
The third hypothesis concerned the emergence of a new policy favoring high-speed rail. Our analysis supports the idea that a different high-speed rail development strategy is emerging in the United States. It is one of the countries that most epitomizes the spectacular history and technical revolution of the railroad. Whereas rail freight in the US continues to achieve solid performances and results, the country is a newcomer to high-speed rail. Despite the profound crisis in passenger rail transportation since the 1950s and the many problems in redeveloping this mode, substantial projects have emerged, especially for the creation of high-speed lines. However, an analysis of these high-speed corridor projects shows that speed is not the dominant paradigm in the planning documents and has in fact been challenged in the scientific literature for many years. In reality, priority is placed on improving and modernizing existing corridors for the launch of higher-speed services, and then on hybrid networks that combine different types of infrastructures. There are no publicly backed projects for new lines exclusively dedicated to high-speed rail. Most of the high-speed corridors are in fact “higher-speed” corridors, some of which are intended to become high-speed at some time in the future, such as the Northeast corridor. For its part, the Californian project is a mix of new infrastructure and upgrades to existing sections. Three findings emerge from our analyses:
- the hybridization of the technical solutions for introducing high-speed intercity rail services – with the de facto coexistence of high-speed corridors in the UIC sense, mixed higher-speed corridors (public and private infrastructure sharing), and private corridors on which the national operator Amtrak is absent;
- a high degree of selectivity in the construction of high-speed lines on a very small number of megaregional corridors with the right geographic and urban conditions;
- the dominant high-speed rail strategies in the US are regionalized, based on a bottom-up approach that reflects local specificities.
The final hypothesis advanced the idea that the rail revival in the US was based on network integration, on the implementation of a policy of intermodality, and on a specific emphasis on the metropolitan embeddedness of rail corridors. Indeed, public actors at all levels prerogatives in the spheres of transportation and/or spatial planning and urbanism, stressed the need for the networks to be interconnected at different scales. The territorialization of rail projects entails the design and construction of transportation networks that are more integrated – at least in terms of service provision and physical connection – and genuinely interconnected. After analyzing projects for the upgrading of higher-speed corridors and the construction of new infrastructures, we note the importance of stations and the emphasis on the need for better coordination between transportation and urbanism through support for station districts. Indeed, a rail corridor project – situated at the intersection of political, economic, technical, and territorial interests – is the nucleus of a process of territorialization that materially embeds the infrastructure within urban spaces, and of a process of politicization through the involvement of local actors. Rail projects seem to be an instrument that leads to the implantation of
7
metropolitan scale facilities (stations, intermodal hubs) and to the shaping or reshaping of the urban fabric (station districts, larger-scale district regeneration projects).
1. GENERAL INTRODUCTION
Since 2015, there have been several encouraging pieces of news concerning rail transport in the United States: the launch of the Californian high-speed line (2015), the signing of a two billion dollar contract between Amtrak and Alstom for the supply of new high-speed trains for the Acela Express (2016), the inauguration of the private Brightline rail service between Miami and West Palm Beach (2018). These events, of differing scales and types, are signals that confirm the hypothesis that a rail revival is taking place in the United States. Indeed, intercity passenger rail transportation is slowly but surely emerging from the trough it has been in since the automobile and the airplane drastically reduced the modal share of rail in the 1940s-1950s. As well as existing services, this rail revival includes the introduction of high-speed rail into the United States. At present, there are no high-speed lines as defined by UIC (International Union of Railways) standards, but only one high-speed line with the Acela Express in the Northeast corridor. There were several major failures in the 1980s and 1990s in Texas, Florida, and Ohio (Perl, 2002). Though there were a few scattered initiatives undertaken by the federal government or by certain states before 2009, it was President Obama’s initiative in favor of high-speed rail in 2009 that rekindled debates, controversies, and interest between public institutions, certain private interest groups, the academic world, and the public. The construction of high-speed lines was conceived, in the context of the global economic crisis, as a means of stimulating activity and supporting territories through investment in infrastructure. This federal initiative, nicknamed “Obamarail“ by the press, ultimately made it possible to mobilize more than ten billion dollars in federal funds between 2009 and 2013, to which should be added the financing obtained through leverage from other levels of government. “Obamarail” has helped launch major projects in the United States: the high-speed rail project in California, the modernization of the Northeast Corridor (NEC) and the improvement of many Amtrak services in the Northeast, in the Midwest and along the West Coast. Despite a fairly sharp ebb in presidential commitment during Barack Obama’s second term and the absence of a specific federal initiative under President Trump’s administration, this new impetus for passenger rail has not stopped. States, some local governments, and the private sector continue to fuel this rail revival with high-speed or higher speed corridor projects. The beginning of the presidency of Joe Biden, known as a long-standing advocate of rail and an Amtrak user when he was a senator, portends a new era of historic investment in both conventional and high-speed rail—the Biden administration’s mid-2021 proposed infrastructure investment plan would, if passed in Congress, provide between $50 billion and $80 billion for the mode.
At the same time, the national rail operator Amtrak is developing major projects to further modernize and improve the performance of its long-distance and regional services. Since its inception in 1970, Amtrak has been in severe difficulty, struggling with chronic deficits fueled by losses in its long-distance services. Despite structural weaknesses in the company’s financial health and a lack of political and financial commitment that hampers its ability to invest, Amtrak has seen increasing ridership and revenue for nearly two decades. Its overall ridership has grown from 20.9 million passengers in 2000 to 31.7 million in 2018. This is a favorable development, especially in the US context, but the modal share of rail in intercity passenger transport remains very modest, at less than 0.3%. This is the two-faceted context within which this research is situated. On the one hand, the public is rediscovering the train as a potentially efficient modal choice and is reappropriating rail policies that have long been marginalized
8
by public authorities concerned with responding to growing congestion on road systems and meeting the demand for public policies that are more favorable to sustainable development and lower greenhouse gas emissions. On the other hand, US financial, institutional, and legislative conditions are broadly unfavorable to rail. The deliberative, decision-making, and financial frameworks of public action are still oriented towards an all-car society.
1.1. Research object and positioning in the literature
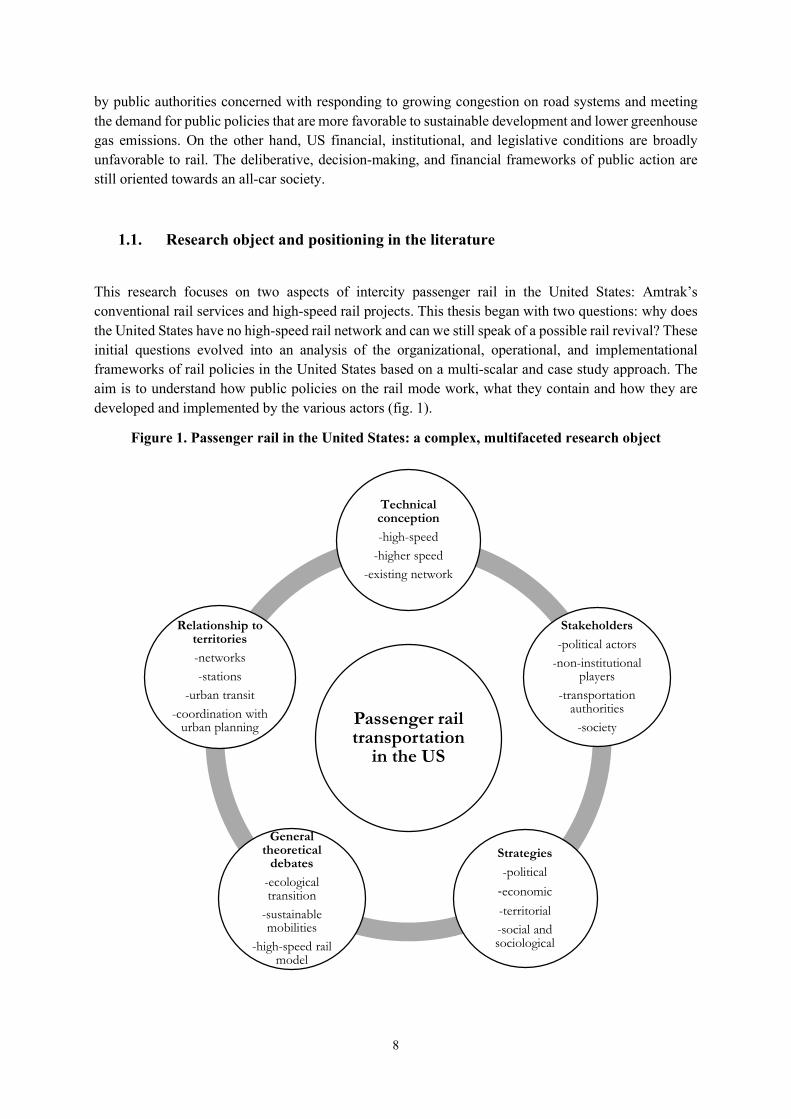
This research focuses on two aspects of intercity passenger rail in the United States: Amtrak’s conventional rail services and high-speed rail projects. This thesis began with two questions: why does the United States have no high-speed rail network and can we still speak of a possible rail revival? These initial questions evolved into an analysis of the organizational, operational, and implementational frameworks of rail policies in the United States based on a multi-scalar and case study approach. The aim is to understand how public policies on the rail mode work, what they contain and how they are developed and implemented by the various actors (fig. 1).
Figure 1. Passenger rail in the United States: a complex, multifaceted research object
Passenger rail transportation
in the US
Technical conception
-high-speed
-higher speed
-existing network
Stakeholders
-political actors
-non-institutional players
-transportation authorities
-society
Strategies
-political
-economic
-territorial
-social and sociological
General theoretical
debates
-ecological transition
-sustainable mobilities
-high-speed rail model
Relationship to territories
-networks
-stations
-urban transit
-coordination with urban planning
9
Passenger rail transportation is first and foremost a technical object, but this research treats it as a geographical object in its own right, involving a complex interplay of scales—national, supra-regional, regional, metropolitan, and local—and diverse territorialities—the corridor nature of the rail mode, its role in the mobility of a region, the integration of the network and its nodes into the urban fabric.
Passenger rail transportation is covered in somewhat disparate ways by the scientific literature, depending on the disciplinary perspective: extensively in the fields of history and economics; partially in political studies, especially since the launch of the Obama administration’s high-speed initiative; and again only partially in the field of transport geography.
The English-language literature on the history of railroads in the United States is abundant, ranging from historical overviews (Douglas, 1992; Stover, 1997; Wolmar, 2012), works on the place of railroads in American culture (Ward, 1986; Gordon, 1997; Grant, 2012), and more specialized studies on transcontinentals (Williams, 1988; White, 2011). In addition, a number of works look at the crisis of the rail industry since the arrival of the automobile (Martin, 1992; Saunders, 2001, 2003; Gallamore and Meyer, 2014) and recent rail issues in the United States (Goddard, 1994; Perl, 2002). A number focus on the opportunities for a revival in the rail mode in light of the continued growth in ridership on the Amtrak system (Perl, 2002; Stilgoe, 2009; Gilbert and Perl, 2010; Perl, 2012; Garrison and Levinson, 2014). The Obama administration’s landmark initiative has helped revive institutional and scholarly output on high-speed rail in the United States. Some publications explore the reasons why the most powerful country in the world does not have a high-speed network, unlike other major developed countries and now emerging countries that see this technology as a way to revitalize passenger rail transportation (Lynch, 1998; Perl, 2002, 2012; Deakin and Cervero, 2008; Wachs, 2012). Some researchers also question the usefulness of this mode in the American context (Button, 2012; Lane, 2012; Levinson, 2012; Ryder, 2012). Political, institutional and scientific reflections have proliferated since 2010 on the political difficulties of implementing high-speed rail in the United States, and on potential strategies for developing such a network (Deakin, 2010; Ashiabor and Wei, 2012; Audikana, 2012; Johnson, 2012; Loukaitou-Sideris, 2013; Kamga, 2015; Perl and Goetz, 2015; Cervero and Murakami, 2017). In the French language, a recent geography thesis sheds fundamental light on the Californian rail network, although the focus of the analysis is the high-speed line project with particular emphasis on the project’s integration into the Los Angeles metropolitan area (Ruggeri, 2015).
1.2. Research questions and hypotheses
This research, which focuses on the current renewal of policies on passenger rail transport, aims to provide answers to two main questions. The first concerns the appropriation or reappropriation of this mode by transportation stakeholders. How are federal, state and Amtrak rail policies constructed and implemented? How are the political, economic and territorial issues of rail transport considered in the overall context of transport in the United States? How do the various actors understand the institutional conflicts around rail, which are fueled by budgetary, legislative, and political factors? The second concerns territorial embeddedness and the process of territorialization of rail policies in a federal system where the federal states and local actors develop their own practices and their own modes of public action according to political and economic considerations that depend little on the national context. What are the factors that foster and constrain the emergence of new rail policies? How are the links and the necessary coordination between intercity rail projects, regional and urban transportation networks, and transit development policies worked out? How do local actors and transportation operators perceive the metropolitan embeddedness of rail projects through stations and station districts?
10
This research is structured by several main hypotheses.
The first hypothesis is that a policy in favor of high-speed rail (HSR) is emerging, propelled by a coalescence of public and/or private players and not by the definition of a national plan for the development of high-speed rail. Our thesis is based on three observations. First, the difficulties in advancing a new federal rail policy inherent in the configuration of the US rail network (freight-oriented network, private companies owning most of the existing infrastructure, increasing bottlenecks in the major metropolitan areas, institutional and financial weakness of Amtrak). Second, the partial failure of the Obama administration’s high-speed initiative despite the unprecedented roll-out of funding. Finally, the fact that the renewal of US rail policies requires greater devolution of transportation-related powers to the federal states and regional/metropolitan authorities (Metropolitan Planning Organizations in particular) in order to circumvent political logjams at federal level.
The second hypothesis is that there has been a change in political paradigm which contributes to the emergence and implementation of policies that favor passenger rail transport. The thesis notes the changes to the transportation policy framework and the emphasis on economic, territorial, and environmental arguments to give credibility to and justify new rail projects and the heavy investment associated with them (greater freeway congestion, future airport congestion, the need to develop policies in favor of transit and decarbonized mobility, a global strategy to reduce greenhouse gas emissions, etc.).
The third hypothesis concerns the emergence of a novel policy in favor of high-speed rail. The development plan for the introduction of high-speed rail in the United States diverges from the speed paradigm and the traditional practice of building a distinct high-speed network to the detriment of the existing network and financial equilibrium. This research, by analyzing the business model and geographical context of the train in the USA, shows that high-speed rail is only appropriate in a limited number of “megaregional” or “megalopolitan” corridors. The development of public policies or private strategies for HSR in the United States takes into account the distinct situations of the different territories and is based, deliberately or by default, on a passenger rail network that includes high-speed corridors in the European and Asian sense of the term (California, North-East corridor) and high-speed corridors that employ upgraded existing infrastructure (Cascade corridor, Florida, Midwest). Beyond the hybrid nature of the technical characteristics of the corridors and the coexistence of different rail services, this novel policy also reflects the importance of regionalized strategies. Indeed, despite undeniable internal differences, the other high-speed rail countries have applied a unified, uniform, top-down vision of regional development and planning through high-speed railways, led by central government. In the United States, the federal government has only limited powers in the sphere of transportation, limited to safety-related issues and the Interstates, or exceptional investments, while Amtrak has limited resources an is struggling to establish itself against competition from private freight companies. The federal government has broad powers in this area, but must deal with a galaxy of local players who also have powers relating to transportation and planning policies. More recently, moreover, private players, independently of any public strategy, have expressed an interest in or made concrete commitments to developing a rail project (Florida, Texas, Midwest). This unique and complex political and institutional situation—a complexity reinforced by the administrative tangle and fragmentation of local government in the United States—favors the development of novel strategies tailored to the regional context, rather than the standardization of practices, objectives, and instruments encouraged by central government.
The final assumption is that the design of this mode, based on a limited number of corridors, the integration of existing networks, and the implementation of a principle of intermodality, is essential in railway policies. Constructing a new high-speed line or improving an existing line imposes three imperatives which are common to all the territories and all the players: (1) connection of the interurban network to the existing regional and urban rail networks in order to improve the operation and overall
11
efficiency of the transportation system, (2) the implementation of an integrative multi- and intermodal concept by coordinating the practices of the various operators and by building or renovating multimodal interchanges, (3) specific attention to the metropolitan embeddedness of the intercity rail corridors by upgrading stations. The station, which symbolizes the material and territorial dimension of rail transport, is undergoing a threefold process of political reappropriation, first through the renewal of its status as an element of metropolitan centrality, then through the conception of the station as a starting point for an urban renewal project, and finally through the development of better coordination between urban planning and networks with the creation of station districts.
1.3. Research framework and methodology
Positioning
In tackling a controversial and highly politicized subject in the United States, we maintain the position of an outside observer for several reasons. Firstly, the few researchers working on the rail mode and high-speed rail in the United States are North Americans and are therefore subject to the political bias associated with the issue. Adopting an apolitical position is easier for a non-North American researcher. Secondly, being an outsider to the rail industry, i.e. someone not attached to a rail policy institution or any operator or regulator, it was possible to approach the subject without any pre-existing bias in favor of rail over other modes, or in favor of one rail project over another. It has been possible to take a dispassionate stance in exploring U.S. rail policies, particularly with respect to HSR. Finally, by comparison with the disciplines that dominate the study of intercity passenger rail, i.e. economics and political science in the scientific literature, our approach to the subject is original. Nonetheless, our research position is not totally neutral since, as a French researcher, we are inevitably affected by French conditions relating to transportation policies and France’s massive development of high-speed rail. At the start of this research, therefore, we had to distance ourselves from this initial standpoint—why is the United States, the world’s leading power, devoid of high-speed lines?—and even distance ourselves from a certain judgementalism arising from the fact that France and the countries around it possess high-speed networks and the underlying assumptions implicit in the question of whether the United States is “condemned” to remain without a high-speed network?
Methodology. Grey literature: primary source
The grey literature constitutes the main research material in this research. Institutional documents allow us to understand the objects of study, to characterize the content of the policies and projects studied, and to identify the goals and rationales of the various actors. This thesis employs a wide variety of documents from institutional, non-institutional and economic actors:
Federal documentation from the U.S. Department of Transportation, the Federal Railroad Administration, the Government Accountability Office, Congress and the White House staff;
the texts of the main federal laws used in this research (ISTEA, PRIIA, FAST); documentation from Amtrak;
institutional literature from the individual states (state transportation departments, state finance or planning departments), and from regional and local actors (Metropolitan Planning Organizations (MPO), municipalities, transportation authorities);
documents from NARP (Rail Passengers Association) and AASHTO (American Association of State Highway and Transportation Officials)—the main non-institutional
12
actors involved—and from private actors (Association of American Railroads, FECI and Brightline for the Florida rail project).
These institutional documents are also diverse in nature: studies on intercity rail transport, development plans, scheduling and funding plans, financial reports, feasibility studies, minutes of meetings or steering committees, appended documents related to planning processes and urban development operations. This institutional documentation is complemented by communication materials of different kinds: websites, promotional videos, press releases and press packs, presentations at meetings or seminars.
Methodology. Additional sources
Semi-structured interviews are the main source of first-hand information for the thesis. The interview questions follow a preset framework, but the interviewee’s answers are not restricted. It is a useful way to understand the discourses and practices around rail policies and to decipher the representations of the actors and the motives behind their action. Several series of interviews were conducted from 2015 to 2017 during the three pieces of field research but also in a continuous thread by Skype, by phone or by a Google Forms questionnaire when we could not make a live appointment. Forty semi-structured interviews—or where appropriate guided interviews by electronic means—were conducted with actors at the federal level, actors at the state level (California, Washington, Oregon), as well as at local level (San Francisco, Seattle, Portland, Miami). A few interviews were conducted with private stakeholders involved in rail issues (Association of American Railroads, freight companies).
Ease of access to the actors varied, depending on their professional position and institutional affiliation. Most of the institutional players responded positively to our requests for interviews despite two significant limitations: the first limitation was that a number of them only view the rail issue from a federal perspective—i.e. Amtrak—and wanted to refer us to the federal level; the second was that rail culture (for intercity travel) has been at a low level for several decades, and some actors found it difficult at times to envisage all the political, economic, territorial, and technical issues relating to rail policies (intermodality, network connection, stations, modal shift). It should be emphasized that it was particularly difficult to establish a dialogue with the private players in the rail sector, particularly the freight companies, which almost invariably declined our requests for a formal interview or even simple contact. Together, these semi-structured interviews made it possible to collect a considerable amount of information, although after the interviews had been transcribed and processed it became apparent that certain stock answers were regularly given to certain questions, answers drawn from institutional documentation and communication materials. This was particularly true for the interviews about ongoing projects (California, Florida) which perhaps required interviewees to be particularly cautious in responding to requests from the academic world.
Secondly, background information and data were collected on Amtrak’s current rail services and the rail projects under consideration, as well as on the territorial context of the three case studies. This covers firstly the socio-demographic and economic context on the one hand, and secondly transportation and mobility (infrastructure and services, modal split, regional and urban ridership, modal comparison information on provision, frequency, and fares).
Lastly, other research materials were used to complete the methodology required for this thesis. Field observations were undertaken in order to understand local urban conditions and to obtain a close-up view of ongoing projects, particularly projects for stations and station districts, and these observations were recorded through photographs, some of which are used to support the analysis. A corpus of more than 700 written press articles was collected in order to understand the representations of the train and
13
of railway policies disseminated in the press. And finally, the submissions of 29 contributors to Congress hearings were viewed and analyzed.
2. PASSENGER RAIL TRANSPORTATION IN THE UNITED STATES: CURRENTLY A FAVOURABLE OUTLOOK
The US rail network is primarily freight-oriented and is mainly owned by private companies. The entire organization of the rail mode, right down to the physical configuration of the network at territorial level, is designed by and for the movement of goods. Until 1970, these private companies provided passenger services. The profound crisis that shook the North American railroad world from the 1920s to the 1960s completed the demise of a passenger transportation network that had already been undermined by the spread of the private automobile and the rise of civil aviation. Established in 1970, the state-owned company Amtrak took over responsibility for weakened and loss-making passenger rail services, with annual ridership levels reduced to a bare minimum—less than 0.3% modal share for intercity travel—and performance that was uncompetitive relative to the automobile and airplane in any market segment. Moreover, Amtrak has suffered from both institutional and political isolation—no major federal support program, no dedicated funding source, a weak position relative to the powerful freight companies that own 95% of the nation’s network—and from chronic underfunding that provides neither the operating expenses nor the investment needed to regenerate aging services or to support high-speed projects. However, despite this bleak picture of the state of passenger rail in the United States, a period of renewal appears to have begun almost two decades ago. By means of restructuring and service reduction since 1970, but also through modest but rising investment, Amtrak has managed to increase its overall ridership and reduce its financial losses. Amtrak’s services are now divided into three categories: the national network consisting of long-distance services, the network of state-supported lines known as regional corridors, which have been managed by the states since 2013, and the Northeast Corridor (NEC) network, which is the only high-speed service in the United States. The Obama administration’s high-speed rail initiative, known as “Obamarail,” has given Amtrak exceptional resources to modernize its network, particularly the regional corridors and the NEC, which are its most dynamic services. In parallel with the conventional network, several high-speed rail projects are currently under construction or in the planning phase, the two most important of which are the California project (supported by the State of California and an ad hoc authority with a multitude of funders) and the project in the North-East region (which aims to transform the current corridor into a true high-speed corridor, supported by Amtrak, which owns the infrastructure but still lacks the necessary level of federal funding). These high-speed rail projects have been initiated or revived thanks to the “Obamarail” initiative, which has leveraged federal funds and unprecedented levels of funding from other sources. The American rail landscape has also been profoundly altered by the re-emergence of private players in the passenger rail sector. Indeed, a number of private initiatives are looking to establish high-speed or private high-speed corridors in dynamic markets (Florida, Las Vegas-Los Angeles corridor, Texas Triangle).
Passenger rail transport, as a geographical object, stands at the intersection of the disciplines of spatial planning, political science and economics. The approach that we adopt here has to take into account the multiple facets of this geographical object. In this first part, the aim is on the one hand to show what makes the US rail network complex and unique in terms of organization and the interplay of actors, and on the other hand to provide a new rail geography of national scale intercity passenger transport. The objective is twofold: to go beyond the evidence of near-disappearance and perpetual crisis in passenger
14
rail transportation and to understand it as a geographical object and a territorial concept by tracking the historical, institutional, and territorial changes that that are shaping this object.
2.1. A growing dichotomy between freight and passenger transport
2.1.1. Constant restructuring of the Amtrak network: keeping a national network alive for passengers
The various legislative developments that have reformed the rail industry in the United States have led to the emergence of a two-tier system characterized by an imbalance between freight and passenger transportation. From a freight perspective, the separation of activities that began in the 1970s has been beneficial and is now working particularly well. The maintenance of an integrated and non-liberalized network has not harmed the rail mode. In contrast, intercity passenger transportation has been in chronic crisis since the creation of Amtrak, although the results of this mode of travel in recent years suggest a modest but solid recovery. The chronic crisis is not so much due to the effects of regulatory flexibility and unbundling, but rather to the inability of political authorities to build a long-term program and to sustain financial resources that Amtrak lacks. By contrast with the situation in Europe, the US has a freight-oriented network owned and operated by private freight companies. So their interests are paramount and this complicates the relationship between Amtrak and them.
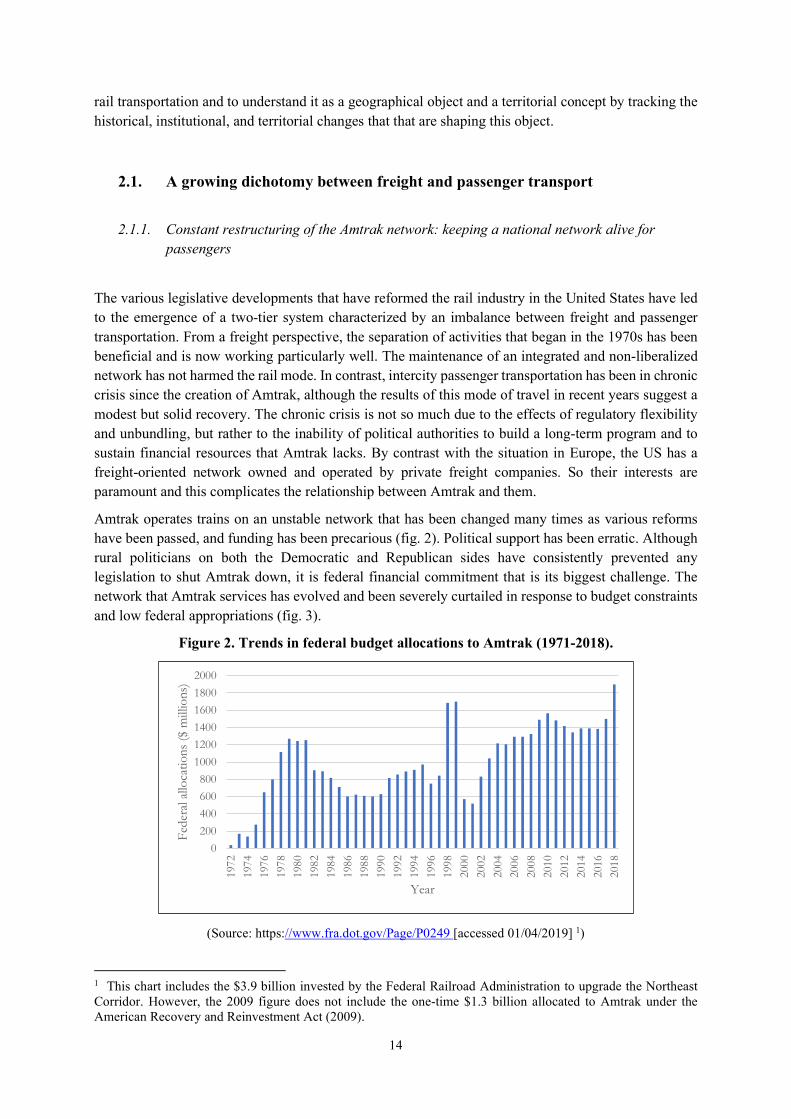
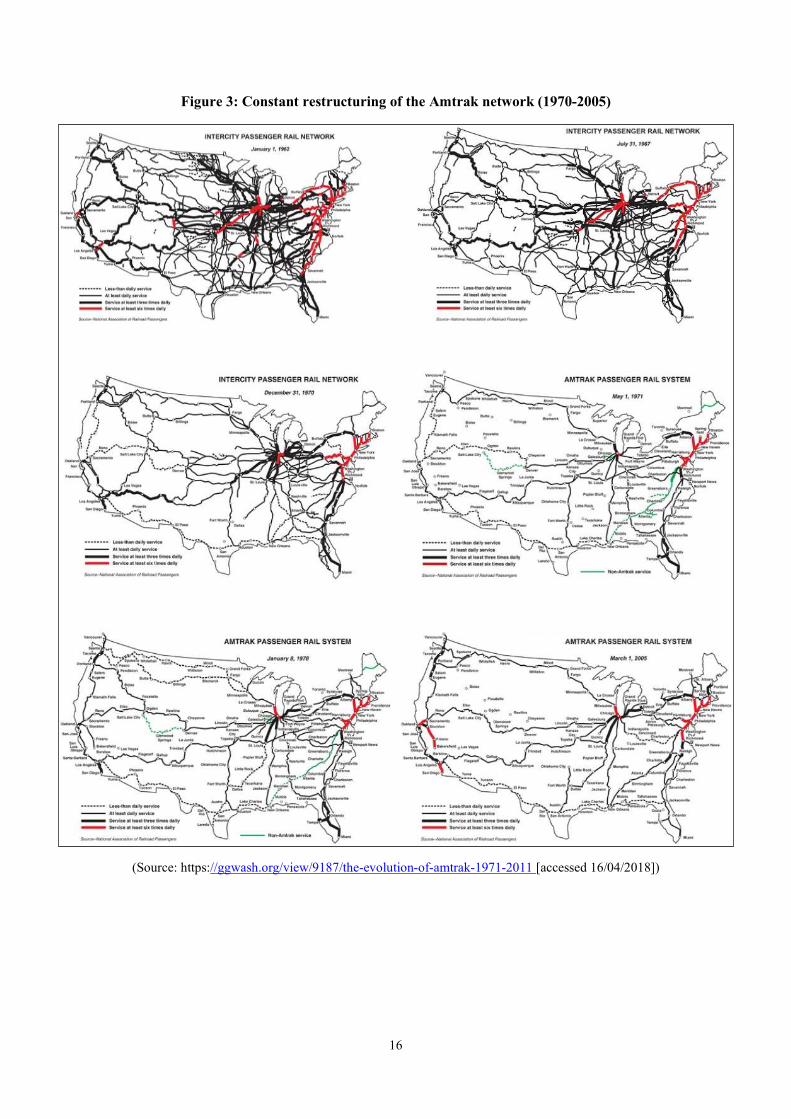
Amtrak operates trains on an unstable network that has been changed many times as various reforms have been passed, and funding has been precarious (fig. 2). Political support has been erratic. Although rural politicians on both the Democratic and Republican sides have consistently prevented any legislation to shut Amtrak down, it is federal financial commitment that is its biggest challenge. The network that Amtrak services has evolved and been severely curtailed in response to budget constraints and low federal appropriations (fig. 3).
Figure 2. Trends in federal budget allocations to Amtrak (1971-2018).
(Source: https://www.fra.dot.gov/Page/P0249 [accessed 01/04/2019] 1)
1 This chart includes the $3.9 billion invested by the Federal Railroad Administration to upgrade the Northeast Corridor. However, the 2009 figure does not include the one-time $1.3 billion allocated to Amtrak under the American Recovery and Reinvestment Act (2009).
0
200
400
600
800
1000
1200
1400
1600
1800
2000
1972
1974
1976
1978
1980
1982
1984
1986
1988
1990
1992
1994
1996
1998
2000
2002
2004
2006
2008
2010
2012
2014
2016
2018
Fed
eral
allo
catio
ns ($
mill
ions
)
Year
15
Amtrak has three sources of revenue: the federal appropriation in the Department of Transportation’s budget allocated by Congress in the regular budget act, operating revenues derived primarily from ticketing, and a very small portion of state and local government funding. Prior to the mid-2000s, the federal endowment fluctuated widely, reaching a low during the Reagan administration. Since 2003, the annual allocation has been maintained at over $1 billion. This demonstrates the lack of financial commitment from the federal government, which allocates an amount that is clearly too small to fund the national railroad. Amtrak uses its budgetary resources to cover a portion of its operating expenses, infrastructure and rolling stock maintenance, capital programs, and debt repayment. Amtrak’s goal, shared by advocates of federally funded rail service, is to maintain a truly national network connecting major metropolitan areas and serving several hundred rural communities across the country. There are those who argue for abandoning long-distance services and maintaining only the most vibrant rail corridors. There is a constant tension between the political will to maintain the network as it is today and the budgetary pressure to eliminate the least profitable services.
16
Figure 3: Constant restructuring of the Amtrak network (1970-2005)
(Source: https://ggwash.org/view/9187/the-evolution-of-amtrak-1971-2011 [accessed 16/04/2018])
17
2.1.2. The relationship between freight companies and Amtrak: the crux of the rail network’s operational complexity
The railroad reform and the profound restructuring of the sector from the 1970s to the 1990s reshaped the relationship between public and private. The drastic reduction in the powers of the regulatory authority (ICC) until its replacement by the STB, which only retains a limited role of arbitration and intervention, largely to avoid a situation of monopoly, led to the public sphere being marginalized to the benefit of the private freight companies, which are favored by the institutional and operational organization of the rail network.
The main objective of the reforms and restructuring is therefore to achieve a more efficient transportation network and a more effective logistics chain. In addition, the contraction of the rail network since the 1970s-1980s as a result of the various reorganizations in the sector has considerably reduced the possibility of alternative bypass routes in the event of incidents or congestion. Projections for rail freight growth suggest a worsening of the current problems of undercapacity and bottleneck formation (United States House of Representatives, 2013). The difficult relationship between Amtrak and the freight companies is the result of both the legislation that established Amtrak (1970) and the reform of the regulatory regime that greatly reduces the scope of the regulator’s intervention. The 1970 Act transferred the intercity passenger rail monopoly to Amtrak in exchange for a guaranteed right of regulatory access to the private network, priority allocation of train paths, and the obligation to compensate the private operators only for avoidable costs.2 In reality, however, the freight companies do not comply with these regulatory obligations, being more interested in furthering their own commercial interests. The private sector sees this law as an attack on the free operation of private enterprise and the market, and the rights set out in the legislation as privileges granted to Amtrak (Bardo, 2013). Henry Posner III (Chairman of the Railroad Development Corporation) recalls that the 1970 compromise took place at a time when the rail industry was in deep crisis, but since then rail freight has recovered strongly and the new equilibrium in the sector hinders the implementation of this compromise. The main problems that complicate the negotiations and the relationship between the host companies and Amtrak relate to:
safety (on certain sections, the tracks used by freight and by passenger trains have to be separated because of problems of speed, frequency, and technical standards; the main problem is the speed differential, since the faster a train is, the more capacity it consumes);
capacity (increasing complexity of train path allocation for passenger trains, either because of the increase in freight traffic or because of the lack of collaboration between the parties);
compensation (refusal of freight companies to indirectly “subsidize” passenger rail transportation in the event of non-compensation for costs—problem of calculating traffic rights);
insurance issues (the question of insurance, liability and financial responsibility in the event of accident—insurance costs are much higher for passenger trains) (Rose, 2009; Dolata et al., 2005; AAR, 2014b).
2 Rail Passenger Service Act of 1970. Pub. L. 91-518, 84 Stat. 1327, 49 U.S.C. § 24701. 1970-30-10.
18
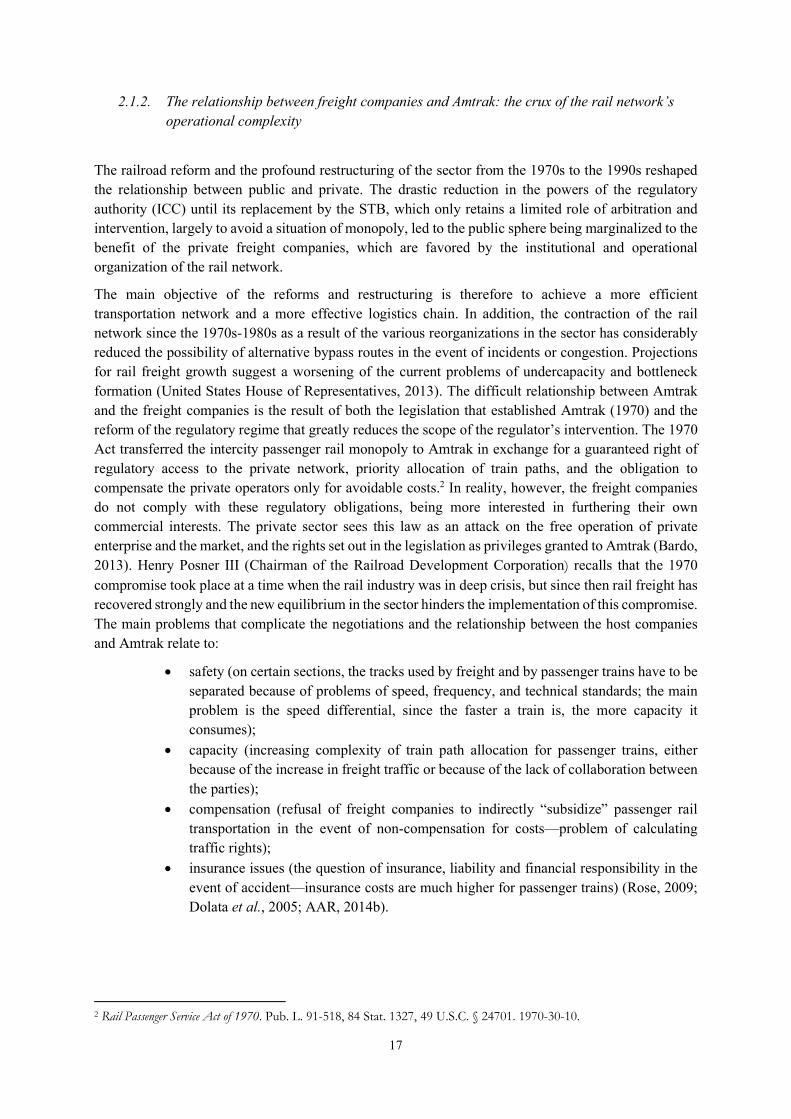
Figure 4. The US rail network stakeholder map
The current organization of the rail network, the result of the intensive restructuring that took place between the 1970s and the 1990s, gives the freight companies a dominant position in the system of actors, since they are the owners of the support network and operators of the rail business. Rail reform in the United States has been a factor in reducing the influence and role of the public sphere in the operation of this sector. However, it should be noted that the shift in the balance between public and private is primarily the result of the separation of freight and passenger activities, rather than caused by regulatory flexibility and reform of the regulatory system. Unlike European rail deregulation, which is based on a combination of dis-integration and openness and on the principle of ‘open access’, which results in a more complex system of actors (Debrie, 2010), the US rail reform—while likewise modifying the public-private dichotomy—does so by introducing conflict rather than complexity into the interplay of actors.
2.1.3. Amtrak and the freight companies: David versus Goliath(s)
The institutional and operational organization of the rail network in the United States, excluding Alaska, favors private freight railroads: more than 70 percent of Amtrak’s services run on private infrastructure, and several dozen urban and regional transit operators also use it. Indeed, most high-speed rail projects
19
are based on the use of private facilities. How Amtrak can use them and run its trains is obviously a major concern for the public company. Yet increasing demand for freight rail and the sometimes obstructive attitude of freight companies complicates the movement of passenger trains, resulting in sometimes significant delays on the Amtrak network. A head-on confrontation is emerging between the two parties, which blame each other for the delays and operational blockages, conflicts that are regularly reported in the press. At the same time, conciliation initiatives are being put in place to try to foment a genuine partnership between Amtrak and the rail freight industry.
The economic causes of this problem are well known: a steady rise in the volume of goods being shipped by rail and more than favorable thirty-year projections for rail freight. Freight companies have been enjoying sustained upward momentum for several decades and their financial situation is more than positive. Their main objective is to continue with the most efficient transport network and logistics chain. The issue of track capacity is therefore a serious problem for Amtrak, against the background of steadily increasing rail freight and very constrained public investment capacity (Allan, 2000, pp. 35-40). John G. Allan also points out the lack of foresight of the transportation authorities over network capacity, since by the 1990s the rail network was well beyond overuse.
Even without the current problems of undercapacity and bottleneck formation, the difficult relationship with Amtrak, to say the least, does not come out of nowhere—it is the legacy of a complicated recent history for passenger rail. In the real world, freight companies do not always meet their regulatory obligations, so these decisions have strained relations between Amtrak and the private sector. Moreover, since the Staggers Rail Act 1980, rail freight companies have operated without public subsidies, and thus accuse the federal government of giving special treatment to a public company that operates with public funding, even though the fees paid by Amtrak may bring them significant additional income (Bardo, 2013). This in large part explains the hostility, distrust, or indifference of these companies to Amtrak.
“Ask a public official with responsibility for planning the expansion of public transportation alternatives for a wish list of the top ten ways to grow efficiently. Do not be surprised to hear among those a clear explanation of how the long-standing freight rail lines that extend into the heart of the city’s downtown area are ideal for some form of rail-based transit. Now ask a freight railroad official for a list of the top ten nightmares he or she faces on the job. That list will almost certainly include the presence of passenger trains (whether long distance intercity or shorter distance commuters) on the company’s lines. (Spitulnik and Rennert, 1999, p. 319)
This hard-hitting introduction (Spitulnik and Rennert, 1999) illustrates the state of the relationship between the parties over the past several years, which has confronted interests that are at first sight divergent and difficult to reconcile. Henri Posner points out that there is an “eternal conflict” between freight companies and Amtrak services because, according to him, the federal government does not provide any guarantee that use of the private network by the national company will not damage freight services. Edward Hamberger emphasizes this point with an effective formula: “To paraphrase Transportation Secretary Ray LaHood, we should not try to create a world-class high-speed rail system at the expense of our world-class freight rail system.”3
The interests are far from irreconcilable, but the crux of the relationship between freight and Amtrak is the capacity of the network and hence the need for investment in rail infrastructure (fig. 16, tab. 9). Some
3 Parliamentary Hearing of Edward Hamberger (President & Chief Executive, AAR), National Rail Policy: Examining Goals, Objectives and Responsibilities, House Subcommittee on Railroads, Pipelines and Hazardous Materials, 27 June 2013.
20
rail corridors are heavily used and in some cases already under-capacity. The existing infrastructure and the associated allocation of train paths do not allow for the replacement of track or an increase in the frequency of passenger trains. The as yet unresolved problem is therefore which actors are financially committed to increasing the capacity of the rail network—the federal government, Amtrak, states, local governments, freight companies—though the latter already invest significant sums to upgrade and maintain the network (Ziolkowski, 2012, pp. 292-293). Henry Posner III, drawing on his experience at the head of a Class II company, the Iowa Interstate Railroad, states that the insurance issue is the most important problem identified by the private freight companies with regard to the operation of the legal regime and the issue of unlimited liability: “we bet the company everyday, every time we run a passenger train”. For him, after the insurance problem, the next most important issues are safety, quality of service, traffic growth, and network profitability.
The five primary hosts for Amtrak services are private freight companies: BNSF, Union Pacific, CSX Transportation, Norfolk Southern, and Canada National Railway. The first point of contention is the shouldering and sharing of costs—”operational payments of negotiated agreements” and “capital costs”—associated with the use of private infrastructure by Amtrak trains. This issue is the subject of very tough negotiations between the freight companies and Amtrak.
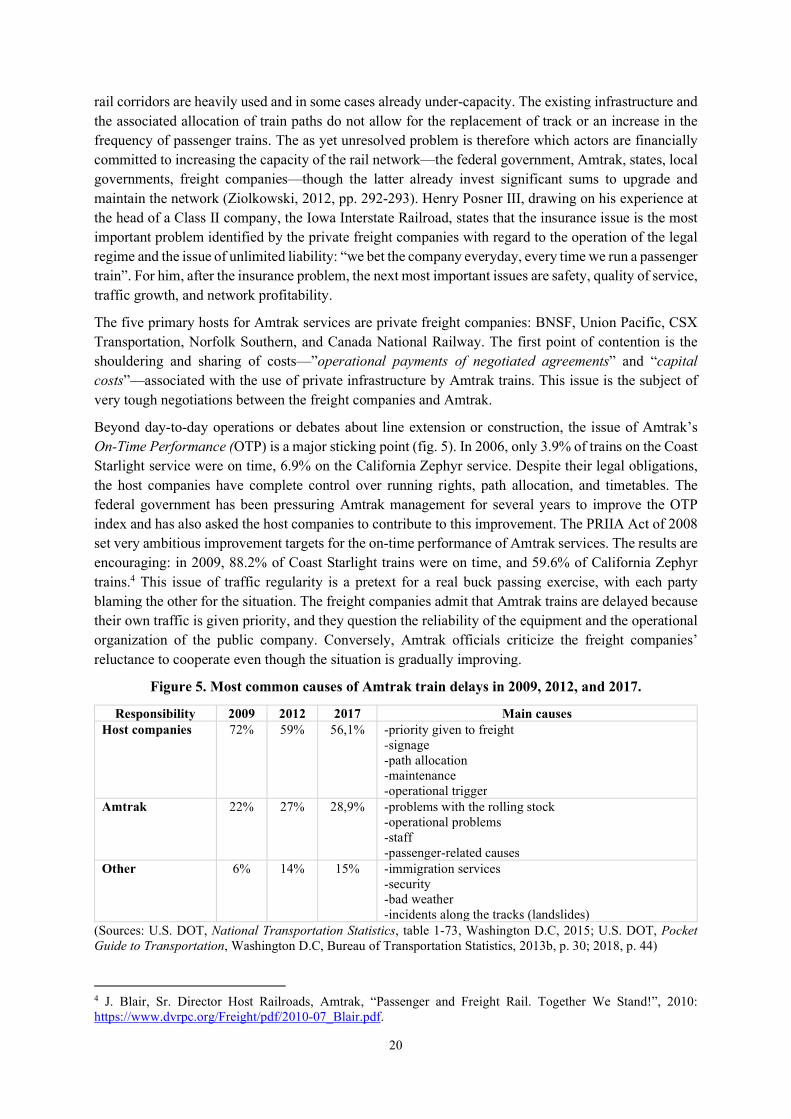
Beyond day-to-day operations or debates about line extension or construction, the issue of Amtrak’s On-Time Performance (OTP) is a major sticking point (fig. 5). In 2006, only 3.9% of trains on the Coast Starlight service were on time, 6.9% on the California Zephyr service. Despite their legal obligations, the host companies have complete control over running rights, path allocation, and timetables. The federal government has been pressuring Amtrak management for several years to improve the OTP index and has also asked the host companies to contribute to this improvement. The PRIIA Act of 2008 set very ambitious improvement targets for the on-time performance of Amtrak services. The results are encouraging: in 2009, 88.2% of Coast Starlight trains were on time, and 59.6% of California Zephyr trains.4 This issue of traffic regularity is a pretext for a real buck passing exercise, with each party blaming the other for the situation. The freight companies admit that Amtrak trains are delayed because their own traffic is given priority, and they question the reliability of the equipment and the operational organization of the public company. Conversely, Amtrak officials criticize the freight companies’ reluctance to cooperate even though the situation is gradually improving.
Figure 5. Most common causes of Amtrak train delays in 2009, 2012, and 2017.
Responsibility 2009 2012 2017 Main causes Host companies 72% 59% 56,1% -priority given to freight
-signage -path allocation -maintenance -operational trigger
Amtrak 22% 27% 28,9% -problems with the rolling stock -operational problems -staff -passenger-related causes
Other 6% 14% 15% -immigration services -security -bad weather -incidents along the tracks (landslides)
(Sources: U.S. DOT, National Transportation Statistics, table 1-73, Washington D.C, 2015; U.S. DOT, Pocket Guide to Transportation, Washington D.C, Bureau of Transportation Statistics, 2013b, p. 30; 2018, p. 44)
4 J. Blair, Sr. Director Host Railroads, Amtrak, “Passenger and Freight Rail. Together We Stand!”, 2010: https://www.dvrpc.org/Freight/pdf/2010-07_Blair.pdf.
21
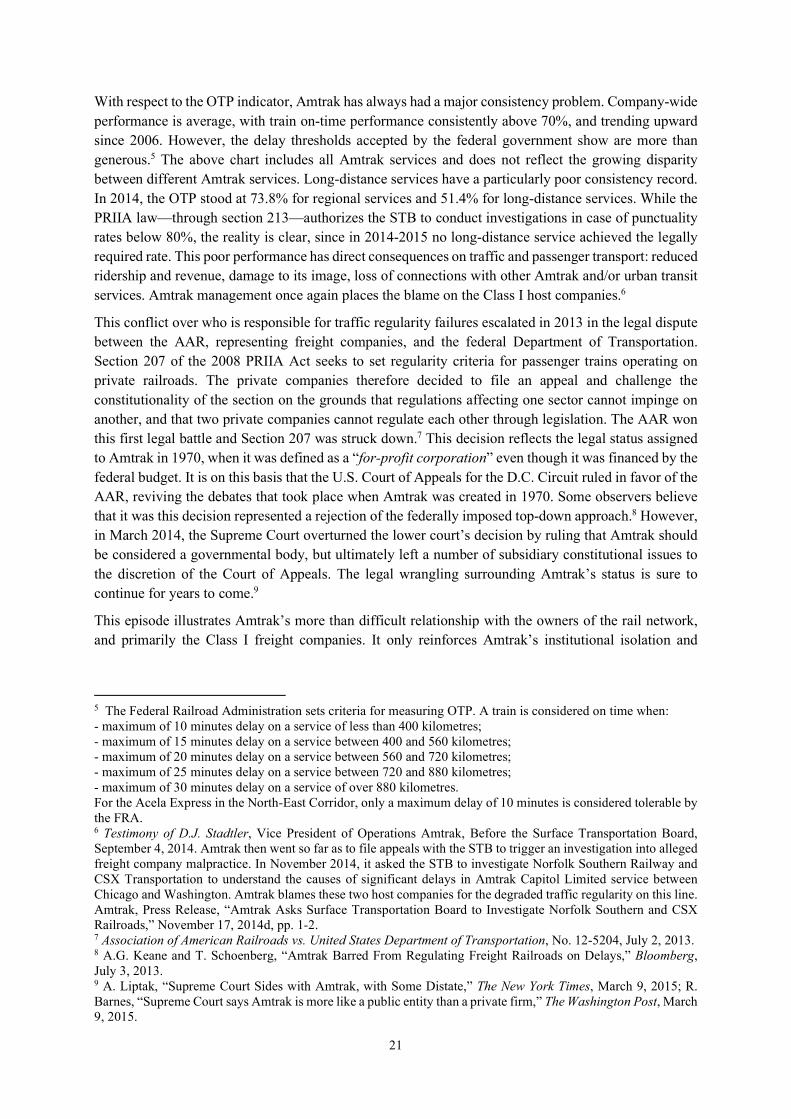
With respect to the OTP indicator, Amtrak has always had a major consistency problem. Company-wide performance is average, with train on-time performance consistently above 70%, and trending upward since 2006. However, the delay thresholds accepted by the federal government show are more than generous.5 The above chart includes all Amtrak services and does not reflect the growing disparity between different Amtrak services. Long-distance services have a particularly poor consistency record. In 2014, the OTP stood at 73.8% for regional services and 51.4% for long-distance services. While the PRIIA law—through section 213—authorizes the STB to conduct investigations in case of punctuality rates below 80%, the reality is clear, since in 2014-2015 no long-distance service achieved the legally required rate. This poor performance has direct consequences on traffic and passenger transport: reduced ridership and revenue, damage to its image, loss of connections with other Amtrak and/or urban transit services. Amtrak management once again places the blame on the Class I host companies.6
This conflict over who is responsible for traffic regularity failures escalated in 2013 in the legal dispute between the AAR, representing freight companies, and the federal Department of Transportation. Section 207 of the 2008 PRIIA Act seeks to set regularity criteria for passenger trains operating on private railroads. The private companies therefore decided to file an appeal and challenge the constitutionality of the section on the grounds that regulations affecting one sector cannot impinge on another, and that two private companies cannot regulate each other through legislation. The AAR won this first legal battle and Section 207 was struck down.7 This decision reflects the legal status assigned to Amtrak in 1970, when it was defined as a “for-profit corporation” even though it was financed by the federal budget. It is on this basis that the U.S. Court of Appeals for the D.C. Circuit ruled in favor of the AAR, reviving the debates that took place when Amtrak was created in 1970. Some observers believe that it was this decision represented a rejection of the federally imposed top-down approach.8 However, in March 2014, the Supreme Court overturned the lower court’s decision by ruling that Amtrak should be considered a governmental body, but ultimately left a number of subsidiary constitutional issues to the discretion of the Court of Appeals. The legal wrangling surrounding Amtrak’s status is sure to continue for years to come.9
This episode illustrates Amtrak’s more than difficult relationship with the owners of the rail network, and primarily the Class I freight companies. It only reinforces Amtrak’s institutional isolation and
5 The Federal Railroad Administration sets criteria for measuring OTP. A train is considered on time when: - maximum of 10 minutes delay on a service of less than 400 kilometres; - maximum of 15 minutes delay on a service between 400 and 560 kilometres; - maximum of 20 minutes delay on a service between 560 and 720 kilometres; - maximum of 25 minutes delay on a service between 720 and 880 kilometres; - maximum of 30 minutes delay on a service of over 880 kilometres. For the Acela Express in the North-East Corridor, only a maximum delay of 10 minutes is considered tolerable by the FRA. 6 Testimony of D.J. Stadtler, Vice President of Operations Amtrak, Before the Surface Transportation Board, September 4, 2014. Amtrak then went so far as to file appeals with the STB to trigger an investigation into alleged freight company malpractice. In November 2014, it asked the STB to investigate Norfolk Southern Railway and CSX Transportation to understand the causes of significant delays in Amtrak Capitol Limited service between Chicago and Washington. Amtrak blames these two host companies for the degraded traffic regularity on this line. Amtrak, Press Release, “Amtrak Asks Surface Transportation Board to Investigate Norfolk Southern and CSX Railroads,” November 17, 2014d, pp. 1-2. 7 Association of American Railroads vs. United States Department of Transportation, No. 12-5204, July 2, 2013. 8 A.G. Keane and T. Schoenberg, “Amtrak Barred From Regulating Freight Railroads on Delays,” Bloomberg, July 3, 2013. 9 A. Liptak, “Supreme Court Sides with Amtrak, with Some Distate,” The New York Times, March 9, 2015; R. Barnes, “Supreme Court says Amtrak is more like a public entity than a private firm,” The Washington Post, March 9, 2015.
22
further illustrates the very limited regulatory regime for the rail industry that has been in place since the 1980s.
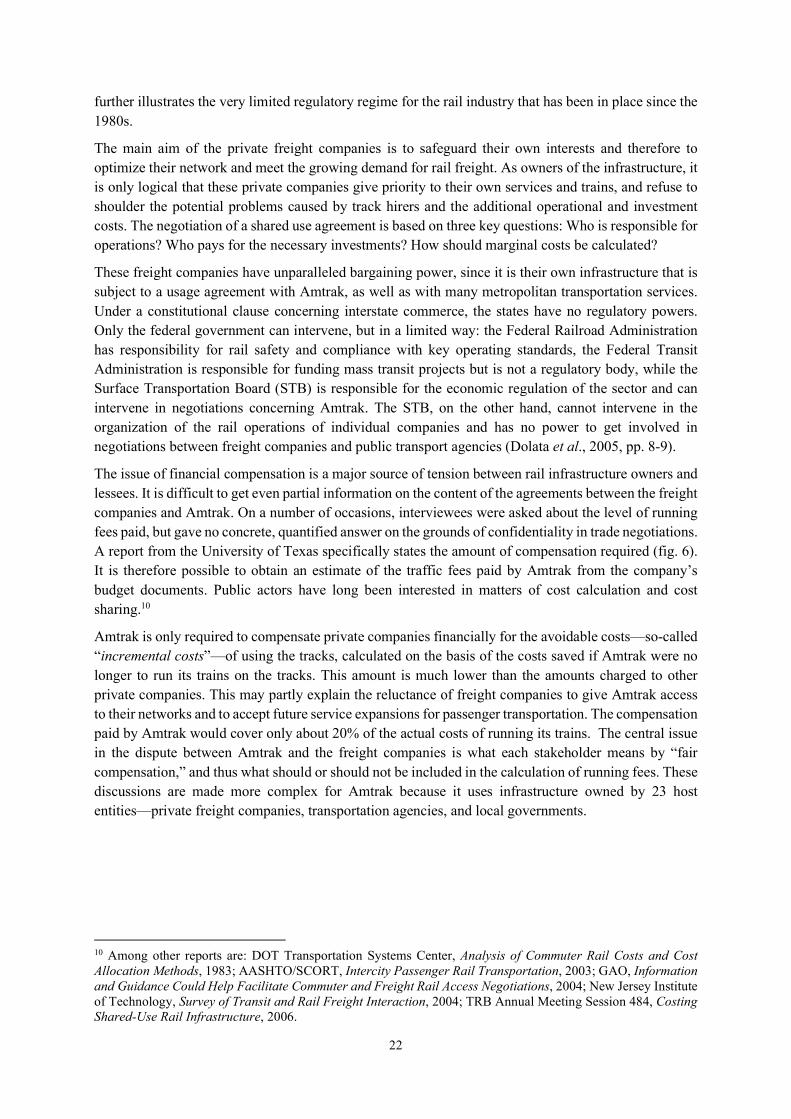
The main aim of the private freight companies is to safeguard their own interests and therefore to optimize their network and meet the growing demand for rail freight. As owners of the infrastructure, it is only logical that these private companies give priority to their own services and trains, and refuse to shoulder the potential problems caused by track hirers and the additional operational and investment costs. The negotiation of a shared use agreement is based on three key questions: Who is responsible for operations? Who pays for the necessary investments? How should marginal costs be calculated?
These freight companies have unparalleled bargaining power, since it is their own infrastructure that is subject to a usage agreement with Amtrak, as well as with many metropolitan transportation services. Under a constitutional clause concerning interstate commerce, the states have no regulatory powers. Only the federal government can intervene, but in a limited way: the Federal Railroad Administration has responsibility for rail safety and compliance with key operating standards, the Federal Transit Administration is responsible for funding mass transit projects but is not a regulatory body, while the Surface Transportation Board (STB) is responsible for the economic regulation of the sector and can intervene in negotiations concerning Amtrak. The STB, on the other hand, cannot intervene in the organization of the rail operations of individual companies and has no power to get involved in negotiations between freight companies and public transport agencies (Dolata et al., 2005, pp. 8-9).
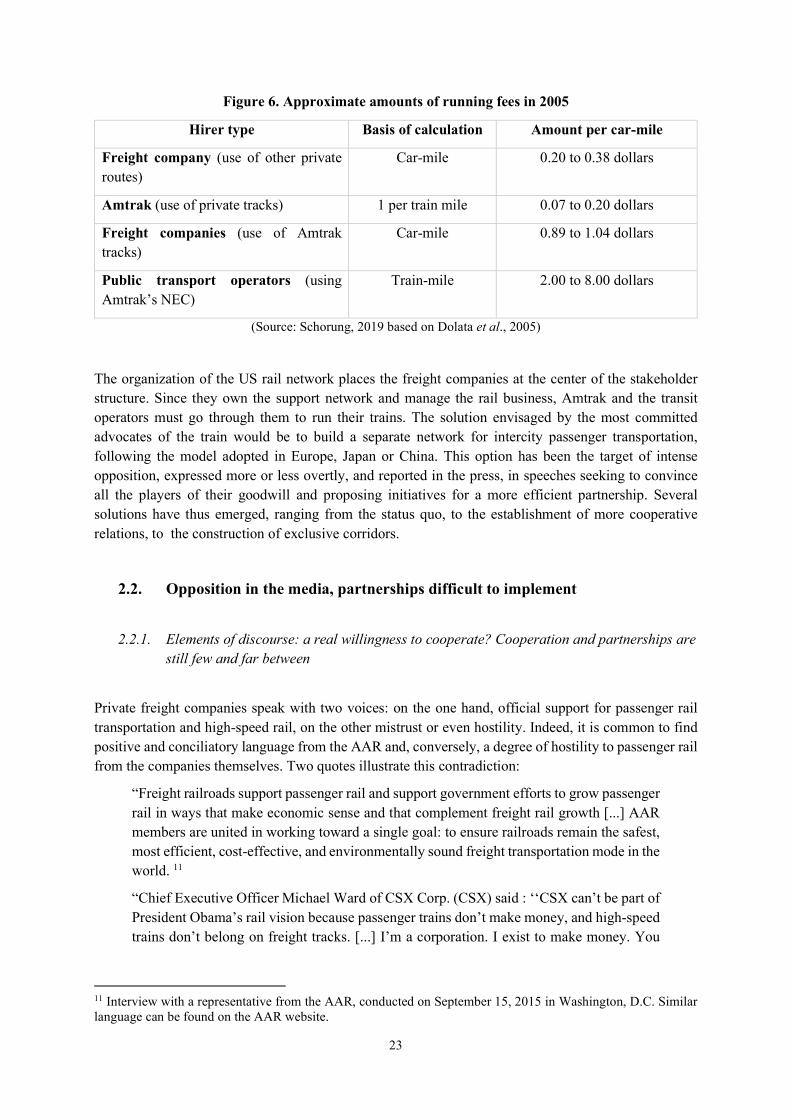
The issue of financial compensation is a major source of tension between rail infrastructure owners and lessees. It is difficult to get even partial information on the content of the agreements between the freight companies and Amtrak. On a number of occasions, interviewees were asked about the level of running fees paid, but gave no concrete, quantified answer on the grounds of confidentiality in trade negotiations. A report from the University of Texas specifically states the amount of compensation required (fig. 6). It is therefore possible to obtain an estimate of the traffic fees paid by Amtrak from the company’s budget documents. Public actors have long been interested in matters of cost calculation and cost sharing.10
Amtrak is only required to compensate private companies financially for the avoidable costs—so-called “incremental costs”—of using the tracks, calculated on the basis of the costs saved if Amtrak were no longer to run its trains on the tracks. This amount is much lower than the amounts charged to other private companies. This may partly explain the reluctance of freight companies to give Amtrak access to their networks and to accept future service expansions for passenger transportation. The compensation paid by Amtrak would cover only about 20% of the actual costs of running its trains. The central issue in the dispute between Amtrak and the freight companies is what each stakeholder means by “fair compensation,” and thus what should or should not be included in the calculation of running fees. These discussions are made more complex for Amtrak because it uses infrastructure owned by 23 host entities—private freight companies, transportation agencies, and local governments.
10 Among other reports are: DOT Transportation Systems Center, Analysis of Commuter Rail Costs and Cost Allocation Methods, 1983; AASHTO/SCORT, Intercity Passenger Rail Transportation, 2003; GAO, Information and Guidance Could Help Facilitate Commuter and Freight Rail Access Negotiations, 2004; New Jersey Institute of Technology, Survey of Transit and Rail Freight Interaction, 2004; TRB Annual Meeting Session 484, Costing Shared-Use Rail Infrastructure, 2006.
23
Figure 6. Approximate amounts of running fees in 2005
Hirer type Basis of calculation Amount per car-mile
Freight company (use of other private routes)
Car-mile 0.20 to 0.38 dollars
Amtrak (use of private tracks) 1 per train mile 0.07 to 0.20 dollars
Freight companies (use of Amtrak tracks)
Car-mile 0.89 to 1.04 dollars
Public transport operators (using Amtrak’s NEC)
Train-mile 2.00 to 8.00 dollars
(Source: Schorung, 2019 based on Dolata et al., 2005)
The organization of the US rail network places the freight companies at the center of the stakeholder structure. Since they own the support network and manage the rail business, Amtrak and the transit operators must go through them to run their trains. The solution envisaged by the most committed advocates of the train would be to build a separate network for intercity passenger transportation, following the model adopted in Europe, Japan or China. This option has been the target of intense opposition, expressed more or less overtly, and reported in the press, in speeches seeking to convince all the players of their goodwill and proposing initiatives for a more efficient partnership. Several solutions have thus emerged, ranging from the status quo, to the establishment of more cooperative relations, to the construction of exclusive corridors.
2.2. Opposition in the media, partnerships difficult to implement
2.2.1. Elements of discourse: a real willingness to cooperate? Cooperation and partnerships are still few and far between
Private freight companies speak with two voices: on the one hand, official support for passenger rail transportation and high-speed rail, on the other mistrust or even hostility. Indeed, it is common to find positive and conciliatory language from the AAR and, conversely, a degree of hostility to passenger rail from the companies themselves. Two quotes illustrate this contradiction:
“Freight railroads support passenger rail and support government efforts to grow passenger rail in ways that make economic sense and that complement freight rail growth [...] AAR members are united in working toward a single goal: to ensure railroads remain the safest, most efficient, cost-effective, and environmentally sound freight transportation mode in the world. 11
“Chief Executive Officer Michael Ward of CSX Corp. (CSX) said : ‘‘CSX can’t be part of President Obama’s rail vision because passenger trains don’t make money, and high-speed trains don’t belong on freight tracks. [...] I’m a corporation. I exist to make money. You
11 Interview with a representative from the AAR, conducted on September 15, 2015 in Washington, D.C. Similar language can be found on the AAR website.
24
can’t make money hauling passengers, so why would I want to do that ? That wouldn’t be fair to my shareholders.12
The language used in communication by AAR representatives to assure Amtrak of their support is fairly standard.13 A look at the BNSF and Union Pacific websites reveals a clear lack of interest in passenger rail services.14 There is no mention of the companies that lease their networks nor of passenger rail on the homepage, in the site menu, or in the tabs devoted to the company itself or to public relations. The press regularly reports on track-sharing issues and the simmering conflict between freight companies and Amtrak. Three main themes emerge in this body of press coverage: Amtrak’s institutional isolation and limited financial resources, the difficult relationship between Amtrak and the host railroads as instanced by the legal battle between the AAR and the FRA, and the poor on-time performance of Amtrak services.
Improved cooperation seems to be desired by all the stakeholders. Many statements point to this, but points of tension remain unresolved. There is a desire for public-private partnerships for freight infrastructure improvement projects where the public interest is clearly at stake. Some partnerships are already in place: the Alameda Corridor, the Heartland Corridor, the CREATE program—”Chicago Region Environmental and Transportation Efficiency”—or the National Gateway Project (AAR, 2017, pp. 1-2). Four contentious issues remain: rail safety—which covers speed, interoperability and track sharing issues;15 infrastructure capacity, full compensation for infrastructure and equipment use by lessees; and the insurance differential between freight and passenger transportation (Spitulnik and Rennert, 1999, pp. 335-337; Reistrup, 2002, pp. 57-60; Prozzi et al., 2006, pp. 25-30). Underlying this, for Amtrak as for urban transportation agencies, is the question of the commitment of public authorities, particularly in terms of high levels of investment.
Freight companies should also find it beneficial for their own operations. Upgrading the network and adapting it for more and faster passenger trains could improve interoperability between container shipping, cabotage, and the core US freight business, the first of which relies on fast and regular service. Allocating public investment to increase the size and capacity of the network could be another contributor to facilitating discussions between Amtrak and the freight companies. Whenever Amtrak proposes a service expansion project that the host company does not like, a stalemate arises very quickly. There are cases in the United States where the company that owns the track has categorically refused to participate in an extension for the benefit of passengers, particularly in freight corridors that are already heavily used and where a global vision of investment and collaboration is not proposed. This is the case in California with Union Pacific’s refusal to authorize an extension to an Amtrak regional line on its own infrastructure. Moreover, when Union Pacific refuses these projects, the State of California, through its Department of Transport, can only note and deplore the refusal but has no legal or administrative leverage to intervene.
12 L. Caruso, “CSX Chief Says He Can’t Be Part of Obama High-Speed Rail Plan,” Bloomberg Corporate News, April 6, 2011. 13 “ Want passenger railroads to succeed”; “importance of rail to America’s future”; “enormous public benefits to our nation”; “interconnected communities”; “environmental interests”: these are just a few examples of the recurring language in AAR statements and communications materials, as here at a public hearing before the Federal High-speed rail Task Force. Statement of Jennifer W. Mac Donald, Assistant Vice President, Government Affairs, AAR, before the National Conference of State Legislatures Committee on Transportation High-speed rail Working Group, April 9, 2010, pp. 1-3. 14 See the websites of the freight companies: www.bnsf.com; www.up.com. 15 Passenger trains generally run at higher speeds than freight trains. Freight trains operate at around 96 km/h (60 mph) or less for long-distance trains, while passenger trains aim to operate at a minimum of around 130 km/h (80 mph). The FRA allows passenger trains to run on freight tracks at around 125 km/h on some sections. These are conventional passenger trains, the target speeds for high-speed rail are much higher.
25
There are examples of what better collaboration can produce, such as the situation on the Amtrak Cascades line. This line, which connects Vancouver (BC), Seattle (WA), and Eugene (OR), saw a remarkable increase in ridership from 94,000 in 1994 to 806,000 in 2018, which meant increasing daily service frequency from 4 trains to 16. This required a medium-term partnership with BNSF, which owns the rail infrastructure on the line, and the Washington and Oregon State Departments of Transportation—WSDOT and ODOT. This partnership is founded on four cornerstones: a medium-term strategy, joint work on investment projects and worksite planning, penalties when service regularity is not maintained, and a substantial financial commitment from the public authorities, since WSDOT approved a $780 million plan in 2010 to invest in this corridor. Provided that there is political and budgetary commitment from political authorities—starting with the states—the establishment of a trustful and collaborative relationship can greatly benefit passenger rail while allaying the rail industry’s suspicion of a hypothetical takeover by the public sphere (Bardo, 2013, pp. 9-10). While the top-down federal approach has partly failed, it seems that this example could pave the way for a diametrically opposed, bottom-up approach based on negotiation and an agreement rather than recourse to law.
In addition, there are national initiatives to promote this collaborative practice, including the OneRail association and the annual Passenger Trains on Freight Railroads conference that has been run by Railway Age for over twenty years. OneRail is a lobby group that promotes the idea that the United States needs a modern rail network for both freight and passengers.16 It lobbies state and local politicians and takes part in various trade and scientific events to emphasize the need for infrastructure investment and the role of rail in the overall transportation system in the United States.17 In addition, the annual Passenger Trains on Freight Railroads conference is the only event in the United States organized by rail professionals to discuss the operation of the rail network and the challenges of sharing infrastructure between freight and passenger rail.18
2.2.2. The exclusive corridor solution
The idea of separating freight and passenger transportation with dedicated infrastructure is advocated both by adherents of high-speed rail (HSR) and by freight companies. For the Government Accountability Office (GAO) officials interested in the rail issue, the only long-term solution for developing HSR remains the construction of dedicated infrastructure, in parallel with the bolstering of urban and regional transport networks and services and electrification of part of the rail network.19 There is no reference to Amtrak’s standard services, which would continue to run on private track as long as
16 This group consists of: American Public Transportation Association (APTA), American Short Line and Regional Railroad Association (ASLRRA), Amtrak, Association of American Railroads (AAR), Brotherhood of Railroad Signalmen (BRS), International Association of Sheet Metal, Air, Rail and Passengers (NARP), Natural Resources Defence Council (NRDC), National Railroad Construction and Maintenance Association (NRC), Railway Supply Institute (RSI), States for Passenger Rail Coalition (SPRC), Surface Transportation Policy Partnership (STPP), Teamsters Rail Conference (BLET), Transportation Communications International Union (TCU). This information was taken from www.onerail.org/about-us [accessed 8/15/2018]. 17 A few titles of their PowerPoint presentations may shed some light on this: “Rail: A Key Element in the Transportation System” (August 2013), “Investing in Rail Infrastructure. Creating Jobs” (January 2013), “Integrating Rail Into the Nation’s Transportation System” (October 2011), “The American Rail Industry: Planning and Investing in Rail Infrastructure” (June 2012). To find these presentations: www.onerail.org/rail-research/onerail-presentations [accessed 08/15/2018]. 18 Access to conference proceedings and presentations is strictly limited and restricted to rail industry professionals who register and pay for the conference. It is therefore very difficult to find out what is said at these conferences. 19 Interview with representatives from the Government Accountability Office (US.GAO), the first conducted on September 10, 2015 in Washington, D.C., the second conducted via a conference call.
26
truly effective partnerships are developed between the various players. The debate around infrastructure separation is about high-speed alone. Today, almost all projects, regardless of their stage of development, are envisaged as sharing infrastructure with freight trains. The high-speed corridors proposed by the Obama administration propose to upgrade the lines already used by Amtrak and to put money into making the infrastructure and equipment compatible with higher speeds.20 The goal, for the federal Department of Transportation, Amtrak and the states involved, is to gradually increase the average speed of passenger trains as the necessary work with the infrastructure owners is completed. Today, only the California project, supported at state level by a dedicated authority, foresees the construction of a new high-speed infrastructure on the central part of the route. However, freight companies are more than skeptical about track sharing for HSR:
“Speaking as a freight railroad CEO, it is possible to increase speeds from 79 mph to 90 mph on tracks that both freight and passenger trains use... At sustained speeds in excess of 90 mph, passenger train operations will need to be segregated from freight operations on separate track. The level of maintenance work required, the very different impacts passenger and freight rolling stock have on the surface of the rail and managing the flow of train traffic with such differences in speeds would make the joint use of track uneconomic and impracticable.” (Rose, 2009)
Beyond the technical arguments advanced, there are obvious signs of a lack of understanding and close collaboration in the planning of these railway projects. This animosity stems above all from a lack of anticipation in the thinking and design of projects for new lines or extensions (Bardo, 2013, pp. 6-7).
The high-speed rail initiative launched by the Obama administration is an illustration of the great reluctance of political authorities to commit to dedicated high-speed corridors (fig. 7). As part of the economic stimulus package introduced to combat the economic crisis in 2009, the Obama administration set aside $8 billion for high-speed rail, plus an additional $2.5 billion from Congress. The level of public funding committed was historic and demonstrated a clear commitment by the federal government. The FRA identified three approaches for the use of these funds: grants for existing projects in the preliminary study stage, financial participation with private partners and thus diversified funding sources, and support for the development of project corridors based on state proposals. For high-speed rail corridors, the FRA identified three categories of projects: “Core Express” corridors with trains running at more than 150 mph, regional corridors with trains running between 90 and 150 mph, and emerging corridors for trains running at less than 90 mph. Only the first category corresponds to the international definition of high-speed rail (FRA, 2009, p. 6).
This proposal for differentiated high-speed corridors suggests a picture of segmented sub-networks with relatively few connections to each other and to urban and metropolitan networks. The distinction between each category is fairly vague and technical details are lacking: dedicated corridors, shared corridors, use of private tracks, overlap with existing Amtrak lines, etc. The FRA and the High-Speed Intercity Passenger Rail Program envision these corridors as a network, but in reality the projects selected in no way form a network and appear to be quite scattered across the country. In addition, the GAO, in a very critical report, argued that the financial resources were insufficient and that the use of the FRA as a pilot for such a project posed a leadership problem (U.S. GAO, 2009, pp. 12-32).
The federal executive’s project looked more like an improvement to pre-existing infrastructures and lines, or even a reappropriation of certain projects already underway, as in California. The exclusive corridors solution is therefore ruled out here, except in the North-East corridor and in California. Even
20 See the Federal Railroad Administration website with the tab dedicated to the Obama administration’s high-speed rail initiative: www.fra.dot.gov/Page/P0060 [accessed 8/20/2018].
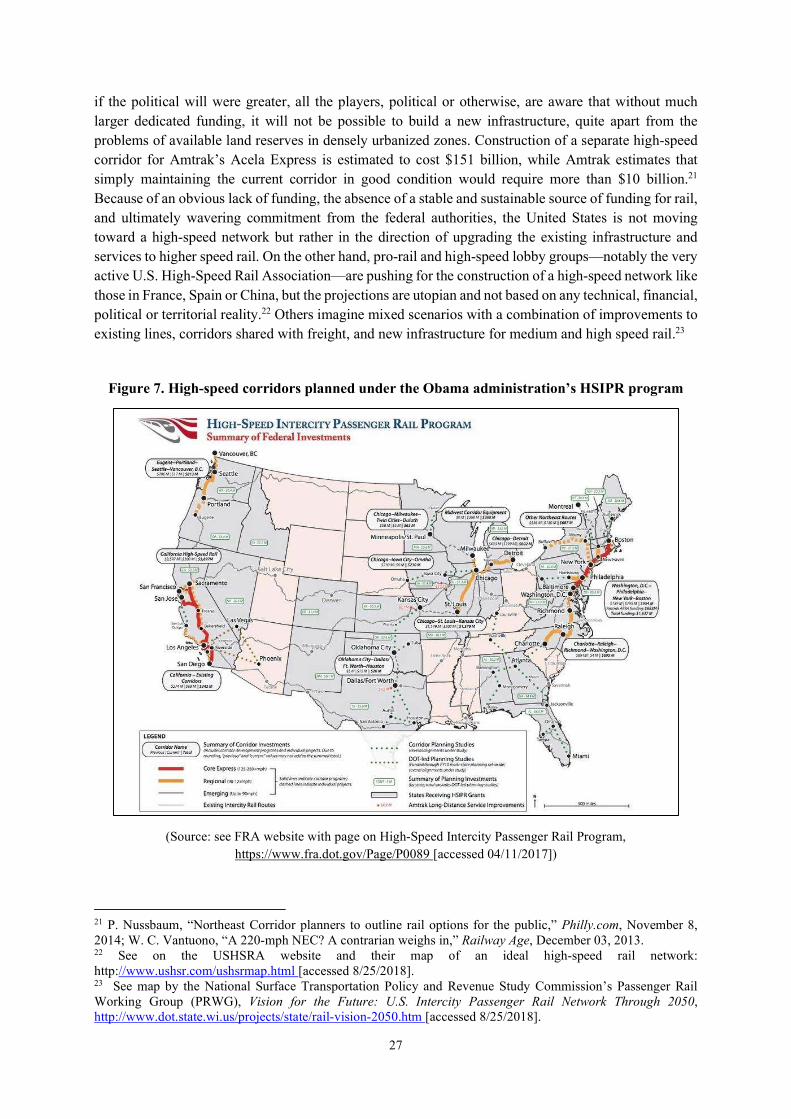
27
if the political will were greater, all the players, political or otherwise, are aware that without much larger dedicated funding, it will not be possible to build a new infrastructure, quite apart from the problems of available land reserves in densely urbanized zones. Construction of a separate high-speed corridor for Amtrak’s Acela Express is estimated to cost $151 billion, while Amtrak estimates that simply maintaining the current corridor in good condition would require more than $10 billion.21 Because of an obvious lack of funding, the absence of a stable and sustainable source of funding for rail, and ultimately wavering commitment from the federal authorities, the United States is not moving toward a high-speed network but rather in the direction of upgrading the existing infrastructure and services to higher speed rail. On the other hand, pro-rail and high-speed lobby groups—notably the very active U.S. High-Speed Rail Association—are pushing for the construction of a high-speed network like those in France, Spain or China, but the projections are utopian and not based on any technical, financial, political or territorial reality.22 Others imagine mixed scenarios with a combination of improvements to existing lines, corridors shared with freight, and new infrastructure for medium and high speed rail.23
Figure 7. High-speed corridors planned under the Obama administration’s HSIPR program
(Source: see FRA website with page on High-Speed Intercity Passenger Rail Program, https://www.fra.dot.gov/Page/P0089 [accessed 04/11/2017])
21 P. Nussbaum, “Northeast Corridor planners to outline rail options for the public,” Philly.com, November 8, 2014; W. C. Vantuono, “A 220-mph NEC? A contrarian weighs in,” Railway Age, December 03, 2013. 22 See on the USHSRA website and their map of an ideal high-speed rail network: http://www.ushsr.com/ushsrmap.html [accessed 8/25/2018]. 23 See map by the National Surface Transportation Policy and Revenue Study Commission’s Passenger Rail Working Group (PRWG), Vision for the Future: U.S. Intercity Passenger Rail Network Through 2050, http://www.dot.state.wi.us/projects/state/rail-vision-2050.htm [accessed 8/25/2018].
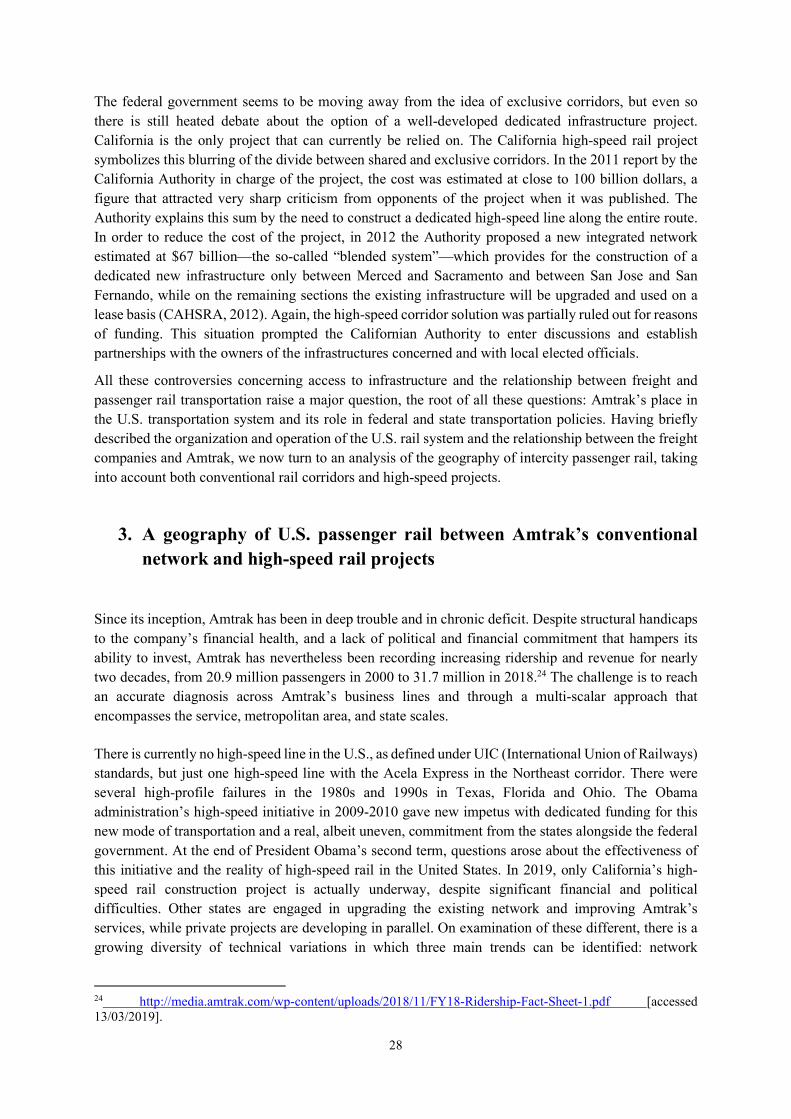
28
The federal government seems to be moving away from the idea of exclusive corridors, but even so there is still heated debate about the option of a well-developed dedicated infrastructure project. California is the only project that can currently be relied on. The California high-speed rail project symbolizes this blurring of the divide between shared and exclusive corridors. In the 2011 report by the California Authority in charge of the project, the cost was estimated at close to 100 billion dollars, a figure that attracted very sharp criticism from opponents of the project when it was published. The Authority explains this sum by the need to construct a dedicated high-speed line along the entire route. In order to reduce the cost of the project, in 2012 the Authority proposed a new integrated network estimated at $67 billion—the so-called “blended system”—which provides for the construction of a dedicated new infrastructure only between Merced and Sacramento and between San Jose and San Fernando, while on the remaining sections the existing infrastructure will be upgraded and used on a lease basis (CAHSRA, 2012). Again, the high-speed corridor solution was partially ruled out for reasons of funding. This situation prompted the Californian Authority to enter discussions and establish partnerships with the owners of the infrastructures concerned and with local elected officials.
All these controversies concerning access to infrastructure and the relationship between freight and passenger rail transportation raise a major question, the root of all these questions: Amtrak’s place in the U.S. transportation system and its role in federal and state transportation policies. Having briefly described the organization and operation of the U.S. rail system and the relationship between the freight companies and Amtrak, we now turn to an analysis of the geography of intercity passenger rail, taking into account both conventional rail corridors and high-speed projects.
3. A geography of U.S. passenger rail between Amtrak’s conventional network and high-speed rail projects
Since its inception, Amtrak has been in deep trouble and in chronic deficit. Despite structural handicaps to the company’s financial health, and a lack of political and financial commitment that hampers its ability to invest, Amtrak has nevertheless been recording increasing ridership and revenue for nearly two decades, from 20.9 million passengers in 2000 to 31.7 million in 2018.24 The challenge is to reach an accurate diagnosis across Amtrak’s business lines and through a multi-scalar approach that encompasses the service, metropolitan area, and state scales.
There is currently no high-speed line in the U.S., as defined under UIC (International Union of Railways) standards, but just one high-speed line with the Acela Express in the Northeast corridor. There were several high-profile failures in the 1980s and 1990s in Texas, Florida and Ohio. The Obama administration’s high-speed initiative in 2009-2010 gave new impetus with dedicated funding for this new mode of transportation and a real, albeit uneven, commitment from the states alongside the federal government. At the end of President Obama’s second term, questions arose about the effectiveness of this initiative and the reality of high-speed rail in the United States. In 2019, only California’s high-speed rail construction project is actually underway, despite significant financial and political difficulties. Other states are engaged in upgrading the existing network and improving Amtrak’s services, while private projects are developing in parallel. On examination of these different, there is a growing diversity of technical variations in which three main trends can be identified: network
24 http://media.amtrak.com/wp-content/uploads/2018/11/FY18-Ridership-Fact-Sheet-1.pdf [accessed 13/03/2019].
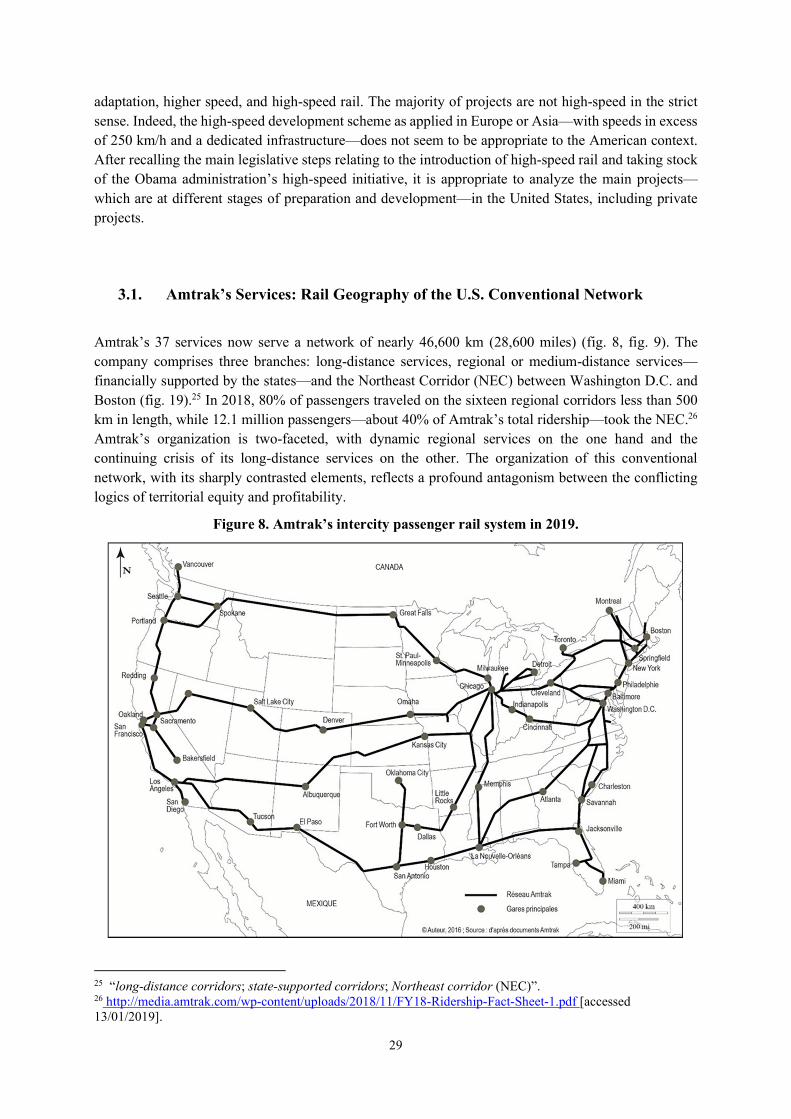
29
adaptation, higher speed, and high-speed rail. The majority of projects are not high-speed in the strict sense. Indeed, the high-speed development scheme as applied in Europe or Asia—with speeds in excess of 250 km/h and a dedicated infrastructure—does not seem to be appropriate to the American context. After recalling the main legislative steps relating to the introduction of high-speed rail and taking stock of the Obama administration’s high-speed initiative, it is appropriate to analyze the main projects—which are at different stages of preparation and development—in the United States, including private projects.
3.1. Amtrak’s Services: Rail Geography of the U.S. Conventional Network
Amtrak’s 37 services now serve a network of nearly 46,600 km (28,600 miles) (fig. 8, fig. 9). The company comprises three branches: long-distance services, regional or medium-distance services—financially supported by the states—and the Northeast Corridor (NEC) between Washington D.C. and Boston (fig. 19).25 In 2018, 80% of passengers traveled on the sixteen regional corridors less than 500 km in length, while 12.1 million passengers—about 40% of Amtrak’s total ridership—took the NEC.26 Amtrak’s organization is two-faceted, with dynamic regional services on the one hand and the continuing crisis of its long-distance services on the other. The organization of this conventional network, with its sharply contrasted elements, reflects a profound antagonism between the conflicting logics of territorial equity and profitability.
Figure 8. Amtrak’s intercity passenger rail system in 2019.
25 “long-distance corridors; state-supported corridors; Northeast corridor (NEC)”. 26 http://media.amtrak.com/wp-content/uploads/2018/11/FY18-Ridership-Fact-Sheet-1.pdf [accessed 13/01/2019].
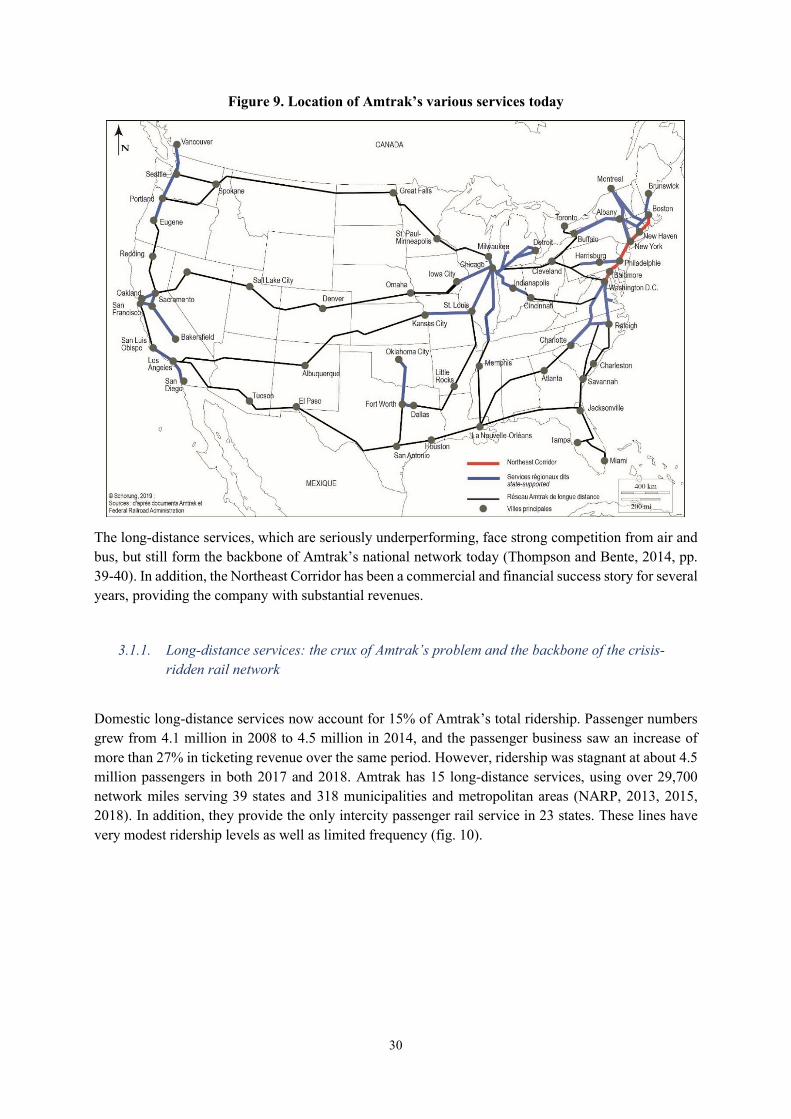
30
Figure 9. Location of Amtrak’s various services today
The long-distance services, which are seriously underperforming, face strong competition from air and bus, but still form the backbone of Amtrak’s national network today (Thompson and Bente, 2014, pp. 39-40). In addition, the Northeast Corridor has been a commercial and financial success story for several years, providing the company with substantial revenues.
3.1.1. Long-distance services: the crux of Amtrak’s problem and the backbone of the crisis-ridden rail network
Domestic long-distance services now account for 15% of Amtrak’s total ridership. Passenger numbers grew from 4.1 million in 2008 to 4.5 million in 2014, and the passenger business saw an increase of more than 27% in ticketing revenue over the same period. However, ridership was stagnant at about 4.5 million passengers in both 2017 and 2018. Amtrak has 15 long-distance services, using over 29,700 network miles serving 39 states and 318 municipalities and metropolitan areas (NARP, 2013, 2015, 2018). In addition, they provide the only intercity passenger rail service in 23 states. These lines have very modest ridership levels as well as limited frequency (fig. 10).
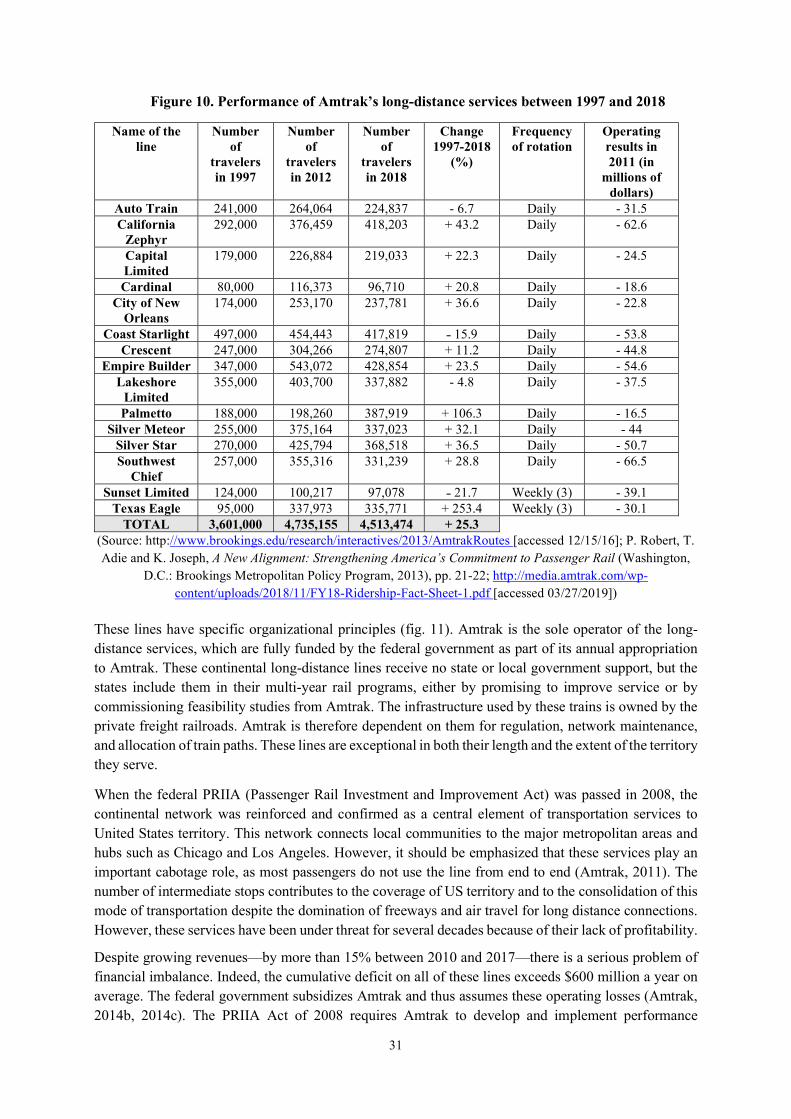
31
Figure 10. Performance of Amtrak’s long-distance services between 1997 and 2018
Name of the line
Number of
travelers in 1997
Number of
travelers in 2012
Number of
travelers in 2018
Change 1997-2018
(%)
Frequency of rotation
Operating results in 2011 (in
millions of dollars)
Auto Train 241,000 264,064 224,837 - 6.7 Daily - 31.5 California
Zephyr 292,000 376,459 418,203 + 43.2 Daily - 62.6
Capital Limited
179,000 226,884 219,033 + 22.3 Daily - 24.5
Cardinal 80,000 116,373 96,710 + 20.8 Daily - 18.6 City of New
Orleans 174,000 253,170 237,781 + 36.6 Daily - 22.8
Coast Starlight 497,000 454,443 417,819 ˗ 15.9 Daily - 53.8 Crescent 247,000 304,266 274,807 + 11.2 Daily - 44.8
Empire Builder 347,000 543,072 428,854 + 23.5 Daily - 54.6 Lakeshore
Limited 355,000 403,700 337,882 - 4.8 Daily - 37.5
Palmetto 188,000 198,260 387,919 + 106.3 Daily - 16.5 Silver Meteor 255,000 375,164 337,023 + 32.1 Daily - 44
Silver Star 270,000 425,794 368,518 + 36.5 Daily - 50.7 Southwest
Chief 257,000 355,316 331,239 + 28.8 Daily - 66.5
Sunset Limited 124,000 100,217 97,078 ˗ 21.7 Weekly (3) - 39.1 Texas Eagle 95,000 337,973 335,771 + 253.4 Weekly (3) - 30.1
TOTAL 3,601,000 4,735,155 4,513,474 + 25.3 (Source: http://www.brookings.edu/research/interactives/2013/AmtrakRoutes [accessed 12/15/16]; P. Robert, T. Adie and K. Joseph, A New Alignment: Strengthening America’s Commitment to Passenger Rail (Washington,
D.C.: Brookings Metropolitan Policy Program, 2013), pp. 21-22; http://media.amtrak.com/wp-content/uploads/2018/11/FY18-Ridership-Fact-Sheet-1.pdf [accessed 03/27/2019])
These lines have specific organizational principles (fig. 11). Amtrak is the sole operator of the long-distance services, which are fully funded by the federal government as part of its annual appropriation to Amtrak. These continental long-distance lines receive no state or local government support, but the states include them in their multi-year rail programs, either by promising to improve service or by commissioning feasibility studies from Amtrak. The infrastructure used by these trains is owned by the private freight railroads. Amtrak is therefore dependent on them for regulation, network maintenance, and allocation of train paths. These lines are exceptional in both their length and the extent of the territory they serve.
When the federal PRIIA (Passenger Rail Investment and Improvement Act) was passed in 2008, the continental network was reinforced and confirmed as a central element of transportation services to United States territory. This network connects local communities to the major metropolitan areas and hubs such as Chicago and Los Angeles. However, it should be emphasized that these services play an important cabotage role, as most passengers do not use the line from end to end (Amtrak, 2011). The number of intermediate stops contributes to the coverage of US territory and to the consolidation of this mode of transportation despite the domination of freeways and air travel for long distance connections. However, these services have been under threat for several decades because of their lack of profitability.
Despite growing revenues—by more than 15% between 2010 and 2017—there is a serious problem of financial imbalance. Indeed, the cumulative deficit on all of these lines exceeds $600 million a year on average. The federal government subsidizes Amtrak and thus assumes these operating losses (Amtrak, 2014b, 2014c). The PRIIA Act of 2008 requires Amtrak to develop and implement performance
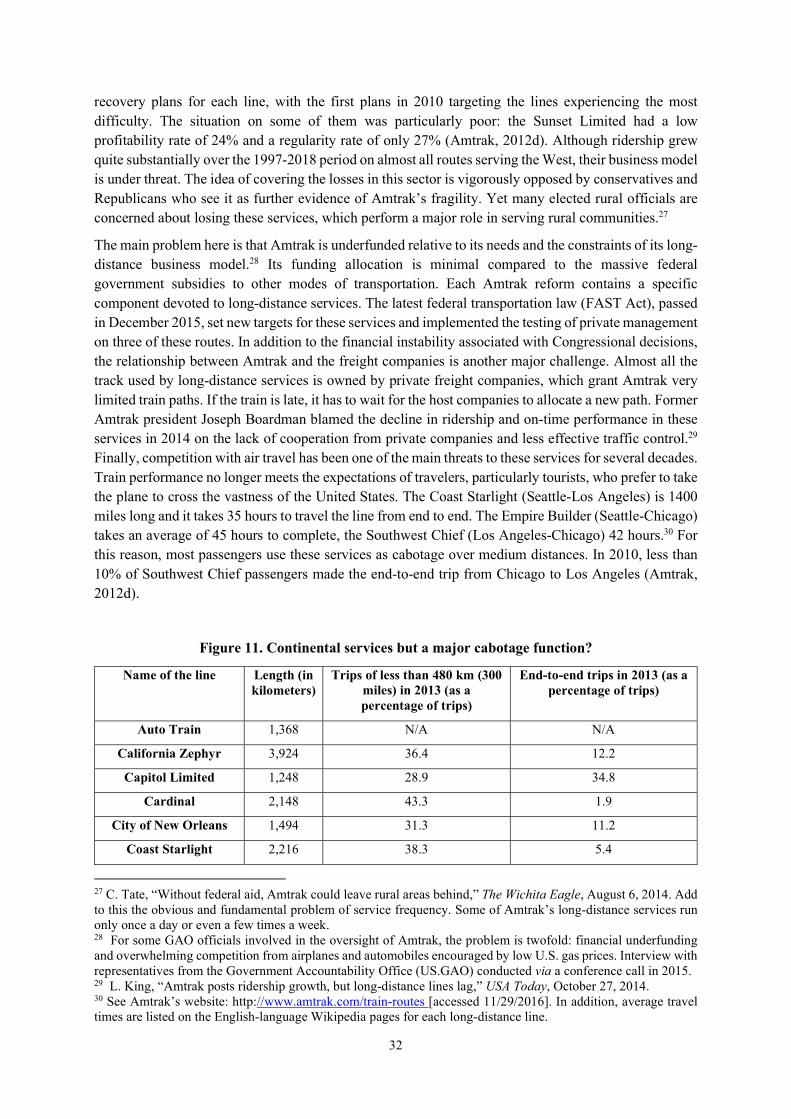
32
recovery plans for each line, with the first plans in 2010 targeting the lines experiencing the most difficulty. The situation on some of them was particularly poor: the Sunset Limited had a low profitability rate of 24% and a regularity rate of only 27% (Amtrak, 2012d). Although ridership grew quite substantially over the 1997-2018 period on almost all routes serving the West, their business model is under threat. The idea of covering the losses in this sector is vigorously opposed by conservatives and Republicans who see it as further evidence of Amtrak’s fragility. Yet many elected rural officials are concerned about losing these services, which perform a major role in serving rural communities.27
The main problem here is that Amtrak is underfunded relative to its needs and the constraints of its long-distance business model.28 Its funding allocation is minimal compared to the massive federal government subsidies to other modes of transportation. Each Amtrak reform contains a specific component devoted to long-distance services. The latest federal transportation law (FAST Act), passed in December 2015, set new targets for these services and implemented the testing of private management on three of these routes. In addition to the financial instability associated with Congressional decisions, the relationship between Amtrak and the freight companies is another major challenge. Almost all the track used by long-distance services is owned by private freight companies, which grant Amtrak very limited train paths. If the train is late, it has to wait for the host companies to allocate a new path. Former Amtrak president Joseph Boardman blamed the decline in ridership and on-time performance in these services in 2014 on the lack of cooperation from private companies and less effective traffic control.29 Finally, competition with air travel has been one of the main threats to these services for several decades. Train performance no longer meets the expectations of travelers, particularly tourists, who prefer to take the plane to cross the vastness of the United States. The Coast Starlight (Seattle-Los Angeles) is 1400 miles long and it takes 35 hours to travel the line from end to end. The Empire Builder (Seattle-Chicago) takes an average of 45 hours to complete, the Southwest Chief (Los Angeles-Chicago) 42 hours.30 For this reason, most passengers use these services as cabotage over medium distances. In 2010, less than 10% of Southwest Chief passengers made the end-to-end trip from Chicago to Los Angeles (Amtrak, 2012d).
Figure 11. Continental services but a major cabotage function?
Name of the line Length (in kilometers)
Trips of less than 480 km (300 miles) in 2013 (as a percentage of trips)
End-to-end trips in 2013 (as a percentage of trips)
Auto Train 1,368 N/A N/A
California Zephyr 3,924 36.4 12.2
Capitol Limited 1,248 28.9 34.8
Cardinal 2,148 43.3 1.9
City of New Orleans 1,494 31.3 11.2
Coast Starlight 2,216 38.3 5.4
27 C. Tate, “Without federal aid, Amtrak could leave rural areas behind,” The Wichita Eagle, August 6, 2014. Add to this the obvious and fundamental problem of service frequency. Some of Amtrak’s long-distance services run only once a day or even a few times a week. 28 For some GAO officials involved in the oversight of Amtrak, the problem is twofold: financial underfunding and overwhelming competition from airplanes and automobiles encouraged by low U.S. gas prices. Interview with representatives from the Government Accountability Office (US.GAO) conducted via a conference call in 2015. 29 L. King, “Amtrak posts ridership growth, but long-distance lines lag,” USA Today, October 27, 2014. 30 See Amtrak’s website: http://www.amtrak.com/train-routes [accessed 11/29/2016]. In addition, average travel times are listed on the English-language Wikipedia pages for each long-distance line.
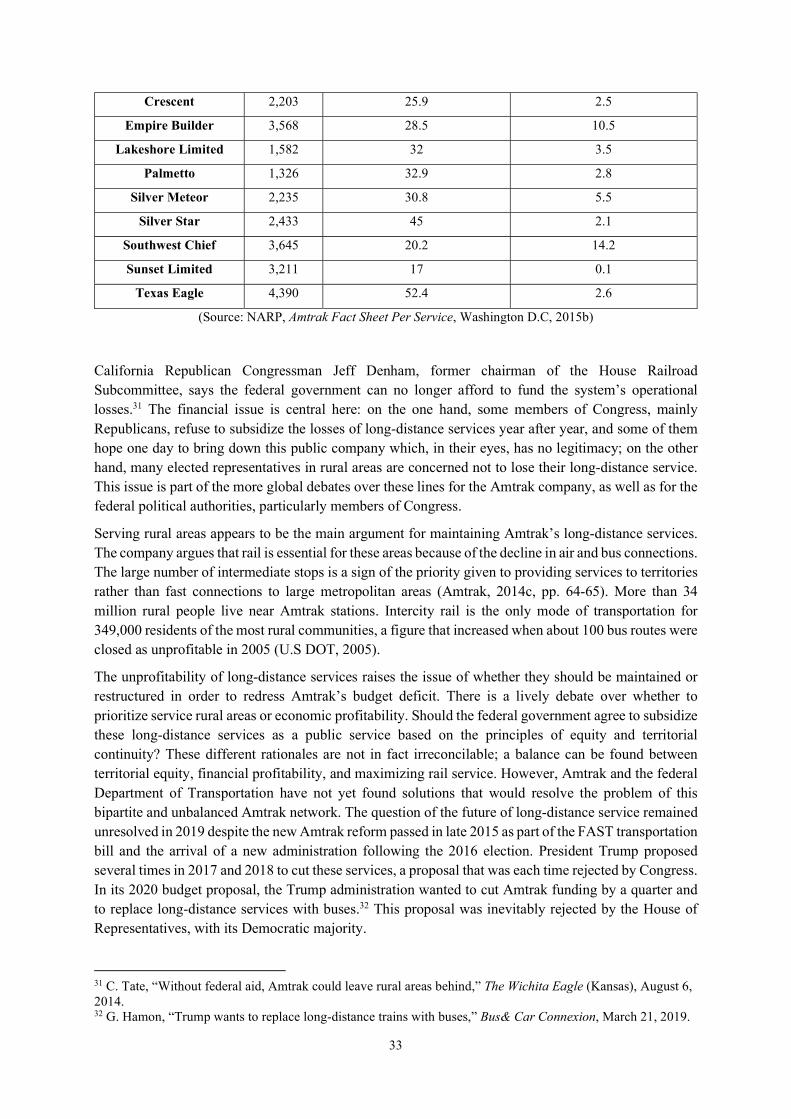
33
Crescent 2,203 25.9 2.5
Empire Builder 3,568 28.5 10.5
Lakeshore Limited 1,582 32 3.5
Palmetto 1,326 32.9 2.8
Silver Meteor 2,235 30.8 5.5
Silver Star 2,433 45 2.1
Southwest Chief 3,645 20.2 14.2
Sunset Limited 3,211 17 0.1
Texas Eagle 4,390 52.4 2.6
(Source: NARP, Amtrak Fact Sheet Per Service, Washington D.C, 2015b)
California Republican Congressman Jeff Denham, former chairman of the House Railroad Subcommittee, says the federal government can no longer afford to fund the system’s operational losses.31 The financial issue is central here: on the one hand, some members of Congress, mainly Republicans, refuse to subsidize the losses of long-distance services year after year, and some of them hope one day to bring down this public company which, in their eyes, has no legitimacy; on the other hand, many elected representatives in rural areas are concerned not to lose their long-distance service. This issue is part of the more global debates over these lines for the Amtrak company, as well as for the federal political authorities, particularly members of Congress.
Serving rural areas appears to be the main argument for maintaining Amtrak’s long-distance services. The company argues that rail is essential for these areas because of the decline in air and bus connections. The large number of intermediate stops is a sign of the priority given to providing services to territories rather than fast connections to large metropolitan areas (Amtrak, 2014c, pp. 64-65). More than 34 million rural people live near Amtrak stations. Intercity rail is the only mode of transportation for 349,000 residents of the most rural communities, a figure that increased when about 100 bus routes were closed as unprofitable in 2005 (U.S DOT, 2005).
The unprofitability of long-distance services raises the issue of whether they should be maintained or restructured in order to redress Amtrak’s budget deficit. There is a lively debate over whether to prioritize service rural areas or economic profitability. Should the federal government agree to subsidize these long-distance services as a public service based on the principles of equity and territorial continuity? These different rationales are not in fact irreconcilable; a balance can be found between territorial equity, financial profitability, and maximizing rail service. However, Amtrak and the federal Department of Transportation have not yet found solutions that would resolve the problem of this bipartite and unbalanced Amtrak network. The question of the future of long-distance service remained unresolved in 2019 despite the new Amtrak reform passed in late 2015 as part of the FAST transportation bill and the arrival of a new administration following the 2016 election. President Trump proposed several times in 2017 and 2018 to cut these services, a proposal that was each time rejected by Congress. In its 2020 budget proposal, the Trump administration wanted to cut Amtrak funding by a quarter and to replace long-distance services with buses.32 This proposal was inevitably rejected by the House of Representatives, with its Democratic majority.
31 C. Tate, “Without federal aid, Amtrak could leave rural areas behind,” The Wichita Eagle (Kansas), August 6, 2014. 32 G. Hamon, “Trump wants to replace long-distance trains with buses,” Bus& Car Connexion, March 21, 2019.
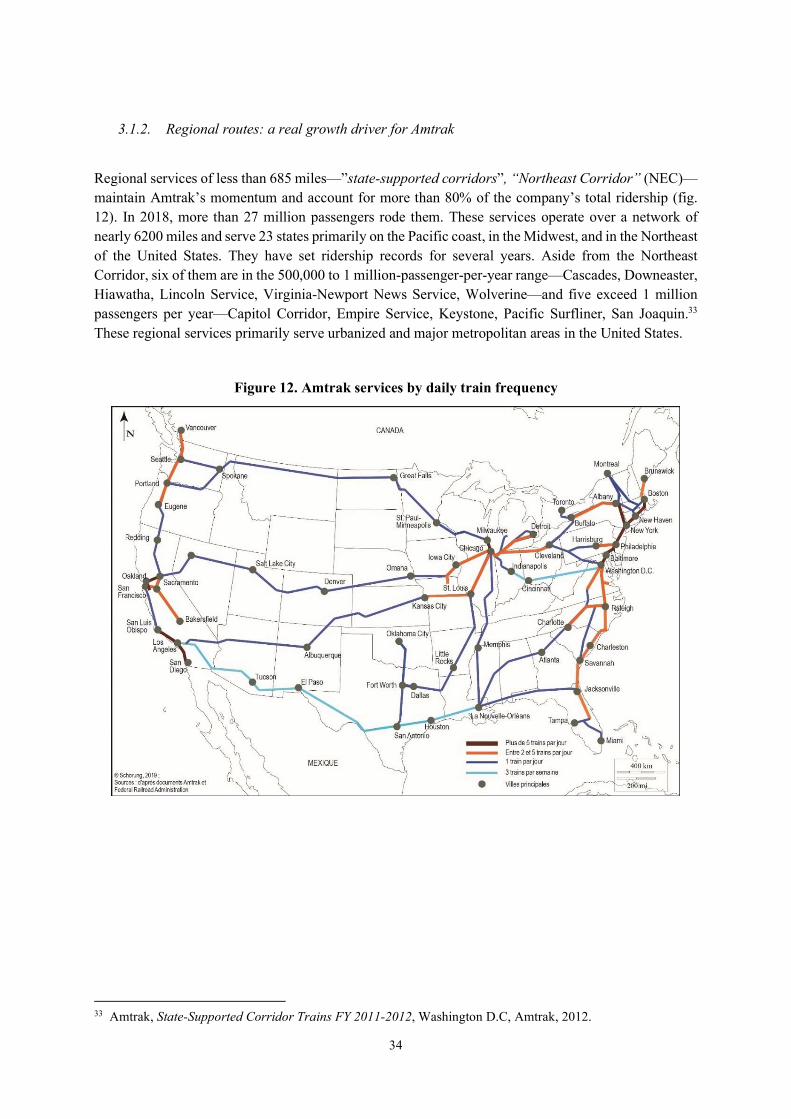
34
3.1.2. Regional routes: a real growth driver for Amtrak
Regional services of less than 685 miles—”state-supported corridors”, “Northeast Corridor” (NEC)— maintain Amtrak’s momentum and account for more than 80% of the company’s total ridership (fig. 12). In 2018, more than 27 million passengers rode them. These services operate over a network of nearly 6200 miles and serve 23 states primarily on the Pacific coast, in the Midwest, and in the Northeast of the United States. They have set ridership records for several years. Aside from the Northeast Corridor, six of them are in the 500,000 to 1 million-passenger-per-year range—Cascades, Downeaster, Hiawatha, Lincoln Service, Virginia-Newport News Service, Wolverine—and five exceed 1 million passengers per year—Capitol Corridor, Empire Service, Keystone, Pacific Surfliner, San Joaquin.33 These regional services primarily serve urbanized and major metropolitan areas in the United States.
Figure 12. Amtrak services by daily train frequency
33 Amtrak, State-Supported Corridor Trains FY 2011-2012, Washington D.C, Amtrak, 2012.
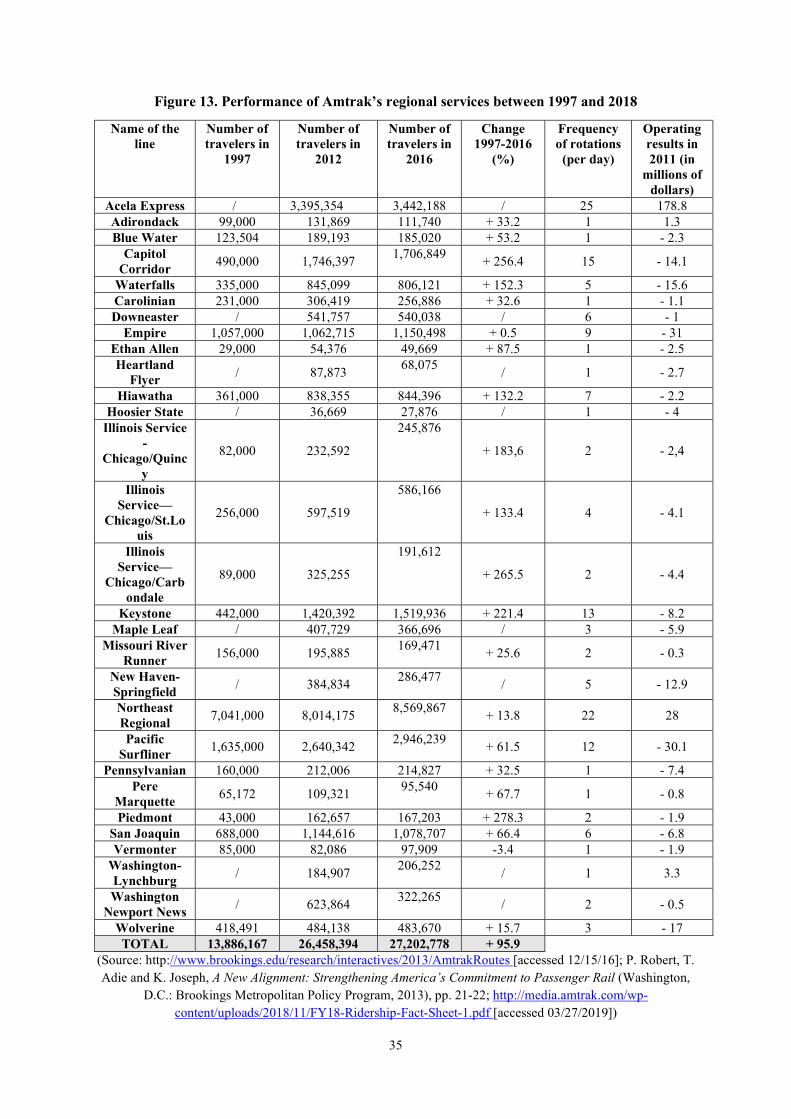
35
Figure 13. Performance of Amtrak’s regional services between 1997 and 2018
Name of the line
Number of travelers in
1997
Number of travelers in
2012
Number of travelers in
2016
Change 1997-2016
(%)
Frequency of rotations
(per day)
Operating results in 2011 (in
millions of dollars)
Acela Express / 3,395,354 3,442,188 / 25 178.8 Adirondack 99,000 131,869 111,740 + 33.2 1 1.3 Blue Water 123,504 189,193 185,020 + 53.2 1 - 2.3
Capitol Corridor
490,000 1,746,397 1,706,849
+ 256.4 15 - 14.1
Waterfalls 335,000 845,099 806,121 + 152.3 5 - 15.6 Carolinian 231,000 306,419 256,886 + 32.6 1 - 1.1 Downeaster / 541,757 540,038 / 6 - 1
Empire 1,057,000 1,062,715 1,150,498 + 0.5 9 - 31 Ethan Allen 29,000 54,376 49,669 + 87.5 1 - 2.5 Heartland
Flyer / 87,873
68,075 / 1 - 2.7
Hiawatha 361,000 838,355 844,396 + 132.2 7 - 2.2 Hoosier State / 36,669 27,876 / 1 - 4
Illinois Service -
Chicago/Quincy
82,000 232,592
245,876
+ 183,6 2 - 2,4
Illinois Service—
Chicago/St.Louis
256,000 597,519
586,166
+ 133.4 4 - 4.1
Illinois Service—
Chicago/Carbondale
89,000 325,255
191,612
+ 265.5 2 - 4.4
Keystone 442,000 1,420,392 1,519,936 + 221.4 13 - 8.2 Maple Leaf / 407,729 366,696 / 3 - 5.9
Missouri River Runner
156,000 195,885 169,471
+ 25.6 2 - 0.3
New Haven-Springfield
/ 384,834 286,477
/ 5 - 12.9
Northeast Regional
7,041,000 8,014,175 8,569,867
+ 13.8 22 28
Pacific Surfliner
1,635,000 2,640,342 2,946,239
+ 61.5 12 - 30.1
Pennsylvanian 160,000 212,006 214,827 + 32.5 1 - 7.4 Pere
Marquette 65,172 109,321
95,540 + 67.7 1 - 0.8
Piedmont 43,000 162,657 167,203 + 278.3 2 - 1.9 San Joaquin 688,000 1,144,616 1,078,707 + 66.4 6 - 6.8 Vermonter 85,000 82,086 97,909 -3.4 1 - 1.9
Washington-Lynchburg
/ 184,907 206,252
/ 1 3.3
Washington Newport News
/ 623,864 322,265
/ 2 - 0.5
Wolverine 418,491 484,138 483,670 + 15.7 3 - 17 TOTAL 13,886,167 26,458,394 27,202,778 + 95.9
(Source: http://www.brookings.edu/research/interactives/2013/AmtrakRoutes [accessed 12/15/16]; P. Robert, T. Adie and K. Joseph, A New Alignment: Strengthening America’s Commitment to Passenger Rail (Washington,
D.C.: Brookings Metropolitan Policy Program, 2013), pp. 21-22; http://media.amtrak.com/wp-content/uploads/2018/11/FY18-Ridership-Fact-Sheet-1.pdf [accessed 03/27/2019])
36
A comparison of the performance of regional and long-distance services reveals the imbalance within Amtrak. The long-distance services are all loss-making, and some have particularly large operating losses, although ridership figures are almost all up. As for regional services, the situation is more mixed. Three observations emerge: the concentration of this rail dynamic around ten corridors or so, the financial imbalance of the majority of services—although losses are much more limited than for long-distance services—and the exceptional nature of the Northeast Corridor. The services in the Northeast Corridor—Acela Express and Northeast Regional—alone capture more than one-third of Amtrak’s total ridership. Service to major metropolitan areas, for short and medium distance trips, is a major pillar of Amtrak’s business model and provides a cabotage function for metropolitan service (Puentes, Adie, and Joseph, 2013, pp. 9-10). Moreover, these regional services, having overall limited operating costs and operational deficits, contribute only marginally to Amtrak’s financial deficit.
These numerous regional services are, as shown in the table above, generally located in highly urbanized and populated areas. In the Northeast region and California the stops serving major urban and economic centers are particularly numerous. Amtrak can be seen as a means of domestic transportation within very large metropolitan areas. Intercity passenger rail in the United States is therefore primarily based on medium-distance regional services. The organizational and management characteristics differ from those of long-distance services, thanks to the partnerships between Amtrak and the states and the devolution of financial responsibility for regional corridors to the states.
Amtrak faces recurrent difficulties arising from its underfunding by the federal government and its institutional isolation. Unlike the highway and airline sectors, Amtrak does not have its own sustainable source of funding. Its business model is based in part on long-distance services, so it has never been able to break even. Amtrak suffers above all from excessively erratic financial and political commitment on the part of the federal authority. For this reason, the federal government would like to see the states make a greater commitment, particularly to regional services.
The federal PRIIA Act of 2008 was intended to make Amtrak sustainable and support improved intercity ridership (Gilbert and Perl, 2010, pp. 297-299). Section 209 of the Act provides for Amtrak’s regional routes to be transferred to the states. Indeed, in 2015, operational management of all Amtrak regional routes was transferred to state departments of transportation. PRIIA further authorized the launch of three new federal investment assistance programs to support passenger rail projects (FRA, 2009; Amtrak, 2012b). In addition, the FAST Act of 2015 once again reformed Amtrak while ensuring the sustainability of its services. Three areas were identified as priorities: improving Amtrak’s financial transparency and management practices, clearly separating the budgets and investments allocated to the Northeast Corridor, and confirming the role of the states in the management of regional lines (United States House of Representatives, 2015).
In 2018, 18 states made financial commitments to the company’s 29 regional services.34 Amtrak was to develop a management and funding partnership with each state based on the sharing of operational costs and investments according to route ridership. Before the cost-sharing arrangement became effective in 2014, Amtrak and the states each contributed half of the funding for these services—an overall financial commitment of $375 million per year. Since 2014, state participation has increased, particularly for capital spending, and states now cover more than 75% of the funding needs of the regional services (U.S GAO, 2016, pp. 40-41).
This partnership between the federal government through Amtrak and the states has resulted in a significant increase in investment. Until 2008, thinking about the future of Amtrak’s services was
34 California, North Carolina, Connecticut, Illinois, Indiana, Maine, Massachusetts, Michigan, Missouri, New York, Oklahoma, Oregon, Pennsylvania, Texas, Vermont, Virginia, Washington, Wisconsin.
37
primarily federal. This paradigm changed with the implementation of PRIIA. States, and in particular their Departments of Transportation, were now required to include intercity rail in their planning documents and budget allocations. The federal government also had to shift some Amtrak-related expenses to another institutional level. States had the opportunity to engage in a wide range of actions: expanding rail services, improving existing services, purchasing rolling stock, replacing inadequate or obsolete infrastructure, upgrading equipment, building or renovating stations (AASHTO, 2012, pp. 3-4). In addition, the Executive Branch and Congress established a new legislative framework from 2008 onwards to prepare for the redevelopment of passenger rail transport. This renewed framework was based in part on three new programs stemming from the PRIIA Act to support major investments—federal funds complemented by the economic stimulus package implemented by the ARRA Act of 2009. This positive environment supports the overall dynamic of Amtrak’s regional services through increased investment, rolling stock renewal, tighter and more decentralized management, and a strong commitment to integration with urban transit systems. Indeed, while the principle of equity, rural service, and continuity of territorial service prevails for long-distance services, the logic for regional services is quite different.
Network connectivity is the most valued goal of supporting the rail initiatives of the states that have financial responsibility for Amtrak’s regional services. The inclusion of these lines in an overall vision of ecomobility is evident in California. The California Department of Transportation’s rail policy has three priorities: providing alternatives to other modes of transport, combating highway and airport congestion, and improving air quality. The need to develop alternative modes of transport and to initiate a genuine modal shift is particularly emphasized. In view of the prospects of strong demographic growth—the State’s population is expected to rise from 38 to 50 million by 2050—and the continuing increase in air and road traffic, the creation of an integrated inter-urban and metropolitan rail network is another priority objective. The idea is both to strengthen and maximize rail service in the metropolitan areas of San Francisco, Sacramento and Los Angeles, and to improve access to certain regions with poor transport links, such as the Central Valley. The concepts of a “seamless network” and the “last mile” are everywhere in the thinking of the California Department of Transportation. The San Joaquin line, for example, has exceptional connectivity to regional or local rail lines—Caltrain, BART, Altamont Commuter Express—with four Amtrak long-distance services and the regional Capitol Corridor line, as well as indirect connections to airports in the region (Caltrans, 2006, 2013).
3.1.3. The Northeast Corridor (NEC): an outstanding commercial and financial success story
Amtrak’s Northeast Corridor, which spans more than 1,200 km, is by far the busiest in North America, with nearly 2,200 trains running on it each day. The NEC’s network includes the main line between Washington DC and Boston—a 460 mile stretch—as well as branch lines serving Harrisburg, Springfield, Albany and Richmond (Fig. 22).
This corridor accommodates both Amtrak trains—Acela Express and Northeast Regional—and urban transit and freight services. The corridor is crossed by a very large number of services that have their own operating and management characteristics:
high-speed service: Acela Express;
Amtrak conventional services: regional services (Regional NEC, Vermonter, Ethan Alley, Adirondack, Maple Leaf and Carolinian); long-distance services (Cardinal, Silver Services, Crescent, Capitol Limited, Lakeshore Limited);
38
Urban and Metropolitan Transportation: Massachusetts Bay Transportation Authority (MBTA), Rhode Island DOT (RIDOT), Shore Line East (SLE), MTA Metro-North Railroad (MNR), MTA Long Island Rail Road (LIRR), New Jersey Transit Corporation (NJT), Southeastern Pennsylvania Transportation Authority (SEPTA), Delaware Department of Transportation (DelDOT), Maryland Rail Commuter (MARC), and Virginia Railway Express (VRE);
rail freight: Conrail Shared Assets Corporation, Providence and Worcester, Pan Am Southern, Canadian Pacific, Connecticut Southern, Norfolk Southern, CSX Transportation (Amtrak, 2010b, pp. 6-8).
The Acela Express is currently the only high-speed line in the United States. After major investments in the 1990s, Amtrak decided to inaugurate this new service in 2000, taking over from the “Metroliners” trains that had been running since the 1970s on the electrified part of the corridor (Washington-New York). The infrastructure on this corridor dates back to the 19th century and was only partially upgraded in the 1930s, so the Acela Express can only run at reduced speed. The Acela Express can reach a top speed of 150 mph, but its average speed is much lower—61 mph between New York and Boston, 85 mph between New York and Washington D.C. The Acela Express is in fact a high-speed service that is intended, according to Amtrak’s master plan for the NEC, to become a high-speed service according to UIC standards. Since the initial investments associated with the launch of the Acela Express, this corridor has suffered from severe underinvestment, delaying the replacement and upgrading of rail infrastructure and equipment. Moreover, this service does not use a dedicated line and is forced to share tracks and paths with almost 2000 other trains and 70 freight convoys per day. This sharing of infrastructure does not allow the Acela Express trains to run at high speed. In addition, the NEC is reaching saturation because of the combined effect of increasing patronage of all services using the NEC and the lack of heavy investment.
The NEC is also unique in the U.S. rail landscape. Unlike most of its services, which use private infrastructure, Amtrak owns much of the infrastructure and equipment in the Northeast Corridor, 360 of the 460 miles of the main line between Washington, D.C. and Boston. Two other sections are owned by other entities: the 56 mile section between New Rochelle, New York and New Haven, Connecticut— 10 miles by the New York Metropolitan Transportation Authority and 46 miles by the Connecticut Department of Transportation—and the 38 mile km section between Rhode Island and Boston by the State of Massachusetts. Smaller sections of the Albany Line are owned by Metro-North Railroad and the freight company CSX Transportation. Amtrak acts as the infrastructure manager to regulate train traffic and allocate train paths.
Despite these challenges, it is Amtrak’s greatest business and financial success. The corridor is a polarizing axis of the mega-region: its network serves 50 cities in 11 states, and 85.4 million people are located within 25 miles of NEC stations. Since the mid-2000s, ridership has grown almost continuously: 11.6 million in 2008, 11.7 in 2011, 12.3 million in 2014, 12.1 million in 2018. Approximately 750,000 passengers, using Amtrak services or metropolitan transportation, travel this corridor each day. The NEC has a significant cabotage function because of the many stops on Amtrak’s regional services and the multiple city transportation services. In 2014, 28.3% of trips were less than 100 miles. Amtrak’s intercity services in this corridor are particularly well positioned in the East Coast transportation system. 30.8% of Amtrak’s trips in this corridor are between 100-200 miles (160-320 km), 37.5% are between 200-300 miles (320-482 km) (NARP, 2015c, p. 1). The Acela Express now operates three-quarters of the routes between New York and Washington DC, and half between Washington DC and Boston. James P. Redeker particularly emphasizes the modal shift generated by the introduction of the Acela Express: “Despite the age of the Corridor’s infrastructure, the demand for passenger rail services continues to
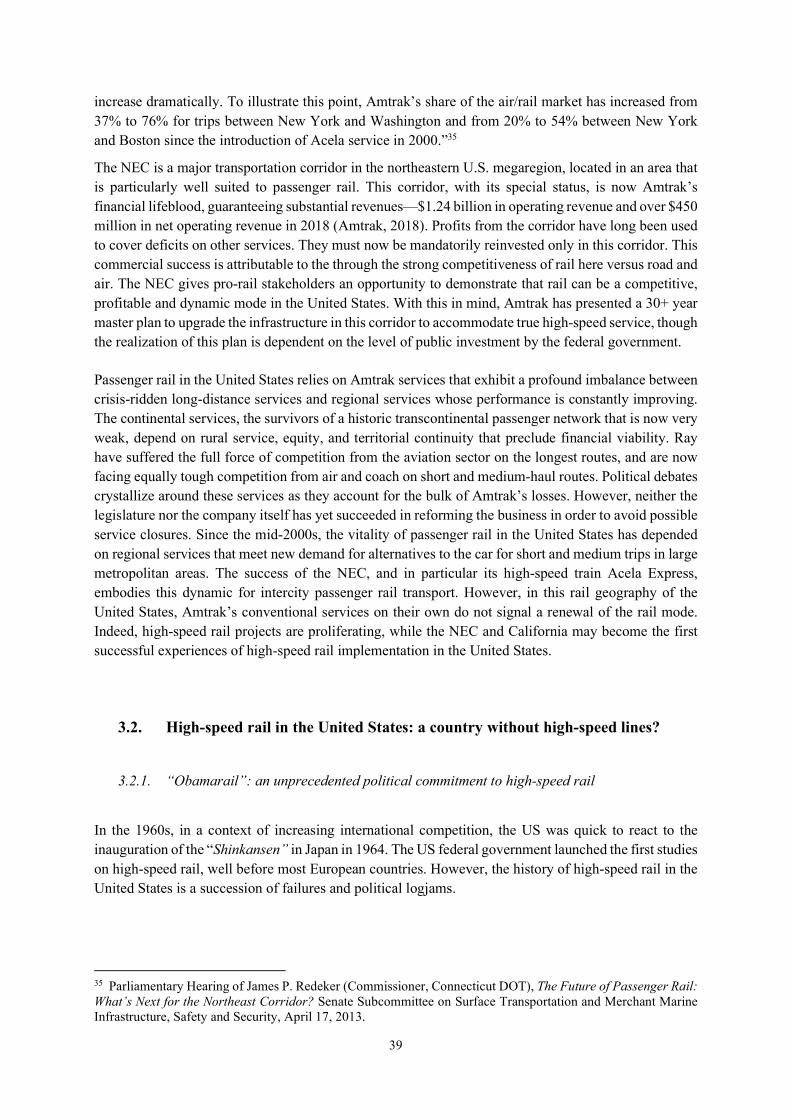
39
increase dramatically. To illustrate this point, Amtrak’s share of the air/rail market has increased from 37% to 76% for trips between New York and Washington and from 20% to 54% between New York and Boston since the introduction of Acela service in 2000.”35
The NEC is a major transportation corridor in the northeastern U.S. megaregion, located in an area that is particularly well suited to passenger rail. This corridor, with its special status, is now Amtrak’s financial lifeblood, guaranteeing substantial revenues—$1.24 billion in operating revenue and over $450 million in net operating revenue in 2018 (Amtrak, 2018). Profits from the corridor have long been used to cover deficits on other services. They must now be mandatorily reinvested only in this corridor. This commercial success is attributable to the through the strong competitiveness of rail here versus road and air. The NEC gives pro-rail stakeholders an opportunity to demonstrate that rail can be a competitive, profitable and dynamic mode in the United States. With this in mind, Amtrak has presented a 30+ year master plan to upgrade the infrastructure in this corridor to accommodate true high-speed service, though the realization of this plan is dependent on the level of public investment by the federal government.
Passenger rail in the United States relies on Amtrak services that exhibit a profound imbalance between crisis-ridden long-distance services and regional services whose performance is constantly improving. The continental services, the survivors of a historic transcontinental passenger network that is now very weak, depend on rural service, equity, and territorial continuity that preclude financial viability. Ray have suffered the full force of competition from the aviation sector on the longest routes, and are now facing equally tough competition from air and coach on short and medium-haul routes. Political debates crystallize around these services as they account for the bulk of Amtrak’s losses. However, neither the legislature nor the company itself has yet succeeded in reforming the business in order to avoid possible service closures. Since the mid-2000s, the vitality of passenger rail in the United States has depended on regional services that meet new demand for alternatives to the car for short and medium trips in large metropolitan areas. The success of the NEC, and in particular its high-speed train Acela Express, embodies this dynamic for intercity passenger rail transport. However, in this rail geography of the United States, Amtrak’s conventional services on their own do not signal a renewal of the rail mode. Indeed, high-speed rail projects are proliferating, while the NEC and California may become the first successful experiences of high-speed rail implementation in the United States.
3.2. High-speed rail in the United States: a country without high-speed lines?
3.2.1. “Obamarail”: an unprecedented political commitment to high-speed rail
In the 1960s, in a context of increasing international competition, the US was quick to react to the inauguration of the “Shinkansen” in Japan in 1964. The US federal government launched the first studies on high-speed rail, well before most European countries. However, the history of high-speed rail in the United States is a succession of failures and political logjams.
35 Parliamentary Hearing of James P. Redeker (Commissioner, Connecticut DOT), The Future of Passenger Rail: What’s Next for the Northeast Corridor? Senate Subcommittee on Surface Transportation and Merchant Marine Infrastructure, Safety and Security, April 17, 2013.
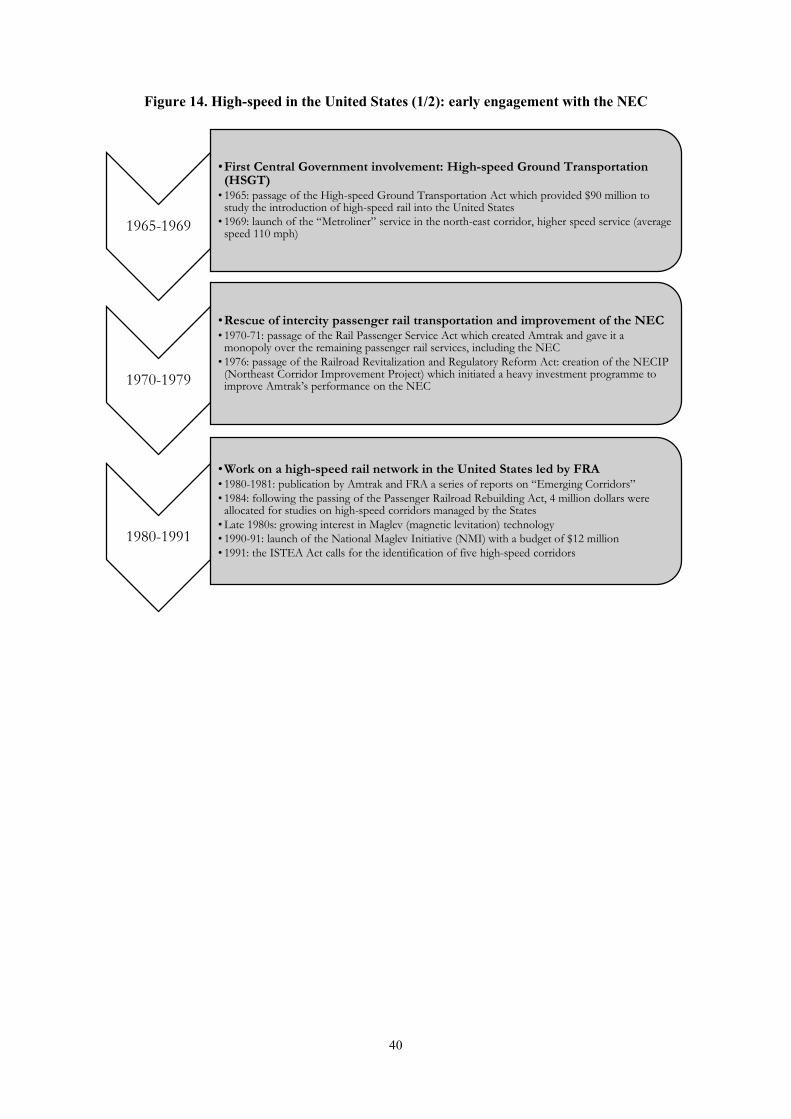
40
Figure 14. High-speed in the United States (1/2): early engagement with the NEC
1965-1969
•First Central Government involvement: High-speed Ground Transportation (HSGT)
• 1965: passage of the High-speed Ground Transportation Act which provided $90 million to study the introduction of high-speed rail into the United States
• 1969: launch of the “Metroliner” service in the north-east corridor, higher speed service (average speed 110 mph)
1970-1979
•Rescue of intercity passenger rail transportation and improvement of the NEC• 1970-71: passage of the Rail Passenger Service Act which created Amtrak and gave it a
monopoly over the remaining passenger rail services, including the NEC• 1976: passage of the Railroad Revitalization and Regulatory Reform Act: creation of the NECIP
(Northeast Corridor Improvement Project) which initiated a heavy investment programme to improve Amtrak’s performance on the NEC
1980-1991
•Work on a high-speed rail network in the United States led by FRA • 1980-1981: publication by Amtrak and FRA a series of reports on “Emerging Corridors”• 1984: following the passing of the Passenger Railroad Rebuilding Act, 4 million dollars were
allocated for studies on high-speed corridors managed by the States• Late 1980s: growing interest in Maglev (magnetic levitation) technology• 1990-91: launch of the National Maglev Initiative (NMI) with a budget of $12 million • 1991: the ISTEA Act calls for the identification of five high-speed corridors
41
Figure 15. High-speed rail in the United States (2/2): the federal government at the helm
To date, the Acela Express service in the Northeast Corridor is the only high-speed service in the United States. In 1964, the Office of High-speed Ground Transportation (OHSGT) was created to study the implementation of high-speed in the Northeast Corridor. In the 1930s, the private company Pennsylvania Central, owner of these tracks, decided to electrify them, which improved train performance. However, there were no major investments between the 1930s and 1960s. The OHSGT project, the product of a public-private partnership, aimed to introduce a fast train, the “Metroliner”. With an initial budget of $44.5 million, the Metroliner entered service in 1969. It was a high-speed service, capable of running at an average speed of 109 mph. In 1970, the Pennsylvania Central company went bankrupt. The new
1992-1997
•Selection of 5 high-speed corridors by the FRA paving the way to the HSR in the United States•1992 : FRA selects these 5 corridors following the federal law, ISTEA :
•Midwest (Chicago-Detroit-St. Louis-Milwaukee)•Florida (Miami-Orlando-Tampa)•California (San Diego-Los Angeles-Bay Area-Sacramento)•Southeast (Charlotte-Richmond-Washington D.C.)•Pacific Northwest (Eugene-Portland-Seattle)
•1993 : publication of a report from the FRA on the NMI (National Maglev Initiative)•1997 : presentation by the FRA of a report to Congress on the economic benefits of HSR (High-speedGround Transportation Commercial Feasibility Study Report)
1998-2004
• Identification of 6 new HSR corridors• 1998-1999 : vote of the TEA-21 federal law which authorizes this identification :
• Gulf Coast• Keystone (Philadelphia-Harrisburg)• Empire State (NYC-Albany-Buffalo)• extension of the Southeast corridor (Atlanta-Macon-Raleigh-Savannah-Jacksonville)• extension of the Midwest corridor, now called Chicago Hub (Milwaukee-Minneapolis; Indianapolis-
Cincinnati)
• 2000 : the USDOT autorizes the extension of 4 corridors et la selection of 2 new corridors :• extension of the Southeast corridor (Macon-Jesup)• extension of the Gulf Coast corridor (Birmingham-Atlanta)• extension of the Keystone corridor (Harrisburg-Pittsburg)• extension of the Chicago Hub (Chicago-Toledo-Cleveland; Indianapolis-Louisville; Cleveland-Columbus-
Dayton-Cincinnati)• Northern New England (Boston-Auburn-Montreal) • South Central (Dallas-Fort Worth-Austin-San Antonio-Oklahoma City-Tulsa)
• 2004 : the Congress (vote of the Consolidated Appropriations Act in 2005) autorizes the extension of the Northern New England corridor (Boston-Springfield-Albany; Springfield-New Haven)
2008-2015
• A new major milestone: the HSIPR• 2008 : vote of the federal law PRIIA which establish a new legislative framework for HSR• 2009 : allocation of $8 billions for HSR corridors (vote of the federal law, ARRA) and publication by the
FRA of a new report on high-speed rail (High-speed rail Strategic Plan)• 2010-2011 : addition of $2,5 billions by Congress• 2012 : Amtrak introduces a new long-term investment plan for the Northeast Corridor• 2013-2014 : reduction of federal appropriations to HSR• 2015 : vote of the federal law FAST plans the launch of a new call for proposals on new HSR corridors,
without any specifications on funding and planning
(Source: FRA website, https://www.fra.dot.gov/Page/P0140 [accessed 11/17/2018])
42
public company Amtrak took over part of its services, and in 1976 Amtrak became the owner of almost all of the NEC’s infrastructure. A first program—NECIP—was launched in 1976 to carry out improvement work, but the Reagan administrations, which saw a sharp drop in federal spending, did not allow for investment in the NEC. It was not until the early 1990s that the NECIP became a reality with new federal funding. Amtrak was committed to both to incremental improvements in the performance of the “Metroliner” and the long-term transformation of the NEC into a high-speed corridor (Perl, 2002; Black, 2005, pp. 18-21; Ruggeri, 2015, pp. 78-79). Beginning in 1997, the federal government endowed Amtrak with $3.2 billion to run high-speed rail between Washington D.C. and Boston. The new Acela Express service was launched in 2000, again a high-speed train. This was because the rail infrastructure, most of which dates back to the late 19th century, cannot be duplicated with a new route because of a lack of funding. In 2012, Amtrak presented a new master plan to modernize the NEC, showing the need for $150 billion to build a true HSR. The Northeast Corridor, which has been a real business and financial success story for Amtrak for nearly two decades, represents a very qualified success story for the implementation of high-speed rail.
Anthony Perl also traces the repeated failures of various high-speed line projects since the 1980s. The Californian case can be described as a false start. The first project, prepared by the AHSRC—American High-speed rail Corporation36—and the State of California in partnership with Japan National Railways, was presented in 1983. It envisaged a train running at 150 mph (250 km/h) linking Los Angeles and San Diego, on a line to be fully opened in 1990. This project was abandoned in November 1984 for lack of funds, even though the impact studies were already underway. It was not until 2008 that California reinvested in a high-speed network project. Other examples in the United States are failures that have never been restarted in Ohio (1980), Texas (1995) or Florida (2004).
In each of these cases, there are two main reasons for the failure of the high-speed line project: the lack of public and/or private funding, and the lack of sustained support from the political authorities. From 1965 until 2008, the federal government took an interest in this innovative mode of transport, appearing ready to lead from the front and committing legislative and financial resources for significant prospective analyses. However, its role was limited to commissioning studies and the legal designation of high-speed corridors. In reality, there were no programs financed in any significant way to support the construction of high-speed lines, except in the North-East corridor, with a flagrant mismatch between the resources required and the sums actually committed. Moreover, despite the 1984 legislation that for the first time placed the states in the position of main players, the other institutional levels remained in the background. This situation is confirmed by the three examples of failure described above: in each case, the federal level decided either to remain on the sidelines and leave it to the private sector, or to withdraw abruptly, causing the project to collapse, or to commit itself but far too timidly, particularly in terms of budget. The year 2008 marked a break in the tormented history of high-speed rail in the United States with a profound renewal of federal rail policy.
The renewal of federal railroad policy was based on three pieces of legislation passed in 2008 and 2009 (FRA, 2009, pp. 9-10; 2009b, pp. 4-5):
Rail Safety Improvement Act (2008): increasing safety requirements and modernizing rail safety legislation;
Passenger Rail Investment and Improvement Act (2008): creation of three investment programs:
36 The purpose of the Passenger Railroad Rebuilding Act of 1980 was for the FRA to work on potential high-speed corridors, designated as emerging corridors. The Office of High-speed Ground Transportation, created in 1965, was given $4 million to fund studies, and an Amtrak subsidiary, the AHSRC, was created to carry out this type of project. The states were encouraged to become involved in high-speed rail projects.
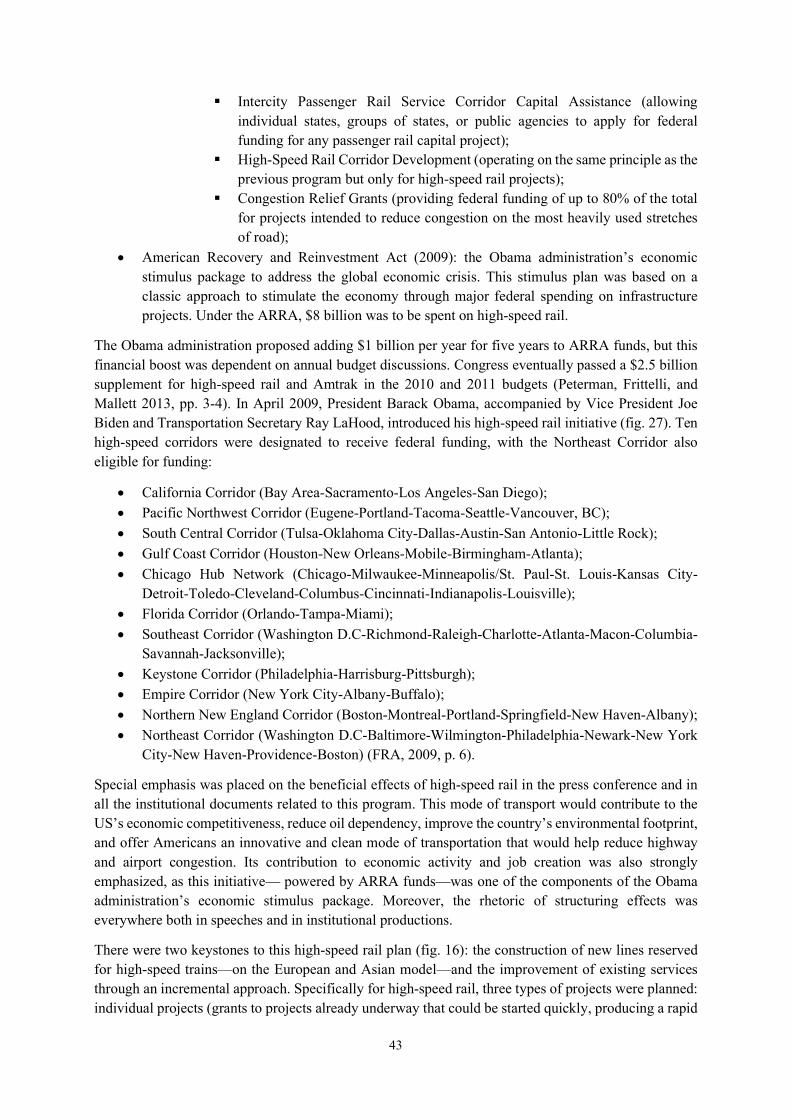
43
Intercity Passenger Rail Service Corridor Capital Assistance (allowing individual states, groups of states, or public agencies to apply for federal funding for any passenger rail capital project);
High-Speed Rail Corridor Development (operating on the same principle as the previous program but only for high-speed rail projects);
Congestion Relief Grants (providing federal funding of up to 80% of the total for projects intended to reduce congestion on the most heavily used stretches of road);
American Recovery and Reinvestment Act (2009): the Obama administration’s economic stimulus package to address the global economic crisis. This stimulus plan was based on a classic approach to stimulate the economy through major federal spending on infrastructure projects. Under the ARRA, $8 billion was to be spent on high-speed rail.
The Obama administration proposed adding $1 billion per year for five years to ARRA funds, but this financial boost was dependent on annual budget discussions. Congress eventually passed a $2.5 billion supplement for high-speed rail and Amtrak in the 2010 and 2011 budgets (Peterman, Frittelli, and Mallett 2013, pp. 3-4). In April 2009, President Barack Obama, accompanied by Vice President Joe Biden and Transportation Secretary Ray LaHood, introduced his high-speed rail initiative (fig. 27). Ten high-speed corridors were designated to receive federal funding, with the Northeast Corridor also eligible for funding:
California Corridor (Bay Area-Sacramento-Los Angeles-San Diego); Pacific Northwest Corridor (Eugene-Portland-Tacoma-Seattle-Vancouver, BC);
South Central Corridor (Tulsa-Oklahoma City-Dallas-Austin-San Antonio-Little Rock);
Gulf Coast Corridor (Houston-New Orleans-Mobile-Birmingham-Atlanta);
Chicago Hub Network (Chicago-Milwaukee-Minneapolis/St. Paul-St. Louis-Kansas City-Detroit-Toledo-Cleveland-Columbus-Cincinnati-Indianapolis-Louisville);
Florida Corridor (Orlando-Tampa-Miami);
Southeast Corridor (Washington D.C-Richmond-Raleigh-Charlotte-Atlanta-Macon-Columbia-Savannah-Jacksonville);
Keystone Corridor (Philadelphia-Harrisburg-Pittsburgh); Empire Corridor (New York City-Albany-Buffalo);
Northern New England Corridor (Boston-Montreal-Portland-Springfield-New Haven-Albany);
Northeast Corridor (Washington D.C-Baltimore-Wilmington-Philadelphia-Newark-New York City-New Haven-Providence-Boston) (FRA, 2009, p. 6).
Special emphasis was placed on the beneficial effects of high-speed rail in the press conference and in all the institutional documents related to this program. This mode of transport would contribute to the US’s economic competitiveness, reduce oil dependency, improve the country’s environmental footprint, and offer Americans an innovative and clean mode of transportation that would help reduce highway and airport congestion. Its contribution to economic activity and job creation was also strongly emphasized, as this initiative— powered by ARRA funds—was one of the components of the Obama administration’s economic stimulus package. Moreover, the rhetoric of structuring effects was everywhere both in speeches and in institutional productions.
There were two keystones to this high-speed rail plan (fig. 16): the construction of new lines reserved for high-speed trains—on the European and Asian model—and the improvement of existing services through an incremental approach. Specifically for high-speed rail, three types of projects were planned: individual projects (grants to projects already underway that could be started quickly, producing a rapid
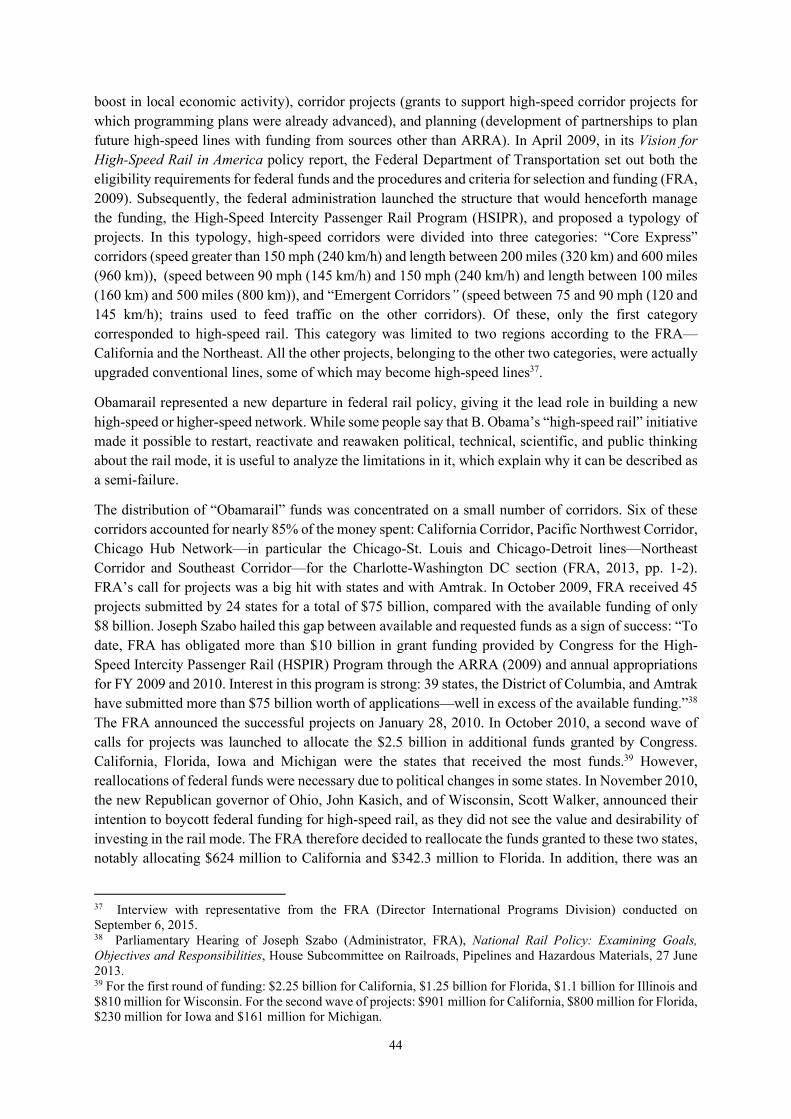
44
boost in local economic activity), corridor projects (grants to support high-speed corridor projects for which programming plans were already advanced), and planning (development of partnerships to plan future high-speed lines with funding from sources other than ARRA). In April 2009, in its Vision for High-Speed Rail in America policy report, the Federal Department of Transportation set out both the eligibility requirements for federal funds and the procedures and criteria for selection and funding (FRA, 2009). Subsequently, the federal administration launched the structure that would henceforth manage the funding, the High-Speed Intercity Passenger Rail Program (HSIPR), and proposed a typology of projects. In this typology, high-speed corridors were divided into three categories: “Core Express” corridors (speed greater than 150 mph (240 km/h) and length between 200 miles (320 km) and 600 miles (960 km)), (speed between 90 mph (145 km/h) and 150 mph (240 km/h) and length between 100 miles (160 km) and 500 miles (800 km)), and “Emergent Corridors” (speed between 75 and 90 mph (120 and 145 km/h); trains used to feed traffic on the other corridors). Of these, only the first category corresponded to high-speed rail. This category was limited to two regions according to the FRA—California and the Northeast. All the other projects, belonging to the other two categories, were actually upgraded conventional lines, some of which may become high-speed lines37.
Obamarail represented a new departure in federal rail policy, giving it the lead role in building a new high-speed or higher-speed network. While some people say that B. Obama’s “high-speed rail” initiative made it possible to restart, reactivate and reawaken political, technical, scientific, and public thinking about the rail mode, it is useful to analyze the limitations in it, which explain why it can be described as a semi-failure.
The distribution of “Obamarail” funds was concentrated on a small number of corridors. Six of these corridors accounted for nearly 85% of the money spent: California Corridor, Pacific Northwest Corridor, Chicago Hub Network—in particular the Chicago-St. Louis and Chicago-Detroit lines—Northeast Corridor and Southeast Corridor—for the Charlotte-Washington DC section (FRA, 2013, pp. 1-2). FRA’s call for projects was a big hit with states and with Amtrak. In October 2009, FRA received 45 projects submitted by 24 states for a total of $75 billion, compared with the available funding of only $8 billion. Joseph Szabo hailed this gap between available and requested funds as a sign of success: “To date, FRA has obligated more than $10 billion in grant funding provided by Congress for the High-Speed Intercity Passenger Rail (HSPIR) Program through the ARRA (2009) and annual appropriations for FY 2009 and 2010. Interest in this program is strong: 39 states, the District of Columbia, and Amtrak have submitted more than $75 billion worth of applications—well in excess of the available funding.”38 The FRA announced the successful projects on January 28, 2010. In October 2010, a second wave of calls for projects was launched to allocate the $2.5 billion in additional funds granted by Congress. California, Florida, Iowa and Michigan were the states that received the most funds.39 However, reallocations of federal funds were necessary due to political changes in some states. In November 2010, the new Republican governor of Ohio, John Kasich, and of Wisconsin, Scott Walker, announced their intention to boycott federal funding for high-speed rail, as they did not see the value and desirability of investing in the rail mode. The FRA therefore decided to reallocate the funds granted to these two states, notably allocating $624 million to California and $342.3 million to Florida. In addition, there was an
37 Interview with representative from the FRA (Director International Programs Division) conducted on September 6, 2015. 38 Parliamentary Hearing of Joseph Szabo (Administrator, FRA), National Rail Policy: Examining Goals, Objectives and Responsibilities, House Subcommittee on Railroads, Pipelines and Hazardous Materials, 27 June 2013. 39 For the first round of funding: $2.25 billion for California, $1.25 billion for Florida, $1.1 billion for Illinois and $810 million for Wisconsin. For the second wave of projects: $901 million for California, $800 million for Florida, $230 million for Iowa and $161 million for Michigan.
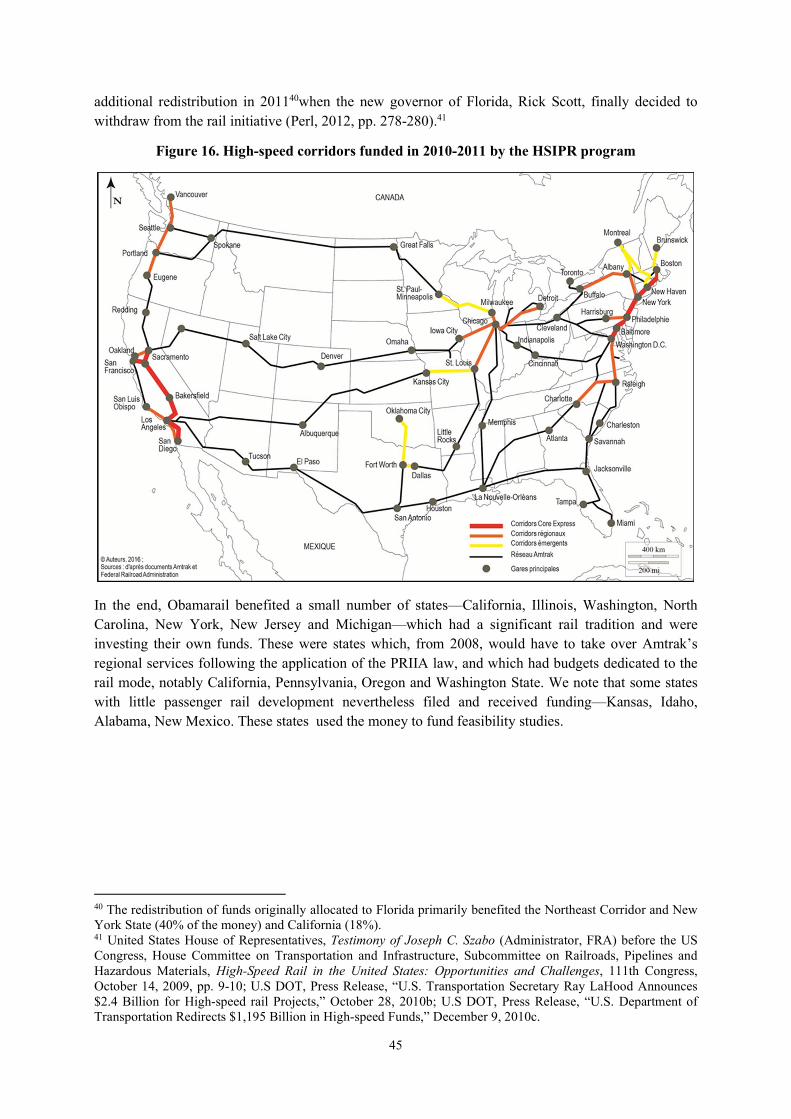
45
additional redistribution in 201140when the new governor of Florida, Rick Scott, finally decided to withdraw from the rail initiative (Perl, 2012, pp. 278-280).41
Figure 16. High-speed corridors funded in 2010-2011 by the HSIPR program
In the end, Obamarail benefited a small number of states—California, Illinois, Washington, North Carolina, New York, New Jersey and Michigan—which had a significant rail tradition and were investing their own funds. These were states which, from 2008, would have to take over Amtrak’s regional services following the application of the PRIIA law, and which had budgets dedicated to the rail mode, notably California, Pennsylvania, Oregon and Washington State. We note that some states with little passenger rail development nevertheless filed and received funding—Kansas, Idaho, Alabama, New Mexico. These states used the money to fund feasibility studies.
40 The redistribution of funds originally allocated to Florida primarily benefited the Northeast Corridor and New York State (40% of the money) and California (18%). 41 United States House of Representatives, Testimony of Joseph C. Szabo (Administrator, FRA) before the US Congress, House Committee on Transportation and Infrastructure, Subcommittee on Railroads, Pipelines and Hazardous Materials, High-Speed Rail in the United States: Opportunities and Challenges, 111th Congress, October 14, 2009, pp. 9-10; U.S DOT, Press Release, “U.S. Transportation Secretary Ray LaHood Announces $2.4 Billion for High-speed rail Projects,” October 28, 2010b; U.S DOT, Press Release, “U.S. Department of Transportation Redirects $1,195 Billion in High-speed Funds,” December 9, 2010c.
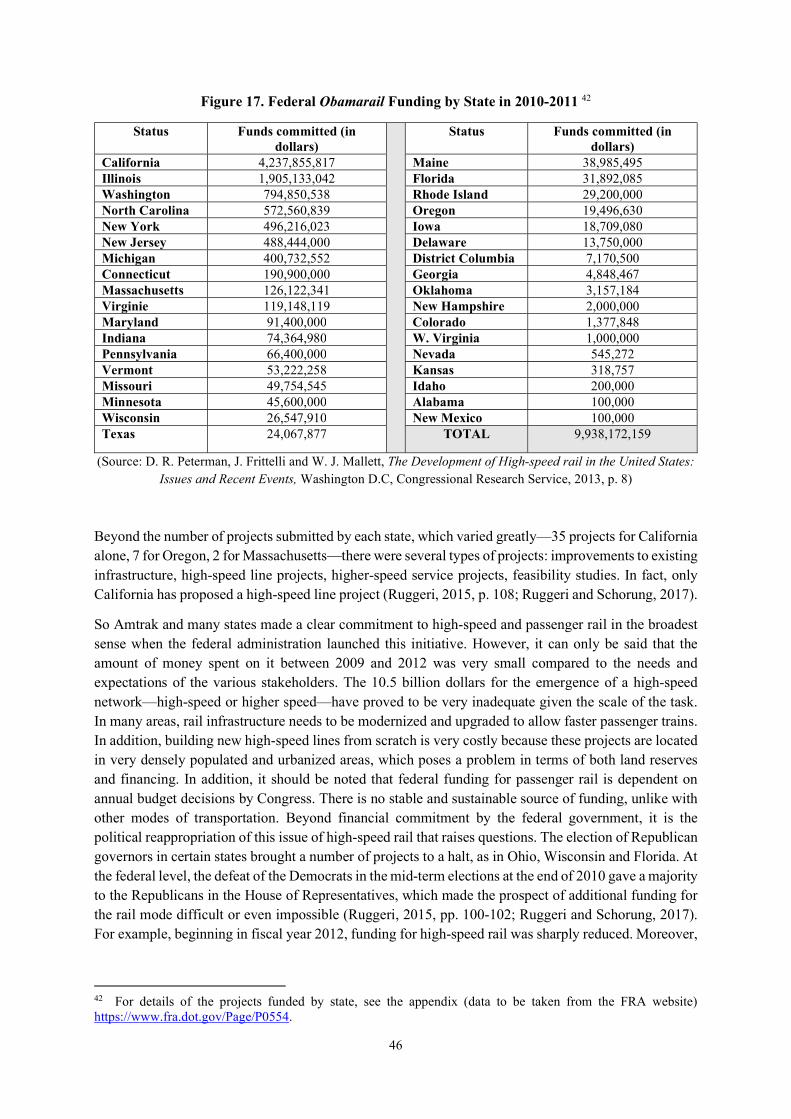
46
Figure 17. Federal Obamarail Funding by State in 2010-2011 42
Status Funds committed (in dollars)
Status Funds committed (in dollars)
California 4,237,855,817 Maine 38,985,495 Illinois 1,905,133,042 Florida 31,892,085 Washington 794,850,538 Rhode Island 29,200,000 North Carolina 572,560,839 Oregon 19,496,630 New York 496,216,023 Iowa 18,709,080 New Jersey 488,444,000 Delaware 13,750,000 Michigan 400,732,552 District Columbia 7,170,500 Connecticut 190,900,000 Georgia 4,848,467 Massachusetts 126,122,341 Oklahoma 3,157,184 Virginie 119,148,119 New Hampshire 2,000,000 Maryland 91,400,000 Colorado 1,377,848 Indiana 74,364,980 W. Virginia 1,000,000 Pennsylvania 66,400,000 Nevada 545,272 Vermont 53,222,258 Kansas 318,757 Missouri 49,754,545 Idaho 200,000 Minnesota 45,600,000 Alabama 100,000 Wisconsin 26,547,910 New Mexico 100,000 Texas 24,067,877 TOTAL 9,938,172,159
(Source: D. R. Peterman, J. Frittelli and W. J. Mallett, The Development of High-speed rail in the United States: Issues and Recent Events, Washington D.C, Congressional Research Service, 2013, p. 8)
Beyond the number of projects submitted by each state, which varied greatly—35 projects for California alone, 7 for Oregon, 2 for Massachusetts—there were several types of projects: improvements to existing infrastructure, high-speed line projects, higher-speed service projects, feasibility studies. In fact, only California has proposed a high-speed line project (Ruggeri, 2015, p. 108; Ruggeri and Schorung, 2017).
So Amtrak and many states made a clear commitment to high-speed and passenger rail in the broadest sense when the federal administration launched this initiative. However, it can only be said that the amount of money spent on it between 2009 and 2012 was very small compared to the needs and expectations of the various stakeholders. The 10.5 billion dollars for the emergence of a high-speed network—high-speed or higher speed—have proved to be very inadequate given the scale of the task. In many areas, rail infrastructure needs to be modernized and upgraded to allow faster passenger trains. In addition, building new high-speed lines from scratch is very costly because these projects are located in very densely populated and urbanized areas, which poses a problem in terms of both land reserves and financing. In addition, it should be noted that federal funding for passenger rail is dependent on annual budget decisions by Congress. There is no stable and sustainable source of funding, unlike with other modes of transportation. Beyond financial commitment by the federal government, it is the political reappropriation of this issue of high-speed rail that raises questions. The election of Republican governors in certain states brought a number of projects to a halt, as in Ohio, Wisconsin and Florida. At the federal level, the defeat of the Democrats in the mid-term elections at the end of 2010 gave a majority to the Republicans in the House of Representatives, which made the prospect of additional funding for the rail mode difficult or even impossible (Ruggeri, 2015, pp. 100-102; Ruggeri and Schorung, 2017). For example, beginning in fiscal year 2012, funding for high-speed rail was sharply reduced. Moreover,
42 For details of the projects funded by state, see the appendix (data to be taken from the FRA website) https://www.fra.dot.gov/Page/P0554.
47
with the Republican Party winning a majority in the Senate in the mid-term elections in late 2014, funding for “Obamarail” was virtually eliminated.
Finally, the lack of long-term vision on the part of the federal administration exacerbates a situation already complicated by budget fluctuations. Looking at the documents published by the Federal Department of Transport, one cannot but notice a lack of political, technical, financial, and territorial coherence (Ashiabor and Wei, 2012). The different types of corridors cover too many different realities and the objectives stated by the FRA seem to consist of good intentions linked to an idealized vision of a future US high-speed network. This reflects the institutional difficulties of the rail mode in the United States, between a federal administration that is too weak, gradual devolution to the state level, and a rail network owned by private freight companies.
The various limitations of this Obama in administration initiative and the difficulties in accepting and exploring this innovative mode of transport—for the United States—have been taken up by a number of players. Joe McAndrew, from T4America, highlights two factors: the low budgets allocated to rail and the political opposition of the Republicans at both federal and state level.43 Nevertheless, the United States is now on the road to high-speed rail. In fact, in two regions—the North East and California—discussions are particularly advanced and work is progressing, to the point that they have become the high-speed rail laboratories of the United States.
3.2.2. A country almost without high speed. The NEC: a long-term project to convert to a high-speed line44
The Northeast Corridor network is the busiest in the United States, carrying a variety of rail services. Indeed, Amtrak forecasts a sharp increase in traffic in the coming years, from 260 million trips in 2009 to over 520 million by 2040 (Amtrak, 2010b, 2018b).45 On this corridor, Amtrak operates the only high-speed train in the United States, the Acela Express. The Acela Express can reach a maximum speed of 150 mph (240 km/h), but operates at an average speed of 65 mph (105 km/h). The full 450 mile (730 km) trip from Washington D.C. to Boston takes an average of seven hours.
The growth prospects for this corridor are favorable, with Amtrak estimating a 60% increase in passengers on all types of service.46 The NEC faces a major capacity problem in the coming years because of this future increase in traffic, compounded by underinvestment and excessive delay. Amtrak estimates that the work needed to maintain the network in good condition will cost ten billion dollars, but that more than 50 billion dollars of investment is required between now and 2030 to keep up with the growth in traffic, to avoid congestion in the corridor, and to progressively improve the performance of its services. Bob Yaro particularly stresses this point: “A recent report by the NEC Commission identified more than $30 billion of projects that are critical. Much of the NEC rail infrastructure was built over a century ago, and a backlog, totaling $9 billion, of deferred maintenance has accumulated. Furthermore, train congestion and antiquated infrastructure prevent increases in speed, frequency and
43 Interview with representative from Transportation for America, conducted on September 12, 2015. 44 We will not deal here with the Californian project, which is the second example of a high-speed rail project in the United States. This case has been analysed in Chapter 7 of the overall dissertation. 45 S. Goodyear, “Transportation Armageddon Is Coming to the Northeast Rail Corridor,” Citylab, August 13, 2015. 46 A. Wood, Chief Next Generation Integration HSR, NEC Infrastructure and Investment Development Amtrak, “The Northeast Corridor Vision for High-speed Rail. How to Build High-speed Rail,” April 10, 2013.
48
reliability.”47 These difficulties are reinforced by the advanced age of the infrastructure in this corridor, which makes heavy investment all the more urgent. In order to improve the performance of Amtrak’s services and to prepare for the arrival of a high-speed service, several major infrastructures need to be replaced, since some of them are more than a hundred years old, to which must be added the modernization of all the tunnels serving New York:
Connecticut River Bridge (built in 1907; $250-300 million investment required);
The Portal Bridge in New Jersey (built in 1906; $900 million needed);
Susquehanna River Bridge in Maryland (built in 1906; $550-750 million required);
The Niantic River Bridge in Connecticut (built in 1907; $150 million required); Baltimore & Potomac Tunnel in Maryland (built in 1873; $1.2 billion required).48
Since the mid-2000s, Amtrak has been engaged in an extensive deliberation and planning process to expand the capabilities of the NEC, and to transform it in the medium term into a true high-speed line. In 2010, the Northeast Corridor Infrastructure Master Plan was released. It was the product of a collaborative effort between twelve northeastern states, the District of Columbia, Amtrak, the federal government (FRA), and eight urban transit agencies and three freight companies. The master plan identifies nearly $52 billion in investments to be made by 2030 to bring the corridor into a state of good repair and to accommodate projected increases in intercity and regional traffic. That same year, Amtrak released a new seminal report, A Vision for High-Speed Rail in the Northeast Corridor. This master plan envisions a new 430 mile (690 km) two-track line between Washington D.C. and Boston for high-speed service—”NextGen HSR”. The report estimates the cost of this new HSR line at $117 billion, with full opening envisaged in 2040. The recommendations of these two reports have been integrated into a single program, the Northeast Corridor Capital Investment Program, designed to calibrate and launch an investment strategy that employs both an incremental approach to improve the existing network and a longer-term approach to lay the foundations for the future high-speed line. The total investment for this program, calculated by Amtrak in 2011, is $151 billion (Amtrak, 2012c, pp. 6-7).49
The NECIP was based on two sub-programs introduced in the 2012 report The Amtrak Vision for the Northeast Corridor: the NEC Upgrade (“NEC-UP”) and the NEC Next-Generation High-Speed Rail (“NEC NextGen HSR”). This new report confirmed the incremental approach Amtrak has taken since the mid-2000s to improve the existing network, and to prepare for the arrival of high-speed rail in this corridor. The choice is explained by the very heavy financial constraints on Amtrak. Amtrak does not have the resources to develop a high-speed program all at once. Phasing the NECIP is the only way to commit modest and sustainable budgets while devising a medium-term process to encourage public actors to commit progressively and to grant credits for the later phases. The first sub-program, “NEC-UP”, proposed working on the existing network between 2015 and 2025 to improve the performance of Amtrak’s services and the fluidity of the corridor as a whole, with the objective of reaching a maximum authorized speed of 150 mph (250 km/h). The second sub-program, “NEC NextGen HSR,” provides for the construction of a double track dedicated to high-speed trains with a maximum permissible speed of 250 mph (350 km/h) by 2040 (Amtrak, 2012c, pp. 11-13).
47 Submission to the Parliamentary Hearing by Bob Yaro (Executive Director, Regional Plan Association), The Importance of the Northeast Corridor, House Subcommittee on Railroads, Pipelines and Hazardous Materials, June 7, 2013. 48 See NEC website: http://nec.amtrak.com/content/investment-needs-corridor [accessed 10/01/2018]. 49 E.G. Fitzsimmons and D.W. Chen, “Aging Infrastructure Plagues Nation’s Busiest Rail Corridor,” The New York Times, July 26, 2015.
49
The second phase of the NECIP is therefore presented by Amtrak as a breakthrough in the history of the Northeast Corridor, which aims to implement a true high-speed service, with high frequency—up to 12 trains at peak times—and travel times reduced by 40 to 60% depending on the section.50 The aim is to confirm the competitiveness of the rail mode in this region, where a large proportion of intercity journeys are already made by train rather than by plane. In parallel with the major operations on infrastructure and rail facilities, a lot of thought is also going into stations. Two major renovation and extension projects are being explored for Washington D.C.’s Union Station and New York’s Penn Station, as well as several proposals for the extension of medium-sized stations—Providence, Boston, Newark, Moyhinan.51 The timelines for the construction of the new high-speed line are still far off, but the federal government and Amtrak are working on capital planning and mandatory environmental documents. This broad effort to think, plan, and forecast around the Northeast Corridor was officially launched in February 2012 by the FRA under the name “NEC Future”, with the aim of maintaining consistency in the preparatory work and the dissemination of public information.52
This very ambitious program reflects a strong desire on the part of Amtrak and the Federal Railroad Administration to create a genuine high-speed corridor linking the major cities of the Northeast and serving as a polarizing axis for the megalopolis. However, two main problems remain to which Amtrak has so far failed to provide an answer: stakeholder commitment and lack of financial resources. In 2010, following the passage of the PRIIA Act in 2008, the federal Department of Transportation created an ad hoc commission—the Northeast Corridor Infrastructure Operations and Advisory Commission—to represent all stakeholders.53 The task of this NEC commission is to establish priority objectives, and to prepare financing plans and a cost allocation method. The existence of such a commission gives the stakeholders a forum for discussion and participation in the governance of the North-East Corridor, but does not guarantee the political, technical and budgetary commitment of these stakeholders. Amtrak has set a medium-term objective of securing the political support of all regional actors and beginning the process of forging partnerships along the corridor (Amtrak, 2012c, p. 34). The lack of financial resources is certainly the most significant barrier to converting the NEC into a true high-speed corridor. Federal budgetary commitment is still not a given. Amtrak is still dependent on annual appropriations during the general budget debates in Congress. Despite the promise of $10 billion for Amtrak in the December 2015 FAST Act (Schorung, 2016), only a tiny fraction of this major infrastructure project is covered. In its latest master plan, Amtrak acknowledges that private investment will have to be used to undertake some of the work on the future high-speed line. Finally, it should be noted that all projections, whether about ridership, revenue, or operating costs, are particularly favorable, in order to demonstrate the viability of the entire project (Amtrak, 2012c, pp. 28-31).
Despite its many limitations, the current corridor conversion project is a hybrid laboratory for high-speed rail in the United States. It constitutes both an upgrade and an optimization of the existing network for high-speed services and new construction to accommodate high-speed services. All of this is taking place on an already heavily used, and partially congested, network with many different services. The Northeast Corridor, which is owned by Amtrak, is a priority for the company and the federal government
50 Travel time would drop from 4 hours to 1 hour and 50 minutes between 2015 and 2040 between New York and Boston, from 3 hours to 1 hour and 50 minutes between New York and Washington, from 1 hour and 10 minutes to 37 minutes between New York and Philadelphia. 51 http://nec.amtrak.com/projects [accessed 06/17/2018]. 52 http://necfuture.com/about/ [accessed 06/17/2018]. 53 The Commission is made up of representatives from the states through which the system passes (Connecticut, Delaware, Maryland, Massachusetts, New Jersey, New York, Pennsylvania, and Rhode Island), the District of Columbia, the federal Department of Transportation, Amtrak, and non-voting members (public transportation agencies and freight companies that use the NEC).
50
because of its favorable growth prospects. It is one of the areas where rail revival is most visible. However, this major multi-decade project to transform the line into a high-speed rail line suffers from some major shortcomings in terms of funding, federal, state and local political commitment, and technical issues, the replacement of heavy infrastructure and the upgrading of New York’s tunnels in particular posing numerous difficulties.54
3.2.3. Is a hybrid high-speed network emerging? The emergence of a new railway geography
In the United States, the definition of high-speed rail is set by Congress and the Federal Railroad Administration. A regulatory definition has been developed through legislation:
High-speed rail Corridors Program (1991): “where railroad speeds of 90 miles or more per hour are occurring or can reasonably be expected to occur in the future” (23 U.S.C. §104d2C);
High-speed rail Assistance (1994): “reasonably expected to reach sustained speeds of more than 125 miles per hour” (49 U.S.C. §26105);
High-speed rail Corridor Development Program (2008): “reasonably expected to reach speeds of at least 110 miles per hour” (49 U.S.C. §26106b(4)) (Peterman, Frittelli, & Mallett, 2013, p. 5).
The Federal Railroad Administration adopted a definition in 2009 based on three categories: emerging corridors (maximum speed between 90 mph (145 km/h) and 110 mph (180 km/h)), regional corridors (maximum speed between 100 mph (180 km/h) and 150 mph (240 km/h) on separate tracks), and “Core Express” corridors (minimum speed of 150 mph (240 km/h) on separate tracks) (FRA, 2009, p. 2). This hybrid approach to speed could circumvent a number of problems inherent in the construction of new high-speed lines in highly urbanized areas: lack of public funding, low availability and high cost of land, public opinion reluctant to invest heavily in this mode of transport, doubts about the socio-economic benefits of high-speed services).55
Although the Obama administration’s initiative led to an increase in the number of projects, in the end only a few circumscribed territories were concerned, identified as “relevant” territories for high-speed rail or high speed. The idea that high-speed trains could cover the entire US territory is unrealistic. From a continental perspective, the issue of high-speed rail would rather apply to regional scale territories. These territories would meet demographic and economic criteria —high population densities, a dynamic labor market, road and air transportation networks saturated or close to saturation, and urban areas less than 500 miles apart. On the basis of these criteria and the progress of the projects, it is possible to identify impetus territories, promising territories, and innovative territories.
54 In current railroad projects, private sector involvement is being considered. However, public-private partnerships are not envisaged at present, although PPPs are widely used in the construction industry. 55 The Government Accountability Office (GAO) released a report in March 2009 on the challenges of building high-speed rail in the United States. The GAO warned of the very heavy investment required to build new infrastructure and purchase new fleet, as well as the high maintenance costs. Federal, state, and private sector financial commitments are required to address such projects. These projects are estimated to cost tens of billions of dollars—over $150 billion for the NEC—because most of the lines are located in densely populated and urbanized metropolitan areas where land constraints are particularly severe. The GAO does not reject the idea of high-speed rail, but it does recommend reserving this innovative mode for a few corridors where the high-speed model is most likely to be profitable, and it also recommends that the federal government play a leading role in this mission (GAO, 2009, pp. 2-7).
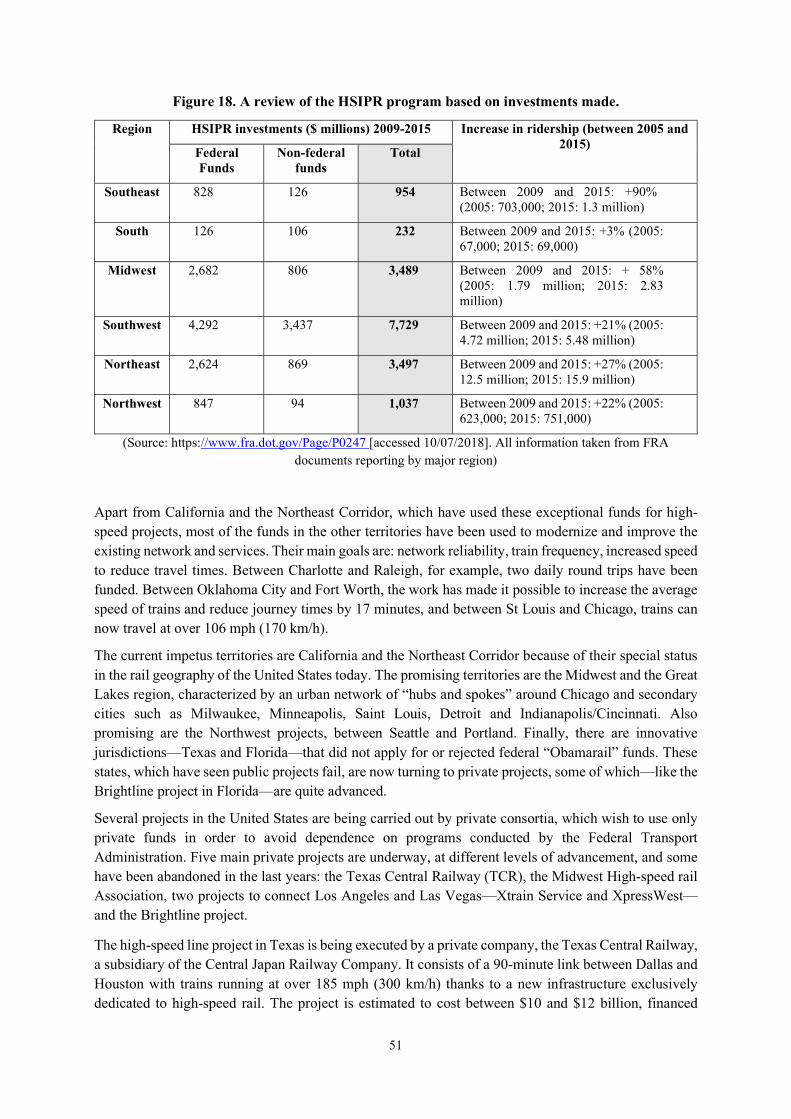
51
Figure 18. A review of the HSIPR program based on investments made.
Region HSIPR investments ($ millions) 2009-2015 Increase in ridership (between 2005 and 2015)
Federal Funds
Non-federal funds
Total
Southeast 828 126 954 Between 2009 and 2015: +90% (2005: 703,000; 2015: 1.3 million)
South 126 106 232 Between 2009 and 2015: +3% (2005: 67,000; 2015: 69,000)
Midwest 2,682 806 3,489 Between 2009 and 2015: + 58% (2005: 1.79 million; 2015: 2.83 million)
Southwest 4,292 3,437 7,729 Between 2009 and 2015: +21% (2005: 4.72 million; 2015: 5.48 million)
Northeast 2,624 869 3,497 Between 2009 and 2015: +27% (2005: 12.5 million; 2015: 15.9 million)
Northwest 847 94 1,037 Between 2009 and 2015: +22% (2005: 623,000; 2015: 751,000)
(Source: https://www.fra.dot.gov/Page/P0247 [accessed 10/07/2018]. All information taken from FRA documents reporting by major region)
Apart from California and the Northeast Corridor, which have used these exceptional funds for high-speed projects, most of the funds in the other territories have been used to modernize and improve the existing network and services. Their main goals are: network reliability, train frequency, increased speed to reduce travel times. Between Charlotte and Raleigh, for example, two daily round trips have been funded. Between Oklahoma City and Fort Worth, the work has made it possible to increase the average speed of trains and reduce journey times by 17 minutes, and between St Louis and Chicago, trains can now travel at over 106 mph (170 km/h).
The current impetus territories are California and the Northeast Corridor because of their special status in the rail geography of the United States today. The promising territories are the Midwest and the Great Lakes region, characterized by an urban network of “hubs and spokes” around Chicago and secondary cities such as Milwaukee, Minneapolis, Saint Louis, Detroit and Indianapolis/Cincinnati. Also promising are the Northwest projects, between Seattle and Portland. Finally, there are innovative jurisdictions—Texas and Florida—that did not apply for or rejected federal “Obamarail” funds. These states, which have seen public projects fail, are now turning to private projects, some of which—like the Brightline project in Florida—are quite advanced.
Several projects in the United States are being carried out by private consortia, which wish to use only private funds in order to avoid dependence on programs conducted by the Federal Transport Administration. Five main private projects are underway, at different levels of advancement, and some have been abandoned in the last years: the Texas Central Railway (TCR), the Midwest High-speed rail Association, two projects to connect Los Angeles and Las Vegas—Xtrain Service and XpressWest—and the Brightline project.
The high-speed line project in Texas is being executed by a private company, the Texas Central Railway, a subsidiary of the Central Japan Railway Company. It consists of a 90-minute link between Dallas and Houston with trains running at over 185 mph (300 km/h) thanks to a new infrastructure exclusively dedicated to high-speed rail. The project is estimated to cost between $10 and $12 billion, financed
52
entirely with private funds, although it has received the support of the main city authorities involved. The TCR continued the work of analysis and preparation, in March 2015 releasing their latest report on the integration of this new line into the two metropolitan areas served (Ruggeri, 2015, p. 115; Texas Central High-Speed Railway, 2015, pp. 1-3).56 It should be noted, moreover, that the company highlights the absence of public funds in the project, on the grounds that it is not the responsibility of the Texas state to concern itself with this type of project, and that it would be unacceptable to call on taxpayers to finance this major infrastructure project.57
The MHSRA—Midwest High-Speed Rail Association—is an association that brings together a wide variety of players from the economic, academic, and railroad sectors. The association’s goal is to create a high-speed rail network in the Midwest, with Chicago as the central hub. The idea is to build several high-speed lines so that Chicago can be reached in less than three hours by train from the main metropolitan areas of the Midwest—Minneapolis-St. Paul, Milwaukee, St. Louis, Indianapolis, Detroit, Cleveland. The association estimates the total cost of the project at between $74 and $83 billion for a network of nearly 1,500 miles (2,300 km) (MHSRA, 2011, pp. 1-6). This private project does not have the support of any public structure, while the states potentially involved are already engaged in projects linked to FRA funds. It is therefore highly unlikely that such a high-speed network will be completed in the coming decades. This is why the MHSRA has increased its advisory and lobbying activity since 2013-2014, for example in order to persuade Illinois to commit funds for Amtrak’s medium-distance services or in support of the major renovation project for Chicago’s Union Station (MHSRA, 2014, pp. 2-3).
In parallel with the high-speed network under construction in California, it is interesting to note new interest on the part of private investors in the Los Angeles-Las Vegas link, with two separate private projects.58 The Xtrain Service project aims to offer a new rail service between Fullerton (California) and Las Vegas, using existing infrastructure to provide a link for leisure travel between two major tourist centers. The project, led by Las Vegas Railway Express Inc., is exclusively private and the estimated cost is $100 million, mainly for the purchase of rolling stock. Amtrak is designated to be the rail operator for this new service.59 It was supposed to begin operations in 2017 but this project has now been abandoned.
The second project, called XpressWest, is more ambitious since it requires the creation of a new infrastructure for high-speed trains as well as the construction of a new station in Las Vegas. It is a 185 mile (300 km) line between Victorville, north of Los Angeles, and Las Vegas, on which trains should run at more than 150 mph (240 km/h), bringing Las Vegas to just 80 minutes from Victorville. The estimated cost of this project is 6.9 billion dollars and it is expected to be financed solely with private funds.60 This project is supported in particular by the local and regional political authorities. The High Desert Corridor Joint Powers Authority, the Southern California Association of Governments, the Los Angeles Metropolitan Transportation Authority Board, and the States of Nevada and California have
56 V. Bradley, “Multi-billion dollar bullet train connecting Houston to Dallas expected to break ground next year,” Houston News, June 12, 2016. 57 http://www.texascentral.com/2016/03/24/high-speed-rail-moving-texas-forward-without-taxpayer-grants-bailouts/ [accessed 10/30/2018]. 58 The idea of a link between these two metropolises is not new. In 2000, a public-private partnership called CNSSTC (California Nevada Super Speed Train Commission) was created, bringing together numerous local and regional agencies and the American Magline Group. The aim was to develop a high-speed electromagnetic levitation link between Las Vegas and Anaheim. The commission published several reports in 2000 and 2002 and prepared the first federal approval in 2004, but the economic crisis in 2009 definitively swept away this project which, at 12.1 billion dollars, was considered too costly. 59 http://vegasxtrain.com/company-info/ [accessed 13/04/2018]. 60 http://www.xpresswest.com/project.html [accessed 13/04/2018].
53
given their political backing to the project, which was approved by the FRA in July 2011. A new 60 mile (96 km) line is being studied by the California Department of Transportation and L.A. Metro between Victorville and Palmdale to connect the Los Angeles regional rail network (Metrolink) to this new line. From 2011 to 2014, XpressWest continued to work towards obtaining all the administrative approvals, and preparing for the operational phase of the work. The year 2015 was particularly important because in June of that year Nevada legally established an independent authority—Nevada High-Speed Rail Authority—to participate in the implementation of this project. In addition, in September of the same year, XpressWest and China Railway International USA Co. announced a joint venture to finance and build the line. With all environmental approvals cleared, construction was scheduled to begin in the fourth quarter of 2016.61 Until late 2018, the project remained at a standstill as the Chinese partner and co-shareholder abruptly withdrew from the project. In the fall of the same year, Florida-based Brightline announced that it would be the new buyer, adopting the same strategy as in Florida.
Finally, the Brightline project is the most advanced, since it began construction in mid-2015. Florida is an iconic territory par excellence, one of the touristic, cultural, and economic symbols of the United States. This project is being developed by a parent company of Florida East Coast Industries-LLC (FECI), a large real estate company that owns the rail corridor between Miami and Cocoa on which a passenger service was inaugurated in late 2017. It is a higher-speed intercity rail service serving four cities—Miami, Fort Lauderdale, West Palm Beach, Orlando—using the company’s existing tracks for 193 miles (312 km). A new 40 mile (64 km) section is planned to open by 2022 or 2023 to connect the Treasure Coast and Orlando Airport. According to FECI, the connection between Miami and Orlando would take three hours, with trains running at an average speed of 105 mph (170 km/h).62 The first phase opened in 2018 and the second phase to Orlando is planned for 2023 at the latest.63
This project represents an innovative model for the development of a higher speed service operated by a private company that owns the rail infrastructure. This private initiative can be interpreted as a way to circumvent political logjams, as Florida’s Republican governors have decided to forgo “Obamarail” funds, and to address the shortcomings of current rail provision. In order to finance this project, FECI is relying on real estate development and value capture, which indicates another private sector strategy for reinvesting in rail. In its communication, All Aboard Florida insists on the future structuring role of this new line in a highly touristic region, which will provide connections and service to the main Florida destinations—Miami and West Palm Beach—and to Orlando, the theme park capital of America. Beyond this objective, the company expects future stations on this line to support larger real estate operations, particularly in Miami. The new station in Miami will serve as a hub between this intercity line and the urban transit networks, and will be part of an impressive real estate operation with several high-rise buildings—luxury apartments, offices—and commercial and business premises.64 In this project’s business model, the new stations are seen as instruments of sustainability and profitability for the future line, in addition to the architectural qualities of the station building.
These multiple private or semiprivate projects, which lie outside the direct scope of the federal and state governments, particularly in their financing, appear to be another example of the renewed interest in passenger rail transportation in the United States. The promoters of these projects, as well as the public
61 N. Broverman, “High-Speed Rail to Vegas Getting Real,” Los Angeles Magazine, November 19, 2015; E. Jaffe, “The Unbreakable U.S. High-Speed Rail System,” Citylab, September 23, 2015; A. Marroquin, “High-speed rail system most desired transportation mode for Las Vegans,” Las Vegas Review Journal, July 10, 2016. 62 www.allaboardflorida.com/project-details/aaf-fact-sheet [accessed 12/11/2018]. 63 G. Garvin, “Bulk of Miami-to-Orlando high-speed rail service customers will come from South Florida,” Miami Herald, May 28, 2015; J. C. Robbins, “MiamiCentral is on track for a 2017 opening,” Miami Today, April 12, 2016. 64 http://www.allaboardflorida.com/stations/miami-central [accessed 12/11/2018].
54
and private supporters of rail, are looking for creative ways to get around the lack of federal and state funding by attracting private investors, setting up partnerships with American or foreign companies, or even by banking on the capture of real estate and land value. The fact that private players are interested in rail, particularly high-speed rail, and are even undertaking projects of considerable complexity and cost, may be seen as a sign that rail in the United States is once again perceived as factor of development. However, this proliferation of private projects can also be interpreted as a response to the lack of stable political and financial commitment from the federal government and some states. In addition, the stalemate in Congress since the mid-term elections, as well as the reversals of Republican governors in some states, have cast doubt on the ability of political actors to honor long-term commitments to major infrastructure projects.
The emergence of private projects, which have in some cases become real competitors to federal and state projects, reflects the current situation of passenger rail transportation in the United States, caught between technological, scientific, and political competition and major financial obstacles. After a significant turnaround in 2008-2009, marked by the passing of several laws and the establishment of a novel mode of governance based on collaboration between the federal and non-federal levels, the Obama administration’s rail policy has been at a virtual standstill since 2011. HSR advocates claim that opponents of the various projects are blocking potential funding. However, the reality seems more pragmatic: there simply would not be funds to block, as rail policy is no longer a federal policy priority.
In view of the rail geography inherited from the Obama administration, it would be overstating the case to say that it has been a total failure. While this rail policy may seem to have had limited results, it is more appropriate to ask whether the policy is sustainable. It seems that the work done by the FRA is an incentive to rethink and revitalize the approach to passenger rail transport. The federal government has been a reluctant and apparently hesitant player in US rail policy since the 1960s-1970s. Since 2009, the federal government has reasserted itself as a pillar of the US rail sector by inaugurating a new policy of partnership with the states. The impact of the Obama administration’s action probably lies less in the results than in the gesture. Donald Trump’s victory in 2016 cast a cloud over the federal government’s transportation policy. Indeed, during his campaign he often criticized the state of infrastructure in the United States and proposed the launch of a major investment plan. In reality, the Trump administration adopted an ambiguous and ambivalent position, on the one hand expressing a desire to cut all investment in rail transportation, and on the other proposing to implement an investment plan to encourage private investment in infrastructure modernization. No major action has been implemented during this term and the administration (2016-2020) tried to cut funding for Amtrak and to block or slow down the Californian HSR project. The infrastructure plan of the Biden administration in November 2021 suggests a new historic cycle of investment in the rail mode.
55
4. Railroad policy at the heart of the interplay between stakeholders: comparison of territorial visions at several scales
This second part of the thesis will first focus on the political and institutional conflictualities—at several administrative levels including federal, state, metropolitan, and local—relating to Amtrak and rail policy. The aim is to analyze federal rail policy through the prism of the various transportation-related laws and Amtrak reforms, and to contrast it with federal support for other modes of transportation. Our goal is also to analyze the national strategy for the development of passenger rail. The growing role of the states in rail policy since the federal PRIIA and FAST Acts is central to this institutional and geopolitical component of the thesis: state responsibilities, transfer of some regional Amtrak services, and the development of comprehensive rail strategies (State Rail Plans). In addition, although the existing regional and metropolitan authorities (RTPO, MPO) do not have direct jurisdiction over intercity rail transport, it is interesting to explore how this level of government does or does not take ownership of the challenges associated with this mode of transportation. This section therefore aims to deal with the institutional players but also to look at non-institutional actors—lobbies, economic actors, the press. These elements can be used to address fundamental debates on governance and US geopolitics: the emergence of regionalism, institutional fragmentation, jurisdictional entanglement, and the role of the federal government relative to lower levels.
The subject of “passenger rail transport” is considered in this section through the prism of territorial and economic political tensions in the United States. This invites us to look at Amtrak’s business model, as well as the business model of high-speed rail. Indeed, in view of the competition from air transportation (for long-distance trips, and increasingly for medium and short distances) and from buses, the relevance of such projects is open to question in this geographical context. Is high-speed rail in the US only relevant along a very limited number of corridors? There are a number of different types of actors interested in restructuring, reinforcing, or reducing rail provision. Several solutions are envisaged: maintaining the national network with adequate funds, restructuring or even abolishing long-distance services, launching a massive investment program to modernize the existing network and build high-speed lines, greater devolution to the federal states and local players, etc. This analysis will explore three elements: an analysis of Amtrak’s business model, an analysis of the projected business model of high-speed rail (based on the examples of the North-East Corridor and the Californian project), and a reflection on the relevance of high-speed rail relative to other modes of transportation and its territorial location.
Our research concerns a field where multiple actors are involved, all differing in their priorities, in their locations, and in their status. The first difficulty is to identify them precisely. One challenge is the sheer multiplicity of the interests potentially involved, which is exacerbated by the need to consider the actors individually, outside the aggregates formed by organizations, parties or different levels of institutional structure. For reasons of readability, certain types of actors are not addressed in our research—civil society organizations, public opinion, localized resident groups—because this would require a specific methodology and a more sociological perspective.
Our main research topic is quite heavily politicized in the United States, which leads to particularly marked polarization between advocates and opponents of the rail mode and high-speed rail. The politicization operates at several levels (federal, state, regional, local), in different domains (political, economic, social), and across various entities, institutional or otherwise (Congress, state governments, lobbies, associations, etc.). Politicization refers to “the process by which issues, activities, practices and discourses are given political significance and are therefore appropriated by the actors invested in the
56
political field (leaders, parties, journalists, interest groups, intellectuals, etc.). These issues may or may not be taken up by public authorities and may or may not be the subject of public policies” (Lefebvre, 2010, p. 16). This process of politicization is plural and complex and the product of power relations between multiple actors— government, civil society organizations, the media.
4.1. Higher levels of government. multiple actors, multiple systems
4.1.1. Federal actors involved in passenger rail
Among the fifteen departments of the central administration, one is exclusively responsible for transportation—the U.S. Department of Transportation (known as U.S. DOT)—whose mission is defined by section 101 of Title 49 of the General Code, which organizes the institutional life of the United States (Title 49 U.S.C.): “The national objectives of general welfare, economic growth and stability, and the security of the USA require the development of transportation policies and programs that contribute to providing fast, safe, efficient, and convenient transportation at the lowest cost consistent with those and other national objectives, including the efficient use and conservation of the resources of the US. The U.S. DOT is composed of the Office of the Secretary of Transportation, the Surface Transportation Board (STB), which acts as a regulatory body, the Office of the Inspector General, and ten specialized agencies (Federal Aviation, Federal Highway, Federal Motor Carrier Safety, Federal Railroad, Federal Transit, Maritime Administration, National Highway Traffic Safety Administration, Pipeline & Hazardous Materials Safety Administration, Research & Innovative Technology Administration, and Saint Lawrence Seaway Development Commission).”65
Within the U.S. DOT, there is an administration that specializes in rail: the Federal Railroad Administration. The FRA has three main missions: “issuance, implementation, and enforcement of safety regulations”; “selective investment in rail corridors across the country”; “research and technology development”. The primary role of the FRA is regulatory, with technical, economic and safety regulations covering more than 760 railway undertakings (27 passenger undertakings, 134 tourist and historical railroads, 640 freight undertakings and 8 switching and terminal undertakings). Since 2007, the FRA’s prerogatives have been greatly expanded and diversified from a body primarily concerned with regulation and safety to a multidimensional body that also deals with planning, foresight, multimodality, and technical and financial support for railway projects. This evolution was enshrined in 2009-2010 with the implementation of “Obamarail”, when the FRA was designated as the lead actor for this new policy in favor of high-speed rail.66 FRA’s passenger rail activities include: administering federal grants and loans, like those to Amtrak, HSR, and Alaska Railroad; supporting the Secretary of Transportation in his capacity as a member of Amtrak’s board of directors; providing guidance and analysis of intercity passenger rail services and HSR. More specifically, it is the Office of Railroad Policy and Development that is the main instrument of federal action, providing financial assistance to projects, quantitative analyses, technical assistance to operators, local authorities, and rail companies, evaluation of Amtrak’s performance, and overseeing the implementation of rail mode development policies and the technical and environmental review of projects. However, this administration, and the associated administrative and technical rail culture, remains small, and this complicates the development of a broad-based federal rail policy that would build on the national operator and that could implement
65 See U.S DOT website: www.transportation.gov/about [accessed 21/01/2019]. 66 See FRA website: www.fra.dot.gov/Page/P0002 [accessed 21/01/2019].
57
the federal government’s vision for HSR (Perl, 2012, p. 280). This situation is further complicated by the fact that the rail mode has extremely limited funding mechanisms.
The challenge for the federal government is to put in place a unified planning strategy. Section 307 of the 2008 PRIIA Act requires the FRA to develop a National Rail Plan that is consistent with the State Rail Plans of the states and with partnerships between private companies and Amtrak for the development of intercity rail. This National Rail Plan is based on four major objectives for the national rail system—improving the performance of rail services, integrating modes of transportation, raising public awareness of alternatives to the private car, and identifying national strategic projects leading to public-private partnerships—and on five priority themes—the development of a high-speed network, rail safety, energy efficiency, improving accessibility and multimodality (FRA, 2009d, pp. 3-8). Part of this commitment to developing a federal strategy is the use of high-speed corridors (Vision for High-Speed Rail in America, 2009) to address highway and airport congestion in US megaregions. By 2050, these megaregions are expected to account for 80% of the country’s population growth and 75% of its population (FRA, 2009, pp. 4-10). Four main challenges are identified for implementing a genuine high-speed development policy at the federal level:
“Lack of expertise and resources. The relatively small investment in passenger rail in recent decades and increasing retirement of personnel throughout the rail sector have resulted in a shrinking pool of experts in the field, including engineers skilled in signal, track, and rolling stock design, along with experienced rail planners and managers;
State fiscal constraints. The economic downturn has left many states in a precarious fiscal condition. Many lack resources to make capital investments or take on the potential cost of rail operations;
Partnerships with private railroads. Partnerships will be needed between states and the private railroads that own the infrastructure. Whether for comprehensive corridor improvement programs or discreet projects, state-railroad agreements will be needed to ensure that public investments will fulfill, and continue to be available for, their intended purposes;
Multi-State partnerships. To successfully plan, fund, build, and operate these corridors, the states involved will need to act in a coordinated fashion, through an interstate pact, a multi-state agreement, or other instrument (FRA, 2009, pp. 1-2; 2010, pp. 4-10).
In 2015, the U.S. DOT launched a new forecasting effort, resulting in the publication of a key report: Beyond Traffic 2045 Trends and Choices. First, it establishes a diagnosis of mobility in the United States: between 2015 and 2040, the US population will grow by more than 70 million. In 2015, the country had 73 million young people aged 18 to 34, referred to as “Millenials”, who drive on average 20% less than the previous generation. They are identified as being less car-bound, more open to using public transportation. Moreover, by 2045, 21% of the population is expected to be over 65 years old and this category of the population uses the car less to travel. These demographic changes have already resulted in a decrease in the number of vehicle-miles per capita since 2006. The report also raises the issue of income and socio-ethnic inequalities, as transportation is the second biggest household spending item after housing (U.S. DOT, 2015b, pp. 10-23). This report also points to changes in work organization and practices—flexible hours, temporary workspaces, telecommuting, homeworking. In 2010, more than 13 million Americans, or 9.4% of the working population, worked at least one day a week from home. This global observation is recalled by John Porcari: “Americans’ travel habits are changing—Reports show that since 2004, the average American has been driving fewer miles each year. In 2011, the average American drove six percent fewer miles than in 2004. Between 2001 and 2009, Americans
58
aged 16 to 34 decreased their average number of vehicle-miles traveled by 23 percent and increased their passenger miles traveled on trains and buses by 40 percent.”67
The report notes a mismatch between the funding needs of the U.S. transportation system and the resources actually available. Between 2015 and 2020, nearly $120 billion per year was needed for highway and bridge maintenance and refurbishment, while the level of spending by all levels of government is barely $83 billion per year. For public transportation, the need is estimated at $43 billion per year, compared with $17 billion actually spent each year. Federal spending on transportation is in fact declining because federal gasoline taxes, which stand at 18.4 cents per gallon, have not been increased since 1993, while the value of the dollar and inflation have caused the amount of money actually available to fluctuate (U.S DOT, 2015b, p. 149): “Since the mid-1990s, inflation has eroded 40 percent of the purchasing power of federal transportation funds and the balances of most dedicated transportation trust funds have declined as outlays have exceeded revenues. Adjusted for inflation, federal and state spending on surface transportation feel between 2002 and 2011” (U.S DOT, 2015b, pp. 159-160). The shortage of financial resources is the main constraint on the development of a federal rail policy, especially for high speed. “Obamarail” represents an important step in the federal commitment to HSR, but nearly $11 billion to develop a dozen high-speed or high speed corridors appears grossly inadequate and could not serve as a funding base for a multi-decade, multi-scalar funding strategy. This situation of budgetary shortfall at the federal level has weakened the budgets of states and local authorities, which have been forced to find new sources of revenue and to resort more to borrowing to finance infrastructure projects—the outstanding debt of the states for transportation projects rose from 11 billion dollars in 2000 to 30 billion in 2010. The central government is therefore faced with a major twofold problem: the long-term financing of surface transportation programs and the preservation of the Transportation Trust Fund.68 The other significant observation about the object of our research is that the rail mode is excluded from this federal funding mechanism. There is a clear separation between the Transportation Trust Fund, which is automatically replenished each year by identified and sustainable revenue sources, and the annual budget allocations to Amtrak, which are subject to the vagaries of political debate in Congress and represent only a fraction of the necessary needs—Amtrak’s budget has ranged in recent years from $1.1 billion to $1.5 billion per year. There are also several findings that emerge from an analysis of key federal transportation legislation:
First, the mobilization of apparently large sums of money that in reality do not cover the investment needs of the US transportation system;
second, the isolation, until at least 2015, of issues relating to Amtrak and the rail mode more generally that are not addressed in traditional transportation legislation but in specific legislation of narrower scope;
67 Congressional Hearing of John Porcari (Deputy Secretary, USDOT)), The Role of Innovative Finance in Intercity Passenger Rail, House Subcommittee on Railroads, Pipelines and Hazardous Materials, July 9, 2013 . 68 The Highway Trust Fund was created by the Federal-Aid Highway Act (1956) as the mechanism to initially finance the construction of the Interstate system. The fund is financed primarily by gasoline and diesel taxes, truck excise taxes, and various small vehicle taxes. The Highway Trust Fund became the Transportation Trust Fund (TTF) and relies on two pillars, the Highway Account and the Mass Transit Account. It is through this budgetary tool that federal funds for the highway mode and mass transit are managed. The problem is that since the end of the 1990s, there has been a growing gap between annual expenditures and the amounts collected. The gap was $8 billion in 2008 and $19.5 billion in 2010. In addition to the freeze on federal gasoline taxes since 1993, this gap is the result of improved vehicle fuel efficiency, lower average fuel consumption for newer models, and fewer vehicle miles driven per capita. As a result, Congress is forced to regularly replenish the FTT from the general budget (Edner and McDowell, 2002; Nigro and Burbank, 2014, pp. 2-3). For a detailed discussion of this issue, see the 2009 GAO report, Highway Trust Fund: Improved Solvency Mechanisms and Communication Needed to Help Avoid Shortfalls in the Highway Account.
59
third, the federal transportation acts are multi-year extensions and renewals of the Federal-Aid Highway Act of 1987, which avoided an abrupt cut in funding but never addressed the structural problems of federal transportation policy;
Fourth, only the ISTEA of 1991 profoundly altered federal transportation policy—extending states’ authority to decide on the allocation of federal funds, installing Metropolitan Planning Organizations (MPOs) as true intermediary transportation actors, creating a new program to address air pollution (“Congestion Mitigation and Air Quality”, CMAQ), renewing transportation planning (“Statewide Transportation Improvement Plans”) (Transportation for America, 2011, p. 21; Dilger, 2015).
Joe McAndrew says that political support depends on both state and central government, but financially, the rail mode depends primarily on the federal government: “Political depends again on the state. Financial, no. The federal government to funding passenger rail capital and operating assistance, but it is meager in comparison to the dollars to highways and transit.”69 Many stakeholders agree that it is this lack of sustained funding that most hinders the emergence of a true rail policy:
“An overarching issue that runs across all of these priorities is the need for sustained and long-term funding, similar to enacted legislation currently in place for highways, transit and aviation. It is difficult and inefficient to make large-scale infrastructure investments on a year-to-year basis.” (Joseph Szabo, Administrator, FRA);
“Expansion and improvement of our current intercity passenger rail system will require a commitment of federal, state, local and private resources—a combination of funding and financing strategies that will not only pay for projects, but also speed their planning, design and construction. APTA recommends an authorization of $50 billion over six years to facilitate the development of a HSIPR system. There should be a dedicated and indexed federal revenue source for planning, design and construction of these projects, other than the current motor fuels excise taxes that fund the Highway Trust Fund. We also suggest that, to attract greater private capital...the use of public private partnerships, should be promoted.” (Michael P. Melaniphy, President & Chief Executive Officer, APTA);
“Congress and the Administration provide for long term stable funding for intercity passenger rail with dedicated, guaranteed funding similar to the Highway Trust Fund with firewalls, guaranteed levels of spending and contract authority.” (Mike Lewis, Director, Rhode Island DOT);
“While highways, public transit, and aviation all benefit from dedicated revenue sources deposited into Trust Funds for their use only, passenger rail in this country is funded on an annual basis from the government’s general funds. As a result, rail must fight for its funding every single year”; “Until Amtrak is provided with stable and dedicated funding, this situation will inhibit the utilization of innovative finance strategies. Private investors in infrastructure projects make long-term commitments, not promises that can be renegotiated every year... As long as rail investment remains a political football in Congress each year, it is doubtful that private sector partners will be interested in making a long-term commitment to rail.” (John Robert Smith, President & CEO, Reconnecting America);
“It [Congress] will need to address the Highway Trust Fund authorization. I believe our country needs to fundamentally rethink how it funds transportation projects of national significance. We need to move away from mode-centric solutions and design a program
69 Interview with representative from Transportation for America, conducted on September 12, 2015.
60
that can fund multi-modal utility designed to address congestion challenges and support a competitive economy.” (Anthony R. Coscia, Chairman of the Board, Amtrak).”70
Since 1987, five multi-year reauthorizations have been passed by Congress:
The Intermodal Surface Transportation Efficiency Act (ISTEA), signed into law in 1991 by President George H. W. Bush, was a six-year, $151 billion allocation;
TEA-21 (Transportation Equity Act for the 21st Century) signed into law in 1998 by President Bill Clinton—a six-year bill that raised $203.4 billion;
The Safe, Accountable, Flexible and Efficient Transportation Equity Act (SAFETEA-LU) signed into law in 2005 by President George W. Bush—a six-year bill that mobilized $286 billion;
The MAP-21 (Moving Ahead for Progress in the 21st Century) Act signed into law in 2012 by President Obama—a 27-month bill that raised $118 billion;
the Fixing America’s Surface Transportation Act (FAST) signed into law in 2015 by President Obama—a five-year bill that mobilized $305 billion (Dilger, 2015, pp. 18-19).
It is for these reasons that the FRA has put forward new instruments to compensate for this failing Transportation Trust Fund and to enable the intercity rail mode to benefit, in particular through so-called innovative financing (TIGER, TIFIA, RRIF) and increased recourse to public-private partnerships. The TIGER (Transportation Investment Generating Economic Recovery) discretionary grant program was used from 2009 to 2015 by the federal administration to invest in transportation projects to help revive the U.S. economy following the 2009 economic crisis. More than $4.6 billion were allocated through seven waves of projects: 32.7% of the funds for 127 highway projects, 28.5% for 71 public transit projects, 21.4% for 60 rail projects (or $985 million), 11.4% for 43 port projects, 4.7% for 16 soft mobility projects, and 1.3% for 64 planning efforts.71 The program was open to states, local governments, transportation authorities, MPOs, or groups of states. On December 18, 2016, President Obama committed an eighth wave, worth a total $500 million, before leaving the White House. After a period of hesitation, the Trump administration’s Transportation Secretary Elaine L. Chao announced a replacement program in December 2018: the Better Utilizing Investments to Leverage Development (BUILD) program for $1.5 billion for 91 projects of all types—with the U.S DOT receiving nearly $11 billion in appropriations.72 The Transportation Infrastructure Finance and Innovation Act (TIFIA) program provides credit assistance for projects of regional or national significance—highway, rail, port, or public transportation projects are eligible. A wide range of actors can apply to this program: states, communities, transport authorities, railway companies, regional authorities, private entities. Its purpose is to leverage federal funds to attract non-federal and private investment when a public or private entity has a primary funding source that is not sufficient to cover
70 United States House of Representatives, National Rail Policy: Examining Goals, Objectives and Responsibilities, House Subcommittee on Railroads, Pipelines and Hazardous Materials, June 27, 2013; United States House of Representatives, The Role of Innovative Finance in Intercity Passenger Rail, House Subcommittee on Railroads, Pipelines and Hazardous Materials, July 9, 2013; United States Senate, Passenger Rail: Investing in Our Nation’s Future, Senate Subcommittee on Surface Transportation and Merchant Marine Infrastructure, Safety and Security, December 10, 2014. 71 Projects funded in 2012 included the West Memphis International Rail Port ($10.9 million), Sacramento Valley Station Improvement ($15 million), Raleigh Union Station Phase 1 ($21 million), Rochester Intermodal Transportation Center ($15 million), and the Siskiyou Summit Railroad Revitalization ($7 million). Many of the rail projects funded are station or multimodal hub projects. https://www.transportation.gov/highlights/tiger/tiger-discretionary-grant-program [accessed 21/02/2019]. 72 https://www.transportation.gov/BUILDgrants [accessed 21/09/2019].
61
the entire cost of a project.73 For example, as of January 2019, the South Transit Extension project in the Seattle area (Lynnwood Link Extension) received $658 million under the TIFIA program out of a total budget of $3.1 billion where the primary funding source is a portion of sales taxes. The Railroad Rehabilitation & Improvement Financing (RRIF) program provides direct loans and loan guarantees for the development of rail infrastructure projects within a limited envelope of $35 billion. It can be used to improve or rehabilitate rail infrastructure, to develop new intermodal structures, to finance transit-oriented development (TOD) operations, or to repay active debt associated with a rail project. Among the most recent projects that have received RRIF funding are the $908 million Dallas Area Rapid Transit project (2019), the $220 million Massachusetts Bay Transportation Authority project (2018), and the $2.4 billion direct loan to Amtrak (2016).74 The development of innovative financial mechanisms makes it possible to include the rail mode, including projects originating from Amtrak, ad hoc authorities, or communities, in major federal funding.
The U.S. DOT encourages the use of public-private partnerships (PPPs) to finance major transportation infrastructure projects, especially since innovative financing mechanisms (TIFIA, RRIF, Private Activity Bonds) can serve as a basis for PPPs since they encourage the use of private funds. Finally, the federal government has been encouraging private sector involvement in transportation projects since the SAFETEA-LU Act on transportation. Private Activity Bonds (PABs) or tax-exempt bonds are the main mechanism here: “Passage of the private activity bond legislation reflects the Federal Government’s desire to increase private sector investment in U.S. transportation infrastructure. Providing private developers and operators with access to tax-exempt interest rates lowers the cost of capital significantly, enhancing investment prospects.”75 As of December 2018, nearly $10.9 billion in bond issues have been awarded or are under consideration, including $1.15 billion for the Brightline Phase 2 project in Florida. From the analysis of funding issues, three findings emerge: an inherited and frozen fiscal policy framework that isolates intercity passenger rail and deprives high-speed projects of major federal revenue sources; fiscal inventiveness to circumvent this institutional and political obstruction so that all modes benefit from federal funding and to attract private funding; and Amtrak’s institutional isolation symbolized by its low annual subsidy allocation and fueled by recurring political conflicts.
4.1.2. A mode of transportation through the prism of its institutional isolation and political difficulties. Amtrak: a weak player with erratic political support
Amtrak’s first decade of existence was primarily about managing the legacy of the private companies. The rolling stock was obsolete, cooperation with local and regional transportation agencies was non-existent, and the stations were in deplorable condition. Initial federal subsidies were small, insufficient for Amtrak to fully replace the rolling stock. Amtrak was also given new responsibilities. In 1973, Congress asked the USRA—a temporary agency supported by the federal Department of Transportation—to find solutions for the Northeast Corridor. In its final proposal, the USRA proposed adding the 500 miles (800 kilometers) of rail infrastructure between Washington D.C. and Boston to Amtrak’s remit. In the 4R Act of 1976, Congress included the Northeast Corridor Improvement Project (NECIP), which launched a major reconstruction and modernization program for the Northeast Corridor. The federal government invested $2.5 billion over ten years. Under the Reagan administration, the
73 https://www.transportation.gov/tifia/tifia-credit-program-overview [accessed 22/02/2019]. 74 https://www.transportation.gov/buildamerica/programs-services/rrif [accessed 22/02/2019]. 75 https://www.transportation.gov/buildamerica/programs-services/pab [accessed on 22/09/2019].
62
NECIP was suspended and it was not until the Democrat Bill Clinton gained the presidency that this investment program was revived (Nice, 1998).
With the Amtrak Improvement Act of 1978, Congress recognized that Amtrak would not be able to become financially self-sufficient in the near future. It changed the company’s charter from stating that Amtrak should “be a for-profit corporation” to “should be owned and operated as a for-profit corporation”.76 This semantic nuance marked a change in Congress’s view of the company, a recognition that Amtrak could not cover all its operating costs. From 1971 to 1978, subsidies increased slowly but steadily. President Jimmy Carter sought to reduce Amtrak’s network. His Secretary of Transportation, Brock Adams, proposed to Congress that Amtrak’s network be reduced from 44,000 to 26,000 miles. Congress finally decided to reduce it to 37,000 miles (Nice, 1998). The 1979 and 1981 reforms were designed to adjust the performance and profitability forecasts in the direction of greater realism, to streamline the management of the company and to obtain a credible and solid improvement program from Amtrak. Between 1980 and 1982, its annual appropriation exceeded $1 billion. Amtrak’s very existence was threatened when Ronald Reagan came to power with a political project to reduce the role of the federal government.
In 1982, W. Graham Claytor Jr. was appointed to head Amtrak and remained in that position for eleven years. He had to reconcile, or at least manage, irreconcilable positions between, on one hand, the conservative government and the Reagan administration, which wanted to abolish Amtrak, and on the other hand the supporters of rail and alternative modes, who were arguing for its retention and the introduction of high-speed rail in the United States. In order to avoid the withdrawal of federal funding, W. G. Claytor reached a compromise with the government and committed to eliminating the operating deficit and achieving financial self-sufficiency by 2000.
A long battle with Congress and the highway and aviation lobbies ensued until the mid-2000s. W.G. Claytor argued that these objectives could only be met if Amtrak was given a specific and stable source of funding, in the same way as highways and airports (Goddard, 1994). For this reason, in 1990, he proposed to Congress that one cent per gallon of the federal gas tax should be dedicated to funding Amtrak, a proposal rejected by Congress. Tom Downs, his successor, continued to pursue the financial goals set by the Claytor Commitment and initiated a number of measures including continued investment in the Northeast Corridor and the launch of the Acela high-speed service in 2000. A new Amtrak reform was passed in 1997—the ARAA—which enshrined the Claytor commitment in law but extended the deadline by two years. It provides for a gradual decrease in the financial allocation to encourage Amtrak to reduce its operating deficit. A council—the Amtrak Reform Council—was also set up to monitor the company’s progress. By 2002, all stakeholders realized that Claytor’s ambitious goals were not being achieved, and that Amtrak was on the verge of bankruptcy because of the gradual decline in its federal funding. The company asked Congress for $1.2 billion in the 2003 budget proposal, threatening that otherwise it would close all long-distance services. Congress has no choice but to accept the request. Amtrak officials, members of Congress, and the federal government acknowledged in 2003-04 that with its current network and business model, Amtrak could not achieve financial self-sufficiency and fully eliminate its operating deficit (Nice, 1998; Perl, 2002).
In the early 2000s, Amtrak was in a difficult situation. The company was suffering from a significant operating deficit due mainly to losses in long-distance services. It was in an unstable financial and institutional situation, as it did not have a dedicated, sustainable source of funding and every year had to wait for the budget vote in Congress to establish its own budget for the following year. Starting in 2003-2004, federal allocations increased again, rising to $1 billion a year. The initial tendency was to
76 See attached Amtrak’s statutes—U.S. Code, Title 49, Subtitle V, Part C, Chapter 243, § 24301.
63
treat Amtrak as a “for-profit” company, implying that government financial support would be temporary and limited. Despite fierce opposition from conservative circles, the Republican Party, and powerful lobbies, Congress has always voted to subsidize Amtrak in response to pressure from rural elected officials and because the federal government cannot resign itself to seeing this mode of transportation disappear altogether (Garrison and Levinson, 2014).
4.1.3. Breakdown of the 2015 FAST Act
On December 2015,1 Congress finally passed the new transportation legislation — called the FAST (Fixing America’s Surface Transportation) Act—which was signed into law by President Barack Obama. This law is seen by the media, political observers, transportation stakeholders, and elected officials as a major piece of legislation. It is the first comprehensive transportation law in a decade. Debates of various kinds accompanied the passage of the law: political debates about the level of federal government intervention, budgetary debates on the sums to be invested in modernizing infrastructure, cultural debates about automobile culture and the role of alternative modes.
The FAST Act was a five-year (2016-2020) programming and appropriations bill designed to improve ground transportation infrastructure and reform several pieces of legislation affecting safety, project planning, or the state-owned company Amtrak (House of Representatives, 2015). The provisions of this act succeeded those of the last multi-year act passed in 2005—SAFETEA-LU. Debates over a new act spanned both of Barack Obama’s terms, particularly when the House of Representatives reverted to a Republican majority in 2010. A bill did pass in 2012—MAP-21—but it only extended existing programs for a short two-year period. The challenge in 2014- 2015 was therefore to engage in a bipartisan negotiation to avoid the abrupt closure of programs dedicated to transportation. The FAST Act ended a long phase of temporary program extensions, budget “patches,” and recurring threats of program shutdowns,77 The new law was based around six priorities:
to maintain the legibility and stability of state and local government projects with medium-term legislation;
to initiate the reinforcement of transportation safety legislation;
to redirect some funding towards new priorities (e.g. the new freeway freight program);
to give state and local governments greater flexibility in managing infrastructure projects;
to modernize passenger rail (Amtrak); to initiate a new round of investment ($305 billion pledged over five years) to modernize
the transportation system.
The details of the Act show that it was the result of a compromise between the Republican and Democratic parties, and that it contains limitations that create uncertainty about the actual amount of investment committed. Despite the large overall sum announced, it remains relatively modest compared to the need for infrastructure investment across the country. Transportation Secretary Anthony Foxx has been arguing for months in favor of a six-year bill with a commitment of at least $400 billion. The legislation was prepared in the midst of a national debate about the state of infrastructure and facilities in the United States, with widespread news reports and articles about poorly maintained roads and
77 Associated Press, “Congress reaches deal on elusive 5-year, $281-billion transportation bill,” LA Times, December 1, 2015.
64
highways, numerous aging bridges and tunnels, some of which had not been maintained in nearly a century, and even tragic accidents involving poor infrastructure. Some elected members of Congress, notably Senators Barbara Boxer (Democrat-California), Rand Paul (Republican-Kentucky), and Bernie Sanders (Democrat-Vermont), pushed for the adoption of a massive investment program; the first two proposed a multi-year $2,000 billion plan.78 From a budgetary point of view, there were two problems with the FAST Act: the lack of dedicated funding for the entire Act and the fact that some programs were still funded through the standard budget process. It did not address the gap between spending and revenue, particularly from gasoline taxes, which amounts to $70 billion.79 This legislative compromise failed to address one of the fundamental problems of federal transportation policy. Conservative elected officials succeeded in maintaining the freeze on the federal gas tax, whereas an increase would have made it possible to finance the new spending. It appears, therefore, that no solution has been found to access a renewable, sustainable and adequate source of funding for the entire US transportation system.80 Moreover, for a number of programs, including Amtrak, the amounts set out in the legislation are subject to annual approval by both houses of Congress during budget debates. Again, an opportunity was missed to provide a clean, sustainable source of funding for passenger rail in the same way as the highway and aviation sectors. Amtrak would still have to wait every year for the legislature’s budget decision to determine the level of federal funding. This situation undermines any attempt by Amtrak to prepare a long-term strategy, since it is unable to plan its investments and projects several years ahead.
The FAST Act cannot, moreover, be considered as a transitional legislation towards a more balanced transportation system. Highways remain particularly well endowed, even though unprecedented funding is needed for alternative modes to the car. The budget figures speak for themselves: $230 billion for highways, $60 billion for public transportation, including $12 billion for mass transit projects, $10 billion for Amtrak, and $5 billion for network security.81 Highways continue to receive the lion’s share of federal funds. This attitude was symbolized by the new freight program written into law, which was the first time Congress has included a freight program in a transportation bill. Under this program, 90% of the funds went to road freight and only 10% to for other modes including ports and railroads. The evolution of the Transportation Alternatives Program is another example of the continuing emphasis on the automobile. It was one of the few not to receive an increase in funding, being frozen at $850 million over five years. In addition, metropolitan areas now had the option of spending up to 50% of the funds on other projects not related to soft mobility, such as road projects.
Passenger rail was expected to undergo profound changes as a result of this new legislation. This was the first time in the history of federal transportation legislation that Amtrak was not treated separately in minor legislation, and that passenger rail was included in a comprehensive surface transportation act. Five areas of reform were earmarked to modernize Amtrak and its services and increase investment in the mode:
78 K. Laing, “Sen. Sanders fills $1T infrastructure bill,” The Hill, January 27, 2015; K. Laing, “Paul, Boxer team up on transportation funding,” The Hill, January 29, 2015; C. Ingraham, “Mapping America’s most dangerous bridges,” The Washington Post, February 4, 2015. 79 With congressmen refusing to raise gasoline taxes, Congress has planned a series of provisions—some editorialists call it tinkering - to try to find that missing $70 billion, including selling part of the Strategic Petroleum Reserve or using part of the U.S. Central Bank’s (FED) reserve fund. H. Siobhan, “Senate Passes Five-Year Highway Bill, Sending it to the White House,” The Wall Street Journal, December 3, 2015. 80 A. Halsey III, “After weeks of negotiations, Congress finalizes 5-year transportation bill,” The Washington Post, December 1, 2015. 81 S. L. Davis, “Think FAST—the good, the bad and the ugly in Congress’ new five-year transportation bill,” T4AmericaBlog, December 2, 2015.
65
Amtrak reform (separation of Northeast Corridor (NEC) investments and revenues from the rest of the system, creation of a state regional line committee, calling on the private sector for certain areas, including stations);
modernization of passenger rail programs (renewal of financial programs, creation of a state-federal partnership to invest in the NEC, opening of some Amtrak long-distance services to private management);
improving rail safety (new safety obligations for Amtrak and transportation authorities);
streamlining of project assessment and approval processes (simplification of environmental procedures in particular);
-reinforced financing of intercity passenger transport projects (reform of the RRIF (Railroad Rehabilitation and Improvement Financing) loan program).82
The FAST Act provides $10 billion in federal passenger rail funding over five years for Amtrak to invest in infrastructure and rolling stock, including $2.6 billion for the NEC and $5.5 billion for the national system. In addition to the financial allocations, certain provisions may ultimately have a profound effect on Amtrak’s operations. Initially, there is a form of continuity with the measures taken in the past. The separation of allocations between the NEC and the national network is a continuation of the PRIIA Act of 2008 (FRA, 2009b), i.e. dedicated investments and revenues from the NEC must be reinvested exclusively in this corridor and not used to make up the shortfall in other services, particularly long-distance services. In addition, the appointment of a regional lines committee composed of representatives of the states to monitor the operator’s activities confirms the key role played by the states in federal rail policy since 2008.
In addition to the traditional measures taken to rationalize Amtrak’s operations, the Act introduces new measures to further reform Amtrak. The most significant element of this reform is the unprecedented experiment of transferring the management of one or more long-distance services to a private operator, an experiment open to involvement by a maximum of three services. Indeed, Amtrak suffers from structural financial problems because of underfunding by the federal government and the profound financial imbalance between regional and long-distance services. On several occasions, the federal authorities have sought to address this problem by restructuring the network or by forcing Amtrak to implement recovery plans. The debate is whether the system should be maintained and recognized as a public service that provides territorial equity and service to rural communities, or whether it should be restructured to ensure Amtrak’s profitability. For decades, the debates have pitted Republicans against Democrats and rural elected officials against those in large metropolitan areas. According to the bill’s explanatory memorandum, the private operator solution could allow Amtrak to divest itself of certain particularly loss-making services while ensuring that the network can be maintained as is. These future private operators will have to prove to public authorities that they can guarantee the same level of service as Amtrak at lower cost.
This new legislation seems, in the text, to assign an important role to this mode of transportation by the symbolism of its inclusion in an act on surface transportation, by its numerous legislative developments which may open up a new era for passenger rail transport, and by its significant financial commitment, albeit insufficient in the light of Amtrak's investment needs. In terms of high-speed rail, this legislation is not particularly ambitious, as there is no program or financial mechanism. In 2016, the Secretary of Transportation initiated a call for projects for the financing, construction, and maintenance of a high-speed rail line in a major metropolitan corridor. Eleven corridors were identified, the same high-speed corridors traditionally referenced in federal documentation. This call for projects was not accompanied
82 https://www.fra.dot.gov/Page/P0919 [accessed on 23/02/2019].
66
by any financial and political strategy for HSR: “No actions without additional authority and adequate resources.” In addition, the law reinforces the regulatory requirements for major infrastructure projects requiring subsidies of more than one billion dollars: the recipient must prove that it has non-federal funds for the project budget; a financial and technical schedule must be provided; project sponsors must prove the usefulness of the project in terms of performance, travel time, and service (United States House of Representatives, 2015b).
The FAST Act, a veritable legislative monument of more than 1,300 pages, contains, in addition to the renewal of existing programs, numerous reforms and new measures that should help bring about change in the US transportation system. Although the budgets are very unbalanced, there is a modest but real political will to move the United States in the direction of alternatives to the car. State departments of transportation and Metropolitan Planning Organizations (MPOs) are now required to take into account all modes of travel and all users in their preparatory studies. Paradoxically, this profusion of reforms does not solve the structural problems of the system, which are caused by funding issues and the hypertrophy of programs and subsidies devoted to highways. Finally, this legislation opens up the possibility for a fundamental change in public policy, greater recognition of the role of the regional and local levels. The FAST Act establishes the states as key players in transportation policy, particularly rail transportation, but sub-state players also acquire prerogatives in the management of a number of programs initiated by the federal government.
4.1.4. Reflections on current political events: the crucial support of the federal executive
Despite the ambivalent role of central government in the United States, the erratic support for Amtrak, and the absence of a structured and funded policy for high-speed rail since “Obamarail”, it appears that HSR projects, contemporary symbols of megaprojects in the country, cannot do without political, technical and budgetary support from the federal government. There are several reasons for this:
first, because the huge budgets that have to be raised for new high-speed rail lines require federal funds—state and local governments do not have the financial clout to do without them;
second, because even the private projects currently underway or under consideration are subject to federal regulations and use funding mechanisms proposed by the federal government—the Brightline project in Florida with BAPs, for example;
finally, because most high-speed rail projects, except for the Californian project, transcend administrative boundaries, including those of the states, and are multi-jurisdictional, which requires impetus and support from central government, whereas there is virtually no supra-regional governance structure, except for the Port Authority of New York & New Jersey (1921).
Analysis of the State of the Union addresses by Presidents B. Obama and D. Trump demonstrates the erratic support for major transportation infrastructure, including high-speed rail. In the case of President Obama, we have the benefit of some hindsight with seven State of the Union addresses. In the case of President Trump, there were four speeches. We have chosen to transcribe the passages concerning infrastructure and high-speed rail—two of these speeches contain no reference to infrastructure and transportation:
“Next, we can put Americans to work today building the infrastructure of tomorrow. From the first railroads to the Interstate Highway System, our nation has always been built to compete. There’s no reason Europe and China should have the fastest trains or the new
67
factories that manufacture clean-energy products. Tomorrow, I’ll visit Tampa, Florida, where workers will soon break ground on a new high-speed railroad funded by the Recovery Act. There are projects like that all across this country that will create jobs and help move our nation’s goods, services and information.” (Barack Obama, Remarks by the President in State of the Union Address, January 27, 2010);
“The third step in winning the future is rebuilding America. Our infrastructure used to be the best, but our lead has slipped. Countries in Europe and Russia invest more in their roads and railways than we do. China is building faster trains and newer airports [...]. So over the last two years, we’ve begun rebuilding for the 21st century, a project that has meant thousands of good jobs for the hard-hit construction industry. And tonight, I’m proposing that we redouble those efforts.... Within 25 years, our goal is to give 80 percent of Americans access to high-speed rail. This could allow you to go places in half the time it takes to travel by car. For some trips, it will be faster” (Barack Obama, Remarks by the President in State of the Union Address, January 25, 2011);
“During the Great Depression, America built the Hoover Dam and the Golden Gate Bridge. After World War II, we connected our states with a system of highways. Democratic and Republican administrations invested in great projects that benefited everybody, from the workers who built them to the businesses that still use them today. In the next few weeks, I will sign an executive order clearing away the red tape that slows down too many construction projects. But you need to fund these projects. Take the money we’re no longer spending at war, use half of it to pay down our debt, and use the rest to do some nation-building right here at home. (Barack Obama, Remarks by the President in State of the Union Address, January 24, 2012);
“America’s energy sector is just one part of an aging infrastructure badly in need of repair. Ask any CEO where they’d rather locate and hire—a country with deteriorating roads and bridges, or one with high-speed rail and Internet; high-tech schools, self-healing power grids. The CEO of Siemens America—a company that brought hundreds of new jobs to North Carolina—said that if we upgrade our infrastructure, they’ll bring even more jobs. And that’s the attitude of a lot of companies all around the world [...]. And to make sure taxpayers don’t shoulder the whole burden, I’m also proposing a Partnership to Rebuild America that attracts private capital to upgrade what our businesses need most.” (Barack Obama, Remarks by the President in State of the Union Address, February 12, 2013);
“Moreover, we can take the money we save with this transition to tax reform to create jobs rebuilding our roads, upgrading our ports, unclogging our commutes—because in today’s global economy, first-class jobs gravitate to first-class infrastructure. But I will act on my own to slash bureaucracy and streamline the permitting process for key projects, so we can get more construction workers on the job as fast as possible.” (Barack Obama, Remarks by the President in State of the Union Address, January 28, 2014);
“Twenty-first century businesses need 21st century infrastructure—modern ports, and stronger bridges, faster trains and the fastest Internet. Democrats and Republicans used to agree on this. So let’s set our sights higher than a single oil pipeline. Let’s pass a bipartisan infrastructure plan that could create more than 30 times as many jobs per year, and make this country stronger for decades to come. Let’s do it. Let’s get it done.” (Barack Obama, Remarks by the President in State of the Union Address, January 20, 2015);
68
“Ø” (Barack Obama, Remarks by the President in State of the Union Address, January 13, 2016);
“To launch our national rebuilding, I will be asking the Congress to approve legislation that produces a $1 trillion investment in the infrastructure of the US—financed through both public and private capital—creating millions of new jobs. This effort will be guided by two core principles: Buy American, and Hire American.” (Donald Trump, Remarks by the President in State of the Union Address, February 28, 2017);
“As we rebuild our industries, it is also time to rebuild our crumbling infrastructure. America is a nation of builders. We built the Empire State Building in just 1 year—is it not a disgrace that it can now take 10 years just to get a permit approved for a simple road? I am asking both parties to come together to give us the safe, fast, reliable and modern infrastructure our economy needs and our people deserve. Tonight, I am calling on the Congress to produce a bill that generates at least $1.5 trillion for the new infrastructure investment we need. Every federal dollar should be leveraged by partnering with state and local governments and, where appropriate, tapping into private sector investment—to permanently fix the infrastructure deficit.” (Donald Trump, Remarks by the President in State of the Union Address, January 30, 2018);
“Ø” (Donald Trump, Remarks by the President in State of the Union Address, February 6, 2019).
From an analysis of these speeches, we can see a very clear drop in President Obama’s political and personal commitment to high-speed rail and, more generally, to infrastructure. Several observations can be made: the comparison with certain foreign countries, where the argument of technical influence in the development of HSR is enshrined; the use of the argument of economic recovery and job creation; the incorporation of the debate on HSR into the context of a much broader infrastructure crisis in the United States; the recurrence of the problem of financing these major projects. In addition, two major arguments are similar between the two Presidents: the evocation of a glorious American past in terms of large infrastructures with the reminder of some major achievements, and the desire to make the private sector contribute more to the development of infrastructures. D. Trump’s speech in February 2019 makes no mention of infrastructure, focusing on foreign policy and the issue of immigration. This prompts us to clarify some of the most recent political news and its impact on transportation and infrastructure issues. During the 2016 presidential campaign, candidate Donald Trump regularly spoke of the infrastructure crisis and the need for massive reinvestment in both transportation and energy infrastructure. In 2017, the Department of Transportation prepared a plan that contained none of the ambition of the campaign promises. Of the $300 billion announced, most was money already earmarked and redirected by the Trump administration, while the private sector was encouraged to intervene more widely in this area. At the same time, no announcements were made about high-speed rail and Amtrak came under renewed budget “attack.” Presidential budget proposals consistently included drastic cuts to Amtrak and closures of the most loss-making long-distance services—all of which were rejected by Congress under the influence of Democrats and moderate and rural Republicans.
69
4.2. The states: new players in railway policy
4.2.1. States and transport policy
States implement their transportation policies through their Departments of Transportation (DOT). DOTs have four main missions:
Prepare and Maintain a Long-Range Statewide Transportation Plan. A State DOT creates long-range transportation plans using performance measures and targets that advance national goals established in Federal law. In addition to Federally required performance measures, States may identify State-level performance indicators to support their decision making. LRSTPs may be broad, policy-oriented plans that do not cite specific projects, or they may be more detailed plans that include recommendations related to particular transportation improvements or programs;
• Develop a Statewide Transportation Improvement Program. State DOT’s create a short-range program of transportation projects, based on long-range transportation plans, called a statewide transportation improvement program (STIP). The State uses spending, regulating, operating, management, and financial tools to estimate progress toward the performance targets noted above that could be achieved by implementing projects and strategies in the STOP. For metropolitan areas of the State, the STIP incorporates the TIP developed by the MPO directly by reference and without change;
• Identify performance measures targets and monitor whether implemented projects are achieving targets. States coordinate with MPOs and transit operators to establish performance targets that address performance measures, as set forth in the Federal law, related to surface transportation and public transportation. Like MPOs, States prepare plans that include performance targets to address performance measures and standards. Statewide and nonmetropolitan transportation plans must integrate goals, objectives, national performance measures, and targets identified as the State level.
• Involve the Public. States must involve the general public and all other affected constituencies in the essential functions listed above. MPOs and States engage the public and stakeholder communities as they prepare procedures that outline how the public will be advised, engaged and consulted throughout the planning process.” (FHWA/FTA, 2007, pp. 7-8)
DOTs play a central role because federalism and devolution give considerable powers to the states. With the launch of federal highway and road programs, specialized state agencies were responsible for the preparation, construction, and maintenance of projects. Prior to the 1900s, the private sector was at the forefront of infrastructure development—shipping links, railways, canals—although some projects could receive state or municipal funding. The federal government was very much in the background, except in the case of very large-scale projects like the National Road project. State involvement increased as the need for road development grew during the Good Roads Movement. States began building road systems at the turn of the century with state funding and highway departments. In 1892, New Jersey inaugurated the first highway department, while a year later the federal government established the Office of Public Road Inquiry. This federal office encouraged the establishment and subsequently the professionalization of dedicated departments in the States (Dilger, 2005; Goetz, 2007,
70
pp. 121-123). By 1915, 45 of the 48 states had created road development grants, and 40 of the 48 states had inaugurated a state highway department. At this time, the road policy of the two higher levels was concomitant: the Federal Highway Aid Act was passed in 1916, providing $75 million to fund projects co-financed by the federal and state governments under the supervision of the DOTs, while by 1917, all states had a DOT. These DOTs gained more financial resources as the states implemented federal gasoline taxes. In addition, there was a real need for national scale visibility, reflection and discussion, recognized in the creation of the AASHTO (American Association of State Highways Officials) and the TRB (Transport Research Board) in 1922. During the period of construction of the Interstate system, the federal government was in the forefront: it invested massively, assuming 90% of the cost of highway projects, setting up the Highway Trust Fund, and significantly increasing federal taxes on gasoline. Nevertheless, the role of the States was central in terms of planning, construction, and maintenance. Departments were gradually encouraged to focus on more than just one mode following the Urban Mass Transportation Act (1964). Moreover, at the federal level, the Bureau of Public Roads became the FHWA (Federal Highway Administration) which in 1966 was incorporated into a larger structure, the Department of Transportation. This last decision prompted a good number of states to convert their highway departments into departments of transportation. However, it was not until the 1990s that the other modes were really taken into account: sub-departments for airports, maritime affairs, rail transportation, and mass transit. For public transportation alone, federal funds rose from 1.8 billion dollars in 1981 to 4.2 billion in 1989 (Goetz, 2007, pp. 126-127).
The recent period brought a new era for the federal states: the era of intermodality. The 1991 federal ISTEA Act for the first time uses the term “intermodal” instead of “highway”: “In order to achieve these goals, Congress authorized $156 billion for the development of a comprehensive intermodal system involving highways, transit, railroads, and water transportation” (Goetz, 2007, pp. 128-132). This law had two major consequences for state transportation policy: the first was the need to work with MPOs, which are now a key component of transportation policy; the second was the requirement that they focus on the design and implementation of an intermodal transportation system (AASHTO, 1998; Dempsey, Goetz, and Larson, 2000; Goetz, Szyliowicz, Vowles, and Taylor, 2004). Today, all States—with the exception of Nebraska—have established teams, policies, and administrative structures that support intermodality. However, the degree to which departments have moved towards real intermodal policies varies greatly from State to State. Among the most advanced are Washington, Oregon, California, and Maryland.
In financial terms, governments have both conventional and innovative mechanisms for financing their transportation policies. States generate more than 40% of their resources for transportation policies through taxes and tolls: gasoline taxes, taxes on petroleum products and distributors, taxes on the sale of vehicles, bond issues, road tolls, earmarked funds from the general budget, excise or axle taxes, taxes on passenger car rentals, etc.83 The majority of the funds go to highways, followed by aviation, and then public transportation (Dierkers and Mattingly, 2009, pp. 7-8). Some states have sought in recent years to change this highway primacy and redirect some of the funding to alternative modes—a constitutional difficulty limits this strategy in many states where state authorities are prohibited from using the federal Highway Trust Fund for anything other than highways/roads. In addition, states are using innovative financing to raise more funds, to provide more money for alternative modes including intercity rail, and to leverage private investment. These innovative financing tools include debt financing—Grant Anticipation Revenue Vehicles (GARVEEs), Private Activity Bonds (PABs) or Build America Bonds
83 Tax and budgetary situations vary greatly from state to state. The taxes mentioned may apply differently and have different rates. Some States have mechanisms that other States do not. The tools mentioned in the text are the most common and apply in all or almost all States.
71
(BABs),84 the two federal tools already mentioned (TIFIA and RRIF), State Infrastructure Banks (SIBs)—congestion pricing mechanisms, public-private partnerships (Dierkers and Mattingly, 2009, pp. 9-14). Here again, states employ these different tools in very different ways (Dierkers and Mattingly, 2009).
As regards the rail mode more specifically, it was not until the second half of the 20th century that the States made a commitment. This commitment was limited to the management of level crossings and small railroad lines. Subsequently, federal rail policy was reinforced, in particular to support and implement public-private partnerships in certain major projects such as the Alameda Corridor Project (Goetz, 2007, pp. 138-140). Until 2007, the role of the states in intercity rail transport was limited to feasibility studies and political support for Amtrak services. There was a change of scale from 2008 onwards, based on two main principles:
- the passage of the Passenger Rail Investment and Improvement Act (PRIIA) in 2008;85
- the implementation of the high-speed rail program under the Obama administration, which makes states the benchmark level of government.
PRIIA transferred operational management and investment of Amtrak’s state-supported corridors to the states (Section 209). It strengthened their role in the conduct of rail policy (Section 303): “PRIIA tasks States with establishing or designating a State Rail transportation authority that will develop statewide rail plans to set policy involving freight and passenger rail transportation within their boundaries, establish priorities and implementation strategies to enhance rail service in the public interest, and serve as the basis for Federal and State rail investments within the State” (FRA, 2009b, pp. 2-3). Although largely dependent on the federal government for funding, the State level is now the cornerstone of US passenger rail and high-speed rail policy.
4.2.2. High-speed Rail: Politicization and Stakeholder Games
The FRA’s call for projects was very successful with some states and with Amtrak. By October 2009, FRA had received submissions for 45 projects from 24 states worth a total of $50 billion, compared to the $8 billion available. The FRA announced the selected projects on January 28, 2010. Two-thirds of the funds were divided among four states: 28% for California, 15% for Florida, 13.7% for Illinois, and 10% for Wisconsin. In October 2010, a second wave of calls for projects was launched to distribute the additional $2.5 billion in funds granted by Congress. California, Florida, Iowa and Michigan are the states that receive the most funds.86 However, reallocations of federal funds were required as a result of political changes in some states. The FRA therefore decided to reallocate $624 million to California and $342.3 million to Florida. A further redistribution took place in 2011 when the new governor of Florida, Rick Scott, finally decided to withdraw from the rail initiative (United States House of Representatives, 2009; FRA, 2009, 2009b; Perl, 2012).87
84 This facility was made possible by the ARRA Act of 2009 to provide a new source of funding for state and local government projects as part of the US economic recovery. It was available for only two years, 2009 and 2010. 85 Public Law No. 110-432, Division B, enacted October 16, 2008, Amtrak/HSR. 86 For the first round of funding: $2.25 billion for California, $1.25 billion for Florida, $1.1 billion for Illinois and $810 million for Wisconsin. For the second wave of projects: $901 million for California, $800 million for Florida, $230 million for Iowa and $161 million for Michigan. 87 The redistribution of funds originally allocated to Florida benefits primarily the Northeast Corridor and New York State (40% of the money) and California (18%).
72
Obamarail ultimately benefited a small number of states—California, Illinois, Washington, North Carolina, New York, New Jersey, Michigan, and Pennsylvania—that have a strong rail tradition and were also investing their own funds. These are states that would be taking over Amtrak’s medium-distance services from 2008 onwards as a result of the implementation of the PRIIA Act, and which have dedicated budgets for rail. We note that some states, where passenger rail is not very developed—Kansas, Idaho, Alabama, New Mexico—nevertheless filed applications and received funds. These states have used the money to fund feasibility studies. Beyond the number of projects submitted by each state, which varies widely—35 projects in California alone, 7 in Oregon, 2 in Massachusetts—there were several types of projects: improvements to existing infrastructure, high-speed line projects, higher speed service projects, feasibility studies (Ruggeri, 2015). The federal government’s lack of a long-term vision aggravates a situation already complicated by budgetary fluctuations. When one looks at the documents published by the Federal Department of Transportation, one cannot help but notice—in line with the analysis by Ashiabor and Wei—a lack of political, technical, financial and territorial coherence (FRA, 2009b; Ashiabor and Wei, 2012). The different types of corridors cover too many different realities and the objectives stated by the FRA seem to be more a matter of good intentions linked to an idealized vision of a future high-speed network.
Political conflicts also appear to be blocking the Obama administration’s “high-speed” initiative. The challenge is to understand the difficulties experienced by the various institutional levels in taking ownership and thinking about this mode of transport.
The funds redistributed in 2010 and 2011 accounted for an initial form of conflict between the federal government and State governors. Indeed, although the states became important players in this new rail policy at the end of 2009, how the federal policy was received depended on electoral vagaries. For example, the election of two new governors in Ohio and Wisconsin in November 2010 triggered a redistribution of funds (Audikana, 2012). As soon as they were elected that November, these two Republican governors, John Kasich in Ohio and Scott Walker in Wisconsin, announced that they would refuse the federal funds, considering the projects too financially risky for their state budgets (Garrison and Levinson, 2014). The purpose of the funds was to improve two corridors, the line between Milwaukee and Madison in Wisconsin, and the line between Cincinnati, Columbus, and Cleveland in Ohio. The funds were redistributed by the FRA as early as December 2010, even before the governors took office in January 2011. At the beginning of 2011, a new redistribution was conducted as a third governor, Rick Scott, elected at the end of 2010 in Florida, blocked a high-speed rail project. He halted the high-speed rail project in the state despite local support for it, particularly from the city of Tampa (Perl, 2012). These new conflicts were largely a consequence of the incursion of the states in the financing of rail policies. For these three governors, this intrusion was a form of interference. In Florida, Rick Scott argued that the financial risk would be too great for taxpayers and took the view that it would be wiser to invest the sums allocated to improve the existing port, rail, and highway infrastructures.88
The conflict between the federal and local levels was not confined to the FRA, the Obama administration and the governors. There was also growing opposition to FRA funding in Congress, i.e. in the House of Representatives and the Senate. This opposition combined with more local opposition and the example of the California project reflects this. For example, in June 2014, a Republican representative from California, Jeff Denham, introduced a bill prohibiting the financing of the California high-speed project with federal funds. Denham was a member of the House Transportation and Infrastructure Committee.
88 Statement by Governor Rick Scott available on the State of Florida website: http://www.flgov.com/2011/02/16/florida-governor-rick-scott-rejects-federal-high-speed-rail/ [accessed 6/27/2018].
73
In the debate over this amendment between Denham and Democratic House member Zoe Lofgren,89 Denham’s argument was that the California project was not moving forward, that it was out of control because the California High-speed Authority was unable to start construction, and that there was insufficient funding. Lofgren defended the project by pointing out that it was already underway: “Now, the project is already creating jobs for Californians. In fact, more than 70 firms that have committed to performing work on this project have offices in the Central Valley, and many of these firms, happily, are veteran-owned. In San Jose, the California high-speed rail project is already providing immediate benefits by investing $1.5 billion in the Caltrain Modernization Program. This program will create over 9,500 jobs, over 90 percent in the San Francisco Bay area. (...) China already has 5,000 miles of high-speed rail, and they intend to double that. Spain has 1,600 miles of high-speed rail, and they are building more. More than a dozen other countries have their own successful high-speed rail systems. Even Morocco is building a high-speed rail system. But we don’t have anything in the United States except for what California is doing.” Despite this speech, which recalled California’s pioneering role and the difficulty of undertaking major projects—Zoe Lofgren took as an example the precedent of the Interstates, which took a long time to finance and build—Jeff Denham’s amendment was passed by 227 representatives to 186. This result is not surprising in a House of Representatives that had had a Republican majority since 2011. However, six Democrats voted for the amendment, including four Californians. Three Republicans voted against the amendment, all three from New York State, demonstrating that party affiliation does not dictate votes and that rail policy funding issues are also regional and local issues (Ruggeri and Schorung, 2017).
89 The entire debate is available on the House of Representatives website: http://beta.congress.gov/congressional-record/2014/06/10/house-section/article/H5212-2 [accessed 6/27/2018].
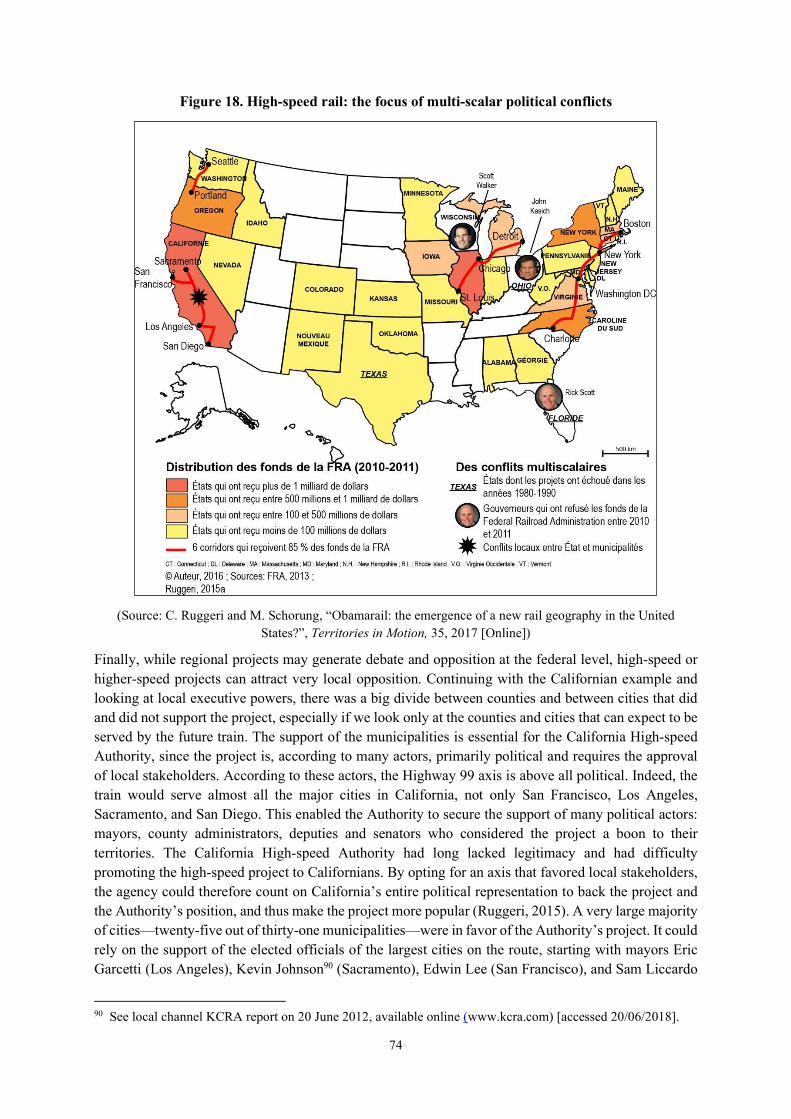
74
Figure 18. High-speed rail: the focus of multi-scalar political conflicts
(Source: C. Ruggeri and M. Schorung, “Obamarail: the emergence of a new rail geography in the United States?”, Territories in Motion, 35, 2017 [Online])
Finally, while regional projects may generate debate and opposition at the federal level, high-speed or higher-speed projects can attract very local opposition. Continuing with the Californian example and looking at local executive powers, there was a big divide between counties and between cities that did and did not support the project, especially if we look only at the counties and cities that can expect to be served by the future train. The support of the municipalities is essential for the California High-speed Authority, since the project is, according to many actors, primarily political and requires the approval of local stakeholders. According to these actors, the Highway 99 axis is above all political. Indeed, the train would serve almost all the major cities in California, not only San Francisco, Los Angeles, Sacramento, and San Diego. This enabled the Authority to secure the support of many political actors: mayors, county administrators, deputies and senators who considered the project a boon to their territories. The California High-speed Authority had long lacked legitimacy and had difficulty promoting the high-speed project to Californians. By opting for an axis that favored local stakeholders, the agency could therefore count on California’s entire political representation to back the project and the Authority’s position, and thus make the project more popular (Ruggeri, 2015). A very large majority of cities—twenty-five out of thirty-one municipalities—were in favor of the Authority’s project. It could rely on the support of the elected officials of the largest cities on the route, starting with mayors Eric Garcetti (Los Angeles), Kevin Johnson90 (Sacramento), Edwin Lee (San Francisco), and Sam Liccardo
90 See local channel KCRA report on 20 June 2012, available online (www.kcra.com) [accessed 20/06/2018].
75
(San Jose).91 Just one big-city mayor was missing, San Diego Republican Mayor Kevin Faulconer. The municipality had not yet publicly stated its position on the project, but it was only concerned with Phase 2, for which the Authority had given no date (Ruggeri, 2015; Ruggeri and Schorung, 2017).
High-speed rail projects and their advocates face political obstacles at all levels, making some of these projects uncertain. Despite this situation, other projects, such as the California project, are moving forward, in part because of the support of key political figures—including governors—for more than a decade. It can be seen that, at all levels, high-speed rail is subject to a fairly intense and complex process of politicization which involves various actors and even transcends traditional political divisions.
The higher levels—the federal government and the states—are the leading actors in rail policy and are at the center of the interplay of actors, the political confrontations, and the process of politicization around the object “high speed”. Because of their administrative and technical clout and their budgetary capacity, these are the two levels that can build and initiate large-scale rail projects in the United States. Through an analysis of their operation, one can understand the political, administrative, and financial obstacles to the development of a large-scale, long-term HSR construction policy. The first of these obstacles is budgetary, since the frameworks of federal and state public action are primarily geared towards carbon-based modes, leaving little room for maneuver for intercity rail. However, when looking at rail projects in the United States, these are not the only actors involved and it is worth analyzing the place of lower levels of government in rail debates and policies.
4.3. The regional and local level: an unthought-of issue for intercity passenger rail transportation
4.3.1. The debates on regionalism in the United States and its emergence in transportation policy
Metropolitan Planning Organizations were created by the Federal-Aid Highway Act (1962) to: “provide local input for urban transportation planning and allocate federal transportation funds for metropolitan areas with populations of more than 50,000 people” (Seltzer and Carbonell, 2011, pp. 180-181). There is a great deal of flexibility afforded to states in the format of MPOs— “part of state government”, “regional COG”, “planning district”, “independent entity”. In San Francisco, MPOs are separate entities from regional planning agencies (ABAG and MTC), while in Washington D.C. the MPO operates as a stand-alone agency within a COG (regional council). AMPOs have four core functions:
to support regional decisions within a metropolitan area;
to develop Transportation Improvement Programs;
to prepare and update regional master plans (Constrained Long-Range Transportation Plan, Metropolitan Transportation Plan);
to include the public and all stakeholders in these discussions.
After a period of weak federal support during the Reagan administration, MPOs grew once again with central government backing. Central government requires the federal level to guarantee and certify
91 See the statement by E. Lee and S. Liccardo in the SF Chronicle in April 2016: http://www.sfchronicle.com/opinion/openforum/article/A-new-plan-for-the-train-to-California-s-future-7258625.php [accessed 6/27/2018].
76
regional planning activities in metropolitan areas with populations over 200,000, and MPOs must work with transportation entities, local governments and states. Each MPO must be recertified every three years. Following the ISTEA (1991) and TEA-21 (1998) bills, four major changes took place: the plans prepared by the MPOs must be fiscally constrained and no longer confined to wish lists; awareness of multimodality and alternative modes; a degree of autonomy for MPOs in the allocation of certain subsidies in consultation with the state DOTs; and a new focus on the management and maintenance of existing networks and facilities in preference to new project planning alone (Plant, 2007, pp. 173-180). Even so, states retained control and MPOs remained weak relative to local and federal authorities (Edner and McDowell, 2002; Plant, 2007, p. 170; Seltzer and Carbonell, 2011, p. 181):
“A major disappointment is the fact that, after ten years, most states have still not embraced the intent of federal law and devolved sufficient powers and responsibilities to their metropolitan areas [...]. Many state DOTs still wield considerable formal and informal power and retain authority over substantial state transportation funds. The governor and state DOT still have veto authority over MPO-selected projects. Although large MPOs (in areas with populations over 200,000) also have authority to veto projects, the reality is that the state receives and manages all the federal transportation money, as well as large amounts of state transportation money, and the state’s political leverage is far greater than the MPOs.” (Katz and Puentes, 2005, p. 21)
MPOs are therefore involved in the operation and improvement of the transportation planning process. The commitment of elected officials and the emergence of genuine political leadership contribute to the success of MPOs (Goetz, Dempsey and Larson, 2002). Over time, these regional entities have also developed technical and administrative skills that have reinforced their institutional and political importance. With regard to our research subject, it is interesting to note that MPOs have only a very limited role in intercity and high-speed rail transportation. MPOs are involved in the discussion and planning processes around major infrastructure projects, as a form of cooperation or at least multi-scalar and cross-sectoral consultation. In reality, they have no prerogatives with respect to projects of this kind and cannot direct funds to them. The funds managed by the MPOs come from federal subsidies, a large part of which goes directly to highways and to public transportation, and only a portion can be administered autonomously and directed towards alternative modes. The MPOs include rail projects in their considerations and distribute some subsidies to interchange or network connection projects, for example.
This situation raises the question of whether regional structures are suitable or unsuitable for high-speed rail projects. In the current state of existing regional structures, they cannot implement HSR projects, and the Californian HSR project is managed by an ad hoc authority backed by the State and its Department of Transportation. Some planning practitioners and academics believe that the megaregion would be the appropriate scale for planning large-scale infrastructure projects and regional economic and urban development policies. This idea was inherited from Jean Gottman (1961) and was subsequently taken up by other researchers, including Richard Florida, Robert Lang, Arthur Nelson, and Catherine Ross. In 2005, the Regional Plan Association and the Lincoln Institute of Land Policy launched the America 2050 program to promote “mega-regional” infrastructure planning and the implementation of sustainable development policies (Seltzer and Carbonell, 2011, pp. 244-246) :
“The emerging HSR system in the United States could provide a superstructure for a new generation of more effective national, megaregional, and regional transportation plans and urban development strategies. In turn these could shape megaregions and metropolitan regions in such a way that they become more compact and efficient in terms of energy and
77
land use, and most of their development would be organized around transit and transit-oriented programs” (Seltzer and Carbonell, 2011, p. 256).
Some researchers consider that intercity transportation infrastructure is the best example of a project that could be carried out by a ‘mega-regional’ structure, in particular a high-speed rail project (Vega and Penne, 2008). Three priorities are identified to this end: “Federal support, coordination assistance and incentives for the creation of partnerships between metropolitan areas, as mega-region planning organizations may be necessary to coordinate the efforts of metropolitan planning organizations and multiple states” (Vega and Penne, 2008: 282). Several previous decisions by the federal government could be seen in retrospect as part of this emerging mega-regional scale of analysis: “Projects of National and Regional Significance” (confirmed by the SAFETEA-LU law), “Corridors of the Future” (initiated by the U.S. DOT), and “High-Speed Rail Corridors” (financed in the framework of “Obamarail”). Joseph Szabo proposes that the federal government set up new governance structures to meet the particular challenges posed by major infrastructures: “The Administration’s goal for a modern rail system that connects communities within America’s ‘megaregions’ will inevitably require corridors to cross several State boundaries. Development and implementation of these corridors can be a challenge due to the number of State and local jurisdictions involved in the process.”92 These few examples tend to show that the federal administration is considering projects on a scale that goes beyond the traditional scales of government without, however, proposing institutional and budgetary changes to go with them. The issue of the emergence of a new scale of governance, either the transportation corridor or the megaregion, remains an open question, although planners, practitioners, researchers and certain political leaders are increasingly exploring this subject.
4.3.2. The local level and rail transport policies. What are the realities for the intercity rail mode?
Regarding the links between intercity rail transportation and the local level, we can make several observations:
there is no involvement by the regional and metropolitan level. Indeed, MPOs and other forms of regional entities, which may have prerogatives in transportation and/or urban planning, have no such prerogatives in intercity rail transportation. This is the responsibility of the national operator and the two higher levels of government;
this is an institutional blind spot for Amtrak and HSR projects, although regional and metropolitan stakeholders are generally involved in discussions and debates in the regions;
the local scale is a gateway to the analysis of the geopolitics of actors associated with high-speed rail. This is possible thanks to the development of regional and local transportation, intermodal strategies, station and station district projects, or a policy of coordination between urban planning and transportation;
however, there is an initial institutional innovation in the consideration of the regional level with the experience of decentralized management of Amtrak services in California.
92 Parliamentary Hearing of Joseph Szabo (Administrator, FRA), National Rail Policy: Examining Goals, Objectives and Responsibilities, House Subcommittee on Railroads, Pipelines and Hazardous Materials, 27 June 2013.
78
Robert Puentes proposes that the lower levels should have more responsibility for this mode of transport: “Provide greater flexibility from Washington. In exchange for greater responsibility from Washington, states should have added flexibility in how they allocate existing funds. For example, current federal law allows states and MPOs to transfer funds between highway and transit programs. Among other benefits, this freedom of financing greatly assists in bottom-up problem solving and gives additional consideration to alternative solutions that achieve a more balanced transportation network.”93
The overlapping of prerogatives and the multiplicity of actors make the management of transportation projects complex, although the State of California retains an essential role in this field. In seeking to explain the consolidation of the metropolitan level as an increasingly present actor in rail policies, California offers a particularly relevant example in that its three regional lines each enjoy a different degree of decentralization (Schorung, 2017).
The San Joaquin service is a partnership between the State of California, via its Department of Transportation, which provides administration and funding, and Amtrak, the rail operator. Within Caltrans, two committees are charged with representing local elected officials: the San Joaquin Valley Rail Committee (SJVRC), which consists of members from Amtrak, the freight companies, MPOs, other state commissions, and the Southern California Association of Governments; and the SJVRC Technical Advisory Committee, which consists of representatives from Amtrak, the California Department of Transportation, BNSF freight companies, and UP. The management of the San Joaquin is evolving. Indeed, the Intercity Passenger Rail Act of 2012, ratified by the Governor of California, establishes the SJJPA—San Joaquin Joint Powers Authority—which marks a transfer of powers from the state to this devolved structure so that it takes over all powers relating to the San Joaquin line (SJJPA, 2014). The full transfer was completed in July 2015. This new administrative authority is composed of representatives from all regional and local agencies involved with the line and possesses all prerogatives, including cooperation with Amtrak, overseeing bus services within the corridor, planning for future construction, coordinating schedules and ticketing services with other transportation modes, and marketing the San Joaquin. The State still plays a significant role through funding, preparation of applications for federal funding, and purchase of rolling stock. The San Joaquin service saw no increase in frequency—six daily rotations—between 2002 and 2015; a seventh was added in 2016. The SJJPA board is composed of elected officials from ten transportation agencies/authorities (Alameda County, Contra Costa Transportation Authority, Fresno Council of Governments, Kings County Association of Governments, Madera County Transportation Commission, Merced County Association of Governments, Sacramento Regional Transit, San Joaquin Regional Rail Commission, Stanislaus Council of Governments, Tulare County Association of Governments) (SJJPA, 2016, pp. 3-6). The San Joaquin service has become an important factor in the success of future high-speed services. Indeed, its route along the Central Valley from Stockton to Fresno and then Bakersfield is close to the route chosen by CAHSRA for future HSR, positioning the San Joaquin as a potential “feeder”. It is only partially anchored in the San Francisco Bay Area (Richmond, Emeryville, Oakland in the north-east of the Bay Area) and will not benefit from a direct connection with the HSR line. In order to coordinate services and create hubs, the SJJPA and CAHSRA signed an initial agreement in June 2013 to formalize a medium-term cooperation. The SJJPA has also developed a ten-year investment program worth $1.5 billion, most of which is not yet financed, to add an eighth daily rotation, increase the average speed of trains, and renew the rolling stock (SJJPA, 2016, pp. 1-2).
The Capitol Corridor is the only successful example of the transfer of powers from the State of California to its own administrative authority. On July 1, 1998, the State and the Capitol Corridor Joint Powers
93 Congressional Hearing of Robert Puentes (Senior Fellow, Brookings Institute), Understanding the Cost Drivers of Passenger Rail, House Subcommittee on Railroads, Pipelines and Hazardous Materials, May 21, 2013.
79
Authority (CCJPA) entered into the final transfer agreement to give full responsibility for the Capitol Corridor to the CCJPA. The CCJPA manages the line, oversees Amtrak’s operations, studies needed system improvements and investments, promotes the line, and serves as a liaison between Amtrak and Union Pacific. Amtrak, through an operating agreement, is the operator of the service and is also responsible for maintenance of the rolling stock. The state funds operating expenses and most capital expenditures, and owns all the rolling stock. The CCJPA has sixteen members from six regional or local transportation agencies (CCJPA, 2014). It is a distinct administrative authority, separate from the Department of Transportation, but it cannot be called an autonomous authority since it is not financially autonomous. The Capitol Corridor line continues to be financed entirely out of state funds. However, there is an innovative model of local ownership and co-management with the State Department of Transportation. The CCJPA board is composed of sixteen elected members representing six transportation agencies/authorities (Placer County Transportation Planning Agency, Solano Transportation Authority, Yolo County Transportation District, Sacramento Regional Transit District, BART, Santa Clara VTA) and ex-officio members (Metropolitan Transportation Commission and Sacramento Area Council of Governments). The Capitol Corridor service is particularly dynamic and policymakers have consistently increased the frequency of trains since 2002 from six daily rotations in 1991 when the service was launched to twelve in 2002 and fifteen in 2015.
The CCJPA is establishing several short and medium term strategies to strengthen rail service with the major difficulty of not having the financial means to fund them.
These developments are a reminder of the extent to which local actors are essential to all public policies not devolved to the federal government. The multiplicity of actors at all levels of political and administrative life in the United States makes it difficult to carry out projects, because these agencies, councils or authorities are not only there to represent their territories and their constituents in higher bodies. Intermediate actors have prerogatives in the field of transportation, urban planning, and land use that make them key players. This situation results in an increasingly complex interplay of actors and pushes political authorities to invent new forms of governance or innovative spaces of cooperation that serve to enhance and develop initiatives in favor of rail transport.
California is an example of the institutional innovations currently being attempted in the field of metropolitan governance and transportation policies. Placing the management of the construction of the high-speed line on the an autonomous authority with powers delegated by the State, and the twofold transfer, now completed, of the management of Amtrak’s “state-supported” lines to the California Department of Transportation and then from the latter to ad hoc agencies (Joint Powers Authorities, JPA), confirm the movement towards the decentralization of rail policies and the emergence of a regional level of governance. However, it is too early to assess the impact of the emergence of regional interests on this new rail dynamic, particularly in terms of finance and service provision.
4.3.3. The battle for stations: the local level
At the most local level, the County has only a peripheral function in intercity transportation through its jurisdiction in matters of land use. It may be involved in the planning process for some station and station district projects. It may also have nuisance powers in relation to certain transportation projects: each county can take legal action to block or even cancel a project. In Florida, some counties that are particularly wary of the private Brightline project have spent large sums of money on legal action to try to stop the second phase of the program.
80
Moreover, at local level, municipalities are in the front line through stations. The old 19th-century stations were a product of railroad links between towns, while the high-speed stations—especially the new ones—are grafted onto an axis (Troin, 1997, p. 37). In the eyes of local actors, the “station” object represents a bouquet of economic and development opportunities, appealing to the still entrenched beliefs of elected officials in the structuring effects of facilities and infrastructures. At the scale of the urban area, three types of issues have been identified: profitability, i.e. the need to attract substantial footfall; accessibility, i.e. the goal of integrating the station into the different transportation networks; and development, i.e. the objective of integrating the station into the spatial dynamics. These issues reflect the main concerns of local stakeholders. Local authorities want to ensure that the population and the economic actors benefit from efficient access to the network, and to capitalize on this enhanced accessibility by pursuing territorial development and enhancement strategies (Facchinetti-Mannone and Bavoux, 2010). This explains why municipalities fight to obtain the best possible stopping points on the network, regardless of the station type —central urban stations in large metropolises, central stations in medium-sized cities, new stations, connecting stations in peripheral areas. Municipalities get involved in railway projects in different ways and to very different degrees: through financial participation, through political commitment, since some municipal teams believe that high-speed rail is a powerful factor in geoeconomic hierarchy because of its anisotropic character, through the construction of new local economic strategies, through the establishment of coalitions of actors seeking to implement a territorial project on the back of the station project (Facchinetti-Mannone, 2012; Billard and Bertrand, 2018; Zembri-Mary, 2018).
Within the framework of the Californian project, a battle for stations is underway both for the choice of stopping points and for the construction of a territorial project. Stakeholder strategies exist but are diverse and local stakeholders are having to become aware of the need to build a coherent project and a community of interests and actions to realize projects associated linked the new rail service (Bazin, Beckerich and Delaplace, 2010; Zembri-Mary, 2018). The local strategies of Californian cities differ: at one extreme, they appropriate the process by constructing their own development project (San Jose, Anaheim, San Francisco), at the other they adopt a wait-and-see attitude that results in the absence of a territorial project (Los Angeles). Municipalities where an HSR station has been confirmed by the Californian High-speed Authority (CAHSRA) accept the project as a whole and its local dimension. On the other hand, in cases where the future route bypasses the city, municipalities make every effort to delay the project. In the city of Santa Clarita, elected officials and economic actors are opposed to the route of the line between Palmdale and Los Angeles, which is expected to pass a few miles from the city with no nearby stops (Ruggeri, 2013, pp. 236-237). The appropriation of the future HSR line in California by local actors—counties, municipalities, non-institutional players—can be symbolic, limited to simple acceptance, and/or concretely embodied in the form of development projects. In the end, only a few municipalities have initiated investments, large-scale urban projects, or at least a substantial process of reflection, notably San Francisco and San Jose. In the context of the Brightline project in Florida, municipalities where a station is programmed support it and are integrating it into their development and urban planning documents. However, given the private nature of the rail project, their development strategies are very limited or non-existent—for example, the new Miami Central station and related developments are undertaken and funded by Brightline because the land is owned by the company. This does not preclude a modest battle of the stations, especially in the long section (from West Palm Beach to Orlando) where there are no stops. Following a call for projects from Brightline, municipalities on the Treasure Coast—Fort Pierce, Sebastian, Stuart and Vero Beach—have expressed
81
an interest in obtaining a stop.94 This is happening in difficult circumstances as the Treasure Coast counties, fiercely opposed to the rail project, have initiated legal proceedings to have it cancelled.
For the rail mode, and for high-speed rail in particular, there is a clash of scales, territorial visions, and levels of government. The higher levels, the federal and state governments, are leading the way in intercity transportation and in current rail projects in the United States. All of the policy frameworks and mechanisms for intercity rail are oriented toward these higher levels. As a result, regional and local levels are left out of the equation in intercity passenger rail. Their ownership of these projects is limited and their possibility of action limited to stations and station areas. This precludes or at least complicates the constitution of broad and fully multiscale coalitions of actors that could participate in the governance of these major projects and support them both politically with citizens and financially.
In order to complete the analysis of the interplay of actors, it is relevant to consider a final category of actors that can have a particular influence on public debates: non-institutional actors.
4.4. A re-emerging player in the railway sector: the private sector
The private sector is another non-institutional actor that needs to be mentioned because it could recapture a role in the renewal of the intercity rail mode. Until the mid-20th century, private railroad companies were at the forefront in the management and operation of passenger transportation services. From the 1960s-1970s onwards, they largely—indeed almost completely—withdrew from these services to focus on freight. Their attitude towards Amtrak even became one of hostility in their desire to protect their interests. In recent years, private actors have started to re-emerge in some high-speed or high speed rail projects. Anthony Perl recalls that three projects, which were not completed, were undertaken by the private sector: the Californian project initiated by the American High-Speed Rail Corporation (AHSRC) (1981-1984), the Texas HSR project (1989-1995), and finally the public-private partnership in Florida (1995-1999) (Perl, 2002, pp. 151-152, pp. 162-163; pp. 170-173). Current reinvestment can take four forms:
running a fully private project in terms of financing, planning, construction, and operation (e.g. the Brightline project in Florida or the new Texas project currently on the drawing board);
private sector contribution to a project carried out by public actors using mechanisms aiming to attract private investment, which would eventually resemble a public-private partnership (e.g. the Californian project);
private sector involvement—for example by developers—as part of a public or private infrastructure project by capturing value and increasing the value of land and real estate linked to stations and station districts, by means of dedicated financing mechanisms (as in the case of the Florida project, particularly around the MiamiCentral station, or the Californian project with the Salesforce Transit Center in San Francisco);
public-private partnerships (no case recorded in the United States for a major infrastructure project of the HSR type).
94 M. Seemuth, “Brightline explores possible station sites in 4 Treasure Coast cities,” The Real Deal, September 1, 2010.
82
The latter form has not yet been implemented in the United States although it has been studied by a number of researchers (Perl, 2002; Asian Development Bank, 2006; de Rus and Nombela, 2007; Cohen and Kamga, 2013; Albalate and Bel, 2014) and by some pro-grandparenting think-tanks (U.S PIRG Education Fund, 2011; Kenton, 2015). A public-private partnership (PPP) can be defined as: “A cooperative venture between the public and private sectors, built on the expertise of each partner, that best meets clearly defined public needs through the appropriate allocation of resources, risks and rewards.”95 There are different models of PPP:
Operation & Maintenance (O&M): in this model, a private operator manages a publicly owned asset on the contract for a given period. The asset remains continues to be owned by the public authority;
Design-Build-Finance-Maintain-Operate-Transfer (DBFMOT): this is a contract under which the contracting authority entrusts an operator with the design, construction, financing, operation, and maintenance of an asset, and recovers its costs from the tariffs paid by users for use of the asset. The asset is transferred to the contracting authority at the end of the contract;
Build-Own-Operate-Transfer (BOOT): this is a contract under which an operator is entrusted with the financing and construction of an infrastructure project and then owns and operates that infrastructure, recovering the investment, operating, and maintenance costs plus a preset profit margin through tariffs, fees, and other charges paid by any user. The asset is transferred to the contracting authority at the end of the contract;
Build-Operate-Transfer (BOT): this is a contract under which the contracting authority entrusts an operator with the construction, financing, operation, and maintenance of an infrastructure and in return is remunerated from the tariffs paid by users in order to recover its costs, with the asset being transferred to the contracting authority at the end of the contract;
Design-Build-Finance-Operate-Maintain (DBFOM): same operation as DBFOMT without transfer;
Build-Own-Operate (BOO): same operation as BOOT without transfer;
Build-Operate (BO): same operation as BOT without transfer;
“Lease-Operate” (LO): this is a contract under which the operator leases a pre-existing structure or facility from the public entity and operates it, agreeing to take on the risks (World Bank Group, 2013, pp. 2-6).
Taking the example of a highway project, Berveley K. Swaim-Staley showed in 2013 how a PPP can be used to finance a major infrastructure project provided that the federal government is fully committed: “The combination of dedicated transportation revenues and the ability to issue debt backed solely by that tax revenue and revenues from department-wide operations, has been an effective model for Maryland for over 40 years. One of the best recent examples of pulling together several innovative financing techniques to develop a project financial plan is the Intercounty Connector (ICC). The ICC is an 18.8 mile, limited access, six-lane, tolled highway... The ICC is essentially completed and now open to traffic. The total cost of the project was $2.425 billion. The financial plan included : GARVEE Bonds—750 million; Transportation Authority Revenue Bonds—571 million; TIFIA Loan—516 million; General Funds—265 million; Transportation Trust Fund—180 million; Transportation
95 Definition from the Canadian Council for PPP: www.pppcouncil.ca/web/Knowledge_Centre/What_are_P3s/Definitions_Models [accessed on 15/02/2019].
83
Authority Cash—124 million; Federal Funds—19 million.”96. Experiments with private sector reinvestment in intercity passenger rail are on the rise in the United States in various forms. An analysis of these projects over time will help to understand their mechanisms, the interplay of actors, the logic, and possible failures. Public sector players would like to see an increase in the use of public-private partnerships for transportation projects. The federal government is keen to develop them but for the moment technical, administrative, and financial support is limited to freeways, ports, and public transportation—this would need to be extended to rail and high speed.97
It appears that rail transportation is caught in the middle of multiscale games between stakeholders and conflicting political perspectives in a process of politicization which results in this mode, and high-speed rail in particular, being a source of division that generates strong political and ideological opposition. The analysis of the main actors involved in rail policies in the United States at different scales prompts several observations:
the federal government remains a key player, although all policies, funding mechanisms, and planning and public action frameworks are unfavorable to intercity rail, despite some recent changes, such as the introduction of innovative funding methods;
the federal states are becoming key players in rail policy thanks to upgrades to their planning practices and the mobilization of new resources. However, Amtrak’s national status and limited financial resources prevent them from committing very large sums to major infrastructure projects. In addition, state policy frameworks are largely oriented toward traditional modes, leaving little room for rail projects;
the regional and local levels play only a peripheral role in the conduct of railroad projects, mainly in station projects, station districts, and connections with urban transit networks;
the private sector is again emerging as a potential player in the renaissance of the rail mode and the implementation of high-speed rail, for the time being through entirely private projects.
5. The economic and territorial impact of the train. Is high-speed rail relevant in the American context?
5.1. In search of the classic train business model. Amtrak’s structural imbalance
5.1.1. Clearly negative balances. Multiscale approach based on certain sections
Since the mid-2000s, Amtrak has been on the path to financial equilibrium in its route operations. The company is also seeking to gradually reduce its debt in order to regain its own capacity for investment. However, its investment needs are still not being met and depend to a large extent on the funds that may or may not be appropriated at each annual budget debate in Congress. Before turning to Amtrak’s
96 Congressional Hearing of Beverley K. Swaim-Staley (President & CEO, Union Station Redevelopment Co.), The Role of Innovative Finance in Intercity Passenger Rail, House Subcommittee on Railroads, Pipelines and Hazardous Materials, July 9, 2013. 97 See: https://www.transportation.gov/buildamerica/programs-services/p3 [accessed 27/02/2019].
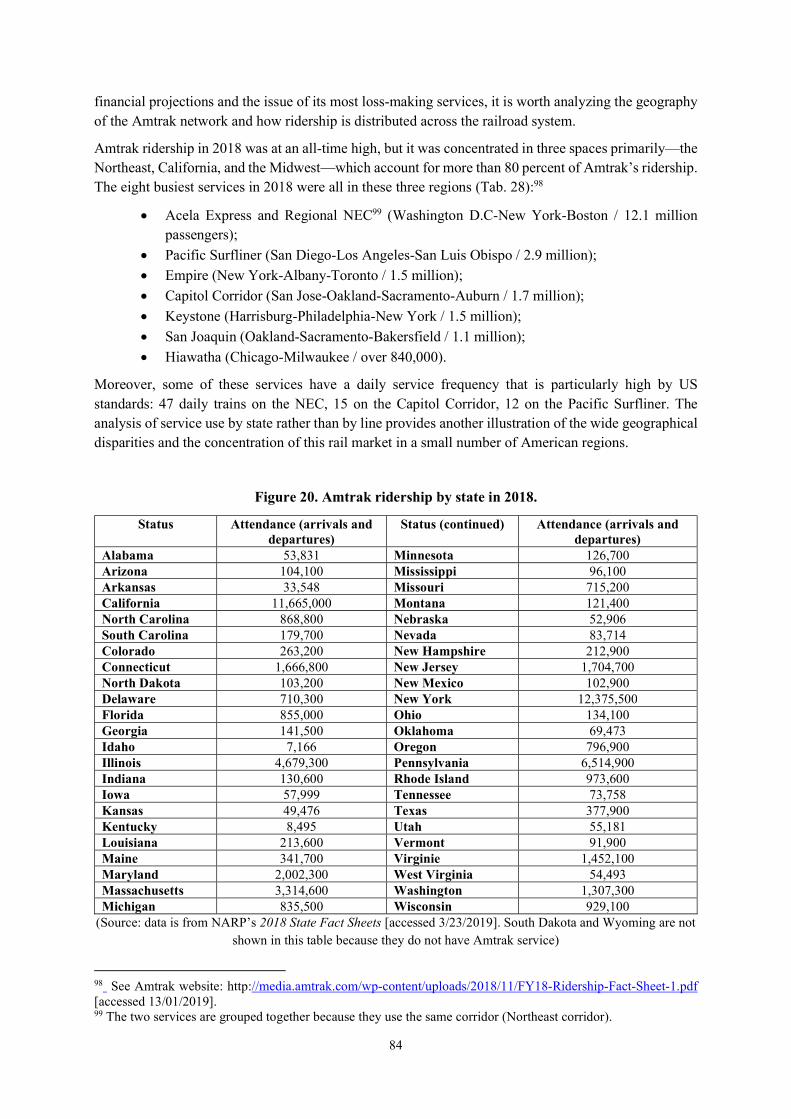
84
financial projections and the issue of its most loss-making services, it is worth analyzing the geography of the Amtrak network and how ridership is distributed across the railroad system.
Amtrak ridership in 2018 was at an all-time high, but it was concentrated in three spaces primarily—the Northeast, California, and the Midwest—which account for more than 80 percent of Amtrak’s ridership. The eight busiest services in 2018 were all in these three regions (Tab. 28):98
Acela Express and Regional NEC99 (Washington D.C-New York-Boston / 12.1 million passengers);
Pacific Surfliner (San Diego-Los Angeles-San Luis Obispo / 2.9 million); Empire (New York-Albany-Toronto / 1.5 million);
Capitol Corridor (San Jose-Oakland-Sacramento-Auburn / 1.7 million);
Keystone (Harrisburg-Philadelphia-New York / 1.5 million);
San Joaquin (Oakland-Sacramento-Bakersfield / 1.1 million);
Hiawatha (Chicago-Milwaukee / over 840,000).
Moreover, some of these services have a daily service frequency that is particularly high by US standards: 47 daily trains on the NEC, 15 on the Capitol Corridor, 12 on the Pacific Surfliner. The analysis of service use by state rather than by line provides another illustration of the wide geographical disparities and the concentration of this rail market in a small number of American regions.
Figure 20. Amtrak ridership by state in 2018.
Status Attendance (arrivals and departures)
Status (continued) Attendance (arrivals and departures)
Alabama 53,831 Minnesota 126,700 Arizona 104,100 Mississippi 96,100 Arkansas 33,548 Missouri 715,200 California 11,665,000 Montana 121,400 North Carolina 868,800 Nebraska 52,906 South Carolina 179,700 Nevada 83,714 Colorado 263,200 New Hampshire 212,900 Connecticut 1,666,800 New Jersey 1,704,700 North Dakota 103,200 New Mexico 102,900 Delaware 710,300 New York 12,375,500 Florida 855,000 Ohio 134,100 Georgia 141,500 Oklahoma 69,473 Idaho 7,166 Oregon 796,900 Illinois 4,679,300 Pennsylvania 6,514,900 Indiana 130,600 Rhode Island 973,600 Iowa 57,999 Tennessee 73,758 Kansas 49,476 Texas 377,900 Kentucky 8,495 Utah 55,181 Louisiana 213,600 Vermont 91,900 Maine 341,700 Virginie 1,452,100 Maryland 2,002,300 West Virginia 54,493 Massachusetts 3,314,600 Washington 1,307,300 Michigan 835,500 Wisconsin 929,100
(Source: data is from NARP’s 2018 State Fact Sheets [accessed 3/23/2019]. South Dakota and Wyoming are not shown in this table because they do not have Amtrak service)
98 See Amtrak website: http://media.amtrak.com/wp-content/uploads/2018/11/FY18-Ridership-Fact-Sheet-1.pdf [accessed 13/01/2019]. 99 The two services are grouped together because they use the same corridor (Northeast corridor).
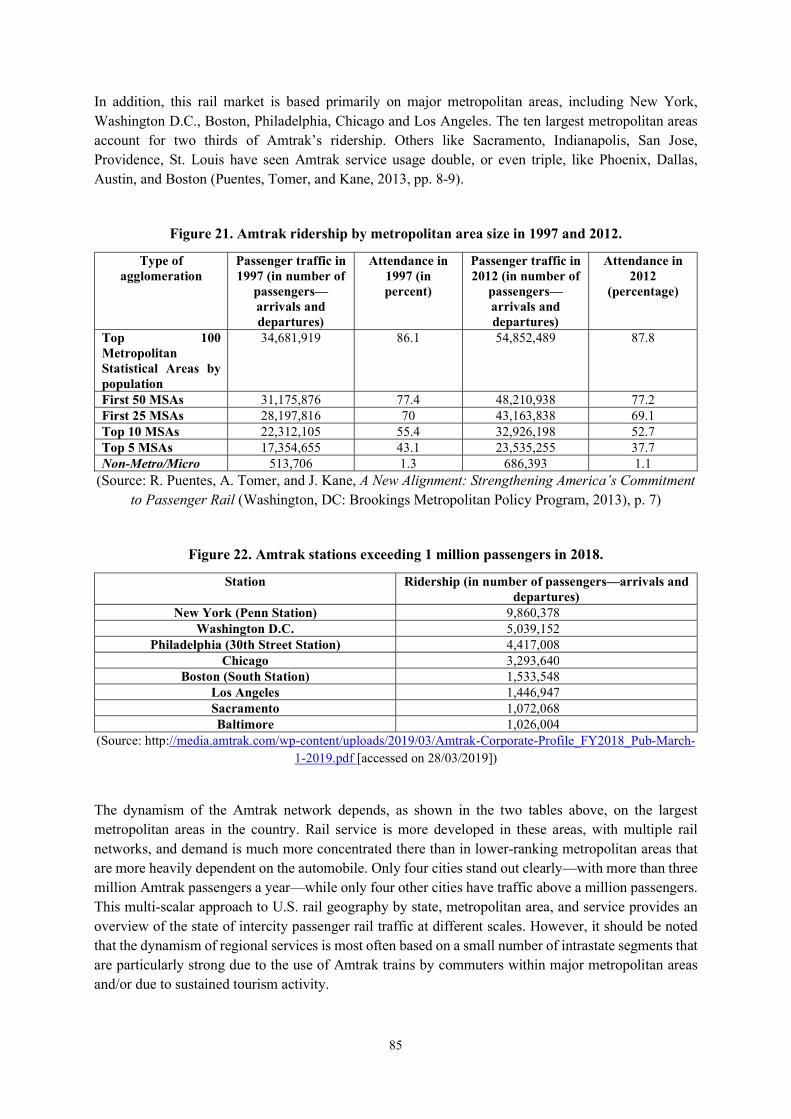
85
In addition, this rail market is based primarily on major metropolitan areas, including New York, Washington D.C., Boston, Philadelphia, Chicago and Los Angeles. The ten largest metropolitan areas account for two thirds of Amtrak’s ridership. Others like Sacramento, Indianapolis, San Jose, Providence, St. Louis have seen Amtrak service usage double, or even triple, like Phoenix, Dallas, Austin, and Boston (Puentes, Tomer, and Kane, 2013, pp. 8-9).
Figure 21. Amtrak ridership by metropolitan area size in 1997 and 2012.
Type of agglomeration
Passenger traffic in 1997 (in number of
passengers—arrivals and departures)
Attendance in 1997 (in percent)
Passenger traffic in 2012 (in number of
passengers—arrivals and departures)
Attendance in 2012
(percentage)
Top 100 Metropolitan Statistical Areas by population
34,681,919 86.1 54,852,489 87.8
First 50 MSAs 31,175,876 77.4 48,210,938 77.2 First 25 MSAs 28,197,816 70 43,163,838 69.1 Top 10 MSAs 22,312,105 55.4 32,926,198 52.7 Top 5 MSAs 17,354,655 43.1 23,535,255 37.7 Non-Metro/Micro 513,706 1.3 686,393 1.1
(Source: R. Puentes, A. Tomer, and J. Kane, A New Alignment: Strengthening America’s Commitment to Passenger Rail (Washington, DC: Brookings Metropolitan Policy Program, 2013), p. 7)
Figure 22. Amtrak stations exceeding 1 million passengers in 2018.
Station Ridership (in number of passengers—arrivals and departures)
New York (Penn Station) 9,860,378 Washington D.C. 5,039,152
Philadelphia (30th Street Station) 4,417,008 Chicago 3,293,640
Boston (South Station) 1,533,548 Los Angeles 1,446,947 Sacramento 1,072,068 Baltimore 1,026,004
(Source: http://media.amtrak.com/wp-content/uploads/2019/03/Amtrak-Corporate-Profile_FY2018_Pub-March-1-2019.pdf [accessed on 28/03/2019])
The dynamism of the Amtrak network depends, as shown in the two tables above, on the largest metropolitan areas in the country. Rail service is more developed in these areas, with multiple rail networks, and demand is much more concentrated there than in lower-ranking metropolitan areas that are more heavily dependent on the automobile. Only four cities stand out clearly—with more than three million Amtrak passengers a year—while only four other cities have traffic above a million passengers. This multi-scalar approach to U.S. rail geography by state, metropolitan area, and service provides an overview of the state of intercity passenger rail traffic at different scales. However, it should be noted that the dynamism of regional services is most often based on a small number of intrastate segments that are particularly strong due to the use of Amtrak trains by commuters within major metropolitan areas and/or due to sustained tourism activity.
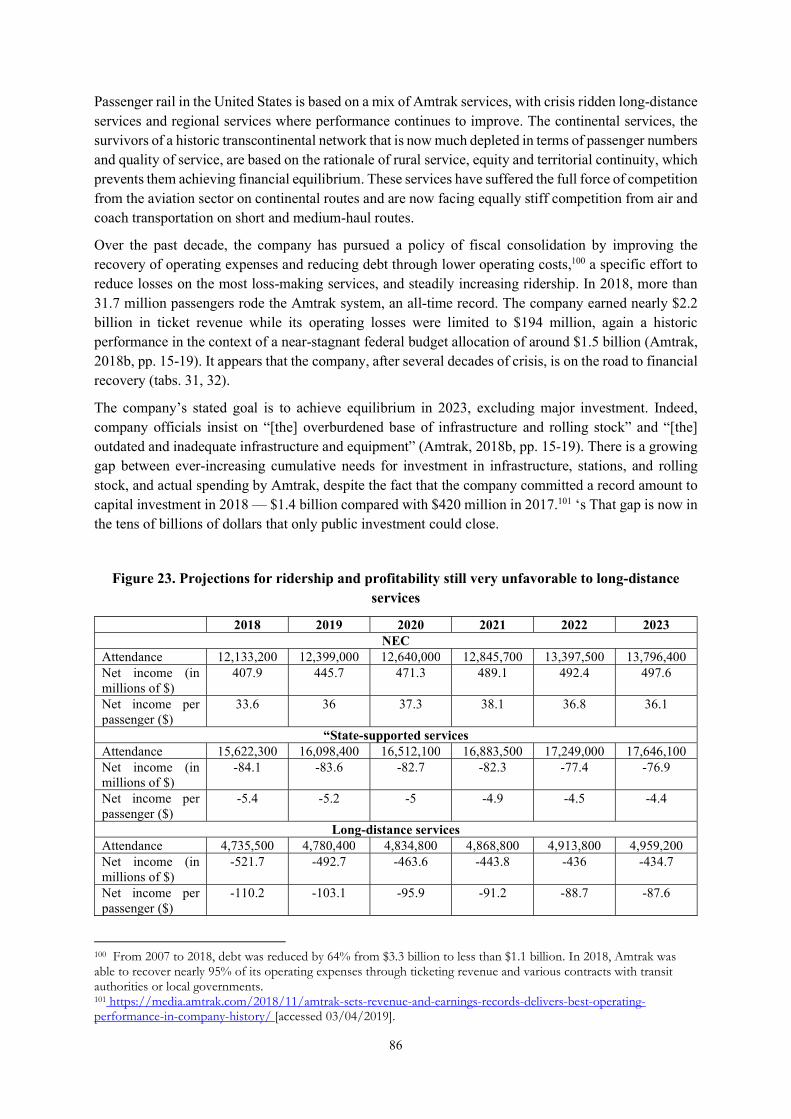
86
Passenger rail in the United States is based on a mix of Amtrak services, with crisis ridden long-distance services and regional services where performance continues to improve. The continental services, the survivors of a historic transcontinental network that is now much depleted in terms of passenger numbers and quality of service, are based on the rationale of rural service, equity and territorial continuity, which prevents them achieving financial equilibrium. These services have suffered the full force of competition from the aviation sector on continental routes and are now facing equally stiff competition from air and coach transportation on short and medium-haul routes.
Over the past decade, the company has pursued a policy of fiscal consolidation by improving the recovery of operating expenses and reducing debt through lower operating costs,100 a specific effort to reduce losses on the most loss-making services, and steadily increasing ridership. In 2018, more than 31.7 million passengers rode the Amtrak system, an all-time record. The company earned nearly $2.2 billion in ticket revenue while its operating losses were limited to $194 million, again a historic performance in the context of a near-stagnant federal budget allocation of around $1.5 billion (Amtrak, 2018b, pp. 15-19). It appears that the company, after several decades of crisis, is on the road to financial recovery (tabs. 31, 32).
The company’s stated goal is to achieve equilibrium in 2023, excluding major investment. Indeed, company officials insist on “[the] overburdened base of infrastructure and rolling stock” and “[the] outdated and inadequate infrastructure and equipment” (Amtrak, 2018b, pp. 15-19). There is a growing gap between ever-increasing cumulative needs for investment in infrastructure, stations, and rolling stock, and actual spending by Amtrak, despite the fact that the company committed a record amount to capital investment in 2018 — $1.4 billion compared with $420 million in 2017.101 ‘s That gap is now in the tens of billions of dollars that only public investment could close.
Figure 23. Projections for ridership and profitability still very unfavorable to long-distance services
2018 2019 2020 2021 2022 2023 NEC
Attendance 12,133,200 12,399,000 12,640,000 12,845,700 13,397,500 13,796,400 Net income (in millions of $)
407.9 445.7 471.3 489.1 492.4 497.6
Net income per passenger ($)
33.6 36 37.3 38.1 36.8 36.1
“State-supported services Attendance 15,622,300 16,098,400 16,512,100 16,883,500 17,249,000 17,646,100 Net income (in millions of $)
-84.1 -83.6 -82.7 -82.3 -77.4 -76.9
Net income per passenger ($)
-5.4 -5.2 -5 -4.9 -4.5 -4.4
Long-distance services Attendance 4,735,500 4,780,400 4,834,800 4,868,800 4,913,800 4,959,200 Net income (in millions of $)
-521.7 -492.7 -463.6 -443.8 -436 -434.7
Net income per passenger ($)
-110.2 -103.1 -95.9 -91.2 -88.7 -87.6
100 From 2007 to 2018, debt was reduced by 64% from $3.3 billion to less than $1.1 billion. In 2018, Amtrak was able to recover nearly 95% of its operating expenses through ticketing revenue and various contracts with transit authorities or local governments. 101 https://media.amtrak.com/2018/11/amtrak-sets-revenue-and-earnings-records-delivers-best-operating-performance-in-company-history/ [accessed 03/04/2019].
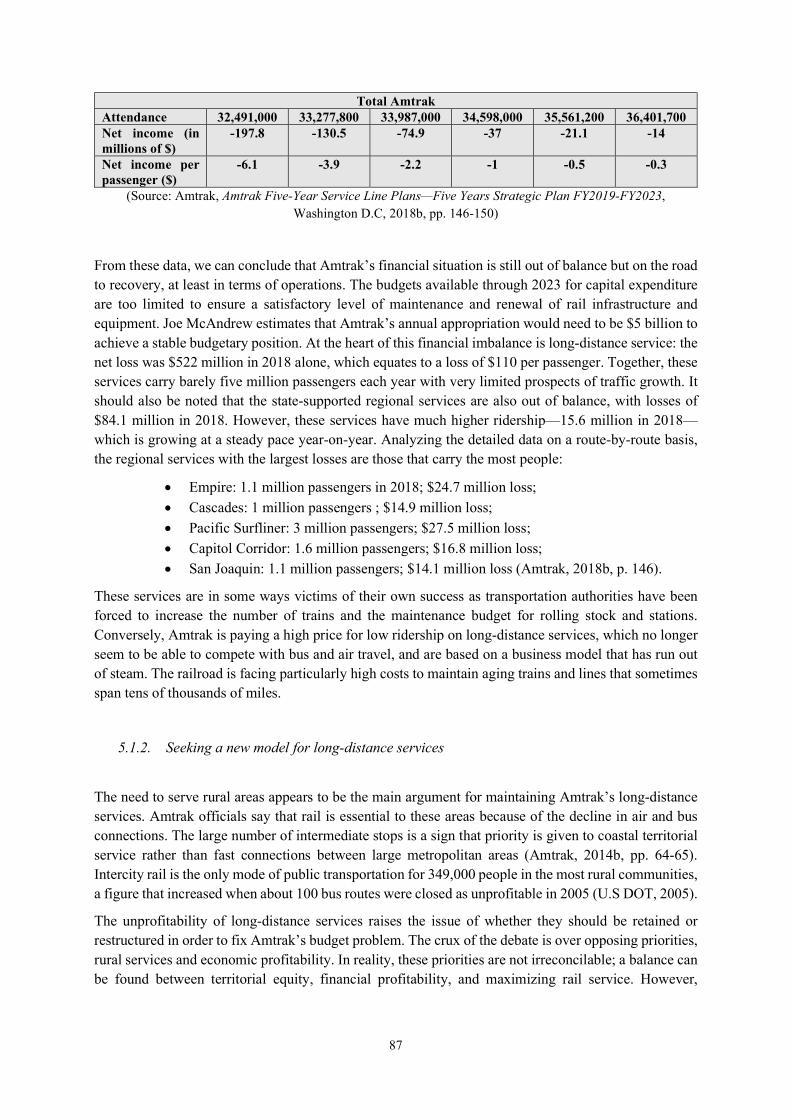
87
Total Amtrak Attendance 32,491,000 33,277,800 33,987,000 34,598,000 35,561,200 36,401,700 Net income (in millions of $)
-197.8 -130.5 -74.9 -37 -21.1 -14
Net income per passenger ($)
-6.1 -3.9 -2.2 -1 -0.5 -0.3
(Source: Amtrak, Amtrak Five-Year Service Line Plans—Five Years Strategic Plan FY2019-FY2023, Washington D.C, 2018b, pp. 146-150)
From these data, we can conclude that Amtrak’s financial situation is still out of balance but on the road to recovery, at least in terms of operations. The budgets available through 2023 for capital expenditure are too limited to ensure a satisfactory level of maintenance and renewal of rail infrastructure and equipment. Joe McAndrew estimates that Amtrak’s annual appropriation would need to be $5 billion to achieve a stable budgetary position. At the heart of this financial imbalance is long-distance service: the net loss was $522 million in 2018 alone, which equates to a loss of $110 per passenger. Together, these services carry barely five million passengers each year with very limited prospects of traffic growth. It should also be noted that the state-supported regional services are also out of balance, with losses of $84.1 million in 2018. However, these services have much higher ridership—15.6 million in 2018—which is growing at a steady pace year-on-year. Analyzing the detailed data on a route-by-route basis, the regional services with the largest losses are those that carry the most people:
Empire: 1.1 million passengers in 2018; $24.7 million loss;
Cascades: 1 million passengers ; $14.9 million loss;
Pacific Surfliner: 3 million passengers; $27.5 million loss;
Capitol Corridor: 1.6 million passengers; $16.8 million loss; San Joaquin: 1.1 million passengers; $14.1 million loss (Amtrak, 2018b, p. 146).
These services are in some ways victims of their own success as transportation authorities have been forced to increase the number of trains and the maintenance budget for rolling stock and stations. Conversely, Amtrak is paying a high price for low ridership on long-distance services, which no longer seem to be able to compete with bus and air travel, and are based on a business model that has run out of steam. The railroad is facing particularly high costs to maintain aging trains and lines that sometimes span tens of thousands of miles.
5.1.2. Seeking a new model for long-distance services
The need to serve rural areas appears to be the main argument for maintaining Amtrak’s long-distance services. Amtrak officials say that rail is essential to these areas because of the decline in air and bus connections. The large number of intermediate stops is a sign that priority is given to coastal territorial service rather than fast connections between large metropolitan areas (Amtrak, 2014b, pp. 64-65). Intercity rail is the only mode of public transportation for 349,000 people in the most rural communities, a figure that increased when about 100 bus routes were closed as unprofitable in 2005 (U.S DOT, 2005).
The unprofitability of long-distance services raises the issue of whether they should be retained or restructured in order to fix Amtrak’s budget problem. The crux of the debate is over opposing priorities, rural services and economic profitability. In reality, these priorities are not irreconcilable; a balance can be found between territorial equity, financial profitability, and maximizing rail service. However,
88
Amtrak and the Federal Department of Transportation have not yet found solutions that would make it possible to resolve the problem of this unbalanced bipartite Amtrak network:
“The economics and consumer demand for long-distance train service do not make it possible to cover operating expenses solely with ticket revenue—it could not exist without the Federal funding to keep it in operation. Rather than subsidizing Amtrak’s losses, we will advocate that the federal government pay Amtrak an agreed price to operate long-distance routes [...]. Like any other federal contractor, money received from the government should be accounted for as revenue from a customer—not subsidy from a public entity.” (Amtrak, 2014c, pp. 26-27)
Starting in 2009, Amtrak embarked on a turnaround strategy for the most loss-making long-distance services. The legislation in the federal PRIIA was the driver for these recovery plans:
Section 207 of the Act establishes performance criteria and standards for all Amtrak lines in the areas of financial performance (loss per passenger-mile, cost recovery rate per passenger-mile, per train-mile), operational performance (average and actual speed, on-time performance at all stations and terminals, cause of delays), and customer satisfaction (on-board and station satisfaction, quality of customer information);
Section 210 of the Act requires Amtrak to implement recovery plans. These are based on nine elements: on-time performance, frequency, feasibility of service change, on-board services, financial contribution of different stakeholders, federal fund requirement, investment requirement, profitability improvement (Amtrak, 2012d, pp. 16-17).
These plans were rolled out over three years, from 2010 to 2012, starting with the most deteriorated lines.102 Beyond the details contained in each of the plans, it is interesting to note that they all have the same structure but also the same shortcomings. Each plan is organized as follows: presentation of the service (technical characteristics, service, ridership, percentage of ridership per market segment), objectives set in the recovery plan, initiatives that can be taken to improve service performance. Three main categories of initiatives common to all lines can be identified:
initiatives concerning rolling stock (modification of sleeper trains, increase in capacity, renewal of trainsets);
initiatives concerning the timetable and the organization of the timetable (evolution of the timetable, harmonization of timetables with other inter-city and metropolitan services, allocation of train paths, relations with host companies);
passenger service initiatives (staff training program, creation of the “Customer Service Performance Metrics Integrator” to better administer and centralize satisfaction surveys) (Amtrak, 2012d, pp. 77-79).
These various measures have improved the performance of these long-distance services, reduced their financial losses, and very modestly increased their patronage. However, they do not address the structural challenges faced by these services. The Government Accountability Office (GAO), in its last
102 Amtrak has developed an overall performance index based on three indicators: CSI (Customer Satisfaction Index), OTP (On-Time Performance), CR (Cost Recovery). In 2010, Sunset Limited (performance index of 44 out of 100), Cardinal (44), Texas Eagle (44), California Zephyr (51) and Capitol Corridor (53) were the first to be affected by this recovery effort. This was followed in 2011 by the Silver Star (54), Lake Shore Limited (57), Palmetto (62), Crescent & Silver Meteor (63) services and in 2012 by plans for the Coast Starlight (63), City of New Orleans (65), Southwest Chief (66), Empire Builder (72) and Auto Train (84).
89
report on Amtrak released in January 2016, took the view that maintaining these continental routes could find dual justification in serving rural and small town areas, and in serving tourist demand. Nevertheless, the GAO identified three major structural risks that have not been addressed by Amtrak in its turnaround strategy: relationships with host airlines that contribute to the deterioration of train punctuality, competition with other modes in both urban and rural areas, and insufficient train frequency, ranging from two daily rotations to only three per week on the least well-endowed services (U.S GAO, 2016, pp. 64-65).
There is a certain incongruity in the way some services are managed. In order to reduce costs and losses on some unprofitable lines, train frequency and the amenities offered to passengers are reduced. However, if the frequency is too low, the service is no longer able to meet demand and continues to lose ridership. This raises the question of the minimum supply required to ensure continuity of service and credibility. Amtrak’s strategy demonstrates a desire to safeguard a truly national network, but some crucial elements are missing, notably a formal analysis of the business model for these routes and of supply and demand in different market segments. It appears that Amtrak’s primary goal is to safeguard existing services by gradually reducing losses and demonstrating its commitment to reform to the federal government, including some members of Congress who are pushing for the closure or privatization of long-distance rail services. The development of a new economic model for long-distance rail also appears to be hampered by this inconsistency of political and financial support, and by cumulative delays in investment. The latest event that may attest to this lack of vision is the decision by Amtrak’s new management team in April 2018 to cut costs associated with onboard dining. Dining cars on two long-distance routes—the Capitol Limited, which runs from Chicago to Washington, D.C., and the Lake Shore Limited, which connects Chicago and New York—were to be eliminated by the end of 2019 and dining options scaled back to resemble the offerings available on airplanes. This decision ignores the practical, touristic, and symbolic role of the dining car on journeys lasting dozens of hours. It runs the risk of depriving the train of this undeniable advantage over the plane or the coach. This change is clearly intended to reduce costs, since Amtrak loses 20 million dollars a year on its restaurant business.103
The debates around long-distance services neglect more in-depth reflection on modal competition and on the competitiveness of rail compared to coach and air.
5.1.3. The question of the competitiveness of conventional rail . Few territories favor the conventional train
In the rhetoric of advocates of the train, the real or anticipated benefits of intercity passenger rail transportation are constantly reiterated and compared with the negative impacts of other modes:
improved air quality (through reduced pollutant emissions);
combating motorway congestion and the upcoming saturation of certain major international airports;
reducing American dependence on cars and oil;
development of a competitive offer for medium-distance journeys compared with air and car (between 90 and 500 miles (150 and 800 km))—80% of journeys over 100 miles (160
103 S. Gulliver, “How to lose money on $9.50 cheeseburgers,” The Economist, October 23, 2012; E. Anzilotti, “Amtrak is swapping dining cars on some trains for airplane food,” FastCompany, April 21, 2018.
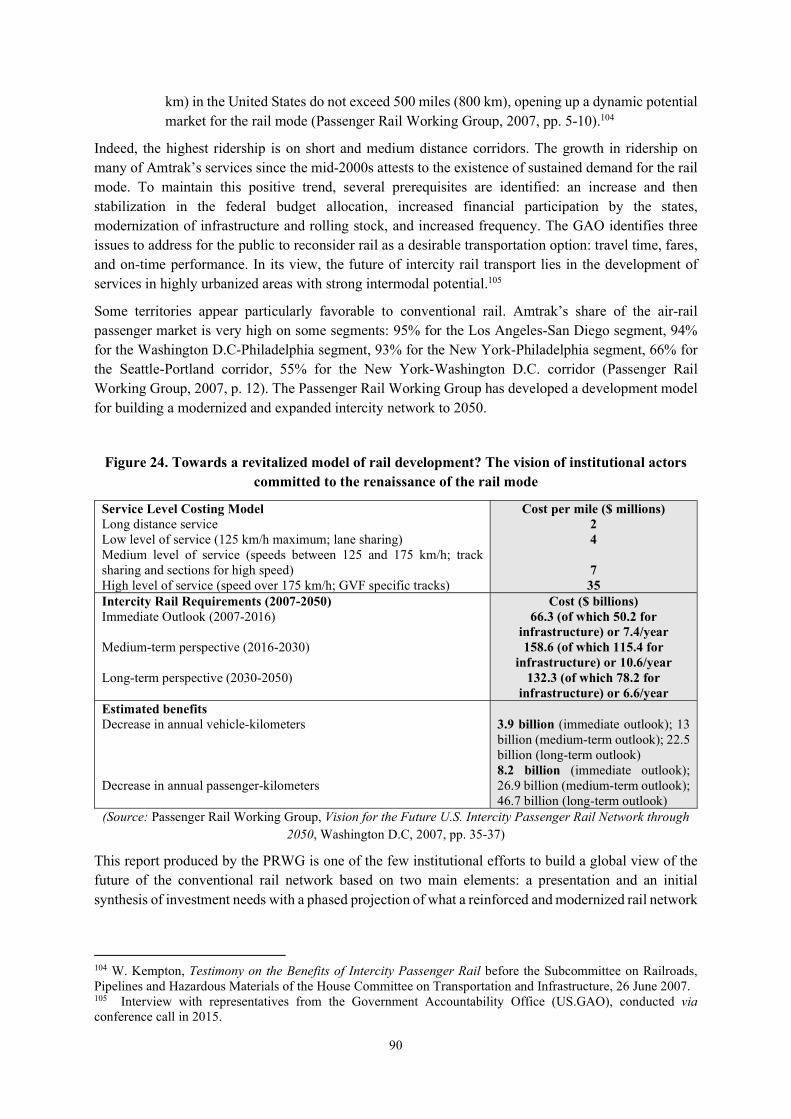
90
km) in the United States do not exceed 500 miles (800 km), opening up a dynamic potential market for the rail mode (Passenger Rail Working Group, 2007, pp. 5-10).104
Indeed, the highest ridership is on short and medium distance corridors. The growth in ridership on many of Amtrak’s services since the mid-2000s attests to the existence of sustained demand for the rail mode. To maintain this positive trend, several prerequisites are identified: an increase and then stabilization in the federal budget allocation, increased financial participation by the states, modernization of infrastructure and rolling stock, and increased frequency. The GAO identifies three issues to address for the public to reconsider rail as a desirable transportation option: travel time, fares, and on-time performance. In its view, the future of intercity rail transport lies in the development of services in highly urbanized areas with strong intermodal potential.105
Some territories appear particularly favorable to conventional rail. Amtrak’s share of the air-rail passenger market is very high on some segments: 95% for the Los Angeles-San Diego segment, 94% for the Washington D.C-Philadelphia segment, 93% for the New York-Philadelphia segment, 66% for the Seattle-Portland corridor, 55% for the New York-Washington D.C. corridor (Passenger Rail Working Group, 2007, p. 12). The Passenger Rail Working Group has developed a development model for building a modernized and expanded intercity network to 2050.
Figure 24. Towards a revitalized model of rail development? The vision of institutional actors committed to the renaissance of the rail mode
Service Level Costing Model Long distance service Low level of service (125 km/h maximum; lane sharing) Medium level of service (speeds between 125 and 175 km/h; track sharing and sections for high speed) High level of service (speed over 175 km/h; GVF specific tracks)
Cost per mile ($ millions) 2 4
7 35
Intercity Rail Requirements (2007-2050) Immediate Outlook (2007-2016) Medium-term perspective (2016-2030)
Long-term perspective (2030-2050)
Cost ($ billions) 66.3 (of which 50.2 for
infrastructure) or 7.4/year 158.6 (of which 115.4 for
infrastructure) or 10.6/year 132.3 (of which 78.2 for
infrastructure) or 6.6/year Estimated benefits Decrease in annual vehicle-kilometers
Decrease in annual passenger-kilometers
3.9 billion (immediate outlook); 13 billion (medium-term outlook); 22.5 billion (long-term outlook) 8.2 billion (immediate outlook); 26.9 billion (medium-term outlook); 46.7 billion (long-term outlook)
(Source: Passenger Rail Working Group, Vision for the Future U.S. Intercity Passenger Rail Network through 2050, Washington D.C, 2007, pp. 35-37)
This report produced by the PRWG is one of the few institutional efforts to build a global view of the future of the conventional rail network based on two main elements: a presentation and an initial synthesis of investment needs with a phased projection of what a reinforced and modernized rail network
104 W. Kempton, Testimony on the Benefits of Intercity Passenger Rail before the Subcommittee on Railroads, Pipelines and Hazardous Materials of the House Committee on Transportation and Infrastructure, 26 June 2007. 105 Interview with representatives from the Government Accountability Office (US.GAO), conducted via conference call in 2015.
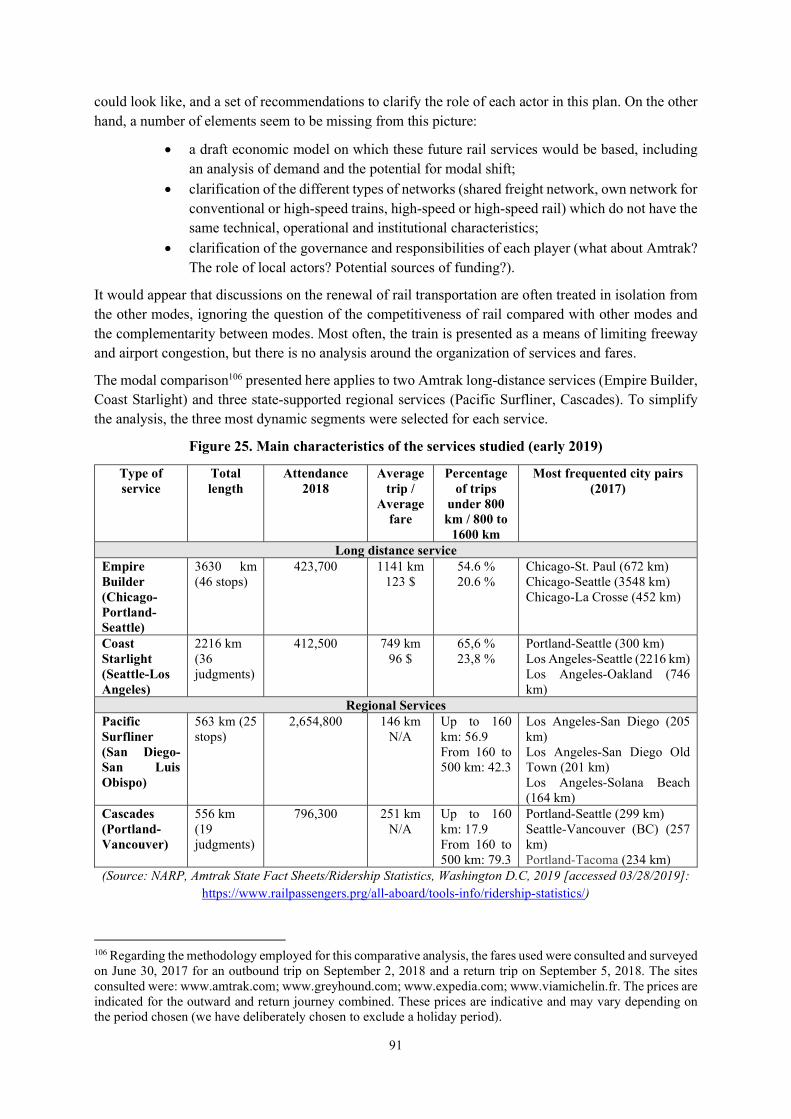
91
could look like, and a set of recommendations to clarify the role of each actor in this plan. On the other hand, a number of elements seem to be missing from this picture:
a draft economic model on which these future rail services would be based, including an analysis of demand and the potential for modal shift;
clarification of the different types of networks (shared freight network, own network for conventional or high-speed trains, high-speed or high-speed rail) which do not have the same technical, operational and institutional characteristics;
clarification of the governance and responsibilities of each player (what about Amtrak? The role of local actors? Potential sources of funding?).
It would appear that discussions on the renewal of rail transportation are often treated in isolation from the other modes, ignoring the question of the competitiveness of rail compared with other modes and the complementarity between modes. Most often, the train is presented as a means of limiting freeway and airport congestion, but there is no analysis around the organization of services and fares.
The modal comparison106 presented here applies to two Amtrak long-distance services (Empire Builder, Coast Starlight) and three state-supported regional services (Pacific Surfliner, Cascades). To simplify the analysis, the three most dynamic segments were selected for each service.
Figure 25. Main characteristics of the services studied (early 2019)
Type of service
Total length
Attendance 2018
Average trip /
Average fare
Percentage of trips
under 800 km / 800 to
1600 km
Most frequented city pairs (2017)
Long distance service Empire Builder (Chicago-Portland-Seattle)
3630 km (46 stops)
423,700 1141 km 123 $
54.6 % 20.6 %
Chicago-St. Paul (672 km) Chicago-Seattle (3548 km) Chicago-La Crosse (452 km)
Coast Starlight (Seattle-Los Angeles)
2216 km (36 judgments)
412,500 749 km 96 $
65,6 % 23,8 %
Portland-Seattle (300 km) Los Angeles-Seattle (2216 km) Los Angeles-Oakland (746 km)
Regional Services Pacific Surfliner (San Diego-San Luis Obispo)
563 km (25 stops)
2,654,800 146 km N/A
Up to 160 km: 56.9 From 160 to 500 km: 42.3
Los Angeles-San Diego (205 km) Los Angeles-San Diego Old Town (201 km) Los Angeles-Solana Beach (164 km)
Cascades (Portland-Vancouver)
556 km (19 judgments)
796,300 251 km N/A
Up to 160 km: 17.9 From 160 to 500 km: 79.3
Portland-Seattle (299 km) Seattle-Vancouver (BC) (257 km) Portland-Tacoma (234 km)
(Source: NARP, Amtrak State Fact Sheets/Ridership Statistics, Washington D.C, 2019 [accessed 03/28/2019]: https://www.railpassengers.prg/all-aboard/tools-info/ridership-statistics/)
106 Regarding the methodology employed for this comparative analysis, the fares used were consulted and surveyed on June 30, 2017 for an outbound trip on September 2, 2018 and a return trip on September 5, 2018. The sites consulted were: www.amtrak.com; www.greyhound.com; www.expedia.com; www.viamichelin.fr. The prices are indicated for the outward and return journey combined. These prices are indicative and may vary depending on the period chosen (we have deliberately chosen to exclude a holiday period).
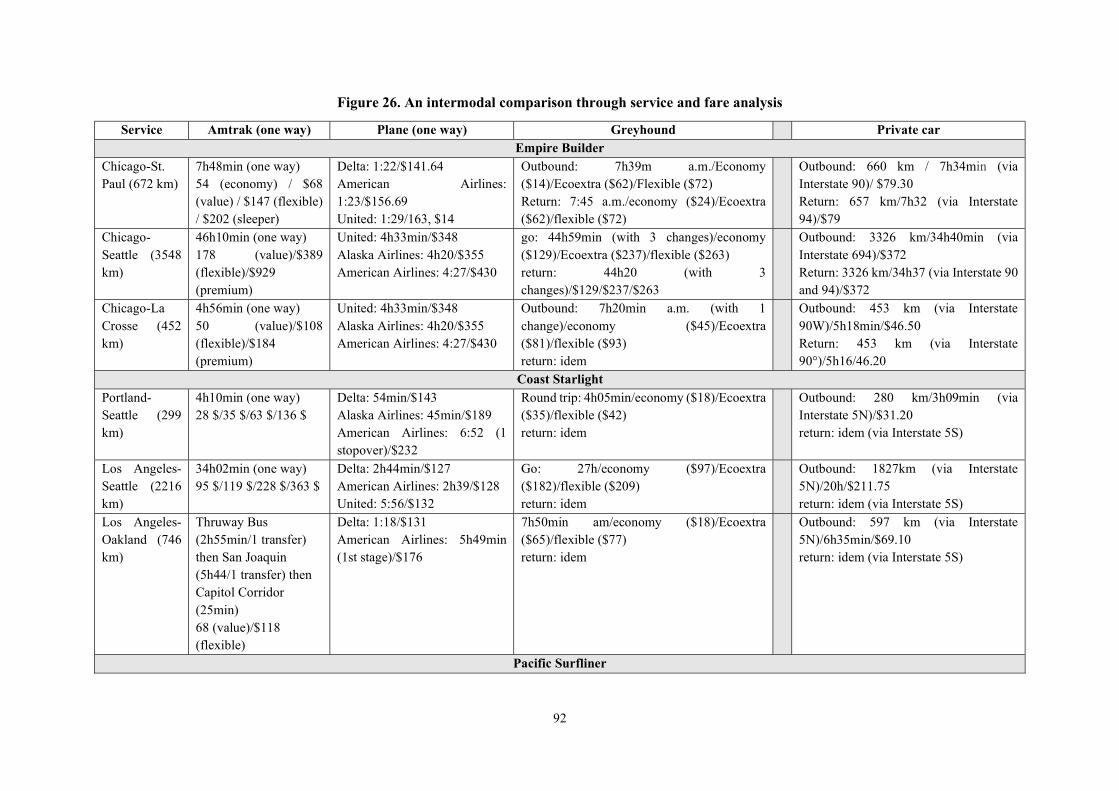
92
Figure 26. An intermodal comparison through service and fare analysis
Service Amtrak (one way) Plane (one way) Greyhound Private car Empire Builder
Chicago-St. Paul (672 km)
7h48min (one way) 54 (economy) / $68 (value) / $147 (flexible) / $202 (sleeper)
Delta: 1:22/$141.64 American Airlines: 1:23/$156.69 United: 1:29/163, $14
Outbound: 7h39m a.m./Economy ($14)/Ecoextra ($62)/Flexible ($72) Return: 7:45 a.m./economy ($24)/Ecoextra ($62)/flexible ($72)
Outbound: 660 km / 7h34min (via Interstate 90)/ $79.30 Return: 657 km/7h32 (via Interstate 94)/$79
Chicago-Seattle (3548 km)
46h10min (one way) 178 (value)/$389 (flexible)/$929 (premium)
United: 4h33min/$348 Alaska Airlines: 4h20/$355 American Airlines: 4:27/$430
go: 44h59min (with 3 changes)/economy ($129)/Ecoextra ($237)/flexible ($263) return: 44h20 (with 3 changes)/$129/$237/$263
Outbound: 3326 km/34h40min (via Interstate 694)/$372 Return: 3326 km/34h37 (via Interstate 90 and 94)/$372
Chicago-La Crosse (452 km)
4h56min (one way) 50 (value)/$108 (flexible)/$184 (premium)
United: 4h33min/$348 Alaska Airlines: 4h20/$355 American Airlines: 4:27/$430
Outbound: 7h20min a.m. (with 1 change)/economy ($45)/Ecoextra ($81)/flexible ($93) return: idem
Outbound: 453 km (via Interstate 90W)/5h18min/$46.50 Return: 453 km (via Interstate 90°)/5h16/46.20
Coast Starlight
Portland-Seattle (299 km)
4h10min (one way) 28 $/35 $/63 $/136 $
Delta: 54min/$143 Alaska Airlines: 45min/$189 American Airlines: 6:52 (1 stopover)/$232
Round trip: 4h05min/economy ($18)/Ecoextra ($35)/flexible ($42) return: idem
Outbound: 280 km/3h09min (via Interstate 5N)/$31.20 return: idem (via Interstate 5S)
Los Angeles-Seattle (2216 km)
34h02min (one way) 95 $/119 $/228 $/363 $
Delta: 2h44min/$127 American Airlines: 2h39/$128 United: 5:56/$132
Go: 27h/economy ($97)/Ecoextra ($182)/flexible ($209) return: idem
Outbound: 1827km (via Interstate 5N)/20h/$211.75 return: idem (via Interstate 5S)
Los Angeles-Oakland (746 km)
Thruway Bus (2h55min/1 transfer) then San Joaquin (5h44/1 transfer) then Capitol Corridor (25min) 68 (value)/$118 (flexible)
Delta: 1:18/$131 American Airlines: 5h49min (1st stage)/$176
7h50min am/economy ($18)/Ecoextra ($65)/flexible ($77) return: idem
Outbound: 597 km (via Interstate 5N)/6h35min/$69.10 return: idem (via Interstate 5S)
Pacific Surfliner
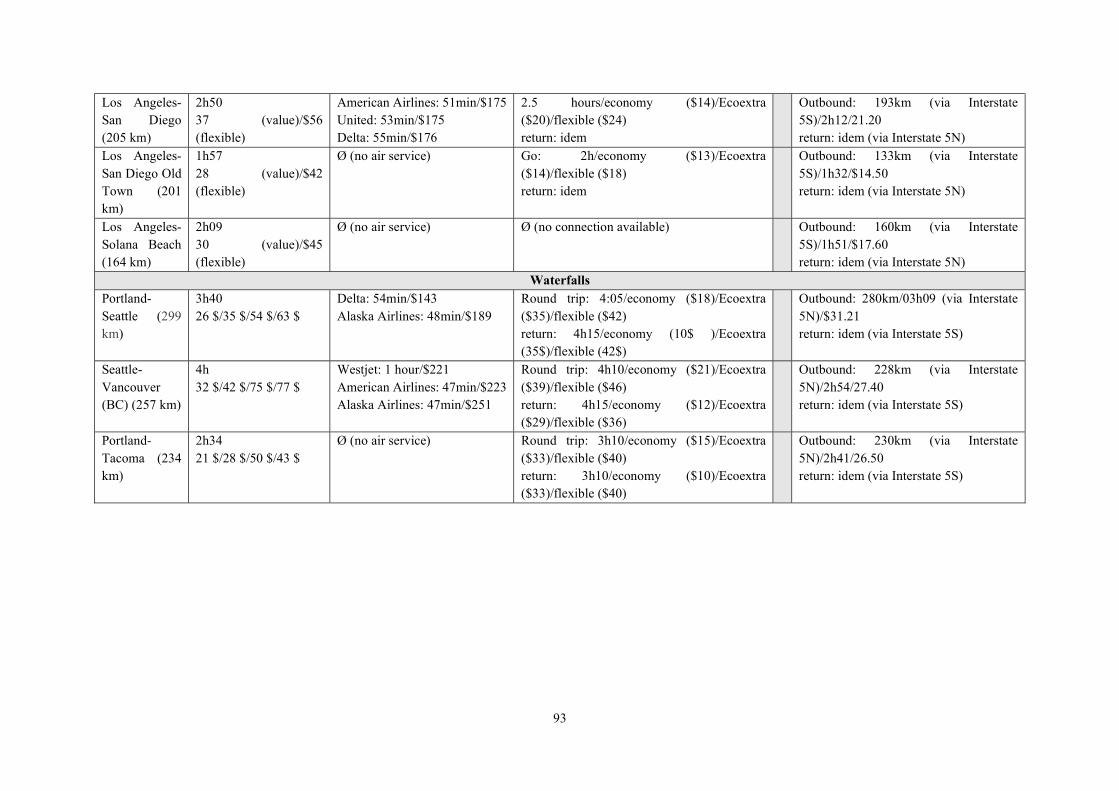
93
Los Angeles-San Diego (205 km)
2h50 37 (value)/$56 (flexible)
American Airlines: 51min/$175 United: 53min/$175 Delta: 55min/$176
2.5 hours/economy ($14)/Ecoextra ($20)/flexible ($24) return: idem
Outbound: 193km (via Interstate 5S)/2h12/21.20 return: idem (via Interstate 5N)
Los Angeles-San Diego Old Town (201 km)
1h57 28 (value)/$42 (flexible)
Ø (no air service) Go: 2h/economy ($13)/Ecoextra ($14)/flexible ($18) return: idem
Outbound: 133km (via Interstate 5S)/1h32/$14.50 return: idem (via Interstate 5N)
Los Angeles-Solana Beach (164 km)
2h09 30 (value)/$45 (flexible)
Ø (no air service) Ø (no connection available) Outbound: 160km (via Interstate 5S)/1h51/$17.60 return: idem (via Interstate 5N)
Waterfalls Portland-Seattle (299 km)
3h40 26 $/35 $/54 $/63 $
Delta: 54min/$143 Alaska Airlines: 48min/$189
Round trip: 4:05/economy ($18)/Ecoextra ($35)/flexible ($42) return: 4h15/economy (10$ )/Ecoextra (35$)/flexible (42$)
Outbound: 280km/03h09 (via Interstate 5N)/$31.21 return: idem (via Interstate 5S)
Seattle-Vancouver (BC) (257 km)
4h 32 $/42 $/75 $/77 $
Westjet: 1 hour/$221 American Airlines: 47min/$223 Alaska Airlines: 47min/$251
Round trip: 4h10/economy ($21)/Ecoextra ($39)/flexible ($46) return: 4h15/economy ($12)/Ecoextra ($29)/flexible ($36)
Outbound: 228km (via Interstate 5N)/2h54/27.40 return: idem (via Interstate 5S)
Portland-Tacoma (234 km)
2h34 21 $/28 $/50 $/43 $
Ø (no air service) Round trip: 3h10/economy ($15)/Ecoextra ($33)/flexible ($40) return: 3h10/economy ($10)/Ecoextra ($33)/flexible ($40)
Outbound: 230km (via Interstate 5N)/2h41/26.50 return: idem (via Interstate 5S)
94
In addition to this comparative work, we can provide additional matter for thought on the low-cost airlines which are potential competitors for the train:107
For the San Francisco-Los Angeles corridor (1 hour 20 minutes): fares range from $59 to $224 depending on the options chosen for the outward and return journeys;
for the San Francisco-San Diego corridor (1.5 hour trip): fares range from $69 to $252 depending on the options chosen;
for the San Francisco-Burbank corridor (1 hour 10 minutes): fares range from $59 to $224 depending on the options chosen.
The comparison of fares and travel times between different modes of transportation on identified sections of the route highlights the comparative advantages of each mode according to distance, and the potential of rail in certain corridors. The analysis of the longest sections on the three long-distance services considered shows the poor performance of rail compared to air travel in terms of price and travel time, and compared with coach travel where the fares are particularly attractive. This intermodal comparison illustrates in part why Amtrak’s long-haul business model is unbalanced and perhaps obsolete. Applying a more attractive fare policy, which would reduce ticketing revenues, and promoting these routes in particular to the tourist sector by highlighting the pleasure of “slow” travel through vast natural landscapes could guarantee the future of these services, which will never be able to compete with the airlines on travel time. This assumes that travel conditions and on-board services remain sufficiently attractive. On the other hand, conventional rail services have a real comparative advantage over medium distances, especially between 90 and 300 miles (150 and 500 km), whereas below 90 miles the private automobile still has an undeniable advantage. For this reason, recent investments by Amtrak and the states in state-supported services, particularly under the HSIPR program, have been concentrated on corridors serving certain U.S. megaregions. Maintaining the competitiveness of the train on this scale requires better coordination of timetables and fares with the metropolitan and regional transportation networks, and greater reliability of service, particularly in terms of punctuality. There is also information that is not included in this comparative table for the sake of readability, which nevertheless needs to be taken into account: the extra charge for checked baggage on domestic flights, the time needed for travelers to get to the airport (check-in, baggage drop-off, security), to access the airport, and to reach the final destination, the negative effects of freeway congestion on journey times by car, and the consequences of the gradual overloading of the major US airports (delays, cancellations).
The Amtrak company manages lines with very diverse geographical, technical, and operational profiles based on very disparate business models. The main reason for Amtrak’s structural imbalance is the existence of these continental scale long-distance services, which still play an important role in terms of accessibility and service in rural and sparsely populated areas. The company’s strategy for more than a decade has been to achieve financial equilibrium and rapid debt reduction through the continuous postponement of investments and through cost-cutting measures, which have reduced or even degraded long-distance rail services without containing the losses associated with them. The various parties involved in federal railroad policy are still trying to establish a new business model, without going so far as to accept the closure of certain lines, while medium-distance rail corridors are developing and have to meet ever-increasing demand under highly restricted operational, institutional, and financial conditions. The fact remains that megalopolitan or “megaregional” corridors are the optimal scale for
107 The site www.expedia.com where we obtained the prices of the traditional airlines does not provide the fares charged by the LCC (low-cost carriers). One company is used here: Southwest Airlines (for the western United States) whose fares correspond to the same period as in the comparison table, taken from the company’s website www.southwest.com.
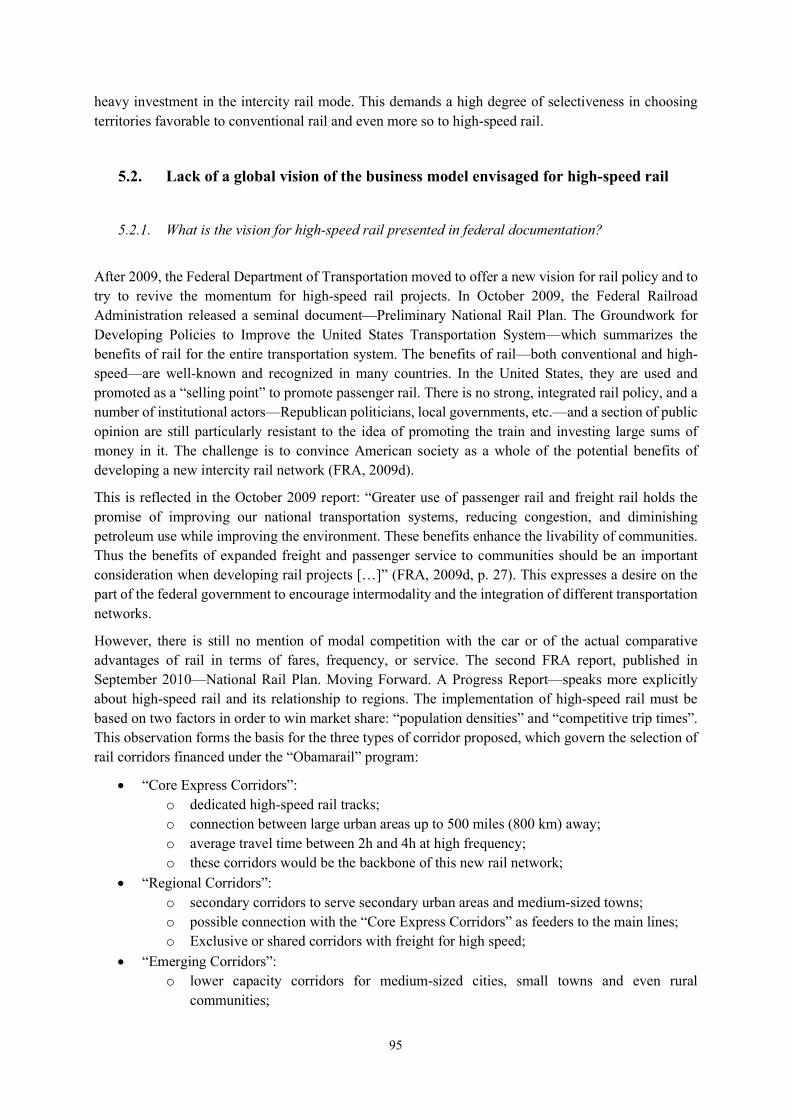
95
heavy investment in the intercity rail mode. This demands a high degree of selectiveness in choosing territories favorable to conventional rail and even more so to high-speed rail.
5.2. Lack of a global vision of the business model envisaged for high-speed rail
5.2.1. What is the vision for high-speed rail presented in federal documentation?
After 2009, the Federal Department of Transportation moved to offer a new vision for rail policy and to try to revive the momentum for high-speed rail projects. In October 2009, the Federal Railroad Administration released a seminal document—Preliminary National Rail Plan. The Groundwork for Developing Policies to Improve the United States Transportation System—which summarizes the benefits of rail for the entire transportation system. The benefits of rail—both conventional and high-speed—are well-known and recognized in many countries. In the United States, they are used and promoted as a “selling point” to promote passenger rail. There is no strong, integrated rail policy, and a number of institutional actors—Republican politicians, local governments, etc.—and a section of public opinion are still particularly resistant to the idea of promoting the train and investing large sums of money in it. The challenge is to convince American society as a whole of the potential benefits of developing a new intercity rail network (FRA, 2009d).
This is reflected in the October 2009 report: “Greater use of passenger rail and freight rail holds the promise of improving our national transportation systems, reducing congestion, and diminishing petroleum use while improving the environment. These benefits enhance the livability of communities. Thus the benefits of expanded freight and passenger service to communities should be an important consideration when developing rail projects […]” (FRA, 2009d, p. 27). This expresses a desire on the part of the federal government to encourage intermodality and the integration of different transportation networks.
However, there is still no mention of modal competition with the car or of the actual comparative advantages of rail in terms of fares, frequency, or service. The second FRA report, published in September 2010—National Rail Plan. Moving Forward. A Progress Report—speaks more explicitly about high-speed rail and its relationship to regions. The implementation of high-speed rail must be based on two factors in order to win market share: “population densities” and “competitive trip times”. This observation forms the basis for the three types of corridor proposed, which govern the selection of rail corridors financed under the “Obamarail” program:
“Core Express Corridors”: o dedicated high-speed rail tracks; o connection between large urban areas up to 500 miles (800 km) away; o average travel time between 2h and 4h at high frequency; o these corridors would be the backbone of this new rail network;
“Regional Corridors”: o secondary corridors to serve secondary urban areas and medium-sized towns; o possible connection with the “Core Express Corridors” as feeders to the main lines; o Exclusive or shared corridors with freight for high speed;
“Emerging Corridors”: o lower capacity corridors for medium-sized cities, small towns and even rural
communities;
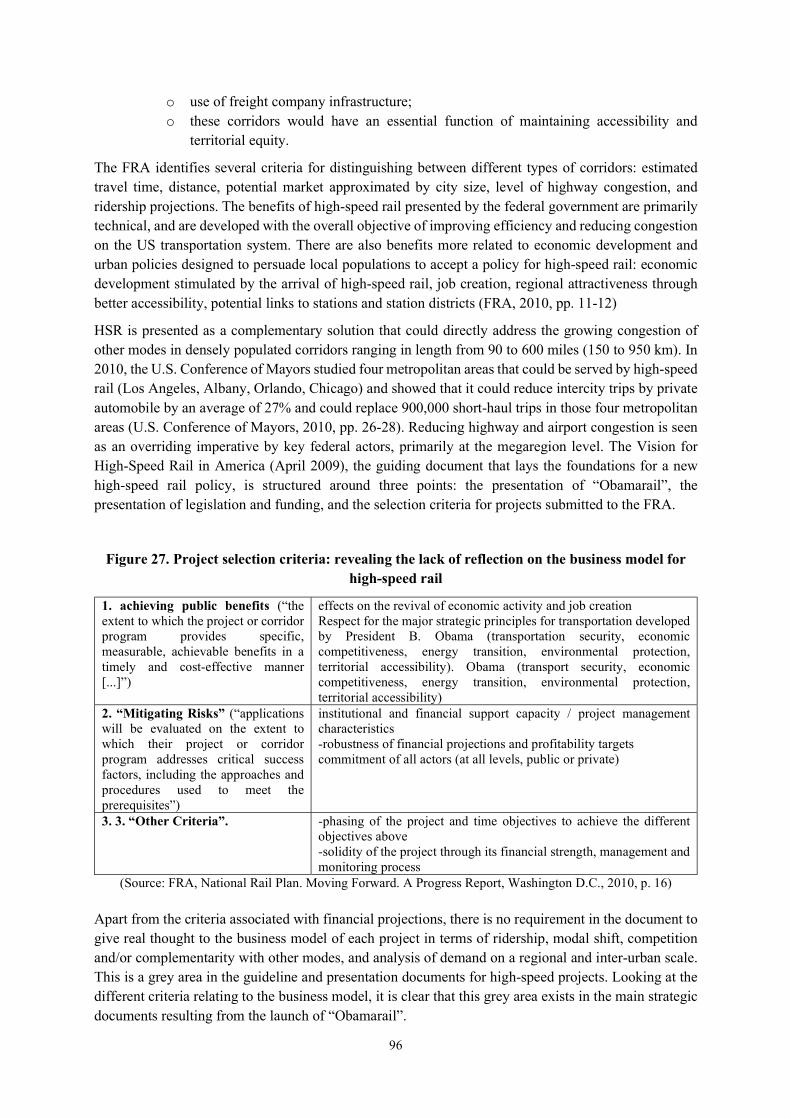
96
o use of freight company infrastructure; o these corridors would have an essential function of maintaining accessibility and
territorial equity.
The FRA identifies several criteria for distinguishing between different types of corridors: estimated travel time, distance, potential market approximated by city size, level of highway congestion, and ridership projections. The benefits of high-speed rail presented by the federal government are primarily technical, and are developed with the overall objective of improving efficiency and reducing congestion on the US transportation system. There are also benefits more related to economic development and urban policies designed to persuade local populations to accept a policy for high-speed rail: economic development stimulated by the arrival of high-speed rail, job creation, regional attractiveness through better accessibility, potential links to stations and station districts (FRA, 2010, pp. 11-12)
HSR is presented as a complementary solution that could directly address the growing congestion of other modes in densely populated corridors ranging in length from 90 to 600 miles (150 to 950 km). In 2010, the U.S. Conference of Mayors studied four metropolitan areas that could be served by high-speed rail (Los Angeles, Albany, Orlando, Chicago) and showed that it could reduce intercity trips by private automobile by an average of 27% and could replace 900,000 short-haul trips in those four metropolitan areas (U.S. Conference of Mayors, 2010, pp. 26-28). Reducing highway and airport congestion is seen as an overriding imperative by key federal actors, primarily at the megaregion level. The Vision for High-Speed Rail in America (April 2009), the guiding document that lays the foundations for a new high-speed rail policy, is structured around three points: the presentation of “Obamarail”, the presentation of legislation and funding, and the selection criteria for projects submitted to the FRA.
Figure 27. Project selection criteria: revealing the lack of reflection on the business model for high-speed rail
1. achieving public benefits (“the extent to which the project or corridor program provides specific, measurable, achievable benefits in a timely and cost-effective manner [...]”)
effects on the revival of economic activity and job creation Respect for the major strategic principles for transportation developed by President B. Obama (transportation security, economic competitiveness, energy transition, environmental protection, territorial accessibility). Obama (transport security, economic competitiveness, energy transition, environmental protection, territorial accessibility)
2. “Mitigating Risks” (“applications will be evaluated on the extent to which their project or corridor program addresses critical success factors, including the approaches and procedures used to meet the prerequisites”)
institutional and financial support capacity / project management characteristics -robustness of financial projections and profitability targets commitment of all actors (at all levels, public or private)
3. 3. “Other Criteria”. -phasing of the project and time objectives to achieve the different objectives above -solidity of the project through its financial strength, management and monitoring process
(Source: FRA, National Rail Plan. Moving Forward. A Progress Report, Washington D.C., 2010, p. 16)
Apart from the criteria associated with financial projections, there is no requirement in the document to give real thought to the business model of each project in terms of ridership, modal shift, competition and/or complementarity with other modes, and analysis of demand on a regional and inter-urban scale. This is a grey area in the guideline and presentation documents for high-speed projects. Looking at the different criteria relating to the business model, it is clear that this grey area exists in the main strategic documents resulting from the launch of “Obamarail”.
97
As the researchers (S. Bazin, C. Beckerich, M. Delaplace, C. Blanquart and L. Vandenbossche, 2011) note in their review of the literature on the effects of high-speed rail (Fig. 33), analysis of the conditions needed for the emergence and realization of territorial and economic effects—demand conditions, economic context, characteristics of HSR services, intermodal competition—is often overlooked or insufficiently taken into account in the non-academic literature. An examination of the federal grey literature on the subject supports this observation. All the factors above should influence public investment decisions and guarantee a degree of financial sustainability in projects. The components of the economic model of each new high-speed service (frequency, service, demand, speed, quality of the offer, market positioning, type of network, etc.) contribute to the commercial success of a new service and to the emergence of structuring effects of varying impact in the territories served.
This lack of clarity regarding the economic model for high-speed rail prompted the GAO to publish a particularly severe report on the challenges that the federal government must tackle to establish a clear and sustainable strategy for high-speed rail. First, there is the issue of the economic viability of high-speed rail and the uncertainty of ridership on future lines:
“Services characteristics relative to other travel alternatives—such as travel time and price competitiveness, high frequency, greater reliability, and safety—are also critical in attracting riders [...]. While several U.S. corridors exhibit characteristics that suggest potential economic viability, decision makers have faced difficulties in ascertaining whether any specific proposed line will be viable due to uncertainties in how accurately project sponsors forecast riders and estimate costs, and to the lack of agreement and standards regarding how a project’s public benefits should be valued and assessed” (U.S GAO, 2009, p. 12).
The GAO highlights some basic criteria for the economic viability of an HSR project: several densely populated metropolises in the same regional area, demographic and economic projections, distance between the main cities, strong economic and cultural links between these different cities, interdependence between the cities, share of business travelers and tourists, etc.
To achieve commercial success and become a competitive mode, high-speed services must be located in corridors 185 to 500 miles (300 to 800 km) long and offer conditions (travel time, price, frequency of service) that can compete with short-haul air services, or in corridors of less than 155 miles (250 km) that face significant highway congestion (Fig. 34). According to Amtrak, the New York-Philadelphia segment ranks third in terms of ridership because the high-speed Acela Express service is seen as a quality alternative to a highly congested highway system (U.S. GAO, 2009, p. 15). Furthermore, the report proposes investment in metropolitan areas with the highest potential for modal shift between air and rail—citing the example of modal shift figures in certain corridors in Japan, Spain or France—and which have airport infrastructures where capacity is on the way to being exceeded. Beyond issues around the state of the transportation system, there is also the question of fares, which has a particularly important impact on the future competitiveness of high-speed rail. Trains will not necessarily be more competitive than coaches or private cars in terms of price, but they can compensate for this through the quality of the experience and significant reductions in travel time. If high-speed services are publicly funded, the debate over pricing policy—i.e. whether prices should be set to maximize revenues or to be competitive with other modes and accessible to a wide population—is particularly legitimate (U.S. GAO, 2009, p. 19). However, focusing on ticket prices raises the broader question of the generalized cost of travel—financial cost and time budget—which can have a major impact on competition between modes. According to GAO analysts, the generalized cost of driving alone is lower in the United States than in other countries (France, Spain, Japan) because of much lower gasoline prices and relatively limited tolls. This is a significant risk for the developers of HSR projects.
98
Finally, three final elements are identified by the GAO as meriting consideration in the development of high-speed line projects:
complementarity with urban and regional transportation networks (with the goal of creating a seamless network), and a key question: will passengers have to use the car to get to the station or to finish their journey?
the reliability of the transportation service (with a poor punctuality record on the conventional network);
the real costs of construction (with an existing network that is not technically suitable for high-speed trains, which require specific infrastructure).
The Government Accountability Office, after analyzing some fifteen high-speed projects, criticized the quality of thinking about the business model for each project, as well as the particularly optimistic cost-benefit and ridership projections (U.S. GAO, 2009, pp. 24-27). This new approach to high-speed rail, encouraged by the presidential initiative of 2009, was a sign of a renewal of institutional thinking despite a clear lack of a technical and economic culture around the subject, since the United States is relatively new to the concept of high-speed rail.
5.2.2. High-speed corridors in the United States: potential, competitiveness, profitability. Based on America 2050: a first attempt to reflect on the relevance of high-speed rail in the United States.
The studies produced by Petra Todorovich and Yoav Hagler for the America 2050 think tank, Where High-Speed Rail Works Best (2009) and High-Speed Rail in America (2011), provides a multi-criteria evaluation of a number of rail corridors to assess the economic and territorial relevance of high-speed rail in the United States (Tab. 39).108 They propose that federal funds should be invested in high-speed rail, starting with the most appropriate corridors as identified by an index established using a set of specific criteria. The objective is to achieve rapid commercial success in order to persuade political authorities and private investors to support a sustainable investment program. The most relevant rail corridors for high-speed rail, where the business case for this new mode could be strongest, are all located in the eleven US megaregions, which account for 70% of the country’s population and wealth creation. The comparative advantages of high-speed rail depend on several socio-economic and demographic factors: “residential and employment density”, “local transit connectivity”, “composition of the labor market”, “connecting transportation options”, “regional congestion on the road network”, “trip time and frequency” (Todorovich and Hagler, 2009, pp 4-11).
108 This report is a synthesis of an analysis of 27,000 city pairs based on several criteria: regional population within 25 miles, employment in the Central Business District, transit connectivity, employment and population, city population within 15 km, city employment within 10 miles, regional population growth, regional passenger air market, access to urban transportation, congestion, proportion of tertiary and finance jobs, proportion of tourism jobs. The authors of this report decided to calculate an index of relevance in each corridor based on the above criteria. The reason for this is that there is a serious shortage of statistical data in the United States on intercity travel. For air travel, data are available on airport arrival and departure flows but not on passenger trips. Data on intercity travel by private car are dated, as the last statistical survey was conducted in 1995 (American Travel Survey). There is no statistical data on passengers using the Amtrak network, only ridership figures for each line and station.
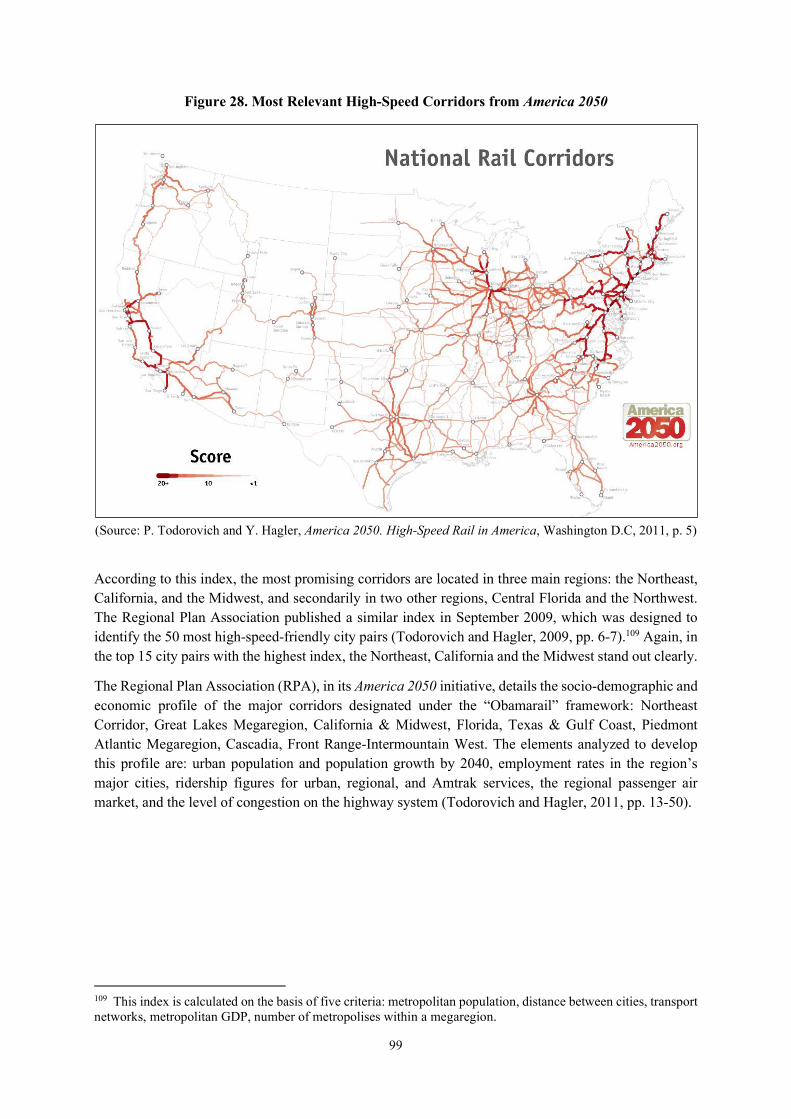
99
Figure 28. Most Relevant High-Speed Corridors from America 2050
(Source: P. Todorovich and Y. Hagler, America 2050. High-Speed Rail in America, Washington D.C, 2011, p. 5)
According to this index, the most promising corridors are located in three main regions: the Northeast, California, and the Midwest, and secondarily in two other regions, Central Florida and the Northwest. The Regional Plan Association published a similar index in September 2009, which was designed to identify the 50 most high-speed-friendly city pairs (Todorovich and Hagler, 2009, pp. 6-7).109 Again, in the top 15 city pairs with the highest index, the Northeast, California and the Midwest stand out clearly.
The Regional Plan Association (RPA), in its America 2050 initiative, details the socio-demographic and economic profile of the major corridors designated under the “Obamarail” framework: Northeast Corridor, Great Lakes Megaregion, California & Midwest, Florida, Texas & Gulf Coast, Piedmont Atlantic Megaregion, Cascadia, Front Range-Intermountain West. The elements analyzed to develop this profile are: urban population and population growth by 2040, employment rates in the region’s major cities, ridership figures for urban, regional, and Amtrak services, the regional passenger air market, and the level of congestion on the highway system (Todorovich and Hagler, 2011, pp. 13-50).
109 This index is calculated on the basis of five criteria: metropolitan population, distance between cities, transport networks, metropolitan GDP, number of metropolises within a megaregion.
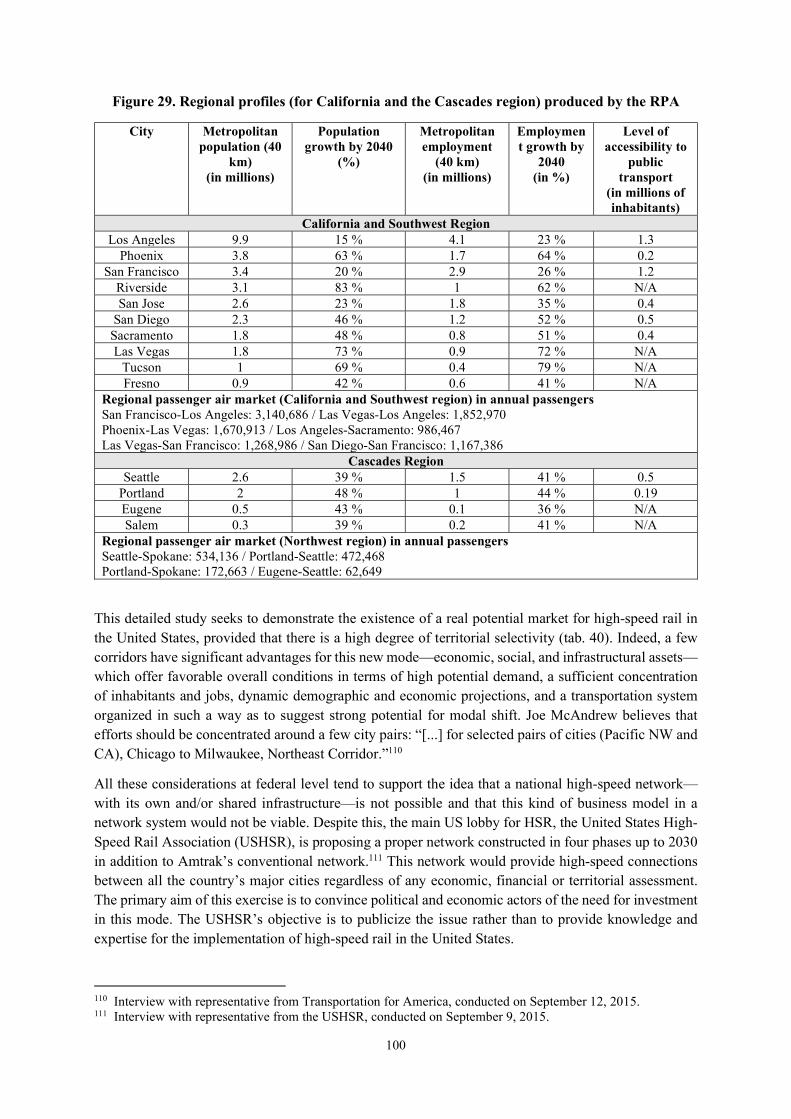
100
Figure 29. Regional profiles (for California and the Cascades region) produced by the RPA
City Metropolitan population (40
km) (in millions)
Population growth by 2040
(%)
Metropolitan employment
(40 km) (in millions)
Employment growth by
2040 (in %)
Level of accessibility to
public transport
(in millions of inhabitants)
California and Southwest Region Los Angeles 9.9 15 % 4.1 23 % 1.3
Phoenix 3.8 63 % 1.7 64 % 0.2 San Francisco 3.4 20 % 2.9 26 % 1.2
Riverside 3.1 83 % 1 62 % N/A San Jose 2.6 23 % 1.8 35 % 0.4
San Diego 2.3 46 % 1.2 52 % 0.5 Sacramento 1.8 48 % 0.8 51 % 0.4 Las Vegas 1.8 73 % 0.9 72 % N/A
Tucson 1 69 % 0.4 79 % N/A Fresno 0.9 42 % 0.6 41 % N/A
Regional passenger air market (California and Southwest region) in annual passengers San Francisco-Los Angeles: 3,140,686 / Las Vegas-Los Angeles: 1,852,970 Phoenix-Las Vegas: 1,670,913 / Los Angeles-Sacramento: 986,467 Las Vegas-San Francisco: 1,268,986 / San Diego-San Francisco: 1,167,386
Cascades Region Seattle 2.6 39 % 1.5 41 % 0.5
Portland 2 48 % 1 44 % 0.19 Eugene 0.5 43 % 0.1 36 % N/A Salem 0.3 39 % 0.2 41 % N/A
Regional passenger air market (Northwest region) in annual passengers Seattle-Spokane: 534,136 / Portland-Seattle: 472,468 Portland-Spokane: 172,663 / Eugene-Seattle: 62,649
This detailed study seeks to demonstrate the existence of a real potential market for high-speed rail in the United States, provided that there is a high degree of territorial selectivity (tab. 40). Indeed, a few corridors have significant advantages for this new mode—economic, social, and infrastructural assets—which offer favorable overall conditions in terms of high potential demand, a sufficient concentration of inhabitants and jobs, dynamic demographic and economic projections, and a transportation system organized in such a way as to suggest strong potential for modal shift. Joe McAndrew believes that efforts should be concentrated around a few city pairs: “[...] for selected pairs of cities (Pacific NW and CA), Chicago to Milwaukee, Northeast Corridor.”110
All these considerations at federal level tend to support the idea that a national high-speed network—with its own and/or shared infrastructure—is not possible and that this kind of business model in a network system would not be viable. Despite this, the main US lobby for HSR, the United States High-Speed Rail Association (USHSR), is proposing a proper network constructed in four phases up to 2030 in addition to Amtrak’s conventional network.111 This network would provide high-speed connections between all the country’s major cities regardless of any economic, financial or territorial assessment. The primary aim of this exercise is to convince political and economic actors of the need for investment in this mode. The USHSR’s objective is to publicize the issue rather than to provide knowledge and expertise for the implementation of high-speed rail in the United States.
110 Interview with representative from Transportation for America, conducted on September 12, 2015. 111 Interview with representative from the USHSR, conducted on September 9, 2015.
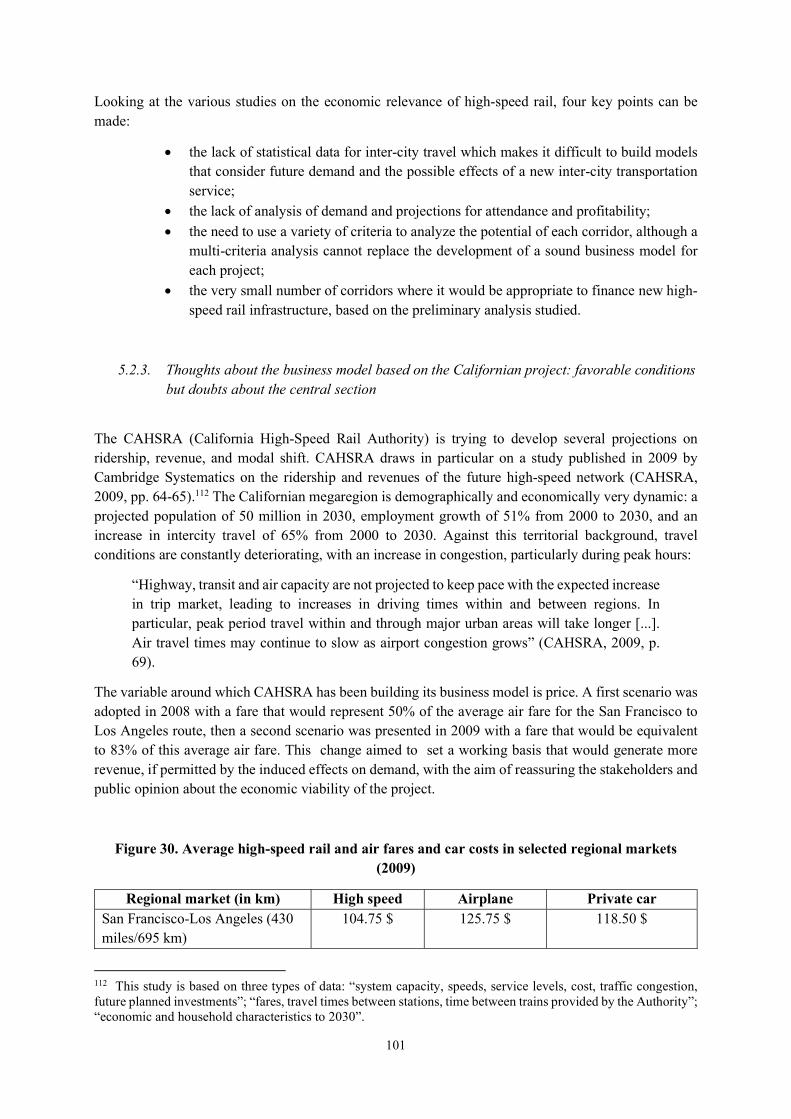
101
Looking at the various studies on the economic relevance of high-speed rail, four key points can be made:
the lack of statistical data for inter-city travel which makes it difficult to build models that consider future demand and the possible effects of a new inter-city transportation service;
the lack of analysis of demand and projections for attendance and profitability;
the need to use a variety of criteria to analyze the potential of each corridor, although a multi-criteria analysis cannot replace the development of a sound business model for each project;
the very small number of corridors where it would be appropriate to finance new high-speed rail infrastructure, based on the preliminary analysis studied.
5.2.3. Thoughts about the business model based on the Californian project: favorable conditions but doubts about the central section
The CAHSRA (California High-Speed Rail Authority) is trying to develop several projections on ridership, revenue, and modal shift. CAHSRA draws in particular on a study published in 2009 by Cambridge Systematics on the ridership and revenues of the future high-speed network (CAHSRA, 2009, pp. 64-65).112 The Californian megaregion is demographically and economically very dynamic: a projected population of 50 million in 2030, employment growth of 51% from 2000 to 2030, and an increase in intercity travel of 65% from 2000 to 2030. Against this territorial background, travel conditions are constantly deteriorating, with an increase in congestion, particularly during peak hours:
“Highway, transit and air capacity are not projected to keep pace with the expected increase in trip market, leading to increases in driving times within and between regions. In particular, peak period travel within and through major urban areas will take longer [...]. Air travel times may continue to slow as airport congestion grows” (CAHSRA, 2009, p. 69).
The variable around which CAHSRA has been building its business model is price. A first scenario was adopted in 2008 with a fare that would represent 50% of the average air fare for the San Francisco to Los Angeles route, then a second scenario was presented in 2009 with a fare that would be equivalent to 83% of this average air fare. This change aimed to set a working basis that would generate more revenue, if permitted by the induced effects on demand, with the aim of reassuring the stakeholders and public opinion about the economic viability of the project.
Figure 30. Average high-speed rail and air fares and car costs in selected regional markets (2009)
Regional market (in km) High speed Airplane Private car San Francisco-Los Angeles (430 miles/695 km)
104.75 $ 125.75 $ 118.50 $
112 This study is based on three types of data: “system capacity, speeds, service levels, cost, traffic congestion, future planned investments”; “fares, travel times between stations, time between trains provided by the Authority”; “economic and household characteristics to 2030”.
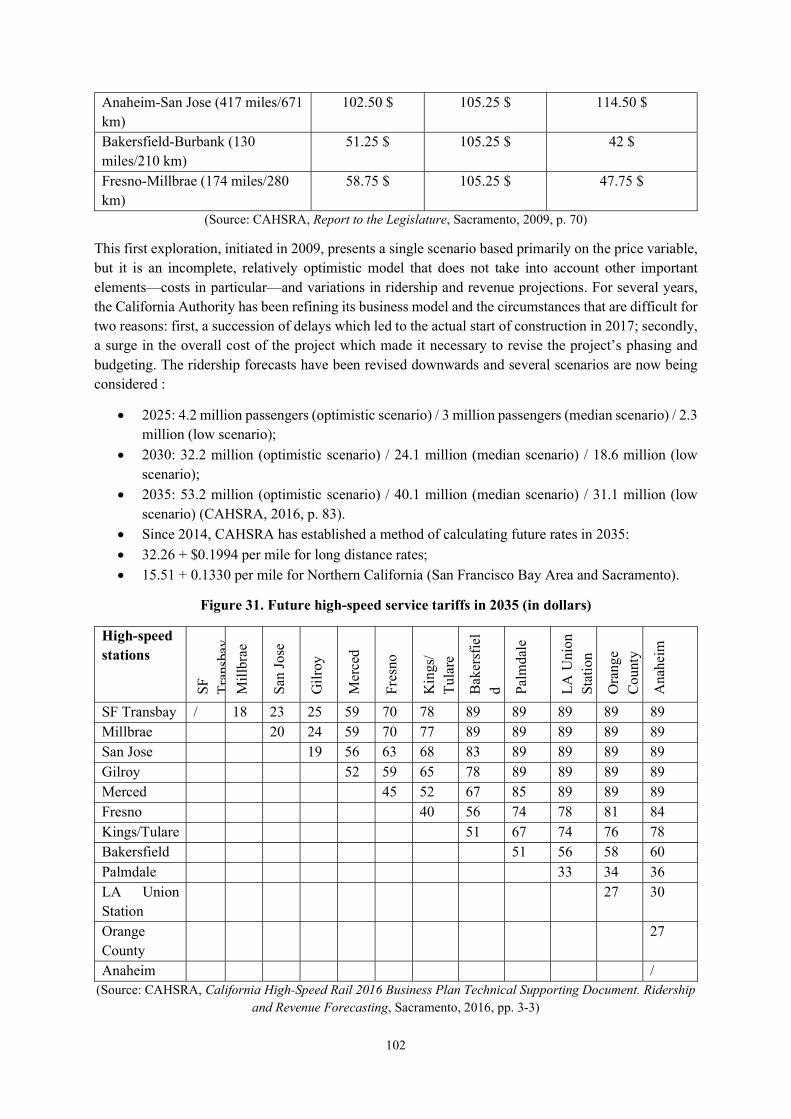
102
Anaheim-San Jose (417 miles/671 km)
102.50 $ 105.25 $ 114.50 $
Bakersfield-Burbank (130 miles/210 km)
51.25 $ 105.25 $ 42 $
Fresno-Millbrae (174 miles/280 km)
58.75 $ 105.25 $ 47.75 $
(Source: CAHSRA, Report to the Legislature, Sacramento, 2009, p. 70)
This first exploration, initiated in 2009, presents a single scenario based primarily on the price variable, but it is an incomplete, relatively optimistic model that does not take into account other important elements—costs in particular—and variations in ridership and revenue projections. For several years, the California Authority has been refining its business model and the circumstances that are difficult for two reasons: first, a succession of delays which led to the actual start of construction in 2017; secondly, a surge in the overall cost of the project which made it necessary to revise the project’s phasing and budgeting. The ridership forecasts have been revised downwards and several scenarios are now being considered :
2025: 4.2 million passengers (optimistic scenario) / 3 million passengers (median scenario) / 2.3 million (low scenario);
2030: 32.2 million (optimistic scenario) / 24.1 million (median scenario) / 18.6 million (low scenario);
2035: 53.2 million (optimistic scenario) / 40.1 million (median scenario) / 31.1 million (low scenario) (CAHSRA, 2016, p. 83).
Since 2014, CAHSRA has established a method of calculating future rates in 2035:
32.26 + $0.1994 per mile for long distance rates; 15.51 + 0.1330 per mile for Northern California (San Francisco Bay Area and Sacramento).
Figure 31. Future high-speed service tariffs in 2035 (in dollars)
High-speed stations
SF
Tra
nsba
y M
illb
rae
San
Jose
Gil
roy
Mer
ced
Fres
no
Kin
gs/
Tul
are
Bak
ersf
iel
d
Palm
dale
LA
Uni
on
Stat
ion
Ora
nge
Cou
nty
Ana
heim
SF Transbay / 18 23 25 59 70 78 89 89 89 89 89 Millbrae 20 24 59 70 77 89 89 89 89 89 San Jose 19 56 63 68 83 89 89 89 89 Gilroy 52 59 65 78 89 89 89 89 Merced 45 52 67 85 89 89 89 Fresno 40 56 74 78 81 84 Kings/Tulare 51 67 74 76 78 Bakersfield 51 56 58 60 Palmdale 33 34 36 LA Union Station
27 30
Orange County
27
Anaheim / (Source: CAHSRA, California High-Speed Rail 2016 Business Plan Technical Supporting Document. Ridership
and Revenue Forecasting, Sacramento, 2016, pp. 3-3)
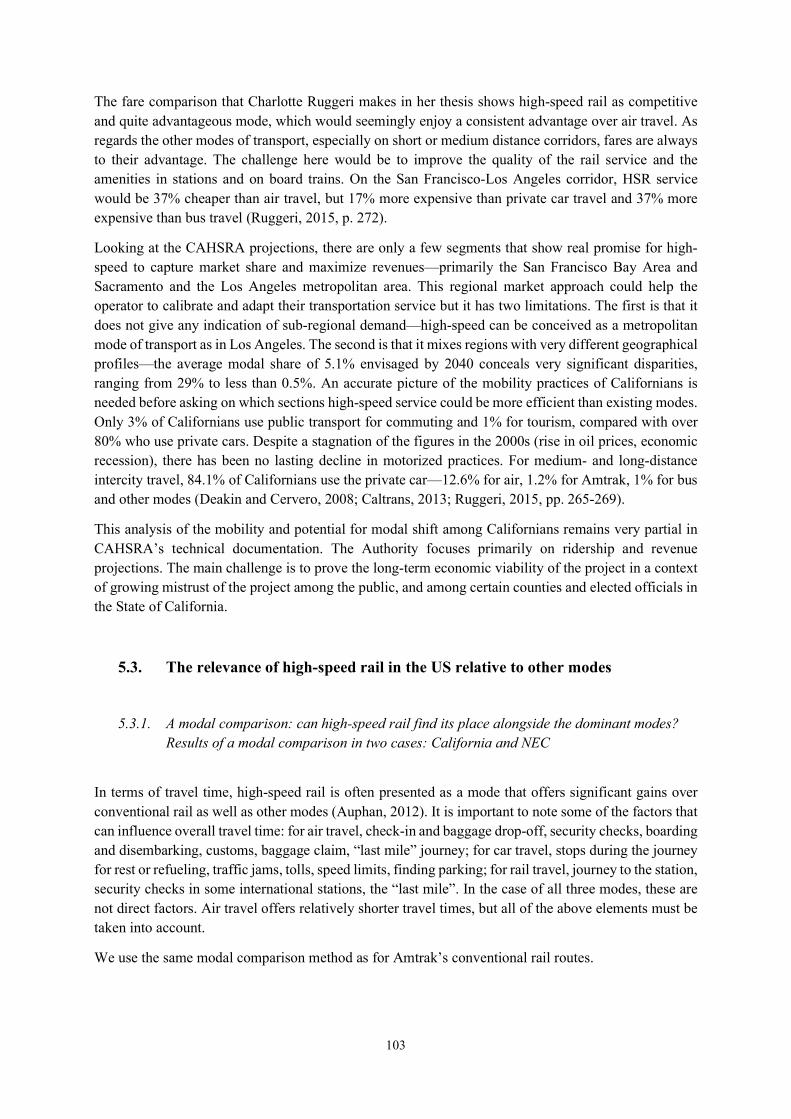
103
The fare comparison that Charlotte Ruggeri makes in her thesis shows high-speed rail as competitive and quite advantageous mode, which would seemingly enjoy a consistent advantage over air travel. As regards the other modes of transport, especially on short or medium distance corridors, fares are always to their advantage. The challenge here would be to improve the quality of the rail service and the amenities in stations and on board trains. On the San Francisco-Los Angeles corridor, HSR service would be 37% cheaper than air travel, but 17% more expensive than private car travel and 37% more expensive than bus travel (Ruggeri, 2015, p. 272).
Looking at the CAHSRA projections, there are only a few segments that show real promise for high-speed to capture market share and maximize revenues—primarily the San Francisco Bay Area and Sacramento and the Los Angeles metropolitan area. This regional market approach could help the operator to calibrate and adapt their transportation service but it has two limitations. The first is that it does not give any indication of sub-regional demand—high-speed can be conceived as a metropolitan mode of transport as in Los Angeles. The second is that it mixes regions with very different geographical profiles—the average modal share of 5.1% envisaged by 2040 conceals very significant disparities, ranging from 29% to less than 0.5%. An accurate picture of the mobility practices of Californians is needed before asking on which sections high-speed service could be more efficient than existing modes. Only 3% of Californians use public transport for commuting and 1% for tourism, compared with over 80% who use private cars. Despite a stagnation of the figures in the 2000s (rise in oil prices, economic recession), there has been no lasting decline in motorized practices. For medium- and long-distance intercity travel, 84.1% of Californians use the private car—12.6% for air, 1.2% for Amtrak, 1% for bus and other modes (Deakin and Cervero, 2008; Caltrans, 2013; Ruggeri, 2015, pp. 265-269).
This analysis of the mobility and potential for modal shift among Californians remains very partial in CAHSRA’s technical documentation. The Authority focuses primarily on ridership and revenue projections. The main challenge is to prove the long-term economic viability of the project in a context of growing mistrust of the project among the public, and among certain counties and elected officials in the State of California.
5.3. The relevance of high-speed rail in the US relative to other modes
5.3.1. A modal comparison: can high-speed rail find its place alongside the dominant modes? Results of a modal comparison in two cases: California and NEC
In terms of travel time, high-speed rail is often presented as a mode that offers significant gains over conventional rail as well as other modes (Auphan, 2012). It is important to note some of the factors that can influence overall travel time: for air travel, check-in and baggage drop-off, security checks, boarding and disembarking, customs, baggage claim, “last mile” journey; for car travel, stops during the journey for rest or refueling, traffic jams, tolls, speed limits, finding parking; for rail travel, journey to the station, security checks in some international stations, the “last mile”. In the case of all three modes, these are not direct factors. Air travel offers relatively shorter travel times, but all of the above elements must be taken into account.
We use the same modal comparison method as for Amtrak’s conventional rail routes.
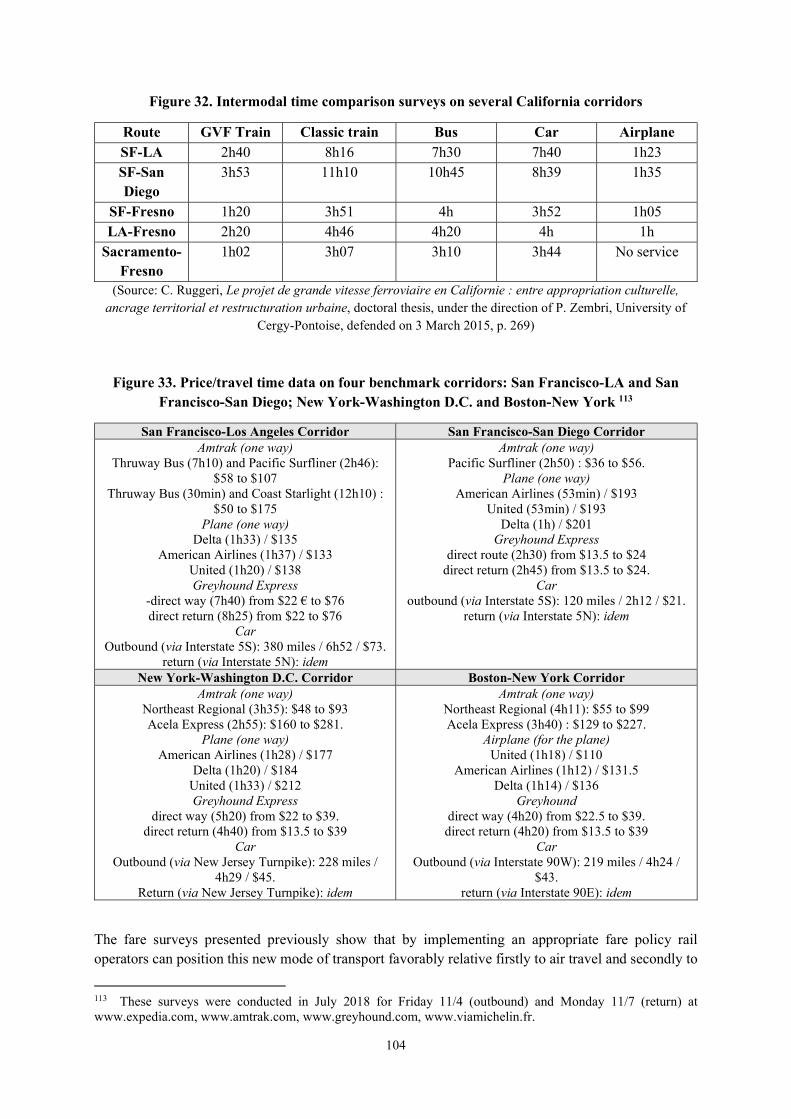
104
Figure 32. Intermodal time comparison surveys on several California corridors
Route GVF Train Classic train Bus Car Airplane SF-LA 2h40 8h16 7h30 7h40 1h23 SF-San Diego
3h53 11h10 10h45 8h39 1h35
SF-Fresno 1h20 3h51 4h 3h52 1h05 LA-Fresno 2h20 4h46 4h20 4h 1h
Sacramento-Fresno
1h02 3h07 3h10 3h44 No service
(Source: C. Ruggeri, Le projet de grande vitesse ferroviaire en Californie : entre appropriation culturelle, ancrage territorial et restructuration urbaine, doctoral thesis, under the direction of P. Zembri, University of
Cergy-Pontoise, defended on 3 March 2015, p. 269)
Figure 33. Price/travel time data on four benchmark corridors: San Francisco-LA and San Francisco-San Diego; New York-Washington D.C. and Boston-New York 113
San Francisco-Los Angeles Corridor San Francisco-San Diego Corridor Amtrak (one way)
Thruway Bus (7h10) and Pacific Surfliner (2h46): $58 to $107
Thruway Bus (30min) and Coast Starlight (12h10) : $50 to $175
Plane (one way) Delta (1h33) / $135
American Airlines (1h37) / $133 United (1h20) / $138 Greyhound Express
-direct way (7h40) from $22 € to $76 direct return (8h25) from $22 to $76
Car Outbound (via Interstate 5S): 380 miles / 6h52 / $73.
return (via Interstate 5N): idem
Amtrak (one way) Pacific Surfliner (2h50) : $36 to $56.
Plane (one way) American Airlines (53min) / $193
United (53min) / $193 Delta (1h) / $201
Greyhound Express direct route (2h30) from $13.5 to $24
direct return (2h45) from $13.5 to $24. Car
outbound (via Interstate 5S): 120 miles / 2h12 / $21. return (via Interstate 5N): idem
New York-Washington D.C. Corridor Boston-New York Corridor Amtrak (one way)
Northeast Regional (3h35): $48 to $93 Acela Express (2h55): $160 to $281.
Plane (one way) American Airlines (1h28) / $177
Delta (1h20) / $184 United (1h33) / $212 Greyhound Express
direct way (5h20) from $22 to $39. direct return (4h40) from $13.5 to $39
Car Outbound (via New Jersey Turnpike): 228 miles /
4h29 / $45. Return (via New Jersey Turnpike): idem
Amtrak (one way) Northeast Regional (4h11): $55 to $99 Acela Express (3h40) : $129 to $227.
Airplane (for the plane) United (1h18) / $110
American Airlines (1h12) / $131.5 Delta (1h14) / $136
Greyhound direct way (4h20) from $22.5 to $39. direct return (4h20) from $13.5 to $39
Car Outbound (via Interstate 90W): 219 miles / 4h24 /
$43. return (via Interstate 90E): idem
The fare surveys presented previously show that by implementing an appropriate fare policy rail operators can position this new mode of transport favorably relative firstly to air travel and secondly to
113 These surveys were conducted in July 2018 for Friday 11/4 (outbound) and Monday 11/7 (return) at www.expedia.com, www.amtrak.com, www.greyhound.com, www.viamichelin.fr.
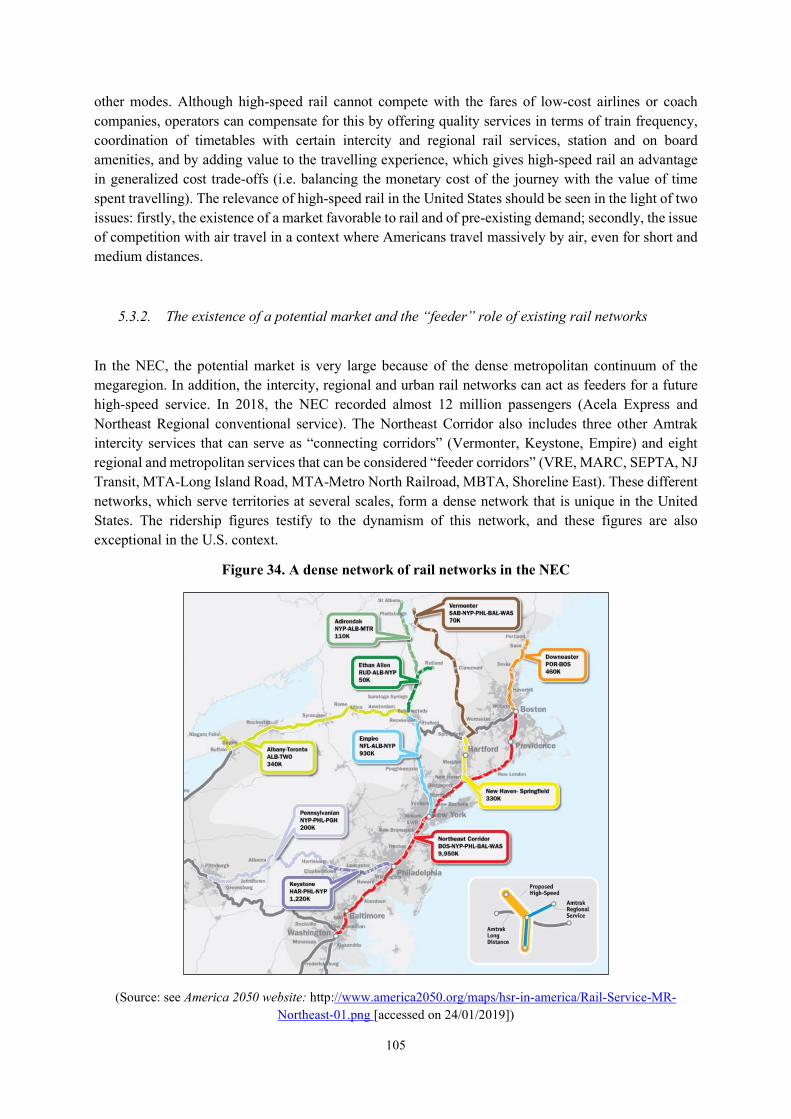
105
other modes. Although high-speed rail cannot compete with the fares of low-cost airlines or coach companies, operators can compensate for this by offering quality services in terms of train frequency, coordination of timetables with certain intercity and regional rail services, station and on board amenities, and by adding value to the travelling experience, which gives high-speed rail an advantage in generalized cost trade-offs (i.e. balancing the monetary cost of the journey with the value of time spent travelling). The relevance of high-speed rail in the United States should be seen in the light of two issues: firstly, the existence of a market favorable to rail and of pre-existing demand; secondly, the issue of competition with air travel in a context where Americans travel massively by air, even for short and medium distances.
5.3.2. The existence of a potential market and the “feeder” role of existing rail networks
In the NEC, the potential market is very large because of the dense metropolitan continuum of the megaregion. In addition, the intercity, regional and urban rail networks can act as feeders for a future high-speed service. In 2018, the NEC recorded almost 12 million passengers (Acela Express and Northeast Regional conventional service). The Northeast Corridor also includes three other Amtrak intercity services that can serve as “connecting corridors” (Vermonter, Keystone, Empire) and eight regional and metropolitan services that can be considered “feeder corridors” (VRE, MARC, SEPTA, NJ Transit, MTA-Long Island Road, MTA-Metro North Railroad, MBTA, Shoreline East). These different networks, which serve territories at several scales, form a dense network that is unique in the United States. The ridership figures testify to the dynamism of this network, and these figures are also exceptional in the U.S. context.
Figure 34. A dense network of rail networks in the NEC
(Source: see America 2050 website: http://www.america2050.org/maps/hsr-in-america/Rail-Service-MR-Northeast-01.png [accessed on 24/01/2019])
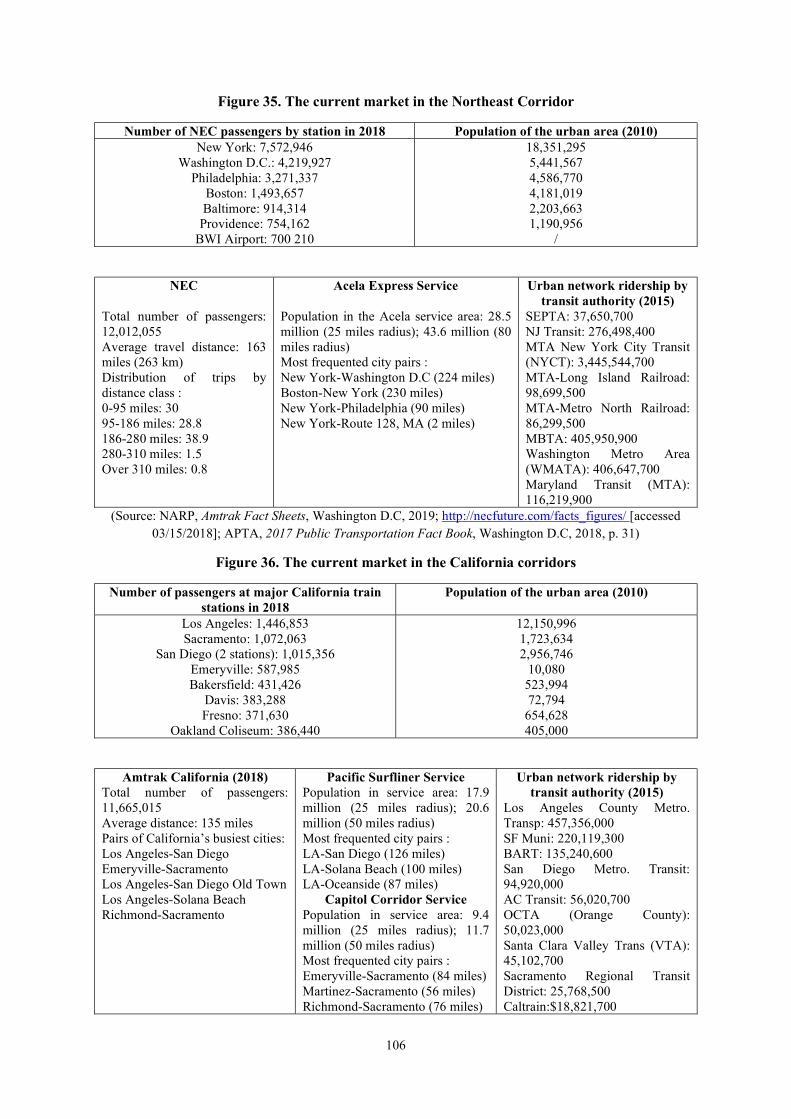
106
Figure 35. The current market in the Northeast Corridor
Number of NEC passengers by station in 2018 Population of the urban area (2010) New York: 7,572,946
Washington D.C.: 4,219,927 Philadelphia: 3,271,337
Boston: 1,493,657 Baltimore: 914,314
Providence: 754,162 BWI Airport: 700 210
18,351,295 5,441,567 4,586,770 4,181,019 2,203,663 1,190,956
/
NEC Total number of passengers: 12,012,055 Average travel distance: 163 miles (263 km) Distribution of trips by distance class : 0-95 miles: 30 95-186 miles: 28.8 186-280 miles: 38.9 280-310 miles: 1.5 Over 310 miles: 0.8
Acela Express Service Population in the Acela service area: 28.5 million (25 miles radius); 43.6 million (80 miles radius) Most frequented city pairs : New York-Washington D.C (224 miles) Boston-New York (230 miles) New York-Philadelphia (90 miles) New York-Route 128, MA (2 miles)
Urban network ridership by transit authority (2015)
SEPTA: 37,650,700 NJ Transit: 276,498,400 MTA New York City Transit (NYCT): 3,445,544,700 MTA-Long Island Railroad: 98,699,500 MTA-Metro North Railroad: 86,299,500 MBTA: 405,950,900 Washington Metro Area (WMATA): 406,647,700 Maryland Transit (MTA): 116,219,900
(Source: NARP, Amtrak Fact Sheets, Washington D.C, 2019; http://necfuture.com/facts_figures/ [accessed 03/15/2018]; APTA, 2017 Public Transportation Fact Book, Washington D.C, 2018, p. 31)
Figure 36. The current market in the California corridors
Number of passengers at major California train stations in 2018
Population of the urban area (2010)
Los Angeles: 1,446,853 Sacramento: 1,072,063
San Diego (2 stations): 1,015,356 Emeryville: 587,985 Bakersfield: 431,426
Davis: 383,288 Fresno: 371,630
Oakland Coliseum: 386,440
12,150,996 1,723,634 2,956,746
10,080 523,994 72,794
654,628 405,000
Amtrak California (2018) Total number of passengers: 11,665,015 Average distance: 135 miles Pairs of California’s busiest cities: Los Angeles-San Diego Emeryville-Sacramento Los Angeles-San Diego Old Town Los Angeles-Solana Beach Richmond-Sacramento
Pacific Surfliner Service Population in service area: 17.9 million (25 miles radius); 20.6 million (50 miles radius) Most frequented city pairs : LA-San Diego (126 miles) LA-Solana Beach (100 miles) LA-Oceanside (87 miles)
Capitol Corridor Service Population in service area: 9.4 million (25 miles radius); 11.7 million (50 miles radius) Most frequented city pairs : Emeryville-Sacramento (84 miles) Martinez-Sacramento (56 miles) Richmond-Sacramento (76 miles)
Urban network ridership by transit authority (2015)
Los Angeles County Metro. Transp: 457,356,000 SF Muni: 220,119,300 BART: 135,240,600 San Diego Metro. Transit: 94,920,000 AC Transit: 56,020,700 OCTA (Orange County): 50,023,000 Santa Clara Valley Trans (VTA): 45,102,700 Sacramento Regional Transit District: 25,768,500 Caltrain:$18,821,700
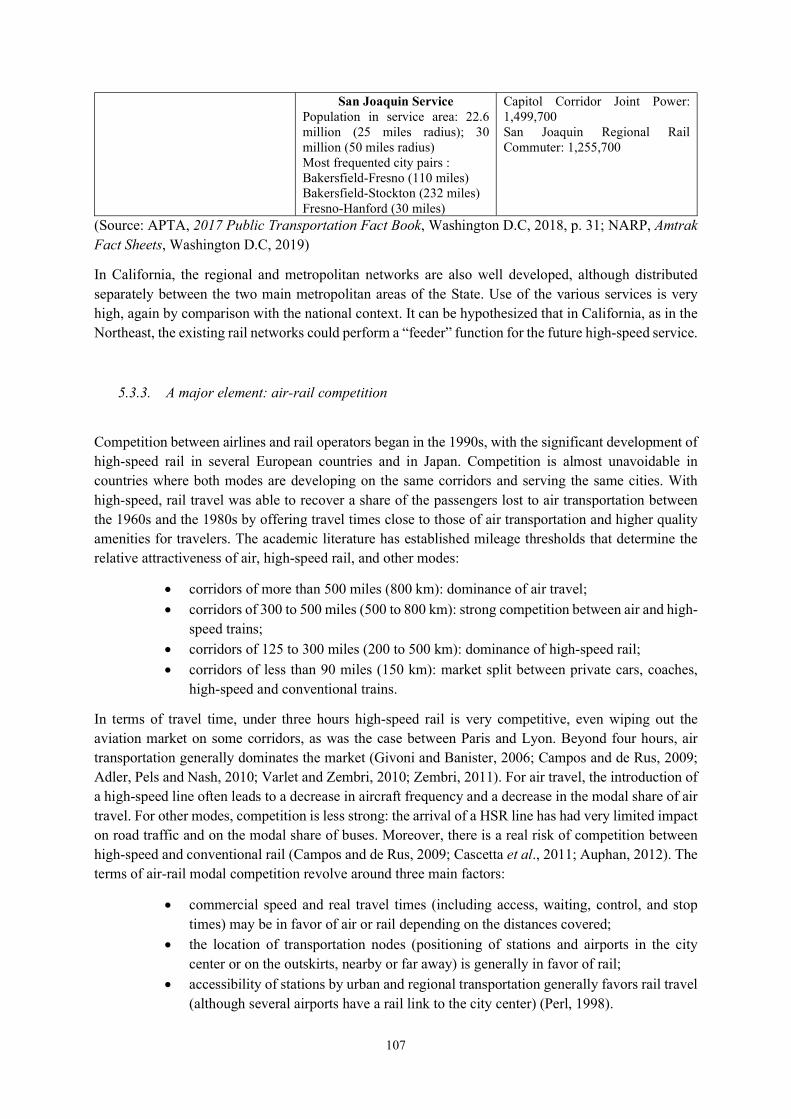
107
San Joaquin Service Population in service area: 22.6 million (25 miles radius); 30 million (50 miles radius) Most frequented city pairs : Bakersfield-Fresno (110 miles) Bakersfield-Stockton (232 miles) Fresno-Hanford (30 miles)
Capitol Corridor Joint Power: 1,499,700 San Joaquin Regional Rail Commuter: 1,255,700
(Source: APTA, 2017 Public Transportation Fact Book, Washington D.C, 2018, p. 31; NARP, Amtrak Fact Sheets, Washington D.C, 2019)
In California, the regional and metropolitan networks are also well developed, although distributed separately between the two main metropolitan areas of the State. Use of the various services is very high, again by comparison with the national context. It can be hypothesized that in California, as in the Northeast, the existing rail networks could perform a “feeder” function for the future high-speed service.
5.3.3. A major element: air-rail competition
Competition between airlines and rail operators began in the 1990s, with the significant development of high-speed rail in several European countries and in Japan. Competition is almost unavoidable in countries where both modes are developing on the same corridors and serving the same cities. With high-speed, rail travel was able to recover a share of the passengers lost to air transportation between the 1960s and the 1980s by offering travel times close to those of air transportation and higher quality amenities for travelers. The academic literature has established mileage thresholds that determine the relative attractiveness of air, high-speed rail, and other modes:
corridors of more than 500 miles (800 km): dominance of air travel;
corridors of 300 to 500 miles (500 to 800 km): strong competition between air and high-speed trains;
corridors of 125 to 300 miles (200 to 500 km): dominance of high-speed rail;
corridors of less than 90 miles (150 km): market split between private cars, coaches, high-speed and conventional trains.
In terms of travel time, under three hours high-speed rail is very competitive, even wiping out the aviation market on some corridors, as was the case between Paris and Lyon. Beyond four hours, air transportation generally dominates the market (Givoni and Banister, 2006; Campos and de Rus, 2009; Adler, Pels and Nash, 2010; Varlet and Zembri, 2010; Zembri, 2011). For air travel, the introduction of a high-speed line often leads to a decrease in aircraft frequency and a decrease in the modal share of air travel. For other modes, competition is less strong: the arrival of a HSR line has had very limited impact on road traffic and on the modal share of buses. Moreover, there is a real risk of competition between high-speed and conventional rail (Campos and de Rus, 2009; Cascetta et al., 2011; Auphan, 2012). The terms of air-rail modal competition revolve around three main factors:
commercial speed and real travel times (including access, waiting, control, and stop times) may be in favor of air or rail depending on the distances covered;
the location of transportation nodes (positioning of stations and airports in the city center or on the outskirts, nearby or far away) is generally in favor of rail;
accessibility of stations by urban and regional transportation generally favors rail travel (although several airports have a rail link to the city center) (Perl, 1998).
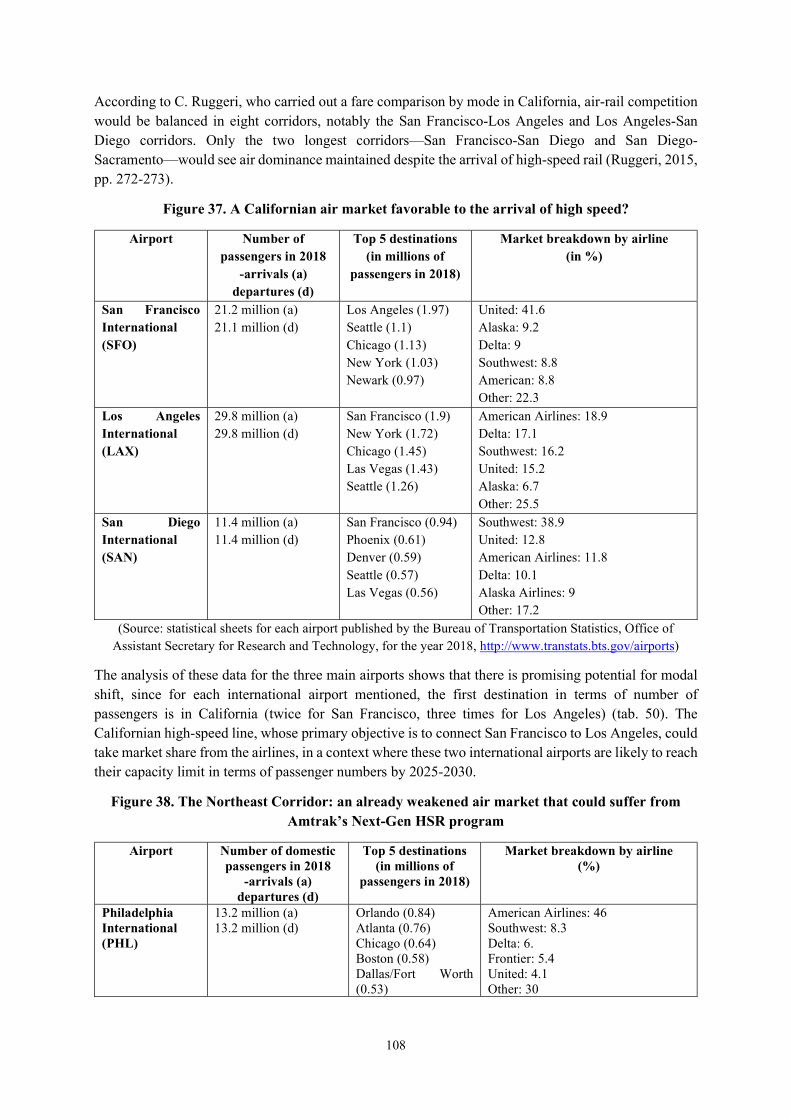
108
According to C. Ruggeri, who carried out a fare comparison by mode in California, air-rail competition would be balanced in eight corridors, notably the San Francisco-Los Angeles and Los Angeles-San Diego corridors. Only the two longest corridors—San Francisco-San Diego and San Diego-Sacramento—would see air dominance maintained despite the arrival of high-speed rail (Ruggeri, 2015, pp. 272-273).
Figure 37. A Californian air market favorable to the arrival of high speed?
Airport Number of passengers in 2018
-arrivals (a) departures (d)
Top 5 destinations (in millions of
passengers in 2018)
Market breakdown by airline (in %)
San Francisco International (SFO)
21.2 million (a) 21.1 million (d)
Los Angeles (1.97) Seattle (1.1) Chicago (1.13) New York (1.03) Newark (0.97)
United: 41.6 Alaska: 9.2 Delta: 9 Southwest: 8.8 American: 8.8 Other: 22.3
Los Angeles International (LAX)
29.8 million (a) 29.8 million (d)
San Francisco (1.9) New York (1.72) Chicago (1.45) Las Vegas (1.43) Seattle (1.26)
American Airlines: 18.9 Delta: 17.1 Southwest: 16.2 United: 15.2 Alaska: 6.7 Other: 25.5
San Diego International (SAN)
11.4 million (a) 11.4 million (d)
San Francisco (0.94) Phoenix (0.61) Denver (0.59) Seattle (0.57) Las Vegas (0.56)
Southwest: 38.9 United: 12.8 American Airlines: 11.8 Delta: 10.1 Alaska Airlines: 9 Other: 17.2
(Source: statistical sheets for each airport published by the Bureau of Transportation Statistics, Office of Assistant Secretary for Research and Technology, for the year 2018, http://www.transtats.bts.gov/airports)
The analysis of these data for the three main airports shows that there is promising potential for modal shift, since for each international airport mentioned, the first destination in terms of number of passengers is in California (twice for San Francisco, three times for Los Angeles) (tab. 50). The Californian high-speed line, whose primary objective is to connect San Francisco to Los Angeles, could take market share from the airlines, in a context where these two international airports are likely to reach their capacity limit in terms of passenger numbers by 2025-2030.
Figure 38. The Northeast Corridor: an already weakened air market that could suffer from Amtrak’s Next-Gen HSR program
Airport Number of domestic passengers in 2018
-arrivals (a) departures (d)
Top 5 destinations (in millions of
passengers in 2018)
Market breakdown by airline (%)
Philadelphia International (PHL)
13.2 million (a) 13.2 million (d)
Orlando (0.84) Atlanta (0.76) Chicago (0.64) Boston (0.58) Dallas/Fort Worth (0.53)
American Airlines: 46 Southwest: 8.3 Delta: 6. Frontier: 5.4 United: 4.1 Other: 30
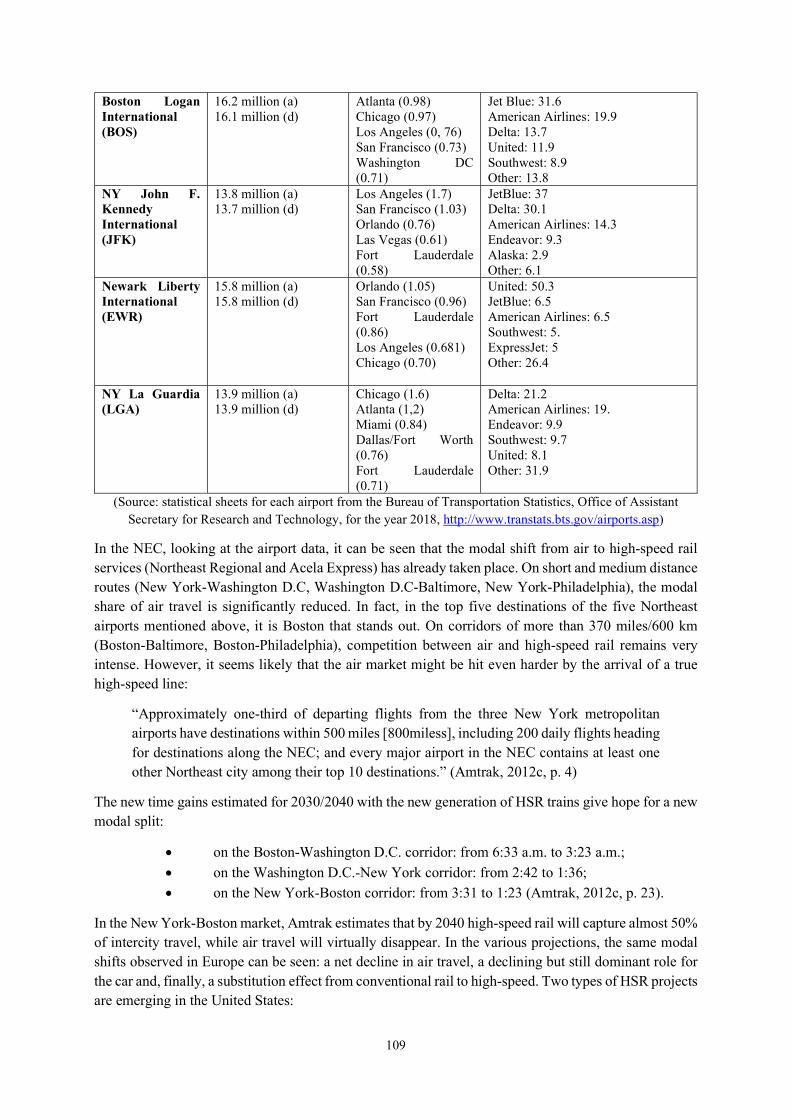
109
Boston Logan International (BOS)
16.2 million (a) 16.1 million (d)
Atlanta (0.98) Chicago (0.97) Los Angeles (0, 76) San Francisco (0.73) Washington DC (0.71)
Jet Blue: 31.6 American Airlines: 19.9 Delta: 13.7 United: 11.9 Southwest: 8.9 Other: 13.8
NY John F. Kennedy International (JFK)
13.8 million (a) 13.7 million (d)
Los Angeles (1.7) San Francisco (1.03) Orlando (0.76) Las Vegas (0.61) Fort Lauderdale (0.58)
JetBlue: 37 Delta: 30.1 American Airlines: 14.3 Endeavor: 9.3 Alaska: 2.9 Other: 6.1
Newark Liberty International (EWR)
15.8 million (a) 15.8 million (d)
Orlando (1.05) San Francisco (0.96) Fort Lauderdale (0.86) Los Angeles (0.681) Chicago (0.70)
United: 50.3 JetBlue: 6.5 American Airlines: 6.5 Southwest: 5. ExpressJet: 5 Other: 26.4
NY La Guardia (LGA)
13.9 million (a) 13.9 million (d)
Chicago (1.6) Atlanta (1,2) Miami (0.84) Dallas/Fort Worth (0.76) Fort Lauderdale (0.71)
Delta: 21.2 American Airlines: 19. Endeavor: 9.9 Southwest: 9.7 United: 8.1 Other: 31.9
(Source: statistical sheets for each airport from the Bureau of Transportation Statistics, Office of Assistant Secretary for Research and Technology, for the year 2018, http://www.transtats.bts.gov/airports.asp)
In the NEC, looking at the airport data, it can be seen that the modal shift from air to high-speed rail services (Northeast Regional and Acela Express) has already taken place. On short and medium distance routes (New York-Washington D.C, Washington D.C-Baltimore, New York-Philadelphia), the modal share of air travel is significantly reduced. In fact, in the top five destinations of the five Northeast airports mentioned above, it is Boston that stands out. On corridors of more than 370 miles/600 km (Boston-Baltimore, Boston-Philadelphia), competition between air and high-speed rail remains very intense. However, it seems likely that the air market might be hit even harder by the arrival of a true high-speed line:
“Approximately one-third of departing flights from the three New York metropolitan airports have destinations within 500 miles [800miless], including 200 daily flights heading for destinations along the NEC; and every major airport in the NEC contains at least one other Northeast city among their top 10 destinations.” (Amtrak, 2012c, p. 4)
The new time gains estimated for 2030/2040 with the new generation of HSR trains give hope for a new modal split:
on the Boston-Washington D.C. corridor: from 6:33 a.m. to 3:23 a.m.;
on the Washington D.C.-New York corridor: from 2:42 to 1:36; on the New York-Boston corridor: from 3:31 to 1:23 (Amtrak, 2012c, p. 23).
In the New York-Boston market, Amtrak estimates that by 2040 high-speed rail will capture almost 50% of intercity travel, while air travel will virtually disappear. In the various projections, the same modal shifts observed in Europe can be seen: a net decline in air travel, a declining but still dominant role for the car and, finally, a substitution effect from conventional rail to high-speed. Two types of HSR projects are emerging in the United States:
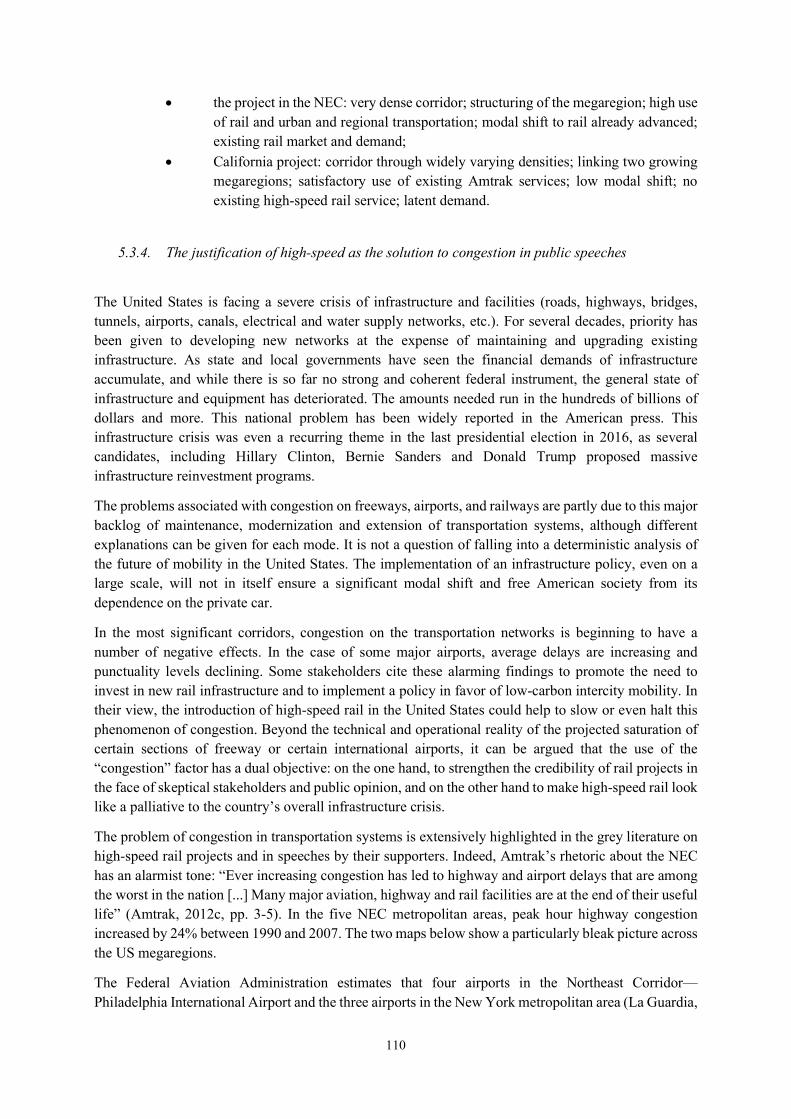
110
the project in the NEC: very dense corridor; structuring of the megaregion; high use of rail and urban and regional transportation; modal shift to rail already advanced; existing rail market and demand;
California project: corridor through widely varying densities; linking two growing megaregions; satisfactory use of existing Amtrak services; low modal shift; no existing high-speed rail service; latent demand.
5.3.4. The justification of high-speed as the solution to congestion in public speeches
The United States is facing a severe crisis of infrastructure and facilities (roads, highways, bridges, tunnels, airports, canals, electrical and water supply networks, etc.). For several decades, priority has been given to developing new networks at the expense of maintaining and upgrading existing infrastructure. As state and local governments have seen the financial demands of infrastructure accumulate, and while there is so far no strong and coherent federal instrument, the general state of infrastructure and equipment has deteriorated. The amounts needed run in the hundreds of billions of dollars and more. This national problem has been widely reported in the American press. This infrastructure crisis was even a recurring theme in the last presidential election in 2016, as several candidates, including Hillary Clinton, Bernie Sanders and Donald Trump proposed massive infrastructure reinvestment programs.
The problems associated with congestion on freeways, airports, and railways are partly due to this major backlog of maintenance, modernization and extension of transportation systems, although different explanations can be given for each mode. It is not a question of falling into a deterministic analysis of the future of mobility in the United States. The implementation of an infrastructure policy, even on a large scale, will not in itself ensure a significant modal shift and free American society from its dependence on the private car.
In the most significant corridors, congestion on the transportation networks is beginning to have a number of negative effects. In the case of some major airports, average delays are increasing and punctuality levels declining. Some stakeholders cite these alarming findings to promote the need to invest in new rail infrastructure and to implement a policy in favor of low-carbon intercity mobility. In their view, the introduction of high-speed rail in the United States could help to slow or even halt this phenomenon of congestion. Beyond the technical and operational reality of the projected saturation of certain sections of freeway or certain international airports, it can be argued that the use of the “congestion” factor has a dual objective: on the one hand, to strengthen the credibility of rail projects in the face of skeptical stakeholders and public opinion, and on the other hand to make high-speed rail look like a palliative to the country’s overall infrastructure crisis.
The problem of congestion in transportation systems is extensively highlighted in the grey literature on high-speed rail projects and in speeches by their supporters. Indeed, Amtrak’s rhetoric about the NEC has an alarmist tone: “Ever increasing congestion has led to highway and airport delays that are among the worst in the nation [...] Many major aviation, highway and rail facilities are at the end of their useful life” (Amtrak, 2012c, pp. 3-5). In the five NEC metropolitan areas, peak hour highway congestion increased by 24% between 1990 and 2007. The two maps below show a particularly bleak picture across the US megaregions.
The Federal Aviation Administration estimates that four airports in the Northeast Corridor—Philadelphia International Airport and the three airports in the New York metropolitan area (La Guardia,
111
JFK, Newark)—will require major development to increase their movement and passenger capacity by 2035. Outside of Atlanta and Chicago, all airports at risk of undercapacity by 2025 are in the Southwest (San Francisco, Oakland, Los Angeles, San Diego, Las Vegas, Phoenix). Although Amtrak has already established positions in the NEC, a significant proportion of flights from New York’s three airports are still short- and medium-haul. About 200 daily flights from New York are to NEC airports.
In the Californian project, in the analysis of the costs and benefits of high-speed rail, the fight against congestion on the transportation networks is also clearly identified:
“High-speed rail trains are a necessary addition to the airport’s current flights that serve passengers flying from the Bay Area to Southern California. In fact, due to runway configuration and geographic location on the water there is no space to accommodate increasing flight demand through expanded capacity without engaging in extensive Bay fill. And that was unsuccessfully tried several years ago.” (CAHSRA, 2016, p. 51) 114
The California High-Speed Rail Authority estimates that future high-speed service would reduce highway traffic by up to 100,000 car trips per day, with significant savings to motorists from reduced highway congestion. These estimates are based on a model with three assumptions:
limited growth in highway congestion to 1.5% per year after 2030;
the effective completion of the highway network extension operations planned between now and 2030;
congestion growth that is slightly higher than population growth (CAHSRA, 2016, p.3).
CAHSRA uses a similar methodology for the airport sector. Within two decades, three international airports—San Diego Lindberg Field International, Los Angeles International, and San Francisco International—are expected to experience unmanageable levels of congestion with deteriorating flight punctuality. For California’s nine major airports, the new HSR network would generate nearly $4 billion through reduced delays and lower airport operating costs (CAHSRA, 2016, pp. 3-5). It is therefore worth raising the question of the reality of this airport congestion, which is a central feature in the discourses of the public and private sponsors of the various high-speed projects. The FAA (Federal Aviation Administration) is taking a close interest in the issue of passenger congestion, which appears to be the real challenge in the decades to come for all the players in the aviation sector—federal authorities, airport authorities, local players, airlines. In 2014, the major US airports attracted 753 million passengers. By 2040, the number of passengers is expected to increase by nearly 40%, approaching the one billion mark. The thirty largest hub airports alone accounted for 545 million passengers in 2014 with estimated growth of 68% by 2040. In addition, lower-tier airports are also expected to be affected by very strong traffic growth (FAA, 2016, pp. 1-2).
In the corridors potentially affected by a future high-speed line, the main international airports are expected to experience significant traffic growth—expressed below in terms of annual enplanements:
Los Angeles International: from 33.9 million enplanements in 2014 to 56.3 million in 2040;
San Francisco International: from 22.5 million enplanements in 2014 to 38.6 million in 2040;
114 Quote from Julian Potter, Chief Administration and Policy Officer at San Francisco International Airport.
112
San Diego International: from 9.1 million enplanements in 2014 to 15.9 million in 2040;
Miami International: from 19.4 million enplanements in 2014 to 34 million in 2040;
Orlando International: from 17 million enplanements in 2014 to 32.6 million in 2040;
Fort Lauderdale/Hollywood International: from 11.7 million enplanements in 2014 to 22.7 million in 2040 (FAA, 2016, p. 11).
The FAA believes that it is primarily the major airports in the Northeast Corridor that are threatened by an incapacitating level of congestion, on the basis of three findings:
“Today delays are concentrated at a few major hub airports, which reflect ongoing trends towards airline consolidation at their hubs. The NYC area airports, Philadelphia International Airport, and Hartsfield-Jackson Atlanta International Airport have significant congestion;
“The NYC area airports will continue to have significant capacity constraints through 2020; LGA and JFK delays are expected to worsen such that congestion will become severe;
“The 2030 scenarios show that with steady traffic growth as forecasted, delays will continue to grow. Without planned improvements beyond near-term NextGen, 12 airports will have significant congestion, including 11 that will have severe congestion” (FAA, 2015, pp. 2-10).
According to these projections, by 2020s, two New York airports (La Guardia and JFK) will have reached their capacity limits, while three others will be at two-thirds capacity (Atlanta, Philadelphia, Newark). The third FAA map shows a severe deterioration in 2030, this time across the whole country: eleven airports should reach their capacity limits.
However, exploring the relevance of high-speed rail in relation to other modes means looking at this issue not only in terms of competition but also in terms of the complementarity between the different modes. The arrival of HSR and the renewal of US rail policy can also be seen from the perspective of intermodality.
5.3.5. The challenge of intermodality: complementarity rather than competition?
Many attempts have been made to define the notion of intermodality, summarized by Sandra Bozzani-Franc in her thesis (2006). Intermodality and multimodality are often confused: intermodality refers to the deliberate organization of a system that allows for the best possible management of load breaks along a single trip, whereas multimodality is the successive use of several modes of transportation for different trips over a given period of time (Ageron, 2013, pp. 36-40; Chrétien, 2017, pp. 141-142). Intermodality corresponds to the quest for integrated management of transportation modes, which entails a whole series of policies: the construction of interchanges, the coordination of timetables, integrated ticketing and reservation, the establishment of a diversified and attractive fare offering. Moreover, the challenges and objectives of intermodal policies are also multiple, affecting territories and all stakeholders:
for operators, it a tool for increasing the profitability of transportation services;
113
for local authorities, it helps to rationalize the use of urban space;
for users, intermodality offers quality and continuity of service;
for the government, it is a way to optimize territorial services and promote sustainable development.
For transportation infrastructure operators (stations, airports), the challenge is to maintain the flow of traffic when it stops. Intermodality is based on three elements: the intermodal organization of the transportation system, the creation of intermodal locations, and the development of intermodal practices. Interconnection is a prerequisite for intermodality, defined by Jean Varlet (Varlet, 1992, 2000) as the connection of at least two networks that are heterogeneous in technical, institutional and service supply terms. The connection of different networks thus occurs as a result of the creation of “interchanges”, i.e. places where several urban and interurban modes ideally converge. Cyprien Richer defines the interchange as “a network organization space that aims to facilitate intermodal practices between different modes of transport and that ensures, through its urban insertion, an interface between the city and the transport network” (Richer, 2007). The following definition of passenger intermodality will be employed for our purposes: “the spatial projection of the voluntary organization, by transport planners and operators, of a chain of journeys leading to a door-to-door journey that is as smooth and as easy as possible for the traveler. This path includes at least two complementary and articulated modes of transport during the same trip [...]” (Ageron, 2013, p. 45).115
The challenges of intermodality play out on two levels:
for operators: the aim is to develop a tool for improving the profitability of the service offering and to allow the combined use of technically and operationally different transportation systems;
for users: the aim is to devise a travel chain in which the entire service is seamless at all levels, and to help set up an integrated offering that meets all mobility needs (Bozzani-Franc, 2006, p. 162).
An intermodal policy can generate several qualitative benefits: operational efficiency around nodal points, reduced congestion, user well-being, improved territorial accessibility and optimization of existing infrastructure (Offner, 1994; Hubert, Margail and Zembri, 1995; Bozzani-Franc, 2006, pp. 200-202). Based on this notion of intermodality, J. Varlet developed the notion of an interconnection trinomial, which S. Bozzani-Franc pursued in order to develop an intermodal territorial system for high-speed rail (Fig. 39):
“Favoring the articulation of scales, its tripartite distribution [that of the interconnection] between an airport platform, a central platform and an efficient infrastructural link (capacity, frequency, speed) (Varlet, 1992, p.44) between the two hubs enhances both the transport locations (station, airport, ferry terminal) and the mobility arc thus created. The creation and use of the trinomial with guaranteed performance gives shape to the territory it serves, both to the platforms, urban living places that have become attractive, and to the corridor supporting the link between the two poles. Interconnection through flows is then achieved by the performance allowed thanks to the constitution of the corridor. C. Richer adds that services are also at the origin of interconnection by flows, “by certain services
115 This definition was initially applied in Pierre Ageron’s dissertation to intercontinental travel with a share of the journey made by air. However, we believe that this definition can also be applied to short and medium distance inter-city trips.
114
(single ticket, baggage check-in in the central station) and in certain situations”. (Varlet, 1992, p. 44; Richer, 2007, p. 86; Ageron, 2013, pp. 48-49)
This three-way interconnection relies on the complementarity between the rail and air modes. Linking between the networks can be achieved by means of four processes:
complementarity: to ensure continuity of movement; the relay principle: to extend an emerging network;
the principle of dependence: for example, to operate nested operations;
the principle of co-operation: where a series of factors are favorable to the development of intermodality (distance, traffic, equipment, level of overload on road infrastructures) (Bavoux and Piquant, 2000; Bozzani-Franc, 2006, pp. 186-187).
Exploiting the complementarity between air and rail requires the creation of powerful intermodal interchanges which will act as nodes that structure the territory at metropolitan and regional levels. The traditional view among transportation specialists is that there is competition between these two modes because of their different fields of application (particularly in terms of distances travelled), and that the modal shift favors high-speed rail in medium distance corridors. The logic of complementarity can be considered valid only under three conditions set out by Jacques Pavaux (1991): that networks are connected by services (timetables) and by infrastructure; that check-in is valid for the whole chain from one end to the other; that there is commercial co-operation to offer users a coherent intermodal service (ticketing, combined pricing).
Efficient air-rail intermodality can enable major cities to improve the performance of their transportation systems and enhance their image: “as a sky station or a station for the interconnection of transport modes, the communication node combining air and (high-speed) rail is now considered an asset in the competition between certain airports [...]” (Bozzani-Franc, 2006, p. 204). Three scenarios emerge from the types of possible coordination between airport and rail service:
the scenario of dedicated city-airport rail links, which can be combined with services at the urban region level;
airports with conventional or high-speed intercity rail links that have no urban rail links;
airports that combine both types of rail service (urban and long-distance).
There are therefore four possible locations for stations in relation to the airport: a station within the airport terminal, a station outside the terminal but connected by a bus service (station a maximum of 1600 feet/500 m) away, the a outside the airport site connected by a bus (station a maximum of 5 miles away), and finally a station in the nearest town connected by a bus service.
In the United States, the federal government has produced numerous studies, reports and laws promoting intermodality and the creation of intermodal hubs: the Intermodal Surface Transportation Act (1991), the TEA-21 Transportation Equity Act for the 21st Century (1998) and the SAFETY-LU Act (2005). The Government Accountability Office (GAO) published a major report in 2007 that highlighted the institutional, organizational and financial shortcomings of implementing a fully intermodal policy (U.S. GAO, 2007). Such a policy would entail a paradigm shift in federal transportation policy: from a mode-segmented policy with strong highway primacy and dominated by local actors, to a truly integrated intermodal policy driven by the federal state and intended to promote greener modes (Ageron, 2013, p. 100). The 2009 high-speed initiative also took up this goal of intermodality, focusing on two elements: the connection of future high-speed networks to existing networks, and the construction or modernization of intermodal hubs. Finally, the federal government has also taken an interest in air-rail complementarity, as instanced by the report commissioned from Matthew Coogan (2008), which takes
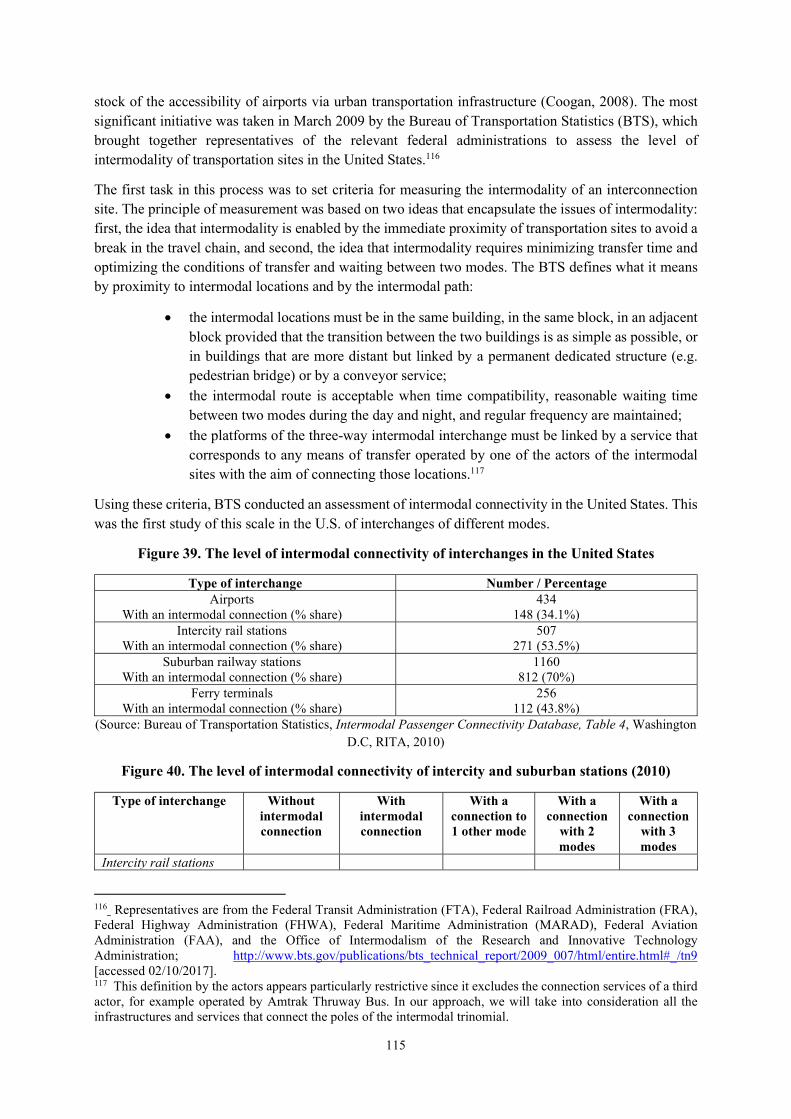
115
stock of the accessibility of airports via urban transportation infrastructure (Coogan, 2008). The most significant initiative was taken in March 2009 by the Bureau of Transportation Statistics (BTS), which brought together representatives of the relevant federal administrations to assess the level of intermodality of transportation sites in the United States.116
The first task in this process was to set criteria for measuring the intermodality of an interconnection site. The principle of measurement was based on two ideas that encapsulate the issues of intermodality: first, the idea that intermodality is enabled by the immediate proximity of transportation sites to avoid a break in the travel chain, and second, the idea that intermodality requires minimizing transfer time and optimizing the conditions of transfer and waiting between two modes. The BTS defines what it means by proximity to intermodal locations and by the intermodal path:
the intermodal locations must be in the same building, in the same block, in an adjacent block provided that the transition between the two buildings is as simple as possible, or in buildings that are more distant but linked by a permanent dedicated structure (e.g. pedestrian bridge) or by a conveyor service;
the intermodal route is acceptable when time compatibility, reasonable waiting time between two modes during the day and night, and regular frequency are maintained;
the platforms of the three-way intermodal interchange must be linked by a service that corresponds to any means of transfer operated by one of the actors of the intermodal sites with the aim of connecting those locations.117
Using these criteria, BTS conducted an assessment of intermodal connectivity in the United States. This was the first study of this scale in the U.S. of interchanges of different modes.
Figure 39. The level of intermodal connectivity of interchanges in the United States
Type of interchange Number / Percentage Airports
With an intermodal connection (% share) 434
148 (34.1%) Intercity rail stations
With an intermodal connection (% share) 507
271 (53.5%) Suburban railway stations
With an intermodal connection (% share) 1160
812 (70%) Ferry terminals
With an intermodal connection (% share) 256
112 (43.8%) (Source: Bureau of Transportation Statistics, Intermodal Passenger Connectivity Database, Table 4, Washington
D.C, RITA, 2010)
Figure 40. The level of intermodal connectivity of intercity and suburban stations (2010)
Type of interchange Without intermodal connection
With intermodal connection
With a connection to 1 other mode
With a connection
with 2 modes
With a connection
with 3 modes
Intercity rail stations
116 Representatives are from the Federal Transit Administration (FTA), Federal Railroad Administration (FRA), Federal Highway Administration (FHWA), Federal Maritime Administration (MARAD), Federal Aviation Administration (FAA), and the Office of Intermodalism of the Research and Innovative Technology Administration; http://www.bts.gov/publications/bts_technical_report/2009_007/html/entire.html#_/tn9 [accessed 02/10/2017]. 117 This definition by the actors appears particularly restrictive since it excludes the connection services of a third actor, for example operated by Amtrak Thruway Bus. In our approach, we will take into consideration all the infrastructures and services that connect the poles of the intermodal trinomial.
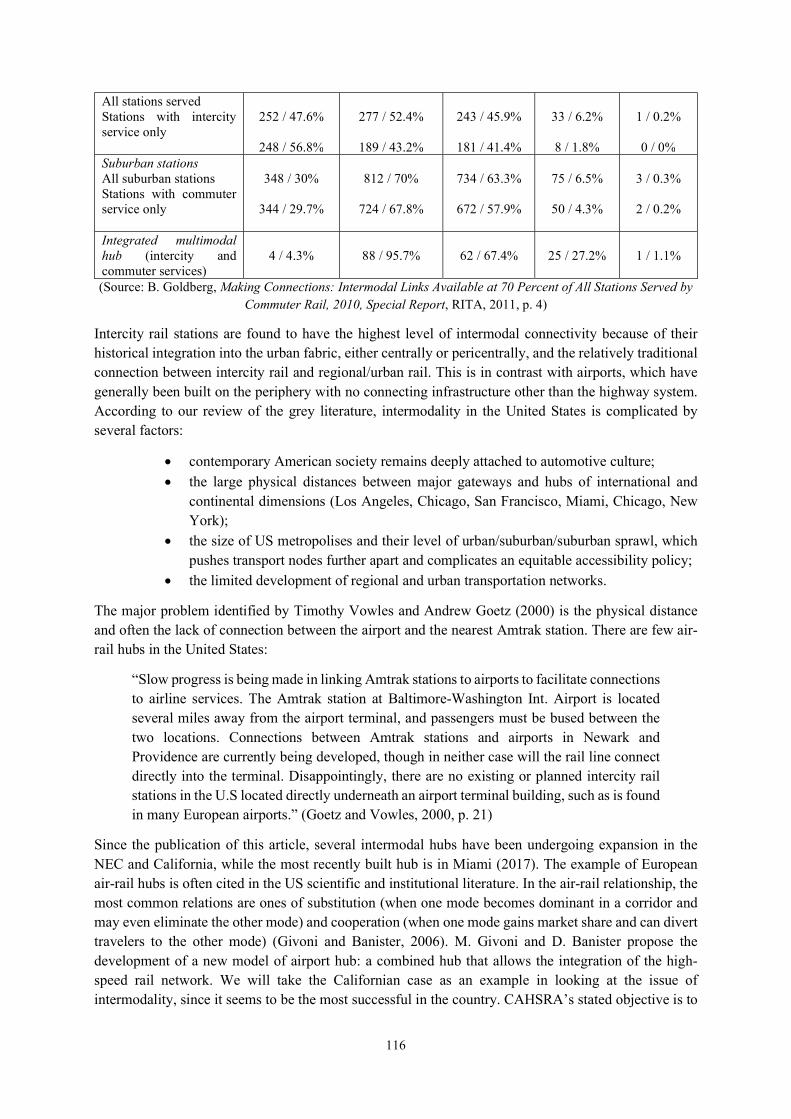
116
All stations served Stations with intercity service only
252 / 47.6%
248 / 56.8%
277 / 52.4%
189 / 43.2%
243 / 45.9%
181 / 41.4%
33 / 6.2%
8 / 1.8%
1 / 0.2%
0 / 0%
Suburban stations All suburban stations Stations with commuter service only
348 / 30%
344 / 29.7%
812 / 70%
724 / 67.8%
734 / 63.3%
672 / 57.9%
75 / 6.5%
50 / 4.3%
3 / 0.3%
2 / 0.2%
Integrated multimodal hub (intercity and commuter services)
4 / 4.3%
88 / 95.7%
62 / 67.4%
25 / 27.2%
1 / 1.1%
(Source: B. Goldberg, Making Connections: Intermodal Links Available at 70 Percent of All Stations Served by Commuter Rail, 2010, Special Report, RITA, 2011, p. 4)
Intercity rail stations are found to have the highest level of intermodal connectivity because of their historical integration into the urban fabric, either centrally or pericentrally, and the relatively traditional connection between intercity rail and regional/urban rail. This is in contrast with airports, which have generally been built on the periphery with no connecting infrastructure other than the highway system. According to our review of the grey literature, intermodality in the United States is complicated by several factors:
contemporary American society remains deeply attached to automotive culture;
the large physical distances between major gateways and hubs of international and continental dimensions (Los Angeles, Chicago, San Francisco, Miami, Chicago, New York);
the size of US metropolises and their level of urban/suburban/suburban sprawl, which pushes transport nodes further apart and complicates an equitable accessibility policy;
the limited development of regional and urban transportation networks.
The major problem identified by Timothy Vowles and Andrew Goetz (2000) is the physical distance and often the lack of connection between the airport and the nearest Amtrak station. There are few air-rail hubs in the United States:
“Slow progress is being made in linking Amtrak stations to airports to facilitate connections to airline services. The Amtrak station at Baltimore-Washington Int. Airport is located several miles away from the airport terminal, and passengers must be bused between the two locations. Connections between Amtrak stations and airports in Newark and Providence are currently being developed, though in neither case will the rail line connect directly into the terminal. Disappointingly, there are no existing or planned intercity rail stations in the U.S located directly underneath an airport terminal building, such as is found in many European airports.” (Goetz and Vowles, 2000, p. 21)
Since the publication of this article, several intermodal hubs have been undergoing expansion in the NEC and California, while the most recently built hub is in Miami (2017). The example of European air-rail hubs is often cited in the US scientific and institutional literature. In the air-rail relationship, the most common relations are ones of substitution (when one mode becomes dominant in a corridor and may even eliminate the other mode) and cooperation (when one mode gains market share and can divert travelers to the other mode) (Givoni and Banister, 2006). M. Givoni and D. Banister propose the development of a new model of airport hub: a combined hub that allows the integration of the high-speed rail network. We will take the Californian case as an example in looking at the issue of intermodality, since it seems to be the most successful in the country. CAHSRA’s stated objective is to
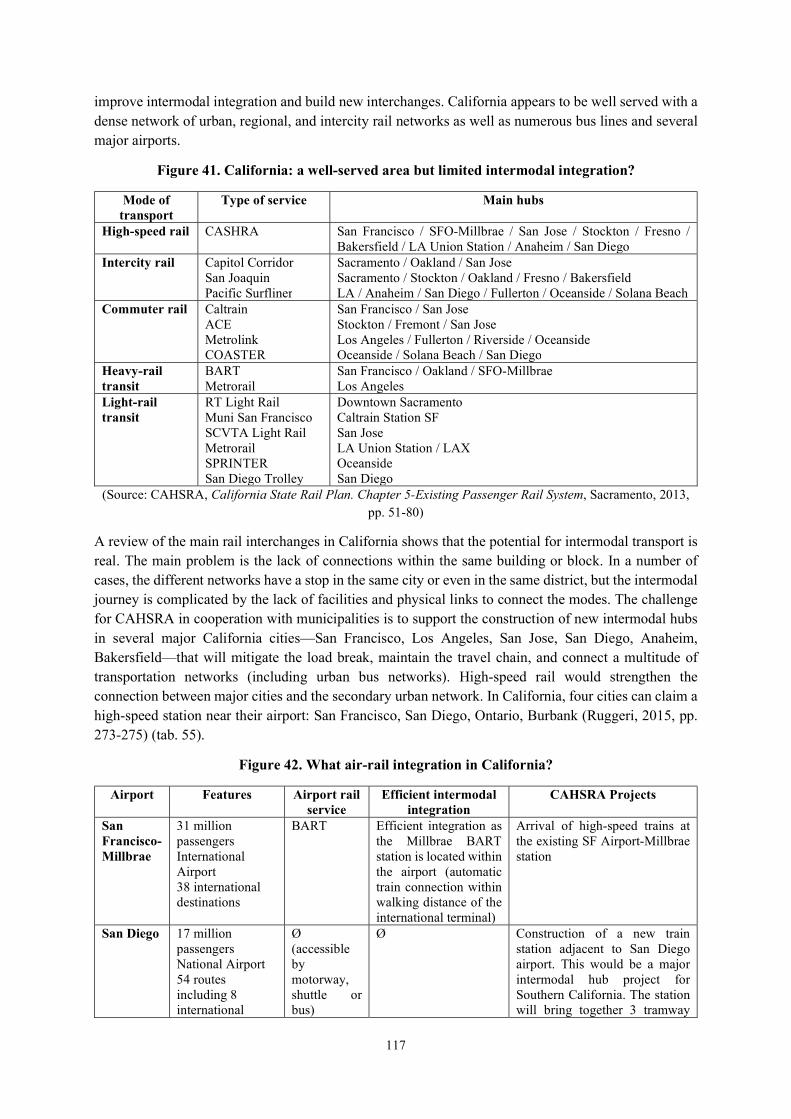
117
improve intermodal integration and build new interchanges. California appears to be well served with a dense network of urban, regional, and intercity rail networks as well as numerous bus lines and several major airports.
Figure 41. California: a well-served area but limited intermodal integration?
Mode of transport
Type of service Main hubs
High-speed rail CASHRA San Francisco / SFO-Millbrae / San Jose / Stockton / Fresno / Bakersfield / LA Union Station / Anaheim / San Diego
Intercity rail Capitol Corridor San Joaquin Pacific Surfliner
Sacramento / Oakland / San Jose Sacramento / Stockton / Oakland / Fresno / Bakersfield LA / Anaheim / San Diego / Fullerton / Oceanside / Solana Beach
Commuter rail Caltrain ACE Metrolink COASTER
San Francisco / San Jose Stockton / Fremont / San Jose Los Angeles / Fullerton / Riverside / Oceanside Oceanside / Solana Beach / San Diego
Heavy-rail transit
BART Metrorail
San Francisco / Oakland / SFO-Millbrae Los Angeles
Light-rail transit
RT Light Rail Muni San Francisco SCVTA Light Rail Metrorail SPRINTER San Diego Trolley
Downtown Sacramento Caltrain Station SF San Jose LA Union Station / LAX Oceanside San Diego
(Source: CAHSRA, California State Rail Plan. Chapter 5-Existing Passenger Rail System, Sacramento, 2013, pp. 51-80)
A review of the main rail interchanges in California shows that the potential for intermodal transport is real. The main problem is the lack of connections within the same building or block. In a number of cases, the different networks have a stop in the same city or even in the same district, but the intermodal journey is complicated by the lack of facilities and physical links to connect the modes. The challenge for CAHSRA in cooperation with municipalities is to support the construction of new intermodal hubs in several major California cities—San Francisco, Los Angeles, San Jose, San Diego, Anaheim, Bakersfield—that will mitigate the load break, maintain the travel chain, and connect a multitude of transportation networks (including urban bus networks). High-speed rail would strengthen the connection between major cities and the secondary urban network. In California, four cities can claim a high-speed station near their airport: San Francisco, San Diego, Ontario, Burbank (Ruggeri, 2015, pp. 273-275) (tab. 55).
Figure 42. What air-rail integration in California?
Airport Features Airport rail service
Efficient intermodal integration
CAHSRA Projects
San Francisco-Millbrae
31 million passengers International Airport 38 international destinations
BART Efficient integration as the Millbrae BART station is located within the airport (automatic train connection within walking distance of the international terminal)
Arrival of high-speed trains at the existing SF Airport-Millbrae station
San Diego 17 million passengers National Airport 54 routes including 8 international
Ø (accessible by motorway, shuttle or bus)
Ø Construction of a new train station adjacent to San Diego airport. This would be a major intermodal hub project for Southern California. The station will bring together 3 tramway
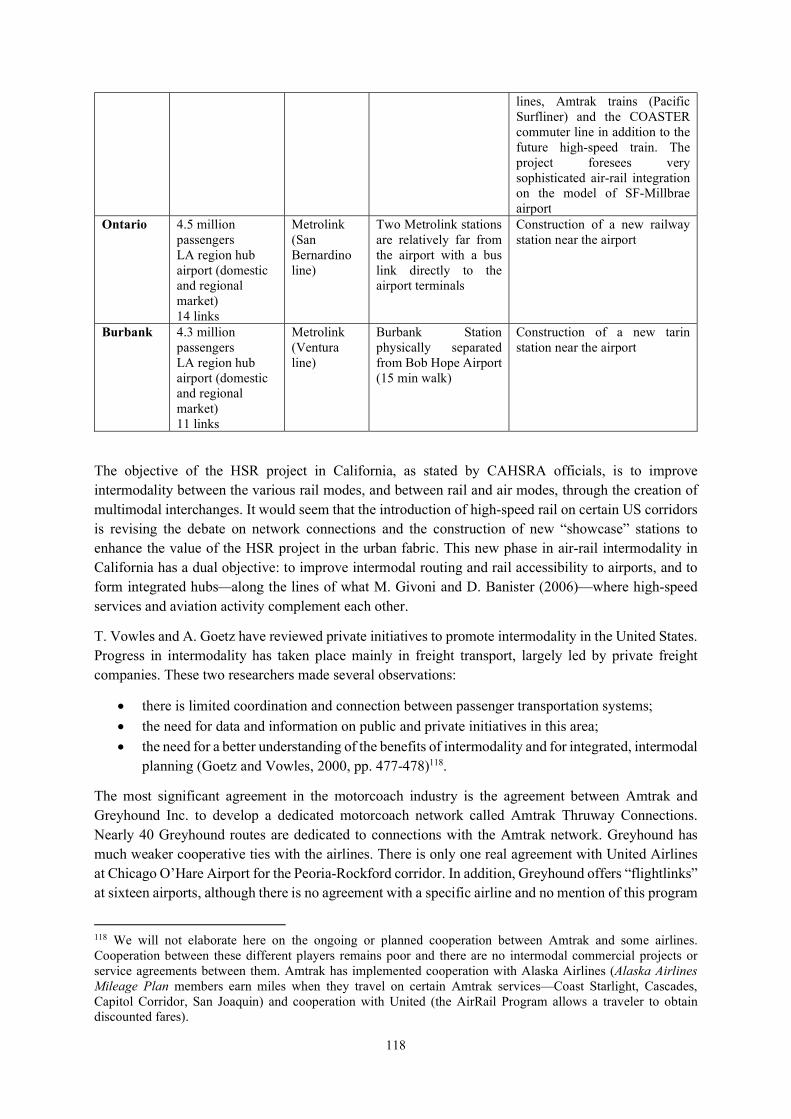
118
lines, Amtrak trains (Pacific Surfliner) and the COASTER commuter line in addition to the future high-speed train. The project foresees very sophisticated air-rail integration on the model of SF-Millbrae airport
Ontario 4.5 million passengers LA region hub airport (domestic and regional market) 14 links
Metrolink (San Bernardino line)
Two Metrolink stations are relatively far from the airport with a bus link directly to the airport terminals
Construction of a new railway station near the airport
Burbank 4.3 million passengers LA region hub airport (domestic and regional market) 11 links
Metrolink (Ventura line)
Burbank Station physically separated from Bob Hope Airport (15 min walk)
Construction of a new tarin station near the airport
The objective of the HSR project in California, as stated by CAHSRA officials, is to improve intermodality between the various rail modes, and between rail and air modes, through the creation of multimodal interchanges. It would seem that the introduction of high-speed rail on certain US corridors is revising the debate on network connections and the construction of new “showcase” stations to enhance the value of the HSR project in the urban fabric. This new phase in air-rail intermodality in California has a dual objective: to improve intermodal routing and rail accessibility to airports, and to form integrated hubs—along the lines of what M. Givoni and D. Banister (2006)—where high-speed services and aviation activity complement each other.
T. Vowles and A. Goetz have reviewed private initiatives to promote intermodality in the United States. Progress in intermodality has taken place mainly in freight transport, largely led by private freight companies. These two researchers made several observations:
there is limited coordination and connection between passenger transportation systems;
the need for data and information on public and private initiatives in this area; the need for a better understanding of the benefits of intermodality and for integrated, intermodal
planning (Goetz and Vowles, 2000, pp. 477-478)118.
The most significant agreement in the motorcoach industry is the agreement between Amtrak and Greyhound Inc. to develop a dedicated motorcoach network called Amtrak Thruway Connections. Nearly 40 Greyhound routes are dedicated to connections with the Amtrak network. Greyhound has much weaker cooperative ties with the airlines. There is only one real agreement with United Airlines at Chicago O’Hare Airport for the Peoria-Rockford corridor. In addition, Greyhound offers “flightlinks” at sixteen airports, although there is no agreement with a specific airline and no mention of this program
118 We will not elaborate here on the ongoing or planned cooperation between Amtrak and some airlines. Cooperation between these different players remains poor and there are no intermodal commercial projects or service agreements between them. Amtrak has implemented cooperation with Alaska Airlines (Alaska Airlines Mileage Plan members earn miles when they travel on certain Amtrak services—Coast Starlight, Cascades, Capitol Corridor, San Joaquin) and cooperation with United (the AirRail Program allows a traveler to obtain discounted fares).
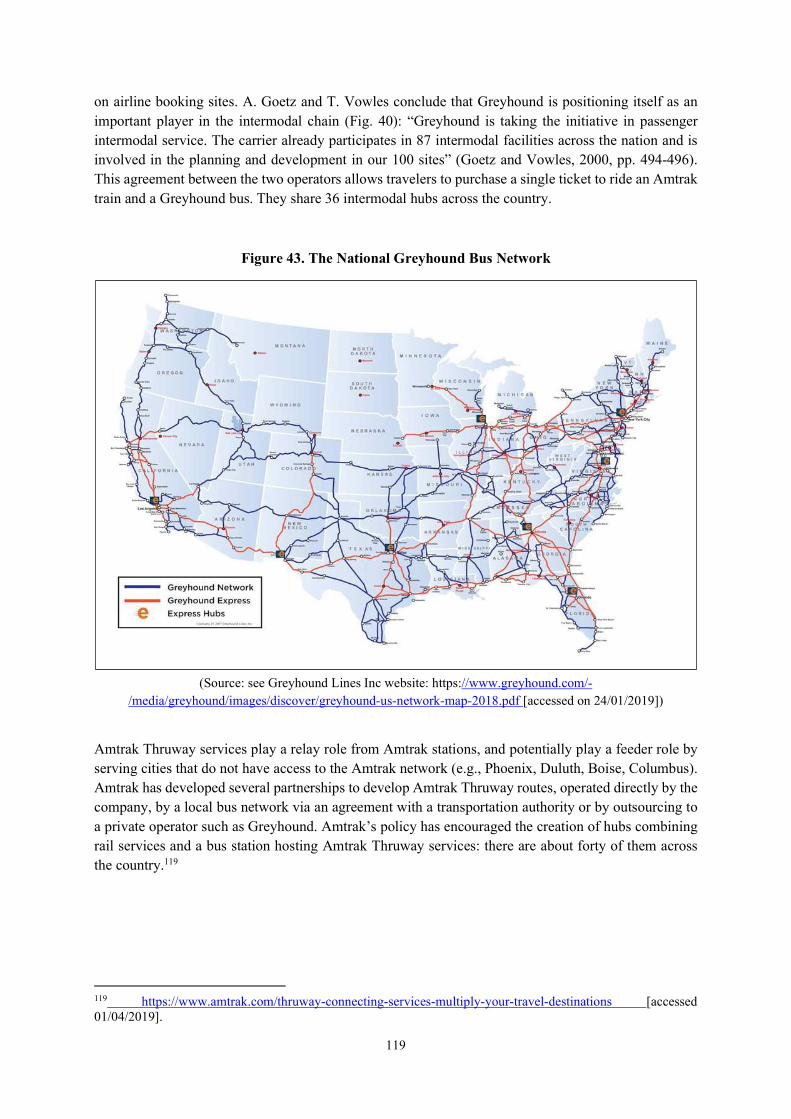
119
on airline booking sites. A. Goetz and T. Vowles conclude that Greyhound is positioning itself as an important player in the intermodal chain (Fig. 40): “Greyhound is taking the initiative in passenger intermodal service. The carrier already participates in 87 intermodal facilities across the nation and is involved in the planning and development in our 100 sites” (Goetz and Vowles, 2000, pp. 494-496). This agreement between the two operators allows travelers to purchase a single ticket to ride an Amtrak train and a Greyhound bus. They share 36 intermodal hubs across the country.
Figure 43. The National Greyhound Bus Network
(Source: see Greyhound Lines Inc website: https://www.greyhound.com/-
/media/greyhound/images/discover/greyhound-us-network-map-2018.pdf [accessed on 24/01/2019])
Amtrak Thruway services play a relay role from Amtrak stations, and potentially play a feeder role by serving cities that do not have access to the Amtrak network (e.g., Phoenix, Duluth, Boise, Columbus). Amtrak has developed several partnerships to develop Amtrak Thruway routes, operated directly by the company, by a local bus network via an agreement with a transportation authority or by outsourcing to a private operator such as Greyhound. Amtrak’s policy has encouraged the creation of hubs combining rail services and a bus station hosting Amtrak Thruway services: there are about forty of them across the country.119
119 https://www.amtrak.com/thruway-connecting-services-multiply-your-travel-destinations [accessed 01/04/2019].
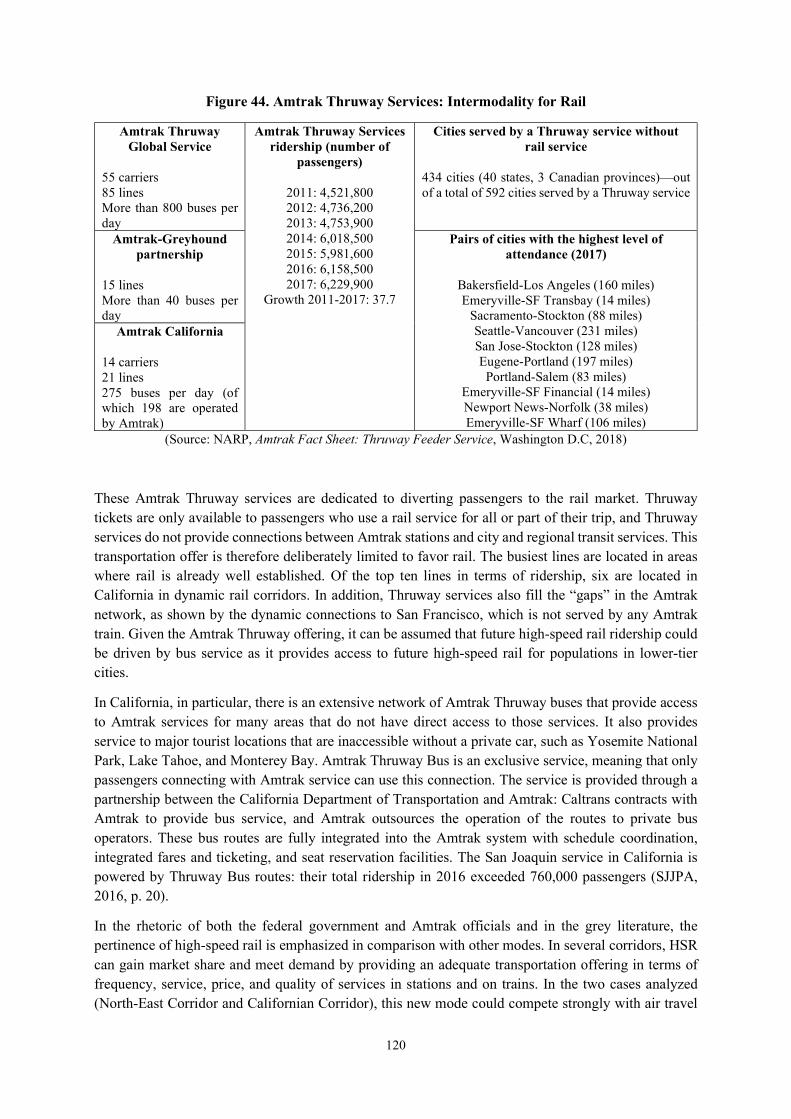
120
Figure 44. Amtrak Thruway Services: Intermodality for Rail
Amtrak Thruway Global Service
55 carriers 85 lines More than 800 buses per day
Amtrak Thruway Services ridership (number of
passengers)
2011: 4,521,800 2012: 4,736,200 2013: 4,753,900 2014: 6,018,500 2015: 5,981,600 2016: 6,158,500 2017: 6,229,900
Growth 2011-2017: 37.7
Cities served by a Thruway service without rail service
434 cities (40 states, 3 Canadian provinces)—out of a total of 592 cities served by a Thruway service
Amtrak-Greyhound partnership
15 lines More than 40 buses per day
Pairs of cities with the highest level of attendance (2017)
Bakersfield-Los Angeles (160 miles) Emeryville-SF Transbay (14 miles)
Sacramento-Stockton (88 miles) Seattle-Vancouver (231 miles) San Jose-Stockton (128 miles) Eugene-Portland (197 miles)
Portland-Salem (83 miles) Emeryville-SF Financial (14 miles) Newport News-Norfolk (38 miles) Emeryville-SF Wharf (106 miles)
Amtrak California
14 carriers 21 lines 275 buses per day (of which 198 are operated by Amtrak)
(Source: NARP, Amtrak Fact Sheet: Thruway Feeder Service, Washington D.C, 2018)
These Amtrak Thruway services are dedicated to diverting passengers to the rail market. Thruway tickets are only available to passengers who use a rail service for all or part of their trip, and Thruway services do not provide connections between Amtrak stations and city and regional transit services. This transportation offer is therefore deliberately limited to favor rail. The busiest lines are located in areas where rail is already well established. Of the top ten lines in terms of ridership, six are located in California in dynamic rail corridors. In addition, Thruway services also fill the “gaps” in the Amtrak network, as shown by the dynamic connections to San Francisco, which is not served by any Amtrak train. Given the Amtrak Thruway offering, it can be assumed that future high-speed rail ridership could be driven by bus service as it provides access to future high-speed rail for populations in lower-tier cities.
In California, in particular, there is an extensive network of Amtrak Thruway buses that provide access to Amtrak services for many areas that do not have direct access to those services. It also provides service to major tourist locations that are inaccessible without a private car, such as Yosemite National Park, Lake Tahoe, and Monterey Bay. Amtrak Thruway Bus is an exclusive service, meaning that only passengers connecting with Amtrak service can use this connection. The service is provided through a partnership between the California Department of Transportation and Amtrak: Caltrans contracts with Amtrak to provide bus service, and Amtrak outsources the operation of the routes to private bus operators. These bus routes are fully integrated into the Amtrak system with schedule coordination, integrated fares and ticketing, and seat reservation facilities. The San Joaquin service in California is powered by Thruway Bus routes: their total ridership in 2016 exceeded 760,000 passengers (SJJPA, 2016, p. 20).
In the rhetoric of both the federal government and Amtrak officials and in the grey literature, the pertinence of high-speed rail is emphasized in comparison with other modes. In several corridors, HSR can gain market share and meet demand by providing an adequate transportation offering in terms of frequency, service, price, and quality of services in stations and on trains. In the two cases analyzed (North-East Corridor and Californian Corridor), this new mode could compete strongly with air travel
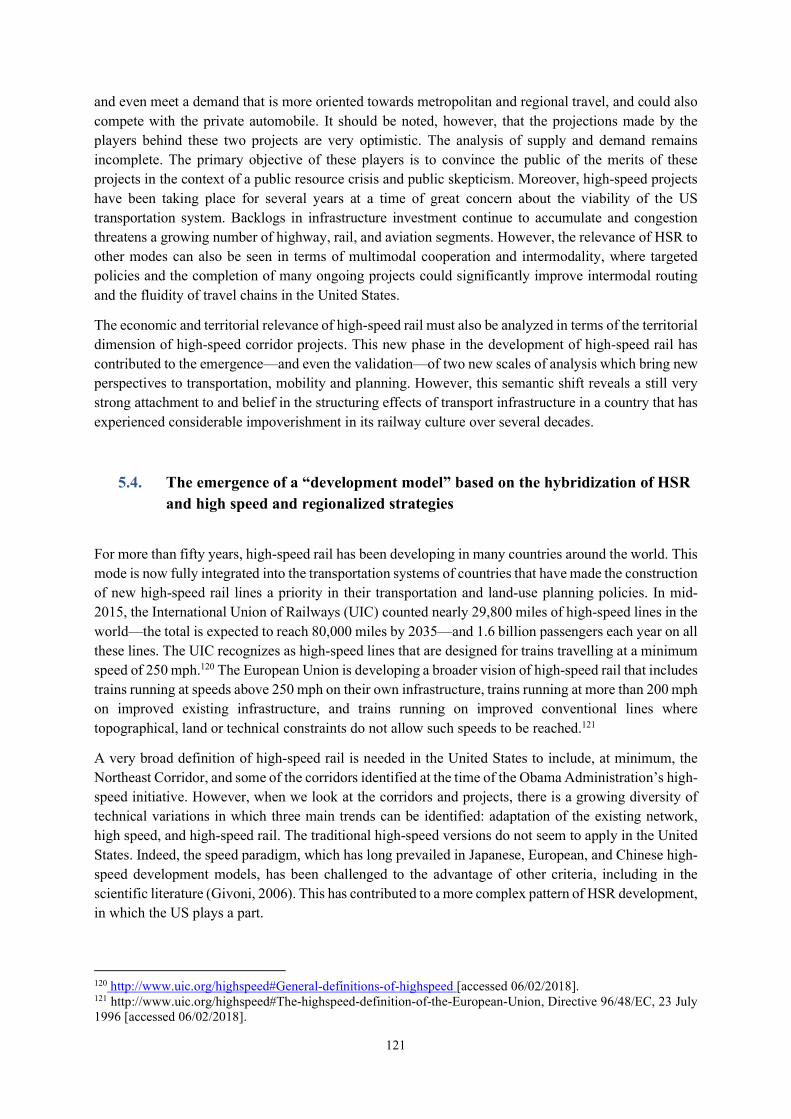
121
and even meet a demand that is more oriented towards metropolitan and regional travel, and could also compete with the private automobile. It should be noted, however, that the projections made by the players behind these two projects are very optimistic. The analysis of supply and demand remains incomplete. The primary objective of these players is to convince the public of the merits of these projects in the context of a public resource crisis and public skepticism. Moreover, high-speed projects have been taking place for several years at a time of great concern about the viability of the US transportation system. Backlogs in infrastructure investment continue to accumulate and congestion threatens a growing number of highway, rail, and aviation segments. However, the relevance of HSR to other modes can also be seen in terms of multimodal cooperation and intermodality, where targeted policies and the completion of many ongoing projects could significantly improve intermodal routing and the fluidity of travel chains in the United States.
The economic and territorial relevance of high-speed rail must also be analyzed in terms of the territorial dimension of high-speed corridor projects. This new phase in the development of high-speed rail has contributed to the emergence—and even the validation—of two new scales of analysis which bring new perspectives to transportation, mobility and planning. However, this semantic shift reveals a still very strong attachment to and belief in the structuring effects of transport infrastructure in a country that has experienced considerable impoverishment in its railway culture over several decades.
5.4. The emergence of a “development model” based on the hybridization of HSR and high speed and regionalized strategies
For more than fifty years, high-speed rail has been developing in many countries around the world. This mode is now fully integrated into the transportation systems of countries that have made the construction of new high-speed rail lines a priority in their transportation and land-use planning policies. In mid-2015, the International Union of Railways (UIC) counted nearly 29,800 miles of high-speed lines in the world—the total is expected to reach 80,000 miles by 2035—and 1.6 billion passengers each year on all these lines. The UIC recognizes as high-speed lines that are designed for trains travelling at a minimum speed of 250 mph.120 The European Union is developing a broader vision of high-speed rail that includes trains running at speeds above 250 mph on their own infrastructure, trains running at more than 200 mph on improved existing infrastructure, and trains running on improved conventional lines where topographical, land or technical constraints do not allow such speeds to be reached.121
A very broad definition of high-speed rail is needed in the United States to include, at minimum, the Northeast Corridor, and some of the corridors identified at the time of the Obama Administration’s high-speed initiative. However, when we look at the corridors and projects, there is a growing diversity of technical variations in which three main trends can be identified: adaptation of the existing network, high speed, and high-speed rail. The traditional high-speed versions do not seem to apply in the United States. Indeed, the speed paradigm, which has long prevailed in Japanese, European, and Chinese high-speed development models, has been challenged to the advantage of other criteria, including in the scientific literature (Givoni, 2006). This has contributed to a more complex pattern of HSR development, in which the US plays a part.
120 http://www.uic.org/highspeed#General-definitions-of-highspeed [accessed 06/02/2018]. 121 http://www.uic.org/highspeed#The-highspeed-definition-of-the-European-Union, Directive 96/48/EC, 23 July 1996 [accessed 06/02/2018].
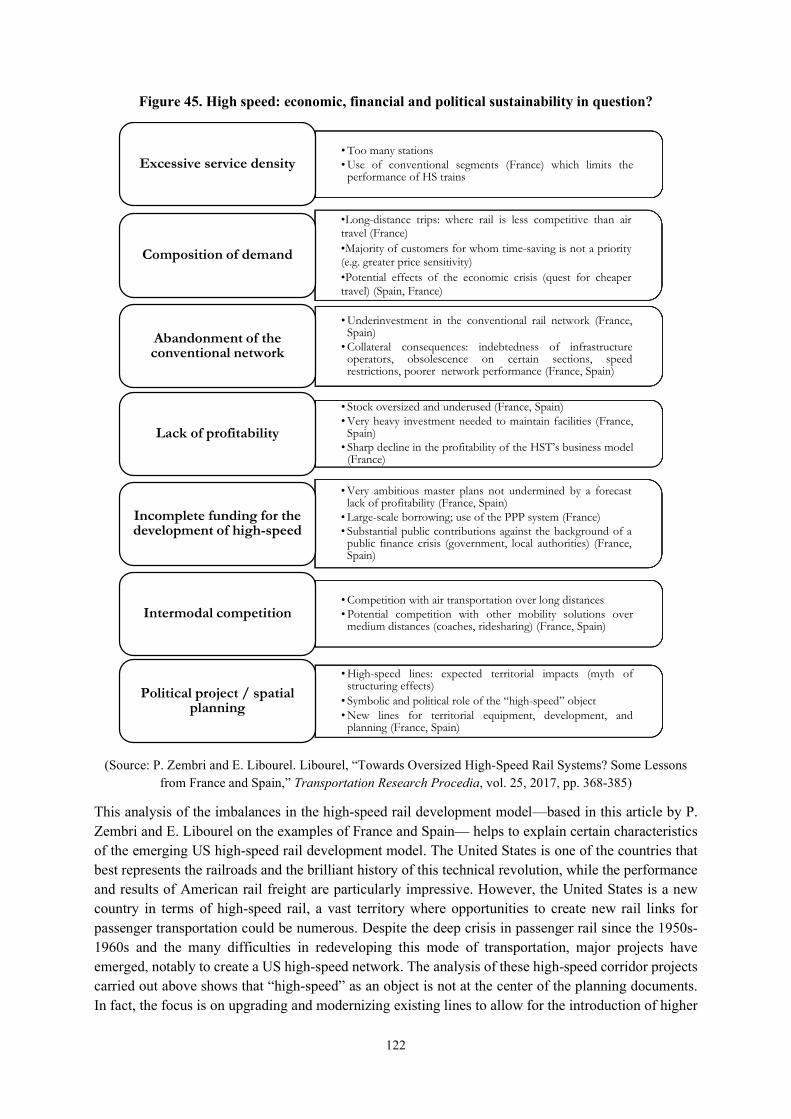
122
Figure 45. High speed: economic, financial and political sustainability in question?
(Source: P. Zembri and E. Libourel. Libourel, “Towards Oversized High-Speed Rail Systems? Some Lessons from France and Spain,” Transportation Research Procedia, vol. 25, 2017, pp. 368-385)
This analysis of the imbalances in the high-speed rail development model—based in this article by P. Zembri and E. Libourel on the examples of France and Spain— helps to explain certain characteristics of the emerging US high-speed rail development model. The United States is one of the countries that best represents the railroads and the brilliant history of this technical revolution, while the performance and results of American rail freight are particularly impressive. However, the United States is a new country in terms of high-speed rail, a vast territory where opportunities to create new rail links for passenger transportation could be numerous. Despite the deep crisis in passenger rail since the 1950s-1960s and the many difficulties in redeveloping this mode of transportation, major projects have emerged, notably to create a US high-speed network. The analysis of these high-speed corridor projects carried out above shows that “high-speed” as an object is not at the center of the planning documents. In fact, the focus is on upgrading and modernizing existing lines to allow for the introduction of higher
• Too many stations• Use of conventional segments (France) which limits the
performance of HS trainsExcessive service density
•Long-distance trips: where rail is less competitive than airtravel (France)•Majority of customers for whom time-saving is not a priority(e.g. greater price sensitivity)•Potential effects of the economic crisis (quest for cheapertravel) (Spain, France)
Composition of demand
• Underinvestment in the conventional rail network (France,Spain)
• Collateral consequences: indebtedness of infrastructureoperators, obsolescence on certain sections, speedrestrictions, poorer network performance (France, Spain)
Abandonment of the conventional network
• Stock oversized and underused (France, Spain)• Very heavy investment needed to maintain facilities (France,
Spain)• Sharp decline in the profitability of the HST’s business model
(France)
Lack of profitability
• Very ambitious master plans not undermined by a forecastlack of profitability (France, Spain)
• Large-scale borrowing; use of the PPP system (France)• Substantial public contributions against the background of a
public finance crisis (government, local authorities) (France,Spain)
Incomplete funding for the development of high-speed
• Competition with air transportation over long distances• Potential competition with other mobility solutions over
medium distances (coaches, ridesharing) (France, Spain)Intermodal competition
• High-speed lines: expected territorial impacts (myth ofstructuring effects)
• Symbolic and political role of the “high-speed” object• New lines for territorial equipment, development, and
planning (France, Spain)
Political project / spatial planning
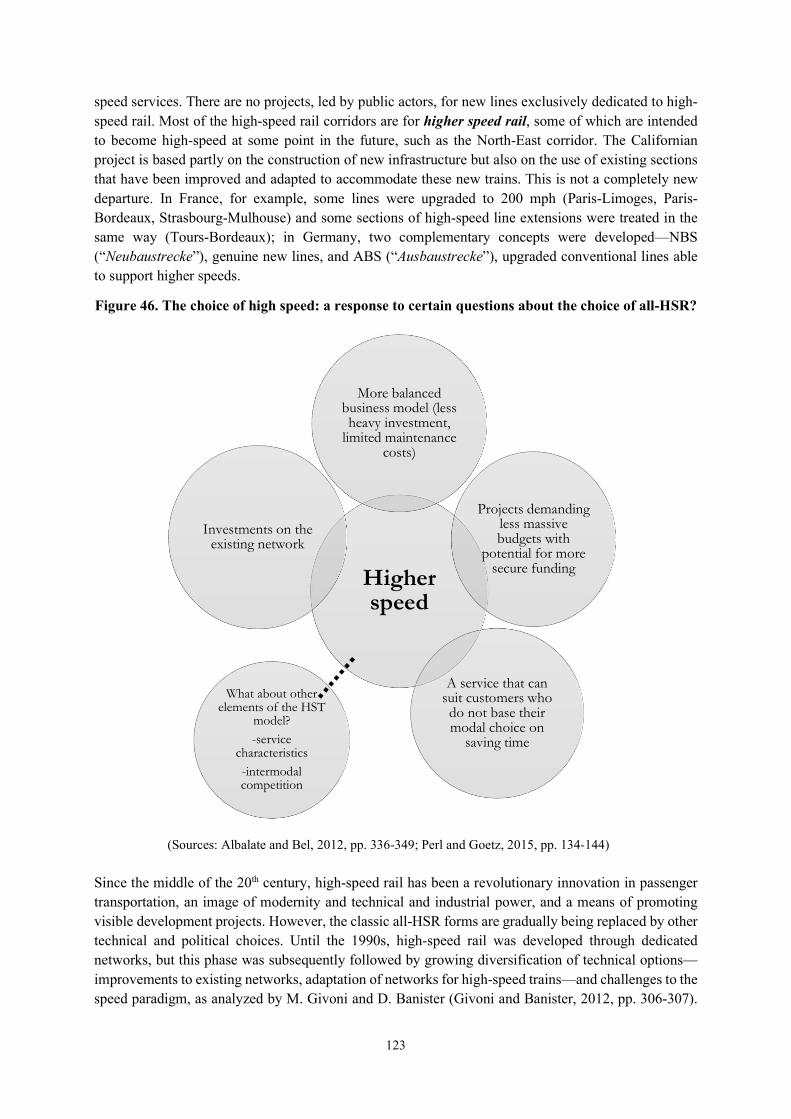
123
speed services. There are no projects, led by public actors, for new lines exclusively dedicated to high-speed rail. Most of the high-speed rail corridors are for higher speed rail, some of which are intended to become high-speed at some point in the future, such as the North-East corridor. The Californian project is based partly on the construction of new infrastructure but also on the use of existing sections that have been improved and adapted to accommodate these new trains. This is not a completely new departure. In France, for example, some lines were upgraded to 200 mph (Paris-Limoges, Paris-Bordeaux, Strasbourg-Mulhouse) and some sections of high-speed line extensions were treated in the same way (Tours-Bordeaux); in Germany, two complementary concepts were developed—NBS (“Neubaustrecke”), genuine new lines, and ABS (“Ausbaustrecke”), upgraded conventional lines able to support higher speeds.
Figure 46. The choice of high speed: a response to certain questions about the choice of all-HSR?
(Sources: Albalate and Bel, 2012, pp. 336-349; Perl and Goetz, 2015, pp. 134-144)
Since the middle of the 20th century, high-speed rail has been a revolutionary innovation in passenger transportation, an image of modernity and technical and industrial power, and a means of promoting visible development projects. However, the classic all-HSR forms are gradually being replaced by other technical and political choices. Until the 1990s, high-speed rail was developed through dedicated networks, but this phase was subsequently followed by growing diversification of technical options— improvements to existing networks, adaptation of networks for high-speed trains—and challenges to the speed paradigm, as analyzed by M. Givoni and D. Banister (Givoni and Banister, 2012, pp. 306-307).
Higher speed
More balanced business model (less heavy investment,
limited maintenance costs)
Projects demanding less massive budgets with
potential for more secure funding
A service that can suit customers who do not base their modal choice on
saving time
What about other elements of the HST
model?
-service characteristics
-intermodal competition
Investments on the existing network
124
Rail projects in the United States, whose promoters retain a fascination with European or Asian high-speed trains, incorporate new parameters influenced by three types of consideration: economic (project costs, structuring effects expected by local actors), territorial (contraction of space-time, continuity of service and territorial equity), and political (HSR as a prestige policy, conflicts over major infrastructure projects).
The US model is similar in some respects to the German ICE (Intercity-Express) model, with integration and interoperability of networks and services, as the tracks can accommodate all types of service. However, the US case differs on two essential points: the ownership of the infrastructure by private freight companies, and the choice not to make “high speed” a primary objective. The high-speed network under construction in the United States is very different from the French, Spanish, Japanese, or Chinese systems. It is primarily based on gradual improvements to sections in order to reduce trip times by increasing average speed, to increase train frequency, and to reduce delays caused by equipment or infrastructure failure.
6. CONCLUSION
This research is based on the observation that intercity passenger rail transportation in the United States has been emerging from deep crisis over the last ten years and that the introduction of high-speed rail is becoming a new paradigm in public transportation policies. Many political and economic actors, at various levels of government, are advocating the development of a new high-speed rail transportation offering to combat congestion, provide an alternative to the private car for inter-city or intra-metropolitan journeys, and encourage the “structuring” of vast polycentric metropolitan regions.
Our goal was to develop a new rail geography of the United States, to analyze the characteristics, logics, and mechanisms of implementation of current rail policies through a continuous interplay of scales, and to work on the local transportation and planning policies implicated in passenger rail. It was based on the analysis of three case studies: the Cascades Corridor (Amtrak’s conventional rail line upgraded with “Obamarail” funds), the Northern California Corridor between San Jose and San Francisco (a corridor that will include both future high-speed service and Caltrain’s upgraded electrified infrastructure), and the Brightline Corridor between Miami and Orlando (a privately funded high-speed link project). This research focused on the characteristics—actors, rationales, programs, financing—of rail infrastructure and equipment projects backed by federal and local public actors. It is therefore based on the concrete expression of railway policies, and their embeddedness in and relations to territories from the perspective of several scales of analysis and several regional contexts.
Our work was based on two main questions:
The first concerned the appropriation or reappropriation of this mode by the transportation stakeholders. How are federal, state, and Amtrak rail policies constructed and implemented? How are the political, economic and territorial issues of rail transportation seen in the overall context of transportation in the United States? How do the various actors understand the institutional conflicts around rail, which are fueled by budgetary, legislative, and political factors?
the second concerned the territorial embeddedness and the process of territorialization of railway policies in a country where the States and local actors develop their own practices and their own modes of public action according to political and economic
125
considerations that do not depend much on the national context. What are the factors that promote and constrain the emergence of new rail policies? How are the links and the necessary coordination between interurban rail projects, regional and urban transportation networks, and public transportation development policies worked out? How do local actors and transportation operators approach the metropolitan embeddedness of railway projects through stations and station districts?
The first hypothesis was that a policy in favor of high-speed rail would emerge, driven by a coalescence of public and/or private players, and not by the establishment of a national plan for the development of high-speed rail.
Our analyses have confirmed this hypothesis. In a nation characterized by recurrent tensions and controversies over the place and role of the federal government, the implementation of a scheme driven by the federal government is compromised. The emergence of more and more private projects reflects the current situation of passenger rail transportation in the United States, caught between technological, scientific, and political emulation and major financial obstacles. After a major turnaround in 2009, marked by the passage of several pieces of legislation and the implementation of an unprecedented funding program based on federal-state collaboration, federal rail policy appears to have been operating in slow motion since 2011. The Obama administration’s top-down initiative helped to change the geography of American rail, but too modestly. It has supported high-speed projects in California and the Northeast and upgraded the existing network in other corridors (Cascades, Midwest, California), but it has not advanced or imposed a uniform vision across the country. It is therefore through a coalescence of actors and strengthened cooperation between them that the rail projects are carried out. The analysis highlights the fact that a bottom-up approach is driving the implementation of projects, as is the case for the Californian HSR project and the modernization of the Cascade corridor. This logic is even being taken to extremes with the proliferation of private rail projects that claim to be independent of the public authorities in terms of decision-making, governance, and financing. This seems to put a definitive end to any attempt to define a national plan for high-speed rail, on the model of what has happened in the historic HSR countries, beyond partisan considerations—i.e. the traditionally stronger commitment of the Democratic Party to major federal investments.
The second hypothesis was that a policy paradigm shift would contribute to the emergence and implementation of policies favorable to passenger rail. This analysis was first conducted at the national and federal levels, focusing on the arguments and rationales in strategic planning documents, both for transportation and for urban or regional development. The dissemination of these arguments and recommendations coincides with the emergence of a large-scale movement to develop sustainable mobility. Two conclusions can be drawn: firstly, the standardization of this argument and recommendations to encourage new rail policies (structuring effects, economic role of high speed, tackling congestion, modal shift); secondly, a tangible commitment at all levels but to varying degrees by public actors in favor of the rail mode. However, this paradigm shift is limited by three factors that we have identified through this research:
first, the lack of a technical and administrative rail culture—since high-speed rail is still an innovative technology in the United States, this makes it more complex for the institutional players to consider HSR-related issues. The signs of this lack of a rail culture are visible both in the development of the business model for each project (market analysis, modal split, supply/demand analysis, changes in the number of passengers induced or transferred, etc.) and in the still strong belief among public players at all levels in the structuring effects of a transport infrastructure by all public players at all levels;
126
the second factor is institutional and political. For several decades, the public policy frameworks of the federal government and many federal states have been shaped by and for the development of the private car and the highway system (permanent and dedicated funding sources, consistent political support for the automobile mode, legislative and even constitutional prohibition on using existing funding for anything other than the highways sector, absence of specific programs and stable dedicated funding for inter-city passenger rail transportation, at both federal and state level);
finally, there is a strong disconnect between formal political commitments, which are present in both grey literature and speeches, and the reality of the jurisdiction of the different players in the transportation field. Although all the players recognize the environmental and economic need to encourage a modal shift from private cars to public transportation and to support the rail mode, the current distribution of powers relating to intercity rail transportation, the institutional isolation of Amtrak, and the clear separation between this intercity mode and other modes in public policies, mean that in reality the territorial players—primarily the MPOs/RTPOs, the counties, and the municipalities—have very little real power to support a large-scale rail project. Their role is limited, in terms of jurisdiction, to the urban development associated with train stations and to the connections between the different transportation networks at the scale of the city or the metropolitan region. Beyond the interpretations that local officials may place on this, there are important convergences of viewpoints and recommendations. The public players in the transportation and planning sectors are taking up and working on the challenge of developing new rail projects within their own jurisdiction and scope of action.
The third hypothesis concerned the emergence of an original policy for high-speed rail. Our analysis supports the view that a different strategy for the development of high-speed rail is being constructed in the United States. The United States is one of the countries that best represents the history of the railroad and the technical revolution that fueled it. While US rail freight today can demonstrate a particularly strong performance and track record, the US is a new country in terms of high-speed rail. Despite the deep crisis in passenger rail transportation since the 1950s-1960s and the many difficulties in redeveloping this mode of travel, major projects have continued to emerge, notably for the creation of high-speed lines. Analysis of these high-speed corridor projects shows that the speed paradigm is not central to the planning documents—in fact, it is a paradigm has been facing challenges in the scientific literature for a member of years. What we are really seeing is first the improvement and upgrading of existing corridors to allow the launch of high-speed services, and secondly mixed networks that combine different types of infrastructure. There are no projects, led by public actors, for new lines exclusively dedicated to HSR. Most of the high-speed corridors are high speed corridors (“higher speed rail”), some of which are slated to become high-speed at some point in the future, such as the North-East corridor. The Californian project, for its part, is based partly on the construction of a new infrastructure but also on the improvement of existing sections. Three findings emerge from our analyses:
there is a hybridization of technical arrangements for the implementation of high-speed intercity rail services—with de facto coexistence between high-speed corridors as defined by the UIC, mixed high-speed corridors (infrastructure shared between the public and private sectors), and private corridors on which the national operator Amtrak does not operate;
127
the emergence of a high degree of territorial selectivity with respect to the construction of high-speed lines—a very limited number of regional or supra-regional corridors have a suitable geographical, urban, and economic configuration;
regionalized strategies for high-speed rail are being implemented in the United States, based on a bottom-up approach, that takes into account local specificities.
The last hypothesis was based on the idea that rail renewal in the United States is based on network integration, the implementation of a policy of intermodality, and specific emphasis on the metropolitan anchoring of rail corridors. Indeed, public actors at all levels, with jurisdiction over matters of transportation and/or urban planning and development, insist on the need to connect networks at different scales. The territorialization of rail projects requires the design and implementation of more integrated transportation networks—at least in terms of service and physical connection— that operate according to a true network logic. Having analyzed projects for the modernization of high-speed corridors and for the construction of new infrastructure, we note the importance of stations and a move towards better coordination between transportation and urban planning through support for station districts. Indeed, a rail corridor project, which stands at the intersection of political, economic, technical and territorial interests, is also at the heart of a process of territorialization which materially inserts the infrastructure into urban spaces, and of a process of politicization through the mobilization of local actors. Railway projects appear to be an instrument for the establishment of metropolitan scale facilities (stations, multimodal interchanges) and for the organization or reconfiguration of the urban fabric (station districts, larger district renewal projects).
Benefits and limitations
Moving between scales and case studies
A constant movement and back-and-forth between scales were essential parts of this research. The challenge was to overcome the opposition in principle between analysis of the rail situation on a national scale and separate analysis of each local context or of one or more specific projects. By combining the analysis of the conception and implementation of three emblematic rail projects, their instruments of territorialization at the regional and local levels and the major general issues (affecting the whole of the United States) relating to rail policy in general and the implementation of high-speed rail in particular, we were able to understand the rationale underlying new rail projects in the United States as well as the issues specific to each level, in an ongoing dialogue to highlight the differences and similarities. By interweaving the scales of analysis employed to encompass the object “intercity passenger rail transportation”, from the federal to the metropolitan scale, we were able to avoid separating the territorialization of rail projects from the major political orientations of the federal government and the states, and to take into account the connections and interrelations between the different levels of governance and decision-making. Working with a continuous set of scales throughout the research was a complex task, but it enabled us to appreciate all the rationales, issues, and interplay of actors relating to the rail mode, especially in a country characterized by strong devolution of powers and the major influence of local governments, as well as by significant institutional fragmentation both in terms of perimeters and competences. Moreover, this interweaving of scales enabled us to characterize both the degree of interpenetration in the interplay of actors around each project and the disparities in the rationales, objectives, and priorities in the implementation of a project and/or a rail transportation policy.
Understanding the situation of the American railroad through the interplay of stakeholders
This thesis offers an overview of the situation of passenger rail transportation and draws up an inventory of the implementation of high-speed rail in the United States. Through this research we have been able
128
to make a contribution to the understanding of the Anglo-American world. In her 2009 book, Transports et territoires. Enjeux et débats, Madeleine Brocard identified one potential avenue for research as seeking a better understanding of transportation and mobility issues in Anglo-American countries (United States, United Kingdom, Canada, Australia). These four countries lag behind other developed countries in their passenger rail policy and are significantly absent or almost absent from the global movement in favor of high-speed rail. We provide a detailed study of the operation and construction of rail policies at different scales by analyzing actors, institutions, and mechanisms of action, as well as by presenting the frameworks of public action in this domain (prerogatives, technical and institutional production, procedures, financing). The main theme that runs through all the scales and case studies is that the frameworks of public action in the USA are inadequate for the rail mode—especially for the launching of new large-scale projects, and especially for HSR—and are overwhelmingly calibrated and oriented towards and in favor of the private car.
129
REFERENCES (Complete bibliography of the dissertation with the references cited in this position paper)
Books and scientific literature
C. J. Abbott, « The Capital of Good Planning. Metropolitan Portland since 1970 » dans R. Fishman (ed.), The American Planning Tradition: Culture and Policy, Washington D.C, Woodrow Wilson Center Press, pp. 241-261.
C. Abraham, L’ouverture à la concurrence du transport ferroviaire de voyageurs, Paris, Centre d’analyse stratégique, 2011.
N. Adler, E. Pels et C. Nash, « High-speed Rail and Air Transport Competition: Game Engineering as Tool for Cost-Benefit Analysis », Transportation Research Part B:Methodological, vol. 44, n° 7, pp. 812-833.
P. Ageron, L'intermodalité-voyageurs au prisme de la mondialisation : vers la structuration d'un méta-réseau intégré, thèse de doctorat, sous la direction de Jean Varlet, Université de Grenoble, soutenue le 14 juin 2013.
D. Albalate et G. Bel, « High-Speed Rail : Lessons for Policy Makers from Experiences Abroad », Public Administration Review, vol. 72, n° 3, 2012, pp. 336-350.
D. Albalate et G. Bel, The Economics and Politics of High-Speed Rail, New York, Lexington Books, 2014.
D. Albalate, J. Campos et J. L. Jimenez, « Tourism and High Speed Rail in Spain : Does the AVE Increase Local Visitors? », Annals of Tourism Research, vol. 65, juillet 2017, pp. 71-82.
L. Alexander, « The Promise and Perils of ‘New Regionalist’ Approaches to Sustainable Communities », Fordham Urban Law Journal, vol. 38, n° 3, 2011, pp. 630-674.
J. G. Allan, « Commuter Rail, Freight Railroads, And The Open Access Debate », Transportation Research Record, n° 1704, papier n° 00-0858, 2000, pp. 35-45.
B. Allen, M. Sussman et D. Miller, « Regional and Short Line Railroads in the United States », Transportation Quarterly, vol. 56, n° 4, 2002, pp. 77-113.
S. E. Ambrose, Nothing Like It in the World: The Men Who Built the Transcontinental Railroad, 1863-1869, New York, Simon & Schuster, 2000.
A. Amekudzi, L. Thomas-Mobley et C. Ross, « Transportation Planning and Infrastructure Delivery in Major Cities and Megacities », Transportation Research Record: Journal of the Transportation Research Board, n° 3, 1997, pp. 17-23.
R.V. Andelson, Land-Value: Taxation around the World, Malden (MA.), Blackwell, 2000.
Y. Alix (ed.), Les corridors de transport, Cormelles-le-Royal, Editions EMS, 2012.
A. Artibise, « Achieving Sustainability in Cascadia: An Emerging Model of Urban Growth Management in the Vancouver-Seattle-Portland Corridor », Urban Affairs Annual Review, vol. 44, 1995, pp. 221-250.
S. Ashiabor et W. Wei, Advancing High-Speed Rail Policy in the United States, San Jose, San Jose State University, Mineta Transportation Institute, 2012.
C. Atkinson-Palombo et M. J. Kuby, « The Geography of Advance Transit-Oriented Development in Metropolitan Phoenix, Arizona 2000-2007 », Journal of Transport Geography, vol. 19, n° 2, 2011, pp. 189-199.
A. Audikana, « La grande vitesse ferroviaire au miroir des élections américaines », Flux, vol. 88, 2012, pp. 71-74.
E. Auphan, « L’espace et les systèmes à grande vitesse », Cahiers du CREPIF, vol. 61, 1997, pp. 9-38.
E. Auphan, « Un quart de siècle de grande vitesse ferroviaire en France », Bulletin de l’Association de Géographes Français, 85/4, 2008, pp. 431-442.
E. Auphan, « Le TGV français ou le démantèlement du réseau ferré français », Annales de géographie, 2012/2, n° 684, pp. 194-213.
N. Aveline, La ville et le rail au Japon, Paris, CNRS Editions, 2003.
B. Balogh, A Government Out of Sight. The Mystery of National Authority in Nineteenth-Century America, Cambridge, Cambridge University Press, 2009.
130
K. Bardo, Relationship Building with Freight Railroads Critical to Support Intercity Passenger Rail Development, Chicago, University of Illinois, College of Urban Planning and Policy, MUPP, 2013.
M. Barlow, Metropolitan Government, London/New York, Routledge, 1991.
C. C. Barnekov et A. N. Kleit, « The Efficiency Effects of Railroad Deregulation in the United States » International Journal of Transport Economics, vol. 17, 1990, pp. 21-36.
H. W. Batt, « Value Capture As Policy Tool in Transportation Economics », American Journal of Economics and Sociology, vol. 60, n° 1, 2001, pp. 195-228.
J-J Bavoux, F. Beaucire, L. Chapelon et P. Zembri, Géographie des transports, Paris, Armand Colin, 2010 (1ère ed. 2005).
J-J. Bavoux et M. Piquant, « Les réseaux de transport entre Paris et Lyon : compétition ou coopération ? », Flux, n° 39-40, 2000, pp. 30-39.
S. Bazin, C. Beckerich, C. Blanquart, M. Delaplace et L. Vandenbossche, « Grande vitesse ferroviaire et développement économique local: une revue de la littérature » Recherche Transports Sécurité, vol. 27, n° 3, 2011, pp. 215–238.
S. Bazin, C. Beckerich, C. Blanquart, M. Delaplace, et L. Vandenbossche, « Grande vitesse ferroviaire et développement économique local : une revue de la littérature », Colloque de l’ASRDLF : Identité, Qualité et Compétitivité Territoriale – Développement économique et cohésion dans les territoires alpins, septembre 2010, Aoste (Italie).
S. Bazin, C. Beckerich, C. Blanquart, M. Delaplace, L. Vandenbossche, « Lignes ferroviaires à grande vitesse et dynamiques locales : une analyse comparée de la littérature », Géotransports, n° 1-2, 2010, pp. 15-34.
S. Bazin, C. Beckerich et M. Delaplace, « High Speed Railway, Service Innovations and Urban and Business Tourisms Development » dans M. Sarmento et A. Matias (dir.), Economics and Management of Tourism : Trends and Recent Developments, Lisbonne, Universidade Luisiada Editora, 2011, pp. 115-141.
S. Bazin et al., « Desserte TGV et villes petites et moyennes. Une illustration par les cas du tourisme à Arras, Auray, Charleville-Mézières et Saverne », Les Cahiers Scientifiques du Transport, n° 63, 2013, pp. 33-62.
S. Bazin, C. Beckerich et M. Delaplace, « Grande vitesse, activation des ressources spécifiques et développement du tourisme urbain : le cas de l’agglomération rémoise », Belgeo, n° 1-2, 2010, pp. 65-78.
S. Bazin, C. Beckerich et M. Delaplace, « Valorisation touristique du patrimoine et dessertes TGV. Le cas de quatre villes intermédiaires proches de Paris », Revue d’Economie Régionale et Urbaine, n° 5, 2014, pp. 5-23.
S. Bazin, C. Beckerich, M. Delaplace et S. Masson, « La LGV Est-Européenne en Champagne-Ardenne : quels effets sur la cohésion territoriale champardennaise ? », Revue d’Economie Régionale et Urbaine, n° 2, 2006, pp. 245-261.
S. Bazin-Benoit et M. Delaplace, « Desserte ferroviaire à grande vitesse et tourisme : entre accessibilité, image et outil de coordination », Teoros, vol. 32, n° 2, 2013, pp. 37-46.
S. Bazin-Benoit et M. Delaplace, « Mise en service des dessertes TGV et gouvernance dans le domaine du tourisme : le cas des villes françaises », Revue géographique de l’Est, vol. 55, n° 3-4, 2015 [Online].
J. E. Bebout, « The Emerging State Governments : A Challenge to Academia », State Government, vol. 45, 1972, pp. 165-179.
C. Behrens et E. Pels, « Intermodal Competition in the London-Paris Passenger Market : High-Speed Rail and Air Transport », Journal of Urban Economics, vol. 71, n° 3, 2012, pp. 278-288.
D. Beland et F. Vergniolle de Chantal, « L’État en Amérique. Entre invisibilité politique et fragmentation institutionnelles », Revue française de science politique, vol. 64, n° 2, 2014, pp. 191-205.
C. Bénit-Gbaffou, S. Fol et G. Pflieger, « Le front anti-métro en Californie. Controverses autour des politiques de transport en commun », L’Espace géographique, tome 6, n° 2, 2007, pp. 115-130.
P. Beria et al., « Comparison of Rail Liberalization Levels across four European Countries », Research in Transportation Economics, vol 36, n° 1, 2012, pp. 110-120.
131
P. Berion, « Analyser les mobilités et le rayonnement des villes pour révéler les effets territoriaux des grandes infrastructures de transport », Les Cahiers Scientifiques du Transport, n° 33, 1998, pp. 109-127.
P. Berion, G. Joignaux et J-F. Langumier, « L’évaluation socio-économique des infrastructures de transport : enrichir les approches du développement territorial », Revue d’Economie Régionale et Urbaine, n° 4, 2007, pp. 651-676.
E. Berndt, A. Friedlaender, J.S. Chiang et C.A. Vellturo, « Cost Effects of Mergers and Deregulation in the U.S. Rail Industry », Journal of Productivity Analysis, vol. 4, n° 1-2, 1993, pp. 127-144.
M. Bernick et R. Cervero, Transit villages in the 21st century, New York, McGraw-Hill, 1997.
L. Bertolini, « Nodes and Places : Complexities of Railway Station Redevelopment », European Planning Studies, vol. 4, pp. 331-345.
L. Bertolini et T. Spit, Cities on Rails. The Redevelopment of Railway Station Areas, London & New York, E&FN SPON, 1998.
L. Bertolini, C. Curtis et J. Renne, « Station Area projects in Europe and Beyond: Towards Transit-Oriented Development? », Built Environment, vol. 38, n° 1, 2012, pp. 31-50.
J. M. Berry, The New Liberalism. The Rising Power of Citizen Groups, Washington D.C, Brookings Institute, 1999.
A. Beyer et D. Chabalier, « La réforme ferroviaire en Europe » dans M. Savy (dir.) Questions clefs pour le transport en Europe, Paris, La Documentation Française, 2009, pp. 97-116.
G. Billard et J. Chevalier, Géographie et géopolitique des États-Unis, Paris, Hatier, 2012.
G. Billard, « Un nouvel agencement de l’environnement urbain pour une nouvelle forme d’organisation sociale ? Exemple de Seattle à travers la stratégie des Villages urbains », Annales de Géographie, tome 109, n° 611, 2000, pp. 84-93.
G. Billard, « Seattle : l’évolution ambitieuse d’une discrète métropole », Mappemonde, Paris, Belin-Reclus, vol. 68, n° 4, 2002, pp. 30-35.
G. Billard, Gouverner, aménager, habiter les métropoles des (ex) nouveaux mondes anglo-saxons (États-Unis, Australie, Canada), Habilitation à Diriger des Recherches, Université de Rouen, 2009.
G. Billard, « Transports en commun et densification. Vers une nouvelle configuration urbaine des villes états-uniennes ? », Bulletin de l’Association des Géographes français, Les États-Unis en 2014, n° 2, 2014, pp. 150-163.
G. Billard et L. Bertrand, « Observer l’impact des lignes à grande vitesse : acteurs et territoires du grand Ouest français », Norois, n° 248, 2018/3, pp. 7-13.
J. Bitzan, « The Structure of Railroad Costs and the Benefits/Costs of Mergers », Research in Transportation Economics, vol. 5, 1999, pp. 1-52.
J. Bitzan et T.E. Keeler, « Economies of Density and Regulatory Change in the U.S. Railroad Freight Industry », Journal of Law and Economics, vol. 50, 2007, pp. 157-179.
J. D. Bitzan et W. Wilson, « Industry Costs and Consolidation : Efficiency Gains and Mergers in the U.S. Railroad Industry », Review of Industrial Organization, vol. 30, n° 2, 2007, pp. 83-105.
P. Blais, Les counties et les special districts aux États-Unis, Province du Québec, Affaires municipales et régions, Synthèse, 2005.
S. Body-Gendrot, Les villes américaines : les politiques urbaines, Paris, Hachette, 1997.
W. Bogart, Don’t Call It Sprawl: Metropolitan Structure in the Twenty-First Century, Cambridge/New York, Cambridge University Press, 2006.
S. A. Bollens, « Fragments of Regionalism : The Limits of Southern California Governance », Journal of Urban Affairs, vol. 19, n° 1, 1997, pp. 105-122.
A. Bonnafous, « The Regional Impact of the TGV », Transportation, vol. 14, n° 2, 1987, pp. 127-137.
132
M-P. Bory, « Air-Rail Intermodality : Optimizing Airport Capacity », Japan Railway & Transport Review, n° 19, pp. 28-29.
D.R. Bowes et K. Ihlanfeldt, « Identifying the Impacts of Rail Transit Stations on Residential Property Values », Journal of Urban Economics, vol. 50, n° 1, 2001, pp. 1-25.
O’M. Bowman et A. Kearney, State and Local Government, Boston, Wadsworth Publishing, 2007 (7ème ed.).
S. Bozzani-Franc, Grandes vitesses, Métropolisation et Organisation des territoires : l’apport de l’intermodalité aéro-ferroviaire à grande vitesse au rayonnement métropolitain, thèse de doctorat, sous la direction de Philippe Menerault, Université Lille I, soutenue le 13 décembre 2006.
S. L. Bradbury, « Planning Transportation Corridors in Post-NAFTA North America », Journal of the American Planning Association, vol. 68, n° 2, 2002, pp. 137‑150.
A. Breen et D. Rigby, Intown Livin’, A Different American Dream, Washington D.C, Island Press, 2005.
N. Brenner, « Decoding the Newest ‘Metropolitan Regionalism’ in the USA: A Critical Overview », Cities, vol. 19, n° 1, 2002, pp. 3-21.
A. Bretagnolle, « Les villes dans l’espace-temps : vitesse des communications et structuration des territoires » dans A. Volvey (ed.), Echelles et temporalités, Paris, Editions Atlande, 2005, pp. 180-187.
M. Brocard, Transports et territoires. Enjeux et débats, Paris, Ellipses, 2009.
J. R. Brown, « Statewide Transportation Planning in California : Past Experiences and Lessons for the Future », Transportation Quarterly, vol. 56, n° 2, 2002, pp. 51-62.
M. Brown et R. Morill (eds.), Seattle Geographies, Seattle, University of Washington Press, 2011.
R. Brunet, « Lignes de force de l’espace européen », Mappemonde, vol. 2, n° 66, 2002, pp. 14–19.
K. Bullard, Economic Development Opportunities for U.S. Megaregions, s.l., s.e., 2007.
A. Burmeister et G. Joignaux (dir.), Infrastructures de transport et territoires. Approches de quelques grands projets, Paris, L’Harmattan, 1997.
M. L. Burton, « Railroad Deregulation, Carrier Behavior, and Shipper Response : A Disaggregated Analysis », Journal of Regulatory Economics, vol. 5, 1993, pp. 417-434.
M. L. Burton, « The Economic Regulation of U.S. Railroads : Understanding Current Outcomes and Deliberating A Future Course », Journal of Transportation Law, Logistics and Policy, vol. 78, n° 4, 2011, pp. 271-279.
K. Button, « Is there any economic justification for high-speed railways in the United States? », Journal of Transport Geography, vol. 22, 2012, pp. 300-302.
P. Calthorpe et W. Fulton, The Regional City, Washington D.C, Island Press, 2001.
J. Campos et G. de Rus, « Some Stylized Facts About High-Speed Rail: A Review of HSR Experiences Around the World », Transport Policy, vol. 16, 2009, pp. 19-28.
A. Carbonell et R. D. Yaro, « American Spatial Development and the New Megalopolis », Land Lines, Lincoln Institute of Land Policy, 2005.
D. J. Carol, Cascadia High-Speed Rail Opportunity Working Paper, New York, WSP/Parsons Brinckerhoff, 2016.
G. Carrouet, Du TGV Rhin-Rhône au ‘’territoire’’ Rhin-Rhône : réticularité, mobilité et territorialité dans un espace intermédiaire, thèse de doctorat, sous la direction de Jean-Jacques Bavoux, Université de Bourgogne, soutenue le 19 mars 2013.
E. Cascetta, A. Papola, F. Pagliara et V. Marzano, « Analysis of Mobility Impacts of The High Speed Rome-Naples Rail Link Using Withiday Dynamic Mode Service Choice Models », Journal of Transport Geography, vol. 19, 2011, pp. 635-643.
E. Cascetta, P. Coppola et V. Velardi, « High-Speed Rail Demand : Before-and-After Evidence from the Italian Market », disP-The Planning Review, vol. 49, n° 2, 2013, pp. 51-59.
133
D. W. Caves, L. Christensen et J.A. Swanson, « The Staggers Act, 30 Years Later », Regulation, vol. 33, n° 4, 2010, pp. 28-31.
A. de Cerreno et D. M. Evans, High Speed Rail Projects in the United States: Identifying the Elements of Success, Part I, San Jose State University, Mineta Transportation Institute, 2005.
A. de Cerreno et S. Marthur, High Speed Rail Projects in the United States ; Identifying the Elements of Success, Part II, San Jose State University, Mineta Transportation Institute, 2005.
R. Cervero, « Transit-based Housing in California: Evidence on Ridership Impacts », Transport Policy, vol. 1, n° 3, 1994, pp. 174-183.
R. Cervero, « Traditional Neighborhoods and Commuting in the San Francisco Bay Area », Transportation, vol. 23, n° 4, 1996, pp. 373-394.
R. Cervero, « Transit-Oriented Development’s Ridership Bonus: A Product of Self-Selection and Public Policies », Environment and Planning A, vol. 39, n° 9, 2007, pp. 2068-2085.
R. Cervero, « A Panorama of TOD, Principles and Experiences », BUFTOD (Building the Urban Future and Transit Oriented Development) Conference, Université Paris-Est/ENPC/IFSTTAR, Marne-la-Vallée, 17 April 2012.
R. Cervero, A. Adkins et C. Sullivan, « Are Suburban TODs Over-Parked? », Journal of Public Transportation, vol. 13, n° 2, 2010, pp. 47-70.
R. Cervero, C. Ferrell et S. Murphy, Transit-Oriented Development and Joint Development in the United States: a Literature Review, Washington D.C, TCRP Research Results Digest, 2002.
R. Cervero et K. Kockelman, « Travel demand and the 3Ds: Density, diversity and design », Transportation Research Part D: Transport and Environment, vol. 2, n° 3, 1997, pp. 199-219.
R. Cervero et J. Landis, « Twenty Years of the Bay Area Rapid Transit System: Land Use and Development Impacts », Transportation Research Part A: Policy and Practice, vol. 31, n° 4, 1997, pp. 309-333.
R. Cervero et al., Transit-Oriented Development in the United States: Experiences, Challenges and Prospects, Transit Cooperative Research Program Report 102, Washington D.C., TRB, 2004.
C. Chaline, Les nouvelles politiques urbaines : une géographie des villes, Paris, Ellipses, 2007.
E. Champagne, L’émergence du nouveau régionalisme aux États6unis et sa portée sur la réorganisation des pratiques métropolitaines, thèse de doctorat, Université du Québec, INRS-Urbanisation, Culture et Société, 2002.
I. Chang et G-L. Chang, « A Network-Based Model for Estimating the Market Share of a New High-Speed Rail System », Transportation Planning and Technology, vol. 27, n° 2, 2004, pp. 67-90.
T. S. Chapin, C. E. Connerly et H. T. Higgins (eds.), Growth Management in Florida. Planning for Paradise, Burlington (VT), Ashgate Publishing Company, 2007.
J. N. Chapalut et al., La grande vitesse ferroviaire, Paris, Centre d’Analyse Stratégique, 2011.
D. Chapman, D. Pratt, P. Larkham et I. Dickins, « Concepts and Definitions of Corridors: Evidence from England’s Midlands », Journal of Transport Geography, vol. 11, n° 3, 2003, pp. 179‑191.
S. Charlot et M. Lafourcade, « Infrastructures publiques, coûts de transport et croissance régionale », Économie Géographique, ASRDLF, Economica, Paris, 2000, pp. 143-177.
Z. Chen et Z. E. Haynes, « Tourism Industry and High Speed Rail, Is There a Linkage? Evidence from China’s High Speed Rail Development », Papier présenté au colloque annuel de l’ASRDLF 2012, Session spéciale « High-Speed Rail, Tourism and Territories », Belfort, France, 9-11 juillet 2012.
Y-H. Cheng, « High-Speed Rail in Taiwan : New Experience and Issues for Future Development », Transport Policy, vol. 17, n° 2, 2010, pp. 51-63.
P. Chiambaretto et C. Decker, « Air-Rail Intermodal Agreements : Balancing the Competition and Environmental Effects », Journal of Air Transport Management, vol. 23, 2012, pp. 36-40.
134
J. Chrétien, Rôle de la mobilité dans la maîtrise d’un quotidien complexe. Pratiques spatiales, choix modal et rapport au temps des Franciliens, thèse de doctorat en sociologie, Université Paris-Est, sous la direction de Frédérick de Coninck et de Marie-Hélène Massot, soutenue le 21 mars 2017.
H. P. Chudacoff, J. E. Smith et P. C. Baldwin, The Evolution of American Urban Society, New York, Routledge, 2016 (1ère ed. 2005).
A. Cigler et B. Loomis, Interest Group Politics, Washington D.C, Congressional Quarterly Press, 2002 (6ème ed.).
F. Clary, Médias, pouvoirs et culture de l’image aux États-Unis, Rouen, Publications de l’Université de Rouen, 2004.
R. L. Clewlow, J. M. Sussman et H. Balakrishnan, « Integration of High-Speed Rail and Aviation », Transportation Research Record: Journal of the Mineta Transportation Institute, n° 1, 2012, pp. 1-10.
B. R. Clifford, « The Acela Express », Japan Railway and Transport Review, vol. 40, 2005, pp. 18-21.
J. Cohen et C. Kamga, « Financing High Speed Rail in the United States and France: The Evolution of Public-Private Partnerships », Research in Transportation Business & Management, vol. 6, 2013, pp. 62-70.
M. Cohou, Le destin d’une voie rapide : jeu d’acteurs, enjeu de développement, Toulouse, Presses Universitaires du Mirail, 2000.
D. Colburn et L. DeHaven-Smith, Florida’s Megatrends Critical Issues in Florida, Gainesville, University Press of Florida, 2010 (2nd ed).
F. Collignon et G. du Chaufaut, « La territorialisation : menace ou levier de l’action publique ? », Entretiens Territoriaux de Strasbourg, Strasbourg, 5-6 décembre 2007.
T. J. Conlan (traduit de l’anglais par L. Laboureau), « Effets de cycle et centralisation politique au sein du fédéralisme américain contemporain », Revue française de science politique, vol. 64, n° 2, 2014, pp. 221-245.
M. A. Coogan, Ground Access to Major Airports by Public Transportation – ACRP Report 4, Washington D.C, Transport Research Board, 2008.
M. A. Coogan, « Quantifying the Scale of Air/Rail Complementarity and Air/Rail Competition in Europe and the United States », TRB Annual Meeting, Washington D.C, 2012.
J-M. Coronado, M. Garmendia, A. Moyano et J. M. Ureña, « Assessing Spanish HSR Network Utility for Same-Day Tourism », Recherche, Transport et Sécurité, vol. 29, 2013, pp. 161-175.
G. Courty, Les groupes d’intérêts, Paris, La Découverte, 2006.
M. Cowell, « Polycentric Regions : Comparing Complementarity and Institutional Governance in the San Francisco Bay Area, the Randstad and Emilia-Romagna », Urban Studies, vol. 47, n° 5, 2010, pp. 945-965.
Y. Crozet et F. Dumont, « Retour sur les effets économiques du TGV. Les effets structurants sont un mythe (interview) », Ville, Rail et Transports, n° 525, 2011, pp. 48–51.
Y. Crozet et F. Dumont, « Retour sur les effets économiques du TGV. Les effets structurants sont un mythe », Ville, Rail et Transports, n° 525, 2011, pp. 48–51.
N. Curien, « « Réseau » : du mot au concept », Flux, n° 13-14, 1993, pp. 52-55.
G. Currie, « Bus Transit Oriented Development – Strengths and Challenges Relative to Rail », Journal of Public Transportation, vol. 9, n° 4, 2006, pp. 1-21.
C. Curtis, « Evolution of the Transit-Oriented Development Model for Low-Density Cities: A Case Study of Perth’s New Railway Corridor », Planning Practice & Research, vol. 23, n° 3, 2008, pp. 285-302.
C. Curtis, « Transitioning to Transit-Oriented Development: The Case of Perth, Western Australia », Urban Policy and Research, vol. 30, n° 3, 2012, pp. 275-292.
C. Curtis, J. Renne, et L. Bertolini, Transit-Oriented Development: Making It Happen, London, Ashgate, 2009.
R. Cutler, « Amtrak Station Planning », Presentation at the FRA Major Stations Planning and Development Conference, Washington D.C., Federal Railroad Administration, 28 juin 2016.
135
A. Cutogno et E. Seltzer, « Towards a Metropolitan Consciousness in the Portland Oregon Metropolitan Area », International Planning Studies, vol. 16, n° 3, 2011, pp. 289-304.
L. Dablanc et A. Frémont (dir), La métropole logistique, Paris, Armand Colin, 2015.
E. Deakin, « Climate Change and Sustainable Transportation : The Case of California », Journal of Transportation Engineering, vol. 137, n° 6, 2011 [Online].
E. Deakin et R. Cervero, « The Challenge of Urban Transportation in California », Access, vol. 32, 2008, pp. 10-17.
I. Deas et A. Lord, « From a New Regionalism to an Unusual Regionalism ? », Urban Studies, vol. 43, n° 10, 2006, pp. 1847-1877.
J. Debrie et P. Zembri, « Approche territoriale de l’évolution des réseaux ferroviaires », dans L. Dablanc (dir.), Quel fret ferroviaire local ? Réalités françaises, éclairages allemands, Paris, La Documentation Française, 2009, pp. 65-94.
J. Debrie et E. Gouvernal, « Les shortlines nord-américaines » dans L. Dablanc (dir.), Quel fret ferroviaire local ? Réalités françaises, éclairages allemands, Paris, La Documentation Française, 2009, pp. 22-31.
J. Debrie, Contribution à une géographie de l’action publique : le transport entre réseaux et territoires, Habilitation à Diriger des Recherches, Université Paris 1 Panthéon-Sorbonne, 2010.
J. Debrie et C. Comtois, « Une relecture du concept de corridors de transport: illustration comparée Europe/Amérique du Nord », Les Cahiers scientifiques du transport, n° 58, 2010, pp. 127‑144.
M. de Lapparent, A. Frei et K. W. Axhausen, Choice of Mode for Long Distance Travel : Current SP-Based Models for Three European Countries, Zurich, Institute for Transport Planning and Systems, 2009.
M. Delaplace, « Grande vitesse, activation des ressources spécifiques et développement du tourisme urbain : le cas de l’agglomération rémoise », Belgeo, n° 1‐2, 2010, pp. 65‐78.
M. Delaplace, « TGV, développement local et taille des villes : une analyse en termes d’innovation de services », Revue d’Economie Régionale et Urbaine, n° 2, 2012, pp. 265-292.
M. Delaplace, « Grande vitesse ferroviaire et tourisme: Quels enseignements des 50 dernières années pour le Maroc ? », Présentation PowerPoint, Ecole Supérieure d’Essaouira, 30-31 mars 2016.
M. Delaplace, « Dessertes TGV et développement du tourisme urbain et d’affaires en France : une liaison conditionnée », Géotransports, n° 7, 2016, pp. 114-116.
M. Delaplace et F. Dobruszkes, « L’analyse du lien entre grande vitesse ferroviaire et territoires : un chantier scientifique encore ouvert », Recherche Transports Sécurité NecPlus, Introduction au numéro spécial « Grande vitesse ferroviaire et territoires », n° 3, 2013, pp. 155-160.
M. Delaplace et F. Dobruszkes, « From Low-Cost Airlines to Low-Cost High-Speed Rail? The French Case », Transport Policy, vol. 38, 2015, pp. 73-85.
M. Delaplace, F. Pagliara, J. Perrin et S. Mermet, « Can High Speed Rail Foster the Choice of Destination for Tourism Purpose? », Procedia – Social and Behavorial Sciences, EWGT2013 – 16th Meeting of the EURO Working Group on Transportation, vol. 111, 5 février 2014, pp. 166-175.
M. Delaplace, F. Pagliara et A. la Pietra, « High-Speed Rail Service and Theme Park: The Case of Futuroscope and Disneyland Paris? », International Conference ‘High Speed Rail and The City’, Labex Week Futurs Urbains, 21-23 janvier 2015.
M. Delaplace et J. Perrin, « Dessertes TGV et tourismes urbain et d’affaires: entre attentes dans les villes de France et renforcement de la double centralité parisienne », Recherche Transport et Sécurité, vol. 29, 2014, pp. 177-191.
E. Delgado et al., Through a Wider Lens: Re-envisioning the Great Lakes Megaregion, The University of Michigan, Urban and Regional Planning Program, 2006.
P. S. Dempsey, A. R. Goetz et C. Larson, Metropolitan Planning Organizations: An Assessment of the Transportation Planning Process. A Report to Congress, Denver, University of Denver Intermodal Transportation Institute and National Center for Intermodal Transportation, 2000.
136
S. Dennis, « Changes in Railroad Rates Since the Staggers Act », Transportation Research Part E, vol. 37, 2000, pp. 55-69.
G. de Rus et G. Nombela, « Is Investment in High Speed Rail Socially Profitable? », Journal of Transport Economics and Policy, vol. 41, n° 1, 2007, pp. 3-23.
G. de Rus et C. Nash, « In What Circumstances is Investment in HSR Worthwhile ? » dans G. de Rus (ed.), Economic Analysis of High Speed Rail in Europe, Bilbao, Fundacion BBVA, 2009, pp. 51-70.
J. de Vries et H. Priemus, « Megacorridors in North-West Europe: Issues for Transnational Spatial Governance », Journal of Transport Geography, vol. 11, n° 3, 2003, pp. 225‑233.
M. Dewar et D. Epstein, « Planning for ‘’Megaregions’’ in the United States », Journal of Planning Literature, vol. 22, n° 2, 2007, pp. 108-124.
G. Di-Méo et al., « Autoroute, constructions géographiques et nouveaux rapports à l’espace : des effets d’annonce à la réalité des impacts », Sud-Ouest Européen n° 12, 2001, pp. 1-8.
R. J. Dilgert, American Transportation Policy, Westport, Praeger, 2003.
H. Dittmar et G. Ohland, The New Transit Town. Best Practices in Transit-Oriented Development, Washington D.C., Island Press, 2004.
F. Dobruszkes, Géographie de la libéralisation du transport aérien passager en Europe, thèse de doctorat, Université Libre de Bruxelles, sous la direction de Christian Vandermotten, soutenue en mai 2007.
F. Dobruszkes, « High-Speed Rail and Air Transport Competition in Western Europe : A Supply-Oriented Perspective », Transport Policy, vol. 18, n° 6, 2011, pp. 870-879.
W. R. Dodge, Regional Excellence – Governing Together to Compete Globally and Flourish Locally, Washington D.C, National League of Cities, 1996.
M. Doherty, Funding Public Transport Development Through Land Value Capture Programs, Working Paper, 2004.
M. Dolata et al., Passenger Rail Sharing Freight Infrastructure Primer, Austin, Center for Transportation Research, The University of Texas, 2005.
M. Duncan, « The Impact of Transit-Oriented Development on Housing Prices in San Diego CA », Urban Studies, vol. 48, n° 1, 2011, pp. 101-127.
B. Dorsey et A. Mulder, « Planning, Place-Making and Building Consensus for Transit-Oriented Development: Ogden, Utah Case Study », Journal of Transport Geography, vol. 32, 2013, pp. 65-76.
N. Douay et O. Roy-Baillargeon, « Le transit-oriented development : vecteur ou mirage des transformations de la planification et de la gouvernance métropolitaines du Grand Montréal ? », Flux, n° 101-102 (juillet-décembre), 2015, pp. 29-41.
G. H. Douglas, All Aboard!: The Railroad in American Life, New York, Paragon House, 1996.
J-F. Doulet et J. Ramos-Doulet, Géopolitique du TGV chinois, Paris, La vie du rail, 2011.
J. A. Dunn Jr. et A. Perl, « Building the Political Infrastructure for High Speed Rail in North America », Transportation Quarterly, vol. 50, n° 1, 1996, pp. 5-22.
J. A. Dunn Jr. et A. Perl, « Toward a ‘’New Model Railway’’ for the 21st Century: Lessons from Five Counties », Transportation Quarterly, vol. 55, n° 2, 2001, pp. 43-57.
G. Dupuy, La dépendance automobile: symptômes, analyses, diagnostic, traitements, Paris, Anthropos: diff Economica, 1999.
P. Duron et al., Mobilité 21 « Pour un schéma national de mobilité durable », rapport au ministre chargé des Transports, de la Mer et de la Pêche, Paris, 2013.
P. Duron et al., TET, Agir pour l’avenir. Rapport au Secrétaire d’État chargé des transports, de la mer et de la pêche, Paris, 2015.
137
S. Edner et B. D. McDowell, « Surface-Transportation Funding in a New Century: Assessing One Slice of the Federal Marble Federalism », Publius: The Journal of Federalism, vol. 32, n° 1, 2002, pp. 7-24.
P. H. Emangard et al., « Acteurs publics, acteurs privés » dans M. Brocard (dir.), Transports et Territoires, Paris, Ellipses, 2009, pp. 157-183.
K. A. Eriksen et K. L. Casavant, « Identifying Needed Transportation Investment, by Corridor, to Support NAFTA Trade Flows in Washington State », Proceedings of the 31st Annual Conference of the Canadian Transportation Research Forum: Transport Gateways and Trade Corridors, Saskatoon, University of Saskatchewan Printing Services, 1996, pp. 662‑676.
J-P. Estival, « Modèles d’organisation des chemins de fer : critères pour un choix national », Rail International – Schienen der Welt, juin-juillet 2004, pp. 16-25.
V. Facchinetti-Mannone, Les gares TGV périphériques : de nouveaux pôles de développement ? Métropolisation et grands équipements structurants, Toulouse, Presses Universitaires du Mirail, 2003.
V. Facchinetti-Mannone, « La nodalité des gares TGV périphériques », Les Cahiers scientifiques du transport, n° 48, 2005, pp. 45-58.
V. Facchinetti-Mannone, La territorialisation des gares de la grande vitesse, Habilitation à Diriger des Recherches, Université de Bourgogne, soutenue le 14 mars 2016.
V. Facchinetti-Mannone et J-J Bavoux, « L’implantation des gares TGV en France : tensions interscalaires, jeux d’acteurs et recompositions spatiales », Belgeo, n° 1-2, 2010, pp. 9-22.
V. Facchinetti-Mannone et C. Richer, « L’intégration territoriale des gares sur lignes à grande vitesse en France : une approche typologique », Recherche Transports Sécurité, vol. 27, n°3, 2011, pp. 200-214.
E. Faivre, Infrastructures autoroutières, mobilités et dynamiques territoriales, thèse de doctorat en géographie, Université de Franche-Comté, sous la direction de D. Mathieu, soutenue le 5 décembre 2003.
M. Faye, « Tours à la conquête du tourisme d'affaires », Norois, n° 178, 1988, pp. 293-300.
P. Fensham et B. Gleeson, « Capturing Value for Urban Management : A New Agenda for Betterment”, Urban Policy and Research, vol. 21, n° 1, 2003, pp. 93-112.
B. Flyvbjerg, « Measuring Inaccuracy in Travel Demand Forecasting: Methodological Considerations Regarding Ramp Up and Sampling », Transportation Research Part A: Policy and Practice, vol. 39, n° 6, 2005, pp. 522-530.
B. Flyvbjerg, M. S. Holm et S. L. Buhl, « How (In) Accurate are Demand Forecasts in Public Works Projects? : The Case of Transportation », Journal of the American Planning Association, vol. 71, n° 2, 2005, pp. 131-146.
M.S. Foster, Nation on Wheels: the Automobile Culture in America since 1945, Belmont, Thomson, Wadsworth, 2003.
J. Fournier, Le train, l’Europe et le service public, Paris, Editions Odile Jacob, 1993.
A. Friedlaender, « Coal Rates and Revenue Adequacy in a Quasi-Regulated Rail Industry », Rand Journal of Economics, vol. 23, 1992, pp. 376-394.
J. Friedmann et C. Weaver, Territory and Function. The Evolution of Planning, Berkeley, University of California Press, 1979.
F. A. Frost et T. Shanka, « Cape to Cairo - Can the dream be realised? », Journal of Vacation Marketing, vol. 7, n° 3, 2001, pp. 235–244.
X. Fu, A. Zhang et Z. Lei, « Will China’s Airline Industry Survive the Entry of High-Speed Rail ? », Research in Transportation Economics, vol. 35, n° 1, 2012, pp. 13-25.
F. Furtado, « U.S. and European Freight Railways: The Differences That Matter », Journal of the Transportation Research Forum, vol. 52, n° 2, 2013, pp. 65-84.
R. Gallamore et J. Meyer, American Railroads: Decline and Renaissance in the Twentieth Century, Cambridge, Harvard University Press, 2014.
138
J. Garreau, The Nine Nations of North America, Houghton Mifflin, 1981.
J. Garreau, Edge City: Life on the New Frontier, Anchor, 1992.
W. Garrison et D. Levinson, The Transportation Experience : Policy, Planning and Deployment, New York, Oxford University Press, 2014.
J-C. Gay, « Transport et mise en tourisme du Monde », Cahiers de Géographie, Collection EDYTEM, n°4, 2006, pp. 11-22.
J-C. Gay et V. Mondou, Tourisme et Transport. Deux siècles d’interactions, Paris, Bréal, 2017.
E. R. Gerber et C. C. Gibson, « Balancing Regionalism and Localism: How Institutions and Incentives Shape American Transportation Policy », American Journal of Political Science, vol. 53, n° 3, 2009, pp. 633-648.
G. Gerstle, Liberty and Coercion. The Paradox of American Government from the Founding to the Present, Princeton/Oxford, Princeton University Press, 2015.
C. Gertz, « Une politique novatrice aux États-Unis dans le domaine des transports, de l’aménagement du territoire et de la qualité de l’air. Enseignements pour les changements de politiques dans d’autres pays », Revue internationale des sciences sociales, vol. 176, n° 2, 2003, pp. 341-347.
C. Ghorra-Gobin, Les États-Unis entre local et mondial, Paris, Presses de Sciences Po, 2000.
C. Ghorra-Gobin, Villes et société urbaine aux États-Unis, Paris, Armand Colin, 2003.
C. Ghorra-Gobin, « Le New Urbanism, marqueur de fragmentation urbaine ? Réflexions sur l’intentionnalité de nouvelles pratiques professionnelles et sur les représentations des résidents à l’heure du débat en faveur de la durabilité urbaine », Cahiers de géographie du Québec, n° 55, vol. 154, 2011, pp. 75-88.
T. A. Gihring, « Applying Value Capture in the Seattle Region », Planning Practice and Research, vol. 16, n° 3-4, 2001, pp. 307-320.
T. A. Gihring, The Value Capture Approach To Stimulating Transit Oriented Development And Financing Transit Station Area Improvements, Victoria, Victoria Transport Policy Institute, 2009.
R. Gilbert et A. Perl, Transport Revolutions. Moving People and Freight Without Oil, Gabriola Island, New Society Publishers, 2010.
M. Givoni, « Development and Impact of the Modern High-Speed Train: A Review », Transport Reviews, vol. 26, n° 5, 2006, pp. 593-611.
M. Givoni et D. Banister, « Airline and Railway Integration », Transport Policy, vol. 13, n° 5, 2006, pp. 386-397.
M. Givoni et D. Banister, « Speed : The Less Important Element of High-Speed Train », Journal of Transport Geography, vol. 22, 2012, pp. 306-307.
M. Givoni et F. Dobruszkes, « A Review of Ex-Post Evidence for Mode Substitution and Induced Demand Following the Introduction of High-Speed Rail », Transport Reviews, vol. 33, n° 6, 2013, pp. 720-742.
M. Givoni et P. Rietveld, « Do Cities Deserve More Railway Stations? The Choice of a Departure Railway Station in a Multiple-Station Region », Journal of Transport Geography, vol. 36, 2014, pp. 89-97.
D. L. Gladstone, « Tourism Urbanization in the United States », Urban Affairs Review, vol. 34, n° 1, 1998, pp. 3-27.
E. L. Gleaser, « Do Regional Economies Need Regional Coordination ? » dans The Economic Geography of Megaregions, Princeton, Policy Research Institute for the Region, 2007, pp. 11-57.
S. B. Goddard, Getting There: The Epic Struggle between Road and Rail in the American Century, New York, Basic Books, 1994.
A. Goetz, « Deregulation, Competition and Antitrust Implications in the US Airline Industry », Journal of Transport Geography, vol. 10, 2002, pp. 1-19.
A. Goetz, « State Departments of Transportation: From Highway Departments to Transportation Agencies » dans J. F. Plant (ed.), Handbook of Transportation Policy and Administration, New York, Taylor & Francis Group, 2007, pp. 121-144.
139
A. Goetz, « Suburban Sprawl or Urban Centres: Tensions and Contradictions of Smart Growth Approaches in Denver, Colorado », Urban Studies, vol. 50, n° 11, 2013, pp. 2178-2195.
A. Goetz, P. S. Dempsey et C. Larson, « Metropolitan Planning Organizations : Findings and Recommendations for Improving Transportation Planning », Publius, vol. 32, n° 1, 2002, pp. 87-105.
A. Goetz et C. Sutton, « The Geography of Deregulation in the U.S. Airline Industry », Annals of the Association of American Geographers, vol. 87, n° 2, 1997, pp. 238-263.
A. Goetz et C. Sutton, « The Geography of Deregulation in the U.S. Airline Industry » dans L. Budd et S. Ison (eds.), Low Cost Carriers: Emergence, Expansion and Evolution, Farnham, Ashgate, 2014, pp. 199-224.
A. Goetz, J. S. Szyliowicz, T. R. Vowles et G. S. Taylor, Assessing Intermodal Transportation Planning at State Departments of Transportation, Denver, National Center for Intermodal Transportation, 2004.
A. Goetz et T. Vowles, « Progress in Intermodal Passenger Transportation: Private Sector Initiatives », Transportation Law Journal, vol. 27, n°3, 2000, pp. 475-513.
A. Goetz et T. Vowles, « The Good, the Bad and the Ugly: 30 Years of US Airline Deregulation », Journal of Transport Geography, vol. 17, 2009, pp. 251-263.
T. Goldman, « Transportation Tax Ballot Initiatives as Regional Planning Processes », Transportation Research Record, 1997, pp. 9-16.
T. Goldman et E. Deakin, « Regionalism Through Partnerships? Metropolitan Planning Since ISTEA », Berkeley Planning Journal, vol. 14, n° 1, 2000, pp. 46-75.
J. Gómez-Ibáňez et G. de Rus (eds.), Competition in the Railway Industry: An International Comparative Analysis, Northampton, Edward Elgar Publishing, 2006.
M. Gonzalez-Savignat, « Will the High-Speed Train Compete Against the Private Vehicle? », Transport Reviews, vol. 24, n° 3, 2004, pp. 293-316.
S. Gordon, Passage to Union: How the Railroads Transformed American Life, 1829-1929, Chicago, Ivan R. Dee, 1996.
J. Gottmann, Megalopolis: the urbanized northeastern seaboard of the United States, Cambridge, M.I.T. Press, 1961.
D. A. Graber, Mass Media and American Politics, Washington D.C, Congressional Quarterly Press, 2010 (8ème ed.).
R. Grant, Railroads and the American People, Bloomington, Indiana University Press, 2012.
E. Grossman et S. Saurugger, Les groupes d’intérêts. Action collective et stratégies de représentation, Paris, Armand Colin, 2006.
O. D. Gutfreund, Twentieth Century Sprawl Highways and the Reshaping of the American Landscape, New York, Oxford University Press, 2004.
P. J. Haas, « Modal Shift and High-Speed Rail : A Review of the Current Literature », MTI Report 12-35, Mineta Transportation Institute, 2014.
P. Hall, Les villes mondiales, Paris, Hachette, 1966.
P. Hall, R.J. McCalla et C. Comtois (dir.), Integrating Seaports and Trade Corridors, Farnham, Ashgate, 2011.
S. Handy, « Regional Transportation Planning in the US : An Examination of Changes in Technical Aspects of the Planning Process in Response to Changing Goals », Transport Policy, vol. 15, n° 2, 2008, pp. 113-126.
P. Hassenteufel, Sociologie politique : l’action publique, Paris, Armand Colin, 2011 (2ème ed.).
K. E. Haynes, J. L. Gifford et D. Pelletiere, « Sustainable Transportation Institutions and Regional Evolution : Global and Local Perspectives », Journal of Transport Geography, vol. 13, 2005, pp. 207-221.
P. Healey, Collaborative Planning. Shaping Places in Fragmented Societies, Londres, MacMillan Press, 1997.
140
D. Hess et P. Lombardi, « Policy Support for and Barriers to Transit-Oriented Development in the Inner City », Transportation Research Record: Journal of the Transportation Research Board, n° 1887, 2004, pp. 26-33.
J. P. Hubert, F. Margail et P. Zembri, Les enjeux organisationnels et territoriaux des interconnexions de réseaux de transports collectifs, GDR-Réseaux, Paris, CNRS, 1995.
M. Iacono et al., « Value Capture for Transportation Finance », Procedia – Social and Behavioral Sciences, vol. 48, 2009, pp. 435-448.
IAU Ile-de-France, Portland, Harbor Drive. La ville après l’autoroute : études de cas, Paris, IAU, 2014.
G. Ingram et Y-H. Hong (eds.), Value Capture and Land Policies, Cambridge, Lincoln Institute of Land Policy, 2012.
J. E. Innes, D. E. Booher et S. Di Vittorio, « Strategies for Megaregion Governance », Journal of the American Planning Association, vol. 77, n° 1, 2010, pp. 55-67.
J. E. Innes et J. Gruber, « Planning Styles in Conflict: The Metropolitan Transportation Commission », Journal of the American Planning Association, vol. 71, n° 2, 2005, pp. 177-188.
J. E. Innes et J. Gruber, Bay Area Transportation Decision Making in the Wake of ISTEA : Planning Styles in Conflict at the Metropolitan Transportation Commission, Berkeley, The University of California Transportation Center, 2011.
M. Ivaldi et G. McCullough, « Density and Integration Effects on Class I U.S. Freight Railroads », Journal of Regulatory Economics, vol. 19, n° 2, 2001, pp. 161-182.
M. Ivaldi et G. McCullough, « Railroad Pricing and Revenue-to-Cost Margins in the Post-Staggers Era », Research in Transportation Economics, vol. 20, 2007, pp. 153-178.
P. Jacquin et D. Royot, Go West ! : Histoire de l’Ouest américain d’hier à aujourd’hui, Paris, Flammarion, 2004.
K. T. Jackson, Crabgrass Frontier: the Suburbanization of the United States, New York, Oxford University Press, 1985.
M. Jahanshasi, « The US Railroad Industry and Open Access », Transport Policy, vol. 5, n° 5, 1998, pp. 73-81.
C-R. Jeng et C-H. Su, « The Predicament of Domestic Airline Service after the Introduction of Taiwan High-Speed Rail », Transportation Journal, vol. 52, n° 1, 2013, pp. 134-143.
J.L. Jimenez et O. Betancor, « When Trains Go Faster than Planes : The Strategic Reaction of Airlines in Spain », Transport Policy, vol. 23, 2012, pp. 34-41.
G. Joignaux et J-F. Langumier, « Les observatoires autoroutiers : l’expérience de la SAPPR et quelques enseignements », Les Cahiers Scientifiques du Transport, n° 46, 2004, pp. 3-24.
V. Jolivet, « Miami, ville-modèle de quelle Amérique ? », Géographie, économie, société, vol. 14, n° 2, 2012, pp. 128-140.
V. Jolivet, Miami la cubaine. Géographie d’une ville-carrefour entre les Amériques, Rennes, PUR, 2015.
A. Jonas et S. Pincetl, « Rescaling Regions in the State : The New Regionalism in California », Political Geography, vol. 25, pp. 482-505.
D.W. Jones, Mass Motorization + Mass Transit an American History and Policy Analysis, Bloomington, Indiana University Press, 2010.
B. Johnson, « American Intercity Passenger Rail Must Be Truly High-Speed and Transit-Oriented », Journal of Transport Geography, vol. 22, 2012, pp. 295-296.
C. Kamga, « Emerging Travel Trends, High-Speed Rail, and the Public Reinvention of U.S. Transportation », Transport Policy, vol. 37, 2015, pp. 111-120.
A. Karner, « Transportation Planning and Regional Equity : History, Policy and Practice », Research Report UCD-ITS6RR612629, Institute of Transportation Studies UC Davis, 2012.
A. Kaspi, Les Américains, tome 1, Paris, Éditions du Seuil, 2012 (1ère ed. 1986).
141
M. Kenney et D. C. Mowery, Public Universities and Regional Growth. Insights from the University of California, Stanford, Stanford University Press, 2014.
M. M. Kenton, « Comparing Financing Models for US Intercity Passenger Rail Development », Term Paper for PUBP 714, Transportation Public-Private Partnership Policy, Fairfax, VA, George Mason University, 2015.
D. King et R. C. Liebermann, « L’État aux États-Unis : Nouvelles perspectives de politique comparée pour en finir avec le mythe de l’État ‘’faible’’ », Revue française de sociologie, vol. 52, n° 3, pp. 481-507.
Y. L. Klein et J. Osleeb, « Determinants of Coastal Tourism : A case study of Florida Beach Counties », Journal of Coastal Research, vol. 26, n° 6, 2010, pp. 1149-1156.
Y. L Klein, J.P. Osleeb et M.R Viola, « Tourism-Generated Earnings in the Coastal Zone », Journal of Coastal Research, vol. 20, 2004, pp. 1080-1088.
O. Klein, E. Ravalet, S. Vincent-Geslin, V. Facchinetti-Mannone et C. Richer, « Les gares TGV dans les zones périurbaines des villes moyennes sont-elles des vecteurs de métropolisation ? », Colloque de l’ASRDLF, juillet 2012, Belfort (France).
P. Krugman, « Increasing Returns and Economic Geography », Journal of Political Economy, vol. 99, n° 3, 1991, pp. 483-499.
P. Krugman et A. J. Venables, « Globalization and the Inequalities of Nations », Quarterly Journal of Economics, n° 110, 1995, pp. 857-880.
J-M. Lacroix, Histoire des États-Unis, Paris, PUF, 2010 (4ème ed.).
B. Ladd, Autophobia: Love and Hate in the Automobile Age, Chicago, University of Chicago Press, 2008.
E. Ladner, « Downtown Living: A Deeper Look », Land Lines, Lincoln Institute of Land Policy, vol. 14, n° 3, 2002 [Online].
P. Lagayette, L’Ouest américain : réalités et mythes, Paris, Ellipses, 1997.
B. Lane, « On the Utility of High-Speed Rail in the United States », Journal of Transport Geography, vol. 22, 2012, pp. 282-284.
R. E. Lang et D. Dhavale, Beyond Megalopolis: Exploring America’s New “Megapolitan” Geography, Brookings Mountain West, 2005.
R. E. Lang et A. C. Nelson, « Megalopolitan America : Defining and Applying a New Geography » dans C. L. Ross, Megaregions: Planning for Global Competitiveness, Washington D.C, Island Press, pp. 107-126.
A. A. Laquian, « Metropolitan Governance in Asia », Public Administration and Development, vol. 25, n° 4, 2005, pp. 307-315.
P.D. Larson, « Deregulation and Mergers among American and Canadian Railroads: A Study of Four Decades », Research in Transportation Business & Management, vol. 6, 2013, pp. 11-18.
P. Lascoumes et P. Le Gales (dir.), Gouverner par les instruments, Paris, Presses de Sciences Po, 2004.
J-P. Lassale, « Les lobbies aux États-Unis : privatisation ou démocratisation du pouvoir ? », Revue Française d’Études Américaines, n° 63, février 1995, pp. 17-30.
A. Laurino, F. Ramella et P. Beria, « The Economic Regulation of Railway Networks: A Worldwide Survey », Transportation Research Part A, vol. 77, 2015, pp. 202-212.
R. W. Lee et C. R. Rivasplata, « Metropolitan Transportation Planning in the 1990s : Comparisons and Contrasts in New Zealand, Chile and California », Transport Policy, vol. 8, 2001, pp. 47-61.
R. Lefebvre, Leçons d’Introduction à la science politique, Paris, Ellipses, 2010.
P. Lefevre, Métropolisation et gouvernance urbaine: les dynamiques territoriales du nouveau régionalisme dans les agglomérations de Los Angeles et San Francisco, thèse de doctorat, sous la direction d’Emmanuel Eveno et Jérôme Monnet, Université Toulouse II Le Mirail, soutenue le 25 novembre 2009.
H. Lefevbre, « La Silicon Valley, une contre-utopie urbaine ? » dans Californie. L’eldorado américain ?, Mappe, HD Ateliers Henry Dougier, 2017.
142
S. Lehman-Frisch, « San Francisco, ville injuste ? La capitale du progressisme états-unien à l’épreuve de la croissance des inégalités », Annales de géographie, n° 714, 2017, pp. 145-168.
S. Lehman-Frisch, Sociologie de San Francisco, Paris, Editions La Découverte, 2018.
P. Lemarchand, Atlas des États-Unis : les paradoxes de la puissance, Paris, Atlande, 1998.
D. Levinson, « Accessibility Impacts of High-Speed Rail », Journal of Transport Geography, vol. 22, 2012, pp. 288-291.
D.M. Levinson et E. Istrate, Access for Value : Financing Transportation Through Land Value Capture, Washington D.C, Brookings Institute, 2011.
J. Levy et M. Lussault (dir.), Dictionnaire de la géographie et de l’espace des sociétés, Paris, Belin, 2013.
P. Lewis et M. Sprague, Federal Transportation Policy and the Role of Metropolitan Planning Organizations in California, San Francisco, Public Policy Institute of Californie, 1997.
T. Leysens, Reconfiguration des réseaux de transport et renouveau urbain. L’enjeu d’un urbanisme orienté vers le rail, thèse de doctorat, sous la direction de Philippe Menerault, Université Lille Nord de France, soutenue le 28 septembre 2011.
J. Lezaun et M. Groenleer, « Food Control Emergencies and the Territorialization of the European Union », European Integration, vol. 28, n° 5, 2006, pp. 437-455.
E. Libourel, Le corridor ferroviaire méditerranéen : planification, politisation et territorialisation d’un projet d’aménagement, thèse de doctorat, sous la direction de N. Baron et J. R. Gonzalez, Université Paris-Est, soutenue le 27 novembre 2015.
E. Libourel, C. Ruggeri et M. Schorung, « La grande vitesse est-elle toujours sur les rails ? », Festival international de Géographie, Session Posters Scientifiques, 30 septembre-2 octobre 2016.
E. Libourel, C. Ruggeri et M. Schorung, « Towards a Reconsideration of the HSR Model of Development? An International Comparative Approach », International Congress on High-Speed Rail, Technologies and Long Term Impacts, 4-6 octobre 2017, Ciudad Real (Espagne).
A. Loukaitou-Sideris, « A New-found Popularity for Transit-Oriented Developments? Lessons from Southern California », Journal of Urban Design, vol. 15, n° 1, 2010, pp. 49-60.
A. Loukaitou-Sideris, D. Cuff, T. Higgins et O. Linovski, « Impact of High-Speed Rail Stations on Local Development: A Delphi Survey », Built Environment, vol. 38, n° 1, 2012, pp. 51-70.
A. Loukaitou-Sideris, « New Rail Hubs Along High-Speed Rail Corridor in California. Urban Design Challenges », Transportation Research Record: Journal of the Transportation Research Board, n° 2350, TRB, Washington DC, 2013, pp. 1-8.
A. Loukaitou-Sideris, D. Cuff, T. Higgins et W. Wei, Planning for Complementarity: An Examination of the Role and Opportunities of First-Tier and Second-Tier Cities Along the High-Speed Rail Network in California, San Jose, Mineta Transportation Institute, 2012.
A. Loukaitou-Sideris, D. Peters et W. Wei, Promoting Intermodal Connectivity at California’s High Speed Rail Stations, MTI Report 12-47, 2015.
K. Lowe, « Bypassing Equity ? Transit Investment and Regional Transportation Planning », Journal of Planning Education and Research, vol. 34, n° 1, 2014, pp. 30-44.
D. W. Lufkin, Many Sovereign States, New York, David McKay, 1975.
H. Lund, R. Willson, et R. Cervero, « A Re-Evaluation of Travel Behavior in California TODs », Journal of Architectural and Planning Research, vol. 23, n° 3, 2006, pp. 247-263.
L. Lumsdon et S.J. Page (eds.), Tourism and Transport. Issues and Agenda for the New Millennium, Londres/New York, Routledge, 2007.
T. Lynch, High-Speed Rail in the United States: Super Trains for the Millennium, New-York, Taylor & Francis Ltd, 1998.
143
A. Mac Farland, « Interest Groups and Theories of Power in America », British Journal of Political Science, vol. 17, n° 2, pp. 129-147.
D. Madar, « Rail Mergers, Trade, and Federal Regulation in the United States and Canada », Publius: The Journal of Federalism, vol. 32, n° 1, 2002, pp. 143-159.
R. Madden, Alaska, New York, Interlink Books, 2005.
P. Mahon et A. Benoit, Droit constitutionnel des États-Unis d’Amérique, Helbing Lichtenhahn, Bâle/Faculté de Droit de l’Université de Neuchâtel, 2011.
V. Mannone, L’impact régional du TGV sud-est, thèse de doctorat géographie, Université de Provence Aix-Marseille I, sous la direction de Bernard Barbier, soutenue en 1995.
J. Maulat, Coordonner urbanisme et transport ferroviaire régional : le modèle à l’épreuve des pratiques. Étude croisée des métropoles de Toulouse et Nantes, thèse de doctorat, sous la direction de Francis Beaucire, Université Paris 1 – Panthéon Sorbonne, soutenue le 11 décembre 2014.
A. Martin, Enterprise Denied: Origins of the Decline of American Railroads, 1897-1917, New York, Columbia University Press, 1971.
A. Martin, Railroads Triumphant: The Growth, Rejection, and Rebirth of a Vital American Force, New York, Oxford University Press, 1992.
C. Martland, « Productivity Improvements in the U.S. Rail Freight Industry 1980-2010 », Journal of the Transportation Research Forum, vol. 51, n° 3, 2012, pp. 83-108.
S. Masson et R. Petiot, « Can the High-Speed Rail Reinforce Tourism Attractiveness? The Case of High Speed Rail between Perpignan (France) and Barcelona (Spain) », Technovation, vol. 29, n° 9, septembre 2009, pp. 611-617.
C. Mayda (ed.), A Regional Geography of the United States and Canada. Toward a Sustainable Future, Lanham (MD), Rowman & Littefield Inc, 2013.
G. McCullough et L. Thompson, « A Further Look at the Staggers Rail Act: Mining the Available Data », Research in Transportation Business & Management, vol. 6, 2013, pp. 3-10.
H. McFarland, « The Effects of United States Railroad Deregulation on Shippers, Labor, and Capital », Journal of Regulatory Economics, vol. 1, 1989, pp. 259-270.
J. G. McGann, Think Tanks and Policy Advice in the US, Washington D.C, Foreign Policy Research Institute, 2005.
S. McNeil, M. Oswald et D. Ames, A Case Study of the BOSWASH Transportation Corridor: Observations Based on Historical Analyses, Newark, University of Delaware University Transportation Center, 2010.
F. Medda, « Land Value Capture Finance for Transport Accessibility: A Review », Journal of Transport Geography, vol. 25, 2012, pp. 154-161.
T. Medvetz, « Les think tanks aux États-Unis. L’émergence d’un sous-espace de production des savoirs », Actes de la recherche en sciences sociales, n° 176-177, 2009/1, pp. 82-93.
T. Medvetz, « Les think tanks dans le champ du pouvoir étatsunien », Actes de la recherche en sciences sociales, n° 200, 2013/5, pp. 44-55.
P. Mélandri, Histoire des États-Unis, Paris, Perrin, 2013.
P. Menerault, « Gares ferroviaires et projets métropolitains : une ville en mutation » dans D. Paris et D. Mons, Lille métropole, Laboratoire du renouveau urbain, Paris, Parenthèses, coll. La ville en train de se faire, 2009, pp. 100-122.
P. Mignerey, Les effets territoriaux de la grande vitesse ferroviaire en France, Paris, La Documentation française, 2012.
W. M. Millar, « Passenger Trains on Freight Railroads: Opportunities for A New Partnership », Conférence « Passenger Trains on Freight Railroads », Railway Age, 10 novembre 1998.
144
M. Minn et A. Goetz, « Case Studies in Passenger Rail and Freight Rail Partnerships », Association of American Geographers Annual Meeting, San Francisco, Rail Landscapes I Transitions Paper Session, 29 mars-2 avril 2016.
C-D. Mitchell-Weaver et R. Miller Dean Jr., « Multi-level Governance and Metropolitan Regionalism in the USA », Urban Studies, vol. 37, n° 5/6, 2002, pp. 851-876.
P. Mokhtarian, F. Samaniego, R. Shumway et N. Willits, « Revisiting the Notion of Induced Traffic Through a Matched-Pairs Study », Transportation, vol. 29, n° 2, 2002, pp. 193-220.
E. Monkkonen, America Becomes Urban : The Development of US Cities & Towns 1780-1980, Berkeley, University of California Press, 1988.
K. J. Morgan (traduit de l’anglais par F. Jacquin), « Obstruction ou réforme ? Le Congrès, la réforme du système de santé et les mutations de l’État fédéral », Revue française de science politique, vol. 64, n° 2, 2014, pp. 247-263.
J. Murakami et R. Cervero, « California HSR and Economic Development : Business Agglomerations and Policy Implications » dans B. L. P. Henriquez et E. Deakin (eds.), High-Speed Rail and Sustainability: Decision-making and the Political Economy of Investment, New York, Routledge, 2017.
C. Nash, « Passenger Railway Reform in the last 20 years – European Experience Reconsidered », Research in Transportation Economics, vol. 22, n° 1, 2008, pp. 61-70.
C. Nash, J. Nilsson et H. Link, « Comparing Three Models for Introduction of Competition into Railways », Journal of Transport Economics Policy, vol. 47, n° 2, pp. 191-206.
A. Nasri et L. Zhang, « The Analysis of Transit-Oriented (TOD) in Washington D.C. and Baltimore Metropolitan Areas », Transport Policy, vol. 32, 2014, pp. 172-179.
O. Nay et A. Smith, « Les intermédiaires en politique. Médiation et jeux d’institution » dans Le gouvernement du compromis. Courtiers et généralistes dans l’action politique, Paris, Economica, pp. 1-21.
J. Nelles, « Cooperation and Capacity ? Exploring the Sources and Limits of City Region Governance Partnerships », International Journal of Urban and Regional Research, vol. 37, n° 4, 2013, pp. 1349-1367.
P. Newman et J. Kenworthy, « The Land Use-Transport Connection : An Overview », Land Use Policy, vol. 13, n° 1, 1996, pp. 1-22.
P. Newman et J. Kenworthy, Sustainable and Cities : Overcoming Automobile Dependence, Washington D.C, Island Press, 1999.
P. Newman, J. Kenworthy et P. Vintila, « Can We Overcome Automobile Dependence?: Physical Planning in An Age of Urban Cynicism », Cities, vol. 12, n° 1, 1995, pp. 53-65.
A. K. Y. Ng, A. E. Velasco et T. Wang, « Institutions and the governance of transport infrastructure projects: Some insight from the planning and construction of the CentrePort Canada Way », Research in Transportation Business & Management, vol. 14, 2015, pp. 25‑33.
D. Nice, Amtrak: the History and Politics of a National Railroad, Boulder, Lynne Rienner, 1998.
J. Nijman, Miami: Mistress of the Americas, Philadelphie, University of Pennsylvania Press, 2011.
D. F. Norris, « Wither Metropolitan Governance », Urban Affairs Review, vol. 36, pp. 532-550.
Y-H. Nouailhat, Évolution économique des États-Unis du milieu du XIXème siècle à 1914, Paris, Société d’édition d’enseignement supérieur, 1982.
W. J. Novak, « The Myth of the ‘’Weak’’ American State », American Historical Review, vol. 113, 2008, pp. 752-772.
A. Nownes et P. Freeman, « Interest Group Activity in the States », The Journal of Politics, vol. 60, n° 1, pp. 86-112.
Numéro spécial de la revue Belgeo, 3/2016, « High-Speed Rail and The City : Urban Dynamics and Tourism ».
Numéro spécial de la revue Espace Géographique, 3/1993, « Réseaux et transports ».
145
Numéro spécial de la revue Espace Géographique, 1/2014, « Les effets structurants des infrastructures de transport ».
Numéro spécial de la revue Géotransports, 7/2016, « Transport et tourisme : rapports mobilités-territoires ».
C. Nuworsoo et E. Deakin, « Transforming High-Speed Rail Stations to Major Activity Hubs: Lessons for California », 88th Annual Meeting of the Transportation Research Board, janvier 2009.
J-M. Offner, « Les ‘’effets structurants’’ du transport : mythe politique, mystification scientifique », L’Espace Géographique, vol. 22, n° 3, 1993, pp. 233-242.
J-M. Offner, Réseaux, territoires et organisation sociale, Paris, La Documentation française, n° 740, 1994.
J. Ollivro, L'homme à toutes vitesses, De la lenteur homogène à la rapidité différenciée, Rennes, PUR, 2000.
L. Onofri et P. Nunes, « Beach ‘lovers’ and ‘greens’ : A Worldwide Empirical Analysis of Coastal Tourism », Ecological Economics, vol. 88, 2013, pp. 49-56.
E. Orban et M. Fortmann (eds.), Le système politique américain, Québec, Les Presses de l’Université de Montréal, 2001.
M. Orfield, Metropolitics : a Regional Agenda for Community and Stability, Washington D.C, Brookings Press, 1997.
M. Orfield, American Metropolitics : the New Suburban Reality, Washington D.C, Brookings Institute Press, 2002.
L. Ortiz, « Espace et efficacité de l’action, le mythe de l’optimum dimensionnel » dans J. P. Neméry (ed.), Le renouveau de l’aménagement du territoire en France et en Europe, Paris, Éditions Economica, 1994, pp. 183-200.
R. O’Toole, « Stopping the Runaway Train. The Case for Privatizing Amtrak », Policy Analysis, n° 712, 2012.
M. Ouellet, « Le smart growth et le nouvel urbanisme : Synthèse de la littérature récente et regard sur la situation canadienne », Cahiers de géographie du Québec, vol. 50, n° 140, 2006, pp. 175-193.
C. P. Ozawa, The Portland Edge. Challenges and Successes in Growing Communities, Washington D.C, Island Press, 2004.
F. Pagliara, M. Delaplace et J. M. Vassalo, « High-Speed Rail Systems and Tourists’ Destination Choice: The Case Studies of Paris and Madrid », The International Journal of Sustainable Development and Planning, vol. 10, n° 3, 2015, pp. 399-410.
F. Pagliara, M. Delaplace et J. M. Vassalo, « High-Speed Trains and Tourists: What Is The Link? Evidence from the French and Spanish Capitals », WIT Transactions on the Built Environment, vol. 1381, n° 2, 2014, pp. 17-27.
F. Pagliara, F. Mauriello et A. Garofalo, « Exploring the Interdependences between High Speed Rail Systems and Tourism: Some Evidence from Italy », Transportation Research Part A: Policy and Practice, vol. 106, 2017, pp. 300-308.
F. Pagliara, A. L. Pietra, J. Gomez et J. M. Vassallo, « High Speed Rail and the Tourism Market: Evidence from the Madrid Case Study », Transport Policy, vol. 37, 2015, pp. 187–194.
K. Pain, « Policy Challenges of Functional Polycentricity in a Global Mega-City Region: South East England », Built Environment, vol. 32, n° 2, 2006, pp. 194-205.
M. B. Palmer, Dernières nouvelles d’Amérique : médias, pouvoirs et langages depuis les États-Unis, Paris, Editions de l’Amandier, 2006.
J. Pavaux, Les complémentarités Train/Avion en Europe, Paris, SETEC, 1991.
A. Perl, « Redesigning an Airport for International Competitiveness: The Politics of Administrative Innovation at CDG », Journal of Air Transport Management, vol. 4, n° 4, 1998, pp. 189-199.
A. Perl, New Departures, Rethinking Rail Passenger Policy in the Twenty-First Century, Lexington, The University Press of Kentucky, 2002.
A. Perl « Assessing the Recent Reformulation of United States Passenger Rail Policy », Journal of Transport Geography, vol. 22, 2012, pp. 271-281.
146
A. Perl et J. Calimente, « Integrating High Speed Rail Into North America’s Next Mobility Transition », Environmental Practice, n° 13, 2011, pp. 47-57.
A. Perl et A. Goetz, High-Speed Passenger Rail: Considering when the US has Come From and Where the World is Going, Denver, University of Denver, 2013.
A. Perl et A. Goetz, « Corridors, Hybrids and Networks: Three Global Development Strategies for High Speed Rail », Journal of Transport Geography, vol. 42, 2015, pp. 134-144.
G. E. Peterson, Unlocking Land Values to Finance Urban Infrastructure: Land-Based Financing Options for Cities, Gridlines n° 40 World Bank, Washington D.C, Banque Mondiale, 2009.
J. Pickus et P. Gober, « Urban Village and Activity Patterns in Phoenix », Urban Geography, vol. 9, n° 1, 1988, pp. 85-97.
R. W. Pittman, « Railroads and Competition : The Santa Fe/Southern Pacific Merger Proposal », The Journal of Industrial Economics, vol. 38, 1990, pp. 1-21.
J. F. Plant (ed.), Handbook of Transportation Policy and Administration, New York, Taylor & Francis Group, 2007.
F. Plassard, Les Autoroutes et le Développement régional, Paris, Éditions Economica, 1977.
F. Plassard, Transport et territoire, Paris, La Documentation Française, 2003.
P. M. Plotch, « What’s Taking So Long ? Identifying the Underlaying Causes of Delays in Planning Transportation Megaprojects in the United States », Journal of Planning Literature, vol. 30, n° 3, 2015, pp. 282-295.
P. Poncet, « Transports », Dictionnaire de la géographie et de l’espace des sociétés, Paris, Belin, 2003, pp. 937-938.
B. E. Prentice, Proceedings of the 31st Annual Conference of the Canadian Transportation Research Forum: Transport Gateways and Trade Corridors, Saskatoon, University of Saskatchewan Printing Services, 1996.
B. Prideaux, « The Role of the Transport System in Destination Development », Tourism Management, vol. 21, n° 1, 2000, pp. 53-63.
J. Prozzi et al., Public Support of Passenger Rail Sharing Freight Infrastructure, Austin, Center for Transportation Research, The University of Texas, 2006.
R. Puentes, A. Tomer et J. Kane, A New Alignment : Strengthening America’s Commitment to Passenger Rail, Washington D.C., The Brookings Institute, Metropolitan Policy Program, 2013.
B. Quinn, « Transit-Oriented Development : Lessons from California », Built Environment, vol. 32, n° 3, 2006, pp. 311-322.
K. Ratner et A. Goetz, « The Reshaping of Land Use and Urban Form in Denver Through Transit-Oriented Development », Cities, vol. 30, n° 1, 2013, pp. 31-46.
J. Rauch, Government’s End. Why Washington Stopped Working, New York, Public Affairs, 1999.
R. Raymond, « La ‘’société civile’’, ce ‘’nouvel’’ acteur de l’aménagement des territoires », L’information géographique, vol. 73, n° 2, 2009, pp. 10-28.
E. Reiskin, « High-Speed Rail in California: Progress and Prospect », Annual Meeting of the Association of American Geographers, San Francisco, 29 mars 2016.
P. Reistrup, « Passenger Trains on Freight Railroads : A View from Both Sides of the Track », Journal of Transportation Law, Logistics and Policy, vol. 70, n° 1, 2002, pp. 57-63.
J. Renne et J. Wells, « Emerging European-Style Planning in the USA: Transit-Oriented Development », World Transport Policy & Practice, vol. 10, n° 2, 2004, pp. 12-84.
J. Renne, « From Transit-Adjacent to Transit Oriented Development », Local Environment, vol. 14, n° 1, 2009, pp. 1-15.
J. Renne, « Smart Growth and Transit-Oriented Development at the State Level: Lessons from California, New Jersey, and Western Australia », Journal of Public Transportation, vol. 11, n° 3, 2011, pp. 77-108.
147
T. J. Revels, Sunshine Paradise. A History of Florida Tourism, Miami, University Press of Florida, 2011.
A. Rich et K. Weaver, « Think Tanks in the Political System of the United States », Briefing Paper Special Issue, septembre 2011.
D. Richard, The Press and American Politics, Upper Saddle River, Prentice Hall, 2001 (3ème ed.).
C. Richer, Multipolarités urbaines et intermodalité : les pôles d’échanges, un enjeu pour la coopération intercommunale ?, thèse de doctorat, sous la direction de Philippe Menerault, Université Lille 1, soutenue le 13 décembre 2007.
E. Riot, L’agencement des grandes gares historiques pour le marché ferroviaire européen, thèse de doctorat, Université Paris-Est, sous la direction de N. Baron et de V. Kaufmann, soutenue le 6 novembre 2015.
J-P. Rodrigue, The Geography of Transport Systems, New York, Routledge, 2013.
J-P. Rodrigue et T. Notteboom, « Comparative North American and European Gateway Logistics : The Regionalism of Freight Distribution », Journal of Transport Geography, vol. 18, n° 4, 2010, pp. 497-507.
A. Romein, T. J. Jacob et J. de Vries, « The Multi-Scalar Complexity of Infrastructure Planning: Evidence from the Dutch–Flemish Megacorridor », Journal of Transport Geography, vol. 11, n° 3, 2003, pp. 205‑213.
M. Rose, « Passenger Trains on Freight Railroads », Railway Age 16th Conference, Washington D.C, 16-19 octobre 2009.
C.L. Ross, Megaregions. Planning for Global Competitiveness, Washington D.C, Island Press, 2009.
D. W. Rossides, Communication, Media and American Society: A Critical Introduction, Lanham, Rowman & Littlefield, 2003.
M.P. Roth, Issues of Westward Expansion, Westport (Conn.), Greenwood Press, 2002.
D. N. Rothblatt et A. Sancton, Metropolitan Governance : American/Canadian Intergovernmental Perspectives, Berkeley, University of California, 1993.
D. L. Roth et R. T. Aggarwala, « Whose Railroad Is This, Anyway ? Opportunities and Challenges in Regionalizing the Northeast Corridor », Transportation Research Board 1785, Paper No. 02-2636, 2002.
O. Roy-Baillargeon, La planification métropolitaine et le transit-oriented development (TOD). Les nouveaux instruments de la gouvernance du Grand Montréal, thèse de doctorat, sous la direction de Michel Gariépy, soutenue le 13 novembre 2015.
D. Royot, S. Ruel, N. Kaplan et al., Les médias et l’information aux États-Unis de 1945 à aujourd’hui, Paris, CNED, 1997.
C. Ruggeri, La baie de San Francisco, un laboratoire pour le financement des politiques publiques de transport urbain ?, Mémoire de Master 2, Université Lyon 2 Lumière, 2011.
C. Ruggeri, « La ligne à grande vitesse californienne : entre mythes et réalités », Recherche Transports Sécurité, Necplus, vol. 29, n° 3, 2013, pp. 229-244.
C. Ruggeri, « The High-Speed Rail Project and Local Government in California: A New Institutional Process? », Selected Proceedings, 13th World Conference on Transport Research, 15-18 juillet, 2013b.
C. Ruggeri, Le projet de grande vitesse ferroviaire en Californie : entre appropriation culturelle, ancrage territorial et restructuration urbaine, thèse de doctorat, Université de Cergy-Pontoise, sous la direction de Pierre Zembri, soutenue le 3 mars 2015.
C. Ruggeri, « Le train à grande vitesse en Californie : un « train pour nulle part » ? », Transports urbains, vol. 126, 2015b, pp. 3-9.
C. Ruggeri, « La gare d’Union Station à Washington D.C : une gare au cœur du pouvoir », Urbanités, novembre 2016 [Online].
C. Ruggeri et M. Schorung, « “L’Obamarail”: l’émergence d’une nouvelle géographie ferroviaire aux États-Unis ? », Territoires en mouvement, 35, 2017 [Online].
D. Rusk, Cities Without Suburbs, Baltimore, Woodrow Wilson Center Press, 1993.
148
R. Rybeck, « Using Value Capture to Finance Infrastructure and Encourage Compact Development », Public Works Management Policy, vol. 8, 2004, pp. 249-260.
A. Ryder, « High Speed Rail », Journal of Transport Geography, vol. 22, 2012, pp. 303-305.
J. Saginor et E. Dumbaugh, « The Public Costs of Private Rail », ITE Journal, octobre 2018, pp. 33-39.
J. C. Sanders, Seattle and the Roots of Urban Sustainability. Inventing Ecotopia, Pittsburgh, University of Pittsburgh Press, 2012.
B. D. Sands, « The Development Effects of High-Speed Rail Stations and Implications for California », Working Paper UCTC n° 115, Berkeley, The University of California Transportation Center, 1993.
C. Sang-Chuel, « Urban corridors in Pacific Asia », Globalization and the World of Large Cities, Y. Yeung éd., Tokyo, UNU Press, 1998, pp. 155‑173.
R. Saunders, Merging Lines: American Railroads, 1900-1970, DeKalb, Northern Illinois University Press, 2001.
R. Saunders, Main Lines: Rebirth of the North American Railroads, 1970-2002, DeKalb, Northern Illinois University Press, 2003.
M. Savy, Le transport de marchandises, Eyrolles-Editions d’organisation, 2006.
A. Schafran, « Rethinking Mega-Regions : Sub-Regional Politics in a Fragmented Metropolis », Regional Studies, vol. 48, n° 4, 2014, pp. 587-602.
M. Schorung, « Nouvelle loi transports aux États-Unis : monument législatif, intentions de réformes et permanence des déséquilibres fondamentaux », Flux, n° 103-104, 2016, pp. 102-106.
M. Schorung, « Le transport ferroviaire interurbain de passagers en Californie : un laboratoire du renouveau ferroviaire aux États-Unis? », Flux, 1, 2017 [Online].
M. Schorung et E. Libourel, « Les corridors de transport en Europe et en Amérique du Nord : des projets d'aménagement à leur mise en œuvre », Géotransports, n° 8, 2016, pp. 39-56.
G-C. Sciara et M. Wachs, « Metropolitan Transportation Funding. Prospects, Progress, and Practical Considerations », Public Works Management & Policy, vol. 12, n° 1, 2007 [Online].
J. W. Scott, « Smart Growth as Urban Reform : A Pragmatic ‘Recoding’ of the New Regionalism », Urban Studies, vol. 44, n° 1, 2001, pp. 15-35.
E. P. Seltzer, Cascadia Ecolopolis 2.0, Portland, Portland State University, 2006.
E. P. Seltzer, « Regional Planning and Local Governance: The Portland Story » dans T. Kidokoro et al. (eds.), Sustainable City Regions: Space, Place and Governance, Tokyo, Springer, 2008, pp. 277-298.
E. P. Seltzer et A. Carbonell (dir.), Regional Planning in America. Practice and Prospect, Cambridge, Lincoln Institute of Land Policy, 2011.
E. P. Seltzer et D. Carlson, Ecolopis 5.0 : High-Speed Rail in Cascadia, Portland, Portland State University, 2011.
M. Shaffer, See America First. Tourism and National Identity, 1880-1940, Washington & Londres, Smithsonian Institution, 2001.
R. Y. Shapiro et L. R. Jacobs (eds.), The Oxford Handbook of American Public Opinion and the Media, Oxford/NY, Oxford University Press, 2011.
I. Sharkansky, The Maligned States: Policy Accomplishments, Problems and Opportunities, New York, McGraw-Hill, 1972.
A. Sheingate (traduit de l’anglais par L. Geant), « Pourquoi les Américains ne voient-ils pas l’État ? », Revue française de science politique, vol. 64, n° 2, 2014, pp. 207-219.
M. Sheridan, « Second-Tier Revivals », Urban Land, 2008, pp. 90-93.
M. Sherwood, Alaska and Its History, Seattle, University of Washington Press, 1967.
P. J. Smith, « Branding Cascadia : Considering Cascadia’s Conflicting Conceptualizations – Who Gets To Decide? », A New Journal of Political Science, vol. 2, n° 2, 2008, pp. 57-83.
149
J.J. Smith et T.A. Gihring, « Financing Transit Systems Through Value Capture », American Journal of Economics and Sociology, vol. 65, 2006, pp. 751-786.
E. Soja, My Los Angeles, From Urban Restructuring to Regional Urbanization, Berkeley, University of California Press, 2014.
C. Spitulnik et J. Rennert, « Use of Freight Rail Lines for Commuter Operations: Public Interest, Private Property », Transportation Law Journal, vol. 26, n° 3, 1999, pp. 319-339.
B. Steck, « West Africa facing the lack of traffic lanes »,. EchoGéo, n° 20, 2012 [Online].
D. Steinberg, « SB 375 Connects Land Use and AB 32 Implementation », The Planning Report, juillet 2007 [Online].
W. Stenberg, « Fragmented Structures and Blurred Boundaries : Strategies for Regional Governance » dans I.W. Morgan et P. J. Davies (eds.), The Federal Nation. Perspectives on American Federalism, New York, Palgrave MacMillan, 2008.
J.R. Stilgoe, Train Time: Railroads and the Imminent Reshaping of the United States Landscape, Charlottesville, University of Virginia Press, 2009.
D. Stone, « Introduction : Think-Tanks, Policy Advice and Governance » dans D. Stone et A. Denham (dir.), Think-Tank Traditions. Policy Research and the Politic of Ideas, Manchester, Manchester UP, pp. 1-16.
J.F. Stover, History of the Baltimore and Ohio Railroad, West Lafayette (Ind.), Purdue University Press, 1987.
J-F. Stover, American Railroads, Chicago, University of Chicago Press, 1997.
P. Subra, « L’aménagement, une question géopolitique ! », Hérodote, vol. 130, n° 3, 2008, pp. 222-250.
H. Suzuski, J. Murakami, Y. H. Hong et B. Tamayose, Financing Transit-Oriented Development and Land Values: Adapting Development-based Land-Value Capture in Developing Countries, Washington D.C, The World Bank Publications, 2015.
C. Taillard, « Un exemple réussi de régionalisation transnationale en Asie orientale : les corridors de la Région du Grand Mékong », L’Espace géographique, vol. 38, n° 1, 2009, pp. 1‑16.
G.R. Taylor, The Transportation Revolution, 1815-1860, New York, Rinehart, 1951.
M. Taylor, « Community Participation in the Real World : Opportunities and Pitfalls in New Governance Spaces », Urban Studies, vol. 44, n° 2, 2007, pp. 297-317.
G.R. Taylor et I.D. Neu, The American Railroad Network, 1861-1890, Cambridge, Harvard University Press, 2003 (1ère ed. 1956).
B. D. Taylor et L. Schweiter, « Assessing the Experience of Mandated Collaborative Inter-Jurisdictional Transport Planning in the United States », Transport Policy, vol. 12, n° 6, 2005, pp. 500-511.
J. C. Teaford, The Rise of the States. Evolution of American State Government, Baltimore, The Johns Hopkins University Press, 2002.
J-J. Terrin (dir.), Gares et dynamiques urbaines. Les enjeux de la grande vitesse, Marseille, Editions Parenthèses, 2011.
I. Thery, « Expertise de service, de consensus, d’engagement : essai de typologie de la mission d’expertise en sciences sociales », Droit et Société, n° 60, pp. 311-329.
L. Thompson et H. Bente, « What is Rail Efficiency and How Can it Be Changed ? », Documents de travail du Forum international des transports, n° 23, Paris, Éditions OCDE, 2014.
L. Thompson et J. Kohon, « Developments in Rail Organization in the Americas, 1990 to Present and Future Directions », Journal of Rail Transport Planning & Management, vol. 2, n° 3, 2012, pp. 51-62.
L.S. Thompson et H. Stephan, « Infrastructure Separation: What Have We Learned So Far? », Rail Business Report, 1998, pp. 5-13.
P. Todorovich, D. Schned et R. Lane, High-Speed Rail, International Lessons for U.S. Policy Makers, Cambridge, Lincoln Institute of Land Policy, 2011.
150
M-F. Toinet, L’État en Amérique, Paris, Presses de Sciences Po, 1989.
H. Trocmé et J. Rovet, Naissance de l’Amérique moderne XVIè-XIXè, Paris, Hachette, 1997.
H. Trocmé, Chicago 1890-1930, audaces et débordements, Paris, Autrement, 2001.
J-F. Troin, Rail et aménagement du territoire : des héritages aux nouveaux défis, Aix-en-Provence, Edisud, 1995.
J-F. Troin, « Les gares TGV et le territoire : débat et enjeux », Annales de géographie, tome 106, n° 593-594, 1997, pp. 34-50.
J-F. Troin, « Le réseau européen des Lignes à Grande Vitesse : Espoir ou impasse ? », Bulletin de l’Association de Géographes Français, vol. 85, n° 4, 2008, pp. 475-486.
D. Tsamboulas, H. Vrenken et A-M. Lekka, « Assessment of a Transport Policy Potential for Intermodal Mode Shift on A European Scale », Transportation Research Part A: Policy and Practice, vol. 41, n° 8, octobre 2007, pp. 715-733.
J-M. Urena, P. Menerault, et M. Garmendia, « The High-Speed Rail Challenge for Big Intermediate Cities: A National, Regional and Local Perspective », Cities, vol. 26, n° 5, 2009, pp. 266-279.
J.M. Urena et C. Ribalaygua Battala, « Le réseau ferroviaire à grande vitesse espagnol : état actuel d’avancement et d’appropriation par les villes desservies », Transports Urbains, n° 106, 2004, pp. 3-10.
E. Valeri, F. Pagliara et E. Marcucci, « A Destination Choice Model for Tourism Purpose », Papier présenté à la conférence annuelle de l’ASRDLF 2012, Session spéciale « High Speed Rail, Tourism and Territories », 9–11 juillet 2012, Belfort, France.
P. Vandergeest, « Mapping Nature: Territorialization of Forest Rights in Thailand », Society and Natural Resources, n° 3, 1996, pp. 159-175.
C. E. Van Horn, « The Quiet Revolution » dans The State of the States, Washington D.C, Congressional Quarterly Press, 1989.
M. Vanier (dir.), Territoires, territorialité, territorialisation, Controverses et perspectives, Rennes, PUR, 2009.
W. C. Vantuono, « Passengers Operators, Freight Railroads: Allies or Antagonists ? », Railway Age, n° 12, 1998, pp. 41-42.
W. C. Vantuono, « Making Room for Passengers : Freight Operators Seem More Than Willing to Accommodate Passenger Trains, As Long As Their Operations Are Not Compromised », Railway Age, vol. 201, n° 11, 2000.
W. C. Vantuono, « A 220-mph NEC? A contrarian weighs in », Railway Age, 2013 [Online].
J. Varlet, L'interconnexion des réseaux de transport en Europe : éléments de géographie prospective, Paris, Institut du transport aérien, 1992.
J. Varlet, « La déréglementation du transport aérien et ses conséquences sur les réseaux et sur les aéroports », Annales de Géographie, tome 106, n° 593-594, 1997, pp. 205-217.
J. Varlet, « Dynamique des interconnexions des réseaux de transports rapides en Europe : devenir et diffusion spatiale d’un concept géographique », Flux, n° 41, 2000, pp. 5-16.
J. Varlet, « Autoroutes, acteurs et dynamiques territoriales », Geocarrefour, vol. 77, n° 1, 2002.
J. Varlet et P. Zembri, Atlas des Transports: Les paradoxes de la mise en réseau du monde, Paris, Autrement, 2010.
J. Vassallo et M. Fagan, « Nature or Nurture: Why do Railroads Carry Greater Freight Share in the United States Than in Europe? », Transportation, vol. 34, n° 2, 2007, pp. 177-193.
H. L. Vega et L. Penne, « Governance and Institutions of Transportation Investments in U.S. Mega-regions », Transport, vol. 23, n° 3, 2008, pp. 279-286.
C. Vellturo et al., « Deregulation, Mergers, and Cost Savings in Class I U.S. Railroads, 1974-86 », Journal of Economics and Management Strategy, vol. 1, n° 2, 1992, pp. 339-369.
F. Vergniolle de Chantal, Fédéralisme et antifédéralisme, Paris, PUF, 2005.
151
F. Vergniolle de Chantal, « Le Congrès des États-Unis : une assemblée incontrôlable ? », Les Etudes du CERI, n° 200, décembre 2013, pp. 2-42.
W. Vernon, « Commuters and Freight Railroading », Rail News, n° 420, novembre 1998, pp. 12-13.
J. I. Vila Vàzquez, « Critical Analysis of the Flagship Urban Projects », IGU Regional Conference, Tel Aviv, Israel, 2010.
R. K. Vogel et N. Nezelkewicz, « Metropolitan Planning Organizations and the New Regionalism: The Case of Louisville », Publius: The Journal of Federalism, vol. 32, n° 1, 2002, pp. 107-129.
M. Wachs, « Planning for High-Speed Rail », Access, vol. 41, 2012, pp. 38-40.
R. Walker et A. Schafran, « The Strange Case of the Bay Area », Environment and Planning A, vol. 47, 2015, pp. 10-29.
R. Walker et S. K. Lodha, The Atlas of California. Mapping the Challenges of a New Era, Berkeley-Los Angeles, University of California Press, 2013.
A. D. Wallis, « Inventing Regionalism : The First Two Waves », National Civic Review, vol. 83, n° 2 [Online].
X. Wang, S. Huang, T. Zou et H. Yan, « Effects of the High Speed Rail Network on China's Regional Tourism Development », Tourism Management Perspectives, vol. 1, n° 1, 2012, pp. 34–38.
J.A. Ward, Railroads and the Character of America, 1820-1887, Knoxville, University of Tennessee Press, 1986.
F. Weil, Histoire de New York, Paris, Fayard, 2004.
M. Weir, J. Rongerude et C. K. Ansell, « Collaboration in Not Enough. Virtuous Cycles of Reform in Transportation Policy », Urban Affairs Review, vol. 44, n° 4, 2009 [En ligne].
S. M. Wheeler, « The New Regionalism : Characteristics of an Emerging Movement », Journal of the American Planning Association, vol. 68, n° 3, 2002, pp. 267-278.
R. White, Railroaded: The Transcontinentals and the Making of Modern America, New York, WW Norton & Co, 2011.
B. J. Wickizer et A. Snow, « Rediscovering the Transportation Frontier: Improving Sustainability in the United States Through Passenger Rail », Sustainable Development Law & Policy, vol. 11, n° 1, 2011, pp. 12-16.
J. Willis, The Media Effect: How the News Influences Politics and Government, Westport/Londres, Praeger, 2007.
F. N. Wilner, Railroad Mergers: History, Analysis, Insight, Omaha, Simmons-Boardman Books Inc., 1997.
W. Wilson, « Legislated Market Dominance », Research in Transportation Economics, vol. 4, 1996, pp. 33-48.
W. Wilson, « Cost Savings and Productivity in the Railroad Industry », Journal of Regulatory Economics, vol. 11, n° 1, 1997, pp. 21-40.
J. Q. Wilson et J. Dilulio Jr., American Government. Institutions and Policies, Boston-NY, Houghton Mifflin Company, 2015 (15ème ed.).
W. Wilson et W. Wilson, « Deregulation, Rate Incentives and Efficiency in the Railroad Market » dans B. McMullen (ed.), Research in Transportation Economics, vol. 6, 2001, pp. 1-24.
W. Winston et al., The Economic Effects of Surface Freight Deregulation, Washington D.C., The Brookings Institute, 1990.
R. Woessner, Les processus de la territorialisation : quelles conditions pour la possibilité de l’advenue d’un système spatial, Habilitation à Diriger des Recherches, Université de Franche-Comté, 2007.
J. F. Wolf, « Assessing Progress : The State of Metropolitan Planning Organizations under ISTEA and TEA-21 », International Journal of Public Administration, vol. 28, n° 13-14, 2005, pp. 1057-1079.
J. F. Wolf et T. K. Bryan, « Identifying the Capacities of Regional Councils of Governement », State and Local Government Review, vol. 41, n° 1, 2009, pp. 61-68.
152
J. Wolf, T. W. Sanchez et M. B. Farquahr, « Metropolitan Planning Organizations and Regional Transportation Planning » dans J. F. Plant (ed.), Handbook of Transportation Policy and Administration, New York, Taylor & Francis Group, 2007, pp. 169-188.
C. Wolmar, The Great Railroad Revolution. The History of Trains in America, New York, PublicAffairs, 2012.
H. Wong, « Regional Governance in the San Francisco Bay Area : the History of the Association of Bay Area Governments », Focus, vol. 10, pp. 61-67.
S. Xu, X. Zhu, L. Kang, B. Long et X. Liu, « Research on Passenger Market Competitiveness of China High-Speed Railway and Railway Traffic », International Conference on Computer, Communications and Information Technology (CCIT), 2014, pp. 33-35.
E. H. Zeigler, The Case for Megalopolitan Growth Management in the 21st Century. Regional Urban Planning and Sustainable Development in the United States, Denver, University of Denver Sturm College of Law, 2008.
P. Zembri, « TGV – Réseau ferré Classique : des rendez-vous manqués ? », Annales de géographie, tome 102, n° 571, 1993, pp. 282-295.
P. Zembri, « The Various’s Roles in Interconnection Processes: The Study of Several Public Transport Networks » dans C. Capineri et P. Rietveld (eds.), Networks in Transport and Communications: A Policy Approach, Londres, Routledge, 1997, pp. 217-231.
P. Zembri, « Les premiers effets spatiaux des recompositions de réseaux aériens en France : des effets d’aubaine fragiles mais une réelle ouverture de nombreuses régions françaises », Flux, vol. 16, n° 41, 2000, pp. 28-40.
P. Zembri, « The Spatial Consequences of Air Transport Deregulation : an Overview of the French Case Since 1995 », NECTAR Euroconference, Umea, juin 2005.
P. Zembri, « Structures des réseaux de transport et déréglementation », Flux, vol. 4, n° 62, 2005, pp. 21-30.
P. Zembri, Pour une approche géographique de la déréglementation dans les transports, Habilitation à Diriger des Recherches, Volume 2, Texte original, Université Paris 1, 2007.
P. Zembri, « New Objectives of the French High-Speed Rail System Within the Framework of a Highly Centralized Network: A Substitute for the Domestic Air Transport Market? », ERSA 2010 Congress, Jonköping (Suède), 19-23 août 2010.
P. Zembri et E. Libourel, « Towards Oversized High-Speed Rail Systems? Some Lessons from France and Spain », Transportation Research Procedia, vol. 25C, 2017, pp. 368–385.
G. Zembri-Mary, « Configurations complexes d’acteurs locaux et négociation des projets et des financements des LGV : le cas de la LGV Bretagne-Pays de la Loire et de la LGV Sud Europe Atlantique », Norois, n° 248, 2018/3, pp. 91-108.
M. Ziolkowski, « The Ties That Bind: Freight and Passenger High-Speed Rail Are Interdependent », Journal of Transport Geography, vol. 22, 2012, pp. 292-293.
T. D. Zoller et J. A. Capizzano, Evolution and Devolution : A National Perspective on the Changing Role of Metropolitan Planning Organizations in Areawide Intermodal Planning, Charlottesville (VA), Virginia Transportation Research Council, 1997.
Grey literature
AAR, Railroad Facts, Washington D.C, 1980, 1998, 2010.
AAR, An Overview of America’s Freight Railroads, Washington D.C, 2012, 2014, 2016, 2018.
AAR, Freight and Passenger Rail : Finding the Right Balance, Washington D.C, 2014b.
AAR, A Short History of U.S. Freight Railroads, Washington D.C, 2015.
AAR, Class I Railroads Statistics, Washington D.C, 2015b.
AAR, Public-Private Partnerships, Washington D.C, 2017.
AASHTO, The Changing State DOT, Washington D.C, 1998.
153
AASHTO, Intercity Passenger Rail Transportation, Washington D.C, 2003.
AASHTO, State Rail Planning Best Practices, Volume 1, Washington D.C, 2009.
AASHTO, Passenger Rail Moves Ahead. Meeting the Needs of the 21st Century, Washington D.C, 2012.
AASHTO, State Rail Planning Best Practices, Volume 2, Washington D.C, 2016.
ABAG, San Francisco Bay Area State of the Region, San Francisco, 2015.
ADB, Best Practices for Private Sector Investment in Railways, Asian Development Bank, 2006.
Alaska Department of a Commerce, Community, and Economic Development, Division of Economic Development, Economic Impact of Alaska’s Visitor Industry 2013-2014, Juneau, ADCCED, 2015.
Alaska Department of Transportation and Public Facilities, Statewide Long Range Transportation Plan, Let’s Get Moving 2030, Juneau, 2008.
Alaska Department of Transportation and Public Facilities, Alaska State Rail Plan Draft, Juneau, 2015.
Alaska Railroad Corporation, South Central Commuter Rail Network Commuter Study and Operation Study, Anchorage, 2002.
Alaska Railroad Corporation, Annual Report, Anchorage, 2013.
Alaska Railroad Corporation, Annual Report, Anchorage, 2014.
Alaska Railroad Corporation, Freight Service Business Facts, Anchorage, 2015.
Alaska Railroad Corporation, Passenger Service Business Facts, Anchorage, 2015b.
Alaska Railroad Corporation, Real Estate and Facilities Business Facts, Anchorage, 2015c.
Alaska Railroad Corporation, Destination Excellence, Strategic Plan 2015-2019, Anchorage, 2015d.
Alaska Railroad Corporation, Winter 2015-2016 Schedules, Fares, Packages, Anchorage, 2015e.
Alaska Railroad Corporation, Railroad at a Glance. Just the Facts, Anchorage, 2016.
All Aboard Florida, Intercity Passenger Rail Project Volume 1 Text, Final Environmental Impact Statement and Section 4(f) Determination, Miami, 2015.
All Aboard Florida, Final Environmental Impact Statement and Section 4(f) Determination, Miami, 2017.
American Association of Airport Executives, History, the Regulation of Air Transportation, Airports and the Federal Aviation Administration, Module 1, Washington D.C, 2004/2005.
Amtrak Cascades/WSDOT/ODOT, Cascades Rail Corridor Management Workplan, Salem, 2013.
Amtrak Statutes – U.S. Code, Ttile 49, Subtitle V, Part C, Chapter 243, $24301
Amtrak, A Vision for High-Speed Rail in the Northeast Corridor, Washington D.C, 2010.
Amtrak, Northeast Corridor Infrastructure Master Plan, Washington D.C, 2010b.
Amtrak, Annual Report Fiscal Year 2011, Washington D.C, 2011.
Amtrak, Union Station Master Plan, Washington D.C, 2012.
Amtrak, State-Supported Corridor Trains, FY 2011-12, Washington D.C, 2012b.
Amtrak, The Amtrak Vision for the Northeast Corridor, 2012 Update Report, Washington D.C, 2012c.
Amtrak, PRIIA Section 210 FY 2012 Performance Improvement Plan, Washington D.C, 2012d.
Amtrak, National Amtrak Fact Sheet, Washington D.C, 2013, 2014, 2015, 2016, 2017, 2018.
Amtrak, Strategic Plan FY2014-FY2018, Washington D.C, 2014b.
Amtrak, FY 2014 Budget and Business Plan / FY 2014-2018 Five Year Financial Plan, Washington D.C, 2014c.
Amtrak, Communiqué de presse, « Amtrak Asks Surface Transportation Board to Investigate Norfolk Southern and CSX Railroads », 17 novembre 2014d.
154
Amtrak, The Northeast Corridor Fact Sheet, Critical Infrastructure for the Northeast, Washington D.C, 2015b.
Amtrak, 5 Year Budget & Business Plan, Washington D.C, 2015c.
Amtrak, Amtrak’s Fiscal Year 2017 General and Legislative Annual Report, Washington D.C, 2016b.
Amtrak, Fact Sheet : Amtrak Per State, Washington D.C, 2016c, 2017b.
Amtrak, Amtrak Five Year Service Line Plans – Five Years Strategic Plan (FY 2019-FY 2023), Washington D.C, 2018b.
Amtrak, Host Railroad Report Card – January thru December 2017, Washington D.C, 2018c.
American Public Transportation Association, An Inventory of the Criticisms of High-Speed Rail, With Suggested Responses and Counterpoints, Washington D.C, APTA, 2012.
American Public Transportation Association, Public Transportation Ridership Report, Washington D.C, APTA, 2016.
American Public Transportation Association, 2017 Public Transportation Fact Book, Washington D.C, 2018.
Association of American Railroads vs. United States Department of Transportation, n° 12-5204, 2 juillet 2013.
BART, BART’s Role in the Region, Oakland, 2016.
BART, 2017 Report to Congress, Oakland, 2017.
J. Blair, Sr. Director Host Railroads, Amtrak, « Passenger and Freight Rail. Together We Stand! », septembre 2010.
Bureau of Transportation Statistics, Intermodal Passenger Connectivity Database, Table 4, Washington D.C, RITA, 2010.
Bureau of Transportation Statistics, The U.S. Rural Population and Scheduled Intercity Transportation in 2010: A Five-Year Decline in Transportation Access, Washington D.C., RITA, 2010b.
Bureau of Transportation Statistics, Government Transportation Financial Statistics, Washington D.C., RITA, 2012.
CAHSRA, Report to the Legislature, Sacramento, 2009.
CAHSRA, HSR Station Area Planning, Sacramento, 2009b.
CAHSRA, Draft 2012 Business Plan, Sacramento, 2011.
CAHSRA, HST Station Area Development : General Principles and Guidelines, Sacramento, 2011b.
CAHSRA, Revised 2012 Business Plan. Building California’s Future, Sacramento, 2012.
CAHSRA, High-Speed Rail Connectivity and Bookends Fact Sheet, Sacramento, 2013.
CAHSRA, 2014 Business Plan. Connecting California, Sacramento, 2014.
CAHSRA, 2016 Business Plan. Connecting and Transforming California, Sacramento, 2016.
California State, Transportation Budget Summary FY 2017-2018, Sacramento, 2017.
CalSTA, California Transportation Infrastructure Priorities : Vision and Interim Recommendations, Sacramento, 2014.
Caltrain, Strategic Plan FY 2015-2024, San Carlos, 2014.
Caltrain, Caltrain Fast Facts, San Carlos, 2016.
Caltrain, Peninsula Corridor Electrification Fact Sheet, San Carlos, 2017.
Caltrain/CAHSRA, Electrification of the Caltrain Corridor Fact Sheet, San Carlos, 2015.
Caltrans, California Transportation Plan 2025, Sacramento, 2006.
Caltrans, California State Rail Plan 2007-08 to 2017-18, Sacramento, 2008.
Caltrans, Pacific Surfliner Route FFY 2007-2008 Business Plan, Sacramento, 2008b.
155
Caltrans, San Joaquin Route FFY 2007-2008 Business Plan, Sacramento, 2008c.
Caltrans, California State Rail Plan, Sacramento, 2013.
Caltrans, California Transportation Plan 2040. Integrating California’s Transportation Future, Sacramento, 2016.
Caltrans, 2018 California State Rail Plan Draft Report, Sacramento, 2018.
J. Campbell-Lorence, « Amtrak’s Approach to Major Stations. Project Management, Procurement, and Funding », présentation à la FRA Rail Program Delivery Conference, Washington D.C., Federal Railroad Administration, 13-15 octobre 2015.
Capitol Corridor Joint Powers Authority, Capitol Corridor 2014 Vision Plan Update Final Version, Oakland, 2014.
Central Waterfront Committee, Strategic Plan for Realizing the Waterfront Seattle Vision, Seattle, 2012.
Central Waterfront Committee, Waterfront Seattle Framework Plan, Seattle, 2012b.
Central Waterfront Committee, Waterfront Seattle Concept Design, Seattle, 2012c.
CHRM Hill Inc., Ultra High-Speed Ground Transportation Study, Draft Final Report, Portland, 2017.
City and County of San Francisco, Safe, Reliable, and Affordable Transportation. Mayor’s Transportation Task Force 2030, San Francisco, 2016.
City of Portland, Bureau of Planning, River District Design Guidelines, Portland, 2008.
City of Portland, Bureau of Planning and Sustainability, Central City 2035 Volume 1 Goals and Practices : Recommended Draft, Portland, 2017.
City of Portland-PDC, Pearl District Development Plan. A Future Vision for a Neighborhood in Transition, Portland, 2001.
City of Portland-PDC, Amended and Restated River District Urban Renewal Plan, Portland, 2008.
City of Portland-PDC, Old Town/Chinatown Five-Year Action Plan, Portland, 2014.
City of Portland-PDC, Broadway Corridor Framework Plan, Portland, 2015.
City of Seattle-Department of Planning and Development, Livable South Downtown Planning Study Executive Recommendations, Seattle, 2009.
City of Seattle DOT, Seattle Transit Plan, To Get Seattle Moving, Seattle, 2005.
City of Seattle DOT, King Street Station Multimodal Transportation Hub Study, Seattle, 2011.
City of Seattle DOT, Transit Master Plan Final Summary Report, Seattle, 2012 (mis à jour en 2016).
W. Cox et J. Vranich, The California High Speed Rail Proposal: A Due Diligence Report, Policy Study 370, Los Angeles, The Reason Foundation, 2008.
E. Deakin, Environmental and Other Co-Benefits of Developing a High Speed Rail System in California: A Prospective Vision 2010-2050, Berkeley, University of California, Center for Environmental Public Policy, 2010.
G. Dierkers et J. Mattingly, How States and Territories Fund Transportation. An Overview of Traditional and Nontraditional Strategies, Washington D.C, NGA Center for Best Practices Environment, Energy & Natural Resources Division, 2009.
R. J. Dilger, Federalism Issues in Surface Transportation Policy: A Historical Perspective, Washington D.C, Congressional Research Service, 2015.
EDR, Return on Investment for Visit Florida, Miami, 2018.
FAA, Fact 3: Airport Capacity Needs in the National Airspace System, Washington D.C, 2015.
FAA, Terminal Area Forecast Summary Fiscal Years 2015-2040, Washington D.C, 2016.
FDOT, Florida Intercity Passenger Rail Vision Plan, Tallahassee, 2006.
156
FDOT, 2006 Florida Freight and Passenger Rail Plan, Final Report, Tallahassee, 2007.
FDOT, The Florida Rail System Plan : Policy Element, Tallahassee, 2009.
FDOT, The Florida Rail System Plan : Investment Element, Tallahassee, 2010.
FDOT, Florida Transportation Trends and Conditions. Travel Demand Tourists and Visitors, Tallahassee, 2012.
FDOT, Florida Transportation Plan Vision Element, Tallahassee, 2015.
FDOT, Florida Transportation Plan Policy Element, Tallahassee, 2015b.
FDOT, Florida Transportation Trends & Conditions, Tallahassee, 2015c.
FDOT, Strategic Intermodal System Policy Plan, Tallahassee, 2016.
FDOT, 2017 Florida Transit Information and Performance Handbook, Tallahassee, 2017.
FDOT, Central Florida Visitor Study, Tallahassee, 2017b.
FDOT/Department of Community Affairs, A Framework for Transit Oriented Development in Florida, Tallahassee, 2011.
FECI, All Aboard Florida Ridership and Revenue Study, Miami, 2015.
FHWA/FTA, The Transportation Planning Process Briefing Book, Washington D.C, Transportation Planning Capacity Building Program, 2007.
FRA-ODOT-PDC, Portland Union Station Summary of Alternatives Considered, Union Station Building and Track Improvements Project, Washington D.C/Portland, 2016.
FRA, Vision for High-Speed Rail in America, Washington D.C, 2009.
FRA, Overview, Highlights and Summary of the Passenger Rail Investment and Improvement Act of 2008, Washington D.C, 2009b.
FRA, Communiqué de presse, « President Obama, Vice President Biden, Secretary LaHood Call for U.S High Speed Passenger Trains », suite à la conférence de presse présidentielle « Vision for a New Era in Rail Entails Clean, Energy-Efficient Option for Travelers », 16 avril 2009c.
FRA, Preliminary National Rail Plan. The Groundwork for Developing Policies to Improve the United States Transportation System, Washington D.C, 2009d.
FRA, Communiqué de presse, « U.S. Department of Transportation Redirects $1,195 Billion in High Speed Funds », Washington D.C., Federal Railroad Administration, 9 décembre 2010.
FRA, National Rail Plan. Moving Forward, Washington D.C, 2010.
FRA, Station Area Planning for High-Speed and Intercity Passenger Rail, Washington D.C, 2011.
FRA, High-Speed Intercity Passenger Rail Program. Federal Investment Highlights, Washington D.C., Washington D.C, 2013.
FRA, State Rail Plan Guidance, Washington D.C, 2013b.
FRA, Northwest Regional Investment Fact Sheet, Washington D.C, 2013c.
FRA, Southwest Multi-State Rail Planning Study. Summary Report, Washington D.C, 2014.
FRA, Federal Register, Notice of Request for Proposals for Implementing a High-Speed Rail Corridor, vol. 81, n° 51, 16 mars 2016, pp. 14212-14125.
B. Goldberg, Making Connections: Intermodal Links Available at 70 percent of All Stations Served by Commuter Rail, 2010, Special Report, Washington D.C, RITA, 2011.
Y. Hagler, America 2050. Defining U.S Megaregions, Washington D.C, 2009.
D. Howard et T. Wickland, Consolidation of Bay Area Transit Agencies, Department of City and Regional Planning, University of California Berkeley, 2012.
157
B. Katz et R. Puentes (eds.), Taking the High Road. A Metropolitan Agenda for Transportation Reform, Washington D.C, Brookings Institute Press, 2005.
Metro, 2014 Regional Transportation Plan, Portland, 2014.
Miami DDA, Downtown Miami. Epicenter of the Americas. 2025 Downtown Miami Master Plan, Miami, 2009.
Miami-Dade MPO, Miami-Dade 2040 Long-Range Transportation Plan, Miami, 2014.
MHSRA, The Economic Impacts of High-Speed Rail: Transforming the Midwest, Chicago, 2011.
MHSRA, Midwest High Speed Rail Association 2013 Progress Report, Chicago, 2014.
MTC, Transportation 2035 Plan for the San Francisco Bay Area. Final Report, San Francisco, 2009.
MTC, OneBayArea Grant Program Fact Sheet, San Francisco, 2016.
MTC/ABAG, Transit-Oriented Development in the SF Bay Area, New Places, New Choices, San Francisco, 2006.
MTC/ABAG, Plan Bay Area. Strategy for a Sustainable Region, San Francisco, 2013.
MTC/ABAG, Plan Bay Area 2040, San Francisco, 2017.
MTC/BART/Caltrain, San Francisco Bay Area Regional Rail Plan Final Report, San Francisco, 2007.
NARP, Amtrak Fact Sheet: Long Distance Sector, Washington D.C, 2013, 2015, 2016, 2017, 2018, 2019.
NARP, Amtrak Fact Sheet Per Service, Washington D.C, 2015b, 2016b, 2017b, 2018b, 2019b.
NARP, Amtrak Fact Sheet : Northeast Corridor Service, Washington D.C, 2015c, 2016c, 2017c, 2018c.
NARP, Amtrak Fact Sheet: Thruway Feeder Service, Washington D.C, 2018d.
NARP, Fact Sheet Amtrak Per State, Washington D.C, 2018e, 2019c.
NCHRP Project 20-65, Cost-Allocation Methods for Commuter, Intercity and Freight Rail Operations on Shared-Use Rail Systems and Corridors, TRB, 2007.
New Jersey Institute of Technology, Survey of Transit and Rail Freight Interactions, New Jersey, 2004.
N. Nigro et C. Burbank, A Primer on Federal Surface Transportation Reauthorization and the Highway Trust Fund, Washington D.C, Center for Climate and Energy Solutions, 2014.
OCDE, Recent Developments in Rail Transportation Services, Paris, OCDE, Comité de la concurrence, Groupe de travail n° 2 concurrence-réglementation, DAF/COMP(2013)24, 2013.
ODOT, Oregon Transportation Plan, Salem, 2006.
ODOT, 2010 Oregon Rail Study, Salem, 2010.
ODOT, Oregon Passenger Rail Eugene-Portland, Revised Draft Final Purpose and Need Statement, Salem, 2013.
ODOT, Revised Draft Final Purpose and Need Statement, Oregon Passenger Rail, Salem, 2013b.
ODOT, Oregon State Rail Plan, Salem, 2014.
ODOT, Portland Transportation System Plan, Salem, 2014b.
ODOT, Oregon Public Transportation Plan, Salem, 2016.
ODOT, OPTP Existing Conditions: Public Transportation Funding Overview, Oregon Public Transportation Plan Final Draft, Olympia, 2016b.
ODOT, Oregon Public Transportation Plan, Draft Vision and Goals, Salem, 2017.
ODOT, Oregon Public Transportation Plan, Salem, 2019.
R. O’Toole, High-Speed Rail, The Wrong Road for America, Washington D.C, Cato Institute, 2008.
Passenger Rail Working Group (PRWG), National Surface Transportation Policy and Revenue Study Commission, Vision for the Future: U.S Intercity Passenger Rail Network Through 2050, Washington D.C, 2007.
158
D.R. Peterman, J. Frittelli et W.J. Mallett, The Development of High Speed Rail in the United States: Issues and Recent Events, Washington D.C, Congressional Research Service, 2013.
President Obama, Remarks by the President in State of the Union Address, 2010-2016.
President Trump, Remarks by the President in State of the Union Address, 2017-2019.
Publius Law No. 110-432, Division B, enacted October 16, 2008, Amtrak/HSR.
Puget Sound Regional Council, Vision 2040, Seattle, 2009.
Puget Sound Regional Council, Overview of the 2017-2020 Regional Transportation Improvement Program, Seattle, 2010.
Puget Sound Regional Council, Transportation 2040. Toward a Sustainable Transportation System, Seattle, 2010b.
Puget Sound Regional Council, Economic Analysis of the Central Puget Sound Region Draft Report, Seattle, 2017.
Rail Passenger Service Act of 1970. Pub. L. 91-518, 84 Stat. 1327, 49 U.S.C. $ 24701. 1970-30-10
Railroad Revitalization and Regulatory Reform Act of 1976. Pub. L. 94-210, 90 Stat. 31, 45 USC $801. 1976-05-02.
Railroad Revitalization and Regulatory Reform Act of 1976, Pub. L. 94-210, 90 Stat. 31, 45 U.S.C. § 801. 1976-02-05.
Regional Plan Association, Northeast Megaregion 2050: A Common Future, New York, 2007.
Regional Plan Association/America 2050, Connecting Cascadia. A High-Speed Rail vision for the Pacific Northwest, Washington D.C, 2010.
Regional Plan Association/America 2050, High-Speed Rail in America, Washington D.C, 2011.
Renaissance Planning Group, Promoting Joint Development in Florida, Rapport préparé pour le FDOT, janvier 2014.
San Joaquin Joint Powers Authority, 2014 San Joaquin Joint Powers Authority Business Plan, Stockton, 2014.
San Joaquin Joint Powers Authority, Draft 2017 SJJPA Business Plan Update, Stockton, 2016.
San Joaquin Joint Powers Authority, San Joaquin Route Fact Sheet, Stockton, 2016b.
C. Schultz, « The Span of Alaska’s Railways: Modern Transportation, Enduring Piece of History », Alaska Economic Trends, Juneau, Department of Labor and Workforce Development, 2012.
Seattle Planning Commission, Seattle Transit Communities, Seattle, 2010.
Seattle Planning Commission, Seattle Transit Communities. Integrating Neighborhoods with Transit, Seattle, 2010b.
SFPD, Transit Center District Plan, from the Informational Presentation Planning Commission, San Francisco Planning Department, 2012.
SFRA, Redevelopment Plan for the Transbay Redevelopment Project Area, San Francisco, 2005.
SFRA, Transit Center District Plan, Draft for Public Review, San Francisco, 2009.
South Florida Regional Planning Council, « Tri-Rail Coastal Link Project Update », présentation PowerPoint, 16 décembre 2016.
SF Redevelopment Agency-SF Planning Department, Transit Center District Plan Draft for Public Review, San Francisco, 2009.
SFRTA, Regional Transit Oriented Development Program Fact Sheet, Miami, 2007.
SFRTA, Miami-Dade County Rail Opportunities, Miami, 2015.
SFRTA, « Tri-Rail Downtown Miami Link », Miami-Dade County Transit & Mobility Committee, Miami, 10 juin 2015.
159
SFRTA, « Tri-Rail Coastal Link Update and Conversation », Communication de J. Stephens, Executive Director, 16 décembre 2016.
SFRTA, SFRTA Forward Plan. Transit Development Plan, FY 2018-2027, Miami, 2017.
SFRTA, « SFRTA TOD Policy and Local Government Outreach », SFRTA Governing Board, Présentation PowerPoint, 28 avril 2017.
SJJPA, San Joaquin Joint Powers Authority Business Plan, Stockton, 2014.
Sound Transit, 2017 Service Implementation Plan, Seattle, 2016.
Sound Transit, System Expansion Implementation Plan, Seattle, 2018.
SPUR, A Mid-Life Crisis for Regional Rail. Fifty Years After BART : What’s Next for Regional Rail?, San Francisco, 2008.
SPUR, Beyond the Tracks. The Potential of HSR to Reshape California’s Growth, SPUR Report, San Francisco, 2011.
SPUR, Seamless Transit. How to Make Bay Area Public Transit Function Like One Regional, Easy-To-Use System, San Francisco, 2015.
Staggers Rail Act of 1980. Pub. L. 96-448, 94 Stat. 1985. 1980-10-14.
Statement of Jennifer W. Mac Donald, Assistant Vice President, Government Affairs, AAR, devant le National Conference of State Legislatures Committee on Transportation High Speed Rail Working Group, 9 avril 2010.
The Congress of the United States – Congressional Budget Office, The Past and Future of U.S. Passenger Rail Service, Washington D.C, 2003.
Testimony of D.J. Stadtler, Vice President of Operations Amtrak, devant le Surface Transportation Board, septembre 2014.
Testimony of W. Kempton on the Benefits of Intercity Passenger Rail devant le Subcommittee on Railroads, Pipelines and Hazardous Materials of the House Committee on Transportation and Infrastructure, 26 juin 2007.
Texas Central High-Speed Railway, Last-Mile Analysis Report. Dallas-Houston High-Speed Rail Project, Arup Texas Inc., 2015.
Texas Transportation Institute, 2011 Annual Urban Mobility Report, 2012.
TJPA, Transbay Transit Center – Key Investment in San Francisco’s Future as a World Class City, San Francisco, 2013.
TJPA, Transbay Joint Powers Authority Fact Sheet, San Francisco, 2016.
P. Todorovich et Y. Hagler, Where High-Speed Rail Works Best, Washington D.C, America 2050, 2009.
P. Todorovich et Y. Hagler, High-Speed Rail in America, Washington D.C, America 2050, 2011.
Transportation for America, Transportation 101: An Introduction to Federal Transportation Policy, Washington D.C, T4America, 2011.
Transportation for America, The Innovative MPO. Smart Planning, Strong Communities. A Guidebook for Metropolitan Transportation Planning, Washington D.C, T4America, 2014.
Transportation for America, Capital Ideas. Winning State Funding for Transportation: Lessons from Recent Successes, Washington D.C, T4America, 2015.
Transportation for America, Capital Ideas II. State Transportation Funding Lessons from 2015-Challenges for 2016, Washington D.C, T4America, 2015.
TRB, « Costing Shared-Use Rail Infrastructure », Transport Research Board Annual Meeting, Session 484, 2006.
U.S Conference of Mayors, The Economic Impact of High-Speed Rail on Cities and Their Metropolitan Areas, Washington D.C, 2010.
160
United States Department of Commerce International Trade Administration, Overseas Visitation Estimates for U.S. States, Cities, and Census Regions 2014, Washington D.C., National Travel and Tourism Office, 2015.
UIC, « High Speed Rail in Europe. Lessons Learned and Experiences », Genève, UNECE, 25 octobre 2013.
UIC, High-Speed Lines in the World, Paris, Union Internationale des Chemins de Fer, 2017.
U.S PIRG Education Fund, A Trade Record for Success. High-Speed rail Around the World and Its Promise for America, Washington D.C, 2010.
U.S. PIRG Education Fund, High-Speed Rail: Public, Private or Both? Assessing the Prospects, Promise and Pitfalls of Public-Private Partnerships, Washington D.C, 2011.
U.S DOT/FTA, Full Funding Grant Agreement. Central Florida Commuter Rail Transit Project, Washington D.C, 2011.
U.S DOT, Prospectus for Change in the Freight Rail Industry, Washington DC, Office of the Secretary, 1978.
U.S DOT, Analysis of Commuter Rail Costs and Cost Allocation Methods, Washington D.C, DOT Transportation Systems Center, 1983.
U.S DOT, Scheduled Intercity Transportation: Rural Service Areas in the United States, Washington D.C, Research and Innovative Technology Administration, 2005.
U.S DOT, The U.S. Rural Population and Scheduled Intercity Transportation in 2010 : A Five-Year Decline in Transportation Access, Washington D.C, RITA Bureau of Transportation Statistics, 2010.
U.S DOT, Communiqué de presse, « U.S. Transportation Secretary Ray LaHood Announces $2,4 Billion for High Speed Rail Projects », Washington D.C., Federal Railroad Administration, 28th octobre 2010b.
U.S DOT, Communiqué de presse, « U.S. Department of Transportation Redirects $1,195 Billion in High Speed Funds », Washington D.C., Federal Railroad Administration, 9th décembre 2010c.
U.S DOT, Analysis of the Causes of Amtrak Train Delays, rapport n° CR-2012-148, Washington D.C, 2012.
U.S DOT, High-Speed Intercity Passenger Rail Program. Federal Investment Highlights, Washington D.C., Federal Railroad Administration, 2013.
U.S DOT, National Transportation Statistics, table 1073, Washington D.C, 2015.
U.S DOT, Beyond Traffic 2045 Trends and Choices, Washington D.C, 2015b.
U.S DOT, Pocket Guide to Transportation, Washington D.C., Bureau of Transportation Statistics, 2013b, 2015c, 2016, 2017, 2018, 2019.
U.S GAO, Information and Guidance Could Help Facilitate Commuter and Freight Rail Access, Washington D.C, GAO, 2004.
U.S GAO, Intercity Passenger Rail: National Policy and Strategies Needed to Maximize Public Benefits from Federal Expenditures, Washington D.C, GAO, 2006.
U.S GAO, Intermodal Transportation. DOT Could Take Further Actions to Address Intermodal Barriers, Washington D.C, GAO, 2007.
U.S GAO, High Speed Passenger Rail, Future Development Will Depend on Addressing Financial and Other Challendes and Establishing a Clear Federal Role, Washington D.C, GAO, 2009.
U.S GAO, Highway Trust Fund: Improved Solvency Mechanisms and Communication Needed to Help Avoid Shortfalls in the Highway Account, Washington D.C, GAO, 2009b.
U.S GAO, Amtrak Better Reporting, Planning, Improved Financial Information Could Enhance Decision Making, Washington D.C, GAO, 2016.
United States House of Representatives, Testimony of Joseph C. Szabo, Administrateur de la FRA, High-Speed Rail in the United States : Opportunities and Challenges, Washington D.C., devant le House Committee on Transportation and Infrastructure, Subcommittee on Railroads, Pipelines and Hazardous Materials, 14 octobre 2009.
161
United States House of Representatives, Findings and Recommendations of the Special Panel on 21st Century Freight Transportation, Washington D.C, House Committee on Transportation and Infrastructure, 2013.
United States House of Representatives, National Rail Policy: Examining Goals, Objectives and Responsibilities, Washington D.C, devant le House Committee on Transportation and Infrastructure, Subcommittee on Railroads, Pipelines and Hazardous Materials, 27 juin 2013.
United States House of Representatives, The Role of Innovative Finance in Intercity Passenger Rail, Washington D.C, devant le House Committee on Transportation and Infrastructure, Subcommittee on Railroads, Pipelines and Hazardous Materials, 9 juillet 2013.
United States House of Representatives, FAST Act. The Fixing America’s Surface Infrastructure Act Summary, Washington D.C., Transportation & Infrastructure Committee, 2015.
United States House of Representatives, FAST Act Information Packet, Washington D.C, Transportation & Infrastructure Committee, 2015b.
United States Senate, Passenger Rail: Investing in Our Nation’s Future, Senate Subcommittee on Surface Transportation and Merchant Marine Infrastructure, Safety and Security, 10 décembre 2014.
VisitFlorida, Florida Visitor Study, Miami, 2010.
Washington State Legislature Joint Transportation Committee, par Parsons Brinckerhoff, Identifying the State Role in Public Transportation Final Report, Olympia, 2011.
Washington State Transportation Commission, The Washington Transportation Plan 2007-2026, Olympia, 2006.
Washington State Transportation Commission, Statewide Rail Capacity and System Needs Study. Final Report, WSTC, Olympia, décembre 2006b.
Washington State Transportation Commission, Washington Transportation Plan 2030. Connecting Washington. Communities for a Prosperous Future, Olympia, 2010.
A.M. Wood, « The Northeast Corridor Vision for High Speed Rail. How to Build High Speed Rail », Chief Next Generation Integration HSR, NEC Infrastructure and Investment Development Amtrak, 10 avril 2013.
World Bank Group, Typologie des PPP : Comparaison juridique et terminologique des PPP dans les conceptions française et anglo-saxonne, Washington D.C, Mission d’appui aux partenariats public-privé, Public-Private Partnership Legal Resource Center, 2013.
WSDOT, Long-Range Plan for Amtrak Cascades, Olympia, 2006.
WSDOT, Amtrak Cascades Mid-Range Plan, Olympia, 2008.
WSDOT, 2010-2030 Freight Rail Plan, Olympia, 2009.
WSDOT, Washington State Rail Plan. Integrated Freight and Passenger Rail Plan 2013-2035, Olympia, 2014.
WSDOT, WTP 2035. Connecting Washington Communities for a Healthy and Prosperous Future, Olympia, 2015.
WSDOT, 2016 Washington State Public Transportation Plan, Olympia, 2016.
WSDOT, Washington State Freight System Plan, Olympia, 2017.
WSDOT, Washington Transportation Plan. Phase 2 – Implementation 2017-2040, Public Review Draft, Olympia, 2017b.
WSDOT/Amtrak Cascades, Cascades High Speed Rail Program, Olympia, 2017c.
WSDOT/ODOT, Station Stop Policy Guidance Document, Olympia, 2016.
Press articles
« Amtrak Chief says finances are better, delays worse », The New York Times, 30 juin 2004.
« Amtrak : delays up, ridership down in Illinois », Chicago Tribune, 28 octobre 2014.
« Amtrak has priority over freight – but passengers don’t benefit », San Francisco Chronicle, 28 novembre 2014.
162
E. Anderson, « Freight, storms slow up Amtrak. Passenger service endures more delays as oil trains use tracks », TimesUnion, 16 avril 2014.
E. Anzilotti, « Amtrak is swapping dining cars on some trains for airplane food », FastCompany, 21 avril 2018.
Associated Press, « Congress reaches deal on elusive 5-year, $ 281 billion-transportation bill », LA Times, 1er décembre 2015.
Associated Press, « Congress reaches final agreement on 5 year-bill to keep highway, transit aid flowing to states », US News, 1er décembre 2015.
G. Balk, « Seattle once again nation’s fastest-growing big city ; population exceeds 700 000 », Seattle Times, 25 mai 2017.
R. Barnes, « Court considers whether Amtrak’s self-created standards are federal regulations », The Washington Post, 8 décembre 2014.
R. Barnes, « Supreme Court says Amtrak is more like a public entity than a private firm », The Washington Post, 9 mars 2015.
Bay City News Service, « Leaders, Community speak out during meeting on high-speed rail project », SFGate, 21 avril 2016.
Bay City News Service, « First Leg of high-speed rail to connect SJ with Central Valley », SFGate, 19 février 2016.
T. Bizjak, T. Sheehan et R. Appleton, « No, Gov. Gavin Newsom didn’t kill high-speed rail. But what’s his Plan B? », The Sacramento Bee, 18 février 2019.
V. Bradley, « Multi-billion dollar bullet train connecting Houston to Dallas excepted to break ground next year », Houston News, 12 juin 2016.
V. Brezina, « Brightline starts site work for $2B Orlando connection », Orlando Business Journal, 12 octobre 2018.
D. Briginshaw, « All Aboard Florida : a new approach for US passenger rail », International Railway Journal, 17 août 2016.
L. Broadt, « Brightline financial documents reveal first quarter ridership revenue », Treasure Coast Newspapers, 29 juin 2018.
L. Broadt, « Brightline makes official bid for Orlando-to-Tampa extension along I-4 corridor », TC Palm, 22 juin 2018.
E. Brehmer, « Anchorage, Railroad Have Ties that Bind », Alaska Journal of Commerce, juin 2015.
N. Broverman, « High-Speed Rail to Vegas Getting Real », Los Angeles Magazine, 19 novembre 2015.
M. Cabanatuan, « Union Pacific won’t share with high-speed rail », SFGate, 6 juin 2008.
N. Crooks, « Florida’s private railroad gets Richard Branson investment », Bloomberg, 16 novembre 2018.
L. Caruso, « CSX chief says he can’t be part of Obama high-speed rail plan », Bloomberg, 9 avril 2011.
J. Cohen, « Seattle Advocated say 25 years is too long for transit expansion », NextCity, 28 novembre 2016.
J. Cote, « Mayor Lee gets on board with proposal for 2nd BART tube », SFGate, 17 janvier 2015.
S. L. Davis, « Think FAST – the good, the bad and the ugly in Congress’ new five-year transportation bill », T4AmericaBlog, 2 décembre 2015.
D. Dietz, « Oregon rail officials look to push high-speed passenger rail service into distant future », The Register-Guard, 17 juillet 2016.
J.K. Dineen, « Transit plan to raze I-280 in SF to be unveiled », SFChronicle, 22 février 2016.
A. Gardner, « MiamiCentral Housing is coming and it’s decidedly non-luxury », Curbed, 11 novembre 2015.
K. Gardner, « Does Fort Pierce have what it takes to lure a Brightline station? », TC Palm, 16 octobre 2018.
G. Garvin, « Bulk of Miami-to-Orlando high-speed rail service customers will come from South Florida », Miami Herald, 28 mai 2015.
E. Glusac, « Downtown Miami. More Than a Gateway to the Beach », The New York Times, 13 octobre 2017.
163
« Good news ! More Amtrak delays », U.S. News, 17 décembre 2014.
S. Goodyear, « Transportation Armageddon’ Is coming to the northeast Rail corridor », Citylab, 13 août 2015.
S. Gulliver, « How to lose money on $9,50 cheeseburgers », The Economist, 23 octobre 2012.
S. Fesler, « High Speed rail in Cascadia will get a deeper look, report due mid-2019 », The Urbanist, 13 mars 2018.
E.G. Fitzsimmons et D.W. Chen, « Aging Infrastructure Plagues Nation’s Busiest Rail Corridor », The New York Times, 26 juillet 2015.
J. Franz, « Amtrak’s Empire Builder struggles in freight boom », The Washington Times, 19 août 2014.
Y. Freemark, « Freight as passenger rail’s worst enemy – or something else ? », The Transport Politic, 29 juin 2011.
« Freight boom means more passenger delays », SFGate, 9 octobre 2014.
A. Halsey III, « After weeks of negotiations, Congress finalizes 5-year transportation bill », The Washington Post, 1er décembre 2015.
G. Hamon, « Trump veut remplacer les trains longue distance par des cars », Bus&Car Connexion, 21 mars 2019.
S. Hananel, « Supreme Court says Amtrak is like a government agency », Boston Globe, 9 mars 2015.
C. Ingraham, « The sorry state of Amtrak’s on-time performance, mapped », The Washington Post, 10 juillet 2014.
C. Ingraham, « Mapping America’s most dangerous bridges », The Washington Post, 4 février 2015.
E. Jaffe, « 11 historical maps and charts that explain the birth of Amtrak », Citylab, 26 février 2015.
E. Jaffe, « There’s an awful lot of parking near this california high-speed rail station », Citylab, 15 septembre 2015.
E. Jaffe, « The Unbreakable U.S High-Speed Rail System », Citylab, 23 septembre 2015.
A.G. Keane et T. Schoenberg, « Amtrak barred from regulating freight railroads on delays », Bloomberg, 3 juillet 2013.
L. King, « Amtrak posts ridership growth, but long-distance lines lag », USA Today, 27 octobre 2014.
K. Laing, « Amtrak exec : freight delays hurt ridership », The Hill, 04 septembre 2014.
K. Laing, « Sen. Sanders fills $1T infrastructure bill », The Hill, 27 janvier 2015.
K. Laing, « Paul, Boxer team up on transportation funding », The Hill, 29 janvier 2015.
M. Lindblom, « $500M hole : how hot economy, city requests punctured Sound Transit’s Lynnwood light-rail budget », Seattle Times, 6 novembre 2017.
A. Liptak, « Supreme Court sides with Amtrak, with some distaste », The New York Times, 9 mars 2015.
M. Maciag, « Some cities are becoming less car-dependent », Future Structure/Transportation, 5 décembre 2017.
J. A. Mann Jr., « Brightline’s West palm beach station nearly completed », The Real Deal, 23 mai 2017.
M. Marani, « Florida’s Brightline makes private, high-speed transit a reality », ArchPaper, 24 janvier 2018.
A. Marroquin, « High-speed rail system most desired transportation mode for Las Vegans », Las Vegas Review Journal, 10 juillet 2016.
E.L. Meyer, « Union Station in Washington has a grand development plan », The New York Times, 15 avril 2015.
E. Mulero, « Trump, Congress Eye Possibility of Infrastructure Bill in 2019 », Transport Topics, 3 janvier 2019.
R. Nixon, « Amtrak subsidy gone, States must pay the freight to keep rail routes », The New York Times, 2 mai 2013.
E. Njus, « TriMet weighing $ 1,7 billion bond measure for light rail, street projects », OregonLive, 28 septembre 2017.
164
P. Nussbaum, « Northeast corridor planners to outline rail options for the public », Philly.com, 8 novembre 2014.
J. Ostrowski, « State Board approves tax-free bond issue for Brightline expansion », The Palm Beach Post, 29 août 2018.
D. Porter, « New locomotives have cut delays nearly 25 percent, Amtrak says », Boston Globe, 5 août 2016.
Progressive Railroading, « Bay Area Rapid Transit Opens Extension to Fremont », 27 mars 2017.
J.C. Robbins, « Miami Central is on track for a 2017 opening », Miami Today, 12 avril 2016.
A. Rosenburg, « Martin, Indian River counties file new lawsuit in accept to block Brightline expansion », TC Palm, 14 février 2018.
E. Russell, « NoMA is one of DC’s fastest growing neighborhoods », Greater Greater Washington, 21 janvier 2016.
« Schedule delays ? Blame freight service, Amtrak says », Pittsburgh Post-Gazette, 19 novembre 2014.
M. Seemuth, « Brightline explores possible station sites in 4 Treasure Coast cities », The Real Deal, 1er septembre 2018.
M.D. Shear et J. Mouawad, « Amtrak says shortfalls and rules delayed its safety system », The New York Times, 14 mai 2015.
T. Sheenan, « Reports anticipate economic growth for Fresno, central San Joaquin Valley », Fresnobee, 2 février 2016.
T. Sheenan, « $1,4 billion bond sale to benefit high-speed rail work in the San Joaquin Valley », Fresnobee, 16 mars 2017.
T. Sheenan, « Feds delay grant approval for Bay Area rail electrification », Fresnobee, 17 février 2017.
D. Shepardson, « Democrats to push for big infrastructure bill with ‘’real money’’ in 2019 », Reuters, 8 novembre 2018.
H. Siobhan, « Senate passes Five-Year Highway Bill, Sending it to the White House », The Wall Street Journal, 3 décembre 2015.
J. Sorentrue, « State group to weigh $1,2 billion bond request for Brightline project », The Palm Beach Post, 14 décembre 2017.
A. Schuessler, « Residents Take in Caltrain Changes », SMDaily Journal, 4 novembre 2017.
K. Spear, « Orlando Airports Give Peek at New Shuttle Train, Parking Garage, Train Station », Orlando Sentinel, 19 octobre 2017.
C. Tate, « Freight trains force repeated delays on popular Amtrak route », The Seattle Times, 25 décembre 2013.
C. Tate, « Without federal aid, Amtrak could leave rural areas behind », The Wichita Eagle, 6 août 2014.
THM Staff, « 800 rental units at MiamiCentral Aimed at young entrepreneurs and working professionals », The Next Miami, 9 novembre 2015.
THM Staff, « Feds approve Tri-Rail to MiamiCentral. Service will begin by the end of 2017 », The Next Miami, 25 avril 2017.
T. Trimbath, « $1M slated to study high-speed rail », Curbed Seattle, 8 février 2017.
« U.S. high court orders new review in Amtrak vs. Freight trains dispute », Pittsburgh Post-Gazette, 9 mars 2015.
R. Vartabedian, « State rail authority reduces size of future bullet train stations », LA Times, 20 octobre 2016.
R.N. Velotta, « Local Leaders hopeful for Las Vegas, Victorville high-speed rail », Las Vegas Review Journal, 10 novembre 2018.
S. Volokh, « Yay minimalism ? Supreme Court totally ducks interesting issues in Amtrak case », The Washington Post, 9 mars 2015.
D. Weil, « Transit Village to create western bookend for downtown WPB », The Real Deal, 31 août 2015.
R. White, « Alaska Railroad Extension Moves Forward », Alaska Business Monthly, juillet 2014.
165
M. Zanona, « Hopes for infrastructure deal with Trump rise if Dems win House », The Hill, 4 octobre 2018.
Sitography
www.abag.ca.gov
www.amtrak.com
www.amtrakcascades.com
www.alaskarailroad.com
www.aar.org
www.allaboardflorida.com
www.archive.freightrailworks.org
www.bart.gov
www.bnsf.com
www.bls.gov
www.bts.gov
www.brookings.edu
www.burnham.com
www.cahsra.com
www.caltrain.com
www.cato.org
www.cc-hsr.org
www.cchsra.org
www.census.gov
www.citizenagainstthetrain.com
www.downsizinggovernment.org
www.edr.state.fl.us
www.expedia.com
www.fdot.gov
www.feci.com
www.floridahighspeedrail.org
www.fra.dot.gov
www.fta.dot.gov
www.gao.gov
www.geoconfluences.ens-lyon.fr
www.ggwash.org
www.gobrighline.com
www.greatamericanstations.com
www.greyhound.com
www.hillaryclinton.com
www.house.gov (House of Representatives)
www.hsr.ca.gov
www.loc.gov

166
www.media.amtrak.com
www.megabus.com
www.miamicentral.com
www.miamidade.gov
www.mtc.ca.gov
www.nec.amtrak.com
www.onerail.org
www.opr.ca.gov
www.oregon.gov
www.oregonmetro.gov
www.pnwer.org
www.portlandoregon.gov
www.pppcouncil.ca
www.psrc.org
www.quickfacts.census.gov
www.railpassengers.org (NARP)
www.seattle.gov
www.senate.gov (Senate)
www.sfrta.fl.gov
www.southwest.com
www.stb.dot.gov
www.sunrail.com
www.texansagainsthsr.com
www.texascentral.com
www.theurbanist.com
www.tod.org
www.tjpa.org
www.transportationca.com
www.transportation.gov (USDOT)
www.transportation.gov/build-america
www.transportation.org (AASHTO)
www.transtats.bts.govwww.whitehouse.gov
www.t4america.org
www.uic.org
www.up.com
www.ushsr.com
www.vegasxtrain.com
www.visitflorida.org
www.whsra.com
167
ABSTRACT The subject of this research is intercity passenger rail transportation in the United States, approached from two perspectives: Amtrak’s traditional rail services and high-speed rail projects. The aim is to understand the workings of public rail transportation policies, what they contain, and how they are developed and pursued by the different actors. The originality of the research lies in its multiscale approach, with a constant back-and-forth between the different scales of analysis, and in its use of several case studies to analyze the territorialization of intercity rail transportation policies. The analysis demonstrates the emergence of a bottom-up approach to projects, notably apparent in the Californian HSR project and in the modernization of the Cascades corridor. This process has even gone to the extreme with the proliferation of private rail projects that stress their independence from government, be it in decision-making, governance, or funding. This seems definitively to preclude any attempt to establish a national framework for high-speed rail, like those found elsewhere in the world, regardless of party-political considerations, i.e. the traditionally greater enthusiasm of the Democratic Party for large-scale federal investment. Two conclusions emerge: first, the development of uniform arguments and recommendations to encourage new rail policies, emphasizing the structuring effects and economic role of high-speed rail, congestion reduction, modal shift; second, a tangible though uneven pro-rail position among public actors at all levels. Priority is placed on improving and modernizing existing corridors for the launch of higher-speed services, and then on hybrid networks that combine different types of infrastructures. There are no publicly backed projects for new lines exclusively dedicated to high-speed rail. Most of the high-speed corridors are in fact “higher-speed” corridors, some of which are intended to become high-speed at some time in the future, such as the Northeast corridor. The territorialization of rail projects entails the design and construction of transportation networks that are more integrated – at least in terms of service provision and physical connection – and genuinely interconnected. After analyzing projects for the upgrading of higher-speed corridors and the construction of new infrastructures, we note the importance of stations and the emphasis on the need for better coordination between transportation and urbanism through support for station districts. Indeed, a rail corridor project – situated at the intersection of political, economic, technical, and territorial interests – is the nucleus of a process of territorialization that materially embeds the infrastructure within urban spaces, and of a process of politicization through the involvement of local actors. Rail projects seem to be an instrument that leads to the implantation of metropolitan scale facilities (stations, intermodal hubs) and to the shaping or reshaping of the urban fabric (station districts, larger-scale district regeneration projects).
Keywords: United States; High-Speed Rail; Rail policies; territorialization; transport geography; Rail stations.

168