Embed Size (px)
Citation preview

Please cite this article in press as: Chadwick et al., A Goal Direction Signal in the Human Entorhinal/Subicular Region, Current Biology(2015), http://dx.doi.org/10.1016/j.cub.2014.11.001
A Goal Direction Signal in th
Current Biology 25, 1–6, January 5, 2015 ª2015 The Authors http://dx.doi.org/10.1016/j.cub.2014.11.001
Reporte Human
Entorhinal/Subicular Region
Martin J. Chadwick,1 Amy E.J. Jolly,1 Doran P. Amos,2
Demis Hassabis,3,* and Hugo J. Spiers1,*1Institute of Behavioural Neuroscience, Department ofExperimental Psychology, Division of Psychology andLanguage Sciences, University College London, 26 BedfordWay, London WC1H 0AP, UK2Clinic for Neurology, Otto-von-Guericke University, 39120Magdeburg, Germany3Gatsby Computational Neuroscience Unit, UniversityCollege, 17 Queen Square, Alexandra House, London WC1N3AR, UK
Summary
Navigating to a safe place, such as a homeor nest, is a funda-
mental behavior for all complex animals. Determining thedirection to such goals is a crucial first step in navigation.
Surprisingly, little is known about how or where in the brainthis ‘‘goal direction signal’’ is represented. In mammals,
‘‘head-direction cells’’ are thought to support this process,but despite 30 years of research, no evidence for a goal direc-
tion representation has been reported [1, 2]. Here, we usedfMRI to recordneural activitywhile participantsmadegoal di-
rection judgments based on a previously learned virtualenvironment. We applied multivoxel pattern analysis [3–5]
to these data and found that the human entorhinal/subicularregion contains a neural representation of intended goal di-
rection. Furthermore, the neural pattern expressed for a
given goal direction matched the pattern expressed whensimply facing that same direction. This suggests the exis-
tence of a shared neural representation of both goal and fac-ing direction. We argue that this reflects a mechanism based
on head-direction populations that simulate future goal di-rections during route planning [6]. Our data further revealed
that the strength of direction information predicts per-formance. Finally, we found a dissociation between this
geocentric information in the entorhinal/subicular regionand egocentric direction information in the precuneus.
Results
Navigating to a remembered goal requires knowing both yourcurrent facing direction and the direction to your goal. ‘‘Head-direction cells,’’ which firewhen an animal is facing in a specificdirection within the environment (e.g., north), have come todominate models of how the mammalian brain represents di-rection information fornavigation [1].However,despite30yearsof research intodirectioncoding, noneural representationof in-tended future goal direction has been discovered yet within themammalian brain [2]. Models disagree as to where and howsuch a signal might be generated [6–10]. One possibility isthat route planning may involve the simulation of the intended
*Correspondence: [email protected] (D.H.), [email protected]
(H.J.S.)
This is an open access article under the CC BY license (http://
creativecommons.org/licenses/by/3.0/).
future route via transient recruitment of spatial representationsactive during travel to the goal [6, 8–13]. For example, simula-tionof an intended routewould involve thesequential activationof place cells that represent locations along that future route.This influential theory has had support from recent findingsthat a rat’s future route can be predicted from the preactivationof sequential place cell firing within the hippocampus [14, 15].Thus, the evidence to date supports the idea that future routesmay be simulated by sequential place cell firing. However,models suggest that planning the route would also involvesimulation of the direction to the intended goal. Indeed, suchdirectional simulationmay form the crucial initial stage of routeplanning [6, 8, 9], prior to subsequent place sequence activity.According to this proposal, during goal direction simulation,the head-direction cell population activity would change fromcells responsive to current facing direction being suppressedto cells representing the desired future heading directionbecoming active. Despite this clear theoretical prediction, theexistence of directional simulation has yet to be empiricallydemonstrated in the mammalian brain. Here, we aimed todirectly test for the presence of head-direction simulationwithin the human brain during navigational decision-making.We applied multivoxel pattern analysis (MVPA) to fMRI data
collected while participants (n = 16) made a series of goal di-rection judgments. All subjects gave informed written consentin accordance with the local research ethics committee. MVPAhas been shown to be sensitive to specific neural representa-tions in various domains [3–5], including place coding [16],scene coding [17–19], and facing direction [20–22]. It is there-fore plausible that this approach may be able to detect neuralrepresentations related to simulation of future goal heading.Prior to scanning, participants learned the spatial layout of asimple virtual environment (Figures 1A and 1B) by freely mov-ing around within it. The environment consisted of four objectsplaced at the corners of four paths arranged in a square. Eachof the four distant edges of the environment consisted of adistinct scene in order to clearly differentiate the four cardinaldirections. During scanning, participants were required tomake goal direction decisions based on their memory of thisenvironment (Figure 1C). Very high performance levels (mean97% accuracy) indicated that participants were successfullyable to engage goal direction systems (for more details onexperimental design andmethods, see Supplemental Informa-tion available online).Any region displaying head-direction simulation should
contain two key neural representations: (1) current facing di-rection and (2) intended future goal direction. Furthermore, ifthe same neural population is involved in representing bothcurrent facing direction and simulating future goal direction,then we should find evidence for a single neural representationof each geocentric direction (e.g., north) that generalizes overboth facing and goal directions. We assessed the represen-tational code of a given region by investigating the patternsimilarity between pairs of trials [23]. In the case of fMRI,pattern similarity was assessed by the spatial correlation inthe blood-oxygen-level-dependent (BOLD) response betweentrial pairs. Trials that shared an underlying neural representa-tion were expected to demonstrate greater similarity thanthose that did not.We expected to find amixture of both facing

Figure 1. The Experimental Design
(A) The layout of the virtual environment from an
elevated view. The four key objects are visible,
as are two of the distal scenes. Note that the par-
ticipants never viewed the environment from this
view but instead could only explore from ground
level.
(B) The same environment from an overhead,
schematic view (not to scale). The four distal
walls have been tilted so that they are visible
from above. For clarity, we arbitrarily refer to
the four cardinal directions as NSEW, but note
that that they were never referred to as such dur-
ing the actual experiment.
(C) The goal direction task on two consecutive tri-
als. The task was to judge the direction of the
goal from the start location, and this could be
required in one of two directional coordinate
systems: environment-centered (geocentric) or
body-centered (egocentric). For the geocentric
question, participants were asked to decide
which of the four distal scenes the goal location
was toward from their start location (i.e., if they
were to draw an arrow between the start and
goal locations, which scene would it be pointing
toward?). Although the focus of this study was
on geocentric direction coding, we also included
an egocentric question, in which the partici-
pant was asked to decide whether the goal loca-
tion was located to the left, right, forward, or
backward from the start location. Both the geocentric and egocentric questions were asked in every trial, with the order randomized. The four letters un-
derneath each scene represent the four possible responses: in the geocentric task, these were desert (D), sea (S), mountain (M), or forest (F), which acted as
semantic labels for the four cardinal directions. In the egocentric task, these were forward (F), backward (B), left (L), or right (R). The mapping between the
four responses and the four buttons was partially randomized.
Current Biology Vol 25 No 12
Please cite this article in press as: Chadwick et al., A Goal Direction Signal in the Human Entorhinal/Subicular Region, Current Biology(2015), http://dx.doi.org/10.1016/j.cub.2014.11.001
and goal direction information present in each trial (Figure 2).Over the 32 distinct trials, the full combination of facing andgoal directions was sampled, allowing us to separate thesetwo types of information. Figure 3A displays the conditionsused to infer both facing direction and goal direction indepen-dently. Importantly, we could also assess whether the neuralpattern for a given geocentric direction (e.g., north) was ex-pressed for both facing and goal directions, as we wouldexpect if a head-direction population were recruited for thesimulation of goal direction. To infer the presence of thiskind of general direction information, we looked for increasedpattern similarity between pairs of trials where the facing direc-tion in trial A matched the goal direction in trial B, which werefer to as a ‘‘cross match’’ (Figure 3A).
We used a searchlight analysis [24] with multiple regres-sions [20] to search across the entire brain for regions display-ing evidence of head-direction simulation while controllingfor other salient factors, such as egocentric goal direction. Acomposite geocentric direction regressor was created bycollapsing the three pattern similarity conditions of interest(facing, goal, and cross match) into a single binary regressor,contrasted against the pattern similarity expressed when noneof these conditions were met (the null condition). As a head-di-rection simulation region should show increased pattern sim-ilarity under all three of these conditions, any such regionshould show a strong response to this geocentric direction re-gressor (Figure 3B). Statistical significance was assessed us-ing nonparametric permutation testing [25]. Small-volumecorrection was applied based on strong a priori predictionsabout the neural regions involved in head-direction process-ing (Figure S1).
This analysis revealed a significant effect centered on theleft entorhinal cortex and extending into the presubiculum
and parasubiculum (we refer to this as the entorhinal/subicularregion). The effect was remarkably selective to this region (Fig-ure 4A), with no other significant response anywhere else in thebrain, even using a liberal statistical threshold (see Supple-mental Information). Further investigation revealed that eachof the three types of information was independently present(facing: t(15) = 3.48, p = 0.0017; goal: t(15) = 2.66, p = 0.009;cross: t(15) = 3.01, p = 0.0044). Thus, the entorhinal/subicularregion contains all three individual components of a truehead-direction simulation system (Figure 4B). Crucially, this in-cludes a significant generalization of the neural pattern acrossfacing and goal direction (the cross match condition), whichprovides clear evidence that the same neural populations arerecruited for both facing and goal direction within a single trial.To further explore the nature of the entorhinal/subicular repre-sentations, we conducted a second analysis based on‘‘pattern construction’’ [26–29]. This method uses a subset ofthe data to construct predicted neural patterns and then teststhese predictions against the remaining data. This revealedthat the voxel patterns expressed on any given trial werebest explained by a linear mixture of both facing and goal di-rection pattern information (see Supplemental Information).We next investigated the possibility that individual differ-
ences in the strength of the neural representations might influ-ence task performance [30]. Such a relationship is a crucialelement in demonstrating that such representations aredirectly relevant to navigational behavior, and yet such a rela-tionship has not been demonstrated in previous studies ofgeocentric direction coding [20, 21, 31]. We found a significantpositive correlation between entorhinal/subicular facing dir-ection information and overall task accuracy (r(15) = 0.59, p =0.016), which remained significant (r(15) = 0.64, p = 0.0095)after removing a possible outlier (defined using a cook’s

Figure 2. Each Experimental Trial Produces a
Mixture of Both Facing Direction and Geocentric
Goal Direction Information
(A) Example of a single-decision trial, as pre-
sented to the participants. The scene displays
the start view for the trial, and the object at the
top represents the goal location for that trial.
Based on this information, participants must first
localize and orient themselves within the environ-
ment. Following this, they then calculate the di-
rection to the goal.
(B) An overhead schematic of the environment
with start and goal locations displayed, along
with facing and goal direction.
(C) The top images show the direction
information expected to be present over the course of this example trial if geocentric goal direction is represented via a process of simulation of future di-
rection by head-direction populations. The bottom images display an abstracted representation of patterns of activity across 16 voxels (darker = greater
activity) expected to be present during this same trial. Initially, the voxel pattern will represent current facing direction (West). During goal direction judg-
ment, this head-direction population activity will shift to representing future geocentric goal direction (North), and the voxel pattern will shift accordingly.
Due to the slow temporal resolution of the BOLD response, we detect amixture of these two signals in a single trial. At the level of voxel activity, this equates
to a mixture of the two patterns for West and North.
A Direction Signal in Entorhinal/Subicular Regions3
Please cite this article in press as: Chadwick et al., A Goal Direction Signal in the Human Entorhinal/Subicular Region, Current Biology(2015), http://dx.doi.org/10.1016/j.cub.2014.11.001
distance threshold of 1). We also found a negative correlationbetween facing direction information and mean response timeon the same decision task (r(15) = 20.56, p = 0.024). Bycontrast, goal direction information did not significantly corre-late with either task accuracy (r(15) = 0.3, p = 0.27) or decisiontime (r(15) =20.17, p = 0.52). These results therefore show thatparticipants with a stronger representation of current headingdirection are both more accurate and faster at making goal di-rection judgments in this task (Figure 4C).
In order to maximally differentiate the four cardinal direc-tions within the virtual environment, we used four distinctdistal scene cues. This raised the possibility that the resultswithin the entorhinal/subicular region were driven purely bythe visual properties of these four scenes. For example, ifparticipants vividly imagined the intended route, then visualrepresentations of the distal scene in the direction of thegoal location might have been activated. If this is the case,then this could potentially explain the results in this regionwithout requiring any abstract direction representation. In or-der to rule out this explanation, we included a visual controlcondition. This involved the presentation of the same set ofstart ‘‘views’’ but simply required the participant to categorizethe displayed scene (e.g., forest), with no navigation requi-rements. This condition should activate purely visual neuralrepresentations, but not more abstract directional representa-tions. Importantly, the entorhinal/subicular region did notcontain any significant information about the visual scenes(t(15) =20.53, p = 0.7), and visual scene informationwas signif-icantly lower than geocentric direction information (t(15) =3.28, p = 0.005). This demonstrates that this information isonly present under conditions that require the computationof goal direction. By contrast, we looked within a region of in-terest in extrastriate cortex and found clear evidence of a neu-ral representation of the visual scenes (t(15) = 1.83, p = 0.044).Indeed, a significant interaction (F(1,15) = 31.15, p = 0.0005)between pattern similarity condition (geocentric directionversus visual scenes) and region (entorhinal/subicular versusextrastriate) suggests the presence of a functional dissocia-tion (see Figure S2), with the entorhinal/subicular regionresponsible for representing geocentric direction and extras-triate cortex responsible for processing the visual elementsof the scenes. Neither main effect was significant. Consistentwith this conclusion, a visual control version of the patternconstruction analysis also failed to find any effect on the
basis of visual scene information alone (see SupplementalInformation).While the main focus of this study was on head direction
simulation and geocentric direction coding, our experimentaldesign also allowed us to search for regions coding foregocentric goal direction. This revealed a selective result inthe left precuneus (Figure 4D). Notably, the location of thisresult is consistent with the peak result of a previous MVPAstudy investigating egocentric direction coding [32], therebyproviding a conceptual replication of the result. A further con-trol demonstrated that egocentric information within the pre-cuneus was not present while making egocentric judgmentsabout dot locations on a screen (t(15) = 20.39, p = 0.65), andthis information was significantly less than the navigation-based egocentric information (t(15) = 2.54, p = 0.023). Thistherefore suggests that the information contained within theprecuneus is specifically related to navigationally salient ego-centric information, supporting the purported role of medialparietal cortex in spatial navigation [2].Thus far, our results have implicated two regions in the
computation of goal direction. However, each of these regionsappears to compute direction in a distinct coordinate frame-work: geocentric in the entorhinal/subicular region and egocen-tric in the precuneus. We further investigated the selectivity ofthese results and found that the entorhinal/subicular regionshows no evidence for egocentric direction representations(t(15) = 0.94, p = 0.18), while the precuneus shows no evidencefor geocentric direction representations (t(15) = 0.41, p = 0.34).Tomore formally test this apparent computational dissociation,we directly compared the two types of information (geocentricand egocentric goal direction) across the two regions of interest(ROIs) with a two-way repeated-measures ANOVA. Neithermain effect was significant, but we did find a significant interac-tion (F(1,15) = 7.7, p = 0.014), which was clearly driven by a biastoward geocentric processing in the entorhinal/subicular re-gion, and egocentric in the precuneus (Figure 4E). This patternof results is consistent with theoretical models of navigation[8, 9]. For additional analyses of start and goal location repre-sentations, see Supplemental Information.
Discussion
In summary, we show that the human entorhinal/subicularregion supports a neural representation of geocentric goal

Figure 3. The Component Conditions Making Up
the Geocentric Direction Analysis
(A) Schematic pairwise match examples in four
conditions (specific pairwise matches indicated
by dotted white box in B). For each condition of in-
terest, we provide an example trial pair where a
specific direction matches, which therefore
should show a higher pattern similarity than trial
pairs that do not match (the null condition). The
specific matching direction (e.g., North) is indi-
cated in brackets underneath the match condition
label. Each direction condition consists of the full
set of trial pair matches fulfilling that condition.
The cross match condition is particularly impor-
tant for the head-direction simulation hypothesis,
as this condition demonstrates a shared neural
representation of geocentric direction regardless
of whether the participant has a goal toward or is
facing that direction.
(B) Matrix representing the match condition for
every possible pair of trials (although note that
for simplicity, this is a reduced 16 3 16 matrix
rather than the full 32 3 32 matrix. It nevertheless
captures the key conditions). The labels along
the top and left indicate the facing direction and
geocentric goal direction of each trial. The color
of each square indicates the match type (color
codes provided in A). The white squares along the diagonal were excluded from the pattern similarity analyses (but see Supplemental Information for addi-
tional analyses related to these diagonal elements). Our general measure of geocentric direction information is derived through a contrast of the three
geocentric conditions of interest (facing, goal, and crossmatch) against the null condition. Thewhite dotted line indicates the four specific pairwisematches
that are illustrated in (A).
Current Biology Vol 25 No 14
Please cite this article in press as: Chadwick et al., A Goal Direction Signal in the Human Entorhinal/Subicular Region, Current Biology(2015), http://dx.doi.org/10.1016/j.cub.2014.11.001
direction. We further show that goal direction shares a com-mon neural representation with facing direction. This suggeststhat head-direction populationswithin the entorhinal/subicularregion are recruited for the simulation of the direction to futuregoals. These results not only provide the first evidence forthe presence of goal direction representations within themammalian brain but also suggest a specific mechanism forthe computation of this neural signal, based on simulation.Furthermore, the strength of the entorhinal/subicular directionrepresentation predicts individual variation in performance onour navigation task, showing that these computations play adirect role in active spatial decision-making. Finally, we finda dissociation between the environment centric representa-tions in the entorhinal/subicular region and egocentric direc-tion representations in the precuneus. Although this computa-tional division of labor is predicted by various theoreticalaccounts of navigation [8, 9], this is the first study to demon-strate that both of these direction coordinate frameworks areactive at the same time, presumably acting together in orderto translate stored representations into representations foraction.
The human entorhinal/subicular region has previously beenshown to contain grid cells [33, 34], cells coding direction ofmotion [35] and representations of distance to a goal [36, 37].In rodents, it is also known to contain conjunctive grid cells,which are modulated by heading direction [35]. Although it isnot clear how our results could be due to the activity of clas-sical grid cells, we cannot rule out a possible contributionfrom conjunctive cell ensembles simulating intended futurevectors [9]. However, such a process is unlikely to occur inthe absence of direction simulation within the connectedhead-direction populations (see Supplemental Informationfor an extended discussion). We therefore suggest that head-direction simulation remains the most parsimonious explana-tion for our results.
Due to the relatively poor temporal resolution of fMRI, we arenot able to determine what the temporal dynamics of head-di-rection simulation may be. Our assumption is that head-direc-tion populations are initially involved in representing currentfacing direction and then switch to simulation during naviga-tional planning. However, other temporal dynamics, such asconstant oscillation between facing and goal direction, wouldexplain our results equally well. Thus, we remain agnosticregarding the precise temporal dynamics involved in head-di-rection simulation, which will have to be resolved with alterna-tive methodological approaches.Given the involvement of the medial temporal lobe in
episodic memory [38], we considered whether our data couldbe interpreted in terms of episodic memory rather than direc-tion coding per se. Importantly, our results provide evidencefor direction coding that generalizes across different locations.If episodic memory were the only process involved, we wouldexpect to find a unique neural representation for each combi-nation of location and direction and would not find evidencefor direction coding that generalizes across locations. There-fore, we do not believe that episodicmemory alone can explainour data, although it may have aided the retrieval of thegeocentric direction representations. We can similarly ruleout an account based on associative encoding of each triadof start location, goal location, and geocentric direction. Thisis due to the fact that learning involved free exploration ofthe environment rather than explicit exposure to each of the32 possible associative triads (see Supplemental Information).One limitation of the current study was the use of a standard
3 mm3 voxel resolution. Although this was necessary in orderto allow us to explore information across the whole brain, itdid constrain our ability to determine the precise anatomicalregion providing the goal direction signal [39]. In particular,both the entorhinal cortex and presubiculum are clear candi-dates for such a signal, but given their small size and close

Figure 4. Geocentric Goal Direction Information
Is Represented in Entorhinal/Subicular Region,
while Egocentric Goal Direction Is Represented
in the Precuneus
(A) The geocentric direction searchlight analysis
revealed a significant cluster (voxel threshold
pseudo-t > 3, family-wise error [FWE]-corrected
cluster threshold k > 88) in the left entorhinal/sub-
icular region (peak Montreal Neurological Insti-
tute [MNI] coordinates: 220, 225, 224; peak
pseudo-t = 3.8; cluster size = 157). This is dis-
played against the mean T1-weighted structural
image. Although the searchlight result was left
lateralized, further analyses demonstrated that
the effect is bilateral in nature, with no evidence
of a significant difference between the hemi-
spheres (see Supplemental Information).
(B) This region displays significant direction cod-
ing across all three conditions of interest. This
was assessed by comparing the mean pattern
similarity for each condition separately against
the null condition, each displayed with standard
error bars.
(C) Individual variation in facing direction infor-
mation within the entorhinal/subicular region cor-
relates positively with goal direction task accu-
racy.
(D) The egocentric direction searchlight analysis
revealed a significant cluster (voxel threshold
pseudo-t > 3, FWE-corrected cluster threshold
k > 49) in the left precuneus (peak MNI coordi-
nates: –6, –61, 39; peak pseudo-t = 3.3; cluster
size = 50). This is displayed against the mean
T1-weighted structural image. Despite the left
lateralized peak of the precuneus result, further
analyses suggest that precuneus represents
this information bilaterally, with no hemispheric
specialization (see Supplemental Information).
(E) The neural coding of direction information
type in the entorhinal/subicular region and pre-
cuneus was directly compared with a region-
by-condition analysis. A significant interaction
was found, which is consistent with a functional
dissociation between the two regions, although
it should be noted that neither region demon-
strated a significant simple effect of condition.
Nevertheless, the pattern of results is consistent
with bias toward geocentric direction in the entorhinal/subicular region and egocentric direction in the precuneus, with the entorhinal/subicualr region
coding for geocentric direction and precuneus coding for egocentric direction. Mean beta coefficients are displayed with standard error bars.
See also Figure S1 for the small-volume correction ROIs used when applying this analysis; Figure S2 for a visual control analysis; and Figure S3 for example
echo planar images demonstrating the extent of coverage within the entorhinal/subicular region.
A Direction Signal in Entorhinal/Subicular Regions5
Please cite this article in press as: Chadwick et al., A Goal Direction Signal in the Human Entorhinal/Subicular Region, Current Biology(2015), http://dx.doi.org/10.1016/j.cub.2014.11.001
proximity, smaller voxel resolution would be required to accu-rately separate these two regions [40]. Further research athigher resolution will be needed to accurately determine whichprecise region is contributing to goal direction.
Overall, our results provide important new insights intothe neural circuits involved in computing the direction to adesired goal beyond the current field of view and suggestthat simulation within the entorhinal/subicular region mayplay an important role. Future work will need to confirmthat simulation is indeed the key mechanism underlying theseresults, as well as demonstrating a causal influence of thismechanism on spatial cognition. Furthermore, it will beimportant to demonstrate that such mechanisms extendbeyond the kind of simple environment used in the currentstudy, into larger and more complex environments. Electro-physiological investigations of head-direction neuronal po-pulations within the entorhinal/subicular region in rodentsshould allow more detailed investigation of these goal direc-tion computations.
Supplemental Information
Supplemental Information includes Supplemental Results, Supplemental
Discussion, Supplemental Experimental Procedures, and three figures
and can be found with this article online at http://dx.doi.org/10.1016/j.
cub.2014.11.001.
Author Contributions
All authors were involved in designing the experiment. M.J.C. and A.E.J.J.
collected the data. M.J.C. analyzed the data. M.J.C. and H.J.S. wrote the
paper.
Acknowledgments
This research was funded by grants awarded to H.J.S. from the James S.
McDonnell Foundation and The Wellcome Trust.
Received: June 13, 2014
Revised: September 29, 2014
Accepted: November 4, 2014
Published: December 18, 2014

Current Biology Vol 25 No 16
Please cite this article in press as: Chadwick et al., A Goal Direction Signal in the Human Entorhinal/Subicular Region, Current Biology(2015), http://dx.doi.org/10.1016/j.cub.2014.11.001
References
1. Taube, J.S. (2007). The head direction signal: origins and sensory-motor
integration. Annu. Rev. Neurosci. 30, 181–207.
2. Spiers, H.J., andBarry, C. (2015). Neural systems supporting navigation.
Curr. Opin. Behav. Sci. 1, 47–55.
3. Haynes, J.-D., and Rees, G. (2006). Decoding mental states from brain
activity in humans. Nat. Rev. Neurosci. 7, 523–534.
4. Norman, K.A., Polyn, S.M., Detre, G.J., and Haxby, J.V. (2006). Beyond
mind-reading: multi-voxel pattern analysis of fMRI data. Trends Cogn.
Sci. 10, 424–430.
5. Chadwick, M.J., Bonnici, H.M., and Maguire, E.A. (2012). Decoding infor-
mation in the human hippocampus: a user’s guide. Neuropsychologia 50,
3107–3121.
6. Erdem, U.M., and Hasselmo, M. (2012). A goal-directed spatial naviga-
tion model using forward trajectory planning based on grid cells. Eur.
J. Neurosci. 35, 916–931.
7. Burgess, N., and O’Keefe, J. (1996). Neuronal computations underlying
the firing of place cells and their role in navigation. Hippocampus 6,
749–762.
8. Byrne, P., Becker, S., and Burgess, N. (2007). Remembering the past
and imagining the future: a neural model of spatial memory and imagery.
Psychol. Rev. 114, 340–375.
9. Bird, C.M., and Burgess, N. (2008). The hippocampus and memory: in-
sights from spatial processing. Nat. Rev. Neurosci. 9, 182–194.
10. Kubie, J.L., and Fenton, A.A. (2012). Linear look-ahead in conjunctive
cells: an entorhinal mechanism for vector-based navigation. Front
Neural Circuits 6, 20.
11. Hassabis, D., and Maguire, E.A. (2009). The construction system of the
brain. Philos. Trans. R. Soc. Lond. B Biol. Sci. 364, 1263–1271.
12. Buckner, R.L. (2010). The role of the hippocampus in prediction and
imagination. Annu. Rev. Psychol. 61, 27–48, C1–C8.
13. Schacter, D.L., Addis, D.R., Hassabis, D., Martin, V.C., Spreng, R.N., and
Szpunar, K.K. (2012). The future of memory: remembering, imagining,
and the brain. Neuron 76, 677–694.
14. Johnson, A., and Redish, A.D. (2007). Neural ensembles in CA3 tran-
siently encode paths forward of the animal at a decision point.
J. Neurosci. 27, 12176–12189.
15. Pfeiffer, B.E., and Foster, D.J. (2013). Hippocampal place-cell se-
quences depict future paths to remembered goals. Nature 497, 74–79.
16. Hassabis, D., Chu, C., Rees, G., Weiskopf, N., Molyneux, P.D., and
Maguire, E.A. (2009). Decoding neuronal ensembles in the human hip-
pocampus. Curr. Biol. 19, 546–554.
17. Chadwick, M.J., Hassabis, D., and Maguire, E.A. (2011). Decoding over-
lapping memories in the medial temporal lobes using high-resolution
fMRI. Learn. Mem. 18, 742–746.
18. Bonnici, H.M., Kumaran, D., Chadwick, M.J.,Weiskopf, N., Hassabis, D.,
and Maguire, E.A. (2012). Decoding representations of scenes in the
medial temporal lobes. Hippocampus 22, 1143–1153.
19. Hannula, D.E., Libby, L.A., Yonelinas, A.P., and Ranganath, C. (2013).
Medial temporal lobe contributions to cued retrieval of items and con-
texts. Neuropsychologia 51, 2322–2332.
20. Vass, L.K., and Epstein, R.A. (2013). Abstract representations of location
and facing direction in the human brain. J. Neurosci. 33, 6133–6142.
21. Marchette, S.A., Vass, L.K., Ryan, J., and Epstein, R.A. (2014).
Anchoring the neural compass: coding of local spatial reference frames
in human medial parietal lobe. Nat. Neurosci. 17, 1598–1606.
22. Chadwick, M.J., and Spiers, H.J. (2014). A local anchor for the brain’s
compass. Nat. Neurosci. 17, 1436–1437.
23. Kriegeskorte, N., and Kievit, R.A. (2013). Representational geometry:
integrating cognition, computation, and the brain. Trends Cogn. Sci.
17, 401–412.
24. Kriegeskorte, N., Goebel, R., and Bandettini, P. (2006). Information-
based functional brain mapping. Proc. Natl. Acad. Sci. USA 103,
3863–3868.
25. Nichols, T.E., andHolmes, A.P. (2002). Nonparametric permutation tests
for functional neuroimaging: a primer with examples. Hum. Brain Mapp.
15, 1–25.
26. Reddy, L., Kanwisher, N.G., and VanRullen, R. (2009). Attention and
biased competition in multi-voxel object representations. Proc. Natl.
Acad. Sci. USA 106, 21447–21452.
27. Macevoy, S.P., and Epstein, R.A. (2009). Decoding the representation of
multiple simultaneous objects in human occipitotemporal cortex. Curr.
Biol. 19, 943–947.
28. MacEvoy, S.P., and Epstein, R.A. (2011). Constructing scenes from ob-
jects in human occipitotemporal cortex. Nat. Neurosci. 14, 1323–1329.
29. Baeck, A., Wagemans, J., and Op de Beeck, H.P. (2013). The distributed
representation of random and meaningful object pairs in human occipi-
totemporal cortex: the weighted average as a general rule. Neuroimage
70, 37–47.
30. Chadwick, M.J., Bonnici, H.M., and Maguire, E.A. (2014). CA3 size pre-
dicts the precision of memory recall. Proc. Natl. Acad. Sci. USA 111,
10720–10725.
31. Baumann, O., and Mattingley, J.B. (2010). Medial parietal cortex en-
codes perceived heading direction in humans. J. Neurosci. 30, 12897–
12901.
32. Schindler, A., and Bartels, A. (2013). Parietal cortex codes for egocentric
space beyond the field of view. Curr. Biol. 23, 177–182.
33. Doeller, C.F., Barry, C., and Burgess, N. (2010). Evidence for grid cells in
a human memory network. Nature 463, 657–661.
34. Jacobs, J., Weidemann, C.T., Miller, J.F., Solway, A., Burke, J.F., Wei,
X.-X., Suthana, N., Sperling, M.R., Sharan, A.D., Fried, I., and Kahana,
M.J. (2013). Direct recordings of grid-like neuronal activity in human
spatial navigation. Nat. Neurosci. 16, 1188–1190.
35. Jacobs, J., Kahana, M.J., Ekstrom, A.D., Mollison, M.V., and Fried, I.
(2010). A sense of direction in human entorhinal cortex. Proc. Natl.
Acad. Sci. USA 107, 6487–6492.
36. Spiers, H.J., andMaguire, E.A. (2007). A navigational guidance system in
the human brain. Hippocampus 17, 618–626.
37. Howard, L.R., Javadi, A.H., Yu, Y., Mill, R.D., Morrison, L.C., Knight, R.,
Loftus, M.M., Staskute, L., and Spiers, H.J. (2014). The hippocampus
and entorhinal cortex encode the path and Euclidean distances to goals
during navigation. Curr. Biol. 24, 1331–1340.
38. Mayes, A.R., and Roberts, N. (2001). Theories of episodic memory.
Philos. Trans. R. Soc. Lond. B Biol. Sci. 356, 1395–1408.
39. Carr, V.A., Rissman, J., and Wagner, A.D. (2010). Imaging the human
medial temporal lobe with high-resolution fMRI. Neuron 65, 298–308.
40. Bonnici, H.M., Chadwick,M.J., Kumaran, D., Hassabis, D.,Weiskopf, N.,
and Maguire, E.A. (2012). Multi-voxel pattern analysis in human hippo-
campal subfields. Front Hum Neurosci 6, 290.

Current Biology, Volume 25
Supplemental Information
A Goal Direction Signal in the Human
Entorhinal/Subicular Region
Martin J. Chadwick, Amy E.J. Jolly, Doran P. Amos, Demis Hassabis, and Hugo J.
Spiers

Supplemental Figures
Figure S1, related to Figure 4. The regions-‐of-‐interest used for small-‐volume correction
(A) A bilateral set of regions thought to be important for head-‐ direction coding was combined into
a single mask for the geocentric direction searchlight small-‐volume-‐correction. This included the
hippocampus, subiculum, entorhinal cortex, retrosplenial cortex, posterior cingulate cortex, and a
portion of the thalamus including anterior and lateral dorsal regions. (B) A bilateral set of parietal
regions thought to be important for egocentric direction coding was combined into a single mask
for the egocentric direction searchlight small-‐volume-‐correction. This included the intraparietal
sulcus, Brodmann area 7, and the precuneus.
A
B

Figure S2, related to Figure 4. Dissociation between visual cortex and entorhinal/subicular region
(A) Visual scene processing in the extrastriate cortex was investigated with a bilateral anatomical
ROI. (B) The entorhinal/subicular region does not contain visual information about the four distal
scene cues. By contrast, extrastriate displays significant coding of visual scene information. A
region by information-‐type ANOVA revealed a significant interaction effect, suggesting a double-‐
dissociation between the neural coding in these two regions, with the entorhinal/subicular region
selectively coding for geocentric direction. However, we note that while the entorhinal/subicular
region displays the expected simple effect (t(15)=3.34, p=0.005), the extrastriate cortex simple
effect was not significant (t(15)=0.98, p=0.39). Thus, while the pattern of results is consistent with
a functional double dissociation, the data do not conclusively demonstrate this. Nevertheless, our
data do firmly support the conclusion that visual scene information is not present within the
entorhinal/subicular region, which was the main purpose of this control analysis. Standard error
bars are displayed.
Entorhinal Extrastriate
Geocentric DirectionVisual Control
0
-0.01
-0.02
0.01
0.02
0.03
Mea
n R
egre
ssio
n B
eta
*
*A B
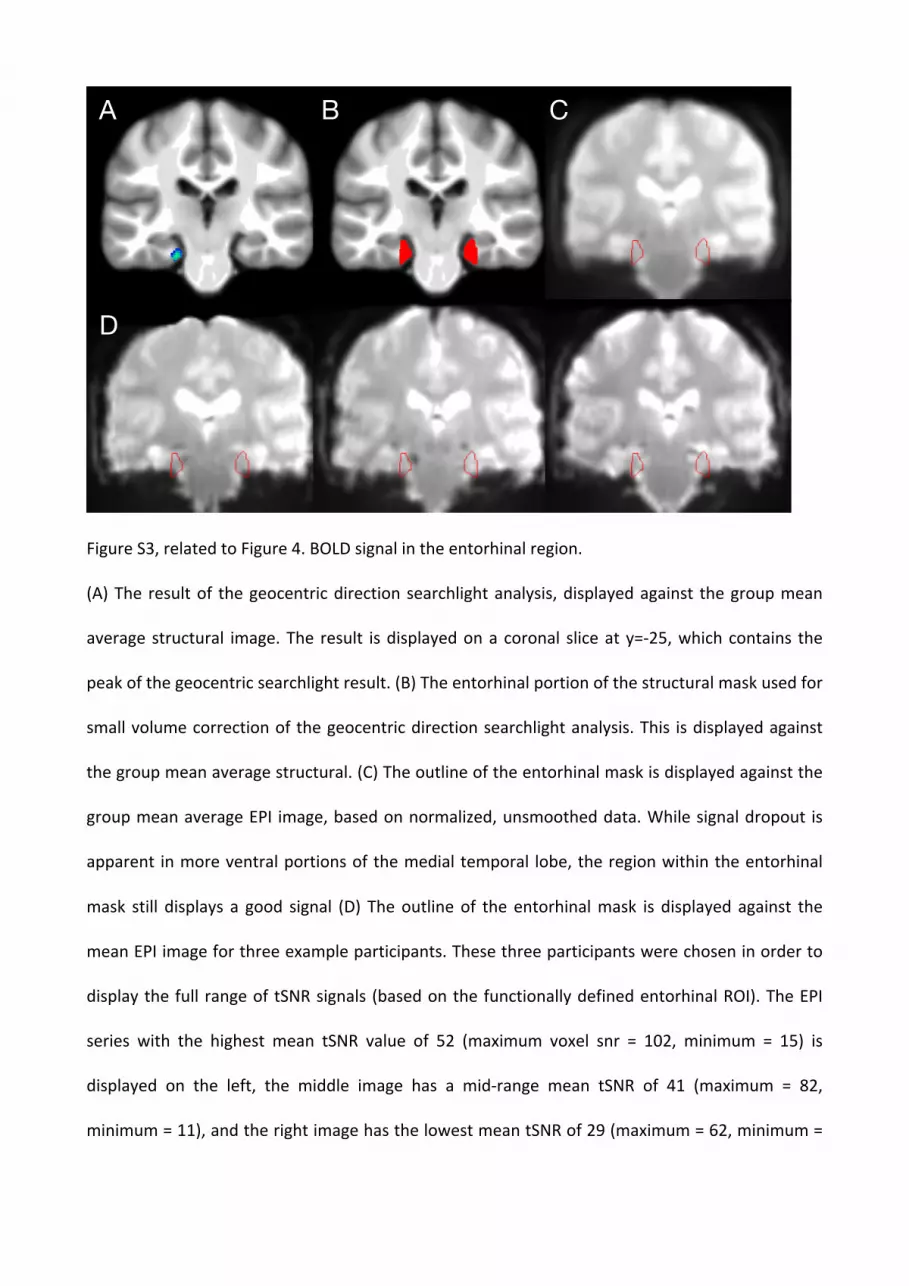
Figure S3, related to Figure 4. BOLD signal in the entorhinal region.
(A) The result of the geocentric direction searchlight analysis, displayed against the group mean
average structural image. The result is displayed on a coronal slice at y=-‐25, which contains the
peak of the geocentric searchlight result. (B) The entorhinal portion of the structural mask used for
small volume correction of the geocentric direction searchlight analysis. This is displayed against
the group mean average structural. (C) The outline of the entorhinal mask is displayed against the
group mean average EPI image, based on normalized, unsmoothed data. While signal dropout is
apparent in more ventral portions of the medial temporal lobe, the region within the entorhinal
mask still displays a good signal (D) The outline of the entorhinal mask is displayed against the
mean EPI image for three example participants. These three participants were chosen in order to
display the full range of tSNR signals (based on the functionally defined entorhinal ROI). The EPI
series with the highest mean tSNR value of 52 (maximum voxel snr = 102, minimum = 15) is
displayed on the left, the middle image has a mid-‐range mean tSNR of 41 (maximum = 82,
minimum = 11), and the right image has the lowest mean tSNR of 29 (maximum = 62, minimum =
A B C
D

9). While there is variation in the extent of dropout in more ventral MTL, all three participants
display minimal or no signal dropout within the entorhinal mask.
Supplemental Experimental Procedures
Participants
Sixteen healthy right-‐handed participants (7 female) were recruited from University of London
institutions. All had normal or corrected-‐to-‐normal vision and gave written consent to participant
in accordance with the local research ethics committee.
Virtual environment
This environment was created using the Vizard VR Software Toolkit. The environment consisted of
four paths arranged in a square, with a goal object at each corner of the square (phone box,
statue, lamppost, and flowerpot). At the four edges of the environment we placed four distinct
scenes (forest, mountain, desert, sea) in order to provide clear, unambiguous information about
the four cardinal directions of the environment. Effectively these four scenes provide a clear cue
for environment-‐centred orientation, equivalent to North, South, East, and West. In the centre of
the square was a fountain, to provide additional visual information for orientation, and at each of
the corners, between the distal scenes, was a tall stone pillar, to provide clear separation of the
different scenes. Similarly, the four paths were not functionally relevant to the task itself, but
could provide additional visual information for orientation. The participants were not restricted to
the paths during initial learning, but could freely explore the entire environment. This specific
environment was created in order to create the simplest possible experimental design that would
allow us to investigate goal direction information. Four objects arranged in a square is the
minimum spatial arrangement required so that there are two potential goal-‐direction vectors in

each of four cardinal directions, thereby allowing us to look at generalized representation of
direction across the specific vectors. By minimising the simplicity of the design, we were able to
maximise the number of trials within each condition, thereby maximising the power of our
analysis.
Using VR to investigate navigation
Under normal circumstances, both visual and vestibular inputs play an important role in
determining the activity of head-‐direction populations. However, when navigating within a virtual
environment, the vestibular input will be uninformative for guiding navigation. Given this, is virtual
reality a viable method for investigating head direction representations [S1]? We suggest that it is
reasonable to assume that, in the absence of informative vestibular input, head-‐direction neurons
will be dominated by visual information instead. This assumption is supported by previous results
indicating that reliable place and grid cell activity can be detected in humans while they navigate
within a virtual environment, where vestibular input is uninformative [S2–S5]. We think it unlikely
that these specialized spatial neurons would be active in isolation from any input from head-‐
direction cells. Indeed, Doeller et al. [S4] used extensive modelling of their data, based on
electrophysiological recordings in the rat entorhinal cortex, to demonstrate that their results
depend on intact conjunctive grid cell populations. Given that conjunctive cells receive their
direction input from head-‐direction cells [S6, S7], this result provides evidence that head-‐direction
signals remain intact within a virtual environment. Furthermore, facing direction coding has been
found within human presubiculum and retrosplenial cortex [S8]. These results fit very well with
the known location of head direction populations. Put together, there is now strong evidence to
suggest that virtual reality taps into the same spatial mechanisms as during real-‐world navigation,
including head-‐direction populations.

Experimental design
Prior to scanning, the participants learned the spatial layout of a simple virtual environment
(Figures 1A and 1B) through twenty minutes of free exploration. While they explored this
environment, participants were instructed to pay particular attention to the location of the four
goal objects, as we would later be testing their memory for this information. To aid our description
of the experiment, we will subsequently refer to these cardinal directions as NSEW, based on our
own arbitrary labels of the layout (see Figure 1B), but note that we never referred to compass
directions during the actual experiment, and never asked the participants to refer to compass
directions. Interspersed with free exploration time, we presented eight probe trials to the
participant to ensure that they were learning the environment. These probe trials were identical
to the goal direction questions in the main scanning task, described below. After the learning
session, but prior to entering the scanner, the participants completed one block of the full
experiment in order to ensure they were well practised at the navigation task, and to try and
minimize any effects of learning during scanning.
The structure of a single trial of the task is shown in Figure 1C. There were four components to
each trial: first there were two control tasks, then two varieties of goal direction task. First we
describe the goal direction tasks, before explaining the purpose of the control tasks. For the goal
direction tasks, the participant was presented with a view taken from within the virtual
environment (Figure 1C). This view was always taken from one of the four goal object locations,
but with all objects now removed from the environment. The view was in one of the four cardinal
directions within the environment, and the pictures were cropped to ensure that they included
only the distal scene that was directly in front of them, and not any of the other scenes. This
picture indicated the “start location” for the trial, and the participant had to determine exactly

where this view was located within the environment, and which direction they would be facing in,
based on the depicted view. Above this view, a picture of one of the four goal objects was
presented against a white background. Participants were instructed to recall where this object was
located within the environment, and this acted as the “goal location” for the trial. The goal
location was never at the start location, and was also never located diagonally across from the
start location – it was always directly towards one of the cardinal directions from the start. The
task was to judge the direction the goal was from the given start location, and this could be one of
two types of direction: environment-‐centred (geocentric) or body-‐centred (egocentric). For the
geocentric question, participants were asked to decide which of the four distal scenes the goal
location was toward from their start location (i.e. if they were to draw an arrow between the start
and goal locations, which scene would it be pointing towards?). This choice was made by pressing
a button corresponding to the scene label (the first letter of the corresponding scene) underneath
the start view. While the focus of this study was on geocentric direction coding, we also included
an egocentric question, where the participant was asked to decide whether the goal location was
located to the left, right, forward, or backward from the start location. Importantly, as we could
independently manipulate start location, start view, and goal location, we were able to
decorrelate geocentric and egocentric goal direction over trials. The two goal direction questions
(geocentric and egocentric) were both presented on every trial, and the order of the questions
was randomized across trials. Each of the four tasks on each trial was self-‐paced, and there was a
1s inter-‐stimulus interval between each trial.
On each trial, prior to these goal direction tasks, there were two control tasks: a geocentric control
and an egocentric control. The geocentric control involved the presentation of the same start view
that would be used in the later goal direction tasks. However, no goal object was presented, and
the task was simply to name the scene category featured in the view by pressing a button

corresponding to the scene label. This task therefore involved visual and semantic representations
of the distal scene cues, but did not require any navigation processing. This condition allowed us
to ensure that any geocentric directional information was not simply based on visual or semantic
representations of the distal scenes. The egocentric control also featured this same view, but in
addition, a red dot was presented on this scene. The task was to decide whether the dot was to
the left, right, above, or below the centre of the scene. This task therefore involves egocentric
spatial decisions that are not navigationally relevant. These two control tasks were both presented
on every trial, and were always presented prior to the goal direction tasks. The order of the two
control tasks was randomized across trials. Each task block included 32 trials (which comprised the
combination of each start location, start view, and goal location) presented in a random order. The
participants completed three task blocks in the scanner, each collected in a separate functional
run.
While the response to each component of each trial was self-‐paced, we report the mean response
times for each of the four tasks:
Geocentric goal direction – 4.52s (sd = 1.41s)
Egocentric goal direction – 3.58s (sd = 0.86s)
Geocentric control – 2.30s (sd = 0.75s)
Egocentric control – 1.91s (sd = 0.41s)
Participants all had very high levels of accuracy in both goal direction tasks (geocentric mean
accuracy = 97% [sd = 0.02]; egocentric mean accuracy = 97% [sd = 0.02]), and in both control tasks
(geocentric control mean accuracy = 99% [sd = 0.01]; egocentric control mean accuracy = 98% [sd
= 0.02]), demonstrating that they had learned the virtual environment very well. Notably, despite

the fact that all participants performed near ceiling on both tasks, there was nevertheless
adequate variance to detect a strong positive correlation between geocentric and egocentric task
performance (r(15) = 0.77, p = 0.00047). This suggests that the individual variance in both decision
tasks may be due to common cognitive and neural components. These two scores were therefore
pooled for the purposes of investigating the neural correlates of overall navigation performance.
MRI scan details
All MRI data was collected using a Siemens Avanto 1.5 tesla MRI scanner with a 32-‐channel head
coil at the Birkbeck-‐UCL Centre for Neuroimaging (BUCNI) in London. The functional data was
acquired using a sequence that has been optimised for medial temporal lobe coverage by the
physics team at BUCNI. This was a gradient-‐echo EPI sequence in an ascending sequence, with a
slice thickness of 2mm and a 1mm gap, TR=85ms, TE=50ms, slice tilt=-‐30°, field of view 192mm,
and matrix size 64x64. The whole brain was acquired with 40 slices, leading to a volume
acquisition time of 3.4s. The precise slice tilt was chosen as a compromise between sensitivity,
coverage, and speed [S9, S10]. Three functional runs were collected for each participant. Following
functional imaging, an anatomical image was acquired for each participant (T1-‐weighted FLASH, TR
= 12ms, TE = 5.6ms, 1mm3 resolution).
Imaging the entorhinal region
It is well known that parts of the medial temporal lobe are susceptible to BOLD signal dropout,
making it a difficult region in which to reliably detect effects of interest [S11]. In order to reduce
such problems, we used a scan sequence that was optimized to minimize signal dropout. In
particular, both thin acquisition slices and slice tilting have been shown to reduce dropout [S9,
S10]. As displayed in Fig S3, the scan sequence used in this study was able to detect a reliable
BOLD signal within the entorhinal region despite some signal dropout in the ventral portions of the

medial temporal lobes. We further investigated the strength of the entorhinal BOLD signal by
calculating the temporal signal-‐to-‐noise ratio (tSNR) within our functionally defined
entorhinal/subicular region of interest [S12]. This was calculated from the normalized,
unsmoothed EPI images. For each session separately, the voxel-‐wise tSNR was calculated as the
mean/standard deviation of each voxel time-‐series. Then for each subject the three sessions were
averaged to create a single summary tSNR value at each voxel within the ROI. We calculated the
mean tSNR across voxels, as well as the maximum and minimum voxel tSNR for each subject. At
the group level, the overall mean tSNR was 43.3 (sd = 6.7), indicating that a BOLD signal was
reliably present within this region. The mean of the maximum tSNR was 89.3 (sd = 12.0), and the
minimum was 9.9 (sd = 3.0), which demonstrates that there was substantial variation in tSNR
across voxels within the ROI.
fMRI pre-‐processing
The first six functional volumes were discarded to allow for T1 equilibration. The remaining
functional volumes were spatially realigned to the first image of the first functional series. Each
participant’s structural image was co-‐registered to the first functional image. The structural
images were segmented and normalized to the DARTEL template using the VBM8 toolbox. The
warps from this procedure were then applied to the functional data. This procedure normalized all
MRI data into MNI space. Note that this procedure also resliced the functional voxels into a new
interpolated resolution of 1.5mm3. For the main analyses, each trial-‐type (unique start-‐view-‐goal
combination) was modelled with a different regressor including its instance in each of the three
functional runs. Each trial was modelled with a boxcar regressor which started from the response
to the first goal-‐direction question, and ended at the second response. The reasoning was that
both geocentric and egocentric goal direction information should be required regardless of the
type of goal direction response required, and so the specific modality of explicit goal response was

not differentiated in these models. Furthermore, we expected the information to be maximally
present at, or just before the first goal direction decision, and to continue to be strongly
represented up until the second decision. We therefore elected to model this specific period of
time during the trial. This provided a parameter estimate at each voxel for each of the 32 trial
types. These were converted to t-‐statistics by dividing the parameter estimate by the estimate of
the standard error, thereby normalizing the responses of each voxel [S13, S14]. For each control
analysis, the same general approach was used, with the difference that each unique trial-‐type was
modelled using an event-‐related regressor locked to the time of the responses, rather than a
boxcar regressor. The resulting t-‐statistic images were left unsmoothed to preserve any fine-‐
grained spatial information [S14].
Small-‐volume correction regions-‐of-‐interest
For the purposes of hypothesis-‐driven small-‐volume correction of the searchlight analyses, we
created two anatomical masks. The first was for the geocentric direction analysis, and consisted of
the combination of a bilateral network of regions thought to contain head direction neuronal
populations. This included the hippocampus [S15] and entorhinal region [S16], retrosplenial and
posterior cingulate cortex [S17], and a region of the thalamus approximately covering the anterior
and lateral dorsal nuclei. This mask was created by manually delineating each of these regions on
the average T1-‐weighted structural image, and then combining all regions into a single mask. As
many of these regions have also been implicated in coding for spatial location within an
environment [S3, S8, S18], we used this same small-‐volume mask for the analysis of start location
information. The second small-‐volume mask was for the egocentric direction analysis, and
consisted of the intraparietal sulcus (IPS) and precuneus bilaterally. This mask was based on a
combination of regions BA7 and the IPS taken from the SPM Anatomy toolbox [S19], but was

manually adjusted to include a greater extent of the precuneus [S20]. See Figure S1 for images of
each of these ROIs.
Searchlight pattern similarity analysis
We used a searchlight analysis in order to search across the whole brain for regions containing
specific neural representations [S21]. This involves stepping through each voxel in the brain, and in
each case running a pattern similarity analysis on the cluster of voxels surrounding that central
voxel (for all analyses, we used a 10mm radius spherical searchlight). This provides a measure of
information at every single voxel, and a group-‐level statistical analysis can determine whether
there are any regions containing a significant amount of information across the group of
participants. For the pattern similarity analysis itself, the similarity between each pair of trials was
measured using a Pearson correlation between the patterns of fMRI voxel activation within the
ROI across each pair of trials. This results in a similarity matrix, with each point in the matrix
representing the pattern similarity between a pair of trials. For the primary analyses we used a
multiple binary regression approach [S8]. Each regressor specifies a contrast of one part of the
similarity matrix against the rest (Figure 3B). By using this approach, it is possible to test the
contrast of interest while controlling for variance that is attributable to other variables. The
multiple regression included four regressors: geocentric direction, egocentric goal direction, start
location, and goal location. Geocentric direction was our primary regressor of interest, and
specified a combined contrast of three similarity conditions (facing, goal, and cross match) against
the null condition (Figure 3A). Any region with head direction simulation properties should include
all three of these conditions, and the geocentric direction regressor should therefore detect any
such region. Egocentric goal direction specified all trial pairs where the egocentric direction to the
goal was the same (e.g. left), against those where they did not. This was our regressor of interest
for the secondary egocentric analyses. Start location specified all trial pairs where the start

location matched against those where they did not, and similarly, goal location specific all trials
pairs where the specific goal location matched. While these additional regressors were not
completely uncorrelated with the geocentric direction regressor, r2 was very small in each case
(0.01 for both start location and goal location, and 0.03 for egocentric direction), and well within
tolerance limits for multiple regression analysis. Thus, this analysis fully controlled for these
extraneous factors.
This searchlight pattern similarity multiple regression analysis results in a beta parameter estimate
for each regressor at each voxel. The brain-‐wide set of parameter estimates for each participant
was passed to a group-‐level nonparametric statistical analysis for each condition of interest (see
next section). Small-‐volume correction was applied separately to each searchlight analysis, based
on strong a priori predictions about the neural regions involved in processing each type of
information (see above and Figure S1).
Nonparametric searchlight statistics
Parametric assumptions regarding the spatial distribution of data may not hold with unsmoothed
data. Nonparametric statistical approaches do not make such assumptions, making them more
suitable for use with unsmoothed data. We therefore analysed the group-‐level data using
statistical nonparametric mapping [S22]. We used 10mm variance smoothing and 10,000 random
permutations. A cluster-‐based threshold was used to assess statistical significance, using an initial
cluster threshold of Pseudo-‐t = 3. Results were considered significant at a family-‐wise-‐error-‐
corrected cluster threshold of p<0.05. This method of FWE correction proceeds as follows. Over
10,000 permutations, each searchlight beta image is randomly assigned to be multiplied by either
1 or -‐1. Under the null hypothesis, we expect that the set of beta values at each voxel should be
symmetric about zero, and hence for a single subject, the observed data can be flipped without

altering its distribution. Thus, under the null hypothesis, randomly flipping the sign of a single
subject’s beta-‐map will leave the joint distribution unchanged. At each voxel, the pseudo-‐t statistic
(more on this below) is calculated for both the observed data, and each set of permuted data. In
order to apply cluster correction for multiple comparisons, an initial voxel-‐level threshold is
applied to each dataset (in this case set to t=3, as suggested by [S22]) Based on this initial
threshold, the permutation distribution of the maximal suprathreshold cluster size can be derived.
This is accomplished by noting, for each permuted statistic image, the largest size of cluster above
the initial voxel-‐level threshold. Corrected p-‐values for each suprathreshold cluster in the
observed statistic image are obtained by comparing their size to the permutation distribution. By
forming the null distribution from the maximal statistic in each permuted image, this ensures that
any resulting p-‐values are fully corrected for multiple comparisons.
The use of nonparametric statistics in fMRI allows the use of variance smoothing, whereby the
variance estimate at each voxel is based on a pooled estimate, spatially smoothed across
neighbouring voxels. This new, pooled variance is then used to compute a more reliable statistic at
that voxel. The resulting statistic does not have a Student’s t-‐distribution under the null
hypothesis, hence the term Pseudo-‐t statistic. Overall this procedure will somewhat increase the
smoothness of the statistic image, but only through a reduction in high-‐frequency noise. Any fine-‐
grained differences in signal between neighbouring voxels will be preserved, making this approach
entirely suitable for MVPA analysis.
Regions-‐of-‐interest from the searchlight analyses
Following the searchlight analyses, we ran a series of follow-‐up analyses within each region. For
each functional cluster (entorhinal/subicular region and precuneus), we defined the region of
interest using a threshold of Pseudo-‐t > 2, in order to provide enough voxels for ROI-‐based RSA

analysis. Notably, at this more liberal threshold, the precuneus cluster is bilateral in nature. The
bilateral extrastriate cortex ROI was defined using the SPM Anatomy toolbox [S19].
ROI statistical tests
For all ROI-‐based tests, each correlation coefficient was normalized using Fisher’s r-‐to-‐z
transformation, in order to allow parametric testing at the group level. Group-‐level statistics were
performed on either the set of beta parameters or correlation coefficients from a given region or
regions across participants. When determining whether a region contains significant information
(i.e. testing beta parameters against zero, or testing correlation coefficients against the null match
condition), one-‐tailed t-‐tests were used as recommended by current methods guidelines for
pattern similarity analysis [S23]. The reason for this is that, given our experimental hypothesis, we
expect an increase in pattern similarity in our experimental compared to null condition, but the
same hypothesis does not provide any explanation for a significant drop in similarity compared to
the null. Note that this is in contrast to a similar analysis of univariate data, where it is always
possible that there could be a task-‐driven deactivation, meaning that two-‐tailed tests in this case
are to be preferred. When comparing information across two conditions of interest (e.g.
geocentric direction vs. visual scene information), or across two regions (e.g. entorhinal/subicular
region vs. precuneus), two-‐tailed t-‐tests were used, as here a significant result could reasonably be
expected in either direction.
Pattern similarity contrasts in the entorhinal/subicular region
The geocentric direction analysis used in the searchlight analysis consisted of the combination of
three conditions (facing, goal, and cross match). In theory, any one of these conditions could have
driven this response without the contribution of the other two – for example, the response could
be driven purely by information about current facing direction, which we know to be present

within the presubiculum (which forms a part of our functional cluster) from previous work [S8]. To
infer the existence of a genuine head direction simulation system, we need to demonstrate the
presence of each of these three types of direction information independently. Within the
entorhinal/subicular ROI we looked at each type of directional information separately, in each
case contrasting the pattern similarity against the null condition using a one-‐tailed paired t-‐test.
Note that any similarity pair that fell into more than one condition (e.g. facing and goal direction)
was excluded, to ensure specificity within each condition. Furthermore, as we were specifically
interested in directional information that generalizes across specific location, we also excluded
similarity pairs that shared the same start location. Thus, any residual information could only
represent a generalized direction representation. Significance was assessed using a Bonferroni-‐
corrected α threshold of p<0.0167 to control for the three separate statistical tests.
Pattern similarity correlation with behavioural variables
We investigated correlations between both facing direction and goal direction
entorhinal/subicular neural representations and individual variation in task accuracy. We
particularly focussed on task performance, as a previous study has found that entorhinal
processing predicts variation in navigation performance across individuals [S4]. Due to the high
correlation between geocentric and egocentric task performance (see above), we used accuracy
pooled across both tasks. A Pearson correlation was used in each analysis, and a significance
threshold of 0.025 was used, Bonferroni-‐corrected for the two correlation analyses. Results are
reported in the main text, but in brief, a significant positive correlation was found between
accuracy and facing direction, but not goal direction. Task accuracy and reaction time were found
to be highly correlated (r(15)=-‐0.76, p=0.0007), and so we predicted that we should find a similar
pattern of results in the reaction time data as with accuracy – i.e. a correlation between reaction
time and facing direction information, but not goal direction information. Given this clear

prediction, we used a significance threshold of p<0.05 to assess the correlation between facing
direction information and reaction time (although we note that the result would also be significant
using a more stringent p<0.025 threshold).
We repeated each of the correlation analyses with facing direction information based on the
unpooled accuracy and reaction time data, in order to check that the results still held. These
analyses found that facing direction information correlated significantly with egocentric task
accuracy (r(15)=0.64, p=0.008) and reaction time (r(15)=-‐0.53, p=0.035), and trended to
significance with geocentric task accuracy (r(15)=0.46, p=0.07) and reaction time (r(15)=-‐0.49
p=0.055). Thus, even using unpooled data, both tasks produced either significant results, or
trended toward significance in the expected direction. We therefore conclude that pooling the
behavioural data across these tasks did not make a substantial impact on the resulting data.
Visual control analysis
In the visual control condition of each trial, we presented the start view, but instead of requiring a
navigation decision, participants simply had to categorize the displayed scene (Forest, Mountain,
Desert, or Sea). This condition should activate purely visual neural representations, but not more
abstract directional representations. Thus, this condition allowed us to search for the presence of
purely visual information. Visual control data were preprocessed using a first-‐level GLM to fit a
regressor for each of the 32 trial types, as with the navigation decision data. However, in this
analysis, the regressors were event-‐related, and modelled the onset of the visual scene in the
visual control component of each trial. In order to ensure that these regressors captured BOLD
signal that was specifically related to the visual processing of each scene prior to the navigation
decision period, we also included regressors for each of the 32 navigation decision periods, using a
boxcar regressor in each case (exactly as used in the main analysis). Note that the inclusion of

these additional regressors in the GLM was necessary for this control analysis, but was not
necessary in the main analysis, as visual scene information was always present within each
navigation period in any case, and was not confounded with the key goal direction analyses. A
visual control pattern similarity analysis was applied to the 32 voxel patterns representing the
visual scene information on each trial. This analysis was a multiple binary regression analysis as
described above, matched as closely as possible to the navigation decision analysis. The contrast
regressor of interest specified the visual scene present on each trial, and three additional
regressors-‐of-‐no-‐interest specified start location, goal location, and egocentric location for that
trial. For a given ROI, beta parameters for the visual scene regressor were calculated for each
participant, and compared against zero with a one-‐tailed t-‐test in order to determine the presence
of purely visual scene information. This analysis was applied both to the left entorhinal/subicular
ROI and also an anatomically defined ROI in bilateral extrastriate cortex. The scene information in
both regions was compared with the geocentric direction information as measured in the main
analysis in a 2x2 repeated measures ANOVA, with factors of region and information type.
There were two elements of the experimental design that provided sufficient temporal separation
between the visual scene control and the navigation portions of each trial to make this control
analysis feasible. First, each condition and trial-‐type occurs once in each of three functional
sessions, and the first level GLM was set up to estimate a single response pattern expressed across
all three sessions. Second, temporal jitter between the different components was a natural part of
the design partly due to the self-‐paced nature of the task, but more importantly due to the
randomized order of the different components. On each trial the order of the two control
conditions was randomized, ensuring a degree of temporal jitter across trials. When measuring the
response patterns over the three functional sessions, this allowed us to temporally separate the
different signals of interest.

Egocentric control analysis
While investigating egocentric goal direction was not our principle aim in this study, we
nevertheless included an additional egocentric control condition. In this condition, the same visual
scene cue was presented as in the main navigation task, and a red dot was presented near this
image. Participants simply had to indicate whether the dot was above, below, to the left, or to the
right of the presented image. This task includes simple egocentric judgments that are not
navigationally relevant. Thus, if a region contains information about this control task, then it is a
more general egocentric representation rather than any specific representation related to
navigation-‐guided behaviour. Egocentric control data were preprocessed using a first-‐level GLM to
fit a regressor for each of the 32 trial types, as with the navigation decision data. However, in this
analysis, the regressors were event-‐related, and modelled the onset of the red dot in the control
component of each trial. Notably, unlike the visual control analysis described above, it was not
necessary to additionally include the 32 navigation decision regressors. This is because the
egocentric directions in the control task and the navigation task were both randomized, and
therefore not confounded with one another across trials. An egocentric control RSA analysis was
applied to the 32 voxel patterns representing egocentric direction onscreen on each trial. This
analysis was a binary regression analysis contrasting trial pairs where the egocentric direction
matched against those where the direction did not match. Within the precuneus ROI, beta
parameters for this egocentric control regression were calculated for each participant, and
compared against zero with a one-‐tailed t-‐test in order to determine the presence of simple
egocentric direction information in the absence of navigation. This was directly contrasted with
the beta parameters from the egocentric goal direction analysis with a two-‐tailed t-‐test.

Supplemental Results Entorhinal lateralization analysis
The geocentric direction searchlight result found a result selectively within the left
entorhinal/subicular region, suggesting that the head direction simulation effect may be left
lateralized. In order to test this idea, we directly compared the geocentric direction information
between the left and right entorhinal region, using anatomically defined regions of interest. These
were manually delineated on the group average structural image using [S15] and [S16] for
guidance. It should be noted that, as these ROIs were delineated on the group average structural
image, not all anatomical landmarks were clearly visible. The ROI is therefore only an anatomical
approximation of the entorhinal cortex (hence the term “entorhinal/subicular region”).
Importantly, the same guidelines were used in both hemispheres, so this gives us an unbiased
method of assessing any lateralized functionality. The analysis used the same pattern similarity
multiple binary regressor as was used in the searchlight, but now specifically focusing on the two
ROIs. This revealed that both hemispheres independently contain geocentric direction information
(Left: t(15) = 3.22, p = 0.0028; Right: t(15) = 1.89, p = 0.039), and while the left does show a greater
effect (consistent with the searchlight result), this difference was not statistically significant (t(15)
= 1.53, p = 0.15). Thus we find no evidence for a hemispheric specialization, but instead find that
both hemispheres independently process geocentric goal direction.
Precuneus lateralization analysis
While the original significant precuneus cluster is confined to the left hemisphere, the ROI used for
all further analyses was based on a more lenient threshold, in order to ensure that sufficient
voxels were included for the RSA analyses (see above). Notably, this larger cluster was bilateral in
nature, and therefore all ROI-‐based results reported in the main text were based on bilateral

precuneus. Nevertheless, it is possible that these results were based largely on just the left
hemisphere voxels. To investigate this, we formally tested for hemispheric specialization of the
precuneus in our dataset. In order to do this, we divided the bilateral precuneus ROI into two at
the midline, creating left and right precuneus ROIs. We applied the same multiple regression
pattern similarity analysis to both independently, and found that both sides independently contain
significant egocentric goal direction information (Left: t(15) = 3.05, p = 0.004; Right: t(15) = 3.26, p
= 0.0026), with no significant difference in the strength of coding between the two (t(15) = 0.0061,
p = 0.995). We therefore find no evidence for hemispheric specialization in egocentric goal
direction coding in our data.
Start and goal location analyses
While the main aim of this study was to investigate direction representations, the experimental
design also allowed us to investigate spatial representations, both for the start location and the
goal location. We note, however, that for the latter analysis, goal location itself is completely
confounded with the visual object used to cue this location on each trial. This cue is not a
confound with respect to any of our primary effects of interest, but is for goal location. Therefore
any results of this particular analysis should be interpreted with caution. No voxels survived
whole-‐brain FWE correction for either the start or goal location analyses (see below for results
using a more liberal threshold). Similarly, follow-‐up analyses in the functionally defined ROIs
revealed no significant effect of either type of spatial information in either the
entorhinal/subicular region or the precuneus. Thus, in the context of this study, we only find
evidence relating to direction coding, not spatial location coding. This suggests that we were not
able to detect grid cell representations, in contrast to previous investigations of the entorhinal
region [S4, S5]. However, these previous studies sampled a much larger range of spatial locations
in order to detect these representations, while our study was instead optimised for detecting

direction representations. In addition, in the current study, each trial required participants to
represent both their own location within the environment, and the goal location, which could
have added considerable noise to the self-‐location analysis.
Exploratory searchlight analyses
While we focus primarily on results that are statistically rigorous based on the relevant SVC region,
it is also informative to ask whether any additional regions in the brain might show an equivalent
effect that would otherwise not show up due to being outside our predicted region of interest. We
therefore conducted additional, exploratory searchlight analyses of each condition in order to
determine whether this might be the case. While any such results are not statistically robust, they
are nevertheless useful for determining whether other regions outside the SVC regions might also
be involved, and therefore targets for future research. In order to do this, we used the same initial
voxel thresholding of pseudo-‐t > 3 in each case, and then where possible took the cluster extent
threshold that was used to determine significance within the SVC of the relevant analysis. For the
geocentric direction analysis, this threshold was k>88, and for the egocentric direction analysis it
was k>49. For the start location analysis, no voxel within the SVC mask survived the initial pseudo-‐
t threshold, and only a single cluster of three voxels survived this across the entire brain. It is clear,
therefore that we find no evidence for spatial location representations within our data. The
geocentric direction analysis similarly produces no additional regions outside the SVC mask with
cluster size greater than the SVC threshold (k>88). However, the egocentric analysis revealed two
addition clusters at this threshold, in the cerebellum (MNI coords: 0, -‐46, -‐41; cluster size k = 91)
and the precentral gyrus (MNI coords: -‐56, -‐3, 34; cluster size k = 68). It is therefore possible that
these additional regions may also contain information about egocentric goal direction. The
(confounded) goal location analysis revealed two clusters at this liberal threshold, in bilateral

dorsolateral PFC (right MNI coord: 33, 9, 26; cluster size 254; left MNI coord: -‐26, 15, 27; cluster
size 73).
Grey matter control analysis
To ensure that the reported results within the entorhinal/subicular region were not primarily
driven by voxels falling within the white matter, we performed an additional control analysis
restricted to grey matter voxels. During preprocessing, each participant’s T1-‐weighted structural
image was segmented into grey and white matter images, each of which has normalized values
between 0 and 1, with higher values indicating higher likelihood of that voxel containing grey
matter. These grey matter images were normalized into MNI space, as described above. We
repeated the analysis of each condition (facing direction, goal direction, crossmatch) within the
entorhinal/subicular ROI, but this time restricting the analysis to grey matter voxels, using subject-‐
specific grey-‐matter masks (with a conservative grey threshold of 0.8). For all three conditions we
again found a significant result within the entorhinal/subicular region (Facing: t(15) = 3.48, p =
0.0017; Goal: t(15) = 1.88, p = 0.04; Cross: t(15) = 2.89, p = 0.0056). It is very unlikely, therefore,
that these effects are driven by activity taking place within the white matter.
Pattern construction analysis
In order to specifically test the hypothesis that a linear mixture of both facing and goal direction
information is present on each trial, we applied a second analysis method based on “pattern
construction” [S24–S27]. The logic of this analysis is simple: On a trial consisting of a North facing
direction and an East goal direction (a N+E trial), we hypothesize that representations of both
North and East will be active, and will be expressed as a linear combination of the voxel patterns
for North and East. Within our data, we have a proportion of trials where the facing direction and
goal direction are identical. On these trials, only one direction signal should be present within the

entorhinal/subicular region, and these we refer to as “pure” direction trials. We can take
advantage of these trials in order to explicitly test the linear combination hypothesis. For the
above example, we would do this by taking the average pattern across all “pure” North trials (both
facing and goal direction are North), and the average pure East pattern, and summing these two
patterns to create a prediction of what a N+E trial pattern should look like if the linear
combination rule holds. We then simply correlate the actual N+E trial with our predicted N+E
pattern to assess how well our prediction matches the data. We applied this logic to the voxel
patterns within the entorhinal/subicular region of interest. The full analysis involved creating pure
direction patterns for each of the four cardinal directions, as described above. From these we then
constructed the full set of possible combined patterns by summing the different combinations of
the pure directions. For each individual, we correlated the pattern for each trial against the
predicted combined pattern for that trial (Note that these trials were completely independent of
the data used to construct the pure and combined patterns). We also correlated the pattern for
each trial against each of the non-‐predicted combined patterns for that trial, and averaged these
correlation coefficients to provide a baseline null for that trial. The predicted and baseline
correlation coefficients were averaged across all trials to form a summary for each participant.
These were then statistically compared at the group level using a one-‐tailed paired t-‐test. This
analysis revealed that the voxel pattern on each trial correlated significantly better with the
predicted pattern than the unpredicted baseline patterns (t(15) = 3.68, p = 0.0011). This
demonstrates that the constructed pattern, formed by a linear combination of both goal and
facing direction, significantly predicts the pattern of voxel activity expressed on trials containing
those two directions. Importantly, the predicted combined patterns also correlated with the trial
voxel patterns significantly better than either the pure facing direction (t(15) = 2.76, p = 0.015;
two-‐tailed t-‐test) or the pure goal direction pattern (t(15) = 2.39, p = 0.03; two-‐tailed t-‐test) for
that trial, demonstrating that this result cannot be explained by either one of these alone –

instead, it is the linear combination of the two direction patterns that best explains the voxel
pattern expressed on any given trial. These results provide further support for the conclusion that
both facing and goal direction information are present within the entorhinal/subicular region.
Exploring the “pure” direction trials
As described above, we refer to those trials where both the facing direction and goal direction
match as “pure” direction trials, as only one single geocentric direction representation should be
active on these trials. We might expect that these trials should have a stronger representation of
this direction compared to trials where two different directions are represented. In order to test
this idea, we specifically assessed the correlation between the matching “pure” direction trials for
each participant, and compared this against the facing direction and goal direction conditions
(after excluding the pure direction trials). We found no evidence for a significantly greater level of
similarity in the pure direction trials compared to either facing direction (t(15)=-‐0.76, p=0.46) or
goal direction (t(15)=-‐0.60, p=0.55), as assessed with a two-‐tailed paired t-‐test. This therefore
suggests that “pure” trials do not have a stronger directional representation. Indeed, we found
that the similarity was somewhat lower in this condition than both the facing and goal direction
conditions, although this was not significant in either case. We attribute this lower similarity score
to the fact that the “pure” condition is based on just four correlation datapoints per subject, as
opposed to 40 and 24 datapoints for facing and goal direction respectively. The small data sample
for each subject is likely to have produced a much less reliable estimate of the true effect in the
“pure” condition compared to either other condition. To examine the impact of sample size, we
performed a bootstrap analysis using the facing direction correlation datapoints. The full sample
includes 40 correlation datapoints per subject, which produced a significant effect compared to
the null match condition (t(15)=3.48, p=0.0017). However, when we randomly sampled 4 of these
correlation pairs per subject over 10,000 repetitions, the probability of detecting a significant
effect was found to be just 28%. When we increased the number of samples to 24, this probability
increased to 94%, showing that sample size for each individual subject has a substantial impact on
power at the group level. This therefore suggests that our “pure” direction analysis was
substantially underpowered to detect our effect of interest, and this result should be interpreted
accordingly.
Pattern construction visual control analysis
We applied a second method of checking whether the visual scene information could explain our
data, this time using the pattern construction method (see above). The method was identical to
that described above, with the exception that the “pure” direction patterns were now constructed
from the visual scene data rather than the navigation data. In this case all visual scenes for each
direction were averaged together to form each “pure” pattern. These were then used to construct
each of the combined patterns that would be predicted if the neural patterns expressed on each
navigation trial were the linear combination of a visual scene response in the facing direction, and
an imagined visual scene in the goal direction (as opposed to representations of geocentric
direction). Based on these predicted combined patterns, the pattern construction analysis was
repeated. In this case, we found that the voxel pattern on each trial did not correlate significantly
better with the predicted pattern than the unpredicted baseline patterns (t(15)=-‐1.11 p=0.86).
Furthermore, the difference between predicted and unpredicted correlation was significantly
greater in the navigation condition than this visual control condition (t(15)=3.57, p=0.0028).
Overall, therefore, this analysis provides confirmatory evidence that our results cannot be
explained on the basis of basic visual scene representations, but instead are likely to be based on
representations of geocentric direction.

Associative learning control
The navigation task used in this experiment could not be solved by any simple paired association
strategy between goal location and the correct direction (or scene), as the correct answer on each
trial depended on the spatial relationship between the start location and the goal location.
However, is it possible that, rather than a simple paired association, participants have encoded a
more complex association between start location, goal location, and direction/scene? If
participants were able to learn these associations through simple associative learning, then they
would be able to solve the geocentric task without the need to use any spatial simulation.
Critically, participants did not have the chance to explicitly learn all 32 of these sets of associative
triads, as the learning of the virtual environment was accomplished through free exploration prior
to scanning. However, 8 trials were explicitly presented, with feedback, as these “probe” trials
were used to assess how well participants were learning the environment. While we note that
these probe trials themselves could not have been solved through associative learning, it is in
theory possible that exposure to these trials could have led to subsequent associative encoding of
these 8 associative triads. To ensure that our results are not primarily due to these 8 trials, we ran
an additional pattern similarity analysis controlling for these 8 probe trials. This was accomplished
using the multiple binary regression approach described above, with the additional of one further
regressor that indexed those trial pairs that included one or more probe trials. This additional
regressor effectively captured variance associated with the probe trials in particular, and ensured
that any remaining variance associated with geocentric direction could not be due to associatively
learned probe trial information. This analysis revealed a significant effect for geocentric direction
coding within the entorhinal/subicular region ROI (t(15) = 3.47, p = 0.0017), providing evidence
that our results cannot be explained by associative learning.

Supplemental Discussion
Conjunctive grid cells
Given that previous studies have demonstrated the presence of grid cell representations within
the entorhinal region, is it possible that our results could be due to grid cell rather than head-‐
direction cell activity? Classical grid cells are not sensitive to direction information, and so it is not
clear how they be responsible for our results. Conjunctive grid cells, on the other hand, do show
modulation by heading direction. Thus, it is possible that the direction signal we detect in the
entorhinal/subicular region is partially driven by conjunctive cell simulation of intended future
vectors [S28]. However, entorhinal conjunctive cells are highly interconnected with head-‐direction
cells, and indeed are assumed to receive their directional input from them [S6, S7]. It is therefore
unlikely that conjunctive cells would be recruited for simulation without the connected head-‐
direction cells also being recruited. Indeed, it is more likely that this simulation begins with head-‐
direction simulation, which then drives conjunctive cell simulation [S29]. Notably, even a recent
model of vector navigation based on conjunctive cell ensembles assumes a stable head-‐direction
input to those conjunctive cells [S28]. This therefore implies that head-‐direction simulation must
precede the conjunctive cell simulations of specific vectors for any direction other than current
heading. We therefore argue that it is unlikely that conjunctive cell populations alone can explain
our results. The most parsimonious explanation is that the goal direction representation is
generated by head-‐direction simulation, but we cannot rule out that conjunctive cell simulation
also contributes to this signal.
Attentional influence on entorhinal/subicular correlations
While we cannot completely rule out that differences in attention across subjects may have
contributed to the correlation we found between entorhinal/subicular facing direction and task

performance, the fact that the results are specific to facing direction information, and not goal
direction, makes this unlikely. Such global differences would be expected to produce a correlation
in both facing and goal direction information.
Supplemental References
S1. Taube, J. S., Valerio, S., and Yoder, R. M. (2013). Is navigation in virtual reality with FMRI really navigation? J. Cogn. Neurosci. 25, 1008–1019.
S2. Ekstrom, A. D., Kahana, M. J., Caplan, J. B., Fields, T. A., Isham, E. A., Newman, E. L., and Fried, I. (2003). Cellular networks underlying human spatial navigation. Nature 425, 184–188.
S3. Hassabis, D., Chu, C., Rees, G., Weiskopf, N., Molyneux, P. D., and Maguire, E. A. (2009). Decoding neuronal ensembles in the human hippocampus. Curr. Biol. 19, 546–554.
S4. Doeller, C. F., Barry, C., and Burgess, N. (2010). Evidence for grid cells in a human memory network. Nature 463, 657–661.
S5. Jacobs, J., Weidemann, C. T., Miller, J. F., Solway, A., Burke, J. F., Wei, X.-‐X., Suthana, N., Sperling, M. R., Sharan, A. D., Fried, I., et al. (2013). Direct recordings of grid-‐like neuronal activity in human spatial navigation. Nat. Neurosci. 16, 1188–1190.
S6. Sargolini, F., Fyhn, M., Hafting, T., McNaughton, B. L., Witter, M. P., Moser, M.-‐B., and Moser, E. I. (2006). Conjunctive representation of position, direction, and velocity in entorhinal cortex. Science 312, 758–762.
S7. Whitlock, J. R., and Derdikman, D. (2012). Head direction maps remain stable despite grid map fragmentation. Front. Neural Circuits 6, 9.
S8. Vass, L. K., and Epstein, R. A. (2013). Abstract representations of location and facing direction in the human brain. J. Neurosci. 33, 6133–6142.
S9. Weiskopf, N., Hutton, C., Josephs, O., and Deichmann, R. (2006). Optimal EPI parameters for reduction of susceptibility-‐induced BOLD sensitivity losses: A whole-‐brain analysis at 3 T and 1.5 T. NeuroImage 33, 493–504.
S10. Weiskopf, N., Hutton, C., Josephs, O., Turner, R., and Deichmann, R. (2007). Optimized EPI for fMRI studies of the orbitofrontal cortex: compensation of susceptibility-‐induced gradients in the readout direction. MAGMA 20, 39–49.
S11. Carr, V. A., Rissman, J., and Wagner, A. D. (2010). Imaging the human medial temporal lobe with high-‐resolution fMRI. Neuron 65, 298–308.
S12. Welvaert, M., and Rosseel, Y. (2013). On the Definition of Signal-‐To-‐Noise Ratio and Contrast-‐To-‐Noise Ratio for fMRI Data. PLoS ONE 8, e77089.

S13. Misaki, M., Kim, Y., Bandettini, P. A., and Kriegeskorte, N. (2010). Comparison of multivariate classifiers and response normalizations for pattern-‐information fMRI. NeuroImage 53, 103–118.
S14. Chadwick, M. J., Bonnici, H. M., and Maguire, E. A. (2012). Decoding information in the human hippocampus: A user’s guide. Neuropsychologia 50, 3107–3121.
S15. Duvernoy, H. M. (2005). The Human Hippocampus: Functional Anatomy, Vascularization and Serial Sections with MRI 3rd ed. (New York, USA: Springer).
S16. Insausti, R., Juottonen, K., Soininen, H., Insausti, A. M., Partanen, K., Vainio, P., Laakso, M. P., and Pitkänen, A. (1998). MR volumetric analysis of the human entorhinal, perirhinal, and temporopolar cortices. AJNR Am. J. Neuroradiol. 19, 659–671.
S17. Vann, S. D., Aggleton, J. P., and Maguire, E. A. (2009). What does the retrosplenial cortex do? Nat. Rev. Neurosci. 10, 792–802.
S18. O’Keefe, J., and Nadel, L. (1978). The Hippocampus as a Cognitive Map (Oxford University Press, USA).
S19. Eickhoff, S. B., Stephan, K. E., Mohlberg, H., Grefkes, C., Fink, G. R., Amunts, K., and Zilles, K. (2005). A new SPM toolbox for combining probabilistic cytoarchitectonic maps and functional imaging data. NeuroImage 25, 1325–1335.
S20. Cavanna, A. E., and Trimble, M. R. (2006). The precuneus: a review of its functional anatomy and behavioural correlates. Brain J. Neurol. 129, 564–583.
S21. Kriegeskorte, N., Goebel, R., and Bandettini, P. (2006). Information-‐based functional brain mapping. Proc. Natl. Acad. Sci. U. S. A. 103, 3863–3868.
S22. Nichols, T. E., and Holmes, A. P. (2002). Nonparametric permutation tests for functional neuroimaging: a primer with examples. Hum. Brain Mapp. 15, 1–25.
S23. Nili, H., Wingfield, C., Walther, A., Su, L., Marslen-‐Wilson, W., Kriegeskorte, N. (2014). A toolbox for representational similarity analysis. PLoS Comput. Biol. 10(4).
S24. Macevoy, S. P., and Epstein, R. A. (2009). Decoding the representation of multiple simultaneous
objects in human occipitotemporal cortex. Curr. Biol. 19, 943–947.
S25. Reddy, L., Kanwisher, N. G., and VanRullen, R. (2009). Attention and biased competition in multi-‐voxel object representations. Proc. Natl. Acad. Sci. U. S. A. 106, 21447–21452.
S26. MacEvoy, S. P., and Epstein, R. A. (2011). Constructing scenes from objects in human occipitotemporal cortex. Nat. Neurosci. 14, 1323–1329.
S27. Baeck, A., Wagemans, J., and Op de Beeck, H. P. (2013). The distributed representation of random and meaningful object pairs in human occipitotemporal cortex: the weighted average as a general rule. NeuroImage 70, 37–47.
S28. Kubie, J. L., and Fenton, A. A. (2012). Linear look-‐ahead in conjunctive cells: an entorhinal mechanism for vector-‐based navigation. Front. Neural Circuits 6, 20.
S29. Erdem, U. M., and Hasselmo, M. (2012). A goal-‐directed spatial navigation model using forward trajectory planning based on grid cells. Eur. J. Neurosci. 35, 916–931.


![[DIRECTION MATTERS] [BAIL APPLICATIONS]](https://img.pdfslide.net/doc/110x75/63279d09e491bcb36c0b5e47/direction-matters-bail-applications.jpg)