Embed Size (px)
Citation preview

THE ROLE OF THE MEDIAL ENTORHINAL CORTEX IN HIPPOCAMPAL SPATIAL AND TEMPORAL CODING
Magdalene I. Schlesiger
Dissertation der Graduate School of Systemic Neurosciences
der Ludwig-Maximilians-Universität München
Submitted 31. May 2016

Research was conducted at the Biological Sciences Department
University of California, San Diego

Date of oral examination: 05.12.2016
Supervisors: Prof. Dr. Christian Leibold
Prof. Dr. Stefan Leutgeb
Abstract The hippocampus (HIPP) is the core of a memory system crucial for the formation of new
episodic (unique event) memories in humans and episodic‐like memories (for what, where and
when) in rodents. Its prevalent role in the formation of memories is thought to rely on a variety of
specialized neural network computations: It is for example believed that hippocampal networks
associate information about different aspects of an experience (such as a particular event and the
place at which the event occurred) into a coherent memory trace. In order to prevent interference
between memories that are similar (such as two different experiences within the same place) each
memory is assigned a neural code that is highly distinct from those for previously acquired
memories. Finally, hippocampal networks are thought to fuse memories for individual fragments of
an experience into a temporally structured sequence which represent an episode. Information about
different aspects of an experience reaches the HIPP via the entorhinal cortex (EC), which is its major
cortical input structure. Electrophysiological single‐unit recordings in behaving rodents revealed that
in particular the medial division of the EC (MEC) contains a variety of cell types that are specialized in
the representation of spatial and self‐motion information. It is therefore believed that input from
the MEC supports the spatial component of memory processing in the HIPP. Here, we tested the
long‐standing hypothesis that hippocampal spatial coding relies on input from the MEC. This was
achieved by performing extensive, bilateral excitotoxic lesions of the MEC and placing electrode
arrays into the CA1 pyramidal cell layer of the HIPP. Hippocampal neural computations were
assessed by recording extracellular action potentials (APs) from individual neurons as rats explored
open field environments. The firing patterns of hippocampal neurons are known to correlate with
the rat’s behavior, in that each cell fires APs at restricted proportions of the environment, forming
spatial receptive fields (so‐called place fields). The spatial precision and organization of those place
fields was examined in control and MEC‐lesioned rats. We found that hippocampal neurons retained
their spatial selectivity after MEC lesions, even though the precision and stability of the hippocampal
spatial code were reduced. The ability to form distinct spatial representation for different
environments was entirely intact in MEC‐lesioned rats. Contrary to most contemporary theories of
hippocampo‐entorhinal function, our findings suggest that the MEC is not the only determinant of
hippocampal spatial computations and that sources lacking sophisticated spatial firing, such as the
lateral division of the entorhinal cortex (LEC) and local hippocampal network computations are
sufficient to support this function. Following the finding that spatial firing was partly preserved in
MEC‐lesioned rats, we tested whether the MEC is necessary for the temporal organization of spike
timing within the place field. Hippocampal place cells that are activated along the rat’s trajectory
through space are thought to be linked into synaptically connected neuronal sequences via a

mechanisms referred to as hippocampal theta phase precession (hTPP). Theta phase precession
reflects the temporal distribution of APs within each place field with reference to the local field
potential (LFP) oscillation at theta frequency (4 to 10 Hz). We found that hTPP was strongly
disrupted in MEC‐lesioned rats, demonstrating that the MEC is necessary for the temporal
organization of hippocampal spatial firing. Cognitive functions that rely on sequentially activated
place cells are thus likely to rely on the MEC. In summary, the presented data demonstrate that the
contribution of the MEC to hippocampal spatial coding is less predominant than postulated by
contemporary theories of hippocampo‐entorhinal function. In addition, the findings suggest that the
MEC, which is widely considered a spatial processing center of the brain, supports memory through
the temporal organization of hippocampal spatial firing.

Table of contents Chapter
1 General introduction 9
1.1 General summary and aims ‐‐‐‐‐‐‐‐‐‐‐‐‐‐‐‐‐‐‐‐‐‐‐‐‐‐‐‐‐‐‐‐‐‐‐‐‐‐‐‐‐‐‐‐‐‐‐‐‐‐‐‐‐‐‐‐‐‐‐‐‐‐‐‐‐‐‐‐‐‐‐‐‐‐ 10
1.2 Anatomical context ‐‐‐‐‐‐‐‐‐‐‐‐‐‐‐‐‐‐‐‐‐‐‐‐‐‐‐‐‐‐‐‐‐‐‐‐‐‐‐‐‐‐‐‐‐‐‐‐‐‐‐‐‐‐‐‐‐‐‐‐‐‐‐‐‐‐‐‐‐‐‐‐‐‐‐‐‐‐‐‐‐‐‐‐ 12
1.2.1 Organization of the hippocampo‐parahippocampal region ‐‐‐‐‐‐‐‐‐‐‐‐‐‐‐‐‐‐‐‐‐‐‐ 12
1.2.2 Connectivity between the HF and MEC. ‐‐‐‐‐‐‐‐‐‐‐‐‐‐‐‐‐‐‐‐‐‐‐‐‐‐‐‐‐‐‐‐‐‐‐‐‐‐‐‐‐‐‐‐‐‐‐ 14
1.3 Spatial coding within the hippocampo‐entorhinal region ‐‐‐‐‐‐‐‐‐‐‐‐‐‐‐‐‐‐‐‐‐‐‐‐‐‐‐‐‐‐‐‐‐‐‐ 15
1.3.1 Hippocampal place cells ‐‐‐‐‐‐‐‐‐‐‐‐‐‐‐‐‐‐‐‐‐‐‐‐‐‐‐‐‐‐‐‐‐‐‐‐‐‐‐‐‐‐‐‐‐‐‐‐‐‐‐‐‐‐‐‐‐‐‐‐‐‐‐‐‐‐‐‐ 15
1.3.2 Spatially modulated firing outside of the HIPP ‐‐‐‐‐‐‐‐‐‐‐‐‐‐‐‐‐‐‐‐‐‐‐‐‐‐‐‐‐‐‐‐‐‐‐‐‐‐‐ 17
1.4 Non‐spatial coding within the hippocampo‐entorhinal region ‐‐‐‐‐‐‐‐‐‐‐‐‐‐‐‐‐‐‐‐‐‐‐‐‐‐‐‐‐ 18
1.5 Computations supporting the formation of distinct memories ‐‐‐‐‐‐‐‐‐‐‐‐‐‐‐‐‐‐‐‐‐‐‐‐‐‐‐‐ 19
1.5.1 The HIPP as an associative network ‐‐‐‐‐‐‐‐‐‐‐‐‐‐‐‐‐‐‐‐‐‐‐‐‐‐‐‐‐‐‐‐‐‐‐‐‐‐‐‐‐‐‐‐‐‐‐‐‐‐‐‐‐ 19
1.5.2 Pattern separation supports the formation of distinct memories ‐‐‐‐‐‐‐‐‐‐‐‐‐‐ 23
1.5.3 Two forms of pattern separation in the hippocampo‐entorhinal system ‐‐‐‐‐ 25
1.6 Temporal coding in the hippocampo‐entorhinal region ‐‐‐‐‐‐‐‐‐‐‐‐‐‐‐‐‐‐‐‐‐‐‐‐‐‐‐‐‐‐‐‐‐‐‐‐‐‐ 29
1.6.1 The theta rhythm ‐‐‐‐‐‐‐‐‐‐‐‐‐‐‐‐‐‐‐‐‐‐‐‐‐‐‐‐‐‐‐‐‐‐‐‐‐‐‐‐‐‐‐‐‐‐‐‐‐‐‐‐‐‐‐‐‐‐‐‐‐‐‐‐‐‐‐‐‐‐‐‐‐‐‐‐ 30
1.6.2 Generation of the hippocampal theta rhythm ‐‐‐‐‐‐‐‐‐‐‐‐‐‐‐‐‐‐‐‐‐‐‐‐‐‐‐‐‐‐‐‐‐‐‐‐‐‐‐ 31
1.6.3 Function of the theta rhythm ‐‐‐‐‐‐‐‐‐‐‐‐‐‐‐‐‐‐‐‐‐‐‐‐‐‐‐‐‐‐‐‐‐‐‐‐‐‐‐‐‐‐‐‐‐‐‐‐‐‐‐‐‐‐‐‐‐‐‐‐‐ 33
1.6.4 Hippocampal theta phase precession ‐‐‐‐‐‐‐‐‐‐‐‐‐‐‐‐‐‐‐‐‐‐‐‐‐‐‐‐‐‐‐‐‐‐‐‐‐‐‐‐‐‐‐‐‐‐‐‐‐‐ 35
1.6.5 Theta phase precession in hippocampal output and input structures ‐‐‐‐‐‐‐‐‐ 39
1.7 Aims revisited ‐‐‐‐‐‐‐‐‐‐‐‐‐‐‐‐‐‐‐‐‐‐‐‐‐‐‐‐‐‐‐‐‐‐‐‐‐‐‐‐‐‐‐‐‐‐‐‐‐‐‐‐‐‐‐‐‐‐‐‐‐‐‐‐‐‐‐‐‐‐‐‐‐‐‐‐‐‐‐‐‐‐‐‐‐‐‐‐‐‐‐ 41

2 Published manuscript (i) 42
Medial entorhinal cortex lesions only partially disrupt hippocampal place cells and
hippocampus‐dependent place memory
2.1 Abstract ‐‐‐‐‐‐‐‐‐‐‐‐‐‐‐‐‐‐‐‐‐‐‐‐‐‐‐‐‐‐‐‐‐‐‐‐‐‐‐‐‐‐‐‐‐‐‐‐‐‐‐‐‐‐‐‐‐‐‐‐‐‐‐‐‐‐‐‐‐‐‐‐‐‐‐‐‐‐‐‐‐‐‐‐‐‐‐‐‐‐‐‐‐‐‐‐‐‐‐ 45
2.2 Introduction ‐‐‐‐‐‐‐‐‐‐‐‐‐‐‐‐‐‐‐‐‐‐‐‐‐‐‐‐‐‐‐‐‐‐‐‐‐‐‐‐‐‐‐‐‐‐‐‐‐‐‐‐‐‐‐‐‐‐‐‐‐‐‐‐‐‐‐‐‐‐‐‐‐‐‐‐‐‐‐‐‐‐‐‐‐‐‐‐‐‐‐‐‐‐ 46
2.3 Results ‐‐‐‐‐‐‐‐‐‐‐‐‐‐‐‐‐‐‐‐‐‐‐‐‐‐‐‐‐‐‐‐‐‐‐‐‐‐‐‐‐‐‐‐‐‐‐‐‐‐‐‐‐‐‐‐‐‐‐‐‐‐‐‐‐‐‐‐‐‐‐‐‐‐‐‐‐‐‐‐‐‐‐‐‐‐‐‐‐‐‐‐‐‐‐‐‐‐‐‐‐ 47
2.4 Discussion ‐‐‐‐‐‐‐‐‐‐‐‐‐‐‐‐‐‐‐‐‐‐‐‐‐‐‐‐‐‐‐‐‐‐‐‐‐‐‐‐‐‐‐‐‐‐‐‐‐‐‐‐‐‐‐‐‐‐‐‐‐‐‐‐‐‐‐‐‐‐‐‐‐‐‐‐‐‐‐‐‐‐‐‐‐‐‐‐‐‐‐‐‐‐‐‐ 58
2.5 Methods ‐‐‐‐‐‐‐‐‐‐‐‐‐‐‐‐‐‐‐‐‐‐‐‐‐‐‐‐‐‐‐‐‐‐‐‐‐‐‐‐‐‐‐‐‐‐‐‐‐‐‐‐‐‐‐‐‐‐‐‐‐‐‐‐‐‐‐‐‐‐‐‐‐‐‐‐‐‐‐‐‐‐‐‐‐‐‐‐‐‐‐‐‐‐‐‐‐‐ 61
2.6 Appendix ‐‐‐‐‐‐‐‐‐‐‐‐‐‐‐‐‐‐‐‐‐‐‐‐‐‐‐‐‐‐‐‐‐‐‐‐‐‐‐‐‐‐‐‐‐‐‐‐‐‐‐‐‐‐‐‐‐‐‐‐‐‐‐‐‐‐‐‐‐‐‐‐‐‐‐‐‐‐‐‐‐‐‐‐‐‐‐‐‐‐‐‐‐‐‐‐‐‐ 64
3 Unpublished manuscript (i) 75
Reorganization of the spatial mapping system in the medial entorhinal is not
required for hippocampal global remapping
3.1 Abstract ‐‐‐‐‐‐‐‐‐‐‐‐‐‐‐‐‐‐‐‐‐‐‐‐‐‐‐‐‐‐‐‐‐‐‐‐‐‐‐‐‐‐‐‐‐‐‐‐‐‐‐‐‐‐‐‐‐‐‐‐‐‐‐‐‐‐‐‐‐‐‐‐‐‐‐‐‐‐‐‐‐‐‐‐‐‐‐‐‐‐‐‐‐‐‐‐‐‐‐ 78
3.2 Introduction ‐‐‐‐‐‐‐‐‐‐‐‐‐‐‐‐‐‐‐‐‐‐‐‐‐‐‐‐‐‐‐‐‐‐‐‐‐‐‐‐‐‐‐‐‐‐‐‐‐‐‐‐‐‐‐‐‐‐‐‐‐‐‐‐‐‐‐‐‐‐‐‐‐‐‐‐‐‐‐‐‐‐‐‐‐‐‐‐‐‐‐‐‐‐ 79
3.3 Methods ‐‐‐‐‐‐‐‐‐‐‐‐‐‐‐‐‐‐‐‐‐‐‐‐‐‐‐‐‐‐‐‐‐‐‐‐‐‐‐‐‐‐‐‐‐‐‐‐‐‐‐‐‐‐‐‐‐‐‐‐‐‐‐‐‐‐‐‐‐‐‐‐‐‐‐‐‐‐‐‐‐‐‐‐‐‐‐‐‐‐‐‐‐‐‐‐‐‐ 80
3.4 Results ‐‐‐‐‐‐‐‐‐‐‐‐‐‐‐‐‐‐‐‐‐‐‐‐‐‐‐‐‐‐‐‐‐‐‐‐‐‐‐‐‐‐‐‐‐‐‐‐‐‐‐‐‐‐‐‐‐‐‐‐‐‐‐‐‐‐‐‐‐‐‐‐‐‐‐‐‐‐‐‐‐‐‐‐‐‐‐‐‐‐‐‐‐‐‐‐‐‐‐‐‐ 84
3.5 Discussion ‐‐‐‐‐‐‐‐‐‐‐‐‐‐‐‐‐‐‐‐‐‐‐‐‐‐‐‐‐‐‐‐‐‐‐‐‐‐‐‐‐‐‐‐‐‐‐‐‐‐‐‐‐‐‐‐‐‐‐‐‐‐‐‐‐‐‐‐‐‐‐‐‐‐‐‐‐‐‐‐‐‐‐‐‐‐‐‐‐‐‐‐‐‐‐‐ 91
3.6 Appendix ‐‐‐‐‐‐‐‐‐‐‐‐‐‐‐‐‐‐‐‐‐‐‐‐‐‐‐‐‐‐‐‐‐‐‐‐‐‐‐‐‐‐‐‐‐‐‐‐‐‐‐‐‐‐‐‐‐‐‐‐‐‐‐‐‐‐‐‐‐‐‐‐‐‐‐‐‐‐‐‐‐‐‐‐‐‐‐‐‐‐‐‐‐‐‐‐‐‐ 95
4 Published manuscript (ii) 97
The medial entorhinal cortex is necessary for temporal organization of
hippocampal neuronal activity
4.1 Abstract ‐‐‐‐‐‐‐‐‐‐‐‐‐‐‐‐‐‐‐‐‐‐‐‐‐‐‐‐‐‐‐‐‐‐‐‐‐‐‐‐‐‐‐‐‐‐‐‐‐‐‐‐‐‐‐‐‐‐‐‐‐‐‐‐‐‐‐‐‐‐‐‐‐‐‐‐‐‐‐‐‐‐‐‐‐‐‐‐‐‐‐‐‐‐‐‐‐‐‐ 100
4.2 Introduction ‐‐‐‐‐‐‐‐‐‐‐‐‐‐‐‐‐‐‐‐‐‐‐‐‐‐‐‐‐‐‐‐‐‐‐‐‐‐‐‐‐‐‐‐‐‐‐‐‐‐‐‐‐‐‐‐‐‐‐‐‐‐‐‐‐‐‐‐‐‐‐‐‐‐‐‐‐‐‐‐‐‐‐‐‐‐‐‐‐‐‐‐‐‐ 101
4.3 Results ‐‐‐‐‐‐‐‐‐‐‐‐‐‐‐‐‐‐‐‐‐‐‐‐‐‐‐‐‐‐‐‐‐‐‐‐‐‐‐‐‐‐‐‐‐‐‐‐‐‐‐‐‐‐‐‐‐‐‐‐‐‐‐‐‐‐‐‐‐‐‐‐‐‐‐‐‐‐‐‐‐‐‐‐‐‐‐‐‐‐‐‐‐‐‐‐‐‐‐‐‐ 102
4.4 Discussion ‐‐‐‐‐‐‐‐‐‐‐‐‐‐‐‐‐‐‐‐‐‐‐‐‐‐‐‐‐‐‐‐‐‐‐‐‐‐‐‐‐‐‐‐‐‐‐‐‐‐‐‐‐‐‐‐‐‐‐‐‐‐‐‐‐‐‐‐‐‐‐‐‐‐‐‐‐‐‐‐‐‐‐‐‐‐‐‐‐‐‐‐‐‐‐‐ 120
4.5 Methods ‐‐‐‐‐‐‐‐‐‐‐‐‐‐‐‐‐‐‐‐‐‐‐‐‐‐‐‐‐‐‐‐‐‐‐‐‐‐‐‐‐‐‐‐‐‐‐‐‐‐‐‐‐‐‐‐‐‐‐‐‐‐‐‐‐‐‐‐‐‐‐‐‐‐‐‐‐‐‐‐‐‐‐‐‐‐‐‐‐‐‐‐‐‐‐‐‐‐ 124
4.6 Appendix ‐‐‐‐‐‐‐‐‐‐‐‐‐‐‐‐‐‐‐‐‐‐‐‐‐‐‐‐‐‐‐‐‐‐‐‐‐‐‐‐‐‐‐‐‐‐‐‐‐‐‐‐‐‐‐‐‐‐‐‐‐‐‐‐‐‐‐‐‐‐‐‐‐‐‐‐‐‐‐‐‐‐‐‐‐‐‐‐‐‐‐‐‐‐‐‐‐‐ 136

5 General discussion 156
5.1 Hippocampal place cells emerge without input from the MEC ................................... 157
5.1.1 Superposition of grid cell input might result in place cell firing ...................... 158
5.1.2 Grid cells are not essential for hippocampal spatial firing .............................. 159
5.1.3 Input from border cells might be sufficient to generate place cell firing ........ 160
5.1.4 Neither medial entorhinal cell type is required for place cell firing ................ 162
5.2 The MEC is not required for the formation of distinct hippocampal maps ................. 164
5.3 Intact hippocampal temporal coding requires input from the MEC ........................... 166
5.3.1 Potential of the direct medial entorhinal‐CA1 pathway ................................. 168
5.3.2 Potential of the indirect medial entorhinal‐CA1 pathway .............................. 171
5.3.3 Input from the LEC is not sufficient for hTPP to emerge ............................... 172
References 177
Abbreviations 191
Eidesstattliche Versicherung/Affidavit 193
List of publications 194
Author contributions 195
Acknowledgements 196
Curriculum Vitae 197

9
Chapter 1
General introduction

10
1.1 General summary and aims The hippocampal formation (HF), which is a collection of brain regions located in the
medial temporal lobe, is known to be a central component of a memory system that includes a
broad range of cortical regions. It is well established that the integrity of the HF is crucial for the
formation of new episodic (unique event) memories in humans (Scoville and Milner 1957; Squire
1982) and for the formation of spatial, contextual and non‐spatial memories (including episodic‐
like memories) in rodents (Morris et al. 1982; Tse et al. 2007). Substantial insight into the nature
of hippocampal processing comes from electrophysiological high‐density recordings in behaving
rodents: Most hippocampal excitatory neurons increase their firing rate when the animal passes
through a particular location in space, forming a so‐called place field. The observation that place
fields recorded from multiple cells cover the entire behavioral arena lead scientists to believe
that the HF forms neural representations of physical space and thus a cognitive map (O'Keefe
and Dostrovsky 1971). The profound importance of hippocampal processing, however, lies not
only in its spatial coding properties but in its ability to associate information about distinct
spatial and non‐spatial components that constitute a memory (Leutgeb, Leutgeb, Barnes, et al.
2005; Wood et al. 2000; Eichenbaum et al. 1999; Wood, Dudchenko, and Eichenbaum 1999;
Rolls 1990). Based on anatomical considerations and electrophysiological evidence, it is believed
that spatial, contextual and non‐spatial information is fed into the HF via the EC. The EC is the
major cortical input source to the HF and, in the rodent, is divided in two subregions, the medial
and the lateral EC (MEC and LEC, respectively). The MEC is considered an extension of the dorsal
visual stream and is known to contain a variety of cell types that are specialized in the
representation of space and self‐motion information (Fyhn et al. 2004; Hafting et al. 2005;
Sargolini et al. 2006; Kropff et al. 2015; van Strien, Cappaert, and Witter 2009). The LEC, in turn,
is considered an extension of the ventral visual stream. Neurons in LEC were found to lack
sophisticated spatial firing in standard experimental settings, and it is known that a proportion
of lateral entorhinal neurons represents objects and their locations (Hargreaves et al. 2005;
Knierim, Lee, and Hargreaves 2006; Tsao, Moser, and Moser 2013). It was therefore
hypothesized that the MEC provides the HF with fundamental spatial information, while
information about contextual and non‐spatial aspects of an experience might reach the HF via
the LEC (Hargreaves et al. 2005). While recent studies testing the effects of EC lesions on
hippocampal coding properties confirmed that the intact LEC is required for hippocampal
context coding (Lu et al. 2013), hippocampal spatial firing was only mildly affected by lesions or
inactivations of the MEC (Miller and Best 1980; Van Cauter, Poucet, and Save 2008; Brun et al.

11
2008; Ormond and McNaughton 2015). This is in stark contrast to a wide range of
computational models that render the spatial mapping system in the MEC crucial for
hippocampal spatial computations to emerge (Solstad, Moser, and Einevoll 2006; Jauffret,
Cuperlier, and Gaussier 2015; de Almeida, Idiart, and Lisman 2009; Savelli and Knierim 2010;
Krupic, Burgess, and O'Keefe 2012; Kammerer and Leibold 2014). However, because medial
entorhinal areas that are specialized in spatial processing were at least partly spared in
previously published studies, it remains unknown whether retained hippocampal spatial firing
was supported by spared MEC tissue or whether it can be maintained by input other than the
MEC.
The work presented in the first part of this dissertation (chapters 1.3, 2 and 5.1) aimed
to test the long‐standing hypothesis that the spatial mapping system in the MEC is crucial for
functional hippocampal spatial coding. To minimize the probability that spared MEC input
obscures our results, we performed nearly complete, bilateral excitotoxic lesions of the MEC.
The focus of the lesion was placed on the dorsocaudal‐most portion of the MEC, which is known
to be highly specialized in the coding of precise spatial and self‐motion information. In order to
assess the effect of MEC lesions on hippocampal physiology, we implanted electrode assemblies
with 14 individually movable tetrodes for bilateral recordings in hippocampal area CA1. Place
cell characteristics in MEC‐lesioned and in control rats where then studied during the
exploration of open field environments. In the second part of this dissertation (chapters 1.5, 3
and 5.2), this approach was extended to investigate whether the MEC is required for the
formation of distinct hippocampal spatial maps, a computation which is thought to prevent
memories of similar events from getting mixed up. In the third and final part (chapters 1.6, 4
and 5.3), I leave the spatial domain to examine how the MEC and hippocampus (HIPP) interact
in order to organize information in a meaningful way. In the mammalian brain, the temporal
organization of information is realized as the ordering of neuronal activity with references to
brain oscillations at different frequencies (Buzsaki, Logothetis, and Singer 2013). One of the
most studied examples of temporal coding in the brain is hippocampal theta phase precession
(hTPP). Theta phase precession describes a progressive change in the timing of APs with respect
to the ongoing local field potential (LFP) theta rhythm (4 to 10 Hz), and this progressive change
correlates with the rat’s distance within the cell’s place field (O'Keefe and Recce 1993). As a
result of TPP, the sequence of place fields that are activated along the rat’s trajectory through
space is replicated within each theta cycle, at a time scale that is relevant for spike‐time‐
dependent synaptic plasticity. The phenomenon of TPP was initially discovered in the HIPP, but
12
has recently also observed in the MEC (Hafting et al. 2008). By analyzing hTPP in rats with
extensive lesions to the MEC, we examined whether it requires input from the MEC.
1.2 Anatomical context
1.2.1 Organization of the hippocampo‐parahippocampal region
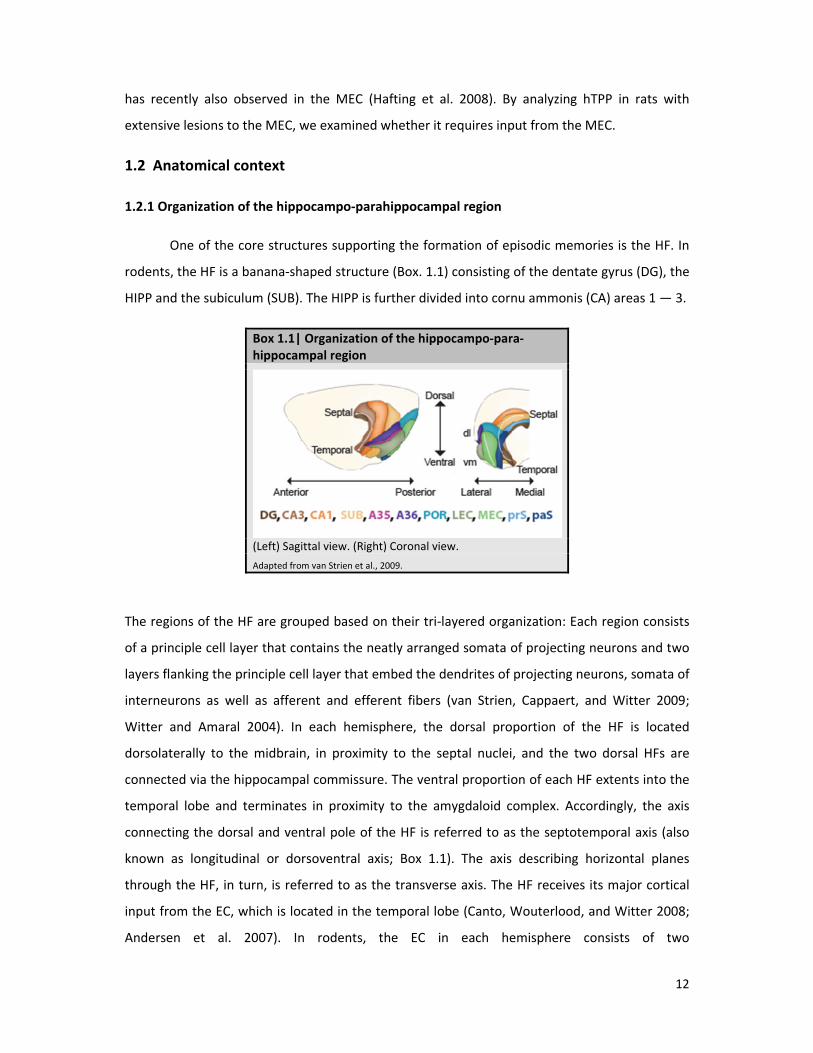
One of the core structures supporting the formation of episodic memories is the HF. In
rodents, the HF is a banana‐shaped structure (Box. 1.1) consisting of the dentate gyrus (DG), the
HIPP and the subiculum (SUB). The HIPP is further divided into cornu ammonis (CA) areas 1 — 3.
Box 1.1| Organization of the hippocampo‐para‐hippocampal region
(Left) Sagittal view. (Right) Coronal view.
Adapted from van Strien et al., 2009.
The regions of the HF are grouped based on their tri‐layered organization: Each region consists
of a principle cell layer that contains the neatly arranged somata of projecting neurons and two
layers flanking the principle cell layer that embed the dendrites of projecting neurons, somata of
interneurons as well as afferent and efferent fibers (van Strien, Cappaert, and Witter 2009;
Witter and Amaral 2004). In each hemisphere, the dorsal proportion of the HF is located
dorsolaterally to the midbrain, in proximity to the septal nuclei, and the two dorsal HFs are
connected via the hippocampal commissure. The ventral proportion of each HF extents into the
temporal lobe and terminates in proximity to the amygdaloid complex. Accordingly, the axis
connecting the dorsal and ventral pole of the HF is referred to as the septotemporal axis (also
known as longitudinal or dorsoventral axis; Box 1.1). The axis describing horizontal planes
through the HF, in turn, is referred to as the transverse axis. The HF receives its major cortical
input from the EC, which is located in the temporal lobe (Canto, Wouterlood, and Witter 2008;
Andersen et al. 2007). In rodents, the EC in each hemisphere consists of two

13
cytoarchitectonically and functionally distinct subdivisions — the LEC and the MEC (van Strien,
Cappaert, and Witter 2009). The EC is part of the parahippocampal region that, additionally,
entails the presubiculum (prS) and the parasubiculum (paS) as well as the perirhinal cortex
(PER). The PER is further divided in Brookman areas 35 and 36 (A35 and A36, respectively). The
parahippocampal region lies posterior to the HF and is adjacent to the SUB. Areas of the
parahippocampal region are distinct from areas of the HF, in that their neurons are organized in
six layers, comparable to other neocortical regions. A diagram of the connectivity between the
areas of the hippocampo‐parahippocampal region is provided in Box 1.2a: Highly processed
multimodal and unimodal sensory information from a variety of neocortical primary sensory and
association areas reaches the MEC and LEC via the POR and PER, respectively. In addition, input
from the retrosplenial cortex and the anterior thalamus is conveyed to both of the entorhinal
subdivision, via the prS and paS. Both divisions of the EC send projections to the HIPP, and the
projection patterns are organized topographical manner, in that the dorsal (d), intermediate
(int) and ventral (v) HIPP receive inputs from the dorsolateral (dl), intermediate and
ventromedial (vm) EC, respectively. The prS and paS send additional direct projection to the HF,
targeting the SUB and the DG.

14
Box 1.2| Hippocampo‐parahippocampal connectivity
(a) Overview over the hippocampo‐parahippocampal circuit. (b) Connectivity between the MEC and individual areas of the HF. Connections with CA2 are omitted for simplicity and connections with the prS/paS are additionally shown.
Adapted from Witter et al., 2013.
1.2.2 Connections between the HF and MEC
In the context of the work presented in this dissertations it is of particular relevance to
further elaborate on the connectivity between the HIPP and the MEC (Box 1.2b). The
hippocampo‐medial‐entorhinal circuitry is organized in a loop, in that the superficial medial
entorhinal layers (MEC II and III) provide input to the HIPP, while the deep medial entorhinal
layers (MEC IV and V) receive its output. CA1 is the major output area of the HIPP, sending
projections to the SUB as well as the MEC, and the MEC receives additional backprojections
from the SUB. Medial entorhinal input can reach the HIPP via two different routes: A direct
route from MEC III to CA1 and an indirect route that originates in MEC II and reaches CA1 via the
DG and CA3. In addition, input from MEC II can reach the HIPP more directly, via CA3.

15
1.3 Spatial coding in the hippocampo‐parahippocampal region
1.3.1 Hippocampal place cells
Substantial insight into the nature of hippocampal processing comes from
electrophysiological high‐density recordings in behaving rodents: Principal neurons in CA1, CA2,
CA3, the DG and the SUB increase their firing rates when the animal passes through a particular
location in space, forming a so‐called place field (Skaggs et al. 1996; Barnes et al. 1990; Mankin
et al. 2015; Leutgeb et al. 2007). While most hippocampal excitatory cells are place cells, only 20
to 60% of all CA1 and CA3 pyramidal cells are active in a standard laboratory recording setting
(i.e., a 1 m2 squared box), where they from one to two place fields (Leutgeb et al. 2004;
Thompson and Best 1989). In a two‐dimensional environment, the location specificity of each
hippocampal place cell is invariant to the running‐direction of the rat, and place fields recorded
from multiple cells cover the entire behavioral arena (Box 1.3a, Box 1.4a). Place cells are
smallest in the dorsal pole of the HIPP, and progressively increase in size towards its ventral pole
(Kjelstrup et al. 2008; Royer et al. 2010). Of note, the distribution of place field locations for a
given environment is established after a few minutes of exploratory behavior (Leutgeb et al.
2004; Frank, Stanley, and Brown 2004), and place field locations remain stable during
subsequent visits of the same environment (Box 1.4b). Because the process requires activity‐
dependent synaptic plasticity, stable hippocampal maps are thought to be the foundation for
the formation of stable spatial memories (Rotenberg et al. 1996; Kentros et al. 1998; Lever et al.
2002). During the initial map‐formation process, place field locations are anchored to a
constellation of salient landmarks, such as the polarizing cue card placed at one of the recording
chamber walls (Box 1.4c) or posters at the room walls. Once a stable map is formed, place cell
firing persist even in total darkness (Quirk, Muller, and Kubie 1990; Gothard, Skaggs, and
McNaughton 1996). Place field firing can thus be controlled by both, sensory information about
the environment as well as self‐motion information (McNaughton et al. 2006; Evans et al. 2015;
Terrazas et al. 2005; Gothard et al. 1996). Finally, place field locations are known reorganize in
response to environmental, motivational or behavioral changes, a phenomenon referred to as
remapping (Wood et al. 2000; Leutgeb et al. 2004; Muller and Kubie 1987; Eschenko and
Mizumori 2007). Hippocampal remapping results in the formation of distinct neural codes for
different situations and is thought to enable the formation of distinct memories. It will be more
thoroughly discussed in later sections of this dissertation (chapters 1.5, 3 and 5.2). Collectively,
the described observations lead scientists to believe that the HIPP forms an abstract neural

16
representation of physical space (a so‐called cognitive map), which can be used for spatial
navigation and the flexible formation of distinct memories (O'Keefe and Dostrovsky 1971;
Buzsaki and Moser 2013; Eichenbaum et al. 1999). Finally, it is important to note that place cell
firing is not confined to rats but has been also observed in other rodent species, such as mice
and gerbils (Mankin et al, 2012a), as well as in bats (Yartsev, Witter, and Ulanovsky 2011;
Ulanovsky and Moss 2007), and related firing pattern were also observed in non‐human
primates and humans (Rolls, Robertson, and Georges‐Francois 1997; Rolls and Stringer 2005;
Rolls, Xiang, and Franco 2005; Miller et al. 2013; Jacobs and Kahana 2010; Ekstrom et al. 2003)
Box 1.3| Spatially modulated firing in HIPP and MEC
(a‐e) Firing patterns recorded from individual cells in HIPP and MEC during 10‐min random foraging sessions in a 1 m2 squared box. For each cell, the rat’s trajectories (gray) with superimposed AP locations (red dots) are shown. (a) Six simultaneously recorded place cells in the HIPP. Note that while each place cell fires at one specific location in space, collectively, the population of active cells covers the entire recording environment. (b‐e) Different cell types found in deep and/or superficial layers of the MEC. (b) Head direction cell that fires whenever the rat faces into the northeast direction. (Left panel) Trajectory plot. (Right panel) Polar distribution of head direction angles associated with the APs fired during the recording session. (c) Grid cell as typically found in the dorsocaudal‐most proportion of the MEC. Firing locations are arranged into equilateral triangles, which form a hexagonal grid. (d) Spatially‐modulated cells that do not fire in a grid pattern (so‐called spatial non‐grid cells). (Left panel) Spatial non‐grid cell with a stripe‐like firing pattern. (Right panel) Cell whose firing pattern resembles hippocampal place cell firing. (e) Border cell that fires along a geometrical border at a preferred direction (west).As reported in Koenig et al., 2011; Hales, Schlesiger et al., 2014; Trajectory maps from medial entorhinal cells provided by Stefan Leutgeb and Julie Koenig; Schematic of hippocampal‐entorhinal connectivity adapted from Piatti, Ewell et al., 2013.

17
Box 1.4| Basic cellular population dynamics in the HIPP
Schematic depicting spatial firing characteristics of simultaneously recorded neurons in the HIPP in (a) a baseline foraging session, during (b) a second visit of the environment encountered in the baseline session and in (c) a condition where the recording chamber was rotated by 90°. The experimental setting is outlined at the left of each panel and the spatial firing patterns of six place cells are simulated at the right of each panel. For each cell, a heatmap is shown and the color scale is from zero (blue) to peak firing rate (red). For visual guidance, each heat map is divided in four equal squares (magenta cross).
As reported in Hales, Schlesiger at al., 2014; Muller and Kubie, 1987.
1.3.2 Spatially modulated firing outside of the HIPP
Spatial firing is not confined to the HF but is also prevalent in upstream areas of the
parahippocampal region. In rodents, one key component of the parahippocampal spatial
mapping system is the head direction (HD) cell. Each HD cell forms a receptive field that is
specific to a narrow range of adjacent HD angles within an allocentric (world‐centered)
reference frame (see Box 1.3b). Head direction cells can be found in a number of serially
connected brain regions, such as the lateral mammillary nuclei, the anterior dorsal thalamic
nucleus, the prS and paS, the MEC, the retrosplenial cortex and the CA1 (Taube, Muller, and
Ranck 1990; Taube, Kesslak, and Cotman 1992; Taube 1995; Sargolini et al. 2006; Cho and Sharp

18
2001; Leutgeb, Ragozzino, and Mizumori 2000; Acharya et al. 2016) . A second cell type found in
the parahippocampal region is the grid cell (Box 1.3c), which is predominant in layer II of the
dorsocaudal MEC (MEC II), but has also been described in other MEC layers, and in the prS and
paS (Fyhn et al. 2004; Hafting et al. 2005; Boccara et al. 2010; Sargolini et al. 2006). Grid cells
show firing characteristics which are similar to hippocampal place cells in that they are active at
particular places within the environment and silent at others. However, while place cell firing in
CA1 and CA3 is confined to one to two spatially receptive fields in a standard experimental
setting, grid cells form multiple firing fields that are arranged in an equilateral triangular lattice
(Box 1.3c). Grid‐like firing patterns from neighboring cells share a common orientation (i.e., the
grids are aligned to a common reference point), and spacing (distance between the firing fields),
but the locations of their fining fields are offset. As a result, multiple simultaneously recorded
grid cells, cover the entire recording arena, forming a map‐like representation of space. Similar
to hippocampal place cells, grid field locations remain stable during repeated visits of the same
environment and persist in darkness (Fyhn et al. 2004; Hafting et al. 2005). Notably, the degree
of spatial precision in the grid cell code decreases with anatomical distance from the dorsal
border of the MEC (along the dorsolateral‐ventromedial axis, see Box 1.1), in that the size of
individual grid fields and the spacing between them increases. This gradient mirrors the field‐
size increase place cells along the hippocampal septotemporal axis. While grid cells have been
initially discovered in rats, they have been recently also found in other mammalian species such
as mice, bats, nonhuman primates and humans (Fyhn et al. 2008; Yartsev, Witter, and Ulanovsky
2011; Killian, Jutras, and Buffalo 2012; Jacobs et al. 2013). In the prS and paS as well as in the
deep MEC layers, grid cells are intermingled with additional spatial cell types. Those include cells
that show spatial firing that is not arranged in a grid pattern (Box 1.3d), cells that fire along
geometrical borders (referred to as border cells; Box 1.3e), cells that are modulated by the
animal’s speed (Kropff et al. 2015; Sun et al. 2015), and conjunctive cells, which are grid cells
that are also modulated by HD (Solstad et al. 2008; Sargolini et al. 2006).
1.4 Non‐spatial coding within the hippocampo‐entorhinal region
In contrast to MEC, which contains a variety of spatially modulated cell types, firing
patterns in LEC were found to be substantially less spatial, in particular in standard open field
foraging tasks (Hargreaves et al. 2005; Yoganarasimha, Rao, and Knierim 2011). The differential
firing characteristics of MEC and LEC cells are considered a result of their distinct connectivity:

19
The LEC is viewed as an extension of the ventral visual stream, receiving its major cortical input
from the PER (see Box 1.2a). The PER connects to the ventral temporal cortex, primary and
secondary auditory regions, pririform as well as the insular cortex and is known to be involved in
the representation of objects (Burke and Barnes 2015; Burke, Maurer, et al. 2012; Burke,
Hartzell, et al. 2012; Deshmukh, Johnson, and Knierim 2012). In contrast to LEC, MEC receives
input from the POR which is part of the dorsal visual stream. The POR is connected to areas that
are known to process visuo‐spatial information, such as the lateral and medial visual association
areas, primary visual areas and posterior parietal cortex (Burwell, Witter, and Amaral 1995;
Witter, Wouterlood, et al. 2000; van Strien, Cappaert, and Witter 2009). Of particular
importance for functional considerations is that the input from the two entorhinal subdivisions
converges on overlapping cell populations in the HIPP. As a result, the HIPP is the recipient of
highly processed information from virtually all cortical association and primary sensory areas,
and thus ideally situated in order to merge information about different aspects of an ongoing
experience into a coherent memory trace (Rolls 2013; Willshaw, Dayan, and Morris 2015; Marr
1971). Our knowledge about network computations that enable the hippocampo‐entorhinal
system to form coherent memories and to distinguish them from memories with overlapping
content will be summarized in the following section of this dissertation.
1.5 Computations supporting the formation of distinct memories
1.5.1 The HIPP as an associative network
The conceptual framework paving our way to understand how the HIPP supports the
formation and recall of distinct memories was originally developed by David Marr in his
manuscript on the function of the mammalian archicortex (Marr 1971). Central to his suggestion
was the idea that information about the distinct features of an experienced event are fed onto a
network of neurons with strong recurrent connectivity and highly modifiable synapses. During
learning, connections between the co‐activated neurons are strengthened via activity‐
dependent synaptic plasticity. The recurrent nature of the network allows subsequent recall of
the entire activity pattern representing the event, even if only fragments of the original input
patterns are present (a process referred to as pattern completion (see Box 1.5a, b). While Marr
did not perform a functional distinction between individual hippocampal subregions, more
recent models place computations supporting pattern completion in the so‐called associative
networks of the CA3 (Treves and Rolls 1994; Rolls and Treves 1994; McClelland, McNaughton,
and O'Reilly 1995; Colgin et al. 2010; Rolls and Kesner 2016). Cornu ammonis area 3 is distinct

20
from CA1 and DG due to the presence of extensive recurrent collaterals with highly modifiable
synapses (Colgin et al. 2010).
An abundance of experimental evidence across a variety of mammalian species, such as
rats, non‐human primates and humans, supports the theory that the HIPP acts as an associative
network. Recent evidence from neurosurgical patients, for example, suggests that hippocampal
neurons acquire associative firing properties during learning (Ison, Quian Quiroga, and Fried
2015): Ison and colleagues recorded activity patterns from a large number of individual neurons
in the medial temporal lobe (including the HIPP) while patients were forming memories. The
patients were presented with pairs of unrelated pictures, one of a spatial scenery and the other
of a person, and were asked to associate the items presented in each pair. For each pair of
pictures, recordings were obtained during the initial presentation, and during the formation of
the combined memory. In accordance with the theory that the HIPP is specialized in the
formation of associative memories, it was found that neurons that fired during the presentation
of an individual picture before learning started to fire selectively when the two items were
presented in a combined picture. Similar learning‐related, associative firing was previously
observed in non‐human primates (Rolls et al. 1989; Miyashita et al. 1989; Cahusac et al. 1993)
and in rats (Wood, Dudchenko, and Eichenbaum 1999; McKenzie et al. 2013; Gill, Mizumori, and
Smith 2011; Eichenbaum et al. 1999). One of the first studies to characterize associative firing
properties in rats was performed by Wood and colleagues, who trained rats to perform an odor‐
guided, non‐match‐to‐sample task (Wood, Dudchenko, and Eichenbaum 1999): After being
presented with an odor at a constant start location, rats had to run into an open field arena in
order to find a bowl with sand. The sand was scented with an odor that was either identical or
different to the odor presented at the start location. Rats learned to dig to retrieve a reward if
the mismatching odor was presented and walk away to initiate the next trial if the matching
odor was presented. The location of the bowl differed from trial to trial, and the proportion of
hippocampal cells responding to different task contingencies was quantified. The researchers
found that a fraction of cells responded exclusively to spatial variables (15%), while other cells
responded exclusively to non‐spatial variables, such as the identity of the odor or the type of the
trial (25%). The largest proportion of cells, however, responded to a combination of spatial and
non‐spatial variables (33%). In accordance with the described neurophysiological data, humans
and non‐human primates with damage to the HIPP were shown to be severely impaired in tasks

21
Box 1.5| Pattern completion in hippocampal area CA3
Each neuron in the CA3 pyramidal cell layer (N1 to N4) receives input from perforant path (PP) neurons (Na to Nc) as well from other CA3 pyramidal cells (recurrent collaterals). Silent cells are shown in black. The flow of activity during (a) encoding of a particular activity pattern and (b) its retrieval from a degraded input pattern is indicated with red arrows. (a) PP‐cells representing a particular input pattern (Nb and Nc) activate a subset of CA3 neurons (N2 and N4) and the coactivation of these neurons results in the strengthening of theirs synapses (orange circles). The coactivation of CA3 pyramidal neurons N2 and N4, in turn, results in additional strengthening of the collateral synapses between them (yellow circles). The processing of perforant path inputs and local CA3 computations give rise to a characteristic output pattern that is then conveyed to hippocampal area CA1. (b) Once the synaptic connectivity matrix is established, the encoded pattern can be fully retrieved even if the input pattern is degraded: Activation of PP‐cell Nc alone results in the direct activation of CA3 pyramidal cell N4, but not N2 (white circle, inactive synapse). N2 is then activated via its collateral synapse with N4, and the complete output pattern is generated.
Connectivity pattern adapted from Rolls, 2016.
that require the formation of associations between objects and places (Burgess, Maguire, and
O'Keefe 2002; Crane and Milner 2005; Gaffan 1994; Gaffan and Saunders 1985; Parkinson,
Murray, and Mishkin 1988; Smith and Milner 1981), and similar deficits were also observed in
rodents with hippocampal damage. It was shown, for example, that rats with selective lesions to
the CA3 were severely impaired in tasks that required the rapid formation of odor‐place
associations (Day, Langston, and Morris 2003; Langston and Wood 2008; Kesner, Hunsaker, and
Warthen 2008), and it is known that the inactivation of the CA3 results in a failure to associate
cocaine‐triggered reward signals with the spatial contexts in which they occur (Luo et al. 2011).
Further support for the theory that the HIPP functions as an associative network comes from
studies identifying computations of pattern completion in the ensemble dynamics of large
populations of simultaneously recorded neurons. Consistent with the prediction that the HIPP is
able to retrieve complete memories from degraded input, it is commonly found that

22
hippocampal place cells demonstrate stable spatial firing, even if a subset of environmental cues
is removed (O'Keefe and Speakman 1987; Nakazawa et al. 2002). Direct experimental evidence
for a link between CA3 plasticity, place field stability and pattern completion was provided by
Nakazawa and colleagues (Nakazawa et al. 2002): Recording from mice with selective ablations
of the N‐methyl‐d‐asparate (NMDA) receptor gene in CA3, they found that the knockout mice
were readily able to form spatial memories in the watermaze, and retain stable spatial firing
patterns in the open field environment. However, place cell stability and watermaze memory
were degraded in conditions in which a subset of the environmental cues was removed, while
wild‐type mice were unaffected by the environmental manipulation. Additional evidence for
pattern completion comes from a series of studies which systematically investigated whether
neural ensembles in area CA3 react more coherently to changes in the environment than those
in its inputs. Environmental changes were induced in the so‐called double‐rotation paradigm, in
which proximal and distal cues were rotated in opposite directions. Specifically, neural activity
was recorded during running on a circular, narrow track, which was divided in four 90 degree
segments. Each of the four segments was covered with a different surface material (such as
rubber mat and sand paper), and the circular track was surrounded by curtains that were
decorated with objects. The different materials covering the track were considered local sensory
cues, while the objects hanging from the curtains were considered distal sensory cues. Neural
activity in different brain regions was then compared between a standard condition with a
familiar cue configuration and a mismatch condition in which the local and distal cues were
rotated in opposite directions. Consistent with what would be expected for a network
performing pattern completion, it was found that one of the major inputs to area CA3, the DG,
produced highly decorrelated representations for the two conditions (Neunuebel and Knierim
2014). Despite receiving an uncorrelated input pattern, CA3 cells responded coherently to the
cue rotation, in that place field locations collectively followed the local cues. CA3 ensembles did
thus not express identical representations between standard and mismatch conditions, but
representations for the two conditions were nevertheless correlated, in that the structure of the
map remained unchanged. The strong coherence in CA3 firing patterns was therefore
interpreted as evidence for pattern completion in area CA3. To convincingly demonstrate that
the coherent population dynamics in CA3 are a result of local circuit computations, it is
important to exclude the possibility that they are inherited from CA3 input structures other than
the dentate gyrus. For example, grid cells, head direction cells and border cells in the MEC are
known to collectively shift their firing patterns in response to rotations of the cue card (Solstad

23
et al. 2008). It is therefore not surprising that a coherent shift in MEC firing patterns was also
found in the double‐rotation experiment (Neunuebel et al. 2013). However, MEC firing patterns
were shown to follow distal cues, and the direction of the shift was therefore in mismatch with
the direction of the shift in CA3 place fields. It is thus not likely that the MEC contributed to the
coherent shift in area CA3. A third major input structure to area CA3 is the LEC, which lacks
highly organized spatial firing and is known to provide the hippocampus with contextual and
other non‐spatial information. Recording from LEC neurons in a double‐rotation experiment,
Neunuebel and colleagues found that LEC cells tend to follow the proximal cues to a
substantially smaller degree than neurons in area CA3 (Neunuebel and Knierim 2014). One could
thus speculate that a weak and sporadic input from the LEC was sufficient to elicit strong and
coherent changes in the hippocampal spatial firing patterns, an interpretation consistent with
pattern completion in area CA3. Finally, it was shown that the tendency to demonstrate
coherent shifts in spatial firing patterns was particularly strong in subdivisions of area CA3 in
which recurrent, collateral connectivity is pronounced (distal CA3, near area CA2), while firing
patterns were decorrelated in subdivisions with limited recurrent connectivity (proximal CA3,
near DG) (Lee et al. 2015). Collectively, those results provide strong evidence for pattern
completion hippocampal area CA3.
1.5.2 Pattern separation supports the formation of distinct memories
The strong recurrent connectivity in the CA3 is well suited to support the recall of
previously stored memories from partial input or noisy cues but might be faced with challenges
in cases where multiple memories with overlapping elements need to be stored. For example, if
the CA3 network were to store memories about distinct events that occurred in the same place
(such as the conversation one had during breakfast as opposed to the one during dinner), and
common places were encoded with an overlapping set of neurons, then the recurrent
connectivity would result in the activation of an overlapping activity pattern for both types of
memories, rendering them undistinguishable. On theoretical grounds, such memory
interference can be prevented if the overlap between the neural activity patterns that represent
different memories is reduced in an additional upstream processing stage. This neural
computation, referred to as pattern separation was initially modeled in granule cells in the
cerebellum (Marr 1969). The concept was subsequently adjusted to model network activity in
the DG (McClelland, McNaughton, and O'Reilly 1995; O'Reilly and McClelland 1994). Intrinsic
architecture and long‐range connectivity of the DG make it particularly well suited to

24
disambiguate cortical input patterns, and to subsequently guide the encoding of distinct
patterns in the recurrent networks of the CA3: As already illustrated in Box 1.6 , principle cells in
the DG (also referred to as granule cells) are part of a competitive network, in which a cell that
receives sufficient excitation to fire APs silences the remaining granule cells (its ‘competitors’)
via inhibitory feedback connections. In addition, granule cells are known for their high input
resistance, and very negative membrane potential (Ewell and Jones 2010; Piatti, Ewell, and
Leutgeb 2013), rendering it particularly difficult to elicit APs in any given granule cell. In
combination, the competitive network dynamics and the high AP threshold are able to
transform the input from a large number of highly active cortical neurons into a very sparse
neural code. The second important architectonic feature of the DG is that granule cells are
extremely numerous compared to neurons in their entorhinal input sources (Rapp and Gallagher
1996). Entorhinal information fed into the DG gets thus spread out onto a more extensive layer
of sparsely firing granule cells [a process called expansion (Knierim and Neunuebel 2016)],
resulting in highly distinct, sparse firing patterns in the DG (see also Box 1.6).
Box 1.6| Pattern separation trough expansion and scarcity
Two patterns that are highly overlapping in the input layer are distributed onto an output layer that (1) contains a large number of neurons and (2) demonstrates very low levels of activity. Cells that represent an individual firing pattern are either red (r) or blue (b), and cells that represent both patterns are bicolored. The connectivity of each cell in the input layer can be traced by following the colored lines. In this simplified schematic, each output cell needs to accumulate at least 3 inputs of one kind to reach firing threshold. Input cells that represent a single pattern contribute two inputs (2b or 2r), while input cells that represent both patterns contribute a mixed input (1b or 1r).
Schematic based on description of the concept of pattern separation through expansion and sparsity in Knierim and Neunuebel, 2015.
Finally, granule cells are known to form very strong synaptic connections with their CA3
pyramidal cell targets, providing powerful feedforward excitation (Henze et al. 2002). Theories
of hippocampal pattern separation suggest that during the encoding of new memories,
powerful, sparse and highly distinct input from the DG biases the activity and plasticity in the
recurrent networks of the CA3, into patterns that are separate from the ones formed by
previous memories. Once the synaptic matrix is established under the guidance of the DG,
encoded CA3 patterns can be retrieved by weaker cortical inputs. In the described theoretical

25
framework, pattern separation in the DG is thus a mechanism that supports encoding of
memories, while pattern completion in the CA3 is crucial for their retrieval (Rolls and Kesner
2016).
1.5.3 Two forms of patterns separation in the hippocampo‐entorhinal region
A potential neural correlate of pattern separation in the HIPP was found by a multitude
of studies describing substantial hippocampal remapping in response to small changes in the
rat’s environment, emotional state or behavioral context (Smith and Mizumori 2006; Bower,
Euston, and McNaughton 2005; Wood et al. 2000; Moita et al. 2004; Wang et al. 2012). For
example, recording hippocampal neural activity during random foraging in open field
environments (similar to those introduced in Box 1.4), Bostock and colleagues found that
hippocampal firing patterns reorganized when a familiar, white cue card was replaced with a
novel, black cue card (Bostock, Muller, and Kubie 1991). Similarly, hippocampal remapping was
often observed in memory tasks that require the rat to pass through the same physical location
repeatedly, but on the way from or to different locations (Wood et al. 2000; Ferbinteanu,
Shirvalkar, and Shapiro 2011; Smith and Mizumori 2006; Ito et al. 2015). It is of note that most
recordings in those early studies were confined to CA1, and it was not yet known whether
distinct hippocampal firing patterns are the result of intrinsic hippocampal computations or
whether they are inherited from upstream structures. In order to determine whether
hippocampal remapping corresponds to the theoretical concept of pattern separation (i.e., the
generation of distinct output patterns from overlapping input patterns), it is necessary to obtain
detailed knowledge about the computations performed within the different hippocampal
subareas as well as their inputs. This approach was used by a series of recent studies which,
guided by the theoretical framework on pattern separation, began to reveal the neural
mechanisms that underlie the formation of highly distinct neural codes in the hippocampo‐
entorhinal system. These studies suggest that rather than reflecting a single computation,
hippocampal remapping can be governed by two different computational modes, ‘rate
remapping’ and ‘global remapping’ (Leutgeb et al. 2004; Leutgeb, Leutgeb, Moser, et al. 2005;
Fyhn et al. 2007; Kitamura et al. 2015). In our current understanding, rate remapping is used to
form highly distinct representations of environmental contexts that are similar, while global
remapping is used to form highly distinct representations of contexts that are distinct. As
discussed below, both of these processes roughly correspond to the theoretical concept of
pattern separation even though the neural mechanisms differ from those proposed in early

26
computational work.
Rate remapping is commonly observed as a response to small changes to the
environmental or behavioral context, for example, when the color or geometry of the recording
chamber is changed. Neurons in CA1, CA3 (Leutgeb, Leutgeb, Barnes, et al. 2005) and the DG
(Leutgeb et al. 2007) respond to such non‐spatial manipulations with changes in their firing
rates, while the organization of the spatial map (i.e., the location of each cell’s place field)
remains preserved. Simultaneous recordings from HIPP and MEC show that position and rate
codes remain stable in grid cells during hippocampal rate remapping, suggesting that rate
differences in the HIPP are not inherited from grid cells. Similarly, it was shown that inputs from
LEC remain constant during hippocampal rate remapping. The high degree of overlap in major
cortical inputs to the HIPP is consistent with the idea that rate remapping is generated by intra‐
hippocampal computations. Direct evidence for the importance of intra‐hippocampal processing
in the generation of rate remapping comes from McHugh and colleagues (2007), who examined
rate remapping in mice in which synaptic plasticity in the DG was reduced due to a knock out
(KO) of an essential NMDA receptor subunit (NR1). Neural activity was recorded in CA3, one
synapse upstream of the DG (McHugh et al. 2007). Firing patterns in CA3 were compared as
mice foraged in a white, circular and a black, squared recording chamber. In support of the
theory that the DG is necessary to distinguish similar contexts, it was found that rate remapping
was substantially reduced in NR1‐KO mice compared to their wild‐type litter mates. In addition,
NR1‐KO mice were impaired in their ability to discriminate between two behavioral chambers
that differed in color, indicating that the impairment in rate remapping was behaviorally
relevant. This deficit was found in a contextual fear conditioning task that was used to test the
degree of generalized fear during the exposure to a behavioral chamber that was associated
with a painful stimulus and a behavioral chamber which was neutral. Control mice showed fear
behavior (i.e., a freezing response) only in the chamber in which they previously received an
electric shock, while NR1‐KO mice froze in both chambers, suggesting that they were not able to
distinguish between the chambers.
A link between rate remapping and pattern separation was demonstrated in a recent
study monitoring changes in population activity of hippocampal neurons to subtle and gradual
changes to the rats’ environment: Leutgeb and colleagues (2007) recorded activity from neurons
in CA3 and the DG as rats foraged in an open field environment that was confined by a circular
27
or squared recording chamber (Leutgeb et al. 2007). Over the course of seven sessions, the walls
of the circular recording chamber were gradually transformed into a square (and vice versa) and
the distinctness between neural representations for the different shapes was determined. As
predicted by computational models of pattern separation, even the small difference in sensory
input between consecutive shapes resulted in neural firing patterns that were highly distinct. In
the DG, a disproportional and strong decorrelation occurred for shapes with a high degree of
similarity, while changes in neural representations in CA3 were less pronounced, and the degree
of decorrelation was roughly proportional to the amount of change in sensory input. Of note is
that the neural mechanisms for pattern separation in the DG were found to be distinct from
those predicted by early theoretical models: As described in Box 1.6, models of pattern
separation predict that a cell is either on or off depending on whether sufficient excitation is
present to reach its firing threshold. On the population level, this results in the activation of
distinct cell populations for different contexts. In contrast to this prediction, Leutgeb and
colleagues found that the same population of DG cells was active across subsequent sessions of
foraging in differentially shaped recording chambers. Instead of recruiting distinct cell
populations, the difference in context was signaled with changes in the cells’ firing rates. Of
note is also that Leutgeb and colleagues did not record from hippocampal input structures, but
where nevertheless able to characterize the firing patterns of a putative grid cell axon that
terminated in the DG. As observed in other rate remapping paradigms (Fyhn et al. 2007), the
firing locations of this putative grid cell remained stable across sessions, and no changes in firing
rate were detected, suggesting that the observed firing patterns in the DG were not inherited
from grid cells. While the firing patterns of other MEC cell types (Diehl et al., 2014) and other
hippocampal input structures remain to be investigated before coherent conclusions can be
reached, the available evidence is nevertheless strongly indicative of pattern separation in the
DG.
While small changes to the rat’s environment are reflected by firing rate changes within
a constant hippocampal map, larger environmental changes induce a more substantial
reorganization of hippocampal firing patterns (Box 1.7a, b). Foraging in two different rooms, for
example, results in the activation of distinct populations of neurons in CA3. The overlap
between the two active cell populations corresponds to the overlap that would be expected by
chance, if different sets of neurons were drawn to represent each environment. In CA1 and the
DG, the same population of neurons is active in different spatial environments, but the firing

28
locations are redistributed randomly, which results in similarly distinct spatial representations
(Leutgeb et al. 2004; Leutgeb and Leutgeb 2007). During the described reorganization, the
relationships between hippocampal place fields change to the extent that distinct hippocampal
spatial maps are formed, and this process is thus referred to as global remapping. It is important
to mention that global remapping does not only occur in cases when the rat explores distinct
spatial locations, but also in cases when the recording chamber remains at a constant spatial
location but is changed to a large degree, for example in shape and texture (Fyhn et al. 2007;
Kitamura et al. 2015). Similarly, global remapping occurs when recording sessions in a constant
environment are interspaced with foraging in the darkness (Fyhn et al. 2007), and a
reorganization of place field locations was also observed after a previously ‘safe’ behavioral
chamber was associated with the occurrence of electrical shocks (Moita et al. 2004). Rather
than being the foundation for the discrimination of different spatial environments, global
remapping might thus support a more general distinction of environmental and behavioral
contexts. It is of note that, during global remapping, hippocampal firing patterns (in particular in
CA3) are highly distinct even in situations in which the environments share substantial overlap
(Leutgeb et al. 2004). The mechanisms that support the formation of such highly distinct spatial
maps are thought to prevent memory interference and therefore roughly correspond to the
theoretical concept of pattern separation described above.
While grid cell input remains stable during rate remapping, global remapping is
predicted by a coordinated shift in grid cell, HD cell and border cell firing patterns (Fyhn et al.
2007; Stensola et al. 2012; Solstad et al. 2008), raising the possibility that the MEC contributes
to hippocampal computations relying on global remapping (Box 1.7, see chapters 3 and 5.2 for
further discussion). Whether the shift of the medial entorhinal map is necessary for intact
hippocampal global remapping, however, remains to be established.

29
Box 1.7| Global remapping in the HIPP and MEC
Schematic depicting spatial firing characteristics of simultaneously recorded neurons in the HIPP and MEC in a global remapping paradigm. Firing patterns are simulated in (a) a baseline foraging session and (b) during foraging in a different room. The experimental setting is outlined at the left of each panel and the spatial firing patterns of six hippocampal place cells and six medial entorhinal cells are simulated at the middle and right of each panel, respectively. Medial entorhinal cells depicted are grid cells (cells 1 and 2), border cells (cells 3 and 4) and HD cells (cells 5 and 6). For each cell, a heatmap is shown and the color scale is from zero (blue) to peak firing rate (red). For visual guidance, each heat map is divided in four equal squares (magenta cross). During global remapping, firing locations of hippocampal place cells are redistributed randomly in CA1 and distinct cell populations are activated in CA3 (not shown). The spatial map in the MEC is rotated (or rotated and shifted, not shown) during global remapping.
As reported in Leutgeb et al., 2004; Fyhn et al., 2007; Solstad et al., 2008.
1.6 Temporal coding in the hippocampo‐entorhinal system
The formation of episodic memories does not only require the association of
information about different aspects of an experience, but also requires that the information is
organized in a meaningful way. The temporal organization of information is thought to rely on
the precise interplay between brain oscillations at different frequencies and the firing of
individual neurons. The aim of the following section is to introduce one of the most prominent
temporal coding schemes in the hippocampo‐entorhinal system. The contribution of the MEC to
hippocampal temporal coding will then be assessed in chapters 4 and 5.3 of this dissertation.

30
1.6.1 The theta rhythm
Studies using LFP recordings in the parahippocampal region of behaving mammals
revealed a variety of behavior‐related network activity patterns that are characterized by
extracellular, oscillatory current flow changes in different frequency bands. One of these
oscillatory patterns is the theta rhythm (4 to 10 Hz). Theta oscillations are observed in all
hippocampal subregions (Kamondi et al. 1998; Buzsaki 2002; Mankin et al. 2015), a variety of
parahippocampal regions (e.g., MEC, SUB, prS, paS but not LEC), and some hippocampal output
regions, such as the medial prefrontal cortex (mPFC) and the amygdala (Hafting et al. 2008;
Mizuseki et al. 2009; Boccara et al. 2010; Kim, Ganguli, and Frank 2012; Pare, Collins, and
Pelletier 2002; Jones and Wilson 2005b, 2005a). In rodents, theta oscillations are predominant
during behavioral states that are associated with active locomotion (O'Keefe and Recce 1993;
Patel et al. 2012; Igarashi et al. 2014). During immobile states, they are typically absent unless
the animal is engaged in behaviors that require active processing, such as decision making
(Johnson and Redish 2007; Wikenheiser and Redish 2015b, 2015a) or the reaction to an aversive
stimulus (Bland 1986). While the theta rhythm is continuous during active locomotion in
rodents, it appears in intermittent bouts in other mammalian species, such as bats, non‐human
primates and humans (Yartsev, Witter, and Ulanovsky 2011; Killian, Jutras, and Buffalo 2012;
Kahana et al. 1999; Kahana, Seelig, and Madsen 2001). It is of note that while theta bouts are
not bound to active locomotion, their behavioral correlates are nevertheless similar to those
observed in rodents. For example, theta oscillations in both rodents and humans were shown to
occur during working memory performance, spatial navigation and the formation of long‐term
memories (Kahana, Seelig, and Madsen 2001; Lega et al. 2016; Jones and Wilson 2005b, 2005a;
Wikenheiser and Redish 2015a, 2012; O'Keefe and Recce 1993). The predominance of
hippocampal theta oscillations during active processing across species is therefore thought to
underlie a common mechanism for the formation of memories (Malhotra, Cross, and van der
Meer 2012; Buzsaki and Moser 2013). In addition to its appearance during awake behavior,
theta rhythmicity is also observed during the rapid eye movement (REM) phase of sleep, where
it supports the sleep‐related restructuring of synaptic connections (Patel et al. 2012; Grosmark
et al. 2012; Cantero et al. 2003). In rodents, the second prominent hippocampal oscillatory
pattern occurs during awake rest periods and during slow wave sleep. In brief, oscillatory LFP
patterns recorded during rest periods and slow wave sleep are characterized by irregularly‐
occurring, large‐amplitude current deflections that last for 40 to 100 ms (so‐called sharp waves).
A sharp wave is initiated through the strongly synchronized bursting of neurons in the CA3

31
which, in turn, results in the strong depolarization of CA1 pyramidal cells. Depolarized CA1 cells
engage in a transient interaction with local interneurons, giving rise to a high frequency
oscillation referred to as ripple (110 to 200 Hz). After their initiation in CA3 and CA1, sharp wave
ripples (SWRs) propagate to neocortical sites via the deep layers of the EC (Maier et al. 2011;
English et al. 2014; Chrobak and Buzsaki 1994, 1996; Stark et al. 2014). Sharp wave ripples are
associated with the replay of neuronal activity patterns that occurred during behavior and are
therefore thought to support the offline‐consolidation of memories (Foster and Wilson 2006;
Csicsvari and Dupret 2014; Atherton, Dupret, and Mellor 2015; Girardeau et al. 2009; Suh et al.
2013).
1.6.2 Generation of the hippocampal theta rhythm
The hippocampal theta rhythm is generated by multiple distinct mechanisms that
involve external pacemakers as well as local dendritic computations. Several subcortical nuclei
are believed to be critically involved in theta rhythm generation, the most important of which is
the medial septum‐diagonal band of Broca (MS‐DBB). The MS‐DBB is reciprocally connected
with the HIPP and MEC (citation for hippocampus; Alonso and Koelner, 1984). Evidence
supporting its involvement in theta rhythm generation comes from studies showing that lesions
or inactivations of the area strongly reduce theta oscillations in the HIPP and MEC (Petsche and
Stumpf 1962; Petsche, Stumpf, and Gogolak 1962; Stumpf, Petsche, and Gogolak 1962; Winson
1978; Buzsaki, Leung, and Vanderwolf 1983; Mizumori et al. 1989; Mizumori, Barnes, and
McNaughton 1989; Koenig et al. 2011; Brandon et al. 2014). In addition, it is known that the
onset of theta‐rhythmic firing in a subset of neurons in the MS‐DBB precedes the onset of theta
oscillations in the HIPP (Bland et al., 1999). Two cell populations in the MS‐DBB have been
associated with the generation of the parahippocampal theta rhythm, long‐range projecting
GABAergic and long‐range projecting cholinergic neurons. Long‐range projecting GABAergic
neurons selectively target local interneurons in the HIPP and MEC (Fuchs et al. 2016). A
proportion of those target neurons are fast‐spiking interneurons that are thought to inherit
theta rhythmicity from the MS‐DBB and impose it on the somata of principle cells in the HIPP
and MEC (Fuchs et al. 2016; Buzsaki, Leung, and Vanderwolf 1983; Stewart and Fox 1990b,
1990a; Buzsaki 2002). The optogenetic activation of long‐range projecting cholinergic cells in the
MS‐DBB, in turn, was shown to suppress competing brain rhythms (i.e., SWRs) and enhance the
amplitude of hippocampal theta oscillations (Vandecasteele et al. 2014). In line with the finding

32
that cholinergic input enhances theta oscillations, it was previously shown that 1) the muscarinic
antagonist atropine abolishes hippocampal theta oscillations in urethane‐anesthetized rats
(Bradley and Nicholson 1962), and that 2) the bath application of the cholinergic agonist
charbachol induces theta oscillations in hippocampal slices (Konopacki et al. 1987; Bland et al.
1988).
A second important contributor to hippocampal theta oscillations is the MEC. As
described in the previous section, the systemic administration of atropine was shown to abolish
theta oscillations in urethane‐anesthetized rats (Bradley and Nicholson 1962). However, the
same manipulation fails to substantially alter theta oscillations in behaving rats (Kramis,
Vanderwolf, and Bland 1975). Of note, it was found that hippocampal theta oscillations can be
effectively abolished when combining atropine administration with lesions of the EC. Entorhinal
lesions alone, in turn, result in a reduction of hippocampal theta oscillations that is smaller in
magnitude than the reduction observed during the approach combining atropine administration
with entorhinal lesions (Buzsaki, Leung, and Vanderwolf 1983). In combination, those findings
suggest that there might be two types of theta oscillations in the HIPP, one dependent on
cholinergic inputs and one dependent on the EC. Consistent with the hypothesis that the EC
contributes to theta rhythmicity in the HIPP, theta amplitude is known to be particularly high in
the stratum lacunosum moleculare (slm), which harbors hippocampo‐entorhinal synapses
(Kamondi et al. 1998; Buzsaki 2002). In accordance, slm synaptic currents that occur during
theta oscillations in healthy rats were found to be strongly reduced in rats with lesions that
included the EC (Kamondi et al. 1998).
The entorhinal cortex is likely to contribute to hippocampal theta oscillations in multiple
ways. First, neurons in the MS‐DBB are known to project to both HIPP and MEC (Fuchs et al.
2016), and the inactivation of the MS‐DBB results in reduced theta amplitude in both regions
(Koenig et al. 2011). It is thus conceivable that MS‐DBB firing drives theta‐rhythmic hippocampal
firing via a direct route as well as an indirect route through the MEC. Second, it was shown that
theta oscillations can be induced in vitro in slices that are limited to the EC, suggesting that
intrinsic entorhinal networks are also able to generate theta oscillations (Golebiewski et al.
1994; Konopacki and Golebiewski 1992). In fact, it is known that the application of simple step
depolarization currents to stellate cells in the MEC induces subthreshold membrane potential
oscillations (MPOs) at theta frequency (Giocomo and Hasselmo 2009). Such resonance
properties are thought to be mediated by the activation of two opposing active dendritic
33
currents, one that is activated by hyperpolarization and results in a rebound depolarization, and
one that acts in the opposite direction (Dickson et al. 2000). The two currents interact in a
‘push‐pull’ fashion, resulting in a MPO at theta frequency. The generated MPOs, in turn, impose
theta rhythmicity on the cells action potential (AP) output, once the excitatory drive is
sufficiently high to reach the firing threshold. Theta rhythmicity generated in the local MEC
networks is then inherited by hippocampal neurons and thus contributes to the hippocampal
LFP theta signal.
Finally, resonance properties were also identified in hippocampal pyramidal neurons,
pointing towards the existence of an additional intra‐hippocampal theta rhythm generator
(Kamondi et al. 1998; Leung and Yu 1998). In support of this hypothesis, it was found that theta
oscillations can be elicited in vitro in slices that are confined to the HIPP (Leung and Yu 1998;
Konopacki et al. 1987; Bland et al. 1988) as well as during in vitro recordings from the CA1
region of the entire, isolated HIPP (Goutagny, Jackson, and Williams 2009). A recent study has
additionally demonstrated that the optogenetic activation of parvalbumin‐expressing (PV+),
fast‐spiking interneurons imposes theta‐rhythmic firing onto hippocampal pyramidal cells,
suggesting that PV+ interneurons are an additional component of the intra‐hippocampal theta
rhythm generator (Stark et al. 2014). It is important to note that such intra‐hippocampal theta
rhythm generators can readily be triggered by currents which lack theta rhythmicity (Kamondi et
al. 1998). As high‐amplitude theta oscillations in the slm are observed in hippocampal areas that
are preferentially innervated by LEC (which lacks theta‐rhythmic firing) or by MEC (in which
theta‐rhythmic firing is pronounced), both entorhinal subdivisions are thus likely to contribute
to hippocampal theta rhythm generation. The strong currents observed at the hippocampo‐
entorhinal synapse in the slm (Kamondi et al. 1998; Buzsaki 2002) might thus partly reflect non‐
rhythmic depolarizing currents that activate intra‐hippocampal rhythm generation.
1.6.3 Function of the theta rhythm
One way to study the function of the theta rhythm is based on the consideration that
brain oscillations are generated by the coordinated activity of neurons surrounding the
electrode. With this perspective, researchers attempted to learn about functional aspects of
neural network computations by investigating the correlates between different aspects of the
LFP theta signal and rat’s behavior. In accordance with the finding that individual

34
parahippocampal neurons process self‐motion information (see chapter 1.3), it was found, for
example, that the amplitude and frequency of the LFP theta oscillation correlates with the rat’s
running speed.
Viewed from a different perspective, theta oscillations might not only reflect the circuit
computations generating them but might themselves serve additional functions. Rhythm
generators in the DS‐MDD, HIPP and MEC might thus entrain theta‐rhythmic firing in their target
neurons and the generated rhythmicity can then serve as a reference for further temporal and
spatial computations. In support of this theory, it is typically observed that manipulations that
profoundly reduce theta rhythmicity in the HIPP and MEC also disrupt grid cell firing (Bonnevie
et al. 2013; Koenig et al. 2011; Brandon et al. 2011): Recording medial entorhinal firing patterns
during the inactivation of the HIPP with muscimol, Bonnevie and colleagues found that grid cells
were severely disrupted by the manipulation. Importantly, it was found that the inactivation of
the HIPP caused both a rapid silencing of hippocampal cells as well as a much slower decrease in
theta power in the HIPP and MEC. While the authors concluded that intact hippocampal firing is
necessary for grid cell firing, the disruption of grid cell firing patterns occurred gradually at a
time course that was in mismatch with the rapid silencing of hippocampal cells. Instead, the
time course of grid cell disruption tightly matched the profile of the reduction in LFP theta
power. More direct evidence for a link between theta rhythmicity and grid cell firing comes from
studies recording hippocampal neuronal activity during the inactivation of the septal area. As
described above, subcortical nuclei including the septal area are a major theta rhythm
generator, and the inactivation of the area therefore results in a pronounced silencing of the
theta rhythm in HIPP and MEC. The pronounced silencing of the theta rhythm, in turn, resulted
in a disruption of grid cell firing patterns (Koenig et al. 2011; Brandon et al. 2011; Brandon et al.
2014; Wang et al. 2015). When discussing the impact of manipulations that disrupt theta
oscillations, it is important to consider that most of the used approaches were highly unspecific,
in that they were likely to affect a variety of neuronal computations that are distributed among
different brain areas. Inactivations of the septal area, for example, also disrupt cholinergic
signaling between the septal area and MEC, and it has been hypothesized that cholinergic input
to the MEC contributes to the generation of grid cell firing (Knierim and Zhang 2012; Newman,
Climer, and Hasselmo 2014). Even though further testing is required before conclusion can be
reached, the theory that theta oscillations support grid cell firing is supported by 1) the fact that
different approaches used to disrupt MEC theta oscillations resulted in a pronounced distortion
of grid cell firing, and 2) the finding that the disruption of grid cell firing tightly matched the time

35
course of the reduction in LFP theta power.
Additional insight into the function of the HIPP as well as the theta signal itself can be
gained when investigating the temporal relationship between the LFP theta signal and the firing
of individual neurons. During exploratory behavior, pyramidal cells in the CA1 layer are
influenced by the LFP theta oscillation, in that their preferred phase, on average, occurs towards
the through of the ongoing theta wave (Box 1.8a, b). This phenomenon of theta phase locking
(Mizuseki et al. 2009; Rutishauser et al. 2010) can be examined when plotting the theta phases
of all APs fired by a given cell (Box 1.8a, b). Theta phase locking is not only observed in the CA1,
but also in all other hippocampal subareas, in various other parahippocampal regions (such as
MEC, SUB, prS and paS), as well as in a variety of hippocampal output regions, including the
amygdala and mPFC (Mizuseki et al. 2009; Boccara et al. 2010; Siapas, Lubenov, and Wilson
2005; Pare, Collins, and Pelletier 2002). It is of note that, in contrast to neurons in MEC, neurons
in LEC show little theta modulation (Deshmukh et al. 2010). When referencing the firing of
simultaneously recorded neurons to the LFP theta oscillation in a given region (for example
CA1), it can be observed that the preferred phase varies across regions, suggesting that LFP
theta oscillations support the efficiency of local computations by coordinating the timing of
different incoming inputs and outgoing outputs (Mizuseki et al. 2009; Chance 2012).
Box 1.8| Theta phase locking in the HIPP
Theta phase locking in a representative, example neuron recorded in CA1. (a) Spike phase histogram for all APs fired during a 10‐min foraging session in the open field. For better visualization, the histogram is plotted twice, and a LFP theta trace, which was recorded in the CA1 cell layer, is additionally shown (filtered trace, blue; raw trace gray). Most APs occurred at the through of the LFP theta oscillation. (b) Same data as in(a) displayed in a polar plot. The mean resultant vector length is used as a
measure of phase locking (gray arrow). The angle of the arrow indicates cell’s preferred theta phase.
As reported in Schlesiger et al., 2015.
1.6.4 Hippocampal theta phase precession
Additional layers of functional complexity were revealed in experiments examining the
relationship between theta‐rhythmic firing and the spatial firing characteristics of hippocampal

36
place cells: Recording activity in CA1 and CA3, O’Keefe and Recce discovered a systematic
relationship between the spike phase with respect to the ongoing LFP theta oscillation and the
rat’s location within the place field (Box 1.9a): As the rat entered the place field, APs occurred at
late phases of the LFP theta cycle (i.e., near the peak of the LFP theta cycle); in the center of the
field, APs preferentially occurred near the through of the LFP theta cycle; as the rat exited the
field, APs occurred near the beginning of the cycle, having preceded by nearly 360°. This phase
shift by ~360° was distributed throughout the seven to eight LFP theta cycles that typically
occurred during the traversal of a place field of ~25 cm in length, as typically found in the dorsal
HIPP (O'Keefe and Recce 1993). The phenomenon is referred to as hippocampal theta phase
precession (hTTP) and has been observed in all hippocampal subregions (CA1, CA2 and CA3) as
well as the DG and the SUB (Mankin et al. 2015; Kim, Ganguli, and Frank 2012; Skaggs et al.
1996). Mechanistically, TPP is the result of a mismatch between the frequency of the LFP theta
oscillation and the frequency at which bursts of APs are fired by the theta‐phase‐precessing cell:
Each cell fires bursts at a frequency that is 0.5 to 1 Hz higher than the LFP theta frequency,
resulting in an increasing offset between the two frequencies as the rat progresses through the
place field (Box 1.9a).
While TPP, by definition, results in a distribution of APs throughout the entire theta cycle, theta
phase locking, as observed in displays without spatial or temporal resolution (Box 1.8), arises
through the fact that the cell’s firing rate is highest in the center of the place field. The Gaussian
shape of the place field thus results in a disproportional accumulation of APs at the through of
the theta cycle. Moreover, more recent research showed that during each individual pass
through the place field the phase offset (i.e., the phase at which TPP begins) and the amount of
TPP are fairly constant (Skaggs et al. 1996; Schmidt et al. 2009; Cabral et al. 2014). Theta phase
precession can therefore be observed in individual passes through a place field, and the phase‐
distance relationship is maintained when pooling all APs that occurred during multiple passes
(Box 1.9b).

37
Box 1.9| Theta phase precession on the single cell level
Schematic of theta phase precession in a single hippocampal place cell. (a) As the rat runs through a place field (green ellipse) on the linear track (black bar), theta phase precession occurs due to a mismatch in the frequency of the LFP theta oscillation (blue) and the frequency at which bursts of action potentials (red ticks) are fired. In other words, the distance between individual AP bursts is slightly smaller than the length of each LFP theta cycle, and APs are thus fired at progressively earlier LFP theta phases as the rat progresses through the place field. Arrow indicates the running direction, and the peak of each LFP theta cycle is marked with a black line. (b) Theta phase precession is visualized by plotting the theta phase at which each AP was fired, against the rat’s distance in the place field. The negative slope of the regression line is indicative of theta phase precession. For better visualization, the theta phase of each AP is replotted in a second cycle in all phase‐distance plots. Theta phase precession is consistent during each pass through the place field. It can therefore be detected in individual passes through the place field (Pass 1 to 5) and in conditions when APs that were fired during multiple passes are pooled (All passes pooled).
As reported in Schlesiger et al., 2015.
Additional insights can be obtained when examining TPP at the population level (Box
1.10a, b): As the rat explores a recording environment, each location is represented by a variety
of cells whose place field locations can be identical, overlapping or distinct. The current location
of the rat is thus represented by fields that are centered at that location, fields that are centered
behind the rat and fields that are centered in front of the rat (Box 1.10a). Because each
hippocampal place cell shows TPP, cells that are centered behind the rat fire at early phases of
the current theta cycle, while cells that are centered in front of the rat fire at late phases. Cells
that have their center at the rat’s current location fire at the through of current theta cycle.
Each theta cycle thus contains information about the rat’s current location as well as about the
locations it just visited and the locations is about to visit. The rat’s entire trajectory (represented
by the sequence of traversed place fields), which occured at a timescale of seconds, can thus be
reconstructed from a single theta cycle that lasts for ~125 ms (Skaggs et al. 1996; Foster and

38
Wilson 2007). A particularly important aspect of this concept is that the spike phase relationship
between two coactive cells bears information about the distance between their place field
centers: If the place field of cell A is in close proximity to the place field of cell B, one cell will
start phase precessing shortly after the other, and the spike phase difference will be small. Cells
that are further from cell A will start phase precessing with larger delays. As a consequence, the
distance between two overlapping place fields is proportional to the cells’ spike phase
difference within each LFP theta cycle. In the dorsal HIPP, the ratio between place field distance
and spike phase difference is approximately 20 (Geisler et al. 2010), resulting in a strong
temporal compression of information about the rats trajectory. At the population level, theta
phase precession is therefore thought to support the temporal compression of information
about events that occurred at the behavioral timescale of seconds to a timescale at which
neurons communicate (tens of ms), and that is relevant for synaptic plasticity mechanisms such
as spike‐timing‐dependent plasticity (Skaggs et al. 1996; Dragoi and Buzsaki 2006; Geisler et al.
2007). Theta phase precession might thus facilitate the learning of sequences of places, and it
has been speculated that the ability to encode such sequences might be crucial for the
formation of temporally structured episodic memories (Buzsaki and Moser 2013).

39
Box 1.10| Theta phase precession at the population level: A mechanism for sequence compression
Sequence compression is effectively achieved in populations of phase‐precessing cells, while it cannot be achieved when neuronal firing is theta‐phase‐locked. (a) Theta phase precession in three cells with overlapping place fields results in sequence compression. Each cell’s firing field on the linear track (black bar) is shown as an ellipse, and the APs fired by each cell are depicted as ticks in corresponding colors. The fields are not filled to visualize their overlap, and bursts are reduced to a single tick, for clarity. The middle of each field is marked with a colored arrow, and the running direction is indicated with a black arrow. The LFP theta oscillation is shown in blue, and the peak of each theta cycle is marked with a black line. Each cell shows TPP, in that APs fired at the entry of the field occur at late theta phases, APs fired in the middle of the field occur at ~180°, and APs fired at the exit of the field occur at early theta phases. At any given location, information about the rat’s distance within each of the overlapping place fields is encoded by the theta phases of APs fired by the corresponding cells. For example, in the middle of the green field, the
APs depicted in green are fired at ~180°.The center of the orange field is behind the rat, and the APs depicted in orange therefore occur at earlier phases, while the center of the blue field is in front of the rat, and the APs depicted in blue therefore occur at later phases. Within each of the theta cycles, the sequence of traversed place fields is therefore reflected in the order of APs fired by the corresponding cells. While the sequence of locations is only traversed once, the sequence of APs representing the visited locations is repeated within each theta cycle. In addition, the theta phase difference of APs fired by neighboring cells is proportional to the distance between their place fields. This results in the repeated compression of information about the sequence of place fields that were traversed at the behavioral timescale of seconds to a timescale of one theta cycle (~125 ms), which is relevant for neuronal computations. (b) Theta phase locking in the absence of theta phase precession, which is commonly observed in other parahippocampal regions, does not result in sequence compression. In this schematic, all APs are phase‐locked to the through of the theta oscillation. Jitter is added to visualize individual APs. This coding scheme does not preserve information about the sequence of traversed place fields. Instead, all APs fired within each theta cycle occur within a short time window, which might facilitate synaptic plasticity between simultaneously active cells, irrespectively of the order of the underlying place fields.
Schematic based on Buzsaki and Dragoi, 2006.
1.6.5 Theta phase precession in hippocampal output and input structures
While TPP was initially discovered in hippocampal place cells, it was subsequently
observed in several brain regions that receive its output: Jones and Wilson recorded from cells
in the mPFC as well in the CA1 as rats performed a working memory task on a figure‐8 maze
(Jones and Wilson 2005a). In contrast to hippocampal place cells, cells in the mPFC showed little
spatial selectivity and their firing tended to span the entire maze. In a proportion of cells, TPP

40
was nevertheless observed as rats traversed the central stem of the maze. Moreover, prefrontal
TPP tended to selectively occur during periods in which the coherence between hippocampal
and prefrontal theta oscillations was increased, a state which indicates increased
communication between the two regions (Jones and Wilson 2005b, 2005a; Igarashi et al. 2014;
Yamamoto et al. 2014). Because such an increase in coherence was observed at the decision
point, and the disruption of hippocampal activity at the decision point resulted in a memory
impairment, it was speculated that prefrontal TPP is inherited from the HIPP in order to support
memory retrieval (Jones and Wilson 2005a). A similar phenomenon was observed in a subset of
cells recorded in the ventral striatum (vStr), in a spatial memory task that required the rat to
learn a sequence of turns in order to reach a learned reward location (van der Meer and Redish
2011). As in the mPFC, cells in the vStr tended to fire over large proportions of the maze. In a
subset of cells, this broad spatial firing patterns where further structured, in that the firing rate
gradually increased as the rat approached a reward location, and this gradual increase in firing
rate was associated with TPP. Such ‘ramping cells’ are well described in the nucleus accumbens
and other ventral striatal areas, and the ramping of firing rate was shown to reflect the
anticipation of a reward (Khamassi et al. 2008; van der Meer and Redish 2009). As observed in
the mPFC, striatal TPP preferentially occurred during periods of increased coherence between
LFP theta oscillations in HIPP and vStr. It was therefore suggested that striatal TPP supports the
linkage between reward information and its location (van der Meer and Redish 2011).
In addition, pronounced TPP was observed in grid cells in MEC II (Fyhn et al. 2007),
which are known to directly project to the HIPP (Zhang et al. 2014; Zhang et al. 2013). Grid cells
in MEC III did not show TPP beyond what would be expected by chance, and TPP in MEC cell
types other than grid cells remains to be assessed in the future. Furthermore, it was shown that
the inactivation of the HIPP with muscimol did not affect TPP in medial entorhinal grid cells,
excluding the possibility that hippocampal backprojections drive TPP in the MEC. Whether the
medial entorhinal TPP affects TPP in the HIPP or whether TPP is generated locally in each of
these brain regions remains to be determined.

41
1.7 Aims revisited
The work presented in this dissertation aims to enhance our understanding of how the
MEC supports hippocampal spatial and temporal coding. As outlined in the sections above, the
hippocampo‐entorhinal system was shown to play a profound role in our ability to form episodic
memories. A variety of computations thought to support the formation of memories were
identified in studies utilizing electrophysiological single‐unit recordings in behaving rats.
Specifically, the MEC was shown to be highly specialized in the coding of spatial and self‐motion
information, and theories of hippocampo‐entorhinal function predict that fundamental spatial
information from the MEC supports hippocampal spatial computations. In addition, it was found
that neurons in both brain regions exhibit TPP, a computations which organizes the timing of AP
within individual place fields. Theta phase precession is thought to support memory by allowing
the linkage of information about multiple visited locations into temporally ordered neural
sequences, and theoretical work suggests that it might be either generated locally in each brain
region or propagate from the MEC to the HIPP.
While many computational models and theories elaborate potential mechanisms of how
medial entorhinal input might support hippocampal spatial and temporal coding, experimental
data feeding into contemporary theories is predominantly correlative. Here we examine the role
of the MEC in hippocampal spatial and temporal coding by recording neuronal activity from
hippocampal neurons in rats with extensive bilateral lesions to the MEC. Specific hippocampal
computations examined in MEC‐lesioned rats include the ability to form spatially receptive fields
(chapters 2 and 5.1), to organize those fields into stable maps of the real‐world environment
(chapter 2), to form distinct maps for different environments (chapters 3 and 5.2), and to exhibit
TPP (chapters 4 and 5.3).

42
Chapter 2
Published manuscript (i)

43
Author contributions
Magdalene Schlesiger (M.S.), Jill Leutgeb (J.L.) and Stefan Leutgeb (S.L.) designed
electrophysiological experiments (Figures 1 and 2, Supplementary figures 1 and 2); Jena Hales
(J.H.), Robert Clark (R.C.) and Larry Squire (L.S.) designed behavioral experiments (Figures 1, 3
and 4, Supplementary figure 3); M.S. and S.L. implanted recording devices; J.H. performed
lesions; M.S. performed electrophysiological experiments with assistance from Brittney Boublil
(B.B.); M.S. analyzed electrophysiological data; J.H. performed behavioral research and analyzed
behavioral data; J.H. quantified the lesion size; M.S., J.H., R.C., S.L., J.L., and L.S. wrote the
paper.

44
Medial entorhinal cortex lesions only partially disrupt hippocampal place cells
and hippocampus‐dependent place memory
Jena B Hales2,6, Magdalene I Schlesiger4,6, Jill K Leutgeb4,
Larry R Squire1,2,3, Stefan Leutgeb4,5,7**, Robert E Clark1,2,7*
Short title: Medial entorhinal cortex, place cells, and memory
1Veterans Affairs San Diego Healthcare System, San Diego, CA 92161, U.S.A.
2Department of Psychiatry, School of Medicine, University of California, San Diego, La Jolla,
California,92093, U.S.A.
3Department of Psychology and Department of Neurosciences, University of California, San
Diego, La
Jolla, California, 92093, U.S.A.
4Neurobiology Section and Center for Neural Circuits and Behavior, Division of Biological
Sciences, University of California, San Diego, La Jolla, California, 92093, U.S.A.
5Kavli Institute for Brain and Mind, University of California, San Diego, La Jolla, California, 92093,
U.S.A.
6 Co‐first author.
7 Co‐senior author.
*To whom correspondence should be addressed:
Robert E. Clark, Veterans Affairs Medical Center, San Diego, and Department of Psychiatry,
University of California, San Diego, La Jolla, CA 92093; e‐mail: [email protected]
or
Stefan Leutgeb, Neurobiology Section and Center for Neural Circuits and Behavior, University of
California, San Diego, La Jolla, CA 92093; e‐mail: [email protected]

45
2.1 Abstract
Entorhinal cortex provides the primary cortical projections to the hippocampus, a brain
structure critical for memory. However, it remains unclear how the precise firing patterns of
medial entorhinal cortex (MEC) cells influence hippocampal physiology and hippocampus‐
dependent behavior. We found that complete bilateral lesions of MEC resulted in a lower
proportion of active hippocampal cells. The remaining active cells had place fields, but with
decreased spatial precision and decreased long‐term spatial stability. In addition, MEC rats were
as impaired at acquiring the watermaze as hippocampus rats, while rats with combined MEC
and hippocampal lesions had an even greater deficit. However, MEC rats were not impaired on
other hippocampus‐dependent tasks, including those in which an object location or context was
remembered. Thus, MEC is not necessary for all types of spatial coding, nor for all types of
hippocampus‐dependent memory, but is necessary for the normal acquisition of place memory.

46
2.2 Introduction
Long‐term memory for facts and events is thought to depend on the interaction of the
hippocampus with widespread neocortical sites (McClelland, McNaughton, and O'Reilly 1995;
Squire and Alvarez 1995). By virtue of its afferent and efferent connections, the entorhinal
cortex connects between these regions. It provides the major cortical inputs to the
hippocampus, receives backprojections from the hippocampus (Witter et al. 1989; Witter and
Amaral 1991), and has numerous connections to neocortical areas. The projections from
neocortical areas to the entorhinal cortex are segregated into two prominent streams, one
through medial entorhinal cortex (MEC) and a second through lateral entorhinal cortex (LEC).
The MEC is densely connected with the postrhinal cortex and is hypothesized to be specialized
for representing spatial information, while the LEC is densely connected with the perirhinal
cortex and is thought to be specialized for representing object information (Witter, Naber, et al.
2000; Knierim, Lee, and Hargreaves 2006; Eichenbaum et al. 2012). In support of this functional
specialization, the MEC contains several cell types that are not found in the LEC. Most
prominently, a substantial proportion of the principal cells in the MEC are grid cells, which fire at
the vertices of highly regular triangular lattices (Hafting et al. 2005). Furthermore, within the
MEC, grid cells are intermingled with other spatially and directionally modulated cell types such
as head direction cells, conjunctive head direction‐grid cells, border cells, and spatially periodic
non‐grid cells (Hafting et al. 2005; Sargolini et al. 2006; Solstad et al. 2008; Krupic, Burgess, and
O'Keefe 2012). All of these cell types have been identified as projecting directly from the MEC to
the dorsal hippocampus (Zhang et al. 2013) and are thought to be the primary source of spatial
information for hippocampal place cells.
Given that MEC cells with spatial and directional firing patterns are a primary entorhinal
input to the hippocampus, lesions of MEC can be expected to markedly disrupt hippocampal
spatial firing and spatial memory. It is therefore notable that prior lesion studies have often not
reported marked effects on place cell physiology (Miller and Best 1980; Van Cauter, Poucet, and
Save 2008). In addition, memory impairment in hippocampus‐dependent tasks after entorhinal
lesions was found to be less robust than after hippocampal damage (Parron, Poucet, and Save
2006; Steffenach et al. 2005). A possible reason for mild impairments on spatial memory is that
many of the reported entorhinal lesions may have spared the dorsocaudal‐most part of the
MEC, where the most precise spatial representations, including grid cells, are found.

47
To determine whether spatial computations in MEC support spatial memory, we
developed a precise set of surgical coordinates for removing the entire MEC, including the most
extreme portion of the dorsocaudal MEC. We then tested whether such complete lesions
disrupted hippocampal spatial firing patterns. Next, we measured the effects of this MEC lesion
on memory tasks, including the watermaze, context and tone fear conditioning, and displaced
and novel object recognition. For the watermaze task, we also asked whether complete MEC
lesions impaired performance as severely as full hippocampal lesions and whether combined
MEC and hippocampal lesions produced a more severe impairment than separate lesions of
each structure.
2.3 Results
Medial entorhinal lesions included the grid cell area
To confirm that the entire MEC, including the dorsocaudal‐most pole with a high
proportion of grid cells, was included in the lesions, we determined the extent of entorhinal
damage in sagittal sections (Figure 1 and S1). The sections were stained with NeuN to visualize
any remaining neurons in the MEC, and the lesion extent was quantified using the Cavalieri
method. In the MEC group, neurons were completely ablated in 82.6% of the total MEC volume
(94.6% of layer II, 83.5% of layer III, and 75.2% of deep layers) with the majority of the sparing in
the most lateral extent of the MEC. Cell loss in adjacent cortical areas was predominantly in the
parasubiculum and postrhinal cortex and was minor in the ventral hippocampus and in the LEC.
In the group with full hippocampal lesions (H), the damaged tissue included 74.4% of the total
hippocampus with the majority of the sparing at the most posterior transition between dorsal
and ventral hippocampus (coronal sections). In the group with combined H and MEC lesions
(MEC+H), the lesion included 86.9% of the total hippocampus and 91.8% of the total MEC (95.1%
of layer II, 91.3% of layer III, and 90.6% of deep layers).

48
Figure 1. MEC lesions and hippocampal lesions included the entire dorsoventral extent (A) Photographs at
three sagittal levels for rats with sham (CON), MEC, and MEC+H lesions (lateral to medial in the columns to the
left of double line) and three coronal levels for rats with CON and H lesions (anterior to posterior in the
columns to the right of double line). The letters around the two CON tissue sections in the top row identify the
orientation of the sections (d, dorsal; v, ventral; a, anterior; p, posterior; l, lateral; m, medial). The black arrows
in the left column indicate the dorsal and ventral borders of the MEC. (B) Electrode tracks that terminated in
the CA1 cell layer (marked by white arrows) in the left and right hemisphere are shown for two rats with MEC
lesions. See also Figure S1. Scale bars below each tissue section indicate 1 mm.

49
A subpopulation of hippocampal cells remained active but with substantially decreased
spatial precision and spatial stability
To examine the extent to which hippocampal physiology was disrupted after MEC lesion,
we recorded hippocampal firing patterns while rats randomly foraged in familiar environments.
First, we tested whether the substantial loss of inputs from MEC to hippocampus resulted in
reduced hippocampal firing rates. The mean firing rate of all recorded cells during random
foraging was 0.32 ± 0.04 Hz in the MEC group compared to 0.63 ± 0.09 Hz in the control (CON)
group (mean ± SEM; Z = 8.25, p < 0.001) (Figure 2A). To test whether this difference in firing rate
emerged from a higher proportion of cells that fired at extremely low rates during behavior, we
selected cells that were active at average rates > 0.25 Hz during random foraging [90/198
(45.5%) in the MEC group and 67/107 (62.6%) in the CON group]. The mean firing rate of this
active cell population was 1.04 ± 0.09 Hz in the MEC group compared to 1.12 ± 0.12 Hz in the
CON group (mean ± SEM; Z = 0.01, p = 0.99). Thus, even though there was a larger fraction of
low‐rate cells in MEC rats compared to controls, there was also a subpopulation of hippocampal
cells in the MEC group that fired at control levels (Figure 2A).
The finding that a subpopulationof hippocampal cells continued to fire at rates that were
comparable to those of place cells in CON rats after the MEC lesion raised the question whether
whether they might also have retained spatial selectivity. Hippocampal principal cells retained
place‐selective firing, but the firing fields of the cells in the MEC group were 94.4 % broader, had
56.5 % less spatial information, and were 23.9 % less coherent than those in the CON group
(place fields size: Z = 6.02, p < 0.001; spatial information: Z = 7.98, p < 0.001; spatial coherence: Z
= 6.58, p < 0.001; Figure 2B, C, S2). The decrease in the quality of spatial firing resulted in path
reconstruction errors of 38.4 cm in ensembles of simultaneously recorded cells (n = 15 to 44
cells) from MEC rats compared to 22.7 cm in CON rats (Z = 4.50, p < 0.001; Figure S3A). In
addition, the cells from MEC rats fired less consistently at the same location than those from
CON rats over intersession intervals of 2 min, 20 min, 6 h, or 1 day (Mann‐Whitney U test, all p
values < 0.01 after Bonferroni‐Holm correction for multiple comparisons; Figure 2D). The most
substantial decrease in place field stability was measured at the 1‐day interval, but stability
nonetheless remained higher than what would correspond to a random reorganization of place
fields (Mann Whitney test, Z = 4.04, p < 0.001).

50
A
*
Firin
gra
te (H
z)
0
Active cells
0.5
1.0
1.5*
Firin
gra
te (H
z)
B
MEC lesion
Rat 504Cell 9 Cell 10 Cell 11 Cell 12
6 Hz 6 4 7
0 0 00 Hz
Cell 1 Cell 2 Cell 3 Cell 417 Hz 7
0
18
0
10
00 Hz
Rat 514Cell 5 Cell 6 Cell 7 Cell 8
10 Hz 5 4 8
0 0 00 Hz
Rat 502Cell 13 Cell 14 Cell 15 Cell 16
7 Hz 4 3 3
0 0 00 Hz
Control
Cell 1 Cell 2 Cell 3 Cell 4Rat 470
17
0
13
0
9
0
4 Hz
0 Hz
Control MEC lesion MEC lesion shuffled
0
0.2
0.4
0.6
0.8
1
1 day6 h20 min2 minInterval between sessions
MEC lesion(2 min)
Control(1 day)
***
MEC lesion(1 day)
*
*
Spat
ialc
orre
latio
nco
effic
ient
10 Hz
0
Cell 1
Cell 2
Cell 3
C
17 Hz
0 Hz
13 Hz
0 Hz
Rat 434
10 min 10 min 10 min 10 min 10 min 10 min//
2 min 20 min 6 h 20 min 2 min 1 day
10 min
0
0.5
1.0
1.5
0
1.52.02.5
1.00.5
Info
rmat
ion
scor
e(b
its/s
pike
) *
00.10.20.30.40.5
*
Plac
e fie
ld s
ize
(m )2

51
Figure 2. Neuronal activity in the hippocampus was disrupted after MEC lesions (A) Left panel: Mean firing
rate of all cells recorded during rest and/or random foraging in three daily 10‐min sessions in a familiar
environment (CON: black solid bar; n = 107 cells, n = 3 rats; MEC: red solid bar; n = 198 cells, n = 5 rats, and
average neuronal firing rate in the population of cells that was active above a threshold of 0.25 Hz (active
cells). Right panel: Firing rates of all cells recorded in three 10‐min sessions in the novel environment (CON:
black open bar; n = 47 cells, n = 2 rats; MEC: red open bar; n = 118 cells, n = 4 rats) and of cells exceeding a
mean firing rate threshold of 0.25 Hz. (B) Differences in mean place field size and spatial information score
between the CON and MEC groups indicate a substantial reduction in spatial precision after the MEC lesion,
particularly in the novel environment. Only cells with mean firing rates > 0.25 Hz were included in the analysis.
(C) Spatial firing patterns of representative cells in the CON (black box) and MEC (red box) groups in the familiar
(left panel) and novel (right panel) environment. The color scale for rate maps is from 0 Hz (blue) to peak rate
(red). (D) Place field stability was measured over a sequence of six 10‐min foraging sessions in the familiar
environment. To be included in the analysis, cells had to exceed a mean firing rate of 0.25 Hz in the first
session of each comparison. Intervals between sessions were 2 min, 20 min, 6 h, or 1 day (top schematic). The
stability of spatial firing between sessions was lower in the MEC compared to the CON group at all four tested
intersession intervals as indicated by the lower mean spatial correlation coefficient (lower graph). However, the
correlation values in the MEC group were higher than chance values that were calculated by shuffling the cell
identity of active cells in the MEC group. Insets: Spatial firing patterns of a representative control cell (1‐day
interval) and of two MEC lesion cells (2‐min interval and 1‐day interval) across two behavioral sessions. See
also Figure S2. * p < 0.05. Error bars represent SEM.
After finding that spatial firing in the hippocampus was reduced in highly familiar
environments after MEC lesion, we tested the contribution of MEC to the initial formation of
hippocampal spatial maps. In contrast to the reduced firing rate in familiar rooms, hippocampal
cells showed similar activity levels in a novel environment after MEC lesions (0.79 ± 0.10 Hz)
compared to controls (0.57 ± 0.09 Hz, Z = 0.23, p = 0.41) and the proportion of active cells was
similar to controls [69/118 (58.5%) in the MEC group and 29/47 (61.7%) in the CON group]. In
addition, cells active during random foraging (average firing rate > 0.25 Hz) fired at higher rates
in MEC rats (1.50 ± 0.13 Hz) compared to CON rats (0.91 ± 0.09, Z = 2.29, p < 0.05). Along with
the overall increase in neuronal activity in the novel environment, the firing fields in MEC
lesioned rats were broader than those in familiar environments. Hippocampal spatial firing
patterns in MEC lesioned rats were thus particularly disrupted when rats were first exposed to a
novel environment.
MEC lesions impaired spatial memory in the watermaze task
The recordings from hippocampal place cells demonstrated that large MEC lesions
substantially disrupted the precision and stability of hippocampal spatial firing, particularly in
novel environments. Accordingly, we expected to find substantial deficits in spatial memory
acquisition. To measure spatial memory performance after MEC lesions, we used a standard
training protocol in the Morris watermaze (4 training trials per day) but with an added reinforced

52
probe trial at the beginning of each training day to determine the learning rate. Rats with MEC
lesions were profoundly impaired at acquiring memory for the platform location (repeated‐
measures ANOVA for group: F(1) = 18.74, p < 0.001; Figure 3). With extended training, these rats
eventually reached control performance levels for time spent in the target quadrant (after 5
days of training; Figure 3A) as well as for the time spent in a small circle around the platform
location (after 9 days of training; Figure 3B).
To determine whether MEC rats found an alternate strategy for solving the task, we
tested spatial memory in the original and in a reconfigured watermaze. A separate set of animals
(MEC and CON groups) was trained for 5 days on the watermaze as described above. During a
second week, the groups were then tested in a reconfigured environment. The room and pool
remained the same, but the distal visual cues and the platform location were changed. After
reconfiguring the room, the CON rats performed as expected for a new maze, with chance levels
of performance on the first day and rapid learning across the following 4 days (Figure 4A). In
contrast, the memory deficit in the MEC group was so profound that they did not learn the new
platform location, never performing above chance on the small circle measure (all t values <
1.04, p > 0.1) and performing above chance only on the 5th day for the quadrant measure (t(7) =
2.77, p < 0.05). Instead of showing improvement for the new platform location, the MEC rats
showed a strong preference for the old platform location, performing above chance at that
location until day 3 by the quadrant measure (days 1 and 2: t > 2.38, p < 0.05). In summary,
although the MEC rats eventually performed comparably to controls after extended training on
the first platform location, their performance in a reconfigured maze was severely impaired
compared to CON rats (all t values for the small circle and quadrant measures > 2.74, p values <
0.05) indicating that they came to approach the task in a different way than CON rats and that
their ability to rapidly and flexibly form new place memories was impaired.
Comparison of MEC lesions to hippocampal lesions and to combined MEC and hippocampal
lesions
Once we determined that MEC rats were impaired at acquiring the watermaze task but
were eventually able to reach asymptotic levels with extended training, we asked whether the
extent of the learning deficit after an MEC lesion might be comparable to that of a complete
hippocampal lesion. H rats also eventually reached control performance levels for the quadrant
measure (after 4 days of training; t(26) = 1.17, p > 0.1; Figure 3A) as well as for the small circle

53
measure (after 8 days of training; t(26) = 1.58, p > 0.1; Figure 3B) and, similar to MEC rats, learned
the platform location with extended training. In particular, the number of training days until
each of the groups showed memory for the platform location was similar. Therefore, the
performance of the H group was comparable to that of the MEC group (repeated‐measures
ANOVA for group: F(1) = 0.17, p > 0.1).
The similar effects of MEC and H lesions on spatial memory could indicate that a lesion
of either area fully disrupted the function of the entorhino‐hippocampal loop and that the
residual capacity for learning was supported by different brain areas. Alternatively, the similar
effects could indicate that in each case the intact brain area (hippocampus or MEC) can support
some spatial learning. To examine whether the MEC and hippocampus can independently
support spatial memory function, we compared the MEC and H groups to rats with a combined
lesion of MEC and hippocampus. For the quadrant measure, the MEC+H group had a much more
pronounced deficit than either the MEC or the H group (through day 6; MEC+H relative to MEC:
t(14) = 2.99, p < 0.01; MEC+H relative to H: t(14) = 2.71, p < 0.05; Figure 3A). A comparison of the
rate of memory acquisition showed that CON rats performed above chance levels beginning on
day 2 of acquisition (t(19) = 4.75, p < 0.001), and H and MEC rats performed above chance levels
on days 4 and 5, respectively (H: t(7) = 3.48, p < 0.05; MEC: t(7) = 2.88, p < 0.05). In contrast,
MEC+H rats failed to perform above chance until day 8 (t(7) = 4.39, p < 0.01). By the third week
of testing, there were no significant group differences (repeated‐measures ANOVA for group: F(3)
= 1.53, p > 0.1). All lesion groups were also impaired at finding the platform during the
acquisition training trials (repeated‐measures ANOVA for group: F(3) = 10.57, p < 0.0001).
However, in contrast to the probe measures, all three lesion groups remained impaired through
the end of the 15 days of training (Figure 3C; see Supplemental Data for additional watermaze
results and statistics).
The substantial decrease in the precision of hippocampal spatial firing after MEC lesions
(see Figure 2) might suggest that memory for a precise spatial location is more severely impaired
after the MEC lesion compared to memory for broader locations. We examined this possibility
by measuring the amount of time that rats spent directly at the platform location (i.e., the small
circle measure). By this measure, the impairments of the MEC group and the H group were as
severe as that of the combined MEC+H group. The H group reached control level performance at
day 8, while the MEC and MEC+H groups reached control level performance on day 9 (Figure

54
3B). The CON group was already above chance levels beginning on day 3 of acquisition (t(18) =
5.62, p < 0.001). By the third week, there were no significant group differences (repeated‐
measures ANOVA for group: F(3) = 0.47, p > 0.1). Our results therefore indicate that the degree to
which the MEC and hippocampus can independently support spatial memory depends on the
spatial precision that needs to be demonstrated (see Supplemental Information and Figure S3 for
additional watermaze results).

55
Figure 3. Watermaze performance is impaired after MEC, H, and MEC+H lesions.
Probe trial performance across the first 5 days of spatial memory acquisition (Acquisition) and across ten
additional training days (Additional training) in rats with lesions of the hippocampus (H, n = 8), lesions of the
medial entorhinal cortex (MEC, n = 8), lesions of both structures (MEC+H, n = 8), and sham lesions (CON, n =
20). The scores represent the % time each group spent in the target quadrant (a) or in a small zone centered on
the trained platform location (b) during a 60‐s probe trial. Dashed lines indicate chance performance for the
quadrant and small zone, which was 25% and 4%, respectively. (c) All lesion groups were impaired at acquiring
the platform location and required longer swim path distances than the CON group to locate the hidden
platform. This impairment persisted throughout all 15 days of training. The inset bar graph is the average
distance each group traveled to reach the platform during the third week of training. All three lesion groups
took a longer average route to the platform than the CON group (see Figure S3 and Supplemental Data for
additional statistics).
%Ti
me
in tr
aini
ng q
uad
rant
1
10
20
30
40
2 3 4 5 6 7 8 9 10 11 12 13 14 15
A Acquisition Additional training
chance
50
60
70
0
Probe trials (days)
%Ti
me
in p
latf
orm
loca
tion
1Probe trials (days)
0
4
8
12
16
20
2 3 4 5 6 7 8 9 10 11 12 13 14 15
BAcquisition Additional training
chance

56
Figure 4. Watermaze performance is inflexible after MEC lesions despite normal performance on other tasks.
(a) CON (n=8) and MEC (n=8) groups were given 5 days of initial watermaze training. The watermaze was
then reconfigured by changing all the distal spatial cues, and the groups were trained for 5 additional days
with the platform in the opposite quadrant (Reconfigured maze). The scores to the left of the vertical line
represent the % time that each group spent in the quadrant containing the platform (top) or in a small circle
centered on the platform (bottom) during initial training (Acquisition). Scores to the right of the vertical line
represent the performance of the groups in the reconfigure maze (Reconfigured maze) when the analysis
was done with the new platform location (New platform) or with the old platform location (Old platform).
%Ti
me
in p
latf
orm
loca
tion
1Probe trials (days)
0
4
8
12
16
20
2 3 4 5 6 7 8 9 10
B
%Ti
me
in tr
aini
ng q
uadr
ant
1
10
20
30
40
2 3 4 5 6 7 8 9 10 6 7 8 9 10
A
chance
50
60
70
0
Probe trials (days)
C
0
60
65
70
75
Control MEClesion
% P
refe
renc
e
Contextual fearconditioning
0
15
30
45
Control
%Fr
eezi
ng
MEClesion
Displaced objectrecognition
Acquisition New platform Old platformReconfigured maze
Acquisition New platform Old platformReconfigured maze
6 7 8 9 10
*
** *
*
***
**
*
*
*
* **

57
The MEC group was impaired on initial acquisition and in learning the new platform location in the
reconfigured maze (New platform). Whereas the CON group approached the reconfigured maze as a new
maze and never spent greater than chance amount of time at the old platform location, the MEC group
persisted in searching for the platform in the old location (Old platform). Dashed line represents chance
performance on a 60‐s probe trial. (b) Performance of the CON (n = 8) and MEC (n = 8) groups on two
hippocampus‐dependent memory tasks requiring spatial information. Both groups preformed equally and
above chance on displaced object recognition (left) and on context memory as measured by % freezing
(right). Both groups also performed equally and better than chance on the novel object recognition task and
freezing to a tone paired with shock (data not shown). * p < 0.05. Error bars represent SEM.
Intact performance after MEC lesions on other memory tasks
After finding a substantial memory deficit in the watermaze, we tested the MEC and
CON groups on a series of non‐navigational tasks that are sensitive to hippocampal damage.
First, we examined Displaced Object Recognition, which requires animals to preferentially
explore a displaced object after a 3‐hr delay. Preference for the displaced object did not differ
between MEC and CON groups (Figure 4B; t(14) = 0.92, p > 0.1) and was above 50% chance in
both groups (MEC: t(7) = 3.05, p < 0.05; CON: t(7) = 2.27, p = 0.058). As a non‐spatial comparison,
we asked whether Novel Object Recognition, which requires rats to recognize a previously
encountered object, is affected by MEC lesion. Preference for the novel object did not differ
between MEC and CON groups (t(14) = 0.41, p > 0.1) and was above 50% chance in both groups
(MEC: t(7) = 6.23, p < 0. 0001; CON: t(7) = 5.25, p < 0.0001). Next, we trained animals in Context
Fear Conditioning to associate a context (i.e., spatial environment) with a foot shock. For
comparison, we also tested for fear conditioning to a tone paired with a shock (Delay
conditioning). The amount of freezing (i.e., the index of fear) did not differ between MEC and
CON groups on the test for context (Figure 4B; t(14) = 0.26, p > 0.1) or on the test for the tone
(t(14) = 0.22, p > 0.1; see Supplemental Data for additional context fear conditioning results).
Amount of freezing in the context that was not associated with the shock also did not differ
between the MEC and CON groups (t(14) = 0.48, p > 0.1) suggesting that generalized fear did not
support the spared function measured in the context associated with the shock. In summary,
MEC rats were not impaired on any of the additional tasks including two standard hippocampus‐
dependent tasks that required an object location (i.e., Displaced Object Recognition) or a spatial
context to be remembered (i.e., Context Fear Conditioning).

58
2.4 Discussion
The majority of spatial and directional inputs to the hippocampus originates from
specialized cell types in the MEC, such as grid cells, head direction cells, conjunctive head‐
direction‐by‐grid cells, border cells, and spatially periodic non‐grid cells (Hafting et al. 2005;
Sargolini et al. 2006; Solstad et al. 2008; Krupic, Burgess, and O'Keefe 2012; Zhang et al. 2013).
Selective damage of the MEC could thus be expected to result in a substantial disruption of
hippocampal spatial firing and of hippocampus‐dependent spatial memory. We produced nearly
complete lesions of the MEC and found that the lesion broadened hippocampal place fields, but
did not completely prevent their formation. Such substantial disruption of hippocampal spatial
firing patterns after MEC lesions would predict a major effect on hippocampus‐dependent
spatial memory. Although we observed memory deficits in the watermaze that were equally
severe as those after hippocampal lesions, we also found that hippocampus‐dependent memory
tasks that require memory for either an object location or a context were entirely unaffected by
the MEC lesion as were two other non‐spatial memory tasks (novel object recognition and tone
fear memory).
The marked effect of our MEC lesion on hippocampal physiology and on spatial memory
in the watermaze differs from more subtle effects in prior studies that targeted the entorhinal
cortex. Our lesion approach differed in that we excluded the lateral entorhinal cortex (LEC), but
made certain to include the most dorsocaudal MEC (dmEC), where the spatial firing of grid cells is
most precise (Hafting et al. 2005). In a recording studies that spared this region, hippocampal
place fields became smaller (Van Cauter, Poucet, and Save 2008) or moderately larger (Brun et
al. 2008) compared to controls. In another study in which the lesion extent within entorhinal
cortex (EC) was large, but not particularly targeted to dmEC, there were no apparent effects on
place field size (Miller and Best 1980). The present lesions are the first where damage to the
MEC was sufficient to result in a substantial increase in place field size. However, even the most
extensive MEC lesions did not completely disrupt hippocampal spatial firing.
In parallel with the previously reported mild effect of EC lesions on hippocampal
physiology, the behavioral effects of EC lesions, including effects on watermaze performance,
have also generally been mild and smaller than effects after complete hippocampal lesions
(Parron, Poucet, and Save 2006; Steffenach et al. 2005). We directly compared the behavioral
effect of our MEC lesion with an essentially complete hippocampal lesion and found that the

59
impairments in the watermaze were equivalent. Although the effects of MEC and hippocampal
lesions on spatial memory were severe, we also observed that the platform location was
eventually learned in both lesion groups. To determine whether the spared performance
depended on a different strategy for reaching the platform location in MEC rats, we tested rats
on a reconfigured watermaze and found that whereas the control rats rapidly learned a second
platform location, MEC rats did not learn the second platform location and perseverated in
searching at the old platform location. Thus, MEC lesions disrupted the ability to rapidly and
flexibly form new spatial memories.
The residual capacity for inflexible spatial learning that we observed could be supported
by spared processing within the entorhino‐hippocampal loop. That is, the hippocampus might
continue to process information through LEC inputs, or, after hippocampal lesion, the MEC
might perform computations without receiving feedback from the hippocampus. For example,
rats with hippocampal lesions have previously been shown to reach control levels of
performance when they are overtrained in the watermaze (Morris et al. 1990). Alternatively, the
residual spatial learning could be entirely supported by brain regions outside of the MEC and the
hippocampus. To distinguish between these possibilities, we compared a lesion of the MEC or of
the hippocampus alone to a combined lesion of both brain areas. We found that the impairment
of the MEC+H rats was equivalent to the MEC or the H rats based on the time in the small target
circle, but was more severe in the combined lesion group compared to both single lesion groups
based on the time in the target quadrant. Our data thus show compensation for remembering
the approximate but not the precise platform location, which might be supported by the broad
residual firing patterns of MEC cells after hippocampal lesions (Fyhn et al. 2004) and of
hippocampal cells after MEC lesions. It has been shown that spatial reference memory is
retained while hippocampal maps reorganize (Jeffery et al. 2003), and our data after MEC
lesions suggest that reference memory can also be supported when hippocampal firing patterns
are only weakly stable. With further overtraining, compensation for remembering the precise
platform location can occur even when both the hippocampus and the entorhinal cortex are
damaged. Gradually acquired, inflexible navigation can thus be executed entirely without the
spatial firing patterns in the hippocampus and MEC.
The input streams from the MEC to the hippocampus are predominantly spatial, and the
streams from the LEC are predominantly nonspatial (Hargreaves et al. 2005; Knierim, Lee, and

60
Hargreaves 2006; Eichenbaum et al. 2012). We therefore expected that MEC lesions would
impair most hippocampus‐dependent tasks that require the rapid acquisition of spatial and
contextual knowledge, including displaced object recognition (Mumby et al. 2002) and context
fear conditioning [ see (Sanders, Wiltgen, and Fanselow 2003) for review]. Similar to those
studies, Van Cauter and colleagues used a one‐trial recognition task where rats explored one
object during a familiarization phase (Van Cauter et al. 2013). During the test phase, presented
15 minutes later, an identical object was added to the arena. Control rats preferentially
explored this object relative to the object from the familiarization phase that remained in place.
MEC lesioned rats failed to show this preference. In contrast, we found that the performance of
MEC rats was intact on the displaced object recognition task; however, there were some key
differences between our studies. Our version of the task was more difficult because both
objects were present during the familiarization phase and then one of those objects was
displaced during the test phase. Further, we used a 3‐h delay and our lesions included more of
the MEC than the Van Cauter et al. (2012) study reported. All of these factors should have made
it more likely to observe an impairment in our study. Yet, our MEC group performed above
chance and equal to controls. This spared performance can be explained in at least two different
ways. 1) In spontaneous preference tasks, above chance performance is a strong indication of
memory and perceptual ability. However, a failure to observe a significant preference, as was
the case in the Van Cauter et al. (2012) study, does not necessarily mean a failure of memory or
perception, but could be due to non‐specific factors like changes in exploratory behavior or
motivation in the lesion group. 2) Comparing these two studies is further complicated by the
fact that Van Cauter et al. (2012) used radiofrequency lesions, which damaged both cell bodies
and fibers and could thus potentially extend to projections from LEC. In contrast, we used
excitotoxic lesions, which damaged only cell bodies in MEC but spared fibers. It is possible that
the performance was spared because spatial information from the LEC would still be available to
the hippocampus. In support of this interpretation, physiological recordings from the LEC have
shown some stable spatial selectivity relative to objects or previously encountered objects in an
environment (Deshmukh and Knierim 2011; Deshmukh, Johnson, and Knierim 2012; Tsao,
Moser, and Moser 2013). Furthermore, a recent study showed that rats with LEC lesions had
intact performance on the watermaze but were impaired on a displaced object recognition task,
suggesting that LEC is necessary to detect differences in object configuration (Van Cauter et al.
2013), but not for remembering a consistent goal location.

61
We found that depriving the hippocampus of the rich spatial processing input stream
from MEC disrupted hippocampal place field precision and stability and impaired the ability to
rapidly acquire the information needed to successfully perform in the watermaze. In contrast,
the EC is not required to successfully recognize a context, detect a spatial change, associate a
tone and shock, or recognize an object. Other work suggests that this area is critical for
performance on non‐spatial tasks that require the flexible use of memory (Sauvage et al. 2010;
Navawongse and Eichenbaum 2013). Thus, the MEC is not specialized for all forms of
hippocampus‐dependent memory, but does appear critical for a limited range of tasks, including
normal acquisition and use of place memory.
2.5 Methods
Subjects
The subjects were 84 experimentally naïve, male Long–Evans rats. Groups with lesions of
the medial entorhinal cortex (MEC, n = 8), lesions of the hippocampus (H, n = 8), combined
lesions (MEC+H, n = 8), and sham lesions (CON, n = 20) were tested in the watermaze for 3
weeks. Additional rats (MEC, n = 8; CON, n = 8) were tested in the original watermaze task for
one week and in a reconfigured maze for a second week. These 16 rats were also tested on
displaced and novel object recognition and on context and tone fear conditioning. Finally, one
naïve group (n = 16) was used as an unshocked fear conditioning control group. For all
behavioral testing, rats were housed individually on a 12 h light/dark cycle with continuous
access to food and water. Testing was performed in the light phase. Eight additional rats
underwent either MEC‐lesion or sham surgery and were implanted with recording electrodes
aimed bilaterally at the hippocampus (MEC, n = 5 and CON, n = 3). These rats were housed
individually on a 12 h reversed light/dark cycle, and the rats were food restricted and
maintained at ~90% of free‐feeding body weight. Testing was performed in the dark phase.
Surgery
All stereotaxic surgery was performed using isoflurane gas anesthesia. Lesions were
produced by ibotenic acid (IBO) in the hippocampus and by NMDA in the MEC. For hippocampal
recordings, an electrode assembly was implanted during the same surgery as the MEC‐lesion
procedures (Koenig et al. 2011). The fourteen tetrodes of the electrode assembly were arranged
into two bundles, each aimed at one hemisphere and containing six to eight independently
movable tetrodes. One electrode in each hemisphere was used to record a reference signal.

62
Electrophysiological recordings
Rats were pretrained for 5 days in two 10‐min sessions per day to forage for randomly
scattered cereal crumbs. After surgery, tetrodes were slowly advanced into the CA1 area of the
hippocampus, and training continued for 7‐10 days with up to six 10‐min sessions per day in a
different room than during pretraining. Recordings during random foraging began when
tetrodes were positioned in the CA1 cell layer and when the rats ran continuously over the
entire box surface throughout each 10‐min random foraging session. In addition to performing
recording sessions in rooms in which the rats had been previously been trained, we also
performed a series of three 10‐min recording sessions in a novel room. See Supplemental
Information for additional detail on the electrophysiological recording and analysis methods.
Behavioral testing
All behavioral testing was postoperative. See Supplemental Information for additional
detail on the behavioral testing methods.
Morris watermaze. Each day, rats were given a reinforced probe trial followed by four
standard training trials (Broadbent, Squire, and Clark 2004; Clark, Broadbent, and Squire 2005).
Performance on the probe trial was calculated by measuring the % time rats spent in the
quadrant of the pool where the platform had been located during training (chance = 25%). In
addition, we calculated the % time each rat spent in a circular zone (30 cm diameter) centered
on the point where the platform had been located during training (chance = 4%). During the
remaining four standard training trials, the platform remained in its raised position. Rats were
tested for 15 days. Reconfigured maze protocol. An MEC and CON group were trained on the
watermaze task for 5 days as described above for Week 1. In week 2 they were then given an
additional 5 acquisition days in a reconfigured room. During this phase, the pool and room were
the same as during Week 1, but a curtain was hung around the pool, new distal visual cues were
displayed on the curtain, and the platform location was moved to the opposite quadrant.
Displaced object recognition, DOR. Identical brown opaque plastic jars served as stimuli.
During a 15‐min familiarization phase, two jars were located in adjacent quadrants while the rat
was allowed to explore the jars. Following a 3‐h delay, the rat was placed back into the
apparatus for the test phase with one of the two jars relocated to a different quadrant. Spatial

63
recognition memory was inferred by a preference for exploring the displaced jar compared to
the jar that remained in the same location.
Novel object recognition, NOR. The rat was placed in the box for a 15‐min familiarization
phase and allowed to explore two identical objects. Following a 3‐h delay period, the rat was
returned to the box with two objects (one novel object and a copy of the object from the
familiarization phase). Object recognition memory was inferred by a preference for the novel
object compared to the familiar object (Broadbent et al., 2010).
Context and Cued fear conditioning. Day 1 Conditioning. The rats were placed into the
chambers for a 7‐min conditioning session that included three tone–shock pairs. Day 2 Context
Test. To assess retention of context fear memory, rats were placed for 8 min into the same
chamber used for conditioning, and freezing was measured. Day 3 Tone Test (cued). To assess
retention of the conditioned fear response to the tone, the rats were placed into a different
conditioning chamber and into a different context and received one 10‐s tone during an 8‐min
trial while freezing was measured.
Author contributions
Author contributions: R.E.C., S.L., J.K.L., and L.R.S. designed research; J.B.H., M.I.S., and
S.L. performed the surgeries; J.B.H. performed behavioral research and analyzed behavioral
data; M.I.S. performed physiological research and analyzed physiological data; and J.B.H., M.I.S.,
R.E.C., S.L., J.K.L., and L.R.S. wrote the paper.
Acknowledgements
We thank L. Johnson, M. Supiurka, B. Boubil, J. Cheung, and M. Wong for technical
assistance and Christopher C. Cannova for providing the software for Baysian decoding. This
work was supported by NINDS 1R01NS086947‐01, a Boehringer Ingelheim Fonds PhD fellowship,
a NIMH/NRSA T32 Training Program in Cognitive Neuroscience training grant (MH020002‐13), an
Ellison Medical Foundation grant (AG‐NS‐0724‐10), the Walter F. Heiligenberg Professorship,
two Medical Research Service of the Department of Veterans Affairs grants, a National Institute
of Mental Health Grant (MH24600), and a NSF Temporal Dynamics of Learning Center grant.

64
2.6 Appendix
Supplemental Data
Degree of retained place cell spatial firing was not predicted small amount of MEC sparing
Because of the large lesion extent, we did not expect that the small fraction of retained
tissue could be used to predict place field quality. Accordingly, we did not find any relation
between the quality of the place fields and the small amount of spared tissue in either the
entire MEC (place field size: r = 0.18, n.s.; spatial information: r = ‐0.13, n.s.) or in any of the
MEC layers. Hippocampal spatial firing in animals with minor MEC sparing was thus equally
disrupted as in animals with near‐complete MEC lesions (see Figure S2).
Behavioral impairment in the watermaze was independent of delay intervals
Another feature of hippocampal recordings was that the consistency of hippocampal
firing was disproportionately impaired in the MEC group relative to the CON group at long
intervals between sessions relative to short intervals. We explored whether this finding might
be associated with a more pronounced memory deficit after longer compared to shorter
retention intervals by performing probe trials at four delays (1 min, 20 min, 90 min, and 6 h)
during the second week of watermaze training. After MEC lesions, the behavioral impairment
was not exacerbated at longer delay intervals relative to shorter delay intervals (Figure S4).
However, there was greater than chance stability in the place fields at intervals of up to 1 day
(see Figure 2D) and sparing of memory even at intervals of 1 day in the MEC group (see Figure
3). The remaining level of hippocampal function may thus have been sufficient to partially
support behavior at all tested intervals or an alternate, slower learning brain system was
beginning to support behavior. Longer latencies and swim path distances in the watermaze for
all lesion groups relative to controls remained throughout the three weeks of testing. All three
lesion groups had longer latencies to locate the hidden platform during the first week of
training trials (repeated‐measures ANOVA for group: F(3) = 8.05, p < 0.001). This impairment
persisted throughout all 15 days of testing. Average latencies during the third week of testing
(days 11‐15) were longer for all lesion groups relative to controls. The average latency to the
platform for CON rats (4.97 ± 0.17 s) was shorter than that of H rats (5.91 ± 0.27 s; t(26) = 2.93,
p < 0.01), MEC rats (7.39 ± 0.48 s; t(26) = 6.01, p < 0.0001), and MEC+H rats (8.96 ± 0.63 s;
t(26) = 8.37, p < 0.0001). H rats also had a shorter latency than MEC+H rats (t(14) = 4.44, p <
65
0.001) and MEC rats (t(14) = 2.70, p < 0.05), while MEC rats had an average latency that was
not different from MEC+H rats (t(14) = 1.99, p = 0.07). Since latencies can be confounded by
swim speed, we also calculated the swim path distances for each training trial. All three lesion
groups had longer swim path distances to locate the hidden platform during the first week of
training trials (repeated‐measures ANOVA for group: F(3) = 10.57, p < 0.0001). This impairment
persisted throughout all 15 days of testing (see Figure 3C). Average swim path distances during
the third week of testing (days 11‐15) were longer for all lesion groups relative to controls. The
average swim path distance to the platform for CON rats (116.49 ± 3.08 cm) was shorter than
that of H rats (138.75 ± 6.55 cm; t(26) = 3.50, p < 0.01), MEC rats (148.76 ± 11.80 cm; t(26) =
3.68, p < 0.01), and MEC+H rats (170.04 ± 9.64 cm; t(26) = 6.95, p < 0.0001). H rats also had a
shorter distance than MEC+H rats (t(14) = 2.68, p < 0.05), while MEC rats had an average path
distance that was not different from MEC+H rats (t(14) = 1.40, p > 0.1) or H rat
(t(14) = 0.74, p > 0.1).
Unshocked control comparison group for context fear conditioning
Both the MEC and CON groups exhibited more freezing than unshocked controls on
the context and cued (tone) tests, demonstrating significant fear memory retention
(unshocked control means did not differ from zero; MEC versus unshocked for context: t(14)
= 4.19, p < 0.001; CON versus unshocked t(14) = 3.18, p < 0.01; MEC versus unshocked for
tone: t(14) = 5.26, p < 0.01; CON versus unshocked t(14) = 7.45, p < 0.001).

66
Supplemental Figures

67
Figure S1. MEC lesions were nearly complete, in particular in the superficial layers, related to Figure 1. (A) Average lesion size in rats used for electrophysiological recordings (P; n = 5) and in rats used for behavioral experiments (B; n = 14). Layer II (blue), layer III (red), and deep layers (V/VI, black) were quantified separately. Error bars represent SEM. (B) Percentage of lesioned tissue for behavioral rats with representative large (Rat 3039) and average (Rat 2983) MEC lesions and for all five rats with hippocampal recordings. L and R correspond to left and right hemisphere, respectively. No successful recordings were obtained from the two hemispheres shaded in grey. (C) Detailed illustration of complete series of sagittal sections. The colored boxes identify corresponding hemispheres in (B) and (C). (D) Amount of MEC tissue in control (left) and MEC (middle) groups and % spared tissue (right). Spared tissue was measured for each section throughout the mediolateral extent of the MEC. Each cell layer in rats used for behavior (top) and electrophysiology (bottom) is shown separately. In the tissue of four hemispheres from three animals with electrophysiological recordings, we observed MEC layer III neurons that showed signs of substantial damage in addition to tissue in which neurons were completely ablated. For these animals, the MEC volume with any stained neurons is shown as red squares and MEC volume with only cells of normal appearance is shown as purple circles. The more conservative estimate that included only tissue without neurons was used in all quantitative analyses, including the calculation of the mean lesion size.*p < 0.001

68
69
Figure S2. The degree of retained spatial firing of hippocampal place cells was not predicted by the small amount of spared tissue in MEC layer III or deep layers, and larger place fields were seen throughout the entire series of six 10‐min recording sessions within a day, related to Figure 2. (A, B) The spatial firing in the MEC group was disrupted, but not completely abolished (see Figure 2). Changes in place field size and spatial information were unrelated to the extent of spared tissue in layer III and in the deep layers (V/VI) of the MEC (all r values are n.s.). The mean of the cells that were recorded in each hemisphere is plotted against the ipsilateral lesion size (n = 8 hemispheres with recordings in five rats). Lesions in layer II of all hemispheres were > 97 % complete, and correlation analysis was not performed because of the small degree of remaining variability.(C) The firing rate (including cells that were active in rest and/or behavior) in the MEC group was also unrelated to the extent of tissue damage in each hemisphere. There was no group difference in firing rate after excluding silent cells and correlation analysis was therefore not performed on these data. (D) Example cells from two control and from two MEC rats with large lesions. For the lesioned rats, cells that were recorded from the left and right hemisphere on the same day are shown. The colored boxes depict hemispheres for which detailed histology is shown with corresponding colors in Figure S1. For each cell, the depicted 10‐min session is the most representative for the day (i.e., closest to the mean field size of the recording sessions of the day). The spatial firing patterns of each cell is shown as the trajectory (grey) with superimposed spike locations (red dots) on the left of each panel and as color‐coded heat maps on the right of each panel. In the heat maps, pixels at the peak firing rate are in red and pixels with no firing are in dark blue. Note that data for Rat 505 were recorded from a square arena. There was substantial variability in the quality of spatial firing between cells that were simultaneously recorded within a recording session, and decreased place cell quality was observed irrespective of the amount of remaining tissue in MEC rats (see A‐C). For example, the layer III lesion in the left hemisphere of rat 434 was > 97 % complete, and the spatial firing of cells was of comparable quality to that of rat 514 in which the lesion in both hemispheres was 88 % complete. Error bars represent SEM. (E) Field size distribution for MEC and CON groups.(F) Examples of firing fields throughout a series of 10‐min sessions within a day. Color‐coded rate maps depict the spatial distribution of firing in the recording enclosure during each 10‐min session. The peak rate (red) is scaled to the maximum for the six sessions. Intervals between sessions were 2 min, 20 min, and 6 h. Each row illustrates a cell. Note that data for MEC lesion Cell 1 and Cell 2 were recorded from a square arena. (G‐J) The firing characteristics of hippocampal cells in the control and in the MEC group are shown separately for each
of the six 10‐min foraging sessions of a day (mean ± SEM). The mean firing rate (G, all cells that were active during behavior and/or during rest periods) in the MEC group increased during the course of the six
daily sessions (Kruskal‐Wallis test, df = 5, p < 0.001 with p < 0.05 for the 1st versus 2nd, 1st versus 3rd,
and 1st versus 4th session), but did not reach control levels (Mann‐Whitney U test for session 4, which is the session with the smallest difference: p < 0.01). The firing rate of active cells (H), the place fields size (I), the spatial information (J), and the spatial coherence (K) did not change over the course of the six daily sessions (Kruskal‐Wallis test, all p values > 0.05).

70
Figure S3. Behavioral impairment in the watermaze following MEC lesion was independent of delay intervals, related to Figure 3. (A) Mean path reconstruction error versus the number of cells used in the reconstruction indicates a decrease in spatial firing quality in MEC rats compared to controls. (B) Probe trial performance during the second week of watermaze training with mixed delay intervals between training and probe trials in rats with lesions of the hippocampus (H, n = 8), lesions of the medial entorhinal cortex (MEC, n = 8), lesions of both structures (MEC+H, n = 8) and sham lesions (CON, n = 20). The scores represent the percentage of time each group spent in the small zone centered on the trained platform location (left) or in the training quadrant (right) the during a 60‐s probe trial performed 1 min, 20 min, 90 min, or 6 h after the last training trial of the day. Small zone measure: The CON group showed declining performance at longer intervals (1 min versus 6 h: t(19) = 6.21, p < 0.0001). All three lesion groups were impaired at the short 1‐min and 20‐min intervals, and the H and MEC+H groups were also impaired at the 90‐min interval relative to the CON group (1 min, MEC+H: t(26) = 3.17, p < 0.01; 1 min, MEC: t(26) = 2.92, p < 0.01; 1 min, H‐: t(26) = 2.52, p < 0.05; 20 min, MEC+H: t(26) = 4.22, p < 0.001; 20 min, MEC: t(26) = 3.94, p < 0.001; 20 min, H: t(26) = 2.15, p < 0.05; 90 min, MEC+H: t(26) = 2.80, p < 0.01; 90 min, H: t(26) = 2.40, p < 0.05). We therefore found impaired performance in all lesion groups at shorter intervals (1 min and 20 min) and not at longer intervals (6 h). Quadrant measure: The CON group showed declining performance at longer intervals (1 min versus 6 h: t(19) = 9.76, p < 0.0001), and the MEC and H groups performed similarly to controls. The MEC+H group was impaired at the shorter intervals but not at the longer intervals (1 min: t(26) = 2.44, p < 0.05; 20 min: t(26) = 3.55, p < 0.01). Taken together, the impairment of all three lesion groups at shorter but not at longer intervals reflected the poorer performance in the CON group at longer intervals and not necessarily a selective impairment of the
Chapter 3
Unpublished manuscript (i)

71
lesion groups at short intervals. Furthermore, the lack of impairment at the longer (i.e., 6 h) interval is consistent with the emerging recovery at the 1day interval during week 2 (see Figure 3). Even though the flat behavioral performance across different retention intervals after MEC lesions did not correspond closely to the decreasing place field stability at longer intervals, it may be sufficient for intact behavioral performance that place cell stability is higher than chance at all of the tested intervals.
Supplemental experimental procedures
Electrophysiological recordings
Apparatus and pretraining. A black square enclosure (1 m x 1 m, 50 cm walls) was placed
in the center of a room. The enclosure contained a polarizing cue card (20 cm x 50 cm),
remained at a constant location within the room, and was surrounded by constant background
cues. No curtains were used. Rats were trained to forage for randomly scattered cereal crumbs
in the enclosure for 5 days in two daily 10‐min sessions.
Recording procedures. After surgery, tetrodes were slowly advanced into the CA1 area of
the hippocampus. As expected (Bragin et al., 1995a, b), sharp wave ripples were not diminished
by the MEC lesion and were used to guide electrode advancement into the cell layer in all rats.
During tetrode advancement and during recordings, the electrode assembly was connected to a
multichannel, impedance matching, unity gain preamplifier headstage. The output routed to a
data acquisition system with 64 digitally programmable differential amplifiers (Neuralynx,
Tucson, AZ, USA). Spike waveforms above a threshold of 40‐45 μV were time‐stamped and
digitized at 32 kHz for 1 ms. The rat’s position was tracked at 30 Hz by recording the position of
light‐emitting diodes that were placed above the head. Local field potentials were acquired by
recording one channel of each tetrode with the filters set to the 1‐450 Hz band.
After recovery from surgery, training continued in a different room than during
pretraining. The second room contained a black circular enclosure (1 m diameter, 50 cm walls,
20 cm wide x 50 cm high cue card), and rats were trained for 7‐10 days to randomly forage for
up to six 10‐min sessions per day. Between sessions, rats rested for two min or 20 min in a
transparent holding chamber placed adjacent to the behavioral apparatus or for 6 h in a holding
area within the laboratory. Recordings during random foraging in this experimental design
began when tetrodes were positioned in the CA1 cell layer and when the rats ran continuously
over the entire box surface throughout each 10‐min random foraging session. For intersession‐
intervals of 1 day, recordings from the same cells were compared between sessions on two
consecutive days. To obtain additional data to assess recording stability, we also recorded spikes

72
and local field potentials while the rat was resting in a holding box for 10 min at the beginning
and for 20 min at the end of each recording day. After up to 4 days of recordings in the room in
which training began after surgery, daily recordings were performed in the room in which
pretraining was performed before surgery. These recordings showed comparable results to the
recordings in the room in which training began after surgery, but are not presented because
they are of lesser relevance to the memory testing, which was performed in rooms that the rats
were not familiarized with before the lesion surgery.
Data Analysis
Spike sorting and cell tracking. Spike sorting was performed off‐line using customized
cluster‐cutting software (MClust, D. Redish) with modifications (Mankin et al., 2012). Recordings
during rest periods throughout the day were used to confirm recording stability during the
experiment and to identify hippocampal cells that were silent or fired at low rates during
behavior. Clustering was performed manually in two‐dimensional projections of the
multidimensional parameter space (consisting of waveform amplitudes, waveform energies, and
the peak‐to‐valley difference) using autocorrelation and cross‐correlation functions as additional
separation tools and separation criteria. Putative excitatory cells were distinguished from
putative inhibitory interneurons by spike width and average rate. Putative interneurons were
not included in the analysis.
Rate maps. The recording enclosure was divided into 5 cm x 5 cm pixels. Spatial firing
rate distributions were constructed by summing the total number of spikes that occurred in each
location bin, dividing by the amount of time that the animal spent in that location, and then
smoothing with a box car filter (Koenig et al., 2011).
Spatial correlation. The spatial similarity of place fields across two conditions was
calculated using Pearson’s correlation. The correlation coefficient was calculated by comparing
the firing rates between all pixels at corresponding locations. Sampling errors for cells with low
firing rates were minimized by excluding cells with fewer than 150 spikes during the 600‐s
recording interval.
Spatial information. The information score describes the information density per spike
and was calculated as described by Skaggs et al. (1996), using the following formula:

73
ii
N
ii
pI log2
1
where I is the information density measured in bits per spike, i is the index of the pixels of the
place field, pi is the probability of the rat being at location i, λi is the average firing rate of the
cell when the rat is at location i, and λ is the total average firing rate.
Spatial coherence. The first order spatial autocorrelation of each place field map was
calculated in order to estimate the extent to which the firing rate in a pixel was predicted by the
firing rates in the neighboring pixels (Muller and Kubie, 1989).
Place field size. To determine the place field size, we recalculated the firing rate in each 5
cm x 5 cm pixel by applying an adaptive smoothing method, which expands a circle around each
pixel until
snr ai
where r is the radius of the circle in bins, n is the number of occupancy samples within the circle,
s is the total number of spikes in those occupancy samples and the constant α is set to 10,000.
Using the adaptive map, the place field size was calculated by identifying the pixel with the peak
firing rate and by then extending the field to any adjacent pixels that exceeded 20 % of the peak
rate. The area that was covered by these pixels was the field size. Fields with a size of less than 9
pixels (i.e., 225 cm2) or with a peak rate of less than 1 Hz were considered spurious firing and
were excluded from the analysis.
Neurohistological methods
Rats were administered an overdose of sodium pentobarbital and perfused
transcardially with buffered 0.9 % NaCl solution followed by either 4 % or 10 % formaldehyde
solution (in 0.1 M phosphate buffer). Brains were then removed from the skull and
cryoprotected in a solution of 20 % glycerol and 10 % formaldehyde or kept in a solution of 4 %
formaldehyde followed by 30 % sucrose. For the H and some of the CON (n = 8) rats, coronal
sections (50 µm) were cut with a freezing microtome beginning just anterior to the
hippocampus and continuing caudally through the length of the hippocampal region. One in
every five sections was mounted and stained with cresyl violet. For the MEC, MEC+H, and the

74
remainder of the CON rats (n = 23), sagittal sections (40 or 50 µm) were cut with a freezing
microtome beginning just lateral to the hippocampus and continuing medially through the
hippocampal region for each hemisphere. For the rats used for physiological recordings (n = 5
MEC, n = 3 CON), every 2nd section was mounted and stained with cresyl violet. For the MEC+H
rats (n = 8) and some of the CON rats (n = 4), every 4th section was mounted and stained with
cresyl violet, and for the MEC and remaining CON rats (n = 16), every 3rd section was mounted
and stained with cresyl violet. The cresyl violet stained sections were used for an initial
assessment of the lesion size and, in recording animals, to determine the tetrode locations
across the series of sections through the hippocampus. An angular deviation between the plane
of sectioning and the electrode tracks resulted in an apparent shift of the tissue damage
between sections. The electrode tip was considered to be located in the section where the
tissue damage was most ventral. Recordings from a tetrode were included in the data analysis if
the tetrode’s final position was in the CA1 pyramidal cell layer.
For each of the lesion animals and for 10 CON animals, additional series of sectioned
brains were prepared for immunolocalization of neuron‐specific nuclear protein (NeuN) by using
an anti‐NeuN (1:15000, Chemicon) monoclonal mouse antibody. A biotinylated anti‐mouse IgG
(H+L) (1:1000, Vector BA‐2000) was used as the secondary antibody. We calculated the volumes
of spared tissue using the Cavalieri method and acquired images of the NeuN stained tissue
sections using a Leica Microsystems, Inc., DM6000 microscope. Stereo Investigator (mbf
Bioscience; MicroBrightField, CA, USA) was used to analyze images from every other mounted
section for all of the stained brains. Two rats in the MEC lesion group for behavioral testing were
excluded from histological quantification due to poor NeuN staining, but the lesions and
behavior of these two animals were indistinguishable from the rest of the MEC group.

75
Chapter 3
Unpublished manuscript (i)

76
Author contributions
Magdalene Schlesiger (M.S.), Jill Leutgeb (J.L.) and Stefan Leutgeb (S.L.) designed the
experiments; M.S. and S.L. implanted recording devices; Jena Hales (J.H.) performed lesions;
M.S. acquired data with assistance from Brittney Boublil (B.B.); M.S. analyzed data; J.H.
quantified the lesion size; M.S. wrote the manuscript with feedback from S.L.

77
REORGANIZATION OF THE MEDIAL ENTORHINAL SPATIAL MAPPING SYSTEM IS NOT REQUIRED
FOR HIPPOCAMPAL GLOBAL REMAPPING
Magdalene I. Schlesiger MacLaren 1,2, Brittney L. Boublil1, Jena B. Hales3, Jill K Leutgeb1, and
Stefan Leutgeb1,4,5
1Neurobiology Section and Center for Neural Circuits and Behavior, University of California, San
Diego, La Jolla, California, 92093, U.S.A.
2Graduate School of Systemic Neurosciences, Ludwig‐Maximilians‐Universität, Munich, 82152,
Planegg, Germany
3 Department of Psychological Sciences, University of San Diego, La Jolla, California, 92093,
U.S.A.
4Kavli Institute for Brain and Mind, University of California, San Diego, La Jolla, California, 92093,
U.S.A.
5Corresponding author. Address: 9500 Gilman Dr., MC 0357, University of California, San Diego,
La Jolla, CA 92093. E‐mail address: [email protected]

78
3.1 Abstract
A high storage capacity for episodic memories is thought to depend on the generation of
distinct firing patterns in the hippocampo‐entorhinal system. This process, referred to as pattern
separation, includes the realignment of the spatial map in the medial entorhinal cortex (MEC)
and the formation of distinct maps in the hippocampus (global remapping). Because MEC
provides spatial information to the hippocampus, it was hypothesized that changes in its input
are a prerequisite for global remapping. In accordance, it was shown that the acute
manipulation of MEC triggers remapping. Here, we performed extensive MEC lesions and tested
whether MEC input is necessary for the formation of distinct hippocampal maps. We found that
remapping remained intact in all rats, even those without sparing of the superficial layers.
Because inputs other than the MEC are known to lack sophisticated spatial firing, these findings
suggest that spatial computations associated with remapping are local to the HIPP and can be
triggered by multiple input sources.

79
3.2 Introduction
A large number of everyday experiences can be stored in memory without interference
between these memories. Theoretical work suggests that the formation of distinguishable
memories relies on pattern separation, a computations that allows the generation of highly
distinct neural codes from overlapping input patterns (Marr 1971, 1969; Treves and Rolls 1994;
Rolls 2016). The concept of pattern separation is thought to be implemented in the neural
networks of the entorhinal cortex (EC) and the hippocampus (HIPP). Specifically, it was found
that the HIPP, upon exposure to a novel context, rapidly forms neuronal representations that
are highly distinct from those for previously experienced contexts (Muller and Kubie 1987;
Leutgeb et al. 2004; Alme et al. 2014). The mechanisms by which this is achieved differ
depending on the nature of input from the medial EC (MEC): For example, when using similar
recording environments, the firing locations of entorhinal grid cells and hippocampal place cells
are retained, while environmental differences are signaled by rate changes in the population of
hippocampal cells. This computation was shown to depend on the lateral EC (LEC) as well as
intrahippocampal processing (Lu et al. 2013; McHugh et al. 2007). During recordings across
different environments, in contrast, distinct hippocampal maps are activated (a process referred
to as global remapping), and this reorganization is predicted by shifts of grid cell locations in the
MEC. Because changes in medial entorhinal firing patterns are concurrent with hippocampal
global remapping, it was hypothesized that computations in the MEC are a prerequisite for the
formation of distinct hippocampal maps (Buzsaki and Moser 2013; Monaco, Knierim, and Zhang
2011; Kammerer and Leibold 2014; Miao et al. 2015; Stensola et al. 2012; Moser, Rowland, and
Moser 2015). However, it was recently shown that global remapping remains intact during
manipulations that include the disruption of grid cells (Brandon et al. 2014), excluding the
possibility that grid cells are the only determinant of hippocampal remapping. Of note, those
manipulations were specific to grid cells and left other medial entorhinal cell types, such as
head direction cells, border cells and spatial non‐grid cells intact. Because changes in such non‐
grid cells are also known to predict hippocampal global remapping (Solstad et al. 2008; Keene et
al. 2016; Kitamura et al. 2015), it is plausible that input from MEC cell types other than grid cells
supports the formation of distinct hippocampal maps. This theory finds further support by a
recent series of studies demonstrating that the acute manipulation of MEC firing patterns
results in the reorganization of hippocampal place fields (Rueckemann et al. 2016; Miao et al.
2015). While these studies show that altered medial entorhinal firing patterns are sufficient to
induce hippocampal remapping, it is not known whether the reorganization of the spatial

80
mapping system in MEC is required to perform this function. Here, we addressed this question by
examining hippocampal global remapping in rats with extensive lesions to the MEC.
3.3 Methods
Subjects
Seven experimentally naïve male Long–Evans rats, obtained from Charles River
Laboratories, were used for this experiment. Rats weighing ~350 g at the beginning of the
experiment were housed individually in transparent plexiglass cages (48 cm x 25 cm x 20 cm)
and were held on a 12 h reversed light/dark cycle. All experiments were performed in the dark
phase of the cycle. The spatial and temporal firing characteristics within single environments
were previously reported for all control rats and four out of five MEC‐lesioned rats (Hales et al.
2014; Schlesiger et al. 2015). During the experiment, rats were food restricted and maintained
at ~90% of their free‐feeding body weight. Water was available ad libitum. All experimental
procedures were approved by the Institutional Animal Care and Use Committee at the
University of California, San Diego.
Surgical Procedures
Medial entorhinal cortex lesion surgeries and sham surgeries were performed as
previously described (Hales et al. 2014). In brief, to lesion the entire dorsoventral axis of the
MEC five rats received NMDA injections at eight different DV coordinates (‐5.2, ‐4.7, ‐4.2, ‐3.7, ‐
3.2, ‐2.7, ‐2.2, ‐1.7), with an infusion rate of 0.1 µl/min (0.13 µl per site). The ML coordinate was
± 4.6, and the needle was angled at 22° in the posterior to anterior direction, with the needle tip
immediately anterior to the transverse sinus. In control rats, a craniotomy identical to the
craniotomy in MEC‐lesioned rats was performed, but dura was not punctured.
For hippocampal recordings, tetrodes were constructed by twisting four 17 μm
polyimide‐coated platinum‐iridium (90%/10%) wires (California Fine Wire, California). The
electrode tips were plated with platinum at 1 kHz to reduce the impedances to 200‐300 kΩ.
Fourteen tetrodes were arranged into two bundles, each containing six to eight independently
movable tetrodes. After the MEC or sham lesion was made, the electrode assembly was secured
to the skull using stainless steel screws and dental cement. The two tetrode bundles were
targeted to the HIPP of each hemisphere (AP: 4.0., ML: ± 2.45, angled laterally towards CA1

81
recording sites at approximately ML ± 3.0). One electrode in each hemisphere was used to
record a reference signal from the cortex.
Recording rooms, recording chambers and random foraging behavior
Three different rooms were introduced to each rat (Figure 1A), except for rat 714 which
was introduced to an additional room, during a second series of recordings. In each room, the
recording system and a light source were located in proximity to the entrance, and a recording
chamber was placed on a table (54 – 66 cm height) that was located in the center of the room.
Recording chambers were either black or white squared boxes (1 m2) or a black cylinder (radius,
1 m) with walls of 50 cm height. A polarizing cue card (20 x 50 cm) was placed in each recording
chamber, at a constant position. During foraging sessions, exploratory behavior was engaged by
randomly scattering cereal crumbs over the surface area of the recording chamber, at intervals
of ~1 min. Before, in‐between and after foraging sessions, the apparatus was cleaned with
water, while rats were resting in a transparent holding box (30 cm x 30 cm x 56 cm) that was
placed on a pedestal of 106 – 116 cm height. No curtains were used to allow the rat a free view
of distal cues, such as posters on the wall and shelves.
Experimental design and recordings
Rats were trained for 5 days in two 10‐min random foraging sessions per day in room a
(Figure 1A). One control rat and four MEC‐lesioned rats were also trained on a six‐arm radial
maze in the same room (Schlesiger et al. 2015; Schlesiger et al. 2013). Rats were subjected to
either sham or MEC‐lesion surgery after pretraining was completed. After a recovery period of 7
days, training was continued in a second room (room b) for 7 to 12 days with two to six 10‐min
random foraging sessions per day. The rats that were trained on a six‐arm maze in room a were
also trained on a six‐arm maze in room b (Figure 1A). During the period of training in room b,
tetrodes were slowly advanced into the CA1 area of the HIPP. After reaching the CA1 cell layer,
hippocampal recordings were performed in two different rooms on the same day over 3
consecutive days (Figure 1B). The two rooms included one of the familiar rooms (room a:
control rats 505 and 614, MEC‐lesioned rats 434 and 514; room b: MEC‐lesioned rats 587 and
645) and one room that was novel to the rats at the beginning of the recording sequence (room
c). MEC‐lesioned rat 714 was first tested in rooms a and c and subsequently tested in a second
experiment, in room b and a forth novel room (room d). Due to the lack of high quality
recordings, only data from day 1 were included for rat 587, and recordings on day 2 instead of

82
day 3 were analyzed for rat 434. On each day, a total of five recording sessions were performed
(Figure 1B). The foraging sessions were separated by inter session intervals of 5 – 10 min, and
the entire block of sessions was preceded and followed by rest sessions of 10 – 20 min. During
tetrode advancement and during recordings, the electrode assembly was connected to a multi‐
channel, impedance‐matching, unity gain preamplifier headstage and recordings were
performed as previously described (Schlesiger et al. 2015).
Figure 1. Experimental design. (A) Experimental timeline. Rats were trained before and after surgery to forage
for randomly scattered chocolate sprinkles in an open field environment, followed by recording sessions in a
two‐room experiment. During the two‐room experiment, foraging in a novel room (room c) was flanked by
foraging in one of the familiar rooms (either room a or b). The shape and color of the recording chamber used
in each room is indicated with squared and circular symbols. No training was performed on the day of surgery
and during a recovery period of 7 days. (B) Detailed design of the two‐room experiment. Random foraging was
performed on 3 consecutive days in five daily 10‐min sessions with inter‐session intervals of 5 to 10 min. For
each group, the within‐room map similarity obtained in room a was not different to map similarity in room b,
and the data was therefore pooled for rats in the MEC lesion and rats in the control groups (P = 0.41, Mann‐
Whitney).

83
Histology
The brains were prepared to identify the tetrode locations in cresyl violet–stained
sections and to quantify the MEC lesion extent in NeuN (1:15,000, Chemicon, CloneA60) stained
sections with the Cavalieri method, as previously described (Hales et al. 2014). The volume of
the spared tissue was estimated for the MEC layer II, MEC layer III, MEC deep layers, dorsal
parasubiculum, ventral parasubiculum, and HIPP.
Data analysis
All data analysis was performed by importing position and spike data into Matlab and by
further processing the data with custom‐written scripts and functions.
Spike sorting, cell tracking and cluster quality. Spike sorting was performed manually
using the graphical cluster‐cutting software (MClust, D. Redish), which we modified in order to
reliably track clusters across sessions (Mankin et al. 2012). Well‐isolated clusters in the
multidimensional parameter space were considered single hippocampal cells, as previously
described (Hales et al. 2014). Putative principal cells were distinguished from putative
interneurons by spike width and average rate, and only putative principal cells were included
into the analysis. Cluster quality was assessed by calculating the L‐ratio and the Mahalanobis
(i.e., isolation) distance (Schmitzer‐Torbert), for each cluster of spikes recorded during the
random foraging task.
Rate maps. The recording enclosure was divided into 5 cm x 5 cm location bins. Spatial
firing rate distributions were constructed by summing the total number of spikes that occurred
in each location bin, dividing the sum by the amount of time that the animal spent in that
location and then smoothing with a box car filter (Koenig et al. 2011).
Spatial correlation. The spatial similarity of place fields across two rooms was calculated
using Pearson’s correlation. We first aligned trajectory maps obtained in each of the two rooms
with respect to their allocentric orientation (i.e., the east wall of the recording chamber in room
a was aligned with the east wall of the recording chamber in room c). For each cell, the
correlation coefficient was then calculated by comparing the firing rates between all bins at
corresponding locations. Cells which did not reach an average firing rate of ≥ 0.25 Hz in at least
one of the 10‐min sessions were excluded from analysis. The chance level was determined by
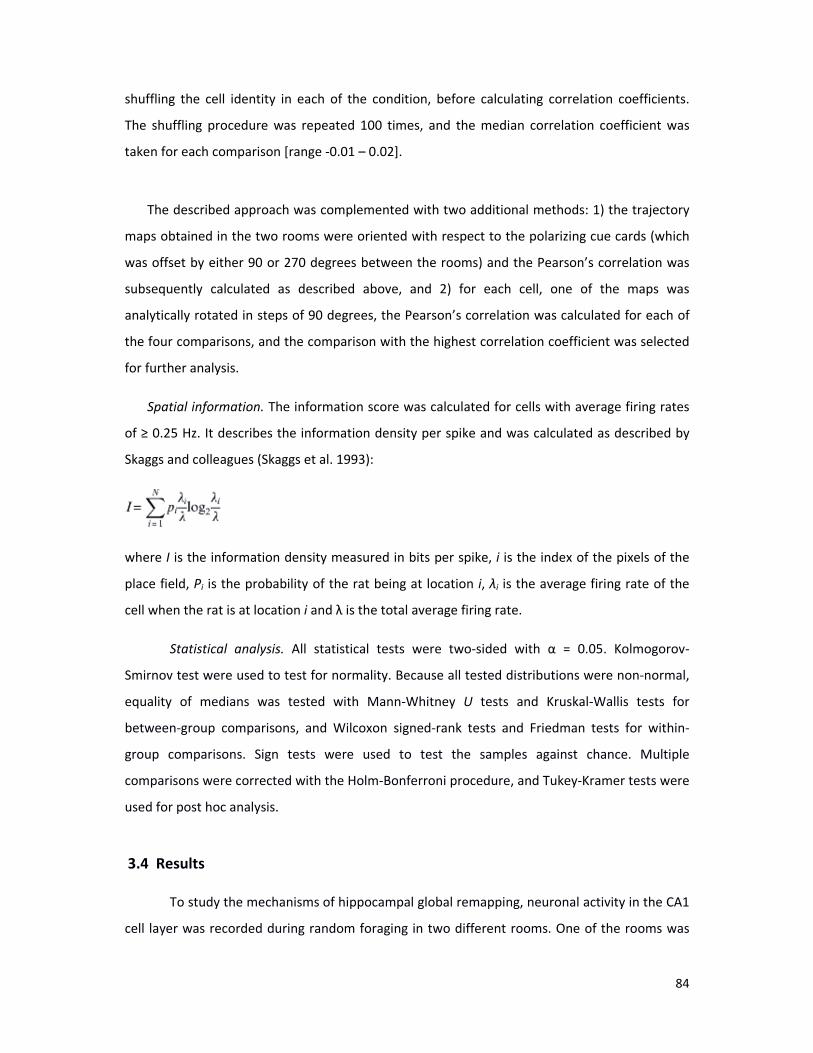
84
shuffling the cell identity in each of the condition, before calculating correlation coefficients.
The shuffling procedure was repeated 100 times, and the median correlation coefficient was
taken for each comparison [range ‐0.01 – 0.02].
The described approach was complemented with two additional methods: 1) the trajectory
maps obtained in the two rooms were oriented with respect to the polarizing cue cards (which
was offset by either 90 or 270 degrees between the rooms) and the Pearson’s correlation was
subsequently calculated as described above, and 2) for each cell, one of the maps was
analytically rotated in steps of 90 degrees, the Pearson’s correlation was calculated for each of
the four comparisons, and the comparison with the highest correlation coefficient was selected
for further analysis.
Spatial information. The information score was calculated for cells with average firing rates
of ≥ 0.25 Hz. It describes the information density per spike and was calculated as described by
Skaggs and colleagues (Skaggs et al. 1993):
where I is the information density measured in bits per spike, i is the index of the pixels of the
place field, Pi is the probability of the rat being at location i, λi is the average firing rate of the
cell when the rat is at location i and λ is the total average firing rate.
Statistical analysis. All statistical tests were two‐sided with α = 0.05. Kolmogorov‐
Smirnov test were used to test for normality. Because all tested distributions were non‐normal,
equality of medians was tested with Mann‐Whitney U tests and Kruskal‐Wallis tests for
between‐group comparisons, and Wilcoxon signed‐rank tests and Friedman tests for within‐
group comparisons. Sign tests were used to test the samples against chance. Multiple
comparisons were corrected with the Holm‐Bonferroni procedure, and Tukey‐Kramer tests were
used for post hoc analysis.
3.4 Results
To study the mechanisms of hippocampal global remapping, neuronal activity in the CA1
cell layer was recorded during random foraging in two different rooms. One of the rooms was

85
highly familiar to the rat, while the other was novel on the first day of the experiment (Figure 1).
The extent of hippocampal global remapping was assessed in control rats as well as rats with
bilateral NMDA lesions to the MEC. The NMDA lesions were designed to 1) be centered on the
dorsocaudal‐most mEC, which is known to be highly specialized in spatial processing, to 2)
include the entire extent of the dorsoventral axis of the MEC and to 3) spare the LEC.
Stereological quantification of brain tissue in which neuronal nuclei were labelled confirmed
that the lesions were extensive and up to 100% complete in the superficial layers of the MEC
(percent damage, n = 5, layer II, median: 100.0, range : 97.9 – 100.0; layer III, median: 92.4,
range: 68.6 – 100.0). If there was minor sparing, it occurred at the most lateral extent of the
MEC (see Hales et al., 2013, Schlesiger et al., 2014 for photographs and detailed quantification
of MEC lesions). Additional major damage occurred in the dorsal parasubiculum (percent
damage, median: 78.0, range: 63.3 – 85.8) and the ventral parasubiculum (percent damage,
median: 66.6, range: 31.0 – 75.8), and minor damage occurred at the border to LEC in 1 out of 5
rats. Cells in dorsal HIPP appeared intact in all rats, and minor damage to the ventral dentate
gyrus could be observed in one out of five MEC‐lesioned rats.
MEC‐lesioned rats showed partly retained place field stability across repeated visits of the
same environment.
Before examining the extent of reorganization between rooms, we first confirmed that
place field locations did not already substantially reorganize during repeated recordings in the
same room (see Hales et al., 2014 for place field characteristics after MEC lesions). We first
analyzed data obtained on day 3 of the two‐room experiment, in conditions where both rooms
were familiar to the rat (Figures 2A and 2B). As expected, control rats showed high map
similarity, in both rooms a/b and room c (median, 0.89 and 0.82, respectively; P = 0.65, χ² =
0.20, Friedman test). MEC‐lesioned rats showed higher map stability in highly familiar rooms a/b
than in room c (median, 0.65 and 0.33, respectively, P‐values ≤ 0.05, χ² = 4.50, Friedman test).
Room c was novel to the rats on the first day of the two‐room experiment. Importantly, the
remaining degree of stability was higher than what would be expected by chance for all
comparisons (all P‐values ≤ 0.00014, Sign tests with Holm‐Bonferroni correction), and there was
therefore sufficient stability to make it feasible to test the extent of remapping across rooms.

86
Global remapping was intact in every MEC‐lesioned rat.
By comparing pairs of rate maps obtained for corresponding cells in different rooms, we
found that the spatial maps shared as little similarity in MEC‐lesioned rats as they did in controls
(Figures 2A and 2C; all P‐values > 0.05, Mann‐Whitney U tests). In both groups, moreover, the
amount of correlation was similar to what would be expected by chance (all P‐values > 0.05,
Sign tests) and lower than for repeated recordings within the same room (all P‐values ≤ 0.001,
X2 ≥ 46.14, Friedman tests). Global remapping between two familiar environments was thus
intact after MEC lesions.
As not all our lesions comprised 100% of the superficial layers, we examined remapping in
individual rats (Figures 3A and 3B). We found that the degree of remapping was similar in all
rats, irrespectively of whether they were in the control or MEC lesion group (P‐value = 0.82, X2 =
2.20, Kruskal‐Wallis test). Moreover, we found that, in each individual control and MEC‐lesioned
rat, across‐room map similarity corresponded to chance levels (all P‐values ≥ 0.27, Sign tests)
and was substantially lower than the corresponding within‐room comparison (all P‐values
≤ ‐0.47, Wilcoxon signed rank tests with Holm‐Bonferroni correction). Of note, we found that a
rat with 100% bilateral damage to MEC layer II and III showed global remapping comparable to
controls, further confirming that remapping in MEC‐lesioned rats was not driven by spared MEC
tissue (see rat 714 in Figures 2A, 3A and 3B).

87

88
Figure 2. Map stability during repeated visits of the same room was reduced, but remapping across rooms
was not disrupted by MEC lesions. The rate map correlation for adjacent sessions within and across rooms
was analyzed on day 2/3 of the experiment, when each rat had at least 1 day of experience in room. (A)
Hippocampal rate maps from simultaneously recorded, representative example cells in control rat 505, and
MEC‐lesioned rats 645 and 714. The color scale is from 0 Hz (blue) to peak rate (red). Rooms used for the
experiment are indicated with letters a‐c. (B) Rate map correlations for pairs of sessions recorded within the
same room. Medians and inter‐quartile range (IQR, left of each panel) and cumulative density functions (right
of each panel) are shown. Within‐room map similarity was decreased in MEC‐lesioned compared to control
rats (all P‐values < 0.05, Mann‐Whitney U tests), but remained nevertheless above chance for all comparisons
(all P‐values < 0.05, Sign tests). (C) Across‐room map similarity was as low in the MEC lesion as in the control
group (all P‐values > 0.05, Mann‐Whitney U tests) and did not differ from chance in either group (all P values >
0.05, Sign tests). Error bars represent IQR, and black dots are values for individual cells. Holm‐Bonferroni
correction procedure was applied for multiple comparisons. *** P < 0.001, MEC lesion vs. control group; # P <
0.05, ### P < 0.001 compared to chance.
In control rats, place field locations can be influenced by distal as well as proximal cues,
such as the room geometry and the polarizing cue card, respectively. In our experimental
design, the orientation of the cue card was rotated across rooms (see Figure 1), by either 90
degrees or 270 degrees. This raises the possibility that the low map similarity observed in MEC‐
lesioned rats was not the result of a random redistribution of place field locations, but, instead,
emerged because the same spatial map was realigned to the new cue card location. In order to
test this possibility, we recalculated the correlations between pairs of rate maps obtained in
different rooms, after analytically rotating the map in room c according to the cue orientation
(Figure S1A). We observed that, after aligning the maps with reference to the cue card, the
similarity between pairs of maps was not different from chance and did not differ between
MEC‐lesioned and control rats (Figure S1B). To also account for the possibility that the maps
could realign to any of the box walls, we calculated the correlations between pairs of maps after
rotating one of the maps in 90 degree steps (Figure S1A), and subsequently selected the highest
pairwise correlation for each cell. Using this method, we found that the scores for the MEC
lesion and control group were not different from each other and not different from chance
(Figure S1C). For both types of rotation analysis, corresponding results were also obtained when
examining each rat individually (Figures S1D and S1E).

89
Figure 3. Global remapping was intact in all MEC‐lesioned rats, including those with the most extensive
lesions. Hippocampal global remapping occurred in control rats (blue) and in rats with extensive (magenta)
and smaller (yellow) damage to MEC III. Note that the amount of MEC II damage was ~100% in all MEC‐
lesioned rats. (A) Rate maps from representative example cells recorded in two adjacent sessions across two
different rooms (rooms a and c or rooms a and b) are shown for rats with varying extent of damage to MEC III.
The color scale is from 0 Hz (blue) to peak rate (red). (B) Remapping was intact in every individual rat. Across‐
room map similarity was not different from chance (all P values > 0.05, Sign tests) and smaller than the
corresponding within‐room comparison in all individual control and MEC‐lesioned rats (all P values < 0.01,
Mann‐Whitney U tests). Holm‐Bonferroni correction procedure was applied for multiple comparisons. * P <
0.05, ** P < 0.005, *** P < 0.001.

90

91
Figure 4. Distinct hippocampal maps emerged rapidly upon the first exposure to a novel environment, in
both MEC‐lesioned and control rats. The rate map correlation for adjacent sessions within and across rooms
was analyzed on day one of the experiment, when room c was novel to the rats. (A) Hippocampal rate maps
from simultaneously recorded, representative example cells in control rat 505, and MEC‐lesioned rats 645 and
514. The color scale is from 0 Hz (blue) to peak rate (red). Rooms used for the experiment are indicated with
letters a‐c. (B) Rate map correlations for pairs of sessions recorded within the same room. Medians and inter‐
quartile range (IQR, left of each panel) and cumulative density functions (right of each panel) are shown.
Within‐room map similarity in the MEC lesion group was lower than in the control group (all P‐values ≤ 0.001,
Mann‐Whitney U tests), but higher than chance, even for the first pair of sessions in the novel room (all P‐
values ≤ 0.0020, Sign tests). In both groups, moreover, the rate map correlation increased from the first to the
second pair of sessions within the novel room (all P‐values ≤ 0.030, Wilcoxon signed‐rank tests). (C) Across‐
room map similarity was as low in the MEC lesion as in the control group (all P‐values > 0.05, Mann‐Whitney U
tests) and did not differ from chance in either group (all P values > 0.05, Sign tests). Error bars are IQR, and
black dots are values for individual cells. Holm‐Bonferroni correction procedure was applied for multiple
comparisons. *** P < 0.001, MEC lesion vs. control group; ## P < 0.005, ### P < 0.001 compared to chance.
Finally, we tested whether experience is required for distinct representations to emerge
after the MEC lesions (Figure 4). Therefore, we examined the place fields within and across
rooms on day 1 of the experiment, when room c was novel to the rat (see Figure 1). We found
that, in both control and MEC‐lesioned rats, within‐room map similarity was already above
chance for the first pair of sessions in the novel room (Figures 4A and 4B, all P‐values ≤ 0.0020,
Sign tests). We then examined remapping across rooms (Figure 4C) and found no difference
between control and MEC‐lesioned rats (all P‐values ≥ 1.00, Mann‐Whitney U tests). Moreover,
the amount of correlation was similar to what would be expected by chance for both groups (all
P‐values ≥ 0.52, Sign tests) and lower than map similarity for adjacent recording sessions within
the same room (all P‐values ≤ 0.047, all X2‐values ≥ 1.57, Friedman tests). In the MEC lesion and
control group, remapping thus occurred rapidly upon exposure to a novel environment.
3.5 Discussion
We asked whether the spatial mapping system in the MEC is required for the emergence
of new and distinct spatial maps in the HIPP. By recording hippocampal spatial firing patterns in
a familiar and a novel room, we found that highly distinct spatial maps emerged rapidly after
exposure to a novel environment, in both MEC‐lesioned and control rats. In both groups,
moreover, the amount of correlation between rooms was similar to what would be expected by
chance and lower than baseline, which was established by repeated recording sessions within
the same room. Importantly, hippocampal global remapping was intact in each MEC‐lesioned

92
rat, even in individuals that had no detectable sparing of the superficial layers, rendering it
unlikely that spared MEC input accounted for the formation of distinct maps. Our findings
suggest that the contribution of the MEC to hippocampal spatial maps needs to be reevaluated.
Since the discovery of remapping, it has been proposed that differences in the firing
patterns of entorhinal cells are forwarded to the HIPP, such that separate hippocampal firing
patterns emerge from the readout of this information (Muller and Kubie 1987). Following the
finding that hippocampal global remapping is accompanied by a coordinated shift in medial
entorhinal grid cell firing patterns (Fyhn et al. 2007), this hypothesis was modified to suggest
that it is predominantly the spatial reorganization of grid cells that generates a redistribution of
firing locations in the HIPP (Buzsaki and Moser 2013; Monaco, Knierim, and Zhang 2011; Miao et
al. 2015; Kammerer and Leibold 2014). However, recent findings demonstrate that grid cells are
not required for hippocampal global remapping (Brandon et al. 2014). Alternative mechanisms
might rely on feed forward connections from MEC cells other than grid cells. For example, a
recent report by Kitamura and colleagues described that a subset of hippocampal projecting,
Reelin expressing MEC cells differentiate between distinct recording chambers (i.e., different
contexts) with changes in their firing rates (Kitamura et al. 2015). As it was previously shown
that grid cells shift their firing locations in similar experimental conditions (without marked
changes in the overall firing rate), those cells are likely to correspond to cell types other than
grid cells (Fyhn et al. 2007). Head direction cells and border cells, which are also known to
differentiate different contexts with a coordinated shift in their firing patterns, are an additional
potential source of hippocampal global remapping (Solstad et al. 2008).
In addition to the correlational findings described above, it was recently shown that the
focal inactivation of the MEC results in the reorganization of hippocampal firing patterns
(Rueckemann et al. 2016; Miao et al. 2015). These findings suggest that changes in MEC input
are sufficient to induce hippocampal remapping. While the MEC is thus likely one source for
hippocampal global remapping, our data demonstrate that input sources other than the MEC
can readily trigger hippocampal global remapping. Spatial computations in specialized cell types,
such as grid, border and context cells are thus not required for the formation of highly distinct
hippocampal maps.

93
As the MEC is the only known source of sophisticated spatial input into the HIPP, our
findings suggest that spatial computations underlying the reorganization of hippocampal place
field locations are intrinsic to the HIPP. In support of this theory, it was previously found that the
induction of activity‐dependent hippocampal synaptic plasticity (long term potentiation, LTP)
causes a reorganization of hippocampal place field locations (Dragoi, Harris, and Buzsaki 2003).
Manipulations such as stress, which are known to reduce hippocampal LTP, in turn, were shown
to impair hippocampal global remapping (Kim et al. 2007; Tomar et al. 2015). Collectively, these
data are consistent with early computational models which suggest that the networks of the
HIPP are organized in attractor maps that can be associated with distinct environmental
contexts (Samsonovich and McNaughton 1997; McNaughton et al. 1996). In the context of these
models, our findings suggest that the transition between different attractor maps could be
achieved by changes in non‐spatial input alone.
While our findings demonstrate that the spatial reorganization of hippocampal firing can
be performed without sophisticated spatial input, it is likely that non‐spatial information about
the distinct environments reached the HIPP via additional routes. One key candidate to trigger
hippocampal global remapping is the LEC, which was spared in our MEC‐lesioned rats. LEC firing
patterns, which are substantially less spatial than MEC firing patterns in simple open field
foraging tasks (Hargreaves et al. 2005), were shown to change in conditions when distinct
contexts are compared (Tsao, Moser, and Moser 2013; Keene et al. 2016). A second potential
source of remapping in the CA1 area is the medial prefrontal cortex (mPFC). Cells in the mPFC
are known to show highly distinct firing patterns for different spatial environments (Hyman et
al. 2012), and are additionally modulated by variables that are associated with hippocampal rate
remapping, such as the receipt of reward and other task contingencies (Hyman et al. 2005;
Hyman et al. 2012; Miyazaki, Miyazaki, and Matsumoto 2004; Ito et al. 2015). A recent study
was able to demonstrate that mPFC projections, conveying information about different
behavioral contexts, drive hippocampal rate coding via the nucleus reuniens of the thalamus
(NR) (Ito et al. 2015), and it is possible that the mPFC‐NR pathway is also involved in the
generation of global remapping. Future studies ought to determine whether hippocampal global
remapping relies on specialized pathways outside the MEC, or whether changes in any type of
information are sufficient to trigger this computation. Taken together, our findings demonstrate
that distinct hippocampal maps emerge without input from specialized spatial cell types in the
MEC. This raises the possibility that the spatial computations associated with global remapping

94
are supported by intrahippocampal computations. Alternative pathways supporting those
computations might include the LEC and/or mPFC both of which have been shown to distinguish
between different contexts.
Acknowledgements
The authors thank Mandy Wong for technical assistance. This work was supported by a
Boehringer Ingelheim Fonds PhD fellowship, the Ellison Medical Foundation grant AG‐NS‐0724‐
10, Walter F. Heiligenberg Professorship, NSF CRCNS grant 1010463, and NIH grants R21
MH100354 and R01 NS086947.
Author contributions
M.I.S., J.K.L., and S.L. designed experiments, M.I.S. and B.L.B. and J.B.H. acquired data,
M.I.S. analyzed data, S.L. supervised the project, M.I.S. and S.L wrote the manuscript.
Competing financial interests
The authors declare no competing financial interests.

95
3.6 Appendix
Supplemental figures
96
Figure S1. Low map similarity across rooms was not the result of the rotation of a constant map. (A) Schematic of the analysis used to examine whether the low map similarity across rooms was the result of the coordinated shift of a constant map. For each cell, a pair of maps (top, purple outline, comparison c2 vs. a2/b2) was compared, after a2/b2 was rotated in one of two different ways: 1) It was rotated to match the orientation of the cue card across rooms (bottom left, ‘Matched cue card’) and 2) it was rotated in steps of 90 degrees, and the comparison with the highest correlation coefficient was selected for each cell (bottom right, ‘Highest correlation’). (B,C) The median spatial correlation was similar between the control and MEC lesion groups (P > 0.05, Mann‐Whitney U tests), and did not deviate from chance (gray stippled line) in either group (all P values > 0.05, Sign tests), in both (B) the ‘Match cue card’ as well as (C) the ‘Highest correlation’ analysis. (D,E) Rotation analysis did not reveal map similarity in any of the rats. Circles represent the median spatial correlation coefficient per rat and are sorted by the extent of MEC III damage. In (D) the ‘Match cue card’, and (E) the ‘Highest correlation’ analysis, the amount of remapping was similar when individual rats were compared to each other (All P values > 0.05, Kruskal‐Wallis tests). In addition, map similarity was not different from chance in each individual control (blue) and MEC‐lesioned (red) rat (all P values > 0.05, Sign tests).

97
Chapter 4
Published manuscript (ii)

98
Author contributions
Magdalene Schlesiger (M.S.), Stefan Leutgeb (S.L.) and Jill Leutgeb (J.L.) designed
experiments; M.S. and S.L. implanted recording devices; Jena Hales (J.H.) performed lesions;
M.S. acquired data with assistance from Brittney Boublil (B.B.); Mark Brandon (M.B.) provided
dataset shown in Figures 7 and 8. Christopher Cannova (C.C.), M.S., Emily Mankin (E.M.),
Christian Leibold (C.L.) and S.L. performed analysis of electrophysiological data; J.H. quantified
the lesion size; M.S., C.C, C.L. and S.L. wrote the manuscript.
99
THE MEDIAL ENTORHINAL CORTEX IS NECESSARY FOR TEMPORAL ORGANIZATION OF
HIPPOCAMPAL NEURONAL ACTIVITY
Magdalene I. Schlesiger1,2,6, Christopher C. Cannova1,6, Brittney L. Boublil1, Jena B. Hales3, Emily
A. Mankin1, Mark P. Brandon1, Jill K. Leutgeb1, Christian Leibold4, and Stefan Leutgeb1,5,7
1Neurobiology Section and Center for Neural Circuits and Behavior, University of California, San
Diego, La
Jolla, California, 92093, U.S.A.
2Graduate School of Systemic Neurosciences, Ludwig‐Maximilians‐Universität, Munich, 82152,
Planegg, Germany
3Department of Psychiatry, School of Medicine, University of California, San Diego, La Jolla,
California, 92093, U.S.A.
4Department Biology II, Ludwig‐Maximilians‐Universität, Munich, 82152, Planegg, Germany
5Kavli Institute for Brain and Mind, University of California, San Diego, La Jolla, California, 92093,
U.S.A.
6These authors contributed equally to this work.
7Corresponding author. Address: 9500 Gilman Dr., MC 0357, University of California, San Diego,
La Jolla, CA 92093. E‐mail address: [email protected]

100
4.1 Abstract
The superficial layers of the medial entorhinal cortex (MEC) are the major input to the
hippocampus. The high proportion of spatially modulated cells, including grid cells and border
cells, in these layers suggests that the MEC inputs to the hippocampus are critical for the
representation of space in the hippocampus. However, selective manipulations of the MEC do
not completely abolish hippocampal spatial firing. To therefore determine whether other
hippocampal firing characteristics depend more critically on MEC inputs, we recorded from
hippocampal CA1 cells in rats with MEC lesions. Strikingly, theta phase precession was
substantially disrupted, even during periods of stable spatial firing. Our findings indicate that
MEC inputs to the hippocampus are required for the temporal organization of hippocampal
firing patterns and suggest that cognitive functions that depend on precise neuronal sequences
within the hippocampal theta cycle are particularly dependent on the MEC.

101
4.2 Introduction
The high proportion of grid cells and of other cell types with spatial and directional firing
patterns in the medial entorhinal cortex (MEC) indicates that its microcircuits are specialized for
processing spatial information (Quirk et al. 1992; Hafting et al. 2005; Sargolini et al. 2006;
Solstad et al. 2008). Even though it has been demonstrated that all spatially modulated cell
types in the superficial layers of the MEC project to the hippocampus (Zhang et al. 2013), it is
still uncertain to what extent the spatial firing of grid cells and other MEC cell types are required
for hippocampal spatial firing. In particular, manipulations that are known to selectively disrupt
grid patterns have not yet been reported to have major effects on hippocampal spatial firing in
familiar environments (Brandon et al. 2011; Brandon et al. 2014; Koenig et al. 2011; Wang et al.
2015). Furthermore, near complete lesions of the MEC result in broadening, but not in the
absence of hippocampal spatial firing fields (Hales et al. 2014). These partial effects on
hippocampal spatial firing therefore raise the question whether the MEC might have a
prominent role in supporting non‐spatial hippocampal circuit functions, such as precise
temporal firing. In addition to the presence of a high proportion of cell types which exhibit
spatial firing, the MEC is distinct from other inputs to the hippocampus, such as the lateral
entorhinal cortex (LEC), in that it exhibits prominent theta (4‐12 Hz) oscillations in the local field
potential (LFP) (Deshmukh et al. 2010). Moreover, similar to hippocampal place cells (O'Keefe
and Recce 1993), the spiking of MEC layer II cells occurs at progressively earlier phases of the
LFP theta cycle as the animal traverses a spatial firing field (Hafting et al. 2008; Mizuseki et al.
2009). As a consequence of this phase precession, the sequence of firing phases across a
population of cells within a theta cycle corresponds to the sequence in which their respective
spatial firing fields were traversed over many seconds (Skaggs et al. 1996; Jensen and Lisman
1996; Melamed et al. 2004; Dragoi and Buzsaki 2006). The compression of sequences on the
behavioral timescale (seconds) to the timescale at which neurons communicate (tens of
milliseconds within a theta cycle) may allow spike‐timing‐dependent learning rules to take place
and thereby facilitate the storage of sequences in synaptic matrices (Bi and Poo 2001; Melamed
et al. 2004; Byrnes et al. 2011). Alternatively, it may reflect the retrieval of sequence memories
or predictions (Tsodyks et al. 1996; Jensen and Lisman 1996; Robbe and Buzsaki 2009; Gupta et
al. 2012; Wang et al. 2015). In principle, phase precession could also support both storage and
retrieval during different phases of the theta cycle (Hasselmo, Bodelon, and Wyble 2002).
Even though the significance of phase precession is widely recognized, the cellular and

102
circuit mechanisms by which such temporal precision emerges have remained elusive. The
finding that phase precession is retained in the MEC while the hippocampus is inactivated
suggests that the MEC can generate phase precession independent of the hippocampus (Hafting
et al. 2008). Moreover, predicted rates and theta phases of hippocampal firing reemerge
immediately after transient hippocampal inactivation, which suggests that external cortical
inputs to the hippocampus can sustain hippocampal phase precession (Zugaro, Monconduit, and
Buzsaki 2005; Moser et al. 2005). However, these findings do not identify whether firing
patterns that are selectively found in the MEC, such as spatially selective, rhythmically
modulated, or phase precessing cells, are necessary for hippocampal phase precession or
whether any excitatory input to the hippocampus, including nonrhythmic excitatory inputs from
the LEC, may be sufficient for reinstantiation. The idea that the excitation does not need to be
theta rhythmic to determine firing phase is supported by models that demonstrate that a
ramping excitation along with local rhythmic inhibition can result in phase precession (Mehta
2001). These models, in turn, are supported by the experimental findings that there is a ramp‐
like increase of the membrane potential within the place field (Harvey et al. 2009) and that a
higher firing rate within a hippocampal place field is coupled to an earlier firing phase in
behaving animals (Harris et al. 2002; Mehta, Lee, and Wilson 2002).
To determine whether hippocampal phase precession is organized by the neuronal firing
patterns of MEC cells or whether input to the hippocampus from other sources can also provide
sufficient excitatory drive to result in phase precession, we performed bilateral lesions of MEC
and then recorded from hippocampal CA1 cells while rats ran back and forth on a linear track.
Based on the observations that lesions of the entorhinal cortex have only a limited effect on
hippocampal spatial firing patterns (Miller and Best 1980; Van Cauter, Poucet, and Save 2008;
Hales et al. 2014) and that even large lesions of the entorhinal cortex only partially reduce
hippocampal oscillations (Ylinen et al. 1995; Kamondi et al. 1998), we reasoned that spatial and
rhythmic firing characteristics would be sufficiently preserved with an MEC lesion such that we
could analyze hippocampal phase precession.
4.3 Results
Hippocampal firing patterns were only transiently location‐selective with MEC lesions
To ask to what extent hippocampal spatial and temporal firing patterns require the MEC,
we obtained single‐unit and local field potential (LFP) recordings from the hippocampal CA1

103
area while rats were running along a linear track. After we verified that our lesion included the
entire dorsoventral extent of the MEC (Supplementary Fig. 1), we examined the precision of
hippocampal spatial firing (Fig. 1a–f and see Supplementary Fig. 2 for additional example cells).
Over the duration of an entire recording session (10‐20 min), the spatial firing of hippocampal
cells was substantially less precise in MEC‐lesioned rats (n = 164 fields from 153 cells in 6 rats)
compared to controls (n = 51 fields from 50 cells in 4 rats). The average place field size was 61.4
% larger, spatial information was 51.8 % lower, and the peak firing rate was 32.9 % lower (Fig.
1g–i and Supplementary Table 1), while the mean firing rate was not different between groups
(Fig. 1j). However, when we inspected each cell’s firing from run to run, we observed that the
reduced precision of spatial firing in the MEC lesion group was not the result of a sustained
broadening of the firing field, but rather emerged from shifting spatial firing fields over the
course of the recording session. The spatial instability occurred even though the recording
stability in MEC‐lesioned rats was not different from control rats (Supplementary Fig. 3). To
identify periods of stable spatial firing (PSSF), we used a sliding window method to detect the
longest period (at least five consecutive runs) during which cells were active and had a robust
mean spatial correlation score (r > 0.5) with a probability of less than 5 % (P < 0.05) of being
obtained from a shuffled spatial distribution (see Online Methods). As expected from only
including runs during which the cells were active, the average firing rate during PSSFs compared
to the entire session increased, although to a similar extent in both the control and MEC lesion
group (Fig. 1j). PSSFs from the cells of control rats tended to comprise most runs within a single
session, while PSSFs from the cells of MEC‐lesioned rats typically consisted of less than a quarter
of the runs (median fraction of all runs in PSSF: 0.74 and 0.19, respectively; Fig. 1c,d,k and
Supplementary Fig. 2). To address whether the spatial firing characteristics during PSSFs were
comparable between control and MEC‐lesioned rats, we recalculated the mean field size, spatial
information, and peak firing rate using only data collected during PSSFs, and found that there
was no longer a significant difference between the control and the MEC lesion group (Fig. 1g–i).
Theta oscillations persisted at a reduced amplitude and frequency with MEC lesions
Before analyzing the temporal coordination of hippocampal cells, we asked to what
extent hippocampal LFP theta oscillations were retained in MEC‐lesioned rats. To compare LFP
theta power between groups, we used the signal from all tetrodes located in the CA1 pyramidal
cell layer (Fig. 2a). The theta power in MEC‐lesioned rats was reduced by an average of 63.2 %
compared to controls (Fig. 2b and Supplementary Table 1). This reduction could not be
104
accounted for by a difference in the running speed between MEC‐lesioned rats and controls (Fig.
2b). To confidently calculate theta phase and frequency despite the reduced theta amplitude,
we used 1/f normalized spectra to select, for each recording session, a tetrode for which the
peak theta power was > 3 times the baseline (Fig. 2c and Supplementary Fig. 1). After
normalization and selection, theta power no longer significantly differed between sessions of
control and MEC‐lesioned rats (Fig. 2d; control, 5.2 fold higher than baseline, MEC lesion, 4.2
fold higher than baseline). However, the median LFP theta frequency was reduced by 0.61 Hz in
MEC‐lesioned compared to control rats (Fig. 2d). We also examined whether the spike timing of
single hippocampal cells remained theta rhythmic (Fig. 2e). Although the theta modulation of
hippocampal firing was significantly lower in MEC‐lesioned rats compared to controls (Fig. 2f
and Supplementary Table 1), a substantial proportion of cells remained theta modulated (theta
ratio > 5; control: 96.7 %, 29 of 30 cells in 4/4 rats; MEC‐lesion: 51.2 %, 21 of 41 cells in 4/5 rats).
For phase precession, the frequency of intracellular theta oscillations and, consequently, the
cells’ firing frequency is increased with respect to LFP theta during place field traversals.
Accordingly, the median firing frequency of control cells was 1.22 Hz higher than the LFP theta

105
Figure 1. Hippocampal firing patterns were only transiently location selective in MEC‐lesioned rats. Each column is data from one hippocampal cell during running in one direction (indicated by arrow) on the linear track (control, black vertical line; MEC lesion, blue vertical line). The cell numbers (e.g., 2‐7) include the tetrode and cell identification. (a,b) Trajectories (black lines) with spike locations (red dots). Turns were excluded from the analysis and are not shown. (c,d) Raster plots with the spike locations during each run. (e,f) Rate versus distance on the linear track. In c–f, place fields for the entire recording session are marked by the entire shaded area and place fields for the period of stable spatial firing (PSSF; see Online Methods) are marked by the darker shaded area. (g–j) Spatial firing characteristics during the entire session (control, n = 51 fields from 50 cells in 4 rats, MEC lesion, n = 164 fields from 153 cells in 6 rats) and during PSSFs (control, n = 31 fields from 31 cells of 4 rats, MEC lesion, n = 73 fields from 62 cells of 5 rats). For the entire session, the place fields of MEC‐lesioned rats were larger, the spatial information scores were lower, and the peak firing rates were lower compared to those of control rats (P = 1.2 x 10‐6, P = 1.59 x 10‐11, and P = 2.9 x 10‐4, Mann‐Whitney U tests). After selecting for PSSFs, these properties did not differ between control and MEC‐lesioned rats (P = 0.13, P = 0.20, and P = 0.37, Mann‐Whitney U tests). Mean firing rates on the track did not differ between control and MEC‐lesioned rats during the entire session nor during PSSFs (P = 0.34 and P = 0.81, Mann‐Whitney U tests). Dot plots include all data points and the median. *** P < 0.001. (k) The number of runs within PSSFs, normalized to the number of runs within the session, was substantially less in MEC‐lesioned compared to control rats (P = 3.5 x 10‐7, Mann‐Whitney U test).

106
frequency within the same recording sessions. In contrast, the firing frequency of theta
modulated cells in MEC‐lesioned rats was 1.70 Hz lower than in control cells and was no longer
consistently higher than the LFP theta frequency (Fig. 2f). We reasoned that the absence of a
consistent frequency difference to LFP theta could result in spiking that is phase‐locked to LFP
theta. Thus, we assessed each cell’s theta phase locking via the mean resultant vector length
obtained from its spike phase distribution within the theta cycle. Surprisingly, we found that the
degree of phase‐locking exhibited by MEC‐lesioned animals was not higher than in controls, in
which the frequency difference of phase precessing cells would preclude phase locking to LFP
theta. These results thus suggest that hippocampal cells, although they partially remain theta
modulated without MEC inputs, fire neither at a consistent frequency difference nor at a
particularly consistent phase with respect to LFP theta. Thus, we next directly examined
whether theta phase precession during passes through the cells’ place fields was disrupted.
Hippocampal phase precession was substantially diminished by MEC lesions
We analyzed phase precession by measuring the firing phase of each cell’s spikes along
the distance through the spatial firing field (Fig. 3a–h and see Supplementary Fig. 4 for
additional examples). We initially restricted the analysis to fields that were defined for PSSFs
because we reasoned that the results would be most directly comparable to control fields that
were equally stable and precise (see Fig. 1g–i). When calculating the circular‐linear correlation
between the firing phase and distance in the field for spikes pooled from all passes through each
field (Fig. 3g,h), we found that the slopes of the regression lines were significant (P < 0.05) and
negative for most individual control fields (74.2 %), as expected for phase precession. In
contrast, the proportion of place fields with significant negative slopes (28.0 %) was
substantially lower in MEC‐lesioned rats (χ2 = 16.5, df = 1, P = 5.0 x 10‐5, chi‐square test).
Moreover, the average slope was less than zero in controls, while it was not different from zero
in MEC‐lesioned rats. Furthermore, it was substantially different between control and MEC‐
lesioned rats (Fig. 3i). We obtained a corresponding pattern of results when either analyzing
data from the entire recording session or when restricting the analysis to place fields < 0.6 m
(Supplementary Table 2). Taken together, these results indicate that the relation between firing
phase and distance through the field was substantially disrupted in the MEC lesion group.

107
Figure 2. Theta rhythmicity is partially retained after MEC lesions. (a) Nissl‐stained sagittal sections from the
left and right dorsal hippocampus (d, dorsal; v, ventral; a, anterior; p, posterior). (b) On tetrodes in the CA1 cell
layer, the theta power in the local field potential (LFP) was reduced by the MEC lesion (control, n = 20 tetrodes
in 4 rats, MEC lesion, n = 30 tetrodes in 5 rats, P = 0.015, Mann‐Whitney U tests) while the running speed was
not different between groups (P = 0.61, Mann‐Whitney U test). (c) To accurately calculate theta phase and
frequency for each recording session, tetrodes for which the peak 1/f‐corrected power in the theta band was >
3 times the baseline were selected. Spectrograms for example selected tetrodes (see Supplementary Fig. 1 for
spectrograms from all rats with PSSFs). Insets show raw (gray line) and filtered LFP traces (4‐12 Hz, black line)
during a single pass through a place field. Vertical lines, peak of each LFP theta cycle. Scale bars, 250 µV and
100 ms. (d) The 1/f corrected theta power of selected tetrodes did not differ (control, n = 6 sessions in 4 rats,
MEC lesion, 9 sessions in 5 rats, P = 0.066, Mann‐Whitney U test), while the theta frequency was reduced by
the MEC lesion (P = 0.0052, Mann‐Whitney U test). (e, top) Spike‐time autocorrelograms of representative CA1
cells. Insets: spike times (red ticks) during a single pass through the cell’s place field relative to the LFP theta
signal (displayed as in c). (e, bottom) Phase distribution plots with the mean resultant vector ( , red arrow)
indicating the degree of phase locking to the LFP theta cycle for the example cells above. (f, top) The amplitude

108
and frequency of the cells’ theta modulation were reduced in MEC‐lesioned compared to control rats
(amplitude: control, n = 30 cells in 4 rats, MEC lesion, n = 41 cells in 5 rats; P = 5.7 x 10‐10 ; frequency: control, n
= 29 cells in 4 rats, MEC lesion, n = 21 cells in 4 rats, P = 3.9 x 10‐6, Mann‐Whitney U tests). Only theta
modulated cells (theta ratio > 5) were included in the frequency analysis. Dot plots include individual data
points and medians. * P < 0.05, ** P < 0.01, *** P < 0.001. (f, bottom left) Theta phase locking of CA1 cells, as
assessed from the median length of did not differ between cells from control and MEC‐lesioned rats (P =
0.57, Mann‐Whitney U test). (f, bottom right) Difference between the cells’ and the LFP theta frequency.
Control cells fired at a higher frequency than LFP theta (P = 1.5 x 10‐5, sign test), while cells of MEC‐lesioned
rats fired without a consistent difference to LFP theta frequency (P = 1.00, sign test). The frequency difference
was higher in control compared to MEC‐lesioned rats (P = 6.5 x 10‐5, Mann‐Whitney U test).

109
Figure 3. The medial entorhinal cortex is necessary for hippocampal phase precession. (a–h) Each column includes data from one example place field (control, black vertical line; MEC lesion, blue vertical line). (a,b) Trajectories (black lines) and spike locations (red dots) within the place field. Vertical lines delineate the place field boundaries. (c,d) Raw LFP trace (gray), filtered LFP trace (4‐12 Hz, black), and spike times (red ticks) for a single pass through the place field. Vertical lines indicate the peak of each theta cycle. Scale bars, 250 µV and 100 ms. (e–h) The theta phase at which each spike occurred versus the relative distance that the rat traveled through the place field. For better visualization, the phase of each spike is replotted in a second cycle in all phase‐distance plots. A regression line (black) was added when the circular‐linear correlation was significant (P < 0.05). (i,j) Distributions of the phase‐distance slopes. Only fields defined during PSSFs were included. The shaded background highlights negative slopes. (i) For each field, the spikes from all passes were pooled before fitting the regression lines. Slopes were less than zero for control fields (all slopes: n = 31 in 4 rats, P = 3.3 x 10‐5; only significant slopes: n = 25, P = 6.2 x 10‐5, t tests) and, for fields from MEC‐lesioned rats, not different from zero for all slopes (n = 50 in 5 rats, P = 0.73), but less than zero for only significant slopes (n = 18 fields, P = 0.039, t tests ). Slopes also substantially differed between control and MEC‐lesioned rats (P = 0.0095, t test). (j) Slopes that were first calculated for single passes through each field and then averaged per field. Insets: field‐average of only significant single‐pass slopes (P < 0.05, circular‐linear correlation). Slopes were different from zero for control fields (all slopes: n = 31, P = 2.6 x 10‐5; only significant slopes: n = 25 fields, P = 0.00015, t tests) but not for fields from MEC‐lesioned rats (all slopes: n = 50 fields, P = 0.90; only significant slopes: n = 27 fields,

110
P = 0.53, t tests), and differed between control and MEC‐lesioned rats (all slopes: P = 0.0062, t test)
Although the diminished phase precession when pooling spikes over multiple passes
could result from the loss of a direct relation between distance and theta phase, phase
precession may also be masked by an onset of spiking at variable phases or by a variable rate of
precession during individual passes through the field. To test for this possibility, we next
analyzed phase precession during single passes through the place field (Kempter et al. 2012)
(see Fig. 3e,f) and averaged, for each field, the slopes for all qualifying passes (see Online
Methods) (Fig. 3j and Supplementary Fig. 4 for additional example passes). Because a small
quantity of phase precession may be masked by including passes in which slopes were
inaccurately estimated, we also took the average of only the slopes where the circular‐linear
correlation was significant (P < 0.05). The mean field‐averaged slope was less than zero in
control rats, not different from zero in MEC‐lesioned rats, and different between MEC‐lesioned
and control rats (Fig. 3j). Furthermore, we performed the single‐pass analysis for firing fields
that were not limited to PSSFs but were smaller than 0.6 m over the entire recording session as
well as for fields of any size over the entire recording session (Supplementary Table 2). While
the field‐averaged slopes were not different from zero when only considering the smaller fields
of the MEC‐lesioned rats (all slopes: n = 41 fields, P = 0.17; only significant slopes: n = 21 fields, P
= 0.44, t test), the slopes were significantly negative when not restricting the field size (all
slopes: n = 133 fields, P = 0.00021, t test; only significant slopes: n = 89 fields, P = 0.035, t test),
but nonetheless remained less negative than in controls (P = 0.0043, t test). To identify how
phase precession may have been more readily detectable when adding passes with less
consistent spatial firing, we examined the slopes of individual passes in detail (Supplementary
Fig. 5). While the slopes of single passes through control fields were typically distributed within
a narrow range around the mean (median standard deviation: 0.35), the slopes of single passes
in MEC‐lesioned rats were extremely variable (median standard deviation: 0.91, P = 3.5 x 10⁻⁹
compared to controls, Mann‐Whitney U test) with many individual slopes smaller than –1 (21.1
% compared to 5.9 % in controls). Because it is known that phase precession in control fields
does not exceed one theta cycle (O'Keefe and Recce 1993; Maurer et al. 2006a), these results
are an additional indication that reliable hippocampal phase precession during individual passes
through the field is disrupted by MEC lesions.

111
Spike timing between pairs of overlapping fields was disrupted
Phase precession is thought to provide a mechanism to achieve consistent spike time
differences between simultaneously active place cells (Skaggs et al. 1996; Dragoi and Buzsaki
2006). Theoretically, however, pairs of neurons could still fire at fixed intervals without relation
to the LFP theta cycle. To test for this possibility, we analyzed whether pairs of neurons with
overlapping PSSFs (Fig. 4a,b) showed a correlation between the distance between their place
fields and the phase difference within a theta cycle of the spike crosscorrelation function (Fig.
4c,d), as previously reported for control cells(Dragoi and Buzsaki 2006). Field distance and theta
offset exhibit a circular‐linear correlation for control pairs (Fig. 4e) but not for pairs from MEC‐
lesioned rats (Fig. 4f). Our analysis therefore did not reveal evidence that the spike timing
relation between pairs of place cells was retained after MEC lesions, and the observed loss of
phase precession was therefore coupled with the broader absence of a temporal code.
Theta‐phase and instantaneous firing rate were decoupled by the MEC lesions
It has been observed that it is not only the distance within the place field, but also the
firing rate within the field that correlates with theta phase (Harris et al. 2002; Mehta, Lee, and
Wilson 2002) but see (Huxter, Burgess, and O'Keefe 2003). This raises the possibility that phase
precession is a consequence of more fundamental, cellular parameters, such as the level of a
cell’s excitation, and that these parameters govern the phase advance irrespective of the
distance within a place field. We therefore directly tested whether higher instantaneous firing
rates (IFR), irrespective of where on the track they occurred, resulted in spiking at earlier theta
phases (Fig. 5a,b). To ensure that the comparison would not be confounded by low firing rates
in the MEC lesion group, we first confirmed that the IFR of cells of MEC‐lesioned rats were at
least that observed in controls (Fig. 5c). As previously reported (Harris et al. 2002; Mehta, Lee,
and Wilson 2002), theta phase correlated with IFR in control rats. In contrast, we found that the
IFR was unrelated to phase in MEC‐lesioned rats (Fig. 5d). Furthermore, we found a correlation
between the phase‐IFR slope and the phase‐distance slope for cells from control but not for
cells from MEC‐lesioned rats (Fig. 5e). This result indicates that, without contribution from MEC,
firing at earlier phases is not predicted by higher firing rates.

112
Figure 4. Spike timing between pairs of fields was disrupted in MEC‐lesioned rats. (a,b) Example cell pairs with overlapping fields defined during PSSFs (control, black line; MEC lesion, blue line). Spikes of the two cells in a pair are in magenta and blue. Arrows indicate running direction. (c,d) Crosscorrelations between the two cells’ spike trains (black) and the corresponding place fields (red) for the example pairs shown above. The black stippled line illustrates the theta phase offset (measured in Hilbert phase with respect to the theta band oscillations of the black correlation function). The red stippled line indicates the place field distance, defined as the shift of the maximum of the place field crosscorrelation function. (e,f) Theta phase offset versus place field distance for all simultaneously recorded pairs of cells with overlapping fields (control, n = 18 pairs from 4 rats, MEC lesion, 63 pairs from 3 rats). Place field distance and theta offset exhibit a circular‐linear correlation for control pairs, but not for pairs from MEC‐lesioned rats.
Phase precession was also disrupted in two‐dimensional environments
Phase precession is also observed during random foraging in two‐dimensional
environments (Skaggs et al. 1996; Harris et al. 2002; Huxter et al. 2008). Therefore, we also
tested the extent of disruption of hippocampal phase precession in the open field. We first
confirmed that we could reliably detect phase precession in place cells of control rats in the
open field and then tested whether phase precession was retained in MEC‐lesioned rats (Fig. 6

113
and Supplementary Fig. 6 for additional example cells). Because we previously found that place
field size in the open field was increased by the MEC lesion (Hales et al. 2014), we restricted the
analysis to only smaller (< 0.25 m2) place fields (control, n = 46/51 fields in 3/3 rats, MEC lesion,
n = 21/45 place fields in 4/6 rats). However, similar results were also obtained without field size
restriction (Supplementary Table 2). Corresponding to the findings on the linear track, we found
that phase precession during random foraging in the open field was substantially diminished in
MEC‐lesioned rats. When pooling the spikes from all passes through each field, the mean slope
was negative for control fields, but not different from zero for fields from MEC‐lesioned rats,
and different between MEC‐lesioned and control rats (Fig. 6d). Moreover, the proportion of
fields with significant negative slopes (P < 0.05, circular‐linear correlation) was substantially
larger in control rats than in MEC‐lesioned rats (76. 1 % and 23.8 %, χ2 = 16.4, df = 1, P = 5.2 x 10‐
5, chi‐square test). We also analyzed single passes and calculated their average slope for each
field (see Supplementary Fig. 7 for examples). The mean field‐averaged slope was negative in
control rats, not different from zero in MEC‐lesioned rats, and differed between fields from
control and MEC‐lesioned rats (Fig. 6e). Together, these data demonstrate that phase
precession on the linear track and in the open field was disrupted by the MEC lesion.
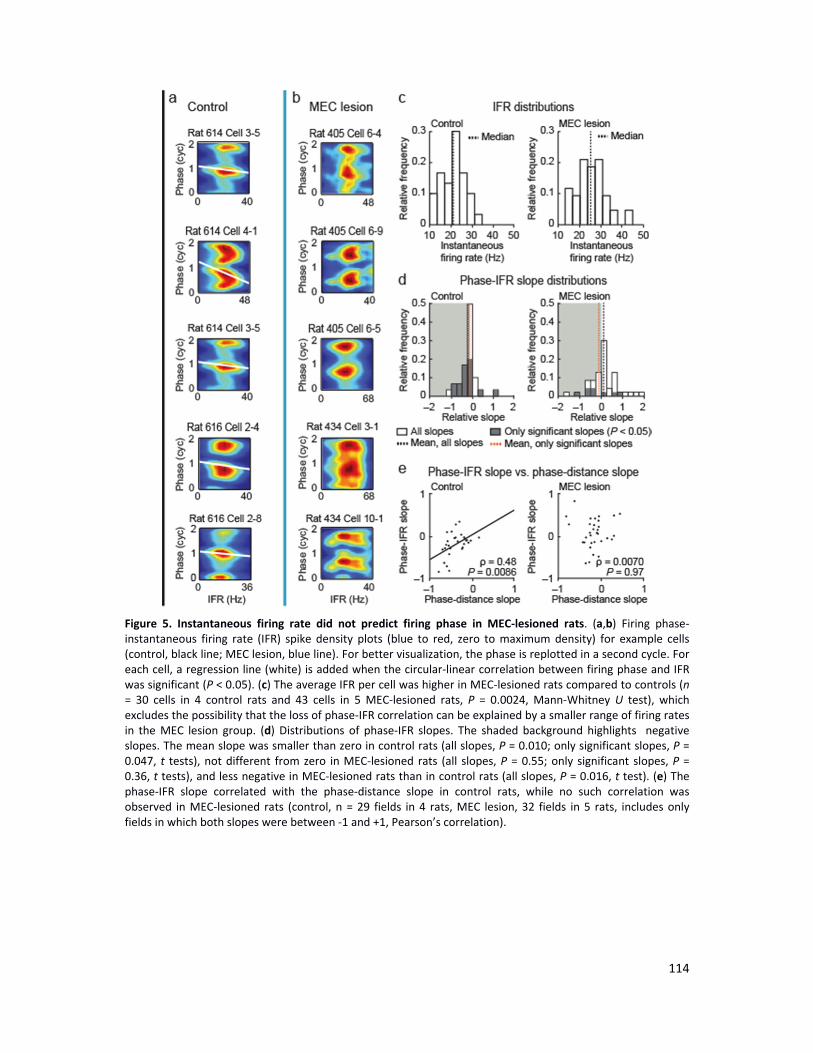
114
Figure 5. Instantaneous firing rate did not predict firing phase in MEC‐lesioned rats. (a,b) Firing phase‐instantaneous firing rate (IFR) spike density plots (blue to red, zero to maximum density) for example cells (control, black line; MEC lesion, blue line). For better visualization, the phase is replotted in a second cycle. For each cell, a regression line (white) is added when the circular‐linear correlation between firing phase and IFR was significant (P < 0.05). (c) The average IFR per cell was higher in MEC‐lesioned rats compared to controls (n = 30 cells in 4 control rats and 43 cells in 5 MEC‐lesioned rats, P = 0.0024, Mann‐Whitney U test), which excludes the possibility that the loss of phase‐IFR correlation can be explained by a smaller range of firing rates in the MEC lesion group. (d) Distributions of phase‐IFR slopes. The shaded background highlights negative slopes. The mean slope was smaller than zero in control rats (all slopes, P = 0.010; only significant slopes, P = 0.047, t tests), not different from zero in MEC‐lesioned rats (all slopes, P = 0.55; only significant slopes, P = 0.36, t tests), and less negative in MEC‐lesioned rats than in control rats (all slopes, P = 0.016, t test). (e) The phase‐IFR slope correlated with the phase‐distance slope in control rats, while no such correlation was observed in MEC‐lesioned rats (control, n = 29 fields in 4 rats, MEC lesion, 32 fields in 5 rats, includes only fields in which both slopes were between ‐1 and +1, Pearson’s correlation).

115
Figure 6. Phase precession was also diminished in the open field. Hippocampal CA1 cells were recorded during 10‐min random foraging sessions, and cells with place fields < 0.25 m
2 were included in the analysis. (a)
MEC‐lesioned rats performed the task at a similar speed to control rats (top; control, n = 7 sessions in 3 rats, MEC lesion, n = 12 sessions in 4 rats, P = 0.12, Mann‐Whitney U test). LFP theta power was not different (middle; control, n = 16 tetrodes in 3 rats, MEC lesion, n = 39 tetrodes in 4 rats, P = 0.76, Mann‐Whitney U test), while the theta modulation of individual cells was reduced in MEC‐lesioned rats compared to controls (bottom; control, n = 45 cells in 3 rats; MEC lesion, n = 24 cells in 4 rats; P = 4.4 x 10‐8, Mann‐Whitney U test). (b,c) Spike patterns of example cells. (Left of each panel) Trajectories (gray line) with spike locations (red dots) and field boundaries (black line). The entire session is on top and two individual passes through the field are below. (Right of each panel) Phase‐distance plots for the passes to the left. Regression lines (black) were added when the circular‐linear correlation was significant (P < 0.05). (d,e) Distributions of the phase‐distance slopes. In d, the spikes from all passes through the field were pooled before fitting the regression line. Slopes were different from zero for control fields (all slopes: n = 46 fields in 3 rats, P = 6.6 x 10‐12; only significant slopes: n = 35 fields, P = 1.4 x 10‐16, t tests), but not for fields from MEC‐lesioned rats (all slopes: 21 fields in 4 rats, P = 0.61; only significant slopes: n = 8, P = 0.39, t tests) and differed between control and MEC‐lesioned rats (all slopes: P = 0.010, t test). In e, slopes were first calculated for single passes through each field and then averaged per field. Insets: field‐average of only significant single‐pass slopes (P < 0.05, circular‐linear correlation). Slopes differed from zero for control fields (all slopes: n = 47 in 3 rats, P = 1.44 x 10‐12; only significant slopes: n = 45, P = 2.8 x 10‐8, t tests), but not for fields from MEC‐lesioned rats (all slopes: n = 25 in 4

116
rats, P = 0.91; only significant slopes: n = 15, P = 0.89, t tests), and were more negative in control compared to MEC‐lesioned rats (all slopes: P = 0.019, t test). Dot plots include individual data points and medians. *** P < 0.001.
Reduced theta amplitude was not sufficient for fully disrupting phase precession
Because the power of LFP theta and the theta modulation of individual cells was
diminished during recordings on the linear track in MEC‐lesioned rats (see Fig. 2b,f), our results
are consistent with the interpretation that theta amplitudes at control levels are necessary for
phase precession. Contrary to this prediction, we found that phase precession was disrupted in
the open field while the LFP theta power of MEC‐lesioned rats was not different from controls
(see Fig. 6a). This suggests that there may not be a direct link between the amplitude of theta
power in the CA1 layer and the disruption of phase precession. However, it has been previously
reported that the most profound reduction in LFP theta power after entorhinal lesions is not in
the CA1 cell layer but rather in the hippocampal fissure (Ylinen et al. 1995; Kamondi et al. 1998).
To therefore more directly examine whether a reduction in the cells’ theta modulation would
disrupt phase precession, we analyzed previously published recordings(Brandon et al. 2014) in
the open field during which the cells’ theta oscillations were as strongly reduced by
pharmacological inactivation of the septal area as by the MEC lesion (Fig. 8a and Supplementary
Table 4). As previously reported, 10‐min recording sessions were performed in a familiar
environment before inactivation and at two time points into the inactivation (30 min and 2 h
after muscimol infusion). At both time points, we observed a pronounced reduction of the LFP
theta power as well as a pronounced reduction of the theta modulation of individual CA1 cells
(Fig. 7a). Despite the substantial reduction of LFP theta power, each recording session had at
least one tetrode in which LFP theta power was > 1.5 times the 1/f baseline and from which the
theta phase could thus be accurately estimated (Supplementary Fig. 8). When comparing the
timing of place cell firing with respect to LFP theta phase before and during the septal
inactivation, we obtained evidence for retained phase precession from both the circular‐linear
regression precession analysis of pooled spikes (Fig. 7b,c) and from a higher oscillation
frequency of the cells compared to LFP theta (Fig. 8). The mean slope of the phase‐distance
regression line was negative before inactivation and remained negative during two sessions that
were conducted during the inactivation (Fig. 7c and Supplementary Table 3). Even though the
slopes remained negative, a partial reduction of phase precession was indicated by a reduction
in the proportion of fields with significant negative slopes (baseline, 72.6 %; first inactivation
session, 40.9 %; second inactivation session, 52.4 %, χ2 = 10.0, df = 2, P = 0.0069, chi‐square

117
test). The reduction in phase precession by septal inactivation was nonetheless less pronounced
than the reduction by the MEC lesion (Fig. 8 and Supplementary Table 4). Phase precession was
thus retained to a larger extent in rats with septal inactivation compared to MEC‐lesioned rats.
This excludes the possibility that a mere reduction in the amplitude of theta oscillations is
sufficient to attenuate phase precession as substantially as the MEC lesion and thus supports a
more direct role of the MEC for organizing temporal firing in the hippocampus.
Figure 7. Substantially reduced LFP theta power and single‐cell theta modulation did not preclude phase precession. The spike timing of hippocampal CA1 cells was analyzed for a 10‐minute session before and for two sessions during inactivation of the septal area. (a) Hippocampal LFP theta power and the theta frequency modulation of individual hippocampal cells were substantially reduced between baseline and each of the two inactivation sessions (LFP power: n = 19 pairwise comparisons between tetrodes in 4 rats, P = 0.00040 and P = 0.00040; cells’ theta modulation: n = 39 pairwise comparisons between cells in 4 rats, P = 1.1 x 10‐6 and n = 35 in 4 rats, P = 1.8 x 10‐5, Wilcoxon signed rank tests, Holm‐Bonferroni corrected). Theta modulation was reduced to a similar extent during the inactivation as by the MEC lesion (blue line, median redrawn from Fig. 6a; baseline, 30 min into inactivation, and 2 h into inactivation vs. MEC lesion, n = 41, 39, 35, and 24 cells, P = 1.9 x 10‐6, P = 0.14, and P = 0.26, Mann Whitney U tests, Holm‐Bonferroni corrected). (b) Phase‐distance plots for example fields from cells that were recorded before and during septal inactivation. For better visualization, the phase of each spike is replotted in a second cycle. Spike for each field were pooled, and regression lines (black) were added when the circular‐linear correlation was significant (P < 0.05). (c) Distributions of phase‐distance slopes. The phase‐distance slopes were negative before inactivation (baseline, all slopes: n = 51 fields

118
in 4 rats, P = 2.0 x 10‐11, sign test; only significant slopes: n = 39 fields in 4 rats, P = 2.8 x 10‐9, sign tests) and remained negative during the two inactivation sessions (all slopes: n = 44 and 42 fields in 4 rats, P = 0.00039 and P = 5.6 x 10‐9; only significant slopes: n = 20 and 23 fields in 4 rats, P = 0.00040 and P = 5.7 x 10‐6, sign test for the sessions 30 min and at 2 h into the inactivation, respectively). *** P < 0.001, compared to zero. ### P < 0.001, baseline vs. inactivation sessions.
When analyzing the slopes of single rather than of pooled passes during septal
inactivation, we could detect phase precession during the baseline session before the
inactivation (all slopes, P < 1.0 x 10‐5, t test; only significant slopes, P < 9.3 x 10‐9, sign test
compared to zero) and during the session 2 h into the inactivation session (all slopes, P < 2.1 x
10‐5, t test; only significant slopes, P = 0.020, sign test compared to zero), but not during the
session 30 min into the inactivation (all slopes: P = 0.54, t test; only significant slopes, P = 0.86,
sign test compared to zero). The inconsistent phase coding in single‐pass data is consistent with
a recent report of reduced hippocampal sequence coding on a square linear maze during septal
inactivation (Wang et al. 2015). To explain the discrepancy between the effect size in the
analysis of the pooled and single pass data, we reasoned that low amplitude LFP theta
oscillations could elicit jitter in the timing of individual spikes or theta‐associated bursts while
nonetheless leaving the average trend for phase precession intact. In this way, phase precession
would remain more readily detectable when spikes from all passes were pooled but not in single
passes (Supplemental Fig. 8). To test whether such a dissociation is feasible, we performed
simulations in which we applied increasing levels of random jitter to either the spike times or
spike phases of baseline data, and observed the degree of jitter at which the mean of the field‐
averaged single pass and pooled pass slope distributions became statistically indistinguishable
from zero. We found that the field‐averaged single‐pass distribution was more sensitive than
the pooled pass distribution to random fluctuations in spike timing or spike phase
(Supplementary Fig. 8). Increased variability in spike timing may thus have resulted in phase
precession that remained detectable in the pooled passes but not in single passes.

119
Figure 8. Phase precession was retained to a larger extent during septal inactivation than by the MEC lesion. (a) (Top) Phase‐distance slopes were more negative during baseline (n = 51 fields in 4 rats) and during the session 2 h into the septal inactivation (n = 42 fields in 4 rats) compared to MEC‐lesioned rats (blue line; n = 21 fields in 4 rats, P = 0.36 and P = 0.037, Mann‐Whitney U tests, Holm‐Bonferroni corrected). The difference between the MEC lesion group and the session 30 min into the septal inactivation session did not reach significance (n = 44 fields in 4 rats, P = 0.081, Mann‐Whitney U test). (Bottom) Corresponding comparison between the MEC lesion and control group (data and statistics as in Fig. 6d). Dot plots include each field’s slope and mean ± SEM. (b) The single cell but not the LFP oscillation frequency was reduced 2 h into the septal inactivation compared to baseline (P = 0.0015 and P = 0.56, respectively, Wilcoxon signed rank tests, Holm‐Bonferroni corrected), and neither frequency was reduced 30 min into the septal inactivation (P = 0.16 and P = 0.56, Wilcoxon signed rank tests, Holm‐Bonferroni corrected). The frequency difference was less than zero during baseline (P = 2.8 x 10‐10, sign test) and remained different from zero during the two inactivation sessions (30 min into septal inactivation, P = 0.00033; 2 h into septal inactivation, P = 0.036, sign tests) and was not different from baseline during each of the inactivation sessions (P = 0.95 and P = 0.62, Wilcoxon signed rank tests). MEC lesions resulted in reduced theta frequency of single cells and of the LFP, but the single‐cell frequency was reduced to a larger extent such that the frequency difference was no longer different from zero (control, P = 9.43 x 10‐7, MEC lesion, P = 0.52, sign tests). In addition, there was a greater reduction in the frequency difference by MEC lesion than during baseline and during each of the two septal inactivation sessions (P = 0.00023, P = 0.0038 and P = 0.026, Mann‐Whitney U tests, Holm‐Bonferroni corrected). Only theta‐modulated cells (theta ratio > 5; baseline, n = 40/41 in 4 rats, 30 min into septal inactivation, n = 31/39 in 4 rats, 2 h into septal inactivation, n = 30/35 in 4 rats, control, n = 45/45 in 4 rats, MEC lesion, n = 23/24 cells in 4 rats) were used to calculate the frequency of the cells’ firing. See Supplementary Tables 1, 3, and 4 for detailed statistics. ## P < 0.01, baseline vs. septal inactivation sessions. * P < 0.05, ** P < 0.01, *** P < 0.001, MEC lesion group vs. baseline, vs. 30 min into septal inactivation, and vs. 2 h into septal inactivation, and vs. control group.
120
4.4 Discussion
The MEC contains cell types with precise spatial and directional firing patterns, such as
grid cells, boundary cells, and head‐direction cells (Hafting et al. 2005; Sargolini et al. 2006;
Solstad et al. 2008). All of these cell types have been confirmed to project to the
hippocampus(Zhang et al. 2013), and are thought to be necessary for spatially and directionally
selective hippocampal firing patterns. In addition, MEC cells have a second key specialization
compared to other inputs to the hippocampus – they are prominently theta modulated
(Hargreaves et al. 2005; Deshmukh et al. 2010). Our recordings from rats during repeated runs
along the same path allowed for a detailed analysis of hippocampal spatial and temporal firing
patterns without MEC inputs. We found that location‐selective firing was retained but typically
only over periods on the order of tens of seconds to minutes. Furthermore, most hippocampal
cells remained theta modulated, but their preferred firing frequency in the theta range
decreased such that it was no longer consistently faster than the LFP theta frequency. The
retained spatial firing and theta modulation afforded us the opportunity to ask to what extent
the temporal organization of hippocampal firing was preserved during periods when
hippocampal cells consistently fired at a discernible location. We found no consistent relation
between the firing phase within the theta cycle and the distance through the place field, and the
disruption of phase precession by the MEC lesion was more profound than during septal
inactivation despite the comparable reduction in the cells’ theta oscillations with both
manipulations. Our findings therefore demonstrate that the MEC inputs to the hippocampus are
necessary for a major component of hippocampal phase precession.
Furthermore, performing phase precession analysis over periods of stable spatial firing
did not reveal more phase precession than was observed when including less consistently tuned
firing. Our data therefore do not support a strong coupling between the inheritance of spatial
tuning by hippocampal cells and the emergence of phase precession. Conversely, a recent study
has shown that phase precession is retained during virtual reality exploration in which
consistent spatial firing patterns were no longer detectable (Acharya et al. 2016). Taken
together, these results indicate that spatial firing patterns of hippocampal place cells and the
precise temporal organization of spike timing within theta cycles can be decoupled. If the MEC
does not support phase precession through the intermediate step of organizing hippocampal
spatial firing, the essential role of MEC cells would be to either directly provide faster oscillatory
inputs and/or to enable mechanisms within the hippocampus that result in the cells’ accelerated

121
oscillation frequency (Supplementary Fig. 9).
Numerous theoretical hypotheses have been proposed to mechanistically explain how
theta phase precession might emerge from oscillations in the hippocampus at the cellular and
circuit levels (O'Keefe and Recce 1993; Tsodyks et al. 1996; Harris et al. 2002; Mehta, Lee, and
Wilson 2002; Lengyel, Szatmary, and Erdi 2003; Thurley et al. 2008; Harvey et al. 2009). In
particular, it has been suggested that an increasing ramp‐like excitatory input to pyramidal cells
is sufficient to explain an increasing firing rate within the place field (Harvey et al. 2009) and, in
combination with oscillating membrane potentials, an advance of the firing phase (Mehta 2001;
Magee 2001; Ekstrom et al. 2001; Mehta, Lee, and Wilson 2002; Harris et al. 2002) but see
(Huxter, Burgess, and O'Keefe 2003). In our recordings from MEC‐lesioned rats, we found
substantial LFP theta oscillations in the hippocampal CA1 cell layer, which can be taken as an
indication that the rhythmic somatic inhibition of principal cell populations was at least partially
retained (Kamondi et al. 1998). In addition, we found that instantaneous firing rates within a
theta cycle were no longer related to the phase advance of spiking within the cycle. To the
extent that the firing rate within a cell’s place field reflects the level of intracellular excitation,
our data therefore suggest that excitatory inputs from sources other than MEC do not combine
with oscillatory inhibition to result in the phase advance of spiking within a theta cycle.
It has also been proposed that phase precession throughout distinct phases of the theta
cycle depends on different classes of local interneurons, including cholecystokinin basket cells
for which GABA‐release is modulated by local cannabinoid release (Klausberger et al. 2005).
Manipulations of cannabinoid receptors reduce phase precession (Robbe and Buzsaki 2009),
which suggests that intrahippocampal modulation of inhibition contributes to phase precession.
Further evidence for an intrahippocampal contribution to phase precession is that theta
sequences of hippocampal cells, which are thought to depend on local recurrent connectivity,
are particularly disrupted during septal inactivation (Wang et al. 2015). Consistent with this
finding and the finding that single‐pass phase precession is required for theta sequences (Feng,
Silva, and Foster 2015), we also observed the disruption of single‐pass phase precession during
septal inactivation (see Supplementary Fig. 8). However, the inactivation did not disrupt
mechanisms that resulted, on average, in an accelerated spiking of hippocampal cells compared
to the LFP. In contrast, MEC lesions reduced the frequency of cell’s theta oscillations to a level
such that there was no longer a consistent frequency difference between the cells’ and the LFP

122
theta oscillations. Our data therefore suggests a necessary role for specifically MEC inputs in
generating the accelerated oscillation frequency of single cells compared to the LFP.
Together with the observation that the intracellular membrane potential does not only
show a ramp‐like excitation but also an increased theta oscillation frequency within the place
field (Harvey et al. 2009; Robbe and Buzsaki 2009), this raises the question how the faster
intracellular oscillations may emerge from MEC inputs. One possibility is that there are already
inputs to CA1 dendrites at the theta frequency of phase precessing cells (Kamondi et al. 1998).
However, in this case it would be unlikely that the inputs originate from direct projections of
MEC layer III to CA1 (Jaramillo, Schmidt, and Kempter 2014) because many layer III neurons are
phase locked to LFP theta rather than exhibiting phase precession (Hafting et al. 2008; Mizuseki
et al. 2009). The input frequency of the direct MEC projections would thus need to be
accelerated by further dendritic computations (Magee 2001; Harris et al. 2001; Chance 2012;
Leung 2011). Alternatively, MEC inputs could take effect more indirectly via MEC layer II,
dentate gyrus and CA3, resulting in de novo generation of phase precession on that pathway.
Although speculative, this de novo generation could occur either by the activation of recurrent
hippocampal circuitry in the dentate/CA3 region (Tsodyks et al. 1996; Jensen and Lisman 1996),
or by mossy fiber facilitation (Thurley et al. 2008) and inheritance from CA3 to CA1 (Jaramillo,
Schmidt, and Kempter 2014). The possibility that hippocampal phase precession specifically
requires phase precession in layer II grid fields (Hafting et al. 2008), which project to the
dentate/CA3 region (Zhang et al. 2013), is less likely based on the observation that medial septal
inactivation substantially disrupts the spatial firing patterns of grid cells (Brandon et al. 2011;
Koenig et al. 2011) while the inactivation only partially reduced phase precession. However, it
remains to be determined whether phase precession in grid cells could be affected to a lesser
extent by septal manipulations than the spatial grid patterns. Regardless of the specific
mechanism, our findings together indicate that a critical function of the MEC is the generation
of precise spike timing during hippocampal theta oscillations and that providing excitation to the
hippocampus from LEC and/or other cortical input sources is not sufficient for phase precession.
Accordingly, cognitive functions for which neuronal sequences within the hippocampal theta
cycle are essential are predicted to be particularly impaired after selective MEC lesions.

123
Acknowledgements
The authors thank Mandy Wong for technical assistance, Geoff Diehl for recording
control data, and Dr. John Lisman for comments on the manuscript. This work was supported by
a Boehringer Ingelheim Fonds PhD fellowship, the German Research Association (DFG) under
grant LE 2250/5‐1, the Ellison Medical Foundation grant AG‐NS‐0724‐10, Walter F. Heiligenberg
Professorship, NSF CRCNS grant 1010463, and NIH grants R21 MH100354 and R01 NS086947.
Author contributions
M.I.S., S.L., and J.K.L designed experiments, M.I.S., J.B.H, and S.L performed surgeries,
M.I.S. and B.L.B. acquired data, M.P.B provided data, C.C.C., M.I.S., J.B.H., E.A.M., C.L., and S.L.
performed analysis, M.I.S., C.C.C, J.K.L., C.L., and S.L wrote the manuscript.
Competing financial interests
The authors declare no competing financial interests.

124
4.5 Methods
Subjects and surgical procedures
The subjects were ten experimentally naïve, male Long–Evans rats weighing
approximately 300‐400 g. The surgical procedures were performed as previously described
(Hales et al. 2014). Six rats received NMDA lesions of the medial entorhinal cortex (MEC) and
four control rats underwent a sham surgical procedure. Animals were randomly assigned to
either the MEC lesion or the control group such that data acquisition for each group was
performed throughout the duration of the study. A fourteen‐tetrode recording assembly was
implanted during the same surgery. Tetrodes were constructed by twisting four 17 μm
polyimide‐coated platinum‐iridium (90 %/10 %) wires, and the electrode tips were plated with
platinum to reduce the impedances to 200‐300 kΩ at 1 kHz. The tetrodes were arranged into
two bundles, with six to eight independently movable tetrodes that were targeted to the
hippocampus of each hemisphere (AP: 4.0., ML: ± 2.45, angled laterally towards CA1 recording
sites at approximately ML ± 3.0). Following a 1‐week recovery period from surgery, rats were
food restricted and maintained at ~90 % of free‐feeding body weight. Rats were housed
individually on a 12 h reversed light/dark cycle, and all behavioral training and recording
sessions was performed in the dark phase of the cycle. All experimental procedures were
approved by the Institutional Animal Care and Use Committee at the University of California,
San Diego. None of the data that were recorded on the linear track have been previously
reported. Data that was recorded in the open field in 8 of the 10 rats (3 of 4 controls; 5 of 6
MEC‐lesioned) correspond to those in a published study (Hales et al. 2014) and were reanalyzed
here for phase precession. In addition, previously published data from 4 additional Long‐Evans
rats in which recordings were performed before and during septal inactivation (Brandon et al.
2014) were reanalyzed for phase precession. The surgical, recording, and behavioral procedures
for these rats have previously been described in detail, and their open field recordings closely
correspond to those in the MEC lesion group. The two reported inactivation sessions were
performed in the familiar room at approximately 30 minutes and 2 hours after the intraseptal
muscimol infusion.
Behavioral tasks and recording procedures
Before surgery, rats were pretrained to forage for randomly scattered cereal crumbs in a
black rectangular enclosure (1 m x 1 m, 50 cm walls), containing a polarizing cue card (20 cm x
50 cm). The enclosure remained at a constant location in the room. No curtains were used,

125
thereby allowing the rat a clear view of multiple distal background cues such as a light source
and surrounding walls. During this phase, rats were trained for 5 days in two daily 10‐min
sessions. In addition, 2 of 4 control and 4 of 6 MEC‐lesioned rats were also pretrained for 10
days on a six‐arm radial maze with 85 cm long and 10 cm wide arms, as previously described
(Schlesiger et al. 2013). After recovery from surgery, training continued in a different room,
which contained a black circular enclosure (1 m diameter, 50 cm walls) with a white cue card (20
cm x 50 cm). In the room where training began after surgery, rats were trained for 5‐10 days to
randomly forage for two to four 10‐min sessions per day. In addition, the subset of rats that was
pretrained on the 6‐arm maze continued to be trained on the six‐arm maze for 12‐14 days after
surgery. During this period, tetrodes were slowly advanced into the CA1 area of the
hippocampus. During tetrode advancement and recordings, the signals were preamplified with a
unity gain headstage and then recorded with a data acquisition system with 64 digitally
programmable differential amplifiers (Neuralynx, Tucson, AZ, USA) as previously described
(Hales et al. 2014). As expected (Bragin et al. 1995), sharp wave ripples were not diminished by
the MEC lesion and could therefore be used to guide electrode advancement into the cell layer
in all rats.
Recording began when tetrodes were stably positioned in the CA1 cell layer and when
the rats ran continuously throughout each 10‐min random foraging session. One electrode in
each hemisphere was used to record a reference signal from the cortex. In the open field
environment, recordings were performed in up to six sessions per day for at least 6 days. To
ensure that each cell was only included in the data analysis once, we only included the data
from the first recording session of a day. After the recordings during random foraging in the
open field, hippocampal cells were recorded for up to two sessions on the linear track that each
lasted 10‐20 min. The session with the highest number of runs between the two ends of the
track was selected for analysis. Two rats (one control and one MEC lesion) were additionally
trained on the linear track for up to forty sessions with up to eight sessions per day. For both
track and open field recordings, only cells from the day with the best isolation distance between
clusters were included for each tetrode, except when a tetrode was moved and a clearly
different set of cells was identified. In addition, we carefully examined the data from rats with
different degrees of experience (e.g., training in the six‐arm maze, additional training on the
track) but found that phase precession was intact in all control rats and disrupted in all MEC‐
lesioned rats, irrespective of their training history. We therefore combined the data from all

126
control rats and from all MEC‐lesioned rats for the analysis of the open field and the linear track
data. Data collection and analysis were not performed blind to the conditions of the experiment.
Histology
The brains were prepared to track the hippocampal tetrode locations in cresyl violet
stained sections and to quantify the MEC lesion extent in NeuN (1:15000, Chemicon, CloneA60)
stained sections with the Cavalieri method, as previously described (Hales et al. 2014). The
volume of the spared tissue was estimated for the MEC layer II, MEC layer III, MEC deep layers,
dorsal parasubiculum, ventral parasubiculum, and hippocampus. Damage to the brain areas
other than MEC was not substantial, as previously reported10.
Data analysis
All data analysis was performed by importing position data, LFP data, and spike data into
Matlab and by further processing the data with custom‐written software. All Matlab functions
that were written by the authors are available upon request.
Spike sorting
Spike sorting was performed manually using the graphical cluster‐cutting software
MClust (A. D. Redish, http://redishlab.neuroscience.umn.edu/MClust/MClust.html). Well‐
isolated clusters in the multidimensional parameter space (consisting of waveform amplitudes,
the difference between peak and trough of the waveform, and waveform energies) were
considered single hippocampal cells. Autocorrelation and cross‐correlation functions were used
as additional identification criteria. Putative principal cells were distinguished from putative
interneurons by spike width and average rate, and only putative principal cells were included in
analysis.
Cluster quality and stability
Cluster quality was accessed by calculating the L‐ratio and the Mahalanobis (i.e.,
isolation) distance (Schmitzer‐Torbert et al. 2005) for each cluster of spikes recorded during
running on the linear track. The Mahalanobis distance was calculated using the same spike‐
features that were used for spike sorting. Recording stability was quantified by dividing the
spikes in each cluster into two equal halves, and by calculating the average amplitude for each
half. The two halves were then compared by calculating (1) the amplitude difference on the

127
channel with the highest amplitude, (2) the percent change on the channel with the highest
amplitude, and (3) the Euclidean distance between the amplitudes on all four channels. These
measures were then compared between cells from MEC‐lesioned and control rats.
One‐dimensional path processing
For each complete session, end‐track coordinates corresponding to the reward zone
were first removed. Next, trajectories with lateral deviation exceeding 10 cm, indicative of
stopping behavior, were excluded. Finally, since one‐dimensional spatial firing is known to be
directionally selective in control cells, the remaining trajectories were split into left‐ and right‐
bound sessions. Only the longitudinal (i.e., x) coordinate was used in subsequent analyses.
Rate map construction
One‐ and two‐dimensional rate maps were constructed by splitting the environment into
5 cm and 5 x 5 cm2 bins, respectively, where the rate assigned to the th bin was calculated as
the total number of spikes in that bin divided by the occupancy time in that bin. One‐
dimensional rate maps were smoothed using a pseudo‐Gaussian kernel with a standard
deviation of one bin. Two‐dimensional rate maps were constructed using the “adaptive binning”
technique described in (ref. Skaggs et al. 1996). To prevent rate inflation due to low occupancy,
bins with occupancy time less than 150 ms were assigned rates exclusively via the smoothing
procedure.
Spatial information
For each cell, the spatial information(Skaggs et al. 1993) was calculated as
∑ log , where is the probability of finding the animal in the th bin, is the rate
assigned to the th bin and is the average bin rate.
Place field definition and size
Place fields were defined as two or more contiguous bins that met or exceeded 20 % of
the peak bin rate for a given cell. Cells with peak bin rate less than 2 Hz were not assigned fields,
and cell counts that are reported in the Results only include cells with at least one field and, for
the spatial analysis on the linear track (see Fig. 1), and the cells twice for which there were fields
in both running direction (linear track, control: 50/82; linear track, MEC‐lesioned: 153/170; open

128
field, control: 51/101; open field, MEC‐lesioned, 45/254). A field boundary and a contour
corresponding to 50 % of the peak bin rate were drawn using Matlab’s contourc() function. One‐
and two‐dimensional field sizes were calculated as the length between the beginning and end of
the field and the area within the field boundary, respectively.
Passes through a field
Candidate passes through a field were defined as groups of time‐contiguous position
coordinates that were within the field boundary (see place field definition and size, above) and
for which the animal spent at least 200 ms within the 50 % contour. A candidate pass was
included in the analysis if its average velocity surpassed 3 cm/s, a minimum of 5 spikes over at
least four theta cycles were fired during its duration, and the maximum interspike interval
during its duration did not exceed 1 s. Only fields with at least one pass meeting these criteria
were included in the phase precession analysis (entire session: control, n = 43 cells, MEC lesion,
n = 97 cells; PSSFs: control, n = 30 cells, MEC lesion, n = 41 cells).
Selecting periods of stable spatial firing (PSSF)
Conceptually, we defined a period of stable spatial firing (PSSF) as a period of time
where a cell exhibited similar spatial firing over the course of five or more consecutive runs (in
one direction) along the linear track. To detect PSSFs quantitatively, we examined the mean
pairwise correlation between the rate maps of groups of five or more consecutive runs.
In detail, for each cell in an ‐run session, a one‐dimensional rate map was constructed
for each of the runs. Let be the rate map corresponding to the th run. A window
⋯ was defined to be a set of consecutive rate maps beginning
with run . For each window ( 5,6,… , ; 1,2, … , 1), Pearson’s correlation
coefficient was calculated for all pairs of constituent rate maps; i.e., , , .
The mean correlation coefficient for each window was calculated as tanh , where
is the empirical mean of the Fisher transformed correlation coefficients atanh ).
A window was considered to exhibit robust spatial firing if its met or exceeded 0.5.
Since single passes with fewer than 5 spikes were excluded from subsequent analyses (see
above), such runs were labeled disposable. In addition, since the correlation coefficient is
undefined for the 0 vector, runs with no spikes were labeled empty. A window was then

129
considered selectable if it contained at most 30 % disposable runs and no empty runs. If was
the largest window size with a stable, selectable window, we selected as a candidate PSSF the
such that max .
To assess the significance of the spatial stability, for each run, the spike locations were
shifted uniformly (with wrapping) by a random quantity. That is, if is the vector of spike
locations for the th run with the element corresponding to the position of the th spike, ℓ is
the track length, and is a standard normal random variable, then we took the modified spike
locations for the th run as
∗ 12ℓ
ℓ,∀12ℓ
ℓ,∀ 112
0,
In this way, the temporal organization of spikes within each run as well as the selectability of
each window was retained. A null distribution of correlation scores was then obtained by
taking the maximum correlation score of all selectable windows of size from each of 500
independent shuffles. The candidate PSSF was selected for further analysis if
0.05 and rejected otherwise.
LFP tetrode selection
To ensure accurate phase and frequency estimation, LFP oscillations were inspected
visually with Neuroview (Neuralynx), and for each session in control and MEC‐lesioned rats, a
tetrode with a 1/f‐corrected theta power > 3 (see below) was chosen. For sessions recorded
from rats with septal inactivation, a tetrode that retained 1/f‐corrected theta power > 1.5 after
inactivation was selected. For analysis of LFP theta power in the CA1 pyramidal cell layer, the
LFP signals from all tetrodes with well‐isolated units were used.
LFP theta frequency and relative power
For each tetrode, a time‐frequency spectrogram was calculated via the Chronux
(www.chronux.org) function mtspecgramc() using a window size and time step of 20 s and 10 s,
respectively. The LFP theta frequency was taken as the frequency at maximum power within the
4‐12 Hz frequency band of the time‐averaged spectrogram. The time‐averaged spectrogram
was then 1/ ‐corrected via the normalization

130
1
where and are coefficients obtained from the linear regression of log on log . The
relative power was then taken as the maximum power of the normalized spectrum within the 4‐
12Hz frequency band.
Single cell temporal autocorrelations, frequency and theta ratio
For each cell, spike times were binned at a sampling rate of 500 Hz. The temporal
autocorrelation between spike times was calculated from the resulting vector. The power
spectrum of the temporal autocorrelation was obtained for the frequency band 0‐125 Hz via the
Chronux function mtspectrumpb() using a padding factor equal to two powers of 2 over the
sample size. The single cell frequency was then taken as the frequency of maximum power
within 4‐12 Hz. The theta ratio was calculated as the power at the single cell frequency over the
average power of the spectrum. Cells were included in this analysis if they had at least one place
field on the linear track (control, n = 30 cells, MEC lesion, n = 47 cells) and at least one field <
0.25 m2 in the open field (control, n = 45 cells, MEC lesion, n = 23 cells).
Instantaneous theta phase, firing phase and phase modulation
A 4‐12 Hz bandpass filter was applied to the signal from each tetrode selected for phase
estimation (see LFP tetrode selection, above). The instantaneous theta phase was obtained from
the Hilbert transform of the filtered signal. Spike and LFP timestamps were then used to linearly
interpolate firing phase from these values. The degree to which single cell firing was modulated
by theta phase was measured by the length of the mean resultant vector obtained for each
cell from the resulting distribution of firing phases. The same set of cells as for calculating the
temporal autocorrelation was used.
Distance through a field
For each pass, the distance at the th position coordinate , was calculated as
where the point , corresponds to the coordinate of field entry. was defined to be 0.
The distance at the th spike ∈ , occurring at time ∈ , was linearly

131
interpolated from these values.
Instantaneous firing rate
For each pass, the instantaneous firing rate at the th spike was calculated as the
number of spikes in a 250 ms window (approx. two theta cycles) around the time of the th spike
.
Circular‐linear regression: General method
The relationship between circular‐linear pairs , was checked for consistency
with the linear model 2 by maximizing the mean result vector length of
the circular errors between the measured circular variable and the model predictions :
1
cos 21
sin 2
does not permit a unique maximum over the whole real line. Thus, we restrict the slopes
to the interval 22 cycles per field and denote the slope of the best fit by
argmax ∈ . In particular, a maximum obtained at the boundary values indicates that the
true maximum of is not in 22 and the slope estimate is therefore not reliable.
Hence, slope estimates such that 2 | | 0.01 were excluded from the analysis. The
phase offset is subsequently estimated by
atan2∑ sin 2∑ cos 2
To assess the significance of the circular‐linear correlation, we first calculate the circular‐linear
correlation coefficient
∑ sin sin
∑ sin ∑ sin
where 2 | | 2 is the circular transformation of the linear variable, and and
are the circular means of the and , respectively. For large n and uncorrelated Gaussian

132
random phases (the null hypothesis), the scaled correlation is given by
1
sin sin
Thus, given z, we obtain a p‐value for the correlation from a cumulative standard normal
distribution. The test statistic used to derive the significance of a circular‐linear correlation is
described in Appendix 2.1 (A2.1) of (ref. Kempter et al. 2012).
Circular‐linear regression: Application
Phase‐distance slopes were obtained for each pass through a field by performing
circular‐linear regression (Kempter et al. 2012) on the points , , where
is the pass normalized distance at the th spike (see above), and is the theta phase at the th
spike (see above). An identical procedure was used to calculate the phase‐distance slope after
pooling the , from all passes through a field. ‐phase slopes were obtained
similarly using the values pooled across each cell normalized by the cell maximum. The
regression slope was obtained from one‐dimensional numerical maximization of using
MATLAB’s fminbnd().
Circular‐linear regression: Statistical analysis
Of particular relevance to analyzing phase precession is that the test statistic for the
regression line is a test against the null hypothesis that the slope of the regression line is zero.
Thus, a significant negative correlation may indicate either robust phase precession or Type I
error (a false positive), while a nonsignificant negative correlation may indicate either noise
(false or random phase precession) or Type II error (a failure to detect phase precession).
Reduced phase precession predicts a shift towards a zero‐centered distribution of slopes, along
with a smaller proportion of significant negative slopes and a higher likelihood for Type II errors.
The absence of phase precession predicts a distribution that is centered around zero and that
any remaining significant negative slopes are Type I errors. To be sensitive to detecting both
reduced phase precession and the absence of phase precession, we inspected the distribution of
all fields’ slopes as well as the distribution of only the slopes for which the circular‐linear
regression was significant. For all slopes, we determined whether the distribution was different

133
from zero (one‐sample t‐test or sign test) and whether distributions differed between groups
(two‐sample t test or Mann Whitney test). For significant negative slopes (P < 0.05, circular‐
linear regression), we tested whether their proportion differed between groups (chi‐square
test). For distributions that included significant negative and significant positive slopes (P < 0.05,
circular‐linear correlation), we tested whether their mean or median was centered on zero (one‐
sample t‐test or sign test), based on the prediction that a distribution without phase precession
would have an approximately equal number of positive and negative significant slopes. For the
latter test, it is important to note that it is the distribution between negative and positive slopes
that is of interest and not the absolute values of the slopes because the slopes were already
selected by the circular‐linear regression for their difference from zero before being tested in
the second step for their distribution around zero. We nonetheless included this test to be
maximally sensitive to any remaining phase precession.
For single passes through a field, it was determined whether the regression line for each
pass was significant (P < 0.05, circular‐linear correlation), and averages were then calculated
separately for all passes through the field and for only the significant passes through the field.
The averaging per field was used so that fields with a high number of qualifying passed would
not be overrepresented. After averaging single passes per field, the statistical tests that were
used for the field‐averaged slopes corresponded to those that were used for the slopes from
pooled passes.
Crosscorrelation analysis of cell pairs
Only pairs of parallel recorded cells went into this analysis where, during overlapping
PSSFs, both cells were firing in the same theta cycle. Spike trains of recorded cells were
convolved with a Gaussian with 10 ms standard deviation. The convolved spike trains for the
relevant pairs were crosscorrelated and the crosscorrelations were filtered in the theta band (6‐
12 Hz) and Hilbert transformed to determine the theta phase shift with respect to time
difference 0. To obtain the crosscorrelation of the place fields the spike positions were
convolved with a Gaussian with standard deviation of 3 cm (red lines in Fig. 5c, d). The
maximum of the crosscorrelation function corresponded to the distance between the maximal
firing rates of the two cells (place field distance).

134
Jitter simulation
To simulate spike time jitter, an 0, random variable was added to the timestamp
of each individual spike. The corresponding theta phase of each spike was then calculated as
described above. To simulate phase‐onset jitter, theta‐associated bursts (TABs) were empirically
defined as sequences of spikes with maximum ISI not exceeding 20 ms. An 0, random
variable was then added to the estimated spike phases of each TAB, such that all spike phases
within a TAB were shifted by the same amount. The phases of spikes that did not occur within a
TAB were shifted individually by an analogous procedure. For spike time jitter simulations, the
value of σ ranged from 0 to 30 ms in 3 ms intervals; for phase‐onset jitter simulations, σ ranged
from 0 to 25 % of a theta cycle in 2.5 % intervals. One‐hundred simulations were performed for
a given σ. For each simulation, a field‐averaged and pooled pass distribution of firing phase‐
distance slopes (see above) was obtained and a one‐sided t test against zero mean was
performed. For each σ, the proportion of simulations significantly different from zero was then
quantified as the proportion of 100 trials that the null hypothesis was rejected at the 5% level.
Statistical analysis
All statistical tests used were two‐sided, and the significance threshold for all tests was α
= 0.05. For each sample distribution, a Kolmogorov‐Smirnov (KS) test was used to test the null
hypothesis that the z‐scored sample was derived from a standard normal distribution. If the KS
null hypothesis failed rejection, a one‐sample t test was used to test the sample mean against
zero. Otherwise, a sign test was used to test the sample median against zero.
For each between‐group comparison, a two‐sample t test was used to test equality of means
only if both sample distributions failed KS test rejection; otherwise, a Mann‐Whitney U test was
used to test the equality of medians. For within‐group comparisons between baseline and septal
inactivation sessions, a Wilcoxon signed rank test was used to test for equality of medians.
Multiple comparisons were corrected for the familywise error rate (FWER) with the Holm‐
Bonferroni procedure.
Statistical power was assessed by simulating sample distributions under the appropriate
alternative hypothesis using the empirical sample size and using bootstrapped estimates of the
relevant population parameters as the true parameters. In particular, the power of one‐ and
two‐sample t tests was assessed by simulating sample distributions derived from a normal

135
distribution with true mean and standard deviation equal to the respective bootstrapped
parameters, while the power of Mann‐Whitney U tests was assessed by bootstrapping values
from the sample distribution above and below the bootstrapped estimate of the median with
equal probability. The statistical power was then estimated as the proportion of 10,000
simulations where the null hypothesis was correctly rejected using a given test. With the effect
size of phase precession in controls and when using sample sizes corresponding to either the
control or lesioned groups, we found that the power was > 0.95 for one‐sample tests against the
null hypothesis that the slope is equal to zero. This indicates that we would likely have rejected
the null hypothesis if there were no effect of the MEC lesion. Furthermore, for all two‐sample
tests that compared phase precession and theta frequency difference between control and
MEC‐lesion groups, the power was > 0.99 and > 0.92, respectively. We therefore concluded that
the sample sizes were sufficiently large to support the main conclusion.

Supplementary Figure 1
Sufficient LFP theta power for phase and frequency analysis was retained in all rats with lesions that included the entire extent of the medial entorhinal cortex. (a) (Top two rows) Photographs of NeuN-stained sections through the medial entorhinal cortex (MEC) from a control rat and from an MEC-lesioned rat in which the lesion size was close to the group average. Three sagittal levels are shown for each rat (d, dorsal; v, ventral; a, anterior; p, posterior). Red lines delineate MEC borders. Scale bars are 1 mm. (Bottom left) Average lesion size in different MEC layers. The percentage of damaged tissue was quantified for each layer along the entire extent of MEC (including dorsal, intermediate and ventral MEC). Dots indicate lesion size in individual hemispheres, and matching colors are from the same rat. Bar graphs, mean ± SEM. (Bottom right) Electrode tracks in the left and right dorsal hippocampus of two MEC-lesioned rats. Termination sites in the CA1 cell layer are marked with arrows. Scale bars are 1 mm. (b,c) Example LFP traces (gray, raw signal; black, 4-12 Hz filtered) and 1/f corrected spectrograms from the selected tetrode that was used for phase and frequency analysis in the three control rats and in five MEC-lesioned rats with recordings on the linear track. An additional rat (Rat 587) with recordings from only 2 cells for which no PSSFs were identified is not shown. Scale bars are 250 V and 100 ms. Vertical lines indicate the peak of each LFP-theta cycle.
Nature Neuroscience: doi:10.1038/nn.4056136

Supplementary Figure 2
Periods of stable spatial firing were shorter in MEC-lesioned than in control rats. Example place fields on the linear track from two control rats (a, rat 616 and rat 614) and from two MEC-lesioned rats (b, rat 645 and rat 434). Data recorded during the turn are not shown and were excluded from the analysis. Each column (from i to iii) depicts the spatial firing pattern of one cell during running in one direction (indicated by the arrow). (i) Trajectories (black lines) and spike locations (red dots) within the place field. (ii) Raster plots with each row corresponding to a run from one end of the track to the other. (iii) Firing rate versus distance on the linear track. Place field boundaries and firing rates are shown for the entire session (gray line and enclosed shaded area) and for the period of stable spatial firing (PSSF; stippled line and enclosed, darker shaded area).
Nature Neuroscience: doi:10.1038/nn.4056137

Supplementary Figure 3
Single unit recordings were stable throughout periods when the spatial firing patterns in MEC lesioned rats shifted. (a,b) Recording quality and cluster stability are depicted for representative tetrodes from a control rat (rat 616, black vertical line) and from an MEC lesioned rat (Rat 434, blue vertical line). (i) Scatter plots of spike amplitudes or spike energy (i.e., the area under the amplitude curve) for two of the four recording channels of a tetrode. The first and second half of the recording session are shown separately. In each scatter plot, spikes are represented as dots. Because spikes that are generated by individual cells tend to have consistent amplitude distributions across channels, spikes from the same cell form clusters within the scatter plots. Spikes assigned to each cluster are shown in matching colors. Spikes that did not clearly separate into clusters were not included into the analysis and are shown in gray. Within each recording session, clusters remained in a stable position in amplitude and energy space. (ii) Raster plots of spatial firing patterns with the spike locations (red dots) during each run in one direction (black arrow) on the linear track. Periods of stable spatial firing (PSSFs) that were used for phase precession analysis are highlighted in gray. (iii) Spike amplitudes over the course of a recording session are shown for the cells in the raster plots. Each tetrode channel is a different color. Cluster quality measures (L ratio and isolation distance) are noted for each cell. Cells recorded from MEC lesioned rats did not show changes in spike amplitude beyond the small variability that was also observed in controls, and these cells thus showed stable spike amplitudes even at time points when the spatial firing patterns shifted. (c) Comparison between the average spike amplitudes during the first and during second half of each recording. The amplitude difference on the channel with the highest amplitude, the percent change on the channel with the highest amplitude, as well as the Euclidean distance between the amplitudes on all four channels were calculated. None of these measurements showed differences between cells from control and cells from MEC lesioned rats (control, n = 74 cells; MEC lesioned, n = 163 cells with > 20 spikes; amplitude difference, P = 0.39; percent change, P = 0.23; Euclidean distance, P = 0.51; Mann Whitney U tests). (d,e) Cluster quality in control and MEC-lesioned rats. The L ratio indicated a better cluster quality in cells from MEC lesioned compared to control rats (control, n = 75 cells; MEC lesioned, n = 170 cells with > 12 spikes; P = 0.049, Mann Whitney U test) while the isolation distance was significantly lower after the MEC lesion (P = 0.040, Mann Whitney U test). Along with these inconsistent differences between the groups, the distributions showed substantial overlap. Together with lack of amplitude differences within the recording sessions (see c), we could therefore not find any indication that the more frequent shifts in spatial firing patterns in the cells from MEC lesioned rats could be explained by differences in cluster stability or quality.
Nature Neuroscience: doi:10.1038/nn.4056138

Supplementary Figure 4
Phase precession is substantially disrupted in all MEC-lesioned rats. Additional examples of spatial and temporal firing patterns on the linear track. Pooled and single pass phase precession analysis from a control rat (a, rat 614) and two MEC-lesioned rats (b, rat 434 and rat 645). For each PSSF, the place field, LFP traces and spike trains are shown. (Top left of each panel) Firing rate on the linear track (stippled line) with the extent of the field during the PSSF indicated by a shaded box. Arrows indicate the running direction. (Top right of each panel) Firing phase versus relative distance in the field for all passes through the field. A regression line (black) is added when the circular-linear correlation was significant (P < 0.05). For better visualization, the phase of each spike is replotted in a second cycle. (Lower panels in each box) For passes through the place field, the LFP trace (gray, raw signal; black, 4-12 Hz filtered) and the spike times are depicted (red ticks). Black vertical lines indicate the peak of each LFP-theta cycle. Scale bars are 250 μV and 100 ms. To the right of the trace for each pass, the corresponding firing phase of each spike is plotted as a function of the relative distance through the field. A regression line (black) is added when the circular-linear correlation was significant (P < 0.05). Analysis of pooled passes and single passes revealed a deficit of phase precession in cells from MEC-lesioned rats, while prominent phase precession was observed in control cells.
Nature Neuroscience: doi:10.1038/nn.4056139

Supplementary Figure 5
MEC lesions resulted in highly variable and a lower proportion of significant phase-distance correlations during single passes through hippocampal place fields. (a,b) Firing phase-distance regression slopes for single passes (blue ticks) through each field. Corresponding field-averaged slope (black tick) and SEM (error bars) are shown on the horizontal axis. Fields are arranged from top to bottom by increasing field-averaged slope. All slopes (top) and only slopes where the circular-linear correlation was significant (P < 0.05) (bottom) are shown for control rats (left) and MEC-lesioned rats (right). (a) Single pass slopes and corresponding field-averages for the entire recording session. (b) Same as in a for periods of stable spatial firing (PSSFs). (c) Slopes were first calculated for single passes through each field and then averaged per field (n = 47 control fields and 133 fields from MEC-lesioned rats). Insets: field-average of only significant slopes (P < 0.05, circular-linear correlation; n = 39 control fields and 89 fields from MEC-lesioned rats). (d) Same as in c for PSSFs (see also Fig. 3; n = 31 control fields and 50 fields from MEC-lesioned rats; only significant slopes: control, n = 25 fields; MEC-lesioned, n = 27 fields).
Nature Neuroscience: doi:10.1038/nn.4056140

Within each graph, the stippled orange line indicates the mean of the field-averaged slopes. Gray shading highlights the region of the graph where slopes are negative. Compared to control rats, the CA1 cells from MEC-lesioned rats exhibited phase-distance slopes that were less frequently negative (entire recording session: 88.9 % for control fields and 61.5 % for fields from MEC-lesioned rats, P = 1.3 x 10⁻⁶, Mann-Whitney U test; PSSFs: 88.9 % for control fields and 60.0 % for fields from MEC-lesioned rats, P = 0.00020, Mann-Whitney U test), less frequently significant (entire recording session: 40.0 % for control fields and 20.0 % for fields from MEC-lesioned rats, P = 0.00019, Mann-Whitney U test; PSSFs: 50.0 % for control fields and 9.6 % for fields from MEC-lesioned rats, P = 0.0045, Mann-Whitney U test), and more variable (median standard deviation in entire recording session: 0.35 for control fields and 0.91 for fields from MEC-lesioned rats, P = 3.5 x 10⁻⁹, Mann-Whitney U test; PSSFs: 0.22 for control fields and 0.87 for fields from MEC-lesioned rats, P = 0.0023, Mann-Whitney U test) during single passes through their respective place fields.
141

Supplementary Figure 6
Spatial and temporal firing characteristics of example place fields recorded in the open field.All cells recorded on one representative tetrode per rat are shown for two control rats (a, black vertical line) and three MEC-lesioned rats (b, blue vertical line). (First column of each cell’s panel) Color-coded rate maps (blue to red, 0 Hz to peak rate). Scale bars are 50 cm. (Second column) Corresponding trajectory plot with the rat’s path (gray line) and the location of spikes (red dots). The place field boundaries are overlaid in black. (Third column) Spike-time autocorrelogram. (Fourth column) The phases of all in-field spikes fired during the 10-min session are plotted as a function of the relative distance through the field. A regression line (black) is added when the circular-linear correlation was significant (P < 0.05, circular-linear correlation). Significant negative slopes, which indicate phase precession, are found for most fields from control rats (35/46, 76.1 %) but only for few fields from MEC-lesioned rats (5/21, 23.8 %).
Nature Neuroscience: doi:10.1038/nn.4056142

Supplementary Figure 7
Example passes through place fields in the open field.
Pooled and single pass analysis for (a) a place cell from a control rat and (b,c) two simultaneously recorded cells from an MEC-lesioned rat. (Top row of each panel, from left to right) Color-coded rate map (blue to red, 0 Hz to peak rate), trajectory plot with the rat’s path (gray line) and the location of spikes (red dots), spike-time autocorrelogram, phase-distance plot for all in-field spikes fired during a 10-min session. (Additional pairs of plots in each panel) Trajectory and phase-distance plots for all individual passes through the place field. The place field boundaries (black line) are overlaid on all trajectory plots. A regression line is added to the phase-distance plots when significant (P < 0.05, circular-linear correlation).
Nature Neuroscience: doi:10.1038/nn.4056143

Supplementary Figure 8
Field-averaged single-pass analysis during septal inactivation. Single trial phase precession was analyzed during a 10-minute session before and at two time points during septal inactivation. (a–c) Phase-distance plots of example cells that were recorded before inactivation, 30 min into the inactivation, and 2 h into the inactivation. For each cell the phase-distance plot is shown for all passes through the place field (pooled passes, left in each panel) as well as for one representative pass through the place field (single pass, right in each panel). For better visualization, the phase of each spike is replotted in a second cycle. Regression lines (black) are added when the circular-linear correlation was significant (P < 0.05). (d, top row) Representative time-averaged and 1/f corrected spectrograms of LFP recordings used for theta phase analysis. (d, bottom row) Distributions of phase-distance slopes. For each cell, slopes were first calculated for single passes through each field and then averaged per field (see Fig. 7 for the analysis of pooled passes). Insets: field-average of only significant slopes (P < 0.05, circular-linear correlation). (e, top) To calculate theta phase and frequency, a recording tetrode with theta power of at least 1.5 times over the 1/f baseline was chosen for each recording session (n = 5, one tetrode per session). Mean theta power on tetrodes selected for phase and frequency analysis. Dots indicate individual sessions, and matching colors are used for the same tetrode. Mean theta power on selected tetrodes in the MEC-lesioned group is shown for comparison (blue line). (e, bottom) The mean field-averaged slope was less than zero before the inactivation (all slopes, n = 52, P = 1.01 x 10⁻⁵, t test; only significant slopes, n = 45, P = 9.33 x 10⁻⁹, sign test), not different from zero during the session 30 min into the inactivation (all slopes, n = 46, P = 0.54, t test; only significant slopes, n = 30, P = 0.86, sign test), and again less than zero during the session 2h into the inactivation (all slopes, n = 44, P = 2.09 x 10⁻⁵, t test; only significant slopes, n = 32, P = 0.020, sign test). The session at 30 min but not at 2 h into the inactivation was different from baseline (P = 0.00027 and P = 0.22, Mann-Whitney U test). The mean field-averaged slope in MEC-lesioned rats (all slopes, n = 25) was different from baseline, but not different from recordings in either of the septal inactivation sessions (P = 0.028, P = 0.97, P = 0.13, Mann-Whitney U test). Bar graphs include mean ± SEM. See Supplementary Table 4 for detailed statistics. *** P < 0.001, * P < 0.05, compared to MEC lesion group. ### P < 0.001, baseline compared to septal inactivation, Holm-Bonferroni corrected for multiple comparisons. (f) Schematic of the relation between spikes (red ticks) and theta oscillations (black lines) with and without jitter. Vertical gray lines indicate the peak of each theta cycle. (Top) Schematic of a spike train that exhibits clear phase precession over the course of three theta cycles. (Middle) Same spike train as shown on top after the application of spike-timing jitter. Spike-timing jitter was simulated by adding zero-mean Gaussian noise with a particular standard deviation ( t) to each spike time prior to phase estimation. (bottom) Same spike train as shown on top after the application of phase-onset jitter. Phase onset jitter was simulated by adding zero-
Nature Neuroscience: doi:10.1038/nn.4056144

mean Gaussian noise with a particular standard deviation ( ) to the phase of all spikes within a theta-associated burst (TAB; see Online Methods). Single spikes not included in a TAB were treated analogously. (g) Phase-distance plots corresponding to spikes pooled from all passes through the same field before and after applying the same jitter as shown in f. Note that, despite the ambiguity introduced at the level of single passes, the overall phase-distance relationship over all passes remains largely unchanged after the application of a relatively large degree of jitter. (h) Phase-distance plots and corresponding circular-linear regression lines obtained from two example passes through a place field (top) before jitter was applied, (middle) after the application of spike time jitter ( t = 20 ms), and (bottom) after the application of phase onset jitter ( = 15.00 % theta cycle). Each spike is replotted in a second cycle for clarity. Note the ambiguity introduced in the phase-distance relationship after the application of jitter and its effect on the slope of the regression line. (i) Spike time (top) and phase onset (bottom) jitter were applied separately to the spikes of cells recorded during baseline conditions, where clear phase precession was observed (see Fig. 7). Data without the application of jitter (Baseline) are represented at a standard deviation of zero. All other symbols (circles) represents the average of 100 iterations (that is for each iteration, jitter applied to all fields) per degree of jitter (that is, standard deviation on horizontal axis). For each iteration, a t test was used to test the means of the resulting field-averaged single pass (green lines) and pooled pass (purple lines) slope distributions against zero at the = 0.05 significance level. The shading of each circle corresponds to the proportion of trial distributions with mean values that were significantly different from zero for each degree of jitter (white to black, 0 to 1). Note that the degree of jitter required to render phase precession undetectable (e.g. obtain an average distribution mean close to 0) is lower for field-averaged single pass distributions than for pooled pass distributions, irrespective of the type of jitter simulated. Phase precession measures based on field-averaged single pass slopes are thus less robust to jitter than slopes obtained by pooling spikes from all passes through a field.
Nature Neuroscience: doi:10.1038/nn.4056145
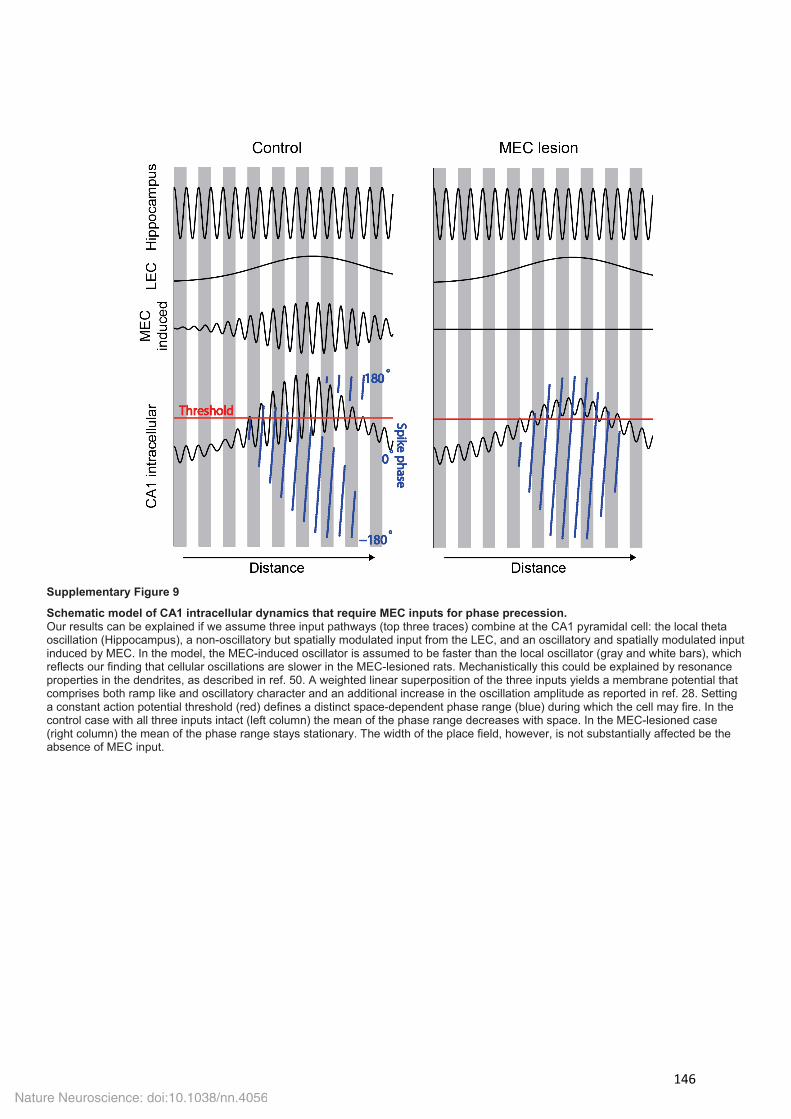
Supplementary Figure 9
Schematic model of CA1 intracellular dynamics that require MEC inputs for phase precession. Our results can be explained if we assume three input pathways (top three traces) combine at the CA1 pyramidal cell: the local theta oscillation (Hippocampus), a non-oscillatory but spatially modulated input from the LEC, and an oscillatory and spatially modulated input induced by MEC. In the model, the MEC-induced oscillator is assumed to be faster than the local oscillator (gray and white bars), which reflects our finding that cellular oscillations are slower in the MEC-lesioned rats. Mechanistically this could be explained by resonance properties in the dendrites, as described in ref. 50. A weighted linear superposition of the three inputs yields a membrane potential that comprises both ramp like and oscillatory character and an additional increase in the oscillation amplitude as reported in ref. 28. Setting a constant action potential threshold (red) defines a distinct space-dependent phase range (blue) during which the cell may fire. In the control case with all three inputs intact (left column) the mean of the phase range decreases with space. In the MEC-lesioned case (right column) the mean of the phase range stays stationary. The width of the place field, however, is not substantially affected be the absence of MEC input.
Nature Neuroscience: doi:10.1038/nn.4056146

Supplementary Table 1. Spatial and temporal firing patterns in the hippocampus of control and MEC-lesioned rats.
Linear track Entire session
Mean ± SEM Median P U z Control MEC
lesion Control MEC lesion
Field size (cm)b 42.30 ± 2.36 63.48 ± 2.10 40.79 65.84 1.18 x 10⁻⁶ 3622 4.86
Information (bits per spike)a
1.07 ± 0.08 0.52 ± 0.03 0.95 0.41 1.59 x 10⁻¹¹ 7531 -6.74
Rate by pass (Hz)a 13.75 ± 0.83 10.30 ± 0.40 12.49 9.83 9.19 x 10⁻⁵ 605 -3.91 Max firing rate
(Hz)a 12.26 ± 1.04 8.22 ± 0.44 10.15 6.81 2.91 x 10⁻⁴ 6407 -3.62
Mean firing rate (Hz)a
3.61 ± 0.31 3.48 ± 0.22 3.65 2.63 0.34 5443 -0.95
Proportion bursts per cella
0.13 ± 0.01 0.15 ± 0.01 0.14 0.14 0.19 4626 1.31
Control: a50 cells (peak rate > 2 Hz), b51 fields, 4 rats
MEC lesion: a153 cells (peak rate > 2 Hz), b164 fields, 6 rats PSSF
Field size (cm)b 44.71 ± 2.66 40.15 ± 2.06 45.80 37.05 0.13 1843 1.53
Information (bits per spike)a
1.02 ± 0.08 0.88 ± 0.04 0.96 0.84 0.20 1618 -1.31
Rate by pass (Hz)a 14.41 ± 0.94 16.58 ± 0.81 13.80 16.18 0.51 611 0.65
Max firing rate (Hz)a
18.78 ± 1.25 20.47 ± 0.99 18.60 18.60 0.37 1347 0.89
Mean firing rate (Hz)a
5.58 ± 0.38 5.97 ± 0.37 5.15 5.32 0.81 1427 0.24
Proportion bursts per cella
0.13 ± 0.01 0.15 ± 0.01 0.13 0.14 0.55 1384 0.59
Theta ratioc 20.08 ± 1.75 5.61 ± 0.44 18.47 5.07 5.70 x 10⁻¹⁰ 1613 -6.20 Mean resultant vector lengthc
0.26 ± 0.04 0.20 ± 0.02 0.20 0.19 0.57 1129 -0.56
Single cell theta frequency (Hz)d
8.40 ± 0.19 6.70 ± 0.27 8.54 6.84 3.90 x 10⁻⁶ 301 -4.62
LFP theta frequency (Hz)e
7.43 ± 0.14 6.92 ± 0.06 7.45 6.84 0.0052 71 N.A.
LFP theta power in CA1 (μV2Hz-1)f
10.54 ± 2.10 6.02 ± 1.69 9.50 3.50 0.015 634 -2.45
Control: a31 cells (peak rate > 2 Hz), b31 fields, c30 cells (as in Fig. 2), d29 cells (theta ratio > 5),
e6 sessions, f20 tetrodes in 4 rats; MEC lesion: a62 cells (peak rate > 2 Hz), b73 fields, c41 cells (as in Fig. 2), d21 cells (theta ratio > 5), e9 sessions, f30 tetrodes in 5 rats
Nature Neuroscience: doi:10.1038/nn.4056
147

Open field Mean ± SEM Median P U z Control MEC
lesion Control MEC lesion
Theta ratioa 27.39 ± 1.60 12.16 ± 1.49 26.24 9.68 4.40 x 10⁻⁸ 405 -5.47
Mean resultant vector lengtha
0.14 ± 0.02 0.14 ± 0.02 0.11 0.11 0.52 892 0.65
Theta frequency single cell (Hz)b
8.19 ± 0.09 6.62 ± 0.28 8.06 7.08 3.36 x 10⁻⁷ 402 -5.10
Frequency difference (Hz)b
Cell-LFP
0.48 -0.57 0.60 -0.12 0.0015 -3.17 549
LFP theta frequency (Hz)c
7.68 ± 0.11 7.14 ± 0.14 7.70 7.20 0.0096 99.5 N/A
LFP theta power in CA1 (μV2Hz-1)d
3.73 ± 1.07 4.44 ± 1.00 2.30 2.46 0.76 431 0.31
Control: a45 cells (fields < 0.25 m2), b45 cells (theta ratio > 5), c7 sessions, d16 tetrodes, 3 rats
MEC lesion: a24 cells (fields < 0.25 m2), b23 cells (theta ratio > 5), c12 sessions, d39 tetrodes, 4 rats
Nature Neuroscience: doi:10.1038/nn.4056
148

Supplementary Table 2. Comparisons of slopes from fields of control and MEC-lesioned rats.
Linear track – pooled-pass analysis Control
Unrestricted
all slopes
Unrestricted significant
slopes
Fields < 60 cm
all slopes
Fields < 60 cm significant
slopes
PSSFs all slopes
PSSFs significant
slopes
46 fields in 4 rats
35 fields in 4 rats
38 fields in 4 rats
29 fields in 4 rats
31 fields in 4 rats
25 fields in 4 rats
Normal Yes Yes Yes Yes Yes Yes
Mean ± SEM
-0.38 ± 0.06
-0.39 ± 0.07
-0.36 ± 0.07
-0.37 ± 0.09
-0.38 ± 0.08
-0.37 ± 0.08
t test
P 1.34 x 10⁻⁷ 7.84 x 10⁻⁶ 9.50 x 10⁻⁶ 2.17 x 10⁻⁴ 3.33 x 10⁻⁵ 6.19 x 10⁻⁵ df 45 34 37 28 30 24 t -6.25 -5.26 -5.13 -4.24 -4.87 -4.84
MEC lesion
128 fields in 6 rats
56 fields in 6 rats
40 fields in 6 rats
13 fields in 5 rats
50 fields in 5 rats
18 fields in 4 rats
Normal Yes Yes Yes Yes Yes Yes
Mean ± SEM
-0.09 ± 0.07
-0.23 ± 0.10
0.02 ± 0.13
-0.28 ± 0.22
-0.04 ± 0.10
-0.30 ± 0.13
t test
P 0.17 0.03 0.91 0.23 0.73 0.039 df 127 55 39 12 49 17 t -1.38 -2.30 0.12 -1.26 -0.35 -2.23
Nature Neuroscience: doi:10.1038/nn.4056
149

Linear track – single-pass analysis Control
Unrestricted
all slopes
Unrestricted significant
slopes
Fields < 60 cm
all slopes
Fields < 60 cm significant
slopes
PSSFs all slopes
PSSFs significant
slopes 47 fields
in 4 rats 39 fields in 4 rats
38 fields in 4 rats
30 fields in 4 rats
31 fields in 4 rats
25 fields in 4 rats
Normal Yes Yes Yes Yes Yes Yes
Mean ± SEM
-0.34 ± 0.04
-0.51 ± 0.07
-0.33 ± 0.05
-0.44 ± 0.06
-0.33 ± 0.07
-0.37 ± 0.08
t test
P 6.21 x 10⁻¹¹ 1.82 x 10⁻⁹ 1.60 x 10⁻⁸ 2.50 x 10⁻⁸ 2.61 x 10⁻⁵ 1.51 x 10⁻⁴ df 46 38 37 29 30 24 t -8.46 -7.85 -7.19 -7.56 -4.96 -4.49
MEC lesion
133 fields in 6 rats
89 fields in 6 rats
41 fields in 6 rats
21 fields in 5 rats
50 fields in 5 rats
27 fields in 4 rats
Normal Yes Yes Yes Yes Yes Yes
Mean ± SEM
-0.17 ± 0.04
-0.21 ± 0.10
-0.14 ± 0.10
-0.17 ± 0.22
0.01 ± 0.22
-0.11 ± 0.18
t test
P 2.05 x 10⁻⁴ 0.035 0.17 0.44 0.90 0.53 df 132 88 40 20 49 26 t -3.82 -2.14 -1.40 0.79 0.13 -0.64
Nature Neuroscience: doi:10.1038/nn.4056
150

Open field – pooled-pass analysis Control
Unrestricted all slopes
Unrestricted significant
slopes
Fields < 0.25 m2 all slopes
Fields < 0.25 m2 significant
slopes
50 fields
in 3 rats 38 fields in 3 rats
46 fields in 3 rats
35 fields in 3 rats
Normal Yes Yes Yes Yes
Mean ± SEM
-0.40 ± 0.06
-0.47 ± 0.05
-0.48 ± 0.05
-0.53 ± 0.04
t test
P 6.56 x 10⁻⁸ 8.37 x 10⁻¹¹ 6.64 x 10⁻¹² 1.41 x 10⁻¹⁶ df 50 37 45 34 t -6.33 -8.96 -9.20 -15.02
MEC lesion 48 fields
in 6 rats 13 fields in 5 rats
21 fields in 4 rats
8 fields in 3 rats
Normal Yes Yes Yes Yes
Mean ±
SEM 0.12
± 0.13 -0.06 ± 0.20
0.10 ± 0.20
-0.15 ± 0.17
t test
P 0.36 0.78 0.61 0.39 df 44 17 20 7 t 0.92 -0.29 0.52 -0.92
151

Open field – single-pass analysis Control
Unrestricted all slopes
Unrestricted significant
slopes
Fields < 0.25 m2 all slopes
Fields < 0.25 m2 significant
slopes
51 fields
in 3 rats 49 fields in 3 rats
47 fields in 3 rats
45 fields in 3 rats
Normal Yes Yes Yes Yes
Mean ± SEM
-0.39 ± 0.04
-0.50 ± 0.08
-0.39 ± 0.04
-0.52 ± 0.08
t test
P 1.66 x 10⁻¹³ 3.41 x 10⁻⁸ 1.44 x 10⁻¹² 2.81 x 10⁻⁸ df 50 49 46 44 t -9.98 -6.54 -9.60 -6.73
MEC lesion 54 fields
in 6 rats 35 fields in 6 rats
25 fields in 4 rats
14 fields in 4 rats
Normal Yes Yes Yes Yes
Mean ± SEM
0.02 ± 0.08
0.00 ± 0.14
0.02 ± 0.16
-0.02 ± 0.14
t test
P 0.79 0.98 0.91 0.89 df 50 40 24 14 t 0.26 -0.02 0.11 -0.14
Nature Neuroscience: doi:10.1038/nn.4056
152

Supplementary Table 3. Comparison of temporal firing patterns and phase precession slopes between MEC-lesioned rats and rats with septal inactivation.
LFP - Theta frequency (Hz) MEC lesion Baseline 30 min into septal
inactivation 2 h into septal
inactivation 12 tetrodes in 4 rats 5 tetrodes in 4 rats 5 tetrodes in 4 rats 5 tetrodes in 4 rats
Normal No No No No Median 7.20 7.70 7.08 7.08 Mean 7.14 7.52 7.13 7.08 SEM 0.14 0.14 0.33 0.32
Baseline vs. MEC lesion MEC lesion vs. 30 min into septal inactivation
MEC lesion vs. 2 h into septal inactivation
P 0.29 1.00 1.00 U N/A N/A N/A z N/A N/A N/A
Single cell - Theta ratio MEC lesion Baseline 30 min into septal
inactivation 2 h into septal
inactivation 24 cells in 4 rats 35 cells in 4 rats 39 cells in 4 rats 41 cells in 4 rats
Normal no no no no Median 9.68 23.70 8.29 8.18 Mean 12.16 28.87 8.69 10.44 SEM 1.49 2.44 0.78 1.15
Baseline vs. MEC lesion MEC lesion vs. 30 min into septal inactivation
MEC lesion vs. 2 h into septal inactivation
P 1.89 x 10⁻⁶ 0.14 0.26 U 425 897 793 z -4.98 1.82 1.12
Single cell - theta frequency (Hz) MEC lesion Baseline 30 min into septal
inactivation 2 h into septal
inactivation 23 cells in 4 rats 40 cells in 4 rats 31 cells in 4 rats 30 cells in 4 rats
Normal no no no no Median 7.08 8.30 7.81 7.57 Mean 6.60 8.29 8.06 7.62 SEM 0.31 0.10 0.21 0.14
Baseline vs. MEC lesion MEC lesion vs. 30 min into septal inactivation
MEC lesion vs. 2 h into septal inactivation
P 1.68 x 10⁻⁷ 0.0010 0.027 U 376 435 498 z -5.18 -3.47 -2.21
Nature Neuroscience: doi:10.1038/nn.4056
153

Frequency difference (Cell – LFP, Hz) MEC lesion Baseline 30 min into septal
inactivation 2 h into septal
inactivation 23 cells in 4 rats 40 cells in 4 rats 31 cells in 4 rats 30 cells in 4 rats
Normal no no no no Median -0.12 0.60 0.49 0.24 Mean -0.57 0.66 0.73 0.34 SEM 0.30 0.09 0.20 0.11
Baseline vs. MEC lesion MEC lesion vs. 30 min into septal inactivation
MEC lesion vs. 2 h into septal inactivation
P 0.00023 0.0038 0.026 U 460 455 497 z -3.95 -3.10 -2.22
Single-pass analysis (all passes) MEC lesion Baseline 30 min into septal
inactivation 2 h into septal
inactivation 25 fields in 4 rats 52 fields in 4 rats 46 fields in 4 rats 44 fields in 4 rats
Normal yes no yes yes Median -0.07 -0.37 -0.04 -0.28 Mean 0.02 -0.32 -0.04 -0.30 SEM 0.16 0.06 0.07 0.06
Baseline vs. MEC lesion MEC lesion vs. 30 min into septal inactivation
MEC lesion vs. 2 h into septal inactivation
P 0.028 0.97 0.13 U 1215 904 1023 z 2.61 0.042 1.84
Pooled-pass analysis (all passes) MEC lesion Baseline 30 min into septal
inactivation 2 h into septal
inactivation 21 fields in 4 rats 51 fields in 4 rats 44 fields in 4 rats 42 fields in 4 rats
Normal yes no yes yes Median 0.08 -0.40 -0.37 -0.38 Mean 0.10 -0.40 -0.31 -0.42 SEM 0.20 0.064 0.12 0.08
Baseline vs. MEC lesion MEC lesion vs. 30 min into septal inactivation
MEC lesion vs. 2 h into septal inactivation
P 0.036 0.081 0.037 U 970 818 834 z 2.51 1.75 2.35
1 When one of the distributions was not normal, the nonparametric test was used for all corresponding comparisons.
Nature Neuroscience: doi:10.1038/nn.4056
154

Supplementary Table 4. Comparisons of slopes from fields recorded before and during septal inactivation.
Open field Single-pass analysis
Baseline
all slopes
30 min into septal
inactivation all slopes
2 h into septal
inactivation all slopes
Baseline significant
slopes
30 min into septal
inactivation all slopes
2 h into septal
inactivation all slopes
52 fields
in 4 rats 46 fields in 4 rats
44 fields in 4 rats
45 fields in 4 rats
30 fields in 4 rats
32 fields in 4 rats
Normal Yes Yes Yes No Yes Yes
Mean ± SEM
-0.32 ± 0.06
-0.04 ± 0.07
-0.30 ± 0.06
-0.48 ± 0.09
0.04 ± 0.13
-0.41 ± 0.12
Median -0.37 -0.042 -0.28 -0.62 -0.11 -0.61
t test
Sign test1
P P 1.01 x 10⁻⁵ 0.54 2.09 x 10⁻⁵ 9.33 x 10⁻⁹ 0.86 0.020 df Sign 51 45 43 4 14 9 t z -4.90 -0.62 -4.78 N/A N/A N/A
Pooled-pass analysis
51 fields in 4 rats
44 fields in 4 rats
42 fields in 4 rats
39 fields in 4 rats
20 fields in 4 rats
23 fields in 4 rats
Normal No Yes Yes No Yes Yes
Mean ± SEM
-0.40 ± 0.064
-0.31 ± 0.12
-0.42 ± 0.08
-0.39 ± 0.07
-0.30 ± 0.11
-0.51 ± 0.09
Median -0.40 -0.31 -0.38 -0.42 -0.37 -0.45
t test
Sign test1
P P 1.97 x 10⁻¹¹ 3.88 x 10⁻⁴ 5.63 x 10⁻⁹ 2.84 x 10⁻⁹ 4.02 x 10⁻⁴ 5.72 x 10⁻⁶ df Sign 3 10 3 2 2 1 t z N/A N/A N/A N/A N/A N/A
1 When one of the distributions was not normal, the nonparametric test was used for all corresponding comparisons.
Nature Neuroscience: doi:10.1038/nn.4056
155

156
Chapter 5
General discussion

157
The aim of this work was to examine the role of the MEC in hippocampal spatial and
temporal coding. Recording hippocampal neuronal activity in rats with extensive MEC lesions,
we made three major observations which will be discussed in the context of the present state of
knowledge. 1) Hippocampal spatial firing persists in MEC‐lesioned rats (chapter 5.1), 2)
hippocampal global remapping – the ability to form highly distinct spatial maps for different
environments – is still observable MEC lesions (chapter 5.2), and 3) hippocampal theta phase
precession is strongly disrupted in MEC‐lesioned rats (chapter 5.3).
5.1 Hippocampal place cells emerge without input from the MEC
The MEC, one of the major cortical input sites to the HIPP, is known to contain a variety
of cell types specialized in the representation of spatial and self‐motion information (chapter
1.3.2). Because of the density of sophisticated spatial computations in the MEC, its output is
widely believed to constitute the foundation for hippocampal spatial coding. In particular the
discovery of grid cells (Box 1.3) in its dorsocaudal‐most proportion inspired a wide range of
theories and computational models detailing potential mechanisms of a grid cell to place cell
transformation (Solstad, Moser, and Einevoll 2006; de Almeida, Idiart, and Lisman 2012, 2009;
Savelli and Knierim 2010; Kammerer and Leibold 2014). Contrary to many of those theories,
mounting experimental evidence suggests that grid cells are not the sole determinant of
hippocampal spatial firing (Brandon et al. 2014; Koenig et al. 2011; Langston et al. 2010; Wills et
al. 2010; Bush, Barry, and Burgess 2014). This raises the possibility that input from medial
entorhinal cells other than grid cells is sufficient to support hippocampal spatial firing (Bush,
Barry, and Burgess 2014; Bjerknes, Moser, and Moser 2014). The first aim of this work was to
determine whether input from the entire pool of medial entorhinal cells is necessary for
hippocampal spatial firing to emerge. To address this question, we implanted electrode
assemblies for recordings in hippocampal area CA1, and performed bilateral neurotoxic lesion to
the MEC. Place cell characteristics in MEC‐lesioned and in control rats where then studied
during the exploration of open field environments. We found that hippocampal cells continued
to form discernable spatial firing fields, even though place field precision and stability were
reduced. Retained spatial firing was observed even in rats that had no detectable sparing to the
superficial layers of the MEC, suggesting that hippocampal place fields emerged without input
from the MEC.
158
5.1.1 Superposition of grid cell input might result in place cell firing
Since the discovery of place cells in the HIPP (Burgess and O'Keefe 2011), decades of
research attempted to identify the neural mechanisms underlying hippocampal spatial coding
(McNaughton et al. 2006; Burgess and O'Keefe 2011). Following the discovery of grid cells in the
MEC (Hafting et al. 2005; Fyhn et al. 2004), the focus of this question was shifted towards
theories elaborating potential mechanisms of grid cell to place cell transformation. Intriguingly,
it was found that grid cell properties, such as their periodic spatial firing and the increase in
spacing from the dorsocaudal to the ventrolateral pole (see chapter 1.3.2), matched earlier
theoretical work describing how the linear summation of oscillatory patterns at multiple scales
results in single‐peaked spatial receptive fields (Riley, Bence, and Hobson 2006)(Riley et al.,
2006). Based on this concept, a variety of computational models were developed, elaborating
potential connectivity patterns and mechanisms that might support the transformation of the
multi‐peaked grid cell firing in the MEC to single‐peaked place cell firing in the HIPP (Solstad,
Moser, and Einevoll 2006; Fuhs and Touretzky 2006; McNaughton et al. 2006). For example,
according to Solstad and colleagues (Solstad, Moser, and Einevoll 2006), the transformation
from grid cells to place cells is implemented in a feed forward network, in which each place cell
is targeted by converging input from multiple grid cells (Box 5.1). At any given location in space,
MEC input is summed by the dendrites of the targeted place cell, which produces APs whenever
a preset threshold is reached. Using this simple thresholding algorithm, single‐peaked place cell
firing is achieved when assuming that each hippocampal cell is targeted by grid cells with similar
spatial phases, but different grid scales and orientations (See Box 5.1 for illustration). Sufficient
excitation to reach AP threshold is only provided in locations in which multiple grid cells have a
firing, resulting in singe‐peaked spatial firing field.

159
Box 5.1| Linear transformation of entorhinal grid cell input might result in single‐peaked spatial firing in the HIPP
Convergent input from grid cells located at varying levels of the dorsoventral axis of the MEC, results in the formation of non‐reoccurring hippocampal firing fields. Place cells with small fields are located in the dorsal HIPP and receive inputs from a selection of grid cells with small to intermediate spacing and field size, while cells in the ventral HIPP have large place fields and receive input from grid cells with intermediate to large spacing and field size. For each place cell, grid cell input varies in spacing and orientation but is constant in phase. This causes an overlap of grid cell firing at a restricted proportion of space (marked with white circles for place cell 1). Unspecific global inhibition (red) is added to maintain physiological activity levels. At each given location, hippocampal place cells perform a linear summation of their grid cell input and produce APs once the excitation is sufficiently high to pass threshold. Action potential threshold in hippocampal cells is only reached in locations in which multiple grid cells have a firing field, resulting in singe‐peaked spatial firing.
Adapted from Solstad et al., 2006.
5.1.2 Grid cells are not essential for hippocampal spatial firing
Recent efforts to experimentally probe the function of grid cells in hippocampal spatial
coding, however, have challenged the simple feed forward mechanisms as described in Box 5.1.
Mounting evidence suggests that grid cells are not essential for hippocampal place cell firing to
emerge: a) Researchers performing recordings from the MEC and CA1 of juvenile rats found that
grid cells with adult‐like properties were not present until after P30. In contrast, the proportion
of hippocampal cells with well‐defined place fields was comparable to adults, even directly after
eye opening at ~P16 (Langston et al. 2010; Wills et al. 2010). In the juvenile rat, mature grid cell
input is thus not required for place fields to emerge. b) It is commonly observed that, after a rat
is placed into a novel environment, hippocampal place cells are initially unstable and place fields
are somewhat larger than in a familiar environment (Leutgeb et al. 2004; Frank, Stanley, and
Brown 2004; Wilson and McNaughton 1993). Similarly, grid cells were shown to demonstrate an
increase in grid scale and grid field size in novel environments (Barry et al. 2012). However, the
time course to settle into stable firing configurations did not match between the two cell
groups, in that grid cell continue to show changes during several recordings sessions after place

160
cells settled into their final configuration. These findings suggest that hippocampal spatial firing
is independent of grid cell input, at least after the initial formation of a stable hippocampal map.
c) Pharmacological inactivation of the septal area results in a disruption of grid cell firing while
leaving spatial firing in CA1 at least partly intact (Brandon et al. 2014; Koenig et al. 2011; Wang
et al. 2015; Mizumori, Barnes, and McNaughton 1989). These observations were made in
familiar as well as novel environments, suggesting that both formation and maintenance of
hippocampal place fields do not require grid cell input [but see (Wang et al. 2015)]. d) Data
obtained in double‐rotation experiments demonstrate that cells in CA3 follow the proximal cues
when proximal and distal cues are rotated in opposite directions (see chapter 1.5.1 for details),
while medial entorhinal grid cell follow the distal cues (Neunuebel et al. 2013; Neunuebel and
Knierim 2014). Place cell firing in CA3 is thus not strongly controlled by grid cells in these
experimental conditions. However, it should be noted that response properties are more
heterogeneous in CA1 (Lee et al. 2004), and firing patterns are entirely decorrelated in the DG
(Neunuebel and Knierim 2014), leaving open the possibility that grid cell firing, at least partly,
controls spatial firing in subregions other than CA3 in double‐rotation experiments. In
combination, the described results nevertheless strongly suggest that grid cells are not a crucial
determinant of place cell firing.
5.1.3 Input from border cells might be sufficient to generate place cell firing
The finding that grid cells are not the sole determinant of hippocampal spatial firing
raises the question whether input from medial entorhinal cell types other than grid cells might
be sufficient to support this function. A potential mechanism for place field generation, which
does not rely on grid cells, might involve the summation of input from border cells and cells that
fire in stripe‐like firing patterns at a certain distance from the wall (see Box 1.3d, e for
examples). While border cells are preferentially found in deep layers of the MEC (Sargolini et al.
2006), a smaller proportion is also found in superficial layers, and a recent study provided
evidence for monosynaptic connections between medial entorhinal border cells and
hippocampal cells (Zhang et al. 2013). Border cells bear striking similarity with boundary vector
cells (BVCs) whose existence was predicted by early computational models. Boundary vector
cells are cells that fire along geometric border, at a defined distance and allocentric direction
(Lever et al. 2009; O'Keefe and Burgess 1996; Hartley et al. 2000; Burgess et al. 2000). In the
context of this framework, experimentally identified border cells might be a subset of BVCs that
fire at short‐distance from a geometrical border, while stripe cells (Box 1.3a) might be BVCs that

161
fire at a long‐distance (even though it remains to be tested whether stripe cells share additional
BVC characteristics). Attempts to model place cell firing from BVC input are based on a similar
concept as described above and in chapter 5.1.1. Specifically, each hippocampal place cell
receives input from multiple BVCs with different preferred firing directions (Box 5.2). The
excitation impinging on each hippocampal cell is summed at any given location, and APs are
fired once the AP threshold is reached. The space at which AP threshold is reached is confined
to the area in which the firing fields of BVCs overlap, which results in spatially confined, single‐
peaked place fields if the input is appropriately arranged.
Box 5.2| Linear transformation of entorhinal BVC input might result in single‐peaked spatial firing in the HIPP
Spatial firing in the HIPP is generated by the summation of inputs from BVCs in the MEC. The firing pattern of each BVC is defined by its preferred distance to the wall, as well as a preferred allocentric direction at which it fires (e.g., west). Place cells perform a linear summation of BVC input at any given location and fire once the AP threshold is reached. The space at which AP threshold is reached is confined to the area in which the firing fields of BVCs overlap, which might result in spatially confined, single‐peaked place fields. In this model, the exact location of a place field is determined by the spatial constellation of its BVC inputs. It is of
note that only BVCs that fire at long‐distance to the walls are able to generate place fields that are in the center of the recording chamber.
Adapted from Bush et al., 2014.
Experimental findings are largely consistent with a potential role of border cells in the
generation of hippocampal spatial firing. It was shown, for example, that border cells
demonstrate mature, adult‐like firing pattern directly after eye opening (~P16), and might
therefore support hippocampal spatial firing at such an early age (Bjerknes, Moser, and Moser
2014; Muessig et al. 2015). In accordance with findings from juvenile rats, it was found that the
inactivation of the septal area disrupts grid cells but leaves other medial entorhinal cell types,
such as border cells, spatial non‐grid cells, and HD cells intact (Brandon et al. 2011; Koenig et al.
2011). Finally, it was shown that, upon exposure to a novel environment, border cells rapidly
settle into their final firing configuration (Lever et al. 2009). Border cell input might thus provide
a stable basis for the formation of hippocampal place fields, despite the fact that grid cell input
is changing in a novel environment.

162
5.1.4 Neither medial entorhinal cell type is required for place cell firing
While the outlined experimental evidence is consistent with the theory that border cells
are sufficient to support hippocampal spatial firing, it was not known, thus far, whether they are
required to perform this function. Recording hippocampal activity in rats with extensive,
bilateral, excitotoxic MEC lesions, we found that spatially selective firing persisted, even in rats
without detectable sparing of medial entorhinal inputs to the HIPP. Our data thus demonstrate
that neither cell type in the MEC is required for hippocampal spatial firing patterns to emerge
and suggest that neither feedforward models of grid cell to place cell (Box 5.1) nor BVC to place
cell (Box 5.2) transformation fully account for hippocampal spatial firing. Our findings were
confirmed and complemented in two more recent studies investigating hippocampal spatial
firing during focal optogenetic inactivation of the MEC (Miao et al. 2015; Rueckemann et al.
2016). The partial, acute inactivation of the MEC resulted in firing rate changes in a subset of
simultaneously recorded place cells, demonstrating that the manipulation was effective.
Remarkably, it was shown that acute manipulation of the MEC did not alter spatial firing
characteristics in the affected cell population. These findings demonstrate that hippocampal
spatial firing is maintained even when a subset of MEC inputs is acutely silenced and suggest
that spared hippocampal spatial firing in our MEC‐lesioned rats was not the result of
compensatory mechanisms (Otchy et al. 2015).
It was suggested, moreover, that border cells are the predominant determinant of
hippocampal spatial firing at short‐distance to the recording chamber walls, (see Box 5.2), while
grid cells may contribute to hippocampal spatial firing in more central parts of the recording
chamber (Muessig et al. 2015; Wang et al. 2015). Contrary to this hypothesis, recently published
data from the Leutgeb laboratory demonstrate that, during the inactivation of the septal area, a
proportion of place cells fire in proximity to the center of the recording chamber (Brandon et al.
2014). As explained above, the inactivation of the septal area disrupts grid cell firing, while
leaving other medial entorhinal cell types such as border cells intact. These data demonstrate
that entorhinal grid cells are not required to elicit hippocampal spatial firing at long‐distance
from geometrical boundaries, at least not in standard environmental settings. However, it was
also found that stripe cells and other spatial non‐grid cells (see Box 1.3d for examples) remain
preserved during septal inactivation (Koenig et al. 2011). Theoretical work suggests that input
from BVCs that resemble stripe cells could generate spatial firing that is not confined to

163
geometrical borders (Box 5.2). It is thus possible that input from spatial non‐grid cells is
sufficient to support hippocampal spatial firing in the center of the recording chamber. While
we did not yet perform a thorough quantification of the place field distribution within the
environment, the visual examination of hippocampal firing patterns leads to the observation
that, even in MEC‐lesioned rats, many place fields are located near the center of the recording
chamber (see Box 5.3 for examples). Our findings therefore demonstrate that hippocampal
spatial firing at any given location within the environment can be prompted by sources outside
of the MEC, and thus that neither grid cells nor spatial non‐grid cells are required to perform
this function. It remains to be determined whether the distribution of place field locations is
affected by the MEC lesion, and whether input outside the MEC is able to sustain hippocampal
firing in the center of environments that are even larger than the one used in the current
experiments (diameter 1 m).

164
Box 5.3| Rats with MEC lesions are able to form place fields that are not in proximity to geometric borders.
Neither medial entorhinal cell type is required for the formation of place fields that are at long‐distance to geometrical borders. (Top) Schematic demonstrating the different cell types previously identified in different layers the MEC (see Box 1.3 for detail), which were all abolished in our MEC‐lesioned rats (green crosses). All of these cell types were shown to project directly to the HIPP (Zhang et al., 2013). (Bottom) Example place fields recorded in the CA1 of three MEC‐lesioned rats. Two example cells with place fields in proximity to the center of the recording chamber were picked for each rat. The diameter for the recording chamber was 1 m. Medial entorhinal cell types as reported in Koenig et al., 2011; Trajectory maps from medial entorhinal cells provided by Stefan Leutgeb and Julie Koenig.
5.2 The MEC is not required for the formation of distinct hippocampal maps
Following the finding that hippocampal spatial firing was partly preserved in MEC‐
lesioned rats, we tested the hypothesis that MEC input supports the formation of distinct
hippocampal spatial maps. As explained in chapters 1.3.1 and 1.5.3 in more detail, firing
patterns in the HIPP are known to undergo drastic changes in response to environmental,
motivational or behavioral changes, a phenomenon referred to as remapping. In different
environments, remapping is manifested as the complete reorganization of place field locations
(or as the activation of distinct cell populations), to the extent that different maps emerge
(global remapping). In cases where changes to the environment are small (for example, when
the color of the recording chamber is changed within a constant environment), place cells
change their firing rates while maintaining stable place field locations (rate remapping). Because
rate and global remapping result in the formation of highly distinct neural codes even when the
two environments are similar, they are thought to roughly correspond to the theoretical
concept of pattern separation (see chapters 1.5.2 and 1.5.3). Pattern separation is a
computation which enables the formation of highly distinct neural codes from overlapping input
patterns, and it was predicted in early theoretical work that the HIPP utilizes pattern separation

165
to prevent that memories with overlapping elements are getting mixed up (see chapters 1.5.1
and 1.5.2).
Since the discovery of remapping, it was suggested that information about distinct
contexts might reach the HIPP via the EC (Muller and Kubie 1987). In accordance with this
prediction, it was recently found that the firing fields of grid cells shifted and rotated during
hippocampal global remapping. During rate remapping, in contrast, grid cell firing locations
remained stable, and no firing rate changes were observed. It was therefore reasoned that
information about distinct contexts might reach the HIPP via the MEC, inducing global
remapping, while information about similar context might reach the HIPP via the LEC (Fyhn et al.
2007). While it was recently confirmed that rate remapping depends on intra‐hippocampal
processing (McHugh et al. 2007) and input from the LEC (Lu et al. 2013), mechanisms of global
remapping are less well understood. Based on the observations that grid cell input changed
during hippocampal global remapping, it was hypothesized that the coordinated shift of the grid
map is a prerequisite for the formation of distinct hippocampal maps (Buzsaki and Moser 2013;
Fyhn et al. 2007; Moser, Rowland, and Moser 2015). This theory was further refined following
the discovery that grid cells are organized in anatomically overlapping, functionally independent
modules that are located along the dorsoventral axis of the MEC: Recording from grid cells in
experimental paradigms that elicit global remapping in the HIPP, Stensola and colleagues first
confirmed that, within each module, firing locations of simultaneously recorded grid cells
rotated coherently. They then compared grid cell firing across modules and found that the angle
of the grid map rotation differed across modules. Based on these findings, it was proposed that
the combination of inputs from different medial entorhinal modules supports hippocampal
global remapping by increasing the number of possible output patterns, thus increasing its
capacity to encode distinct episodic memories (Stensola et al. 2012; Buzsaki and Moser 2013;
Alme et al. 2014; Rowland and Moser 2014). Contrary to the prediction that grid cells are
required for intact hippocampal global remapping, recent work from the Leutgeb laboratory
demonstrates that distinct hippocampal maps emerge even when grid cell firing is disrupted
during the inactivation of the septal area (Brandon et al. 2014). It is of note, however, that
medial entorhinal cell types other than grid cells, such as border cells and HD cells also undergo
changes during hippocampal global remapping (Solstad et al. 2008). In addition, Kitamura and
colleagues identified MEC cell types that predicted hippocampal global remapping with changes
to their firing rates (Kitamura et al. 2015). Because those cells are not affected by the

166
inactivation of the septal area (Koenig et al. 2011; Brandon et al. 2011), it was unknown whether
input from medial entorhinal cell types other than grid cells is an additional driving force of
hippocampal global remapping. Manipulations targeting all medial entorhinal cell types, such as
the acute, focal, optogenetic silencing of the MEC, were shown to induce remapping in CA1
(Rueckemann et al. 2016) and CA3 (Miao et al. 2015), suggesting that changing MEC input is
sufficient to trigger the reorganization of hippocampal maps. Whether the medial entorhinal
spatial mapping system is necessary to perform this function, however, remained unknown. We
addressed this question by examining the effect of MEC lesions as rats explored two different
environments. Surprisingly, we found that global remapping remained intact in MEC‐lesioned
rats. Contrary to contemporary theories of medial entorhinal function, our results thus
demonstrate that spatial computations in the MEC are not required for hippocampal remapping
to emerge. Combined with the finding that acute inactivations of the MEC trigger hippocampal
remapping (Miao et al. 2015; Rueckemann et al. 2016), our results demonstrate that the
formation distinct hippocampal maps can be induced by multiple input sources. Alternative
input sources might involve the LEC and the mPFC, because cells in both structures were shown
to distinguish between different contexts with changes in their firing rates (Hyman et al. 2012;
Tsao, Moser, and Moser 2013; Keene et al. 2016). While context coding in distinct input sources
might trigger hippocampal global remapping, input source other than the MEC, to our
knowledge, lack sophisticated spatial reorganization (Hargreaves et al. 2005; Yoganarasimha,
Rao, and Knierim 2011), raising the possibility that the spatial computations associated with
global remapping (i.e., the redistribution of firing locations) is intrinsic to the hippocampus
(Dragoi, Harris, and Buzsaki 2003).
5.3 Intact hippocampal temporal coding requires input from the MEC
The formation of spatial memories does not only require precise information about
spatial locations, but also requires that the information is organized in a meaningful way. The
temporal organization of information is thought to rely on the precise interplay between brain
oscillations at different frequencies and the firing of individual neurons (see chapters 1.6.3 and
1.6.4). One of the best studied examples of such temporal coding is hippocampal theta phase
precession (hTPP). Theta phase precession describes a progressive change in the timing of APs
with respect to the ongoing LFP theta rhythm, and this progressive change correlates with the
rat’s distance within the cell’s place field (see chapter 1.6.4). On the population level, hTPP

167
results in the compression of information about the rat’s trajectory through space, to a time
scale that allows synaptic modification between sequentially activated place cells (see chapter
1.6.4). Based on these compelling properties, it was speculated that TPP enables the HIPP to link
the distinct fragments of an experience into a temporally structures memory (Buzsaki and
Moser 2013). While TPP was originally discovered in the HIPP, it was recently found to be part of
a larger circuitry including the MEC (see chapter 1.6.5). The question arises whether TPP
propagates from MEC to HIPP or whether it is generated locally in each of the regions. To
address this question, we analyzed hTPP in rats with MEC lesions and asked whether the intact
MEC is required for hTPP to emerge. We found that hTPP was strongly disrupted in MEC‐
lesioned rats, despite the fact that spatial firing remained partly preserved. The strong reduction
of hTPP could not be fully explained by the partial disruption of theta rhythmicity, because hTPP
was substantially less affected in rats in which the major theta rhythm generator, the medial
septal area (see chapter 1.6.2), was inactivated with muscimol.
A wide range of mechanisms were proposed to account for hTTP, some of which rely on
cellular computations or local circuit interactions, while others include external TPP generators.
In the following section, I will discuss our findings with respect to contemporary models of hTPP.
The function of the MEC will be discussed with focus on the individual anatomical pathways that
might contribute to hTPP. Additional emphasis will be placed on the contribution of different
medial entorhinal cell types. For the latter consideration, I will apply the strategy outlined in
previous sections and exploit the fact that the inactivation of the septal area selectively disrupts
grid cell firing, while our lesions disrupted inputs from all medial entorhinal cell types. Where
appropriate, I will additionally suggest follow‐up experiments that might help to resolve
outstanding questions.

168
5.3.1 Potential contribution of the direct medial entorhinal‐CA1 pathway
Table 5.1. Theta phase precession in direct input pathways to CA1. Pathway MEC III to CA1: Direct projections
from MEC III to CA1 were shown to arise from various spatially modulated cell types (Zhang et al. 2013). So far,
cell type specific TPP was only analyzed in grid cells, which do not show TPP beyond chance level (Hafting et al.
2008). It remains to be determined whether TPP is more pronounced in other cell types. Pathway mEC II to
CA1: Excitatory neurons in MEC II that express CB and Wfs1 were recently shown to project to CA1, and these
neurons were found to be predominantly pyramidal cells (Kitamura et al. 2014; Ray et al. 2014) but see (Fuchs
et al. 2016). Pyramidal cells in MEC II, in turn, were found to show TPP.
While our lesions encompassed all layers of the MEC and it is therefore not possible to
experimentally dissociate the contribution of individual entorhinal‐hippocampal pathways, I will
attempt to learn about their potential contribution by synthetizing information about the
electrophysiological properties of each MEC layer and relevant models of hTPP. The most
prominent monosynaptic input to CA1 arises from MEC III, which is known to contain grid cells
as well as other spatially modulated cells (see Box 1.2 and Table 5.1). As explained in chapter
1.6.5, gird cells in the MEC were found to demonstrate TPP, and it is intuitive to assume that
theta‐rhythmic firing at a frequency that is faster than the LFP could be imposed on
hippocampal place cells by phase‐precessing grid cells. Theoretical approaches (see Box 5.4), in
fact, demonstrate that TPP could be inherited from any structure that contains spatially
modulated, phase‐precessing cells (Jaramillo, Schmidt, and Kempter 2014; D'Albis et al. 2015).
However, when examining temporal firing properties of grid cells in different MEC layers, it
becomes apparent that grid cells in MEC II demonstrate pronounced TPP, while the proportion
of phase‐precessing cells in MEC III is comparable to the proportion that would be expected by
169
chance (Hafting et al. 2008). Direct input from grid cells in MEC III is thus not likely a source of
TPP in CA1 (Table 5.1). It should be noted, however, that most studies investigating the
electrophysiological properties of MEC focused on grid cells (Hafting et al. 2008) or did not
distinguish between different cell types (Mizuseki et al. 2009). It is therefore possible that hTPP
is inherited from a specialized cell type in MEC III that yet remains to be identified. This
hypothesis could be tested by performing recordings from identified medial entorhinal cell types
other than grid cells (see Diehl et al., 2015 for preliminary data). In the event TPP is found in
MEC III, the causality between TPP in MEC III and CA1 could be tested by selectively disrupting
the direct medial entorhinal‐CA1 pathway. Approaches previously used to disrupt the
connections from MEC III to CA1 include selective MEC III lesions with γ‐acetylenic GABA (Brun
et al. 2008) and the usage of a transgenic mouse line in which the selective genetic tagging of
neurons in MEC III was combined with the conditional expression of a neurotoxin (Suh et al.
2011).

170
In addition, it was recently found that a small proportion of excitatory cells in MEC II is
not part of the indirect medial entorhinal‐CA1 pathway (see chapter 1.2 and Box 1.2, Table 5.1)
but, instead, directly targets local, dendrite‐targeting interneurons in CA1 (Kitamura et al. 2014).
CA1‐targeting cells in MEC II are organized in small clusters that are distributed throughout the
layer, are characterized by the expression of Wfs1 and Calbindin (CB), and were shown to be
predominantly pyramidal cells. Importantly, pyramidal cells in MEC II were recently shown to
demonstrate TPP (Reifenstein et al. 2016; Kitamura et al. 2014; Ray et al. 2014). It is thus
possible that phase‐precessing, Wfs1‐expressing (Wfs1+) cells in MEC II impose their theta
rhythmicity on hippocampal interneurons which, in turn, drive TPP in CA1 pyramidal cells. In
accordance with this hypothesis, it was shown that a subset of interneurons in CA1
demonstrates TPP (Maurer et al. 2006b; Geisler et al. 2010) and that the optogenetic silencing
of perisomatic and dendritic‐targeting CA1 interneurons attenuates hTPP (Royer et al. 2012). As
hippocampal interneurons demonstrate little spatial specificity, the mechanism driving hTPP
would differ from the mechanism described by the inheritance model of TPP (see Box 5.4),
which assumes that spatial firing properties and TPP are inherited from the same cell
population. Instead, TPP would be imposed on CA1 pyramidal cells by interneurons that are
driven by MEC input, while their spatial firing characteristics would be governed by alternative
pathways, such as the direct input from MEC III, the Schaffer collateral input from CA3 and/or
local network computations (Brun et al. 2002; Brun et al. 2008; de Almeida, Idiart, and Lisman
2012, 2009). While such a scenario is consistent with our observation that spatially modulated
firing persisted after MEC lesions, while hTPP was strongly reduced, it is of note that it is
Box 5.4| Inheritance model of theta phase precession
The observation that TPP occurs in the HIPP as well as in a subset of its input and output structures (see chapter 1.6.5 for detail) inspired the development of a theoretical framework that seeks to explain how TPP might propagate through serially connected brain regions. According to these models, TPP can be inherited from any structure that contains spatially modulated, phase‐precessing cells. This is true for the direct projection from MEC III to CA1, which is topic of the current section, as well for intra‐hippocampal projections (e.g. from CA3 to CA1), which will be further addressed in later sections of this discussion. For example, in a model developed by Jaramillo and colleagues (Jaramillo et al., 2014), each CA1 pyramidal cell receives a constant, rhythmic, inhibitory input that matches the LFP theta frequency and is independent of the cell’s preferred firing location. As the rat enters a place field, the corresponding CA1 pyramidal cell is additionally driven by a population of spatially modulated cells with matching firing field locations (this can be place cells or grid cells). The Gaussian shape of the CA1 field is thus inherited from a population of spatially modulated cells that are located in an upstream structure. Furthermore, each of the input cells shows TPP, and their synchronized, theta‐rhythmic excitation results in an additional modulation of the CA1 cell’s excitatory potential. The frequency of the resulting MPO is higher than the frequency of the LFP theta oscillation, giving rise to TPP. In this model, both TPP and spatial firing characteristics are thus inherited by the upstream structure.

171
typically reported that only a fraction of interneurons demonstrate TPP, while the fraction of
TPP place fields that are active in any given environment is large (Maurer et al. 2006b; Geisler et
al. 2010). Whether this small subset of phase‐precessing interneurons is a specialized cell type
that is preferentially targeted by medial entorhinal pyramidal cells, and whether its connectivity
patterns are suited to support sequence coding at the population level remains to be
determined in future experiments.
5.3.2 Potential contribution of the indirect medial entorhinal‐CA1 pathway
While grid cell in MEC III do not show pronounced TPP, theta‐rhythmic firing at a
frequency faster than the LFP theta rhythm was found in grid cells located in MEC II (Hafting et
al. 2008). This raises the possibility that TPP originates in MEC II (or its inputs), and then
propagates along the indirect medial entorhinal‐CA1 pathway (see chapter 1.2 and Box 1.2).
First steps to test this hypothesis can be undertaken by examining hTPP during the inactivation
of the septal area, which disrupts the spatial firing patterns of grid cells while leaving other
medial entorhinal cell types intact (Koenig et al. 2011; Brandon et al. 2011). Analyzing previously
published recording data (Brandon et al. 2014), we found that the inactivation of the septal area
with muscimol only mildly affected hTTP. Our findings thus demonstrate that the intact spatial
structure of grid cell firing is not crucial for the generation of hTPP. However, grid cells are not
entirely silenced during septal inactivation, and it remains to be determined in future
experiments whether they continue to fire bursts at a frequency that is higher than the LFP
theta frequency (and thus continue to show TPP). A finding that grid cells continue to
demonstrate TPP would leave open the possibility that hTTP is driven by grid cells. Contrary to
this prediction, preliminary results from the Leutgeb laboratory demonstrate that the
inactivation of the septal area disrupts TPP in grid cells (Diehl et al., 2015). Collectively, my
findings and the preliminary findings by Diehl and colleagues thus indicate that neither the
spatial structure nor the temporal firing patterns of grid cells are required for hTPP to emerge.
An alternative possibility is that hTTP is generated de novo in the DG and/or CA3 and is
subsequently inherited by CA1. In our study, recordings in MEC‐lesioned rats were confined to
CA1, and it is possible that the excitatory drive onto DG cells and/or CA3 cells was sufficiently
disrupted to strongly reduce firing in those areas. Under this scenario, MEC input would only
indirectly contribute to TPP in CA1, by driving firing in other hippocampal subareas. In particular

172
CA3 was focus of a multitude of modeling studies outlining how the synaptic interactions
between reciprocally connected CA3 cells might give rise to hTPP (see Box 5.5 for detail). The
question of whether the networks of CA3 and/or the DG are crucial for the generation of TPP in
CA1 remains to be answered in future experiments and could be addressed by manipulating
each of the hippocampal regions upstream of CA1 and assessing the effects on TPP in the
corresponding output region.
5.3.3 Input from the LEC is not sufficient for hTPP to emerge
While the previous section focused mainly on mechanisms of hTPP that are based on
input from phase‐precessing cells or on complex network interactions, it is important to
consider that hTPP might emerge through more simple cellular computations. For example, the
somatic‐dendritic‐interference (SDI) model assumes that hTPP arises through a gradual increase
in the excitatory potential with respect to a constant rhythmic inhibitory input. The first
generation of SDI models is based on two cellular compartments, the soma and the dendrites
(Kamondi et al. 1998; Magee 2001; Mehta, Lee, and Wilson 2002; McLelland and Paulsen 2009).
A membrane potential oscillation (MPO) at LFP theta frequency is generated either by sinusoidal
inputs to the soma and the dendrites (at matching frequencies) or by sinusoidal input to the
soma alone (see Box 5.6 and Box 5.7, respectively). The theta phase of spiking is determined by
the amplitude of the excitatory postsynaptic potential (EPSP) in that large EPSPs exceed the AP
threshold at earlier theta phases than small EPSPs. The amplitude of the EPSP is determined by
the strength of the excitatory driving force (Magee 2001) or by synaptic facilitation (Thurley et
al. 2008). Such a mechanism would result in TPP, if one assumed that dendritic depolarization
ramps up with the rat’s distance in the place field (Box 5.7). According to this class of models,
hippocampal temporal coding is the result of a cellular computation which translates the
amplitude of the EPSP into a corresponding theta phase. Because the transformation occurs at
the cellular level, varying excitatory input and a theta‐rhythmic inhibitory drive are the only
prerequisites for hTPP to emerge.

173
Box 5.5| Sequential activation of asymmetrically connected neurons might result in TPP
A popular class of computational models assumes that hTPP arises through synaptic interactions between reciprocally connected neurons in CA3. For example, in the attractor network model (McNaughton et al., 1996), hippocampal place cell activity is modeled in a sheet of reciprocally connected CA3 neurons. Neighboring neurons share similar place field locations and form particularly strong connections. The connection strength and the overlap between place field locations declines with distance between neurons. Based on this connectivity pattern, initial activation of a neuron within the sheet will result in the activation of a set of neighboring neurons, which, in turn, activate their synaptic partners. This results in a cascade of activity that moves throughout the sheet of neurons (the so‐called activity bump), without the requirement of additional external input. In many attractor‐network‐based models of hippocampal function, the neural sheet is mapped onto the real‐world environment, providing a cognitive map of space (McNaughton et al., 2006). The trajectory of the activity bump within the neural sheet is further guided by information about the rat’s movement direction and speed (conveyed by inputs from the vestibular system). In models of TPP, place fields are asymmetrically connected so that the activity bump only moves in a predetermined direction. In the following section, a schematic form Jensen and Lisman (1996) is utilized in order to explain how TPP can arise through the activation of a sequence of synaptically connected neurons. The principle explained in this graphic accounts for TPP in attractor networks and other arrangements of synaptically connected neurons. Jensen and Lisman assume that the increments at which each cell advances from theta cycle to theta cycle are determined by the gamma rhythm (see below).
Schematic demonstrating theta TPP as a rat moves through a sequence of spatially overlapping place fields (represented by C1‐C13). In the Jensen and Lisman model, the LFP theta rhythm is modulated by gamma oscillations and spiking occurs at the peak of each gamma cycle. Each place cell shows TPP in increments of one gamma cycle per theta cycle. In the beginning of the rat’s trajectory, cells that receive the strongest excitation at the rat’s current location fire at the peak of the theta cycle (see C1 during the first theta cycle). Neighboring cells that are directly connected to the active cell population (such as C2) will start to fire with short delays (i.e., at a late phase of the ongoing theta cycle), while cells that are further away (such as C5) will start to fire with larger delays (i.e., at early phases of the ongoing theta cycle). As drives the firing of the next cell in the sequence, at the peak of the the rat
moves forward, external input ongoing theta cycle (C2, second theta cycle). In this scheme, the rat’s current location is represented at the end (the peak) of the theta cycle and each place cell begins to fire ahead of the location it represents. The cell drops out of the sequence, once it precessed by a full theta cycle (see C7 for illustration; diagonal line is added for visual guidance). It is of note that only cells representing the rat’s current position at the peak of the theta cycle receive external input, while the activation of the reminder of the sequence is governed by local synaptic connectivity.
Adapted from Lisman and Jensen, 1996.
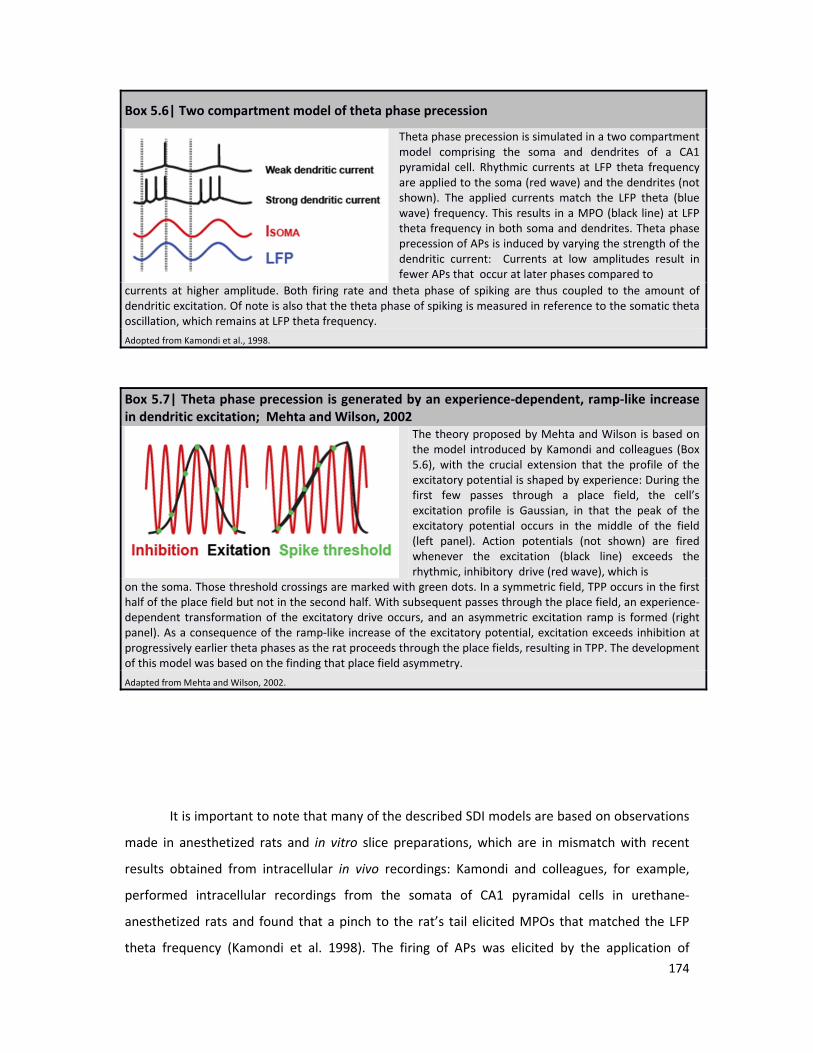
174
It is important to note that many of the described SDI models are based on observations
made in anesthetized rats and in vitro slice preparations, which are in mismatch with recent
results obtained from intracellular in vivo recordings: Kamondi and colleagues, for example,
performed intracellular recordings from the somata of CA1 pyramidal cells in urethane‐
anesthetized rats and found that a pinch to the rat’s tail elicited MPOs that matched the LFP
theta frequency (Kamondi et al. 1998). The firing of APs was elicited by the application of
Box 5.6| Two compartment model of theta phase precession
Theta phase precession is simulated in a two compartment model comprising the soma and dendrites of a CA1 pyramidal cell. Rhythmic currents at LFP theta frequency are applied to the soma (red wave) and the dendrites (not shown). The applied currents match the LFP theta (blue wave) frequency. This results in a MPO (black line) at LFP theta frequency in both soma and dendrites. Theta phase precession of APs is induced by varying the strength of the dendritic current: Currents at low amplitudes result in fewer APs that occur at later phases compared to
currents at higher amplitude. Both firing rate and theta phase of spiking are thus coupled to the amount of dendritic excitation. Of note is also that the theta phase of spiking is measured in reference to the somatic theta oscillation, which remains at LFP theta frequency.
Adopted from Kamondi et al., 1998.
Box 5.7| Theta phase precession is generated by an experience‐dependent, ramp‐like increase in dendritic excitation; Mehta and Wilson, 2002
The theory proposed by Mehta and Wilson is based on the model introduced by Kamondi and colleagues (Box 5.6), with the crucial extension that the profile of the excitatory potential is shaped by experience: During the first few passes through a place field, the cell’s excitation profile is Gaussian, in that the peak of the excitatory potential occurs in the middle of the field (left panel). Action potentials (not shown) are fired whenever the excitation (black line) exceeds the rhythmic, inhibitory drive (red wave), which is
on the soma. Those threshold crossings are marked with green dots. In a symmetric field, TPP occurs in the first half of the place field but not in the second half. With subsequent passes through the place field, an experience‐dependent transformation of the excitatory drive occurs, and an asymmetric excitation ramp is formed (right panel). As a consequence of the ramp‐like increase of the excitatory potential, excitation exceeds inhibition at progressively earlier theta phases as the rat proceeds through the place fields, resulting in TPP. The development of this model was based on the finding that place field asymmetry.
Adapted from Mehta and Wilson, 2002.

175
depolarizing currents at varying strengths, and it was found that stronger depolarizing currents
resulted in APs that, on average, occurred at earlier theta phases than APs elicited by weak
depolarizing currents (see Box 5.6 for corresponding model). According to these findings, TPP
would thus be driven by increasing amounts of dendritic depolarization and result in a spike
phase shift with reference to both the MPO and the LFP theta oscillation. In follow‐up
experiments, Magee and colleagues made similar observations by injecting depolarizing
currents into the dendrites of CA1 pyramidal cells in a slice preparation (Magee 2001). As
observed in anesthetized rats, the strength of the applied current was a major determinant of
the spike phase with reference to the MPO. In contrast to those early observations, recent data
obtained from intracellular in vivo recordings demonstrate that, in healthy behaving animals,
the MPO oscillates at a frequency that is slightly higher than the frequency of the LFP theta
oscillation (Harvey et al. 2009). Action potentials are phase‐locked to the peak of the MPO and
hTPP arises because the peak of the MPO shifts with respect to the LFP theta oscillation. The
experimentally induced shift of APs with respect to the MPO, as described in earlier studies
(Magee 2001; Losonczy et al. 2010), did thus reproduce the phenotype of hTPP, but did not fully
capture the mechanisms of naturally occurring hTPP. An aim for future studies is thus to develop
in vitro models of hTPP that include a frequency mismatch between the MPO and the LFP (Kwag
et al. 2014).
Even though the induction of spike phase shifts with respect to the MPO might not fully
capture the mechanisms of hTPP, Kamondi and collages made the interesting observation that
the frequencies of the MPO and the LFP theta oscillation matched in urethane‐anesthetized rats
(Kamondi et al. 1998). Given that a missmatch between these two oscillations is likely to be a
major determinant of hTPP (Harvey et al. 2009), urethane anesthesia might thus tap into the
mechanisms of hTPP. Of note, effects of urethane anesthesia include the attenuation of
glutamatergic synaptic transmission between the MEC and the HIPP, and it was observed that
the effects on hippocampal synaptic currents are comparable between urethane anesthesia and
extensive EC lesions (Kamondi et al. 1998; Buzsaki 2002). We could thus 1) speculate that the
lack of MEC input resulted in a match between MPO and LFP theta oscillation during urethane
anesthesia, and 2) hypothesize that the mechanism by which our MEC lesions disrupted hTPP
was by slowing down the frequency of the MPO. Consistent with this hypothesis, we found that,
in our MEC lesion group, a proportion of cells remained theta‐modulated, firing burst of AP at
LFP theta frequency. The outlined hypothesis can be further tested by combining MEC lesions

176
with recordings of the MPO in hippocampal cells as well as with extracellular recordings of the
hippocampal LFP. Irrespectively of the exact mechanism by which medial entorhinal input
contributes to hTPP, our data demonstrate that the function of the MEC, which is widely
considered the spatial processing center of the brain, is to support hippocampal precessing by
the temporal organization of hippocampal spatial firing.

177
References
Acharya, L., Z. M. Aghajan, C. Vuong, J. J. Moore, and M. R. Mehta. 2016. 'Causal Influence of Visual Cues on Hippocampal Directional Selectivity', Cell, 164: 197‐207.
Alme, C. B., C. Miao, K. Jezek, A. Treves, E. I. Moser, and M. B. Moser. 2014. 'Place cells in the hippocampus: eleven maps for eleven rooms', Proc Natl Acad Sci U S A, 111: 18428‐35.
Andersen, P., R. Morris, D. G. Amaral, T. Bliss, and J O'Keefe. 2007. The Hippocampus book 37–114 (Oxford Univ. Press, New York).
Atherton, L. A., D. Dupret, and J. R. Mellor. 2015. 'Memory trace replay: the shaping of memory consolidation by neuromodulation', Trends Neurosci, 38: 560‐70.
Barnes, C. A., B. L. McNaughton, S. J. Mizumori, B. W. Leonard, and L. H. Lin. 1990. 'Comparison of spatial and temporal characteristics of neuronal activity in sequential stages of hippocampal processing', Prog Brain Res, 83: 287‐300.
Barry, C., L. L. Ginzberg, J. O'Keefe, and N. Burgess. 2012. 'Grid cell firing patterns signal environmental novelty by expansion', Proc Natl Acad Sci U S A, 109: 17687‐92.
Bi, G., and M. Poo. 2001. 'Synaptic modification by correlated activity: Hebb's postulate revisited', Annu Rev Neurosci, 24: 139‐66.
Bjerknes, T. L., E. I. Moser, and M. B. Moser. 2014. 'Representation of geometric borders in the developing rat', Neuron, 82: 71‐8.
Bland, B. H. 1986. 'The physiology and pharmacology of hippocampal formation theta rhythms', Prog Neurobiol, 26: 1‐54.
Bland, B. H., L. V. Colom, J. Konopacki, and S. H. Roth. 1988. 'Intracellular records of carbachol‐induced theta rhythm in hippocampal slices', Brain Res, 447: 364‐8.
Boccara, C. N., F. Sargolini, V. H. Thoresen, T. Solstad, M. P. Witter, E. I. Moser, and M. B. Moser. 2010. 'Grid cells in pre‐ and parasubiculum', Nat Neurosci, 13: 987‐94.
Bonnevie, T., B. Dunn, M. Fyhn, T. Hafting, D. Derdikman, J. L. Kubie, Y. Roudi, E. I. Moser, and M. B. Moser. 2013. 'Grid cells require excitatory drive from the hippocampus', Nat Neurosci, 16: 309‐17.
Bostock, E., R. U. Muller, and J. L. Kubie. 1991. 'Experience‐dependent modifications of hippocampal place cell firing', Hippocampus, 1: 193‐205.
Bower, M. R., D. R. Euston, and B. L. McNaughton. 2005. 'Sequential‐context‐dependent hippocampal activity is not necessary to learn sequences with repeated elements', J Neurosci, 25: 1313‐23.
Bradley, P. B., and A. N. Nicholson. 1962. 'The effect of some drugs on hippocampal arousal', Electroencephalogr Clin Neurophysiol, 14: 824‐34.
Bragin, A., G. Jando, Z. Nadasdy, M. van Landeghem, and G. Buzsaki. 1995. 'Dentate EEG spikes and associated interneuronal population bursts in the hippocampal hilar region of the rat', J Neurophysiol, 73: 1691‐705.
Brandon, M. P., A. R. Bogaard, C. P. Libby, M. A. Connerney, K. Gupta, and M. E. Hasselmo. 2011. 'Reduction of theta rhythm dissociates grid cell spatial periodicity from directional tuning', Science, 332: 595‐9.
Brandon, M. P., J. Koenig, J. K. Leutgeb, and S. Leutgeb. 2014. 'New and distinct hippocampal place codes are generated in a new environment during septal inactivation', Neuron, 82: 789‐96.
Broadbent, N. J., L. R. Squire, and R. E. Clark. 2004. 'Spatial memory, recognition memory, and the hippocampus', Proc Natl Acad Sci U S A, 101: 14515‐20.
Brun, V. H., S. Leutgeb, H. Q. Wu, R. Schwarcz, M. P. Witter, E. I. Moser, and M. B. Moser. 2008. 'Impaired spatial representation in CA1 after lesion of direct input from entorhinal cortex', Neuron, 57: 290‐302.
Brun, V. H., M. K. Otnass, S. Molden, H. A. Steffenach, M. P. Witter, M. B. Moser, and E. I. Moser. 2002. 'Place cells and place recognition maintained by direct entorhinal‐hippocampal circuitry', Science, 296: 2243‐6.

178
Burgess, N., A. Jackson, T. Hartley, and J. O'Keefe. 2000. 'Predictions derived from modelling the hippocampal role in navigation', Biol Cybern, 83: 301‐12.
Burgess, N., E. A. Maguire, and J. O'Keefe. 2002. 'The human hippocampus and spatial and episodic memory', Neuron, 35: 625‐41.
Burgess, N., and J. O'Keefe. 2011. 'Models of place and grid cell firing and theta rhythmicity', Curr Opin Neurobiol, 21: 734‐44.
Burke, S. N., and C. A. Barnes. 2015. 'The neural representation of 3‐dimensional objects in rodent memory circuits', Behav Brain Res, 285: 60‐6.
Burke, S. N., A. L. Hartzell, J. P. Lister, L. T. Hoang, and C. A. Barnes. 2012. 'Layer V perirhinal cortical ensemble activity during object exploration: a comparison between young and aged rats', Hippocampus, 22: 2080‐93.
Burke, S. N., A. P. Maurer, A. L. Hartzell, S. Nematollahi, A. Uprety, J. L. Wallace, and C. A. Barnes. 2012. 'Representation of three‐dimensional objects by the rat perirhinal cortex', Hippocampus, 22: 2032‐44.
Burwell, R. D., M. P. Witter, and D. G. Amaral. 1995. 'Perirhinal and postrhinal cortices of the rat: a review of the neuroanatomical literature and comparison with findings from the monkey brain', Hippocampus, 5: 390‐408.
Bush, D., C. Barry, and N. Burgess. 2014. 'What do grid cells contribute to place cell firing?', Trends Neurosci, 37: 136‐45.
Buzsaki, G. 2002. 'Theta oscillations in the hippocampus', Neuron, 33: 325‐40. Buzsaki, G., L. W. Leung, and C. H. Vanderwolf. 1983. 'Cellular bases of hippocampal EEG in the
behaving rat', Brain Res, 287: 139‐71. Buzsaki, G., N. Logothetis, and W. Singer. 2013. 'Scaling brain size, keeping timing: evolutionary
preservation of brain rhythms', Neuron, 80: 751‐64. Buzsaki, G., and E. I. Moser. 2013. 'Memory, navigation and theta rhythm in the hippocampal‐
entorhinal system', Nat Neurosci, 16: 130‐8. Byrnes, S., A. N. Burkitt, D. B. Grayden, and H. Meffin. 2011. 'Learning a sparse code for temporal
sequences using STDP and sequence compression', Neural Comput, 23: 2567‐98. Cabral, H. O., C. Fouquet, L. Rondi‐Reig, C. M. Pennartz, and F. P. Battaglia. 2014. 'Single‐trial
properties of place cells in control and CA1 NMDA receptor subunit 1‐KO mice', J Neurosci, 34: 15861‐9.
Cahusac, P. M., E. T. Rolls, Y. Miyashita, and H. Niki. 1993. 'Modification of the responses of hippocampal neurons in the monkey during the learning of a conditional spatial response task', Hippocampus, 3: 29‐42.
Cantero, J. L., M. Atienza, R. Stickgold, M. J. Kahana, J. R. Madsen, and B. Kocsis. 2003. 'Sleep‐dependent theta oscillations in the human hippocampus and neocortex', J Neurosci, 23: 10897‐903.
Canto, C. B., F. G. Wouterlood, and M. P. Witter. 2008. 'What does the anatomical organization of the entorhinal cortex tell us?', Neural Plast, 2008: 381243.
Chance, F. S. 2012. 'Hippocampal phase precession from dual input components', J Neurosci, 32: 16693‐703a.
Cho, J., and P. E. Sharp. 2001. 'Head direction, place, and movement correlates for cells in the rat retrosplenial cortex', Behav Neurosci, 115: 3‐25.
Chrobak, J. J., and G. Buzsaki. 1994. 'Selective activation of deep layer (V‐VI) retrohippocampal cortical neurons during hippocampal sharp waves in the behaving rat', J Neurosci, 14: 6160‐70.
Chrobak, J. J., and G. Buzsaki. 1996. 'High‐frequency oscillations in the output networks of the hippocampal‐entorhinal axis of the freely behaving rat', J Neurosci, 16: 3056‐66.
Clark, R. E., N. J. Broadbent, and L. R. Squire. 2005. 'Impaired remote spatial memory after hippocampal lesions despite extensive training beginning early in life', Hippocampus, 15: 340‐6.

179
Colgin, L. L., S. Leutgeb, K. Jezek, J. K. Leutgeb, E. I. Moser, B. L. McNaughton, and M. B. Moser. 2010. 'Attractor‐map versus autoassociation based attractor dynamics in the hippocampal network', J Neurophysiol, 104: 35‐50.
Crane, J., and B. Milner. 2005. 'What went where? Impaired object‐location learning in patients with right hippocampal lesions', Hippocampus, 15: 216‐31.
Csicsvari, J., and D. Dupret. 2014. 'Sharp wave/ripple network oscillations and learning‐associated hippocampal maps', Philos Trans R Soc Lond B Biol Sci, 369: 20120528.
D'Albis, T., J. Jaramillo, H. Sprekeler, and R. Kempter. 2015. 'Inheritance of Hippocampal Place Fields Through Hebbian Learning: Effects of Theta Modulation and Phase Precession on Structure Formation', Neural Comput, 27: 1624‐72.
Day, M., R. Langston, and R. G. Morris. 2003. 'Glutamate‐receptor‐mediated encoding and retrieval of paired‐associate learning', Nature, 424: 205‐9.
de Almeida, L., M. Idiart, and J. E. Lisman. 2009. 'The input‐output transformation of the hippocampal granule cells: from grid cells to place fields', J Neurosci, 29: 7504‐12.
de Almeida, L., M. Idiart, and J. E. Lisman. 2012. 'The single place fields of CA3 cells: a two‐stage transformation from grid cells', Hippocampus, 22: 200‐8.
Deshmukh, S. S., J. L. Johnson, and J. J. Knierim. 2012. 'Perirhinal cortex represents nonspatial, but not spatial, information in rats foraging in the presence of objects: comparison with lateral entorhinal cortex', Hippocampus, 22: 2045‐58.
Deshmukh, S. S., and J. J. Knierim. 2011. 'Representation of non‐spatial and spatial information in the lateral entorhinal cortex', Front Behav Neurosci, 5: 69.
Deshmukh, S. S., D. Yoganarasimha, H. Voicu, and J. J. Knierim. 2010. 'Theta modulation in the medial and the lateral entorhinal cortices', J Neurophysiol, 104: 994‐1006.
Dickson, C. T., J. Magistretti, M. H. Shalinsky, E. Fransen, M. E. Hasselmo, and A. Alonso. 2000. 'Properties and role of I(h) in the pacing of subthreshold oscillations in entorhinal cortex layer II neurons', J Neurophysiol, 83: 2562‐79.
Dragoi, G., and G. Buzsaki. 2006. 'Temporal encoding of place sequences by hippocampal cell assemblies', Neuron, 50: 145‐57.
Dragoi, G., K. D. Harris, and G. Buzsaki. 2003. 'Place representation within hippocampal networks is modified by long‐term potentiation', Neuron, 39: 843‐53.
Eichenbaum, H., P. Dudchenko, E. Wood, M. Shapiro, and H. Tanila. 1999. 'The hippocampus, memory, and place cells: is it spatial memory or a memory space?', Neuron, 23: 209‐26.
Eichenbaum, H., M. Sauvage, N. Fortin, R. Komorowski, and P. Lipton. 2012. 'Towards a functional organization of episodic memory in the medial temporal lobe', Neurosci Biobehav Rev, 36: 1597‐608.
Ekstrom, A. D., M. J. Kahana, J. B. Caplan, T. A. Fields, E. A. Isham, E. L. Newman, and I. Fried. 2003. 'Cellular networks underlying human spatial navigation', Nature, 425: 184‐8.
Ekstrom, A. D., J. Meltzer, B. L. McNaughton, and C. A. Barnes. 2001. 'NMDA receptor antagonism blocks experience‐dependent expansion of hippocampal "place fields"', Neuron, 31: 631‐8.
English, D. F., A. Peyrache, E. Stark, L. Roux, D. Vallentin, M. A. Long, and G. Buzsaki. 2014. 'Excitation and inhibition compete to control spiking during hippocampal ripples: intracellular study in behaving mice', J Neurosci, 34: 16509‐17.
Eschenko, O., and S. J. Mizumori. 2007. 'Memory influences on hippocampal and striatal neural codes: effects of a shift between task rules', Neurobiol Learn Mem, 87: 495‐509.
Evans, T., A. Bicanski, D. Bush, and N. Burgess. 2015. 'How environment and self‐motion combine in neural representations of space', J Physiol.
Ewell, L. A., and M. V. Jones. 2010. 'Frequency‐tuned distribution of inhibition in the dentate gyrus', J Neurosci, 30: 12597‐607.
Feng, T., D. Silva, and D. J. Foster. 2015. 'Dissociation between the experience‐dependent development of hippocampal theta sequences and single‐trial phase precession', J Neurosci, 35: 4890‐902.

180
Ferbinteanu, J., P. Shirvalkar, and M. L. Shapiro. 2011. 'Memory modulates journey‐dependent coding in the rat hippocampus', J Neurosci, 31: 9135‐46.
Foster, D. J., and M. A. Wilson. 2006. 'Reverse replay of behavioural sequences in hippocampal place cells during the awake state', Nature, 440: 680‐3.
Foster, D. J., and M. A. Wilson. 2007. 'Hippocampal theta sequences', Hippocampus, 17: 1093‐9. Frank, L. M., G. B. Stanley, and E. N. Brown. 2004. 'Hippocampal plasticity across multiple days of
exposure to novel environments', J Neurosci, 24: 7681‐9. Fuchs, E. C., A. Neitz, R. Pinna, S. Melzer, A. Caputi, and H. Monyer. 2016. 'Local and Distant Input
Controlling Excitation in Layer II of the Medial Entorhinal Cortex', Neuron, 89: 194‐208. Fuhs, M. C., and D. S. Touretzky. 2006. 'A spin glass model of path integration in rat medial
entorhinal cortex', J Neurosci, 26: 4266‐76. Fyhn, M., T. Hafting, A. Treves, M. B. Moser, and E. I. Moser. 2007. 'Hippocampal remapping and grid
realignment in entorhinal cortex', Nature, 446: 190‐4. Fyhn, M., T. Hafting, M. P. Witter, E. I. Moser, and M. B. Moser. 2008. 'Grid cells in mice',
Hippocampus, 18: 1230‐8. Fyhn, M., S. Molden, M. P. Witter, E. I. Moser, and M. B. Moser. 2004. 'Spatial representation in the
entorhinal cortex', Science, 305: 1258‐64. Gaffan, D. 1994. 'Scene‐specific memory for objects: a model of episodic memory impairment in
monkeys with fornix transection', J Cogn Neurosci, 6: 305‐20. Gaffan, D., and R. C. Saunders. 1985. 'Running recognition of configural stimuli by fornix‐transected
monkeys', Q J Exp Psychol B, 37: 61‐71. Geisler, C., K. Diba, E. Pastalkova, K. Mizuseki, S. Royer, and G. Buzsaki. 2010. 'Temporal delays
among place cells determine the frequency of population theta oscillations in the hippocampus', Proc Natl Acad Sci U S A, 107: 7957‐62.
Geisler, C., D. Robbe, M. Zugaro, A. Sirota, and G. Buzsaki. 2007. 'Hippocampal place cell assemblies are speed‐controlled oscillators', Proc Natl Acad Sci U S A, 104: 8149‐54.
Gill, P. R., S. J. Mizumori, and D. M. Smith. 2011. 'Hippocampal episode fields develop with learning', Hippocampus, 21: 1240‐9.
Giocomo, L. M., and M. E. Hasselmo. 2009. 'Knock‐out of HCN1 subunit flattens dorsal‐ventral frequency gradient of medial entorhinal neurons in adult mice', J Neurosci, 29: 7625‐30.
Girardeau, G., K. Benchenane, S. I. Wiener, G. Buzsaki, and M. B. Zugaro. 2009. 'Selective suppression of hippocampal ripples impairs spatial memory', Nat Neurosci, 12: 1222‐3.
Golebiewski, H., B. Eckersdorf, M. Blaszczyk, R. Grabowski, and J. Konopacki. 1994. 'Muscarinic (M1) mediation of carbachol‐induced theta in the cat entorhinal cortex in vitro', Neuroreport, 5: 1989‐92.
Gothard, K. M., W. E. Skaggs, and B. L. McNaughton. 1996. 'Dynamics of mismatch correction in the hippocampal ensemble code for space: interaction between path integration and environmental cues', J Neurosci, 16: 8027‐40.
Gothard, K. M., W. E. Skaggs, K. M. Moore, and B. L. McNaughton. 1996. 'Binding of hippocampal CA1 neural activity to multiple reference frames in a landmark‐based navigation task', J Neurosci, 16: 823‐35.
Goutagny, R., J. Jackson, and S. Williams. 2009. 'Self‐generated theta oscillations in the hippocampus', Nat Neurosci, 12: 1491‐3.
Grosmark, A. D., K. Mizuseki, E. Pastalkova, K. Diba, and G. Buzsaki. 2012. 'REM sleep reorganizes hippocampal excitability', Neuron, 75: 1001‐7.
Gupta, A. S., M. A. van der Meer, D. S. Touretzky, and A. D. Redish. 2012. 'Segmentation of spatial experience by hippocampal theta sequences', Nat Neurosci, 15: 1032‐9.
Hafting, T., M. Fyhn, T. Bonnevie, M. B. Moser, and E. I. Moser. 2008. 'Hippocampus‐independent phase precession in entorhinal grid cells', Nature, 453: 1248‐52.
Hafting, T., M. Fyhn, S. Molden, M. B. Moser, and E. I. Moser. 2005. 'Microstructure of a spatial map in the entorhinal cortex', Nature, 436: 801‐6.

181
Hales, J. B., M. I. Schlesiger, J. K. Leutgeb, L. R. Squire, S. Leutgeb, and R. E. Clark. 2014. 'Medial entorhinal cortex lesions only partially disrupt hippocampal place cells and hippocampus‐dependent place memory', Cell Rep, 9: 893‐901.
Hargreaves, E. L., G. Rao, I. Lee, and J. J. Knierim. 2005. 'Major dissociation between medial and lateral entorhinal input to dorsal hippocampus', Science, 308: 1792‐4.
Harris, E., M. P. Witter, G. Weinstein, and M. Stewart. 2001. 'Intrinsic connectivity of the rat subiculum: I. Dendritic morphology and patterns of axonal arborization by pyramidal neurons', J Comp Neurol, 435: 490‐505.
Harris, K. D., D. A. Henze, H. Hirase, X. Leinekugel, G. Dragoi, A. Czurko, and G. Buzsaki. 2002. 'Spike train dynamics predicts theta‐related phase precession in hippocampal pyramidal cells', Nature, 417: 738‐41.
Hartley, T., N. Burgess, C. Lever, F. Cacucci, and J. O'Keefe. 2000. 'Modeling place fields in terms of the cortical inputs to the hippocampus', Hippocampus, 10: 369‐79.
Harvey, C. D., F. Collman, D. A. Dombeck, and D. W. Tank. 2009. 'Intracellular dynamics of hippocampal place cells during virtual navigation', Nature, 461: 941‐6.
Hasselmo, M. E., C. Bodelon, and B. P. Wyble. 2002. 'A proposed function for hippocampal theta rhythm: separate phases of encoding and retrieval enhance reversal of prior learning', Neural Comput, 14: 793‐817.
Henze, D. A., D. B. McMahon, K. M. Harris, and G. Barrionuevo. 2002. 'Giant miniature EPSCs at the hippocampal mossy fiber to CA3 pyramidal cell synapse are monoquantal', J Neurophysiol, 87: 15‐29.
Huxter, J., N. Burgess, and J. O'Keefe. 2003. 'Independent rate and temporal coding in hippocampal pyramidal cells', Nature, 425: 828‐32.
Huxter, J. R., T. J. Senior, K. Allen, and J. Csicsvari. 2008. 'Theta phase‐specific codes for two‐dimensional position, trajectory and heading in the hippocampus', Nat Neurosci, 11: 587‐94.
Hyman, J. M., L. Ma, E. Balaguer‐Ballester, D. Durstewitz, and J. K. Seamans. 2012. 'Contextual encoding by ensembles of medial prefrontal cortex neurons', Proc Natl Acad Sci U S A, 109: 5086‐91.
Hyman, J. M., E. A. Zilli, A. M. Paley, and M. E. Hasselmo. 2005. 'Medial prefrontal cortex cells show dynamic modulation with the hippocampal theta rhythm dependent on behavior', Hippocampus, 15: 739‐49.
Igarashi, K. M., L. Lu, L. L. Colgin, M. B. Moser, and E. I. Moser. 2014. 'Coordination of entorhinal‐hippocampal ensemble activity during associative learning', Nature, 510: 143‐7.
Ison, M. J., R. Quian Quiroga, and I. Fried. 2015. 'Rapid Encoding of New Memories by Individual Neurons in the Human Brain', Neuron, 87: 220‐30.
Ito, H. T., S. J. Zhang, M. P. Witter, E. I. Moser, and M. B. Moser. 2015. 'A prefrontal‐thalamo‐hippocampal circuit for goal‐directed spatial navigation', Nature, 522: 50‐5.
Jacobs, J., and M. J. Kahana. 2010. 'Direct brain recordings fuel advances in cognitive electrophysiology', Trends Cogn Sci, 14: 162‐71.
Jacobs, J., C. T. Weidemann, J. F. Miller, A. Solway, J. F. Burke, X. X. Wei, N. Suthana, M. R. Sperling, A. D. Sharan, I. Fried, and M. J. Kahana. 2013. 'Direct recordings of grid‐like neuronal activity in human spatial navigation', Nat Neurosci, 16: 1188‐90.
Jaramillo, J., R. Schmidt, and R. Kempter. 2014. 'Modeling inheritance of phase precession in the hippocampal formation', J Neurosci, 34: 7715‐31.
Jauffret, A., N. Cuperlier, and P. Gaussier. 2015. 'From grid cells and visual place cells to multimodal place cell: a new robotic architecture', Front Neurorobot, 9: 1.
Jeffery, K. J., A. Gilbert, S. Burton, and A. Strudwick. 2003. 'Preserved performance in a hippocampal‐dependent spatial task despite complete place cell remapping', Hippocampus, 13: 175‐89.
Jensen, O., and J. E. Lisman. 1996. 'Hippocampal CA3 region predicts memory sequences: accounting for the phase precession of place cells', Learn Mem, 3: 279‐87.

182
Johnson, A., and A. D. Redish. 2007. 'Neural ensembles in CA3 transiently encode paths forward of the animal at a decision point', J Neurosci, 27: 12176‐89.
Jones, M. W., and M. A. Wilson. 2005a. 'Phase precession of medial prefrontal cortical activity relative to the hippocampal theta rhythm', Hippocampus, 15: 867‐73.
Jones, M. W., and M. A. Wilson. 2005b. 'Theta rhythms coordinate hippocampal‐prefrontal interactions in a spatial memory task', PLoS Biol, 3: e402.
Kahana, M. J., D. Seelig, and J. R. Madsen. 2001. 'Theta returns', Curr Opin Neurobiol, 11: 739‐44. Kahana, M. J., R. Sekuler, J. B. Caplan, M. Kirschen, and J. R. Madsen. 1999. 'Human theta oscillations
exhibit task dependence during virtual maze navigation', Nature, 399: 781‐4. Kammerer, A., and C. Leibold. 2014. 'Hippocampal remapping is constrained by sparseness rather
than capacity', PLoS Comput Biol, 10: e1003986. Kamondi, A., L. Acsady, X. J. Wang, and G. Buzsaki. 1998. 'Theta oscillations in somata and dendrites
of hippocampal pyramidal cells in vivo: activity‐dependent phase‐precession of action potentials', Hippocampus, 8: 244‐61.
Keene, C. S., J. Bladon, S. McKenzie, C. D. Liu, J. O'Keefe, and H. Eichenbaum. 2016. 'Complementary Functional Organization of Neuronal Activity Patterns in the Perirhinal, Lateral Entorhinal, and Medial Entorhinal Cortices', J Neurosci, 36: 3660‐75.
Kempter, R., C. Leibold, G. Buzsaki, K. Diba, and R. Schmidt. 2012. 'Quantifying circular‐linear associations: hippocampal phase precession', J Neurosci Methods, 207: 113‐24.
Kentros, C., E. Hargreaves, R. D. Hawkins, E. R. Kandel, M. Shapiro, and R. V. Muller. 1998. 'Abolition of long‐term stability of new hippocampal place cell maps by NMDA receptor blockade', Science, 280: 2121‐6.
Kesner, R. P., M. R. Hunsaker, and M. W. Warthen. 2008. 'The CA3 subregion of the hippocampus is critical for episodic memory processing by means of relational encoding in rats', Behav Neurosci, 122: 1217‐25.
Khamassi, M., A. B. Mulder, E. Tabuchi, V. Douchamps, and S. I. Wiener. 2008. 'Anticipatory reward signals in ventral striatal neurons of behaving rats', Eur J Neurosci, 28: 1849‐66.
Killian, N. J., M. J. Jutras, and E. A. Buffalo. 2012. 'A map of visual space in the primate entorhinal cortex', Nature, 491: 761‐4.
Kim, J. J., H. J. Lee, A. C. Welday, E. Song, J. Cho, P. E. Sharp, M. W. Jung, and H. T. Blair. 2007. 'Stress‐induced alterations in hippocampal plasticity, place cells, and spatial memory', Proc Natl Acad Sci U S A, 104: 18297‐302.
Kim, S. M., S. Ganguli, and L. M. Frank. 2012. 'Spatial information outflow from the hippocampal circuit: distributed spatial coding and phase precession in the subiculum', J Neurosci, 32: 11539‐58.
Kitamura, T., M. Pignatelli, J. Suh, K. Kohara, A. Yoshiki, K. Abe, and S. Tonegawa. 2014. 'Island cells control temporal association memory', Science, 343: 896‐901.
Kitamura, T., C. Sun, J. Martin, L. J. Kitch, M. J. Schnitzer, and S. Tonegawa. 2015. 'Entorhinal Cortical Ocean Cells Encode Specific Contexts and Drive Context‐Specific Fear Memory', Neuron, 87: 1317‐31.
Kjelstrup, K. B., T. Solstad, V. H. Brun, T. Hafting, S. Leutgeb, M. P. Witter, E. I. Moser, and M. B. Moser. 2008. 'Finite scale of spatial representation in the hippocampus', Science, 321: 140‐3.
Klausberger, T., L. F. Marton, J. O'Neill, J. H. Huck, Y. Dalezios, P. Fuentealba, W. Y. Suen, E. Papp, T. Kaneko, M. Watanabe, J. Csicsvari, and P. Somogyi. 2005. 'Complementary roles of cholecystokinin‐ and parvalbumin‐expressing GABAergic neurons in hippocampal network oscillations', J Neurosci, 25: 9782‐93.
Knierim, J. J., I. Lee, and E. L. Hargreaves. 2006. 'Hippocampal place cells: parallel input streams, subregional processing, and implications for episodic memory', Hippocampus, 16: 755‐64.
Knierim, J. J., and J. P. Neunuebel. 2016. 'Tracking the flow of hippocampal computation: Pattern separation, pattern completion, and attractor dynamics', Neurobiol Learn Mem, 129: 38‐49.

183
Knierim, J. J., and K. Zhang. 2012. 'Attractor dynamics of spatially correlated neural activity in the limbic system', Annu Rev Neurosci, 35: 267‐85.
Koenig, J., A. N. Linder, J. K. Leutgeb, and S. Leutgeb. 2011. 'The spatial periodicity of grid cells is not sustained during reduced theta oscillations', Science, 332: 592‐5.
Konopacki, J., and H. Golebiewski. 1992. 'Theta rhythms in the rat medial entorhinal cortex in vitro: evidence for involvement of muscarinic receptors', Neurosci Lett, 141: 93‐6.
Konopacki, J., M. B. Maciver, B. H. Bland, and S. H. Roth. 1987. 'Theta in hippocampal slices: relation to synaptic responses of dentate neurons', Brain Res Bull, 18: 25‐7.
Kramis, R., C. H. Vanderwolf, and B. H. Bland. 1975. 'Two types of hippocampal rhythmical slow activity in both the rabbit and the rat: relations to behavior and effects of atropine, diethyl ether, urethane, and pentobarbital', Exp Neurol, 49: 58‐85.
Kropff, E., J. E. Carmichael, M. B. Moser, and E. I. Moser. 2015. 'Speed cells in the medial entorhinal cortex', Nature, 523: 419‐24.
Krupic, J., N. Burgess, and J. O'Keefe. 2012. 'Neural representations of location composed of spatially periodic bands', Science, 337: 853‐7.
Kwag, J., H. J. Jang, M. Kim, and S. Lee. 2014. 'M‐type potassium conductance controls the emergence of neural phase codes: a combined experimental and neuron modelling study', J R Soc Interface, 11.
Langston, R. F., J. A. Ainge, J. J. Couey, C. B. Canto, T. L. Bjerknes, M. P. Witter, E. I. Moser, and M. B. Moser. 2010. 'Development of the spatial representation system in the rat', Science, 328: 1576‐80.
Langston, R. F., and E. R. Wood. 2008. 'Arbitrary associations in animals: what can paired associate recall in rats tell us about the neural basis of episodic memory? Theoretical comment on Kesner, Hunsaker, & Warthen (2008)', Behav Neurosci, 122: 1391‐6.
Lee, H., C. Wang, S. S. Deshmukh, and J. J. Knierim. 2015. 'Neural Population Evidence of Functional Heterogeneity along the CA3 Transverse Axis: Pattern Completion versus Pattern Separation', Neuron, 87: 1093‐105.
Lee, I., D. Yoganarasimha, G. Rao, and J. J. Knierim. 2004. 'Comparison of population coherence of place cells in hippocampal subfields CA1 and CA3', Nature, 430: 456‐9.
Lega, B., J. Burke, J. Jacobs, and M. J. Kahana. 2016. 'Slow‐Theta‐to‐Gamma Phase‐Amplitude Coupling in Human Hippocampus Supports the Formation of New Episodic Memories', Cereb Cortex, 26: 268‐78.
Lengyel, M., Z. Szatmary, and P. Erdi. 2003. 'Dynamically detuned oscillations account for the coupled rate and temporal code of place cell firing', Hippocampus, 13: 700‐14.
Leung, L. S. 2011. 'A model of intracellular theta phase precession dependent on intrinsic subthreshold membrane currents', J Neurosci, 31: 12282‐96.
Leung, L. S., and H. W. Yu. 1998. 'Theta‐frequency resonance in hippocampal CA1 neurons in vitro demonstrated by sinusoidal current injection', J Neurophysiol, 79: 1592‐6.
Leutgeb, J. K., S. Leutgeb, M. B. Moser, and E. I. Moser. 2007. 'Pattern separation in the dentate gyrus and CA3 of the hippocampus', Science, 315: 961‐6.
Leutgeb, S., and J. K. Leutgeb. 2007. 'Pattern separation, pattern completion, and new neuronal codes within a continuous CA3 map', Learn Mem, 14: 745‐57.
Leutgeb, S., J. K. Leutgeb, C. A. Barnes, E. I. Moser, B. L. McNaughton, and M. B. Moser. 2005. 'Independent codes for spatial and episodic memory in hippocampal neuronal ensembles', Science, 309: 619‐23.
Leutgeb, S., J. K. Leutgeb, M. B. Moser, and E. I. Moser. 2005. 'Place cells, spatial maps and the population code for memory', Curr Opin Neurobiol, 15: 738‐46.
Leutgeb, S., J. K. Leutgeb, A. Treves, M. B. Moser, and E. I. Moser. 2004. 'Distinct ensemble codes in hippocampal areas CA3 and CA1', Science, 305: 1295‐8.
Leutgeb, S., K. E. Ragozzino, and S. J. Mizumori. 2000. 'Convergence of head direction and place information in the CA1 region of hippocampus', Neuroscience, 100: 11‐9.

184
Lever, C., S. Burton, A. Jeewajee, J. O'Keefe, and N. Burgess. 2009. 'Boundary vector cells in the subiculum of the hippocampal formation', J Neurosci, 29: 9771‐7.
Lever, C., T. Wills, F. Cacucci, N. Burgess, and J. O'Keefe. 2002. 'Long‐term plasticity in hippocampal place‐cell representation of environmental geometry', Nature, 416: 90‐4.
Losonczy, A., B. V. Zemelman, A. Vaziri, and J. C. Magee. 2010. 'Network mechanisms of theta related neuronal activity in hippocampal CA1 pyramidal neurons', Nat Neurosci, 13: 967‐72.
Lu, L., J. K. Leutgeb, A. Tsao, E. J. Henriksen, S. Leutgeb, C. A. Barnes, M. P. Witter, M. B. Moser, and E. I. Moser. 2013. 'Impaired hippocampal rate coding after lesions of the lateral entorhinal cortex', Nat Neurosci, 16: 1085‐93.
Luo, A. H., P. Tahsili‐Fahadan, R. A. Wise, C. R. Lupica, and G. Aston‐Jones. 2011. 'Linking context with reward: a functional circuit from hippocampal CA3 to ventral tegmental area', Science, 333: 353‐7.
Magee, J. C. 2001. 'Dendritic mechanisms of phase precession in hippocampal CA1 pyramidal neurons', J Neurophysiol, 86: 528‐32.
Maier, N., A. Tejero‐Cantero, A. L. Dorrn, J. Winterer, P. S. Beed, G. Morris, R. Kempter, J. F. Poulet, C. Leibold, and D. Schmitz. 2011. 'Coherent phasic excitation during hippocampal ripples', Neuron, 72: 137‐52.
Malhotra, S., R. W. Cross, and M. A. van der Meer. 2012. 'Theta phase precession beyond the hippocampus', Rev Neurosci, 23: 39‐65.
Mankin, E. A., G. W. Diehl, F. T. Sparks, S. Leutgeb, and J. K. Leutgeb. 2015. 'Hippocampal CA2 activity patterns change over time to a larger extent than between spatial contexts', Neuron, 85: 190‐201.
Mankin, E. A., F. T. Sparks, B. Slayyeh, R. J. Sutherland, S. Leutgeb, and J. K. Leutgeb. 2012. 'Neuronal code for extended time in the hippocampus', Proc Natl Acad Sci U S A, 109: 19462‐7.
Marr, D. 1969. 'A theory of cerebellar cortex', J Physiol, 202: 437‐70. Marr, D. 1971. 'Simple memory: a theory for archicortex', Philos Trans R Soc Lond B Biol Sci, 262: 23‐
81. Maurer, A. P., S. L. Cowen, S. N. Burke, C. A. Barnes, and B. L. McNaughton. 2006a. 'Organization of
hippocampal cell assemblies based on theta phase precession', Hippocampus, 16: 785‐94. Maurer, A. P., S. L. Cowen, S. N. Burke, C. A. Barnes, and B. L. McNaughton. 2006b. 'Phase precession
in hippocampal interneurons showing strong functional coupling to individual pyramidal cells', J Neurosci, 26: 13485‐92.
McClelland, J. L., B. L. McNaughton, and R. C. O'Reilly. 1995. 'Why there are complementary learning systems in the hippocampus and neocortex: insights from the successes and failures of connectionist models of learning and memory', Psychol Rev, 102: 419‐57.
McHugh, T. J., M. W. Jones, J. J. Quinn, N. Balthasar, R. Coppari, J. K. Elmquist, B. B. Lowell, M. S. Fanselow, M. A. Wilson, and S. Tonegawa. 2007. 'Dentate gyrus NMDA receptors mediate rapid pattern separation in the hippocampal network', Science, 317: 94‐9.
McKenzie, S., N. T. Robinson, L. Herrera, J. C. Churchill, and H. Eichenbaum. 2013. 'Learning causes reorganization of neuronal firing patterns to represent related experiences within a hippocampal schema', J Neurosci, 33: 10243‐56.
McLelland, D., and O. Paulsen. 2009. 'Neuronal oscillations and the rate‐to‐phase transform: mechanism, model and mutual information', J Physiol, 587: 769‐85.
McNaughton, B. L., C. A. Barnes, J. L. Gerrard, K. Gothard, M. W. Jung, J. J. Knierim, H. Kudrimoti, Y. Qin, W. E. Skaggs, M. Suster, and K. L. Weaver. 1996. 'Deciphering the hippocampal polyglot: the hippocampus as a path integration system', J Exp Biol, 199: 173‐85.
McNaughton, B. L., F. P. Battaglia, O. Jensen, E. I. Moser, and M. B. Moser. 2006. 'Path integration and the neural basis of the 'cognitive map'', Nat Rev Neurosci, 7: 663‐78.
Mehta, M. R. 2001. 'Neuronal dynamics of predictive coding', Neuroscientist, 7: 490‐5. Mehta, M. R., A. K. Lee, and M. A. Wilson. 2002. 'Role of experience and oscillations in transforming
a rate code into a temporal code', Nature, 417: 741‐6.

185
Melamed, O., W. Gerstner, W. Maass, M. Tsodyks, and H. Markram. 2004. 'Coding and learning of behavioral sequences', Trends Neurosci, 27: 11‐4; discussion 14‐5.
Miao, C., Q. Cao, H. T. Ito, H. Yamahachi, M. P. Witter, M. B. Moser, and E. I. Moser. 2015. 'Hippocampal Remapping after Partial Inactivation of the Medial Entorhinal Cortex', Neuron, 88: 590‐603.
Miller, J. F., M. Neufang, A. Solway, A. Brandt, M. Trippel, I. Mader, S. Hefft, M. Merkow, S. M. Polyn, J. Jacobs, M. J. Kahana, and A. Schulze‐Bonhage. 2013. 'Neural activity in human hippocampal formation reveals the spatial context of retrieved memories', Science, 342: 1111‐4.
Miller, V. M., and P. J. Best. 1980. 'Spatial correlates of hippocampal unit activity are altered by lesions of the fornix and endorhinal cortex', Brain Res, 194: 311‐23.
Miyashita, Y., E. T. Rolls, P. M. Cahusac, H. Niki, and J. D. Feigenbaum. 1989. 'Activity of hippocampal formation neurons in the monkey related to a conditional spatial response task', J Neurophysiol, 61: 669‐78.
Miyazaki, K., K. W. Miyazaki, and G. Matsumoto. 2004. 'Different representation of forthcoming reward in nucleus accumbens and medial prefrontal cortex', Neuroreport, 15: 721‐6.
Mizumori, S. J., C. A. Barnes, and B. L. McNaughton. 1989. 'Reversible inactivation of the medial septum: selective effects on the spontaneous unit activity of different hippocampal cell types', Brain Res, 500: 99‐106.
Mizumori, S. J., B. L. McNaughton, C. A. Barnes, and K. B. Fox. 1989. 'Preserved spatial coding in hippocampal CA1 pyramidal cells during reversible suppression of CA3c output: evidence for pattern completion in hippocampus', J Neurosci, 9: 3915‐28.
Mizuseki, K., A. Sirota, E. Pastalkova, and G. Buzsaki. 2009. 'Theta oscillations provide temporal windows for local circuit computation in the entorhinal‐hippocampal loop', Neuron, 64: 267‐80.
Moita, M. A., S. Rosis, Y. Zhou, J. E. LeDoux, and H. T. Blair. 2004. 'Putting fear in its place: remapping of hippocampal place cells during fear conditioning', J Neurosci, 24: 7015‐23.
Monaco, J. D., J. J. Knierim, and K. Zhang. 2011. 'Sensory feedback, error correction, and remapping in a multiple oscillator model of place‐cell activity', Front Comput Neurosci, 5: 39.
Morris, R. G., P. Garrud, J. N. Rawlins, and J. O'Keefe. 1982. 'Place navigation impaired in rats with hippocampal lesions', Nature, 297: 681‐3.
Morris, R. G., F. Schenk, F. Tweedie, and L. E. Jarrard. 1990. 'Ibotenate Lesions of Hippocampus and/or Subiculum: Dissociating Components of Allocentric Spatial Learning', Eur J Neurosci, 2: 1016‐28.
Moser, E. I., M. B. Moser, P. Lipa, M. Newton, F. P. Houston, C. A. Barnes, and B. L. McNaughton. 2005. 'A test of the reverberatory activity hypothesis for hippocampal 'place' cells', Neuroscience, 130: 519‐26.
Moser, M. B., D. C. Rowland, and E. I. Moser. 2015. 'Place cells, grid cells, and memory', Cold Spring Harb Perspect Biol, 7: a021808.
Muessig, L., J. Hauser, T. J. Wills, and F. Cacucci. 2015. 'A Developmental Switch in Place Cell Accuracy Coincides with Grid Cell Maturation', Neuron, 86: 1167‐73.
Muller, R. U., and J. L. Kubie. 1987. 'The effects of changes in the environment on the spatial firing of hippocampal complex‐spike cells', J Neurosci, 7: 1951‐68.
Mumby, D. G., S. Gaskin, M. J. Glenn, T. E. Schramek, and H. Lehmann. 2002. 'Hippocampal damage and exploratory preferences in rats: memory for objects, places, and contexts', Learn Mem, 9: 49‐57.
Nakazawa, K., M. C. Quirk, R. A. Chitwood, M. Watanabe, M. F. Yeckel, L. D. Sun, A. Kato, C. A. Carr, D. Johnston, M. A. Wilson, and S. Tonegawa. 2002. 'Requirement for hippocampal CA3 NMDA receptors in associative memory recall', Science, 297: 211‐8.
Navawongse, R., and H. Eichenbaum. 2013. 'Distinct pathways for rule‐based retrieval and spatial mapping of memory representations in hippocampal neurons', J Neurosci, 33: 1002‐13.

186
Neunuebel, J. P., and J. J. Knierim. 2014. 'CA3 retrieves coherent representations from degraded input: direct evidence for CA3 pattern completion and dentate gyrus pattern separation', Neuron, 81: 416‐27.
Neunuebel, J. P., D. Yoganarasimha, G. Rao, and J. J. Knierim. 2013. 'Conflicts between local and global spatial frameworks dissociate neural representations of the lateral and medial entorhinal cortex', J Neurosci, 33: 9246‐58.
Newman, E. L., J. R. Climer, and M. E. Hasselmo. 2014. 'Grid cell spatial tuning reduced following systemic muscarinic receptor blockade', Hippocampus, 24: 643‐55.
O'Keefe, J., and N. Burgess. 1996. 'Geometric determinants of the place fields of hippocampal neurons', Nature, 381: 425‐8.
O'Keefe, J., and J. Dostrovsky. 1971. 'The hippocampus as a spatial map. Preliminary evidence from unit activity in the freely‐moving rat', Brain Res, 34: 171‐5.
O'Keefe, J., and M. L. Recce. 1993. 'Phase relationship between hippocampal place units and the EEG theta rhythm', Hippocampus, 3: 317‐30.
O'Keefe, J., and A. Speakman. 1987. 'Single unit activity in the rat hippocampus during a spatial memory task', Exp Brain Res, 68: 1‐27.
O'Reilly, R. C., and J. L. McClelland. 1994. 'Hippocampal conjunctive encoding, storage, and recall: avoiding a trade‐off', Hippocampus, 4: 661‐82.
Ormond, J., and B. L. McNaughton. 2015. 'Place field expansion after focal MEC inactivations is consistent with loss of Fourier components and path integrator gain reduction', Proc Natl Acad Sci U S A, 112: 4116‐21.
Otchy, T. M., S. B. Wolff, J. Y. Rhee, C. Pehlevan, R. Kawai, A. Kempf, S. M. Gobes, and B. P. Olveczky. 2015. 'Acute off‐target effects of neural circuit manipulations', Nature, 528: 358‐63.
Pare, D., D. R. Collins, and J. G. Pelletier. 2002. 'Amygdala oscillations and the consolidation of emotional memories', Trends Cogn Sci, 6: 306‐14.
Parkinson, J. K., E. A. Murray, and M. Mishkin. 1988. 'A selective mnemonic role for the hippocampus in monkeys: memory for the location of objects', J Neurosci, 8: 4159‐67.
Parron, C., B. Poucet, and E. Save. 2006. 'Cooperation between the hippocampus and the entorhinal cortex in spatial memory: a disconnection study', Behav Brain Res, 170: 99‐109.
Patel, J., S. Fujisawa, A. Berenyi, S. Royer, and G. Buzsaki. 2012. 'Traveling theta waves along the entire septotemporal axis of the hippocampus', Neuron, 75: 410‐7.
Petsche, H., and C. Stumpf. 1962. '[The origin of theta‐rhytm in the rabbit hippocampus]', Wien Klin Wochenschr, 74: 696‐700.
Petsche, H., C. Stumpf, and G. Gogolak. 1962. '[The significance of the rabbit's septum as a relay station between the midbrain and the hippocampus. I. The control of hippocampus arousal activity by the septum cells]', Electroencephalogr Clin Neurophysiol, 14: 202‐11.
Piatti, V. C., L. A. Ewell, and J. K. Leutgeb. 2013. 'Neurogenesis in the dentate gyrus: carrying the message or dictating the tone', Front Neurosci, 7: 50.
Quirk, G. J., R. U. Muller, and J. L. Kubie. 1990. 'The firing of hippocampal place cells in the dark depends on the rat's recent experience', J Neurosci, 10: 2008‐17.
Quirk, G. J., R. U. Muller, J. L. Kubie, and J. B. Ranck, Jr. 1992. 'The positional firing properties of medial entorhinal neurons: description and comparison with hippocampal place cells', J Neurosci, 12: 1945‐63.
Rapp, P. R., and M. Gallagher. 1996. 'Preserved neuron number in the hippocampus of aged rats with spatial learning deficits', Proc Natl Acad Sci U S A, 93: 9926‐30.
Ray, S., R. Naumann, A. Burgalossi, Q. Tang, H. Schmidt, and M. Brecht. 2014. 'Grid‐layout and theta‐modulation of layer 2 pyramidal neurons in medial entorhinal cortex', Science, 343: 891‐6.
Reifenstein, E. T., C. L. Ebbesen, Q. Tang, M. Brecht, S. Schreiber, and R. Kempter. 2016. 'Cell‐Type Specific Phase Precession in Layer II of the Medial Entorhinal Cortex', J Neurosci, 36: 2283‐8.
Riley, K.F., S.J. Bence, and M.P. Hobson. 2006. ' Mathematical Methods for Physics and Engineering. Cambridge: Cambridge University Press.'.

187
Robbe, D., and G. Buzsaki. 2009. 'Alteration of theta timescale dynamics of hippocampal place cells by a cannabinoid is associated with memory impairment', J Neurosci, 29: 12597‐605.
Rolls, E. T. 1990. 'Theoretical and neurophysiological analysis of the functions of the primate hippocampus in memory', Cold Spring Harb Symp Quant Biol, 55: 995‐1006.
Rolls, E. T. 2013. 'The mechanisms for pattern completion and pattern separation in the hippocampus', Front Syst Neurosci, 7: 74.
Rolls, E. T. 2016. 'Pattern separation, completion, and categorisation in the hippocampus and neocortex', Neurobiol Learn Mem, 129: 4‐28.
Rolls, E. T., and R. P. Kesner. 2016. 'Pattern separation and pattern completion in the hippocampal system. Introduction to the Special Issue', Neurobiol Learn Mem, 129: 1‐3.
Rolls, E. T., Y. Miyashita, P. M. Cahusac, R. P. Kesner, H. Niki, J. D. Feigenbaum, and L. Bach. 1989. 'Hippocampal neurons in the monkey with activity related to the place in which a stimulus is shown', J Neurosci, 9: 1835‐45.
Rolls, E. T., R. G. Robertson, and P. Georges‐Francois. 1997. 'Spatial view cells in the primate hippocampus', Eur J Neurosci, 9: 1789‐94.
Rolls, E. T., and S. M. Stringer. 2005. 'Spatial view cells in the hippocampus, and their idiothetic update based on place and head direction', Neural Netw, 18: 1229‐41.
Rolls, E. T., and A. Treves. 1994. 'Neural networks in the brain involved in memory and recall', Prog Brain Res, 102: 335‐41.
Rolls, E. T., J. Xiang, and L. Franco. 2005. 'Object, space, and object‐space representations in the primate hippocampus', J Neurophysiol, 94: 833‐44.
Rotenberg, A., M. Mayford, R. D. Hawkins, E. R. Kandel, and R. U. Muller. 1996. 'Mice expressing activated CaMKII lack low frequency LTP and do not form stable place cells in the CA1 region of the hippocampus', Cell, 87: 1351‐61.
Rowland, D. C., and M. B. Moser. 2014. 'From cortical modules to memories', Curr Opin Neurobiol, 24: 22‐7.
Royer, S., A. Sirota, J. Patel, and G. Buzsaki. 2010. 'Distinct representations and theta dynamics in dorsal and ventral hippocampus', J Neurosci, 30: 1777‐87.
Royer, S., B. V. Zemelman, A. Losonczy, J. Kim, F. Chance, J. C. Magee, and G. Buzsaki. 2012. 'Control of timing, rate and bursts of hippocampal place cells by dendritic and somatic inhibition', Nat Neurosci, 15: 769‐75.
Rueckemann, J. W., A. J. DiMauro, L. M. Rangel, X. Han, E. S. Boyden, and H. Eichenbaum. 2016. 'Transient optogenetic inactivation of the medial entorhinal cortex biases the active population of hippocampal neurons', Hippocampus, 26: 246‐60.
Rutishauser, U., I. B. Ross, A. N. Mamelak, and E. M. Schuman. 2010. 'Human memory strength is predicted by theta‐frequency phase‐locking of single neurons', Nature, 464: 903‐7.
Samsonovich, A., and B. L. McNaughton. 1997. 'Path integration and cognitive mapping in a continuous attractor neural network model', J Neurosci, 17: 5900‐20.
Sanders, M. J., B. J. Wiltgen, and M. S. Fanselow. 2003. 'The place of the hippocampus in fear conditioning', Eur J Pharmacol, 463: 217‐23.
Sargolini, F., M. Fyhn, T. Hafting, B. L. McNaughton, M. P. Witter, M. B. Moser, and E. I. Moser. 2006. 'Conjunctive representation of position, direction, and velocity in entorhinal cortex', Science, 312: 758‐62.
Sauvage, M. M., Z. Beer, M. Ekovich, L. Ho, and H. Eichenbaum. 2010. 'The caudal medial entorhinal cortex: a selective role in recollection‐based recognition memory', J Neurosci, 30: 15695‐9.
Savelli, F., and J. J. Knierim. 2010. 'Hebbian analysis of the transformation of medial entorhinal grid‐cell inputs to hippocampal place fields', J Neurophysiol, 103: 3167‐83.
Schlesiger, M. I., C. C. Cannova, B. L. Boublil, J. B. Hales, E. A. Mankin, M. P. Brandon, J. K. Leutgeb, C. Leibold, and S. Leutgeb. 2015. 'The medial entorhinal cortex is necessary for temporal organization of hippocampal neuronal activity', Nat Neurosci.

188
Schlesiger, M. I., J. C. Cressey, B. Boublil, J. Koenig, N. R. Melvin, J. K. Leutgeb, and S. Leutgeb. 2013. 'Hippocampal activation during the recall of remote spatial memories in radial maze tasks', Neurobiol Learn Mem, 106: 324‐33.
Schmidt, R., K. Diba, C. Leibold, D. Schmitz, G. Buzsaki, and R. Kempter. 2009. 'Single‐trial phase precession in the hippocampus', J Neurosci, 29: 13232‐41.
Schmitzer‐Torbert, N., J. Jackson, D. Henze, K. Harris, and A. D. Redish. 2005. 'Quantitative measures of cluster quality for use in extracellular recordings', Neuroscience, 131: 1‐11.
Scoville, W. B., and B. Milner. 1957. 'Loss of recent memory after bilateral hippocampal lesions', J Neurol Neurosurg Psychiatry, 20: 11‐21.
Siapas, A. G., E. V. Lubenov, and M. A. Wilson. 2005. 'Prefrontal phase locking to hippocampal theta oscillations', Neuron, 46: 141‐51.
Skaggs, W. E., B. L. McNaughton, M. A. Wilson, and C. A. Barnes. 1996. 'Theta phase precession in hippocampal neuronal populations and the compression of temporal sequences', Hippocampus, 6: 149‐72.
Skaggs, W.E., B.L. McNaughton, K.M. Gothard, and E.J Markus. 1993. 'An information‐theoretic approach to deciphering the hippocampl code. ', Advances in Neural Information Processing Systems.
Smith, D. M., and S. J. Mizumori. 2006. 'Learning‐related development of context‐specific neuronal responses to places and events: the hippocampal role in context processing', J Neurosci, 26: 3154‐63.
Smith, M. L., and B. Milner. 1981. 'The role of the right hippocampus in the recall of spatial location', Neuropsychologia, 19: 781‐93.
Solstad, T., C. N. Boccara, E. Kropff, M. B. Moser, and E. I. Moser. 2008. 'Representation of geometric borders in the entorhinal cortex', Science, 322: 1865‐8.
Solstad, T., E. I. Moser, and G. T. Einevoll. 2006. 'From grid cells to place cells: a mathematical model', Hippocampus, 16: 1026‐31.
Squire, L. R. 1982. 'The neuropsychology of human memory', Annu Rev Neurosci, 5: 241‐73. Squire, L. R., and P. Alvarez. 1995. 'Retrograde amnesia and memory consolidation: a neurobiological
perspective', Curr Opin Neurobiol, 5: 169‐77. Stark, E., L. Roux, R. Eichler, Y. Senzai, S. Royer, and G. Buzsaki. 2014. 'Pyramidal cell‐interneuron
interactions underlie hippocampal ripple oscillations', Neuron, 83: 467‐80. Steffenach, H. A., M. Witter, M. B. Moser, and E. I. Moser. 2005. 'Spatial memory in the rat requires
the dorsolateral band of the entorhinal cortex', Neuron, 45: 301‐13. Stensola, H., T. Stensola, T. Solstad, K. Froland, M. B. Moser, and E. I. Moser. 2012. 'The entorhinal
grid map is discretized', Nature, 492: 72‐8. Stewart, M., and S. E. Fox. 1990a. 'Do septal neurons pace the hippocampal theta rhythm?', Trends
Neurosci, 13: 163‐8. Stewart, M., and S. E. Fox. 1990b. 'Firing relations of lateral septal neurons to the hippocampal theta
rhythm in urethane anesthetized rats', Exp Brain Res, 79: 92‐6. Stumpf, C., H. Petsche, and G. Gogolak. 1962. 'The significance of the rabbit's septum as a relay
station between the midbrain and the hippocampus. II. The differential influence of drugs upon both the septal cell firing pattern and the hippocampus theta activity', Electroencephalogr Clin Neurophysiol, 14: 212‐9.
Suh, J., D. J. Foster, H. Davoudi, M. A. Wilson, and S. Tonegawa. 2013. 'Impaired hippocampal ripple‐associated replay in a mouse model of schizophrenia', Neuron, 80: 484‐93.
Suh, J., A. J. Rivest, T. Nakashiba, T. Tominaga, and S. Tonegawa. 2011. 'Entorhinal cortex layer III input to the hippocampus is crucial for temporal association memory', Science, 334: 1415‐20.
Sun, C., T. Kitamura, J. Yamamoto, J. Martin, M. Pignatelli, L. J. Kitch, M. J. Schnitzer, and S. Tonegawa. 2015. 'Distinct speed dependence of entorhinal island and ocean cells, including respective grid cells', Proc Natl Acad Sci U S A.

189
Taube, J. S. 1995. 'Head direction cells recorded in the anterior thalamic nuclei of freely moving rats', J Neurosci, 15: 70‐86.
Taube, J. S., J. P. Kesslak, and C. W. Cotman. 1992. 'Lesions of the rat postsubiculum impair performance on spatial tasks', Behav Neural Biol, 57: 131‐43.
Taube, J. S., R. U. Muller, and J. B. Ranck, Jr. 1990. 'Head‐direction cells recorded from the postsubiculum in freely moving rats. II. Effects of environmental manipulations', J Neurosci, 10: 436‐47.
Terrazas, A., M. Krause, P. Lipa, K. M. Gothard, C. A. Barnes, and B. L. McNaughton. 2005. 'Self‐motion and the hippocampal spatial metric', J Neurosci, 25: 8085‐96.
Thompson, L. T., and P. J. Best. 1989. 'Place cells and silent cells in the hippocampus of freely‐behaving rats', J Neurosci, 9: 2382‐90.
Thurley, K., C. Leibold, A. Gundlfinger, D. Schmitz, and R. Kempter. 2008. 'Phase precession through synaptic facilitation', Neural Comput, 20: 1285‐324.
Tomar, A., D. Polygalov, S. Chattarji, and T. J. McHugh. 2015. 'The dynamic impact of repeated stress on the hippocampal spatial map', Hippocampus, 25: 38‐50.
Treves, A., and E. T. Rolls. 1994. 'Computational analysis of the role of the hippocampus in memory', Hippocampus, 4: 374‐91.
Tsao, A., M. B. Moser, and E. I. Moser. 2013. 'Traces of experience in the lateral entorhinal cortex', Curr Biol, 23: 399‐405.
Tse, D., R. F. Langston, M. Kakeyama, I. Bethus, P. A. Spooner, E. R. Wood, M. P. Witter, and R. G. Morris. 2007. 'Schemas and memory consolidation', Science, 316: 76‐82.
Tsodyks, M. V., W. E. Skaggs, T. J. Sejnowski, and B. L. McNaughton. 1996. 'Population dynamics and theta rhythm phase precession of hippocampal place cell firing: a spiking neuron model', Hippocampus, 6: 271‐80.
Ulanovsky, N., and C. F. Moss. 2007. 'Hippocampal cellular and network activity in freely moving echolocating bats', Nat Neurosci, 10: 224‐33.
Van Cauter, T., J. Camon, A. Alvernhe, C. Elduayen, F. Sargolini, and E. Save. 2013. 'Distinct roles of medial and lateral entorhinal cortex in spatial cognition', Cereb Cortex, 23: 451‐9.
Van Cauter, T., B. Poucet, and E. Save. 2008. 'Unstable CA1 place cell representation in rats with entorhinal cortex lesions', Eur J Neurosci, 27: 1933‐46.
van der Meer, M. A., and A. D. Redish. 2009. 'Covert Expectation‐of‐Reward in Rat Ventral Striatum at Decision Points', Front Integr Neurosci, 3: 1.
van der Meer, M. A., and A. D. Redish. 2011. 'Theta phase precession in rat ventral striatum links place and reward information', J Neurosci, 31: 2843‐54.
van Strien, N. M., N. L. Cappaert, and M. P. Witter. 2009. 'The anatomy of memory: an interactive overview of the parahippocampal‐hippocampal network', Nat Rev Neurosci, 10: 272‐82.
Vandecasteele, M., V. Varga, A. Berenyi, E. Papp, P. Bartho, L. Venance, T. F. Freund, and G. Buzsaki. 2014. 'Optogenetic activation of septal cholinergic neurons suppresses sharp wave ripples and enhances theta oscillations in the hippocampus', Proc Natl Acad Sci U S A, 111: 13535‐40.
Wang, M. E., E. G. Wann, R. K. Yuan, M. M. Ramos Alvarez, S. M. Stead, and I. A. Muzzio. 2012. 'Long‐term stabilization of place cell remapping produced by a fearful experience', J Neurosci, 32: 15802‐14.
Wang, Y., S. Romani, B. Lustig, A. Leonardo, and E. Pastalkova. 2015. 'Theta sequences are essential for internally generated hippocampal firing fields', Nat Neurosci, 18: 282‐8.
Wikenheiser, A. M., and A. D. Redish. 2012. 'Hippocampal sequences link past, present, and future', Trends Cogn Sci, 16: 361‐2.
Wikenheiser, A. M., and A. D. Redish. 2015a. 'Decoding the cognitive map: ensemble hippocampal sequences and decision making', Curr Opin Neurobiol, 32: 8‐15.
Wikenheiser, A. M., and A. D. Redish. 2015b. 'Hippocampal theta sequences reflect current goals', Nat Neurosci, 18: 289‐94.

190
Wills, T. J., F. Cacucci, N. Burgess, and J. O'Keefe. 2010. 'Development of the hippocampal cognitive map in preweanling rats', Science, 328: 1573‐6.
Willshaw, D. J., P. Dayan, and R. G. Morris. 2015. 'Memory, modelling and Marr: a commentary on Marr (1971) 'Simple memory: a theory of archicortex'', Philos Trans R Soc Lond B Biol Sci, 370.
Wilson, M. A., and B. L. McNaughton. 1993. 'Dynamics of the hippocampal ensemble code for space', Science, 261: 1055‐8.
Winson, J. 1978. 'Loss of hippocampal theta rhythm results in spatial memory deficit in the rat', Science, 201: 160‐3.
Witter, M. P. , and D. G Amaral. 2004. 'Nervous System 3rd edn (ed. Paxinos, G.) 637–703 (Elsevier Academic Press, San Diego)'.
Witter, M. P., and D. G. Amaral. 1991. 'Entorhinal cortex of the monkey: V. Projections to the dentate gyrus, hippocampus, and subicular complex', J Comp Neurol, 307: 437‐59.
Witter, M. P., H. J. Groenewegen, F. H. Lopes da Silva, and A. H. Lohman. 1989. 'Functional organization of the extrinsic and intrinsic circuitry of the parahippocampal region', Prog Neurobiol, 33: 161‐253.
Witter, M. P., P. A. Naber, T. van Haeften, W. C. Machielsen, S. A. Rombouts, F. Barkhof, P. Scheltens, and F. H. Lopes da Silva. 2000. 'Cortico‐hippocampal communication by way of parallel parahippocampal‐subicular pathways', Hippocampus, 10: 398‐410.
Witter, M. P., F. G. Wouterlood, P. A. Naber, and T. Van Haeften. 2000. 'Anatomical organization of the parahippocampal‐hippocampal network', Ann N Y Acad Sci, 911: 1‐24.
Wood, E. R., P. A. Dudchenko, and H. Eichenbaum. 1999. 'The global record of memory in hippocampal neuronal activity', Nature, 397: 613‐6.
Wood, E. R., P. A. Dudchenko, R. J. Robitsek, and H. Eichenbaum. 2000. 'Hippocampal neurons encode information about different types of memory episodes occurring in the same location', Neuron, 27: 623‐33.
Yamamoto, J., J. Suh, D. Takeuchi, and S. Tonegawa. 2014. 'Successful execution of working memory linked to synchronized high‐frequency gamma oscillations', Cell, 157: 845‐57.
Yartsev, M. M., M. P. Witter, and N. Ulanovsky. 2011. 'Grid cells without theta oscillations in the entorhinal cortex of bats', Nature, 479: 103‐7.
Ylinen, A., I. Soltesz, A. Bragin, M. Penttonen, A. Sik, and G. Buzsaki. 1995. 'Intracellular correlates of hippocampal theta rhythm in identified pyramidal cells, granule cells, and basket cells', Hippocampus, 5: 78‐90.
Yoganarasimha, D., G. Rao, and J. J. Knierim. 2011. 'Lateral entorhinal neurons are not spatially selective in cue‐rich environments', Hippocampus, 21: 1363‐74.
Zhang, S. J., J. Ye, J. J. Couey, M. Witter, E. I. Moser, and M. B. Moser. 2014. 'Functional connectivity of the entorhinal‐hippocampal space circuit', Philos Trans R Soc Lond B Biol Sci, 369: 20120516.
Zhang, S. J., J. Ye, C. Miao, A. Tsao, I. Cerniauskas, D. Ledergerber, M. B. Moser, and E. I. Moser. 2013. 'Optogenetic dissection of entorhinal‐hippocampal functional connectivity', Science, 340: 1232627.
Zugaro, M. B., L. Monconduit, and G. Buzsaki. 2005. 'Spike phase precession persists after transient intrahippocampal perturbation', Nat Neurosci, 8: 67‐71.

191
Abbreviations
% percent
~ approximately
A35 Brodmann area 35
A36 Brodmann area 36
AP action potential
AP anterior‐posterior
BVC boundary vector cell
BVC boundary vector cell
CA cornu ammonis
CB calbindin
DG dentate gyrus
dl dorsolateral
DV dorso‐ventral
EC entorhinal cortex
EPSP excitatory postsynaptic potential
GABA gamma‐Aminobutyric acid
h hour
HD head direction
HF hippocampal formation
HIPP hippocampus
hTPP
hippocampal theta phase
precession
Hz hertz
IFR instentanuous firing rate
int intermediate
iqr inter quartile range
lEC lateral entorhinal cortex
LFP local field potential
LTP long term potentiation
m meters
mEC medial entorhinal cortex

192
mEC II layer two of the mEC
mEC III layer three of the mEC
mEC IV layer four of the mEC
mEC V layer five of the mEC
min minute
ML medio‐lateral
mPFC medial prefrontal cortex
MPO membrane potential oscillation
ms millisecond
MS‐
DBB
medial septum ‐ diagonal band of
Broca
NMDA N‐Methyl‐D‐aspartate
P16 postnatal day 16
P30 postnatal day 30
paS parasubiculum
PER perirhinal cortex
POR postrhinal cortex
PP perforant path
prS presubiculum
PV+ parvalbumin expressing
REM rapid eye movement
SDI somatic‐dendritic‐interference
SEM Standard error of the mean
slm stratum lacunosum moleculare
SUB subiculum
SWR sharp wave ripples
TPP theta phase precession
vm ventromedial
vStr ventral striatum
wfs1+ wfs1 expressing

193
Eidesstattliche Versicherung/Affidavit Hiermit versichere ich an Eides statt, dass ich die vorliegende Dissertation ‚The role of the medial entorhinal cortex in hippocampal spatial and temporal coding‘ selbstständig angefertigt habe, mich außer der angegebenen keiner weiteren Hilfsmittel bedient und alle Erkenntnisse, die aus dem Schrifttum ganz oder annähernd übernommen sind, als solche kenntlich gemacht und nach ihrer Herkunft unter Bezeichnung der Fundstelle einzeln nachgewiesen habe. I hereby confirm that the dissertation ‘The role of the medial entorhinal cortex in hippocampal spatial and temporal coding’ is the result of my own work and that I have only used sources or materials listed and specified in the dissertation. München, den 31.05.2016 Munich, 31.05.2016
Magdalene Schlesiger Unterschrift/signature

194
List of publications
Hales, J. B.*, M. I. Schlesiger*, J. K. Leutgeb, L. R. Squire, S. Leutgeb #, and R. E. Clark #. 2014. 'Medial
entorhinal cortex lesions only partially disrupt hippocampal place cells and hippocampus -
dependent place memory', Cell Rep, 9: 893-901.
Schlesiger, M. I. *, C. C. Cannova*, B. L. Boublil, J. B. Hales, E. A. Mankin, M. P. Brandon, J. K.
Leutgeb, C. Leibold, and S. Leutgeb. 2015. 'The medial entorhinal cortex is necessary for
temporal organization of hippocampal neuronal activity', Nat Neurosci.
* Co-first author
# Co-senior author

195
Author contributions
Medial entorhinal cortex lesions only partially disrupt hippocampal place cells and
hippocampus-dependent place memory Magdalene Schlesiger (M.S.), Jill Leutgeb (J.L.) and Stefan
Leutgeb (S.L.) designed electrophysiological experiments (Figures 1 and 2, Supplementary figures 1
and 2); Jena Hales (J.H.), Robert Clark (R.C.) and Larry Squire (L.S.) designed behavioral experiments
(Figures 1, 3 and 4, Supplementary figure 3); M.S. and S.L. implanted recording devices; J.H.
performed lesions; M.S. performed electrophysiological experiments with assistance from Brittney
Boublil (B.B.); M.S. analyzed electrophysiological data; J.H. performed behavioral research and
analyzed behavioral data; J.H. quantified the lesion size; M.S, J.H., R.C., S.L., J.L., and L.S. wrote the
paper.
Reorganization of the spatial mapping system in the medial entorhinal cortex is not required for
hippocampal global remapping M.S., J.L. and S.L. designed experiments; M.S. and S.L. implanted
recording devices; J.H. performed lesions; M.S. performed electrophysiological experiments with
assistance from B.B.; M.S. analyzed electrophysiological data; J.H. quantified lesion size; M.S. wrote
the manuscript with feedback from S.L.
The medial entorhinal cortex is necessary for temporal organization of hippocampal neuronal
activity M.S., S.L. and J.L. designed experiments; M.S. and S.L. implanted recording devices; J.H.
performed lesions; M.S. acquired data with assistance from B.B.; Mark Brandon (M.B.) provided
dataset shown in Figures 7 and 8; Christopher Cannova (C.C.), M.S., Emily Mankin (E.M.), Christian
Leibold (C.L.) and S.L. performed analysis of electrophysiological data; J.H. quantified the lesion size;
M.S., C.C, C.L. and S.L. wrote the manuscript.
Signatures Christian Leibold Stefan Leutgeb Jena Hales

196
Acknowledgements
I would like to thank …
… Stefan Leutgeb for offering me the opportunity to work in the excellent research environment at
the Division of Biological Sciences, UCSD, for arranging fruitful collaborations and for allowing me to
work with a team of exceptionally talented students. I am particularly grateful for his continued
guidance and mentorship throughout my training. I greatly benefited from his unfailing efforts to
teach me to design and conduct rigorous scientific experiments, to think and behave like a scientist,
and to communicate the results of my work to the scientific community.
… Christian Leibold for insightful discussions and help with data analysis, for his steady support and
help to maneuver difficult situations.
… Jena Hales for performing MEC lesions surgeries and quantifying the lesion size and Brittney Boublil
for help with histology and data acquisition. I would like to thank Brittney and Jena for their
exceptional dedication to our collaboration. I would also like to acknowledge Christopher Cannova’s
help with the theta phase precession analysis and thank Mandy Wong for technical assistance .
… Jill Leutgeb, Christian Leibold, Robert Clark and Larry Squire for their contribution to developing
the project and their help with writing manuscripts. I am particularly grateful to Jill Leutgeb for
insightful discussions of my results and her helpful comments during the preparation for my postdoc
interviews.
… the members of the Leutgeb laboratories, in particular Laura Ewell, Vero Piatti, Emily Mankin, Vicky
Lam, Brittney Boublil, Ipshita Zutshi, Marta Sabariego, Mark Brandon and Geoffrey Diehl, for creating
an inspiring working atmosphere, for valuable discussions as well as their friendship and support
throughout my scientific endeavor at UCSD.
… Benedikt Grothe and the GSN team for their support to conduct my research at UCSD.
… my husband Duncan MacLaren for valuable discussion, help with trouble-shooting, proof-reading
of my dissertation and for his support and friendship throughout my PhD.
Vielen Dank an meine Eltern und meinen Bruder für ihre andauernede Unterstützung und
Ermutigung.

Magdalene Isabell Schlesiger
Division of Biological SciencesUniversity of California, San Diego9500 Gilman Dr.La Jolla, CA 92093, USA
EDUCATION
2008 - 2010 Heidelberg University, Heidelberg, Germany M.S., Molecular Biosciences, Major in Neußroscience
2005 - 2008 Wilhelms-University of Münster, Münster, Germany B.Sc., Biological Sciences
RESEARCH EXPERIENCE
09/2011 - present Graduate Student, University of California, San Diego, La Jolla, CA, USA
Research Advisor: Prof. Dr. Stefan LeutgebLarge-scale in vivo electrophysiological recordings from the hippocampo-entorhinal
circuitry.
01 - 09/2011 Ludwig Maximilian University of Munich, Munich, GermanyDivision of Neurobiology, Department Biology II
In vivo
08/2009 - 09/2010 Master’s student and junior research fellow, University of St Andrews, St Andrews, UKSchool of Psychology and NeuroscienceResearch Advisor: Dr. James Ainge
03 - 08/2009
Research Advisor: Prof. Dr. Andreas Draguhn
2011 - present Ludwig Maximilian University of Munich, Munich, GermanyPh.D. in Systemic Neuroscience

07/2007 - 09/2008 Bachelor’s student and research assistant, University of Science and Technology, Trondheim, Norway
Research Advisor: Prof. Dr. Stefan Leutgeb
FELLOWSHIPS AND AWARDS
2011 - 2014 Boehringer Ingelheim Fonds Ph.D. fellowship to conduct graduate research at theUniversity of California, San Diego, La Jolla, CA, USA
2012 Boehringer Ingelheim Fonds travel grant
2013 Boehringer Ingelheim Fonds travel grant
2009 - 2010 Junior Research Fellowship awarded by the University of St Andrews to conduct Master’sthesis research the University of St Andrews, St Andrews, UK
2007 - 2008 Erasmus Scholarship to study and conduct undergraduate research at the University of Science and Technology, Trondheim, Norway
PUBLICATIONS
2014 Boehringer Ingelheim Fonds travel grant The Neurobiology of Learning and Memory, Park City, UT, USA
th
rd
nd
Schlesiger MI*, Cannova CC*, Boublil B, Hales JB, Mankin E, Brandon M, Leutgeb JK, Leibold C, Leutgeb S (2015). The medial entorhinal cortex is necessary for temporal organiza on of hippocampal neuronal
Nat Neurosci. In Press. *These authors contributed equally.
1.
2.
Publica ons in prepara on
Schlesiger MI, , Leutgeb JK, Leutgeb S. The medial entorhinal spatial mapping system is
1.
Schlesiger MI*, Hales JB*, Leutgeb JK, Squire LR, Leutgeb S#, Clark RE# (2014). Medial entorhinal cortex lesions only par ally disrupt hippocampal place cells and hippocampus-dependent place memory. Cell Rep. 9(3):893-901. *, # These authors contributed equally.
Schlesiger MI, Cressey JC, Boublil B, Koenig J, Melvin NR, Leutgeb JK, Leutgeb S (2013). Hippocampal ac va on during the recall of remote spa al memories in radial maze tasks. Neurobiol Learn Mem. 106:324-33.
3.
Wilson DI, Langston RF, Schlesiger MI, Wagner M, Watanabe S, Ainge JA (2013). Lateral entorhinal cortex is cri cal for novel object-context recogni on. Hippocampus. 23(5):352-66.
4.
2015 Boehringer Ingelheim Fonds alumni travel grant
P
Boublil B, Hales JBnot required for hippocampal global remapping. Manuscript in preparation for Neuron

3.
Speaker at the Neuroscience seminar series of the Neurosciences Departement, San Diego, La Jolla, CA, USA, February 2014
Place cells persist without phase precessio lesions to the grid cell network.annual Winter Conference, Neurobiology of Learning and Memory January 2014
Are medial entorhinal inputs required fo oding and memory? Speaker at the Neuroscience seminar series of the Neuroscience department, University of California, San Diego,
La Jolla, CA, USA, November 2013
Is the entorhinal cortex required for hippocampal coding and memory? Speaker at the 9 North America Mee ng organized by Boehringer Ingelheim Fonds,
mechanisms fo memory in hippocampo-entorhinal networks of the ratgiven at ‘Communica ng Science’ seminar organized by Boehringer NY, USA, February 2012
Schlesiger MI, Hales JB, Leutgeb JK , Leutgeb S (2012). Hippocampal place cell stabilityof the grid cell area in the medial entorhinal cortex. No. 203.02 Neuroscienc
Neuroscience 42 New Orleans, LA, USA
Wilson D, Langston RF, Schlesiger MI, Wagner M, Watanabe S, Ainge JA (2012). episodic memory into context: Memory for object-c requires lateral entorhinal cortex. Neuroscience Society for Neuroscience 42 annual me ,
New Orleans, LA, USA
Hales JB, Schlesiger MI, Leutgeb JK, Leutgeb S, Squire LR, Clark RE (2012). Impaire memory following lesions of the physiologically-defined grid cell area of rat medial entorhinal cortex. No.
203.04 Neuroscience Planner. Society for Neuroscience 42 annual me New Orleans, LA, USA
No. 293.10
4.Planner. Society
5.
6. Ainge JA, Schlesiger MI, Langston RF (2010). Lateral entorhinal cortex iobject-contex No. 708.9 Neuroscienc Planner. Society for Neuroscience , San Diego, CA, USA
Schlesiger MI, Cressey JC, Koenig J, Leutgeb S (2010). No. 708.9 Neuroscience Planner. Society
San Diego, CA, USA
40
7.
SELECTED PRESENTATIONS
1.
2.
3.
4.
Woods
5.Ingelheim Fonds, Cold Spring Harbor,
University of California,
in Park City, UT, USA,
Hole, MA, USA, September 2012
2. Schlesiger MI, Cannova C, Mankin E, Boublil B, Hales JB, Leutgeb JK, Leutgeb S. (2013). The medial entorhinal cortex is required for hippocampal phase precession. No. 203.8 Neuroscie Society for Neuroscience 43 San Diego, CA, USA rd
nd
ndfor
nd
th
th
thSpeaker at the 38
th
1. Leibold C, Schlesiger MI, Cannova C, Boublil B, Hales J, Leutgeb J, Leutgeb S. (2015). Hippocampal phase precession is disrupted a er medial entorhinal cortex lesions. No. III-65 Cosyne 2015 Program Book. Cosyne 2015, Salt Lake City, UT, USA


