Embed Size (px)
Citation preview

A Murine Inhalation Model to Characterize PulmonaryExposure to Dry Aspergillus fumigatus ConidiaAmanda D. Buskirk1, Brett J. Green1, Angela R. Lemons1, Ajay P. Nayak1, W. Travis Goldsmith2,
Michael L. Kashon3, Stacey E. Anderson1, Justin M. Hettick1, Steven P. Templeton1, Dori R. Germolec4,
Donald H. Beezhold1*
1 Allergy and Clinical Immunology Branch, Health Effects Laboratory Division, National Institute for Occupational Safety and Health, Centers for Disease Control and
Prevention, Morgantown, West Virginia, United States of America, 2 Pathology and Physiology Research Branch, Health Effects Laboratory Division, National Institute for
Occupational Safety and Health, Centers for Disease Control and Prevention, Morgantown, West Virginia, United States of America, 3 Biostatistics and Epidemiology
Branch, Health Effects Laboratory Division, National Institute for Occupational Safety and Health, Centers for Disease Control and Prevention, Morgantown, West Virginia,
United States of America, 4 Toxicology Branch, National Toxicology Program Division, National Institute of Environmental Health Sciences, Research Triangle Park, North
Carolina, United States of America
Abstract
Most murine models of fungal exposure are based on the delivery of uncharacterized extracts or liquid conidia suspensionsusing aspiration or intranasal approaches. Studies that model exposure to dry fungal aerosols using whole body inhalationhave only recently been described. In this study, we aimed to characterize pulmonary immune responses followingrepeated inhalation of conidia utilizing an acoustical generator to deliver dry fungal aerosols to mice housed in a nose onlyexposure chamber. Immunocompetent female BALB/cJ mice were exposed to conidia derived from Aspergillus fumigatuswild-type (WT) or a melanin-deficient (Dalb1) strain. Conidia were aerosolized and delivered to mice at an estimateddeposition dose of 16105 twice a week for 4 weeks (8 total). Histopathological and immunological endpoints were assessed4, 24, 48, and 72 hours after the final exposure. Histopathological analysis showed that conidia derived from both strainsinduced lung inflammation, especially at 24 and 48 hour time points. Immunological endpoints evaluated inbronchoalveolar lavage fluid (BALF) and the mediastinal lymph nodes showed that exposure to WT conidia led to elevatednumbers of macrophages, granulocytes, and lymphocytes. Importantly, CD8+ IL17+ (Tc17) cells were significantly higher inBALF and positively correlated with germination of A. fumigatus WT spores. Germination was associated with specific IgG tointracellular proteins while Dalb1 spores elicited antibodies to cell wall hydrophobin. These data suggest that inhalationexposures may provide a more representative analysis of immune responses following exposures to environmentally andoccupationally prevalent fungal contaminants.
Citation: Buskirk AD, Green BJ, Lemons AR, Nayak AP, Goldsmith WT, et al. (2014) A Murine Inhalation Model to Characterize Pulmonary Exposure to DryAspergillus fumigatus Conidia. PLoS ONE 9(10): e109855. doi:10.1371/journal.pone.0109855
Editor: Scott G. Filler, David Geffen School of Medicine at University of California Los Angeles, United States of America
Received May 21, 2014; Accepted September 4, 2014; Published October 23, 2014
This is an open-access article, free of all copyright, and may be freely reproduced, distributed, transmitted, modified, built upon, or otherwise used by anyone forany lawful purpose. The work is made available under the Creative Commons CC0 public domain dedication.
Data Availability: The authors confirm that all data underlying the findings are fully available without restriction. All relevant data are within the paper and itsSupporting Information files.
Funding: This study was supported by intramural National Institute for Occupational Safety and Health (NIOSH) funding and by an interagency agreement withNIEHS IAA# AES 12007-00100000. The funders had no role in study design, data collection and analysis, decision to publish, or preparation of the manuscript.
Competing Interests: The authors have declared that no competing interests exist.
* Email: [email protected]
Introduction
Exposure to fungi derived from contaminated building materials
are of growing concern in the general population [1–3]. Fungal
exposures have been associated with multiple adverse health
outcomes including invasive disease, allergic sensitization, hyper-
sensitivity pneumonitis, and asthma [1]. Consensus documents
published by the Institute of Medicine and the World Health
Organization have identified associations between living in damp
indoor environments containing mold and health effects, partic-
ularly asthma [4,5]. Although sufficient evidence of associations
exist, the fungal-specific factors and immunological mechanisms
that lead to the induction of these allergic diseases require further
characterization [6].
To date, numerous animal models of fungal exposure have been
developed to investigate the immunological responses that follow
fungal challenge [1,7–9]. Although these studies have provided
new insight, the test articles are often uncharacterized extracts,
individual antigens or liquid spore suspensions that do not
resemble typical human exposures. Many of these studies are
based on a single exposure with few studies using repeated
exposures [1,10,11], and even fewer studies utilizing inhalation
exposures [12,13].
To address the limitations associated with previous inhalation
studies [12,13], we developed a nose-only, acoustical generator
exposure system (AGS) that allows for real-time analysis of particle
size, deposition estimations, and manipulation of exposure
concentrations. We used an immunocompetent murine model of
repeated inhalation exposures with dry conidia to more closely
model the burden of fungi encountered in the environment.
Aspergillus fumigatus was chosen as the model organism to
directly compare to previous exposure models, as well as previous
PLOS ONE | www.plosone.org 1 October 2014 | Volume 9 | Issue 10 | e109855

studies conducted in our laboratory [14,15]. Using this new
system, we characterized the pulmonary immune responses to
repeated inhalation of A. fumigatus conidia. Continuous moni-
toring of the real-time particle mass concentration in the animal’s
breathing zone allowed us to calculate estimates for the number of
conidia that were deposited in the upper and lower respiratory
tract. We additionally explored the response to A. fumigatus wild-
type (WT) as well as a melanin-deficient (Dalb1) strain to examine
the role of melanin and conidia germination on pulmonary
immune responses following repeated dry fungal exposures in
naı̈ve mice.
Materials and Methods
Fungal cultureA. fumigatus strains B-5233/ATCC 13073 (wild-type (WT)
parent strain) and Dalb1 were received as a gift from Dr. June
Kwon-Chung (NIAID, Bethesda, MD) [16]. Fungal cultures were
grown for 14 days at room temperature (RT) on malt extract agar
(MEA) as previously described [14]. For acoustical generation, a
modified method was used to grow conidia [17]. In brief, 10 mL of
sterilized, distilled, deionized water was added to one A. fumigatusMEA plate and conidia were suspended by disruption with a
sterile inoculating loop. The fungal suspension (10 mL) was then
used to inoculate 200 mL of dry brown rice (Mahatma brown rice,
Allentown, PA) that was autoclaved (30 min, 121uC). The rice was
completely submerged by the addition of 100 mL sterile water and
approximately 10–12 g of wet rice was added to sterile 100 mm
petri dishes. The plates were wrapped with parafilm and incubated
at room temperature for 10–14 days with shaking once daily to
prevent rice aggregates and ensure homogenous growth. Addi-
tional MEA plates were inoculated with the original suspension to
ensure cultures were homogenous.
AnimalsFemale BALB/cJ mice, aged 5–7 weeks (Jackson Laboratory,
Bar Harbor, ME), were acclimated for approximately one week
prior to exposures. The mice were housed in HEPA filtered,
ventilated polycarbonate cages in groups of 5 on autoclaved
hardwood chip bedding. Mice were provided with NIH-31
modified 6% irradiated rodent chow (Harlan Teklad) and tap
water ad libitum. Sentinel mice were free of viral and bacterial
pathogens. The National Institute for Occupational Safety and
Health (NIOSH) animal facility is an environmentally controlled
barrier facility that is fully accredited by the Association for the
Assessment and Accreditation of Laboratory Animal Care
International. All animal procedures were performed under a
NIOSH Animal Care and Use Committee approved protocol 12-
BG-M-003.
Dry fungal aerosol exposure systemThe nose-only inhalation AGS (Figure 1A) used conditioned air
from a water seal compressor that passed through a dryer, a
charcoal filter, and a high efficiency particulate air (HEPA) filter.
The flow was regulated at 6 L/min by a mass flow controller
(GFC37, Aalborg, Orangeburg, NY). The conditioned air flowed
through a modified PITT-3 AGS consisting of a speaker covered
with a rubber membrane, on which rice cultures were placed and
allowed to settle 12–24 hours prior to exposure. Acoustical energy
was then used to vibrate the conidia-laden rice resulting in the
detachment, de-aggregation, and aerosolization of the conidia
within the generator. The air-conidia mixture then passed into a
modified nose-only exposure chamber (Intox Products, LLC,
Moriarty, NM). The conidia entered the top of the chamber into a
column where animals were positioned in separate pods that
projected out radially from the column. The conidia entered the
pods directly in front of the nose of the animals and exhaled air
exited via radial ports around the nose of the mouse into a second
column where the air was HEPA filtered and exhausted. Of 24
pods, 2 pods were reserved as sample ports; one was used to
gravimetrically measure the conidial mass concentration and the
second used a light scattering device (DataRAM4, ThermoElec-
tron Co., Franklin, MA) to provide a real-time estimate of the mass
concentration of the conidia in the exposure chamber. The
DataRAM also recorded the chamber temperature and humidity.
During test runs, the gravimetric sample port was used to collect
samples for electron microscopy and to size the particles with an
aerodynamic particle sizer (APS, TSI Inc., Shoreview, MN;
Figure 1B and 1C).
A mouse lung deposition model, based on deposition measure-
ments from Raabe et al. [18], was developed to allow for
estimation of the number of conidia deposited within the murine
lung. The conidia frequency in each size bin of APS measurements
were cross-referenced to the corresponding interpolated mouse
lung deposition fraction for that particle size. A scale factor was
established and applied to the DataRAM signal to estimate the
real-time number of conidia deposited based on the DataRAM’s
mass concentration measurements and a mouse minute volume of
25 mL. The integrated value of deposition was calculated
throughout the exposures using custom software and the system
automatically turned off when the desired conidial deposition was
reached (,100 min). Animals were acclimated to the exposure
chamber by placing them in the nose-only housing units for
increasing time intervals (up to 2 hours), over the course of a one
week period prior to the first exposure. The acclimation was to
reduce potential stress or other adverse conditions resulting from
prolonged restraint required for the fungal exposures.
For exposures, fifteen mice per time point were exposed to A.fumigatus WT conidia, Dalb1 conidia, or HEPA filtered air only.
Mice were placed individually in the exposure units attached to the
acoustical generator for approximately 2 hours, while the gener-
ator was automatically turned off when real-time particle dose
estimates reached 16105 conidia. Mice were exposed twice per
week (Thursday and Monday or Friday and Tuesday) for 4 weeks,
and sacrificed at 4, 24, 48, or 72 hours post-final exposure using
an intraperitoneal injection of 100 uL (100 mg/kg body weight) of
sodium pentobarbital (Sleepaway, Fort Dodge Animal Health,
Fort Dodge, IA).
Modified local lymph node assayMice were exposed to 56103, 16104, 16105, 16106 WT
conidia or HEPA filtered air only via the AGS exposure chamber
once daily for three days, and then rested for two days. To serve as
a positive control for exposures, a group of mice were exposed to
200 mg of hyphal extract via pharyngeal aspiration using the same
exposure schedule. On the sixth day, mice were injected
intravenously via the lateral tail vein with 20 mCi 3H-thymidine
(Dupont NEN, Waltham, MA; specific activity 2 Ci/mmol). Five
hours following 3H-thymidine injection, animals were euthanized
via CO2 inhalation. The mediastinal lymph nodes (MLNs), located
at the bifurcation of the bronchi in the lung, were removed for
analysis. MLNs were homogenized between frosted microscope
slides, cell suspensions were prepared, and samples were incubated
with 5% trichloroacetic acid overnight at 4uC. Samples were then
mixed with scintillation fluid and counted using a Tri-Carb
2500TR liquid scintillation counter. Stimulation indices (SIs) were
calculated by dividing the mean disintegrations per minute (DPM)
by the mean DPM obtained from the control chamber exposure
A Murine Inhalation Model of Aspergillus fumigatus Exposure
PLOS ONE | www.plosone.org 2 October 2014 | Volume 9 | Issue 10 | e109855

mice. Pre- and post-weight data was additionally recorded to assess
potential toxicity. Concentrations of conidia that induced greater
than 10% weight loss were not considered for the repeated
exposures, despite the SI value.
HistologyFor each experiment, three mice per time point were selected
for histology analysis. Lungs were dissected and fixed as previously
described [14]. Tissues were sectioned and stained with hematox-
ylin and eosin (H&E), Periodic Acid Shift (PAS), and Grocott’s
Methenamine Silver (GMS) staining.
Conidia were identified using GMS stain and quantified by
counting the number visualized in 100 random fields of view
(4006magnification), covering both lungs fields. Conidia .26the
size of resting conidia were classified as swollen and the emergence
of germ tubes from conidia were classified as germinated. Data
were presented as the total conidial counts per exposure or the
Figure 1. Preliminary acoustical generator exposure chamber experiments. A) Illustration showing the acoustical generator inhalationexposure system. Supply air is HEPA filtered and directed into the acoustical generator. The acoustical generator is then sent a signal to vibrate at adesignated frequency resulting in the formation of fungal aerosols from inoculated rice grains. The fungal aerosol is then directed into a multi-animal,nose-only chamber. After passing through the animal’s breathing zone the air is filtered before being sent into the exhaust system. A real-timeparticle counter attached to the computer calculates the concentration of fungal particles being deposited into the airways, and the DataRAM reportsthat number to the computer, which can be altered during the exposure to obtain the desired deposition concentration. B) The Aspergillus fumigatusaerosol particle size distribution produced by the acoustical generator. The size of single or aggregate A. fumigatus conidia is 2–5 mm. C) Fieldemission scanning electron microscopy image of A. fumigatus fungal conidia deposited on a polycarbonate filter collected from one of the samplingports of the nose-only exposure chamber.doi:10.1371/journal.pone.0109855.g001
A Murine Inhalation Model of Aspergillus fumigatus Exposure
PLOS ONE | www.plosone.org 3 October 2014 | Volume 9 | Issue 10 | e109855

percentage of total conidia that were germinating (swollen+germinated).
Collection of bronchoalveolar lavage fluid, mediastinallymph nodes, and serum
Bronchoalveolar lavage fluid (BALF) and serum was collected as
previously described [14]. Serum was collected from mice 7 days
following final exposure to WT and Dalb1 conidia. Following
collection of BALF, the MLNs were dissected, cleared of adipose
tissue and homogenized by grinding the nodes between frosted
microscope slides. Cells isolated from the BALF and MLN were
then prepared for flow cytometry analysis.
Differential cell stainingCellularity was determined by flow cytometry using reagents
obtained from BD Biosciences (San Jose, CA) unless otherwise
specified. The resuspended BALF and MLN cells were divided in
two for differential and intracellular cytokine staining. One half of
the BALF cells were stained for 30 minutes using the following
antibodies at 1:100 rat anti-mouse Ly-6G, rat anti-mouse Siglec-F,
pan-leukocyte rat anti-mouse CD45, and Armenian hamster anti-
mouse CD11c (eBioscience Inc. San Diego, CA). MLN cells were
also stained to identify B cell populations using B220/CD45R
antibodies. After staining, cells were washed and fixed with BD
Cytofix. Cells were then washed and resuspended in FACS buffer.
Cell populations were evaluated on a BD LSRII (BD
Biosciences, San Jose, CA). Neutrophils were defined as
CD45hiLy-6Ghi, eosinophils as Ly-6GlowSiglecFhiCD11clow, and
alveolar macrophages as Ly-6GlowSiglecFhiCD11chi as previously
reported [14,19]. Total cell numbers were quantified using
acridine orange nuclear staining and an automated cell counter
(Cellometer AutoX4, Nexcelom Bioscience, Lawrence, MA). Total
numbers of each cell population were obtained by multiplying the
frequency of specific population by the total number of BALF cells
recovered for each animal.
Intracellular cytokine stainingBALF and MLN T-cells were quantified using rat anti-mouse
CD8 and CD4 antibodies. T-cell cytokine production was
determined by fluorescent intracellular cytokine staining (ICS) as
previously described [20]. Briefly, the BALF and MLN suspen-
sions were washed and incubated in Leukocyte Activation Cocktail
with GolgiPlug at 37uC in 5% CO2 for 4 hours. Following
incubation, the BALF cells were washed and stained for flow
cytometry analysis using rat anti-mouse CD4, rat anti-mouse
CD8, rat anti-mouse B220/CD45R, and rat anti-mouse CD25.
MLNs were stained using Syrian hamster anti-mouse CD3e, rat
anti-mouse CD4, and rat anti-mouse CD8 antibodies. Cells were
then washed, resuspended in BD Cytofix/Cytoperm, and incu-
bated for 15 minutes at 4uC. Cells were washed and resuspended
in PermWash. Each BALF sample was stained 1:100 with rat anti-
mouse IFN-c, rat anti-mouse IL-13, rat anti-mouse IL-10, and rat
anti-mouse IL-17A (eBioscience, San Diego, CA). MLNs were
stained with rat anti-mouse IL-13, (BioLegend, San Diego, CA),
rat anti-mouse IL-10, rat anti-mouse IL-12, rat anti-mouse IL-22,
rat anti-mouse IL-17A, and rat anti-mouse IFN-c. Cell popula-
tions were analyzed on a BD LSRII, with lymphocytes gated on
the basis of low forward and side scatter, then subsequently gated
on CD4+ or CD8+ populations to determine intracellular
expression of cytokines.
Aspergillus fumigatus protein extractionConidial protein extracts from WT and Dalb1 conidia were
obtained from 14 day old MEA plates. Conidia were harvested
from the plates by adding 5 mL of sterile, distilled, deionized
water, and agitating the surface of the agar with a sterile
inoculating loop. Samples were frozen overnight at 280uC, and
then lyophilized for 3–5 days to remove the suspension solution.
Glass beads (0.5 mm) were added to each sample. Conidia were
then subjected to 361 minute bead beating cycles using a mini-
bead beater (BioSpec, Bartlesville, OK). Sodium bicarbonate
buffer (pH 8.0, 2 ml), containing 0.5 mM EDTA and protease
inhibitors (Complete Mini, Roche Diagnostics, Indianapolis, IN)
was added and the samples were agitated by three one-minute
bead-beating cycles, centrifuged, and the resulting supernatant was
used for SDS-PAGE.
For Western blot and ELISA analyses, hyphal extracts were
prepared by harvesting mycelial cultures by centrifugation at
4,1006 g for 5 min. The hyphal pellet was collected and
concentrated by lyophilization. Lyophilized hyphae were then
macerated in a mortar and pestle containing liquid N2 and
suspended in cold PBS, pH 7.4, containing Complete Mini
Protease Inhibitor Cocktail (Roche Diagnostics, Indianapolis,
IN). Proteins were extracted overnight at 4uC on a rocker. The
extract was then centrifuged at 4,1006 g for 5 min, and the
supernatant fluid was collected, aliquoted, and stored at 280uCfor further analysis.
For two-dimensional Western blot analysis, mycelial extracts
were prepared based on previously published methods [21].
Briefly, hyphae were ground in liquid nitrogen using a mortar and
pestle and resuspended in 10% (w/v) trichloroacetic acid (TCA).
After centrifugation at 20,2006g for 10 min at 4uC, samples were
washed twice in ice cold acetone. The pellets were then
resuspended in IEF buffer (10 mM Tris, 8 M urea, 2 M thiourea,
4% (w/v) CHAPS, 1% (v/v) Triton X-100, 65 mM dithiothreitol
(DTT) and 0.8% (w/v) IPG buffer), centrifuged at 14,0006 g for
5 min at 4uC, and the resulting supernatant was used for analysis.
Protein concentrations in all fungal extract preparations were
determined using a NanoDrop ND-1000 spectrophotometer
(NanoDrop Technologies, Wilmington, DE).
SDS PAGE and Western blot analysisA. fumigatus WT and Dalb1 conidial and hyphal extracts
(10 mg) were prepared as described above and mixed with
Laemmli sample buffer (Bio-Rad, Hercules, CA) containing b-
mercaptoethanol and heated at 95uC for 5 minutes. Samples were
loaded in individual lanes (10 mg/well) and resolved using a 12%
polyacrylamide gel with a 4% stacking gel ran at 100 V for
90 minutes. Proteins were transferred to a 0.2 mm nitrocellulose
membrane at 16 V overnight at 4uC. The membrane was blocked
for 1 hour with 5% non-fat dry milk powder (SM) in Tris-buffered
saline containing 0.05% Tween-20 (TBST). Pooled polyclonal sera
from mice 7 days post exposure was diluted to 1:200 in SM-TBST
and incubated with the membrane at room temperature (RT) for 1
hour with gentle agitation. The blot was then washed 3 times with
TBST and incubated with alkaline phosphatase (AP)-conjugated
goat anti-mouse IgG heavy and light chain (Promega, Madison,
WI) diluted 1:5000 in SM-TBST for 1 hour (RT) with gentle
agitation. The blot was then washed 3 times with TBST and
developed using the AP substrate, 1-Step NBT/BCIP Solution
(Thermo Scientific, Rockford, IL).
Two-dimensional Western blot analysisA. fumigatus B5233 hyphal proteins (500 mg) prepared in IEF
buffer as described above were suspended in 130 ml sample
A Murine Inhalation Model of Aspergillus fumigatus Exposure
PLOS ONE | www.plosone.org 4 October 2014 | Volume 9 | Issue 10 | e109855

solubilization buffer (8 M urea, 2% (w/v) CHAPS, 0.5% (w/v)
IPG Buffer, 20 mM DTT, trace bromophenol blue) containing
0.625 ml ampholytes (3–10, GE Healthcare, Uppsala Sweden).
The protein was then loaded onto a 7 cm ReadyStrip IPG strip,
pH 3–10 (GE Healthcare) and focused at 4000 V for 15 kVh and
held at 500 V (Protean i12 IEF Cell, BioRad, Hercules, CA). IPG
strips were equilibrated for 15 min at RT in equilibration buffer (6
M urea, 2% (w/v) SDS, 50 mM Tris/HCl, pH 8.8, 20% (v/v)
glycerol) containing 130 mM DTT, followed by a second 15 min
incubation in equilibration buffer containing 135 mM iodoaceta-
mide. The equilibrated IPG strip was then placed on a 1.5 mm,
12% gel, electrophoresed at 100 V for 1.5 hr and transferred
overnight at 15 V to a nitrocellulose membrane (0.2 mm, BioRad).
Western blot analysis was performed as previously described.
Proteomic characterization of murine IgG reactive A.fumigatus antigens
Murine IgG reactive A. fumigatus-specific protein bands were
identified by Western blot and excised from imperial stained SDS-
PAGE gels prepared in parallel. Excised spots were digested with
porcine trypsin (Sigma Aldrich) and analyzed using a nanoAC-
QUITY UPLC coupled to a SYNAPT quadrupole time-of-flight
mass spectrometer (qTOFMS; Waters, Milford, MA) according to
previously published methods [22,23].
Total IgE ELISATotal IgE titers in pre-bleed sera and pooled polyclonal sera
isolated from mice exposed to WT and Dalb1 strains were
determined using a total IgE kit, as per the manufacturer’s
instructions (Biolegend, San Diego, CA). Sera were prepared at
1:10 and serially diluted and plates were read at 450 and 570 nm.
Background absorbance values obtained from the 570 nm
readings were subtracted from the 450 nm values. The standard
curve was created from known concentrations of IgE standards,
and unknown IgE sample concentrations were extrapolated from
the curve.
Specific IgG ELISASpecific IgG concentrations in pooled polyclonal sera obtained
7 days post exposure to WT and Dalb1 strains were determined
using an indirect ELISA. Briefly, Corning high protein binding 96-
well plates (Corning, NY) were coated with 3 mg/mL A. fumigatusconidial or hyphal extract in 0.1 M sodium carbonate, pH 9.6
overnight at 4uC. The wells were washed three times with PBS
containing 0.05% Tween 20 (PBST) and blocked with 200 mL/
well 3% non-fat dry milk powder in PBST (SM-PBST) for 1 hour
at 37uC. Duplicate wells were incubated with mouse sera diluted
1:200 in SM-PBST for 1 hour at 37uC. Wells were washed and
incubated for 1 h at 37uC with AP-conjugated anti-mouse IgG
heavy and light chain antibody (Promega) diluted 1:5000 in SM-
PBST. Wells were washed and developed with 0.5 mg/mL p-
nitrophenyl phosphate in AP substrate. The optical density was
determined spectrophotometrically at 405 nm using a SpectraMax
M4 microplate reader (Molecular Devices, Sunnyvale, CA).
Data analysis methodsAnalysis of flow cytometric samples was performed with BD
FACSDiva software (BD Biosciences, San Jose, CA). SigmaPlot
(Systat Software, Inc., San Jose, CA) was used for graphs, and
GraphPad Prism (GraphPad Software, La Jolla, CA) for statistical
analysis of conidial clearance/germination and total IgE levels.
The data were analyzed via two way analysis of variance
(ANOVA) followed by Bonferroni post-test. Statistical analysis of
cellularity was performed using SAS version 9.3 for Windows
(SAS, Cary, NC). The data were log transformed prior to analysis
and Proc Mix was used to run a two-way factorial analysis of
variance (Fungal Exposure by Time). Pairwise comparisons were
performed using Fishers Least Significant Difference test. Differ-
ences between experimental groups were considered significant
with p-values #0.05.
Results
Characterization of the fungal acoustical generatorsystem
A new inhalation exposure system was developed to enable
characterization of pulmonary immune responses to dry particles
[24]. Figure 1A depicts a schematic of the AGS adapted for use
with fungal conidia. The AGS was capable of producing mass
concentrations of up to 60 mg/m3 (count concentration 2.66109
conidia/m3; data not shown) and field emission scanning electron
microscopy (FESEM) showed aerosols composed of individual
conidia, and in some cases aggregate conidia (Figure 1B and 1C),
with a size distribution within the aerodynamic diameter of
individual conidia (Figure 1B). Rice grain fragments or fungal
fragments (fractured conidia or hyphae) were not observed by
FESEM. These findings demonstrated that conidia could be
aerosolized in reproducible quantities and delivered to mice
housed in the multi-animal nose only exposure chamber.
Histopathological assessment of animals in a pilot study confirmed
that fungal conidia were deposited within the upper respiratory
tract and in the smaller airways (data not shown).
Lymphoproliferation induced by repeated dry A.fumigatus exposures
The optimal dose for inhalation experiments was determined by
a modified local lymph node assay following 3 repeated inhalation
exposures to A. fumigatus WT spores (56103, 16104, 16105, or
16106 calculated airway deposition, CAD). Proliferation of
lymphocytes as determined by the incorporation of radiolabeled
tritiated thymidine in the MLNs was dose dependent and 16106
conidia (CAD) induced the highest stimulation index (,100 SI
units (fold change over vehicle control); Figure S1); however, mice
exposed to this dose had greater than 10% weight loss so 16105
was selected for future experiments. This dose corresponds to the
fungal burden that may be encountered in contaminated indoor
and some occupational environments [1].
HistopathologyUsing 16105 spores, experiments were performed to charac-
terize the pulmonary response to repeated fungal conidia
exposures. After 8 exposures, H&E staining revealed inflammation
predominantly affecting the bronchioles, characterized by leuko-
cyte infiltration (Figure 2A) and giant cell formation (data not
shown). Airway remodeling, increased mucus production and
goblet cell hyperplasia were also observed (data not shown). The
time course revealed that by 24 hours, mucus production had
begun to resolve and the cellularity was largely composed of
neutrophils and lymphocytes surrounding the bronchioles (Fig-
ure 2A). Granulomas were occasionally observed near the larger
airways (data not shown). Compared to WT exposures, mice
exposed to Dalb1 conidia did not have as pronounced inflamma-
tion; however, airway remodeling, increased mucus production,
and goblet cell hyperplasia were observed (Figure S2).
Within 4 hours of final exposure, GMS stained WT conidia
could be microscopically observed in the lung interstitium. Some
conidia were swollen and minimal germ tube formation was
A Murine Inhalation Model of Aspergillus fumigatus Exposure
PLOS ONE | www.plosone.org 5 October 2014 | Volume 9 | Issue 10 | e109855

present at this time point (Figure 2B and C). Considerably fewer
conidia (mean = 66.5) were resolved in the lungs of mice exposed
to Dalb1 conidia at 4 hours (Figure 2C). By 24 and 48 hours,
germination of WT conidia was significantly increased compared
to Dalb1 conidia that had not germinated (Figure 2C). By
72 hours, most inflammatory changes observed in histopathology
were resolving and few conidia were observed (Figure 2).
BALF CellularityQuantification of total BALF cell numbers showed a statistically
significant difference in the cellular influx between the WT
Figure 2. Histopathology of sections derived from Aspergillus fumigatus WT exposed mice. A) Representative histopathology sections fromWT exposed mice sacrificed at the indicated time points. Top panel-H&E stained sections at 1006magnification, Bottom panel-PAS stained sectionsat 1006magnification. B) GMS stained sections at 4006magnification. Black arrow heads indicate swollen conidia (24 hr), while red arrow headsindicate conidia germination and emergence of hyphal tubes (48 hr). C) Quantification of conidia and germination (swollen conidia+germ tubeformation) over time. Values were obtained by quantifying the number of conidia visualized by counting 100 random fields of view covering bothlung fields at a magnification of 4006. Conidia were considered swollen when the size was .26 that of resting conidia. Data are presented as theaverage 6 standard error of measure. ****P#0.0001, ***P#0.001, **P#0.01.doi:10.1371/journal.pone.0109855.g002
A Murine Inhalation Model of Aspergillus fumigatus Exposure
PLOS ONE | www.plosone.org 6 October 2014 | Volume 9 | Issue 10 | e109855

exposure group and controls. Mice exposed to WT conidia had
significantly higher BALF cell counts (monocytic cells and
eosinophils) at 48 hours with significantly elevated neutrophil
counts persisting at 72 hours (Figure 3). Compared to WT
conidia, BALF cellularity in mice exposed to Dalb1 conidia was
generally lower and peaked for most cell types by 4 hours
(Figure 3).
To further characterize the pulmonary immune responses,
lymphocyte subpopulations were examined. Exposures to WT
conidia resulted in peak CD8+ T cell counts at 24 hours followed
by a gradual decline to 72 hours. A similar response was not
observed with the Dalb1 conidia. CD4+ T cell responses showed a
sharp peak at 48 hours following WT exposures; however, the
levels of this cell population at the other time points were similar to
Dalb1 exposed mice (Figure 3). Intracellular cytokine staining of
the BALF cells revealed mice exposed to WT conidia recruited
significantly more CD4+IL-17+ T cells (Th17) to the airways at
48 hours compared to the Dalb1 exposure group (Figure 4).
Interestingly, CD8+IL-17+ T cells (Tc17) reflected a majority of
the overall CD8+ T cell response observed in WT exposed mice
and this population peaked at the 24 hour time point (Figure 4).
Additional lymphocyte phenotypes demonstrating a mixed Th1/
Th2 response can be found in File S1, Figure S3.
Mediastinal Lymph Node CellularityIn the draining mediastinal lymph nodes (MLN), the numbers of
total MLN cells and B cells increased up to 72 hours in WT
exposures; however, in the Dalb1 exposure group, the highest
MLN and B cell counts were observed at 4 hours (Figure 5). These
counts were reduced at 24 hours, and began to increase slightly
again by 72 hours (Figure 5).
WT exposures resulted in a steady increase in CD4+ T cells up
to 72 hours, while in Dalb1 exposure, CD4+ T cells were highest at
4 hours (Figure 5). Intracellular cytokine staining revealed that
Tc17 responses also increased with each time interval and reached
highest levels at 72 hours following the final exposure to WT
conidia (data not shown). Additional lymphocytic phenotypes
determined by intracellular cytokine staining can be found in
Figure S4 and indicated a mixed Th1/Th2 response.
Aspergillus fumigatus-specific antibody productionELISA analysis of A. fumigatus-specific antibody showed
presence of IgG at 7 days (Figure 6C) but IgM was not detected
in either group (data not shown). In Western blots, WT exposed
sera reacted to a greater number of bands in hyphal extracts
compared with conidial extracts from both WT and Dalb1 strains
(Figure 6A). Conversely, Dalb1 exposed sera reacted to fewer
proteins; however, immunostaining of conidial proteins showed
prominent immunoreactive bands localized between 10–15 kDa
in both WT (band 2) and Dalb1 (band 1 and 3) conidia extracts
(Figure 6B).
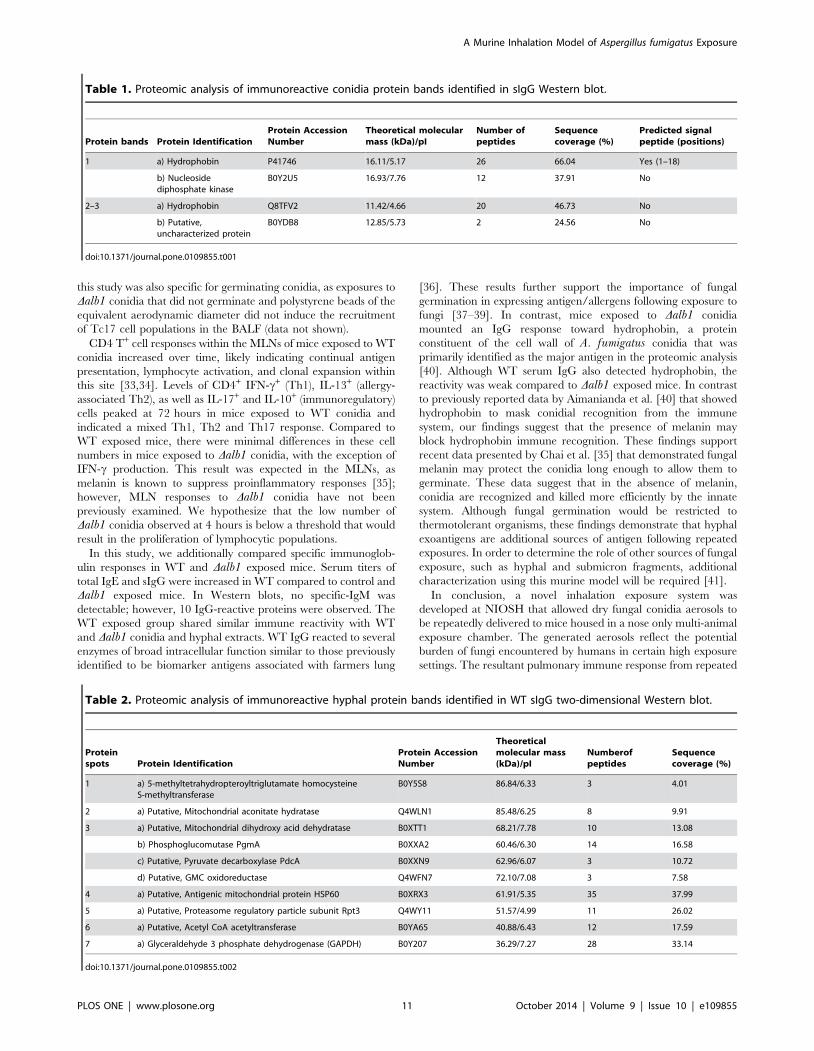
Proteomic analysis was performed on protein bands identified to
bind sIgG. Prominent bands from WT and Dalb1 hyphal extracts
were identified at approximately 85 kDa, 65 kDa, and 52 kDa.
These proteins were further resolved by two-dimensional Western
blot (Figure S6, Table 1, Table 2). LC-MS/MS analysis of the
hyphal proteins identified to bind WT sIgG showed that many of
these spots were derived from intracellular proteins with a range of
functions (Table 2). Protein spots 1–2 (,85 kDa), 3 (,65 kDa), 4
(,60 kDa) and 6 (41 kDa) were identified as mitochondrial
proteins involved in various biosynthetic and metabolic processes.
Other proteins binding WT sIgG were identified as enzymes
involved in metabolic processes in the cytosol, namely spot 5
(52 kDa) identified as proteasome regulatory particle subunit Rpt3
and spot 7 (37 kDa) identified as glyceraldehyde 3 phosphate
dehydrogenase (GAPDH). Interestingly, the prominent immuno-
reactive conidial proteins recognized by the Dalb1 conidia exposed
sera (between 10–15 kDa) were identified in both WT (band 2)
and Dalb1 (bands 1 & 3) to be predominantly derived from
hydrophobins (Table 1).
Figure 3. Total cell counts in the BALF. Following 8 dry conidial exposures, mice were sacrificed at the indicated time points to determine thekinetics of the cellular influx to the lung. Total cell numbers were obtained through acridine orange staining and quantified using an automated cellcounter. Each cell population was quantified by multiplying the frequency of each by the total cell counts. Data are presented as the average 6standard error of measure. (Control n = 30 mice/time point, Exposed n = 7–10 mice/group/time point). ****P#0.0001, ***P#0.001, **P#0.01, *P#0.05.doi:10.1371/journal.pone.0109855.g003
A Murine Inhalation Model of Aspergillus fumigatus Exposure
PLOS ONE | www.plosone.org 7 October 2014 | Volume 9 | Issue 10 | e109855

Serum IgE was additionally quantified to further characterize
the immune response following repeated A. fumigatus WT and
Dalb1 conidia exposures. Total IgE concentrations were signifi-
cantly increased in each exposure group despite the presence of
melanin (Figure S5). Similar to the Western blot data, IgE titers
increased by approximately 1000 ng/mL (WT exposed) and
1500 ng/mL (Dalb1) between days 3 and 7. Overall, these data
demonstrated that nose-only exposures to dry A. fumigatusconidia may result in the production of sIgG, as well as total IgE.
Discussion
Animal models of fungal exposure have provided understanding
of the pulmonary immune mechanisms that mediate fungal
clearance and pathogenesis [9–11]. However, many of these
studies use pharyngeal and intratracheal aspiration or intranasal
methodologies to deliver uncharacterized extracts or conidia
suspensions to animals [1,9–11]. These variables may not
represent exposure to fungal bioaerosols typically encountered in
the environment. Recently, several animal studies have evaluated
inhalation exposures to aerosolized fungal conidia that more
closely reflect human exposures to indoor, outdoor, or occupa-
tional environments [12,13,25]. In this study, we describe a system
that more closely represents typical inhalational exposures to
fungal conidia and the pulmonary immune responses in immu-
nocompetent mice following repeated (n = 8) exposures to a lung
dose of 16105 dry A. fumigatus conidia. It is estimated that this
lung burden would be equivalent to a worker breathing a constant
conidia workplace air level concentration of 5.606104 spores/m3
(0.93 mg/m3) over a 45 year working career. This daily dose could
be encountered in contaminated occupational environments [1].
An innovative AGS, based on a similar system developed at
NIOSH [26] was used to produce homogenous A. fumigatus WT
and Dalb1 (melanin deficient) conidia aerosols that were delivered
to mice housed in a multi-animal nose only exposure chamber.
The AGS allows the controlled delivery of fungal conidia to mice,
limits fungal bioaerosol deposition distal to the neck, and reduces
supplementary exposures such as the ingestion of conidia
associated with barbering. The inhalation of the dry aerosol also
avoids alterations to the conidia as a result of preparation of fungal
extracts or liquid conidia suspensions. The AGS uses mass
concentration measurements to estimate particle deposition
numbers so that exposure/deposition could be kept constant
throughout the duration of the exposures. These variables could
not be controlled in previously published murine inhalation
models of A. fumigatus exposure [12,13].
Previously, we published an aspiration exposure model of
repeated exposures to A. fumigatus mutant strains [14]. Mice were
exposed twice weekly for 4 weeks and harvested 72 hours after the
final exposure. In that study, we observed moderate to severe
inflammation resembling hypersensitivity pneumonitis, and while
similar inflammatory changes were observed between mutant
strains of A. fumigatus, histological differences in conidia
clearance were readily apparent. In the present study, we extended
these observations to an inhalation exposure and we examined 4
time points post exposure to characterize the dynamics of the
immune response of mice. Histopathologic analysis revealed a
severe inflammatory response within 4 hours of the final exposure.
Figure 4. Intracellular cytokine flow cytometry analysis of the BALF. IL-17+ CD4+ and CD8+ T cells were quantified by multiplyingthe frequency of each individual cell population by the total cell counts. Mice were sacrificed at the indicated time points after the 8thexposure. Data are presented as the average 6 standard error of measure. n = 7–10 mice/group per time point. ****P#0.0001, **P#0.01.doi:10.1371/journal.pone.0109855.g004
A Murine Inhalation Model of Aspergillus fumigatus Exposure
PLOS ONE | www.plosone.org 8 October 2014 | Volume 9 | Issue 10 | e109855

Influx of innate cells could be observed, as well as conidia
transported from the airways into the surrounding lung intersti-
tium. Mucus production by goblet cells, bronchiolar pneumonia,
and tissue remodeling were also observed. Large numbers of
neutrophils and eosinophils were observed surrounding the larger
airways and giant cell formation and granulomas were apparent.
Overall, the inflammation observed in the present study was not as
severe compared to previous A. fumigatus aspiration studies that
delivered as much as 26106 conidia [14,15]. However, these
results do support histopathological findings of previously reported
murine intranasal [10] and whole body guinea pig studies [25].
Fogelmark and colleagues [25] demonstrated increased alveolar
wall thickening with interstitial cells and granuloma formation
following A. fumigatus exposure. Similarly, Murdock and
colleagues observed goblet cell metaplasia following repeated
exposures [10]. In the present study, inflammation appeared to be
resolving by 48 and 72 hours, although, giant cells, and
granulomas were still observed.
Microscopic evaluation of tissue sections demonstrated a small
proportion of conidia (,10%) had become metabolically active
(swollen conidia) by 4 hours and by 24–48 hours germ tubes had
formed (,15% conidia). By 72 hours, conidia were nearly
undetectable, likely processed and removed by neutrophils.
Metabolically active conidia appeared to drive a mixed Th1/
Th2/Th17 response that was characterized by the recruitment of
neutrophils and eosinophils between 48–72 hours; however, these
results should be interpreted with caution as the complete fungal
lung burden was not assessed in the present study. These
preliminary data suggest that as conidia began to swell and
germinate, a unique T cell response appeared. BALF Th17 cells
peaked at 48 hours in mice exposed to WT conidia that
corresponded to the highest neutrophil counts in the BALF.
Previous reports have shown that a major role for Th17 cells
includes the recruitment of neutrophils, and this cell population
has also been shown to contribute to viral persistence, allergy,
chronic inflammation associated with parasitic infection and is
important in immunity against opportunistic fungal pathogens,
such as Candida albicans [27–29]. Recent intranasal and
aspiration studies of A. fumigatus have also identified Th17
responses in the lungs of mice following repeated exposure [10,14].
A CD8+ T cell response was additionally observed to
correspond to A. fumigatus conidial germination. Compared to
a previous study that showed the production of CD8+ IFNc+ cell
population following A. fumigatus aspiration [15], approximately
1/3 of the total CD8+ T cells were a CD8+ IL17+ (Tc17) cell
population that peaked at 24 hours. The Tc17 population
correlated with WT conidia germination, as well as the highest
concentrations of mononuclear cells, neutrophils, and eosinophils
present in the BALF. These results are consistent with the reported
role for Tc17 cells in innate cell recruitment [30,31]. CD8+ T cells
Figure 5. Total cell counts in the MLNs. Following 8 dry conidial exposures, mice were sacrificed at the indicated time points to determine thecellular influx kinetics to the lung-associated nodes. Total cell numbers were obtained through acridine orange staining and quantified using anautomated cell counter. Each cell population was quantified by multiplying the frequency of each by the total cell counts. Data are presented as theaverage 6 standard error of measure. (Control-n = 30 mice/time point, Exposed n = 7–10 mice/group/time point). ***P#0.001, **P#0.01, *P#0.05.doi:10.1371/journal.pone.0109855.g005
A Murine Inhalation Model of Aspergillus fumigatus Exposure
PLOS ONE | www.plosone.org 9 October 2014 | Volume 9 | Issue 10 | e109855

have been shown to be protective by Carvalho and colleagues
[32]; however, the role of Tc17 cells has remained less clear. Tc17
cells are a unique subset of CD8+ T cells associated with viral
immunity (viral clearance), pulmonary inflammatory responses,
systemic lupus erythematosus, control of tumor growth, and
contact dermatitis [30]. Tc17 cells demonstrate functional
plasticity and are reported to produce proinflammatory cytokines
and chemokines responsible for the recruitment of neutrophils
[31]. Recently, aspects of CD8+ and Tc17 immunity to A.fumigatus have been reported by our laboratory [14] as well as for
the dimorphic fungal pathogens, Blastomyces dermatitidis and
Histoplasma capsulatum [30]. Interestingly, the Tc17 response in
Figure 6. Specific IgG from A. fumigatus WT or Dalb1 exposed mice. Western blot analysis of specific IgG in serum from mice exposed toacoustically aerosolized conidia from (A) WT or (B) Dalb1 strains. Lanes 1-molecular weight markers, 2-ASF WT conidial extract, 3-Dalb1 conidialextract, 4-ASF WT hyphal extract, 5-Dalb1 hyphal extract (10 mg protein/lane). Numbered bands were excised and identified using LC/MS analyses.The asterisks (*) denote weak binding of WT–exposed serum antibody to hydrophobin. C) ELISA analysis of IgG specific for A. fumigatus WT and Dalb1conidial proteins or hyphal extracts. Results are representative of the mean OD405 values for each mouse sera diluted 1:200 6 the standard deviationof duplicate ELISA wells coated with 3 mg/mL protein.doi:10.1371/journal.pone.0109855.g006
A Murine Inhalation Model of Aspergillus fumigatus Exposure
PLOS ONE | www.plosone.org 10 October 2014 | Volume 9 | Issue 10 | e109855
this study was also specific for germinating conidia, as exposures to
Dalb1 conidia that did not germinate and polystyrene beads of the
equivalent aerodynamic diameter did not induce the recruitment
of Tc17 cell populations in the BALF (data not shown).
CD4 T+ cell responses within the MLNs of mice exposed to WT
conidia increased over time, likely indicating continual antigen
presentation, lymphocyte activation, and clonal expansion within
this site [33,34]. Levels of CD4+ IFN-c+ (Th1), IL-13+ (allergy-
associated Th2), as well as IL-17+ and IL-10+ (immunoregulatory)
cells peaked at 72 hours in mice exposed to WT conidia and
indicated a mixed Th1, Th2 and Th17 response. Compared to
WT exposed mice, there were minimal differences in these cell
numbers in mice exposed to Dalb1 conidia, with the exception of
IFN-c production. This result was expected in the MLNs, as
melanin is known to suppress proinflammatory responses [35];
however, MLN responses to Dalb1 conidia have not been
previously examined. We hypothesize that the low number of
Dalb1 conidia observed at 4 hours is below a threshold that would
result in the proliferation of lymphocytic populations.
In this study, we additionally compared specific immunoglob-
ulin responses in WT and Dalb1 exposed mice. Serum titers of
total IgE and sIgG were increased in WT compared to control and
Dalb1 exposed mice. In Western blots, no specific-IgM was
detectable; however, 10 IgG-reactive proteins were observed. The
WT exposed group shared similar immune reactivity with WT
and Dalb1 conidia and hyphal extracts. WT IgG reacted to several
enzymes of broad intracellular function similar to those previously
identified to be biomarker antigens associated with farmers lung
[36]. These results further support the importance of fungal
germination in expressing antigen/allergens following exposure to
fungi [37–39]. In contrast, mice exposed to Dalb1 conidia
mounted an IgG response toward hydrophobin, a protein
constituent of the cell wall of A. fumigatus conidia that was
primarily identified as the major antigen in the proteomic analysis
[40]. Although WT serum IgG also detected hydrophobin, the
reactivity was weak compared to Dalb1 exposed mice. In contrast
to previously reported data by Aimanianda et al. [40] that showed
hydrophobin to mask conidial recognition from the immune
system, our findings suggest that the presence of melanin may
block hydrophobin immune recognition. These findings support
recent data presented by Chai et al. [35] that demonstrated fungal
melanin may protect the conidia long enough to allow them to
germinate. These data suggest that in the absence of melanin,
conidia are recognized and killed more efficiently by the innate
system. Although fungal germination would be restricted to
thermotolerant organisms, these findings demonstrate that hyphal
exoantigens are additional sources of antigen following repeated
exposures. In order to determine the role of other sources of fungal
exposure, such as hyphal and submicron fragments, additional
characterization using this murine model will be required [41].
In conclusion, a novel inhalation exposure system was
developed at NIOSH that allowed dry fungal conidia aerosols to
be repeatedly delivered to mice housed in a nose only multi-animal
exposure chamber. The generated aerosols reflect the potential
burden of fungi encountered by humans in certain high exposure
settings. The resultant pulmonary immune response from repeated
Table 1. Proteomic analysis of immunoreactive conidia protein bands identified in sIgG Western blot.
Protein bands Protein IdentificationProtein AccessionNumber
Theoretical molecularmass (kDa)/pI
Number ofpeptides
Sequencecoverage (%)
Predicted signalpeptide (positions)
1 a) Hydrophobin P41746 16.11/5.17 26 66.04 Yes (1–18)
b) Nucleosidediphosphate kinase
B0Y2U5 16.93/7.76 12 37.91 No
2–3 a) Hydrophobin Q8TFV2 11.42/4.66 20 46.73 No
b) Putative,uncharacterized protein
B0YDB8 12.85/5.73 2 24.56 No
doi:10.1371/journal.pone.0109855.t001
Table 2. Proteomic analysis of immunoreactive hyphal protein bands identified in WT sIgG two-dimensional Western blot.
Proteinspots Protein Identification
Protein AccessionNumber
Theoreticalmolecular mass(kDa)/pI
Numberofpeptides
Sequencecoverage (%)
1 a) 5-methyltetrahydropteroyltriglutamate homocysteineS-methyltransferase
B0Y5S8 86.84/6.33 3 4.01
2 a) Putative, Mitochondrial aconitate hydratase Q4WLN1 85.48/6.25 8 9.91
3 a) Putative, Mitochondrial dihydroxy acid dehydratase B0XTT1 68.21/7.78 10 13.08
b) Phosphoglucomutase PgmA B0XXA2 60.46/6.30 14 16.58
c) Putative, Pyruvate decarboxylase PdcA B0XXN9 62.96/6.07 3 10.72
d) Putative, GMC oxidoreductase Q4WFN7 72.10/7.08 3 7.58
4 a) Putative, Antigenic mitochondrial protein HSP60 B0XRX3 61.91/5.35 35 37.99
5 a) Putative, Proteasome regulatory particle subunit Rpt3 Q4WY11 51.57/4.99 11 26.02
6 a) Putative, Acetyl CoA acetyltransferase B0YA65 40.88/6.43 12 17.59
7 a) Glyceraldehyde 3 phosphate dehydrogenase (GAPDH) B0Y207 36.29/7.27 28 33.14
doi:10.1371/journal.pone.0109855.t002
A Murine Inhalation Model of Aspergillus fumigatus Exposure
PLOS ONE | www.plosone.org 11 October 2014 | Volume 9 | Issue 10 | e109855

inhalation exposures had a mixed Th1/Th2/Th17 cytokine
profile. Tc17 cells were additionally identified in response to A.fumigatus germination. This T cell population may be an
important source of IL-17 responsible for heightened recruitment
of innate phagocytes observed at 24 and 48 hours following the
final exposure. Additionally, we observed the production of
specific IgG to prominent antigens derived from WT and Dalb1conidia and hyphal extracts. This study provides further insight
into the role of conidial melanin in the induction of immune
responses and demonstrates that sIgG could be produced to
hydrophobin. Future studies that evaluate other mold species of
environmental and occupational significance are required to
provide further insight into the resulting pulmonary immune
responses. Other potential uses of this inhalation model include
studies of the pathogenesis of either acute or chronic aspergillosis
and the influence of different immunosuppressive agents on the
establishment of opportunistic fungal infections. These studies may
identify additional biomarkers of fungal exposure that could prove
useful in immunodiagnostics but more importantly, may provide
further data to determine limits of personal and occupational
exposure.
Supporting Information
Data S1 Supporting file containing original datasetsassociated with each manuscript and supporting infor-mation figure.(ZIP)
Figure S1 Average stimulation indices (SI) determinedby a modified local lymph node assay. Mice were exposed
to the indicated deposition concentration of WT conidia. SI were
calculated as average disintegration per minute of the exposed
group/average disintegration per minute control group. Horizon-
tal line at SI of 10 is an arbitrary index used to determine positive
lymphocyte proliferation in these studies. n = 10 mice/group.
(TIF)
Figure S2 Histopathology of sections derived from A.fumigatus Dalb1 exposed mice. A) Representative histopa-
thology sections from WT exposed mice sacrificed at the indicated
time points. Top panel-H&E stained sections at 1006 objective,
Bottom panel-PAS stained sections at 106 objective.
(TIF)
Figure S3 Flow cytometry analysis of intracellularcytokine production in the BALF. CD4+ and CD8+ T cellswere quantified by multiplying the frequency of each
individual cell population by the total cell counts. Mice
were sacrificed at the indicated time points after the 8th exposure.
Data are presented as the average 6 standard error of measure.
n = 7–10 mice/group per time point. ****P#0.0001, ***P#0.001,
*P#0.05.
(TIF)
Figure S4 Intracellular cytokine flow cytometry analy-sis of the MLNs. CD4+ and CD8+ T cells were quantifiedby multiplying the frequency of each individual cellpopulation by the total cell counts. Mice were sacrificed at
the indicated time points after the 8th exposure. Data are
presented as the average 6 standard error of measure. n = 7–10
mice/group per time point. ****P#0.0001, ***P#0.001, *P#
0.05.
(TIF)
Figure S5 Total IgE quantification via ELISA. Sera from
exposed mice was obtained at 3 days or 7 days following the final
exposure, and analyzed via a commercially available total IgE
ELISA kit (Biolegend, San Diego, CA). Each sample was prepared
in duplicate and the values presented are the average 6 standard
error of measure.
(TIF)
Figure S6 Specific IgG from A. fumigatus WT exposedmice. Two dimensional Western blot analysis of specific IgG in
serum from WT mice exposed to proteins generated from an A.fumigatus WT hyphal extract.
(TIF)
File S1 Supporting file containing additional BALF andMLN results.(DOCX)
Acknowledgments
The authors wish to thank Diane Schwegler-Berry for FESEM analysis.
The findings and the conclusions in this report are those of the authors and
do not necessarily represent the views of the National Institute for
Occupational Safety and Health.
Author Contributions
Conceived and designed the experiments: ADB BJG WTG SEA JMH SPT
DRG DHB. Performed the experiments: ADB BJG ARL APN WTG SEA
JMH. Analyzed the data: ADB BJG ARL APN WTG MLK JMH.
Contributed reagents/materials/analysis tools: BJG WTG MLK SEA
JMH. Wrote the paper: ADB BJG ARL APN WTG MLK SEA JMH SPT
DRG DHB.
References
1. Eduard W (2009) Fungal spores: a critical review of the toxicological and
epidemiological evidence as a basis for occupational exposure limit setting. Crit
Rev Toxicol 39: 799–864.
2. Devereux G (2006) The increase in the prevalence of asthma and allergy: food
for thought. Nat Rev Immunol 6: 869–874.
3. Black PN, Udy AA, Brodie SM (2000) Sensitivity to fungal allergens is a risk
factor for life-threatening asthma. Allergy 55: 501–504.
4. WHO (2009). WHO Guidelines for Indoor Air Quality: Dampness and Mould.
Geneva.
5. Institute of Medicine (U.S.). Committee on Damp Indoor Spaces and Health.
(2004) Damp indoor spaces and health. Washington, DC: National Academies
Press. xi, 355 p. p.
6. Crameri R, Weichel M, Fluckiger S, Glaser AG, Rhyner C (2006) Fungal
allergies: a yet unsolved problem. Chem Immunol Allergy 91: 121–133.
7. Simon-Nobbe B, Denk U, Poll V, Rid R, Breitenbach M (2008) The spectrum of
fungal allergy. Int Arch Allergy Immunol 145: 58–86.
8. Bakker-Woudenberg IA (2003) Experimental models of pulmonary infection.
J Microbiol Methods 54: 295–313.
9. Templeton SP, Buskirk AD, Green BJ, Beezhold DH, Schmechel D (2010)
Murine models of airway fungal exposure and allergic sensitization. Med Mycol
48: 217–228.
10. Murdock BJ, Shreiner AB, McDonald RA, Osterholzer JJ, White ES, et al.
(2011) Coevolution of TH1, TH2, and TH17 responses during repeated
pulmonary exposure to Aspergillus fumigatus conidia. Infect Immun 79: 125–
135.
11. Shreiner AB, Murdock BJ, Sadighi Akha AA, Falkowski NR, Christensen PJ, et
al. (2012) Repeated exposure to Aspergillus fumigatus conidia results in CD4+ T
cell-dependent and -independent pulmonary arterial remodeling in a mixed
Th1/Th2/Th17 microenvironment that requires interleukin-4 (IL-4) and IL-10.
Infect Immun 80: 388–397.
12. Hoselton SA, Samarasinghe AE, Seydel JM, Schuh JM (2010) An inhalation
model of airway allergic response to inhalation of environmental Aspergillusfumigatus conidia in sensitized BALB/c mice. Med Mycol 48: 1056–1065.
13. Samarasinghe AE, Hoselton SA, Schuh JM (2011) A comparison between
intratracheal and inhalation delivery of Aspergillus fumigatus conidia in the
development of fungal allergic asthma in C57BL/6 mice. Fungal Biol 115: 21–
29.
A Murine Inhalation Model of Aspergillus fumigatus Exposure
PLOS ONE | www.plosone.org 12 October 2014 | Volume 9 | Issue 10 | e109855

14. Buskirk AD, Templeton SP, Nayak AP, Hettick JM, Law BF, et al. (2014)
Pulmonary immune responses to Aspergillus fumigatus in an immunocompetentmouse model of repeated exposures. J Immunotoxicol 11: 180–189.
15. Templeton SP, Buskirk AD, Law B, Green BJ, Beezhold DH (2011) Role of
germination in murine airway CD8+ T-cell responses to Aspergillus conidia.PLoS One 6: e18777.
16. Tsai HF, Wheeler MH, Chang YC, Kwon-Chung KJ (1999) A developmentallyregulated gene cluster involved in conidial pigment biosynthesis in Aspergillusfumigatus. J Bacteriol 181: 6469–6477.
17. Jarvis BB, Sorenson WG, Hintikka EL, Nikulin M, Zhou Y, et al. (1998) Study oftoxin production by isolates of Stachybotrys chartarum and Memnoniella echinataisolated during a study of pulmonary hemosiderosis in infants. Appl EnvironMicrobiol 64: 3620–3625.
18. Raabe OG, Al-Bayati MA, Teague SV, Rasolt A (1988) Regional deposition ofinhaled monodisperse coarse and fine aerosol particles in small laboratory
animals. Ann Occup Hyg 32: 53–63.
19. Stevens WW, Kim TS, Pujanauski LM, Hao X, Braciale TJ (2007) Detectionand quantitation of eosinophils in the murine respiratory tract by flow
cytometry. J Immunol Methods 327: 63–74.20. Foster B, Prussin C, Liu F, Whitmire JK, Whitton JL (2007) Detection of
intracellular cytokines by flow cytometry. Curr Protoc Immunol Chapter 6: Unit
6 24.21. Collins C, Keane TM, Turner DJ, O’Keeffe G, Fitzpatrick DA, et al. (2013)
Genomic and proteomic dissection of the ubiquitous plant pathogen, Armillariamellea: toward a new infection model system. J Proteome Res 12: 2552–2570.
22. Chakraborty AB, Berger SJ, Gebler JC (2007) Use of an integrated MS–multiplexed MS/MS data acquisition strategy for high-coverage peptide
mapping studies. Rapid Commun Mass Spectrom 21: 730–744.
23. Green BJ, Cummings KJ, Rittenour WR, Hettick JM, Bledsoe TA, et al. (2011)Occupational sensitization to soy allergens in workers at a processing facility.
Clin Exp Allergy 41: 1022–1030.24. Shvedova AA, Kisin E, Murray AR, Johnson VJ, Gorelik O, et al. (2008)
Inhalation vs. aspiration of single-walled carbon nanotubes in C57BL/6 mice:
inflammation, fibrosis, oxidative stress, and mutagenesis. Am J Physiol LungCell Mol Physiol 295: L552–565.
25. Fogelmark B, Lacey J, Rylander R (1991) Experimental allergic alveolitis afterexposure to different microorganisms. Int J Exp Pathol 72: 387–395.
26. McKinney W, Chen B, Frazer D (2009) Computer controlled multi-walledcarbon nanotube inhalation exposure system. Inhal Toxicol 21: 1053–1061.
27. van de Veerdonk FL, Gresnigt MS, Kullberg BJ, van der Meer JW, Joosten LA,
et al. (2009) Th17 responses and host defense against microorganisms: anoverview. BMB Rep 42: 776–787.
28. Liang SC, Long AJ, Bennett F, Whitters MJ, Karim R, et al. (2007) An IL-17F/
A heterodimer protein is produced by mouse Th17 cells and induces airway
neutrophil recruitment. J Immunol 179: 7791–7799.
29. Huppler AR, Conti HR, Hernandez-Santos N, Darville T, Biswas PS, et al.
(2014) Role of Neutrophils in IL-17-Dependent Immunity to Mucosal
Candidiasis. J Immunol 192: 1745–1752.
30. Nanjappa SG, Heninger E, Wuthrich M, Gasper DJ, Klein BS (2012) Tc17 cells
mediate vaccine immunity against lethal fungal pneumonia in immune deficient
hosts lacking CD4+ T cells. PLoS Pathog 8: e1002771.
31. Hamada H, Garcia-Hernandez Mde L, Reome JB, Misra SK, Strutt TM, et al.
(2009) Tc17, a unique subset of CD8 T cells that can protect against lethal
influenza challenge. J Immunol 182: 3469–3481.
32. Carvalho A, De Luca A, Bozza S, Cunha C, D’Angelo C, et al. (2012) TLR3
essentially promotes protective class I-restricted memory CD8(+) T-cell
responses to Aspergillus fumigatus in hematopoietic transplanted patients.
Blood 119: 967–977.
33. Lambrecht BN, Hammad H (2003) Taking our breath away: dendritic cells in
the pathogenesis of asthma. Nat Rev Immunol 3: 994–1003.
34. Obst R, van Santen HM, Mathis D, Benoist C (2005) Antigen persistence is
required throughout the expansion phase of a CD4(+) T cell response. J Exp
Med 201: 1555–1565.
35. Chai LY, Netea MG, Sugui J, Vonk AG, van de Sande WW, et al. (2010)
Aspergillus fumigatus conidial melanin modulates host cytokine response.
Immunobiology 215: 915–920.
36. Millon L, Roussel S, Rognon B, Quadroni M, Salamin K, et al. (2012)
Aspergillus species recombinant antigens for serodiagnosis of farmer’s lung
disease. J Allergy Clin Immunol 130: 803–805 e806.
37. Green BJ, Mitakakis TZ, Tovey ER (2003) Allergen detection from 11 fungal
species before and after germination. J Allergy Clin Immunol 111: 285–289.
38. Green BJ, Sercombe JK, Tovey ER (2005) Fungal fragments and undocumented
conidia function as new aeroallergen sources. J Allergy Clin Immunol 115:
1043–1048.
39. Mitakakis TZ, Barnes C, Tovey ER (2001) Spore germination increases allergen
release from Alternaria. J Allergy Clin Immunol 107: 388–390.
40. Aimanianda V, Bayry J, Bozza S, Kniemeyer O, Perruccio K, et al. (2009)
Surface hydrophobin prevents immune recognition of airborne fungal spores.
Nature 460: 1117–1121.
41. Green BJ, Tovey ER, Sercombe JK, Blachere FM, Beezhold DH, et al. (2006)
Airborne fungal fragments and allergenicity. Med Mycol 44 Suppl 1: S245–255.
A Murine Inhalation Model of Aspergillus fumigatus Exposure
PLOS ONE | www.plosone.org 13 October 2014 | Volume 9 | Issue 10 | e109855


