Embed Size (px)
Citation preview
Nuclear Instruments and Methods in Physics Research B 211 (2003) 259–264
www.elsevier.com/locate/nimb
A new 3D micro X-ray fluorescence analysis set-up– First archaeometric applications
Birgit Kanngießer a,*, Wolfgang Malzer a, Ina Reiche b,1
a Institute for Atomic Physics and Teacher Training, Technical University of Berlin, Hardenbergstrasse 36, D-10623 Berlin, Germanyb Rathgen-Research Laboratory of the State Museums of Berlin, Schloßstr. 1a, D-14059 Berlin, Germany
Received 6 February 2003
Abstract
A new 3D micro X-ray fluorescence (micro-XRF) analysis method based on a confocal X-ray set-up is presented.
The capabilities of this new method are evaluated and illustrated with depth sensitive investigations of paint layers in
ancient Indian Mughal miniatures. Successive paint layers could be distinguished non-destructively with a depth res-
olution of about 10 lm. Major and minor elements are detectable and can be discriminated in different layers. New light
could be shed on ancient painting techniques and materials with this new 3D micro-XRF set-up.
� 2003 Elsevier B.V. All rights reserved.
PACS: 07.85.Qe; 82.80.Ej
Keywords: 3D micro-XRF; Depth profiling of elemental composition; Paint layers
1. Introduction
Micro X-ray fluorescence analysis (micro-XRF)
is one of the newest branches of XRF. It has been
developed very rapidly in the past 10 years which is
mainly due to the use of synchrotron radiation.
Nowadays micro-XRF is a well established, non-
destructive analytical method in a large variety of
fields of application like materials science/quality
control, environmental science, geology, life sci-
* Corresponding author. Tel.: +49-30-314-21428; fax: +49-
30-314-23018.
E-mail address: [email protected] (B. Kann-
gießer).1 Present address: Centre of Research and Restauration of
the French Museums, UMR 171 CNRS, Paris, France.
0168-583X/$ - see front matter � 2003 Elsevier B.V. All rights reser
doi:10.1016/S0168-583X(03)01321-1
ence and archaeometry. An overview of the in-
strumentation and the fields of application can befound in [1]. Very soon after the first micro-XRF
set-ups have been built up, they were also used for
the analysis of valuable unique art or archaeo-
logical objects [2–5]. However, the microscopic
excitation spot has been used to perform very local
analysis by 2D elemental mapping or line-scanning
on the sample surface but not to perform investi-
gations in depth. We improved the capabilities ofthe micro-XRF method towards a three dimen-
sional (3D) micro-XRF by realizing a confocal
X-ray set-up and applied it to the investigation of
art-historical objects.
These art-historical objects were ancient
Indian Mughal miniatures. Mughal miniatures,
representations of sovereigns or other important
ved.
260 B. Kanngießer et al. / Nucl. Instr. and Meth. in Phys. Res. B 211 (2003) 259–264
personalities (16–19th century), were produced in
particular workshops in India. These paintings
consist of several well separated polished pigment
layers on paper. Until now, only scarce informa-tion is available on this painting technique and the
artists pigment palette. Moreover, it is known
from the 18th century onwards that there was an
important production of miniatures copying mas-
terpieces from the ‘‘classical’’ period, sometimes by
overpainting old miniatures of low value. With the
possibility to get insights non-destructively into
the chemical composition of the layered pigmentstructure, new clues for the distinction of later
copies from originals may be obtained.
2. Experimental set-up
The confocal X-ray set-up (Fig. 1) consists of
X-ray optics in the excitation as well as in thedetection channel. A micro-volume is defined by
the overlap of the foci of both X-ray optics with
which the chemical composition of samples can be
non-destructively investigated not only laterally
but also into the depth. The depth of the micro-
volume depends on the energy of the exciting ra-
diation, the energy of the fluorescence radiation,
the incidence angle, the angle of reflection, and thesample composition. By moving the sample, the
micro-volume to be analyzed can be displaced
Fig. 1. Scheme of the confocal set-up for the 3D micro X-ray
fluorescence analysis.
laterally or in a direction perpendicular to its
surface. Thus, depth information on chemical
composition can also be obtained non-destruc-
tively. Additionally, a better peak-to-background-ratio can be reached due to the restriction of the
detector field of view. Such a set-up has also been
proposed by Kumakhov [6].
This confocal X-ray set-up was first realized at
the 7T wavelengthshifter beamline, the BAMline,
at BESSY II (Fig. 2). After passing through the
ionization chamber, the monochromatic (17.4 keV)
X-rays were focused by a polycapillary halflens.Working with synchrotron radiation a halflens is
the most suited X-ray optics for the use in the
excitation channel. The halflens has a greater en-
trance diameter as a full lens, thus accepting more
from the quasi-parallel synchrotron beam. Fur-
thermore, beam position fluctuations can be
compensated for to a certain extent. If the syn-
chrotron radiation is already focused down to afew tenth of micrometers by an optical element of
the beamline, an X-ray optic in the excitation
channel is no longer necessary provided the beam
position is stable.
We used a polycapillary halflens with a focus
FWHM of about 30 lm at a working distance of
16 mm. The micro-volume was produced by the
overlap of the halflens focus with the focus of apolycapillary conical collimator (poly CCC) ad-
justed in front of a Si(Li) detector. The focus of the
poly CCC has a FWHM of 20 lm at a working
distance of 1.2 mm.
The use of a poly CCC is much more effective
than the use of a polycapillary full lens in the de-
tection channel, as proposed by Kumakhov [6].
For radiation with an energy below around 8 keV,the poly CCC has a smaller focus size as any
polycapillary lens which can actually be produced.
For radiation with a higher energy the size of the
foci is comparable. Even more important is that
the poly CCC has a greater acceptance angle
leading to a higher transmittance of the radiation.
A disadvantage of the poly CCC is the very small
working distance which aggravates the adjustmentof the sample.
The second detector of the set-up, a drift
chamber detector, was used to monitor the radia-
tion coming from the sample in order to obtain a
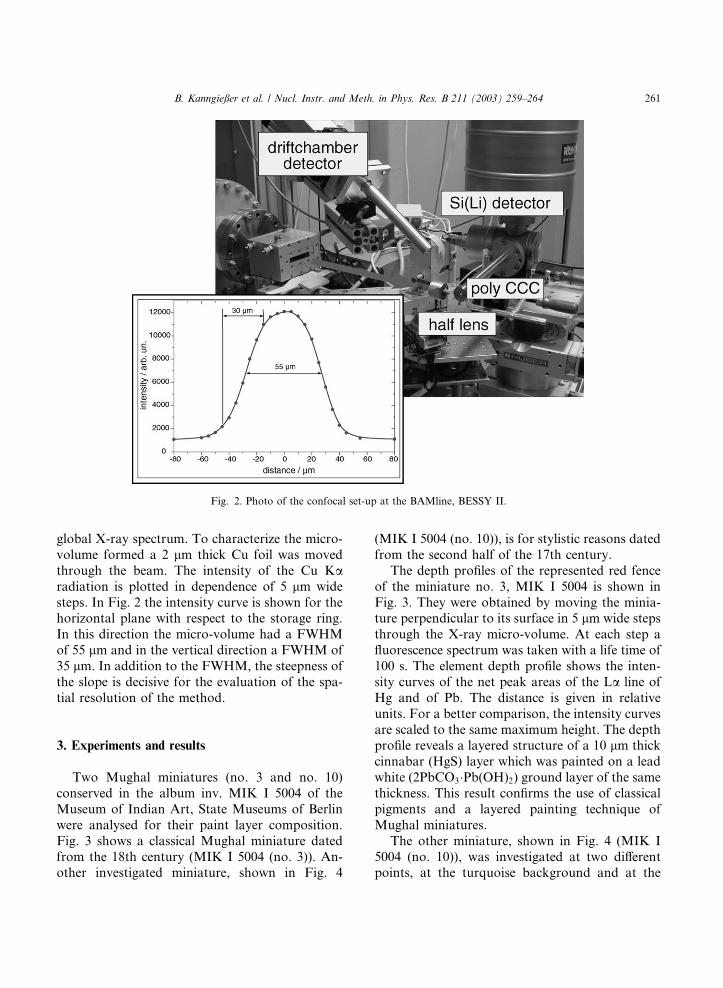
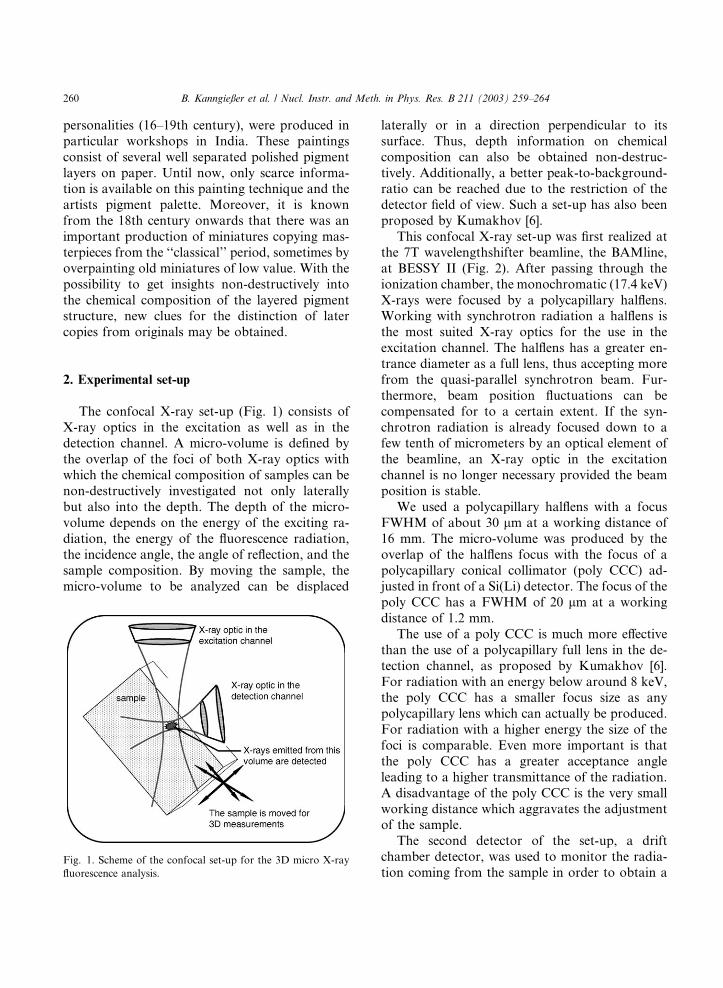
Fig. 2. Photo of the confocal set-up at the BAMline, BESSY II.
B. Kanngießer et al. / Nucl. Instr. and Meth. in Phys. Res. B 211 (2003) 259–264 261
global X-ray spectrum. To characterize the micro-
volume formed a 2 lm thick Cu foil was moved
through the beam. The intensity of the Cu Karadiation is plotted in dependence of 5 lm wide
steps. In Fig. 2 the intensity curve is shown for thehorizontal plane with respect to the storage ring.
In this direction the micro-volume had a FWHM
of 55 lm and in the vertical direction a FWHM of
35 lm. In addition to the FWHM, the steepness of
the slope is decisive for the evaluation of the spa-
tial resolution of the method.
3. Experiments and results
Two Mughal miniatures (no. 3 and no. 10)
conserved in the album inv. MIK I 5004 of the
Museum of Indian Art, State Museums of Berlin
were analysed for their paint layer composition.
Fig. 3 shows a classical Mughal miniature dated
from the 18th century (MIK I 5004 (no. 3)). An-other investigated miniature, shown in Fig. 4
(MIK I 5004 (no. 10)), is for stylistic reasons dated
from the second half of the 17th century.
The depth profiles of the represented red fence
of the miniature no. 3, MIK I 5004 is shown in
Fig. 3. They were obtained by moving the minia-ture perpendicular to its surface in 5 lm wide steps
through the X-ray micro-volume. At each step a
fluorescence spectrum was taken with a life time of
100 s. The element depth profile shows the inten-
sity curves of the net peak areas of the La line of
Hg and of Pb. The distance is given in relative
units. For a better comparison, the intensity curves
are scaled to the same maximum height. The depthprofile reveals a layered structure of a 10 lm thick
cinnabar (HgS) layer which was painted on a lead
white (2PbCO3�Pb(OH)2) ground layer of the same
thickness. This result confirms the use of classical
pigments and a layered painting technique of
Mughal miniatures.
The other miniature, shown in Fig. 4 (MIK I
5004 (no. 10)), was investigated at two differentpoints, at the turquoise background and at the
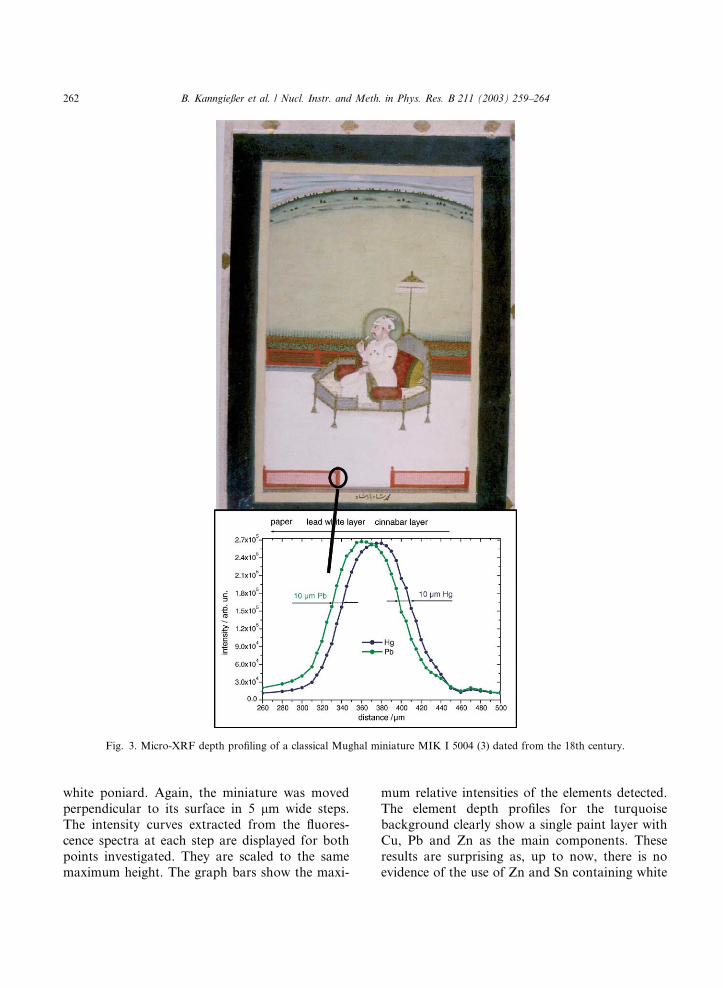
Fig. 3. Micro-XRF depth profiling of a classical Mughal miniature MIK I 5004 (3) dated from the 18th century.
262 B. Kanngießer et al. / Nucl. Instr. and Meth. in Phys. Res. B 211 (2003) 259–264
white poniard. Again, the miniature was moved
perpendicular to its surface in 5 lm wide steps.
The intensity curves extracted from the fluores-
cence spectra at each step are displayed for both
points investigated. They are scaled to the same
maximum height. The graph bars show the maxi-
mum relative intensities of the elements detected.
The element depth profiles for the turquoise
background clearly show a single paint layer with
Cu, Pb and Zn as the main components. These
results are surprising as, up to now, there is no
evidence of the use of Zn and Sn containing white
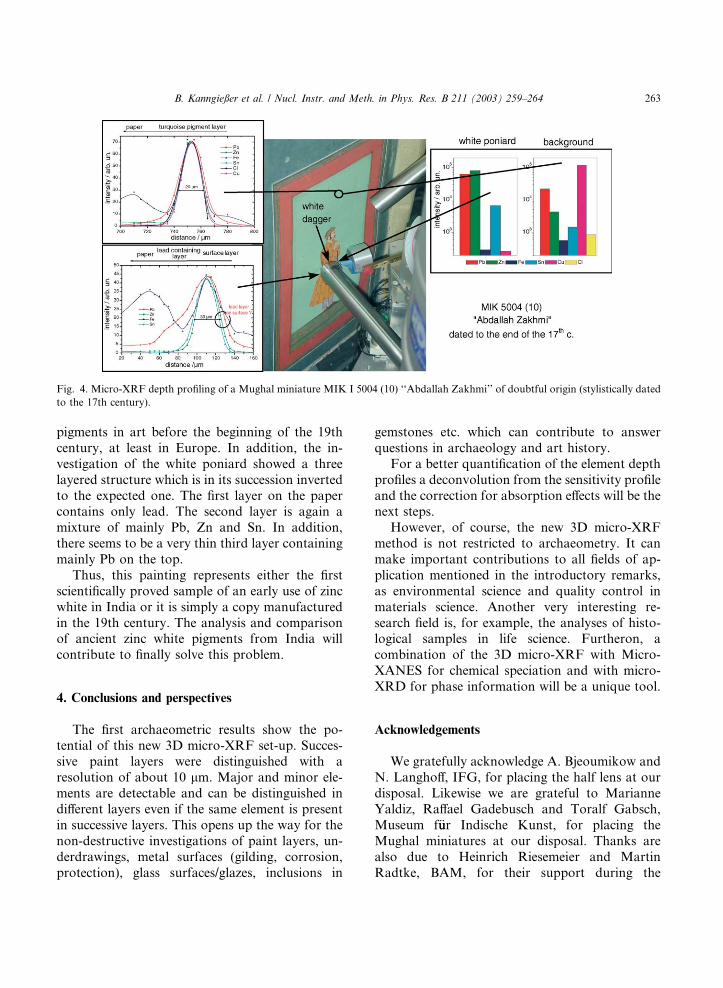
Fig. 4. Micro-XRF depth profiling of a Mughal miniature MIK I 5004 (10) ‘‘Abdallah Zakhmi’’ of doubtful origin (stylistically dated
to the 17th century).
B. Kanngießer et al. / Nucl. Instr. and Meth. in Phys. Res. B 211 (2003) 259–264 263
pigments in art before the beginning of the 19th
century, at least in Europe. In addition, the in-
vestigation of the white poniard showed a three
layered structure which is in its succession inverted
to the expected one. The first layer on the papercontains only lead. The second layer is again a
mixture of mainly Pb, Zn and Sn. In addition,
there seems to be a very thin third layer containing
mainly Pb on the top.
Thus, this painting represents either the first
scientifically proved sample of an early use of zinc
white in India or it is simply a copy manufactured
in the 19th century. The analysis and comparisonof ancient zinc white pigments from India will
contribute to finally solve this problem.
4. Conclusions and perspectives
The first archaeometric results show the po-
tential of this new 3D micro-XRF set-up. Succes-sive paint layers were distinguished with a
resolution of about 10 lm. Major and minor ele-
ments are detectable and can be distinguished in
different layers even if the same element is present
in successive layers. This opens up the way for the
non-destructive investigations of paint layers, un-
derdrawings, metal surfaces (gilding, corrosion,
protection), glass surfaces/glazes, inclusions in
gemstones etc. which can contribute to answer
questions in archaeology and art history.
For a better quantification of the element depth
profiles a deconvolution from the sensitivity profile
and the correction for absorption effects will be thenext steps.
However, of course, the new 3D micro-XRF
method is not restricted to archaeometry. It can
make important contributions to all fields of ap-
plication mentioned in the introductory remarks,
as environmental science and quality control in
materials science. Another very interesting re-
search field is, for example, the analyses of histo-logical samples in life science. Furtheron, a
combination of the 3D micro-XRF with Micro-
XANES for chemical speciation and with micro-
XRD for phase information will be a unique tool.
Acknowledgements
We gratefully acknowledge A. Bjeoumikow and
N. Langhoff, IFG, for placing the half lens at our
disposal. Likewise we are grateful to Marianne
Yaldiz, Raffael Gadebusch and Toralf Gabsch,
Museum f€uur Indische Kunst, for placing the
Mughal miniatures at our disposal. Thanks are
also due to Heinrich Riesemeier and Martin
Radtke, BAM, for their support during the

264 B. Kanngießer et al. / Nucl. Instr. and Meth. in Phys. Res. B 211 (2003) 259–264
beamtime. This work was partially supported by
the DFG.
References
[1] K.H.A. Janssens, F.C.V. Adams, A. Rindby (Eds.), Micro-
scopic X-ray Fluorescence Analysis, John Wiley and Sons,
Chichester, 2000.
[2] I. Brissaud, J.X. Wang, P. Chevallier, J. Radioanal. Nucl.
Chem. 131 (1989) 399.
[3] I. Nakai, I. Taguchi, K. Yamasaki, Anal. Sci. 7 (Supple-
ment) (1991).
[4] I. Nakai, A. Iida, Adv. X-ray Anal. 35 (1992)
1307.
[5] I. Reiche, M. Radtke, C. Brouder, Physik in unserer Zeit 34
(2) (2003) 80.
[6] M.A. Kumakhov, X-ray Spectrom. 29 (2000)
343.


