Embed Size (px)
Citation preview

Ann. Zool. Fennici 34: 187–196 ISSN 0003-455XHelsinki 18 September 1997 © Finnish Zoological and Botanical Publishing Board 1997
Developmental stability in the Eurasian Otter (Lutralutra) in Denmark
Cino Pertoldi, Volker Loeschcke, Aksel Bo Madsen & Ettore Randi
Pertoldi, C. & Loeschcke, V., Department of Ecology and Genetics, University of Aarhus,Building 540, Ny Munkegade, DK-8000 Aarhus C, DenmarkMadsen, A. B., Department of Landscape Ecology, National Environmental ResearchInstitute, Kalø Grenåvej 14, DK-8410 Rønde, DenmarkRandi, E., Istituto Nazionale per la Fauna Selvatica, via Ca´ Fornacetta 9, I-40064Ozzano Emilia (Bo), Italy
Received 6 February 1997, accepted 11 April 1997
Fluctuating asymmetry (FA) as expressed in metric and meristic skull traits was ana-lysed in a sample of 172 otters collected in Denmark between 1861 and 1994. Tissuelevels of organochlorine pesticide residues and PCBs were determined and the correla-tion between contaminant concentration and FA was tested. A significant correlationwas found between FA in different traits and the year of collection, but there was nosignificant correlation between FA and the concentration of contaminants. These re-sults suggest that factors other than pesticides have affected the developmental stabilityof skulls in the Danish otter population. Among these, a population bottleneck follow-ing habitat fragmentation is discussed as a possible cause.
1. Introduction
The otter (Lutra lutra), once a widespread spe-cies in Denmark, is today largely restricted to theLimfjord area in the northern part of Jutland(Fig. 1), with isolated population fragments in thesurrounding region (Hammershøj et al. 1996).Toxic chemicals are believed to be responsiblefor the decline of otter populations both in Den-mark and over much of lowland Europe (Mason& Macdonald 1986, Mason 1989). Additionalthreats to the remaining otter population in Den-mark are traffic mortality, wetland destruction andhuman disturbance (see Madsen 1996 for a re-view).
Fluctuating asymmetry (FA) occurs when anindividual is unable to undergo identical devel-opment on both sides of a bilaterally symmetricaltrait (Van Valen 1962, Palmer & Strobeck 1986).FA tends to become elevated under stress (Leary& Allendorf 1989). Stress factors known to raiseFA include various chemicals, including pesti-cides (Valentine & Soulé 1973), polluted habitats(Weiner & Rago 1987), extreme temperatures(Parsons 1962, Siegel & Doyle 1975, Sciulli etal. 1979), audiogenic stress (Sciulli et al. 1979),and food deficiency either in terms of quality orquantity (Parsons 1990). Also severe restrictionsin the availability of nutrients to females duringpregnancy causes asymmetry in the skeletal traits

Pertoldi et al. • ANN. ZOOL. FENNICI Vol. 34188
of offspring (Sciulli et al. 1979). Furthermore,directional selection, homozygosity, inbreedingand mutations, are also thought to be associatedwith elevated levels of FA (see Parsons 1992 forreview). For example, Clarke and McKenzie (1987)demonstrated that homozygous individuals wereoften developmentally less stable than theirheterozygous counterparts (but see also Britten 1996for a different view).
Three groups of stressing factors could haveaffected the dynamics of otter populations in Den-mark, and have influenced their degree of devel-opmental stability: (1) contamination of habitatsby pesticides, (2) population decline with subse-quent erosion of genetic diversity and increasingrate of inbreeding, (3) strong sexual selectionwhich can differentially affect developmental sta-bility in both sexes (males have a larger body sizethan females, Moors 1980), can result in sexualdimorphism.
Persistent pollutants, which accumulate in liv-ing tissues, are a particular problem in fresh wa-ter habitats of otters because there are many sourcesof contamination. Rainfall washes atmosphericpollutants and chemicals applied to land intowaterbodies. Many industries discharge effluentsinto rivers, directly or indirectly. Small amountsof persistent pollutants in effluents may becomequickly concentrated in the biota. PCBs were notidentified as environmental contaminants until 1966(Jensen 1972), though they had been in industrialuse for at least 35 years before that, and have sincebeen proved to be widespread in the ecosystem.Of pesticides, the chlorinated hydrocarbons dis-solve readily in animal fats and hence accumu-late in tissues. When these fats are mobilised dur-ing periods of stress, such as food shortage or re-production, large amounts of pesticides may bereleased into the blood stream.
The otter population in Denmark declinedsharply starting from an estimated size of morethan 1 500 individuals in 1961 to only 200 in 1980(Schimmer 1981), and increased thereafter againto 400 animals censused in 1991. This decline wasprobably an effect of pesticide contamination (Ma-son & Madsen 1993). The reproductive biologyof otters suggests that the ratio of the effectivepopulation size Ne to the observed population sizeN is on average 0.11 (see Frankham 1995 for re-view). Therefore, the population bottleneck dur-
ing the 80s should have been Ne about 20 indi-viduals for at least 5 generations. During this pe-riod, the Danish otter population may have lostrare alleles and possibly became less heterozy-gous. The estimates of low effective populationsizes are also supported by very low genetic vari-ability found in the mitochondrial DNA controlregion (D-loop) (N. Mucci, C. Pertoldi, A. B. Mad-sen, V. Loeschcke and E. Randi unpubl.).
FA tends to be higher in sexually selected char-acters than non-sexually selected traits (Møller1992, Manning & Chamberlain 1993). However,it is not known whether nutrient deficiency, orany of the other factors listed above, cause anydifferential effect on FA in characters subjectedto sexual selection as compared with ordinarymorphologically traits.
In this paper, we aim to estimate FA in metricand meristic skull traits in Eurasian otters collectedin Denmark from 1861 until 1994. FA will be cor-related with morphometric variability, the periodof sample collection, demographic trends of theDanish otter population, and levels of pesticideand PCB contaminants in tissues.
2. Material and methods
We used skulls of Eurasian otters (Lutra lutra) from theZoological Museum, Copenhagen (skulls from 1861 until1959), the Natural History Museum, Aarhus (1959–1961)and the National Environmental Research Institute, Kalø(DMU) (1979–1993). Animals from DMU (only animalsfrom DMU were age-determined) were considered as juve-niles (less than about 5 months old) if tooth replacementwas incomplete, subadults (5–18 months) if the epiphysealclosure of humerus and femur at their proximal and distalends was not finished, or as adults (older than about 18months). In males, the length of the baculum was also usedin age determination (Van Bree et al. 1966). Skull growthin otters is complete by the third year of life (Chanin 1991),and further changes, except senility changes in the skullwill not affect the skull measurements.
All skulls, until 1961 originated from different parts ofDenmark (Jutland, and the isles of Zealand and Funen). Afterthat date, no more otters were found on the isles (Fig. 1).
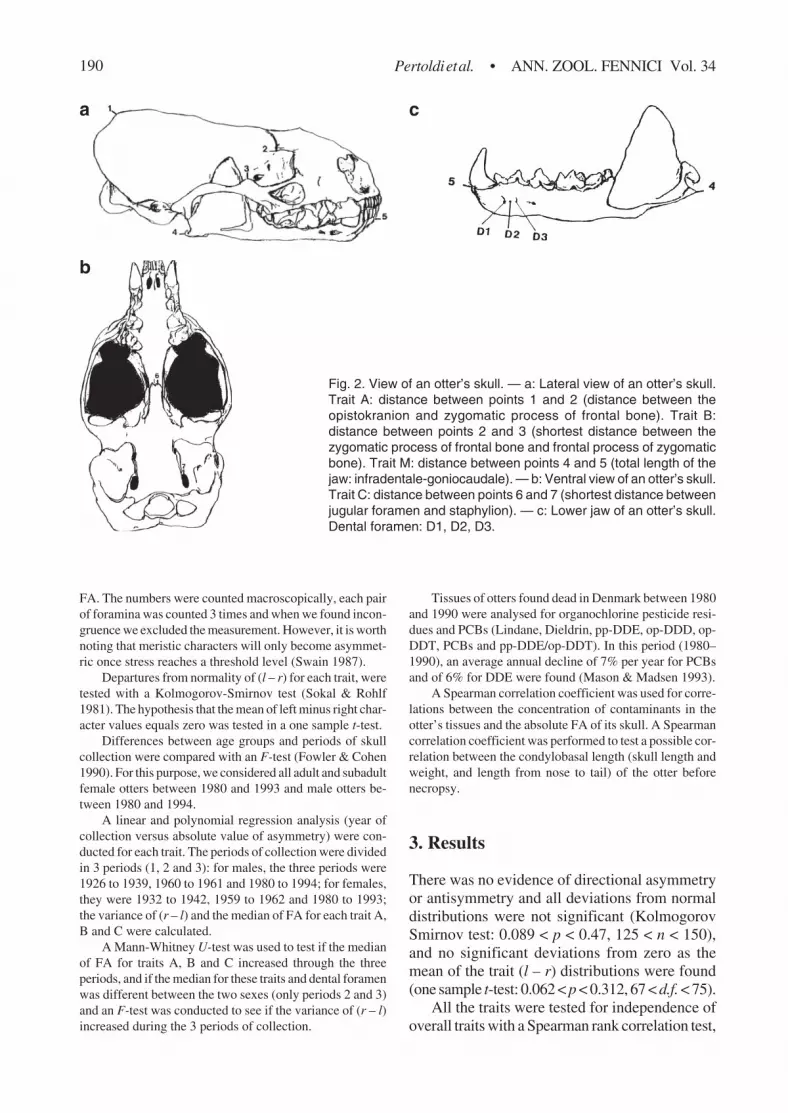
A total of 172 skulls were examined. Four charactersof the skulls A, B, C and M, and the Dental foramen (whichare small openings for nerves and blood vessels) of the lowerjaws were counted (Fig. 2). Trait A is the distance betweenthe opistokranion and zygomatic process of frontal bone,trait B is the shortest distance between the zygomatic proc-ess of frontal bone and frontal process of zygomatic bone,trait C is the shortest distance between the jugular foramen

ANN. ZOOL. FENNICI Vol. 34 • Developmental stability in the Eurasion Otter in Denmark 189
Fig. 1. The distribution ofthe otter in Denmark in1996, 1991, between 1984and 1986, and between1960 and 1980.
and staphylion and trait M is the total length of the jaw:infradentale-goniocaudale. The traits chosen (Fig. 2a–c)appeared to show a high level of fluctuating asymmetry.
The traits A, B, C and M were measured with a digitalcalliper to the nearest 0.1 mm. The magnitude of asymme-try was estimated from the difference in length betweeneach bilateral pair as right minus left (r – l). FA was calcu-lated as the absolute value of asymmetry and as the vari-ance of (r – l) (Palmer & Strobeck 1986). To reduce themeasurement error, all measurements were replicated 3
times (at an interval of 3 hours), and the median of the 3measures was chosen. The overall repeatability (rI; see Zar1984) of the size measurement was estimated to be around97% (0.968 < rI < 0.982, p < 0.001), so that the measure-ment error should have accounted for no more than 3% ofthe total variation in even the least repeatable character. Nomeasurements were attempted on broken or worn parts ofthe skulls, therefore, for some skulls we have missing val-ues. The difference in number between sides of the bilat-eral pair of foramina was used to estimate the magnitude of
Pertoldi et al. • ANN. ZOOL. FENNICI Vol. 34190
a c
b
FA. The numbers were counted macroscopically, each pairof foramina was counted 3 times and when we found incon-gruence we excluded the measurement. However, it is worthnoting that meristic characters will only become asymmet-ric once stress reaches a threshold level (Swain 1987).
Departures from normality of (l – r) for each trait, weretested with a Kolmogorov-Smirnov test (Sokal & Rohlf1981). The hypothesis that the mean of left minus right char-acter values equals zero was tested in a one sample t-test.
Differences between age groups and periods of skullcollection were compared with an F-test (Fowler & Cohen1990). For this purpose, we considered all adult and subadultfemale otters between 1980 and 1993 and male otters be-tween 1980 and 1994.
A linear and polynomial regression analysis (year ofcollection versus absolute value of asymmetry) were con-ducted for each trait. The periods of collection were dividedin 3 periods (1, 2 and 3): for males, the three periods were1926 to 1939, 1960 to 1961 and 1980 to 1994; for females,they were 1932 to 1942, 1959 to 1962 and 1980 to 1993;the variance of (r – l) and the median of FA for each trait A,B and C were calculated.
A Mann-Whitney U-test was used to test if the medianof FA for traits A, B and C increased through the threeperiods, and if the median for these traits and dental foramenwas different between the two sexes (only periods 2 and 3)and an F-test was conducted to see if the variance of (r – l)increased during the 3 periods of collection.
Tissues of otters found dead in Denmark between 1980and 1990 were analysed for organochlorine pesticide resi-dues and PCBs (Lindane, Dieldrin, pp-DDE, op-DDD, op-DDT, PCBs and pp-DDE/op-DDT). In this period (1980–1990), an average annual decline of 7% per year for PCBsand of 6% for DDE were found (Mason & Madsen 1993).
A Spearman correlation coefficient was used for corre-lations between the concentration of contaminants in theotter’s tissues and the absolute FA of its skull. A Spearmancorrelation coefficient was performed to test a possible cor-relation between the condylobasal length (skull length andweight, and length from nose to tail) of the otter beforenecropsy.
3. Results
There was no evidence of directional asymmetryor antisymmetry and all deviations from normaldistributions were not significant (KolmogorovSmirnov test: 0.089 < p < 0.47, 125 < n < 150),and no significant deviations from zero as themean of the trait (l – r) distributions were found(one sample t-test: 0.062 < p < 0.312, 67 < d.f. < 75).
All the traits were tested for independence ofoverall traits with a Spearman rank correlation test,
Fig. 2. View of an otter’s skull. — a: Lateral view of an otter’s skull.Trait A: distance between points 1 and 2 (distance between theopistokranion and zygomatic process of frontal bone). Trait B:distance between points 2 and 3 (shortest distance between thezygomatic process of frontal bone and frontal process of zygomaticbone). Trait M: distance between points 4 and 5 (total length of thejaw: infradentale-goniocaudale). — b: Ventral view of an otter’s skull.Trait C: distance between points 6 and 7 (shortest distance betweenjugular foramen and staphylion). — c: Lower jaw of an otter’s skull.Dental foramen: D1, D2, D3.

ANN. ZOOL. FENNICI Vol. 34 • Developmental stability in the Eurasion Otter in Denmark 191
and no significant correlation was found for males,although for females the trait A was correlated withtraits B and C (A and B: rs = 0.29, n = 49, p = 0.044,between traits A and C: rs = 0.31, n = 52, p = 0.026).
No significant differences of FA between thetwo age groups (adults and subadults) of the samesex were found (Table 1) and, therefore, the twoage groups were pooled in the following regres-sion analyses (Table 1).
No correlation was found at the 0.01 level be-tween overall length of the traits (A, B, C and M)and the degree of FA in these traits (males: – 0.02< rs < 0.17, d.f. = 61–73, 0.09 < p < 0.96, females:– 0.05 < rs < 0.24, d.f. = 50–65, 0.06 < p < 0.74).
A strong positive correlation (Spearman test)was found in both sexes between the condylobasallength of the skull, and its weight and length be-fore necropsy, indicating that skull length is a goodindicator of the body mass of an otter: femalesrs = 0.41, n = 25, p = 0.046, males rs = 0.75, n =35, p = 0.0001; “body length–condylobasallength”: females rs = 0.75, n = 25, p = 0.0002,males rs = 0.84, n = 38, p = 0.0001.
No significant correlation (Spearman test) wasfound between the degree of asymmetry and con-taminant concentration at the level of p < 0.01,indicating that factors other than contaminantshave contributed to the levels of FA (Table 2).
Table 2. Spearman rank correlation coefficients and corresponding test values p and rs for testing correlationsbetween the absolute value of FA in the traits: A, B, C and M, and the concentration of 6 contaminants.(Contaminants: Lindane, Dieldrin, pp-DDE, op-DDD, op-DDT, PCBs and the ratio of pp-DDE/DDT).—————————————————————————————————————————————————
Traits—————————————————————————————————————————————————Males
A 15 < d.f. < 18 (0.21 < rs < 0.20) 0.38 < p < 0.83B 15 < d.f. < 17 (– 0.12 < rs < 0.27) 0.26 < p < 0.88C 19 < d.f. < 22 (– 0.49 < rs < 0.18) 0.021) < p < 0.42M 15 < d.f. < 19 (– 0.03 < rs < 0.43) 0.06 < p < 0.93
FemalesA 8 < d.f. < 14 (– 0.53 < rs < 0.23) 0.13 < p < 0.84B 6 < d.f. < 10 (– 0.62 < rs < – 0.05) 0.051) < p < 0.91C 10 < d.f. < 20 (– 0.57 < rs < 0.09) 0.07 < p < 0.97M 6 < d.f. < 16 (– 0.57 < rs < 0.01) 0.021) < p < 0.97
—————————————————————————————————————————————————1) Significance disappears if one extreme value is removed.
Table 1. Comparison of fluctuating asymmetry variance of left–right-hand size measurements of skull characters(traits: A, B, C and M) in adults and subadults.—————————————————————————————————————————————————
Adults (81–94) Subadults (80–93)Traits Variance n Variance n F p
—————————————————————————————————————————————————Males
A 0.67 23 0.50 22 1.34 n.s.B 0.50 20 0.35 23 1.43 n.s.C 0.36 27 0.30 28 1.20 n.s.M 0.30 23 0.26 31 1.15 n.s.Dental foramen 0.90 7 1.72 17 1.90 n.s.
FemalesA 0.70 21 0.42 10 1.70 n.s.B 0.29 14 0.15 8 1.90 n.s.C 0.29 18 0.28 19 1.10 n.s.M 0.16 17 0.12 19 1.30 n.s.Dental foramen 2.17 6 1.61 10 1.40 n.s.
—————————————————————————————————————————————————

Pertoldi et al. • ANN. ZOOL. FENNICI Vol. 34192
Fig. 3. Linear regression(females) of the absolutevalues of FA (1/10 mm) fortraits A, B and C versus theyear of skull collection. —A: Females. — B: Males(the trait C is not significantin the regression).
Significant correlations were found betweenthe year of skull collection and the absolute val-ues of FA (Fig. 3AB, Table 3). The relationship andits significance did not disappear when we re-moved the two skulls collected in 1861 from theregression analysis for females, but the signifi-cance of the correlation disappeared for trait A in
males when we removed the 3 skulls collectedbefore 1950 from the regression analysis. Signifi-cant differences in variance (F-test) of FA betweenthe three different periods were found (Table 4).
Significant differences of the median of FA inthe three periods were found (Mann-Whitney U-test, Table 5).

ANN. ZOOL. FENNICI Vol. 34 • Developmental stability in the Eurasion Otter in Denmark 193
Significant differences were found betweensexes in the median of FA for traits A and C in theperiods two and three (males showed higher FA,see Mann-Whitney U-test, Table 6).
4. Discussion
PCBs dissolve readily in animal fats and henceaccumulate in tissues. When these fats are mobi-
lised during periods of stress, such as food short-age or periods of reproduction, large amounts ofpesticide may be released into the blood stream(see Mason 1989 for review).
There was, however, no evidence for a rela-tionship between asymmetry and pesticide con-centration. The lack of correlation between con-taminant concentration and FA could be due todifferent factors that could have confused rela-tions. First, in mammals, females detoxicate
Table 4. F-test. Comparison of variance of the skull traits (A, B and C and dental foramen, named F) in the 3 periods(1, 2 and 3). The sign (+) or (–) indicate an increase or decrease in variance of the traits (r – l) with respect to theprevious period. The numbers in parentheses are degrees of freedom and X indicates the absence of sufficent data.—————————————————————————————————————————————————
Period 1 Period 2A B C F A B C F
—————————————————————————————————————————————————Males
Period 2A XB XC (+)*(2,17)F (+) n.s. (2,13)
Period 3A X (+) n.s. (16,45)B X (+)*(17,43)C (+)*(3,55) (–)*(17,55)1)
F (+) n.s. (2,24) (+) n.s. (13,24)
FemalesPeriod 2A (+) n.s. (7,25)B (+)*(6,22)C (+) n.s. (6,19)F (+) n.s. (6,16)
Period 3A (+)*(7,31) (+) n.s. (25,31)B (+)*(6,22) (+) n.s. (22,22)C (+)*(6,37) (+)*(19,37)F (+) n.s. (6,16) (+)*(16,16)
—————————————————————————————————————————————————1) Significance disappears if one extreme value is removed, p < 0.05 = *
Table 3. Linear, 2nd and 3rd order polynomial regressions between the absolute value of FA in traits A, B andC and the year of skull collection. The numbers in parentheses are the sample sizes and the standard error forthe regression coefficient, respectively.—————————————————————————————————————————————————
Traits Linear regression 2nd order 3rd order—————————————————————————————————————————————————Males
A 0.26 (n = 65, S.E. = 0.003)* n.s. n.s.B 0.34 (n = 62, S.E. = 0.003)** 0.35 (n = 62, S.E. = 2.682 × 10– 4)* n.s.C n.s. 0.31 (n = 75, S.E. = 1.672 × 10– 4)* n.s.
FemalesA 0.38 (n = 66, S.E. = 0.002)** 0.41 (n = 66, S.E. = 3.914 × 10– 5)** 0.41 (n = 66, S.E. =1.843 × 10– 6)**B 0.35 (n = 51, S.E. = 0.002)* 0.35 (n = 51, S.E. = 1.158 × 10– 4)* n.s.C 0.32 (n = 65, S.E. = 0.002)** 0.32 (n = 65, S.E. = 3.202 × 10– 5)* n.s.
—————————————————————————————————————————————————p < 0.05 = *, p < 0.01 = **
Pertoldi et al. • ANN. ZOOL. FENNICI Vol. 34194
through nursing, where the organochlorines aretransferred from mother to cub in the lipids of themilk (Tanabe et al. 1982). Thus, a female otter,after the nursing period, will have a lower con-centration of PCBs, and developmental stabilitymay thus not be related to pesticide concentra-tions. Hence, male and subadult otters may bemore appropriate for this comparison, however,no significant correlations were found for thesegroups alone either.
The high correlation between the year of col-lection and FA may be explained by the increasein disturbing factors due to landscape fragmenta-
tion, pollution, human activity and agriculturalpractice. All these factors began to increase sharp-ly at the beginning of the 1940s. A declining trendin population size prevailed throughout the 1970s.Populations of small size, for a number of gen-erations, may lose a substantial proportion of ge-netic variation, and the genetic structure of thepopulation will change, homozygosity will in-crease and inbreeding depression may becomesignificant. The bottleneck around 1970–1980may have resulted in increased FA in otter skulls.The Ne of about 20 individuals hypothesised inthe 1970s, was probably even lower due to the
Table 6. Mann-Whitney U-test for testing the differences of FA in traits A, B and C and dental foramen betweenthe two sexes. For this test, only two periods are considered (periods 1 and 2). n1 and n2 are the sample sizesand U the test values. An asterisk means a significantly higher degree of FA in males.—————————————————————————————————————————————————
TraitsA B C Dental foramen
—————————————————————————————————————————————————Period 2 U = 95* n.s. U = 118* n.s.
n1 = 22, n2 = 16 n1 = 24, n2 = 17
Period 3 U = 231* n.s. n.s. n.s.n1 = 22, n2 = 45
—————————————————————————————————————————————————p < 0.05 = *
Table 5. Mann-Whitney U-test for testing if FAs of traits A, B and C are significantly higher in the later of the twoperiods compared. n1 and n2 are the sample sizes and U the test values. The values in parentheses are themean and the standard error of FA of the earlier of the two periods compared.—————————————————————————————————————————————————
TraitsA B C
—————————————————————————————————————————————————Males
Periods 1–2 U = 4.5* (0, 0) n.s. n.s.n1 = 3, n2 = 16
Periods 2–3 n.s. U = 220.5* (0.339, 0.061) U = 283.5* (0.659, 0.101)n1 = 17 n2 = 43 n1 = 17 n2 = 55
Periods 1–3 U = 3** (0.659, 0.069) n.s. n.s.n1 = 3, n2 = 45
FemalesPeriods 1–2 n.s. U = 29* (0.083, 0.065) n.s.
n1 = 6, n2 = 22
Periods 2–3 U = 238* (0.376, 0.089) n.s. n.s.n1 = 25, n2 = 31
Periods 1–3 U = 40.5* (0.639, 0.079) U = 15** (0.44, 0.069) U = 49.5* (0.46, 0.053)n1 = 7, n2 = 31 n1 = 6, n2 = 22 n1 = 6, n2 = 37
—————————————————————————————————————————————————p < 0.05 = *, p < 0.01 = **

ANN. ZOOL. FENNICI Vol. 34 • Developmental stability in the Eurasion Otter in Denmark 195
effect that PCBs have on female fertility. Experi-ments with the closely related mink (Mustelavison) showed that pup mortality was severe whentissue concentrations of PCBs in their mother ex-ceeded 50 mg kg–1 fat (Jensen et al. 1977). 18% ofDanish otters had tissue concentrations exceed-ing 50 mg kg–1 and 21% had tissue PCB concen-trations greater than 30 mg kg–1 (Mason & Madsen1993).
Strong FAs, as in the skulls of otters, that arevisible macroscopically, have been suggested tobe the result of strong selective forces (Møller1992). Probably, male and female otters are sub-ject to different selective forces. In the Eurasianotter (like all mustelids), males are always thelarger sex and until now there are two explana-tions for this size dimorphism (Moors 1980). Thefirst hypothesis suggests that the dimorphism re-duces intersexual competition for food by ena-bling each sex to exploit different prey. The sec-ond hypothesis takes into account the polygynousbreeding systems of mustelids and that femalesalone raise their litters. It proposes that small fe-males are favoured because they need less energyfor daily maintenance. Because of this, they canchannel more energy into reproduction than largerfemales. Larger males are favoured by sexual se-lection and the ability to exploit a wide range ofprey, and for the enhanced dominance and mobil-ity. Under these circumstances, dissimilar evolu-tionary forces would be acting on each sex andconsequently the optimum size of each sex re-sults from different selective pressures.
The only evidence for intrasexual selectionfavouring larger male mustelids comes from ob-servations of fighting during the breeding season,and this is a common phenomenon among ottersand other mustelids (Moors 1980). One factor thatmay help to promote fight avoidance is that resi-dent and probably larger otters know their placein the social hierarchy. Nothing is known aboutthe extent of epigamic selection in otters or itspossible influence on the size of males. In mam-mals, male hierarchy positions appear to bestrongly correlated with body size (Schaller 1967,Grant 1970, Erlinge 1977). If a larger body sizegives a reproductive advantage to males and asmaller one gives an energetic advantage to fe-males, body sizes are subject to selection withopposite directions between sexes. The intensity
of selection may have increased with increasedlandscape fragmentation, because the decreasingnumber of suitable sites will increase the territo-rial behaviour due to the increased density of in-dividuals in the suitable sites. Only the dominantmale, with a large body size, may be able to de-fend a good territory. The length of skulls (condy-lobasal-length) was strongly correlated to weight.So probably the size of the skull reflects domi-nance of an individual, and the selective forcesacting on this character may explain the relativelyhigh level of FA found on the more recent otterskulls. Another interesting observation is the high-er degree of FA found in males than in females,suggesting the potentially stronger effect of stressacting on males.
Acknowledgements. Part of the work has been supportedby a grant from the Danish Rektorkollegiet. We thank Prof.Anders Pape Møller for his constructive critique of themanuscript, Henrik Rønnow for his drawing of the otterskull, Mogens Andersen (Zoological Museum, Copenha-gen) and to Erling Mørch and Bjørn Jacobsen (Natural His-tory Museum, Aarhus) for providing access to collections.Furthermore we thank Anabela Jensen and Luigi Cagnolarofor suggestions.
References
Britten, B. H. 1996: Meta-analyses of the association be-tween multilocus heterozygosity and fitness. — Evo-lution 50: 2158–2164.
Chanin, P. 1991: Otter. — In: Corbet, G. B. & Harris, S. H.(eds.), The handbook of British mammals: 423–431.Blackwell Scientific Publications, Oxford.
Clarke, G. M. & McKenzie, J. A. 1987: Developmental sta-bility of insecticide resistant phenotypes in blowfly; aresult of canalizing natural selection. — Nature, Lond.325: 345–346.
Erlinge, S. 1977: Agonistic behaviour and dominance in stoat(Mustela erminea). — L. Z. Tierpsychol. 44: 375–388.
Fowler, J. & Cohen L. 1990: Practical statistics for fieldbiology. — Open University Press, Philadelphia.
Frankham, R. 1995: Effective population size/adult popu-lation size ratios in wildlife: a review. — Genet. Res.66: 95–107.
Grant, T. R. 1970: Experimental studies of competitive in-teraction in a two species system: II, the behaviour of(Microtus), (Peromyscus) and (Clethrionomys) species.— Animal Behaviour 18: 411–426.
Hammershøj, M., Madsen, A. B., Bruun-Schmidt, I. Ø.,Gaardmand, B., Jensen, A., Jensen, B., Jeppesen, J. L.& Laursen, J. T. 1996: Overvågning af odder (Lutralutra) i Danmark 1996. Danish Nat. Env. Res. Inst.

Pertoldi et al. • ANN. ZOOL. FENNICI Vol. 34196
Report N° 172.Jensen, S. 1972: The PCB story. — Ambio 1: 123–131.Jensen, S. & Kihlstrom, M., Olsson, C., Lundberg, C. &
Orberg, J. 1977: Effects of PCB and DDT on mink(Mustela vison) during the reproductive season. —Ambio 6: 239.
Leary, R. F. & Allendorf, F. W. 1989: Fluctuating asym-metry as an indicator of stress: Implications for conser-vation biology. — Trends Ecol. Evol. 4: 214–217.
Madsen, A. B. 1996: Odderens (Lutra lutra) økologi ogforvaltning i Danmark. The ecology and conservationof the Otter (Lutra lutra) in Denmark. — Ph.D.-thesis.Danish Nat. Env. Res. Inst. 84 pp.
Manning, J. T. & Chamberlain, A. T. 1993: Fluctuatingasymmetry, sexual selection and canine teeth in pri-mates. — Proc. R. Soc. Lond. B251: 83–87.
Mason, C. F. 1989: Water pollution and otter distribution :a review. — Lutra 32: 97–131.
Mason, C. F. & Macdonald, S. M. 1986: Otters: Ecologyand Conservation. — Cambridge University Press,Cambridge.
Mason, C. F. & Madsen, A. B. 1993: Organochlorine pes-ticide residues and PCBs in Danish otters (Lutra lutra).— The Science of the Total Environment 133: 73–81.
Møller, A. P. 1992: Patterns of fluctuating asymmetry inweapons: evidence for reliable signalling of quality inbeetle horns and bird spurs. — Proc. R. Soc. Lond.B248: 199–206.
Moors, P. J. 1980: Sexual dimorphism in the body size ofmustelids (Carnivora): the roles of food habits andbreeding systems. — Oikos 34: 147–158.
Palmer, A. R. & Strobeck, C. 1986: Fluctuating asymme-try: measurement, analysis, patterns. — Annu. Rev.Ecol. Syst. 17: 391–421.
Parsons, P. A. 1962: Maternal age and developmental vari-ability. — J. Exp. Biol. 39: 251–260.
Parsons, P. A. 1990: Fluctuating asymmetry: An epigeneticmeasure of stress. — Biol. Rev. 65: 131–145.
Parsons, P. A. 1992: Fluctuating asymmetry: a biologicalmonitor of environmental stress. — Heredity 68: 361–364.
Schaller, G. B. 1967: The deer and the tiger: a study of wild-life in India. — University of Chicago Press, Chicago.
Schimmer, A. 1981: Odderen i Danmark 1950–1980. —M.Sc.-thesis. University of Copenhagen. 108 + 149 pp.
Sciulli, P. W., Doyle, W. J., Kelley, C., Siegel, P. & Siegel,M. I. 1979: The interaction of stressors in the inductionof increased levels of fluctuating asymmetry in the labo-ratory rat. — Am. J. Phys. Anthropol. 50: 279–284.
Siegel, M. I. & Doyle, W. J. 1975: The differential effect ofprenatal and postnatal audiogenic stress on fluctuatingdental asymmetry. — J. Exp. Zool. 191: 211–214.
Sokal, R. R. & Rohlf, F. J. 1981: Biometry. — W. H. Free-man, San Francisco.
Swain, D. P. 1987: A problem with the use of meristic char-acters to estimate developmental stability. — Am.Natur. 129: 761–768.
Tanabe, S., Tatsukawa, R., Maruyama, K. & Miyazoki, N.1982: Transplacental transfer of PCBs and Chlorinatedhydrocarbon pesticides from pregnant striped dolphin(Stenella coeruleoalba) to her foetus. — Agric. Biol.Chem. 46: 1249–1254.
Valentine, D. W. & Soulé, M. E. 1973: Effect of p,p’ DDTon developmental stability of pectoral fin rays in thegrunion (Leuresthes tenius). — Fishery Bull. 71: 920–921.
Van Bree, P. J. H., Jensen, B. & Kleijn, L. J. K. 1966: Skulldimensions and the length/weight relation of thebaculum as age indications in the common otter, (Lutralutra) (Linnaeus, 1758). — Dan. Rev. Game Biol. 4:97–104.
Van Valen, L. 1962: A study of fluctuating asymmetry. —Evolution 16: 125–142.
Weiner, J. G. & Rago, P. J. 1987: A test of fluctuating asym-metry in bluegills (Lepomis macrochirus) as a measureof PH related stress. — Environ. Pollut. 44: 27–36.
Zar, J. H. 1984: Biostatistical Analysis. — Prentice Hall,New Jersey.


![Živé organizmy. [Living organisms]](https://img.pdfslide.net/doc/110x75/635021dd0ca35926a70963e5/zive-organizmy-living-organisms.jpg)


