Embed Size (px)
Citation preview

www.elsevier.com/locate/agee
Agriculture, Ecosystems and Environment 105 (2005) 1–16
A novel indicator of environmental risks due to nitrogen
management on grasslands
Frank Pervanchona,*, Christian Bockstallera, Bernard Amiauda,Josephine Peigneb, Pierre-Yves Bernardc, Francoise Vertesd,
Jean-Louis Fiorellic, Sylvain Plantureuxa
aUMR INPL(ENSAIA)-INRA Agronomie et Environnement, BP 172, 54505 Vandoeuvre-les-Nancy cedex, FrancebISARA, 31 place Bellecour, 69288 Lyon cedex 02, France
cINRA SAD, Domaine du Joly, BP 29, 88501 Mirecourt cedex, FrancedUMR INRA-ENSAR Sol-Agronomie-Spatialisation, 4 rue Stang Vihan, 29000 Quimper, France
Received 13 May 2002; received in revised form 21 June 2004; accepted 28 June 2004
Abstract
An agro-ecological indicator IN losses was introduced in order to estimate the risks of air and water pollution through nitrogen
management on grasslands. The IN losses score in this study corresponded to the lowest score of four sub-indicators (INH3, IN2O,
INO and INO3) which, respectively, provide information on volatilisation, nitrous and nitric oxide emissions in the air and nitrate
leaching in groundwater. The score of each sub-indicator was obtained by comparing nitrogen losses to a threshold which
corresponded to the maximal level acceptable for the environment (e.g. 50 mg NO3 L�1 for the leaching sub-indicator INO3). The
losses in air of NH3, N2O, NO were calculated by means of emission coefficients. Nitrate leaching was estimated from the
residual mineral nitrogen in grassland soil found at the beginning of the drainage period. A validation of the indicator by
comparing calculated data with measurements of nitrate leaching by ceramic cups was carried out on grazed and hay grasslands.
A discrepancy between observed and calculated data was observed when using data from ceramic cups to validate the indicator.
Nevertheless, the indicator gave realistic results and is valid for use in order to indicate the degree of pollution risk in agricultural
management.
# 2004 Elsevier B.V. All rights reserved.
Keywords: Nitrogen balance; Soil residual nitrogen; Agro-ecological indicators; Permanent grasslands; Nitrogen management; Pollution
* Corresponding author. Present adress: TRAME, 9 rue de la
Baume, 75008 Paris, France. Tel.: +33 144 950 826;
fax: +33 140 740 302.
E-mail address: [email protected] (F. Pervanchon).
0167-8809/$ – see front matter # 2004 Elsevier B.V. All rights reserved
doi:10.1016/j.agee.2004.06.001
1. Introduction
The study of the effect of agricultural management
practices on nitrogen losses have primarily focused on
arable fields and have shown that the management of
grassland systems impacts the environment (Ryden
.

F. Pervanchon et al. / Agriculture, Ecosystems and Environment 105 (2005) 1–162
et al., 1984; Watson and Foy, 2001). Nitrogen losses in
air (Freibauer and Kaltschmitt, 2000) and to ground-
water by leaching are higher in intensively-managed
grasslands than in arable crops (Hack-ten Broeke
et al., 1999). Therefore, in order to improve the
sustainability of grassland husbandry it is necessary to
take into account the environmental risk through
nitrogen losses associated with nitrogen management.
Because of high financial costs and time, direct
nitrogen loss measurements in fields cannot be carried
out. In the last decades, in order to improve
agricultural management many simulation models
have been developed for use in providing information
on such variables as nitrate leaching (Addiscott and
Wagenet, 1985). Several models, looking at mixed
farming systems have taken into account nitrogen
losses in both air and water (Ledgard et al., 1999), in
pastures (Scholefield et al., 1991), or specifically in
grasslands (Bhogal et al., 2001). Other models have
considered only one aspect of nitrogen losses (e.g.
nitrate leaching in Tuck et al., 2000) or one part of the
system (e.g. losses due to the spreading of manure in
Chambers et al., 1999). Despite the effort made to
reduce the number of input variables in functional
models (Addiscott and Wagenet, 1985), for the most
part models are still too complex for most rural
managers and advisors working with farmers.
Indicators have been proposed by many researchers
as operational tools for a global diagnostic assessment
of the effects of agricultural management on
environment (Lenz et al., 2000; van der Werf and
Petit, 2001). These indicators are tools that simplify
the ability to describe quantitatively or qualitatively
complex phenomena or complex systems (Girardin
et al., 2000; Merkle and Kaupenjohann, 2000).
In looking at nitrogen management in farming
systems, most authors have proposed indicators
calculated from the difference between nitrogen
outputs and inputs at various scales in order to
calculate nitrogen balance or budget (Benoıt, 1992;
Hanegraaf, 1998; Simon et al., 2000; van Eerdt and
Fong, 1998). These indicators are helpful for
analysing farming systems, but do not provide
accurate information about the fate of the nitrogen
surplus lost to the environment (Simon et al., 2000).
Furthermore, contradictory results have emerged from
validation studies done in grasslands (Laurent et al.,
2000; ten Berge, 2002). In determining nitrogen
leaching losses in grazed pastures, the best indicator
has been found to be the stocking rate expressed in
number of livestock units by grazing days (Simon
et al., 2000), but some variability has still been
observed, due mainly to management practices that
interact with climate and different soil types.
The IN losses indicator introduced in this article is an
attempt to go beyond the simple calculation of a field
nitrogen balance. This indicator’s intent is to provide
complete and detailed information concerning the
impact of grassland management decisions on water
and air quality and not only a nitrogen surplus to the
environment. With this approach, the IN losses indicator
could help potential users, especially farmers and rural
managers, to improve their grassland husbandry in
order to achieve the target of sustainable forage
production (hay and/or pasture), and environment
preservation (air and water).
In order to describe the development of the IN losses
indicator, this article has been divided into three
sections. The first identifies the environmental risks
which have to be estimated by the IN losses indicator.
The second lists in three steps the methodology of
IN losses development: (i) calculation of the emissions
in air and water; (ii) development of a sub-indicator
for each emission; and (iii) aggregation of the sub-
indicators to obtain the final IN losses indicator. The
third section of this article describes simulations and
tests carried out on IN losses. All variables used to
develop the indicator are included in Appendix A.
2. Identification of the objectives of the IN losses
indicator
The development of an agro-ecological indicator,
such as IN losses is feasible but it has to be based on
present available scientific knowledge (Girardin et al.,
1999). This statement implies that the indicator is to be
calculated from easily attainable on-farm data. In the
development of the IN losses attention must be paid to
the comprehensibility and to the pertinence for users
(farmers or rural managers), and take into account the
sensitivity to differences in agricultural practices.
Water quality is threatened mainly by nitrate (NO3)
leaching which occurs under grazed grasslands
(Jarvis, 2000). Losses by NO3 leaching can be high
when hay is produced on over-fertilised grasslands

F. Pervanchon et al. / Agriculture, Ecosystems and Environment 105 (2005) 1–16 3
(ten Berge et al., 2002b). It has been assumed that
nitrogen loss through surface runoff is negligible for
grassland systems due to vegetative cover of the soil
(Scholefield and Stone, 1995). For simplicities sake,
the differentiation of NO3 leaching loads was not
considered. The total amount of nitrogen loss below
rooting depth is here in considered as leached, even
though it may flow to surface water by subsurface
lateral flow, which is especially true in for clay soils
with an impermeable layer.
The main forms of nitrogen known to pollute air are:
ammonia (NH3), nitrous oxide (N2O) and nitric oxide
(NO) (Olivier et al., 1998). Emissions of NH3 occur
mainly during soil eutrophication or acidification, and
in modification of flora diversity and during the
development of plant diseases (Marshall et al., 1998;
Misselbrook et al., 2000). Agriculture is the major
source of the addition of NH3 to the environment as it is
volatilised from excreta of domestic animals and from
synthetic fertilisers (Olivier et al., 1998). A major
greenhouse gas, N2O in agriculture plays a significant
role in its global emissions (Freibauer, 2003). The
losses of N2O due to both nitrification and denitrifica-
tion are higher in grasslands than in arable soils
(Bouwman, 1996; Henault and Germon, 1995).
Increased production of ozone in the troposphere is
due to NO, which can also endanger human health and
cause soil acidification (Olivier et al., 1998). The NO
emissions due to agriculture appear much lower than
the emissions caused by industry (Freibauer and
Kaltschmitt, 2000), but there is a paucity of data from
field experiments (Harrison and Webb, 2001).
Consequently, the objective of IN losses indicator
was to estimate the four main environmental impacts
of nitrogen: NH3, N2O and NO emissions, and NO3
leaching.
3. Calculation of the nitrogen losses to the
environment for the development of IN losses
indicator
3.1. Time scale and spatial scale
The gaseous losses of nitrogen were calculated
from the nitrogen inputs for a one-year management
period (between the 1st of January and 31st of
December). Emissions of NH3 were first considered
because they are observed within immediately
following the spreading of fertiliser, or in the case
of manure, during the week following spreading
(Sommer and Hutchings, 2001). N2O and NO was
assessed globally for the year because emissions are
observed periodically, and the mechanisms influen-
cing N2O and NO emissions are not well-known
(Rudaz et al., 1999). For NO3 leaching, the calculation
method was more complex, because it occurs mainly
during the winter drainage period. During periods of
high vegetation development, it is assumed that the
soil mineral nitrogen available is low due to high
microbial immobilisation process (Recous et al.,
1997) and vegetation uptake. Leaching of NO3 was
due mostly to the accumulation of mineral N in the soil
during the management period of the current
measurement year.
The spatial scale considered for the application of
the IN losses indicator was a grassland plot that had
received uniform management treatment, and which
had the same soil and climatic influences.
3.2. Determination of the nitrogen inputs
Nitrogen in this study was restricted to the mineral
form of nitrogen which can be directly assimilated by
grassland vegetation during the year of its application.
Nitrogen inputs were therefore the sum of nitrogen
from spreading of mineral chemical fertilisers and
organic fertilisers plus nitrogen excreted by animals.
The amounts of organic or mineral fertilisers spread
by the farmer were obtained by on-farm interviews.
The amount of nitrogen excreted by the animals was
determined from simple models (Farruggia et al.,
2000; Scholefield et al., 1991; Delaby et al., 1997). For
organic fertilisers or for faeces and urine, it was
necessary to use data from tables or from expert
knowledge in order to determine the mineral nitrogen
(ammonium) available to vegetation grassland during
the production year studied.
3.3. Determination of the nitrogen losses in air
3.3.1. Losses of ammonia through agricultural
practices (LNH3)
The updated coefficients of Freibauer and Kaltsch-
mitt (2000) were chosen for mineral fertilisers N loss
to the air. For organic fertilisers, technical data

F. Pervanchon et al. / Agriculture, Ecosystems and Environment 105 (2005) 1–164
corresponding to output of empirical models was
available and these models outputs allow the rather
precise determination of volatilisation coefficients for
slurry and manure (Chambers et al., 1997; Menzi
et al., 1997). The incorporation of liquid manure in
soil according to the farming practices was considered
only because liquid manure was incorporated into
grasslands. Concerning faeces and urine, a respective
coefficient of 3% and 12% of volatilised nitrogen was
chosen (average from bibliographical synthesis by
Decau, 1997; Barre, 2001). The total amount of NH3
emitted in air from agricultural management practices
is calculated in Eq. (1).
LNH3¼ SðQ fertkCNH3 kÞ (1)
where LNH3is the total amount of NH3 emitted to air
due to agricultural practices (in kg NH3-N ha�1 yr�1),
Q fertk (in kg N ha�1 yr�1) is the amount of mineral
nitrogen (mostly ammonium ions) directly supplied by
the farmer in the form k (the form k can be mineral
fertilisers, organic fertilisers, faeces or urine), and
CNH3 k is the volatilisation coefficient for a given
fertiliser in the form k (examples in Table 1).
3.3.2. Losses of nitrous oxide due to agricultural
practices (LN2O)
Data determing the assessment of coefficients are
less available for N2O emission than for NH3
volatilisation, and as well, there is a high coefficient
of variation according to statistical analyses in the
bibliographic data (Henault and Germon, 1995).
Therefore, for the sake of consistency the N2O
emission coefficient 0.0125 given by Freibauer and
Table 1
Example of some emission factors CNH3for ammonia emissions which corr
nitrogen content of the fertilisers (the organic nitrogen mineralised over
Input types (k) Not injected into soil
Spreading period (month)
November–
January
April–May or
September–October
Jun
Au
Manure
Cattle 0.60
Pig 0.60
Poultry 0.40
Slurry
Cattle 0.65 0.70 0.8
Pig 0.30 0.40 0.4
Kaltschmitt (2000) was chosen, integrated through
CN2O k in Eq. (2).
LN2O ¼ FX
ðCN2O kðQ Nk � ðQ fertkCNH3 kÞÞÞ (2)
where LN2O is the total amount of N2O emitted to air
due to agricultural practices (in kg N2O-N ha�1 yr�1),
Q Nk is the total amount of nitrogen spread on grass-
land in the form k, CN2O k is the N2O emission
coefficient due to nitrogen inputs in the form k, and
F is a factor that determines N2O emissions according
to soil type or agricultural practices (irrigation or
cutting). For F, suggested values are: (i) if the grass-
land is cut more than two times, F = 0.70 (adapted
from Kammann et al., 1998); (ii) if the grassland is
irrigated, or in the case of clay soil or hydromorphic
soil, F = 1.5 (adapted from Barton, 1999; Muller et al.,
2002); (iii) in the case of organic soils, F = 2 (adapted
from Velthof and Oenema, 1997). The nitrogen vola-
tilised factor (Q fertkCNH3 k) is removed, because it is
no longer available for nitrification and denitrification
(Bouwman, 1996).
3.3.3. Losses of nitric oxide due to agricultural
practices (LNO)
There is insufficient information in the literature to
establish emission coefficients for nitric oxide (NO)
emissions. Therefore in this study, a conservative
estimate of 1% of fertiliser and manure equivalent
nitrogen has been chosen (Freibauer and Kaltschmitt,
2000). The amount of NH3 and N2O previously
calculated have been removed because they are no
longer available for NO emissions. It was also
espond to the fraction of nitrogen emitted in the air versus the mineral
one year is not taken into account)
Injected into soil
Spreading period (month)
e–
gust
November–
January
April–May or
September–October
June–
August
Unrealistic
Unrealistic
Unrealistic
0 0.35 0.40 0.50
5 0.20 0.20 0.25

F. Pervanchon et al. / Agriculture, Ecosystems and Environment 105 (2005) 1–16 5
necessary to remove N2 emitted when the process of
nitrate reduction has been completed. It is difficult to
calculate the N2 emissions as the ratio N2/N2O is
highly variable and no generalisation is possible
(Rudaz et al., 1999). Nevertheless, because of the 1%
coefficient, the score of INO will always be lower
compared to NH3 or N2O, even if N2 emissions are not
subtracted as these emission are negligible (Eq. (3)).
LNO ¼ 0:01ðNinput � ðLNH3þ LN2OÞÞ (3)
3.4. Equation for leaching in groundwater (LNO3)
3.4.1. Determination of the part of nitrogen leaching
(Nleachable)
The amount of nitrogen leaching in groundwater
was estimated from the residual nitrogen measured in
the grassland soil at the beginning of the drainage
period (ten Berge et al., 2002b). Residual N will be
low and constant as long as there has been no nitrogen
over-fertilisation (Fig. 1). If over-fertilisation has
occured, meaning that a critical input has been
exceeded, then, the amount of mineral residual
nitrogen increased rapidly (ten Berge et al., 2002b).
For hay grasslands, ten Berge (2002) derived by
regression means (from numerous mineral and organic
fertilisation trials) the mineral residual nitrogen in
soils (Eq. (4)).
Nleachable ¼ Nmin H0 þ mðNinput � Ninput critÞ2;
withm ¼ 0:000924(4)
Fig. 1. Illustration of the residual mineral nitrogen determination
(Nleachable) in grassland soils (from ten Berge et al., 2002a).
and if
Ninput � Ninput crit; Nleachable ¼ Nmin H0
where Nleachable is the amount of mineral residual
nitrogen in soil (in kg NO3-N ha�1 yr�1). NminH0 is
the mineral residual nitrogen observed in soils when
the N fertilisation rate was limiting (in kg NO3-N
ha�1 yr�1), equal to 10 (Hoving and van Riel, 2002).
Ninput is the amount of mineral nitrogen inputs (in kg N
ha�1 yr�1) managed by the farmer. In the case of
organic fertilisers, ammonia volatilisation is sub-
tracted to obtain Ninput (ten Berge et al., 2002a).
Ninput crit is the nitrogen required (in kg N ha�1 yr�1)
�1) to meet the forage production required for
animal breeding. Ninput crit can be determined by
model from dataset (ten Berge et al., 2002b). Alter-
natively, a simplified equation can be used to deter-
mine the recommended nitrogen input (Farruggia
et al., 2000). The mathematical function m(Ninput �Ninput crit)
2 provides the increase of residual nitrogen
due to over-fertilisation. The parameter m takes into
account the various nitrogen losses in the air, except
the volatilisation from organic fertilisers subtracted
from the total amount of Ninput (ten Berge et al.,
2002).
To adapt Eq. (4) for grazing conditions, it is
necessary that the available nitrogen coming from
grazing animals is added to the other nitrogen inputs
(organic and mineral fertilisers), and that volatilisation
is subtracted, as for organic fertilisers.
3.4.2. Determination of the amount of nitrogen
leaching (LNO3)
Amount of nitrogen leaching (in kg N ha�1 yr�1) is
calculated from the product of the amount of nitrogen
leaching by a leaching factor (Eq. (5)).
LNO3¼ 100ððNleachable �%NleachedÞ=WdÞ4:42 (5)
where LNO3is the amount of losses of nitrogen to the
environment through NO3 leaching due to agricultural
practices (in mg NO3 L�1), Wd is the average drainage
(in mm) over 30 years, %Nleached is the part of nitrogen
leached to water, and Nleachable is calculated in Eq. (4).
The constant 100 is for the conversion of kg N ha�1 in
mg L�1, and 4.42 is to convert kg N into kg NO3.
To estimate %Nleached, we propose to use a
simplified equation of the Burns’ model (Burns,
1976). Eq. (6) is adapted for French conditions with

F. Pervanchon et al. / Agriculture, Ecosystems and Environment 105 (2005) 1–166
the assumption that nitrogen is uniformly allocated in
the soil (Party et al., 1999).
%Nleached ¼ ðWd=ðWd þ ðWsr=10ÞÞÞD=2 (6)
where Wd is the average drainage (in mm) over 30
years during the drainage period, Wsr is the volumetric
soil water retention (in %) and D is the rooting depth
(in cm).
4. Transformation of the nitrogen losses quantities
into a final score for the IN losses indicator
4.1. Calculation of the sub-indicators INH3, IN2O,
INO and INO3
4.1.1. Determination of a scale
In order to calculate the score of an indicator, the N
losses in environment need to be compared to a
reference because it makes the interpretation easier for
decision-making (Riley, 2001). The reference used
will correspond to a threshold of acceptable losses for
the environment and the transformation of the losses
into a score has to be based on two points: (i) the best
value of the indicator corresponds to an ideal situation
of zero N losses; (ii) the reference corresponds to the
maximum N level acceptable for the environment
(Girardin et al., 1999).
In order to make the comparison legible for users,
Girardin et al. (1999) suggested to express the score of
an indicator between 0 for high risks and 10 for no risk
to the environment, with a reference at 7. This scale
was used for the score of each sub-indicator of IN losses
(Eq. (7)).
Ii ¼ 10 � ð3Li=Nmax iÞ (7)
and if
Ii < 0 then Ii ¼ 0
where Ii is the sub-indicator of the IN losses indicator; it
estimates the pollution risk due to nitrogen losses in
the form i (NH3, N2O, NO and NO3) for environment.
Li is the losses of nitrogen to the environment in the
form i (NH3, N2O, NO and NO3) through agricultural
practices. The determination of Nmax i value is based
on the European norm fixed at a maximum of
Nmax NO3¼ 50 mg NO3 L�1. For volatilisation, the
norm is based on benchmark values of atmospheric
deposition of NH3 below which effects on flora and
soil quality is noticeable. A median value of the
different thresholds given by Bobbink et al. (1996):
Nmax NH3¼ 20 kg NH3-N ha�1 yr�1 was used. Unfor-
tunately, for N2O and NO there are no fixed bench-
marks in the literature. For N2O emissions from
temperate and boreal grasslands, the maximum is
18 kg N2O-N ha�1 yr�1 and the minimum is 0 kg
N2O-N ha�1 yr�1 (Freibauer and Kaltschmitt,
2000). For NO emissions, only preliminary results
were at our disposal: in Europe, the maximum is
4.3 kg NO-N ha�1 yr�1 for an Austrian extensive
grassland and 0 kg NO-N ha�1 yr�1 for an untreated
pasture in UK (Freibauer and Kaltschmitt, 2000).
Thus, by linear interpolation, a benchmark value for
the indicator corresponding to Nmax N2O ¼ 5:4 kg
N2O-N ha�1 yr�1 for N2O emissions and Nmax NO =
1.3 kg NO-N ha�1 yr�1 for NO emissions on grass-
lands was used.
4.2. Equation of the IN losses indicator
The indicator IN losses score corresponds to the
minimal score of the four sub-indicators in order to
take the lowest case between the different pathways of
nitrogen losses in air or in water (Eq. (8)). This
corresponds to the precautionary principle, as it is not
possible at present to know which impact is the most
harmful for environment or human health.
IN losses ¼ MinðINH3; IN2O; INO; INO3
Þ (8)
where IN losses is the indicator of nitrogen losses for
grassland management, INH3, IN2O; INO and INO3
are
four sub-indicators which determine the environmen-
tal effect of, respectively NH3, N2O, NO on air, and
NO3 on groundwater.
5. The three levels of information given by the
calculation of IN losses
The IN losses indicator offers a way to identify the
causes of pollution, and to compare the pollution
sources in order to find management solutions through
the use of three complementary levels of information
on pollution risks due to nitrogen management in
grasslands. Table 3 illustrates the three levels of
information according to four different management

F. Pervanchon et al. / Agriculture, Ecosystems and Environment 105 (2005) 1–16 7
Table 2
Description of the four scenarios used to test the sensitivity of the IN losses indicator and the sub-indicators INH3, IN2O, INO and INO3
Scenarios Organic fertilisationa Mineral fertilisationb Grazing days Ninputc Ninput crit
d
Extensive hay grasslands 20 60 – 100 80
Intensive hay grasslands 70 200 – 340 200
Extensive grazed grasslands 0 80 100 110 80
Intensive grazed grasslands 20 200 500 420 200
a Amount of manure expressed in t ha�1 yr�1.b Amount of chemical fertiliser expressed in kg N ha�1 yr�1.c In kg N ha�1 yr�1.d In kg N ha�1 yr�1. It is the nitrogen necessary for forage production.
scenarios and two types of soil, as detailed in Table 2.
The type of soil is taken into account through the
factor F which determines the N2O emissions (F = 1.5
for clay soils and F = 1.0 for sandy loam soil in Table
3) (adapted from Barton, 1999; Muller et al., 2002).
The first level gives general information on
pollution risk due to agricultural practices given by
the score of the IN losses indicator. The second level of
information is for sources of air and water pollution
risk according to environmental norms given by the
score of each sub-indicator. At this second level, it is
possible to compare the impact of each sub-indicator
according to the acceptable reference (e.g., 50 mg
NO3 L�1). The third level of information is the amount
of nitrogen (in kg N ha�1 yr�1) lost in water or to air,
given by the equations on which the sub-indicators are
Table 3
Illustration of the three levels of information allowed by indicator methodo
of soil (clay soil, corresponding to F = 1.5, and sandy loam soil correspo
Levels of information Extensive hay grassland Intensive hay grass
Clay soil Sandy soil Clay soil Sandy
Losses (in kg ha�1 yr�1)
NH3 6.0 6.0 20.5 20.5
N2O 2.9 1.9 9.9 6.6
NO 0.9 0.9 3.1 3.1
NO3 14.3 14.3 20.9 20.9
Sub indicator value
INH39.1 9.1 6.9 6.9
IN2O 8.4 8.9 4.5 6.3
INO 9.4 9.4 7.8 7.8
INO38.7 8.7 8.2 8.2
Final indicator value
IN losses 8.4 8.7 4.5 6.3
based (Eqs. (1)–(3) for gaseous emissions, and
adaptation of Eq. (5) for leaching). These three levels
allow managers to make decisions in order to limit the
pollution risk of nitrogen through agricultural prac-
tices. For instance, if at the first level, the score is good
(between 7 and 10 in the case of the indicator scale
proposed by Girardin et al., 1999), current practices
can be maintained. If the score is lower than 7, the
second level of information helps to identify the
source of pollution. The third level improves the
precision of the diagnosis: for instance, a low score of
INO3is due to high NO3 concentration in water, but
this high NO3 concentration can be due to a high
amount of nitrate lost per hectare (anthropogenic
factor), or a small quantity of drained water (climatic
factor). In the first case, management practices should
logy from four management scenarios given in Table 2 and two types
nding to F=1.0)
land Extensive grazed grassland Intensive grazed grassland
soil Clay soil Sandy soil Clay soil Sandy soil
6.4 6.4 28.2 28.2
2.0 1.4 9.4 6.2
1.0 1.0 3.8 3.9
13.2 13.2 41.3 41.3
9.0 9.0 5.8 5.8
8.9 9.2 4.8 6.5
9.3 9.3 7.3 7.3
8.8 8.8 6.4 6.4
8.8 8.8 4.8 5.8

F. Pervanchon et al. / Agriculture, Ecosystems and Environment 105 (2005) 1–168
be changed and in the second case, the farmer can do
little because the source of the problem is climatic.
Fig. 2. Illustration of a sensitivity test on the indicator IN losses for
intensive management of hay grasslands. The four sub-indicators of
the indicator (INH3(&), IN2O (~), INO (*) and INO3
(*), were tested
according to the variation of chemical fertilisers (Q fertchem), and
mineral nitrogen inputs in the form of organic fertilisers (Q fertorg).
6. Evaluation of the indicator IN losses
6.1. Sensitivity tests on the indicator IN losses
Once an indicator has been developed, it is
necessary to test its sensitivity (Girardin et al.,
1999) to input variables and to determine the
respective effect of each variable. Thus, in our study,
tests were carried out for four different scenarios of
nitrogen management described in Table 2. For each
test, one variable’s values was changed with range of
French agricultural practices, whereas the other
variables were fixed for each of the four scenarios
(Pervanchon et al., 2002).
For extensive management, the indicator sensitivity
to the variables variation was very low (graphs not
shown). The decrease was small for extensive hay
grasslands: within a range of 1 point for INH3for a
variation of the fertiliser amount; and less than 0.5
point for IN2O and INO, whereas for INO3, the score
remains constant at 9.3. For extensive grazed grass-
lands, the range of variations of the sub-indicators
value due to grazing days and mineral fertilisers, were
close to those of hay grasslands. The sub-indicators
score for gaseous emissions did not vary at all with
rooting depth, drainage or soil water retention.
For intensive management, the sub-indicator scores
varied considerably according to variation in inputs.
For the hay grassland scenario (Fig. 2 for the influence
of the variation of organic and mineral fertilisers), the
INO3and INH3
sub-indicators were less sensitive than
in the case of grazing, but the range of variation
remained high. The range of variation of INO and IN2O
was of the same order as that for grazed grasslands:
within a range of two points. For grazed grasslands
(Fig. 3 for the influence of the variation of grazing
days and chemical fertiliser amount), the highest
sensitivity was observed for INO3and concerns for
both the fertiliser amount and the grazing days. The
sub-indicator INH3was more sensitive to variations in
grazing days than to fertiliser amounts. The NO sub-
indicator did not vary much, whereas the range of
variations of IN2O was within two points. The INO3was
also very sensitive to rooting depth, drainage and soil
water retention in the case of intensive grazed
grasslands, but indicated little variation in the case
of hay grasslands because leaching was too low.
These results demonstrate that the indicator was
sensitive to management decisions. The indicator
underlined that the risk of leaching was close to zero
for grasslands managed extensively; the risk of
ammonia emissions was higher, but the emissions
remained in an environmentally acceptable range. In
the case of intensive management, above all for grazed
grasslands, the indicator underlined a high risk of
pollution.
6.2. Test on the calculation of the leaching for the
indicator development
In the case of a composite indicator as IN losses, the
validation of each sub-indicator was made by
comparison with measured data or from another data
source (data obtained by modelling or by experts)

F. Pervanchon et al. / Agriculture, Ecosystems and Environment 105 (2005) 1–16 9
0
2
4
6
8
10
70 100 130 160 190 220 250
0
2
4
6
8
10
180 280 380 480 580 680 780
Indi
cato
r va
lue
Indi
cato
r va
lue
Input of mineral fertiliserQ fertchem (kg N ha-1yr-1)
Numb of grazing daysd graz (d LU ha-1)
Fig. 3. Illustration of a sensitivity test on the indicator IN losses for
intensive management of grazed grasslands. The four sub-indicators
of the indicator (INH3(&), IN2O (~), INO (*) and INO3
(*) are tested
according to the variation of chemical fertilisers (Q fertchem), and the
number of grazing days (d graz).
when observed data are not available (Bockstaller and
Girardin, 2003). If the indicator has been based on a
quantitative model, the validation should first focus
on this model. This was the case for the leaching sub-
indicator of IN losses, where measured data for INO3
were available. These measurements were carried out
on permanent hay grasslands and perennial hay
grasslands from both Eastern and Western France
(Table 4), in semi-continental and oceanic climate,
respectively, where the drainage period begins in
October and finishes in April.
For a validation of a model, Mayer and Butler
(1993) insist on the necessity to use several measure-
ments to determine ‘‘the whole picture’’ of the model.
Three independent statistical variables (Yang et al.,
2000) were calculated (Table 5). For the entire dataset
(hay and grazed grasslands), the mean error (ME)
close to zero confirmed an apparent lack of systematic
bias. The root mean square error (RMSE) showed a
low accuracy considering the norm fixed at 50 mg L�1
(the ratio between the norm and RMSE should be
lower than 0.5). The forecasting efficiency (EF) which
was considered preferable to the classical coefficient
of determination R2 by several authors (Mayer and
Butler, 1993; Mitchell, 1997; Yang et al., 2000),
showed an average quality of prediction.
For the grazed grasslands, bias for the lowest values
of leaching were observed between calculated and
observed data. This was confirmed by the positive ME
which indicated an underestimation of the nitrate
concentration. The EF was lower than for the whole set
of data but still positive, whereas the accuracy of
prediction was the lowest as shown by the higher value
of RMSE. Concerning the hay grasslands, the accuracy
of prediction was acceptable with a RMSE equal to
11 mg NO3� L�1 whereas the ME indicated a slight
underestimation. The negative value of EF demon-
strated that the quality of prediction was not satisfactory
at all.
These results were not surprising for the leaching
sub-indicator of IN losses, INO3as they were based on a
simple model using many data set and coefficients
from different bibliographic sources and from a large
range of management conditions (Vertes et al., 2002).
Nevertheless, the aim of an indicator was not to
forecast but to give information on a risk level under
the given conditions. According to Bockstaller and
Girardin (2003), the validation procedure should show
at least realistic results by means of a probability test
based on the comparison between classes: e.g. if INO3
does not show a risk of leaching in water above the EU
standard of 50 mg NO3 L�1. For the entire data set the
test gave acceptable results for the two levels of
accuracy: 79% (91 grasslands over 117) of realistic
results under 25 mg NO3 L�1 range classes, and 92%
(108 grasslands over 117) of realistic results under
50 mg NO3 L�1 range classes (Fig. 4). The results for
hay grasslands were very satisfactory (98% of realistic
results under 25 mg NO3 L�1 and 100% under 50 mg
NO3 L�1 corresponding to 51 hay grasslands over 52
and 52 plots over 52, respectively). The results were
least realistic for grazed grassland (66% and 86%
corresponding to 43 grazed grasslands over 65 and 56
over 65, respectively). Thus, despite a lack of

F.
Perva
nch
on
eta
l./Ag
ricultu
re,E
cosystem
sa
nd
Enviro
nm
ent
10
5(2
00
5)
1–
16
10
Table 4
Description of the data set used to test the leaching calculation (total = 117; n = 65 for grazed grasslands, and n = 52 for hay grasslands)
Location Type of
grassland
Number of
grazing days
Type of management Number
of data
Leachinga
Mirecourt Permanent 0 Manure (19–36 t, nitrogen rate of 6 kg N t�1 on average) 8 2.3–13.7 (138)b
Eastern France Permanent 0 Diluted slurry (30–160 t, nitrogen rate of 2.5 kg N t�1
on average)
8 1.4–21.2 (144)b
Permanent 0 Chemical fertiliser (90–170 kg N ha�1) 7 0.8–9.0 (108)b
Permanent 0 No fertilisation 9 0.4–27.8 (158)b
Permanent 217–557 Manure (0–72 t, nitrogen rate of 6 kg N t�1 on average);
chemical fertiliser (100–200 kg N ha�1)
6 2.2–37.3 (85)b
Temporary 0 Chemical fertiliser (130–150 kg N ha�1) 18 1.8–8.2 (196)b
Permanent 194–427 Chemical fertiliser (42–112 kg N ha�1) 12 4.4–37.3 (67)b
Temporary 0–18 Chemical fertiliser (116–160 kg N ha�1) 4 0.5–5.9 (152)b
Temporary 0–60 Chemical fertiliser (122–140 kg N ha�1) 4 4.2–16.4 (115)b
Permanent 179–496 Manure (0–11 t, nitrogen rate of 6 kg N t�1 on average);
mineral fertiliser (95–210 kg N ha�1)
11 0.9–67.4 (97.2)b
La Jailliere Temporary 216–909 Chemical fertiliser (100–250 kg N ha�1 yr�1) 9 23.7–119 (60)b
Pin-au-Haras Temporary 425–709 Chemical fertiliser (0–331 kg N ha�1 yr�1) 9 0.1–332 (60)b
Kerbenez Temporary (grass-clover) 420–510 No fertilisation 6 9.6–40 (129)c
Western France Temporary (ray-grass) 467–500 Chemical fertiliser (250 kg N ha�1 yr�1) 6 10.6–61.6 (133)c
a In milligrams of NO3 L�1; average coefficient of variation in parentheses.b From ceramic cups.c From lysimeters.

F. Pervanchon et al. / Agriculture, Ecosystems and Environment 105 (2005) 1–16 11
Table 5
Results from the comparison of calculated and measured data for
nitrate leaching
Data RMSEa MEb EFc
Total 27.18 0.54 0.47
Grazed grasslands 37.80 12.37 0.35
Hay grasslands 11.23 �8.07 �3.15
a Root mean square error.b Mean error.c Forecasting efficiency.
Fig. 4. Probability test for the leaching sub-indicator INO3. Each cell
gives the number of points (in bold for grazed grassland). The test
consists in verifying whether the observed–calculated points are
within an acceptance area. The area of acceptance are the shaded
cells for a range within 25 mg NO3 L�1 and the bold framed cell for
a range within 50 mg NO3 L�1.
prediction quality, results of INO3for hay grassland
remained realistic if classes were within a range of
25 mg NO3 L�1 and within a range of 50 mg NO3 L�1
for grazed grasslands (based on the EU standards).
7. Discussion
7.1. Methodological choices for the calculation of
IN losses
In order to have a tool to aid decisions which is
feasible, legible and convenient for farmers and rural
managers, methodological choices were necessary in
order to determine IN losses. It is important first, that the
calculation of IN losses be independent of variations in
climate and water fluxes. Climatic data used for the
development of IN losses came from 30-year average
data in order to avoid yearly variations which could
mask the environmental effect of agricultural prac-
tices. If nitrogen management by farmers is envir-
onmentally sound, the IN losses score would be
satisfactory, even if the climatic conditions for the
year of study should favour leaching or gaseous
emissions, as it would ultimately correspond to a
‘‘mean potential’’ nitrogen loss.
Second, in models for NH3 emissions (Sommer and
Hutchings, 2001) or for N2O emissions (Conen et al.,
2000; Pedersen, 2000) precise or complex atmo-
spheric and pedological conditions data (e.g. wind
speed, temperature, soil moisture content, etc.) are
necessary to work. Furthermore, models of N2O
emissions only give information on denitrification and
do not calculate a net N2O emission (Golterman, 2000;
Henault and Germon, 2000; Liang and Xu, 2000). For
NO emissions on the other hand, there is no available
model (Freibauer and Kaltschmitt, 2000). Therefore,
models are not structured with the aim to determine
IN losses with easily available data. The NH3 volatilisa-
tion coefficients chosen in our indicator were sensitive
to management practices such as the fertiliser type and
the spreading period. For N2O, we were able to add to
the emission coefficient a correction factor (F) in order
to take into account not only the fertiliser rate but the
management conditions and the soil type. Thus, in the
case of organic, hydromorphic or clay soils, IN losses
points out that the risk of N2O emissions is higher than
the risk of leaching, which is consistent with available
data on denitrification (Barton, 1999). The NO
changes are only kept in the study for pedagogic
purposes (Freibauer and Kaltschmitt, 2000) because
the NO emission and the score of the sub-indicator INO
are always the least compared to the other sub-
indicators. Concerning N2, it has no direct environ-
mental impact, thus, it is not necessary to determine a
specific sub-indicator for N2.
A simple model was chosen to calculate the nitrate
leaching that avoided the calculation of N2 emissions
which may be a greater source of N losses than
leaching in the case of clay or organic soils
(Krysanova and Haberlandt, 2002; Muller et al.,

F. Pervanchon et al. / Agriculture, Ecosystems and Environment 105 (2005) 1–1612
2002). The N2 emissions are considered in empirical
parameter (m) obtained through multiple regression
calculation (ten Berge, 2002). This empirical para-
meter also integrates the emissions of N2O and
NO, and under certain conditions, those of NH3.
Additionally this chosen parameter relies on the
separate calculation between gaseous emissions and
nitrate leaching, which avoids common errors in the
approximation of a balance. Therefore, this model has
the additional advantage that it only needs necessary
data concerning the level of grass production related to
the potential production of the area concerned, and
the soil nitrogen supply, for a complete nitrogen
balance (Schroder et al., 1996). These data are needed
to determine the required level of input (Farruggia
et al., 2000; ten Berge, 2002). Lastly, the model is
based on the assessment of the available N reserves
before winter, which was recommended as a relevant
indicator by several authors (ten Berge, 2002; Van Bol
and Peeters, 1997).
The simple model herein developed for leaching is
limited in that it is applicable only for hay grasslands.
In order to adapt it for grazing conditions, it is
assumed that animal excrements (faeces and urine) are
the same N amounts as organic fertilisers. This
assumption needs to be confirmed with field trials (ten
Berge, 2002). Another criticism is that the Burns’
equation, used to obtain the amount of N leaching, is
not adapted to clay soils (Scotter et al., 1993). In fact,
leaching is calculated for the drainage period when the
soil is wet, when there is no crack pattern in the clay,
and preferential flow from soil cracks is assumed to be
negligible.
7.2. Validation of IN losses
IN losses was tested and validated for various soil
and climate conditions in Eastern and Western
France and proved to be sensitive to soil type. The
adapted equations used for leaching were initially
developed for The Netherlands (ten Berge, 2002)
and IN losses is adapted to areas characterised from
a temperate oceanic climate to semi-continental
climate. The discrepancy between observed and
calculated data, may be due to the statistical
coefficients used from the bibliography (especially
for the assessment of N from animal excrements),
and difficulties to estimate key variables such as
produced biomass and net N mineralisation in
grassland soils (Vertes et al., 2002). Thus, the trend
to underestimate nitrate concentration by INO3may
be explained by enhanced soil nitrogen mineralisa-
tion through long-term manuring. Nevertheless, low
values shown by the validation procedure of the
model to determine INO3have to be adjusted. The
discrepancy between observed and calculated data
may also be due to methodological problems when
using data from ceramic cups which have a high
variability (the variation coefficient can sometimes
reach more than 150% on average in ceramic cups).
It may be profitable to use other methods to measure
the nitrogen available in soil before winter, such as
soil analyses (Vertes et al., 2002). To validate the
indicator, long-term experiments are necessary to
gather data on gaseous emissions, water pollution by
nitrates, and nitrogen mineralised by grassland soils.
These observations should be obtained according to
agricultural practices in various conditions but at
present no such data exist.
Despite choices which were necessary to develop
IN losses, the probability tests show realistic results in
comparison with the EU standard of water quality,
meaning that the indicator is able to alert farmers to
whether they should improve their nitrogen manage-
ment strategies in regards to the risk of nitrate
leaching.
8. Conclusion
The IN losses indicator is a novel tool, that can be
placed between simple (e.g., balance models) and
complex model. This indicator provides a way to
identify the causes of pollution due to nitrogen
management in grasslands. The IN losses indicator can
be used as an alarm in conjunction with a set of other
indicators in order to evaluate the sustainability of
agriculture by giving information on socially accep-
table levels of potential polluting effects of agricul-
ture. For instance, nitrogen management has potential
effects on water and air, but it also influences the
floristic diversity and the agronomic value of grass-
lands, which should be quantified (work in process).
As agro-ecological indicators are tools to assess the
ecological sustainability of agroecosystems, they
could also be made more fully operational with
F. Pervanchon et al. / Agriculture, Ecosystems and Environment 105 (2005) 1–16 13
addition of economic and social indicators, at various
levels (field, farm, landscape, region).
Acknowledgements
Many thanks to Damien Foissy and Claude
Bazard (INRA SAD, Mirecourt), and Marie-Laure
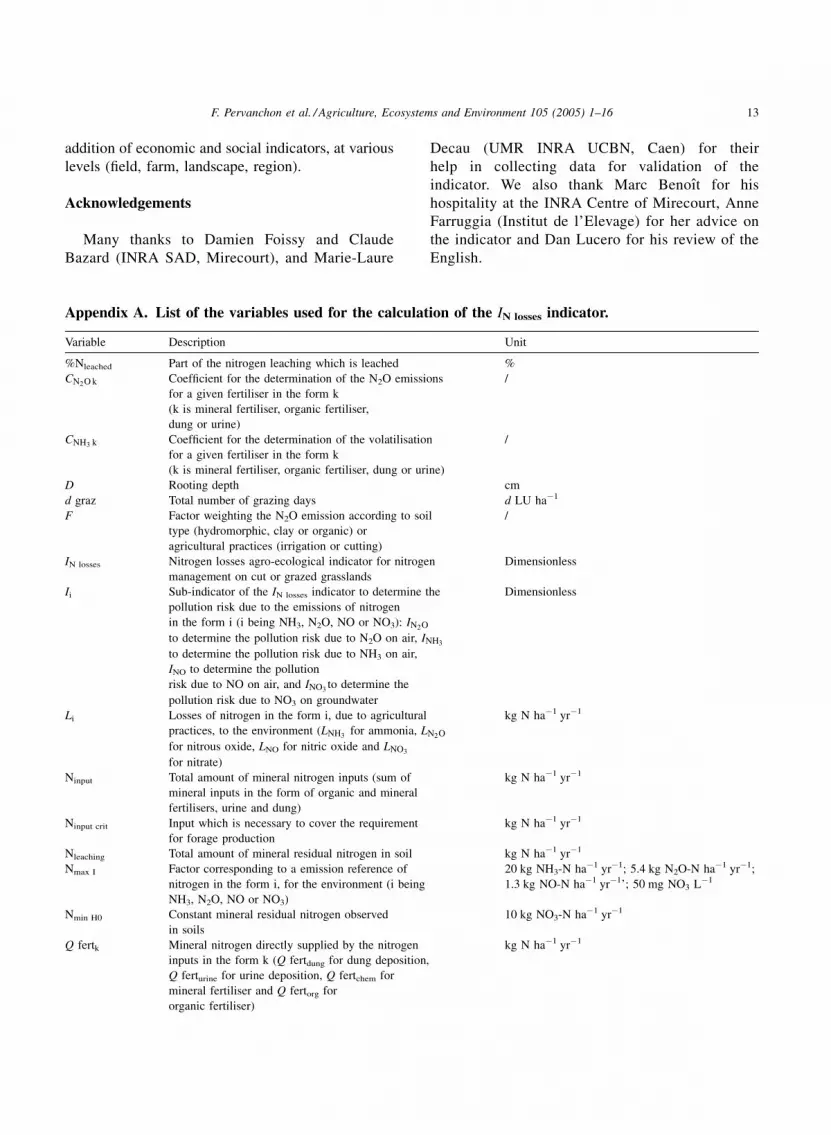
Appendix A. List of the variables used for the calculat
Variable Description
%Nleached Part of the nitrogen leaching which is leached
CN2O k Coefficient for the determination of the N2O emissi
for a given fertiliser in the form k
(k is mineral fertiliser, organic fertiliser,
dung or urine)
CNH3 k Coefficient for the determination of the volatilisatio
for a given fertiliser in the form k
(k is mineral fertiliser, organic fertiliser, dung or uri
D Rooting depth
d graz Total number of grazing days
F Factor weighting the N2O emission according to soi
type (hydromorphic, clay or organic) or
agricultural practices (irrigation or cutting)
IN losses Nitrogen losses agro-ecological indicator for nitroge
management on cut or grazed grasslands
Ii Sub-indicator of the IN losses indicator to determine t
pollution risk due to the emissions of nitrogen
in the form i (i being NH3, N2O, NO or NO3): IN2O
to determine the pollution risk due to N2O on air, IN
to determine the pollution risk due to NH3 on air,
INO to determine the pollution
risk due to NO on air, and INO3to determine the
pollution risk due to NO3 on groundwater
Li Losses of nitrogen in the form i, due to agricultural
practices, to the environment (LNH3for ammonia, L
for nitrous oxide, LNO for nitric oxide and LNO3
for nitrate)
Ninput Total amount of mineral nitrogen inputs (sum of
mineral inputs in the form of organic and mineral
fertilisers, urine and dung)
Ninput crit Input which is necessary to cover the requirement
for forage production
Nleaching Total amount of mineral residual nitrogen in soil
Nmax I Factor corresponding to a emission reference of
nitrogen in the form i, for the environment (i being
NH3, N2O, NO or NO3)
Nmin H0 Constant mineral residual nitrogen observed
in soils
Q fertk Mineral nitrogen directly supplied by the nitrogen
inputs in the form k (Q fertdung for dung deposition,
Q ferturine for urine deposition, Q fertchem for
mineral fertiliser and Q fertorg for
organic fertiliser)
Decau (UMR INRA UCBN, Caen) for their
help in collecting data for validation of the
indicator. We also thank Marc Benoıt for his
hospitality at the INRA Centre of Mirecourt, Anne
Farruggia (Institut de l’Elevage) for her advice on
the indicator and Dan Lucero for his review of the
English.
ion of the IN losses indicator.
Unit
%
ons /
n
ne)
/
cm
d LU ha�1
l /
n Dimensionless
he
H3
Dimensionless
N2O
kg N ha�1 yr�1
kg N ha�1 yr�1
kg N ha�1 yr�1
kg N ha�1 yr�1
20 kg NH3-N ha�1 yr�1; 5.4 kg N2O-N ha�1 yr�1;
1.3 kg NO-N ha�1 yr�1’; 50 mg NO3 L�1
10 kg NO3-N ha�1 yr�1
kg N ha�1 yr�1

F. Pervanchon et al. / Agriculture, Ecosystems and Environment 105 (2005) 1–1614
Appendix A. (Continued )
Variable Description Unit
Q Nk Mineral nitrogen supplied by fertiliser in the form k
(Q Ndung for dung deposition, Q Nurine for urine
deposition, Q Nchem for mineral fertiliser and Q Norg
for organic fertiliser)
kg N ha�1 yr�1
Wd Water drainage in grassland soil (30 years average) mm
Wsr Soil water retention (30 years average) %
References
Addiscott, T., Wagenet, R.J., 1985. Concept of solute leaching in
soil: a review of modelling approaches. J. Soil Sci. 36, 411–424.
Barre, C., 2001. Devenir de l’azote des pissats de vache emis sur une
prairie paturee. PhD Thesis, Ecole Nationale Superieure d’Agro-
nomie de Rennes, France, 116 pp.
Barton, L., 1999. Annual denitrification rates in agricultural and
forest soils. Aust. J. Soil Res. 37, 1073–1093.
Benoıt, M., 1992. Un indicateur des risques de pollution azotee
nomme ‘‘Bascule’’ (Balance Azotee Spatialisee des systemes de
CULture de l’Exploitation). Fourrages 129, 95–110.
Bhogal, A., Shepherd, M.A., Hatch, D.J., Brown, L., Jarvis, S.C.,
2001. Evaluation of two N cycle models for the prediction of N
mineralization from grassland soils in the UK. Soil Use Manage.
17, 163–172.
Bobbink, R., Hornug, M., Roelofs, J.G.M., 1996. Empirical nitrogen
critical loads for natural and semi-natural ecosystems. In: Wer-
ner, B., Sprenger, T. (Eds.), Manual on methodologies for
mapping critical loads/levels and geographical areas where they
are exceeded. Umweltbundesamt (UBA), Berlin, Germany, pp.
1–54.
Bockstaller, C., Girardin, P., 2003. How to validate environmental
indicators? Agric Syst. 76, 639–653.
Bouwman, A.F., 1996. Direct emission of nitrous oxide from
agricultural soils. Nutr. Cycl. Agroecosys. 46, 53–70.
Burns, I.G., 1976. Equations to predict the leaching of nitrate
uniformly incorporated to a known depth or uniformly distrib-
uted throughout a soil profile. J. Agric. Sci. 86, 305–313.
Chambers, B.J., Lord, E.I., Nicholson, F.A., Smith, K.A., 1999.
Predicting nitrogen availability and losses following application
of organic manures to arable land: MANNER. Soil Use Manage.
15, 137–143.
Chambers, B.J., Smith, K.A., Van der Weerden, T.J., 1997. Ammo-
nia emissions following the land spreading of solid manures. In:
Jarvis, S.C., Pain, B.F. (Eds.), Gaseous Nitrogen Emissions
from Grasslands. CAB International, Wallington, UK, pp.
275–280.
Conen, F., Dobbie, K.E., Smith, K.A., 2000. Predicting N2O emis-
sions from agricultural land through related soil parameters.
Global Change Biol. 6, 417–426.
Decau, M. L., 1997. Flux d’azote en prairies paturees par des bovins:
de l’etude du compartiment mineral et de la lixiviation a la
modelisation de l’ensemble du systeme. Ph.D. Thesis, Univer-
site de Caen, France, 121 pp.
Delaby, L., Decau, M.L., Peyraud, J.L., Accarie, P., 1997. Azopat:
une description quantifiee des flux annuels d’azote en prairie
paturee par les vaches laitieres. I. Les flux associes a l’animal.
Fourrages 151, 297–311.
Farruggia, A., Castillon, P., Le Gall, A., Cabaret, M., 2000. Proposi-
tion d’une methode de calcul permettant de raisonner la ferti-
lisation azotee des prairies. Fourrages 164, 355–372.
Freibauer, A., 2003. Regionalised inventory of biogenic greenhouse
gas emissions from European agriculture. Eur. J. Agron. 19,
135–160.
Freibauer, A., Kaltschmitt, M., 2000. Emission rates and emissions
factors of greenhouse gas fluxes in arable and animal agriculture.
European summary report of the EU Concerted Action ‘‘Bio-
genic Emissions of Greenhouse Gases caused by Arable and
Animal Agriculture’’ (FAIR3-CT96-1877) financed by EU
DGVI Project Report Task 1. Institut fur Energiewirtschaft
und Rationelle Energieanwendung (Universitat Stuttgart), Stutt-
gart (http://opus-ho.uni-stuttgart.de/hop/volltexte/2002/22/pdf/
Freibauer_diss.pdf), 196 pp.
Girardin, P., Bockstaller, C., van der Werf, H., 1999. Indicators: tools
to evaluate the environmental impacts of farming systems. J.
Sustain. Agric. 13, 5–21.
Girardin, P., Bockstaller, C., van der Werf, H., 2000. Assessment of
potential impacts of agricultural practices on the environment:
the AGRO*ECO method. Environ. Impact Assess. Rev. 20, 227–
239.
Golterman, H.L., 2000. Denitrification and a numerical modelling
approach for shallow waters. Hydrobiologia 431, 93–104.
Hack-ten Broeke, M.J.D., Schut, A.G.T., Bouma, J., 1999. Effects
on nitrate leaching and yield potential of implementing newly
developed sustainable land use systems for dairy farming on
sandy soils in The Netherlands. Geoderma 91, 217–235.
Hanegraaf, M.C., 1998. Environmental performance indicators for
nitrogen. Environ. Pollut. 102, 711–715.
Harrison, R., Webb, J., 2001. A review of the effect of N fertilizer
type on gaseous emissions. Adv. Agron. 73, 65–108.
Henault, C., Germon, J.C., 1995. Quantification de la denitrification
et des emissions de protoxyde d’azote (N2O) par les sols.
Agronomie 15, 321–355.
Henault, C., Germon, J.C., 2000. NEMIS, a predictive model of
denitrification on the field scale. Eur. J. Soil Sci. 51, 257–270.
Hoving, I.E., van Riel, J.W., 2002. Accumulation of residual mineral
nitrogen in grassland under cutting regime.. In: ten Berge,
H.F.M. (Ed.), A review of potential indicators for nitrate loss
from cropping and farming systems in The Netherlands. Plant

F. Pervanchon et al. / Agriculture, Ecosystems and Environment 105 (2005) 1–16 15
Research International, Wageningen, The Netherlands, pp. 61–
76.
Jarvis, S.C., 2000. Progress studies of nitrate leaching from grass-
land soils. Soil Use Manage. 16, 152–156.
Kammann, C., Grunhage, L., Muller, C., Jacobi, S., Jager, H.J.,
1998. Seasonnal variability and mitigation options for N2O
emissions from differently managed grasslands. Environ. Pollut.
102, 179–186.
Krysanova, V., Haberlandt, U., 2002. Assessment of nitrogen leach-
ing from arable land in large river basins. Part I: simulation
experiments using a dynamic model. Ecol. Model. 150, 255–
275.
Laurent, F., Farruggia, A., Vertes, F., Kerveillant, P., 2000. Effets des
modes de conduite de la prairie sur les pertes d’azote par
lessivage; propositions pour une maıtrise du risque a la parcelle.
Fourrages 164, 397–420.
Ledgard, S.F., Edgecombe, G.A., Roberts, A.H.C., 1999. Applica-
tion of the nutrient budgeting model OVERSEER TM to assess
management options and Regional Council consent require-
ments on a Hawke’s Bay dairy farm. Proc. N. Z. Grass. Assoc.
61, 227–231.
Lenz, R., Malkina-Pykh, I.G., Pykh, Y., 2000. Workshop on envir-
onmental indicators and indices: Introduction and overview.
Ecol. Model. 130, 1–11.
Liang, Y.L., Xu, B.C., 2000. Simulated carbon and nitrogen contents
in arid farmland ecosystem in China using denitrification-
decomposition model. Commun. Soil Sci. Plan. 31, 2445–2456.
Marshall, S.B., Wood, C.W., Braun, L.C., Cabrera, M.L., Mullen,
M.D., Guertal, E.A., 1998. Ammonia volatilization from tall
fescue pastures fertilized with broiler litter. J. Environ. Qual. 27,
1125–1129.
Mayer, D.G., Butler, D.G., 1993. Statistical validation. Ecol. Model.
68, 21–32.
Menzi, H., Katz, P., Frick, R., Fahrni, M., Keller, M., 1997.
Ammonia emissions following the application of solid manure
to grassland.. In: Jarvis, S.C., Pain, B.F. (Eds.), Gaseous Nitro-
gen Emissions from Grasslands. CAB International, Wallington,
UK, pp. 265–274.
Merkle, A., Kaupenjohann, M., 2000. Derivation of ecosystemic
effect indicators: method. Ecol. Model. 130, 39–46.
Misselbrook, T.M., van der Weerden, T.J., Pain, B.F., Jarvis, S.C.,
Chambers, B.J., Smith, K.A., Phillips, V.R., Demmers, T.G.M.,
2000. Ammonia emission factors fo UK agriculture. Atmos.
Environ. 34, 871–880.
Mitchell, P.L., 1997. Misuse of regression for empirical validation of
models. Agric. Syst. 54, 313–326.
Muller, C., Martin, M., Stevens, R.J., Laughlin, R.J., Kammann, C.,
Ottow, J.C.G., Jager, H.-J., 2002. Processes leading to N2O
emissions in grassland soil during freezing and thawing. Soil
Biol. Biochem. 34, 1325–1331.
Olivier, J.G.J., Bouwman, A.F., Van der Hoek, K.W., Berdowski,
J.J.M., 1998. Global air emission inventories for anthropogenic
sources of NOx, NH3 and N2O in 1990. Environ. Pollut. 102,
135–148.
Party, J.P., Sauter, J., Burtin, M.L., Koller, R., 1999. Guide des sols
d’Alsace, petite region naturelle Plaine Sud-Alsace: un guide
pour l’identification des sols et leur valorisation agronomique.
Association Pour la Relance Agronomique en Alsace, Stras-
bourg, France.
Pedersen, A.R., 2000. Estimating the nitrous oxide emission rate
from the soil surface by means of a diffusion model. Scand. J.
Stat. 27, 385–403.
Pervanchon, F., Bockstaller, C., Girardin, P., 2002. Assessment of
energy use in arable farming systems by means of an agro-
ecological indicator: the energy indicator. Agric. Syst. 72, 149–
172.
Recous, S., Loiseau, P., Machet, J.M., Mary, B., 1997. Transforma-
tions et devenir de l’azote de l’engrais sous cultures annuelles et
sous prairies. In: Lemaire, G., Nicolardot, B. (Eds.), Maıtrise de
l’azote dans les agrosystemes. INRA Editions, Paris, France, pp.
105–120.
Riley, J., 2001. Multidisciplinary indicators of impact and change—
key issues for identification and summary. Agric. Ecosyst.
Environ. 87, 245–259.
Rudaz, A.O., Walti, E., Kyburz, G., Lehmann, P., Fuhrer, J., 1999.
Temporal variation in N2O and N2 fluxes from a permanent
pasture in Switzerland in relation to management, soil water
content and soil temperature. Agric. Ecosyst. Environ. 73, 83–
91.
Ryden, J.C., Ball, P.R., Garwood, E.A., 1984. Nitrate leaching from
grasslands. Nature 311, 50–53.
Scholefield, D., Lockyer, D.R., Whitehead, D.C., Tyson, K.C., 1991.
A model to predict transformations and losses of nitrogen in UK
pastures grazed by beef cattle. Plant Soil 132, 165–177.
Scholefield, D., Stone, A.C., 1995. Nutrient losses in runoff water
following application of different fertilisers to grassland cut for
silage. Agric. Ecosyst. Environ. 55, 181–191.
Schroder, J.J., van Asperen, P., van Dogen, G.J.M., Wijnands, F.G.,
1996. Nutrient surpluses on integrated arable farms. Eur. J.
Agron. 5, 181–191.
Scotter, D.R., White, R.E., Dyson, J.S., 1993. The Burns leaching
equation. J. Soil Sci. 51, 413–424.
Simon, J.-C., Grignani, C., Jacquet, A., Le Corre, L., Pages, J., 2000.
Typologie des bilans d’azote de divers types d’exploitation
agricole: recherche d’indicateurs de fonctionnement. Agrono-
mie 20, 175–195.
Sommer, S.G., Hutchings, N.J., 2001. Ammonia emission from field
applied manure and its reduction—invited paper. Eur. J. Agron.
15, 1–15.
ten Berge, H.F.M., 2002. A review of potential indicators for nitrate
loss from cropping and farming systems in The Netherlands.
Plant Research International B.V, Wageningen, The Nether-
lands, 168 pp..
ten Berge, H.F.M., Burgers, S.L.G.E., Schroder, J.J., Hofstad, E.J.,
2002a. ‘Partial balance’—regression models for Nmin, H. In: ten
Berge, H.F.M. (Ed.), A review of potential indicators for nitrate
loss from cropping and farming systems in The Netherlands.
Plant Research International, Wageningen, The Netherlands, pp.
25–60.
ten Berge, H.F.M., van der Meer, H.G., Carlier, L., Baan Hofman, T.,
Neeteson, J.J., 2002b. Limits to nitrogen use on grasslands.
Environ. Pollut. 118, 225–238.
Tuck, G., Matthews, A.M., Harris, G.L., Dailey, A.G., Armstrong,
A.C., Addiscott, T.M., 2000. Simulating nitrate concentrations

F. Pervanchon et al. / Agriculture, Ecosystems and Environment 105 (2005) 1–1616
in water draining from a small arable catchment in England. Soil
Use Manage. 16, 66–70.
Van Bol, V., Peeters, A., 1997. Nitrogen resources conservation in a
mixed dairy farming system—inter leacheable nitrate risk
assessment. Proceedings of the European Newsletter of organic
farming (ENOF), pp. 349–352.
van der Werf, H.M.G., Petit, J., 2001. Evaluation of the environ-
mental impact of agriculture at the farm level: a comparison and
analysis of 12 indicator-based methods. Agric. Ecosyst. Environ.
93, 131–145.
van Eerdt, M.M., Fong, P.K.N., 1998. The monitoring of
nitrogen surpluses from agriculture. Environ. Pollut. 102,
227–233.
Velthof, G.L., Oenema, O., 1997. Nitrous oxide emissions from
dairy farming systems in The Netherlands. Netherlands J. Agric
Sci. 45, 347–360.
Vertes, F., Journet, M., Alard, V., Etesse, A., 2002. Le paturage et les
pertes d’azote. In: Alard, V., Beranger, C., Journet, M. (Eds.), A
la Recherche d’une agriculture durable: Etude de systemes
herbagers economes en Bretagne. INRA editions, pp. 115–144.
Watson, C.J., Foy, R.H., 2001. Environmental impacts of nitrogen
and phosphorus cycling in grassland systems. Outlook Agric. 30,
117–127.
Yang, J., Greenwood, D.J., Rowell, D.L., Wadsworth, G.A., Burns,
I.G., 2000. Statistical methods for evaluating a crop nitrogen
simulation model. N_ABLE. Agric. Syst. 64, 37–53.


