Embed Size (px)
Citation preview
HAL Id: hal-02335215https://hal.archives-ouvertes.fr/hal-02335215
Submitted on 15 Dec 2020
HAL is a multi-disciplinary open accessarchive for the deposit and dissemination of sci-entific research documents, whether they are pub-lished or not. The documents may come fromteaching and research institutions in France orabroad, or from public or private research centers.
L’archive ouverte pluridisciplinaire HAL, estdestinée au dépôt et à la diffusion de documentsscientifiques de niveau recherche, publiés ou non,émanant des établissements d’enseignement et derecherche français ou étrangers, des laboratoirespublics ou privés.
A Promiscuous CYP706A3 Reduces Terpene VolatileEmission from Arabidopsis Flowers, Affecting Florivores
and the Floral MicrobiomeBenoit Boachon, Yannick Burdloff, Ju-Xin Ruan, Rakotoharisoa Rojo, RobertR. Junker, Bruno Vincent, Florence Nicolè, Françoise Bringel, Agnes Lesot,
Laura Henry, et al.
To cite this version:Benoit Boachon, Yannick Burdloff, Ju-Xin Ruan, Rakotoharisoa Rojo, Robert R. Junker, et al..A Promiscuous CYP706A3 Reduces Terpene Volatile Emission from Arabidopsis Flowers, AffectingFlorivores and the Floral Microbiome. The Plant cell, American Society of Plant Biologists (ASPB),2019, 31 (12), pp.2947-2972. �10.1105/tpc.19.00320�. �hal-02335215�
RESEARCH ARTICLE A Promiscuous CYP706A3 Reduces Terpene Volatile Emission from Arabidopsis Flowers, Affecting Florivores and the Floral Microbiome Benoît Boachona,b,c, Yannick Burdloffa, Ju-Xin Ruand, Rakotoharisoa Rojoe, Robert R. Junkerf, Bruno Vincentg, Florence Nicolèc, Françoise Bringelh, Agnès Lesota, Laura Henryb, Jean-Etienne Bassarda, Sandrine Mathieua, Lionel Allouchef, Ian Kaplani, Natalia Dudarevab, Stéphane Vuilleumierh, Laurence Mieschj, François Andrée, Nicolas Navrota, Xiao-Ya Chend
and Danièle Werck-Reichharta,h
a Institut de Biologie Moléculaire des Plantes du Centre National de la Recherche Scientifique (CNRS), Unité Propre de Recherche 2357, Université de Strasbourg, France. b Department of Biochemistry, Purdue University, West Lafayette, IN, USA. c University of Lyon, UJM-Saint-Etienne, CNRS, BVpam Fédération de Recherche en Evolution 3727, Saint-Etienne, France. d National Key Laboratory of Plant Molecular Genetics, CAS Center for Excellence in Molecular Plant Sciences, Shanghai Institute of Plant Physiology and Ecology, University of CAS, Chinese Academy of Sciences, Shanghai, China. Plant Science Research Center, Shanghai Key Laboratory of Plant Functional Genomics and Resources, Shanghai Chenshan Botanical Garden, Shanghai, China. e Institute for Integrative Biology of the Cell (I2BC), iBiTec-S/SB2SM, Commissariat à l’Energie Atomique, CNRS, Université Paris Sud, Université Paris-Saclay, Gif-sur-Yvette, France. fEvolutionary Ecology of Plants, Department Biodiversity of Plants, Faculty of Biology, Philipps-University Marburg, Evolutionary Ecology of Plants, Department Biology, Karl-von-Frisch Str. 8, 35043 Marburg, Germany. g Plateforme d’Analyses pour la Chimie, GDS 3648, CNRS, Université de Strasbourg, France. h
Génétique Moléculaire, Génomique, Microbiologie, Université de Strasbourg, UMR 7156 CNRS, Strasbourg, France. I Department of Entomology, Purdue University, West Lafayette, IN 47907, United States. j Equipe de Synthèse Organique et Phytochimie, Institut de Chimie, Unité Mixte de Recherche 7177, CNRS, Université de Strasbourg, France. h Corresponding Author: [email protected] Short Title: Floral terpene metabolism in Arabidopsis One sentence summary: A gene cluster encoding two promiscuous enzymes modulates volatile emissions from Arabidopsis thaliana flowers, formation of insect-deterring terpene oxides, and the composition of the floral microbiome. The author responsible for distribution of materials integral to the findings presented in this article in accordance with the policy described in the Instructions for Authors (www.plantcell.org) is Nicolas Navrot ([email protected]). ABSTRACT Flowers are essential but vulnerable plant organs, exposed to pollinators and florivores; however, flower chemical defenses are rarely investigated. We show here that two clustered terpene synthase and cytochrome P450 encoding genes (TPS11 and CYP706A3) on chromosome 5 of Arabidopsis thaliana are tightly co-expressed in floral tissues, upon anthesis and during floral bud development. TPS11 was previously reported to generate a blend of sesquiterpenes. By heterologous co-expression of TPS11 and CYP706A3 in yeast and Nicotiana benthamiana, we demonstrate that CYP706A3 is active on TPS11 products and also further oxidizes its own primary oxidation products. Analysis of headspace and soluble metabolites in cyp706a3 and 35S:CYP706A3 mutants indicate that CYP706A3-mediated metabolism largely suppresses sesquiterpene and most monoterpene emissions from opening flowers, and generates terpene oxides that are retained in floral tissues. In flower buds, the combined expression of TPS11 and CYP706A3 also suppresses volatile emissions and generates soluble sesquiterpene oxides. Florivory assays with the Brassicaceae specialist Plutella xylostella demonstrate that insect larvae avoid feeding on buds expressing CYP706A3 and accumulating terpene oxides. Composition of the floral microbiome appears also to be modulated by CYP706A3 expression. TPS11 and CYP706A3 simultaneously evolved within Brassicaceae and form the most versatile functional gene cluster described in higher plants so far.
Introduction Flowers are essential reproductive organs of plants, but also comprise their most vulnerable tissues
and thus require sophisticated defense strategies to preserve plant fertility. The “optimal defense
theory” predicts that tissues within a plant are defended in proportion to their fitness value and risk
of attack (McKey, 1979). Indeed, flowers are vehicles of Darwinian fitness due to their involvement
in pollen and seed production, and at the same time are particularly exposed to attack by insects
and pathogens (Li et al., 2017). In addition, pollinators are often florivores at another stage of their
life cycle (Abdalsamee and Müller, 2015). Surprisingly, however, flower defense mechanisms have
rarely been investigated, especially at the metabolic level (Junker, 2016). For example, it has been
known since the Middle Ages that one of the most potent natural insect repellents (presently
identified as pyrethrin) is generated mainly by the buds and flowers of some Asteraceae, in particular
Tanacetum cinerariifolium (Katsuda, 2012). Although the metabolic pathway leading to pyrethrin has
now been elucidated (Kikuta et al., 2012; Xu et al., 2018), its direct impact on plant defenses has
not been reported. In Nicotiana attenuata, one of the best described models of flower chemical
ecology, a complex interplay between several plant pathways, signaling, and insects or
hummingbirds has been observed in field studies, revealing different plant strategies to attract
pollinators, and to deter or attract florivores (Kessler et al., 2010, 2015; Euler and Baldwin, 1996; Li
et al., 2017, 2018). In Brassicaceae and especially the Arabidopsis thaliana model, such a
multipartite interplay largely remains to be investigated.
A. thaliana is a selfing species, with flowers emitting an essentially terpenoid volatile bouquet that is
complex but weak in intensity (Chen et al., 2003; Tholl and Lee, 2011). It is produced by six terpene
synthases (Chen et al., 2003; Tholl and Lee, 2011) (Figure 1) and is dominated by (E)-β-
caryophyllene generated by TPS21 (Tholl et al., 2005). The next two most significant contributors
to Arabidopsis floral emissions are TPS24, which generates monoterpenes such as α-pinene or β-
myrcene, and TPS11, which produces a complex mixture of sesquiterpenes dominated by (+)-α-
barbatene and (+)-thujopsene (Tholl et al., 2005). The only metabolic process so far reported to
prevent excessive damage from pollinators and florivores in flowers from wild-type A. thaliana is the
oxidative metabolism of linalool, which generates both volatile and soluble repellent compounds
(Boachon et al., 2015). The production of volatile linalool by the flower-expressed terpene synthases
TPS10 and TPS14, which attract insects, is significantly reduced by P450-mediated oxidative
metabolism depending on CYP76C1, leading to the production of repellent lilac aldehydes, lilac
alcohols and carboxylinalool. These oxygenated metabolites are largely converted to glucosides,
which facilitates their storage in flower tissues. It thus seems reasonable to speculate that this
oxidative metabolism constitutes an adaptation for fitness optimization and decreased risk of attack
by consumers.
A second mechanism for Arabidopsis flower protection is associated with the production of the
sesquiterpene (E)-β-caryophyllene (Huang et al., 2012). In this case, (E)-β-caryophyllene was
demonstrated to protect flowers from bacterial pathogens, although its impact on insect herbivory
was not tested. The antibacterial activity of (E)-β-caryophyllene against Pseudomonas syringae pv.
tomato DC3000 (Pto DC300) was demonstrated in vitro, and tps21 mutants lacking (E)-β-
caryophyllene showed enhanced growth of (Pto DC300) on their stigmas, and production of lighter
seeds upon infection with the pathogen.
To uncover further metabolic processes associated with floral defense in A. thaliana, in particular
those relying on oxygenated non-volatile compounds, we investigate here the function of a small
gene cluster of two genes encoding a sesquiterpene synthase (TPS11, At5g44630) and a
cytochrome P450 (CYP706A3, At5g44620), which are tightly co-expressed in Arabidopsis flowers
and flower buds. We demonstrate that CYP706A3 efficiently oxidizes TPS11 products and the
products of other flower-expressed mono- and sesquiterpene synthases, thereby suppressing floral
volatile emissions. We show that expression of CYP706A3 impacts the composition of the floral
microbiome, as well as the feeding behaviour of Plutella xylostella on flower buds. Flower protection
provided by the TPS11-CYP706A3 cluster starts well before anthesis and extends throughout floral
bud development. This cluster of two physically and functionally linked genes is unusual and
CYP706A3 represents the most promiscuous plant P450 oxygenase reported to date.
Results CYP706A3 and TPS11 are clustered on chromosome 5 and tightly co-expressed in flowers Co-expression of CYP706A3 and TPS11 in Arabidopsis flowers was first evidenced by an in silico
analysis aimed at identifying P450s involved in specific metabolic pathways. CYP706A3 and TPS11
emerged as among the most tightly co-expressed terpene synthase and cytochrome P450 genes
(correlation coefficient r = 0.94) in the plant organ dataset (Ehlting et al., 2008) (http://www-ibmp.u-
strasbg.fr/~CYPedia/CYP706A3/CoExpr_CYP706A3_Organs.html). This result was confirmed and
refined using BAR Expression Angler (Toufighi et al., 2005) with CYP706A3 as the bait, which
indicated that TPS11 was the gene most tightly co-regulated with CYP706A3 when using the
“Extended Tissue Compendium” data set (Figure 2A, Supplemental Dataset 1). Conversely,
CYP706A3 was the P450 gene the most tightly co-regulated with TPS11. Both genes were spatially
and developmentally co-expressed, with the highest levels detected in carpels from flower stage 12
to 15, and in samples from the shoot apical meristem and inflorescence apex. Co-expression in
flowers and especially carpels at anthesis was further validated by RT-qPCR (Figure 2B). While
suggesting that both genes might contribute to reproductive fitness, their expression patterns also
provided a first hint that CYP706A3 might be acting on TPS11 products.
Genomic organization further supported this hypothesis: CYP706A3 and TPS11 are two adjacent
genes on chromosome 5 of A. thaliana, separated only by 5 kb of non-coding sequence and
transcribed in opposite directions (Figure 2C). As this hinted that these two genes might form the
core of a larger metabolic cluster (Nützmann and Osbourn, 2014; Nützmann et al., 2016),
neighboring genes were also inspected. Two genes coding for S-adenosyl methyltransferases, and
both predicted to be located in plastids, showed expression profiles not matching those of TPS11
and CYP706A3. Other genes were unlikely to contribute to a terpenoid-tailoring pathway (Figure
2C, Supplemental Figure 1). Moreover, no relevant metabolic gene(s) closely associated with the
TPS11/CYP706A3 locus was part of the list of most co-expressed genes in BAR Expression Angler.
It thus seems likely that TPS11 and CYP706A3 form a minimal metabolic cluster of two co-
transcribed genes. Both proteins are located in the cytoplasmic compartment, with CYP706A3
anchored to the endoplasmic reticulum (Supplemental Figure 2).
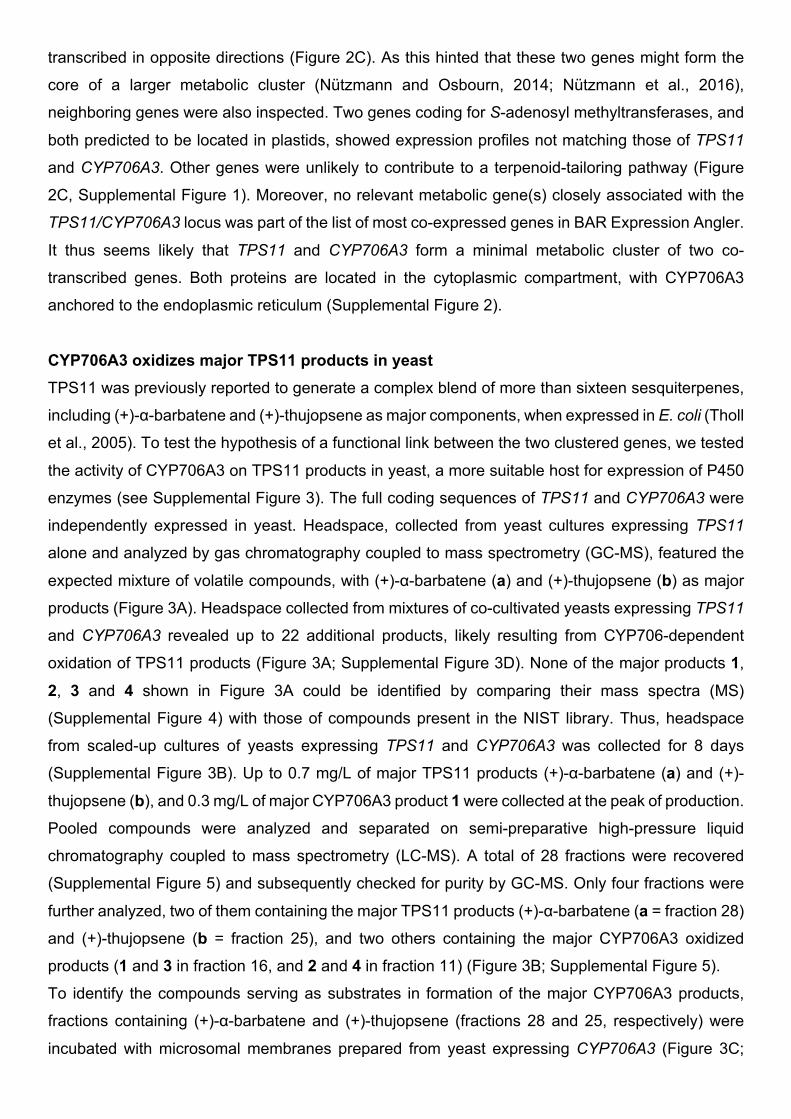
CYP706A3 oxidizes major TPS11 products in yeast TPS11 was previously reported to generate a complex blend of more than sixteen sesquiterpenes,
including (+)-α-barbatene and (+)-thujopsene as major components, when expressed in E. coli (Tholl
et al., 2005). To test the hypothesis of a functional link between the two clustered genes, we tested
the activity of CYP706A3 on TPS11 products in yeast, a more suitable host for expression of P450
enzymes (see Supplemental Figure 3). The full coding sequences of TPS11 and CYP706A3 were
independently expressed in yeast. Headspace, collected from yeast cultures expressing TPS11
alone and analyzed by gas chromatography coupled to mass spectrometry (GC-MS), featured the
expected mixture of volatile compounds, with (+)-α-barbatene (a) and (+)-thujopsene (b) as major
products (Figure 3A). Headspace collected from mixtures of co-cultivated yeasts expressing TPS11
and CYP706A3 revealed up to 22 additional products, likely resulting from CYP706-dependent
oxidation of TPS11 products (Figure 3A; Supplemental Figure 3D). None of the major products 1,
2, 3 and 4 shown in Figure 3A could be identified by comparing their mass spectra (MS)
(Supplemental Figure 4) with those of compounds present in the NIST library. Thus, headspace
from scaled-up cultures of yeasts expressing TPS11 and CYP706A3 was collected for 8 days
(Supplemental Figure 3B). Up to 0.7 mg/L of major TPS11 products (+)-α-barbatene (a) and (+)-
thujopsene (b), and 0.3 mg/L of major CYP706A3 product 1 were collected at the peak of production.
Pooled compounds were analyzed and separated on semi-preparative high-pressure liquid
chromatography coupled to mass spectrometry (LC-MS). A total of 28 fractions were recovered
(Supplemental Figure 5) and subsequently checked for purity by GC-MS. Only four fractions were
further analyzed, two of them containing the major TPS11 products (+)-α-barbatene (a = fraction 28)
and (+)-thujopsene (b = fraction 25), and two others containing the major CYP706A3 oxidized
products (1 and 3 in fraction 16, and 2 and 4 in fraction 11) (Figure 3B; Supplemental Figure 5).
To identify the compounds serving as substrates in formation of the major CYP706A3 products,
fractions containing (+)-α-barbatene and (+)-thujopsene (fractions 28 and 25, respectively) were
incubated with microsomal membranes prepared from yeast expressing CYP706A3 (Figure 3C;
Supplemental Figure 6). (+)-α-barbatene was converted by CYP706A3 into products 1 and 3 of
purified fraction 16, and into two other products (7) and (8) previously detected in headspace of
mixed yeast cultures (numbering according to Supplemental Figure 3). (+)-thujopsene (Figure 3C),
as well as pure (-)-thujopsene (as the only commercially available product) were both transformed
into products 2 and 4 (Supplemental Figure 6B to D). Retention times (RT) and MS of these products
were compared with those of corresponding compounds present in fractions 11 and 16 and in
headspace from mixed yeast cultures (Supplemental Figure 4). Products 1 and 3, derived from (+)-
α-barbatene, yielded distinct fragmentation spectra, suggesting different structures. Products 2 and
4, derived from (-/+)-thujopsene, had similar fragmentation spectra and were thus most likely
stereoisomers.
NMR spectroscopy enabled identification of the major CYP706A3 products as 2 diastereoisomers
of (+)-1-oxo-thujopsene (products 2 and 4 in fraction 11), and as a mix of 2 diastereoisomers of (+)-
6-oxo-α-barbatene and (+)-6-OH-α-barbatene (products 3 and 1 in fraction 16, respectively) (Figure
3; Supplemental Figure 7).
Samples from yeast headspace, purified fractions and in vitro incubations were analyzed and
compared by LC-MS and LC-MS/MS (Supplemental Figure 8). Mass spectra of compounds 1, 2, 3
and 4 in fractions 11 and 16 confirmed GC-MS and NMR structure assignments (Supplemental
Figure 9). The purified fractions 11 and 16, respectively containing CYP706A3-generated
thujopsene oxides and barbatene oxides, were then incubated with microsomal membranes isolated
from yeast expressing CYP706A3. LC-MS/MS analysis of the resulting reaction medium extracts
revealed activity of CYP706A3 on both thujopsene and barbatene oxides. The primary products of
(+)-α-barbatene oxidation (fraction 16) were further converted by CYP706A3 into products 5, 6, 7
and 8, while those of (+)-thujopsene (fraction 11) were converted into products 9, 10 and 11 (Figure
3D and Supplemental Figure 8C). RT and MS of these secondary products indicated that most of
them were further oxygenated compounds (Supplemental Figure 10).
Taken together, these data suggest a scenario involving a sequential activity of CYP706A3 on (+)-
α-barbatene, (+)-thujopsene and on their respective oxides, as summarized in Figure 4.
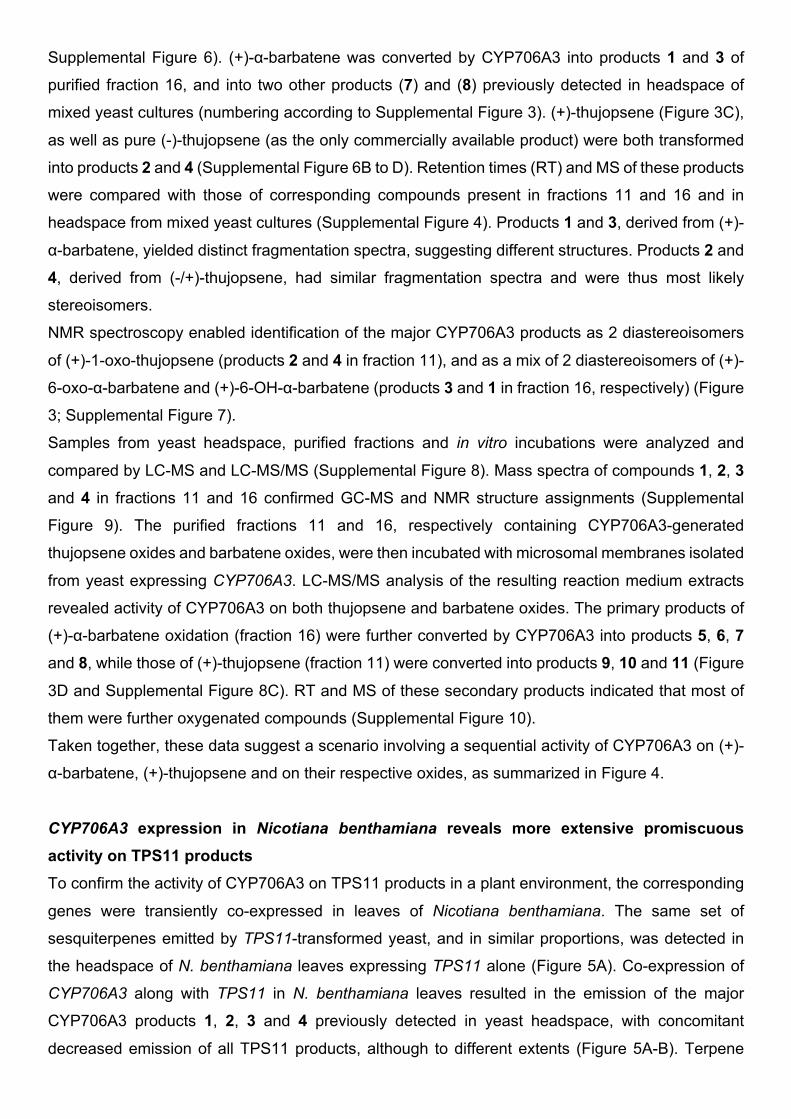
CYP706A3 expression in Nicotiana benthamiana reveals more extensive promiscuous activity on TPS11 products To confirm the activity of CYP706A3 on TPS11 products in a plant environment, the corresponding
genes were transiently co-expressed in leaves of Nicotiana benthamiana. The same set of
sesquiterpenes emitted by TPS11-transformed yeast, and in similar proportions, was detected in
the headspace of N. benthamiana leaves expressing TPS11 alone (Figure 5A). Co-expression of
CYP706A3 along with TPS11 in N. benthamiana leaves resulted in the emission of the major
CYP706A3 products 1, 2, 3 and 4 previously detected in yeast headspace, with concomitant
decreased emission of all TPS11 products, although to different extents (Figure 5A-B). Terpene
structures had a major impact on emission decrease that was more pronounced for multi-cyclic
compounds such as barbatene, thujopsene, chamigrene, cuprenene, isobazzanene and acoradiene
(the emission of which decreased by more than 50%) than for monocyclic and acyclic compounds
such as cuparene, sesquiphellandrene, zingiberene and farnesene (Figure 5B; Supplemental Table
1).
Decreased emission of TPS11 products was not due to the reduced production of TPS11 potentially
resulting from its co-expression with another protein, since co-expression of TPS11 and CYP76C1
(the endogenous Arabidopsis linalool hydroxylase P450 inactive on TPS11 products), did not result
in decreased emissions of TPS11 products (Supplemental Table 1).
To summarize, TPS11 and CYP706A3 co-expression in N. benthamiana confirmed CYP706A3-
dependent formation of barbatene and thujopsene oxides in planta, and also revealed the
promiscuity of CYP706A3 allowing oxidation of most TPS11 products, with a preference for more
bulky multi-cyclic sesquiterpenoid structures.
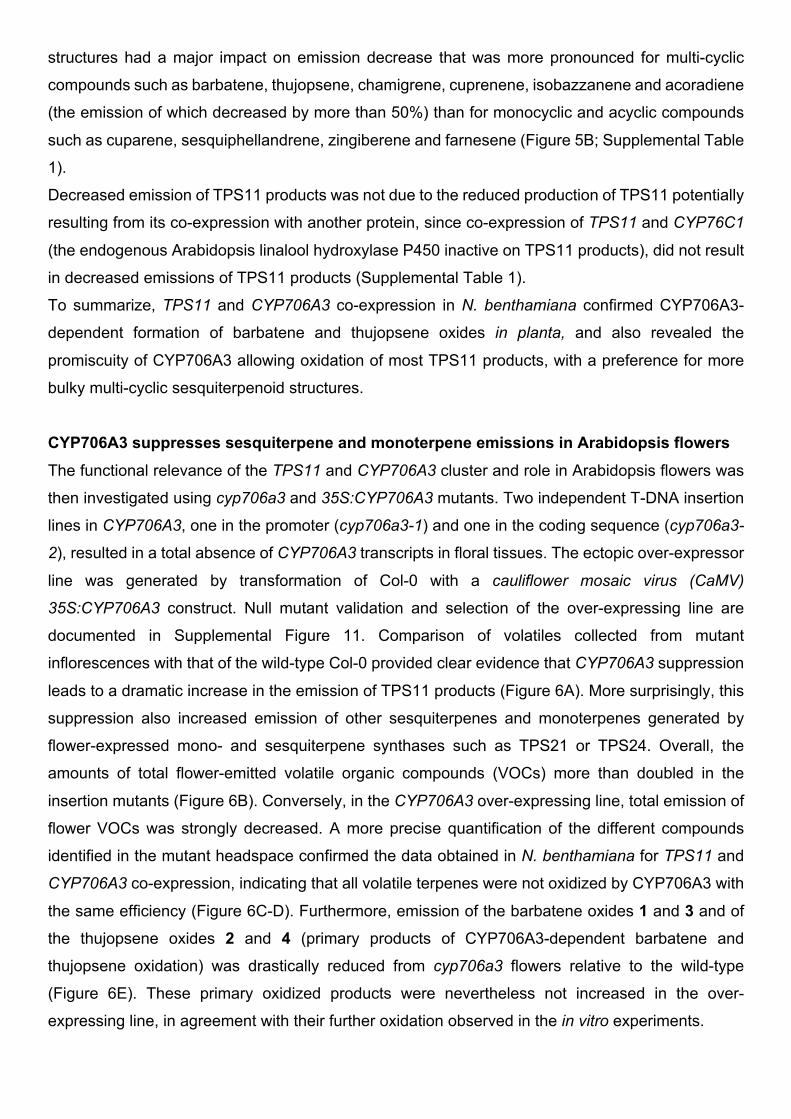
CYP706A3 suppresses sesquiterpene and monoterpene emissions in Arabidopsis flowers The functional relevance of the TPS11 and CYP706A3 cluster and role in Arabidopsis flowers was
then investigated using cyp706a3 and 35S:CYP706A3 mutants. Two independent T-DNA insertion
lines in CYP706A3, one in the promoter (cyp706a3-1) and one in the coding sequence (cyp706a3-
2), resulted in a total absence of CYP706A3 transcripts in floral tissues. The ectopic over-expressor
line was generated by transformation of Col-0 with a cauliflower mosaic virus (CaMV)
35S:CYP706A3 construct. Null mutant validation and selection of the over-expressing line are
documented in Supplemental Figure 11. Comparison of volatiles collected from mutant
inflorescences with that of the wild-type Col-0 provided clear evidence that CYP706A3 suppression
leads to a dramatic increase in the emission of TPS11 products (Figure 6A). More surprisingly, this
suppression also increased emission of other sesquiterpenes and monoterpenes generated by
flower-expressed mono- and sesquiterpene synthases such as TPS21 or TPS24. Overall, the
amounts of total flower-emitted volatile organic compounds (VOCs) more than doubled in the
insertion mutants (Figure 6B). Conversely, in the CYP706A3 over-expressing line, total emission of
flower VOCs was strongly decreased. A more precise quantification of the different compounds
identified in the mutant headspace confirmed the data obtained in N. benthamiana for TPS11 and
CYP706A3 co-expression, indicating that all volatile terpenes were not oxidized by CYP706A3 with
the same efficiency (Figure 6C-D). Furthermore, emission of the barbatene oxides 1 and 3 and of
the thujopsene oxides 2 and 4 (primary products of CYP706A3-dependent barbatene and
thujopsene oxidation) was drastically reduced from cyp706a3 flowers relative to the wild-type
(Figure 6E). These primary oxidized products were nevertheless not increased in the over-
expressing line, in agreement with their further oxidation observed in the in vitro experiments.
Analyses of the headspace collected from the flowers of the CYP706A3 mutants (Figure 6A) further
suggested an unexpected promiscuous activity of CYP706A3 on TPS21 (sesquiterpene) and TPS24
(monoterpene) products. CYP706A3 activity was thus further investigated by co-expression with
TPS21 or TPS24 in yeast cultures and N. benthamiana leaves. Mixing yeasts producing terpene
synthases and CYP706A3 and co-expressing TPS21 or TPS24 with CYP706A3 in N. benthamiana
largely reduced terpene emissions compared to levels emitted by yeast or N. benthamiana leaves
producing only terpene synthases (Supplemental Figures 12 and 13). CYP706A3 activity on TPS21
products resulted in the emission of oxidized derivatives in yeast and N. benthamiana (Supplemental
Figures 12A-B). Some of these oxidized compounds were also generated by the incubation of (-)-
E-β-caryophyllene (major TPS21 product) with the microsomal fraction of CYP706A3-transformed
yeast. Among those, some were found at decreased levels in the headspace of cyp706a3 flowers
as compared to the wild type (Supplemental Figures 12C-E). By contrast, no volatile oxidation
products were detected in yeast or N. benthamiana headspace when both TPS24 and CYP706A3
were expressed (Supplemental Figure 13A-B). CYP706A3 activity on TPS24 monoterpene products
was nevertheless observed following incubation of four pure standards (α-pinene, (+)-sabinene, β-
pinene, and α-phellandrene) with a microsomal fraction of CYP706A3-transformed yeast, revealing
the formation of several unknown oxygenated products (Supplemental Figure 13C). Taken together,
these results confirm the promiscuous activity of CYP706A3 on a large subset of sesquiterpenes
and monoterpenes generated by Arabidopsis flowers, still with a preference for cyclic compounds
as substrates.
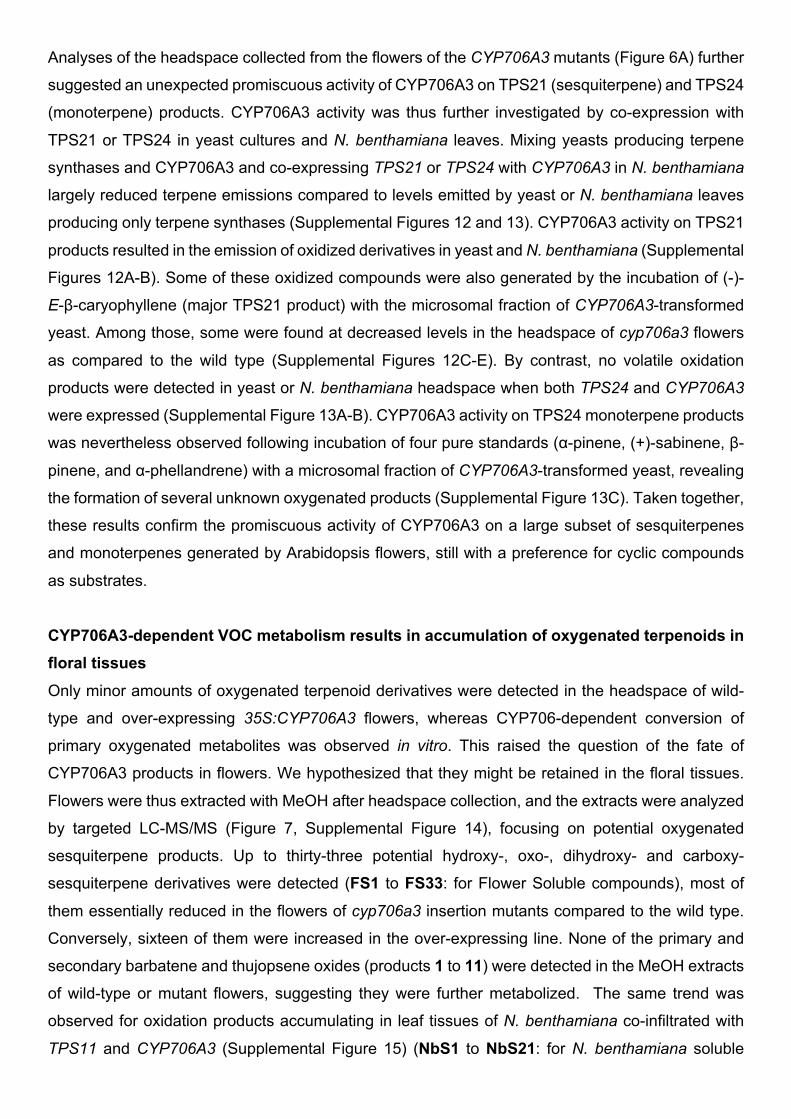
CYP706A3-dependent VOC metabolism results in accumulation of oxygenated terpenoids in floral tissues Only minor amounts of oxygenated terpenoid derivatives were detected in the headspace of wild-
type and over-expressing 35S:CYP706A3 flowers, whereas CYP706-dependent conversion of
primary oxygenated metabolites was observed in vitro. This raised the question of the fate of
CYP706A3 products in flowers. We hypothesized that they might be retained in the floral tissues.
Flowers were thus extracted with MeOH after headspace collection, and the extracts were analyzed
by targeted LC-MS/MS (Figure 7, Supplemental Figure 14), focusing on potential oxygenated
sesquiterpene products. Up to thirty-three potential hydroxy-, oxo-, dihydroxy- and carboxy-
sesquiterpene derivatives were detected (FS1 to FS33: for Flower Soluble compounds), most of
them essentially reduced in the flowers of cyp706a3 insertion mutants compared to the wild type.
Conversely, sixteen of them were increased in the over-expressing line. None of the primary and
secondary barbatene and thujopsene oxides (products 1 to 11) were detected in the MeOH extracts
of wild-type or mutant flowers, suggesting they were further metabolized. The same trend was
observed for oxidation products accumulating in leaf tissues of N. benthamiana co-infiltrated with
TPS11 and CYP706A3 (Supplemental Figure 15) (NbS1 to NbS21: for N. benthamiana soluble
compounds). β–glycosidase treatment did not reveal new metabolites or increased amounts of
detected oxidation products. This led us to conclude that most CYP706A3 products are sequentially
oxidized, subjected to downstream modification, and become soluble enough to be stored in plant
tissues.
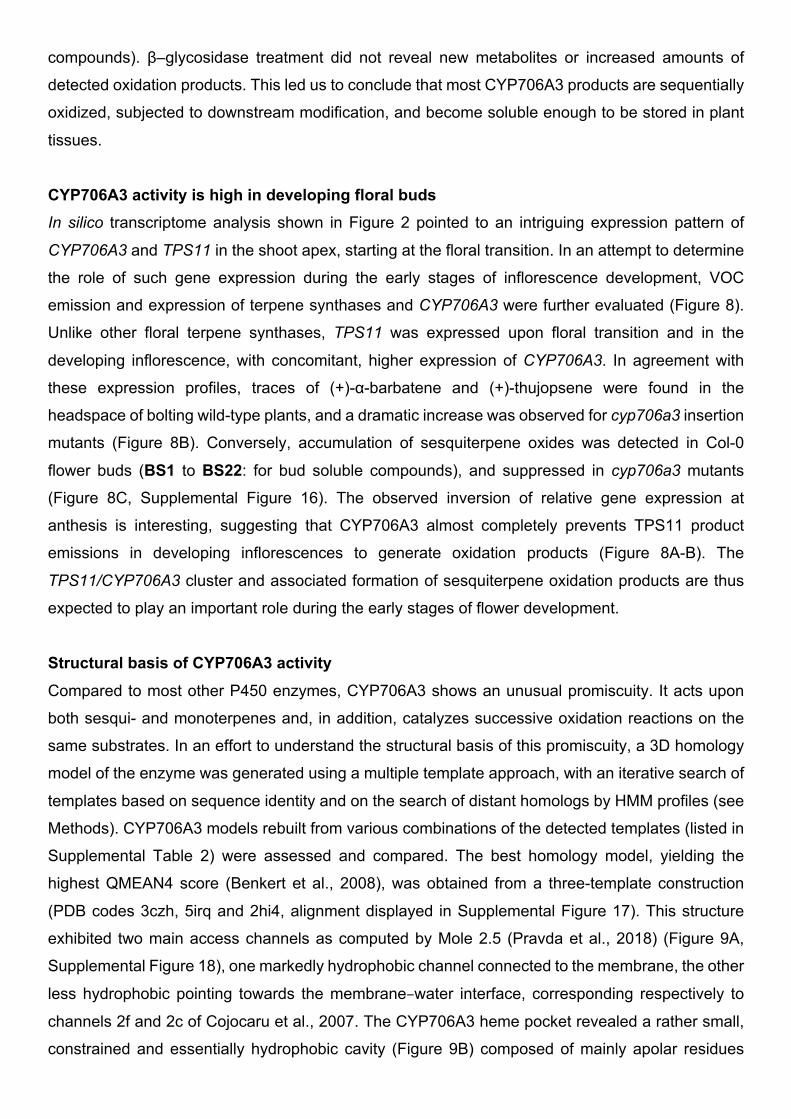
CYP706A3 activity is high in developing floral buds In silico transcriptome analysis shown in Figure 2 pointed to an intriguing expression pattern of
CYP706A3 and TPS11 in the shoot apex, starting at the floral transition. In an attempt to determine
the role of such gene expression during the early stages of inflorescence development, VOC
emission and expression of terpene synthases and CYP706A3 were further evaluated (Figure 8).
Unlike other floral terpene synthases, TPS11 was expressed upon floral transition and in the
developing inflorescence, with concomitant, higher expression of CYP706A3. In agreement with
these expression profiles, traces of (+)-α-barbatene and (+)-thujopsene were found in the
headspace of bolting wild-type plants, and a dramatic increase was observed for cyp706a3 insertion
mutants (Figure 8B). Conversely, accumulation of sesquiterpene oxides was detected in Col-0
flower buds (BS1 to BS22: for bud soluble compounds), and suppressed in cyp706a3 mutants
(Figure 8C, Supplemental Figure 16). The observed inversion of relative gene expression at
anthesis is interesting, suggesting that CYP706A3 almost completely prevents TPS11 product
emissions in developing inflorescences to generate oxidation products (Figure 8A-B). The
TPS11/CYP706A3 cluster and associated formation of sesquiterpene oxidation products are thus
expected to play an important role during the early stages of flower development.
Structural basis of CYP706A3 activity Compared to most other P450 enzymes, CYP706A3 shows an unusual promiscuity. It acts upon
both sesqui- and monoterpenes and, in addition, catalyzes successive oxidation reactions on the
same substrates. In an effort to understand the structural basis of this promiscuity, a 3D homology
model of the enzyme was generated using a multiple template approach, with an iterative search of
templates based on sequence identity and on the search of distant homologs by HMM profiles (see
Methods). CYP706A3 models rebuilt from various combinations of the detected templates (listed in
Supplemental Table 2) were assessed and compared. The best homology model, yielding the
highest QMEAN4 score (Benkert et al., 2008), was obtained from a three-template construction
(PDB codes 3czh, 5irq and 2hi4, alignment displayed in Supplemental Figure 17). This structure
exhibited two main access channels as computed by Mole 2.5 (Pravda et al., 2018) (Figure 9A,
Supplemental Figure 18), one markedly hydrophobic channel connected to the membrane, the other
less hydrophobic pointing towards the membrane–water interface, corresponding respectively to
channels 2f and 2c of Cojocaru et al., 2007. The CYP706A3 heme pocket revealed a rather small,
constrained and essentially hydrophobic cavity (Figure 9B) composed of mainly apolar residues
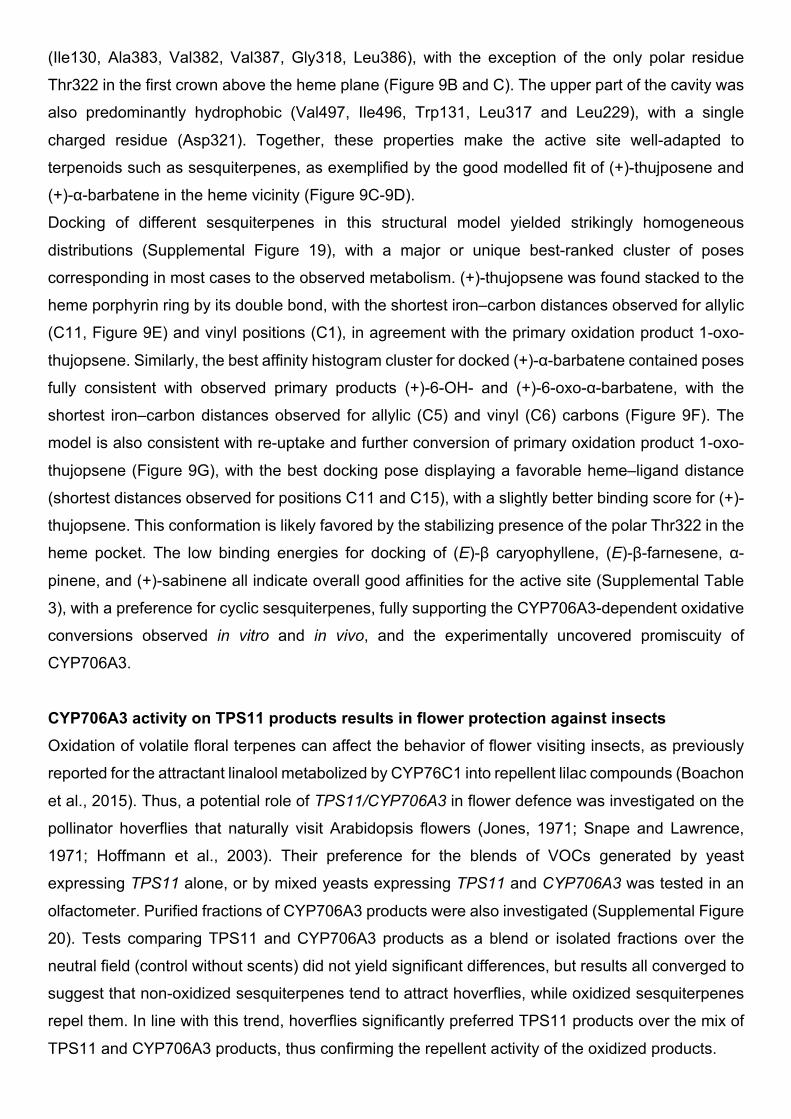
(Ile130, Ala383, Val382, Val387, Gly318, Leu386), with the exception of the only polar residue
Thr322 in the first crown above the heme plane (Figure 9B and C). The upper part of the cavity was
also predominantly hydrophobic (Val497, Ile496, Trp131, Leu317 and Leu229), with a single
charged residue (Asp321). Together, these properties make the active site well-adapted to
terpenoids such as sesquiterpenes, as exemplified by the good modelled fit of (+)-thujposene and
(+)-α-barbatene in the heme vicinity (Figure 9C-9D).
Docking of different sesquiterpenes in this structural model yielded strikingly homogeneous
distributions (Supplemental Figure 19), with a major or unique best-ranked cluster of poses
corresponding in most cases to the observed metabolism. (+)-thujopsene was found stacked to the
heme porphyrin ring by its double bond, with the shortest iron–carbon distances observed for allylic
(C11, Figure 9E) and vinyl positions (C1), in agreement with the primary oxidation product 1-oxo-
thujopsene. Similarly, the best affinity histogram cluster for docked (+)-α-barbatene contained poses
fully consistent with observed primary products (+)-6-OH- and (+)-6-oxo-α-barbatene, with the
shortest iron–carbon distances observed for allylic (C5) and vinyl (C6) carbons (Figure 9F). The
model is also consistent with re-uptake and further conversion of primary oxidation product 1-oxo-
thujopsene (Figure 9G), with the best docking pose displaying a favorable heme–ligand distance
(shortest distances observed for positions C11 and C15), with a slightly better binding score for (+)-
thujopsene. This conformation is likely favored by the stabilizing presence of the polar Thr322 in the
heme pocket. The low binding energies for docking of (E)-β caryophyllene, (E)-β-farnesene, α-
pinene, and (+)-sabinene all indicate overall good affinities for the active site (Supplemental Table
3), with a preference for cyclic sesquiterpenes, fully supporting the CYP706A3-dependent oxidative
conversions observed in vitro and in vivo, and the experimentally uncovered promiscuity of
CYP706A3.
CYP706A3 activity on TPS11 products results in flower protection against insects Oxidation of volatile floral terpenes can affect the behavior of flower visiting insects, as previously
reported for the attractant linalool metabolized by CYP76C1 into repellent lilac compounds (Boachon
et al., 2015). Thus, a potential role of TPS11/CYP706A3 in flower defence was investigated on the
pollinator hoverflies that naturally visit Arabidopsis flowers (Jones, 1971; Snape and Lawrence,
1971; Hoffmann et al., 2003). Their preference for the blends of VOCs generated by yeast
expressing TPS11 alone, or by mixed yeasts expressing TPS11 and CYP706A3 was tested in an
olfactometer. Purified fractions of CYP706A3 products were also investigated (Supplemental Figure
20). Tests comparing TPS11 and CYP706A3 products as a blend or isolated fractions over the
neutral field (control without scents) did not yield significant differences, but results all converged to
suggest that non-oxidized sesquiterpenes tend to attract hoverflies, while oxidized sesquiterpenes
repel them. In line with this trend, hoverflies significantly preferred TPS11 products over the mix of
TPS11 and CYP706A3 products, thus confirming the repellent activity of the oxidized products.
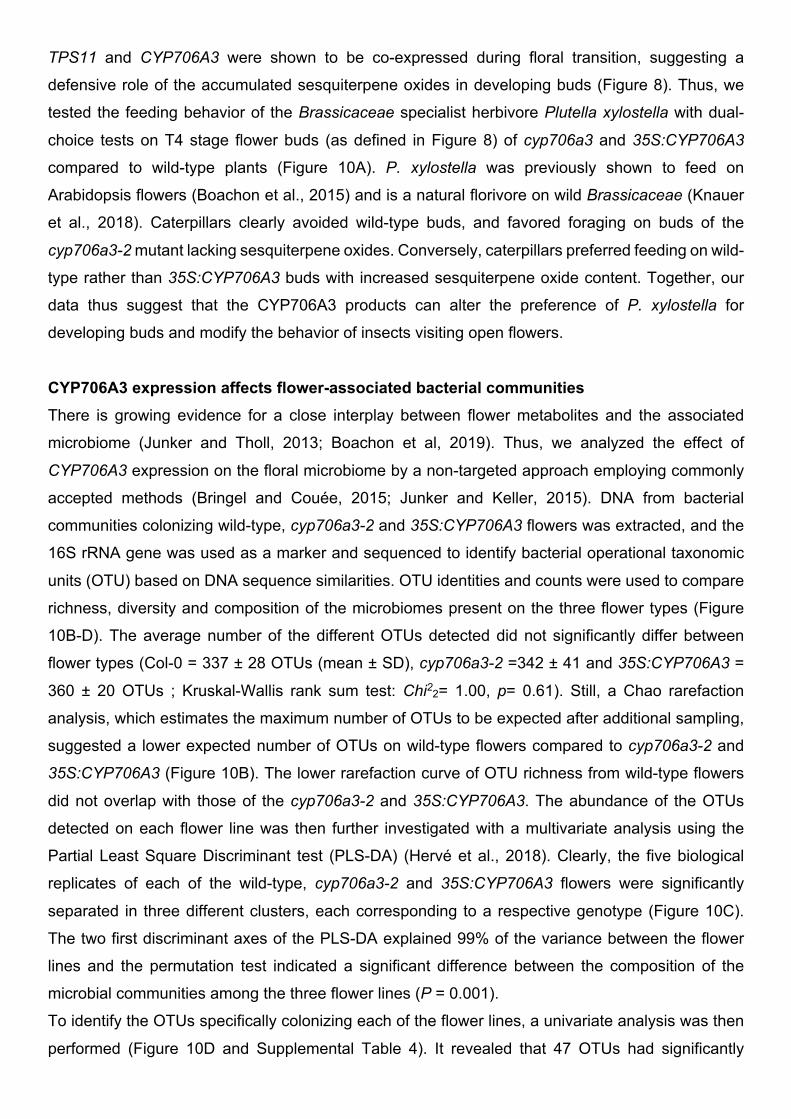
TPS11 and CYP706A3 were shown to be co-expressed during floral transition, suggesting a
defensive role of the accumulated sesquiterpene oxides in developing buds (Figure 8). Thus, we
tested the feeding behavior of the Brassicaceae specialist herbivore Plutella xylostella with dual-
choice tests on T4 stage flower buds (as defined in Figure 8) of cyp706a3 and 35S:CYP706A3
compared to wild-type plants (Figure 10A). P. xylostella was previously shown to feed on
Arabidopsis flowers (Boachon et al., 2015) and is a natural florivore on wild Brassicaceae (Knauer
et al., 2018). Caterpillars clearly avoided wild-type buds, and favored foraging on buds of the
cyp706a3-2 mutant lacking sesquiterpene oxides. Conversely, caterpillars preferred feeding on wild-
type rather than 35S:CYP706A3 buds with increased sesquiterpene oxide content. Together, our
data thus suggest that the CYP706A3 products can alter the preference of P. xylostella for
developing buds and modify the behavior of insects visiting open flowers.
CYP706A3 expression affects flower-associated bacterial communities There is growing evidence for a close interplay between flower metabolites and the associated
microbiome (Junker and Tholl, 2013; Boachon et al, 2019). Thus, we analyzed the effect of
CYP706A3 expression on the floral microbiome by a non-targeted approach employing commonly
accepted methods (Bringel and Couée, 2015; Junker and Keller, 2015). DNA from bacterial
communities colonizing wild-type, cyp706a3-2 and 35S:CYP706A3 flowers was extracted, and the
16S rRNA gene was used as a marker and sequenced to identify bacterial operational taxonomic
units (OTU) based on DNA sequence similarities. OTU identities and counts were used to compare
richness, diversity and composition of the microbiomes present on the three flower types (Figure
10B-D). The average number of the different OTUs detected did not significantly differ between
flower types (Col-0 = 337 ± 28 OTUs (mean ± SD), cyp706a3-2 =342 ± 41 and 35S:CYP706A3 =
360 ± 20 OTUs ; Kruskal-Wallis rank sum test: Chi22= 1.00, p= 0.61). Still, a Chao rarefaction
analysis, which estimates the maximum number of OTUs to be expected after additional sampling,
suggested a lower expected number of OTUs on wild-type flowers compared to cyp706a3-2 and
35S:CYP706A3 (Figure 10B). The lower rarefaction curve of OTU richness from wild-type flowers
did not overlap with those of the cyp706a3-2 and 35S:CYP706A3. The abundance of the OTUs
detected on each flower line was then further investigated with a multivariate analysis using the
Partial Least Square Discriminant test (PLS-DA) (Hervé et al., 2018). Clearly, the five biological
replicates of each of the wild-type, cyp706a3-2 and 35S:CYP706A3 flowers were significantly
separated in three different clusters, each corresponding to a respective genotype (Figure 10C).
The two first discriminant axes of the PLS-DA explained 99% of the variance between the flower
lines and the permutation test indicated a significant difference between the composition of the
microbial communities among the three flower lines (P = 0.001).
To identify the OTUs specifically colonizing each of the flower lines, a univariate analysis was then
performed (Figure 10D and Supplemental Table 4). It revealed that 47 OTUs had significantly
different colonization patterns on the flowers of the three lines. Specifically, 20 and 25 OTUs were
significantly enriched in the microbiome colonizing cyp706a3-2 and 35S:CYP706A3 flowers relative
to wild-type flowers, out of which 20 were barely detectable or absent on wild-type. By contrast, 19
and 19 OTUs found in wild-type flowers were significantly depleted from cyp706a3-2 and
35S:CYP706A3 flowers, respectively, out of which 14 and 6 were barely detectable or absent.
Such data suggest that the CYP706A3-generated metabolites play a role in the assembly of specific
bacterial taxa colonizing Arabidopsis flowers.
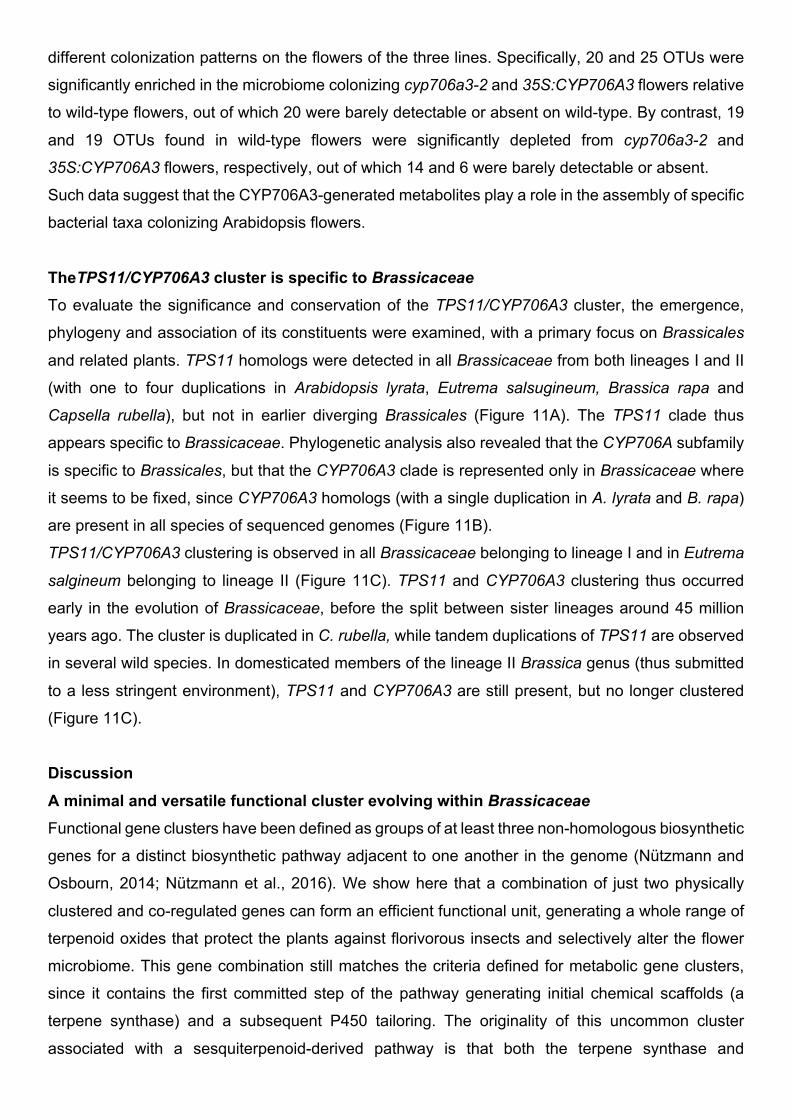
TheTPS11/CYP706A3 cluster is specific to Brassicaceae To evaluate the significance and conservation of the TPS11/CYP706A3 cluster, the emergence,
phylogeny and association of its constituents were examined, with a primary focus on Brassicales
and related plants. TPS11 homologs were detected in all Brassicaceae from both lineages I and II
(with one to four duplications in Arabidopsis lyrata, Eutrema salsugineum, Brassica rapa and
Capsella rubella), but not in earlier diverging Brassicales (Figure 11A). The TPS11 clade thus
appears specific to Brassicaceae. Phylogenetic analysis also revealed that the CYP706A subfamily
is specific to Brassicales, but that the CYP706A3 clade is represented only in Brassicaceae where
it seems to be fixed, since CYP706A3 homologs (with a single duplication in A. lyrata and B. rapa)
are present in all species of sequenced genomes (Figure 11B).
TPS11/CYP706A3 clustering is observed in all Brassicaceae belonging to lineage I and in Eutrema
salgineum belonging to lineage II (Figure 11C). TPS11 and CYP706A3 clustering thus occurred
early in the evolution of Brassicaceae, before the split between sister lineages around 45 million
years ago. The cluster is duplicated in C. rubella, while tandem duplications of TPS11 are observed
in several wild species. In domesticated members of the lineage II Brassica genus (thus submitted
to a less stringent environment), TPS11 and CYP706A3 are still present, but no longer clustered
(Figure 11C).
Discussion
A minimal and versatile functional cluster evolving within Brassicaceae Functional gene clusters have been defined as groups of at least three non-homologous biosynthetic
genes for a distinct biosynthetic pathway adjacent to one another in the genome (Nützmann and
Osbourn, 2014; Nützmann et al., 2016). We show here that a combination of just two physically
clustered and co-regulated genes can form an efficient functional unit, generating a whole range of
terpenoid oxides that protect the plants against florivorous insects and selectively alter the flower
microbiome. This gene combination still matches the criteria defined for metabolic gene clusters,
since it contains the first committed step of the pathway generating initial chemical scaffolds (a
terpene synthase) and a subsequent P450 tailoring. The originality of this uncommon cluster
associated with a sesquiterpenoid-derived pathway is that both the terpene synthase and
cytochrome P450 enzymes yield several products and/or transform a large set of substrates.
CYP706A3, alone, catalyzes not only the oxidation of a broad range of sesqui- and monoterpenes,
but also a cascade of reactions on the same original substrate. Our data suggest that both TPS11
and CYP706A3 evolved early within Brassicaceae, and became clustered before the split of
Brassicaceae lineages I and II. This minimal functional cluster is possibly representative of an early
stage of the formation of more complex metabolic gene clusters, such as those reported in
angiosperms. It may also be representative of a more flexible and transient organization suited to
the inherent promiscuity of enzymes involved in small isoprenoid (mono- and sesquiterpenes)
metabolism for swift plant adaptation.
CYP706A3 generates a versatile defense arsenal exapted from flower scent Both TPS11 and CYP706A3 seem to be fixed in Brassicaceae, and their clustering is maintained in
wild species. This might result from a dual selective advantage for such a structural arrangement.
One is reduced emission and enhanced detoxification of membrane-damaging terpenes abundantly
formed in flower tissues essential for reproduction. Another is the formation of defense molecules
that protect flower organs from pathogens and herbivores. Our data demonstrate that CYP706A3
not only acts upon products of TPS11, but also on mono- and sesquiterpenes generated by other
flower-expressed TPS enzymes, such as (E)-β-caryophyllene or α-pinene. Remarkably, primary
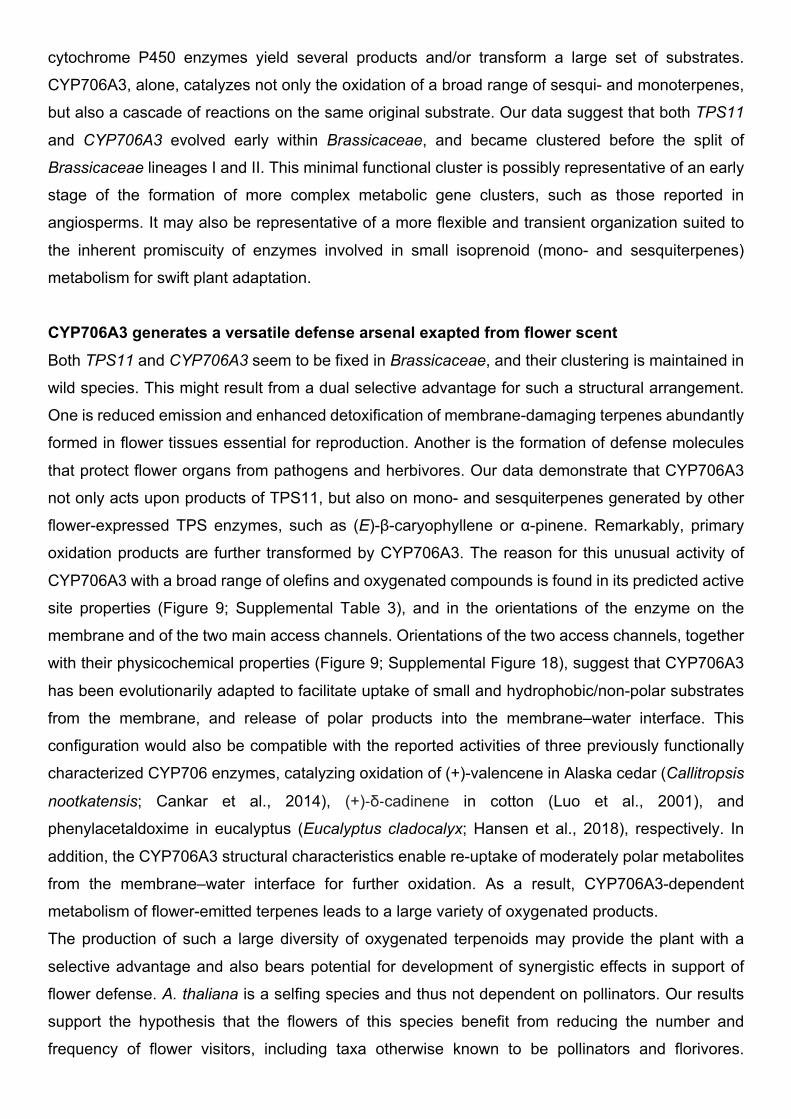
oxidation products are further transformed by CYP706A3. The reason for this unusual activity of
CYP706A3 with a broad range of olefins and oxygenated compounds is found in its predicted active
site properties (Figure 9; Supplemental Table 3), and in the orientations of the enzyme on the
membrane and of the two main access channels. Orientations of the two access channels, together
with their physicochemical properties (Figure 9; Supplemental Figure 18), suggest that CYP706A3
has been evolutionarily adapted to facilitate uptake of small and hydrophobic/non-polar substrates
from the membrane, and release of polar products into the membrane–water interface. This
configuration would also be compatible with the reported activities of three previously functionally
characterized CYP706 enzymes, catalyzing oxidation of (+)-valencene in Alaska cedar (Callitropsis
nootkatensis; Cankar et al., 2014), (+)-δ-cadinene in cotton (Luo et al., 2001), and
phenylacetaldoxime in eucalyptus (Eucalyptus cladocalyx; Hansen et al., 2018), respectively. In
addition, the CYP706A3 structural characteristics enable re-uptake of moderately polar metabolites
from the membrane–water interface for further oxidation. As a result, CYP706A3-dependent
metabolism of flower-emitted terpenes leads to a large variety of oxygenated products.
The production of such a large diversity of oxygenated terpenoids may provide the plant with a
selective advantage and also bears potential for development of synergistic effects in support of
flower defense. A. thaliana is a selfing species and thus not dependent on pollinators. Our results
support the hypothesis that the flowers of this species benefit from reducing the number and
frequency of flower visitors, including taxa otherwise known to be pollinators and florivores.
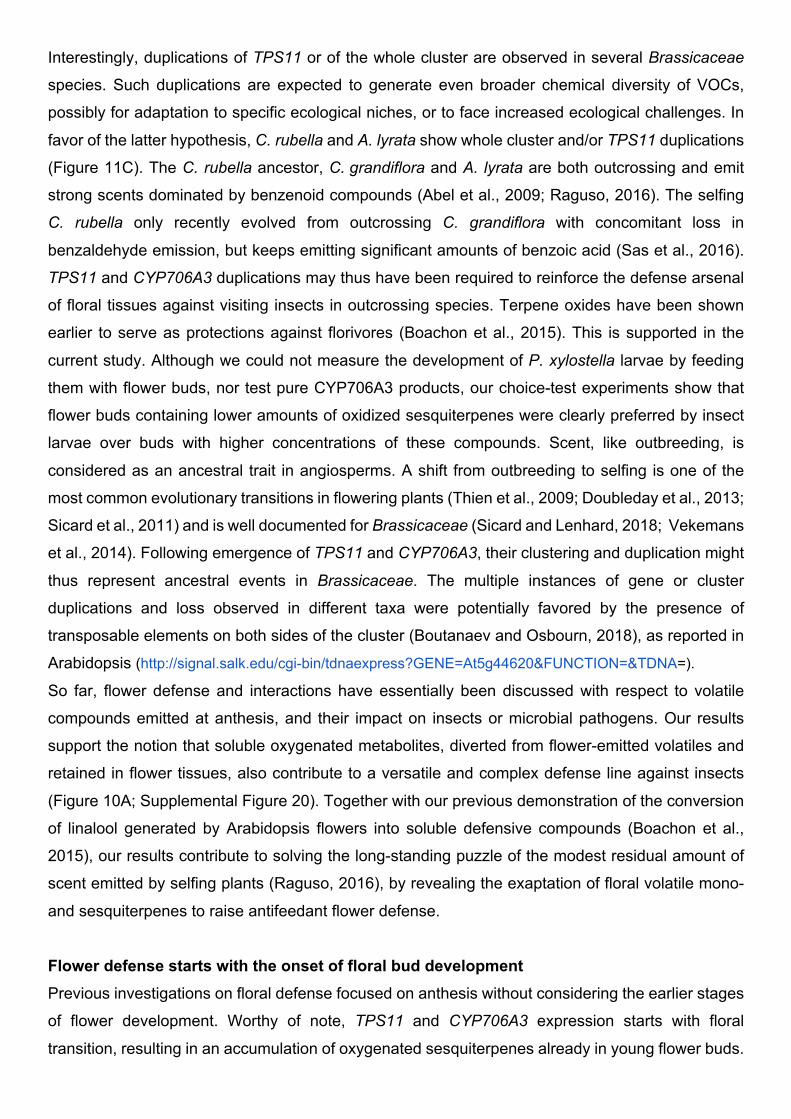
Interestingly, duplications of TPS11 or of the whole cluster are observed in several Brassicaceae
species. Such duplications are expected to generate even broader chemical diversity of VOCs,
possibly for adaptation to specific ecological niches, or to face increased ecological challenges. In
favor of the latter hypothesis, C. rubella and A. lyrata show whole cluster and/or TPS11 duplications
(Figure 11C). The C. rubella ancestor, C. grandiflora and A. lyrata are both outcrossing and emit
strong scents dominated by benzenoid compounds (Abel et al., 2009; Raguso, 2016). The selfing
C. rubella only recently evolved from outcrossing C. grandiflora with concomitant loss in
benzaldehyde emission, but keeps emitting significant amounts of benzoic acid (Sas et al., 2016).
TPS11 and CYP706A3 duplications may thus have been required to reinforce the defense arsenal
of floral tissues against visiting insects in outcrossing species. Terpene oxides have been shown
earlier to serve as protections against florivores (Boachon et al., 2015). This is supported in the
current study. Although we could not measure the development of P. xylostella larvae by feeding
them with flower buds, nor test pure CYP706A3 products, our choice-test experiments show that
flower buds containing lower amounts of oxidized sesquiterpenes were clearly preferred by insect
larvae over buds with higher concentrations of these compounds. Scent, like outbreeding, is
considered as an ancestral trait in angiosperms. A shift from outbreeding to selfing is one of the
most common evolutionary transitions in flowering plants (Thien et al., 2009; Doubleday et al., 2013;
Sicard et al., 2011) and is well documented for Brassicaceae (Sicard and Lenhard, 2018; Vekemans
et al., 2014). Following emergence of TPS11 and CYP706A3, their clustering and duplication might
thus represent ancestral events in Brassicaceae. The multiple instances of gene or cluster
duplications and loss observed in different taxa were potentially favored by the presence of
transposable elements on both sides of the cluster (Boutanaev and Osbourn, 2018), as reported in
Arabidopsis (http://signal.salk.edu/cgi-bin/tdnaexpress?GENE=At5g44620&FUNCTION=&TDNA=).
So far, flower defense and interactions have essentially been discussed with respect to volatile
compounds emitted at anthesis, and their impact on insects or microbial pathogens. Our results
support the notion that soluble oxygenated metabolites, diverted from flower-emitted volatiles and
retained in flower tissues, also contribute to a versatile and complex defense line against insects
(Figure 10A; Supplemental Figure 20). Together with our previous demonstration of the conversion
of linalool generated by Arabidopsis flowers into soluble defensive compounds (Boachon et al.,
2015), our results contribute to solving the long-standing puzzle of the modest residual amount of
scent emitted by selfing plants (Raguso, 2016), by revealing the exaptation of floral volatile mono-
and sesquiterpenes to raise antifeedant flower defense.
Flower defense starts with the onset of floral bud development Previous investigations on floral defense focused on anthesis without considering the earlier stages
of flower development. Worthy of note, TPS11 and CYP706A3 expression starts with floral
transition, resulting in an accumulation of oxygenated sesquiterpenes already in young flower buds.
Our data thus associate initiation of the defense of reproductive organs to early stages of flower
development. In young buds, moreover, the ratio of TPS11 to CYP706A3 expression is inverted
compared to open flowers, preventing emission of insect-attracting volatile terpenes and ensuring
their complete conversion into soluble defense compounds. The observed ratio inversion also
indicates that whilst both genes are essentially co-regulated, independent developmental
modulation of their respective expression is also possible.
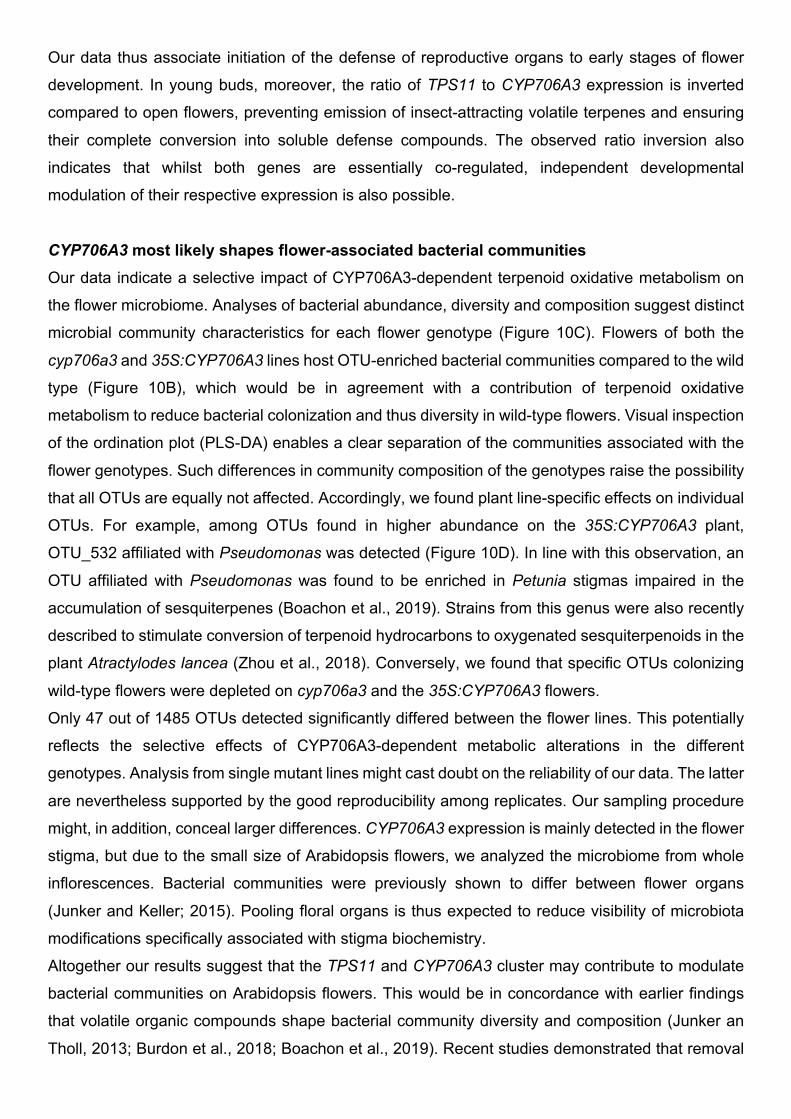
CYP706A3 most likely shapes flower-associated bacterial communities Our data indicate a selective impact of CYP706A3-dependent terpenoid oxidative metabolism on
the flower microbiome. Analyses of bacterial abundance, diversity and composition suggest distinct
microbial community characteristics for each flower genotype (Figure 10C). Flowers of both the
cyp706a3 and 35S:CYP706A3 lines host OTU-enriched bacterial communities compared to the wild
type (Figure 10B), which would be in agreement with a contribution of terpenoid oxidative
metabolism to reduce bacterial colonization and thus diversity in wild-type flowers. Visual inspection
of the ordination plot (PLS-DA) enables a clear separation of the communities associated with the
flower genotypes. Such differences in community composition of the genotypes raise the possibility
that all OTUs are equally not affected. Accordingly, we found plant line-specific effects on individual
OTUs. For example, among OTUs found in higher abundance on the 35S:CYP706A3 plant,
OTU_532 affiliated with Pseudomonas was detected (Figure 10D). In line with this observation, an
OTU affiliated with Pseudomonas was found to be enriched in Petunia stigmas impaired in the
accumulation of sesquiterpenes (Boachon et al., 2019). Strains from this genus were also recently
described to stimulate conversion of terpenoid hydrocarbons to oxygenated sesquiterpenoids in the
plant Atractylodes lancea (Zhou et al., 2018). Conversely, we found that specific OTUs colonizing
wild-type flowers were depleted on cyp706a3 and the 35S:CYP706A3 flowers.
Only 47 out of 1485 OTUs detected significantly differed between the flower lines. This potentially
reflects the selective effects of CYP706A3-dependent metabolic alterations in the different
genotypes. Analysis from single mutant lines might cast doubt on the reliability of our data. The latter
are nevertheless supported by the good reproducibility among replicates. Our sampling procedure
might, in addition, conceal larger differences. CYP706A3 expression is mainly detected in the flower
stigma, but due to the small size of Arabidopsis flowers, we analyzed the microbiome from whole
inflorescences. Bacterial communities were previously shown to differ between flower organs
(Junker and Keller; 2015). Pooling floral organs is thus expected to reduce visibility of microbiota
modifications specifically associated with stigma biochemistry.
Altogether our results suggest that the TPS11 and CYP706A3 cluster may contribute to modulate
bacterial communities on Arabidopsis flowers. This would be in concordance with earlier findings
that volatile organic compounds shape bacterial community diversity and composition (Junker an
Tholl, 2013; Burdon et al., 2018; Boachon et al., 2019). Recent studies demonstrated that removal
of the floral microbiome resulted in a decrease of floral terpene emission (Peñuelas et al. 2014) and
modified the floral metabolome (Gargallo-Garriga et al. 2016). In addition, epiphytic bacteria altered
floral scent emissions (Helletsgruber et al. 2017). Conversely, floral volatiles can also affect
microbes colonizing flowers, such as (E)-β-caryophyllene generated by TPS21 in Arabidopsis
flowers that was shown to confer protection against the bacterial pathogen Pseudomonas syringae
(Huang et al., 2012). The organ-specific ecological role of bacterial sub-populations and their
advantage for flower fitness thus remain to be determined. Furthermore, the selective effects of
CYP706A3 substrates and products on relevant microbial species merit further investigations. More
complex levels of multi-organism interactions may also be considered to link the flower-associated
microbiome and flower visitors (Farré-Armengol and Junker, 2019).
Methods Plant growth A. thaliana Col-0 and N. benthamiana plants were cultivated in growth chambers under standard
conditions as described previously (Boachon et al., 2015). Seeds were sown on a standard soil
compost mixture in 7 cm diameter pots and cultivated in growth chambers under white fluorescent
lamps with a light intensity of 100-150 µmol.m-2.s-1 at 22°C during the 12 h day period and 19°C
during the 12 h night period for Arabidopsis, and at 24°C during the 16 h day period and at 20°C
during the 8 h night period for N. benthamiana.
Gene co-expression analysis and quantification of gene expression CYP706A3 and TPS11 co-expression patterns were investigated using the ‘Expression Angler’ tool
(Toufighi et al., 2005). Quantification of expression of CYP706A3, TPS03, TPS10, TPS11, TPS14,
TPS21 and TPS24 genes was performed by RT-qPCR as previously described (Boachon et al.,
2015). Primers used for each gene are listed in Supplemental Table 5. Relative transcript levels
were calculated using the EΔCt method (Pfaffl, 2001), taking the specific amplification efficiency of
each primer pair into account, and were normalized with four reference genes whose stable
expression is validated (Czechowski et al., 2005). Four biological replicates (pooled organs collected
from individual plants) were used for plant organ tissues and flower organs, and three for floral
transition analysis.
Generation of vector constructs To express CYP706A3 and terpene synthase genes in plant and yeast, plasmids were constructed
as previously described (Höfer et al., 2014; Boachon et al., 2015) using the USERTM cloning system
(New England Biolabs) according to Nour-Eldin et al. (Nour-Eldin et al., 2006). Coding sequences
(CDS) were inserted into the yeast expression plasmid pYeDP60u2 and into the plant expression
vector pCAMBIA3300u. To study subcellular localization, CYP706A3 and TPS11 CDSs with
modified 3’ ends were inserted in Gateway binary vectors 5’ to the sequence of G3GFP in pGWB451
and of RFP in pGWB461, respectively (Nakagawa et al., 2007). Plants and yeasts were transformed
as previously described (Ginglinger et al., 2013; Höfer et al., 2014; Boachon et al., 2015). Primers
used for cloning are listed in Supplemental Table 5.
Confocal microscopy of CYP706A3 and TPS11 in N. benthamiana Fluorescent protein fusion constructs were transformed into the hypervirulent A. tumefaciens strain
LBA4404. The leaves of three-week-old N. benthamiana plants were co-transformed by agro-
infiltration with cultures of equal density of agrobacteria harboring the genes of interest or the p19
gene (silencing suppressor) (Voinnet et al., 2003) in a ratio of 1/1 (v/v) for transient expression as
described in Bassard et al. (Bassard et al., 2012). Four days post-infiltration, leaf discs were excised
for observation by laser scanning confocal microscopy. Cell imaging was performed using the A1R
confocal system microscope (Nikon, Japan). Images were recorded with a 40x water immersion
Apochromat Long Working Distance (LWD) objective lens and a 1.15 numerical Aperture objective
(Nikon, Japan). Excitation/emission wavelengths were 488/500-550 nm for G3GFP and
CYP706A3:G3GFP constructs, and 561/570-620 nm for the TPS11:mRFP construct, respectively.
Z-stack image series were sequentially acquired using the A1R confocal system with NIS-Element
software (Nikon, Japan). Images were processed via contrasts and brightness corrections with
ImageJ software version 1.51n (NIH, USA; http://rsb.info.nih.gov/ij).
Heterologous expression in yeast, VOCs collection and purification To test the activity of CYP706A3 on products formed by terpene synthases, yeast expression
plasmids carrying CYP706A3, TPS11 and TPS21 CDSs were each transformed into the WAT11
yeast strain (Höfer et al., 2014; Boachon et al., 2015), while expression plasmid carrying TPS24
CDS was transformed into the K197G yeast strain as previously described (Fischer et al., 2011;
Ginglinger et al., 2013). Individual colonies were verified by PCR and cultivation was carried out in
the appropriate media as previously described for WAT11 (Höfer et al., 2014; Boachon et al., 2015)
and K197G yeast strains (Fischer et al., 2011; Ginglinger et al., 2013). Individual transformed
colonies were grown in minimum selection medium for at least 24 hours, and then 10 times diluted
in complete medium and grown for 30 hours. 250 mL of yeast culture of each transformant in co-
culture with 250 mL of yeast culture of the corresponding strain transformed with the empty vector,
or co-cultures of 250 mL of yeast transformed with CYP706A3 CDS mixed with 250 mL of yeast
culture transformed with plasmids carrying either TPS11, TPS21 or TPS24 CDSs were then induced
overnight with galactose (20 g/L). Cultures were poured in 1L glass bottles equipped with a lid with
2 entries (in and out) on which was inserted a TEFLON tube inserted in the culture at the inlet and
a glass cartridge containing 500 mg of Poropak Q (80-100 mesh) (Sigma-Aldrich, St Louis, MO,
USA) at the outlet. Cultures were stirred with a magnetic bar, and a vacuum pump was used to
pump out VOCs through the Poropak Q cartridges, enabling oxygenation of the cultures by bubbling
the air flux through the inlet tube as shown on the scheme in Supplemental Figure 3. VOCs were
collected from the yeast cultures for 2 days, and cartridges were eluted every 24 hours with 1 mL
dichloromethane spiked with nonyl acetate as internal standard before analysis by GC-MS. To
produce and purify TPS11 products further converted by CYP706A3, yeast cultures were grown
under similar conditions, but with optimization and upscaling. Briefly, 100 mL of a culture of yeast
co-transformed with both TPS11 and CYP706A3 expression plasmids was mixed, at the start of
galactose induction, with 900 mL of a culture of yeast transformed with only CYP706A3 expression
plasmid. Up to six 1 L cultures were grown at the same time in 2 L glass bottles for 8 days, and
VOCs were collected as described above. Cartridges were eluted every day with 1 mL
dichloromethane; eluates were then pooled and concentrated under a gentle stream of argon. After
analysis of diluted samples by GC-MS to check for products, concentrated samples were diluted in
MeOH and run on a semi-preparative High Performance Liquid Chromatography system (e2695
separation module Waters) coupled to an ACQUITY QDa Mass Spectrometer system (Waters). The
semi-preparative system was equipped with a Kinetex® 5 µm C18 100 Å Column 250 x 10.0 mm,
Ea (Phenomenex), a diode array detector (DAD) and a fraction collector. Chromatography was run
with (A) water and (B) methanol as mobile phase, both containing 0.1% formic acid and starting for
1 min at 85% B. A linear gradient was applied to reach 100% B in 12 min, followed by 100% B for
10 min. Return to initial conditions was achieved in 1 min followed by 22 min of column conditioning
with 85% B for a total run time of 45 min. The column was operated at 35°C with a flow rate of 3
mL/min, injecting 200 µL sample per run. Following separation on the column, 10% of the products
were directed to the Q-da mass spectrometer while the remaining 90% was directed to the DAD and
fraction collector through a split line. The Q-da mass spectrometer was set to ionize in positive mode
and the cone voltage was set at 10 V. Products were identified based on their putative oxygenated
mass, and fractions collected accordingly. Each collected fraction was enriched through several
runs, and then diluted with pure water so as to reduce the concentration of eluting solvent MeOH to
less than 5%. Sesquiterpene products in each fraction were subsequently concentrated by solid
phase extraction (SPE) on Oasis HLB extraction cartridges (Waters) as previously described (Höfer
et al., 2014). Products were eluted with CDCl3 prior to GC-MS analysis to verify the purity of each
fraction. Selected fractions were submitted to NMR analysis for product identification.
NMR characterization of products Selected fractions containing substrates or products of CYP706A3 were analyzed on a 500 MHz
Bruker Avance spectrometer equipped with a 5-mm DCH dual cryoprobe with z-gradient operating
at 500.13 MHz for 1H and 125.758 MHz for 13C. 1D 1H, 1H -1H COSY, edited 1H -13C HSQC and 1H
-13C HMBC were recorded for each sample, adding 1H -1H NOESY and 1D 13C as required.
In vitro activity of CYP706A3 on purified sesquiterpenes Yeast transformed with CYP706A3 expression plasmid was grown, expression induced, microsomal
fraction extracted and P450 expression quantified as previously described (Höfer et al., 2014). To
analyze CYP706A3 activity on different substrates, assays were carried out in 300 µL of 20 mM
sodium phosphate buffer (pH 7.4) containing 100 µM substrates, 1 mM NADPH, and an adjusted
amount of CYP706A3, as yeast microsomal fraction. To improve dissolution of sesqui- and
monoterpenes, the latter were added directly to microsomal fractions before dilution with buffer
containing up to 5% DMSO. Samples were incubated at 28°C for 1 hour and subsequently extracted
with 600 µL ethyl acetate spiked with 10 µM nonyl acetate. After vortexing and short centrifugation
at 4,000 g for 2 min at room temperature, the ethyl acetate phase was recovered, dried on anhydrous
Na2SO4 (Sigma-Aldrich), and analyzed by GC-MS.
For Liquid Chromatography coupled to tandem Mass Spectrometry (LC-MS/MS) analysis of
products, similar reactions were stopped by addition of 250 µL of MeOH, vortexed for 10 s, and
centrifuged at 5,500 g for 5 min at room temperature. A volume of 400 µL of the supernatant was
transferred into LC vials for analysis.
Isolation of insertion mutant and overexpression lines Arabidopsis insertion lines cyp706a3-1 (SALK_057031) and cyp706a3-2 (SALKseq_052540) were
identified using the T-DNA Express tool from SALK (Alonso et al., 2003), and requested from the
Nottingham Arabidopsis Stock Center. Homozygous mutant lines were selected for absence of
transcripts in insertion lines by RT-PCR amplifying the full CDS, and RT-qPCR in flower tissues as
described above. Over-expressed lines (35S:CYP706A3) were generated by transforming the plant
expression plasmid pCAMBIA3300 carrying the CYP706A3 CDS into the Agrobacterium GV3101
strain, before transformation of Col-0 plants by floral dip. Transformants in the T1 progeny were
selected by germination on phosphinothricin (BASTA) at 10 ug/mL, and resistant lines were
screened by RT-qPCR for CYP706A3 expression in flower tissues. Selected T1 lines showing
highest expression were brought to T3 stable progeny by germination on BASTA. CYP706A3 over-
expression was analyzed on T3 lines by RT-qPCR in flower tissues as described above.
VOC collection from the headspace of Arabidopsis flowers and transformed N. benthamiana leaves VOCs emitted from Arabidopsis flowers were collected as previously described, with minor changes
(Boachon et al., 2015). About 50 to 60 inflorescences from each line were used for each sample
collection, with at least three biological replicates. Detached inflorescences were placed in 12 mL
glass tubes filled with water and placed in 1 L glass jars equipped with an inlet and an outlet. Volatiles
were pumped out from the jar with a vacuum pump at ~100 mL min-1 and trapped on a cartridge
filled with 30 mg Porapak Q (80-100 mesh, Grace scientific) at the outlet. A similar cartridge was
placed at the inlet to ensure purification of the incoming air. VOCs were sampled for 24 h. After
volatile collection, flowers were cut from inflorescences and weighed before further analysis of
soluble compounds. Porapak Q cartridges were eluted with 200 µL dichloromethane spiked with 10
µM nonyl acetate, and VOC analysis and quantification were performed by GC-MS.
To measure VOCs emitted from Arabidopsis plants during floral transition, plants were grown
individually on Jiffy-7 peat pellets (Jiffy) under standard conditions, until the appearance of the first
inflorescence. Four plants were used per sample, placed in 1 L glass jars, and VOCs were collected
as described above. Porapak Q cartridges were eluted every day until the first inflorescence opened,
and samples were analyzed by GC-MS.
For headspace analysis of VOCs emitted from transformed N. benthamiana leaves, plant expression
constructs carrying the CDS of CYP706A3, CYP76C1, TPS11, TPS21 or TPS24 were transformed
into hypervirulent A. tumefaciens LBA4404, which was used to infiltrate the N. benthamiana leaves
as described previously (Ginglinger et al., 2013). After two days, infiltrated leaves were detached,
and their petioles dipped into a 12 mL glass vial filled with water that was placed in a 1 L glass jar.
VOCs emitted from the headspace were collected from 3 to 4 infiltrated leaves per sample for 24
hours following the same procedure as described above for Arabidopsis flower VOCs and
subsequently analyzed by GC-MS.
GC-MS analysis Capillary GC was performed as described previously (Boachon et al., 2015), on a PerkinElmer
Clarus 680 gas chromatograph coupled to a PerkinElmer Clarus 600T mass spectrometer
(PerkinElmer), using a HP-5ms column (30 m, 0.25 mm, 0.25 µm; Agilent technologies). Samples
were injected by splitless injection, at 250°C injector temperature, using a program consisting of 0.5
min at 50°C, followed by 20°C min-1 to 320°C, then 5 min at 320°C, with a flow of 1.2 ml min-1 of He
as carrier gas. Products were identified based on their retention times and electron ionization mass
spectra (70 eV, m/z 50-300), and compared to those present in the NIST and WILEY libraries and
to previously published Arabidopsis flower VOCs (Tholl et al., 2005).
Extraction of soluble compounds Following collection of VOCs from Arabidopsis flowers and N. benthamiana transformed leaves,
plant material was extracted with MeOH for analysis of the soluble compounds. The extraction
procedure was as previously described (Boachon et al., 2015), and samples were analyzed by LC-
MS/MS.
LC-MS/MS analysis of soluble compounds LC-MS/MS analyses were essentially performed as described previously (Boachon et al., 2015).
Quantitative analyses were carried out using several multiple reaction monitoring channels, each
specific for a potential oxidized sesquiterpene mass (based on soluble products from yeast-
expressed cultures), with specific MS/MS transition and tunes as listed in Supplemental Table 6.
Insect behavior We tested florivory with the herbivore Plutella xylostella, since it is a Brassicaceae specialist that
had been shown to feed on floral tissues of Arabidopsis in previous experiments (Boachon et al.,
2015) and on Brassicaceae flowers in nature (Knauer et al., 2018). Preference of the P. xylostella
L3 larvae for flowers from wild-type, cyp706a3 or 35S:CYP706A3 mutants was tested using a dual-
choice feeding test, essentially as described previously (Boachon et al., 2015), except that closed
flowers at stage T3 (see Figure 8) were used. Briefly, five Col-0 and five cyp706A3-2 or
35S:CYP706A3 closed buds were set in 1% agarose on opposite sides of a Petri dish. One insect
was placed in the center of the Petri dish. The number of flowers (or flower parts) consumed by the
insect was recorded after three hours.
The behavior of adult hoverflies (Episyrphus balteus) was tested with headspace collected from
yeast cultures expressing CYP706A3 alone, together with TPS11, or with purified fractions, in a star-
shaped olfactometer described previously (Junker et al., 2010). Experiments were carried out as
described previously (Boachon et al., 2015). The field of the olfactometer defined as substance field
was supplied with an air stream from a desiccator in which 100 µg of compounds dissolved in MeOH
was placed on a filter. The field of the olfactometer defined as neutral was supplied with an air
stream from a control desiccator in which the same amount of MeOH was placed on a filter.
Hoverflies were placed one by one for 4 min in the olfactometer and time spent in the neutral or
substance fields was measured. Substances in the desiccator were replaced every 20 min.
Phylogenetic analysis Sequences of CYP706 and TPS11 from different available Brassicales genomes were retrieved
using a Blast homology search with AtTPS11 and AtCYP706A3 as bait on the Phytozome website
(http://phytozome.jgi.doe.gov/), the BrassicaDB page (http://brassicadb.org), or Dr. David Nelson’s
website (http://drnelson.uthsc.edu/CytochromeP450.html). Homologous sequences were then
aligned with other representative TPS (AtTPS12, 13, 23) and CYP76 family members, and more
distantly related sequences as outgroup (CYP76C1, CYP76G1, CYP71A12). Sequences were
discarded if not grouping with TPS11 or CYP706 in alignments including these outgroup sequences.
Short incomplete sequences were manually curated and removed, and remaining sequences were
then aligned using MUSCLE and default settings with Seaview (Gouy et al., 2010; Edgar, 2004),
and Gblocks sets defined on protein sequence alignments. Phylogenetic trees were then built using
PhyML (Guindon et al., 2010), using the LG model for TPS, and JTT model for CYP706, and
consistency was tested by performing 100 bootstrap iterations. If not specifically named to date,
sequences were referred to according to their position in the different branches of the tree.
Microbiome analysis
For microbial DNA extraction, micro-organisms were collected from inflorescences of 5- to 6-week-
old Arabidopsis plants. For each sample, 5 fully opened inflorescences were harvested from one
plant using sterile forceps. Each biological replicate was collected from a different plant.
Inflorescences were placed in BashingBeads Lysis tubes from the Xpedition™ Fungal/Bacterial
DNA Miniprep kit (Zymo Research) containing lysis solution. Lysis tubes were shaken for 5 min at
20 Hz using TissueLyser II (Qiagen, Hilden, Germany) to extract DNA following the manufacturer’s
guidelines (Zymo Research). After DNA extraction, the 16S rRNA gene V5-V7 hypervariable region
was PCR amplified using primers 799F/1193r as previously described (Supplemental Table 5;
Bodenhausen et al., 2013). Amplicon DNA libraries were constructed by the Illumina TruSeq DNA
library preparation protocol. Sequencing was performed at MR DNA (www.mrdnalab.com,
Shallowater, TX, USA) by MiSeq (2x300bp) following the manufacturer’s guidelines. Sequence data
were processed using the MR DNA analysis pipeline (MR DNA, Shallowater, TX, USA). In summary,
sequences were joined, barcodes removed, and sequences <150 bp or with ambiguous base calls
were discarded. Sequences were denoised, OTUs generated and chimeras removed. Operational
taxonomic units (OTUs) were defined by clustering at 3% divergence (97% similarity). Final OTUs
were taxonomically classified using BLASTn against a curated database derived from GreenGenes,
RDPII and NCBI (www.ncbi.nlm.nih.gov, DeSantis et al. 2006, http://rdp.cme.msu.edu). The
resulting OTU table was used to determine taxonomic relative abundances and subsequent
statistical analyses of alpha- and beta-diversity using the R package vegan (Dixon, 2003)
(Supplemental Table 4). The Kruskal-Wallis rank sum test was performed to probe differences in
the OTU richness in wild-type, cyp706a3 mutant and complemented flowers. Chao rarefaction
analysis was used to estimate the maximal number of OTUs associated with the flowers of specific
lines given a complete sampling. Partial Least Square Discriminant Analysis (PLS-DA) was
performed to discriminate the entire bacterial community composition between the flowers of the
three Arabidopsis lines. The PLS framework is suited to analyzed data when the number of variables
is equal to or greater than samples, which was the case in our data with 15 samples and 1485
variables (number of OTUs) (Hervé et al, 2018). Furthermore, this framework can be applied to
quantitative data without any assumption on their distribution. PLS-DA tests whether lines have
different bacterial communities. To validate the PLS-DA model, we used a permutation test to
evaluate significant differences between groups (Hervé et al, 2018). Finally, a Kruskal-Wallis rank
sum test was performed to identify OTUs that significantly differed between all lines and a Wilcoxon
rank sum test was performed to identify OTUs being significantly different between a pair of lines.
Construction of 3D models of CYP706A3 Modeller9v14 and Autodock4 calculations were performed using the computing facilities of the CEA-
DRF-Joliot (cluster Gabriel) at Saclay. GROMACS (2016.1) calculations were performed on the
I2BC (CNRS/CEA-Gif) cluster.
3D models of A. thaliana CYP706A3 (519 amino acids) were rebuilt without the N-terminal
membrane segment (catalytic domain 38-519) using Modeller9v14 (Webb and Sali, 2014) and the
crystal structures of Protein Data Bank (PDB) selected as templates. Choice of templates was
guided by an iterative process that optimized both the multiple sequence alignment (MSA) between
the CYP706A3 sequence and templates, and the quality score of models implied by each alignment.
The protocol started with 6 templates selected on the basis of the best similarity according to Blast-
PDB, HMMER (https://www.ebi.ac.uk/Tools/hmmer/search/hmmscan) and HHPRED
(https://toolkit.tuebingen.mpg.de/#/tools/hhblits), summarized in Supplemental Table 2, and on the
basis of other criteria such as highest alignment length, best atomic resolution, and highest
quantitative model energy analysis (QMEAN) scores. All suitable templates proved to be human
isoforms, and exhibited rather low sequence identities with AtCYP706A3 (24-25%). However,
corresponding 3D structures were well-aligned by structure alignment algorithms MUSTANG
(Konagurthu et al., 2006) and PROMALS3D (Konagurthu et al., 2006; Pei et al., 2008). Resulting
MSA were consistent with those obtained with the MAFFT-L-INS-I algorithm (Pei et al., 2008; Katoh
and Standley, 2013). As a result of the iterative process, final construction giving rise to the best
model involved the three templates CYP2R1 (pdb 3czh), CYP17A1 (pdb 5irq), and CYP1A2 (pdb
2hi4) (see features in Supplemental Table 2). The validated MSA used as input for MODELLER is
shown in Supplemental Figure 17.
Several runs of 100 models each were performed, and generated models sorted by the MODELLER
objective function were also evaluated by their DOPE (Discrete Optimized Protein Energy) and
GA341 scores calculated by MODELLER. The best models having the lowest DOPE score or best
objective function issued from each run were pooled and submitted to the online metaserver SAVES
(Structural Analysis and Verification Server (http://services.mbi.ucla.edu/SAVES), and finally to the
QMEAN scoring function (Benkert et al., 2008) server (Benkert et al., 2009) for model quality
assessment. The final model selected for docking studies was the best one according to a good
compromise between the scores calculated by the SAVES server scoring programs and the
QMEAN4 value and Z-score. As a result, the selected AtCYP706A3 model had a QMEAN4 value
and Z-score equal to 0.71 and -2.2 respectively, which are reasonably good scores when compared
to the QMEAN scores of individual PDB templates (Supplemental Table 2). The Ramachandran plot
exhibited only one residue in disallowed regions (Ile55), located in the disordered N-terminal
segment, upstream of A helix. RMSDs calculated between a-carbons of each template and of the
model ranged between 0.61 and 0.88 Å.
Preparation of AtCYP706A3 structures for docking studies Protein structures generated by Modeller were first stripped of all hydrogen atoms, and then atom
charges and hydrogen atoms were added to the protein with the UCSF Chimera package
(www.cgl.ucsf.edu/chimera) UCSF chimera 2004 (Pettersen et al., 2004) using AMBER ff14SB
parameters. Parameters (geometry and atom charges) applied for the heme in the initial step of the
catalytic cycle (defined as FeIII protoporphyrin IX) were taken from an AMBER-compatible heme
model developed by Shahrokh et al. (Shahrokh et al., 2012), and in some docking experiments with
(+)-thujopsene the heme cofactor was also defined as the highly reactive intermediate compound I
(FeIV=O)+.. The atom charges of the proximal cysteine thiolate were taken from the same work.
Docking procedure of sesquiterpenes Molecular docking experiments with sesquiterpene molecules into the CYP706A3 active site were
performed using AutoDock 4 (release 4.2.6) in the semi-flexible mode, and prepared with AutoDock
Tools (Morris et al., 2009). Ligand molecules were parameterized under the UCSF Chimera
molecular modeling suite using AM1-BCC charges model, and the structure files saved under MOL2
format as input files for AutoDock. Usually, the semi-flexible mode in Autodock means that the ligand
is fully flexible and the receptor kept rigid. In multi-cyclic sesquiterpenoid structures, however, there
is no rotatable bond detected by Autodock in the torsion tree. For handling unsaturated ring flexibility,
several conformations of the non-aromatic rings were generated by short molecular dynamics (MD)
simulations and minimization steps performed under Chimera, and used as a starting point for
docking to allow better conformational sampling of the ligands under Autodock 4. The MOL2 format
files created in Chimera for the receptor and ligands was converted into PDBQT format with merging
all nonpolar hydrogen atoms, and with original charges (AMBER 14ff and AM1-BCC) maintained.
The receptor was kept either rigid or flexible. The modeled structure of AtCYP706A3 was also
optimized by short 30 ns MD runs (GROMACS 2016) to generate various relaxed conformations of
the protein, in addition to the initial MODELLER structure. As a whole, in most cases, the best
docking results were obtained using different conformations of multi-cyclic compounds docked in
the rigid receptor mode, onto the initial MODELLER structure, with the heme in the FeIII state.
The docking box, in which grid maps were computed using the program AutoGrid (Morris et al.,
2009), included the active site with the iron-protoporphyrin group on one edge, and the whole distal
moiety of the enzyme to allow a large sampling of potential poses. A “blind” docking test was first
done with a grid built by AutoGrid with 64, 88, and 80 points in the x, y, and z directions and a grid
spacing of 0.37Å to allow for a good compromise between the resolution of the explored volume
and the size of the binding area. In most cases and remarkably, the docking experiments revealed
a unique pose in the active site, close to the heme iron (Supplemental Figure 19A and B). The
docking box size was then decreased to 52x54x54 points (x,y,z) with a grid spacing of 0.27Å to
allow for a more detailed view of conformations docked in the active site (Supplemental Figure 19C
as example). For each sesquiterpene conformer, 100 independent runs were performed using the
Lamarckian genetic algorithm (Fuhrmann et al., 2010). The default settings were applied for all other
parameters.
The resulting poses were assigned a score calculated by Autodock that can be considered as an
estimated free energy of ligand binding (indicative of binding affinity), then clustered as a function
of the closeness of their positions and conformations with Root Mean Square Deviation (RMSD) set
at 2.0 Å or 1.0 Å, and finally ranked by their binding score (for the best pose in the cluster). The
resulting histograms of 100 poses of (+)-thujopsene docked into AtCYP706A3 shown in
Supplemental Figure 19 revealed solutions markedly focused in the first cluster, sometimes
gathered in a unique cluster within 2Å of RMSD as for conformer 2 of (+)-thujopsene (Supplemental
Figure 19A). To resolve slightly different positions of the ligand in the vicinity of the heme, it proved
to be more informative to cluster at 1Å of RMSD (Supplemental Figure 19B and C).
Accession Numbers
Sequence data from this article can be found in the Arabidopsis Genome Initiative or GenBank/EMBL databases under the following accession numbers: CYP706A3 (AT5G44620), TPS11 (AT5G44630), TPS21 (AT5G23960), TPS24 (AT3G25810), CYP76C1 (At2g45560), TPS03 (AT4G16740), TPS10 (At2g24210), TPS14 (AT1G61680). Microbiome SRA accession: PRJNA562511. Supplemental Data Supplemental Figure 1. CYP706A3-TPS11 cluster on chromosome 5 of A. thaliana.
Supplemental Figure 2. CYP706A3 and TPS11 subcellular localizations. Supplemental Figure 3. Activity of yeast-expressed CYP706A3 on TPS11 products detected by GC-MS.
Supplemental Figure 4. Mass spectra confirm the identity of compounds detected and further used in our experiments.
Supplemental Figure 5. Identification, separation and enrichment of TPS11 and CYP706A3 products from yeast headspace by semi-preparative LC-Qda.
Supplemental Figure 6. Activity of yeast-expressed CYP706A3 on (-)-thujopsene.
Supplemental Figure 7. Structure of sesquiterpene oxide products formed by CYP706A3 according to NMR spectra.
Supplemental Figure 8. Sequential activity of yeast-expressed CYP706A3 on TPS11 products analyzed by LC-MS/MS.
Supplemental Figure 9. LC-MS of CYP706A3 primary products.
Supplemental Figure 10. LC-MS of CYP706A3 secondary products
Supplemental Figure 11. Genotyping of CYP706A3 mutants.
Supplemental Figure 12. Activity of CYP706A3 on TPS21 products. Supplemental Figure 13. Activity of CYP706A3 on TPS24 products.
Supplemental Figure 14. Targeted LC-MS/MS profiling of the sesquiterpene oxide metabolites present in the flowers of wild-type Arabidopsis and CYP706A3 mutants.
Supplemental Figure 15. Targeted LC-MS/MS profiling of the sesquiterpene oxide metabolites in N. benthamiana leaves transiently co-expressing TPS11 and CYP706A3.
Supplemental Figure 16. Targeted LC-MS/MS profiling of sesquiterpene oxide metabolites in buds of wild-type Arabidopsis and cyp706a3-2 insertion mutant.
Supplemental Figure 17. Multiple sequence alignment of templates used for homology modelling. Supplemental Figure 18. Channel profiles of physico-chemical properties calculated by Mole2.5.
Supplemental Figure 19: Examples of clustering of 100 docking runs of two different initial conformations of (+)-thujopsene performed by Autodock 4.2.6 on the rebuilt 3D model of AtCYP706A3. Supplemental Figure 20: Ecological impact of CYP706A3 products on hoverflies.
Supplemental Table 1. Quantification of sesquiterpene emissions upon heterologous expression in Nicotiana benthamiana.
Supplemental Table 2. List of potential templates for AtCYP706A3 modelling detected by remote homology methods (based on HMM profiles, or structure prediction by HMM-HMM comparison).
Supplemental Table 3. Binding energy scores obtained by docking the mentioned sesqui- and monoterpene substrates with the AtCYP706A3 model.
Supplemental Table 4. Detailed taxonomic designation for bacterial OTUs that are significantly different between a pair of Arabidopsis lines (Col-0, cyp706a3-2, and 35S:CYP706A3). Supplemental Table 5: PCR primer list.
Supplemental Table 6: MS/MS conditions and set-up for the LC analysis in multiple reaction monitoring (MRM) of putative sesquiterpene oxides.
Supplemental Dataset 1. Raw and complete data for the fifty most co-expressed genes identified using BAR expression Angler (Toufighi et al., 2011) and CYP706A3 as bait.
Supplemental Dataset 2: Flower microbiome raw data. Supplemental Dataset 3: Statistical analysis. Supplemental Dataset 4: Protein sequence alignment used to generate TPS11 phylogeny. Supplemental Dataset 5: Tree resulting from alignment in Dataset 4. Supplemental Dataset 6: Protein sequence alignment used to generate CYP706A3 phylogeny. Supplemental Dataset 7: Tree resulting from Dataset 6.
Author contributions BB: designed experiments, performed experiments and interpreted results; YB performed
experiments and analyzed data; RJ, X-YC: generated and provided mutants; BV, LA and LM: RMN
analysis and interpretation; SM: constructed vectors and mutants; FB, SV, RRJ, FN, FB and SV:
microbiome analysis; LH, JEB: confocal microscopy; RR, FA: modeling and docking studies; AL:
yeast expression; NN: phylogenomic analysis; BB, YB, RRJ, ND, and IK: designed insect behaviour
experiment and analyzed data; DW-R funding and work design; BB and DW-R wrote the manuscript.
All authors read and edited the manuscript.
Acknowledgments BB, YB and DW acknowledge the support of the European Fund for Regional Development in the
program INTERREG IVA Broad Region EU invests in your future to the SaarLorBiotech project. The
authors acknowledge the use of the facilities of the Bindley Bioscience Center, a core facility of the
NIH-funded Indiana Clinical and Translational Sciences Institute. We thank Todd Blevins for
contributing to the editing of the manuscript.
References
Abdalsamee, M.K. and Müller, C. (2015) Uncovering different parameters influencing florivory in a specialist herbivore. Ecol. Entomol. 40: 258-268.
Abel, C., Clauss, M., Schaub, A., Gershenzon, J., and Tholl, D. (2009). Floral and insect-induced volatile
formation in Arabidopsis lyrata ssp. petraea, a perennial, outcrossing relative of A. thaliana. Planta 230: 1–11.
Alonso, J.M. et al. (2003). Genome-wide insertional mutagenesis of Arabidopsis thaliana. Science 301: 653–
657.
Bassard, J.-E. et al. (2012). Protein-protein and protein-membrane associations in the lignin pathway. Plant Cell 24: 4465–4482.
Benkert, P., Künzli, M., and Schwede, T. (2009). QMEAN server for protein model quality estimation. Nucleic Acids Res. 37: W510–4.
Benkert, P., Tosatto, S.C.E., and Schomburg, D. (2008). QMEAN: A comprehensive scoring function for model quality assessment. Proteins 71: 261–277.
Boachon, B. et al. (2015). CYP76C1 (cytochrome P450)-mediated linalool metabolism and the formation of volatile and soluble linalool oxides in Arabidopsis flowers: a strategy for defense against floral antagonists. Plant Cell 27: 2972–2990.
Boachon, B., Lynch, J.H., Ray, S., Yuan, J., Clado, K.M.P., Junker, R.R., Kessler, S.A., Morgan, J.A and, Dudareva, N. (2019) Natural fumigation as a mechanism for volatile transport between flower organs. Nature Chemical Biology 15 583-588.
Boutanaev, A.M. and Osbourn, A.E. (2018) Multigenome analysis 2018implicates miniature inverted-repeat transposable elements (MITEs) in metabolic diversification in eudicots.Proc Natl Acad Sci U S A. 115:E6650-E6658.
Bringel, F. and Couée, I. (2015) Pivotal roles of phyllosphere microorganisms at the interface between plant
functioning and atmospheric trace gas dynamics. Front. Microbiol., 6:486.
Burdon, R.C.F., Junker R.R., Scofield, D.G., and Parachnowitsch, A.L. (2018) Bacteria colonising Penstemon digitalis show volatile and tissue-specific responses to a natural concentration range of the floral volatile linalool. Chemoecology 28 :11-19.
Bodenhausen, N., Horton, M.W., and Bergelson, J. (2013). Bacterial communities associated with the leaves and the roots of Arabidopsis thaliana. PLoS One 8: e56329.
Cankar, K., van Houwelingen, A., Goedbloed, M., Renirie, R., de Jong, R.M., Bouwmeester, H., Bosch, D., Sonke, T., and Beekwilder, J. (2014). Valencene oxidase CYP706M1 from Alaska cedar (Callitropsis nootkatensis). FEBS Lett. 588: 1001–1007.
Chen, F., Tholl, D., D’Auria, J.C., Farooq, A., Pichersky, E., and Gershenzon, J. (2003). Biosynthesis and emission of terpenoid volatiles from Arabidopsis flowers. Plant Cell 15: 481–494.
Cojocaru, V., Winn, P.J., and Wade, R.C. (2007). The ins and outs of cytochrome P450s. Biochim. Biophys. Acta 1770: 390–401.
Czechowski, T., Stitt, M., Altmann, T., Udvardi, M.K., and Scheible, W.-R. (2005). Genome-wide identification and testing of superior reference genes for transcript normalization in Arabidopsis. Plant Physiol. 139: 5–17.
Dixon, P. (2003). VEGAN, a package of R functions for community ecology. J. Veg. Sci. 14: 927-930.
Doubleday, L.A.D., Raguso, R.A., and Eckert, C.G. (2013). Dramatic vestigialization of floral fragrance across a transition from outcrossing to selfing in Abronia umbellata (Nyctaginaceae). Am. J. Bot. 100: 2280–2292.
Edgar, R.C. MUSCLE: multiple sequence alignment with improved accuracy and speed. In Proceedings. 2004 IEEE Computational Systems Bioinformatics Conference, 2004. CSB 2004.
Ehlting, J., Sauveplane, V., Olry, A., Ginglinger, J.-F., Provart, N.J., and Werck-Reichhart, D. (2008). An extensive (co-)expression analysis tool for the cytochrome P450 superfamily in Arabidopsis thaliana. BMC Plant Biol. 8: 47.
Euler, M. and Baldwin, I.T. (1996). The chemistry of defense and apparency in the corollas of Nicotiana attenuata. Oecologia 107: 102–112.
Farré-Armengo, G. and Junker, J.J. (2019) Bacteria associated with flowers affect the reproductive success of Brassica napusL. via scent-mediated interactions with pollinators. https://www.biorxiv.org/content/10.1101/685453v1.
Fischer, M.J.C., Meyer, S., Claudel, P., Bergdoll, M., and Karst, F. (2011). Metabolic engineering of monoterpene synthesis in yeast. Biotechnol. Bioeng. 108: 1883–1892.
Fuhrmann, J., Rurainski, A., Lenhof, H.-P., and Neumann, D. (2010). A new Lamarckian genetic algorithm for flexible ligand-receptor docking. J. Comput. Chem. 31: 1911–1918.
Gargallo-Garriga, A., Sardans, J., Pérez-Trujillo, M., Guenther, A., Llusià, J., Rico, L., Terradas, J., Farré-Armengol, G., Filella, I., Parella T. and Peñuelas J. (2016) Shifts in plant foliar and floral metabolomes in response to the suppression of the associated microbiota. BMC Plant Biol. 16:78.
Ginglinger, J.-F. et al. (2013). Gene coexpression analysis reveals complex metabolism of the monoterpene alcohol linalool in Arabidopsis flowers. Plant Cell 25: 4640–4657.
Gouy, M., Guindon, S., and Gascuel, O. (2010). SeaView version 4: A multiplatform graphical user interface for sequence alignment and phylogenetic tree building. Mol. Biol. Evol. 27: 221–224.
Guindon, S., Dufayard, J.F., Lefort, V., Anisimova, M., Hordijk, W. and Gascuel, O. (2010). New Algorithms and Methods to Estimate Maximum-Likelihood Phylogenies: Assessing the Performance of PhyML 3.0. Syst. Biol. 59:307-321.
Hansen, C.C., Sørensen, M., Veiga, T.A.M., Zibrandtsen, J.F.S., Heskes, A.M., Olsen, C.E., Boughton, B.A., Møller, B.L., and Neilson, E.H.J. (2018). Reconfigured cyanogenic glucoside biosynthesis in involves a cytochrome P450 CYP706C55. Plant Physiol. 178: 1081–1095.
Helletsgruber, C., Dötterl, S., Ruprecht, U.. and Junker, R.R. (2017) Epiphytic Bacteria Alter Floral Scent Emissions. J. Chem. Ecol. 43:1073-1077.
Hervé, M.R., Nicolè, F. and Lê Cao, K.A. (2018) Multivariate Analysis of Multiple Datasets: a Practical Guide for Chemical Ecology. J. Chem. Ecol. 44: 215-234.
Höfer, R., Boachon, B., Renault, H., Gavira, C., Miesch, L., Iglesias, J., Ginglinger, J.-F., Allouche, L., Miesch, M., Grec, S., Larbat, R., and Werck-Reichhart, D. (2014). Dual function of the cytochrome P450 CYP76 family from Arabidopsis thaliana in the metabolism of monoterpenols and phenylurea herbicides. Plant Physiol. 166: 1149–1161.
Hoffmann, M.H., Bremer, M., Schneider, K., Burger, F., Stolle, E., and Moritz, G. (2003). Flower visitors in a natural population of Arabidopsis thaliana. Plant Biol. 5: 491-494.
Huang, M., Sanchez-Moreiras, A.M., Abel, C., Sohrabi, R., Lee, S., Gershenzon, J., and Tholl, D. (2012).
The major volatile organic compound emitted from Arabidopsis thaliana flowers, the sesquiterpene (E)-β-caryophyllene, is a defense against a bacterial pathogen. New Phytol. 193: 997–1008.
Jones, M.E. (1971). The population genetics of Arabidopsis thaliana I. The breeding system. Heredity 27: 39-50.
Junker, R.R. (2016). Multifunctional and diverse floral scents mediate biotic interactions embedded in
communities. Deciphering Chemical Language of Plant Communication, eds Blande J, Glinwood R (Springer, Cham), pp 257–282.
Junker, R.R., Heidinger, I.M.M., and Blüthgen, N. (2010). Floral scent terpenoids deter the facultative florivore Metrioptera bicolor (Ensifera, Tettigoniidae, Decticinae). J. Orthoptera Res. 19: 69–74.
Junker, R.R. and Keller, A. (2015). Microhabitat heterogeneity across leaves and flower organs promotes bacterial diversity. FEMS Microbiol. Ecol. 91: fiv097.
Junker, R.R. and Tholl, D. (2013). Volatile organic compound mediated interactions at the plant-microbe interface. J. Chem. Ecol. 39: 810–825.
Katoh, K. and Standley, D.M. (2013). MAFFT multiple sequence alignment software version 7: improvements in performance and usability. Mol. Biol. Evol. 30: 772–780.
Katsuda, Y. (2012). Progress and future of pyrethroids. Top. Curr. Chem. 314: 1–30.
Kessler, D., Diezel, C., and Baldwin, I.T. (2010). Changing pollinators as a means of escaping herbivores. Curr. Biol. 20: 237–242.
Kessler, D., Kallenbach, M., Diezel, C., Rothe, E., Murdock, M., and Baldwin, I.T. (2015). How scent and nectar influence floral antagonists and mutualists. Elife 4.
Kikuta, Y., Ueda, H., Takahashi, M., Mitsumori, T., Yamada, G., Sakamori, K., Takeda, K., Furutani, S., Nakayama, K., Katsuda, Y., Hatanaka, A., and Matsuda, K. (2012). Identification and characterization of a GDSL lipase-like protein that catalyzes the ester-forming reaction for pyrethrin biosynthesis in Tanacetum cinerariifolium- a new target for plant protection. Plant J. 71: 183–193.
Knauer, A.C., Bakhtiari, M. and Schiestl, F.P. (2018) Crab spiders impact floral-signal evolution indirectly through removal of florivores. Nat Commun. 9: 1367.
Konagurthu, A.S., Whisstock, J.C., Stuckey, P.J., and Lesk, A.M. (2006). MUSTANG: a multiple structural alignment algorithm. Proteins 64: 559–574.
Li, R., Schuman, M.C., Wang, Y., Llorca, L.C., Bing, J., Bennion, A., Halitschke, R., and Baldwin, I.T. (2018). Jasmonate signalling makes flowers attractive to pollinators and repellant to florivores in nature.
J. Integr. Plant Biol. 60: 190–194.
Li, R., Wang, M., Wang, Y., Schuman, M.C., Weinhold, A., Schäfer, M., Jiménez-Alemán, G.H., Barthel, A., and Baldwin, I.T. (2017). Flower-specific jasmonate signalling regulates constitutive floral defenses in wild tobacco. Proc. Natl. Acad. Sci. U. S. A. 114: E7205–E7214.
Luo, P., Wang, Y.H., Wang, G.D., Essenberg, M., and Chen, X.Y. (2001). Molecular cloning and functional identification of (+)-delta-cadinene-8-hydroxylase, a cytochrome P450 mono-oxygenase (CYP706B1) of cotton sesquiterpene biosynthesis. Plant J. 28: 95–104.
McKey D. (1979) The distribution of secondary compounds within plants. Herbivores: Their Interaction with Secondary Plant Metabolites (Academic, New York), pp 55–133.
Morris, G.M., Huey, R., Lindstrom, W., Sanner, M.F., Belew, R.K., Goodsell, D.S., and Olson, A.J. (2009). AutoDock4 and AutoDockTools4: Automated docking with selective receptor flexibility. J. Comput. Chem. 30: 2785–2791.
Nakagawa, T. et al. (2007). Improved Gateway binary vectors: high-performance vectors for creation of fusion constructs in transgenic analysis of plants. Biosci. Biotechnol. Biochem. 71: 2095–2100.
Nour-Eldin, H.H., Nørholm, M.H.H., and Halkier, B.A. (2006). Screening for plant transporter function by expressing a normalized Arabidopsis full-length cDNA library in Xenopus oocytes. Plant Methods 2: 1-17.
Nützmann, H.-W., Huang, A., and Osbourn, A. (2016). Plant metabolic clusters - from genetics to genomics. New Phytol. 211: 771–789.
Nützmann, H.-W. and Osbourn, A. (2014). Gene clustering in plant specialized metabolism. Curr. Opin. Biotechnol. 26: 91–99.
Pei, J., Tang, M., and Grishin, N.V. (2008). PROMALS3D web server for accurate multiple protein sequence and structure alignments. Nucleic Acids Res. 36: 2295–2300.
Peñuelas, J., Farré-Armengol, G., Llusia, J., Gargallo-Garriga, A., Rico L., Sardans, J., Terradas, J. and Filella I. (2014) Removal of floral microbiota reduces floral terpene emissions.Sci. Rep. 4:6727.
Pettersen, E.F., Goddard, T.D., Huang, C.C., Couch, G.S., Greenblatt, D.M., Meng, E.C., and Ferrin, T.E. (2004). UCSF Chimera--a visualization system for exploratory research and analysis. J. Comput. Chem. 25: 1605–1612.
Pfaffl, M.W. (2001). A new mathematical model for relative quantification in real-time RT-PCR. Nucleic Acids Res. 29: e45.
Pravda, L., Sehnal, D., Toušek, D., Navrátilová, V., Bazgier, V., Berka, K., Svobodová Vareková, R., Koca, J., and Otyepka, M. (2018). MOLEonline: a web-based tool for analyzing channels, tunnels and pores (2018 update). Nucleic Acids Res. 46: W368–W373.
Raguso, R.A. (2016). Plant evolution: Repeated loss of floral scent - A path of least resistance? Curr. Biol. 26: R1282–R1285.
Sas, C., Müller, F., Kappel, C., Kent, T.V., Wright, S.I., Hilker, M. and Lenhard, M. (2016) Repeated Inactivation of the First Committed Enzyme Underlies the Loss of Benzaldehyde Emission after the Selfing Transition in Capsella. Curr Biol. 26:3313-3319.
Shahrokh, K., Orendt, A., Yost, G.S., and Cheatham, T.E., 3rd (2012). Quantum mechanically derived AMBER-compatible heme parameters for various states of the cytochrome P450 catalytic cycle. J. Comput. Chem. 33: 119-133.
Sicard, A. and Lenhard, M. (2018). Capsella. Curr. Biol. 28: R920–R921.
Sicard, A., Stacey, N., Hermann, K., Dessoly, J., Neuffer, B., Bäurle, I., and Lenhard, M. (2011). Genetics, evolution, and adaptive significance of the selfing syndrome in the genus Capsella. Plant Cell 23: 3156–3171.
Slotte, T. et al. (2013). The Capsella rubella genome and the genomic consequences of rapid mating system evolution. Nat. Genet. 45: 831-835.
Snape, J.W., and Lawrence, M.J. (1971). The breeding system of Arabidopsis thaliana. Heredity 27: 299-302.
Thien, L.B., Bernhardt, P., Devall, M.S., Chen, Z.-D., Luo, Y.-B., Fan, J.-H., Yuan, L.-C., and Williams,
J.H. (2009). Pollination biology of basal angiosperms (ANITA grade). Am. J. Bot. 96: 166–182.
Tholl, D., Chen, F., Petri, J., Gershenzon, J., and Pichersky, E. (2005). Two sesquiterpene synthases are responsible for the complex mixture of sesquiterpenes emitted from Arabidopsis flowers. Plant J. 42: 757–771.
Tholl, D. and Lee, S. (2011). Terpene specialized metabolism in Arabidopsis thaliana. Arabidopsis Book 9: e0143.
Toufighi, K., Brady, S.M., Austin, R., Ly, E., and Provart, N.J. (2005). The botany array resource: e-Northerns, expression angling, and promoter analyses. Plant J. 43: 153–163.
Vekemans, X., Poux, C., Goubet, P.M., and Castric, V. (2014). The evolution of selfing from outcrossing ancestors in Brassicaceae: what have we learned from variation at the S-locus? J. Evol. Biol. 27: 1372–1385.
Voinnet, O., Rivas, S., Mestre, P., and Baulcombe, D. (2003). An enhanced transient expression system in plants based on suppression of gene silencing by the p19 protein of tomato bushy stunt virus. Plant J. 33: 949–956.
Webb, B. and Sali, A. (2014). Comparative protein ptructure modeling using MODELLER. Curr. Protoc. Bioinformatics 47: 5.6.1–32.
Xu, H., Moghe, G.D., Wiegert-Rininger, K., Schilmiller, A.L., Barry, C.S., Last, R.L., and Pichersky, E. (2018). Coexpression analysis identifies two oxidoreductases involved in the biosynthesis of the monoterpene acid moiety of natural pyrethrin insecticides in Tanacetum cinerariifolium. Plant Physiol. 176: 524–537.
Zhou, J.-Y., Sun, K., Chen, F., Yuan, J., Li, X., and Dai, C.-C. (2018). Endophytic Pseudomonas induces metabolic flux changes that enhance medicinal sesquiterpenoid accumulation in Atractylodes lancea. Plant Physiol. Biochem. 130: 473–481.
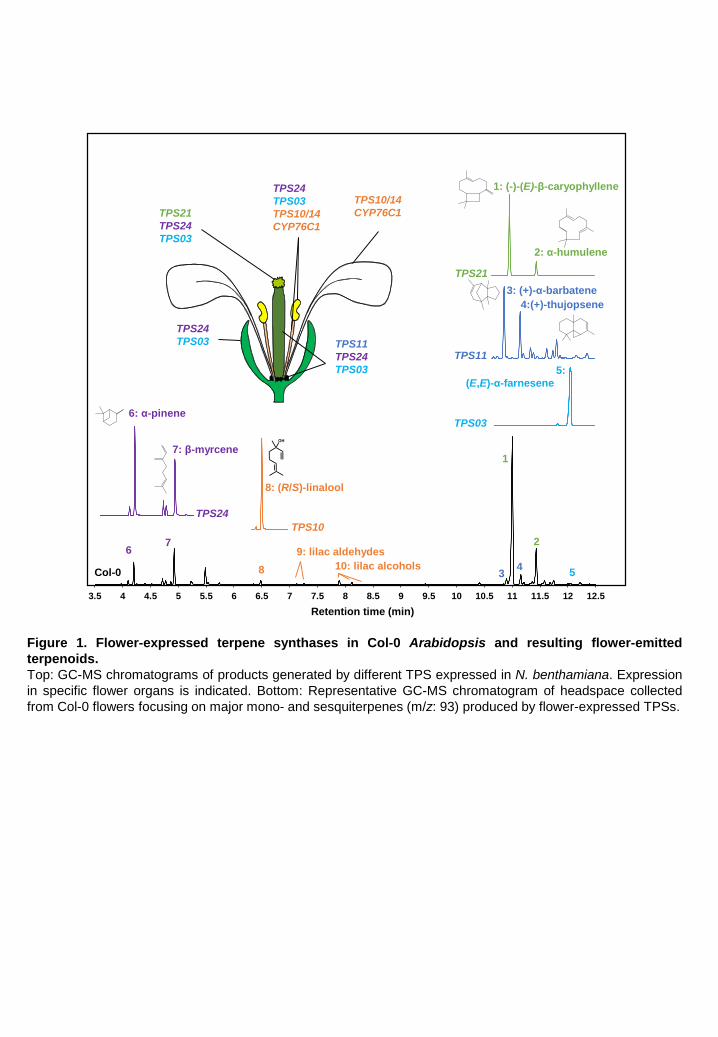
3.5 4 4.5 5 5.5 6 6.5 7 7.5 8 8.5 9 9.5 10 10.5 11 11.5 12 12.5
1: (-)-(E)-β-caryophyllene
TPS11
TPS24
TPS03
TPS21
TPS24
TPS03
6: α-pinene
7: β-myrcene1
2
34
TPS10/14
CYP76C1
TPS10
Retention time (min)
8: (R/S)-linalool
5
67
8
TPS11
TPS21
Col-0
TPS03
TPS24
9: lilac aldehydes
10: lilac alcohols
2: α-humulene
4:(+)-thujopsene
3: (+)-α-barbatene
5:
(E,E)-α-farnesene
TPS24
TPS03
TPS10/14
CYP76C1
TPS24
TPS03
Figure 1. Flower-expressed terpene synthases in Col-0 Arabidopsis and resulting flower-emitted
terpenoids.
Top: GC-MS chromatograms of products generated by different TPS expressed in N. benthamiana. Expression
in specific flower organs is indicated. Bottom: Representative GC-MS chromatogram of headspace collected
from Col-0 flowers focusing on major mono- and sesquiterpenes (m/z: 93) produced by flower-expressed TPSs.
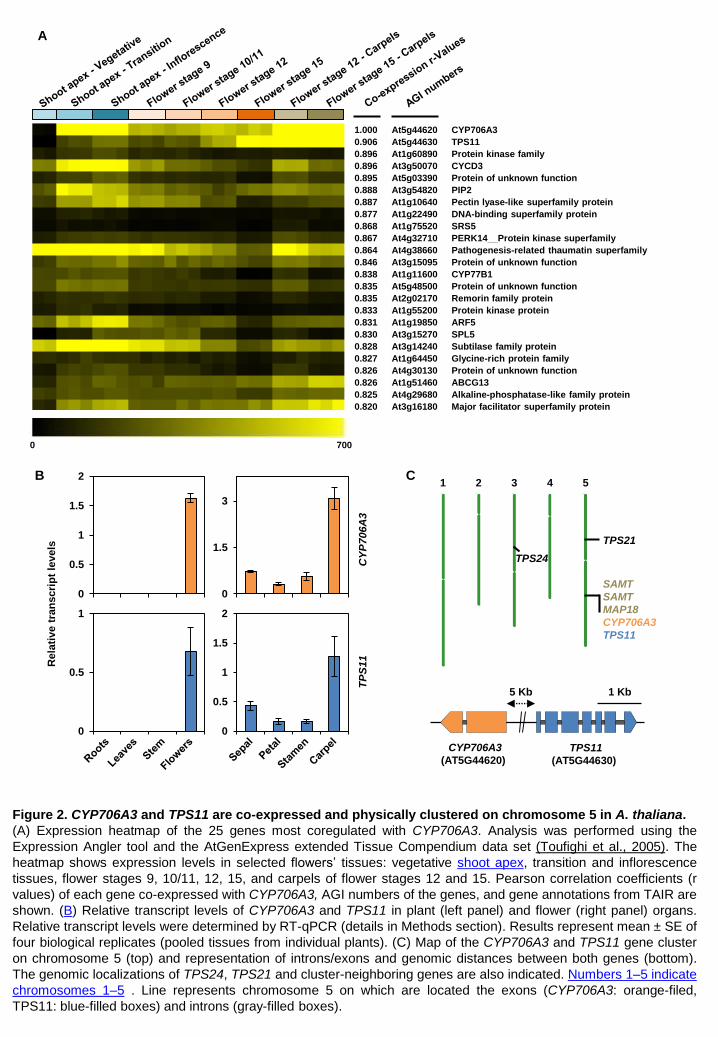
A
0
1.5
3
0
0.5
1
1.5
2
CY
P706A
3T
PS
11
Rela
tive t
ran
scri
pt
levels
B C
SAMT
SAMT
MAP18
CYP706A3
TPS11
1 2 3 4 5
TPS21
TPS24
CYP706A3
(AT5G44620)
TPS11
(AT5G44630)
5 Kb 1 Kb
0
0.5
1
1.5
2
0
0.5
1
1.000 At5g44620 CYP706A3
0.906 At5g44630 TPS11
0.896 At1g60890 Protein kinase family
0.896 At3g50070 CYCD3
0.895 At5g03390 Protein of unknown function
0.888 At3g54820 PIP2
0.887 At1g10640 Pectin lyase-like superfamily protein
0.877 At1g22490 DNA-binding superfamily protein
0.868 At1g75520 SRS5
0.867 At4g32710 PERK14__Protein kinase superfamily
0.864 At4g38660 Pathogenesis-related thaumatin superfamily
0.846 At3g15095 Protein of unknown function
0.838 At1g11600 CYP77B1
0.835 At5g48500 Protein of unknown function
0.835 At2g02170 Remorin family protein
0.833 At1g55200 Protein kinase protein
0.831 At1g19850 ARF5
0.830 At3g15270 SPL5
0.828 At3g14240 Subtilase family protein
0.827 At1g64450 Glycine-rich protein family
0.826 At4g30130 Protein of unknown function
0.826 At1g51460 ABCG13
0.825 At4g29680 Alkaline-phosphatase-like family protein
0.820 At3g16180 Major facilitator superfamily protein
0 700
Figure 2. CYP706A3 and TPS11 are co-expressed and physically clustered on chromosome 5 in A. thaliana.
(A) Expression heatmap of the 25 genes most coregulated with CYP706A3. Analysis was performed using the
Expression Angler tool and the AtGenExpress extended Tissue Compendium data set (Toufighi et al., 2005). The
heatmap shows expression levels in selected flowers’ tissues: vegetative shoot apex, transition and inflorescence
tissues, flower stages 9, 10/11, 12, 15, and carpels of flower stages 12 and 15. Pearson correlation coefficients (r
values) of each gene co-expressed with CYP706A3, AGI numbers of the genes, and gene annotations from TAIR are
shown. (B) Relative transcript levels of CYP706A3 and TPS11 in plant (left panel) and flower (right panel) organs.
Relative transcript levels were determined by RT-qPCR (details in Methods section). Results represent mean ± SE of
four biological replicates (pooled tissues from individual plants). (C) Map of the CYP706A3 and TPS11 gene cluster
on chromosome 5 (top) and representation of introns/exons and genomic distances between both genes (bottom).
The genomic localizations of TPS24, TPS21 and cluster-neighboring genes are also indicated. Numbers 1–5 indicate
chromosomes 1–5 . Line represents chromosome 5 on which are located the exons (CYP706A3: orange-filed,
TPS11: blue-filled boxes) and introns (gray-filled boxes).
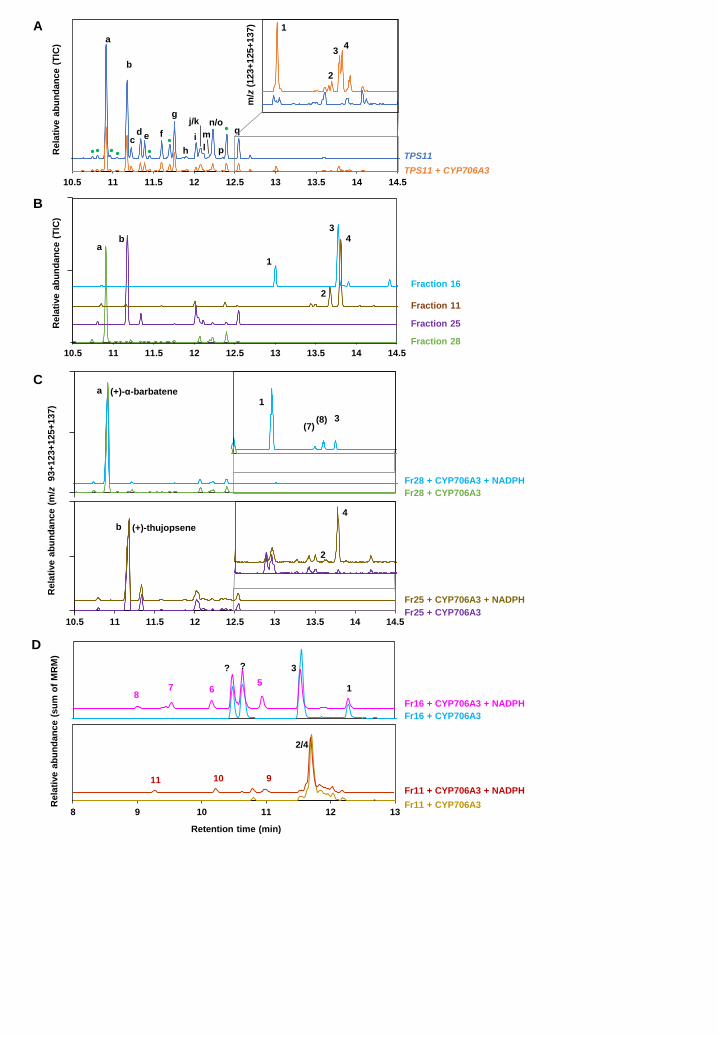
10.5 11 11.5 12 12.5 13 13.5 14 14.5
8 9 10 11 12 13
i
1
TPS11
TPS11 + CYP706A3
cd e f
g
h
j/k
m
n/o
p
q
a
b
l
b
Fr25 + CYP706A3 + NADPH
Fr25 + CYP706A3
2
4
Rela
tive a
bu
nd
an
ce (
TIC
)
10.5 11 11.5 12 12.5 13 13.5 14 14.5
Fraction 28
Fraction 25
Fraction 11
Fraction 16
Rela
tive a
bu
nd
an
ce (
TIC
)
1
2
4 3
ab
C
Fr28 + CYP706A3 + NADPH
a
Fr28 + CYP706A3
1
3 (8)(7)
1
3 ? ?
Fr16 + CYP706A3 + NADPH
Fr16 + CYP706A3
Fr11 + CYP706A3 + NADPH
Fr11 + CYP706A3
2/4
Rela
tive a
bu
nd
an
ce (
m/z
93+
123+
125+
137)
A
B
D
Rela
tive a
bu
nd
an
ce (
su
m o
f M
RM
)
Retention time (min)
5 6 7
8
9 10 11
2
3 4
m/z
(123+
125+
137)
10.5 11 11.5 12 12.5 13 13.5 14 14.5
(+)-α-barbatene
(+)-thujopsene
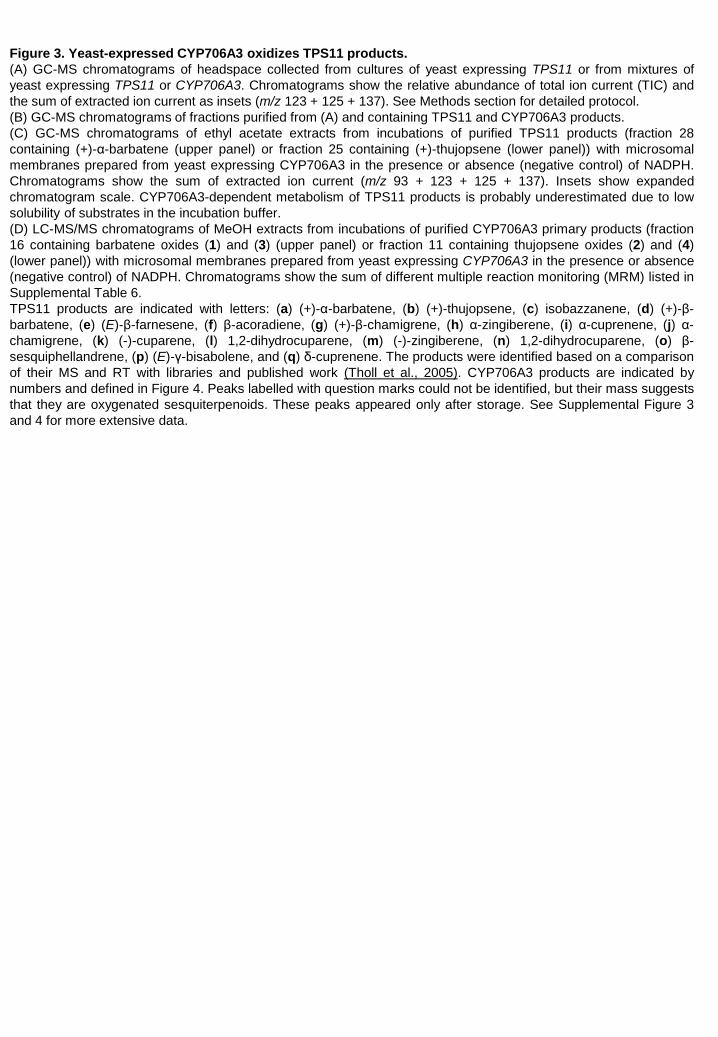
Figure 3. Yeast-expressed CYP706A3 oxidizes TPS11 products.
(A) GC-MS chromatograms of headspace collected from cultures of yeast expressing TPS11 or from mixtures of
yeast expressing TPS11 or CYP706A3. Chromatograms show the relative abundance of total ion current (TIC) and
the sum of extracted ion current as insets (m/z 123 + 125 + 137). See Methods section for detailed protocol.
(B) GC-MS chromatograms of fractions purified from (A) and containing TPS11 and CYP706A3 products.
(C) GC-MS chromatograms of ethyl acetate extracts from incubations of purified TPS11 products (fraction 28
containing (+)-α-barbatene (upper panel) or fraction 25 containing (+)-thujopsene (lower panel)) with microsomal
membranes prepared from yeast expressing CYP706A3 in the presence or absence (negative control) of NADPH.
Chromatograms show the sum of extracted ion current (m/z 93 + 123 + 125 + 137). Insets show expanded
chromatogram scale. CYP706A3-dependent metabolism of TPS11 products is probably underestimated due to low
solubility of substrates in the incubation buffer.
(D) LC-MS/MS chromatograms of MeOH extracts from incubations of purified CYP706A3 primary products (fraction
16 containing barbatene oxides (1) and (3) (upper panel) or fraction 11 containing thujopsene oxides (2) and (4)
(lower panel)) with microsomal membranes prepared from yeast expressing CYP706A3 in the presence or absence
(negative control) of NADPH. Chromatograms show the sum of different multiple reaction monitoring (MRM) listed in
Supplemental Table 6.
TPS11 products are indicated with letters: (a) (+)-α-barbatene, (b) (+)-thujopsene, (c) isobazzanene, (d) (+)-β-
barbatene, (e) (E)-β-farnesene, (f) β-acoradiene, (g) (+)-β-chamigrene, (h) α-zingiberene, (i) α-cuprenene, (j) α-
chamigrene, (k) (-)-cuparene, (l) 1,2-dihydrocuparene, (m) (-)-zingiberene, (n) 1,2-dihydrocuparene, (o) β-
sesquiphellandrene, (p) (E)-γ-bisabolene, and (q) δ-cuprenene. The products were identified based on a comparison
of their MS and RT with libraries and published work (Tholl et al., 2005). CYP706A3 products are indicated by
numbers and defined in Figure 4. Peaks labelled with question marks could not be identified, but their mass suggests
that they are oxygenated sesquiterpenoids. These peaks appeared only after storage. See Supplemental Figure 3
and 4 for more extensive data.
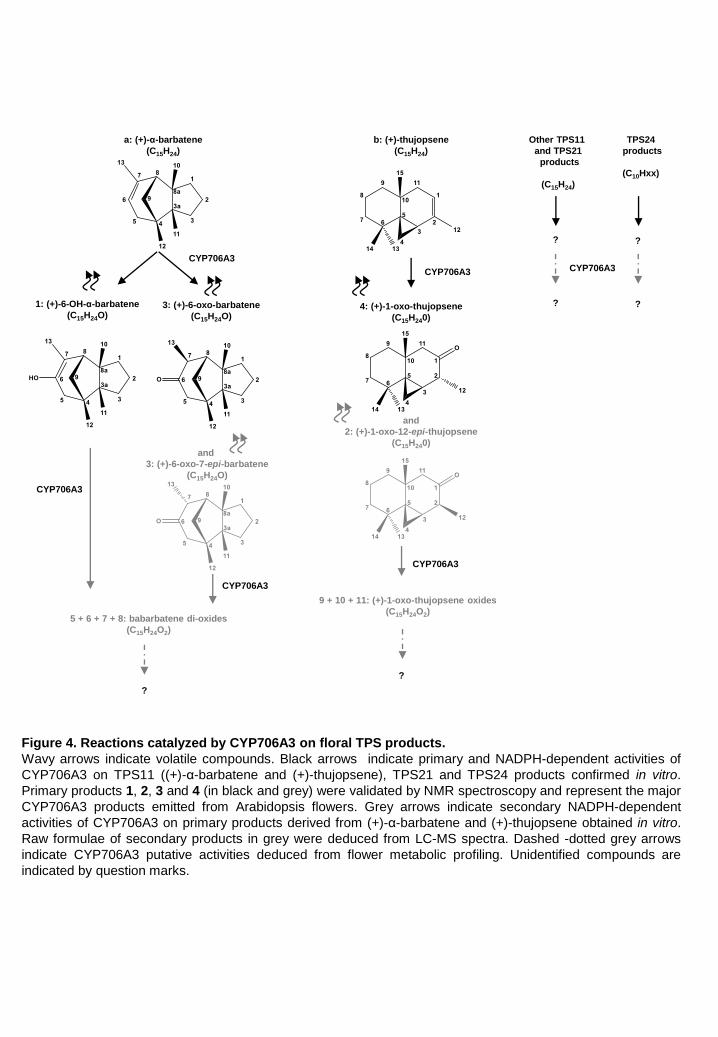
b: (+)-thujopsene
(C15H24)
CYP706A3
4: (+)-1-oxo-thujopsene
(C15H240)
CYP706A3
9 + 10 + 11: (+)-1-oxo-thujopsene oxides
(C15H24O2)
a: (+)-α-barbatene
(C15H24)
3: (+)-6-oxo-barbatene
(C15H24O)
5 + 6 + 7 + 8: babarbatene di-oxides
(C15H24O2)
CYP706A3
CYP706A3
1: (+)-6-OH-α-barbatene
(C15H24O)
CYP706A3
Other TPS11
and TPS21
products
(C15H24)
CYP706A3
TPS24
products
(C10Hxx)
?
?
? ?
? ?
and
3: (+)-6-oxo-7-epi-barbatene
(C15H24O)
and
2: (+)-1-oxo-12-epi-thujopsene
(C15H240)
Figure 4. Reactions catalyzed by CYP706A3 on floral TPS products.
Wavy arrows indicate volatile compounds. Black arrows indicate primary and NADPH-dependent activities of
CYP706A3 on TPS11 ((+)-α-barbatene and (+)-thujopsene), TPS21 and TPS24 products confirmed in vitro.
Primary products 1, 2, 3 and 4 (in black and grey) were validated by NMR spectroscopy and represent the major
CYP706A3 products emitted from Arabidopsis flowers. Grey arrows indicate secondary NADPH-dependent
activities of CYP706A3 on primary products derived from (+)-α-barbatene and (+)-thujopsene obtained in vitro.
Raw formulae of secondary products in grey were deduced from LC-MS spectra. Dashed -dotted grey arrows
indicate CYP706A3 putative activities deduced from flower metabolic profiling. Unidentified compounds are
indicated by question marks.
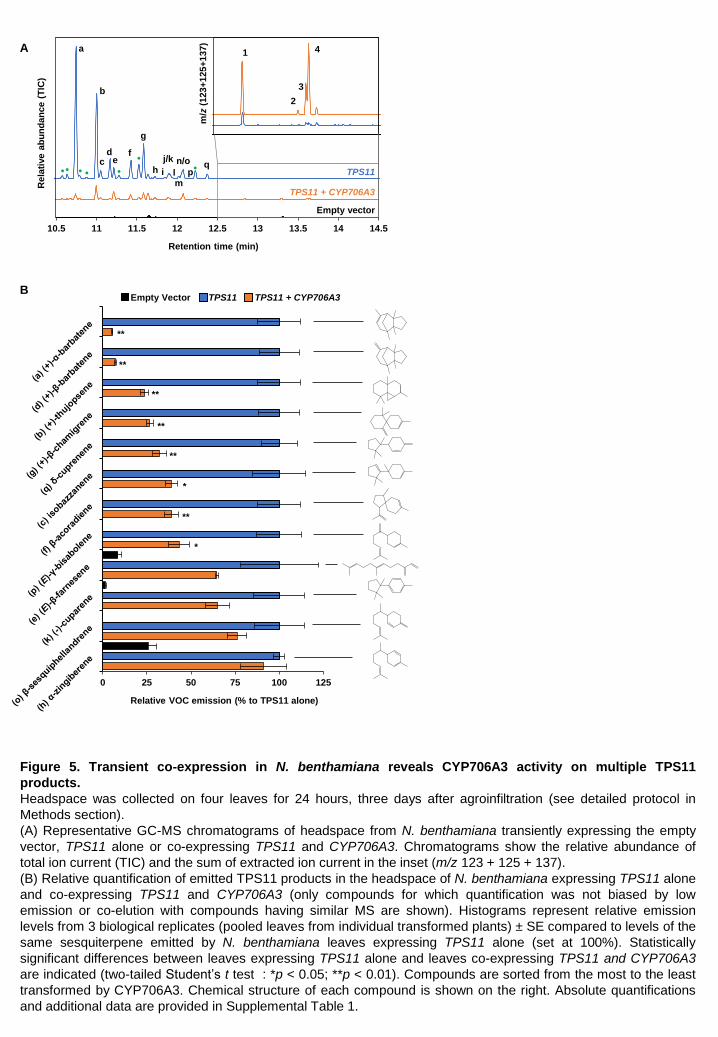
10.5 11 11.5 12 12.5 13 13.5 14 14.5
a
b
cd
ef
g
h
Rela
tive a
bu
nd
an
ce (
TIC
)
m/z
(123+
125+
137)
Retention time (min)
1
2
3
4
i
j/k
lm
n/o
pq
Empty vector
TPS11
TPS11 + CYP706A3
A
0 25 50 75 100 125
Empty Vector TPS11 TPS11 + CYP706A3B
Relative VOC emission (% to TPS11 alone)
**
**
**
**
**
*
**
*
Figure 5. Transient co-expression in N. benthamiana reveals CYP706A3 activity on multiple TPS11
products.
Headspace was collected on four leaves for 24 hours, three days after agroinfiltration (see detailed protocol in
Methods section).
(A) Representative GC-MS chromatograms of headspace from N. benthamiana transiently expressing the empty
vector, TPS11 alone or co-expressing TPS11 and CYP706A3. Chromatograms show the relative abundance of
total ion current (TIC) and the sum of extracted ion current in the inset (m/z 123 + 125 + 137).
(B) Relative quantification of emitted TPS11 products in the headspace of N. benthamiana expressing TPS11 alone
and co-expressing TPS11 and CYP706A3 (only compounds for which quantification was not biased by low
emission or co-elution with compounds having similar MS are shown). Histograms represent relative emission
levels from 3 biological replicates (pooled leaves from individual transformed plants) ± SE compared to levels of the
same sesquiterpene emitted by N. benthamiana leaves expressing TPS11 alone (set at 100%). Statistically
significant differences between leaves expressing TPS11 alone and leaves co-expressing TPS11 and CYP706A3
are indicated (two-tailed Student’s t test : *p < 0.05; **p < 0.01). Compounds are sorted from the most to the least
transformed by CYP706A3. Chemical structure of each compound is shown on the right. Absolute quantifications
and additional data are provided in Supplemental Table 1.
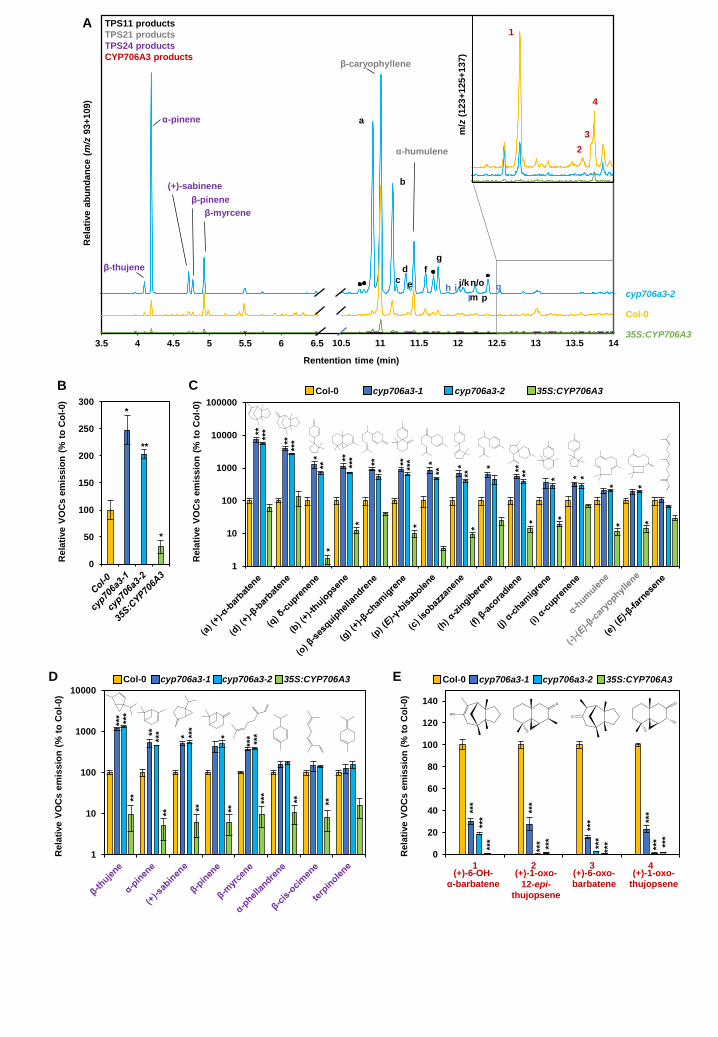
0
20
40
60
80
100
120
140
1 2 3 4
Col-0 cyp706a3-1 cyp706a3-2 35S:CYP706A3
1
10
100
1000
10000
100000
Col-0 cyp706a3-1 cyp706a3-2 35S:CYP706A3
1
10
100
1000
10000
Col-0 cyp706a3-1 cyp706a3-2 35S:CYP706A3
10.5 11 11.5 12 12.5 13 13.5 143.5 4 4.5 5 5.5 6 6.5
Rentention time (min)
35S:CYP706A3
Col-0
cyp706a3-2
1
2
3
4
a
b
Rela
tive a
bu
nd
an
ce (
m/z
93+
109)
m/z
(123+
125+
137)
A
β-thujene
α-pinene
(+)-sabinene
β-pinene
β-myrcene
β-caryophyllene
α-humulene
c
d
e
f
h ij/k
lm
n/o
p
q
Rela
tive V
OC
s e
mis
sio
n (
% t
o C
ol-
0)
B
g
Rela
tive V
OC
s e
mis
sio
n (
% t
o C
ol-
0)
C
0
50
100
150
200
250
300*
**
*
D E
Rela
tive V
OC
s e
mis
sio
n (
% t
o C
ol-
0)
TPS11 products
TPS21 products
TPS24 products
CYP706A3 products
Rela
tive V
OC
s e
mis
sio
n (
% t
o C
ol-
0)
(+)-6-OH-α-barbatene
(+)-1-oxo-
12-epi-thujopsene
(+)-6-oxo-barbatene
(+)-1-oxo-thujopsene
***
***
***
****
*
***
*
*
***
****
**
***
***
*
****
*
****
*
*
*
**** *
*
**
**
**
***
***
**
****
***
* ***
**
***
***
***
***
** **
***
***
***
***
***
***
***
***
***

Figure 6 . Flower-emitted VOCs in CYP706A3 mutants.
(A) GC-MS chromatograms of headspace collected from flowers of Col-0, cyp706a3 and CYP706A3 over-expressing
lines. Chromatograms show the relative abundance of the sum of extracted ion current (m/z 93 + 109) to display the
major mono- and sesquiterpenes. Chromatograms in the inset show the relative abundance of the sum of extracted
ion current (m/z 123 + 125 + 137) to highlight the major CYP706A3 primary and volatiles products.
(B–E) GC-MS relative quantification of (B) total VOCs emissions, (C) TPS11 and TPS21 products, (D) TPS24
products, (E) and CYP706A3 oxygenated products 1, 2, 3, and 4. VOCs emitted by flowers of different lines were
compared to those emitted by Col-0 (100%). Note that the y-axis in (C) and (E) are in logarithmic scale. Compounds
in (C) and (D) are sorted from the most to least increased in insertion mutants. Data are the mean ± SE of three
biological replicates (pooled inflorescences from individual plants). Statistically significant differences relative to Col-
0 are indicated (two-tailed Student’s t test: *p < 0.05; **p < 0.01, ***p < 0.001).
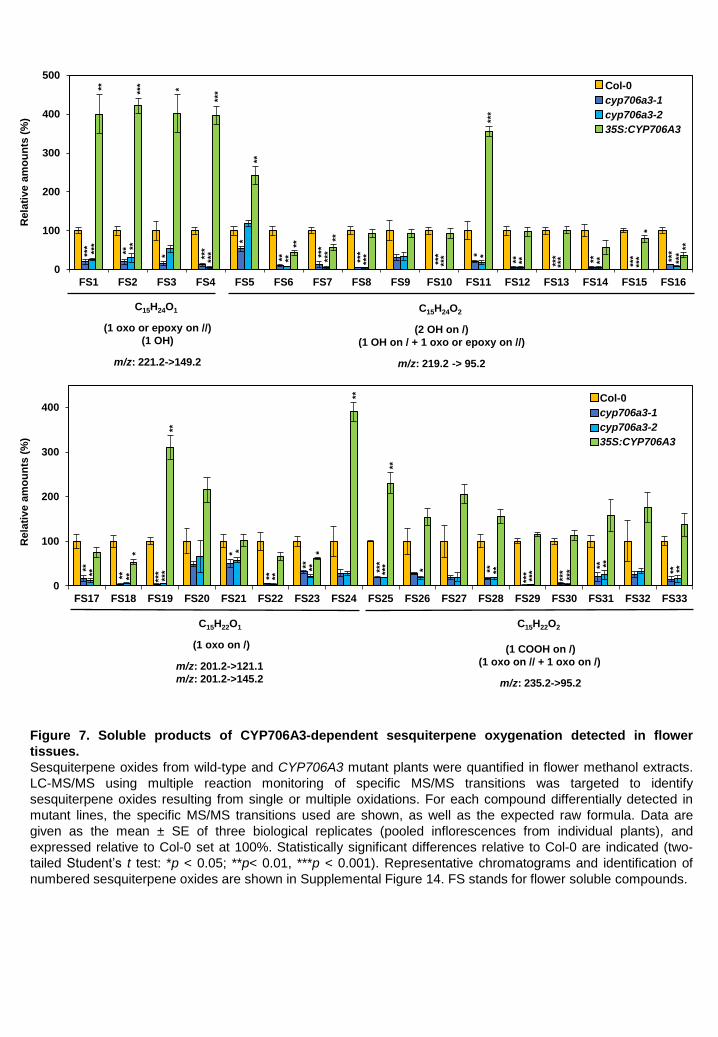
0
100
200
300
400
FS17 FS18 FS19 FS20 FS21 FS22 FS23 FS24 FS25 FS26 FS27 FS28 FS29 FS30 FS31 FS32 FS33
Col-0
cyp706a3-1
cyp706a3-2
35S:CYP706A3
0
100
200
300
400
500
FS1 FS2 FS3 FS4 FS5 FS6 FS7 FS8 FS9 FS10 FS11 FS12 FS13 FS14 FS15 FS16
Col-0
cyp706a3-1
cyp706a3-2
35S:CYP706A3
***
***
C15H22O1
(1 oxo on /)
m/z: 201.2->121.1
m/z: 201.2->145.2
C15H24O2
(2 OH on /)
(1 OH on / + 1 oxo or epoxy on //)
m/z: 219.2 -> 95.2
C15H24O1
(1 oxo or epoxy on //)
(1 OH)
m/z: 221.2->149.2
C15H22O2
(1 COOH on /)
(1 oxo on // + 1 oxo on /)
m/z: 235.2->95.2
Rela
tive a
mo
un
ts(%
) R
ela
tive a
mo
un
ts(%
)
****
***
*
****
***
*
*
******
***
*
**
** ****
***
***
**
***
*** * *
***
** ** ***
*** ** ** ***
*** **
***
***
**** ** **
*
***
***
**
* *
** **
** ***
**
***
***
**
* ** **
***
***
***
*** ** **
** **
*
Figure 7. Soluble products of CYP706A3-dependent sesquiterpene oxygenation detected in flower
tissues.
Sesquiterpene oxides from wild-type and CYP706A3 mutant plants were quantified in flower methanol extracts.
LC-MS/MS using multiple reaction monitoring of specific MS/MS transitions was targeted to identify
sesquiterpene oxides resulting from single or multiple oxidations. For each compound differentially detected in
mutant lines, the specific MS/MS transitions used are shown, as well as the expected raw formula. Data are
given as the mean ± SE of three biological replicates (pooled inflorescences from individual plants), and
expressed relative to Col-0 set at 100%. Statistically significant differences relative to Col-0 are indicated (two-
tailed Student’s t test: *p < 0.05; **p< 0.01, ***p < 0.001). Representative chromatograms and identification of
numbered sesquiterpene oxides are shown in Supplemental Figure 14. FS stands for flower soluble compounds.
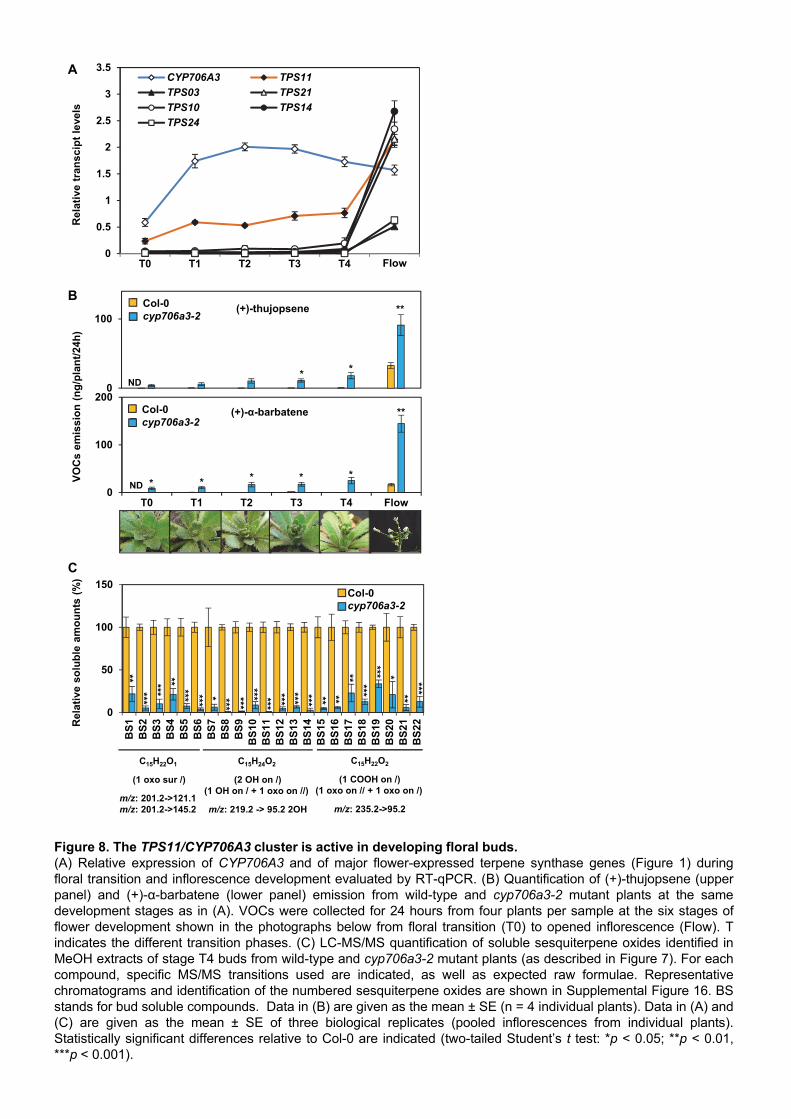
0
100
200
T0 T1 T2 T3 T4 Flow
Col-0 Barbatenecyp706a3 Barbatene
0
100
Col-0 Thujopsene
cyp706a3 Thujopsene
0
50
100
150
BS
1B
S2
BS
3B
S4
BS
5B
S6
BS
7B
S8
BS
9B
S10
BS
11B
S12
BS
13B
S14
BS
15B
S16
BS
17B
S18
BS
19B
S20
BS
21B
S22
Col-0cyp706a3-2
0
0.5
1
1.5
2
2.5
3
3.5
T0 T1 T2 T3 T4 T5
CYP706A3 TPS11
TPS03 TPS21
TPS10 TPS14
TPS24
Rel
ativ
e tr
ansc
ipt
leve
lsA
B
C15H22O1
(1 oxo sur /)
m/z: 201.2->121.1 m/z: 201.2->145.2
C15H24O2
(2 OH on /)(1 OH on / + 1 oxo on //)
m/z: 219.2 -> 95.2 2OH
C15H22O2
(1 COOH on /)(1 oxo on // + 1 oxo on /)
m/z: 235.2->95.2
Rel
ativ
e so
lub
le a
mo
un
ts(%
)
C
Flow
Col-0cyp706a3-2
(+)-α-barbatene
(+)-thujopsene
Col-0cyp706a3-2
VO
Cs
emis
sio
n(n
g/p
lan
t/24
h)
*****
*****
*** **** ******
************** **
***
*****
*** ***
***ND
ND * *
*
* *
*
**
**
*
Figure 8. The TPS11/CYP706A3 cluster is active in developing floral buds.(A) Relative expression of CYP706A3 and of major flower-expressed terpene synthase genes (Figure 1) duringfloral transition and inflorescence development evaluated by RT-qPCR. (B) Quantification of (+)-thujopsene (upperpanel) and (+)-α-barbatene (lower panel) emission from wild-type and cyp706a3-2 mutant plants at the samedevelopment stages as in (A). VOCs were collected for 24 hours from four plants per sample at the six stages offlower development shown in the photographs below from floral transition (T0) to opened inflorescence (Flow). Tindicates the different transition phases. (C) LC-MS/MS quantification of soluble sesquiterpene oxides identified inMeOH extracts of stage T4 buds from wild-type and cyp706a3-2 mutant plants (as described in Figure 7). For eachcompound, specific MS/MS transitions used are indicated, as well as expected raw formulae. Representativechromatograms and identification of the numbered sesquiterpene oxides are shown in Supplemental Figure 16. BSstands for bud soluble compounds. Data in (B) are given as the mean ± SE (n = 4 individual plants). Data in (A) and(C) are given as the mean ± SE of three biological replicates (pooled inflorescences from individual plants).Statistically significant differences relative to Col-0 are indicated (two-tailed Student’s t test: *p < 0.05; **p < 0.01,***p < 0.001).
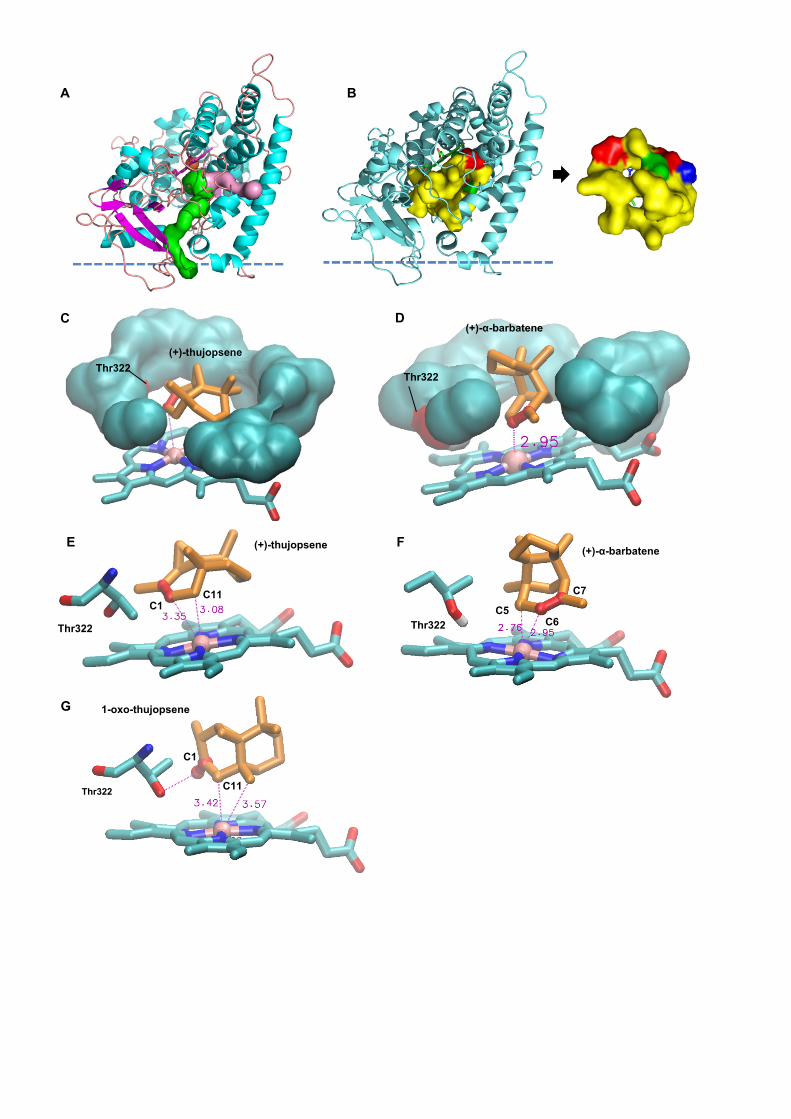
A B
(+)-thujopsene
C
C1C11
Thr322
E (+)-thujopsene
1-oxo-thujopsene
Thr322 C11
C1
G
D
F
(+)-α-barbatene
(+)-α-barbatene
Thr322 C6C5
C7
Thr322Thr322
B
Figure 9. 3D structural model of the CYP706A3 active site and comparative docking of relevantsubstrates.Structural model of AtCYP706A3 (segment 38-519) showing potential channels for substrate access, active sitetopology/characteristics, and docking positions for (+)-α-barbatene, (+)-thujopsene, and (+)-1-oxo-thujopsenedetermined by Autodock4.(A) Overall structure displaying the two main channels (represented in surface mode in pink and green) withbottleneck values of 1.4 Å, positive hydropathy indexes, and logP values higher than 1. The predicted position ofthe membrane surface calculated by the PPM server of the OPM database(https://opm.phar.umich.edu/ppm_server) is schematized by the horizontal dashed line. The most hydrophobicchannel (green) connects directly to the membrane bilayer while the other channel (pink) connects the activesite to the interfacial medium.(B) Display of the small internal cavity mostly delineated by hydrophobic residues (in yellow, surface mode).Two apertures are visible, corresponding to egress channels. Polar (green) and charged (red) residuescorrespond to Thr322 and Asp314, respectively. Thr322 is the only non-hydrophobic residue in contact with theactive site cavity.(C) View of (+)-thujopsene buried in the small hydrophobic pocket. Only the first crown of interacting residues isdisplayed. The only polar residue Thr322 of the cavity is shown on the left (red surface). The thujopsene doublebond is indicated in red.(D) View of (+)-α-barbatene in the small hydrophobic pocket. Only the first crown of residues is displayed. Theonly polar residue Thr322 of the cavity is shown on the left (red surface). The barbatene double bond isindicated in red. Distance (≈3Å) between the oxidation site and heme iron is indicated.(E) Predominant docking pose of (+)-thujopsene, with high affinity energy binding of –9.2 kcal.mol–1. The twoatoms closest to the heme iron are C1 and C11, in full agreement with oxidation site. Distances to heme iron areindicated in red with dotted lines, and double bond C1-C2 is shown in red.(F) Predominant docking pose of (+)-α-barbatene, with high affinity energy binding of –9.39 kcal.mol–1. Twoatoms (red ball-and-stick) closest to heme iron (pink) C5 and C6 are at equivalent distances. The polar sidechain of Thr322 is displayed.(G) Predominant docking pose of (+)-1-oxo-thujopsene, with high affinity energy binding of –9.8 kcal.mol–1. Theketo group (C1=O), shown in red, is oriented on the same side as the polar side chain of Thr322.
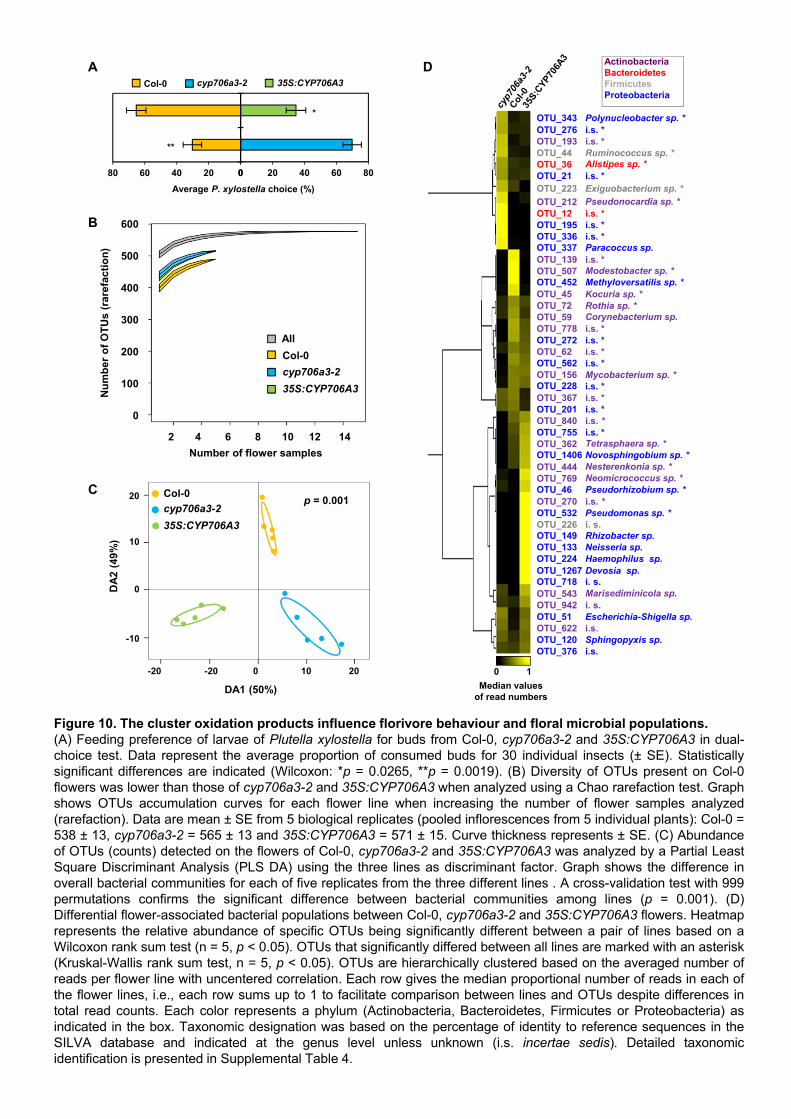
2 4 6 8 10 12 14
600
500
400
300
200
100
0
OTU_343 Polynucleobacter sp. *OTU_276 i.s. *OTU_193 i.s. *OTU_44 Ruminococcus sp. *OTU_36 Alistipes sp. *OTU_21 i.s. *OTU_223 Exiguobacterium sp. *
OTU_212 Pseudonocardia sp. *OTU_12 i.s. *OTU_195 i.s. *OTU_336 i.s. *OTU_337 Paracoccus sp. OTU_139 i.s. *OTU_507 Modestobacter sp. *OTU_452 Methyloversatilis sp. * OTU_45 Kocuria sp. *OTU_72 Rothia sp. *OTU_59 Corynebacterium sp.OTU_778 i.s. *OTU_272 i.s. *OTU_62 i.s. *OTU_562 i.s. *OTU_156 Mycobacterium sp. * OTU_228 i.s. *OTU_367 i.s. *OTU_201 i.s. *OTU_840 i.s. *OTU_755 i.s. *OTU_362 Tetrasphaera sp. * OTU_1406 Novosphingobium sp. * OTU_444 Nesterenkonia sp. *OTU_769 Neomicrococcus sp. * OTU_46 Pseudorhizobium sp. *OTU_270 i.s. *OTU_532 Pseudomonas sp. *OTU_226 i. s.OTU_149 Rhizobacter sp.OTU_133 Neisseria sp.OTU_224 Haemophilus sp. OTU_1267 Devosia sp. OTU_718 i. s.OTU_543 Marisediminicola sp.OTU_942 i. s.OTU_51 Escherichia-Shigella sp.OTU_622 i.s.OTU_120 Sphingopyxis sp. OTU_376 i.s.
Median values of read numbers
0 1
ActinobacteriaBacteroidetesFirmicutesProteobacteria
D
Nu
mb
ero
f O
TU
s(r
aref
acti
on
)
B
Number of flower samples
0 20 40 60 80
cyp706a3-2
35S:CYP706A3-2
Average P. xylostella choice (%)
020406080
Col-0
Col-0
A
**
*
Col-0 35S:CYP706A3cyp706a3-2
DA1 (50%)
DA
2 (4
9%
)
-20 200
0
20
-10
Col-0
cyp706a3-2
35S:CYP706A3
Cp = 0.001
10
10-20
Col-0
cyp706a3-2
35S:CYP706A3
Figure 10. The cluster oxidation products influence florivore behaviour and floral microbial populations.(A) Feeding preference of larvae of Plutella xylostella for buds from Col-0, cyp706a3-2 and 35S:CYP706A3 in dual-choice test. Data represent the average proportion of consumed buds for 30 individual insects (± SE). Statisticallysignificant differences are indicated (Wilcoxon: *p = 0.0265, **p = 0.0019). (B) Diversity of OTUs present on Col-0flowers was lower than those of cyp706a3-2 and 35S:CYP706A3 when analyzed using a Chao rarefaction test. Graphshows OTUs accumulation curves for each flower line when increasing the number of flower samples analyzed(rarefaction). Data are mean ± SE from 5 biological replicates (pooled inflorescences from 5 individual plants): Col-0 =538 ± 13, cyp706a3-2 = 565 ± 13 and 35S:CYP706A3 = 571 ± 15. Curve thickness represents ± SE. (C) Abundanceof OTUs (counts) detected on the flowers of Col-0, cyp706a3-2 and 35S:CYP706A3 was analyzed by a Partial LeastSquare Discriminant Analysis (PLS DA) using the three lines as discriminant factor. Graph shows the difference inoverall bacterial communities for each of five replicates from the three different lines . A cross-validation test with 999permutations confirms the significant difference between bacterial communities among lines (p = 0.001). (D)Differential flower-associated bacterial populations between Col-0, cyp706a3-2 and 35S:CYP706A3 flowers. Heatmaprepresents the relative abundance of specific OTUs being significantly different between a pair of lines based on aWilcoxon rank sum test (n = 5, p < 0.05). OTUs that significantly differed between all lines are marked with an asterisk(Kruskal-Wallis rank sum test, n = 5, p < 0.05). OTUs are hierarchically clustered based on the averaged number ofreads per flower line with uncentered correlation. Each row gives the median proportional number of reads in each ofthe flower lines, i.e., each row sums up to 1 to facilitate comparison between lines and OTUs despite differences intotal read counts. Each color represents a phylum (Actinobacteria, Bacteroidetes, Firmicutes or Proteobacteria) asindicated in the box. Taxonomic designation was based on the percentage of identity to reference sequences in theSILVA database and indicated at the genus level unless unknown (i.s. incertae sedis). Detailed taxonomicidentification is presented in Supplemental Table 4.
All
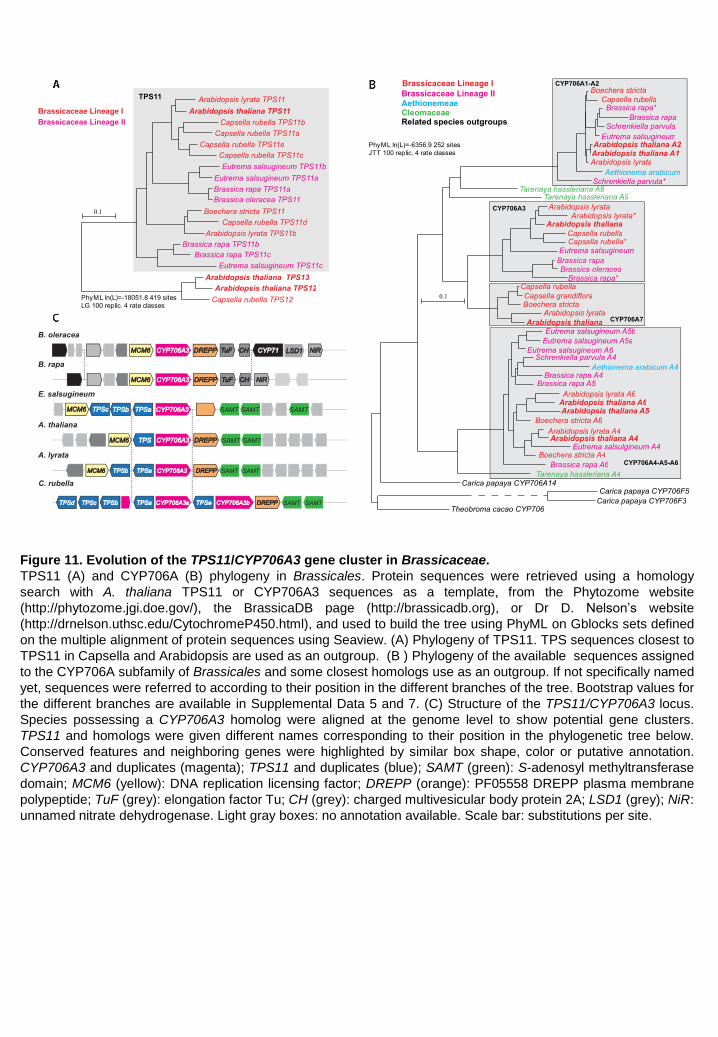
Figure 11. Evolution of the TPS11/CYP706A3 gene cluster in Brassicaceae.
TPS11 (A) and CYP706A (B) phylogeny in Brassicales. Protein sequences were retrieved using a homology
search with A. thaliana TPS11 or CYP706A3 sequences as a template, from the Phytozome website
(http://phytozome.jgi.doe.gov/), the BrassicaDB page (http://brassicadb.org), or Dr D. N o ’ website
(http://drnelson.uthsc.edu/CytochromeP450.html), and used to build the tree using PhyML on Gblocks sets defined
on the multiple alignment of protein sequences using Seaview. (A) Phylogeny of TPS11. TPS sequences closest to
TPS11 in Capsella and Arabidopsis are used as an outgroup. (B ) Phylogeny of the available sequences assigned
to the CYP706A subfamily of Brassicales and some closest homologs use as an outgroup. If not specifically named
yet, sequences were referred to according to their position in the different branches of the tree. Bootstrap values for
the different branches are available in Supplemental Data 5 and 7. (C) Structure of the TPS11/CYP706A3 locus.
Species possessing a CYP706A3 homolog were aligned at the genome level to show potential gene clusters.
TPS11 and homologs were given different names corresponding to their position in the phylogenetic tree below.
Conserved features and neighboring genes were highlighted by similar box shape, color or putative annotation.
CYP706A3 and duplicates (magenta); TPS11 and duplicates (blue); SAMT (green): S-adenosyl methyltransferase
domain; MCM6 (yellow): DNA replication licensing factor; DREPP (orange): PF05558 DREPP plasma membrane
polypeptide; TuF (grey): elongation factor Tu; CH (grey): charged multivesicular body protein 2A; LSD1 (grey); NiR:
unnamed nitrate dehydrogenase. Light gray boxes: no annotation available. Scale bar: substitutions per site.