Embed Size (px)
Citation preview

A Robot-Based Platform to Measure Multiple EnzymeActivities in Arabidopsis Using a Set of Cycling Assays:Comparison of Changes of Enzyme Activities and TranscriptLevels during Diurnal Cycles and in Prolonged Darkness W
Yves Gibon,1 Oliver E. Blaesing, Jan Hannemann, Petronia Carillo, Melanie Hohne, Janneke H.M. Hendriks,
Natalia Palacios, Joanna Cross, Joachim Selbig, and Mark Stitt
Max Planck Institute of Molecular Plant Physiology, Science Park Golm, 14476 Golm-Potsdam, Germany
A platform has been developed to measure the activity of 23 enzymes that are involved in central carbon and nitrogen
metabolism in Arabidopsis thaliana. Activities are assayed in optimized stopped assays and the product then determined
using a suite of enzyme cycling assays. The platform requires inexpensive equipment, is organized in a modular manner to
optimize logistics, calculates results automatically, combines high sensitivity with throughput, can be robotized, and has
a throughput of three to four activities in 100 samples per person/day. Several of the assays, including those for sucrose
phosphate synthase, ADP glucose pyrophosphorylase (AGPase), ferredoxin-dependent glutamate synthase, glycerokinase,
and shikimate dehydrogenase, provide large advantages over previous approaches. This platform was used to analyze the
diurnal changes of enzyme activities in wild-type Columbia-0 (Col-0) and the starchless plastid phosphoglucomutase (pgm)
mutant, and in Col-0 during a prolongation of the night. The changes of enzyme activities were compared with the changes
of transcript levels determined with the Affymetrix ATH1 array. Changes of transcript levels typically led to strongly damped
changes of enzyme activity. There was no relation between the amplitudes of the diurnal changes of transcript and enzyme
activity. The largest diurnal changes in activity were found for AGPase and nitrate reductase. Examination of the data and
comparison with the literature indicated that these are mainly because of posttranslational regulation. The changes of
enzyme activity are also strongly delayed, with the delay varying from enzyme to enzyme. It is proposed that enzyme
activities provide a quasi-stable integration of regulation at several levels and provide useful data for the characterization
and diagnosis of different physiological states. As an illustration, a decision tree constructed using data from Col-0 during
diurnal changes and a prolonged dark treatment was used to show that, irrespective of the time of harvest during the diurnal
cycle, the pgm mutant resembles a wild-type plant that has been exposed to a 3 d prolongation of the night.
INTRODUCTION
The relatively simple chemistry of nucleic acids has made it
possible to develop array technologies that allow genome-wide
profiling of transcript levels in sequenced organisms (DeRisi
et al., 1997; Celis et al., 2000; Michaut et al., 2003), including
Arabidopsis thaliana (Wang et al., 2003; Thimm et al., 2004;
AtGenExpress, www.arabidopsis.org). The sensitivity and pre-
cisionwithwhich transcript levels can be quantifiedwill be further
increased by multiplexed real-time RT-PCR (Czechowski et al.,
2004). Interpretation depends on assumptions about the relation
between the levels of transcripts and proteins. This is difficult to
predict because it will depend on how far the transcript concen-
tration affects the rate of translation, how rapidly the protein turns
over, and whether the rate of degradation is coordinately
regulated. In some cases, the response may be attenuated,
and in others posttranscriptional regulation may lead to exag-
gerated or independent changes. For example, nitrate reductase
(NIA) protein increases twofold in leaves during the first part of
the light period, whereas NIA transcript decreases rapidly
(Scheible et al., 1997a). This occurs because illumination stim-
ulates the synthesis and inhibits the breakdown of NIA protein
(Kaiser and Huber, 1999; Weiner and Kaiser, 1999). The large
number of genes involved in protein degradation in Arabidopsis
(Arabidopsis Genome Initiative, 2000) underlines the potential
importance of posttranscriptional regulation.
Quantification of proteins at the proteome scale poses amajor
technical challenge (Greenbaum et al., 2003). Although methods
are being developed (Steen and Pandey, 2002), they lag behind
the techniques for expression profiling and require costly and
extensive infrastructure. Enzyme activity assays require inex-
pensive equipment and provide quantitative data. Measure-
ments in optimized assays that allow maximum activity (ap
Rees and Hill, 1994) could act as a proxy for quantitative
proteomics, at least for studies of metabolism. Throughput can
1 To whom correspondence should be addressed. E-mail [email protected]; fax 49-331-567-8101.The author responsible for distribution of materials integral to thefindings presented in this article in accordance with the policy describedin the Instructions for Authors (www.plantcell.org) is: Yves Gibon([email protected]).WOnline version contains Web-only data.Article, publication date, and citation information can be found atwww.plantcell.org/cgi/doi/10.1105/tpc.104.025973.
The Plant Cell, Vol. 16, 3304–3325, December 2004, www.plantcell.orgª 2004 American Society of Plant Biologists

be increased by transferring existing protocols to microplates
and using robots (Ashour et al., 1987; Kiianitsa et al., 2003). High
throughput assays of individual enzymes are used routinely in
drug or herbicide discovery (Lein et al., 2004). The uncommon-
ness of each reaction and resulting diversity of assay systems
will make it logistically impossible to measure an entire enzy-
mome, but it may be possible to create efficient platforms for
subsets of enzymes by grouping them in modules that share
a common detection method.
Such platforms could provide quantitative data that provide
insights into the relation between transcript levels and protein
levels in genomics studies. Activity measurements can also
provide information about posttranslational regulation in cases
where it alters the kinetic properties (Kaiser and Huber, 1994,
1999). Another potential application is in the diagnosis of
genotypes or physiological states. It can also be approached
via machine learning, in which a training data set from a series of
defined conditions is used to generate a classification key that is
used as a diagnostic tool to classify unknown samples (Quinlan,
1979; Kononenko, 2001). Machine learning can be used on data
sets with a relatively small number of parameters but requires
good replication and reliable quantification.
This article presents a set of robotized microplate-based
activity assays for 23 enzymes from central carbon and nitrogen
metabolism. In addition to allowing high-throughput analyses,
most of the assays are highly sensitive, allowing very low
activities to be detected or very small samples to be analyzed.
The platform has been used to investigate the changes of
enzyme activities during the diurnal cycle in wild-type Arabidop-
sis and a starchless mutant where carbohydrate storage is
disturbed and during a prolonged dark treatment of wild-type
Arabidopsis. These treatments allow us to ask if rapid changes in
transcript levels during the diurnal rhythm lead to changes in the
activity of the encoded enzyme and if larger changes of transcript
levels in the starchless pgm mutant or more prolonged changes
in prolonged starvation lead to more marked changes in enzyme
activity. Methods are presented that integrate information about
transcript levels and enzyme activity, provide insights into the
quantitative relation between changes of transcript levels and
enzyme activities, and highlight cases where translational regu-
lation or protein turnover may contribute. The data sets are also
used to illustrate the utility of enzyme activities for diagnosis
using machine learning.
RESULTS
Design of an Analytic Platform for Parallel Determination
of Enzyme Activities in Central Metabolism
Enzymes were assayed using stopped assays, in which aliquots
of extracts are incubated with their substrates for a fixed time
before stopping the reaction and the product then determined in
a second assay. Stopped assays can be performed in parallel,
stored, and combined with sets of samples from the same or
other enzymes before measuring the product. They can be
performed in a smaller volume than is usually required for
detection in a spectrophotometer or a fluorimeter, which de-
creases the amount of extract and reagent required. Although
they require more pipetting steps than direct assays, this does
not represent a major disadvantage when the assays are
robotized (see Methods).
In most cases, cycling assays (Gibon et al., 2002) were used to
determine the products of the enzyme reactions. The principle is
that the net rate of the cycle is a pseudo zero-order reaction
whose rate (d[analyte measured]/dt ¼ �d[precursor of this
analyte]/dt) depends on the initial concentration of themetabolite
being determined. Quantification is achieved by comparisonwith
a standard curve, in which different concentrations of themetab-
olite in question are added in the presence of pseudo-extract
(Gibon et al., 2002). A combination of stopped and cycling
assays can provide 10,000-fold higher sensitivity than conven-
tional assays. The sensitivity limit for routine measurements in
leaf extracts was 0.01 to 1 nmol product per assay. This allows
extracts to be diluted far more strongly in the assay, which
increases the reliability of stopped assays. Interference by other
components in the extract is reduced, substrates can be main-
tained at near-constant levels throughout the assay, product
inhibition is minimized because the amounts accumulated are
very low (typically below 20 mM), and interference by other
enzymes is decreased.
The platform uses three cycling systems (Table 1, Figure 1).
Glycerol-3-P and dihydroxyacetone-P are measured by a glyc-
erol-3-Pdehydrogenase/glycerol-3-Poxidasecycle (Gibonetal.,
2002), NADPþ and NADPH by a glucose-6-P dehydrogenase/
phenazine methosulfate (G6PDH/PMS) cycle (Nisselbaum and
Green, 1969), and NADþ and NADH by an alcohol dehydroge-
nase/phenazine ethosulfate (ADH/PES) cycle (Bernofsky and
Swan, 1973). Reactions were stopped using HCl, except when
the direct or indirect product was a reduced coenzyme, in which
case NaOH was added. Oxidized NAD(P)þ is stable at low pH
and labile at high pH, and reduced NAD(P)H is labile at low pH
and stable at high pH (Nisselbaum and Green, 1969). This
combination allows a wide range of enzyme activities to be
measured, including all NAD(P)-dependent dehydrogenases and
all activities that generate ATP or UTP because the latter can be
coupled to glycerol-3-P formation. In some cases, one of these
metabolites is the direct product of the enzyme reaction. Other-
wise, coupling enzymes are included to convert a product into
one of these metabolites. The modular organization allows many
different enzyme assays to be fed into a pipeline with just three
downstream cycling systems, which simplifies logistics and
increases throughput.
An alternative strategy to achieve high sensitivity is to use
fluorigenic reactions. For example, to assay invertase, an exist-
ing stopped assay (Huber, 1984) was modified by measuring
glucose via a glucose oxidase/peroxidase coupling system that
oxidizes dihydroxyphenoxazin into the fluorescent dye resorufin.
An analogous approach could be used for many other enzymes
because a range of oxidases and fluorigenic substrates are
commercially available.
A small number of enzymes required dedicated assays. We
have not yet found a procedure that combines high sensitivity
and high throughput for enzymes that produce ADP from ATP
(e.g., Gln synthetase; GS). GS activity was high enough to use an
existing assay, in which ADP is measured by coupling it to NADH
formation via pyruvate kinase (PK) and lactate dehydrogenase
Transcript Levels and Enzyme Activities 3305

(Scheible et al., 1997a). DTT is often required to stabilize
enzymes like NIA but interferes with the G6PDH/PMS and
ADH/PES cycling systems because it reduces methylthiazolyldi-
phenyl-tetrazolium bromide (MTT) and the peroxidase-
dependent oxidation of dihydroxyphenoxazin. NIA had to be
assayed using an existing protocol that measures nitrite forma-
tion (Scheible et al., 1997b, 1997c). The assay for ferredoxin-
dependent glutamate synthase (Fd-GOGAT) contains a mix of
reductants (DTT to stabilize Fd-GOGAT and dithionite to drive
the reaction). Furthermore, the product (glutamate) has to be
measured in the presence of a vast excess of 2-oxoglutarate
and Gln. To achieve this, glutamate dehydrogenase (GDH) was
coupled to diaphorase and MTT to displace the equilibrium
toward glutamate oxidation. Before determining glutamate, an
excess of N-ethylmaleimide was included to remove DTT and
dithionite because they would otherwise reduce MTT to its for-
mazan. Fortunately, GDHwas not inhibited byN-ethylmaleimide.
All of the standard assays contained optimized levels of sub-
strates and, where necessary, activators, pH, and ionic condi-
tions to allow maximum activity. In specific cases, it is also
possible to use a second assay system with suboptimal levels of
specific substrates or effectors to detect posttranslational reg-
ulation. As an example, posttranscriptional regulation of NIA was
monitored by comparing activity in the presence of excess Mg2þ
to stabilize a complex between the phosphorylated protein and
the inhibitory 14-3-3 protein and selectively assay the active
nonphosphorylated protein, and in the presence of excess EDTA
to trap Mg2þ and allow the phosphorylated form to be released
and regain activity to determine maximal activity (Kaiser and
Huber, 1999).
Optimization and Validation
This section describes the optimization and validation of the
assay for fumarase. The same strategy was applied to all assays.
Fumarase catalyzes the hydration of fumarate to malate. Malate
dehydrogenase is included as a coupling enzyme to oxidize
malate to oxaloacetate and simultaneously reduce NADþ to
NADH. Because oxaloacetate exerts strong product inhibition on
malate dehydrogenase, it was removed by including citrate
synthase and an excess of acetyl-CoA. The assay is stopped
with an excess of NaOH, the nonreduced NADþ destroyed by
heating at 958C for 5 min, the extract neutralized with HCl, and
NADH determined using the ADH/PES cycle system. Activity
wasmeasured by comparing the signalswith the complete assay
Table 1. Assay Principles, Stability to a Freeze/Thaw Cycle, Optimal Extract Dilution, Average Activity, and Average Coefficient of Variation between
Biological Replicates of Rosettes from 5-Week-Old Arabidopsis Col-0 Collected at Various Time Points throughout a 12-h-Day and 12-h-Night Cycle
Enzyme Method
Freeze/Thawing
Stability
(% Retained 6 SD)
Dilution
of FW
Average Activity
(Arabidopsis
Rosette, nmol
g�1 FW min�1)
Average
Coefficient
of Variation
(%)
AGPase
G3POX/G3PDH
85 6 5 1,000 1,255 12
NAD-GAPDH 90 6 1 20,000 36,981 15
NADP-GAPDH 86 6 3 10,000 17,041 14
PFP 26 6 9 1,000 191 16
PK 70 6 9 1,000 952 18
SPS ND 1,000 540 8
TK 99 6 3 1,000 7,462 17
GK 51 6 9 500 18 33
cFBPase
G6PDH/(PMS þ MTT)
55 6 26 500 105 23
GlcK 65 6 13 1,000 150 23
FruK 65 6 11 1,000 179 18
G6PDH 37 6 9 5,000 849 13
ICDH 97 6 29 2,000 1,506 24
ShikDH 48 6 5 2,000 598 18
AlaAT
ADH/(PES þ MTT)
79 6 21 20,000 5,462 20
AspAT 81 6 30 20,000 5,229 19
Fumarase 9 6 3 20,000 4,875 10
GLDHam 97 6 7 1,000 876 11
PEPCase 126 6 35 1,000 744 19
Acid Inv Glucose oxidase
þ dihydroxyphenoxazine
62 6 14 1,000 532 20
Fd-GOGAT GLDH 37 6 7 500 1,685 13
NIA SA þ NNEDA175 6 49 (Vsel)
500– 12
93 6 18 (Vmax) 575 8
GS PK þ LDH 129 6 16 1,000 1,867 14
See Figure 1 for abbreviations. Acid Inv, acid invertase; cFBPase, cytosolic FBPase; GLDHam, GLDH aminating; NAD-GAPDH, NAD-dependent
GAPDH; NADP-GAPDH, NADP-dependent GAPDH; MTT, methylthiazolyldiphenyl-tetrazolium bromide; NNEDA, N(1-naphtyl)ethylendiamide dihy-
drochloride; SA, sulfanilamide; ND, not determined; –, not determinable.
3306 The Plant Cell

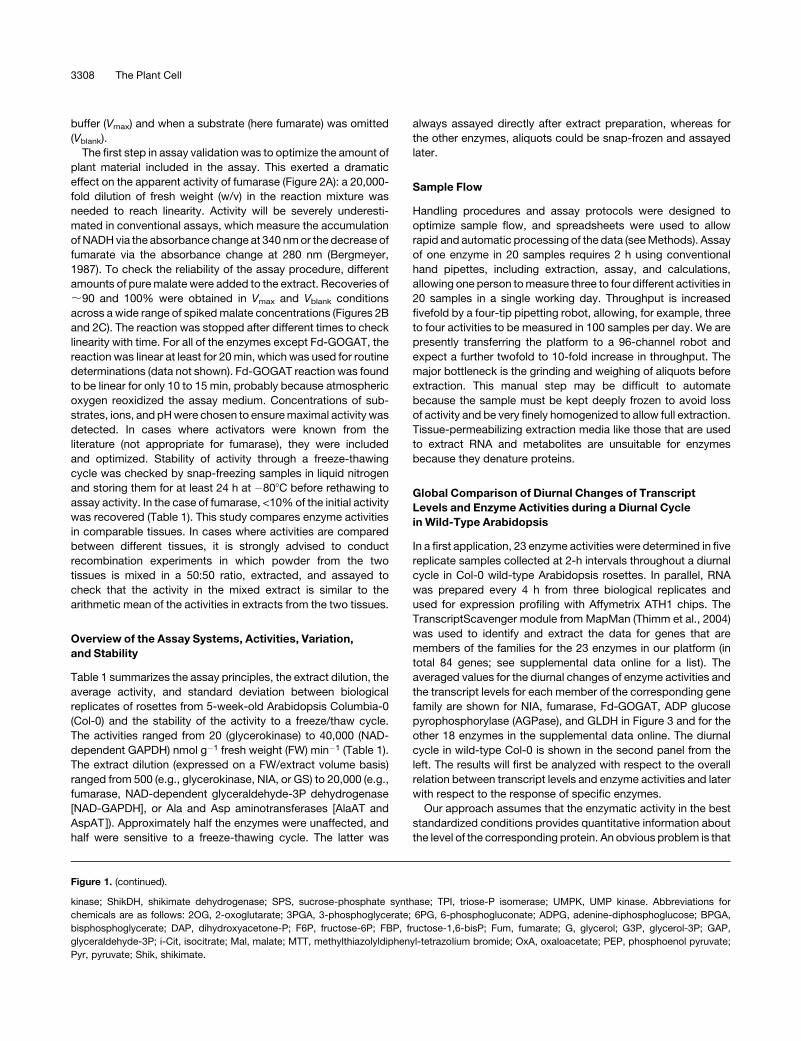
Figure 1. Principles of Stopped Assays for Enzyme Activities That Use a Cycling Assay to Determine the Product of the Reaction.
(A) and (B) Determinations based on the glycerol-3P-cycling assay.
(C) and (D) Determinations based on the NADP-cycling assay.
(E) and (F) Determinations based on the NAD-cycling assay.
(A), (C), and (E) represent the stopped step leading to glycerol-3P or dihydroxyacetone-P, NADPH, or NAD(H), respectively, directly or via coupled
reactions. The enzyme measured is in bold. For clarity, products that are not measured have been omitted as well as the cosubstrates required for the
coupling reactions.
(B), (D), and (F) represent the principles of the cycling reactions for the determination of glycerol-3P or dihydroxyacetone-P, NADP(H), or NAD(H),
respectively.
AGPase, glucose-1-phosphate adenyltransferase; Ald, aldolase; AlaAT, Ala aminotransferase; AspAT, Asp aminotransferase; CS, citrate synthase;
FBPase, fructose-1,6-bisphosphatase; FruK, fructokinase; Fum, fumarase; G3PDH, glycerol-3P dehydrogenase; G3POX, glycerol-3P oxidase;
G6PDH, glucose-6P dehydrogenase; GlcK, glucokinase; GAP DH, glyceraldehyde-3P dehydrogenase; GK, glycerokinase; GLDH, glutamate
dehydrogenase; ICDH, isocitrate dehydrogenase; LDH, lactate dehydrogenase; MDH, malate dehydrogenase; PEPC, phosphoenolpyruvate
carboxylase; PFP, pyrophosphate-dependent phosphofructokinase; PGI, phosphoglucose isomerase; PGK, phosphoglycerate kinase; PK, pyruvate
Transcript Levels and Enzyme Activities 3307
buffer (Vmax) and when a substrate (here fumarate) was omitted
(Vblank).
The first step in assay validation was to optimize the amount of
plant material included in the assay. This exerted a dramatic
effect on the apparent activity of fumarase (Figure 2A): a 20,000-
fold dilution of fresh weight (w/v) in the reaction mixture was
needed to reach linearity. Activity will be severely underesti-
mated in conventional assays, which measure the accumulation
of NADHvia the absorbance change at 340 nmor the decrease of
fumarate via the absorbance change at 280 nm (Bergmeyer,
1987). To check the reliability of the assay procedure, different
amounts of puremalate were added to the extract. Recoveries of
;90 and 100% were obtained in Vmax and Vblank conditions
across a wide range of spikedmalate concentrations (Figures 2B
and 2C). The reaction was stopped after different times to check
linearity with time. For all of the enzymes except Fd-GOGAT, the
reaction was linear at least for 20min, which was used for routine
determinations (data not shown). Fd-GOGAT reaction was found
to be linear for only 10 to 15 min, probably because atmospheric
oxygen reoxidized the assay medium. Concentrations of sub-
strates, ions, and pHwere chosen to ensuremaximal activity was
detected. In cases where activators were known from the
literature (not appropriate for fumarase), they were included
and optimized. Stability of activity through a freeze-thawing
cycle was checked by snap-freezing samples in liquid nitrogen
and storing them for at least 24 h at �808C before rethawing to
assay activity. In the case of fumarase, <10% of the initial activity
was recovered (Table 1). This study compares enzyme activities
in comparable tissues. In cases where activities are compared
between different tissues, it is strongly advised to conduct
recombination experiments in which powder from the two
tissues is mixed in a 50:50 ratio, extracted, and assayed to
check that the activity in the mixed extract is similar to the
arithmetic mean of the activities in extracts from the two tissues.
Overview of the Assay Systems, Activities, Variation,
and Stability
Table 1 summarizes the assay principles, the extract dilution, the
average activity, and standard deviation between biological
replicates of rosettes from 5-week-old Arabidopsis Columbia-0
(Col-0) and the stability of the activity to a freeze/thaw cycle.
The activities ranged from 20 (glycerokinase) to 40,000 (NAD-
dependent GAPDH) nmol g�1 fresh weight (FW) min�1 (Table 1).
The extract dilution (expressed on a FW/extract volume basis)
ranged from 500 (e.g., glycerokinase, NIA, or GS) to 20,000 (e.g.,
fumarase, NAD-dependent glyceraldehyde-3P dehydrogenase
[NAD-GAPDH], or Ala and Asp aminotransferases [AlaAT and
AspAT]). Approximately half the enzymes were unaffected, and
half were sensitive to a freeze-thawing cycle. The latter was
always assayed directly after extract preparation, whereas for
the other enzymes, aliquots could be snap-frozen and assayed
later.
Sample Flow
Handling procedures and assay protocols were designed to
optimize sample flow, and spreadsheets were used to allow
rapid and automatic processing of the data (seeMethods). Assay
of one enzyme in 20 samples requires 2 h using conventional
hand pipettes, including extraction, assay, and calculations,
allowing one person tomeasure three to four different activities in
20 samples in a single working day. Throughput is increased
fivefold by a four-tip pipetting robot, allowing, for example, three
to four activities to be measured in 100 samples per day. We are
presently transferring the platform to a 96-channel robot and
expect a further twofold to 10-fold increase in throughput. The
major bottleneck is the grinding and weighing of aliquots before
extraction. This manual step may be difficult to automate
because the sample must be kept deeply frozen to avoid loss
of activity and be very finely homogenized to allow full extraction.
Tissue-permeabilizing extraction media like those that are used
to extract RNA and metabolites are unsuitable for enzymes
because they denature proteins.
Global Comparison of Diurnal Changes of Transcript
Levels and Enzyme Activities during a Diurnal Cycle
in Wild-Type Arabidopsis
In a first application, 23 enzyme activities were determined in five
replicate samples collected at 2-h intervals throughout a diurnal
cycle in Col-0 wild-type Arabidopsis rosettes. In parallel, RNA
was prepared every 4 h from three biological replicates and
used for expression profiling with Affymetrix ATH1 chips. The
TranscriptScavenger module from MapMan (Thimm et al., 2004)
was used to identify and extract the data for genes that are
members of the families for the 23 enzymes in our platform (in
total 84 genes; see supplemental data online for a list). The
averaged values for the diurnal changes of enzyme activities and
the transcript levels for each member of the corresponding gene
family are shown for NIA, fumarase, Fd-GOGAT, ADP glucose
pyrophosphorylase (AGPase), and GLDH in Figure 3 and for the
other 18 enzymes in the supplemental data online. The diurnal
cycle in wild-type Col-0 is shown in the second panel from the
left. The results will first be analyzed with respect to the overall
relation between transcript levels and enzyme activities and later
with respect to the response of specific enzymes.
Our approach assumes that the enzymatic activity in the best
standardized conditions provides quantitative information about
the level of the corresponding protein. An obvious problem is that
Figure 1. (continued).
kinase; ShikDH, shikimate dehydrogenase; SPS, sucrose-phosphate synthase; TPI, triose-P isomerase; UMPK, UMP kinase. Abbreviations for
chemicals are as follows: 2OG, 2-oxoglutarate; 3PGA, 3-phosphoglycerate; 6PG, 6-phosphogluconate; ADPG, adenine-diphosphoglucose; BPGA,
bisphosphoglycerate; DAP, dihydroxyacetone-P; F6P, fructose-6P; FBP, fructose-1,6-bisP; Fum, fumarate; G, glycerol; G3P, glycerol-3P; GAP,
glyceraldehyde-3P; i-Cit, isocitrate; Mal, malate; MTT, methylthiazolyldiphenyl-tetrazolium bromide; OxA, oxaloacetate; PEP, phosphoenol pyruvate;
Pyr, pyruvate; Shik, shikimate.
3308 The Plant Cell

small gene families encodemost of the enzymes, and the assays
do not distinguish the different isoforms. Fortunately, for most
enzymes the signals for transcripts for one or two family
members were much higher than the other members, and these
major forms showed a similar diurnal response. The main
exceptions are sucrose phosphate synthase (SPS), AspAT,
glucose-6-phosphate dehydrogenase (G6PDH), GS, and PK
(see supplemental data online). These enzymes were excluded
from some of the following analyses.
The data were statistically analyzed to uncover general fea-
tures of the relation between transcript levels and enzyme
activities. A formula given in Methods was used to estimate
a smoothness value, which has an optimal value of zero if every
data point lies on a smooth curve that moves through one
maximumand oneminimumper diurnal cycle, rising to one as the
data points become increasingly irregular (see supplemental
data online for examples of the values obtained for a set of
randomly generated data points). Values between 0 and 0.05
were arbitrarily chosen as indicating a good oscillation for
transcripts and enzyme activities, values ranging from 0.05 to
0.1 as indicating a possible oscillation, and values >0.1 as
indicating no oscillation of transcripts and enzyme. Figure 4A
indicates that almost all transcripts but only 30% of the enzyme
activities show a smooth oscillation (Figure 4A). A further 43% of
the enzymes show a slightly irregular oscillation. The amplitude
of the change is smaller for enzyme activities, making themmore
susceptible to experimental noise.
The amplitude of the diurnal change was estimated from the
difference between the maximum and minimum values and
expressed as apercentage of themaximumvalue (seeMethods).
To allow data compression, a probability mass function curve
(see Methods) was calculated for both populations (Figure 4B).
On average, transcript levels exhibit an almost twofold larger
amplitude than enzyme activities during the 24-h diurnal cycle
(Figure 4B). The same trend was obtained when the analysis was
restricted to major transcripts (i.e., those arbitrarily chosen as
exhibiting a maximum level >30% of the maximum level of the
highest expressed transcript or when all transcripts in a given
family were added together; see Supplemental Figure 2 online).
These data indicate that whereasmost transcript levels exhibit
a clear and marked diurnal rhythm, the response of the corre-
sponding activities was damped, and in some cases hardly
detectable. The amplitude of the diurnal changes of transcripts
may still be an underestimate for low-expressed genes. It has
been inferred that hybridization kinetics on expression arrays are
second order (Holland, 2002), and the linear range afforded by
the Affymetrix ATH1 arrays (three to four orders of magnitude)
may lead to some attenuation of the signals. Comparison of the
signals for >1400 transcription factors measured by real-time
PCR and the ATH1 array in Arabidopsis shoot and root samples
(Czechowski et al., 2004) and in Arabidopsis seedlings in
differing nitrogen nutrition (Scheible et al., 2004) reveals that
theATH1signals in the lowsignal range are attenuated bya factor
of three. Transcription factors are low-expressed genes, and
a better quantitative agreement might be expected for genes
whose transcripts are present at higher levels. A well-correlated
fit line with a slope close to one was found between data
obtained from ATH1 probe arrays (expressed as Log2 ratios) and
Figure 2. Validation of the Assay for Fumarase.
(A) Relation between the dilution of the extract and the apparent activity
determined. Dilutions were made with the extraction buffer before the
assay.
(B) and (C) Recovery of malate standards (0, 0.1, 0.2, and 0.5 nmol) from
Arabidopsis rosette extracts set to a 20,000-fold dilution of FW (w/v). The
slope of the lines gives the fraction of malate recovered. Data are given in
mOD min�1 6 SD (n ¼ 3).
Transcript Levels and Enzyme Activities 3309

Figure 3. Changes of Enzyme Activity and Transcript Levels for Each Member of the Corresponding Gene Family in 5-Week-Old Arabidopsis
Col-0 Wild-Type and pgm Rosettes throughout a Night and Day Cycle (12 h/12 h) and Wild-Type Rosettes after a Transfer to Continuous Darkness.
(A) Nitrate reductase.
(B) ADP-glucose pyrophosphorylase.
(C) Fumarase.
3310 The Plant Cell

real-time PCR (expressed as average cycle time differences) for
a small set of more strongly expressed genes (Redman et al.,
2004).
Global Comparison of Diurnal Changes of Transcript
Levels and Enzyme Activities during a Diurnal Cycle
in the Starchless pgm Mutant
In the light, photosynthesis leads to synthesis of sucrose that is
exported to support respiration and growth in the remainder of
the plant. At night, the entire plant becomes a net consumer of
fixed carbon. Somephotosynthate is stored in leaves as starch in
the light and is remobilized at night to support leaf respiration and
the continued synthesis and export of sucrose. This provides
a buffer against the daily alternation of the carbon budget. The
starchless pgm mutant lacks plastidic phosphoglucomutase,
which is essential for starch synthesis in the leaf (Caspar et al.,
1985). Sugars accumulate during the day but are rapidly de-
pleted in the first part of the night. A recurring phase of sugar
starvation during the second part of the night leads to a severe
growth impairment (Gibon et al., 2004). The transcriptome of
pgm at the end of the day resembles wild-type Arabidopsis,
whereas the transcriptome at the end of the night resembles
wild-type plants after a 6-h extension of the night (Gibon et al.,
2004; Thimm et al., 2004). Diurnal changes of enzyme activities
were investigated in pgm because it was expected that they
would be larger than in wild-type plants. It is already known that
acid invertase (Caspar et al., 1985) and SPS and AGPase
activities (Caspar et al., 1985) are higher in pgm plants.
For pgm, enzyme activities were measured in five replicates.
Transcript profiles were only repeated at the end of the night and
at the end of the day. The reproducibility found for these data
points was very good (data not shown). For transcript levels, the
smoothness factor moved even closer to the ideal value of zero
(Figure 5A) than inwild-type plants. This trendmight be explained
because the larger diurnal changes make the data less suscep-
tible to random noise. By contrast, smoothness increased only
slightly for a subset of the enzyme activities (Figure 5B). There
was a clear increase in the amplitude of the diurnal changes of
transcript levels (the average value rose from 35% in wild-type
plants to almost 60% in pgm; Figure 5C), but the amplitude of the
diurnal changes of enzyme activities was not altered (Figure 5D).
Direct Comparison of the Diurnal Changes of Transcripts
and Enzyme Activities
The previous statistical analysis treated transcripts and enzyme
activities as populations. In a complementary approach, we
compared the response for each individual enzyme. Figure 6
summarizes the amplitudes of the diurnal changes of transcripts
and activities for each enzyme. To generate this plot, the signals
for different transcripts for a particular enzyme were summed.
Data for AspAT,G6PDH,GS, PK, andSPSwere omitted because
the diurnal changes of transcripts for different familymembers for
these enzymes aremarkedly out of phase. Transcript levels show
larger diurnal changes than enzyme activities and that the larger
changes of transcripts in pgm do not lead to a larger diurnal
change of enzyme activity. However, when individual enzymes
are compared, there is no correlation between the amplitude of
the diurnal changes of transcript and enzyme activity. A small
subset of enzymes (includingAGPaseandNAD-GAPDH) showed
larger diurnal changes of activity than of transcript levels.
To analyze the temporal relation between changes of tran-
script levels and enzyme activity, the change of the transcript
level and the change of the time-averaged enzyme activity was
calculated for each 4-h time interval and normalized as the
percentage of the average level (seeMethods). This provides two
local vectors that describe the change of transcript and the
change of enzyme activity during a given 4-h interval. This
calculation was made for each individual transcript that encodes
a particular enzyme (see supplemental data online) and for the
summed signal of all the transcripts for the enzyme (Figure 7).
Figures 7A to 7F show the 23 vector pairs for the changes of the
transcript levels and enzyme activities during each of the six time
intervals. These plots allow three conclusions. First, illumination
and, to a lesser extent, darkening are followed by marked
changes of the levels of many transcripts and activities. This is
accentuated in pgm, indicating that it is related to the provision of
sugar rather than light per se. Second, transcript levels change
more than enzyme activities. Two interesting exceptions are NIA
and AGPase (noted by arrows in Figures 7A and 7B) during the
first 4 h of the light period (see below for more details). Third,
changes of activities do not correlatewith changes of transcripts;
indeed, in many cases, there is a negative correlation.
One explanation for the poor correlation would be that there is
a delay before changes of transcript levels lead to changes of
enzyme activity. This is supported by visual inspection of the
original data (Figure 3; see supplemental data online). To explore
this possibility systematically, the change of transcript in a par-
ticular time interval was plotted against the change of enzyme
activity in the same time interval and in a time interval 4, 8, 12, 16,
or 20 h later and the regression coefficient calculated. For these
analyses, all of the transcripts that encode a particular enzyme
were summed. This procedure was performed six times (using
the normalized change of transcript levels between 0 to 4 h, 4 to
8 h, 8 to 12 h, 12 to 16 h, 16 to 20 h, and 20 to 0 h) to provide six
independent estimates of the regression coefficient between
changes of transcripts and enzyme activity when a given time
delay is introduced into the comparison (see supplemental data
online for the original values). Figures 7G and 7H group the
Figure 3. (continued).
(D) Ferredoxin-dependent glutamate synthase.
(E) Glutamate dehydrogenase.
The diurnal cycle in wild-type Col-0 is shown in the second panel from left, the diurnal cycle in pgm is shown in the first panel from left, and the extended
night in panels 3 and 4 from left. Enzyme activities are expressed as nmol g�1 FWmin�16 SD (n¼ 5). For NIA, maximal (max) and selective (sel) activities
are given. Transcript levels are expressed as robust multichip average–normalized signals 6SD (n ¼ 3; wild type only).
Transcript Levels and Enzyme Activities 3311

averaged regression coefficients for these six comparisons for 22
enzymes (SPS was omitted because data points were missing)
into different classes. When changes of transcript levels are
comparedwith changes of enzyme activities in the same4-h time
interval, most enzymes showed a very poor or even a negative
correlation between the change of transcript and activity (Figures
7A to 7F). When a time delay was introduced, the proportion of
positive correlations increased. The highest proportion of posi-
tive correlations was obtained when a delay of 12 to 16 h was
introduced.
Figure 7I shows the results for selected enzymes. In many
cases, an average regression coefficient >0.8wasobtainedwhen
changes of transcripts were plotted against the changes of
enzyme activities that occurred at a later time point. Different
enzymes respond with a different time delay. For example, a set
of key enzymes in nitrogen metabolism (NIA, GS, Fd-GOGAT,
AlaAT, and GLDH) show a lag of 12 h or longer between rapid
changes in transcript levels and the corresponding changes of
enzyme activity. NADP-isocitrate dehydrogenase responds sim-
ilarly, whereas fumarase, pyrophosphate-dependent phospho-
fructokinase (PFP), and especially fructokinase respond with
a shorter delay, and NADP-GAPDH shows an extremely long
delay. It has been noted that AGPase shows the largest diurnal
changes of all the enzymes studies. The changes are strongly
delayed compared with the change of transcript levels and the
regression coefficients rather poor. In most cases, a similar trend
is found in wild-type plants and in pgm. Invertase showed
a strikingly different response in wild-type plants and pgm. This
might bebecauseonly one specificmember of the invertasegene
family is strongly induced in pgm (see supplemental data online).
Comparison of Time Courses of Transcripts and Activities
for a Set of 23 Enzymes in a Transition to an Extended
Night in Arabidopsis Col-0
The relatively short time between the maximum and minimum of
transcript levels during a diurnal cycle may prevent the enzyme
activity from fully adjusting to the change in transcript level.
Prolongation of the night leads within hours to dramatic changes
of many transcripts for enzymes involved in central metabolism
(Thimm et al., 2004). This system was used to investigate the
impact of prolonged changes of transcript levels on enzyme
activities.
Samples were taken 2, 4, 6, 8, 24, and 48 h into the extended
night to measure transcript levels and 2, 4, 8, 12, 24, 48, 72, and
148 h into the extended night to measure enzyme activities. The
results were expressed relative to the value at the end of the
normal night, converted to a log2 scale to linearize the distribution
and used to calculate the probability mass for each time point
(Figures 8A to 8G). There were detectable changes of some
transcript levels by 2 h (Figure 8A) and marked changes of most
by 4 h (Figure 8B). For most enzymes, there were no large
changes of activity until 48 to 72 h into the extended night
(Figures 8E and 8F). The only exception was NIA, which showed
a rapid decrease of activity. For every enzyme activity, a P value
was calculated to reveal whether the activity at each time in the
prolonged night was significantly different from the activity at the
end of the normal night. Figure 8G summarizes the average and
SE of the P values (n¼ 23 enzyme) at each time point and reveals
that enzyme activities, considered as a whole, did not change
significantly until the plants had been subjected to 2 d of carbon
starvation.
Specific Case Studies of the Relation between Transcript
Levels and Enzyme Activities in Diurnal Cycles and
a Prolonged Night
Our data set can also be analyzed to provide specific information
about the diurnal regulation of individual enzymes. Graphs
displaying the changes of transcripts and the enzyme activities
in Col-0 and pgm during the diurnal cycle and in Col-0 during
a prolonged night are available for inspection in the supplemental
data online. Two examples that show striking changes (NIA and
Figure 4. Evaluation of the Periodic Variation for 84 Transcript Levels
and the Corresponding 23 Enzyme Activities and Distribution of Their
Amplitudes in Arabidopsis Col-0 Wild Type.
(A) Smoothness classes for transcripts (black bars) and activities (gray
bars).
(B) Probability mass function of amplitudes for transcripts (black circles)
and activities (gray circles). The calculation of the smoothness classes
and the probability mass function is presented in Methods.
3312 The Plant Cell

AGPase) will be contrasted with two that show typical responses
(fumarase and Fd-GOGAT).
NIA is subject to sophisticated transcriptional, posttranscrip-
tional, and posttranslational regulation in tobacco (Nicotiana
tabacum) leaves (see Introduction). Our results (Figure 3A) reveal
a similarly complex network in Arabidopsis. Of the two genes that
encode NIA in Arabidopsis, one is highly (At1g37130) and the
other weakly (At1g77760) expressed in rosettes. Wild-type
plants show large diurnal changes of transcripts and smaller
changes of activity (amplitudes¼ 80 and 88% forNIA1 andNIA2
transcripts and 36% for NIA activity), with transcripts peaking at
the end of the night and enzyme activity;6 h later in the middle
of the light period. Comparedwith wild-type plants, pgm showed
a slight reduction in transcript levels and a 1.5-fold to twofold
reduction of activity. The diurnal changes of transcripts were less
marked, but the diurnal changes of activity remained large.
Prolongation of the night led to a rapid and marked decrease of
NIA transcript and activity. NIA protein also decreases rapidly in
response to carbon starvation in tobacco leaves (Klein et al.,
2000). NIA is subject to reversible posttranslational regulation, in
which phosphorylation of Ser-534 leads to binding of a 14-3-3
protein that inhibits activity andmay also increase degradation of
NIA protein (Kaiser and Huber, 1999; Meyer and Stitt, 2001).
Posttranslational regulation was monitored using a selective
assay. In wild-type plants, overall NIA activity and NIA activation
are low during the night, increase rapidly after illumination, and
decrease as the light period progresses. In pgm, overall activity
and activation increased slowly at the start of the light period but
remained high until the end of the day.
AGPase (Figure 3B) is a heterotetramer consisting of two large
(AGPS) and two small (AGPB) subunits.AGPB is encoded by one
gene (At5g48300; Hendriks et al., 2003) and AGPS by a four-
member family, of which one is highly (At5g19220), two are
weakly (At4g39210 and At1g27680), and one is very weakly
(At2g21590) expressed in rosettes. Transcripts forAGPB and the
major AGPS form showed weak diurnal changes, with peaks
during and at the end of the light period, respectively. These
resultswere confirmed using real-timeRT-PCR (data not shown).
AGPase activity was assayed in the presence of excess levels of
the allosteric activator 3-phosphoglycerate and DTT to com-
pletely convert the enzyme into the active reduced form (Tiessen
et al., 2002; Hendriks et al., 2003) and to ensure that the activity
measurements reflected changes in AGPase protein. AGPase
activity fell rapidly during the first part of the day and recovered in
the last part of the light period and during the night. AGPase was
the only enzyme where the changes of activity (51%) were larger
than the changes in transcript levels (12 and 13% for AGPB and
the major AGPS transcript). These were the largest diurnal
Figure 5. Comparison between Arabidopsis Col-0 Wild Type and pgm of the Periodic Variation for 84 Transcript Levels and the Corresponding 23
Enzyme Activities and for the Distribution of Their Amplitudes.
(A) Smoothness classes for transcripts levels.
(B) Smoothness classes for activities calculated after smoothing.
(C) and (D) Probability mass function of the amplitudes of transcripts levels (C) and activities (D).
Transcript Levels and Enzyme Activities 3313

changes of activity in the entire set of enzymes. Total AGPase
activity decreased in the first part of the light period, when AGPB
and AGPS transcripts were stable or rising. A similar picture
emerged during diurnal changes in pgm, where the changes
were even more pronounced (amplitudes of 69% for activity, 45
and 38% for transcripts for AGPB and the major AGPS family
member, respectively). When wild-type plants were exposed to
a prolonged night, transcripts decreased but activity stayed
high.
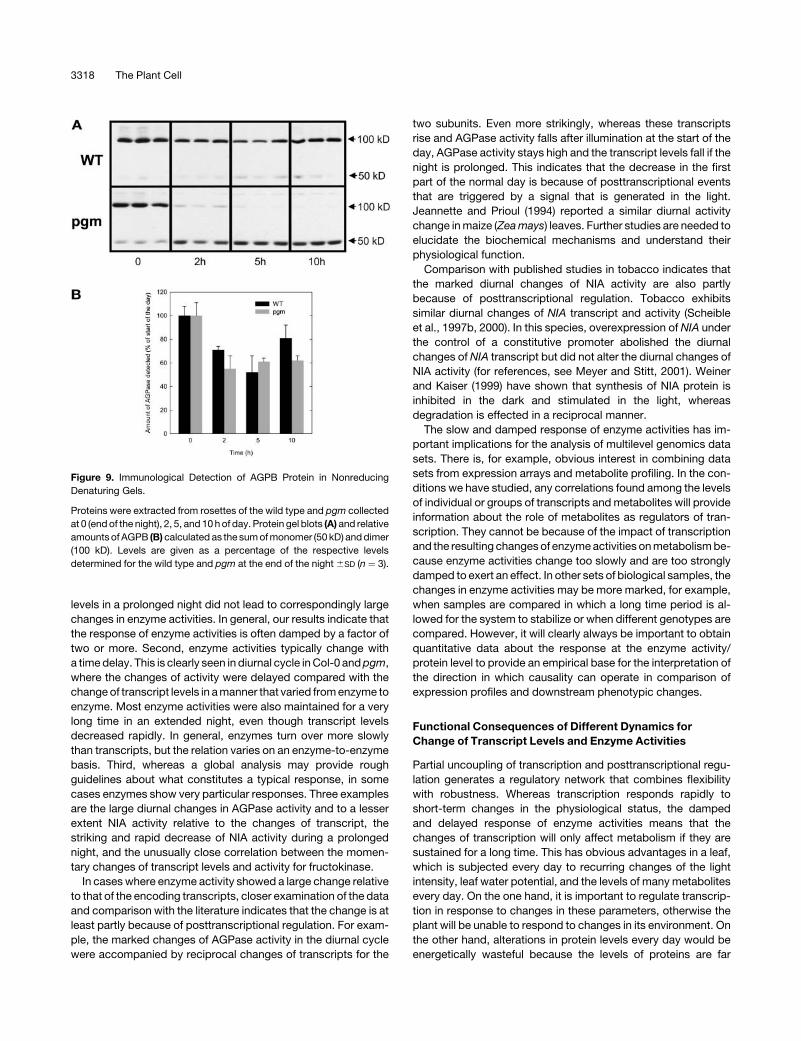
Protein gel blots were performed to check that the changes of
AGPase activity reflect changes of protein. The gels were run in
the absence of DTT so that the reduced (monomer) and oxidized
(dimer) forms (Figure 9A) are visible (Hendriks et al., 2003). An
increase of the ratio between reduced and oxidized forms has
been associated with the activation of AGPase (Tiessen et al.,
2002; Hendriks et al., 2003), and the strong monomerization
found in pgm has been discussed elsewhere (Hendriks et al.,
2003). Total AGPB protein was measured by summing the
signals from both bands. The diurnal changes of AGPB protein
agree well with the changes of total AGPase activity (cf. Figures
3B and 9B). This figure also illustrates that by using suitable
extraction and assay conditions, it is indeed possible to override
posttranslational changes and obtain a measurement of activity
that reflects total protein.
Fumarase (Figure 3C) is encoded by a single gene in Arabi-
dopsis. There was a strong diurnal change of transcript and
much smaller changes of activity in wild-type plants (amplitudes
of 62 and 23%, respectively), with the peak of transcript pre-
ceding the peak of activity by 10 h. Compared with wild-type
plants, pgm had slightly lower levels of transcript and activity,
and the diurnal changes of transcript and activity were larger and
smaller (73 and 11%, respectively) than in wild-type plants.
During a prolonged night, transcript remained similar for at least
48 h to that found during a normal night. Activity decreased
presumably as a delayed aftermath of the decrease of transcript
during the normal night.
Fd-GOGAT (Figure 3D) is encoded by one major transcript
(At5g04140).Wild-type plants hadmarked diurnal changes of the
major transcript (35%), whichwere followedwith an;12-h delay
by damped changes of enzyme activity (18%). The average
transcript and activity levels in pgm were 1.6- and 1.9-fold lower
than in wild-type plants. The diurnal changes were slightly larger
(51% for the transcript and 20% for activity). Prolongation of the
night led to a rapid and marked 50% decrease of transcript,
falling to 50%by 8 h, and 10%by 48 h,whereas activity remained
unaltered for at least 7 d.
Inspection of the results for other enzymes reinforces the
conclusion that changes of transcript levels are accompanied by
muchsmaller changesofenzymeactivitiesduring thediurnal cycle
and to strongly damped and slow responses in a prolonged night
(AlaAT, cytosolic fructose-1,6-bisphosphatase, fructokinase,
hexokinase, NAD- and NADP-GAPDH, isocitrate dehydrogenase,
phosphoenolpyruvate carboxylase, PFP, and transketolase). In
some cases, no relation was apparent (glycerokinase and shiki-
mate dehydrogenase). These activities were, however, very low
and more difficult to assay precisely.
Comparison of Wild-Type Arabidopsis and the
pgm Mutant
Compared with Col-0, pgm has twofold lower NIA and Fd-
GOGAT activity (see above), slightly lower fumarase, GS, iso-
citrate dehydrogenase, phosphoenol pyruvate carboxylase,
PFP, and transketolase activity (see supplemental data online)
and twofold higher acid invertase (Caspar et al., 1985) andGLDH
activity (Figure 3E).
Transcripts for GDH1 (At5g18170) and GDH2 (At5g07440)
underwent extreme diurnal changes in pgm, with a 20-fold
increase toward the end of the night (Figure 7E). This contrasts
with wild-type plants, where there were only small diurnal
changes of transcripts. The average level of the GDH1 and
GDH2 transcripts across the entire diurnal cycle was 6.7- and
3.2-fold higher, respectively, in pgm. Activity in pgm showed only
a slight diurnal oscillation but was 1.8-fold higher than in wild-
type plants. This indicates that recurring transient peak of GLDH
transcript at the end of each night leads to a quasi-stable
increase of GLDH activity throughout the entire diurnal cycle.
GDH transcript levels increased dramatically during the first hour
of a prolonged night before relaxing to levels that were approx-
imately fourfold higher than those found for a normal night in
wild-type rosettes. The sustained increase of GDH1 and GDH2
transcript levels in a prolonged night leads to increased GLDH
activity, but the response was damped by a factor of two to three
and only developed after a considerable time lag. These results
indicate that the increase of the GDH transcripts in the later part
of the night in pgm is a response to low sugar.
A similar response was found for acid invertase (see supple-
mental data online). The major transcript (At1g12240) showed
much larger diurnal changes (10-fold) than in wild-type plants,
falling to lower levels at the end of the day and rising to threefold
Figure 6. Comparison of the Amplitude of the Diurnal Changes of
Transcripts and the Amplitudes of the Diurnal Changes of Enzyme
Activities in Arabidopsis Col-0 Wild Type and pgm.
The results are calculated from the data in Figure 3 and the supplemental
data online using the equation given in the text. Data for AspAT, G6PDH,
PK, and SPS are omitted. The data points corresponding to AGPase and
NIA are identified with arrows.
3314 The Plant Cell

Figure 7. Global Overview of the Time Lag of Changes of Enzyme Activities Compared with Transcript Levels in Arabidopsis Col-0 Wild Type and pgm
Plants.
Transcript Levels and Enzyme Activities 3315

higher levels at the end of the night. The 10-fold diurnal changes
of transcript in pgm were not accompanied by diurnal changes
of activity. However, invertase activity increased 1.7-fold, com-
pared with wild-type plants. Transcript increased threefold at the
start of a prolonged night, before relaxing to a sustained twofold
higher level. This was followed over several days by a slow
twofold increase of activity. In both treatments, changes of
At1g12240 transcript do lead to marked changes of invertase
activity but only after a considerable time lag.
The Use of Enzyme Activities as Diagnostic Markers
In machine learning, a training data set obtained in a set of
defined conditions is used to generate a classification model,
which can be used as a diagnostic tool to automatically classify
further unknown samples. Their relative stability indicated that
enzyme activities might provide a suitable data set for machine
learning. A data set made of two experiments for wild-type
plants, including 60 samples collected at 12 different times
during the normal diurnal cycle and 55 samples collected
at different times during a prolonged night were used to con-
struct a decision tree. The decision tree separated the wild-type
samples into six classes corresponding to samples harvested at
any time during a normal diurnal cycle, samples harvested during
the first 12 h of an extended night, and samples harvested 1, 2, 3,
and 7 d into a prolonged night (Figure 10A). Four (NIA, AGPase,
NAD, and NADP-GAPDH) of the 23 enzymes were excluded
because their activity underwent very large changes in the
normal diurnal cycle, which made the decision tree unstable
(data not shown). It used information with approximately nine
(GLDH, PK, shikimate dehydrogenase, G6PDH, GS, glyceroki-
nase, fructose-1,6-bisphosphatase, fructokinase, and invertase)
of the remaining 19 enzymes.
The decision tree was then used to diagnose 60 pgm samples
collected at 12 different time points during the diurnal cycle. Each
sample is independently examined and classified by the decision
tree. The vast majority (>90%) were classified as similar to wild-
type plants that had been in the dark for 3 d (Figure 10B).
DISCUSSION
Design of a Platform for High-Throughput Determination
of Multiple Enzyme Activities
Whereas high throughput has become state-of-the-art for pro-
filing transcript and metabolite levels, techniques for assaying
enzymes are still slow and cumbersome. We have developed
a platform of enzyme assays that combines high sensitivity with
throughput. Enzymes were assayed using stopped assays to
streamline sample handling and save costs by allowing the use of
small volumes. The assays were fed into a platform of three
cycling assays, supplemented by a small number of dedicated
tests to determine the products. Cycling assays are extremely
sensitive and can be easily adapted to use with microplate
readers, which are standard equipment in many laboratories.
This platform, when combined with high-performance robots,
has the potential to allowmore than eight enzyme activities to be
determined in 100 samples in a single day.
Several of the assays provide large advantages over previous
approaches. Glycerokinase and shikimate dehydrogenase,
which have rarely been assayed in plants, can now be routinely
determined in crude extracts. The development of an assay that
allows glutamate to be measured via GLDH allows hundreds of
measurements of Fd-GOGAT within a day, compared with
previous assays that used HPLC (Suzuki et al., 1994) or ninhydrin
(Hecht et al., 1988) to measure glutamate. The new assay for
AGPase is a large advance for measurements in photosynthetic
tissues, where previously a cumbersome radioactive test was
needed. Although a conventional coupled assay exists in which
AGPase is assayed by coupling glucose-1-P formation via
phosphoglucose isomerase and G6PDH to NADPþ reduction,
this assay is unusable in leaves. The other product is ATP, and to
obtain maximum activity, the assay must include the allosteric
activator glycerate-3-P. Leaf extracts contain high activities of
phosphoglycerate kinase and NADP-GAPDH, which convert
ATP and glycerate-3-P to triose-phosphate and reoxidize
NADPH. In the new assay, ATP reacts with glycerol in the
presence of an excess of glycerokinase, and glycerate-3-P can
be included in the assay without danger of interference. Previous
assays for SPS also had major drawbacks. The widely used
anthrone test (Huber et al., 1989) suffers from a low sensitivity
and requires a desalting step and the use of concentrated
sulphuric acid. In our lab, ;40 extracts could be analyzed per
day with this method. An alternative assay measures UDP via PK
and lactate dehydrogenase functions (Stitt et al., 1988). How-
ever, PK has a relatively poor affinity for UDP (http://www.bren-
da.uni-koeln.de), which makes this assay unsuitable for many
plant tissues because they contain high UDPase activity. The
new assay detects UDP via UMP-kinase, glycerokinase, and
a cycling assay and allows efficient recovery of UDP, especially
when it is combinedwith high (1000-fold) dilution of the extract. It
also allows >10-fold higher throughput than the anthrone assay.
Figure 7. (continued).
(A) to (F) The normalized changes of summed transcripts levels and enzyme activities were estimated for each 4 h. The changes of transcript levels were
plotted against the change of enzyme levels in the same time interval (wild type, black circles; pgm, gray circles) and in an interval 4, 8, 12, 16, and 20 h
later and the correlation coefficients calculated for each enzyme. This was repeated for each of the six time intervals.
(G) and (H) The regression coefficients for a given time delay were combined across all six time intervals and 23 enzymes and are depicted divided into
seven classes (R2$ 0.75; 0.50# R2 < 0.75; 0.25# R2 < 0.50;�0.25 < R2 < 0.25;�0.50 < R2#�0.25;�0.75 < R2#�0.50; R2#�0.75) for the wild type
(G) and pgm (H).
(I) Time lag of the response of individual enzyme activities in wild-type (black circles) and pgm (gray circles) plants. Regression coefficients were estimated
([G]and [H]) andareplottedhere for10selectedenzymes.Eachpoint represents the regressioncoefficients, calculatedover six timepoints fromaplot of the
changeof transcript against the changeof enzymeactivity after a given delay (x axis) for each of the six 4-h time intervals. Abbreviations are given in Figure 1.
3316 The Plant Cell

Relation between Changes of Transcripts and Changes
of Enzyme Activities
We have used measurements of enzyme activities in optimized
conditions as a proxy for quantitative determination of proteins.
The assumption that the activity in the assay reflects the amount
of enzyme protein was checked by optimizing the assays with
respect to all available information about the kinetic properties of
the enzymes. It remains possible that some enzymes have
unknown effectors or are subject to posttranslational regulation
that affects their Vmax rather than kinetic properties and is not
overridden by including high levels of substrates and effectors
and optimizing the pH and ionic conditions. However, this would
affect only the results for individual enzymes and not the general
conclusions. A second limitation is that the enzyme assays do
not distinguish among isoforms. For this reason, we have been
cautious in using data for five enzymes, where the gene family
members showed contrasting changes of their transcript levels.
The results from our study show that quantification of enzyme
activities or proteins will be crucial in system biology. First,
changes in transcript levels do not lead to quantitatively similar
changes of enzyme activity. The diurnal changes of transcript
levels were usually larger than the changes of the corresponding
enzymeactivities, the increased amplitudeof thediurnal changes
of transcripts in pgm did not lead to increased diurnal changes of
enzymes, and the large and sustained changes of transcript
Figure 8. Comparison of the Changes in Transcript Levels with the Changes in Enzyme Activities after 2, 4, 8, 24, 48, 72, and 148 h after a Transfer to
a Prolonged Night.
For each analyte, the ratios between values at t and t0 (start of the experiment) were first calculated, then converted to their basis 2 logarithm to
approach the normal distribution, and the probability mass was calculated for transcripts and activities after 2 (A), 4 (B), 8 (C), 24 (D), 48 (E), 72 (F), and
148 h (G). Open circles, changes in transcript levels; closed circles, changes in enzyme activities. Transcript levels were not determined at 72 and 148 h
of extended night. Significance of the changes in enzyme activities was also estimated by calculating the average P values at each point (H), obtained
by calculating P values for every activity, using the t test (t0, t, two tails, and heteroscedastic). Bars ¼ means 6 SE (n ¼ 23).
Transcript Levels and Enzyme Activities 3317
levels in a prolonged night did not lead to correspondingly large
changes in enzyme activities. In general, our results indicate that
the response of enzyme activities is often damped by a factor of
two or more. Second, enzyme activities typically change with
a timedelay. This is clearly seen in diurnal cycle inCol-0 andpgm,
where the changes of activity were delayed compared with the
change of transcript levels in amanner that varied fromenzyme to
enzyme. Most enzyme activities were also maintained for a very
long time in an extended night, even though transcript levels
decreased rapidly. In general, enzymes turn over more slowly
than transcripts, but the relation varies on an enzyme-to-enzyme
basis. Third, whereas a global analysis may provide rough
guidelines about what constitutes a typical response, in some
cases enzymes show very particular responses. Three examples
are the large diurnal changes in AGPase activity and to a lesser
extent NIA activity relative to the changes of transcript, the
striking and rapid decrease of NIA activity during a prolonged
night, and the unusually close correlation between the momen-
tary changes of transcript levels and activity for fructokinase.
In caseswhere enzyme activity showed a large change relative
to that of the encoding transcripts, closer examination of the data
and comparison with the literature indicates that the change is at
least partly because of posttranscriptional regulation. For exam-
ple, the marked changes of AGPase activity in the diurnal cycle
were accompanied by reciprocal changes of transcripts for the
two subunits. Even more strikingly, whereas these transcripts
rise and AGPase activity falls after illumination at the start of the
day, AGPase activity stays high and the transcript levels fall if the
night is prolonged. This indicates that the decrease in the first
part of the normal day is because of posttranscriptional events
that are triggered by a signal that is generated in the light.
Jeannette and Prioul (1994) reported a similar diurnal activity
change inmaize (Zeamays) leaves. Further studies are needed to
elucidate the biochemical mechanisms and understand their
physiological function.
Comparison with published studies in tobacco indicates that
the marked diurnal changes of NIA activity are also partly
because of posttranscriptional regulation. Tobacco exhibits
similar diurnal changes of NIA transcript and activity (Scheible
et al., 1997b, 2000). In this species, overexpression of NIA under
the control of a constitutive promoter abolished the diurnal
changes ofNIA transcript but did not alter the diurnal changes of
NIA activity (for references, see Meyer and Stitt, 2001). Weiner
and Kaiser (1999) have shown that synthesis of NIA protein is
inhibited in the dark and stimulated in the light, whereas
degradation is effected in a reciprocal manner.
The slow and damped response of enzyme activities has im-
portant implications for the analysis of multilevel genomics data
sets. There is, for example, obvious interest in combining data
sets from expression arrays and metabolite profiling. In the con-
ditions we have studied, any correlations found among the levels
of individual or groups of transcripts andmetabolites will provide
information about the role of metabolites as regulators of tran-
scription. They cannot be because of the impact of transcription
and the resulting changesof enzymeactivities onmetabolismbe-
cause enzyme activities change too slowly and are too strongly
damped to exert an effect. In other sets of biological samples, the
changes in enzyme activities may be more marked, for example,
when samples are compared in which a long time period is al-
lowed for the system to stabilize or when different genotypes are
compared. However, it will clearly always be important to obtain
quantitative data about the response at the enzyme activity/
protein level to provide an empirical base for the interpretation of
the direction in which causality can operate in comparison of
expression profiles and downstream phenotypic changes.
Functional Consequences of Different Dynamics for
Change of Transcript Levels and Enzyme Activities
Partial uncoupling of transcription and posttranscriptional regu-
lation generates a regulatory network that combines flexibility
with robustness. Whereas transcription responds rapidly to
short-term changes in the physiological status, the damped
and delayed response of enzyme activities means that the
changes of transcription will only affect metabolism if they are
sustained for a long time. This has obvious advantages in a leaf,
which is subjected every day to recurring changes of the light
intensity, leaf water potential, and the levels of many metabolites
every day. On the one hand, it is important to regulate transcrip-
tion in response to changes in these parameters, otherwise the
plant will be unable to respond to changes in its environment. On
the other hand, alterations in protein levels every day would be
energetically wasteful because the levels of proteins are far
Figure 9. Immunological Detection of AGPB Protein in Nonreducing
Denaturing Gels.
Proteins were extracted from rosettes of the wild type and pgm collected
at 0 (endof the night), 2, 5, and 10hof day. Protein gel blots (A) and relative
amountsof AGPB (B)calculated as the sumofmonomer (50 kD) anddimer
(100 kD). Levels are given as a percentage of the respective levels
determined for the wild type and pgm at the end of the night6SD (n ¼ 3).
3318 The Plant Cell

higher than of individual transcript. Even more crucially, changes
of enzyme levels would impair metabolism and growth on the
next day, until they are reversed (Gibon et al., 2004). The results in
this article show that for most enzymes, changes in transcript
levels have only a small impact on enzyme activities within
a single day but lead to marked changes if the diurnal pattern is
modified for several days. For example, the period of carbon
starvation at the end of every night in pgm (Gibon et al., 2004;
Thimm et al., 2004) leads to recurring changes in the levels of
transcripts that generate stable changes in the levels of several
enzymes, including increased activities of GLDH and invertase
and decreased activities of NIA and GOGAT. In a more extreme
treatment, whereas transcript levels respond to a prolonged
night within 4 to 8 h, enzyme activities, with one exception, do not
change markedly for 48 h.
Use of Enzyme as Diagnostic Markers
The relative stability of enzyme activities and the likelihood that
they reflect long-term acclimation rather than a rapid response
Figure 10. Enzyme Activities as Diagnostic Markers.
(A) Six classes of wild-type samples corresponding to controls harvested throughout a normal night and day cycle or plants exposed to a prolonged
night for <1, 1, 2, 3, or 7 d were used to build a decision tree that placed the sample in the correct class with a learning accuracy of 75%, which was
obtained via a 15-fold cross-validation. All enzyme activities measured were used except AGPase, NAD-GAPDH, NADP-GAPDH, and NIA.
(B) The decision tree was then used to classify 60 samples of pgm plants harvested at six time points throughout a night and day cycle. The y axis shows
the frequency and the weighted frequency with which a sample was assigned to a particular class.
Transcript Levels and Enzyme Activities 3319
to a transient situation makes them ideal diagnostic markers. To
illustrate this, we have used a machine-learning approach to
diagnose the physiological status of the starchless pgmmutant.
After several hours of acute sugar depletion during the second
part of the night (Gibon et al., 2004), the transcript profile in pgm
at the end of the night resembles a wild-type plant that has
experienced a 4 to 6 h extension of the night (Thimm et al., 2004).
The decision tree that we constructed revealed that the enzyme
activity profile in pgm resembles that in a wild-type plant that has
experienced 3 d of continuous darkness. This result is obtained
irrespective of the time of day when pgm is harvested. This
illustrates that the rapid changes of transcripts generated by the
daily recurrence of a period of sugar starvation are integrated to
generate a quasi-stable enzyme profile that resembles a wild-
type plant that has been exposed to several days of carbon
starvation. We are presently collecting a portfolio of potential
diagnostic enzyme activities from plants based on data obtained
across a range of growth conditions. The data will be used as
training sets for machine-learning systems. We expect this
approach to become useful for the characterization of ecotypes,
mutants, and other genetically altered plants and for the evalu-
ation of plant performance in different conditions.
METHODS
Plant Material
Arabidopsis thaliana var Col-0, the wild type, and a plastidic pgm (Caspar
et al., 1985) were grown in an 8-h day phytotron. At least 3 weeks before
their use, the plants were transferred into a small growth cabinet with a
12-h d of 160 mE and 208C throughout the day/night cycle. Harvests of 15
plant rosettes at a time point were performed sequentially every 2 hwithin
a day/night cycle or 0, 2, 4, 8, 24, 48, 72, and 148 h in total darkness. Each
sample typically contained three rosettes, equivalent to ;500 mg FW.
The entire sample was powdered under liquid nitrogen and stored
at �808C until its use.
Reagents
Chemicals were purchased from Sigma (Taufkirchen, Germany), except
NADþ, NADH, NADPþ, NADPH, and phosphoenolpyruvate (Roche,
Mannheim, Germany) and glucose, fructose, sucrose (Merck, Darmstadt,
Germany). Xylulose-5-phosphate was purchased from W.D. Fessner
(University of Darmstadt, Germany). Dihydroxyphenoxazine (Amplex red)
was purchased fromMolecular Probes Europe (Leiden, TheNetherlands).
Enzymes for analysis were purchased from Roche except phosphogly-
cerokinase and glycerokinase (Sigma-Aldrich). UMP-kinase was overex-
pressed and purified as in Serina et al. (1995). The clone encoding
UMP-kinase is a generous gift from Octavian Barzu (Institut Pasteur,
Paris, France).
Preparation of RNA, cDNA, and Labeled cRNA, Array
Hybridization, and Data Evaluation
Extraction of RNA, cDNA synthesis and labeling, and hybridization on
Affymetrix ATH1 arrays were performed as in Thimmet al. (2004) and data
evaluation as in Gibon et al. (2004).
Extraction of Enzymes
For routinemeasurements, samples corresponding to;500mg FWwere
collected, ground to a powder in liquid nitrogen, and stored at �808C.
Aliquots of 10 to 20 mg FW were subaliquoted at �1808C and extracted
by vigorous vortexing with extraction buffer. The composition of the
extraction buffer was 10% (v/v) glycerol, 0.25% (w/v) BSA, 0.1% (v/v)
Triton X-100, 50 mM Hepes/KOH, pH 7.5, 10 mM MgCl2, 1 mM EDTA,
1 mM EGTA, 1 mM benzamidine, 1 mM e-aminocapronic acid, 1 mM
phenylmethylsulfonyl fluoride, 10 mM leupeptin, and 1 mM DTT. Phenyl-
methylsulfonyl fluoride was added just before extraction. DTT was
omitted when using peroxidase-based orMTT-based indicator reactions.
In all cases, 500 to 1000 mL of extraction buffer was used, leading to an
initial;50-fold (w/v) dilution. Subaliquotswere diluted further to generate
appropriate dilutions for the different enzymes.
Pipetting Scheme for Stopped Assays
Ninety-six–well microplates were prepared using aMultiprobe II pipetting
robot equipped with a cooling block, an incubation block, a shaker, and
a gripper (Perkin-Elmer, Zaventem, Belgium). When necessary, the
extracts were further diluted in the extraction buffer using an automated
program on the robot. Then, aliquots of 5 mL of extracts as well as
standards were dispensed into a 96-well microplate held at 48C, then 40
mL of reaction mix were added. The microplate was transferred to 258C,
gently shaken, and preincubated for 5min. Then, 5mL of a starter solution
were added, and themicroplatewas shaken again. After a defined time (0,
10, or 20 min, depending on the assay), 20 mL of a stop solution (NaOH,
HCl, or N-ethylmaleimide, depending on the assay) were added, and the
plates were incubated at room temperature for a further 10 min. Then, 20
mL of a neutralizing solution and 50 mL of the appropriate determination
mix to determine the product accumulated were added, and the reaction
was immediately monitored by measuring change in absorbance or
fluorescence in a SynergyHT (Bio-Tek, Denkendorf, Germany)microplate
reader. The rates of reactions were calculated as the decrease of the
absorbance in mODmin�1 using KC4 software (Bio-Tek). One microplate
allowed the activity of one enzyme to be measured in 20 samples. Vblank
and Vmax assays were performed for every sample in duplicate, and each
plate included four standards. Samples were randomly distributed to
avoid local artifacts.
Spreadsheets were used to track samples and allow automatic data
processing. A file containing raw data from the microplate reader was
pasted into a template Excel sheet, which automatically calculated the
activity for each well on the microplate. Standard curves and technical
error (expressed as SD for every technical duplicate) were also displayed.
The time required for calculations including the quality control is <5 min
per microplate. The technical error was usually <5%. Results were
uploaded into standardized spreadsheets that contain information about
all the samples for a given experiment, including the FW taken for
extraction, to calculate activities on a FW basis.
Determinations Based on the Glycerol-3-Phosphate
Cycling Assay
Step 1. Enzymatic Reaction
ADP-glucose pyrophosphorylasewas assayed in the reverse direction by
measuring the PPi-dependent production of ATP from ADP-glucose. The
concentrations used for the substrates and for the activator 3-phospho-
glycerate were chosen according to Merlo et al. (1993). Extracts, as well
as ATP standards prepared in the extraction buffer and ranging from 0 to
1 nmol, were incubated in a medium containing 50 mM Hepes/KOH, pH
7.5, 5 mMMgCl2, 1 unit�mL�1 glycerokinase, 0 (blank) or 1 mM (maximal
activity) ADP-glucose, 5 mM 3-phosphoglycerate, 1.5 mM sodium
fluoride, and 120 mM glycerol. The reaction was started by the addition
of PPi to a final concentration of 2 mM. The reaction was stopped with
20 mL of 0.5 M HCl.
3320 The Plant Cell

Glycerokinase was assayed in conditions adapted from Sadava and
Moore (1987). Extracts, as well as glycerol-3-P standards prepared in the
extractionbuffer and ranging from0 to80mM,were incubated inamedium
containing 100 mM Tricine/KOH, pH 8.0, 8 mMMgCl2, and 120 mM glyc-
erol. The reaction was started by the addition of ATP to a final concen-
tration of 0 or 0.8 mM. The reaction was stopped with 20 mL of 0.5 M HCl.
NAD-dependent GAP DH was assayed in conditions adapted from
Plaxton (1990). Extracts, as well as dihydroxyacetone-P standards pre-
pared in the extraction buffer and ranging from 0 to 500 mM, were
incubated in a medium containing 100 mM Tricine/KOH, pH 8.0, 30 mM
MgCl2, 20 mM KCl, 2 mM EDTA, 5 mM DTT, 0.4 mM NADH, 0 (blank) or
6 mM of 3-phosphoglycerate (maximal activity), 10 units�mL�1 phospho-
glycerate kinase, 1 unit�mL�1 triose-P isomerase, and 1 unit�mL�1
glycerol-3-P dehydrogenase. The reaction was started by the addition
of ATP to a final concentration of 2 mM. The reaction was stopped with
20 mL of 0.5 M HCl. Because the NADP-dependent GAP DH also reacts
with NAD(H), its activity was retrieved.
NADP-dependent GAP DH was assayed in conditions adapted from
Stitt et al. (1989). Extracts, as well as dihydroxyacetone-P standards
prepared in the extraction buffer and ranging from 0 to 500 mM, were
incubated in a medium containing 100 mM Tricine/KOH, pH 8.0, 30 mM
MgCl2, 20 mMKCl, 2 mM EDTA, 5 mMDTT, 5 mMATP, 0 (blank) or 6 mM
of 3-phosphoglycerate (maximal activity), 10 units�mL�1 phosphoglycer-
ate kinase, and 1 unit�mL�1 triose-P isomerase. The reaction was started
by the addition of NADPH to a final concentration of 0.5 mM. The reaction
was stopped with 20 mL of 0.5 M HCl.
PFP was assayed in conditions adapted from Scott et al. (1995).
Extracts, as well as fructose-1,6-bisP standards prepared in the extrac-
tion buffer and ranging from 0 to 80 mM, were incubated in a medium
containing 50 mM Hepes/KOH, pH 7.5, 2 mM MgCl2, 0.25 mM NADH,
5 mM ATP, 7.5 mM fructose-6P, 10 mM fructose-2,6-bisphosphate,
1 unit�mL�1 aldolase, 1 unit�mL�1 triose-P isomerase, and 1 unit�mL�1
glycerol-3P dehydrogenase. The reaction was started by the addition of
PPi to a final concentration of 0 (blank) or 0.25 mM (maximal activity). The
reaction was stopped with 20 mL of 0.5 M HCl.
PKwas assayed in the reverse direction bymeasuring the phosphoenol
pyruvate-dependent production of ATP from ADP. The concentrations
used for phosphoenol pyruvate, ADP, and KCl were chosen according to
Bergmeyer (1987). Extracts, as well as ATP standards prepared in the
extraction buffer and ranging from 0 to 1 nmol, were incubated in
a medium containing 100 mM Tricine/KOH, pH 8.0, 10 mM MgCl2,
1 mM EDTA, 1 unit�mL�1 glycerokinase, 200 mM KCl, 1 mM ADP, 1 mM
AMP, 120 mM glycerol, and 0 (blank) or 5 mM (maximal activity)
phosphoenol pyruvate. The reaction was stopped with 20 mL of 0.5 M
HCl. AMP was used to inhibit myokinase activity. Preliminary tests
established that AMP exerted no effect on the activity of PK.
SPS was assayed in the forward direction by measuring the fructose-
6P-dependent production of UDP from UDP-glucose. The concentra-
tions used for fructose-6P, glucose-6P, and phosphate were chosen
according to Huber et al. (1989). Extracts, as well as UDP standards
prepared in the extraction buffer and ranging from 0 to 1 nmol, were
incubated in a medium containing 50 mM Hepes/KOH, pH 7.5, 10 mM
MgCl2, 1 mMEDTA, 1 unit�mL�1 UMP-kinase, 1 unit�mL�1 glycerokinase,
10mMUDP-glucose, 50mMADP, 1mMAMP, 120mMglycerol, 0 (blank)
or 12mM (maximal activity) fructose-6P, and 0 (blank) or 36mM (maximal
activity) glucose-6P. The reaction was stopped with 20 mL of 0.5 M HCl.
Preliminary tests established that AMP exerted no effect on the activity
of SPS.
Transketolase was assayed according to conditions adapted from
Henkes et al. (2001). Extracts, as well as dihydroxyacetone-P standards
prepared in the extraction buffer and ranging from 0 to 80 mM, were
incubated in a medium containing 50 mM Hepes/KOH, pH 7.7, 10 mM
MgCl2, 0.8 mM NADH, 1.25 mM thiamine pyrophosphate, 1 unit�mL�1
triose-P isomerase, and 1 unit�mL�1 glycerol-3P dehydrogenase. The
reaction was started by the addition of erythrose-4P and xylulose-5P to
final concentrations of 0 or 2.5 mM and 0 or 10 mM, respectively. The
reaction was stopped with 20 mL of 0.5 M HCl.
Step 2
Glycerol-3-P was measured as described in Gibon et al. (2002), in the
presence of 1.8 units�mL�1 glycerol-3-P oxidase, 0.7 unit�mL�1 glycerol-
3-P dehydrogenase, 1 mM NADH, 1.5 mM MgCl2, and 100 mM Tricine/
KOH, pH 8.0. When determining glyceraldehyde-3-phosphate dehydro-
genases, 1 unit�mL�1 triose-phosphate isomerase was added. The
absorbancewas red at 340 nm and at 308C until the rates were stabilized.
The rates of reactions were calculated as the increase of the absorbance
in mOD min�1.
Determinations Based on the NADP1 Cycling Assay
Step 1. Enzymatic Reaction
Cytosolic fructose-1,6-bisphosphatase was assayed in conditions
adapted from Stitt (1989). Extracts, as well as fructose-6P standards pre-
pared in the extraction buffer and ranging from 0 to 20 mM, were incu-
bated in a medium containing 50 mM Hepes/KOH, pH 7.0, 2 mM MgCl2,
0.4 mM NADPþ, 1 unit�mL�1 phosphoglucose isomerase, and 1 unit�mL�1 glucose-6P dehydrogenase. The reaction was started by the addi-
tion of fructose-1,6-bisphosphate to a final concentration of 0 (blank) or
20 mM (maximal activity). The reaction was stopped with 20 mL of 0.5 M
NaOH.
Glucokinase activity was assayed in conditions adapted from Renz
et al. (1993). Extracts, as well as glucose-6P standards prepared in the
extraction buffer and ranging from 0 to 80 mM, were incubated in
a medium containing 100 mM Tricine/KOH, pH 8.0, 5 mM MgCl2, 2 mM
glucose, 0.4 mM NADPþ, and 1 unit�mL�1 glucose-6P dehydrogenase.
The reaction was started by the addition of ATP to a final concentration of
0 (blank) or 0.8 mM (maximal activity). The reaction was stopped with
20 mL of 0.5 M NaOH.
Fructokinase activity was assayed in conditions adapted from Renz
et al. (1993). Extracts, as well as glucose-6P standards prepared in the
extraction buffer and ranging from 0 to 80 mM, were incubated in
a medium containing 100 mM Tricine/KOH, pH 8.0, 5 mM MgCl2, 2 mM
fructose, 0.4 mM NADPþ, 1 unit�mL�1 phosphoglucose isomerase, and
1 unit�mL�1 glucose-6P dehydrogenase. The reaction was started by the
addition of ATP to a final concentration of 0 (blank) or 0.8 mM (maximal
activity). The reaction was stopped with 20 mL of 0.5 M NaOH.
G6PDH was assayed in conditions adapted from Graeve et al. (1994).
Extracts, as well as NADPH standards prepared freshly in the extraction
buffer and ranging from 0 to 80 mM, were incubated in a medium
containing 100 mM Tricine/KOH, pH 9.0, 10 mM MgCl2, and 0.5 mM
NADPþ. The reaction was started by the addition of glucose-6P to a final
concentration of 0 (blank) or 5 mM (maximal activity). The reaction was
stopped with 20 mL of 0.5 M NaOH.
NADP-dependent isocitrate dehydrogenase activity was assayed in
conditions adapted from Sadka et al. (2000). Extracts, as well as NADPH
standards freshly prepared in the extraction buffer and ranging from 0 to
80 mM, were incubated in a medium containing 100 mM Tricine/KOH, pH
8.0, 4 mM MgCl2, and 1 mM NADPþ. The reaction was started by the
addition of isocitrate to a final concentration of 0 (blank) or 2mM (maximal
activity). The reaction was stopped with 20 mL of 0.5 M NaOH.
Shikimate dehydrogenase activity was assayed in conditions adapted
from Lourenco and Neves (1984). Extracts, as well as NADPH standards
freshly prepared in the extraction buffer and ranging from 0 to 1 nmol,
were incubated in a medium containing 100 mM Tricine/KOH, pH 8.0,
Transcript Levels and Enzyme Activities 3321

4 mMMgCl2, and 1 mMNADPþ. The reaction was started by the addition
of shikimate to a final concentration of 0 (blank) or 2 mM (maximal
activity). The reaction was stopped with 20 mL of 0.5 M NaOH.
Step 2. Destruction of NADP1
The plates were mixed and centrifuged (2 min at 2000 rpm). They were
then sealed using an adhesive aluminum foil and heated at 958C for 5min.
After cooling down, 10 mL of HCl M and 0.2 M Tricine/KOH, pH 9.0, were
added to adjust the pH to 9.
Step 3. Determination of NADPH
NADPH was measured as described by Gibon et al. (2002) in the
presence of 3 units�mL�1 G6PDH grade I, 100 mM Tricine/KOH, pH 9.0,
5mMMgCl2, 4mMEDTA, 0.1mMPMS, 0.6mMMTT, and 3mMglucose-
6-phosphate. The absorbance was red at 570 nm and at 308C until the
rates were stabilized. The rates of reactions were calculated as the
increase of the absorbance in mOD min�1.
Determinations Based on the NAD1 Cycling Assay
Step 1. Enzymatic Reaction
AlaAT activity was assayed in conditions adapted fromBergmeyer (1987).
Extracts, as well as pyruvate standards freshly prepared in the extraction
buffer and ranging from 0 to 1 nmol, were incubated in a medium
containing 100 mM Tricine/KOH, pH 8.0, 2.5 mM Ala, 0.1 mMNADH, and
0.25 unit�mL�1 lactate dehydrogenase. Contaminating NADþ was re-
moved from the NADH stock solution (20 mM in 100 mM NaOH) before
the assay by heating for 10 min at 958C. The reaction was started by the
addition of 2-oxoglutarate to a final concentration of 0 (blank) or 2 mM
(maximal activity). The reaction was stopped with 20 mL of 0.5 M HCl.
AspAT activity was assayed in conditions adapted from Bergmeyer
(1987). Extracts, aswell as oxaloacetate standards freshly prepared in the
extraction buffer and ranging from 0 to 1 nmol, were incubated in
a medium containing 100 mM Tricine/KOH, pH 8.0, 2.5 mM Asp,
0.1 mM NADH, and 0.25 unit�mL�1 malate dehydrogenase. Contaminat-
ing NADþ was removed from the NADH stock solution (20 mM in 100 mM
NaOH) before the assay by heating for 10 min at 958C. The reaction was
started by the addition of 2-oxoglutarate to a final concentration of
0 (blank) or 2mM (maximal activity). The reaction was stopped with 20 mL
of 0.5 M HCl.
Fumarase was assayed in the malate-forming direction. Extracts, as
well as malate standards prepared in the extraction buffer and ranging
from 0 to 1 nmol, were incubated in amedium containing 100mMTricine/
KOH, pH 8.0, 0.2 mM acetyl-CoA, 5 mM phosphate, 5 mM MgCl2,
0.15mMNADþ, 0.05 (v/v) Triton X-100, 10 units�mL�1 malate dehydroge-
nase, and 1 unit�mL�1 citrate synthase. The reaction was started by the
addition of fumarate to a final concentration of 0 (blank) or 10 mM
(maximal activity). The reaction was stopped with 20 mL of 0.5 M NaOH.
GLDH activity was assayed in the aminating direction in conditions
adapted from Turano et al. (1996). Extracts, as well as NADþ standards
freshly prepared in the extraction buffer and ranging from 0 to 1 nmol,
were incubated in a medium containing 100 mM Tricine/KOH, pH 8.0,
1 mM CaCl2, 640 mM ammonium acetate, and 0.1 mM NADH. Contami-
nating NADþ was removed from the NADH stock solution (20 mM in
100 mMNaOH) before the assay by heating for 10 min at 958C. The reac-
tion was started by the addition of 2-oxoglutarate to a final concentration
of 0 (blank) or 15 mM (maximal activity). The reaction was stopped with
20 mL of 0.5 M HCl.
Phosphoenolpyruvate carboxylase activity was assayed in conditions
adapted from Uedan and Sugiyama (1976). Extracts, as well as NADþ
standards freshly prepared in the extraction buffer and ranging from 0 to
1 nmol, were incubated in a medium containing 100 mM Tricine/KOH, pH
8.0, 20 mMMgCl2, 1 unit�mL�1 malate dehydrogenase, 10 mM NaHCO3,
and 0.1 mM NADH. Contaminating NADþ was removed from the NADH
stock solution (20 mM in 100 mM NaOH) before the assay by heating for
10 min at 958C. The reaction was started by the addition of phosphoenol
pyruvate to a final concentration of 0 (blank) or 2 mM (maximal activity).
The reaction was stopped with 20 mL of 0.5 M HCl.
Step 2. Destruction of NAD1 or NADH
The plates were mixed and centrifuged (2 min at 2000 rpm). They were
thensealedusinganadhesive aluminum foil andheatedat 958C for 10min.
After cooling down, 10 mL of HCl M or NaOH M, and 10 mL of 0.2 M
Tricine/KOH, pH 9.0, were added to adjust the pH to 9.0.
Step 3. Determination of NADH or NAD1
NAD(H) was measured in the presence of 6 units�mL�1 ADH, 100 mM
Tricine/KOH, pH 9.0, 4 mM EDTA, 0.1 mM PES, 0.6 mM MTT, and 500
mM ethanol. The absorbance was red at 570 nm and at 308C until the
rates were stabilized. The rates of reactions were calculated as the
increase of the absorbance in mOD min�1.
Determination of Acid Invertase
Acid invertase was assayed in conditions adapted from Huber (1984).
Sorbitol (250mM)was added to the extraction buffer according toGreiner
et al. (1999) to improve the recovery of invertase. Extracts, as well as
glucose standards prepared in the extraction buffer and ranging from 0 to
1 nmol, were incubated in 50 mM acetate/KOH, pH 4.5. The reaction was
started by the addition of sucrose to a final concentration of 20 mM. The
reaction was stopped with 20mL of 0.5MNaOH after 10 and 20min. After
another 10-min incubation, the wells were neutralized with 20 mL of 0.5 M
HCl and 0.1 M Hepes/KOH, pH 7.0, buffer. The determination was
performed using fluorimetry (excitation 530 nm, emission 590 nm) after
addition of 50 mM Hepes/KOH, pH 7.0, 1 unit�mL�1 glucose oxidase,
0.0015 unit�mL�1 horseradish peroxidase, and 0.2 mM dihydroxyphe-
noxazine final concentrations.
Determination of Fd-GOGAT
GOGAT activity was assayed in conditions adapted from Hecht et al.
(1988). Extracts, as well as glutamate standards prepared in the extrac-
tion buffer and ranging from 0 to 10 nmol, were incubated in a medium
containing 50 mM Hepes/KOH, pH 7.5, 10 mM Gln, 5 mM methyl
viologen, 3mM2-oxoglutarate, and 1mMaminooxyacetate. The reaction
was started by the addition of sodium dithionite and NaHCO3 to re-
spective final concentrations of 2 mg/mL. The reaction was stopped with
20mL of 100mMN-methylmaleimide. After heating for 10min at 958C, the
plates were cooled and centrifuged (2 min at 2000 rpm). Then 100 mL of
the determination mix were added. Final concentrations of additional
reagents were 100mMTricine/KOH, pH 8.5, 0.6mMMTT, 1.8mMNADþ,
0.3% (v/v) Triton X-100, and 0.15 unit�mL�1 diaphorase. The absorbance
was red at 570 nm until OD stabilized, and 1 mL of 1000 units�mL�1 GLDH
was then added. Absorbance was red until the endpoint was reached (in
the conditions described above, it took 30 to 40 min).
Determination of NIA
NIA was determined in conditions adapted from Scheible et al. (1997b)
(1997c). Extracts, as well as nitrite standards prepared in the extraction
buffer and ranging from 0 to 10 nmol, were incubated in a medium
3322 The Plant Cell

containing 50 mM Hepes/KOH, pH 7.5, 0.04% (v/v) Triton X-100, 2 mM
EDTA, 10 mMNa2MoO4, 20 mM flavin adenine dinucleotide, 0.5 mMDTT,
20 mM leupeptin, 20 mM potassium nitrate, and 0 (maximal activity) or
10mM(selectiveactivity)MgCl2. The reactionwasstartedby theadditionof
NADH to a final concentration of 0.6 mM. The reaction was stopped with
20 mL of 0.6 M zinc acetate. Then, 15 mL of 0.25 mM PMS were added,
and the plates were incubated for 10 min at room temperature. Finally,
100 mL of 0.5% (w/v) sulfanilamide and 0.01% (w/v) N(1-naphtyl)ethy-
lendiamine dihydrochloride in 2.5% (v/v) H3PO4 were added. After 5 min,
the OD was red at 540 nm.
Determination of GS
GS was determined as in Scheible et al. (1997a), except that the volume
was scaled down to 100 mL and the maximal activity and blank (where
glutamate was omitted) rates were run simultaneously in separate wells.
Extracts were incubated in a medium containing 50 mM Hepes/KOH, pH
7.5, 10% (v/v) glycerol, 10mMMgCl2, 2mMEDTA, 0.2mMNaVO3, 40mM
59,59-diadenosinpentaphosphate, 2 mM ammonium chloride, 5 mM ATP,
1 mM phosphoenol pyruvate, 0.6 mM NADH, 1 unit�mL�1 PK, 0.7
unit�mL�1 lactate dehydrogenase, and 0 (blank) or 45 mM (maximal
activity) glutamate. The absorbance was then red at 340 nm until the rate
was stabilized (20 to 30 min).
AGPase Gel Blot Analysis
Extraction of AGPase for blotting and procedures for gels and quantifi-
cation were performed as in Hendriks et al. (2003).
Statistics
Standard procedures were performed using functions of the Excel
program.
The smoothness value, which indicates if the variance in a set of time-
related data points is because of a smooth diurnal change or random
noise, was estimated as follows:
smoothness ¼ +n
ijXiþ1 � Xij
Xmax � Xmin
� 2
� �1
n� 2
� �
This equation has a value of zero if every data point lies on a smooth
curve that moves through one maximum and one minimum per diurnal
cycle. Increasing values reveal that the curve is becoming increasingly
irregular with a maximum value of 1. The left hand term uses the data to
estimate the smoothness term, and the right hand term normalizes the
results so that the values vary between limits of 0 and 1. A set of illustrative
sample curves with the respective smoothness value is given in the
supplemental data online.
The lowcost and high throughput of the enzyme determination platform
allowed enzyme activities to be measured at 2-h intervals. To exploit this
increased data density, moving averages were calculated throughout the
night and day cycle for every two consecutive data points (see Supple-
mental Table 1 online). Use of these time-averaged data improved the
smoothness factor formany enzyme activities andwas used for statistical
analyses. This transformation was not performed for the transcript data
set because they were only measured every 4 h, and the smoothness
factor was already close to zero for most transcripts.
To allow data compression, a probability mass function curve was
calculated for both populations. The probability mass function is given by
the following:
probabilitymass ¼ 1ffiffiffiffiffiffiffi2P
pse�ðX� �XXÞ2
2s2
This calculation assumes a normal distribution. A true normal distribu-
tion gives a skewness of zero. Skewness was calculated as follows:
skewness ¼ n
ðn� 1Þðn� 2Þ+X� �XX
s
� �3
The estimated values for transcripts and for activities were 0.7 and 1.2,
respectively, which was considered acceptable.
To analyze the temporal relation between changes of transcripts and
enzyme activity in more detail, the change of the transcript level and the
change of the time-averaged enzyme activity was calculated for each 4-h
time interval and normalized as the percentage of the average level using
the following equation:
local vector ¼ slopeð½Xt; Xtþ4�; ½t; tþ 4�Þ � 4�XX
� 100
To generate decision trees (Quinlan, 1979), a heuristic divide-and-
conquer strategy was applied that incorporated as the split criterion the
normalized mutual information. Trees were generated by recursively
splitting the training set according to the variable with the maximal
amount of this quantity. To avoid over-fitting, trees were pruned by the
removal of those subtrees that are estimated to increase the error rate
minimally. The program used to generate decision treeswas the J4.8 data
mining software (WEKA, Waikato, New Zealand), which is a Java imple-
mentation of the C4.5 software (Quinlan, 1993). The assignment of further
samples to the classes was calculated as frequencies. For each sample,
an assignment probability was also calculated and used to determine
weighted frequencies.
ACKNOWLEDGMENTS
This research was supported by the Max Planck Society and by the
German Ministry for Research and Technology, in the framework of the
German plant genomics program Genomanalyse im Biologischen Sys-
tem Pflanze (0312277A). Thanks are due to Alisdair Fernie, Oliver
Thimm, and John Lunn for their tips and comments. Thanks are also
due to Linda Bartezko, Manuela Gunther, Sonja Kohler, and Kristin
Retzlaff for technical assistance.
Received July 8, 2004; accepted September 3, 2004.
REFERENCES
ap Rees, T., and Hill, S.A. (1994). Metabolic control analysis of plant
metabolism. Plant Cell Environ. 17, 587–599.
Arabidopsis Genome Initiative (2000). Analysis of the genome
sequence of the flowering plant Arabidopsis thaliana. Nature 408,
796–815.
Ashour, M.B.A., Gee, S.J., and Hammock, B.D. (1987). Use of a 96-
well microplate reader for measuring routine enzyme activities. Anal.
Biochem. 166, 353–360.
Bergmeyer, H.U. (1987). Methods of Enzymatic Analysis. (Weinheim,
Germany: VCH).
Transcript Levels and Enzyme Activities 3323

Bernofsky, C., and Swan, M. (1973). Improved cycling assay for
nicotinamide adenine-dinucleotide. Anal. Biochem. 53, 452–458.
Caspar, T., Huber, S.C., and Somerville, C. (1985). Alterations in
growth, photosynthesis, and respiration in a starchless mutant of
Arabidopsis thaliana (L) deficient in chloroplast phosphoglucomutase
activity. Plant Physiol. 79, 11–17.
Celis, J.E., Kruhoffer, M., Gromove, I., Frederiksen, C., Ostergaard,
M., Thykjaer, T., Gromova, P., Yu, J., Palsdottir, H., Mangnusson,
N., and Ornoft, T.F. (2000). Gene expression profiling: Monitoring
transcription and translation products using DNA microarrays and
proteomics. FEBS Lett. 480, 2–16.
Czechowski, T., Bari, R.P., Stitt, M., Scheible, W.R., and Udvardi,
M.K. (2004). Real-time RT-PCR profiling of over 1400 Arabidopsis
transcription factors: Unprecedented sensitivity reveals novel root-
and shoot-specific genes. Plant J. 38, 366–379.
DeRisi, J.L., Iyer, V.R., and Brown, P.O. (1997). Exploring the meta-
bolic and genetic control of gene expression on a genomic scale.
Science 278, 680–686.
Gibon, Y., Blasing, O.E., Palacios, N., Pankovic, D., Hendriks,
J.H.M., Fisahn, J., Hohne, M., Gunter, M., and Stitt, M. (2004).
Adjustment of diurnal starch turnover to short days: Depletion of sugar
during the night leads to a temporary inhibition of carbohydrate
utilisation, accumulation of sugars and post-translational activation of
ADP-glucose pyrophosphorylase in the following light period. Plant J.
39, 847–862.
Gibon, Y., Vigeolas, H., Tiessen, A., Geigenberger, P., and Stitt, M.
(2002). Sensitive and high throughput metabolite assays for inorganic
pyrophosphate, ADPGlc, nucleotide phosphates, and glycolytic inter-
mediates based on a novel enzymic cycling system. Plant J. 30,
221–235.
Graeve, K., Vonschaewen, A., and Scheibe, R. (1994). Purification,
characterization, and cDNA sequence of glucose-6-phosphate-de-
hydrogenase from potato (Solanum tuberosum L). Plant J. 5, 353–361.
Greenbaum, D., Colangelo, C., Williams, K., and Gerstein, M. (2003).
Comparing protein abundance and mRNA expression levels on
a genomic scale. Genome Biol. 4, 117.
Greiner, S., Rausch, T., Sonnewald, U., and Herbers, K. (1999).
Ectopic expression of a tobacco invertase inhibitor homolog prevents
cold-induced sweetening of potato tubers. Nat. Biotechnol. 17,
708–711.
Hecht, U., Oelmueller, R., Schmidt, S., and Mohr, H. (1988). Action of
light, nitrate and ammonium on the levels of NADH- and ferredox-
independent glutamate synthases in the cotyledons of mustard seed-
lings. Planta 175, 130–138.
Hendriks, J.H.M., Kolbe, A., Gibon, Y., Stitt, M., and Geigenberger,
P. (2003). ADP-glucose pyrophosphorylase is activated by posttrans-
lational redox-modification in response to light and to sugars in leaves
of Arabidopsis and other plant species. Plant Physiol. 133, 838–849.
Henkes, S., Sonnewald, U., Badur, R., Flachmann, R., and Stitt, M.
(2001). A small decrease of plastid transketolase activity in antisense
tobacco transformants has dramatic effects on photosynthesis and
phenylpropanoid metabolism. Plant Cell 13, 535–551.
Holland, M.J. (2002). Transcript abundance in yeast varies over six
orders of magnitude. J. Biol. Chem. 277, 14363–14366.
Huber, J.L., Huber, S.C., and Hamborg-Nielsen, T. (1989). Protein
phosphorylation as a mechanism for regulation of spinach leaf
sucrose-phosphate synthase activity. Arch. Biochem. Biophys. 270,
681–690.
Huber, S.C. (1984). Biochemical basis for effects of K-deficiency on
assimilate export rate and accumulation of soluble sugars in soybean
leaves. Plant Physiol. 76, 424–430.
Jeannette, E., and Prioul, J.L. (1994). Variations of ADPGlucose
pyrophosphorylase activity from maize leaf during day/night cycle.
Plant Cell Physiol. 35, 869–878.
Kaiser, W.M., and Huber, S.C. (1994). Posttranslational regulation of
nitrate reductase in higher plants. Plant Physiol. 106, 817–821.
Kaiser, W.M., and Huber, S.C. (1999). Nitrate reductase in higher
plants: A case study for transduction of environmental stimuli into
control of catalytic activity. Physiol. Plant. 105, 385–390.
Kiianitsa, K., Solinger, J.A., and Heyer, W.D. (2003). NADH-coupled
microplate photometric assay for kinetic studies of ATP-hydrolyzing
enzymes with low and high specific activities. Anal. Biochem. 321,
266–271.
Klein, D., Krapp, A., and Stitt, M. (2000). The regulation of NIA expres-
sion by nitrate and glutamine is overridden when sugars decrease to
low levels in tobacco leaves. Plant Cell Environ. 23, 863–871.
Kononenko, I. (2001). Machine learning for medical diagnosis: History,
state of the art and perspective. Artif. Intell. Med. 23, 89–109.
Lein, W., Bornke, F., Reindl, A., Ehrhardt, T., Stitt, M., and
Sonnewald, U. (2004). Target-based discovery of novel herbicides.
Curr. Opin. Plant Biol. 7, 219–225.
Lourenco, E.J., and Neves, V.A. (1984). Partial purification and some
properties of shikimate dehydrogenase from tomatoes. Phytochem-
istry 23, 497–499.
Merlo, L., Geigenberger, P., Hajirezaei, M., and Stitt, M. (1993).
Changes of carbohydrates, metabolites and enzyme activities in
potato tubers during development and within a single tuber along
a stolon-apex gradient. J. Plant Physiol. 142, 392–402.
Meyer, C., and Stitt, M. (2001). Nitrate reduction. In Plant Nitrogen, P.J.
Lea and J.-F. Morot-Gaudry, eds (Heidelberg, Germany: Springer
Verlag), pp. 37–60.
Michaut, L., Flister, S., Neeb, M., White, K.P., Certa, U., and Gehring,
W.J. (2003). Analysis of the eye developmental pathway in Drosophila
using DNA microarrays. Proc. Natl. Acad. Sci. USA 100, 4024–4029.
Nisselbaum, J.S., and Green, S. (1969). A simple ultramicro method for
determination of pyridine nucleotides in tissues. Anal. Biochem. 27,
212–217.
Plaxton, W.C. (1990). Glycolysis. In Methods in Plant Biochemistry, Vol.
3, P.J. Lea, ed (London: Academic Press), pp. 145–173.
Quinlan, J.R. (1979). Discovering rules from large collections of exam-
ples. In Expert Systems in the Microelectronic Age, D. Michie, ed
(Edinburgh, UK: Edingburgh University Press), pp. 168–201.
Quinlan, J.R. (1993). C4.5: Programs for Machine Learning. (San Mateo,
CA: Morgan Kaufmann Publishers)
Redman, J.C., Haas, B.J., Tanimoto, G., and Town, C.D. (2004).
Development and evaluation of an Arabidopsis whole genome Affy-
metrix probe array. Plant J. 38, 545–561.
Renz, A., Merlo, L., and Stitt, M. (1993). Partial purification from potato
tubers of 3 fructokinases and 3 hexokinases which show differing
organ and developmental specificity. Planta 190, 156–165.
Sadava, D., and Moore, K. (1987). Glycerol metabolism in higher
plants: Glycerol kinase. Biochem. Biophys. Res. Commun. 143,
977–983.
Sadka, A., Dahan, E., Or, E., and Cohen, L. (2000). NADP(þ)-isocitrate
dehydrogenase gene expression and isozyme activity during citrus
fruit development. Plant Sci. 158, 173–181.
Scheible, W.R., Gonzalez-Fontes, A., Lauerer, M., Muller-Rober, B.,
Caboche, M., and Stitt, M. (1997a). Nitrate acts as a signal to induce
organic acid metabolism and repress starch metabolism in tobacco.
Plant Cell 9, 783–798.
Scheible, W.R., Gonzalez-Fontes, A., Morcuende, R., Lauerer, M.,
Geiger, M., Glaab, J., Gojon, A., Schulze, E.D., and Stitt, M.
(1997b). Tobacco mutants with a decreased number of functional nia
genes compensate by modifying the diurnal regulation of transcription,
3324 The Plant Cell

post-translational modification and turnover of nitrate reductase.
Planta 203, 304–319.
Scheible, W.R., Krapp, A., and Stitt, M. (2000). Reciprocal diurnal
changes of phosphoenolpyruvate carboxylase expression and cyto-
solic pyruvate kinase, citrate synthase and NADP-isocitrate dehydro-
genase expression regulate organic acid metabolism during nitrate
assimilation in tobacco leaves. Plant Cell Environ. 23, 1155–1167.
Scheible, W.R., Lauerer, M., Schulze, E.D., Caboche, M., and Stitt,
M. (1997c). Accumulation of nitrate in the shoot acts as a signal to
regulate shoot-root allocation in tobacco. Plant J. 11, 671–691.
Scheible, W.-R., Morcuende, R., Czechowski, T., Osuna, D., Fritz,
C., Palacios-Rojas, N., Thimm, O., Udvardi, M.K., and Stitt, M.
(2004). Genome-wide reprogramming of primary and secondary
metabolism, protein synthesis, cellular growth processes, and the
regulatory infrastructure of Arabidopsis in response to nitrogen. Plant
Physiol. 136, 2483–2499.
Scott, P., Lange, A.J., Pilkis, S.J., and Kruger, N.J. (1995). Carbon
metabolism in leaves of transgenic tobacco (Nicotiana tabacum L)
containing elevated fructose 2,6-bisphosphate levels. Plant J. 7,
461–469.
Serina, L., Blondin, C., Krin, E., Sismeiro, O., Danchin, A., Sakamoto,
H., Gilles, A.M., and Barzu, O. (1995). Escherichia coli UMP-kinase,
a member of the aspartokinase family, is a hexamer regulated by
guanine nucleotides and UTP. Biochemistry 34, 5066–5074.
Steen, H., and Pandey, A. (2002). Proteomics goes quantitative:
Measuring protein abundance. Trends Biotechnol. 20, 361–364.
Stitt, M. (1989). Control analysis of photosynthetic sucrose synthesis:
Assignment of elasticity coefficients and flux control coefficients to
the cytosolic fructose 1,6-bisphosphatase and sucrose phosphate
synthase. Philos. Trans. R. Soc. Lond. B Biol. Sci. 323, 327–338.
Stitt, M., Lilley, R.M.C., Gerhardt, R., and Heldt, H.W. (1989).
Metabolite levels in specific cells and subcellular compartments in
plant leaves. Methods Enzymol. 174, 518–552.
Stitt, M., Wilke, I., Feil, R., and Heldt, H.W. (1988). Coarse control of
sucrose phosphate synthase in leaves: Alterations of the kinetic
properties in response to the rate of photosynthesis and the accu-
mulation of sucrose. Planta 174, 217–230.
Suzuki, A., Vergnet, C., Morot-Gaudry, J.-F., Zehnacker, C., and
Grosclaude, J. (1994). Immunological characterization of ferredoxin
and methyl viologen interaction domains of glutamate synthase using
monoclonal antibodies. Plant Physiol. Biochem. 32, 619–626.
Thimm, O., Blasing, O., Gibon, Y., Nagel, A., Meyer, S., Kruger, P.,
Selbig, J., Muller, L.A., Rhee, S.Y., and Stitt, M. (2004). MAPMAN: A
user-driven tool to display genomics data sets onto diagrams of
metabolic pathways and other biological processes. Plant J. 37,
914–939.
Tiessen, A., Hendriks, J.H.M., Stitt, M., Branscheid, A., Gibon, Y.,
Farre, E.M., and Geigenberger, P. (2002). Starch synthesis in potato
tubers is regulated by post-translational redox modification of ADP-
glucose pyrophosphorylase: A novel regulatory mechanism linking
starch synthesis to the sucrose supply. Plant Cell 14, 2191–2213.
Turano, F.J., Dashner, R., Upadhyaya, A., and Caldwell, C.R. (1996).
Purification of mitochondrial glutamate dehydrogenase from dark-
grown soybean seedlings. Plant Physiol. 112, 1357–1364.
Uedan, K., and Sugiyama, T. (1976). Purification and characteriza-
tion of phosphoenolpyruvate carboxylase from maize leaves. Plant
Physiol. 57, 906–910.
Wang, R., Okamoto, M., Xing, X., and Crawford, N.M. (2003). Micro-
array analysis of the NO3- response in Arabidopsis roots and shoots
reveals over 1000 rapidly responding genes new linkages to glucose,
trehalose-6-phosphate, iron, and sulfate metabolism. Plant Physiol.
132, 556–567.
Weiner, H., and Kaiser, W. (1999). 14-3-3 proteins control proteolysis
of nitrate reductase in spinach leaves. FEBS Lett. 455, 75–78.
Transcript Levels and Enzyme Activities 3325


