Embed Size (px)
Citation preview

This is an Open Access version of the article: Nosrati K, Govers G, Ahmadi H, Sharif F, Amoozegar MA, Merckx R, Vanmaercke M (2011) An exploratory study on the use of enzyme activities as sediment tracers: biochemical fingerprints? International Journal of Sediment Research 26: 136-151.
An exploratory study on the use of enzyme activities
as sediment tracers: biochemical fingerprints?
Kazem NOSRATI1, Gerard GOVERS2, Hassan AHMADI3, Forood SHARIFI4, Mohammad Ali AMOOZEGAR5, Roel MERCKX6, and Matthias VANMAERCKE7
1 Assis. Prof., Department of Physical Geography, Faculty of Earth Sciences, Shahid Beheshti University, 1983963113 Tehran, Iran, Corresponding author. Tel.: +98 21 29902602; Fax: +98 21 29902628. E-mail: [email protected] (K. Nosrati). 2 Full Prof., Division of Geography, Department of Earth and Environmental Sciences, K.U. Leuven, Celestijnenlaan 200E, 3001 Leuven, Belgium 3 Full Prof., Faculty of Natural Resources, University of Tehran, Karaj, Iran 4 Assis. Prof., Forest, Range and Watershed Management Organization, Tehran, Iran 5 Associate Professor, Faculty of Biology, College of Sciences, University of Tehran, Tehran, Iran 6 Full Prof., Division of Soil and Water Management, Department of Earth and Environmental Sciences, K.U. Leuven, Kasteelpark Arenberg 20, 3001 Leuven, Belgium 7 Ph.D. candidate, Division of Geography, Department of Earth and Environmental Sciences, K.U. Leuven, Celestijnenlaan 200E, 3001 Leuven, Belgium
Abstract
Little information exists on the potential of soil enzyme activities, which are sensitive to soil
properties and management, for the characterization of sediment sources at the catchment scale. The
objective of this study is to explore and evaluate enzyme activity as tracer for sediment fingerprinting
in the Hiv catchment (55 km2), Iran. Therefore, four enzymes were measured from 42 different
sampling sites, covering three sediment source areas (rangeland/surface erosion, orchard/surface
erosion, and streambank erosion), as well as from 12 sediment samples from reservoir check dams
(sediment sinks). The results indicate that, based upon backward mode discriminant analysis, β-
glucosidase and dehydrogenase, allowed more than 95% of the samples to be correctly assigned to
their source areas. These enzymes were selected as input data for a mixing-model to determine the
relative contribution of the sampled sediment sources. The mean contributions from rangeland,
orchard and streambank sources in the study area were estimated as 11.3%, 15.1% and 73.7%,
respectively. Using geochemical tracers, the mean contribution from rangeland, orchard and
streambank sources was estimated as 14.1%, 9.5% and 74.8%, respectively. Combined biochemical
and geochemical tracers, similar values were obtained (18.7%, 10.7% and 70.7%, respectively). Our
results indicate that soil enzyme activity allows for a good characterization of sediment sources, and
can provide a complementary tool to currently existing sediment fingerprinting approaches. However,
the method should be also tested in other regions.
Key Words: Sediment source, Enzyme activity, Biochemical fingerprints, Mixing model, Hiv
Catchment
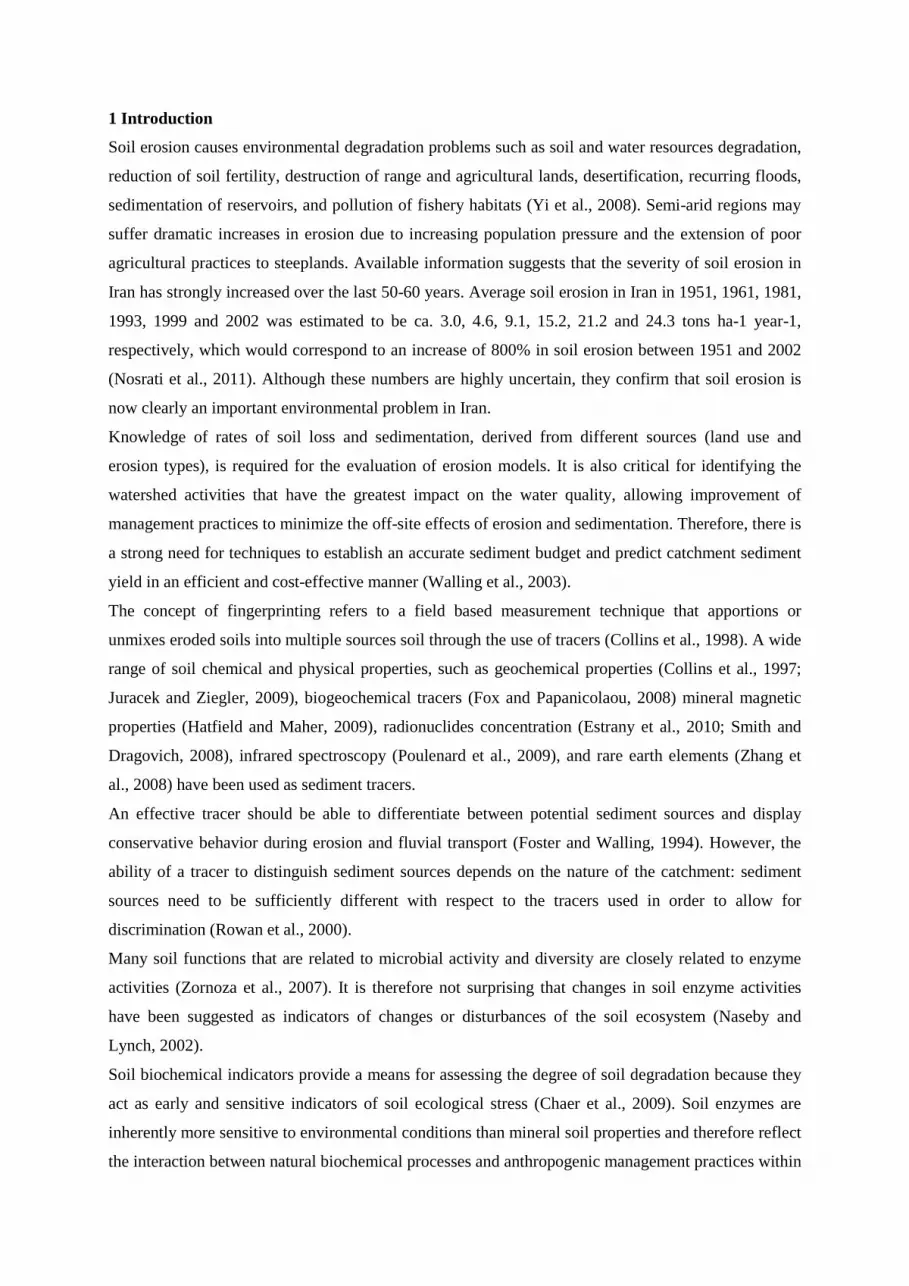
1 Introduction
Soil erosion causes environmental degradation problems such as soil and water resources degradation,
reduction of soil fertility, destruction of range and agricultural lands, desertification, recurring floods,
sedimentation of reservoirs, and pollution of fishery habitats (Yi et al., 2008). Semi-arid regions may
suffer dramatic increases in erosion due to increasing population pressure and the extension of poor
agricultural practices to steeplands. Available information suggests that the severity of soil erosion in
Iran has strongly increased over the last 50-60 years. Average soil erosion in Iran in 1951, 1961, 1981,
1993, 1999 and 2002 was estimated to be ca. 3.0, 4.6, 9.1, 15.2, 21.2 and 24.3 tons ha-1 year-1,
respectively, which would correspond to an increase of 800% in soil erosion between 1951 and 2002
(Nosrati et al., 2011). Although these numbers are highly uncertain, they confirm that soil erosion is
now clearly an important environmental problem in Iran.
Knowledge of rates of soil loss and sedimentation, derived from different sources (land use and
erosion types), is required for the evaluation of erosion models. It is also critical for identifying the
watershed activities that have the greatest impact on the water quality, allowing improvement of
management practices to minimize the off-site effects of erosion and sedimentation. Therefore, there is
a strong need for techniques to establish an accurate sediment budget and predict catchment sediment
yield in an efficient and cost-effective manner (Walling et al., 2003).
The concept of fingerprinting refers to a field based measurement technique that apportions or
unmixes eroded soils into multiple sources soil through the use of tracers (Collins et al., 1998). A wide
range of soil chemical and physical properties, such as geochemical properties (Collins et al., 1997;
Juracek and Ziegler, 2009), biogeochemical tracers (Fox and Papanicolaou, 2008) mineral magnetic
properties (Hatfield and Maher, 2009), radionuclides concentration (Estrany et al., 2010; Smith and
Dragovich, 2008), infrared spectroscopy (Poulenard et al., 2009), and rare earth elements (Zhang et
al., 2008) have been used as sediment tracers.
An effective tracer should be able to differentiate between potential sediment sources and display
conservative behavior during erosion and fluvial transport (Foster and Walling, 1994). However, the
ability of a tracer to distinguish sediment sources depends on the nature of the catchment: sediment
sources need to be sufficiently different with respect to the tracers used in order to allow for
discrimination (Rowan et al., 2000).
Many soil functions that are related to microbial activity and diversity are closely related to enzyme
activities (Zornoza et al., 2007). It is therefore not surprising that changes in soil enzyme activities
have been suggested as indicators of changes or disturbances of the soil ecosystem (Naseby and
Lynch, 2002).
Soil biochemical indicators provide a means for assessing the degree of soil degradation because they
act as early and sensitive indicators of soil ecological stress (Chaer et al., 2009). Soil enzymes are
inherently more sensitive to environmental conditions than mineral soil properties and therefore reflect
the interaction between natural biochemical processes and anthropogenic management practices within

a catchment. Therefore, enzymes may also be used as biochemical indices to discriminate sediment
sources.
Acosta-Martinez and Zobeck (2004) studied the potential of three enzyme activities (β-glucosidase,
alkaline phosphatase, and arylsulfatase) to discriminate wind soil erosion sources and concluded that
enzyme activity allowed to identify the soil source of the dust samples.
The usability of enzymes as tracers crucially depends on their stability. Some enzyme activities do not
show seasonal variation, probably because most of the activity is associated with enzymes stabilized
by soil colloids (Nannipieri et al., 2002; Tate, 2002). Enzymes are reported to be stable for many
months and even years in air-dried soils (Tabatabai and Dick, 2002). Also the assays of soil enzymes
are generally simple, accurate, sensitive, and relatively rapid (Nannipieri et al., 2002). Consequently,
sediment fingerprinting using enzymes could be complementary tool to currently existing
fingerprinting techniques as they may allow to identify the contributions of different sediment sources
that are otherwise very similar in composition. The objective of this study was therefore to explore and
evaluate the potential of soil enzyme activities as tracers for sediment source fingerprinting in a semi-
arid mountainous area in Iran by comparing the results of enzyme analysis to that of a classical
geochemical fingerprinting approach.
2 Materials and methods
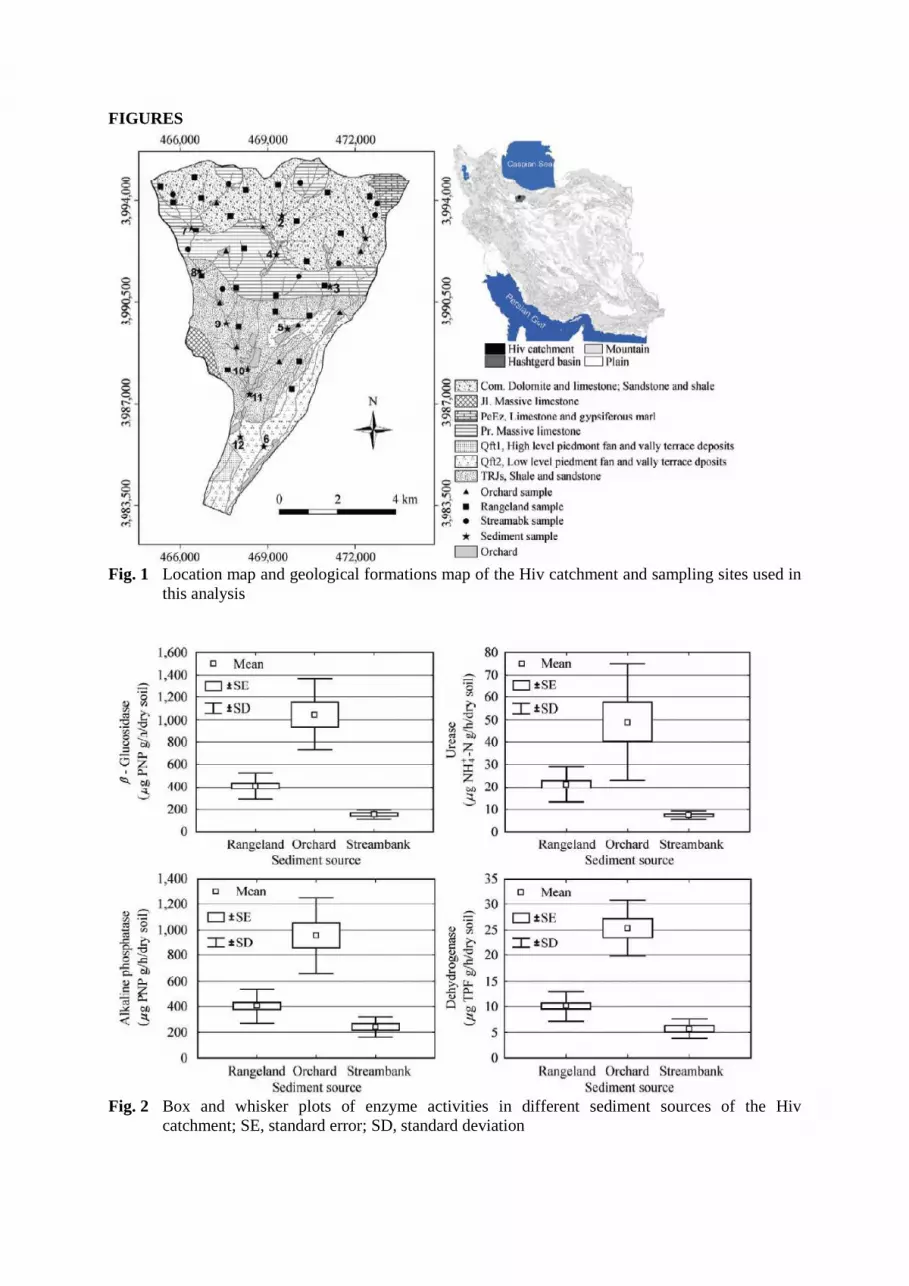
2.1 Study area
The study was conducted in the Hiv catchment (35°59' to 36° 07' N and 50°36' to 50°43' E) which is
part of the Hashtgerd Drainage Basin, in the Southern Alborz Mountains, 70 km Northwest of Tehran,
Iran (Fig. 1). The drainage area of the Hiv catchment is 55 km2 including 400 ha (7.3%) of orchards
(walnut, almond and cherry trees), 128 ha (2.3% of total area) of residential rural area, 4322 ha (78.6%
of total area) rangelands, and 650 ha (11.8% of total area) of rock outcrops. The catchment has
variable lithological characteristics, with outcrops of Pre-Cambrian to Quaternary Formations (Fig. 1).
The Hiv catchment has a mountaineous topography, with a minimum and maximum height 1,280 m
and 2,720 m above sea level respectively. The average slope gradient is 27%. The soils within the
catchment are mainly Typic Xerorthents and Typic Calcixerepts. A dispersed topsoil sample may
contain 16 to 84% sand, 9 to 57% silt, and 7 to 35% of clay (Nosrati, 2010). Long-term (1975-2003)
mean annual precipitation in the study area is ca. 445 mm.
Throughout Iran and particularly in semi-arid areas where the effects of erosion are considerable, the
construction of check dams is widespread. In the drainage network of the study area, some concrete
and cement check dams are present in streams and channels. These check-dams are small barriers (in
general less than 5 m high) built across the direction of water flow on shallow rivers and streams for
the purpose of sediment retention and erosion reduction.
2.2 Sampling and data collection

Potential sediment sources were classified in three main groups; rangeland/surface erosion,
orchard/surface erosion and streambank erosion. 42 representative samples were collected from these
potential sources at different locations within the study catchment (Fig. 1).
The samples were collected by taking a representative sample of the upper layer of the source material
(0–5 cm) using a trowel. In the orchards and on the rangeland 5 sub-samples were collected over an
area of approximately 100 m2 which were mixed into a single composite sample. On the channel
banks, 5 subsamples were collected with 20 m from each other. Furthermore, 12 sediment samples
were collected from fresh surface dam reservoirs deposits. In reservoirs with a large (>0.5 m) water
depth samples were collected using a 0.02 m² Petit-Ponar grab sampler, while a trowel was used when
water depth was low. At each sampling location 7 small (500 g) samples of deposited sediment were
collected and homogeneously mixed. Once collected, whenever necessary, the soil and sediment
samples were gently air-dried to the point of soil moisture suitable for sieving. In order to remove bias
associated with grainsize effects, only the <63 µm soil and sediment fraction was used for enzyme
activity and geochemical analysis (Collins et al., 1997). After sieving, the samples were temporarily
conserved in sealed plastic bags and were stored in a field refrigerator on ice and transported to the
laboratory. The samples for enzyme activity analysis were kept field moist and stored frozen until
analysis. In the laboratory, grain size composition was measured after adding H2O2 and (NaPO3)6 as
dispersants.
2.3 Enzyme activities
Four enzyme activities (urease, alkaline phosphatase, β-glucosidase and dehydrogenase) were
measured in the sediment and sediment source samples. For the determination of urease activity, 5 g of
the soil was incubated with 2.5 ml of a urea solution and 20 ml borate buffer for 2 h at 37°C. After the
incubation, released ammonium was extracted with 50 ml of KCl solution. The solution was filtered
and 9 ml of distilled water, 5 ml of Na-salicylate/NaOH solution and 2 ml of Na-dichloroisocyanurate
solution were added to 1ml of the clear solution. Blanks were performed by adding the urea at the end
of incubation. The ammonium was determined by absorption on a spectrophotometer (Shimadzu UV-
160A) at a wavelength of 690 nm (Kandeler and Gerber, 1988; Alef and Nannipieri, 1995).
Soil alkaline phosphatase and β -glucosidase activity were determined using p-nitrophenylphosphate
(PNPP, 0.05M) and p-nitrophenyl- β -D-glucopyranoside (PNG, 0.05M) as substrates, respectively
(Tabatbai, 1994). These assays were based on the release and detection of p-nitrophenol (PNP). 1 g of
soil was incubated with 4 ml of modified universal buffer (MUB, pH=6 for β -glucosidase and pH=11
for alkaline phosphatase) together with 1 ml substrates for 1 hour at 37°C. After incubation, the
reaction was stopped and the yellow color from the p-nitrophenol was developed by the addition of 1
ml 0.5 M CaCl2 and 4 ml of 0.1M THAM buffer (pH 12) for β -glucosidase, and 1 ml 0.5 M CaCl2
and 4 ml of 0.5M NaOH for alkaline phosphatase. The solution was mixed and filtered (Whatman No.
42). Controls were performed by adding the substrate after the reaction was stopped. PNP activity was

measured by absorption in a spectrophotometer (Shimadzu UV-160A) at a wavelength of 400-420 nm
and quantified by comparison with a standard curve (Tabatabai, 1994; Acosta-Martinez and Zobeck,
2004; Chaer et al.,2009).
For the determination of dehydrogenase activity, 20 g of soil samples were mixed with 0.2 g CaCO3
and 3 replicates of 6 g of mixed soil were incubated for 24 h at 37°C with 1 ml substrate of 3% 2,3,5-
triphenyltetrazolium chloride (TTC) and 2.5 ml of distilled water. After incubation, 10 ml methanol
was added, then filtered and diluted the filtrate to 100 ml volume with methanol. The amount of
triphenyl formazan (TPF) was measured by absorption on a spectrophotometer (Shimadzu UV-160A)
at a wavelength of 485 nm with methanol as a blank and calculated with a reference calibration graph
prepared from a TPF standard (Tabatabai, 1994). The results of enzyme activities were reported on an
oven dry-weight basis, determined by drying the soils for 24 h at 105°C.
2.4 Geochemical analysis
3 g of the soil and sediment samples (<63 µm) was digested on water bath at 95 °C using aqua regia
(HCl–HNO3; 3:1) for 2 h (Reis et al., 2007) and HClO4 for 1 h. After digestion, all samples were
filtered through S&S ME24 (0.2 µm) filter paper and replenished to 50 ml with de-ionized water, and
stored in sterile polythene tubes prior to analysis. The solutions were analysed by ICP-OES (GBC
Integra) for Al, B, Ba, Be, Bi, Ca, Cd, Co, Cr, Cu, Fe, Ga, K, Li, Mg, Mn, Mo, Na, Ni, P, Pb, Se, Sr,
Te, Tl and Zn. In order to assess the validity of the analytical results, accuracy and precision
(repeatability) were calculated. The results show that the accuracy of the analytical procedure was
usually below 5.5%, while the precision was less than 5% for all elements. Total N was determined by
the Kjeldahl method (Rutherford et al., 2008) and the total organic C content was measured by the
Walkley-Black method (Skjemstad and Baldock, 2008).
2.5 Source discrimination
A key requirement of any sediment source fingerprinting exercise is the use of statistical tests to
identify a composite fingerprint or set of source material properties that is capable of discriminating
between potential sources. In this study, a two stage procedure proposed by (Collins et al., 1997) was
used to identify composite fingerprints capable of discriminating the samples collected to represent
individual source types. In the first stage, the Kruskall–Wallis test was used to identify those
fingerprint properties which were able to discriminate between the three potential sources. The
Kruskall-Wallis test is a non-parametric alternative to one-way (between-groups) ANOVA. It is used
to compare three or more samples, and it tests the null hypothesis that the different samples in the
comparison were drawn from the same distribution or from distributions with the same median. Thus,
the interpretation of the Kruskall-Wallis test is basically similar to that of the parametric one-way
ANOVA, except that it is based on ranks rather than means (Sprent and Smeeton, 2001).
In the second stage, a stepwise multivariate discriminant function analysis (DA) was undertaken, in
order to select the optimum combination of enzyme activities as biochemical tracers. The membership
of the sediment source samples was the dependent variable, whereas the measured soil enzyme
activities constituted the independent variables. There are different tests to determine whether
discriminant functions are statistically significant. The eigenvalue reflects the ratio of importance of
the dimensions which classify cases of the dependent variable. The largest eigenvalue corresponds to
the eigenvector in the direction of the maximum spread of the groups’ means. The canonical
correlation (R) is a measure of the association between the groups formed by the dependent variable
and the given discriminant function. Values close to 1 indicate a strong correlation between the
discriminant scores and the groups. Wilks' Lambda is used to test the significance of the discriminant
function as a whole. Wilks' Lambda is the proportion of the total variance in the discriminant scores
not explained by differences among the groups. A chi-square transformation of Wilks' Lambda is used
along with the degrees of freedom to determine its significance. Wilks' Lambda ranges between 0 and
1. Values close to 0 indicate the group means are different. If the associated probability is small (<
0.10) group means differ (Härdle and Simar, 2007; Hill and Lewicki, 2007).
The squared Mahalanobis distance, which is the distance of a tracer property associated with each
sample from the centroid in the multidimensional space defined by independent variables, was also
used as auxiliary information to evaluate the capacity of the set of property variables to discriminate
between the source groups. The Mahalanobis distance is similar to the squared Euclidean distance.
However, unlike the Euclidean distance, the Mahalanobis distance takes into account the
intercorrelations between the variables in the model. Therefore, this measure provides an indication of
whether or not a tracer property associated with each sample is an outlier with respect to the potential
sediment source values (Hill and Lewicki, 2007).
Standard, forward and backward stepwise DA was performed to find the best set of tracers. Three
analyses were performed: one with biochemical tracers only, one with geochemical tracers only and
one where all tracers were combined. All statistical analyses were performed using STATISTICA
V.6.0 (StatSoft Inc., 2001).
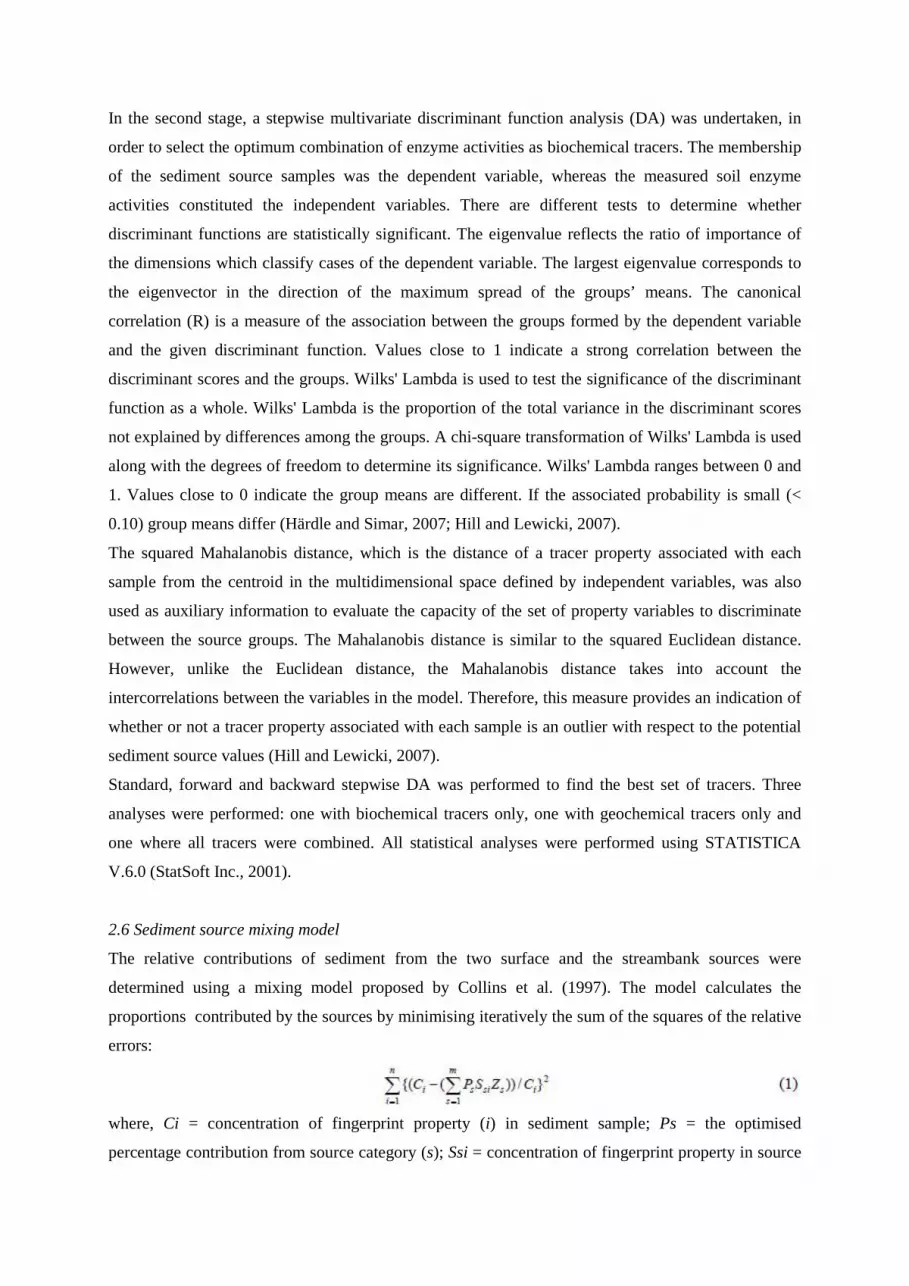
2.6 Sediment source mixing model
The relative contributions of sediment from the two surface and the streambank sources were
determined using a mixing model proposed by Collins et al. (1997). The model calculates the
proportions contributed by the sources by minimising iteratively the sum of the squares of the relative
errors:
where, Ci = concentration of fingerprint property (i) in sediment sample; Ps = the optimised
percentage contribution from source category (s); Ssi = concentration of fingerprint property in source

category (s); Zs= particle size correction factor for source category calculated as the ratio of the
specific surface area of the sediment samples to the mean of the individual source types; n= number of
fingerprint properties; m=number of sediment sources.
The equation established by Collins et al. (1997) includes corrections for particle size and organic
matter (using organic carbon). It may be expected that the particle size correction factor (Zs) shows the
same trend as the organic matter correction factor. Therefore no additional correction was applied for
the organic fractions/tracers.
The model is based on the following constraints: the fraction of source contributions must lie between
0 and 1 ; and the percentage source contributions must sum to 1 ( ). The mixing
model was implemented in MATLAB and the contribution of each source to the sediment samples
was calculated.
3 Results
3.1 Source discrimination
An important consideration for sediment tracer studies is data variability within the sediment sources.
Comparison of rangeland, orchard, and streambank sediment source data shows that orchards have a
higher mean value for all soil enzymes data compared to rangelands and streambanks (Fig. 2). Soil
enzyme activities are higher on agricultural land due to addition of carbon, nitrogen and phosphor
sources from fertilizers and manure (Stark et al., 2007). It is therefore not unexpected that relatively
strong correlations exist between SOC content and enzyme activity (Fig. 3). Correlations with other
geochemical tracers were variable: Tl was positively correlated with all soil biochemical tracers
(r>0.32) and B was negatively correlated with alkaline phosphatase (r=0.31). Sr was not correlated
with other biochemical properties (Fig. 3).
Catchment characteristics (such as geological formation and soil types) could be controlling the
variability of the enzyme activities in different sediment sources. The dependence of enzyme activities
upon geological formation and soil types was statistically analyzed using ANOVA for sediment
sources, separately. ANOVA tests the significant difference between means of each level (e.g., Typic
Xerorthents versus Typic Calcixerepts for soil types). The ANOVA results are shown in Table 1. For
rangeland, geological formation and soil type showed significance for alkaline phosphatase, β -
glucosidase and dehydrogenase and were therefore included in the sediment source model (Table 1).
For orchard sediment source model geological formation showed significance for alkaline phosphatase
(Table 1). For the streambank samples, both geological formation and soil type showed significance
for dehydrogenase and were therefore included in the sediment source model (Table 1).
One-way ANOVA using Tukey unequal N HSD Post Hoc tests (unequal samples sizes) were
performed to test the significance of the difference in mean values of the enzyme activities within
different sediment sources (interaction). All enzyme means for the three sediment sources were

significantly different except for the difference between alkaline phosphatase and urease values for
rangeland and streambank sediment sources (Table 2). Results for the Kruskal-Wallis test are
presented in Table 3 and indicate that all four enzyme activities showed a statistically significant
difference between the sources. These results demonstrate that the enzyme activities have significant
contrasts between sediment sources under catchment characteristics and are promising to be diagnostic
properties for the fingerprinting techniques.
DA was done with the three sediment sources as grouping variable and the 4 enzymes as independent
variables. A highly significant result was obtained, independent of the discriminant function removal
method used (Table 4). Wilk’s Lambda values indicate that 85-86% of the total variance is explained
by differences between groups. Thus, the set of enzymes used clearly allow discriminating between
the three potential sediment sources.
The Mahalanobis distance shows that the rangeland and streambank source groups are the most similar
in terms of their composite fingerprints (Table 5). However, the distances between all sources are
significantly different. F-values of the backward mode are significantly higher as compared to
standard and forward mode.
The standard and forward stepwise discriminant analysis mode yielded classification matrices
assigning ca. 95% of the cases correctly (Tables 6 and 8). However, in the backward stepwise mode,
95.2% of the sediment sources were correctly classified by a model using only two discriminant
parameters, β -glucosidase and dehydrogenase (Tables 6 and 8).
DA was also done with the three sediment sources as grouping variable and the 18 geochemical tracers
remaining after the Kruskall-Wallis test (Table 3) as independent variables. The results of Chi-Square
tests and Mahalanobis distance were shown in Tables 4 and 5. The backward DA stepwise mode
showed that 92.9% of the sediment sources were correctly classified by a model using 4 discriminant
parameters, boron, B, carbon, C, strontium, Sr and thallium, Tl (Tables 6 and 8).
Furthermore DA was done with the three sediment sources as grouping variable and the 22 enzymes
and geochemical tracers as independent variables. The Chi-Square tests and Mahalanobis distance
results were shown in Tables 4 and 5. The backward DA stepwise mode showed that 100% of the
sediment sources were correctly classified by a model using 6 discriminant parameters,
dehydrogenase, boron, B, carbon, C, beryllium, Be, cobalt, Co, and thallium, Tl (Tables 7 and 8).
3.2 Sediment source contribution
The mixing model was set up using only the enzymes retained by backward DA. Using β –glucosidase
and dehydrogenase as sediment tracers the mean relative contributions (average±SE) from rangeland,
orchard and streambank sources was calculated as 11.3±6.3%, 15.1±6.2% and 73.7±9.1%, respectively
(Table 9).
The mean contribution from rangeland, orchard and streambank sources was estimated 14.1±5.6%,
9.5±4.1% and 74.8±6.4%, respectively, using the geochemical tracers boron, B, carbon, C, strontium,

Sr and thallium, Tl which were selected using backward DA (Table 9). In addition, the results of using
the combined biochemical and geochemical tracers dehydrogenase, boron, B, carbon, C, beryllium,
Be, cobalt, Co, and thallium, Tl showed that the mean contribution from rangeland, orchard and
streambank sources was 18.7±6.6%, 10.7±4.6% and 70.7±8.2%, respectively (Table 9). The results of
mixing model based on the best subset of composite biochemical fingerprints (β -glucosidase and
dehydrogenase), have been plotted on the study area (Fig. 5).
Comparison of relative contribution of each source for each of the sediment samples as calculated
from geochemical and biochemical tracer analysis showed that for individual samples the calculated
sediment source partitioning differed often considerably, depending on the tracer type used: the root
mean square difference is below 25% for 50% of the samples but can be as high as 48% (Table 9).
Except for one case the very high root mean square difference values are all associated with a higher
estimated contribution of the streambanks to the deposited sediment when enzymes are used. Two
reasons may cause this. First, it is possible that this might be caused by the fact that enzyme activity in
the sediment samples has evolved after sediment deposition thereby becoming more similar in pattern
to what is found on the river banks. This is unlikely: the sediment samples were collected from the
upper layer of sediment which was deposited during recent events. Furthermore, the environmental
conditions in sediment stores and streambanks are very different. Once particulate organic substrates
have been deposited behind check dams, the anoxic conditions and low temperatures reduce microbial
activities thereby favoring enzyme preservation. Alternatively, this finding may indicate that some of
the sediment found in the deposition areas has the rangelands as its primary sources, but has resided
for a relatively long time period within the streambank, so that the signal picked up by the biochemical
tracers is no longer that of the primary sediment source, but that of the secondary reservoir. Samples 5
and 11 were taken in stream section crossing an orchard zone: the biochemical markers indicate a
strong contribution from the orchards, while the geochemical markers point to a streambank origin of
the sediment (Fig. 5). The biochemical markers pick up the signal present in the organic fraction,
which may indeed be different from the signal present in the mineralogical fraction. The signal in the
organic fraction may be strongly affected by a local source if the latter provides a relatively low
amount of sediment that is strongly enriched in organic carbon. The root mean square difference
between the results from the composite biogeochemical and the results from geochemical tracers only
is lower than the difference between the composite biogeochemical tracers and the biochemical tracers
only (Table 9).
4 Discussion
Our results indicate that soil enzymes are promising tools for sediment fingerprinting. They allow for a
meaningful separation of sediment sources which appears to be preserved in the mixed samples found
in sediment deposits. Two factors are key:
- Enzymes do indeed allow to discriminate between different sediment sources. This discrimination is

undoubtedly to a large extent due to human impact: fertilization and management lead to increased
SOC content having a very important effect on enzyme activity. A distinction between streambanks
and rangelands is also possible: this is probably related to the variation of soil microbial activity with
depth. Soil microbial activity at the surface (on the rangeland) is generally higher than soil microbial
activity at depth in a streambank. The generally lower soil microbial activity in streambanks causes a
decrease in enzyme activities. Hence enzyme activity is significantly lower in streambank sediments
compared to other sources.
- Enzymes are products of microbial activity that may show important temporal dynamics. However,
several recent studies indicate that the activity of enzymes in a soil environment is often relatively
stable (Nannipieri et al., 2002; Tabatabai and Dick, 2002; Tate, 2002). The soil environment within
which the enzyme activities occur is a complex array of sand, silt, and clay particles intermixed with a
diverse array of organic substances. The adsorption of enzymes on clay and/or humic substances and
the mineral phase of soil has important consequences not only for their mobility and stabilization
(Tate, 2002), but also for their detachment and movement by water during the erosion process.
Organic matter in soils protects enzymes against microbial degradation. Numerous studies have shown
that enzyme activities are significantly correlated with organic C in surface soils and soil profiles (e.g.
Chaer et al., 2009). Therefore it is generally accepted that enzymes in soils are immobilized within a
network of organomineral complexes (Tabatabai and Dick, 2002) that can persist for extended periods
of time and have a very important role in the biogeochemical cycles of major elements (C, N, P, and S;
Killham and Staddon, 2002). Enzymes appear therefore to be sufficiently stable to be used as sediment
tracers provide that fresh sediment samples are used. Clearly this needs further confirmation through
specifically designed experiments.
5 Conclusions
Soil enzymes were hitherto only rarely used to discriminate between sediment sources. Our results
obtained from an experimental area in Iran indicate that, nevertheless, the use of enzymes has a
potential to complement existing methods to identify sediment sources. Enzyme activity under
different land uses/landscape settings is indeed sufficiently different to allow for discrimination. Using
enzymes we obtained a sediment source discrimination that was generally similar to the one we
obtained from geochemical tracers but some important differences were identified.
Biochemical tracers may provide complementary information to geochemical tracers. While the
former will give an indication of the primary sources of sediment enzymes may provide valuable
additional information about the residence time of sediments within the system, thereby allowing a
further differentiation and a better understanding of the system. However, there are some factors that
enhance the uncertainty of the results from the individual enzyme activities such as the lack of reliable
quantitative information on how enzyme activity varies with the specific-surface-area of soil particles
and affect enzyme activity and preservation.

Evidently, a major concern is the stability of enzymes when they are moved from one environment to
another. Recent literature indicates that enzymes are indeed stable over extended periods of time: this
may especially be true in depositional environments due to the lack of oxygen and the relatively low
temperatures. However, quantitative information on the length of this “extended” time period is still
absent: further research should on enzyme stability would therefore be of great help to define the
conditions under which enzyme activity may be successfully used as a sediment tracer.
Acknowledgements
The authors gratefully acknowledge the Forest, Range and Watershed Management Organization,
Tehran, Iran for financial support. We also thank Engineer P. Garshasebi for assisting us with field
work and Mr. A. Abbasi for assisting us with laboratory studies at Faculty of Biology, University of
Tehran. Matthias Vanmaercke received a PhD-scholarship from the Research Foundation - Flanders
(FWO), Belgium.
References Acosta-Martinez V. and Zobeck T. M. 2004, Enzyme activities and arylsulfatase protein content of
dust and the soil source: biochemical fingerprints? Journal of Environmental Quality, Vol. 33, pp. 1653–1661.
Alef K. and Nannipieri P. 1995, Urease activity. In: Alef K. and Nannipieri P. (Eds) Methods in Applied Soil Microbiology and Biochemistry. Academic Press, Inc., San Diego, CA, pp. 316–320.
Chaer G. M., Myrold D. D., and Bottomley P. J. 2009, A soil quality index based on the equilibrium between soil organic matter and biochemical properties of undisturbed coniferous forest soils of the Pacific Northwest. Soil Biology & Biochemistry, Vol. 41, pp. 822–830.
Collins A. L., Walling D. E., and Leeks G. J. L. 1997, Source type ascription for fluvial suspended sediment based on a quantitative composite fingerprinting technique. Catena, Vol. 29, No. 1, pp. 1–27.
Collins A. L., Walling D. E., and Leeks G. J. L. 1998, Use of composite fingerprints to determine the provenance of the contemporary suspended sediment loads transported by rivers. Earth Surface Processes and Landforms, Vol. 23, pp. 31–52.
Estrany J., Garcia C., and Walling D. E. 2010, An investigation of soil erosion and redistribution in a Mediterranean lowland agricultural catchment using caesium-137. International Journal of Sediment Research, Vol. 25, pp. 1–16.
Foster I. D. L. and Walling D. E. 1994, Using reservoir deposits to reconstruct changing sediment yields and sources in the catchment of the Old Mill Reservoir, South Devon, UK, over the past 50 years. Hydrological Sciences Journal, Vol. 39, pp. 347–368.
Fox J. F. and Papanicolaou A. N. 2008, Application of the spatial distribution of nitrogen stable isotopes for sediment tracing at the watershed scale. Journal of Hydrology, Vol. 358, No. 1–2, pp. 46–55.
Härdle W. and Simar L. 2007, Applied Multivariate Statistical Analysis. Second Edition Springer-Verlag Berlin
Heidelberg. Hatfield R. G. and Maher B. A. 2009, Fingerprinting upland sediment sources: particle size-specific magnetic linkages between soils, lake sediments and suspended sediments. Earth Surface Processes and Landforms, Vol. 34, pp. 1359–1373.
Hill T. and Lewicki P. 2007, STATISTICS Methods and Applications. StatSoft, Tulsa, OK. Juracek K. E. and Ziegler A. C. 2009, Estimation of sediment sources using selected chemical tracers
in the Perry lake basin, Kansas, USA. International Journal of Sediment Research, Vol. 24, pp. 108–125.

Kandeler E. and Gerber H. 1988, Short-term assay of soil urease activity using colorimetric determination of ammonium. Biology and Fertility of Soils, Vol. 6, pp. 68–72.
Killham K. and Staddon W. J. 2002, Bioindicators and sensors of soil health and the application of geostatistics. In: Burns R. G. and Dick R. P. (Eds.), Enzymes in the Environment: Activity, Ecology and Applications. Marcel Dekker, Inc., New York, pp. 391–405.
Nannipieri P., Kandeler E., and Ruggiero P. 2002, Enzyme activities and microbiological and biochemical processes in soil. In: Burns R. G. and Dick R. P. (Eds.), Enzymes in the Environment: Activity, Ecology and Applications. Marcel Dekker, Inc., New York, pp. 1–33.
Naseby D. C. and Lynch J. M. 2002, Enzymes and microorganisms in the rhizosphere. In: Burns R. G. and Dick R. P. (Eds.), Enzymes in the Environment: Activity, Ecology and Applications. Marcel Dekker, Inc., New York, pp. 109–123.
Nosrati K. 2010, Impact of erosion on the variation of some soil physico-chemical and biological properties. PhD thesis, Faculty of Natural Resources, University of Tehran.
Nosrati K., Feiznia F., Van Den Eeckhaut M., and Duiker S.W. 2011. Assessment of soil erodibility in Taleghan Drainage Basin, Iran using multivariate statistics. Physical Geography, Vol. 32, No. 1, pp. 78–96.
Poulenard J., Perrette Y., Fanget B., Quetin P., Trevisan D., and Dorioz J. M. 2009, Infrared spectroscopy tracing of sediment sources in a small rural watershed (French Alps). Science of the Total Environment, Vol. 407, No. 8, pp. 2808–2819.
Reis A. P., Menezes de Almeida L., Ferreira da Silva E., Sousa A. J., Patinha C., and Fonseca E. C. 2007, Assessing the geochemical inherent quality of natural soils in the Douro river basin for grapevine cultivation using data analysis and geostatistics. Geoderma, Vol. 141, pp. 370–383.
Rowan J. S., Goodwill P., and Franks S. W. 2000, Uncertainty estimation in fingerprinting suspended sediment sources. In: Foster I. D. L. (Ed.), Tracers in Geomorphology. Wiley, Chichester, UK, pp. 279–290.
Rutherford P. M., McGill W. B., Arocena J. M., and Figueiredo C. T. 2008, Total nitrogen. In: Carter M. R. and Gregorich E. G. (Eds.), Soil Sampling and Methods of Analysis, Second Edition, CRC Press, Taylor & Francis Group, Boca Raton, pp. 225–237.
Skjemstad J. O. and Baldock J. A. 2008, Total and organic carbon. In: Carter M. R. and Gregorich E. G. (Eds.), Soil Sampling and Methods of Analysis, Second Edition, CRC Press, Taylor & Francis Group, Boca Raton, pp. 225–237.
Smith H. G. and Dragovich D. 2008, Improving precision in sediment source and erosion process distinction in an upland catchment, south-eastern Australia. Catena, Vol. 72, No. 1, pp. 191–203.
Sprent P. and Smeeton N. C. 2001, Applied Nonparametric Statistical Methods. Third Edition, CRC Press LLC, Boca Raton, Florida.
Stark C., Condron L. M., Stewart A., Di H. J., and O’Callaghan M. 2007, Effects of past and current crop management on soil microbial biomass and activity. Biology and Fertility of Soils, Vol. 43, pp. 531–540.
StatSoft Inc. 2001, STATISTICA: [data analysis software system], Version 6.0 for Windows update. StatSoft, Inc. Tabatabai M. A. 1994, Soil enzymes. In: Weaver R. W., Angle J. S. and Bottomley P. J. (Eds.), Methods of Soil Analysis. Part 2, Microbiological and Biochemical Properties. SSSA, Madison, pp. 775–833.
Tabatabai M. A. and Dick W. A. 2002, Enzymes in soil research and developments in measuring activities. In: Burns R. G. and Dick R. P. (Eds.), Enzymes in the Environment: Activity, Ecology and Applications. Marcel Dekker, Inc.,New York, pp. 567–596.
Tate III A. L. 2002, Microbiology and enzymology of carbon and nitrogen cycling. In: Burns R. G. and Dick R. P. (Eds.), Enzymes in the Environment: Activity, Ecology and Applications. Marcel Dekker, Inc., New York, pp. 227–248.
Walling D. E., Collins A. L., and Sichingabula H. M. 2003, Using unsupported lead-210 measurements to investigate soil erosion and sediment delivery in a small Zambian catchment. Geomorphology, Vol. 52, No. 3-4, pp. 193–213.
Yi Y., Wang Z., Zhang K., Yu G., and Duan X. 2008, Sediment pollution and its effect on fish through food chain in the Yangtze River. International Journal of Sediment Research, Vol. 23, pp. 338–347.

Zhang Q., Lei T., and Zhao J. 2008, Estimation of the detachment rate in eroding rills in flume experiments using an REE tracing method. Geoderma, Vol. 147, No. 1–2, pp. 8–15.
Zornoza R., Mataix-Solera J., Guerrero C., Arcenegui V., García-Orenes F., Mataix-Beneyto J., and Morugán A. 2007, Evaluation of soil quality using multiple lineal regression based on physical, chemical and biochemical properties. Science of the Total Environment, Vol. 378, pp. 233–237.
FIGURES
Fig. 1 Location map and geological formations map of the Hiv catchment and sampling sites used in
this analysis
Fig. 2 Box and whisker plots of enzyme activities in different sediment sources of the Hiv
catchment; SE, standard error; SD, standard deviation

Fig. 3 Scatterplot matrix of the biochemical and geochemical properties used in sediment
fingerprinting in Hiv catchment; (**) correlation is significant at the 0.01 level and (*) correlation is significant at the 0.05 level
Fig. 4 Scatterplot of the first and second discriminant functions calculated using backward DA
associated with selection of the optimum composite (a) biochemical tracers (β-glucosidase and dehydrogenase), (b) geochemical tracers (B, C, Sr and Tl), and (c) combined biochemical and geochemical tracers (dehydrogenase, B, Be, C, Co and Tl) for the Hiv catchment

Fig. 5 Relative contribution of sediment stacked bars based on the biochemical tracers plotted on the
study area

TABLES Table 1 ANOVA models for enzyme activities for sediment sources
Table 2 p-value of one-way ANOVA using Tukey unequal N HSD that comparedthe enzyme
activities within different sediment sources

Table 3 The result of the Kruskall-Wallis H test for the sediment source discrimination in Hiv catchment
Table 4 Chi-Square tests with successive discriminant functions removed for discriminant analysis
applied to three sediment sources of Hiv catchment
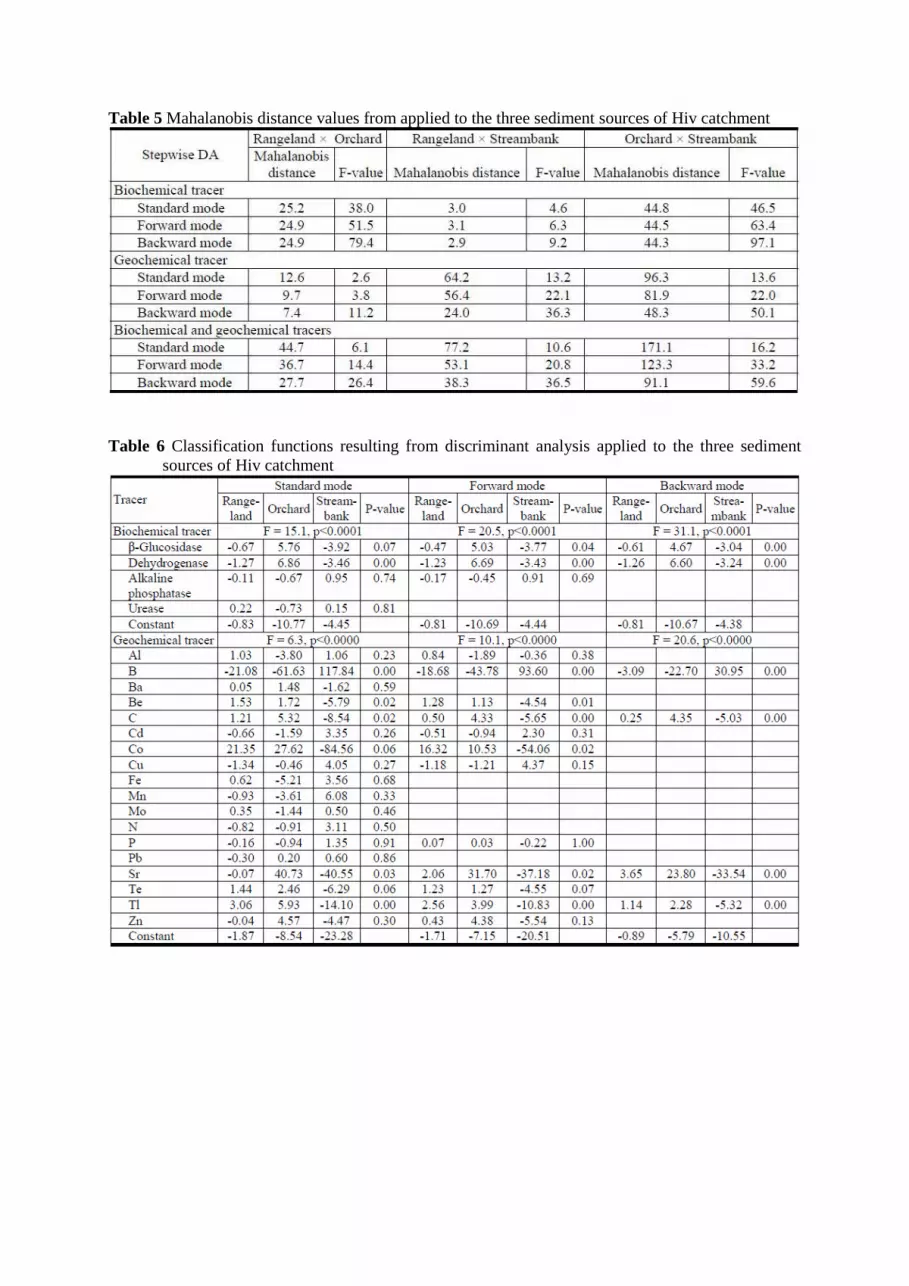
Table 5 Mahalanobis distance values from applied to the three sediment sources of Hiv catchment
Table 6 Classification functions resulting from discriminant analysis applied to the three sediment
sources of Hiv catchment

Table 7 Classification functions resulting from discriminant analysis applied to the three sediment sources of Hiv catchment using combined biochemical and geochemical tracers
Table 8 Classification matrix resulting from discriminant analysis applied to the three sediment
sources of Hiv catchment

Table 9 relative contributions of the three sediment source groups to the sediment yield of individual sediment samples using individual biochemical and geochemical tracers as well as combined biochemical and geochemical tracers resulted from stepwise DA in Hiv catchment


