Embed Size (px)
Citation preview
Page 1/24
A Study on Spatio-Temporal Variations in Physicochemical Parameters andCiliate Community Structure of Three Freshwater Bodies from Delhi, India.Jeeva Susan Abraham
University of Delhi Acharya Narendra Dev CollegeSripoorna Somasundaram
University of Delhi Acharya Narendra Dev CollegeSwati Maurya
University of Delhi Acharya Narendra Dev CollegeRenu Gupta
Maitreyi CollegeRavi Toteja
University of Delhi Acharya Narendra Dev CollegeSeema Makhija ( [email protected] )
University of Delhi Acharya Narendra Dev College https://orcid.org/0000-0003-0615-8485
Research Article
Keywords: Ciliates, Diversity, Freshwater, Physicochemical parameters, Spirotrich
Posted Date: September 3rd, 2021
DOI: https://doi.org/10.21203/rs.3.rs-684219/v1
License: This work is licensed under a Creative Commons Attribution 4.0 International License. Read Full License
Page 2/24
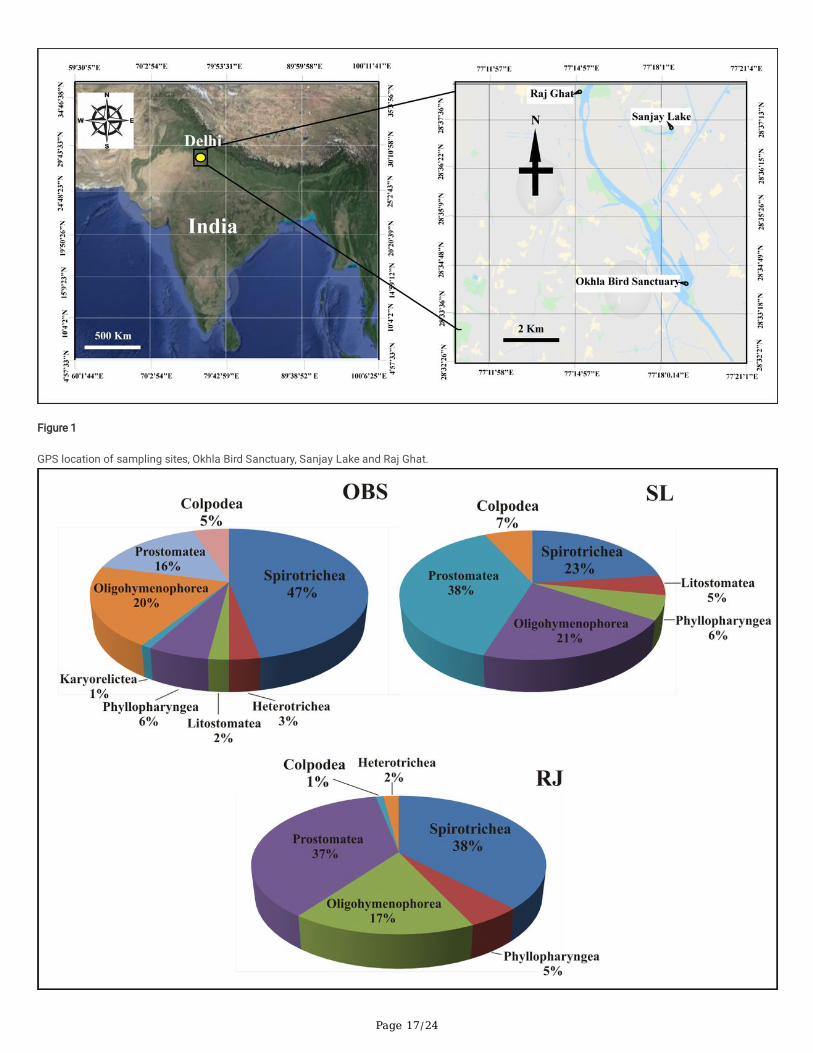
AbstractThe present investigation studied the spatial and temporal variation of the physicochemical parameters and their correlation with the ciliate communitystructure. Samples were collected from three freshwater sites viz., Okhla Bird Sanctuary (OBS), Sanjay Lake (SL) and Raj Ghat (RJ) in alternate monthsfor one year from September 2018 to August 2019. Physicochemical parameters studied were temperature, pH, dissolved oxygen (DO), total dissolvedsolids (TDS), water hardness (WH), chloride, sulphate, phosphate, nitrite, nitrate and ammonia. Ciliate diversity, structure and abundance were studiedusing various diversity indices. Multiple statistical methods such as Pearson correlation coe�cients, principal component analysis (PCA) and non-metricmultidimensional scaling (NMDS) were applied to analyze the data. Maximum ciliate diversity, richness and evenness were observed in the OBS site.Maximum ciliate diversity was observed from class Spirotrichea (47%), followed by Oligohymenophorea (20%), Prostomatea (16%), Phyllopharyngea(6%), Colpodea (5%), Heterotrichea (3%), Litostomatea (2%) and Karyorelictea (1%). Maximum diversity was observed during the monsoon and postmonsoon season and lowest during the winter and summer season. The present study on the dynamics of the environment driven community assemblysuggests that ciliates are good indicators for assessing community-level responses and can be useful in predicting the water quality as well asenvironmental degradation in future.
IntroductionFreshwater habitats support about 6% of all described species representing 0.01% of the world’s water (Dudgeon et al. 2006). Unfortunately, theseecosystems are the most vulnerable in the world, and even those that are well protected are at risk due to different kinds of anthropogenic activities, suchas industrial and domestic sewage and runoff from farms (Pander and Geist 2013; Xiong et al. 2018), hence causing a signi�cant level of pollution in theecosystem. Therefore, habitat quality and corresponding biodiversity are severely compromised (Hadwen et al. 2003; Soller et al. 2010). Freshwaterbiodiversity provides valuable ecosystem services, such as climate stabilization, drinking water, irrigation, nutrient recycling, and recreational amenities(Covich et al. 2004; Strayer and Dudgeon 2010). In order to maintain a healthy and sustainable ecosystem, it is important to have proper knowledge aswell as systematic documentation of the ecosystems (World Health Organization 2005).
Various physicochemical parameters corresponding to the habitat of the ciliate species are important in community studies. Numerous studies haveshown the effect of various physicochemical parameters on the ciliate diversity and their distribution (Andrushchyshyn et al. 2007; Debels et al. 2005;Dhib et al. 2013; Xiong et al. 2019). Physical parameters such as temperature, conductivity, salinity, pH, transparency, depth, and chemical parameterssuch as dissolved oxygen, nitrite, nitrate, ammonia, total phosphorous, sulphate and calcium have been studied profoundly in the marine ecosystemsand their correlations with the ciliate community have been found to be signi�cant (Grinienė et al. 2019; Xu et al. 2011; Ustaoğlu et al. 2020). Severalreports suggest a prevalence of oligotrich ciliate during spring season along with a low concentration of total phosphorous, total nitrogen,orthophosphate and nitrite (Balkis 2004; Dhib et al. 2013; Dolan and Marassé 1995; Nogueira et al. 2005; Pérez et al. 2000; Xu and Cronberg 2010). Astudy from the coastal waters of Port Blair, Andaman showed that the abundance of various loricate ciliate species and microzooplankton is correlatedto the environmental variables such as temperature, pH, salinity, dissolved oxygen, and rainfall (Elangovan et al. 2017). A long term study of six yearsfrom the Lake Ringsjön showed that the ciliate species composition in the lake did not change in the year 1988–1990 and in 1998–2000 but meanabundance and biomass of ciliates decreased with respect to minor �uctuations in the physicochemical parameters (Xu and Cronberg 2010). Anotherstudy from lake Donghu, China showed that the ciliate communities composed of larger carnivorous and herbivorous species were replaced by smallerbacterivorous species (Gong 1986). Also, in another study from the Mediterranean Sea, it was found that temperature, total phosphate, nitrogen, nitrate,and orthophosphate were signi�cantly related to the ciliate abundance (Dhib et al. 2013). The study also showed that spatial variation had no signi�cantcorrelation with ciliate abundance but temporal variation had signi�cant effect on physicochemical parameters (Dhib et al. 2013). Also, in another studyfrom Delhi, it was found that there was signi�cant difference in the physicochemical parameters and the taxonomic diversity of ciliate communities inpolluted and non-polluted sites (Abraham et al. 2019). These studies suggest that spatial and temporal variations in the ciliate community structure weresigni�cantly correlated with certain environmental variables. These �ndings also suggest that the spatial patterns of ciliate communities re�ect thehabitat (water or terrestrial) conditions and have the potential for assessing environmental status. Such studies at global level may be useful in betterpredicting the environment related changes (Sonntag et al. 2006; Sunagawa et al. 2020).
The main objectives of the present study were (1) to study the physicochemical parameters and ciliate diversity of the three sites (2) to reveal the spatialand temporal variations in the physicochemical parameters and ciliate diversity (3) to correlate the variations in physicochemical parameters with ciliatecommunity structure of the three sites. Three selected sites, OBS, SL and RJ were studied for a period of one year from September, 2018 to August, 2019in the present study.
Materials And Methods
Study area(1) Okhla Bird Sanctuary (OBS) (28º34’12"N, 77º18’8.28"E), is a bird sanctuary at the Okhla barrage over River Yamuna. The site is located at the pointwhere the River enters Uttar Pradesh. It spreads over 4 km2, with 20% area having depth of 2–3 m and rest of the area with depth of more than 3 m.
(2) Sanjay Lake (SL) (28º36’51.12"N, 77º18’14.04"E) is an arti�cial lake developed by the Delhi Development Authority (DDA). It is located in Trilokpuri inEast Delhi and surrounded by the residential areas of Kalyanpuri on the eastern side and Mayur Vihar on the western side. Its surface area is about 0.17km2, depth of 1 m to 2.5 m and has extensive growth of water hyacinth.
Page 3/24
(3) Raj Ghat Pond (RJ) (28º38’26.16"N, 77º14’57.84"E) is a man-made pond located inside Raj Ghat which is a memorial to Mahatma Gandhi. It is amajor tourist spot in India. The pond is small and shallow with a surface area of about 0.01 km2 and depth of about 2 m.
SamplingSampling was carried out in alternate months from September 2018 to August 2019 to have representation from all seasons of Delhi. Different monthcorresponds to different seasons viz. September, November, January, March, May and July represents Post-monsoon, Autumn, Winter, Spring, Summerand Monsoon, respectively. The water samples were collected from the edge of the water bodies near the land using a beaker. Samples were brought tothe laboratory in 500–1,000 ml bottles after which the samples were passed through a Nytex net/mesh of 120 µm to �lter out large crustaceans, debris,and other unwanted materials. These �ltered samples were immediately transferred to 500–1,000 ml beakers and protected from arti�cial light bycovering with aluminium foil papers. About 250 ml of the samples were kept in 4 ºC for further physicochemical analyses. Rest of the samples weremaintained at room temperature for studying ciliate diversity, richness and evenness.
Physicochemical AnalysesAtmospheric temperature, temperature inside water (TIW), pH and dissolved oxygen (DO) were measured at the time of collection. Atmospheric andtemperature inside water (TIW) was measured by a standard mercury thermometer, pH was measured by standard pH meter (EUTECH instruments),dissolved oxygen (DO) was determined using the Winkler’s method (APHA 2005; Gautam et al. 2011; Montgomery et al. 1964; Winkler 1888). Electricalconductivity (EC) was measured by an HM digital AP-2 AquaPro Water quality tester (EC tester). Total dissolved solids (TDS) were measured usingWellon digital LcdTds meter Water�lter tester. Water hardness (WH) was determined by the EDTA titration method (Gautam et al. 2011; Goetz and Smith1959). Chloride, sulphate, nitrite, nitrate and phosphate were estimated by standard methods (APHA 2005; Gautam et al. 2011; Rossum and Villarruz1961). Ammonia concentration in the sample was estimated using Sera Ammonium/Ammonia-Test kit (NH4/NH3) according to the manufacturer’sprotocol. All the physicochemical parameters were analysed in triplicates and one control or blank solution was also analysed for each test.
Ciliate Diversity AnalysisThe samples were maintained at room temperature for diversity analysis. Samples were subjected to periodic microscopic examination for about 15–20days. Total species number and abundance per ml were analyzed using samples collected from different sites in triplicates. The ciliate diversity indifferent samples was determined by Shannon-Weiner index and Simpson index (Shannon and Wiener 1949; Simpson 1949). Species richness wascalculated by Margalef’s Index (Margalef, 1966) and species evenness was estimated by the Pielou’s Index (Pielou 1966). The biodiversity calculatorused for the study was available online (http://alyoung.com/labs/biodiversity calculator.html) (Young 2017). Percent relative abundance (RA) was alsocalculated for each species and dominant or rare species were determined from the collected data (Achacoso et al. 2016). Dominant species wereidenti�ed as the species with the relative abundance more than or equal to 5% (RA ≥ 5%) and rare species were identi�ed as species with relativeabundance less than or equal to 0.5% (RA ≤ 0.5%).
Statistical analysisAnalysis of variance (ANOVA) was done to measure the differences among the means of the values of physicochemical parameters as well as thediversity indices (Fisher 1954; Fisher and Yates 1963). Two way ANOVA was done to estimate the difference in the means of physicochemicalparameters and diversity indices of different sites and seasons. A post-hoc analysis Tukey’s test was performed to determine which mean pairs weresigni�cant (Vajravelu et al. 2018). A p value less than 0.05 (≤ 0.05) was considered statistically signi�cant (Fisher 1922; Lehmann 2011; Wooditch et al.2020). Correlations between physicochemical parameters and ciliate communities were estimated using Pearson correlation, Principal componentanalysis (PCA) and non-metric multidimensional scaling (NMDS). This was used to estimate relationships between different seasons and sites in termsof physicochemical and diversity indices (Clarke and Warwick 2001; Hure et al. 2020; Li et al. 2018). All statistical analyses were performed using IBMSPSS 22.0 statistics software.
Results And Discussion
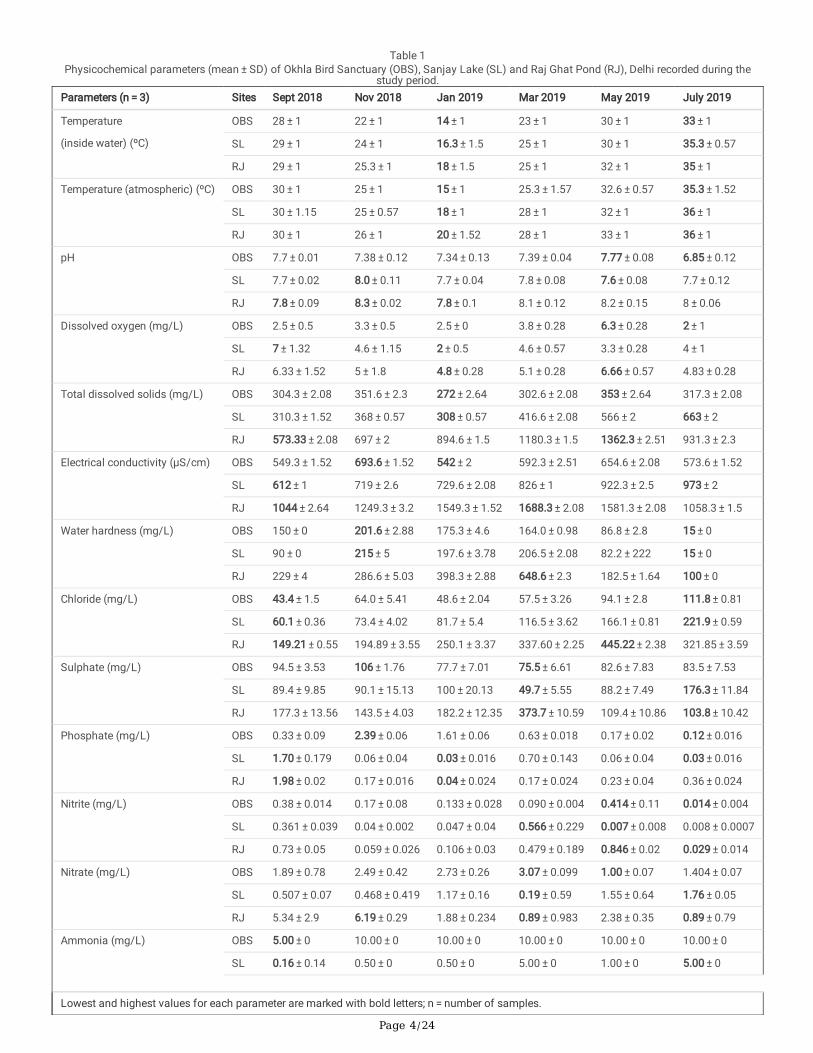
Spatial and temporal variations in physicochemical parametersThe physicochemical parameters were compared site wise (spatial variations) as well as during different seasons (temporal variations). The meanvalues of the physicochemical parameters studied for the three sites Okhla Bird Sanctuary (OBS), Sanjay Lake (SL) and Raj Ghat (RJ) pond for differentseasons are given in Table 1 and Fig. 2.
Page 4/24
Table 1Physicochemical parameters (mean ± SD) of Okhla Bird Sanctuary (OBS), Sanjay Lake (SL) and Raj Ghat Pond (RJ), Delhi recorded during the
study period.Parameters (n = 3) Sites Sept 2018 Nov 2018 Jan 2019 Mar 2019 May 2019 July 2019
Temperature
(inside water) (ºC)
OBS 28 ± 1 22 ± 1 14 ± 1 23 ± 1 30 ± 1 33 ± 1
SL 29 ± 1 24 ± 1 16.3 ± 1.5 25 ± 1 30 ± 1 35.3 ± 0.57
RJ 29 ± 1 25.3 ± 1 18 ± 1.5 25 ± 1 32 ± 1 35 ± 1
Temperature (atmospheric) (ºC) OBS 30 ± 1 25 ± 1 15 ± 1 25.3 ± 1.57 32.6 ± 0.57 35.3 ± 1.52
SL 30 ± 1.15 25 ± 0.57 18 ± 1 28 ± 1 32 ± 1 36 ± 1
RJ 30 ± 1 26 ± 1 20 ± 1.52 28 ± 1 33 ± 1 36 ± 1
pH OBS 7.7 ± 0.01 7.38 ± 0.12 7.34 ± 0.13 7.39 ± 0.04 7.77 ± 0.08 6.85 ± 0.12
SL 7.7 ± 0.02 8.0 ± 0.11 7.7 ± 0.04 7.8 ± 0.08 7.6 ± 0.08 7.7 ± 0.12
RJ 7.8 ± 0.09 8.3 ± 0.02 7.8 ± 0.1 8.1 ± 0.12 8.2 ± 0.15 8 ± 0.06
Dissolved oxygen (mg/L) OBS 2.5 ± 0.5 3.3 ± 0.5 2.5 ± 0 3.8 ± 0.28 6.3 ± 0.28 2 ± 1
SL 7 ± 1.32 4.6 ± 1.15 2 ± 0.5 4.6 ± 0.57 3.3 ± 0.28 4 ± 1
RJ 6.33 ± 1.52 5 ± 1.8 4.8 ± 0.28 5.1 ± 0.28 6.66 ± 0.57 4.83 ± 0.28
Total dissolved solids (mg/L) OBS 304.3 ± 2.08 351.6 ± 2.3 272 ± 2.64 302.6 ± 2.08 353 ± 2.64 317.3 ± 2.08
SL 310.3 ± 1.52 368 ± 0.57 308 ± 0.57 416.6 ± 2.08 566 ± 2 663 ± 2
RJ 573.33 ± 2.08 697 ± 2 894.6 ± 1.5 1180.3 ± 1.5 1362.3 ± 2.51 931.3 ± 2.3
Electrical conductivity (µS/cm) OBS 549.3 ± 1.52 693.6 ± 1.52 542 ± 2 592.3 ± 2.51 654.6 ± 2.08 573.6 ± 1.52
SL 612 ± 1 719 ± 2.6 729.6 ± 2.08 826 ± 1 922.3 ± 2.5 973 ± 2
RJ 1044 ± 2.64 1249.3 ± 3.2 1549.3 ± 1.52 1688.3 ± 2.08 1581.3 ± 2.08 1058.3 ± 1.5
Water hardness (mg/L) OBS 150 ± 0 201.6 ± 2.88 175.3 ± 4.6 164.0 ± 0.98 86.8 ± 2.8 15 ± 0
SL 90 ± 0 215 ± 5 197.6 ± 3.78 206.5 ± 2.08 82.2 ± 222 15 ± 0
RJ 229 ± 4 286.6 ± 5.03 398.3 ± 2.88 648.6 ± 2.3 182.5 ± 1.64 100 ± 0
Chloride (mg/L) OBS 43.4 ± 1.5 64.0 ± 5.41 48.6 ± 2.04 57.5 ± 3.26 94.1 ± 2.8 111.8 ± 0.81
SL 60.1 ± 0.36 73.4 ± 4.02 81.7 ± 5.4 116.5 ± 3.62 166.1 ± 0.81 221.9 ± 0.59
RJ 149.21 ± 0.55 194.89 ± 3.55 250.1 ± 3.37 337.60 ± 2.25 445.22 ± 2.38 321.85 ± 3.59
Sulphate (mg/L) OBS 94.5 ± 3.53 106 ± 1.76 77.7 ± 7.01 75.5 ± 6.61 82.6 ± 7.83 83.5 ± 7.53
SL 89.4 ± 9.85 90.1 ± 15.13 100 ± 20.13 49.7 ± 5.55 88.2 ± 7.49 176.3 ± 11.84
RJ 177.3 ± 13.56 143.5 ± 4.03 182.2 ± 12.35 373.7 ± 10.59 109.4 ± 10.86 103.8 ± 10.42
Phosphate (mg/L) OBS 0.33 ± 0.09 2.39 ± 0.06 1.61 ± 0.06 0.63 ± 0.018 0.17 ± 0.02 0.12 ± 0.016
SL 1.70 ± 0.179 0.06 ± 0.04 0.03 ± 0.016 0.70 ± 0.143 0.06 ± 0.04 0.03 ± 0.016
RJ 1.98 ± 0.02 0.17 ± 0.016 0.04 ± 0.024 0.17 ± 0.024 0.23 ± 0.04 0.36 ± 0.024
Nitrite (mg/L) OBS 0.38 ± 0.014 0.17 ± 0.08 0.133 ± 0.028 0.090 ± 0.004 0.414 ± 0.11 0.014 ± 0.004
SL 0.361 ± 0.039 0.04 ± 0.002 0.047 ± 0.04 0.566 ± 0.229 0.007 ± 0.008 0.008 ± 0.0007
RJ 0.73 ± 0.05 0.059 ± 0.026 0.106 ± 0.03 0.479 ± 0.189 0.846 ± 0.02 0.029 ± 0.014
Nitrate (mg/L) OBS 1.89 ± 0.78 2.49 ± 0.42 2.73 ± 0.26 3.07 ± 0.099 1.00 ± 0.07 1.404 ± 0.07
SL 0.507 ± 0.07 0.468 ± 0.419 1.17 ± 0.16 0.19 ± 0.59 1.55 ± 0.64 1.76 ± 0.05
RJ 5.34 ± 2.9 6.19 ± 0.29 1.88 ± 0.234 0.89 ± 0.983 2.38 ± 0.35 0.89 ± 0.79
Ammonia (mg/L) OBS 5.00 ± 0 10.00 ± 0 10.00 ± 0 10.00 ± 0 10.00 ± 0 10.00 ± 0
SL 0.16 ± 0.14 0.50 ± 0 0.50 ± 0 5.00 ± 0 1.00 ± 0 5.00 ± 0
Lowest and highest values for each parameter are marked with bold letters; n = number of samples.
Page 5/24
Parameters (n = 3) Sites Sept 2018 Nov 2018 Jan 2019 Mar 2019 May 2019 July 2019
RJ 0.25 ± 0 0.50 ± 0 0.50 ± 0 0.50 ± 0 0.50 ± 0 0.50 ± 0
Lowest and highest values for each parameter are marked with bold letters; n = number of samples.
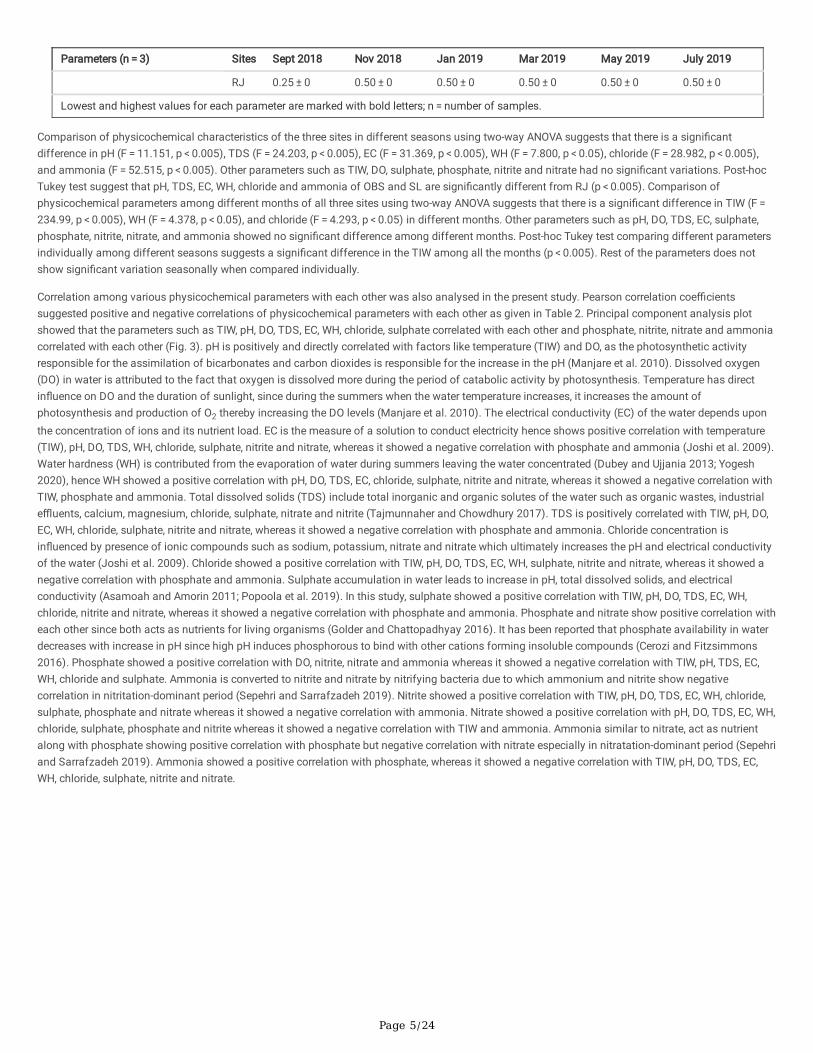
Comparison of physicochemical characteristics of the three sites in different seasons using two-way ANOVA suggests that there is a signi�cantdifference in pH (F = 11.151, p < 0.005), TDS (F = 24.203, p < 0.005), EC (F = 31.369, p < 0.005), WH (F = 7.800, p < 0.05), chloride (F = 28.982, p < 0.005),and ammonia (F = 52.515, p < 0.005). Other parameters such as TIW, DO, sulphate, phosphate, nitrite and nitrate had no signi�cant variations. Post-hocTukey test suggest that pH, TDS, EC, WH, chloride and ammonia of OBS and SL are signi�cantly different from RJ (p < 0.005). Comparison ofphysicochemical parameters among different months of all three sites using two-way ANOVA suggests that there is a signi�cant difference in TIW (F = 234.99, p < 0.005), WH (F = 4.378, p < 0.05), and chloride (F = 4.293, p < 0.05) in different months. Other parameters such as pH, DO, TDS, EC, sulphate,phosphate, nitrite, nitrate, and ammonia showed no signi�cant difference among different months. Post-hoc Tukey test comparing different parametersindividually among different seasons suggests a signi�cant difference in the TIW among all the months (p < 0.005). Rest of the parameters does notshow signi�cant variation seasonally when compared individually.
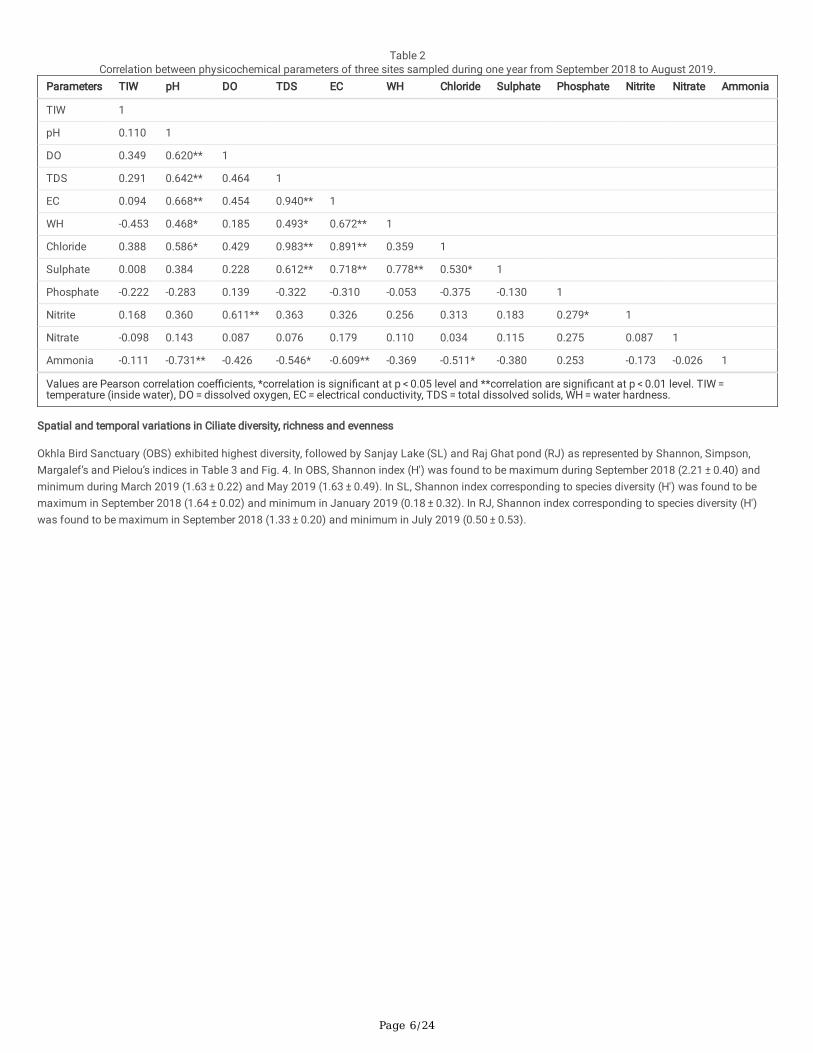
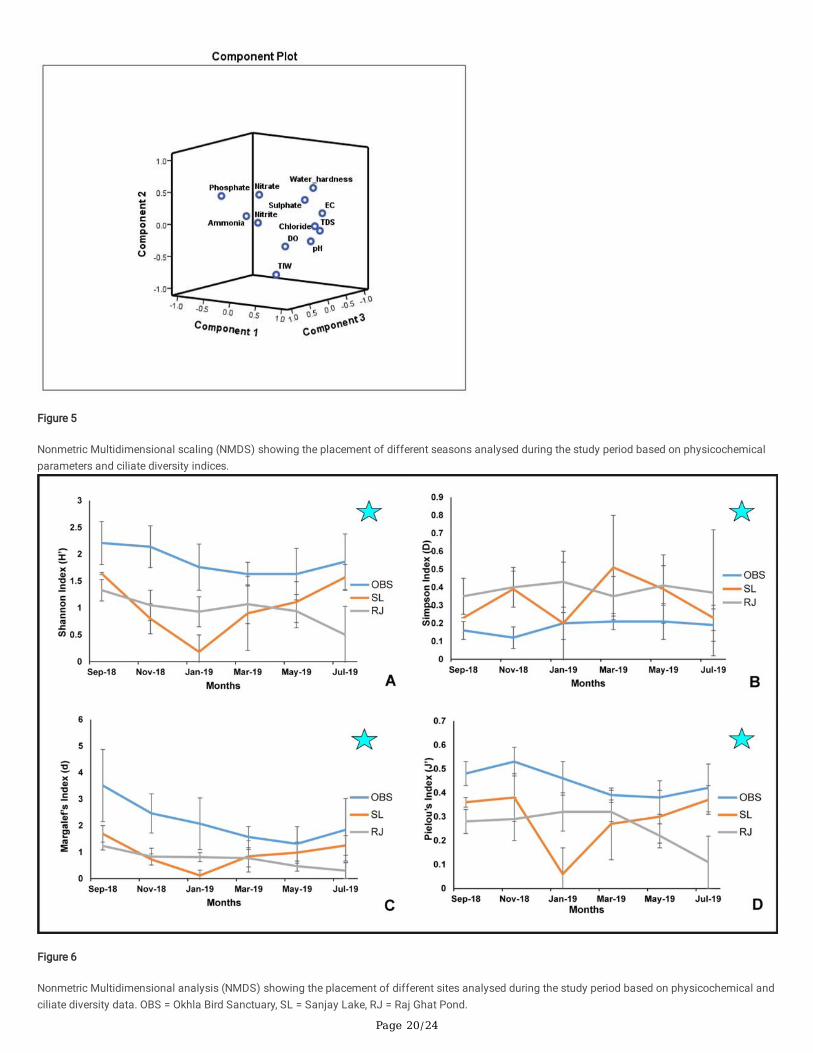
Correlation among various physicochemical parameters with each other was also analysed in the present study. Pearson correlation coe�cientssuggested positive and negative correlations of physicochemical parameters with each other as given in Table 2. Principal component analysis plotshowed that the parameters such as TIW, pH, DO, TDS, EC, WH, chloride, sulphate correlated with each other and phosphate, nitrite, nitrate and ammoniacorrelated with each other (Fig. 3). pH is positively and directly correlated with factors like temperature (TIW) and DO, as the photosynthetic activityresponsible for the assimilation of bicarbonates and carbon dioxides is responsible for the increase in the pH (Manjare et al. 2010). Dissolved oxygen(DO) in water is attributed to the fact that oxygen is dissolved more during the period of catabolic activity by photosynthesis. Temperature has directin�uence on DO and the duration of sunlight, since during the summers when the water temperature increases, it increases the amount ofphotosynthesis and production of O2 thereby increasing the DO levels (Manjare et al. 2010). The electrical conductivity (EC) of the water depends uponthe concentration of ions and its nutrient load. EC is the measure of a solution to conduct electricity hence shows positive correlation with temperature(TIW), pH, DO, TDS, WH, chloride, sulphate, nitrite and nitrate, whereas it showed a negative correlation with phosphate and ammonia (Joshi et al. 2009).Water hardness (WH) is contributed from the evaporation of water during summers leaving the water concentrated (Dubey and Ujjania 2013; Yogesh2020), hence WH showed a positive correlation with pH, DO, TDS, EC, chloride, sulphate, nitrite and nitrate, whereas it showed a negative correlation withTIW, phosphate and ammonia. Total dissolved solids (TDS) include total inorganic and organic solutes of the water such as organic wastes, industriale�uents, calcium, magnesium, chloride, sulphate, nitrate and nitrite (Tajmunnaher and Chowdhury 2017). TDS is positively correlated with TIW, pH, DO,EC, WH, chloride, sulphate, nitrite and nitrate, whereas it showed a negative correlation with phosphate and ammonia. Chloride concentration isin�uenced by presence of ionic compounds such as sodium, potassium, nitrate and nitrate which ultimately increases the pH and electrical conductivityof the water (Joshi et al. 2009). Chloride showed a positive correlation with TIW, pH, DO, TDS, EC, WH, sulphate, nitrite and nitrate, whereas it showed anegative correlation with phosphate and ammonia. Sulphate accumulation in water leads to increase in pH, total dissolved solids, and electricalconductivity (Asamoah and Amorin 2011; Popoola et al. 2019). In this study, sulphate showed a positive correlation with TIW, pH, DO, TDS, EC, WH,chloride, nitrite and nitrate, whereas it showed a negative correlation with phosphate and ammonia. Phosphate and nitrate show positive correlation witheach other since both acts as nutrients for living organisms (Golder and Chattopadhyay 2016). It has been reported that phosphate availability in waterdecreases with increase in pH since high pH induces phosphorous to bind with other cations forming insoluble compounds (Cerozi and Fitzsimmons2016). Phosphate showed a positive correlation with DO, nitrite, nitrate and ammonia whereas it showed a negative correlation with TIW, pH, TDS, EC,WH, chloride and sulphate. Ammonia is converted to nitrite and nitrate by nitrifying bacteria due to which ammonium and nitrite show negativecorrelation in nitritation-dominant period (Sepehri and Sarrafzadeh 2019). Nitrite showed a positive correlation with TIW, pH, DO, TDS, EC, WH, chloride,sulphate, phosphate and nitrate whereas it showed a negative correlation with ammonia. Nitrate showed a positive correlation with pH, DO, TDS, EC, WH,chloride, sulphate, phosphate and nitrite whereas it showed a negative correlation with TIW and ammonia. Ammonia similar to nitrate, act as nutrientalong with phosphate showing positive correlation with phosphate but negative correlation with nitrate especially in nitratation-dominant period (Sepehriand Sarrafzadeh 2019). Ammonia showed a positive correlation with phosphate, whereas it showed a negative correlation with TIW, pH, DO, TDS, EC,WH, chloride, sulphate, nitrite and nitrate.
Page 6/24
Table 2Correlation between physicochemical parameters of three sites sampled during one year from September 2018 to August 2019.
Parameters TIW pH DO TDS EC WH Chloride Sulphate Phosphate Nitrite Nitrate Ammonia
TIW 1
pH 0.110 1
DO 0.349 0.620** 1
TDS 0.291 0.642** 0.464 1
EC 0.094 0.668** 0.454 0.940** 1
WH -0.453 0.468* 0.185 0.493* 0.672** 1
Chloride 0.388 0.586* 0.429 0.983** 0.891** 0.359 1
Sulphate 0.008 0.384 0.228 0.612** 0.718** 0.778** 0.530* 1
Phosphate -0.222 -0.283 0.139 -0.322 -0.310 -0.053 -0.375 -0.130 1
Nitrite 0.168 0.360 0.611** 0.363 0.326 0.256 0.313 0.183 0.279* 1
Nitrate -0.098 0.143 0.087 0.076 0.179 0.110 0.034 0.115 0.275 0.087 1
Ammonia -0.111 -0.731** -0.426 -0.546* -0.609** -0.369 -0.511* -0.380 0.253 -0.173 -0.026 1
Values are Pearson correlation coe�cients, *correlation is signi�cant at p < 0.05 level and **correlation are signi�cant at p < 0.01 level. TIW = temperature (inside water), DO = dissolved oxygen, EC = electrical conductivity, TDS = total dissolved solids, WH = water hardness.
Spatial and temporal variations in Ciliate diversity, richness and evenness
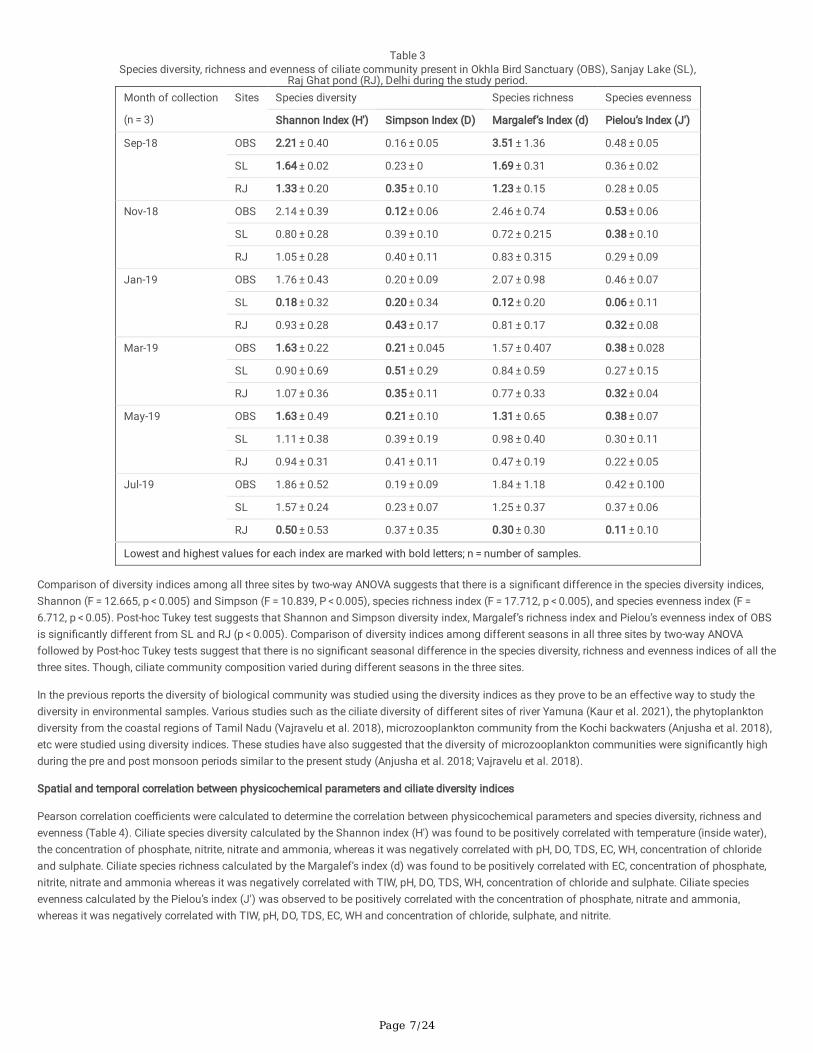
Okhla Bird Sanctuary (OBS) exhibited highest diversity, followed by Sanjay Lake (SL) and Raj Ghat pond (RJ) as represented by Shannon, Simpson,Margalef’s and Pielou’s indices in Table 3 and Fig. 4. In OBS, Shannon index (H') was found to be maximum during September 2018 (2.21 ± 0.40) andminimum during March 2019 (1.63 ± 0.22) and May 2019 (1.63 ± 0.49). In SL, Shannon index corresponding to species diversity (H') was found to bemaximum in September 2018 (1.64 ± 0.02) and minimum in January 2019 (0.18 ± 0.32). In RJ, Shannon index corresponding to species diversity (H')was found to be maximum in September 2018 (1.33 ± 0.20) and minimum in July 2019 (0.50 ± 0.53).
Page 7/24
Table 3Species diversity, richness and evenness of ciliate community present in Okhla Bird Sanctuary (OBS), Sanjay Lake (SL),
Raj Ghat pond (RJ), Delhi during the study period.Month of collection
(n = 3)
Sites Species diversity Species richness Species evenness
Shannon Index (H') Simpson Index (D) Margalef’s Index (d) Pielou’s Index (J')
Sep-18 OBS 2.21 ± 0.40 0.16 ± 0.05 3.51 ± 1.36 0.48 ± 0.05
SL 1.64 ± 0.02 0.23 ± 0 1.69 ± 0.31 0.36 ± 0.02
RJ 1.33 ± 0.20 0.35 ± 0.10 1.23 ± 0.15 0.28 ± 0.05
Nov-18 OBS 2.14 ± 0.39 0.12 ± 0.06 2.46 ± 0.74 0.53 ± 0.06
SL 0.80 ± 0.28 0.39 ± 0.10 0.72 ± 0.215 0.38 ± 0.10
RJ 1.05 ± 0.28 0.40 ± 0.11 0.83 ± 0.315 0.29 ± 0.09
Jan-19 OBS 1.76 ± 0.43 0.20 ± 0.09 2.07 ± 0.98 0.46 ± 0.07
SL 0.18 ± 0.32 0.20 ± 0.34 0.12 ± 0.20 0.06 ± 0.11
RJ 0.93 ± 0.28 0.43 ± 0.17 0.81 ± 0.17 0.32 ± 0.08
Mar-19 OBS 1.63 ± 0.22 0.21 ± 0.045 1.57 ± 0.407 0.38 ± 0.028
SL 0.90 ± 0.69 0.51 ± 0.29 0.84 ± 0.59 0.27 ± 0.15
RJ 1.07 ± 0.36 0.35 ± 0.11 0.77 ± 0.33 0.32 ± 0.04
May-19 OBS 1.63 ± 0.49 0.21 ± 0.10 1.31 ± 0.65 0.38 ± 0.07
SL 1.11 ± 0.38 0.39 ± 0.19 0.98 ± 0.40 0.30 ± 0.11
RJ 0.94 ± 0.31 0.41 ± 0.11 0.47 ± 0.19 0.22 ± 0.05
Jul-19 OBS 1.86 ± 0.52 0.19 ± 0.09 1.84 ± 1.18 0.42 ± 0.100
SL 1.57 ± 0.24 0.23 ± 0.07 1.25 ± 0.37 0.37 ± 0.06
RJ 0.50 ± 0.53 0.37 ± 0.35 0.30 ± 0.30 0.11 ± 0.10
Lowest and highest values for each index are marked with bold letters; n = number of samples.
Comparison of diversity indices among all three sites by two-way ANOVA suggests that there is a signi�cant difference in the species diversity indices,Shannon (F = 12.665, p < 0.005) and Simpson (F = 10.839, P < 0.005), species richness index (F = 17.712, p < 0.005), and species evenness index (F = 6.712, p < 0.05). Post-hoc Tukey test suggests that Shannon and Simpson diversity index, Margalef’s richness index and Pielou’s evenness index of OBSis signi�cantly different from SL and RJ (p < 0.005). Comparison of diversity indices among different seasons in all three sites by two-way ANOVAfollowed by Post-hoc Tukey tests suggest that there is no signi�cant seasonal difference in the species diversity, richness and evenness indices of all thethree sites. Though, ciliate community composition varied during different seasons in the three sites.
In the previous reports the diversity of biological community was studied using the diversity indices as they prove to be an effective way to study thediversity in environmental samples. Various studies such as the ciliate diversity of different sites of river Yamuna (Kaur et al. 2021), the phytoplanktondiversity from the coastal regions of Tamil Nadu (Vajravelu et al. 2018), microzooplankton community from the Kochi backwaters (Anjusha et al. 2018),etc were studied using diversity indices. These studies have also suggested that the diversity of microzooplankton communities were signi�cantly highduring the pre and post monsoon periods similar to the present study (Anjusha et al. 2018; Vajravelu et al. 2018).
Spatial and temporal correlation between physicochemical parameters and ciliate diversity indices
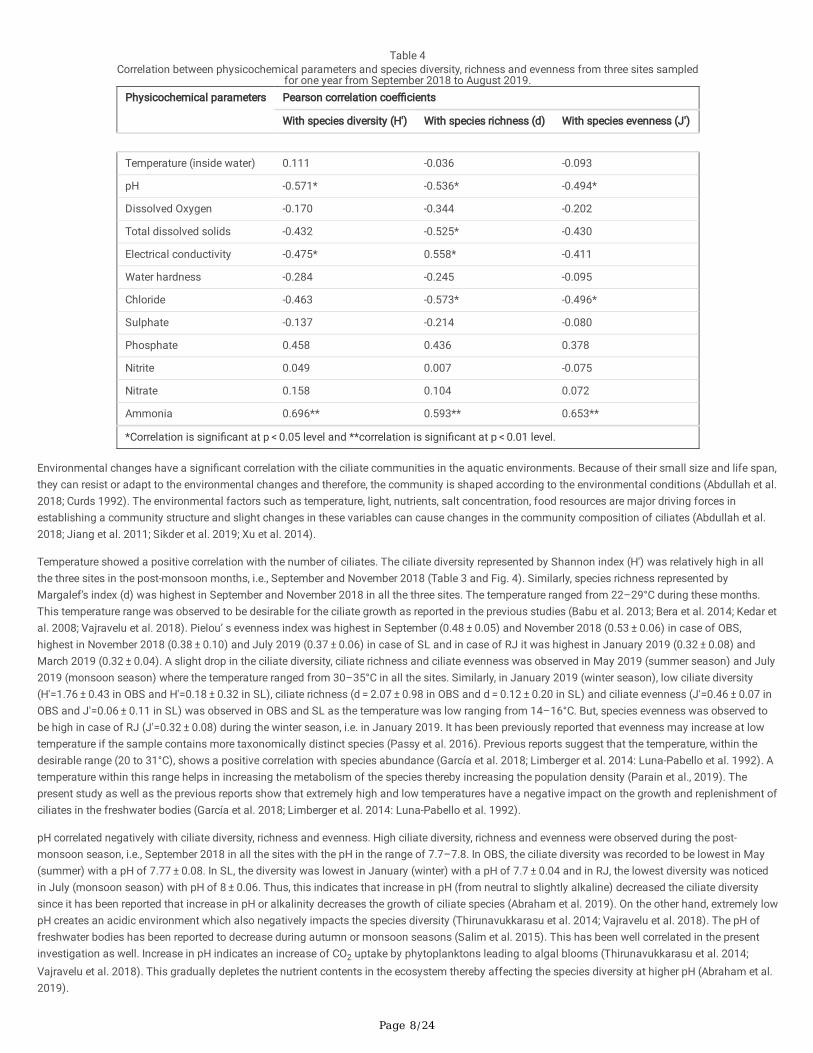
Pearson correlation coe�cients were calculated to determine the correlation between physicochemical parameters and species diversity, richness andevenness (Table 4). Ciliate species diversity calculated by the Shannon index (H') was found to be positively correlated with temperature (inside water),the concentration of phosphate, nitrite, nitrate and ammonia, whereas it was negatively correlated with pH, DO, TDS, EC, WH, concentration of chlorideand sulphate. Ciliate species richness calculated by the Margalef’s index (d) was found to be positively correlated with EC, concentration of phosphate,nitrite, nitrate and ammonia whereas it was negatively correlated with TIW, pH, DO, TDS, WH, concentration of chloride and sulphate. Ciliate speciesevenness calculated by the Pielou’s index (J') was observed to be positively correlated with the concentration of phosphate, nitrate and ammonia,whereas it was negatively correlated with TIW, pH, DO, TDS, EC, WH and concentration of chloride, sulphate, and nitrite.
Page 8/24
Table 4Correlation between physicochemical parameters and species diversity, richness and evenness from three sites sampled
for one year from September 2018 to August 2019.Physicochemical parameters Pearson correlation coe�cients
With species diversity (H') With species richness (d) With species evenness (J')
Temperature (inside water) 0.111 -0.036 -0.093
pH -0.571* -0.536* -0.494*
Dissolved Oxygen -0.170 -0.344 -0.202
Total dissolved solids -0.432 -0.525* -0.430
Electrical conductivity -0.475* 0.558* -0.411
Water hardness -0.284 -0.245 -0.095
Chloride -0.463 -0.573* -0.496*
Sulphate -0.137 -0.214 -0.080
Phosphate 0.458 0.436 0.378
Nitrite 0.049 0.007 -0.075
Nitrate 0.158 0.104 0.072
Ammonia 0.696** 0.593** 0.653**
*Correlation is signi�cant at p < 0.05 level and **correlation is signi�cant at p < 0.01 level.
Environmental changes have a signi�cant correlation with the ciliate communities in the aquatic environments. Because of their small size and life span,they can resist or adapt to the environmental changes and therefore, the community is shaped according to the environmental conditions (Abdullah et al.2018; Curds 1992). The environmental factors such as temperature, light, nutrients, salt concentration, food resources are major driving forces inestablishing a community structure and slight changes in these variables can cause changes in the community composition of ciliates (Abdullah et al.2018; Jiang et al. 2011; Sikder et al. 2019; Xu et al. 2014).
Temperature showed a positive correlation with the number of ciliates. The ciliate diversity represented by Shannon index (H') was relatively high in allthe three sites in the post-monsoon months, i.e., September and November 2018 (Table 3 and Fig. 4). Similarly, species richness represented byMargalef’s index (d) was highest in September and November 2018 in all the three sites. The temperature ranged from 22–29°C during these months.This temperature range was observed to be desirable for the ciliate growth as reported in the previous studies (Babu et al. 2013; Bera et al. 2014; Kedar etal. 2008; Vajravelu et al. 2018). Pielou’ s evenness index was highest in September (0.48 ± 0.05) and November 2018 (0.53 ± 0.06) in case of OBS,highest in November 2018 (0.38 ± 0.10) and July 2019 (0.37 ± 0.06) in case of SL and in case of RJ it was highest in January 2019 (0.32 ± 0.08) andMarch 2019 (0.32 ± 0.04). A slight drop in the ciliate diversity, ciliate richness and ciliate evenness was observed in May 2019 (summer season) and July2019 (monsoon season) where the temperature ranged from 30–35°C in all the sites. Similarly, in January 2019 (winter season), low ciliate diversity(H'=1.76 ± 0.43 in OBS and H'=0.18 ± 0.32 in SL), ciliate richness (d = 2.07 ± 0.98 in OBS and d = 0.12 ± 0.20 in SL) and ciliate evenness (J'=0.46 ± 0.07 inOBS and J'=0.06 ± 0.11 in SL) was observed in OBS and SL as the temperature was low ranging from 14–16°C. But, species evenness was observed tobe high in case of RJ (J'=0.32 ± 0.08) during the winter season, i.e. in January 2019. It has been previously reported that evenness may increase at lowtemperature if the sample contains more taxonomically distinct species (Passy et al. 2016). Previous reports suggest that the temperature, within thedesirable range (20 to 31°C), shows a positive correlation with species abundance (García et al. 2018; Limberger et al. 2014: Luna-Pabello et al. 1992). Atemperature within this range helps in increasing the metabolism of the species thereby increasing the population density (Parain et al., 2019). Thepresent study as well as the previous reports show that extremely high and low temperatures have a negative impact on the growth and replenishment ofciliates in the freshwater bodies (García et al. 2018; Limberger et al. 2014: Luna-Pabello et al. 1992).
pH correlated negatively with ciliate diversity, richness and evenness. High ciliate diversity, richness and evenness were observed during the post-monsoon season, i.e., September 2018 in all the sites with the pH in the range of 7.7–7.8. In OBS, the ciliate diversity was recorded to be lowest in May(summer) with a pH of 7.77 ± 0.08. In SL, the diversity was lowest in January (winter) with a pH of 7.7 ± 0.04 and in RJ, the lowest diversity was noticedin July (monsoon season) with pH of 8 ± 0.06. Thus, this indicates that increase in pH (from neutral to slightly alkaline) decreased the ciliate diversitysince it has been reported that increase in pH or alkalinity decreases the growth of ciliate species (Abraham et al. 2019). On the other hand, extremely lowpH creates an acidic environment which also negatively impacts the species diversity (Thirunavukkarasu et al. 2014; Vajravelu et al. 2018). The pH offreshwater bodies has been reported to decrease during autumn or monsoon seasons (Salim et al. 2015). This has been well correlated in the presentinvestigation as well. Increase in pH indicates an increase of CO2 uptake by phytoplanktons leading to algal blooms (Thirunavukkarasu et al. 2014;Vajravelu et al. 2018). This gradually depletes the nutrient contents in the ecosystem thereby affecting the species diversity at higher pH (Abraham et al.2019).
Page 9/24
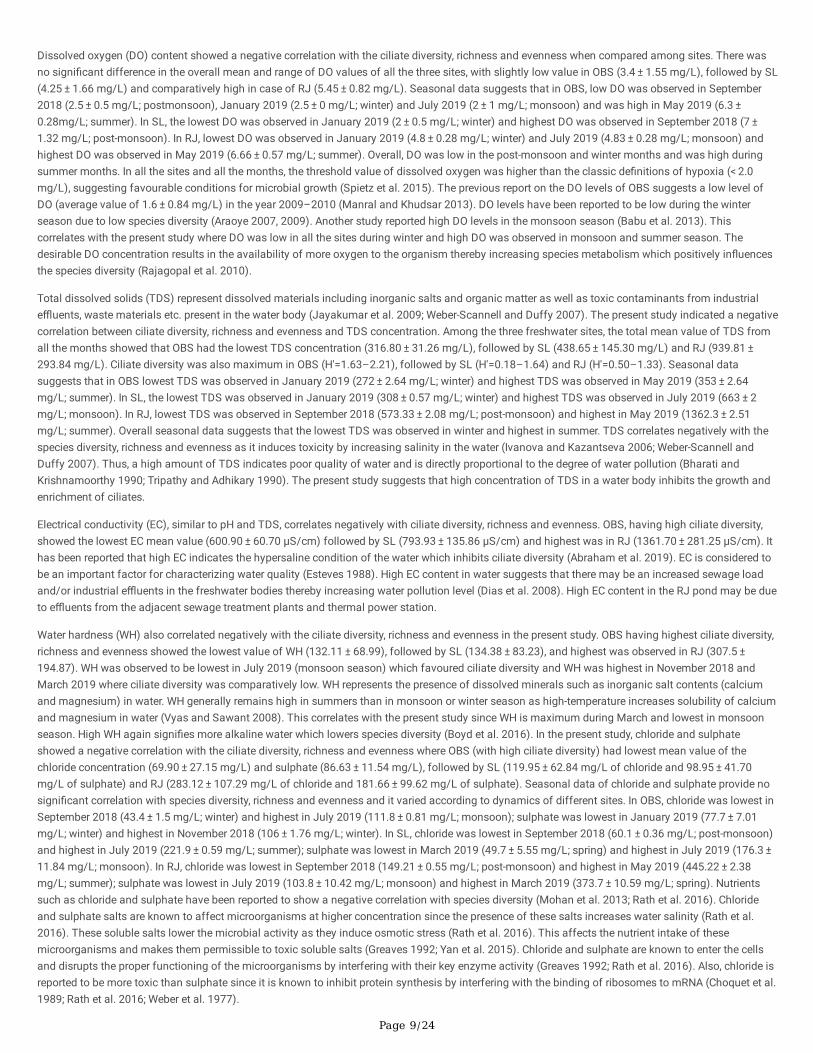
Dissolved oxygen (DO) content showed a negative correlation with the ciliate diversity, richness and evenness when compared among sites. There wasno signi�cant difference in the overall mean and range of DO values of all the three sites, with slightly low value in OBS (3.4 ± 1.55 mg/L), followed by SL(4.25 ± 1.66 mg/L) and comparatively high in case of RJ (5.45 ± 0.82 mg/L). Seasonal data suggests that in OBS, low DO was observed in September2018 (2.5 ± 0.5 mg/L; postmonsoon), January 2019 (2.5 ± 0 mg/L; winter) and July 2019 (2 ± 1 mg/L; monsoon) and was high in May 2019 (6.3 ± 0.28mg/L; summer). In SL, the lowest DO was observed in January 2019 (2 ± 0.5 mg/L; winter) and highest DO was observed in September 2018 (7 ± 1.32 mg/L; post-monsoon). In RJ, lowest DO was observed in January 2019 (4.8 ± 0.28 mg/L; winter) and July 2019 (4.83 ± 0.28 mg/L; monsoon) andhighest DO was observed in May 2019 (6.66 ± 0.57 mg/L; summer). Overall, DO was low in the post-monsoon and winter months and was high duringsummer months. In all the sites and all the months, the threshold value of dissolved oxygen was higher than the classic de�nitions of hypoxia (< 2.0mg/L), suggesting favourable conditions for microbial growth (Spietz et al. 2015). The previous report on the DO levels of OBS suggests a low level ofDO (average value of 1.6 ± 0.84 mg/L) in the year 2009–2010 (Manral and Khudsar 2013). DO levels have been reported to be low during the winterseason due to low species diversity (Araoye 2007, 2009). Another study reported high DO levels in the monsoon season (Babu et al. 2013). Thiscorrelates with the present study where DO was low in all the sites during winter and high DO was observed in monsoon and summer season. Thedesirable DO concentration results in the availability of more oxygen to the organism thereby increasing species metabolism which positively in�uencesthe species diversity (Rajagopal et al. 2010).
Total dissolved solids (TDS) represent dissolved materials including inorganic salts and organic matter as well as toxic contaminants from industriale�uents, waste materials etc. present in the water body (Jayakumar et al. 2009; Weber-Scannell and Duffy 2007). The present study indicated a negativecorrelation between ciliate diversity, richness and evenness and TDS concentration. Among the three freshwater sites, the total mean value of TDS fromall the months showed that OBS had the lowest TDS concentration (316.80 ± 31.26 mg/L), followed by SL (438.65 ± 145.30 mg/L) and RJ (939.81 ± 293.84 mg/L). Ciliate diversity was also maximum in OBS (H'=1.63–2.21), followed by SL (H'=0.18–1.64) and RJ (H'=0.50–1.33). Seasonal datasuggests that in OBS lowest TDS was observed in January 2019 (272 ± 2.64 mg/L; winter) and highest TDS was observed in May 2019 (353 ± 2.64mg/L; summer). In SL, the lowest TDS was observed in January 2019 (308 ± 0.57 mg/L; winter) and highest TDS was observed in July 2019 (663 ± 2mg/L; monsoon). In RJ, lowest TDS was observed in September 2018 (573.33 ± 2.08 mg/L; post-monsoon) and highest in May 2019 (1362.3 ± 2.51mg/L; summer). Overall seasonal data suggests that the lowest TDS was observed in winter and highest in summer. TDS correlates negatively with thespecies diversity, richness and evenness as it induces toxicity by increasing salinity in the water (Ivanova and Kazantseva 2006; Weber-Scannell andDuffy 2007). Thus, a high amount of TDS indicates poor quality of water and is directly proportional to the degree of water pollution (Bharati andKrishnamoorthy 1990; Tripathy and Adhikary 1990). The present study suggests that high concentration of TDS in a water body inhibits the growth andenrichment of ciliates.
Electrical conductivity (EC), similar to pH and TDS, correlates negatively with ciliate diversity, richness and evenness. OBS, having high ciliate diversity,showed the lowest EC mean value (600.90 ± 60.70 µS/cm) followed by SL (793.93 ± 135.86 µS/cm) and highest was in RJ (1361.70 ± 281.25 µS/cm). Ithas been reported that high EC indicates the hypersaline condition of the water which inhibits ciliate diversity (Abraham et al. 2019). EC is considered tobe an important factor for characterizing water quality (Esteves 1988). High EC content in water suggests that there may be an increased sewage loadand/or industrial e�uents in the freshwater bodies thereby increasing water pollution level (Dias et al. 2008). High EC content in the RJ pond may be dueto e�uents from the adjacent sewage treatment plants and thermal power station.
Water hardness (WH) also correlated negatively with the ciliate diversity, richness and evenness in the present study. OBS having highest ciliate diversity,richness and evenness showed the lowest value of WH (132.11 ± 68.99), followed by SL (134.38 ± 83.23), and highest was observed in RJ (307.5 ± 194.87). WH was observed to be lowest in July 2019 (monsoon season) which favoured ciliate diversity and WH was highest in November 2018 andMarch 2019 where ciliate diversity was comparatively low. WH represents the presence of dissolved minerals such as inorganic salt contents (calciumand magnesium) in water. WH generally remains high in summers than in monsoon or winter season as high-temperature increases solubility of calciumand magnesium in water (Vyas and Sawant 2008). This correlates with the present study since WH is maximum during March and lowest in monsoonseason. High WH again signi�es more alkaline water which lowers species diversity (Boyd et al. 2016). In the present study, chloride and sulphateshowed a negative correlation with the ciliate diversity, richness and evenness where OBS (with high ciliate diversity) had lowest mean value of thechloride concentration (69.90 ± 27.15 mg/L) and sulphate (86.63 ± 11.54 mg/L), followed by SL (119.95 ± 62.84 mg/L of chloride and 98.95 ± 41.70mg/L of sulphate) and RJ (283.12 ± 107.29 mg/L of chloride and 181.66 ± 99.62 mg/L of sulphate). Seasonal data of chloride and sulphate provide nosigni�cant correlation with species diversity, richness and evenness and it varied according to dynamics of different sites. In OBS, chloride was lowest inSeptember 2018 (43.4 ± 1.5 mg/L; winter) and highest in July 2019 (111.8 ± 0.81 mg/L; monsoon); sulphate was lowest in January 2019 (77.7 ± 7.01mg/L; winter) and highest in November 2018 (106 ± 1.76 mg/L; winter). In SL, chloride was lowest in September 2018 (60.1 ± 0.36 mg/L; post-monsoon)and highest in July 2019 (221.9 ± 0.59 mg/L; summer); sulphate was lowest in March 2019 (49.7 ± 5.55 mg/L; spring) and highest in July 2019 (176.3 ± 11.84 mg/L; monsoon). In RJ, chloride was lowest in September 2018 (149.21 ± 0.55 mg/L; post-monsoon) and highest in May 2019 (445.22 ± 2.38mg/L; summer); sulphate was lowest in July 2019 (103.8 ± 10.42 mg/L; monsoon) and highest in March 2019 (373.7 ± 10.59 mg/L; spring). Nutrientssuch as chloride and sulphate have been reported to show a negative correlation with species diversity (Mohan et al. 2013; Rath et al. 2016). Chlorideand sulphate salts are known to affect microorganisms at higher concentration since the presence of these salts increases water salinity (Rath et al.2016). These soluble salts lower the microbial activity as they induce osmotic stress (Rath et al. 2016). This affects the nutrient intake of thesemicroorganisms and makes them permissible to toxic soluble salts (Greaves 1992; Yan et al. 2015). Chloride and sulphate are known to enter the cellsand disrupts the proper functioning of the microorganisms by interfering with their key enzyme activity (Greaves 1992; Rath et al. 2016). Also, chloride isreported to be more toxic than sulphate since it is known to inhibit protein synthesis by interfering with the binding of ribosomes to mRNA (Choquet et al.1989; Rath et al. 2016; Weber et al. 1977).
Page 10/24
The present investigation showed a positive correlation between ciliate diversity and phosphate, nitrite, nitrate and ammonia. Among the threefreshwater sites, OBS, which had highest ciliate diversity, showed a signi�cantly high concentration of phosphate (0.87 ± 0.92 mg/L) and ammonia (9.16 ± 2.04 mg/L) as compared to SL (0.43 ± 0.67 mg/L of phosphate and 2.02 ± 2.31 mg/L of ammonia) and RJ (0.49 ± 0.73 mg/L of phosphate and 0.45 ± 0.102 mg/L of ammonia). In all the sites, phosphate was highest in September 2018 (post-monsoon) and November 2018 (autumn) and ammonia waslow in September 2018. Nitrite and nitrate showed no speci�c pattern seasonally it varied according to the dynamics of the site. Phosphate andinorganic nitrogen (nitrite, nitrate and ammonia) are known to correlate positively with species diversity by increasing ciliate biomass since they act asnutrients and help in the growth of microorganisms (Dopheide et al. 2009; Wang et al. 2014). Phosphate and inorganic nitrogen have been reported todirectly favour the growth of photosynthetic ciliates and indirectly favour the growth of heterotrophic ciliates (Wang et al. 2014). The inorganic nitrogenparameters (nitrite, nitrate and ammonia) are generally present in abundance in areas having nitrifying bacteria which act as primary feeders for ciliates(Prast et al. 2007).
Physicochemical and ciliate diversity data for all the seasons and all the sites were combined and plotted using nonmetric multidimensional scaling(NMDS) (Fig. 5). The plot and the distance values suggest that the physicochemical parameters and diversity data estimated for September 2018 aredistinct from the other months, hence lies separated at the upper right quadrant of the plot. May 2019 and July 2019 lie at the lower right quadrant of theplot. January 2019 and November 2019 lie at the lower left quadrant. March 2019 lies separately at the lower left quadrant. The distance values alsosuggest that the characteristics of September 2018 were distinct from the other months.
Physicochemical and ciliate diversity data for all the sites studied for different months were combined and plotted using nonmetric multidimensionalscaling (NMDS)
(Fig. 6). The three sites OBS, SL and RJ were placed separately in different quadrants on the plot. The distances of sites with each other suggest that thephysicochemical parameters and ciliate diversity data of OBS were closely related to SL than with the RJ. SL and RJ were more closely related to eachother than with OBS.
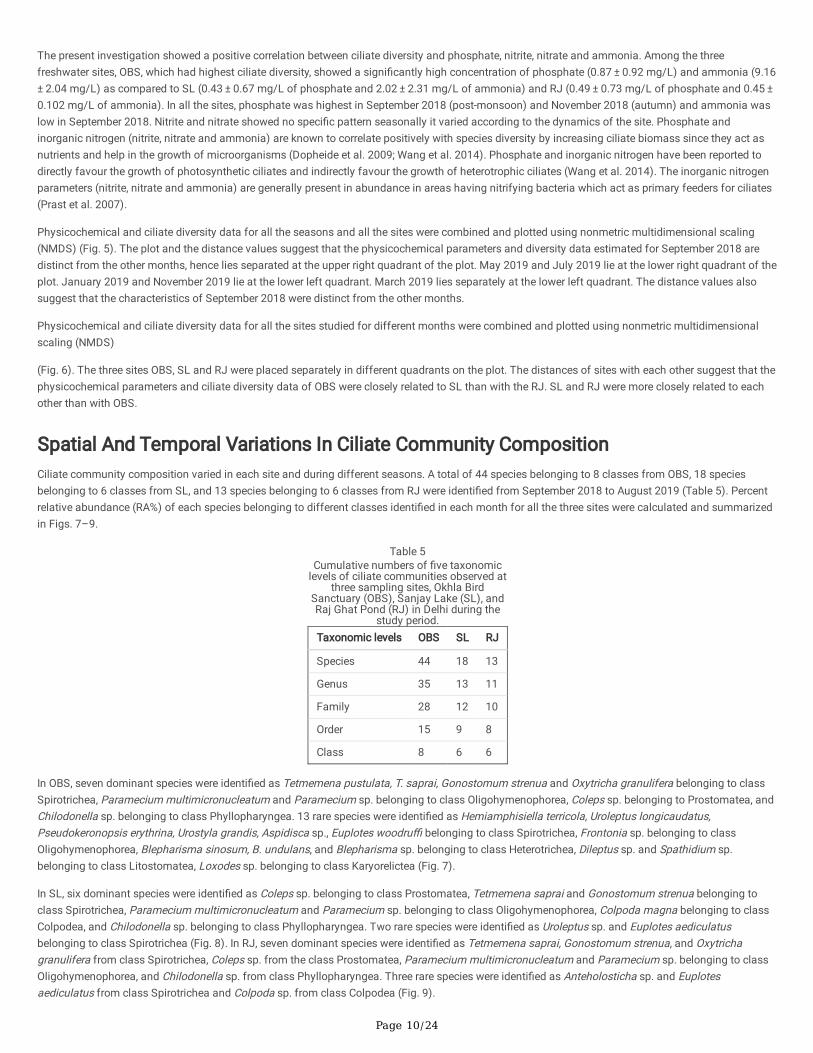
Spatial And Temporal Variations In Ciliate Community CompositionCiliate community composition varied in each site and during different seasons. A total of 44 species belonging to 8 classes from OBS, 18 speciesbelonging to 6 classes from SL, and 13 species belonging to 6 classes from RJ were identi�ed from September 2018 to August 2019 (Table 5). Percentrelative abundance (RA%) of each species belonging to different classes identi�ed in each month for all the three sites were calculated and summarizedin Figs. 7–9.
Table 5Cumulative numbers of �ve taxonomic
levels of ciliate communities observed atthree sampling sites, Okhla Bird
Sanctuary (OBS), Sanjay Lake (SL), andRaj Ghat Pond (RJ) in Delhi during the
study period.Taxonomic levels OBS SL RJ
Species 44 18 13
Genus 35 13 11
Family 28 12 10
Order 15 9 8
Class 8 6 6
In OBS, seven dominant species were identi�ed as Tetmemena pustulata, T. saprai, Gonostomum strenua and Oxytricha granulifera belonging to classSpirotrichea, Paramecium multimicronucleatum and Paramecium sp. belonging to class Oligohymenophorea, Coleps sp. belonging to Prostomatea, andChilodonella sp. belonging to class Phyllopharyngea. 13 rare species were identi�ed as Hemiamphisiella terricola, Uroleptus longicaudatus,Pseudokeronopsis erythrina, Urostyla grandis, Aspidisca sp., Euplotes woodru� belonging to class Spirotrichea, Frontonia sp. belonging to classOligohymenophorea, Blepharisma sinosum, B. undulans, and Blepharisma sp. belonging to class Heterotrichea, Dileptus sp. and Spathidium sp.belonging to class Litostomatea, Loxodes sp. belonging to class Karyorelictea (Fig. 7).
In SL, six dominant species were identi�ed as Coleps sp. belonging to class Prostomatea, Tetmemena saprai and Gonostomum strenua belonging toclass Spirotrichea, Paramecium multimicronucleatum and Paramecium sp. belonging to class Oligohymenophorea, Colpoda magna belonging to classColpodea, and Chilodonella sp. belonging to class Phyllopharyngea. Two rare species were identi�ed as Uroleptus sp. and Euplotes aediculatusbelonging to class Spirotrichea (Fig. 8). In RJ, seven dominant species were identi�ed as Tetmemena saprai, Gonostomum strenua, and Oxytrichagranulifera from class Spirotrichea, Coleps sp. from the class Prostomatea, Paramecium multimicronucleatum and Paramecium sp. belonging to classOligohymenophorea, and Chilodonella sp. from class Phyllopharyngea. Three rare species were identi�ed as Anteholosticha sp. and Euplotesaediculatus from class Spirotrichea and Colpoda sp. from class Colpodea (Fig. 9).
Page 11/24
In OBS, species with maximum relative abundance belonged to the class Spirotrichea (47%) followed by class Oligohymenophorea (20%), Prostomatea(16%), Phyllopharyngea (6%), Colpodea (5%), Heterotrichea (3%), Litostomatea (2%) and Karyorelictea (1%). In SL, species with maximum relativeabundance belonged to the class Prostomatea (38%), followed by Spirotrichea (23%), Oligohymenophorea (21%), Colpodea (7%), Phyllopharyngea (6%),Litostomatea (5%). In RJ, species with maximum relative abundance belonged to the class Spirotrichea (38%), followed by Prostomatea (37%),Oligohymenophorea (17%), Phyllopharyngea (5%), Heterotrichea (2%), and Colpodea (1%) (Fig. 10).
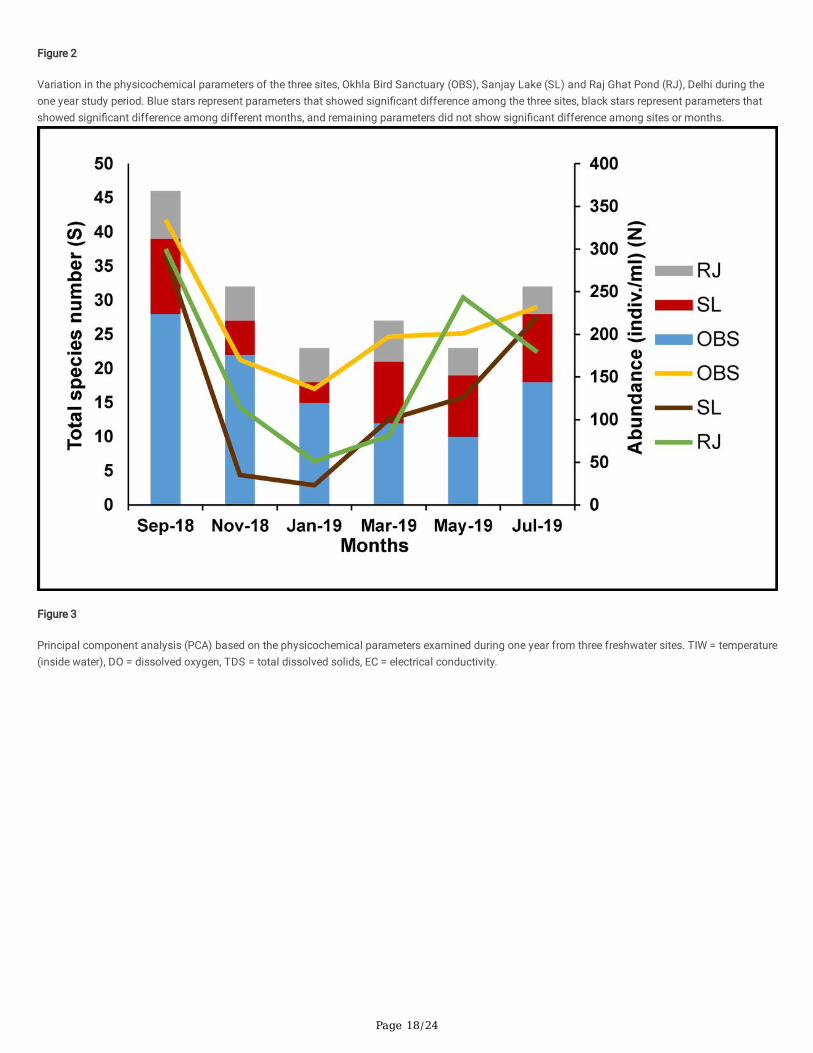
In the present study, signi�cant temporal variations in the ciliate composition was observed i.e. some ciliates were observed throughout the year andsome were observed only once or twice in the year. Their temporal variations were analysed based on the number of species and their percent relativeabundance for each site and each month (Figs. 7–9). Total abundance corresponds to the approximate number of individuals observed per ml whichwas calculated for each site for each month and summarised in Fig. 11. In OBS, the highest number of species were observed in September 2018 (29species), followed by November 2018 (23 species), July 2019 (18 species), January 2019 (15 species), March 2019 (12 species), and May 2019 (10species). Species that were observed in all the months (6 out of 6 months) were from the genera Aponotohymena, Tetmemena and Paramecium.Species observed in 5 out of 6 months sampled belonged to the genera Oxytricha, Gonostomum, and Coleps. In SL, the highest number of species wereobserved in September 2018 (11 species), followed by March 2019 (9 species), November 2018 (5 species), July 2019 (5 species), May 2019 (4 species),and January 2019 (3 species). Some species that were observed in most of the sampled months i.e. 6 out of 6 months was Coleps, Tetmemena (5 out of6 months) and Gonostomum (4 out of 6 months). In RJ, the highest number of species was observed in September 2018 (7 species), followed by March2019 (6 species), November 2018 (5 species), January 2019 (5 species), July 2019 (5 species) and May 2019 (4 species). Species that were observed inmost of the months were members of the genera Coleps (6 out of 6 months). Gonostomum (4 out of 6 months), and Paramecium (4 out of 6 months). Inall the three sites, the total number of species showed a peak in September 2018 and there was a signi�cant drop in January 2019 and May 2019.Abundance was observed to be highest in September 2018 and lowest in January 2019 (Fig. 11).
This study evidently shows that ciliate diversity and composition depends on season as well as dynamics of each site. Also, the major contributors tothe community structure were ciliates belonging to the classes Spirotrichea, Oligohymenophorea, and Prostomatea which were predominantly present inthe monsoon (July 2019) and post-monsoon seasons (September 2018 and November 2018). The ciliates of these classes were comparatively low inthe summer (May 2019) and winter (January 2019) seasons in all the three sites. The present study is similar to the previous reports which indicated thatthe ciliate abundance was low in the summer and winter seasons (Sikder and Xu 2020; Zhang and Xu 2015; Zhang et al. 2013). This could be due to theextreme water temperature and/or inadequate food supply (Sikder and Xu 2020). Class Spirotrichea was predominantly observed in all the threesampling sites which is similar to other reported studies from Delhi (Kaur et al. 2021), Tamil Nadu (Basuri et al. 2020), Tunisia (Dhib et al. 2013), and theYellow Sea, China (Sikder and Xu 2020). OBS site had the highest percentage of spirotrich ciliates as compared to the other two sites. Spirotrich ciliates,especially urostylid group was observed only in OBS. Growth of Spirotrich ciliates including urostylids is generally encouraged in sites enriched withnutrients such as phosphate and inorganic nitrogen contents (Basuri et al. 2020; Dhib et al. 2013). Since OBS site had high concentration of phosphate(0.87 ± 0.92 mg/L) and ammonia (9.16 ± 2.04 mg/L), that could be related to high percent of spirotrich ciliates.
Blepharisma spp. was observed only in OBS as it has been reported earlier that Blepharisma spp. is generally present in low or neutral pH (7.40 ± 0.32)and shows sensitivity towards the alkaline conditions. It has been reported in earlier studies that the growth of Blepharisma spp. is favoured in the pHrange of 7.2–7.8 (Repak 1991). OBS had neutral pH (7.40 ± 0.32) favouring the growth of Blepharisma spp. whereas SL and RJ had slightly alkaline pH.Tetmemena spp. and Gonostomum strenua, had high relative abundance in comparison to other species belonging to class Spirotrichea. In classOligohymenophorea, the genus Paramecium was observed to be present predominantly. These ciliate species were observed to be present in all theseasons and in all three freshwater sites but predominantly noticed to be present in September 2018 and July 2019 which are the post monsoon andmonsoon seasons, respectively. The high abundance of Paramecium spp. in September 2018 was similar to previously reported study whereParamecium spp. was found to be abundantly present during September (Dhib et al. 2013). It has been observed that during these two months (July andSeptember), temperature, pH and electrical conductivity are desirable in all the three sites. These factors could have encouraged the growth ofTetmemena spp., Gonostomum strenua and Paramecium spp.
Loxodes sp. belonging to class Karyorelictea was found only in the OBS site predominantly in January 2019. This could be because of low DOconcentration at the OBS site (2–6 mg/L) as compared to the other two sites (2–7 mg/L in SL and 5–7 mg/L in RJ). Loxodes sp. belonged to acommunity called “Metopetum” (Foissner and Berger 1996). The community “Metopetum” contains anaerobic organisms which do not havemitochondria, thus, indicating that Loxodes sp. prefers low oxygen content for its survival (Czapik 1982; Dias et al. 2008). Since, OBS site had low DOconcentration as compared to the other two sites, this may have favoured the growth of Loxodes sp.
Coleps sp. of class Prostomatea and Colpoda sp. of class Colpodea were observed to be present predominantly in all the three sites in January 2019(winter). The survival of Colpoda sp. in adverse condition (very low temperature and high pH) could be due to their ability to form cyst very frequently(Kaur et al. 2021; Bhamare et al. 2012; Funadani et al. 2013, 2016). Similarly, the survival of Coleps sp. in extreme conditions could be due to thepresence of the calcium carbonate containing alveolar plates assembled to form an armor on its body (Buonanno et al. 2014; Lemloh et al. 2013).Coleps sp. and Colpoda sp. were observed to be more abundant in SL and RJ site as compared to the OBS site, suggesting their ability to survive withless favourable conditions.
Chilodonella sp. of class Phyllopharyngea was observed to be present predominantly in all the three freshwater sites in May 2019 (summer). It has beenreported that Chilodonella sp. exhibits a wide temperature tolerance and can survive well in warmer climates (Gomes et al. 2016). Chilodonella sp. existsas parasitic and free-living ciliates thus, showing high tolerance towards warmer climates (Gomes et al. 2016).
Page 12/24
ConclusionThree-dimensional approach in the present study, offers an account of the spatial and temporal variations in physicochemical gradients and theircorrelation with the ciliate diversity, richness and evenness. This study indicates the inter-relationship of desirable conditions for increased speciesdiversity, richness and abundance as temperature (22–29 °C), neutral pH (7–7.5), dissolved oxygen level more than 2 mg/L, lower levels of totaldissolved solids, water hardness, chloride, and sulphate concentration and, increased levels of phosphate, nitrite, nitrate and ammonia levels. Theseconditions support the growth and enrichment of the ciliates as also reported in previous studies (Abdullah et al. 2018; Vajravelu et al. 2018; Xu et al.2014). The physicochemical conditions at OBS site favour ciliate growth conditions, hence maximum diversity was observed at this site. The high valueof diversity indices (species diversity, richness and evenness) at the OBS site indicates presence of desirable conditions for ciliate growth as compared toSL and RJ site. Ciliate diversity, richness and evenness were maximum during the monsoon and post-monsoon season, whereas diversity and richnesswere lowest during summer and winter seasons. The present study on the dynamics of the environment driven community assembly suggests thatciliates are good indicators for assessing community-level responses and can be useful in predicting the water quality as well as environmentaldegradation in the future.
DeclarationsAcknowledgements
The authors appreciate the facilities provided by the Principal, Acharya Narendra Dev College, University of Delhi for carrying out the present study. Thesupport extended by the Principal, Maitreyi College, University of Delhi is thankfully acknowledged.
Author contribution
S Makhija, R Toteja and R Gupta designed and supervised the research study. JS Abraham, S Somasundaram, and S Maurya collected samples,performed experiments and analyzed the data. JS Abraham wrote the original draft. S Makhija, R Toteja and R Gupta revised and improved themanuscript.
Funding
The work was supported by Senior Research Fellowships to JS Abraham and S Maurya from Council of Scienti�c and Industrial Research (CSIR), NewDelhi and to S Somasundaram from University Grants Commission (UGC) New Delhi, India. The work was also supported by SERB project �le no.CRG/2020/003493.
Data Availability
The data that support the �ndings of this study are available on request from the corresponding author.
Ethics approval
Not applicable.
Consent to participate
Not applicable.
Competing interests
The authors declare that they have no competing interests.
Consent for publication
All authors read and approved the �nal version of the paper to be published.
References1. Abdullah MA, Alam MD, Akhtar A, Kamal AHM, Islam MS, Alam MW, Forruq RM, Uddin MM, Xu H (2018) Seasonal shift in soft bottom-dwelling
community structure in coastal waters of the northern Bay of Bengal, Indian Ocean. Indian J Geo Mar Sci 47:2021–2031.
2. Abraham JS, Sripoorna S, Dagar J, Jangra S, Kumar A, Yadav K, Singh S, Zutshi S, Singh B, Dagar J, Kumar A, Goyal A, Bhatnagar M, Upadhaya M,Choudhary A, Toteja R, Gupta R, Gambhir G, Makhija S (2019) Soil ciliates of the Indian Delhi Region: Their community characteristics withemphasis on their ecological implications as sensitive bio-indicators for soil quality. Saudi J Biol Sci 26:1305–1313.
3. Achacoso SC, Walag AMP, Saab LL (2016) A rapid assessment of foliage spider fauna diversity in Sinaloc, El Salvador City, Philippines: acomparison between habitats receiving different degrees of disturbance. Biodiversity 17:156–161.
Page 13/24
4. American Public Health Association (APHA) (2005) Standard methods for the examination of water and wastewater Method 2540 D: Totalsuspended solids. In: Standard methods for the examination of water and wastewater, 21st edn. Washington DC: American Public HealthAssociation (APHA), American Water Works Association (AWWA), and Water Environment Federation (WEF), pp 2 –58.
5. Andrushchyshyn OP, Wilson KP, Williams DD (2007) Ciliate communities in shallow groundwater: Seasonal and spatial characteristics. FreshwBiol 52:1745–1761.
�. Anjusha A, Jyothibabu R, Jagadeesan L (2018) Response of microzooplankton community to the hydrographical transformations in the coastalwaters off Kochi, along the southwest coast of India. Cont Shelf Res 167:111–124.
7. Araoye PA (2007) Aspects of meteorological factors and temperature regime of Asa Lake, Ilorin Nigeria. The Zoologist 5:39–46.
�. Araoye PA (2009) The seasonal variation of pH and dissolved oxygen (DO2) concentration in Asa lake Ilorin, Nigeria. Int J Phys Sci 4:271–274.
9. Asamoah DN, Amorin R (2011) Assessment of the quality of bottled/sachet water in the Tarkwa-Nsuaem municipality (TM) of Ghana. Res J ApplSci Eng Technol 3:377–385.
10. Babu A, Varadharajan D, Vengadesh PN, Thilagavathi B, Manikandarajan T, Sampathkumar, P, Balasubramanian T (2013) Diversity of phytoplanktonin different stations from Muthupettai, South east coast of India. J Mar Sci Res Dev 3:1–11.
11. Balkis N (2004) Tintinnids (Protozoa: Ciliophora) of the Büyükçekmece Bay in the Sea of Marmara. Sci Mar 68:33–44.
12. Basuri CK, Pazhaniyappan E, Munnooru K, Chandrasekaran M, Vinjamuri RR, Karri R, Mallavarapu RV (2020) Composition and distribution ofplanktonic ciliates with indications to water quality in a shallow hypersaline lagoon (Pulicat Lake, India). Environ Sci Pollut Res 27:18303–18316.
13. Bera A, Dutta TK, Patra BC, Sar UK (2014) Correlation study on zooplankton availability and physico-chemical parameters of Kangsabati Reservoir,West Bengal, India. Int Res J Environ Sci 3:28–32.
14. Bhamare SN, Nikam SV, Jadhav BN (2012) Prevalence and morphological details in the common freshwater ciliate, Coleps hirtus from Nashikdistrict of Maharashtra. Aquaculture 45:7787–7792.
15. Bharati SG, Krishnamurthy SR (1990) Effect of industrial e�uents on River Kali around Dandeli, Karnataka. I, Physico-chemical complexes. Indian JEnviron Health 32:167–171.
1�. Boyd CE, Tucker CS, Somridhivej B (2016) Alkalinity and hardness: Critical but elusive concepts in aquaculture. J World Aquac Soc 47:6–41.
17. Buonanno F, Anesi A, Guella G, Kumar S, Bharti D, La Terza A, Quassinti L, Bramucci M, Ortenzi C (2014) Chemical offense by means of toxicysts inthe freshwater ciliate, Coleps hirtus. J Eukaryot Microbiol 61:293–304.
1�. Cerozi BD, Fitzsimmons K (2016) The effect of pH on phosphorus availability and speciation in an aquaponics nutrient solution. Bioresour Technol219:778–81.
19. Choquet CG, Kamekura M, Kushner DJ (1989) In vitro protein synthesis by the moderate halophile Vibrio costicola: Site of action of Cl- ions. JBacteriol 171:880–886.
20. Clarke KR, Warwick RM (2001) Changes in marine communities: an approach to statistical analysis and interpretation, 2nd edn. Primer-E Ltd.,Plymouth, United Kingdom, pp 1–256
21. Covich AP, Austen MC, Bärlocher F, Chauvet E, Cardinale BJ, Biles CL, Inchausti P, Dangles O, Solan M, Gessner MO, Statzner B, Moss B (2004) Therole of biodiversity in the functioning of freshwater and marine benthic ecosystems. BioScience 54:767–775.
22. Curds CR (1992) Protozoa in the water industry. Cambridge University Press, Cambridge.
23. Czapik A (1982) Effect of waste water on ciliate communities in the Biala Przemsza River [Poland]. Acta Hydrobiol 24:29–37.
24. Debels P, Figueroa R, Urrutia R, Barra R, Niell X (2005) Evaluation of water quality in the Chillán River (Central Chile) using physicochemicalparameters and a modi�ed water quality index. Environ Monit Assess 110:301–322.
25. Dhib A, Brahim MB, Ziadi B, Akrout F, Turki S, Aleya L (2013) Factors driving the seasonal distribution of planktonic and epiphytic ciliates in aeutrophicated Mediterranean Lagoon. Mar Pollut Bull 74:383–395.
2�. Dias RJP, Wieloch AH, D'Agosto M (2008) The in�uence of environmental characteristics on the distribution of ciliates (Protozoa, Ciliophora) in anurban stream of southeast Brazil. Brazil J Biol 68:287–295.
27. Dolan JR, Marrasé C (1995) Planktonic ciliate distribution relative to a deep chlorophyll maximum: Catalan Sea, NW Mediterranean, June1993. Deep-Sea Res Part I Oceanogr Res Pap 42:1965–1987.
2�. Dopheide A, Lear G, Stott R, Lewis G (2009) Relative diversity and community structure of ciliates in stream bio�lms according to molecular andmicroscopy methods. Appl Environ Microbiol 75:5261–5272.
29. Dubey M, Ujjania NC (2013) Water quality and pollution status of Tapi river, Gujarat, India. Int J Pure Appl Zool 1:261–266.
30. Dudgeon D, Arthington AH, Gessner MO, Kawabata ZI, Knowler DJ, Lévêque C, Naiman RJ, Prieur-Richard AH, Soto D, Stiassny MLJ, Sullivan CA(2006) Freshwater biodiversity: Importance, threats, status and conservation challenges. Biol Rev 81:163–182.
31. Elangovan SS, Padmavati G, Karthik R, Sankar RS, Rakesh OD, Kumar MA (2017) Comparison between microzooplankton population in polluted andmoderately polluted coastal waters of Port Blair, South Andaman. Environ Monit Assess 189:1–10.
32. Esteves FA (1988) Considerations on the application of temperate lake typology to tropical lakes. Acta Limnol Bras 2:3–28.
33. Fisher RA (1922) On the mathematical foundations of theoretical statistics. In: Philosophical Transactions of the Royal Society, London (Vol. 222),pp 309–368.
Page 14/24
34. Fisher RA (1954) Statistical methods for research workers. In: Biological monographs and manuals (Vol. 5), 12th edn. Oliver and Boyd, Edinburgh.
35. Fisher RA, Yates F (1963) Statistical tables for biological, agricultural and medical research (6th edn.). Oliver and Boyd, Edinburgh.
3�. Foissner W, Berger H (1996) A user-friendly guide to the ciliates (Protozoa, Ciliophora) commonly used by hydrobiologists as bioindicators in rivers,lakes, and waste waters, with notes on their ecology. Freshw Biol 35:375–482.
37. Funadani R, Suetomo Y, Matsuoka T (2013) Emergence of the terrestrial ciliate Colpoda cucullus from a resting cyst wall by active expansion of anexcystation vacuole. Microbes Environ 28:149–152.
3�. Funadani R, Sogame Y, Kojima K, Takeshita T, Yamamoto K, Tsujizono T, Yamamoto K, Suizu F, Miyata S, Yagyu K, Suzuki T, Arikawa M, Matsuoka T(2016) Morphogenetic and molecular analyses of cyst wall components in the ciliated protozoan Colpoda cucullus Nag-1. FEMS microbiollett 363:fnw203.
39. García FC, Bestion E, War�eld R, Yvon-Durocher G (2018) Changes in temperature alter the relationship between biodiversity and ecosystemfunctioning. Proc Natl Acad Sci 115:10989–10994.
40. Gautam SP, Reeta K, Suniti P, Basu DD, Kamyotra JS (2011) Guide manual: Water and wastewater analysis. In: Central Pollution Control Board,Ministry of Environment and Forests, Government of India.
41. Goetz CA, Smith RC (1959) Evaluation of various methods and reagents for total hardness and calcium hardness in water. Iowa State Coll J Sci34:81.
42. Golder D, Chattopadhyay S (2016) Interrelationship between physico-chemical characteristics of a tropical lake and their impact on biodiversity ofplanktons. J Environ Biol 37:1281–1289.
43. Gomes GB, Jerry DR, Miller TL, Hutson KS (2016) Current status of parasitic ciliates Chilodonella spp. (Phyllopharyngea: Chilodonellidae) infreshwater �sh aquaculture. J Fish Dis 40:703–715.
44. Gong XJ (1986) The development of eutrophication in Lake Donghu, Wuhan, during the last two decades based on the investigation of protozoanchanges. Acta Hydrobiol Sin 10:340–352.
45. Greaves JE (1922) In�uence of salts on bacterial activities of soil. Bot Gaz 73:161–180.
4�. Grinienė E, Lesutienė J, Gorokhova E, Zemlys P, Gasiūnaitė ZR (2019) Lack of ciliate community integrity in transitional waters: A case study fromthe Baltic Sea. Estuar Coast Shelf Sci 226:1–12.
47. Hadwen WL, Arthington AH, Mosisch TD (2003) The impact of tourism on dune lakes on Fraser Island, Australia. Lakes Reserv Res Manag 8:15–26.
4�. Hure M, Batistić M, Kovačević V, Bensi M, Garić R (2020) Copepod community structure in pre- and post-winter conditions in the southern AdriaticSea (NE Mediterranean). J Mar Sci Eng 8:1–23.
49. Ivanova MB, Kazantseva TI (2006) Effect of water pH and total dissolved solids on the species diversity of pelagic zooplankton in lakes: a statisticalanalysis. Russ J Ecol 37:264–270.
50. Jayakumar P, Jothivel N, Thimmappa A, Paul VI (2009) Physicochemical characterisation of a lentic water body from Tamil Nadu with specialreference to its pollution status. Ecoscan 3:59–64.
51. Jiang Y, Xu H, Hu X, Zhu M, Al-Rasheid KAS, Warren A (2011) An approach to analyzing spatial patterns of planktonic ciliate communities formonitoring water quality in Jiaozhou Bay, Northern China. Mar Pollut Bull 62:227–235.
52. Joshi DM, Bhandari NS, Kumar A, Agrawal N (2009) Statistical analysis of physicochemical parameters of water of River Ganga in Haridwardistrict. Rasayan J Chem 2:579–587.
53. Kaur H, Warren A, Kamra K (2021) Spatial variation in ciliate communities with respect to water quality in the Delhi NCR stretch of River Yamuna,India. Eur J Protistol 79:125793.
54. Kedar GT, Patil, GP, Yeole SM (2008) Effect of physicochemical factor on the seasonal abundance of zooplankton population in Rishi Lake. In: ProcTaal 2007, 12th World Lake Conf, pp 88–91.
55. Lehmann EL (2011) Fisher, Neyman, and the creation of classical statistics. Springer, New York, pp 1–115.
5�. Lemloh ML, Marin F, Herbst F, Plasseraud L, Schweikert M, Baier J, Bill J, Brümmer F (2013) Genesis of amorphous calcium carbonate containingalveolar plates in the ciliate Coleps hirtus (Ciliophora, Prostomatea). J Struct Biol 181:155–161.
57. Li J, Shen Z, Li C, Kou Y, Wang Y, Tu B, Zhang S, Li X (2018) Stair-step pattern of soil bacterial diversity mainly driven by pH and vegetation typesalong the elevational gradients of Gongga Mountain, China. Front Microbiol 9:1–10.
5�. Limberger R, Low-Décarie E, Fussmann GF (2014) Final thermal conditions override the effects of temperature history and dispersal in experimentalcommunities. Proc Royal Soc B- Biol Sci 281:1–9.
59. Luna-Pabello VM, Aladro-Lubel A, Durán-de-Bazúa C (1992) Temperature effects on ciliates diversity and abundance in a rotating biological reactor.Bioresour Technol 39:55–60.
�0. Manjare SA, Vhanalakar SA, Muley DV (2010) Analysis of water quality using physicochemical parameters Tamdalge tank in Kolhapur district,Maharashtra. Int J Adv Biotechnol Res 1:115–119.
�1. Manral U, Khudsar FA (2013) Assessment of wetland water quality and avian diversity of a human-modi�ed �oodplain wetland on River Yamuna.Not Sci Biol 5:25–33.
�2. Margalef R (1966) Fluctuations of many years period in West Mediterranean phytoplankton. Sec Int Oceanogr Congress:243–244.
Page 15/24
�3. Mohan VC, Sharma KK, Sharma A (2013) Seasonal variations and diversity of zooplanktons community structure in Chenani hydroelectric reservoir,its feeding Channel and River Tawi, Udhampur, J&K, India. Int Res J Biol Sci 2:37–43.
�4. Montgomery HAC, Thom NS, Cockburn A (1964) Determination of dissolved oxygen by the Winkler method and the solubility of oxygen in pure waterand sea water. J Appl Chem 14:280–296.
�5. Nogueira J, Lecuona A, Rodriguez PA, Alfaro JA, Acosta A (2005) Limits on the resolution of correlation PIV iterative methods. Practicalimplementation and design of weighting functions. Exp Fluids 39:314–321.
��. Pander J, Geist J (2013) Ecological indicators for stream restoration success. Ecol Indic 30:106–118.
�7. Parain EC, Rohr RP, Gray SM, Bersier LF (2019) Increased temperature disrupts the biodiversity–ecosystem functioning relationship. AmNat 193:227–239.
��. Passy P, Le Gendre R, Garnier J, Cugier P, Callens J, Paris F, Billen G, Riou P, Romero E (2016) Eutrophication modelling chain for improvedmanagement strategies to prevent algal blooms in the Bay of Seine. Mar Ecol Prog Ser 543:107–125.
�9. Pérez MT, Dolan JR, Vidussi F, Fukai E (2000) Diel vertical distribution of planktonic ciliates within the surface layer of the NW Mediterranean (May1995). Deep-Sea Res Part I Oceanogr Res Pap 47:479–503.
70. Pielou EC (1966) The measurement of diversity in different types of biological collections. J Theor Biol 13:131–144.
71. Popoola LT, Yusuff AS, Aderibigbe TA (2019) Assessment of natural groundwater physico-chemical properties in major industrial and residentiallocations of Lagos metropolis. Appl Water Sci 9:1 –10.
72. Prast M, Bischoff AA, Waller U, Amann R, Berninger UG (2007) Effect of ciliates on nitri�cation and nitrifying bacteria in Baltic Sea sediments. MarEcol Prog Ser 350:55–61.
73. Rajagopal T, Thangamani A, Sevarkodiyone SP, Sekar M, Archunan G (2010) Zooplankton diversity and physico-chemical conditions in threeperennial ponds of Virudhunagar district, Tamilnadu. J Environ Biol 31:265–272.
74. Rath KM, Maheshwari A, Bengtson P, Rousk J (2016) Comparative toxicities of salts on microbial processes in soil. Appl Environ Microbiol 82:2012–2020.
75. Repak AJ (1991) Effect of cyst age, media, pH, temperature, and time, on excystment of Blepharisma stoltei Isquith. J Wash Acad Sci 81:151–156.
7�. Rossum JR, Villarruz PA (1961) Suggested method for turbidimetric determination of sulfate in water. J Am Water Works Assoc 53:873–876.
77. Salim M, Kumar P, Gupta MK, Kumar S (2015) Seasonal variation in some chemical characteristics of the soil under different land uses of JhilmilJheel wetland, Haridwar-Uttrakhand, India. Int J Sci Res Public 5:1–9.
7�. Sepehri A, Sarrafzadeh MH (2019) Activity enhancement of ammonia-oxidizing bacteria and nitrite-oxidizing bacteria in activated sludge process:metabolite reduction and CO2 mitigation intensi�cation process. Appl Water Sci 9:1–12.
79. Shannon CE, Wiener W (1949) A mathematical theory of communication. Bell Syst Tech J 27:379–423.
�0. Sikder MNA, Xu H (2020) Seasonal variations in colonization dynamics of periphytic protozoa in coastal waters of the Yellow Sea, northern China.Eur J Protistol 72:1–12.
�1. Sikder MNA, Bai X, Warren A, Xu H (2019) An approach to determining homogeneity in taxonomic breadth of periphytic ciliate communities incolonization surveys for bioassessment. Ecol Indic 107:1–6.
�2. Simpson EH (1949) Measurement of diversity. Nature 163:688–688.
�3. Soller JA, Bartrand T, Ashbolt NJ, Ravenscroft J, Wade TJ (2010) Estimating the primary etiologic agents in recreational freshwaters impacted byhuman sources of faecal contamination. Water Res 44:4736–4747.
�4. Sonntag B, Posch T, Klammer S, Teubner K, Psenner R (2006) Phagotrophic ciliates and �agellates in an oligotrophic, deep, alpine lake: contrastingvariability with seasons and depths. Aquat Microb Ecol 43:193–207.
�5. Spietz RL, Williams CM, Rocap G, Horner-Devine MC (2015) A dissolved oxygen threshold for shifts in bacterial community structure in a seasonallyhypoxic estuary. PloS One 10:1–18.
��. Strayer DL, Dudgeon D (2010) Freshwater biodiversity conservation: recent progress and future challenges. J North Am Benthol Soc 29:344–358.
�7. Sunagawa S, Acinas SG, Bork P, Bowler C, Coordinators TO, Eveillard D, Gorsky G, Guidi L, Ludicone D, Karsenti E, Lombard F, Ogata H, Pesant S,Ogata H, Pesant S, Sullivan MB, Wincker P, de Vargas C (2020) Tara Oceans: towards global ocean ecosystems biology. Nat Rev Microbiol 18:428–445.
��. Tajmunnaher T, Chowdhury MAI (2017) Correlation Study for Assessment of Water Quality and its Parameters of Kushiyara River, Sylhet,Bangladesh. Int J New Technol Res 3:263179.
�9. Thirunavukkarasu K, Soundarapandian P, Varadharajan D, Gunalan B (2014) Physico-chemical characteristics of Kottakudi and Nari Backwaters,South East of Tamil Nadu. J Earth Sci Climate Change 5:1–7.
90. Tripathy PK, Adhikary SP (1990) Preliminary studies on the water pollution of river Nandira. Indian J Environ Health 32:363–368.
91. Ustaoğlu F, Tepe Y, Taş B (2020) Assessment of stream quality and health risk in a subtropical Turkey river system: A combined approach usingstatistical analysis and water quality index. Ecol Indic 113:105815.
92. Vajravelu M, Martin Y, Ayyappan S, Mayakrishnan M (2018) Seasonal in�uence of physico-chemical parameters on phytoplankton diversity,community structure and abundance at Parangipettai coastal waters, Bay of Bengal, South East Coast of India. Oceanologia 60:114–127.
Page 16/24
93. Vyas HV, Sawant VA (2008) Seasonal variations in drinking water quality of some Borewell waters in urban area of Kolhapur city. Nature EnvironPollut Technol 7:261–266.
94. Wang Y, Zhang W, Lin Y, Cao W, Zheng L, Yang J (2014) Phosphorus, nitrogen and chlorophyll-a are signi�cant factors controlling ciliatecommunities in summer in the northern Beibu Gulf, South China Sea. PLoS One 9:1–14.
95. Weber LA, Hickey ED, Maroney PA, Baglioni C (1977) Inhibition of protein synthesis by Cl. J Biol Chem 252:4007–4010.
9�. Weber-Scannell PK, Duffy LK (2007) Effects of total dissolved solids on aquatic organism: a review of literature and recommendation for salmonidspecies. Am J Environ Sci 3:1–6.
97. Winkler LW (1888) Die bestimmung des im wasser gelösten sauerstoffes. Ber der Dtsch Chem Ges 21:2843–2854.
9�. Wooditch A, Fisher R, Wu X, Johnson NJ (2020) P-value problems? An examination of evidential value in criminology. J Quant Criminol 36:305–328.
99. World Health Organization (2005) Ecosystems and human well-being: health synthesis: a report of the Millennium Ecosystem Assessment. Geneva:World Health Organization.
100. Xiong Q, Zhou M, Liu M, Jiang S, Hou H (2018) The transformation behaviors of heavy metals and dewaterability of sewage sludge during the dualconditioning with Fe2+-sodium persulfate oxidation and rice husk. Chemosphere 208:93–100.
101. Xiong W, Ni P, Chen Y, Gao Y, Li S, Zhan A (2019) Biological consequences of environmental pollution in running water ecosystems: a case study inzooplankton. Environ Pollut 252:1483–1490.
102. Xu H, Jiang Y, Al-Rasheid KA, Al-Farraj SA, Song W (2011) Application of an indicator based on taxonomic relatedness of ciliated protozoanassemblages for marine environmental assessment. Environ Sci Pollut Res 18:1213–1221.
103. Xu H, Zhang W, Jiang Y, Yang EJ (2014) Use of bio�lm-dwelling ciliate communities to determine environmental quality status of coastal waters. SciTotal Environ 470–471: 511–518.
104. Xu R, Cronberg R (2010) Planktonic ciliates in Western Basin of Lake Ringsjön, Sweden: community structure, seasonal dynamics and long-termchanges. Protistology 6:173–187.
105. Xu Y, Huang J, Hu X, Al-Rasheid KAS, Song W, Warren A (2011) Taxonomy, ontogeny and molecular phylogeny of Anteholosticha marimonilata spec.nov. (Ciliophora, Hypotrichida) from the Yellow Sea, China. Int J Syst Evol Microbiol 61:2000–2014.
10�. Yan N, Marschner P, Cao W, Zuo C, Qin W (2015) In�uence of salinity and water content on soil microorganisms. Int Soil Water Conserv Res 3:316–323.
107. Yogesh M (2020) Seasonal variation in water quality parameters of Loni dam Rewa, Madhya Pradesh. GSC Biol Pharm Sci 11:157–160.
10�. Young TM (2017) Biodiversity calculator for the Simpson and Shannon indexes. Formula and manual for the calculation of Shannon-Wiener indexAlpha biodiversity [α] (pp 4). Retrieved from https://www.alyoung.com/labs/biodiversity_ calculator.html
109. Zhang W, Xu H (2015) Seasonal shift in community pattern of periphytic ciliates and its environmental drivers in coastal waters of the Yellow Sea,northern China. J Mar Biol Assoc U K 95:277–288.
110. Zhang W, Xu H, Jiang Y, Zhu M, Al-Rasheid KAS (2013) Colonization dynamics of periphytic ciliate communities on an arti�cial substratum incoastal waters of the Yellow Sea, northern China. J Mar Biol Assoc U K 93:57–68.
Figures
Page 17/24
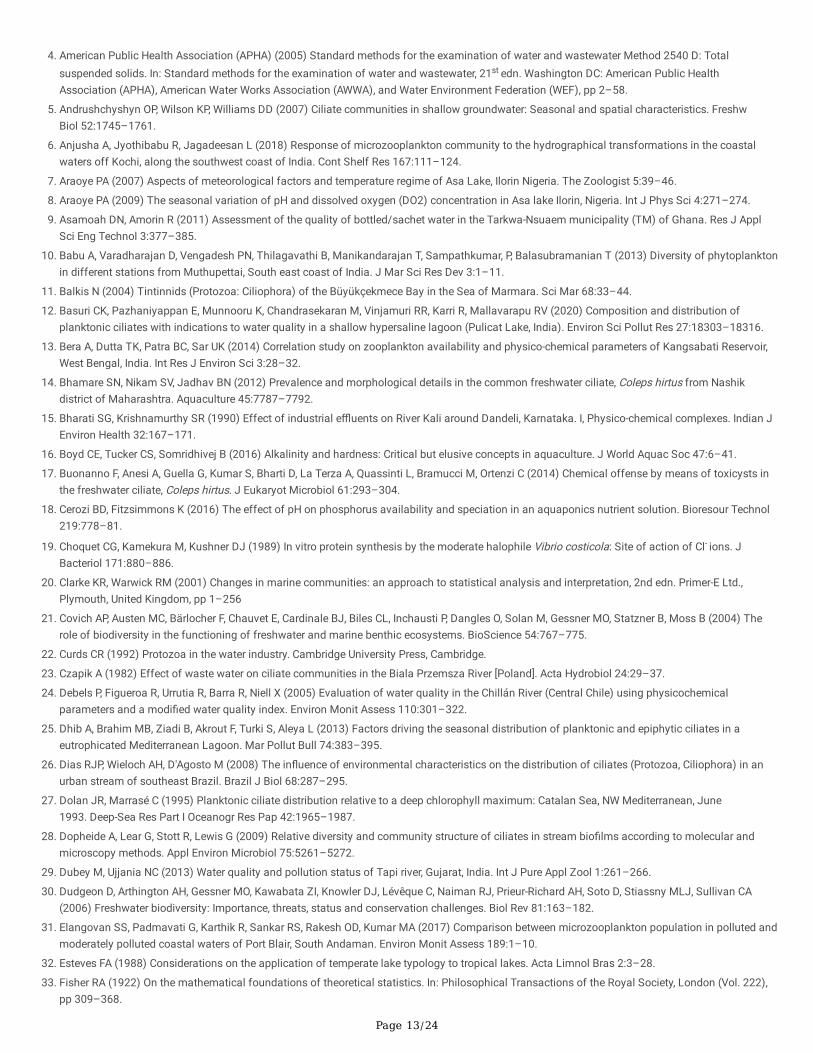
Figure 1
GPS location of sampling sites, Okhla Bird Sanctuary, Sanjay Lake and Raj Ghat.
Page 18/24
Figure 2
Variation in the physicochemical parameters of the three sites, Okhla Bird Sanctuary (OBS), Sanjay Lake (SL) and Raj Ghat Pond (RJ), Delhi during theone year study period. Blue stars represent parameters that showed signi�cant difference among the three sites, black stars represent parameters thatshowed signi�cant difference among different months, and remaining parameters did not show signi�cant difference among sites or months.
Figure 3
Principal component analysis (PCA) based on the physicochemical parameters examined during one year from three freshwater sites. TIW = temperature(inside water), DO = dissolved oxygen, TDS = total dissolved solids, EC = electrical conductivity.
Page 19/24
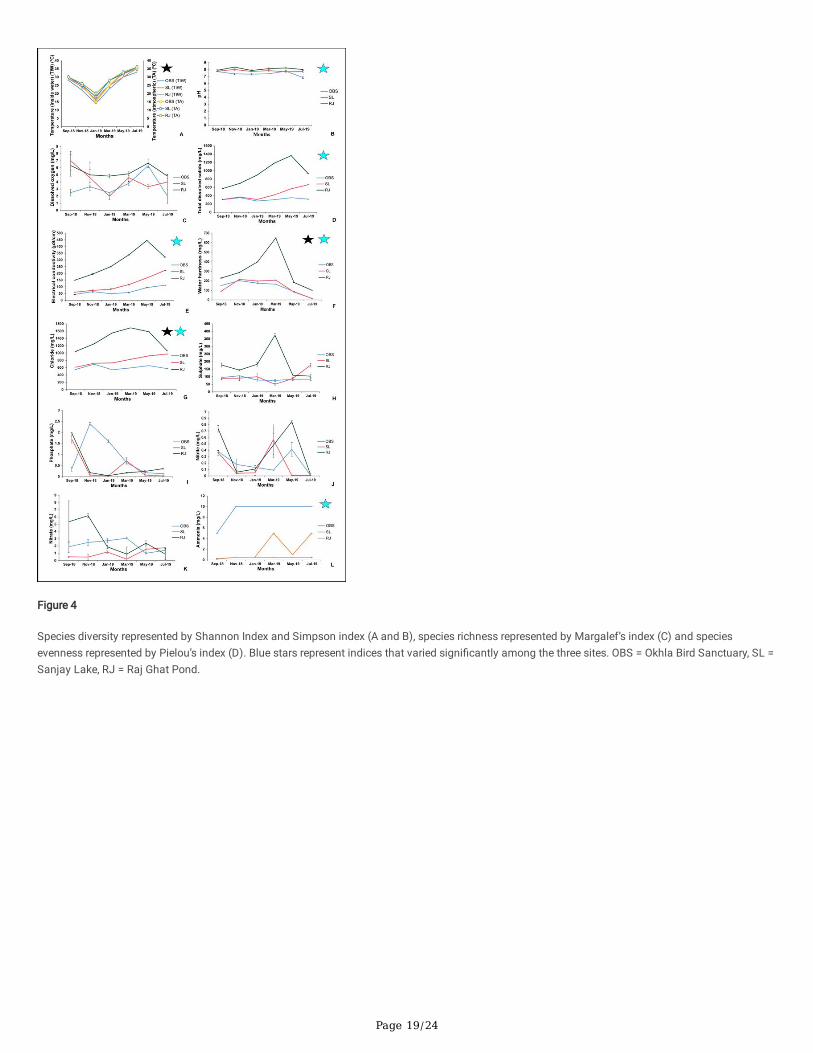
Figure 4
Species diversity represented by Shannon Index and Simpson index (A and B), species richness represented by Margalef’s index (C) and speciesevenness represented by Pielou’s index (D). Blue stars represent indices that varied signi�cantly among the three sites. OBS = Okhla Bird Sanctuary, SL =Sanjay Lake, RJ = Raj Ghat Pond.
Page 20/24
Figure 5
Nonmetric Multidimensional scaling (NMDS) showing the placement of different seasons analysed during the study period based on physicochemicalparameters and ciliate diversity indices.
Figure 6
Nonmetric Multidimensional analysis (NMDS) showing the placement of different sites analysed during the study period based on physicochemical andciliate diversity data. OBS = Okhla Bird Sanctuary, SL = Sanjay Lake, RJ = Raj Ghat Pond.
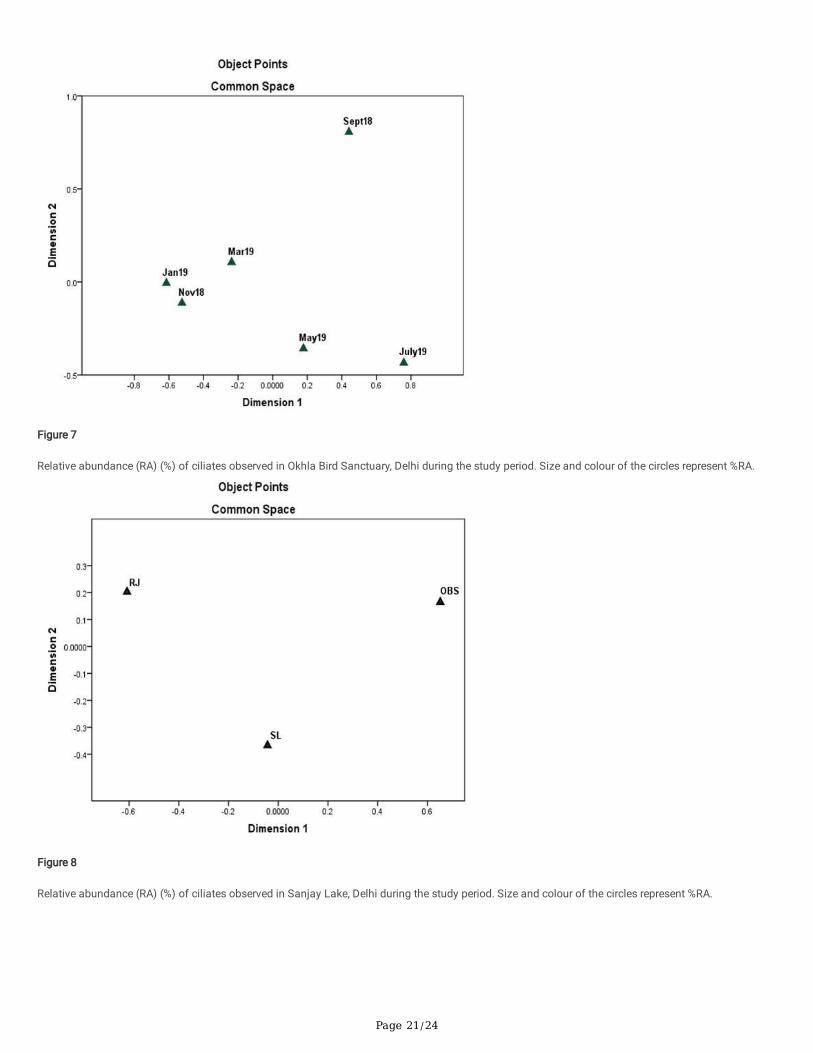
Page 21/24
Figure 7
Relative abundance (RA) (%) of ciliates observed in Okhla Bird Sanctuary, Delhi during the study period. Size and colour of the circles represent %RA.
Figure 8
Relative abundance (RA) (%) of ciliates observed in Sanjay Lake, Delhi during the study period. Size and colour of the circles represent %RA.
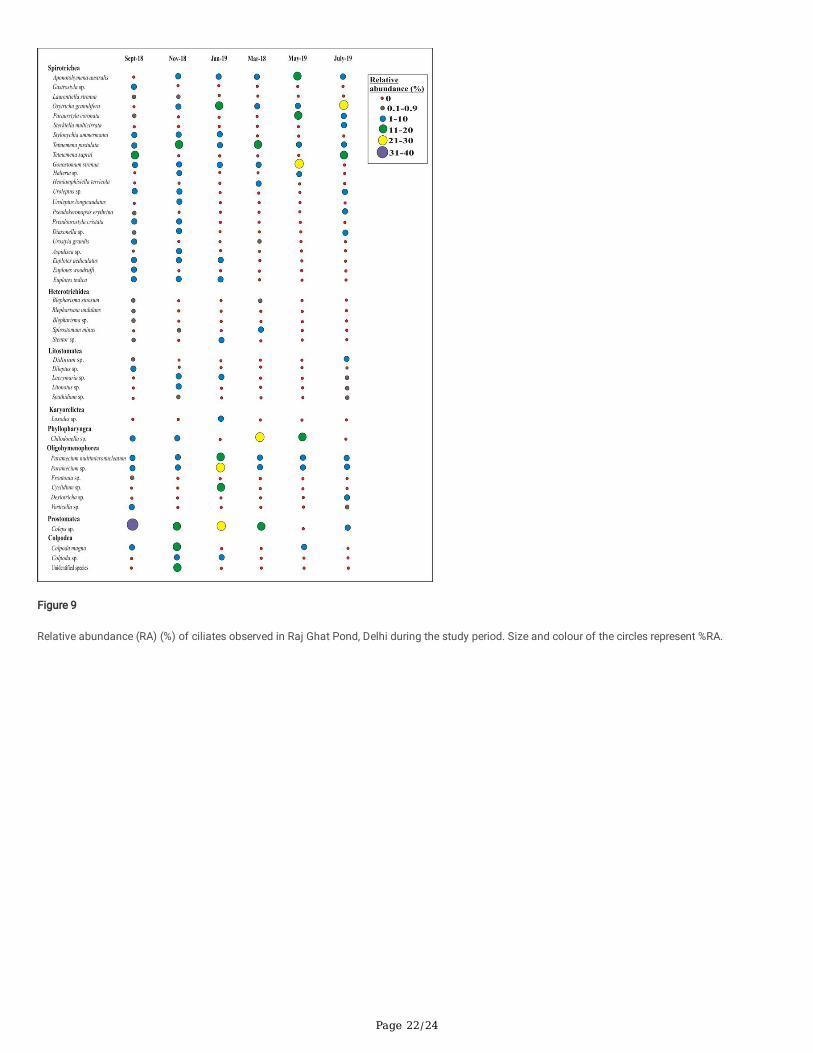
Page 22/24
Figure 9
Relative abundance (RA) (%) of ciliates observed in Raj Ghat Pond, Delhi during the study period. Size and colour of the circles represent %RA.
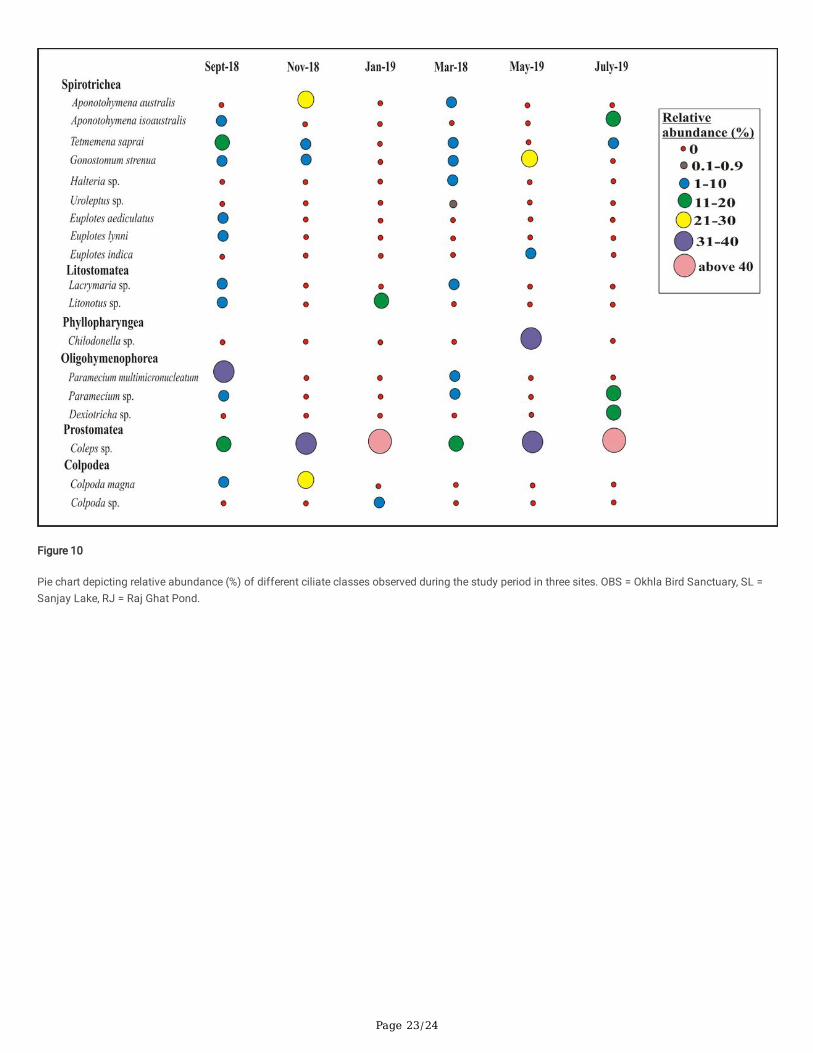
Page 23/24
Figure 10
Pie chart depicting relative abundance (%) of different ciliate classes observed during the study period in three sites. OBS = Okhla Bird Sanctuary, SL =Sanjay Lake, RJ = Raj Ghat Pond.
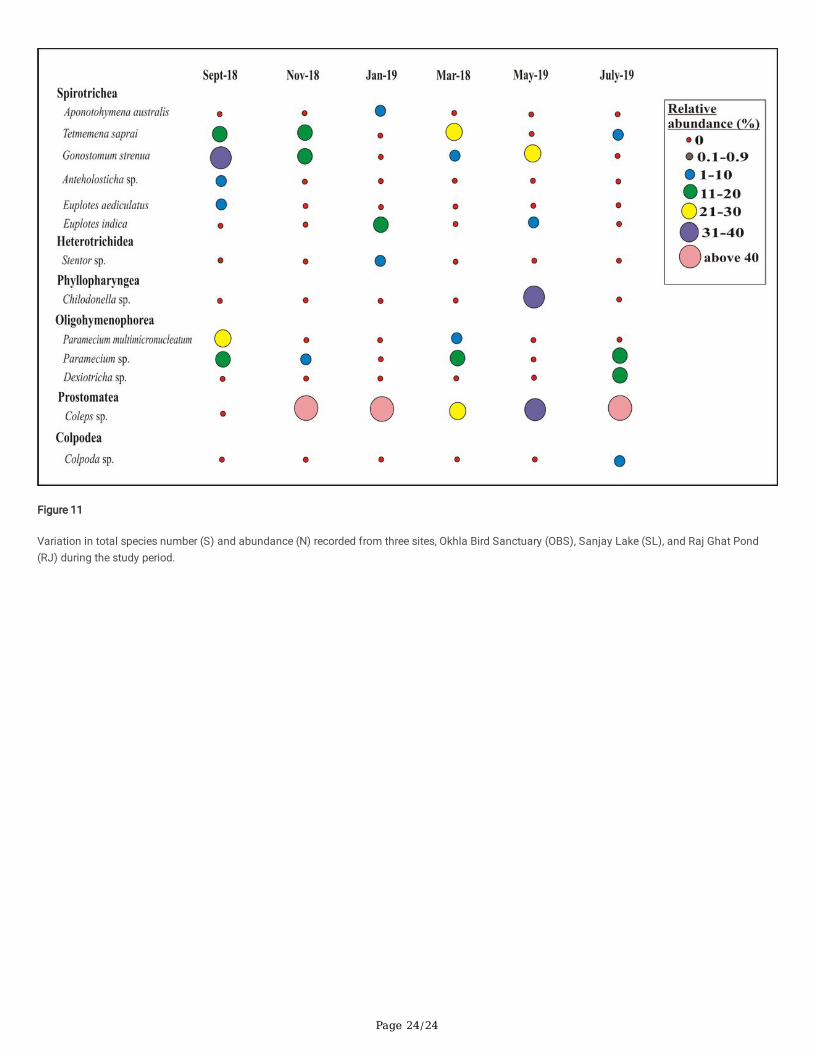
Page 24/24
Figure 11
Variation in total species number (S) and abundance (N) recorded from three sites, Okhla Bird Sanctuary (OBS), Sanjay Lake (SL), and Raj Ghat Pond(RJ) during the study period.


