Embed Size (px)
Citation preview
ORIGINAL ARTICLE
A study on the hydrogeology and hydrogeochemistryof groundwater from different depths in a coastal aquifer:Annamalai Nagar, Tamilnadu, India
S. Chidambaram Æ G. Senthil Kumar ÆM. V. Prasanna Æ A. John Peter Æ AL. Ramanthan ÆK. Srinivasamoorthy
Received: 18 December 2007 / Accepted: 3 March 2008 / Published online: 4 April 2008
� Springer-Verlag 2008
Abstract Chemical characterization of groundwater is
essential to bring out its nature and utility. Samples from
shallow and deep ground water of the same location were
collected and studied for their geochemical characteristics
following standard procedures (APHA 1998). Sediment
samples from different depths were collected and analysed
for minerals using FTIR and SEM. Resisitivity logging was
carried out in the bore well to understand the variations in
depth to fresh water potential. The shallow ground water is
dominated by Na–Cl–HCO3–SO4 and deeper groundwater
by Na–HCO3–SO4–Cl types. It is observed that there is a
significant ionic variation with depth. The ionic strength of
the deeper samples is lesser than in the shallower samples.
Wide pH variations in the shallow water samples are due to
ion exchange process. Thermodynamic stability plot was
used to identify the state of stability. It is inferred that there
is no major significant difference in the thermodynamic
state of stability in the shallow and the deeper aquifers as
the aquifer matrix for the shallow and deeper aquifers are
almost similar. Saturation index of Gibbsite, Kaolinite,
Calcite, Dolomite and anhydrite, were studied for shallow
and deep aquifers, to identify the difference in hydro
chemical signatures. The Si/Al ratios of shallow samples
are less when compared with the deeper samples. Leaching
of secondary salts was the chief mechanism controlling the
ground water chemistry of the region.
Keywords Groundwater � Resistivity log �Hydrogeochemistry � Thermodynamic stability �Saturation index
Introduction
Aquifers in the coast are generally fragile and in most of
the regions the shallow aquifers are easily depleted due to
over exploitation of groundwater. The deeper aquifers are
comparatively of lesser contamination. In the areas of
extensive extraction, characterization of shallow and dee-
per aquifers is essential to elucidate their geochemical
nature and its relation to aquifer matrix. Annamalai Uni-
versity is situated in Annamalai Nagar Township, which
lies in eastern side of Chidambaram, the taluk headquarters
of Cuddalore district, Tamilnadu, India. The campus area is
about 1,000 acres, north of the river Coleroon, which joins
the Bay of Bengal. Chidambaram is located 250 Km SW of
Chennai. The area is located between the geographical
coordinates, latitudes of 11�200 and 11�250 and between
longitudes of 79�420 and 79�450. The region falls in the
topo sheet of 58 M/11 covering an area of about 1,000
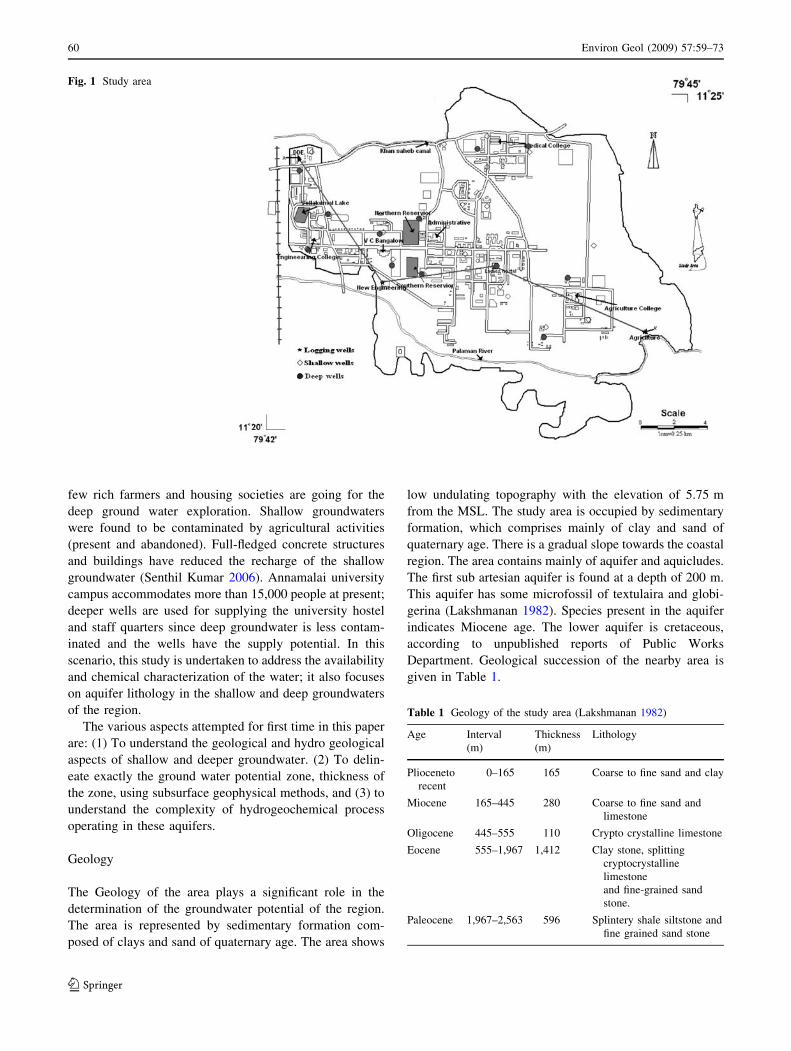
acres (Fig. 1). Annamalai Nagar is linked to Chidambaram
town by metal road for 2 km. Chidambaram is linked to the
main cities by road. The area suffers tropical climate with
maximum temperature observed during May and the min-
imum in December. There is good amount of rainfall
during the NE monsoon (October–December) and scanty
rainfall during the SW monsoon (June–September). There
is an average rainfall of 1,500 mm/year.
In Annamalai Nagar, for the past two decades, local
village people are using shallow aquifers for the agricul-
tural and domestic purposes. The deep bore wells are
mainly used for the university utility purposes, and now
S. Chidambaram � M. V. Prasanna � A. John Peter �AL. Ramanthan (&) � K. Srinivasamoorthy
Department of Earth Sciences, Annamalai University,
Annamalai Nagar, Chidambaram, India
e-mail: [email protected]
G. Senthil Kumar
School of Environmental Sciences,
JNU, New Delhi 110067, India
123
Environ Geol (2009) 57:59–73
DOI 10.1007/s00254-008-1282-4
few rich farmers and housing societies are going for the
deep ground water exploration. Shallow groundwaters
were found to be contaminated by agricultural activities
(present and abandoned). Full-fledged concrete structures
and buildings have reduced the recharge of the shallow
groundwater (Senthil Kumar 2006). Annamalai university
campus accommodates more than 15,000 people at present;
deeper wells are used for supplying the university hostel
and staff quarters since deep groundwater is less contam-
inated and the wells have the supply potential. In this
scenario, this study is undertaken to address the availability
and chemical characterization of the water; it also focuses
on aquifer lithology in the shallow and deep groundwaters
of the region.
The various aspects attempted for first time in this paper
are: (1) To understand the geological and hydro geological
aspects of shallow and deeper groundwater. (2) To delin-
eate exactly the ground water potential zone, thickness of
the zone, using subsurface geophysical methods, and (3) to
understand the complexity of hydrogeochemical process
operating in these aquifers.
Geology
The Geology of the area plays a significant role in the
determination of the groundwater potential of the region.
The area is represented by sedimentary formation com-
posed of clays and sand of quaternary age. The area shows
low undulating topography with the elevation of 5.75 m
from the MSL. The study area is occupied by sedimentary
formation, which comprises mainly of clay and sand of
quaternary age. There is a gradual slope towards the coastal
region. The area contains mainly of aquifer and aquicludes.
The first sub artesian aquifer is found at a depth of 200 m.
This aquifer has some microfossil of textulaira and globi-
gerina (Lakshmanan 1982). Species present in the aquifer
indicates Miocene age. The lower aquifer is cretaceous,
according to unpublished reports of Public Works
Department. Geological succession of the nearby area is
given in Table 1.
Fig. 1 Study area
Table 1 Geology of the study area (Lakshmanan 1982)
Age Interval
(m)
Thickness
(m)
Lithology
Plioceneto
recent
0–165 165 Coarse to fine sand and clay
Miocene 165–445 280 Coarse to fine sand and
limestone
Oligocene 445–555 110 Crypto crystalline limestone
Eocene 555–1,967 1,412 Clay stone, splitting
cryptocrystalline
limestone
and fine-grained sand
stone.
Paleocene 1,967–2,563 596 Splintery shale siltstone and
fine grained sand stone
60 Environ Geol (2009) 57:59–73
123
Drainage
The Khan Saheb canal, which originates from the lower
anicut, runs in the northern side of the university campus.
The Uspur channel runs south of the campus. The entire
region gently slopes towards Southeast. There are three
main reservoir tanks present in this region (Fig. 1). Retta-
ikulam to the north and south of the university road,
Vellakulam reservoir near the Engineering Block and Tir-
uvetkulam temple tank are the storage structures of the
region.
Aquifer parameters
The pump test data of the shallow wells reveals that
Transmissivity ranges from 800 to 850 gpd/ft. In case of
deep bore well about 400 m at the pavilion has 45,300 gpd/
feet (635 m3/day m-1) (Lakshmanan 1982; Arul 1990).
Hence it is believed that the deep bore wells in the campus
have high transmissivity. The ‘‘K’’ values in the shallow
well also reflect the lesser hydraulic conductivity than the
deep wells. The K values of the shallow wells ranging from
29.74 to 77.86 gpd/ft2 were observed in shallow well, and
deep pavilion well shows 394.5 gpd/ft2, invariably larger
thickness. Hence, the transmissivity and hydraulic con-
ductivity of the deeper wells are greater. By applying the
relationship, the thickness of the aquifer yielding to the
pavilion well is approximately 35.27 m and similarly for
the shallow wells range from 8.07 to 3.298 m.
Water table
The water table helps us to determine the direction of
movement of water and approximately the location of the
catchment area. The water level studies by earlier authors
(Lakshmanan et al. 1982; Arul 1990; Senthil Kumar 2006)
reveal that the ground water flows from the SE to the NW
in the eastern side of the campus. The earlier studies also
point out that the movement of water was based on the
Coleroon River and the Khan Saheb canal. During 1980,
the depth of the water table in the open wells was observed
to range from 1.88 to 2.87 m. The recent water level detail
indicates that the table ranges from 7 to 10 m and the
deepest water level present at the NE side of the study area,
and the movement is generally from the southwest to
northeast.
Subsurface investigations
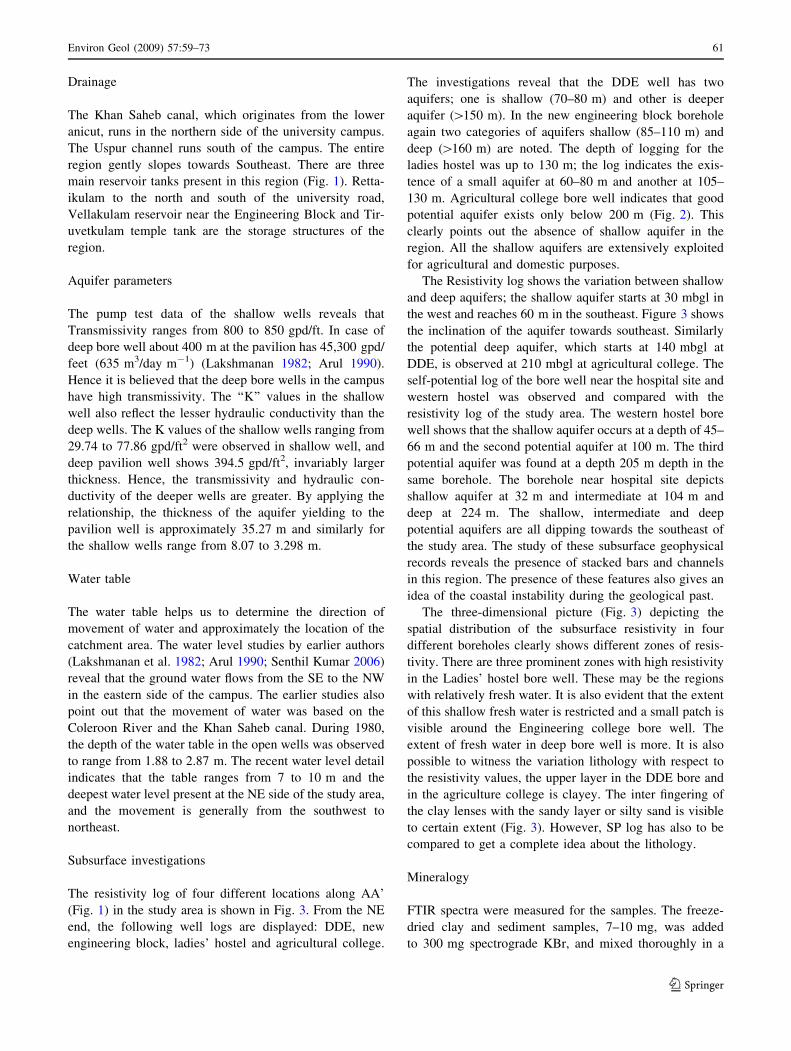
The resistivity log of four different locations along AA’
(Fig. 1) in the study area is shown in Fig. 3. From the NE
end, the following well logs are displayed: DDE, new
engineering block, ladies’ hostel and agricultural college.
The investigations reveal that the DDE well has two
aquifers; one is shallow (70–80 m) and other is deeper
aquifer ([150 m). In the new engineering block borehole
again two categories of aquifers shallow (85–110 m) and
deep ([160 m) are noted. The depth of logging for the
ladies hostel was up to 130 m; the log indicates the exis-
tence of a small aquifer at 60–80 m and another at 105–
130 m. Agricultural college bore well indicates that good
potential aquifer exists only below 200 m (Fig. 2). This
clearly points out the absence of shallow aquifer in the
region. All the shallow aquifers are extensively exploited
for agricultural and domestic purposes.
The Resistivity log shows the variation between shallow
and deep aquifers; the shallow aquifer starts at 30 mbgl in
the west and reaches 60 m in the southeast. Figure 3 shows
the inclination of the aquifer towards southeast. Similarly
the potential deep aquifer, which starts at 140 mbgl at
DDE, is observed at 210 mbgl at agricultural college. The
self-potential log of the bore well near the hospital site and
western hostel was observed and compared with the
resistivity log of the study area. The western hostel bore
well shows that the shallow aquifer occurs at a depth of 45–
66 m and the second potential aquifer at 100 m. The third
potential aquifer was found at a depth 205 m depth in the
same borehole. The borehole near hospital site depicts
shallow aquifer at 32 m and intermediate at 104 m and
deep at 224 m. The shallow, intermediate and deep
potential aquifers are all dipping towards the southeast of
the study area. The study of these subsurface geophysical
records reveals the presence of stacked bars and channels
in this region. The presence of these features also gives an
idea of the coastal instability during the geological past.
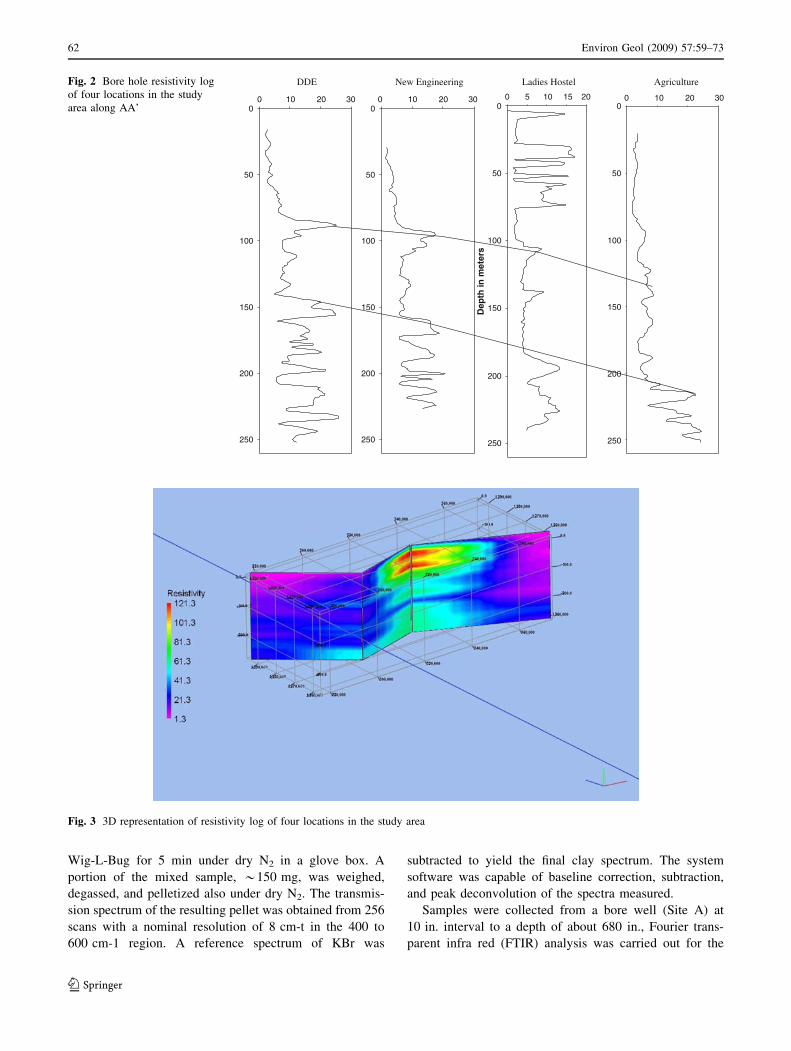
The three-dimensional picture (Fig. 3) depicting the
spatial distribution of the subsurface resistivity in four
different boreholes clearly shows different zones of resis-
tivity. There are three prominent zones with high resistivity
in the Ladies’ hostel bore well. These may be the regions
with relatively fresh water. It is also evident that the extent
of this shallow fresh water is restricted and a small patch is
visible around the Engineering college bore well. The
extent of fresh water in deep bore well is more. It is also
possible to witness the variation lithology with respect to
the resistivity values, the upper layer in the DDE bore and
in the agriculture college is clayey. The inter fingering of
the clay lenses with the sandy layer or silty sand is visible
to certain extent (Fig. 3). However, SP log has also to be
compared to get a complete idea about the lithology.
Mineralogy
FTIR spectra were measured for the samples. The freeze-
dried clay and sediment samples, 7–10 mg, was added
to 300 mg spectrograde KBr, and mixed thoroughly in a
Environ Geol (2009) 57:59–73 61
123
Wig-L-Bug for 5 min under dry N2 in a glove box. A
portion of the mixed sample, *150 mg, was weighed,
degassed, and pelletized also under dry N2. The transmis-
sion spectrum of the resulting pellet was obtained from 256
scans with a nominal resolution of 8 cm-t in the 400 to
600 cm-1 region. A reference spectrum of KBr was
subtracted to yield the final clay spectrum. The system
software was capable of baseline correction, subtraction,
and peak deconvolution of the spectra measured.
Samples were collected from a bore well (Site A) at
10 in. interval to a depth of about 680 in., Fourier trans-
parent infra red (FTIR) analysis was carried out for the
0
50
100
150
200
250
0
50
100
150
200
250
0
50
100
150
200
250
0
50
100
150
200
250
300 10 20 300 0 5 10 15 2010 20 300 10 20
Dep
th in
met
ers
New EngineeringDDE AgricultureLadies HostelFig. 2 Bore hole resistivity log
of four locations in the study
area along AA’
Fig. 3 3D representation of resistivity log of four locations in the study area
62 Environ Geol (2009) 57:59–73
123
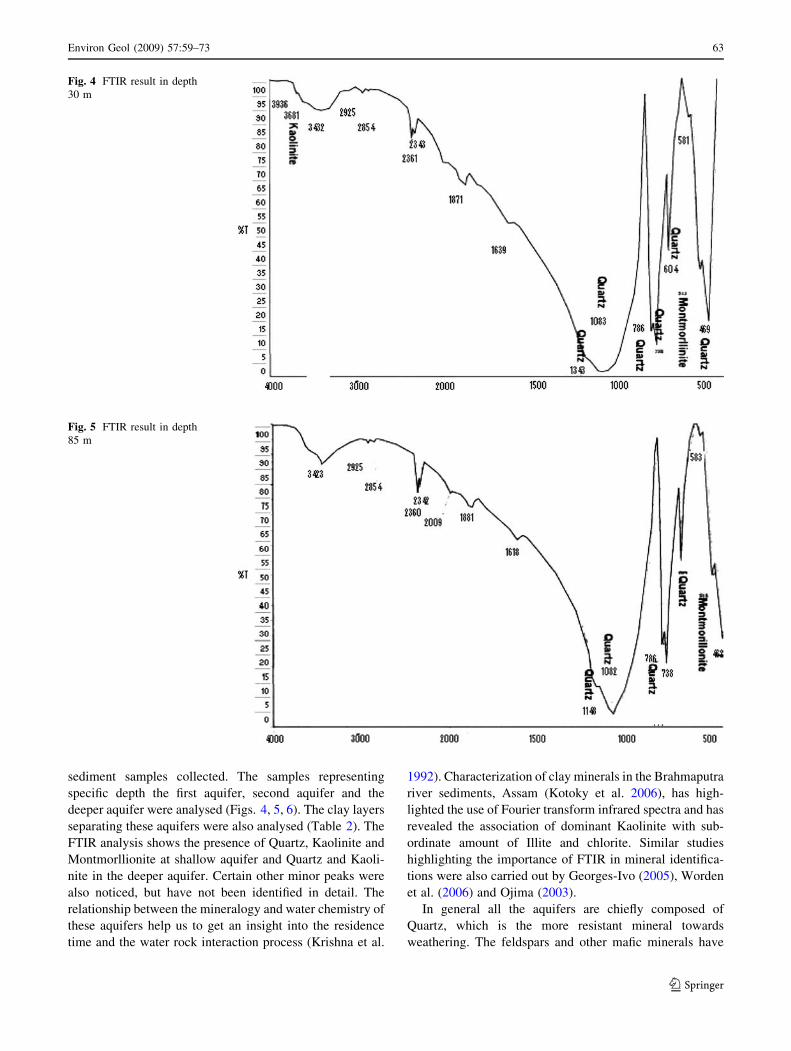
sediment samples collected. The samples representing
specific depth the first aquifer, second aquifer and the
deeper aquifer were analysed (Figs. 4, 5, 6). The clay layers
separating these aquifers were also analysed (Table 2). The
FTIR analysis shows the presence of Quartz, Kaolinite and
Montmorllionite at shallow aquifer and Quartz and Kaoli-
nite in the deeper aquifer. Certain other minor peaks were
also noticed, but have not been identified in detail. The
relationship between the mineralogy and water chemistry of
these aquifers help us to get an insight into the residence
time and the water rock interaction process (Krishna et al.
1992). Characterization of clay minerals in the Brahmaputra
river sediments, Assam (Kotoky et al. 2006), has high-
lighted the use of Fourier transform infrared spectra and has
revealed the association of dominant Kaolinite with sub-
ordinate amount of Illite and chlorite. Similar studies
highlighting the importance of FTIR in mineral identifica-
tions were also carried out by Georges-Ivo (2005), Worden
et al. (2006) and Ojima (2003).
In general all the aquifers are chiefly composed of
Quartz, which is the more resistant mineral towards
weathering. The feldspars and other mafic minerals have
Fig. 4 FTIR result in depth
30 m
Fig. 5 FTIR result in depth
85 m
Environ Geol (2009) 57:59–73 63
123
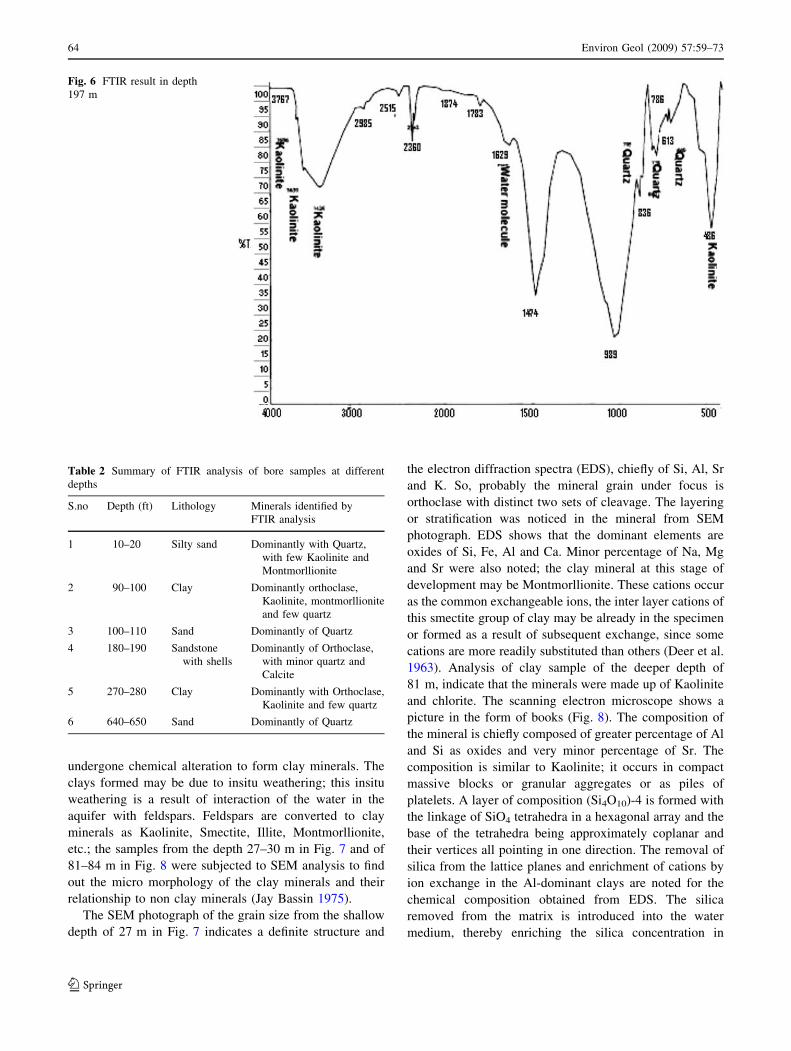
undergone chemical alteration to form clay minerals. The
clays formed may be due to insitu weathering; this insitu
weathering is a result of interaction of the water in the
aquifer with feldspars. Feldspars are converted to clay
minerals as Kaolinite, Smectite, Illite, Montmorllionite,
etc.; the samples from the depth 27–30 m in Fig. 7 and of
81–84 m in Fig. 8 were subjected to SEM analysis to find
out the micro morphology of the clay minerals and their
relationship to non clay minerals (Jay Bassin 1975).
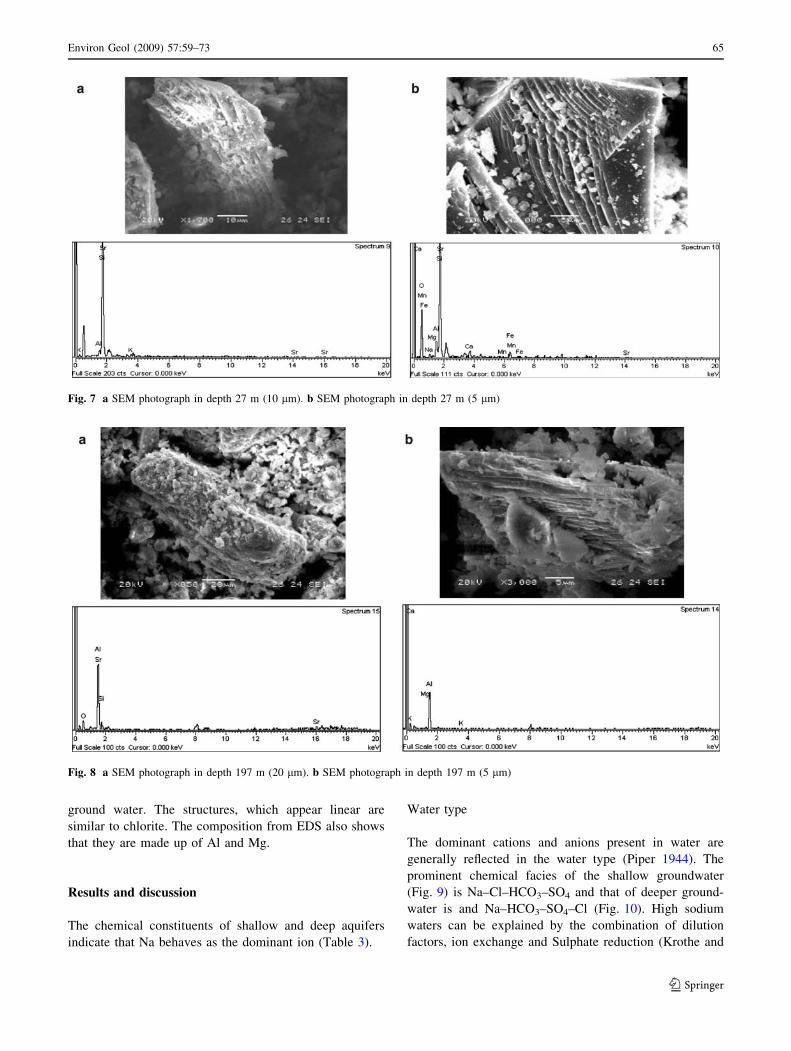
The SEM photograph of the grain size from the shallow
depth of 27 m in Fig. 7 indicates a definite structure and
the electron diffraction spectra (EDS), chiefly of Si, Al, Sr
and K. So, probably the mineral grain under focus is
orthoclase with distinct two sets of cleavage. The layering
or stratification was noticed in the mineral from SEM
photograph. EDS shows that the dominant elements are
oxides of Si, Fe, Al and Ca. Minor percentage of Na, Mg
and Sr were also noted; the clay mineral at this stage of
development may be Montmorllionite. These cations occur
as the common exchangeable ions, the inter layer cations of
this smectite group of clay may be already in the specimen
or formed as a result of subsequent exchange, since some
cations are more readily substituted than others (Deer et al.
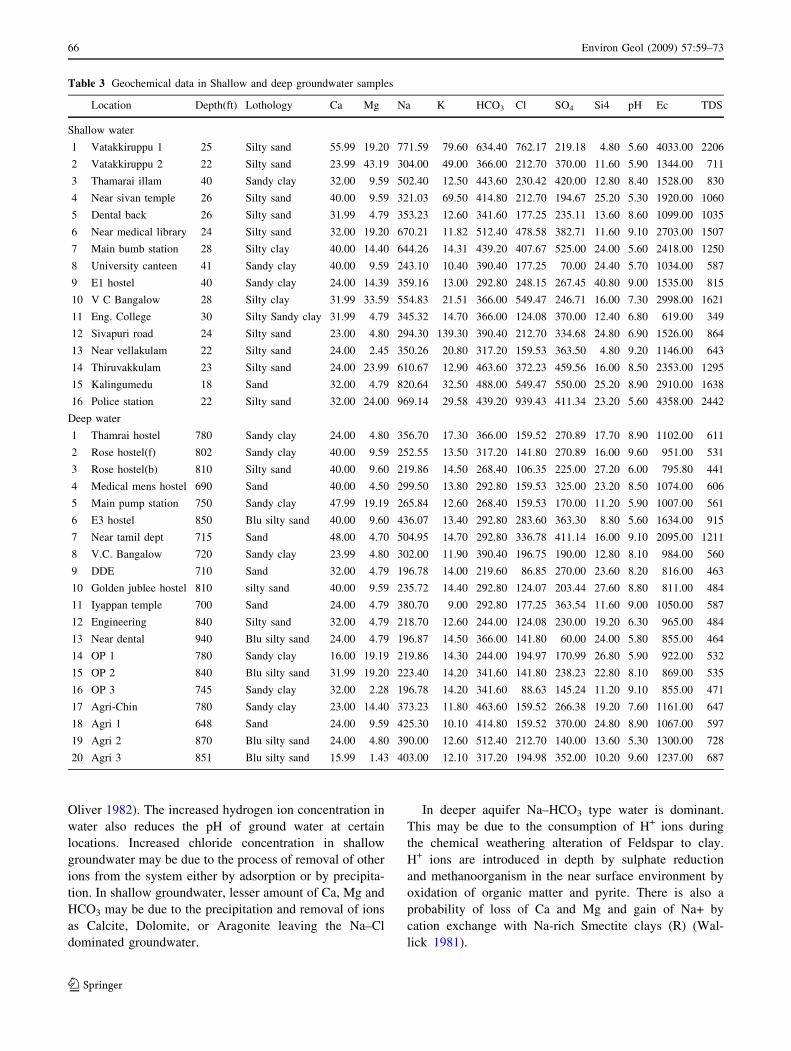
1963). Analysis of clay sample of the deeper depth of
81 m, indicate that the minerals were made up of Kaolinite
and chlorite. The scanning electron microscope shows a
picture in the form of books (Fig. 8). The composition of
the mineral is chiefly composed of greater percentage of Al
and Si as oxides and very minor percentage of Sr. The
composition is similar to Kaolinite; it occurs in compact
massive blocks or granular aggregates or as piles of
platelets. A layer of composition (Si4O10)-4 is formed with
the linkage of SiO4 tetrahedra in a hexagonal array and the
base of the tetrahedra being approximately coplanar and
their vertices all pointing in one direction. The removal of
silica from the lattice planes and enrichment of cations by
ion exchange in the Al-dominant clays are noted for the
chemical composition obtained from EDS. The silica
removed from the matrix is introduced into the water
medium, thereby enriching the silica concentration in
Fig. 6 FTIR result in depth
197 m
Table 2 Summary of FTIR analysis of bore samples at different
depths
S.no Depth (ft) Lithology Minerals identified by
FTIR analysis
1 10–20 Silty sand Dominantly with Quartz,
with few Kaolinite and
Montmorllionite
2 90–100 Clay Dominantly orthoclase,
Kaolinite, montmorllionite
and few quartz
3 100–110 Sand Dominantly of Quartz
4 180–190 Sandstone
with shells
Dominantly of Orthoclase,
with minor quartz and
Calcite
5 270–280 Clay Dominantly with Orthoclase,
Kaolinite and few quartz
6 640–650 Sand Dominantly of Quartz
64 Environ Geol (2009) 57:59–73
123
ground water. The structures, which appear linear are
similar to chlorite. The composition from EDS also shows
that they are made up of Al and Mg.
Results and discussion
The chemical constituents of shallow and deep aquifers
indicate that Na behaves as the dominant ion (Table 3).
Water type
The dominant cations and anions present in water are
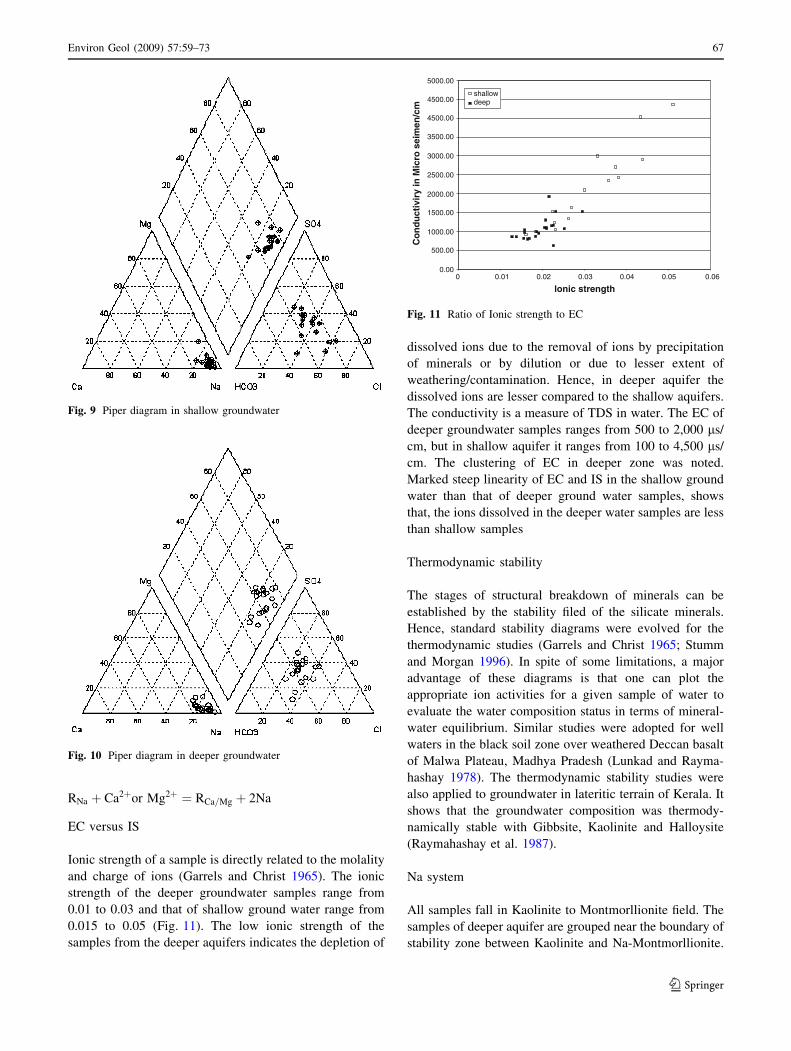
generally reflected in the water type (Piper 1944). The
prominent chemical facies of the shallow groundwater
(Fig. 9) is Na–Cl–HCO3–SO4 and that of deeper ground-
water is and Na–HCO3–SO4–Cl (Fig. 10). High sodium
waters can be explained by the combination of dilution
factors, ion exchange and Sulphate reduction (Krothe and
Fig. 7 a SEM photograph in depth 27 m (10 lm). b SEM photograph in depth 27 m (5 lm)
Fig. 8 a SEM photograph in depth 197 m (20 lm). b SEM photograph in depth 197 m (5 lm)
Environ Geol (2009) 57:59–73 65
123
Oliver 1982). The increased hydrogen ion concentration in
water also reduces the pH of ground water at certain
locations. Increased chloride concentration in shallow
groundwater may be due to the process of removal of other
ions from the system either by adsorption or by precipita-
tion. In shallow groundwater, lesser amount of Ca, Mg and
HCO3 may be due to the precipitation and removal of ions
as Calcite, Dolomite, or Aragonite leaving the Na–Cl
dominated groundwater.
In deeper aquifer Na–HCO3 type water is dominant.
This may be due to the consumption of H+ ions during
the chemical weathering alteration of Feldspar to clay.
H+ ions are introduced in depth by sulphate reduction
and methanoorganism in the near surface environment by
oxidation of organic matter and pyrite. There is also a
probability of loss of Ca and Mg and gain of Na+ by
cation exchange with Na-rich Smectite clays (R) (Wal-
lick 1981).
Table 3 Geochemical data in Shallow and deep groundwater samples
Location Depth(ft) Lothology Ca Mg Na K HCO3 Cl SO4 Si4 pH Ec TDS
Shallow water
1 Vatakkiruppu 1 25 Silty sand 55.99 19.20 771.59 79.60 634.40 762.17 219.18 4.80 5.60 4033.00 2206
2 Vatakkiruppu 2 22 Silty sand 23.99 43.19 304.00 49.00 366.00 212.70 370.00 11.60 5.90 1344.00 711
3 Thamarai illam 40 Sandy clay 32.00 9.59 502.40 12.50 443.60 230.42 420.00 12.80 8.40 1528.00 830
4 Near sivan temple 26 Silty sand 40.00 9.59 321.03 69.50 414.80 212.70 194.67 25.20 5.30 1920.00 1060
5 Dental back 26 Silty sand 31.99 4.79 353.23 12.60 341.60 177.25 235.11 13.60 8.60 1099.00 1035
6 Near medical library 24 Silty sand 32.00 19.20 670.21 11.82 512.40 478.58 382.71 11.60 9.10 2703.00 1507
7 Main bumb station 28 Silty clay 40.00 14.40 644.26 14.31 439.20 407.67 525.00 24.00 5.60 2418.00 1250
8 University canteen 41 Sandy clay 40.00 9.59 243.10 10.40 390.40 177.25 70.00 24.40 5.70 1034.00 587
9 E1 hostel 40 Sandy clay 24.00 14.39 359.16 13.00 292.80 248.15 267.45 40.80 9.00 1535.00 815
10 V C Bangalow 28 Silty clay 31.99 33.59 554.83 21.51 366.00 549.47 246.71 16.00 7.30 2998.00 1621
11 Eng. College 30 Silty Sandy clay 31.99 4.79 345.32 14.70 366.00 124.08 370.00 12.40 6.80 619.00 349
12 Sivapuri road 24 Silty sand 23.00 4.80 294.30 139.30 390.40 212.70 334.68 24.80 6.90 1526.00 864
13 Near vellakulam 22 Silty sand 24.00 2.45 350.26 20.80 317.20 159.53 363.50 4.80 9.20 1146.00 643
14 Thiruvakkulam 23 Silty sand 24.00 23.99 610.67 12.90 463.60 372.23 459.56 16.00 8.50 2353.00 1295
15 Kalingumedu 18 Sand 32.00 4.79 820.64 32.50 488.00 549.47 550.00 25.20 8.90 2910.00 1638
16 Police station 22 Silty sand 32.00 24.00 969.14 29.58 439.20 939.43 411.34 23.20 5.60 4358.00 2442
Deep water
1 Thamrai hostel 780 Sandy clay 24.00 4.80 356.70 17.30 366.00 159.52 270.89 17.70 8.90 1102.00 611
2 Rose hostel(f) 802 Sandy clay 40.00 9.59 252.55 13.50 317.20 141.80 270.89 16.00 9.60 951.00 531
3 Rose hostel(b) 810 Silty sand 40.00 9.60 219.86 14.50 268.40 106.35 225.00 27.20 6.00 795.80 441
4 Medical mens hostel 690 Sand 40.00 4.50 299.50 13.80 292.80 159.53 325.00 23.20 8.50 1074.00 606
5 Main pump station 750 Sandy clay 47.99 19.19 265.84 12.60 268.40 159.53 170.00 11.20 5.90 1007.00 561
6 E3 hostel 850 Blu silty sand 40.00 9.60 436.07 13.40 292.80 283.60 363.30 8.80 5.60 1634.00 915
7 Near tamil dept 715 Sand 48.00 4.70 504.95 14.70 292.80 336.78 411.14 16.00 9.10 2095.00 1211
8 V.C. Bangalow 720 Sandy clay 23.99 4.80 302.00 11.90 390.40 196.75 190.00 12.80 8.10 984.00 560
9 DDE 710 Sand 32.00 4.79 196.78 14.00 219.60 86.85 270.00 23.60 8.20 816.00 463
10 Golden jublee hostel 810 silty sand 40.00 9.59 235.72 14.40 292.80 124.07 203.44 27.60 8.80 811.00 484
11 Iyappan temple 700 Sand 24.00 4.79 380.70 9.00 292.80 177.25 363.54 11.60 9.00 1050.00 587
12 Engineering 840 Silty sand 32.00 4.79 218.70 12.60 244.00 124.08 230.00 19.20 6.30 965.00 484
13 Near dental 940 Blu silty sand 24.00 4.79 196.87 14.50 366.00 141.80 60.00 24.00 5.80 855.00 464
14 OP 1 780 Sandy clay 16.00 19.19 219.86 14.30 244.00 194.97 170.99 26.80 5.90 922.00 532
15 OP 2 840 Blu silty sand 31.99 19.20 223.40 14.20 341.60 141.80 238.23 22.80 8.10 869.00 535
16 OP 3 745 Sandy clay 32.00 2.28 196.78 14.20 341.60 88.63 145.24 11.20 9.10 855.00 471
17 Agri-Chin 780 Sandy clay 23.00 14.40 373.23 11.80 463.60 159.52 266.38 19.20 7.60 1161.00 647
18 Agri 1 648 Sand 24.00 9.59 425.30 10.10 414.80 159.52 370.00 24.80 8.90 1067.00 597
19 Agri 2 870 Blu silty sand 24.00 4.80 390.00 12.60 512.40 212.70 140.00 13.60 5.30 1300.00 728
20 Agri 3 851 Blu silty sand 15.99 1.43 403.00 12.10 317.20 194.98 352.00 10.20 9.60 1237.00 687
66 Environ Geol (2009) 57:59–73
123
RNa þ Ca2þor Mg2þ ¼ RCa=Mg þ 2Na
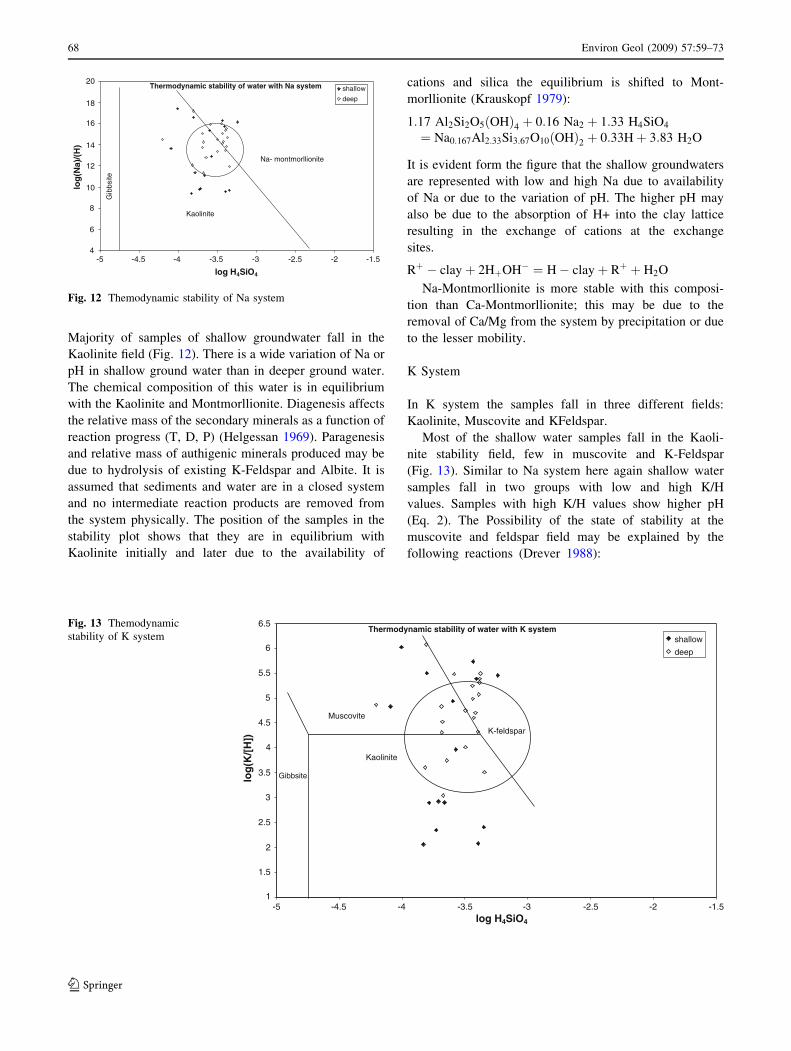
EC versus IS
Ionic strength of a sample is directly related to the molality
and charge of ions (Garrels and Christ 1965). The ionic
strength of the deeper groundwater samples range from
0.01 to 0.03 and that of shallow ground water range from
0.015 to 0.05 (Fig. 11). The low ionic strength of the
samples from the deeper aquifers indicates the depletion of
dissolved ions due to the removal of ions by precipitation
of minerals or by dilution or due to lesser extent of
weathering/contamination. Hence, in deeper aquifer the
dissolved ions are lesser compared to the shallow aquifers.
The conductivity is a measure of TDS in water. The EC of
deeper groundwater samples ranges from 500 to 2,000 ls/
cm, but in shallow aquifer it ranges from 100 to 4,500 ls/
cm. The clustering of EC in deeper zone was noted.
Marked steep linearity of EC and IS in the shallow ground
water than that of deeper ground water samples, shows
that, the ions dissolved in the deeper water samples are less
than shallow samples
Thermodynamic stability
The stages of structural breakdown of minerals can be
established by the stability filed of the silicate minerals.
Hence, standard stability diagrams were evolved for the
thermodynamic studies (Garrels and Christ 1965; Stumm
and Morgan 1996). In spite of some limitations, a major
advantage of these diagrams is that one can plot the
appropriate ion activities for a given sample of water to
evaluate the water composition status in terms of mineral-
water equilibrium. Similar studies were adopted for well
waters in the black soil zone over weathered Deccan basalt
of Malwa Plateau, Madhya Pradesh (Lunkad and Rayma-
hashay 1978). The thermodynamic stability studies were
also applied to groundwater in lateritic terrain of Kerala. It
shows that the groundwater composition was thermody-
namically stable with Gibbsite, Kaolinite and Halloysite
(Raymahashay et al. 1987).
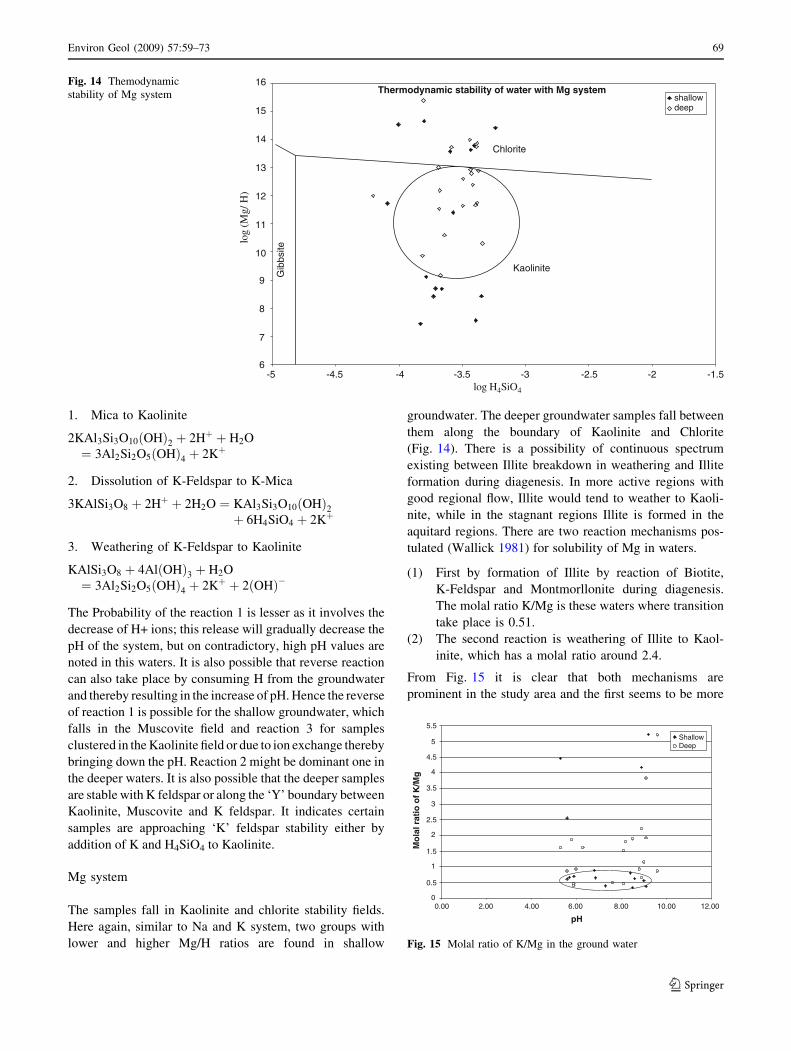
Na system
All samples fall in Kaolinite to Montmorllionite field. The
samples of deeper aquifer are grouped near the boundary of
stability zone between Kaolinite and Na-Montmorllionite.
Fig. 9 Piper diagram in shallow groundwater
Fig. 10 Piper diagram in deeper groundwater
5000.00
shallowdeep4500.00
4500.00
3500.00
3000.00
2500.00
2000.00
1500.00
1000.00
500.00
0.000 0.01 0.02 0.03
lonic strength0.04 0.05 0.06
Co
nd
uct
ivir
y in
Mic
ro s
eim
en/c
m
Fig. 11 Ratio of Ionic strength to EC
Environ Geol (2009) 57:59–73 67
123
Majority of samples of shallow groundwater fall in the
Kaolinite field (Fig. 12). There is a wide variation of Na or
pH in shallow ground water than in deeper ground water.
The chemical composition of this water is in equilibrium
with the Kaolinite and Montmorllionite. Diagenesis affects
the relative mass of the secondary minerals as a function of
reaction progress (T, D, P) (Helgessan 1969). Paragenesis
and relative mass of authigenic minerals produced may be
due to hydrolysis of existing K-Feldspar and Albite. It is
assumed that sediments and water are in a closed system
and no intermediate reaction products are removed from
the system physically. The position of the samples in the
stability plot shows that they are in equilibrium with
Kaolinite initially and later due to the availability of
cations and silica the equilibrium is shifted to Mont-
morllionite (Krauskopf 1979):
1:17 Al2Si2O5ðOHÞ4 þ 0:16 Na2 þ 1:33 H4SiO4
¼ Na0:167Al2:33Si3:67O10ðOHÞ2 þ 0:33Hþ 3:83 H2O
It is evident form the figure that the shallow groundwaters
are represented with low and high Na due to availability
of Na or due to the variation of pH. The higher pH may
also be due to the absorption of H+ into the clay lattice
resulting in the exchange of cations at the exchange
sites.
Rþ � clayþ 2HþOH� ¼ H� clayþ Rþ þ H2O
Na-Montmorllionite is more stable with this composi-
tion than Ca-Montmorllionite; this may be due to the
removal of Ca/Mg from the system by precipitation or due
to the lesser mobility.
K System
In K system the samples fall in three different fields:
Kaolinite, Muscovite and KFeldspar.
Most of the shallow water samples fall in the Kaoli-
nite stability field, few in muscovite and K-Feldspar
(Fig. 13). Similar to Na system here again shallow water
samples fall in two groups with low and high K/H
values. Samples with high K/H values show higher pH
(Eq. 2). The Possibility of the state of stability at the
muscovite and feldspar field may be explained by the
following reactions (Drever 1988):
4
6
8
10
12
14
16
18
20
-5 -4.5 -4 -3.5 -3 -2.5 -2 -1.5
log H4SiO4
log
(Na)
/(H
)shallow
deep
Thermodynamic stability of water with Na system
Kaolinite
Na- montmorllionite
Gib
bsite
Fig. 12 Themodynamic stability of Na system
1
1.5
2
2.5
3
3.5
4
4.5
5
5.5
6
6.5
-5 -4.5 -4 -3.5 -3 -2.5 -2 -1.5log H4SiO4
log
(K/[
H])
Muscovite
K-feldspar
shallow
deep
Kaolinite
Gibbsite
Thermodynamic stability of water with K system Fig. 13 Themodynamic
stability of K system
68 Environ Geol (2009) 57:59–73
123
1. Mica to Kaolinite
2KAl3Si3O10ðOHÞ2 þ 2Hþ þ H2O
¼ 3Al2Si2O5ðOHÞ4 þ 2Kþ
2. Dissolution of K-Feldspar to K-Mica
3KAlSi3O8 þ 2Hþ þ 2H2O ¼ KAl3Si3O10ðOHÞ2þ 6H4SiO4 þ 2Kþ
3. Weathering of K-Feldspar to Kaolinite
KAlSi3O8 þ 4AlðOHÞ3 þ H2O
¼ 3Al2Si2O5ðOHÞ4 þ 2Kþ þ 2ðOHÞ�
The Probability of the reaction 1 is lesser as it involves the
decrease of H+ ions; this release will gradually decrease the
pH of the system, but on contradictory, high pH values are
noted in this waters. It is also possible that reverse reaction
can also take place by consuming H from the groundwater
and thereby resulting in the increase of pH. Hence the reverse
of reaction 1 is possible for the shallow groundwater, which
falls in the Muscovite field and reaction 3 for samples
clustered in the Kaolinite field or due to ion exchange thereby
bringing down the pH. Reaction 2 might be dominant one in
the deeper waters. It is also possible that the deeper samples
are stable with K feldspar or along the ‘Y’ boundary between
Kaolinite, Muscovite and K feldspar. It indicates certain
samples are approaching ‘K’ feldspar stability either by
addition of K and H4SiO4 to Kaolinite.
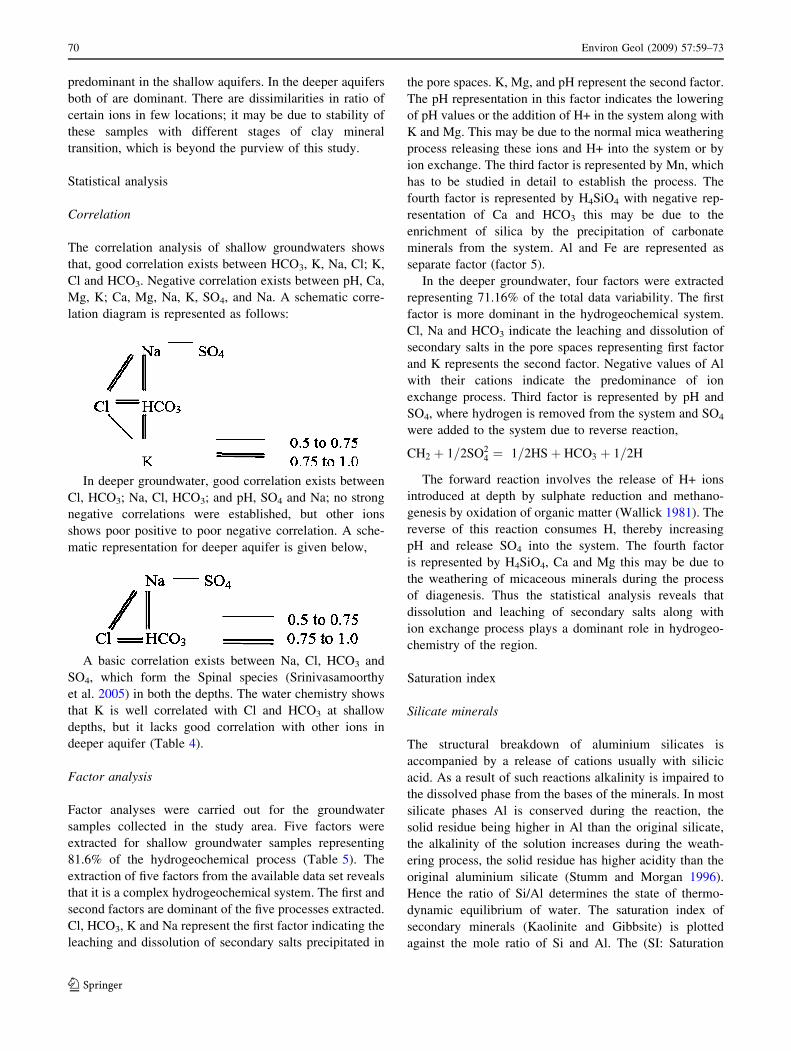
Mg system
The samples fall in Kaolinite and chlorite stability fields.
Here again, similar to Na and K system, two groups with
lower and higher Mg/H ratios are found in shallow
groundwater. The deeper groundwater samples fall between
them along the boundary of Kaolinite and Chlorite
(Fig. 14). There is a possibility of continuous spectrum
existing between Illite breakdown in weathering and Illite
formation during diagenesis. In more active regions with
good regional flow, Illite would tend to weather to Kaoli-
nite, while in the stagnant regions Illite is formed in the
aquitard regions. There are two reaction mechanisms pos-
tulated (Wallick 1981) for solubility of Mg in waters.
(1) First by formation of Illite by reaction of Biotite,
K-Feldspar and Montmorllonite during diagenesis.
The molal ratio K/Mg is these waters where transition
take place is 0.51.
(2) The second reaction is weathering of Illite to Kaol-
inite, which has a molal ratio around 2.4.
From Fig. 15 it is clear that both mechanisms are
prominent in the study area and the first seems to be more
6
7
8
9
10
11
12
13
14
15
16
-5 -4.5 -4 -3.5 -3 -2.5 -2 -1.5
Thermodynamic stability of water with Mg system
Chlorite
Kaolinite
shallowdeep
Gib
bsite
log H4SiO4
log
(Mg/
H)
Fig. 14 Themodynamic
stability of Mg system
0
0.5
1
1.5
2
2.5
3
3.5
4
4.5
5
5.5
0.00 2.00 4.00 6.00 8.00 10.00 12.00
pH
Mo
lal r
atio
of
K/M
g
ShallowDeep
Fig. 15 Molal ratio of K/Mg in the ground water
Environ Geol (2009) 57:59–73 69
123
predominant in the shallow aquifers. In the deeper aquifers
both of are dominant. There are dissimilarities in ratio of
certain ions in few locations; it may be due to stability of
these samples with different stages of clay mineral
transition, which is beyond the purview of this study.
Statistical analysis
Correlation
The correlation analysis of shallow groundwaters shows
that, good correlation exists between HCO3, K, Na, Cl; K,
Cl and HCO3. Negative correlation exists between pH, Ca,
Mg, K; Ca, Mg, Na, K, SO4, and Na. A schematic corre-
lation diagram is represented as follows:
In deeper groundwater, good correlation exists between
Cl, HCO3; Na, Cl, HCO3; and pH, SO4 and Na; no strong
negative correlations were established, but other ions
shows poor positive to poor negative correlation. A sche-
matic representation for deeper aquifer is given below,
A basic correlation exists between Na, Cl, HCO3 and
SO4, which form the Spinal species (Srinivasamoorthy
et al. 2005) in both the depths. The water chemistry shows
that K is well correlated with Cl and HCO3 at shallow
depths, but it lacks good correlation with other ions in
deeper aquifer (Table 4).
Factor analysis
Factor analyses were carried out for the groundwater
samples collected in the study area. Five factors were
extracted for shallow groundwater samples representing
81.6% of the hydrogeochemical process (Table 5). The
extraction of five factors from the available data set reveals
that it is a complex hydrogeochemical system. The first and
second factors are dominant of the five processes extracted.
Cl, HCO3, K and Na represent the first factor indicating the
leaching and dissolution of secondary salts precipitated in
the pore spaces. K, Mg, and pH represent the second factor.
The pH representation in this factor indicates the lowering
of pH values or the addition of H+ in the system along with
K and Mg. This may be due to the normal mica weathering
process releasing these ions and H+ into the system or by
ion exchange. The third factor is represented by Mn, which
has to be studied in detail to establish the process. The
fourth factor is represented by H4SiO4 with negative rep-
resentation of Ca and HCO3 this may be due to the
enrichment of silica by the precipitation of carbonate
minerals from the system. Al and Fe are represented as
separate factor (factor 5).
In the deeper groundwater, four factors were extracted
representing 71.16% of the total data variability. The first
factor is more dominant in the hydrogeochemical system.
Cl, Na and HCO3 indicate the leaching and dissolution of
secondary salts in the pore spaces representing first factor
and K represents the second factor. Negative values of Al
with their cations indicate the predominance of ion
exchange process. Third factor is represented by pH and
SO4, where hydrogen is removed from the system and SO4
were added to the system due to reverse reaction,
CH2 þ 1=2SO24 ¼ 1=2HSþ HCO3 þ 1=2H
The forward reaction involves the release of H+ ions
introduced at depth by sulphate reduction and methano-
genesis by oxidation of organic matter (Wallick 1981). The
reverse of this reaction consumes H, thereby increasing
pH and release SO4 into the system. The fourth factor
is represented by H4SiO4, Ca and Mg this may be due to
the weathering of micaceous minerals during the process
of diagenesis. Thus the statistical analysis reveals that
dissolution and leaching of secondary salts along with
ion exchange process plays a dominant role in hydrogeo-
chemistry of the region.
Saturation index
Silicate minerals
The structural breakdown of aluminium silicates is
accompanied by a release of cations usually with silicic
acid. As a result of such reactions alkalinity is impaired to
the dissolved phase from the bases of the minerals. In most
silicate phases Al is conserved during the reaction, the
solid residue being higher in Al than the original silicate,
the alkalinity of the solution increases during the weath-
ering process, the solid residue has higher acidity than the
original aluminium silicate (Stumm and Morgan 1996).
Hence the ratio of Si/Al determines the state of thermo-
dynamic equilibrium of water. The saturation index of
secondary minerals (Kaolinite and Gibbsite) is plotted
against the mole ratio of Si and Al. The (SI: Saturation
70 Environ Geol (2009) 57:59–73
123
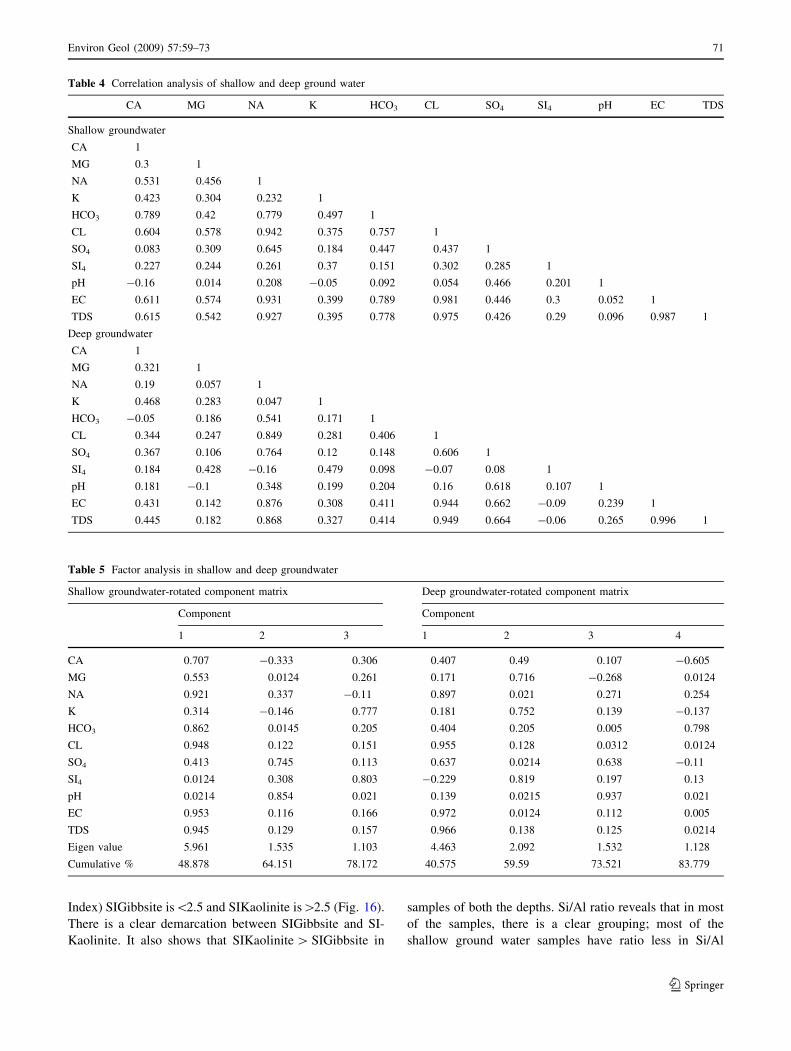
Index) SIGibbsite is\2.5 and SIKaolinite is[2.5 (Fig. 16).
There is a clear demarcation between SIGibbsite and SI-
Kaolinite. It also shows that SIKaolinite [ SIGibbsite in
samples of both the depths. Si/Al ratio reveals that in most
of the samples, there is a clear grouping; most of the
shallow ground water samples have ratio less in Si/Al
Table 4 Correlation analysis of shallow and deep ground water
CA MG NA K HCO3 CL SO4 SI4 pH EC TDS
Shallow groundwater
CA 1
MG 0.3 1
NA 0.531 0.456 1
K 0.423 0.304 0.232 1
HCO3 0.789 0.42 0.779 0.497 1
CL 0.604 0.578 0.942 0.375 0.757 1
SO4 0.083 0.309 0.645 0.184 0.447 0.437 1
SI4 0.227 0.244 0.261 0.37 0.151 0.302 0.285 1
pH -0.16 0.014 0.208 -0.05 0.092 0.054 0.466 0.201 1
EC 0.611 0.574 0.931 0.399 0.789 0.981 0.446 0.3 0.052 1
TDS 0.615 0.542 0.927 0.395 0.778 0.975 0.426 0.29 0.096 0.987 1
Deep groundwater
CA 1
MG 0.321 1
NA 0.19 0.057 1
K 0.468 0.283 0.047 1
HCO3 -0.05 0.186 0.541 0.171 1
CL 0.344 0.247 0.849 0.281 0.406 1
SO4 0.367 0.106 0.764 0.12 0.148 0.606 1
SI4 0.184 0.428 -0.16 0.479 0.098 -0.07 0.08 1
pH 0.181 -0.1 0.348 0.199 0.204 0.16 0.618 0.107 1
EC 0.431 0.142 0.876 0.308 0.411 0.944 0.662 -0.09 0.239 1
TDS 0.445 0.182 0.868 0.327 0.414 0.949 0.664 -0.06 0.265 0.996 1
Table 5 Factor analysis in shallow and deep groundwater
Shallow groundwater-rotated component matrix Deep groundwater-rotated component matrix
Component Component
1 2 3 1 2 3 4
CA 0.707 -0.333 0.306 0.407 0.49 0.107 -0.605
MG 0.553 0.0124 0.261 0.171 0.716 -0.268 0.0124
NA 0.921 0.337 -0.11 0.897 0.021 0.271 0.254
K 0.314 -0.146 0.777 0.181 0.752 0.139 -0.137
HCO3 0.862 0.0145 0.205 0.404 0.205 0.005 0.798
CL 0.948 0.122 0.151 0.955 0.128 0.0312 0.0124
SO4 0.413 0.745 0.113 0.637 0.0214 0.638 -0.11
SI4 0.0124 0.308 0.803 -0.229 0.819 0.197 0.13
pH 0.0214 0.854 0.021 0.139 0.0215 0.937 0.021
EC 0.953 0.116 0.166 0.972 0.0124 0.112 0.005
TDS 0.945 0.129 0.157 0.966 0.138 0.125 0.0214
Eigen value 5.961 1.535 1.103 4.463 2.092 1.532 1.128
Cumulative % 48.878 64.151 78.172 40.575 59.59 73.521 83.779
Environ Geol (2009) 57:59–73 71
123
values (\2.5 ppm). There are few shallow groundwater
samples showing higher value, this may be due to the
increased dissolution of H4SiO4 in the system or enrich-
ment of Al in the solid phase induces the formation of
secondary minerals promoting higher saturation index for
these secondary minerals and higher alkalinity to the sys-
tem (Stumm and Morgan 1996).
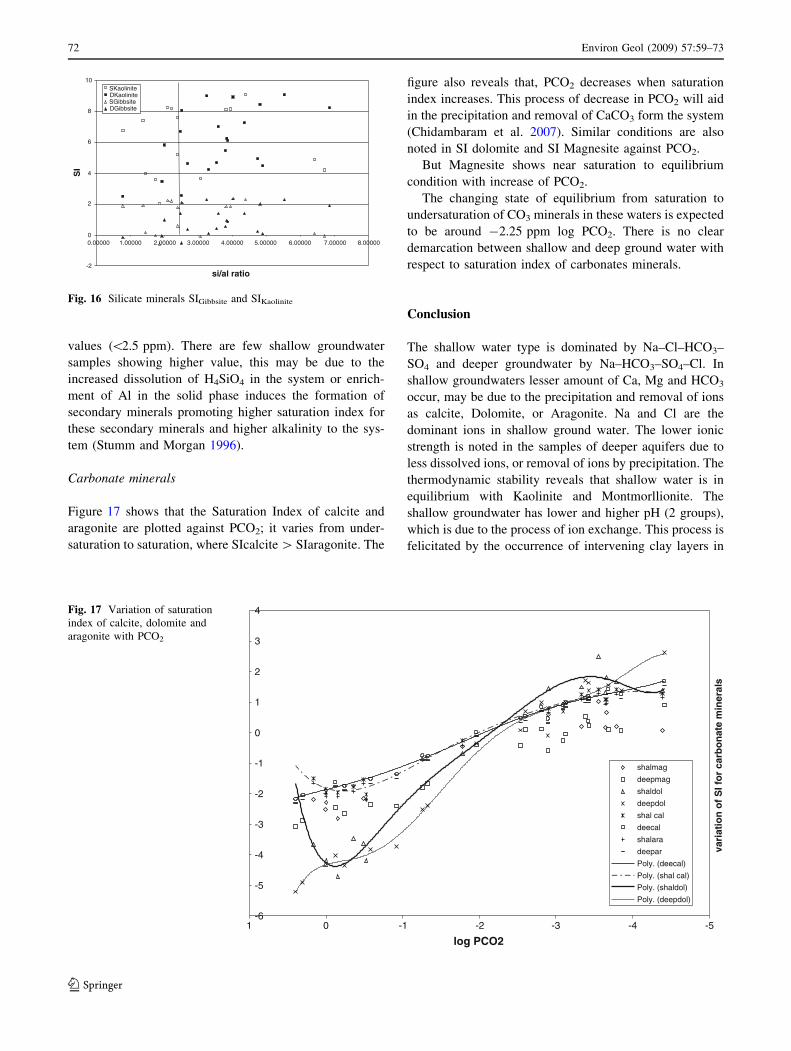
Carbonate minerals
Figure 17 shows that the Saturation Index of calcite and
aragonite are plotted against PCO2; it varies from under-
saturation to saturation, where SIcalcite [ SIaragonite. The
figure also reveals that, PCO2 decreases when saturation
index increases. This process of decrease in PCO2 will aid
in the precipitation and removal of CaCO3 form the system
(Chidambaram et al. 2007). Similar conditions are also
noted in SI dolomite and SI Magnesite against PCO2.
But Magnesite shows near saturation to equilibrium
condition with increase of PCO2.
The changing state of equilibrium from saturation to
undersaturation of CO3 minerals in these waters is expected
to be around -2.25 ppm log PCO2. There is no clear
demarcation between shallow and deep ground water with
respect to saturation index of carbonates minerals.
Conclusion
The shallow water type is dominated by Na–Cl–HCO3–
SO4 and deeper groundwater by Na–HCO3–SO4–Cl. In
shallow groundwaters lesser amount of Ca, Mg and HCO3
occur, may be due to the precipitation and removal of ions
as calcite, Dolomite, or Aragonite. Na and Cl are the
dominant ions in shallow ground water. The lower ionic
strength is noted in the samples of deeper aquifers due to
less dissolved ions, or removal of ions by precipitation. The
thermodynamic stability reveals that shallow water is in
equilibrium with Kaolinite and Montmorllionite. The
shallow groundwater has lower and higher pH (2 groups),
which is due to the process of ion exchange. This process is
felicitated by the occurrence of intervening clay layers in
-2
0
2
4
6
8
10
0.00000 1.00000 2.00000 3.00000 4.00000 5.00000 6.00000 7.00000 8.00000
si/al ratio
SI
SKaolinite DKaolinite SGibbsite DGibbsite
Fig. 16 Silicate minerals SIGibbsite and SIKaolinite
-6
-5
-4
-3
-2
-1
0
1
2
3
4
-5-4-3-2-101
log PCO2
vari
atio
n o
f S
I fo
r ca
rbo
nat
e m
iner
als
shalmag
deepmag
shaldol
deepdol
shal cal
deecal
shalara
deepar
Poly. (deecal)
Poly. (shal cal)
Poly. (shaldol)
Poly. (deepdol)
Fig. 17 Variation of saturation
index of calcite, dolomite and
aragonite with PCO2
72 Environ Geol (2009) 57:59–73
123
the shallow aquifers. The deeper water samples are
grouped into specific region in the stability plots with not
much variation in their respective fields. The correlation
existing between Na, Cl, HCO3 and SO4, shows the pos-
sible formation of spinal species at both depths. The factor
analysis reveals that leaching of secondary salts remains
the chief mechanism in controlling water chemistry in both
the depths, but ion exchange and weathering are dominant
in the shallow depth. The deeper aquifer shows signatures
of methanogenesis. SIKaolinite [ SIGibbsite in samples of
both the depths. Si/Al ratio reveals a clear grouping, most
of the shallow groundwater samples have low Si/Al ratio.
There is a decrease of PCO2 values with increase of satu-
ration index of carbonate minerals, which helps in their
precipitation and removal from the liquid phase. There is
no clear demarcation of shallow and deep ground water
with respect to Saturation Index of carbonates, as higher
and low SI of carbonate minerals are observed in both the
depths.
References
APHA (1998) Standard methods for the examination of water and
wastewater, 19th edn. APHA, Washington DC
Arul P (1990) Geophysical and hydrological studies of A.U. Campus,
Annamalai Nagar, Tamil Nadu, 98p
Chidambaram S, Vijayakumar V, Srinivasamoorthy K, Anandhan P,
Prasanna MV, Vasudevan S (2007) A study on Hydrogeochem-
ical signatures of hard and sedimentary aquifers in the Gadilam
river basin, Tamilnadu, India. J Geol Soc India (in press)
Deer WA, Howie RA, Zussman J (1963) Rock-forming minerals, vol
4, Framework Silicates, Longmans, p 435
Drever JI (1988) Geochemistry of natural waters, 2nd edn. Eagle
Wood Cliffs, Prentice Hall, 388p
Garrels RM, Christ JC (1965) Solutions, minerals, and equilibria.
Freeman, Cooper, San Francisco
Georges-Ivo EE (2005) Fourier transform infrared spectrophotometry
and X-ray powder diffractometry as complementary techniques
in characterizing clay size fraction of Kaolin. J Appl Sci Environ
Mgt 9(2):43–48
Helgessan HC (1969) Thermodynamics of hydrothermal systems at
elevated temperatures and pressures. Am J Sci 267:729–804
Jay Bassin N (1975) Suspended marine clay mineral identification by
scanning electron microscopy and energy-dispersive X-ray
analysis. Am Soc of Limnol Oceanogr 20(1):136
Kotoky P, Bezbaruah P, Baruah J, Borah GC, Sarma JN (2006)
Characterization of clay minerals in the Brahmaputra river
sediments, Assam, India. Curr Sci 91(9):247–1250
Krauskopf KB (1979) Introduction to geochemistry, 2nd edn. Mc
Graw hill international Services, Singapore, 617p
Krishna B, Miller JD, Joseph S (1992) FTIR study of deuterated
Montmorillonites: structural Features relevant to pillared clay
stability. Clays Clay Minerals 40(1):92–102
Krothe NC, Oliver JW (1982) Sulfur isotopic composition and water
chemistry from the High Plains aquifer, Oklahoma panhandle
and southwestern Kansas: U.S. Geological Survey Water
Resources Investigations 82-12, 28 p
Lakshmanan S (1982) Hydrogeological studies of Annamalai Uni-
versity campus. M.Phil Thesis, Department of Geology,
Annamalai University, 92p (unpublished)
Lakshmanan AR, Krishna Rao T, Viswanathan S (1982) Nitrate and
fluoride level in drinking waters of Hyderabad Ind J Environ
Health 28(1):39–47
Lunkad SK, Raymahashay BC (1978) Ground water quality in
weathered Deccan Basalt of Malwa Plateau, India. Quart J Eng
Geol Hydrogeol 11:273–277
Ojima J (2003) Determining of crystalline silica in respirable dust
samples by infrared spectrophotometry in the presence of
interferences. J Occupational Health 45:94–103
Piper AM (1944) A graphic procedure in geochemical interpretation
of water analysis. Trans Geophys Union 25:914–923
Raymahashay BC, Rao KS, Mehta VK, Bhavana PR (1987)
Mineralogy and geochemistry of lateritic soil profiles in Kerala,
India. Chem Geol 60(1–4):327–330
Senthil Kumar G (2006) Hydrogeochemical studies in and around
Annamalai Nagar Region Tamilnadu, India. MSc dissertation,
Department of Earth sciences, Annamalai University, Tamiln-
adu, 120p
Srinivasamoorthy K, Chidambaram S, Anandan P (2005) Equilibrium
and thermodynamic approach of groundwater chemistry from a
hard rock terrain, Mettur, a case Salem district, Tamilnadu. Ind J
Geochem 20:181–190
Stumm W, Morgan JJ (1996) Aquatic chemistry. Wiley Interscience,
New York, pp 349–424
Wallick EI (1981) Chemical evolution of groundwater in a drainage
basin of Holocene age, east-central Alberta, Canada. J Hydrol
54(1–3):245–283
Worden RH, Needham SJ, Cuadros J (2006) The worm gut; a natural
clay mineral factory and a possible cause of diagenetic grain
coats in sandstones. J Geochem Explor 89(1–3): 428–431
Environ Geol (2009) 57:59–73 73
123


