Embed Size (px)
Citation preview
A sys t e m a tic r eview of t h e disc ri min a tin g bio m e c h a nic al
p a r a m e t e r s d u rin g t h e single leg s q u a t
Warn er, MB, Wilson, DA, H e r rin g to n, LC, Dixon, S, Pow er, C, Jone s, R, H eller, MO, Ca r d e n, P a n d Lewis, CL
h t t p://dx.doi.o rg/1 0.10 1 6/j.p t sp.2 0 1 9.0 1.0 0 7
Tit l e A sys t e m a tic r evie w of t h e di sc ri min a tin g bio m e c h a nic al p a r a m e t e r s d u rin g t h e single leg s q u a t
Aut h or s Warn er, MB, Wilson, DA, H e r rin g to n, LC, Dixon, S, Pow er, C, Jone s, R, H eller, MO, Ca r d e n, P a n d Lewis, CL
Typ e Article
U RL This ve r sion is available a t : h t t p://usir.s alfor d. ac.uk/id/e p rin t/49 9 2 9/
P u bl i s h e d D a t e 2 0 1 9
U SIR is a digi t al collec tion of t h e r e s e a r c h ou t p u t of t h e U nive r si ty of S alford. Whe r e copyrigh t p e r mi t s, full t ex t m a t e ri al h eld in t h e r e posi to ry is m a d e fre ely availabl e online a n d c a n b e r e a d , dow nloa d e d a n d copied for no n-co m m e rcial p riva t e s t u dy o r r e s e a r c h p u r pos e s . Ple a s e c h e ck t h e m a n u sc rip t for a ny fu r t h e r copyrig h t r e s t ric tions.
For m o r e info r m a tion, including ou r policy a n d s u b mission p roc e d u r e , ple a s econ t ac t t h e Re posi to ry Tea m a t : u si r@s alford. ac.uk .
brought to you by COREView metadata, citation and similar papers at core.ac.uk
provided by University of Salford Institutional Repository
A Systematic Review of the Discriminating Biomechanical Parameters during the Single Leg Squat
Martin B. Warner12, David A. Wilson12, Lee Herrington3, Sharon Dixon4, Conor Power1, Richard
Jones3, Markus O. Heller52, Patrick Carden4, Cara L. Lewis6
1School of Health Sciences, University of Southampton, Southampton, UK
2Arthritis Research UK Centre for Sport, Exercise and Osteoarthritis
3Centre for Health Sciences Research, University of Salford, Salford, UK
4 Sport and Health Sciences, College of Life and Environmental Sciences, University of Exeter, UK
5School of Engineering, University of Southampton, Southampton, UK
6Department of Physical Therapy & Athletic Training, College of Health & Rehabilitation Sciences:
Sargent College, Boston University
Abstract 1
Objective: To determine whether there are common biomechanical parameters when analysing the 2
single leg squat movement to compare pathological and non-pathological groups and whether these 3
parameters are able to effectively distinguish between groups. 4
Methods: Five electronic databases were searched using MESH terms, keywords and phrases across 5
four constructs: squat, biomechanical measures, region of interest, study design. Studies were 6
selected based on inclusion of a quantitative biomechanical measure, compared between a 7
pathological and a non-pathological group, and participants performed a single leg squat movement. 8
Results: Fifteen studies were included and reviewed, where the majority of studies investigated 9
patellofemoral pain. There was considerable variation in the biomechanical outcome measure used 10
to compare between groups. The frontal plane projection angle was the most commonly reported 11
measure. There was considerable variation in the manner in which the single leg squat was 12
performed. 13
Conclusion: Due to variation in how the single leg squat was performed, it was not possible to 14
determine specific biomechanical parameters that distinguish between pathological and non-15
pathological groups. Frontal plane projection angle appeared to be a parameter that could be 16
effectively utilised. Standardisation of the single leg squat movement is needed to allow comparison 17
between studies of pathological and non-pathological groups. 18
19

3
Keywords 1
Single leg squat, biomechanics, injury 2
3
4
INTRODUCTION 1
The single leg squat (SLS) is a movement task regularly used in clinical practice as it simulates 2
common everyday tasks, such as stair ascent and descent, as well as sporting activities1 and is often 3
pain provoking. This task is part of the growing field of observational movement screening tests, 4
which have become an increasingly used tool to identify individuals who might be at risk of 5
musculoskeletal injury enabling targeted interventions to reduce the potential risk. A variety of 6
methods are currently used to assess movement during a single leg squat, ranging from visual 7
qualitative assessments,2 to assessment involving 3D motion capture using inertial sensors.3 Visual 8
observational movement screening tests offer a cost-effective, time-efficient method of assessing 9
movement ability in both a clinical or field setting for a large number of participants and provide 10
instant results. Qualitative type assessment of the SLS grade an individual’s ability to perform the 11
task against benchmarked criteria.4 The qualitative based criteria within the tests are often based on 12
the ability to perform gross movements and could be subject to rater bias through a subjective 13
interpretation of whether the movement meets the required criteria. Additionally, the ability of 14
movement screening tests to predict musculoskeletal injuries is low.5-7 15
The use of objective biomechanical measures provides the researcher or clinician with the 16
ability to quantitatively assess movement during a given task and provide greater fidelity in 17
understanding the movement and potentially removes subjective interpretation. Biomechanical 18
measures, such as kinematic and kinetics parameters, have also been used to validate movement 19
screen tasks.8-10 In addition to providing objective measures, a further use of biomechanical 20
measures is the ability to understand the mechanisms and, therefore, the potential causes of injury 21
to the musculoskeletal system. The range of biomechanical methods and outcome measures, 22
however, is vast and can encompass the use of marker based motion capture systems or inertial 23
measurement units through to dynamic medical imaging such as video fluoroscopy to obtain a 24
kinematic analysis of movement. Force platforms, pressure plates, in-shoe pressure systems and 25
inverse dynamic analyses are commonly employed for kinetic analysis of movement. Identifying the 26
biomechanical parameters and methods that have been used previously to analyse these tasks 27
would help researchers and clinicians to develop standardised methods. This would enable the 28
quantification of parameters associated with injury, potentially facilitating the development of 29
training interventions. However, it is not currently known which potential parameters characterise 30
and discriminate between pathological groups. The aim of this systematic review, therefore, was to 31
determine whether there are common biomechanical parameters utilised when analysing the single 32
leg squat movement comparing pathological and non-pathological groups and whether these 33
5
parameters are able to effectively distinguish between pathological and non-pathological groups 1
providing some insight in to the mechanisms and causes of joint injury. 2
3
METHOD 4
Search strategy 5
A systematic search of PUBMED, CINAHL, SCOPUS, EMBASE and DELPHIS databases was performed; 6
the latest search was completed in February 2018. A combination of Medical Subject Headings 7
(MeSH) terms, keywords and phrases were derived in consultation with the author group to search 8
for relevant articles (Table 1). Search terms were truncated and wildcard operators used where 9
appropriate to reduce the number of required key words. Near operators were used in order to 10
identify different combinations of phrases. The search terms were divided into four constructs: 11
squat related, biomechanical measures, region of interest, and study design. The Boolean operator 12
‘AND’ was used between constructs, with the exception of study design where the ‘NOT’ operator 13
was used. Inclusion criteria consisted of: study performed a comparison between two groups, 14
participants performed squat-based manoeuvre, and biomechanical related measures were used to 15
quantify differences between groups. 16
17
Table 1: MeSH terms, key words and phrases used in the systematic search of databases. A Boolean operator used between each character presented in parenthesis after each category heading. Inverted commas represent phrase, asterix represents truncated term with wildcard operator, ‘n’ represents near operator with the number of words within which the term should appear.
Category MeSH terms Key words and phrases
Squat related (AND) Squat “Step down” “Small knee bend” Biomechanical measures (AND) Biomechanics Kinematic* Kinematics Kinetic* Kinetics Kinesio* Torque Force* Motion “Centre of pressure” n3 Pressure Angle* Accelerometry Moment* Torque* Jerk Velocit* “Angular velocity” Acceleration* Impulse* “Angular impulse” “Vector coding” “Coupling angles”
6
Stereophotogrammetr* “Computed tomography” MRI “Magnetic resonance imag*” Motion “Motion analysis” Mechanics Fluroscop* IMU “Inertial measurement unit” Distance* Displacement* “2D video” Load Sway Region of interest (AND) Lower extremity “Lower Extremity” Hip Joint “Lower Extremities” Knee joint “Lower Limb” Foot joint Hip Knee Ankle Foot Feet Leg Shank Thigh Femur Tibia Pelvis Study design (NOT) Surgical procedures Case reports Consensus Meta-analysis Clinical conference Scientific integrity
review
1
Following the search in each database the results were imported into an Endnote (version X7) library 2
(Clavariate Analytics, Philadelphia, USA). Duplicates were identified and removed from the list using 3
the built-in function within Endnote. Remaining references were then exported as a text file. A 4
custom written MATLAB (MathWorks, Massachusetts, USA) Graphical User Interface (GUI) function 5
was created to assist with the screening of the study titles and abstracts. The GUI imported the text 6
file from Endnote, parsed the author name, year of publication, article title and abstract, and 7
displayed this information for each article in turn. The tool automatically excluded articles that were 8
7
not full text articles based on the Endnote text export format that places inverted commas around 1
the title of the article for journal articles (i.e. articles that did not have inverted commas around their 2
title were excluded). A pool of eight reviewers screened the titles and abstracts of the articles. The 3
articles were equally divided into four groups of articles which were then assigned to pairs of 4
authors for title and abstract screening, where each reviewer of the pair screened all assigned 5
articles. Articles were screened and excluded based on the following criteria: no single leg squat 6
task, no quantitative biomechanical measures, not lower limb, no human participants, strength 7
measures only, electromyography only, simulation study, cadaver study, surgical intervention, not 8
original article, no comparison between pathological and non-pathological groups, reliability study 9
only and validity study only. The results between the reviewers of each pair were compared and 10
where disagreement over the inclusion or exclusion of an article occurred, the lead author reviewed 11
the article and made the final decision for inclusion or exclusion. As the purpose of the review was to 12
investigate squat movements that are conducted without outside influence that could affect the 13
performance of the movement the full text records of the selected articles were then reviewed and 14
excluded based on the following criteria: increased load during the squat movement, concerned 15
with resistance training, included vibration, included a fatiguing protocol, squat movements that 16
involved isometric contractions and studies that included movements with eyes closed. In addition, 17
studies including participants with neurological impairments were excluded in order to focus on 18
musculoskeletal conditions. 19
20
Articles that were included in the final review were then assessed for methodological quality using a 21
modified version of the STROBE checklist.11 The STROBE checklist is a reporting standard, however, 22
due to the lack of an appropriate tool to assess the methodological quality of observational studies, 23
the STROBE checklist was deemed a reasonable tool to adopt as it is generally expected that 24
observational studies should include all items within the checklist. The articles were assessed against 25
each item of the STROBE checklist and given a score of 1 where the article met the criteria and 0 26
where it did not. An additional two items were added to the STROBE checklist: “Did the article report 27
or provide reference to appropriate evidence of the validity of the outcome measure?” and “Did the 28
article report or provide reference to appropriate evidence of the reliability of the outcome 29
measure” in order to score the article based on the robustness of the outcome measures. As some 30
items of the STROBE checklist were not applicable to all articles, the final score was normalised with 31
respect to the number of applicable answers and expressed as a percentage. A pool of eight 32
reviewers scored the included articles that were equally divided across four groups of reviewers, 33
where each reviewer scored each article that was allocated to their group. The scores from the pairs 34

8
of reviewers were assessed for agreement; disagreements were then assessed and settled by the 1
lead author. 2
9
RESULTS 1
2
Identification of Studies 3
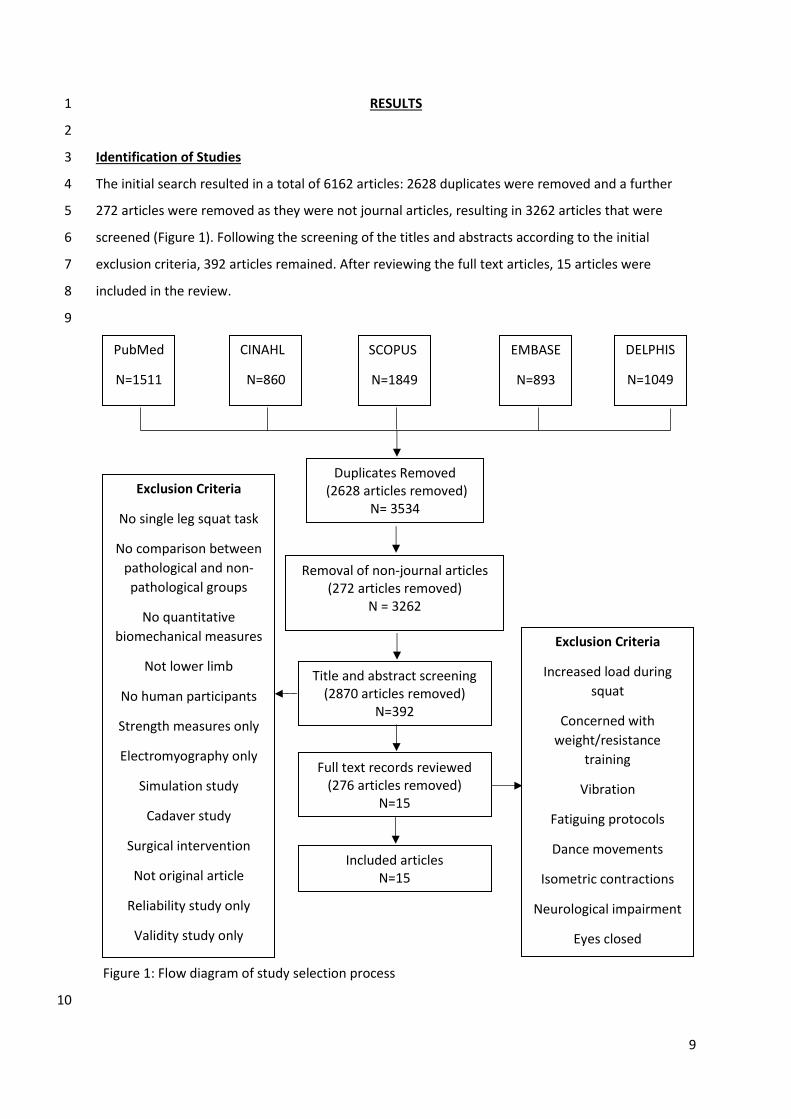
The initial search resulted in a total of 6162 articles: 2628 duplicates were removed and a further 4
272 articles were removed as they were not journal articles, resulting in 3262 articles that were 5
screened (Figure 1). Following the screening of the titles and abstracts according to the initial 6
exclusion criteria, 392 articles remained. After reviewing the full text articles, 15 articles were 7
included in the review. 8
9
Figure 1: Flow diagram of study selection process
10
PubMed
N=1511
CINAHL
N=860
SCOPUS
N=1849
EMBASE
N=893
DELPHIS
N=1049
Duplicates Removed (2628 articles removed)
N= 3534
Removal of non-journal articles (272 articles removed)
N = 3262
Title and abstract screening (2870 articles removed)
N=392
Exclusion Criteria
No single leg squat task
No comparison between
pathological and non-
pathological groups
No quantitative
biomechanical measures
Not lower limb
No human participants
Strength measures only
Electromyography only
Simulation study
Cadaver study
Surgical intervention
Not original article
Reliability study only
Validity study only
Full text records reviewed (276 articles removed)
N=15
Included articles N=15
Exclusion Criteria
Increased load during
squat
Concerned with
weight/resistance
training
Vibration
Fatiguing protocols
Dance movements
Isometric contractions
Neurological impairment
Eyes closed
10
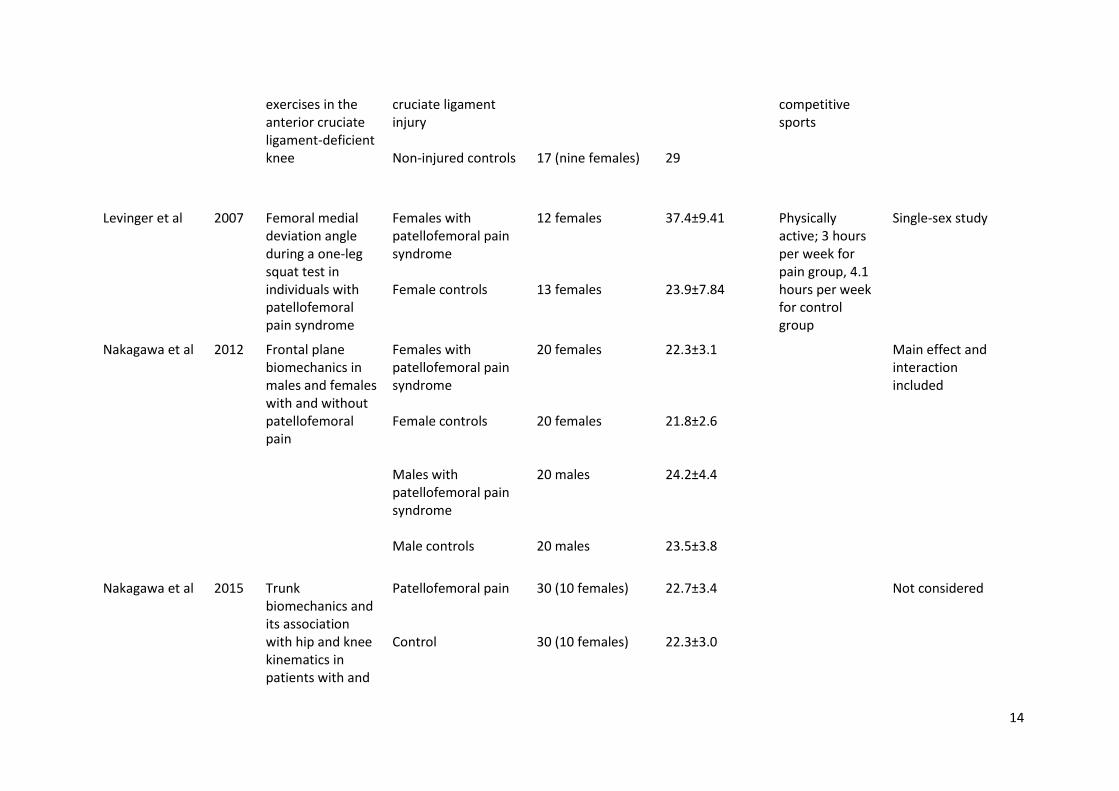
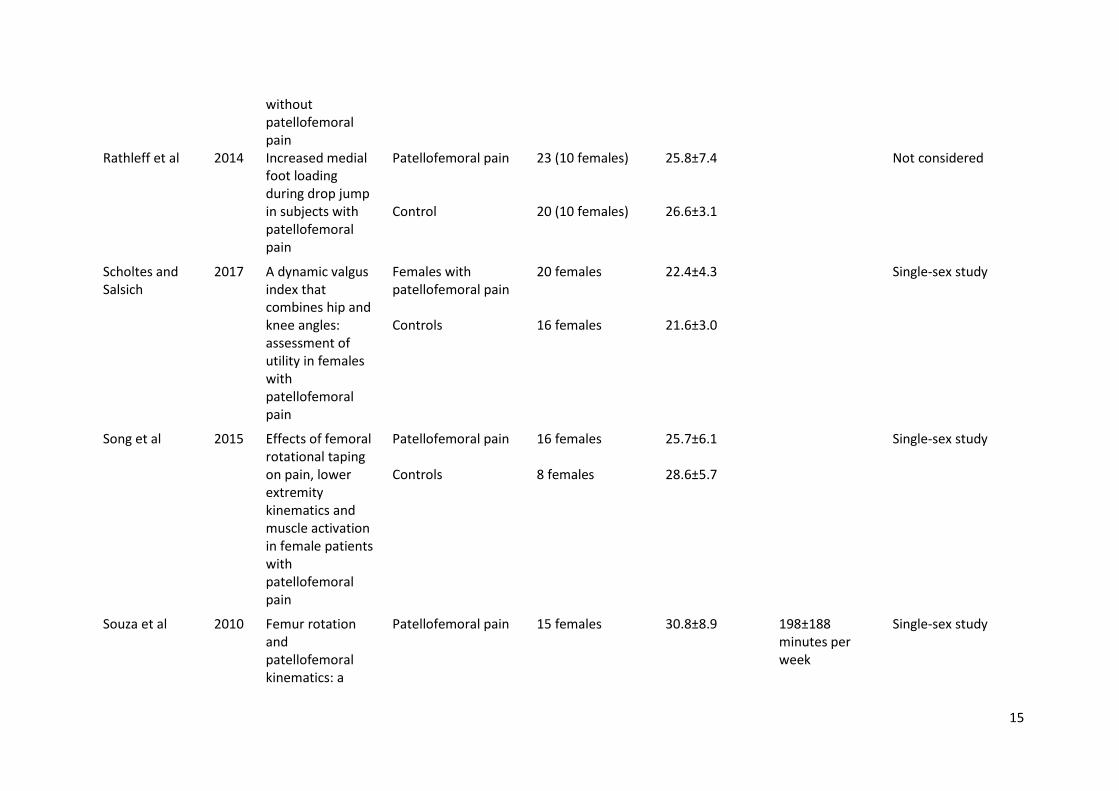
Study Characteristics 1
The included studies all investigated a group comparison between an injured and a non-injured 2
cohort (Table 2). The most common condition that was investigated was patellofemoral pain (n=11) 3
12-22, followed by anterior cruciate ligament injury (n = 3)23-25 and one study on hip chondropathy.26 4
Of the studies that investigated patellofemoral pain eight included female participants only,12 13 17-22 5
while three studies investigated both females and males.14-16 Of the studies that investigated 6
anterior cruciate ligament injury two had both male and female participants23 25 and one had male 7
participants only.24 The study on hip chondropathy included both male and female participants.26 8
The average ages of participants were generally between 20 and 30 years old (Table 2); one study 9
examined adolescent females22 and one study had average ages of 37 and 35 years for their 10
pathological and control groups respectively.26 11
12
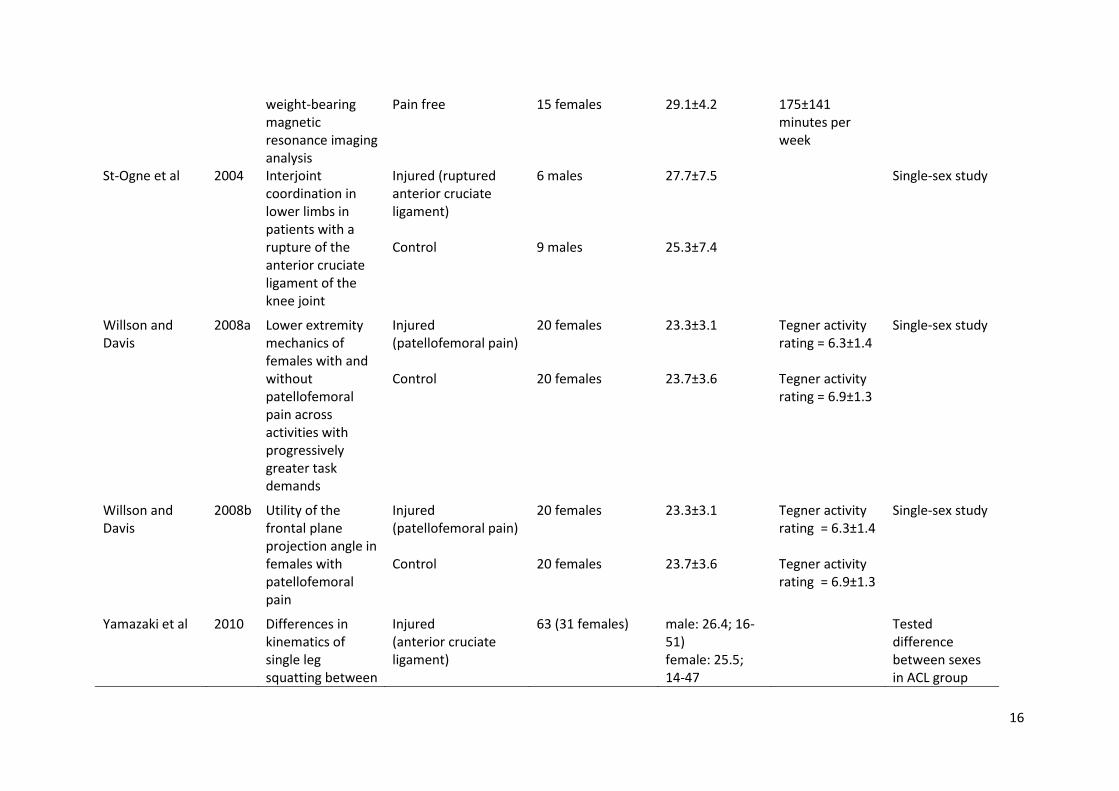
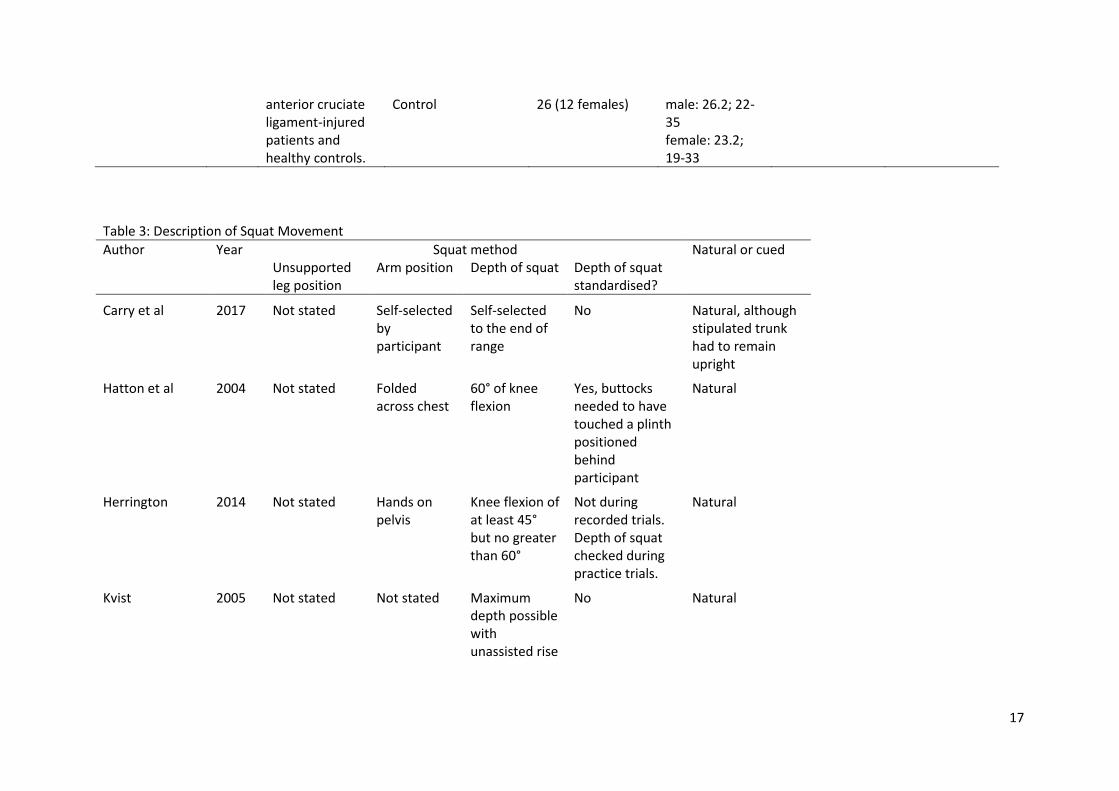
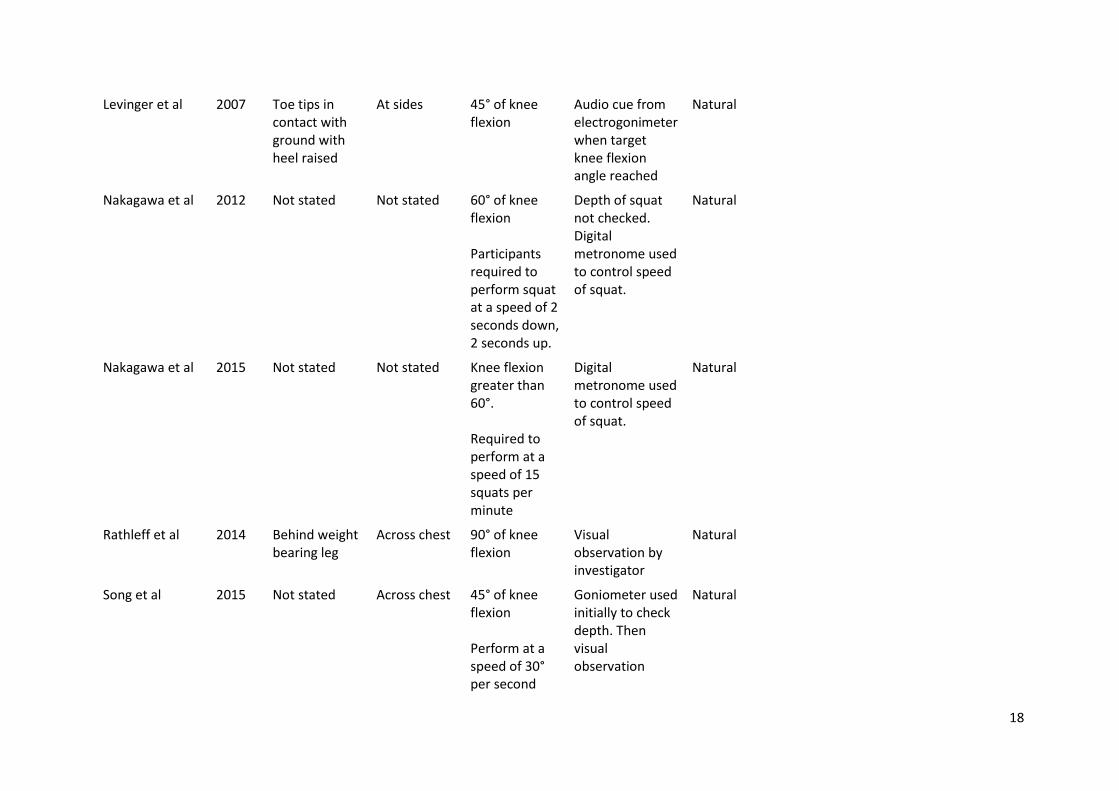
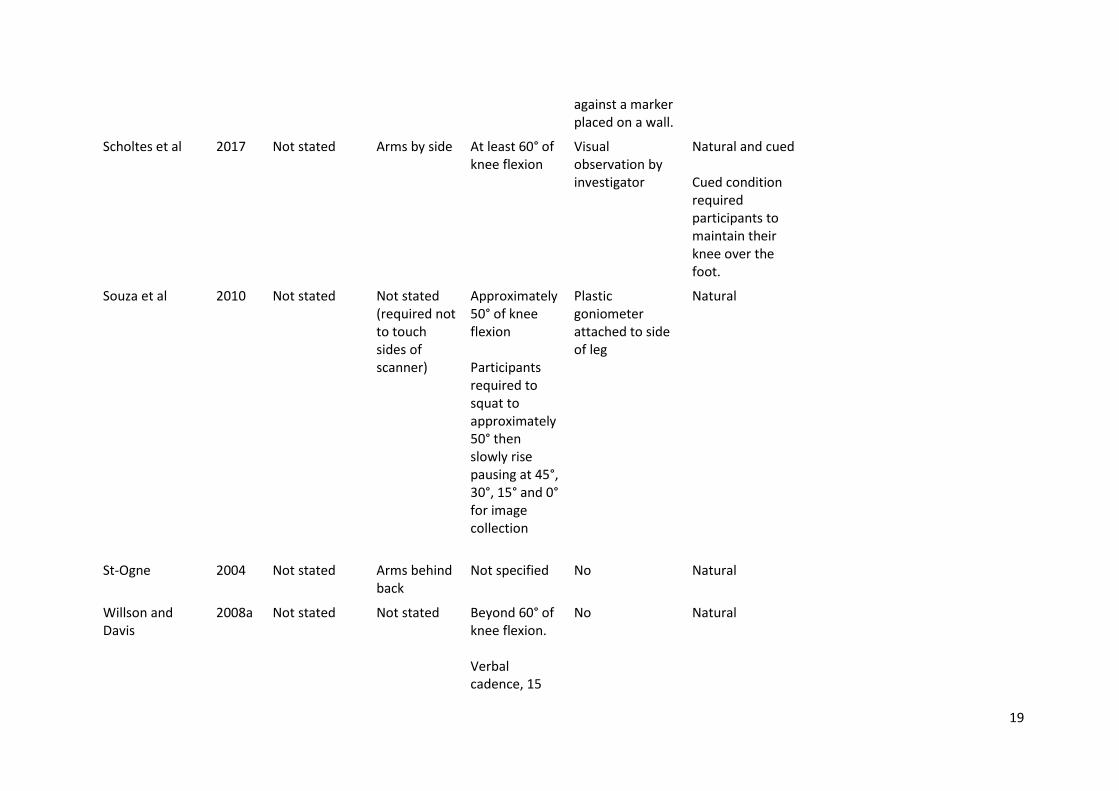
Squat Characteristics 13
There were large variations in the manner in which the SLS was performed and wide spread 14
omissions in the description of the methods (Table 3). When asking participants to perform the 15
squat movement all studies except for one required a natural movement, i.e. participants were not 16
instructed to maintain prescribed orientations for the supporting leg, pelvis or trunk. The study of 17
Scholtes and co-workers21 asked participants to perform a single leg squat under natural and cued 18
conditions. The cued condition required participants to maintain their knee over the middle of the 19
foot. The depth of squat required of participants varied across the included studies and ranged from 20
45° of knee flexion to maximal depth achievable (Table 3). The studies also varied in the method 21
used to standardise the depth of the squat ranging from using a goniometer,17 18 an 22
electrogoniometer,13 or an external target (i.e. buttocks touching a plinth).26 The majority of studies 23
(n = 11), however, did not standardise the depth of squat during the data collection, although some 24
studies did provide feedback during practice trials prior to data collection and some provided 25
feedback as to the speed of the squat using a metronome (Table 3). Only three studies explicitly 26
stated the position of the unsupported leg during the squat movement where the leg was placed 27
behind the participant16 25 or kept the toes in contact with the ground with the heel raised.13 The 28
most common position for the arms during the movement was across the chest (n=5), with one 29
study placing them on the pelvis,12 two studies placing them by their sides13 21 and one behind their 30
backs.24 The remaining studies (n = 6) did not specify where the arm were placed or were self-31
selected by the participants (Table 3). None of the studies included a qualitative measure of the 32
movement. 33
34
11
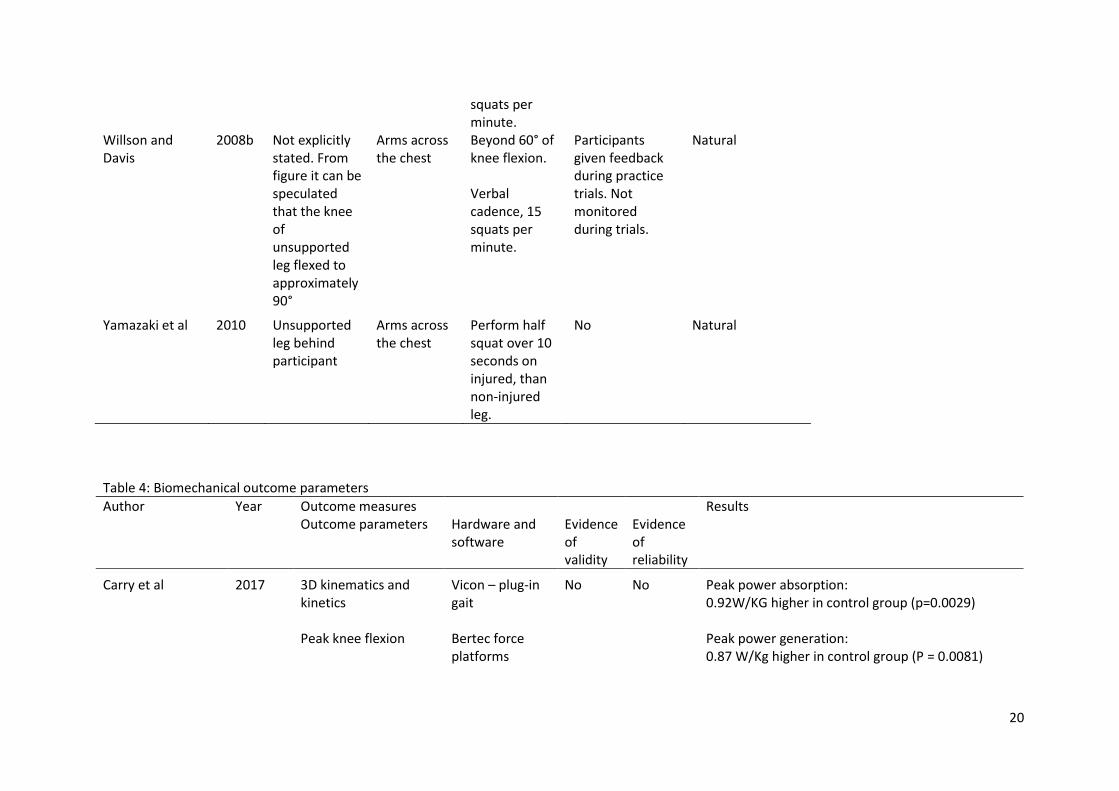
Biomechanical Measures 1
The biomechanical outcome parameters reported by the studies primarily consisted of 3D kinematic 2
parameters; some studies reported 2D projection angles and two studies reported pressure-related 3
outcome variables (Table 4). With regards to the 3D kinematics the outcome measures included 4
trunk lean, contralateral pelvis drop, peak hip adduction, hip internal rotation, peak knee abduction, 5
knee flexion, patellar flexion/extension, patellar mediolateral rotation, patellar displacement and 6
ankle flexion (Table 4). Studies utilising 2D projection angles reported knee valgus angle or femoral 7
angle in the frontal plane.12 13 20 21 All cases which used the frontal plane projection angle compared 8
participants with patellofemoral pain to control participants. One study utilised open MRI to 9
determine patella displacement in 2D. 18 The majority of studies reported single indices extracted 10
from the measured data (e.g. maximum angle) with exception of one study which additionally 11
utilised Principal Component Analysis on the 3D kinematic waveforms.24 Five studies provided 12
evidence for the validity and reliability of the outcome measures,16 20 21 23 25 one study reported 13
evidence of validity only,17 six studies reported evidence of reliability only12-15 18 26 and four studies 14
reported no evidence for either validity or reliability.19 20 22 24 15
16
Comparisons between Pathological and Non-Pathological Groups - Summary of Results 17
A range of biomechanical parameters were used to compare various pathological groups. The most 18
commonly used parameter was the frontal plane projection angle, which was used to compare 19
patellofemoral pain with control participants. The frontal plane projection angle, however, was not 20
used to compare other conditions, such as anterior cruciate ligament injury. 21
22
Patellofemoral pain participants had a greater knee frontal plane projection angle compared to 23
controls, ranging from 4° to 8°.12 13 20 21 Patellofemoral pain participants also demonstrated a 2.6° 24
greater ipsilateral trunk lean,14 15 a 2.9° greater pelvis drop,15 greater hip adduction (24°±6.5 vs. 25
19.2°±6) and knee abduction (10.5°±6.4 vs. 6.8°±5.3),14 and greater frontal plane hip adduction 26
(19.7°± 7.7 vs. 14.2°±6.5)21 compared to control participants (Table 4). A ‘Dynamic Valgus Index’, 27
defined as the sum of the hip and knee angles and intended to provide a more comprehensive 28
representation of movement than a single angle, demonstrated that patellofemoral pain participants 29
had greater movement both in 2D (31.1°±13.4 vs. 18.3°±18.0) and 3D (12.4°±9.8 vs. 1.81°±13.4) 30
than control participants.21 Patellofemoral pain participants also demonstrated greater lateral 31
displacement and tilt of the patella compared to control participants during the squat movement 32
when the supporting knee was flexed to 15° and 30°. However, the largest difference was observed 33
at 0° of knee flexion (75%±8 vs. 58%±7; lateral patella displacement, 13.1°± 5.8 vs. 8.1°±4.1; lateral 34
12
patella tilt). 18 In terms of kinetics related parameters, patellofemoral pain participants had a 32% 1
relative group difference in force compared to controls.16 Control participants demonstrated a 2
higher centre of pressure range (7.72cm mean difference), a higher peak power absorption 3
(0.92W/Kg mean difference) and a higher peak power generation (0.87W/Kg) compared to 4
patellofemoral pain participants.22 One study found no significant group differences between 5
patellofemoral pain and control participants.17 6
7
Participants with anterior cruciate ligament injury demonstrated greater knee translation 8
(9.1mm±2.5 vs. 6.7mm±2.4),23 knee external rotation (18.9°±34.3 vs. 38.8°±12.2; males only),25 hip 9
rotation (9.1°±8 vs. 1.7°±6.1; females only),25 knee flexion (73.9°±13.3 vs. 66.2°±9.9; females only)25 10
and hip flexion (29.9°±18.4 vs. 48°±11.3; females only)25 compared to control participants (Table 4). 11
One study found no group differences between anterior cruciate ligament injury and control 12
participants.24 13
14
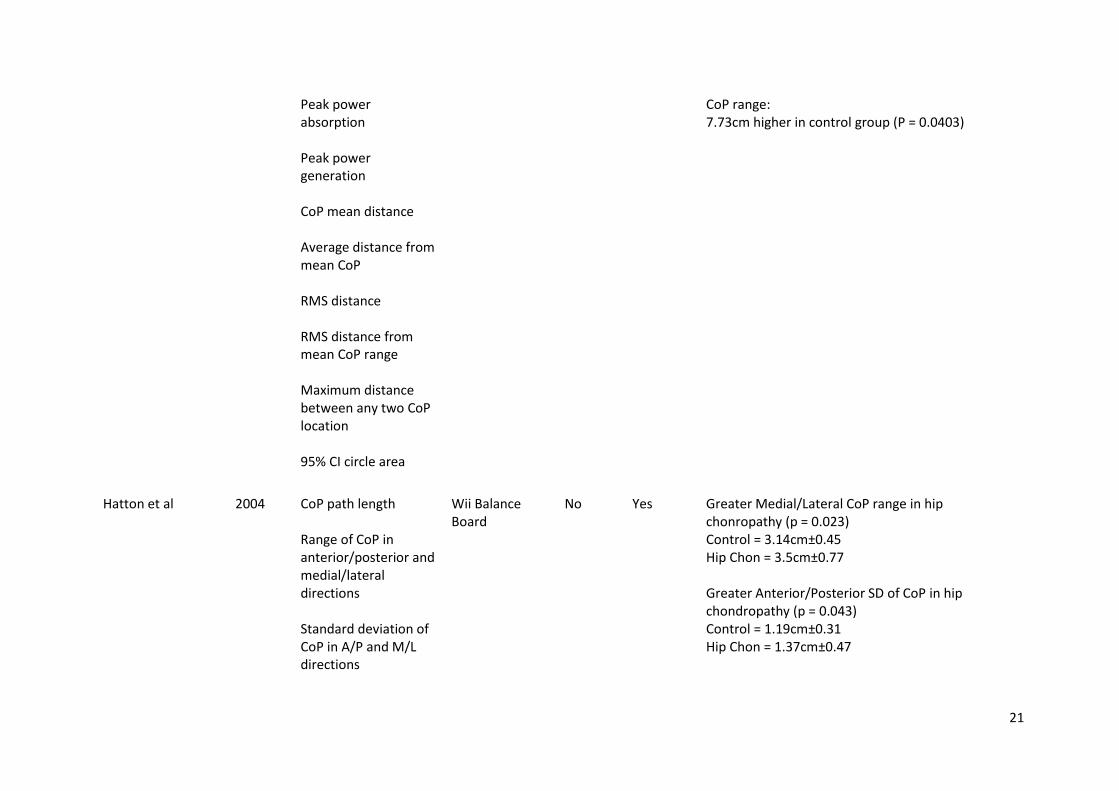
The study on hip chondropathy participants showed a greater range of medial/lateral and 15
anterior/posterior centre of pressure compared to control participants (Table 4). 16
17
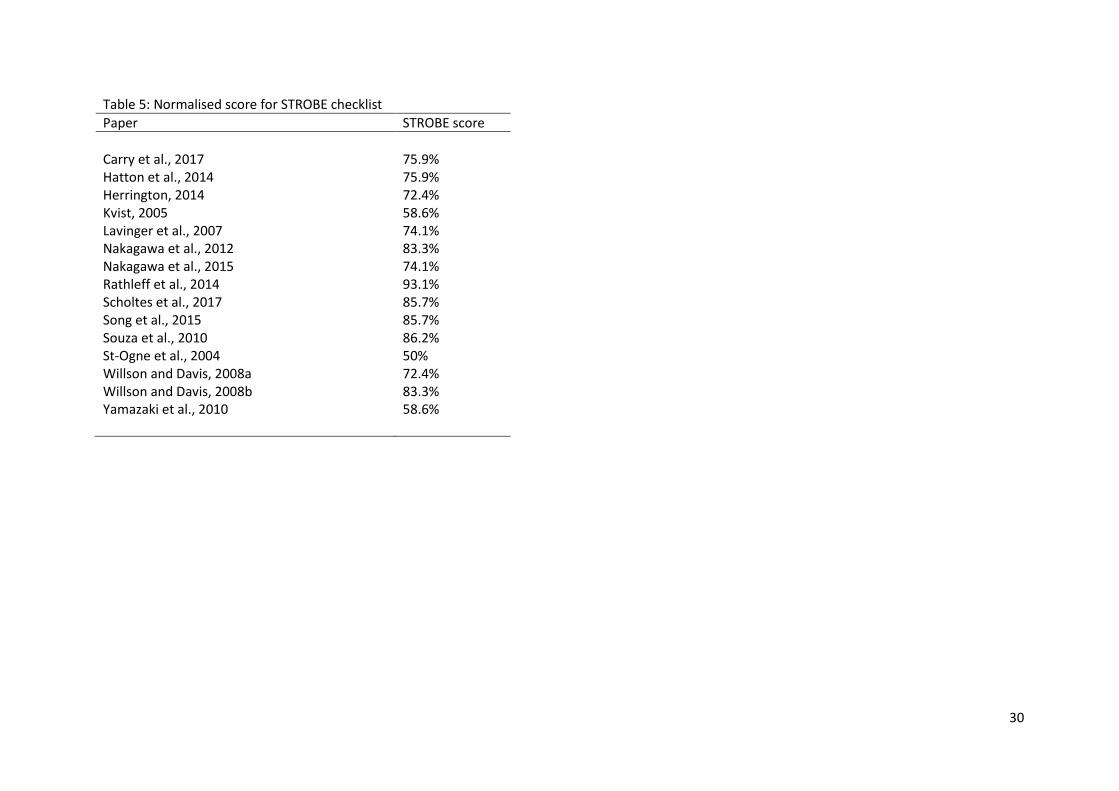
Quality of studies 18
The normalised scores for the STROBE assessment of the articles ranged from 50% to 93.1% (Table 19
5). None of the studies reported the dates of recruitment, exposure, data collection or follow-up. 20
Other items that had few studies (< 6) scoring points were “Describing efforts to address potential 21
sources of bias”, “Explaining how the study size was arrived at”, “Reporting of evidence for the 22
validity of the outcome measure” and “Discussed the generalizability (external validity) of the study 23
results”. 24
13
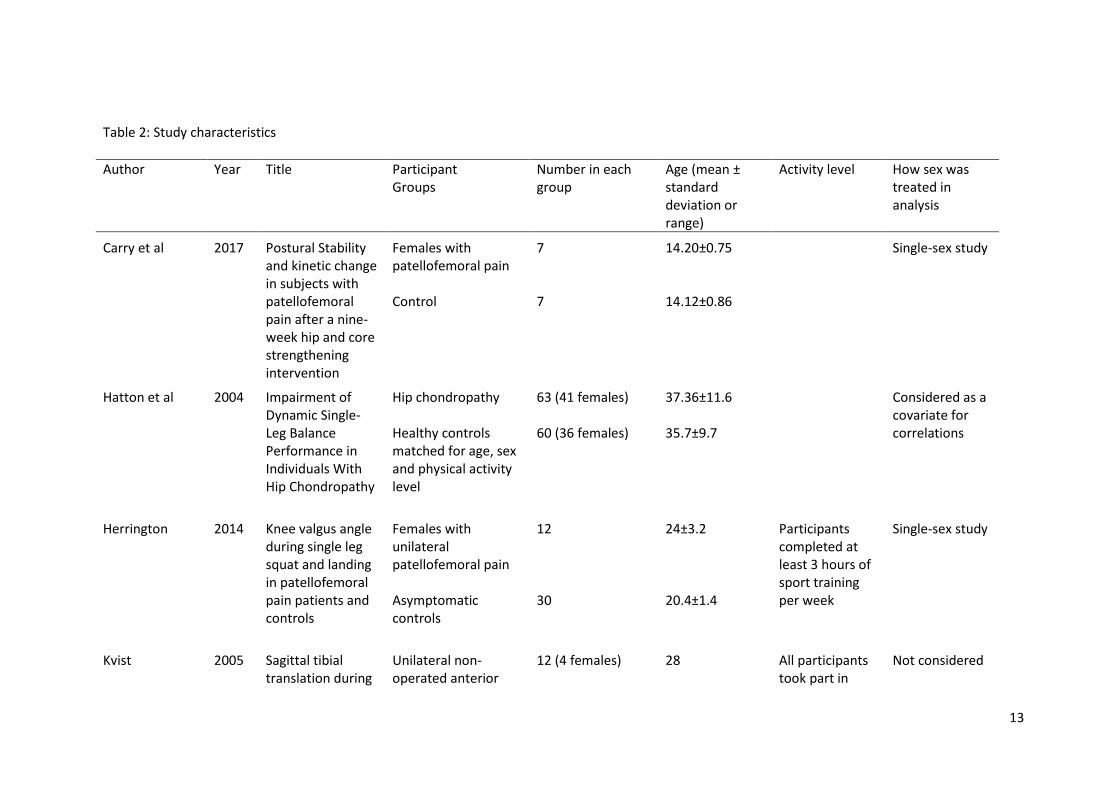
Table 2: Study characteristics
Author Year Title Participant Groups
Number in each group
Age (mean ± standard deviation or range)
Activity level How sex was treated in analysis
Carry et al 2017 Postural Stability and kinetic change in subjects with patellofemoral pain after a nine-week hip and core strengthening intervention
Females with patellofemoral pain Control
7 7
14.20±0.75 14.12±0.86
Single-sex study
Hatton et al 2004 Impairment of Dynamic Single-Leg Balance Performance in Individuals With Hip Chondropathy
Hip chondropathy Healthy controls matched for age, sex and physical activity level
63 (41 females) 60 (36 females)
37.36±11.6 35.7±9.7
Considered as a covariate for correlations
Herrington 2014 Knee valgus angle during single leg squat and landing in patellofemoral pain patients and controls
Females with unilateral patellofemoral pain Asymptomatic controls
12 30
24±3.2 20.4±1.4
Participants completed at least 3 hours of sport training per week
Single-sex study
Kvist 2005 Sagittal tibial translation during
Unilateral non-operated anterior
12 (4 females)
28
All participants took part in
Not considered
14
exercises in the anterior cruciate ligament-deficient knee
cruciate ligament injury Non-injured controls
17 (nine females)
29
competitive sports
Levinger et al 2007 Femoral medial deviation angle during a one-leg squat test in individuals with patellofemoral pain syndrome
Females with patellofemoral pain syndrome Female controls
12 females 13 females
37.4±9.41 23.9±7.84
Physically active; 3 hours per week for pain group, 4.1 hours per week for control group
Single-sex study
Nakagawa et al 2012 Frontal plane biomechanics in males and females with and without patellofemoral pain
Females with patellofemoral pain syndrome Female controls Males with patellofemoral pain syndrome Male controls
20 females 20 females 20 males 20 males
22.3±3.1 21.8±2.6 24.2±4.4 23.5±3.8
Main effect and interaction included
Nakagawa et al 2015 Trunk biomechanics and its association with hip and knee kinematics in patients with and
Patellofemoral pain Control
30 (10 females) 30 (10 females)
22.7±3.4 22.3±3.0
Not considered
15
without patellofemoral pain
Rathleff et al 2014 Increased medial foot loading during drop jump in subjects with patellofemoral pain
Patellofemoral pain Control
23 (10 females) 20 (10 females)
25.8±7.4 26.6±3.1
Not considered
Scholtes and Salsich
2017 A dynamic valgus index that combines hip and knee angles: assessment of utility in females with patellofemoral pain
Females with patellofemoral pain Controls
20 females 16 females
22.4±4.3 21.6±3.0
Single-sex study
Song et al 2015 Effects of femoral rotational taping on pain, lower extremity kinematics and muscle activation in female patients with patellofemoral pain
Patellofemoral pain Controls
16 females 8 females
25.7±6.1 28.6±5.7
Single-sex study
Souza et al 2010 Femur rotation and patellofemoral kinematics: a
Patellofemoral pain
15 females
30.8±8.9
198±188 minutes per week
Single-sex study
16
weight-bearing magnetic resonance imaging analysis
Pain free 15 females
29.1±4.2
175±141 minutes per week
St-Ogne et al 2004 Interjoint coordination in lower limbs in patients with a rupture of the anterior cruciate ligament of the knee joint
Injured (ruptured anterior cruciate ligament) Control
6 males 9 males
27.7±7.5 25.3±7.4
Single-sex study
Willson and Davis
2008a Lower extremity mechanics of females with and without patellofemoral pain across activities with progressively greater task demands
Injured (patellofemoral pain) Control
20 females 20 females
23.3±3.1 23.7±3.6
Tegner activity rating = 6.3±1.4 Tegner activity rating = 6.9±1.3
Single-sex study
Willson and Davis
2008b Utility of the frontal plane projection angle in females with patellofemoral pain
Injured (patellofemoral pain) Control
20 females 20 females
23.3±3.1 23.7±3.6
Tegner activity rating = 6.3±1.4 Tegner activity rating = 6.9±1.3
Single-sex study
Yamazaki et al 2010 Differences in kinematics of single leg squatting between
Injured (anterior cruciate ligament)
63 (31 females)
male: 26.4; 16-51) female: 25.5; 14-47
Tested difference between sexes in ACL group
17
anterior cruciate ligament-injured patients and healthy controls.
Control 26 (12 females)
male: 26.2; 22-35 female: 23.2; 19-33
Table 3: Description of Squat Movement
Author Year Squat method Natural or cued Unsupported leg position
Arm position Depth of squat Depth of squat standardised?
Carry et al 2017 Not stated Self-selected by participant
Self-selected to the end of range
No Natural, although stipulated trunk had to remain upright
Hatton et al 2004 Not stated Folded across chest
60° of knee flexion
Yes, buttocks needed to have touched a plinth positioned behind participant
Natural
Herrington 2014 Not stated Hands on pelvis
Knee flexion of at least 45° but no greater than 60°
Not during recorded trials. Depth of squat checked during practice trials.
Natural
Kvist 2005 Not stated Not stated Maximum depth possible with unassisted rise
No Natural
18
Levinger et al 2007 Toe tips in contact with ground with heel raised
At sides 45° of knee flexion
Audio cue from electrogonimeter when target knee flexion angle reached
Natural
Nakagawa et al 2012 Not stated Not stated 60° of knee flexion Participants required to perform squat at a speed of 2 seconds down, 2 seconds up.
Depth of squat not checked. Digital metronome used to control speed of squat.
Natural
Nakagawa et al 2015 Not stated Not stated Knee flexion greater than 60°. Required to perform at a speed of 15 squats per minute
Digital metronome used to control speed of squat.
Natural
Rathleff et al 2014 Behind weight bearing leg
Across chest 90° of knee flexion
Visual observation by investigator
Natural
Song et al 2015 Not stated Across chest 45° of knee flexion Perform at a speed of 30° per second
Goniometer used initially to check depth. Then visual observation
Natural
19
against a marker placed on a wall.
Scholtes et al 2017 Not stated Arms by side At least 60° of knee flexion
Visual observation by investigator
Natural and cued Cued condition required participants to maintain their knee over the foot.
Souza et al 2010 Not stated Not stated (required not to touch sides of scanner)
Approximately 50° of knee flexion Participants required to squat to approximately 50° then slowly rise pausing at 45°, 30°, 15° and 0° for image collection
Plastic goniometer attached to side of leg
Natural
St-Ogne 2004 Not stated Arms behind back
Not specified No Natural
Willson and Davis
2008a Not stated Not stated Beyond 60° of knee flexion. Verbal cadence, 15
No Natural
20
squats per minute.
Willson and Davis
2008b Not explicitly stated. From figure it can be speculated that the knee of unsupported leg flexed to approximately 90°
Arms across the chest
Beyond 60° of knee flexion. Verbal cadence, 15 squats per minute.
Participants given feedback during practice trials. Not monitored during trials.
Natural
Yamazaki et al 2010 Unsupported leg behind participant
Arms across the chest
Perform half squat over 10 seconds on injured, than non-injured leg.
No Natural
Table 4: Biomechanical outcome parameters
Author Year Outcome measures Results Outcome parameters Hardware and
software Evidence of validity
Evidence of reliability
Carry et al 2017 3D kinematics and kinetics Peak knee flexion
Vicon – plug-in gait Bertec force platforms
No No Peak power absorption: 0.92W/KG higher in control group (p=0.0029) Peak power generation: 0.87 W/Kg higher in control group (P = 0.0081)
21
Peak power absorption Peak power generation CoP mean distance Average distance from mean CoP RMS distance RMS distance from mean CoP range Maximum distance between any two CoP location 95% CI circle area
CoP range: 7.73cm higher in control group (P = 0.0403)
Hatton et al 2004 CoP path length Range of CoP in anterior/posterior and medial/lateral directions Standard deviation of CoP in A/P and M/L directions
Wii Balance Board
No Yes Greater Medial/Lateral CoP range in hip chonropathy (p = 0.023) Control = 3.14cm±0.45 Hip Chon = 3.5cm±0.77 Greater Anterior/Posterior SD of CoP in hip chondropathy (p = 0.043) Control = 1.19cm±0.31 Hip Chon = 1.37cm±0.47
22
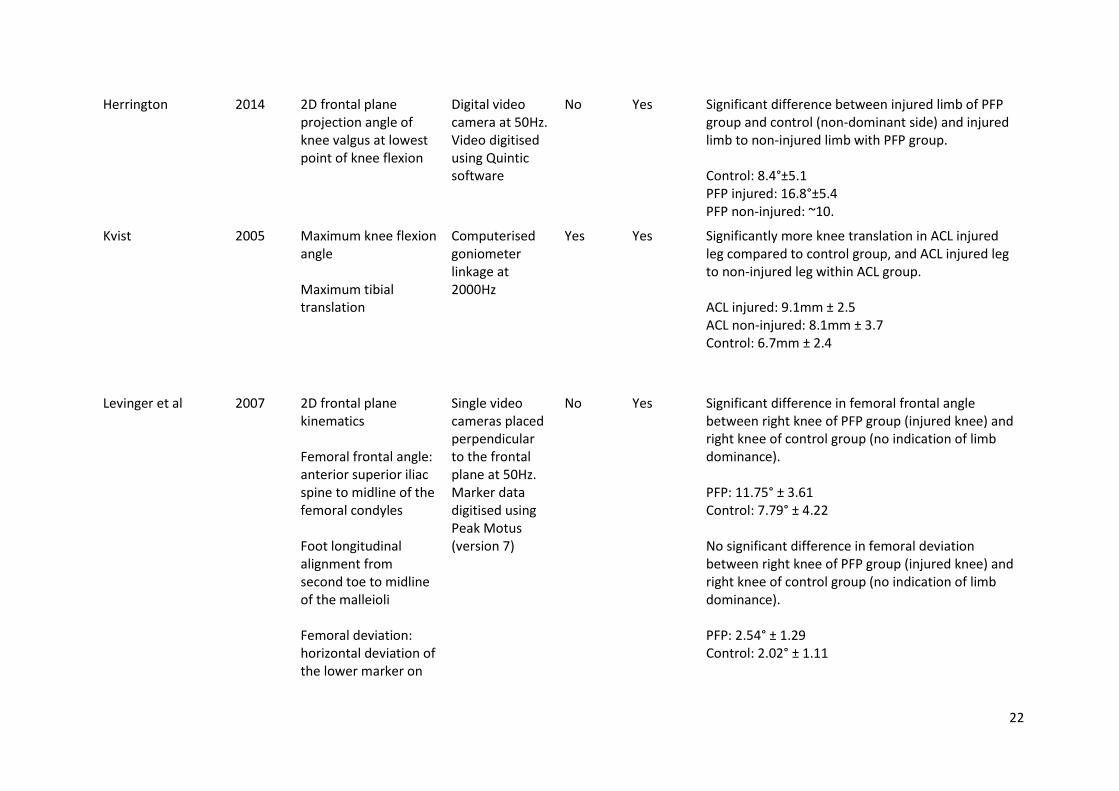
Herrington 2014 2D frontal plane projection angle of knee valgus at lowest point of knee flexion
Digital video camera at 50Hz. Video digitised using Quintic software
No Yes Significant difference between injured limb of PFP group and control (non-dominant side) and injured limb to non-injured limb with PFP group. Control: 8.4°±5.1 PFP injured: 16.8°±5.4 PFP non-injured: ~10.
Kvist 2005 Maximum knee flexion angle Maximum tibial translation
Computerised goniometer linkage at 2000Hz
Yes Yes Significantly more knee translation in ACL injured leg compared to control group, and ACL injured leg to non-injured leg within ACL group. ACL injured: 9.1mm ± 2.5 ACL non-injured: 8.1mm ± 3.7 Control: 6.7mm ± 2.4
Levinger et al 2007 2D frontal plane kinematics Femoral frontal angle: anterior superior iliac spine to midline of the femoral condyles Foot longitudinal alignment from second toe to midline of the malleioli Femoral deviation: horizontal deviation of the lower marker on
Single video cameras placed perpendicular to the frontal plane at 50Hz. Marker data digitised using Peak Motus (version 7)
No Yes Significant difference in femoral frontal angle between right knee of PFP group (injured knee) and right knee of control group (no indication of limb dominance). PFP: 11.75° ± 3.61 Control: 7.79° ± 4.22 No significant difference in femoral deviation between right knee of PFP group (injured knee) and right knee of control group (no indication of limb dominance). PFP: 2.54° ± 1.29 Control: 2.02° ± 1.11
23
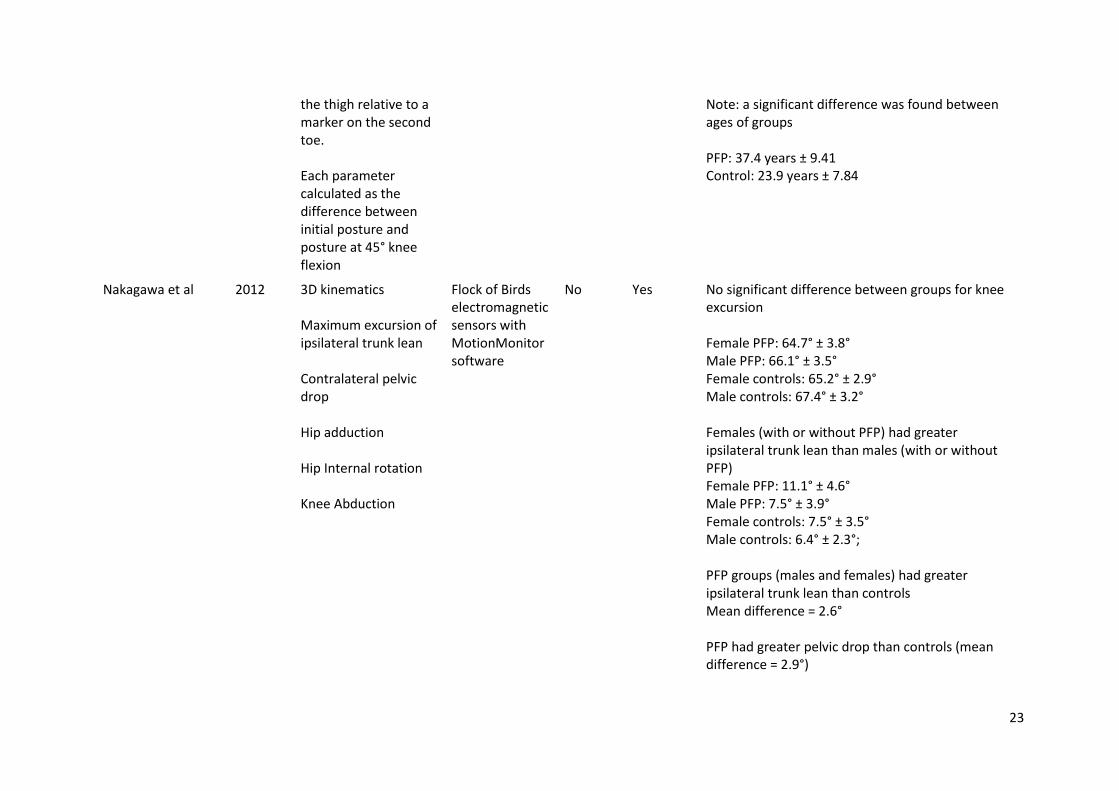
the thigh relative to a marker on the second toe. Each parameter calculated as the difference between initial posture and posture at 45° knee flexion
Note: a significant difference was found between ages of groups PFP: 37.4 years ± 9.41 Control: 23.9 years ± 7.84
Nakagawa et al 2012 3D kinematics Maximum excursion of ipsilateral trunk lean Contralateral pelvic drop Hip adduction Hip Internal rotation Knee Abduction
Flock of Birds electromagnetic sensors with MotionMonitor software
No Yes No significant difference between groups for knee excursion Female PFP: 64.7° ± 3.8° Male PFP: 66.1° ± 3.5° Female controls: 65.2° ± 2.9° Male controls: 67.4° ± 3.2° Females (with or without PFP) had greater ipsilateral trunk lean than males (with or without PFP) Female PFP: 11.1° ± 4.6° Male PFP: 7.5° ± 3.9° Female controls: 7.5° ± 3.5° Male controls: 6.4° ± 2.3°; PFP groups (males and females) had greater ipsilateral trunk lean than controls Mean difference = 2.6° PFP had greater pelvic drop than controls (mean difference = 2.9°)
24
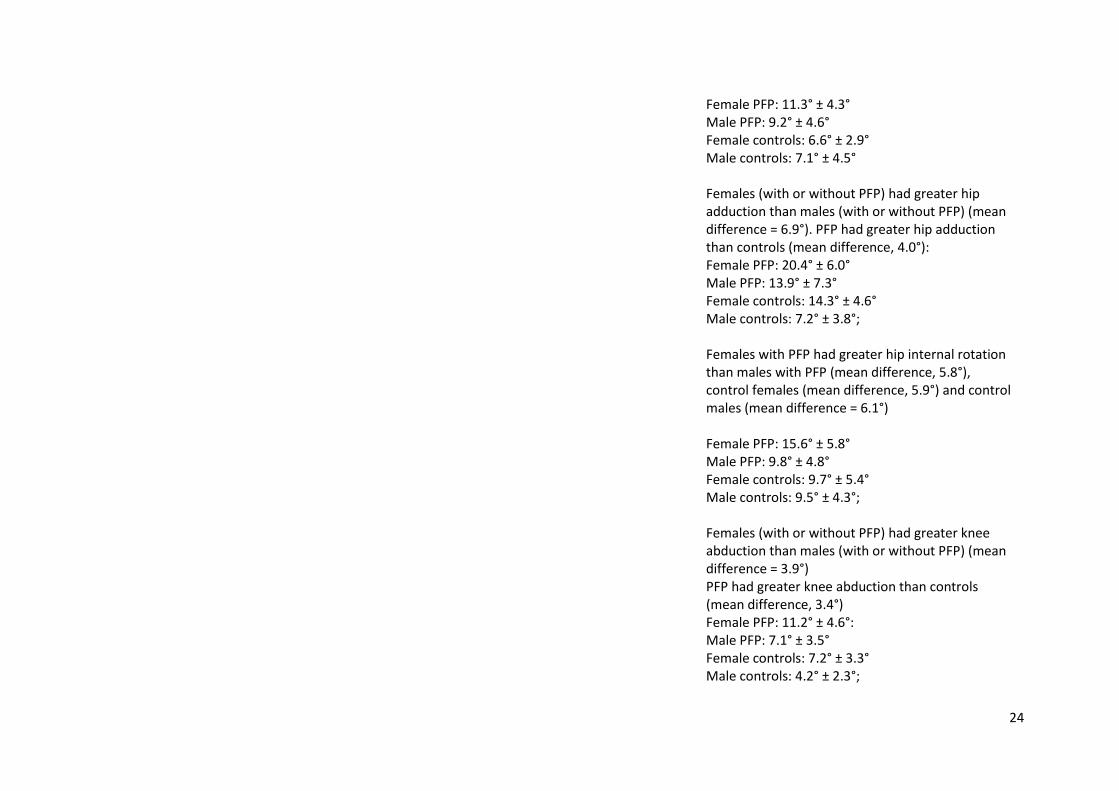
Female PFP: 11.3° ± 4.3° Male PFP: 9.2° ± 4.6° Female controls: 6.6° ± 2.9° Male controls: 7.1° ± 4.5° Females (with or without PFP) had greater hip adduction than males (with or without PFP) (mean difference = 6.9°). PFP had greater hip adduction than controls (mean difference, 4.0°): Female PFP: 20.4° ± 6.0° Male PFP: 13.9° ± 7.3° Female controls: 14.3° ± 4.6° Male controls: 7.2° ± 3.8°; Females with PFP had greater hip internal rotation than males with PFP (mean difference, 5.8°), control females (mean difference, 5.9°) and control males (mean difference = 6.1°) Female PFP: 15.6° ± 5.8° Male PFP: 9.8° ± 4.8° Female controls: 9.7° ± 5.4° Male controls: 9.5° ± 4.3°; Females (with or without PFP) had greater knee abduction than males (with or without PFP) (mean difference = 3.9°) PFP had greater knee abduction than controls (mean difference, 3.4°) Female PFP: 11.2° ± 4.6°: Male PFP: 7.1° ± 3.5° Female controls: 7.2° ± 3.3° Male controls: 4.2° ± 2.3°;
25
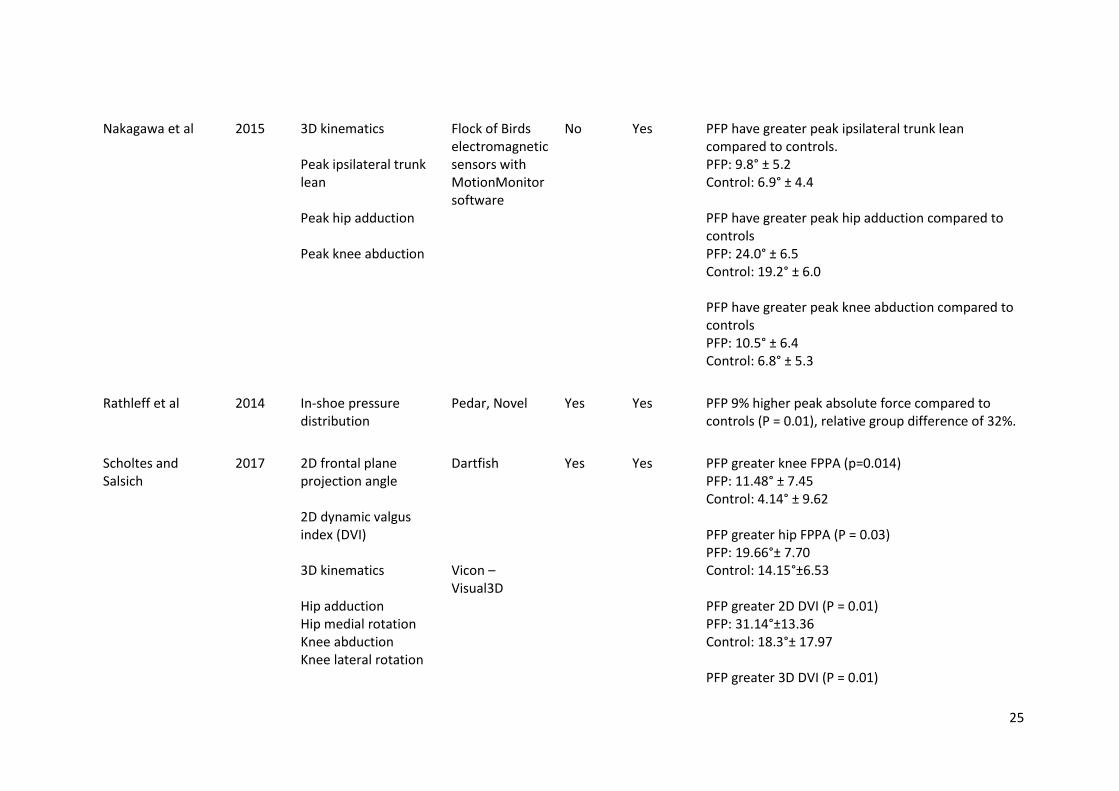
Nakagawa et al 2015 3D kinematics Peak ipsilateral trunk lean Peak hip adduction Peak knee abduction
Flock of Birds electromagnetic sensors with MotionMonitor software
No Yes PFP have greater peak ipsilateral trunk lean compared to controls. PFP: 9.8° ± 5.2 Control: 6.9° ± 4.4 PFP have greater peak hip adduction compared to controls PFP: 24.0° ± 6.5 Control: 19.2° ± 6.0 PFP have greater peak knee abduction compared to controls PFP: 10.5° ± 6.4 Control: 6.8° ± 5.3
Rathleff et al 2014 In-shoe pressure distribution
Pedar, Novel Yes Yes PFP 9% higher peak absolute force compared to controls (P = 0.01), relative group difference of 32%.
Scholtes and Salsich
2017 2D frontal plane projection angle 2D dynamic valgus index (DVI) 3D kinematics Hip adduction Hip medial rotation Knee abduction Knee lateral rotation
Dartfish Vicon – Visual3D
Yes Yes PFP greater knee FPPA (p=0.014) PFP: 11.48° ± 7.45 Control: 4.14° ± 9.62 PFP greater hip FPPA (P = 0.03) PFP: 19.66°± 7.70 Control: 14.15°±6.53 PFP greater 2D DVI (P = 0.01) PFP: 31.14°±13.36 Control: 18.3°± 17.97 PFP greater 3D DVI (P = 0.01)
26
3D dynamic valgus index
PFP: 12.41° ± 9.77 Control: 1.81° ± 13.44
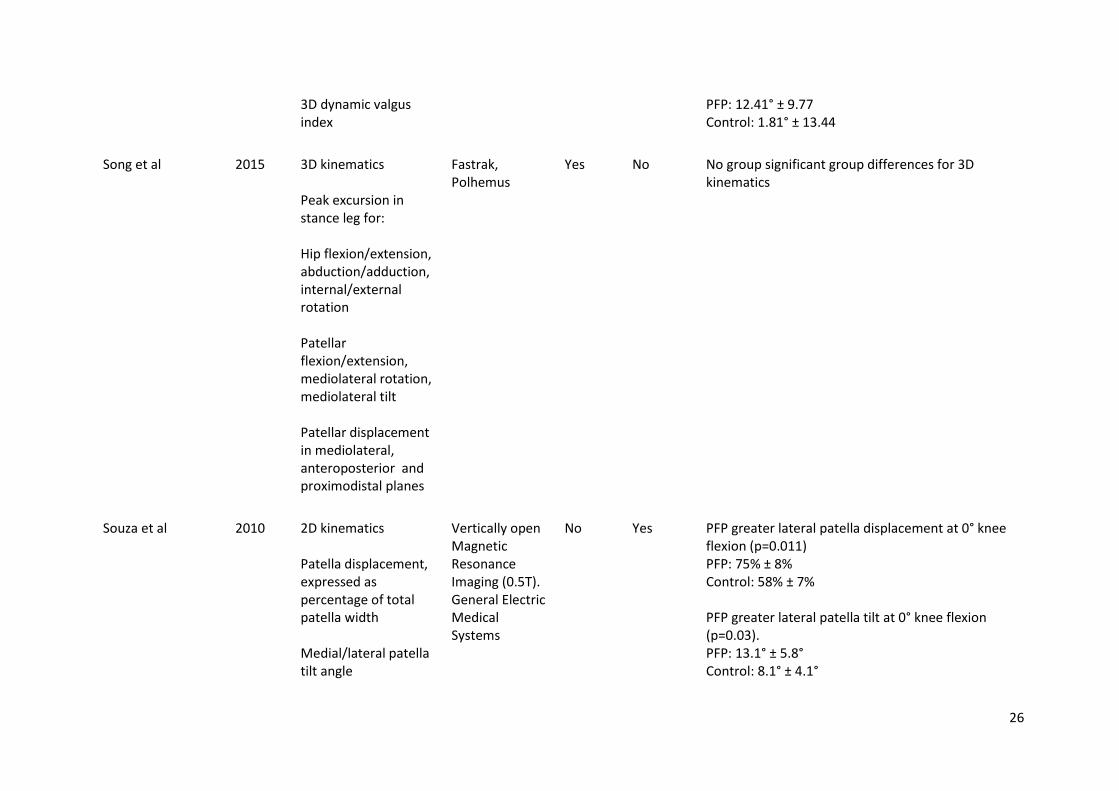
Song et al 2015 3D kinematics Peak excursion in stance leg for: Hip flexion/extension, abduction/adduction, internal/external rotation Patellar flexion/extension, mediolateral rotation, mediolateral tilt Patellar displacement in mediolateral, anteroposterior and proximodistal planes
Fastrak, Polhemus
Yes No No group significant group differences for 3D kinematics
Souza et al 2010 2D kinematics Patella displacement, expressed as percentage of total patella width Medial/lateral patella tilt angle
Vertically open Magnetic Resonance Imaging (0.5T). General Electric Medical Systems
No Yes PFP greater lateral patella displacement at 0° knee flexion (p=0.011) PFP: 75% ± 8% Control: 58% ± 7% PFP greater lateral patella tilt at 0° knee flexion (p=0.03). PFP: 13.1° ± 5.8° Control: 8.1° ± 4.1°
27
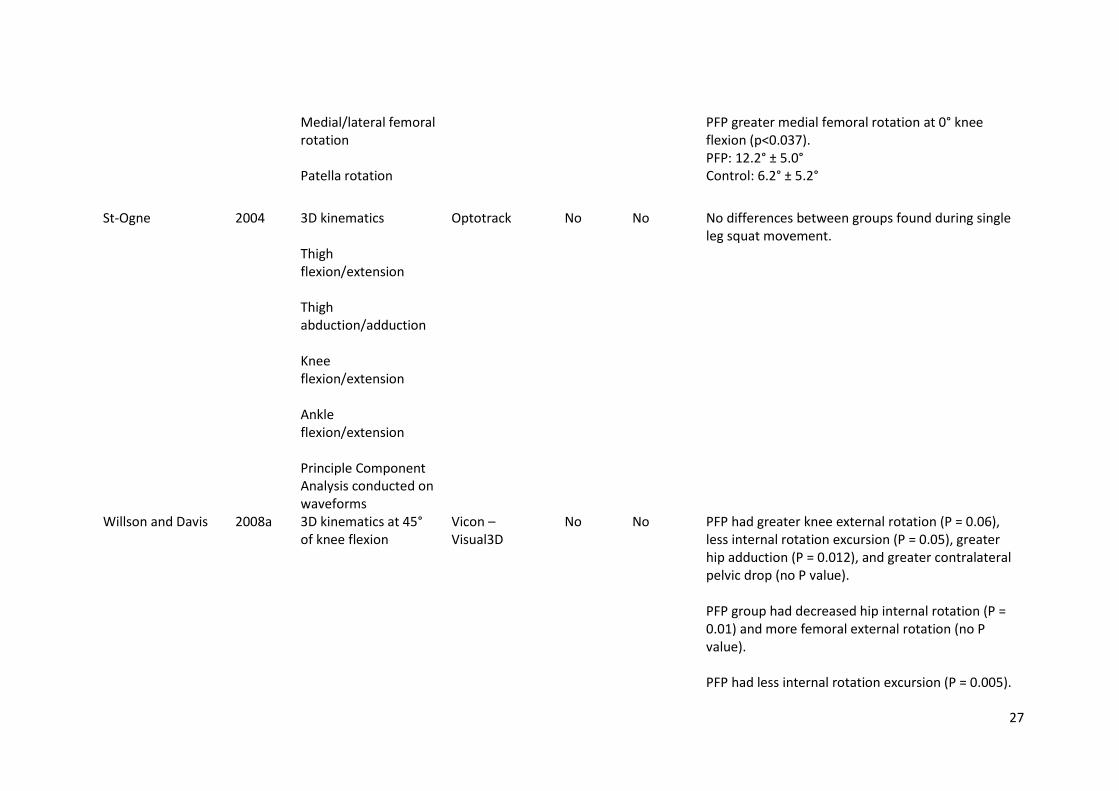
Medial/lateral femoral rotation Patella rotation
PFP greater medial femoral rotation at 0° knee flexion (p<0.037). PFP: 12.2° ± 5.0° Control: 6.2° ± 5.2°
St-Ogne 2004 3D kinematics Thigh flexion/extension Thigh abduction/adduction Knee flexion/extension Ankle flexion/extension Principle Component Analysis conducted on waveforms
Optotrack No No No differences between groups found during single leg squat movement.
Willson and Davis 2008a 3D kinematics at 45° of knee flexion
Vicon – Visual3D
No No PFP had greater knee external rotation (P = 0.06), less internal rotation excursion (P = 0.05), greater hip adduction (P = 0.012), and greater contralateral pelvic drop (no P value). PFP group had decreased hip internal rotation (P = 0.01) and more femoral external rotation (no P value). PFP had less internal rotation excursion (P = 0.005).
28
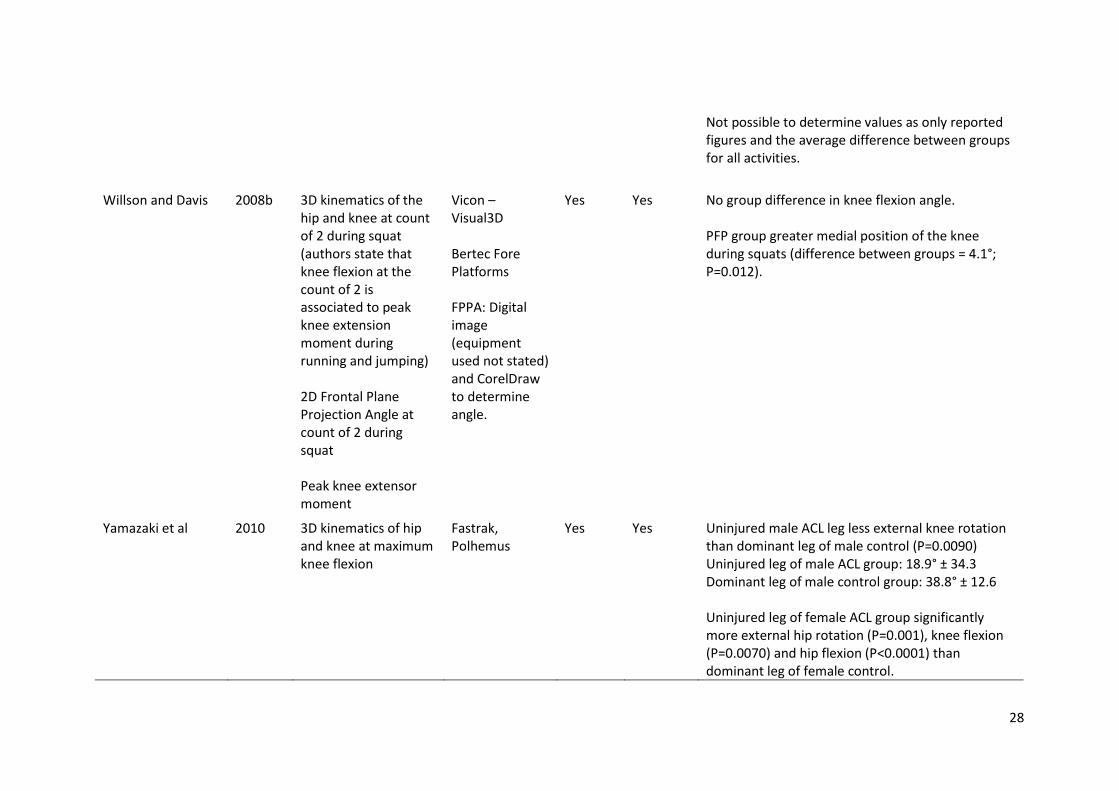
Not possible to determine values as only reported figures and the average difference between groups for all activities.
Willson and Davis 2008b 3D kinematics of the hip and knee at count of 2 during squat (authors state that knee flexion at the count of 2 is associated to peak knee extension moment during running and jumping) 2D Frontal Plane Projection Angle at count of 2 during squat Peak knee extensor moment
Vicon – Visual3D Bertec Fore Platforms FPPA: Digital image (equipment used not stated) and CorelDraw to determine angle.
Yes Yes No group difference in knee flexion angle. PFP group greater medial position of the knee during squats (difference between groups = 4.1°; P=0.012).
Yamazaki et al 2010 3D kinematics of hip and knee at maximum knee flexion
Fastrak, Polhemus
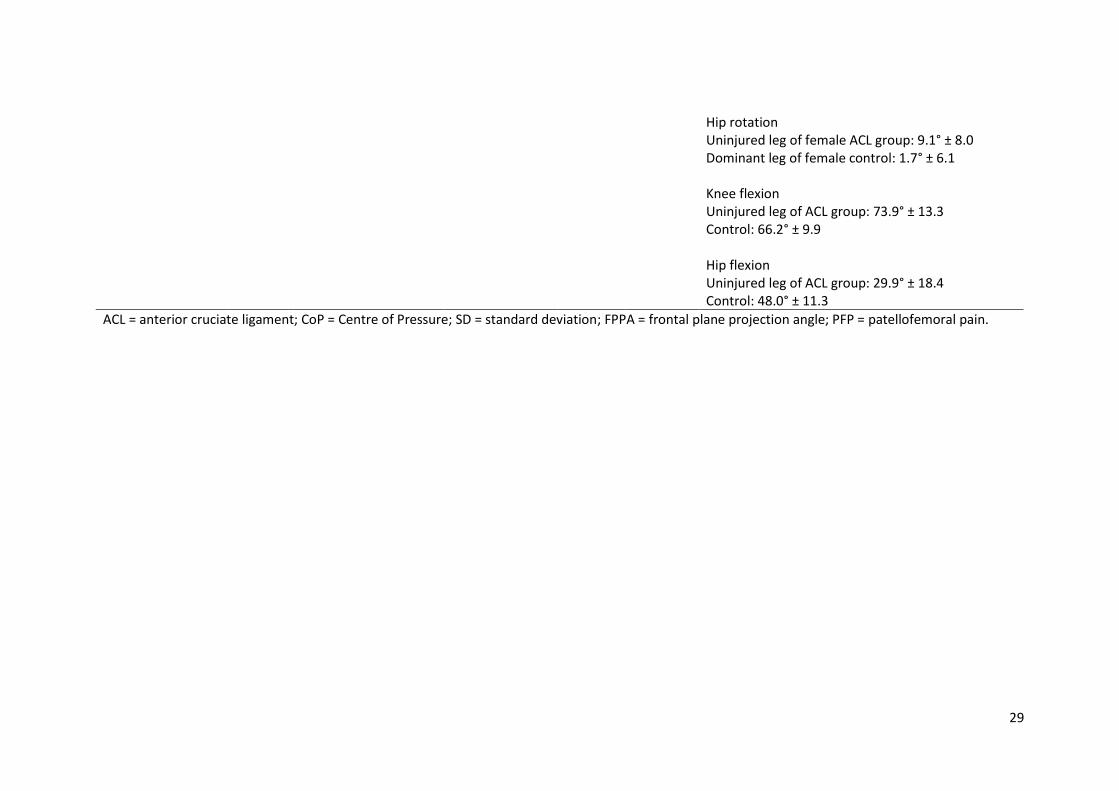
Yes Yes Uninjured male ACL leg less external knee rotation than dominant leg of male control (P=0.0090) Uninjured leg of male ACL group: 18.9° ± 34.3 Dominant leg of male control group: 38.8° ± 12.6 Uninjured leg of female ACL group significantly more external hip rotation (P=0.001), knee flexion (P=0.0070) and hip flexion (P<0.0001) than dominant leg of female control.
29
Hip rotation Uninjured leg of female ACL group: 9.1° ± 8.0 Dominant leg of female control: 1.7° ± 6.1 Knee flexion Uninjured leg of ACL group: 73.9° ± 13.3 Control: 66.2° ± 9.9 Hip flexion Uninjured leg of ACL group: 29.9° ± 18.4 Control: 48.0° ± 11.3
ACL = anterior cruciate ligament; CoP = Centre of Pressure; SD = standard deviation; FPPA = frontal plane projection angle; PFP = patellofemoral pain.
30
Table 5: Normalised score for STROBE checklist
Paper STROBE score
Carry et al., 2017 75.9% Hatton et al., 2014 75.9% Herrington, 2014 72.4% Kvist, 2005 58.6% Lavinger et al., 2007 74.1% Nakagawa et al., 2012 83.3% Nakagawa et al., 2015 74.1% Rathleff et al., 2014 93.1% Scholtes et al., 2017 85.7% Song et al., 2015 85.7% Souza et al., 2010 86.2% St-Ogne et al., 2004 50% Willson and Davis, 2008a 72.4% Willson and Davis, 2008b 83.3% Yamazaki et al., 2010 58.6%
31
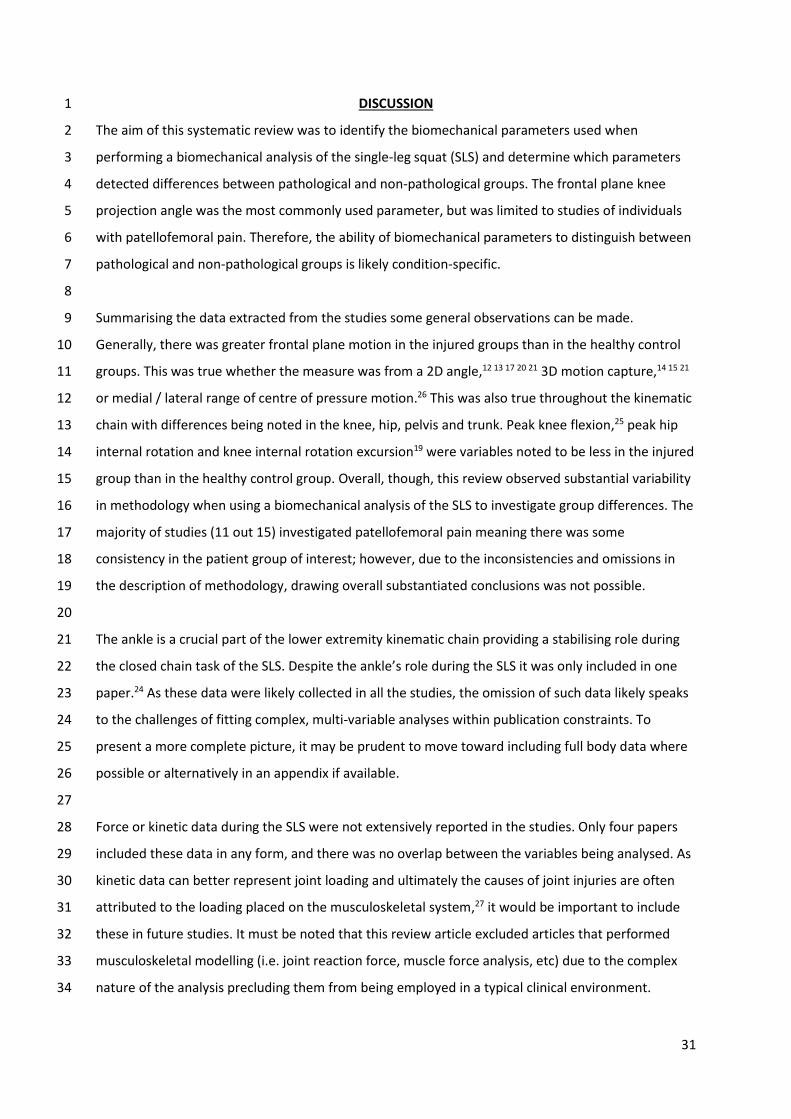
DISCUSSION 1
The aim of this systematic review was to identify the biomechanical parameters used when 2
performing a biomechanical analysis of the single-leg squat (SLS) and determine which parameters 3
detected differences between pathological and non-pathological groups. The frontal plane knee 4
projection angle was the most commonly used parameter, but was limited to studies of individuals 5
with patellofemoral pain. Therefore, the ability of biomechanical parameters to distinguish between 6
pathological and non-pathological groups is likely condition-specific. 7
8
Summarising the data extracted from the studies some general observations can be made. 9
Generally, there was greater frontal plane motion in the injured groups than in the healthy control 10
groups. This was true whether the measure was from a 2D angle,12 13 17 20 21 3D motion capture,14 15 21 11
or medial / lateral range of centre of pressure motion.26 This was also true throughout the kinematic 12
chain with differences being noted in the knee, hip, pelvis and trunk. Peak knee flexion,25 peak hip 13
internal rotation and knee internal rotation excursion19 were variables noted to be less in the injured 14
group than in the healthy control group. Overall, though, this review observed substantial variability 15
in methodology when using a biomechanical analysis of the SLS to investigate group differences. The 16
majority of studies (11 out 15) investigated patellofemoral pain meaning there was some 17
consistency in the patient group of interest; however, due to the inconsistencies and omissions in 18
the description of methodology, drawing overall substantiated conclusions was not possible. 19
20
The ankle is a crucial part of the lower extremity kinematic chain providing a stabilising role during 21
the closed chain task of the SLS. Despite the ankle’s role during the SLS it was only included in one 22
paper.24 As these data were likely collected in all the studies, the omission of such data likely speaks 23
to the challenges of fitting complex, multi-variable analyses within publication constraints. To 24
present a more complete picture, it may be prudent to move toward including full body data where 25
possible or alternatively in an appendix if available. 26
27
Force or kinetic data during the SLS were not extensively reported in the studies. Only four papers 28
included these data in any form, and there was no overlap between the variables being analysed. As 29
kinetic data can better represent joint loading and ultimately the causes of joint injuries are often 30
attributed to the loading placed on the musculoskeletal system,27 it would be important to include 31
these in future studies. It must be noted that this review article excluded articles that performed 32
musculoskeletal modelling (i.e. joint reaction force, muscle force analysis, etc) due to the complex 33
nature of the analysis precluding them from being employed in a typical clinical environment. 34
32
1
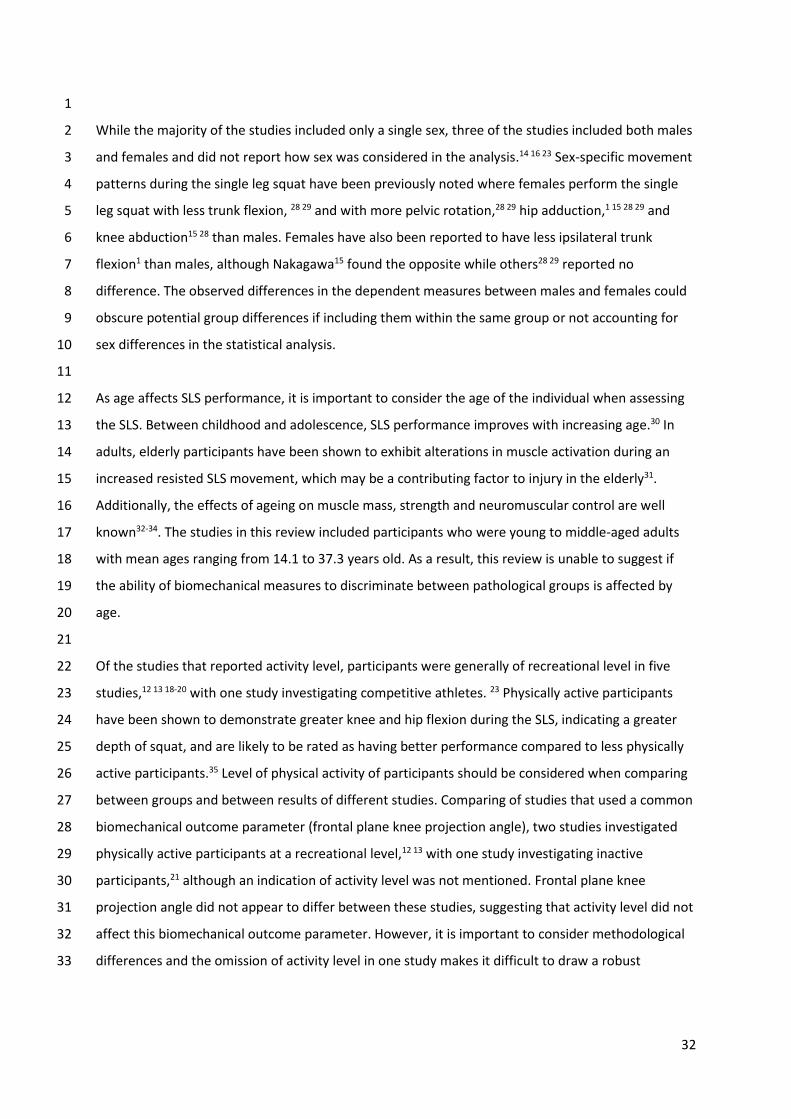
While the majority of the studies included only a single sex, three of the studies included both males 2
and females and did not report how sex was considered in the analysis.14 16 23 Sex-specific movement 3
patterns during the single leg squat have been previously noted where females perform the single 4
leg squat with less trunk flexion, 28 29 and with more pelvic rotation,28 29 hip adduction,1 15 28 29 and 5
knee abduction15 28 than males. Females have also been reported to have less ipsilateral trunk 6
flexion1 than males, although Nakagawa15 found the opposite while others28 29 reported no 7
difference. The observed differences in the dependent measures between males and females could 8
obscure potential group differences if including them within the same group or not accounting for 9
sex differences in the statistical analysis. 10
11
As age affects SLS performance, it is important to consider the age of the individual when assessing 12
the SLS. Between childhood and adolescence, SLS performance improves with increasing age.30 In 13
adults, elderly participants have been shown to exhibit alterations in muscle activation during an 14
increased resisted SLS movement, which may be a contributing factor to injury in the elderly31. 15
Additionally, the effects of ageing on muscle mass, strength and neuromuscular control are well 16
known32-34. The studies in this review included participants who were young to middle-aged adults 17
with mean ages ranging from 14.1 to 37.3 years old. As a result, this review is unable to suggest if 18
the ability of biomechanical measures to discriminate between pathological groups is affected by 19
age. 20
21
Of the studies that reported activity level, participants were generally of recreational level in five 22
studies,12 13 18-20 with one study investigating competitive athletes. 23 Physically active participants 23
have been shown to demonstrate greater knee and hip flexion during the SLS, indicating a greater 24
depth of squat, and are likely to be rated as having better performance compared to less physically 25
active participants.35 Level of physical activity of participants should be considered when comparing 26
between groups and between results of different studies. Comparing of studies that used a common 27
biomechanical outcome parameter (frontal plane knee projection angle), two studies investigated 28
physically active participants at a recreational level,12 13 with one study investigating inactive 29
participants,21 although an indication of activity level was not mentioned. Frontal plane knee 30
projection angle did not appear to differ between these studies, suggesting that activity level did not 31
affect this biomechanical outcome parameter. However, it is important to consider methodological 32
differences and the omission of activity level in one study makes it difficult to draw a robust 33
33
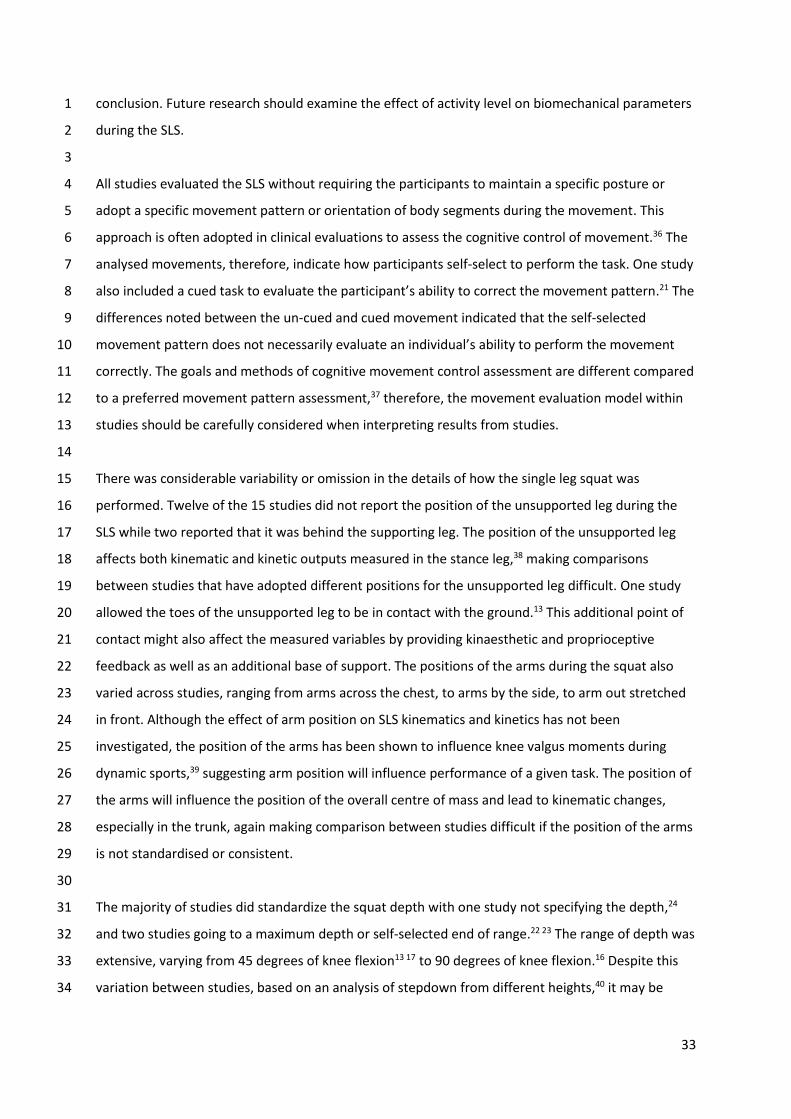
conclusion. Future research should examine the effect of activity level on biomechanical parameters 1
during the SLS. 2
3
All studies evaluated the SLS without requiring the participants to maintain a specific posture or 4
adopt a specific movement pattern or orientation of body segments during the movement. This 5
approach is often adopted in clinical evaluations to assess the cognitive control of movement.36 The 6
analysed movements, therefore, indicate how participants self-select to perform the task. One study 7
also included a cued task to evaluate the participant’s ability to correct the movement pattern.21 The 8
differences noted between the un-cued and cued movement indicated that the self-selected 9
movement pattern does not necessarily evaluate an individual’s ability to perform the movement 10
correctly. The goals and methods of cognitive movement control assessment are different compared 11
to a preferred movement pattern assessment,37 therefore, the movement evaluation model within 12
studies should be carefully considered when interpreting results from studies. 13
14
There was considerable variability or omission in the details of how the single leg squat was 15
performed. Twelve of the 15 studies did not report the position of the unsupported leg during the 16
SLS while two reported that it was behind the supporting leg. The position of the unsupported leg 17
affects both kinematic and kinetic outputs measured in the stance leg,38 making comparisons 18
between studies that have adopted different positions for the unsupported leg difficult. One study 19
allowed the toes of the unsupported leg to be in contact with the ground.13 This additional point of 20
contact might also affect the measured variables by providing kinaesthetic and proprioceptive 21
feedback as well as an additional base of support. The positions of the arms during the squat also 22
varied across studies, ranging from arms across the chest, to arms by the side, to arm out stretched 23
in front. Although the effect of arm position on SLS kinematics and kinetics has not been 24
investigated, the position of the arms has been shown to influence knee valgus moments during 25
dynamic sports,39 suggesting arm position will influence performance of a given task. The position of 26
the arms will influence the position of the overall centre of mass and lead to kinematic changes, 27
especially in the trunk, again making comparison between studies difficult if the position of the arms 28
is not standardised or consistent. 29
30
The majority of studies did standardize the squat depth with one study not specifying the depth,24 31
and two studies going to a maximum depth or self-selected end of range.22 23 The range of depth was 32
extensive, varying from 45 degrees of knee flexion13 17 to 90 degrees of knee flexion.16 Despite this 33
variation between studies, based on an analysis of stepdown from different heights,40 it may be 34
34
more important to standardize the point at which the variables are measured. In a repeated 1
measures analysis, when the dependent variables were analysed at peak knee flexion, the stepdown 2
from a 16 cm step appears to use a different movement pattern than the stepdown from a 24 cm 3
step. However, when analysed at 60 degrees of knee flexion, only trunk flexion was different 4
between the tasks. Thus, if peak knee flexion may be different between groups, it may also be 5
important to include a standardised angle at which data are analysed. However, depending on the 6
research question, peak angles throughout the movement may also be of interest.15 17 23 Another 7
consideration is whether a peak angle is used or the change in the angle over a time frame (i.e. 8
excursion). The use of excursion may obscure differences when there is an offset in the initial 9
position that contributes to the difference in peak angles. This situation is noted in Willson et al19 10
where differences in peak angles were noted, but not in excursions. In addition, the definition of 11
‘zero’ and its relation to a neutral joint position is important to consider. Differences in the definition 12
of the neutral joint angle will influence the absolute angles reported, requiring a clear and consistent 13
definition of the neutral angle to ensure comparisons between groups are valid. 14
15
The SLS is often used as a tool to assess movement due to its perceived relationship to functional 16
movement, yet the relationship between the SLS and more dynamic sporting tasks must be 17
considered. The SLS is typically performed in a controlled manner in a bid to simulate activities of 18
daily living, such as walking down stairs. However, it is the more dynamic movements seen in sports, 19
for example, that may be the likely causative factor for joint injury. The velocity of the SLS influences 20
the latency of hip muscle activation,41 and may have subsequent effects on lower limb kinematics 21
and kinetics. Therefore, the slow velocity in which the SLS is performed will not produce the same 22
demands on the musculoskeletal system of the lower limb as a faster dynamic task. Of the studies 23
reported in this review only two standardised the velocity of performing the SLS.14 15 Although the 24
SLS has been shown to be related to pathology and injury,42 which suggests a relationship between 25
SLS performance and functional movement, evidence on a direct comparison is limited. Movement 26
patterns during the SLS are related to observed patterns during single leg landing43 and bilateral 27
drop jump tasks,43 44 but further research is needed to establish the relationship between SLS and 28
dynamic performance. With the development of inertial measurement units the possibility of 29
establishing kinematic relationships and specific clinical measures such as the SLS can be established. 30
31
The current systematic review had a number of limitations. The review was not constrained to a 32
single type of pathology; therefore, it was not possible to combine the results and perform a meta-33
analysis to determine possible effect sizes for the discriminatory power of the biomechanical 34
35
outcome parameters. The choice of not constraining the type of pathology was made, as it was not 1
known prior to undertaking the study which pathologies are assessed using a single leg squat 2
movement. The current review was also limited to only including cross-sectional studies that 3
compared a pathological to non-pathological group. To determine the biomechanical measures that 4
are indicative of alterations in movement a review of studies that have examined changes in 5
biomechanical parameters during the single leg squat following an intervention would be needed. 6
7
A number of research and clinical recommendations can be stated as a result of this review. Firstly, it 8
is important to standardise and report the position of the unsupported leg and arms during the SLS 9
as differing positions can alter the kinematic profile when performing the movement. 10
Recommendations on the position to adopt include placing the unsupported leg behind with the 11
knee flexed to 90°, and arms across the chest. To account for the differences in depth of squat 12
employed in studies, it would be beneficial to report parameters at different levels of knee flexion 13
during the SLS. This would allow a comparison of studies irrespective of the depth of squat. Many 14
studies only reported kinematics of a single joint, however, the relationship between kinematics and 15
pathology are likely to be multifactorial and therefore it is important to consider the entire kinetic 16
chain. These data should be presented in the paper, or as an appendix or supplementary material as 17
appropriate. In addition, many biomechanics laboratories are equipped with force platforms but 18
very few studies report kinetic findings on the SLS. It is suggested that kinetic data should be 19
considered in future reporting. Due to the known differences in kinematic parameters when 20
performing the SLS the inclusion of sex as a covariate must be considered in future studies. Clinical 21
recommendations again must be circumspect, however, the clinician should consider the following 22
points when using the SLS as a tool to assess a patient. Frontal plane motion appears to be the most 23
important factor related to patellofemoral pain in females and should be the focus of the 24
assessment; consistency in the position of the unsupported leg and arms should be employed; and it 25
should be considered that males and females may perform the movement differently irrespective of 26
pathology. 27
28
CONCLUSION 29
The SLS provides a controlled means to assess dynamic movement during a simulated movement 30
that occurs in activities of daily living and sporting activities. Through the use of biomechanical 31
measures it is possible to obtain quantitative, and potentially less biased than visual observational 32
measures, measures of movement that will assist in elucidating the mechanisms of joint injuries. 33
This review found large variability in the parameters used to distinguish between pathological and 34
36
non-pathological groups. Of the biomechanical parameters reported by studies, frontal plane 1
kinematics showed the most differences between pathological and non-pathological groups. This 2
review also found large variability in the way in which the SLS was performed and the dependent 3
variables used to determine groups differences. Based on this review a series of recommendations 4
are suggested for future studies: 1) standardising the position of the unsupported leg during the SLS; 5
2) standardising arm position during the SLS; 3) reporting kinematic for all joints, included as an 6
appendix if necessary; 4) giving more consideration to kinetic outcome parameters; and 5) 7
considering sex as a covariate. 8
9
10
37
REFERENCES 1
1. Zeller BL, McCrory JL, Kibler WB, et al. Differences in kinematics and electromyographic activity 2 between men and women during the single-legged squat. The American journal of sports 3 medicine 2003;31(3):449-56. doi: 10.1177/03635465030310032101 [published Online First: 4 2003/05/17] 5
2. Whatman C, Hume DR, Hing W. The reliability and validity of visual rating of dynamic alignment 6 during lower extremity functional screening tests: a review of the literature. Physical 7 Therapy Reviews 2015;20(3):210-24. 8
3. Ageberg E, Bennell KL, Hunt MA, et al. Validity and inter-rater reliability of medio-lateral knee 9 motion observed during a single-limb mini squat. BMC musculoskeletal disorders 10 2010;11(1):265. 11
4. Crossley KM, Zhang W-J, Schache AG, et al. Performance on the Single-Leg Squat Task Indicates 12 Hip Abductor Muscle Function. The American journal of sports medicine 2011;39(4):866-73. 13 doi: 10.1177/0363546510395456 14
5. Hegedus EJ, McDonough S, Bleakley C, et al. Clinician-friendly lower extremity physical 15 performance measures in athletes: a systematic review of measurement properties and 16 correlation with injury, part 1. The tests for knee function including the hop tests. British 17 journal of sports medicine 2015;49(10):642-48. doi: 10.1136/bjsports-2014-094094 18
6. Hegedus EJ, McDonough SM, Bleakley C, et al. Clinician-friendly lower extremity physical 19 performance tests in athletes: a systematic review of measurement properties and 20 correlation with injury. Part 2—the tests for the hip, thigh, foot and ankle including the star 21 excursion balance test. British journal of sports medicine 2015;49(10):649-56. doi: 22 10.1136/bjsports-2014-094341 23
7. Whittaker JL, Booysen N, de la Motte S, et al. Predicting sport and occupational lower extremity 24 injury risk through movement quality screening: a systematic review. British journal of sports 25 medicine 2017;51(7):580-85. doi: 10.1136/bjsports-2016-096760 26
8. Whatman C, Hume P, Hing W. Kinematics during lower extremity functional screening tests in 27 young athletes - are they reliable and valid? Physical therapy in sport : official journal of the 28 Association of Chartered Physiotherapists in Sports Medicine 2013;14(2):87-93. doi: 29 10.1016/j.ptsp.2012.06.001 [published Online First: 2012/10/24] 30
9. Dingenen B, Malfait B, Vanrenterghem J, et al. The reliability and validity of the measurement of 31 lateral trunk motion in two-dimensional video analysis during unipodal functional screening 32 tests in elite female athletes. Physical therapy in sport : official journal of the Association of 33 Chartered Physiotherapists in Sports Medicine 2014;15(2):117-23. doi: 34 10.1016/j.ptsp.2013.05.001 [published Online First: 2013/07/31] 35
10. Ageberg E, Bennell KL, Hunt MA, et al. Validity and inter-rater reliability of medio-lateral knee 36 motion observed during a single-limb mini squat. BMC musculoskeletal disorders 37 2010;11:265. doi: 10.1186/1471-2474-11-265 [published Online First: 2010/11/18] 38
11. Vandenbroucke JP, von Elm E, Altman DG, et al. Strengthening the Reporting of Observational 39 Studies in Epidemiology (STROBE): Explanation and Elaboration. PLOS Medicine 40 2007;4(10):e297. doi: 10.1371/journal.pmed.0040297 41
12. Herrington L. Knee valgus angle during single leg squat and landing in patellofemoral pain 42 patients and controls. The Knee 2014;21(2):514-7. doi: 10.1016/j.knee.2013.11.011 43 [published Online First: 2014/01/02] 44
13. Levinger P, Gilleard W, Coleman C. Femoral medial deviation angle during a one-leg squat test in 45 individuals with patellofemoral pain syndrome. Physical Therapy in Sport 2007;8(4):163-68. 46
14. Nakagawa TH, Maciel CD, Serrao FV. Trunk biomechanics and its association with hip and knee 47 kinematics in patients with and without patellofemoral pain. Manual therapy 48 2015;20(1):189-93. doi: 10.1016/j.math.2014.08.013 [published Online First: 2014/09/28] 49
15. Nakagawa TH, Moriya ET, Maciel CD, et al. Trunk, pelvis, hip, and knee kinematics, hip strength, 50 and gluteal muscle activation during a single-leg squat in males and females with and 51
38
without patellofemoral pain syndrome. The Journal of orthopaedic and sports physical 1 therapy 2012;42(6):491-501. doi: 10.2519/jospt.2012.3987 [published Online First: 2 2012/03/10] 3
16. Rathleff MS, Richter C, Brushoj C, et al. Increased medial foot loading during drop jump in 4 subjects with patellofemoral pain. Knee surgery, sports traumatology, arthroscopy : official 5 journal of the ESSKA 2014;22(10):2301-7. doi: 10.1007/s00167-014-2943-3 [published Online 6 First: 2014/03/25] 7
17. Song CY, Huang HY, Chen SC, et al. Effects of femoral rotational taping on pain, lower extremity 8 kinematics, and muscle activation in female patients with patellofemoral pain. Journal of 9 science and medicine in sport 2015;18(4):388-93. doi: 10.1016/j.jsams.2014.07.009 10 [published Online First: 2014/08/16] 11
18. Souza RB, Draper CE, Fredericson M, et al. Femur rotation and patellofemoral joint kinematics: a 12 weight-bearing magnetic resonance imaging analysis. The Journal of orthopaedic and sports 13 physical therapy 2010;40(5):277-85. doi: 10.2519/jospt.2010.3215 [published Online First: 14 2010/05/04] 15
19. Willson JD, Davis IS. Lower extremity mechanics of females with and without patellofemoral pain 16 across activities with progressively greater task demands. Clinical Biomechanics 17 2008;23(2):203-11. 18
20. Willson JD, Davis IS. Utility of the frontal plane projection angle in females with patellofemoral 19 pain. Journal of Orthopaedic & Sports Physical Therapy 2008;38(10):606-15. 20
21. Scholtes SA, Salsich GB. A DYNAMIC VALGUS INDEX THAT COMBINES HIP AND KNEE ANGLES: 21 ASSESSMENT OF UTILITY IN FEMALES WITH PATELLOFEMORAL PAIN. International journal of 22 sports physical therapy 2017;12(3):333-40. [published Online First: 2017/06/09] 23
22. Carry PM, Gala R, Worster K, et al. POSTURAL STABILITY AND KINETIC CHANGE IN SUBJECTS 24 WITH PATELLOFEMORAL PAIN AFTER A NINE-WEEK HIP AND CORE STRENGTHENING 25 INTERVENTION. International journal of sports physical therapy 2017;12(3):314-23. 26 [published Online First: 2017/06/09] 27
23. Kvist J. Sagittal tibial translation during exercises in the anterior cruciate ligament-deficient knee. 28 Scandinavian journal of medicine & science in sports 2005;15(3):148-58. doi: 10.1111/j.1600-29 0838.2004.401.x [published Online First: 2005/05/12] 30
24. St-Onge N, Duval N, Yahia LH, et al. Interjoint coordination in lower limbs in patients with a 31 rupture of the anterior cruciate ligament of the knee joint. Knee Surgery, Sports 32 Traumatology, Arthroscopy 2004;12(3):203-16. 33
25. Yamazaki J, Muneta T, Ju YJ, et al. Differences in kinematics of single leg squatting between 34 anterior cruciate ligament-injured patients and healthy controls. Knee surgery, sports 35 traumatology, arthroscopy : official journal of the ESSKA 2010;18(1):56-63. doi: 36 10.1007/s00167-009-0892-z [published Online First: 2009/08/21] 37
26. Hatton AL, Kemp JL, Brauer SG, et al. Impairment of dynamic single-leg balance performance in 38 individuals with hip chondropathy. Arthritis care & research 2014;66(5):709-16. doi: 39 10.1002/acr.22193 [published Online First: 2013/10/12] 40
27. Bennell KL, Bowles KA, Wang Y, et al. Higher dynamic medial knee load predicts greater cartilage 41 loss over 12 months in medial knee osteoarthritis. Annals of Rheumatic Diseases 42 2011;70(10):1770-74. 43
28. Graci V, Van Dillen LR, Salsich GB. Gender differences in trunk, pelvis and lower limb kinematics 44 during a single leg squat. Gait & posture 2012;36(3):461-6. doi: 45 10.1016/j.gaitpost.2012.04.006 [published Online First: 2012/05/18] 46
29. Weeks BK, Carty CP, Horan SA. Effect of sex and fatigue on single leg squat kinematics in healthy 47 young adults. BMC musculoskeletal disorders 2015;16:271. doi: 10.1186/s12891-015-0739-3 48 [published Online First: 2015/10/02] 49
39
30. Agresta CE, Church C, Henley J, et al. Single Leg Squat Performance in Active Adolescents Age 8 1 to 17 Years. Journal of strength and conditioning research 2016 doi: 2 10.1519/jsc.0000000000001617 [published Online First: 2016/08/31] 3
31. Madhavan S, Burkart S, Baggett G, et al. Influence of age on neuromuscular control during a 4 dynamic weight-bearing task. Journal of aging and physical activity 2009;17(3):327-43. 5
32. Deschenes MR. Effects of aging on muscle fibre type and size. Sports medicine (Auckland, NZ) 6 2004;34(12):809-24. [published Online First: 2004/10/07] 7
33. Nikolic M, Bajek S, Bobinac D, et al. Aging of human skeletal muscles. Collegium antropologicum 8 2005;29(1):67-70. [published Online First: 2005/08/25] 9
34. Hunter SK, Pereira HM, Keenan KG. The aging neuromuscular system and motor performance. 10 Journal of applied physiology (Bethesda, Md : 1985) 2016;121(4):982-95. doi: 11 10.1152/japplphysiol.00475.2016 [published Online First: 08/11] 12
35. Gianola S, Castellini G, Stucovitz E, et al. Single leg squat performance in physically and non-13 physically active individuals: a cross-sectional study. BMC musculoskeletal disorders 14 2017;18(1):299-99. doi: 10.1186/s12891-017-1660-8 15
36. Botha N, Warner M, Gimpel M, et al. Movement patterns during a small knee bend test in 16 academy footballers with femoroacetabular impingement (FAI)2014. 17
37. Dingenen B, Blandford L, Comerford M, et al. The assessment of movement health in clinical 18 practice: A multidimensional perspective. Physical therapy in sport : official journal of the 19 Association of Chartered Physiotherapists in Sports Medicine 2018;32:282-92. doi: 20 10.1016/j.ptsp.2018.04.008 [published Online First: 2018/05/26] 21
38. Khuu A, Foch E, Lewis CL. NOT ALL SINGLE LEG SQUATS ARE EQUAL: A BIOMECHANICAL 22 COMPARISON OF THREE VARIATIONS. International journal of sports physical therapy 23 2016;11(2):201-11. [published Online First: 2016/04/23] 24
39. Chaudhari AM, Hearn BK, Andriacchi TP. Sport-Dependent Variations in arm Position during 25 Single-Limb Landing Influence Knee Loading:Implications for Anterior Cruciate Ligament 26 Injury. The American journal of sports medicine 2005;33(6):824-30. doi: 27 10.1177/0363546504270455 28
40. Lewis CL, Foch E, Luko MM, et al. Differences in Lower Extremity and Trunk Kinematics between 29 Single Leg Squat and Step Down Tasks. PloS one 2015;10(5):e0126258. doi: 30 10.1371/journal.pone.0126258 31
41. Orozco-Chavez I, Mendez-Rebolledo G. Effect of squatting velocity on hip muscle latency in 32 women with patellofemoral pain syndrome. Journal of physical therapy science 33 2018;30(3):381-86. doi: 10.1589/jpts.30.381 [published Online First: 03/02] 34
42. Kivlan BR, Martin RL. Functional performance testing of the hip in athletes: a systematic review 35 for reliability and validity. International journal of sports physical therapy 2012;7(4):402-12. 36 [published Online First: 2012/08/16] 37
43. Munro A, Herrington L, Comfort P. The relationship between 2-dimensional knee-valgus angles 38 during single-leg squat, single-leg-land, and drop-jump screening tests. Journal of sport 39 rehabilitation 2017;26(1):72-77. doi: 10.1123/jsr.2015-0102 40
44. Ugalde V, Brockman C, Bailowitz Z, et al. Single Leg Squat Test and Its Relationship to Dynamic 41 Knee Valgus and Injury Risk Screening. PM&R 2015;7(3):229-35. doi: 42 https://doi.org/10.1016/j.pmrj.2014.08.361 43
44


