Embed Size (px)
Citation preview

A two-dimensional nonequilibrium model of cascaded arc plasma flows J. J. Beulens, D. Milojevic,“) D. C. Schram, and P. M. Vallinga Department of Physics, Eindhoven University of Technology, P. 0. Box 513,5600 MB Eindhoven, The Netherlands
(Received 5 February 1991; accepted 29 May 1991)
A nonequilibrium model is developed for the prediction of two-dimensional flow, electron and heavy particle temperatures, and number density distributions in cascaded arcs of monatomic gases. The system of strongly coupled elliptic partial differential equations describing plasma flow is solved by a numerical method based on a control volume with a nonstaggered numerical grid. The model is applied for the computation of both stagnation and flowing argon arc plasmas. The results show that the plasma in stagnation arcs is nearly in local thermal equilibrium (LTE), except very close to the wall, whereas fast flowing arc plasmas exhibit a significant degree of nonequilibrium, both close to the wall and in the inlet region. The results of the calculations are in satisfactory agreement with experimental data, both for the cases of stagnation and flowing argon cascaded arc plasmas.
I. INTRODUCTION Thermal plasmas, as plasma torches and inductively
coupled plasmas (ICP), have become very important for many industrial applications such as plasma spraying, cut- ting, welding, powder processing, high-pressure light sources, and spectrochemistry. Also, more recently, for plas- ma deposition thermal plasmas and cascaded arcs, in partic- ular, have proven to offer great advantages in terms of effec- tiveness of the process and hence of the deposition rate.
For the latter application, a good control of the plasma properties such as ionization degree and flow velocity is cru- cial. Therefore it is essential to have a two-dimensional mod- el of the plasma flow, which takes into account correctly phenomena such as high nonisothermal flow, deviations from local thermal equilibrium (LTE), as well as diffusion and heat conduction.
in accordance with the applications, extensive experi- mental work has been conducted to obtain insight into the extent to which nonequilibrium exists in cascaded arc ther- mal plasmas. Most of these investigations concern stagnant, and thus homogeneous, cylindrical plasmas. This permitted, besides side-on, end-on (axial) observation and, in particu- lar, for argon, the small deviations from LTE in stagnant arcs, have been measured with great precision.
The electron density has been measured very accurately with interferometry; IV3 electron temperature and density ob- tained by the source function method yields the effect of non- LTE, expressed in an overpopulation factor of the ground state 6, which is the ratio of the actual neutral ground state density and the Saha-equilibrium value. It also appears that above a critical current density and thus ionization degree in stagnant arcs, the heavy particle temperature equals the electron temperature. This is no more guaranteed in flowing cascaded arc plasmas. Here, in particular, experimental work has been done concerning the flow velocity.4*5 This experimental work has been supported by one-dimensional
a’ Also at The Boris Kidric Instituteof Nuclear Sciences, Vinca Institute for Thermal Engineering and Energy Research, P. 0. Box 522, 11001 Bel- grade, Yugoslavia.
modeling, which gave reasonable agreement with experi- ments.5
In this work, it was felt that there exists a need to devel- op a concise two-dimensional model. This was particularly true with regard to a correct description of the neutral flow besides electron density, temperatures, and flow velocity, and their radial dependencies. Therefore an attempt has been made in the present work to develop a basic two-dimen- sional two-temperature nonequilibrium model and a predic- tion procedure for cascaded arc monatomic plasma flows. After this basic model is verified by experiments, it can be extended to other plasma flow situations, such as the expan- sion of plasmas into vacuum, complex gas mixture plasmas, strongly recombining plasma jets, and impinging jets at solid surfaces for the purpose of plasma deposition processes.
In the approach adopted in this work, the plasma is treated as a two-phase medium that consists of heavy parti- cles (neutral atoms and ions) and light particles (electrons). For the full description of this two-phase flow one needs to solve the mass, momentum, and energy equations for both phases. However, because of the small electron mass, their momentum is neglected in comparison with the heavy parti- cle momentum, and both phases are assumed to have the same convective velocity field, except for the electron veloc- ity associated with the divergence-free current density. So the two-phase flow character is kept only with respect to the heavy particle and electron temperatures , which are as- sumed to be different and described by separate energy equa- tions. The cascaded arc plasma is created by Ohmic heating of the gas due to the current flowing between the cathode and the anode. Ohmic heat input is consumed by electrons whose temperature increases. Frequent elastic and inelastic collisions with the heavy particles result in an increasing gas temperature and a higher ionization degree. The mass of the electrons is small and if the flow velocity is large, the elastic collisions are not always efficient enough to equalize the temperatures of the two-phases, especially at inlet regions of the flow, where the cold gas is introduced and in the vicinity of cooled walls.
The model is first applied for the case of a stagnation
2548 Phys. Fluids B 3 (9). September 1991 08994322i /91/092548-i 0$02.00 @ 1991 American Institute of Physics 2548
Downloaded 21 Mar 2005 to 131.155.111.63. Redistribution subject to AIP license or copyright, see http://pop.aip.org/pop/copyright.jsp
argon plasma at very low gas flow rates at different arc cur- rents, thus simulating the experiments of Rosado and Tim- mermans et al.,‘** which makes it possible to assess the mod- eling of near-equilibrium processes. In the next step the model is applied for the prediction of strongly flowing arcs, experimentally investigated by de Haa~,~ Kroesen’ and Beu- lens,6 which allows the verification of the nonequilibrium plasma modeling.
II. MATHEMATICAL MODEL In the experiments of Timmermans’82 and Kroesen,’ the
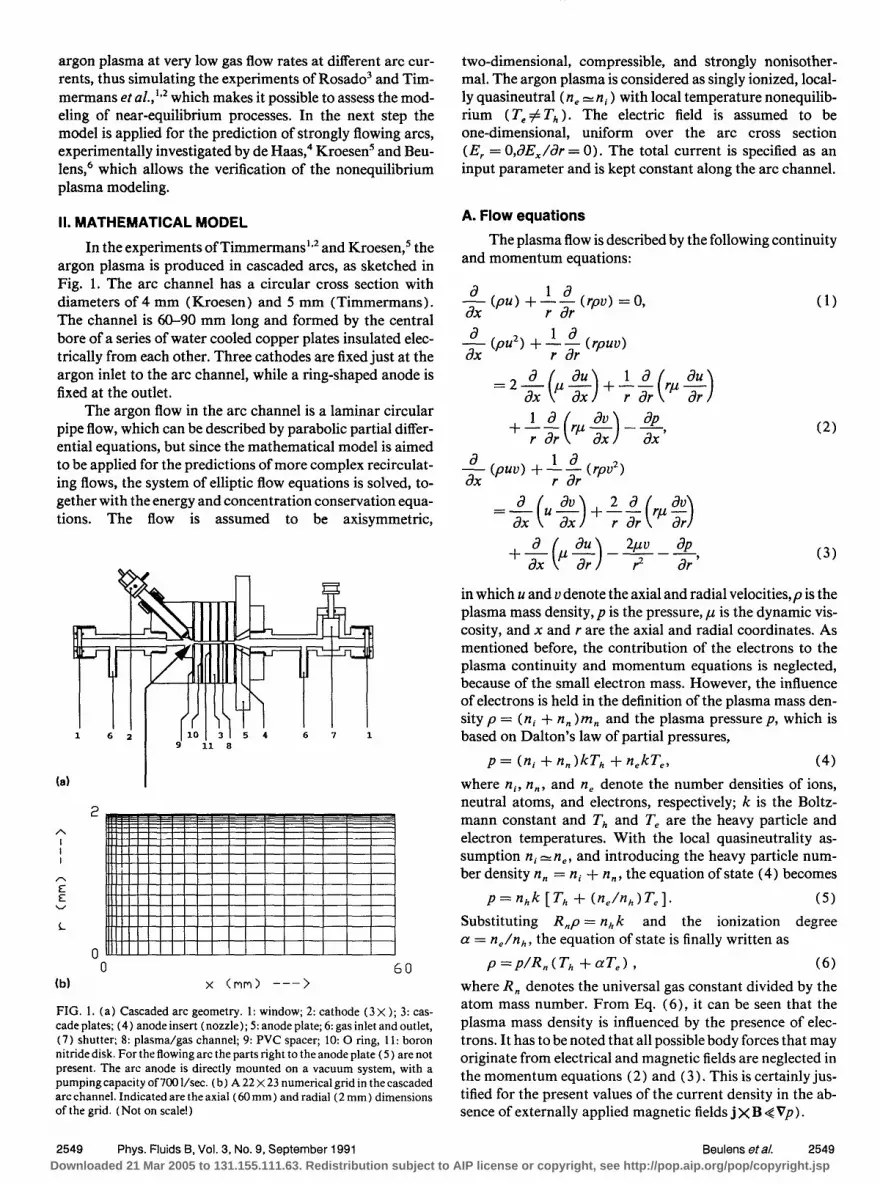
argon plasma is produced in cascaded arcs, as sketched in Fig. 1. The arc channel has a circular cross section with diameters of 4 mm (Kroesen) and 5 mm (Timmermans). The channel is 60-90 mm long and formed by the central bore of a series of water cooled copper plates insulated elec- trically from each other. Three cathodes are fixed just at the argon inlet to the arc channel, while a ring-shaped anode is fixed at the outlet.
The argon flow in the arc channel is a laminar circular pipe flow, which can be described by parabolic partial differ- ential equations, but since the mathematical model is aimed to be applied for the predictions of more complex recirculat- ing flows, the system of elliptic flow equations is solved, to- gether with the energy and concentration conservation equa- tions. The flow is assumed to be axisymmetric,
1
(a)
2 A I I
A E ” L
0
k
0 60 (b) x Cmm> --->
FIG. 1. (a) Cascaded arc geometry. 1: window; 2: cathode (3 x ); 3: cas- cade plates; (4) anode insert (nozzle); 5: anode plate; 6: gas inlet and outlet, (7) shutter; 8: plasma/gas channel; 9: PVC spacer; 10: 0 ring, 11: boron nitride disk. For the flowing arc the parts right to the anode plate (5) are not present. The arc anode is directly mounted on a vacuum system, with a pumping capacity of 700 l/set. (b) A 22 X 23 numerical grid in the cascaded arc channel. Indicated are the axial (60 mm) and radial (2 mm) dimensions of the grid. (Not on scale!)
two-dimensional, compressible, and strongly nonisother- mal. The argon plasma is considered as singly ionized, local- ly quasineutral (n, u ni ) with local temperature nonequilib- rium (T, # T,, ). The electric field is assumed to be one-dimensional, uniform over the arc cross section (E, = OJE,/& = 0). The total current is specified as an input parameter and is kept constant along the arc channel.
A. Flow equations The plasma tlow is described by the following continuity
and momentum equations:
+++&(rpu)=O, -& (pa + $ $ (rpuv)
=2&(p$)+$g(rp$-) +I2 rpdv -ap
r dr ( > ax ax’
$ (puv) +$$ (rpu2)
=&(u$)++g(rp$)
+-$ p$ ---q---g ( >
2P JP
(2)
in which u and u denote the axial and radial velocities,p is the plasma mass density, p is the pressure, p is the dynamic vis- cosity, and x and r are the axial and radial coordinates. As mentioned before, the contribution of the electrons to the plasma continuity and momentum equations is neglected, because of the small electron mass. However, the influence of electrons is held in the definition of the plasma mass den- sity p = ( ni + n, )m, and the plasma pressure p, which is based on Dalton’s law of partial pressures,
P = (ni -I- n,, )kTh + n&f’,, (4) where ni, n,, and n, denote the number densities of ions, neutral atoms, and electrons, respectively; k is the Boltz- mann constant and Th and T, are the heavy particle and electron temperatures. With the local quasineutrality as- sumption nj z-n,, and introducing the heavy particle num- ber density n, = ni -I- n,, the equation of state (4) becomes
p=n,k[T, + (n,h,)T,]. (5) Substituting R,p = nh k and the ionization degree a = n,/n,, the equation of state is finally written as
p=p/R,CT,, +aT,l, (6) where R, denotes the universal gas constant divided by the atom mass number. From Eq. (6), it can be seen that the plasma mass density is influenced by the presence of elec- trons. It has to be noted that all possible body forces that may originate from electrical and magnetic fields are neglected in the momentum equations (2) and (3). This is certainly jus- tified for the present values of the current density in the ab- sence of externally applied magnetic fields j x B &VP).
2549 Phys. Fluids B, Vol. 3, No. 9, September 1991 Beulens eta/. 2549 Downloaded 21 Mar 2005 to 131.155.111.63. Redistribution subject to AIP license or copyright, see http://pop.aip.org/pop/copyright.jsp

B. Plasma composition equations The model is formulated for a monatonic gas undergo-
ing single ionization at locally quasineutral conditions. Therefore the plasma composition is defined by a single con- servation equation; the electron continuity equation
& (4~) + $ $ (rw)
=~(~=~)+~~(r~=~)+R~~, (7)
where -ct, denotes the ambipolar diffusion coefficient and R,, is the electron source term, which coincides with the volumetric ionization-recombination rate.
C. Energy equations The energy conservation equations are written both for
the heavy particles and the electrons. The heavy particle en- ergy equation is given in the form of conservation of the heavy particle stagnation enthalpy h, = Cph T, f 4 v;, u: = u* -t- v*, (8)
G& (pub, 1 + $- $ (rpvh, 1 =-f-($-~)+J--(r$~)
+-$ [P(l-~)~]
+$-f-[$I -k-z] +Q,,, (9) E. Source terms
where Cph = 5R,/2 denotes the specific heat of heavy parti- cles, il, is the heavy particle heat conductivity, and P, =&,,,/,I, is the heavy particle Prandtl number. The viscosity term (V.lI)*v is approximated by V*pV( $$), The energy gain and loss because of collisions induced by the electric field and the current density (en,E*v and R*v), re- spectively, vanish when for E = vj ( =: electron momentum equation) and for R = - en,vj - R, in which R, is a ther- mal force is filled in.’ The thermal force (l/n,)j*R, can be neglected because R r depends on the gradient of the electron temperature, which is very small in the direction of the cur- rent density, which is still valid near the walls of the arc. The last term on the right-hand side of Eq. (9) Qh is the net volumetric energy exchange rate between electrons and heavy particles due to elastic collisions.
The intrinsic electron energy equation has the following form:
& (%.;K ) t ; fJ5ry$T,)
+ Qo,,m + Q,,, - Qeh + Qractt (10)
where ;2, is the electron heat conductivity, Qo,,,,, is the ener- gy source due to the Ohmic heating, Qi,, is the energy sink for ionization of neutral atoms or source if ion recombina- tion takes place, and Qrad is the net volumetric radiative en- ergy exchange rate. In this equation, the velocities U, and v, are the electron velocities. These can be rewritten using the current density j = n,q( vi - v, ), in which vi is the ion ve- locity and equal to the gas velocity, and v, is the electron velocity.
D. Efectric field equations
The electric field in the arc channel is described by a very simple algebraic model that assumes a one-dimensional field such that the radial component E, is zero and the axial component E, is uniform over the arc cross section:
(11)
The axial electric field component E = EX is calculated from the specific, axially preserved total discharge current I and the electrical conductivity a, averaged over the cross sec- tion:
E= I
(2n.@a,r dr) ’
where R is the radius of the arc channel. The local axial current densityjis determined from the known local electri- cal conductivity and electric field
kil = a,E, j, = 0. (13)
The system of equations given above is very near to the exact mathematical description of a locally neutral, singly ionized monatomic plasma flow. However, modeling is needed for the physical phenomena that enter in the source terms, transport coefficients, and boundary conditions of the differential equations. In many situations, the source terms are dominant and some differential terms in the equations can be neglected. That is why the source terms bring the most important physical information in the plasma model.
The volumetric ionization recombination rate R,, can be written as2
R ne==ne(nn-nns)K,+, (14)
where nns is defined by the Saha ionization equilibrium coef- ficient S, .+ ,
n If’ = L, PI2 s S I+
,~ =~~2kT’)“2e~p(f!&),
where m, is the electron mass. The statistical weightsg, and g, , , according to Drawin and Felenbok,s are
go = 1, and g1+ =4f2exp( -2059/T,). The ionization energy Hi,,,, (J) is defined by Hi~n = e(E,, - AE), where Eb, (eV) is 15.76 eV and the lower-
ing of the ionization energy is given by AE = 2.086 X 10 - I’,/= in eV, where e is the eIementary charge.
The combined rate coefficient for excitation and ioniza-
2550 Phys. Fluids B, Vol. 3, No. 9, September 1991 Beulens et a/. 2550
Downloaded 21 Mar 2005 to 131.155.111.63. Redistribution subject to AIP license or copyright, see http://pop.aip.org/pop/copyright.jsp

tion K, + in the source term (14) is approximated by the following semiempirical formula, obtained by fitting the nu- merical data of Willems,’ based on the model of Van der Sijde,” K I+ = exp( - 2.699 83 X lo- 15Tz
+ 1.213 73x lo- “Tj
- 2.1524x 10⁻⁶T3 + 1.890 74
X IO-“T, - 114.838) in (m3/sec). The energy source terms Qohm , Qion, Qe,, , and Qrad are very important for the correct prediction of the plasma flow. Oh- mic heating is the only source of thermal energy in the plas- ma:
Q Ohm = j-E. (15) The ionization-recombination energy source term is calcu- lated from the ionization-recombination rate ( 14)
Qmn = - Hion Rm (16) The net volumetric energy exchange rate between electrons and heavy particles due to elastic collisions is given by
Q,, = 3n, ~v,,k(T, - T,), (17)
where m,, is the heavy particle mass and Y,,, = Y,~ + v~,, de- notes the average elastic collision frequency between elec- trons and heavy particles, which is determined from the characteristic electron-ion (Y,, ) and electron-neutral (Y,, ) collision frequencies:
vei = ( e4n, In A/ 1 2reo ‘) /Jm, (18)
Y cn = n,, CQ,,, >,/m. (19) The Coulomb logarithm In A is defined by
A = A-,/b,, (20) where& and b, are the Debye length and impact parameter for a 90” scattering of the particles:
A, = [e,kT,/(n, + ni)e2]“*, (21) b, = e2/12vcokT,. (22)
Finally, A can be written as
A = 6@[ (eok)/e6]3’2~~, (23)
which, after substitution of all physical constants, gives
A = 8.76~ 106[ (m/K)‘.5]Jm. (24)
This value is $ times lower than the value obtained from a definition of the Debye length without taking into account the shielding of the ions,
R b = (.sokT,/n,e2)“2, (25)
A’ = 1.24x lO’[ (m/K)‘.‘],/m. (26) The choice of the definition of the Debye length may have an important influence on the results of model predictions at lower temperatures, especially for high-density low-tem- perature plasmas where also nonideality effects should be taken into account. These effects change the electrical con-
ductivity and electric field calculations and to much less ex- tent the thermal energy transfer. In the present work, a de- finition of the Debye length, which takes into account both electrons and ions suffices [ Eq. (21) 1, in accordance with Gunther et al.,‘l which results in the Coulomb logarithm defined by Eqs. (23) and (24). However, the calculations are performed also with Eqs. (25) and (26) for comparison purposes.
The average electron-neutral collision cross section (Q,, ) in Eq. ( 19) is evaluated by the semiempirical expres- sion, which is obtained by fitting the data of Milloy:12
(Q,,) = 2.8X 10⁻²⁴T, - 4.1 X 10⁻³⁴T:
- 3X lo-” in (m’). (27) For evaluation of the radiative energy exchange rate Qrad , a modeling of the radiative energy transfer is needed, which should take into account emission, absorption, and scatter- ing of radiation. In strongly flowing arcs, the radiative terms are small compared to the convection termsI For stagnant arcs, however, radiation must be taken into account because then it makes up a significant part of the energy source term. According to Kroesen, I3 the radiation to the ground state is mathematically taken into account in the term containing K,, as in Eq. 14. Therefore only free-free radiation, line radi- ation, and free-bound radiation, except to the ground state, are needed. The electron-neutral free-free term can be rep- resented by
Q 2 = 53.759& 3~25iio, (28) in which the dimensionless electron density Ze = n,/lOzO, and the dimensionless neutral density E, = no/1024. In the same way, the electron-ion free-free radiation loss is ap- proximated by
Q;;; = 9105:. (29) For the line radiation, the 4p-4s radiation is dominant and represented by
Q ::: = 2.572 x 10⁴Z;.57. (30) In this simple model, no absorption is taken into account, especially because radiation to the ground state is strongly absorbed.
F. Transport properties A two-temperature treatment of the plasma requires the
determination of nonequilibrium transport properties. Spe- cific heat and Prandtl number of the heavy particles are as- sumed to be constant.
C,, = 5RJ2 and P, = 3’. (31) The heat conductivity of the heavy particles is assumed to have the near-equilibrium values calculated by Devoto,14 which at lower temperatures can be approximated by
iz, = 2.43~lO-~Ti’~for T,<7004 K, (32) and at higher temperatures by the expression obtained by Spitzer and Harm,” Ah = 1.84X lo-“( Ti’*/ln A) for T,, > 7000 K. (33)
2551 Phys. Fluids B, Vol. 3, No. 9, September 1991 Beulens et a/. 2551 Downloaded 21 Mar 2005 to 131.155.111.63. Redistribution subject to AIP license or copyright, see http://pop.aip.org/pop/copyright.jsp

The plasma viscosity is calculated from the definition of the Prandtl number,
P = R&/C,, 1, (34) which is in agreement with the data tabulated by Vargaf- tik.”
The ambipolar diffusion coefficient is determined by the expression of Devote,”
D amb = 3kT,/4,&,, (35) in which R, is a first approximation to the ion-atom colli- sion integral’
fi, = 2.84X 10’-‘7T0,36(m3/sec). (36) In order to follow the local quasineutrality assumption, i.e., the correspondence between the electron and ion diffusion fluxes, we have replaced T, by T,, in Eq. (34), which has negligible influence on the results of the calculations. The replacement results in a better stability of the model, without significant expedience. For strong nonequilibrium ( Th/Te 4 I), e.g., near walls, this replacement leads to an underestimated ambipolar diffusion. For the nonflowing cascaded arc the influence is negligible because T, = Th, ex- cept very close to the walls, while for the strongly flowing arc the diffusion term is negligible with respect to the convection flow. Note that, e.g., for inductively coupled plasmas, the influence is significant because of both a strong nonequilibri- urn and a low flow velocity near the edge of the plasma and the skin regions.
The electron heat conductivity and the plasma electrical conductivity are determined by using Frost mixture rules given by Mitchner and Kruger,‘* in which the Coulomb log- arithm is evaluated by expressions (21)-( 24), taking into account the ion shielding.
6. Boundary conditions
The system of elliptic partial differential equations ( l)- ( IO) needs the boundary conditions for all variables to be specified at all boundaries of the flow domain. The cascaded arc, as shown in Fig. 1 (a), is treated as axisymmetrical and the computational flow domain is taken to be bounded by the inlet and outlet plains, the arc channel wall and the symme- try axis [Fig. 1 (b) 1. For this flow, the following boundary conditions are specified.
(a) Inlet cross section (x = 0). The average axial flow velocity uin is calculated from a given mass flow rate 6,; the radial flow velocity u,, = 0. The inlet pressure pin is speci- fied, Thin = Tein = 300 K, and the electron number density, which corresponds to a very low ionization degree of a, = 10 - ‘, is also given.
(b) Arc channel wall (r= R). Here u = u = 0, ThW = 500 K, T,, = 1000 K, and n, corresponds to the ionization degree of a, = 10 - 6.
(c) Symmetry axis (r = 0). Here u = 0, and the gradi- ents of all other variables are equal to zero.
(d) Outlet cross section. Here d ‘p/dx’ = 0, i.e., a con- stant pressure gradient, and zero gradients of all other vari- ables. It has to be noted that the solutions ofthe electron continuity and energy equations depend only weakly on the boundary
conditions at the inlet and at the wall, because of the small values of the diffusion coefficient and electron heat conduc- tivity at low temperatures, and because of the large local source terms. Hence zero gradients of the electron number density and temperature can be specified at the inlet and at the wall, without any noticeable difference in the results. For strongly flowing arcs, the outlet conditions are not correct because the Mach number, which is coupled with the heavy particle temperature and indirectly with the inlet pressure and the mass flow rate, should equal unity. Because of the elliptic differential equations, the outlet conditions influence the upstream calculations only slightly.
III. NUMERICAL SOLUTIONS The system of partial differential equations ( 1 )-( 10) is
solved by a control volume numerical method of Patankar and Spalding. *9*20 However, their basis numerical method and iterative “SIMPLE" solution procedure for the elliptic flow equations are considerably extended in this work by incorporating a nonstaggered grid approach of Rhie2’ with momentum interpolation at control volume faces, as sug- gested and discussed in detail by Majumdar.22 For the treat- ment of strongly compressible flow in the cascaded arc, den- sity and temperature corrections from the equation of state are introduced into the pressure correction equation, as pro- posed by Jensen et al. 23 and Karki and Patankar,24 but with an additional upwindiike scheme, representing the influence of density on the pressure, which ensures always positive coefficients and convergence of the pressure correction equation. The system of algebraic discretization equations for each variable are solved by the strongly implicit (SIP) procedure of Stone.25
The solution procedure of the cascaded arc plasma flow equations has the following basic steps.
(a) Guess the initial field of variables and transport co- efficients,
(b) The solution of the laminar gas flow equations by the extended version of the “SIMPLE" algorithm, which in- cludes the solution of the axial and radial momentum equa- tions, interpolation of control volume face velocities, and face mass fluxes, solution of the pressure correction equa- tion, including density corrections from the equation of state (6). The calculated pressure correction field is used for the corrections of the pressure, velocities, and control volume face mass fluxes.
(c) The solution of the plasma composition equations, in this case, the electron number density conservation equa- tion.
(d) The solution of the energy equations for the elec- trons and for the heavy particles.
(e) Updating the plasma properties and the transport coefficients, to be used in the next iteration. The numerical solution is assumed to be converged as soon as the maximum relative residual sum for all equations is smaller than 0.5%. Because of the strong nonlinearity of the coupled set of equations, especially because of the exponen- tial dependence of some source terms on the temperature, more than 400 and in some cases even up to 2000 iterations
2552 Phys. Fluids B, Vol. 3, No. 9, September 1991 Beulens et al. 2552
Downloaded 21 Mar 2005 to 131.155.111.63. Redistribution subject to AIP license or copyright, see http://pop.aip.org/pop/copyright.jsp

are needed to obtain a converged solution. A numerical grid with 23 X 22 nonuniformly distributed points is used for all calculations in this work, which were checked to give grid- independent results by changing the grid expansion rate.
IV. RESULTS AND DISCUSSION
The cascaded arc (CARC) plasma flow model de- scribed in the previous sections is applied for the calculations of both stagnation and flowing arcs, in order to check and verify the model assumptions, especially the modeling of the source terms and transport coefficients, by means of com- parison with the existing experimental data of Rosado, Timmermans,‘.’ and Kroesen.’ At the same time, the calcu- lations are used to investigate some of the plasma properties that are not measured, such as the current density distribu- tion over the cross section of the arc channel, plasma veloc- ity, and the evolution of the heavy particle temperature pro- file along the arc, as well as the local temperature nonequilibrium in the arc.
A. Stagnation arcs
Stagnation arcs are cascaded arcs operated at low gas flow rates, so that the convection phenomena can be neglect- ed, the plasma properties are one dimensional, i.e., they vary only in the radial direction and the variations of all proper- ties in the axial direction are negligible. It can be recognized that our model is too complex for the treatment of such a one-dimensional diffusion-source-dominated plasma. It should be noted here that, unless the low flow rates, a change in rates by a factor 2, results in a change in, e.g., electron temperature by 2%-5%. However, the application of the model to stagnation arcs enhances a separate verification of the model assumptions for diffusion processes, ionization rate, electron-heavy particle collisional energy transfer, ra- diative losses, modeling of the electric field, the current den- sity distribution, and the Ohmic heating. In the figures, the end effects (first two and last two grid points), where the deviation from a one-dimensional character of the model is the strongest, are not shown. The results for axial points in between the end-effect regions show negligible difference, so results for only one axial position (in the middle of the arc) are shown.
Calculations for stagnation arcs are performed for a 5 mm diam cascaded arc, operated at low (2 x 10 - ’ kg/set) argon flow rate, at discharge currents of 40,80,140, and 200 A, in order to simulate the experimental conditions of Ro- sado3 and Timmermans et aZ.lt2
Figure 2 shows the radial distributions of measured (symbols) and predicted electron temperatures (dashed curves), as well as predicted heavy particle temperatures obtained at different electrical currents. The agreement be- tween the predictions and the experiments is quite satisfac- tory, but the measured electron temperature profiles are more uniform over the radius than predicted. At higher cur- rents ( 100 and 200 A), the reason for this discrepancy can be the fact that the reabsorption of the radiation energy loss is not taken into account in the model, but the same discrepan- cy exists at lower currents, where the radiation loss presents only a minor loss. Another possible reason can be the fact
2553 Phys. Fluids B, Vol. 3, No. 9, September 1991
16000
e ?! 3 12000 L tii z
i 8000 -
0.00 0.20 0.40 0.60 0.80 1 .oo
Radial position r/R
FIG. 2. Stagnation arc: electron and heavy particle temperature versus radi- al position in the arc for different arc currents; electron temperature mea- surements(Timmermans):D,Z=6OA;A,Z=SOA; +,Z=14OA;and 0, Z= 200 A. Calculations (CARC) -, electron temperature; - - -, heavy particle temperature.
that the spectroscopic measurements of the electron tem- perature and density were performed with a spatial resolu- tion of 0.4 mm, which means an integration over almost 20% of the arc radius. This will result in more uniform profiles of the electron temperature. Figure 2 also shows that the plas- ma is nearly in equilibrium, except very close to the wall, where the electron and heavy particle temperatures differ significantly.
The comparisons of the measured and calculated elec- tron density and ionization degree profiles are given in the Figs. 3 and 4, respectively. The agreement is very good and the differences are practically within experimental error, which is estimated to be 10% (Timmermans et al.‘). We emphasize that the comparison between experimental and model values is based on absolute values!
2 :: 0 z z .z z 7J E Y iii
1600
800
400
0' I
0.00 0.20 0.40 0.60 0.80 1 .oo
Radial position r/R
FIG. 3. Stagnation arc: electron density versus radial position in the arc for different arc currents; experiments (Timmermans) : n , Z = 60 A; A, Z = 80 A; + , Z = 140 A, and 0, I = 200 A. Calculations (CARC) are solid lines.
Beulens eta/. 2553
Downloaded 21 Mar 2005 to 131.155.111.63. Redistribution subject to AIP license or copyright, see http://pop.aip.org/pop/copyright.jsp

0.8 ii b 2-i 0.6 r 00 z 0.4 .N E
0.2
0.0 z
0.00 0.20 0.40 0.60 0.80 1 .oo
Radial position r/R
FIG. 4. Stagnation arc: ionization degreeversus radial position in thearc for different arc currents: - - -, 60A;-..-,80A;---, 14OA;-,200A.
One of the most important characteristics of the plasma generator, for engineering purposes, is the relationship be- tween the mean axial electric field and axial current. The comparison of measured and predicted electric field distri- butions for different total discharge currents is shown in Fig. 5. The calculation in which the ion shielding is taken into account in the definition of the Coulomb logarithm [see Eq. (24) 1, as shown by the solid line in Fig. 5, is in perfect agree- ment with the experiments. If the shielding of the ions is not taken into account [see Eq. (26) J, the electric field is ap- proximately 5% higher, as shown by the dashed curve in Fig. 5. The difference appears to be mainly due to the influ- ence of the Coulomb logarithm on the electron-ion collision frequency and thus on the electrical conductivity.
The most critical part of the cascaded arc model is the calculation of the total radiation loss, as given by expressions (28)-( 30). In order to illustrate the importance of the radi- ation loss at high arc currents, Fig. 6 shows the comparison of the calculated radial temperature profiles with the radi- ation loss taken into account (solid line) and neglected (dashed line) with the experimental values (symbols) for a
2000
E 1600
2 0 1200 g 2 s 800 x iii
400
0
/
.
0 50 100 150 200 250 0.00 0.20 0.40 0.60 0.80 1 .oo
Arc current [A] Radial position r/R
FIG. 5. Stagnation arc: electric field versus arc current; n , experiments (Timmermans); calculations (CARC): -, with ion shielding in In A; ---, without ion shielding in ln A.
FIG. 7. Stagnation arc: calculated relative current density distributions ver- sus the radial position in the arc for different total arc currents: -*v-, 1=60A;----,I=80&--9 I= 14OA;and---,1=2OOA.
16000 z e J 12000 2 G E 8000
t-" 4000
0
IP
0.00 0.20 0.40 0.60 0.80 1 .oo
Radial position r/R
FIG. 6. Stagnation arc (I = 200 A): influence of radiation loss; q , experi- ments (Timmermans); calculations (CARC): -, T,,; - - -, T, with radi- ation loss; -, T,; - - -,T,, without radiation loss (upper curve), and double radiation loss (lowest curves).
discharge current of 200 A. The influence of the radiation loss is very pronounced and it is believed that a more elabor- ated modeling of the radiation transfer is needed for higher temperature plasmas.
Another simplified part of the cascaded arc model is the treatment of the electric field equations ( 1 1 )-( 13). It is as- sumed that the electric field is one dimensional and constant over the arc radius. That is why the radial distribution of the current densityj is inffuenced only by the distribution of the electrical conductivity [see Eq. ( 13) 1. However, the calcu- lated distribution of the current density appears to be differ- ent for different total currents, as shown in Fig. 7. The same figure also shows the rather high currents in the near-wall region, despite the fact that both the heavy particle tempera- ture and the electron density are low in that region.
B. Flowing arcs
Cascaded arcs operated at high gas flow rates are named flowing arcs, due to their feature that the plasma properties
2 E 1.6
G i 1.2 -5 0 F
0.8
‘F; cd F IT 0.4
2554 Phys. Fluids B, Vol. 3, No. 9, September 1991 Beulens eta/, 2554
Downloaded 21 Mar 2005 to 131.155.111.63. Redistribution subject to AIP license or copyright, see http://pop.aip.org/pop/copyright.jsp
iz E 10000 2 I & z 5000
0' I
0.00 0.20 0.40 0.60 0.60 1 .oo
Axial position [x6 cm]
FIG. 8. Flowing arc: variation of temperature along the arc for different argon flow rates. Electron temperature measurements (Kroesen): + , 50 scc/sec, A, 100 scc/sec, 0, 200 scc/sec; Calculations: -, see set, - - -, IOU scc/sec, - - -, 200 scc/sec, centerline electron temperature (upper curves) and the heavy particle temperature (lower curves).
are significantly influenced by flow phenomena. The arc be- comes fully two dimensional and plasma nonequilibrium is more emphasized.
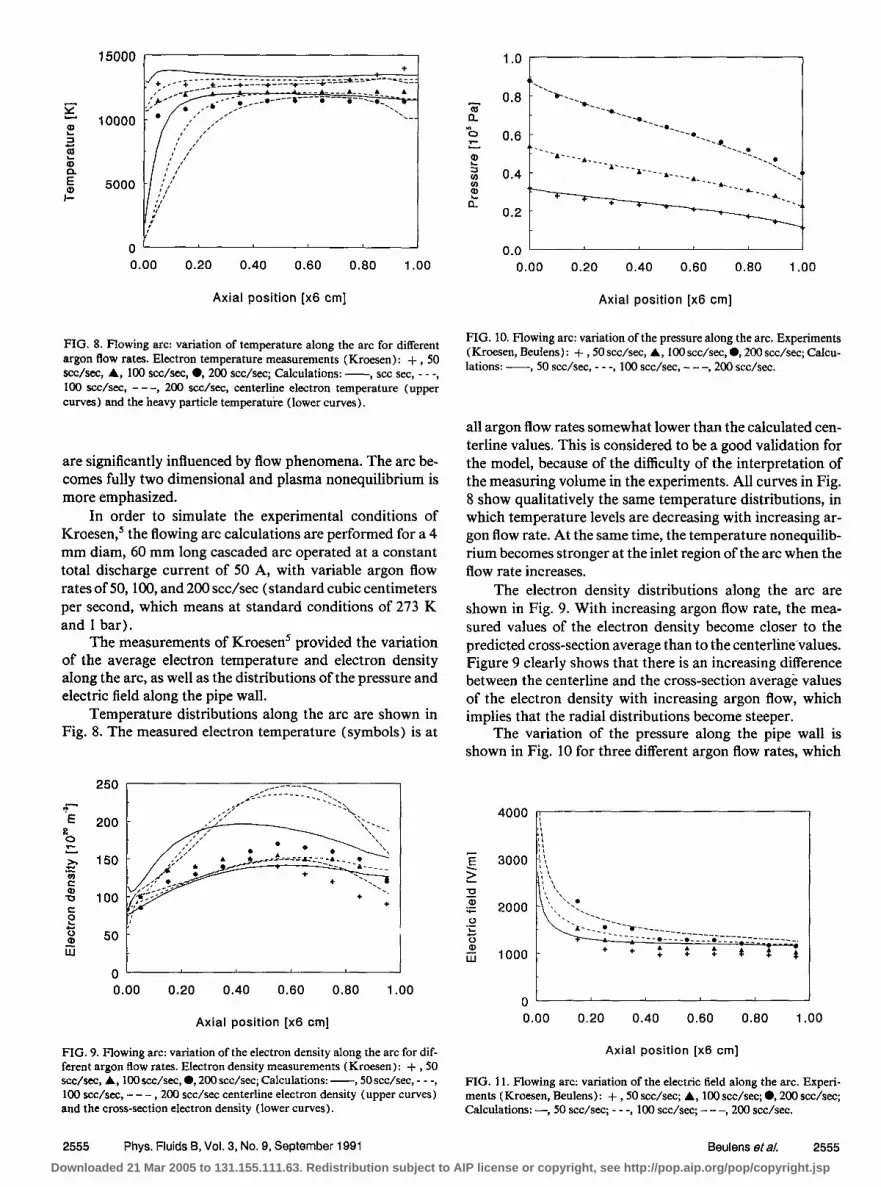
In order to simulate the experimental conditions of Kroesen,’ the flowing arc calculations are performed for a 4 mm diam, 60 mm long cascaded arc operated at a constant total discharge current of 50 A, with variable argon flow rates of 50,100, and 200 scc/sec (standard cubic centimeters per second, which means at standard conditions of 273 K and 1 bar).
The measurements of Kroesen’ provided the variation of the average electron temperature and electron density along the arc, as well as the distributions of the pressure and electric field along the pipe wall.
Temperature distributions along the arc are shown in Fig. 8. The measured electron temperature (symbols) is at
-T-r ‘E
250
200
150
100
0’ 0.00 0.20 0.40 0.60 0.60 1 .oo
Axial position [x6 cm]
FIG. 9. Flowing arc: variation of the electron density along the arc for dif- ferent argon flow rates. Electron density measurements (Kroesen): + ,50 scc/sec, A, 100 scc/sec, 0,200 scc/sec; Calculations: -, 50 scc/sec, - - -, 100 scc/sec, - - - , 200 scc/sec centerline electron density (upper curves) and the cross-section electron density (lower curves).
0.6
0.0 L I
0.00 0.20 0.40 0.60 0.80 1 .oo
Axial position [x6 cm]
FIG. 10. Flowing arc: variation of the pressure along the arc. Experiments (Kroesen, Beulens) : -t- ,50 scc/sec, A, 100 scc/sec, 0,200 scc/sec; Calcu- lations: -, 50 scc/sec, - - -, 100 scc/sec, - - -, 200 scc/sec.
all argon flow rates somewhat lower than the calculated cen- terline values. This is considered to be a good validation for the model, because of the difficulty of the interpretation of the measuring volume in the experiments. All curves in Fig. 8 show qualitatively the same temperature distributions, in which temperature levels are decreasing with increasing ar- gon flow rate. At the same time, the temperature nonequilib- rium becomes stronger at the inlet region of the arc when the flow rate increases.
The electron density distributions along the arc are shown in Fig. 9. With increasing argon flow rate, the mea- sured values of the electron density become closer to the predicted cross-section average than to the centerline’values. Figure 9 clearly shows that there is an increasing difference between the centerline and the cross-section average values of the electron density with increasing argon flow, which implies that the radial distributions become steeper.
The variation of the pressure along the pipe wall is shown in Fig. 10 for three different argon flow rates, which
4000 fi t: :I
E z
3000 ii\
‘D g .p ij 2 W
OL -I 0.00 0.20 0.40 0.60 0.80 1 .oo
Axial position [x6 cm]
FIG. 11. Flowing arc: variation of the electric field along the arc. Experi- ments (Kroesen, Beulens): + ,50 scc/sec; A, 100 scc/sec; 0,200 scc/sec; Calculations: -, 50 scc/sec; - - -, 100 scc/sec; - - 200 scc/sec. -,
2555 Phys. Fluids B, Vol. 3, No. 9, September 1991 Beulens eta/. 2555
Downloaded 21 Mar 2005 to 131.155.111.63. Redistribution subject to AIP license or copyright, see http://pop.aip.org/pop/copyright.jsp

6000
0' 1
0.00 0.20 0.40 0.60 0.80 1 .oo
Radial position r/R Radial position r/R
FIG. 12. Flowing arc: calculated radial profiles of the electron (upper curves) and heavy particle (lower curves) temperature at different axial positions and for argon flow rates of 200 scc/sec. The axial positions are denoted by + , x/l = 0.045; A, x/l = 0.21; l , x/l = 0.52; q , x/l = 0.72; fl, x/l = 1. The arc current is 50 A.
FIG. 14. Flowing arc: calculated radial profiles of the plasma velocity at different axial positions and for argon flow rates of 100 scc/sec. ‘Ihe axial positions are denoted by f , x/l = 0.045; A, x/f = 0.21; 0, x/l = 0.52; D, X/l = OS’!‘& 8, x/l = 1. The arc current is 50 A.
were investigated by Kroeser? and Beulens.6 It has to be noted here that all three flow regimes correspond to the sonic conditions near the arc exit at different pressures and slightly different exit temperatures. The flow is strongly compress- ible with M = 1 at the arc exit, so that the good agreement of the measured and predicted pressure distributions in Fig. 10 can be considered as a good check for both the pressure and temperature calculations.
Figure 11 shows the variation of the electric field along the arc. In this case, the present model overestimates the experimental values of Kroesen’ and Beulens.6 This is possi- bly due to the error in the calculations of the electrical con- ductivity at significant nonequilibrium conditions in the flowing arc. However, there is also a possibility of undeter- minacy of the experimental results, due to measurement of voltage differences between neighboring cascaded arc plates, whose distance is comparable to their thickness.
The calculated radial temperature profiles are shown in
5 :: 0 c A .*z E u 5 5 ‘D w
250
200
150
100
50
t Y 0' J
0.00 0.20 0.40 0.60 0.80 1 .oo
Radial position r/R
FIG. 13. Flowing arc: calculated radial profiles of the electron density at different axial positions and for an argon flow rate of 200 scc/se~ The axial positions are denoted by + , x/l = 0.045; A, x/l = 0.21; 0, x/t = 0.52; q , x/l = 0.72; B, x/l = 1. The arc current is 50 A.
2000
1500 F E > .z 1000
0 8
500
0 0.00 0.20 0.40 0.60 0.80 1 .oo
Figs. 12 for different axial positions. The differences between the electron and heavy particle temperatures are very large. At each axial location, the electron and heavy particle tem- perature profiles appear to be nearly equidistant over the radius. It can also be seen that all temperature profiles be- come practically fully developed at relative distances x/l larger than approximately 0.5, especially at higher argon flow rates. This implies that the arc behaves similarly as a stagnation arc with much more emphasized temperature nonequilibrium.
The calculated radial electron density profiles at differ- ent axial positions are shown in Fig. 13. However, the elec- tron density distributions do not show any fully developed character, probably because of the pressure and density vari- ation along the flowing arc.
Figures 14 show the calculated radial profiles of the plasma velocity U, at different axial positions. The increase of the velocity is mainly due to the decrease of the plasma den-
2000 , I’ ,’
1500 - F E > .g 1000 -
0 >”
1 0.00 0.20 0.40 0.60 0.80 1.00
Axial position [x6 cm]
FIG. 15. Flowing arc: calculated centerline values of the axial plasma veloc- ity along the arc, for different argon flow ratesr -, 50 sec/seq - - -, loo scc/sec; - - -, 200 acdsec. The arc current is 50 A.
2556 Phys. Fluids B, Vol. 3, No. 9, September 1991 Beulens et a/. 255%
Downloaded 21 Mar 2005 to 131.155.111.63. Redistribution subject to AIP license or copyright, see http://pop.aip.org/pop/copyright.jsp

Ld = m 0.06 _
5 FE
0.00 0.20 0.40 0.60 0.80 1 .oo
Axial position [x6 cm]
FIG. 16. Flowing arc: calculated values of the axial cross-sectional averaged ionization degree along the arc, for different argon flow rates: -, 50 scc/sec; * - -, 100 scc/sec; - - -, 200 scc/sec. The arc current is 50 A.
sity, which is caused both by the increase of the temperature and the decrease of the pressure along the arc. The sonic p lasma velocity, which is approached at the arc exit, is pro- portional to the square root of the temperature. The exit temperature is nearly the same at all three argon flow rates (see F ig. 8). Consequently, the plasma velocities differ only slightly, as shown in F ig. 15, in which the calculated center- line velocities are compared.
One of the most important p lasma parameters is the ionization degree. F igure 16 shows the calculated cross-sec- tion averaged ionization degree as a function of the axial position in the arc, for different argon flow rates. The ioniza- tion degree decreases with increasing flow rate. Because of the large variety of different regimes in which the plasma can be produced, it looks reasonable to take the ionization degree rather than the electron density as a parameter for the plas- ma production effectiveness.
V. CONCLUSIONS The cascaded arc (CARC) plasma mode l is developed
and appl ied for the description of both stagnation and flow- ing argon arcs. The results show that the stagnation arcs are close to local temperature equil ibrium conditions, except in the regions near the wall. The calculated values of the elec- tric field are practically identical to the measured values if both electron and ion shielding is taken into account in the definition of the Coulomb logarithm.
F lowing arcs show very strong temperature nonequil ib- r ium effects, both in the regions near the wall and in the inlet
region of the arc. The calculated values of the pressure distri- butions are in very good agreement with the experimental data, thus showing that the mode l is applicable to strongly compressible flows.
ACKNOWLEDGMENTS
The authors acknowledge the discussions with Dr. C. J. T immermans (stagnation arc), Dr. G . M . W . Kroesen (flowing arc), and thank Mr. A. B. M . Husken for his assis- tance with the implementation of the computer program.
This work has been supported partly by a grant from NUFFIC and formed part of a research program for NET and the foundation FOM.
‘C. J. Timmermans, R. J. Rosado, and D. C. Schram, Z. Naturforsch. 4OA, 810 (1985).
*C. J. T immermans, Ph.D. thesis, Eindhoven University of Technology, The Netherlands, 1984.
3R. J. Rosado, Ph.D. thesis, Eindhoven University of Technology, The Netherlands, 198 1.
4J. C. M. de Haas, Ph.D. thesis, Eindhoven University ofTechnology, The Netherlands, 1986.
5G. M. W . Kroesen, Ph.D. thesis, Eindhoven University of Technology, The Netherlands, 1988.
‘J. J. Beulens, M. J. de Graaf, G. M. W . Kroesen, and D. C. Schram, Pro- ceedings of the Materials Research Society, San Francisco (Materials Re- search Society, Pittsburgh, PA, 1990), Vol. 190, p. 311.
‘S. I. Braginskii, Rev. Plasma Phys. 1, 205 (1965). *H. W . Drawin and P. Felenbok, Datafor Plasmas in Local Thermodynam- ic Equilibrium (Gauthiers-Vilars, Paris, France, 1965).
9H. M. J. Wil lems (private communication). ‘“B. van der Sijde, J. J. A. M. van der Mullen, and D. C. Schram, Beitr.
Plasmasphys. 24,447 ( 1984). “K. Gunther, S. Lang, and R. Radtke, J. Phys. D: Appl. Phys. 16, 1235
(1983). “H. B. Milloy, R. W . Crompton, J. A. Rees, and A. G. Robertson, Austr. J.
Phys. 30,61 (1977). ‘“G. M. W . Kroesen, D. C. Schram, C. J. T immermans, and J. C. M. de
Haas, IEEE Trans. Plasma. Sci. PS-18,985 ( 1990). 14R. S. Devoto, Phys. Fluids 10, 354 (1967). 15L. R. Spitzer, Jr. and R. Harm, Phys. Rev. 89,977 ( 1953 ). ‘“N B Vargaftik, in Normal and Dissociated States, 2nd ed. (Hemisphere, . .
Washington, DC, 1975). “R. S. Devoto, Phys. Fluids 9, 1230 ( 1966). “M. Mitchner and C. H. Kruger, Partially Ionized Gases (Wiley, New
York, 1973). ‘%. V. Patankar and D. B. Spalding, Int. J. Heat Mass Transfer 15, 1787
(1972). *OS. V. Patankar, Numerical Heat Transfer and Fluid Flow (McGraw-Hill,
New York, 1980). *‘C. M. Rhie and W . L. Chow, AIAA J. 21, 1525 (1983). **S. Majumdar, Numer. Heat Transfer 13, 125 ( 1988). “D E Jensen, D. B. Spalding, D. G. Tatchell, and A. S. Wilson, Combust.
F lame 34, 309 ( 1979). 24K. C. Karki and S. V. Patankar, AIAA J. 27, 1167 (1989). 25H. L. Stone, SIAM J. Numer. Anal. 5,530 ( 1968).
2557 Phys. Fluids B, Vol. 3, No. 9, September 1991 Beulens eta/. 2557
Downloaded 21 Mar 2005 to 131.155.111.63. Redistribution subject to AIP license or copyright, see http://pop.aip.org/pop/copyright.jsp


