Embed Size (px)
Citation preview
�����������������
Citation: Kao, C.-Y.; Chueh, H.-E. A
Vendor-Managed Inventory
Mechanism Based on SCADA of
Internet of Things Framework.
Electronics 2022, 11, 881. https://
doi.org/10.3390/electronics11060881
Academic Editor: Francisco Falcone
Received: 9 February 2022
Accepted: 7 March 2022
Published: 10 March 2022
Publisher’s Note: MDPI stays neutral
with regard to jurisdictional claims in
published maps and institutional affil-
iations.
Copyright: © 2022 by the authors.
Licensee MDPI, Basel, Switzerland.
This article is an open access article
distributed under the terms and
conditions of the Creative Commons
Attribution (CC BY) license (https://
creativecommons.org/licenses/by/
4.0/).
electronics
Article
A Vendor-Managed Inventory Mechanism Based on SCADA ofInternet of Things FrameworkChang-Yi Kao 1 and Hao-En Chueh 2,*
1 Department of Computer Science & Information Management, Soochow University,Taipei City 100006, Taiwan; [email protected]
2 Department of Information Management, Chung Yuan Christian University, Taoyuan City 320314, Taiwan* Correspondence: [email protected]
Abstract: In recent years, with the rise of the Internet of Things (IoT) and artificial intelligence (AI),intelligent applications in various fields, such as intelligent manufacturing, have been prioritized. Themost important issue in intelligent manufacturing is to maintain a high utilization rate of production.On the one hand, for maintaining high utilization, the production line must have enough materialsat any time; on the other hand, too many materials in stock would greatly increase the operatingcost of the factory. Therefore, maintaining sufficient inventory while avoiding excessive inventory isan important key issue in intelligent manufacturing. After the factory receives the order, it wouldissue the manufacturing order to the production line for manufacturing. The capacities of differentproduction lines are different. If the Supervisory Control And Data Acquisition (SCADA) systembased on the IoT framework can be used to monitor the capacity of each production line, in additionto estimating the capacity, the usage of key materials can also be accurately estimated throughAI; when the quantity of key materials is below the safety stock, the manufacturer can activelynotify the supplier and request for replenishment. This is a Customer-to-Business (C2B) safetystock management model (i.e., the vendor-managed inventory, VMI), which combines AI and IoT.In particular, in the case of consumer electronics, because their life cycles are short and they arevulnerable to market fluctuations, the manufacturer must adjust the production capacity. This studywill propose to construct a SCADA system based on the IoT, including the capacity of the productionline, materials inventory, and downstream order requirements, and use the Artificial Neural Network(ANN) to accurately predict inventory requirements. In this study, through the factory, a SCADAsystem based on AI and IoT will be constructed to monitor the factory’s manufacturing capacity andpredict the product sales of downstream manufacturers, for the purpose of facilitating the analysisand decision-making of safety stock. In addition to effectively reducing the inventory level, inessence, the purpose of this study is to enhance the competitiveness of the overall production andsales ecosystem, and to achieve the goal of digital transformation of manufacturing with AI and IoT.
Keywords: Internet of Things; SCADA; Customer-to-Business; vendor-managed inventory; ArtificialNeural Network; digital transformation
1. Introduction
Intelligent manufacturing is an important application under Industry 4.0. In particular,after the outbreak of the COVID-19 pandemic, the monitoring system can be quickly setup through Artificial Intelligence Plus the Internet of Things (AIoT), and the managementcan be conducted remotely, for the purpose of reducing the cases of human-to-humantransmission. Specifically, in response to the rise of the Internet of Everything (IoE), factoriesgenerally construct SCADA systems based on the IoT. This study proposes a safety stockmanagement model (i.e., the VMI), with a view to improving the utilization and the on-timedelivery of the factory itself. In addition, the AI prediction is conducted by interfacingwith the product sales data of downstream manufacturers. Thus, the consumption of
Electronics 2022, 11, 881. https://doi.org/10.3390/electronics11060881 https://www.mdpi.com/journal/electronics
Electronics 2022, 11, 881 2 of 13
key materials and inventory requirements can be effectively estimated; when necessary,the manufacturer can actively report the quantity demanded to upstream key materialsuppliers, so that they can quickly provide sufficient inventory. This is also the intelligentapplication of intelligent factories in Industry 4.0: C2B safety stock services that integratethe value chain.
In the past, the production mode of the factory was that after the retail industryplaced a purchase order to the manufacturing industry, the factory would schedule theproduction line for production, then issue the manufacturing order, and place the ordersfor materials separately, and the operation process was all manual operation. However,with the popularization of AI and IoT technologies, the C2B model has also emerged. C2Bstresses the customer engagement business model, and the customer engagement C2Bmodel would take the application of AIoT as the implementation model/approach. In theC2B model, firstly, the sales data of downstream manufacturers would be collected fromthe factory side through IoT services, which would be combined with SCADA data foranalysis. Then, AI is used to estimate the usage of key materials and indicate whetherthey are sufficient or not (the notice is sent to upstream manufacturers or connected toupstream manufacturers’ MES/SCM systems). This allows us to achieve a managementmodel of key materials safety stock, improving the on-time delivery of production lines,and implementing the C2B service model that integrates downstream manufacturers. Inthis study, under the model of C2B integrated manufacturing order arrangement andmanagement, SCADA is used to acquire information on the production line capacity,and combined with the sales prediction of downstream manufacturers, the usage of keymaterials and parts can be accurately estimated, thus practicing the management mode ofC2B safety stock of key materials.
2. Literature Review
In the production model of consumer electronics, the manufacturing industry takesorders and then the factory manufactures the consumer electronics. However, in the fu-ture, the production characteristics of electronics will gradually move towards a trend ofsmall-quantity but diverse electronics, which requires the ability to adjust the capacity ofthe production line with high flexibility. In the manufacturing industry, it is a standardizedprocess to manufacture products after taking orders, for the purpose of delivering the prod-ucts on time. In particular, the key raw materials for the products are generally stocked,because if there are no key materials in the production process, the production will beseriously delayed. However, the procurement specialists of different factories procure rawmaterials from the supply chain partners. In addition to long procurement times and slowresponse times at the supply side, there is no standard for raw material preparation quanti-ties. These problems may cause excess inventory or insufficient material preparation, thusincreasing the cost of the supply chain. The manufacturing industry has also begun to assistproduction management through various information and communication technologies(ICTs): predicting the quantity of materials demanded based on the orders of downstreammanufacturers, which is an application that uses sales prediction to assist in estimatingcapacity requirements. In the past, the prediction model was mainly manual, which alsoresulted in the application effect of prediction in most enterprises being lower than ex-pected [1]. Generally speaking, the manufacturing industry cannot grasp the sales status ofdownstream manufacturers. If the quantity of key materials cannot be estimated, it willcause the hoarding or shortage of key materials. The hoarding of materials would increasethe cost of the enterprise, while the shortage of materials would make the enterprise unableto deliver the products on time. Thus, the enterprise would lose its competitiveness [2].
The production processes in the manufacturing industry consist of such steps asorder taking, material requirement exploration, material and part management, materialprocurement, factory production, transportation management, and delivery. However,from the perspective of the strategy of the entire product value chain, the manufacturingindustry responsible for production in the value chain should establish close integration
Electronics 2022, 11, 881 3 of 13
with upstream suppliers and downstream customers to form a collaborative supply valuechain. Collaborative Planning, Forecasting, and Replenishment (CPFR) [3,4] is a valuechain collaboration model. CPFR focuses on efficiency, so the practice of Just-In-Time (JIT)is promoted and discussed [5–7]. JIT can reduce costs and waste, while it can increaseflexibility and many interactions [8–10], such as delivery time and delivery quantity.
In addition, from the perspective of the manufacturing industry, the manufacturingindustry is facing the trend of market globalization. The manufacturing industry doeseverything possible to reduce the costs of production and product development. Therefore,predicting the upstream material quantity based on the downstream orders is a collabora-tion that saves manufacturing costs, and it is also regarded as a C2B [11,12] model. This isparticularly true for consumer electronics due to the high market volatility. Furthermore,the degree of digitalization of the manufacturing industry is not high, the basic environ-ment is still in great demand, and the establishment rate of intelligent software is not high.Therefore, the top priority for using CPFR in the manufacturing industry is to transformthe traditional supply chain into digital and intelligent information and communicationservices [13,14], interface the systems, and use the joint prediction model to predict thematerial inventory [15], with a view to improving the efficiency of collaboration.
In terms of safety stock management, some studies have used the PHLX Semicon-ductor Sector Index to predict the safety stock [16], which is a method of analysis andprediction based on the financial index. There are also related academic studies that usevarious indicators to analyze the material inventory, which is taken as a managementmodel, but this mode is difficult to apply to the production of products that have nothingto do with financial indicators. In addition, the preparation time and delivery time of theorder, the delivery time of the goods, and the preparation time of the goods are known asthe lead time of the order, and the lead time can also be used as an estimation model forsafety stock [17,18]. Analyzing the safety stock from the supplier’s operation processes,using the relationship between industry indicators and demand [19], and so on, are allrelated research topics within safety stock management. The tools used include MACD [20],calculation of the demand index (DI) [19], and exponential moving average (EMA) [21].
This study proposes a mechanism based on CPFR to predict the safety stock in lightof the orders or sales data at the downstream of the value chain, the utilization of theproduction line, and the usage of key materials. In this study, the basis for safety stockis sales prediction. With respect to a literature review on the studies on sales prediction,some scholars proposed the grey correlation analysis, in which the analysis is conducted bycombining with the neural network [22]; in addition, [23,24] other scholars also proposeda new prediction model using the evolutionary neural network, the effect of which isbetter than that of the traditional neural network. Compared with the ARIMA predictionmethod [25], the fuzzy logic rules [26–28], as well as the inference mechanism [29–31] andthe statistical model, the neural network does not need to specify a specific function type,and the data are not limited to a certain statistical distribution assumption, thus havingmore application space in the prediction. The data used for these analyses will be salesdata at the downstream of the value chain, the data collected by IoT devices in factories,and the data from SCADA [32–34] monitoring systems. There will be no shortage of keymaterials under the safety stock prediction model of this study.
3. Proposed Architecture and Method
In this section, the overall framework of safety stock, the pre-processing of dataanalysis, and the prediction model will be explained.
3.1. System Framework
The SCADA system is important and essential in improving the production yield,digital transformation, and data retrospect of the manufacturing industry, and enhancingits competitive strengths, etc. However, in a traditional SCADA system, due to factors suchas the fact that the consoles on the production line cannot provide the Application Program-
Electronics 2022, 11, 881 4 of 13
ming Interface (API) and it is not easy to implement function expansion and subsequentmaintenance, it is difficult for small-sized manufacturing industries to accept the tradi-tional SCADA framework. Therefore, the construction of a cloud-based SCADA system,suitable for traditional small- and medium-sized manufacturing industries, would helpthe manufacturing industry to conduct operations management. To take the framework ofthe Internet of Things as the foundation, i.e., to transmit the data sensed and collected bythe Internet of Things to the application layer through the network (i.e., the cloud-basedSCADA system), is to improve the traceability of production data. The method proposedin this study can estimate the production capacity based on production data and, combinedwith the data of downstream manufacturers, conduct sales predictions. Predicting therequired inventory based on the AI analysis of the data, the production line can maintain ahigh utilization rate.
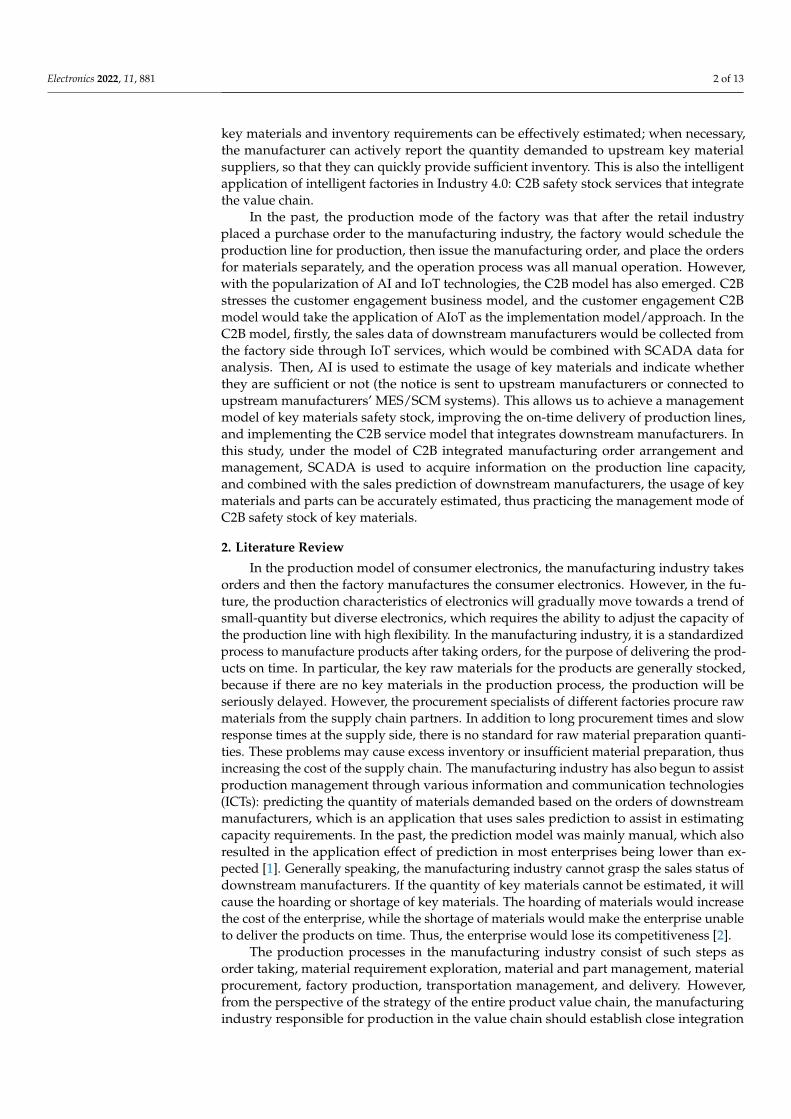
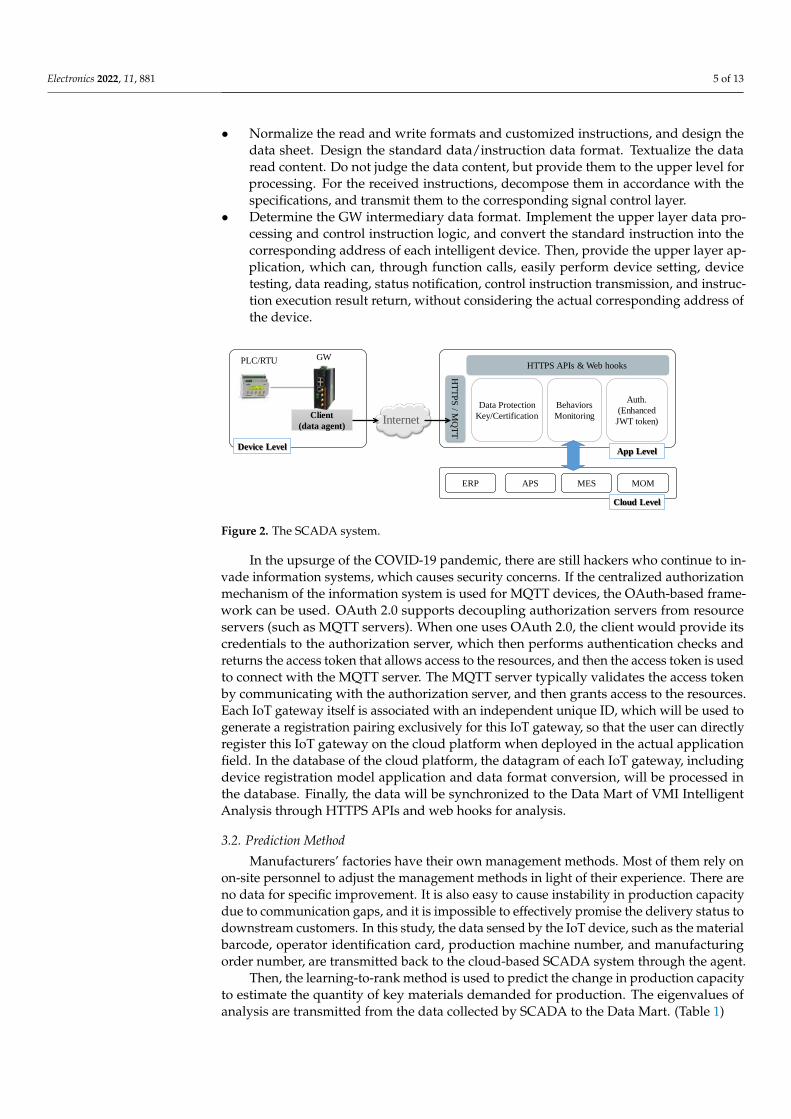
The overall framework proposed in this study consists of two parts, as shown inFigure 1. The first part is the cloud-based solution for SCADA; the purpose of the SCADAsolution in this study is to collect production process data in order to estimate produc-tion capacity, which includes the required IoT hardware and the corresponding real-timemonitoring system. The second part is to intelligently analyze and estimate the requiredkey materials by integrating the sales data of the suppliers, so as to provide the purchasereference for safety stock.
Electronics 2022, 11, x FOR PEER REVIEW 4 of 13
3.1. System Framework The SCADA system is important and essential in improving the production yield,
digital transformation, and data retrospect of the manufacturing industry, and enhancing its competitive strengths, etc. However, in a traditional SCADA system, due to factors such as the fact that the consoles on the production line cannot provide the Application Programming Interface (API) and it is not easy to implement function expansion and sub-sequent maintenance, it is difficult for small-sized manufacturing industries to accept the traditional SCADA framework. Therefore, the construction of a cloud-based SCADA sys-tem, suitable for traditional small- and medium-sized manufacturing industries, would help the manufacturing industry to conduct operations management. To take the frame-work of the Internet of Things as the foundation, i.e., to transmit the data sensed and col-lected by the Internet of Things to the application layer through the network (i.e., the cloud-based SCADA system), is to improve the traceability of production data. The method proposed in this study can estimate the production capacity based on production data and, combined with the data of downstream manufacturers, conduct sales predic-tions. Predicting the required inventory based on the AI analysis of the data, the produc-tion line can maintain a high utilization rate.
The overall framework proposed in this study consists of two parts, as shown in Fig-ure 1. The first part is the cloud-based solution for SCADA; the purpose of the SCADA solution in this study is to collect production process data in order to estimate production capacity, which includes the required IoT hardware and the corresponding real-time mon-itoring system. The second part is to intelligently analyze and estimate the required key materials by integrating the sales data of the suppliers, so as to provide the purchase ref-erence for safety stock.
Figure 1. The architecture based on the SCADA of Internet of Things framework.
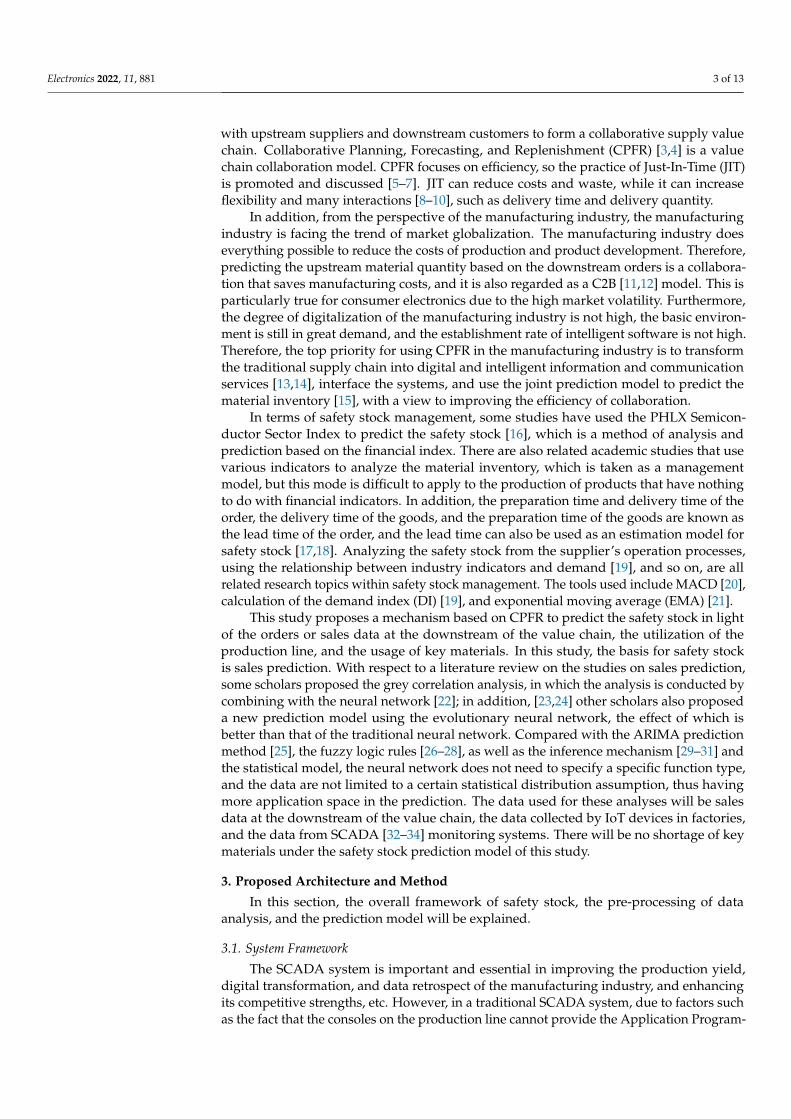
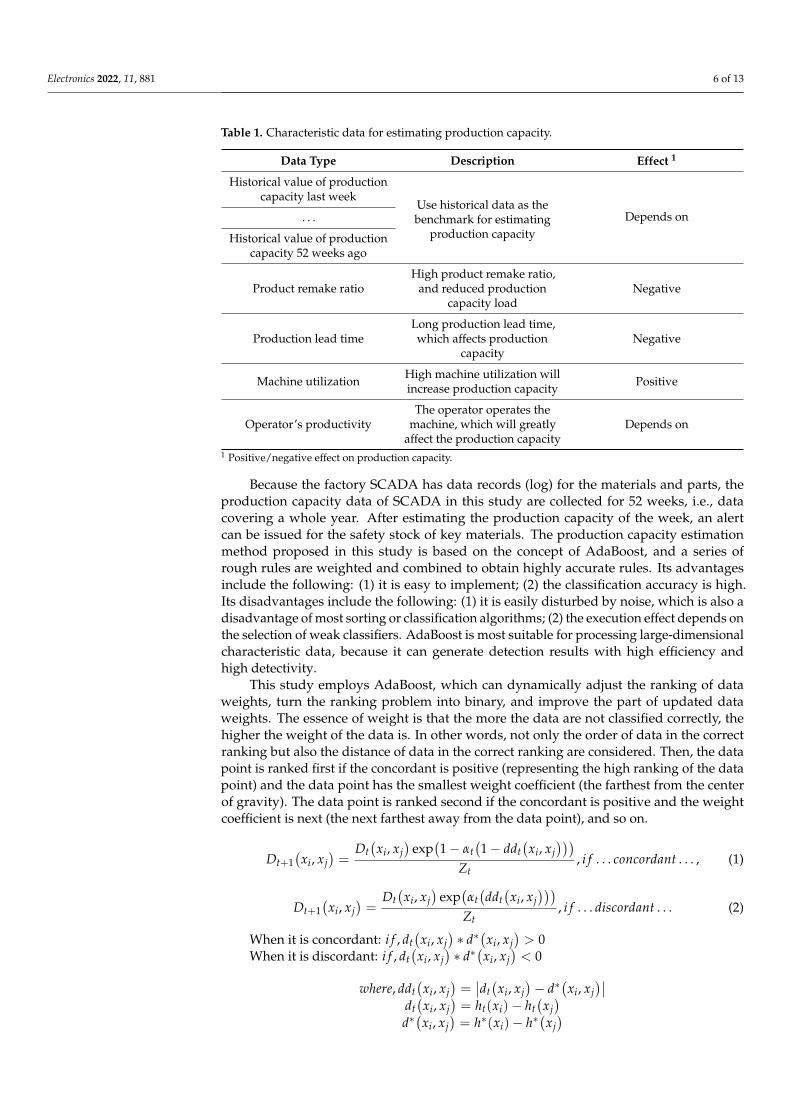
The first part is the cloud-based solution for SCADA. At the device level, the online IoT sensing device of production would transmit the data back to the SCADA system through the client data agent application, which would be set up on the gateway (GW). In order to identify which networked device senses and collects the data, the client data agent application has a simple pairing mechanism. In addition, in order to more easily manage the data collected by the client data agent application at the device level, the SCADA application includes authentication and behavior monitoring, etc. As shown in Figure 2, the factory side uses a variety of IoT devices for monitoring. Various sensing devices have different signal sources and data formats, different network addresses, and even different temperature units (Fahrenheit/Celsius). Previously, to solve this problem, it was necessary to write customized reading methods and control instructions for each IoT device on the GW side and convert the data format correctly. In this study, it is de-signed to standardize various signals and data formats and interface the signals through agents. The work items related to the device agent application interface are as follows:
Supplier
POSdata
Others
Purchase Data
ETL
VMI Intelligent Analysis
預估數量
key materials required
Dates
QuantityPrediction
ModelData Mart
SCADA
Device LevelCloud Level
App Level
Figure 1. The architecture based on the SCADA of Internet of Things framework.
The first part is the cloud-based solution for SCADA. At the device level, the onlineIoT sensing device of production would transmit the data back to the SCADA systemthrough the client data agent application, which would be set up on the gateway (GW). Inorder to identify which networked device senses and collects the data, the client data agentapplication has a simple pairing mechanism. In addition, in order to more easily managethe data collected by the client data agent application at the device level, the SCADAapplication includes authentication and behavior monitoring, etc. As shown in Figure 2,the factory side uses a variety of IoT devices for monitoring. Various sensing devices havedifferent signal sources and data formats, different network addresses, and even differenttemperature units (Fahrenheit/Celsius). Previously, to solve this problem, it was necessaryto write customized reading methods and control instructions for each IoT device on theGW side and convert the data format correctly. In this study, it is designed to standardizevarious signals and data formats and interface the signals through agents. The work itemsrelated to the device agent application interface are as follows:
• Analyze the device control signals and data signals (sequence signals). Developthe application for processing the underlying serial communication at the firmwarelayer, read different device communication interfaces according to different serialcommunication properties, and process control signals and data signal sequences, aswell as maintain the status of intelligent devices, record the occurrence of events, andprocess error exceptions.
Electronics 2022, 11, 881 5 of 13
• Normalize the read and write formats and customized instructions, and design thedata sheet. Design the standard data/instruction data format. Textualize the dataread content. Do not judge the data content, but provide them to the upper level forprocessing. For the received instructions, decompose them in accordance with thespecifications, and transmit them to the corresponding signal control layer.
• Determine the GW intermediary data format. Implement the upper layer data pro-cessing and control instruction logic, and convert the standard instruction into thecorresponding address of each intelligent device. Then, provide the upper layer ap-plication, which can, through function calls, easily perform device setting, devicetesting, data reading, status notification, control instruction transmission, and instruc-tion execution result return, without considering the actual corresponding address ofthe device.
Electronics 2022, 11, x FOR PEER REVIEW 5 of 13
• Analyze the device control signals and data signals (sequence signals). Develop the application for processing the underlying serial communication at the firmware layer, read different device communication interfaces according to different serial communication properties, and process control signals and data signal sequences, as well as maintain the status of intelligent devices, record the occurrence of events, and process error exceptions.
• Normalize the read and write formats and customized instructions, and design the data sheet. Design the standard data/instruction data format. Textualize the data read content. Do not judge the data content, but provide them to the upper level for pro-cessing. For the received instructions, decompose them in accordance with the spec-ifications, and transmit them to the corresponding signal control layer.
• Determine the GW intermediary data format. Implement the upper layer data pro-cessing and control instruction logic, and convert the standard instruction into the corresponding address of each intelligent device. Then, provide the upper layer ap-plication, which can, through function calls, easily perform device setting, device testing, data reading, status notification, control instruction transmission, and in-struction execution result return, without considering the actual corresponding ad-dress of the device.
Figure 2. The SCADA system.
In the upsurge of the COVID-19 pandemic, there are still hackers who continue to invade information systems, which causes security concerns. If the centralized authoriza-tion mechanism of the information system is used for MQTT devices, the OAuth-based framework can be used. OAuth 2.0 supports decoupling authorization servers from re-source servers (such as MQTT servers). When one uses OAuth 2.0, the client would pro-vide its credentials to the authorization server, which then performs authentication checks and returns the access token that allows access to the resources, and then the access token is used to connect with the MQTT server. The MQTT server typically validates the access token by communicating with the authorization server, and then grants access to the re-sources. Each IoT gateway itself is associated with an independent unique ID, which will be used to generate a registration pairing exclusively for this IoT gateway, so that the user can directly register this IoT gateway on the cloud platform when deployed in the actual application field. In the database of the cloud platform, the datagram of each IoT gateway, including device registration model application and data format conversion, will be pro-cessed in the database. Finally, the data will be synchronized to the Data Mart of VMI Intelligent Analysis through HTTPS APIs and web hooks for analysis.
3.2. Prediction Method Manufacturers’ factories have their own management methods. Most of them rely on
on-site personnel to adjust the management methods in light of their experience. There are no data for specific improvement. It is also easy to cause instability in production ca-pacity due to communication gaps, and it is impossible to effectively promise the delivery status to downstream customers. In this study, the data sensed by the IoT device, such as
App Level
PLC/RTU GW
Client(data agent)
Device Level
HTTPS APIs & Web hooks
HTTPS / M
QTT
Internet
Auth. (Enhanced
JWT token)
Data ProtectionKey/Certification
Behaviors Monitoring
ERP APS MES MOM
Cloud Level
Figure 2. The SCADA system.
In the upsurge of the COVID-19 pandemic, there are still hackers who continue to in-vade information systems, which causes security concerns. If the centralized authorizationmechanism of the information system is used for MQTT devices, the OAuth-based frame-work can be used. OAuth 2.0 supports decoupling authorization servers from resourceservers (such as MQTT servers). When one uses OAuth 2.0, the client would provide itscredentials to the authorization server, which then performs authentication checks andreturns the access token that allows access to the resources, and then the access token is usedto connect with the MQTT server. The MQTT server typically validates the access tokenby communicating with the authorization server, and then grants access to the resources.Each IoT gateway itself is associated with an independent unique ID, which will be used togenerate a registration pairing exclusively for this IoT gateway, so that the user can directlyregister this IoT gateway on the cloud platform when deployed in the actual applicationfield. In the database of the cloud platform, the datagram of each IoT gateway, includingdevice registration model application and data format conversion, will be processed inthe database. Finally, the data will be synchronized to the Data Mart of VMI IntelligentAnalysis through HTTPS APIs and web hooks for analysis.
3.2. Prediction Method
Manufacturers’ factories have their own management methods. Most of them rely onon-site personnel to adjust the management methods in light of their experience. There areno data for specific improvement. It is also easy to cause instability in production capacitydue to communication gaps, and it is impossible to effectively promise the delivery status todownstream customers. In this study, the data sensed by the IoT device, such as the materialbarcode, operator identification card, production machine number, and manufacturingorder number, are transmitted back to the cloud-based SCADA system through the agent.
Then, the learning-to-rank method is used to predict the change in production capacityto estimate the quantity of key materials demanded for production. The eigenvalues ofanalysis are transmitted from the data collected by SCADA to the Data Mart. (Table 1)
Electronics 2022, 11, 881 6 of 13
Table 1. Characteristic data for estimating production capacity.
Data Type Description Effect 1
Historical value of productioncapacity last week
Use historical data as thebenchmark for estimating
production capacityDepends on. . .
Historical value of productioncapacity 52 weeks ago
Product remake ratioHigh product remake ratio,
and reduced productioncapacity load
Negative
Production lead timeLong production lead time,which affects production
capacityNegative
Machine utilization High machine utilization willincrease production capacity Positive
Operator’s productivityThe operator operates the
machine, which will greatlyaffect the production capacity
Depends on
1 Positive/negative effect on production capacity.
Because the factory SCADA has data records (log) for the materials and parts, theproduction capacity data of SCADA in this study are collected for 52 weeks, i.e., datacovering a whole year. After estimating the production capacity of the week, an alertcan be issued for the safety stock of key materials. The production capacity estimationmethod proposed in this study is based on the concept of AdaBoost, and a series ofrough rules are weighted and combined to obtain highly accurate rules. Its advantagesinclude the following: (1) it is easy to implement; (2) the classification accuracy is high.Its disadvantages include the following: (1) it is easily disturbed by noise, which is also adisadvantage of most sorting or classification algorithms; (2) the execution effect depends onthe selection of weak classifiers. AdaBoost is most suitable for processing large-dimensionalcharacteristic data, because it can generate detection results with high efficiency andhigh detectivity.
This study employs AdaBoost, which can dynamically adjust the ranking of dataweights, turn the ranking problem into binary, and improve the part of updated dataweights. The essence of weight is that the more the data are not classified correctly, thehigher the weight of the data is. In other words, not only the order of data in the correctranking but also the distance of data in the correct ranking are considered. Then, the datapoint is ranked first if the concordant is positive (representing the high ranking of the datapoint) and the data point has the smallest weight coefficient (the farthest from the centerof gravity). The data point is ranked second if the concordant is positive and the weightcoefficient is next (the next farthest away from the data point), and so on.
Dt+1(
xi, xj)=
Dt(xi, xj
)exp
(1 − αt
(1 − ddt
(xi, xj
)))Zt
, i f . . . concordant . . . , (1)
Dt+1(
xi, xj)=
Dt(xi, xj
)exp
(αt(ddt(
xi, xj)))
Zt, i f . . . discordant . . . (2)
When it is concordant: i f , dt(xi, xj
)∗ d∗
(xi, xj
)> 0
When it is discordant: i f , dt(xi, xj
)∗ d∗
(xi, xj
)< 0
where, ddt(xi, xj
)=∣∣dt(xi, xj
)− d∗
(xi, xj
)∣∣dt(xi, xj
)= ht(xi)− ht
(xj)
d∗(xi, xj
)= h∗(xi)− h∗
(xj)
Electronics 2022, 11, 881 7 of 13
At the same time, the pair difference of the ideal ranking function h* is considered,and then the difference from the subtraction represents the similarity between the weaklearner and the correct ranking. The two cases of concordant and discordant are discussedseparately. The learning-to-rank method is used to find out which week’s productioncapacity in the 53 weeks is the closest to that of the estimated week, and the closest one isranked first. This study uses the ranking similarity as a means to estimate the productioncapacity. However, there is still a lack of important data to estimate the safety stock of keymaterials, i.e., the order quantities of downstream manufacturers. However, usually, theorder quantities cannot be estimated, so this study estimates how much production volumemay be required in the future from the sales prediction of downstream manufacturers, andthen calculates the key materials that may be required. Because the SCADA productioncapacity estimation collects 52-week historical data, the sales data are also analyzed using52-week data. (Table 2)
Table 2. Characteristic data for sales prediction.
Data Type Description Data Source
Historical value of salesvolume last week
Used as the benchmark forestimating production capacity
POS data of downstreammanufacturers
. . .
Historical value of salesvolume 52 weeks ago
Promotion information Are there any special offers thisweek?
Manual seedingTraditional festivals covered Whether they include New Year’sDay, Mother’s Day, and Christmas
Winter and summer vacations Whether it is winter or summervacation
Data analysis requires data normalization to compress the data. In other words,dimensionality reduction is performed through PCA, and the eigenvalues with a highcorrelation with the prediction target are reserved as the dependent variable of salesprediction. Among the many eigenvalues, eliminating the variables with low correlationto sales is called data preprocessing. After data preprocessing, the sales data, discountdata, traditional festivals covered, and winter and summer vacations in the previous week,previous 4 weeks, previous 8 weeks, and previous 12 weeks are important variables, sothey are selected as the eigenvalue variables of the prediction model.
In this study, the prediction model employs the Back-Propagation Neural Network(BPN) of artificial intelligence. BPN is used by many scholars for prediction analysis. BPNincludes an input layer, a hidden layer, and an output layer. The model uses the hiddenlayer to convert the data of the input layer into the nonlinear function, and then the hiddenlayer is converted again in the output layer. BPN has been used in research in other fields.The steps used in this study are briefly described as follows:
Training stage hidden layer:
neth = ∑i
W_xhih·Xi − θ_hh (3)
Hh = f(netj
)=
11 + exp−neth
(4)
and ∆W_xhih = ηδhXi + α·∆W_xhih, ∆θ_hh = −ηδh + α·∆θ_hh.The output is W_hyhj = W_hyhj + ∆W_hyhj, θ_yj = θ_yj + ∆θ_yj.
Electronics 2022, 11, 881 8 of 13
Hh is the output vector, ∆W is Wij, which mimics the strength of the connectionbetween the i-th and j-th neurons, and δ is the amount of difference between the processingunit connected to W and the upper-level processing unit.
In the validation stage, the error function of the network is minimized, and the learningquality of the model is generally adjusted by using the formula error function. In thisstudy, the execution result of the proposed prediction model is compared with the usage ofkey materials in the production line capacity prediction. After deducting the usage of keymaterials of the order in the prediction model of the deep learning model from the usageof key materials, if it is lower than the threshold value, it indicates that the key materialswill soon be short, i.e., the stock is unsafe, and the key materials shall be ordered from thesuppliers of the key materials; on the contrary, the key materials are still within the scopeof safety stock.
4. Experience Result
After the rise of the Internet of Things, many emerging electronics are moving towardscustomized production. Factory production is characterized by a small quantity/varietyand high added value, which requires high flexibility to adjust the production line capacity.After the order is established, the electronics will be manufactured according to the manu-facturing order, and the factory will receive the order, customize the electronics, issue themanufacturing order, and deliver the electronics. In the future, consumer electronics willrequire a highly customized production strategy; the management of key materials andparts required for production is very important, especially the safety stock management ofkey materials.
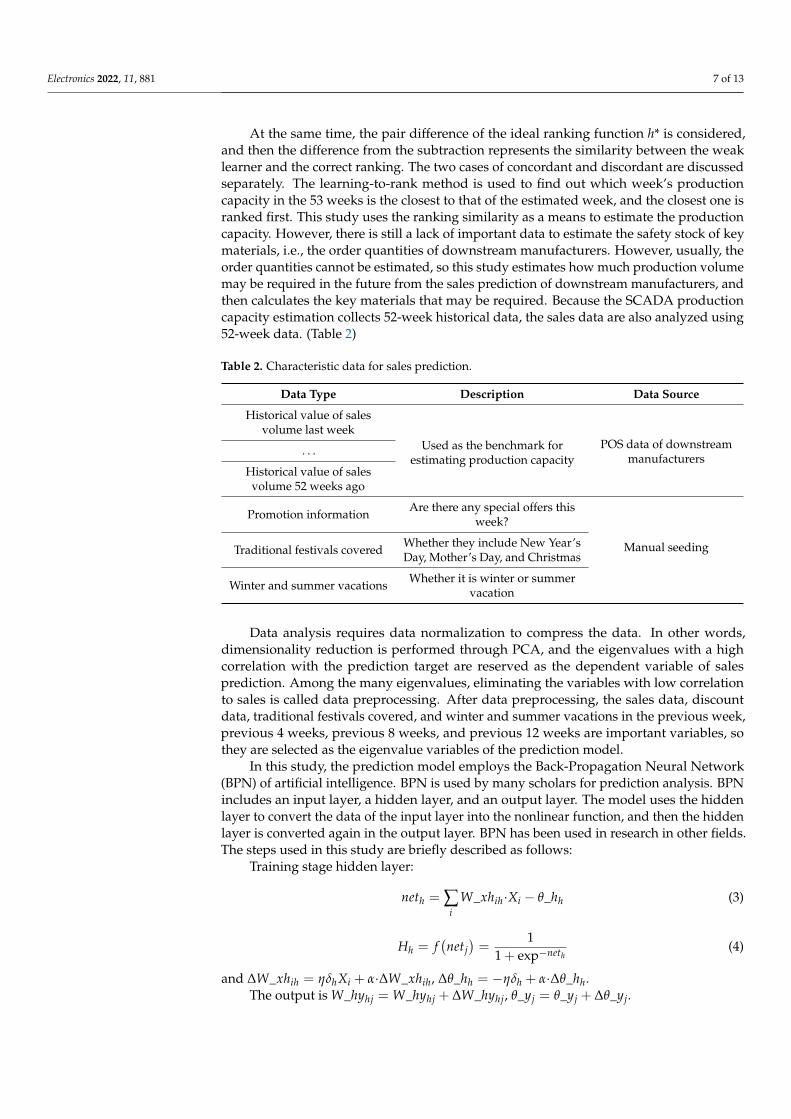
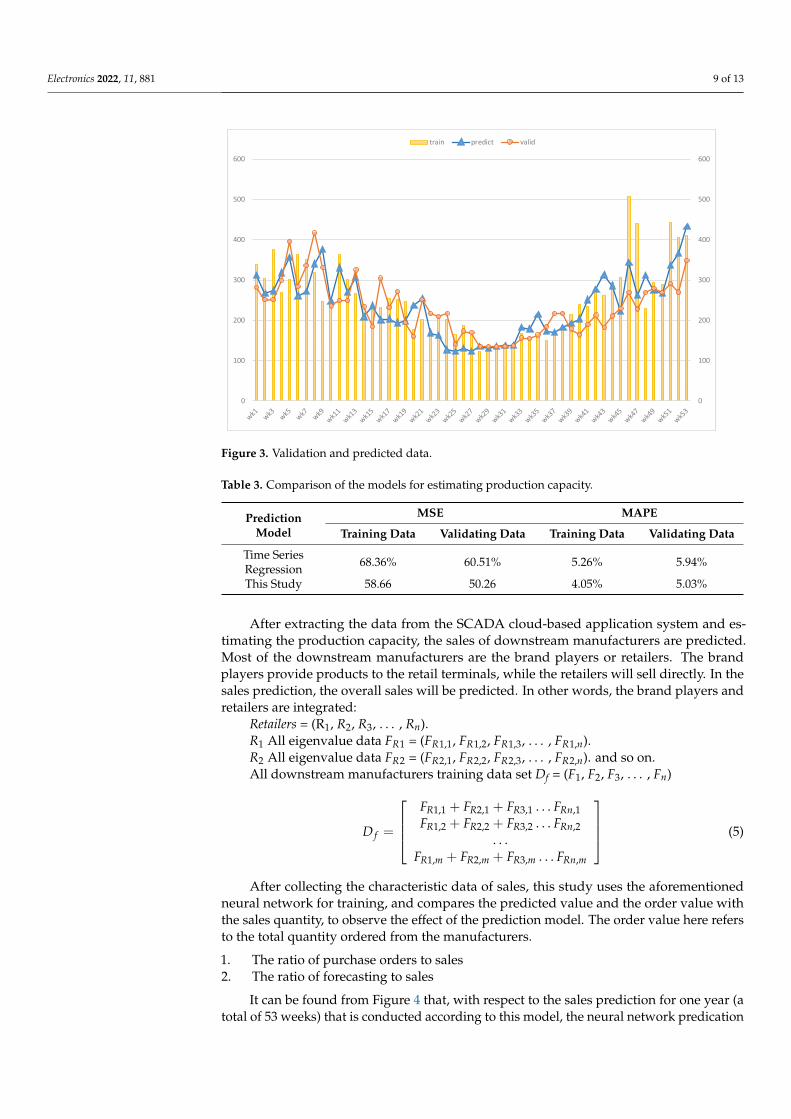
This study takes consumer electronics as the experimental subject, uses the IoT totransmit production data to the SCADA cloud-based application system under the afore-mentioned framework, and then extracts and analyzes the data from the SCADA cloud-based application system. The weekly production capacity data and product remake ratiofrom 1 week to 52 weeks are obtained from the Work In Process (WIP) tracking system ofits single production line, the production lead time is obtained from the automatic MaterialControl System (MCS), and the machine utilization and operator’s productivity are ob-tained from the Engineering Data Collection (EDC) system. After the expected productioncapacity is finally estimated, the quantities of key materials in the Material RequirementsPlanning (MRP) system are compared. Each group of data in this experiment is on a weeklybasis, with a total of 106 groups of data (which means the data in 106 weeks). There are atotal of 53 groups of data (the data in 53 weeks) in one year, so there are 2 years of data.Among them, the data of a complete year are used as the training data, while the other53 groups of data are used as the validating data. In order to estimate the productioncapacity through the ranking, we need to have a group of estimated data, and then comparethis group of data with the 53 groups of data for the ranking. This group of estimated datawill be set by the experts in light of their experience. In the future, the estimated value canbe given by the factory director or manager under actual circumstances. The histogram inFigure 3 is the training data, the triangle legend of the line chart is the estimated productioncapacity using the ranking method of Learning-To-Rank, and the circle legend of the linechart is the validating data. The method proposed in this study can be observed fromFigure 3: (1) The estimated production capacity is roughly in line with the trend of thevalidating data; (2) The production capacity peaks in the first and fourth quarters, andtroughs in the third quarter. In the section of data validation, the Mean Absolute PercentageError (MAPE) and Mean Absolute Error (MSE) are used for comparing the prediction errorvalue. In other words, the model trained with the data of the previous year is used tocompare the prediction error value with the data of the second year. Judging from theerrors in the table below (Table 3), for estimating production capacity, the prediction modelof Learning-To-Rank is feasible.
Electronics 2022, 11, 881 9 of 13Electronics 2022, 11, x FOR PEER REVIEW 9 of 13
Figure 3. Validation and predicted data.
Table 3. Comparison of the models for estimating production capacity.
Prediction Model MSE MAPE
Training Data Validating Data Training Data Validating Data Time Series Regression 68.36% 60.51% 5.26% 5.94%
This Study 58.66 50.26 4.05% 5.03%
After extracting the data from the SCADA cloud-based application system and esti-mating the production capacity, the sales of downstream manufacturers are predicted. Most of the downstream manufacturers are the brand players or retailers. The brand play-ers provide products to the retail terminals, while the retailers will sell directly. In the sales prediction, the overall sales will be predicted. In other words, the brand players and retailers are integrated:
Retailers = (R1, R2, R 3,…, R n). R1 All eigenvalue data FR1 = (FR1,1, F R1,2, F R1,3,…, F R1,n). R2 All eigenvalue data FR2 = (FR2,1, F R2,2, F R2,3,…, F R2,n).And so on. All downstream manufacturers training data set Df = (F1, F2, F3,…, Fn)
𝑫𝑫𝒇𝒇 = �
𝑭𝑭𝑹𝑹𝑹𝑹,𝑹𝑹 + 𝑭𝑭𝑹𝑹𝑹𝑹,𝑹𝑹 + 𝑭𝑭𝑹𝑹𝑹𝑹,𝑹𝑹 …𝑭𝑭𝑹𝑹𝑹𝑹,𝑹𝑹 𝑭𝑭𝑹𝑹𝑹𝑹,𝑹𝑹 + 𝑭𝑭𝑹𝑹𝑹𝑹,𝑹𝑹 + 𝑭𝑭𝑹𝑹𝑹𝑹,𝑹𝑹 …𝑭𝑭𝑹𝑹𝑹𝑹,𝑹𝑹
…𝑭𝑭𝑹𝑹𝑹𝑹,𝒎𝒎 + 𝑭𝑭𝑹𝑹𝑹𝑹,𝒎𝒎 + 𝑭𝑭𝑹𝑹𝑹𝑹,𝒎𝒎 …𝑭𝑭𝑹𝑹𝑹𝑹,𝒎𝒎
� (5)
After collecting the characteristic data of sales, this study uses the aforementioned neural network for training, and compares the predicted value and the order value with the sales quantity, to observe the effect of the prediction model. The order value here re-fers to the total quantity ordered from the manufacturers. 1. The ratio of purchase orders to sales 2. The ratio of forecasting to sales
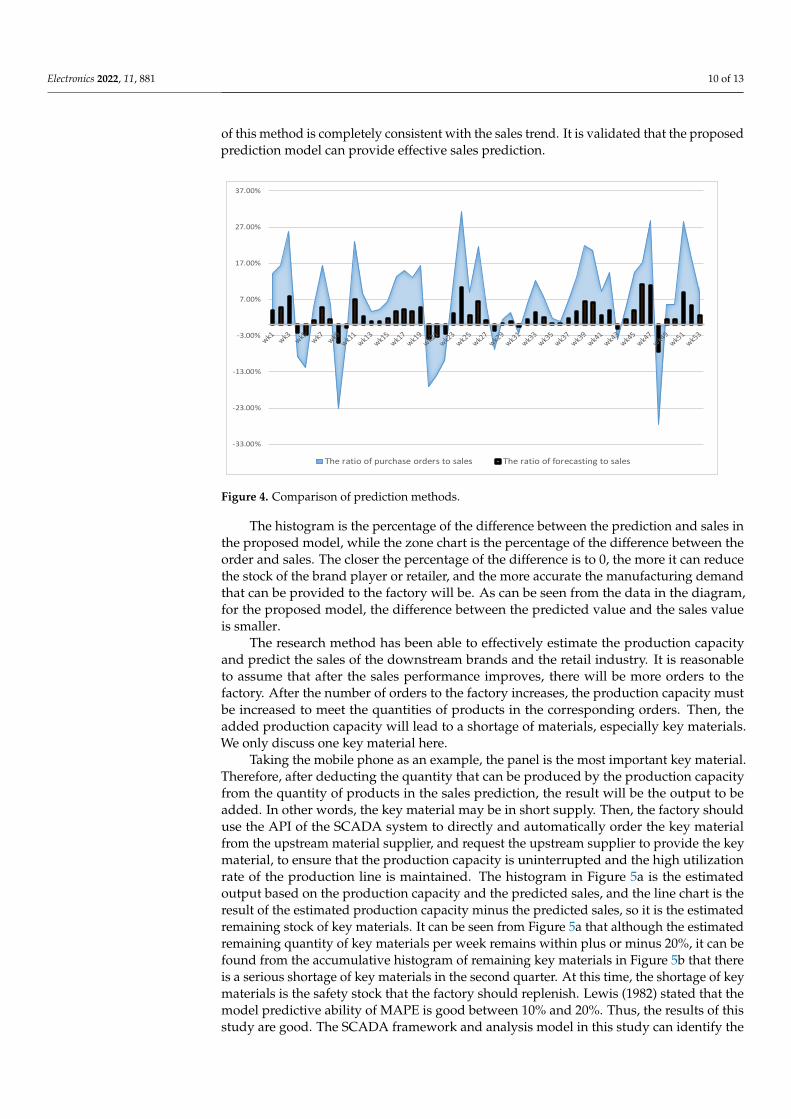
It can be found from Figure 4 that, with respect to the sales prediction for one year (a total of 53 weeks) that is conducted according to this model, the neural network predica-tion of this method is completely consistent with the sales trend. It is validated that the proposed prediction model can provide effective sales prediction.
The histogram is the percentage of the difference between the prediction and sales in the proposed model, while the zone chart is the percentage of the difference between the
0
100
200
300
400
500
600
0
100
200
300
400
500
600
train predict valid
Figure 3. Validation and predicted data.
Table 3. Comparison of the models for estimating production capacity.
PredictionModel
MSE MAPE
Training Data Validating Data Training Data Validating Data
Time SeriesRegression 68.36% 60.51% 5.26% 5.94%
This Study 58.66 50.26 4.05% 5.03%
After extracting the data from the SCADA cloud-based application system and es-timating the production capacity, the sales of downstream manufacturers are predicted.Most of the downstream manufacturers are the brand players or retailers. The brandplayers provide products to the retail terminals, while the retailers will sell directly. In thesales prediction, the overall sales will be predicted. In other words, the brand players andretailers are integrated:
Retailers = (R1, R2, R3, . . . , Rn).R1 All eigenvalue data FR1 = (FR1,1, FR1,2, FR1,3, . . . , FR1,n).R2 All eigenvalue data FR2 = (FR2,1, FR2,2, FR2,3, . . . , FR2,n). and so on.All downstream manufacturers training data set Df = (F1, F2, F3, . . . , Fn)
D f =
FR1,1 + FR2,1 + FR3,1 . . . FRn,1FR1,2 + FR2,2 + FR3,2 . . . FRn,2
. . .FR1,m + FR2,m + FR3,m . . . FRn,m
(5)
After collecting the characteristic data of sales, this study uses the aforementionedneural network for training, and compares the predicted value and the order value withthe sales quantity, to observe the effect of the prediction model. The order value here refersto the total quantity ordered from the manufacturers.
1. The ratio of purchase orders to sales2. The ratio of forecasting to sales
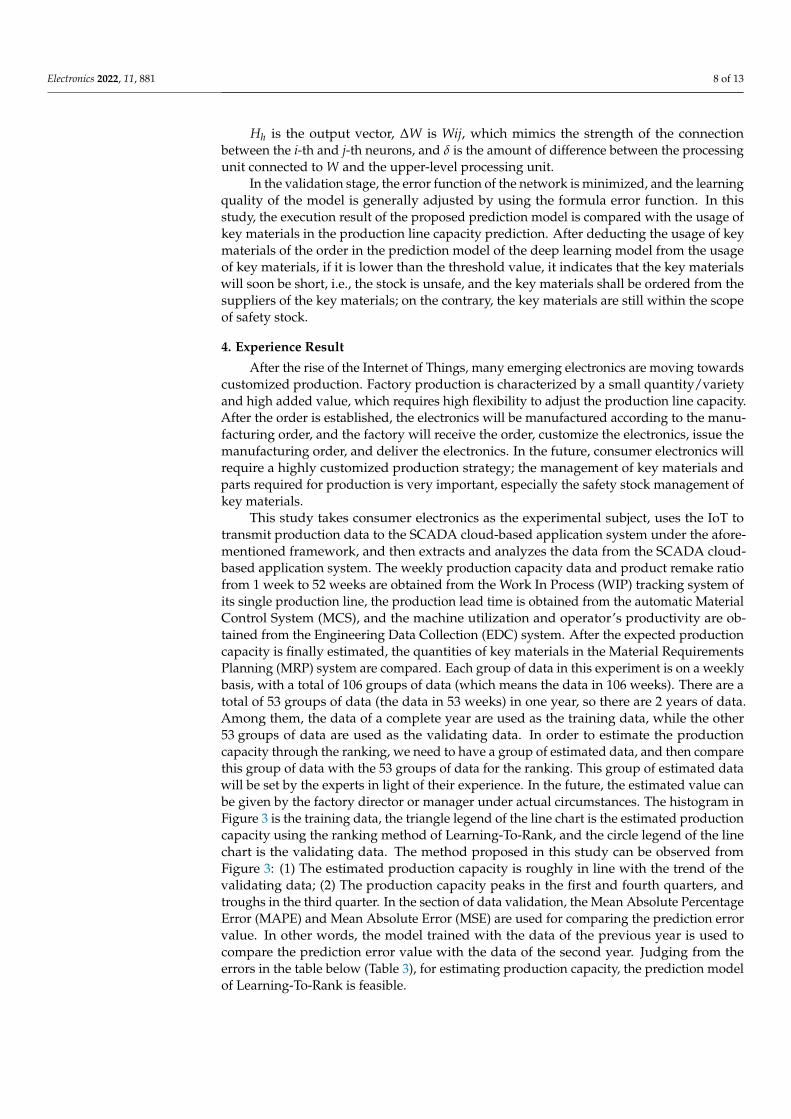
It can be found from Figure 4 that, with respect to the sales prediction for one year (atotal of 53 weeks) that is conducted according to this model, the neural network predication
Electronics 2022, 11, 881 10 of 13
of this method is completely consistent with the sales trend. It is validated that the proposedprediction model can provide effective sales prediction.
Electronics 2022, 11, x FOR PEER REVIEW 10 of 13
order and sales. The closer the percentage of the difference is to 0, the more it can reduce the stock of the brand player or retailer, and the more accurate the manufacturing demand that can be provided to the factory will be. As can be seen from the data in the diagram, for the proposed model, the difference between the predicted value and the sales value is smaller.
Figure 4. Comparison of prediction methods.
The research method has been able to effectively estimate the production capacity and predict the sales of the downstream brands and the retail industry. It is reasonable to assume that after the sales performance improves, there will be more orders to the factory. After the number of orders to the factory increases, the production capacity must be in-creased to meet the quantities of products in the corresponding orders. Then, the added production capacity will lead to a shortage of materials, especially key materials. We only discuss one key material here.
Taking the mobile phone as an example, the panel is the most important key material. Therefore, after deducting the quantity that can be produced by the production capacity from the quantity of products in the sales prediction, the result will be the output to be added. In other words, the key material may be in short supply. Then, the factory should use the API of the SCADA system to directly and automatically order the key material from the upstream material supplier, and request the upstream supplier to provide the key material, to ensure that the production capacity is uninterrupted and the high utiliza-tion rate of the production line is maintained. The histogram in Figure 5a is the estimated output based on the production capacity and the predicted sales, and the line chart is the result of the estimated production capacity minus the predicted sales, so it is the estimated remaining stock of key materials. It can be seen from Figure 5a that although the estimated remaining quantity of key materials per week remains within plus or minus 20%, it can be found from the accumulative histogram of remaining key materials in Figure 5b that there is a serious shortage of key materials in the second quarter. At this time, the shortage of key materials is the safety stock that the factory should replenish. Lewis (1982) stated that the model predictive ability of MAPE is good between 10% and 20%. Thus, the results of this study are good. The SCADA framework and analysis model in this study can iden-tify the shortage in advance, so that the factory can replenish the safety stock as soon as possible, thus effectively improving the utilization of the production line.
-33.00%
-23.00%
-13.00%
-3.00%
7.00%
17.00%
27.00%
37.00%
The ratio of purchase orders to sales The ratio of forecasting to sales
Figure 4. Comparison of prediction methods.
The histogram is the percentage of the difference between the prediction and sales inthe proposed model, while the zone chart is the percentage of the difference between theorder and sales. The closer the percentage of the difference is to 0, the more it can reducethe stock of the brand player or retailer, and the more accurate the manufacturing demandthat can be provided to the factory will be. As can be seen from the data in the diagram,for the proposed model, the difference between the predicted value and the sales valueis smaller.
The research method has been able to effectively estimate the production capacityand predict the sales of the downstream brands and the retail industry. It is reasonableto assume that after the sales performance improves, there will be more orders to thefactory. After the number of orders to the factory increases, the production capacity mustbe increased to meet the quantities of products in the corresponding orders. Then, theadded production capacity will lead to a shortage of materials, especially key materials.We only discuss one key material here.
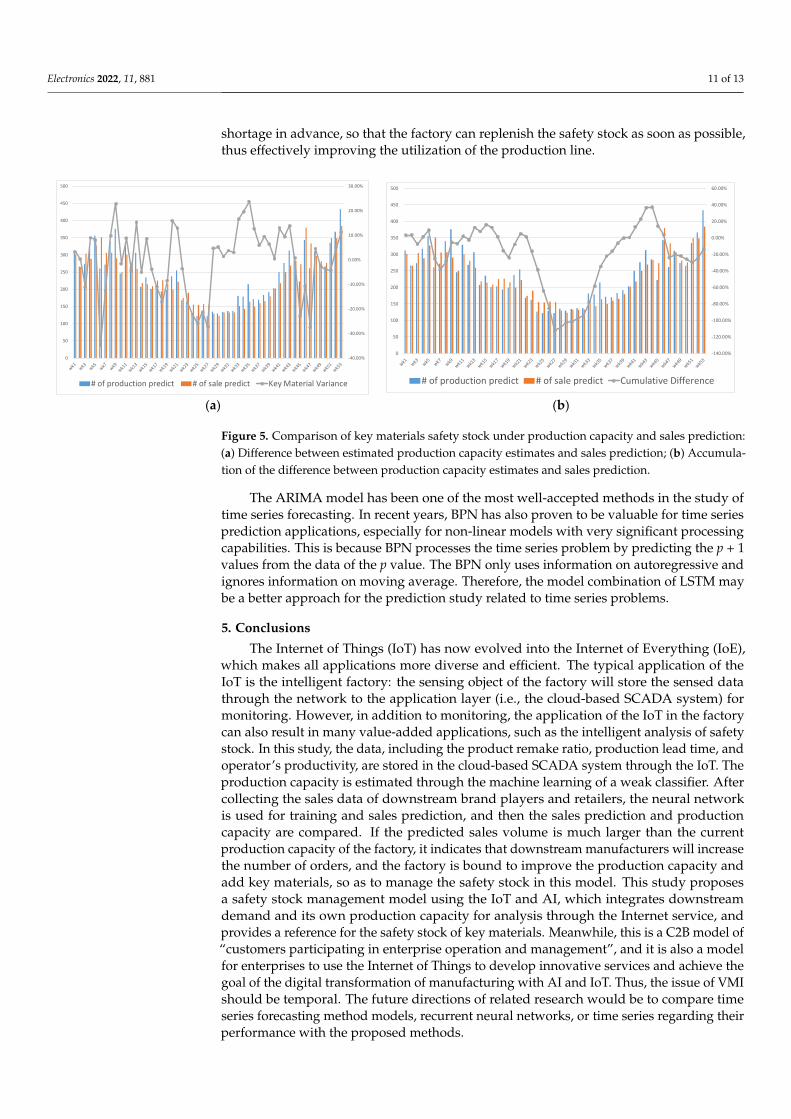
Taking the mobile phone as an example, the panel is the most important key material.Therefore, after deducting the quantity that can be produced by the production capacityfrom the quantity of products in the sales prediction, the result will be the output to beadded. In other words, the key material may be in short supply. Then, the factory shoulduse the API of the SCADA system to directly and automatically order the key materialfrom the upstream material supplier, and request the upstream supplier to provide the keymaterial, to ensure that the production capacity is uninterrupted and the high utilizationrate of the production line is maintained. The histogram in Figure 5a is the estimatedoutput based on the production capacity and the predicted sales, and the line chart is theresult of the estimated production capacity minus the predicted sales, so it is the estimatedremaining stock of key materials. It can be seen from Figure 5a that although the estimatedremaining quantity of key materials per week remains within plus or minus 20%, it can befound from the accumulative histogram of remaining key materials in Figure 5b that thereis a serious shortage of key materials in the second quarter. At this time, the shortage of keymaterials is the safety stock that the factory should replenish. Lewis (1982) stated that themodel predictive ability of MAPE is good between 10% and 20%. Thus, the results of thisstudy are good. The SCADA framework and analysis model in this study can identify the
Electronics 2022, 11, 881 11 of 13
shortage in advance, so that the factory can replenish the safety stock as soon as possible,thus effectively improving the utilization of the production line.
Electronics 2022, 11, x FOR PEER REVIEW 11 of 13
(a) (b)
Figure 5. Comparison of key materials safety stock under production capacity and sales prediction: (a) Difference between estimated production capacity estimates and sales prediction; (b) Accumu-lation of the difference between production capacity estimates and sales prediction.
The ARIMA model has been one of the most well-accepted methods in the study of time series forecasting. In recent years, BPN has also proven to be valuable for time series prediction applications, especially for non-linear models with very significant processing capabilities. This is because BPN processes the time series problem by predicting the p + 1 values from the data of the p value. The BPN only uses information on autoregressive and ignores information on moving average. Therefore, the model combination of LSTM may be a better approach for the prediction study related to time series problems.
5. Conclusions The Internet of Things (IoT) has now evolved into the Internet of Everything (IoE),
which makes all applications more diverse and efficient. The typical application of the IoT is the intelligent factory: the sensing object of the factory will store the sensed data through the network to the application layer (i.e., the cloud-based SCADA system) for monitoring. However, in addition to monitoring, the application of the IoT in the factory can also result in many value-added applications, such as the intelligent analysis of safety stock. In this study, the data, including the product remake ratio, production lead time, and operator’s productivity, are stored in the cloud-based SCADA system through the IoT. The produc-tion capacity is estimated through the machine learning of a weak classifier. After collect-ing the sales data of downstream brand players and retailers, the neural network is used for training and sales prediction, and then the sales prediction and production capacity are compared. If the predicted sales volume is much larger than the current production capacity of the factory, it indicates that downstream manufacturers will increase the num-ber of orders, and the factory is bound to improve the production capacity and add key materials, so as to manage the safety stock in this model. This study proposes a safety stock management model using the IoT and AI, which integrates downstream demand and its own production capacity for analysis through the Internet service, and provides a reference for the safety stock of key materials. Meanwhile, this is a C2B model of “custom-ers participating in enterprise operation and management”, and it is also a model for en-terprises to use the Internet of Things to develop innovative services and achieve the goal of the digital transformation of manufacturing with AI and IoT. Thus, the issue of VMI should be temporal. The future directions of related research would be to compare time series forecasting method models, recurrent neural networks, or time series regarding their performance with the proposed methods.
-40.00%
-30.00%
-20.00%
-10.00%
0.00%
10.00%
20.00%
30.00%
0
50
100
150
200
250
300
350
400
450
500
# of production predict # of sale predict Key Material Variance
-140.00%
-120.00%
-100.00%
-80.00%
-60.00%
-40.00%
-20.00%
0.00%
20.00%
40.00%
60.00%
0
50
100
150
200
250
300
350
400
450
500
# of production predict # of sale predict Cumulative Difference
Figure 5. Comparison of key materials safety stock under production capacity and sales prediction:(a) Difference between estimated production capacity estimates and sales prediction; (b) Accumula-tion of the difference between production capacity estimates and sales prediction.
The ARIMA model has been one of the most well-accepted methods in the study oftime series forecasting. In recent years, BPN has also proven to be valuable for time seriesprediction applications, especially for non-linear models with very significant processingcapabilities. This is because BPN processes the time series problem by predicting the p + 1values from the data of the p value. The BPN only uses information on autoregressive andignores information on moving average. Therefore, the model combination of LSTM maybe a better approach for the prediction study related to time series problems.
5. Conclusions
The Internet of Things (IoT) has now evolved into the Internet of Everything (IoE),which makes all applications more diverse and efficient. The typical application of theIoT is the intelligent factory: the sensing object of the factory will store the sensed datathrough the network to the application layer (i.e., the cloud-based SCADA system) formonitoring. However, in addition to monitoring, the application of the IoT in the factorycan also result in many value-added applications, such as the intelligent analysis of safetystock. In this study, the data, including the product remake ratio, production lead time, andoperator’s productivity, are stored in the cloud-based SCADA system through the IoT. Theproduction capacity is estimated through the machine learning of a weak classifier. Aftercollecting the sales data of downstream brand players and retailers, the neural networkis used for training and sales prediction, and then the sales prediction and productioncapacity are compared. If the predicted sales volume is much larger than the currentproduction capacity of the factory, it indicates that downstream manufacturers will increasethe number of orders, and the factory is bound to improve the production capacity andadd key materials, so as to manage the safety stock in this model. This study proposesa safety stock management model using the IoT and AI, which integrates downstreamdemand and its own production capacity for analysis through the Internet service, andprovides a reference for the safety stock of key materials. Meanwhile, this is a C2B model of“customers participating in enterprise operation and management”, and it is also a modelfor enterprises to use the Internet of Things to develop innovative services and achieve thegoal of the digital transformation of manufacturing with AI and IoT. Thus, the issue of VMIshould be temporal. The future directions of related research would be to compare timeseries forecasting method models, recurrent neural networks, or time series regarding theirperformance with the proposed methods.

Electronics 2022, 11, 881 12 of 13
Author Contributions: Conceptualization, C.-Y.K.; methodology, C.-Y.K.; validation, C.-Y.K. andH.-E.C.; formal analysis, C.-Y.K. and H.-E.C.; investigation, C.-Y.K. and H.-E.C.; data curation, C.-Y.K.and H.-E.C.; writing—original draft preparation, C.-Y.K.; writing—review and editing, C.-Y.K. andH.-E.C.; visualization, C.-Y.K.; supervision, C.-Y.K. and H.-E.C. All authors have read and agreed tothe published version of the manuscript.
Funding: This research received no external funding.
Conflicts of Interest: The authors declare no conflict of interest.
References1. Adebanjo, D.; Mann, R. Identifying Problems in Forecasting Consumer Demand in the Fast Moving Consumer Goods Sector.
Benchmark. Int. J. 2000, 7, 223–230. [CrossRef]2. Venkatraman, N.; Ramanujam, V. Measurement of business performance in strategy research: A comparison of approaches. Acad.
Manag. Rev. 1986, 11, 801–815. [CrossRef]3. Panahifar, F.; Byrne, P.J.; Heavey, C. A hybrid approach to the study of CPFR implementation enablers. Prod. Plan. Control 2015,
26, 1090–1109. [CrossRef]4. Lin, R.H.; Ho, P.Y. The study of CPFR implementation model in medical SCM of Taiwan. Prod. Plan. Control 2014, 25, 260–271.
[CrossRef]5. Folinas, D.K.; Fotiadis, T.A.; Coudounaris, D.N. Just-in-time theory: The panacea to the business success? Int. J. Value Chain.
Manag. 2017, 8, 171–190. [CrossRef]6. Wang, D.; Chen, Y.J.; Chen, D. Efficiency optimization and simulation to manufacturing and service systems based on manufac-
turing technology Just-In-Time. Pers. Ubiquitous Comput. 2018, 22, 1061–1073. [CrossRef]7. Zhou, B.H.; Peng, T. Scheduling the in-house logistics distribution for automotive assembly lines with just-in-time principles.
Assem. Autom. 2017, 37, 51–63. [CrossRef]8. Willis, T.; Huston, C. Vendor requirements and evaluation in a JIT environment. Int. J. Oper. Prod. Manag. 1990, 10, 41–50.
[CrossRef]9. Lawrence, J.J.; Lewis, H.S. Understanding the use of just-in-time purchasing in a developing country: The case of Mexico. Int. J.
Oper. Prod. Manag. 1996, 16, 68–80. [CrossRef]10. Schonberger, R.J.; Gilbert, J.P. Just-in-time purchasing: A challenge for U.S. industry. Calif. Manag. Rev. 1983, 26, 54–68. [CrossRef]11. Liang, C.C.; Liang, W.Y.; Tseng, T.L. Evaluation of intelligent agents in consumer-to-business e-Commerce. Comput. Stand.
Interfaces 2019, 65, 122–131. [CrossRef]12. Zhang, X.Y.; Ming, X.G.; Liu, Z.; Yin, D. State-of-the-art review of customer to business (C2B) model. Comput. Stand. Interfaces
2019, 132, 207–222. [CrossRef]13. Sagar, N. CPFR at Whirlpool Corporation: Two heads and an exception engine. J. Bus. Forecast. Methods Syst. 2003, 22, 3–8.14. Simchi-Levi, D.; Kaminsky, P. Designing and Managing the Supply Chain: Concepts, Strategies and Case Studies, 3rd ed.; McGraw Hill
Professional: New York, NY, USA, 2009.15. Danese, P. Collaboration forms, information and communication technologies, and coordination mechanisms in CPFR. Int. J.
Prod. Res. 2006, 44, 3207–3226. [CrossRef]16. David, F.R. Competing through Supply Chain Management: Creating Market-Winning Strategies through Supply Chain Partnership;
Springer: Berlin/Heidelberg, Germany, 1997.17. Pyke, D.F.; Peterson, R.; Sliver, E.A. Inventory Management and Production Planning and Scheduling. J. Oper. Res. Soc. 2001,
52, 845.18. Tony, W. Best Practice in Inventory Management, 3rd ed.; Elsevier Science Ltd.: Amsterdam, The Netherlands, 2002.19. Gerald, A.W. Frederick Hitschler, Stock Market Trading Systems: A Guide to Investment Strategy, 1st ed.; Traders Press. Inc.: Cedar
Falls, IA, USA, 1979.20. Waheed, A. Analysis of Moving Average Convergence Divergence (MACD) as a Tool of Equity Trading at the Karachi Stock
Exchange. J. Financ. 2013, 20, 78–92.21. Wilson, A.R. Event triggered analog data acquisition using the exponential moving average. IEEE Sens. J. 2014, 14, 2048–2055.
[CrossRef]22. Chen, F.L.; Ou, T.Y. Grey relation analysis and multilayer function link network sales forecasting model for perishable food in
convenience store. Expert Syst. Appl. 2009, 36, 7054–7063. [CrossRef]23. Sun, Z.L.; Choi, T.M.; Au, K.F.; Yu, Y. Sales forecasting using extreme learning machine with applications in fashion retailing.
Decis. Support Syst. 2008, 46, 411–419. [CrossRef]24. Chen, Y.; Yao, Y. A multiview approach for intelligent data analysis based on data operators. Inf. Sci. Int. J. 2008, 178, 1–20.
[CrossRef]25. Lee, Y.S.; Tong, L.I. Forecasting time series using a methodology based on autoregressive integrated moving average and genetic
programming. Knowl. Based Syst. 2011, 24, 66–72. [CrossRef]26. Hilletofth, P.; Sequeira, M.; Adlemo, A. Three novel fuzzy logic concepts applied to reshoring decision-making. Expert Syst. Appl.
2019, 126, 133–143. [CrossRef]

Electronics 2022, 11, 881 13 of 13
27. Rajeswari, A.M.; Deisy, C. Fuzzy logic based associative classifier for slow learners prediction. J. Intell. Fuzzy Syst. 2019, 36,2691–2704. [CrossRef]
28. Yadav, H.B.; Kumar, S.; Kumar, Y.; Yadav, D.K. A fuzzy logic based approach for decision making. J. Intell. Fuzzy Syst. 2018, 35,1531–1539. [CrossRef]
29. Golemanova, E.; Golemanov, T.; Kratchanov, K. Comparative Study of the Inference Mechanisms in PROLOG and SPIDER. TEMJ. Technol. Educ. Manag. Inform. 2018, 7, 892–901.
30. Araujo, D.A.; Hentges, A.R.; Rigo, S.J.; RighiSilva, R.R. Applying Parallelization Strategies for Inference Mechanisms PerformanceImprovement. IEEE Lat. Am. Trans. 2018, 16, 2881–2887. [CrossRef]
31. Buelens, B.; Burger, J.; van den Brakel, J.A. Comparing Inference Methods for Non-probability Samples. Int. Stat. Rev. 2018, 86,322–343. [CrossRef]
32. Tao, L.; Siqi, Q.; Zhang, Y.; Shi, H. Abnormal Detection of Wind Turbine Based on SCADA Data Mining. Math. Probl. Eng. 2020,9, 751. [CrossRef]
33. Gonzalez, E.; Tautz-Weinert, J.; Melero, J.J.; Watson, S.J. Statistical evaluation of SCADA data for wind turbine conditionmonitoring and farm assessment. J. Phys. Conf. Ser. 2018, 1037, 032038. [CrossRef]
34. Pandit, R.K.; Infield, D. SCADA-based nonparametric models for condition monitoring of a wind turbine. J. Eng. 2019, 2019,4723–4727. [CrossRef]


