Embed Size (px)
Citation preview
Seediscussions,stats,andauthorprofilesforthispublicationat:https://www.researchgate.net/publication/247952387
AbioticimpactsonspatialandtemporaldistributionofCorbiculafluminea(Müller,1774)intheRiverMinhoEstuary,Portugal
ArticleinAquaticConservationMarineandFreshwaterEcosystems·January2008
DOI:10.1002/aqc.838
CITATIONS
51
READS
115
5authors,including:
Someoftheauthorsofthispublicationarealsoworkingontheserelatedprojects:
FRESHCO-MultipleimplicationsofinvasivespeciesonFreshwaterMusselcoextinction
processes.Viewproject
NEXT-SEANextgenerationmonitoringofcoastalecosystemsinascenarioofglobalchange
Viewproject
RonaldoSousa
UniversityofMinho
99PUBLICATIONS1,797CITATIONS
SEEPROFILE
MartaRufino
InstitutoPortuguêsdoMaredaAtmosfera
48PUBLICATIONS414CITATIONS
SEEPROFILE
CarlosAntunes
UniversityofPorto
88PUBLICATIONS1,441CITATIONS
SEEPROFILE
LúciaGuilhermino
ICBAS&CIIMAR,UniversityofPorto,Port…
208PUBLICATIONS5,849CITATIONS
SEEPROFILE
AllcontentfollowingthispagewasuploadedbyRonaldoSousaon24December2013.
Theuserhasrequestedenhancementofthedownloadedfile.Allin-textreferencesunderlinedinblue
arelinkedtopublicationsonResearchGate,lettingyouaccessandreadthemimmediately.
AQUATIC CONSERVATION: MARINE AND FRESHWATER ECOSYSTEMS
Aquatic Conserv: Mar. Freshw. Ecosyst. 18: 98–110 (2008)
Published online 17 July 2007 in Wiley InterScience(www.interscience.wiley.com) DOI: 10.1002/aqc.838
Abiotic impacts on spatial and temporal distribution ofCorbicula fluminea (Muller, 1774) in the River Minho
Estuary, Portugal
RONALDO SOUSAa,b,*, MARTA RUFINOc, MIGUEL GASPARc, CARLOS ANTUNESa,d andLUCIA GUILHERMINOa,b
aCIIMAR}Centro Interdisciplinar de Investigacao Marinha e Ambiental, Porto, Portugalb ICBAS}Instituto de Ciencias Biomedicas de Abel Salazar, Universidade do Porto, Departamento de Estudos de
Populacoes, Laboratorio de Ecotoxicologia, Porto, Portugalc INIAP/IPIMAR}Instituto Nacional de Investigacao Agraria e das Pescas, Centro Regional de Investigacao Pesqueira
do Sul (CRIPSul), Olhao, PortugaldAquamuseu do Rio Minho, Vila Nova de Cerveira, Portugal
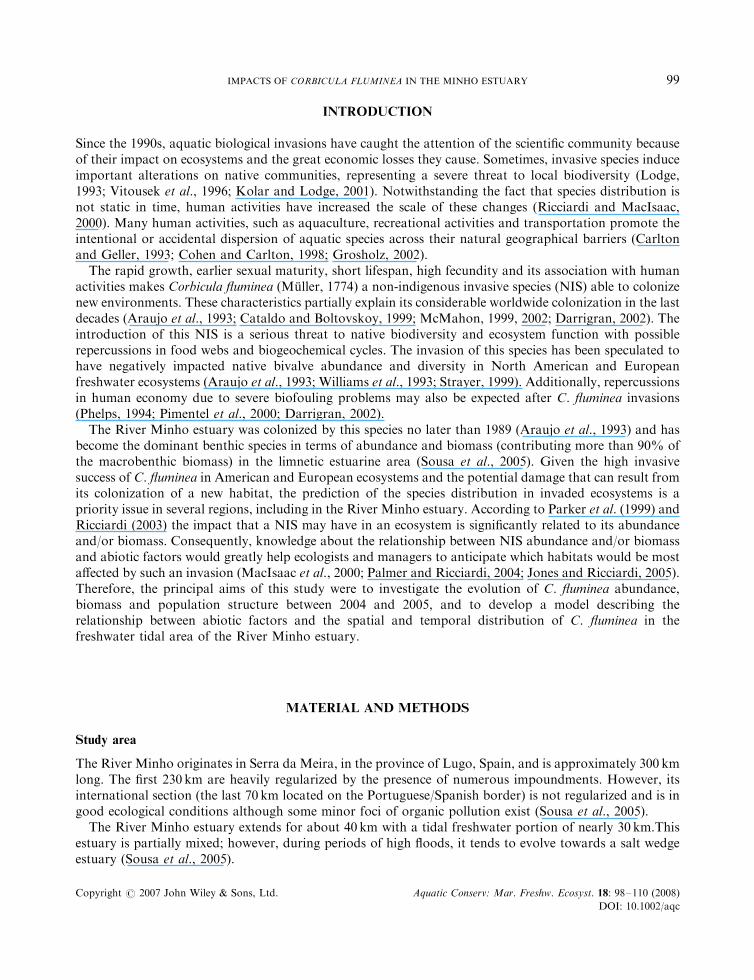
ABSTRACT
1. The non-indigenous species Corbicula fluminea (Muller, 1774) is one of the most invasivebivalves in freshwater ecosystems. This Asian clam was first reported in the River Minho estuary in1989. After a short period of time, it became the major component of the local benthic fauna in termsof abundance and biomass.2. In the autumn of 2004 and 2005, spatial and temporal variations in abundance, biomass and
population structure of C. fluminea were investigated at 16 sites in the freshwater subtidal area of theRiver Minho estuary. Mean abundance and biomass per site ranged from 80 to 4185 ind.m�2 and8.5 to 465.9 g AFDWm�2, respectively.3. The environmental characterization of the area was performed through multivariate analysis,
which revealed three distinct areas subjected to different abiotic conditions. C. fluminea populationstructure is well correlated with these three distinct areas.4. The combination of several abiotic variables determining C. fluminea biomass distribution was
evaluated through a stepwise multiple regression. This model showed that redox potential, nutrientconcentrations, hardness, organic matter and sediment characteristics explained almost 60% of thevariation in C. fluminea biomass in the freshwater subtidal area of the River Minho estuary(R2 ¼ 59:3%; F½9;86� ¼ 13:9; p50.001).5. Improved ecological knowledge is essential for future C. fluminea management, in order to
protect local habitats and biodiversity, and to reduce the economic impact of this non-indigenousinvasive species.Copyright # 2007 John Wiley & Sons, Ltd.
Received 27 March 2006; Revised 1 October 2006; Accepted 20 January 2007
KEY WORDS: Minho estuary; Corbicula fluminea; population structure; stepwise multiple regression; abiotic
factors
*Correspondence to: R. Sousa, CIIMAR}Centro Interdisciplinar de Investigacao Marinha e Ambiental, Rua dos Bragas 289,4050-123 Porto, Portugal. E-mail: [email protected]
Copyright # 2007 John Wiley & Sons, Ltd.
INTRODUCTION
Since the 1990s, aquatic biological invasions have caught the attention of the scientific community becauseof their impact on ecosystems and the great economic losses they cause. Sometimes, invasive species induceimportant alterations on native communities, representing a severe threat to local biodiversity (Lodge,1993; Vitousek et al., 1996; Kolar and Lodge, 2001). Notwithstanding the fact that species distribution isnot static in time, human activities have increased the scale of these changes (Ricciardi and MacIsaac,2000). Many human activities, such as aquaculture, recreational activities and transportation promote theintentional or accidental dispersion of aquatic species across their natural geographical barriers (Carltonand Geller, 1993; Cohen and Carlton, 1998; Grosholz, 2002).
The rapid growth, earlier sexual maturity, short lifespan, high fecundity and its association with humanactivities makes Corbicula fluminea (Muller, 1774) a non-indigenous invasive species (NIS) able to colonizenew environments. These characteristics partially explain its considerable worldwide colonization in the lastdecades (Araujo et al., 1993; Cataldo and Boltovskoy, 1999; McMahon, 1999, 2002; Darrigran, 2002). Theintroduction of this NIS is a serious threat to native biodiversity and ecosystem function with possiblerepercussions in food webs and biogeochemical cycles. The invasion of this species has been speculated tohave negatively impacted native bivalve abundance and diversity in North American and Europeanfreshwater ecosystems (Araujo et al., 1993; Williams et al., 1993; Strayer, 1999). Additionally, repercussionsin human economy due to severe biofouling problems may also be expected after C. fluminea invasions(Phelps, 1994; Pimentel et al., 2000; Darrigran, 2002).
The River Minho estuary was colonized by this species no later than 1989 (Araujo et al., 1993) and hasbecome the dominant benthic species in terms of abundance and biomass (contributing more than 90% ofthe macrobenthic biomass) in the limnetic estuarine area (Sousa et al., 2005). Given the high invasivesuccess of C. fluminea in American and European ecosystems and the potential damage that can result fromits colonization of a new habitat, the prediction of the species distribution in invaded ecosystems is apriority issue in several regions, including in the River Minho estuary. According to Parker et al. (1999) andRicciardi (2003) the impact that a NIS may have in an ecosystem is significantly related to its abundanceand/or biomass. Consequently, knowledge about the relationship between NIS abundance and/or biomassand abiotic factors would greatly help ecologists and managers to anticipate which habitats would be mostaffected by such an invasion (MacIsaac et al., 2000; Palmer and Ricciardi, 2004; Jones and Ricciardi, 2005).Therefore, the principal aims of this study were to investigate the evolution of C. fluminea abundance,biomass and population structure between 2004 and 2005, and to develop a model describing therelationship between abiotic factors and the spatial and temporal distribution of C. fluminea in thefreshwater tidal area of the River Minho estuary.
MATERIAL AND METHODS
Study area
The River Minho originates in Serra da Meira, in the province of Lugo, Spain, and is approximately 300 kmlong. The first 230 km are heavily regularized by the presence of numerous impoundments. However, itsinternational section (the last 70 km located on the Portuguese/Spanish border) is not regularized and is ingood ecological conditions although some minor foci of organic pollution exist (Sousa et al., 2005).
The River Minho estuary extends for about 40 km with a tidal freshwater portion of nearly 30 km.Thisestuary is partially mixed; however, during periods of high floods, it tends to evolve towards a salt wedgeestuary (Sousa et al., 2005).
IMPACTS OF CORBICULA FLUMINEA IN THE MINHO ESTUARY 99
Copyright # 2007 John Wiley & Sons, Ltd. Aquatic Conserv: Mar. Freshw. Ecosyst. 18: 98–110 (2008)
DOI: 10.1002/aqc
Sampling and laboratory analysis
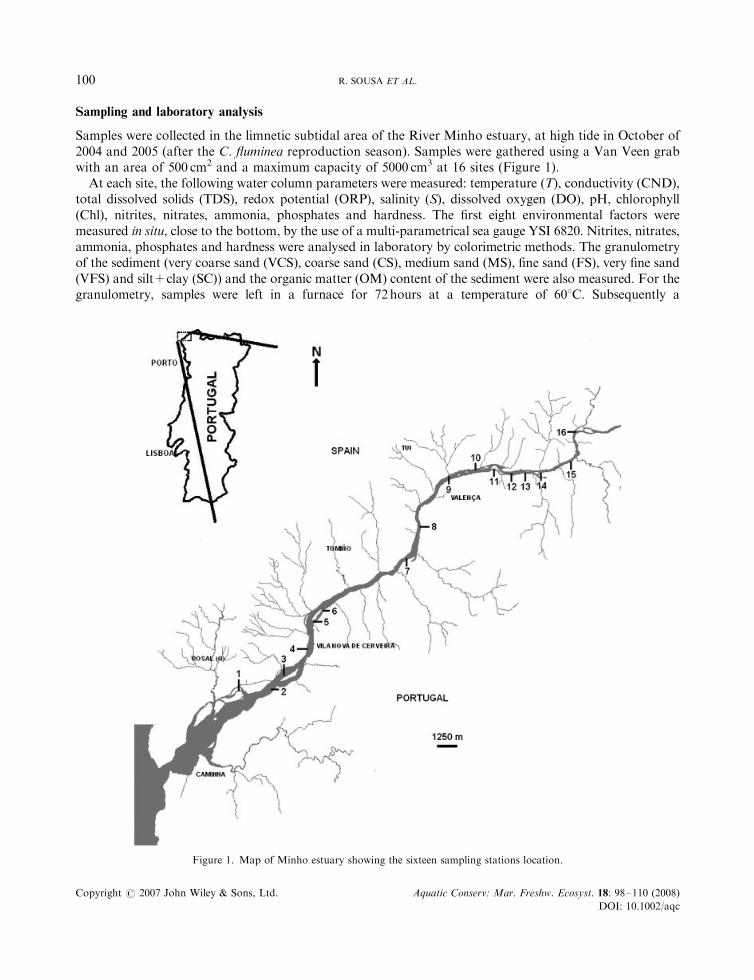
Samples were collected in the limnetic subtidal area of the River Minho estuary, at high tide in October of2004 and 2005 (after the C. fluminea reproduction season). Samples were gathered using a Van Veen grabwith an area of 500 cm2 and a maximum capacity of 5000 cm3 at 16 sites (Figure 1).
At each site, the following water column parameters were measured: temperature (T), conductivity (CND),total dissolved solids (TDS), redox potential (ORP), salinity (S), dissolved oxygen (DO), pH, chlorophyll(Chl), nitrites, nitrates, ammonia, phosphates and hardness. The first eight environmental factors weremeasured in situ, close to the bottom, by the use of a multi-parametrical sea gauge YSI 6820. Nitrites, nitrates,ammonia, phosphates and hardness were analysed in laboratory by colorimetric methods. The granulometryof the sediment (very coarse sand (VCS), coarse sand (CS), medium sand (MS), fine sand (FS), very fine sand(VFS) and silt+clay (SC)) and the organic matter (OM) content of the sediment were also measured. For thegranulometry, samples were left in a furnace for 72hours at a temperature of 608C. Subsequently a
Figure 1. Map of Minho estuary showing the sixteen sampling stations location.
R. SOUSA ET AL.100
Copyright # 2007 John Wiley & Sons, Ltd. Aquatic Conserv: Mar. Freshw. Ecosyst. 18: 98–110 (2008)
DOI: 10.1002/aqc
dimensional analysis by sifting with a Ro-Tap agitation, with columns of sieves corresponding to integervalues of the Wentworth scale, was performed. The organic matter content was determined by 24-hcombustion at 5508C in a muffle furnace. Values were expressed as percentage of each sample weight.
Biological samples from the 16 sites were processed through a sieve with a mesh size of 500 mm and C.fluminea specimens were separated, sorted and preserved. All organisms were then counted and their shelllength measured with a digital dial caliper. C. fluminea biomass was calculated using the ash-free dry weightmethod } AFDW (Kramer et al., 1994) } for each site and year.
Statistical analysis
The relationship between abundance and biomass was estimated through a linear regression. Meanabundance, biomass and shell length and respective standard deviation were also calculated. Theenvironmental characterization of the area was performed through multivariate analysis, using non-metricmultidimensional scaling (nMDS), applied to the Euclidean distance matrix of the standardized variables(standardized by the range) (r-project, using package Vegan; Ihaka and Gentleman, 1996).
Differences in bivalve biomass (loge transformed) between sample years (2004 and 2005), were tested witha t-test, after verifying homogeneity of variances using the Bartlett’s test. For data analysis, bivalvebiomasses were loge transformed to normalize and stabilize variances. Accordingly, each predictor variablewas also observed in detail, to determine whether a transformation improved their distribution. Thus,conductivity (log.CND), total dissolved solids (log.TDS), redox potential (log.ORP), salinity (log.S),nitrites (log.nitrites), nitrates (log.nitrates), ammonia (log.ammonia), phosphates (log.phosphates),hardness (log.hardness) and pH (log.pH) were loge transformed. Variables in percentage (i.e. sedimentgranulometry: asi.VCS, asi.CS, asi.MS, asi.FS, asi.VFS, and asi.SC; and organic matter: asi.OM) werearcsine transformed, as recommended by Zar (1999).
The relationship between bivalve biomass and environmental variables was then analysed throughstepwise multiple regression, using BIC (Schwarz’s Bayesian information criterion) as a selection criterion,as recommended by Quinn and Keough (2002). Prior to the multiple regression analysis, Kendallcorrelation coefficient was calculated for the relationship between all pairs of environmental variables, todetermine and avoid collinearity. Total dissolved solids and salinity were correlated with each other, andorganic matter was correlated with very fine sand and silt+clay. Thus, total dissolved solids, very fine sandand silt+clay were removed from further analysis. Nitrites (correlated with nitrates) and chlorophyll (onlymeasured in 2004, owing to calibration problems in 2005) were also removed from further analysis.
RESULTS
Abiotic characterization
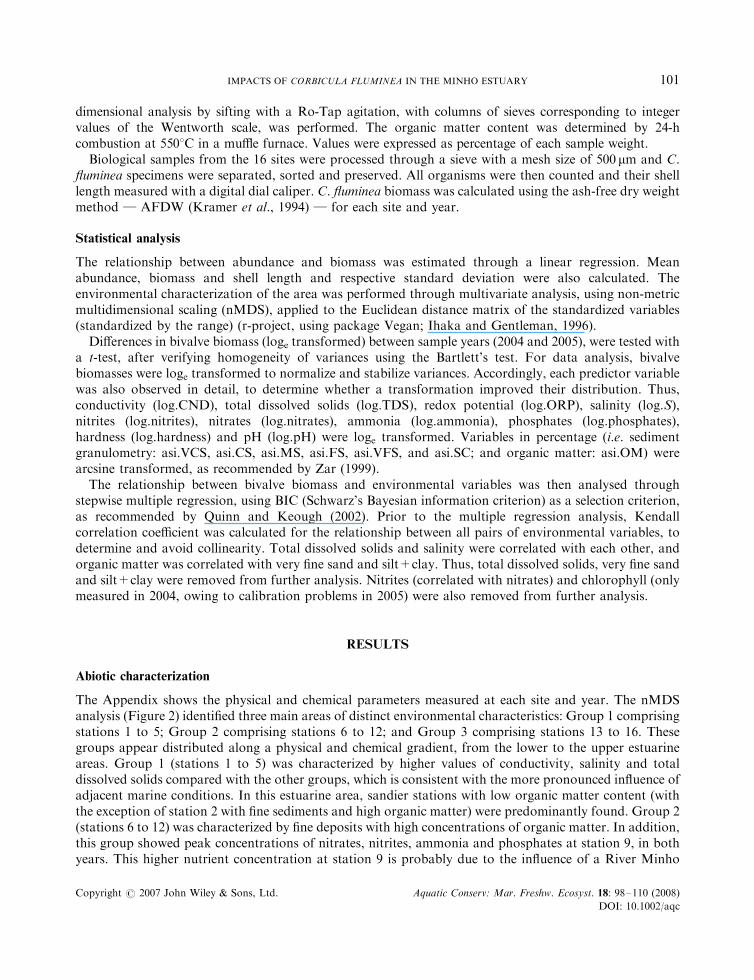
The Appendix shows the physical and chemical parameters measured at each site and year. The nMDSanalysis (Figure 2) identified three main areas of distinct environmental characteristics: Group 1 comprisingstations 1 to 5; Group 2 comprising stations 6 to 12; and Group 3 comprising stations 13 to 16. Thesegroups appear distributed along a physical and chemical gradient, from the lower to the upper estuarineareas. Group 1 (stations 1 to 5) was characterized by higher values of conductivity, salinity and totaldissolved solids compared with the other groups, which is consistent with the more pronounced influence ofadjacent marine conditions. In this estuarine area, sandier stations with low organic matter content (withthe exception of station 2 with fine sediments and high organic matter) were predominantly found. Group 2(stations 6 to 12) was characterized by fine deposits with high concentrations of organic matter. In addition,this group showed peak concentrations of nitrates, nitrites, ammonia and phosphates at station 9, in bothyears. This higher nutrient concentration at station 9 is probably due to the influence of a River Minho
IMPACTS OF CORBICULA FLUMINEA IN THE MINHO ESTUARY 101
Copyright # 2007 John Wiley & Sons, Ltd. Aquatic Conserv: Mar. Freshw. Ecosyst. 18: 98–110 (2008)
DOI: 10.1002/aqc
tributary (River Louro) with considerable organic pollution. Group 3, including stations 13 to 16, wascharacterized by sandier deposits with low organic matter, indicating a non-polluted area less affected byhuman activities. However, station 16 receives water from a River Minho tributary (River Tea) and in 2004some organic pollution was detected.
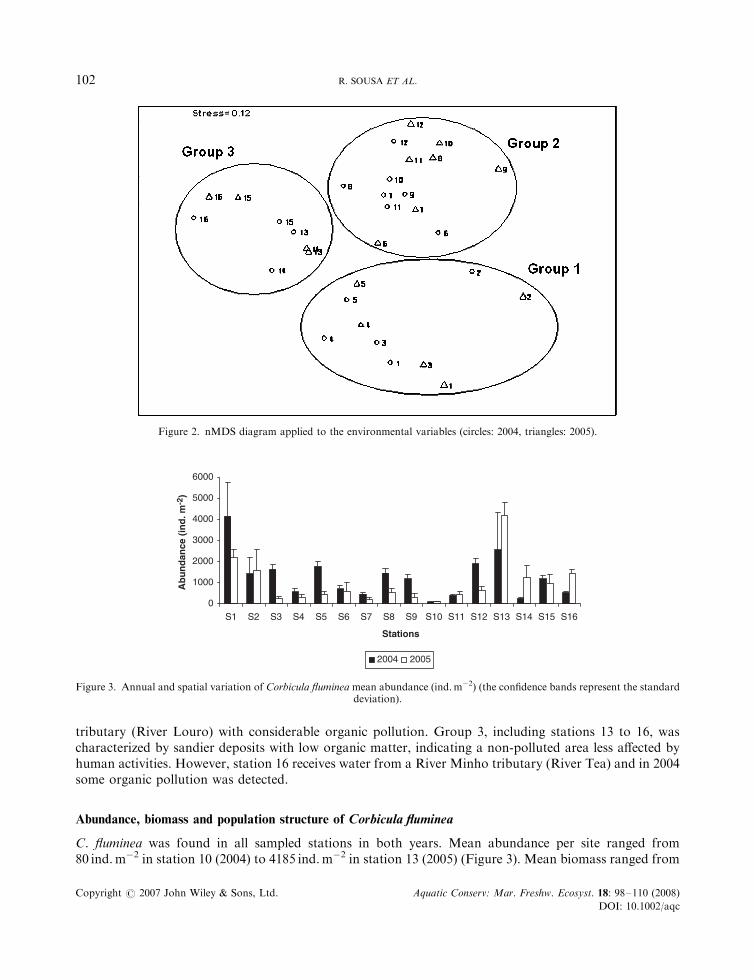
Abundance, biomass and population structure of Corbicula fluminea
C. fluminea was found in all sampled stations in both years. Mean abundance per site ranged from80 ind.m�2 in station 10 (2004) to 4185 ind.m�2 in station 13 (2005) (Figure 3). Mean biomass ranged from
Figure 2. nMDS diagram applied to the environmental variables (circles: 2004, triangles: 2005).
0
1000
2000
3000
4000
5000
6000
S1 S2 S3 S4 S5 S6 S7 S8 S9 S10 S11 S12 S13 S14 S15 S16
Stations
Ab
un
dan
ce (
ind
. m-2
)
2004 2005
Figure 3. Annual and spatial variation of Corbicula fluminea mean abundance (ind.m�2) (the confidence bands represent the standarddeviation).
R. SOUSA ET AL.102
Copyright # 2007 John Wiley & Sons, Ltd. Aquatic Conserv: Mar. Freshw. Ecosyst. 18: 98–110 (2008)
DOI: 10.1002/aqc
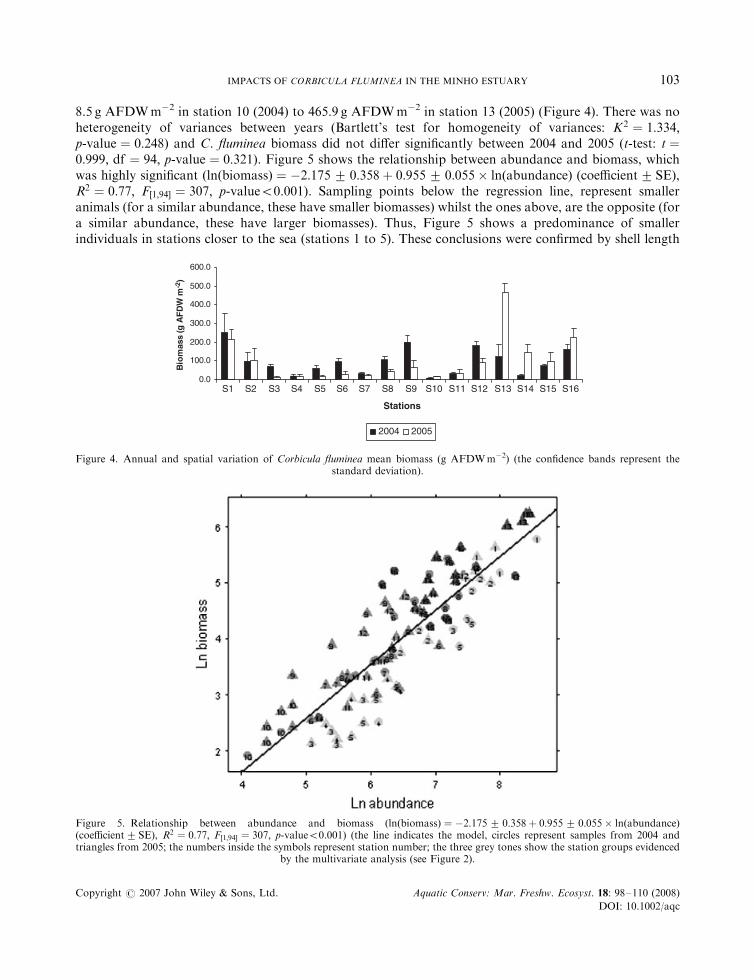
8.5 g AFDWm�2 in station 10 (2004) to 465.9 g AFDWm�2 in station 13 (2005) (Figure 4). There was noheterogeneity of variances between years (Bartlett’s test for homogeneity of variances: K2 ¼ 1:334;p-value ¼ 0:248) and C. fluminea biomass did not differ significantly between 2004 and 2005 (t-test: t ¼0:999; df ¼ 94; p-value ¼ 0:321). Figure 5 shows the relationship between abundance and biomass, whichwas highly significant ðlnðbiomassÞ ¼ �2:175� 0:358þ 0:955� 0:055� lnðabundanceÞ (coefficient� SE),R2 ¼ 0:77; F½1;94� ¼ 307; p-value50.001). Sampling points below the regression line, represent smalleranimals (for a similar abundance, these have smaller biomasses) whilst the ones above, are the opposite (fora similar abundance, these have larger biomasses). Thus, Figure 5 shows a predominance of smallerindividuals in stations closer to the sea (stations 1 to 5). These conclusions were confirmed by shell length
0.0
100.0
200.0
300.0
400.0
500.0
600.0
Bio
mas
s (g
AF
DW
m-2
)
S1 S2 S3 S4 S5 S6 S7 S8 S9 S10 S11 S12 S13 S14 S15 S16
Stations
2004 2005
Figure 4. Annual and spatial variation of Corbicula fluminea mean biomass (g AFDWm�2) (the confidence bands represent thestandard deviation).
Figure 5. Relationship between abundance and biomass ðlnðbiomassÞ ¼ �2:175� 0:358þ 0:955� 0:055� lnðabundanceÞ(coefficient� SE), R2 ¼ 0:77; F½1;94� ¼ 307; p-value50.001) (the line indicates the model, circles represent samples from 2004 andtriangles from 2005; the numbers inside the symbols represent station number; the three grey tones show the station groups evidenced
by the multivariate analysis (see Figure 2).
IMPACTS OF CORBICULA FLUMINEA IN THE MINHO ESTUARY 103
Copyright # 2007 John Wiley & Sons, Ltd. Aquatic Conserv: Mar. Freshw. Ecosyst. 18: 98–110 (2008)
DOI: 10.1002/aqc
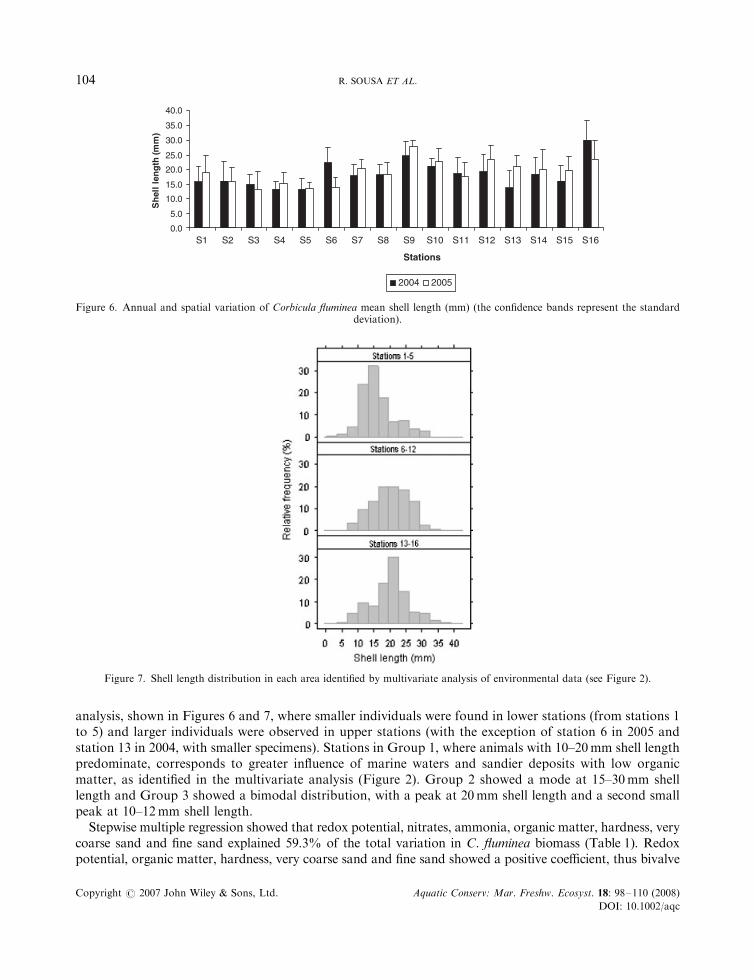
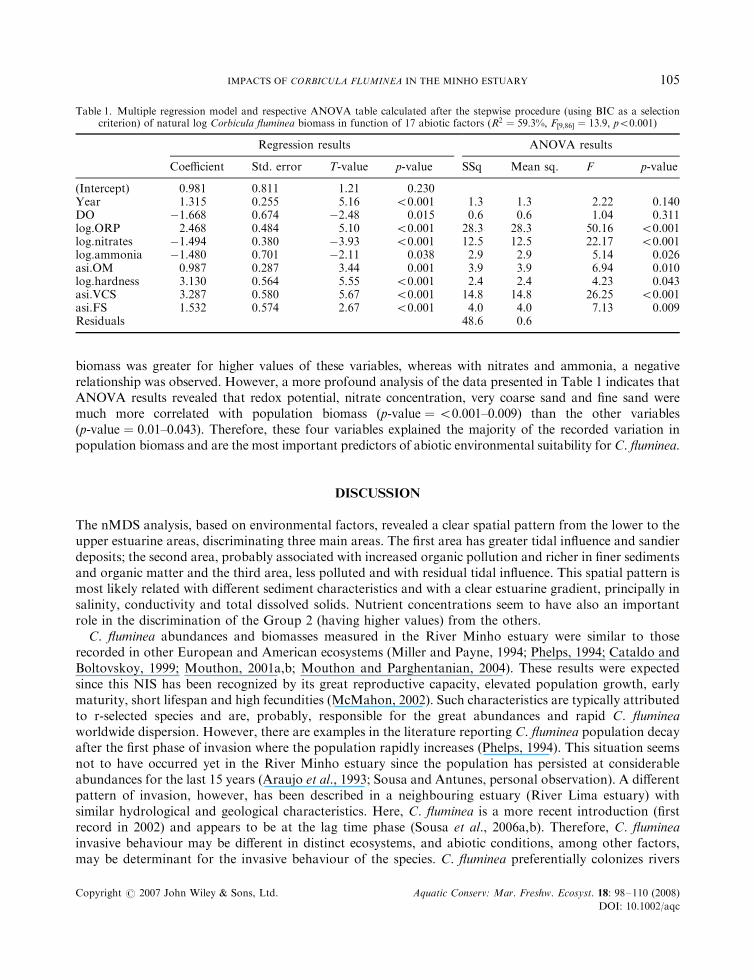
analysis, shown in Figures 6 and 7, where smaller individuals were found in lower stations (from stations 1to 5) and larger individuals were observed in upper stations (with the exception of station 6 in 2005 andstation 13 in 2004, with smaller specimens). Stations in Group 1, where animals with 10–20mm shell lengthpredominate, corresponds to greater influence of marine waters and sandier deposits with low organicmatter, as identified in the multivariate analysis (Figure 2). Group 2 showed a mode at 15–30mm shelllength and Group 3 showed a bimodal distribution, with a peak at 20mm shell length and a second smallpeak at 10–12mm shell length.
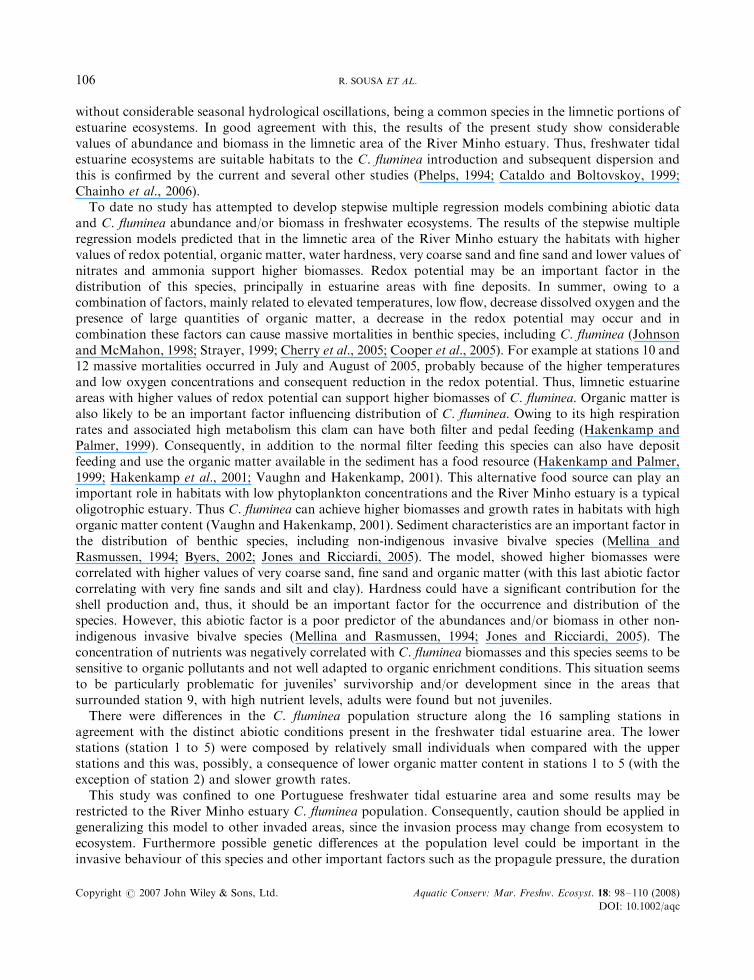
Stepwise multiple regression showed that redox potential, nitrates, ammonia, organic matter, hardness, verycoarse sand and fine sand explained 59.3% of the total variation in C. fluminea biomass (Table 1). Redoxpotential, organic matter, hardness, very coarse sand and fine sand showed a positive coefficient, thus bivalve
0.0
5.0
10.0
15.0
20.0
25.0
30.0
35.0
40.0
Sh
ell
len
gth
(mm
)
S1 S2 S3 S4 S5 S6 S7 S8 S9 S10 S11 S12 S13 S14 S15 S16
Stations
2004 2005
Figure 6. Annual and spatial variation of Corbicula fluminea mean shell length (mm) (the confidence bands represent the standarddeviation).
Figure 7. Shell length distribution in each area identified by multivariate analysis of environmental data (see Figure 2).
R. SOUSA ET AL.104
Copyright # 2007 John Wiley & Sons, Ltd. Aquatic Conserv: Mar. Freshw. Ecosyst. 18: 98–110 (2008)
DOI: 10.1002/aqc
biomass was greater for higher values of these variables, whereas with nitrates and ammonia, a negativerelationship was observed. However, a more profound analysis of the data presented in Table 1 indicates thatANOVA results revealed that redox potential, nitrate concentration, very coarse sand and fine sand weremuch more correlated with population biomass (p-value ¼50:001–0.009) than the other variables(p-value ¼ 0:01–0.043). Therefore, these four variables explained the majority of the recorded variation inpopulation biomass and are the most important predictors of abiotic environmental suitability for C. fluminea.
DISCUSSION
The nMDS analysis, based on environmental factors, revealed a clear spatial pattern from the lower to theupper estuarine areas, discriminating three main areas. The first area has greater tidal influence and sandierdeposits; the second area, probably associated with increased organic pollution and richer in finer sedimentsand organic matter and the third area, less polluted and with residual tidal influence. This spatial pattern ismost likely related with different sediment characteristics and with a clear estuarine gradient, principally insalinity, conductivity and total dissolved solids. Nutrient concentrations seem to have also an importantrole in the discrimination of the Group 2 (having higher values) from the others.
C. fluminea abundances and biomasses measured in the River Minho estuary were similar to thoserecorded in other European and American ecosystems (Miller and Payne, 1994; Phelps, 1994; Cataldo andBoltovskoy, 1999; Mouthon, 2001a,b; Mouthon and Parghentanian, 2004). These results were expectedsince this NIS has been recognized by its great reproductive capacity, elevated population growth, earlymaturity, short lifespan and high fecundities (McMahon, 2002). Such characteristics are typically attributedto r-selected species and are, probably, responsible for the great abundances and rapid C. flumineaworldwide dispersion. However, there are examples in the literature reporting C. fluminea population decayafter the first phase of invasion where the population rapidly increases (Phelps, 1994). This situation seemsnot to have occurred yet in the River Minho estuary since the population has persisted at considerableabundances for the last 15 years (Araujo et al., 1993; Sousa and Antunes, personal observation). A differentpattern of invasion, however, has been described in a neighbouring estuary (River Lima estuary) withsimilar hydrological and geological characteristics. Here, C. fluminea is a more recent introduction (firstrecord in 2002) and appears to be at the lag time phase (Sousa et al., 2006a,b). Therefore, C. flumineainvasive behaviour may be different in distinct ecosystems, and abiotic conditions, among other factors,may be determinant for the invasive behaviour of the species. C. fluminea preferentially colonizes rivers
Table 1. Multiple regression model and respective ANOVA table calculated after the stepwise procedure (using BIC as a selectioncriterion) of natural log Corbicula fluminea biomass in function of 17 abiotic factors (R2 ¼ 59:3%; F½9;86� ¼ 13:9; p50.001)
Regression results ANOVA results
Coefficient Std. error T-value p-value SSq Mean sq. F p-value
(Intercept) 0.981 0.811 1.21 0.230Year 1.315 0.255 5.16 50.001 1.3 1.3 2.22 0.140DO �1.668 0.674 �2.48 0.015 0.6 0.6 1.04 0.311log.ORP 2.468 0.484 5.10 50.001 28.3 28.3 50.16 50.001log.nitrates �1.494 0.380 �3.93 50.001 12.5 12.5 22.17 50.001log.ammonia �1.480 0.701 �2.11 0.038 2.9 2.9 5.14 0.026asi.OM 0.987 0.287 3.44 0.001 3.9 3.9 6.94 0.010log.hardness 3.130 0.564 5.55 50.001 2.4 2.4 4.23 0.043asi.VCS 3.287 0.580 5.67 50.001 14.8 14.8 26.25 50.001asi.FS 1.532 0.574 2.67 50.001 4.0 4.0 7.13 0.009Residuals 48.6 0.6
IMPACTS OF CORBICULA FLUMINEA IN THE MINHO ESTUARY 105
Copyright # 2007 John Wiley & Sons, Ltd. Aquatic Conserv: Mar. Freshw. Ecosyst. 18: 98–110 (2008)
DOI: 10.1002/aqc
without considerable seasonal hydrological oscillations, being a common species in the limnetic portions ofestuarine ecosystems. In good agreement with this, the results of the present study show considerablevalues of abundance and biomass in the limnetic area of the River Minho estuary. Thus, freshwater tidalestuarine ecosystems are suitable habitats to the C. fluminea introduction and subsequent dispersion andthis is confirmed by the current and several other studies (Phelps, 1994; Cataldo and Boltovskoy, 1999;Chainho et al., 2006).
To date no study has attempted to develop stepwise multiple regression models combining abiotic dataand C. fluminea abundance and/or biomass in freshwater ecosystems. The results of the stepwise multipleregression models predicted that in the limnetic area of the River Minho estuary the habitats with highervalues of redox potential, organic matter, water hardness, very coarse sand and fine sand and lower values ofnitrates and ammonia support higher biomasses. Redox potential may be an important factor in thedistribution of this species, principally in estuarine areas with fine deposits. In summer, owing to acombination of factors, mainly related to elevated temperatures, low flow, decrease dissolved oxygen and thepresence of large quantities of organic matter, a decrease in the redox potential may occur and incombination these factors can cause massive mortalities in benthic species, including C. fluminea (Johnsonand McMahon, 1998; Strayer, 1999; Cherry et al., 2005; Cooper et al., 2005). For example at stations 10 and12 massive mortalities occurred in July and August of 2005, probably because of the higher temperaturesand low oxygen concentrations and consequent reduction in the redox potential. Thus, limnetic estuarineareas with higher values of redox potential can support higher biomasses of C. fluminea. Organic matter isalso likely to be an important factor influencing distribution of C. fluminea. Owing to its high respirationrates and associated high metabolism this clam can have both filter and pedal feeding (Hakenkamp andPalmer, 1999). Consequently, in addition to the normal filter feeding this species can also have depositfeeding and use the organic matter available in the sediment has a food resource (Hakenkamp and Palmer,1999; Hakenkamp et al., 2001; Vaughn and Hakenkamp, 2001). This alternative food source can play animportant role in habitats with low phytoplankton concentrations and the River Minho estuary is a typicaloligotrophic estuary. Thus C. fluminea can achieve higher biomasses and growth rates in habitats with highorganic matter content (Vaughn and Hakenkamp, 2001). Sediment characteristics are an important factor inthe distribution of benthic species, including non-indigenous invasive bivalve species (Mellina andRasmussen, 1994; Byers, 2002; Jones and Ricciardi, 2005). The model, showed higher biomasses werecorrelated with higher values of very coarse sand, fine sand and organic matter (with this last abiotic factorcorrelating with very fine sands and silt and clay). Hardness could have a significant contribution for theshell production and, thus, it should be an important factor for the occurrence and distribution of thespecies. However, this abiotic factor is a poor predictor of the abundances and/or biomass in other non-indigenous invasive bivalve species (Mellina and Rasmussen, 1994; Jones and Ricciardi, 2005). Theconcentration of nutrients was negatively correlated with C. fluminea biomasses and this species seems to besensitive to organic pollutants and not well adapted to organic enrichment conditions. This situation seemsto be particularly problematic for juveniles’ survivorship and/or development since in the areas thatsurrounded station 9, with high nutrient levels, adults were found but not juveniles.
There were differences in the C. fluminea population structure along the 16 sampling stations inagreement with the distinct abiotic conditions present in the freshwater tidal estuarine area. The lowerstations (station 1 to 5) were composed by relatively small individuals when compared with the upperstations and this was, possibly, a consequence of lower organic matter content in stations 1 to 5 (with theexception of station 2) and slower growth rates.
This study was confined to one Portuguese freshwater tidal estuarine area and some results may berestricted to the River Minho estuary C. fluminea population. Consequently, caution should be applied ingeneralizing this model to other invaded areas, since the invasion process may change from ecosystem toecosystem. Furthermore possible genetic differences at the population level could be important in theinvasive behaviour of this species and other important factors such as the propagule pressure, the duration
R. SOUSA ET AL.106
Copyright # 2007 John Wiley & Sons, Ltd. Aquatic Conserv: Mar. Freshw. Ecosyst. 18: 98–110 (2008)
DOI: 10.1002/aqc
of the lag phase and differences in the community’s structure were not taken into account in this model.However, there is no a priori reason for assuming that these results are unique and thus this model shouldbe of great help to ecologists and managers working on invasive species. Although microhabitat variablesappear important to the distribution of C. fluminea in the River Minho estuary, it could still be influencedby other abiotic factors not measured in this study (e.g. current velocity could have an influence on thejuveniles’ distribution). However, sediment granulometry can give some indication of the prevailinghydrological conditions, including current velocity. In addition, biotic factors such as predation,competition, parasitism and presence of submerged vegetation may also have an effect on thedistribution of the species. Future studies should examine these biotic and abiotic factors and possiblybe added to the stepwise multiple regression model.
Colonization of C. fluminea in the River Minho estuary may be posing a serious threat to nativebiodiversity and ecosystem function with possible environmental and economic repercussions. An adequateunderstanding of the processes responsible for the distribution and abundance of C. fluminea in the RiverMinho estuary is essential to inform future management decisions. Considering the great abundance andbiomass already recorded in the River Minho estuary and the well known reproductive and dispersioncapacity of C. fluminea, its eradication may be impossible. Biological management is possible and couldserve to control population densities (Zavaleta et al., 2001) thus reducing both ecological and economicdamage resulting from an invasion. It is also important to recognize that the River Minho estuary is apotential source for the introduction of C. fluminea to other aquatic ecosystems. Therefore, it is essential tominimize any form of transport of this species to other adjacent aquatic ecosystems.
ACKNOWLEDGEMENTS
This work was funded by Fundacao para a Ciencia e a Tecnologia}Portugal (FCT) and FEDER European funds,through the project RISKA (POCTI/BSE/46225/2002) and a PhD grant to Ronaldo Sousa (SFRH/BD/18426/2004).Special thanks are addressed to Professor Luıs Sieuve Monteiro and Professor James Byers for helpful discussions, andEduardo Martins, Goncalves and Hugo Santos for technical assistance. Detailed comments from two anonymousreviewers were also highly appreciated and helped to improve an earlier version of the manuscript.
REFERENCES
Araujo R, Moreno D, Ramos MA. 1993. The asiatic clam Corbicula fluminea (Muller, 1774) (Bivalvia: Corbiculidae) inEurope. American Malacological Bulletin 10: 39–49.
Byers JE. 2002. Physical habitat attribute mediates biotic resistance to non-indigenous species invasion. Oecologia 130:146–156.
Carlton JT, Geller JB. 1993. Ecological roulette: the global transport of non-indigenous marine organisms. Science 261:78–83.
Cataldo D, Boltovskoy D. 1999. Population dynamics of Corbicula fluminea (Bivalvia) in the Parana river delta(Argentina). Hydrobiologia 380: 153–163.
Chainho P, Costa JL, Chaves ML, Lane MF, Dauer DM, Costa MJ. 2006. Seasonal and spatial patterns of distributionof subtidal benthic invertebrates communities in the Mondego River, Portugal } a poikilohaline estuary.Hydrobiologia 555: 59–74.
Cherry DS, Scheller JL, Cooper NL, Bidwell JR. 2005. Potential effects of Asian clam (Corbicula fluminea) die-offs onnative freshwater mussels (Unionidae) I: water-column ammonia levels and ammonia toxicity. Journal of the NorthAmerican Benthological Society 24: 369–380.
Cohen AN, Carlton JT. 1998. Accelerating invasion rate in a highly invaded estuary. Science 279: 555–558.Cooper NL, Bidwell JR, Cherry DS. 2005. Potential effects of Asian clam (Corbicula fluminea) die-offs on nativefreshwater mussels (Unionidae) II: pore-water ammonia. Journal of the North American Benthological Society 24:381–394.
IMPACTS OF CORBICULA FLUMINEA IN THE MINHO ESTUARY 107
Copyright # 2007 John Wiley & Sons, Ltd. Aquatic Conserv: Mar. Freshw. Ecosyst. 18: 98–110 (2008)
DOI: 10.1002/aqc
Darrigran G. 2002. Potential impact of filter-feeding invaders on temperate inland freshwater environments. BiologicalInvasions 4: 145–156.
Grosholz E. 2002. Ecological and evolutionary consequences of coastal invasions. Trends in Ecology and Evolution17: 22–27.
Hakenkamp CC, Palmer MA. 1999. Introduced bivalves in freshwater ecosystems: the impact of Corbicula on organicmatter dynamics in a sandy stream. Oecologia 119: 445–451.
Hakenkamp CC, Ribblett SG, Palmer MA, Swan CM, Reid JW, Goodison MR. 2001. The impact of an introducedbivalve (Corbicula fluminea) on the benthos of a sandy stream. Freshwater Biology 46: 491–501.
Ihaka R, Gentleman R. 1996. R: A language for data analysis and graphics. Journal of Computational and GraphicalStatistics 5: 299–314.
Johnson PD, McMahon RF. 1998. Effects of temperature and chronic hypoxia on survivorship of the zebra mussel(Dreissena polymorpha) and Asian clam (Corbicula fluminea). Canadian Journal of Fisheries and Aquatic Sciences 55:1564–1572.
Jones LA, Ricciardi A. 2005. Influence of physicochemical factors on the distribution and biomass of invasive mussels(Dreissena polymorpha and Dreissena bugensis) in the St. Lawrence River. Canadian Journal of Fisheries and AquaticSciences 62: 1953–1962.
Kolar CS, Lodge DM. 2001. Progress in invasion biology: predicting invaders. Trends in Ecology and Evolution 16: 199–204.Kramer KJM, Brockmann UH, Warwick RM. 1994. Tidal Estuaries. Manual of Sampling and Analytical Procedure.Balkema: Rotterdam.
Lodge DM. 1993. Biological invasions: lessons for ecology. Trends in Ecology and Evolution 8: 133–137.MacIsaac HJ, Ketelaars HAM, Grigorovich IA, Ramcharan CW, Yan ND. 2000. Modelling Bythotrephes longimanusinvasions in the Great Lakes basin based on its European distribution. Archiv fur Hydrobiologie 149: 1–21.
McMahon RF. 1999. Invasive characteristics of the freshwater bivalve Corbicula fluminea. In Nonindigenous FreshwaterOrganisms: Vectors, Biology and Impacts, Claudi R, Leach J (eds). Lewis Publishers: Boca Raton, FL; 315–343.
McMahon RF. 2002. Evolutionary and physiological adaptations of aquatic invasive animals: r selection versusresistance. Canadian Journal of Fisheries and Aquatic Sciences 59: 1235–1244.
Mellina E, Rasmussen JB. 1994. Patterns in the distribution and abundance of zebra mussel (Dreissena polymorpha) inrivers and lakes in relation to substrate and other physicochemical factors. Canadian Journal of Fisheries and AquaticSciences 51: 1024–1036.
Miller AC, Payne BS. 1994. Co-occurrence of native freshwater mussels (Unionidae) and the non-indigenous Corbiculafluminea at two stable shoals in the Ohio River, USA. Malacological Review 27: 87–97.
Mouthon J. 2001a. Life cycle and population dynamics of the Asian clam Corbicula fluminea (Bivalvia: Corbiculidae) inthe Rhone River at Creys-Malville (France). Archiv fur Hydrobiologie 151: 571–589.
Mouthon J. 2001b. Life cycle and populations dynamics of the Asian clam Corbicula fluminea (Bivalvia: Corbiculidae)in the Saone River at Lyon (France). Hydrobiologia 452: 109–119.
Mouthon J, Parghentanian T. 2004. Comparison of the life cycle and population dynamics of two Corbicula species,C. fluminea and C. fluminalis (Bivalvia: Corbiculidae) in two French canals. Archiv fur Hydrobiologie 161: 267–287.
Palmer ME, Ricciardi A. 2004. Physical factors affecting the relative abundance of native and invasive amphipods in St.Lawrence River. Canadian Journal of Zoology 82: 1886–1893.
Parker IM, Simberloff D, Lonsdale WM, Goodell K, Wonham M, Kareiva PM, Williamson MH, VonHolle B, MoylePB, Byers JE, Goldwasser L. 1999. Impact: toward a framework for understanding the ecological effects of invaders.Biological Invasions 1: 3–19.
Phelps HL. 1994. The Asiatic clam (Corbicula fluminea) invasion and system-level ecological change in the PotomacRiver Estuary near Washington, D.C. Estuaries 17: 614–621.
Pimentel D, Lach L, Zuniga R, Morrisson D. 2000. Environmental and economic costs of non-indigenous species in theUnited States. BioScience 50: 53–65.
Quinn GP, Keough MJ. 2002. Experimental Design and Data Analysis for Biologists. Cambridge University Press:Cambridge.
Ricciardi A. 2003. Predicting the impacts of an introduced species from its invasion history: an empirical approachapplied to zebra mussel invasions. Freshwater Biology 48: 912–981.
Ricciardi A, MacIsaac HJ. 2000. Recent mass invasion of the North American Great Lakes by Ponto–Caspian species.Trends in Ecology and Evolution 15: 62–65.
Sousa R, Guilhermino L, Antunes C. 2005. Molluscan fauna in the freshwater tidal area of the River Minho estuary,NW of Iberian Peninsula. Annales de Limnologie } International Journal of Limnology 41: 141–147.
Sousa R, Dias S, Antunes C. 2006a. Spatial subtidal macrobenthic distribution in relation to abiotic conditions in theLima estuary, NW of Portugal. Hydrobiologia 559: 135–148.
R. SOUSA ET AL.108
Copyright # 2007 John Wiley & Sons, Ltd. Aquatic Conserv: Mar. Freshw. Ecosyst. 18: 98–110 (2008)
DOI: 10.1002/aqc
Sousa R, Antunes C, Guilhermino L. 2006b. Factors influencing the occurrence and distribution of Corbicula fluminea(Muller, 1774) in the River Lima estuary. Annales de Limnologie } International Journal of Limnology 42: 165–171.
Strayer DL. 1999. Effects of alien species on freshwater molluscs in North America. Journal of the North AmericanBenthological Society 18: 74–98.
Vitousek DM, D’Antonio CM, Loope LL, Westbrooks R. 1996. Biological invasions as global environmental change.American Scientist 84: 468–478.
Vaughn CC, Hakenkamp CC. 2001. The functional role of burrowing bivalves in freshwater ecosystems. FreshwaterBiology 46: 1431–1446.
Williams AC, Warren ML, Cumming KS, Harris JL, Neves RJ. 1993. Conservation status of freshwater mussels of theUnited States and Canada. Fisheries 18: 6–22.
Zar JH. 1999. Biostatistical Analysis, 4th edn. Prentice Hall: New Jersey.Zavaleta ES, Hobbs RJ, Money HA. 2001. Viewing invasive species removal in a whole ecosystem context. Trends inEcology and Evolution 16: 454–459.
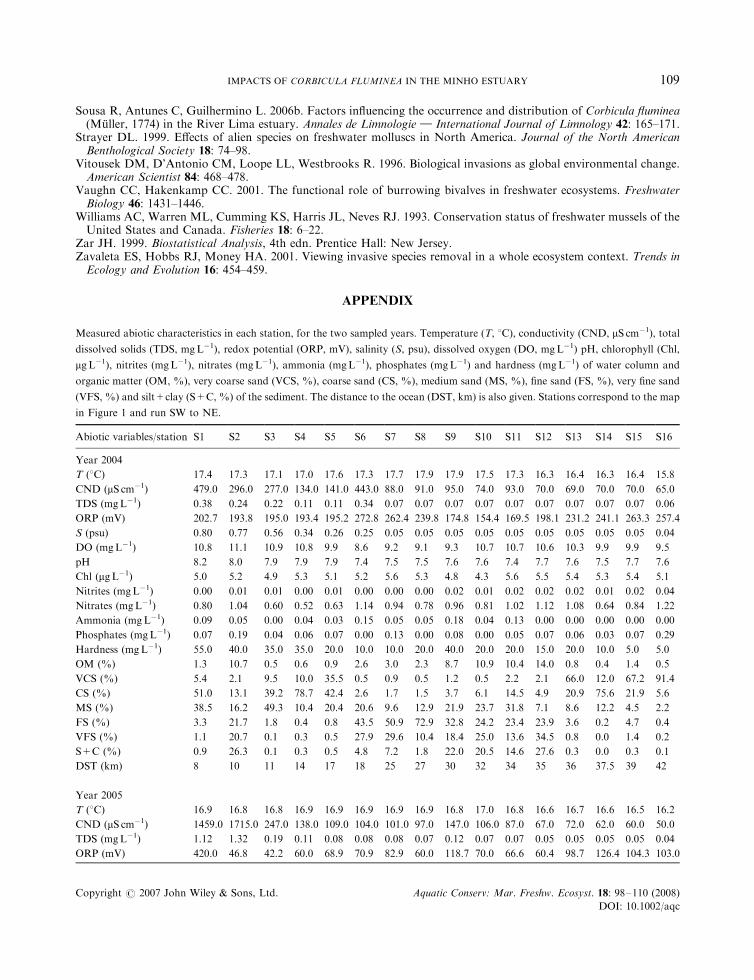
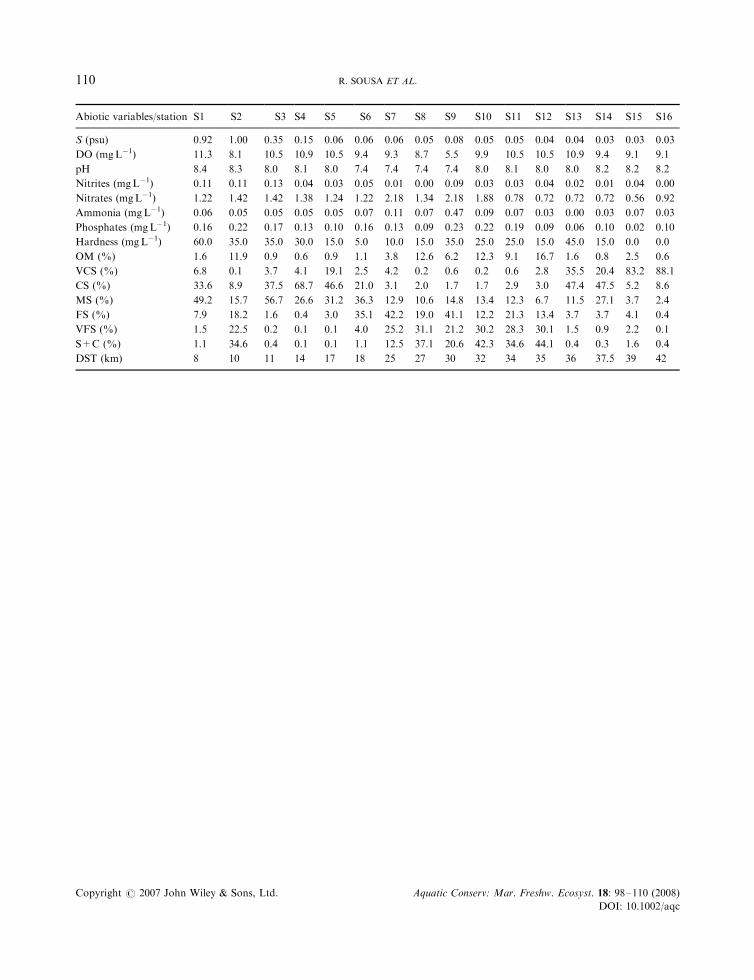
APPENDIX
Measured abiotic characteristics in each station, for the two sampled years. Temperature (T, 8C), conductivity (CND, mS cm�1), total
dissolved solids (TDS, mgL�1), redox potential (ORP, mV), salinity (S, psu), dissolved oxygen (DO, mgL�1) pH, chlorophyll (Chl,
mgL�1), nitrites (mgL�1), nitrates (mgL�1), ammonia (mgL�1), phosphates (mgL�1) and hardness (mgL�1) of water column and
organic matter (OM, %), very coarse sand (VCS, %), coarse sand (CS, %), medium sand (MS, %), fine sand (FS, %), very fine sand
(VFS, %) and silt+clay (S+C, %) of the sediment. The distance to the ocean (DST, km) is also given. Stations correspond to the map
in Figure 1 and run SW to NE.
Abiotic variables/station S1 S2 S3 S4 S5 S6 S7 S8 S9 S10 S11 S12 S13 S14 S15 S16
Year 2004
T (8C) 17.4 17.3 17.1 17.0 17.6 17.3 17.7 17.9 17.9 17.5 17.3 16.3 16.4 16.3 16.4 15.8
CND (mS cm�1) 479.0 296.0 277.0 134.0 141.0 443.0 88.0 91.0 95.0 74.0 93.0 70.0 69.0 70.0 70.0 65.0
TDS (mgL�1) 0.38 0.24 0.22 0.11 0.11 0.34 0.07 0.07 0.07 0.07 0.07 0.07 0.07 0.07 0.07 0.06
ORP (mV) 202.7 193.8 195.0 193.4 195.2 272.8 262.4 239.8 174.8 154.4 169.5 198.1 231.2 241.1 263.3 257.4
S (psu) 0.80 0.77 0.56 0.34 0.26 0.25 0.05 0.05 0.05 0.05 0.05 0.05 0.05 0.05 0.05 0.04
DO (mgL�1) 10.8 11.1 10.9 10.8 9.9 8.6 9.2 9.1 9.3 10.7 10.7 10.6 10.3 9.9 9.9 9.5
pH 8.2 8.0 7.9 7.9 7.9 7.4 7.5 7.5 7.6 7.6 7.4 7.7 7.6 7.5 7.7 7.6
Chl (mgL�1) 5.0 5.2 4.9 5.3 5.1 5.2 5.6 5.3 4.8 4.3 5.6 5.5 5.4 5.3 5.4 5.1
Nitrites (mgL�1) 0.00 0.01 0.01 0.00 0.01 0.00 0.00 0.00 0.02 0.01 0.02 0.02 0.02 0.01 0.02 0.04
Nitrates (mgL�1) 0.80 1.04 0.60 0.52 0.63 1.14 0.94 0.78 0.96 0.81 1.02 1.12 1.08 0.64 0.84 1.22
Ammonia (mgL�1) 0.09 0.05 0.00 0.04 0.03 0.15 0.05 0.05 0.18 0.04 0.13 0.00 0.00 0.00 0.00 0.00
Phosphates (mgL�1) 0.07 0.19 0.04 0.06 0.07 0.00 0.13 0.00 0.08 0.00 0.05 0.07 0.06 0.03 0.07 0.29
Hardness (mgL�1) 55.0 40.0 35.0 35.0 20.0 10.0 10.0 20.0 40.0 20.0 20.0 15.0 20.0 10.0 5.0 5.0
OM (%) 1.3 10.7 0.5 0.6 0.9 2.6 3.0 2.3 8.7 10.9 10.4 14.0 0.8 0.4 1.4 0.5
VCS (%) 5.4 2.1 9.5 10.0 35.5 0.5 0.9 0.5 1.2 0.5 2.2 2.1 66.0 12.0 67.2 91.4
CS (%) 51.0 13.1 39.2 78.7 42.4 2.6 1.7 1.5 3.7 6.1 14.5 4.9 20.9 75.6 21.9 5.6
MS (%) 38.5 16.2 49.3 10.4 20.4 20.6 9.6 12.9 21.9 23.7 31.8 7.1 8.6 12.2 4.5 2.2
FS (%) 3.3 21.7 1.8 0.4 0.8 43.5 50.9 72.9 32.8 24.2 23.4 23.9 3.6 0.2 4.7 0.4
VFS (%) 1.1 20.7 0.1 0.3 0.5 27.9 29.6 10.4 18.4 25.0 13.6 34.5 0.8 0.0 1.4 0.2
S+C (%) 0.9 26.3 0.1 0.3 0.5 4.8 7.2 1.8 22.0 20.5 14.6 27.6 0.3 0.0 0.3 0.1
DST (km) 8 10 11 14 17 18 25 27 30 32 34 35 36 37.5 39 42
Year 2005
T (8C) 16.9 16.8 16.8 16.9 16.9 16.9 16.9 16.9 16.8 17.0 16.8 16.6 16.7 16.6 16.5 16.2
CND (mS cm�1) 1459.0 1715.0 247.0 138.0 109.0 104.0 101.0 97.0 147.0 106.0 87.0 67.0 72.0 62.0 60.0 50.0
TDS (mgL�1) 1.12 1.32 0.19 0.11 0.08 0.08 0.08 0.07 0.12 0.07 0.07 0.05 0.05 0.05 0.05 0.04
ORP (mV) 420.0 46.8 42.2 60.0 68.9 70.9 82.9 60.0 118.7 70.0 66.6 60.4 98.7 126.4 104.3 103.0
IMPACTS OF CORBICULA FLUMINEA IN THE MINHO ESTUARY 109
Copyright # 2007 John Wiley & Sons, Ltd. Aquatic Conserv: Mar. Freshw. Ecosyst. 18: 98–110 (2008)
DOI: 10.1002/aqc
Abiotic variables/station S1 S2 S3 S4 S5 S6 S7 S8 S9 S10 S11 S12 S13 S14 S15 S16
S (psu) 0.92 1.00 0.35 0.15 0.06 0.06 0.06 0.05 0.08 0.05 0.05 0.04 0.04 0.03 0.03 0.03
DO (mgL�1) 11.3 8.1 10.5 10.9 10.5 9.4 9.3 8.7 5.5 9.9 10.5 10.5 10.9 9.4 9.1 9.1
pH 8.4 8.3 8.0 8.1 8.0 7.4 7.4 7.4 7.4 8.0 8.1 8.0 8.0 8.2 8.2 8.2
Nitrites (mgL�1) 0.11 0.11 0.13 0.04 0.03 0.05 0.01 0.00 0.09 0.03 0.03 0.04 0.02 0.01 0.04 0.00
Nitrates (mgL�1) 1.22 1.42 1.42 1.38 1.24 1.22 2.18 1.34 2.18 1.88 0.78 0.72 0.72 0.72 0.56 0.92
Ammonia (mgL�1) 0.06 0.05 0.05 0.05 0.05 0.07 0.11 0.07 0.47 0.09 0.07 0.03 0.00 0.03 0.07 0.03
Phosphates (mgL�1) 0.16 0.22 0.17 0.13 0.10 0.16 0.13 0.09 0.23 0.22 0.19 0.09 0.06 0.10 0.02 0.10
Hardness (mgL�1) 60.0 35.0 35.0 30.0 15.0 5.0 10.0 15.0 35.0 25.0 25.0 15.0 45.0 15.0 0.0 0.0
OM (%) 1.6 11.9 0.9 0.6 0.9 1.1 3.8 12.6 6.2 12.3 9.1 16.7 1.6 0.8 2.5 0.6
VCS (%) 6.8 0.1 3.7 4.1 19.1 2.5 4.2 0.2 0.6 0.2 0.6 2.8 35.5 20.4 83.2 88.1
CS (%) 33.6 8.9 37.5 68.7 46.6 21.0 3.1 2.0 1.7 1.7 2.9 3.0 47.4 47.5 5.2 8.6
MS (%) 49.2 15.7 56.7 26.6 31.2 36.3 12.9 10.6 14.8 13.4 12.3 6.7 11.5 27.1 3.7 2.4
FS (%) 7.9 18.2 1.6 0.4 3.0 35.1 42.2 19.0 41.1 12.2 21.3 13.4 3.7 3.7 4.1 0.4
VFS (%) 1.5 22.5 0.2 0.1 0.1 4.0 25.2 31.1 21.2 30.2 28.3 30.1 1.5 0.9 2.2 0.1
S+C (%) 1.1 34.6 0.4 0.1 0.1 1.1 12.5 37.1 20.6 42.3 34.6 44.1 0.4 0.3 1.6 0.4
DST (km) 8 10 11 14 17 18 25 27 30 32 34 35 36 37.5 39 42
R. SOUSA ET AL.110
Copyright # 2007 John Wiley & Sons, Ltd. Aquatic Conserv: Mar. Freshw. Ecosyst. 18: 98–110 (2008)
DOI: 10.1002/aqc