Embed Size (px)
Citation preview

Aga Deedar Hussain Pathan
Maio de 2013UM
inho
|201
3
Contributions for Improving Textile Supply Chain Management in Pakistan
Universidade do Minho
Escola de Engenharia
Aga
Dee
dar
Hus
sain
Pat
han
Co
ntr
ibu
tio
ns
for
Imp
rovi
ng
Text
ile
S
up
ply
Ch
ain
Ma
na
ge
me
nt
in P
akis
tan


Programa Doutoral em Engenharia Industrial e Sistemas
Trabalho efetuado sob a orientação do
Professor Doutor Manuel Carlos Figueiredo
e do
Professor Doutor Fernando Nunes Ferreira
Aga Deedar Hussain Pathan
Maio de 2013
Contributions for Improving Textile Supply Chain Management in Pakistan
Universidade do Minho
Escola de Engenharia

É AUTORIZADA A REPRODUÇÃO PARCIAL DESTA TESE APENAS PARA EFEITOS DE INVESTIGAÇÃO, MEDIANTE DECLARAÇÃO ESCRITA DO INTERESSADO, QUE A TAL SECOMPROMETE;
Universidade do Minho, ___/___/______
Assinatura: ________________________________________________

ii
Acknowledgement
“Let us learn from the weavers who have the sensitive profession of joining;
They are always focused and never leave the disconnections unrepaired”
Shah Abdul latif Bhitai
This thesis is the result of four years of hard work. It presents the development of the
scientific thought which is a great professional and personal achievement for me. It was not
possible without the help of many people and I would like to acknowledge their support
and influence.
I feel obliged to work with my supervisors, Professor Manuel Figueiredo and Professor
Fernando Nunes Ferreira. Their guidance provided the foundation of this work. I thank
them for all the opportunities they offered me to learn and conclude this research.
Professor Figueiredo is a great person for me, an example of commitment to teach, guide
and nurture the thinking ability. His understanding on the supply chain systems helped me
to formulate the overall research and to join various parts of the research and to develop the
strategic view of the system. I lost an excellent model of life, my teacher Sahib Dino
Memon, the time has shown to me another. I just hope that my work will reward them for
their generosity.
Professor Fernando‟s guidance was valuable in developing the scenario of recent
developments in textile and clothing supply chains. He is an outstanding professional
whose profound knowledge of textile and clothing areas guided me to bring new insight for
the textile and clothing supply chain system of Pakistan.
I also thank Professor Anabela Tereso for her valuable guidance on the multicriteria
decision methods. Her advices made it possible to link our knowledge of textile area to
strategic decision theory and to analyse the strategic plans of the system.

iii
I would also like to mention the inputs provided by Dr Sheeraz Hussain Yousfani, Faisal
Shaukat, Muhammad Zeeshan, Kashif Ahmad Solangi and Syed Zameer Shah on the textile
and clothing system in Pakistan. Without their inputs, it was difficult to formulate the
strategic insight. The access provided by Somelos Fabrics to their production systems and
data helped us a lot to generate the recent scenario of developments in textile and clothing.
I offer my thanks to Eng. Acácio and Conceição for their valuable support on technical and
administrative matters.
In addition, I would like to acknowledgement the NED University of Engineering and
Technology for financially supporting this research and University of Minho, in particular
the Production and Systems Department of School of Engineering, which provided me all
the technical support, equipment and work conditions for the research work.
Very special thanks go to my close friends and family members, for their special care and
affection.
I dedicate this research to persons who raised me physically and my consciousness,
including my parents Zohran Begum and late Aga Ghulam Hussain and my teacher Sahib
Dino Memon.
Braga, March 2013
Deedar Hussain
iv
Contributions for Improving Textile Supply Chain Management in
Pakistan
In the last decades, trade liberalization and communication innovations have increased the
opportunities for retailers and brands to buy their products from producers worldwide.
These are transformed into global sourcing companies, which outsource the production of
goods they sell, to suppliers and producers worldwide through complex international
networks or global supply chains. They control the supply chains (SCs) and determine
price, quality levels, delivery times, and labour conditions for the suppliers and producers.
Under this transformation, the global textile and clothing SC activities are divided into high
and low profit steps. Retailers and brands keep high profit steps such as innovation,
marketing and retailing. Low profit steps, such as sourcing raw materials, production and
assembly, finishing and packing, are outsourced to mid-chain suppliers and low-cost
producers worldwide. This has created labour-intensive exports from low-cost locations
especially Asia and Far East. The migration of textile and clothing industry has unlocked
the potential of new markets including China, South Asia, Brazil and Middle East.
In the global restructuring of the textile and clothing, competitive capabilities including
design, innovativeness and time-based performance emerged as the main factors of
profitability. Now, the capabilities on quality, value-addition and customer service are
utilized to maintain the overall strategic position of the SCs.
There are many textile and fashion brands which are manufactured now in India, Pakistan
and Bangladesh. Pakistan is an important textile producer with proper resources, which are
required for this industry including manufacturing setup, raw material availability and
cheap labour. Meanwhile, it is producing standard products, directed to low profit markets.
Many countries have successfully increased their export shares in textile and clothing after
the elimination of the world quotas. Unfortunately, Pakistan was unable to increase its
export share in its non-traditional markets like fashion clothing because of not developing
relevant strategies and not upgrading its domestic textile and clothing industry. It is obvious
v
that the industry is not prepared for this scenario and it has difficulties in meeting short lead
times and higher responsiveness which are expected now a day by most customers.
This research is focused on the textile and clothing SC system of Pakistan. The structure
and the characteristics of the system were studied and the growth patterns were identified in
the sectors, especially, for the activities in the cotton value chain which are in the formal
setup. The informal setup is beyond the scope of this research. There is very low research at
this scale for the supply chain system, which restricts the global view of the system and
makes it difficult to adopt relevant strategic directions when working on the overall system
improvement. Therefore, the intention was to identify the strategic environment of the
system and the relevant strategic directions. The motivation behind this research is that the
industry needs a proper restructuring to improve its overall competitiveness in the areas
which can bring higher profits and for this a detailed study of the textile and clothing
system was needed.
The strengths of this research are based on its multidimensional approach; strategic insight
is produced on the overall system which is supported with tactical view of an advance
supply chain. We believe this will provide a better understanding on the issues which are
now faced in the global textile and clothing supply chains.
vi
Contributos para uma melhor Gestão da Cadeia de Abastecimento Têxtil no
Paquistão
Nas últimas décadas, a liberalização comercial e as inovações na área das comunicações
têm aumentado as oportunidades para os grandes retalhistas e as grandes marcas se
abastecerem em fornecedores e fabricantes de todo o mundo. Transformaram-se assim em
empresas globais que subcontratam a produção dos bens que comercializam a fornecedores
e produtores situados em qualquer parte do mundo através de complexas redes
internacionais ou de cadeias de abastecimento globais. Desta forma, os grandes retalhistas e
as grandes marcas controlam estas cadeias de abastecimento (CAs) e determinam os níveis
de preço, qualidade, prazos de entrega e condições de trabalho para os fornecedores e
produtores que fazem parte da CA.
Como resultado desta transformação, as atividades globais da cadeia de abastecimento
têxtil e do vestuário estão divididas em operações de lucro elevado e operações de baixa
rentabilidade. Retalhistas e marcas retém os processos de lucro elevado, tais como
inovação, marketing e retalho. As operações de menor valor acrescentado, como o
abastecimento de matérias-primas, a produção e montagem, o acabamento e embalagem,
são subcontratadas a produtores de baixo custo em todo o mundo. Isso criou exportações
intensivas de trabalho dos locais de baixo custo especialmente Ásia e Extremo Oriente. Esta
migração da indústria têxtil e do vestuário tem desbloqueado potenciais novos mercados,
incluindo a China, a Ásia do Sul, o Brasil e o Médio Oriente.
Na reestruturação global da indústria têxtil e de vestuário, capacidades competitivas como
inovação, design e rapidez de resposta emergiram como os principais fatores de
rentabilidade. Nos dias de hoje, a qualidade, a adição de valor e o serviço ao cliente são
utilizados para manter a posição estratégica global das CAs
Existem muitas marcas de têxteis e vestuário que são fabricadas atualmente na Índia,
Paquistão e Bangladesh. O Paquistão é um importante produtor têxtil, dispondo dos
recursos necessários para esta indústria, nos quais se incluem instalações, tecnologia,

vii
disponibilidade de matéria-prima e mão de obra barata. Apesar disso, tem produzido
essencialmente produtos standard, de baixo valor acrescentado e dirigidos para sectores do
mercado de menor rentabilidade. Muitos países aumentaram as suas quotas de exportação
de produtos têxteis e de vestuário após a eliminação do regime de quotas. Infelizmente, o
Paquistão não foi capaz de aumentar a sua quota de exportação nos seus mercados não
tradicionais, como o do vestuário de moda, por falta de estratégias adequadas e de
modernização da sua indústria têxtil e do vestuário. Tornou-se claro que a indústria não está
preparada para este novo cenário tendo dificuldades em cumprir prazos de entrega curtos e
em dar respostas rápidas exigidas pela maioria dos clientes hoje em dia.
Este trabalho centra-se na cadeia de abastecimento têxtil e do vestuário do Paquistão.
Foram estudadas a estrutura e as características do sistema e os seus padrões de
desenvolvimento sectoriais, em especial, para as actividades da cadeia de valor do algodão,
que se encontram na configuração formal. A configuração informal está para além do
âmbito desta pesquisa. Existem poucos estudos a essa escala para o sistema de cadeia de
abastecimento, o que restringe a visão global do sistema e torna difícil a adopção de
orientações estratégicas relevantes quando se trabalha na melhoria global do sistema.
Assim, o objectivo foi identificar o ambiente estratégico do sistema e as decisões
estratégicas mais relevantes. A motivação por trás desta pesquisa está no facto de a
indústria precisar de uma reestruturação adequada para melhorar a sua competitividade
global nas áreas que podem trazer maiores lucros e, para isso, um estudo detalhado do
sector têxtil e do vestuário foi necessário.
Os pontos principais deste trabalho centram-se na sua abordagem multidimensional; É feita
uma análise estratégica de todo o sistema, que é apoiada do ponto de vista táctico no estudo
de uma cadeia de abastecimento moderna. Acreditamos que isso irá proporcionar um
melhor entendimento sobre as questões que são enfrentadas atualmente, à escala global,
pelas cadeias de abastecimento têxtil e do vestuário.
viii
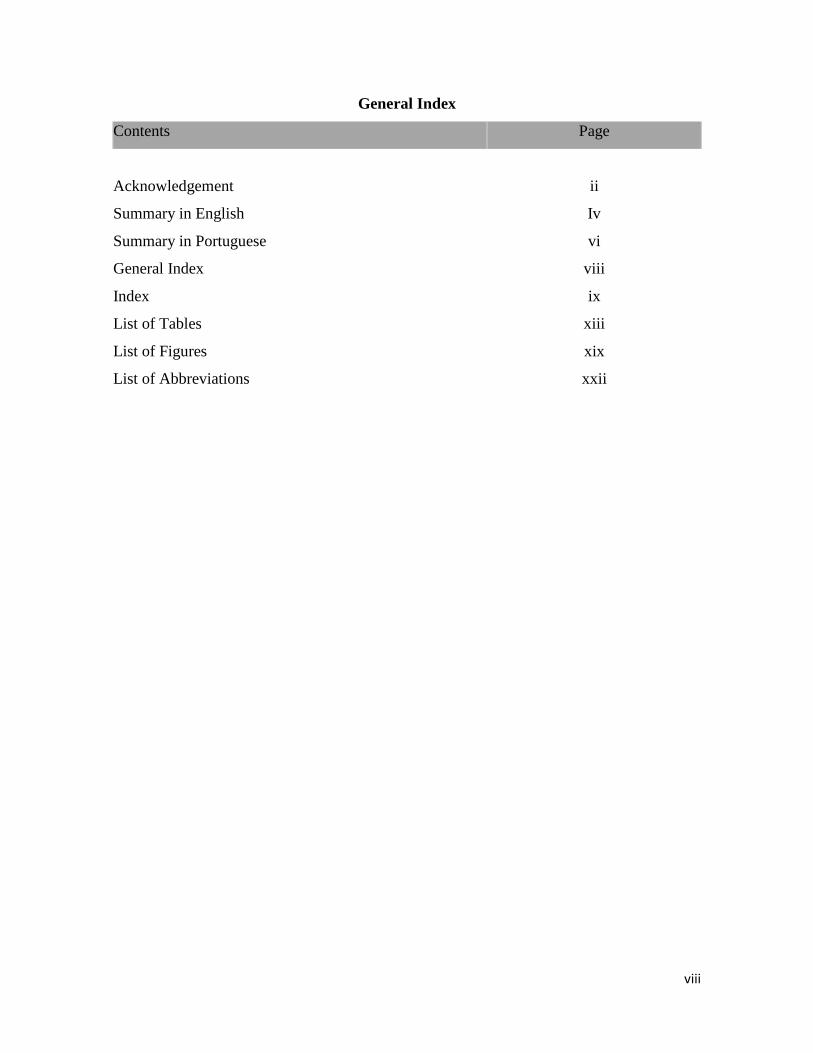
General Index
Contents Page
Acknowledgement ii
Summary in English Iv
Summary in Portuguese vi
General Index viii
Index ix
List of Tables xiii
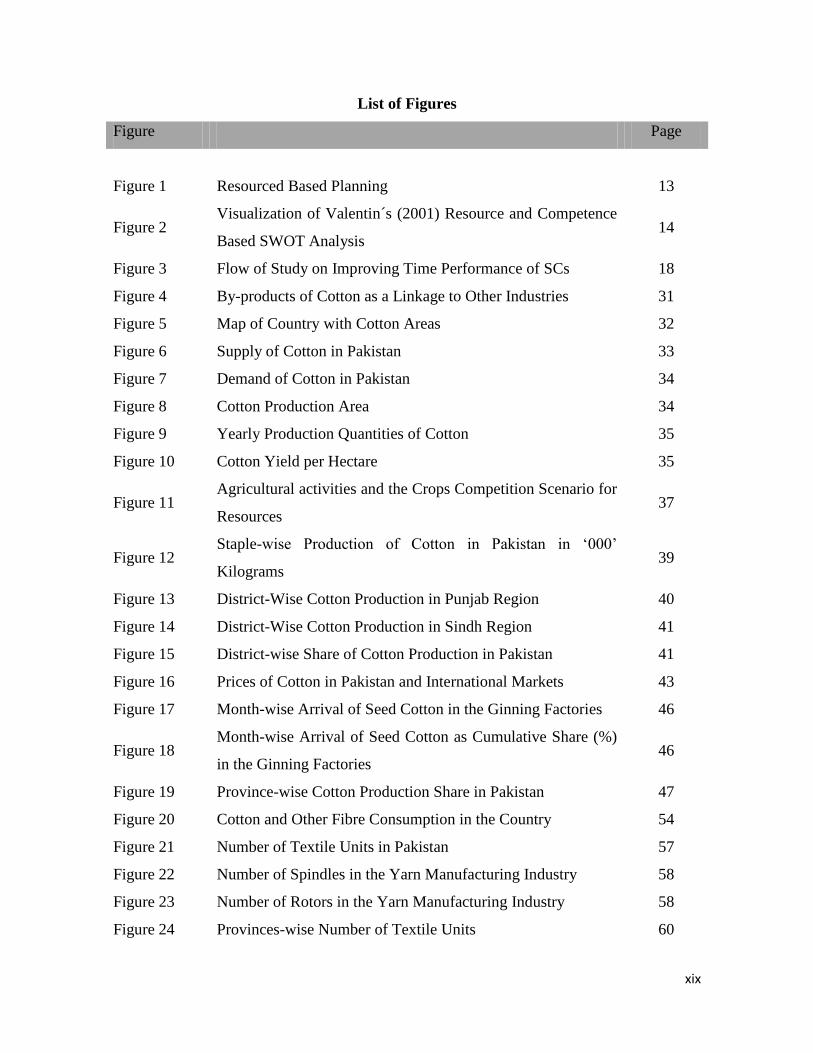
List of Figures xix
List of Abbreviations xxii

ix
Index
Contents Page
Chapter I Introduction 1
I.1. Global Textile and Clothing Supply Chain System 2
I.2. Position of the Textile and Clothing SC System of
Pakistan in the World 5
I.3. Research Objectives and the Questions 7
Chapter II Literature Review & Research Design 9
II.1. Literature Review 10
II.1.1. Strategic Planning 10
II.1.2. Configuration of the Supply Chains in Textile and
Clothing 16
II.2. Research Design 19
II.2.1. Strategic Issues 19
II.2.2. Tactical Issues 22
Chapter III Analysing the Strategic Environment of the T&C
System in Pakistan 26
III.1. Brief Historical View on the Textile and Clothing
Sectors in the Region 27
III.2. Textile and Clothing Supply Chain System in Pakistan 29
III.2.1. Cotton Production 30
III.2.1.1. Policy Interventions on the Cotton Trade 42
III.2.2. Ginning 45
III.2.3. Other Fibres (Except Cotton) 52
III.2.4. Yarn Manufacturing 56
III.2.5. Fabric Manufacturing 70
III.2.6. Dyeing, Printing and Finishing Sectors 81
III.2.7. Textile Made-up Sectors 82
III.2.8. Apparel and Clothing Sectors 87
III.2.8.1. Characteristics of the Clothing and Apparel Sectors 91

x
Contents Page
III.2.9. Study Programs in Textile, Clothing and Related Areas 98
III.2.10. Logistics 101
III.3. Results and Discussion 102
III.3.1. Development Status of the Supply Chain and Related
Segments 109
III.3.1. Identification of SWOTs for the System 110
III.4. Conclusion 112
Chapter IV Strategic Planning for the Textile and Clothing SC
System in Pakistan 114
IV.1. Development of the Strategic Plans 115
IV.2. Evaluation of the Strategic Plans 118
IV.2.1. Decision Methods of AHP and ANP in SWOT 119
IV.2.1.1. Application of ANP in SWOT 126
IV.2.1.2. Results with AHP in SWOT 135
IV.2.1.3. Comparison of Results 136
IV.2.1.4. Sensitivity Analysis on Results of the Performance
Evaluation 137
IV.2.2. Evaluation on the Implementation Characteristics of the
Plans 140
IV.2.2.1. Simple Additive Weighting (SAW) 140
IV.2.2.2. Criteria for the Implementation Phase 141
IV.2.2.3. Application of SAW Method to Analyse the
Implementation Character of the Strategic Plans 143
IV.2.2.4. Results on the Implementation Character 143
IV.2.2.5. Sensitivity Analysis on the Results of Implementation
Character 145
IV.2.3. Discussion on the Results of the Strategic Planning 148
IV.2.4. Conclusion 153

xi
Contents Page
Chapter V An Insight on the Tactical Issues of a Modern Textile
and Clothing SC 156
V.1. Introduction 157
V.2. The Case Study: A Textile and Clothing Chain from
Portugal 159
V.2.1. Configuration and Attributes of the Supply-Production-
Delivery Chain 160
V.2.1.1. Supply /Procurement Strategy 160
V.2.1.2. Production Strategy 161
V.2.1.3. Delivery Strategy 164
V.2.2. Sales and Demand Behaviour of the Markets for the
Products of the Company 164
V.2.3. Linkage and Structure of Segments and Functioning of
Chain on Order Fulfilment Process 165
V.2.3.1. Functioning of the Chain on Order Fulfilment Process 167
V.2.3.2. Structure of the Fabric Manufacturing Segment 168
V.2.4. Time Elements in the Order Fulfilment Process 169
V.2.4.1. Data Analysis on the Time Elements in CTP Orders 171
V.2.5. Style Change Activity and the Analysis of Its
Performance 175
V.2.6. Discussion 179
V.2.7. Conclusion 182
Chapter VI Conclusion & Future Research 184
VI.1. Conclusion 185
VI.2. Future Research 190
References 192
Appendices 202
Appendix III. A Data Tables for the Textile and Clothing Sectors 202
Appendix III.B Survey Form on the Strategic Environment of System 215

xii
Contents Page
Appendix IV. A. Pairwise Comparison Matrices for SWOT Sub-factors 220
Appendix IV. B. Pairwise Comparison Matrices for Alternatives 221
Appendix V. A. Survey Form on the Transportation Time of Pakistan
(Logistics and Shipping Companies) 232
Appendix V. B. Survey Results on the Transportation Time of Pakistan 235
xiii
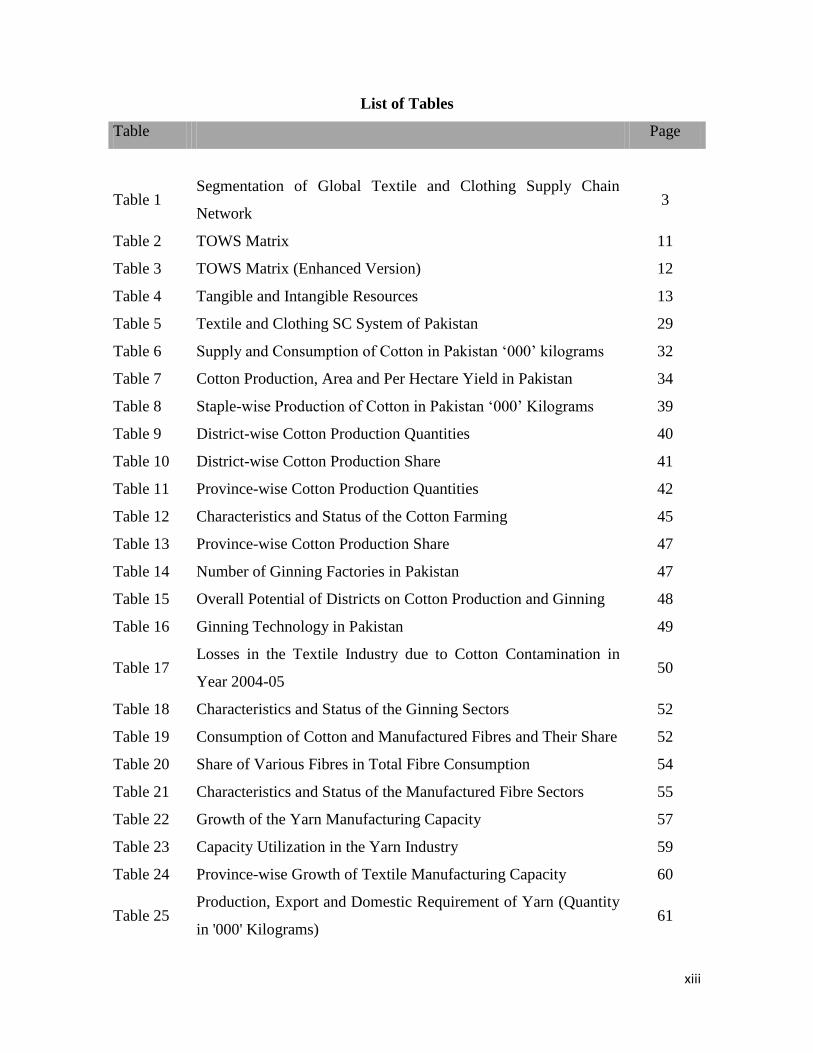
List of Tables
Table Page
Table 1 Segmentation of Global Textile and Clothing Supply Chain
Network 3
Table 2 TOWS Matrix 11
Table 3 TOWS Matrix (Enhanced Version) 12
Table 4 Tangible and Intangible Resources 13
Table 5 Textile and Clothing SC System of Pakistan 29
Table 6 Supply and Consumption of Cotton in Pakistan „000‟ kilograms 32
Table 7 Cotton Production, Area and Per Hectare Yield in Pakistan 34
Table 8 Staple-wise Production of Cotton in Pakistan „000‟ Kilograms 39
Table 9 District-wise Cotton Production Quantities 40
Table 10 District-wise Cotton Production Share 41
Table 11 Province-wise Cotton Production Quantities 42
Table 12 Characteristics and Status of the Cotton Farming 45
Table 13 Province-wise Cotton Production Share 47
Table 14 Number of Ginning Factories in Pakistan 47
Table 15 Overall Potential of Districts on Cotton Production and Ginning 48
Table 16 Ginning Technology in Pakistan 49
Table 17 Losses in the Textile Industry due to Cotton Contamination in
Year 2004-05 50
Table 18 Characteristics and Status of the Ginning Sectors 52
Table 19 Consumption of Cotton and Manufactured Fibres and Their Share 52
Table 20 Share of Various Fibres in Total Fibre Consumption 54
Table 21 Characteristics and Status of the Manufactured Fibre Sectors 55
Table 22 Growth of the Yarn Manufacturing Capacity 57
Table 23 Capacity Utilization in the Yarn Industry 59
Table 24 Province-wise Growth of Textile Manufacturing Capacity 60
Table 25 Production, Export and Domestic Requirement of Yarn (Quantity
in '000' Kilograms) 61

xiv
Table Page
Table 26 Province-wise Production of Yarn “000 Kilograms” 63
Table 27 World Production of Cotton Yarn 64
Table 28 Count-wise Production of Yarn in Metric Tones 64
Table 29 Production of Various Categories of Yarn (Metric Tons) 66
Table 30 Count-wise Production Shares of Yarn 67
Table 31 Share of Coarse and Medium Fine Yarns 67
Table 32 Share of Fine and Super Fine Yarns 68
Table 33 Share of Various Types of Cotton Fibre in the Overall Production 68
Table 34 Exports Data of Main Yarn Exporters 69
Table 35 Characteristics and Status of the Yarn Sectors 70
Table 36 Installed and Working Capacities of the Weaving Sector 75
Table 37 Textile Manufacturing Industry in Various Districts of Pakistan 76
Table 38 Region-wise Textile Manufacturing Capacity 76
Table 39 Fabric Production and Export (Million Square Meters) 78
Table 40 Quality-wise Share of Cloth Produced in the Organised Sector 78
Table 41 Fabric Exports of Pakistan 79
Table 42 Knitting and Hosiery Industry in Pakistan 80
Table 43 Characteristics and Status of the Weaving and knitting Sectors 81
Table 44 Characteristics and the Status of the Dyeing, Printing and
Finishing Sectors 82
Table 45 Export Figures of the Main Exporters in the Made-up Sector 83
Table 46 World Towel and Cleaning Cloth Exports 83
Table 47 Towel and Cleaning Cloth Exports of Pakistan 84
Table 48 Expansion of the Towel Industry in the Country 84
Table 49 Development Status of the Towel Sector 86
Table 50 Bed Wear Exports in Million US Dollars 86
Table 51 Characteristics and Status of the Textile Made-up Industry 87
Table 52 World Clothing Exports 88
Table 53 Clothing Exports of the World and Pakistan 89
xv
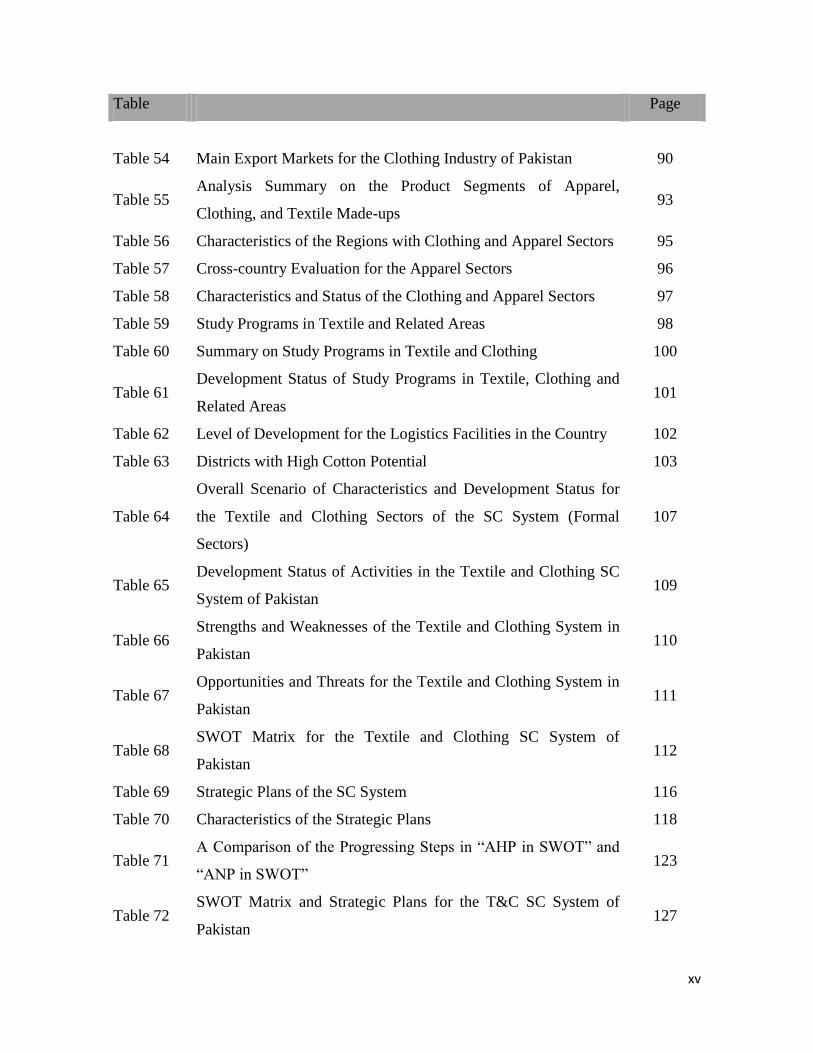
Table Page
Table 54 Main Export Markets for the Clothing Industry of Pakistan 90
Table 55 Analysis Summary on the Product Segments of Apparel,
Clothing, and Textile Made-ups 93
Table 56 Characteristics of the Regions with Clothing and Apparel Sectors 95
Table 57 Cross-country Evaluation for the Apparel Sectors 96
Table 58 Characteristics and Status of the Clothing and Apparel Sectors 97
Table 59 Study Programs in Textile and Related Areas 98
Table 60 Summary on Study Programs in Textile and Clothing 100
Table 61 Development Status of Study Programs in Textile, Clothing and
Related Areas 101
Table 62 Level of Development for the Logistics Facilities in the Country 102
Table 63 Districts with High Cotton Potential 103
Table 64
Overall Scenario of Characteristics and Development Status for
the Textile and Clothing Sectors of the SC System (Formal
Sectors)
107
Table 65 Development Status of Activities in the Textile and Clothing SC
System of Pakistan 109
Table 66 Strengths and Weaknesses of the Textile and Clothing System in
Pakistan 110
Table 67 Opportunities and Threats for the Textile and Clothing System in
Pakistan 111
Table 68 SWOT Matrix for the Textile and Clothing SC System of
Pakistan 112
Table 69 Strategic Plans of the SC System 116
Table 70 Characteristics of the Strategic Plans 118
Table 71 A Comparison of the Progressing Steps in “AHP in SWOT” and
“ANP in SWOT” 123
Table 72 SWOT Matrix and Strategic Plans for the T&C SC System of
Pakistan 127
xvi
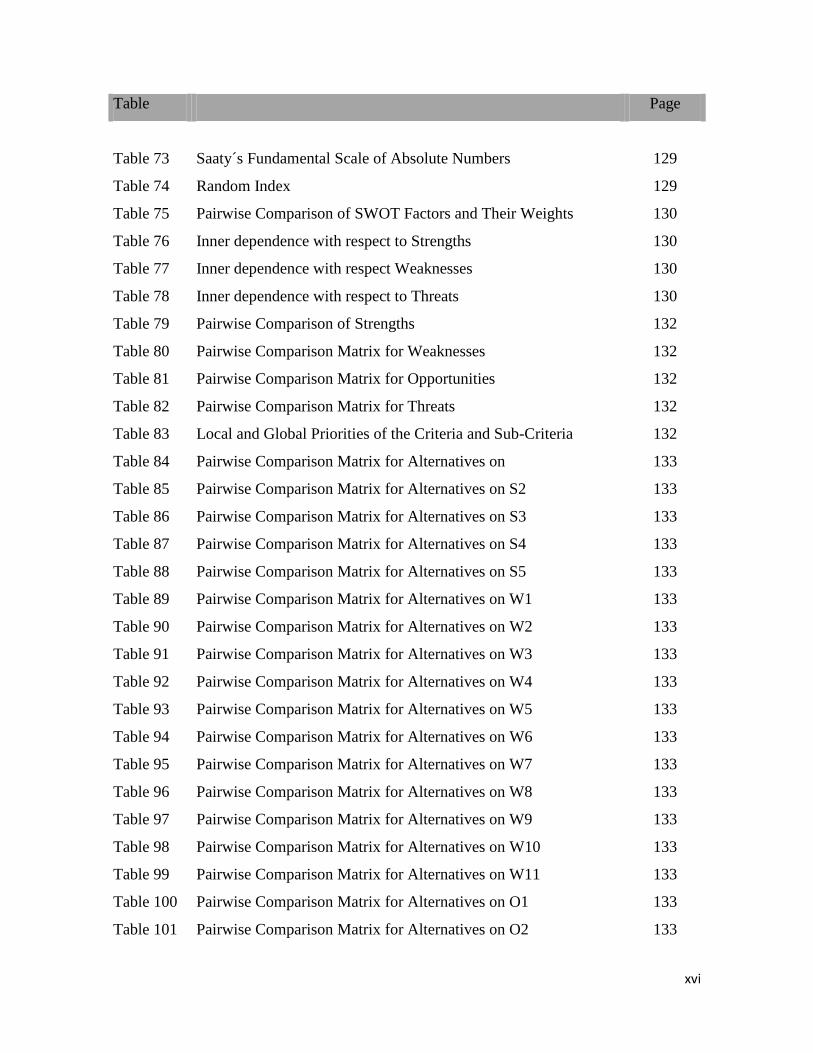
Table Page
Table 73 Saaty´s Fundamental Scale of Absolute Numbers 129
Table 74 Random Index 129
Table 75 Pairwise Comparison of SWOT Factors and Their Weights 130
Table 76 Inner dependence with respect to Strengths 130
Table 77 Inner dependence with respect Weaknesses 130
Table 78 Inner dependence with respect to Threats 130
Table 79 Pairwise Comparison of Strengths 132
Table 80 Pairwise Comparison Matrix for Weaknesses 132
Table 81 Pairwise Comparison Matrix for Opportunities 132
Table 82 Pairwise Comparison Matrix for Threats 132
Table 83 Local and Global Priorities of the Criteria and Sub-Criteria 132
Table 84 Pairwise Comparison Matrix for Alternatives on 133
Table 85 Pairwise Comparison Matrix for Alternatives on S2 133
Table 86 Pairwise Comparison Matrix for Alternatives on S3 133
Table 87 Pairwise Comparison Matrix for Alternatives on S4 133
Table 88 Pairwise Comparison Matrix for Alternatives on S5 133
Table 89 Pairwise Comparison Matrix for Alternatives on W1 133
Table 90 Pairwise Comparison Matrix for Alternatives on W2 133
Table 91 Pairwise Comparison Matrix for Alternatives on W3 133
Table 92 Pairwise Comparison Matrix for Alternatives on W4 133
Table 93 Pairwise Comparison Matrix for Alternatives on W5 133
Table 94 Pairwise Comparison Matrix for Alternatives on W6 133
Table 95 Pairwise Comparison Matrix for Alternatives on W7 133
Table 96 Pairwise Comparison Matrix for Alternatives on W8 133
Table 97 Pairwise Comparison Matrix for Alternatives on W9 133
Table 98 Pairwise Comparison Matrix for Alternatives on W10 133
Table 99 Pairwise Comparison Matrix for Alternatives on W11 133
Table 100 Pairwise Comparison Matrix for Alternatives on O1 133
Table 101 Pairwise Comparison Matrix for Alternatives on O2 133

xvii
Table Page
Table 102 Pairwise Comparison Matrix for Alternatives on O3 133
Table 103 Pairwise Comparison Matrix for Alternatives on O4 133
Table 104 Pairwise Comparison Matrix for Alternatives on O5 133
Table 105 Pairwise Comparison Matrix for Alternatives on O6 133
Table 106 Pairwise Comparison Matrix for Alternatives on O7 133
Table 107 Pairwise Comparison Matrix for Alternatives on T1 133
Table 108 Pairwise Comparison Matrix for Alternatives on T2 133
Table 109 The Importance of the Strategies with ANP in SWOT 135
Table 110 The Importance Values of Alternatives with AHP in SWOT 135
Table 111 Comparison of Results 136
Table 112 Categorisation of Strategies on their Importance Value 136
Table 113 Cost Scale 142
Table 114 Implementation Time Scale 142
Table 115 Scale for Implementability 142
Table 116 Values for the Implementation Behaviour of Strategies 143
Table 117 Ranking of Strategies in their Implementation Behaviour 144
Table 118 Dependence Scenario of Strategies 148
Table 119 Categorisation of the Strategies on SWOT Dimensions 149
Table 120 Dependence Scenario and Implementation Behaviour of
Strategies 150
Table 121 Main attributes of the Textile and Clothing Supply Chain 160
Table 122 Main Activities of the Collection Development Cycle 163
Table 123 Characteristics of the Collections 163
Table 124 Data Summary on the Time Elements in the CTP Order
Fulfilment for Yarn-dyed Fabrics 172
Table 125 Time Standard for Various Types of Mounting Operations 175
Table 126 Month Data Summary on Mounting Operations 176
Table 127 Relative Comparison of Mounting Operation on Time 177
Table 128 Inland Transportation Times from Industrial Locations to Karachi 190
xviii
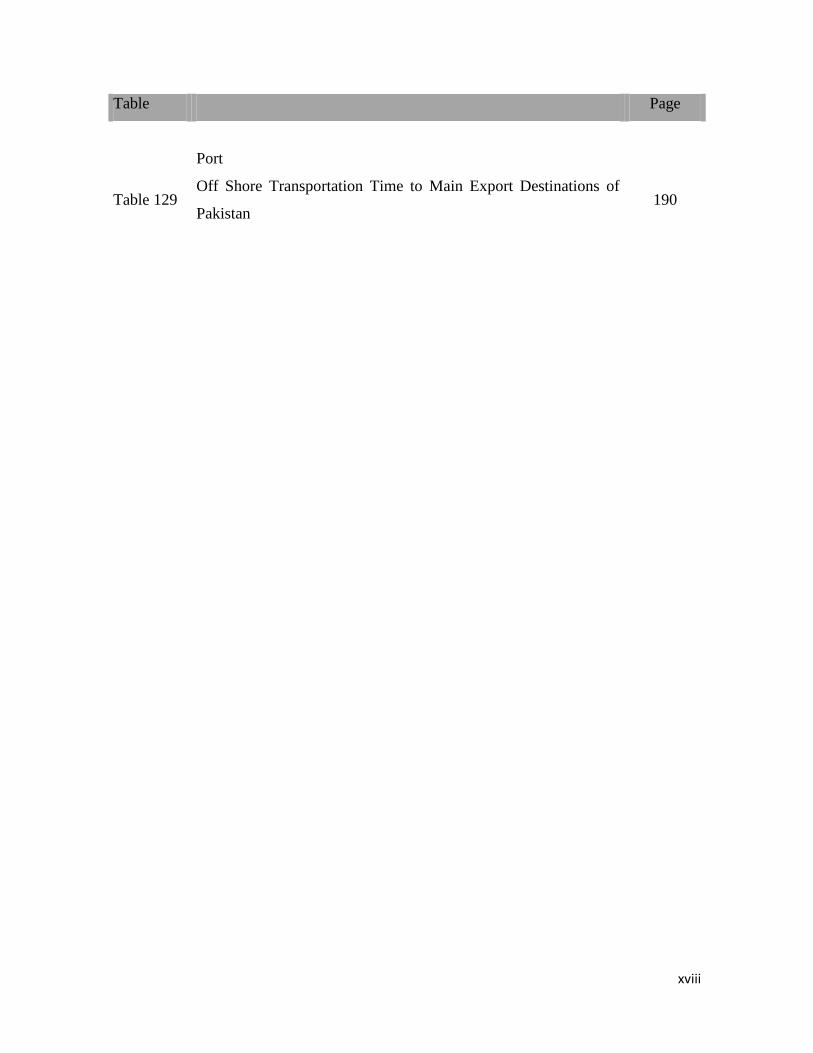
Table Page
Port
Table 129 Off Shore Transportation Time to Main Export Destinations of
Pakistan 190
xix
List of Figures
Figure Page
Figure 1 Resourced Based Planning 13
Figure 2 Visualization of Valentin´s (2001) Resource and Competence
Based SWOT Analysis 14
Figure 3 Flow of Study on Improving Time Performance of SCs 18
Figure 4 By-products of Cotton as a Linkage to Other Industries 31
Figure 5 Map of Country with Cotton Areas 32
Figure 6 Supply of Cotton in Pakistan 33
Figure 7 Demand of Cotton in Pakistan 34
Figure 8 Cotton Production Area 34
Figure 9 Yearly Production Quantities of Cotton 35
Figure 10 Cotton Yield per Hectare 35
Figure 11 Agricultural activities and the Crops Competition Scenario for
Resources 37
Figure 12 Staple-wise Production of Cotton in Pakistan in „000‟
Kilograms 39
Figure 13 District-Wise Cotton Production in Punjab Region 40
Figure 14 District-Wise Cotton Production in Sindh Region 41
Figure 15 District-wise Share of Cotton Production in Pakistan 41
Figure 16 Prices of Cotton in Pakistan and International Markets 43
Figure 17 Month-wise Arrival of Seed Cotton in the Ginning Factories 46
Figure 18 Month-wise Arrival of Seed Cotton as Cumulative Share (%)
in the Ginning Factories 46
Figure 19 Province-wise Cotton Production Share in Pakistan 47
Figure 20 Cotton and Other Fibre Consumption in the Country 54
Figure 21 Number of Textile Units in Pakistan 57
Figure 22 Number of Spindles in the Yarn Manufacturing Industry 58
Figure 23 Number of Rotors in the Yarn Manufacturing Industry 58
Figure 24 Provinces-wise Number of Textile Units 60

xx
Figure Page
Figure 25 Province-wise Number of Spindles in the Yarn Industry 60
Figure 26 Province-wise Number of Rotors in the Yarn Industry 60
Figure 27 Production, Export and Domestic Requirement of Yarn 62
Figure 28 Province-wise Production of Yarn 63
Figure 29 Count-wise Production of Yarn in Pakistan 65
Figure 30 Production of Various Categories of Yarn in Pakistan (Metric
Tons) 67
Figure 31 Province-wise Number of Weaving Machines in the Fabric
Industry 73
Figure 32 Planning-Link for the Strategic Planning Scenario of the TC
System in Pakistan 115
Figure 33 Hierarchical and Network Decision Structure 120
Figure 34 Decision Structure under AHP in SWOT and ANP in SWOT 124
Figure 35 Inner dependence Model 124
Figure 36 Decision Model for the Strategic Planning of Textile and
Clothing SC System in Pakistan with AHP in SWOT 128
Figure 37 The Importance of the Strategies with AHP in SWOT 135
Figure 38 Sensitivity Analysis on Results of Performance Evaluation 138
Figure 39 Values of Implementation Behaviour for Strategies 144
Figure 40 Sensitivity Analysis on the Results of Implementation
Behaviour of Strategies under Cost Criterion 146
Figure 41 Sensitivity Analysis on the Results of Implementation
Behaviour of Strategies under Time Criterion 146
Figure 42 Sensitivity Analysis on the Results of Implementation
Behaviour of Strategies under Implementability Criterion 147
Figure 43 Implementation Scenario of the Strategic Planning Process 151
Figure 44 Strategies on the Diversification Dimension 152
Figure 45 Strategies on the Responsiveness Dimension 153
Figure 46 The Vertical Chain of the Textile and Clothing Company 159
xxi
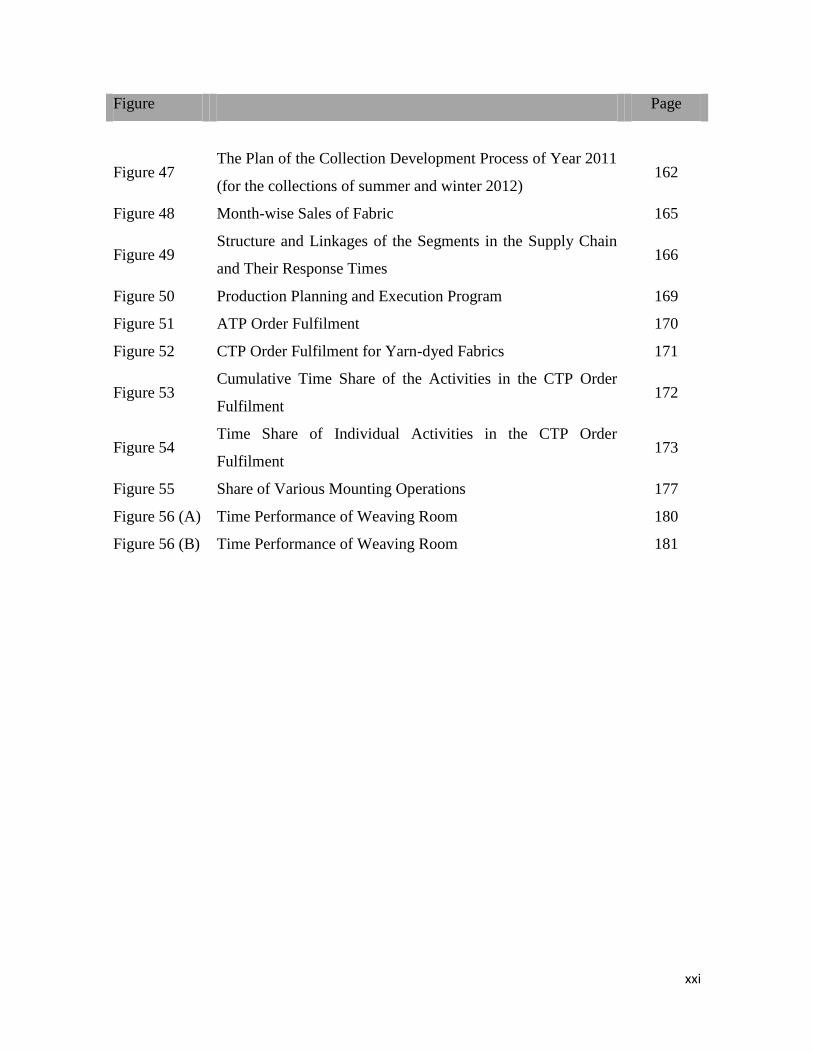
Figure Page
Figure 47 The Plan of the Collection Development Process of Year 2011
(for the collections of summer and winter 2012) 162
Figure 48 Month-wise Sales of Fabric 165
Figure 49 Structure and Linkages of the Segments in the Supply Chain
and Their Response Times 166
Figure 50 Production Planning and Execution Program 169
Figure 51 ATP Order Fulfilment 170
Figure 52 CTP Order Fulfilment for Yarn-dyed Fabrics 171
Figure 53 Cumulative Time Share of the Activities in the CTP Order
Fulfilment 172
Figure 54 Time Share of Individual Activities in the CTP Order
Fulfilment 173
Figure 55 Share of Various Mounting Operations 177
Figure 56 (A) Time Performance of Weaving Room 180
Figure 56 (B) Time Performance of Weaving Room 181
xxii
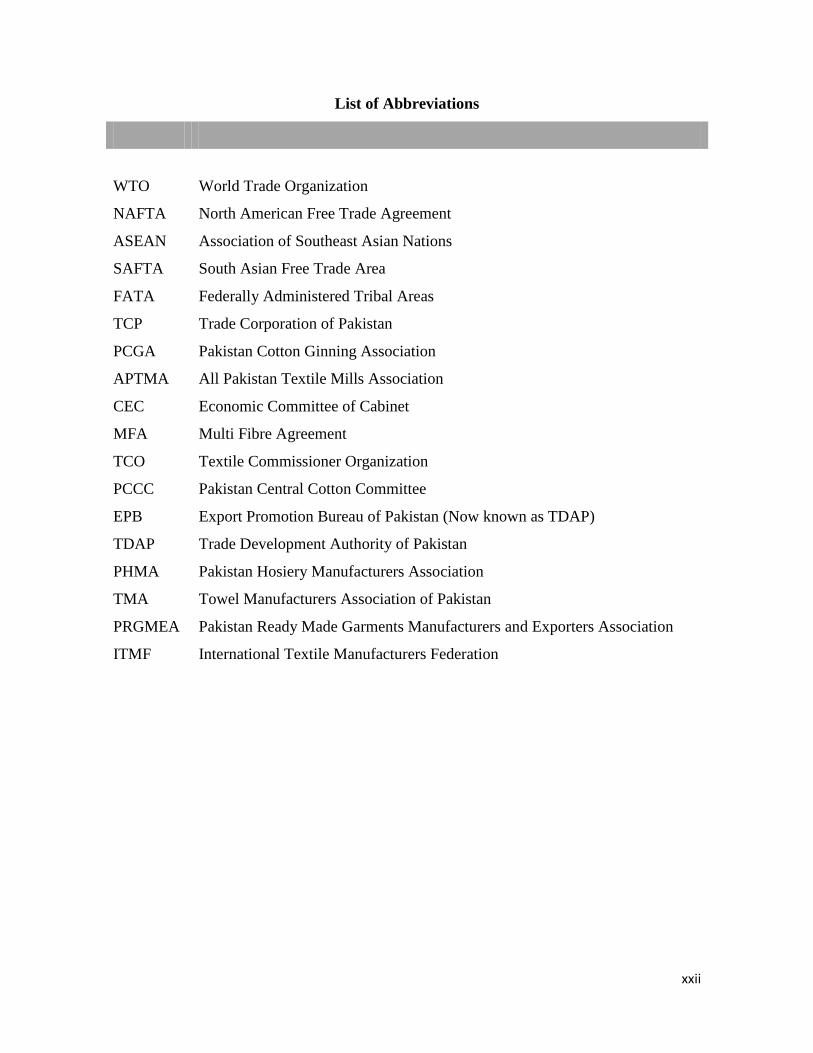
List of Abbreviations
WTO World Trade Organization
NAFTA North American Free Trade Agreement
ASEAN Association of Southeast Asian Nations
SAFTA South Asian Free Trade Area
FATA Federally Administered Tribal Areas
TCP Trade Corporation of Pakistan
PCGA Pakistan Cotton Ginning Association
APTMA All Pakistan Textile Mills Association
CEC Economic Committee of Cabinet
MFA Multi Fibre Agreement
TCO Textile Commissioner Organization
PCCC Pakistan Central Cotton Committee
EPB Export Promotion Bureau of Pakistan (Now known as TDAP)
TDAP Trade Development Authority of Pakistan
PHMA Pakistan Hosiery Manufacturers Association
TMA Towel Manufacturers Association of Pakistan
PRGMEA Pakistan Ready Made Garments Manufacturers and Exporters Association
ITMF International Textile Manufacturers Federation

1
Chapter I Introduction Page
I.1. Global Textile and Clothing Supply Chain System 2
I.2. Position of the Textile and Clothing SC System of Pakistan in
the World 5
I.3. Research Objectives and the Questions 7
2
I.1. Global Textile and Clothing Supply Chain System
Over the past 25 years, trade liberalization and communication innovations have increased the
opportunities for retailers and brands to buy their products from producers worldwide. According
to studies, these retailers and brands have become “global sourcing companies”, outsourcing the
production of goods they sell to tiers of competing suppliers and producers through complex
international networks, or global supply chains. Now, the supply chains (SCs) are driven by big
brands and retailers that have tremendous power in determining price, quality, delivery, and
labour conditions for suppliers and producers down the chain. The SC segments are divided into
high and low profit steps. Retailers and brands keep high profit steps such as innovation,
marketing and retailing. Low profit steps, such as sourcing raw materials, production and
assembly, finishing and packing, are outsourced to mid-chain suppliers and low-cost producers
worldwide. Thus global supply chains have created labour-intensive exports from low-cost
locations especially Asian and Far East regions. The result is an enormous growth in the number
of producers, increasing competition among the world‟s factories at the bottom of the chain. The
phenomenon of the industrial shift to the low labour cost economies is discussed by Loo (2002)
and Bolisani and Scarso (1996). As a result of this industrial shift in the last couple of decades,
the major competing SCs in textile and clothing are now routed from countries like China, India,
Pakistan, Turkey, Indonesia, Thailand and Vietnam and some others are emerging from Brazil
and Bangladesh. The textiles and clothing sector generated, in 2007, flows of about 583.4 Billion
$US, amounting to almost 4.2% of total world exports (WTO Statistics, 2007). The clothing
sector, accounting for about 345.3 Billion $US, is particularly important to many developing
countries where textiles are the main source of export revenue and manufacturing employment.
In such a situation, the suppliers in the global textile and clothing networks are adopting
competitive strategies to improve their attractiveness to the global customers. The choice of
competitive strategies depends on many factors, including geographical location of the suppliers,
development status of the country´s infrastructure in which they operate, their capability in
design and innovation, level of their advancement in the communication technologies and
awareness to the needs and requirements of the end user. Based on these factors for example, the
application and usage of the competitive strategies vary in the upward and downward segments
of the textile and clothing chains because of the recent regionalization of these sectors. The
generic nature of the products in the upward segments of the chain has made the choice of
competitive options more specific, leaving cost, quality, service and reliability as some suitable

3
choices. These are the options which are favourable to adopt in the countries producing the
generic products because of being far away from the main markets but being rich in raw materials
and having cheap labour. On the other hand, the diverse nature of the customer segments and
their needs have transformed the conventional, slow style changing and mass producers to
modern, quick style changing and customized producers. They are technologically advanced and
locate in regions of well-developed infrastructure having high speed transportation linkage to the
important international markets. Tersine and Hummingbird (1995) discussed the strategic
competitive options under different product environments of the companies which if merged to
the current segmentation of the activities in the global context of textile and clothing
manufacturing discussed by Teng and Jaramillo (2005), the situation which emerges is presented
in Table 1 (Hussain et al. (2011b)).
Table 1: Segmentation of Global Textile and Clothing Supply Chain Network
Segments Competitive Options Current State Remarks
Up
war
d C
hai
n
(Raw
Mat
eria
ls t
o F
abri
c)
Producers:
Asia (China,
India,
Pakistan,
Turkey),
S. America,
Africa.
Markets:
N. America,
Europe,
Asia
Price/Cost,
Quality,
Delivery Time,
Reliability, Service,
Flexibility
Experiencing significant
changes and new players are
positioning themselves in new
situation.
Competition is fierce in gaining
and maintaining position in
markets when cost and delivery
times are the critical options to
maintain and control.
Maquiladoras initiated the transfer of these industries from
North America to Central America and NAFTA accelerated
this shift. Then the different events as revaluation of currency
by Mexico, elimination of quotas and entrance of China into
WTO regime, created a shift of textile and clothing
manufacturing near to resource rich and low-cost locations.
Do
wn
war
d C
hai
n
(Clo
thin
g;
Des
ign a
nd D
evel
op
men
t; C
ust
om
er L
ink
)
Markets:
N. America
Europe,
Japan,
Russia
Emerging
Markets:
China,
India,
Brazil
Producers:
Asia,
Europe,
South
America
Design,
Services
Differentiation with
Shortest Possible
Lead Times
Controlled by big brands and
retailers
(Wal-Mart, Zara, Gap, etc.)
Preferred geographical locations exists near main and
emerging markets which support to compete on design and
time

4
In the course of development, competitive capabilities including the design and innovation and
the time-based performance of the supply chains have emerged as the main driving forces for the
profitability of the companies involved in these saturated markets, specifically in fashion clothing
sectors. Simultaneously, quality, value-addition and customer service help in developing the
overall strategic position of the company in terms of its long term competitiveness and
sustainability.
The success or failure when competing on the above factors depends on different parameters of
the system. For example, the innovation and design mainly depend on the performance of the
human skills. These capabilities have their strength in the product and market research. To
develop these skills, experience and commitment in the system are needed. Better performance
on time, quality, value-addition and customer service need a lot of investment in advanced
technology, whereas the requirement to invest in human skill is lower in these scenarios.
As the textile and clothing companies are scattered around the world, they operate in very
different environments and differ a lot in the level of their development. Therefore, the strengths
and the level of maturity of the companies under the competitive factors are quite different in
various regions of the world. In general, the process of historical development of the company
and its environment govern the working culture of the organization. The success to develop
specific strengths in the system depends mainly on the business culture. Therefore, companies
should configure their SCs depending upon the historical development of the environment,
available skills, other strengths and technological resources, which will ultimately affect the
range of their product environment and types of services, offered to various customer segments.
Most recently, when the companies collaborate internationally and integrate their operations to
form a network of SC system, they produce a wide range of products and services for the global
markets. This created a new and advanced demand and supply market where players collaborate
with their suppliers and share market information and risks (Harland and Knight (2001); Hartley
et al. (1997)).
There are many textile and fashion brands which are manufactured now in countries like
Pakistan, India and Bangladesh. The fashion cycles of these brands are mainly once or twice per
year, making it possible, to some extent, for the suppliers of these countries to respond to their
lead times. However, world trends in textile and fashion business clearly indicate that the lead
times are continuously reducing specially in the main markets of Europe and North America.
5
I.2. Position of the Textile and Clothing SC System of Pakistan in the World
Looking at the product environment of the textile and clothing industry of Pakistan, it can be
observed that the country is producing narrow range of products and most of these are directed to
the low profit segments of the international markets. The SC system mainly produces cotton-
based standard products including coarse-to-medium fine cotton yarns and low-to-medium
weight woven and knitted cloths (the fact which has its support in the export/production data in
Chapter III). The manufacturers and producers, in the country, are accustomed to supply low cost
products of good quality to the world markets. This was the main reason that the share of the
country in the world exports in these sectors is stagnant after the phasing-out of the quota regime
in 2005. On the other hand, many countries have successfully increased their shares of textile
and/or clothing exports under the new scenario by working with other countries and devising
mutual trade agreements like ASEAN economic trade zone and trade agreements of SAFTA and
NAFTA. Unfortunately, Pakistan was not able to increase its share in its non-traditional markets
because of not developing such strategies and not upgrading its domestic textile and clothing
industry. Therefore, the weaknesses of the planning to improve the national industry and its
integration to other important players should be the main factors behind the lower growth of the
country‟s textile and clothing exports in comparison to other players in the world.
In the current business environment, focusing on the complete SCs with respect to planning and
management is important in addition to focusing on the individual entities. Nowadays, many
companies in the developed world rely on supply chain management (SCM) as a key competitive
strategy. Large and small businesses alike have reported remarkable results, including dramatic
reductions in the cycle time and costs and increase in their responsiveness on customers‟
inquiries. In this scenario, as the competing textile and clothing SC systems have developed their
competitive strengths on design, delivery times and product diversification, SCM should be one
of the key focuses of Pakistani textile industry to improve its performance and to attract the
higher-end markets of fashion and clothing. It is obvious that the industry is not prepared for this
scenario and it has difficulties in meeting short lead times or other time-based performance and
higher responsiveness which are expected now a day by most customers in these sectors. Authors
have defined the term SCM as follows.
SCM is the systemic, strategic coordination of the traditional business functions and the tactics across these business
functions within a particular company and across businesses within the supply chain, for the purpose of improving
the long-term performance of the individual companies and the supply chain as a whole (Mentzer et al (2001)).
6
SCM has been used to explain the planning and control of material and information flows as well as the logistics
activities not only internally within a company but also externally between companies (Cooper et al. (1997) and
Fisher (1997), cited by Chen and Paulraj (2004).
SCM is an interdisciplinary field that emphasizes cross-functional links and seeks to manage those links to enhance a
company‟s competitive advantage. It involves forecasting, resource allocation, production planning, flow, process
and inventory management, customer delivery, after-sales support and service, and a multitude of other activities and
processes familiar and essential to business.
It is more relevant to observe the overall SC system and to evaluate its potential on main factors
which can support the SCM activities and the orientation of the business networks in textile and
clothing sectors in Pakistan. This approach is adopted in the development of the research.
Today, the fashion markets frequently create changing short-run orders causing a strong impact
on the planning function which should be equipped with advance planning and decision making
systems to facilitate quick response. Despite having latest computerized manufacturing machines,
textile and clothing companies in Pakistan put less emphasis on such tools which can help fast
decision making by demand forecasting, planning and control of production, inventory, etc. This
behaviour results in higher costs of operations and late deliveries. Thus, even with state of the art
machinery and access to capital, Pakistani textile and clothing industry is compelled to
manufacture and export non-seasonal and low value textile products where high capital is
required to manufacture at extremely low margins. Although, the main constraint in order to
decrease the lead times for the main international markets of USA and Europe is the geographical
location of the country, advance technologies can help to reduce this gap for specific customer
segments. Anyway, the measures which can enhance the responsiveness of the country in the
above markets will definitely enhance its strategic position in the emerging markets of China,
India and Pakistan itself. Therefore, there is a need to address the factors on which the time-based
performance of the system depends. These factors include poor logistics, limited use of advance
technologies in planning and controls and low usage of advance information and communication
in the SC system.
We will continue exploring the above factors in Chapters III and IV. In the following sections,
we will discuss the objectives and the scope of the research.

7
I.3. Research Objectives and Questions
Many researchers have studied the competitive options in the supply and demand chain networks,
including Tersine and Hummingbird (1995), Teng and Jaramillo (2005), Cox (2005) and Omera
(2008).
Omera (2008) and Cox (2005) concluded that product design is a key factor in today‟s
challenging markets for companies working in UK. In her case study, Omera (2008) described
that with a strong product design background, companies in England have the support of
geographical location and advance infrastructure which enhance their ability to reduce the time to
market their products. In this way, the companies maintain their profitability even with the higher
labour and material costs in the country.
We believe that improving the time-based performance in the textile and clothing supply chain
system of Pakistan will increase its attractiveness in the higher-end markets of fashion and
clothing. It will also decrease the overall cost as decreasing the flow time in the SC should lead
to cost reductions. The factors, on which the competitiveness of the system can be based, include
the research environment, skills on design, innovation and the diversification of fibres. At this
stage, the expansion of the textile activities to the application areas of automotive, medical,
construction and agriculture should also be focused. This will lead the product environment of
the system to the advance industries of technical and functional textiles and will improve its
technological and research dimensions.
Once the governing factors are in place, the time-based performance and the competitiveness can
be improved significantly. Otherwise, the companies will try to improve their performance and
the system will waste their efforts. Also, it will cost a lot to the individual companies to adopt
such strategies on their own resources. This will ultimately result in the loss of their motivation to
achieve competitiveness on the factors of strategic importance at higher costs. Therefore, it is
logical to study the overall supply chain system of the country in order to analyse how the
existing potential of the system can support the individual companies and supply chain networks
to adopt the discussed competitive options. The study will also help to identify the strategic
directions for the supply chain system of the country.
8
Therefore, keeping in view the overall supply chain system and its lead times or more generally
the responsiveness on the market demands, the following research questions are evolved.
1. Which are the main characteristics of the textile and clothing supply chain system of
Pakistan and how the linkages of the system can be improved to the main markets?
2. Which are the lead times in textile and clothing supply chains and how are these
composed for Pakistan´s case? How these can be decreased without significantly
increasing the cost?
In chapters III and IV, we will discuss the textile and clothing SCs in general, and then we will
focus on the textile and clothing supply chain system of Pakistan in order to answer “Question 1”.
Our objectives are to develop the structure of the supply chain system and to identify its
characteristics. The status of development for various sectors will also be presented and the
strategic directions for the system will be formulated. This part of the study will conclude with
the evaluation of the devised strategies. The competitive options which were discussed above will
help to devise the essential strategies of the system in the current and the future scenarios of
global textile and clothing markets.
In order to support the fresh insight on the developments in the international textile and clothing
SC systems, a case study will be discussed in Chapter V. It was conducted in a textile and
clothing SC chain in Portugal. The time performance of the SC chain on the customer orders was
analysed in this study to develop the scenario of lead times in the advance textile and clothing
SCs. The country has a strong background on the manufacturing activities in textile and clothing.
Meanwhile, working inside the European markets also makes such a case study the most logical
approach to reflect on the recent developments in these networks. The knowledge developed in
this case study has a strong utility in the countries which are recently growing in these areas
including Pakistan. This will also provide means to understand the strategic moves of the
developed markets. Combining the production times of Portugal and transportation time of
Pakistan will further help to answer the “Question 2” of the research.
In the next chapter, we have discussed the research methods and tools which helped to advance
this research.

9
Chapter II Literature Review & Research Design Page
II.1. Literature Review 10
II.1.1. Strategic Planning 10
II.1.2. Configuration of the Supply Chains in Textile and Clothing 16
II.2. Research Design 19
II.2.1. Strategic Issues 19
II.2.2. Tactical Issues 22

10
II.1. Literature Review
The activity of literature review was divided under two main themes which covered the areas of
strategic planning in the textile and clothing SC systems and their configurations. Section II.1.1
covers the strategic planning process and section II.1.2 addresses the other part of the activity
related to the configurations of the textile and clothing SCs.
II.1.1. Strategic Planning
Strategic planning, discussed in the planning theory is the process of fitting a match between the
external opportunities and threats and the internal resources and capabilities of a firm. SWOT
analysis is its simplest tool which identifies the SWOTs through internal and external appraisal
and provides a basis for the planning process. Dyson (2004) related it to the contemporary
planning methods of resource and competency-based planning.
Pickton and Sheila (1998) wrote:
“Businesses seek survival, improvement and success. To fulfil such outcomes, management planning and
decision making require information about business operations and circumstances which surround them; such
information is the basis upon which business decisions may be made…
So-called ´environmental scanning´ and ´environmental analysis´ (although many may use different terminology) are
considered such a fundamental and basic part of the business planning process that the need to carry them out is
accepted without question.” (p. 102-103)
Hill and Westbrook (1997) associated the development and use of SWOT study in the works of
business policy academics at Harvard Business School and other American business schools;
they found the work of Kenneth Andrew (1971) as influential in popularizing the idea that
strategic planning of a firm is creating a match between its external (threats and opportunities)
and internal factors (strengths and weaknesses). However, Dyson (2004) connected the origins of
SWOT analysis to the work of Learned et al. (1965).
In order to motivate a new strategic initiative, a variation of SWOT analysis was emerged as
TOWS matrix which provided pairing of the factors like opportunities with strengths SO, WO,
etc. (Dyson (2004)). The structure of a TOWS matrix is presented below.

11
Table 2: TOWS Matrix
Strengths Weaknesses
Opportunities SO Strategy WO Strategy
Threats TS Strategy WT Strategy
When discussing the value of SWOT analysis, it is rated as simple-to-perform and effective in
performance. Hill and Westbrook (1997), Pickton and Sheila (1998), Valentin (2001) and Dyson
(2004) are some of the authors who have appraised the SWOT analysis and Dyson (2004),
Houben et al. (1999) and others applied it for their planning problems.
Some authors have casted their doubts for even considering it as an analytical tool including Hill
and Westbrook (1997). Others have tried to supersede it with resource-based planning as
Wenerfelt, 1984 and Grant, 1991, and with competence-based planning (Ulrich and Lake, 1990).
Criticizing the process of traditional, simple SWOT listing, Valentin (2001) wrote:
…Rather than provide a sense of direction for delving deeply into strategic issues, conventional SWOT
checklists seemingly beckon analysts to limit their work to judging offhandedly which listed items characterize a
business and which do not. They are laden with catchall questions that lack coherent theoretical underpinnings, slight
contextual complexities, prompt analysts to meander haphazardly from one issue to another, and leave in doubt how
listed issues are to be examined. Consequently, traditional SWOT analyses often yield only shallow extemporaneous
inventories that are as likely to detract from critical issues, themes, and thrusts as illuminate them.
Dyson (2004) considered the contemporary approaches of resource and competence-based
planning as the development of the internal appraisal of SWOT rather than its replacement. In the
same context, he considered the scenario based planning as a development of its external
appraisal. In his general recommendations, Dyson (2004) assigned the SWOT as being a firm
foundation for resource and competency-based planning and presented the enhanced version of
TOWS matrix, based on the recent contemporary approaches. It is offered in the following figure.
12
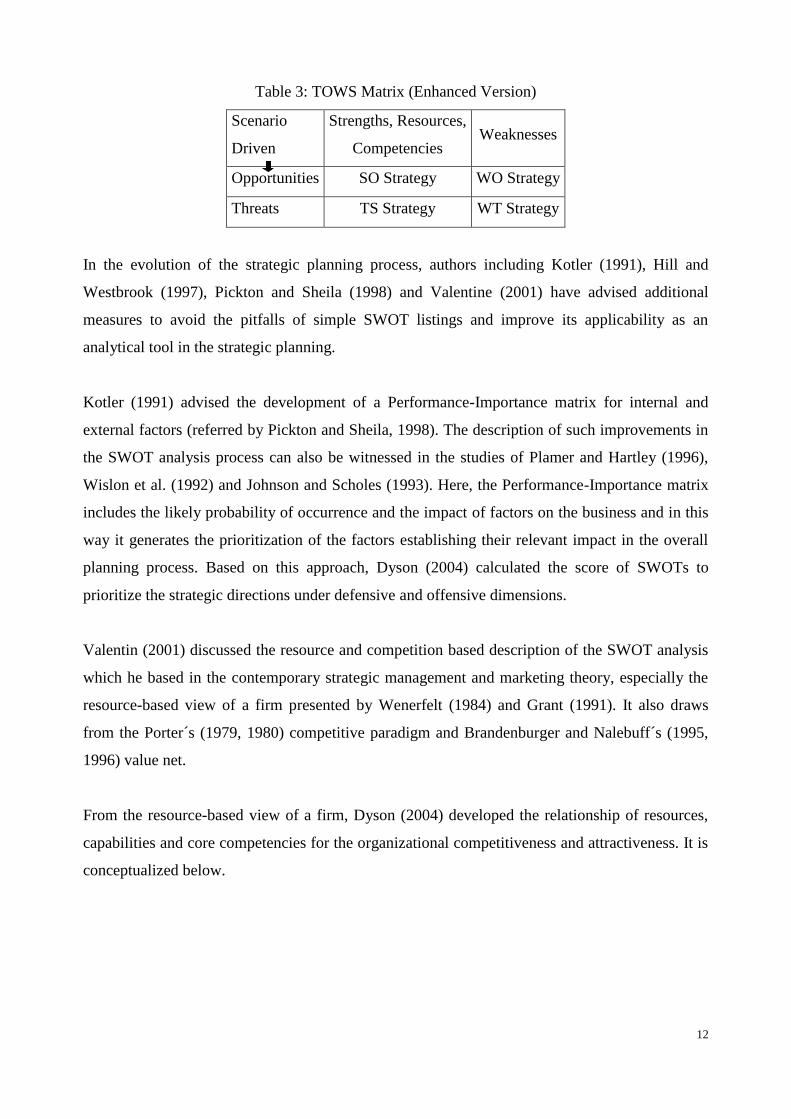
Table 3: TOWS Matrix (Enhanced Version)
Scenario
Driven
Strengths, Resources,
Competencies Weaknesses
Opportunities SO Strategy WO Strategy
Threats TS Strategy WT Strategy
In the evolution of the strategic planning process, authors including Kotler (1991), Hill and
Westbrook (1997), Pickton and Sheila (1998) and Valentine (2001) have advised additional
measures to avoid the pitfalls of simple SWOT listings and improve its applicability as an
analytical tool in the strategic planning.
Kotler (1991) advised the development of a Performance-Importance matrix for internal and
external factors (referred by Pickton and Sheila, 1998). The description of such improvements in
the SWOT analysis process can also be witnessed in the studies of Plamer and Hartley (1996),
Wislon et al. (1992) and Johnson and Scholes (1993). Here, the Performance-Importance matrix
includes the likely probability of occurrence and the impact of factors on the business and in this
way it generates the prioritization of the factors establishing their relevant impact in the overall
planning process. Based on this approach, Dyson (2004) calculated the score of SWOTs to
prioritize the strategic directions under defensive and offensive dimensions.
Valentin (2001) discussed the resource and competition based description of the SWOT analysis
which he based in the contemporary strategic management and marketing theory, especially the
resource-based view of a firm presented by Wenerfelt (1984) and Grant (1991). It also draws
from the Porter´s (1979, 1980) competitive paradigm and Brandenburger and Nalebuff´s (1995,
1996) value net.
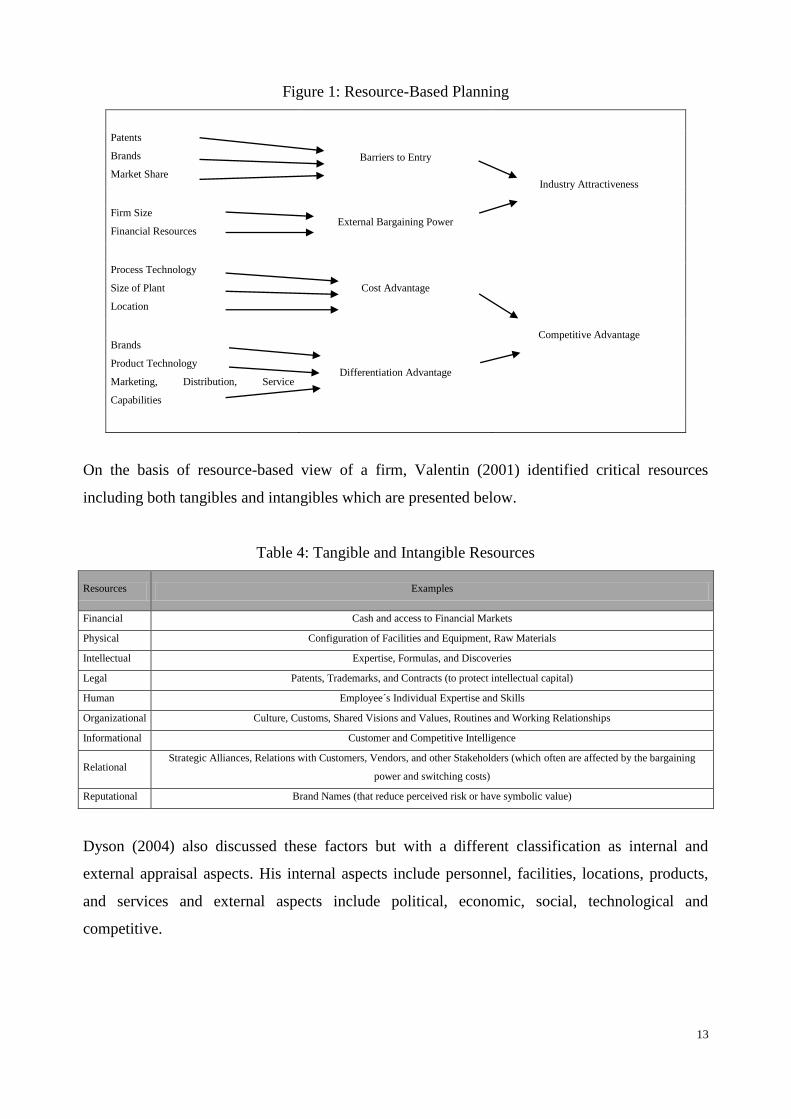
From the resource-based view of a firm, Dyson (2004) developed the relationship of resources,
capabilities and core competencies for the organizational competitiveness and attractiveness. It is
conceptualized below.
13
Figure 1: Resource-Based Planning
Patents
Brands
Market Share
Barriers to Entry
Industry Attractiveness
Firm Size
Financial Resources External Bargaining Power
Process Technology
Size of Plant
Location
Cost Advantage
Competitive Advantage
Brands
Product Technology
Marketing, Distribution, Service
Capabilities
Differentiation Advantage
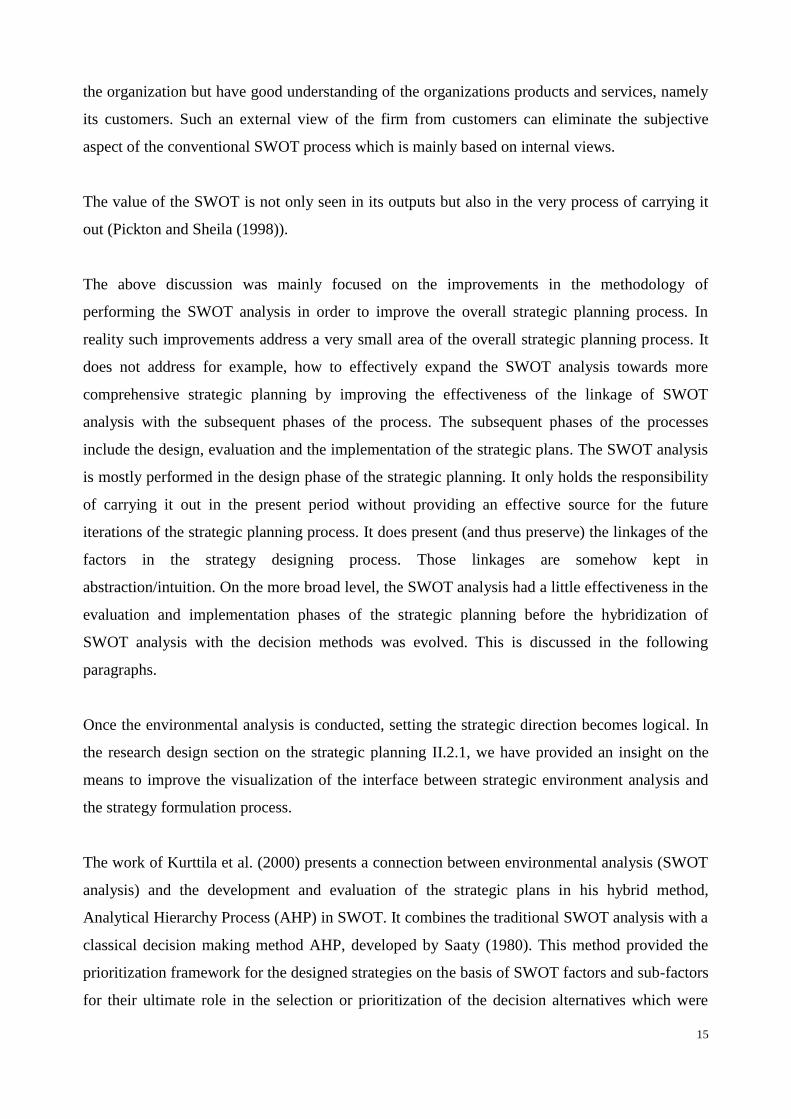
On the basis of resource-based view of a firm, Valentin (2001) identified critical resources
including both tangibles and intangibles which are presented below.
Table 4: Tangible and Intangible Resources
Resources Examples
Financial Cash and access to Financial Markets
Physical Configuration of Facilities and Equipment, Raw Materials
Intellectual Expertise, Formulas, and Discoveries
Legal Patents, Trademarks, and Contracts (to protect intellectual capital)
Human Employee´s Individual Expertise and Skills
Organizational Culture, Customs, Shared Visions and Values, Routines and Working Relationships
Informational Customer and Competitive Intelligence
Relational Strategic Alliances, Relations with Customers, Vendors, and other Stakeholders (which often are affected by the bargaining
power and switching costs)
Reputational Brand Names (that reduce perceived risk or have symbolic value)
Dyson (2004) also discussed these factors but with a different classification as internal and
external appraisal aspects. His internal aspects include personnel, facilities, locations, products,
and services and external aspects include political, economic, social, technological and
competitive.
14
Valentin´s (2001) resource-based SWOT mainly analyses the defensive and offensive context for
a firm by examining forces that affect its product´s Customer Value-Cost differential and
competitive position from…
…a defensive perspective by identifying and assessing threats, conceiving counter measures,
discovering weaknesses that exacerbate threats, and recognizing strengths that mitigate threats.
…an offensive vantage point by identifying promising expansion paths.
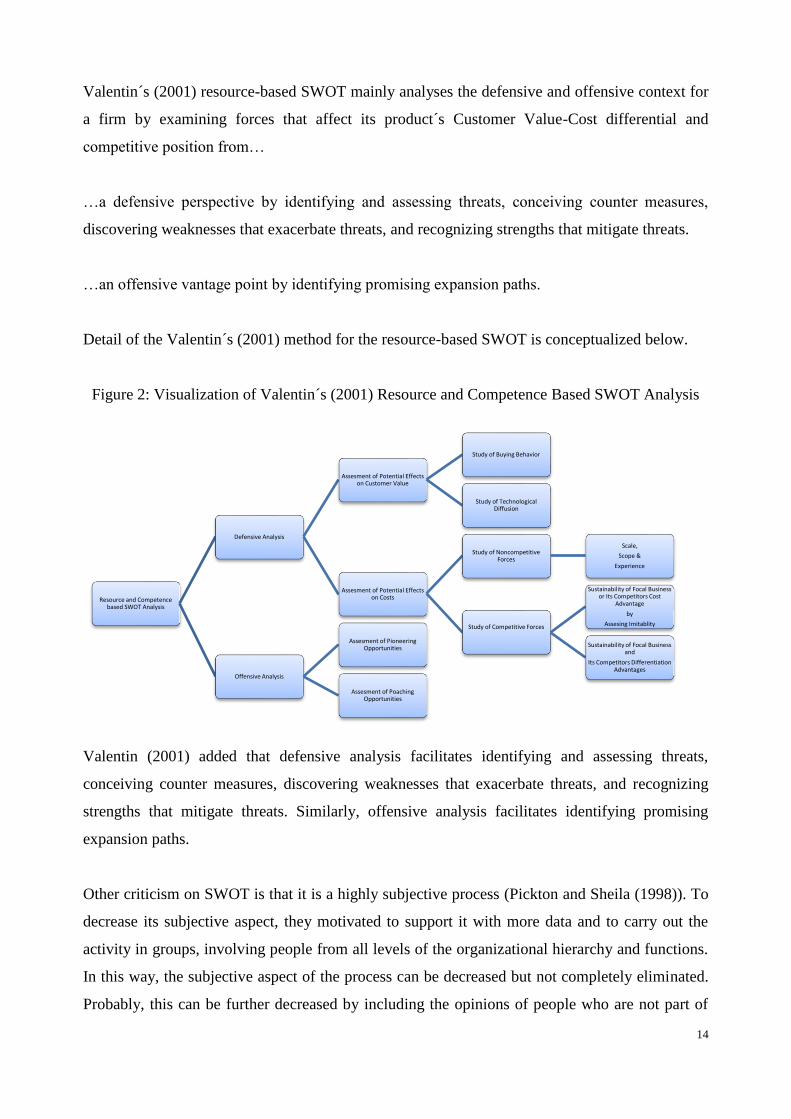
Detail of the Valentin´s (2001) method for the resource-based SWOT is conceptualized below.
Figure 2: Visualization of Valentin´s (2001) Resource and Competence Based SWOT Analysis
Valentin (2001) added that defensive analysis facilitates identifying and assessing threats,
conceiving counter measures, discovering weaknesses that exacerbate threats, and recognizing
strengths that mitigate threats. Similarly, offensive analysis facilitates identifying promising
expansion paths.
Other criticism on SWOT is that it is a highly subjective process (Pickton and Sheila (1998)). To
decrease its subjective aspect, they motivated to support it with more data and to carry out the
activity in groups, involving people from all levels of the organizational hierarchy and functions.
In this way, the subjective aspect of the process can be decreased but not completely eliminated.
Probably, this can be further decreased by including the opinions of people who are not part of
Resource and Competence based SWOT Analysis
Defensive Analysis
Assesment of Potential Effects on Customer Value
Study of Buying Behavior
Study of Technological Diffusion
Assesment of Potential Effects on Costs
Study of Noncompetitive Forces
Scale,
Scope &
Experience
Study of Competitive Forces
Sustainability of Focal Business or Its Competitors Cost
Advantage
by
Assesing Imitablity
Sustainability of Focal Business and
Its Competitors Differentiation Advantages
Offensive Analysis
Assesment of Pioneering Opportunities
Assesment of Poaching Opportunities
15
the organization but have good understanding of the organizations products and services, namely
its customers. Such an external view of the firm from customers can eliminate the subjective
aspect of the conventional SWOT process which is mainly based on internal views.
The value of the SWOT is not only seen in its outputs but also in the very process of carrying it
out (Pickton and Sheila (1998)).
The above discussion was mainly focused on the improvements in the methodology of
performing the SWOT analysis in order to improve the overall strategic planning process. In
reality such improvements address a very small area of the overall strategic planning process. It
does not address for example, how to effectively expand the SWOT analysis towards more
comprehensive strategic planning by improving the effectiveness of the linkage of SWOT
analysis with the subsequent phases of the process. The subsequent phases of the processes
include the design, evaluation and the implementation of the strategic plans. The SWOT analysis
is mostly performed in the design phase of the strategic planning. It only holds the responsibility
of carrying it out in the present period without providing an effective source for the future
iterations of the strategic planning process. It does present (and thus preserve) the linkages of the
factors in the strategy designing process. Those linkages are somehow kept in
abstraction/intuition. On the more broad level, the SWOT analysis had a little effectiveness in the
evaluation and implementation phases of the strategic planning before the hybridization of
SWOT analysis with the decision methods was evolved. This is discussed in the following
paragraphs.
Once the environmental analysis is conducted, setting the strategic direction becomes logical. In
the research design section on the strategic planning II.2.1, we have provided an insight on the
means to improve the visualization of the interface between strategic environment analysis and
the strategy formulation process.
The work of Kurttila et al. (2000) presents a connection between environmental analysis (SWOT
analysis) and the development and evaluation of the strategic plans in his hybrid method,
Analytical Hierarchy Process (AHP) in SWOT. It combines the traditional SWOT analysis with a
classical decision making method AHP, developed by Saaty (1980). This method provided the
prioritization framework for the designed strategies on the basis of SWOT factors and sub-factors
for their ultimate role in the selection or prioritization of the decision alternatives which were

16
developed as a result of the analysis of decision environment. AHP is a decision tool which takes
into account the hierarchical relationship of the decision elements (including SWOT factors and
sub-factors) and their effects on the decision alternatives. The methodology was also adopted,
later in other studies including Stewart et al. (2002), Kajanus et al. (2004), Shrestha et al. (2004),
Leskinen et al. (2006) and Masozera et al. (2006).
The hybrid method of Kurttila et al. (2000) provided the means to measure the hierarchical
relationship of the decision elements i.e. SWOT factors and sub-factors and the strategy
alternatives. The hierarchical effects are measured in a top-to-bottom hierarchy of decision levels.
The dependence of the higher level decision elements on lower level elements is mainly
measured in a top to bottom hierarchy where each element at top depends on the bottom element.
It does not measure the effects of the inner dependence within clusters or feedback of lower
levels. In real world problems the inner dependence in the elements of the same level exists and
in some cases the lower level elements also affect the top level elements. As it is difficult to
evaluate all these affects in single iteration of the analysis, experts measure them in iterations in
order to observe them more rigorously and to separate their effects. Therefore, working on the
same lines of Kurttila et al. (2000), Yuksel and Dagdeviren (2007) developed the hybrid method
of ANP in SWOT for measuring the inner dependence of SWOT factors in the analysis for the
strategic decision making. The base methods of AHP and ANP were developed by Saaty,
discussion on these methods can be found in Saaty (1980), Saaty and Takizawa (1986), Saaty
(1996), Foreman and Gass (2001), Saaty and Vergas (2006) and Saaty and Sodenkamp (2008).
These methods are explained in chapter IV, where we have applied these to the evaluation of the
strategic plans of the textile and clothing SC system in Pakistan. Analysis of the internal and
external environment for the textile and clothing SC system is also conducted, which helped to
identify the position of the SC system in the global scenario and in designing strategic plans for
its competitive functioning. These are covered in Chapters III and IV. Before that, we will
discuss the design of the above analysis in section II.2.1.
II.1.2. Configuration of Supply Chains in Textile and Clothing
In the developed and developing countries, the configurations of modern day textile and clothing
chains are very different as they work for different product environments. In the developed
countries, the SCs which produce for the fashion segments for example are configured to respond
17
very fast to cope with the seasonal cycles and rapidly changing styles (Bruce and Daly (2011)).
There are many other SC configurations in the textile and clothing networks under various
product areas. These reflect to the developments which are taking place to maintain the
competitiveness in these networks (Hussain et al. (2011b)). It will be insightful for the strategic
moves of the textile and clothing industry in Pakistan to learn from these developments. In this
perspective, this section and the resulting studies were performed to gain such an insight on the
recent developments.
The time as a competitive option is not a very recent concept in the marketing strategies. It was
discussed earlier by Alderson (1954) for example and later by Tersine and Hummingbird (1995).
The application of time-based competitiveness is being observed more recently in many
developed countries to maintain competitiveness in certain product segments of textile and
clothing, especially in the high profit markets of fashion clothing and in some other product
segments. Adopting this strategy looks more logical when other competitive options of cost,
quality, design and service are being adopted by the SCs operating from newly developing
countries (Hussain et al. (2011b)). In the time-based competitiveness, a priority is maintained for
specific regions close to the main markets and/or logistically well-linked regions for the
manufacturing of specific products. As an example, the main markets of Europe can be supplied
more quickly for the seasonal items from the countries of East Europe and South Europe or
countries of North Africa which are considered as low cost production locations, till now,
compared to the countries of central Europe. Here, the countries of East and South Europe have a
comparative advantage over countries of North Africa and other non-European countries, in term
of higher development of logistics infrastructure which serve as main advantage for them in
situations of quick response in fashion clothing and seasonal items. Therefore, it provides a
control to keep certain share of textile and clothing manufacturing inside specific economic
regions to support low technology and low skill employment for less educated and low skilled
labour force. The textile and clothing activity also supports other objectives of the economic
activity in these countries.
Tersine and Hummingbird (1995) provided insight on the time elements for various product
environments including engineer-to-order, make-to-order, assemble-to-order and make-to-stock.
Under these product environments, the time segments should be separated for activities of
design/development, procurement, production and distribution for example. Therefore the
allocation and control of these elements is associated with the product environment in which a

18
firm opts to operate. Another important aspect of the above product environments (-to-order and -
to-stock) is that they provide decoupling points in the Supply-Production-Delivery (SPD) chain
segments and allow them to behave with anticipative and reactive responses to the customer
orders/requirements (Hoekstra and Romme (1991), refer to Fleischmann and Myer (2003)).
Additionally, these decoupling points help to model SPD chains to fill the gaps of time, space,
quantity, variety, information and quality which are always present in the supply, production and
consumption sides (Tersine and Hummingbird (1995)). Thus the strategy to compete on time is
based on identifying and findings the means to control and reduce the time elements in the SPD
chain. The flow of such a study is conceptualized in figure below.
Figure 3: Flow of Study on Improving Time Performance of SCs
The process starts with the identification of the product environment and the configuration of the
SPD chain. It follows the process to develop the models on order fulfilment and the identification
of its time elements. The time elements are measured and analysed to identify the inefficient
areas. The areas of time waste are improved and next iterations of the process analysis are
initiated.
This was a view with a closer look on the SC configurations in response to adopting different
strategies to compete. This discussion will be continued in Chapter V with facts from a real case

19
study, conducted in such a SC. We will also bring the helpful insight for the textile and clothing
SC system in Pakistan, from the case study.
II.2. Research Design
At this stage, we can add that this research will proceed at two different levels including strategic
and tactical dimensions. Question 1 will be covered in the strategic level by working on the
strategic environment of the textile and clothing system in the country. Meanwhile, Question 2 is
focused to provide insight on the tactical issues of an advance textile and clothing chain and will
be covered through case study approach. Working at these levels, it will improve the visibility of
the research design and the conduct of the research.
II.2.1. Strategic Issues
Here, Question 1 is termed as Study I to develop its process. The methodology for its conduct is
discussed here. The study develops in various phases. It refers to the analysis of the strategic
environment including potential markets, the structure and the characteristics of the system. It
follows the designing of the relevant strategies for the system which will be evaluated for their
importance in scenario of recent developments. Meanwhile, the adopted approach will help to
bring the clear insight on the factors which are responsible for achieving the above objectives.
Study I: Which are the main characteristics of the textile and clothing supply chain system of
Pakistan and how the linkages of the system can be improved to the main markets?
Two dimensions of the problem can be identified in this study including the analysis of the
characteristics and structure of the system and the improvement of the linkages of the system to
the main markets of textile, clothing and related areas.
The development of the system environment is the most difficult step in this study as no such
effort was performed on the overall textile and clothing system of the country by the scientific
community to serve as a starting point for this research. Further, the system is very broad and
capturing its overall view is a complicated task. In general, it was required to develop the broader
environment of the system in which various sectors of the industry operate and by which these
are affected. The strategic environment was constructed from the analysis on the secondary data,

20
study reports of various government and private organizations which discussed the individual or
more segments of the chain. These did not cover the broad environment of the system. The
consultation and interviews of experts and managers, inside and outside the system, were also
utilized to improve the findings of our research.
The second part of the study is focused on two types of issues; formulating the strategic
directions for the system and the evaluation of their importance. With this dissection of the
problem, the overall study was followed through the following steps.
1. To develop the strategic environment of the textile and clothing system of Pakistan based
on its structure, characteristics and the potential markets
2. To formulate the strategic plans for the system on the basis of its potential and the
identified markets
3. To evaluate the performance of the strategic plans in terms of their importance to achieve
the overall objective of the improvement of the SC system
After the development of the structure and characteristics of the system, it was much easier to
follow the other steps of designing the strategies and evaluating their performance. It is
interesting to draw some insight on the implementation character of the devised strategies, which
was also developed after performing the mentioned steps. These are discussed in Chapter IV.
The process of the strategic planning was embraced for the study, the discussion on its theory and
the process was initiated in section II.1.1, which will continue here and in chapter III and IV.
The analysis of the strategic environment is based on the identification of the main factors which
can affect its performance both from outside and from inside (within) the system. The outside
factors are termed as external factors and they include opportunities and threats whereas the
factors within the system are termed as internal factors and include strengths and weaknesses of
the system. The main sources which were utilised to identify the SWOT factors for the system are
secondary data, literature review and inputs of experts. During the analysis of the secondary data
on the system, the development status of the sectors was also created, which took into account the
growth of the factors responsible for the development of the sectors. The strength of this analysis
has provided us the ability to develop a new tool called Planning-Link to synchronise the
strategic environment with the strategy design process. This tool is discussed in Chapter IV.
21
The growth of the main factors identified the development status of sectors and the Planning-link
provided the basis for devising the strategic directions for the system. Moreover, the inputs of the
experts allowed us to refine our ideas on the strategic dimensions and the content of strategies.
These strategic directions are intended to improve the competitiveness of the system by
enhancing its responsiveness and capability in the directed markets.
The initial view of the system and its environment was formulated from the study of reports and
discussion with various personnel in the SC; results were presented in the study by Hussain et al.
(2009). Later, resources of secondary data were consulted to broaden the view of this study and
the inputs of external experts were added to verify the findings. The overall findings are
presented in Chapter III.
The devised strategies were evaluated with the process of strategic decision making, which was
discussed in section II.1.1. At this stage, the evaluation is based on their importance in relation to
identified markets and their implementability in relation to the time and resources. In these
evaluations, the effects of the strategic factors of the system environment on the strategic
directions were studied. This can be explained in terms of the strategic decision theory as the
hierarchical dependence of the higher level decision elements (SWOT) on the lower level
elements (Sub-SWOTs) and the inner dependence of factors. Further explanation is provided in
Chapter IV.
Following four steps provide the best simplification of the strategic planning process discussed
above and how it is covered in Chapters III to IV.
1. Resource-based SWOT analysis on the Textile and Clothing SC System of Pakistan
2. Formulating the Strategic Directions for the SC System
3. Evaluation of the Performance of the Strategic Plans
4. Evaluation of the Implementation Character of the Strategic Plans
The evaluation of the importance of the devised strategies was intended to provide their relevance
in the scenario of current development status of the system and its potential to supply the
identified markets. Meanwhile, the implementation character of the devised plans is evaluated to
help the formulation of their implementation plans. Steps 3 and 4 address these areas and these
are covered in chapter IV.

22
It can be explained further that the Steps 1 & 2 have high exploratory contents. The overall
approach for developing the environment of the system is similar to the perspective of a critical
realist (Saunders et al. (2007)). Meanwhile, we have analysed the system from the inputs of the
internal and external experts, the study reports of various organizations, historical secondary data
and the work of some authors. The sources utilised for the study are referred in detail in Chapter
III.
II.2.2. Tactical Issues
Here, Question 2 is termed as Study II to develop its process. It covers the tactical issues
including the configuration of a modern textile and clothing supply chain and analyses the time
performance of the SC activities. The design of research is based on the methods available in the
scientific literature, discussed in section II.1.2. It is explained below.
Study II: Which are the configuration and structure of a modern day Textile and Clothing SC and
how the time components exist in the segments of the chain?
The study covers various aspects of a modern textile and clothing chain, including its product
environment, supply chain configuration, order flow and the time based performance of various
activities. The main focus is to analyse the time performance of the chain on the customer orders
to develop insight on the importance of the time responsiveness in these supply chains. The study
will bring important insight on the working of a textile and clothing supply chain in the
developed countries and the implications of future environment for these supply chains which are
operating in developing countries. To conduct the study, the steps identified in section II.1.2 are
followed. Thus, it can be divided into the following parts.
1. Identification of the Product Environment
2. Study of the Characteristics of the Supply-Production-Delivery Functions
3. Modelling the Order Fulfilment Process and identify the Time Elements
4. Collection of data on time elements and time based performance of chain segments
5. Analysing the time performance of the order fulfilment and chain segments
6. Identifying the areas for improvement
23
The findings of the above parts can be extended to the textile and clothing SC system of Pakistan
by including following parts into this study.
7. Generalize the results for similar supply chains like Pakistan
8. Collecting the data on transportation times from Pakistan to main T&C Markets
9. Developing the time based scenario in various product segments for Pakistan
The method of case study research is proposed which will support the exploratory nature of the
study. To conduct the study two main strategies are proposed; to observe the functions and
processes during the actual flow of specific orders through all the functions of the chain; to
conduct detailed non-structured interviews and open-discussions with the managers of the
functions in order to develop the integration of the chain activities and therefore to develop the
linkage of those activities in the overall configuration of the value chain. The observation and the
data collection process should adopt the role of an Observer-as-Participant in the fourfold
categorization of Gill and Johnson (2002), cited by Saunders et al. (2007).
The findings will be triangulated from the structure of the information and management system.
Later, the data will be collected on different types of order flows based on the order flow models
to measure the time performance of the chain on order fulfilment and various activities in the
chain. The areas for improvement will be discussed and recommendations will be formulated.
Due to limitation of resources and time, one such case study is conducted which will serve as
purposive extreme (excellent) case (Patton (2002) and Peters and Waterman´s (1982), cited by
Saunders et al. (2007)). The consideration of such a company as a sample case also lies in the fact
that maintaining profitable manufacturing in textile and clothing products inside Europe is
becoming more and more difficult as labour and material costs are increasing and the competition
from the Asian countries is also soaring. Thus the companies which are continuing their
manufacturing inside Europe operate under both severe competition and high costs of operation.
They can survive only by developing their strengths in design, quick response and providing
higher levels of value addition. The shorter transportation times to main markets provide an
advantage to the companies to compete against the low cost Asian suppliers by shortening their
lead times but the design and higher levels of value addition are never compromised. On the other
hand an extreme (worst) case can provide an opportunity to compare the two systems and their
competitive positions under the same or different product environments and customer segments.
24
Certainly, the time based performance should be different for both such systems as the adopted
theory of the chain functioning is different for both such configurations. Such an opposite case
for example can be chosen from the textile and clothing industry of Pakistan to further enhance
the quality of results of this research to higher level. However, such a case study is placed in the
future directions of this research due to limitations of time and resources. The findings of
conducted case study are presented in Chapter V.
Portugal being closer to main markets of Europe possesses the advantage to offer quick response
times to the main European markets. This advantage is supported with advance technologies,
design and innovation capabilities (the fact which is obvious from the results of the case study).
The configuration and structure of the Portuguese companies can provide a valuable insight for
the tactical issues of the supply chains in Pakistan within the identified segments of textiles,
woven clothing, home textile, terry towel etc.
The conclusions of the case study performed in a Portuguese textile and clothing company, are
generalized for the textile and clothing system of Pakistan. Such generalization is reasonable as
some segments of the supply chain system in Pakistan including textiles, woven clothing, home
textile, terry towel, etc., are performing reasonably well in comparison to other systems. They
seem to be at good level of development (the fact which has its support in the evaluation,
performed in Chapter III) according to the export patterns of the country to the main markets of
the world. Meanwhile, the Portuguese companies which had a similar level of development in the
1980s and 1990s present the future scenario for the textile and clothing companies of Pakistan.
Therefore, they can provide valuable insight on the tactical issues of these supply chain segments.
The scenario of the time-based performance on the customer orders in the TC supply chain in
Portugal can be utilized for the TC companies in Pakistan with similar configurations in order to
see how they should respond in Pakistan by transforming the transportation/delivery times
accordingly. Thus production times of companies inside Portugal with transportation/delivery
times of Pakistan will present a new scenario of supply chain network in TC from Pakistan which
will advise the system for new production and marketing strategies in future not only for the main
markets of Europe and North America but also for the emerging markets of Asia like India, China
and Pakistan. Structured surveys for the transportation times to main textile and clothing markets
from Pakistan will help formulate such scenario. The delivery process for the export orders can
further be divided into the transportation times inside country and off-shore shipping times,

25
which should present the potential of various locations in Pakistan to support various product
segments. These areas are addressed in parts 7 to 9 above.
The scenario of lead time issues for Pakistan is initiated here by conducting surveys on the
shipping times and inland transportation times in Pakistan. Parts 7 and 9 will extend these
findings to provide a complete view on the issues of lead times for various markets for Pakistan.

26
Chapter III Analysing the Strategic Environment of the T&C System in
Pakistan Page
III.1. Brief Historical View on the Textile and Clothing Sectors in the
Region 27
III.2. Textile and Clothing Supply Chain System in Pakistan 29
III.2.1. Cotton Production 30
III.2.1.1. Policy Interventions on the Cotton Trade 42
III.2.2. Ginning 45
III.2.3. Other Fibres (Except Cotton) 52
III.2.4. Yarn Manufacturing 56
III.2.5. Fabric Manufacturing 70
III.2.6. Dyeing, Printing and Finishing Sectors 81
III.2.7. Textile Made-up Sectors 82
III.2.8. Apparel and Clothing Sectors 87
III.2.8.1. Characteristics of the Clothing and Apparel Sectors 91
III.2.9. Study Programs in Textile, Clothing and Related Areas 98
III.2.10. Logistics 101
III.3. Results and Discussion 102
III.3.1. Development Status of the Supply Chain and Related Segments 109
III.3.1. Identification of SWOTs for the System 110
III.4. Conclusion 112

27
III.1. Brief Historical View on the Textile and Clothing Sectors in the Region
The textile and clothing sectors in Pakistan have their origin in the historical production and
usage of cotton and other natural fibres in the region. The use of manufactured fibres was started
three decades back in early 1980s in the industry, to fulfil the demands of the export markets. In
general, the diversity of the textile fibres used in these sectors of the country is low and the
industry is dependent on low number of natural and manufactured fibres. This low range of fibres
provides opportunity to specialize in certain areas and markets but offers constraints on the
expansion of the product range of the sectors for the global markets of textile, clothing, related
areas and advance textiles. This type of growth and expansion and the study of the important
characteristics of these sectors in Pakistan are the main subject of discussion in this chapter.
The formal industrialization process in the country was started in late 1950s and was mainly
focused on textile and clothing industry because of having an informal and cottage level industry
in these areas. The regions of Pakistan, India, Bangladesh and Sri Lank had formal and informal
sectors of cotton value chain because of the production of cotton fibre and its use in the clothing
and furnishing. The cotton production also provided many benefits to other sectors including
animal feed and production of vegetable oil, for example. During the de-regionalization of the
Indian sub-continent into the boundaries of India and Pakistan in 1947, the existing region of
Pakistan was producing almost 40% of the cotton of the overall Indian sub-continent (Gilham et
al. (1995)). There was very limited number of textile manufacturing units in the formal or
organised sector of the country (only two factories from the colonial heritage in the region
(Ghayur and Zar (1993) cited by Siegmann (2005)). However, before the colonial era, the region
was leading the world in the production of textile and clothing through its cottage industry in
textile, clothing and furnishing. Later, it lost its competitiveness to England and other countries in
Europe, where the process of industrialization was already started, which brought production
efficiencies and competitiveness of the industry. Many other factors were also responsible for the
shift of these areas from Indian sub-continent to Europe and England.
In its long history, Indus valley which now lies in the boundaries of Pakistan, holds the historical
proofs of cotton production, yarn and fabric manufacturing, printing and dyeing dating back as
early as 3000 BC. The artefacts found at “Mohenjo-Daro” which was once a flourishing town in
Sindh, a region in Pakistan, tell the glorious history of the region in production and trade of
textile and clothing in the world (Gilham et al (1995)). The Indus valley is situated on both the
28
sides of the river Indus (Sindhu) which is the very origin of the name “India” and starts in the
north of the country in the mountains of Himalaya. The valley is one of the oldest regions on the
globe and existed as an important trade route between South-Western India and other parts of the
world. Arabs entered into India through this region and occupied it for many centuries. The
Persians and the Afghans also attacked and destroyed it many times in order to take control of
this important link in the Indian Ocean. The regions which are now part of Pakistan include
Baluchistan, KP (Khyber Pakhtunkha), Sindh, Punjab, part of Kashmir and other autonomous
regions of Gilgit-Baltistan and Federally Administered Areas (FATA).
Various regions of the country once existed as independent states with distinct language and rich
and diverse culture which can bring a large diversification of design and styles in the clothing and
furnishing products. However, the design areas are weak in most of the sectors, a fact which has
the basis in our study in the following sections which identifies the current status of development
of the value chain segments. The design and styles need attention to achieve competitiveness in
the international and local markets through diversification and differentiation of the products and
services.
After the separation from the Indian sub-continent, the country mainly focused on developing a
strong industry in textile and clothing. Other sectors were developed later, including home
textiles, towel, tents, canvas, etc. Many of these segments are competing well in the international
markets except clothing which is not yet at a very competitive position. There are many reasons
for the weak performance of clothing industry in the country. There are strong regional players
like China and India, recently Bangladesh, and there is lack of effort inside the country to
compete in these segments, a fact which will be further discussed in the following sections. On
the other hand, the advantage of market access into the main clothing markets of the world for
some of the regional competitors also increased the hardship for these sectors to compete on price
in the global markets. For many countries, price is a competitive advantage which works well
specially in textile and clothing areas (Loo (2002), Bolisani and Scarso (1996)). The factors for
the success of the country in textile and related industries include cheap raw material, low wages
and labour supply and a lot of incentives; these factors will also be discussed in detail in the
following sections.
In neighbouring countries, India has a diversified base of natural and man-made fibres and has
strong textile and clothing industry. Bangladesh does not produce cotton and imports the raw

29
material, yarn and/or fabric from India, Pakistan and China. Meanwhile, Bangladesh has
developed a strong clothing sector. After phasing out of the quota regime of Multi-fibre
Agreement (MFA), South Asian region including India, Pakistan and Bangladesh have evolved
as strong players in the world for textile and clothing production and supply. The combined
production of China and South Asian countries in textile, clothing and related areas stands around
two-third of the world production. The cotton is still an important textile fibre and three top
cotton producers in the world out of four are here in this region i.e. China (1st), India (2nd) and
Pakistan (4th). These facts are discussed by Gilham et al. (1995), Altaf (2008), Bedi (2008),
Vivian and Au (2008) and Bolisani and Scarso (1996).
III.2. Textile and Clothing Supply Chain System in Pakistan
The textile and clothing supply chain system in Pakistan includes the activities of cotton
production, its ginning, production of manufactured fibres including polyester, viscose and
acrylic, yarn manufacturing with ring spinning and rotor technologies, fabric manufacturing
through weaving and knitting and the process industries including dyeing, printing and finishing
to improve the fabric aesthetics. The fabric is converted into apparel and made-ups. There are
other segments which support these activities including chemical industry, machines and tools
manufacturing, logistics industry and the sectors of information and communication technologies.
The main activities of the system and the supporting sectors are identified in Table 5.
Table 5: Textile and Clothing SC System of Pakistan
Common Functions, Technology and Skills Supply Chain Entities
Textile Fibre Production
Cotton farming
Ginning
Others (Silk, Wool, ...)
Man Made Fibres
Yarn Manufacturing
Ring Spinning
Rotor Spinning
Others (Air Jet, …)
Fabric Manufacturing
Weaving
Knitting
Others (Nonwoven, …)
Fabric Coloration
Dyeing

30
Common Functions, Technology and Skills Supply Chain Entities
Printing
Fabric Finishing
Conversion into Made-ups and Apparel
Associated Industries
ICT and Applications
Machine Manufacturing
Dyes and Chemical
Marketing
Research and Development
Technology and Skills
Logistics Infrastructure
Rail Transportation
Road Transportation
Air Transportation
Ports
Storage Facilities
Communication
All the mentioned areas have different level of development. Similarly, the competitive position
of the sectors is also at different levels in comparison to same sectors in the other countries of the
region. It is important to analyse their potential in detail to identify the overall strategic position
of the country in the global context of changing supply and demand patterns in textile, clothing
and related areas. In the following sections, these activities are discussed individually and the
secondary data for them is analysed. The objectives are to identify their development status and
the main characteristics which can help to identify the areas for improvement to enhance the
overall competitive position of the country.
III.2.1. Cotton Production
The authors including Gilham et al. (1995), Siegmann (2005), Salam (2008) and Altaf (2008)
have discussed the cotton production sector of the country. They have developed an important
insight on the sector and have identified that an extensive forward and backward linkage exists in
the cotton chain of the country. This makes it important for the country´s economy and an
imperative for the sustainable development of agriculture, food security (vegetable oil and animal
feed) and poverty alleviation through employment generation. For example, around 85 per cent of
the edible oil is produced from cottonseed, the cake produced during oil extraction process is
used for stock-feed, 38 per cent of the industrial employment and two third of country‟s exports
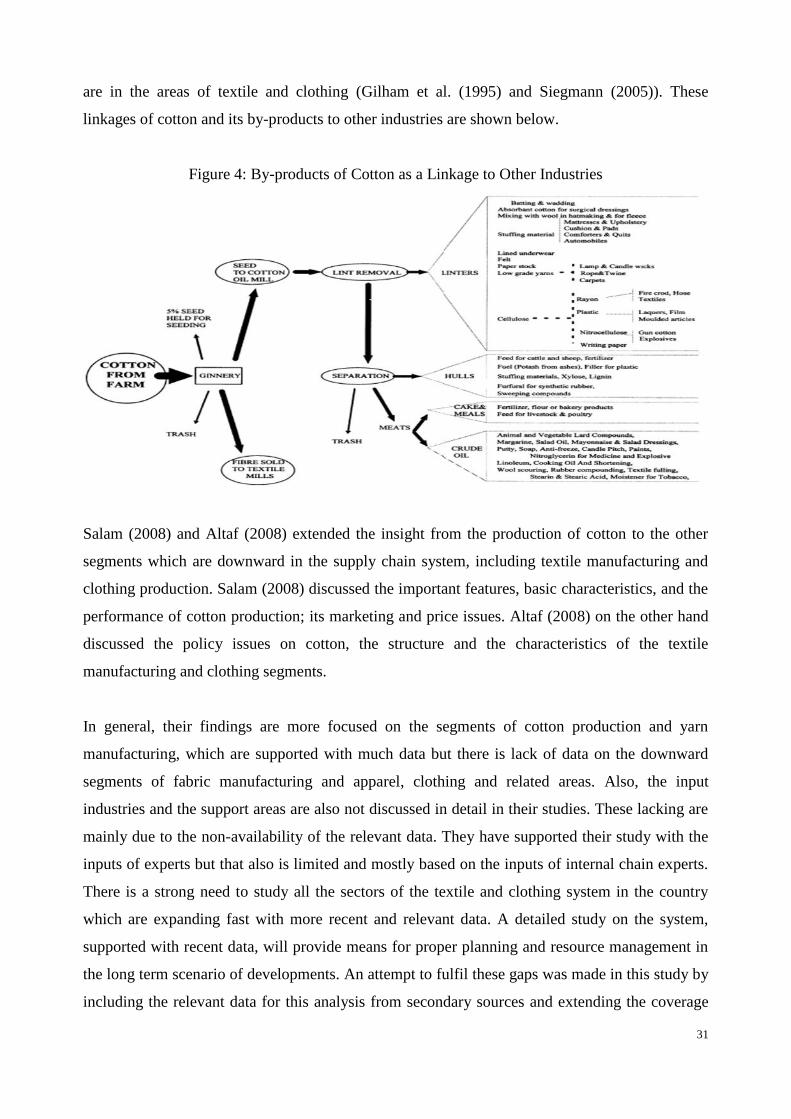
31
are in the areas of textile and clothing (Gilham et al. (1995) and Siegmann (2005)). These
linkages of cotton and its by-products to other industries are shown below.
Figure 4: By-products of Cotton as a Linkage to Other Industries
Salam (2008) and Altaf (2008) extended the insight from the production of cotton to the other
segments which are downward in the supply chain system, including textile manufacturing and
clothing production. Salam (2008) discussed the important features, basic characteristics, and the
performance of cotton production; its marketing and price issues. Altaf (2008) on the other hand
discussed the policy issues on cotton, the structure and the characteristics of the textile
manufacturing and clothing segments.
In general, their findings are more focused on the segments of cotton production and yarn
manufacturing, which are supported with much data but there is lack of data on the downward
segments of fabric manufacturing and apparel, clothing and related areas. Also, the input
industries and the support areas are also not discussed in detail in their studies. These lacking are
mainly due to the non-availability of the relevant data. They have supported their study with the
inputs of experts but that also is limited and mostly based on the inputs of internal chain experts.
There is a strong need to study all the sectors of the textile and clothing system in the country
which are expanding fast with more recent and relevant data. A detailed study on the system,
supported with recent data, will provide means for proper planning and resource management in
the long term scenario of developments. An attempt to fulfil these gaps was made in this study by
including the relevant data for this analysis from secondary sources and extending the coverage

32
of sectors which are at the downside of the chain. The findings of the expert surveys conducted in
the customer base will further enhance the quality and authenticity of the findings and bring new
insight on the demand-side. The secondary data is available online; the resources which were
utilized are referred at relevant places in the data tables and are also produced in the appendix of
the chapter. These sources have helped to develop a more detailed and valid insight on the overall
supply chain system of the country.
The production areas of cotton in the country are shown below.
Figure 5: Map of Country with Cotton Areas
The main cotton production base of the country is in the south-eastern regions of Punjab and
Sindh. Also, the formal industrial activities in textile and clothing are mainly in these regions. In
other regions including KP (Khyber Pakhtunkha), Baluchistan and Kashmir (Pakistan), there is
low industrial activity. Meanwhile, the informal sectors are located around the country to supply
the local demand and there is no data and studies on these sectors. Therefore, the informal sectors
of the industries in the country will not be discussed.
The figures on cotton supply, consumption and the trade are given at Table 6: Supply and
Consumption of Cotton in Pakistan „000‟ Kilograms (see Appendix III.A)
The historical growths on cotton production, consumption and trade are shown below.
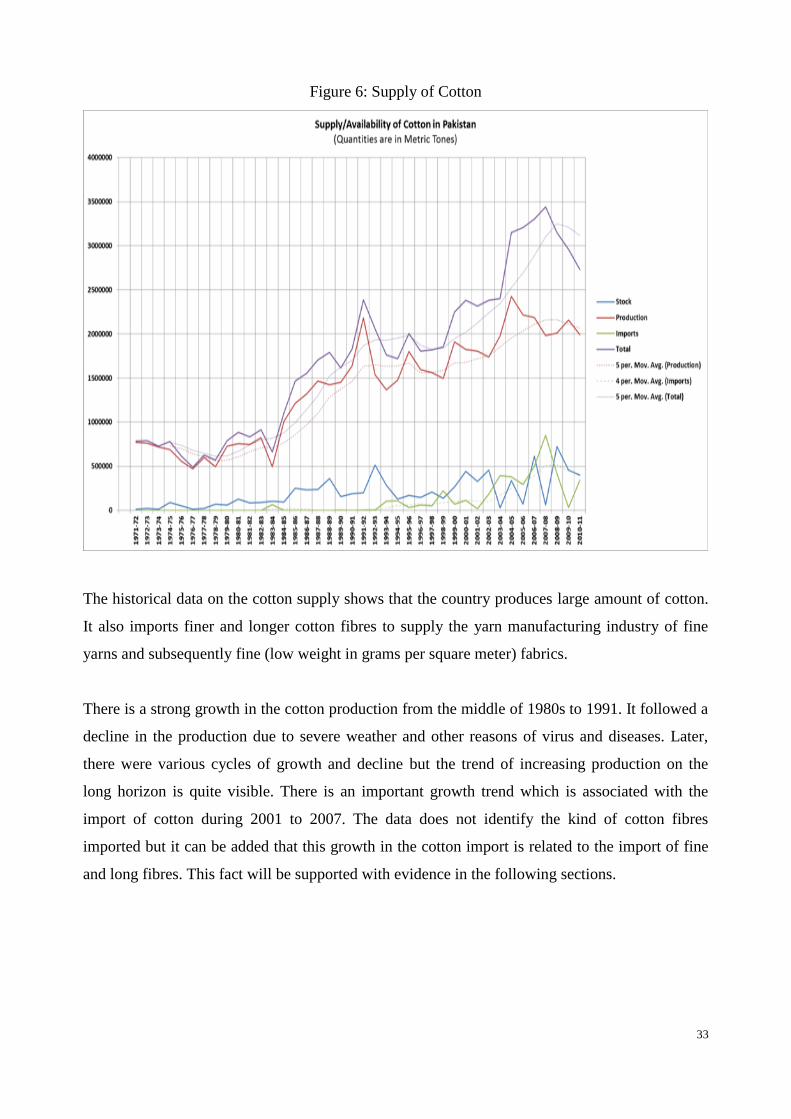
33
Figure 6: Supply of Cotton
The historical data on the cotton supply shows that the country produces large amount of cotton.
It also imports finer and longer cotton fibres to supply the yarn manufacturing industry of fine
yarns and subsequently fine (low weight in grams per square meter) fabrics.
There is a strong growth in the cotton production from the middle of 1980s to 1991. It followed a
decline in the production due to severe weather and other reasons of virus and diseases. Later,
there were various cycles of growth and decline but the trend of increasing production on the
long horizon is quite visible. There is an important growth trend which is associated with the
import of cotton during 2001 to 2007. The data does not identify the kind of cotton fibres
imported but it can be added that this growth in the cotton import is related to the import of fine
and long fibres. This fact will be supported with evidence in the following sections.
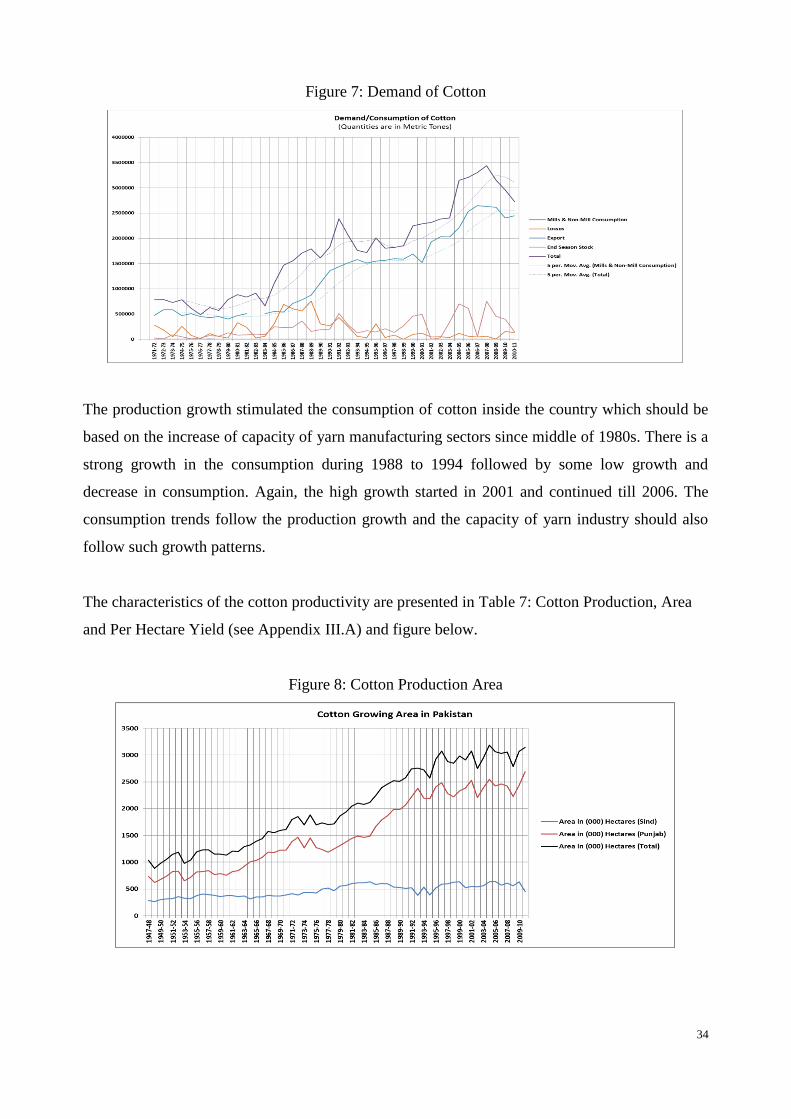
34
Figure 7: Demand of Cotton
The production growth stimulated the consumption of cotton inside the country which should be
based on the increase of capacity of yarn manufacturing sectors since middle of 1980s. There is a
strong growth in the consumption during 1988 to 1994 followed by some low growth and
decrease in consumption. Again, the high growth started in 2001 and continued till 2006. The
consumption trends follow the production growth and the capacity of yarn industry should also
follow such growth patterns.
The characteristics of the cotton productivity are presented in Table 7: Cotton Production, Area
and Per Hectare Yield (see Appendix III.A) and figure below.
Figure 8: Cotton Production Area
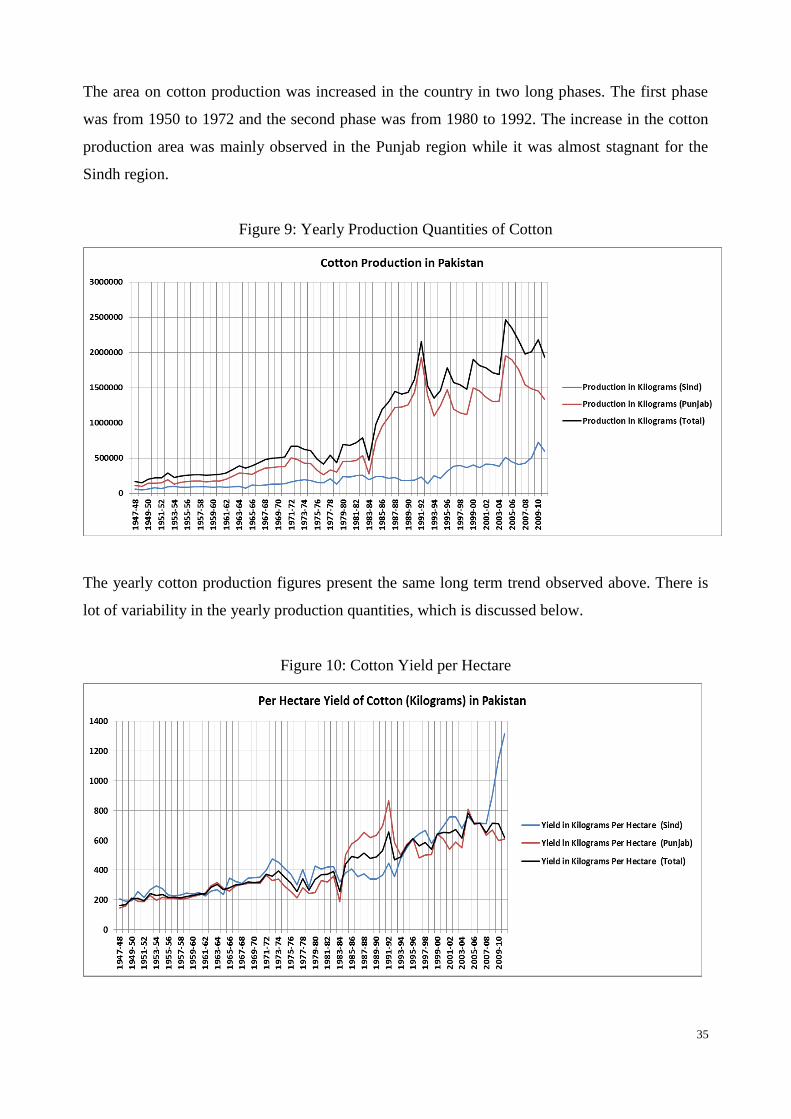
35
The area on cotton production was increased in the country in two long phases. The first phase
was from 1950 to 1972 and the second phase was from 1980 to 1992. The increase in the cotton
production area was mainly observed in the Punjab region while it was almost stagnant for the
Sindh region.
Figure 9: Yearly Production Quantities of Cotton
The yearly cotton production figures present the same long term trend observed above. There is
lot of variability in the yearly production quantities, which is discussed below.
Figure 10: Cotton Yield per Hectare

36
This increase of cotton yield per hectare is an important factor, which can be associated with the
improvements in farming technology, practices of farming community and the development of
improved varieties of cotton. The first phases of the nominal increase in yield are visible from
1966 to 1972 where the increase was higher in Sindh region. The second prominent increase is
from 1984 to 1992 where the increase is much higher in the Punjab region. There is a sharp
increase in the yield figures of Sindh after 1994 and also more recently. The yield in Punjab has a
lot of fluctuations. The insight provided by other authors on cotton productivity will continue in
the following paragraphs.
The figures show a lot of variation in the yearly production quantities of cotton, the area under
cultivation and the yield per hectare in the country (Salam (2008)). The year-to-year changes in
cotton production ranged from −29 per cent to 45 per cent in the period from 1991 to 2005,
translating into a loss of 641,000 tons and a gain of 774,000 tons, respectively. These are
staggering quantities with serious repercussions for farm revenues, capacity utilization of the
ginning sector, supply of raw material to the industry, institutional infrastructure and logistic
arrangements for handling and marketing the produce. A large proportion of the fluctuations in
cotton production have its origins in the variations of cotton yield per hectare. The coefficient of
variation of cotton yield, during that period, was 17.5 per cent, with year-to-year changes in
yields ranging from −29 per cent to 35 per cent.
The variations in the area under cotton production also increase the variations of yearly quantities
of cotton, increasing the uncertainty of cotton supplies and uncontrolled fluctuations of prices.
Although, the coefficient of variation of cotton area is smaller (5.6 per cent) compared to cotton
yield per hectare, where the annual fluctuations range between −10 per cent and 13 per cent. This,
translate to a contraction of 322,000 hectares and to an expansion of 344,000 hectares,
respectively.
The variations in production area can be related with the changing interests of farmers on the
crops of high profitability and low risk. Cotton is highly vulnerable to viruses, disease and severe
weather conditions; higher risks are associated with its production. Crop insurance does not exist
in the country, which can provide some security against such risks and can improve the farmer´s
confidence in growing cotton. The crops competing with cotton include wheat, rice, sugarcane
and maize. They compete for labour and time management in various months of cotton growing
seasons (Gilham et al. (1995), p. 167). It is difficult to comment on the amount of labour and
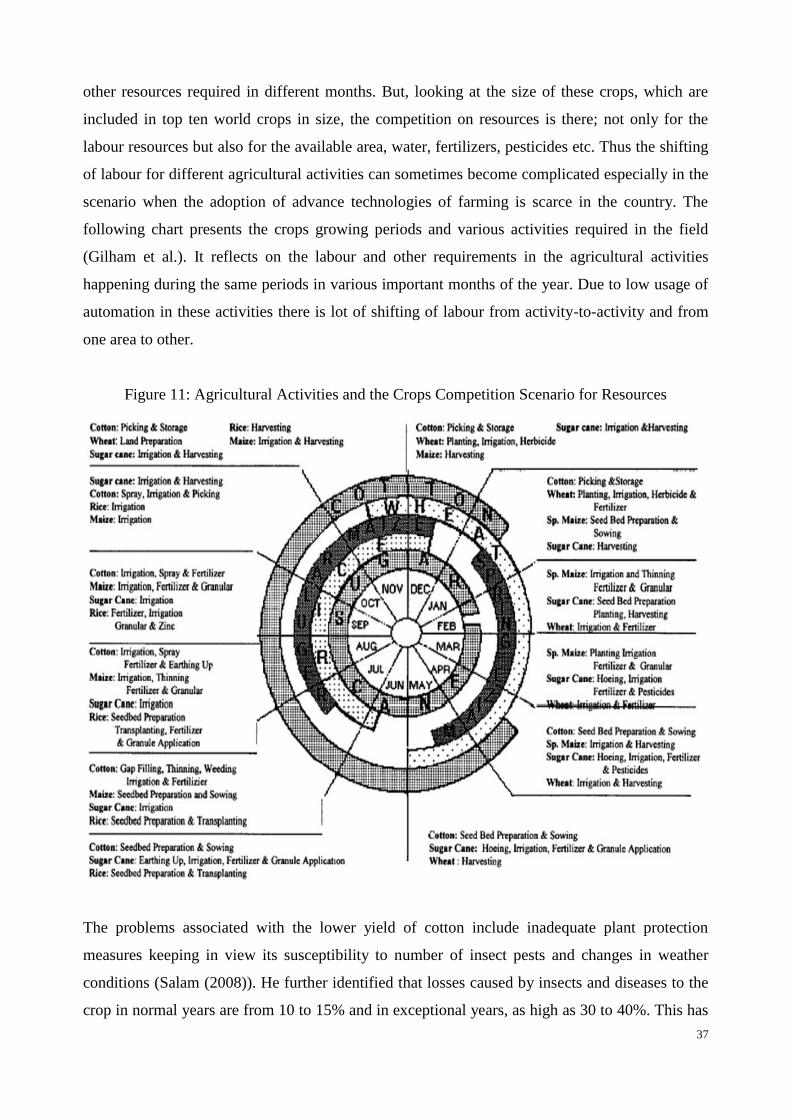
37
other resources required in different months. But, looking at the size of these crops, which are
included in top ten world crops in size, the competition on resources is there; not only for the
labour resources but also for the available area, water, fertilizers, pesticides etc. Thus the shifting
of labour for different agricultural activities can sometimes become complicated especially in the
scenario when the adoption of advance technologies of farming is scarce in the country. The
following chart presents the crops growing periods and various activities required in the field
(Gilham et al.). It reflects on the labour and other requirements in the agricultural activities
happening during the same periods in various important months of the year. Due to low usage of
automation in these activities there is lot of shifting of labour from activity-to-activity and from
one area to other.
Figure 11: Agricultural Activities and the Crops Competition Scenario for Resources
The problems associated with the lower yield of cotton include inadequate plant protection
measures keeping in view its susceptibility to number of insect pests and changes in weather
conditions (Salam (2008)). He further identified that losses caused by insects and diseases to the
crop in normal years are from 10 to 15% and in exceptional years, as high as 30 to 40%. This has

38
placed the production of cotton at higher risk, requiring high expenditure for pest control. This
moves the farmers‟ choice of crops away from cotton, towards more easily manageable and low
risk crops. Other factors which play a part in higher cost of cotton cultivation include substandard
insecticides, aggressive marketing by pesticide companies and the limited knowledge of farming
community for pest control methods and technology. These cause the inefficient usage of
chemicals.
The variations in the per hectare yield are the result of many factors which include lack of
advance farming practices, higher costs of inputs, vulnerability of cotton crop to weather,
diseases and viruses etc. The variations in the overall cotton productions are the combined result
of variations in area and yield.
To overcome the problems related to cotton production, Salam (2008) recommended the
strengthening of the research base to develop the varieties of cotton, resistant to plant diseases
and to adopt the practices to control insects. He also suggested the strengthening of the pest-
scouting and the training of farmers for monitoring pest infestation to achieve efficient pest
control and to introduce the weed control programs. He motivates to adopt a clear policy for
developing the necessary institutional capacity and expertise to address and evaluate the
emerging technological issues and to ascertain the risks involved in tackling the important issues
like introduction of BT cotton. Salam (2008) and Gilham et al. (1995) have provided detailed
insight on the measures which can further improve the cotton production in the country but
discussing them will take us away from the scope of our project.
The prices of seed cotton have witnessed substantial inter and intra-year fluctuations in the
country (Salam (2008)). Some of the reasons for these fluctuations have their origins in the
international commodity markets, which are beyond the control of policy makers. There are
causes of these fluctuations which are very much country specific which should be addressed. For
example, cotton season in the country which spans from September to December (although, bulk
of domestic trade in cotton is concentrated in November to January,) is now stretching from July
to January/February and there is always lot of uncertainty surrounding the size of harvest and
speculations on the prices of the product. There is a need to strengthen the institutional base and
provide the framework for estimating the size of harvest to have a realistic and sound basis of the
crop size. It is also important to have the support/reference price of cotton lint determined
transparently in consultation with the stakeholders after the announcement of prices of seed

39
cotton rather than to leave it to the judgment of the Trading Corporation of Pakistan (TCP)
(Salam (2008)). There is also a need for fine-tuning the implementation of a price stabilization
program to save the farming community from the avoidable losses and machinations of
unscrupulous trade.
The annual growth on the production cost of cotton, is higher than CPI (Salam (2008)), resulting
in negative effects on the cotton profitability which also affects the farmers‟ choice on crops.
The figures on the type of fibres produced in the country are presented below. Table 8: Staple-
wise Production of Cotton „000‟ Kilograms (see Appendix III.A) provides an overview of the
material available for the production of various types of yarns including coarse to very delicate
qualities or fine yarns.
Figure 12: Staple-wise Production of Cotton
„000‟ Kilograms
It can be observed that there is an increase in the production of long fibre cotton which supports
higher value addition in yarn and fabric manufacturing. Although the data is not complete for the
recent years, the trend is clearly visible. Further, the production of medium-long staple fibre has
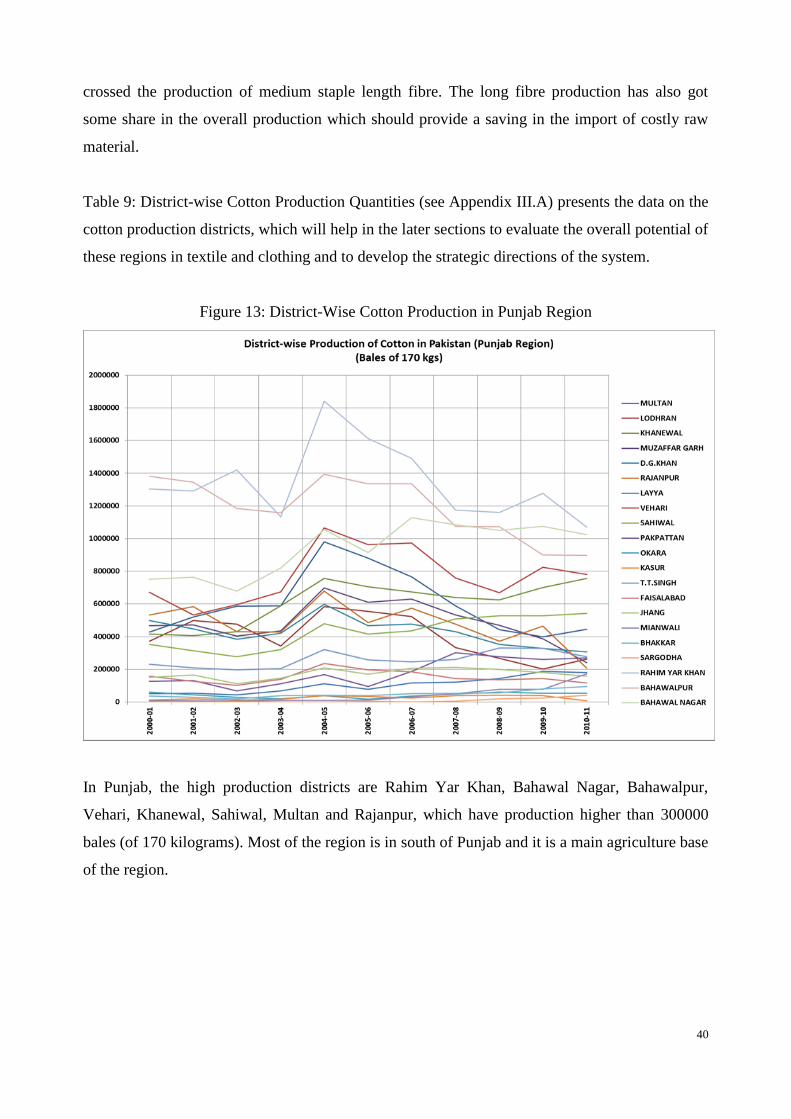
40
crossed the production of medium staple length fibre. The long fibre production has also got
some share in the overall production which should provide a saving in the import of costly raw
material.
Table 9: District-wise Cotton Production Quantities (see Appendix III.A) presents the data on the
cotton production districts, which will help in the later sections to evaluate the overall potential of
these regions in textile and clothing and to develop the strategic directions of the system.
Figure 13: District-Wise Cotton Production in Punjab Region
In Punjab, the high production districts are Rahim Yar Khan, Bahawal Nagar, Bahawalpur,
Vehari, Khanewal, Sahiwal, Multan and Rajanpur, which have production higher than 300000
bales (of 170 kilograms). Most of the region is in south of Punjab and it is a main agriculture base
of the region.

41
Figure 14: District-Wise Cotton Production in Sindh Region
Sanghar is the highest cotton producing district in Sindh and in overall Pakistan. Other important
cotton producing districts in Sindh are Tharparker, Hyderabad, Nawabshah and Sukkur. Most of
the cotton producing area exists in the north part of the province, Table 10: District-wise Cotton
Production Share (see Appendix III.A).
Figure 15: District-wise Share of Cotton Production in Pakistan
Region-wise production figures are presented below.

42
Table 11: Province-wise Cotton Production Quantities
(Qty. in Bales of 170 kilogram)
Region 2000-01 01-02 02-03 03-04 04-05 05-06 06-07 07-08 08-09 09-10 10-11
Punjab 8008833 7959233 7457465 7664973 11296659 9849284 10090277 8831617 8353604 8458483 7904247
Sindh 2178553 2351233 2211061 2125957 3019986 2531605 2309926 2504908 2986025 4212752 3769801
Baluchistan - 3779 9875 3596 30387 13900 10417 16400 9400 22033 24118
Pakistan 10187386 10314245 9678401 9794526 14347032 12394789 12410620 11352925 11349029 12693268 11698166
Source: PCGA (Data available at www.aptma.org.pk)
There was a clear rise in the overall production of cotton in the country from year 2000 to 2005.
Later, there was a decrease in the production quantities which was fluctuating a bit in last five
years. In the long terms increasing trend continues. Major increase was observed in the
production quantities of both Sindh and Punjab in year 2004-05 and then in Sindh in years 2009
to 2011. The share of Sindh region in the overall production has reached around two-third which
was around 21 per cent in year 2000-01. This is a huge increase especially when the increase is
mainly based on the improvement of yield per hectare.
The main cotton producing base of the country is in the centre of the country, i.e. north-east of
Sindh and South-east of Punjab. This area in general is very strong in the agricultural activities.
III.2.1.1. Policy Interventions on the Cotton Trade
It should be clear now that the share of cotton production in the economic activity has made it
very important to direct the strategic and economic goals of the country. In order to develop an
insight on the growth and problems of the textile and clothing sectors, it is important to take a
close look on the history of policy interventions on cotton sectors.
It was mentioned above that the cotton production was an important crop in Indian subcontinent
since last many centuries. After partition, the trade of cotton in Pakistan was open to the private
sector in the period from 1947 to 1974. Then, the government intervened to take control of the
economic activity in the country. This was based on the rationale that the producer was not
getting their due economic share because of the poor performance of industry in the international
markets and it was unable to transfer the economic benefit to the country (Altaf (2008)). As a
result, the industry was nationalized in the middle of 1970s and Economic Committee of Cabinet
(CEC) was formed to control the trade of cotton on government regulated prices. An export tax of
around 30 to 35 per cent was imposed on cotton exports so that low cost raw material could be

43
supplied to the yarn industry. As a result of such moves, cotton producers were not able to get
better prices of their product compared to prices in the international markets and they lost their
motivation to improve the quality of cotton. The productivity was the only way out to
compensate the losses, which was stagnant because of the constraints including low usage of
technology at farming and low research in cotton production and varieties development.
Therefore, no considerable improvements in cotton yield were achieved in these periods. It was
also observed in the figures of the per hectare yield presented above. The comparison on the
cotton prices inside the country and in the international markets is presented below.
Figure 16: Prices of Cotton in Pakistan and International Markets
It is clear that the local prices are quite low in comparison to international markets. The
advantage of low price raw material is available to the domestic yarn industry to keep it
profitable, contrary to its own commitment to compete with strong players. This price advantage
was always there for the yarn industry. As a result, mal practices of keeping the high impurity
contents in the raw and ginned cotton and keeping high moisture content in the stages of cotton
cleaning arose to increase the profits at those stages. Thus inefficiencies crept into the system
including lower raw material quality in the upward chain segments and lower productivity in the
downward segments of the value chain. The SC was mainly composed of cotton production and
yarn and fabric manufacturing in these times. For that reason, termination of the free market
operations resulted in lower levels of competitions in domestic industry and it reduced the
44
competitiveness of the sectors. Later, the private sector was partly re-introduced in the cotton
trade with its exports were subject to Minimum Export Price (MEP). During most of this period,
the industry was involved in the under invoicing of raw material exports and over invoicing of
machinery imports which hurt the industrialization process (Altaf (2008)). The practices to stop
the mal practices were never successful due to the power of trade and industrial sectors which got
political affiliations in different eras of industrial development. For example, until the mid of
1980s, it was required to get a permission to install an industrial unit in the country in the sectors
of textile, cement, sugar etc. These permissions were utilized to gain political motives during
those periods in many industrial sectors including the yarn industry. Many of the yarn and
ginning industries in the country are examples of government supported economic activities.
After 1980s, government reduced its playing with the industrial activities and private sector
motivated again to participate in these activities.
The decade of 1990s observed free business activity although the main industrial potential was in
the hands of old players. The yarn and fabric industries grew and the consumption of raw
material too. The deficiencies in the supply system started to decrease in 1990s due to increased
participation of the private sector. The consumption of raw material increased, export duty on
cotton was removed and it was allowed to trade freely although the man-made fibre production in
the country is still protected with duties on its import which lowers the competitiveness of the
downstream sectors. When these developments were taking place, the textile and clothing system
of the country had protection under the international quotas and there was some buffer to
compensate for the deficiencies. In 1990s, many developing countries of the region started
restructuring their textile and clothing chains like China and India and lately Bangladesh also
joined the race to increase their share in world exports of textile and clothing. Due to the size of
textile and clothing activity in these countries, they are mostly net exporters, which give them
certain importance in the post-quota world of textile and clothing. Thus in the historical course of
development, late 1990s till 2004 was a preparation period for the country to enter into post-
quota period to retain and attract the added share in the textile and clothing trade which was not
fully utilized as the textile and clothing exports are mostly stagnant.
Currently, China, India, Turkey, Pakistan, Bangladesh are the main competitors in the region and
also main players in the world textile and clothing trade. China and India have a very strong
vertical integration whereas Turkey and Bangladesh are somewhat dependent in terms of cotton
production and textile manufacturing. Bangladesh is weak in its upward chain development. The

45
development of textile segments are more advance in Pakistan than its clothing sector but China
and India are well developed in all segments. In the wake of increasing globalization and the
abolition of the Multi-fibre Agreement (MFA), it was a necessity for the country to keep abreast
of the policies of other countries in general and competing countries in particular as well as with
the developments in the world commodity markets. It was required to strengthen the institutional
framework and to develop the indigenous expertise to cater to the fast changing requirements and
emerging situations (Salam (2008)) but it seems that improvements are not addressed.
The overall status of the cotton production is presented below.
Table 12: Characteristics and Status of the Cotton Farming
Segment Status of
Development*
Factors Responsible for the Development of the Sector
*(Development is the function of following variables.)
Inputs Supply Medium Strong-
to-Strong
Availability of Labour, Medium High Skills of Farming, Weather Uncertainties, High Risk of Virus
and Diseases, High Cost of Pesticides, Fertilisers etc. Non availability of Advance Farming
Technology, Existence of Research on Cotton Varieties,
Farming Sector Strong
High Expansion of the Cotton Production Activity in the Country, Low Advancement in Farming
Technology, Growth of the Farming Area and Yield per Hectare, Variations in Production Area and
Yield, Lot of Risks
Demand in National
Markets High Growth of Ginning and Yarn Industry
Demand in
International
Markets
Average to High Low Knowledge of Markets, Low Picking Quality, Low Use of Information Technology
Overall Cotton
Farming Sector Strong
Scale: 1 = Weak , 2 = Weak-to-Medium Strong, 3 = Medium Strong, 4 = Medium Strong-to-Strong, 5 = Strong
III.2.2. Ginning
In order to develop the insight on the ginning industry, the data on the cotton arrival periods in
ginning factories, the quantity of cotton produced in various districts, and the location of the
ginning factories is studied. This will help to discuss the requirements of the industry including
labour required in various months and in various districts. It will also give an overview on the
transportation requirement to carry the produce from field to the ginning factories.
The cotton arrival in the ginning factories is presented in the next figures.
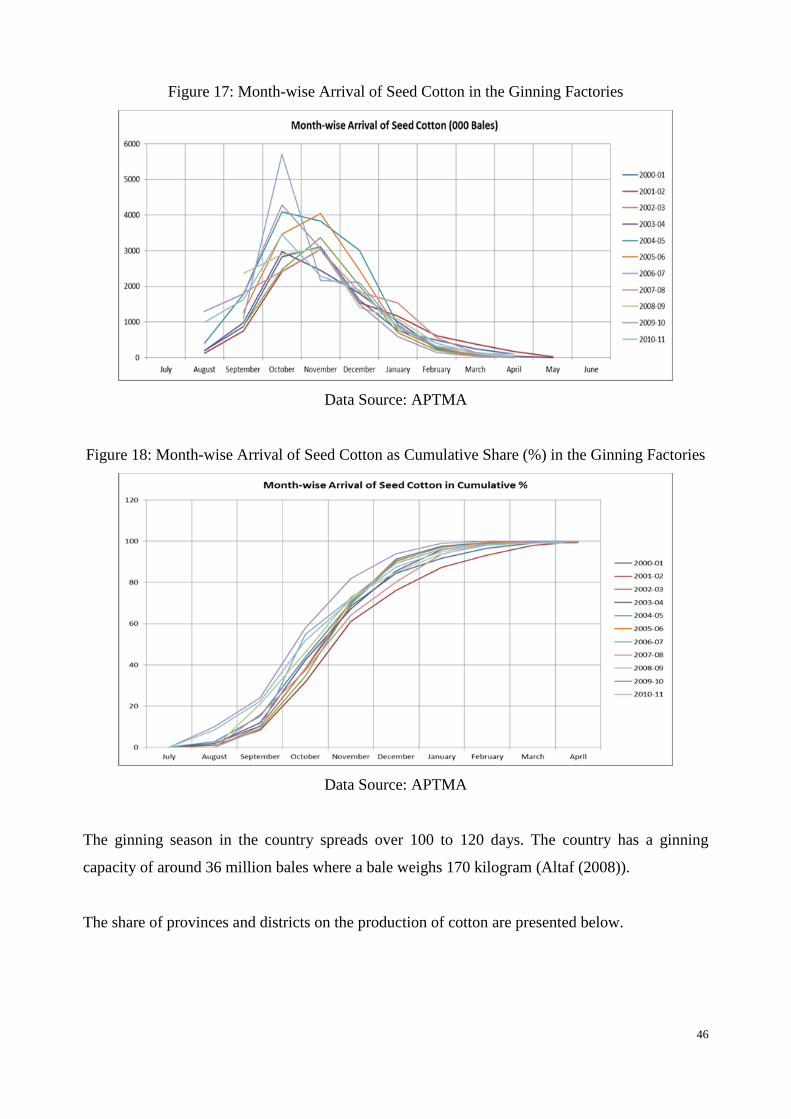
46
Figure 17: Month-wise Arrival of Seed Cotton in the Ginning Factories
Data Source: APTMA
Figure 18: Month-wise Arrival of Seed Cotton as Cumulative Share (%) in the Ginning Factories
Data Source: APTMA
The ginning season in the country spreads over 100 to 120 days. The country has a ginning
capacity of around 36 million bales where a bale weighs 170 kilogram (Altaf (2008)).
The share of provinces and districts on the production of cotton are presented below.
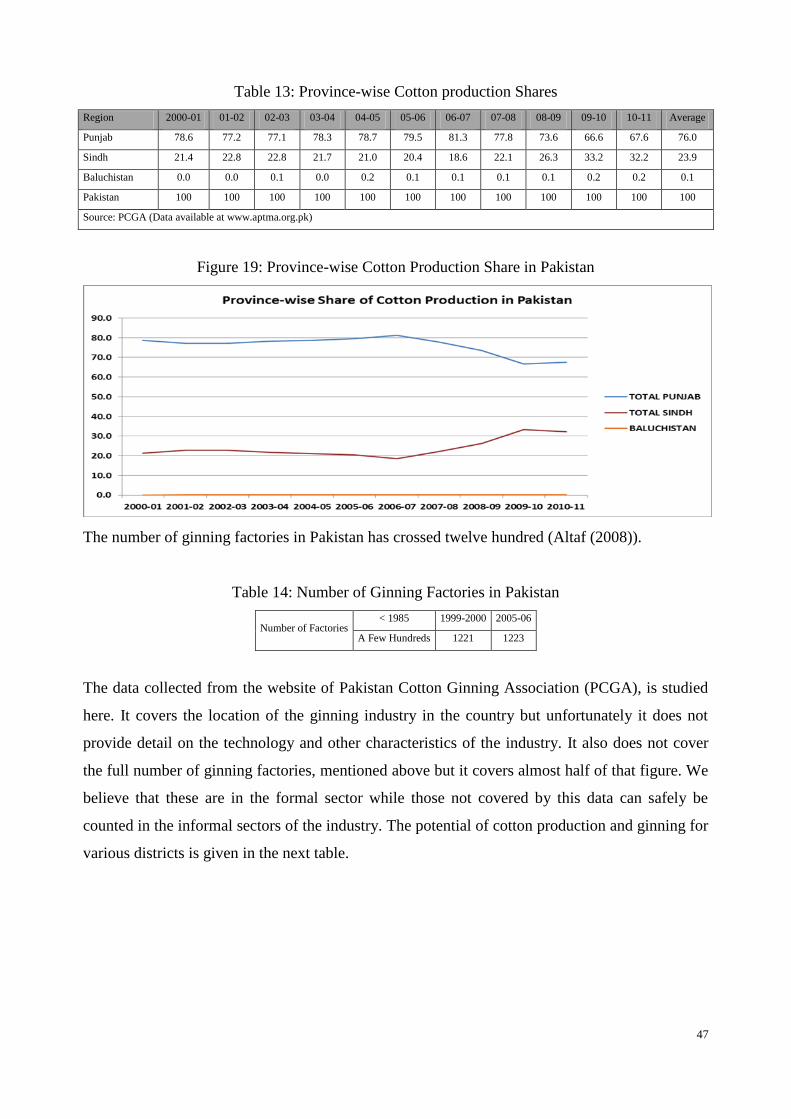
47
Table 13: Province-wise Cotton production Shares
Region 2000-01 01-02 02-03 03-04 04-05 05-06 06-07 07-08 08-09 09-10 10-11 Average
Punjab 78.6 77.2 77.1 78.3 78.7 79.5 81.3 77.8 73.6 66.6 67.6 76.0
Sindh 21.4 22.8 22.8 21.7 21.0 20.4 18.6 22.1 26.3 33.2 32.2 23.9
Baluchistan 0.0 0.0 0.1 0.0 0.2 0.1 0.1 0.1 0.1 0.2 0.2 0.1
Pakistan 100 100 100 100 100 100 100 100 100 100 100 100
Source: PCGA (Data available at www.aptma.org.pk)
Figure 19: Province-wise Cotton Production Share in Pakistan
The number of ginning factories in Pakistan has crossed twelve hundred (Altaf (2008)).
Table 14: Number of Ginning Factories in Pakistan
Number of Factories < 1985 1999-2000 2005-06
A Few Hundreds 1221 1223
The data collected from the website of Pakistan Cotton Ginning Association (PCGA), is studied
here. It covers the location of the ginning industry in the country but unfortunately it does not
provide detail on the technology and other characteristics of the industry. It also does not cover
the full number of ginning factories, mentioned above but it covers almost half of that figure. We
believe that these are in the formal sector while those not covered by this data can safely be
counted in the informal sectors of the industry. The potential of cotton production and ginning for
various districts is given in the next table.
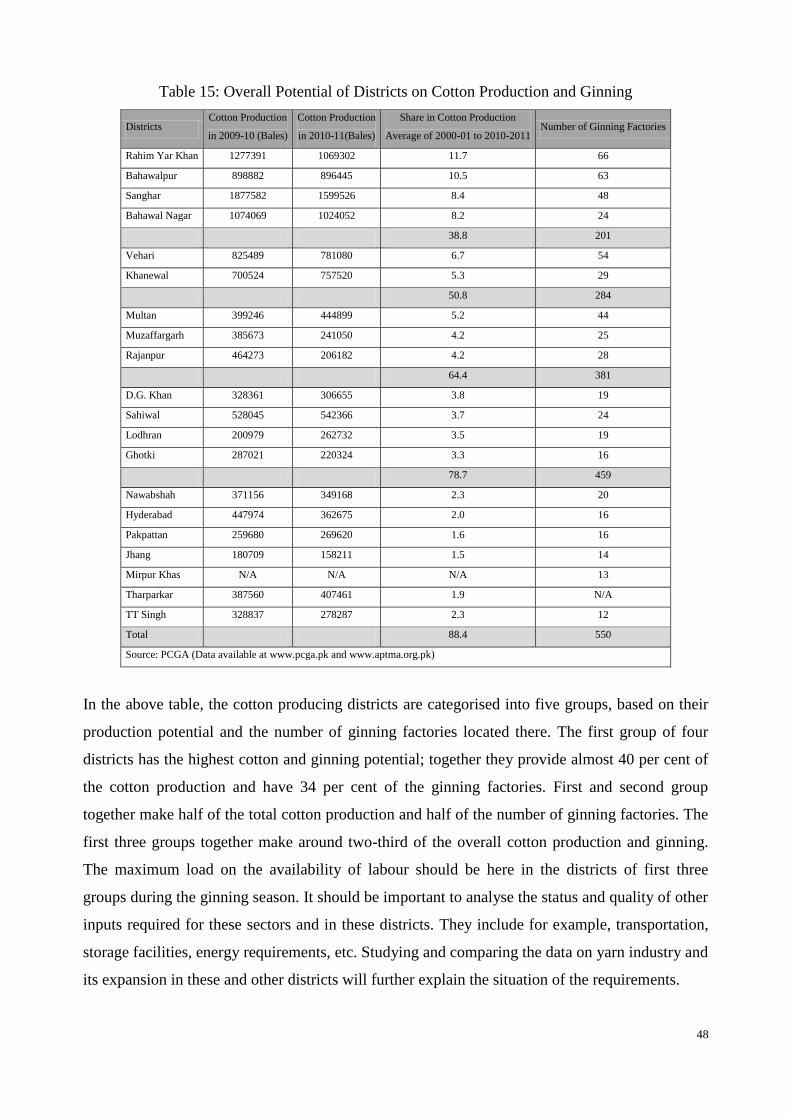
48
Table 15: Overall Potential of Districts on Cotton Production and Ginning
Districts Cotton Production
in 2009-10 (Bales)
Cotton Production
in 2010-11(Bales)
Share in Cotton Production
Average of 2000-01 to 2010-2011 Number of Ginning Factories
Rahim Yar Khan 1277391 1069302 11.7 66
Bahawalpur 898882 896445 10.5 63
Sanghar 1877582 1599526 8.4 48
Bahawal Nagar 1074069 1024052 8.2 24
38.8 201
Vehari 825489 781080 6.7 54
Khanewal 700524 757520 5.3 29
50.8 284
Multan 399246 444899 5.2 44
Muzaffargarh 385673 241050 4.2 25
Rajanpur 464273 206182 4.2 28
64.4 381
D.G. Khan 328361 306655 3.8 19
Sahiwal 528045 542366 3.7 24
Lodhran 200979 262732 3.5 19
Ghotki 287021 220324 3.3 16
78.7 459
Nawabshah 371156 349168 2.3 20
Hyderabad 447974 362675 2.0 16
Pakpattan 259680 269620 1.6 16
Jhang 180709 158211 1.5 14
Mirpur Khas N/A N/A N/A 13
Tharparkar 387560 407461 1.9 N/A
TT Singh 328837 278287 2.3 12
Total 88.4 550
Source: PCGA (Data available at www.pcga.pk and www.aptma.org.pk)
In the above table, the cotton producing districts are categorised into five groups, based on their
production potential and the number of ginning factories located there. The first group of four
districts has the highest cotton and ginning potential; together they provide almost 40 per cent of
the cotton production and have 34 per cent of the ginning factories. First and second group
together make half of the total cotton production and half of the number of ginning factories. The
first three groups together make around two-third of the overall cotton production and ginning.
The maximum load on the availability of labour should be here in the districts of first three
groups during the ginning season. It should be important to analyse the status and quality of other
inputs required for these sectors and in these districts. They include for example, transportation,
storage facilities, energy requirements, etc. Studying and comparing the data on yarn industry and
its expansion in these and other districts will further explain the situation of the requirements.

49
The ginning process separates the cotton fibres from non-fibrous material. Some idea of the
technology, utilized in the ginning industry can be established from the following data.
Table 16: Ginning Technology in Pakistan
Machine Type No. of Installed Machines Machine Capacity
(bales per 8 hour shift)
Total Capacity
(bales per day per shift)
80 Saw 229 12.5 2863
90 Saw 3500 18.5 59235
100 Saw 132 31.0 4092
Total 5488 12 Million bales
Source: Altaf, (2008)
Most of the industry is based on the technology of saw-ginning. There is no data on the pre-
ginning and post-ginning steps which can provide further explanation on the potential of the
industry in terms of quality addition to the lint cotton. Meanwhile, our discussion with the
industry experts identified that the use of post-ginning cleaning steps are rare in the industry.
These stages add cost to the product and the yarn industry does not show willingness to pay for
the higher quality of fibres. As a result, the ginning industry hesitates to improve the quality of
the fibre in their process. Introduction of the cotton fibre industry to the international markets can
resolve this issue and can bring strong motivation in the domestic industry to improve their
quality and get higher prices. This will also bring quality benefits for the local yarn industry.
Yarn manufacturing separate the non-fibrous material from the fibres rigorously in their
preparation stages, which create other quality problems of increasing short fibres and the higher
requirement of energy at this stage. The yarn industry has strong political strength and it is
always in a position to demand concessions on energy and other issues from the government
which will not improve the overall situation. It should be important to study the cost saving from
the quality improvement in ginning compared to using severe cleaning in yarn manufacturing and
also to study the effects on the quality of yarn produced in both cases. This will provide an
insight on the policy issues in these segments.
There is a huge gap in the research at this point to reflect on the costs and on the other affects
which the subsequent industries are observing because of the postponement of such cleaning till
the preparation stages of yarn manufacturing. It is important to mention here that the ginning
industry forms a compact package of cotton fibre called a bale, in order to ease the transportation
and storing. Later, when the yarn manufacturer starts processing the fibres, he performs opening

50
processes which also reduces the impurity size and it can become more difficult to remove that
impurity and more energy and costs should be required to separate these impurities.
Producing 100 bales of lint cotton (17200kg) requires around 52000kg of seed cotton with 33%
ginning output. Remaining is seed cotton (averaging 32240 kg and around 62%) and trash
(around 2560kg around 5%). On average, there is almost 7-8% foreign material found after
ginning in Pakistan which is sometimes as high as 12% (Salam (2008)). Different sources of
foreign matter in the cotton which is delivered to the yarn industry, include non-standard packing
(fibres of jute, polypropylene, and pieces of polythene bag are common); uncovered
transportation of fibres and its open storage in ginneries with unpaved floors (attracting tree
leaves, dirt and dust). Other contaminants are human hairs, bird feathers, cotton twigs, unopened
bolls, and leaves. The amount of foreign matter in cotton after ginning are around 2 to 3% in US,
which can be seen as a benchmark and it identifies the room for improvement. It is interesting to
comment that the cotton in US is mostly machine picked whereas it is hand-picked in Pakistan.
The hand picked cotton should be cleaner than the machine picked; interestingly, it is contrary in
this case. There is a need to convince the stakeholders to reduce this gap if the industry wants to
decrease its energy consumption which is the only option in the current situation of huge energy
shortfall.
The calculated losses in the downstream sectors due to cotton contamination were calculated by
Textile Commissioner Organization (TCO), these are given below.
Table 17: Losses in the Textile Industry for Cotton Contamination in Year 2004-05
Product Category Value (US $)
Cotton Yarn 55370
Cotton Fabric 104604
Ready-made Garments 61425
Knit-wear 99786
Bed-wear 321185
Towels 586999
Other Textile Products 1069394
Total 2298763
The calculation methods and the accuracy of data utilized for these figures are not clear, but they
identify an increasing loss of dollar value in the subsequent processes. These losses point out that
more and more effort is needed to remove or treat the contaminations present in the product as
the processing stages go beyond the ginning stage. Thus any decrease in the amounts of
51
contamination at ginning will improve the quality of the products and reduce their processing
cost.
Ginning productivity in developed countries has reached 60 bales per hour whereas in Pakistan
and other developing countries, it is 10-12 bales per hour (Altaf (2008)). The factors which have
kept the ginning process of the country unimproved and non-competitive at international level
include the low automation, old technology, non-standard operations in ginning, lack of training
on skills and on entrepreneurship and low research on the operations, process and technology.
The strategy of giving low importance to the sector was adopted to provide low price raw
material to the yarn industry and therefore, the ginning industry and the cotton production sectors
were kept away from the international markets. The figures of price difference on the cotton in
international and domestic markets have already shown evidence on such strategies. In the
competitive textile and clothing supply and demand chains of today, the survival is for the
efficient industries which can follow the market trends at fast pace and to retain competitive
position. The global markets are more open now and there are lot of opportunities to trade in the
international markets but the industry in the country has to learn how to compete without
concessions otherwise shifting of industry is already a well-known phenomenon in these sectors.
The main requirements which are necessary at this stage in the ginning sectors include training
and research facilities, technology up-gradation, standardizing the handling, transportation and
storage practices of cotton in the processes of pre-ginning, post-ginning and ginning (Salam
(2008) and Altaf (2008)). These measures will increase the quality of output and decrease the
usage of energy at the subsequent stages of yarn and fabric manufacturing. Salam (2008) also
recommended changing the marketing strategies of cotton from variety basis to quality based
system which will improve the quality of cotton.
In general, the practices, methods, training and technology in the ginning sector need a
substantial improvement. A good linkage of the domestic and international markets is also a need
so that the benefits of handpicked cotton can be realized. It will also help to maintain the
competitive edge of the country in the world markets in the yarn and fabric manufacturing sectors
and it will improve the cotton production and farming. Thus, country can neutralize the risks and
decrease losses in the economy caused by the incompetence or low development of some sectors.
The characteristics and status of ginning sector is given below.
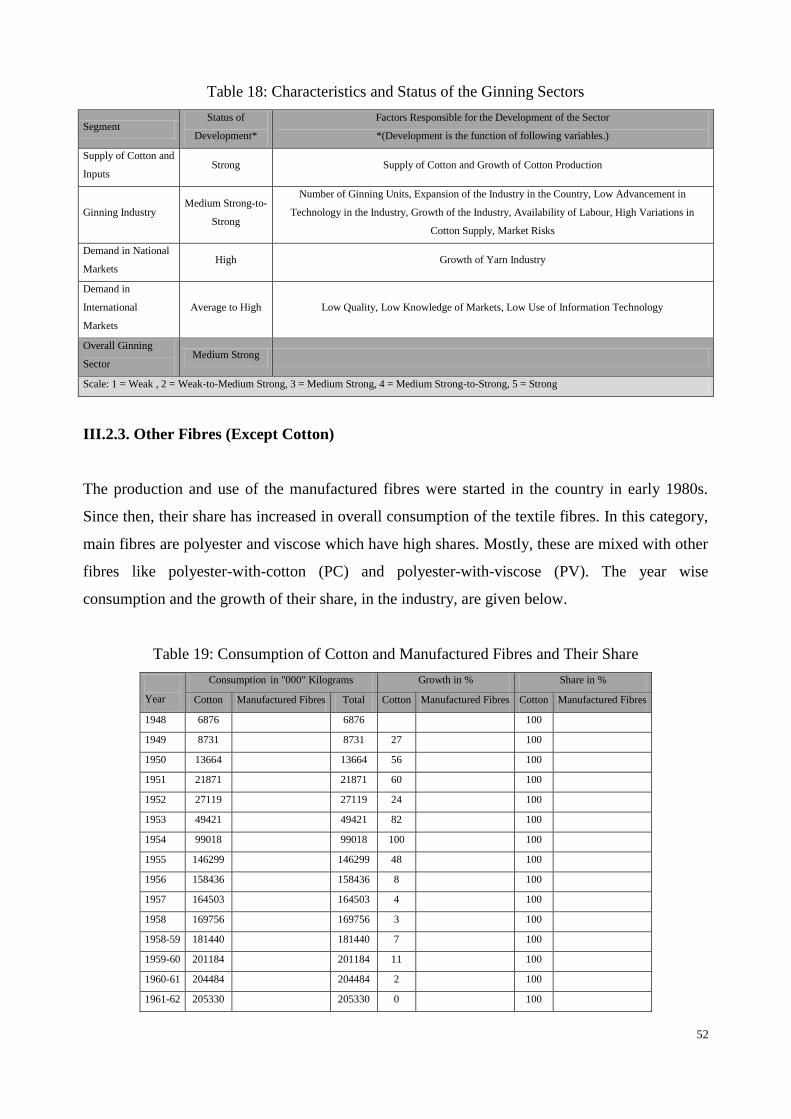
52
Table 18: Characteristics and Status of the Ginning Sectors
Segment Status of
Development*
Factors Responsible for the Development of the Sector
*(Development is the function of following variables.)
Supply of Cotton and
Inputs Strong Supply of Cotton and Growth of Cotton Production
Ginning Industry Medium Strong-to-
Strong
Number of Ginning Units, Expansion of the Industry in the Country, Low Advancement in
Technology in the Industry, Growth of the Industry, Availability of Labour, High Variations in
Cotton Supply, Market Risks
Demand in National
Markets High Growth of Yarn Industry
Demand in
International
Markets
Average to High Low Quality, Low Knowledge of Markets, Low Use of Information Technology
Overall Ginning
Sector Medium Strong
Scale: 1 = Weak , 2 = Weak-to-Medium Strong, 3 = Medium Strong, 4 = Medium Strong-to-Strong, 5 = Strong
III.2.3. Other Fibres (Except Cotton)
The production and use of the manufactured fibres were started in the country in early 1980s.
Since then, their share has increased in overall consumption of the textile fibres. In this category,
main fibres are polyester and viscose which have high shares. Mostly, these are mixed with other
fibres like polyester-with-cotton (PC) and polyester-with-viscose (PV). The year wise
consumption and the growth of their share, in the industry, are given below.
Table 19: Consumption of Cotton and Manufactured Fibres and Their Share
Year
Consumption in "000" Kilograms Growth in % Share in %
Cotton Manufactured Fibres Total Cotton Manufactured Fibres Cotton Manufactured Fibres
1948 6876
6876
100
1949 8731
8731 27
100
1950 13664
13664 56
100
1951 21871
21871 60
100
1952 27119
27119 24
100
1953 49421
49421 82
100
1954 99018
99018 100
100
1955 146299
146299 48
100
1956 158436
158436 8
100
1957 164503
164503 4
100
1958 169756
169756 3
100
1958-59 181440
181440 7
100
1959-60 201184
201184 11
100
1960-61 204484
204484 2
100
1961-62 205330
205330 0
100

53
Year
Consumption in "000" Kilograms Growth in % Share in %
Cotton Manufactured Fibres Total Cotton Manufactured Fibres Cotton Manufactured Fibres
1962-63 213224
213224 4
100
1963-64 233540
233540 10
100
1964-65 237402
237402 2
100
1965-66 230669
230669 -3
100
1966-67 243593
243593 6
100
1967-68 271896
271896 12
100
1968-69 296125
296125 9
100
1969-70 334693
344693 13
100
1970-71 360006
360006 8
100
1971-72 407147
407147 13
100
1972-73 463118
463118 14
100
1973-74 475348
475348 3
100
1974-75 420608
420608 -12
100
1975-76 419735
419735 0
100
1976-77 343194
343194 -18
100
1977-78 355986
355986 4
100
1978-79 387581
387581 9
100
1979-80 428554
428554 11
100
1980-81 407523 37088 444611 -5
92 8
1981-82 459459 4155 501009 13 12 92 8
1982-83 478716 37983 516699 4 -9 93 7
1983-84 457629 48829 506458 -4 29 90 10
1984-85 459394 52237 511631 0 7 90 10
1985-86 500065 58534 558599 9 12 90 10
1986-87 634886 62833 697719 27 7 90 10
1987-88 712456 67282 779738 12 7 91 9
1988-89 809978 69256 879234 14 3 92 8
1989-90 998447 71904 1070351 23 4 93 7
1990-91 1128978 8556 1214538 13 19 93 7
1991-92 1257399 105775 1363174 11 24 92 8
1992-93 1318892 125525 1444417 5 19 91 9
1993-94 1511610 182077 1693687 15 45 89 11
1994-95 1412732 192152 1604884 -7 6 88 12
1995-96 1509955 192691 1702646 7 0 89 11
1996-97 1444368 236692 1681060 -4 23 86 14
1997-98 1471169 318923 1790092 2 35 82 18
1998-99 1441923 407686 1849609 -2 28 78 22
1999-00 1566348 404008 1970356 9 -1 79 21
2000-01 1673280 405038 2078318 7 0 81 19
2001-02 1755669 409557 2165226 5 1 81 19
2002-03 1943197 449424 2392621 11 10 81 19
2003-04 1938678 468984 2407662 0 4 81 19
2004-05 2099380 488804 2588184 8 4 81 19
2005-06 2407560 525000 2932560 15 7 82 18
2006-07 2563510 580000 3143510 6 10 82 18

54
Year
Consumption in "000" Kilograms Growth in % Share in %
Cotton Manufactured Fibres Total Cotton Manufactured Fibres Cotton Manufactured Fibres
2007-08 2521170 638000 3159170 -2 10 80 20
2008-09 2519184 676464 3195648 -0.1 6 79 21
2009-10 2401840 970524 3372364 -4.7 43 71 29
2010-11 2444176 961551 3405727 1.8 -1 72 28
Source : TCO (Data available at www.aptma.org.pk)
Figure 20: Cotton and Other Fibre Consumption in the Country
Table 20: Share of Various Fibres in Total Fibre Consumption
Period Cotton Other Fibres
Average 1948-80 100 0.0
Average 1980-90 91.3 8.7
Average 1990-95 90.4 9.6
1996-97 85.9 14.1
1997-98 82.2 17.8
1998-99 78.0 22.0
1999-00 79.5 20.5
2000-01 80.5 19.5
2001-02 81.1 18.9
2002-03 81.2 18.8
2003-04 80.5 19.5
2004-05 81.1 18.9
Source: TCO, Pakistan

55
The manufactured fibres (polyester and viscose) have established their place in the supply chain
system and it is only a matter of time and evolution which will ultimately improve the quality and
competitiveness of these sectors. Meanwhile, exposing their production to international markets,
will improve their performance more quickly. In general, the sourcing patterns of the textile and
clothing supplies in the world, discussed earlier, identify the South Asian region with great
potential and these sectors in the country should benefit from these opportunities both in the
international and regional markets. The main strength of the manufactured fibre industry is that it
is in an organised sector; strong research component will improve its competitiveness in the
international markets. The use of elastic filaments as core spun has also increased in the country
because of high demand in the international markets. Most of these fibres are imported in the
country and their production can be focused for the future directions of the industry.
Other natural textile fibres except cotton include wool, silk and hair fibres (protein fibres); linen
or flex (cellulose fibre). The production and use of these fibres are at different levels of growth.
For example, wool fibre is produced and also imported in the related sectors but the quality and
design versatility of the woollen products are low. As a result, the industry is mainly fulfilling the
demand of the local markets. Silk is also produced and converted into textile and products but
mostly in the unorganized or informal sectors. Serious effort is required to orient these sectors
towards international markets. Linen fibre has a great potential in the country because of its
aesthetic effects in the fabrics and also due to the weather conditions which make it suitable for
wearing purpose in the region. Its usage is low because of less production of the fibre and also
because of the higher dependence of the country on cotton which is available easily.
In general, the manufactured fibre sectors are improving but at low pace. The sectors of natural
fibres, other than cotton are mostly in the informal sectors. It is needed to transform these into
formal industrial activities. The characteristics and overall status of manufactured fibres and
natural fibres, other than cotton are presented below.
Table 21: Characteristics and Status of the Manufactured Fibre Sectors
Segment Status of Development* Factors Responsible for the Development of the Sector
*(Development is the function of following variables.)
Raw Material Supply Medium Strong Dependency on Imports
Manufactured Fibre Industry Medium Strong Discussion with Industry Personnel
Demand in National Markets Average to High Medium Quality and Rates, High Competition
Demand in International Markets Average Medium Quality and Rates, High Competition
Overall Manufactured Fibre Industry Medium Strong
Scale: 1 = Weak , 2 = Weak-to-Medium Strong, 3 = Medium Strong, 4 = Medium Strong-to-Strong, 5 = Strong

56
III.2.4. Yarn Manufacturing
The yarn industry in the country is a strong and big supplier of world markets especially for the
coarse and medium-fine yarn counts of cotton yarns and mixed fibres yarns. The growth of the
sector was impressive and was based on the facts that it enjoyed strong political support,
availability of cheap raw material and export quotas in the quota regime. After the demolition of
the quota system, the industry struggled for some period and tried to improve and compete in the
new scenario. The export data presented below, show that the yarn sector is performing well
against its competitors. Meanwhile, the questions of how it is performing well or what incentives
or benefits are supporting such an ability of the industry are interesting to discuss here. Some of
these factors were discussed above, which were related to raw material and the discussion will
continue on other such incentives here in this section.
The support for the yarn industry, include the bulk supply of low price cotton, the availability of
manufactured fibres, low labour wages, labour availability, the historical developments in the
textile and clothing sectors and the strong government support. Other attractions for the industry
include the support of the international agencies for development and research and the global
trends of the transfer of these manufacturing activities near to their resources. The developed
world has adopted strategies to move towards the manufacturing of high value added goods and
services in the technologically advanced areas like Nano-technology and bio-technology etc.
Their economic interests are in the research for the advancement of technology, engineering,
science, innovation, systems and other similar areas. As a result, the industrial activities in low
value addition and high labour demand, including textile and clothing are encouraged to move in
countries like China, India, Pakistan, Indonesia, Brazil and Bangladesh and South Africa etc. The
trade in textile and clothing has globalised at all levels and sectors.
Such developments and the support from developed countries to those countries having some
potential in textile and clothing have raised the industrial activity in the developing countries and
the income level of their populations. The sectors of yarn and fabric manufacturing in Pakistan
provide strong base for the other related industries too inside the country. These sectors are also
supply inputs to other regional manufacturers of textile and clothing like Bangladesh, Sri Lanka
and Indonesia.
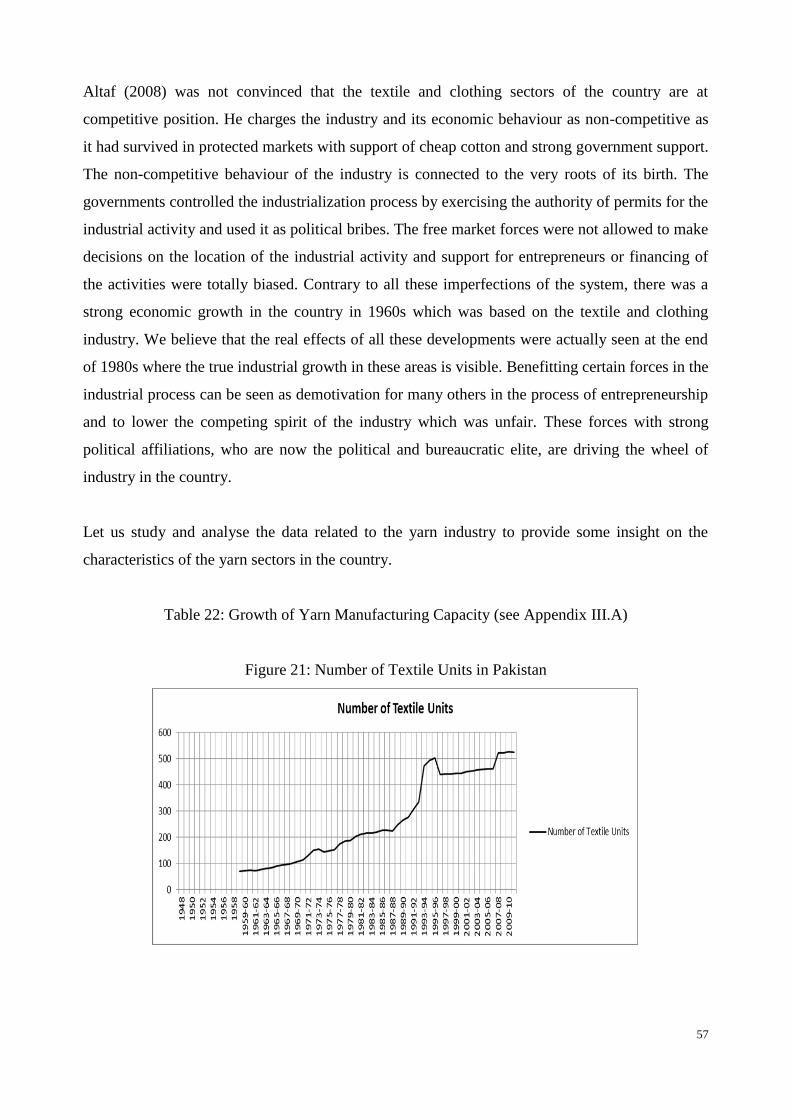
57
Altaf (2008) was not convinced that the textile and clothing sectors of the country are at
competitive position. He charges the industry and its economic behaviour as non-competitive as
it had survived in protected markets with support of cheap cotton and strong government support.
The non-competitive behaviour of the industry is connected to the very roots of its birth. The
governments controlled the industrialization process by exercising the authority of permits for the
industrial activity and used it as political bribes. The free market forces were not allowed to make
decisions on the location of the industrial activity and support for entrepreneurs or financing of
the activities were totally biased. Contrary to all these imperfections of the system, there was a
strong economic growth in the country in 1960s which was based on the textile and clothing
industry. We believe that the real effects of all these developments were actually seen at the end
of 1980s where the true industrial growth in these areas is visible. Benefitting certain forces in the
industrial process can be seen as demotivation for many others in the process of entrepreneurship
and to lower the competing spirit of the industry which was unfair. These forces with strong
political affiliations, who are now the political and bureaucratic elite, are driving the wheel of
industry in the country.
Let us study and analyse the data related to the yarn industry to provide some insight on the
characteristics of the yarn sectors in the country.
Table 22: Growth of Yarn Manufacturing Capacity (see Appendix III.A)
Figure 21: Number of Textile Units in Pakistan
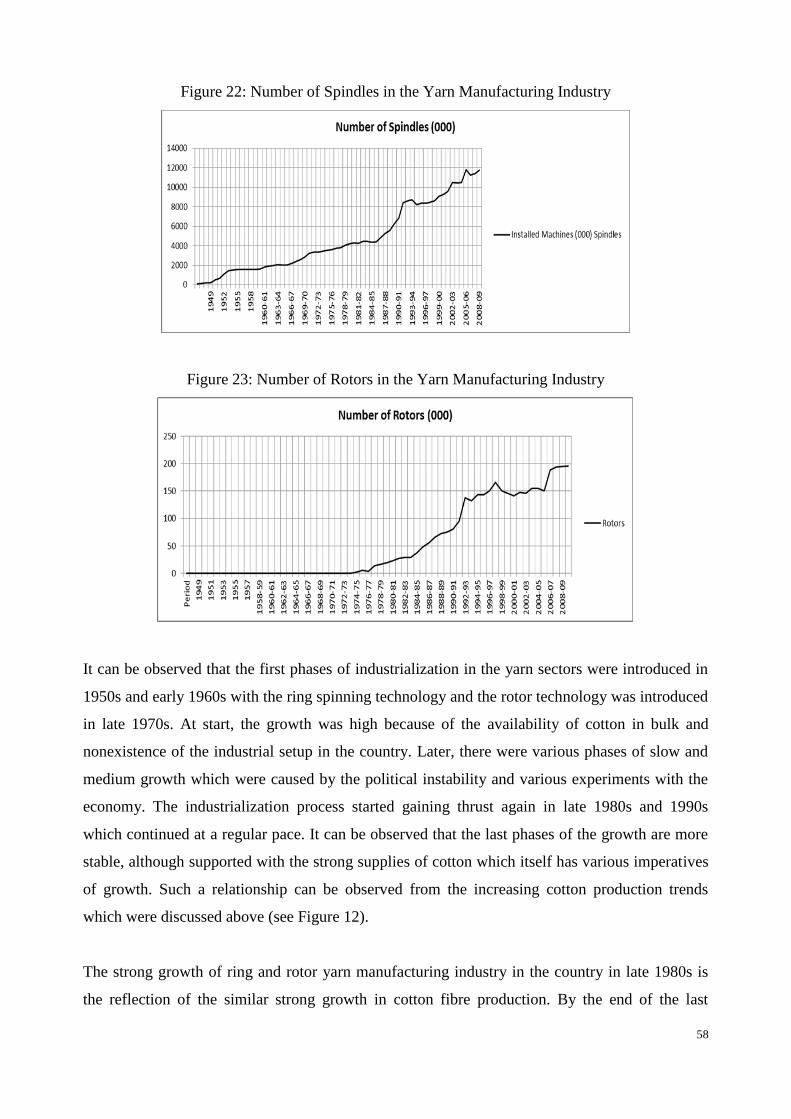
58
Figure 22: Number of Spindles in the Yarn Manufacturing Industry
Figure 23: Number of Rotors in the Yarn Manufacturing Industry
It can be observed that the first phases of industrialization in the yarn sectors were introduced in
1950s and early 1960s with the ring spinning technology and the rotor technology was introduced
in late 1970s. At start, the growth was high because of the availability of cotton in bulk and
nonexistence of the industrial setup in the country. Later, there were various phases of slow and
medium growth which were caused by the political instability and various experiments with the
economy. The industrialization process started gaining thrust again in late 1980s and 1990s
which continued at a regular pace. It can be observed that the last phases of the growth are more
stable, although supported with the strong supplies of cotton which itself has various imperatives
of growth. Such a relationship can be observed from the increasing cotton production trends
which were discussed above (see Figure 12).
The strong growth of ring and rotor yarn manufacturing industry in the country in late 1980s is
the reflection of the similar strong growth in cotton fibre production. By the end of the last

59
century, the cotton production and yarn manufacturing sectors were at strong positions to support
other activities in the value chain.
The data on the capacity utilization in the yarn sector is presented in the next table.
Table 23: Capacity Utilization in the Yarn Industry
Year Units Installed Capacity (000) Working Capacity (000) Capacity Utilization %
Spindles Rotors Spindles Rotors Spindles Rotors
1958-59 70 1581 0 1488 0
1979-80 187 3781 16 2701 14 0.9* 0.59
1989-90 266 5271 72 4489 64 074† 0.83
1990-91 277 5568 75 4827 67 0.87 0.89
1995-96 503 8717 143 6548 80 0.73 0.56
1996-97 440 8230 143 6538 87 0.75 0.56
1997-98 442 8368 150 6631 80 0.79 0.61
1998-99 442 8392 166 6671 66 0.79 0.53
1999-00 443 8477 150 6825 66 0.79 0.40
2000-01 444 8601 146 6913 70 0.81 0.44
2001-02 450 9060 141 7440 66 0.80 0.48
2002-03 453 9260 148 7676 70 0.82 0.47
2003-04 456 9592 146 8009 66 0.83 0.47
2004-05 458 10485 155 8492 79 0.83 0.45
Source: Altaf, (2008); TCO
*Average capacity utilization for 1958-1979 (spindle and rotors)
†Average capacity utilization for 1980-1990 (spindles and rotors)
It can be observed that the capacity utilization in the ring spinning sectors was high, at around 83
per cent whereas much lower at around 50 per cent in the rotor sectors. The recent data is not
available which can bring the fresh insight on the capacity utilization in the yarn industry. The
higher capacity utilization in the ring spinning sectors can be associated with the higher demands
and the trends of the domestics yarn consumption or the marketing focus of the country which is
in the traditional tight-fabric constructions for the clothing and shirting areas. The denim industry
and the terry sectors have expanded a lot in the last decades and the situation of capacity
utilization in the rotor yarn manufacturing sectors should have increased. The factors of growth in
the size of the cotton crop in the country and the higher demand of yarn in the neighbouring
countries have boosted the overall yarn industry in Pakistan and the utilization of its capacity
should also have positive effects in recent years.
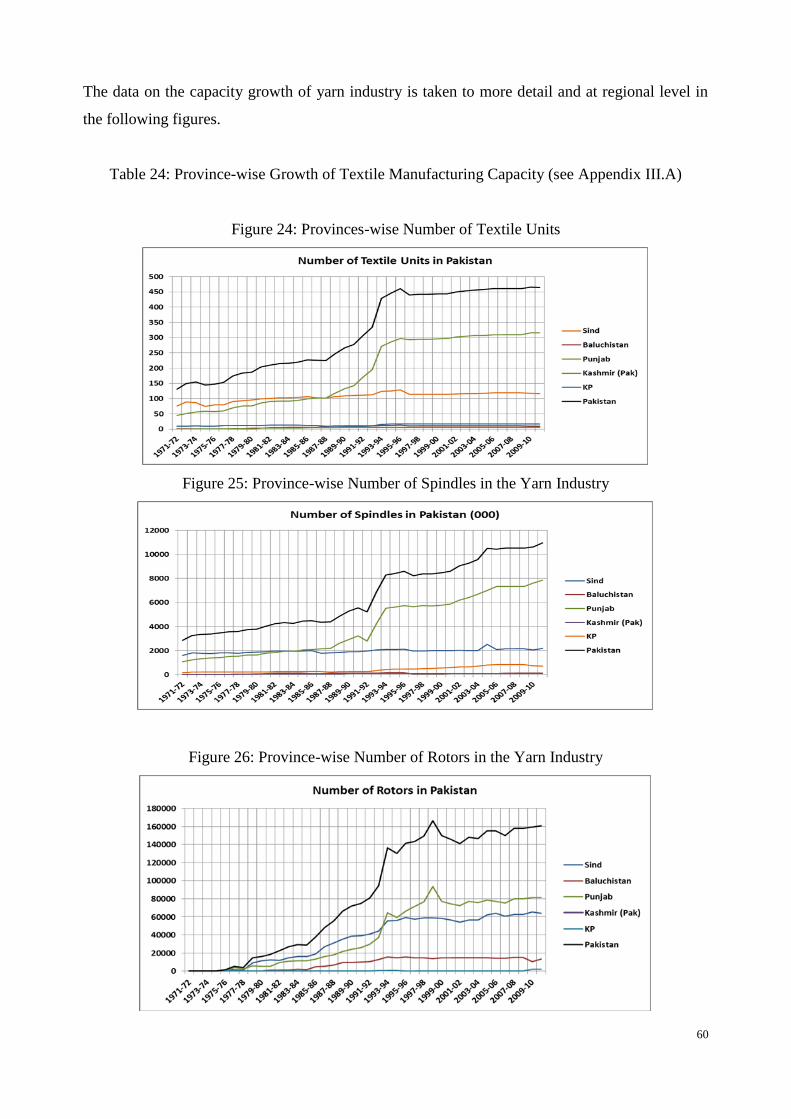
60
The data on the capacity growth of yarn industry is taken to more detail and at regional level in
the following figures.
Table 24: Province-wise Growth of Textile Manufacturing Capacity (see Appendix III.A)
Figure 24: Provinces-wise Number of Textile Units
Figure 25: Province-wise Number of Spindles in the Yarn Industry
Figure 26: Province-wise Number of Rotors in the Yarn Industry
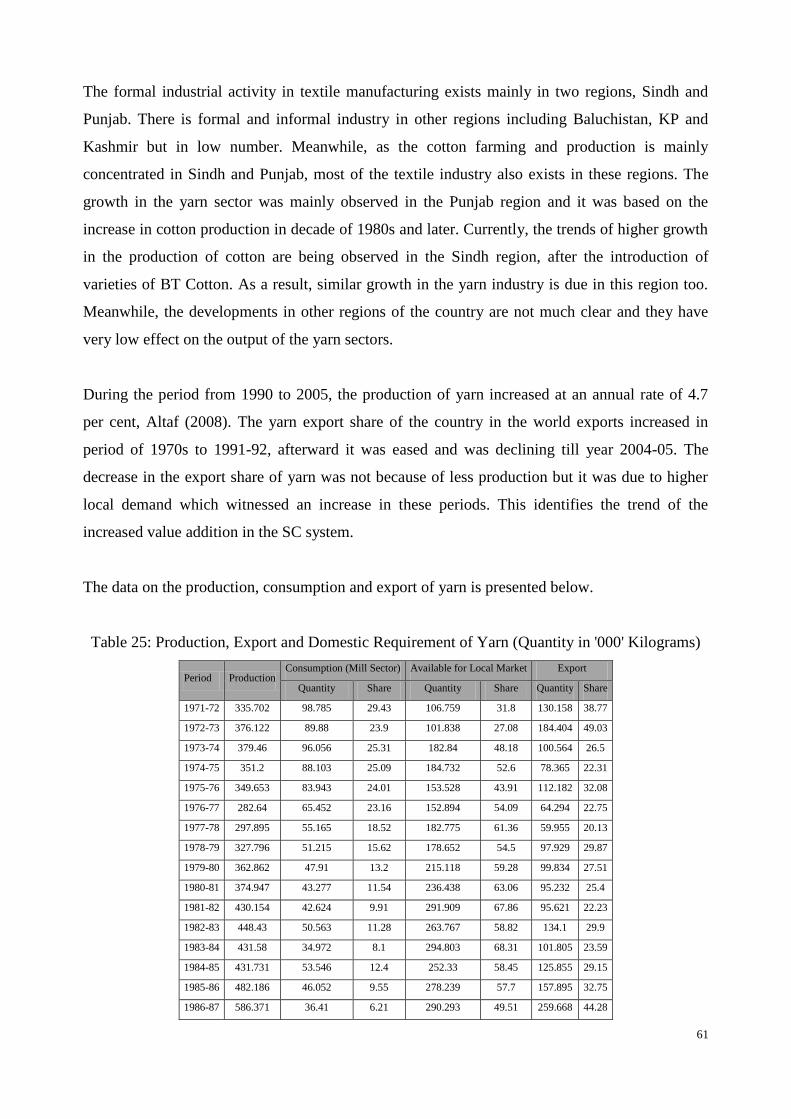
61
The formal industrial activity in textile manufacturing exists mainly in two regions, Sindh and
Punjab. There is formal and informal industry in other regions including Baluchistan, KP and
Kashmir but in low number. Meanwhile, as the cotton farming and production is mainly
concentrated in Sindh and Punjab, most of the textile industry also exists in these regions. The
growth in the yarn sector was mainly observed in the Punjab region and it was based on the
increase in cotton production in decade of 1980s and later. Currently, the trends of higher growth
in the production of cotton are being observed in the Sindh region, after the introduction of
varieties of BT Cotton. As a result, similar growth in the yarn industry is due in this region too.
Meanwhile, the developments in other regions of the country are not much clear and they have
very low effect on the output of the yarn sectors.
During the period from 1990 to 2005, the production of yarn increased at an annual rate of 4.7
per cent, Altaf (2008). The yarn export share of the country in the world exports increased in
period of 1970s to 1991-92, afterward it was eased and was declining till year 2004-05. The
decrease in the export share of yarn was not because of less production but it was due to higher
local demand which witnessed an increase in these periods. This identifies the trend of the
increased value addition in the SC system.
The data on the production, consumption and export of yarn is presented below.
Table 25: Production, Export and Domestic Requirement of Yarn (Quantity in '000' Kilograms)
Period Production Consumption (Mill Sector) Available for Local Market Export
Quantity Share Quantity Share Quantity Share
1971-72 335.702 98.785 29.43 106.759 31.8 130.158 38.77
1972-73 376.122 89.88 23.9 101.838 27.08 184.404 49.03
1973-74 379.46 96.056 25.31 182.84 48.18 100.564 26.5
1974-75 351.2 88.103 25.09 184.732 52.6 78.365 22.31
1975-76 349.653 83.943 24.01 153.528 43.91 112.182 32.08
1976-77 282.64 65.452 23.16 152.894 54.09 64.294 22.75
1977-78 297.895 55.165 18.52 182.775 61.36 59.955 20.13
1978-79 327.796 51.215 15.62 178.652 54.5 97.929 29.87
1979-80 362.862 47.91 13.2 215.118 59.28 99.834 27.51
1980-81 374.947 43.277 11.54 236.438 63.06 95.232 25.4
1981-82 430.154 42.624 9.91 291.909 67.86 95.621 22.23
1982-83 448.43 50.563 11.28 263.767 58.82 134.1 29.9
1983-84 431.58 34.972 8.1 294.803 68.31 101.805 23.59
1984-85 431.731 53.546 12.4 252.33 58.45 125.855 29.15
1985-86 482.186 46.052 9.55 278.239 57.7 157.895 32.75
1986-87 586.371 36.41 6.21 290.293 49.51 259.668 44.28
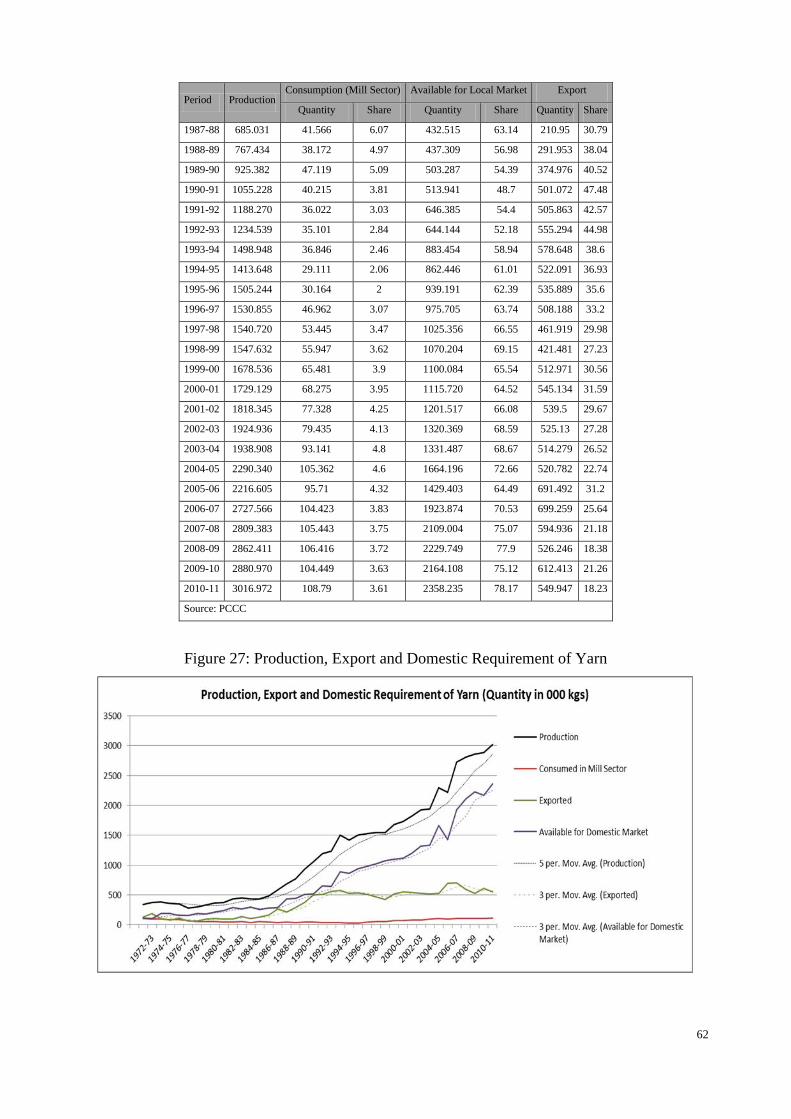
62
Period Production Consumption (Mill Sector) Available for Local Market Export
Quantity Share Quantity Share Quantity Share
1987-88 685.031 41.566 6.07 432.515 63.14 210.95 30.79
1988-89 767.434 38.172 4.97 437.309 56.98 291.953 38.04
1989-90 925.382 47.119 5.09 503.287 54.39 374.976 40.52
1990-91 1055.228 40.215 3.81 513.941 48.7 501.072 47.48
1991-92 1188.270 36.022 3.03 646.385 54.4 505.863 42.57
1992-93 1234.539 35.101 2.84 644.144 52.18 555.294 44.98
1993-94 1498.948 36.846 2.46 883.454 58.94 578.648 38.6
1994-95 1413.648 29.111 2.06 862.446 61.01 522.091 36.93
1995-96 1505.244 30.164 2 939.191 62.39 535.889 35.6
1996-97 1530.855 46.962 3.07 975.705 63.74 508.188 33.2
1997-98 1540.720 53.445 3.47 1025.356 66.55 461.919 29.98
1998-99 1547.632 55.947 3.62 1070.204 69.15 421.481 27.23
1999-00 1678.536 65.481 3.9 1100.084 65.54 512.971 30.56
2000-01 1729.129 68.275 3.95 1115.720 64.52 545.134 31.59
2001-02 1818.345 77.328 4.25 1201.517 66.08 539.5 29.67
2002-03 1924.936 79.435 4.13 1320.369 68.59 525.13 27.28
2003-04 1938.908 93.141 4.8 1331.487 68.67 514.279 26.52
2004-05 2290.340 105.362 4.6 1664.196 72.66 520.782 22.74
2005-06 2216.605 95.71 4.32 1429.403 64.49 691.492 31.2
2006-07 2727.566 104.423 3.83 1923.874 70.53 699.259 25.64
2007-08 2809.383 105.443 3.75 2109.004 75.07 594.936 21.18
2008-09 2862.411 106.416 3.72 2229.749 77.9 526.246 18.38
2009-10 2880.970 104.449 3.63 2164.108 75.12 612.413 21.26
2010-11 3016.972 108.79 3.61 2358.235 78.17 549.947 18.23
Source: PCCC
Figure 27: Production, Export and Domestic Requirement of Yarn
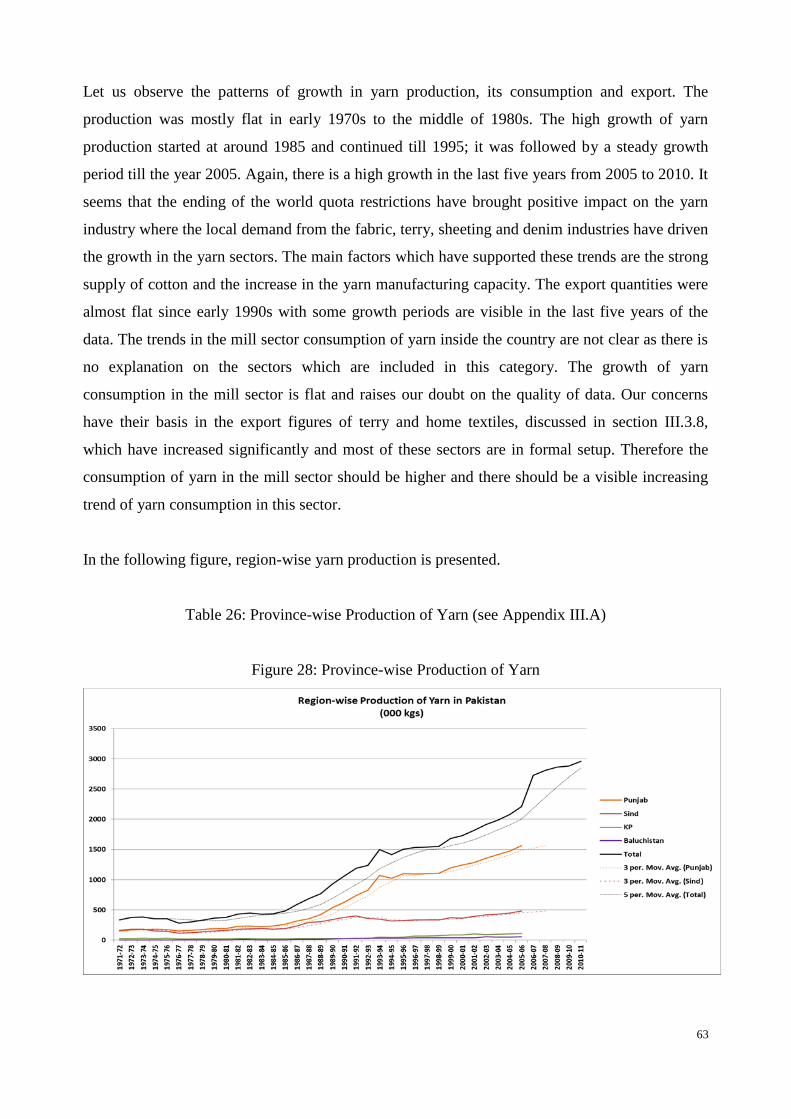
63
Let us observe the patterns of growth in yarn production, its consumption and export. The
production was mostly flat in early 1970s to the middle of 1980s. The high growth of yarn
production started at around 1985 and continued till 1995; it was followed by a steady growth
period till the year 2005. Again, there is a high growth in the last five years from 2005 to 2010. It
seems that the ending of the world quota restrictions have brought positive impact on the yarn
industry where the local demand from the fabric, terry, sheeting and denim industries have driven
the growth in the yarn sectors. The main factors which have supported these trends are the strong
supply of cotton and the increase in the yarn manufacturing capacity. The export quantities were
almost flat since early 1990s with some growth periods are visible in the last five years of the
data. The trends in the mill sector consumption of yarn inside the country are not clear as there is
no explanation on the sectors which are included in this category. The growth of yarn
consumption in the mill sector is flat and raises our doubt on the quality of data. Our concerns
have their basis in the export figures of terry and home textiles, discussed in section III.3.8,
which have increased significantly and most of these sectors are in formal setup. Therefore the
consumption of yarn in the mill sector should be higher and there should be a visible increasing
trend of yarn consumption in this sector.
In the following figure, region-wise yarn production is presented.
Table 26: Province-wise Production of Yarn (see Appendix III.A)
Figure 28: Province-wise Production of Yarn

64
These figures also confirm the patterns of growth discussed above. Higher growth can be
observed in Punjab region and similar trend is due in Sindh region from the recent rise in the
cotton production. KP and Baluchistan have minor shares in the yarn production.
In the following table, the share of main yarn producers in the world is provided.
Table 27: World Production of Cotton Yarn
Year
Production (Million Metric Tons)
World China India Pakistan United States
% % % %
1994 16.2 4.9 30.2 1.6 10.0 1.2 7.2 2.0 12.2
1995 16.7 4.5 32.5 1.8 11.0 1.2 7.3 2.0 12.1
1996 16.7 5.1 30.7 2.1 12.5 1.3 7.7 2.0 11.8
1997 15.6 5.6 35.9 2.3 14.4 1.2 8.0 0.1
1998 16.9 5.4 32.2 2.0 12.0 1.2 6.8 2.0 11.8
1999 17.7 5.7 32.0 2.2 12.2 1.6 9.1 1.9 10.8
2000 19.7 6.6 33.4 2.3 11.6 1.7 8.7 1.9 9.7
2001 19.7 7.0 35.3 2.2 11.2 1.8 9.0 1.6 8.0
2002 20.9 8.5 40.6 2.2 10.5 1.9 8.9 1.4 6.6
2003 22.1 9.8 44.5 2.1 9.4 2.0 8.9 1.2 5.6
2004 23.2 10.9 46.8 2.2 9.7 2.1 9.1 1.3 5.8
Source: Altaf, (2008); International Cotton Advisory Committee
It shows that the country has increased its share in the world production of yarn from 7.2 per cent
to 9.1 per cent in the period from 1994 to 2004. Both China and Pakistan have increased their
production potential whereas the shares of US and India have decreased. The yarn industry in US
should have contracted while in India, the reasons are not clear. Most probably, the production of
yarn in India is stagnant and the overall growth of world production has decreased its global
share. Overall, India has a very strong yarn industry. As the recent data is not present, our
comments should be less representative on the current situation.
The growth of the production of various types of yarns is presented at Table 28 (see Appendix
III.A).
The yarn industry is mostly producing the single yarn in the yarn Counts of Ne: 10, 12, 16, 20,
24, and 30. Other yarn Counts are also produced but in low quantities. For example, in year 2004-
05, the production for the above six categories of Count was around 66 per cent of the total
production; in year 2003-04 the share was 65.1 per cent of the total and so on. The finding that

65
the country mainly produces coarse cotton yarns has its basis in the supply of raw material which
is suitable for these yarn Counts. The data on the types of cotton fibres, produced in the country
confirms such an assumption. The process technology of the yarn industry is also adopted
keeping in view the coarse yarn production potential of the country.
Figure 29: Count-wise Production of Yarn in Pakistan
In the above figure, the coarse yarn production is the highest with steady growth. The production
of mixed fibre yarns has crossed the production quantities of medium yarn counts. The
production of medium yarn counts was stagnant for long period from early 1990s till 2005-06 and
then there is some increase in the production. The production of fine and super fine yarns have
very low share but a growth can be observed in the recent data. For the production of fine and
super fine yarn counts, the country imports fine fibres and there is also an increase in the import
of such fibres from North America and Egypt for example.
The data on the production of various yarn counts is categorized and presented in the next table.

66
Table 29: Production of Various Categories of Yarn (Metric Tons)
Period Textile Mills Coarse Counts Medium Counts Fine Counts S. Fine Waste P. with Viscose P. with Cotton Total
1972-73 109 198.396 161.166 13.767 2.793 0
376.122
1973-74 118 209.12 143.512 16.848 3.491 2.125
4.364 379.46
1974-75 123 202.923 126.783 11.238 3.443 1.229
5.584 351.2
1975-76 116 215.7 113.253 11.364 3.811 770
4.755 349.653
1976-77 126 162.065 93.271 9.383 2.969 537
14.415 282.64
1977-78 136 172.232 91.479 10.408 3.037 841
19.897 297.894
1978-79 143 172.449 110.343 10.865 2.548 2.562
29.031 327.798
1979-80 149 187.405 118.84 11.651 3.669 8.08
33.217 362.862
1980-81 148 165.724 145.127 12.427 4.624 8.26
38.785 374.947
1981-82 157 185.632 165.888 18.128 8.359 19.362 18.032 14.753 430.154
1982-83 158 191.753 182.53 20.133 11.235 9.511 16.779 16.489 448.43
1983-84 161 163.334 179.538 19.789 15.545 9.372 22.441 21.561 431.58
1984-85 158 164.554 191.684 21.397 12.744 8.391 15.821 17.14 431.731
1985-86 160 146.867 238.126 28.498 15.544 7.909 20.359 24.883 482.186
1986-87 187 224.505 262.28 29.225 13.6 9.606 21.22 25.935 586.371
1987-88 197 249.72 311.559 29.272 17.088 10.189 26.881 40.322 685.031
1988-89 223 275.302 349 14.943 11.172 13.384 35.77 67.863 767.434
1989-90 266 351.262 412.149 16.31 7.739 14.21 32.771 90.941 925.382
1990-91 277 424.727 435.278 17.16 9.137 15.826 43.25 109.85 1055.288
1991-92 307 464.66 482.05 31.912 14.755 16.826 68.094 109.973 1188.270
1992-93 334 521.475 451.557 30.081 20.949 18.508 110.348 81.621 1234.539
1993-94 429 588.603 424.127 32.773 16.068 23.733 121.265 120.107 1498.948
1994-95 448 620.691 443.762 49.549 19.498 22.334 89.554 135.314 1413.648
1995-96 503 684.913 451.646 60.177 22.827 21.044 99.68 134.784 1505.244
1996-97 440 699.893 425.165 58.165 23.043 27.127 104.502 192.96 1530.855
1997-98 442 686.718 413.294 60.14 17.591 19.608 100.78 242.589 1540.720
1998-99 442 707.723 368.424 35.969 18.437 22.478 117.452 277.149 1547.632
1999-00 443 806.556 382.33 36.014 19.126 32.069 129.229 273.212 1678.536
2000-01 444 832.4 410.91 37.892 20.204 34.222 112.289 281.212 1729.129
2001-02 450 885.889 381.387 53.674 25.41 38.545 101.823 331.619 1818.347
2002-03 453 916.37 430.13 60.282 35.086 27.185 84.492 371.391 1924.936
2003-04 456 928.589 417.779 60.015 34.69 26.148 89.624 376.044 1938.889
2004-05 458 1003.636 457.543 91.754 38.006 27.483 90.833 378.032 2087.287
2005-06 461 1045.372 479.708 101.98 53.756 36.255 95.671 403.86 2216.602
2006-07 461 1064.584 547.45 14.543 80.605 66.706 81.082 259.176 2241.146
2007-08 461 1027.014 532.06 131.543 75.605 67 100.254 375.924 2309.400
2008-09 461 1033.014 535.06 142.115 80 67.028 102 376 2335.217
2009-10 439 1038.460 539.467 151.015 80.987 65.228 102 376 2353.157
N.A = Not Available
Source: TCO

67
Figure 30: Production of Various Categories of Yarn in Pakistan (Metric Tons)
The figure clarifies the share of manufactured fibres in the overall production. Polyester-with-
cotton (PC) blend is at the third place in terms of quantity produced whereas polyester-with-
viscose (PV) has also a good share with stable quantities. The quantities for the fine and super
fine yarns are also growing.
The following tables present the yearly data on the share of different categories of yarn, produced
in the country.
Table 30: Count-wise Production Shares of Yarn (see Appendix III.A)
Table 31: Share of Coarse and Medium Fine Yarns
Period 10s 12s 16s 20s 30s Sub-Total
1971-80 16.4 3.4 9.1 23.2 6.9 59
1981-90 11.3 4.2 7.6 8.6 7.5 39.2
1990-91 11.3 1.7 10.0 16.5 8.7 48.2
1991-92 10.0 1.5 9.0 18.1 10.4 49
1992-93 9.1 1.6 9.7 21.4 10.8 52.6
1993-94 8.7 2.2 9.4 25.7 12.8 58.8
1994-95 8.4 2.0 10.1 27.2 14.3 62
1995-96 9.0 2.1 10.5 26.0 12.7 60.3
1996-97 9.6 2.4 10.8 25.5 12.4 60.7
1997-98 8.5 2.8 11.5 24.9 12.3 60
1998-99 9.3 3.1 13.3 26.9 12.8 65.4
1999-00 8.9 3.1 12.1 29.3 12.7 66.1
2000-01 7.6 3.2 12.9 29.1 12.8 65.6
2001-02 9.3 3.6 12.6 28.8 11.1 65.4
2002-03 9.1 4.4 10.9 25.6 11.6 61.6
2003-04 8.8 4.6 11.1 26.1 10.6 61.2
2004-05 9.7 4.7 10.2 25.0 11.3 60.9

68
The share of the coarse and medium fine yarns is more than half of the overall yarn production in
the country. Their share crossed the two-third of the overall amount in the periods from 1998 to
2001. In latest figures, their share was decreasing most probably because of the increasing share
of the fine counts.
Table 32: Share of Fine and Super Fine Yarns
Period 40s 47s 48s 60s 80s Sub-Total
1971-80 2.2 0.2 0.2 0.6 0.2 3.4
1981-90 1.6 1.1 0.5 1.5 0.6 5.3
1990-91 0.7 0.1 0.2 0.8 0.1 1.9
1991-92 0.9 0.1 0.3 1.0 0.1 2.4
1992-93 1.0 0.1 0.4 1.2 0.4 3.1
1993-94 1.1 0.2 0.3 0.7 0.5 2.8
1994-95 2.0 0.2 0.2 0.5 1.0 3.9
1995-96 2.4 0.2 0.4 0.7 0.8 4.5
1996-97 2.0 0.2 0.4 0.5 1.0 4.1
1997-98 2.1 0.3 0.5 0.4 0.7 4
1998-99 1.6 0.3 0.5 0.5 0.7 3.6
1999-00 1.8 0.3 0.3 0.3 0.9 3.6
2000-01 1.9 0.3 0.4 0.3 0.9 3.8
2001-02 2.8 0.3 0.4 0.3 1.2 5
2002-03 2.6 0.5 0.7 0.6 1.1 5.5
2003-04 2.9 0.9 0.7 0.7 1.1 6.3
2004-05 3.7 0.9 0.6 0.6 1.2 7
The share of fine and super fine yarn counts was below five per cent of the overall yarn
production. Meanwhile it crossed this limit in year 2001 and since then, their share is increasing.
The production growth of fine presents evidence of the value addition in the yarn sector and also
in the subsequent segments of the value chain. The products from fine counts offer higher profits
and their demand is also associated with products which are in higher levels of quality standards.
Although, the production of fine yarns also require finer fibres which are mostly imported to
fulfil these needs.
Table 33: Share of Various Types of Cotton Fibre in the Overall Production
Period Short
(<20.64mm)
Medium
(20.64-2540mm)
Medium Long
(26.19-27.78mm)
Long
(28.57-33.34mm)
1947-1970 13.6 82.5 7.4 0.4
1970-1980 6.2 77.5 15.3 1.0
1980-1990 2.7 26.4 55.4 15.5
1990-1991 1.0 4.1 59.5 35.4
1991-1992 1.0 9.0 61.1 29.0
1992-1993 1.0 3.1 73.8 22.2

69
Period Short
(<20.64mm)
Medium
(20.64-2540mm)
Medium Long
(26.19-27.78mm)
Long
(28.57-33.34mm)
1993-1994 1.1 23.4 71.4 4.1
1994-1995 1.3 20.1 73.0 5.6
1995-1996 0.9 53.5 45.4 0.2
1996-1997 1.1 37.1 58.9 2.9
1997-1998 1.2 14.0 72.0 12.8
1998-1999 1.2 37.2 59.0 2.7
1999-2000 0.0 33.0 63.0 4.0
2000-2001 0.0 12.4 83.4 4.2
2001-2002 0.5 28.5 67.9 3.2
Source: PCCC
In the data on fibre production, it seems that major fibre production interests were moved from
long fibre production to medium and medium-long fibres in the period from 1980 to 1993. Since
year 1999, slight opposite growth can be observed.
The strong demand from the local producers of heavy cloth, terry and home textiles should be the
main motivation for the cotton producers to grow medium and medium-long fibres. Later, when
the demand for light fabrics and yarns increased, the industry started importing the fine cotton
from North America and Egypt. Part of the yarn manufacturing industry have shifted their
production on fine counts and the country is emerging as an importer of fine and long fibre cotton
(Pima, Giza and other such varieties). Such imports have increased in the recent years to fulfil the
international demand.
The data on the yarn supplies in the world from different countries is presented in following
table.
Table 34: Exports Data of Main Yarn Exporters
Region 1990 91 92 93 94 95 96 97 98 99 2000 01 02 03 04 05 06
World
Value 18.4 18.6 23.3 20.7 24.2 30.0 30.4 32.2 30.4 28.5 31.0 29.0 29.8 33.4 37.5 37.7 21.5
Volume 5.3 4.1 5.2 5.6 6.2 7.2 7.9 10.4 13.7 9.1 10.5 10.2 10.8 10.8 11.5 11.3 6.5
Price 3.5 4.5 4.4 3.7 3.9 4.2 3.9 3.1 2.2 3.1 2.9 2.8 2.7 3.1 3.3 3.3 3.3
Pakistan
Value 1.0 1.2 1.3 1.2 1.6 1.7 1.5 1.1 1.1 1.2 1.1 1.0 1.2 1.1 1.3 1.5
Volume 0.4 0.5 0.6 0.6 0.5 0.6 0.5 0.5 0.5 0.6 0.6 0.6 0.5 0.5 0.6 0.7
Price 2.2 2.4 2.2 2.0 3.1 2.8 2.7 2.4 2.2 2.1 1.9 1.7 2.2 2.3 2.1 2.1
China
Value 1.3 1.3 1.8 2.1 1.9 2.3 2.0 2.2 2.7 2.7 3.1 3.8 4.4 5.2 6.6
Volume 0.4 0.5 0.5 0.6 0.5 0.7 0.6 0.6 0.7 0.8 1.1 1.3 1.4 1.7 2.2
Price 3.2 2.9 3.4 3.8 3.8 3.6 3.5 3.5 3.8 3.4 2.9 3.0 3.1 3.1 3.0
Hong Kong, China
Value 1.9 1.9 2.3 2.8 3.1 3.2 2.9 2.6 3.0 3.1 3.2 3.6 3.9 3.5 3.6
Volume 0.5 0.6 0.7 0.8 0.9 0.9 1.0 0.8 0.8 0.8 0.9 1.0 1.0 1.0 1.0
Price 3.8 3.3 3.2 3.5 3.4 3.4 3.0 3.4 3.7 3.7 3.4 3.5 3.8 3.6 3.6
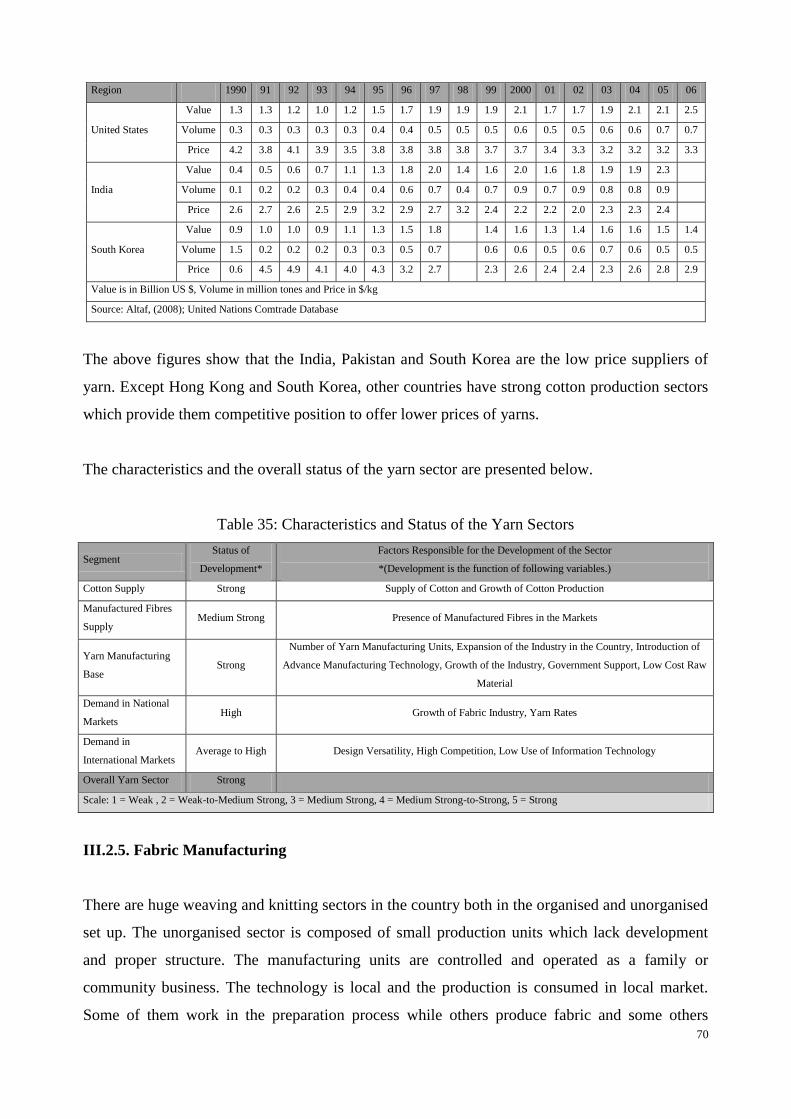
70
Region 1990 91 92 93 94 95 96 97 98 99 2000 01 02 03 04 05 06
United States
Value 1.3 1.3 1.2 1.0 1.2 1.5 1.7 1.9 1.9 1.9 2.1 1.7 1.7 1.9 2.1 2.1 2.5
Volume 0.3 0.3 0.3 0.3 0.3 0.4 0.4 0.5 0.5 0.5 0.6 0.5 0.5 0.6 0.6 0.7 0.7
Price 4.2 3.8 4.1 3.9 3.5 3.8 3.8 3.8 3.8 3.7 3.7 3.4 3.3 3.2 3.2 3.2 3.3
India
Value 0.4 0.5 0.6 0.7 1.1 1.3 1.8 2.0 1.4 1.6 2.0 1.6 1.8 1.9 1.9 2.3
Volume 0.1 0.2 0.2 0.3 0.4 0.4 0.6 0.7 0.4 0.7 0.9 0.7 0.9 0.8 0.8 0.9
Price 2.6 2.7 2.6 2.5 2.9 3.2 2.9 2.7 3.2 2.4 2.2 2.2 2.0 2.3 2.3 2.4
South Korea
Value 0.9 1.0 1.0 0.9 1.1 1.3 1.5 1.8 1.4 1.6 1.3 1.4 1.6 1.6 1.5 1.4
Volume 1.5 0.2 0.2 0.2 0.3 0.3 0.5 0.7 0.6 0.6 0.5 0.6 0.7 0.6 0.5 0.5
Price 0.6 4.5 4.9 4.1 4.0 4.3 3.2 2.7 2.3 2.6 2.4 2.4 2.3 2.6 2.8 2.9
Value is in Billion US $, Volume in million tones and Price in $/kg
Source: Altaf, (2008); United Nations Comtrade Database
The above figures show that the India, Pakistan and South Korea are the low price suppliers of
yarn. Except Hong Kong and South Korea, other countries have strong cotton production sectors
which provide them competitive position to offer lower prices of yarns.
The characteristics and the overall status of the yarn sector are presented below.
Table 35: Characteristics and Status of the Yarn Sectors
Segment Status of
Development*
Factors Responsible for the Development of the Sector
*(Development is the function of following variables.)
Cotton Supply Strong Supply of Cotton and Growth of Cotton Production
Manufactured Fibres
Supply Medium Strong Presence of Manufactured Fibres in the Markets
Yarn Manufacturing
Base Strong
Number of Yarn Manufacturing Units, Expansion of the Industry in the Country, Introduction of
Advance Manufacturing Technology, Growth of the Industry, Government Support, Low Cost Raw
Material
Demand in National
Markets High Growth of Fabric Industry, Yarn Rates
Demand in
International Markets Average to High Design Versatility, High Competition, Low Use of Information Technology
Overall Yarn Sector Strong
Scale: 1 = Weak , 2 = Weak-to-Medium Strong, 3 = Medium Strong, 4 = Medium Strong-to-Strong, 5 = Strong
III.2.5. Fabric Manufacturing
There are huge weaving and knitting sectors in the country both in the organised and unorganised
set up. The unorganised sector is composed of small production units which lack development
and proper structure. The manufacturing units are controlled and operated as a family or
community business. The technology is local and the production is consumed in local market.
Some of them work in the preparation process while others produce fabric and some others

71
perform marketing and other activities. Most of the units operate on conversion basis and charge
for their services for performing some operation. In general, the sector functions in an extended
network and different entities are strongly dependent on the performance of each other. The
production and efficiency are low and the quality of the product is mostly inconsistent. The
master workers transfer their skills to the next generations while the process of development is
very slow for the development of higher skills, technology upgrading and entrepreneurship. On
the other hand, the units which are shifted to the advance technology or the ones which adopted
the new technology at their inception are at proper level of development. They are in the
organised setup with higher production capacity and follow proper quality system. They have
proper marketing functions which are linked to national and/or international markets and can
better understand and fulfil the customer trends in these markets. Although, the linkage between
the suppliers and international consumers is still at lower level of development, it is much higher
than the unorganised sectors. That is why the areas of clothing and apparel are at low level of
competitiveness in the international markets.
The organised sector exports most of its products to the international markets. If required, this
sector hires the production capacity in the unorganised sectors in the situation of demand higher
than their capacity. In these situations, they control the production and quality plans of the hired
units. Thus with the help and support of organised sector, the informal sector also participates in
the production activities intended for international markets. This helps them to adopt better
practices and their transformation to the organised setup. In general, this transition is very slow in
the country as it requires much capital and effort which are difficult to arrange for majority of
such units. That is why; a huge unorganised sector still exists in the country. Meanwhile, there
are also some benefits associated to the existence of this sector. For example, it creates labour for
huge workforce who is uneducated and it can be difficult to provide work for them in other
industrial activities of higher technology. The sector is more flexible in its production patterns
and working environment and is efficient in creation of jobs at low wages. Further, it requires
fewer resources to initiate economic activity and the industrial culture of these sectors is close to
the social patterns of life in the society.
Some segments of this sector are focused in the product segments with cultural components of
design and style. For example, some of the historical centres of textile design existed in the towns
of Hala, Multan, Swat, Kamalia, Lahore, etc. and they are still the source of motivation in design
and creativity. These can be considered as high value adding segments while the products are

72
intended for specific customer segments. They have small setups and are specialised in producing
for clothing and furnishing areas. Lack of technology and resources restrict them to the local
markets. Very small portion of their products arrive in the international markets. This is the
original potential of the regions inside the country on the design, which is yet not fully recognised
but can provide the future driving force to the textile, clothing and furnishing sectors of the
country. The fashion and design industry is trying to revive the cultural diversity in the design by
developing design schools at these locations. These developments will be discussed in the later
sections. This fact has support in the evaluation of the study programs, presented in section II.2.9.
In general, the existing structure of the fabric industry can produce for the traditional areas of
clothing and furnishing sectors. Recently, the country is trying to introduce the non-traditional
sectors of functional and technical textiles by establishing some research centres in these areas.
The level of development in the industries where these products can be utilized, support such
activity. The local industry can absorb the initial production before their acceptance in the
international markets. These strategies will be discussed after studying the overall structure of the
textile and clothing system, which will enable us to visualise the realization of these opportunities
in more detail.
The secondary data available on the fabric industry is mostly focused on the formal and organised
sectors in the country. Therefore, our discussion will be focused on these areas of the fabric
industry.
The weaving industry has the production technology of shuttle and shuttle-less weaving including
projectile, rapier, air jet and water jet machines. The shuttle weaving is old technology which still
exists in the unorganised sectors of the industry. These machines are produced inside the country
and provide low investment opportunity for establishing a fabric production unit. The sector is
mainly concentrated at some locations including Faisalabad, Multan, Lahore, Gujranwala,
Kamalia, Sialkot, Hala, Hyderabad and Karachi. The shuttle-less weaving technology was
introduced in the country in early years of 1980s. It helped in improving the level of technology
in the industry and to increase the production capacity of weaving units. Many units in the
unorganised setup were upgraded and most of the newly established units were based on the
advance technology. A huge decrease can be observed in the number of weaving machines in the
yearly data presented below as a result of these developments.

73
Figure 31: Province-wise Number of Weaving Machines
Initially, there is a steady decrease in the number of weaving machines in the industry from year,
1977 to 1996 followed by a slight increase till year, 2004 and then again a slight decrease. The
initial decline in the number of machines can be associated with two different factors including
transfer of industry due to unfavourable conditions inside the country in 1970s and the shift to the
advance technology in 1980s. The later decline is mostly because of the shift to the advance
technology. The first factor brought negative effects on the industry and it was moved to other
countries whereas the second factor has left positive effects by improving the level of technology.
This transformation also affected the other characteristics of the weaving industry including the
size of the units, capital requirement, labour requirements and the overall structure of the
industry. It has improved the skills on new technology. These developments are also improving
the other industrial activities including the chemical industry related to textile and clothing, areas
of information and communication technology, etc. The strength of these effects is high due to
the higher participation in such activities and due to high economic dependence of the country on
these areas. Further, these developments are improving the linkages of the industry to the
international markets and as a result, closing the gaps of technology in many areas, associated to
these sectors.
The main share of the fabric production comes from the weaving sector which is available for
local and international markets. The investment required for a weaving unit is much higher in the
organized sector with shuttle-less weaving technology whereas low capital is needed to install a
power loom unit.
74
The development of the knitwear and hosiery industry was started in the decade of 1970s and it
continued in the later periods. We will present the data on the expansion of the knitting industry
inside the country in the later paragraphs. Here, we will continue with general characteristics of
the industry. The knitting industry fulfils the local and international demands but most of the
production is exported because the clothing trends in the country are more focused on the use of
woven fabrics. The knitting industry is in the organized and unorganized setups. The organized
sector has well developed structure and lot of composite knitting units exist in the industry. Their
value chain is longer than the units in the unorganised sectors, including the production of fabric,
dyeing, finishing and apparel making within intra-company setup. The unorganized sector is
based on the less advance and cheaper technology which is produced inside the country or
imported from China. Most of the units in the unorganised sector have single process stage in the
value chain like fabric production or subsequent process of dyeing, finishing or apparel
manufacturing.
The raw material requirement of the weaving and knitting industry is mostly fulfilled from the
local yarn industry.
In the early years of the formal industry, fabrics of medium and low weight were produced
because of the power loom technology utilised in those days. The power looms were capable of
producing such fabric constructions. The new technology has increased the fabric style range.
Now, the industry is not concentrated on the low weight and fine fabrics but it is producing the
heavy fabrics; consequently the technologies of the processing and finishing of such fabrics are
also adopted in the country. Since then, many segments are added into the fabric manufacturing
base including heavy weight canvas fabrics and denim fabrics, for example. In last decades, the
exports of the country in the heavy fabrics grew fast, which on the supply-side of the industry
was supported with strong supplies of domestic cheap raw material. The demand of such fabric in
the developed countries created a suitable environment for the growth of such sectors inside the
country. When the industry started upgrading itself with new machinery and technology, the
requirement for the skilled and educated labour was increased. Subsequently, the facilities for
training and education in these areas also started emerging. The level of development of these
areas can be rated low or medium because of low research component but naturally it will
improve soon. At this stage, the country is moving towards knowledge and skill based industry
with advance fabric manufacturing technology of shuttle-less looms (projectile, rapier, air-jet and
water-jet) and skilled labour. The improvements in the process and operations are continued with

75
the introduction of the management systems and information technology, which will bring further
improvements.
From another view, the weaving industry of the country can be divided into three levels:
composite units, independent shuttles weaving units and the power loom sector or non-mill
sector. Most of the composite units are vertically integrated. The vast non-mill or power loom
sector produces around 90 per cent of the countries woven cloth (Altaf (2008)). The share of non-
mill sector in the cloth production is higher but it started decreasing from the year 2002-03 and
the mill sector has started growing its share. Although, the recent data is not available yet, but it
can safely be stated these shares are changed because lot of investment was observed in the
textile sector since 2002-03 period and level of technology is improved in the textile industry.
There was already strong growth of around 5.6 per cent in the cloth production during the period
from 1990 to 2005 due to the above developments in the industry.
The figures on the capacity of the weaving sector in the country are presented below.
Table 36: Installed and Working Capacities of the Weaving Sector
Year Textile Units Installed Capacity
(000)
Working Capacity
(000)
Capacity utilization
%
1958-59 70 27 24
1979-80 187 25 14
Average 1958-79 0.85
1989-90 266 15 8
Average 1980-90 0.53
1990-91 277 15 8 0.53
1991-92 307 14 8 0.53
1992-93 334 14 6 0.57
1993-94 471 14 6 0.43
1994-95 494 13 5 0.43
1995-96 503 10 5 0.38
1996-97 440 10 5 0.50
1997-98 442 10 4 0.50
1998-99 442 10 5 0.40
1999-00 443 10 4 0.50
2000-01 444 10 4 0.40
2001-02 450 10 5 0.40
2002-03 453 10 5 0.50
2003-04 456 10 4 0.50
2004-05 458 9 4 0.40
Source: Altaf, (2008); TCO

76
The main trends include the decrease in the number of weaving machines in the country, which
was discussed above. The figures related with the utilization of the available capacity are very
low, which create our doubts in the authenticity of these figures. The data show a mere 40 to 50
per cent utilization of the available capacity which is much lower than the figures described by
the industry personnel. The important aspect is that there is gap in capacity utilization which
needs attention of various forces including industry and policy makers. The data presented below
and more explanations in this direction can help to devise policies to improve the capacity
utilization.
Table 37: Textile Manufacturing Industry in Various Districts of Pakistan
District Spindles Rotors Air Jet Looms Shuttle-less Looms Other Looms Employees
Kohat 144,610 1,000 46
3,620
Swabi 322,884 0 0
5,919
Total KP 519,838 1,000 46 0 0 10,930
Faisalabad 1326971 4008 724 374 148 29105
Kasur 1149405 1008 740 518 0 21580
Lahore 442960 4728 496 272 4 22388
Multan 443644 4880 732 180 0 11464
Muzaffargarh 471072 780 130 205 0 6173
Rawalpindi 188160 576 204 0 0 2505
Sheikhupura 669366 4000 240 794 0 11706
Total Punjab 6091050 30115 3622 2451 152 140623
Dadu 850563 17528 387 238 100 25919
Hyderabad 244932 0 0 0 0 5580
Karachi 458264 17348 463 1312 267 23074
Lasbelo 80216 5180 0 0 0 452
Sindh & Baluchistan 1655563 40056 850 1550 367 55375
Islamabad 59580 0 0 0 0 0
Total 8,326,031 71,171 4,518 4,001 519 206,928
Total Pakistan 10965000 160635
Source: APTMA (Data available at www.aptma.org.pk)
Table 38: Region-wise Textile Manufacturing Capacity (Part of Table 24)
PERIOD Textile Units Installed Spindles in "000" Installed Rotors Installed Looms
S B P K KP Pak S B P K KP Pak S B P KP Pak S B P K KP Pak
2010-11 116 9 316 6 17 464 2188 130 7841 94 712 10965 63892 13180 81538 2008 160635 3578 0 3592
0 7170
Source: TCO (Data available at www.aptma.org.pk)
Abbreviations: S = Sindh, B = Baluchistan, P = Punjab (Pakistan), K = Kashmir (Pakistan), KP = Khaiber Pakhtunkha,
The above categorization will help to identify various needs and their availability at these
locations and in providing the required inputs. We identified the districts with high potential to
77
discuss their structure and what requirements or inputs are needed there. Here, the high potential
is meant to represent better capacity in one sector or growth of various sectors although with low
potential in one single sector.
With high potential, there are two districts from KP; seven from Punjab; three from Sindh and
one from Baluchistan. The districts of Lasbelo and Hyderabad can be placed at medium level but
their proximity to Karachi and Kotri, the other major industrial sites improves their rating. On the
whole, all seven districts of Punjab, Kohat from KP and Karachi and Dadu from Sindh have the
highest potential in the textile manufacturing sectors of the country. It should be important to
study the status of requirements which are needed at these locations including inputs of raw
material and machinery or equipment, labour and the infrastructure. A general view of the
development tells us that the Punjab and Sindh are developing better and more integrated
infrastructure at locations of Faisalabad, Lahore, Multan, Sheikhupura, Karachi, Hyderabad and
Dadu. The future activities of clothing, apparel, technical and functional textile will emerge here
in the coming decade; the improvements are already started. The combined potential of
Islamabad and Rawalpindi is also improving fast due to having the status of twin cities and
Islamabad as being capital of the country.
It is important to remind that the above data is mainly focused to the organised sectors of the
textile and clothing areas in the country and some of the unorganised sectors can bring more
locations in picture. Also the above data do not cover fully the overall country; although it covers
more than two-third of the overall figures in yarn and fabric manufacturing in the organised
sectors.
The data on the cloth production and types; export quantities and export destinations is presented
below.
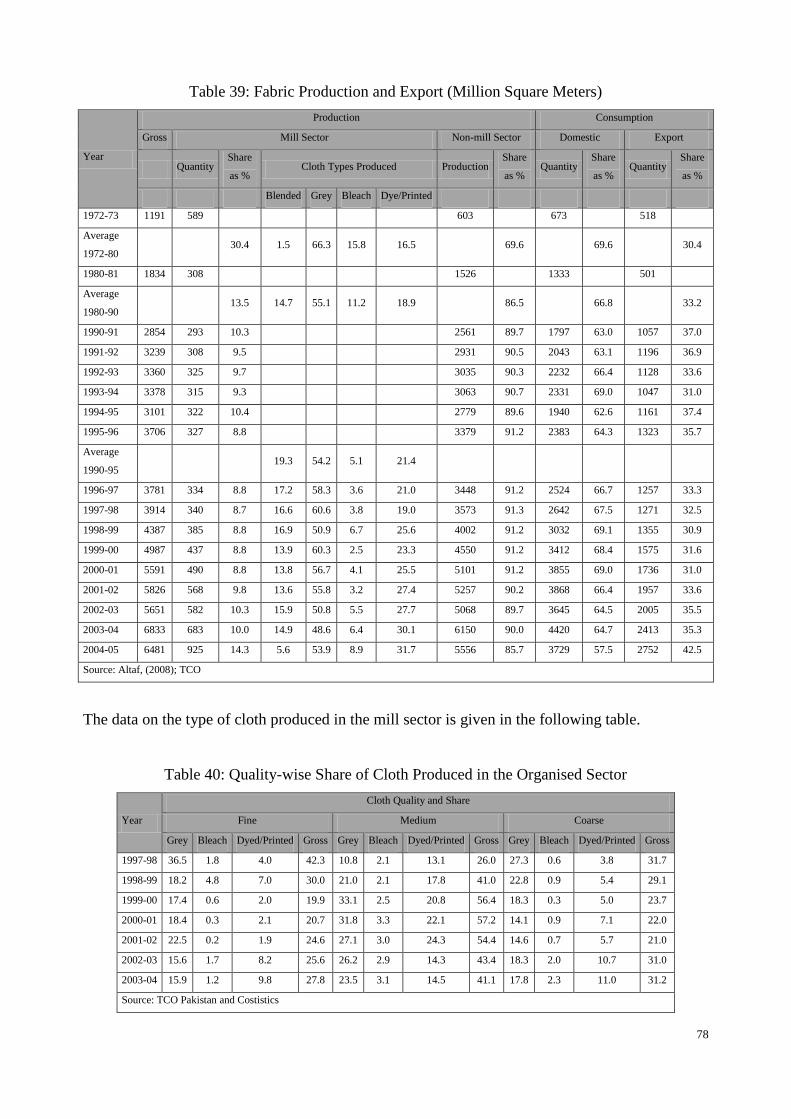
78
Table 39: Fabric Production and Export (Million Square Meters)
Year
Production Consumption
Gross Mill Sector Non-mill Sector Domestic Export
Quantity Share
as % Cloth Types Produced Production
Share
as % Quantity
Share
as % Quantity
Share
as %
Blended Grey Bleach Dye/Printed
1972-73 1191 589 603 673 518
Average
1972-80 30.4 1.5 66.3 15.8 16.5 69.6 69.6 30.4
1980-81 1834 308 1526 1333 501
Average
1980-90 13.5 14.7 55.1 11.2 18.9 86.5 66.8 33.2
1990-91 2854 293 10.3 2561 89.7 1797 63.0 1057 37.0
1991-92 3239 308 9.5 2931 90.5 2043 63.1 1196 36.9
1992-93 3360 325 9.7 3035 90.3 2232 66.4 1128 33.6
1993-94 3378 315 9.3 3063 90.7 2331 69.0 1047 31.0
1994-95 3101 322 10.4 2779 89.6 1940 62.6 1161 37.4
1995-96 3706 327 8.8 3379 91.2 2383 64.3 1323 35.7
Average
1990-95 19.3 54.2 5.1 21.4
1996-97 3781 334 8.8 17.2 58.3 3.6 21.0 3448 91.2 2524 66.7 1257 33.3
1997-98 3914 340 8.7 16.6 60.6 3.8 19.0 3573 91.3 2642 67.5 1271 32.5
1998-99 4387 385 8.8 16.9 50.9 6.7 25.6 4002 91.2 3032 69.1 1355 30.9
1999-00 4987 437 8.8 13.9 60.3 2.5 23.3 4550 91.2 3412 68.4 1575 31.6
2000-01 5591 490 8.8 13.8 56.7 4.1 25.5 5101 91.2 3855 69.0 1736 31.0
2001-02 5826 568 9.8 13.6 55.8 3.2 27.4 5257 90.2 3868 66.4 1957 33.6
2002-03 5651 582 10.3 15.9 50.8 5.5 27.7 5068 89.7 3645 64.5 2005 35.5
2003-04 6833 683 10.0 14.9 48.6 6.4 30.1 6150 90.0 4420 64.7 2413 35.3
2004-05 6481 925 14.3 5.6 53.9 8.9 31.7 5556 85.7 3729 57.5 2752 42.5
Source: Altaf, (2008); TCO
The data on the type of cloth produced in the mill sector is given in the following table.
Table 40: Quality-wise Share of Cloth Produced in the Organised Sector
Year
Cloth Quality and Share
Fine Medium Coarse
Grey Bleach Dyed/Printed Gross Grey Bleach Dyed/Printed Gross Grey Bleach Dyed/Printed Gross
1997-98 36.5 1.8 4.0 42.3 10.8 2.1 13.1 26.0 27.3 0.6 3.8 31.7
1998-99 18.2 4.8 7.0 30.0 21.0 2.1 17.8 41.0 22.8 0.9 5.4 29.1
1999-00 17.4 0.6 2.0 19.9 33.1 2.5 20.8 56.4 18.3 0.3 5.0 23.7
2000-01 18.4 0.3 2.1 20.7 31.8 3.3 22.1 57.2 14.1 0.9 7.1 22.0
2001-02 22.5 0.2 1.9 24.6 27.1 3.0 24.3 54.4 14.6 0.7 5.7 21.0
2002-03 15.6 1.7 8.2 25.6 26.2 2.9 14.3 43.4 18.3 2.0 10.7 31.0
2003-04 15.9 1.2 9.8 27.8 23.5 3.1 14.5 41.1 17.8 2.3 11.0 31.2
Source: TCO Pakistan and Costistics

79
In the categories of Fine and Coarse cloths, high share of cloth export was in the low value
addition (mostly grey fabric) for the early years of the data. There is significant change in the
later years to higher value addition (dyed and printed fabric), probably because of the fresh
investment in these segments of the industry or better opportunities in the international markets.
There was already better export share in the higher level of value addition in the product
segments of medium weight fabrics. The development of the competitive apparel and clothing
sectors will further improve the value addition in these areas in the coming years.
In the cloth production industry, the range of products is limited. Mostly standard products are
produced to supply a wider market base thus keeping oneself at lower risk level. Most of the
power loom sector is in sheeting and shuttle-less looms are producing shirting fabrics and twills
(Altaf (2008)). The export destinations of the fabric produced are the main markets of the world
as the following export figures identify. This can be considered as a confidence of the
international markets in the fabric industry of the country. This will facilitate the expansion of the
production and diversification of product range. There is a need to study the recent data to
identify more recent situation in the export trends.
Table 41: Fabric Exports of Pakistan
Countries 2003-04 2004-05
United States 19.5 15.7
Turkey 6.9 7.7
Hong Kong, China 6.4 5.9
United Arab Emirates 3.7 5.2
Italy 4.9 5.0
Bangladesh 4.0 3.8
Spain 3.6 3.5
United Kingdom 4.8 3.6
Sri Lanka 2.5 2.9
China 3.1 2.8
Others 40.8 43.8
Source: Altaf, (2008); EPB
In the following paragraphs we will discuss the characteristics of the Knitting industry in the
country. Following facts are associated with the hosiery and knitwear industry in Pakistan,
provide by the Association of Hosiery Manufacturers (PHMA).
The hosiery and knitwear industry of the country has around 3500 manufacturing units of all
sizes including large, medium and small. The basis of such classification is not clear but it can be

80
added that the medium and large units can be placed in the organised sectors while others in the
unorganised sector. Some portion of the small knitting units can also lie in the organised sector
because of the low capital requirement compared to weaving sector. Overall, 85 per cent of the
units are small; 10 per cent large and 5 per cent are rated as medium size units.
The industry is scattered around the country in the cities and towns which support the industrial
activity. The data provided by PHMA on the location of this industry covers around 997 units,
which are more than 35 per cent of the overall population. This should mainly composed of
medium and large size units and part of the small unit category, which is in the organised sector.
The sector provides employment to around 700000 skilled and unskilled labour and more than
300000 people earn from the associated cottage industries. A huge investment exists in the sector
and the industry supplies large quantities of knitted fabric to the international markets. The share
of the industry in the overall exports of the country stands at around 30 to 35 per cent. The main
products include knitted fabrics, garments, bed sheets, socks, etc.
The summary on the location of the knitting industry in the country is presented below.
Table 42: Knitting and Hosiery Industry in Pakistan
District Number of Factories
Karachi 419
Faisalabad 258
Sialkot 170
Lahore 150
Total 997
Source: PHMA
(Data Available at www.phma.com)
Most of the organised activity of the knitting industry is concentrated at five locations. These
locations have better infrastructure and their input industry also support the industrial activities.
Karachi alone has around half of the share in the organised sector and probably the share will
surpass the half, if the figures of the unorganised sectors are added.
The main inputs for the weaving and knitting industry include raw material, labour, technology
and design. Value addition can be achieved with the improvements of the design capability and
the optimisation of the activities. These improvements will also enhance the competitiveness of
the industry, which is evident from the developed textile and clothing industries of the Europe,

81
North America, etc. Some insight is provided on the structure and configuration of the textile and
clothing supply chains of the advanced countries in the case study presented in Chapter 5.
Fatima and Ahmed (2005) stated that the status of the knitting sector in the country is at low
maturity. They rated the potential of the sector poor, which we believe should be rated higher as
the characteristics and growth of the factors identified. Therefore, this study suggests the
following status of the weaving and knitting sectors of the country.
Table 43: Characteristics and Status of the Weaving and knitting Sectors
Segment Status of
Development*
Factors Responsible for the Development of the Sector
*(Development is the function of following variables.)
Cotton Based Raw Material
Supply Strong Supply of Cotton and Growth of Yarn Industry
Manufactured Fibres Based Raw
Material Supply Medium Presence of Manufactured Fibres in the Markets
Fabric Manufacturing Base Strong Number of Fabric Manufacturing Units, Expansion of Industry in the Country,
Introduction of Advance Manufacturing Technology, Growth of Industry
Demand in National Markets Average Low Development of the Demand Generating Factors
Demand in International Markets Average Low Design Versatility, High Competition, Low Use of Information Technology
Overall Fabric Sector Medium Strong-to-
Strong
Scale: 1 = Weak , 2 = Weak-to-Medium Strong, 3 = Medium Strong, 4 = Medium Strong-to-Strong, 5 = Strong
III.2.6. Dyeing, Printing and Finishing Sectors
There is no appropriate data available to study the characteristics of this sector. An initial view on
this sector was developed and an attempt will be made to provide the insight developed from the
discussion with the industry personnel. Some reflection on the status of the activities of this
sector can be found in the data on other sectors. For example, the data presented on the fabric
exports in the above section also presents some figures on this sector.
In past, domestics industry of dyeing, printing and finishing mostly fulfilled the local demand and
grey fabric was exported to various countries for further processing. Therefore, the export was
mainly in the grey and bleached fabrics refer to the production of the grey and bleached fabrics in
the above section. In the periods of 1972 to 1980 and 1980 to 1990, the combined production of
cloth in the categories of grey and bleached fabric was 82 and 66 per cent respectively whereas
the share of dyed and/or printed cloth was 16.5 and 19 per cent. There was an improvement of
around 2.5 per cent in the second period. More significant improvement is visible in the most

82
recent years where the share of dyed and printed cloth has reached at almost one-third of the total
fabric produced in the country. It identifies improvement of value addition in these sectors.
The industry is passing through a modernization phase as discussed with various experts in and
outside the country. It has improved its capability to cope with the changing needs of the
international markets but the limited range of the products and blends have compelled it to focus
on cotton products. Also, there is wide gap in the finishing industry of the country and the
finishing industry of the advance countries. The research gap further widens the competitiveness
of these industries on the global level where China and India and other regional competitors are
doing well.
We will bring some more insight on these areas from our survey results which are being
conducted in the international and domestic experts in the textile and clothing areas.
Table 44: Characteristics and Status of the Dyeing, Printing and Finishing Sectors
Segment Status of
Development*
Factors Responsible for the Development of the Sector
*(Development is the function of following variables.)
Supply Side Medium Strong Bulk Supply of Fabric, Low Diversity in Design and Style, Supply of Other Inputs (Dyes,
Chemicals) is Medium Strong, Low wage labour, Low Research
Dyeing/Printing and
Finishing Industry Strong
High Expansion of Industry in the Country, Low Number of Units with Advance
Technology, Medium Growth of Industries,
Demand in National Markets Average Low Development of the Demand Generating Factors
Demand in International
Markets Average
Low Design Versatility, High Competition, Low Knowledge of Developed Markets
Requirements on Quality, Design and Trends on Colour and Finishes, Low Use of
Information Technology
Overall Dyeing, Printing and
Finishing Sectors
Medium Strong-to-
Strong
Scale: 1 = Weak , 2 = Weak-to-Medium Strong, 3 = Medium Strong, 4 = Medium Strong-to-Strong, 5 = Strong
III.2.7. Textile Made-up Sectors
The products which are produced under this sector include six categories namely, towels and
cleaning cloths; bed wear and linens; blankets; curtains and furnishings; canvas products; and
table linens. Major competitors in these area areas are China, Pakistan, India, Turkey and
Portugal. The data on the share of these countries in the world exports is given in the following
table.

83
Table 45: Export Figures of the Main Exporters in the Made-up Sector
Year
Exports in Billion US $
Total World China Pakistan India Turkey Portugal
Amount Share in % Amount Share in % Amount Share in % Amount Share in % Amount Share in %
2001 17.4 3.7 21.2 1.5 8.6 1.1 6.3 1.0 6.0 0.8 4.5
2002 19.1 4.4 22.9 1.8 9.2 1.3 6.6 1.2 6.5 0.8 4.1
2003 23.5 6.1 26.2 2.3 10.0 1.6 6.8 1.6 6.9 0.8 3.5
2004 26.4 7.7 29.3 2.3 8.9 1.8 6.8 1.8 7.0 0.8 3.2
2005 30.2 10.3 33.9 3.1 10.1 2.4 7.9 2.0 6.5 0.8 2.5
Source: Altaf, (2008); International Trade Statistics
In these years, China, Pakistan and India have improved their share in these areas whereas the
share of Turkey is stable and Portugal is losing its share in these areas. We believe that the strong
supply side in China, Pakistan and India is the main force that helped them to improve their share
in these market segments.
Towel industry in Pakistan is mostly in the organized sector consisting of around 325 units, out of
which 250 are in the organized setup (Altaf (2008)). The technology in the unorganised sector is
old and of low production whereas advance technology is adopted in the organised sectors. There
are around 9000 terry machines in the country including 250 machines of advance technology.
The figures on the advance terry machines are quite low and should not be recent. Probably, these
are earlier than the years 2004-05 when the industry started upgrading its technology. Meanwhile,
the export of the country in this area arose significantly in the last decade. The country has
second highest share in the exports of towel and cleaning cloth after China which support the fact
of the strong potential of the country in this area.
Table 46: World Towel and Cleaning Cloth Exports
Year
Exports in Million US $
Total World China Pakistan Portugal Turkey Belgium Germany Brazil Others
Amount Share Amount Share Amount Share Amount Share Amount Share Amount Share Amount Share Amount Share
2002 3469 797 23.0 247 7.1 316 9.1 148 4.3 215 6.2 283 8.2 161 4.6 1302 37.5
2003 3752 865 23.1 321 8.6 302 8.0 172 4.6 217 5.8 278 7.4 168 4.5 1429 38.1
2004 5025 1900 37.8 305 6.1 284 5.7 251 5.0 238 4.7 260 5.2 181 3.6 1606 32.2
2005 4196 989 23.6 346 8.2 284 6.8 271 6.5 271 6.5 273 6.5 156 3.7 1606 38.3
2006 3838 913 23.8 375 9.8 265 6.9 251 6.5 251 6.5 213 5.5 156 4.1 1414 36.8
Source: Altaf, (2008); International Trade Statistics

84
Table 47: Towel and Cleaning Cloth Exports of Pakistan
Commodity 1999-00 2000-01 2004-05 2005-06
Cotton Gauze etc.
Cotton Gauze Bleached 11.3 5.4 5.4 11.2
Towelling Cotton Bleached 30.1 4.1 4.1 30.4
Other Terry Towels Cotton 0.5 1.3 1.3 0.5
Other Linens of Cotton
Towels Cotton Mill-Made 193.1 241.8 241.8 193.0
Towels Cotton Handloom 1.8 1.5 1.5 1.8
Toilet, Kitchen Linens Mill 12.0 12.1 12.1 12.0
Other Linens and Fibres
Toilet, Kitchen Linens Flax 4.6 4.4 4.6 4.6
Cleaning Cloth
Dish Cloth 10.2 11.0 11.0 10.0
Wash Cloth 65.2 82.4 82.4 65.2
Dusters 10.3 9.0 9.0 10.3
Bar Mops 40.2 39.1 39.0 40.2
Source: International Trade Statistics
The sectors of towel and cleaning cloth are performing well against many competing countries
and earning higher unit price with overall high export share. From the discussions with the
industry personnel, the sector is trying to diversify the design and product characteristics.
Meanwhile, it is investing in yarn dyeing machinery to improve the colour quality. To improve
the aesthetics and the absorbance behaviour of the terry products it is improving the yarn
characteristics like introduction of zero twist yarn etc. The process improvements are also
initiated.
The expansion of the organized towel sector in the country was studied. It is summarised in the
table below.
Table 48: Expansion of the Towel Industry in the Country
Location
Number of
Units Characteristics of the Industry in Different Regions of Pakistan
South Zone 158 The industry is mostly in the organized sectors and well established for domestic and international
markets. Karachi 158
North Zone 27
The industry is mostly in the unorganized sector and is changing to the organized sector. Most of the
unorganized sector is located in Faisalabad and Lahore.
Lahore 19
Faisalabad 04
Multan 03
Gujranwala 01
Total Units 185
Data Source: TMA

85
The towel industry is concentrated at low number of locations including Karachi which has more
than 85 per cent of the terry units of the organised sector. Lahore follows with 10 per cent share
of the organised units the rest of the units are located in Faisalabad, Multan and Gujranwala. The
unorganized sector exists mainly in Faisalabad. In general, the industry is transforming itself into
the organized sector more rapidly than the conventional power loom sector which still exists in a
large size in the country.
The growth of the towel sector was exceptional which is clear from the export data of the
country. The main factors behind the strong growth are the supply of short length fibres and the
growth of the yarn manufacturing capacity in coarse yarns. The textile made-up sectors also
grown because of their low dependence on design skills as the industry lacks in its design
capabilities which confines it to standard products like terry, sheeting etc. The deficiency of skills
on design and poor knowledge on the international fashion markets offer the main difficulty to
enter into these areas.
The towel industries which are using advance technology and proper management systems and
skilled labour are competing well at the international level. They participate in the international
fairs to observe and present their design trends and they attract the demands from the
international customers. They have better understanding on the requirements of international
customers. Having expanded chains, they also offer complete services. They have better design
skills and research functions, which work on the process and product development. The smaller
units in the organized sector are doing well but they do not offer complete services. They produce
terry towels and terry cloth in grey and sell to the other domestic and international customers.
Towel in grey is mostly sold in local market where it is dyed and finished and then exported. The
towel industries in the organised sector buy production capacities in the unorganised sector to
meet the demands higher than their capacities. The unorganized towel sector in the country is at
lower level of development in term of technology, skills, productivity and export potential.
Meanwhile, the organised sector can be rated as medium strong in terms of the above factors.
The status for the organized towel sector of the country is given in the next table.
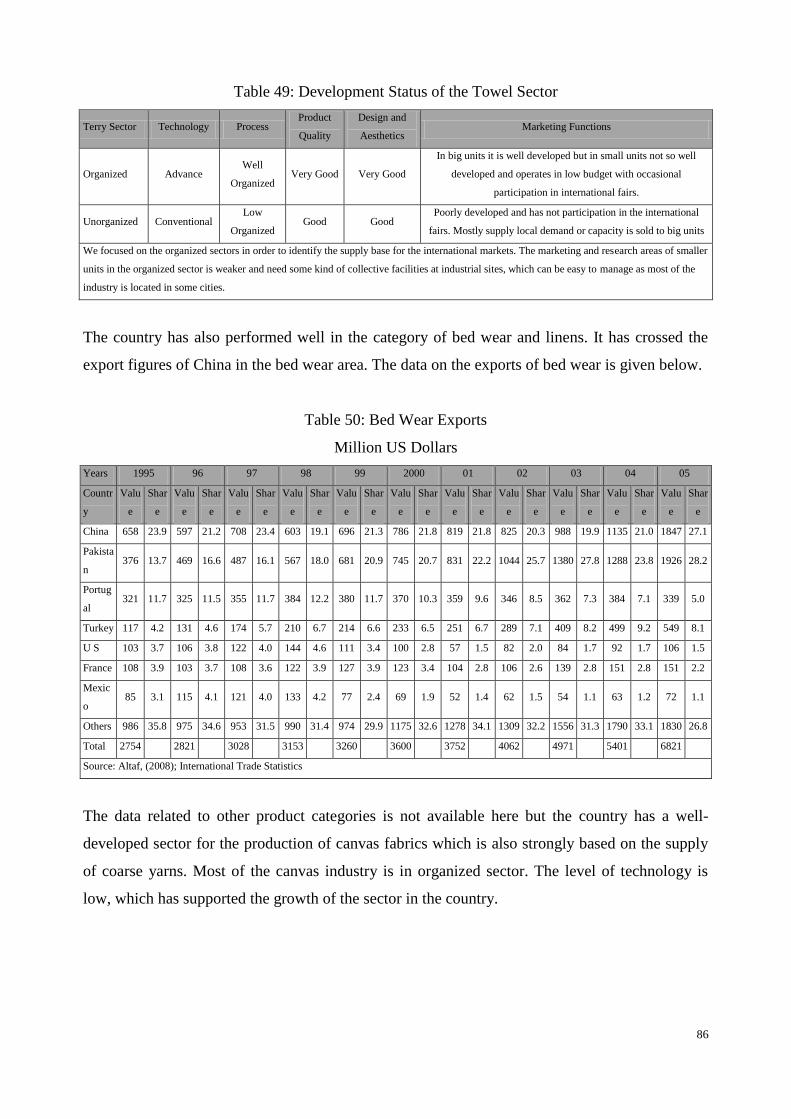
86
Table 49: Development Status of the Towel Sector
Terry Sector Technology Process Product
Quality
Design and
Aesthetics Marketing Functions
Organized Advance Well
Organized Very Good Very Good
In big units it is well developed but in small units not so well
developed and operates in low budget with occasional
participation in international fairs.
Unorganized Conventional Low
Organized Good Good
Poorly developed and has not participation in the international
fairs. Mostly supply local demand or capacity is sold to big units
We focused on the organized sectors in order to identify the supply base for the international markets. The marketing and research areas of smaller
units in the organized sector is weaker and need some kind of collective facilities at industrial sites, which can be easy to manage as most of the
industry is located in some cities.
The country has also performed well in the category of bed wear and linens. It has crossed the
export figures of China in the bed wear area. The data on the exports of bed wear is given below.
Table 50: Bed Wear Exports
Million US Dollars
Years 1995 96 97 98 99 2000 01 02 03 04 05
Countr
y
Valu
e
Shar
e
Valu
e
Shar
e
Valu
e
Shar
e
Valu
e
Shar
e
Valu
e
Shar
e
Valu
e
Shar
e
Valu
e
Shar
e
Valu
e
Shar
e
Valu
e
Shar
e
Valu
e
Shar
e
Valu
e
Shar
e
China 658 23.9 597 21.2 708 23.4 603 19.1 696 21.3 786 21.8 819 21.8 825 20.3 988 19.9 1135 21.0 1847 27.1
Pakista
n 376 13.7 469 16.6 487 16.1 567 18.0 681 20.9 745 20.7 831 22.2 1044 25.7 1380 27.8 1288 23.8 1926 28.2
Portug
al 321 11.7 325 11.5 355 11.7 384 12.2 380 11.7 370 10.3 359 9.6 346 8.5 362 7.3 384 7.1 339 5.0
Turkey 117 4.2 131 4.6 174 5.7 210 6.7 214 6.6 233 6.5 251 6.7 289 7.1 409 8.2 499 9.2 549 8.1
U S 103 3.7 106 3.8 122 4.0 144 4.6 111 3.4 100 2.8 57 1.5 82 2.0 84 1.7 92 1.7 106 1.5
France 108 3.9 103 3.7 108 3.6 122 3.9 127 3.9 123 3.4 104 2.8 106 2.6 139 2.8 151 2.8 151 2.2
Mexic
o 85 3.1 115 4.1 121 4.0 133 4.2 77 2.4 69 1.9 52 1.4 62 1.5 54 1.1 63 1.2 72 1.1
Others 986 35.8 975 34.6 953 31.5 990 31.4 974 29.9 1175 32.6 1278 34.1 1309 32.2 1556 31.3 1790 33.1 1830 26.8
Total 2754 2821 3028 3153 3260 3600 3752 4062 4971 5401 6821
Source: Altaf, (2008); International Trade Statistics
The data related to other product categories is not available here but the country has a well-
developed sector for the production of canvas fabrics which is also strongly based on the supply
of coarse yarns. Most of the canvas industry is in organized sector. The level of technology is
low, which has supported the growth of the sector in the country.
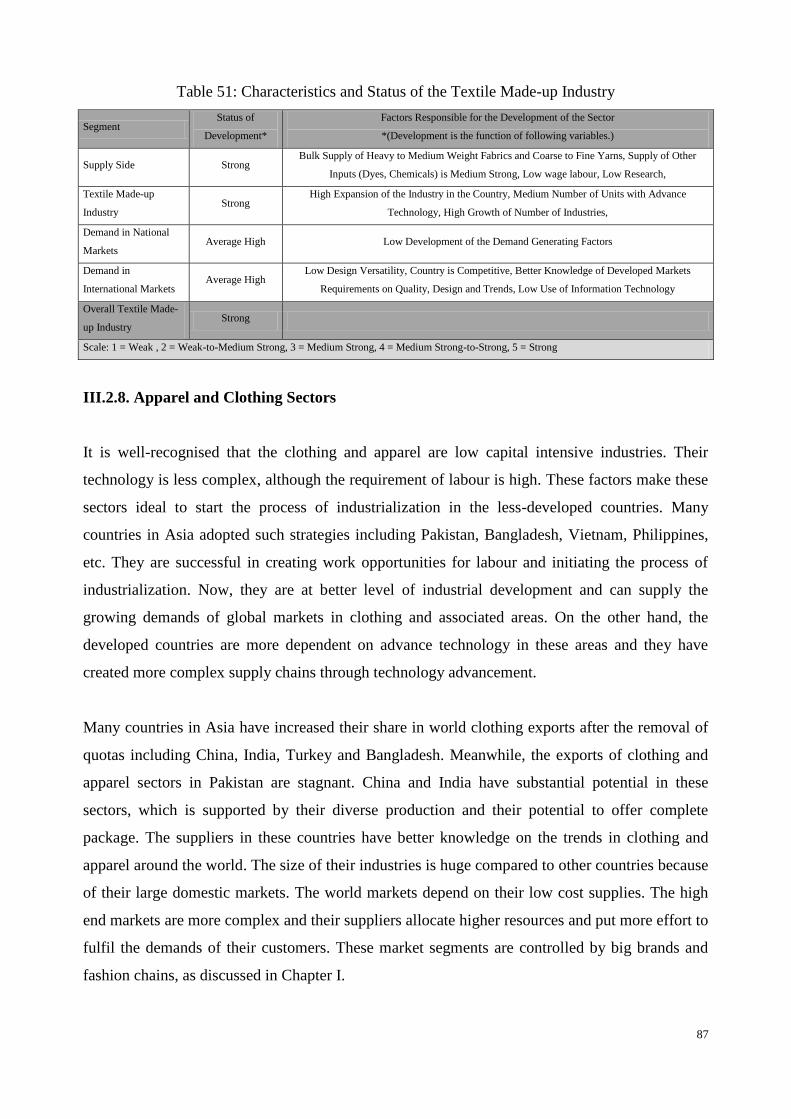
87
Table 51: Characteristics and Status of the Textile Made-up Industry
Segment Status of
Development*
Factors Responsible for the Development of the Sector
*(Development is the function of following variables.)
Supply Side Strong Bulk Supply of Heavy to Medium Weight Fabrics and Coarse to Fine Yarns, Supply of Other
Inputs (Dyes, Chemicals) is Medium Strong, Low wage labour, Low Research,
Textile Made-up
Industry Strong
High Expansion of the Industry in the Country, Medium Number of Units with Advance
Technology, High Growth of Number of Industries,
Demand in National
Markets Average High Low Development of the Demand Generating Factors
Demand in
International Markets Average High
Low Design Versatility, Country is Competitive, Better Knowledge of Developed Markets
Requirements on Quality, Design and Trends, Low Use of Information Technology
Overall Textile Made-
up Industry Strong
Scale: 1 = Weak , 2 = Weak-to-Medium Strong, 3 = Medium Strong, 4 = Medium Strong-to-Strong, 5 = Strong
III.2.8. Apparel and Clothing Sectors
It is well-recognised that the clothing and apparel are low capital intensive industries. Their
technology is less complex, although the requirement of labour is high. These factors make these
sectors ideal to start the process of industrialization in the less-developed countries. Many
countries in Asia adopted such strategies including Pakistan, Bangladesh, Vietnam, Philippines,
etc. They are successful in creating work opportunities for labour and initiating the process of
industrialization. Now, they are at better level of industrial development and can supply the
growing demands of global markets in clothing and associated areas. On the other hand, the
developed countries are more dependent on advance technology in these areas and they have
created more complex supply chains through technology advancement.
Many countries in Asia have increased their share in world clothing exports after the removal of
quotas including China, India, Turkey and Bangladesh. Meanwhile, the exports of clothing and
apparel sectors in Pakistan are stagnant. China and India have substantial potential in these
sectors, which is supported by their diverse production and their potential to offer complete
package. The suppliers in these countries have better knowledge on the trends in clothing and
apparel around the world. The size of their industries is huge compared to other countries because
of their large domestic markets. The world markets depend on their low cost supplies. The high
end markets are more complex and their suppliers allocate higher resources and put more effort to
fulfil the demands of their customers. These market segments are controlled by big brands and
fashion chains, as discussed in Chapter I.
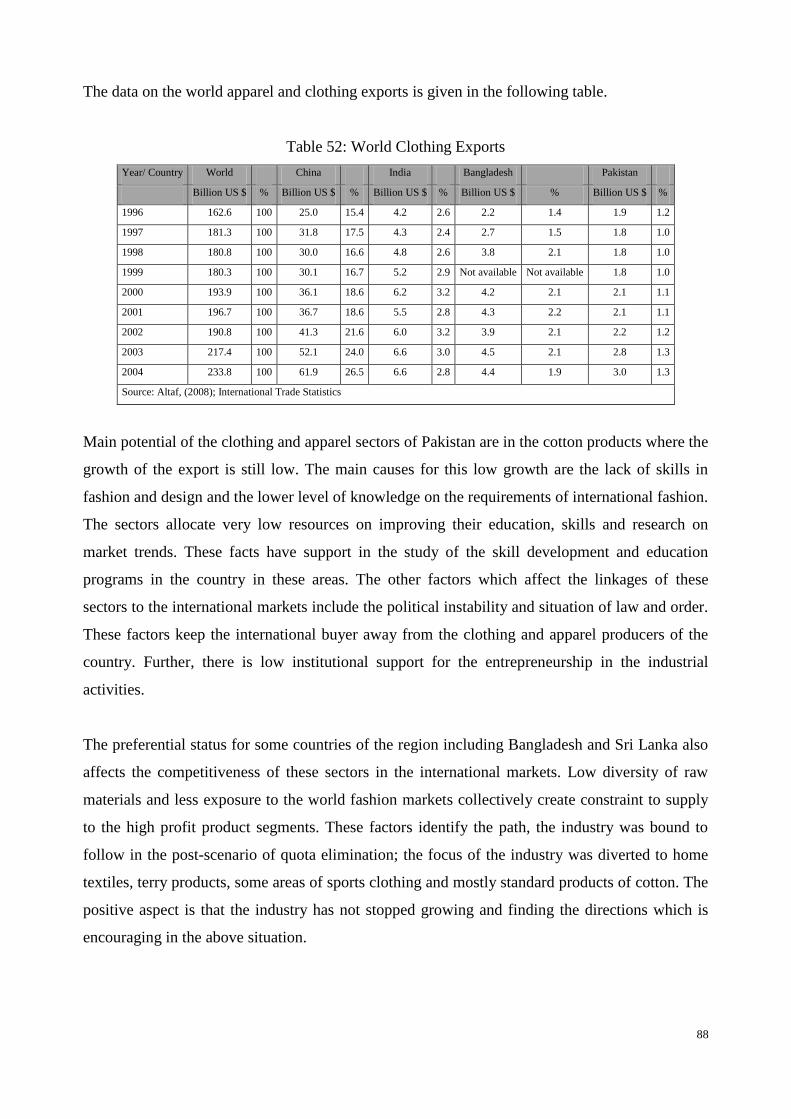
88
The data on the world apparel and clothing exports is given in the following table.
Table 52: World Clothing Exports
Year/ Country World China India Bangladesh Pakistan
Billion US $ % Billion US $ % Billion US $ % Billion US $ % Billion US $ %
1996 162.6 100 25.0 15.4 4.2 2.6 2.2 1.4 1.9 1.2
1997 181.3 100 31.8 17.5 4.3 2.4 2.7 1.5 1.8 1.0
1998 180.8 100 30.0 16.6 4.8 2.6 3.8 2.1 1.8 1.0
1999 180.3 100 30.1 16.7 5.2 2.9 Not available Not available 1.8 1.0
2000 193.9 100 36.1 18.6 6.2 3.2 4.2 2.1 2.1 1.1
2001 196.7 100 36.7 18.6 5.5 2.8 4.3 2.2 2.1 1.1
2002 190.8 100 41.3 21.6 6.0 3.2 3.9 2.1 2.2 1.2
2003 217.4 100 52.1 24.0 6.6 3.0 4.5 2.1 2.8 1.3
2004 233.8 100 61.9 26.5 6.6 2.8 4.4 1.9 3.0 1.3
Source: Altaf, (2008); International Trade Statistics
Main potential of the clothing and apparel sectors of Pakistan are in the cotton products where the
growth of the export is still low. The main causes for this low growth are the lack of skills in
fashion and design and the lower level of knowledge on the requirements of international fashion.
The sectors allocate very low resources on improving their education, skills and research on
market trends. These facts have support in the study of the skill development and education
programs in the country in these areas. The other factors which affect the linkages of these
sectors to the international markets include the political instability and situation of law and order.
These factors keep the international buyer away from the clothing and apparel producers of the
country. Further, there is low institutional support for the entrepreneurship in the industrial
activities.
The preferential status for some countries of the region including Bangladesh and Sri Lanka also
affects the competitiveness of these sectors in the international markets. Low diversity of raw
materials and less exposure to the world fashion markets collectively create constraint to supply
to the high profit product segments. These factors identify the path, the industry was bound to
follow in the post-scenario of quota elimination; the focus of the industry was diverted to home
textiles, terry products, some areas of sports clothing and mostly standard products of cotton. The
positive aspect is that the industry has not stopped growing and finding the directions which is
encouraging in the above situation.
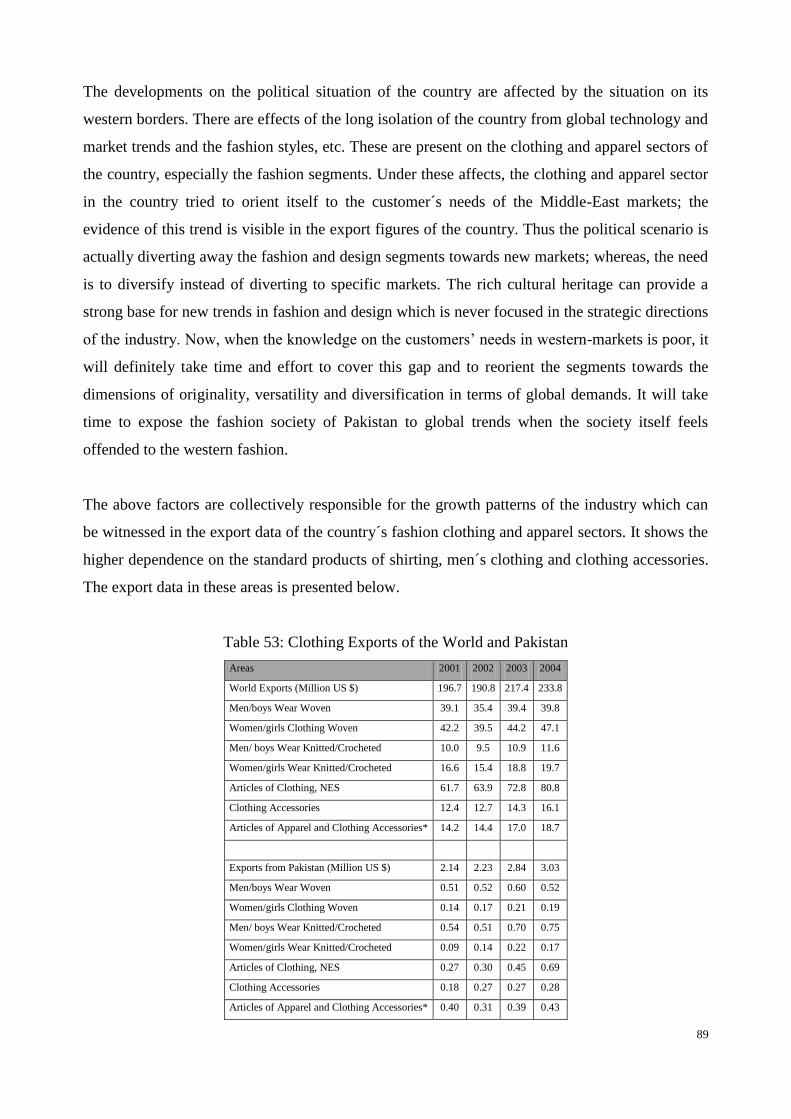
89
The developments on the political situation of the country are affected by the situation on its
western borders. There are effects of the long isolation of the country from global technology and
market trends and the fashion styles, etc. These are present on the clothing and apparel sectors of
the country, especially the fashion segments. Under these affects, the clothing and apparel sector
in the country tried to orient itself to the customer´s needs of the Middle-East markets; the
evidence of this trend is visible in the export figures of the country. Thus the political scenario is
actually diverting away the fashion and design segments towards new markets; whereas, the need
is to diversify instead of diverting to specific markets. The rich cultural heritage can provide a
strong base for new trends in fashion and design which is never focused in the strategic directions
of the industry. Now, when the knowledge on the customers‟ needs in western-markets is poor, it
will definitely take time and effort to cover this gap and to reorient the segments towards the
dimensions of originality, versatility and diversification in terms of global demands. It will take
time to expose the fashion society of Pakistan to global trends when the society itself feels
offended to the western fashion.
The above factors are collectively responsible for the growth patterns of the industry which can
be witnessed in the export data of the country´s fashion clothing and apparel sectors. It shows the
higher dependence on the standard products of shirting, men´s clothing and clothing accessories.
The export data in these areas is presented below.
Table 53: Clothing Exports of the World and Pakistan
Areas 2001 2002 2003 2004
World Exports (Million US $) 196.7 190.8 217.4 233.8
Men/boys Wear Woven 39.1 35.4 39.4 39.8
Women/girls Clothing Woven 42.2 39.5 44.2 47.1
Men/ boys Wear Knitted/Crocheted 10.0 9.5 10.9 11.6
Women/girls Wear Knitted/Crocheted 16.6 15.4 18.8 19.7
Articles of Clothing, NES 61.7 63.9 72.8 80.8
Clothing Accessories 12.4 12.7 14.3 16.1
Articles of Apparel and Clothing Accessories* 14.2 14.4 17.0 18.7
Exports from Pakistan (Million US $) 2.14 2.23 2.84 3.03
Men/boys Wear Woven 0.51 0.52 0.60 0.52
Women/girls Clothing Woven 0.14 0.17 0.21 0.19
Men/ boys Wear Knitted/Crocheted 0.54 0.51 0.70 0.75
Women/girls Wear Knitted/Crocheted 0.09 0.14 0.22 0.17
Articles of Clothing, NES 0.27 0.30 0.45 0.69
Clothing Accessories 0.18 0.27 0.27 0.28
Articles of Apparel and Clothing Accessories* 0.40 0.31 0.39 0.43
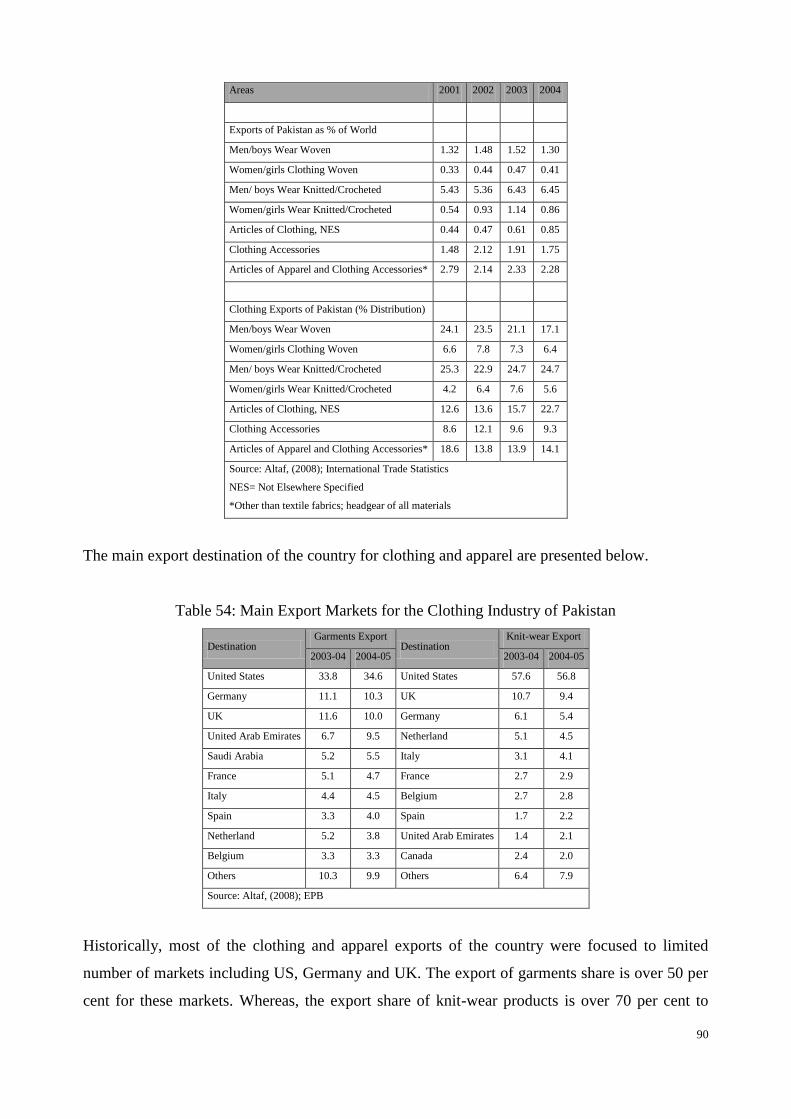
90
Areas 2001 2002 2003 2004
Exports of Pakistan as % of World
Men/boys Wear Woven 1.32 1.48 1.52 1.30
Women/girls Clothing Woven 0.33 0.44 0.47 0.41
Men/ boys Wear Knitted/Crocheted 5.43 5.36 6.43 6.45
Women/girls Wear Knitted/Crocheted 0.54 0.93 1.14 0.86
Articles of Clothing, NES 0.44 0.47 0.61 0.85
Clothing Accessories 1.48 2.12 1.91 1.75
Articles of Apparel and Clothing Accessories* 2.79 2.14 2.33 2.28
Clothing Exports of Pakistan (% Distribution)
Men/boys Wear Woven 24.1 23.5 21.1 17.1
Women/girls Clothing Woven 6.6 7.8 7.3 6.4
Men/ boys Wear Knitted/Crocheted 25.3 22.9 24.7 24.7
Women/girls Wear Knitted/Crocheted 4.2 6.4 7.6 5.6
Articles of Clothing, NES 12.6 13.6 15.7 22.7
Clothing Accessories 8.6 12.1 9.6 9.3
Articles of Apparel and Clothing Accessories* 18.6 13.8 13.9 14.1
Source: Altaf, (2008); International Trade Statistics
NES= Not Elsewhere Specified
*Other than textile fabrics; headgear of all materials
The main export destination of the country for clothing and apparel are presented below.
Table 54: Main Export Markets for the Clothing Industry of Pakistan
Destination Garments Export
Destination Knit-wear Export
2003-04 2004-05 2003-04 2004-05
United States 33.8 34.6 United States 57.6 56.8
Germany 11.1 10.3 UK 10.7 9.4
UK 11.6 10.0 Germany 6.1 5.4
United Arab Emirates 6.7 9.5 Netherland 5.1 4.5
Saudi Arabia 5.2 5.5 Italy 3.1 4.1
France 5.1 4.7 France 2.7 2.9
Italy 4.4 4.5 Belgium 2.7 2.8
Spain 3.3 4.0 Spain 1.7 2.2
Netherland 5.2 3.8 United Arab Emirates 1.4 2.1
Belgium 3.3 3.3 Canada 2.4 2.0
Others 10.3 9.9 Others 6.4 7.9
Source: Altaf, (2008); EPB
Historically, most of the clothing and apparel exports of the country were focused to limited
number of markets including US, Germany and UK. The export of garments share is over 50 per
cent for these markets. Whereas, the export share of knit-wear products is over 70 per cent to
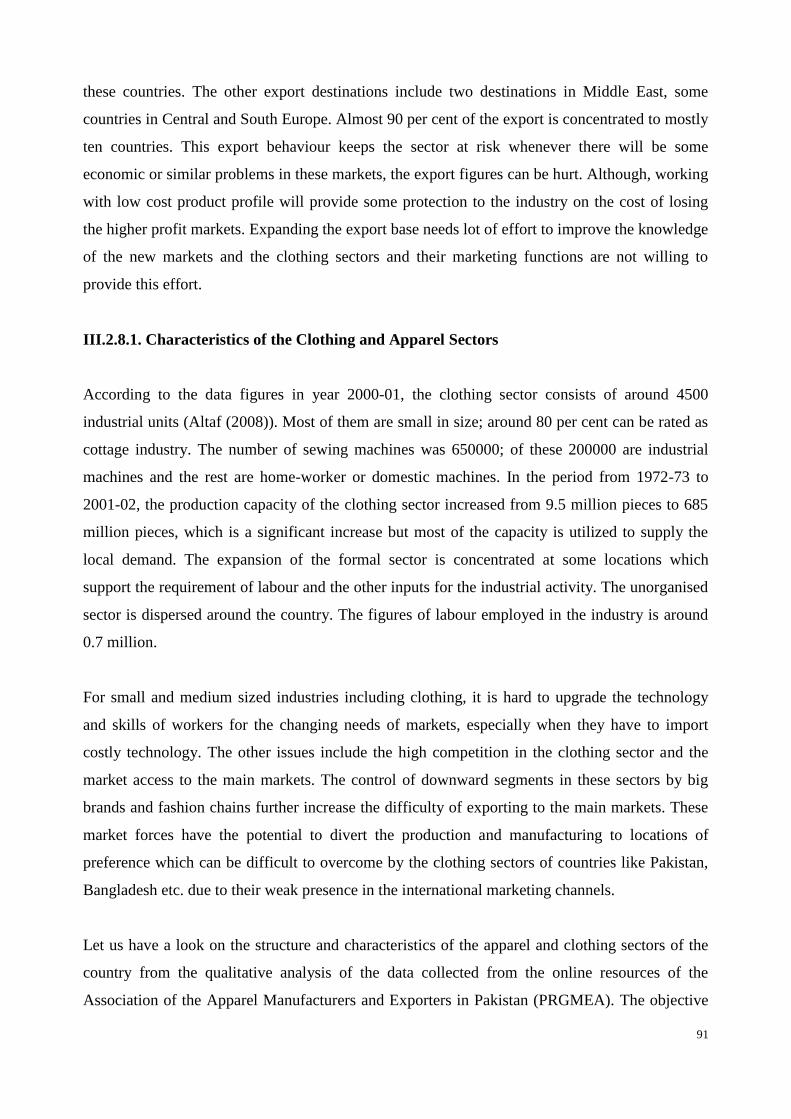
91
these countries. The other export destinations include two destinations in Middle East, some
countries in Central and South Europe. Almost 90 per cent of the export is concentrated to mostly
ten countries. This export behaviour keeps the sector at risk whenever there will be some
economic or similar problems in these markets, the export figures can be hurt. Although, working
with low cost product profile will provide some protection to the industry on the cost of losing
the higher profit markets. Expanding the export base needs lot of effort to improve the knowledge
of the new markets and the clothing sectors and their marketing functions are not willing to
provide this effort.
III.2.8.1. Characteristics of the Clothing and Apparel Sectors
According to the data figures in year 2000-01, the clothing sector consists of around 4500
industrial units (Altaf (2008)). Most of them are small in size; around 80 per cent can be rated as
cottage industry. The number of sewing machines was 650000; of these 200000 are industrial
machines and the rest are home-worker or domestic machines. In the period from 1972-73 to
2001-02, the production capacity of the clothing sector increased from 9.5 million pieces to 685
million pieces, which is a significant increase but most of the capacity is utilized to supply the
local demand. The expansion of the formal sector is concentrated at some locations which
support the requirement of labour and the other inputs for the industrial activity. The unorganised
sector is dispersed around the country. The figures of labour employed in the industry is around
0.7 million.
For small and medium sized industries including clothing, it is hard to upgrade the technology
and skills of workers for the changing needs of markets, especially when they have to import
costly technology. The other issues include the high competition in the clothing sector and the
market access to the main markets. The control of downward segments in these sectors by big
brands and fashion chains further increase the difficulty of exporting to the main markets. These
market forces have the potential to divert the production and manufacturing to locations of
preference which can be difficult to overcome by the clothing sectors of countries like Pakistan,
Bangladesh etc. due to their weak presence in the international marketing channels.
Let us have a look on the structure and characteristics of the apparel and clothing sectors of the
country from the qualitative analysis of the data collected from the online resources of the
Association of the Apparel Manufacturers and Exporters in Pakistan (PRGMEA). The objective

92
is to identify the potential of the clothing sector on the fashion products mainly, although it will
also identify other areas which exist in these sectors.
We roughly assume that the 20 per cent of the population of clothing and apparel units in the
country belong to the organised sector which creates a figure of around 900 units. This
assumption is based on discussion with the industry experts. Further, some of these units should
be at higher level of development and others at medium level of development. In general, we start
from the assumption that the overall population of the organized sector is around 900 in the
country. In the following paragraph, we will draw some insight on the product segmentation of
the sector and we will also discuss its dispersion in the country. The study in the next section on
the educational programs will provide support on the findings of this section.
The following summary is generated from the member directory of the PRGMEA which is
presented in the appendix. The association is a representative body of the large population of the
clothing units inside the country and we rely on their data.
The analysis is mainly on the qualitative characteristics of the clothing units and was performed
on their names and location. We have tried to categorise the clothing units into various product
segments from the symbolic components of their names. The categories are presented in the
following table. The units are placed into specific group depending upon the components of their
names. Then the quantitative summaries are developed to provide a general insight on the
segmentation of the industries. We acknowledge that our data is weak and the analysis is also not
very strong but it provides a basis for the development status of the industry which is supported
from multi-dimensions. Further, this will provide basis for the future research of the subject area.
This analysis represents one of the dimensions in the overall strategy to reflect upon these areas
while the other dimensions included the support from input industries and the study of the export
structure.
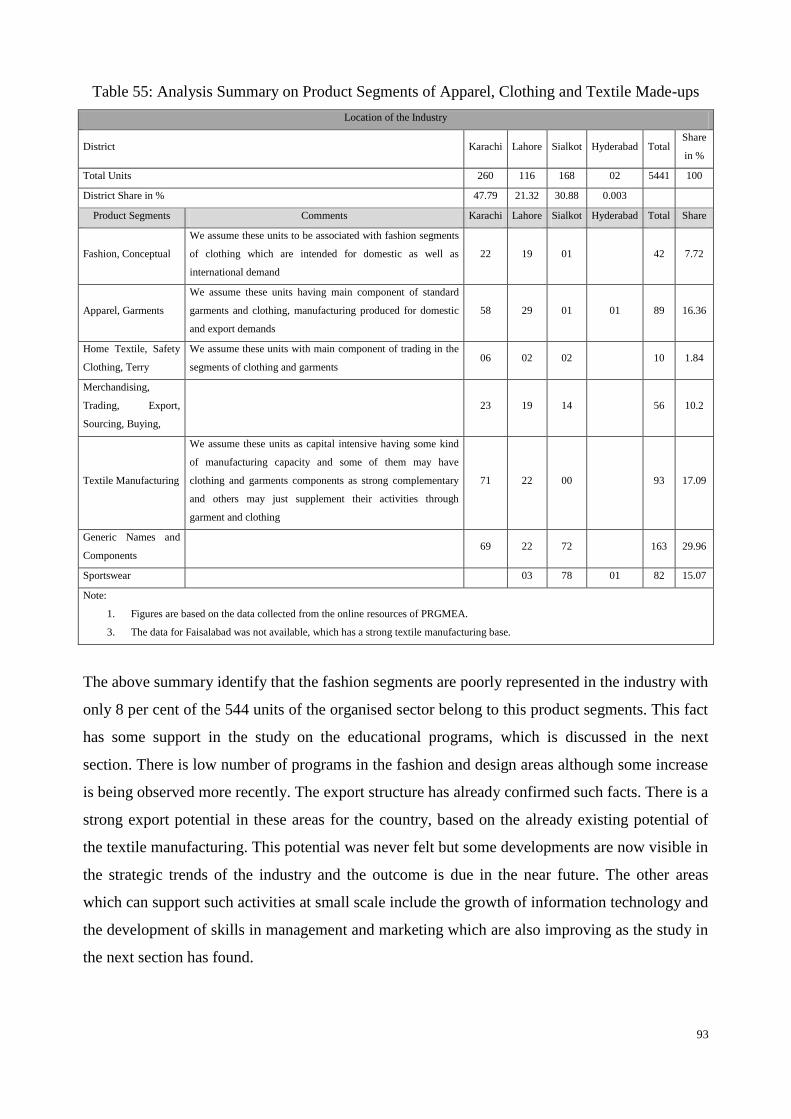
93
Table 55: Analysis Summary on Product Segments of Apparel, Clothing and Textile Made-ups
Location of the Industry
District Karachi Lahore Sialkot Hyderabad Total Share
in %
Total Units 260 116 168 02 5441 100
District Share in % 47.79 21.32 30.88 0.003
Product Segments Comments Karachi Lahore Sialkot Hyderabad Total Share
Fashion, Conceptual
We assume these units to be associated with fashion segments
of clothing which are intended for domestic as well as
international demand
22 19 01 42 7.72
Apparel, Garments
We assume these units having main component of standard
garments and clothing, manufacturing produced for domestic
and export demands
58 29 01 01 89 16.36
Home Textile, Safety
Clothing, Terry
We assume these units with main component of trading in the
segments of clothing and garments 06 02 02 10 1.84
Merchandising,
Trading, Export,
Sourcing, Buying,
23 19 14 56 10.2
Textile Manufacturing
We assume these units as capital intensive having some kind
of manufacturing capacity and some of them may have
clothing and garments components as strong complementary
and others may just supplement their activities through
garment and clothing
71 22 00 93 17.09
Generic Names and
Components
69 22 72 163 29.96
Sportswear 03 78 01 82 15.07
Note:
1. Figures are based on the data collected from the online resources of PRGMEA.
3. The data for Faisalabad was not available, which has a strong textile manufacturing base.
The above summary identify that the fashion segments are poorly represented in the industry with
only 8 per cent of the 544 units of the organised sector belong to this product segments. This fact
has some support in the study on the educational programs, which is discussed in the next
section. There is low number of programs in the fashion and design areas although some increase
is being observed more recently. The export structure has already confirmed such facts. There is a
strong export potential in these areas for the country, based on the already existing potential of
the textile manufacturing. This potential was never felt but some developments are now visible in
the strategic trends of the industry and the outcome is due in the near future. The other areas
which can support such activities at small scale include the growth of information technology and
the development of skills in management and marketing which are also improving as the study in
the next section has found.

94
The other poorly represented category is the Home Textile, Safety Clothing and Terry Fabric.
The industry of safety clothing is not developed at large scale in the country; only fragmented
industrial units are working in this area without proper direction. The figures represent a true
picture of the growth of this area in the country. On the other hand, home textiles and terry
industries are well developed and are recognized in the international markets as their export
figures reflect. The terry sectors is better represented in our data analysis on the terry segments in
the above section whereas the area of home textile is difficult to separate from the other product
segments, at least in this qualitative analysis and on the basis of data which was available to us.
In the above sections, the export structure identified that the products of the home textile sectors
are also well placed in the international markets; this supports us to add that the home textile
industry is also well developed in the country. We believe that their share is shifted in the
categories of Textile Manufacturing and Generic Names which collectively occupy 47 per cent
share in the above summary.
The product category of Standard Apparel and Garments and the activities of Trading etc. have
better shares in industry which stood at 16% and 10% respectively. Again some portion from the
categories in Generic and Textile Manufacturing can affect their share to increase. Especially, the
share of Standard Apparel and Garment Manufacturing can increase significantly.
The interesting results are on the sportswear, the industrial activity which is mainly concentrated
at a couple of locations in Karachi and Sialkot. The main reason behind such a concentration of
the sectors at some location can be considered as the development of the sport equipment
industry at these sites which may have provided some motivation for the industry of sports
clothing at these locations. The other factors should include the low capital requirements and the
industrial environment of these locations. It offers good example for the development of small
scale industrial activity for other districts also from a low capital investment.
It is important to mention that the above data is not complete and most probably some regions are
not covered well as the data is obtained from the member directory of PRGMEA, an association
of garments and exporters. The membership for such associations is not mandatory. However,
industries are normally obliged to become a member of such association which bring
participation in the policy development on various issues at regional and country level. Normally,
these associations have good representation of their sectors. The number of industrial units
covered by the association‟s member directory is large more than 50 per cent if we consider our
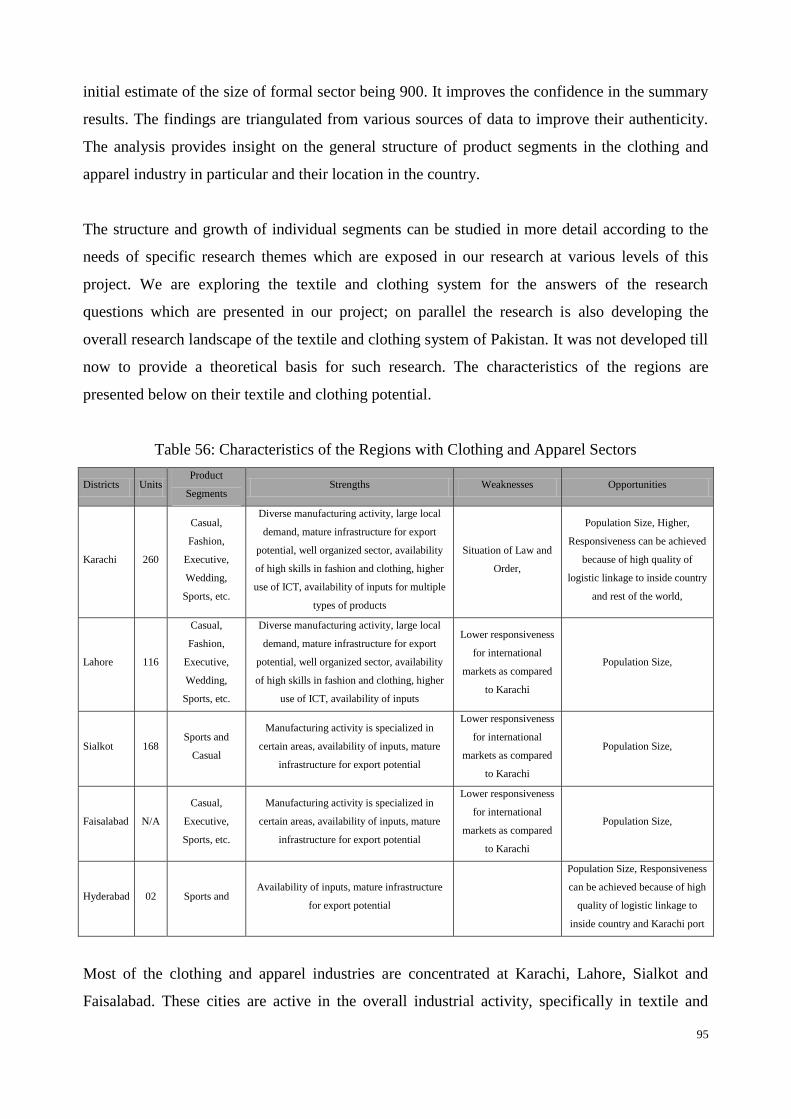
95
initial estimate of the size of formal sector being 900. It improves the confidence in the summary
results. The findings are triangulated from various sources of data to improve their authenticity.
The analysis provides insight on the general structure of product segments in the clothing and
apparel industry in particular and their location in the country.
The structure and growth of individual segments can be studied in more detail according to the
needs of specific research themes which are exposed in our research at various levels of this
project. We are exploring the textile and clothing system for the answers of the research
questions which are presented in our project; on parallel the research is also developing the
overall research landscape of the textile and clothing system of Pakistan. It was not developed till
now to provide a theoretical basis for such research. The characteristics of the regions are
presented below on their textile and clothing potential.
Table 56: Characteristics of the Regions with Clothing and Apparel Sectors
Districts Units Product
Segments Strengths Weaknesses Opportunities
Karachi 260
Casual,
Fashion,
Executive,
Wedding,
Sports, etc.
Diverse manufacturing activity, large local
demand, mature infrastructure for export
potential, well organized sector, availability
of high skills in fashion and clothing, higher
use of ICT, availability of inputs for multiple
types of products
Situation of Law and
Order,
Population Size, Higher,
Responsiveness can be achieved
because of high quality of
logistic linkage to inside country
and rest of the world,
Lahore 116
Casual,
Fashion,
Executive,
Wedding,
Sports, etc.
Diverse manufacturing activity, large local
demand, mature infrastructure for export
potential, well organized sector, availability
of high skills in fashion and clothing, higher
use of ICT, availability of inputs
Lower responsiveness
for international
markets as compared
to Karachi
Population Size,
Sialkot 168 Sports and
Casual
Manufacturing activity is specialized in
certain areas, availability of inputs, mature
infrastructure for export potential
Lower responsiveness
for international
markets as compared
to Karachi
Population Size,
Faisalabad N/A
Casual,
Executive,
Sports, etc.
Manufacturing activity is specialized in
certain areas, availability of inputs, mature
infrastructure for export potential
Lower responsiveness
for international
markets as compared
to Karachi
Population Size,
Hyderabad 02 Sports and Availability of inputs, mature infrastructure
for export potential
Population Size, Responsiveness
can be achieved because of high
quality of logistic linkage to
inside country and Karachi port
Most of the clothing and apparel industries are concentrated at Karachi, Lahore, Sialkot and
Faisalabad. These cities are active in the overall industrial activity, specifically in textile and
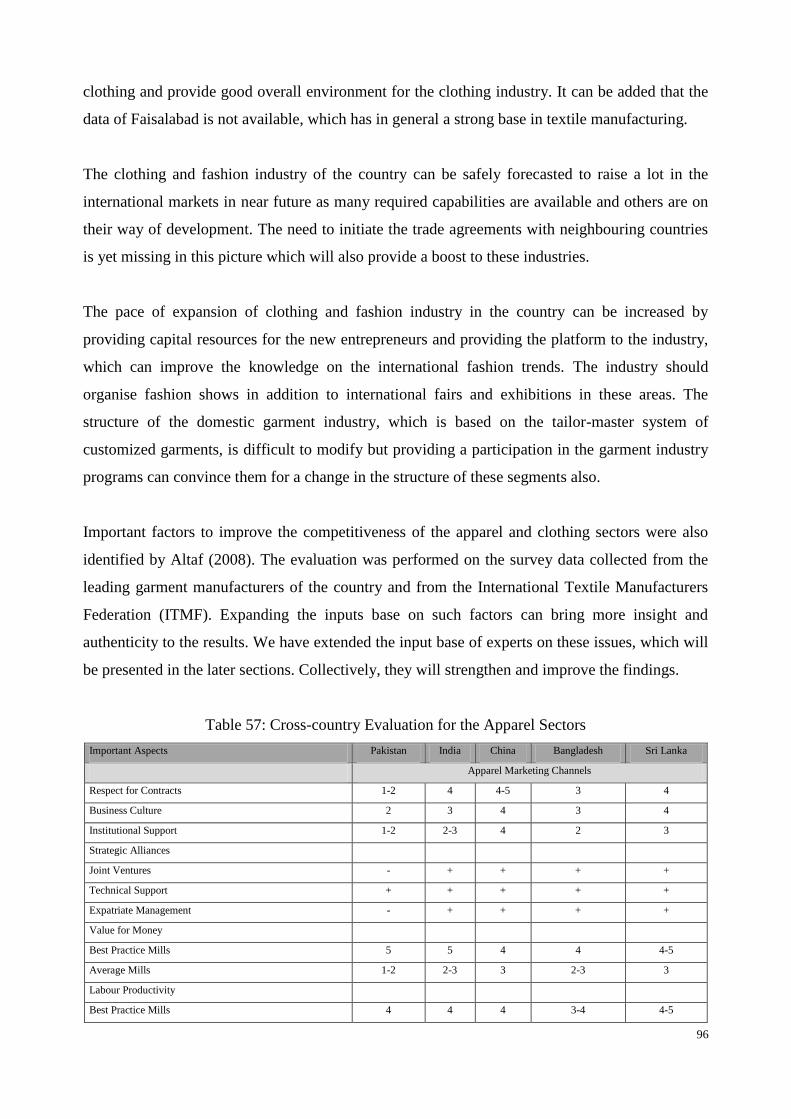
96
clothing and provide good overall environment for the clothing industry. It can be added that the
data of Faisalabad is not available, which has in general a strong base in textile manufacturing.
The clothing and fashion industry of the country can be safely forecasted to raise a lot in the
international markets in near future as many required capabilities are available and others are on
their way of development. The need to initiate the trade agreements with neighbouring countries
is yet missing in this picture which will also provide a boost to these industries.
The pace of expansion of clothing and fashion industry in the country can be increased by
providing capital resources for the new entrepreneurs and providing the platform to the industry,
which can improve the knowledge on the international fashion trends. The industry should
organise fashion shows in addition to international fairs and exhibitions in these areas. The
structure of the domestic garment industry, which is based on the tailor-master system of
customized garments, is difficult to modify but providing a participation in the garment industry
programs can convince them for a change in the structure of these segments also.
Important factors to improve the competitiveness of the apparel and clothing sectors were also
identified by Altaf (2008). The evaluation was performed on the survey data collected from the
leading garment manufacturers of the country and from the International Textile Manufacturers
Federation (ITMF). Expanding the inputs base on such factors can bring more insight and
authenticity to the results. We have extended the input base of experts on these issues, which will
be presented in the later sections. Collectively, they will strengthen and improve the findings.
Table 57: Cross-country Evaluation for the Apparel Sectors
Important Aspects Pakistan India China Bangladesh Sri Lanka
Apparel Marketing Channels
Respect for Contracts 1-2 4 4-5 3 4
Business Culture 2 3 4 3 4
Institutional Support 1-2 2-3 4 2 3
Strategic Alliances
Joint Ventures - + + + +
Technical Support + + + + +
Expatriate Management - + + + +
Value for Money
Best Practice Mills 5 5 4 4 4-5
Average Mills 1-2 2-3 3 2-3 3
Labour Productivity
Best Practice Mills 4 4 4 3-4 4-5

97
Important Aspects Pakistan India China Bangladesh Sri Lanka
Average Mills 1-2 2 2-3 1 3
Labour Cost $/hour 0.55 0.60 0.65 0.45 0.52
Apparel Human Resource
Industry weaknesses
Operator Skills 1-2 1-22 3 1 4
Market Management and Shop Floor 1-2 2-3 3-4 2 4
Management Organization 1-2 3 4 2-3 4
Education Training
Primary 1-2 3 1-2 1 2
Secondary 1-2 3 1-2 1-2 3
Operator/vocational 1-2 2-3 2 1 2-3
Market Management and Shop Floor 1-2 2-3 2-3 1 3
University/College - + + + +
Apparel Bureaucracy and Infrastructure
Bureaucracy: Perceived Performance
Central Boards of Revenue 1-2 1 3 1-2 3
Export Promotion Bureaus 1-2 1 3 1-2 3
Customs 1-2 1-2 3 1 3
Banks 1-2 2 3 1 3
Infrastructure
Road Paved as % of overall 54% 46% N A 10% 95%
Railway 2-3 2-3 3 2 N A
Ports 2 2 3-4 1-2 3
Telecommunications 3 3 3-4 2 4
Source: Interviews with Leading Garment manufacturers; International Textile Manufacturers Federation (ITMF)
Legend: 1 = Very Poor, 2 = Poor, 3 = Average, 4 = Good, 5 = Very Good, - = Generally Negative, + = Generally Positive, N A = Not Available
The level of development of the clothing and apparel sectors is presented below.
Table 58: Characteristics and Status of the Clothing and Apparel Sectors
Segment Status of
Development*
Factors Responsible for the Development of the Sector
*(Development is the function of following variables.)
Supply Side Very Strong
Bulk Supply of Cotton Fabrics, Medium Strong Supply of Other Inputs (Button, Zippers, etc.) and
Higher Dependence on Imports, Low wage labour, Low Research, Low Design Versatility, Low
Skills in Fashion and Designs
Clothing and Apparel
Industry Weak
High Expansion in the Unorganised Structure, Low Number of Units with Advance Technology,
Weak Linkages with International Markets, Low Branding,
Demand in National
Markets Average Low Development of the Demand Generating Factors
Demand in
International Markets Average to High
Low Design Versatility, Industry is Low Competitive, Low Knowledge of Developed Markets
Requirements on Quality, Design and Trends, Low Use of Information Technology
Overall Clothing and
Apparel Sectors
Weak-to-Medium
Strong
Scale: 1 = Weak , 2 = Weak-to-Medium Strong, 3 = Medium Strong, 4 = Medium Strong-to-Strong, 5 = Strong

98
In the following sections, we will continue developing our insight on the other important areas
which can improve the SC system.
III.2.9. Study Programs in Textile, Clothing and Related Areas
In order to develop a fresh insight on the skill development in textile, clothing and related areas,
we have collected and analysed the study programs. We consulted various resources including
people from academia and the internet resources to identify the study programs offered in the
country under technology, engineering, and science and design fields. A summary is generated,
which is presented below.
Table 59: Study Programs in Textile and Related Areas
District Engineering Science Fashion and Design Business
Bachelor Masters PhD Bachelor Masters PhD Bachelor Masters PhD Bachelor Masters PhD
Karachi
1 (Comb.);
1(T);
1(P&P);
1(Chemical
)
1
(Comb.);
1(EM)
By
Research
Work
1(T&D);
1(T); 1(TF);
1(TP); 1(T);
1(T); 1(TP
Component);
1(FMM)
1(TP
Component);
1(DMM)
By
Research
Work
1(TD);
1(TD);
1(FD);
1(TD);
1(FD);
1(TD);
1(FD)
1PGD(TD);
1PGD(AD);
1PGD(F);
1PGD(FD)
By
Research
Work
1(TMM);
1(AM);
1(FDM);
1(T)
1(T)
By
Research
Work
05 02 08 02 07 04 04 01
Jamshoro 1(Comb.) 1(Comb.)
By
Research
Work
By
Research
Work
1(TD);
1(TD) 1(TD)
By
Research
Work
01 01 02 01
Hala 1(TD)
01
Sindh 06 03 09 02 09 05 04 01
Faisalabad
1(TY);
1(TF);
1(TG);
1(T Pol.);
1(TP); 1(T)
1(T)
1(T) By
Course
Work
1(T) 1(F&T)
By
Research
Work
1(TD);
1(TD);
1(FD);
1(FD);
1(TD)
1(TMM);
1(TM);
1(AM)
1(T)
06 01 01 01 01 05 03 01
Lahore
By
Research
Work
1(FMM);
1(FD);
1(TD);
1(TY);
1(TF);
1(TP); 1(A);
1(TT);
1(TTM)
1(TP);
1(TY);
1(TF);
1(TP); 1(A);
1(TM)
1(T) By
Research
Work
1(TD);
1(TD);
1(FD);
1(FD);
1(TD);
1(FD);
1(TD);
1(FD)
1(TD);
1(FD);
1(TD);
1(TD);
1(FD)
By
Research
Work
By
Research
Work
09 06 01 08 05
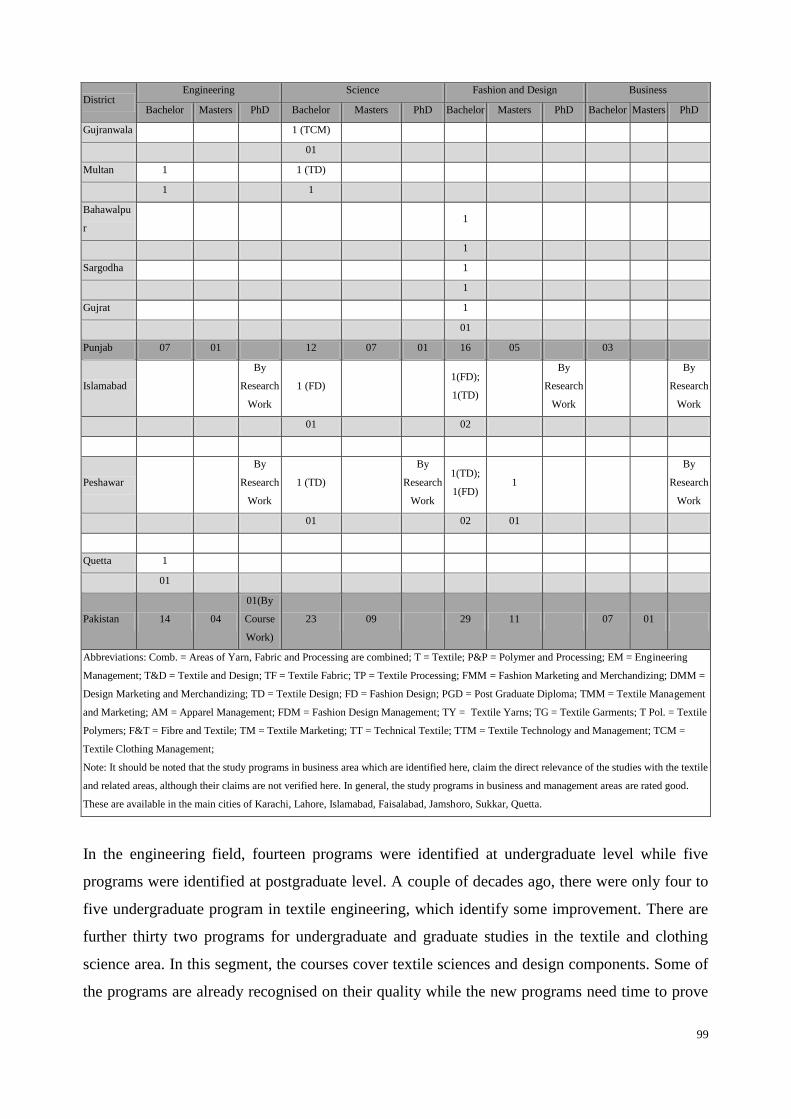
99
District Engineering Science Fashion and Design Business
Bachelor Masters PhD Bachelor Masters PhD Bachelor Masters PhD Bachelor Masters PhD
Gujranwala 1 (TCM)
01
Multan 1 1 (TD)
1 1
Bahawalpu
r 1
1
Sargodha 1
1
Gujrat 1
01
Punjab 07 01 12 07 01 16 05 03
Islamabad
By
Research
Work
1 (FD) 1(FD);
1(TD)
By
Research
Work
By
Research
Work
01 02
Peshawar
By
Research
Work
1 (TD)
By
Research
Work
1(TD);
1(FD) 1
By
Research
Work
01 02 01
Quetta 1
01
Pakistan 14 04
01(By
Course
Work)
23 09 29 11 07 01
Abbreviations: Comb. = Areas of Yarn, Fabric and Processing are combined; T = Textile; P&P = Polymer and Processing; EM = Engineering
Management; T&D = Textile and Design; TF = Textile Fabric; TP = Textile Processing; FMM = Fashion Marketing and Merchandizing; DMM =
Design Marketing and Merchandizing; TD = Textile Design; FD = Fashion Design; PGD = Post Graduate Diploma; TMM = Textile Management
and Marketing; AM = Apparel Management; FDM = Fashion Design Management; TY = Textile Yarns; TG = Textile Garments; T Pol. = Textile
Polymers; F&T = Fibre and Textile; TM = Textile Marketing; TT = Technical Textile; TTM = Textile Technology and Management; TCM =
Textile Clothing Management;
Note: It should be noted that the study programs in business area which are identified here, claim the direct relevance of the studies with the textile
and related areas, although their claims are not verified here. In general, the study programs in business and management areas are rated good.
These are available in the main cities of Karachi, Lahore, Islamabad, Faisalabad, Jamshoro, Sukkar, Quetta.
In the engineering field, fourteen programs were identified at undergraduate level while five
programs were identified at postgraduate level. A couple of decades ago, there were only four to
five undergraduate program in textile engineering, which identify some improvement. There are
further thirty two programs for undergraduate and graduate studies in the textile and clothing
science area. In this segment, the courses cover textile sciences and design components. Some of
the programs are already recognised on their quality while the new programs need time to prove

100
their effectiveness. The old courses had low contents on advance technology; these are revised to
introduce relevant contents and new technology inputs. The diversification of the study areas and
the content improvement of courses are just initiated through the introduction of courses on
fashion, design, technical textiles, and by the revision of course content. The effects and later
iterations of the continuous improvement are due in future.
Various levels of studies now exist including certificate courses, graduate, masters and doctoral
studies. The certificate and diploma courses are not covered well here but there exist many
diploma and short courses especially in cities and towns including Karachi, Lahore, Faisalabad,
Multan, Sialkot, Gujranwala, Hyderabad, etc. These courses fulfil the needs of continuous
upgrading of the specific skills in addition to the development of basic skills. The regular
programs offer higher skill development.
This summary on study programs is more recent and identifies some improvement on skill
development in many areas. There is still a shortage of qualified workforce in the textile, clothing
and related areas. Considering that many study programs were started in near past (in the last
decade), the effects in the industry will be realized in coming years. We anticipate that the results
of master level courses will bring better results in the intended directions. When the graduates of
fashion and design areas will establish their effective career in the fashion industry, a lot of
improvement is also expected in these sectors. The research components are still weak in these
programs which can further improve many aspects of the industry. From the experience of the
developed countries, it can be said that it takes lot of effort and resources to improve the quality
and advancement of the textile and clothing sectors which are not allocated and/or utilized
efficiently in developing countries.
The region-wise summary is presented below.
Table 60: Summary on Study Programs in Textile and Clothing
District Engineering Science Fashion and Design
Bachelor Masters PhD Bachelor Masters PhD Bachelor Masters PhD
Karachi 05 02 08 02 07 04
Jamshoro 01 01 02 01
Hala 01
Total Sindh 06 03 09 02 09 05
Faisalabad 06 01 01 01 01 05
Lahore 09 06 01 08 05
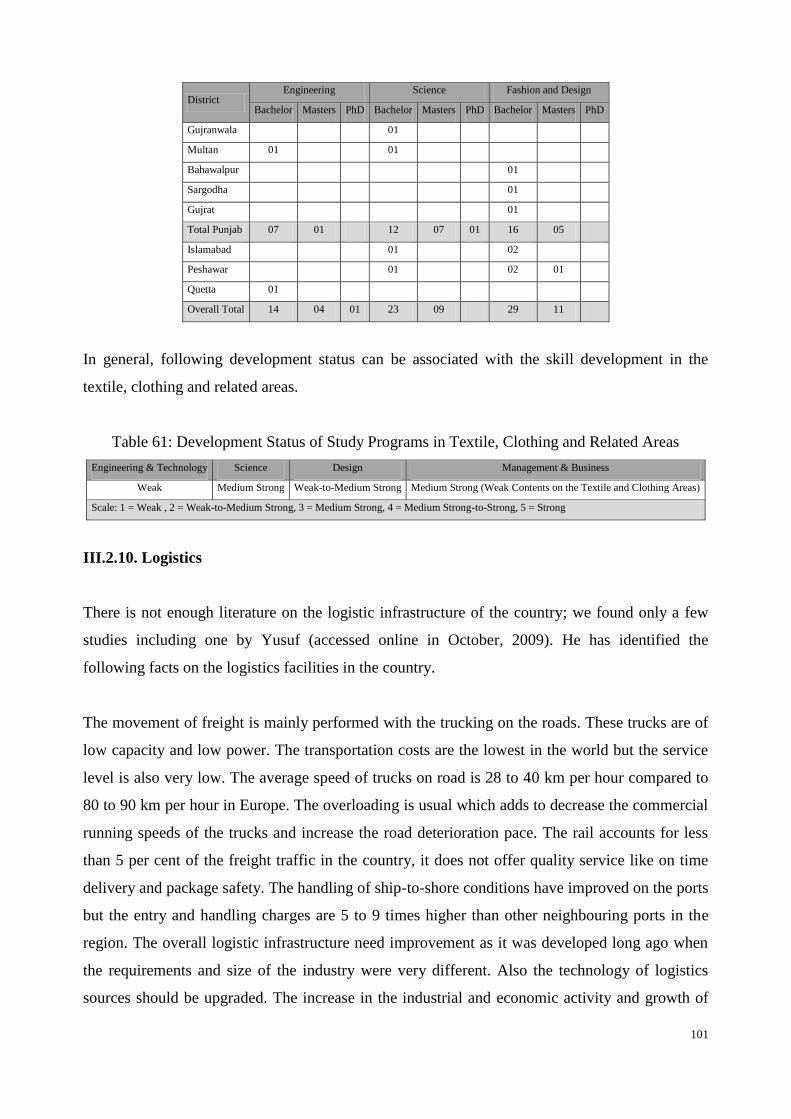
101
District Engineering Science Fashion and Design
Bachelor Masters PhD Bachelor Masters PhD Bachelor Masters PhD
Gujranwala 01
Multan 01 01
Bahawalpur 01
Sargodha 01
Gujrat 01
Total Punjab 07 01 12 07 01 16 05
Islamabad 01 02
Peshawar 01 02 01
Quetta 01
Overall Total 14 04 01 23 09 29 11
In general, following development status can be associated with the skill development in the
textile, clothing and related areas.
Table 61: Development Status of Study Programs in Textile, Clothing and Related Areas
Engineering & Technology Science Design Management & Business
Weak Medium Strong Weak-to-Medium Strong Medium Strong (Weak Contents on the Textile and Clothing Areas)
Scale: 1 = Weak , 2 = Weak-to-Medium Strong, 3 = Medium Strong, 4 = Medium Strong-to-Strong, 5 = Strong
III.2.10. Logistics
There is not enough literature on the logistic infrastructure of the country; we found only a few
studies including one by Yusuf (accessed online in October, 2009). He has identified the
following facts on the logistics facilities in the country.
The movement of freight is mainly performed with the trucking on the roads. These trucks are of
low capacity and low power. The transportation costs are the lowest in the world but the service
level is also very low. The average speed of trucks on road is 28 to 40 km per hour compared to
80 to 90 km per hour in Europe. The overloading is usual which adds to decrease the commercial
running speeds of the trucks and increase the road deterioration pace. The rail accounts for less
than 5 per cent of the freight traffic in the country, it does not offer quality service like on time
delivery and package safety. The handling of ship-to-shore conditions have improved on the ports
but the entry and handling charges are 5 to 9 times higher than other neighbouring ports in the
region. The overall logistic infrastructure need improvement as it was developed long ago when
the requirements and size of the industry were very different. Also the technology of logistics
sources should be upgraded. The increase in the industrial and economic activity and growth of

102
population and the influx of millions of migrants from India, Afghanistan, Iran and other
neighbouring countries have created a huge demand gap.
In general, a detailed study is required to address the gaps of research in the logistic areas in the
country. Some improvements in the logistics infrastructure are being observed due to expansion
of the logistic activity and participation from the private sectors in these areas which will bring
positive effects in near future. There is a need to analyse industry specific requirements of
logistics and to develop such services. We will present some findings on the structure of the lead
time in textile and the requirement of some segments in these directions in Chapter V.
Following status can be related to the logistics facilities in the country.
Table 62: Level of Development for the Logistics Facilities in the Country
Storage Facilities Rail Transportation Road Transportation Air Transport Port and Sea Transportation Communication Facilities
Weak Weak Weak-to-Medium Strong Weak Medium Strong Strong
Scale: 1 = Weak , 2 = Weak-to-Medium Strong, 3 = Medium Strong, 4 = Medium Strong-to-Strong, 5 = Strong
Communication facilities are improved due to high FDI in this sector in past. Road and Ports
facilities are also at better level of development. The worse areas in term of development are rail
transportation and storage facilities. They require huge resources which are not available inside
the country and no interest is yet shown to attract foreign investment in these areas by the policy
makers. The transportation by air is also at low development and no specific interest is visible in
improving this area too. Without providing better logistics infrastructure, it will be difficult to
maintain and gain competitiveness in the existing and new markets for the textile, clothing and
many other industries which are highly dependent on them. These participate in improving the
responsiveness of the producers to react on their customer demands.
III.3. Results and Discussion
In this chapter, we developed the overall insight on the textile and clothing SC system of
Pakistan. The summary of the findings is presented and discussed below.
The main cotton producing base is in the centre of the country, i.e. north-east of Sindh and South-
east of Punjab. This area in general is very strong in the agricultural activities.
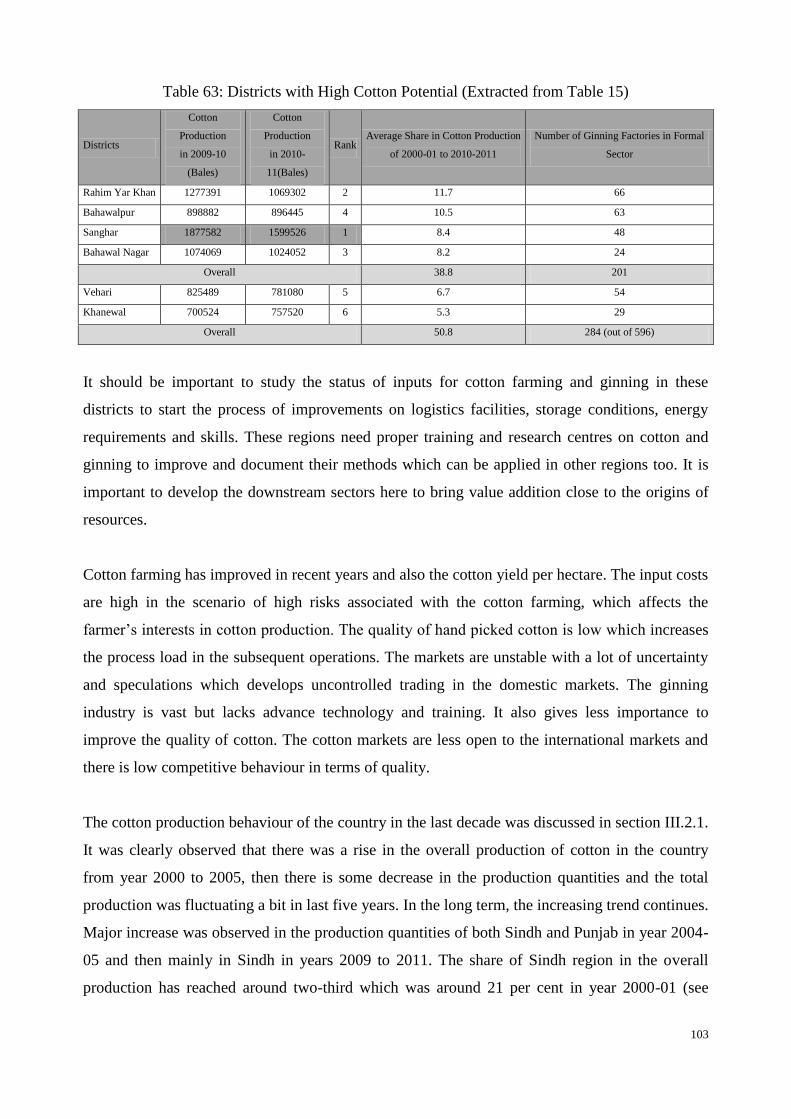
103
Table 63: Districts with High Cotton Potential (Extracted from Table 15)
Districts
Cotton
Production
in 2009-10
(Bales)
Cotton
Production
in 2010-
11(Bales)
Rank Average Share in Cotton Production
of 2000-01 to 2010-2011
Number of Ginning Factories in Formal
Sector
Rahim Yar Khan 1277391 1069302 2 11.7 66
Bahawalpur 898882 896445 4 10.5 63
Sanghar 1877582 1599526 1 8.4 48
Bahawal Nagar 1074069 1024052 3 8.2 24
Overall 38.8 201
Vehari 825489 781080 5 6.7 54
Khanewal 700524 757520 6 5.3 29
Overall 50.8 284 (out of 596)
It should be important to study the status of inputs for cotton farming and ginning in these
districts to start the process of improvements on logistics facilities, storage conditions, energy
requirements and skills. These regions need proper training and research centres on cotton and
ginning to improve and document their methods which can be applied in other regions too. It is
important to develop the downstream sectors here to bring value addition close to the origins of
resources.
Cotton farming has improved in recent years and also the cotton yield per hectare. The input costs
are high in the scenario of high risks associated with the cotton farming, which affects the
farmer‟s interests in cotton production. The quality of hand picked cotton is low which increases
the process load in the subsequent operations. The markets are unstable with a lot of uncertainty
and speculations which develops uncontrolled trading in the domestic markets. The ginning
industry is vast but lacks advance technology and training. It also gives less importance to
improve the quality of cotton. The cotton markets are less open to the international markets and
there is low competitive behaviour in terms of quality.
The cotton production behaviour of the country in the last decade was discussed in section III.2.1.
It was clearly observed that there was a rise in the overall production of cotton in the country
from year 2000 to 2005, then there is some decrease in the production quantities and the total
production was fluctuating a bit in last five years. In the long term, the increasing trend continues.
Major increase was observed in the production quantities of both Sindh and Punjab in year 2004-
05 and then mainly in Sindh in years 2009 to 2011. The share of Sindh region in the overall
production has reached around two-third which was around 21 per cent in year 2000-01 (see
104
Table 11 and Table 12). This is an important rise especially when this was achieved with the
improvement of the yield per hectare.
The manufactured fibre industry is developed mainly to supply the local demand and it has
expanded fast in last two decades. The products and costs are less competitive due to their
absence from the international markets. We did not find proper data to comment in detail on these
sectors which require further study.
The yarn sectors are also dispersed mainly in two regions, Sindh and Punjab. These are well
developed and have advance technology and lot of incentives from government. The yarn sectors
have grown a lot in last decades because of strong cotton supplies and because of growth in
neighbouring regions in fabric and clothing sectors. The major growth of yarn industry was
observed in Punjab region due to higher cotton supplies and similar trend is due for Sindh region
where cotton production has doubled in the last decade. The coarse and medium fine yarns are
the main potentials of the sectors which support the huge textile made-up sectors of the country.
There is some growth on the fine yarns due to increasing demand in the local industry on fine
fabrics, which has increased the import of fine cotton fibres. There is a need to increase the value
addition by adopting better marketing practices, developing high value customer segments and by
improving the diversification of the product range of yarn sectors. Both, Pakistan and India are
among the lowest price suppliers in the world in cotton yarn and there is need to increase the real
profitability of these sectors.
The formal industrial activity of fabric manufacturing in the country is mainly composed of two
sectors, weaving and knitting. The expansion of the fabric industry is wider than the yarn industry
where the formal and informal sectors can be found in most of the regions of the country. The
formal sectors produce for the export markets and the production of informal sectors is mainly
consumed in local markets. Although, the formal sector sometimes utilise the capacity of
informal sectors to produce for export markets. The formal sector is clustered at less number of
locations; mainly in Sindh and Punjab. The expansion of the informal sectors is wider. The
informal sectors help to provide employment to huge uneducated labour, which otherwise should
be difficult to be employed in other industrial sectors with higher technological developments.
The technology of the formal sectors has improved a lot in the last decades by moving towards
the shuttles technology and the introduction of advance preparation technology and production
systems. The automation of the processes is also improved which have improved the capacity of
105
the individual units. The product diversification is higher in informal sectors due to the input of
cultural design aspects whereas, the product diversification is limited in the formal sectors of the
industry. The formal sectors of both yarn and fabric industries have improved the skills of the
labour on the advance technology and have also advanced the technology in the related areas.
The knitting sector has huge potential to supply the international markets, which is looking for
the improvement of skills on design and production systems and the development of logistics and
market channels to enter into the high profit markets of fashion clothing. The weaving and
knitting sectors are the strong support of the textile made-up sectors which are competing well in
the international markets.
The technology of dyeing, printing and finishing has improved in the last decade and many
industries have imported advance technology to prepare them for producing for the international
export markets. The research environment is improving in the dyeing and printing areas although
it is poor in the finishing areas. We did not find proper data to comment in detail on these sectors
which require further study.
The sectors of textile made-ups are working better in the global markets due to their low
dependence on the design aspects. The strong textile manufacturing sectors support the
competitive position of these sectors in the global markets. The towel sector is placed at second
position in terms of global exports after China. It is improving fast in terms of production
technology, product diversification and its linkage with the international markets. The country is
placed at top in terms of global exports in the areas of bed wear and performing well against its
competitors. The data was not available on the other sectors in the category of textile made-ups
but it was identified in the discussions with the industry experts that the canvas sector is also well
developed in the country. The status of the remaining sectors is not clear well, which needs
further study.
The sectors of clothing and apparel are mostly producing standard products for the low profit
markets due to their inability to compete in the markets of fashion clothing. Most of the sector is
exporting on the strategy of low price. Slight change in the production behaviour is being
observed by the SC experts as some local brands in fashion clothing are emerging which will
bring further evolutions in the clothing and apparel sectors. It is too early to provide insight on
future behaviour of the sectors or growth in these areas. Keeping in view the growth of the textile
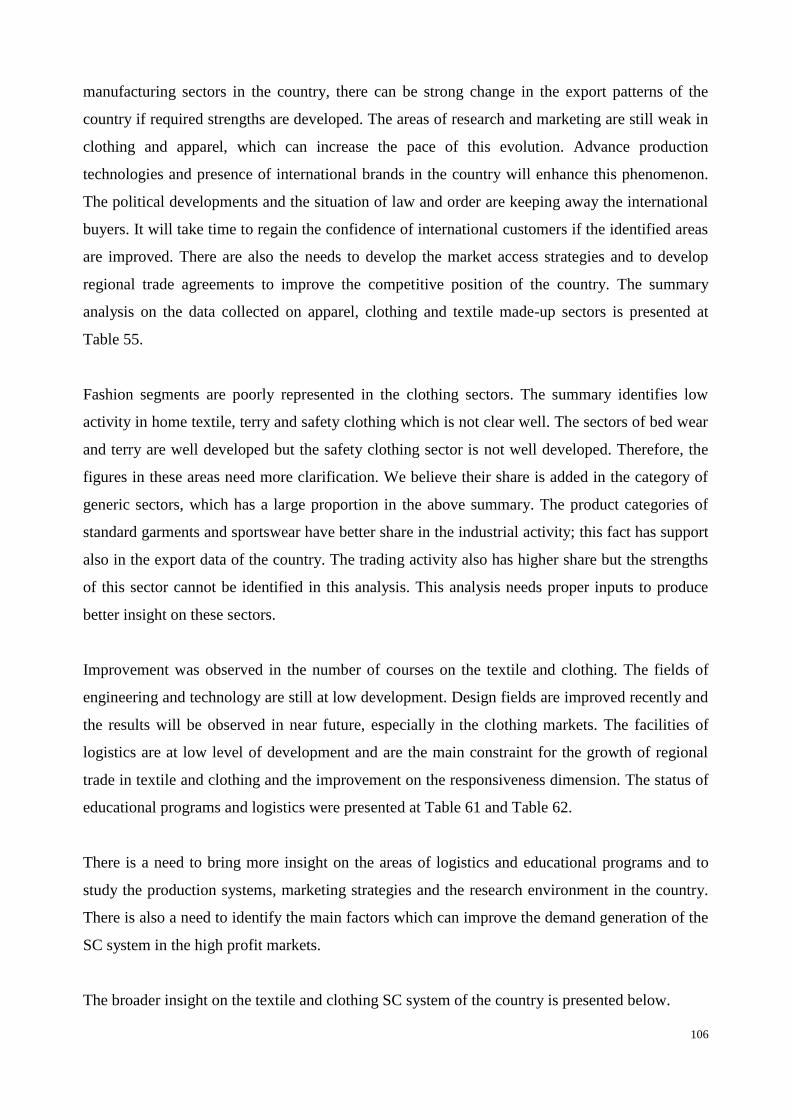
106
manufacturing sectors in the country, there can be strong change in the export patterns of the
country if required strengths are developed. The areas of research and marketing are still weak in
clothing and apparel, which can increase the pace of this evolution. Advance production
technologies and presence of international brands in the country will enhance this phenomenon.
The political developments and the situation of law and order are keeping away the international
buyers. It will take time to regain the confidence of international customers if the identified areas
are improved. There are also the needs to develop the market access strategies and to develop
regional trade agreements to improve the competitive position of the country. The summary
analysis on the data collected on apparel, clothing and textile made-up sectors is presented at
Table 55.
Fashion segments are poorly represented in the clothing sectors. The summary identifies low
activity in home textile, terry and safety clothing which is not clear well. The sectors of bed wear
and terry are well developed but the safety clothing sector is not well developed. Therefore, the
figures in these areas need more clarification. We believe their share is added in the category of
generic sectors, which has a large proportion in the above summary. The product categories of
standard garments and sportswear have better share in the industrial activity; this fact has support
also in the export data of the country. The trading activity also has higher share but the strengths
of this sector cannot be identified in this analysis. This analysis needs proper inputs to produce
better insight on these sectors.
Improvement was observed in the number of courses on the textile and clothing. The fields of
engineering and technology are still at low development. Design fields are improved recently and
the results will be observed in near future, especially in the clothing markets. The facilities of
logistics are at low level of development and are the main constraint for the growth of regional
trade in textile and clothing and the improvement on the responsiveness dimension. The status of
educational programs and logistics were presented at Table 61 and Table 62.
There is a need to bring more insight on the areas of logistics and educational programs and to
study the production systems, marketing strategies and the research environment in the country.
There is also a need to identify the main factors which can improve the demand generation of the
SC system in the high profit markets.
The broader insight on the textile and clothing SC system of the country is presented below.

107
Table 64: Overall Scenario of Characteristics and Development Status for the Textile and
Clothing Sectors of the SC System (Formal Sectors)
Areas Status of
Development*
Factors Responsible for the Development of the Sector
*(Development is the function of following variables.)
Cotton Farming
Inputs Supply Medium Strong-
to-Strong
Availability of Labour, Medium High Skills of Farming, Weather Uncertainties, High Risk of
Virus and Diseases, High Cost of Pesticides, Fertilisers etc. Non availability of Advance
Farming Technology, Existence of Research on Cotton Varieties,
Farming Sector Strong
High Expansion of the Cotton Production Activity in the Country, Low Advancement in
Farming Technology, Growth of the Farming Area and Yield per Hectare, Variations in
Production Area and Yield, Lot of Risks
Demand in National
Markets High Growth of Ginning and Yarn Industry
Demand in International
Markets Average to High Low Knowledge of Markets, Low Picking Quality, Low Use of Information Technology
Overall Cotton Farming
Sector Strong
Ginning Sector
Supply of Cotton and
Inputs Strong Supply of Cotton and Growth of Cotton Production
Ginning Industry Medium Strong-
to-Strong
Number of Ginning Units, Expansion of the Industry in the Country, Low Advancement in
Technology in the Industry, Growth of the Industry, Availability of Labour, High Variations in
Cotton Supply, Market Risks
Demand in National
Markets High Growth of Yarn Industry
Demand in International
Markets Average to High Low Quality, Low Knowledge of Markets, Low Use of Information Technology
Overall Ginning Sector Medium Strong
Manufactured Fibre Sectors
Raw Material Supply Medium Strong Dependency on Imports
Manufactured Fibre
Industry Medium Strong Discussion with Industry Personnel
Demand in National
Markets Average to High Medium Quality and Rates, High Competition
Demand in International
Markets Average Medium Quality and Rates, High Competition
Overall Manufactured
Fibre Industry Medium Strong
Yarn Sectors
Cotton Supply Strong Supply of Cotton and Growth of Cotton Production
Manufactured Fibres
Supply Medium Strong Presence of Manufactured Fibres in the Markets
Yarn Manufacturing Base Strong
Number of Yarn Manufacturing Units, Expansion of the Industry in the Country, Introduction
of Advance Manufacturing Technology, Growth of the Industry, Government Support, Low
Cost Raw Material
Demand in National
Markets High Growth of Fabric Industry, Yarn Rates
Demand in International Average to High Design Versatility, High Competition, Low Use of Information Technology

108
Areas Status of
Development*
Factors Responsible for the Development of the Sector
*(Development is the function of following variables.)
Markets
Overall Yarn Sector Strong
Weaving and knitting Sectors
Cotton Based Raw
Material Supply Strong Supply of Cotton and Growth of Yarn Industry
Manufactured Fibres Based
Raw Material Supply Medium Presence of Manufactured Fibres in the Markets
Fabric Manufacturing Base Strong Number of Fabric Manufacturing Units, Expansion of Industry in the Country, Introduction of
Advance Manufacturing Technology, Growth of Industry
Demand in National
Markets Average Low Development of the Demand Generating Factors
Demand in International
Markets Average Low Design Versatility, High Competition, Low Use of Information Technology
Overall Fabric Sector Medium Strong-
to-Strong
Dyeing, Printing and Finishing Sectors
Supply Side Medium Strong Bulk Supply of Fabric, Low Diversity in Design and Style, Supply of Other Inputs (Dyes,
Chemicals) is Medium Strong, Low wage labour, Low Research
Dyeing/Printing and
Finishing Industry Strong
High Expansion of Industry in the Country, Low Number of Units with Advance Technology,
Medium Growth of Industries,
Demand in National
Markets Average Low Development of the Demand Generating Factors
Demand in International
Markets Average
Low Design Versatility, High Competition, Low Knowledge of Developed Markets
Requirements on Quality, Design and Trends on Colour and Finishes, Low Use of Information
Technology
Overall Dyeing, Printing
and Finishing Sectors
Medium Strong-
to-Strong
Textile Made-up Industry
Supply Side Strong Bulk Supply of Heavy to Medium Weight Fabrics and Coarse to Fine Yarns, Supply of Other
Inputs (Dyes, Chemicals) is Medium Strong, Low wage labour, Low Research,
Textile Made-up Industry Strong High Expansion of the Industry in the Country, Medium Number of Units with Advance
Technology, High Growth of Number of Industries,
Demand in National
Markets Average High Low Development of the Demand Generating Factors
Demand in International
Markets Average High
Low Design Versatility, Country is Competitive, Better Knowledge of Developed Markets
Requirements on Quality, Design and Trends, Low Use of Information Technology
Overall Textile Made-up
Industry Strong
Clothing and Apparel Sectors
Supply Side Very Strong
Bulk Supply of Cotton Fabrics, Medium Strong Supply of Other Inputs (Button, Zippers, etc.)
and Higher Dependence on Imports, Low wage labour, Low Research, Low Design Versatility,
Low Skills in Fashion and Designs
Clothing and Apparel
Industry Weak
High Expansion in the Unorganised Structure, Low Number of Units with Advance
Technology, Weak Linkages with International Markets, Low Branding,
Demand in National
Markets Average Low Development of the Demand Generating Factors
Demand in International Average to High Low Design Versatility, Industry is Low Competitive, Low Knowledge of Developed Markets
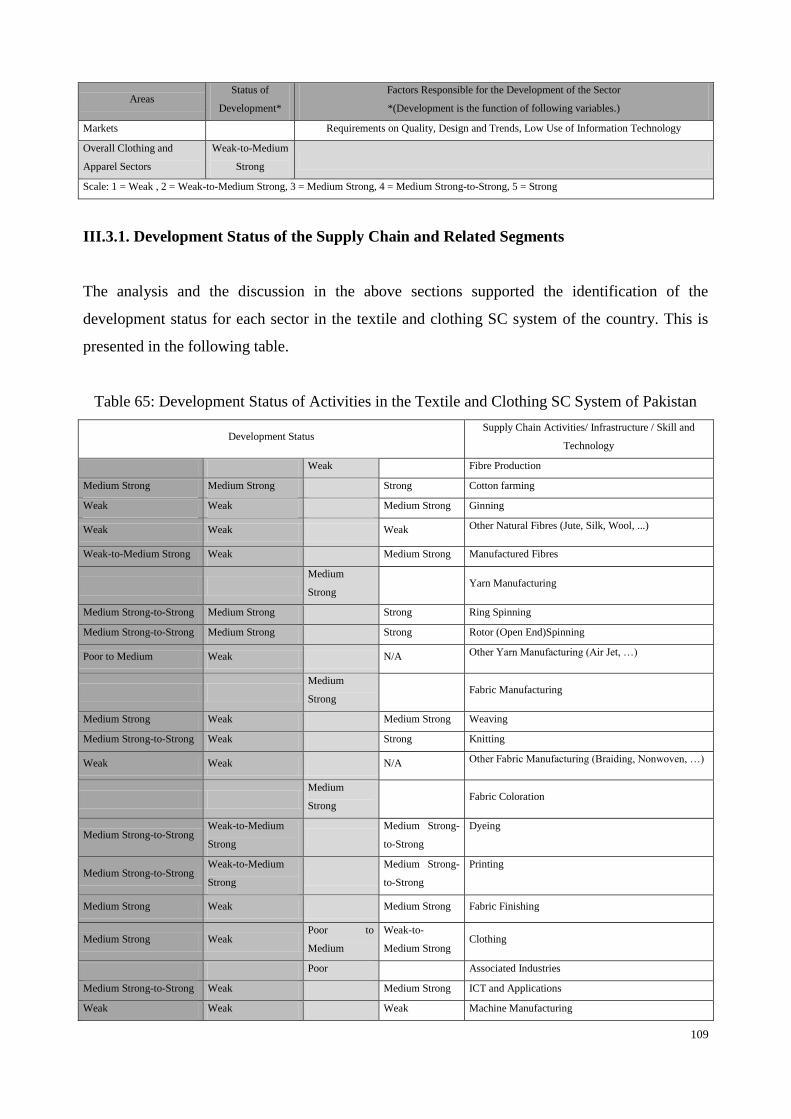
109
Areas Status of
Development*
Factors Responsible for the Development of the Sector
*(Development is the function of following variables.)
Markets Requirements on Quality, Design and Trends, Low Use of Information Technology
Overall Clothing and
Apparel Sectors
Weak-to-Medium
Strong
Scale: 1 = Weak , 2 = Weak-to-Medium Strong, 3 = Medium Strong, 4 = Medium Strong-to-Strong, 5 = Strong
III.3.1. Development Status of the Supply Chain and Related Segments
The analysis and the discussion in the above sections supported the identification of the
development status for each sector in the textile and clothing SC system of the country. This is
presented in the following table.
Table 65: Development Status of Activities in the Textile and Clothing SC System of Pakistan
Development Status Supply Chain Activities/ Infrastructure / Skill and
Technology
Weak Fibre Production
Medium Strong Medium Strong Strong Cotton farming
Weak Weak Medium Strong Ginning
Weak Weak Weak Other Natural Fibres (Jute, Silk, Wool, ...)
Weak-to-Medium Strong Weak Medium Strong Manufactured Fibres
Medium
Strong Yarn Manufacturing
Medium Strong-to-Strong Medium Strong Strong Ring Spinning
Medium Strong-to-Strong Medium Strong Strong Rotor (Open End)Spinning
Poor to Medium Weak N/A Other Yarn Manufacturing (Air Jet, …)
Medium
Strong Fabric Manufacturing
Medium Strong Weak Medium Strong Weaving
Medium Strong-to-Strong Weak Strong Knitting
Weak Weak N/A Other Fabric Manufacturing (Braiding, Nonwoven, …)
Medium
Strong Fabric Coloration
Medium Strong-to-Strong Weak-to-Medium
Strong
Medium Strong-
to-Strong
Dyeing
Medium Strong-to-Strong Weak-to-Medium
Strong
Medium Strong-
to-Strong
Printing
Medium Strong Weak Medium Strong Fabric Finishing
Medium Strong Weak Poor to
Medium
Weak-to-
Medium Strong Clothing
Poor Associated Industries
Medium Strong-to-Strong Weak Medium Strong ICT and Applications
Weak Weak Weak Machine Manufacturing
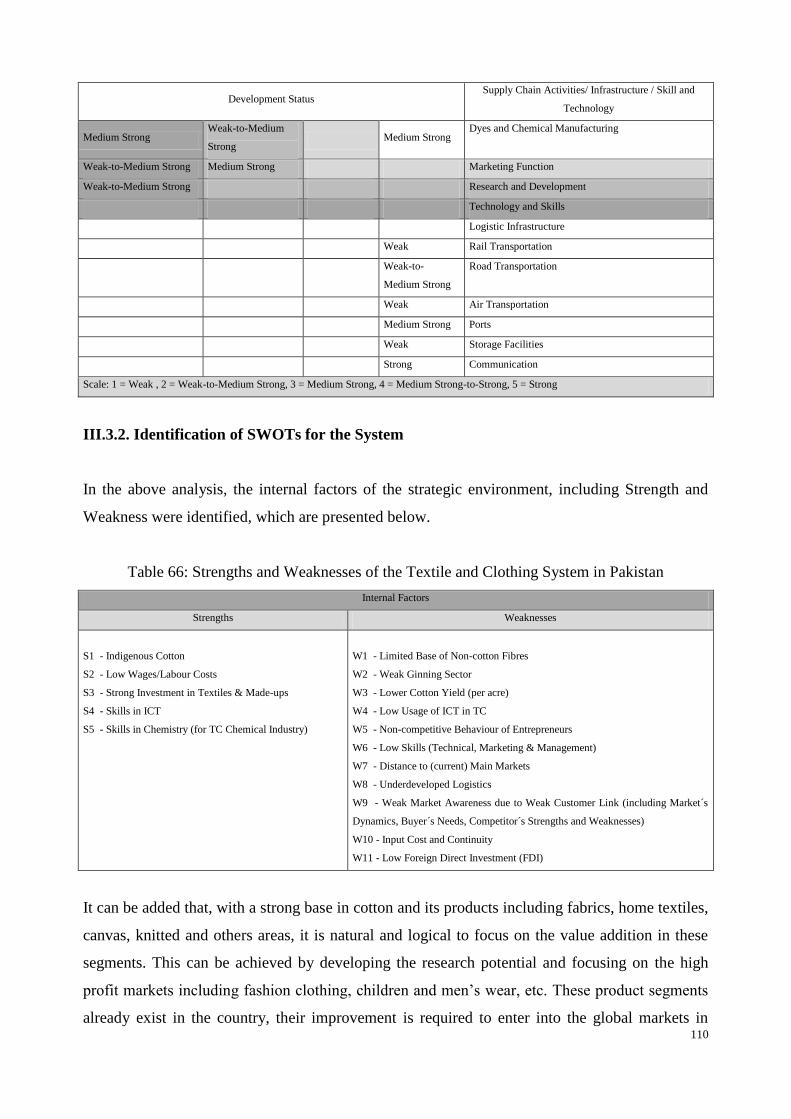
110
Development Status Supply Chain Activities/ Infrastructure / Skill and
Technology
Medium Strong Weak-to-Medium
Strong Medium Strong
Dyes and Chemical Manufacturing
Weak-to-Medium Strong Medium Strong Marketing Function
Weak-to-Medium Strong Research and Development
Technology and Skills
Logistic Infrastructure
Weak Rail Transportation
Weak-to-
Medium Strong
Road Transportation
Weak Air Transportation
Medium Strong Ports
Weak Storage Facilities
Strong Communication
Scale: 1 = Weak , 2 = Weak-to-Medium Strong, 3 = Medium Strong, 4 = Medium Strong-to-Strong, 5 = Strong
III.3.2. Identification of SWOTs for the System
In the above analysis, the internal factors of the strategic environment, including Strength and
Weakness were identified, which are presented below.
Table 66: Strengths and Weaknesses of the Textile and Clothing System in Pakistan
Internal Factors
Strengths Weaknesses
S1 - Indigenous Cotton
S2 - Low Wages/Labour Costs
S3 - Strong Investment in Textiles & Made-ups
S4 - Skills in ICT
S5 - Skills in Chemistry (for TC Chemical Industry)
W1 - Limited Base of Non-cotton Fibres
W2 - Weak Ginning Sector
W3 - Lower Cotton Yield (per acre)
W4 - Low Usage of ICT in TC
W5 - Non-competitive Behaviour of Entrepreneurs
W6 - Low Skills (Technical, Marketing & Management)
W7 - Distance to (current) Main Markets
W8 - Underdeveloped Logistics
W9 - Weak Market Awareness due to Weak Customer Link (including Market´s
Dynamics, Buyer´s Needs, Competitor´s Strengths and Weaknesses)
W10 - Input Cost and Continuity
W11 - Low Foreign Direct Investment (FDI)
It can be added that, with a strong base in cotton and its products including fabrics, home textiles,
canvas, knitted and others areas, it is natural and logical to focus on the value addition in these
segments. This can be achieved by developing the research potential and focusing on the high
profit markets including fashion clothing, children and men‟s wear, etc. These product segments
already exist in the country, their improvement is required to enter into the global markets in
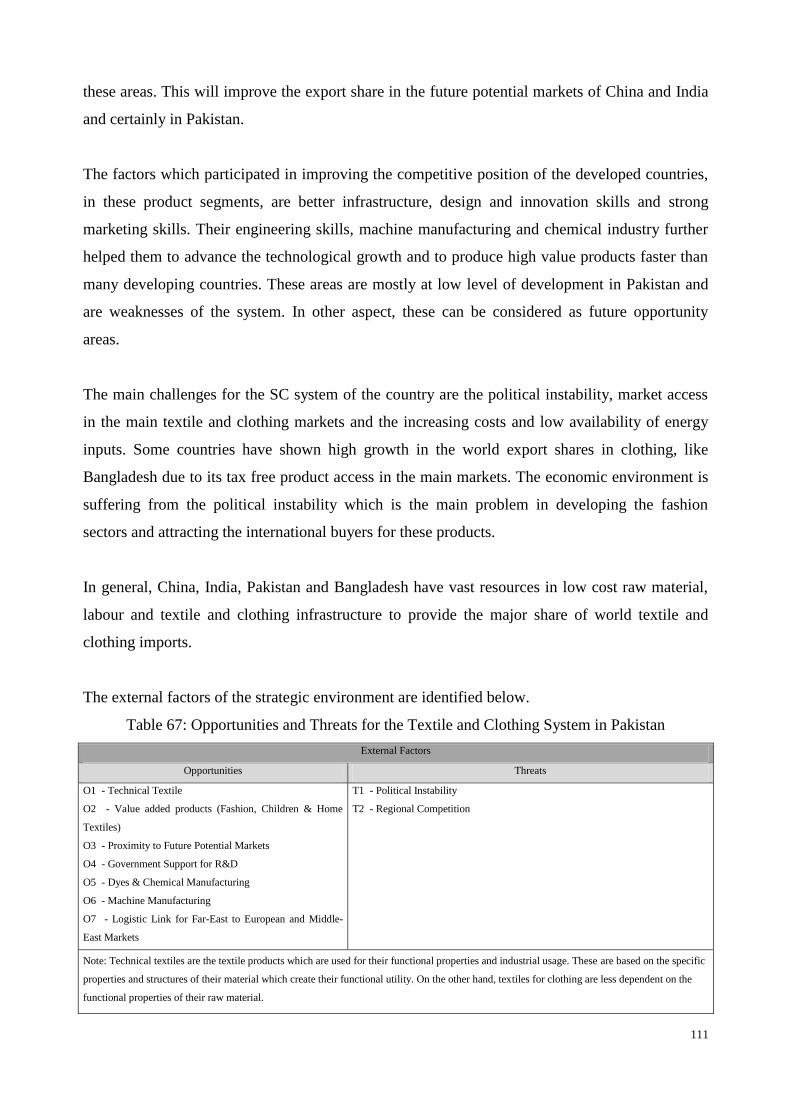
111
these areas. This will improve the export share in the future potential markets of China and India
and certainly in Pakistan.
The factors which participated in improving the competitive position of the developed countries,
in these product segments, are better infrastructure, design and innovation skills and strong
marketing skills. Their engineering skills, machine manufacturing and chemical industry further
helped them to advance the technological growth and to produce high value products faster than
many developing countries. These areas are mostly at low level of development in Pakistan and
are weaknesses of the system. In other aspect, these can be considered as future opportunity
areas.
The main challenges for the SC system of the country are the political instability, market access
in the main textile and clothing markets and the increasing costs and low availability of energy
inputs. Some countries have shown high growth in the world export shares in clothing, like
Bangladesh due to its tax free product access in the main markets. The economic environment is
suffering from the political instability which is the main problem in developing the fashion
sectors and attracting the international buyers for these products.
In general, China, India, Pakistan and Bangladesh have vast resources in low cost raw material,
labour and textile and clothing infrastructure to provide the major share of world textile and
clothing imports.
The external factors of the strategic environment are identified below.
Table 67: Opportunities and Threats for the Textile and Clothing System in Pakistan
External Factors
Opportunities Threats
O1 - Technical Textile
O2 - Value added products (Fashion, Children & Home
Textiles)
O3 - Proximity to Future Potential Markets
O4 - Government Support for R&D
O5 - Dyes & Chemical Manufacturing
O6 - Machine Manufacturing
O7 - Logistic Link for Far-East to European and Middle-
East Markets
T1 - Political Instability
T2 - Regional Competition
Note: Technical textiles are the textile products which are used for their functional properties and industrial usage. These are based on the specific
properties and structures of their material which create their functional utility. On the other hand, textiles for clothing are less dependent on the
functional properties of their raw material.

112
Collectively, these can be transformed into a complete SWOT matrix of the system, produced in
Table 68.
Table 68: SWOT Matrix for the Textile and Clothing SC System of Pakistan
Internal Factors
Strengths Weaknesses
S1 - Indigenous cotton crop
S2 - Low wages/labour costs
S3 - Strong investment in textiles & made-ups
S4 - Skills in ICT
S5 - Skills in chemistry (for textile & clothing
chemical industry)
W1 - Limited base of non-cotton fibres
W2 - Weak ginning sector
W3 - Lower cotton yield (per acre)
W4 - Low application & usage of ICT
W5 - Non-competitive behaviour of entrepreneurs
W6 - Skills (technical, marketing & management)
W7 - Distance to (current) markets
W8 - Underdeveloped logistics
W9 - Weak market awareness (market´s dynamics, buyer´s needs, competitor´s strengths and
weaknesses); because of weak ultimate-customer link
W10 - Input´s costs and continuity
W11 - Low Foreign Direct Investment (FDI)
External Factors
Opportunities Threats
O1 - Technical Textile
O2 - Value added products (fashion, children
clothing & home textiles)
O3 - Proximity to future potential markets
O4 - Government support for R&D
O5 - Dyes & chemical manufacturing
O6 - Machine manufacturing
O7 - Logistic link for Far East to European and
Middle East Markets
T1 - Political instability
T2 - Regional competitors
III.4. Conclusion
The strategic environment of the textile and clothing SC system in Pakistan was analysed in this
chapter. The main factors which are responsible for the growth were identified. These factors
provided the basis for the identifying the development status of the SC segments. Textile
manufacturing, textile made-ups and the cotton production sectors are the strongest in the system.
At this stage of the development, the system is demanding to reorient the fashion clothing and
apparel sectors which will bring higher value addition and more opportunities for the system.
Logistics is an important area which needs attention to enhance the performance on the customer
delivery process and to improve the customer service. There is a need to utilize the skills in
information and communication technologies to improve the management and production
113
systems. Also, the marketing skills need improvement to enhance the capability to understand the
needs of the international markets and to visualize the product segmentation. Improving these
areas will bring many opportunities in the international markets including the emerging markets
of South Asia and Middle East.
Positive developments are already being observed in the skill development programs. The
number of study programs has increased in science, engineering and design fields for the textile,
clothing and emerging areas. Meanwhile, these programs are being offered at limited number of
locations like other developments in the country, which should be expanded.
There is very low interest in the non-traditional markets and advance textiles, which can bring
new opportunities for the SC system. The growth of agricultural and the industrial base in the
country offer strong motivation in these sectors. Some strategies are emerging from the
government side in the areas of protective clothing, textiles for automobiles, textiles for
construction and agriculture industry and medical textiles. There is a long way ahead to prove
some success in these areas which strongly depend on the scientific research which is weak in the
country. The raw material base of the country is a constraint for these areas in the current
scenario, which also needs attention of the policy makers and the industrial community.
The expansion of the formal industry is very limited in various regions of the country, except
Punjab. Such a concentrated growth of the sectors has imposed various types of pressures on such
locations, including fast population growth and shortage of infrastructure. There is a need to
expand the industrial base of the country to district level especially in Sindh and KP regions,
which lack in such expansion of the industry. This will bring additional benefits to the economy
of the country.
The findings of the study on the growth of the textile, clothing and related areas in different
regions of the country, the development status of the sectors and the SWOT matrix on the SC
system revealed the strategic environment of the SC system. These are the main inputs for the
strategic planning process in the SC system. The categorization of the factors on the strategic
dimensions, performed above, will help to formulate and to evaluate the strategic planning.

114
Chapter IV Strategic Planning for the Textile and Clothing SC System in
Pakistan Page
IV.1. Development of Strategic Plans 115
IV.2. Evaluation of the Strategic Plans 118
IV.2.1. Decision Methods of AHP and ANP in SWOT 119
IV.2.1.1. Application of ANP in SWOT 126
IV.2.1.2. Results with AHP in SWOT 135
IV.2.1.3. Comparison of Results 136
IV.2.1.4. Sensitivity Analysis on Results of the Performance Evaluation 137
IV.2.2. Evaluation of the Implementation Characteristics of the Plans 140
IV.2.2.1. Simple Additive Weighting (SAW) 140
IV.2.2.2. Criteria for the Implementation Phase 141
IV.2.2.3. Application of SAW Method to Analyse the Implementation
Character of the Strategic Plans 143
IV.2.2.4. Results on the Implementation Character 143
IV.2.2.5. Sensitivity Analysis on Results of the Implementation Character 145
IV.2.3. Discussion on Overall Results of the Strategic Planning 148
IV.2.4. Conclusion 153
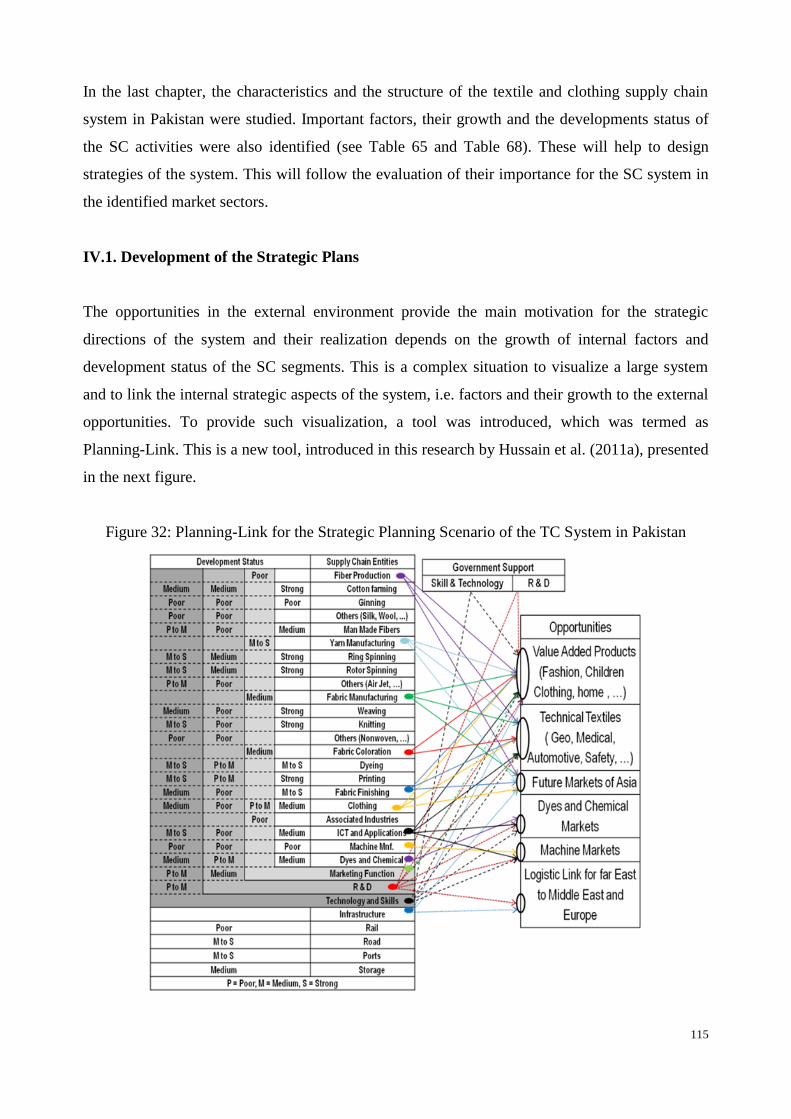
115
In the last chapter, the characteristics and the structure of the textile and clothing supply chain
system in Pakistan were studied. Important factors, their growth and the developments status of
the SC activities were also identified (see Table 65 and Table 68). These will help to design
strategies of the system. This will follow the evaluation of their importance for the SC system in
the identified market sectors.
IV.1. Development of the Strategic Plans
The opportunities in the external environment provide the main motivation for the strategic
directions of the system and their realization depends on the growth of internal factors and
development status of the SC segments. This is a complex situation to visualize a large system
and to link the internal strategic aspects of the system, i.e. factors and their growth to the external
opportunities. To provide such visualization, a tool was introduced, which was termed as
Planning-Link. This is a new tool, introduced in this research by Hussain et al. (2011a), presented
in the next figure.
Figure 32: Planning-Link for the Strategic Planning Scenario of the TC System in Pakistan

116
It shows the relationship between various interfaces like the development-status of the SC
segments and the opportunities for the system. It effectively identified the potential strategic
directions and offered good visibility on the process and on the linkages of the interfaces to
individuals, who were involved in the strategy formulation stage. Besides, it preserved the main
aspects of the strategy formulation stage for the next iterations of the process and for the future
revisions. The continuity aspects of planning and the policy are difficult to maintain in situations
where the process is performed at long time horizons and involving different individuals/experts;
offering both temporal and spatial variations. This tool also helps to achieve consistency in the
present-to-future course of actions. Planning-Link and the evaluation on the strategic
environment helped to devise the strategies and preserved the input-output scenario of the
planning situation. It also facilitated the evaluation of the strategies. Strategies were devised and
evaluated on the basis of their links with supply chain entities and the available or potential
opportunities. A link gets higher priority in the process of prioritisation if it affects many outputs.
The above inputs of the strategy formulation process including SWOTs, the growth of the SC
activities (Development Status) and their linkage to opportunities (Planning-Link) were discussed
with the experts, resulting in the following strategies.
Table 69: Strategic Plans of the SC System
SO Strategies WO Strategies
SO1 -Diversification of Product Range
SO2 - Establishing Industrial-Parks (with Common Facilities of Design &
Development, ICT Centres, Effluent Treatment, etc.)
SO3 -Applying Export Incentives
SO4 - Establishing Down-stream links/facilities in Competing Regions (Turkey,
Egypt, Bangladesh, Mexico etc.)
SO5 - Improving Domestic Chemical Industry
WO1 - Skill Development Programs
WO2 - Expanding Non-cotton Fibre Base
WO3 - Improving logistics
WO4 - Developing Effective Linkage in Industry,
Academia and R&D Centres
WO5 - Developing Domestic Engineering Industry
ST Strategies WT Strategies
ST1 - Development of Markets Access Strategies
ST2 - Establishing Down-stream Facilities in Stable, Near-to-market and Competing
Regions
WT1 - Work in Collaboration with Competitors
WT2 - Development and Implementation of Long-term
and Coordinated Policies
WT3 - Introduction of Industry Relief Packages
These are grouped on the four dimensions of the SWOT framework of scanning the strategic
environment. In this framework, the strengths of the system enable it to seize the available
opportunities (SO-Dimension). They also reduce the effects of the threats on the system (ST-
Dimension). The weaknesses react as an opposite force by impeding the system for the successful

117
realization of the opportunities (WO-Dimension) and increase the failure of the system against
the threats (WT-Dimension). Further, the external threats are supported by the internal
constraints. The system therefore struggles to maximize its strengths and minimize its
weaknesses in response to improve its position. Keeping in view the above phenomenon, four
sets of strategies were identified on the dimensions of Strengths-Opportunities (SO), Strengths-
Threats (ST), Weaknesses-Opportunities (WO) and Weaknesses-Threats (WT). Again, in this
process of strategy design, the strengths (for which different authors have utilized different terms
like capabilities, etc.) are the main driving forces and the weaknesses are the main constraints in
the system. These help and/or restrict the materialization of the opportunities. Our strategy
formulation process was focused to improve the system so that its potential to materialize the
maximum opportunities can be enhanced by improving the weak areas of the SC system.
Simultaneously, the maximization of the opportunity materialization is directed in the traditional
markets as well as in the non-traditional areas.
The available strengths (resources and capabilities) were considered first in order to devise the
SO group of strategies. The focus is to transform the resources and capabilities of lower strength
to higher level, which will help the system to seize the opportunities in the higher-end markets of
the traditional segments for the SC system. Further, it is focused on improving the comparative
advantage over competing systems in terms of system strengths. In this group, five strategies
were devised for product diversification, infrastructure improvement, improvement of the
domestic input industry and the linkages to the main markets. The SO group of strategies takes
into account the short-to-medium term future environment. The WO group of strategies supports
the SO strategies for its short-to-medium term goals. Simultaneously, it covers the long-term
scenarios of growth in the international markets. Therefore, the characteristics and time
dimensions of WO strategies are different than those of SO strategies; this will be further
explored while evaluating their implementation characteristics. Five strategies were devised
under the WO class. In their short time effects, they support the SO strategy dimensions by
addressing the issues of skills and the linkages of the research entities. On the long terms, these
focus on the wider issue of infrastructure and input areas like machine manufacturing and
speciality fibre production; the areas which can assist the system into the emerging fields in the
global markets. Here, the skills and the research linkages focus on the short-to-medium term
opportunities whereas machine manufacturing and specialty fibre production focus on the future
needs of the technical and functional textile industries. Finally, in order to neutralize the threats,
the dimensions of strengths and weaknesses are considered by avoiding and/or overcoming on the

118
threats. Five strategies were devised under these two groups of ST and WT; two for the ST
dimension and three for the WT. The characteristics of the devised strategies are summarized
below.
Table 70: Characteristics of the Strategic Plans
Strategies Characteristics
SO Strategies
SO1 -Diversification of Product Range Diversification
SO2 - Establishing Industrial-Parks (with Common Facilities of Design & Development, ICT
Centres, Effluent Treatment, etc.) Responsiveness
SO3 -Applying Export Incentives Market Linkages
SO4 - Establishing Down-stream links/facilities in Competing Regions (Turkey, Egypt,
Bangladesh, Mexico etc.) Market Linkages, Responsiveness
SO5 - Improving Domestic Chemical Industry Input Control
ST Strategies
ST1 - Development of Markets Access Strategies Market Linkages, Competitive Position
ST2 - Establishing Down-stream Facilities in Stable, Near-to-market and Competing Regions Market Linkage, Responsiveness
WO Strategies
WO1 - Skill Development Programs Multiple Effects
WO2 - Expanding Non-cotton Fibre Base Inputs Control, Diversification
WO3 - Improving logistics Responsiveness
WO4 - Developing Effective Linkage in Industry, Academia and R&D Centres Multiple Effects
WO5 - Developing Domestic Engineering Industry Long Term Effects
WT Strategies
WT1 - Work in Collaboration with Competitors Differentiation, Diversification
WT2 - Development and Implementation of Long-term and Coordinated Policies Multiple Effects: Long Term Vision & Policy
Consistency
WT3 - Introduction of Industry Relief Packages Short Term Relief
IV.2. Evaluation of the Strategic Plans
In this section, the evaluation of strategies is discussed. It was performed to develop their
priorities considering the status of the activities in the SC system, strategic factors and focused
opportunities. This will help to allocate the resources and manage the efforts in the required areas
of strategic importance and to improve the competitiveness of the system.
It should also be helpful to identify the entities which can take part in the implementation of the
plans. These may include, Ministry of Textile, Trade Development Authority, Council of
Scientific and Industrial Research, Agency for Industrial Estate Development, Various Research
Centres, Education Institutes, etc. It will also be necessary to identify and analyse the role of
119
these entities in the implementation phases. Our focus will be on the evaluation of the strategic
plans and generating their priorities.
IV.2.1. Decision Methods of AHP and ANP in SWOT
Referring to the review of the scientific literature on the subject of strategic planning, performed
in Chapter III, simple and valuable methods were identified. These provided means of analysis on
the strategic environment and to visualize the linkages of factors in the system to design and
evaluate the strategies. These include, the hybrid methods of AHP in SWOT and ANP in SWOT,
developed by Kurttila et al. (2000) and Yuksel and Dagdeverin (2007), respectively. The methods
have their basis in the Saaty's Analytical Hierarchy Process (AHP) and Analytical Network
Process (ANP) which take into account the hierarchical and network effects of the decision
situation (Forman and Gass (2001)).
These are applied by many authors in various situations of supply chain optimization. Korpela
and Tuominen (1996) used AHP for the decision of warehouse site selection, Badri (1998)
combined AHP with his goal programming (GP) model for global facility location, Kurtilla et al.
(2000) used it with SWOT in his hybrid method for a case study on the forest certification,
Korpela et al. (2002) integrated it with mixed integer programming (MIP) for production capacity
allocation and supply chain design, Farkasovsky and Anna (2004) applied it for the outsourcing
decisions of firm´s application development function and Yuksel and Dagdeviren (2007) utilized
it in the strategic planning for a clothing firm.
AHP and ANP were developed by Saaty in the 1970s. These are defined as follows.
The AHP is a general theory of measurement. It is used to derive priorities on absolute scales (invariant under the
identity transformation) from both discrete and continuous paired comparisons in multi-level hierarchic structure.
These comparisons may be taken from actual measurement or from a fundamental scale that reflects the relative
strengths of preferences and feelings. The AHP has a special concern with departure from consistency and the
measurement of this departure and with dependence within and between the groups of elements of its structure…In
using the AHP or its generalization to feedback networks, the Analytical Network Process (ANP) to model a
problem, one needs a hierarchic or a network structure to represent that problem, as well as pairwise comparisons to
establish relations within the structure (Saaty and Vergas (2006)).
Forman and Gass (2001) described AHP on the basis of its functions; it provides the structuring
of the complexity of decision problem, measuring on the ratio scale and to synthesize the
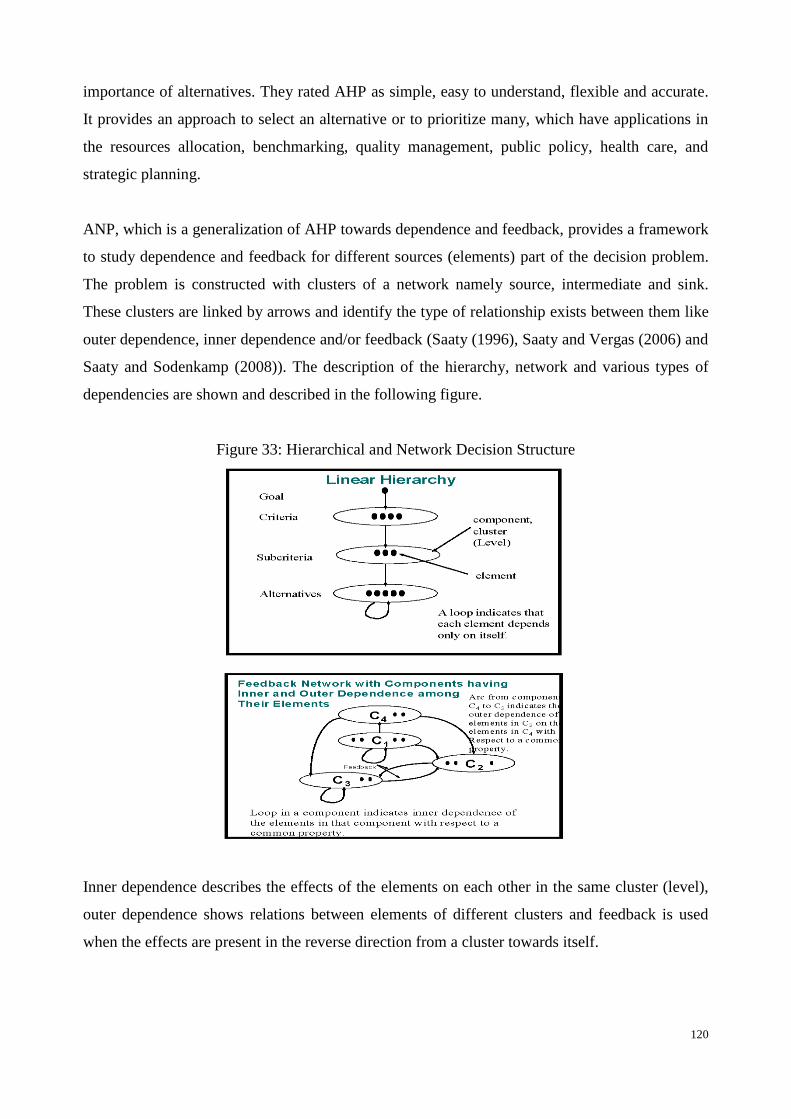
120
importance of alternatives. They rated AHP as simple, easy to understand, flexible and accurate.
It provides an approach to select an alternative or to prioritize many, which have applications in
the resources allocation, benchmarking, quality management, public policy, health care, and
strategic planning.
ANP, which is a generalization of AHP towards dependence and feedback, provides a framework
to study dependence and feedback for different sources (elements) part of the decision problem.
The problem is constructed with clusters of a network namely source, intermediate and sink.
These clusters are linked by arrows and identify the type of relationship exists between them like
outer dependence, inner dependence and/or feedback (Saaty (1996), Saaty and Vergas (2006) and
Saaty and Sodenkamp (2008)). The description of the hierarchy, network and various types of
dependencies are shown and described in the following figure.
Figure 33: Hierarchical and Network Decision Structure
Inner dependence describes the effects of the elements on each other in the same cluster (level),
outer dependence shows relations between elements of different clusters and feedback is used
when the effects are present in the reverse direction from a cluster towards itself.
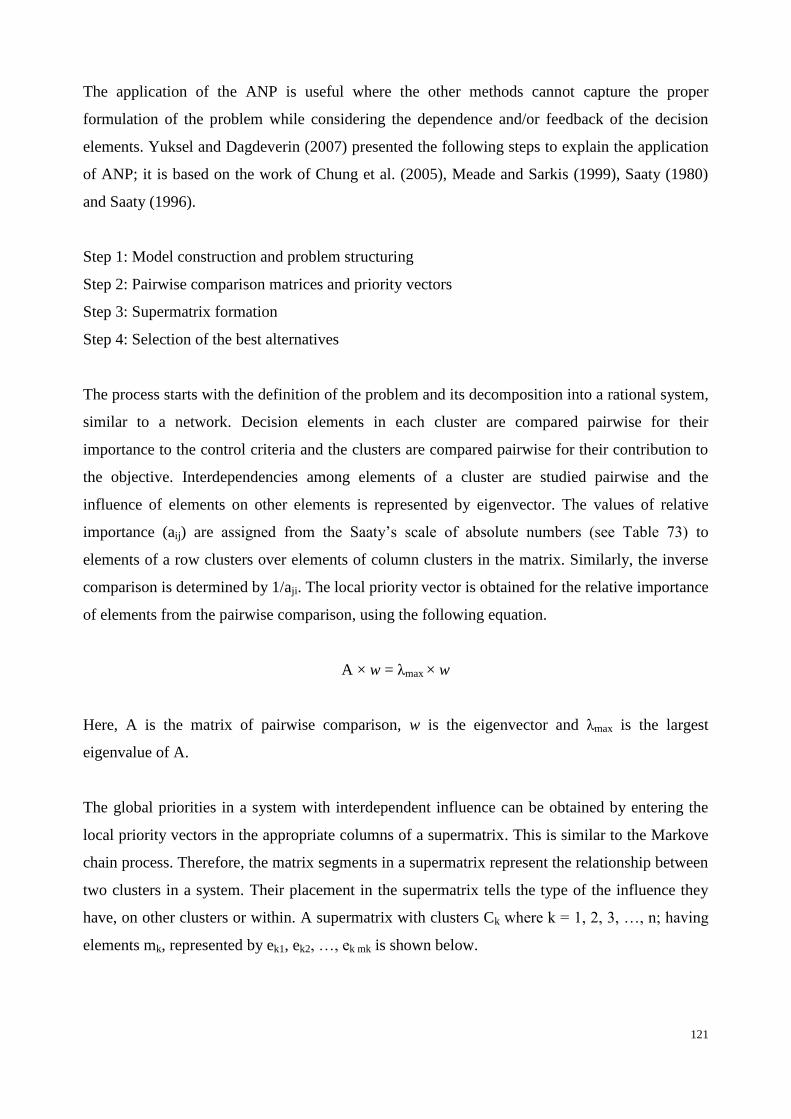
121
The application of the ANP is useful where the other methods cannot capture the proper
formulation of the problem while considering the dependence and/or feedback of the decision
elements. Yuksel and Dagdeverin (2007) presented the following steps to explain the application
of ANP; it is based on the work of Chung et al. (2005), Meade and Sarkis (1999), Saaty (1980)
and Saaty (1996).
Step 1: Model construction and problem structuring
Step 2: Pairwise comparison matrices and priority vectors
Step 3: Supermatrix formation
Step 4: Selection of the best alternatives
The process starts with the definition of the problem and its decomposition into a rational system,
similar to a network. Decision elements in each cluster are compared pairwise for their
importance to the control criteria and the clusters are compared pairwise for their contribution to
the objective. Interdependencies among elements of a cluster are studied pairwise and the
influence of elements on other elements is represented by eigenvector. The values of relative
importance (aij) are assigned from the Saaty‟s scale of absolute numbers (see Table 73) to
elements of a row clusters over elements of column clusters in the matrix. Similarly, the inverse
comparison is determined by 1/aji. The local priority vector is obtained for the relative importance
of elements from the pairwise comparison, using the following equation.
A × w = λmax × w
Here, A is the matrix of pairwise comparison, w is the eigenvector and λmax is the largest
eigenvalue of A.
The global priorities in a system with interdependent influence can be obtained by entering the
local priority vectors in the appropriate columns of a supermatrix. This is similar to the Markove
chain process. Therefore, the matrix segments in a supermatrix represent the relationship between
two clusters in a system. Their placement in the supermatrix tells the type of the influence they
have, on other clusters or within. A supermatrix with clusters Ck where k = 1, 2, 3, …, n; having
elements mk, represented by ek1, ek2, …, ek mk is shown below.
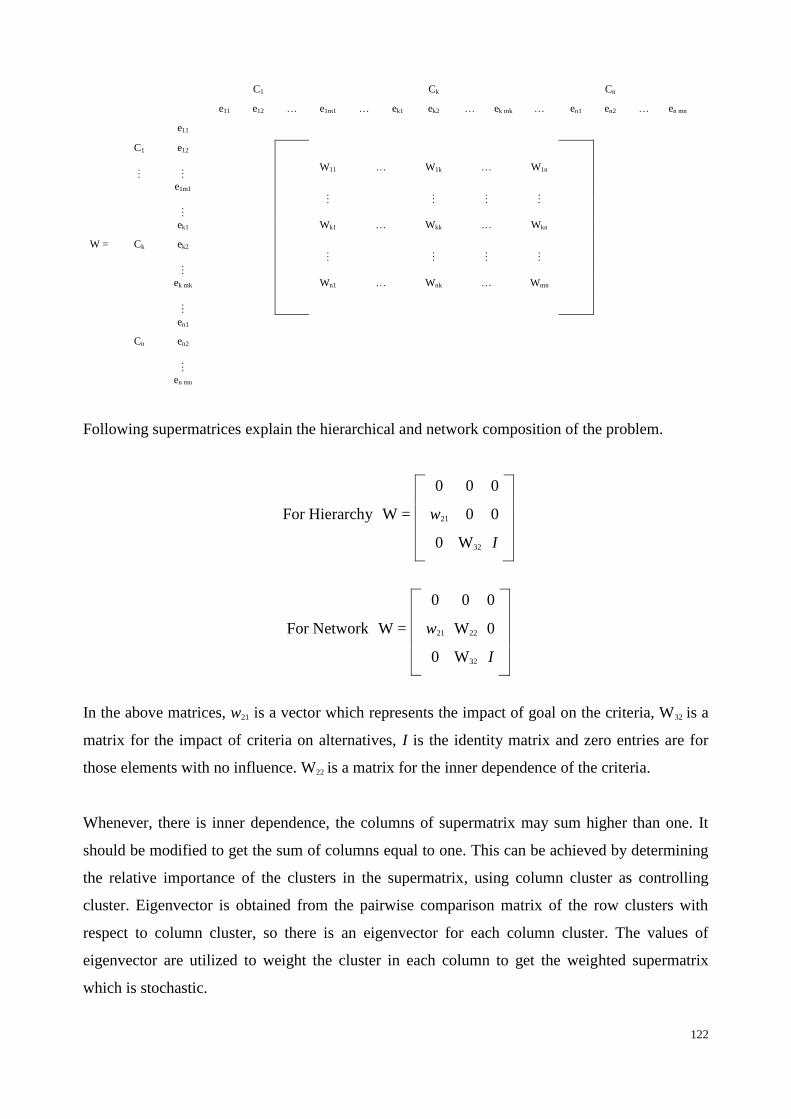
122
C1 Ck Cn
e11 e12 … e1m1 … ek1 ek2 … ek mk … en1 en2 … en mn
e11
C1 e12
…
…
W11 … W1k … W1n
e1m1 …
…
…
…
…
ek1 Wk1 … Wkk … Wkn
W = Ck ek2 …
…
…
…
…
ek mk Wn1 … Wnk … Wmn
…
en1
Cn en2
…
en mn
Following supermatrices explain the hierarchical and network composition of the problem.
0 0 0
For Hierarchy W = w21 0 0
0 W32 I
0 0 0
For Network W = w21 W22 0
0 W32 I
In the above matrices, w21 is a vector which represents the impact of goal on the criteria, W32 is a
matrix for the impact of criteria on alternatives, I is the identity matrix and zero entries are for
those elements with no influence. W22 is a matrix for the inner dependence of the criteria.
Whenever, there is inner dependence, the columns of supermatrix may sum higher than one. It
should be modified to get the sum of columns equal to one. This can be achieved by determining
the relative importance of the clusters in the supermatrix, using column cluster as controlling
cluster. Eigenvector is obtained from the pairwise comparison matrix of the row clusters with
respect to column cluster, so there is an eigenvector for each column cluster. The values of
eigenvector are utilized to weight the cluster in each column to get the weighted supermatrix
which is stochastic.
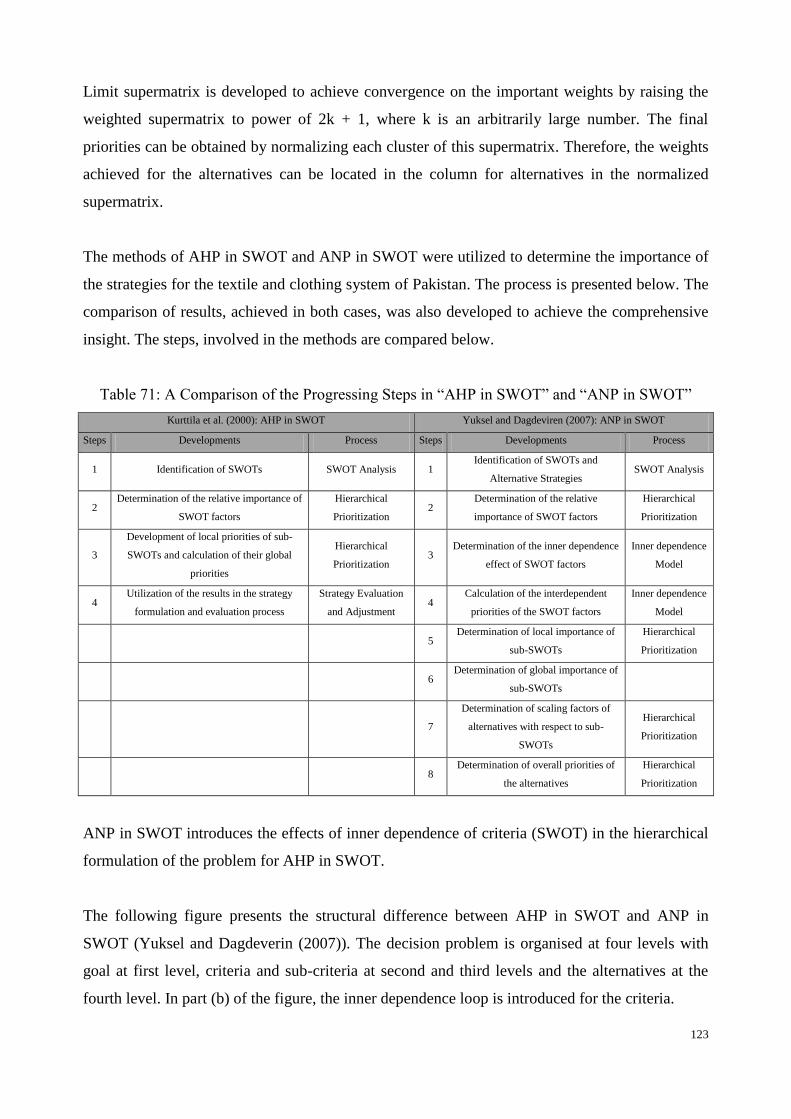
123
Limit supermatrix is developed to achieve convergence on the important weights by raising the
weighted supermatrix to power of 2k + 1, where k is an arbitrarily large number. The final
priorities can be obtained by normalizing each cluster of this supermatrix. Therefore, the weights
achieved for the alternatives can be located in the column for alternatives in the normalized
supermatrix.
The methods of AHP in SWOT and ANP in SWOT were utilized to determine the importance of
the strategies for the textile and clothing system of Pakistan. The process is presented below. The
comparison of results, achieved in both cases, was also developed to achieve the comprehensive
insight. The steps, involved in the methods are compared below.
Table 71: A Comparison of the Progressing Steps in “AHP in SWOT” and “ANP in SWOT”
Kurttila et al. (2000): AHP in SWOT Yuksel and Dagdeviren (2007): ANP in SWOT
Steps Developments Process Steps Developments Process
1 Identification of SWOTs SWOT Analysis 1 Identification of SWOTs and
Alternative Strategies SWOT Analysis
2 Determination of the relative importance of
SWOT factors
Hierarchical
Prioritization 2
Determination of the relative
importance of SWOT factors
Hierarchical
Prioritization
3
Development of local priorities of sub-
SWOTs and calculation of their global
priorities
Hierarchical
Prioritization 3
Determination of the inner dependence
effect of SWOT factors
Inner dependence
Model
4 Utilization of the results in the strategy
formulation and evaluation process
Strategy Evaluation
and Adjustment 4
Calculation of the interdependent
priorities of the SWOT factors
Inner dependence
Model
5 Determination of local importance of
sub-SWOTs
Hierarchical
Prioritization
6 Determination of global importance of
sub-SWOTs
7
Determination of scaling factors of
alternatives with respect to sub-
SWOTs
Hierarchical
Prioritization
8 Determination of overall priorities of
the alternatives
Hierarchical
Prioritization
ANP in SWOT introduces the effects of inner dependence of criteria (SWOT) in the hierarchical
formulation of the problem for AHP in SWOT.
The following figure presents the structural difference between AHP in SWOT and ANP in
SWOT (Yuksel and Dagdeverin (2007)). The decision problem is organised at four levels with
goal at first level, criteria and sub-criteria at second and third levels and the alternatives at the
fourth level. In part (b) of the figure, the inner dependence loop is introduced for the criteria.

124
Figure 34: The Decision Structure with “AHP in SWOT” and “ANP in SWOT”
The importance of the SWOT factors is obtained by their relative comparison on the main
objective. The inner dependence of the SWOT factors is calculated from the inner dependence
model, presented at Figure 35. Then the importance of the sub-factors is calculated from their
relative comparison on their parent element. In this way, the weights of the criteria and the local
weights/priorities of the sub-factors are obtained. In the next steps, the local priorities of the sub-
factors are transformed into their global priorities by multiplying the weights of the parent
element. Finally, the alternatives are compared against each other on the sub-factors to obtain
their relative importance which was multiplied with the global priorities of the sub-factors to
calculate the final priorities.
In the above structure, w21 is the priority vector for the SWOT factors. W32 and W43 are the
comparison matrices for sub-factors and alternatives with respect to their parent elements. W2
represents the matrix for the inner dependence values for criteria (SWOT factors)..
Figure 35: Inner dependence Model
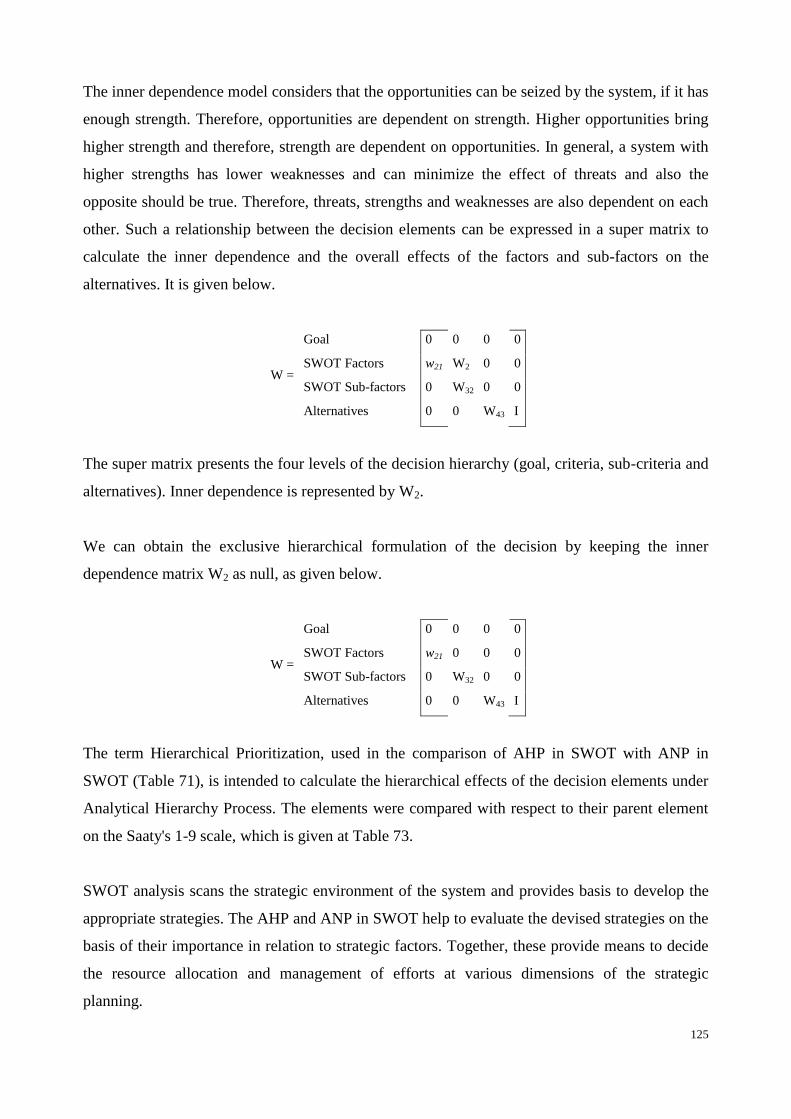
125
The inner dependence model considers that the opportunities can be seized by the system, if it has
enough strength. Therefore, opportunities are dependent on strength. Higher opportunities bring
higher strength and therefore, strength are dependent on opportunities. In general, a system with
higher strengths has lower weaknesses and can minimize the effect of threats and also the
opposite should be true. Therefore, threats, strengths and weaknesses are also dependent on each
other. Such a relationship between the decision elements can be expressed in a super matrix to
calculate the inner dependence and the overall effects of the factors and sub-factors on the
alternatives. It is given below.
Goal 0 0 0 0
W = SWOT Factors w21 W2 0 0
SWOT Sub-factors 0 W32 0 0
Alternatives 0 0 W43 I
The super matrix presents the four levels of the decision hierarchy (goal, criteria, sub-criteria and
alternatives). Inner dependence is represented by W2.
We can obtain the exclusive hierarchical formulation of the decision by keeping the inner
dependence matrix W2 as null, as given below.
Goal 0 0 0 0
W = SWOT Factors w21 0 0 0
SWOT Sub-factors 0 W32 0 0
Alternatives 0 0 W43 I
The term Hierarchical Prioritization, used in the comparison of AHP in SWOT with ANP in
SWOT (Table 71), is intended to calculate the hierarchical effects of the decision elements under
Analytical Hierarchy Process. The elements were compared with respect to their parent element
on the Saaty's 1-9 scale, which is given at Table 73.
SWOT analysis scans the strategic environment of the system and provides basis to develop the
appropriate strategies. The AHP and ANP in SWOT help to evaluate the devised strategies on the
basis of their importance in relation to strategic factors. Together, these provide means to decide
the resource allocation and management of efforts at various dimensions of the strategic
planning.
126
The following sections presents the decision model, the allocation of weights to criteria and sub-
factors on the basis of the inputs of experts, the relative comparison of the decision alternatives
and finally the calculation of their priorities.
IV.2.1.1. Application of ANP in SWOT
Step 1: Identification of SWOTs and Alternative Strategies
The sub-factors were developed from the resource-based SWOT analysis on the supply chain
system. Five strengths, eleven weaknesses, seven opportunities and two threats were identified.
After developing the criteria and the sub-factors, strategies were devised on four dimensions (SO,
WO, ST and WT), in consultation with SC experts. In total, fifteen strategies were identified, five
under SO dimension, five for WO, two for ST and three under WT dimensions. These inputs are
presented in the next table.

127
Table 72: SWOT Matrix and Strategic Plans for the T&C SC System of Pakistan
Internal Factors
Strengths Weaknesses
S1 - Indigenous cotton crop
S2 - Low wages/labour costs
S3 - Strong investment in textiles &
made-ups
S4 - Skills in ICT
S5 - Skills in chemistry (for textile &
clothing chemical industry)
W1 - Limited base of non-cotton fibres
W2 - Weak ginning sector
W3 - Lower cotton yield (per acre)
W4 - Low application & usage of ICT
W5 - Non-competitive behaviour of
entrepreneurs
W6 - Skills (technical, marketing &
management)
W7 - Distance to (current) markets
W8 - Underdeveloped logistics
W9 - Weak market awareness (market´s
dynamics, buyer´s needs, competitor´s
strengths and weaknesses); because of weak
ultimate-customer link
W10 - Input´s costs and continuity
W11 - Low Foreign Direct Investment (FDI)
Opportunities SO Strategy WO Strategy
Ex
tern
al F
acto
rs
O1 - Technical Textile
O2 - Value added products (fashion,
children clothing & home textiles)
O3 - Closed proximity to future
potential markets
O4 - Government support for R&D
O5 - Dyes & chemical manufacturing
O6 - Machine manufacturing
O7 - Logistic link for Far East to
European and Middle East Markets
SO1 - Diversification of product range
SO2 - Establishing industrial-parks with
common facilities of design &
development centres, ICT application
centres effluent treatment, etc.
SO3 - Applying export incentives
SO4 - Establishing downstream
links/facilities in competing regions
(Turkey, Egypt, Bangladesh & Mexico...)
SO5 - Improving domestic chemical
industry
WO1 - Skill development programs
WO2 - Expanding non cotton fibres base
WO3 - Improving logistics
WO4 - Developing effective linkage between
industry, academia and R&D institutes
WO5 - Developing domestic engineering
industry
Threats
T1 - Political instability
T2 - Regional competitors
ST Strategy
ST1 - Development of markets access
strategies
ST2 - Establishing down-stream facilities
in stable, near-to-market and competing
regions
WT Strategy
WT1 - Work in collaboration with
competitors
WT2 - Development and implementation of
long-term and coordinated policies
WT3 - Introduction of industry relief
packages
The strategic planning problem was transformed into a hierarchical decision structure (Kurtilla et
al. (2000) and Yuksel and Dagdeverin (2007)). The goal “Determining the Best Strategy” was
placed on the top, followed by the SWOT factors and sub-factors at intermediate levels and the
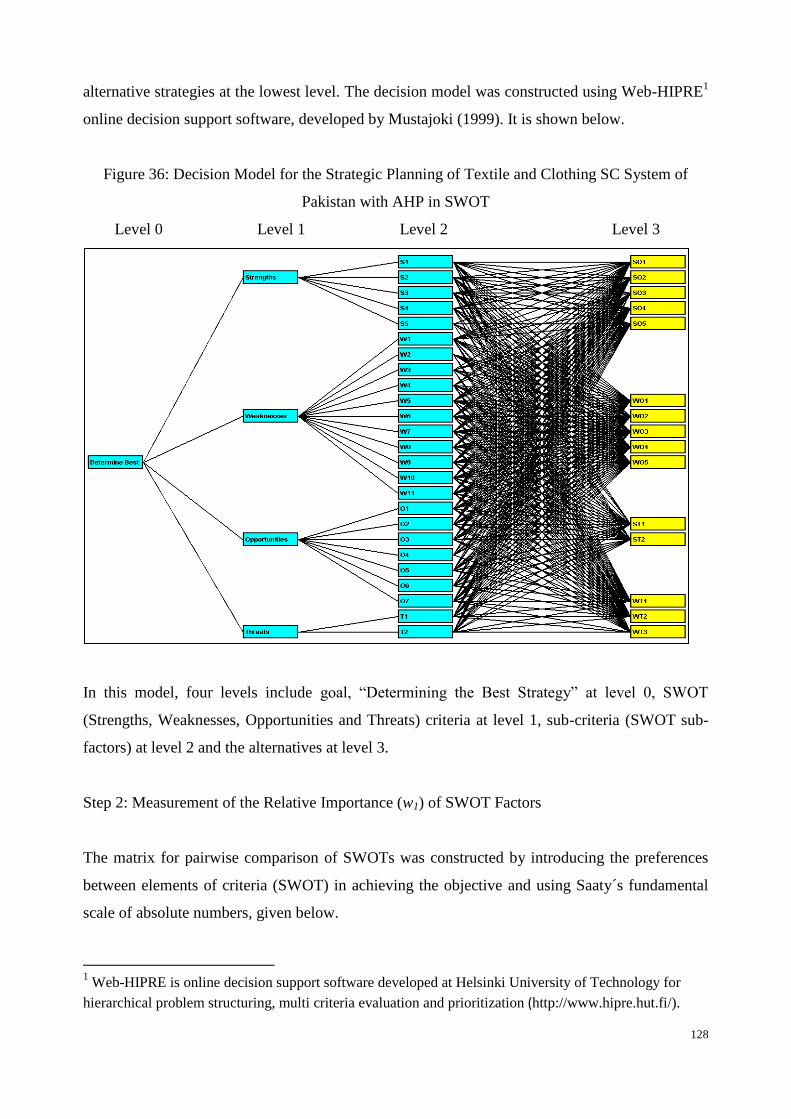
128
alternative strategies at the lowest level. The decision model was constructed using Web-HIPRE1
online decision support software, developed by Mustajoki (1999). It is shown below.
Figure 36: Decision Model for the Strategic Planning of Textile and Clothing SC System of
Pakistan with AHP in SWOT
Level 0 Level 1 Level 2 Level 3
In this model, four levels include goal, “Determining the Best Strategy” at level 0, SWOT
(Strengths, Weaknesses, Opportunities and Threats) criteria at level 1, sub-criteria (SWOT sub-
factors) at level 2 and the alternatives at level 3.
Step 2: Measurement of the Relative Importance (w1) of SWOT Factors
The matrix for pairwise comparison of SWOTs was constructed by introducing the preferences
between elements of criteria (SWOT) in achieving the objective and using Saaty´s fundamental
scale of absolute numbers, given below.
1 Web-HIPRE is online decision support software developed at Helsinki University of Technology for
hierarchical problem structuring, multi criteria evaluation and prioritization (http://www.hipre.hut.fi/).

129
Table 73: Saaty´s Fundamental Scale of Absolute Numbers
Intensity of
importance Definition Explanation
1 Equal importance Two activities contribute equally to the objective
2 Weak or slight
3 Moderate importance Experience and judgment slightly
favour one activity over another
4 Moderate plus
5 Strong importance Experience and judgment strongly favour one
activity over another
6 Strong plus
7 Very strong or demonstrated importance An activity is favoured very strongly over
another; its dominance demonstrated in practice
8 Very, very strong
9 Extreme importance The evidence favouring one activity over another
is of the highest possible order of affirmation
Reciprocals of
above
If activity i has one of the above nonzero numbers assigned to it when
compared with activity j, then j has the reciprocal value when compared
with i
A logical assumption
The values were assigned by experts in a group activity and the consensus approach was adopted
to finalize the individual values. Otherwise it was difficult to maintain the consistency of the
values as the number of comparisons was high. Saaty and Sodenkamp (2008) emphasized
keeping the consistency ratio (CR) below 0.1 when constructing the comparison matrices of
orders larger than 5×5. The consistency ratio was calculated from the consistency index (CI) and
random index (RI) (Yuksel and Dagdeverin (2007)).
CR = CI / RI
The consistency index was calculated with the following equation.
CI = (λmax – n) / (n - 1)
Here, λmax is the maximum eigenvalue and n is the size of the matrix. The RI for the matrices of
various sizes is given below (Saaty and Sodenkamp (2008)).
Table 74: Random Index
Order 1 2 3 4 5 6 7 8 9 10 11 12 13 14 15
RI 0 0 0.52 0.89 1.11 1.25 1.35 1.40 1.45 1.49 1.52 1.54 1.56 1.58 1.59
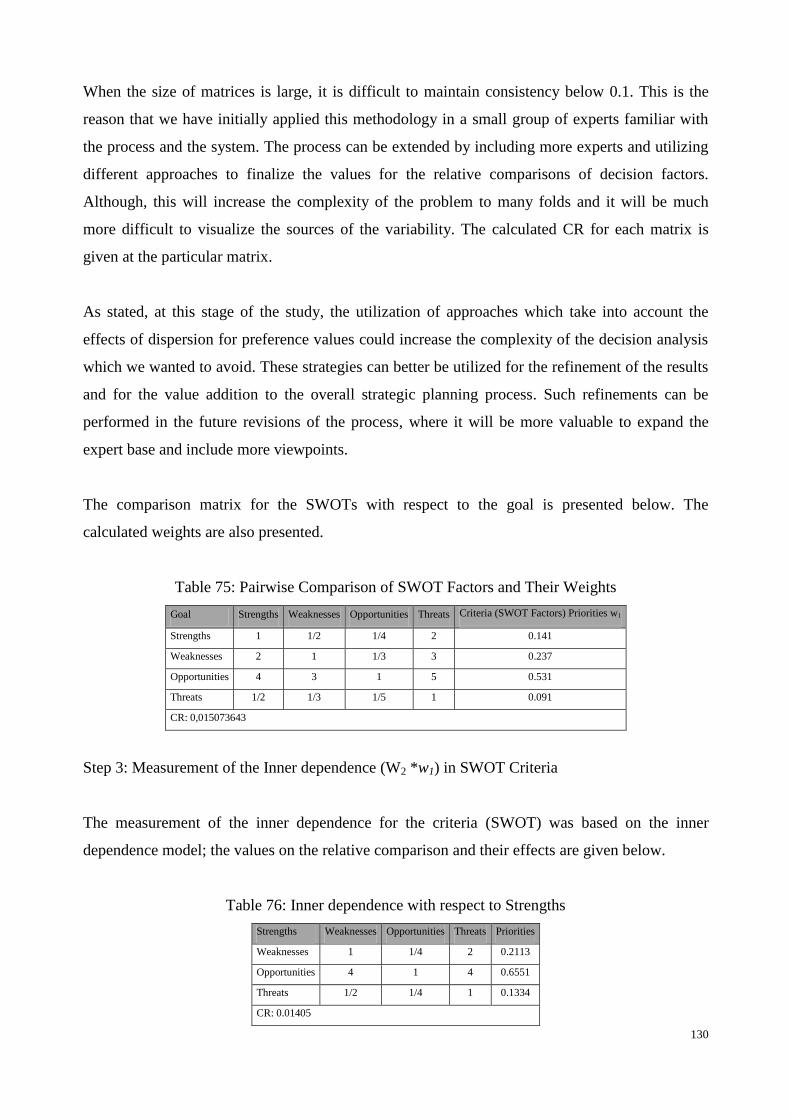
130
When the size of matrices is large, it is difficult to maintain consistency below 0.1. This is the
reason that we have initially applied this methodology in a small group of experts familiar with
the process and the system. The process can be extended by including more experts and utilizing
different approaches to finalize the values for the relative comparisons of decision factors.
Although, this will increase the complexity of the problem to many folds and it will be much
more difficult to visualize the sources of the variability. The calculated CR for each matrix is
given at the particular matrix.
As stated, at this stage of the study, the utilization of approaches which take into account the
effects of dispersion for preference values could increase the complexity of the decision analysis
which we wanted to avoid. These strategies can better be utilized for the refinement of the results
and for the value addition to the overall strategic planning process. Such refinements can be
performed in the future revisions of the process, where it will be more valuable to expand the
expert base and include more viewpoints.
The comparison matrix for the SWOTs with respect to the goal is presented below. The
calculated weights are also presented.
Table 75: Pairwise Comparison of SWOT Factors and Their Weights
Goal Strengths Weaknesses Opportunities Threats Criteria (SWOT Factors) Priorities w1
Strengths 1 1/2 1/4 2 0.141
Weaknesses 2 1 1/3 3 0.237
Opportunities 4 3 1 5 0.531
Threats 1/2 1/3 1/5 1 0.091
CR: 0,015073643
Step 3: Measurement of the Inner dependence (W2 *w1) in SWOT Criteria
The measurement of the inner dependence for the criteria (SWOT) was based on the inner
dependence model; the values on the relative comparison and their effects are given below.
Table 76: Inner dependence with respect to Strengths
Strengths Weaknesses Opportunities Threats Priorities
Weaknesses 1 1/4 2 0.2113
Opportunities 4 1 4 0.6551
Threats 1/2 1/4 1 0.1334
CR: 0.01405
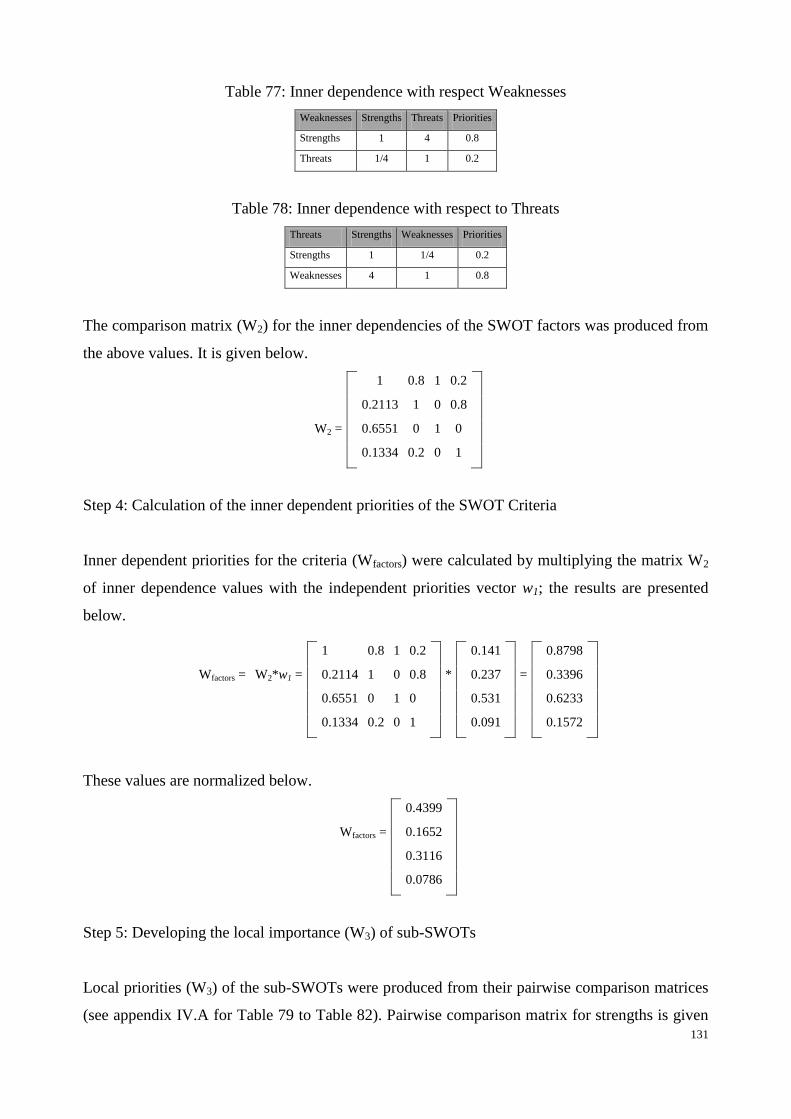
131
Table 77: Inner dependence with respect Weaknesses
Weaknesses Strengths Threats Priorities
Strengths 1 4 0.8
Threats 1/4 1 0.2
Table 78: Inner dependence with respect to Threats
Threats Strengths Weaknesses Priorities
Strengths 1 1/4 0.2
Weaknesses 4 1 0.8
The comparison matrix (W2) for the inner dependencies of the SWOT factors was produced from
the above values. It is given below.
1 0.8 1 0.2
0.2113 1 0 0.8
W2 = 0.6551 0 1 0
0.1334 0.2 0 1
Step 4: Calculation of the inner dependent priorities of the SWOT Criteria
Inner dependent priorities for the criteria (Wfactors) were calculated by multiplying the matrix W2
of inner dependence values with the independent priorities vector w1; the results are presented
below.
These values are normalized below.
0.4399
Wfactors = 0.1652
0.3116
0.0786
Step 5: Developing the local importance (W3) of sub-SWOTs
Local priorities (W3) of the sub-SWOTs were produced from their pairwise comparison matrices
(see appendix IV.A for Table 79 to Table 82). Pairwise comparison matrix for strengths is given
1 0.8 1 0.2 0.141 0.8798
Wfactors = W2*w1 = 0.2114 1 0 0.8 * 0.237 = 0.3396
0.6551 0 1 0 0.531 0.6233
0.1334 0.2 0 1 0.091 0.1572

132
below as example. The strengths are compared against each other under their parent element; the
local weights are also given.
Table 79: Pairwise Comparison of Strengths
Strengths S1 S2 S3 S4 S5 Local Weights
S1 1 3 2 3 4 0.395
S2 1/3 1 ½ 1 3 0.147
S3 ½ 2 1 3 3 0.262
S4 1/3 1 1/3 1 2 0.124
S5 1/4 1/3 1/3 ½ 1 0.072
CR = 0.03166
Table 80: (see Appendix III.A)
Table 81: (see Appendix III.A)
Table 82: (see Appendix III.A)
Step 6: Producing the Global Weights for the Sub-SWOTs
The local priorities of the sub-SWOTs were converted into their global priorities by multiplying
them with the inner dependent priorities of the criteria Wfactors, obtained in Step 4. These are
given at the next table.
Table 83: Local and Global Priorities of the Criteria and Sub-Criteria
Criteria
Priorities of Criteria (Wfactors) with Inner
dependence
(Step-4)
Sub-
SWOTs
Local Priorities of the Sub-SWOTs
(W32)
(Step-5)
Global Priorities of Sub-
SWOTs
(wsub-factor (global))
(Step-6)
Strengths 0.4399
S1 0.395 0.1737
S2 0.147 0.0646
S3 0.262 0.1152
S4 0.124 0.0545
S5 0.072 0.0316
Weaknesses 0.1698
W1 0.09 0.0152
W2 0.035 0.0059
W3 0.057 0.0096
W4 0.128 0.0217
W5 0.092 0.0156
W6 0.262 0.0444
W7 0.034 0.0057
W8 0.034 0.0057
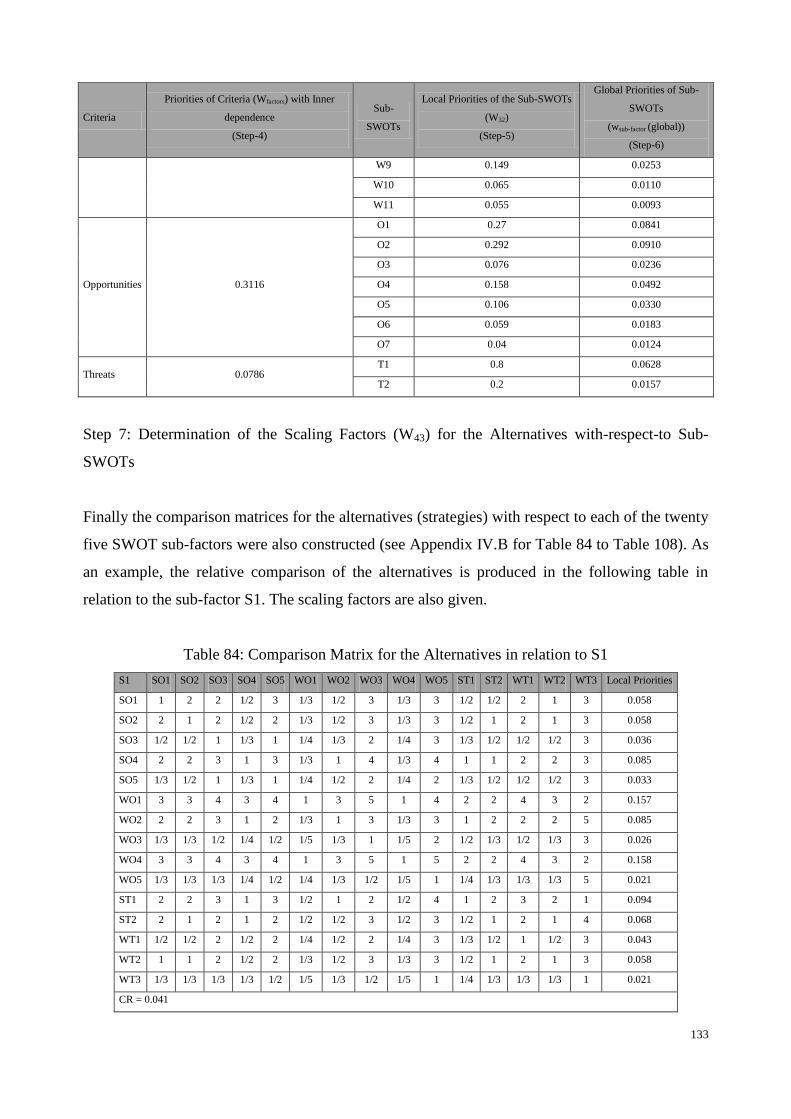
133
Criteria
Priorities of Criteria (Wfactors) with Inner
dependence
(Step-4)
Sub-
SWOTs
Local Priorities of the Sub-SWOTs
(W32)
(Step-5)
Global Priorities of Sub-
SWOTs
(wsub-factor (global))
(Step-6)
W9 0.149 0.0253
W10 0.065 0.0110
W11 0.055 0.0093
Opportunities 0.3116
O1 0.27 0.0841
O2 0.292 0.0910
O3 0.076 0.0236
O4 0.158 0.0492
O5 0.106 0.0330
O6 0.059 0.0183
O7 0.04 0.0124
Threats 0.0786 T1 0.8 0.0628
T2 0.2 0.0157
Step 7: Determination of the Scaling Factors (W43) for the Alternatives with-respect-to Sub-
SWOTs
Finally the comparison matrices for the alternatives (strategies) with respect to each of the twenty
five SWOT sub-factors were also constructed (see Appendix IV.B for Table 84 to Table 108). As
an example, the relative comparison of the alternatives is produced in the following table in
relation to the sub-factor S1. The scaling factors are also given.
Table 84: Comparison Matrix for the Alternatives in relation to S1
S1 SO1 SO2 SO3 SO4 SO5 WO1 WO2 WO3 WO4 WO5 ST1 ST2 WT1 WT2 WT3 Local Priorities
SO1 1 2 2 1/2 3 1/3 1/2 3 1/3 3 1/2 1/2 2 1 3 0.058
SO2 2 1 2 1/2 2 1/3 1/2 3 1/3 3 1/2 1 2 1 3 0.058
SO3 1/2 1/2 1 1/3 1 1/4 1/3 2 1/4 3 1/3 1/2 1/2 1/2 3 0.036
SO4 2 2 3 1 3 1/3 1 4 1/3 4 1 1 2 2 3 0.085
SO5 1/3 1/2 1 1/3 1 1/4 1/2 2 1/4 2 1/3 1/2 1/2 1/2 3 0.033
WO1 3 3 4 3 4 1 3 5 1 4 2 2 4 3 2 0.157
WO2 2 2 3 1 2 1/3 1 3 1/3 3 1 2 2 2 5 0.085
WO3 1/3 1/3 1/2 1/4 1/2 1/5 1/3 1 1/5 2 1/2 1/3 1/2 1/3 3 0.026
WO4 3 3 4 3 4 1 3 5 1 5 2 2 4 3 2 0.158
WO5 1/3 1/3 1/3 1/4 1/2 1/4 1/3 1/2 1/5 1 1/4 1/3 1/3 1/3 5 0.021
ST1 2 2 3 1 3 1/2 1 2 1/2 4 1 2 3 2 1 0.094
ST2 2 1 2 1 2 1/2 1/2 3 1/2 3 1/2 1 2 1 4 0.068
WT1 1/2 1/2 2 1/2 2 1/4 1/2 2 1/4 3 1/3 1/2 1 1/2 3 0.043
WT2 1 1 2 1/2 2 1/3 1/2 3 1/3 3 1/2 1 2 1 3 0.058
WT3 1/3 1/3 1/3 1/3 1/2 1/5 1/3 1/2 1/5 1 1/4 1/3 1/3 1/3 1 0.021
CR = 0.041
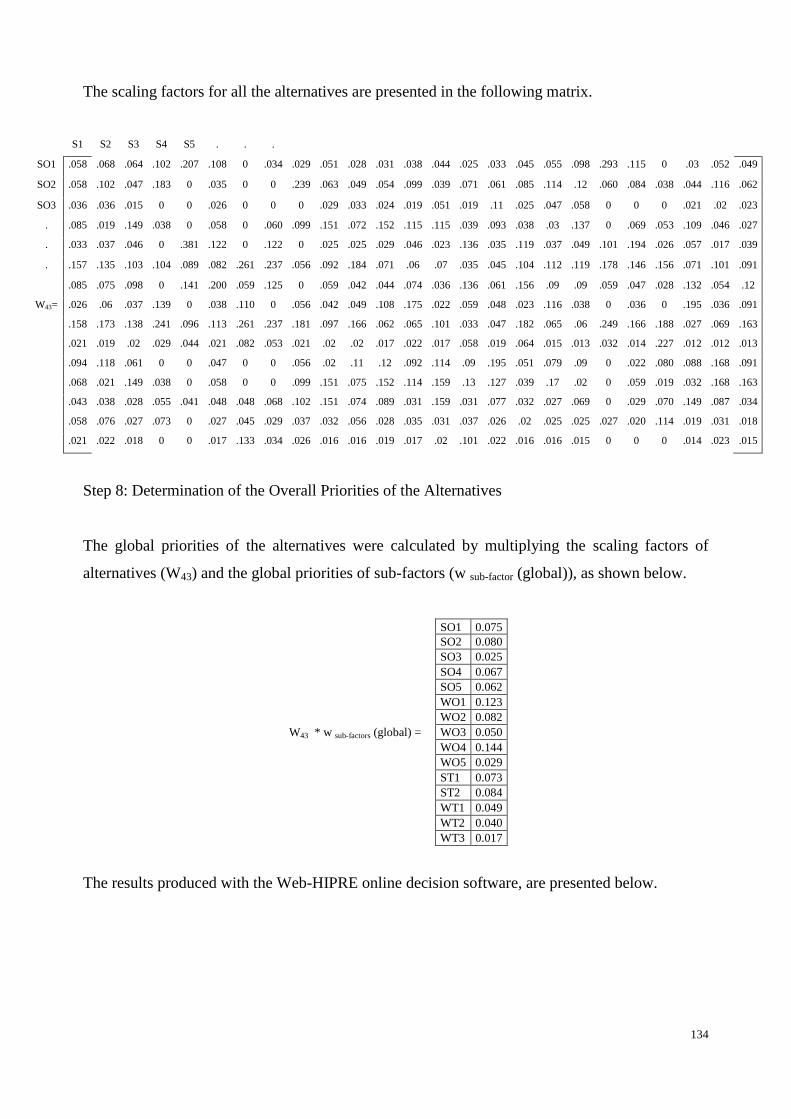
134
The scaling factors for all the alternatives are presented in the following matrix.
S1 S2 S3 S4 S5 . . .
SO1 .058 .068 .064 .102 .207 .108 0 .034 .029 .051 .028 .031 .038 .044 .025 .033 .045 .055 .098 .293 .115 0 .03 .052 .049
SO2 .058 .102 .047 .183 0 .035 0 0 .239 .063 .049 .054 .099 .039 .071 .061 .085 .114 .12 .060 .084 .038 .044 .116 .062
SO3 .036 .036 .015 0 0 .026 0 0 0 .029 .033 .024 .019 .051 .019 .11 .025 .047 .058 0 0 0 .021 .02 .023
. .085 .019 .149 .038 0 .058 0 .060 .099 .151 .072 .152 .115 .115 .039 .093 .038 .03 .137 0 .069 .053 .109 .046 .027
. .033 .037 .046 0 .381 .122 0 .122 0 .025 .025 .029 .046 .023 .136 .035 .119 .037 .049 .101 .194 .026 .057 .017 .039
. .157 .135 .103 .104 .089 .082 .261 .237 .056 .092 .184 .071 .06 .07 .035 .045 .104 .112 .119 .178 .146 .156 .071 .101 .091
.085 .075 .098 0 .141 .200 .059 .125 0 .059 .042 .044 .074 .036 .136 .061 .156 .09 .09 .059 .047 .028 .132 .054 .12
W43= .026 .06 .037 .139 0 .038 .110 0 .056 .042 .049 .108 .175 .022 .059 .048 .023 .116 .038 0 .036 0 .195 .036 .091
.158 .173 .138 .241 .096 .113 .261 .237 .181 .097 .166 .062 .065 .101 .033 .047 .182 .065 .06 .249 .166 .188 .027 .069 .163
.021 .019 .02 .029 .044 .021 .082 .053 .021 .02 .02 .017 .022 .017 .058 .019 .064 .015 .013 .032 .014 .227 .012 .012 .013
.094 .118 .061 0 0 .047 0 0 .056 .02 .11 .12 .092 .114 .09 .195 .051 .079 .09 0 .022 .080 .088 .168 .091
.068 .021 .149 .038 0 .058 0 0 .099 .151 .075 .152 .114 .159 .13 .127 .039 .17 .02 0 .059 .019 .032 .168 .163
.043 .038 .028 .055 .041 .048 .048 .068 .102 .151 .074 .089 .031 .159 .031 .077 .032 .027 .069 0 .029 .070 .149 .087 .034
.058 .076 .027 .073 0 .027 .045 .029 .037 .032 .056 .028 .035 .031 .037 .026 .02 .025 .025 .027 .020 .114 .019 .031 .018
.021 .022 .018 0 0 .017 .133 .034 .026 .016 .016 .019 .017 .02 .101 .022 .016 .016 .015 0 0 0 .014 .023 .015
Step 8: Determination of the Overall Priorities of the Alternatives
The global priorities of the alternatives were calculated by multiplying the scaling factors of
alternatives (W43) and the global priorities of sub-factors (w sub-factor (global)), as shown below.
SO1 0.075
SO2 0.080
SO3 0.025
SO4 0.067
SO5 0.062
WO1 0.123
WO2 0.082
W43 * w sub-factors (global) = WO3 0.050
WO4 0.144
WO5 0.029
ST1 0.073
ST2 0.084
WT1 0.049
WT2 0.040
WT3 0.017
The results produced with the Web-HIPRE online decision software, are presented below.
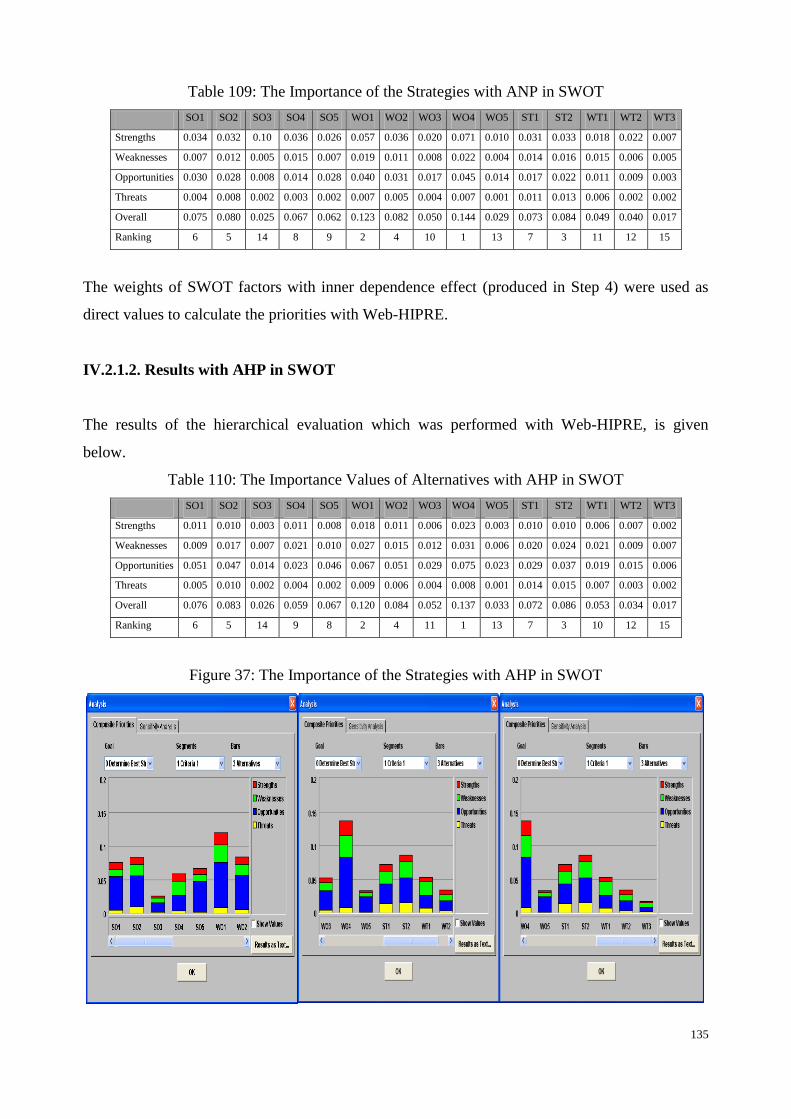
135
Table 109: The Importance of the Strategies with ANP in SWOT
SO1 SO2 SO3 SO4 SO5 WO1 WO2 WO3 WO4 WO5 ST1 ST2 WT1 WT2 WT3
Strengths 0.034 0.032 0.10 0.036 0.026 0.057 0.036 0.020 0.071 0.010 0.031 0.033 0.018 0.022 0.007
Weaknesses 0.007 0.012 0.005 0.015 0.007 0.019 0.011 0.008 0.022 0.004 0.014 0.016 0.015 0.006 0.005
Opportunities 0.030 0.028 0.008 0.014 0.028 0.040 0.031 0.017 0.045 0.014 0.017 0.022 0.011 0.009 0.003
Threats 0.004 0.008 0.002 0.003 0.002 0.007 0.005 0.004 0.007 0.001 0.011 0.013 0.006 0.002 0.002
Overall 0.075 0.080 0.025 0.067 0.062 0.123 0.082 0.050 0.144 0.029 0.073 0.084 0.049 0.040 0.017
Ranking 6 5 14 8 9 2 4 10 1 13 7 3 11 12 15
The weights of SWOT factors with inner dependence effect (produced in Step 4) were used as
direct values to calculate the priorities with Web-HIPRE.
IV.2.1.2. Results with AHP in SWOT
The results of the hierarchical evaluation which was performed with Web-HIPRE, is given
below.
Table 110: The Importance Values of Alternatives with AHP in SWOT
SO1 SO2 SO3 SO4 SO5 WO1 WO2 WO3 WO4 WO5 ST1 ST2 WT1 WT2 WT3
Strengths 0.011 0.010 0.003 0.011 0.008 0.018 0.011 0.006 0.023 0.003 0.010 0.010 0.006 0.007 0.002
Weaknesses 0.009 0.017 0.007 0.021 0.010 0.027 0.015 0.012 0.031 0.006 0.020 0.024 0.021 0.009 0.007
Opportunities 0.051 0.047 0.014 0.023 0.046 0.067 0.051 0.029 0.075 0.023 0.029 0.037 0.019 0.015 0.006
Threats 0.005 0.010 0.002 0.004 0.002 0.009 0.006 0.004 0.008 0.001 0.014 0.015 0.007 0.003 0.002
Overall 0.076 0.083 0.026 0.059 0.067 0.120 0.084 0.052 0.137 0.033 0.072 0.086 0.053 0.034 0.017
Ranking 6 5 14 9 8 2 4 11 1 13 7 3 10 12 15
Figure 37: The Importance of the Strategies with AHP in SWOT

136
IV.2.1.3. Comparison of Results
The results with AHP in SWOT and ANP in SWOT are compared next.
Table 111: Comparison of Results
Alternatives SO1 SO2 SO3 SO4 SO5 WO1 WO2 WO3 WO4 WO5 ST1 ST2 WT1 WT2 WT3
Importance with Inner
Dependence 0.075 0.080 0.025 0.067 0.062 0.123 0.082 0.050 0.144 0.029 0.073 0.084 0.049 0.040 0.017
Ranking 6 5 14 8 9 2 4 10 1 13 7 3 11 12 15
Importance without Inner
Dependence 0.076 0.083 0.026 0.059 0.067 0.120 0.084 0.052 0.137 0.033 0.072 0.086 0.053 0.034 0.017
Ranking 6 5 14 9 8 2 4 11 1 13 7 3 10 12 15
Table 112: Categorisation of Strategies on their Importance Value
Rank Strategy
Priorities
With Criteria Inner
dependencies
Without Criteria Inner
dependencies
Group I
1st WO4: Developing Effective Linkage between Industry, Academia and R&D
Institutes 0.144 0.137
2nd WO1: Skill Development Programs 0.123 0.120
3rd ST2: Establishing Down Stream Facilities in Stable, Near to Market and Competing
Regions 0.084 0.086
4th WO2: Expanding Non-cotton Fibre Base 0.082 0.084
Overall Group Priority 0.433 0.427
Group II
5th SO2: Establishing Industrial Parks with Common Facilities of Design &
Development Centres, ICT Application Centres & Effluent Treatment Plants etc. 0.080 0.083
6th SO1: Diversification of Product Range 0.075 0.076
7th ST1: Development of Market Access Strategies 0.073 0.072
8th SO4: Establishing Downstream Facilities in Competing Regions 0.067 0.059
9th SO5: Improving Domestic Chemical Industry 0.062 0.067
10th WO3: Improving Logistics 0.050 0.052
11th WT1: Work in Close Collaboration with Competitors 0.049 0.053
Overall Group Priority 0.456 0.462
Group III
12th WT2: Development and Implementation of Long-term & Coordinated Policies 0.040 0.034
13th WO5: Developing Domestic Engineering Industry 0.029 0.033
14th SO3: Applying Export Incentives 0.025 0.026
15th WT3: Introduction of Industry Relief Packages 0.017 0.017
Overall Group Priority 0.111 0.11

137
The overall scores of the first group of strategies were 0.433 and 0.427 with ANP in SWOT and
AHP in SWOT, respectively. The group is mainly focused on skill development and improving
coordination between research institutes and different stakeholders in the chain. The downstream
link of the chain (activities which are close to consumer) also achieved higher attention in the
scenario of targeted opportunities. Reducing the gap between supply chain system and consumer
can improve the confidence of consumers and the responsiveness in the supply chain; it will also
reduce the effects of threats. This downstream focus needs higher usage of non-cotton fibres and
the expansion of fibre base to help the diversification strategy.
The scores of the second group of strategies were 0.456 and 0.462 with ANP in SWOT and AHP
in SWOT, respectively. It is focused on developing a more reliable supply side by improving the
internal infrastructure which will also bring higher quality of products and services. It also
identify the need to improve the communication and relationship with competitors. It addresses
the effects of competition by establishing market access. Product diversification and the
responsiveness, both dimensions have their constituents in this category. It should be emphasized
that dependence on the strategies of market access can also decrease the desire to improve the
competitive position of the industries.
The overall score of the third group of strategies was 0.11. It is focused on the gaps of policy,
limited engineering base and the short term relief for the industry in the present scenario of
political instability, energy shortfalls and higher support for competitors. This group covers
dimensions other than diversification and responsiveness and is more general in its aspects.
IV.2.1.4. Sensitivity Analysis on Results of the Performance Evaluation
In the process of strategic decision making, presented above, it is always difficult to validate the
findings. The decision models are developed to design the future course of action. In the process
of planning and implementation, the factors and their intensity for the importance of alternatives
can change due to the strategic actions of various forces. In such situations, experts recommend
to perform the sensitivity analysis which can help to visualize the effects of various factors.
The sensitivity analysis, for the problem in study, is presented in the following figure.
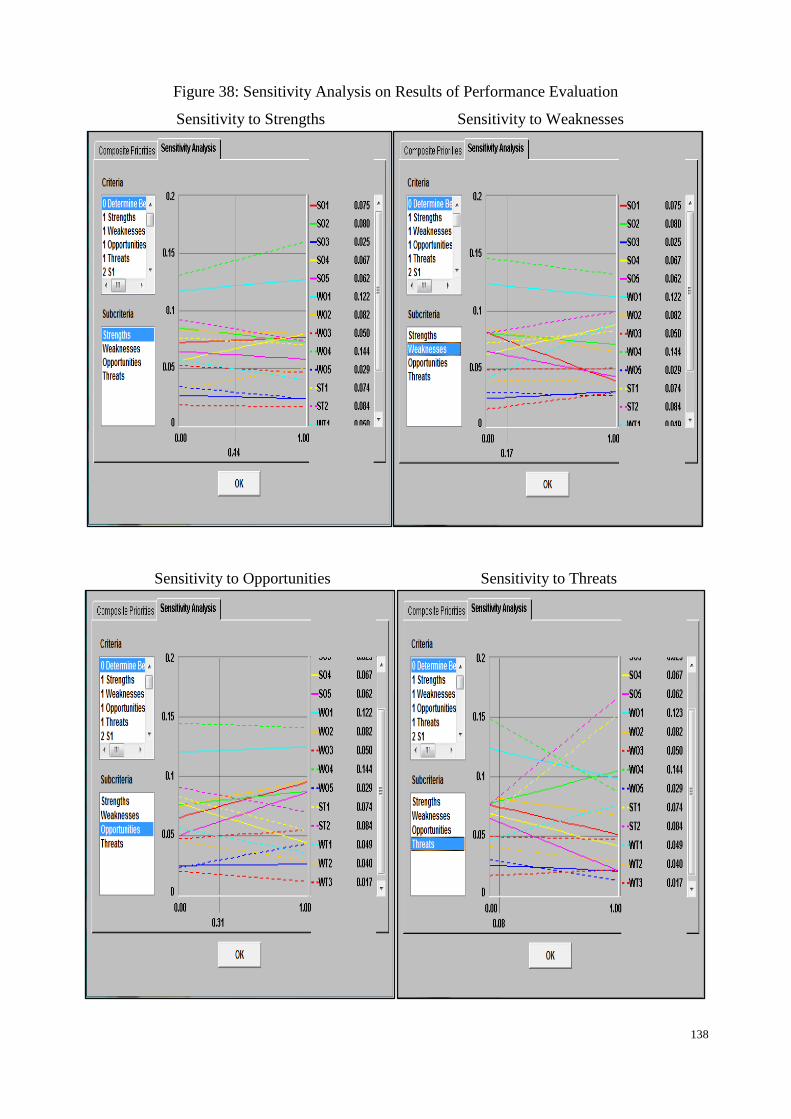
138
Figure 38: Sensitivity Analysis on Results of Performance Evaluation
Sensitivity to Strengths Sensitivity to Weaknesses
Sensitivity to Opportunities Sensitivity to Threats

139
It was observed that the overall ranking of the alternatives was mostly stable in a reasonable
range of weight, assigned to factors (strengths, weaknesses, opportunities and threats). Notably,
ST1 and ST2 seem emerging strategies in case of higher importance to threats.
Increasing the weight of the opportunities, signifies four strategies, SO1, SO2, SO5 and WO2.
These strategies address the areas of product diversification and improvement of domestic
infrastructure in order to increase the market share in the non-traditional markets of the system.
The collective weight of strength and opportunity factors is already high, i.e. 0.75 (0.44 and 0.31,
respectively). Increasing the weight of one or the other will decrease the attention from the ones,
which offer constraints to the system and include internal weaknesses and external threats. The
Threats needs proper attention and serious efforts to neutralize them and should not be neglected
while giving higher priority to other factors. In the current scenario, the effects of the external
forces are high; the competition is increasing and the political and economic situation is getting
worse. These are taking the opportunities away from the system. Therefore, there is a need to
analyse and neutralize the comparative advantages of competing systems and other threats.
Therefore, increase in the weight of the opportunity factor does not justify.
When the weight for weakness was increased, strategies SO4, ST1, ST2 and WT1 started
emerging. These strategies are focused to improve the responsiveness of the system by
establishing the downstream facilities in near-to-market and stable regions and by increasing the
manufacturer confidence with market access. In the global perspective, the main weakness of the
supply chain system is its low responsiveness, especially when we observe the existing potential
of the system in the high profit markets. This can be improved by working with the above
strategies or even designing other relevant strategies. Other weaknesses can be recognised by
observing closely their competitors and improving the relationship with them. The broad insight
can be developed by observing the Weaknesses with Threats and/or competition. The weight for
the weakness should increase as there is high competition and higher level of threats, which
means that to seize more opportunities or even to retain the traditional markets, the system should
decrease its weaknesses. It is important to emphasize again that the share of the system is
stagnant in the international export markets of textile and clothing. The producers (in south east
Asian countries) with similar resources and capabilities are improving their potential. This will
certainly increase the risk of losing the international markets share to the regional competitors.
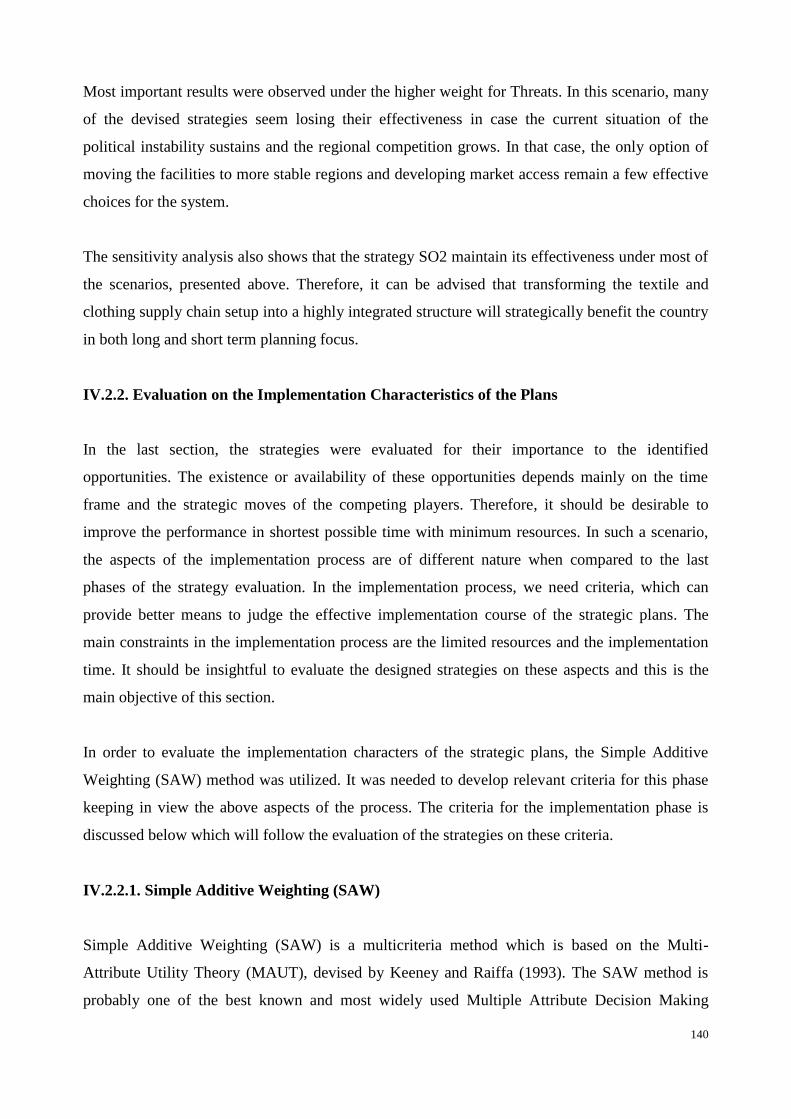
140
Most important results were observed under the higher weight for Threats. In this scenario, many
of the devised strategies seem losing their effectiveness in case the current situation of the
political instability sustains and the regional competition grows. In that case, the only option of
moving the facilities to more stable regions and developing market access remain a few effective
choices for the system.
The sensitivity analysis also shows that the strategy SO2 maintain its effectiveness under most of
the scenarios, presented above. Therefore, it can be advised that transforming the textile and
clothing supply chain setup into a highly integrated structure will strategically benefit the country
in both long and short term planning focus.
IV.2.2. Evaluation on the Implementation Characteristics of the Plans
In the last section, the strategies were evaluated for their importance to the identified
opportunities. The existence or availability of these opportunities depends mainly on the time
frame and the strategic moves of the competing players. Therefore, it should be desirable to
improve the performance in shortest possible time with minimum resources. In such a scenario,
the aspects of the implementation process are of different nature when compared to the last
phases of the strategy evaluation. In the implementation process, we need criteria, which can
provide better means to judge the effective implementation course of the strategic plans. The
main constraints in the implementation process are the limited resources and the implementation
time. It should be insightful to evaluate the designed strategies on these aspects and this is the
main objective of this section.
In order to evaluate the implementation characters of the strategic plans, the Simple Additive
Weighting (SAW) method was utilized. It was needed to develop relevant criteria for this phase
keeping in view the above aspects of the process. The criteria for the implementation phase is
discussed below which will follow the evaluation of the strategies on these criteria.
IV.2.2.1. Simple Additive Weighting (SAW)
Simple Additive Weighting (SAW) is a multicriteria method which is based on the Multi-
Attribute Utility Theory (MAUT), devised by Keeney and Raiffa (1993). The SAW method is
probably one of the best known and most widely used Multiple Attribute Decision Making
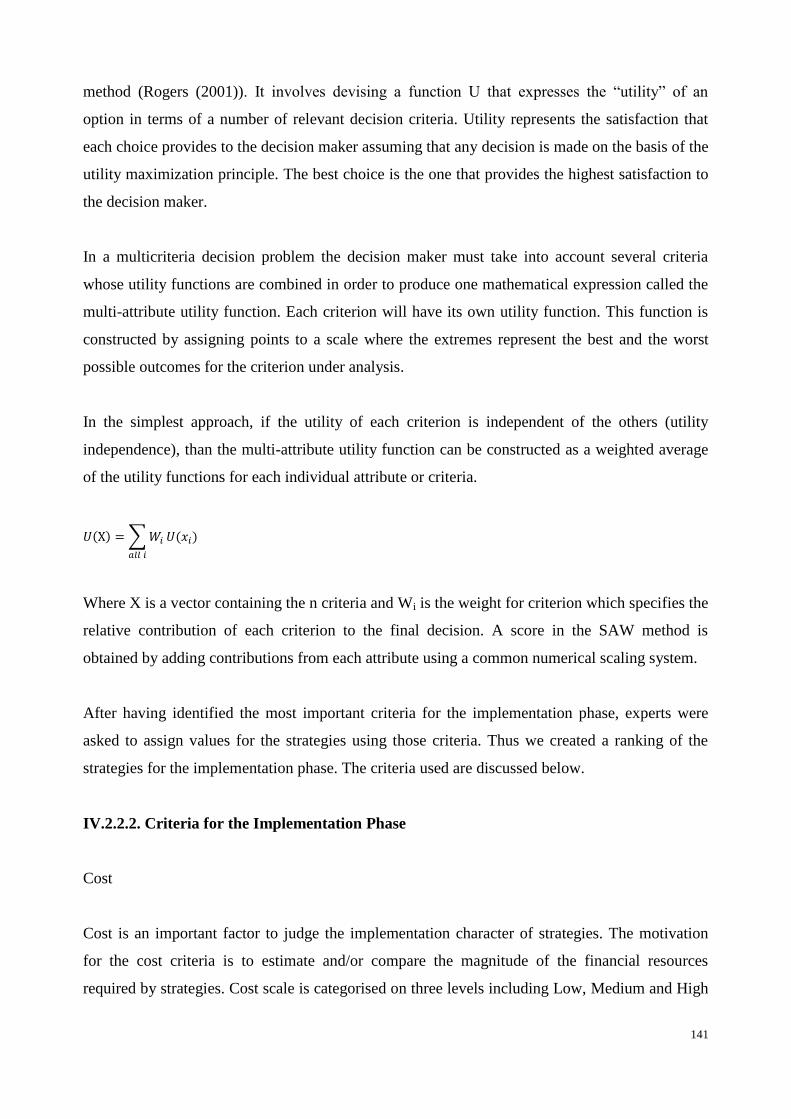
141
method (Rogers (2001)). It involves devising a function U that expresses the “utility” of an
option in terms of a number of relevant decision criteria. Utility represents the satisfaction that
each choice provides to the decision maker assuming that any decision is made on the basis of the
utility maximization principle. The best choice is the one that provides the highest satisfaction to
the decision maker.
In a multicriteria decision problem the decision maker must take into account several criteria
whose utility functions are combined in order to produce one mathematical expression called the
multi-attribute utility function. Each criterion will have its own utility function. This function is
constructed by assigning points to a scale where the extremes represent the best and the worst
possible outcomes for the criterion under analysis.
In the simplest approach, if the utility of each criterion is independent of the others (utility
independence), than the multi-attribute utility function can be constructed as a weighted average
of the utility functions for each individual attribute or criteria.
( ) ∑
( )
Where X is a vector containing the n criteria and Wi is the weight for criterion which specifies the
relative contribution of each criterion to the final decision. A score in the SAW method is
obtained by adding contributions from each attribute using a common numerical scaling system.
After having identified the most important criteria for the implementation phase, experts were
asked to assign values for the strategies using those criteria. Thus we created a ranking of the
strategies for the implementation phase. The criteria used are discussed below.
IV.2.2.2. Criteria for the Implementation Phase
Cost
Cost is an important factor to judge the implementation character of strategies. The motivation
for the cost criteria is to estimate and/or compare the magnitude of the financial resources
required by strategies. Cost scale is categorised on three levels including Low, Medium and High

142
ratings. Strategies requiring lower financial resources are favoured relatively to higher cost
strategies in the prioritization process. Values for the cost criterion are shown below.
Table 113: Cost Scale
Intensity Value
Low Cost 1
Medium Cost 2
High Cost 3
Time
Time is the other important criterion for the evaluation of the implementation character of the
strategies. The time factor is also divided into three levels including Short, Medium and Long
Time. The objective is to give priority to the strategies which can be implemented in shortest
times. The values for the time scale are presented in the following table.
Table 114: Implementation Time Scale
Intensity Value
Short Time (Less than 1 Year) 1
Medium Time (1 to 3 Years) 2
Long Time (Longer than 3 Years) 3
Implementability
It is meaningful to evaluate the strategies if these can be implemented with ease or difficulty.
Some of these will require higher involvement and interaction of various players, which will
ultimately make their implementation more difficult. Here, the implementability of the strategies
is thought in terms of their dependency on the interaction of players and the development status
of the activities in focus. Under this criterion, the objective is to favour those strategies which
have less dependency on the commitment required or which are already at a higher level of
implementation. The implementability scale is given below.
Table 115: Scale for Implementability
Intensity Value
Easily Implementable 3
Implementable with Moderate Commitment 2
Difficult to Implement ( Need Higher Commitment) 1

143
IV.2.2.3. Application of the SAW Method to Analyse the Implementation Character of the
Strategic Plans
The evaluation is based on the expert assessment, performed on the strategies on the basis of the
criteria developed above. The findings of the research in the previous stages were discussed with
them in order to aid this assessment.
The weights for the criteria were calculated as weighted average on the basis of the values
assigned by the group members to the individual criterion on a scale of 1-10. Then the values
were assigned to the strategies under new criteria which are presented in the following table
together with criteria weights.
Table 116: Values for the Implementation Behaviour of Strategies
Strategy Criteria Values for Implementation Phase
Cost (0.5) Time (0.3) Implementability (0.2)
WO4 1 1 2
WT1 2 1 2
ST1 2 2 2
SO3 3 1 3
WT3 3 1 3
WO1 2 3 2
SO5 3 3 1
SO2 3 2 2
SO1 2 3 1
WT2 2 3 1
IV.2.2.4. Results on the Implementation Character
The ranking of the strategies was determined using the Simple Additive Weighting (SAW)
method, described above. The values obtained for the strategies are presented below.
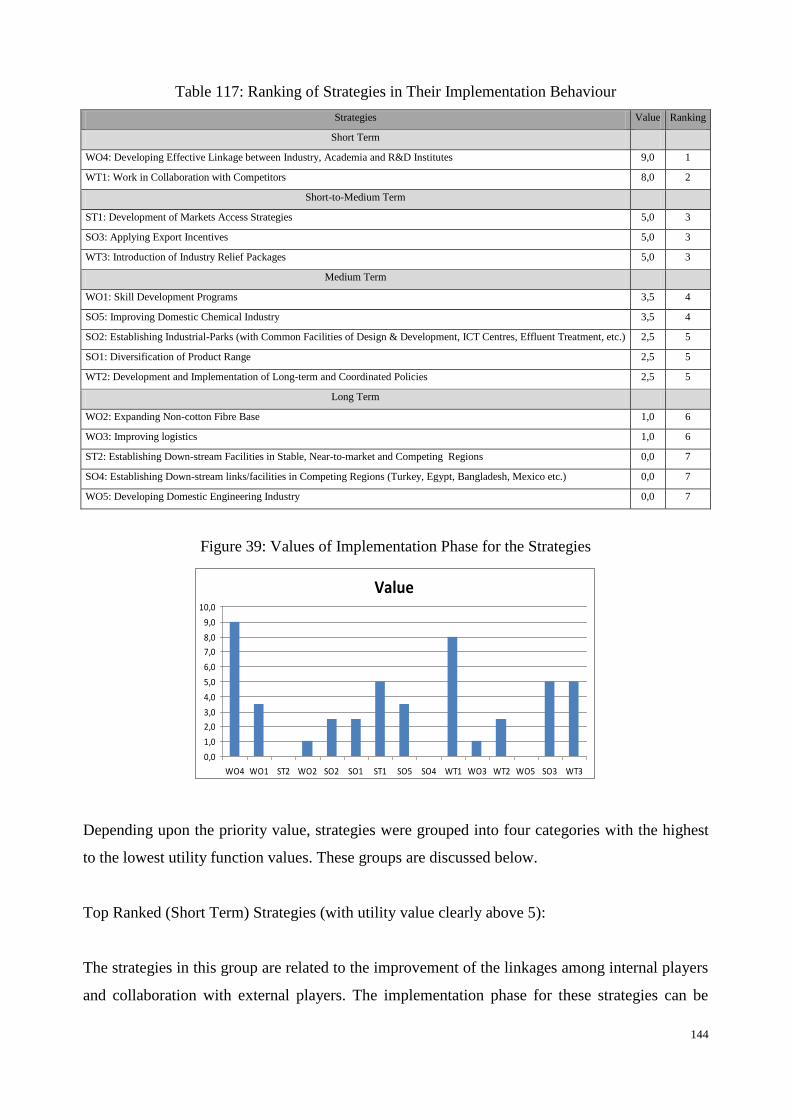
144
Table 117: Ranking of Strategies in Their Implementation Behaviour
Strategies Value Ranking
Short Term
WO4: Developing Effective Linkage between Industry, Academia and R&D Institutes 9,0 1
WT1: Work in Collaboration with Competitors 8,0 2
Short-to-Medium Term
ST1: Development of Markets Access Strategies 5,0 3
SO3: Applying Export Incentives 5,0 3
WT3: Introduction of Industry Relief Packages 5,0 3
Medium Term
WO1: Skill Development Programs 3,5 4
SO5: Improving Domestic Chemical Industry 3,5 4
SO2: Establishing Industrial-Parks (with Common Facilities of Design & Development, ICT Centres, Effluent Treatment, etc.) 2,5 5
SO1: Diversification of Product Range 2,5 5
WT2: Development and Implementation of Long-term and Coordinated Policies 2,5 5
Long Term
WO2: Expanding Non-cotton Fibre Base 1,0 6
WO3: Improving logistics 1,0 6
ST2: Establishing Down-stream Facilities in Stable, Near-to-market and Competing Regions 0,0 7
SO4: Establishing Down-stream links/facilities in Competing Regions (Turkey, Egypt, Bangladesh, Mexico etc.) 0,0 7
WO5: Developing Domestic Engineering Industry 0,0 7
Figure 39: Values of Implementation Phase for the Strategies
Depending upon the priority value, strategies were grouped into four categories with the highest
to the lowest utility function values. These groups are discussed below.
Top Ranked (Short Term) Strategies (with utility value clearly above 5):
The strategies in this group are related to the improvement of the linkages among internal players
and collaboration with external players. The implementation phase for these strategies can be
Value
0,0
1,0
2,0
3,0
4,0
5,0
6,0
7,0
8,0
9,0
10,0
WO4 WO1 ST2 WO2 SO2 SO1 ST1 SO5 SO4 WT1 WO3 WT2 WO5 SO3 WT3

145
divided into two parts which cover the initiation and the accomplishment of the desired results.
The former needs low resources and higher commitment whereas the later needs much more time
and high commitment. In this evaluation, only the initiation part of the implementation phase is in
focus. The initiation phase can be regarded as short term whereas the result realization part can be
regarded as medium-to-long term.
Short to Medium Term Strategies (with utility values around 5):
In this group, strategies SO3 and WT3 are related to the internal aspects of the chain which can
be implemented more easily but require higher resources. However, strategy ST1 covers external
aspects and it is more difficult to implement although it needs less resources. Strategies SO3 and
WT3 are focused to improve the present environment for the industrial activity in order to direct
the products to value added segments.
Medium Term Strategies (with utility values clearly below 5 but greater than 1):
In this group, most of the strategies are focused on the development of infrastructure and skills.
The level of development for the activities/segments of the SC system, which are in focus here, is
at higher difference, so the requirement of effort and resources is also high. Similarly, the time to
initiate these plans and to get the results will also be high. Strategies WO1 and SO2 are already in
implementation, which caused their placement under this category.
Long Term Strategies (with utility values 1 or below):
The strategies in this group are the ones which require the highest level of resources because of
their scope and their present level of development. To implement these strategies, many players
from different segments of the system will need to be involved, which increase the difficulties in
their implementation. The strategies under this group are more general in nature and also affect
the other sectors of the industrial and business activities in the country, apart from textile and
clothing. The resources needed for them can be drawn from the generic plans of development for
the industrial activities.
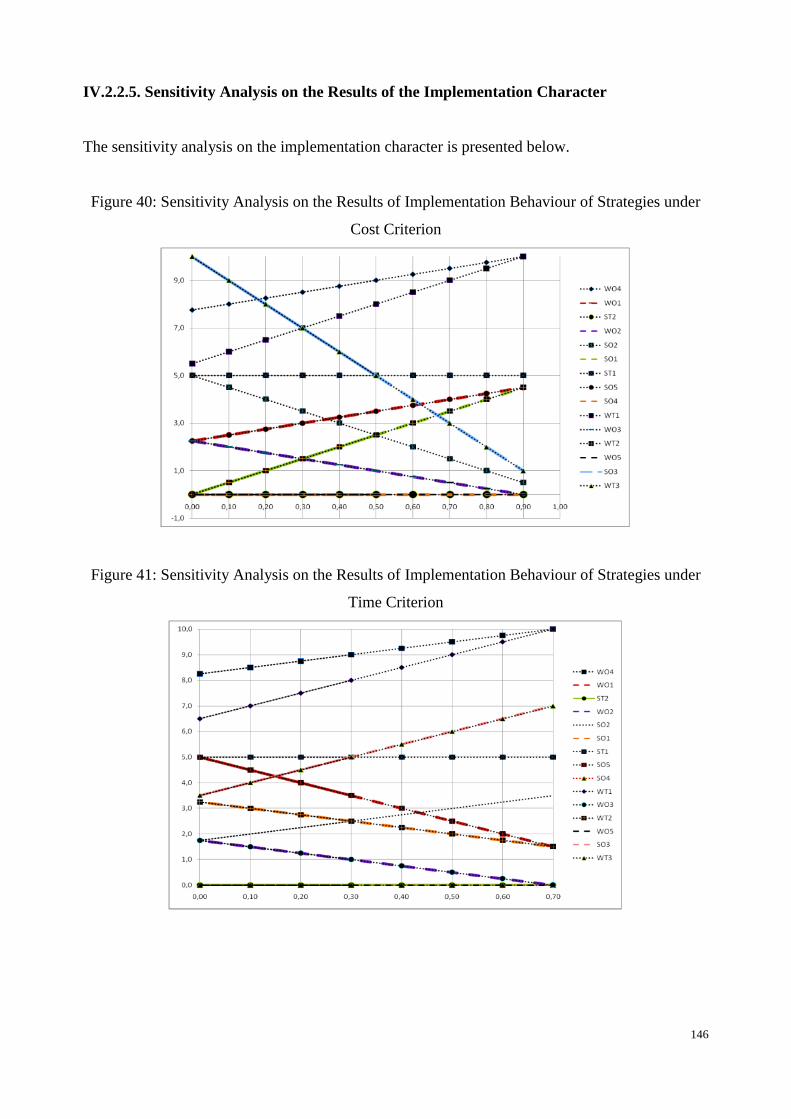
146
IV.2.2.5. Sensitivity Analysis on the Results of the Implementation Character
The sensitivity analysis on the implementation character is presented below.
Figure 40: Sensitivity Analysis on the Results of Implementation Behaviour of Strategies under
Cost Criterion
Figure 41: Sensitivity Analysis on the Results of Implementation Behaviour of Strategies under
Time Criterion
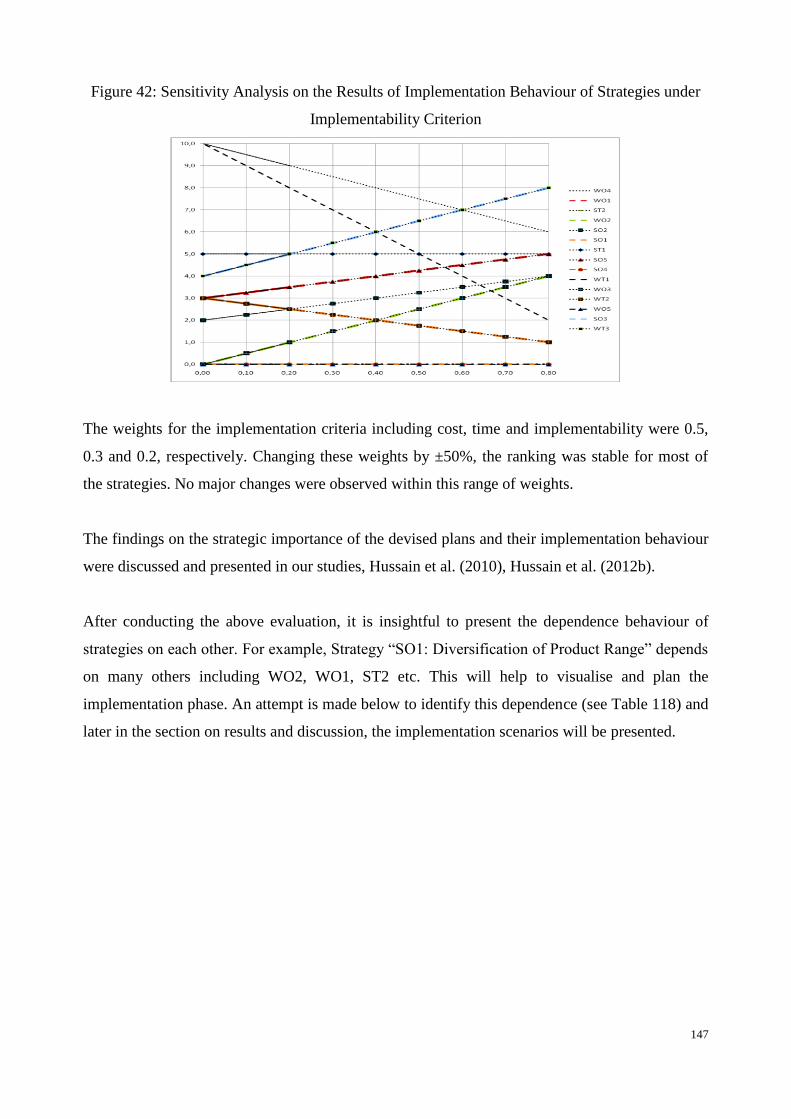
147
Figure 42: Sensitivity Analysis on the Results of Implementation Behaviour of Strategies under
Implementability Criterion
The weights for the implementation criteria including cost, time and implementability were 0.5,
0.3 and 0.2, respectively. Changing these weights by ±50%, the ranking was stable for most of
the strategies. No major changes were observed within this range of weights.
The findings on the strategic importance of the devised plans and their implementation behaviour
were discussed and presented in our studies, Hussain et al. (2010), Hussain et al. (2012b).
After conducting the above evaluation, it is insightful to present the dependence behaviour of
strategies on each other. For example, Strategy “SO1: Diversification of Product Range” depends
on many others including WO2, WO1, ST2 etc. This will help to visualise and plan the
implementation phase. An attempt is made below to identify this dependence (see Table 118) and
later in the section on results and discussion, the implementation scenarios will be presented.
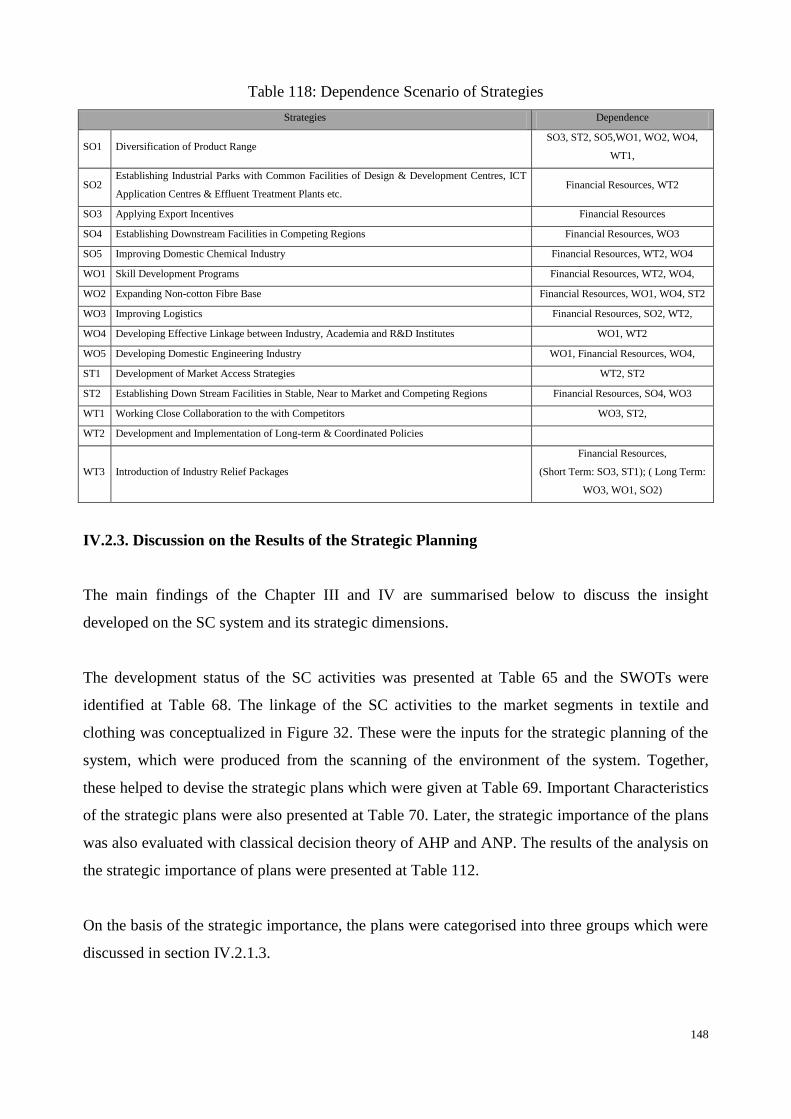
148
Table 118: Dependence Scenario of Strategies
Strategies Dependence
SO1 Diversification of Product Range SO3, ST2, SO5,WO1, WO2, WO4,
WT1,
SO2 Establishing Industrial Parks with Common Facilities of Design & Development Centres, ICT
Application Centres & Effluent Treatment Plants etc. Financial Resources, WT2
SO3 Applying Export Incentives Financial Resources
SO4 Establishing Downstream Facilities in Competing Regions Financial Resources, WO3
SO5 Improving Domestic Chemical Industry Financial Resources, WT2, WO4
WO1 Skill Development Programs Financial Resources, WT2, WO4,
WO2 Expanding Non-cotton Fibre Base Financial Resources, WO1, WO4, ST2
WO3 Improving Logistics Financial Resources, SO2, WT2,
WO4 Developing Effective Linkage between Industry, Academia and R&D Institutes WO1, WT2
WO5 Developing Domestic Engineering Industry WO1, Financial Resources, WO4,
ST1 Development of Market Access Strategies WT2, ST2
ST2 Establishing Down Stream Facilities in Stable, Near to Market and Competing Regions Financial Resources, SO4, WO3
WT1 Working Close Collaboration to the with Competitors WO3, ST2,
WT2 Development and Implementation of Long-term & Coordinated Policies
WT3 Introduction of Industry Relief Packages
Financial Resources,
(Short Term: SO3, ST1); ( Long Term:
WO3, WO1, SO2)
IV.2.3. Discussion on the Results of the Strategic Planning
The main findings of the Chapter III and IV are summarised below to discuss the insight
developed on the SC system and its strategic dimensions.
The development status of the SC activities was presented at Table 65 and the SWOTs were
identified at Table 68. The linkage of the SC activities to the market segments in textile and
clothing was conceptualized in Figure 32. These were the inputs for the strategic planning of the
system, which were produced from the scanning of the environment of the system. Together,
these helped to devise the strategic plans which were given at Table 69. Important Characteristics
of the strategic plans were also presented at Table 70. Later, the strategic importance of the plans
was also evaluated with classical decision theory of AHP and ANP. The results of the analysis on
the strategic importance of plans were presented at Table 112.
On the basis of the strategic importance, the plans were categorised into three groups which were
discussed in section IV.2.1.3.
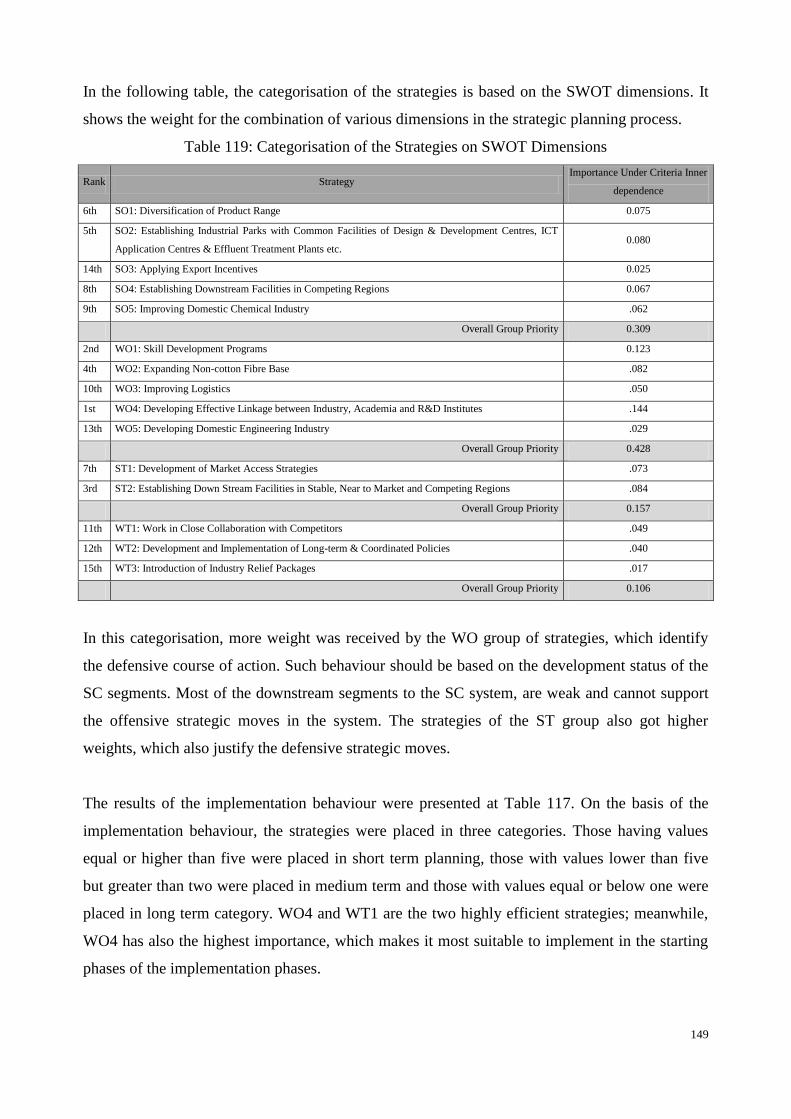
149
In the following table, the categorisation of the strategies is based on the SWOT dimensions. It
shows the weight for the combination of various dimensions in the strategic planning process.
Table 119: Categorisation of the Strategies on SWOT Dimensions
Rank Strategy Importance Under Criteria Inner
dependence
6th SO1: Diversification of Product Range 0.075
5th SO2: Establishing Industrial Parks with Common Facilities of Design & Development Centres, ICT
Application Centres & Effluent Treatment Plants etc. 0.080
14th SO3: Applying Export Incentives 0.025
8th SO4: Establishing Downstream Facilities in Competing Regions 0.067
9th SO5: Improving Domestic Chemical Industry .062
Overall Group Priority 0.309
2nd WO1: Skill Development Programs 0.123
4th WO2: Expanding Non-cotton Fibre Base .082
10th WO3: Improving Logistics .050
1st WO4: Developing Effective Linkage between Industry, Academia and R&D Institutes .144
13th WO5: Developing Domestic Engineering Industry .029
Overall Group Priority 0.428
7th ST1: Development of Market Access Strategies .073
3rd ST2: Establishing Down Stream Facilities in Stable, Near to Market and Competing Regions .084
Overall Group Priority 0.157
11th WT1: Work in Close Collaboration with Competitors .049
12th WT2: Development and Implementation of Long-term & Coordinated Policies .040
15th WT3: Introduction of Industry Relief Packages .017
Overall Group Priority 0.106
In this categorisation, more weight was received by the WO group of strategies, which identify
the defensive course of action. Such behaviour should be based on the development status of the
SC segments. Most of the downstream segments to the SC system, are weak and cannot support
the offensive strategic moves in the system. The strategies of the ST group also got higher
weights, which also justify the defensive strategic moves.
The results of the implementation behaviour were presented at Table 117. On the basis of the
implementation behaviour, the strategies were placed in three categories. Those having values
equal or higher than five were placed in short term planning, those with values lower than five
but greater than two were placed in medium term and those with values equal or below one were
placed in long term category. WO4 and WT1 are the two highly efficient strategies; meanwhile,
WO4 has also the highest importance, which makes it most suitable to implement in the starting
phases of the implementation phases.

150
The dependence scenario (see Table 118) and the implementation behaviour of the strategies
(see Table 117) are combined together in the following table.
Table 120: Dependence Scenario and Implementation Behaviour of Strategies
Implementation
Effort
Implementation
Efficiency Strategies Dependence
7.5 2.5 SO1 Diversification of Product Range SO3, ST2, SO5,WO1, WO2,
WO4, WT1,
7.5 2.5 SO2
Establishing Industrial Parks with Common Facilities of Design
& Development Centres, ICT Application Centres & Effluent
Treatment Plants etc.
Financial Resources, WT2
5 5 SO3 Applying Export Incentives Financial Resources
10 0 SO4 Establishing Downstream Facilities in Competing Regions Financial Resources, WO3
6.5 3.5 SO5 Improving Domestic Chemical Industry Financial Resources, WT2,
WO4
6.5 3.5 WO1 Skill Development Programs Financial Resources, WT2,
WO4,
9 1 WO2 Expanding Non-cotton Fibre Base Financial Resources, WO1,
WO4, ST2
9 1 WO3 Improving Logistics Financial Resources, SO2,
WT2, WO4,
1 9 WO4 Developing Effective Linkage between Industry, Academia and
R&D Institutes WO1, WT2
10 0 WO5 Developing Domestic Engineering Industry WO1, Financial Resources,
WO4,
5 5 ST1 Development of Market Access Strategies WT2, ST2
10 0 ST2 Establishing Down Stream Facilities in Stable, Near to Market
and Competing Regions
Financial Resources, SO4,
WO3
2 8 WT1 Working Close Collaboration to the with Competitors WO3, ST2,
7.5 2.5 WT2 Development and Implementation of Long-term & Coordinated
Policies
5 5 WT3 Introduction of Industry Relief Packages
Financial Resources,
(Short Term: SO3, ST1);
(Long Term: WO3, WO1,
SO2)
Keeping in view the implementation behaviour, the dependence of the strategies on each other
and their partial implementation in the system, the overall strategic planning of the SC system
was visualized and discussed below. This evaluation also reflected on various strategic
dimensions of competitiveness in the SC system, including diversification and responsiveness.
The weights, obtained from the evaluation of the implementation behaviour of strategies, are
employed to identify the duration of their effective implementation. Effective implementation can
be related to a stage, where the real effects of the plans start-to-realize. The efficient strategies
were identified from the utility function values. We subtracted these from the overall score of 9 to

151
get the magnitude of required effort; this helped us to develop the implementation scenario. In the
following figures, every cell on the horizontal dimension represents two points of the effort
value. The grey shade represents the partial progress on various strategies.
Figure 43: Implementation Scenario of the Strategic Planning Process
SO3 = 0.02
WT2=0.040
SO5=0.062
WO2=0.082
WO4 = 0.144
WO1=0.123
ST2 = 0.084
(ST2
includes the Strategy SO4
= 0.067)
WT1 = 0.049
SO2 = 0.080
WO3=0.050
SO1=0.075
ST1=0.073
WT3=0.017
WO5=0.029
The evaluation of the strategic environment, conducted in Chapter III guided that some of the
above strategies including SO2, WO1, WO3 and WT2 are already in implementation but without
any proper planning and control on their progress. Strategies, SO2 and WO3 are at higher level of
progress than WO1 and WT2. Meanwhile, some improvement is seen on the direction of WO1. It
is difficult to comment on the status of strategy WT2 without observing the actual policy making
process. In general, the process of the system improvement is highly biased in the country; some
regions obtain higher resources and efficient means to implement the strategies while others are
allocated lower resources and inefficient means of implementations. In the same situation,
strategy WT3 has the objectives to improve the system but it is mostly utilised to gain benefits for
inefficient players through political negotiations.
Other strategies, especially those which are directed to improve the market linkages and which
can speed up the process of improving the competitive behaviour in the system, are at poor level
of implementation. It can be added that low attention is received by these moves in the system
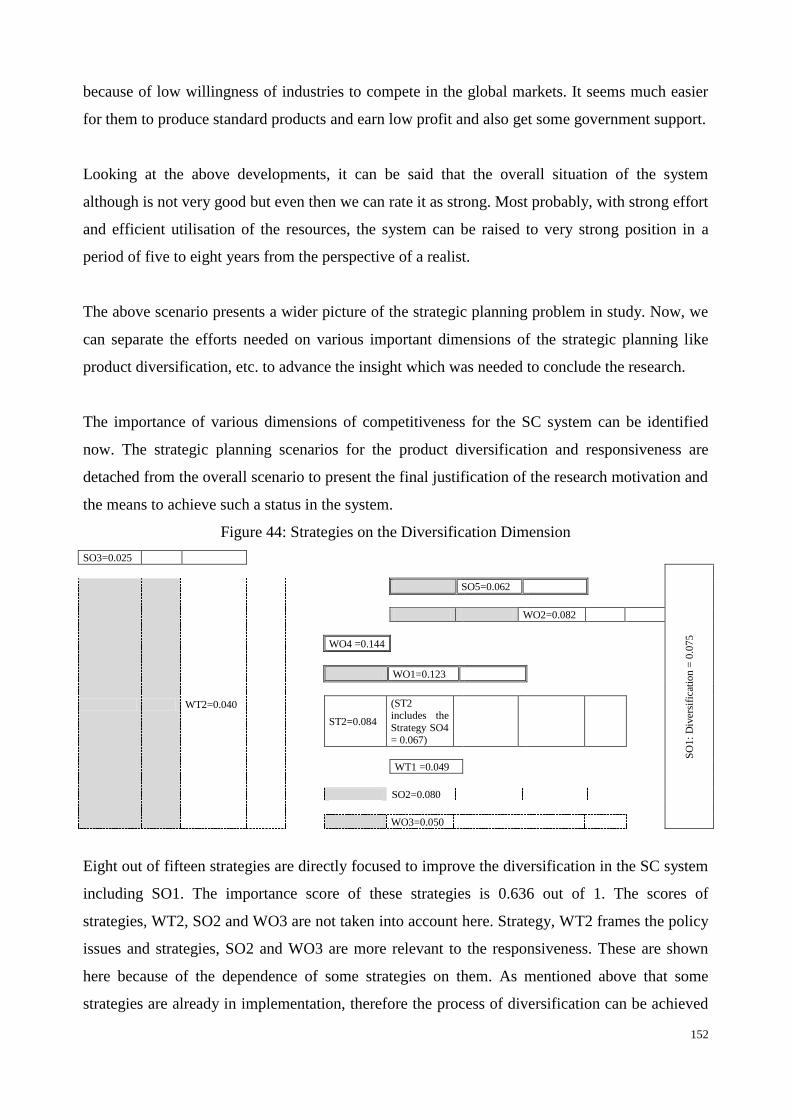
152
because of low willingness of industries to compete in the global markets. It seems much easier
for them to produce standard products and earn low profit and also get some government support.
Looking at the above developments, it can be said that the overall situation of the system
although is not very good but even then we can rate it as strong. Most probably, with strong effort
and efficient utilisation of the resources, the system can be raised to very strong position in a
period of five to eight years from the perspective of a realist.
The above scenario presents a wider picture of the strategic planning problem in study. Now, we
can separate the efforts needed on various important dimensions of the strategic planning like
product diversification, etc. to advance the insight which was needed to conclude the research.
The importance of various dimensions of competitiveness for the SC system can be identified
now. The strategic planning scenarios for the product diversification and responsiveness are
detached from the overall scenario to present the final justification of the research motivation and
the means to achieve such a status in the system.
Figure 44: Strategies on the Diversification Dimension
SO3=0.025
SO
1:
Div
ersi
fica
tio
n =
0.0
75
WT2=0.040
SO5=0.062
WO2=0.082
WO4 =0.144
WO1=0.123
ST2=0.084
(ST2 includes the
Strategy SO4
= 0.067)
WT1 =0.049
SO2=0.080
WO3=0.050
Eight out of fifteen strategies are directly focused to improve the diversification in the SC system
including SO1. The importance score of these strategies is 0.636 out of 1. The scores of
strategies, WT2, SO2 and WO3 are not taken into account here. Strategy, WT2 frames the policy
issues and strategies, SO2 and WO3 are more relevant to the responsiveness. These are shown
here because of the dependence of some strategies on them. As mentioned above that some
strategies are already in implementation, therefore the process of diversification can be achieved

153
earlier than identified. Acceptance and commitment are the main inputs for success in these
situations, which lack in many cases.
Figure 45: Strategies on the Responsiveness Dimension
WT2=0.040
SO5=0.062
Res
pon
siven
ess
WO4
=0.144
WO1=0.123
SO2=0.080
WO3=0.050
Five out of fifteen strategies have the direct role to improve the responsiveness. Their importance
score is 0.459. The scores of three strategies, SO5, WO4 and WO1 were included in the
dimension of diversification; therefore, leaving their scores will result in a value, 0.13, i.e. the
combined score of strategies SO2 and WO3. While separating the scores of SO5, WO4 and
WO1, we can add that the delivery efficiency is mainly addressed by strategies SO2 and WO3
whereas other aspects of responsiveness are covered in strategies SO2, SO5, WO4 and WO1.
Therefore, improving the delivery efficiency gets a value around 0.13 out of 1. The
implementation scenario of the strategies which are responsible for improving the responsiveness
of the system is much higher than it was for the diversification process. WO1, SO2 and WO3 are
already in better implementation status and the objective of improving the responsiveness of the
system can be achieved much earlier than the diversification process.
IV.2.4. Conclusion
The strategic environment of the textile and clothing supply chain system of Pakistan was
analysed in this research. The objective was to improve the competitiveness of the system on the
dimensions of responsiveness and diversification in the identified product areas or opportunities.
The strategic directions were identified and evaluated to measure their importance in relation to
the objectives; their implementation behaviour was also analysed to observe the future scenario
of developments. In general, the research identified the strategic importance of various factors
and strategies and explained the implementation behaviour of the strategies. These were utilized
to develop the overall strategic planning of the system.
154
The strategies which are at higher importance include WO4, WO1, ST2 and WO2 with score,
0.433 out of 1. Strategy, WO4 which is focused to the improvement of the linkages between
industry (application of knowledge) and academic institutes (learning of knowledge) and research
institutes (development of knowledge). It has the highest importance and it can be implemented
most efficiently. Collectively, strategies WO4 and WO1 (WO1: Skills Improvement) can bring
the major improvements in the system. In general, this group is mainly attributed to the
diversification dimension of the system competitiveness.
The strategy, WO4 is the most important for example and it is also fast to implement with limited
resources and therefore maintains its top rank and should be placed in short term strategic plans.
Strategy, WO1 is the second most important, it needs high resources and time. Therefore, its
implementation character placed it in the medium term strategic plans. Strategy, ST2 is ranked
third according to its importance but it is one of the most difficult strategies to implement and
much time and high resources are required, which led to place it in the long term plans. This
strategy has both short term and long term effects on the system. Therefore, it needs further
analysis to find how the implementation process of this strategy can be fasten or if the system can
decrease the effects of the threat which are political in nature and political stability in the country
can play its role in decreasing these. Meanwhile, the effects of the threats are already visible as
the activities are shifting to countries which are more stable and offer higher attractiveness. This
phenomenon was envisioned in our studies and it can be advised to encourage the relocation of
some activity in the downstream segments in other countries of strategic importance for the
international clothing markets. This will improve the competitiveness of the system in terms of its
responsiveness and not just relocation to escape from temporary threats. Strategy, WO2 was
ranked fourth in the strategic importance value, it require more resources and effort which advise
its placement in the long time horizons. The strategy has both short and long term effects,
therefore some sectors can be chosen in the short term expansion while others in longer plans.
In a different categorisation of the strategies, based on the SWOT dimensions, higher weight was
received by the WO group of strategies. This identifies a defensive course of action. Such
behaviour can be justified in the development status of the SC segments, which are weak in the
downstream activities and cannot support the offensive strategic moves in the system. The
strategies of the ST group also got higher weights, which also support the defensive strategic
moves.
155
The importance values provide the criteria to allocate the resources and efforts on the strategic
dimensions. The other important aspect of the strategic planning is the scheduling of the activities
(strategies) under constraints and available resources including cost, time to implement,
complexity of implementation, etc. This task of scheduling can be based on the implementation
behaviour of strategies. We recommend the results of the research for the allocation of the
resources and for planning the strategies in short, medium and long planning horizons. Moreover,
the resources can be spared and channelled according to the requirement of the time horizons.
The planning scenario actually explains the strategic moves and their sequence in this situation.
For example, under strategy WO2 the fibres which can expand the product base of fashion and
other clothing and home textiles (the areas which are relatively mature in present) can be placed
in short-to-medium term plans whereas the advance fibres (for areas which are in process of
development including technical and functional textiles) can be placed in the long term plans. It
is added the devised strategies will improve the status of the system on the opportunity areas
including O2, O3, O5 and O7. Further, it will bring partial improvements in the system for
opportunities, O1 and O6.
The sensitivity analysis evaluated the changes in the results under different values of the criteria
or factors. In the evaluation of strategic importance, the increase in the weight of factor “threat”
recognised a visible change for some strategies, which is associated with the unstable political
environment in the country. The cost factor identified some changes in the implementation
behaviour of the plans. In general, within a reasonable range of criteria‟s weights, the
performance of the strategies was stable.
The significance of the strategies can be viewed both in global context and also for the system in
focus. The strategies, WO4 and WO1 which have higher importance in the above evaluation also
have universal significance in many strategic planning situations. Their scores, 0.144 and 0.123,
are more relevant to the textile and clothing system in Pakistan. Similarly, strategies, ST2 and
WO2, are mainly related to the system; whereas, these have lower universal significance.
Therefore, some of the strategies developed above can be applicable in similar situations in other
systems but their importance values are specific for the system in study at this stage of its
development.
156
Chapter V An Insight on the Tactical Issues of a Modern Textile and
Clothing SC Page
V.1. Introduction 157
V.2. The Case Study: A Textile and Clothing Chain from Portugal 159
V.2.1. Configuration and Attributes of the Supply-Production-Delivery
Chain 160
V.2.1.1. Supply /Procurement Strategy 160
V.2.1.2. Production Strategy 161
V.2.1.3. Delivery Strategy 164
V.2.2. Sales and Demand Behaviour of the Markets for the Products of
the Company 164
V.2.3. Linkage and Structure of Segments and Functioning of Chain on
Order Fulfilment Process 165
V.2.3.1. Functioning of the Chain on Order Fulfilment Process 167
V.2.3.2. Structure of the Fabric Manufacturing Segment 168
V.2.4. Time Elements in the Order Fulfilment Process 169
V.2.4.1. Data Analysis on the Time Elements in CTP Orders 171
V.2.5. Style Change Activity and the Analysis of Its Performance 175
V.2.6. Discussion 179
V.2.7. Conclusion 182
157
V.1. Introduction
The behaviour of supply chains which produce for the global SCs networks, should follow the
global competitive behaviour. Also, their structures should be configured according to the needs
of the global networks. The SC which is discussed here is based in Portugal. It is an advance and
complex network of activities. It imports raw material, supplies and intermediate products to
manufacture textiles, shirting cloth and shirts for its domestic and international consumers. The
products are positioned in specific customer segments which are discussed in the following
sections. The SC is successfully satisfying its customers for a couple of decades. In the recent
developments in the global textile and clothing scenario, it is observing pressure and a need is
being felt to review the overall order fulfilment strategy and to improvement the functional
performance of activities.
The objectives, to develop order fulfilment model on time and to analyse various time elements
and time performance of chain segments are desired in this detailed case study of textile and
clothing chain. The study is exploratory in nature to observe in-depth various phenomena which
affect the time performance of chain segments and order flow. We believe that it will discover
many interesting aspects for further studies. The flow of study is based on the concepts of the
Tersine and Hummingbird (1995), which focuses on the flow of material and information,
separates the time elements for various activities in the value chain, measures the identified
elements and finally concludes with the analysis of those elements which should identify the
areas of time waste and help in reducing them. The flow of the study was conceptualized in
Figure 3 (see page 18).
Here, the product environment of the fabric manufacturing segment is in focus and was identified
first, which is discussed in the section on the production strategy. Later, the flow of orders in the
process was developed and associated with those product environments, which is covered in
section on order fulfilment. The process followed the separation of time elements and their
measurement for the internal functions in the fabric manufacturing and the outsourced activities.
The linkages of internal and outsourced functions were also developed and their expected lead
times were identified. They were used to analyse the time performance of the chain on order
flows and the productivity and gaps in the chain. In general, the nature of such a process is
continuous and it does not stop at this iteration and should be considered as a part of continuous
improvement cycle. Our analysis should be regarded a part of an iteration of the continuous
158
improvement cycle which is performed on discrete time events. We will present the importance
of these discrete events at relevant sections, which should be considered as an important basis for
such analysis in similar situations.
To conduct the study two main strategies were adopted; one was to observe the functions and
processes during the actual flow of specific orders through all the functions of the chain; the
second strategy was based on conducting the detailed non-structured interviews and open-
discussions with the managers of the functions in order to develop the integration of the chain
activities and therefore to develop the linkage of those activities in the overall configuration of
the value chain.
In the observation and data collection phases, the author observed the activities performed in a
Capable-to-Promise (CTP) order fulfilment process on the internal links of the chain and
measured the time elements for the order fulfilment activities. Various order fulfilment processes
are discussed in the respective section in the following paragraphs and shown in Fig. 5, 7 and 8.
The main activities in the order fulfilment process, depending upon the product characteristics
and environment, include order receiving and acceptance, planning, raw material
sourcing/reservation, dyeing of yarn, preparation for weaving, mounting in weaving, weaving,
inspection, finishing and shipment to the customer.
In the interviews and open-discussions, main target group included the managers of logistics,
technical design (Debuxo), planning, yarn store, preparation, mounting, weaving, cloth
inspection, cloth store, information system and creation/design functions. The main focus was on
the functioning of the operations, their management structures and linkage to other functions and
the expected response times. These characteristics of the chain were studied in the observation
strategy described above and also from the structure of the information system. Thus the linkages
of the chain segments and its configuration were developed from three different views which
included the observation on the actual product flow, the understandings/knowledge of managers
for their system and the structure of the information system. It provides a more global view of the
chain and detailed insight is developed on the factors responsible for time performance in the
chain and on various orders fulfilment strategies.
Various means of triangulation were adopted to reach at a detailed insight, including personal
observation on the actual order flow, open discussions and in depth non-structured interviews

159
with managers and operators and the study of information and management systems. It is also
important to mention that the data is limited to specific orders and to discrete sets of time for
evaluating the performance of activities. It does not provide a continuous evaluation of all orders
which entered into the production system. It does not cover the effects of interference of order
preference and the availability and utilization of resources, waiting times, etc. It do cover the
overall environment in which the firm operates, the evaluations of time performance of main
production activities. It also suggests the directions to improve the linkage of the activities in
order to improve the competitiveness on response time of supply chain.
V.2. The Case Study: A Textile and Clothing Chain from Portugal
The supply chain produces woven shirting fabric for their customer segments. The fabric
manufacturing facility, discussed here is part of their vertical chain which produces the textile
and clothing products and also develops software for planning and control in textile and clothing.
The company is located in the north of Portugal; it has close working relations with textile and
clothing SCs in Brazil. The chain consists of the activities of yarn and fabric manufacturing,
dyeing and finishing and garment manufacturing (see Fig. 46).
Figure 46: The Vertical Chain of the Textile and Clothing Company
Suppliers (Asia, North Africa and Europe)
Yarn Manufacturing
Services
FLUXODATA
Fabric Manufacturing
Dyeing and Finishing
Garment Manufacturing
Customers (Europe, Central & South America)
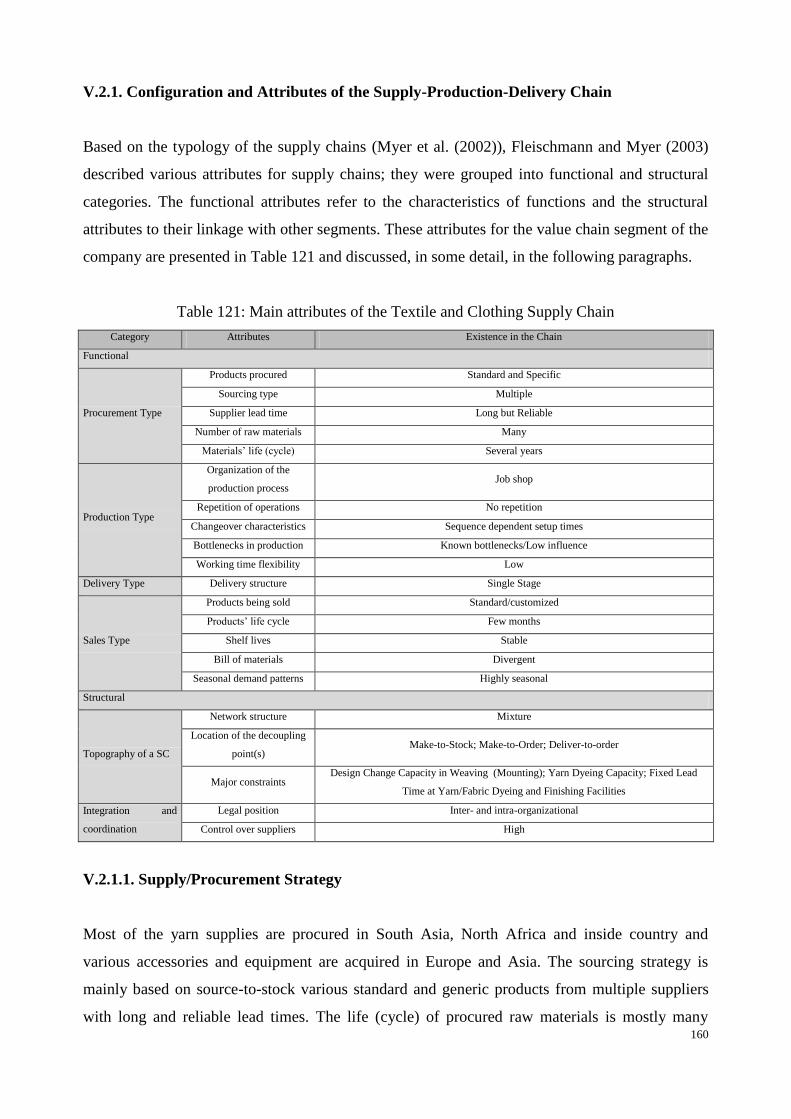
160
V.2.1. Configuration and Attributes of the Supply-Production-Delivery Chain
Based on the typology of the supply chains (Myer et al. (2002)), Fleischmann and Myer (2003)
described various attributes for supply chains; they were grouped into functional and structural
categories. The functional attributes refer to the characteristics of functions and the structural
attributes to their linkage with other segments. These attributes for the value chain segment of the
company are presented in Table 121 and discussed, in some detail, in the following paragraphs.
Table 121: Main attributes of the Textile and Clothing Supply Chain
Category Attributes Existence in the Chain
Functional
Procurement Type
Products procured Standard and Specific
Sourcing type Multiple
Supplier lead time Long but Reliable
Number of raw materials Many
Materials‟ life (cycle) Several years
Production Type
Organization of the
production process Job shop
Repetition of operations No repetition
Changeover characteristics Sequence dependent setup times
Bottlenecks in production Known bottlenecks/Low influence
Working time flexibility Low
Delivery Type Delivery structure Single Stage
Sales Type
Products being sold Standard/customized
Products‟ life cycle Few months
Shelf lives Stable
Bill of materials Divergent
Seasonal demand patterns Highly seasonal
Structural
Topography of a SC
Network structure Mixture
Location of the decoupling
point(s) Make-to-Stock; Make-to-Order; Deliver-to-order
Major constraints Design Change Capacity in Weaving (Mounting); Yarn Dyeing Capacity; Fixed Lead
Time at Yarn/Fabric Dyeing and Finishing Facilities
Integration and
coordination
Legal position Inter- and intra-organizational
Control over suppliers High
V.2.1.1. Supply/Procurement Strategy
Most of the yarn supplies are procured in South Asia, North Africa and inside country and
various accessories and equipment are acquired in Europe and Asia. The sourcing strategy is
mainly based on source-to-stock various standard and generic products from multiple suppliers
with long and reliable lead times. The life (cycle) of procured raw materials is mostly many
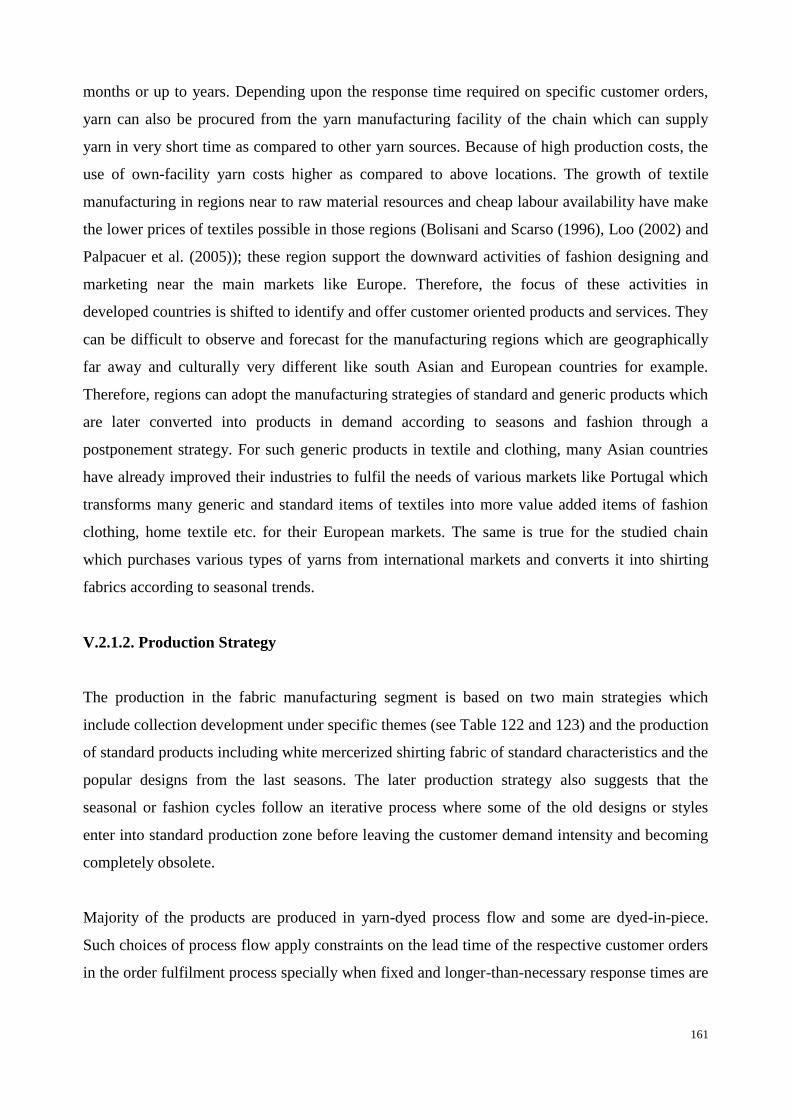
161
months or up to years. Depending upon the response time required on specific customer orders,
yarn can also be procured from the yarn manufacturing facility of the chain which can supply
yarn in very short time as compared to other yarn sources. Because of high production costs, the
use of own-facility yarn costs higher as compared to above locations. The growth of textile
manufacturing in regions near to raw material resources and cheap labour availability have make
the lower prices of textiles possible in those regions (Bolisani and Scarso (1996), Loo (2002) and
Palpacuer et al. (2005)); these region support the downward activities of fashion designing and
marketing near the main markets like Europe. Therefore, the focus of these activities in
developed countries is shifted to identify and offer customer oriented products and services. They
can be difficult to observe and forecast for the manufacturing regions which are geographically
far away and culturally very different like south Asian and European countries for example.
Therefore, regions can adopt the manufacturing strategies of standard and generic products which
are later converted into products in demand according to seasons and fashion through a
postponement strategy. For such generic products in textile and clothing, many Asian countries
have already improved their industries to fulfil the needs of various markets like Portugal which
transforms many generic and standard items of textiles into more value added items of fashion
clothing, home textile etc. for their European markets. The same is true for the studied chain
which purchases various types of yarns from international markets and converts it into shirting
fabrics according to seasonal trends.
V.2.1.2. Production Strategy
The production in the fabric manufacturing segment is based on two main strategies which
include collection development under specific themes (see Table 122 and 123) and the production
of standard products including white mercerized shirting fabric of standard characteristics and the
popular designs from the last seasons. The later production strategy also suggests that the
seasonal or fashion cycles follow an iterative process where some of the old designs or styles
enter into standard production zone before leaving the customer demand intensity and becoming
completely obsolete.
Majority of the products are produced in yarn-dyed process flow and some are dyed-in-piece.
Such choices of process flow apply constraints on the lead time of the respective customer orders
in the order fulfilment process specially when fixed and longer-than-necessary response times are

162
present in the chain. Such effects are identified in later sub-sections where specific orders are
studied with their lead times.
Collection Development: Two collections are produced each year for each season of summer and
winter. Working on them starts a year in advance and they are presented in national and
international clothing fairs to attract customer orders. Standard and non-seasonal products are
produced in low demand periods and the seasonal items are produced near or during the season
where the seasonal trends are more visible and/or customer demands arrive in the system. In this
way the long-term production is spread out in low and high demand seasons from standard and
seasonal products. In this context, the overall productions strategy is to produce standard products
and collections with produce-to-stock or produce-to-present in non-season periods of the year and
to focus on the seasonal products near and during the seasons with strategies of produce-to-order
or even produce-to-stock for high demand items.
The development of collections starts February and October for following year´s summer and
winter seasons respectively. The collection development process, in year 2011 for the collections
of summer and winter 2012, is presented in Fig.47 and the related activities are identified in
Table 122.
Figure 47: The Plan of the Collection Development Process of Year 2011 (for the collections of
summer and winter 2012)
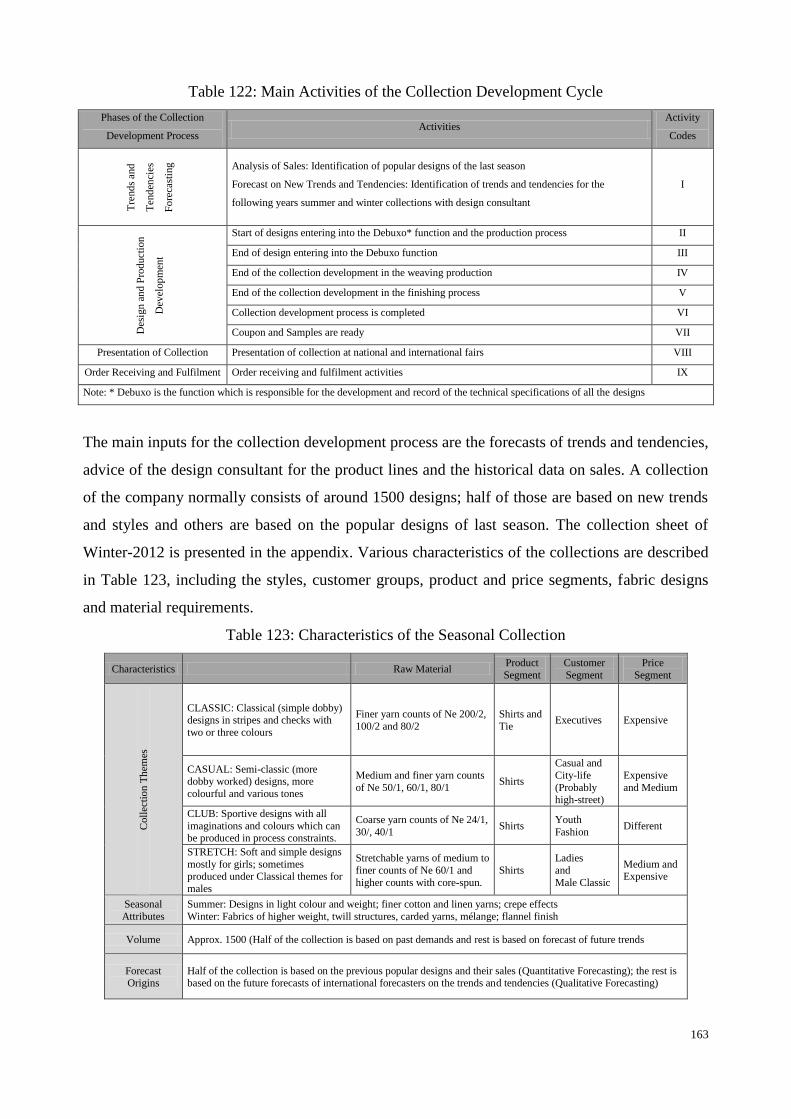
163
Table 122: Main Activities of the Collection Development Cycle
Phases of the Collection
Development Process Activities
Activity
Codes T
rend
s an
d
Ten
den
cies
Fo
reca
stin
g
Analysis of Sales: Identification of popular designs of the last season
Forecast on New Trends and Tendencies: Identification of trends and tendencies for the
following years summer and winter collections with design consultant
I
Des
ign
an
d P
rod
uct
ion
Dev
elop
men
t
Start of designs entering into the Debuxo* function and the production process II
End of design entering into the Debuxo function III
End of the collection development in the weaving production IV
End of the collection development in the finishing process V
Collection development process is completed VI
Coupon and Samples are ready VII
Presentation of Collection Presentation of collection at national and international fairs VIII
Order Receiving and Fulfilment Order receiving and fulfilment activities IX
Note: * Debuxo is the function which is responsible for the development and record of the technical specifications of all the designs
The main inputs for the collection development process are the forecasts of trends and tendencies,
advice of the design consultant for the product lines and the historical data on sales. A collection
of the company normally consists of around 1500 designs; half of those are based on new trends
and styles and others are based on the popular designs of last season. The collection sheet of
Winter-2012 is presented in the appendix. Various characteristics of the collections are described
in Table 123, including the styles, customer groups, product and price segments, fabric designs
and material requirements.
Table 123: Characteristics of the Seasonal Collection
Characteristics Raw Material Product
Segment
Customer
Segment
Price
Segment
Coll
ecti
on T
hem
es
CLASSIC: Classical (simple dobby) designs in stripes and checks with
two or three colours
Finer yarn counts of Ne 200/2,
100/2 and 80/2
Shirts and
Tie Executives Expensive
CASUAL: Semi-classic (more dobby worked) designs, more
colourful and various tones
Medium and finer yarn counts
of Ne 50/1, 60/1, 80/1 Shirts
Casual and
City-life
(Probably high-street)
Expensive
and Medium
CLUB: Sportive designs with all
imaginations and colours which can be produced in process constraints.
Coarse yarn counts of Ne 24/1,
30/, 40/1 Shirts
Youth
Fashion Different
STRETCH: Soft and simple designs
mostly for girls; sometimes produced under Classical themes for
males
Stretchable yarns of medium to
finer counts of Ne 60/1 and
higher counts with core-spun.
Shirts
Ladies
and
Male Classic
Medium and Expensive
Seasonal
Attributes
Summer: Designs in light colour and weight; finer cotton and linen yarns; crepe effects
Winter: Fabrics of higher weight, twill structures, carded yarns, mélange; flannel finish
Volume Approx. 1500 (Half of the collection is based on past demands and rest is based on forecast of future trends
Forecast Origins
Half of the collection is based on the previous popular designs and their sales (Quantitative Forecasting); the rest is based on the future forecasts of international forecasters on the trends and tendencies (Qualitative Forecasting)

164
It can be observed that the process is a complex process and planning and performing these
activities in the production process need a lot of care and control where the process constraints
can decrease the overall time performance of the chain.
V.2.1.3. Delivery Strategy
The customer‟s base of the chain is dispersed in Portugal, Europe, Central and South America.
The delivery operation in the segment is a single-stage process without any distribution centre.
Various modes of delivery are adopted including own transport carriers and third party transport
carriers. The vehicles of the company deliver products within country, mainly in the north zone.
National carriers are utilized for other areas including central and southern zones. International
carriers and air modes are used for countries in Europe and outside which makes the delivery
process faster than usual. The time-to-deliver with company transport is less than 8 hours;
deliveries inside Portugal are covered in a day time and international deliveries inside Europe
take a couple of days to a week time. Deliveries in Central and South America are covered by air
carriers and completed in a week time. Therefore, the delivery times range from couple of hours
to couple of weeks. The strategy of short quantity orders of specialized items made it possible to
supply the customer orders through air delivery which otherwise was costly to implement.
V.2.2. Sales and Demand Behaviour of the Markets for the Products of the Company
The sales patterns of the chain identify the main buying periods for summer and winter seasons
and the normal demand periods round the year. The sale for summer season starts in January and
February while March and April are the peak demand months. Similarly, the winter sale starts in
July and August and peak demand is observed in September and October (see Fig. 48). The
production strategy which was discussed above is designed to follow these seasonal patterns.

165
Figure 48: Month-wise Sales of Fabric (January, 2009 to December, 2011)
V.2.3. Linkage and Structure of Segments and Functioning of Chain on Order Fulfilment
Process
In this section, we will develop and discuss the linkage of activities and the functioning of the
chain in relation to the order fulfilment process. Later we will identify various time elements in
the order fulfilment process and analyse them for improvement of time performance. The process
should present a logical approach to analyse the time performance of various segments linked in
intra-company and inter-company setting in the chain. The linkage of chain segments and
activities is shown in Fig. 49. The discussion on order fulfilment under various product
environments will continue in the following sub-section and subsequent sections.

166
Figure 49: Structure and Linkages of the Segments in the Supply Chain and Their Response
Times
It can be observed in Fig.46 and Fig. 49, that the company has developed a mature supply chain
network of a woven shirt manufacturing value-chain within an intra-company set-up. In Fig.49,
the structure of the fabric manufacturing segment is shown in detail at the central part, under the
heading of Intra-organization. Supply, delivery, and outsourced activities including yarn supplies
and manufacturing, yarn and fabric dyeing and finishing and garment manufacturing etc. are also
briefly attached on the network with their fixed lead times which will help us to study various

167
types of order flows in the fabric manufacturing. Further, in this part of the figure, the continuous
lines with arrows show the existence of material and information flows whereas the broken lines
with arrow represent the sharing of information through activities. Various order fulfilment flows
like Available-to-Promise (ATP) and Capable-to-Promise (CTP), are also identified with
diagonal lines on the activity boxes. Some boxes are linked through multiple continuous lines
which represent the process flow options. Various activities including data and information
management, execution of plans, control of activities and processes, communication etc. are
supported with central management execution system.
Let us observe the functioning of the chain on different types of order fulfilment process and the
role of the various functions and segments.
V.2.3.1. Functioning of the Chain on Order Fulfilment Process
The commercial function is the outer link of the chain segment to customer markets. It receives
enquiries and consults customers to define their needs including design and delivery times. When
the needs are defined, the orders are entered into the system to check their fulfilment feasibility
under ATP and CTP order fulfilment strategies. After the orders are entered into the system,
logistics and planning function take control of these. The system monitors the flow in every
function of the fabric manufacturing facility but it does not cover other segments of chain. The
system facilitates integrated planning and management of customer orders, information sharing
and decision making in the scenario of huge number of customer orders flowing through the
value chain segment, which is rare in such facilities elsewhere. We have identified some aspects
of the decision environment at different levels of the order processing activity in Fig. 49 at the
right most part of the figure. They cover the general decision making process on these stages.
The flow of orders in the preparation, production and other stages is controlled by the planning
function which is responsible for the induction of all customer orders into the process. The
planning function serves two objectives; at one side it assists the logistics for checking the
availability of delivery dates for new orders and to insert the new orders into the production
process. On the other side it monitors the flow of orders in the process and exercises the authority
to introduce and/or perform updates on deviations of the schedules in the actual flow of orders.
The role of planning department should be very important in the situations of quick response as it
is the main decision making authority in the delivery dates decisions. Collectively, planning and

168
logistics have the key to implement various order fulfilment strategies in the value chain and they
can provide the transformation from existing order fulfilment strategies towards quick response
strategies.
The production status and productions plans are updated regularly in the system at required
stages of the process; such inputs include for example the production data and status of quality
and time schedules. Meanwhile, all the information including progress on orders is available to
the concerned departments and decision makers in real times. The system also identifies the
constraints on the resources, which help to decide the appropriate delivery times and to arrange
required resources at various levels of the process at due time. When the production phase is
completed, the logistics and commercial manage the delivery with the cloth store and dispatch
function. The dispatch process is systemized to provide better delivery quality and better inside
controls.
The system does not provide the information on production or other delays to the logistics or
commercial functions and, as a result, the information do not pass to the customers in case some
adjustments are needed and thus the information cycle breaks in the order control system and do
not fulfil the objectives of sharing information across the systems. Although, the planning
function accommodates deviations of plans within the system but at times it should worth more
that such information is available to logistics function that normally has better knowledge on the
customer requirements and their reaction on delay. Keeping in view the number of orders, it
should not be easy to develop such feedback system at various levels of process but it should be
important when focusing the time based performance of the customer orders.
It was observed that the management practices are not yet standardized in accordance with the
advance planning system which is searching for management confidence to approve its authority
and utilization.
V.2.3.2. Structure of the Fabric Manufacturing Segment
The process of fabric manufacturing is separated into the preparation and main production stages.
Yarn store is responsible for yarn stock and availability. The procurement of yarn is arranged on
the basis of production plans which are updated regularly for the future production and the
historical consumption of yarn is also taken into account during the process. Winding, warping,

169
slashing, drawing-in, knotting and mounting operations schedule their plans to meet the starting
date in weaving thus they react to feed the production at weaving stage. We can say that the
weaving stage is the active stage in the planning system and most of the processes before it are
reactive ones. There is slack capacity available at the preparation stages. Mounting and drawing-
in processes are the main capacity bottlenecks especially in high design change seasons of peak
demand and collection development. GPAC is the main program for management execution and
control of activities and resources to respond to the customer orders. It is developed internally
and its main components are captured in Fig. 50.
Figure 50: Production Planning and Execution Program (GPAC)
Like many other planning programs, it is based on the spread sheet modelling and takes into
account the constraints on resources of the chain. In the above figure, the Gantt chart in the lower
part shows the schedule of planned and running orders on the weaving machines. The sections in
the central right part cover the mounting and drawing-in activities including their schedules,
capacities and resources short comings. The central parts provide the control and planning of
warps in preparation sections. The sections at top deal with the design and material requirements.
V.2.4. Time Elements in the Order Fulfilment Process
As discussed earlier, the fabric manufacturing segment operates with two main production
strategies, make-to-stock and make-to-order. In the make-to-order situation, the customer orders

170
have to penetrate upward in the value chain following a CTP order fulfilment course. On the
other hand, make-to-stock strategy is focused for the standard designs and the popular styles of
last season. Majority of the orders lie in the yarn-dyed and piece-dyed process categories and
only a small share of orders belong to the category of white mercerized fabric. The order
fulfilment process under ATP and CTP for these process types were developed with a general
order fulfilment view in Fig. 49. They will help us to analyse the time response of make-to-order
and deliver-to-order situations while separate models for these categories are developed in the
following paragraphs.
Whenever the fabric, inquired by a customer is available in stock, orders are processed under
ATP and deliveries are arranged through logistics. On the other hand, in case of CTP orders,
production orders are issued to initiate the subsequent activities of planning, preparation,
production and delivery etc. This way, the ATP orders penetrate though commercial and logistics
to cloth store (see Fig. 51) and delivery (or dispatch process) is arranged within couple of days or
even on the same day. The ATP order fulfilment is a result of the strong linkage of the
commercial department with demand markets and the forecasting abilities of the commercial and
design development sections on the demand behaviour of these markets. They work closely with
the marketing forces of the downward chain.
Figure 51: ATP Order Fulfilment
On the other hand, the CTP orders enter in the planning and yarn store to confirm the availability
of production capacity and raw material under the make-to-order process; they follow the
negotiation process with customers on delivery times and prices. Involving the yarn store in the
initial stages helps to determine better delivery schedules as the activity of yarn processing can be
saved if different lots of yarns can be used in intended customer order, therefore reducing the
order lead time. In general, the time allocation for the activities of yarn dyeing, weaving and
finishing processes is around two weeks for each activity, which make six weeks of production
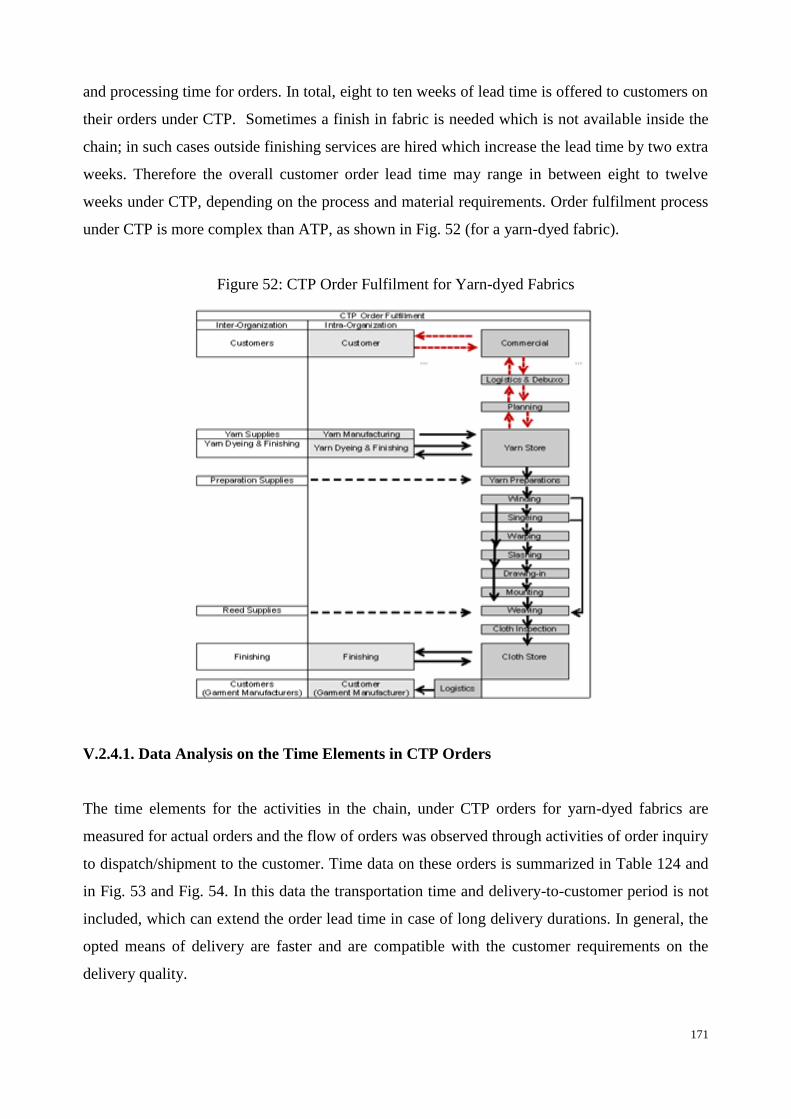
171
and processing time for orders. In total, eight to ten weeks of lead time is offered to customers on
their orders under CTP. Sometimes a finish in fabric is needed which is not available inside the
chain; in such cases outside finishing services are hired which increase the lead time by two extra
weeks. Therefore the overall customer order lead time may range in between eight to twelve
weeks under CTP, depending on the process and material requirements. Order fulfilment process
under CTP is more complex than ATP, as shown in Fig. 52 (for a yarn-dyed fabric).
Figure 52: CTP Order Fulfilment for Yarn-dyed Fabrics
V.2.4.1. Data Analysis on the Time Elements in CTP Orders
The time elements for the activities in the chain, under CTP orders for yarn-dyed fabrics are
measured for actual orders and the flow of orders was observed through activities of order inquiry
to dispatch/shipment to the customer. Time data on these orders is summarized in Table 124 and
in Fig. 53 and Fig. 54. In this data the transportation time and delivery-to-customer period is not
included, which can extend the order lead time in case of long delivery durations. In general, the
opted means of delivery are faster and are compatible with the customer requirements on the
delivery quality.
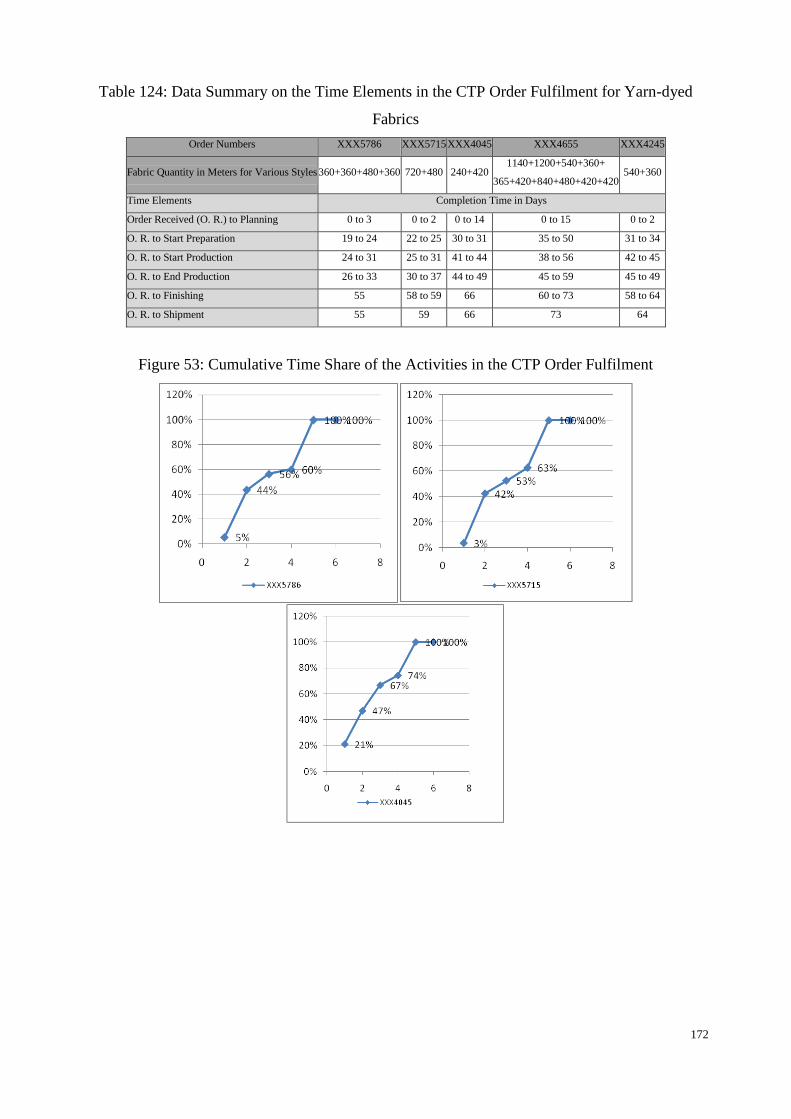
172
Table 124: Data Summary on the Time Elements in the CTP Order Fulfilment for Yarn-dyed
Fabrics
Order Numbers XXX5786 XXX5715 XXX4045 XXX4655 XXX4245
Fabric Quantity in Meters for Various Styles 360+360+480+360 720+480 240+420 1140+1200+540+360+
365+420+840+480+420+420 540+360
Time Elements Completion Time in Days
Order Received (O. R.) to Planning 0 to 3 0 to 2 0 to 14 0 to 15 0 to 2
O. R. to Start Preparation 19 to 24 22 to 25 30 to 31 35 to 50 31 to 34
O. R. to Start Production 24 to 31 25 to 31 41 to 44 38 to 56 42 to 45
O. R. to End Production 26 to 33 30 to 37 44 to 49 45 to 59 45 to 49
O. R. to Finishing 55 58 to 59 66 60 to 73 58 to 64
O. R. to Shipment 55 59 66 73 64
Figure 53: Cumulative Time Share of the Activities in the CTP Order Fulfilment
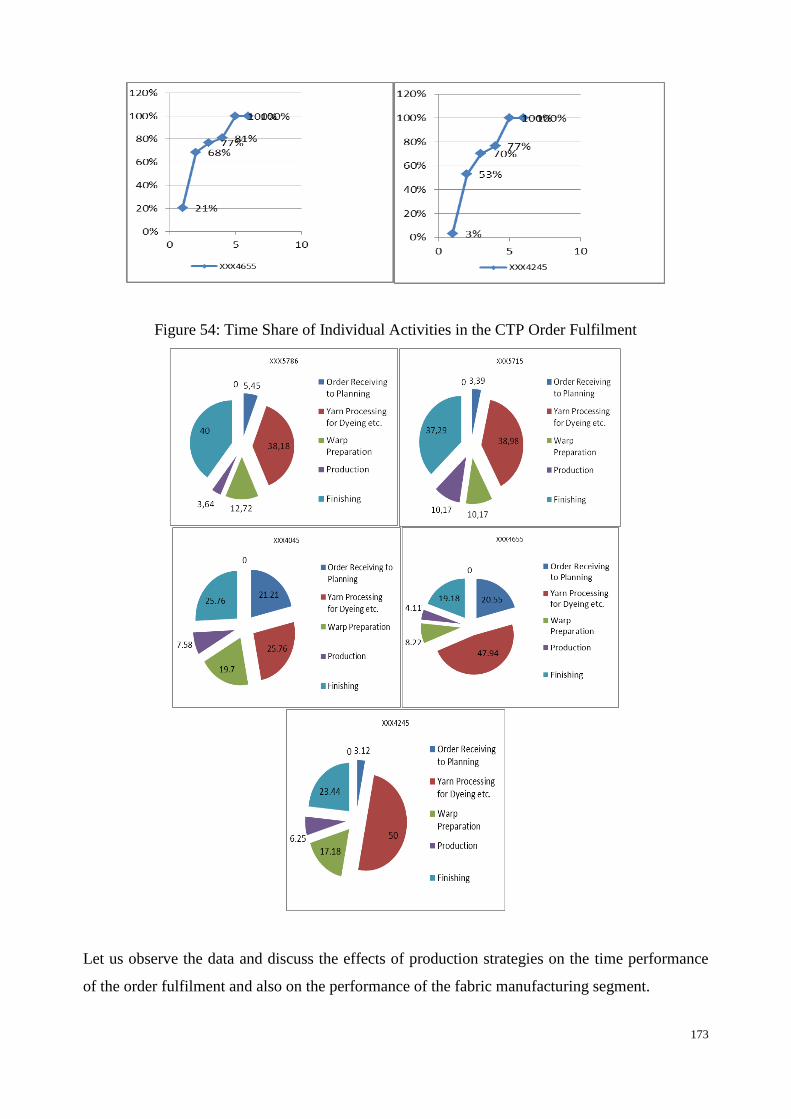
173
Figure 54: Time Share of Individual Activities in the CTP Order Fulfilment
Let us observe the data and discuss the effects of production strategies on the time performance
of the order fulfilment and also on the performance of the fabric manufacturing segment.

174
In Table 124, Fig. 53 and Fig. 54, the time elements are separated for the activities of: a) Order
Receiving to Planning, b) Yarn Processing, c) Warp Preparation, d) Fabric Production, e) Fabric
Finishing and f) Shipment. The time elements for activities “a” to “e” are collected and these are
presented in these diagrams as a cumulative sum on the preceding activities whereas the data end
i.e. activity “e” is considered as the start of the dispatch/shipment activity which is element “f” in
this case. Although, for many orders the delivery activity is not controlled internally, as it is
outsourced, and the delivery durations are not available, it was observed that the dispatch
function takes care of delivery quality including time with the help of the concerned carrier
service.
In the order flow of yarn-dyed fabrics, the highest time shares are present at the external links of
the chain or outsourced activities of yarn dyeing and cloth finishing. On these links, the lead
times are fixed and these are not based on the actual work content of orders. Control on their lead
times is not explained and is not exercised in the order execution system of fabric manufacturing
facility. In the scenario of time based performance on the customer orders, the reduction of the
fixed lead times on these external links can be focused for such strategies and major reductions
on order lead times can be achieved. The uncertainties of the preparation stage of yarn processing
(yarn dyeing and finishing) increase the uncertainty of planning at weaving stage which can be
reduced by inducting the production control of yarn processing in the weaving preparation. Such
a change should not be difficult to implement while the process of yarn dyeing has not a complex
structure but it‟s restructuring in terms of its production control under weaving segment and its
modified linkage will ease communication load and streamline the decision making at planning
stage in the fabric manufacturing. Additionally, it will help to reduce the order fulfilment time
and most probably increase the weaving shed time efficiency because of reduced planning
uncertainty and also because of improved performance in preparatory process due to higher
visibility.
The highest time share in the internal activities of fabric manufacturing segment lie on the warp
preparation activity which has a share of 10 to 15 % of order lead time in the observed customer
orders; they need further evaluation in terms of expansion of data to more customer orders and
evaluation of participating activities. Following section will contribute in these aspects as a main
preparation activity is analysed there in terms of its effects on the time performance of the
weaving production and as a capacity constraint in the style change process.

175
V.2.5. Style Change Activity and the Analysis of Its Performance
The style change or mounting operation is the main bottle neck in the fabric manufacturing
segment of the chain and similar constraints should exist in facilities which follow same
production strategies. Studying the characteristics and analysing the time performance of the
process will identify the effects of mounting on weaving production and order fulfilment process.
Further, these will suggest the improvements which are required in the operation, structure of the
mounting team and the process. This will reduce the effects of capacity constraints in the high
style change periods of the year. These high style change periods are associated with the high
demand seasons and collection development phases.
The mounting operation is performed to change the fabric design on the weaving machine. The
fabric design includes various properties of fabric such as thread interlacement or weave, threads
density in horizontal and vertical dimensions, fabric width, patterns of colour in yarn directions,
thread thicknesses, etc. The required amount of changes affects the mounting time and it require
much time to perform a mounting operation when design properties vary a lot from the design
which was previously being produced on the machine. In situations where the two styles are
similar in terms of these properties, the conversion process needs less effort and time and even
the skills of workers.
The classification of type of mounting operations is given in Table 125. The process time
standard of the company is also shown.
Table 125: Time Standard for Various Types of Mounting Operations
Mounting Type Time Standard
Hours Minutes
Knotting (one warp with similar width as old warp) N/A N/A
Knotting (one warp with different width from old warp) 07 420
Knotting (two warps; similar width) N/A N/A
Knotting (two warps; different width) 14 840
Remeter (one warp; almost similar widths) N/A N/A
Remeter* (one warp; different width) 12 720
Remeter with Contra- Marche* (one beam; different width) 16 960
Remeter (two warps; similar width) N/A N/A
Remeter (two warps; different width) 16 960
Remeter with Contra-Marche** (two warps; different width) 18 1080
Sample Knotting (probably on sample machine) 03 180
Note: * The term Remeter is used for Drawing-in process in Portuguese language; ** The term Contra-Marche is used for fabric manufacturing
process with varying weft densities

176
Keeping in consideration the above standards of time, let us observe and analyse the time
performance of mounting operations for the month of November, 2011. The data on various types
of mounting operations and their time share, actual, standard time and wasted time and other
summaries are presented in Table 126 and Fig. 55.
Table 126: Month Data Summary on Mounting Operations (November, 2011)
Total Non-working Time in Weaving in the Month of November, 2011 = 22491.45 Hours
Operation Type
Standar
d
“Min”
Oper
ation
s
Shar
e %
“Qua
ntity
”
Required
Std. Min.
Share %
“Std.
Time”
Act Min Used
Share
%
“Act.
Time
”
Diff=Act-Std
Sh
ar
e
%
of
Di
ff.
Was
ted
Tim
e per
Oper
ation
Avg.
Minutes
Used
a b b/Ʃb a*b a*b/Ʃ(a*b
) c c/Ʃc (c-a)*b c/b
EM.ARRANGEW. 180 12 0.71
9 2160 0.255 4362 0.402 2202 1
183.
5 363.50
Knotting
(1-warp; Different-
width)
420 942 56.4
07 395640 46.793 514118
47.39
6 118478 50
125.
8 545.77
Knotting (2 Warps) 840 14 0.83
8 11760 1.391 11475 1.058 -285 0
-
20.4 819.64
Sample Knotting 180 186 11.1
38 33480 3.960 52714 4.860 19234 8
103.
4 283.41
Remeter (2 Warps)
MALHA
INGLESA
1440 3 0.18
0 4320 0.511 5277 0.486 957 0
319.
0 1759.00
Remeter
(1-warp; Different-
width)
720 398 23.8
32 286560 33.892 369485
34.06
3 82925 35
208.
4 928.35
Remeter with
Contra-Marche (1
Warp)
960 38 2.27
5 36480 4.315 44000 4.056 7520 3
197.
9 1157.89
Remeter
(2-warps; Different-
width)
960 67 4.01
2 64320 7.607 70645 6.513 6325 3 94.4 1054.40
Remeter with
Contra-Marche (2
Warps)
1080 10 0.59
9 10800 1.277 12643 1.166 1843 1
184.
3 1264.30
Total (Ʃ)
Ʃb =
1670
Ʃ(a*b) =
845520 Ʃc = 1084719
Ʃ(c-a)*b = 239199
10
0
Required
Hours
=14092
Hours Consumed =
18078.65
Wasted Hours =
3986.65
Share in Total Non-
working hours = 80.38
%
Share in Total Non-
working hours = 17.73
%

177
Figure 55: Share of Different Mounting Operations in November, 2011
The data summary informs that the main time share in the mounting is composed of Knotting (1-
warp; Different-width), Remeter (1-warp; Different-width) and Remeter (2-warps; Different-
width). The operation, Remeter with Contra-Marche (1-warp; Different-width) also has a good
share in total spent time due to the fact of its higher time requirement in a single operation and is
significantly higher than the time required by other types of mounting operations. Such a relative
comparison of required time is developed for various mounting operations by considering the
standard time of Knotting (1-warp; Different-width) as value 1 and transforming other standard
operation times against this index value (see Table 127).
Table 127: Relative Comparison of Mounting Operation Times
Mounting Type Relative Time for Various Mounting Operations Against the Index value of Time for “Knotting
(1 warp; different width)”
Knotting (one warp; similar width) N/A
Knotting (two warps; similar width) N/A
Remeter (one warp; almost similar widths) N/A
Remeter (two warps; similar width) N/A
Sample Knotting (probably on sample
machine) 0.43
Knotting (one warp; different width) 1.00
Remeter (one warp; different width) 1.71
Knotting (two warps; different width) 2.00
Remeter with Contra-marche (one beam;
different width) 2.28
Remeter (two warps; different width) 2.28
Remeter with Contra-marche (two warps;
different width) 2.57

178
Other important summary (see Table 126) is the amounts of wasted time and their shares. Again,
three operations, Knotting (1-warp; Different-width), Remeter (1-warp; Different-width) and
Sample Knotting have around 93 per cent share in the wasted time whereas. Adding the share of
two other operations, Remeter with Contra-Marche (1-warp; Different-width) and Remeter (2-
warps; Different-width) will raise their total wasted time share to 99 per cent. Initially, these
operations can be focused for standardization, training of technicians and for other strategies of
efficient performance. It is important to mention that our data analysis does not identify these
factors but their relevance was felt during the observation of the operation. The highest waste of
time in terms of wasted amount per operation has occurred on operations of Remeter and
Remeter with Contra-Marche which should be the obvious candidates for further analysis.
The number of non-working hours in weaving in the same month, caused by the mounting
operation is 18078.65 out of the total non-working machine hours of 22491.45, which accounts
for the 80.38 per cent share of the non-working time in the weaving, which is huge. Waste of
time due to various inefficiencies in the mounting operation caused a 17.37% loss of time, which
is also huge amount and can bring additional useful production time if planned and controlled
more efficiently. It is clear that the role of mounting activity has the highest share in non-working
hours of the weaving room; measures should be taken to reduce time waste here which will
improve the overall performance of the chain.
In this study, the standard time does not represent the theoretical time needed by relevant
operations but it is the time standard, developed in the case company considering many factors
including technician skills, their availability to perform the operation and availability of various
other requirements which are needed for the uninterrupted performance of mounting. We cannot
verify the authenticity of these standards in terms of the above factors which were identified by
concerned functions; but we want to add that they need more rigorous inputs as our general
observation is that the standards have a wide slack. Our assumption has its basis in the
observation of actual mounting operations; they should be analysed in greater detail to construct a
more precise planning program to avoid the planning inconsistencies, resulting from such wide
slacks which make it inconsistent. Additionally, the above data can be extended to other months
to study the seasonal effects of demand on the mounting operation and to observe the variation of
process performance under those seasonal effects and similarly under different phases of
production strategies. This will help to design relevant strategies on load balancing in those high
design change periods.

179
V.2.6. Discussion
The structure and the characteristics of a textile and clothing supply chain are studied; the focus
was on the order fulfilment process in the fabric manufacturing segment of the chain. The partial
results were presented in our study, Hussain et al. (2012a) and the detail on the overall findings is
covered here.
The fabric manufacturing is supported with up and downward value chain segments; the support
of program development for data management and order execution is also available in the chain
(Fig. 50). In the last couple of decades, the supply chain has gone through many phases of
evolution and has developed very strong customer relations on the basis of quality and
innovativeness in their designs. The changes in the global textile manufacturing moved the
business strategy of the chain towards lower quantities and higher number of fabric styles. Such
moves brought higher loads on the planning and execution system and on the activity of design
change (mounting) and converted them into the main bottle necks. Higher working times for
machine setup reduced the time performance in production, which was compensated with higher
prices of the high-end markets. The study on such comparisons is not included here but it can
bring further facts on the profit scenario of the value chain.
Here, the process of order fulfilment was modelled and the time based performance of the chain
including lead time performance was analysed. Currently, the order fulfilment strategies of the
chain are not based on achieving shorter lead times but they can bring additional benefits for the
chain, although with a lot of effort. We have identified the restructuring of specific functions in
the chain including planning, yarn dyeing and the mounting activities to initiate the transition for
shorter lead times, and also to improve the performance of the chain even in its current
configuration. The planning activity is kept closer to production in terms of its functionality
and/or control than to logistics which should be the logical companion or authority of the
planning function. Together, they should be more effective in implementing various planning
situations without creating planning inconsistencies, thus reducing rework. Specially, their
combination will help implementing short lead time strategies. Yarn dyeing is located on external
link for fabric manufacturing and thus the planning and start-of-production for specific orders is
mainly dependent on the fixed lead time of this activity. Bringing its production control under
fabric manufacturing can help reduce the Planning-to-Production duration to a period of 2 to 3
weeks, which in many orders is around 4 to 7 weeks.
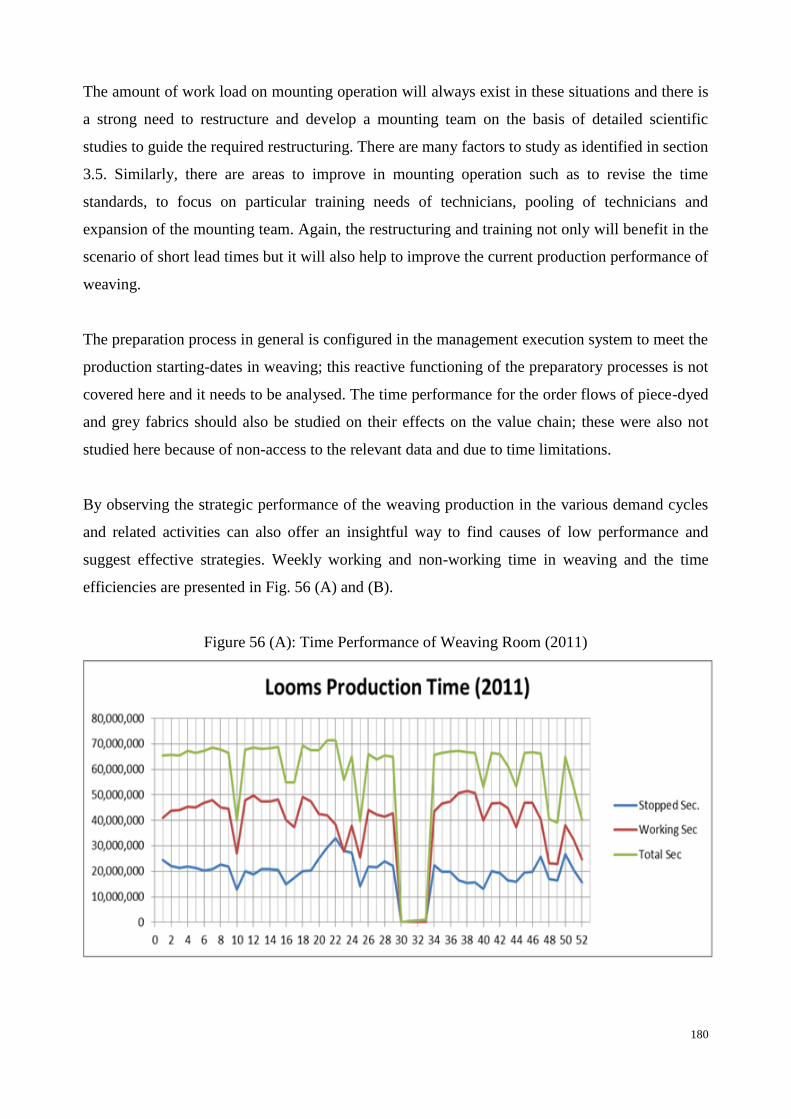
180
The amount of work load on mounting operation will always exist in these situations and there is
a strong need to restructure and develop a mounting team on the basis of detailed scientific
studies to guide the required restructuring. There are many factors to study as identified in section
3.5. Similarly, there are areas to improve in mounting operation such as to revise the time
standards, to focus on particular training needs of technicians, pooling of technicians and
expansion of the mounting team. Again, the restructuring and training not only will benefit in the
scenario of short lead times but it will also help to improve the current production performance of
weaving.
The preparation process in general is configured in the management execution system to meet the
production starting-dates in weaving; this reactive functioning of the preparatory processes is not
covered here and it needs to be analysed. The time performance for the order flows of piece-dyed
and grey fabrics should also be studied on their effects on the value chain; these were also not
studied here because of non-access to the relevant data and due to time limitations.
By observing the strategic performance of the weaving production in the various demand cycles
and related activities can also offer an insightful way to find causes of low performance and
suggest effective strategies. Weekly working and non-working time in weaving and the time
efficiencies are presented in Fig. 56 (A) and (B).
Figure 56 (A): Time Performance of Weaving Room (2011)

181
Figure 56 (B): Time Performance of Weaving Room (2011)
On average, almost 30% of the time in weaving is non-productive. It can be observed that there is
an extra production loss of 10 to 20 per cent in weeks 20 to 29 and 46 to 52. Let us observe the
various phenomena happening in weaving during weeks 10 to 30 and 41 to 55 in order to identify
the factors which are responsible for this loss.
The collection development plan (see Fig. 47) shows that the activities II to V involve production
activity of the process and affect the normal working of the weaving room and preparation
departments. The period in which these activities were planned and carried out in the year 2011,
for Summer-2012 collection, ranges from week 10 to 30 i.e. around 21 weeks. The lowest
production performance can be observed in weeks 20 to 27, which is a transition phase from
highest seasonal demand (see Fig. 48) to normal demand. This transition and/or effect of
collection development should be the main cause for low performance in these weeks. The
collection development activities for the Winter-2012 collection took place from week 41 to 55
(3rd week of following year, 2012), which makes a period of around 15 weeks. Again, the poor
production performance in weaving can be observed from week 46 and onward and a transition
from normal demand to seasonal growth is taking place. Various demand cycles, collection
activities and other factors are responsible for low production performance in various time
periods in weaving. Design and production periods for summer and winter collections
development vary and thus there should be more pressure on the production process for the
winter collection as compared to the summer collection.

182
We have already observed in the data analysis of mounting activity of November, 2011, that the
share of this activity is around 80% in overall non-productive time in weaving. Further, the waste
of time by mounting operation stands to be around 5% of total available time, and this makes
considerable loss of working time.
The number of monthly mounting operations and the required time for the activity is very high in
comparison to many other fabric manufacturing facilities which operate under mass-production
or other production strategies. Such a characteristic is specific for a diversification-in-design
business strategy and this brings high planning and other work load for the system. In reality, it is
very difficult to control and manage the supply chain system without proper planning and
management execution systems. The factors which can improve the time performance of the
activity include for example the automation in the process, experience and skills of the
technicians, their physical and psychological health, distribution of work load on the basis of
complexity of the operation and the capacity of the technicians. The studies which can
quantitatively explain the relationship of these factors to the time performance of the activity
under various workload situations will help further to identify the required adjustments in design
and training of the mounting teams and developing working strategies in such situations.
V.2.7. Conclusion
The time based competitive position of the supply chain is not very strong on CTP orders which
take around 8 to 12 weeks of order fulfilment time. In general, the lead times and the time
performance of the chain in various activities point out that time is not part of the competitive
strategy of the chain yet. The main competitive strengths are style diversification and quality and
these are well-suited to fulfil the needs of their customers. Improving the time performance can
bring additional capacity and add value to responsiveness on customer orders and will enhance
customer confidence in the supply chain. This will improve the competitive position of the supply
chain in the global context as many other similar supply chains can try to achieve similar quality
and design strengths and even adopt configurations to fulfil customer orders in lower lead times.
In the current state of the value chain, important areas which can contribute for reducing the order
fulfilment time are external links of yarn dyeing and cloth finishing. Our analysis suggests that
the segments of yarn processing and mounting operation should be considered for further
evaluation and for reorientation and/or restructuring. Moreover, the control and monitoring of the
183
yarn processing segment should be included in the order execution system. These changes will
reduce the fix response time of the segment and will also help to improve the time performance
of the weaving room, which in the current situation absorbs a lot of planning inconsistency due to
the uninformed yarn processing stage. Also, the order execution system does not inform on the
deviations from the planned activities to the logistics and commercial functions, which it should
in order to emphasize the time performance on order fulfilment.
The management process in the supply chain is in transition. Advance information and
management systems were inducted into the system to enhance the competitive position of the
chain but effective utilization of these systems was not achieved yet. The process needs flexibility
to transform itself according to the needs of the changing production cycles in different seasons
and changes in the strategic environment and this flexibility is limited in the chain. The supply
chain has its own evolution pace depending upon many factors including those mentioned above
and collectively they are the main constraints to the time based performance in the chain.
The strategies chosen in the value chain are demanding and the decision making system is more
centralized. It should be difficult to monitor and control such complexity with such central
control. We believe that the decentralization of the decision making process and increasing the
participation of various levels of management should reduce the overall complexity. Such a
complexity should not be considered as a particular characteristic of the supply chain in study but
it should exist in other areas too where there is high competition, abundance of business models
to occupy customer segments, and low barriers of entry including capital, skills, and technology
etc.
Moving towards short lead times is a choice or option in the studied supply chain but there are
many product and service areas where time based performance and time based order fulfilment
are not a choice but a compulsion. There are potentially hundreds of areas including health,
perishable items and food chains for example where such compulsions exist and the research
directions and findings of this study can be utilized there effectively.

184
Chapter VI Conclusion & Future Research Page
VI.1. Conclusion 185
VI.2. Future Research 190

185
VI.1. Conclusion
Textile manufacturing, textile made-ups and the cotton production sectors are the strongest in the
textile and clothing system of Pakistan. At this stage of the development, the system is
demanding to restructure the fashion clothing and apparel sectors which will bring higher value
addition and more opportunities for the system. Logistics is an important area which is poorly
developed. It needs proper development to enhance the performance of the supply and delivery
processes which will improve the customer service. The country has better development in
information and communication technologies. There is a need to utilize these technologies in the
management and production systems. The marketing functions are weak in most of the sectors.
By improving these functions, the image of the system will improve. Further, the supply
performance of the system can be enhanced by analysing the trends of the international markets
in various product segments. Improving the above areas will bring many opportunities for the
system in the international markets and emerging markets of South Asia and Middle East.
Positive developments were observed in the skill development programs. The number of study
programs has increased in science, engineering and design fields of textile, clothing and related
areas. Meanwhile, these programs are being offered at limited number of locations similar to the
expansion behaviour of the industry. It is needed to expand the skill programs to district level in
order to improve the performance of the industry. The quality of these programs can be improved
by improving the share of advance technology and research components.
In Sindh and KP regions, the industry is concentrated at limited locations. It is required to expand
the industry to the districts where the other inputs have improved recently including raw material
supply and labour skills. The focus on the development of infrastructure can help these regions to
develop their industry and the government should act as a facilitator instead of wasting the
resources on supporting the incompetent industries.
The importance of the strategic directions was also evaluated. The strategies with higher
importance include WO4, WO1, ST2 and WO2 having a score of 0.433 out of 1.
Strategy WO4 which is focused to improve the linkages between industry (application of
knowledge), educational institutes (learning of knowledge) and research centres (development of
knowledge), has the highest importance. Further, it can be added from the evaluation of its
186
implementation behaviour that it can be followed efficiently. Strategy WO1 (Skills improvement)
requires higher resources and time and thus its implementation character places it in the medium
term strategic plans. Together, strategies WO4 and WO1 will bring the main improvements in the
system on short to medium term opportunities.
Strategy ST2 (Establishing Down Stream Facilities in Stable, Near to Market and Competing
Regions) is one of the most difficult in terms of implementation. It will require high
implementation time and cost, which place it in the long term plans. This strategy has both short
term and long term effects and needs further evaluation to find out how the implementation
process of this strategy can be enhanced or if the system can decrease the effects of the threats
which are political in nature and can be decreased with political stability in the country.
Meanwhile, the effects of the threats are already visible as the manufacturing activities are
migrating to countries which are more stable and offer higher attractiveness. It can be advised to
encourage the relocation of some manufacturing activity, in the downstream segments of SC
system, in countries of strategic importance for the international clothing markets instead of
looking for short term protection. This will improve the competitiveness of the system in terms of
responsiveness.
Strategy WO2 (Expanding Non-cotton Fibre Base) was ranked fourth in the strategic importance
value. It requires more resources and effort which advise its placement in the long time horizons.
The strategy has both short and long term effects, therefore some sectors can be chosen in the
short term expansion while others in longer plans. The sectors which can bring product
diversification in textile and clothing sectors can be considered in short to medium term plans
whereas those which can bring strengths in the advance areas of functional and technical textiles
can be placed in the long term plans. The planning scenario which was developed, also explains
the strategic moves and their sequence in this situation. For example, under strategy WO2 the
fibres which can expand the product base of fashion and other clothing and home textiles (the
areas which are relatively mature in present) can be placed in short-to-medium term plans
whereas the advance fibres (for areas which are in process of development including technical
and functional textiles) can be placed in the long term plans.
In general, the above strategies are mainly attributed to the diversification dimension of the
competitiveness. The overall strategies will improve the status of the system on the opportunity

187
areas including O2, O3, O5 and O7. Further, it will bring partial improvements in the system for
opportunities, O1 and O6.
In a different categorisation of the strategies, based on SWOT dimensions, higher weight was
received by the WO group of strategies. This identifies a defensive course of actions in the
strategic planning. Such behaviour is justified in the current status of the SC segments; these are
weak on the downstream side and cannot support the offensive strategic moves. The strategies of
the ST group also got higher weights, which also support the defensive strategic approach.
These values can be utilised to allocate the resources and efforts on the strategic dimensions. The
other important aspect of the strategic planning is the scheduling of the activities (strategies)
under various constraints and available resources. The task of scheduling can be based on the
implementation behaviour of strategies, which was based on the implementation criteria of cost,
time and implementability. We strongly recommend that the results are suitable for the allocation
of resources and for the planning of strategies on short, medium and long planning horizons.
The significance of the strategies can be viewed both in global context and also for the system in
focus. Strategies WO4 and WO1 which have higher importance in the above evaluation, also
have universal significance in other planning situations. Their scores, 0.144 and 0.123, are
primarily relevant to the textile and clothing system in Pakistan. Meanwhile, strategies ST2 and
WO2 are only related to the system and have lower universal significance. Therefore, some of the
strategies developed above can be applicable in similar situations in other systems but their
importance values are specific for the system in study and its current state of development.
An important and detailed insight was developed from the case study, conducted in an advanced
textile and clothing supply chain in Portugal. The transformation of the production strategy from
mass production to minimum customer orders has a huge impact on the case supply chain. The
supply chain is operating with the competitive strategies of quality and design diversification. It
was observed that the time-based performance of the supply chain was low even with the
introduction of advanced production control systems. The human factor should be the most
important in the evolution of the systems. The external system, in which the supply chain
operates, evolved faster than the system, especially after the emergence of the European Union.
The factor of human development was not improved at proper pace which has restricted the
evolution of the textile and clothing systems, more specifically in the case supply chain. Various

188
types of pressures were observed on different functions including planning, design, delivery, etc.
Such pressures are characteristics to the adopted competitive strategies and because of the recent
developments in the global textile and clothing sectors.
The production strategies which are followed in most of the textile and clothing industry in
Pakistan are mass production, and the product diversification is very limited. Mostly, standard
products are produced. This situation will change in the near future as the regional competitors
will force the textile and clothing sectors to adopt other strategies to improve the competitiveness.
In the recent situation, the system has some support of cheap raw material and low cost labour.
The conversion of raw material into low value products will not work long as the new players
will evolve to add higher value to their products, which will bring pressure to the clothing and
fashion industry in Pakistan and ultimately will force its closure. The worse development state of
the logistics will further deteriorate the competitive position of the country.
The findings of the case study support the recommendations of the strategic planning. The high
rating of strategies WO4, WO1, ST2 and WO2, is asking for the attention of various entities to
address these issues with their due importance. This will improve the performance of the supply
chain entities on their tactical dimensions and develop the strategic strengths in the system.
The status of the SC activities and the poor coordination between various entities identify that
product areas of fashion and clothing are not well prepared to compete to other main producers of
clothing. The findings also guide to raise the following issues on the other strategic opportunities.
Concerning the areas of functional and technical textiles, there are a many factors which need
attention to achieve success in the international and domestic markets and to gain a competitive
position. The behaviour and characteristics of the technical textile industry are reasonably
different in terms of product and market segments as compared to textiles for clothing and
furnishing. This is an application oriented field for textile manufacturing, which is based on
research rigor and creative and efficient application of materials and the structural properties of
textile products. Therefore, the factors of research, development of advance materials and
structures, application creativity, etc. are the main inputs for these areas. Such developments lack
in Pakistan. Therefore, at this stage, it should be difficult to gain some share in the international
export markets in these areas. At this stage, it is advisable to produce for the domestic markets
which can consume the products, developed initially, to validate their performance. Meanwhile, it
189
should be important to improve the research skills in these areas and to introduce the
interdisciplinary approach to create proper environment for the product development process.
These textiles can be categorised into various application fields including textiles for medical,
automobile, agriculture, construction, etc. The development of industry in some of these areas
should be easier in Pakistan. The country has a strong agricultural base. The development and
application capability of the textile products can be focused for this area. This will require
interdisciplinary research groups with knowledge of textiles, materials, agriculture, etc. Similar
research groups can be developed for other technical textile areas as mentioned above. The
research laboratories will play an important role in these areas, where the prototypes can be
developed and experimentation on the industrial production process can be initiated to validate
the production economies. The skills and expertise will evolve with time and the increase in the
industry. The strong base of research will develop the confidence in the utility of the products and
the economies of scale in production. The acceptance of the developed products will depend on
various factors of the markets, including market maturity, product acceptance, etc.
The industrial activity in fashion clothing is usually strengthened with the diversification of
materials, designs and styles, artistic skills and understanding of the customer segments and their
needs. Infrastructure and logistics further strengthen the competitive muscle by improving the
responsiveness. The basic requirements for the standard clothing are raw material, production
technology and skills. The infrastructure and logistics play a minor role in the competitive
strengths. The time gaps are larger for standard products and it is easy to follow the production
demands of various markets around the world. In case of fashion clothing the time gaps are
shorter and when there is a large space gap, then the under developed infrastructure restricts the
required responsiveness. In product segments of home textile, taste of customers and the
aesthetics of products are main driving factors to gain market share. Therefore, knowing the
customer needs has higher importance. The gaps of time are wider in the areas of home textiles in
order to plan and produce the trends or seasonal requirements of markets. In the case of technical
textiles, the superiority and performance of the products ultimately provide the acceptance to the
products and serve as their competitive strengths.
The main factors, which contribute for the production of technical textiles, are at low level of
development as observed in Chapter III and IV. Therefore, the industrial activity in technical

190
textiles should be difficult to initiate in Pakistan. However, fashion and clothing, home textiles
and furnishing areas can be improved with little effort, as the main inputs are already developed.
VI.2. Future Directions
It can be confirmed that the potential of the regional producers will not hurt the textile
manufacturing base of Pakistan due to its strength in cotton supplies. Meanwhile, the clothing
and apparel sectors will be under intense competition. The findings of the case study on the
structure and performance of an advanced textile and clothing SC and its production strategies
provide insight on the approaches to improve the competitive position of the clothing industry in
Pakistan. Therefore, similar studies in Pakistan can help to develop a comparative scenario and to
identify the current potential and the shortcomings of the industries.
The dimension of the production times for various order fulfilment strategies in Pakistan will
help to establish the order lead time for various markets and product segments. This will provide
insight on the time based competitive scenario for the country and will explain the choice of
strategies. There are many product segments in the high profit markets, which can be supplied
from Pakistan with the improvement of the responsiveness in the system. The time for
transporting the goods from Pakistan is presented at Table 128 and Table 129 (see Appendices
V.A and V.B). These will explain the role of delivery process in the overall responsiveness of the
country. The delivery process can be analysed further to find the areas of time waste, which will
help to improve the delivery efficiency.
The limitation of resources did not allowed us to conduct case studies in Pakistan, therefore, these
are placed in the future directions of this research. These will conclude the incomplete parts 7 and
9 of the Study II, which was designed in Chapter II. These will also allow us to generalize the
results of these case studies for textile and clothing supply chains in a broader context.
The process of strategic planning was based on the analysis of the secondary data of the supply
chain. The past studies on the system were also considered in this analysis. It is possible to
validate the findings with expert surveys. Although, our experience guide that it is not easy to
find experts, who can fill these surveys of such a wide research scope, with confidence. At least,
we were not successful to find many people to complete the survey. The survey form is provided
191
at Appendix III.B. Keeping in view the above problems, this task is placed in the future
directions.
Following studies are also the logical flow of this research.
1. The study on the demand patterns of global textile and clothing markets to identify the
prospective markets for the SC system
2. The growth of responsiveness, diversification and flexibility as competitive strategies in
the textile and clothing SCs of Pakistan
3. The characteristics and growth of the manufactured and non-cotton fibre sectors
4. The characteristics and growth of the technical and functional textile industry
Studies 1, 2 and 3 will further clarify the objectives of the planning horizons for the existing
sectors and studies 3 and 4 will explain the strategic moves for the areas of advanced textiles.

192
Reference
Agarwal, A., Shankar, R. and Tiwari, M. K. (2006) „Modeling the metrics of lean, agile and
leagile supply chain: An ANP-based approach‟, European Journal of Operation Research, 173,
211-225.
Ahmad Z., Haleemi, M. A. and Naqvi, K. M. (1988) „Harmful insects of cotton and their control‟,
Pakistan Mein Kapas, Karachi: Central Cotton Committee, and Rome: Food and Agriculture
Organization.
Alderson, W. (1954). Factors Governing the Development of Marketing Channels in Clewett
R.M. (Eds.), Marketing Channels for Manufactured Products, Irwin, Homewood, IL, 5-34.
Altaf, Z. (2008) Challenges in the Pakistan Cotton, Yarn, Textile and Apparel Sectors, IFPRI
Discussion Paper 00800, Chapter 4. (accessed online in September, 2009), available at:
<http://www.ifpri.org/publication/cotton-textile-apparel-sectors-pakistan>.
APTMA (All Pakistan Textile Mills Association) (accessed online in various months of 2011 and
2012), available at: <http://aptma.org.pk/index.php/statistics/>.
APTMA (All Pakistan Textile Mills Association) (accessed online in various months of 2011 and
2012), available at: <http://aptma.org.pk/index.php/become-a-member/member-list/>.
Badri, M. A. (1998) „Combining the analytic hierarchy process and goal programming for global
facility location-allocation problem‟, International Journal of Production Economics, 62, 237-
248.
Bedi, J. S. and Cororaton, C. B. (2008) Cotton-Textile-Apparel Sectors of India; Situation and
Challenges Faced, IFPRI Discussion Paper 00801. (accessed online in September, 2009),
available at <http://www.ifpri.org/publication/cotton-textile-apparel-sectors-india>.
Bolisani, E. and Scarso, E. (1996) „International Manufacturing Strategies: Experiences from
Clothing Industry‟, International Journal of Operations & Production Management, 16: 11, 71-
84.
193
Bottani, E. (2010) „Profile and enablers of agile companies: An empirical investigation‟,
International Journal of Production Economics, 125, 251-261.
Brandenburger, A. M. and Barry, J. Nalebuff (1995) „The Right Game: Use Game Theory to
Shape Strategy‟, Harvard Business Review, 73(July-August), 57-71.
Brandenburger, A. M. and Barry, J. Nalebuff (1996). Co-opetition. New York: Currency.
Bruce, M. and Lucy, D. (2011) „Adding Value: challenges for UK apparel supply chain
management – a review‟, Production Planning and Control, 22: 3, 210-220.
Bruce, M., Daly, L., and Towers, N. (2004) „Lean or agile: A solution for supply chain
management in the textiles and clothing industry?‟, International Journal of Operations and
Production Management, 24: 2, 151–170.
Chen, I. J. and Paulraj, A. (2004) „Towards a theory of supply chain management: the constructs
and measurements‟, Journal of Operations Management, 22, 119-150
Christopher, M. (2000) „The agile supply chain, competing in volatile markets‟, Industrial
Marketing Management, 29, 37–44.
Christopher, M., Towill, D.R. (2001) „An integrated model for the design of agile supply chains‟,
International Journal of Physical Distribution and Logistics Management, 31: 4, 235–246.
Chung, S. H., Lee, A. H. L. and Pearn, W. L. (2005) „Analytical network process (ANP)
approach for product mix planning in semiconductor fabricator‟, International Journal of
Production Economics, 96, 15-30.
Cooper, M. C., Lambert, D. M. and Pagh, J. D. (19997) „Supply chain management: more than a
new name for logistics‟, International Journal of Logistics Management, 8: 1, 1-13.

194
Cororaton, C. B., Salam, A., Altaf, Z., Orden, D. (2008) Cotton-Textile-Apparel Sectors of
Pakistan; Situation and Challenges Faced, IFPRI Discussion Paper 00800. (accessed online in
September, 2009), available at <http://www.ifpri.org/publication/cotton-textile-apparel-sectors-
pakistan>.
Cox G. (2005) Cox Review of Creativity in Business: Building on the UK´s Strengths, London,
HMSO. (accessed online in January, 2010), available at
<http://webarchive.nationalarchives.gov.uk/+/http://www.hm-
treasury.gov.uk/independent_reviews/cox_review/coxreview_index.cfm>.
Dyson, G. R. (2004) „Strategic Development and SWOT analysis at the University of Warwick‟,
European Journal of Operational Research, 152, 631-640.
Fatima, M. and Ahmed, E. (2005) „Quality Management in Pakistan‟s Knitwear Industry‟,
Quality Engineering, 18: 1, 15-22.
Farkasovsky, M. D. and Greda, A. (2004) „Outsourcing Firm´s Application Development Group‟,
in Saaty, T. L. and Luis, G. V. (2006) Decision Making with Analytical Network Process,
Springer, US, pp. 63-87.
Fisher, M. L. (1997) „What is the right supply chain for your product?‟ Harvard Business Review,
75: 2, 105-116.
Fleischmann, B. and Myer, H. (2003) „Planning Hierarchy, Modeling and Advance Planning
Systems‟ in A. G. de Kok and Graves, S. C. (eds) Supply chain management: design,
coordination and operation, North-Holland: Amsterdam. pp. 457-523.
Forman, E. H. and Gass, S. I. (2001) „The Analytical Hierarchy Process- An Exposition‟,
Operations Research, 49: 4,469-486.
Ghayur, S. and Zar, Z. (1993) Pakistan: Working Conditions in the Textile Sector. A Study of the
Large-Scale Textile Manufacturing Sector in the City of Karachi. Islamabad.
195
Gilham, Fred E. M., Bell, T. M., Arin, T., Matthews, G. A., Le Rumeur, C. and Brian, A. H.
(1995) Cotton Production Prospectus for The Next Decade, Technical Paper-287, World Bank,
Washington, D.C. (accessed online in August, 2010), available at
<http://go.worldbank.org/MIRNCN2DR0>.
Gill, J. and Johnson, P. (2002) Research Methods for Managers, London, Sage Publishing.
Grant, R. M. (1991) „The resource-based theory of competitive advantage‟, California
Management Review, 33: 3, 114–135.
Harland, C. M. and Knight, L. A. (2001) „Supply network strategy: role and competence
requirements‟, International Journal of Operations and Production Management, 21: 4, 467-489.
Hartley, J. L., Zirger, B. J. and Kamath, R. R. (1997) „Managing the buyer-supplier interface for
on-time performance in product development‟, Journal of Operations Management, 15: 1, 57-70.
Hill, T. and Westbrook, R. (1997) „SWOT Analysis: It´s Time for a Product Recall‟, Long Range
Planning, 30: 1, 46-52.
Hoekstra, S. and Romme, J. (eds) (1991) Integral Logistic Structures: Developing Customer-
oriented Goods Flow, New York: Industrial Press Inc.
Houben, G., Lenie, K. and Vanhoof, K. (1999) „A knowledge-based SWOT-analysis system as
an instrument for strategic planning in small and medium sized enterprises‟, Decision Support
Systems, 26, 125-135.
Hussain, D., Figueiredo, M. and Ferreira, F. (2009) „SWOT Analysis of Pakistan Textile Supply
Chain‟, Book of Proceedings of IX Congreso Galego de Estatística e Investigación de
Operacións, 12-14 November 2009, 293-299.
Hussain, D., Figueiredo, M., Tereso A. and Ferreira, F. (2010) „A Study of Textile & Clothing
Supply Chain in Pakistan‟, CD-ROM Proceedings of 2nd International Conference on
Engineering Optimization, 6 - 9 September 2010, Lisbon, Portugal.
196
Hussain, D., Figueiredo, M., Tereso, A. and Ferreira, F. (2011a) „Textile and Clothing Supply
Chain: Use of Planning-Link in the Strategic Planning Process‟, CD-ROM Proceedings of X
Congreso Galego de Estatística e Investigación de Operacións, 3–4–5 de novembro de 2011,
Pontevedra, Spain. ISBN: 978-84-938642-2-4
Hussain, D., Figueiredo, M., Tereso, A. and Ferreira, F. (2011b) „Competitiveness in Textile and
Clothing Supply Chain‟, CD-ROM Proceedings of International Conference on Engineering
UBI2011, 28-30 November 2011, Covilhã, Portugal. ISBN: 978-989-654-079-1
Hussain, D., Ferreira, F., Figueiredo, M. and Tereso, A. (2012a) „A Study on the Time Elements
in a Textile and Clothing Supply Chain‟, Book of Proceedings of 12th
World Textile Conference,
AUTEX, 13-15 June, 2012, 1325-1330, Zadar, Croatia.
Hussain, D., Figueiredo, M., Tereso, A. and Ferreira, F. (2012b) „Strategic Planning for the
Textile and Clothing Supply Chain‟, Book of Proceeding of the World Congress on Engineering
2012, Vol III, WCE 2012, July 4-6, 1621-1626, London, U.K.
World Trade Organization (2007) International Trade Statistics 2007, (accessed online in
August, 2009). available at:
<http://www.wto.org/english/res_e/statis_e/its2007_e/its07_toc_e.htm>.
Johnson, G. and Scholes, K. (1993) Exploring Corporate Strategy, Prentice-Hall, Englewood
Cliffs, NJ.
Kajanus, M., Kangas, J. and Kurttila, M. (2004) „The use of value focused thinking and the
A‟WOT hybrid method in tourism management‟, Tourism Management, 25, 499–506.
Kamal, M. and Hussain, T. (1988) „Cotton diseases and their control‟, Pakistan Mein Kapas,
Karachi: Pakistan Central Cotton Committee, and Rome: Food and Agriculture Organization.
Keeney, R. L. and Raiffa, H. (1993) Decisions with Multiple Objectives: Preferences and Value
Tradeoffs, Wiley, New York. Cambridge Univ. Press, New York.
Kenneth, R. A. (1971) The Concept of Corporate Strategy, Irwin, Homeland, IL.

197
Korpela, J. and Tuominen, M. (1996) „A decision aid in warehouse site selection‟, International
Journal of Production Economics, 45, 169-180.
Korpela, J., KylaKheiko, K., Lehmusvaara, A. and Tuominen, M. (2002) „An analytic approach
to production capacity allocation and supply chain design‟, International Journal of Production
Economics, 78, 187-195.
Kotler, P. (1991) Marketing Management, Prentice-Hall, Englewood Cliffs, NJ.
Kurttila, M., Pesonen, M., Kangas, J. and Kajanus, M. (2000) „Utilizing the analytical hierarchy
process (AHP) in SWOT analysis – a hybrid method and its application to a forest-certification
case‟, Forest Policy and Economics, 1: 1, 41-52.
Learned, E. P., Christensen, C. R., Andrews, K. E. and Guth, W. D. (1965) Business Policy: Text
and Cases, Irwin, Homewood, IL.
Leskinen, L. A., Leskinen, P., Kurttila, M., Kangas, J. and Kajanus, M. (2006) „Adapting modern
strategic decision support tools in the participatory strategy process-a case study of a forest
research station‟, Forest Policy and Economics, 8, 267–278.
Loo, B. P. Y. (2002) „The Textile and Clothing Industries Under the Fifth Kondratieff Wave:
Some Insights from the Case of Hong Kong‟, World Development, 30: 5, 847–872.
Masozera, M. K., Alavalapati, J. R. R., Jacobson, S. K. and Shresta, R. K. (2006) „Assessing the
suitability of community-based management for the Nyungwe Forest Reserve, Rwanda‟, Forest
Policy and Economics, 8, 206–216.
Meade, L. M. and Sarkis, J. (1999) „Analyzing organisational project alternatives for agile
manufacturing processes: an analytical network process approach‟, International Journal of
Production Research, 37, 241-261.
Mentzer, J. T., DeWitt, W., Keebler, J. S., Min, S., Nix, N. W., Smith, C. D., Zacharia, Z. G.
(2001) „Defining Supply Chain Management‟, Journal of Business Logistics, 22: 2, 1-25.

198
Mustajoki, J. (1999) Web-HIPRE - A Multiattribute Decision Support System on the Internet,
MSc Thesis, Helsinki University of Technology: Finland. (http://www.hipre.hut.fi/)
Myer, H., Rohde, J., and Stadtler, H. (2002) „Basics for Modeling‟, in Stadtler, H., and Kilger, C.
(eds) Supply Chain Management and Advance Planning, 2nd edn., Berlin, Springer, pp. 45-70.
Naylor, J. B., Naim, M. M. and Berry, D. (1999) „Leagility: Integrating the lean and agile
manufacturing paradigms in the total supply chain‟, International Journal of Production
Economics, 62, 107–118.
Omera, K., Creazza, A. (2008). The Impact of Product Design on the Supply Chain. Chartered
Institute of Logistics and Transport (UK), Seed Corn Research Fund 2007-2008.
Palmer, A. and Hartley, B. (1996) The Business and Marketing Environment, McGraw-Hill, New
York.
Palpacuer, F., Gibbon, P. and Thomsen, L. (2005) „New challenges for developing country
suppliers in global clothing chains: a comparative European perspective‟, World Development,
33: 3, 409-430.
Patton, M. Q. (2002) Qualitative Research and Evaluation Methods, Thousand Oaks, CA, Sage.
PCGA (Pakistan Cotton Ginners Association) (accessed online in various months of 2011 and
2012), available at: <http://www.pcga.org/facts___figures.html>.
PCGA (Pakistan Cotton Ginners Association) (accessed online in various months of 2011 and
2012), available at: <http://www.pcga.org/members.html>.
Peters, T. and Waterman, R. (1982) In Search of Excellence, New York, Harper & Row.
PHMA (Pakistan Hosiery Manufacturers Association) (accessed online in various months of
2011 and 2012), available at: <http://www.phmaonline.com/MembersList.asp>.

199
Pickton, David W. and Sheila W. (1998) „What´s is swot in strategic analysis?‟, Strategic
Change, 7, 101-109.
Porter, M. E. (1979) „How Competitive Forces Shape Strategy‟, Harvard Business Review,
57(March-April), 137-45.
Porter, M. E. (1980) Competitive Strategy, New York: Free Press.
PRGMEA (Pakistan Readymade Garments Manufacturers and Exporters Association) (accessed
online in various months of 2012), available at: <http://www.prgmea.org/north.asp>.
PRGMEA (Pakistan Readymade Garments Manufacturers and Exporters Association) (accessed
online in various months of 2012), available at: <http://www.prgmea.org/south.asp>.
Rogers, M. (2001) Engineering Project Appraisal, Blackwell Science.
Saaty, T. L. (1996). Decision Making with Dependence and Feedback: The Analytic Network
Process. RWS Publications, Pittsburgh.
Saaty, T. L. and Takizawa, M. (1986) „Dependence and independence: from linear hierarchies to
nonlinear Networks‟, European Journal of Operational Research, 26, 229–237.
Saaty, T. L. (1980) The Analytic Hierarchy Process, McGraw-Hill, New York,.
Saaty, T. L. and Sodenkamp, M. (2008) „Making decisions in hierarchic and network systems‟,
International Journal of Applied Decision Sciences, 1: 1, 24-79.
Saaty, T. L. and Vergas, L. G. (2006) Decision Making with Analytical Network Process,
Springer.
Salam, A., Soomro, B.A. (1988). Cotton Varieties and Their Cultivation. Pakistan Mein Kapas,
Karachi: Pakistan Central Cotton Committee and Rome: Food and Agriculture Organization.

200
Salam, A. (2008). Production, Prices, and Emerging Challenges in Pakistan Cotton Sector. IFPRI
Discussion Paper 00800, 22-51. (accessed online in September, 2009), available at
<http://www.ifpri.org/publication/cotton-textile-apparel-sectors-pakistan>.
Saunders, M., Lewis, P. and Thornhill, A. (2007). Research Methods for Business Students (4th
edn), Pearson.
Sharifi, H. and Zhang, Z. (2001) „Agile manufacturing in practice: application of a methodology‟,
International Journal of Operations and Production Management, 21: 5–6, 772–794.
Shrestha, R. K., Alavalapati, J. R. R. and Kalmbacher, R. S. (2004) „Exploring the potential for
silvopasture adoption in South-central Florida: an application of SWOT-AHP method‟,
Agricultural Systems, 81, 185–199.
Siegmann, K. A. (2005) „The Agreement on Textile and Clothing: Potential effects on gendered
employment in Pakistan‟, International Labour Review, 144: 4, 401-421.
Stewart, R., Moamed S. and Daet R. (2002) „Strategic implementation of IT/IS projects in
construction: a case study‟, Automation in Construction, 11, 681–694.
Syracuse University Academic Areas (accessed online in October, 2009), available at:
<http://apps.whitman.syr.edu/Academics/Marketing/SupplyChain/intro.asp>
Teng, S. Gery and Jaramillo, H. (2005) „A model for evaluation and selection of suppliers in
global textile and apparel supply chains‟, Distribution and Logistics Management, 35: 7, 503-
523.
Tersine, J. Richard and Hummingbird, Edward A. (1995) „Lead-time reduction: the search for
competitive advantage‟, International Journal of Operations and Production Management, 15: 2,
8-18.
TMA (Towel Manufacturers Association) (accessed online in various months of 2011), available
at: <http://www.towelassociation.com/AboutUs.asp>.

201
TMA (Towel Manufacturers Association) (accessed online in various months of 2011), available
at: <http://www.towelassociation.com/Members.asp>.
Ulrich, D. and Lake, D. (1990) Organizational Capability: Competing from the Inside Out,
Wiley, New York.
Valentin, Erhard K. (2001) „SWOT Analysis from a Resource-Based View‟, Journal of
Marketing Theory and Practice, Spring 2001, 54-69.
Vivian, Wai-Yan T. and Au, Kin-Fan (2008) „Regionalization of Textile Trade: Evidence from
the EU, NAFTA, AFTA, and SAPTA‟, The International Trade Journal, 22: 4, 457-483.
Wenerfelt, B. (1984) „A resource-based view of the firm‟, Strategic Management Journal, 5,
171-180.
Wilson, R., Gilligan, C. with Pearson, D. (1992) Strategic Marketing Management, Butterworth-
Heinemann, Oxford.
Yuksel, I. and Dagdeviren, M. (2007) „Using the analytical network process (ANP) in a SWOT
analysis – A case study for a textile firm‟, Information Sciences, 177, 3364-3382.
Yusuf, M. An Overview of the Transport sector in Study on State of Domestic Commerce in
Pakistan. IDS, Islamabad. (accessed online in October, 2009), available at
<http://s3.amazonaws.com/zanran_storage/www.commerce.gov.pk/ContentPages/15852217.pdf>
Yusuf, Y. Y., Sarhadi, M. and Gunasekaran, A. (1999) „Agile Manufacturing: The drivers,
concepts and attributes‟, International Journal of Production Economics, 62, 33-43.

202
Appendices
Appendix III.A. Data Tables for the Textile and Clothing Sectors
Table 6: Supply and Consumption of Cotton in Pakistan („000‟ kilograms)
Years
Supply/Availability of Cotton Demand/Consumption of Cotton
Stock Production Imports Total Consumption
(Mills & Non-Mill Sectors) Losses Export End Season Stock Total
1971-72 13691 770264 889 784845 476881 282537 0 25427 784845
1972-73 25427 764219 533 790179 587122 185987 3912 13158 790179
1973-74 13158 717100 356 730613 586055 53342 0 91216 730613
1974-75 91216 690428 356 782000 471191 257999 0 52809 782000
1975-76 52809 559384 711 612904 506397 82147 10491 13869 612904
1976-77 13869 473503 1600 488972 449143 14758 0 25071 488972
1977-78 25071 601880 356 627307 431362 114331 8357 73257 627307
1978-79 73257 495551 533 569341 450032 56543 0 62766 569341
1979-80 60044 728355 680 789080 402960 25855 0 127573 789080
1980-81 127573 757102 1021 885695 468447 330839 0 86409 885695
1981-82 86409 748427 1021 835857 509951 237796 0 88110 835857
1982-83 88110 823950 850 912911
27556 170 104780 912911
1983-84 104780 494472 64467 663718 507059 60384 0 96275 663718
1984-85 96275 1008675 2041 1106991 550094 306345 0 250553 1106991
1985-86 250553 1217044 1361 1468958 541589 693826 0 233543 1468958
1986-87 233543 1319953 510 1554006 709645 606226 510 237626 1554006
1987-88 237626 1468447 1021 1707093 781936 559959 1871 363327 1707093
1988-89 363327 1426263 1361 1790951 874809 759483 1021 155639 1790951
1989-90 155639 1454499 3572 1613710 1116347 306685 0 190679 1613710
1990-91 190679 1637694 340 1828713 1357374 268923 340 202075 1828713
1991-92 202075 2180984 4252 2387311 1440041 433237 0 514033 2387311
1992-93 514373 1540058 5613 2060045 1517435 254805 0 287804 2060045
1993-94 287804 1367750 106651 1762205 1577820 55282 0 129104 1762205
1994-95 129104 1479334 109713 1718150 1510631 36571 0 170947 1718150
1995-96 170947 1802178 34019 2007145 1550094 307535 0 149515 2007145
1996-97 149515 1594489 61915 1805920 1561831 35720 0 208369 1805920
1997-98 208369 1562171 51199 1821739 1598572 86579 0 136588 1821739
1998-99 136588 1495153 223337 1855078 1587345 1531 0 266202 1855078
1999-00 266202 1911890 71611 2249703 1691274 99677 0 458752 2249703
2000-01 441402 1825481 113965 2380848 1521177 120599 0 494472 2289336
2001-02 328968 1805069 18370 2317742 1931962 45586 0 340 2317742
2002-03 458241 1736860 187617 2382719 2032999 50349 0 29937 2382719
2003-04 29937 1978568 393264 2401770 2025005 37081 0 339684 2401770
2004-05 339684 2426434 382548 3148666 2208880 119748 0 700800 3148666
2005-06 70080 2214493 293928 3209220 2533765 59874 0 615581 3209220
2006-07 615581 2186767 502126 3304474 2649941 47287 0 60725 3304474
2007-08 60725 1982481 850995 3440722 2629700 58513 0 752509 3440722

203
Years
Supply/Availability of Cotton Demand/Consumption of Cotton
Stock Production Imports Total Consumption
(Mills & Non-Mill Sectors) Losses Export End Season Stock Total
2008-09 723593 2010376 417758 3151727 2615752 7654 0 458071 3151727
2009-10 458071 2159041 34189 2959007 2403130 156489 0 399388 2959007
2010-11 399388 1989795 340534 2729717 2445655 130805 0 153257 2729717
Source: PCCC (Data available at www.aptma.org.pk)
Note: Mill & Non Mill Consumption and End Season Stock figures are Provisional
Table 7: Cotton Production, Area and Per Hectare Yield
Period Area („000‟ Hectares) Production (Kilograms) Yield (Kilogram Per Hectare)
Sindh Punjab Total Sindh Punjab Total Sindh Punjab Total
1947-48 280 734 1035 58321 110063 168384 208 146 163
1948-49 263 620 883 50142 98150 148292 191 158 168
1949-50 302 677 979 58143 143847 201990 193 212 206
1950-51 316 737 1053 80369 141713 222082 254 192 211
1951-52 319 823 1142 69345 152737 222082 217 186 194
1952-53 358 831 1189 95661 192033 287693 267 231 242
1953-54 328 649 977 96016 128733 224749 293 198 230
1954-55 321 717 1038 88015 155404 243419 274 217 235
1955-56 376 818 1194 87482 171407 258888 233 210 217
1956-57 406 825 1231 91749 174074 265823 226 211 216
1957-58 391 842 1233 91038 174074 265112 233 207 215
1958-59 383 769 1152 93705 161983 255688 245 211 222
1959-60 358 790 1148 86059 175496 261556 240 222 228
1960-61 372 757 1129 93171 177097 270268 250 234 239
1961-62 377 826 1203 84637 202701 287338 225 245 239
1962-63 357 841 1198 92460 246442 338902 259 293 283
1963-64 368 924 1292 99217 291783 391000 270 316 303
1964-65 316 1006 1322 75035 280581 355616 237 279 269
1965-66 350 1031 1389 121087 268668 389755 346 259 281
1966-67 350 1087 1437 112730 320054 432785 322 294 301
1967-68 384 1189 1573 119131 361306 480437 310 304 305
1968-69 371 1178 1549 128911 366818 495729 347 311 320
1969-70 368 1224 1592 128200 378020 506219 348 309 318
1970-71 390 1221 1611 137979 379798 517777 354 311 321
1971-72 411 1386 1797 163939 507108 671047 399 366 373
1972-73 388 1461 1849 183853 482215 666069 474 330 360
1973-74 435 1265 1700 196656 429229 625884 452 339 396
1974-75 435 1450 1885 179408 423716 603125 412 292 352
1975-76 423 1274 1697 156827 326100 482927 371 256 314
1976-77 498 1238 1736 150603 262445 413048 302 212 257
1977-78 514 1188 1702 208035 335524 543559 405 282 344
1978-79 469 1247 1716 133889 302985 436874 285 243 264
1979-80 554 1312 1866 235754 456030 691784 426 248 337
1980-81 563 1377 1940 229801 454499 684300 408 330 369
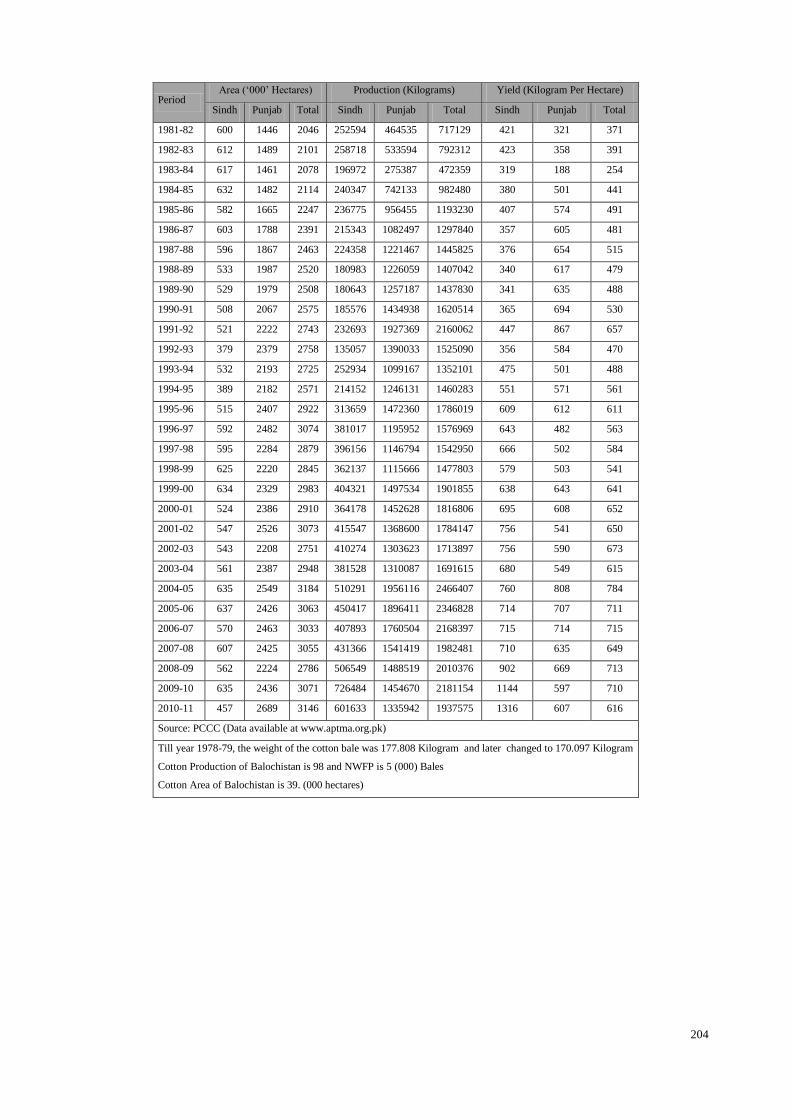
204
Period Area („000‟ Hectares) Production (Kilograms) Yield (Kilogram Per Hectare)
Sindh Punjab Total Sindh Punjab Total Sindh Punjab Total
1981-82 600 1446 2046 252594 464535 717129 421 321 371
1982-83 612 1489 2101 258718 533594 792312 423 358 391
1983-84 617 1461 2078 196972 275387 472359 319 188 254
1984-85 632 1482 2114 240347 742133 982480 380 501 441
1985-86 582 1665 2247 236775 956455 1193230 407 574 491
1986-87 603 1788 2391 215343 1082497 1297840 357 605 481
1987-88 596 1867 2463 224358 1221467 1445825 376 654 515
1988-89 533 1987 2520 180983 1226059 1407042 340 617 479
1989-90 529 1979 2508 180643 1257187 1437830 341 635 488
1990-91 508 2067 2575 185576 1434938 1620514 365 694 530
1991-92 521 2222 2743 232693 1927369 2160062 447 867 657
1992-93 379 2379 2758 135057 1390033 1525090 356 584 470
1993-94 532 2193 2725 252934 1099167 1352101 475 501 488
1994-95 389 2182 2571 214152 1246131 1460283 551 571 561
1995-96 515 2407 2922 313659 1472360 1786019 609 612 611
1996-97 592 2482 3074 381017 1195952 1576969 643 482 563
1997-98 595 2284 2879 396156 1146794 1542950 666 502 584
1998-99 625 2220 2845 362137 1115666 1477803 579 503 541
1999-00 634 2329 2983 404321 1497534 1901855 638 643 641
2000-01 524 2386 2910 364178 1452628 1816806 695 608 652
2001-02 547 2526 3073 415547 1368600 1784147 756 541 650
2002-03 543 2208 2751 410274 1303623 1713897 756 590 673
2003-04 561 2387 2948 381528 1310087 1691615 680 549 615
2004-05 635 2549 3184 510291 1956116 2466407 760 808 784
2005-06 637 2426 3063 450417 1896411 2346828 714 707 711
2006-07 570 2463 3033 407893 1760504 2168397 715 714 715
2007-08 607 2425 3055 431366 1541419 1982481 710 635 649
2008-09 562 2224 2786 506549 1488519 2010376 902 669 713
2009-10 635 2436 3071 726484 1454670 2181154 1144 597 710
2010-11 457 2689 3146 601633 1335942 1937575 1316 607 616
Source: PCCC (Data available at www.aptma.org.pk)
Till year 1978-79, the weight of the cotton bale was 177.808 Kilogram and later changed to 170.097 Kilogram
Cotton Production of Balochistan is 98 and NWFP is 5 (000) Bales
Cotton Area of Balochistan is 39. (000 hectares)

205
Table 8: Staple-wise Production of Cotton („000‟ Kilograms)
Period Short Staple
(Below 20.64mm)
Medium Staple
(20.64 To 25.40 mm)
Medium-Long Staple
(26.19 To 27.78 mm)
Long Staple
(28.57 To 33.34 mm) Total Production
1947-48 30583 166073
196656
1948-49 26671 144736
171407
1949-50 21337 198967
220304
1950-51 47119 202879
249998
1951-52 47119 201279
248398
1952-53 50497 266890
317209
1953-54 43563 209813
253376
1954-55 56721 224749
281470
1955-56 55298 243064
298362
1956-57 54409 249820
304229
1957-58 54587 249109
303696
1958-59 42496 239330 356
282181
1959-60 48719 236307 6401
291427
1960-61 41074 247687 12091
300851
1961-62 45519 259955 18670
324144
1962-63 37517 304941 23826
366284
1963-64 39296 349037 30227
418560
1964-65 31472 314187 32005
377664
1965-66 31650 345659 37162
414470
1966-67 39118 378909 45341
463368
1967-68 38762 423539 55298
517599
1968-69 40896 420338 65433 889 527556
1969-70 37695 427628 66678 3556 535558
1970-71 26849 443098 70590 1778 542314
1971-72 37340 575209 94060 889 707498
1972-73 38407 539469 117887 6045 701808
1973-74 37340 502308 116109 2845 658601
1974-75 36806 479015 116464 1956 634241
1975-76 35028 391000 86415 1245 513687
1976-77 40540 357750 27205 9424 434918
1977-78 31294 456078 75924 11558 574853
1978-79 41785 368418 55120 8001 473325
1979-80 32999 496173 186086 13097 728355
1980-81 30277 296989 377105 10206 714577
1981-82 31128 325225 381528 10206 748087
1982-83 31638 271815 477973 42524 823950
1983-84 22113 212281 187447 72802 494642
1984-85 26195 257697 446505 278279 1008675
1985-86 23643 248172 630039 315020 1216874
1986-87 22113 103759 894200 299881 1319953
1987-88 22623 141691 874639 429495 1468447
1988-89 19221 203946 937064 266032 1426263
1989-90 18200 372512 951693 113625 1456030
1990-91 17180 66338 973975 580201 1637694
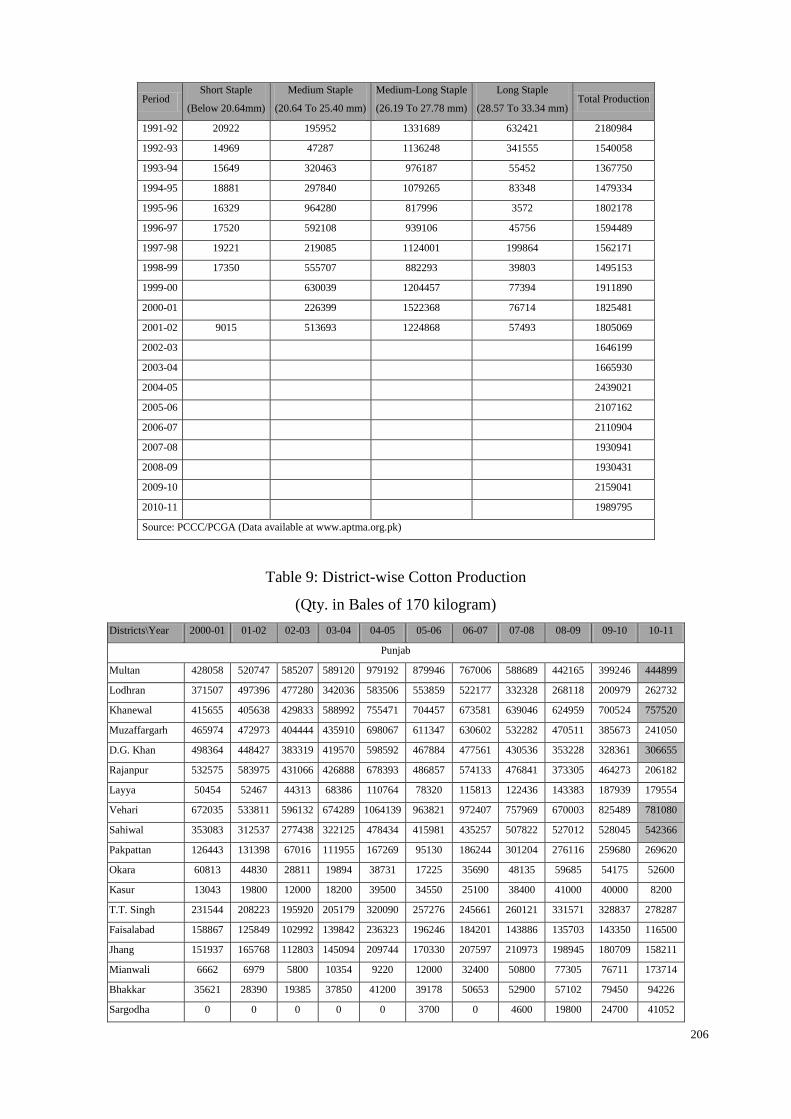
206
Period Short Staple
(Below 20.64mm)
Medium Staple
(20.64 To 25.40 mm)
Medium-Long Staple
(26.19 To 27.78 mm)
Long Staple
(28.57 To 33.34 mm) Total Production
1991-92 20922 195952 1331689 632421 2180984
1992-93 14969 47287 1136248 341555 1540058
1993-94 15649 320463 976187 55452 1367750
1994-95 18881 297840 1079265 83348 1479334
1995-96 16329 964280 817996 3572 1802178
1996-97 17520 592108 939106 45756 1594489
1997-98 19221 219085 1124001 199864 1562171
1998-99 17350 555707 882293 39803 1495153
1999-00
630039 1204457 77394 1911890
2000-01
226399 1522368 76714 1825481
2001-02 9015 513693 1224868 57493 1805069
2002-03
1646199
2003-04
1665930
2004-05
2439021
2005-06
2107162
2006-07
2110904
2007-08
1930941
2008-09
1930431
2009-10
2159041
2010-11
1989795
Source: PCCC/PCGA (Data available at www.aptma.org.pk)
Table 9: District-wise Cotton Production
(Qty. in Bales of 170 kilogram)
Districts\Year 2000-01 01-02 02-03 03-04 04-05 05-06 06-07 07-08 08-09 09-10 10-11
Punjab
Multan 428058 520747 585207 589120 979192 879946 767006 588689 442165 399246 444899
Lodhran 371507 497396 477280 342036 583506 553859 522177 332328 268118 200979 262732
Khanewal 415655 405638 429833 588992 755471 704457 673581 639046 624959 700524 757520
Muzaffargarh 465974 472973 404444 435910 698067 611347 630602 532282 470511 385673 241050
D.G. Khan 498364 448427 383319 419570 598592 467884 477561 430536 353228 328361 306655
Rajanpur 532575 583975 431066 426888 678393 486857 574133 476841 373305 464273 206182
Layya 50454 52467 44313 68386 110764 78320 115813 122436 143383 187939 179554
Vehari 672035 533811 596132 674289 1064139 963821 972407 757969 670003 825489 781080
Sahiwal 353083 312537 277438 322125 478434 415981 435257 507822 527012 528045 542366
Pakpattan 126443 131398 67016 111955 167269 95130 186244 301204 276116 259680 269620
Okara 60813 44830 28811 19894 38731 17225 35690 48135 59685 54175 52600
Kasur 13043 19800 12000 18200 39500 34550 25100 38400 41000 40000 8200
T.T. Singh 231544 208223 195920 205179 320090 257276 245661 260121 331571 328837 278287
Faisalabad 158867 125849 102992 139842 236323 196246 184201 143886 135703 143350 116500
Jhang 151937 165768 112803 145094 209744 170330 207597 210973 198945 180709 158211
Mianwali 6662 6979 5800 10354 9220 12000 32400 50800 77305 76711 173714
Bhakkar 35621 28390 19385 37850 41200 39178 50653 52900 57102 79450 94226
Sargodha 0 0 0 0 0 3700 0 4600 19800 24700 41052

207
Districts\Year 2000-01 01-02 02-03 03-04 04-05 05-06 06-07 07-08 08-09 09-10 10-11
Rahim Yar Khan 1304152 1291624 1420902 1132933 1840132 1611304 1490324 1175005 1160815 1277391 1069302
Bahawalpur 1380825 1344027 1184462 1156492 1393595 1335583 1334846 1073879 1072887 898882 896445
Bahawal Nagar 751221 764374 678342 819864 1054297 914290 1129024 1083765 1049991 1074069 1024052
Total Punjab 8008833 7959233 7457465 7664973 11296659 9849284 10090277 8831617 8353604 8458483 7904247
Sindh
Hyderabad 196074 171864 123540 119865 189834 182606 208503 244191 334051 447974 362675
Tharparker 144964 146855 122660 103050 235539 179647 176092 216755 303517 387560 407461
Sanghar 715196 566970 504544 637772 936081 909162 793071 885310 1322084 1877582 1599526
Nawabshah 240892 257551 212539 267516 286280 280694 197099 248178 214778 371156 349168
Naushehro Feroz 148683 197157 157473 161245 230682 182229 175819 155442 149073 226965 194458
Khairpur 122088 176026 199343 200975 235864 170636 155951 172393 168614 215294 208542
Ghotki 401208 560371 573895 358664 511242 330645 315579 277163 210443 287021 220324
Sukkur 171985 217928 239644 228942 283286 208204 192238 224543 197684 279990 308770
Dadu 37463 56511 77423 47928 111178 87782 95574 80933 85781 119210 118877
Total Sindh 2178553 2351233 2211061 2125957 3019986 2531605 2309926 2504908 2986025 4212752 3769801
Baluchistan
Baluchistan - 3779 9875 3596 30387 13900 10417 16400 9400 22033 24118
Pakistan
Grand Total 10187386 10314245 9678401 9794526 14347032 12394789 12410620 11352925 11349029 12693268 11698166
Source: PCGA (Data available at www.aptma.org.pk)
Table 10: District-wise Cotton Production Share
Districts 2000-01 01-02 02-03 03-04 04-05 05-06 06-07 07-08 08-09 09-10 10-11 Average
Rahim Yar Khan 12.8 12.5 14.7 11.6 12.8 13.0 12.0 10.3 10.2 10.1 9.1 11.7
Bahawalpur 13.6 13.0 12.2 11.8 9.7 10.8 10.8 9.5 9.5 7.1 7.7 10.5
Sanghar 7.0 5.5 5.2 6.5 6.5 7.3 6.4 7.8 11.6 14.8 13.7 8.4
Bahawal Nagar 7.4 7.4 7.0 8.4 7.3 7.4 9.1 9.5 9.3 8.5 8.8 8.2
Vehari 6.6 5.2 6.2 6.9 7.4 7.8 7.8 6.7 5.9 6.5 6.7 6.7
Khanewal 4.1 3.9 4.4 6.0 5.3 5.7 5.4 5.6 5.5 5.5 6.5 5.3
Multan 4.2 5.0 6.0 6.0 6.8 7.1 6.2 5.2 3.9 3.1 3.8 5.2
Muzaffargarh 4.6 4.6 4.2 4.5 4.9 4.9 5.1 4.7 4.1 3.0 2.1 4.2
Rajanpur 5.2 5.7 4.5 4.4 4.7 3.9 4.6 4.2 3.3 3.7 1.8 4.2
D.G. Khan 4.9 4.3 4.0 4.3 4.2 3.8 3.8 3.8 3.1 2.6 2.6 3.8
Sahiwal 3.5 3.0 2.9 3.3 3.3 3.4 3.5 4.5 4.6 4.2 4.6 3.7
Lodhran 3.6 4.8 4.9 3.5 4.1 4.5 4.2 2.9 2.4 1.6 2.2 3.5
Ghotki 3.9 5.4 5.9 3.7 3.6 2.7 2.5 2.4 1.9 2.3 1.9 3.3
Nawabshah 2.4 2.5 2.2 2.7 2.0 2.3 1.6 2.2 1.9 2.9 3.0 2.3
T.T. Singh 2.3 2.0 2.0 2.1 2.2 2.1 2.0 2.3 2.9 2.6 2.4 2.3
Sukkar 1.7 2.1 2.5 2.3 2.0 1.7 1.5 2.0 1.7 2.2 2.6 2.0
Hyderabad 1.9 1.7 1.3 1.2 1.3 1.5 1.7 2.2 2.9 3.5 3.1 2.0
Tharparker 1.4 1.4 1.3 1.1 1.6 1.4 1.4 1.9 2.7 3.1 3.5 1.9
Khairpur 1.2 1.7 2.1 2.1 1.6 1.4 1.3 1.5 1.5 1.7 1.8 1.6
Naushehro Feroz 1.5 1.9 1.6 1.6 1.6 1.5 1.4 1.4 1.3 1.8 1.7 1.6
Pakpattan 1.2 1.3 0.7 1.1 1.2 0.8 1.5 2.7 2.4 2.0 2.3 1.6
Jhang 1.5 1.6 1.2 1.5 1.5 1.4 1.7 1.9 1.8 1.4 1.4 1.5

208
Districts 2000-01 01-02 02-03 03-04 04-05 05-06 06-07 07-08 08-09 09-10 10-11 Average
Faisalabad 1.6 1.2 1.1 1.4 1.6 1.6 1.5 1.3 1.2 1.1 1.0 1.3
Layya 0.5 0.5 0.5 0.7 0.8 0.6 0.9 1.1 1.3 1.5 1.5 0.9
Dadu 0.4 0.5 0.8 0.5 0.8 0.7 0.8 0.7 0.8 0.9 1.0 0.7
Bhakkar 0.3 0.3 0.2 0.4 0.3 0.3 0.4 0.5 0.5 0.6 0.8 0.4
Okara 0.6 0.4 0.3 0.2 0.3 0.1 0.3 0.4 0.5 0.4 0.4 0.4
Mianwali 0.1 0.1 0.1 0.1 0.1 0.1 0.3 0.4 0.7 0.6 1.5 0.4
Kasur 0.1 0.2 0.1 0.2 0.3 0.3 0.2 0.3 0.4 0.3 0.1 0.2
Baluchistan 0.0 0.0 0.1 0.0 0.2 0.1 0.1 0.1 0.1 0.2 0.2 0.1
Sargodha 0.0 0.0 0.0 0.0 0.0 0.0 0.0 0.0 0.2 0.2 0.4 0.1
Total Punjab 78.6 77.2 77.1 78.3 78.7 79.5 81.3 77.8 73.6 66.6 67.6 76.0
Total Sindh 21.4 22.8 22.8 21.7 21.0 20.4 18.6 22.1 26.3 33.2 32.2 23.9
Baluchistan 0.0 0.0 0.1 0.0 0.2 0.1 0.1 0.1 0.1 0.2 0.2 0.1
Total Pakistan 100 100 100 100 100 100 100 100 100 100 100 100
Source: PCGA (Data available at www.aptma.org.pk)
Table 22: Growth of the Yarn Manufacturing Capacity
Period Number of Textile Units
Installed Machines (000) Working Machines (000) and their Growth on the Previous Year
Spindles Rotors Spindles Working Spindles
Growth (GOPY) Rotors
Working Rotor
Growth (GOPY)
1948
78 0 78
0 0.00
1949
137 0 137 75.64 0 0.00
1950
182 0 182 32.85 0 0.00
1951
225 0 225 23.63 0 0.00
1952
499 0 302 34.22 0 0.00
1953
649 0 600 98.68 0 0.00
1954
1113 0 940 56.67 0 0.00
1955
1449 0 1355 44.15 0 0.00
1956
1518 0 1422 4.94 0 0.00
1957
1568 0 1447 1.76 0 0.00
1958
1569 0 1459 0.83 0 0.00
1958-59 70 1581 0 1488 1.99 0 0.00
1959-60 72 1582 0 1491 0.20 0 0.00
1960-61 74 1586 0 1531 26.80 0 0.00
1961-62 71 1644 0 1524 -0.46 0 0.00
1962-63 76 1850 0 1810 18.77 0 0.00
1963-64 81 1913 0 1792 -0.99 0 0.00
1964-65 83 1967 0 1852 3.35 0 0.00
1965-66 89 2056 0 1871 1.03 0 0.00
1966-67 94 2043 0 1888 0.91 0 0.00
1967-68 95 2048 0 1916 1.48 0 0.00
1968-69 100 2175 0 2090 9.08 0 0.00
1969-70 107 2397 0 2327 11.34 0 0.00
1970-71 113 2605 0 2491 7.05 0 0.00
1971-72 131 2863 0 2650 6.38 0 0.00
1972-73 150 3266 0 3057 15.36 0 0.00
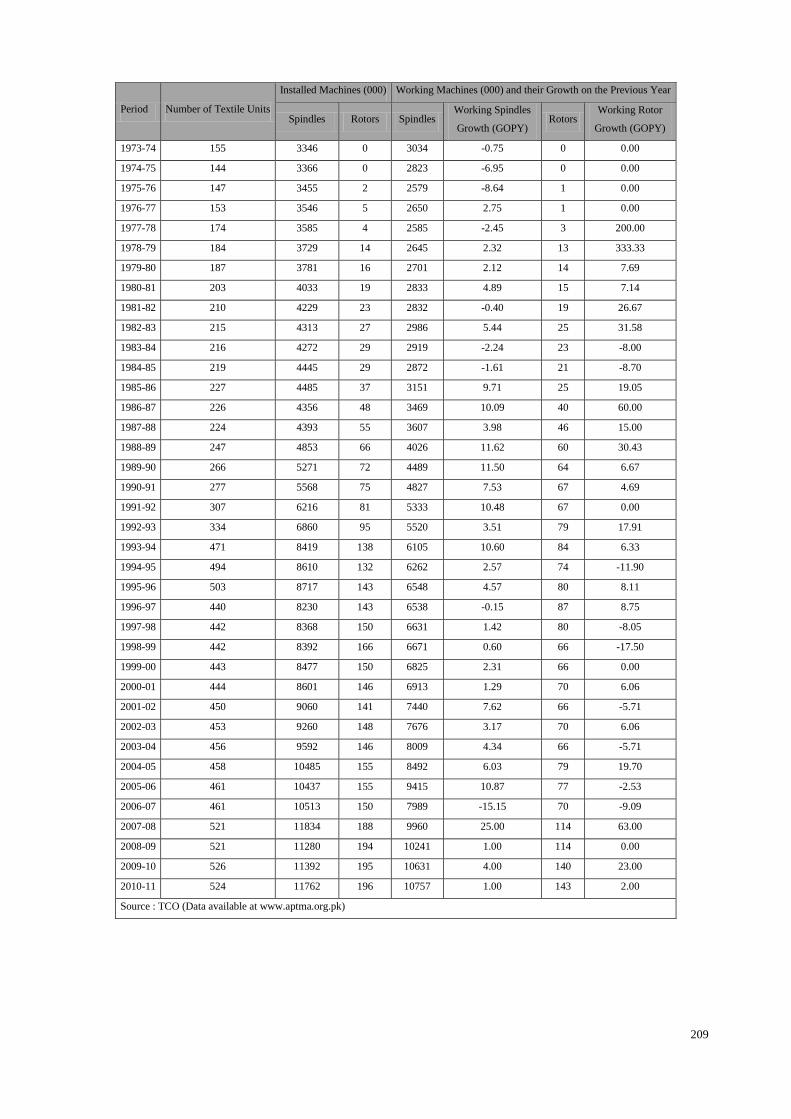
209
Period Number of Textile Units
Installed Machines (000) Working Machines (000) and their Growth on the Previous Year
Spindles Rotors Spindles Working Spindles
Growth (GOPY) Rotors
Working Rotor
Growth (GOPY)
1973-74 155 3346 0 3034 -0.75 0 0.00
1974-75 144 3366 0 2823 -6.95 0 0.00
1975-76 147 3455 2 2579 -8.64 1 0.00
1976-77 153 3546 5 2650 2.75 1 0.00
1977-78 174 3585 4 2585 -2.45 3 200.00
1978-79 184 3729 14 2645 2.32 13 333.33
1979-80 187 3781 16 2701 2.12 14 7.69
1980-81 203 4033 19 2833 4.89 15 7.14
1981-82 210 4229 23 2832 -0.40 19 26.67
1982-83 215 4313 27 2986 5.44 25 31.58
1983-84 216 4272 29 2919 -2.24 23 -8.00
1984-85 219 4445 29 2872 -1.61 21 -8.70
1985-86 227 4485 37 3151 9.71 25 19.05
1986-87 226 4356 48 3469 10.09 40 60.00
1987-88 224 4393 55 3607 3.98 46 15.00
1988-89 247 4853 66 4026 11.62 60 30.43
1989-90 266 5271 72 4489 11.50 64 6.67
1990-91 277 5568 75 4827 7.53 67 4.69
1991-92 307 6216 81 5333 10.48 67 0.00
1992-93 334 6860 95 5520 3.51 79 17.91
1993-94 471 8419 138 6105 10.60 84 6.33
1994-95 494 8610 132 6262 2.57 74 -11.90
1995-96 503 8717 143 6548 4.57 80 8.11
1996-97 440 8230 143 6538 -0.15 87 8.75
1997-98 442 8368 150 6631 1.42 80 -8.05
1998-99 442 8392 166 6671 0.60 66 -17.50
1999-00 443 8477 150 6825 2.31 66 0.00
2000-01 444 8601 146 6913 1.29 70 6.06
2001-02 450 9060 141 7440 7.62 66 -5.71
2002-03 453 9260 148 7676 3.17 70 6.06
2003-04 456 9592 146 8009 4.34 66 -5.71
2004-05 458 10485 155 8492 6.03 79 19.70
2005-06 461 10437 155 9415 10.87 77 -2.53
2006-07 461 10513 150 7989 -15.15 70 -9.09
2007-08 521 11834 188 9960 25.00 114 63.00
2008-09 521 11280 194 10241 1.00 114 0.00
2009-10 526 11392 195 10631 4.00 140 23.00
2010-11 524 11762 196 10757 1.00 143 2.00
Source : TCO (Data available at www.aptma.org.pk)

210
Table 24: Province-wise Growth of Textile Manufacturing Capacity
PERIOD Textile Units Installed Spindles in "000" Installed Rotors Installed Looms
S B P K KP Pak S B P K KP Pak S B P KP Pak S B P K KP Pak
1971-72 76 1 45 0 9 131 1606 12 1080 0 165 2863 0 0 0 0 0 14000 0 15000
1000 30000
1972-73 89 1 51 0 9 150 1816 12 1229 0 209 3266 0 0 0 0 0 14000 0 14000
1000 29000
1973-74 87 1 56 1 10 155 1777 12 1323 13 221 3346 0 0 0 0 0 14000 0 14000
1000 29000
1974-75 75 1 58 1 9 144 1755 12 1377 13 209 3366 0 0 0 0 0 14000 0 14000
1000 29000
1975-76 79 1 57 1 9 147 1796 12 1425 13 209 3455 1536 0 0 0 1536 14000 0 14000
1000 29000
1976-77 79 1 60 1 12 153 1796 12 1502 13 223 3546 1536 0 3600 0 5136 14000 0 14000
1000 29000
1977-78 90 1 69 2 12 174 1777 25 1539 25 219 3585 1200 0 2400 0 3600 12441 0 12379
1510 26330
1978-79 93 1 76 2 12 184 1826 25 1634 25 219 3729 8800 0 5650 0 14450 12766 0 11967
1827 26560
1979-80 95 1 76 3 12 187 1857 25 1633 50 216 3781 11200 0 5000 0 16200 12666 0 11598
1898 26162
1980-81 99 3 86 3 12 203 1914 75 1778 50 216 4033 12400 1200 5000 0 18600 12300 1100 10044
1530 24974
1981-82 100 4 90 3 13 210 1973 125 1841 48 242 4229 11800 1200 9600 0 22600 11611 2200 9196
1500 24507
1982-83 103 4 92 3 13 215 1966 125 1931 48 243 4313 14800 1200 10800 0 26800 10835 2200 9832
1494 24361
1983-84 103 5 92 3 13 216 1927 125 1928 48 244 4272 16000 1984 11400 0 29384 10812 2200 9518
1495 24025
1984-85 104 5 94 3 13 219 1976 125 2063 49 232 4445 16000 1484 11400 0 28884 10629 2200 9119
1495 23443
1985-86 106 6 99 4 12 227 1991 100 2099 63 232 4485 19080 4976 13400 0 37456 7680 2200 8447
1045 19372
1986-87 103 6 101 4 12 226 1792 100 2157 63 244 4356 26842 5376 15976 0 48194 7001 2328 7097
1045 17471
1987-88 101 8 102 4 9 224 1806 112 2186 63 226 4393 30848 6816 17969 0 55633 6050 2328 7607
384 16369
1988-89 107 10 117 4 9 247 1851 112 2592 63 235 4853 35072 9480 21856 0 66408 6678 2300 7315
360 16653
1989-90 109 11 132 5 9 266 1908 129 2919 75 240 5271 38604 9432 23992 0 72028 5596 2300 7252
436 15584
1990-91 110 11 142 5 9 277 1910 129 3210 75 244 5568 38820 9840 25862 0 74522 5189 2300 7278
546 15313
1991-92 111 11 171 5 9 307 1948 129 2806 75 258 5216 40988 10240 29792 0 81020 5131 2300 6925
454 14810
1992-93 112 11 195 6 10 334 2053 129 4245 92 341 6860 44444 12808 37036 400 94688 4694 2300 6587
454 14035
1993-94 124 12 271 6 16 429 2084 151 5513 94 434 8276 55644 15688 64524 400 136256 4942 2300 5864
454 13560
1994-95 125 12 286 6 17 446 2080 151 5627 94 449 8401 55980 14536 59488 400 130404 5746 2300 5557
454 14057
1995-96 128 13 297 6 17 461 2128 166 5740 94 459 8587 59420 15688 66472 0 141580 4815 2300 5761
442 13318
1996-97 114 10 293 6 17 440 1948 70 5654 94 464 8230 57236 14592 71632 0 143460 4626 100 4769
442 9937
1997-98 114 10 295 6 17 442 1958 70 5749 94 497 8368 58632 14592 76412 0 149636 4167 100 5055
442 9764
1998-99 114 10 295 6 17 442 1982 70 5715 94 531 8392 58968 13632 93765 0 166365 4158 100 5176
442 9876
1999-00 114 10 296 6 17 443 1997 70 5775 94 541 8477 58200 14400 77180 0 149780 4200 100 5202
442 9944
2000-01 114 10 297 6 17 444 1991 83 5858 94 574 8600 56576 14592 74360 0 145528 4356 100 5083
442 9981
2001-02 115 10 302 6 17 450 2024 96 6199 94 648 9061 53968 14592 72624 0 141184 4428 100 5144
442 10114
2002-03 116 10 304 6 17 453 1997 91 6424 94 655 9261 56428 14592 77104 0 148124 4713 100 5112
442 10367
2003-04 116 10 307 6 17 456 1996 94 6698 93 709 9590 56404 14592 75644 0 146640 4673 100 5428
442 10646
2004-05 118 10 307 6 17 458 2512 99 6998 93 781 10485 62052 14592 78516 0 155160 4184 100 4324
442 9050
2005-06 119 10 309 6 17 461 2100 103 7328 93 812 10437 63836 14016 77052 200 155104 3858 100 4347
442 8747
2006-07 119 10 309 6 17 461 2132 127 7349 94 812 10514 60748 14016 75068 200 150032 3318 100 4021
160 7599
2007-08 119 10 309 6 17 461 2132 127 7349 94 812 10513 62748 14962 80068 200 157995 3318 100 4021
160 7599
2008-09 119 10 309 6 17 461 2132 127 7349 94 813 10513 62748 14962 80068 200 157995 3318 100 4021
160 7899
2009-10 118 9 316 6 17 466 2056 125 7606 94 745 10626 65356 10300 81538 2008 159219 3578 0 3592
0 7170
2010-11 116 9 316 6 17 464 2188 130 7841 94 712 10965 63892 13180 81538 2008 160635 3578 0 3592
0 7170
Source: TCO (Data available at www.aptma.org.pk)
Abbreviations: S = Sindh, B = Baluchistan, P = Punjab (Pakistan), K = Kashmir (Pakistan), KP = Khaiber Pakhtunkha,

211
Table 26: Province-wise Production of Yarn (“000” Kilograms)
Period Punjab Sindh KP Baluchistan Total Growth in %
1971-72 149.07 161.878 24.754 0 335.702
1972-73 167.934 180.303 27.885 0 376.122 12.04
1973-74 171.87 176.447 31.143 0 379.46 0.89
1974-75 176.793 148.775 25.632 0 351.2 -7.45
1975-76 176.247 144.365 29.041 0 349.653 -0.44
1976-77 149.564 112.371 20.705 0 282.64 -19.17
1977-78 158.758 117.824 21.312 0 297.894 5.4
1978-79 173.148 135.485 19.165 0 327.798 10.04
1979-80 193.374 150.934 18.554 0 362.862 10.7
1980-81 193.41 159.362 21.22 0.955 374.947 3.33
1981-82 223.861 176.336 22.227 7.73 430.154 14.72
1982-83 231.225 186.56 25.043 5.602 448.43 4.25
1983-84 221.992 188.646 19.885 1.057 431.58 -3.76
1984-85 230.838 178.896 20.012 1.985 431.731 0.03
1985-86 263.815 194.137 21.476 2.758 482.186 11.69
1986-87 318.381 230.936 26.885 10.169 586.371 21.61
1987-88 352.9 291.666 27.81 12.655 685.031 16.83
1988-89 419.803 305.816 26.777 15.038 767.434 12.03
1989-90 532.989 342.522 27.877 21.994 925.382 20.58
1990-91 626.978 376.794 26.405 25.051 1055.228 14.03
1991-92 734.927 398.344 28.478 26.521 1188.270 12.61
1992-93 823.961 354.643 27.418 28.517 1234.539 3.89
1993-94 1070.422 347.375 47.363 33.788 1498.948 21.42
1994-95 1020.640 315.258 44.969 32.781 1413.648 -5.69
1995-96 1100.914 324.152 47.931 32.247 1505.244 6.48
1996-97 1095.740 332.547 65.879 36.689 1530.855 1.7
1997-98 1099.311 335.862 68.02 37.527 1540.720 0.64
1998-99 1107.240 333.622 70.588 36.182 1547.632 0.45
1999-00 1194.377 367.173 81.95 35.036 1678.536 8.46
2000-01 1239.358 365.029 87.133 37.609 1729.129 3.01
2001-02 1283.964 391.492 104.081 38.808 1818.345 5.16
2002-03 1353.027 417.513 91.857 51.784 1914.181 5.27
2003-04 1411.817 428.411 95.397 49.494 1985.119 3.71
2004-05 1475.853 446.309 104.504 50.841 2077.507 5.14
2005-06 1562.670 482.746 109.145 52.264 2206.825 11.17
2006-07
2727.556 23.6
2007-08
2809.383 3
2008-09
2862.411 1.89
2009-10
2880.970 0.65
2010-11
2956.972 2.64
Source: TCO (Data available at www.aptma.org.pk)

212
Table 28: Count-wise Production of Yarn
Count-wise Production of Yarn in Pakistan (Metric Tons)
Per
iod
Coar
se Y
arn C
ounts
Coar
se Y
arn C
ounts
(1-2
0 N
e)
Med
ium
Fin
e Y
arn
Counts
Med
ium
Fin
e Y
arn
Counts
(21
-34 N
e)
Fin
e Y
arn C
ounts
Fin
e Y
arn C
ounts
(36-
47 N
e)
S.
Fin
e Y
arn C
ounts
S.
Fin
e Y
arn C
ounts
(48
-80 N
e)
Mix
ed f
ibre
Yar
ns
Mix
ed f
ibre
Yar
ns
Mix
ed F
ibre
s
Tota
l
1-9
s
10s
12s
14s
16s
18s
20s
sub
-tota
l
21s
24s
28s
30s
32s
34s
sub
-tota
l
36s
40s
47s
sub
-tota
l
48s
60s
80s
sub
-tota
l
Poly
/Vis
cose
Poly
/Cott
on
sub
-tota
l
Was
te
71-
72
12.06
2 30.734
13.57
3
14.99
3
28.31
6 1.367
56.81
7
157.86
2
106.6
16 N.A
13.86
8
23.78
8
12.29
9 1.42
157.9
91 7.35 8.46 540 16.35 1.698 1.138 663 3.499 0 0 0 0
335.70
2
72-
73
15.58
5 51.478
13.43
6 7.546
26.67
8 1.148
82.52
5
198.39
6
110.6
78 N.A
13.27
1
24.34
5
10.95
1 1.921
161.1
66 6.131 7.126 510
13.76
7 493 1.348 502 2.793 0 0 0 0
376.12
2
73-
74
10.68
6 57.863
13.23
7 8.281
25.26
2 1.276
92.51
5 209.12
76.82
2 N.A
11.30
9
30.45
4
22.93
2 1.995
143.5
12 4.51
11.08
8 1.25
16.84
8 656 2.404 431 3.491 0 4.364 4.364 2.125 379.46
74-
75 7.346 47.889 9.152 8.503
31.61
6 1.745
96.67
2
202.92
3
71.91
1 N.A
14.41
6
23.20
1
16.40
5 850
126.7
83 3.731 6.6 907
11.23
8 655 2.423 365 3.443 0 5.584 5.584 1.229 351.2
75-
76 12.08 70.879
11.15
1 7.894
23.83
6 1.164
88.69
6 215.7
63.19
5 N.A
13.11
5
22.31
1
14.05
5 577
113.2
53 4.553 6.07 741
11.36
4 661 2.752 398 3.811 0 4.755 4.755 770
349.65
3
76-
77 5.285 44.904 8.575 5.756
19.81
4 940
76.79
1
162.06
5
53.04
8 N.A
10.78
5
16.28
3
12.75
4 401
93.27
1 2.758 5.95 675 9.383 504 2.098 367 2.969 0
14.41
5
14.41
5 537 282.64
77-
78 4.666 48.82 8.153 4.254
25.13
2 645
80.56
2
172.23
2
46.81
2 N.A
12.10
8
19.85
1
12.05
5 653
91.47
9 2.409 7.369 630
10.40
8 209 2.374 454 3.037 0
19.89
7
19.89
7 841
297.89
4
78-
79 5.449 56.018
10.73
3 3.804
41.66
4 1.111 53.67
172.44
9 60.43 N.A 13.53
18.76
9
16.56
6 1.048
110.3
43 2.993 7.19 682
10.86
5 313 1.558 859 2.548 0
29.03
1
29.03
1 2.562
327.79
8
79-
80 4.313 70.335
11.98
2 6.167
41.68
2 3.829
49.06
7
187.40
5
55.27
1 N.A
19.00
4
24.83
5 18.61 1.12
118.8
4 4.872 5.408 1.371
11.65
1 104 2.623 942 3.669 0
33.21
7
33.21
7 8.08
362.86
2
80-
81
13,53
3 56.962
11.36
2
10.42
1
26.46
2 5.943
41.04
1
165.72
4
68.48
1 N.A
28.05
4
23.32
8
20.87
2 4.392
145.1
27 4.867 6.161 1.399
12.42
7 243 3.152 1.229 4.624 0
38.78
5
38.78
5 8.26
374.94
7
81-
82 15.63 36.774
29.62
4
26.59
8
31.41
7
23.52
9 22.06
185.63
2
48.56
5
19.85
3
21.08
2
30.80
4
24.04
6
21.53
8
165.8
88 6.101 8.361 3.666
18.12
8 2.483 3.869 2.007 8.359
18.03
2
14.75
3
32.78
5
19.36
2
430.15
4
82-
83
19.24
9 29.358
29.48
3
23.01
5
29.48
1
27.82
5
33.34
2
191.75
3
42.18
2
18.91
6
20.08
7 33.86
30.87
9
36.60
6
182.5
3 7.638 7.229 5.266
20.13
3 4.445 3.847 2.943
11.23
5
16.77
9
16.48
9
33.26
8 9.511
448.43
0
83-
84
13.72
6 30.298
24.89
5
23.55
7
23.55
9 21.75
25.54
9
163.33
4
37.47
9
18.00
1
19.11
4
38.22
5
38.98
2
27.73
7
179.5
38 2.478
10.04
7 7.264
19.78
9 5.133 6.101 4.311
15.54
5
22.44
1
21.56
1
44.00
2 9.372
431.58
0
84-
85
19.30
3 42.609
20.53
6
21.66
4 26.26
13.71
7
20.46
5
164.55
4
79.50
8
20.49
6
21.76
3
24.60
1
25.25
5
20.06
1
191.6
84 7.908 7.185 6.304
21.39
7 2.223 6.243 4.278
12.74
4
15.82
1 17.14
32.96
1 8.391
731.73
1
85-
86
10.47
2 57.278
12.74
8 9.188
30.01
9 5.243
21.29
6
146.86
7
140.3
75
22.53
2
23.92
6
21.45
5
16.09
8 13.74
238.1
26
16.39
2 7.606 4.5
28.49
8 1.781 8.167 5.596
15.54
4
20.35
9
24.88
3
45.24
2 7.909
482.18
6
86-
87
16.76
2 71.664 8.774
17.21
3
41.71
7 7.369
61.00
6
224.50
5
152.0
54
22.80
9 24.22
31.44
4
14.68
3 17.07
262.2
8
13.77
6 7.708 7.741
29.22
5 2.072 9.821 1.707 13.6 21.22
25.93
5
47.15
5 9.606
586.37
1
87-
88
19.74
9 81.789
12.91
4
21.69
8
45.04
5 5.909
62.61
6 249.72
169.5
08
28.06
6
33.61
7 44.35
22.03
9
13.97
9
311.5
59 11.33
11.00
4 6.938
29.27
2 1.403
14.02
3 1.662
17.08
8
26.88
1
40.32
2
67.20
3
10.18
9
685.03
1
88-
89
18.54
2 89.571
13.48
3
19.40
2
52.38
7 6.891
75.02
6
275.30
2
196.0
99
37.68
1
42.93
4 46.35
18.85
8 7.078 349 8.587 4.019 2.337
14.94
3 991 8.858 1.323
11.17
2 35.77
67.86
3
103.6
33
13.38
4
767.43
4
89-
90
33.91
3 91.199 14.78
25.96
7
72.00
1 7.539
105.8
63
351.26
2
207.8
16
55.41
8
53.60
3
71.88
2
20.58
3 2.847
412.1
49 9.168 5.175 1.967 16.31 503 6.049 1.187 7.739
32.77
1
90.94
1
123.7
12 14.21
925.38
2
90-
91
42.58
8
100.09
6
14.83
2
27.01
6
88.78
7 5.071
146.3
37
424.72
7
211.6
51
71.56
1
52.23
9
76.91
7
20.17
3 2.737
435.2
78
10.07
7 5.883 1.2 17.16 1.541 6.695 901 9.137 43.25
109.8
5 153.1
15.82
6
1055.2
28
91-
92
44.87
3 99.421
14.69
4
27.76
3
89.29
3 8.47
180.1
46
464.66
0
211.0
49 80.42
54.32
6
103.5
51
29.27
9 3.425
482.0
5
22.28
3 9.124 505
31.91
2 3.074
10.25
6 1.425
14.75
5
68.09
4
109.9
73
178.0
67
16.82
6
1188.2
70
92-
93
52.66
5 93.555
16.51
4
26.51
8
99.67
1
12.91
9
219.6
33
521.47
5
182.8
52
70.90
3
51.61
7
111.0
7
33.03
8 2.077
451.5
57 18.18
10.37
9 1.522
30.08
1 4.559
12.69
6 3.694
20.94
9
110.3
48
81.62
1
191.9
69
18.50
8
1234.5
39
93-
94
56.61
4 91.922
23.83
5
28.68
7
99.98
3
14.69
2
272.8
7
588.60
3
151.4
02
57.89
1
41.20
7
136.1
21
31.84
5 5.661
424.1
27
18.26
2
12.07
1 2440
32.77
3 2.827 7.483 5.758
16.06
8
121.2
65
120.1
07
241.3
72
23.73
3
1326.6
76
94-
95 41.07 95.362
22.64
6
27.76
4
115.0
34 10.78
308.2
17
620.69
1
135.6
29
73.51
1
30.61
3
162.2
61
34.37
3 7.375
443.7
62
25.28
8
22.46
1 1.8
49.54
9 2.511 6.046
10.94
1
19.49
8
89.55
4
135.3
14
224.8
68
22.33
4
1380.7
02
95-
96
55.88
9
110.14
8 26.1
24.62
3
128.3
65
22.87
5
316.9
13
684.91
3
129.5
75
79.11
2
32.85
9
154.9
75
47.06
6 8.059
451.6
46
28.90
8
29.41
2 1.857
60.17
7 4.42 8.404
10.00
3
22.82
7 99.68
134.7
84
234.4
64
21.04
4
1475.0
71
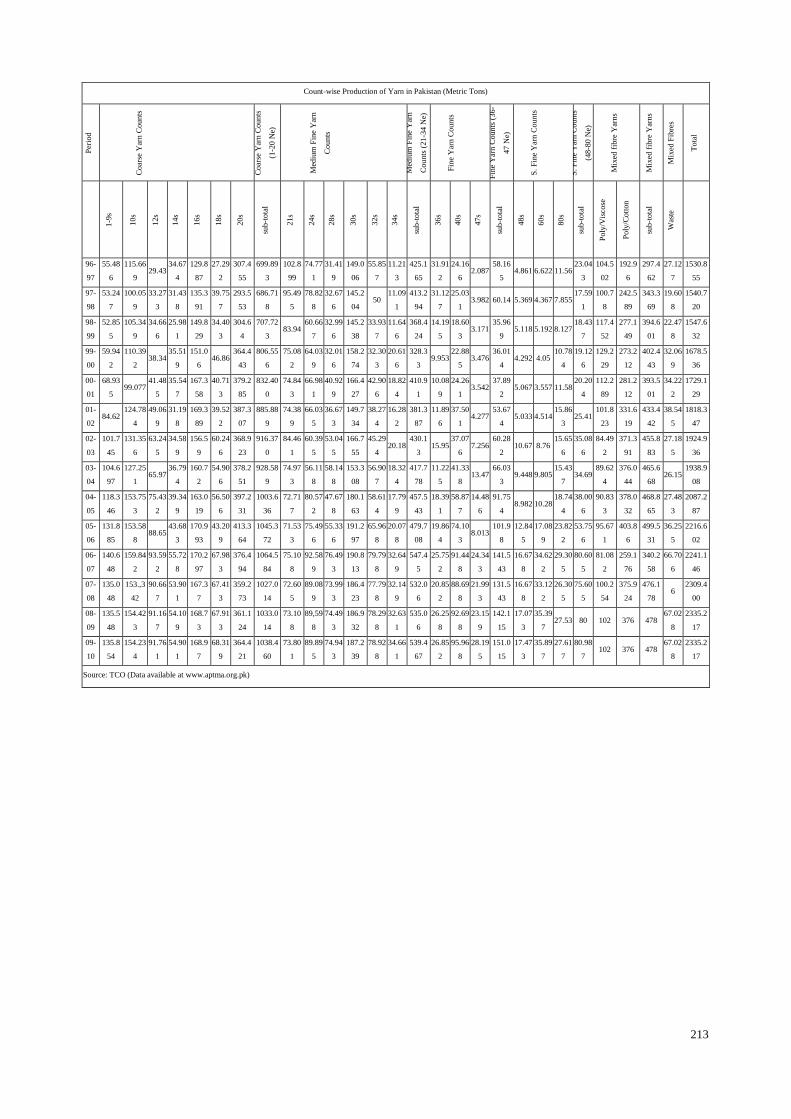
213
Count-wise Production of Yarn in Pakistan (Metric Tons) P
erio
d
Coar
se Y
arn C
ounts
Coar
se Y
arn C
ounts
(1-2
0 N
e)
Med
ium
Fin
e Y
arn
Counts
Med
ium
Fin
e Y
arn
Counts
(21
-34 N
e)
Fin
e Y
arn C
ounts
Fin
e Y
arn C
ounts
(36-
47 N
e)
S.
Fin
e Y
arn C
ounts
S.
Fin
e Y
arn C
ounts
(48
-80 N
e)
Mix
ed f
ibre
Yar
ns
Mix
ed f
ibre
Yar
ns
Mix
ed F
ibre
s
Tota
l
1-9
s
10s
12s
14s
16s
18s
20s
sub-t
ota
l
21s
24s
28s
30s
32s
34s
sub-t
ota
l
36s
40s
47s
sub-t
ota
l
48s
60s
80s
sub-t
ota
l
Poly
/Vis
cose
Poly
/Cott
on
sub-t
ota
l
Was
te
96-
97
55.48
6
115.66
9 29.43
34.67
4
129.8
87
27.29
2
307.4
55
699.89
3
102.8
99
74.77
1
31.41
9
149.0
06
55.85
7
11.21
3
425.1
65
31.91
2
24.16
6 2.087
58.16
5 4.861 6.622 11.56
23.04
3
104.5
02
192.9
6
297.4
62
27.12
7
1530.8
55
97-
98
53.24
7
100.05
9
33.27
3
31.43
8
135.3
91
39.75
7
293.5
53
686.71
8
95.49
5
78.82
8
32.67
6
145.2
04 50
11.09
1
413.2
94
31.12
7
25.03
1 3.982 60.14 5.369 4.367 7.855
17.59
1
100.7
8
242.5
89
343.3
69
19.60
8
1540.7
20
98-
99
52.85
5
105.34
9
34.66
6
25.98
1
149.8
29
34.40
3
304.6
4
707.72
3 83.94
60.66
7
32.99
6
145.2
38
33.93
7
11.64
6
368.4
24
14.19
5
18.60
3 3.171
35.96
9 5.118 5.192 8.127
18.43
7
117.4
52
277.1
49
394.6
01
22.47
8
1547.6
32
99-
00
59.94
2
110.39
2 38.34
35.51
9
151.0
6 46.86
364.4
43
806.55
6
75.08
2
64.03
9
32.01
6
158.2
74
32.30
3
20.61
6
328.3
3 9.953
22.88
5 3.476
36.01
4 4.292 4.05
10.78
4
19.12
6
129.2
29
273.2
12
402.4
43
32.06
9
1678.5
36
00-
01
68.93
5 99.077
41.48
5
35.54
7
167.3
58
40.71
3
379.2
85
832.40
0
74.84
3
66.98
1
40.92
9
166.4
27
42.90
6
18.82
4
410.9
1
10.08
9
24.26
1 3.542
37.89
2 5.067 3.557 11.58
20.20
4
112.2
89
281.2
12
393.5
01
34.22
2
1729.1
29
01-
02 84.62
124.78
4
49.06
9
31.19
8
169.3
89
39.52
2
387.3
07
885.88
9
74.38
9
66.03
5
36.67
3
149.7
34
38.27
4
16.28
2
381.3
87
11.89
6
37.50
1 4.277
53.67
4 5.033 4.514
15.86
3 25.41
101.8
23
331.6
19
433.4
42
38.54
5
1818.3
47
02-
03
101.7
45
131.35
6
63.24
5
34.58
9
156.5
9
60.24
6
368.9
23
916.37
0
84.46
1
60.39
5
53.04
5
166.7
55
45.29
4 20.18
430.1
3 15.95
37.07
6 7.256
60.28
2 10.67 8.76
15.65
6
35.08
6
84.49
2
371.3
91
455.8
83
27.18
5
1924.9
36
03-
04
104.6
97
127.25
1 65.97
36.79
4
160.7
2
54.90
6
378.2
51
928.58
9
74.97
3
56.11
8
58.14
8
153.3
08
56.90
7
18.32
4
417.7
78
11.22
5
41.33
8 13.47
66.03
3 9.448 9.805
15.43
7 34.69
89.62
4
376.0
44
465.6
68 26.15
1938.9
08
04-
05
118.3
46
153.75
3
75.43
2
39.34
9
163.0
19
56.50
6
397.2
31
1003.6
36
72.71
7
80.57
2
47.67
8
180.1
63
58.61
4
17.79
9
457.5
43
18.39
1
58.87
7
14.48
6
91.75
4 8.982 10.28
18.74
4
38.00
6
90.83
3
378.0
32
468.8
65
27.48
3
2087.2
87
05-
06
131.8
85
153.58
8 88.65
43.68
3
170.9
93
43.20
9
413.3
64
1045.3
72
71.53
3
75.49
6
55.33
6
191.2
97
65.96
8
20.07
8
479.7
08
19.86
4
74.10
3 8.013
101.9
8
12.84
5
17.08
9
23.82
2
53.75
6
95.67
1
403.8
6
499.5
31
36.25
5
2216.6
02
06-
07
140.6
48
159.84
2
93.59
2
55.72
8
170.2
97
67.98
3
376.4
94
1064.5
84
75.10
8
92.58
9
76.49
3
190.8
13
79.79
8
32.64
9
547.4
5
25.75
2
91.44
8
24.34
3
141.5
43
16.67
8
34.62
2
29.30
5
80.60
5
81.08
2
259.1
76
340.2
58
66.70
6
2241.1
46
07-
08
135.0
48
153.,3
42
90.66
7
53.90
1
167.3
7
67.41
3
359.2
73
1027.0
14
72.60
5
89.08
9
73.99
3
186.4
23
77.79
8
32.14
9
532.0
6
20.85
2
88.69
8
21.99
3
131.5
43
16.67
8
33.12
2
26.30
5
75.60
5
100.2
54
375.9
24
476.1
78 6
2309.4
00
08-
09
135.5
48
154.42
3
91.16
7
54.10
9
168.7
3
67.91
3
361.1
24
1033.0
14
73.10
8
89,59
8
74.49
3
186.9
32
78.29
8
32.63
1
535.0
6
26.25
8
92.69
8
23.15
9
142.1
15
17.07
3
35.39
7 27.53 80 102 376 478
67.02
8
2335.2
17
09-
10
135.8
54
154.23
4
91.76
1
54.90
1
168.9
7
68.31
9
364.4
21
1038.4
60
73.80
1
89.89
5
74.94
3
187.2
39
78.92
8
34.66
1
539.4
67
26.85
2
95.96
8
28.19
5
151.0
15
17.47
3
35.89
7
27.61
7
80.98
7 102 376 478
67.02
8
2335.2
17
Source: TCO (Data available at www.aptma.org.pk)
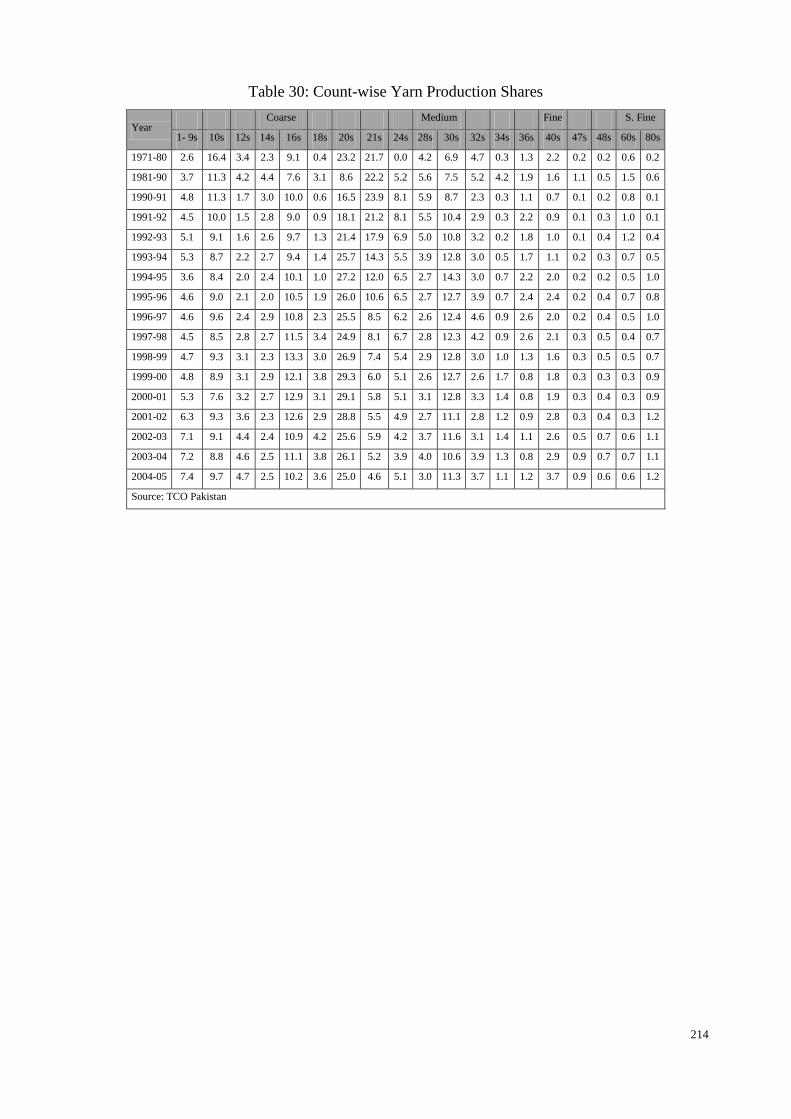
214
Table 30: Count-wise Yarn Production Shares
Year Coarse Medium Fine S. Fine
1- 9s 10s 12s 14s 16s 18s 20s 21s 24s 28s 30s 32s 34s 36s 40s 47s 48s 60s 80s
1971-80 2.6 16.4 3.4 2.3 9.1 0.4 23.2 21.7 0.0 4.2 6.9 4.7 0.3 1.3 2.2 0.2 0.2 0.6 0.2
1981-90 3.7 11.3 4.2 4.4 7.6 3.1 8.6 22.2 5.2 5.6 7.5 5.2 4.2 1.9 1.6 1.1 0.5 1.5 0.6
1990-91 4.8 11.3 1.7 3.0 10.0 0.6 16.5 23.9 8.1 5.9 8.7 2.3 0.3 1.1 0.7 0.1 0.2 0.8 0.1
1991-92 4.5 10.0 1.5 2.8 9.0 0.9 18.1 21.2 8.1 5.5 10.4 2.9 0.3 2.2 0.9 0.1 0.3 1.0 0.1
1992-93 5.1 9.1 1.6 2.6 9.7 1.3 21.4 17.9 6.9 5.0 10.8 3.2 0.2 1.8 1.0 0.1 0.4 1.2 0.4
1993-94 5.3 8.7 2.2 2.7 9.4 1.4 25.7 14.3 5.5 3.9 12.8 3.0 0.5 1.7 1.1 0.2 0.3 0.7 0.5
1994-95 3.6 8.4 2.0 2.4 10.1 1.0 27.2 12.0 6.5 2.7 14.3 3.0 0.7 2.2 2.0 0.2 0.2 0.5 1.0
1995-96 4.6 9.0 2.1 2.0 10.5 1.9 26.0 10.6 6.5 2.7 12.7 3.9 0.7 2.4 2.4 0.2 0.4 0.7 0.8
1996-97 4.6 9.6 2.4 2.9 10.8 2.3 25.5 8.5 6.2 2.6 12.4 4.6 0.9 2.6 2.0 0.2 0.4 0.5 1.0
1997-98 4.5 8.5 2.8 2.7 11.5 3.4 24.9 8.1 6.7 2.8 12.3 4.2 0.9 2.6 2.1 0.3 0.5 0.4 0.7
1998-99 4.7 9.3 3.1 2.3 13.3 3.0 26.9 7.4 5.4 2.9 12.8 3.0 1.0 1.3 1.6 0.3 0.5 0.5 0.7
1999-00 4.8 8.9 3.1 2.9 12.1 3.8 29.3 6.0 5.1 2.6 12.7 2.6 1.7 0.8 1.8 0.3 0.3 0.3 0.9
2000-01 5.3 7.6 3.2 2.7 12.9 3.1 29.1 5.8 5.1 3.1 12.8 3.3 1.4 0.8 1.9 0.3 0.4 0.3 0.9
2001-02 6.3 9.3 3.6 2.3 12.6 2.9 28.8 5.5 4.9 2.7 11.1 2.8 1.2 0.9 2.8 0.3 0.4 0.3 1.2
2002-03 7.1 9.1 4.4 2.4 10.9 4.2 25.6 5.9 4.2 3.7 11.6 3.1 1.4 1.1 2.6 0.5 0.7 0.6 1.1
2003-04 7.2 8.8 4.6 2.5 11.1 3.8 26.1 5.2 3.9 4.0 10.6 3.9 1.3 0.8 2.9 0.9 0.7 0.7 1.1
2004-05 7.4 9.7 4.7 2.5 10.2 3.6 25.0 4.6 5.1 3.0 11.3 3.7 1.1 1.2 3.7 0.9 0.6 0.6 1.2
Source: TCO Pakistan

215
Appendix III.B. Survey Form on the Strategic Environment of the System
Semi-Structured Interview & Survey
Global Textile & Clothing Supply Chain Systems and Pakistan
Instructions to Complete the Survey:
Please write your inputs in the area shaded blue for the following sections 1 to 9 and use the scales shaded in brown or green, where advised.
1. Detail of the Survey Responder
Name
Education/Qualification
Areas of Interest/Work & Experience
Activities (Production, Manufacturing, Sourcing, Trading,
Reatiling etc. of Products and/or Services)
Countries of Operations
Supplier or Sourcing Countries of the Company (or Person)
Delivery Countries and the Markets of the Company
Company/Individual Contacts Email:
Phone:
2. The Image of the Countries, their Products and Companies in the International Textile and Clothing Markets
Scale: (1 = Poor 5 = Average 9 = Excellent N/A = No Idea)
Country Environment Product Image Company Image
Political Economic Responsiveness Design Quality Cost Commitment Responsiveness
Brazil
Bngladesh
China
Germany
India
Indonesia
Italy
Mexico
Pakistan
Portugal
Sri Lanka
Turkey
Vietnam
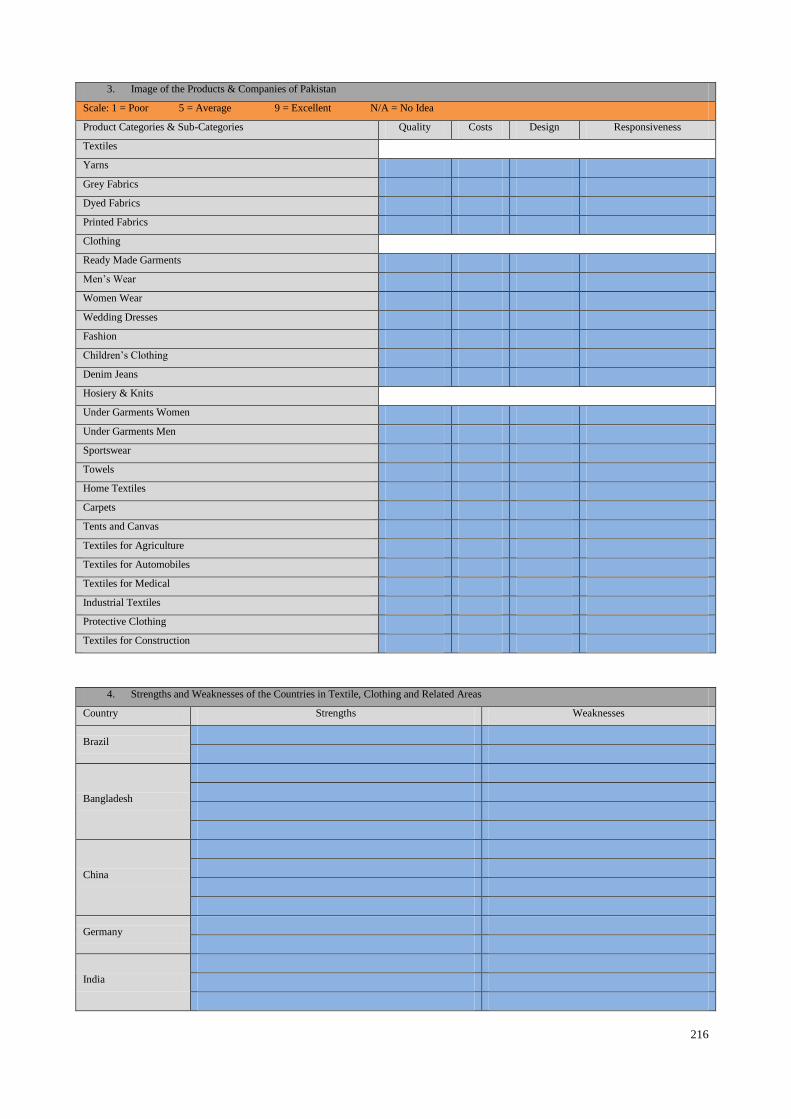
216
3. Image of the Products & Companies of Pakistan
Scale: 1 = Poor 5 = Average 9 = Excellent N/A = No Idea
Product Categories & Sub-Categories Quality Costs Design Responsiveness
Textiles
Yarns
Grey Fabrics
Dyed Fabrics
Printed Fabrics
Clothing
Ready Made Garments
Men‟s Wear
Women Wear
Wedding Dresses
Fashion
Children‟s Clothing
Denim Jeans
Hosiery & Knits
Under Garments Women
Under Garments Men
Sportswear
Towels
Home Textiles
Carpets
Tents and Canvas
Textiles for Agriculture
Textiles for Automobiles
Textiles for Medical
Industrial Textiles
Protective Clothing
Textiles for Construction
4. Strengths and Weaknesses of the Countries in Textile, Clothing and Related Areas
Country Strengths Weaknesses
Brazil
Bangladesh
China
Germany
India
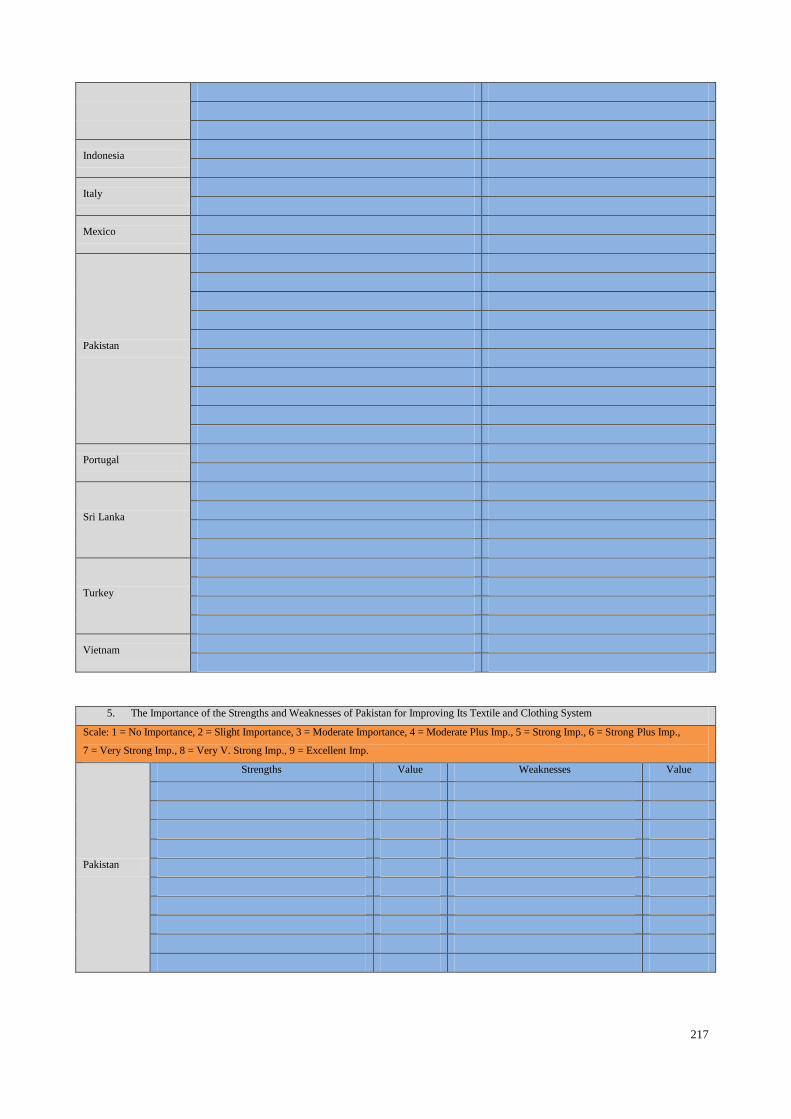
217
Indonesia
Italy
Mexico
Pakistan
Portugal
Sri Lanka
Turkey
Vietnam
5. The Importance of the Strengths and Weaknesses of Pakistan for Improving Its Textile and Clothing System
Scale: 1 = No Importance, 2 = Slight Importance, 3 = Moderate Importance, 4 = Moderate Plus Imp., 5 = Strong Imp., 6 = Strong Plus Imp.,
7 = Very Strong Imp., 8 = Very V. Strong Imp., 9 = Excellent Imp.
Pakistan
Strengths Value Weaknesses Value
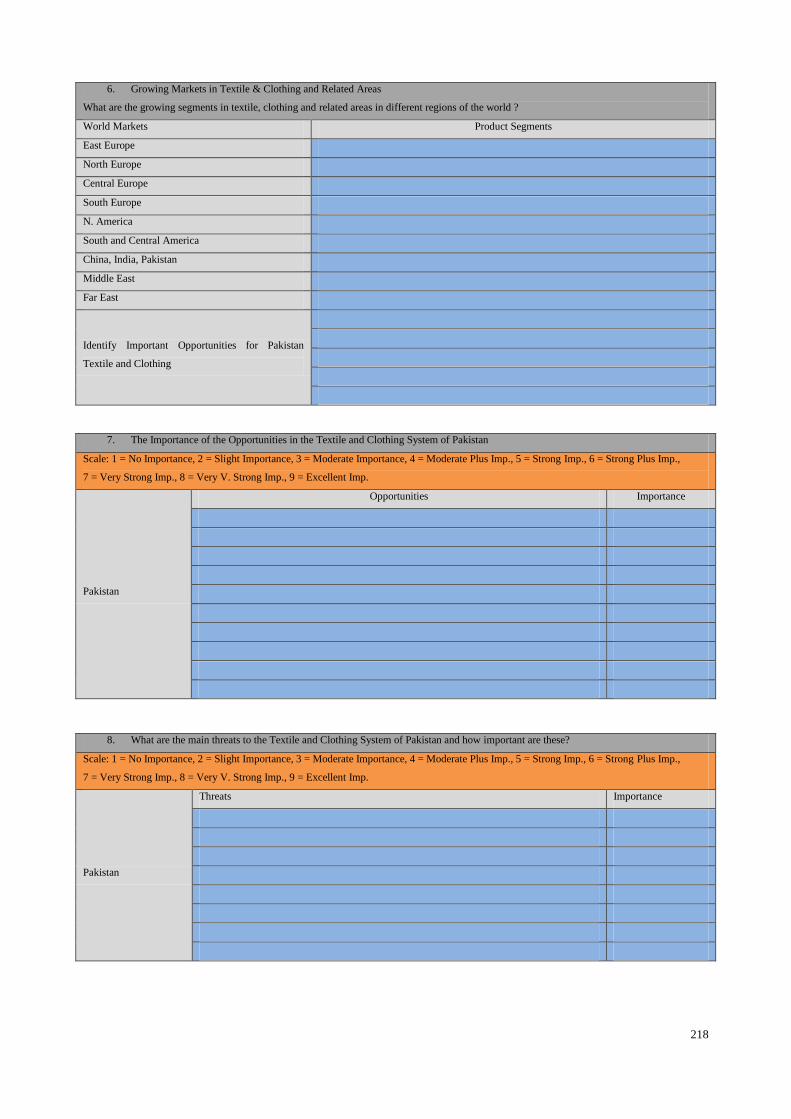
218
6. Growing Markets in Textile & Clothing and Related Areas
What are the growing segments in textile, clothing and related areas in different regions of the world ?
World Markets Product Segments
East Europe
North Europe
Central Europe
South Europe
N. America
South and Central America
China, India, Pakistan
Middle East
Far East
Identify Important Opportunities for Pakistan
Textile and Clothing
7. The Importance of the Opportunities in the Textile and Clothing System of Pakistan
Scale: 1 = No Importance, 2 = Slight Importance, 3 = Moderate Importance, 4 = Moderate Plus Imp., 5 = Strong Imp., 6 = Strong Plus Imp.,
7 = Very Strong Imp., 8 = Very V. Strong Imp., 9 = Excellent Imp.
Pakistan
Opportunities Importance
8. What are the main threats to the Textile and Clothing System of Pakistan and how important are these?
Scale: 1 = No Importance, 2 = Slight Importance, 3 = Moderate Importance, 4 = Moderate Plus Imp., 5 = Strong Imp., 6 = Strong Plus Imp.,
7 = Very Strong Imp., 8 = Very V. Strong Imp., 9 = Excellent Imp.
Pakistan
Threats Importance

219
9. Development Status of the Activities in Textile, Clothing and Related Areas in the Supply Chain System of Pakistan
Scale: 1-Poor, 2-Poor-to-Medium, 3-Medium, 4-Medium-to-Strong, 5-Strong
Activities in the Supply Chain System & their Development Status Extended Functions in the Supply Chain System and their Development
Status
Activities & Sub-Activities Development
Status Marketting Research
Technology
(Equipment & Processes) Skills
Fiber Production
Cotton Farming
Cotton Research
Ginning (Organized)
Ginning (Un-Organized)
Other Natural Fibers (Jute, Silk, Wool, ...)
Man Made Fibers
Yarn Manufacturing
(Mostly Organized Sector)
Ring Spinning
Rotor (Open End) Spinning
Other Yarn Manufacturing (Air Jet, …)
Fabric Manufacturing
Weaving (Organized)
Weaving (Un-Organized)
Knitting (Organized)
Other Fabric Manufacturing (Braiding,
Nonwoven, …)
Fabric Coloration & Finishing
Dyeing (Organized)
Dyeing (Un-Organized)
Printing (Organized)
Printing (Un-Organized)
Finishing (Organized)
Finishing (Un-Organized)
Clothing (Organized)
Clothing (Un-Organized)
Input Industries
Dyes and Chemical Mnf. (Organized)
Dyes and Chemical Mnf. (Un-Organized)
Machine Manufacturing
Helping Areas
ICT and Applications (in Organized)
ICT and Applications (in Un-Organized)
Logistics Companies
Infrastructure
Rail
Roads
Ports
Storage
We offer our thanks for your valuable feedback!
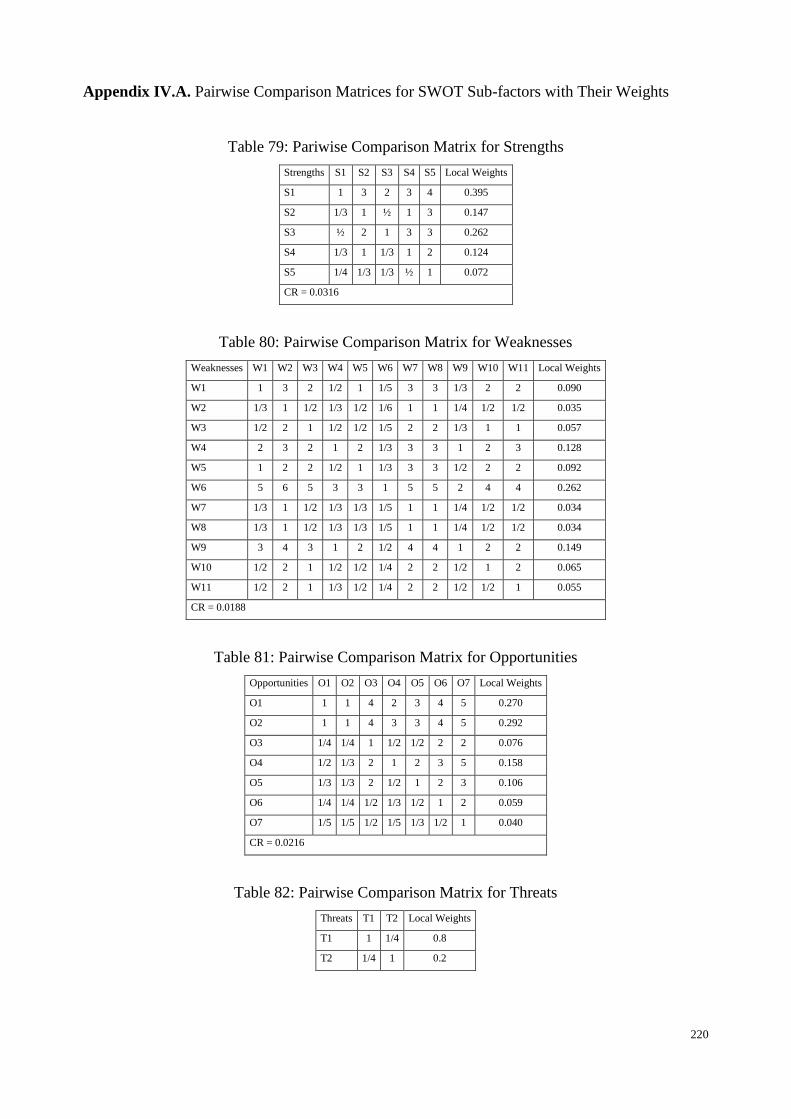
220
Appendix IV.A. Pairwise Comparison Matrices for SWOT Sub-factors with Their Weights
Table 79: Pariwise Comparison Matrix for Strengths
Strengths S1 S2 S3 S4 S5 Local Weights
S1 1 3 2 3 4 0.395
S2 1/3 1 ½ 1 3 0.147
S3 ½ 2 1 3 3 0.262
S4 1/3 1 1/3 1 2 0.124
S5 1/4 1/3 1/3 ½ 1 0.072
CR = 0.0316
Table 80: Pairwise Comparison Matrix for Weaknesses
Weaknesses W1 W2 W3 W4 W5 W6 W7 W8 W9 W10 W11 Local Weights
W1 1 3 2 1/2 1 1/5 3 3 1/3 2 2 0.090
W2 1/3 1 1/2 1/3 1/2 1/6 1 1 1/4 1/2 1/2 0.035
W3 1/2 2 1 1/2 1/2 1/5 2 2 1/3 1 1 0.057
W4 2 3 2 1 2 1/3 3 3 1 2 3 0.128
W5 1 2 2 1/2 1 1/3 3 3 1/2 2 2 0.092
W6 5 6 5 3 3 1 5 5 2 4 4 0.262
W7 1/3 1 1/2 1/3 1/3 1/5 1 1 1/4 1/2 1/2 0.034
W8 1/3 1 1/2 1/3 1/3 1/5 1 1 1/4 1/2 1/2 0.034
W9 3 4 3 1 2 1/2 4 4 1 2 2 0.149
W10 1/2 2 1 1/2 1/2 1/4 2 2 1/2 1 2 0.065
W11 1/2 2 1 1/3 1/2 1/4 2 2 1/2 1/2 1 0.055
CR = 0.0188
Table 81: Pairwise Comparison Matrix for Opportunities
Opportunities O1 O2 O3 O4 O5 O6 O7 Local Weights
O1 1 1 4 2 3 4 5 0.270
O2 1 1 4 3 3 4 5 0.292
O3 1/4 1/4 1 1/2 1/2 2 2 0.076
O4 1/2 1/3 2 1 2 3 5 0.158
O5 1/3 1/3 2 1/2 1 2 3 0.106
O6 1/4 1/4 1/2 1/3 1/2 1 2 0.059
O7 1/5 1/5 1/2 1/5 1/3 1/2 1 0.040
CR = 0.0216
Table 82: Pairwise Comparison Matrix for Threats
Threats T1 T2 Local Weights
T1 1 1/4 0.8
T2 1/4 1 0.2
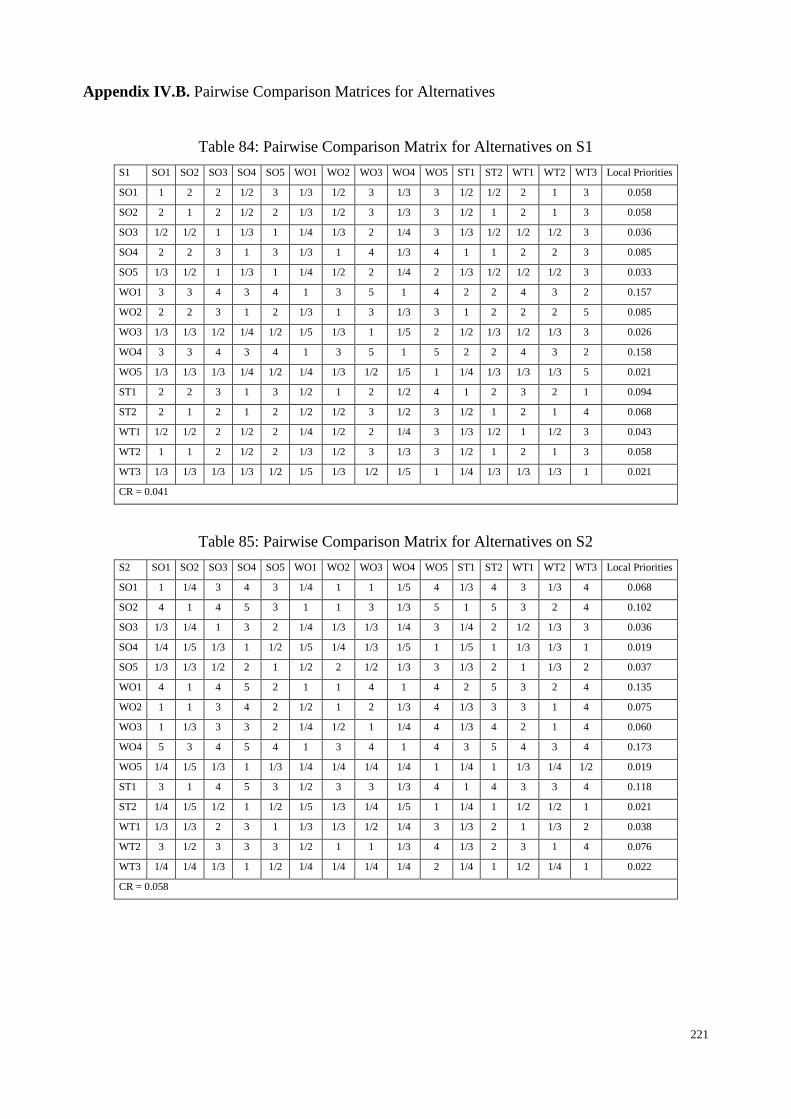
221
Appendix IV.B. Pairwise Comparison Matrices for Alternatives
Table 84: Pairwise Comparison Matrix for Alternatives on S1
S1 SO1 SO2 SO3 SO4 SO5 WO1 WO2 WO3 WO4 WO5 ST1 ST2 WT1 WT2 WT3 Local Priorities
SO1 1 2 2 1/2 3 1/3 1/2 3 1/3 3 1/2 1/2 2 1 3 0.058
SO2 2 1 2 1/2 2 1/3 1/2 3 1/3 3 1/2 1 2 1 3 0.058
SO3 1/2 1/2 1 1/3 1 1/4 1/3 2 1/4 3 1/3 1/2 1/2 1/2 3 0.036
SO4 2 2 3 1 3 1/3 1 4 1/3 4 1 1 2 2 3 0.085
SO5 1/3 1/2 1 1/3 1 1/4 1/2 2 1/4 2 1/3 1/2 1/2 1/2 3 0.033
WO1 3 3 4 3 4 1 3 5 1 4 2 2 4 3 2 0.157
WO2 2 2 3 1 2 1/3 1 3 1/3 3 1 2 2 2 5 0.085
WO3 1/3 1/3 1/2 1/4 1/2 1/5 1/3 1 1/5 2 1/2 1/3 1/2 1/3 3 0.026
WO4 3 3 4 3 4 1 3 5 1 5 2 2 4 3 2 0.158
WO5 1/3 1/3 1/3 1/4 1/2 1/4 1/3 1/2 1/5 1 1/4 1/3 1/3 1/3 5 0.021
ST1 2 2 3 1 3 1/2 1 2 1/2 4 1 2 3 2 1 0.094
ST2 2 1 2 1 2 1/2 1/2 3 1/2 3 1/2 1 2 1 4 0.068
WT1 1/2 1/2 2 1/2 2 1/4 1/2 2 1/4 3 1/3 1/2 1 1/2 3 0.043
WT2 1 1 2 1/2 2 1/3 1/2 3 1/3 3 1/2 1 2 1 3 0.058
WT3 1/3 1/3 1/3 1/3 1/2 1/5 1/3 1/2 1/5 1 1/4 1/3 1/3 1/3 1 0.021
CR = 0.041
Table 85: Pairwise Comparison Matrix for Alternatives on S2
S2 SO1 SO2 SO3 SO4 SO5 WO1 WO2 WO3 WO4 WO5 ST1 ST2 WT1 WT2 WT3 Local Priorities
SO1 1 1/4 3 4 3 1/4 1 1 1/5 4 1/3 4 3 1/3 4 0.068
SO2 4 1 4 5 3 1 1 3 1/3 5 1 5 3 2 4 0.102
SO3 1/3 1/4 1 3 2 1/4 1/3 1/3 1/4 3 1/4 2 1/2 1/3 3 0.036
SO4 1/4 1/5 1/3 1 1/2 1/5 1/4 1/3 1/5 1 1/5 1 1/3 1/3 1 0.019
SO5 1/3 1/3 1/2 2 1 1/2 2 1/2 1/3 3 1/3 2 1 1/3 2 0.037
WO1 4 1 4 5 2 1 1 4 1 4 2 5 3 2 4 0.135
WO2 1 1 3 4 2 1/2 1 2 1/3 4 1/3 3 3 1 4 0.075
WO3 1 1/3 3 3 2 1/4 1/2 1 1/4 4 1/3 4 2 1 4 0.060
WO4 5 3 4 5 4 1 3 4 1 4 3 5 4 3 4 0.173
WO5 1/4 1/5 1/3 1 1/3 1/4 1/4 1/4 1/4 1 1/4 1 1/3 1/4 1/2 0.019
ST1 3 1 4 5 3 1/2 3 3 1/3 4 1 4 3 3 4 0.118
ST2 1/4 1/5 1/2 1 1/2 1/5 1/3 1/4 1/5 1 1/4 1 1/2 1/2 1 0.021
WT1 1/3 1/3 2 3 1 1/3 1/3 1/2 1/4 3 1/3 2 1 1/3 2 0.038
WT2 3 1/2 3 3 3 1/2 1 1 1/3 4 1/3 2 3 1 4 0.076
WT3 1/4 1/4 1/3 1 1/2 1/4 1/4 1/4 1/4 2 1/4 1 1/2 1/4 1 0.022
CR = 0.058
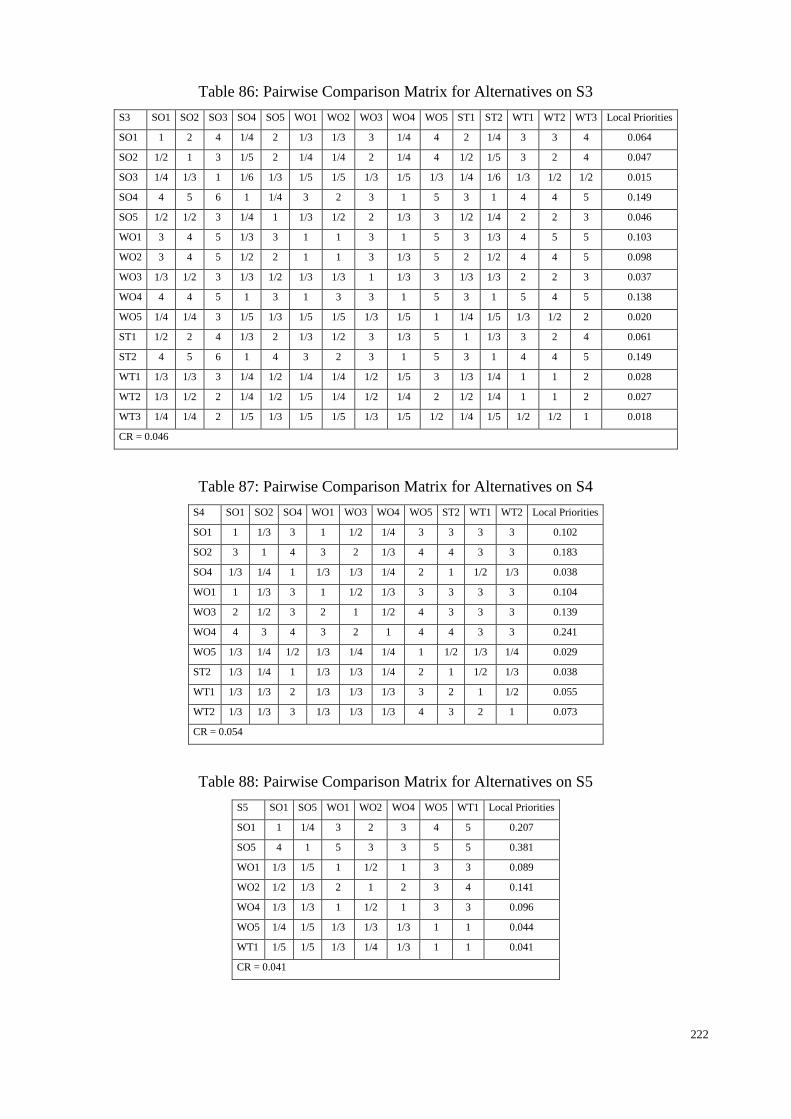
222
Table 86: Pairwise Comparison Matrix for Alternatives on S3
S3 SO1 SO2 SO3 SO4 SO5 WO1 WO2 WO3 WO4 WO5 ST1 ST2 WT1 WT2 WT3 Local Priorities
SO1 1 2 4 1/4 2 1/3 1/3 3 1/4 4 2 1/4 3 3 4 0.064
SO2 1/2 1 3 1/5 2 1/4 1/4 2 1/4 4 1/2 1/5 3 2 4 0.047
SO3 1/4 1/3 1 1/6 1/3 1/5 1/5 1/3 1/5 1/3 1/4 1/6 1/3 1/2 1/2 0.015
SO4 4 5 6 1 1/4 3 2 3 1 5 3 1 4 4 5 0.149
SO5 1/2 1/2 3 1/4 1 1/3 1/2 2 1/3 3 1/2 1/4 2 2 3 0.046
WO1 3 4 5 1/3 3 1 1 3 1 5 3 1/3 4 5 5 0.103
WO2 3 4 5 1/2 2 1 1 3 1/3 5 2 1/2 4 4 5 0.098
WO3 1/3 1/2 3 1/3 1/2 1/3 1/3 1 1/3 3 1/3 1/3 2 2 3 0.037
WO4 4 4 5 1 3 1 3 3 1 5 3 1 5 4 5 0.138
WO5 1/4 1/4 3 1/5 1/3 1/5 1/5 1/3 1/5 1 1/4 1/5 1/3 1/2 2 0.020
ST1 1/2 2 4 1/3 2 1/3 1/2 3 1/3 5 1 1/3 3 2 4 0.061
ST2 4 5 6 1 4 3 2 3 1 5 3 1 4 4 5 0.149
WT1 1/3 1/3 3 1/4 1/2 1/4 1/4 1/2 1/5 3 1/3 1/4 1 1 2 0.028
WT2 1/3 1/2 2 1/4 1/2 1/5 1/4 1/2 1/4 2 1/2 1/4 1 1 2 0.027
WT3 1/4 1/4 2 1/5 1/3 1/5 1/5 1/3 1/5 1/2 1/4 1/5 1/2 1/2 1 0.018
CR = 0.046
Table 87: Pairwise Comparison Matrix for Alternatives on S4
S4 SO1 SO2 SO4 WO1 WO3 WO4 WO5 ST2 WT1 WT2 Local Priorities
SO1 1 1/3 3 1 1/2 1/4 3 3 3 3 0.102
SO2 3 1 4 3 2 1/3 4 4 3 3 0.183
SO4 1/3 1/4 1 1/3 1/3 1/4 2 1 1/2 1/3 0.038
WO1 1 1/3 3 1 1/2 1/3 3 3 3 3 0.104
WO3 2 1/2 3 2 1 1/2 4 3 3 3 0.139
WO4 4 3 4 3 2 1 4 4 3 3 0.241
WO5 1/3 1/4 1/2 1/3 1/4 1/4 1 1/2 1/3 1/4 0.029
ST2 1/3 1/4 1 1/3 1/3 1/4 2 1 1/2 1/3 0.038
WT1 1/3 1/3 2 1/3 1/3 1/3 3 2 1 1/2 0.055
WT2 1/3 1/3 3 1/3 1/3 1/3 4 3 2 1 0.073
CR = 0.054
Table 88: Pairwise Comparison Matrix for Alternatives on S5
S5 SO1 SO5 WO1 WO2 WO4 WO5 WT1 Local Priorities
SO1 1 1/4 3 2 3 4 5 0.207
SO5 4 1 5 3 3 5 5 0.381
WO1 1/3 1/5 1 1/2 1 3 3 0.089
WO2 1/2 1/3 2 1 2 3 4 0.141
WO4 1/3 1/3 1 1/2 1 3 3 0.096
WO5 1/4 1/5 1/3 1/3 1/3 1 1 0.044
WT1 1/5 1/5 1/3 1/4 1/3 1 1 0.041
CR = 0.041
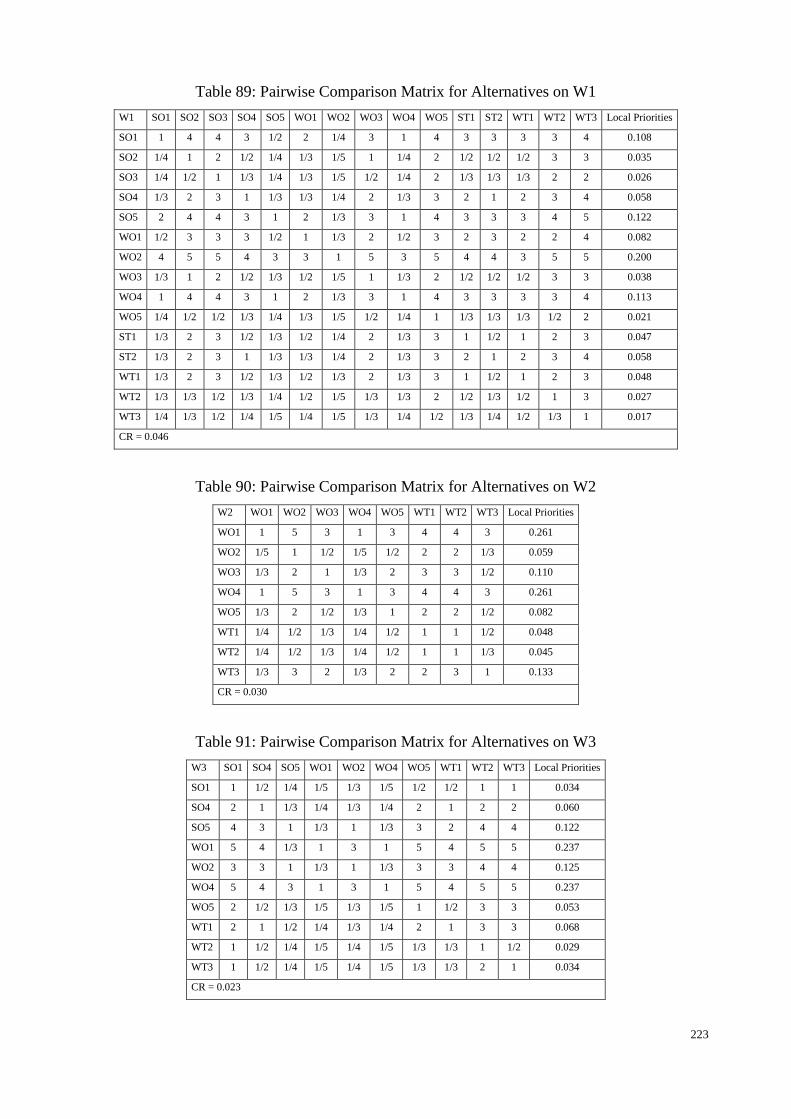
223
Table 89: Pairwise Comparison Matrix for Alternatives on W1
W1 SO1 SO2 SO3 SO4 SO5 WO1 WO2 WO3 WO4 WO5 ST1 ST2 WT1 WT2 WT3 Local Priorities
SO1 1 4 4 3 1/2 2 1/4 3 1 4 3 3 3 3 4 0.108
SO2 1/4 1 2 1/2 1/4 1/3 1/5 1 1/4 2 1/2 1/2 1/2 3 3 0.035
SO3 1/4 1/2 1 1/3 1/4 1/3 1/5 1/2 1/4 2 1/3 1/3 1/3 2 2 0.026
SO4 1/3 2 3 1 1/3 1/3 1/4 2 1/3 3 2 1 2 3 4 0.058
SO5 2 4 4 3 1 2 1/3 3 1 4 3 3 3 4 5 0.122
WO1 1/2 3 3 3 1/2 1 1/3 2 1/2 3 2 3 2 2 4 0.082
WO2 4 5 5 4 3 3 1 5 3 5 4 4 3 5 5 0.200
WO3 1/3 1 2 1/2 1/3 1/2 1/5 1 1/3 2 1/2 1/2 1/2 3 3 0.038
WO4 1 4 4 3 1 2 1/3 3 1 4 3 3 3 3 4 0.113
WO5 1/4 1/2 1/2 1/3 1/4 1/3 1/5 1/2 1/4 1 1/3 1/3 1/3 1/2 2 0.021
ST1 1/3 2 3 1/2 1/3 1/2 1/4 2 1/3 3 1 1/2 1 2 3 0.047
ST2 1/3 2 3 1 1/3 1/3 1/4 2 1/3 3 2 1 2 3 4 0.058
WT1 1/3 2 3 1/2 1/3 1/2 1/3 2 1/3 3 1 1/2 1 2 3 0.048
WT2 1/3 1/3 1/2 1/3 1/4 1/2 1/5 1/3 1/3 2 1/2 1/3 1/2 1 3 0.027
WT3 1/4 1/3 1/2 1/4 1/5 1/4 1/5 1/3 1/4 1/2 1/3 1/4 1/2 1/3 1 0.017
CR = 0.046
Table 90: Pairwise Comparison Matrix for Alternatives on W2
W2 WO1 WO2 WO3 WO4 WO5 WT1 WT2 WT3 Local Priorities
WO1 1 5 3 1 3 4 4 3 0.261
WO2 1/5 1 1/2 1/5 1/2 2 2 1/3 0.059
WO3 1/3 2 1 1/3 2 3 3 1/2 0.110
WO4 1 5 3 1 3 4 4 3 0.261
WO5 1/3 2 1/2 1/3 1 2 2 1/2 0.082
WT1 1/4 1/2 1/3 1/4 1/2 1 1 1/2 0.048
WT2 1/4 1/2 1/3 1/4 1/2 1 1 1/3 0.045
WT3 1/3 3 2 1/3 2 2 3 1 0.133
CR = 0.030
Table 91: Pairwise Comparison Matrix for Alternatives on W3
W3 SO1 SO4 SO5 WO1 WO2 WO4 WO5 WT1 WT2 WT3 Local Priorities
SO1 1 1/2 1/4 1/5 1/3 1/5 1/2 1/2 1 1 0.034
SO4 2 1 1/3 1/4 1/3 1/4 2 1 2 2 0.060
SO5 4 3 1 1/3 1 1/3 3 2 4 4 0.122
WO1 5 4 1/3 1 3 1 5 4 5 5 0.237
WO2 3 3 1 1/3 1 1/3 3 3 4 4 0.125
WO4 5 4 3 1 3 1 5 4 5 5 0.237
WO5 2 1/2 1/3 1/5 1/3 1/5 1 1/2 3 3 0.053
WT1 2 1 1/2 1/4 1/3 1/4 2 1 3 3 0.068
WT2 1 1/2 1/4 1/5 1/4 1/5 1/3 1/3 1 1/2 0.029
WT3 1 1/2 1/4 1/5 1/4 1/5 1/3 1/3 2 1 0.034
CR = 0.023

224
Table 92: Pairwise Comparison Matrix for Alternatives on W4
W4 SO1 SO2 SO4 WO1 WO3 WO4 WO5 ST1 ST2 WT1 WT2 WT3 Local Priorities
SO1 1 1/2 1/4 1/3 1/3 1/2 3 1/3 1/4 1/4 1/2 2 0.029
SO2 5 1 4 4 4 3 5 4 4 3 5 5 0.239
SO4 4 1/4 1 3 3 1/4 4 3 1 1 3 3 0.099
WO1 3 1/4 1/3 1 1 1/3 3 1 1/3 1/3 3 3 0.056
WO3 3 1/4 1/3 1 1 1/3 3 1 1/3 1/3 3 3 0.056
WO4 5 1/3 4 3 3 1 5 3 4 3 4 4 0.181
WO5 1/3 1/5 1/4 1/3 1/3 1/5 1 1/3 1/4 1/4 1/3 1/2 0.021
ST1 3 1/4 1/3 1 1 1/3 3 1 1/3 1/3 3 3 0.056
ST2 4 1/4 1 3 3 1/4 4 3 1 1 3 3 0.099
WT1 4 1/3 1 3 3 1/3 4 3 1 1 3 3 0.102
WT2 2 1/5 1/3 1/3 1/3 1/4 3 1/3 1/3 1/3 1 3 0.037
WT3 1/2 1/5 1/3 1/3 1/3 1/4 2 1/3 1/3 1/3 1/3 1 0.026
CR = 0.062
Table 93: Pairwise Comparison Matrix for Alternatives on W5
W5 SO1 SO2 SO3 SO4 SO5 WO1 WO2 WO3 WO4 WO5 ST1 ST2 WT1 WT2 WT3 Local Priorities
SO1 1 1/2 2 1/4 3 1/3 1/2 2 1/3 3 4 1/4 1/4 3 4 0.051
SO2 2 1 3 1/3 3 1/2 1 2 1/2 4 4 1/3 1/3 2 4 0.063
SO3 1/2 1/3 1 1/5 2 1/4 1/3 1/2 1/4 2 2 1/5 1/5 1 3 0.029
SO4 4 3 5 1 5 3 4 4 2 5 5 1 1 4 5 0.151
SO5 1/3 1/2 1/2 1/5 1 1/4 1/3 1/3 1/4 2 2 1/5 1/5 1/2 3 0.025
WO1 3 2 4 1/3 4 1 3 3 1 4 4 1/3 1/3 3 4 0.092
WO2 2 1 3 1/4 3 1/3 1 2 1/3 4 4 1/4 1/4 2 4 0.059
WO3 1/2 1/2 2 1/4 3 1/3 1/2 1 1/3 3 3 1/4 1/4 2 3 0.042
WO4 3 2 4 1/2 4 1 3 3 1 4 4 1/2 1/2 3 4 0.097
WO5 1/3 1/4 1/2 1/5 1/2 1/4 1/4 1/3 1/4 1 1 1/5 1/5 1/2 2 0.020
ST1 1/4 1/4 1/2 1/5 1/2 1/4 1/4 1/3 1/4 1 1 1/5 1/5 1/2 2 0.020
ST2 4 3 5 1 5 3 4 4 2 5 5 1 1 4 5 0.151
WT1 4 3 5 1 5 3 4 4 2 5 5 1 1 4 5 0.151
WT2 1/3 1/2 1 1/4 2 1/3 1/2 1/2 1/3 2 2 1/4 1/4 1 3 0.032
WT3 1/4 1/4 1/3 1/5 1/3 1/4 1/4 1/3 1/4 1/2 1/2 1/5 1/5 1/5 1 0.016
CR = 0.039

225
Table 94: Pairwise Comparison Matrix for Alternatives on W6
W6 SO1 SO2 SO3 SO4 SO5 WO1 WO2 WO3 WO4 WO5 ST1 ST2 WT1 WT2 WT3 Local Priorities
SO1 1 1/3 1 1/3 2 1/5 1/2 1/3 1/5 2 1/4 1/3 1/3 1/3 3 0.028
SO2 3 1 2 1/2 3 1/4 2 1 1/4 3 1/3 1/2 1/2 1/2 4 0.049
SO3 1 1/2 1 1/2 2 1/4 1/2 1/2 1/4 2 1/3 1/2 1/2 1/2 3 0.033
SO4 3 2 2 1 3 1/4 2 2 1/4 4 1/3 1 1 3 4 0.072
SO5 1/2 1/3 1/2 1/3 1 1/5 1/3 1/3 1/5 2 1/3 1/3 1/2 1/3 3 0.025
WO1 5 4 4 4 5 1 4 4 2 5 3 3 3 4 5 0.184
WO2 2 1/2 2 1/2 3 1/4 1 1/2 1/4 3 1/3 1/2 1/2 1/2 4 0.042
WO3 3 1 2 1/2 3 1/4 2 1 1/4 3 1/3 1/2 1/2 1/2 4 0.049
WO4 5 4 4 4 5 1/2 4 4 1 4 3 3 3 4 5 0.166
WO5 1/2 1/3 1/2 1/4 1/2 1/5 1/3 1/3 1/4 1 1/4 1/4 1/4 1/4 2 0.020
ST1 4 3 3 3 3 1/3 3 3 1/3 4 1 2 2 3 4 0.110
ST2 3 2 2 1 3 1/3 2 2 1/3 4 1/2 1 1 3 4 0.075
WT1 3 2 2 1 3 1/3 2 2 1/3 4 1/2 1 1 3 4 0.074
WT2 3 2 2 1/3 3 1/4 2 2 1/4 4 1/3 1/3 1/3 1 4 0.056
WT3 1/3 1/4 1/3 1/4 1/3 1/5 1/4 1/4 1/5 1/2 1/4 1/4 1/4 1/4 1 0.016
CR = 0.048
Table 95: Pairwise Comparison Matrix for Alternatives on W7
W7 SO1 SO2 SO3 SO4 SO5 WO1 WO2 WO3 WO4 WO5 ST1 ST2 WT1 WT2 WT3 Local Priorities
SO1 1 1/3 2 1/4 1 1/3 1/2 1/4 1/3 3 1/4 1/4 1/3 1 3 0.031
SO2 3 1 3 1/3 2 1/2 2 1/3 1/2 4 1/3 1/3 1/2 3 3 0.054
SO3 1/2 1/3 1 1/4 1/2 1/3 1/3 1/4 1/3 2 1/4 1/4 1/4 1 2 0.024
SO4 4 3 4 1 4 3 3 3 4 5 2 1 2 4 5 0.152
SO5 1 1/2 2 1/4 1 1/3 1/3 1/3 1/3 2 1/4 1/4 1/3 1 2 0.029
WO1 3 2 3 1/3 3 1 3 1/3 2 4 1/3 1/3 1/2 3 4 0.071
WO2 2 1/2 3 1/3 3 1/3 1 1/3 1/3 3 1/3 1/3 1/3 2 3 0.044
WO3 4 3 4 1/3 3 3 3 1 3 4 1/2 1/3 2 4 5 0.108
WO4 3 2 3 1/4 3 1/2 3 1/3 1 4 1/3 1/4 1/3 3 4 0.062
WO5 1/3 1/4 1/2 1/5 1/2 1/4 1/3 1/4 1/4 1 1/4 1/5 1/4 1/2 1/2 0.017
ST1 4 3 4 1/2 4 3 3 2 3 4 1 1/2 2 3 4 0.120
ST2 4 3 4 1 4 3 3 3 4 5 2 1 2 4 5 0.152
WT1 3 2 4 1/2 3 2 3 1/2 3 4 1/2 1/2 1 3 4 0.089
WT2 1 1/3 1 1/4 1 1/3 1/2 1/4 1/3 2 1/3 1/4 1/3 1 2 0.028
WT3 1/3 1/3 1/2 1/5 1/2 1/4 1/3 1/5 1/4 2 1/4 1/5 1/5 1/2 1 0.019
CR = 0.045
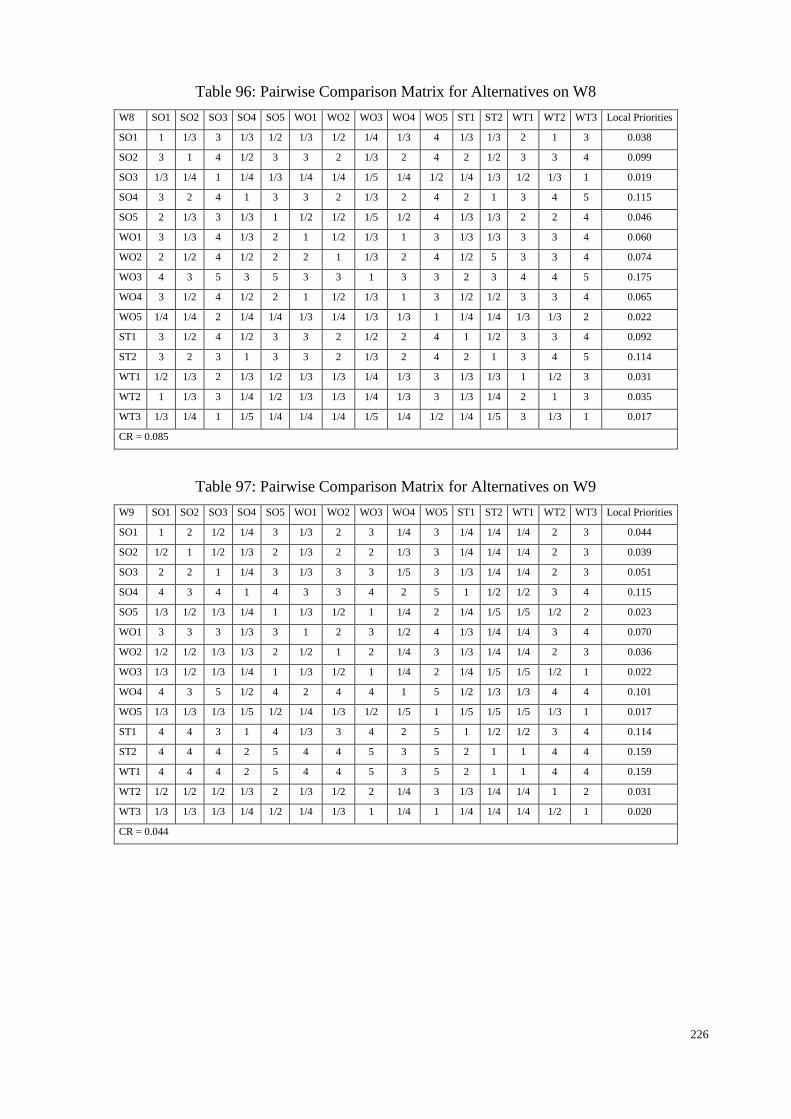
226
Table 96: Pairwise Comparison Matrix for Alternatives on W8
W8 SO1 SO2 SO3 SO4 SO5 WO1 WO2 WO3 WO4 WO5 ST1 ST2 WT1 WT2 WT3 Local Priorities
SO1 1 1/3 3 1/3 1/2 1/3 1/2 1/4 1/3 4 1/3 1/3 2 1 3 0.038
SO2 3 1 4 1/2 3 3 2 1/3 2 4 2 1/2 3 3 4 0.099
SO3 1/3 1/4 1 1/4 1/3 1/4 1/4 1/5 1/4 1/2 1/4 1/3 1/2 1/3 1 0.019
SO4 3 2 4 1 3 3 2 1/3 2 4 2 1 3 4 5 0.115
SO5 2 1/3 3 1/3 1 1/2 1/2 1/5 1/2 4 1/3 1/3 2 2 4 0.046
WO1 3 1/3 4 1/3 2 1 1/2 1/3 1 3 1/3 1/3 3 3 4 0.060
WO2 2 1/2 4 1/2 2 2 1 1/3 2 4 1/2 5 3 3 4 0.074
WO3 4 3 5 3 5 3 3 1 3 3 2 3 4 4 5 0.175
WO4 3 1/2 4 1/2 2 1 1/2 1/3 1 3 1/2 1/2 3 3 4 0.065
WO5 1/4 1/4 2 1/4 1/4 1/3 1/4 1/3 1/3 1 1/4 1/4 1/3 1/3 2 0.022
ST1 3 1/2 4 1/2 3 3 2 1/2 2 4 1 1/2 3 3 4 0.092
ST2 3 2 3 1 3 3 2 1/3 2 4 2 1 3 4 5 0.114
WT1 1/2 1/3 2 1/3 1/2 1/3 1/3 1/4 1/3 3 1/3 1/3 1 1/2 3 0.031
WT2 1 1/3 3 1/4 1/2 1/3 1/3 1/4 1/3 3 1/3 1/4 2 1 3 0.035
WT3 1/3 1/4 1 1/5 1/4 1/4 1/4 1/5 1/4 1/2 1/4 1/5 3 1/3 1 0.017
CR = 0.085
Table 97: Pairwise Comparison Matrix for Alternatives on W9
W9 SO1 SO2 SO3 SO4 SO5 WO1 WO2 WO3 WO4 WO5 ST1 ST2 WT1 WT2 WT3 Local Priorities
SO1 1 2 1/2 1/4 3 1/3 2 3 1/4 3 1/4 1/4 1/4 2 3 0.044
SO2 1/2 1 1/2 1/3 2 1/3 2 2 1/3 3 1/4 1/4 1/4 2 3 0.039
SO3 2 2 1 1/4 3 1/3 3 3 1/5 3 1/3 1/4 1/4 2 3 0.051
SO4 4 3 4 1 4 3 3 4 2 5 1 1/2 1/2 3 4 0.115
SO5 1/3 1/2 1/3 1/4 1 1/3 1/2 1 1/4 2 1/4 1/5 1/5 1/2 2 0.023
WO1 3 3 3 1/3 3 1 2 3 1/2 4 1/3 1/4 1/4 3 4 0.070
WO2 1/2 1/2 1/3 1/3 2 1/2 1 2 1/4 3 1/3 1/4 1/4 2 3 0.036
WO3 1/3 1/2 1/3 1/4 1 1/3 1/2 1 1/4 2 1/4 1/5 1/5 1/2 1 0.022
WO4 4 3 5 1/2 4 2 4 4 1 5 1/2 1/3 1/3 4 4 0.101
WO5 1/3 1/3 1/3 1/5 1/2 1/4 1/3 1/2 1/5 1 1/5 1/5 1/5 1/3 1 0.017
ST1 4 4 3 1 4 1/3 3 4 2 5 1 1/2 1/2 3 4 0.114
ST2 4 4 4 2 5 4 4 5 3 5 2 1 1 4 4 0.159
WT1 4 4 4 2 5 4 4 5 3 5 2 1 1 4 4 0.159
WT2 1/2 1/2 1/2 1/3 2 1/3 1/2 2 1/4 3 1/3 1/4 1/4 1 2 0.031
WT3 1/3 1/3 1/3 1/4 1/2 1/4 1/3 1 1/4 1 1/4 1/4 1/4 1/2 1 0.020
CR = 0.044

227
Table 98: Pairwise Comparison Matrix for Alternatives on W10
W10 SO1 SO2 SO3 SO4 SO5 WO1 WO2 WO3 WO4 WO5 ST1 ST2 WT1 WT2 WT3 Local Priorities
SO1 1 1/3 2 1/2 1/4 1/2 1/4 1/3 1/2 1/3 1/3 1/3 1/2 1/2 1/3 0.025
SO2 3 1 3 2 1/3 3 1/3 2 3 2 1/2 1/3 3 2 1/2 0.071
SO3 1/2 1/3 1 1/3 1/5 1/2 1/5 1/3 1/2 1/3 1/4 1/5 1/2 1/2 1/4 0.019
SO4 2 1/2 3 1 1/4 1 1/4 1/2 2 1/2 1/3 1/3 2 1 1/3 0.039
SO5 4 3 5 4 1 3 1 3 3 2 3 1 3 3 2 0.136
WO1 2 1/3 2 1 1/3 1 1/3 1/2 1 1/2 1/3 1/3 1 1 1/3 0.035
WO2 4 3 5 4 1 3 1 3 3 2 3 1 3 3 2 0.136
WO3 3 1/2 3 2 1/3 2 1/3 1 2 2 1/3 1/3 3 2 1/3 0.059
WO4 2 1/3 2 1/2 1/3 1 1/3 1/2 1 1/2 1/3 1/3 1 1 1/3 0.033
WO5 3 1/2 3 2 1/2 2 1/2 1/2 2 1 1/2 1/3 3 2 1/2 0.058
ST1 3 2 4 3 1/3 3 1/3 3 3 2 1 1/2 3 3 1/2 0.090
ST2 3 3 5 3 1 3 1 3 3 3 2 1 3 3 2 0.130
WT1 2 1/3 2 1/2 1/3 1 1/3 1/3 1 1/3 1/3 1/3 1 1/2 1/3 0.031
WT2 2 1/2 2 1 1/3 1 1/3 1/2 1 1/2 1/3 1/3 2 1 1/3 0.037
WT3 3 2 4 3 1/2 3 1/2 3 3 2 2 1/2 3 3 1 0.101
CR = 0.032
Table 99: Pairwise Comparison Matrix for Alternatives on W11
W11 SO1 SO2 SO3 SO4 SO5 WO1 WO2 WO3 WO4 WO5 ST1 ST2 WT1 WT2 WT3 Local Priorities
SO1 1 1/2 1/3 1/3 1 1/2 1/2 1/2 1/2 3 1/4 1/3 1/2 1 2 0.033
SO2 2 1 1/3 1/2 2 2 1 2 2 4 1/4 1/3 1/2 3 3 0.061
SO3 3 3 1 2 3 3 3 2 3 4 1/3 1/2 2 3 3 0.110
SO4 3 2 1/2 1 3 3 3 2 2 4 1/4 1/2 2 3 3 0.093
SO5 1 1/2 1/3 1/3 1 1/2 1/2 1/2 1/2 3 1/4 1/3 1/2 2 2 0.035
WO1 2 1/2 1/3 1/3 2 1 1/2 1 1 4 1/4 1/3 1/3 2 3 0.045
WO2 2 1 1/3 1/3 2 2 1 2 2 4 1/3 1/3 1/2 3 3 0.061
WO3 2 1/2 1/2 1/2 2 1 1/2 1 1 4 1/4 1/3 1/2 2 3 0.048
WO4 2 1/2 1/3 1/2 2 1 1/2 1 1 4 1/4 1/3 1/2 2 3 0.047
WO5 1/3 1/4 1/4 1/4 1/3 1/4 1/4 1/4 1/4 1 1/5 1/5 1/3 1 1 0.019
ST1 4 4 3 4 4 4 3 4 4 5 1 3 3 4 5 0.195
ST2 3 3 2 2 3 3 3 3 3 5 1/3 1 2 3 4 0.127
WT1 2 2 1/2 1/2 2 3 2 2 2 3 1/3 1/2 1 3 3 0.077
WT2 1 1/3 1/3 1/3 1/2 1/2 1/3 1/2 1/2 1 1/4 1/3 1/3 1 1 0.026
WT3 1/2 1/3 1/3 1/4 1/2 1/3 1/3 1/3 1/3 1 1/5 1/4 1/3 1 1 0.022
CR = 0.036
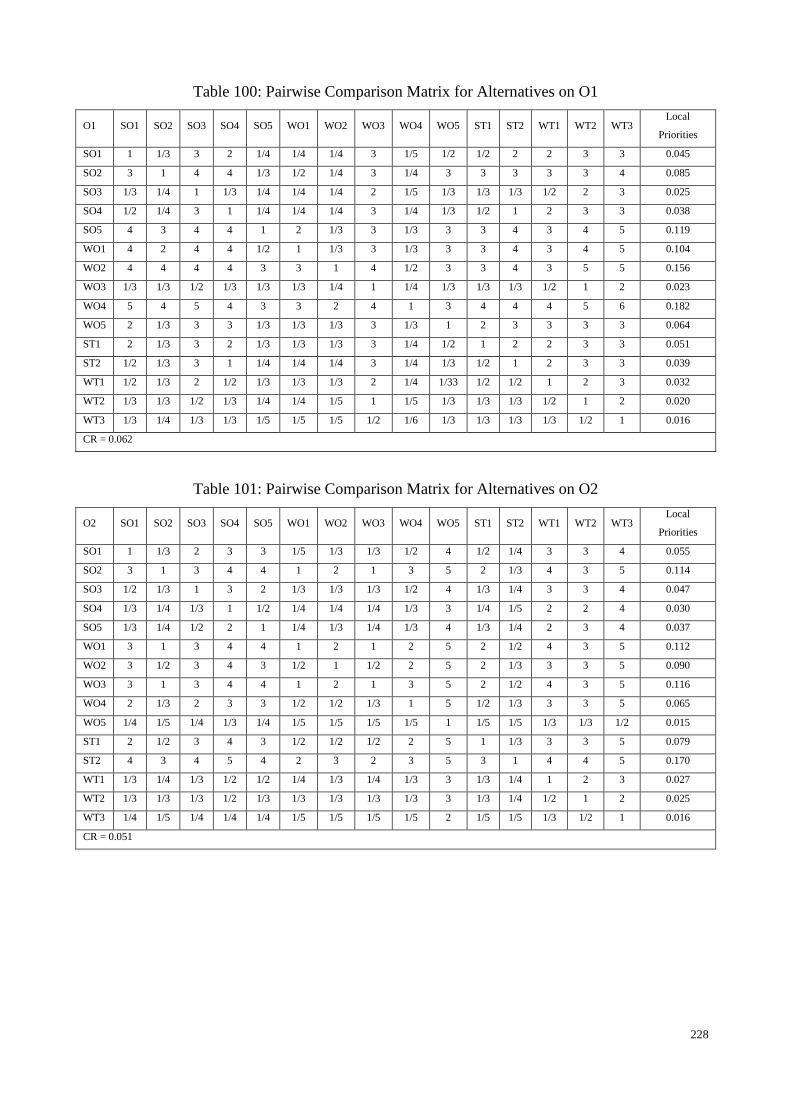
228
Table 100: Pairwise Comparison Matrix for Alternatives on O1
O1 SO1 SO2 SO3 SO4 SO5 WO1 WO2 WO3 WO4 WO5 ST1 ST2 WT1 WT2 WT3 Local
Priorities
SO1 1 1/3 3 2 1/4 1/4 1/4 3 1/5 1/2 1/2 2 2 3 3 0.045
SO2 3 1 4 4 1/3 1/2 1/4 3 1/4 3 3 3 3 3 4 0.085
SO3 1/3 1/4 1 1/3 1/4 1/4 1/4 2 1/5 1/3 1/3 1/3 1/2 2 3 0.025
SO4 1/2 1/4 3 1 1/4 1/4 1/4 3 1/4 1/3 1/2 1 2 3 3 0.038
SO5 4 3 4 4 1 2 1/3 3 1/3 3 3 4 3 4 5 0.119
WO1 4 2 4 4 1/2 1 1/3 3 1/3 3 3 4 3 4 5 0.104
WO2 4 4 4 4 3 3 1 4 1/2 3 3 4 3 5 5 0.156
WO3 1/3 1/3 1/2 1/3 1/3 1/3 1/4 1 1/4 1/3 1/3 1/3 1/2 1 2 0.023
WO4 5 4 5 4 3 3 2 4 1 3 4 4 4 5 6 0.182
WO5 2 1/3 3 3 1/3 1/3 1/3 3 1/3 1 2 3 3 3 3 0.064
ST1 2 1/3 3 2 1/3 1/3 1/3 3 1/4 1/2 1 2 2 3 3 0.051
ST2 1/2 1/3 3 1 1/4 1/4 1/4 3 1/4 1/3 1/2 1 2 3 3 0.039
WT1 1/2 1/3 2 1/2 1/3 1/3 1/3 2 1/4 1/33 1/2 1/2 1 2 3 0.032
WT2 1/3 1/3 1/2 1/3 1/4 1/4 1/5 1 1/5 1/3 1/3 1/3 1/2 1 2 0.020
WT3 1/3 1/4 1/3 1/3 1/5 1/5 1/5 1/2 1/6 1/3 1/3 1/3 1/3 1/2 1 0.016
CR = 0.062
Table 101: Pairwise Comparison Matrix for Alternatives on O2
O2 SO1 SO2 SO3 SO4 SO5 WO1 WO2 WO3 WO4 WO5 ST1 ST2 WT1 WT2 WT3 Local
Priorities
SO1 1 1/3 2 3 3 1/5 1/3 1/3 1/2 4 1/2 1/4 3 3 4 0.055
SO2 3 1 3 4 4 1 2 1 3 5 2 1/3 4 3 5 0.114
SO3 1/2 1/3 1 3 2 1/3 1/3 1/3 1/2 4 1/3 1/4 3 3 4 0.047
SO4 1/3 1/4 1/3 1 1/2 1/4 1/4 1/4 1/3 3 1/4 1/5 2 2 4 0.030
SO5 1/3 1/4 1/2 2 1 1/4 1/3 1/4 1/3 4 1/3 1/4 2 3 4 0.037
WO1 3 1 3 4 4 1 2 1 2 5 2 1/2 4 3 5 0.112
WO2 3 1/2 3 4 3 1/2 1 1/2 2 5 2 1/3 3 3 5 0.090
WO3 3 1 3 4 4 1 2 1 3 5 2 1/2 4 3 5 0.116
WO4 2 1/3 2 3 3 1/2 1/2 1/3 1 5 1/2 1/3 3 3 5 0.065
WO5 1/4 1/5 1/4 1/3 1/4 1/5 1/5 1/5 1/5 1 1/5 1/5 1/3 1/3 1/2 0.015
ST1 2 1/2 3 4 3 1/2 1/2 1/2 2 5 1 1/3 3 3 5 0.079
ST2 4 3 4 5 4 2 3 2 3 5 3 1 4 4 5 0.170
WT1 1/3 1/4 1/3 1/2 1/2 1/4 1/3 1/4 1/3 3 1/3 1/4 1 2 3 0.027
WT2 1/3 1/3 1/3 1/2 1/3 1/3 1/3 1/3 1/3 3 1/3 1/4 1/2 1 2 0.025
WT3 1/4 1/5 1/4 1/4 1/4 1/5 1/5 1/5 1/5 2 1/5 1/5 1/3 1/2 1 0.016
CR = 0.051
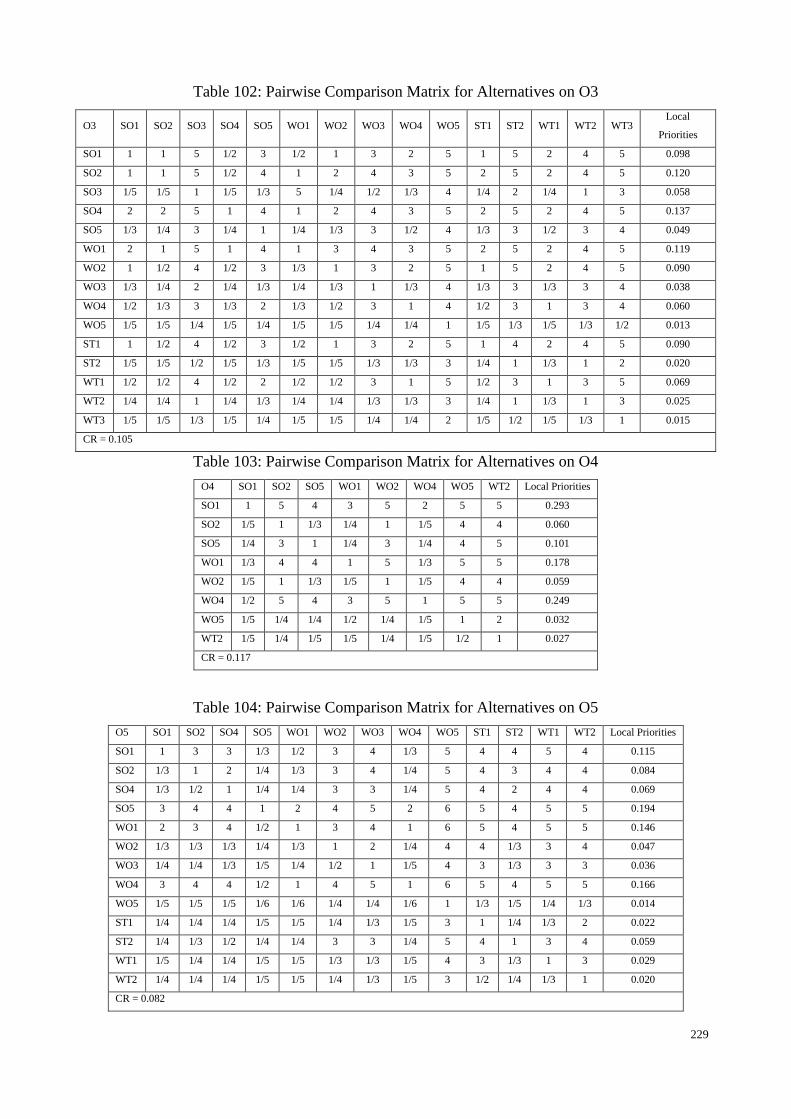
229
Table 102: Pairwise Comparison Matrix for Alternatives on O3
O3 SO1 SO2 SO3 SO4 SO5 WO1 WO2 WO3 WO4 WO5 ST1 ST2 WT1 WT2 WT3 Local
Priorities
SO1 1 1 5 1/2 3 1/2 1 3 2 5 1 5 2 4 5 0.098
SO2 1 1 5 1/2 4 1 2 4 3 5 2 5 2 4 5 0.120
SO3 1/5 1/5 1 1/5 1/3 5 1/4 1/2 1/3 4 1/4 2 1/4 1 3 0.058
SO4 2 2 5 1 4 1 2 4 3 5 2 5 2 4 5 0.137
SO5 1/3 1/4 3 1/4 1 1/4 1/3 3 1/2 4 1/3 3 1/2 3 4 0.049
WO1 2 1 5 1 4 1 3 4 3 5 2 5 2 4 5 0.119
WO2 1 1/2 4 1/2 3 1/3 1 3 2 5 1 5 2 4 5 0.090
WO3 1/3 1/4 2 1/4 1/3 1/4 1/3 1 1/3 4 1/3 3 1/3 3 4 0.038
WO4 1/2 1/3 3 1/3 2 1/3 1/2 3 1 4 1/2 3 1 3 4 0.060
WO5 1/5 1/5 1/4 1/5 1/4 1/5 1/5 1/4 1/4 1 1/5 1/3 1/5 1/3 1/2 0.013
ST1 1 1/2 4 1/2 3 1/2 1 3 2 5 1 4 2 4 5 0.090
ST2 1/5 1/5 1/2 1/5 1/3 1/5 1/5 1/3 1/3 3 1/4 1 1/3 1 2 0.020
WT1 1/2 1/2 4 1/2 2 1/2 1/2 3 1 5 1/2 3 1 3 5 0.069
WT2 1/4 1/4 1 1/4 1/3 1/4 1/4 1/3 1/3 3 1/4 1 1/3 1 3 0.025
WT3 1/5 1/5 1/3 1/5 1/4 1/5 1/5 1/4 1/4 2 1/5 1/2 1/5 1/3 1 0.015
CR = 0.105
Table 103: Pairwise Comparison Matrix for Alternatives on O4
O4 SO1 SO2 SO5 WO1 WO2 WO4 WO5 WT2 Local Priorities
SO1 1 5 4 3 5 2 5 5 0.293
SO2 1/5 1 1/3 1/4 1 1/5 4 4 0.060
SO5 1/4 3 1 1/4 3 1/4 4 5 0.101
WO1 1/3 4 4 1 5 1/3 5 5 0.178
WO2 1/5 1 1/3 1/5 1 1/5 4 4 0.059
WO4 1/2 5 4 3 5 1 5 5 0.249
WO5 1/5 1/4 1/4 1/2 1/4 1/5 1 2 0.032
WT2 1/5 1/4 1/5 1/5 1/4 1/5 1/2 1 0.027
CR = 0.117
Table 104: Pairwise Comparison Matrix for Alternatives on O5
O5 SO1 SO2 SO4 SO5 WO1 WO2 WO3 WO4 WO5 ST1 ST2 WT1 WT2 Local Priorities
SO1 1 3 3 1/3 1/2 3 4 1/3 5 4 4 5 4 0.115
SO2 1/3 1 2 1/4 1/3 3 4 1/4 5 4 3 4 4 0.084
SO4 1/3 1/2 1 1/4 1/4 3 3 1/4 5 4 2 4 4 0.069
SO5 3 4 4 1 2 4 5 2 6 5 4 5 5 0.194
WO1 2 3 4 1/2 1 3 4 1 6 5 4 5 5 0.146
WO2 1/3 1/3 1/3 1/4 1/3 1 2 1/4 4 4 1/3 3 4 0.047
WO3 1/4 1/4 1/3 1/5 1/4 1/2 1 1/5 4 3 1/3 3 3 0.036
WO4 3 4 4 1/2 1 4 5 1 6 5 4 5 5 0.166
WO5 1/5 1/5 1/5 1/6 1/6 1/4 1/4 1/6 1 1/3 1/5 1/4 1/3 0.014
ST1 1/4 1/4 1/4 1/5 1/5 1/4 1/3 1/5 3 1 1/4 1/3 2 0.022
ST2 1/4 1/3 1/2 1/4 1/4 3 3 1/4 5 4 1 3 4 0.059
WT1 1/5 1/4 1/4 1/5 1/5 1/3 1/3 1/5 4 3 1/3 1 3 0.029
WT2 1/4 1/4 1/4 1/5 1/5 1/4 1/3 1/5 3 1/2 1/4 1/3 1 0.020
CR = 0.082

230
Table 105: Pairwise Comparison Matrix for Alternatives on O6
O6 SO2 SO4 SO5 WO1 WO2 WO4 WO5 ST1 ST2 WT1 WT2 Local Priorities
SO2 1 1/3 3 1/4 3 1/5 1/5 1/4 4 1/4 1/4 0.038
SO4 3 1 4 1/4 3 1/5 1/5 1/3 4 1/3 1/4 0.053
SO5 1/3 1/4 1 1/4 1/2 1/4 1/5 1/4 3 1/4 1/4 0.026
WO1 4 4 4 1 4 1/2 1/3 4 5 4 3 0.156
WO2 1/3 1/3 2 1/4 1 1/5 1/5 1/4 3 1/4 1/4 0.028
WO4 5 5 4 2 5 1 1/2 4 5 4 3 0.188
WO5 5 5 5 3 5 2 1 4 5 4 3 0.227
ST1 4 3 4 1/4 4 1/4 1/4 1 4 2 1/3 0.080
ST2 1/4 1/4 1/3 1/5 1/3 1/5 1/5 1/4 1 1/4 1/5 0.019
WT1 4 3 4 1/4 4 1/4 1/4 1/2 4 1 1/3 0.070
WT2 4 4 4 1/3 4 1/3 1/3 1/3 5 3 1 0.114
CR = 0.086
Table 106: Pairwise Comparison Matrix for Alternatives on O7
O7 SO1 SO2 SO3 SO4 SO5 WO1 WO2 WO3 WO4 WO5 ST1 ST2 WT1 WT2 WT3 Local
Priorities
SO1 1 1/3 3 1/4 1/3 1/4 1/4 1/6 2 4 1/4 1/2 1/5 3 3 0.030
SO2 3 1 3 1/4 1/3 1/3 1/4 1/5 3 4 1/4 3 1/4 3 4 0.044
SO3 1/3 1/3 1 1/5 1/4 1/4 1/5 1/5 1/2 3 1/4 1/3 1/5 2 3 0.021
SO4 4 4 5 1 4 3 1/3 1/3 4 5 3 5 1/3 4 5 0.109
SO5 3 3 4 1/4 1 1/3 1/4 1/4 3 4 1/4 4 1/4 4 5 0.057
WO1 4 3 4 1/3 3 1 1/3 1/4 3 5 1/2 4 1/4 4 5 0.071
WO2 4 4 5 3 4 3 1 1/3 4 6 3 5 1/2 5 6 0.132
WO3 6 5 5 3 4 4 3 1 5 7 4 5 3 5 6 0.195
WO4 1/2 1/3 2 1/4 1/3 1/3 1/4 1/5 1 4 1/4 1/2 1/4 3 3 0.027
WO5 1/4 1/4 1/3 1/5 1/4 1/5 1/6 1/7 1/4 1 1/5 1/4 1/6 1/3 1/2 0.012
ST1 4 4 4 1/3 4 2 1/3 1/4 4 5 1 5 1/3 4 5 0.088
ST2 2 1/3 3 1/5 1/4 1/4 1/5 1/5 2 4 1/5 1 1/5 3 3 0.032
WT1 5 4 5 3 4 4 2 1/3 4 6 3 5 1 5 5 0.149
WT2 1/3 1/3 1/2 1/4 1/4 1/4 1/5 1/5 1/3 3 1/4 1/3 1/5 1 2 0.019
WT3 1/3 1/4 1/3 1/5 1/5 1/5 1/6 1/6 1/3 2 1/5 1/3 1/5 1/2 1 0.014
CR = 0.088
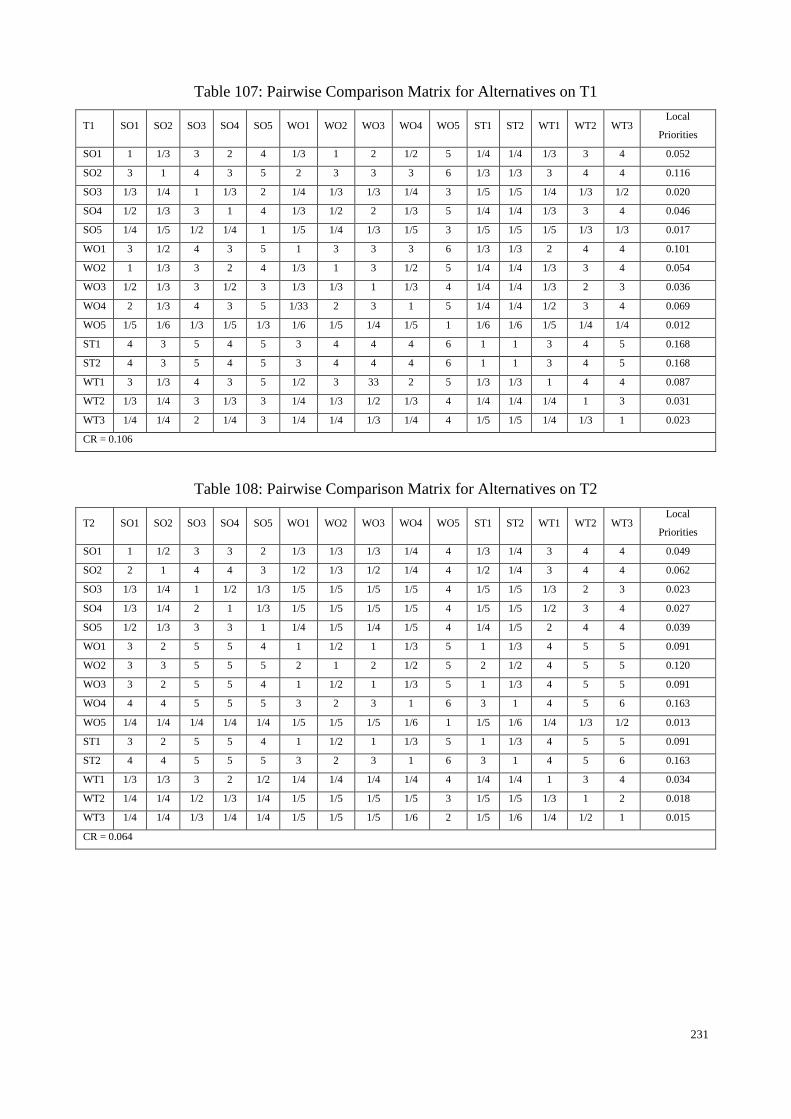
231
Table 107: Pairwise Comparison Matrix for Alternatives on T1
T1 SO1 SO2 SO3 SO4 SO5 WO1 WO2 WO3 WO4 WO5 ST1 ST2 WT1 WT2 WT3 Local
Priorities
SO1 1 1/3 3 2 4 1/3 1 2 1/2 5 1/4 1/4 1/3 3 4 0.052
SO2 3 1 4 3 5 2 3 3 3 6 1/3 1/3 3 4 4 0.116
SO3 1/3 1/4 1 1/3 2 1/4 1/3 1/3 1/4 3 1/5 1/5 1/4 1/3 1/2 0.020
SO4 1/2 1/3 3 1 4 1/3 1/2 2 1/3 5 1/4 1/4 1/3 3 4 0.046
SO5 1/4 1/5 1/2 1/4 1 1/5 1/4 1/3 1/5 3 1/5 1/5 1/5 1/3 1/3 0.017
WO1 3 1/2 4 3 5 1 3 3 3 6 1/3 1/3 2 4 4 0.101
WO2 1 1/3 3 2 4 1/3 1 3 1/2 5 1/4 1/4 1/3 3 4 0.054
WO3 1/2 1/3 3 1/2 3 1/3 1/3 1 1/3 4 1/4 1/4 1/3 2 3 0.036
WO4 2 1/3 4 3 5 1/33 2 3 1 5 1/4 1/4 1/2 3 4 0.069
WO5 1/5 1/6 1/3 1/5 1/3 1/6 1/5 1/4 1/5 1 1/6 1/6 1/5 1/4 1/4 0.012
ST1 4 3 5 4 5 3 4 4 4 6 1 1 3 4 5 0.168
ST2 4 3 5 4 5 3 4 4 4 6 1 1 3 4 5 0.168
WT1 3 1/3 4 3 5 1/2 3 33 2 5 1/3 1/3 1 4 4 0.087
WT2 1/3 1/4 3 1/3 3 1/4 1/3 1/2 1/3 4 1/4 1/4 1/4 1 3 0.031
WT3 1/4 1/4 2 1/4 3 1/4 1/4 1/3 1/4 4 1/5 1/5 1/4 1/3 1 0.023
CR = 0.106
Table 108: Pairwise Comparison Matrix for Alternatives on T2
T2 SO1 SO2 SO3 SO4 SO5 WO1 WO2 WO3 WO4 WO5 ST1 ST2 WT1 WT2 WT3 Local
Priorities
SO1 1 1/2 3 3 2 1/3 1/3 1/3 1/4 4 1/3 1/4 3 4 4 0.049
SO2 2 1 4 4 3 1/2 1/3 1/2 1/4 4 1/2 1/4 3 4 4 0.062
SO3 1/3 1/4 1 1/2 1/3 1/5 1/5 1/5 1/5 4 1/5 1/5 1/3 2 3 0.023
SO4 1/3 1/4 2 1 1/3 1/5 1/5 1/5 1/5 4 1/5 1/5 1/2 3 4 0.027
SO5 1/2 1/3 3 3 1 1/4 1/5 1/4 1/5 4 1/4 1/5 2 4 4 0.039
WO1 3 2 5 5 4 1 1/2 1 1/3 5 1 1/3 4 5 5 0.091
WO2 3 3 5 5 5 2 1 2 1/2 5 2 1/2 4 5 5 0.120
WO3 3 2 5 5 4 1 1/2 1 1/3 5 1 1/3 4 5 5 0.091
WO4 4 4 5 5 5 3 2 3 1 6 3 1 4 5 6 0.163
WO5 1/4 1/4 1/4 1/4 1/4 1/5 1/5 1/5 1/6 1 1/5 1/6 1/4 1/3 1/2 0.013
ST1 3 2 5 5 4 1 1/2 1 1/3 5 1 1/3 4 5 5 0.091
ST2 4 4 5 5 5 3 2 3 1 6 3 1 4 5 6 0.163
WT1 1/3 1/3 3 2 1/2 1/4 1/4 1/4 1/4 4 1/4 1/4 1 3 4 0.034
WT2 1/4 1/4 1/2 1/3 1/4 1/5 1/5 1/5 1/5 3 1/5 1/5 1/3 1 2 0.018
WT3 1/4 1/4 1/3 1/4 1/4 1/5 1/5 1/5 1/6 2 1/5 1/6 1/4 1/2 1 0.015
CR = 0.064
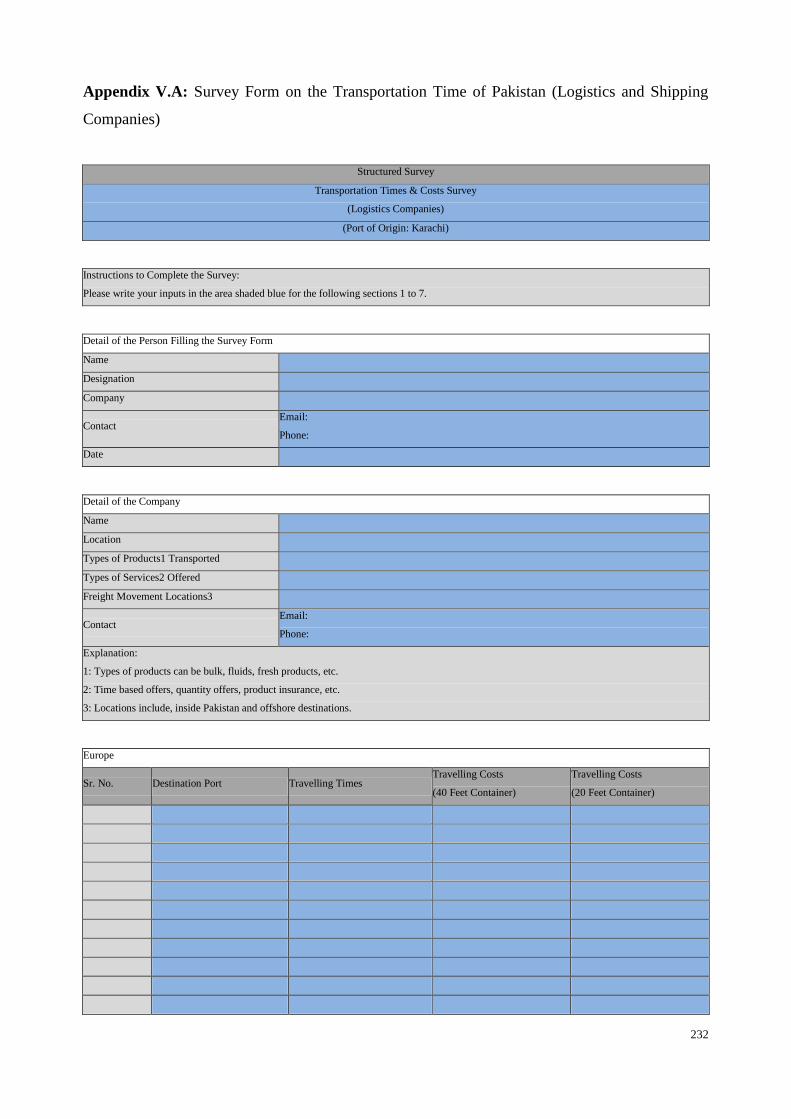
232
Appendix V.A: Survey Form on the Transportation Time of Pakistan (Logistics and Shipping
Companies)
Structured Survey
Transportation Times & Costs Survey
(Logistics Companies)
(Port of Origin: Karachi)
Instructions to Complete the Survey:
Please write your inputs in the area shaded blue for the following sections 1 to 7.
Detail of the Person Filling the Survey Form
Name
Designation
Company
Contact Email:
Phone:
Date
Detail of the Company
Name
Location
Types of Products1 Transported
Types of Services2 Offered
Freight Movement Locations3
Contact Email:
Phone:
Explanation:
1: Types of products can be bulk, fluids, fresh products, etc.
2: Time based offers, quantity offers, product insurance, etc.
3: Locations include, inside Pakistan and offshore destinations.
Europe
Sr. No. Destination Port Travelling Times Travelling Costs
(40 Feet Container)
Travelling Costs
(20 Feet Container)
233
America
Sr. No. Destination Port Travelling Times Travelling Costs
(40 Feet Container)
Travelling Costs
(20 Feet Container)
Asia
Sr. No. Destination Port Travelling Times Travelling Costs
(40 Feet Container)
Travelling Costs
(20 Feet Container)
Far East
Sr. No. Destination Port Travelling Times Travelling Costs
(40 Feet Container)
Travelling Costs
(20 Feet Container)
234
Africa
Sr. No. Destination Port Travelling Times Travelling Costs
(40 Feet Container)
Travelling Costs
(20 Feet Container)
In-Country Transportation Times and Costs (Main Industrial Locations to Karachi Port)
Origins Travelling Times Cost
(40 Feet Container)
Cost
(20 Feet Container)
Karachi
Nooriabad
Hyderabad
Mirpur Khas
Nawabshah
Khairpur
Sukkar
Rahim Yar Khan
Bahawalpur
Multan
Faisalabad
Lahore
Rawalpindi
Sargodha
Kohat
Peshawar
Dera Ismail Khan
Quetta
Sibi
Gawadar
Muzafarabad

235
Appendix V.B: Survey Results on the Transportation Time of Pakistan
Table 128: Inland Transportation Time from Industrial Locations to Karachi Port
Region Industrial Locations Transportation Times
Baluchistan Hub 01
Quetta; Gawadar 02
Kashmir and Northern Areas 02-03
Khyber Phakhtunkha Peshawar; Mardan; Swabi; Kohat 02
Sindh Karachi; Hyderabad; Dadu; Jamshoro;
Nawabshah; Sukkar; Sanghar; Khairpur 01
Punjab
Rahim Yar Khan; Bhawalpur; Mulatn;
Muzaffargarh; Lahore; Faisalabad;
Rawalpindi; Sialkot; Gujrat
02
Table 129: Off Shore Transportation Time to Main Export Destinations of Pakistan
Destinations Time in days
Europe
United Kingdom (Felixstowe Port) 19-20
Germany 22-23
France 28-30
Italy 21-22
Norway 34-35
Portugal 34-35
Far East
Australia 34-35
New Zealand N/A
Indonesia N/A
Malaysia 16-17
Japan 24-25
Vietnam 21-22
Africa
South Africa 24-25
Algeria 24-25
Egypt 18-20
Libya 18-20
Morocco N/A
Tunisia 29-30
Middle East and South Asia
Saudi Arabia 10-11
India (Bombay) 2-3
Bangladesh 18-20