Embed Size (px)
Citation preview
2021
See full report: vtclimate.org
ABOUT THE VERMONT CLIMATE ASSESSMENT
The Vermont Climate Assessment (VCA) provides a framework for understanding climate change impacts in Vermont. It is written to help citizens and decision-makers make sense of climate data and prepare for future impacts across key sectors (for example, the Vermont Climate Council, which is working to reduce the state’s GHG emissions and identify actions Vermont communities can take to better prepare for more extreme weather). The VCA 2021 updates the University of Vermont’s pio-neering state climate assessment in 2014, which was the first to provide state-level data similar to the National Climate Assessment.
The VCA 2021 included a process to engage key stakeholders from the beginning of the assessment. Understanding stakeholder interests enabled the VCA team to focus on relevant, useful research. Re-searcher Laura Edling led a needs assessment in 2020 to:
• Understand what VCA information would be most useful and why;• Facilitate ongoing knowledge exchange among VCA researchers and a variety of stakeholders;
and• Identify diverse sources of knowledge that are relevant to climate research and decision-making.
Many stakeholders were interested in impacts related to precipitation, storms, and flooding. For ex-ample, stakeholders in the agriculture sector expressed a desire to know “will my field flood” and requested data that could help them plan infrastructure upgrades and drainage strategies. The VCA 2021 report aims to further local understanding of climate change and its impacts and provide climate information that is used and useful.
THIS WORK WAS GENEROUSLY SUPPORTED BY
• University of Vermont (UVM)• UVM Rubenstein School of Environment and Natural Resources• UVM Gund Institute for Environment• The Nature Conservancy, Vermont• Norman Foundation• Private donors who chose to contribute to the Vermont Climate Assessment
ADDITIONAL SUPPORT
• Tamarack Media Cooperative• Emily Copeland and Julianna White – lead copyeditors• Milena Stier, Mary Kueser, Basil Waugh, and Stephen Posner – web design assistance• Eve Frankel, Ariana Cano – TNC communications
EXECUTIVE SUMMARY
“The impacts of climate change are already being felt in communities across the country.”
‑Fourth National Climate Assessment, U.S. Global Change Research Program, 2018
The Earth’s climate is changing. Data for the past several decades show long‑term shifts in temperature, precipitation, and the risks of certain types of severe weather. As climate change unfolds, it is important to understand the impacts globally and locally here in Vermont.
The Vermont Climate Assessment 2021 (VCA) assesses the science of climate change and its impacts across Vermont. The VCA examines what climate change means for different sectors in Vermont and summarizes what we know about possible climate fu‑tures. It represents our current best understanding of climate change in Vermont.
This executive summary is a high‑level overview of the underlying report. The VCA high‑lights the following main findings.
Executive Summary | Vermont Climate Assessment, 2021
CLIMATE CHANGE IS HERE.There is strong evidence that Vermont’s climate is changing. Vermont is becoming warmer (average annual temperature is about 2°F warmer since 1900), and Vermont’s winters are becoming warmer more quickly (winter temperatures have warmed 2.5x more quickly than average annual temperature since 1960). Vermont is also becoming wetter (average annual precipitation has increased by 21% or 7.5 inches since 1900). How-ever, Vermont still experiences prolonged droughts because of shifts in the water cycle, and different regions of Vermont can experience different climate impacts. The data for Vermont mirror trends at the regional, national, and global scale.
CLIMATE CHANGE IS IMPACTING COMMUNITIES ACROSS VERMONT. PEOPLE ARE RESPONDING.Climate change is transforming people’s lives in Vermont, now and in the future. This report and others like it are increasingly documenting climate risks and vulnerabilities. For example, rivers overflowing from more rain increases risks of flooding that can damage homes, roads, bridges, and farm fields. Heavier rainstorms impact farm and forestry operations. Climate change affects people’s recreation year-round: Vermont’s ski season is shorter, spring activities are disrupted by more rain than in the past, and summer recreation faces increased risk of harmful algal blooms in lakes. And climate-related health impacts – greater risk of heat exposure, water and air quality issues, and natural disasters – threaten some parts of the population more than others, highlighting the unequal burden of climate impacts for people who are over 65, of low socioeco-nomic status, or have previous health issues. People are responding, for example by resizing culverts, riding snowmobiles less, storing piles of snow in attempts to extend the Nordic ski season, and managing water differently in farm fields. In planning for climate impacts, communities cannot assume that future climate conditions will resemble the past.
THERE ARE INTERACTIONS AMONG CLIMATE IMPACTS. Multiple stressors can stack up to have an outsized effect on people and nature. Continuing to study these issues will help us understand how multiple, interacting factors will affect strategies designed to lessen climate impacts. For example, drought plus the spread of invasive pests could interact to stress trees and diminish the ability of forests to capture and store carbon from the atmosphere. We can anticipate some interactions among climate impacts; we will be surprised by other interactions that are difficult to predict. Interactions could push natural systems past tipping points, or limits in long-balanced ecosystems after which drastic changes lead to completely different systems. The long-term, persistent, and complex nature of climate change can also intensify other stresses on society, such as managing public health crises or confronting social inequities.
Executive Summary | Vermont Climate Assessment, 2021
THE VCA 2021 UPDATES – AND IS LARGELY CONSISTENT WITH – THE ORIGINAL VCA 2014 STUDY. The 2021 report builds from pioneering work completed in VCA 2014, the first state-level climate assessment in the U.S. Conclusions between the 2014 and 2021 reports are consistent. With additional data and new tools for visualizing climate change, the VCA 2021 finds:
• Vermont’s average annual temperature increase since 1960 is 1.47°F compared to the previous esti-mate of 1.3°F.
• Vermont’s average annual precipitation increase since 1960 is 6.71 inches compared to the previous estimate of 5.9 inches.
The VCA 2021 features new data that provide further evidence of warming in Vermont, including plots that show fewer cold days (max temperature less than or equal to 0°F) and more warm winter days (max tempera-ture greater than or equal to 50°F during winter months). VCA 2021 incorporates new data to show how Ver-mont is experiencing 2.4 more days of heavy precipitation since 1960 (days with precipitation greater than or equal to 1 inch).
INFORMATION ABOUT CLIMATE IMPACTS IS VALUABLE FOR VERMONT DECISION MAKERS. Planning for climate change requires sound scientific evidence. The VCA provides information on climate change and its impacts at scales relevant to policy and decision making. The information in this report can inform many decision makers in Vermont, from individual farmers to town highway departments to region-al planning councils to state agencies. Bringing global and national climate assessment techniques to the state-level equips local stakeholders to make decisions based on scientific data. For example, the Vermont Climate Council is responding to concerns about Vermont’s changing climate. Without action and invest-ment, climate-related impacts and risks will continue to grow for current and future generations.
THE FOLLOWING KEY MESSAGES SUMMARIZE THE EVIDENCE AND MAIN FINDINGS FROM THE VCA 2021 REPORT.
1 CLIMATE CHANGE IN VERMONT
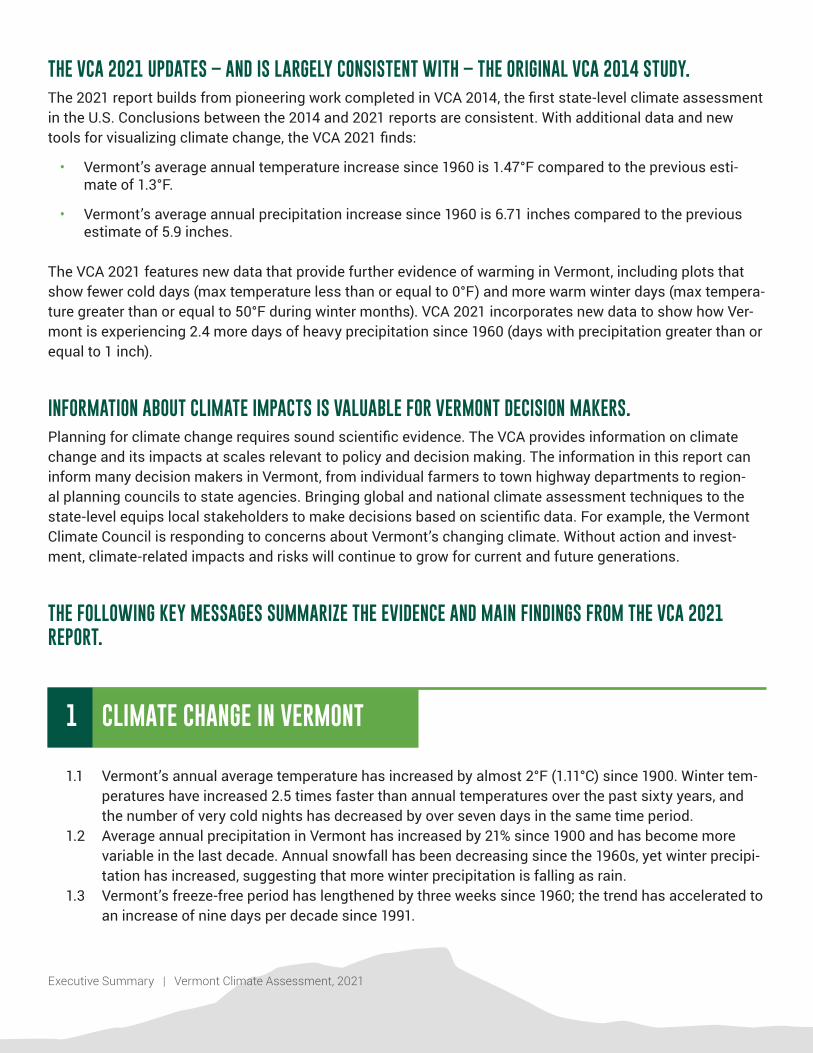
1.1 Vermont’s annual average temperature has increased by almost 2°F (1.11°C) since 1900. Winter tem-peratures have increased 2.5 times faster than annual temperatures over the past sixty years, and the number of very cold nights has decreased by over seven days in the same time period.
1.2 Average annual precipitation in Vermont has increased by 21% since 1900 and has become more variable in the last decade. Annual snowfall has been decreasing since the 1960s, yet winter precipi-tation has increased, suggesting that more winter precipitation is falling as rain.
1.3 Vermont’s freeze-free period has lengthened by three weeks since 1960; the trend has accelerated to an increase of nine days per decade since 1991.
Executive Summary | Vermont Climate Assessment, 2021
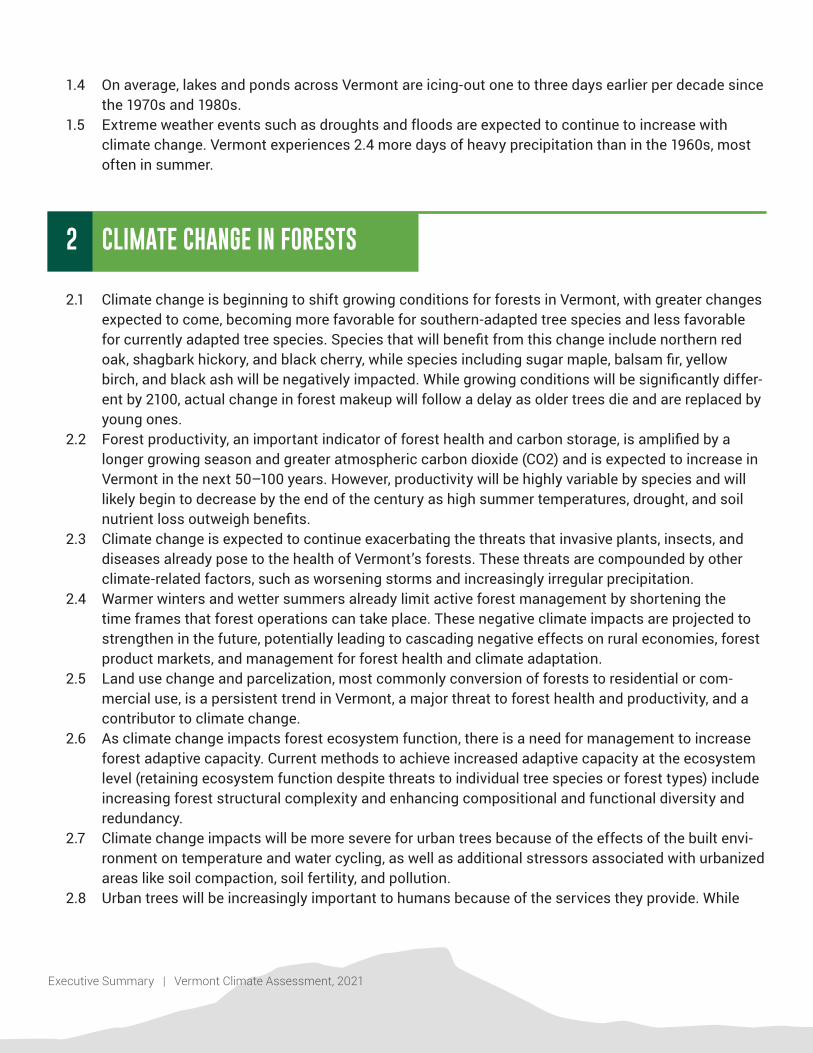
1.4 On average, lakes and ponds across Vermont are icing-out one to three days earlier per decade since the 1970s and 1980s.
1.5 Extreme weather events such as droughts and floods are expected to continue to increase with climate change. Vermont experiences 2.4 more days of heavy precipitation than in the 1960s, most often in summer.
2 CLIMATE CHANGE IN FORESTS
2.1 Climate change is beginning to shift growing conditions for forests in Vermont, with greater changes expected to come, becoming more favorable for southern-adapted tree species and less favorable for currently adapted tree species. Species that will benefit from this change include northern red oak, shagbark hickory, and black cherry, while species including sugar maple, balsam fir, yellow birch, and black ash will be negatively impacted. While growing conditions will be significantly differ-ent by 2100, actual change in forest makeup will follow a delay as older trees die and are replaced by young ones.
2.2 Forest productivity, an important indicator of forest health and carbon storage, is amplified by a longer growing season and greater atmospheric carbon dioxide (CO2) and is expected to increase in Vermont in the next 50–100 years. However, productivity will be highly variable by species and will likely begin to decrease by the end of the century as high summer temperatures, drought, and soil nutrient loss outweigh benefits.
2.3 Climate change is expected to continue exacerbating the threats that invasive plants, insects, and diseases already pose to the health of Vermont’s forests. These threats are compounded by other climate-related factors, such as worsening storms and increasingly irregular precipitation.
2.4 Warmer winters and wetter summers already limit active forest management by shortening the time frames that forest operations can take place. These negative climate impacts are projected to strengthen in the future, potentially leading to cascading negative effects on rural economies, forest product markets, and management for forest health and climate adaptation.
2.5 Land use change and parcelization, most commonly conversion of forests to residential or com-mercial use, is a persistent trend in Vermont, a major threat to forest health and productivity, and a contributor to climate change.
2.6 As climate change impacts forest ecosystem function, there is a need for management to increase forest adaptive capacity. Current methods to achieve increased adaptive capacity at the ecosystem level (retaining ecosystem function despite threats to individual tree species or forest types) include increasing forest structural complexity and enhancing compositional and functional diversity and redundancy.
2.7 Climate change impacts will be more severe for urban trees because of the effects of the built envi-ronment on temperature and water cycling, as well as additional stressors associated with urbanized areas like soil compaction, soil fertility, and pollution.
2.8 Urban trees will be increasingly important to humans because of the services they provide. While
Executive Summary | Vermont Climate Assessment, 2021
urbanized areas in Vermont make up less than 2% of the state’s land area, they are home to nearly 243,000 people, 39% of the Vermont population. Because of the high population density and lower tree cover in urbanized areas, per-tree ecosystem services can be higher than in a forest setting. In addition to critical climate and ecosystem benefits provided by trees everywhere, urban trees miti-gate the urban heat island effect through cooling and shading and reduce stormwater runoff from extreme rainfall events
3 WATER RESOURCES
3.1 Due to extreme variation in precipitation with our changing climate, periods of prolonged dry-spells and drought, coupled with higher water usage in snowmaking and agriculture could exacerbate low water availability.
3.2 Increases in overall precipitation, and extreme precipitation, have caused streamflows to rise since 1960. Climate change will further this pattern, although the overall increase in streamflow comes with disruptions in seasonal flows cycles.
3.3 Increases in heavy precipitation jeopardize water quality in Vermont. Storms produce large runoff events that contribute to erosion and nutrient loading. Combined with warm temperatures, this cre-ates favorable conditions for cyanobacteria blooms.
3.4 Increased occurrence of high streamflows increase the risk of flooding that causes damages to many roads and crossing structures. Risk reduction requires addressing outdated and unfit struc-tures.
3.5 Nature-based solutions are an effective, low-cost approach to climate change adaptation. River cor-ridor, floodplain, and wetland protection dampen flood impacts and improve water quality along with green infrastructure.
4 FISH AND WILDLIFE IN VERMONT
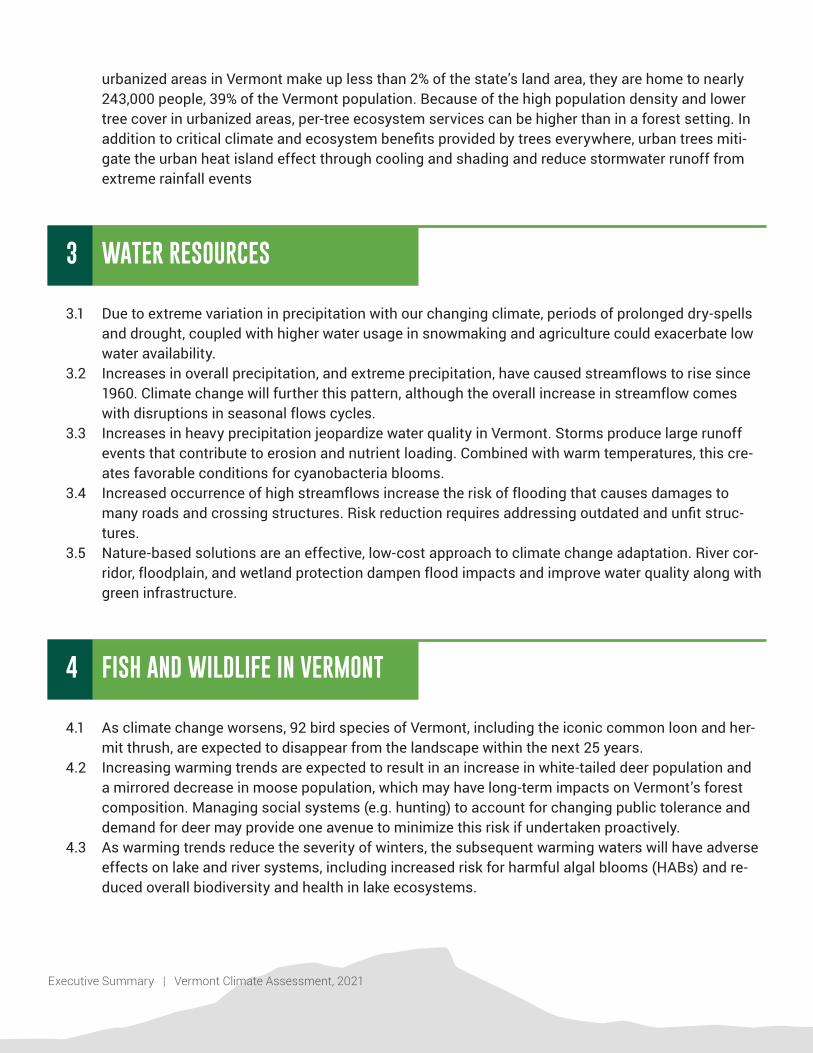
4.1 As climate change worsens, 92 bird species of Vermont, including the iconic common loon and her-mit thrush, are expected to disappear from the landscape within the next 25 years.
4.2 Increasing warming trends are expected to result in an increase in white-tailed deer population and a mirrored decrease in moose population, which may have long-term impacts on Vermont’s forest composition. Managing social systems (e.g. hunting) to account for changing public tolerance and demand for deer may provide one avenue to minimize this risk if undertaken proactively.
4.3 As warming trends reduce the severity of winters, the subsequent warming waters will have adverse effects on lake and river systems, including increased risk for harmful algal blooms (HABs) and re-duced overall biodiversity and health in lake ecosystems.
Executive Summary | Vermont Climate Assessment, 2021
5 AGRICULTURE AND FOOD SYSTEMS
5.1 Vermont’s climate is already changing in ways that benefit its agricultural system, including longer growing periods (freeze-free periods lengthened twenty-one days since early 1900s) and milder tem-peratures (annual average temperature increase of 2°F (1.1°C) since the 1990s), allowing farmers to experiment with new crops or practices not previously viable in Vermont.
5.2 The changing climate also brings agricultural setbacks, such as negative impacts on fruit-bearing species like apple trees that require a sufficient over-wintering period for success in the next growing season. The maple syrup industry is also at risk due to variations in winter temperatures.
5.3 Climate models predict tougher growing conditions due to greater variability in temperature and pre-cipitation, including heavy precipitation and dry spells.
5.4 Vermont’s average annual precipitation has increased 6.7 inches since the 1960s. Summer precip-itation has increased most (additional 2.6 inches since 1960s) and is characterized by more heavy precipitation events (defined as more than one inch of precipitation in one day) (additional 1.0 day/year), although spring precipitation has also increased notably (additional 2.11 inches/year since 1960s, and 0.8 days/year with heavy precipitation). Spring precipitation accumulates in the soil and can make farm operations difficult. While precipitation during the growing season is trending upward, precipitation falls in fewer, more extreme events and is coupled with longer periods of no rain at times when crop water requirements are still high; thus, irrigation may become increasingly important.
5.5 At the Earth’s surface, increasing concentrations of carbon dioxide may benefit yields in crops that utilize the C3 photosynthetic pathway (i.e., many of Vermont’s forages) if conditions are otherwise ideal. Conversely, an increase in surface-level ozone concentrations may reduce crop productivity.
5.6 Extreme events are expected to increase. More periods of flooding and drought will lead to more crop damage or failure. Stormwater and irrigation infrastructure will be crucial in mitigating these effects.
5.7 Agriculture and food systems may play an important role in mitigating climate change, if mitigation provides financial opportunities, are distributed fairly and accurately, and are implemented with careful monitoring, reporting, and verification. Urban and suburban areas in Vermont have the po-tential to improve adaptation and mitigation of climate change by growing food closer to where it is consumed.
6 ENERGY
6.1 Vermont drivers have the highest average miles traveled per capita in the Northeast United States. Transportation is the largest source of greenhouse gas emissions in Vermont. Thermal energy use
Executive Summary | Vermont Climate Assessment, 2021
is a close second to the largest source of greenhouse gas emissions in Vermont, and the largest use of energy. Reducing energy use in these sectors by choosing more efficient vehicles, selecting heat sources with less emissions, and weatherizing homes will help Vermont meet its energy goals.
6.2 The electricity in Vermont has the lowest carbon intensity in the country. Electrifying transportation and thermal energy use will significantly reduce Vermont’s carbon footprint.
6.3 In the short term, there is extra power line capacity to serve significantly more load in Vermont; how-ever, some areas of Vermont have limited capacity to support further renewable energy generation. Areas where there is limited generation hosting capacity could be prioritized to shift local energy use to electricity to reduce congestion on local transmission lines. The priority in areas with extra gen-eration hosting capacity can be two-fold: building new renewable generation and electrifying local energy use.
6.4 The storms that cause the most frequent power outages are expected to become more intense in the future, increasing the frequency of power outages, particularly in winter. Vermont can increase its energy resilience with distributed solar and storage, secondary heating systems (e.g., wood), and community buildings with resilient heating solutions.
7 RECREATION AND TOURISM
Winter
7.1 Downhill skiing, with the help of snowmaking, will likely remain largely viable in Vermont up until approximately 2050. By 2080, the Vermont ski season will be shortened by two weeks (under a low emissions scenario) or by a whole month (under a high emissions scenario), and some ski areas will remain viable.
7.2 Winter temperatures are increasing in Vermont, reducing the length of season for most snow sports.7.3 February Median Flow, a measurement used by ski areas to collect water for snowmaking, has
steadily increased across Vermont.
Summer
7.4 Summer recreation activities in Vermont will continue to be popular, with water-based activities likely to increase in interest as air temperatures rise. However, water quality issues will also become more prevalent.
7.5 Vermont may see an increase in summer “seasonal climate refugees” as the rise in temperatures nationwide draws visitors looking to escape extreme heat.
7.6 Vermont has the potential to increase tourism revenue via gastrotourism and agritourism as the growing seasons lengthen.
Executive Summary | Vermont Climate Assessment, 2021
Fall/Spring
7.7 Transition seasons are becoming more important for tourism and recreation as Vermont is already experiencing warmer temperatures in fall and spring.
7.8 Trees, particularly sugar maples, are an important aspect of many fall/spring recreation activities (leaf peeping, maple syrup, apple picking), but may be negatively affected by warmer temperatures.
7.9 Fall and spring seasons offer new opportunities for lower-cost recreation and tourism opportunities that attract a wider range of potential visitors.
8 HUMAN HEALTH
8.1 Climate change affects human health by exacerbating existing health problems and amplifying con-ditions for new health problems.
8.2 Individuals who are children, over 65 years of age, of low socioeconomic status, Indigenous, or have previous health issues are more vulnerable to the health effects of climate change.
8.3 Warmer and more moist temperatures in Vermont are likely to create more habitat for disease-carry-ing ticks and mosquitoes.
8.4 Increases in the number and severity of natural disasters in Vermont will likely increase the risk of injury, illness, and death.
8.5 Climate change could affect the quality and safety of food and water, which could lead to increases in food and water-borne illnesses.
8.6 Decreases in air quality will exacerbate existing chronic diseases and decrease water quality.8.7 Mental health is inextricably linked with environmental health. Impacts from climate change could
contribute to mental health challenges.
9 COMMUNITY DEVELOPMENT
9.1 Flooding is the most likely natural disaster to occur in Vermont and should be accounted for in all community development and planning efforts in the state; however, extremes will become more common, so community development and planning efforts should also account for chronic hazards, such as drought.
9.2 Systems interconnections are essential to consider in community development and planning of future climate change scenarios, particularly in the context of disasters.
9.3 Vermont is expected to continue to have a favorable climate under future climate change projections, however, there is very little information to predict if the state will face an influx of climate migration.
Executive Summary | Vermont Climate Assessment, 2021
9.4 Engaging in planning is essential for Vermont communities to access federal funding and to prepare for current and future climate change impacts, including population growth, flooding, and droughts.
9.5 Climate change will not impact all communities equally; the needs and capacity of vulnerable popu-lations should be considered with all community planning efforts.
10 SPECIAL TOPIC: CARBON SEQUESTRATION IN AGRICULTURAL SOILS
10.1 The soil carbon sequestration potential of agricultural management practices in Vermont is un-certain and likely mediated by site-specific factors such as soil type, geography, land use history, and weather. Climate change mitigation benefits are possible but not guaranteed from the use of common practices implemented to sequester carbon (such as cover cropping, conservation tillage, no-till, and rotational grazing) on Vermont agricultural lands. There is evidence, however, that these practices can improve soil health and increase farm resilience to climate change.
10.2 Assigning carbon offsets or payments for climate mitigation services provided by Vermont agricul-tural lands based on practice adoption alone currently lacks a strong scientific foundation. Further investigation and monitoring is needed to improve understanding of management practices and soil carbon sequestration, including field studies and modeling. Well-calibrated models, validated for application in Vermont, have potential for identifying relationships between management change(s) and carbon dynamics. Participatory research that engages the expertise and needs of farmers is necessary to assess the local impacts of best management practices and make projections into the future.
10.3 Whole-system accounting is required to assess potential trade-offs and to determine net climate change mitigation benefits of soil management strategies. Changes in soil carbon stocks at a given location are only one piece in climate mitigation accounting. In all cases where offsite carbon sourc-es are being used to boost soil organic carbon, a broader life cycle assessment extending beyond the farm gate is needed that considers offsite carbon source removal, transport, and processing; al-ternative end uses of the carbon source; interactions with other soil GHG-producing processes; and synergies between the soil amendments and the input of in situ plant-derived carbon. It is critical to keep in mind the primary objective: increase the net transfer of CO2-equivalents from atmosphere to land – only strategies achieving this primary objective should be considered climate mitigation. Failing to account for other fluxes of carbon and greenhouse gases could result in unintended conse-quences due to trade-offs.
ACRONYMS
ASCE • American Society of Civil Engineers
BRIC • Building Resilient Infrastructure and Communities (FEMA)
C • Carbon
CARES • Coronavirus Aid, Relief, and Economic Security Act (U.S.)
CDC • U.S. Centers for Disease Control and Prevention
CEP • Comprehensive Energy Plan (Vermont)
CFS • Cubic feet per second
CH4 • Methane
CIS • Community Information Systems (FEMA)
CO2 • Carbon dioxide
COPD • Chronic obstructive pulmonary disease
DEIJ • Diversity, equity, inclusion, and justice
EAB • Emerald ash borer
ED • Emergency department
EEE • Eastern Equine Encephalitis (mosquito-borne disease)
EPA • U.S. Environmental Protection Agency
EV • Electric vehicles
FEMA • U.S. Federal Emergency Management Agency
FMF • February median flow
FTC • Forest tent caterpillar
GCM • Global climate model
GHGs • Greenhouse gases
GI • Green infrastructure
GWSA • Global Warming Solutions Act (Vermont)
HAB • Harmful algal bloom
HWA • Hemlock Wooly Adelgid
IPCC • Intergovernmental Panel on Climate Change
LCA • Life cycle assessment
LOI • Loss on ignition
Mgal • Million gallons (of water)
MMt CO2e • Million metric tons of carbon dioxide equivalent
MSPR • Multi-species pastured rotation
Mt CO2e • Metric tons of carbon dioxide equivalent
N2O • Nitrous oxide
NASS • National Agricultural Statistics Service
NFIP • National Flood Insurance Program
NFNA • New Farms for New Americans
NIOSH • National Institute for Occupational Safety and Health
NOAA • National Oceanic and Atmospheric Administration
NPP • Net primary productivity
NWS • National Weather Service
O3 • Ozone
PES • Payment for ecosystem services
RCP • Representative concentration pathway
RECs • Renewable energy certificates
SFHA • Special Flood Hazard Area (FEMA)
SOC • Soil organic carbon
SPEED • Sustainably Priced Energy for Economic Development (Vermont)
T&D • Transmission and distribution
TNC • The Nature Conservancy
TRPT • Transportation Resilience Planning Tool (Vermont)
UNFCCC • United Nations Framework Convention on Climate Change
USDA • U.S. Department of Agriculture
USGS • United States Geological Survey
VCA • Vermont Climate Assessment
VCE • Vermont Center for Ecostudies
VCRD • Vermont Council on Rural Development
VDH • Vermont Department of Health
VELCO • Vermont Electric Power Company
VNRC • Vermont Natural Resources Council
VOREC • Vermont Outdoor Recreation Economic Collaborative
VT PUC • Vermont Public Utility Commission
VT UCF • Vermont Urban & Community Forestry Program
WNV • West Nile Virus (mosquito-borne disease)
1
table of contents
1 CLIMATE CHANGE IN VERMONT ........................................................................................................ 4 1.1 KEY MESSAGES ....................................................................................................................................................... 5 1.2 BACKGROUND AND GLOBAL CONTEXT ............................................................................................................. 5 1.3 VERMONT’S CHANGING CLIMATE (METHODS) ............................................................................................ 10 1.4 VERMONT’S RISING TEMPERATURES ............................................................................................................ 14 1.5 INCREASING PRECIPITATION ........................................................................................................................... 18 1.6 CLIMATE INDICATORS ........................................................................................................................................ 24 1.7 EXTREME EVENTS ............................................................................................................................................... 31 1.8 TRACEABLE ACCOUNTS ..................................................................................................................................... 34 1.9 APPENDIX TO CHAPTER 1 ................................................................................................................................. 37 1.10 ACKNOWLEDGEMENTS ...................................................................................................................................... 40 1.11 REFERENCES ........................................................................................................................................................ 40
2 CLIMATE CHANGE IN FORESTS ....................................................................................................... 44 2.1 KEY MESSAGES .................................................................................................................................................... 45 2.2 FOREST STRUCTURE AND COMPOSITION .................................................................................................... 46 2.3 FOREST PRODUCTIVITY ..................................................................................................................................... 55 2.4 DISTURBANCE ...................................................................................................................................................... 62 2.5 MANAGEMENT AND MITIGATION .................................................................................................................... 75 2.6 FOREST MANAGEMENT CHALLENGES AND OPPORTUNITIES ................................................................ 85 2.7 FOREST ADAPTATION AND MANAGEMENT .................................................................................................. 93 2.8 URBAN FORESTS AND CLIMATE .................................................................................................................... 101 2.9 TRACEABLE ACCOUNTS ................................................................................................................................... 108 2.10 ACKNOWLEDGEMENTS .................................................................................................................................... 112 2.11 RESOURCES ........................................................................................................................................................ 112 2.12 REFERENCES ...................................................................................................................................................... 113
3 WATER RESOURCES ....................................................................................................................... 125 3.1 KEY MESSAGES .................................................................................................................................................. 126 3.2 BACKGROUND ..................................................................................................................................................... 126 3.3 WATER SUPPLY AND USE ................................................................................................................................ 129 3.4 STREAMFLOW ..................................................................................................................................................... 135 3.5 WATER QUALITY ................................................................................................................................................. 141
2
3.6 FLOODING ............................................................................................................................................................ 150 3.7 RESOURCES FOR COMMUNITY MEMBERS AND PLANNERS ................................................................. 172 3.8 TRACEABLE ACCOUNTS ................................................................................................................................... 175 3.9 REFERENCES ...................................................................................................................................................... 177
4 FISH AND WILDLIFE IN VERMONT ................................................................................................. 184 4.1 KEY MESSAGES .................................................................................................................................................. 185 4.2 BACKGROUND ..................................................................................................................................................... 185 4.3 INSECTS: POLLINATORS AND FOREST PESTS ........................................................................................... 187 4.4 BIRDS .................................................................................................................................................................... 190 4.5 BATS ...................................................................................................................................................................... 205 4.6 LARGE UNGULATES (MOOSE AND DEER) .................................................................................................... 206 4.7 AQUATIC SPECIES .............................................................................................................................................. 216 4.8 TRACEABLE ACCOUNTS ................................................................................................................................... 223 4.9 REFERENCES ...................................................................................................................................................... 225
5 AGRICULTURE AND FOOD SYSTEMS ............................................................................................ 234 5.1 KEY MESSAGES .................................................................................................................................................. 235 5.2 OVERVIEW ............................................................................................................................................................ 236 5.3 AGRICULTURE AND FOOD SYSTEMS IN A CHANGING CLIMATE ........................................................... 236 5.4 MITIGATION, RESILIENCE, AND ADAPTATION ............................................................................................ 248 5.5 TRACEABLE ACCOUNTS ................................................................................................................................... 260 5.6 REFERENCES ...................................................................................................................................................... 262
6 ENERGY ............................................................................................................................................ 268 6.1 KEY MESSAGES .................................................................................................................................................. 269 6.2 BACKGROUND/OVERVIEW ............................................................................................................................... 269 6.3 ENERGY USE IN VERMONT .............................................................................................................................. 272 6.4 ENERGY PLANNING AND EQUITY .................................................................................................................. 283 6.5 IMPACTS OF CLIMATE CHANGE ON ENERGY INFRASTRUCTURE AND SOLUTIONS ....................... 294 6.6 TRACEABLE ACCOUNTS ................................................................................................................................... 297 6.7 ACKNOWLEDGEMENTS .................................................................................................................................... 298 6.8 REFERENCES ...................................................................................................................................................... 298
7 RECREATION AND TOURISM .......................................................................................................... 302 7.1 KEY MESSAGES .................................................................................................................................................. 303 7.2 INTRODUCTION .................................................................................................................................................. 304 7.3 WINTER ................................................................................................................................................................. 307 7.4 SUMMER .............................................................................................................................................................. 314
3
1.2 SHOULDER SEASONS: FALL AND SPRING ................................................................................................... 319 7.5 CONCLUSIONS .................................................................................................................................................... 324 7.6 REFERENCES ...................................................................................................................................................... 325
8 HUMAN HEALTH ............................................................................................................................. 328 8.1 KEY MESSAGES .................................................................................................................................................. 329 8.2 INTRODUCTION: CLIMATE CHANGE AND HEALTH .................................................................................... 329 8.3 TEMPERATURE AND HUMAN HEALTH ......................................................................................................... 331 8.4 AIR QUALITY, POLLUTION, AND HEALTH IMPACTS ................................................................................... 341 8.5 EXTREME WEATHER EVENTS ......................................................................................................................... 355 8.6 VECTORS .............................................................................................................................................................. 365 8.7 WATER AND FOOD ............................................................................................................................................. 383 8.8 MENTAL HEALTH ............................................................................................................................................... 395 8.9 TRACEABLE ACCOUNTS ................................................................................................................................... 402 8.10 ACKNOWLEDGEMENTS .................................................................................................................................... 404 8.11 REFERENCES ...................................................................................................................................................... 404
9 COMMUNITY DEVELOPMENT ........................................................................................................ 418 9.1 KEY MESSAGES .................................................................................................................................................. 419 9.2 INTRODUCTION .................................................................................................................................................. 419 9.3 CLIMATE CHANGE IMPACTS RELEVANT TO COMMUNITY DEVELOPMENT ....................................... 423 9.4 INFRASTRUCTURE SYSTEMS AND THEIR INTERCONNECTIONS IN THE CONTEXT OF CLIMATE
CHANGE ....................................................................................................................................................................... ................................................................................................................................................................................ 435
9.5 VERMONT PLANNING IN THE FACE OF CLIMATE CHANGE .................................................................... 452 9.6 TRACEABLE ACCOUNTS ................................................................................................................................... 459 9.7 ACKNOWLEDGEMENTS .................................................................................................................................... 461 9.8 REFERENCES ...................................................................................................................................................... 461
10 CARBON SEQUESTRATION IN AGRICULTURAL SOILS ................................................................. 473 10.1 KEY MESSAGES .................................................................................................................................................. 474 10.2 ADDITIONAL SUMMARY POINTS .................................................................................................................... 475 10.3 INTRODUCTION .................................................................................................................................................. 476 10.4 THE BIOGEOCHEMISTRY OF CLIMATE MITIGATION BY AGRICULTURAL SOILS ............................... 477 10.5 THE AVAILABLE EVIDENCE LINKING PRACTICES TO CLIMATE MITIGATION ..................................... 479 10.6 MONITORING AND CONSIDERATIONS FOR PAYMENT SCHEMES ........................................................ 491 10.7 RECOMMENDATIONS FOR NEXT STEPS IN VERMONT ............................................................................ 495 10.8 TRACEABLE ACCOUNTS ................................................................................................................................... 497 10.9 REFERENCES ...................................................................................................................................................... 499
Climate Change in Vermont Vermont Climate Assessment, 2021 4
1 climate change in vermont
Recommended Citation for Chapter Clark, M., Crossett, C., 2021. Climate Change in Vermont. In Galford, G.L., Faulkner, J. et al. (Eds), The Vermont Climate Assessment 2021. Burlington, Vermont: Gund Institute for Environment at the University of Vermont. On the web: https://vtclimate.org
Caitlin Crossett Department of Civil and Environmental Engineering and Vermont EPSCoR, University of Vermont, Burlington, Vermont 05405
Mahalia Clark Rubenstein School of Environment and Natural Resources, University of Vermont, Burlington, Vermont 05405
Climate Change in Vermont Vermont Climate Assessment, 2021 5
1.1 key messages
1. Vermont’s annual average temperature has increased by almost 2°F (1.11°C) since
1900. Winter temperatures have increased 2.5 times faster than annual temperatures
over the past sixty years, and the number of very cold nights has decreased by over
seven days in the same time period.
2. Average annual precipitation in Vermont has increased by 21% since 1900 and has
become more variable in the last decade. Annual snowfall has been decreasing since
the 1960s, yet winter precipitation has increased, suggesting that more winter
precipitation is falling as rain.
3. Vermont’s freeze-free period has lengthened by three weeks since 1960; the trend has
accelerated to an increase of nine days per decade since 1991.
4. On average, lakes and ponds across Vermont are icing-out one to three days earlier per
decade since the 1970s and 1980s.
5. Extreme weather events such as droughts and floods are expected to continue to
increase with climate change. Vermont experiences 2.4 more days of heavy
precipitation than in the 1960s, most often in summer.
1.2 background and global context
The world’s climate is changing and is projected to continue to change over the next century.
This chapter examines recent trends in our local climate and can help us understand how
climate change will continue to affect Vermont.
1.2.1 Weather and Climate How does climate differ from weather? Climate is the average weather (defined over 30-year
averaging periods by the National Oceanic and Atmospheric Administration—NOAA)
experienced in a place (e.g., you expect cold and snow in Vermont’s winters), while weather is
Climate Change in Vermont Vermont Climate Assessment, 2021 6
the day-to-day variation in things like temperature and precipitation (e.g., the 10-day forecast).
There is a saying that “climate is what you expect, weather is what you get”. Unfortunately, as
the climate changes, it is getting increasingly difficult to know what to expect.
1.2.2 Causes of Climate Change Climate change is largely caused by increasing heat trapped in the Earth’s atmosphere. The
release of heat-trapping greenhouse gases, particularly carbon dioxide (CO2), has increased the
heat in the atmosphere. Greenhouse gases act like a transparent blanket around the Earth—
allowing sunlight to reach and warm the air, ground, and oceans but preventing heat from
leaving the atmosphere into space. Over time, the trapped heat accumulates, warming our
planet and causing temperatures to rise. Although greenhouse gases are a natural part of the
atmosphere, human activities such as burning fossil fuels have drastically increased their
abundance (Hayhoe et al. 2018). Like adding an extra blanket, the effect is to warm the Earth
beyond the temperature variability expected based solely on natural forcings (e.g., variability
of the Earth’s orbit, volcanic eruptions). Oceans absorb roughly 90% of the excess heat, but
humans are starting to feel the remaining 10%, as the atmosphere warms the land.
Human activities have been releasing greenhouse gases since the beginning of the Industrial
Revolution in the mid-1700s. Human sources of greenhouse gases increased dramatically in
the mid-20th century as burning of fossil fuels increased. Human contributions to greenhouse
gas emissions, and thus global temperature change, exceed any variations in natural factors
such as the Earth’s orbit, volcanic activity, or energy emitted by the Sun (Hayhoe et al. 2018).
Further, the rate of human-induced greenhouse gas emissions has increased far faster than
forests, oceans, and other natural processes can remove them from the atmosphere.
Climate Change in Vermont Vermont Climate Assessment, 2021 7
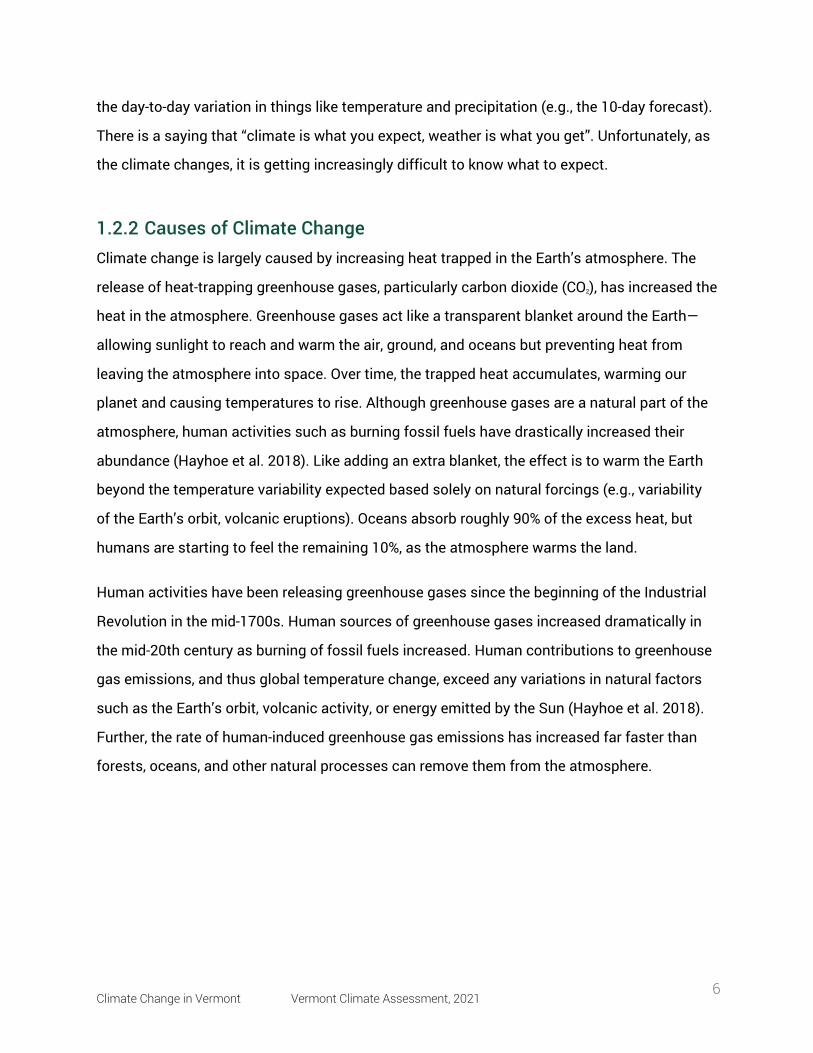
Figure 1-1: Historical and projected global carbon emissions (left); historical and projected global temperature change with global climate models’ range shaded in red and green (right), 1900 to 2100 (Hayhoe et al. 2018)
1.2.3 Future Climate Change Scientists have developed scenarios that represent plausible alternative futures based on key
drivers and relationships between greenhouse gas emissions and climate change mitigation
actions. Scenarios are neither forecasts nor projections, but they are useful in considering
which pathway(s) humans may pursue. The Intergovernmental Panel on Climate Change
(IPCC), a body of the United Nations, provides global scientific analysis on climate change and
defines future climate change scenarios based on four representative concentration pathways
(RCPs). Each RCP corresponds to an increase in radiative forcing, or change in energy flux in
the atmosphere caused by climate change by the year 2100 based on a particular scenario.
RCP2.6, the most stringent mitigation scenario, has peak radiative forcing at 3 W m-2 before
2100 and then declines. The intermediate scenarios, RCP4.5 and RCP6.0, stabilize radiative
forcing at 4.5 W m-2 and 6.0 W m-2 after 2100, respectively. The RCP with the highest amount of
climate change, RCP8.5, has the highest radiative forcing of 8.5 W m-2 by 2100, which
continues to rise after that time. RCP8.5 estimates a global increase in temperature of 3.7
degrees C, 0.63 meters sea level rise, more extreme weather events, and requires high levels of
societal adaptation at a high cost by 2100 (Table 1-1; Figure 1-1; IPCC 2014).
Climate Change in Vermont Vermont Climate Assessment, 2021 8
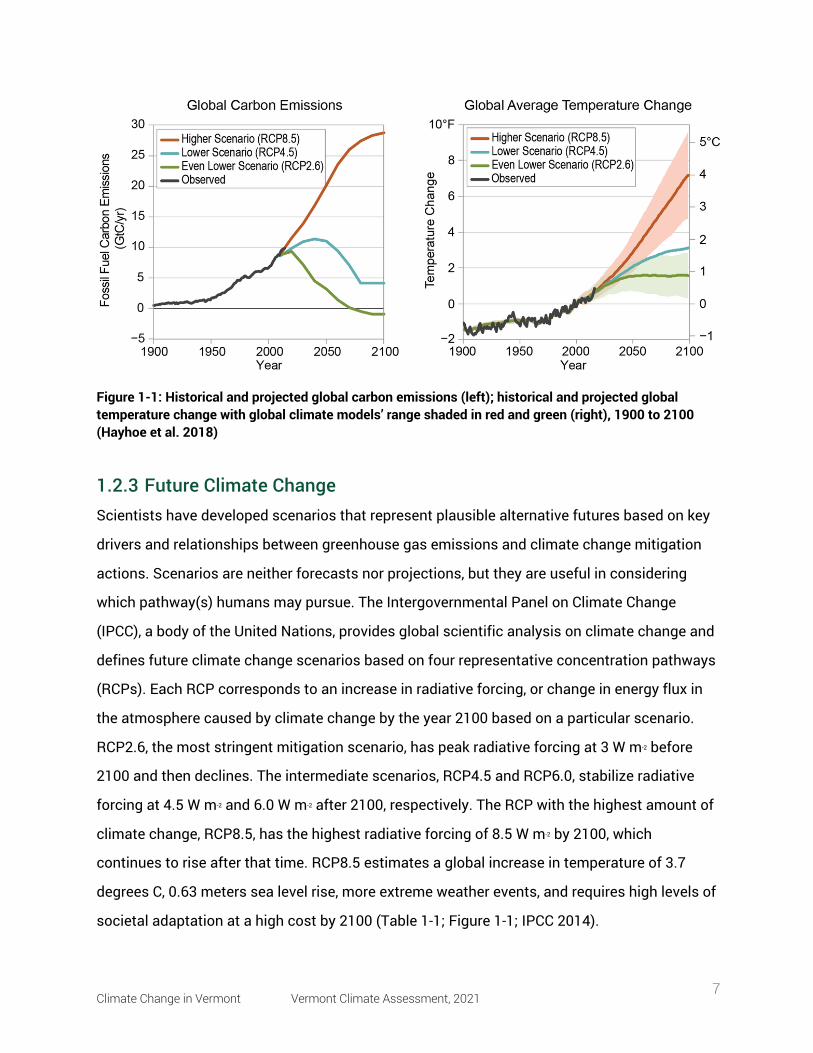
Table 1-1: Description of RCP pathways used in CMIP5 Global Climate Model, adapted from IPCC Summary for Policymakers (IPCC 2014)
Global mean surface temperature change (ºC) Mean [likely range]
Global mean sea level rise (m) Mean [likely range]
Scenario 2046–2065 2081–2100 2046–2065 2081–2100
RCP2.6 1.0 [0.4 to 1.6] 1.0 [0.3 to 1.7] 0.24 [0.17 to 0.32] 0.40 [0.26 to 0.55]
RCP4.5 1.4 [0.9 to 2.0] 1.8 [1.1 to 2.6] 0.26 [0.19 to 0.33] 0.47 [0.32 to 0.63]
RCP6.0 1.3 [0.8 to 1.8] 2.2 [1.4 to 3.1] 0.25 [0.18 to 0.32] 0.48 [0.33 to 0.63]
RCP8.5 2.0 [1.4 to 2.6] 3.7 [2.6 to 4.8] 0.30 [0.22 to 0.38] 0.63 [0.45 to 0.82]
Scientists estimate the impacts of altered atmospheric composition on the climate using
global climate models (GCMs). Complex computer models, GCMs simulate how the
atmosphere interacts with the oceans and landscape to understand how temperatures,
precipitation, and weather patterns may change over time. Each GCM performs slightly
differently, e.g., a GCM developed in Europe may more closely match the observed climate in
that region compared to other regions. Typically, a large number of GCMs are run with the
same scenarios, and together they predict the future climate associated with each scenario,
e.g., the shaded cone in Figure 1-1 shows a range of GCM estimates.
In Vermont and across the world, the climate is changing and will continue to change over the
next century. The Earth has warmed by 1.8°F since 1901 and could warm by another 3.6°F to
9°F by 2100, depending on human activities (Hayhoe et al. 2018).
1.2.4 Signs of Climate Change Different parts of the world experience climate change differently. Warm air has the capacity
to hold more moisture than cooler air. As the atmosphere’s temperature rises, evaporation and
humidity increase. Eventually, this water vapor is released as precipitation, effectively
increasing rainfall potential in some areas, even as this heat and evaporation cause other
regions to suffer more droughts. The high energy in warmer and wetter air can lead to more
Climate Change in Vermont Vermont Climate Assessment, 2021 9
intense storms, even hurricanes, and increases the potential for more destructive winds and
heavier downpours (Dupigny-Giroux et al. 2018; Hayhoe et al. 2018). Climate-related changes
in the atmosphere’s energy are increasing the variability in weather due to the stalling of
weather patterns and a changing climate baseline. Increased variability means places like
Vermont might experience both more frequent dry-spells or drought and more intense
rainstorms (Betts 2017).
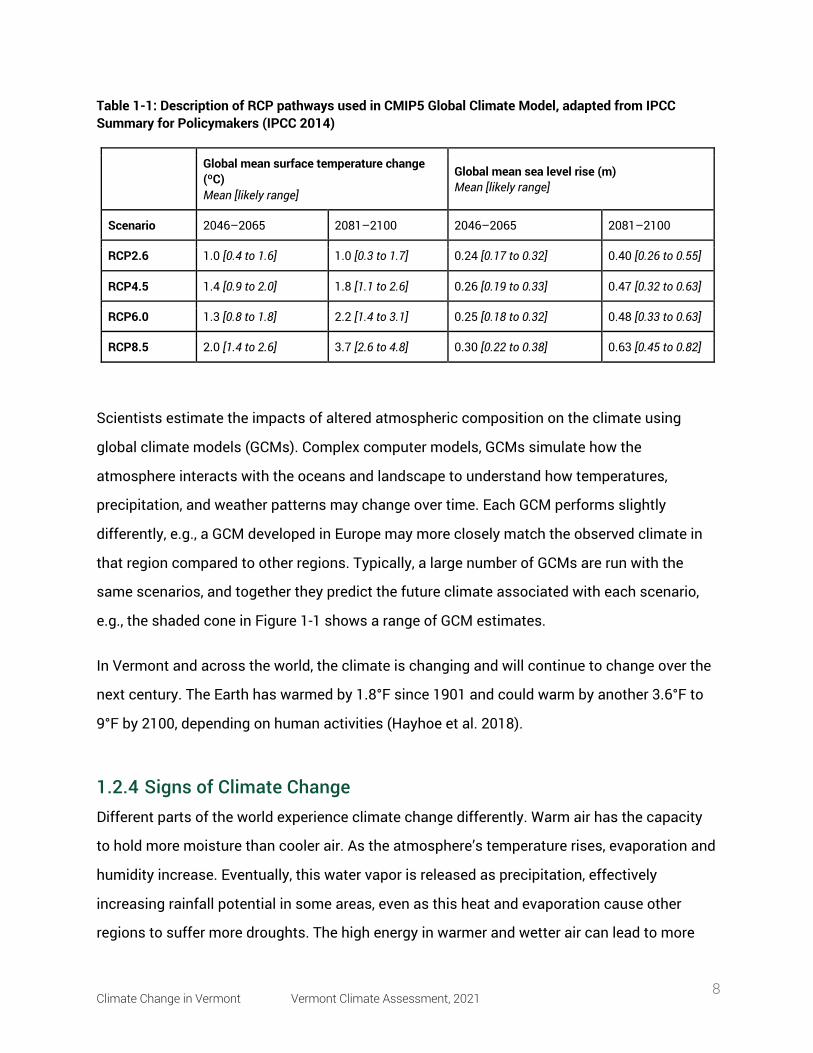
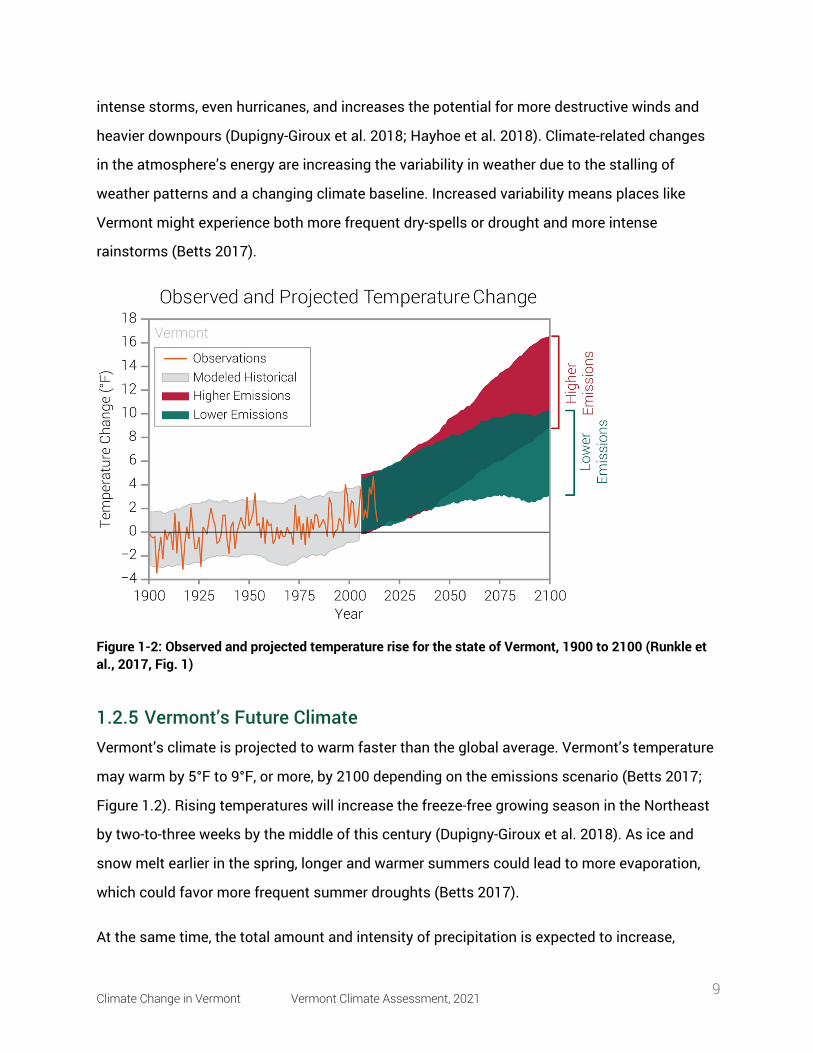
Figure 1-2: Observed and projected temperature rise for the state of Vermont, 1900 to 2100 (Runkle et al., 2017, Fig. 1)
1.2.5 Vermont’s Future Climate Vermont’s climate is projected to warm faster than the global average. Vermont’s temperature
may warm by 5°F to 9°F, or more, by 2100 depending on the emissions scenario (Betts 2017;
Figure 1.2). Rising temperatures will increase the freeze-free growing season in the Northeast
by two-to-three weeks by the middle of this century (Dupigny-Giroux et al. 2018). As ice and
snow melt earlier in the spring, longer and warmer summers could lead to more evaporation,
which could favor more frequent summer droughts (Betts 2017).
At the same time, the total amount and intensity of precipitation is expected to increase,
Climate Change in Vermont Vermont Climate Assessment, 2021 10
particularly in winter and spring (Betts 2017). Across the Northeast, monthly precipitation for
December through April is projected to increase by up to one inch by 2100 in RCP8.5, the
IPCC’s highest emissions scenario (Dupigny-Giroux et al. 2018). The Northeast is also
expected to experience more frequent and powerful storms (Dupigny-Giroux et al. 2018).
Factors like wetter winters and springs, a faster spring thaw, and more intense rainfall could
contribute to increased flooding across Vermont. Intense rainfall can be particularly hazardous
when it falls on soils that are already waterlogged, as was the case with Hurricane Irene in
2011.
1.3 vermont’s changing climate (methods)
In Vermont, recent decades have seen warmer temperatures, increased precipitation, earlier
spring thaws, and a longer growing season. Climate models give useful projections of the
climate for large regions like the entire Northeast, but they can’t always capture variations in
climate at finer resolutions, such as within Vermont. Historical climate records document local
trends and changes in climate within Vermont. Recent trends are likely to continue for the next
few decades, so long-term climate observations from 18 weather stations around Vermont are
used in this analysis.
This analysis of Vermont’s changing climate covers temperature trends; precipitation trends,
including heavy precipitation and snowfall; climate indicators, including the length of the
freeze-free period and the timing of ice-out; and extreme events such as flooding and
droughts.
1.3.1 Historical Climate Data Our analyses utilized observations from 18 National Oceanic and Atmospheric Administration
National Weather Service (NOAA NWS) U.S. Cooperative Observer Network weather stations
across Vermont (Figure 1-3; see Table 1A-1 for station attributes). Data was acquired from the
Global Summaries of the Month, Version 1 Dataset (Lawrimore et al. 2016) and from the
Applied Climate Information System (DeGaetano et al. 2015; xmACIS 2021). These eighteen
Climate Change in Vermont Vermont Climate Assessment, 2021 11
stations were selected because they have at least thirty years of observations with which we
could compute yearly and seasonal climate variables. All climate variables were calculated for
the state of Vermont and for each of its three climate divisions (northeastern, western, and
southeastern). Climate divisions were defined by the U.S. Weather Bureau (now National
Weather Service) and represent regions of a state that have a similar climate, similar dominant
crop types, or are within the same drainage basin, and they are useful for local climate
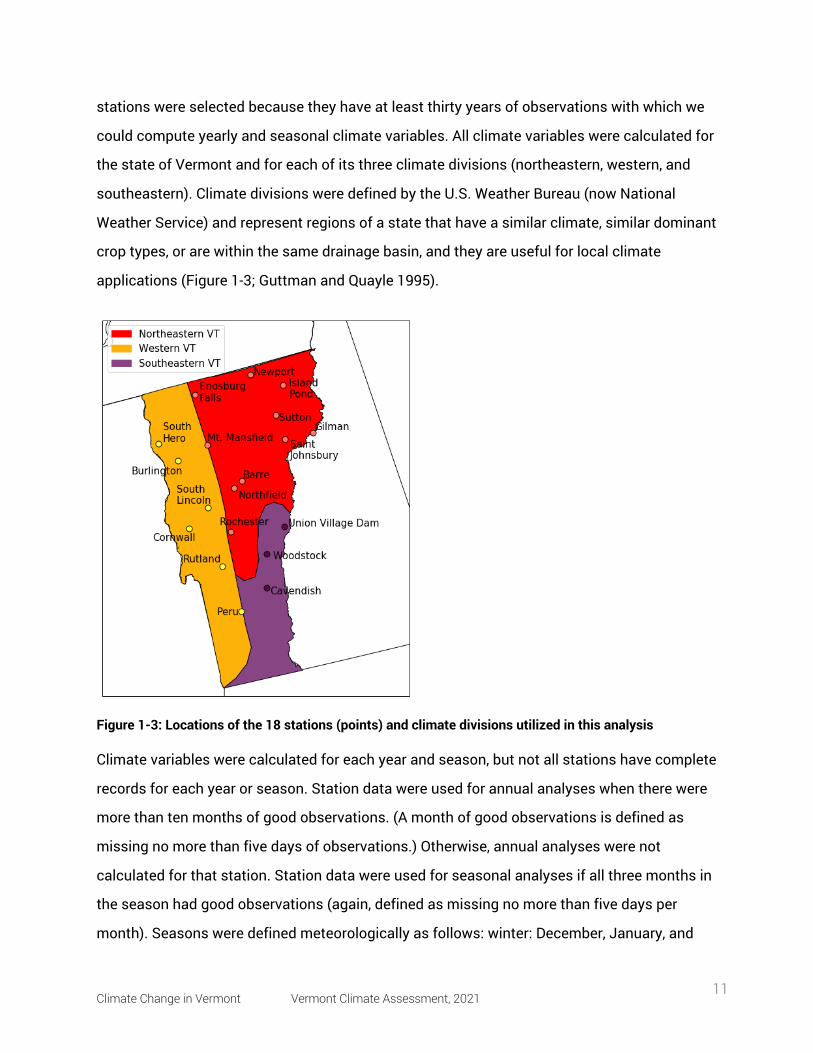
applications (Figure 1-3; Guttman and Quayle 1995).
Figure 1-3: Locations of the 18 stations (points) and climate divisions utilized in this analysis
Climate variables were calculated for each year and season, but not all stations have complete
records for each year or season. Station data were used for annual analyses when there were
more than ten months of good observations. (A month of good observations is defined as
missing no more than five days of observations.) Otherwise, annual analyses were not
calculated for that station. Station data were used for seasonal analyses if all three months in
the season had good observations (again, defined as missing no more than five days per
month). Seasons were defined meteorologically as follows: winter: December, January, and
Climate Change in Vermont Vermont Climate Assessment, 2021 12
February (DJF), spring: March, April, and May (MAM), summer: June, July, and August (JJA),
and fall: September, October, and November (SON). Annual and seasonal average values for
the state were calculated as the average of annual or seasonal climate variables for all active
stations with good observations; likewise, climate division average values utilized good
observations within the climate division in question. Decadal mean values for the state and
climate divisions were computed by averaging that decade’s annual values for all stations
across the state or climate division.
As new stations came online over time, and some years or seasons were discarded for lack of
good observations, the number of stations considered each year varied (Figure 1A-1).
Sensitivity tests were completed to address possible impacts that the variable number of
stations may pose to the following results. Representative stations were chosen as the station
with the longest complete record in a climate division and were not subject to station
relocation. The representative stations’ trend and decadal variability analyses were compared
to analyses for the climate division. Results from sensitivity testing illustrated consistency in
the magnitude and direction of trends and decadal variability between individual stations and
their climate division over all time periods considered. The changing number of stations over
time does not appear to impact findings. The annual standard deviation around the long-term
(1900–2020) mean temperature does increase as the Mount Mansfield station comes online
in 1955, but the inclusion of this station does not appear to have an impact on the magnitude
of trends or decadal variability.
1.3.2 Notes on Snowfall Data Measurements of snowfall are inherently difficult to capture due to blowing snow,
measurements consistency, and varying water content in snow. Information presented here on
snowfall trends and variability in snowfall started in 1930 because Vermont’s first snowfall
measurements in more than one climate division began in 1930, although snowfall
measurements did not start in southeastern Vermont until 1946. Snowfall is reported in inches
of snow. Seasonal precipitation, including snow and rain, is reported as “liquid equivalent”, i.e.,
the amount of liquid produced if you were to melt frozen precipitation. Liquid equivalent
Climate Change in Vermont Vermont Climate Assessment, 2021 13
precipitation measurements ensure that frozen precipitation (i.e., snow) with different water
content can be directly compared. The average snow-to-liquid ratio in Vermont is 12:1 to 13:1
(Baxter et al. 2005), meaning that melting the twelve to thirteen inches of snow on the ground
would produce one inch of liquid water. The snow-to-liquid ratio is highly variable across
Vermont and can range more than seven inches above or below the average, the largest being
40:1 or greater (P. Banacos, personal communication, 2021). The lowest snow-to-liquid ratios
(wettest snows) across the state are in southeastern Vermont due to the proximity to the
Atlantic Ocean, and the highest snow-to-liquid ratios (driest snows) are in the northern
portions of the western and northeastern climate divisions of Vermont (Baxter et al. 2005).
1.3.3 Statistical Analyses Trends in climate variables were computed using the Mann-Kendall test (Kendall 1975; Mann
1945) and were evaluated for statistical significance using the pyMannKendall package in
python (Hussain and Mahmud 2019). A statistically significant trend is unlikely to have
occurred randomly, and so is likely a meaningful trend. Trends which are not statistically
significant are unlikely to be meaningful.
1.3.4 Climate Normals NOAA NWS considers climate the most recent thirty years of observed weather patterns and
calls this climate normals. Climate normals are used daily for weather interpretation, as they
help forecasters explain how current weather conditions compare to the recent past described
by the climate normal. NOAA climate normals are updated every ten years in accordance with
standards set by the World Meteorological Organization and an 1890 congressional mandate
(National Centers for Environmental Information 2021). NOAA NWS updated climate normals
in spring 2021. For Vermont, these updated values highlighted the impacts of climate change.
For example, from the 1981-2010 climate normal to the 1991-2020 climate normal, the average
time from Burlington’s first to last frost decreased by 6 days (shorter winter) and the average
annual temperature increased from 46°F to 47.6°F (xmACIS 2021; analysis by Peter Banacos,
NOAA NWS Burlington).
Climate Change in Vermont Vermont Climate Assessment, 2021 14
In this study, change in climate and long-term trends were considered for three periods: 1)
near-term (1991 to 2020), consistent with the calculation of NOAA Climate Normals,
2) mid-term (1960 to 2020), and 3) long-term (1900 to 2020). The number of active stations
with good observations for each time-period are shown in Figure 1A-1.
1.4 vermont’s rising temperatures
Historical observations indicate Vermont’s temperatures are increasing based on near-, mid-,
and long-term trends and individual seasons. A comparison of the long-term (1900-2020), mid-
term (1960-2020), and near-term (1991-2020) climate periods shows accelerating rates of
warming for all temperature variables—average, seasonal (except winter), minimum, and
maximum temperatures (Table 1-2).
1.4.1 Average Temperatures Vermont’s average annual temperature has increased by 2ºF (42.1ºF to 44.1ºF) in the long-
term, most of which occurred more recently: 2ºF (42.6ºF to 44.1ºF) in the mid-term and 1.1ºF
(43.0ºF to 44.1ºF) in the near-term (Table 1A-2).
1.4.2 Seasonal Temperature Changes In the long-term, average temperature has increased since the early 1900s the most in winter
(+3.3ºF), least in spring (+0.2ºF), and in between in summer and fall (+1.6ºF and +1.5ºF
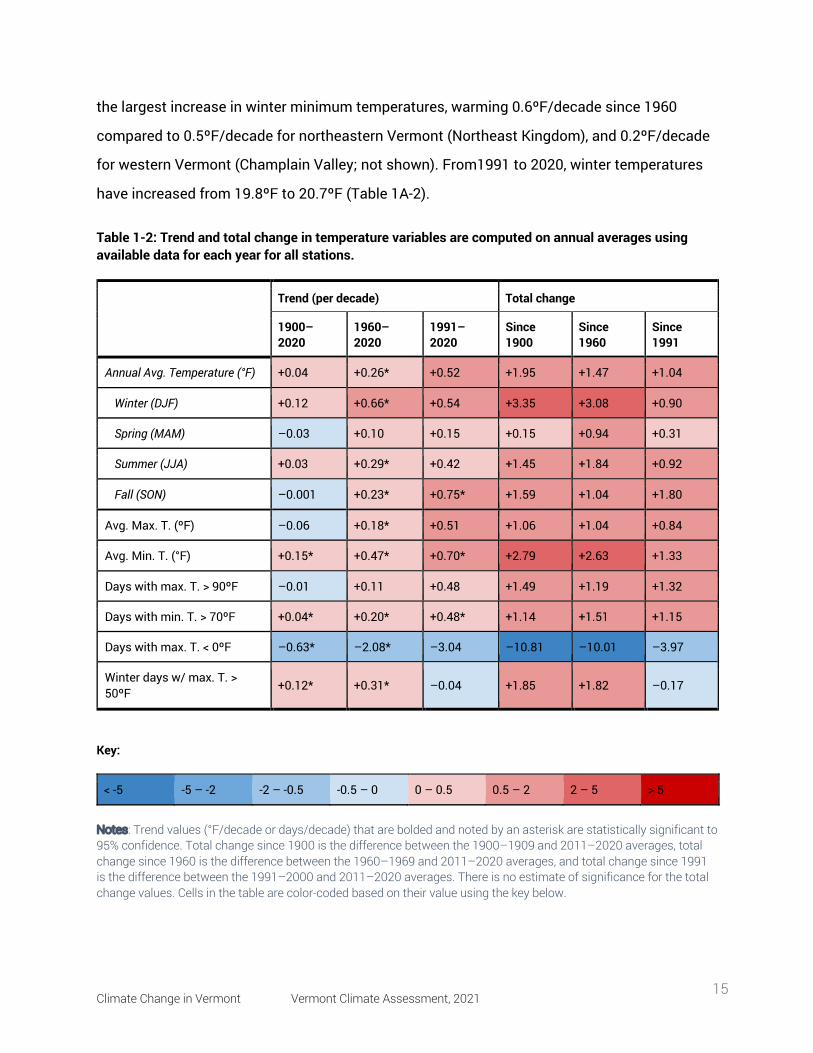
respectively; Table 1-2). Compared to the long-term mean winter temperature (1900–2020) of
19.1ºF, winter temperatures vary by +/- 0.9ºF, compared to a +/-0.6ºF variation in summer
temperatures (Figure 1-5).
In the mid-term (1960–2020), average winter temperatures have warmed 2.3 and 2.8 times
faster than summer and fall, respectively. Warming during this period was greatest with
observed minimum temperatures: average minimum temperatures increased +3ºF, 2.6 times
faster than average maximum temperatures (+1ºF) (Table 1A-3). Southeastern Vermont had
Climate Change in Vermont Vermont Climate Assessment, 2021 15
the largest increase in winter minimum temperatures, warming 0.6ºF/decade since 1960
compared to 0.5ºF/decade for northeastern Vermont (Northeast Kingdom), and 0.2ºF/decade
for western Vermont (Champlain Valley; not shown). From1991 to 2020, winter temperatures
have increased from 19.8ºF to 20.7ºF (Table 1A-2).
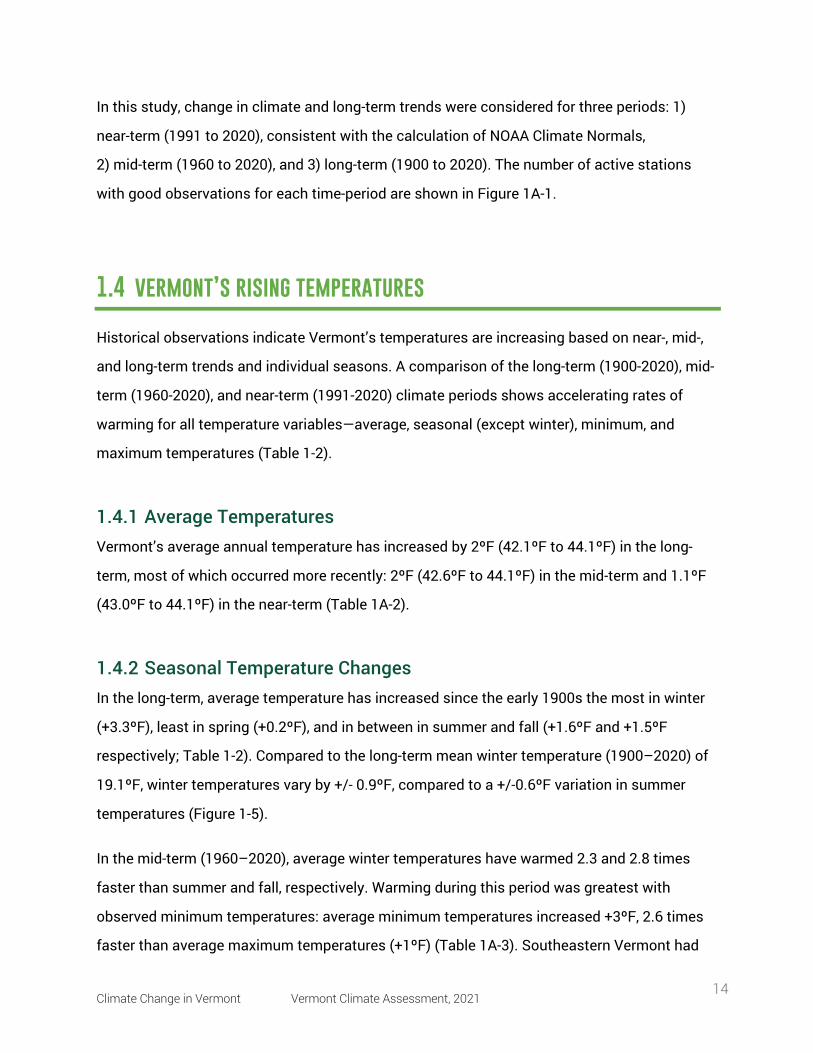
Table 1-2: Trend and total change in temperature variables are computed on annual averages using available data for each year for all stations.
Trend (per decade) Total change
1900–2020
1960–2020
1991–2020
Since 1900
Since 1960
Since 1991
Annual Avg. Temperature (°F) +0.04 +0.26* +0.52 +1.95 +1.47 +1.04
Winter (DJF) +0.12 +0.66* +0.54 +3.35 +3.08 +0.90
Spring (MAM) –0.03 +0.10 +0.15 +0.15 +0.94 +0.31
Summer (JJA) +0.03 +0.29* +0.42 +1.45 +1.84 +0.92
Fall (SON) –0.001 +0.23* +0.75* +1.59 +1.04 +1.80
Avg. Max. T. (ºF) –0.06 +0.18* +0.51 +1.06 +1.04 +0.84
Avg. Min. T. (°F) +0.15* +0.47* +0.70* +2.79 +2.63 +1.33
Days with max. T. > 90ºF –0.01 +0.11 +0.48 +1.49 +1.19 +1.32
Days with min. T. > 70ºF +0.04* +0.20* +0.48* +1.14 +1.51 +1.15
Days with max. T. < 0ºF –0.63* –2.08* –3.04 –10.81 –10.01 –3.97
Winter days w/ max. T. > 50ºF +0.12* +0.31* –0.04 +1.85 +1.82 –0.17
Key:
< -5 -5 – -2 -2 – -0.5 -0.5 – 0 0 – 0.5 0.5 – 2 2 – 5 > 5
Notes: Trend values (°F/decade or days/decade) that are bolded and noted by an asterisk are statistically significant to 95% confidence. Total change since 1900 is the difference between the 1900–1909 and 2011–2020 averages, total change since 1960 is the difference between the 1960–1969 and 2011–2020 averages, and total change since 1991 is the difference between the 1991–2000 and 2011–2020 averages. There is no estimate of significance for the total change values. Cells in the table are color-coded based on their value using the key below.
Climate Change in Vermont Vermont Climate Assessment, 2021 16
Figure 1-5: Annual temperatures by year: annual average (black line), winter months (DJF; blue line), and summer months (JJA; red line).
Notes: Dashed lines indicate the long-term (1900–2020) mean. Shading represents the standard deviation of all observations. Increased standard deviations after 1955 can be attributed to the Mount Mansfield station coming online.
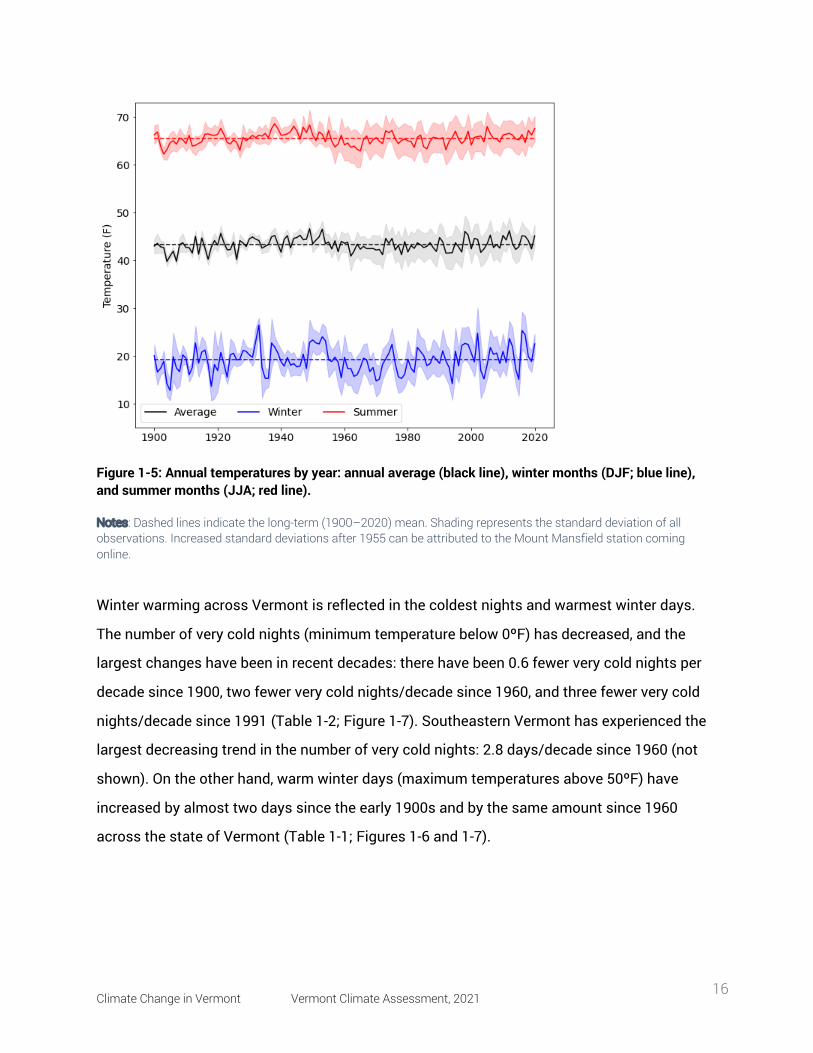
Winter warming across Vermont is reflected in the coldest nights and warmest winter days.
The number of very cold nights (minimum temperature below 0ºF) has decreased, and the
largest changes have been in recent decades: there have been 0.6 fewer very cold nights per
decade since 1900, two fewer very cold nights/decade since 1960, and three fewer very cold
nights/decade since 1991 (Table 1-2; Figure 1-7). Southeastern Vermont has experienced the
largest decreasing trend in the number of very cold nights: 2.8 days/decade since 1960 (not
shown). On the other hand, warm winter days (maximum temperatures above 50ºF) have
increased by almost two days since the early 1900s and by the same amount since 1960
across the state of Vermont (Table 1-1; Figures 1-6 and 1-7).
Climate Change in Vermont Vermont Climate Assessment, 2021 17
Figure 1-6: Decadal averages of cold and warm winter days plotted above and below the 1900–2019 mean value (solid black line).
Notes: (a) The number of days with minimum temperature below 0ºF. (b) The number of winter days with maximum temperature above 50ºF.
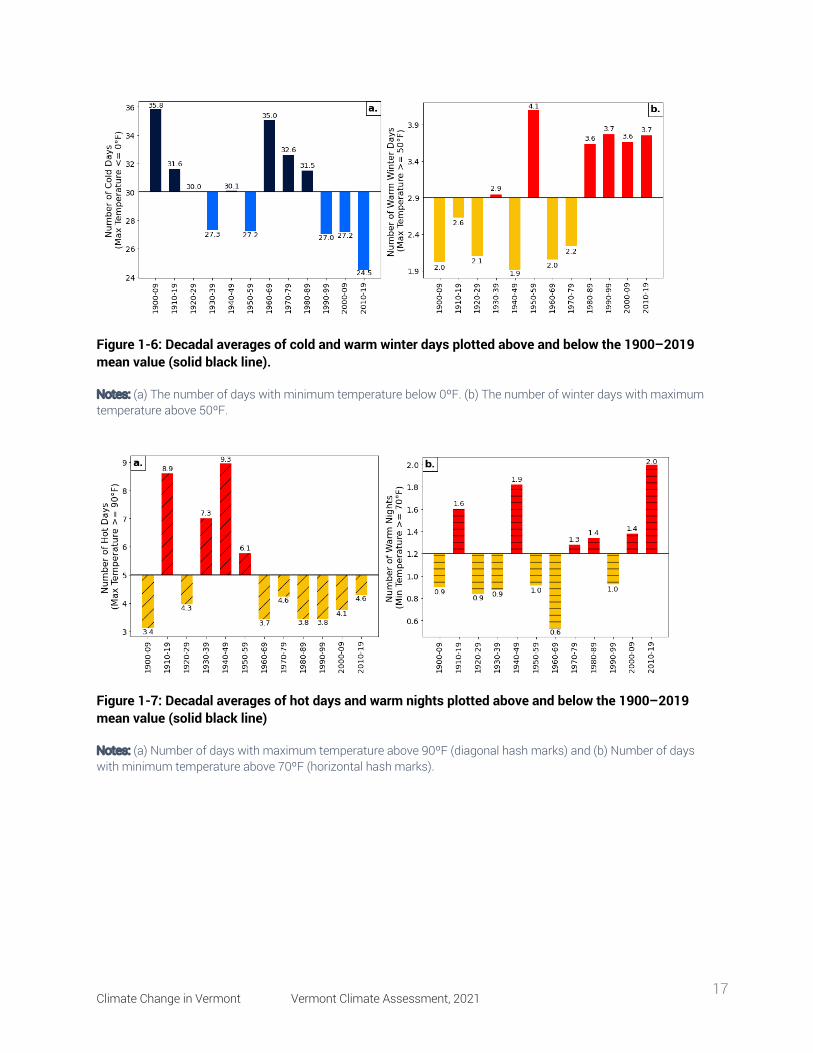
Figure 1-7: Decadal averages of hot days and warm nights plotted above and below the 1900–2019 mean value (solid black line)
Notes: (a) Number of days with maximum temperature above 90ºF (diagonal hash marks) and (b) Number of days with minimum temperature above 70ºF (horizontal hash marks).
Climate Change in Vermont Vermont Climate Assessment, 2021 18
1.5 increasing precipitation
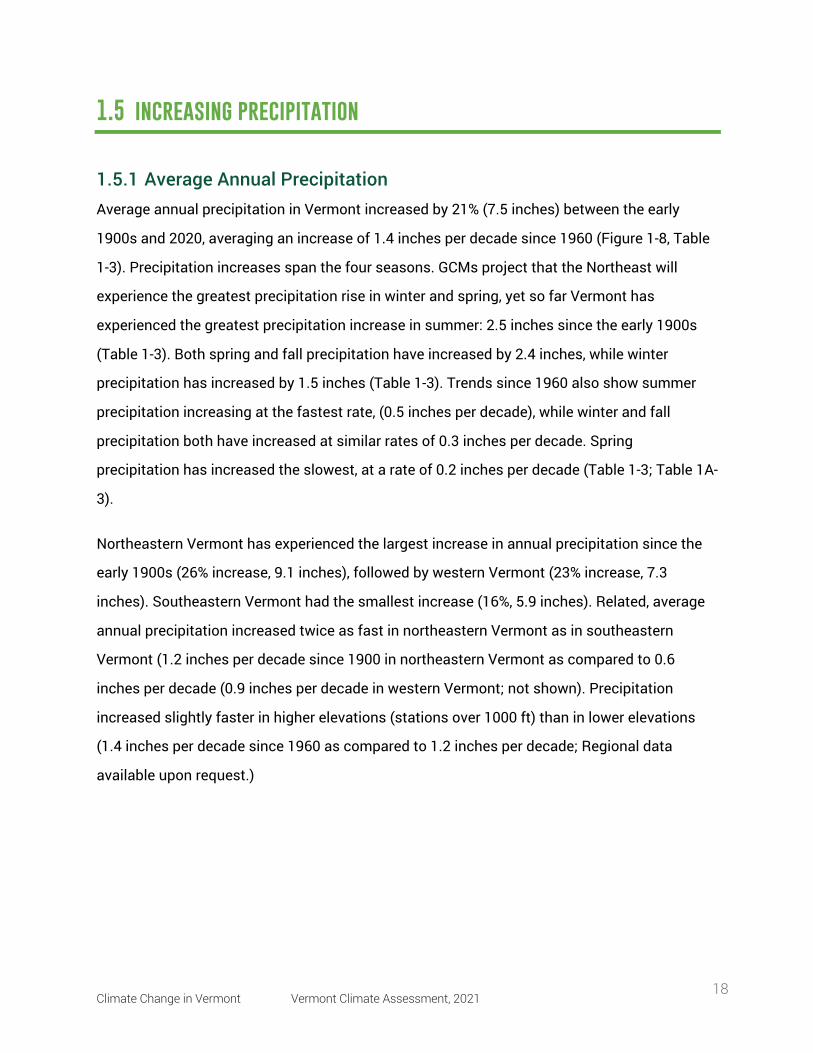
1.5.1 Average Annual Precipitation Average annual precipitation in Vermont increased by 21% (7.5 inches) between the early
1900s and 2020, averaging an increase of 1.4 inches per decade since 1960 (Figure 1-8, Table
1-3). Precipitation increases span the four seasons. GCMs project that the Northeast will
experience the greatest precipitation rise in winter and spring, yet so far Vermont has
experienced the greatest precipitation increase in summer: 2.5 inches since the early 1900s
(Table 1-3). Both spring and fall precipitation have increased by 2.4 inches, while winter
precipitation has increased by 1.5 inches (Table 1-3). Trends since 1960 also show summer
precipitation increasing at the fastest rate, (0.5 inches per decade), while winter and fall
precipitation both have increased at similar rates of 0.3 inches per decade. Spring
precipitation has increased the slowest, at a rate of 0.2 inches per decade (Table 1-3; Table 1A-
3).
Northeastern Vermont has experienced the largest increase in annual precipitation since the
early 1900s (26% increase, 9.1 inches), followed by western Vermont (23% increase, 7.3
inches). Southeastern Vermont had the smallest increase (16%, 5.9 inches). Related, average
annual precipitation increased twice as fast in northeastern Vermont as in southeastern
Vermont (1.2 inches per decade since 1900 in northeastern Vermont as compared to 0.6
inches per decade (0.9 inches per decade in western Vermont; not shown). Precipitation
increased slightly faster in higher elevations (stations over 1000 ft) than in lower elevations
(1.4 inches per decade since 1960 as compared to 1.2 inches per decade; Regional data
available upon request.)
Climate Change in Vermont Vermont Climate Assessment, 2021 19
Figure 1-8: Decadal averages of observed annual precipitation in Vermont
Climate Change in Vermont Vermont Climate Assessment, 2021 20
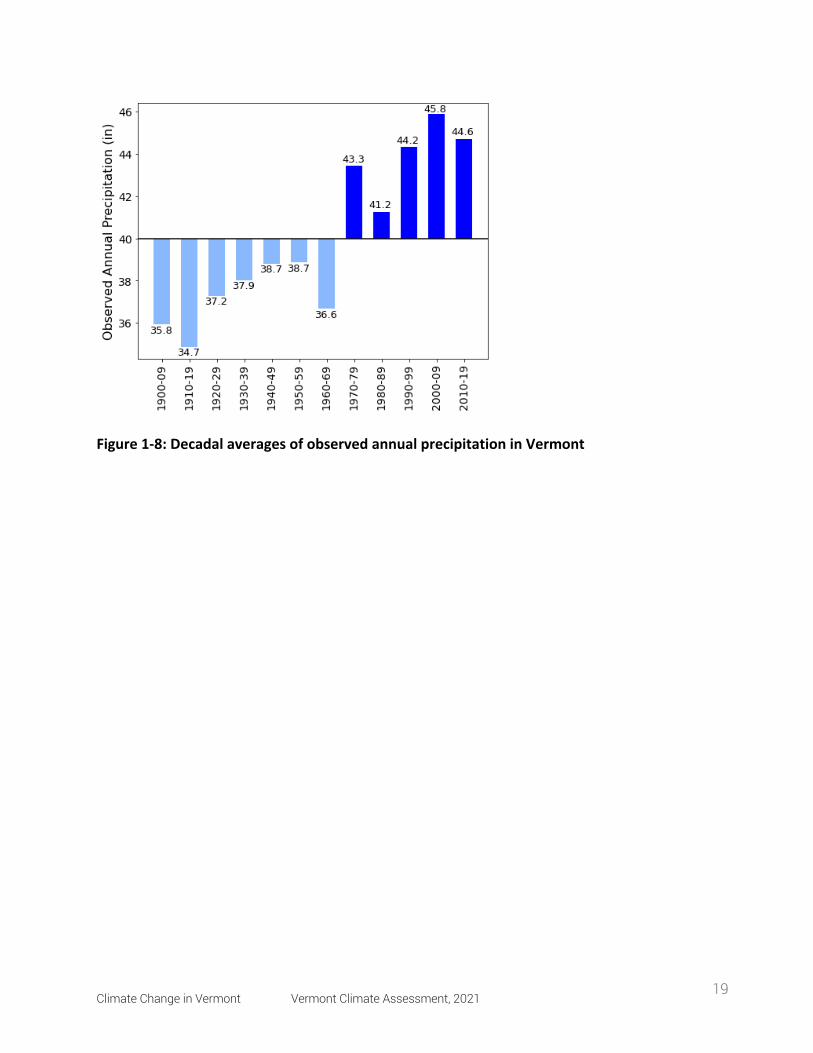
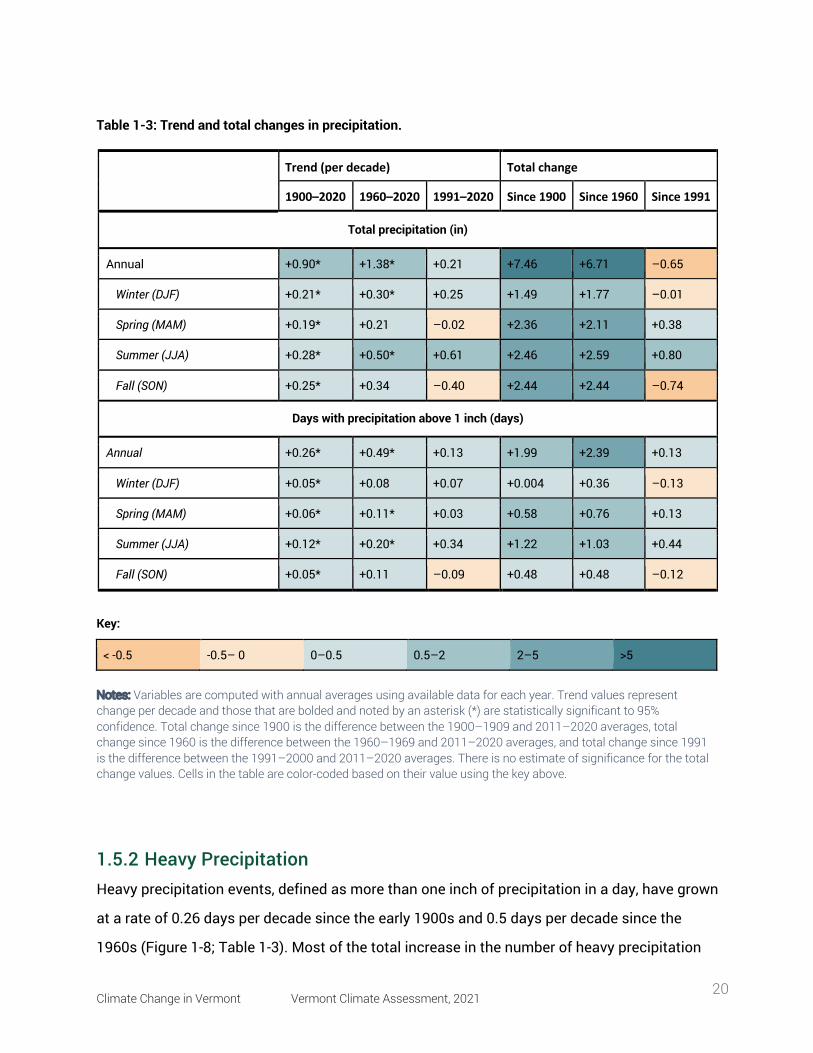
Table 1-3: Trend and total changes in precipitation.
Trend (per decade) Total change
1900–2020 1960–2020 1991–2020 Since 1900 Since 1960 Since 1991
Total precipitation (in)
Annual +0.90* +1.38* +0.21 +7.46 +6.71 –0.65
Winter (DJF) +0.21* +0.30* +0.25 +1.49 +1.77 –0.01
Spring (MAM) +0.19* +0.21 –0.02 +2.36 +2.11 +0.38
Summer (JJA) +0.28* +0.50* +0.61 +2.46 +2.59 +0.80
Fall (SON) +0.25* +0.34 –0.40 +2.44 +2.44 –0.74
Days with precipitation above 1 inch (days)
Annual +0.26* +0.49* +0.13 +1.99 +2.39 +0.13
Winter (DJF) +0.05* +0.08 +0.07 +0.004 +0.36 –0.13
Spring (MAM) +0.06* +0.11* +0.03 +0.58 +0.76 +0.13
Summer (JJA) +0.12* +0.20* +0.34 +1.22 +1.03 +0.44
Fall (SON) +0.05* +0.11 –0.09 +0.48 +0.48 –0.12
Key:
< -0.5 -0.5– 0 0–0.5 0.5–2 2–5 >5
Notes: Variables are computed with annual averages using available data for each year. Trend values represent change per decade and those that are bolded and noted by an asterisk (*) are statistically significant to 95% confidence. Total change since 1900 is the difference between the 1900–1909 and 2011–2020 averages, total change since 1960 is the difference between the 1960–1969 and 2011–2020 averages, and total change since 1991 is the difference between the 1991–2000 and 2011–2020 averages. There is no estimate of significance for the total change values. Cells in the table are color-coded based on their value using the key above.
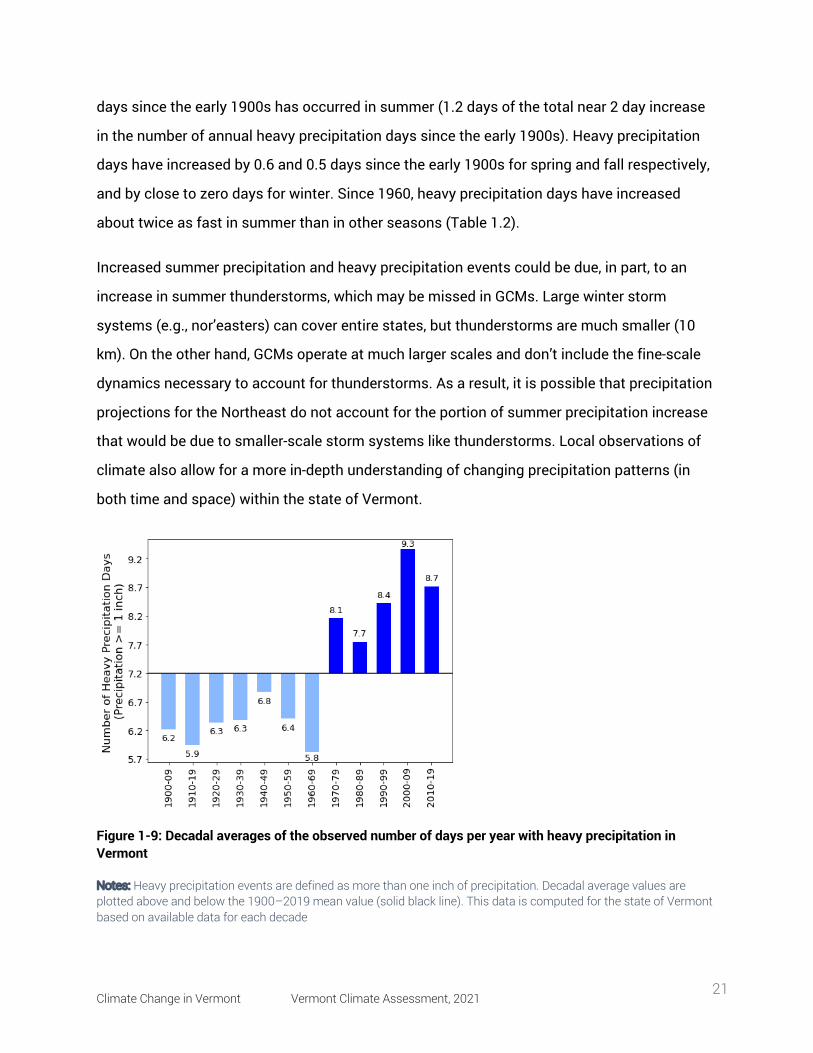
1.5.2 Heavy Precipitation Heavy precipitation events, defined as more than one inch of precipitation in a day, have grown
at a rate of 0.26 days per decade since the early 1900s and 0.5 days per decade since the
1960s (Figure 1-8; Table 1-3). Most of the total increase in the number of heavy precipitation
Climate Change in Vermont Vermont Climate Assessment, 2021 21
days since the early 1900s has occurred in summer (1.2 days of the total near 2 day increase
in the number of annual heavy precipitation days since the early 1900s). Heavy precipitation
days have increased by 0.6 and 0.5 days since the early 1900s for spring and fall respectively,
and by close to zero days for winter. Since 1960, heavy precipitation days have increased
about twice as fast in summer than in other seasons (Table 1.2).
Increased summer precipitation and heavy precipitation events could be due, in part, to an
increase in summer thunderstorms, which may be missed in GCMs. Large winter storm
systems (e.g., nor’easters) can cover entire states, but thunderstorms are much smaller (10
km). On the other hand, GCMs operate at much larger scales and don’t include the fine-scale
dynamics necessary to account for thunderstorms. As a result, it is possible that precipitation
projections for the Northeast do not account for the portion of summer precipitation increase
that would be due to smaller-scale storm systems like thunderstorms. Local observations of
climate also allow for a more in-depth understanding of changing precipitation patterns (in
both time and space) within the state of Vermont.
Figure 1-9: Decadal averages of the observed number of days per year with heavy precipitation in Vermont
Notes: Heavy precipitation events are defined as more than one inch of precipitation. Decadal average values are plotted above and below the 1900–2019 mean value (solid black line). This data is computed for the state of Vermont based on available data for each decade
Climate Change in Vermont Vermont Climate Assessment, 2021 22
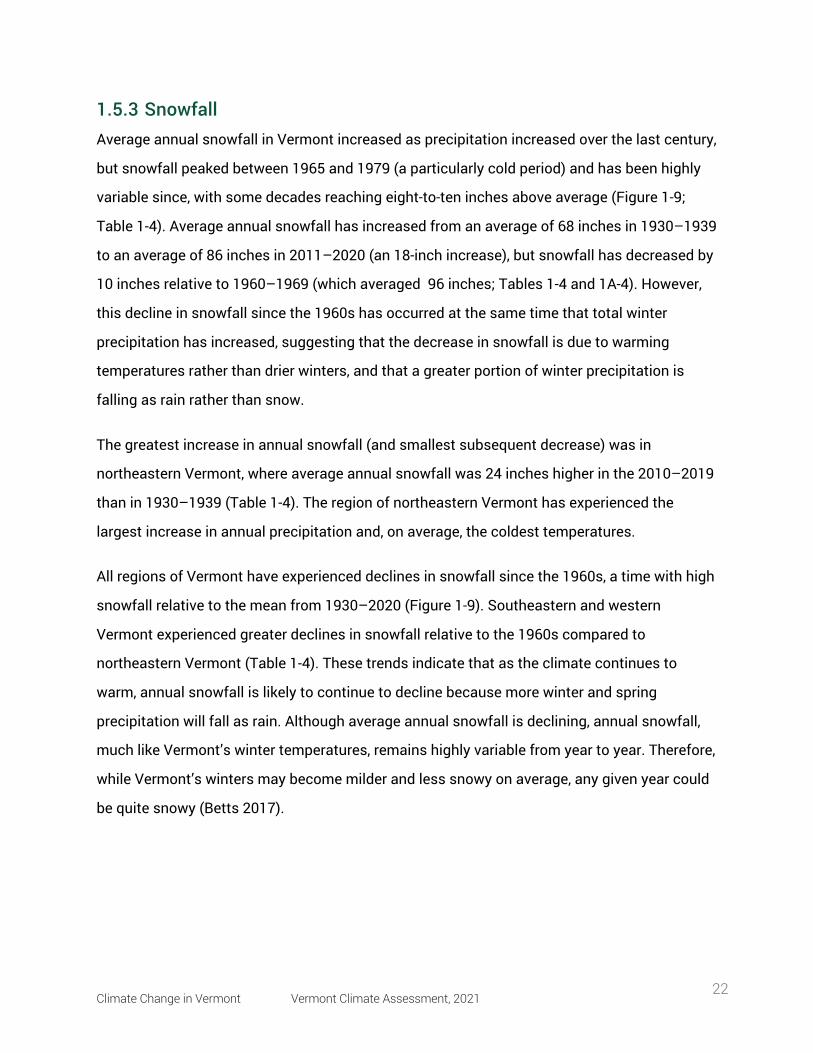
1.5.3 Snowfall Average annual snowfall in Vermont increased as precipitation increased over the last century,
but snowfall peaked between 1965 and 1979 (a particularly cold period) and has been highly
variable since, with some decades reaching eight-to-ten inches above average (Figure 1-9;
Table 1-4). Average annual snowfall has increased from an average of 68 inches in 1930–1939
to an average of 86 inches in 2011–2020 (an 18-inch increase), but snowfall has decreased by
10 inches relative to 1960–1969 (which averaged 96 inches; Tables 1-4 and 1A-4). However,
this decline in snowfall since the 1960s has occurred at the same time that total winter
precipitation has increased, suggesting that the decrease in snowfall is due to warming
temperatures rather than drier winters, and that a greater portion of winter precipitation is
falling as rain rather than snow.
The greatest increase in annual snowfall (and smallest subsequent decrease) was in
northeastern Vermont, where average annual snowfall was 24 inches higher in the 2010–2019
than in 1930–1939 (Table 1-4). The region of northeastern Vermont has experienced the
largest increase in annual precipitation and, on average, the coldest temperatures.
All regions of Vermont have experienced declines in snowfall since the 1960s, a time with high
snowfall relative to the mean from 1930–2020 (Figure 1-9). Southeastern and western
Vermont experienced greater declines in snowfall relative to the 1960s compared to
northeastern Vermont (Table 1-4). These trends indicate that as the climate continues to
warm, annual snowfall is likely to continue to decline because more winter and spring
precipitation will fall as rain. Although average annual snowfall is declining, annual snowfall,
much like Vermont’s winter temperatures, remains highly variable from year to year. Therefore,
while Vermont’s winters may become milder and less snowy on average, any given year could
be quite snowy (Betts 2017).
Climate Change in Vermont Vermont Climate Assessment, 2021 23
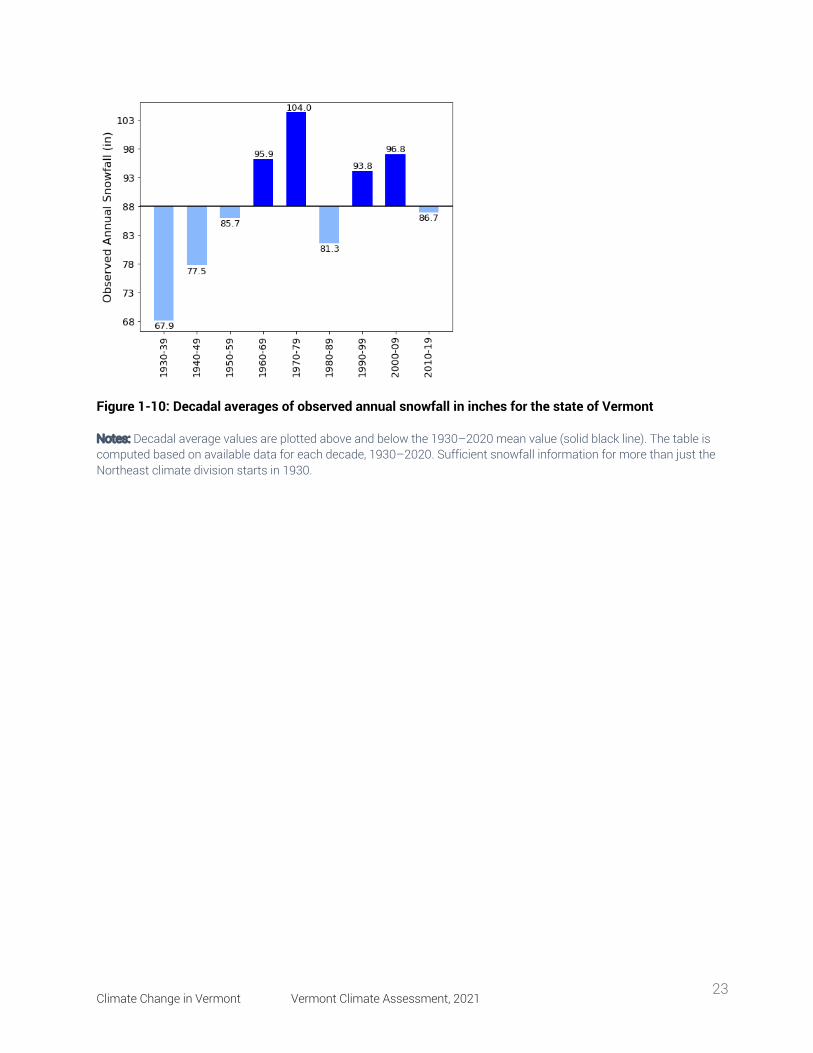
Figure 1-10: Decadal averages of observed annual snowfall in inches for the state of Vermont
Notes: Decadal average values are plotted above and below the 1930–2020 mean value (solid black line). The table is computed based on available data for each decade, 1930–2020. Sufficient snowfall information for more than just the Northeast climate division starts in 1930.
Climate Change in Vermont Vermont Climate Assessment, 2021 24
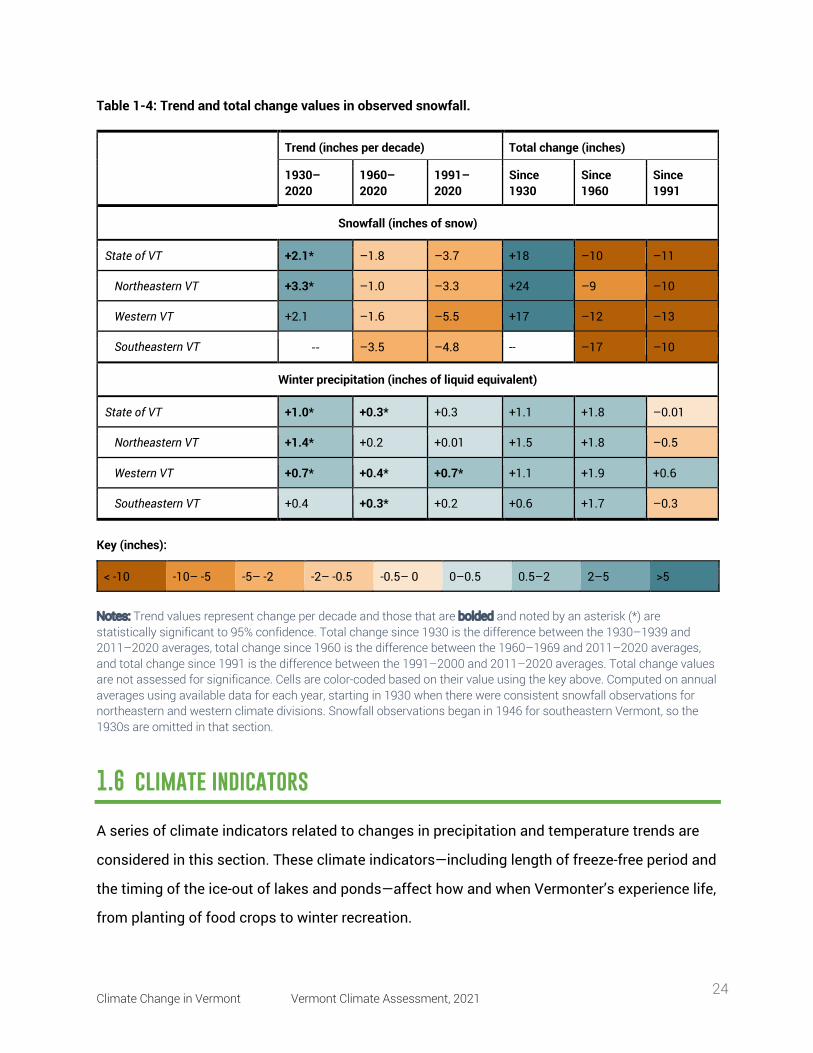
Table 1-4: Trend and total change values in observed snowfall.
Trend (inches per decade) Total change (inches)
1930–2020
1960–2020
1991–2020
Since 1930
Since 1960
Since 1991
Snowfall (inches of snow)
State of VT +2.1* –1.8 –3.7 +18 –10 –11
Northeastern VT +3.3* –1.0 –3.3 +24 –9 –10
Western VT +2.1 –1.6 –5.5 +17 –12 –13
Southeastern VT -- –3.5 –4.8 -- –17 –10
Winter precipitation (inches of liquid equivalent)
State of VT +1.0* +0.3* +0.3 +1.1 +1.8 –0.01
Northeastern VT +1.4* +0.2 +0.01 +1.5 +1.8 –0.5
Western VT +0.7* +0.4* +0.7* +1.1 +1.9 +0.6
Southeastern VT +0.4 +0.3* +0.2 +0.6 +1.7 –0.3
Key (inches):
< -10 -10– -5 -5– -2 -2– -0.5 -0.5– 0 0–0.5 0.5–2 2–5 >5
Notes: Trend values represent change per decade and those that are bolded and noted by an asterisk (*) are statistically significant to 95% confidence. Total change since 1930 is the difference between the 1930–1939 and 2011–2020 averages, total change since 1960 is the difference between the 1960–1969 and 2011–2020 averages, and total change since 1991 is the difference between the 1991–2000 and 2011–2020 averages. Total change values are not assessed for significance. Cells are color-coded based on their value using the key above. Computed on annual averages using available data for each year, starting in 1930 when there were consistent snowfall observations for northeastern and western climate divisions. Snowfall observations began in 1946 for southeastern Vermont, so the 1930s are omitted in that section.
1.6 climate indicators
A series of climate indicators related to changes in precipitation and temperature trends are
considered in this section. These climate indicators—including length of freeze-free period and
the timing of the ice-out of lakes and ponds—affect how and when Vermonter’s experience life,
from planting of food crops to winter recreation.
Climate Change in Vermont Vermont Climate Assessment, 2021 25
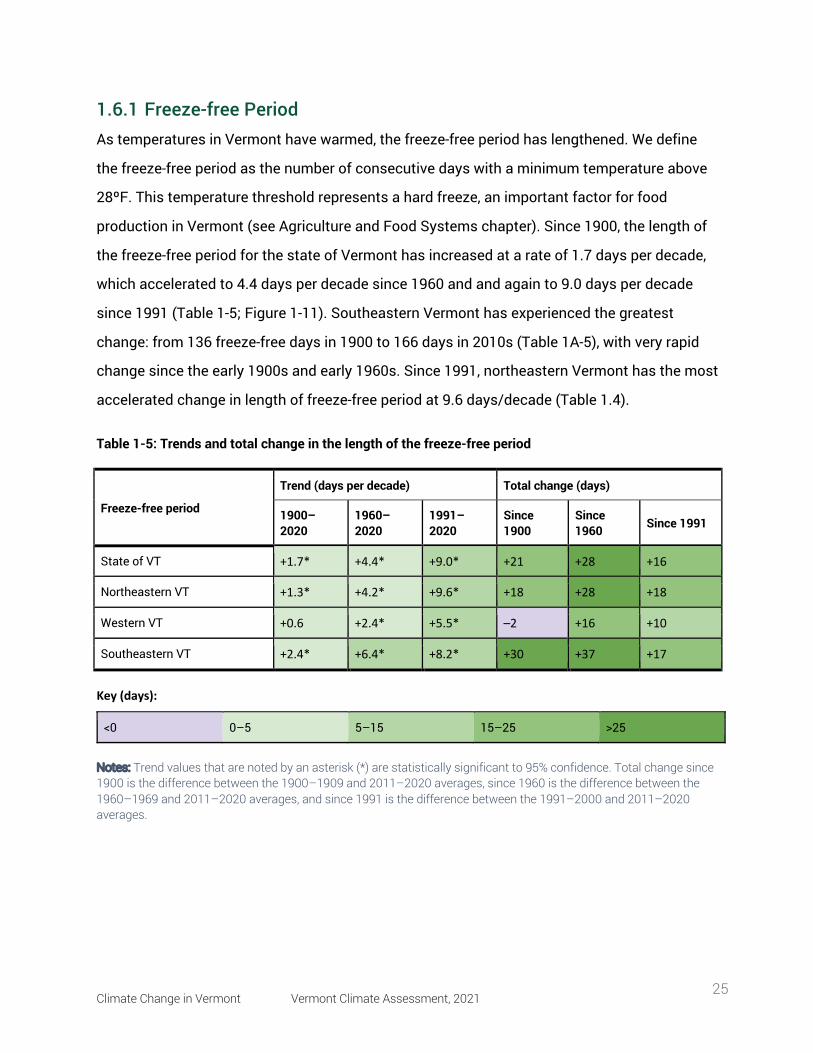
1.6.1 Freeze-free Period As temperatures in Vermont have warmed, the freeze-free period has lengthened. We define
the freeze-free period as the number of consecutive days with a minimum temperature above
28ºF. This temperature threshold represents a hard freeze, an important factor for food
production in Vermont (see Agriculture and Food Systems chapter). Since 1900, the length of
the freeze-free period for the state of Vermont has increased at a rate of 1.7 days per decade,
which accelerated to 4.4 days per decade since 1960 and and again to 9.0 days per decade
since 1991 (Table 1-5; Figure 1-11). Southeastern Vermont has experienced the greatest
change: from 136 freeze-free days in 1900 to 166 days in 2010s (Table 1A-5), with very rapid
change since the early 1900s and early 1960s. Since 1991, northeastern Vermont has the most
accelerated change in length of freeze-free period at 9.6 days/decade (Table 1.4).
Table 1-5: Trends and total change in the length of the freeze-free period
Freeze-free period Trend (days per decade) Total change (days)
1900–2020
1960–2020
1991–2020
Since 1900
Since 1960 Since 1991
State of VT +1.7* +4.4* +9.0* +21 +28 +16
Northeastern VT +1.3* +4.2* +9.6* +18 +28 +18
Western VT +0.6 +2.4* +5.5* –2 +16 +10
Southeastern VT +2.4* +6.4* +8.2* +30 +37 +17 Key (days):
<0 0–5 5–15 15–25 >25
Notes: Trend values that are noted by an asterisk (*) are statistically significant to 95% confidence. Total change since 1900 is the difference between the 1900–1909 and 2011–2020 averages, since 1960 is the difference between the 1960–1969 and 2011–2020 averages, and since 1991 is the difference between the 1991–2000 and 2011–2020 averages.
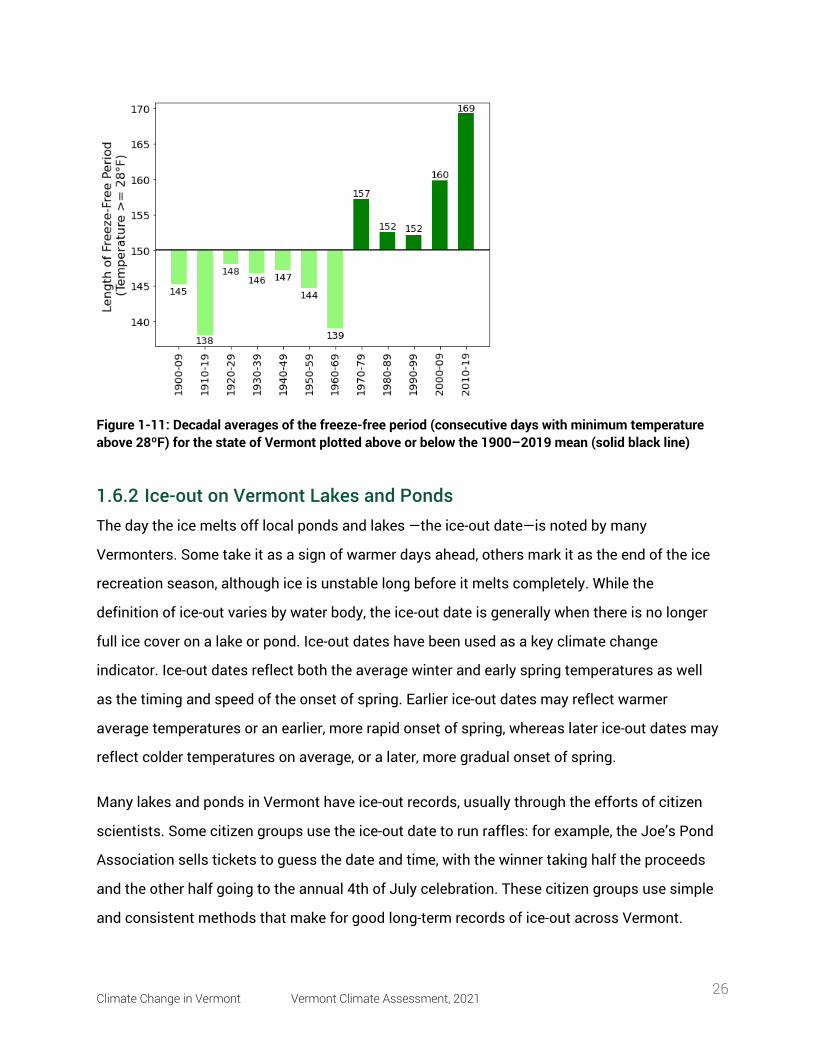
Climate Change in Vermont Vermont Climate Assessment, 2021 26
Figure 1-11: Decadal averages of the freeze-free period (consecutive days with minimum temperature above 28ºF) for the state of Vermont plotted above or below the 1900–2019 mean (solid black line)
1.6.2 Ice-out on Vermont Lakes and Ponds The day the ice melts off local ponds and lakes —the ice-out date—is noted by many
Vermonters. Some take it as a sign of warmer days ahead, others mark it as the end of the ice
recreation season, although ice is unstable long before it melts completely. While the
definition of ice-out varies by water body, the ice-out date is generally when there is no longer
full ice cover on a lake or pond. Ice-out dates have been used as a key climate change
indicator. Ice-out dates reflect both the average winter and early spring temperatures as well
as the timing and speed of the onset of spring. Earlier ice-out dates may reflect warmer
average temperatures or an earlier, more rapid onset of spring, whereas later ice-out dates may
reflect colder temperatures on average, or a later, more gradual onset of spring.
Many lakes and ponds in Vermont have ice-out records, usually through the efforts of citizen
scientists. Some citizen groups use the ice-out date to run raffles: for example, the Joe’s Pond
Association sells tickets to guess the date and time, with the winner taking half the proceeds
and the other half going to the annual 4th of July celebration. These citizen groups use simple
and consistent methods that make for good long-term records of ice-out across Vermont.
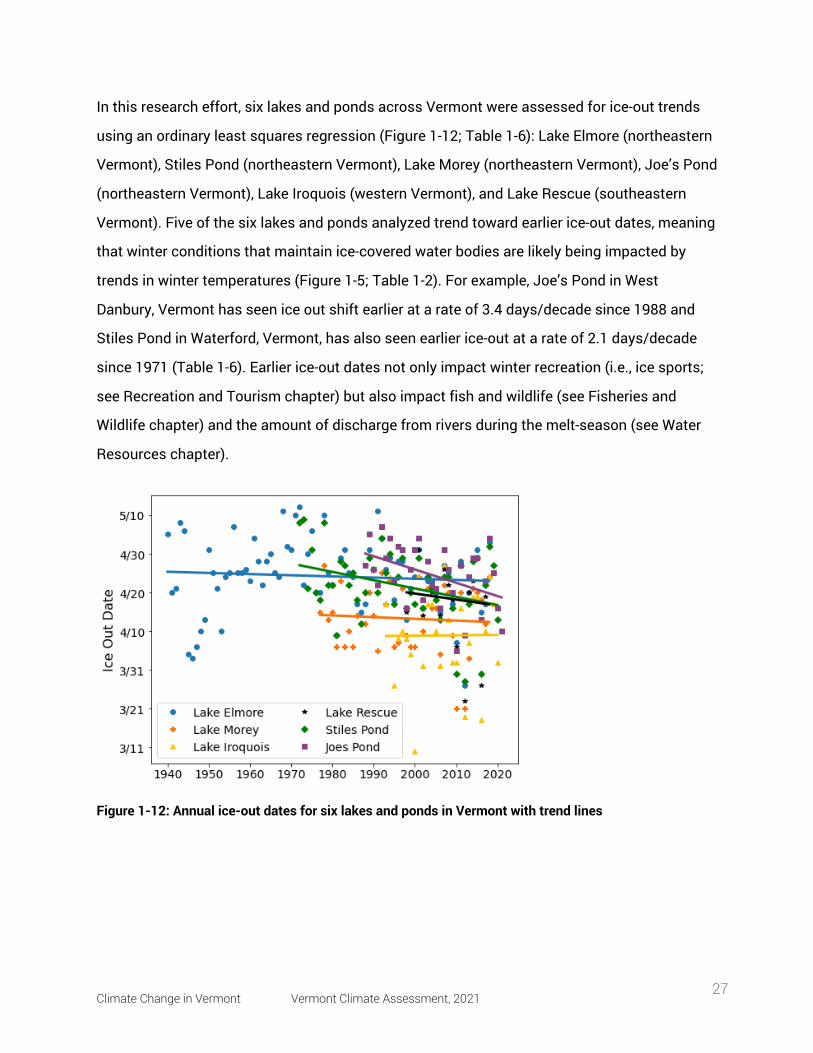
Climate Change in Vermont Vermont Climate Assessment, 2021 27
In this research effort, six lakes and ponds across Vermont were assessed for ice-out trends
using an ordinary least squares regression (Figure 1-12; Table 1-6): Lake Elmore (northeastern
Vermont), Stiles Pond (northeastern Vermont), Lake Morey (northeastern Vermont), Joe’s Pond
(northeastern Vermont), Lake Iroquois (western Vermont), and Lake Rescue (southeastern
Vermont). Five of the six lakes and ponds analyzed trend toward earlier ice-out dates, meaning
that winter conditions that maintain ice-covered water bodies are likely being impacted by
trends in winter temperatures (Figure 1-5; Table 1-2). For example, Joe’s Pond in West
Danbury, Vermont has seen ice out shift earlier at a rate of 3.4 days/decade since 1988 and
Stiles Pond in Waterford, Vermont, has also seen earlier ice-out at a rate of 2.1 days/decade
since 1971 (Table 1-6). Earlier ice-out dates not only impact winter recreation (i.e., ice sports;
see Recreation and Tourism chapter) but also impact fish and wildlife (see Fisheries and
Wildlife chapter) and the amount of discharge from rivers during the melt-season (see Water
Resources chapter).
Figure 1-12: Annual ice-out dates for six lakes and ponds in Vermont with trend lines
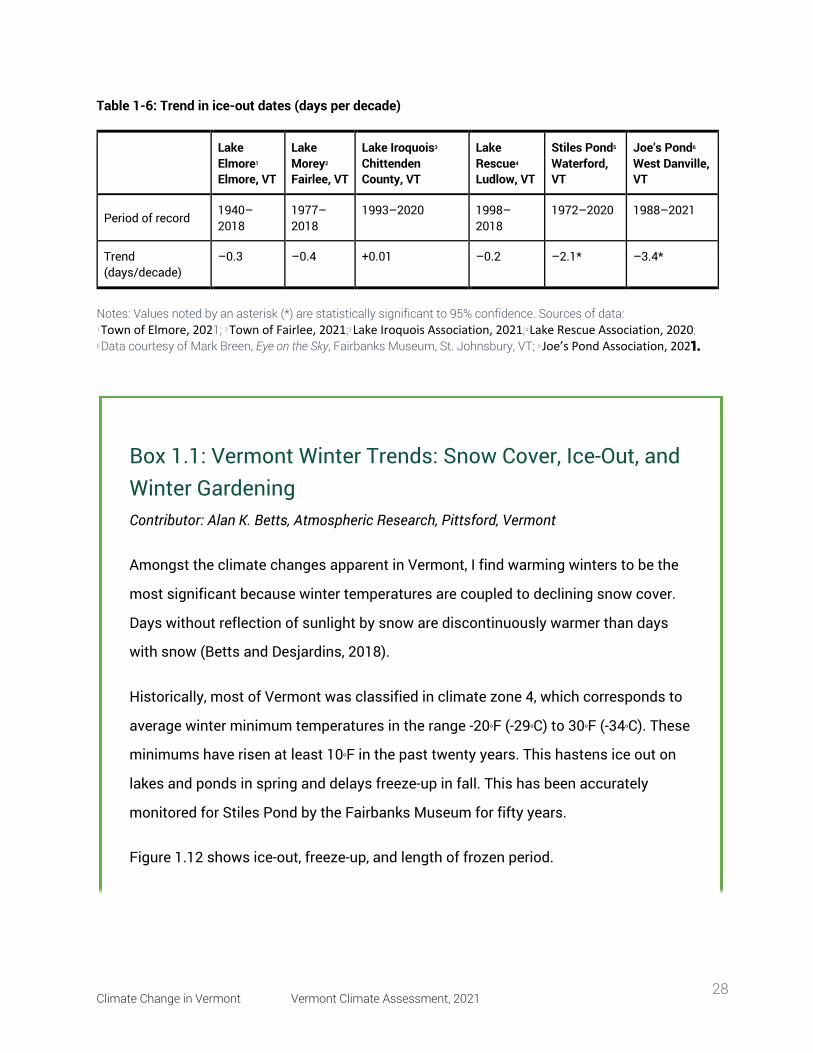
Climate Change in Vermont Vermont Climate Assessment, 2021 28
Table 1-6: Trend in ice-out dates (days per decade)
Lake Elmore1 Elmore, VT
Lake Morey2 Fairlee, VT
Lake Iroquois3 Chittenden County, VT
Lake Rescue4 Ludlow, VT
Stiles Pond5 Waterford, VT
Joe’s Pond6 West Danville, VT
Period of record 1940–2018
1977–2018
1993–2020 1998–2018
1972–2020 1988–2021
Trend (days/decade)
–0.3 –0.4 +0.01 –0.2 –2.1* –3.4*
Notes: Values noted by an asterisk (*) are statistically significant to 95% confidence. Sources of data: 1 Town of Elmore, 2021; 2 Town of Fairlee, 2021;3 Lake Iroquois Association, 2021;4 Lake Rescue Association, 2020; 5 Data courtesy of Mark Breen, Eye on the Sky, Fairbanks Museum, St. Johnsbury, VT; 6 Joe’s Pond Association, 2021.
Box 1.1: Vermont Winter Trends: Snow Cover, Ice-Out, and Winter Gardening
Contributor: Alan K. Betts, Atmospheric Research, Pittsford, Vermont
Amongst the climate changes apparent in Vermont, I find warming winters to be the
most significant because winter temperatures are coupled to declining snow cover.
Days without reflection of sunlight by snow are discontinuously warmer than days
with snow (Betts and Desjardins, 2018).
Historically, most of Vermont was classified in climate zone 4, which corresponds to
average winter minimum temperatures in the range -20oF (-29oC) to 30oF (-34oC). These
minimums have risen at least 10oF in the past twenty years. This hastens ice out on
lakes and ponds in spring and delays freeze-up in fall. This has been accurately
monitored for Stiles Pond by the Fairbanks Museum for fifty years.
Figure 1.12 shows ice-out, freeze-up, and length of frozen period.
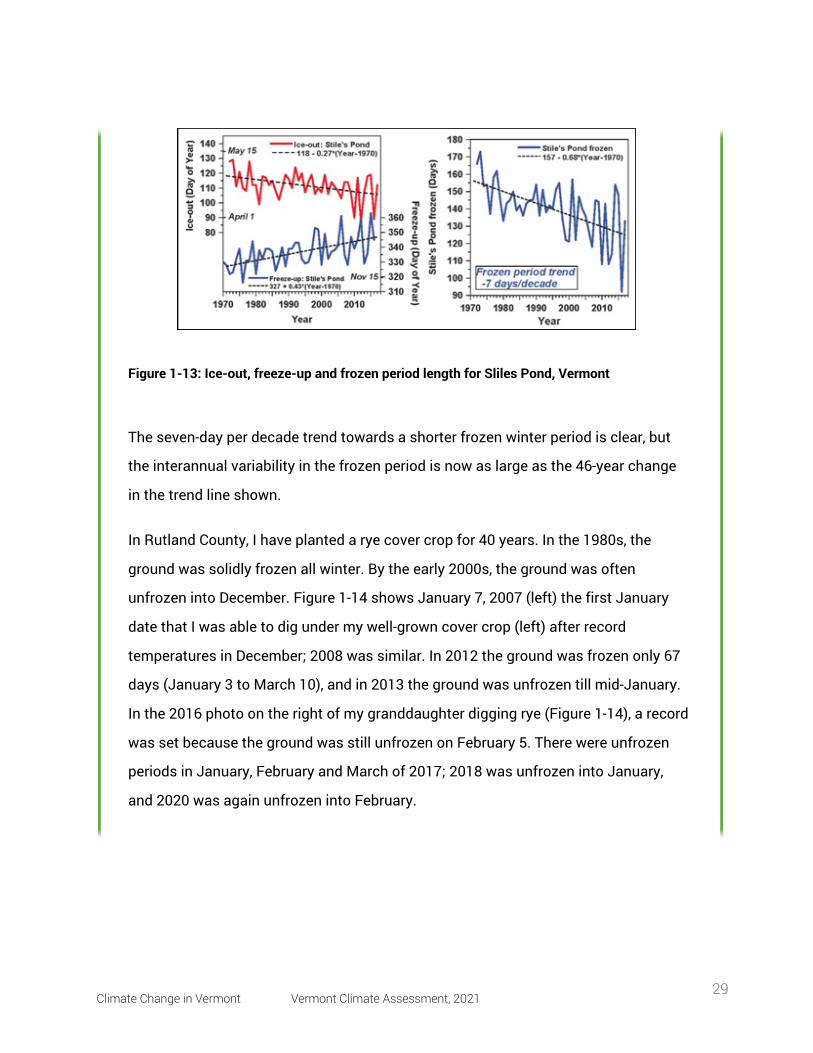
Climate Change in Vermont Vermont Climate Assessment, 2021 29
Figure 1-13: Ice-out, freeze-up and frozen period length for Sliles Pond, Vermont
The seven-day per decade trend towards a shorter frozen winter period is clear, but
the interannual variability in the frozen period is now as large as the 46-year change
in the trend line shown.
In Rutland County, I have planted a rye cover crop for 40 years. In the 1980s, the
ground was solidly frozen all winter. By the early 2000s, the ground was often
unfrozen into December. Figure 1-14 shows January 7, 2007 (left) the first January
date that I was able to dig under my well-grown cover crop (left) after record
temperatures in December; 2008 was similar. In 2012 the ground was frozen only 67
days (January 3 to March 10), and in 2013 the ground was unfrozen till mid-January.
In the 2016 photo on the right of my granddaughter digging rye (Figure 1-14), a record
was set because the ground was still unfrozen on February 5. There were unfrozen
periods in January, February and March of 2017; 2018 was unfrozen into January,
and 2020 was again unfrozen into February.
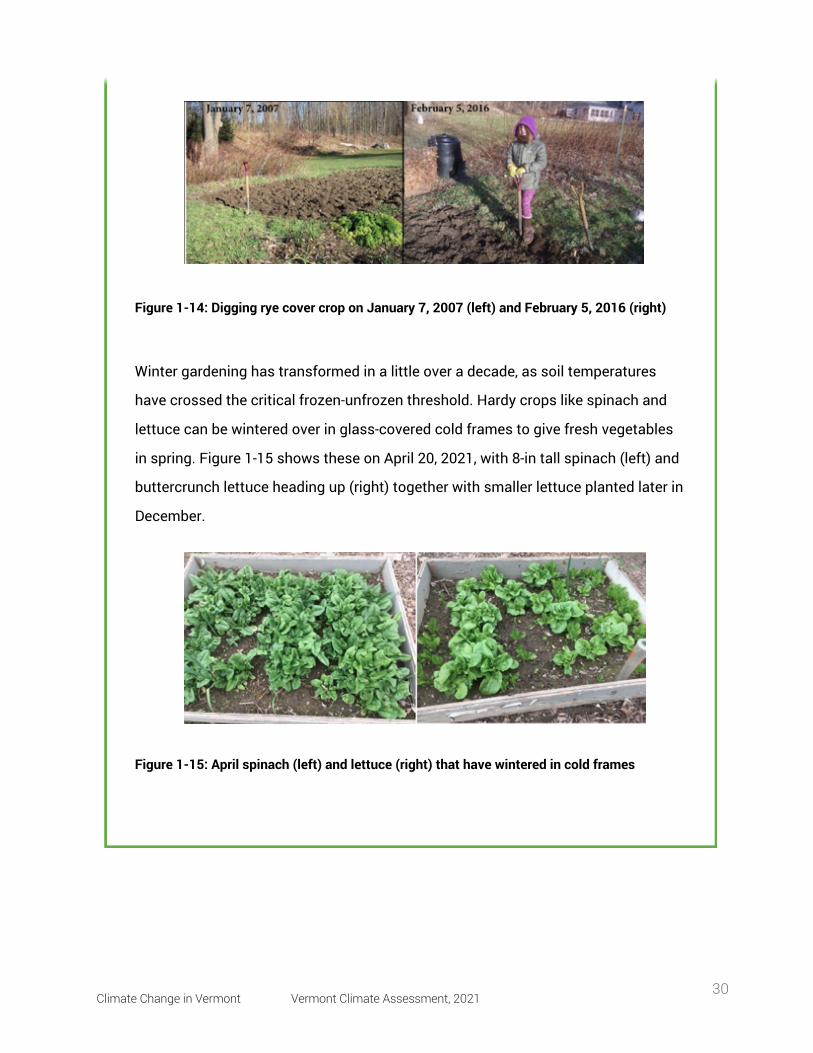
Climate Change in Vermont Vermont Climate Assessment, 2021 30
Figure 1-14: Digging rye cover crop on January 7, 2007 (left) and February 5, 2016 (right)
Winter gardening has transformed in a little over a decade, as soil temperatures
have crossed the critical frozen-unfrozen threshold. Hardy crops like spinach and
lettuce can be wintered over in glass-covered cold frames to give fresh vegetables
in spring. Figure 1-15 shows these on April 20, 2021, with 8-in tall spinach (left) and
buttercrunch lettuce heading up (right) together with smaller lettuce planted later in
December.
Figure 1-15: April spinach (left) and lettuce (right) that have wintered in cold frames
Climate Change in Vermont Vermont Climate Assessment, 2021 31
1.7 extreme events
Climate change is expected to increase the variability in climate extremes. While some of the
impacts of climate change on atmospheric, oceanic, and land-surface processes are known,
the interactions of the changes across different spheres over time are less clear, since the
climate will move in and out of historically rare climate states (Betts 2017). Extreme events
can happen in Vermont in all seasons and include (but are not limited to): heavy precipitations
(from tropical cyclones, severe thunderstorms) and variability in related events like flooding,
heavy snowfall, ice storms, and drought.
1.7.1 Flooding Flooding in Vermont can be caused by heavy precipitation (from tropical cyclones, winter
storms, or severe thunderstorms) in all seasons or ice-jam flooding in the winter and spring.
The most massive recent flooding event in Vermont was caused by Tropical Storm Irene on 28
August 2011; it resulted in an estimated $733 million dollars of damage and three fatalities
(Runkle et al. 2017). In addition to the 4–8 inches of rain produced by Irene, existing high
levels of soil moisture due to earlier heavy rain events in 2011 meant that much of Irene’s
record-breaking rainfall could not infiltrate into the soil and instead ran off the landscape
directly into rivers. The heavy rains and large amount of runoff contributed to substantial
flooding across the state, second only to the flooding caused by the Great Flood of 1927
(Preliminary Hurricane/Tropical Storm Irene Weather Summary for the North Country n.d.; Top 5
Weather Events of 2011 across the North Country n.d.). More recently, the Halloween storm of
2019 produced 3–5 inches of rain in a single day, broke multiple precipitation and temperature
records, led to extensive flooding, and caused over $6 million dollars of damage to
infrastructure across the state (Hastings and Taber 2019; President Signs Disaster Declaration
for Halloween Storm 2020).
Ice-jams are a principal mechanism for winter flooding in Vermont. Ice-jams occur when warm
temperatures, snowmelt, and rainfall cause ice in rivers to break up rapidly. This newly mobile
ice accumulates and creates a dam, or ice-jam, causing water behind the ice-jam to rise, often
Climate Change in Vermont Vermont Climate Assessment, 2021 32
topping riverbanks and filling floodplains. For example, from 12–14 January 2018, a
combination of record warmth, record atmospheric moisture, a deep existing snowpack, and
rains of 0.5– 2 inches led to ice-jams caused by rapid breaking up of river ice and resulted in
flooding along the Missisquoi, Lamoille, and Winooski Rivers in Vermont (The Widespread Ice
Jam Flooding and Wintry Mixed Precipitation Event on January 12-13, 2018 n.d.).
1.7.2 Dry Spells and Droughts Drought events in Vermont range from severe multi-year droughts that impact the entire state,
to shorter lived, more frequent, localized events (Dupigny-Giroux 2001). The impacts of
drought events can be far-reaching, affecting agriculture, water resources, forestry, and
tourism in the state (Dupigny-Giroux 2001). Since the inception of the U.S. Drought Monitor
(USDM) in 2000 (Svoboda et al. 2002), Vermont has experienced several significant droughts
(Table 1-7). Vermont’s longest drought since the start of this record lasted forty-five weeks (21
July 2016 to 25 April 2017), during which conditions ranged from moderately to exceptionally
dry, or D1-D4 in the USDM drought classification (Drought in Vermont from 2000-Present n.d.).
More recently, Vermont experienced its most intense drought since the start of the USDM
during the week of 29 September 2020, when severe drought conditions, D2 in the USDM
classification, impacted 29.39% of the state. Extended periods with little-to-no precipitation
and above-average summer temperatures (+6.2ºF in Burlington, Vermont) resulted in the
lowest seven-day average streamflow in September 2020 in 30 years for fourteen USGS
streamflow gauges across New England (seven of which were in Vermont) (Figure 1-16;
Lombard et al. 2021). Other notable droughts in the state occurred in 1930–1936, 1939–1943,
1960–1969, 1980–1981, 1988–1989, 1991, 1995, 1998, 2001-2002 (Dupigny-Giroux 2001,
Table 1.6; Dupigny-Giroux 2002; Lombard et al. 2021).
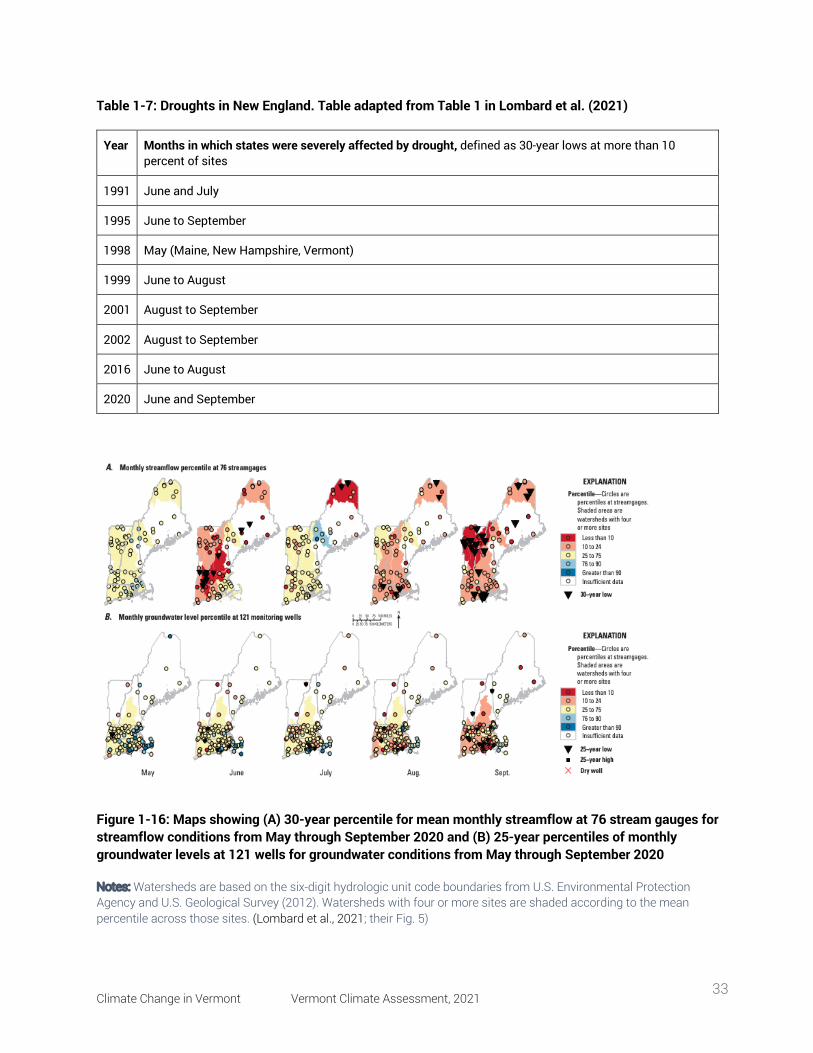
Climate Change in Vermont Vermont Climate Assessment, 2021 33
Table 1-7: Droughts in New England. Table adapted from Table 1 in Lombard et al. (2021)
Year Months in which states were severely affected by drought, defined as 30-year lows at more than 10 percent of sites
1991 June and July
1995 June to September
1998 May (Maine, New Hampshire, Vermont)
1999 June to August
2001 August to September
2002 August to September
2016 June to August
2020 June and September
Figure 1-16: Maps showing (A) 30-year percentile for mean monthly streamflow at 76 stream gauges for streamflow conditions from May through September 2020 and (B) 25-year percentiles of monthly groundwater levels at 121 wells for groundwater conditions from May through September 2020
Notes: Watersheds are based on the six-digit hydrologic unit code boundaries from U.S. Environmental Protection Agency and U.S. Geological Survey (2012). Watersheds with four or more sites are shaded according to the mean percentile across those sites. (Lombard et al., 2021; their Fig. 5)
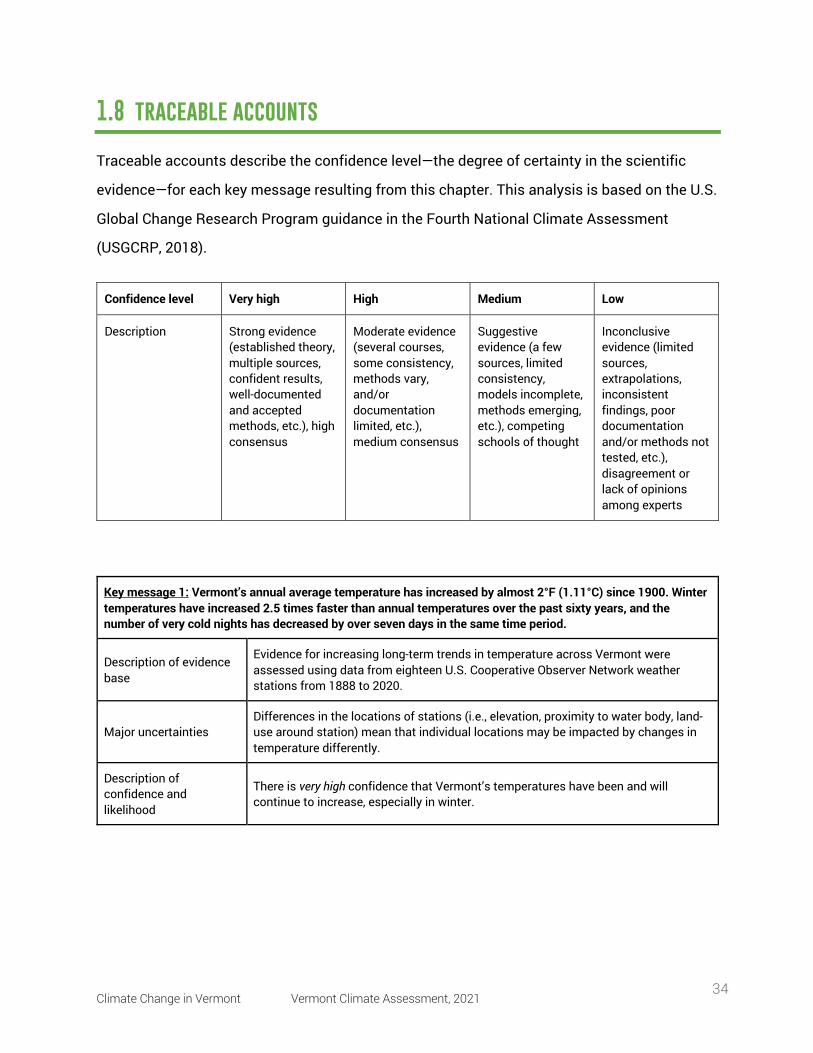
Climate Change in Vermont Vermont Climate Assessment, 2021 34
1.8 traceable accounts
Traceable accounts describe the confidence level—the degree of certainty in the scientific
evidence—for each key message resulting from this chapter. This analysis is based on the U.S.
Global Change Research Program guidance in the Fourth National Climate Assessment
(USGCRP, 2018).
Confidence level Very high High Medium Low
Description Strong evidence (established theory, multiple sources, confident results, well-documented and accepted methods, etc.), high consensus
Moderate evidence (several courses, some consistency, methods vary, and/or documentation limited, etc.), medium consensus
Suggestive evidence (a few sources, limited consistency, models incomplete, methods emerging, etc.), competing schools of thought
Inconclusive evidence (limited sources, extrapolations, inconsistent findings, poor documentation and/or methods not tested, etc.), disagreement or lack of opinions among experts
Key message 1: Vermont’s annual average temperature has increased by almost 2°F (1.11°C) since 1900. Winter temperatures have increased 2.5 times faster than annual temperatures over the past sixty years, and the number of very cold nights has decreased by over seven days in the same time period.
Description of evidence base
Evidence for increasing long-term trends in temperature across Vermont were assessed using data from eighteen U.S. Cooperative Observer Network weather stations from 1888 to 2020.
Major uncertainties Differences in the locations of stations (i.e., elevation, proximity to water body, land-use around station) mean that individual locations may be impacted by changes in temperature differently.
Description of confidence and likelihood
There is very high confidence that Vermont’s temperatures have been and will continue to increase, especially in winter.
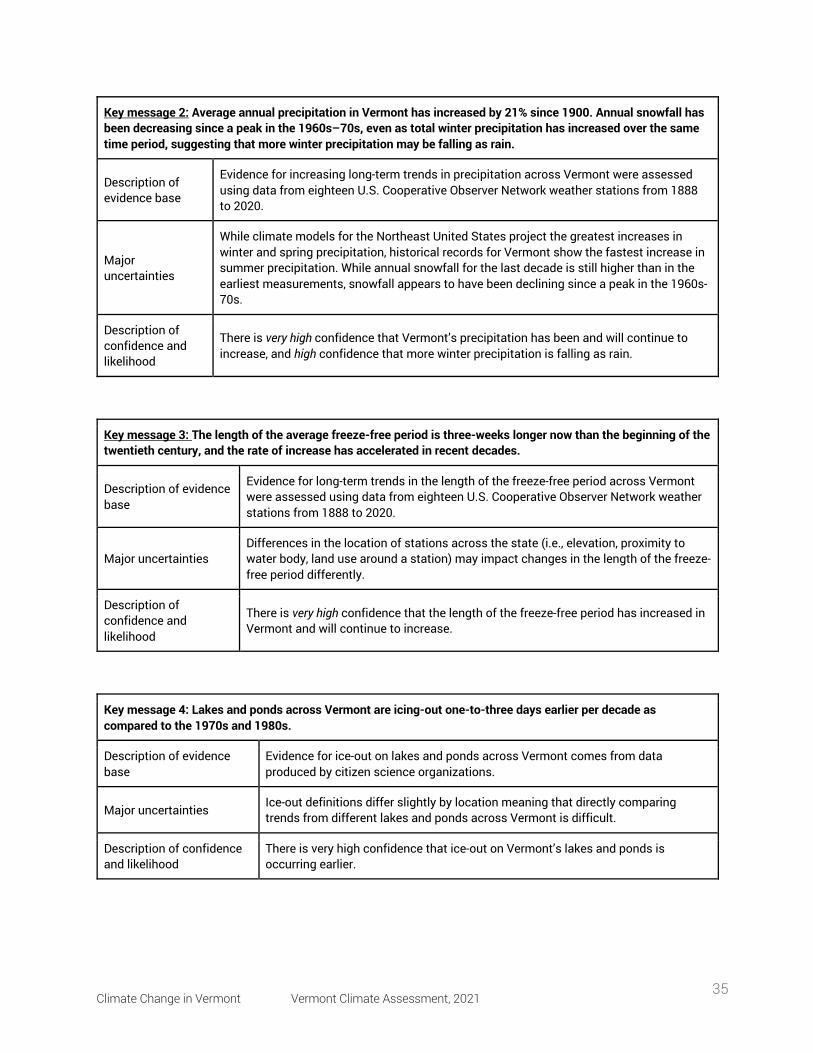
Climate Change in Vermont Vermont Climate Assessment, 2021 35
Key message 2: Average annual precipitation in Vermont has increased by 21% since 1900. Annual snowfall has been decreasing since a peak in the 1960s–70s, even as total winter precipitation has increased over the same time period, suggesting that more winter precipitation may be falling as rain.
Description of evidence base
Evidence for increasing long-term trends in precipitation across Vermont were assessed using data from eighteen U.S. Cooperative Observer Network weather stations from 1888 to 2020.
Major uncertainties
While climate models for the Northeast United States project the greatest increases in winter and spring precipitation, historical records for Vermont show the fastest increase in summer precipitation. While annual snowfall for the last decade is still higher than in the earliest measurements, snowfall appears to have been declining since a peak in the 1960s-70s.
Description of confidence and likelihood
There is very high confidence that Vermont’s precipitation has been and will continue to increase, and high confidence that more winter precipitation is falling as rain.
Key message 3: The length of the average freeze-free period is three-weeks longer now than the beginning of the twentieth century, and the rate of increase has accelerated in recent decades.
Description of evidence base
Evidence for long-term trends in the length of the freeze-free period across Vermont were assessed using data from eighteen U.S. Cooperative Observer Network weather stations from 1888 to 2020.
Major uncertainties Differences in the location of stations across the state (i.e., elevation, proximity to water body, land use around a station) may impact changes in the length of the freeze-free period differently.
Description of confidence and likelihood
There is very high confidence that the length of the freeze-free period has increased in Vermont and will continue to increase.
Key message 4: Lakes and ponds across Vermont are icing-out one-to-three days earlier per decade as compared to the 1970s and 1980s.
Description of evidence base
Evidence for ice-out on lakes and ponds across Vermont comes from data produced by citizen science organizations.
Major uncertainties Ice-out definitions differ slightly by location meaning that directly comparing trends from different lakes and ponds across Vermont is difficult.
Description of confidence and likelihood
There is very high confidence that ice-out on Vermont’s lakes and ponds is occurring earlier.
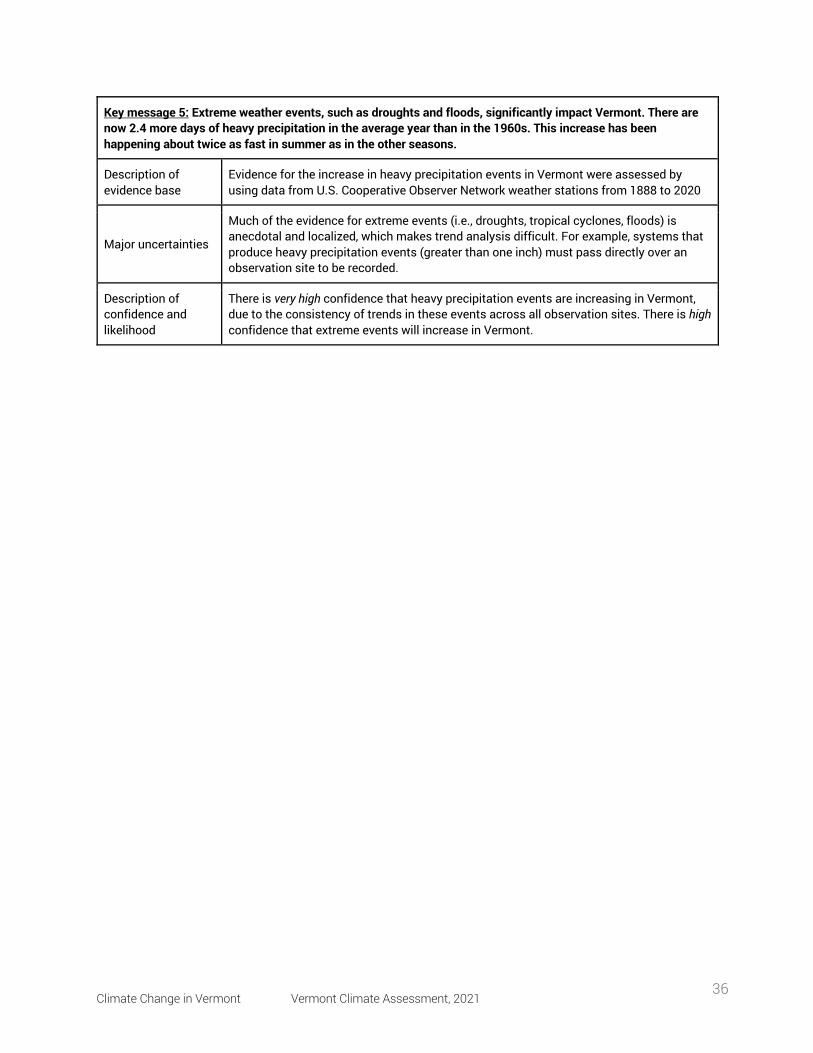
Climate Change in Vermont Vermont Climate Assessment, 2021 36
Key message 5: Extreme weather events, such as droughts and floods, significantly impact Vermont. There are now 2.4 more days of heavy precipitation in the average year than in the 1960s. This increase has been happening about twice as fast in summer as in the other seasons.
Description of evidence base
Evidence for the increase in heavy precipitation events in Vermont were assessed by using data from U.S. Cooperative Observer Network weather stations from 1888 to 2020
Major uncertainties Much of the evidence for extreme events (i.e., droughts, tropical cyclones, floods) is anecdotal and localized, which makes trend analysis difficult. For example, systems that produce heavy precipitation events (greater than one inch) must pass directly over an observation site to be recorded.
Description of confidence and likelihood
There is very high confidence that heavy precipitation events are increasing in Vermont, due to the consistency of trends in these events across all observation sites. There is high confidence that extreme events will increase in Vermont.
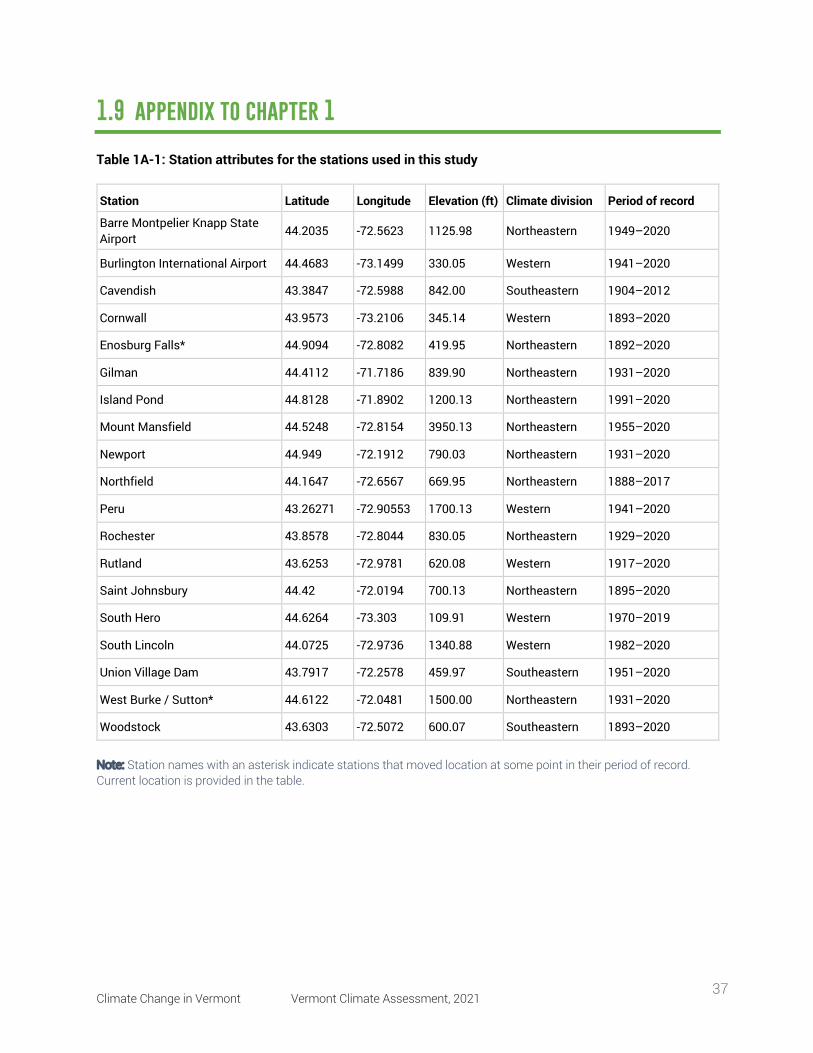
Climate Change in Vermont Vermont Climate Assessment, 2021 37
1.9 appendix to chapter 1
Table 1A-1: Station attributes for the stations used in this study
Station Latitude Longitude Elevation (ft) Climate division Period of record
Barre Montpelier Knapp State Airport 44.2035 -72.5623 1125.98 Northeastern 1949–2020
Burlington International Airport 44.4683 -73.1499 330.05 Western 1941–2020
Cavendish 43.3847 -72.5988 842.00 Southeastern 1904–2012
Cornwall 43.9573 -73.2106 345.14 Western 1893–2020
Enosburg Falls* 44.9094 -72.8082 419.95 Northeastern 1892–2020
Gilman 44.4112 -71.7186 839.90 Northeastern 1931–2020
Island Pond 44.8128 -71.8902 1200.13 Northeastern 1991–2020
Mount Mansfield 44.5248 -72.8154 3950.13 Northeastern 1955–2020
Newport 44.949 -72.1912 790.03 Northeastern 1931–2020
Northfield 44.1647 -72.6567 669.95 Northeastern 1888–2017
Peru 43.26271 -72.90553 1700.13 Western 1941–2020
Rochester 43.8578 -72.8044 830.05 Northeastern 1929–2020
Rutland 43.6253 -72.9781 620.08 Western 1917–2020
Saint Johnsbury 44.42 -72.0194 700.13 Northeastern 1895–2020
South Hero 44.6264 -73.303 109.91 Western 1970–2019
South Lincoln 44.0725 -72.9736 1340.88 Western 1982–2020
Union Village Dam 43.7917 -72.2578 459.97 Southeastern 1951–2020
West Burke / Sutton* 44.6122 -72.0481 1500.00 Northeastern 1931–2020
Woodstock 43.6303 -72.5072 600.07 Southeastern 1893–2020
Note: Station names with an asterisk indicate stations that moved location at some point in their period of record. Current location is provided in the table.
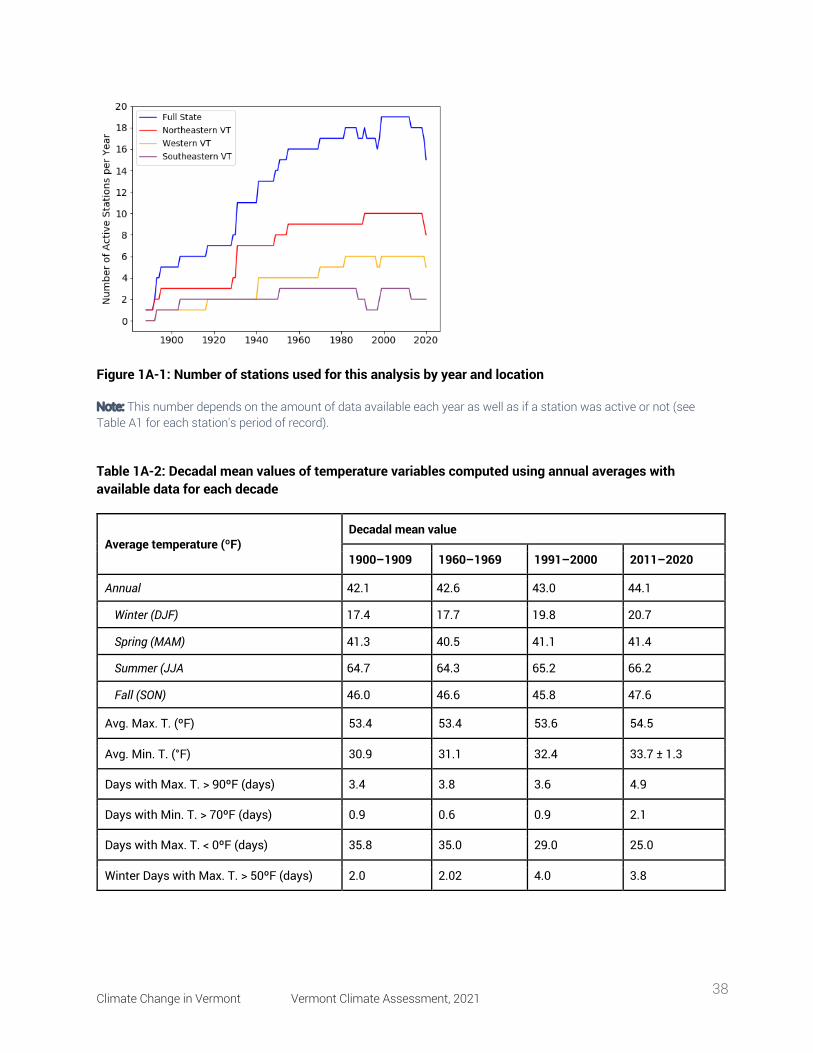
Climate Change in Vermont Vermont Climate Assessment, 2021 38
Figure 1A-1: Number of stations used for this analysis by year and location
Note: This number depends on the amount of data available each year as well as if a station was active or not (see Table A1 for each station's period of record).
Table 1A-2: Decadal mean values of temperature variables computed using annual averages with available data for each decade
Average temperature (ºF) Decadal mean value
1900–1909 1960–1969 1991–2000 2011–2020
Annual 42.1 42.6 43.0 44.1
Winter (DJF) 17.4 17.7 19.8 20.7
Spring (MAM) 41.3 40.5 41.1 41.4
Summer (JJA 64.7 64.3 65.2 66.2
Fall (SON) 46.0 46.6 45.8 47.6
Avg. Max. T. (ºF) 53.4 53.4 53.6 54.5
Avg. Min. T. (°F) 30.9 31.1 32.4 33.7 ± 1.3
Days with Max. T. > 90ºF (days) 3.4 3.8 3.6 4.9
Days with Min. T. > 70ºF (days) 0.9 0.6 0.9 2.1
Days with Max. T. < 0ºF (days) 35.8 35.0 29.0 25.0
Winter Days with Max. T. > 50ºF (days) 2.0 2.02 4.0 3.8
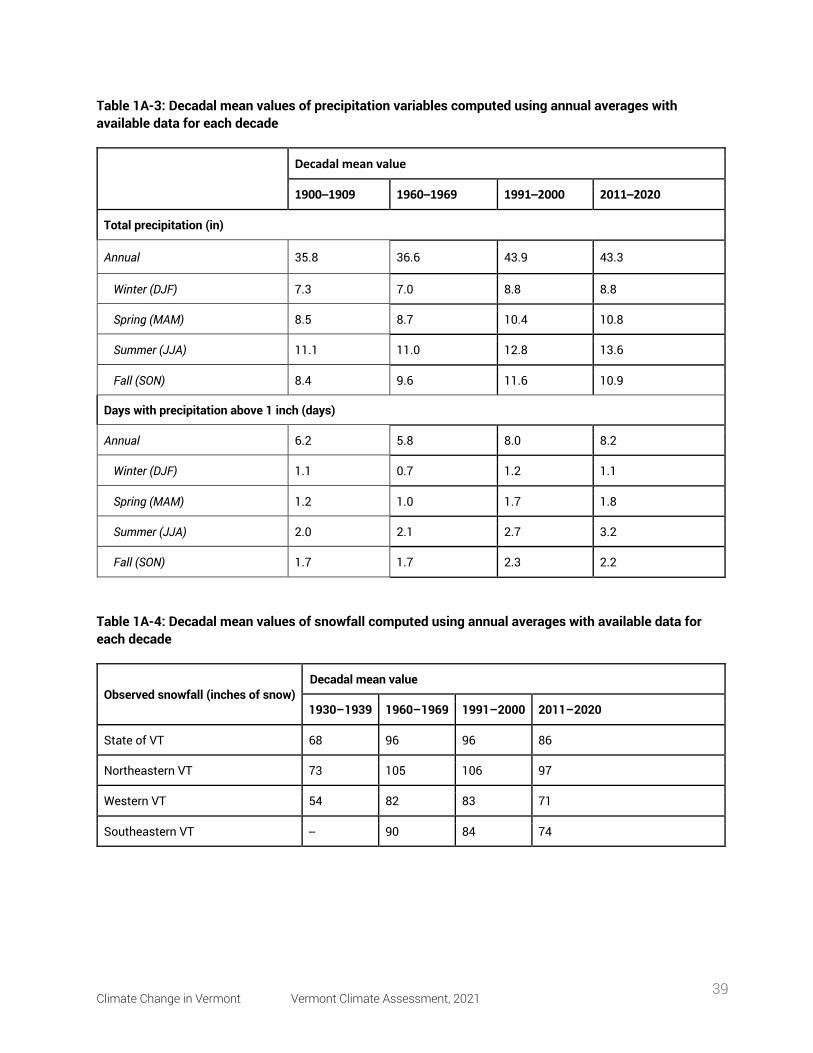
Climate Change in Vermont Vermont Climate Assessment, 2021 39
Table 1A-3: Decadal mean values of precipitation variables computed using annual averages with available data for each decade
Decadal mean value
1900–1909 1960–1969 1991–2000 2011–2020
Total precipitation (in)
Annual 35.8 36.6 43.9 43.3
Winter (DJF) 7.3 7.0 8.8 8.8
Spring (MAM) 8.5 8.7 10.4 10.8
Summer (JJA) 11.1 11.0 12.8 13.6
Fall (SON) 8.4 9.6 11.6 10.9
Days with precipitation above 1 inch (days)
Annual 6.2 5.8 8.0 8.2
Winter (DJF) 1.1 0.7 1.2 1.1
Spring (MAM) 1.2 1.0 1.7 1.8
Summer (JJA) 2.0 2.1 2.7 3.2
Fall (SON) 1.7 1.7 2.3 2.2
Table 1A-4: Decadal mean values of snowfall computed using annual averages with available data for each decade
Observed snowfall (inches of snow) Decadal mean value
1930–1939 1960–1969 1991–2000 2011–2020
State of VT 68 96 96 86
Northeastern VT 73 105 106 97
Western VT 54 82 83 71
Southeastern VT -- 90 84 74
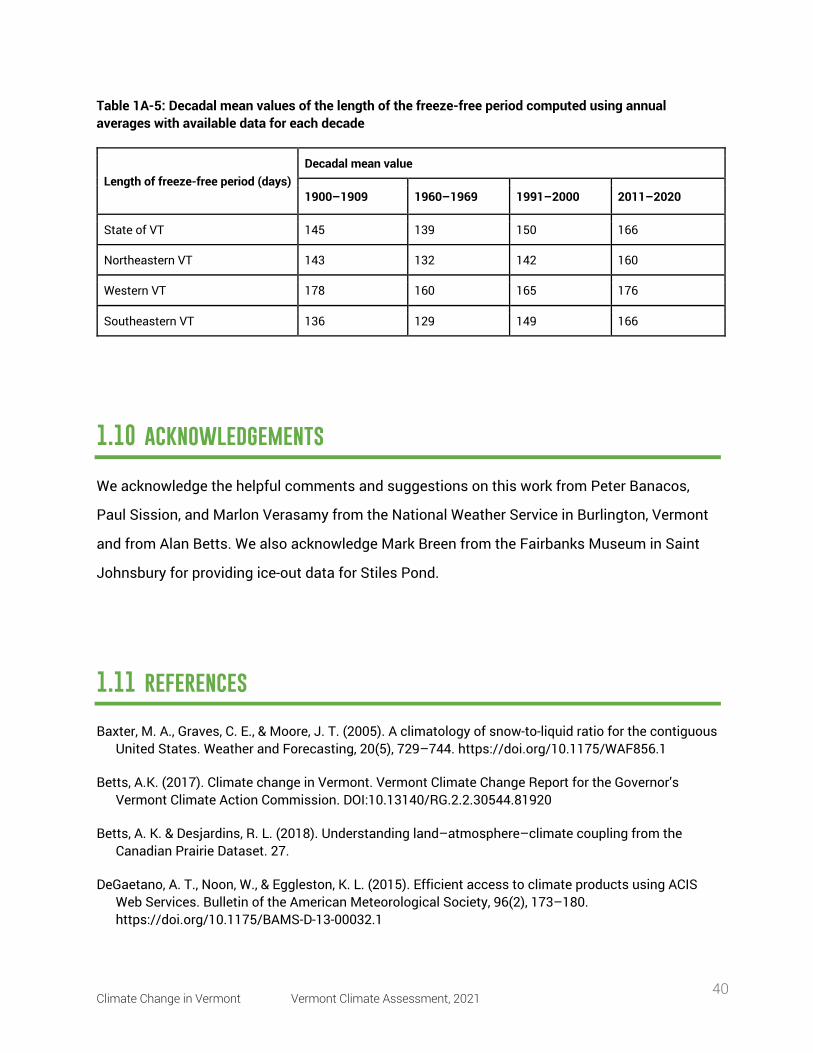
Climate Change in Vermont Vermont Climate Assessment, 2021 40
Table 1A-5: Decadal mean values of the length of the freeze-free period computed using annual averages with available data for each decade
Length of freeze-free period (days) Decadal mean value
1900–1909 1960–1969 1991–2000 2011–2020
State of VT 145 139 150 166
Northeastern VT 143 132 142 160
Western VT 178 160 165 176
Southeastern VT 136 129 149 166
1.10 acknowledgements
We acknowledge the helpful comments and suggestions on this work from Peter Banacos,
Paul Sission, and Marlon Verasamy from the National Weather Service in Burlington, Vermont
and from Alan Betts. We also acknowledge Mark Breen from the Fairbanks Museum in Saint
Johnsbury for providing ice-out data for Stiles Pond.
1.11 references
Baxter, M. A., Graves, C. E., & Moore, J. T. (2005). A climatology of snow-to-liquid ratio for the contiguous United States. Weather and Forecasting, 20(5), 729–744. https://doi.org/10.1175/WAF856.1
Betts, A.K. (2017). Climate change in Vermont. Vermont Climate Change Report for the Governor’s Vermont Climate Action Commission. DOI:10.13140/RG.2.2.30544.81920
Betts, A. K. & Desjardins, R. L. (2018). Understanding land–atmosphere–climate coupling from the Canadian Prairie Dataset. 27.
DeGaetano, A. T., Noon, W., & Eggleston, K. L. (2015). Efficient access to climate products using ACIS Web Services. Bulletin of the American Meteorological Society, 96(2), 173–180. https://doi.org/10.1175/BAMS-D-13-00032.1
Climate Change in Vermont Vermont Climate Assessment, 2021 41
Drought in Vermont from 2000-Present. (n.d.). National Integrated Drought Information System. Retrieved March 12, 2021, from https://www.drought.gov/states/vermont#:~:text=Drought%20in%20Vermont&text=The%20U.S.%20Drought%20Monitor%20started,affected%2029.39%25%20of%20Vermont%20land
Dupigny-Giroux, L. (2001). Towards Characterizing and Planning for Drought in Vermont-Part I: A Climatological Perspective. JAWRA Journal of the American Water Resources Association, 37(3), 505–525. https://doi.org/10.1111/j.1752-1688.2001.tb05489.x
Dupigny-Giroux, L.A. (2002, February 21). The 2001-2002 Drought in Vermont. The 2001-2002 Drought in Vermont. http://www.uvm.edu/~vtstclim/drought_vermont.html
Dupigny-Giroux, L.-A., Mecray, E., Lemcke-Stampone, M., Hodgkins, G. A., Lentz, E. E., Mills, K. E., Lane, E. D., Miller, R., Hollinger, D., Solecki, W. D., Wellenius, G. A., Sheffield, P. E., MacDonald, A. B., & Caldwell, C. (2018). Chapter 18: Northeast. Impacts, Risks, and Adaptation in the United States: The Fourth National Climate Assessment, Volume II. U.S. Global Change Research Program. https://doi.org/10.7930/NCA4.2018.CH18
Guttman, N. B., & Quayle, R. G. (1995). A Historical Perspective of U.S. Climate Divisions. Bulletin of the American Meteorological Society, 12.
Hastings, M., & Taber, B. (2019, December 12). The Halloween 2019 Significant Flooding and High Wind Event. National Weather Service. https://www.weather.gov/btv/The-Halloween-2019-Significant-Flooding-and-High-Wind-Event
Hayhoe, K., Wuebbles, D. J., Easterling, D. R., Fahey, D. W., Doherty, S., Kossin, J. P., Sweet, W. V., Vose, R. S., & Wehner, M. F. (2018). Chapter 2: Our Changing Climate. Impacts, Risks, and Adaptation in the United States: The Fourth National Climate Assessment, Volume II. U.S. Global Change Research Program. https://doi.org/10.7930/NCA4.2018.CH2
Hussain, Md., & Mahmud, I. (2019). pyMannKendall: A python package for non parametric Mann Kendall family of trend tests. Journal of Open Source Software, 4(39), 1556. https://doi.org/10.21105/joss.01556
IPCC. (2014). Climate Change 2014: Synthesis Report. Contribution of Working Groups I, II and II to the Fifth Assessment Report of the Intergovernmental Panel on Climate Change (p. 151). IPCC. https://ar5-syr.ipcc.ch/topic_futurechanges.php
Joe’s Pond Association. (2021). Joe’s Pond Ice Out. Joe’s Pond Vermont. https://www.joespondvermont.com/ice-out.html
Kendall, M. G. (1975). Rank correlation methods. Oxford University Press.
Lake Iroquois Association. (2021). Ice Out on Lake Iroquois. Lake Iroquois Association. https://www.lakeiroquois.org/enjoying/ice-out-dates
Lake Rescue Association. (2020). Ice Out. Lake Rescure Association. https://lakerescue.org/ice-out/
Climate Change in Vermont Vermont Climate Assessment, 2021 42
Lawrimore, J. H., Ray, R., Applequist, S., Korzeniewski, B., & Menne, M. J. (2016). Global Summary of the Month (GSOM) Version 1. NOAA National Centers for Environmental Information. https://doi.org/10.7289/V5QV3JJ5
Lombard, P. J., Barclay, J. R., & McCarthy, D.-A. E. (2021). 2020 Drought in New England (ver. 1.1, February 2021). U.S. Geologic Survey. https://pubs.er.usgs.gov/publication/ofr20201148
Mann, H. B. (1945). Nonparametric Tests Against Trend. Econometrica, 13(3), 245. https://doi.org/10.2307/1907187
National Centers for Environmental Information. (2021). U.S. Climate Normals. https://www.ncei.noaa.gov/products/us-climate-normals
Preliminary Hurricane/Tropical Storm Irene Weather Summary for the North Country. (n.d.). National Weather Service Forecast Office, Burlington, VT. Retrieved March 12, 2021, from https://www.weather.gov/media/btv/events/Irene2011/Irene2011.pdf
President signs disaster declaration for Halloween storm. (2020, January 17). Vermontbiz. https://vermontbiz.com/news/2020/january/17/president-signs-disaster-declaration-halloween-storm
Runkle, J., Kunkel, K. E., Champion, S., & Dupigny-Giroux, L. (2017). Vermont State Climate Summary. NOAA Technical Report NESDIS 149-VT. https://statesummaries.ncics.org/chapter/vt/#:~:text=Average%20annual%20precipitation%20has%20increased%20nearly%206%20inches%20since%20the%201960s.&text=Below%20average%20annual%20precipitation%20occurred,of%2042.4%20inches%20per%20year
Svoboda, M., LeComte, D., Hayes, M., Heim, R., Gleason, K., Angel, J., Rippey, B., Tinker, R., Palecki, M., Stooksbury, D., Miskus, D., & Stephens, S. (2002). The drough monitor. Bulletin of the American Meteorological Society, 83(8), 1181–1190. https://doi.org/10.1175/1520-0477-83.8.1181
The Widespread Ice Jam Flooding and Wintry Mixed Precipitation Event on January 12-13, 2018. (n.d.). National Weather Service Forecast Office, Burlington, VT. Retrieved March 12, 2021, from https://www.weather.gov/media/btv/events/12-13Jan2018.pdf
Top 5 Weather Events of 2011 across the North Country. (n.d.). National Weather Service Forecast Office, Burlington, VT. Retrieved March 12, 2021, from https://www.weather.gov/media/btv/events/Top5_2011.pdf
Town of Elmore. (2021). Lake Elmore Iceout Dates. Town of Elmore, Vermont. https://www.elmorevt.org/community/iceout
Town of Fairlee. (2021). Ice Out on Lake Morey. Fairlee, Vermont The Town Under the Cliff. https://www.fairleevt.org/2016/03/ice-out-on-lake-morey-1977-2016/
Climate Change in Vermont Vermont Climate Assessment, 2021 43
USGCRP. (2018). Impacts, Risks, and Adaptation in the United States: Fourth National Climate Assessment, Volume II: [Reidmiller, D.R., C.W. Avery, D.R. Easterling, K.E. Kunkel, K.L.M. Lewis, T.K. Maycock, and B.C. Stewart (eds.)]. U.S. Global Change Research Program, Washington, DC, USA, 1515 pp. doi: 10.7930/NCA4.2018.
xmACIS. (2021, January 24). Applied Climate Information System NOAA Regional Climate Centers. http://xmacis.rcc-acis.org/
Climate Change in Forests Vermont Climate Assessment, 2021 44
2 climate change in forests
Recommended Citation for Chapter Wikle, J., Higgins, H., Clark, P., Cook, D., Dutton, D., Garton, J., Kosiba, A., Schadler, E., 2021. Climate Change in Forests. In Galford, G.L., Faulkner, J. et al. (Eds), The Vermont Climate Assessment 2021. Burlington, Vermont: Gund Institute for Environment at the University of Vermont. On the web: https://vtclimate.org
Jessica Wikle (co-lead) Rubenstein School of Environment and Natural Resources, University of Vermont Gund Institute for Environment
Hanusia Higgins (co-lead) Rubenstein School of Environment and Natural Resources, University of Vermont
Deniz Dutton Rubenstein School of Environment and Natural Resources, University of Vermont Gund Institute for Environment
Elise Schadler Department of Forests, Parks, & Recreation, Vermont Agency of Natural Resources; Wrote Urban Forests and Climate section
Alexandra Kosiba Department of Forests, Parks, & Recreation, Vermont Agency of Natural Resources; Wrote Urban Forests and Climate section
Joanne Garton Department of Forests, Parks, & Recreation, Vermont Agency of Natural Resources; Wrote Urban Forests and Climate section
Peter Clark Rubenstein School of Environment and Natural Resources, University of Vermont; Wrote boxes 2.3 and 2.6
Dani Cook Forest Ecosystem Monitoring Cooperative, University of Vermont; Wrote Infrastructure Costs section
Climate Change in Forests Vermont Climate Assessment, 2021 45
2.1 key messages
1. Climate change is beginning to shift growing conditions for forests in Vermont, with
greater changes expected to come, becoming more favorable for southern-adapted tree
species and less favorable for currently adapted tree species. Species that will benefit
from this change include northern red oak, shagbark hickory, and black cherry, while
species including sugar maple, balsam fir, yellow birch, and black ash will be negatively
impacted. While growing conditions will be significantly different by 2100, actual
change in forest makeup will follow a delay as older trees die and are replaced by
young ones.
2. Forest productivity, an important indicator of forest health and carbon storage, is
amplified by a longer growing season and greater atmospheric carbon dioxide (CO2)
and is expected to increase in Vermont in the next 50–100 years. However, productivity
will be highly variable by species and will likely begin to decrease by the end of the
century as high summer temperatures, drought, and soil nutrient loss outweigh
benefits.
3. Climate change is expected to continue exacerbating the threats that invasive plants,
insects, and diseases already pose to the health of Vermont’s forests. These threats
are compounded by other climate-related factors, such as worsening storms and
increasingly irregular precipitation.
4. Warmer winters and wetter summers already limit active forest management by
shortening the time frames that forest operations can take place. These negative
climate impacts are projected to strengthen in the future, potentially leading to
cascading negative effects on rural economies, forest product markets, and
management for forest health and climate adaptation.
5. Land use change and parcelization, most commonly conversion of forests to
residential or commercial use, is a persistent trend in Vermont, a major threat to forest
health and productivity, and a contributor to climate change.
6. As climate change impacts forest ecosystem function, there is a need for management
to increase forest adaptive capacity. Current methods to achieve increased adaptive
Climate Change in Forests Vermont Climate Assessment, 2021 46
capacity at the ecosystem level (retaining ecosystem function despite threats to
individual tree species or forest types) include increasing forest structural complexity
and enhancing compositional and functional diversity and redundancy.
7. Climate change impacts will be more severe for urban trees because of the effects of
the built environment on temperature and water cycling, as well as additional stressors
associated with urbanized areas like soil compaction, soil fertility, and pollution.
8. Urban trees will be increasingly important to humans because of the services they
provide. While urbanized areas in Vermont make up less than 2% of the state’s land
area, they are home to nearly 243,000 people, 39% of the Vermont population. Because
of the high population density and lower tree cover in urbanized areas, per-tree
ecosystem services can be higher than in a forest setting. In addition to critical climate
and ecosystem benefits provided by trees everywhere, urban trees mitigate the urban
heat island effect through cooling and shading and reduce stormwater runoff from
extreme rainfall events.
2.2 forest structure and composition
To understand the relationship of Vermont’s forests to climate change, it is important to
examine the current state of the forests’ structure and composition. Forest structure can be
broadly defined by elements such as trees and downed logs and the spatial arrangement of
these elements (Franklin et al., 2002). Forest composition describes the number and
distribution of species present in a forest. Both influence forest health, function, and resilience
to climate change. Vermont’s forest composition is projected to change as climate conditions
shift, with warmer-adapted species expanding range across the region and colder-adapted
species decreasing range to higher altitudes and latitudes (Iverson et al., 2019). Understanding
how the existing forest will respond to climate change is essential to managing it and will
impact objectives including conservation, recreation, and aesthetic benefits.
Climate Change in Forests Vermont Climate Assessment, 2021 47
2.2.1 Historic and Current Forest Structure in Vermont Vermont’s forests have undergone several major shifts before developing into the largely
northern hardwood-dominated forests found across much of the state today (Figure 2-1). The
most recent drastic change was precipitated by European colonialism. Prior to European
settlement, Vermont’s forests were characterized by maple species and beech, with an
increasing spruce-fir component further north (Cogbill et al., 2002). Although Indigenous
communities utilized the forest, the dominant disturbances were small-scale weather events
such as wind and ice storms (Seymour, 2005). For several centuries, clearing land clearing for
agriculture, building, and logging increased in Vermont until only 20% of the state remained
forested in the late 1800s (Jeon et al., 2014).
During the 1900s, as agricultural production declined in Vermont in favor of more profitable
lands elsewhere, forest cover reversed course and began increasing. This agricultural
abandonment led to secondary forests (forests growing on previously cleared land) with an
even-aged dominance of 80–100 years for most trees, minimal old growth, and some younger
age classes arising (Figure 2-2). More recently, younger age classes face establishment
challenges including deer browse and less-than-optimal regeneration conditions due to
invasive species, as discussed in the Disturbance section.
Currently, forests cover 74% of Vermont, a slight decline from 78% near the turn of the twenty-
first century. About 80% of Vermont’s forests are owned by families and individual landowners,
the remaining is mostly publicly owned, except for a small percent under corporate ownership
(USDA Forest Service, 2020). The most prevalent forest type in Vermont is northern hardwood,
and the most prevalent overstory species is sugar maple (Acer saccharum). As climate change
shifts many species’ habitability ranges and intensifies disturbances, Vermont’s forests may
look as different 100 years from now as they did 100 years ago.
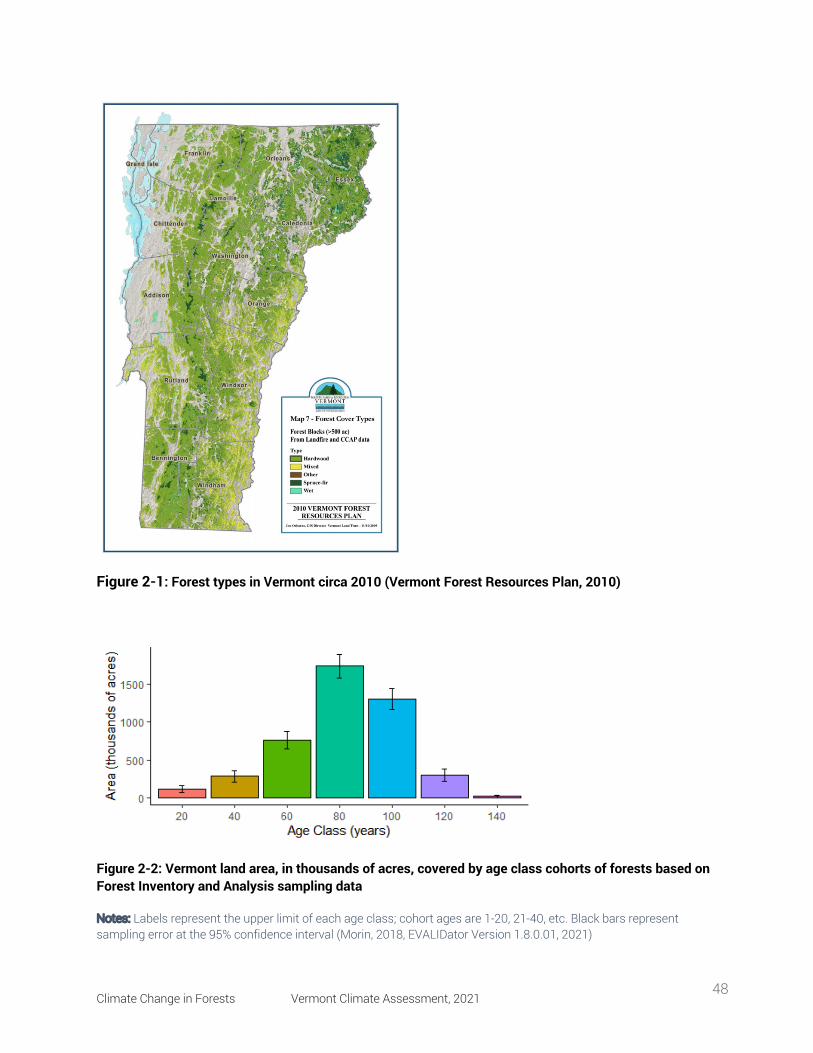
Climate Change in Forests Vermont Climate Assessment, 2021 48
Figure 2-1: Forest types in Vermont circa 2010 (Vermont Forest Resources Plan, 2010)
Figure 2-2: Vermont land area, in thousands of acres, covered by age class cohorts of forests based on Forest Inventory and Analysis sampling data
Notes: Labels represent the upper limit of each age class; cohort ages are 1-20, 21-40, etc. Black bars represent sampling error at the 95% confidence interval (Morin, 2018, EVALIDator Version 1.8.0.01, 2021)
Climate Change in Forests Vermont Climate Assessment, 2021 49
Forest resilience to climate change is tied to structural, compositional, and functional
complexity at both the stand (local) and landscape scale. Within a forest stand, structural
complexity relates to the arrangement of mixed elements, such as live and dead trees and
downed logs; a structurally complex forest has a varied arrangement of these elements
(Figure 2-3A). Landscape-scale structural heterogeneity (diversity of arrangement of structure
types, including canopy gaps or groups of old trees) creates a variety of recovery pathways for
forests and thus increases forests’ ability to bounce back after a disturbance (Figure 2-3B).
Compositional complexity and functional complexity are highly related. A compositionally
complex forest has different species present in varying proportions. A functionally complex
forest has trees that encompass a variety of functional traits as well as redundancy of these
traits across the tree species present. Functional traits are related to plant colonization,
survival, growth, and mortality, and they are strongly linked to ecological function (Violle et al.,
2007). While species composition can provide information about diversity, it cannot provide
specific information about biological function, ecological services, or occupation of ecological
niches, all of which are valuable to understand ecosystem function (Messier et al., 2019).
Diverse forests are resilient to a wider range of threats: for example, if a disease affects only a
single tree species or a specific age class of trees, forests with greater variety in species or
age classes will be less impacted by this disturbance than a simpler forest. Managing forests
for structural, compositional, and functional complexity has multiple benefits, including
enhanced habitat value, greater adaptive capacity, and carbon storage (D’Amato and Palik,
2020; Keeton, 2006). (See also forest adaptation in this chapter.)
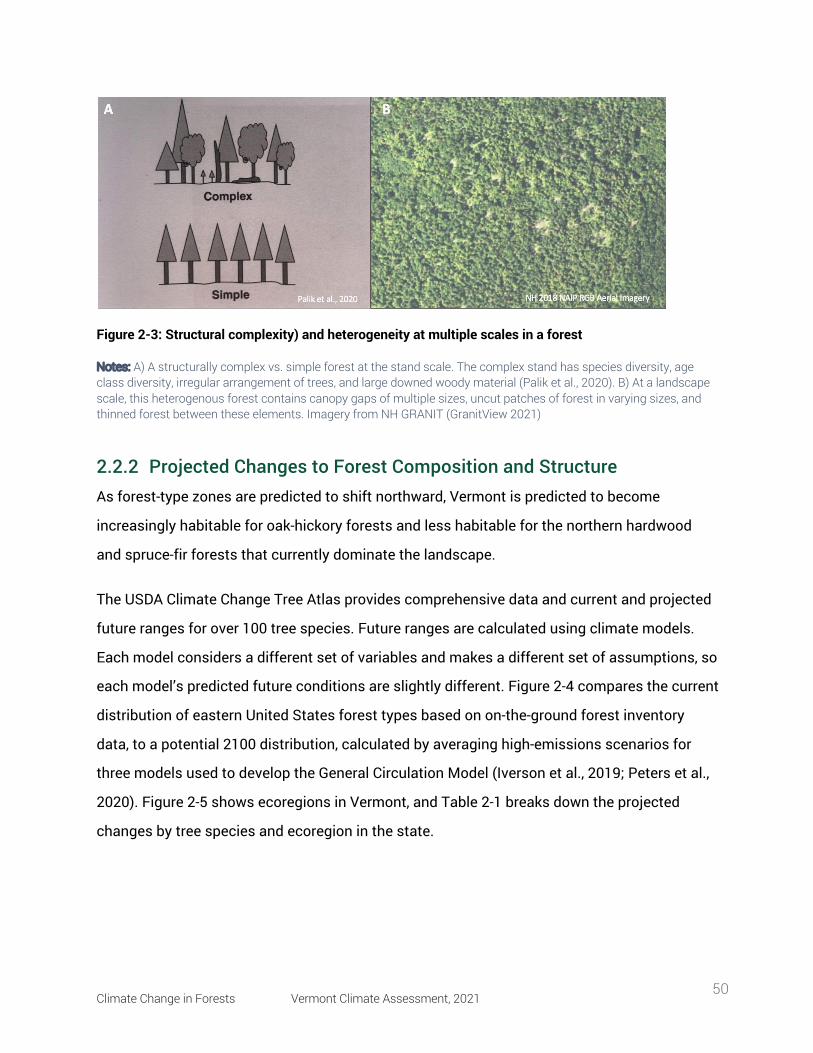
Climate Change in Forests Vermont Climate Assessment, 2021 50
Figure 2-3: Structural complexity) and heterogeneity at multiple scales in a forest
Notes: A) A structurally complex vs. simple forest at the stand scale. The complex stand has species diversity, age class diversity, irregular arrangement of trees, and large downed woody material (Palik et al., 2020). B) At a landscape scale, this heterogenous forest contains canopy gaps of multiple sizes, uncut patches of forest in varying sizes, and thinned forest between these elements. Imagery from NH GRANIT (GranitView 2021)
2.2.2 Projected Changes to Forest Composition and Structure As forest-type zones are predicted to shift northward, Vermont is predicted to become
increasingly habitable for oak-hickory forests and less habitable for the northern hardwood
and spruce-fir forests that currently dominate the landscape.
The USDA Climate Change Tree Atlas provides comprehensive data and current and projected
future ranges for over 100 tree species. Future ranges are calculated using climate models.
Each model considers a different set of variables and makes a different set of assumptions, so
each model’s predicted future conditions are slightly different. Figure 2-4 compares the current
distribution of eastern United States forest types based on on-the-ground forest inventory
data, to a potential 2100 distribution, calculated by averaging high-emissions scenarios for
three models used to develop the General Circulation Model (Iverson et al., 2019; Peters et al.,
2020). Figure 2-5 shows ecoregions in Vermont, and Table 2-1 breaks down the projected
changes by tree species and ecoregion in the state.
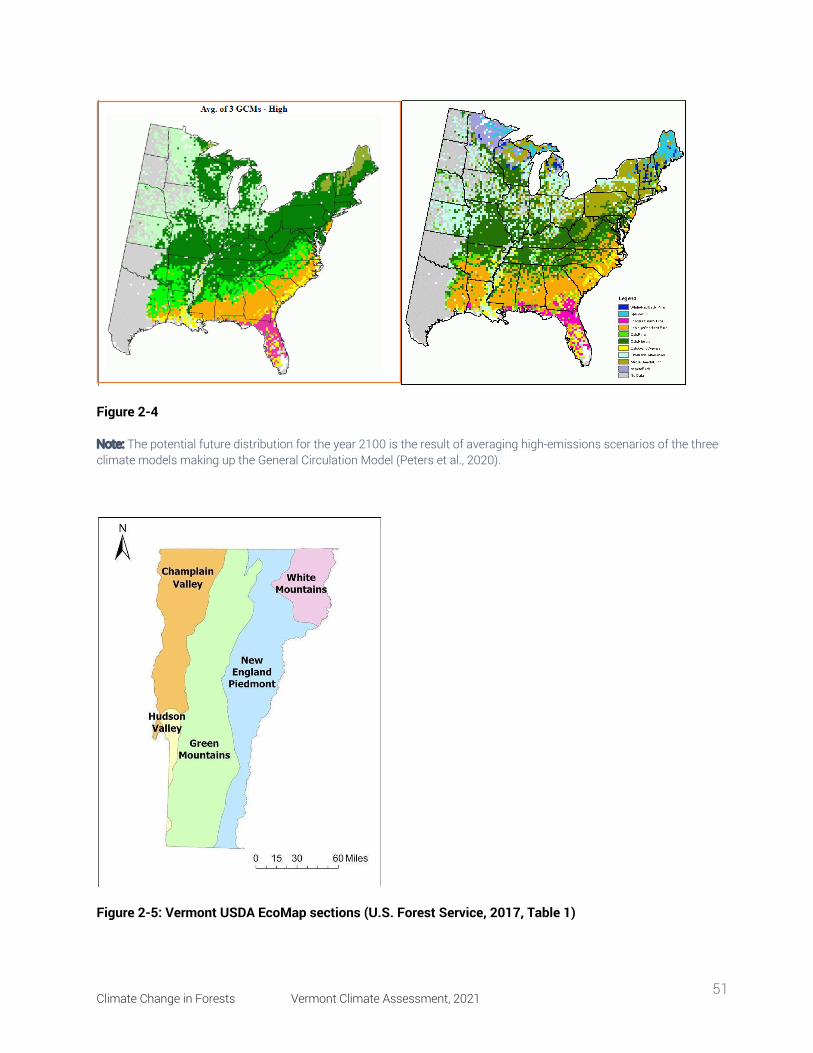
Climate Change in Forests Vermont Climate Assessment, 2021 51
Figure 2-4
Note: The potential future distribution for the year 2100 is the result of averaging high-emissions scenarios of the three climate models making up the General Circulation Model (Peters et al., 2020).
Figure 2-5: Vermont USDA EcoMap sections (U.S. Forest Service, 2017, Table 1)
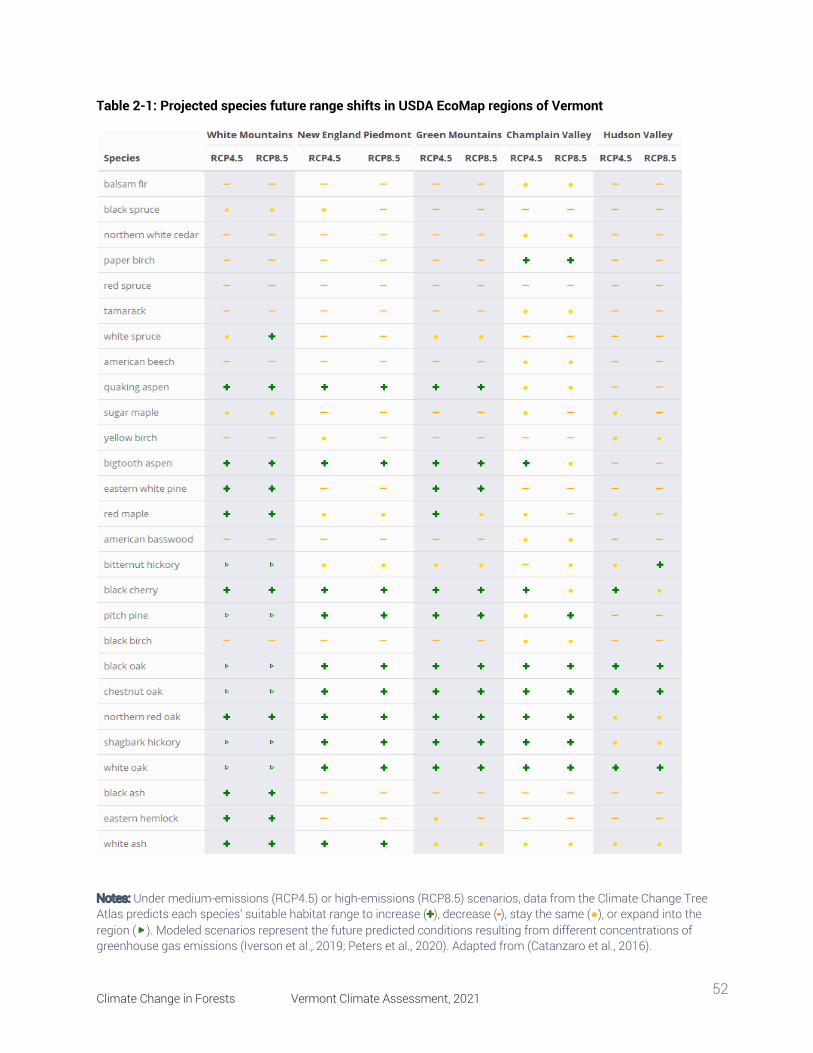
Climate Change in Forests Vermont Climate Assessment, 2021 52
Table 2-1: Projected species future range shifts in USDA EcoMap regions of Vermont
Notes: Under medium-emissions (RCP4.5) or high-emissions (RCP8.5) scenarios, data from the Climate Change Tree Atlas predicts each species’ suitable habitat range to increase (+), decrease (-), stay the same (●), or expand into the region (▹). Modeled scenarios represent the future predicted conditions resulting from different concentrations of greenhouse gas emissions (Iverson et al., 2019; Peters et al., 2020). Adapted from (Catanzaro et al., 2016).
Climate Change in Forests Vermont Climate Assessment, 2021 53
Box 2.1: Vermont Sugar Maple Sugar maple is Vermont’s most common tree species. In addition to the usual tree
benefits of shade and wood, its sweet sap plays a big role in the state. Maple syrup
production is a major industry in Vermont, representing $54 million in revenue for
sugar makers in 2019 (Vermont Agency of Agriculture, Food & Markets 2019 Legislative
Summary, 2020). Because sap collection requires specific weather conditions of cold
spring nights and above-freezing days, the changing climate may significantly impact
maple syrup production in Vermont.
Future climate regime models predict that the habitable area for sugar maple will
decrease overall, though some new habitat refuges for sugar maples will become
available (Rapp et al., 2019). Climate change may also impact the forest tent
caterpillar (FTC), a native insect that eats the leaves of sugar maple and other trees
in Vermont. FTC outbreaks occur in periodic cycles, most recently in 2016-2018
(Vermont Department of Forests, Parks & Recreation, 2018). Shifting temperatures
are likely to affect FTC survival and shift the synchrony between egg hatching and
bud break, though it is not yet clear whether the net effect for sugar maples will be
positive or negative (Uelmen et al., 2016). These hungry caterpillars can compound
with climate change factors—such as earlier leaf-out dates, late spring frosts, and
drought—to increase stress on sugar maples and make them less suitable for
tapping (Oswald et al., 2018). In other words, trees already stressed by insect attacks
are more vulnerable to the effects of unusual temperature and precipitation changes.
Figure 2-6 shows the variance of average leaf-out dates of sugar maples over time;
this is just one metric showing how unusual temperature and precipitation changes
are influencing sugar maples.
The dates of highest sap flow are shrinking overall and shifting earlier in the season,
requiring maple producers to change their schedules to keep up with current levels of
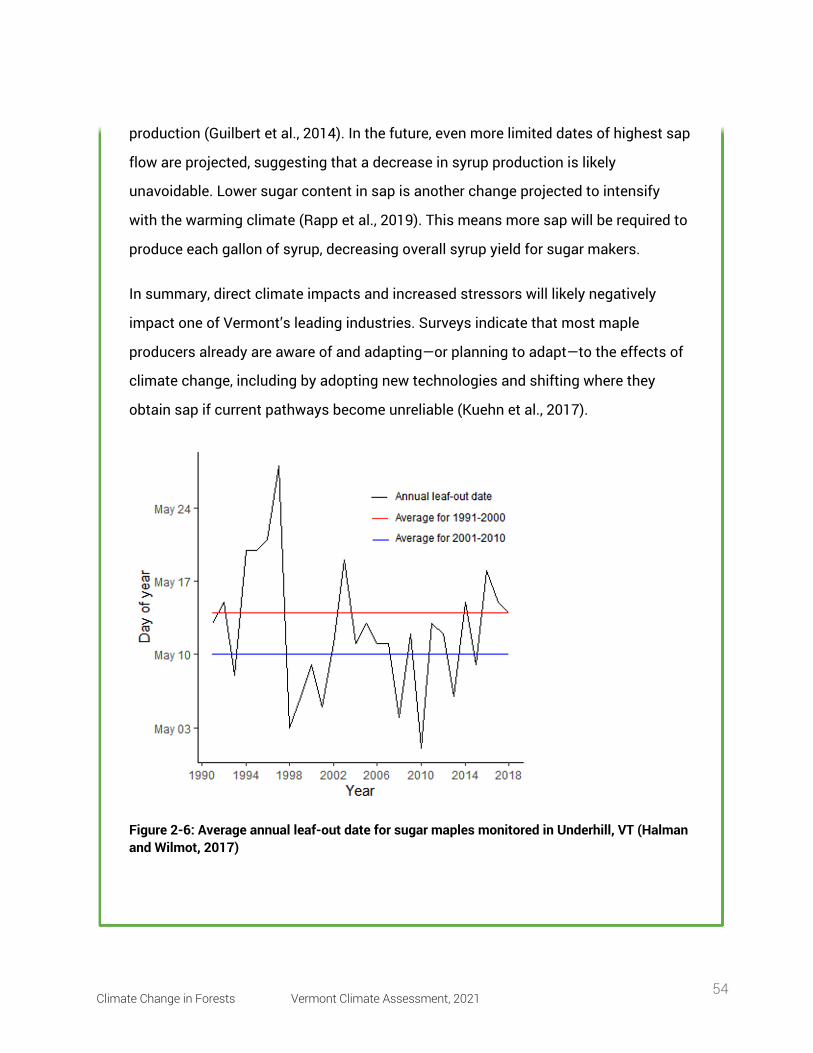
Climate Change in Forests Vermont Climate Assessment, 2021 54
production (Guilbert et al., 2014). In the future, even more limited dates of highest sap
flow are projected, suggesting that a decrease in syrup production is likely
unavoidable. Lower sugar content in sap is another change projected to intensify
with the warming climate (Rapp et al., 2019). This means more sap will be required to
produce each gallon of syrup, decreasing overall syrup yield for sugar makers.
In summary, direct climate impacts and increased stressors will likely negatively
impact one of Vermont’s leading industries. Surveys indicate that most maple
producers already are aware of and adapting—or planning to adapt—to the effects of
climate change, including by adopting new technologies and shifting where they
obtain sap if current pathways become unreliable (Kuehn et al., 2017).
Figure 2-6: Average annual leaf-out date for sugar maples monitored in Underhill, VT (Halman and Wilmot, 2017)
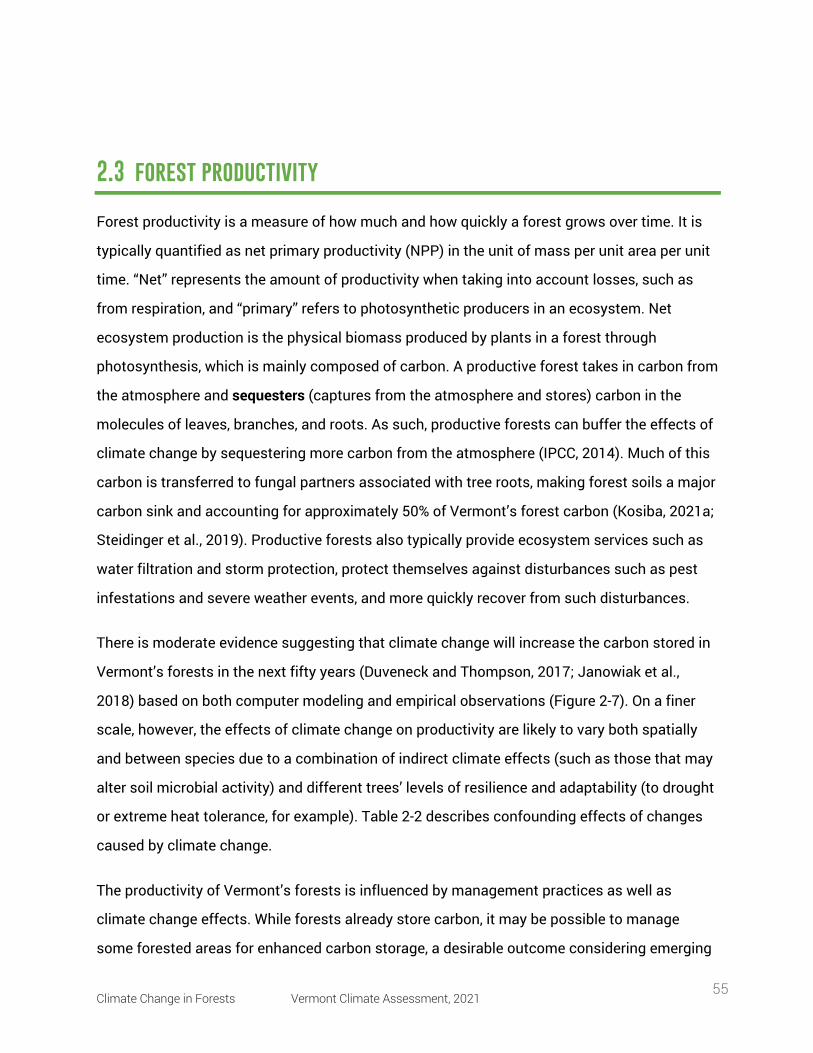
Climate Change in Forests Vermont Climate Assessment, 2021 55
2.3 forest productivity
Forest productivity is a measure of how much and how quickly a forest grows over time. It is
typically quantified as net primary productivity (NPP) in the unit of mass per unit area per unit
time. “Net” represents the amount of productivity when taking into account losses, such as
from respiration, and “primary” refers to photosynthetic producers in an ecosystem. Net
ecosystem production is the physical biomass produced by plants in a forest through
photosynthesis, which is mainly composed of carbon. A productive forest takes in carbon from
the atmosphere and sequesters (captures from the atmosphere and stores) carbon in the
molecules of leaves, branches, and roots. As such, productive forests can buffer the effects of
climate change by sequestering more carbon from the atmosphere (IPCC, 2014). Much of this
carbon is transferred to fungal partners associated with tree roots, making forest soils a major
carbon sink and accounting for approximately 50% of Vermont’s forest carbon (Kosiba, 2021a;
Steidinger et al., 2019). Productive forests also typically provide ecosystem services such as
water filtration and storm protection, protect themselves against disturbances such as pest
infestations and severe weather events, and more quickly recover from such disturbances.
There is moderate evidence suggesting that climate change will increase the carbon stored in
Vermont’s forests in the next fifty years (Duveneck and Thompson, 2017; Janowiak et al.,
2018) based on both computer modeling and empirical observations (Figure 2-7). On a finer
scale, however, the effects of climate change on productivity are likely to vary both spatially
and between species due to a combination of indirect climate effects (such as those that may
alter soil microbial activity) and different trees’ levels of resilience and adaptability (to drought
or extreme heat tolerance, for example). Table 2-2 describes confounding effects of changes
caused by climate change.
The productivity of Vermont’s forests is influenced by management practices as well as
climate change effects. While forests already store carbon, it may be possible to manage
some forested areas for enhanced carbon storage, a desirable outcome considering emerging
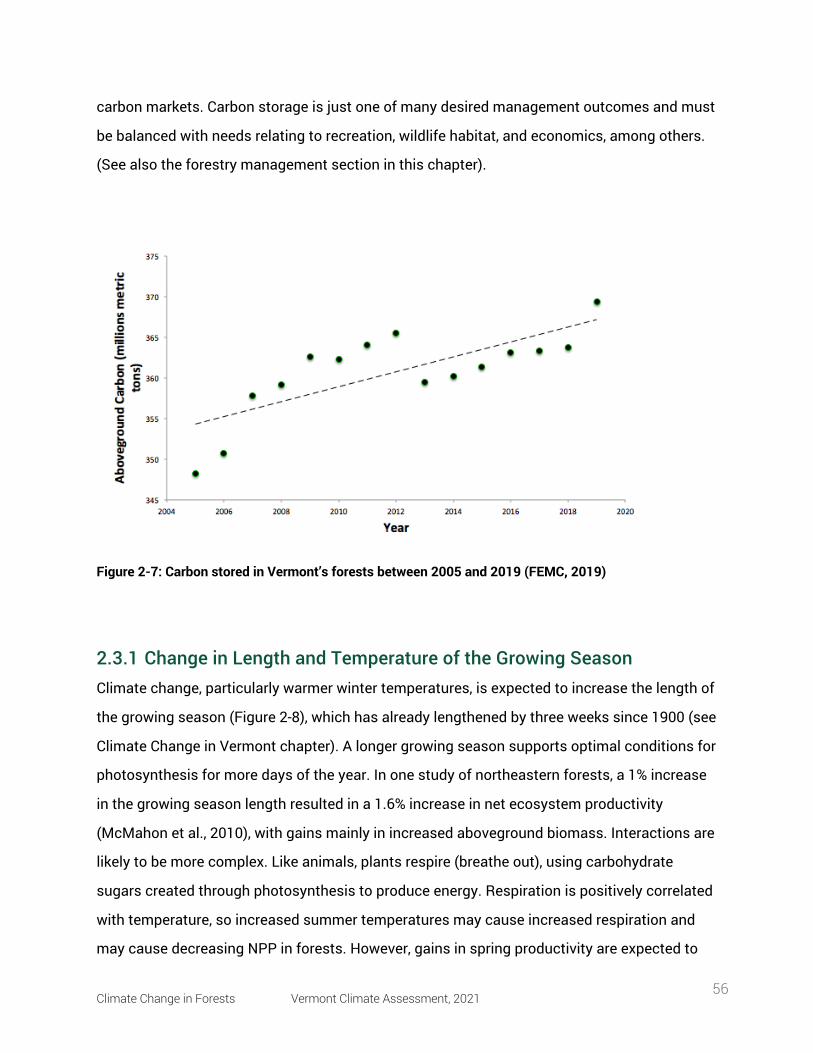
Climate Change in Forests Vermont Climate Assessment, 2021 56
carbon markets. Carbon storage is just one of many desired management outcomes and must
be balanced with needs relating to recreation, wildlife habitat, and economics, among others.
(See also the forestry management section in this chapter).
Figure 2-7: Carbon stored in Vermont’s forests between 2005 and 2019 (FEMC, 2019)
2.3.1 Change in Length and Temperature of the Growing Season Climate change, particularly warmer winter temperatures, is expected to increase the length of
the growing season (Figure 2-8), which has already lengthened by three weeks since 1900 (see
Climate Change in Vermont chapter). A longer growing season supports optimal conditions for
photosynthesis for more days of the year. In one study of northeastern forests, a 1% increase
in the growing season length resulted in a 1.6% increase in net ecosystem productivity
(McMahon et al., 2010), with gains mainly in increased aboveground biomass. Interactions are
likely to be more complex. Like animals, plants respire (breathe out), using carbohydrate
sugars created through photosynthesis to produce energy. Respiration is positively correlated
with temperature, so increased summer temperatures may cause increased respiration and
may cause decreasing NPP in forests. However, gains in spring productivity are expected to
Climate Change in Forests Vermont Climate Assessment, 2021 57
exceed the increased summer respiration (Buermann et al., 2013; Duveneck et al., 2016;
Keenan et al., 2014). Respiration may exceed productivity in more extreme warming climate
scenarios (e.g., RCP8.5) and/or for tree species that have low temperature optimums for
photosynthesis (such as spruce) (Ollinger et al., 2008), although some young trees are able to
adjust their physiology to photosynthesize more efficiently under warmer temperatures. In
addition to respiration from plants, warmer temperatures have been shown to increase soil
respiration from bacteria (Campbell et al., 2009), releasing some soil carbon and decreasing
ecosystem productivity overall. By one estimate, temperate forest systems respire 10% of their
total carbon, with that number increasing annually (Zhao et al., 2017). Another potentially
damaging effect of extended growing seasons is warm spring temperatures that lead to earlier
leaf-out may result in frost injury to trees, diminishing the benefit caused by the longer growing
season (Hufkens et al., 2012).
Figure 2-8: Length of Vermont’s freeze-free period by decade (consecutive days with minimum temperature above 28ºF) plotted above and below the 1900–2019 mean value (solid black line). (See Climate Change in Vermont chapter.)
2.3.2 CO2 Fertilization Effect “CO2 fertilization” is a phenomenon in which increased levels of atmospheric CO2 enhance
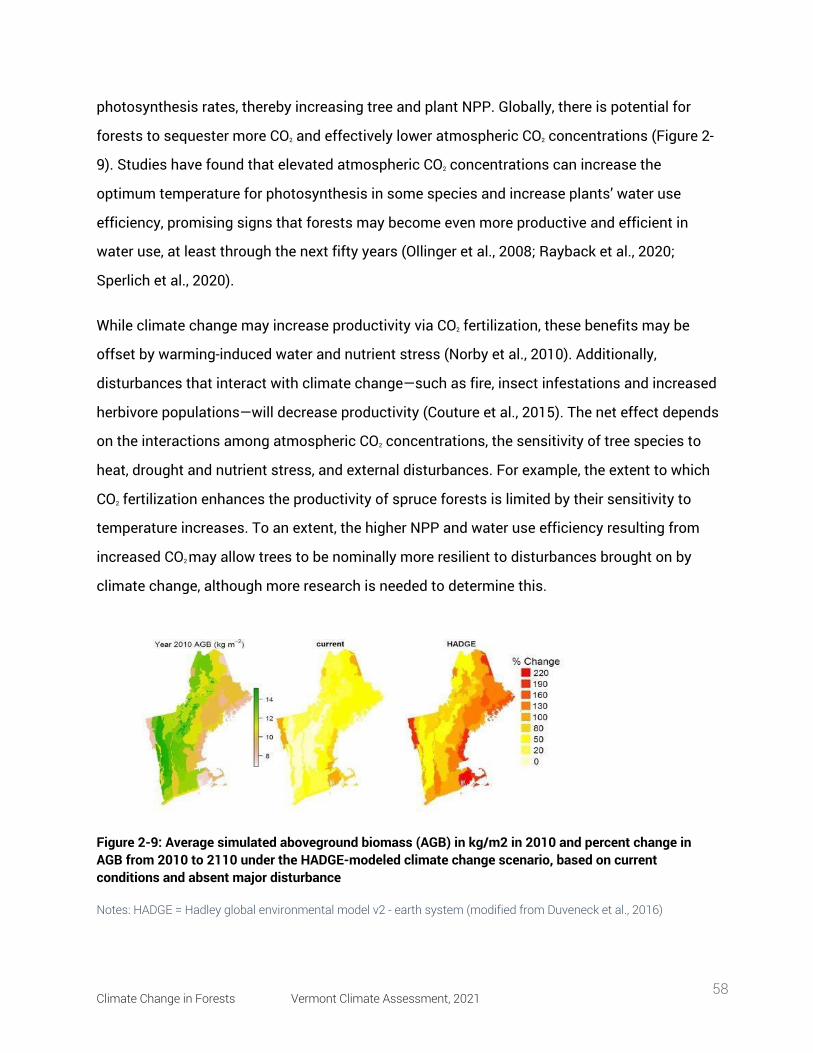
Climate Change in Forests Vermont Climate Assessment, 2021 58
photosynthesis rates, thereby increasing tree and plant NPP. Globally, there is potential for
forests to sequester more CO2 and effectively lower atmospheric CO2 concentrations (Figure 2-
9). Studies have found that elevated atmospheric CO2 concentrations can increase the
optimum temperature for photosynthesis in some species and increase plants’ water use
efficiency, promising signs that forests may become even more productive and efficient in
water use, at least through the next fifty years (Ollinger et al., 2008; Rayback et al., 2020;
Sperlich et al., 2020).
While climate change may increase productivity via CO2 fertilization, these benefits may be
offset by warming-induced water and nutrient stress (Norby et al., 2010). Additionally,
disturbances that interact with climate change—such as fire, insect infestations and increased
herbivore populations—will decrease productivity (Couture et al., 2015). The net effect depends
on the interactions among atmospheric CO2 concentrations, the sensitivity of tree species to
heat, drought and nutrient stress, and external disturbances. For example, the extent to which
CO2 fertilization enhances the productivity of spruce forests is limited by their sensitivity to
temperature increases. To an extent, the higher NPP and water use efficiency resulting from
increased CO2 may allow trees to be nominally more resilient to disturbances brought on by
climate change, although more research is needed to determine this.
Figure 2-9: Average simulated aboveground biomass (AGB) in kg/m2 in 2010 and percent change in AGB from 2010 to 2110 under the HADGE-modeled climate change scenario, based on current conditions and absent major disturbance
Notes: HADGE = Hadley global environmental model v2 - earth system (modified from Duveneck et al., 2016)
Climate Change in Forests Vermont Climate Assessment, 2021 59
2.3.3 Impacts to Nutrient Cycling To carry out their metabolic processes and produce biomass, trees and other plants rely on
nutrients and water from soils. Two of the most important nutrients are phosphorus and
nitrogen and phosphorus. Phosphorus is deposited in soils through the weathering of rocks.
Nitrogen is abundant in the atmosphere, but most plants can use it only if it is converted to a
compound called nitrate (NO3) by nitrogen-fixing bacteria that live in soils and the roots of
some leguminous plants. Nitrogen is generally a growth-limiting nutrient in temperate forest
ecosystems because nitrate occurs in low concentrations (Campbell et al., 2009).
Warming spring temperatures cause snowpack to disappear earlier in Vermont, impacting
nutrient cycling in different ways. Snowmelt may leach nutrients from the soil when it occurs
before photosynthesis has resumed and plants can retain nutrients (Contosta et al., 2017;
Groffman et al., 2012). Earlier peak snowmelt may limit water availability during the height of
the growing season (Wilson et al., 2020), depending on spring and summer rainfall. A
combination of earlier snowmelt and decreased snowpack depth (see Climate Change in
Vermont chapter) exposes soils to colder temperatures since snowpack tends to insulate
soils. Soil-freezing events damage plants’ root tissues so they take up less nitrogen, leading to
leaching of nitrogen from the soil over time (Campbell et al., 2014). Under a changing climate,
temperature, precipitation, and biogeochemical cycles will interact in new ways that is highly
likely to cause a net decrease in key nutrients in Vermont’s soils, limiting the growth of forests
and forest productivity.
2.3.4 Impact to Beneficial Plant-Fungus Relationships Soil microbes and fungi play a large role in the productivity of forest ecosystems.
Ectomycorrhizal (which surround plant roots) and arbuscular mycorrhizal (which penetrate
plant roots) are two of the most abundant root-colonizing fungi that provide trees with critical
nutrients and, in exchange, receive carbon from tree roots. These fungi are crucial to carbon
sequestration and storage in forest ecosystems.
Certain types of fungal symbiotic partners, in particular ectomycorrhizal fungi, dominate in
Climate Change in Forests Vermont Climate Assessment, 2021 60
forests where seasonally cold and sometimes dry conditions inhibit decomposition and where
nitrogen is a limiting nutrient—as in Vermont. These fungi have evolved symbiotic
relationships with 60% of all tree species, mainly in higher latitudes and altitudes (Steidinger et
al., 2019). However, as environmental conditions become more like lower latitudes and
altitudes (e.g., warmer, wetter), these fungi are threatened. Declines in such fungi could cause
declines in the trees adapted to them, including beech (Fagus grandifolia), white pine (Pinus
strobus), oaks (Fagus spp.), and many other northern hardwood species. However, when
combined with other climate adaptability indicators of tree species, different patterns emerge.
For example, the range of oak species may expand (Figure 2-4, Table 2-1). Change in fungal
composition in Vermont’s soils along with increasing temperature and precipitation will
facilitate changes in the composition of forests (Classen et al., 2015). Changing temperature
and precipitation regimes are also compromising the functionality of the fungi and microbes,
which trees depend on to assimilate nutrients from the soil, causing negative impacts on
productivity that may not be mitigated by longer growing season length and CO2 fertilization.
2.3.5 Atmospheric Deposition Humans release many compounds that can affect forest productivity to the atmosphere. For
example, volatile sulfur and nitrogen compounds originating from industrial activities are
deposited from the atmosphere by rain and snowfall in relatively high concentrations in the
northeastern United States (“atmospheric deposition”) (Pardo et al., 2011), though the
production of these compounds is expected to decrease because of measures to reduce
greenhouse gas emissions. Atmospheric deposition of nitrogen and sulfur to soils can alter
the biogeochemistry of forest ecosystems. Nitrogen saturation has been shown to decrease
the allocation of carbon to mycorrhizal fungi, weakening the essential relationship between
trees and fungi (Frey et al., 2014). Nitrogen and sulfur deposition has been shown to make
trees more vulnerable to drought and insect infestations, weakening resilience to climate
change (McNulty and Boggs, 2010; Pardo et al., 2011), and acid deposition can leach nutrients
from foliage and forest soils, leading to nutrient depletion (DeHayes et al., 1999). While
atmospheric deposition is not a direct effect of climate change, it comes from the same root
Climate Change in Forests Vermont Climate Assessment, 2021 61
cause (e.g., human combustion of fossil fuels). The use of products containing nitrogen and
sulfur increased for many decades before regulations began limiting production. There are
indications of ecosystem recovery from some of these pollutants (Kosiba et al., 2018) but
stress brought on by climate change could exacerbate the negative effects of nitrogen and
sulfur deposition.
Ground-level ozone is an atmospheric pollutant that affects stomatal control, decreases water
use efficiency, and damages plant tissues, thus causing water stress and decreased biomass
and productivity. Plants with increased ozone exposure have declines that offset gains in
productivity from CO2 fertilization (Mohan et al., 2009; Rustad et al., 2012) Ozone levels are
closely linked to the presence of nitrogen oxides (products of fossil fuel combustion) in the
atmosphere, so decreased ozone emissions could have positive effects for forest productivity
barring negative interactions with other climate change stressors.
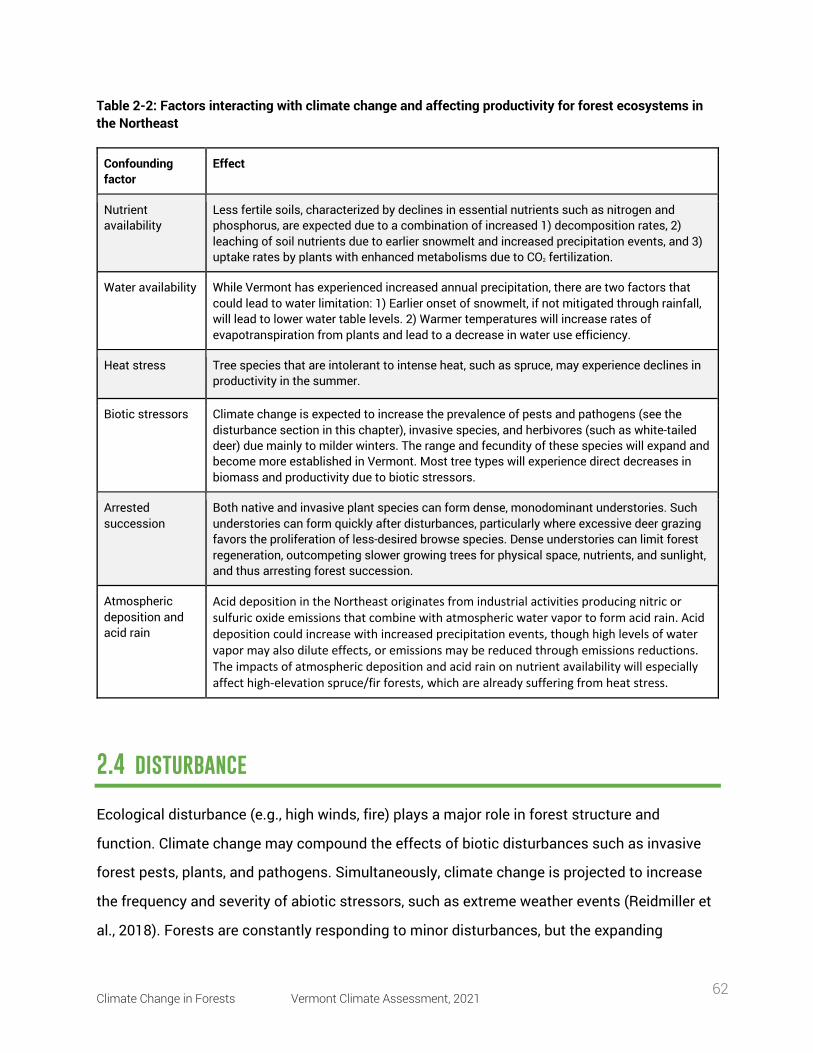
Climate Change in Forests Vermont Climate Assessment, 2021 62
Table 2-2: Factors interacting with climate change and affecting productivity for forest ecosystems in the Northeast
Confounding factor
Effect
Nutrient availability
Less fertile soils, characterized by declines in essential nutrients such as nitrogen and phosphorus, are expected due to a combination of increased 1) decomposition rates, 2) leaching of soil nutrients due to earlier snowmelt and increased precipitation events, and 3) uptake rates by plants with enhanced metabolisms due to CO2 fertilization.
Water availability While Vermont has experienced increased annual precipitation, there are two factors that could lead to water limitation: 1) Earlier onset of snowmelt, if not mitigated through rainfall, will lead to lower water table levels. 2) Warmer temperatures will increase rates of evapotranspiration from plants and lead to a decrease in water use efficiency.
Heat stress Tree species that are intolerant to intense heat, such as spruce, may experience declines in productivity in the summer.
Biotic stressors Climate change is expected to increase the prevalence of pests and pathogens (see the disturbance section in this chapter), invasive species, and herbivores (such as white-tailed deer) due mainly to milder winters. The range and fecundity of these species will expand and become more established in Vermont. Most tree types will experience direct decreases in biomass and productivity due to biotic stressors.
Arrested succession
Both native and invasive plant species can form dense, monodominant understories. Such understories can form quickly after disturbances, particularly where excessive deer grazing favors the proliferation of less-desired browse species. Dense understories can limit forest regeneration, outcompeting slower growing trees for physical space, nutrients, and sunlight, and thus arresting forest succession.
Atmospheric deposition and acid rain
Acid deposition in the Northeast originates from industrial activities producing nitric or sulfuric oxide emissions that combine with atmospheric water vapor to form acid rain. Acid deposition could increase with increased precipitation events, though high levels of water vapor may also dilute effects, or emissions may be reduced through emissions reductions. The impacts of atmospheric deposition and acid rain on nutrient availability will especially affect high-elevation spruce/fir forests, which are already suffering from heat stress.
2.4 disturbance
Ecological disturbance (e.g., high winds, fire) plays a major role in forest structure and
function. Climate change may compound the effects of biotic disturbances such as invasive
forest pests, plants, and pathogens. Simultaneously, climate change is projected to increase
the frequency and severity of abiotic stressors, such as extreme weather events (Reidmiller et
al., 2018). Forests are constantly responding to minor disturbances, but the expanding
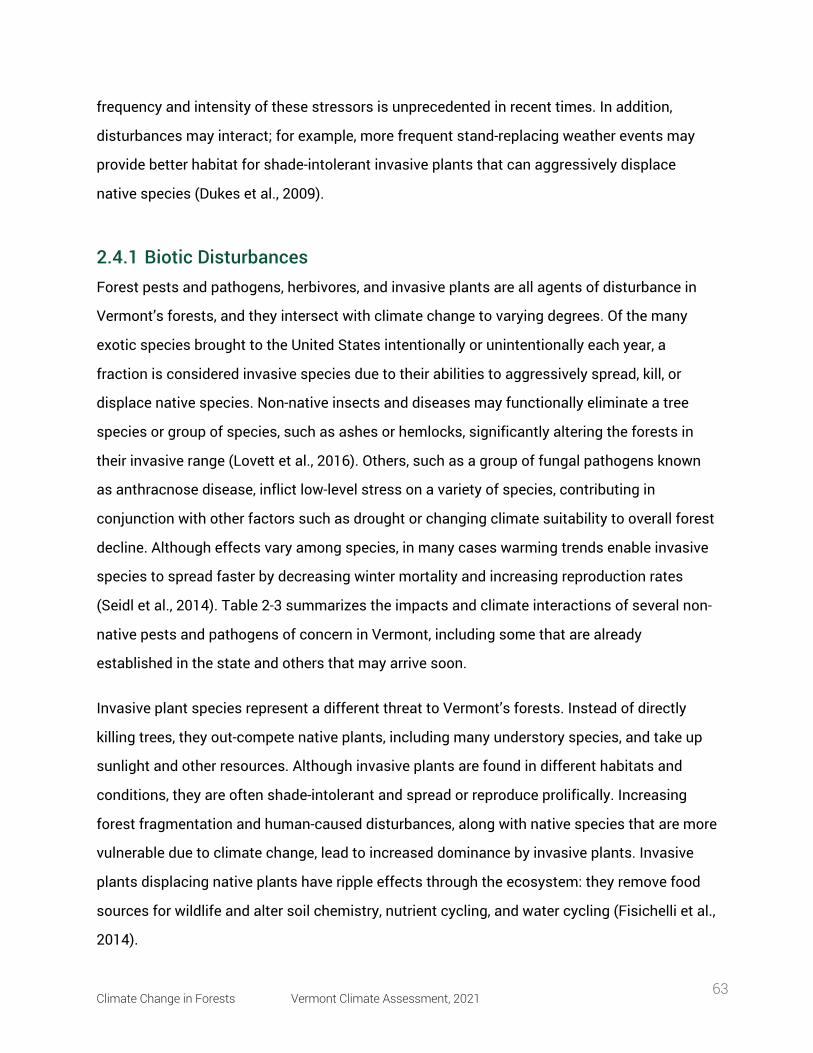
Climate Change in Forests Vermont Climate Assessment, 2021 63
frequency and intensity of these stressors is unprecedented in recent times. In addition,
disturbances may interact; for example, more frequent stand-replacing weather events may
provide better habitat for shade-intolerant invasive plants that can aggressively displace
native species (Dukes et al., 2009).
2.4.1 Biotic Disturbances Forest pests and pathogens, herbivores, and invasive plants are all agents of disturbance in
Vermont’s forests, and they intersect with climate change to varying degrees. Of the many
exotic species brought to the United States intentionally or unintentionally each year, a
fraction is considered invasive species due to their abilities to aggressively spread, kill, or
displace native species. Non-native insects and diseases may functionally eliminate a tree
species or group of species, such as ashes or hemlocks, significantly altering the forests in
their invasive range (Lovett et al., 2016). Others, such as a group of fungal pathogens known
as anthracnose disease, inflict low-level stress on a variety of species, contributing in
conjunction with other factors such as drought or changing climate suitability to overall forest
decline. Although effects vary among species, in many cases warming trends enable invasive
species to spread faster by decreasing winter mortality and increasing reproduction rates
(Seidl et al., 2014). Table 2-3 summarizes the impacts and climate interactions of several non-
native pests and pathogens of concern in Vermont, including some that are already
established in the state and others that may arrive soon.
Invasive plant species represent a different threat to Vermont’s forests. Instead of directly
killing trees, they out-compete native plants, including many understory species, and take up
sunlight and other resources. Although invasive plants are found in different habitats and
conditions, they are often shade-intolerant and spread or reproduce prolifically. Increasing
forest fragmentation and human-caused disturbances, along with native species that are more
vulnerable due to climate change, lead to increased dominance by invasive plants. Invasive
plants displacing native plants have ripple effects through the ecosystem: they remove food
sources for wildlife and alter soil chemistry, nutrient cycling, and water cycling (Fisichelli et al.,
2014).
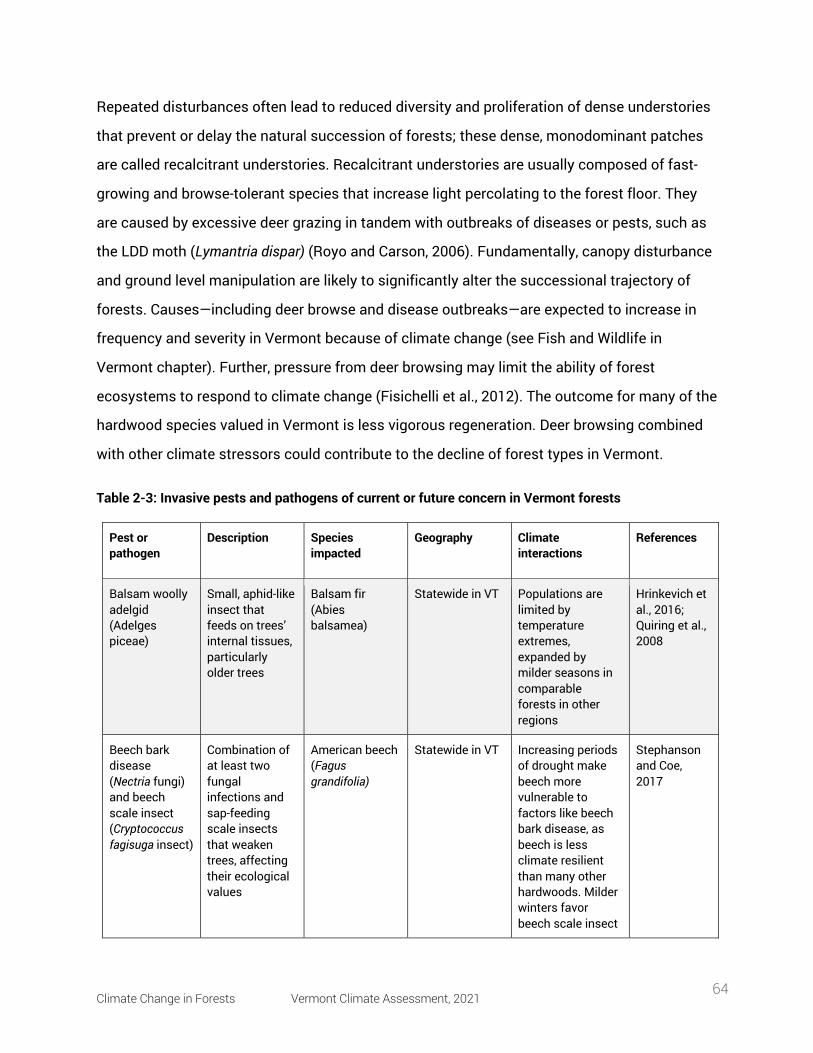
Climate Change in Forests Vermont Climate Assessment, 2021 64
Repeated disturbances often lead to reduced diversity and proliferation of dense understories
that prevent or delay the natural succession of forests; these dense, monodominant patches
are called recalcitrant understories. Recalcitrant understories are usually composed of fast-
growing and browse-tolerant species that increase light percolating to the forest floor. They
are caused by excessive deer grazing in tandem with outbreaks of diseases or pests, such as
the LDD moth (Lymantria dispar) (Royo and Carson, 2006). Fundamentally, canopy disturbance
and ground level manipulation are likely to significantly alter the successional trajectory of
forests. Causes—including deer browse and disease outbreaks—are expected to increase in
frequency and severity in Vermont because of climate change (see Fish and Wildlife in
Vermont chapter). Further, pressure from deer browsing may limit the ability of forest
ecosystems to respond to climate change (Fisichelli et al., 2012). The outcome for many of the
hardwood species valued in Vermont is less vigorous regeneration. Deer browsing combined
with other climate stressors could contribute to the decline of forest types in Vermont.
Table 2-3: Invasive pests and pathogens of current or future concern in Vermont forests
Pest or pathogen
Description Species impacted
Geography Climate interactions
References
Balsam woolly adelgid (Adelges piceae)
Small, aphid-like insect that feeds on trees’ internal tissues, particularly older trees
Balsam fir (Abies balsamea)
Statewide in VT Populations are limited by temperature extremes, expanded by milder seasons in comparable forests in other regions
Hrinkevich et al., 2016; Quiring et al., 2008
Beech bark disease (Nectria fungi) and beech scale insect (Cryptococcus fagisuga insect)
Combination of at least two fungal infections and sap-feeding scale insects that weaken trees, affecting their ecological values
American beech (Fagus grandifolia)
Statewide in VT Increasing periods of drought make beech more vulnerable to factors like beech bark disease, as beech is less climate resilient than many other hardwoods. Milder winters favor beech scale insect
Stephanson and Coe, 2017
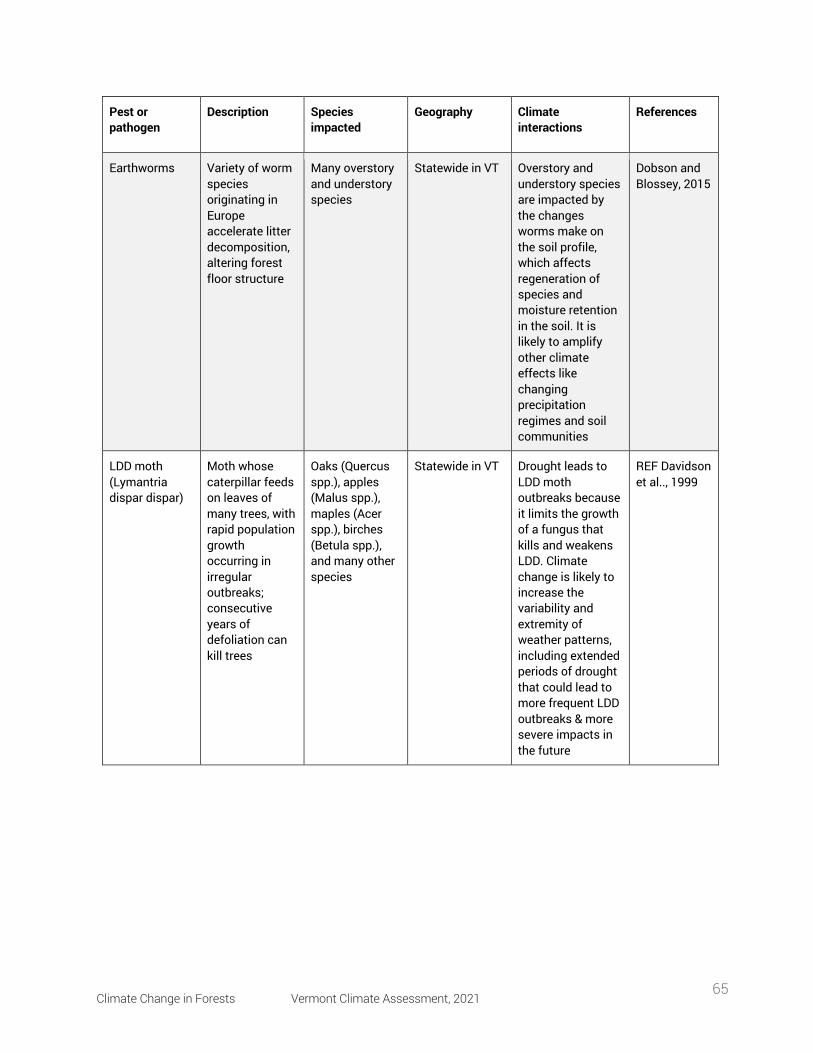
Climate Change in Forests Vermont Climate Assessment, 2021 65
Pest or pathogen
Description Species impacted
Geography Climate interactions
References
Earthworms Variety of worm species originating in Europe accelerate litter decomposition, altering forest floor structure
Many overstory and understory species
Statewide in VT Overstory and understory species are impacted by the changes worms make on the soil profile, which affects regeneration of species and moisture retention in the soil. It is likely to amplify other climate effects like changing precipitation regimes and soil communities
Dobson and Blossey, 2015
LDD moth (Lymantria dispar dispar)
Moth whose caterpillar feeds on leaves of many trees, with rapid population growth occurring in irregular outbreaks; consecutive years of defoliation can kill trees
Oaks (Quercus spp.), apples (Malus spp.), maples (Acer spp.), birches (Betula spp.), and many other species
Statewide in VT Drought leads to LDD moth outbreaks because it limits the growth of a fungus that kills and weakens LDD. Climate change is likely to increase the variability and extremity of weather patterns, including extended periods of drought that could lead to more frequent LDD outbreaks & more severe impacts in the future
REF Davidson et al.., 1999
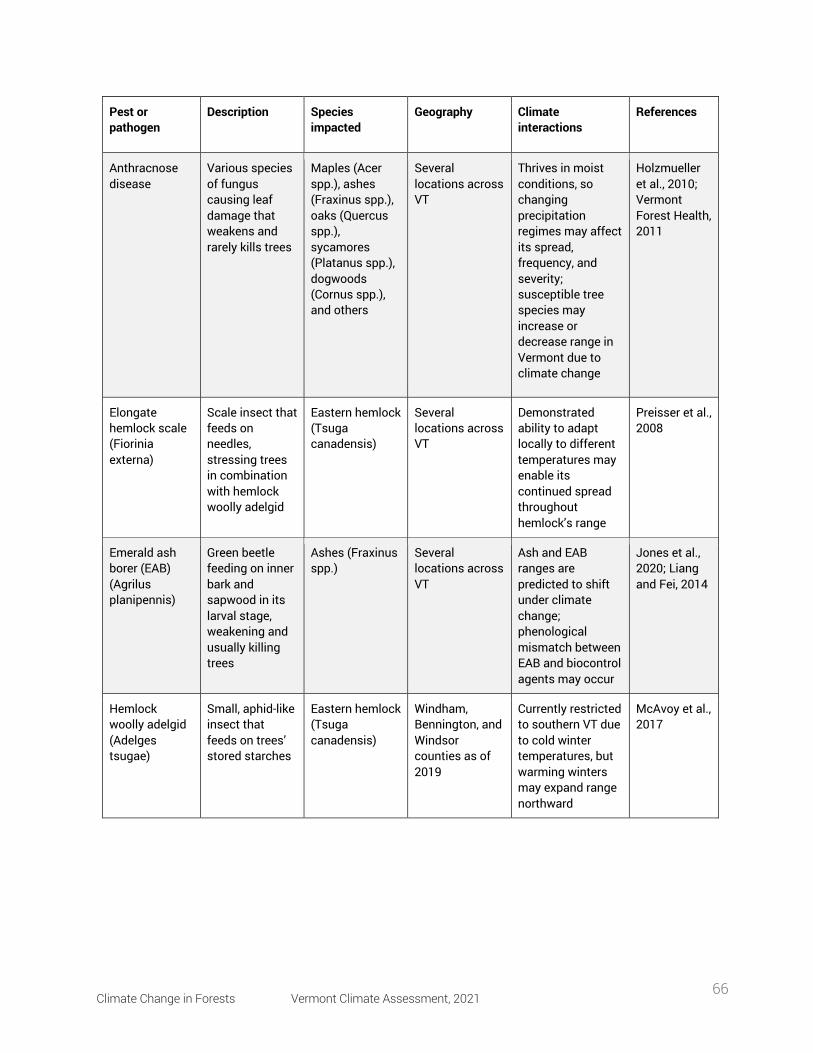
Climate Change in Forests Vermont Climate Assessment, 2021 66
Pest or pathogen
Description Species impacted
Geography Climate interactions
References
Anthracnose disease
Various species of fungus causing leaf damage that weakens and rarely kills trees
Maples (Acer spp.), ashes (Fraxinus spp.), oaks (Quercus spp.), sycamores (Platanus spp.), dogwoods (Cornus spp.), and others
Several locations across VT
Thrives in moist conditions, so changing precipitation regimes may affect its spread, frequency, and severity; susceptible tree species may increase or decrease range in Vermont due to climate change
Holzmueller et al., 2010; Vermont Forest Health, 2011
Elongate hemlock scale (Fiorinia externa)
Scale insect that feeds on needles, stressing trees in combination with hemlock woolly adelgid
Eastern hemlock (Tsuga canadensis)
Several locations across VT
Demonstrated ability to adapt locally to different temperatures may enable its continued spread throughout hemlock’s range
Preisser et al., 2008
Emerald ash borer (EAB) (Agrilus planipennis)
Green beetle feeding on inner bark and sapwood in its larval stage, weakening and usually killing trees
Ashes (Fraxinus spp.)
Several locations across VT
Ash and EAB ranges are predicted to shift under climate change; phenological mismatch between EAB and biocontrol agents may occur
Jones et al., 2020; Liang and Fei, 2014
Hemlock woolly adelgid (Adelges tsugae)
Small, aphid-like insect that feeds on trees’ stored starches
Eastern hemlock (Tsuga canadensis)
Windham, Bennington, and Windsor counties as of 2019
Currently restricted to southern VT due to cold winter temperatures, but warming winters may expand range northward
McAvoy et al., 2017
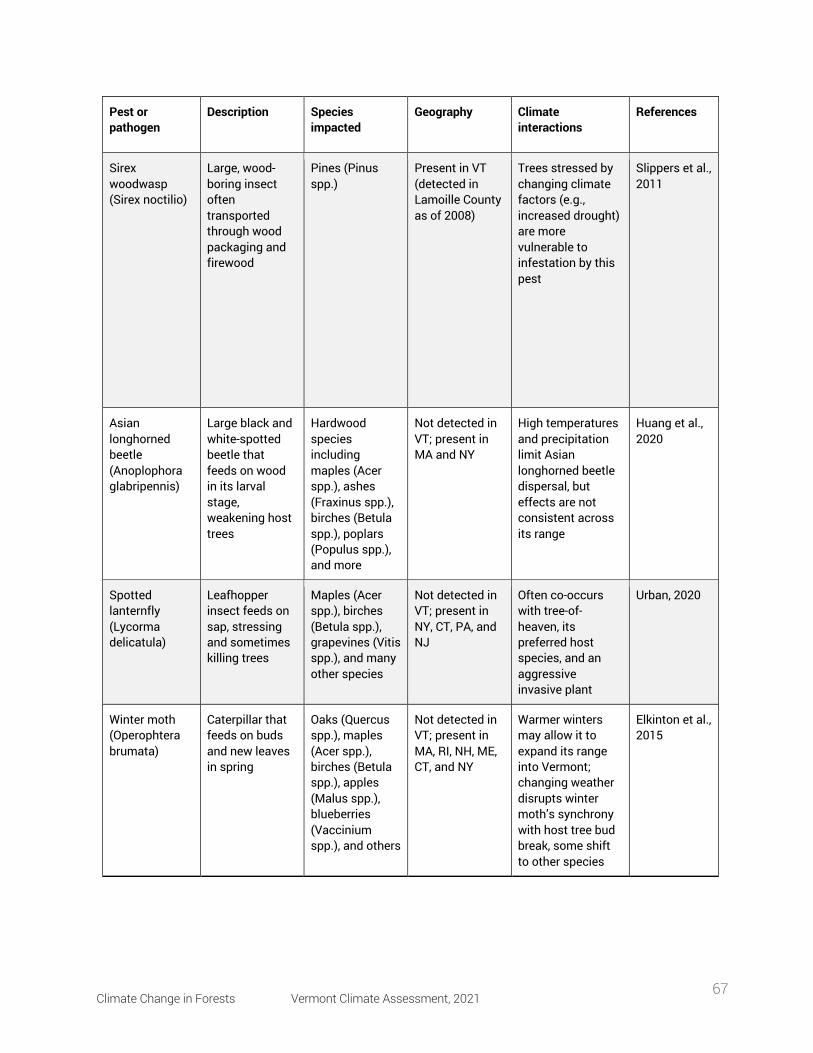
Climate Change in Forests Vermont Climate Assessment, 2021 67
Pest or pathogen
Description Species impacted
Geography Climate interactions
References
Sirex woodwasp (Sirex noctilio)
Large, wood-boring insect often transported through wood packaging and firewood
Pines (Pinus spp.)
Present in VT (detected in Lamoille County as of 2008)
Trees stressed by changing climate factors (e.g., increased drought) are more vulnerable to infestation by this pest
Slippers et al., 2011
Asian longhorned beetle (Anoplophora glabripennis)
Large black and white-spotted beetle that feeds on wood in its larval stage, weakening host trees
Hardwood species including maples (Acer spp.), ashes (Fraxinus spp.), birches (Betula spp.), poplars (Populus spp.), and more
Not detected in VT; present in MA and NY
High temperatures and precipitation limit Asian longhorned beetle dispersal, but effects are not consistent across its range
Huang et al., 2020
Spotted lanternfly (Lycorma delicatula)
Leafhopper insect feeds on sap, stressing and sometimes killing trees
Maples (Acer spp.), birches (Betula spp.), grapevines (Vitis spp.), and many other species
Not detected in VT; present in NY, CT, PA, and NJ
Often co-occurs with tree-of-heaven, its preferred host species, and an aggressive invasive plant
Urban, 2020
Winter moth (Operophtera brumata)
Caterpillar that feeds on buds and new leaves in spring
Oaks (Quercus spp.), maples (Acer spp.), birches (Betula spp.), apples (Malus spp.), blueberries (Vaccinium spp.), and others
Not detected in VT; present in MA, RI, NH, ME, CT, and NY
Warmer winters may allow it to expand its range into Vermont; changing weather disrupts winter moth’s synchrony with host tree bud break, some shift to other species
Elkinton et al., 2015
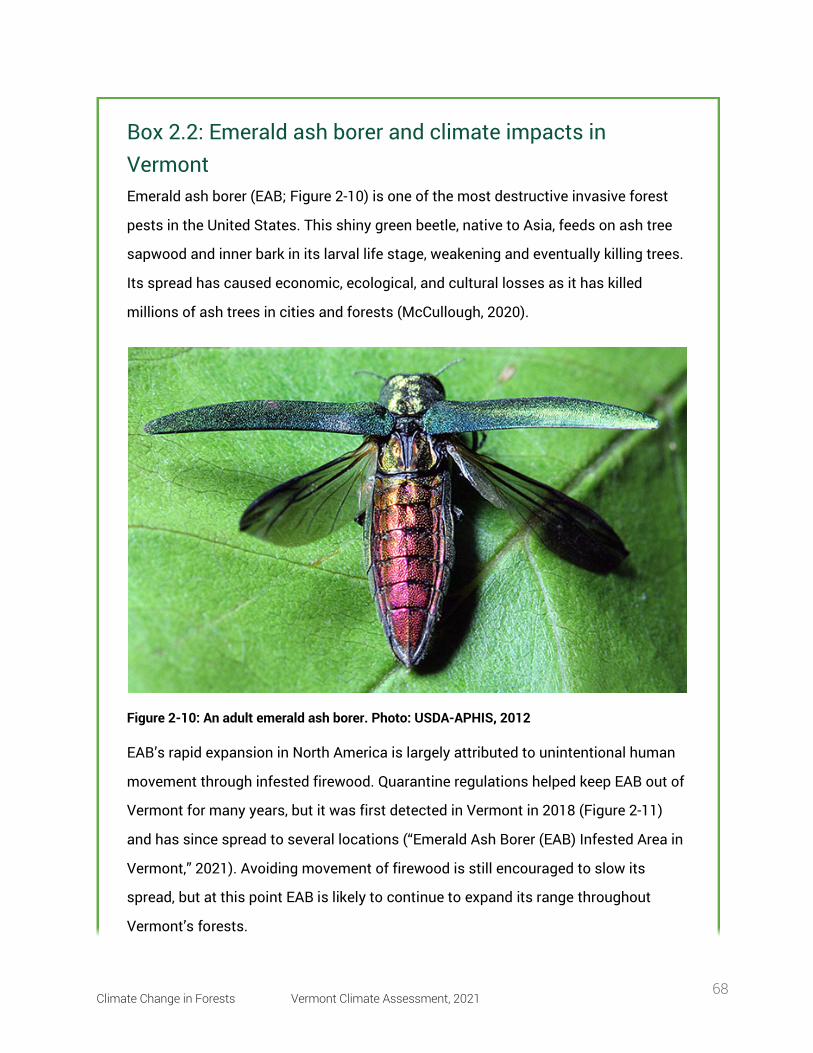
Climate Change in Forests Vermont Climate Assessment, 2021 68
Box 2.2: Emerald ash borer and climate impacts in Vermont Emerald ash borer (EAB; Figure 2-10) is one of the most destructive invasive forest
pests in the United States. This shiny green beetle, native to Asia, feeds on ash tree
sapwood and inner bark in its larval life stage, weakening and eventually killing trees.
Its spread has caused economic, ecological, and cultural losses as it has killed
millions of ash trees in cities and forests (McCullough, 2020).
Figure 2-10: An adult emerald ash borer. Photo: USDA-APHIS, 2012
EAB’s rapid expansion in North America is largely attributed to unintentional human
movement through infested firewood. Quarantine regulations helped keep EAB out of
Vermont for many years, but it was first detected in Vermont in 2018 (Figure 2-11)
and has since spread to several locations (“Emerald Ash Borer (EAB) Infested Area in
Vermont,” 2021). Avoiding movement of firewood is still encouraged to slow its
spread, but at this point EAB is likely to continue to expand its range throughout
Vermont’s forests.
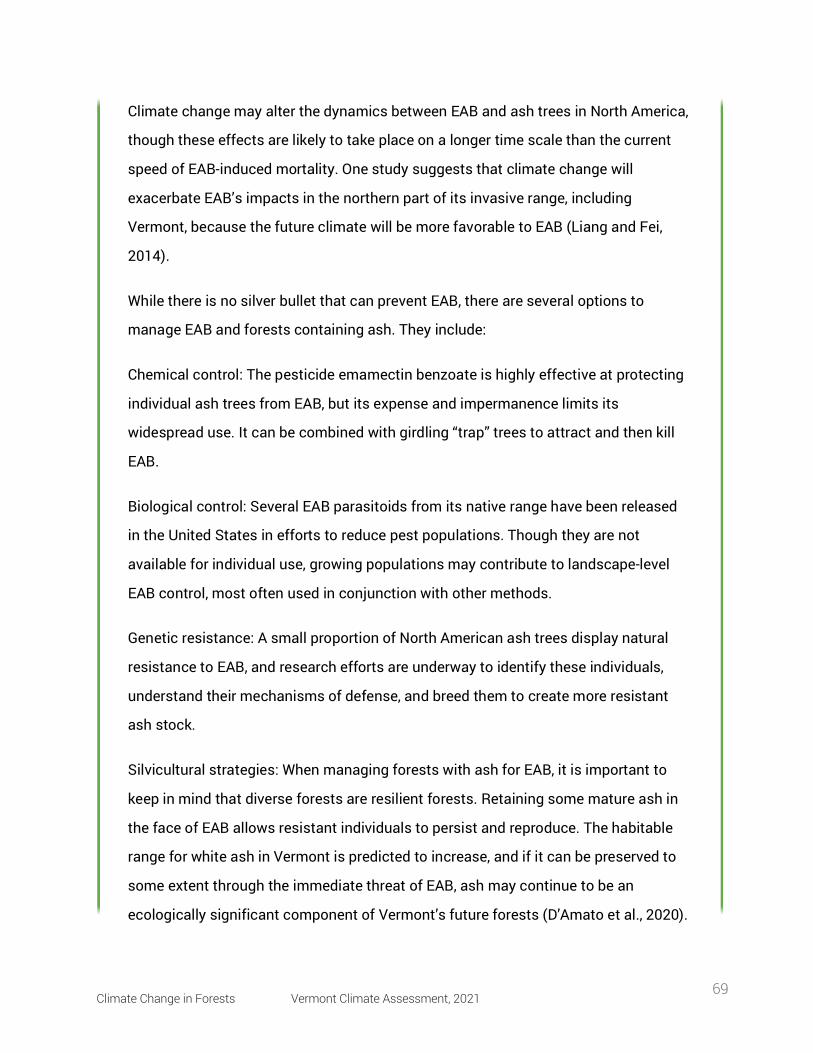
Climate Change in Forests Vermont Climate Assessment, 2021 69
Climate change may alter the dynamics between EAB and ash trees in North America,
though these effects are likely to take place on a longer time scale than the current
speed of EAB-induced mortality. One study suggests that climate change will
exacerbate EAB’s impacts in the northern part of its invasive range, including
Vermont, because the future climate will be more favorable to EAB (Liang and Fei,
2014).
While there is no silver bullet that can prevent EAB, there are several options to
manage EAB and forests containing ash. They include:
Chemical control: The pesticide emamectin benzoate is highly effective at protecting
individual ash trees from EAB, but its expense and impermanence limits its
widespread use. It can be combined with girdling “trap” trees to attract and then kill
EAB.
Biological control: Several EAB parasitoids from its native range have been released
in the United States in efforts to reduce pest populations. Though they are not
available for individual use, growing populations may contribute to landscape-level
EAB control, most often used in conjunction with other methods.
Genetic resistance: A small proportion of North American ash trees display natural
resistance to EAB, and research efforts are underway to identify these individuals,
understand their mechanisms of defense, and breed them to create more resistant
ash stock.
Silvicultural strategies: When managing forests with ash for EAB, it is important to
keep in mind that diverse forests are resilient forests. Retaining some mature ash in
the face of EAB allows resistant individuals to persist and reproduce. The habitable
range for white ash in Vermont is predicted to increase, and if it can be preserved to
some extent through the immediate threat of EAB, ash may continue to be an
ecologically significant component of Vermont’s future forests (D’Amato et al., 2020).
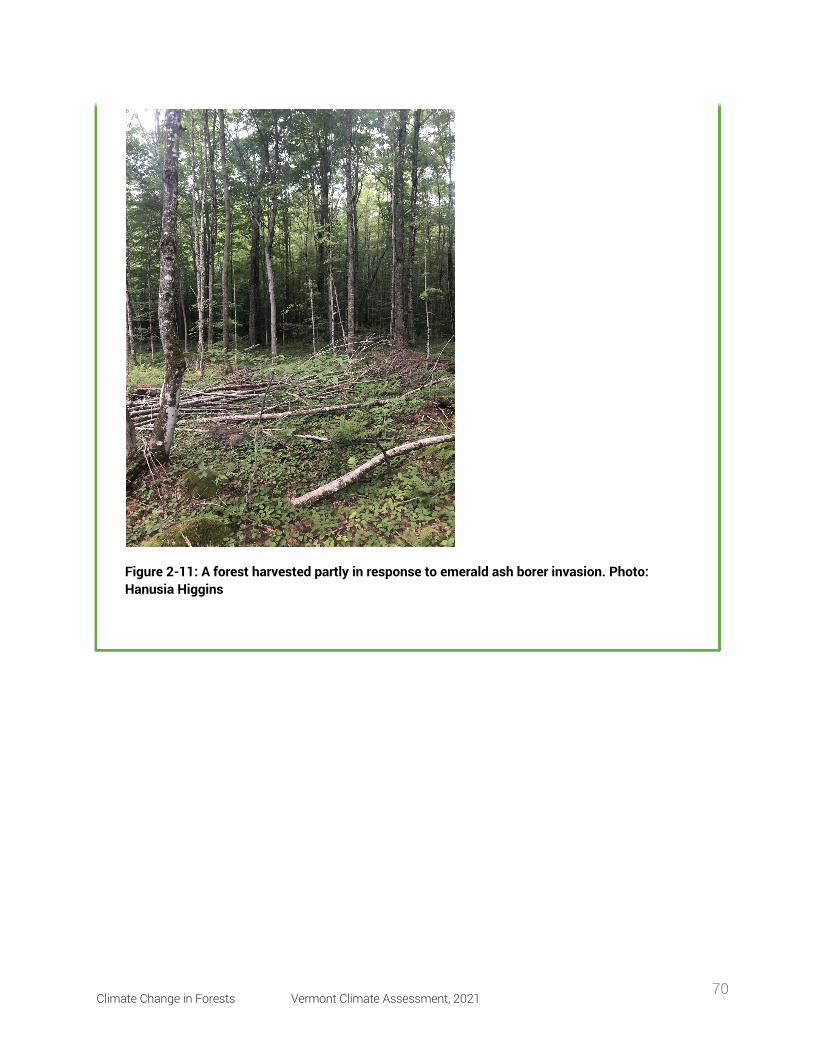
Climate Change in Forests Vermont Climate Assessment, 2021 70
Figure 2-11: A forest harvested partly in response to emerald ash borer invasion. Photo: Hanusia Higgins
Climate Change in Forests Vermont Climate Assessment, 2021 71
Box 2.3: LDD Moth (Lymantria dispar dispar) outbreak of 2021 In 2021, Vermont and other parts of New England saw the largest outbreak of the
Lymantria dispar (LDD) moth (Figure 2-12) in three decades (Vermont Department of
Forests, Parks & Recreation, 2021). LDD is an invasive pest that was introduced to
North America in 1869. LDD caterpillars prefer feeding on oak leaves but will eat the
leaves of many other trees, including maples, birches, and even pines when their
favorite host is not available (Davidson et al., 1999). The caterpillars in 2021 were
prolific enough that they caught the notice of many Vermonters (Robinson, 2021). In
addition to defoliating many trees, LDD caterpillars can cause uncomfortable rashes
for some people who come into contact with them (Kikuchi et al., 2012).
Populations of LDD, though present at low levels each year, are usually kept in check
by a fungus that needs wet conditions to thrive. Vermont’s recent drought conditions
have prevented the fungus from carrying out its population control, leading to the
2021 LDD explosion. The next few years could see more high levels of LDD if dry
periods continue. Though one year of LDD defoliation is not catastrophic for trees
(Figure 2-13), two or more consecutive years could be deadly (Vermont Department of
Forests, Parks & Recreation, 2021). Especially in combination with other stressors
like drought, LDD is a serious threat to Vermont’s forests. Climate change is causing
more variable and extreme precipitation changes. If more drought is in the future,
then more LDD destruction certainly is too (Davidson et al., 1999). Vermonters should
read the advice from its Vermont Department of Forests, Parks, and Recreation to
control the spread of LDD in future years (Vermont Department of Forests, Parks &
Recreation, 2021).
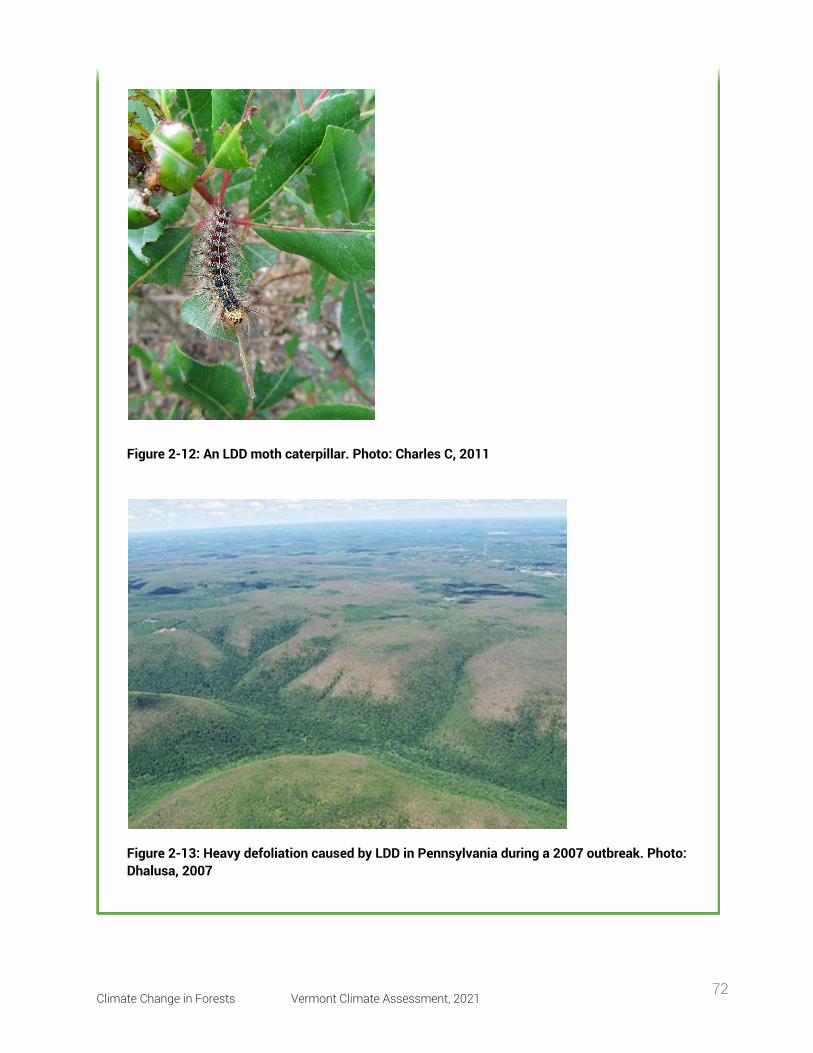
Climate Change in Forests Vermont Climate Assessment, 2021 72
Figure 2-12: An LDD moth caterpillar. Photo: Charles C, 2011
Figure 2-13: Heavy defoliation caused by LDD in Pennsylvania during a 2007 outbreak. Photo: Dhalusa, 2007
Climate Change in Forests Vermont Climate Assessment, 2021 73
2.4.2 Abiotic Disturbances Although large-magnitude disturbances such as windstorms and ice storms are historically
rare in Vermont, these extreme events are projected to increase in frequency and severity due
to climate change (Reidmiller et al., 2018). Models indicate that such events will occur with
increasing stochasticity (unpredictability), making specific future impacts difficult to forecast
(Janowiak et al., 2018). Abiotic disturbances have a range of impacts on Vermont’s forests,
from tree mortality to altered forest structure to changing soil conditions.
Box 2.4: Effects of future precipitation scenarios on forest regeneration Written by Peter Clark, University of Vermont
Climate change has already increased precipitation and altered the intensity of
precipitation in Vermont, trends that are expected to continue (see Climate Change in
Vermont chapter). In the northeastern United States, heavy precipitation events (>1
inch per day) punctuated by long periods of drying are already more common and are
projected to increase throughout the twenty-first century with broadscale
consequences on forest ecosystem function, composition, and the delivery of
ecosystem services.
A recent scientific experiment was conducted in the University of Vermont’s Jericho
Research Forest to understand the effects of future precipitation changes on forest
regeneration (Clark and D’Amato, 2019). This study focused on recently harvested
areas that are now forest gaps (Figure 2-14). Within forest gaps, seedling germination
and survival was measured with experimental treatments controlling precipitation.
Replicated precipitation manipulation experiments were installed for a series of
monitoring plots. Experimental treatments manipulated water input to simulate
historic precipitation conditions in some plots and scenarios of future precipitation in
others. The precipitation manipulations included total precipitation as well as different
Climate Change in Forests Vermont Climate Assessment, 2021 74
combinations of rainfall frequency and heavy precipitation events, creating extreme
short- and long-term drying and wetting conditions.
This study showed that seedling survival was controlled by precipitation treatment,
functional traits (e.g., seed mass), and planting microsite. While the role of climate in
seedling survival has been well described in scientific literature (e.g., Fisichelli et al.,
2014), this study showed that the survival response to precipitation was largely
controlled by species-specific functional attributes. For instance, species with smaller-
massed seeds (i.e., birches, pines, maples, and hemlock) were significantly affected by
differences in precipitation treatments, but larger massed species (i.e., oaks, hickories,
beech, and chestnut) were unaffected.
These findings suggest that heavy precipitation events will not be enough to offset
moisture deficits during prolonged dry periods in the future when it comes to seedling
germination and survival. Future forest regeneration will favor species adapted to
extended drying. Precipitation played an important role in seedling survival, but this
study also showed that seedbed microsite conditions (e.g., mixed scarified >
unmodified forest soils) were over twice as important in determining seedling survival
than the precipitation regimes in the study. The implications of this work suggest that
interacting effects of climate, species functional traits, and microsite conditions via
disturbance or management will influence many aspects of the regeneration of future
northeastern forests.
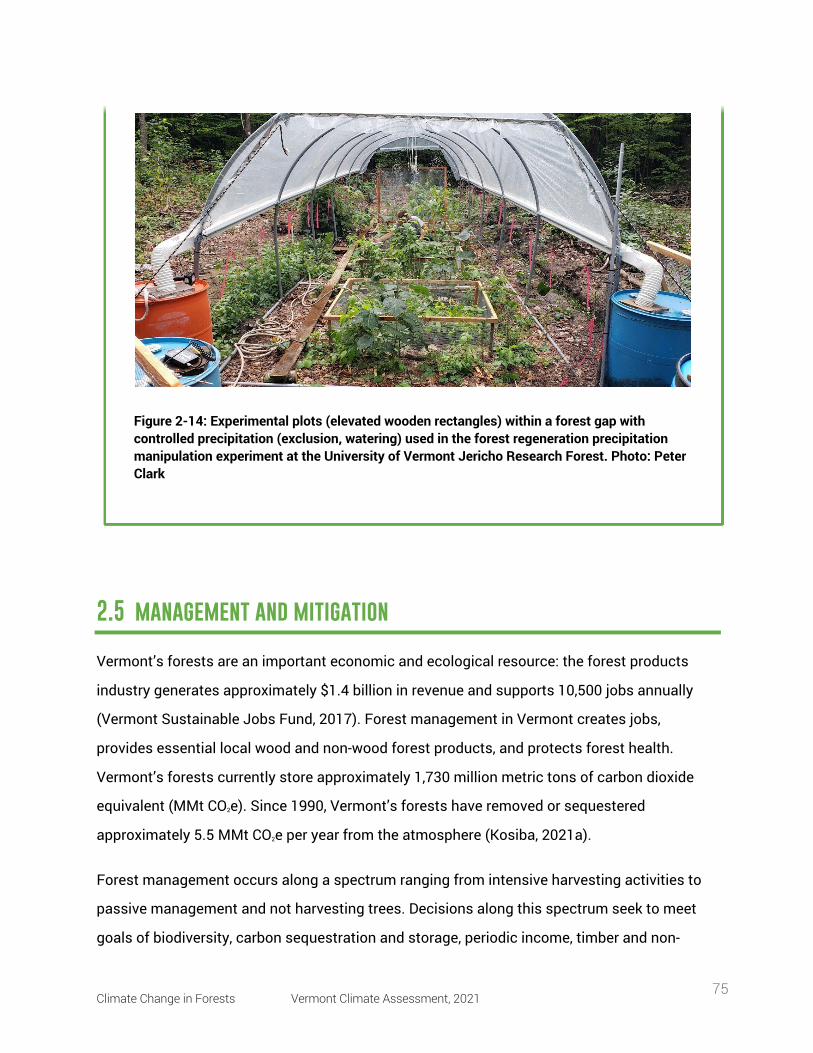
Climate Change in Forests Vermont Climate Assessment, 2021 75
2.5 management and mitigation
Vermont’s forests are an important economic and ecological resource: the forest products
industry generates approximately $1.4 billion in revenue and supports 10,500 jobs annually
(Vermont Sustainable Jobs Fund, 2017). Forest management in Vermont creates jobs,
provides essential local wood and non-wood forest products, and protects forest health.
Vermont’s forests currently store approximately 1,730 million metric tons of carbon dioxide
equivalent (MMt CO2e). Since 1990, Vermont’s forests have removed or sequestered
approximately 5.5 MMt CO2e per year from the atmosphere (Kosiba, 2021a).
Forest management occurs along a spectrum ranging from intensive harvesting activities to
passive management and not harvesting trees. Decisions along this spectrum seek to meet
goals of biodiversity, carbon sequestration and storage, periodic income, timber and non-
Figure 2-14: Experimental plots (elevated wooden rectangles) within a forest gap with controlled precipitation (exclusion, watering) used in the forest regeneration precipitation manipulation experiment at the University of Vermont Jericho Research Forest. Photo: Peter Clark
Climate Change in Forests Vermont Climate Assessment, 2021 76
timber forest product output, recreation, aesthetics, forest health, and global change
adaptation. Generally, any management decision requires calculating tradeoffs between the
above objectives. Passive management does not necessarily mean that a forest will remain
undisturbed in the long term, but it does mean that the next disturbance is less likely to be
directly caused by humans (see Disturbance section).
Climate change poses a threat to forest management operations, as shorter, warmer winters
make it harder to carry out management activities typically conducted when the ground is
frozen. These new challenges have cascading negative effects on rural economies and
management actions that would benefit forest climate change adaptation, response to forest
disturbances, wildlife habitat, and forest productivity.
Globally, forest management with a primary or solitary goal of carbon storage or sequestration
is becoming popular as a climate mitigation solution, but management for a singular goal may
have detrimental effects on forest economies, biodiversity, and forest health at the expense of
other forest processes and ecosystem services. For example, a forest that is managed
passively may have higher carbon stocks (i.e., carbon in aboveground biomass) than a recently
harvested forest, but it could be sequestering carbon at a lower rate (i.e., lower NPP) and due
to past human activity, lack the structural and functional complexity that provides it resistance
or resilience to climate change (e.g., Bradford and D’Amato, 2012). Further, owning land costs
money (e.g., landowners must pay taxes, maintenance of access to the land), and periodic
timber harvests provide income to pay these expenses, incentivizing landowners to keep
forests as forests. Wilderness conservation easements or payments for carbon storage (see
Mitigation section) often do not provide the same sort of periodic long-term income (Graves et
al., 2020).
2.5.1 Impacts on Length of Logging Season The logging industry in Vermont historically has been dependent on operations that take place
in the winter on frozen ground or on snowpack atop frozen ground, as loggers work to
minimize soil erosion and potential damage to tree root systems at sensitive sites. Warmer
Climate Change in Forests Vermont Climate Assessment, 2021 77
nighttime temperatures in December and January (see Climate Change in Vermont chapter)
mean that the ground is not freezing fully as early as it used to, and it is thawing earlier in the
spring, shortening the logging season, (Figure 2-15; Contosta et al., 2019). Vermont’s freeze-
free period has increased by three weeks since 1960 (see Climate Change in Vermont chapter).
Further, snow often falls before the ground is fully frozen, insulating the ground from frost and
potentially leading to winters where the ground never fully freezes (Rittenhouse and Rissman,
2015). These conditions reduce the number of operable days for logging contractors.
Dry summer months offer the second major logging season in the state. However, increased
rainfall in June and August, often falling in the form of heavy precipitation events (greater than
one inch), saturates the soils with water. This limits loggers’ ability to operate during these
months without causing significant ecological damage or physical damage to infrastructure
and machinery.
Poor logging conditions also lead to a need for longer contracts; rather than finishing jobs in
six months to one year, contracts often need to last two full years to ensure enough operable
days. This can disincentivize landowners to take on active management activities and mean
that logging contractors must spread their operations across many sites based on weather
and market conditions.
1.1.1 Impacts on Logging Occupation One way that logging contractors improve their ability to operate in poor conditions is to
expand or alter their equipment inventory. It often becomes necessary for contractors to own a
bulldozer or excavator to protect sites, adding to costs when there is already a low profit
margin (Kuloglu et al., 2019). Different logging equipment choices are needed for different
sites and conditions, so operators are forced to make tough decisions about what might serve
them best in the future. Sustained or higher costs combined with fewer days available to work
means that fewer logging contractors can maintain their businesses. Between 2002 and 2016
there was a 36% decrease in jobs in the forest products industry and 11% decrease in forest
products businesses (Vermont Sustainable Jobs Fund, 2017). These changes are not solely
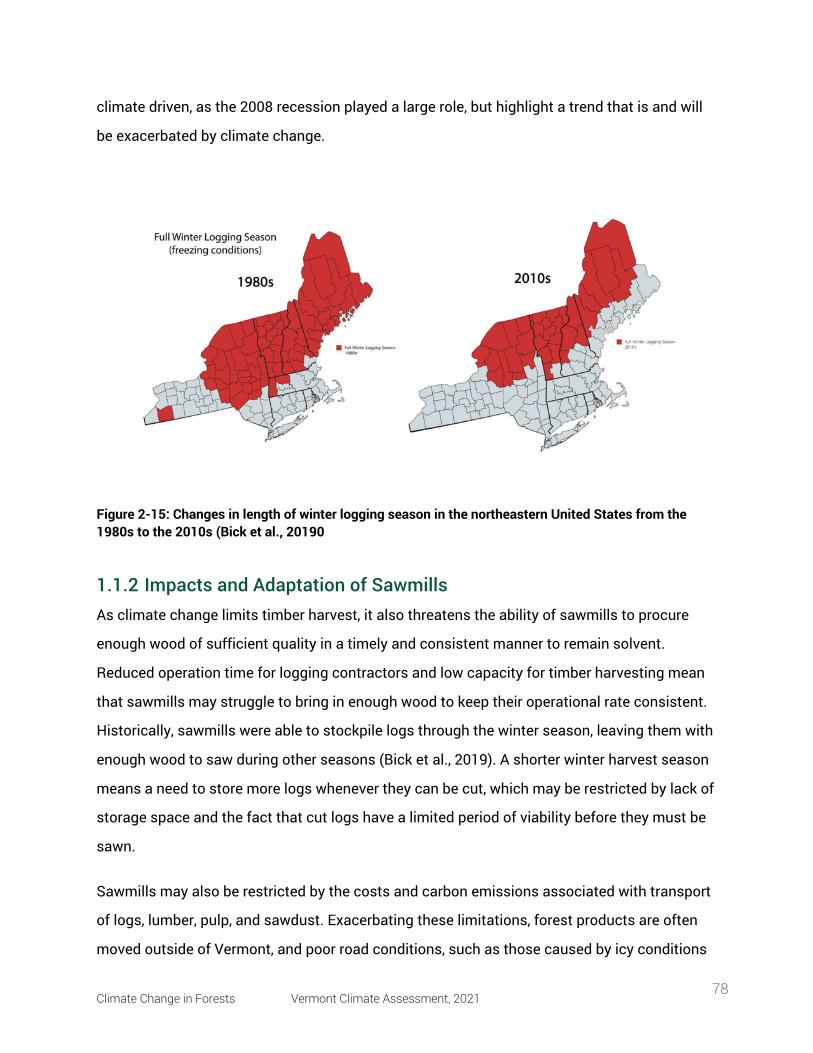
Climate Change in Forests Vermont Climate Assessment, 2021 78
climate driven, as the 2008 recession played a large role, but highlight a trend that is and will
be exacerbated by climate change.
Figure 2-15: Changes in length of winter logging season in the northeastern United States from the 1980s to the 2010s (Bick et al., 20190
1.1.2 Impacts and Adaptation of Sawmills As climate change limits timber harvest, it also threatens the ability of sawmills to procure
enough wood of sufficient quality in a timely and consistent manner to remain solvent.
Reduced operation time for logging contractors and low capacity for timber harvesting mean
that sawmills may struggle to bring in enough wood to keep their operational rate consistent.
Historically, sawmills were able to stockpile logs through the winter season, leaving them with
enough wood to saw during other seasons (Bick et al., 2019). A shorter winter harvest season
means a need to store more logs whenever they can be cut, which may be restricted by lack of
storage space and the fact that cut logs have a limited period of viability before they must be
sawn.
Sawmills may also be restricted by the costs and carbon emissions associated with transport
of logs, lumber, pulp, and sawdust. Exacerbating these limitations, forest products are often
moved outside of Vermont, and poor road conditions, such as those caused by icy conditions
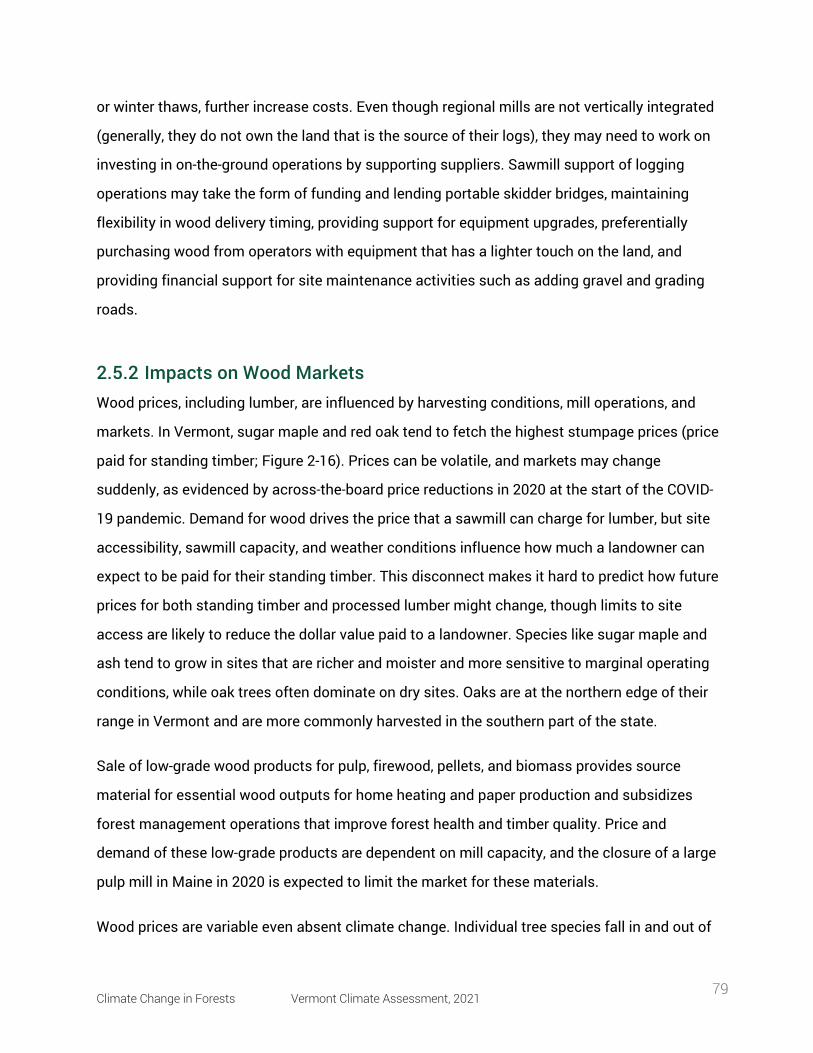
Climate Change in Forests Vermont Climate Assessment, 2021 79
or winter thaws, further increase costs. Even though regional mills are not vertically integrated
(generally, they do not own the land that is the source of their logs), they may need to work on
investing in on-the-ground operations by supporting suppliers. Sawmill support of logging
operations may take the form of funding and lending portable skidder bridges, maintaining
flexibility in wood delivery timing, providing support for equipment upgrades, preferentially
purchasing wood from operators with equipment that has a lighter touch on the land, and
providing financial support for site maintenance activities such as adding gravel and grading
roads.
2.5.2 Impacts on Wood Markets Wood prices, including lumber, are influenced by harvesting conditions, mill operations, and
markets. In Vermont, sugar maple and red oak tend to fetch the highest stumpage prices (price
paid for standing timber; Figure 2-16). Prices can be volatile, and markets may change
suddenly, as evidenced by across-the-board price reductions in 2020 at the start of the COVID-
19 pandemic. Demand for wood drives the price that a sawmill can charge for lumber, but site
accessibility, sawmill capacity, and weather conditions influence how much a landowner can
expect to be paid for their standing timber. This disconnect makes it hard to predict how future
prices for both standing timber and processed lumber might change, though limits to site
access are likely to reduce the dollar value paid to a landowner. Species like sugar maple and
ash tend to grow in sites that are richer and moister and more sensitive to marginal operating
conditions, while oak trees often dominate on dry sites. Oaks are at the northern edge of their
range in Vermont and are more commonly harvested in the southern part of the state.
Sale of low-grade wood products for pulp, firewood, pellets, and biomass provides source
material for essential wood outputs for home heating and paper production and subsidizes
forest management operations that improve forest health and timber quality. Price and
demand of these low-grade products are dependent on mill capacity, and the closure of a large
pulp mill in Maine in 2020 is expected to limit the market for these materials.
Wood prices are variable even absent climate change. Individual tree species fall in and out of
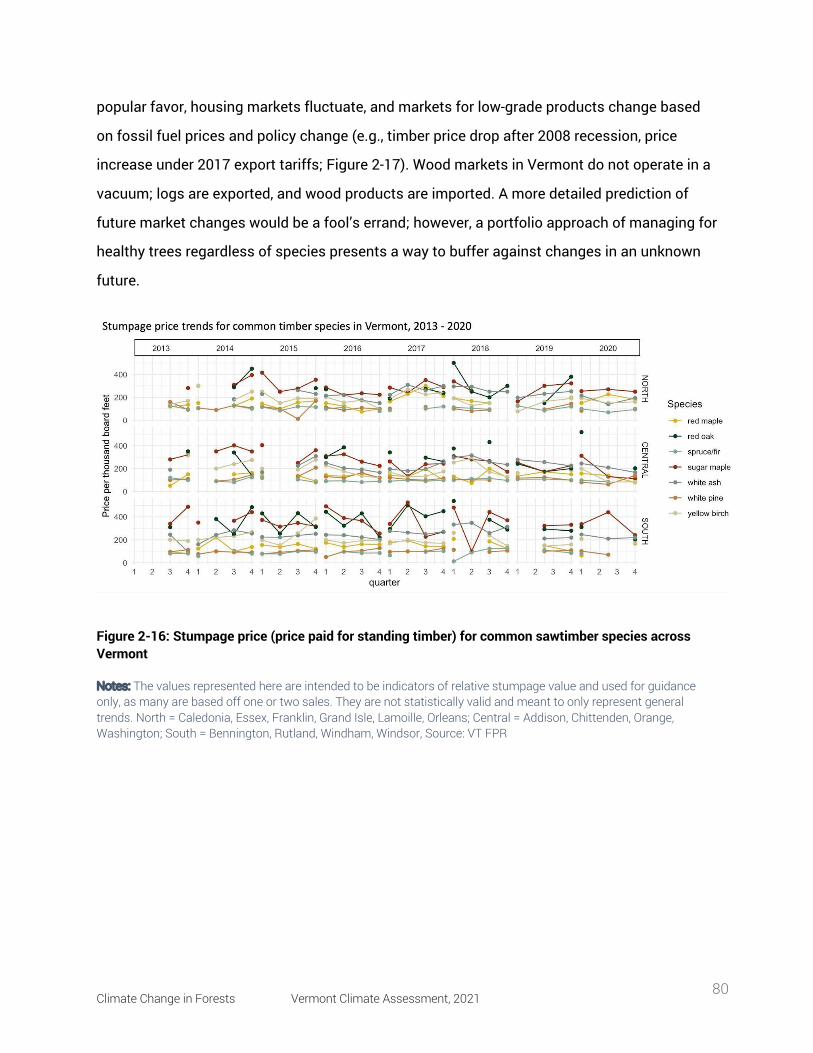
Climate Change in Forests Vermont Climate Assessment, 2021 80
popular favor, housing markets fluctuate, and markets for low-grade products change based
on fossil fuel prices and policy change (e.g., timber price drop after 2008 recession, price
increase under 2017 export tariffs; Figure 2-17). Wood markets in Vermont do not operate in a
vacuum; logs are exported, and wood products are imported. A more detailed prediction of
future market changes would be a fool’s errand; however, a portfolio approach of managing for
healthy trees regardless of species presents a way to buffer against changes in an unknown
future.
Figure 2-16: Stumpage price (price paid for standing timber) for common sawtimber species across Vermont
Notes: The values represented here are intended to be indicators of relative stumpage value and used for guidance only, as many are based off one or two sales. They are not statistically valid and meant to only represent general trends. North = Caledonia, Essex, Franklin, Grand Isle, Lamoille, Orleans; Central = Addison, Chittenden, Orange, Washington; South = Bennington, Rutland, Windham, Windsor, Source: VT FPR
Climate Change in Forests Vermont Climate Assessment, 2021 81
Figure 2-17: Price trends for low-grade wood products across Vermont. Source: VT FPR
Notes: The values represented here are intended to be indicators of relative stumpage value and used for guidance only, as many are based off one or two sales. They are not statistically valid and meant to only represent general trends. North = Caledonia, Essex, Franklin, Grand Isle, Lamoille, Orleans; Central = Addison, Chittenden, Orange, Washington; South = Bennington, Rutland, Windham, Windsor Source: VT FPR.
2.5.3 Infrastructure Costs As precipitation and winter temperatures increase, road improvements are often needed for
operators to move wood on harvest sites and along roads to mills. On harvest sites, this
means more time and resources spent on road construction, increased need for gravel to
stabilize roads, and more robust structures to manage water flow. On paved roads where
heavy log trucks travel to mills, water flow structures are likely to need improvement to handle
increased run-off and avoid damages to roads.
The United States Forest Service has adopted stream-simulation design, or drainage
structures that retain the natural stream bottom rather than round culverts, as the preferred
approach in their forest road systems. In the Green Mountain National Forest, Vermont
identified culverts that were replaced with stream-simulation design before Tropical Storm
Irene occurred (Gillespie et al., 2014) The difference in cost between using the prior design and
the stream-simulation design varied from 9 to 22%. Even more noteworthy is the difference
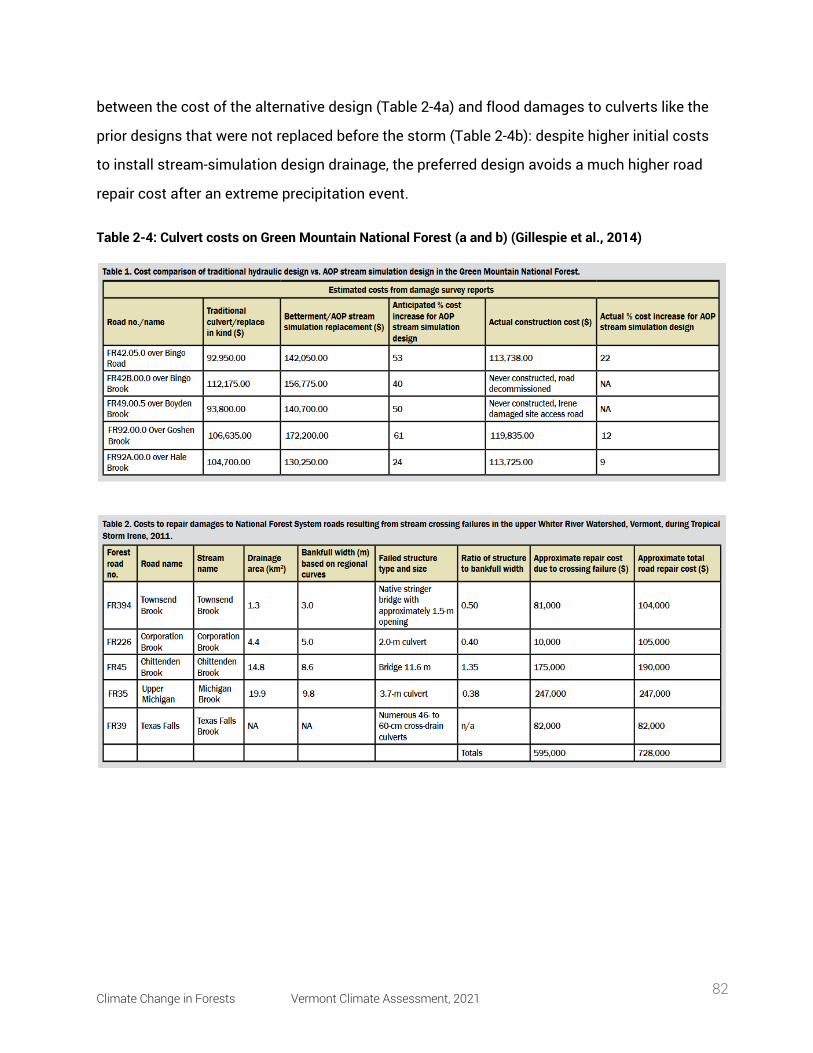
Climate Change in Forests Vermont Climate Assessment, 2021 82
between the cost of the alternative design (Table 2-4a) and flood damages to culverts like the
prior designs that were not replaced before the storm (Table 2-4b): despite higher initial costs
to install stream-simulation design drainage, the preferred design avoids a much higher road
repair cost after an extreme precipitation event.
Table 2-4: Culvert costs on Green Mountain National Forest (a and b) (Gillespie et al., 2014)
Climate Change in Forests Vermont Climate Assessment, 2021 83
Box 4.4: Testing Adaptation Methods for Forest Management Operations Climate change is expected to limit operability for carrying out forest management
activities. Concerns revolve around longer mud seasons in the spring and fall and
warmer winters with less frozen ground and snow cover that may not safely freeze
roads and stream crossings, thereby limiting erosion. A joint project between Atlas
Timberlands and Vermont Land Trust (Climate Change Response Framework, 2020)
tested options to keep operating logging equipment in the midst of climate change by
focusing more on preventing problems than fixing them. (Note: This land has since
changed hands and the project has ended).
Option 1: Changing equipment. A shift from skidding wood to cut-to-length systems
limits impact to the ground and provides incentive to retain slash in the woods. The
downside is the expense to change equipment; this change requires a cut-to-length
harvester and forwarder.
Option 2: Cut in summer and minimize impacts via improved bridges and other road
construction. A greater investment in road construction and portable skidder bridges
makes summer logging more feasible (and summer drought could help this), but extra
costs are incurred.
Option 3: Pre-manage roads. Construction of smaller water bars (earthen drainage
structures that direct water off roads to prevent erosion) before close-out (as opposed
to waiting until close-out to install full water bars) and brushing in roads before they
get muddy are both ways to protect roads and increase the number of workdays
possible at minimal cost.
Outcomes: This case study illustrates that it is cheaper and easier to log during a cold
winter (Table 2-5), though, unfortunately, this is becoming less possible. Logging in
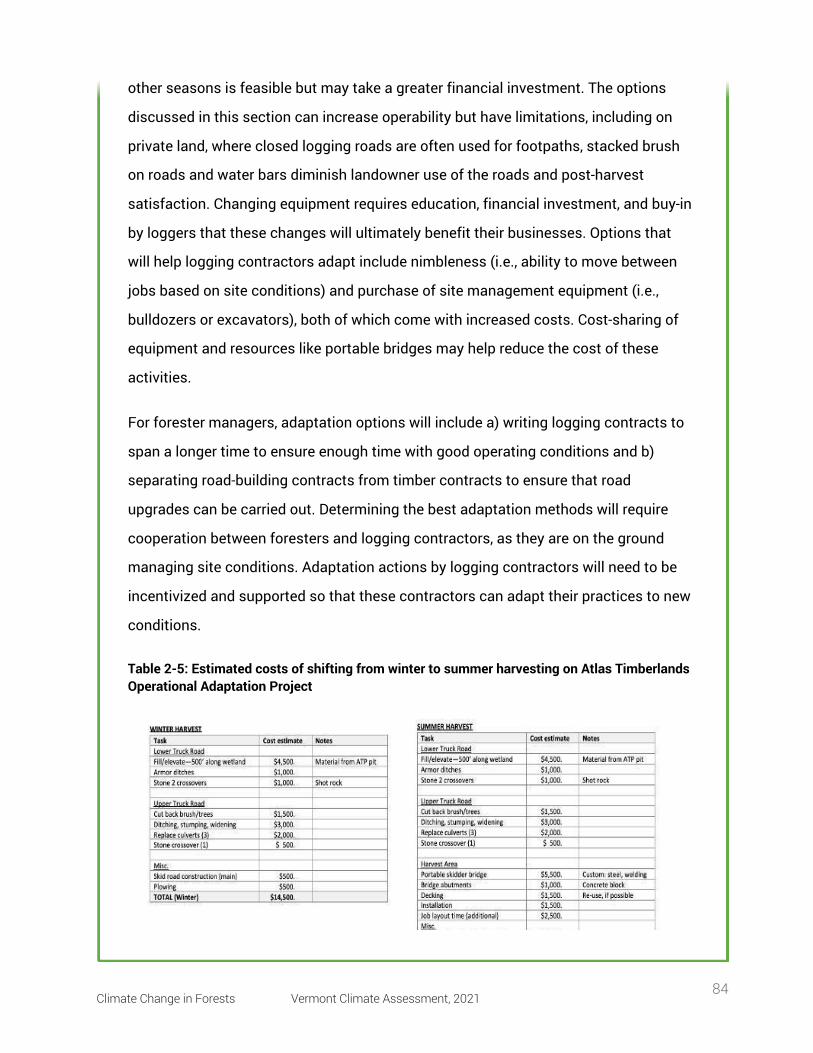
Climate Change in Forests Vermont Climate Assessment, 2021 84
other seasons is feasible but may take a greater financial investment. The options
discussed in this section can increase operability but have limitations, including on
private land, where closed logging roads are often used for footpaths, stacked brush
on roads and water bars diminish landowner use of the roads and post-harvest
satisfaction. Changing equipment requires education, financial investment, and buy-in
by loggers that these changes will ultimately benefit their businesses. Options that
will help logging contractors adapt include nimbleness (i.e., ability to move between
jobs based on site conditions) and purchase of site management equipment (i.e.,
bulldozers or excavators), both of which come with increased costs. Cost-sharing of
equipment and resources like portable bridges may help reduce the cost of these
activities.
For forester managers, adaptation options will include a) writing logging contracts to
span a longer time to ensure enough time with good operating conditions and b)
separating road-building contracts from timber contracts to ensure that road
upgrades can be carried out. Determining the best adaptation methods will require
cooperation between foresters and logging contractors, as they are on the ground
managing site conditions. Adaptation actions by logging contractors will need to be
incentivized and supported so that these contractors can adapt their practices to new
conditions.
Table 2-5: Estimated costs of shifting from winter to summer harvesting on Atlas Timberlands Operational Adaptation Project
Climate Change in Forests Vermont Climate Assessment, 2021 85
2.6 forest management challenges and opportunities
2.6.1 Ability to Carry Out Silvicultural Operations Management for wood products, non-timber forest products, wildlife habitat, recreation, and
climate mitigation are all dependent on the ability to carry out silviculture, or the planning of
goal-based forest management activities around the ecology of the forest and the species that
occupy it. Limits to operability in forests may lead to struggles to reach silvicultural goals. For
example, sugar maple, a dominant and desired tree in Vermont, regenerates best through leaf
litter on the forest floor. Harvesting in snowy conditions leaves the forest floor undisturbed,
but as winter harvest becomes more difficult and less common, more ground scarification can
occur during harvest, benefitting the regeneration of other species. Beech trees, already
impacted by beech bark disease (see disturbance subsection; Cale et al., 2015) will
aggressively root sprout with ground disturbance, and forests containing high amounts of
diseased beech are often intentionally managed in the winter. The loss of winter logging may
have cascading effects on forests, increasing beech sprouting, which will ultimately limit the
regeneration of other desired tree species such as sugar maple.
More generally, stressors related to climate change and globalization (e.g., spread of
invasives) will require forest management action to aid with ecosystem adaptation. Economic
impacts that reduce operator availability, close mills, discourage forest products as a career
path, or constrain forest management limit the ability for foresters, who are trained and able to
manage forests for adaptation, to carry out management actions that can benefit the forests
and rural communities and provide local wood to Vermonters. Wood product consumption
tends to remain fairly consistent, so if not sourced locally then wood is being harvested
elsewhere, potentially in a location with fewer environmental regulations, greater costs, and
increased carbon emissions from longer transportation routes (Berlik et al., 2002).
2.6.2 Active Management vs. Passive Management As climate change mitigation becomes more of a policy priority, the value of forests as a
Climate Change in Forests Vermont Climate Assessment, 2021 86
natural carbon sink is increasingly recognized. This has led to a flurry of recent research
seeking to understand how much carbon is stored by forests and which forest types, forest
ages, and management approaches are best for climate mitigation. The science of forest
carbon is in a state of flux, as new measurements and methods arise to understand carbon
dynamics and climate mitigation potential. Passive management, or the decision to not carry
out management activities in a forest, has been put forth as the way to maximize forest
carbon storage, though not necessarily sequestration (Luyssaert et al., 2008), but recent
research indicates that old or passively managed forests may not be storing as much carbon
as previously suspected (Gundersen et al., 2021). Additionally, good, active forest
management can lead to large healthy trees that, when harvested, convert to carbon storage in
durable wood products; this can be a long-term (100-year) solution for keeping carbon out of
the atmosphere while still realizing a broad suite of services from the forest (Dugan et al.,
2021). Prioritizing the mitigation value of forests by choosing a passive management
approach has both positive and negative effects; no one management solution is best for all
forests. Funding for carbon credits (see below) can support conservation of forest land,
insurance from land use change, and good business practices. High levels of carbon
sequestration in forests can offset the carbon emitted by fossil fuel use, but this process can
be only one part of climate mitigation and must go hand in hand with reduction of CO2
emissions. Depending on the scale employed, passive management with the sole emphasis of
maximizing carbon storage creates the potential to minimize other ecosystem goods and
services provided by forests, such as wildlife habitat, wood products, non-timber forest
products, water filtration, and recreation.
One point of confusion is the differences between carbon sequestration and carbon storage.
Sequestration describes the amount of carbon that is actively being removed from the
atmosphere, while storage is the amount of carbon that is being held in trees and forest soils.
Sequestration and storage have different relationships with stages of forest development:
while older forests store more carbon, younger forests tend to sequester more carbon (Figure
2-18). While some research indicates that old forests store a significant volume of carbon,
forests are dynamic systems, and old forests do not remain in a steady state. As a result of
Climate Change in Forests Vermont Climate Assessment, 2021 87
past land use, Vermont’s forests are predominantly in the eighty to hundred-year age class
(see Structure and Composition subsection). This uniformity in age class means that a greater
portion of the forests are vulnerable to similar types of disturbances, threatening their ability
to store carbon and opening the possibility that vast portions of the forest could revert to a
younger state simultaneously, upsetting the current carbon dynamics of Vermont’s forests.
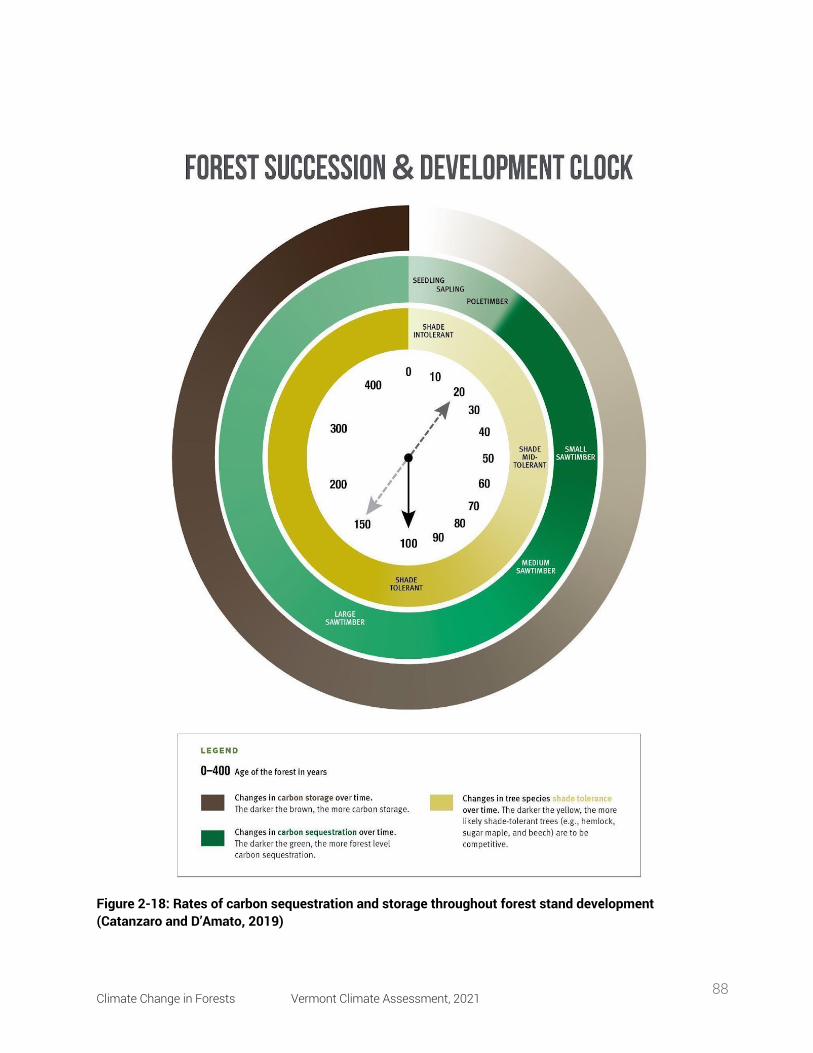
Climate Change in Forests Vermont Climate Assessment, 2021 88
Figure 2-18: Rates of carbon sequestration and storage throughout forest stand development (Catanzaro and D’Amato, 2019)
Climate Change in Forests Vermont Climate Assessment, 2021 89
2.6.3 Land Use Change Written by Jamey Fidel, General Counsel, Forest and Wildlife Program Director, Vermont Natural
Resources Council.
Vermont is the fourth most heavily forested state in the country, and while approximately 74%
of the state is covered by forests, forests are declining in extent on an annual basis (USDA
Forest Service, 2020). While it is extremely hard to pinpoint the exact amount of forest loss,
according to the Forest Service, approximately 14,207 acres of forest land are being converted
to non-forest every year (USDA Forest Service, 2020) After factoring in land that may revert to
forest, at this rate a net of over 300,000 acres of forestland may be converted to non-forest by
2050 (USDA Forest Service, 2019).
As forests become more compromised by development and urbanization, their ability to
remain healthy and provide ecosystem services, such as sequestering and storing carbon, will
be diminished. For example, a Forest Carbon Assessment documented that the total annual
uptake of carbon was less in 2015 (the end of the period of analysis) than in previous decades,
in part due to declining acres of forest land (Schultz et al., 2017). A more recent forest carbon
inventory confirmed that land use change has resulted in net emissions in Vermont, which is
concerning because forest land that is converted not only emits stored carbon, but it also
reduces future forest carbon sequestration (Kosiba, 2021a).
As large undeveloped forests are broken into smaller and smaller parcels from subdivision,
forest management becomes more challenging, and the relationships between parcel size and
forest owner behaviors have important implications for timber supply, resiliency, restoration,
and keeping forests as forests (Butler et al., 2021). Data gleaned from the Grand List in
Vermont highlights that undeveloped woodland as a land category decreased significantly
from 2004 to 2016, while residential acreage increased by almost 162,670 acres (Fidel et al.,
2018). During the same period, the amount of land in parcels 50 acres or larger declined by
about 110,300 acres, while the number of parcels under 50 acres in size with new houses
increased by 20,747 parcels (Fidel et al., 2018). This highlights an increasing trend in Vermont:
undeveloped forest land is being converted to residential development with houses and
Climate Change in Forests Vermont Climate Assessment, 2021 90
associated infrastructure, and smaller parcels are being created through the fragmentation
and parcelization of forestland from subdivision and development. Left unaddressed, these
trends will limit the ability of forests to remain resilient and provide vital services to mitigate
the impacts of climate change.
2.6.4 Carbon Markets Vermont’s Department of Forests, Parks, and Recreation has created comprehensive reports
explaining forest carbon, the carbon market, and its status and relevance in Vermont (Kosiba,
2021b). Here, carbon offsets as a forest management opportunity for Vermont’s landowners
are summarized.
Forest carbon offsets aim to reduce global CO2 emissions by taking advantage of forests’
ability to sequester and store carbon. Carbon offsets put a market value on sequestration or
storage to make up for emissions of CO2 in cases where CO2 reduction is impossible or
undesirable. Carbon offsets allow companies or individuals to offset their own carbon
emissions by paying to guarantee that carbon elsewhere is sequestered (actively removed from
the atmosphere and stored in another form or location) or stored (remaining in another form or
location, preventing its release back to the atmosphere). The key to effective carbon offsets is
that the payment is responsible for carbon sequestration or storage that would not have
happened or continued without it. Because forests are excellent at storing and sequestering
carbon, they are an opportunity for CO2 emitters to offset their climate impacts. And because
forests cover much of Vermont, the growing market for carbon offsets is an economic
opportunity for Vermont’s forest landowners.
Carbon offsets, also known as carbon credits, are treated as a currency in units of the
equivalent of 1 metric ton of CO2. A metric ton is about the amount of CO2 emitted by an
American car driven regularly for two-and-a-half months or the amount of carbon sequestered
by forty-six mature trees in a year (US EPA, 2015). Carbon offsets are bought and sold on
carbon markets or registries, of which there are several, each with somewhat different
restrictions and requirements. Some carbon markets are regulatory, used as a tool to help
Climate Change in Forests Vermont Climate Assessment, 2021 91
large emitters in states like California meet state CO2 emission guidelines, while others are
voluntary, where companies and individuals choose to pay to offset their emissions. Over the
past several decades, an industry has grown around these carbon markets, so there are now
organizations and consultants—such as carbon developers and third-party verifiers—engaging
in every step of the process that facilitate these transactions.
Forest carbon offset projects fall into one of three categories: 1) afforestation or reforestation
(tree planting), 2) avoided conversion (blocking the clearing of already-forested land), and 3)
improved forest management (shifting management practices to allow an existing forest to
store and/or sequester more carbon than before). Improved forest management is the most
relevant to Vermont’s forest landowners. Through a variety of management techniques, both
active and passive, forests are intentionally managed to maintain their carbon storage at or
above an agreed-upon level.
Two key components of carbon offset projects are permanence and additionality. Permanence
means carbon must be continually stored for the duration of the project’s contract, often from
40 to 100 years, and the carbon stored must remain above and beyond the amount that is
stored under a “business as usual” scenario, which is typically benchmarked at a baseline
year. Additionality is the difference between the increased carbon stored in the offset-insured
forest and the baseline of carbon stored without the offset incentive. Determining baselines
for forest carbon offset projects can be complicated, and regulations vary among carbon
markets. Defining the baseline for a carbon offset project depends on a specific property’s
circumstances, including legal encumbrances (i.e., easements or deed restrictions) and
harvesting regulations. For example, a forest previously protected by a “Forever Wild”
conservation easement with no logging allowed may not qualify for a carbon offset project; as
the forest is already guaranteed to remain unharvested, there is no additionality possible
through an improved forest management project.
However, forest carbon offset projects are compatible with existing programs in other ways.
Protecting a forest with a conservation easement at the same time it enters the carbon market
can help ensure the permanence of carbon-centric management of the parcel. Forests enrolled
Climate Change in Forests Vermont Climate Assessment, 2021 92
in Vermont’s popular Use Value Appraisal (or Current Use) program, which provides a tax
benefit for actively managed forestland, may also enter a carbon offset project, provided the
requirements of both programs continue to be met.
Since carbon markets are varied and evolving, contacting a carbon developer is the best way
for interested landowners to learn about the process and whether it may be right for them. The
most established carbon registries typically deal with large forest parcels (>2,000 acres), but
new and emerging companies are extending this opportunity to smaller forest landowners.
Under the right circumstances, projects that aggregate many small landholdings may be
appropriate to join the carbon market (see Box 2.5). Small landowners may also benefit from
emerging practice-based carbon programs such as the Family Forest Carbon Program being
developed by the American Forest Foundation and The Nature Conservancy.
Box 2.5: Cold Hollow to Canada Forests provide a multitude of ecosystem benefits including wildlife habitat,
improved water and air quality, and recreational and aesthetic benefits to humans.
Fragmentation diminishes these benefits. For example, the habitat of some birds that
nest in interior forests is greatly reduced when these forests are broken up into
smaller patches with more exposed edges and less interior. Therefore, small, privately
owned forest parcels pose a challenge to conservation; if one of those parcels is
developed, the impacts extend to the surrounding forest as well (Baldwin and Fouch,
2018). Landowner cooperation has other benefits, too: sharing resources, equipment,
and services such as management planning contribute to more cohesive
management and lower costs for individual forest owners (Kittredge, 2005). Carbon
markets are set up to include large forest parcels; programs that work with smaller
areas are few and still emerging. At this time, managing small, adjacent forest parcels
as an aggregate is beneficial both to the humans and animals who use these forests
and to the individual landowners who have more options to enter the carbon market.
Climate Change in Forests Vermont Climate Assessment, 2021 93
2.7 forest adaptation and management
Forest adaptation describes the capacity to respond to new or novel conditions. Uncertainty is
a recurring theme when it comes to forest adaptation to climate change. Over very long
historic time scales (thousands of years or more) forests responded to changing climate
conditions and persisted, but climate changes now are happening on the scale of decades, so
there is concern that forests may not be able to adapt at that pace. In response, forestry has
adopted adaptive management, which includes changing forest management approaches in
response to changing local conditions and is driven by research and practitioner action.
Forest adaptation and management can be understood within a matrix of change and
response, with approaches laid out along a continuum (Figure 2-19; Millar et al., 2007). In
forest adaptation and management, there is not one simple solution; rather, site-specific
decisions are made based on local conditions and dynamics, management objectives, and
Beginning in 2018, the Vermont Land Trust and Cold Hollow to Canada coordinated
the aggregation and sale of carbon offsets for the forests of ten private landowners.
This cooperative project is the first of its kind in the United States. Individual
landowners with properties too small to be lucrative on the existing carbon market
worked together with partner organizations to sell carbon offsets as a group for their
forested land totaling over 7,500 acres (Hancock, 2020). Although historically, only
large forest parcels of thousands of acres were economically viable in the carbon
market, the Cold Hollow to Canada project represents a way forward for smaller
landowners in Vermont and beyond. By banding together, the connected forests are
protected as a unit for at least forty years. And by managing for carbon storage, many
other ecosystem benefits result; for example, improved water quality and wildlife
habitat are amplified by the larger footprint of this project’s carbon-rich forests.
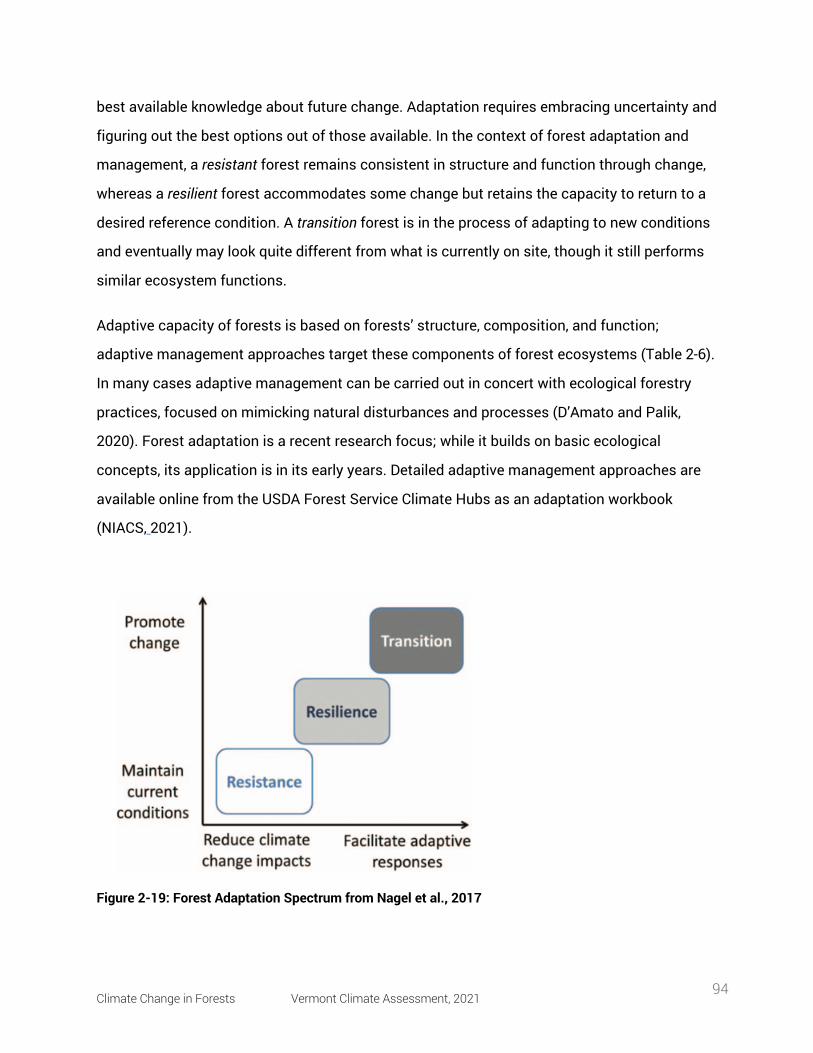
Climate Change in Forests Vermont Climate Assessment, 2021 94
best available knowledge about future change. Adaptation requires embracing uncertainty and
figuring out the best options out of those available. In the context of forest adaptation and
management, a resistant forest remains consistent in structure and function through change,
whereas a resilient forest accommodates some change but retains the capacity to return to a
desired reference condition. A transition forest is in the process of adapting to new conditions
and eventually may look quite different from what is currently on site, though it still performs
similar ecosystem functions.
Adaptive capacity of forests is based on forests’ structure, composition, and function;
adaptive management approaches target these components of forest ecosystems (Table 2-6).
In many cases adaptive management can be carried out in concert with ecological forestry
practices, focused on mimicking natural disturbances and processes (D’Amato and Palik,
2020). Forest adaptation is a recent research focus; while it builds on basic ecological
concepts, its application is in its early years. Detailed adaptive management approaches are
available online from the USDA Forest Service Climate Hubs as an adaptation workbook
(NIACS, 2021).
Figure 2-19: Forest Adaptation Spectrum from Nagel et al., 2017
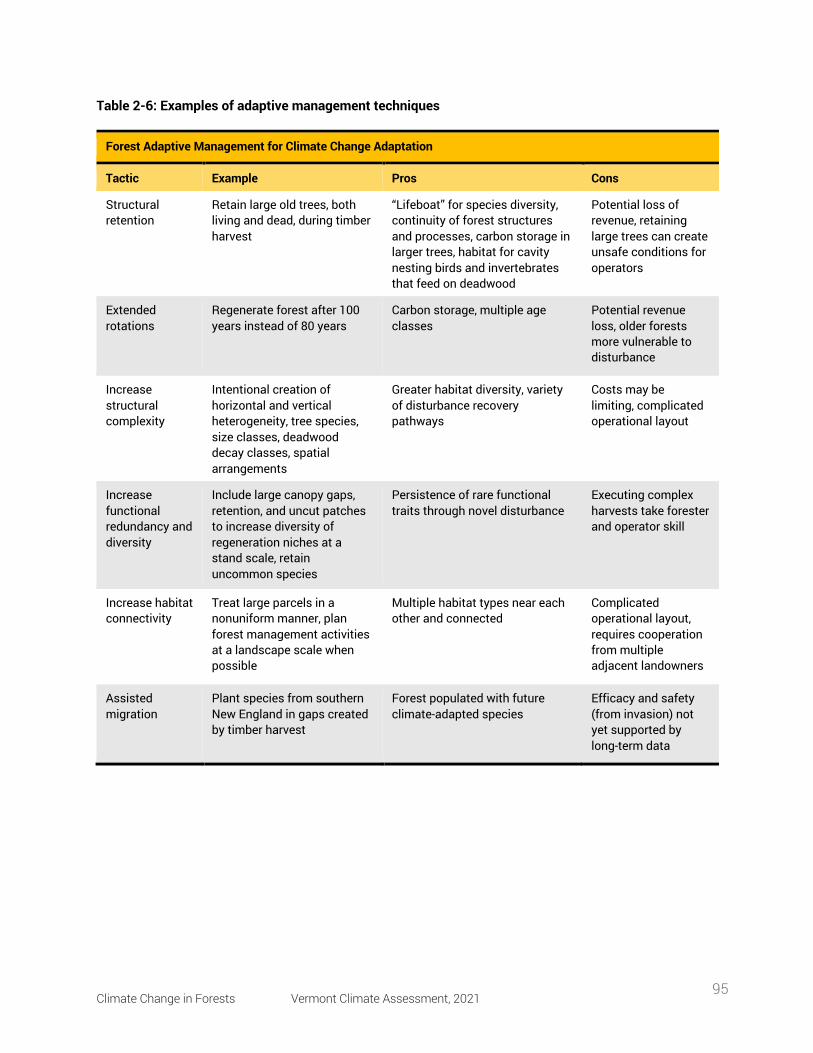
Climate Change in Forests Vermont Climate Assessment, 2021 95
Table 2-6: Examples of adaptive management techniques
Forest Adaptive Management for Climate Change Adaptation
Tactic Example Pros Cons
Structural retention
Retain large old trees, both living and dead, during timber harvest
“Lifeboat” for species diversity, continuity of forest structures and processes, carbon storage in larger trees, habitat for cavity nesting birds and invertebrates that feed on deadwood
Potential loss of revenue, retaining large trees can create unsafe conditions for operators
Extended rotations
Regenerate forest after 100 years instead of 80 years
Carbon storage, multiple age classes
Potential revenue loss, older forests more vulnerable to disturbance
Increase structural complexity
Intentional creation of horizontal and vertical heterogeneity, tree species, size classes, deadwood decay classes, spatial arrangements
Greater habitat diversity, variety of disturbance recovery pathways
Costs may be limiting, complicated operational layout
Increase functional redundancy and diversity
Include large canopy gaps, retention, and uncut patches to increase diversity of regeneration niches at a stand scale, retain uncommon species
Persistence of rare functional traits through novel disturbance
Executing complex harvests take forester and operator skill
Increase habitat connectivity
Treat large parcels in a nonuniform manner, plan forest management activities at a landscape scale when possible
Multiple habitat types near each other and connected
Complicated operational layout, requires cooperation from multiple adjacent landowners
Assisted migration
Plant species from southern New England in gaps created by timber harvest
Forest populated with future climate-adapted species
Efficacy and safety (from invasion) not yet supported by long-term data
Climate Change in Forests Vermont Climate Assessment, 2021 96
Box 2.7a: Early Lessons from Adaptation Plantings Aimed at Transitioning Species Composition for Climate Change in the Northeastern United States Written by Peter Clark, University of Vermont
In 2018, adaptation plantings were installed in harvest gaps in northern hardwood
and mixed conifer-hardwood forest across sites in Vermont and New Hampshire as
part of the New England installation of the Adaptive Silviculture for Climate Change
project (adaptivesilviculture.org). The goal of this experiment was to examine the
performance of future-climate adapted tree species from a suite of functional traits
(e.g., seed mass, shade tolerance, growth rates) to better understand the relationship
between introduced species and contemporary drivers that may control seedling
growth and survival.
The future-adapted species (“adaptation plantings”) tested included a) “population
enrichment” plantings (northern red oak, black cherry, red spruce, white pine, eastern
hemlock, and bigtooth aspen), which were generally underrepresented onsite but
have ranges that encompassed research sites (Figure 2-20) and b) “assisted range
expansion” plantings (black birch (Betula lenta), bitternut hickory (Carya cordiformis),
and American chestnut (Castanea dentata), which were currently not onsite but
planted with modest advances outside of current range but within future projected
habitat range.
Over three growing seasons, 3,152 out of 5,620 total seedling transplants survived
(approximately 57%). Seedling growth and survival varied considerably among
species, with slight inverse relationships (i.e., some species grew faster, while others
had higher survival rates; Figure 2-21). The major factors influencing seedling
performance were competition from shrubs and herbaceous plants, species
Climate Change in Forests Vermont Climate Assessment, 2021 97
regeneration traits, initial size and health of seedling, and transfer distance from
species range.
Sites with strong “ecological memory” in the form of dense natural regeneration were
more likely to outcompete the new or novel adaptation plantings; however, sites with
heavy deer browse slowed down natural competition, which inadvertently favored
many adaption plantings. Moreover, species traits moderated seedling response,
such as the ability to root-sprout after winter injury or dieback (e.g., hickory and
chestnut), rapid initial growth to outcompete vegetative competition (e.g., aspen,
cherry, and pine), energy allocation to roots (e.g., red oak), and inherent deep shade
tolerance to persist under competition (e.g., spruce and hemlock).
Population enrichment species performed significantly better than assisted range
expansion species, which exhibited more maladaptation, further highlighting the
challenges of assisted migration. Additionally, these adaptation plantings
experienced extreme climate events, such as a once-in-a-century spring drought
during planting and late spring frosts in subsequent years that caused negative
consequences on seedling performance that differed by species and across regional
sites. Extreme climate events like these are important future climate analogues for
conditions that managers will contend with as they consider implementation of
adaptation plantings.
Forests in the Northeast are projected to experience profound changes in suitable
tree habitats, highlighting the potential importance of adaptation plantings. Assisted
migration activities may be necessary to establish future-adapted trees, so the
strength of local site competition, adaptive traits, assisted migration distance, and
availability of quality and diverse nursery seedling stock will play important roles in
determining performance and efficacy of efforts to transition forest composition.
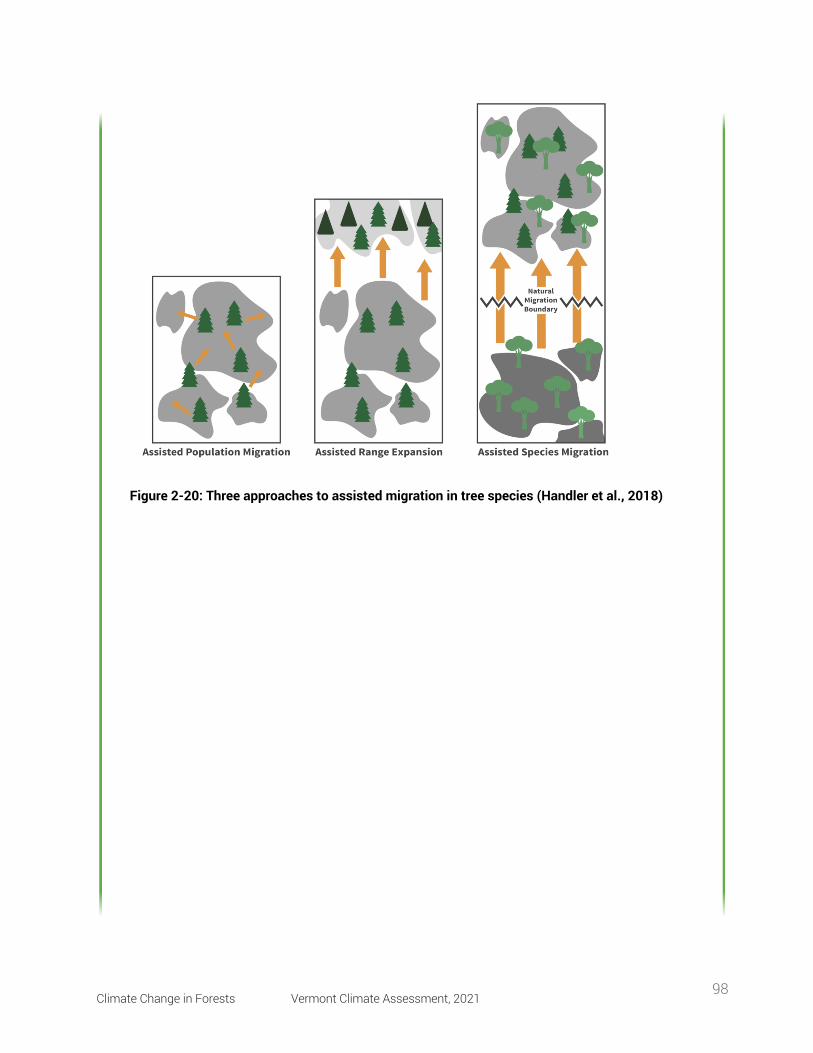
Climate Change in Forests Vermont Climate Assessment, 2021 98
Figure 2-20: Three approaches to assisted migration in tree species (Handler et al., 2018)
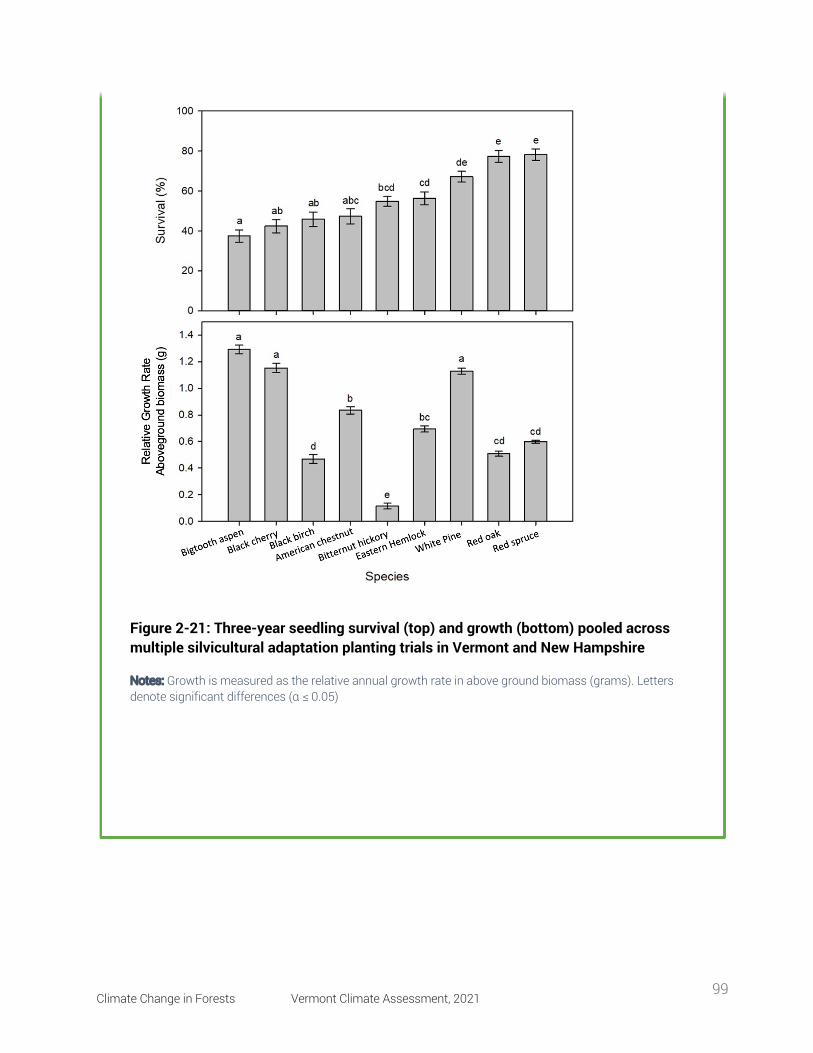
Climate Change in Forests Vermont Climate Assessment, 2021 99
Figure 2-21: Three-year seedling survival (top) and growth (bottom) pooled across multiple silvicultural adaptation planting trials in Vermont and New Hampshire
Notes: Growth is measured as the relative annual growth rate in above ground biomass (grams). Letters denote significant differences (α ≤ 0.05)
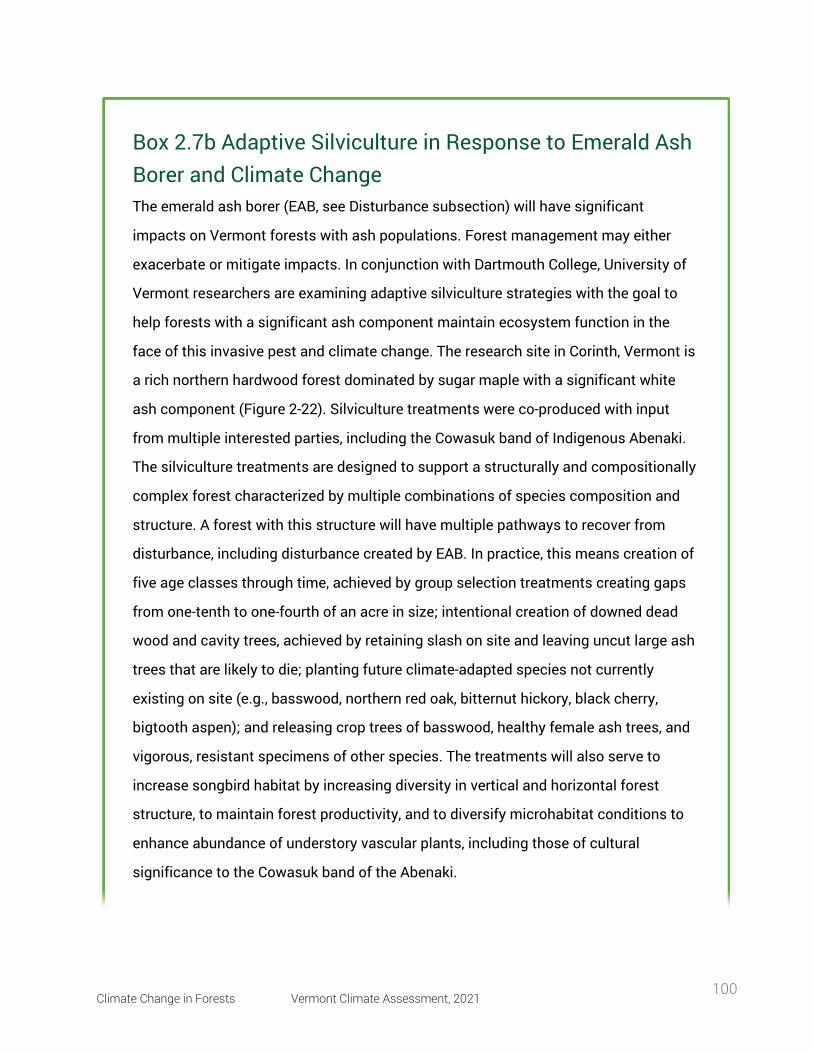
Climate Change in Forests Vermont Climate Assessment, 2021 100
Box 2.7b Adaptive Silviculture in Response to Emerald Ash Borer and Climate Change The emerald ash borer (EAB, see Disturbance subsection) will have significant
impacts on Vermont forests with ash populations. Forest management may either
exacerbate or mitigate impacts. In conjunction with Dartmouth College, University of
Vermont researchers are examining adaptive silviculture strategies with the goal to
help forests with a significant ash component maintain ecosystem function in the
face of this invasive pest and climate change. The research site in Corinth, Vermont is
a rich northern hardwood forest dominated by sugar maple with a significant white
ash component (Figure 2-22). Silviculture treatments were co-produced with input
from multiple interested parties, including the Cowasuk band of Indigenous Abenaki.
The silviculture treatments are designed to support a structurally and compositionally
complex forest characterized by multiple combinations of species composition and
structure. A forest with this structure will have multiple pathways to recover from
disturbance, including disturbance created by EAB. In practice, this means creation of
five age classes through time, achieved by group selection treatments creating gaps
from one-tenth to one-fourth of an acre in size; intentional creation of downed dead
wood and cavity trees, achieved by retaining slash on site and leaving uncut large ash
trees that are likely to die; planting future climate-adapted species not currently
existing on site (e.g., basswood, northern red oak, bitternut hickory, black cherry,
bigtooth aspen); and releasing crop trees of basswood, healthy female ash trees, and
vigorous, resistant specimens of other species. The treatments will also serve to
increase songbird habitat by increasing diversity in vertical and horizontal forest
structure, to maintain forest productivity, and to diversify microhabitat conditions to
enhance abundance of understory vascular plants, including those of cultural
significance to the Cowasuk band of the Abenaki.
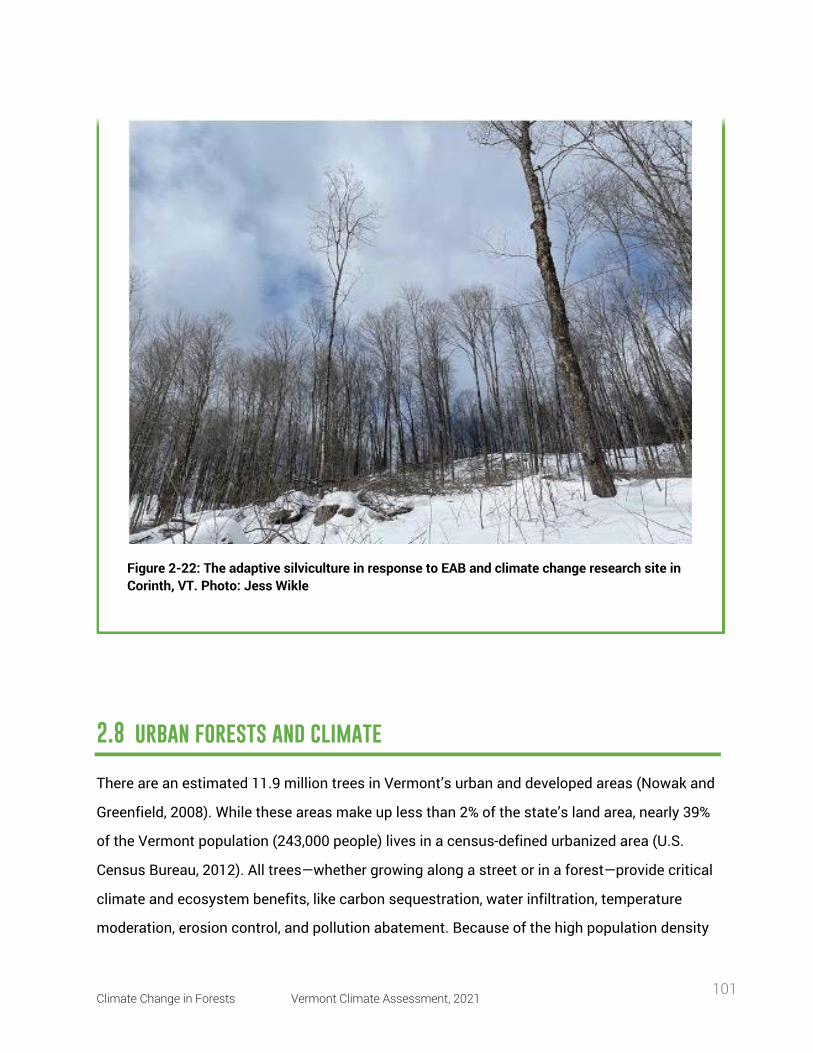
Climate Change in Forests Vermont Climate Assessment, 2021 101
2.8 urban forests and climate
There are an estimated 11.9 million trees in Vermont’s urban and developed areas (Nowak and
Greenfield, 2008). While these areas make up less than 2% of the state’s land area, nearly 39%
of the Vermont population (243,000 people) lives in a census-defined urbanized area (U.S.
Census Bureau, 2012). All trees—whether growing along a street or in a forest—provide critical
climate and ecosystem benefits, like carbon sequestration, water infiltration, temperature
moderation, erosion control, and pollution abatement. Because of the high population density
Figure 2-22: The adaptive silviculture in response to EAB and climate change research site in Corinth, VT. Photo: Jess Wikle
Climate Change in Forests Vermont Climate Assessment, 2021 102
and lower tree cover in urbanized areas, per-tree ecosystem services in urbanized areas can be
higher than in forest settings. Yet because of the amplifying effects of the built environment
on temperature and water cycling, along with additional stressors associated with urbanized
areas like soil compaction, poor soil fertility, and pollution, urban trees are highly vulnerable to
climate change.
2.8.1 Urban Forests and Carbon Like forest trees, trees growing along roads and in yards, parks, and community forests
provide important climate mitigation effects by sequestering and storing atmospheric CO2 in
wood and soil. Unfortunately, there is no standard definition of what constitutes an urban or
community forest, so it is difficult to compare mitigation estimates from various sources.
Additionally, estimating tree carbon, especially annual sequestration, is challenging and
imprecise. It requires modeling a tree’s biomass based on the carbon in a reference set of
sample trees. These models can be inaccurate for street and yard trees because the growing
conditions are highly variable compared to forest-grown reference trees (McHale et al., 2009;
McPherson et al., 2016). Finally, to compute the actual climate mitigation effect of a tree, the
maintenance inputs should be included (Nowak et al., 2013), and this is often either unknown
or highly variable.
Despite these challenges, several sources have estimated the total carbon storage and annual
sequestration of Vermont’s urban trees. According to these estimates, trees in urbanized areas
store about 15 MMt CO2e (equivalent to the annual emissions from 3.8 coal fired power plants)
and sequester 157,000–500,000 Mt CO2e per year (equivalent to 18,000-60,000 U.S. homes’
annual energy use) (Domke et al., 2020; EPA, 2021; Nowak et al., 2013; Zheng et al., 2013). On
a per area basis, some estimates suggest that Vermont’s street trees sequester CO2 at a higher
annual rate compared to forest trees (Nowak et al., 2013), as urban trees tend to have wider
tree crowns, experience less competition from other trees, and have a greater leaf area
compared to forest-grown trees. However, urban trees have significantly shorter lifespans and
greater maintenance demands, which affect their lifetime carbon storage potential and
resultant mitigation benefit (Nowak et al., 2013). After accounting for the greenhouse gas
Climate Change in Forests Vermont Climate Assessment, 2021 103
emissions from growing, planting, and maintaining urban trees, one study found that an urban
tree must live a minimum of ten years to provide a net positive mitigation benefit (Nowak et al.,
2013).
In addition to the direct benefit of sequestering atmospheric CO2, trees in urbanized areas
provide important indirect climate benefits. All trees moderate temperature fluctuations by
shading surfaces and transpiring water vapor, but in urban areas this is particularly important
because of the urban heat island effect (Millward et al., 2014; US EPA, 2014). A tree’s canopy
provides shade and wind protection for buildings, which reduces energy needs. This results in
lower greenhouse gas emissions and reduced heating and cooling costs (McPherson and
Simpson, 1999; US EPA, 2014). Trees also act as green infrastructure, reducing stormwater
runoff from extreme rainfall events by transpiring water and keeping soil intact with their roots
(Nowak et al., 2020).
2.8.2 Specific Climate Change Impacts on Urban Forests Trees in urbanized areas experience different and often intensified impacts from climate
change because of the built environment. Urban areas may experience hotter and drier
climates than interior forests (Fahey et al., 2013). There are more impervious surfaces that
cause stormwater runoff (Solecki and Marcotullio, 2013). Under a warmer climate, we may see
more ice and windstorms, which can damage trees, infrastructure, and property (Dale et al.,
2001; Neumann et al., 2015). Urban trees may be weakened by compounding stresses of heat,
drought, extreme weather events, and pests and pathogens, which may not only decrease
vigor and growth, but increase mortality. This, in turn, reduces the ability of urban trees to
sequester and store carbon (Figure 2-23). A study from Cambridge, Massachusetts found that
climate-related changes could result in 58% tree mortality (Foran et al., 2015). Current and
future management responses will influence the vulnerability of urban trees and forests.
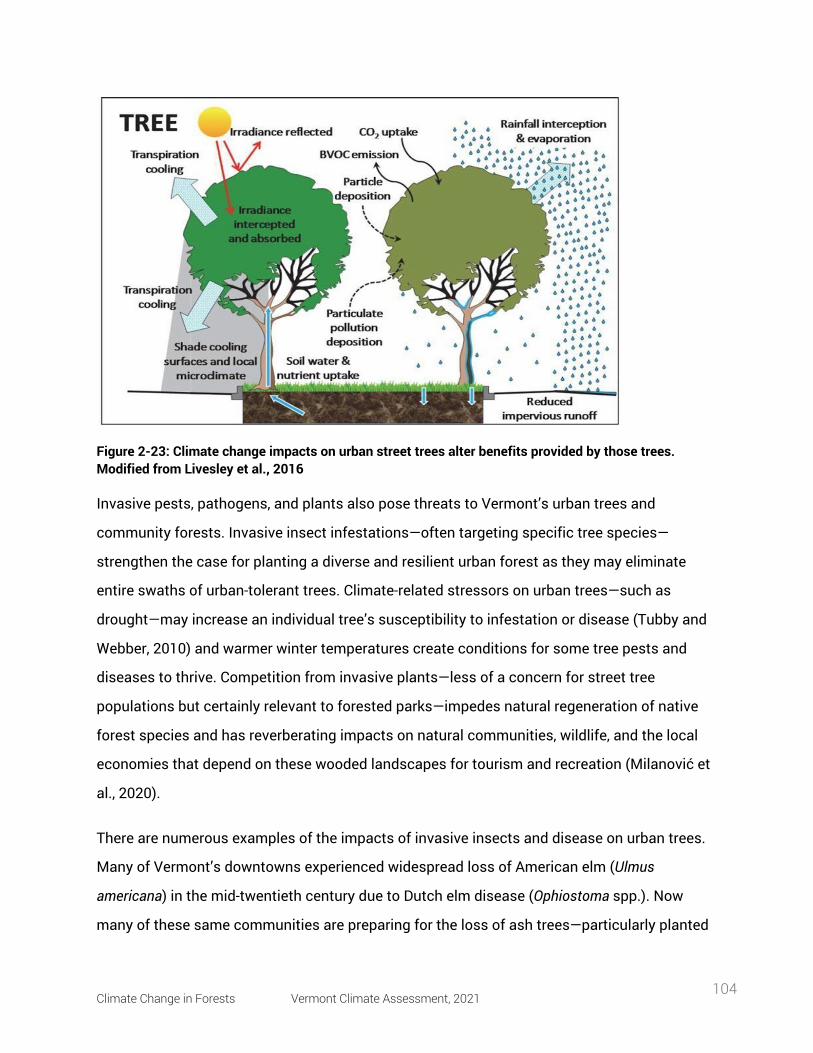
Climate Change in Forests Vermont Climate Assessment, 2021 104
Figure 2-23: Climate change impacts on urban street trees alter benefits provided by those trees. Modified from Livesley et al., 2016
Invasive pests, pathogens, and plants also pose threats to Vermont’s urban trees and
community forests. Invasive insect infestations—often targeting specific tree species—
strengthen the case for planting a diverse and resilient urban forest as they may eliminate
entire swaths of urban-tolerant trees. Climate-related stressors on urban trees—such as
drought—may increase an individual tree’s susceptibility to infestation or disease (Tubby and
Webber, 2010) and warmer winter temperatures create conditions for some tree pests and
diseases to thrive. Competition from invasive plants—less of a concern for street tree
populations but certainly relevant to forested parks—impedes natural regeneration of native
forest species and has reverberating impacts on natural communities, wildlife, and the local
economies that depend on these wooded landscapes for tourism and recreation (Milanović et
al., 2020).
There are numerous examples of the impacts of invasive insects and disease on urban trees.
Many of Vermont’s downtowns experienced widespread loss of American elm (Ulmus
americana) in the mid-twentieth century due to Dutch elm disease (Ophiostoma spp.). Now
many of these same communities are preparing for the loss of ash trees—particularly planted
Climate Change in Forests Vermont Climate Assessment, 2021 105
green ash (Fraxinus pennsylvanica)—from streets and parks due to the invasive emerald ash
borer, which was first detected in Vermont in 2018. According to the Vermont Urban &
Community Forestry Program’s (VT UCF) inventory of public urban trees (>24,000 trees across
thirty municipalities), approximately one out of every six Vermont downtown and
neighborhood trees is an ash. Additionally, municipal staff and volunteers in more than forty
towns and cities have recorded over 45,000 ash trees along rural roadsides using VT UCF’s
Rural Roadside Ash Inventory Tool (VT UCF, 2021a).
Together, these stressors add complexity to the already daunting task of selecting and
sourcing urban-tolerant tree species for planting and of moving the needle towards diverse
species composition in urban areas. Only four Vermont municipalities have an arborist on
staff. This means that in most communities, tree planting and maintenance efforts are led by
citizen volunteers or are contracted to outside organizations. Vermont’s limited number of tree
nurseries are challenged with selecting and propagating species that will be successful in an
uncertain future. Until recently, there has been little attention to genotypes (genetic
adaptation) when breeding trees for planting. Even within a species there is significant
variability in physiological response to climate and site factors, such that seed source is an
important consideration under a changing climate. Resources to aid these decision-makers is
increasingly important to steward long-lived tree species that can provide sustained benefits
for urban populations. The US Forest Service’s Climate Change Tree Atlas is an example of one
such resource that supports strategic selection of tree species that have high adaptive
capacity in the face of climate change (Peters et al., 2020).
2.8.3 Adapting Urban Forests Worldwide, many cities, regions, and even countries are assessing existing canopy cover using
advanced spatial analysis tools (e.g., aerial imagery, satellite imagery, LiDAR) and establishing
ambitious urban tree canopy (UTC) cover goals as part of climate action plans. In Vermont, the
University of Vermont’s Spatial Analysis Lab continues to build its database of remote imagery
and pioneers UTC work at a national level. The VT UCF program has funded UTC assessments
in Montpelier, St. Albans City, Rutland City, and South Burlington, and two UTC assessments
Climate Change in Forests Vermont Climate Assessment, 2021 106
for the City of Burlington to assess change over time (VT UCF, 2021b). In concert with UTC
goals is the recent proliferation of million and even trillion tree-planting initiatives. This
collective recognition of the power and importance of urban forestry is encouraging, but they
are only worth engaging in if they are done well. Investment in the proper care of urban and
community forest trees is vital. Large, long-lived species that have been maintained for
structural integrity will provide the most benefits over time (Nowak et al., 2002).
As Vermont urban and community forestry managers consider the role that trees will play in
strengthening communities’ resilience to climate change, they must also plan to adapt to
climate change. Fortunately, there are resources—many online and free—to support climate
change resilience and adaptation efforts. The US Forest Service’s Vibrant Cities Lab and
Climate Change Resource Center and the Northern Institute of Applied Climate Science’s
Urban Forestry Climate Change Response Framework support climate change-informed urban
forestry planning (NIACS, 2021; USDA Forest Service, 2021) The i-Tree suite of tools quantifies
the values provided by trees and aids in planning at multiple scales (i-Tree, 2021) New
resources like American Forests’ Tree Equity Score Tool and the US Forest’s Urban Forest
Inventory and Analysis (FIA) program support data-driven strategic tree-planting plans so that
all people have access to the vast benefits that tree canopy provides (American Forests, 2021;
USDA Forest Service, 2021). Organizations such as City Forest Credits are even engaging in
efforts to legitimately fund urban forestry through carbon offsets.
While urban and developed areas cover smaller areas of Vermont than other states in New
England, future expansion of developed areas is likely. These expansions could result in
conversion of forests and other natural and working lands to developed lands, reducing tree
cover and forest regeneration while increasing impervious surfaces. Land use planning with a
climate adaptation lens that includes healthy trees and forests will be critical to ensuring
resilience to climate change.
Climate Change in Forests Vermont Climate Assessment, 2021 107
Box 2.7: Spotlight on Vermont Urban and Community Forestry Program The Vermont Urban & Community Forestry Program (VT UCF) was established in 1991
as a collaborative effort between the Vermont Department of Forests, Parks, and
Recreation and University of Vermont Extension. The program provides technical,
financial, and educational assistance to roughly 100 municipalities each year to
support the management and stewardship of these forest resources (Figure 2-24).
Since 2017, the program has given 1,250 free containerized trees to 645 households
in seven priority municipalities through a partnership with the Arbor Day Foundation’s
Community Canopy Program (formerly known as Energy-Saving Trees). The Vermont
Department of Health’s Climate and Health Program has contributed as a funding
partner for multiple years, forging a cross-agency collaboration that recognizes the
links between tree canopy cover, public health, and the climate-related services trees
provide.
Research from the Climate and Health Program has informed partner selection for VT
UCF’s Vermont Community Canopy Program with the goal to provide free trees to
communities that are most vulnerable to heat-related illness. The Vermont Heat
Vulnerability Index draws together seventeen different measures of vulnerability in six
different themes: population, socioeconomic, health, environmental, climate, and heat
illness. The municipalities engaged in the program in its first four years are Barre City,
Bennington, Bradford, Brattleboro, Newport City, Rutland City, and St. Albans City.
Residents select up to two free trees and use the Arbor Day Foundation’s software
interface to identify the ideal tree planting locations on their property to maximize the
air, water, energy, and carbon benefits of their tree(s). VT UCF coordinates community
tree pick-up events and provides guidance on proper tree planting and care to the
participants. The Arbor Day Foundation provides an impact report (see graphic below)
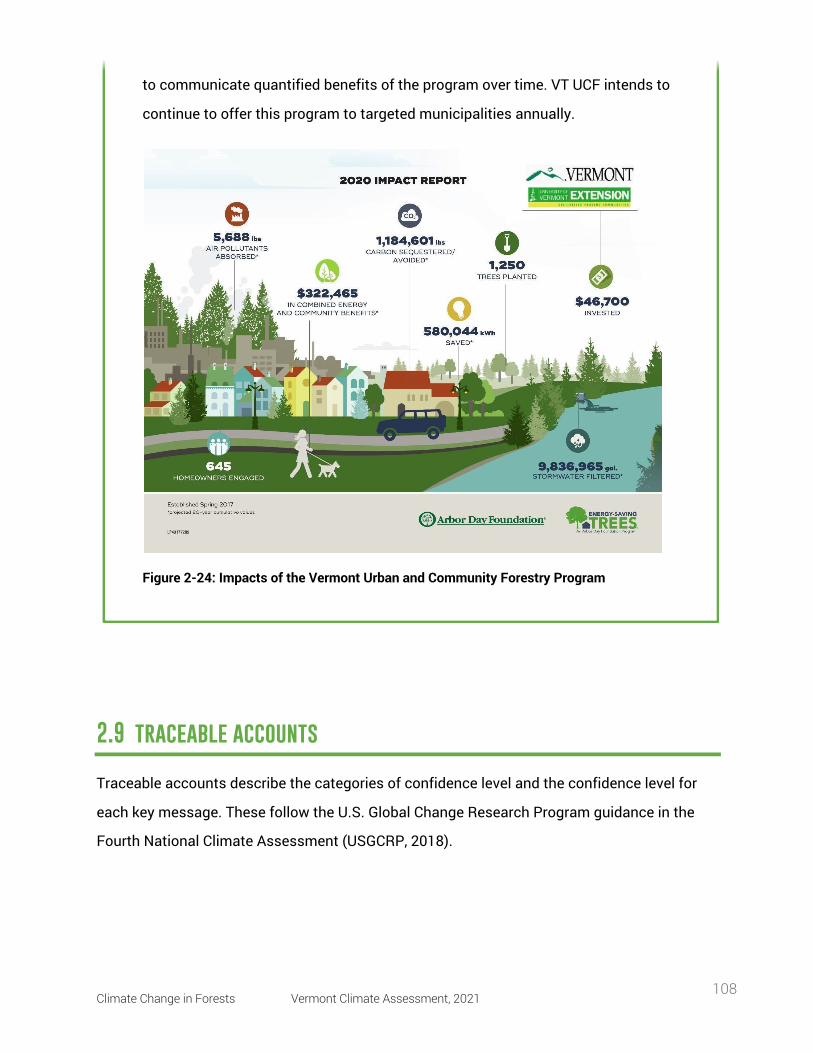
Climate Change in Forests Vermont Climate Assessment, 2021 108
2.9 traceable accounts
Traceable accounts describe the categories of confidence level and the confidence level for
each key message. These follow the U.S. Global Change Research Program guidance in the
Fourth National Climate Assessment (USGCRP, 2018).
to communicate quantified benefits of the program over time. VT UCF intends to
continue to offer this program to targeted municipalities annually.
Figure 2-24: Impacts of the Vermont Urban and Community Forestry Program
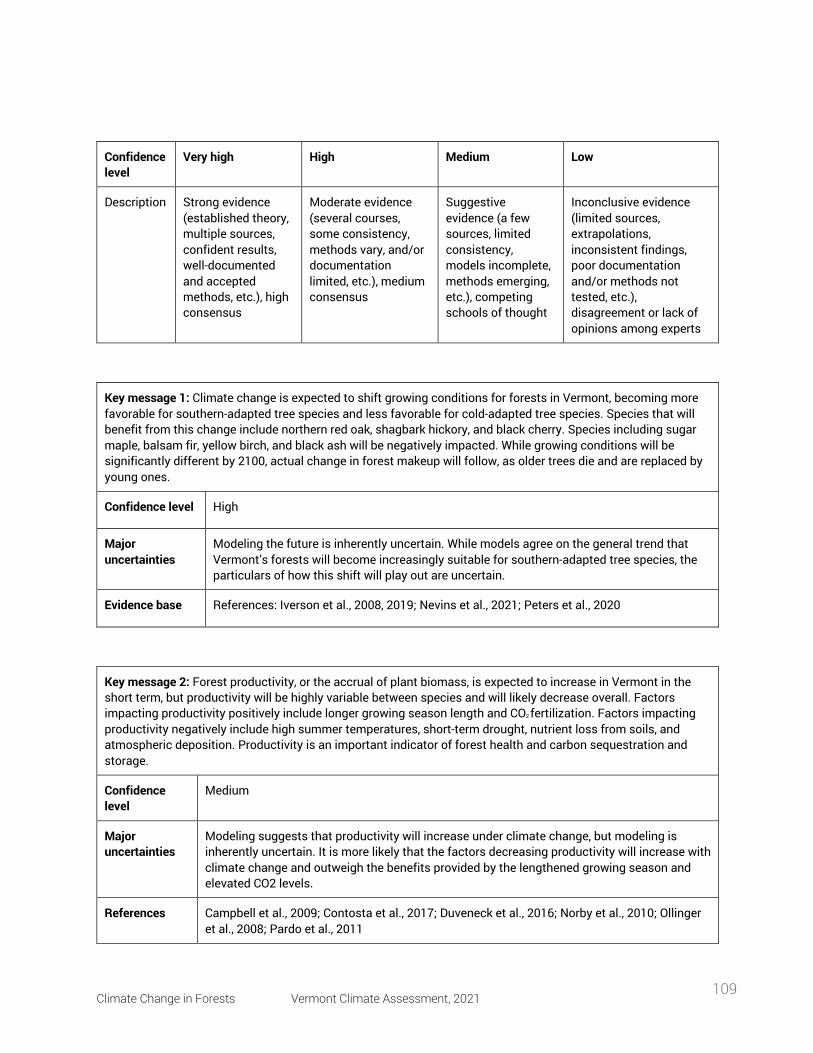
Climate Change in Forests Vermont Climate Assessment, 2021 109
Confidence level
Very high High Medium Low
Description Strong evidence (established theory, multiple sources, confident results, well-documented and accepted methods, etc.), high consensus
Moderate evidence (several courses, some consistency, methods vary, and/or documentation limited, etc.), medium consensus
Suggestive evidence (a few sources, limited consistency, models incomplete, methods emerging, etc.), competing schools of thought
Inconclusive evidence (limited sources, extrapolations, inconsistent findings, poor documentation and/or methods not tested, etc.), disagreement or lack of opinions among experts
Key message 1: Climate change is expected to shift growing conditions for forests in Vermont, becoming more favorable for southern-adapted tree species and less favorable for cold-adapted tree species. Species that will benefit from this change include northern red oak, shagbark hickory, and black cherry. Species including sugar maple, balsam fir, yellow birch, and black ash will be negatively impacted. While growing conditions will be significantly different by 2100, actual change in forest makeup will follow, as older trees die and are replaced by young ones.
Confidence level High
Major uncertainties
Modeling the future is inherently uncertain. While models agree on the general trend that Vermont’s forests will become increasingly suitable for southern-adapted tree species, the particulars of how this shift will play out are uncertain.
Evidence base References: Iverson et al., 2008, 2019; Nevins et al., 2021; Peters et al., 2020
Key message 2: Forest productivity, or the accrual of plant biomass, is expected to increase in Vermont in the short term, but productivity will be highly variable between species and will likely decrease overall. Factors impacting productivity positively include longer growing season length and CO2 fertilization. Factors impacting productivity negatively include high summer temperatures, short-term drought, nutrient loss from soils, and atmospheric deposition. Productivity is an important indicator of forest health and carbon sequestration and storage.
Confidence level
Medium
Major uncertainties
Modeling suggests that productivity will increase under climate change, but modeling is inherently uncertain. It is more likely that the factors decreasing productivity will increase with climate change and outweigh the benefits provided by the lengthened growing season and elevated CO2 levels.
References Campbell et al., 2009; Contosta et al., 2017; Duveneck et al., 2016; Norby et al., 2010; Ollinger et al., 2008; Pardo et al., 2011
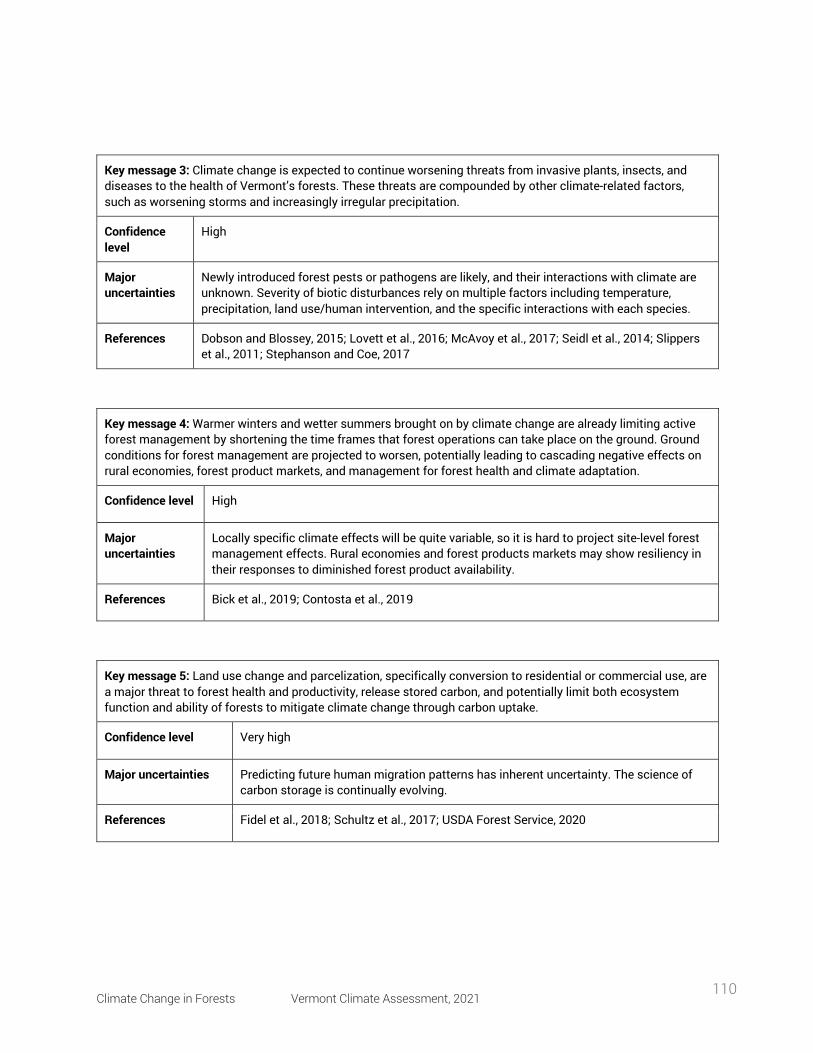
Climate Change in Forests Vermont Climate Assessment, 2021 110
Key message 3: Climate change is expected to continue worsening threats from invasive plants, insects, and diseases to the health of Vermont’s forests. These threats are compounded by other climate-related factors, such as worsening storms and increasingly irregular precipitation.
Confidence level
High
Major uncertainties
Newly introduced forest pests or pathogens are likely, and their interactions with climate are unknown. Severity of biotic disturbances rely on multiple factors including temperature, precipitation, land use/human intervention, and the specific interactions with each species.
References Dobson and Blossey, 2015; Lovett et al., 2016; McAvoy et al., 2017; Seidl et al., 2014; Slippers et al., 2011; Stephanson and Coe, 2017
Key message 4: Warmer winters and wetter summers brought on by climate change are already limiting active forest management by shortening the time frames that forest operations can take place on the ground. Ground conditions for forest management are projected to worsen, potentially leading to cascading negative effects on rural economies, forest product markets, and management for forest health and climate adaptation.
Confidence level High
Major uncertainties
Locally specific climate effects will be quite variable, so it is hard to project site-level forest management effects. Rural economies and forest products markets may show resiliency in their responses to diminished forest product availability.
References Bick et al., 2019; Contosta et al., 2019
Key message 5: Land use change and parcelization, specifically conversion to residential or commercial use, are a major threat to forest health and productivity, release stored carbon, and potentially limit both ecosystem function and ability of forests to mitigate climate change through carbon uptake.
Confidence level Very high
Major uncertainties Predicting future human migration patterns has inherent uncertainty. The science of carbon storage is continually evolving.
References Fidel et al., 2018; Schultz et al., 2017; USDA Forest Service, 2020
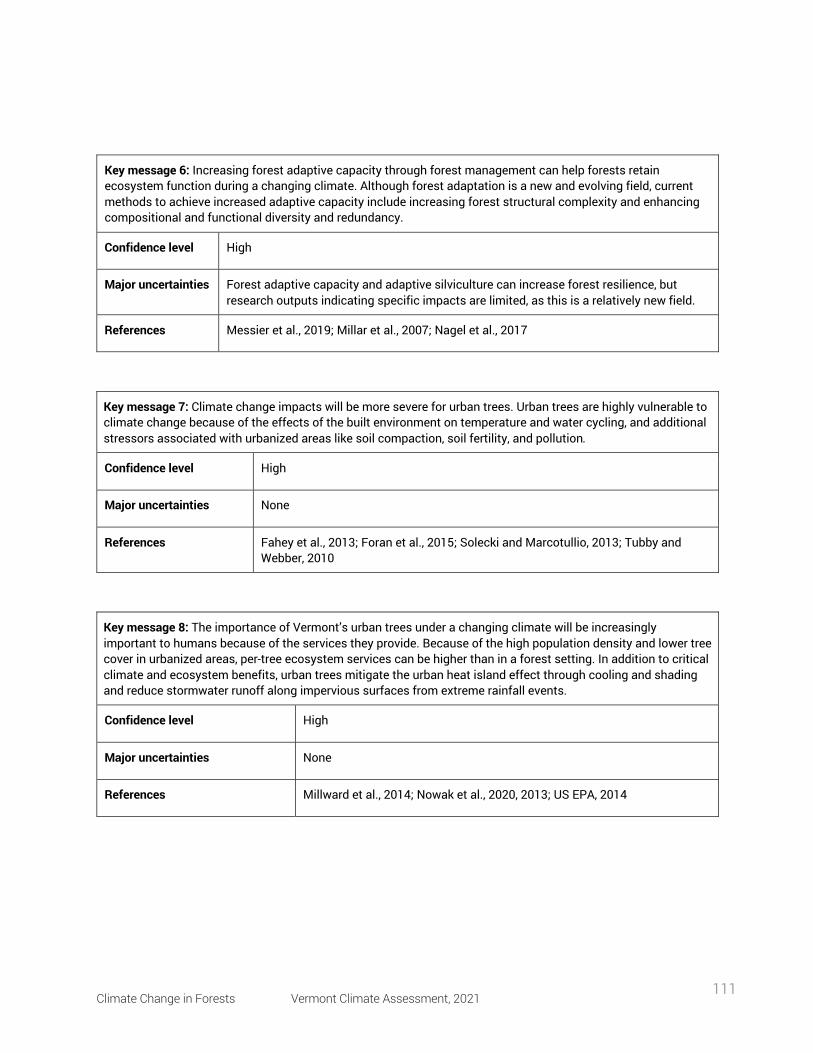
Climate Change in Forests Vermont Climate Assessment, 2021 111
Key message 6: Increasing forest adaptive capacity through forest management can help forests retain ecosystem function during a changing climate. Although forest adaptation is a new and evolving field, current methods to achieve increased adaptive capacity include increasing forest structural complexity and enhancing compositional and functional diversity and redundancy.
Confidence level High
Major uncertainties Forest adaptive capacity and adaptive silviculture can increase forest resilience, but research outputs indicating specific impacts are limited, as this is a relatively new field.
References Messier et al., 2019; Millar et al., 2007; Nagel et al., 2017
Key message 7: Climate change impacts will be more severe for urban trees. Urban trees are highly vulnerable to climate change because of the effects of the built environment on temperature and water cycling, and additional stressors associated with urbanized areas like soil compaction, soil fertility, and pollution.
Confidence level High
Major uncertainties None
References Fahey et al., 2013; Foran et al., 2015; Solecki and Marcotullio, 2013; Tubby and Webber, 2010
Key message 8: The importance of Vermont’s urban trees under a changing climate will be increasingly important to humans because of the services they provide. Because of the high population density and lower tree cover in urbanized areas, per-tree ecosystem services can be higher than in a forest setting. In addition to critical climate and ecosystem benefits, urban trees mitigate the urban heat island effect through cooling and shading and reduce stormwater runoff along impervious surfaces from extreme rainfall events.
Confidence level High
Major uncertainties None
References Millward et al., 2014; Nowak et al., 2020, 2013; US EPA, 2014
Climate Change in Forests Vermont Climate Assessment, 2021 112
2.10 acknowledgements
We would like to thank the reviewers who took time to provide feedback on earlier drafts of
this chapter: Tony D’Amato, Jamey Fidel, Jared Nunery, Ali Kosiba, and Jim Shallow. In
addition, we are grateful to the many stakeholders who shared their thoughts on the needs for
information about how climate change impacts Vermont’s forests and vice versa. We would
also like to thank the Northeast Climate Adaptation Science Center and the D’Amato lab for
support provided to authors Wikle and Higgins throughout this writing process.
2.11 resources
• As a subset of the references listed below, the following resources are likely to be
useful for readers interested in practical information and more detail about the topics
discussed.
• Climate Change Tree Atlas (https://www.fs.fed.us/nrs/atlas/tree/ provides further
information about predicted suitable habitat shifts and adaptability for individual tree
species.
• VTInvasives.org (https://www.vtinvasives.org) contains a plethora of helpful guides to
the invasive species affecting Vermont’s forests.
• Ten Recommendations for Managing Ash in the Face of Emerald Ash Borer and
Climate Change (https://forestadaptation.org/sites/default/files/Ten-
Recommendations-for-Managing-Ash.pdf) provides practical management
recommendations for ash.
• Forest Carbon Markets for Vermont Landowners
(https://fpr.vermont.gov/sites/fpr/files/Forest_and_Forestry/Climate_Change/Files/Fo
restCarbonOffsetsForVermontLandowners_Mar2021.pdf) is an in-depth resource
Climate Change in Forests Vermont Climate Assessment, 2021 113
detailing the process of a carbon offset project and specific recommendations for
landowners to pursue.
• Climate Change Response Framework (https://forestadaptation.org/) describes
resources on forest adaptation and access to the forest adaptation workbook.
• Adaptive Silviculture for Climate Change (https://www.adaptivesilviculture.org)
provides operational examples of adaptive silviculture in action.
• Forest Impacts of Climate Change: Monitoring Indicators
(https://www.uvm.edu/femc/climate_indicators/) includes climate-change indicators
for Vermont, New York and greater New England across categories like aquatic
systems, forest systems, trees and wildlife.
2.12 references
American Forests. (2021). Tree equity score. https://www.treeequityscore.org/
Baldwin, R.F., Fouch, N.T. (2018). Understanding the biodiversity contributions of small, protected areas presents many challenges. Land 7, 123. https://doi.org/10.3390/land7040123
Berlik, M.M., Kittredge, D.B., Foster, D.R. (2002). The illusion of preservation: a global environmental argument for the local production of natural resources. Journal of Biogeography 29, 1557–1568.
Bick, S., Berry, A.H., Frederick, P., Steele, A. (2019). Climate adaptation in the northeast’s forest products supply chain: a vulnerability assessment of the primary forest products sector.
Bradford, J.B., D’Amato, A.W. (2012). Recognizing trade-offs in multi-objective land management. Frontiers in Ecology and the Environment 10, 210–216. https://doi.org/10.1890/110031
Buermann, W., Bikash, P.R., Jung, M., Burn, D.H., Reichstein, M. (2013). Earlier springs decrease peak summer productivity in North American boreal forests. Environ. Res. Lett. 8, 024027. https://doi.org/10.1088/1748-9326/8/2/024027
Butler, B.J., Caputo, J., Robillard, A.L., Sass, E.M., Sutherland, C. (2021). One size does not fit all: relationships between size of family forest holdings and owner attitudes and behaviors. Journal of Forestry 119, 28–44. https://doi.org/10.1093/jofore/fvaa045
Cale, J.A., Teale, S.A., Johnston, M.T., Boyer, G.L., Perri, K.A., Castello, J.D. (2015). New ecological and physiological dimensions of beech bark disease development in aftermath forests. Forest Ecology and Management 336, 99–108. https://doi.org/10.1016/j.foreco.2014.10.019
Climate Change in Forests Vermont Climate Assessment, 2021 114
Campbell, J., Rustad, L.E., Boyer, E.W., Christopher, S.F., Driscoll, C.T., Fernandez, I., Groffman, P.M., Houle, D., Kiekbusch, J., Magill, A.H., Mitchell, M.J., & Ollinger, S.V. (2009). Consequences of climate change for biogeochemical cycling in forests of northeastern North America. Canadian Journal of Forest Research 39.
Campbell, J.L., Socci, A.M., & Templer, P.H. (2014). Increased nitrogen leaching following soil freezing is due to decreased root uptake in a northern hardwood forest. Global Change Biology 20, 2663–2673. https://doi.org/10.1111/gcb.12532
Catanzaro, P., D’Amato, A., & Huff, E.S. (2016). Increasing Forest Resiliency for an Uncertain Future.
Catanzaro, P., & D’Amato, A.W. (2019). Forest Carbon: An essential natural solution for climate change.
Clark, P., & D’Amato, T. (2019). Germination, Phenology, and Plant Allocation Patterns of Northeastern Tree Seedlings in Response to Future Precipitation Scenarios.
Classen, A.T., Sundqvist, M.K., Henning, J.A., Newman, G.S., Moore, J.A.M., Cregger, M.A., Moorhead, L.C., & Patterson, C.M. (2015). Direct and indirect effects of climate change on soil microbial and soil microbial-plant interactions: What lies ahead? Ecosphere 6, art130. https://doi.org/10.1890/ES15-00217.1
Climate Change Response Framework. (2020). Vermont Land Trust: Increasing Opportunities for Sustainable Timber Harvest on the Atlas Timberlands [WWW Document]. URL https://forestadaptation.org/adapt/demonstration-projects/vermont-land-trust-increasing-opportunities-sustainable-timber-harvest (accessed 6.9.21).
Cogbill, C.V., Burk, J., & Motzkin, G. (2002). The forests of presettlement New England, USA: spatial and compositional patterns based on town proprietor surveys. Journal of Biogeography 29, 1279–1304. https://doi.org/10.1046/j.1365-2699.2002.00757.x
Contosta, A.R., Adolph, A., Burchsted, D., Burakowski, E., Green, M., Guerra, D., Albert, M., Dibb, J., Martin, M., McDowell, W.H., Routhier, M., Wake, C., Whitaker, R., & Wollheim, W. (2017). A longer vernal window: the role of winter coldness and snowpack in driving spring transitions and lags. Global Change Biology 23, 1610–1625. https://doi.org/10.1111/gcb.13517
Contosta, A.R., Casson, N.J., Garlick, S., Nelson, S.J., Ayres, M.P., Burakowski, E.A., Campbell, J., Creed, I., Eimers, C., Evans, C., Fernandez, I., Fuss, C., Huntington, T., Patel, K., Sanders-DeMott, R., Son, K., Templer, P., & Thornbrugh, C. (2019). Northern forest winters have lost cold, snowy conditions that are important for ecosystems and human communities. https://doi.org/10.1002/eap.1974
Couture, J.J., Meehan, T.D., Kruger, E.L., & Lindroth, R.L. (2015). Insect herbivory alters impact of atmospheric change on northern temperate forests. Nature Plants 1, 1–5. https://doi.org/10.1038/nplants.2015.16
Dale, V.H., Joyce, L.A., McNulty, S., Neilson, R.P., Ayres, M.P., Flannigan, M.D., Hanson, P.J., Irland, L.C., Lugo, A.E., Peterson, C.J., Simberloff, D., Swanson, F.J., Stocks, B.J., & Wotton, B.M. (2001). Climate change and forest disturbances: Climate change can affect forests by altering the frequency, intensity, duration, and timing of fire, drought, introduced species, insect and pathogen outbreaks, hurricanes, windstorms, ice storms, or landslides. BioScience 51, 723–734. https://doi.org/10.1641/0006-3568(2001)051[0723:CCAFD]2.0.CO;2
Climate Change in Forests Vermont Climate Assessment, 2021 115
D’Amato, A.W., Mahaffey, A., Pepper, L., Kosiba, A., Patch, N., & van Loon, P. (2020). Ten Recommendations for Managing Ash in the Face of Emerald Ash Borer and Climate Change 3.
D’Amato, A.W. & Palik, B.J. (2020). Building on the last “new” thing: exploring the compatibility of ecological and adaptation silviculture. Canadian Journal of Forest Research 142. https://doi.org/10.1139/cjfr-2020-0306
Davidson, C.B., Gottschalk, K.W., & Johnson, J.E. (1999). Tree mortality following defoliation by the European gypsy moth (Lymantria dispar L.) in the United States: a review. Forest Science 45:1. https://doi.org/10.1093/forestscience/45.1.74 \
DeHayes, D.H., Schaberg, P.G., Hawley, G.J., & Strimbeck, G.R. (1999). Acid rain impacts on calcium nutrition and forest health: Alteration of membrane-associated calcium leads to membrane destabilization and foliar injury in red spruce. BioScience 49, 789–800. https://doi.org/10.2307/1313570
Dobson, A. & Blossey, B. (2015). Earthworm invasion, white-tailed deer, and seedling establishment in deciduous forests of north-eastern North America. J Ecol 103, 153–164. https://doi.org/10.1111/1365-2745.12350
Domke, G.M., Walters, B.F., Nowak, D.J., Smith, J., Ogle, S.M., Coulston, J.W., & Wirth, T.C., (2020). Greenhouse gas emissions and removals from forest land, woodlands, and urban trees in the United States, 1990-2018. https://doi.org/10.2737/FS-RU-227
Dugan, A.J., Lichstein, J.W., Steele, A., Metsaranta, J.M., Bick, S., & Hollinger, D.Y. (2021). Opportunities for forest sector emissions reductions: a state-level analysis. Ecological Applications n/a, e02327. https://doi.org/10.1002/eap.2327
Dukes, J.S., Pontius, J., Orwig, D., Garnas, J.R., Rodgers, V.L., Brazee, N., Cooke, B., Theoharides, K.A., Stange, E.E., Harrington, R., Ehrenfeld, J., Gurevitch, J., Lerdau, M., Stinson, K., Wick, R., & Ayres, M. (2009). Responses of insect pests, pathogens, and invasive plant species to climate change in the forests of northeastern North America: What can we predict? Can. J. For. Res. 39, 231–248. https://doi.org/10.1139/X08-171
Duveneck, M.J. & Thompson, J.R. (2017). Climate change imposes phenological trade-offs on forest net primary productivity. Journal of Geophysical Research: Biogeosciences 122, 2298–2313. https://doi.org/10.1002/2017JG004025
Duveneck, M.J., Thompson, J.R., Gustafson, E.J., Liang, Y., & Bruijn, A.M.G. de. (2016). Recovery dynamics and climate change effects to future New England forests. Landscape Ecol 32, 1385–1397. https://doi.org/10.1007/s10980-016-0415-5
Elkinton, J., Boettner, G., Liebhold, A.M., & Gwiazdowski, R. (2015). Biology, spread, and biological control of winter moth in the eastern United States. 24.
Emerald Ash Borer (EAB) Infested Area in Vermont. (2021).
EPA. (2021). Greenhouse Gas Equivalencies Calculator [WWW Document]. U.S. Environmental Protection Agency Energy and Environment. URL https://www.epa.gov/energy/greenhouse-gas-equivalencies-calculator (accessed 6.8.21).
Climate Change in Forests Vermont Climate Assessment, 2021 116
Fahey, R.T., Bialecki, M.B., & Carter, D.R. (2013). Tree growth and resilience to extreme drought across an urban land-use gradient. Arboriculture and Urban Forestry 39, 279–285.
FEMC. (2019). Dataset: Carbon storage and Net Growth of the Northeastern Forests. Forest Ecosystem Monitoring Cooperative - University of Vermont.
Fidel, J., McCarthy, K., & Voigt, B. (2018). Tracking parcelization over time: updating the Vermont database to inform planning and policy (Phase III Report).
Fisichelli, N., Frelich, L.E., & Reich, P.B. (2012). Sapling growth responses to warmer temperatures ‘cooled’ by browse pressure. Global Change Biology 18, 3455–3463. https://doi.org/10.1111/j.1365-2486.2012.02785.x
Fisichelli, N.A., Abella, S.R., Peters, M., & Krist, F.J. (2014). Climate, trees, pests, and weeds: Change, uncertainty, and biotic stressors in eastern U.S. national park forests. Forest Ecology and Management 327, 31–39. https://doi.org/10.1016/j.foreco.2014.04.033
Foran, C.M., Baker, K.M., Narcisi, M.J., & Linkov, I. (2015). Susceptibility assessment of urban tree species in Cambridge, MA, from future climatic extremes. Environ Syst Decis 35, 389–400. https://doi.org/10.1007/s10669-015-9563-4
Franklin, J.F., Spies, T.A., Pelt, R.V., Carey, A.B., Thornburgh, D.A., Berg, D.R., Lindenmayer, D.B., Harmon, M.E., Keeton, W.S., Shaw, D.C., Bible, K., & Chen, J. (2002). Disturbances and structural development of natural forest ecosystems with silvicultural implications, using Douglas-fir forests as an example. Forest Ecology and Management, Forest Ecology in the next millennium: Putting the long view into Practice 155, 399–423. https://doi.org/10.1016/S0378-1127(01)00575-8
Frey, S.D., Ollinger, S., Nadelhoffer, K., Bowden, R., Brzostek, E., Burton, A., Caldwell, B.A., Crow, S., Goodale, C.L., Grandy, A.S., Finzi, A., Kramer, M.G., Lajtha, K., LeMoine, J., Martin, M., McDowell, W.H., Minocha, R., Sadowsky, J.J., Templer, P.H., & Wickings, K. (2014). Chronic nitrogen additions suppress decomposition and sequester soil carbon in temperate forests. Biogeochemistry 121, 305–316. https://doi.org/10.1007/s10533-014-0004-0
Gillespie, N., Unthank, A., Campbell, L., Anderson, P., Gubernick, R., Weinhold, M., Cenderelli, D., Austin, B., McKinley, D., Wells, S., Rowan, J., Orvis, C., Hudy, M., Bowden, A., Singler, A., Fretz, E., Levine, J., & Kirn, R. (2014). Flood Effects on Road–Stream Crossing Infrastructure: Economic and Ecological Benefits of Stream Simulation Designs. Fisheries 39, 62–76. https://doi.org/10.1080/03632415.2013.874527
Graves, R.A., Haugo, R.D., Holz, A., Nielsen-Pincus, M., Jones, A., Kellogg, B., Macdonald, C., Popper, K., & Schindel, M. (2020). Potential greenhouse gas reductions from natural climate solutions in Oregon, USA. PLOS ONE 15, e0230424. https://doi.org/10.1371/journal.pone.0230424
Groffman, P.M., Rustad, L.E., Templer, P.H., Campbell, J.L., Christenson, L.M., Lany, N.K., Socci, A.M., Vadeboncoeur, M.A., Schaberg, P.G., Wilson, G.F., Driscoll, C.T., Fahey, T.J., Fisk, M.C., Goodale, C.L., Green, M.B., Hamburg, S.P., Johnson, C.E., Mitchell, M.J., Morse, J.L., Pardo, L.H., & Rodenhouse, N.L. (2012). Long-term integrated studies show complex and surprising effects of climate change in the northern hardwood forest. BioScience 62, 1056–1066. https://doi.org/10.1525/bio.2012.62.12.7
Guilbert, J., Beckage, B., Winter, J.M., Horton, R.M., Perkins, T., & Bomblies, A. (2014). Impacts of
Climate Change in Forests Vermont Climate Assessment, 2021 117
projected climate change over the Lake Champlain Basin in Vermont. Journal of Applied Meteorology and Climatology 53, 1861–1875. https://doi.org/10.1175/JAMC-D-13-0338.1
Gundersen, P., Thybring, E.E., Nord-Larsen, T., Vesterdal, L., Nadelhoffer, K.J., & Johannsen, V.K. (2021). Old-growth forest carbon sinks overestimated. Nature 591, E21–E23. https://doi.org/10.1038/s41586-021-03266-z
Halman, J., & Wilmot, S. (2017). Early averages of sugar maple bud development stages.
Hancock, C. (2020). Forest carbon: a natural climate solution and tool for advancing the pace of conservation. Cold Hollow to Canada. URL https://www.coldhollowtocanada.org/what/news/article/forest-carbon-a-natural-climate-solution-and-tool-for-advancing-the-pace-of-conservation (accessed 6.10.21).
Handler, S.D., Pike, C., & St. Clair, B. (2018). Assisted Migration | USDA Climate Change Resource Center. URL https://www.fs.usda.gov/ccrc/topics/assisted-migration (accessed 6.9.21).
Holzmueller, E.J., Jose, S., & Jenkins, M.A. (2010). Ecological consequences of an exotic fungal disease in eastern U.S. hardwood forests. Forest Ecology and Management 259, 1347–1353. https://doi.org/10.1016/j.foreco.2010.01.014
Hrinkevich, K.H., Progar, R.A., & Shaw, D.C. (2016). Climate risk modelling of balsam woolly adelgid damage severity in subalpine fir stands of western North America. PLOS ONE 11, e0165094. https://doi.org/10.1371/journal.pone.0165094
Huang, J., Qu, B., Fang, G., Li, X., & Zong, S. (2020). The drivers of the Asian long horned beetle disaster show significant spatial heterogeneity. Ecological Indicators 117, 106680. https://doi.org/10.1016/j.ecolind.2020.106680
Hufkens, K., Friedl, M., Sonnentag, O., Braswell, B.H., Milliman, T., & Richardson, A.D. (2012). Linking near-surface and satellite remote sensing measurements of deciduous broadleaf forest phenology. Remote Sensing of Environment, Remote Sensing of Urban Environments 117, 307–321. https://doi.org/10.1016/j.rse.2011.10.006
IPCC. (2014). Climate Change 2014: Synthesis Report. Contribution of Working Groups I, II, and III to the Fifth Assessment Report of the Intergovernmental Panel on Climate Change. IPCC, Geneva, Switzerland.
i-Tree, 2021. i-Tree. URL itreetools.org (accessed 6.8.21).
Iverson, L., Prasad, A., & Matthews, S. (2008). Modeling potential climate change impacts on the trees of the northeastern United States. Mitig Adapt Strateg Glob Change 13, 487–516. https://doi.org/10.1007/s11027-007-9129-y
Iverson, L.R., Prasad, A.M., Peters, M.P., & Matthews, S.N. (2019). Facilitating adaptive forest management under climate change: a spatially specific synthesis of 125 species for habitat changes and assisted migration over the eastern United States. Forests 10, 989. https://doi.org/10.3390/f10110989
Janowiak, M.K., D’Amato, A.W., Swanston, C.W., Iverson, L., Thompson, F.R., Dijak, W.D., Matthews, S.,
Climate Change in Forests Vermont Climate Assessment, 2021 118
Peters, M.P., Prasad, A., Fraser, J.S., Brandt, L.A., Butler-Leopold, P., Handler, S.D., Shannon, P.D., Burbank, D., Campbell, J., Cogbill, C., Duveneck, M.J., Emery, M.R., Fisichelli, N., Foster, J., Hushaw, J., Kenefic, L., Mahaffey, A., Morelli, T.L., Reo, N.J., Schaberg, P.G., Simmons, K.R., Weiskittel, A., Wilmot, S., Hollinger, D., Lane, E., Rustad, L., & Templer, P. (2018). New England and northern New York forest ecosystem vulnerability assessment and synthesis: a report from the New England Climate Change Response Framework project (No. NRS-GTR-173). U.S. Department of Agriculture, Forest Service, Northern Research Station, Newtown Square, PA. https://doi.org/10.2737/NRS-GTR-173
Jeon, S.B., Olofsson, P., & Woodcock, C.E. (2014). Land use change in New England: a reversal of the forest transition. Journal of Land Use Science 9, 105–130. https://doi.org/10.1080/1747423X.2012.754962
Jones, M.I., Gould, J.R., Mahon, H.J., & Fierke, M.K. (2020). Phenology of Emerald Ash Borer (Coleoptera: Buprestidae) and Its Introduced Larval Parasitoids in the Northeastern United States. Journal of Economic Entomology 113, 622–632. https://doi.org/10.1093/jee/toz304
Keenan, T.F., Gray, J., Friedl, M.A., Toomey, M., Bohrer, G., Hollinger, D.Y., Munger, J.W., O’Keefe, J., Schmid, H.P., Wing, I.S., Yang, B., & Richardson, A.D. (2014). Net carbon uptake has increased through warming-induced changes in temperate forest phenology. Nature Clim Change 4, 598–604. https://doi.org/10.1038/nclimate2253
Keeton, W.S. (2006). Managing for late-successional/old-growth characteristics in northern hardwood-conifer forests. Forest Ecology and Management 235, 129–142. https://doi.org/10.1016/j.foreco.2006.08.005
Kikuchi, T., Kobayashi K. Sakata, K. Akasaka, T. 2012. Gypsy moth-induced dermatitis: a hospital review and community survey. European Journal of Dermatology 22:3. https://doi.org/10.1684/ejd.2012.1722
Kittredge, D.B. (2005). The cooperation of private forest owners on scales larger than one individual property: international examples and potential application in the United States. Forest Policy and Economics 7, 671–688. https://doi.org/10.1016/j.forpol.2003.12.004
Kosiba, A.M. (2021a). Vermont Forest Carbon Inventory.
Kosiba, A.M. (2021b). Forest Carbon Offsets for Vermont Landowners.
Kosiba, A.M., Schaberg, P.G., Rayback, S.A., & Hawley, G.J. (2018). The surprising recovery of red spruce growth shows links to decreased acid deposition and elevated temperature. Science of The Total Environment 637–638, 1480–1491. https://doi.org/10.1016/j.scitotenv.2018.05.010
Kuehn, D., Chase, L., & Sharkey, T. (2017). Adapting to Climate Change: Perceptions of Maple Producers in New York and Vermont. Journal of Agriculture, Food Systems, and Community Development 7, 43–65. https://doi.org/10.5304/jafscd.2017.073.020
Kuloglu, T.Z., Lieffers, V.J., & Anderson, A.E. (2019). Impact of Shortened Winter Road Access on Costs of Forest Operations. Forests 10, 447. https://doi.org/10.3390/f10050447
Liang, L., & Fei, S. (2014). Divergence of the potential invasion range of emerald ash borer and its host distribution in North America under climate change. Climatic Change 122, 735–746.
Climate Change in Forests Vermont Climate Assessment, 2021 119
https://doi.org/10.1007/s10584-013-1024-9
Livesley, S.J., McPherson, E.G., & Calfapietra, C. (2016). The Urban Forest and Ecosystem Services: Impacts on Urban Water, Heat, and Pollution Cycles at the Tree, Street, and City Scale. Journal of Environmental Quality 45, 119–124. https://doi.org/10.2134/jeq2015.11.0567
Lovett, G.M., Weiss, M., Liebhold, A.M., Holmes, T.P., Leung, B., Lambert, K.F., Orwig, D.A., Campbell, F.T., Rosenthal, J., McCullough, D.G., Wildova, R., Ayres, M.P., Canham, C.D., Foster, D.R., LaDeau, S.L., & Weldy, T. (2016). Nonnative forest insects and pathogens in the United States: Impacts and policy options. Ecological Applications 26, 1437–1455. https://doi.org/10.1890/15-1176
Luyssaert, S., Schulze, E.-D., Börner, A., Knohl, A., Hessenmöller, D., Law, B.E., Ciais, P., & Grace, J. (2008). Old-growth forests as global carbon sinks. Nature 455, 213–215. https://doi.org/10.1038/nature07276
McAvoy, T.J., Régnière, J., St-Amant, R., Schneeberger, N.F., & Salom, S.M. (2017). Mortality and Recovery of Hemlock Woolly Adelgid (Adelges tsugae) in Response to Winter Temperatures and Predictions for the Future. Forests 8, 497. https://doi.org/10.3390/f8120497
McCullough, D.G. (2020). Challenges, tactics, and integrated management of emerald ash borer in North America. Forestry (Land) 93, 197–211. https://doi.org/10.1093/forestry/cpz049
McHale, M.R., Burke, I.C., Lefsky, M.A., Peper, P.J., & McPherson, E.G. (2009). Urban forest biomass estimates: is it important to use allometric relationships developed specifically for urban trees? Urban Ecosyst 12, 95–113. https://doi.org/10.1007/s11252-009-0081-3
McMahon, S.M., Parker, G.G., & Miller, D.R. (2010). Evidence for a recent increase in forest growth. PNAS 107, 3611–3615. https://doi.org/10.1073/pnas.0912376107
McNulty, S.G., & Boggs, J.L. (2010). A conceptual framework: Redefining forest soil’s critical acid loads under a changing climate. Environmental Pollution, Advances of air pollution science: from forest decline to multiple-stress effects on forest ecosystem services 158, 2053–2058. https://doi.org/10.1016/j.envpol.2009.11.028
McPherson, E.G., Doorn, N.S. van, & Peper, P.J. (2016). Urban tree database and allometric equations. Gen. Tech. Rep. PSW-GTR-253. Albany, CA: U.S. Department of Agriculture, Forest Service, Pacific Southwest Research Station. 86 p. 253. https://doi.org/10.2737/PSW-GTR-253
McPherson, E.G., & Simpson, J.R. (1999). Carbon dioxide reduction through urban forestry: guidelines for professional and volunteer tree planters. Gen. Tech. Rep. PSW-GTR-171. Albany, CA: U.S. Department of Agriculture, Forest Service, Pacific Southwest Research Station. 237 p. 171. https://doi.org/10.2737/PSW-GTR-171
Messier, C., Bauhus, J., Doyon, F., Maure, F., Sousa-Silva, R., Nolet, P., Mina, M., Aquilué, N., Fortin, M.-J., & Puettmann, K. (2019). The functional complex network approach to foster forest resilience to global changes. Forest Ecosystems 6, 21. https://doi.org/10.1186/s40663-019-0166-2
Milanović, M., Knapp, S., Pyšek, P., & Kühn, I. (2020). Linking traits of invasive plants with ecosystem services and disservices. Ecosystem Services 42, 101072. https://doi.org/10.1016/j.ecoser.2020.101072
Climate Change in Forests Vermont Climate Assessment, 2021 120
Millar, C.I., Stephenson, N.L., & Stephens, S.L. (2007). Climate change and forests of the future: managing in the face of uncertainty. Ecological Applications 17, 2145–2151. https://doi.org/10.1890/06-1715.1
Millward, A.A., Torchia, M., Laursen, A.E., & Rothman, L.D. (2014). Vegetation placement for summer-built surface temperature moderation in an urban microclimate. Environmental Management 53, 1043–1057. https://doi.org/10.1007/s00267-014-0260-8
Mohan, J.E.M.E., Cox, R.M.C.M., & Iverson, L.R.I.R. (2009). Composition and carbon dynamics of forests in northeastern North America in a future, warmer world. From: NE Forests 2100: A Synthesis of Climate Change Impacts on Forests of the Northeastern US and Eastern Canada. Canadian Journal of Forest Research. https://doi.org/10.1139/X08-185
Morin, R., 2018. Forestland area by age class.
Nagel, L.M., Palik, B.J., Battaglia, M.A., D’Amato, A.W., Guldin, J.M., Swanston, C.W., Janowiak, M.K., Powers, M.P., Joyce, L.A., Millar, C.I., Peterson, D.L., Ganio, L.M., Kirschbaum, C., & Roske, M.R. (2017). Adaptive silviculture for climate change: a national experiment in manager-scientist partnerships to apply an adaptation framework. Journal of Forestry; Bethesda 115, 167–178. http://dx.doi.org/10.5849/jof.16-039
Neumann, J.E., Price, J., Chinowsky, P., Wright, L., Ludwig, L., Streeter, R., Jones, R., Smith, J.B., Perkins, W., Jantarasami, L., & Martinich, J. (2015). Climate change risks to US infrastructure: impacts on roads, bridges, coastal development, and urban drainage. Climatic Change 131, 97–109. https://doi.org/10.1007/s10584-013-1037-4
Nevins, M.T., D’Amato, A.W., & Foster, J.R. (2021). Future forest composition under a changing climate and adaptive forest management in southeastern Vermont, USA. Forest Ecology and Management 479, 118527. https://doi.org/10.1016/j.foreco.2020.118527
NIACS. (2021). Adaptation Workbook. USDA Climate Hub’s Northern Institute of Applied Climate Science. URL adaptationworkbook.org (accessed 6.9.21).
Norby, R.J., Warren, J.M., Iversen, C.M., Medlyn, B.E., & McMurtrie, R.E. (2010). CO2 enhancement of forest productivity constrained by limited nitrogen availability. PNAS 107, 19368–19373. https://doi.org/10.1073/pnas.1006463107
Nowak, D.J., Coville, R., Endreny, T., Abdi, R., & Van Stan II, J.T. (2020). Valuing Urban Tree Impacts on Precipitation Partitioning, in: Van Stan, I., John T., Gutmann, E., Friesen, J. (Eds.), Precipitation Partitioning by Vegetation: A Global Synthesis. Springer International Publishing, Cham, pp. 253–268. https://doi.org/10.1007/978-3-030-29702-2_15
Nowak, D.J., & Greenfield, E.J. (2008). Urban and community forests of New England: Connecticut, Maine, Massachusetts, New Hampshire, Rhode Island, Vermont. Gen. Tech. Rep. NRS-38. Newtown Square, PA: U.S. Department of Agriculture, Forest Service, Northern Research Station. 62 p. 38. https://doi.org/10.2737/NRS-GTR-38
Nowak, D.J., Greenfield, E.J., Hoehn, R.E., & Lapoint, E. (2013). Carbon storage and sequestration by trees in urban and community areas of the United States. Environmental Pollution 178, 229–236. https://doi.org/10.1016/j.envpol.2013.03.019
Climate Change in Forests Vermont Climate Assessment, 2021 121
Nowak, D.J., Stevens, J.C., Sisinni, S.M., & Luley, C.J. (2002). Effects of urban tree management and species selection on atmospheric carbon dioxide.
Ollinger, S.V., Richardson, A.D., Martin, M.E., Hollinger, D.Y., Frolking, S.E., Reich, P.B., Plourde, L.C., Katul, G.G., Munger, J.W., Oren, R., Smith, M.-L., U, K.T.P., Bolstad, P.V., Cook, B.D., Day, M.C., Martin, T.A., Monson, R.K., & Schmid, H.P. (2008). Canopy nitrogen, carbon assimilation, and albedo in temperate and boreal forests: Functional relations and potential climate feedbacks. PNAS 105, 19336–19341. https://doi.org/10.1073/pnas.0810021105
Oswald, E.M., Pontius, J., Rayback, S.A., Schaberg, P.G., Wilmot, S.H., & Dupigny-Giroux, L.-A. (2018). The complex relationship between climate and sugar maple health: Climate change implications in Vermont for a key northern hardwood species. Forest Ecology and Management 422, 303–312. https://doi.org/10.1016/j.foreco.2018.04.014
Palik, B., D’Amato, A.W., Franklin, J.F., & Johnson, K.N. (2020). Ecological Silviculture: Foundations and Applications. Waveland Press, Incorporated.
Pardo, L.H., Fenn, M.E., Goodale, C.L., Geiser, L.H., Driscoll, C.T., Allen, E.B., Baron, J.S., Bobbink, R., Bowman, W.D., Clark, C.M., Emmett, B., Gilliam, F.S., Greaver, T.L., Hall, S.J., Lilleskov, E.A., Liu, L., Lynch, J.A., Nadelhoffer, K.J., Perakis, S.S., Robin-Abbott, M.J., Stoddard, J.L., Weathers, K.C., & Dennis, R.L. (2011). Effects of nitrogen deposition and empirical nitrogen critical loads for ecoregions of the United States. Ecological Applications 21, 3049–3082. https://doi.org/10.1890/10-2341.1
Peters, M.P., Prasad, A.M., Matthews, S.N., & Iverson, L.R. (2020). Climate change tree atlas, Version 4.
Preisser, E.L., Elkinton, J.S., & Abell, K. (2008). Evolution of increased cold tolerance during range expansion of the elongate hemlock scale Fiorinia externa Ferris (Hemiptera: Diaspididae). Ecological Entomology 33, 709–715. https://doi.org/10.1111/j.1365-2311.2008.01021.x
Quiring, D., Ostaff, D., Hartling, L., Lavigne, D., Moore, K., & DeMerchant, I. (2008). Temperature and plant hardiness zone influence distribution of balsam woolly adelgid damage in Atlantic Canada. The Forestry Chronicle 84, 558–562. https://doi.org/10.5558/tfc84558-4
Rapp, J.M., Lutz, D.A., Huish, R.D., Dufour, B., Ahmed, S., Morelli, T.L., & Stinson, K.A. (2019). Finding the sweet spot: Shifting optimal climate for maple syrup production in North America. Forest Ecology and Management 448, 187–197. https://doi.org/10.1016/j.foreco.2019.05.045
Rayback, S.A., Belmecheri, S., Gagen, M.H., Lini, A., Gregory, R., & Jenkins, C. (2020). North American temperate conifer (Tsuga canadensis) reveals a complex physiological response to climatic and anthropogenic stressors. New Phytologist 228, 1781–1795. https://doi.org/10.1111/nph.16811
Robinson, R. (June 10, 2021). Vermont is facing its biggest gypsy moth outbreak in decades. VT Digger. https://vtdigger.org/2021/06/10/vermont-is-facing-its-biggest-gypsy-moth-outbreak-in-decades/
Rittenhouse, C.D., & Rissman, A.R. (2015). Changes in winter conditions impact forest management in north temperate forests. Journal of Environmental Management 149, 157–167. https://doi.org/10.1016/j.jenvman.2014.10.010
Royo, A.A., & Carson, W.P. (2006_. On the formation of dense understory layers in forests worldwide:
Climate Change in Forests Vermont Climate Assessment, 2021 122
consequences and implications for forest dynamics, biodiversity, and succession. Can. J. For. Res. 36, 1345–1362. https://doi.org/10.1139/x06-025
Rustad, L., Campbell, J., Dukes, J.S., Huntington, T., Fallon Lambert, K., Mohan, J., & Rodenhouse, N. (2012). Changing climate, changing forests: The impacts of climate change on forests of the northeastern United States and eastern Canada (No. NRS-GTR-99). U.S. Department of Agriculture, Forest Service, Northern Research Station, Newtown Square, PA. https://doi.org/10.2737/NRS-GTR-99
Schultz, B., Hanson, T., Halman, J., Wilmot, S., Spinney, E., & Greaves, T. (2017). Vermont Forest Carbon Assessment, in: Forest Insect and Disease Conditions in Vermont, 2016. Agency of Natural Resources, Department of Forests, Parks & Recreation, Montpelier, VT.
Seidl, R., Rammer, W., & Spies, T.A. (2014). Disturbance legacies increase the resilience of forest ecosystem structure, composition, and functioning. Ecological Applications 24, 2063–2077. https://doi.org/10.1890/14-0255.1
Seymour, R.S. (2005). Integrating natural disturbance parameters into conventional silviculture systems: experience from the Acadian Forest of northeastern North American. In: Balancing Ecosystem Values: Innovative Experiments for Sustainable Forestry. (Charles E. Peterson and Douglas A. Maguire, Eds.) U.S. Department of Agriculture, Forest Service, Pacific Northwest Research Station.
Slippers, B., Groot, P. de, & Wingfield, M.J. (2011). The Sirex Woodwasp and its Fungal Symbiont: Research and Management of a Worldwide Invasive Pest. Springer Science & Business Media.
Solecki, W.D., & Marcotullio, P.J. (2013). Climate change and urban forest vulnerability, in: Urbanization, Biodiversity, and Ecosystem Services: Challenges and Opportunities. Springer.
Sperlich, D., Nadal-Sala, D., Gracia, C., Kreuzwieser, J., Hanewinkel, M., & Yousefpour, R. (2020). Gains or Losses in Forest Productivity under Climate Change? The Uncertainty of CO2 Fertilization and Climate Effects. Climate 8, 141. https://doi.org/10.3390/cli8120141
Steidinger, B.S., Crowther, T.W., Liang, J., Van Nuland, M.E., Werner, G.D.A., Reich, P.B., Nabuurs, G.J., de-Miguel, S., Zhou, M., Picard, N., Herault, B., Zhao, X., Zhang, C., Routh, D., & Peay, K.G. (2019). Climatic controls of decomposition drive the global biogeography of forest-tree symbioses. Nature 569, 404–408. https://doi.org/10.1038/s41586-019-1128-0
Stephanson, C.A., & Coe, N.R. (2017). Impacts of Beech Bark Disease and Climate Change. American Beech 17.
Tubby, K.V., & Webber, J.F. (2010). Pests and diseases threatening urban trees under a changing climate. Forestry: An International Journal of Forest Research 83, 451–459. https://doi.org/10.1093/forestry/cpq027
Uelmen, J.A., Lindroth, R.L., Tobin, P.C., Reich, P.B., Schwartzberg, E.G., & Raffa, K.F. (2016). Effects of winter temperatures, spring degree-day accumulation, and insect population source on phenological synchrony between forest tent caterpillar and host trees. Forest Ecology and Management 362, 241–250. https://doi.org/10.1016/j.foreco.2015.11.045
Climate Change in Forests Vermont Climate Assessment, 2021 123
Urban, J.M. (2020). Perspective: shedding light on spotted lanternfly impacts in the USA. Pest Management Science 76, 10–17. https://doi.org/10.1002/ps.5619
U.S. Census Bureau. (2012). 2010 Census of population and housing, population, and housing unit counts (No. CPH-2-47, Vermont). U.S. Government Printing Office, Washington, D.C.
USDA Forest Service. (2021). Urban FIA Program [WWW Document]. Forest Inventory and Analysis National Program. URL https://www.fia.fs.fed.us/program-features/urban/ (accessed 6.8.21).
USDA Forest Service. (2020). Forests of Vermont, 2019. Resource Update FS-243 2. https://doi.org/10.2737/FS-RU-243
USDA Forest Service. (2019). Forests of Vermont, 2018. Resource Update FS–212. Newtown Square, PA: U.S. Department of Agriculture Forest Service, Northern Research Station. 2 p. 212. https://doi.org/10.2737/FS-RU-212
USDA-APHIS. (2012). English: Dorsal view of emerald ash borer adult with elytra and wings spread.
US EPA. (2015). Greenhouse Gas Equivalencies Calculator [WWW Document]. US EPA. URL https://www.epa.gov/energy/greenhouse-gas-equivalencies-calculator (accessed 6.10.21).
US EPA. (2014). Improving Indoor Air Quality [WWW Document]. US EPA. URL https://www.epa.gov/indoor-air-quality-iaq/improving-indoor-air-quality (accessed 3.16.21).
US Forest Service. (2017). EcoMap Sections.
USGCRP. (2018). Impacts, Risks, and Adaptation in the United States: Fourth National Climate Assessment, Volume II: [Reidmiller, D.R., C.W. Avery, D.R. Easterling, K.E. Kunkel, K.L.M. Lewis, T.K. Maycock, and B.C. Stewart (eds.)]. U.S. Global Change Research Program, Washington, DC, USA, 1515 pp. doi: 10.7930/NCA4.2018.
Vermont Agency of Agriculture, Food & Markets. (2020). 2019 Legislative Summary. Vermont Agency of Agriculture, Food & Markets.
Vermont Department of Forests, Parks & Recreation. (2018). Forest Tent Caterpillar Update (No. Vermont Forest Health leaflet 2018-13). Vermont Department of Forests, Parks & Recreation.
Vermont Department of Forests, Parks & Recreation. (June 8, 2021). Gypsy moths are making a comeback in Vermont: caterpillar infestations target tree foliage. https://fpr.vermont.gov/news/gypsy-moths-making-a-comeback-in-vermont
Vermont Forest Health. (2011). Anthracnose Disease. Vermont Department of Forests, Parks & Recreation.
Vermont Forest Resources Plan. (2010). Division of Forests, Vermont Department of Forests, Parks and Recreation, Agency of Natural Resources.
Vermont Sustainable Jobs Fund. (2017). Economic Impact | Vermont Forestry & Wood Products. URL https://www.vsjf.org/impact/forest-products/ (accessed 6.8.21).
Climate Change in Forests Vermont Climate Assessment, 2021 124
Violle, C., Navas, M.-L., Vile, D., Kazakou, E., Fortunel, C., Hummel, I., Garnier, E. (2007). Let the concept of trait be functional! Oikos 116, 882–892. https://doi.org/10.1111/j.0030-1299.2007.15559.x
VT FPR. (n.d.). Stumpage Price Reports | Department of Forests, Parks and Recreation [WWW Document]. URL https://fpr.vermont.gov/stumpage-price-reports (accessed 6.8.21).
VT UCF. (2021a). Ash Tree Inventories [WWW Document]. Vermont Urban and Community Forestry Inventories and Management Plans. URL https://vtcommunityforestry.org/ash-inventory (accessed 6.8.21).
VT UCF. (2021b). Tree Canopy Assessments [WWW Document]. Vermont Urban and Community Forestry Inventories and Management Plans. URL https://vtcommunityforestry.org/resources/inventories-management-plans/tree-canopy-assessments (accessed 6.8.21).
Wilson, G., Green, M., Brown, J., Campbell, J., Groffman, P., Durán, J., & Morse, J. (2020). Snowpack affects soil microclimate throughout the year. Climatic Change 163, 705–722. https://doi.org/10.1007/s10584-020-02943-8
Zhao, Z., Peng, C., Yang, Q., Meng, F.-R., Song, X., Chen, S., Epule, T.E., Li, P., & Zhu, Q. (2017). Model prediction of biome-specific global soil respiration from 1960 to 2012. Earth’s Future 5, 715–729. https://doi.org/10.1002/2016EF000480
Zheng, D., Ducey, M.J., & Heath, L.S. (2013). Assessing net carbon sequestration on urban and community forests of northern New England, USA. Urban Forestry & Urban Greening 12, 61–68. https://doi.org/10.1016/j.ufug.2012.10.003
Water Resources Vermont Climate Assessment, 2021 125
3 water resources
Recommended Citation for Chapter Cook, D., Swanberg, N., 2021. Water Resources. In Galford, G.L., Faulkner, J. et al. (Eds), The Vermont Climate Assessment 2021. Burlington, Vermont: Gund Institute for Environment at the University of Vermont. On the web: https://vtclimate.org
Danielle Cook Forest Ecosystem Monitoring Cooperative, University of Vermont AmeriCorp
Ned Swanberg Vermont Department of Environmental Conservation Flood Ready Vermont
Water Resources Vermont Climate Assessment, 2021 126
3.1 key messages
1. Due to extreme variation in precipitation with our changing climate, periods of
prolonged dry-spells and drought, coupled with higher water usage in snowmaking and
agriculture could exacerbate low water availability.
2. Increases in overall precipitation and extreme precipitation have caused streamflows
to rise since 1960. Climate change will further this pattern, although the overall
increase in streamflow comes with disruptions in seasonal flows cycles.
3. Increases in heavy precipitation jeopardize water quality in Vermont. Storms produce
large runoff events that contribute to erosion and nutrient loading. Combined with
warm temperatures, this creates favorable conditions for cyanobacteria blooms.
4. Increased occurrence of high streamflows increase the risk of flooding that causes
damages to many roads and crossing structures. Risk reduction requires addressing
outdated and unfit structures.
5. Nature-based solutions are an effective, low-cost approach to climate change
adaptation. River corridor, floodplain, and wetland protection dampen flood impacts
and improve water quality along with green infrastructure.
3.2 background
Key Point: Historical changes in total precipitation, heavy precipitation events, and temperature have had observable impacts on Vermont’s water resources.
3.2.1 Increasing water Precipitation in Vermont and the Northeast has been steadily increasing, although prolonged
dry-spells and droughts are more common (see Climate Change in Vermont chapter). Recent
evidence of climate change and its impacts give a sense of near-term (10-30 year) trends that
are likely to continue. Increasing precipitation is expected to continue in Vermont and
throughout the Northeast through the 21st century (Dupigny-Giroux et al., 2018; Guilbert et al.,
Water Resources Vermont Climate Assessment, 2021 127
2014). In Vermont, average annual precipitation has increased by 7.5 inches since the early
1900s, and has been increasing at a rate of 1.4 inches per decade in the same period (see
Climate Change in Vermont chapter).
Increases in heavy precipitation events (greater than 1 inch of precipitation a day) are
projected to continue throughout New England at a rate of 15% or more compared to the
historical baseline (Dupigny-Giroux et al., 2018). Heavy precipitation events have increased in
Vermont with decadal averages of 6.2 days/year in 1900s, 5.8 in 1960s, 8.4 in 1990s and 8.7
today (see Climate Change in Vermont chapter). Heavy precipitation results in higher volumes
of stormwater runoff (LCBP, 2015), which can carry sediment and nutrients to our streams and
lakes. For example, only 6% of the Lake Champlain Basin is impervious surfaces but these
developed areas discharge more than other land uses (e.g., agriculture) (LCBP, 2018).
Increased runoff drives erosion and moves contaminants that impair water quality to our lakes
and rivers.
High-magnitude storm and/or precipitation events increase the likelihood of flooding (Guilbert
et al., 2015). Flooding impacts range from property damage to infrastructure failure to loss of
human life. How Vermont manages its natural resources, like its floodplains and wetlands, will
play a large role in the future under altered conditions. Wetlands and riparian forests can
attenuate water flows by holding water during times of extreme precipitation and releasing
stored water during times of low flow. These land covers can both reduce flooding and effects
of drought.
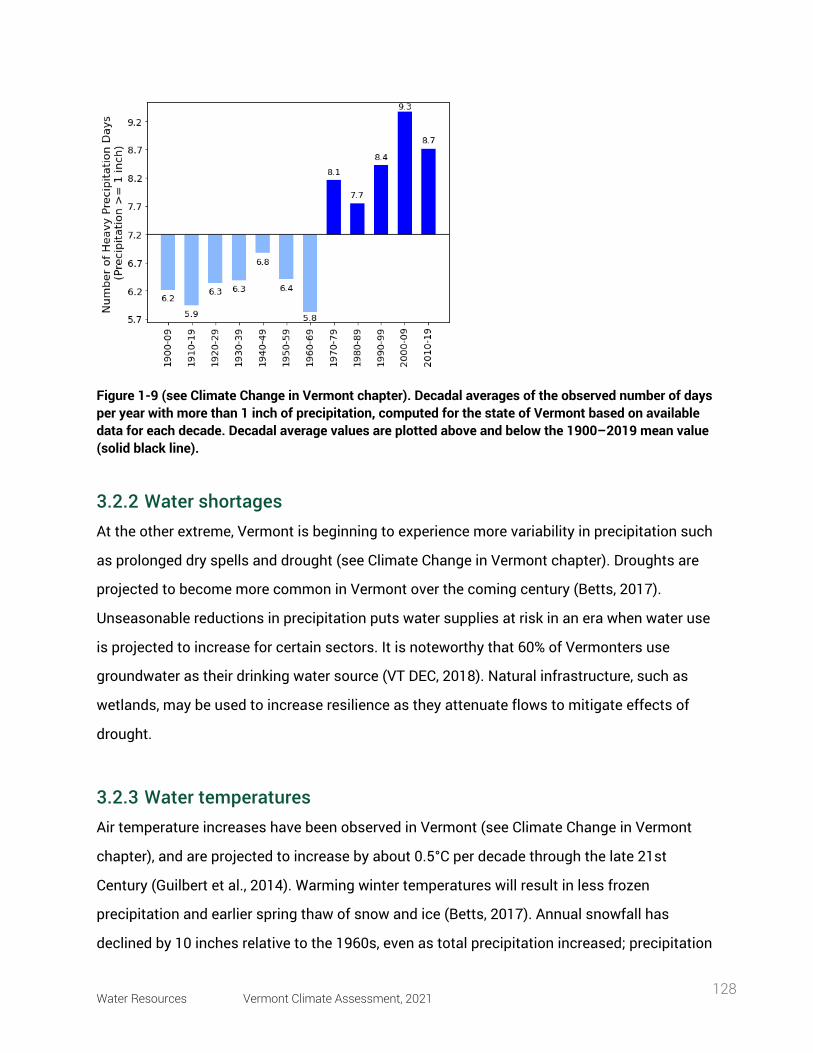
Water Resources Vermont Climate Assessment, 2021 128
Figure 1-9 (see Climate Change in Vermont chapter). Decadal averages of the observed number of days per year with more than 1 inch of precipitation, computed for the state of Vermont based on available data for each decade. Decadal average values are plotted above and below the 1900–2019 mean value (solid black line).
3.2.2 Water shortages At the other extreme, Vermont is beginning to experience more variability in precipitation such
as prolonged dry spells and drought (see Climate Change in Vermont chapter). Droughts are
projected to become more common in Vermont over the coming century (Betts, 2017).
Unseasonable reductions in precipitation puts water supplies at risk in an era when water use
is projected to increase for certain sectors. It is noteworthy that 60% of Vermonters use
groundwater as their drinking water source (VT DEC, 2018). Natural infrastructure, such as
wetlands, may be used to increase resilience as they attenuate flows to mitigate effects of
drought.
3.2.3 Water temperatures Air temperature increases have been observed in Vermont (see Climate Change in Vermont
chapter), and are projected to increase by about 0.5°C per decade through the late 21st
Century (Guilbert et al., 2014). Warming winter temperatures will result in less frozen
precipitation and earlier spring thaw of snow and ice (Betts, 2017). Annual snowfall has
declined by 10 inches relative to the 1960s, even as total precipitation increased; precipitation
Water Resources Vermont Climate Assessment, 2021 129
is falling as rain rather than snow due to warming conditions. Ice-out is also moving earlier by
several days on Vermont’s inland lakes (see Climate Change in Vermont chapter).
These temperature increases are reflected in the water temperatures of Vermont’s lakes and
rivers. According to measurements taken in ten regions of Lake Champlain, summer surface
water temperatures have increased significantly in the last 50 years. An analysis of August
lake temperature from 1964-2009 yielded an increase of 1.6 to 3.8°C (up to 0.085 °C/year).
Summer air temperatures in the Lake Champlain Basin increased by about 0.037 °C/year from
1976-2005 (Smeltzer et al., 2012). Summer lake temperatures matched and even surpassed
the rate of increase for air temperatures, illustrating the effect of warming climate.
Researchers attributed these results to declining ice cover in Lake Champlain. With the
absence of ice, the surface layers of the water begin to absorb radiation early in the spring,
even as lower strata remain cooler (Smetzer et al., 2012). Warming temperatures further
enforce thermal stratification because warmer water is less dense, so it remains on top,
resisting mixing of the layers (US EPA, 2013).
There is also evidence that temperatures in many rivers and streams have increased over time
in the United States. Stream temperatures are subject to many factors, including groundwater
inputs, geography, dams, and thermal discharge from plants, on top of air temperature and
solar radiation (Kaushal et al., 2010). Water temperature does not fluctuate like air
temperature, since cool groundwater inflows (e.g., wetland seeps) tend to stabilize river
temperatures (Hodgkins & Dudley, 2011). However, despite differences in environmental
conditions, many streams have shown increases consistent with long-term warming (Kaushal
et al., 2010) This has especially negative impacts for aquatic biota, like cold-adapted fish
species (Hodgkins & Dudley, 2011) (see Fish and Wildlife in Vermont chapter).
3.3 water supply and use
Key Point: Water supplies are already under stress in some areas of Vermont, and usage will likely increase for certain sectors. Increased occurrence of drought due to climate change will exacerbate this effect.
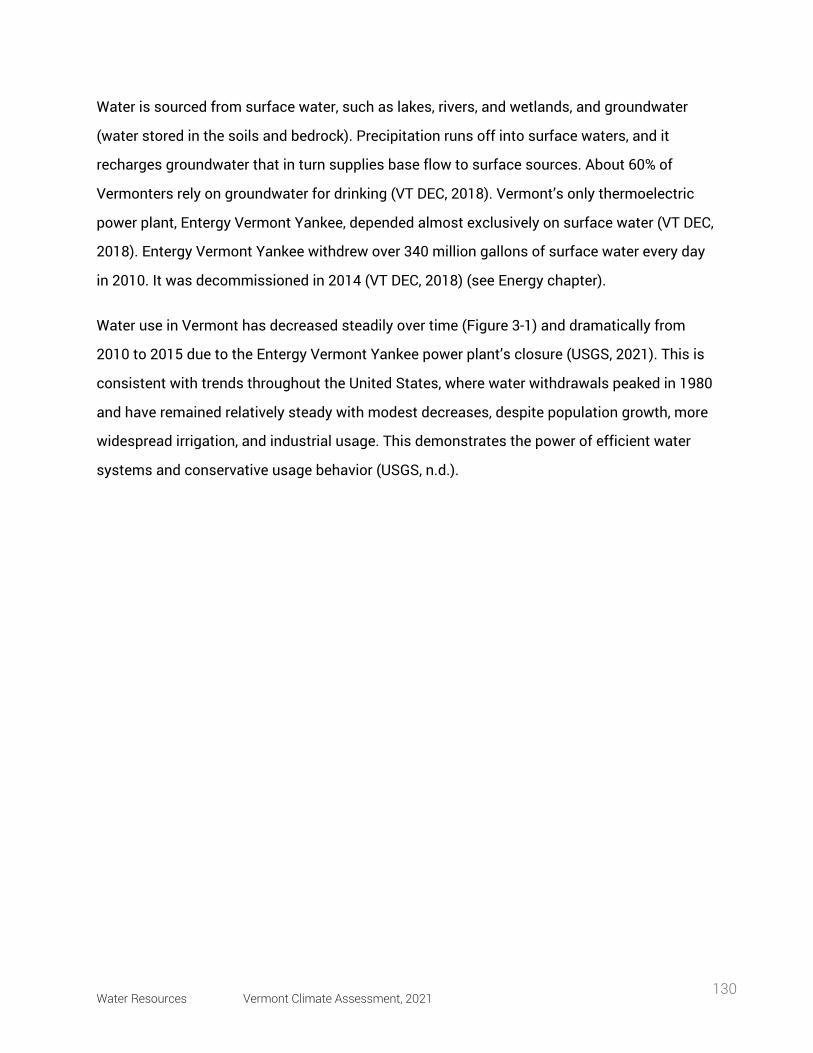
Water Resources Vermont Climate Assessment, 2021 130
Water is sourced from surface water, such as lakes, rivers, and wetlands, and groundwater
(water stored in the soils and bedrock). Precipitation runs off into surface waters, and it
recharges groundwater that in turn supplies base flow to surface sources. About 60% of
Vermonters rely on groundwater for drinking (VT DEC, 2018). Vermont’s only thermoelectric
power plant, Entergy Vermont Yankee, depended almost exclusively on surface water (VT DEC,
2018). Entergy Vermont Yankee withdrew over 340 million gallons of surface water every day
in 2010. It was decommissioned in 2014 (VT DEC, 2018) (see Energy chapter).
Water use in Vermont has decreased steadily over time (Figure 3-1) and dramatically from
2010 to 2015 due to the Entergy Vermont Yankee power plant’s closure (USGS, 2021). This is
consistent with trends throughout the United States, where water withdrawals peaked in 1980
and have remained relatively steady with modest decreases, despite population growth, more
widespread irrigation, and industrial usage. This demonstrates the power of efficient water
systems and conservative usage behavior (USGS, n.d.).
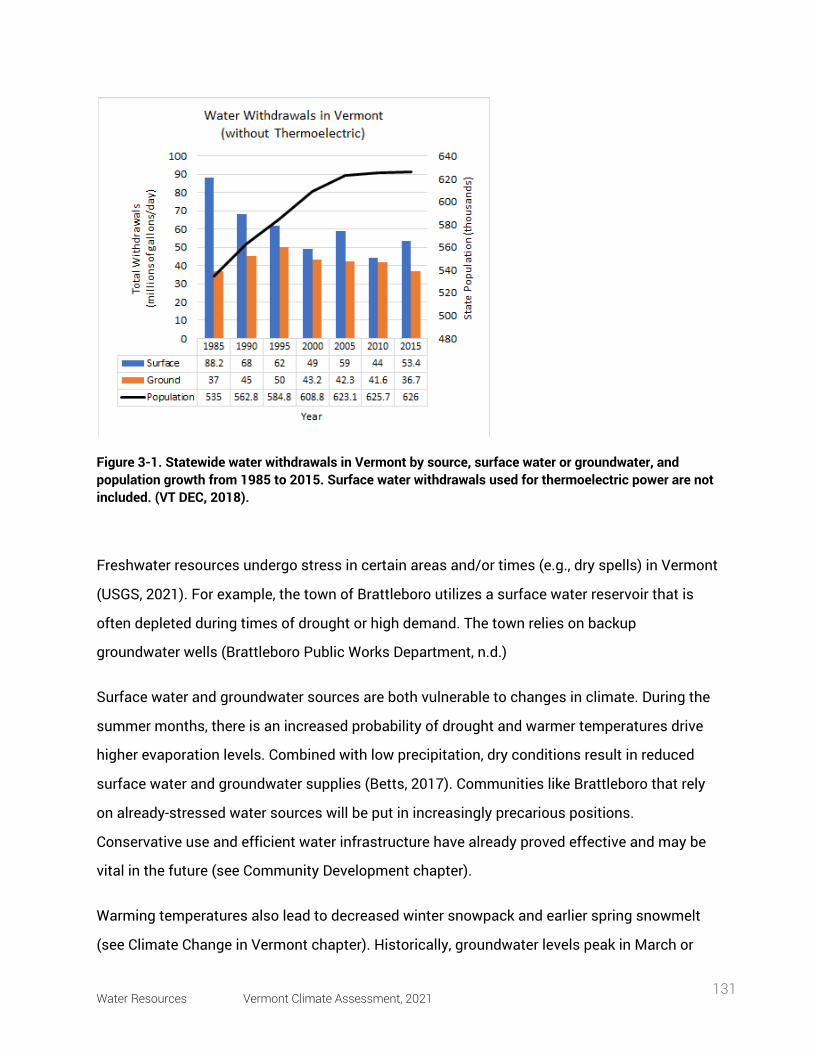
Water Resources Vermont Climate Assessment, 2021 131
Figure 3-1. Statewide water withdrawals in Vermont by source, surface water or groundwater, and population growth from 1985 to 2015. Surface water withdrawals used for thermoelectric power are not included. (VT DEC, 2018).
Freshwater resources undergo stress in certain areas and/or times (e.g., dry spells) in Vermont
(USGS, 2021). For example, the town of Brattleboro utilizes a surface water reservoir that is
often depleted during times of drought or high demand. The town relies on backup
groundwater wells (Brattleboro Public Works Department, n.d.)
Surface water and groundwater sources are both vulnerable to changes in climate. During the
summer months, there is an increased probability of drought and warmer temperatures drive
higher evaporation levels. Combined with low precipitation, dry conditions result in reduced
surface water and groundwater supplies (Betts, 2017). Communities like Brattleboro that rely
on already-stressed water sources will be put in increasingly precarious positions.
Conservative use and efficient water infrastructure have already proved effective and may be
vital in the future (see Community Development chapter).
Warming temperatures also lead to decreased winter snowpack and earlier spring snowmelt
(see Climate Change in Vermont chapter). Historically, groundwater levels peak in March or
Water Resources Vermont Climate Assessment, 2021 132
April due to gradual recharge from snowmelt (Dudley & Hodgkins, 2013). With less snowpack
and earlier snowmelt, groundwater may be more easily depleted moving into the summer
months during dry conditions. Conversely, the increase in Vermont’s heavy precipitation
events (see Climate Change in Vermont chapter) do little to recharge groundwater stores. The
vast majority of groundwater recharge comes from the small, frequent precipitation events,
whereas high-intensity storms lend more to stormwater runoff into streams, rivers and lakes
(LCBP, 2015).
3.3.1 Winter Recreation Water Use As the climate changes, demand for water may increase in certain industries. Warming winter
temperatures coincide with higher likelihood that winter precipitation will fall as rain instead of
snow (Betts, 2017). For Vermont’s busy winter sports industry, this threatens to shorten the
season suitable for winter sports and reduce snowpack (see Recreation and Tourism chapter).
Guilbert et al. (2014) estimated that annual snowfall will decrease roughly in half (47% to 52%
by the late 21st Century) for several ski resorts in the Lake Champlain Basin.
In Vermont, natural snowfall is commonly supplemented with human-made snow which
requires a reservoir of stored water; many winter resorts have artificial or natural water
reservoirs for quick withdrawals, some drawing from multiple surface water sources (Figure 3-
2) (Wilson et al., 2018). Snowmaking withdrawals consistently reach 30 million gallons per
winter season (defined here as November through February of the next year) across ten of
Vermont’s major ski areas.
Water Resources Vermont Climate Assessment, 2021 133
Figure 3-2. Water withdrawals (in millions of gallons) for snowmaking by ski area and winter season. This represents a sum of all withdrawals for that resort from November - February of the next year. Data was not available for every year at every site. All data is openly available at https://anrgeodata.vermont.gov/datasets/snowmaking-withdrawal
Winter temperatures are rising faster than any other season (see Climate Change in Vermont
chapter), so natural snowfall and suitable conditions for supplemental snowmaking will both
decrease by the end of the 21st Century (Guilbert et al., 2014). Snowmaking requirements are
projected to increase significantly for many of Vermont’s resorts, potentially by 25% by 2040
(Dawson & Scott, 2007). Water availability, in addition to temperature suitability, must be
recognized in considering the viability of the winter sports industry in the Northeast under
climate change (Wilson et al., 2018). February Median Flow (FMF) is a particularly important
metric for water withdrawals from Vermont rivers, as the FMF value determines the minimum
flow rate that must be maintained (at or above) when water is withdrawn for snowmaking per
Vermont rules (VT ANR, 1996) (see Recreation and Tourism chapter).
3.3.2 Agricultural Water Use Water usage is incredibly important in agriculture, especially as the climate changes. In
Vermont, 85-90% of farms rely on groundwater sources for agricultural purposes (VT DEC,
2018). The amount of land in Vermont that uses irrigation has almost doubled since 1995, yet
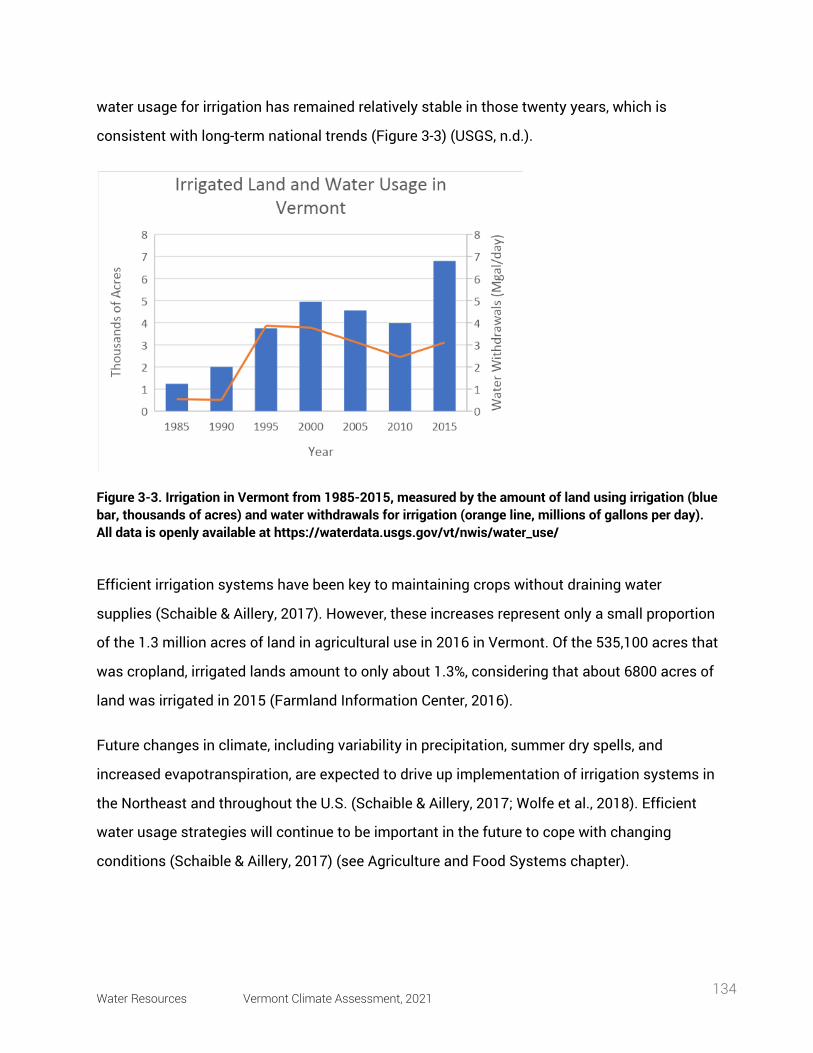
Water Resources Vermont Climate Assessment, 2021 134
water usage for irrigation has remained relatively stable in those twenty years, which is
consistent with long-term national trends (Figure 3-3) (USGS, n.d.).
Figure 3-3. Irrigation in Vermont from 1985-2015, measured by the amount of land using irrigation (blue bar, thousands of acres) and water withdrawals for irrigation (orange line, millions of gallons per day). All data is openly available at https://waterdata.usgs.gov/vt/nwis/water_use/
Efficient irrigation systems have been key to maintaining crops without draining water
supplies (Schaible & Aillery, 2017). However, these increases represent only a small proportion
of the 1.3 million acres of land in agricultural use in 2016 in Vermont. Of the 535,100 acres that
was cropland, irrigated lands amount to only about 1.3%, considering that about 6800 acres of
land was irrigated in 2015 (Farmland Information Center, 2016).
Future changes in climate, including variability in precipitation, summer dry spells, and
increased evapotranspiration, are expected to drive up implementation of irrigation systems in
the Northeast and throughout the U.S. (Schaible & Aillery, 2017; Wolfe et al., 2018). Efficient
water usage strategies will continue to be important in the future to cope with changing
conditions (Schaible & Aillery, 2017) (see Agriculture and Food Systems chapter).
Water Resources Vermont Climate Assessment, 2021 135
3.4 streamflow
Key Point: Average annual streamflow has increased in Vermont over time and across most seasons. Further increases can be expected under a wetter climate with intense storm events, creating challenges for water retention and flood risks.
Changes in precipitation and storm patterns are evident in Vermont’s waterways the past few decades.
Streamflow can be used as an indicator because the amount of precipitation directly affects how much
water ends up in streams and rivers. Base flow of streams is derived long-term from groundwater
storage, bank storage, and landscape sources like lakes, ponds, and wetlands that drain in. Storm flow
adds on to the base flow when precipitation runs off into the stream in the short-term (Hodgkins &
Dudley, 2011). Following a given precipitation event, runoff quantities depend on many factors, like land
use, topography, vegetation, and soil properties. Urban areas with impervious surfaces and lands lacking
vegetation allow more runoff than those that are forested (LCBP, 2015), although given the small total
area in impervious surfaces the changes in runoff are largely attributable to increased precipitation.
Beyond an indicator of climate change, streamflow is a measure of water availability and flow power.
For example, snowmaking guidelines in Vermont keep a discharge threshold to determine water supply
for withdrawals (VT ANR, 1996) (see Recreation and Tourism chapter). Similarly, the U.S. Fish and
Wildlife Service uses streamflow as an indicator of critical habitat for native fish (Lang, 1999). Flooding
events can also be directly monitored by assessing discharge levels, and drought periods are likewise
characterized by low flows (see Climate Change in Vermont chapter). Therefore, streamflow is a direct
measure of how much water is running through a waterway, which has practical, ecological, and
economic ties.
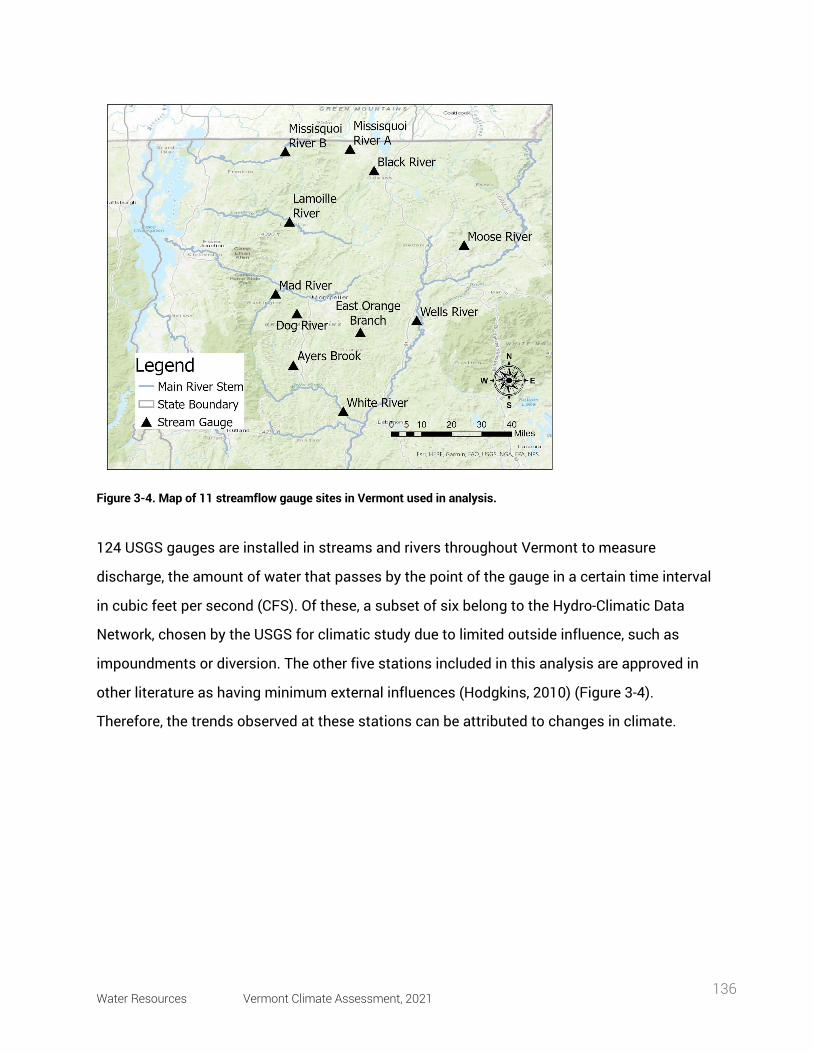
Water Resources Vermont Climate Assessment, 2021 136
Figure 3-4. Map of 11 streamflow gauge sites in Vermont used in analysis. 124 USGS gauges are installed in streams and rivers throughout Vermont to measure
discharge, the amount of water that passes by the point of the gauge in a certain time interval
in cubic feet per second (CFS). Of these, a subset of six belong to the Hydro-Climatic Data
Network, chosen by the USGS for climatic study due to limited outside influence, such as
impoundments or diversion. The other five stations included in this analysis are approved in
other literature as having minimum external influences (Hodgkins, 2010) (Figure 3-4).
Therefore, the trends observed at these stations can be attributed to changes in climate.
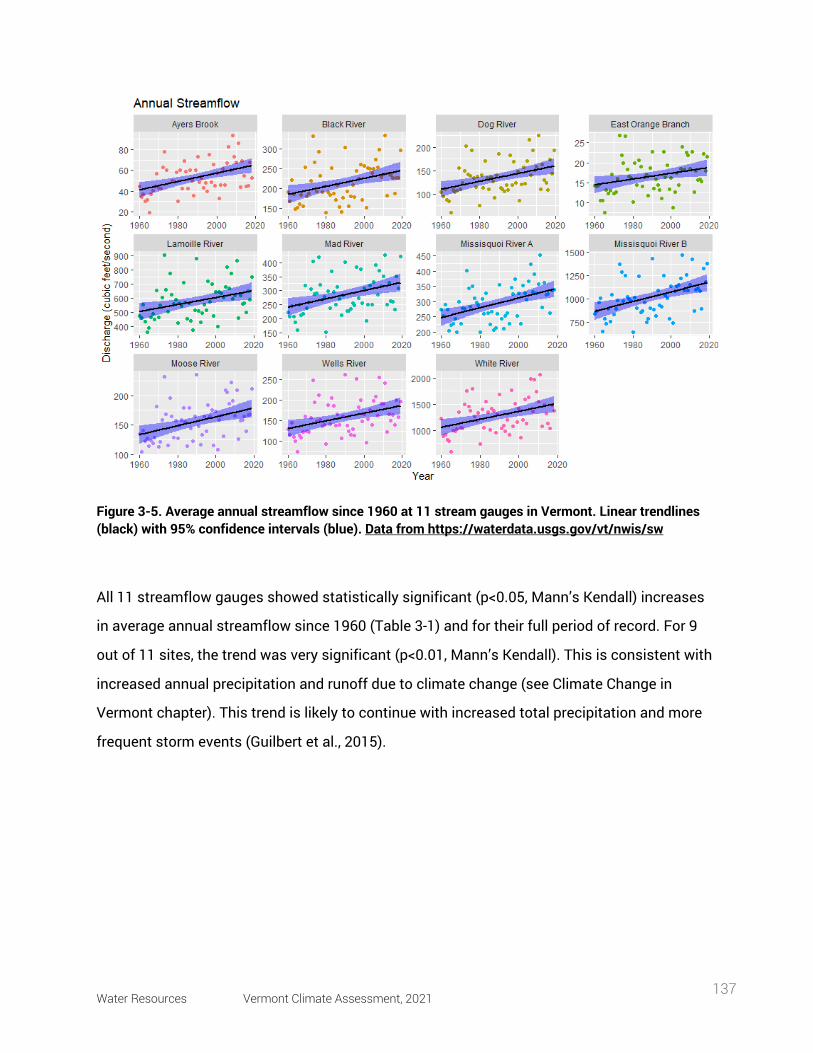
Water Resources Vermont Climate Assessment, 2021 137
Figure 3-5. Average annual streamflow since 1960 at 11 stream gauges in Vermont. Linear trendlines (black) with 95% confidence intervals (blue). Data from https://waterdata.usgs.gov/vt/nwis/sw
All 11 streamflow gauges showed statistically significant (p<0.05, Mann’s Kendall) increases
in average annual streamflow since 1960 (Table 3-1) and for their full period of record. For 9
out of 11 sites, the trend was very significant (p<0.01, Mann’s Kendall). This is consistent with
increased annual precipitation and runoff due to climate change (see Climate Change in
Vermont chapter). This trend is likely to continue with increased total precipitation and more
frequent storm events (Guilbert et al., 2015).
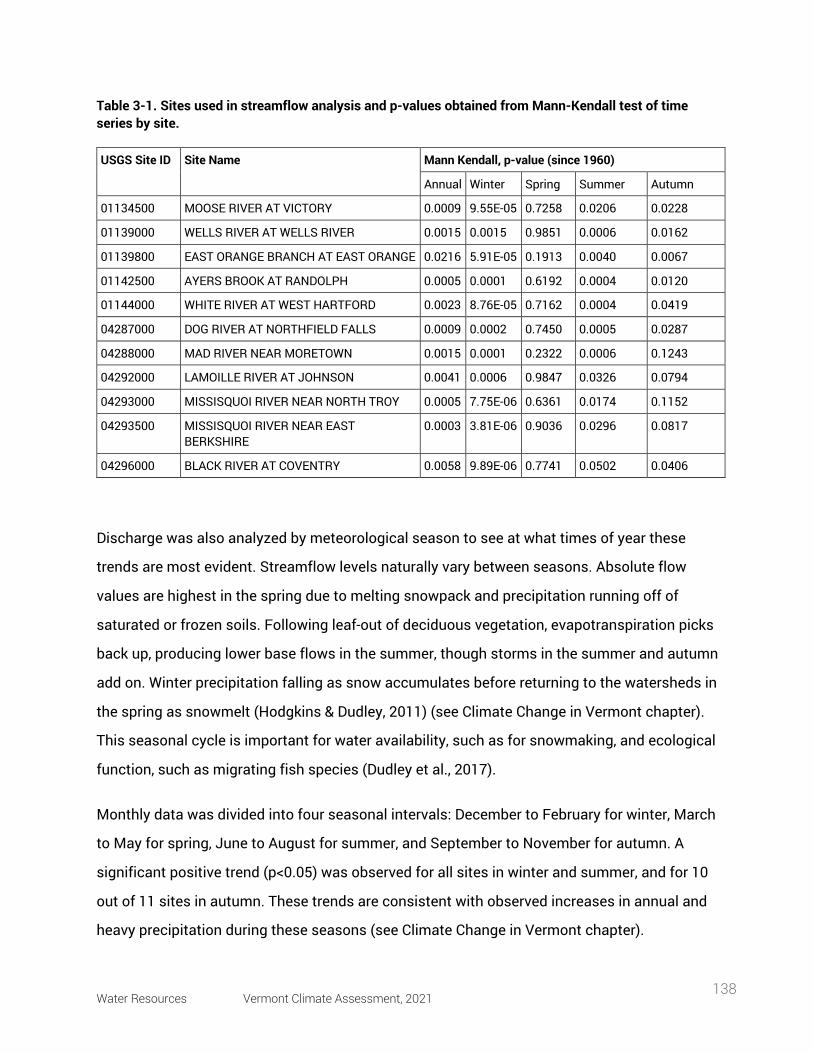
Water Resources Vermont Climate Assessment, 2021 138
Table 3-1. Sites used in streamflow analysis and p-values obtained from Mann-Kendall test of time series by site.
USGS Site ID Site Name Mann Kendall, p-value (since 1960)
Annual Winter Spring Summer Autumn
01134500 MOOSE RIVER AT VICTORY 0.0009 9.55E-05 0.7258 0.0206 0.0228
01139000 WELLS RIVER AT WELLS RIVER 0.0015 0.0015 0.9851 0.0006 0.0162
01139800 EAST ORANGE BRANCH AT EAST ORANGE 0.0216 5.91E-05 0.1913 0.0040 0.0067
01142500 AYERS BROOK AT RANDOLPH 0.0005 0.0001 0.6192 0.0004 0.0120
01144000 WHITE RIVER AT WEST HARTFORD 0.0023 8.76E-05 0.7162 0.0004 0.0419
04287000 DOG RIVER AT NORTHFIELD FALLS 0.0009 0.0002 0.7450 0.0005 0.0287
04288000 MAD RIVER NEAR MORETOWN 0.0015 0.0001 0.2322 0.0006 0.1243
04292000 LAMOILLE RIVER AT JOHNSON 0.0041 0.0006 0.9847 0.0326 0.0794
04293000 MISSISQUOI RIVER NEAR NORTH TROY 0.0005 7.75E-06 0.6361 0.0174 0.1152
04293500 MISSISQUOI RIVER NEAR EAST BERKSHIRE
0.0003 3.81E-06 0.9036 0.0296 0.0817
04296000 BLACK RIVER AT COVENTRY 0.0058 9.89E-06 0.7741 0.0502 0.0406
Discharge was also analyzed by meteorological season to see at what times of year these
trends are most evident. Streamflow levels naturally vary between seasons. Absolute flow
values are highest in the spring due to melting snowpack and precipitation running off of
saturated or frozen soils. Following leaf-out of deciduous vegetation, evapotranspiration picks
back up, producing lower base flows in the summer, though storms in the summer and autumn
add on. Winter precipitation falling as snow accumulates before returning to the watersheds in
the spring as snowmelt (Hodgkins & Dudley, 2011) (see Climate Change in Vermont chapter).
This seasonal cycle is important for water availability, such as for snowmaking, and ecological
function, such as migrating fish species (Dudley et al., 2017).
Monthly data was divided into four seasonal intervals: December to February for winter, March
to May for spring, June to August for summer, and September to November for autumn. A
significant positive trend (p<0.05) was observed for all sites in winter and summer, and for 10
out of 11 sites in autumn. These trends are consistent with observed increases in annual and
heavy precipitation during these seasons (see Climate Change in Vermont chapter).
Water Resources Vermont Climate Assessment, 2021 139
Spring is the only season in which significant changes in streamflow were not observed, with
trends remaining relatively steady (p>0.05, Mann’s Kendall). This is surprising because spring
precipitation has increased over time like the other seasons (see Climate Change in Vermont
chapter). One explanation for this is based on temperature changes, not precipitation.
Temperatures are warming most significantly during winter, with total snowfall trending
downwards since the 1960-70s, but precipitation trending upwards. Therefore, winter
precipitation is falling more often as rain rather than snow, leading to less snow accumulation
(see Climate Change in Vermont chapter). This snowpack is also melting earlier in the year.
Dudley et al. (2017) analyzed historical trends in snowmelt-related streamflow timing using the
winter-spring center of volume date, or the date when half of the volume of water for the winter
and spring seasons has passed the gauge. They found that in the Eastern United States, the
average for this date has advanced by over 8 days between 1940 and 2014, driven by February-
May temperature increases. Therefore, water that is typically stored as snowpack, which later
melts contributing to spring streamflow, is now falling as rain in the wintertime. The snowpack
that does form is melting earlier in the winter-spring season, potentially contributing to the
steady trend exhibited by spring streamflow over time.
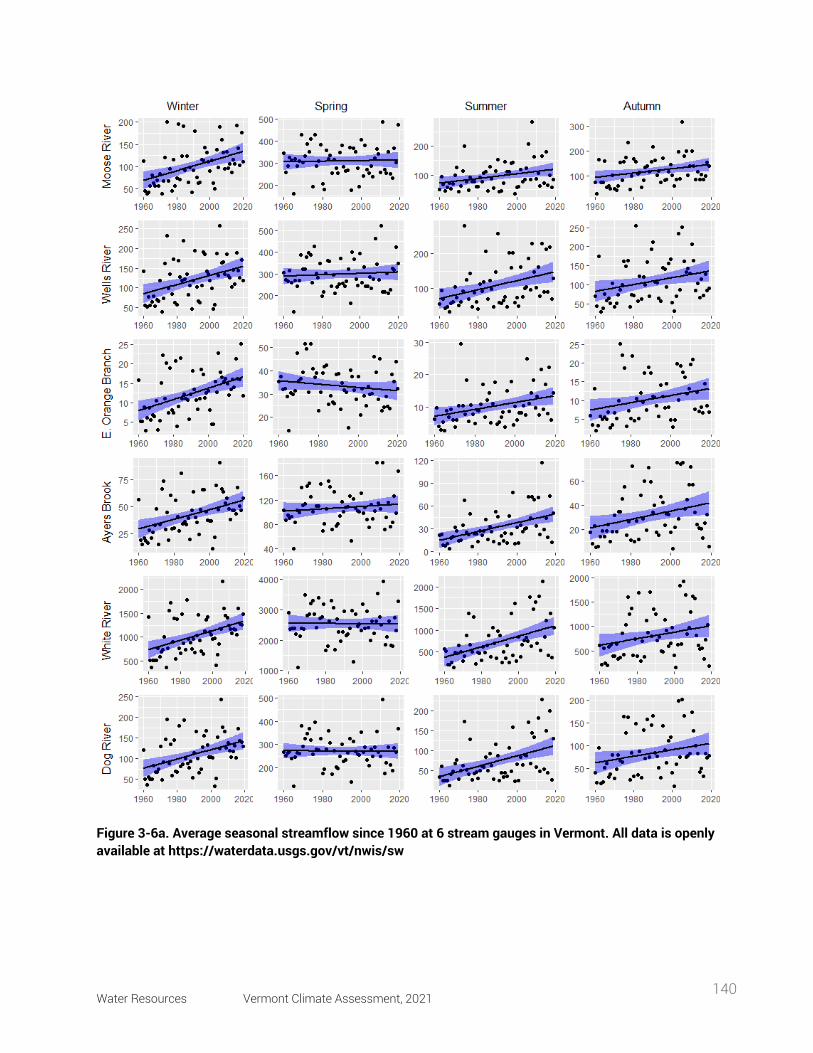
Water Resources Vermont Climate Assessment, 2021 140
Figure 3-6a. Average seasonal streamflow since 1960 at 6 stream gauges in Vermont. All data is openly available at https://waterdata.usgs.gov/vt/nwis/sw
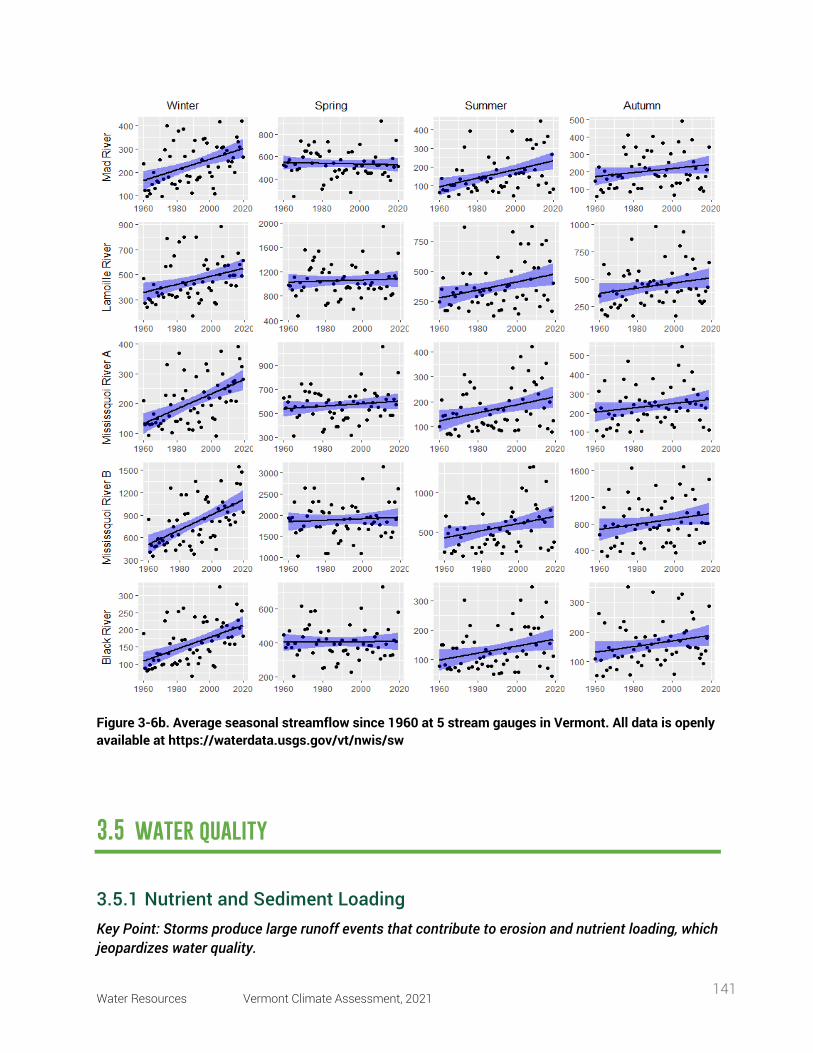
Water Resources Vermont Climate Assessment, 2021 141
Figure 3-6b. Average seasonal streamflow since 1960 at 5 stream gauges in Vermont. All data is openly available at https://waterdata.usgs.gov/vt/nwis/sw
3.5 water quality
3.5.1 Nutrient and Sediment Loading Key Point: Storms produce large runoff events that contribute to erosion and nutrient loading, which jeopardizes water quality.
Water Resources Vermont Climate Assessment, 2021 142
Greater amounts of runoff not only leads to higher streamflows; it also drives erosion and
carries pollutants and sediments into Vermont’s waterways. In 2018, nutrients were the cause
of impairment for 54.8 miles of Vermont’s streams and rivers, and sedimentation impaired
63.1 miles (VT ANR & VT DEC, 2018). Lake Champlain Basin (including NY and VT), for
example, has a ratio of 18:1 land to water; that is a primary reason water quality challenges
result from land-based nutrient and sediment inputs. Vermont’s lakes and ponds, as well as
wetlands, can be hardened by sedimentation and excess nutrients. For example, buildup of
sediments can alter hydrology, or invasive plants are able to colonize disturbed wetlands.
Storms in particular contribute large volumes of nutrients and sediments in short amounts of
time (Stockwell et al., 2020), and a reduction in the frozen period for soils may make them
more susceptible to erosion. Segments of seventeen waterbodies (rivers or lakes) in Vermont
are impaired due to stormwater runoff, while twenty-five are impaired by nutrients or nutrients
and sediment and fifteen by sediment inputs (VT DEC, 2018). Therefore, as the climate
changes and heavy precipitation events increase, these individual storm events play an
oversized role in water quality impairment.
In Vermont, phosphorus is often considered the most troublesome pollutant. Phosphorus
pollution comes from point sources like wastewater treatment centers, as well as non-point
sources such as stormwater runoff and agricultural runoff. Phosphorus levels are over the
allowed limit in many waterbodies, mostly from non-point sources. Reducing inputs from
runoff, while far more difficult than for point sources, is imperative (Smeltzer et al., 2012). In
2016, the US Environmental Protection Agency (EPA) found that the leading contributor of
phosphorus inputs into Lake Champlain is the agricultural sector, primarily from cropland and
soil erosion (US EPA, 2016). Phosphorus accumulation in agricultural soils is a legacy of
Vermont’s agricultural identity, which cannot be avoided even with sharp reductions in current
imports. Phosphorus continues to accrue by 5 kg per hectare per year in Vermont due to
applications of manure and fertilizer, as part of the net importation of phosphorus in animal
feed and fertilizer (Wironen et al., 2018) yet developed lands contribute twice the phosphorous
load as agricultural lands (0.51 metric tons per square mile and 0.25 metric tons per square
mile, respectively) (LCBP, 2018).
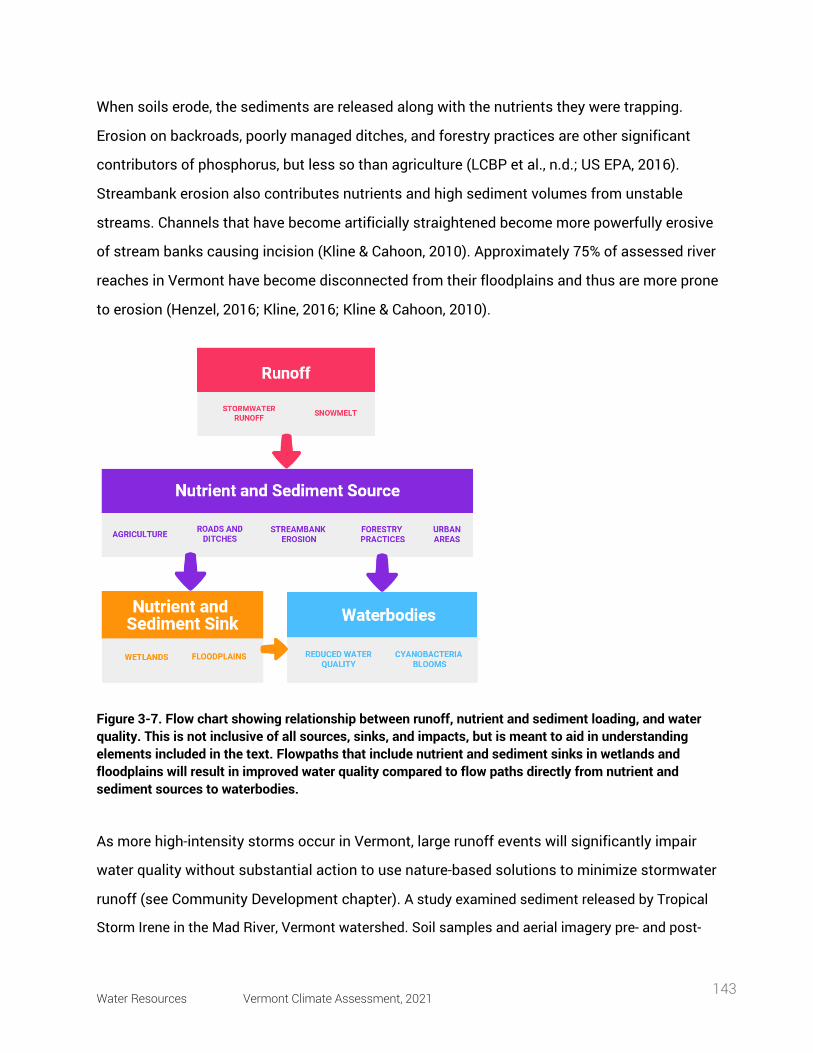
Water Resources Vermont Climate Assessment, 2021 143
When soils erode, the sediments are released along with the nutrients they were trapping.
Erosion on backroads, poorly managed ditches, and forestry practices are other significant
contributors of phosphorus, but less so than agriculture (LCBP et al., n.d.; US EPA, 2016).
Streambank erosion also contributes nutrients and high sediment volumes from unstable
streams. Channels that have become artificially straightened become more powerfully erosive
of stream banks causing incision (Kline & Cahoon, 2010). Approximately 75% of assessed river
reaches in Vermont have become disconnected from their floodplains and thus are more prone
to erosion (Henzel, 2016; Kline, 2016; Kline & Cahoon, 2010).
Figure 3-7. Flow chart showing relationship between runoff, nutrient and sediment loading, and water quality. This is not inclusive of all sources, sinks, and impacts, but is meant to aid in understanding elements included in the text. Flowpaths that include nutrient and sediment sinks in wetlands and floodplains will result in improved water quality compared to flow paths directly from nutrient and sediment sources to waterbodies.
As more high-intensity storms occur in Vermont, large runoff events will significantly impair
water quality without substantial action to use nature-based solutions to minimize stormwater
runoff (see Community Development chapter). A study examined sediment released by Tropical
Storm Irene in the Mad River, Vermont watershed. Soil samples and aerial imagery pre- and post-
Water Resources Vermont Climate Assessment, 2021 144
Tropical Storm Irene were used to calculate how much sediment and phosphorus were released
due to erosion from high flows. The results suggest that this one extreme event delivered as much
sediment and phosphorus into the stream as is normally exported over an entire year (Ross et al.,
2019).
Adaptation measures, particularly in developed areas and farmlands, can help mitigate runoff
volume and velocity. Wetlands and floodplains are vital natural features that preserve water
quality, and restoration is a cost-effective mitigation measure, such as in marginal farmlands
(Rousseau, 2020). Implementation of green stormwater infrastructure can greatly reduce
runoff to preserve water quality (LCBP, 2015) (see Community Development chapter).
Box 3.1 The Value of Water Quality in Lake Champlain Though water seems a plentiful resource in Vermont, clean water is vital to its
citizens’ lifestyles and livelihoods. Lake Champlain alone is an economic
powerhouse in terms of property value, tourism revenue, and employment
opportunities. A 2015 study found that for the four counties in Vermont adjacent to
Lake Champlain, just a one-meter decrease in water clarity has consequences. A one-
meter decrease means that the water is less clear at shallower depths due to
sediments and algae growth; this is measured by lowering an object into the water
and recording the depth when it disappears. An extrapolated model shows that this
loss in water quality would in turn lead to a loss of approximately 195 full-time jobs, a
$12.6 million reduction in tourism expenditures, and a total economic reduction of
nearly $16.8 million (Voigt et al., 2015). Payment for Ecosystem Services programs
are an option for reducing phosphorus loading (see Agriculture and Food Systems
chapter).
Water Resources Vermont Climate Assessment, 2021 145
3.5.2 Floodplains and River Corridors The floodplain is an area outside a waterbody where floodwaters can go. When rivers are well
connected to their floodplains, these riverside areas can accommodate the overbank flow,
capture sediment, and store floodwaters to reduce the volume and peaks of flows experienced
in downstream reaches. Floodplains host moist deep and varied soils and unique natural
communities, and these stone-free floodplain soils are valued for agriculture and forestry.
Sediments and nutrients carried in the water settle out onto the floodplain instead of routing
back to the waterbody; maintaining water quality is an important ecosystem service provided
by floodplains (Figure 3-7).
Stream and river channels adjust dynamically to accommodate the flow of water, sediment,
and debris. River Corridors identify the minimum lateral area needed for stream and river
channels to freely adjust and manage these forces. River Corridors in Vermont are mapped to
include the channel meander belt and room for a stable vegetated bank (Kline & Cahoon,
2010). This vegetation helps to prevent streambank erosion (Singh et al., 2018).
River corridors and floodplains provide foundational ecosystem services with critical public
safety, fiduciary, water quality, habitat, social and economic benefits. However, in the Northern
hemisphere, over 95% of streams have been modified by human activity (Singh et al., 2018).
Historical land use choices have involved channel and floodplain manipulation to straighten,
dredge, armor, and berm rivers to protect riverside infrastructure. A straightened channel
becomes more erosive and can lose functional connection with its floodplain. Within Vermont,
over 75% of assessed streams have lost some degree of connection to the floodplain and are
incised (Henzel, 2016).
3.5.3 Wetlands and Water Quality Wetlands are inundated by surface water or groundwater seasonally, such as vernal pools, or
year-round. They serve a variety of functions and values to human society, in addition to
supporting robust plant and wildlife communities (see Fish and Wildlife in Vermont chapter)
(VT DEC, 2019).
Water Resources Vermont Climate Assessment, 2021 146
The impacts of climate change on wetlands are poorly understood, especially for freshwater
inland wetlands like those in Vermont. Wetlands in Vermont do not face the same threats as
coastal wetlands from saltwater intrusion, or wetlands in areas prone to frequent drought and
wildfire. However, regardless of geographic region, wetland functionality can be impaired by
increased temperatures, drought and flooding events, and carbon dioxide increases (Junk et
al., 2013; Moomaw et al., 2018). Ephemeral wetlands, or vernal pools, depend largely on the
length of time they are inundated, or the hydroperiod. Drought and flooding events can shorten
or prolong the hydroperiod, making it less suitable for some wildlife that depend on them for
habitat or breeding (Brooks, 2009) (see Fish and Wildlife in Vermont chapter). Wetlands’
vulnerability to changes in climate goes in hand with the natural mitigation services they offer.
Wetlands play an important role in moderating the effects of climate change in terms of water
quality. (Adusumilli, 2015; Junk et al., 2013; VT DEC, n.d.). Wetlands serve as natural filtration
systems for nutrients and sediments (Carr et al., n.d.; VT DEC, 2019). The binding roots of
wetland plants can remove up to 90% of sediments present in runoff or streamflow (VT DEC,
n.d.). Excess nitrogen and phosphorus are taken up by wetland plants and recycled through
the system (Junk et al., 2013; VT DEC, 2019). Because of these benefits, wetlands are regarded
as a natural solution to impaired water quality and eutrophication (Lester et al., 2019; VT DEC,
2019).
A study in the Lake Champlain Basin was dedicated to optimizing wetland restoration to
reduce phosphorus export (Lester et al., 2019). The researchers developed a framework based
on ecosystem service modeling; how much phosphorus could be reduced for the lowest cost?
They found that phosphorus exports throughout the basin could be reduced by 2.6% for a $50
million budget, and by 5.1% for a $200 million budget. With access to finer spatial resolution
data, in order to locate “hotspots”, phosphorus reduction could potentially reach twice that for
the same budget. This study highlights the major role Vermont’s wetlands take in clean water.
Another important way that wetlands increase resilience to climate change is through carbon
sequestration. Carbon dioxide in the atmosphere is absorbed by wetlands, stored in plant
biomass for decades and in its soils for potentially thousands of years (Carr et al., n.d.;
Water Resources Vermont Climate Assessment, 2021 147
Milligan et al., 2019). The exact amount of carbon stored is difficult to determine, and it varies
by location, wetland size, and other factors. Wetlands in the Northeast and Midwest store
more carbon than any other region in the United States; one study estimated about 475 metric
tonnes per hectare in the soils alone (Nahlik & Fennessy, 2016). Another calculated that
wetland plants sequester over 8 tonnes of carbon per hectare every year, though for a specific
wetland in Connecticut (Milligan et al., 2019). Wetlands also release carbon dioxide, through
respiration, and emit methane, but they are largely considered valuable carbon sinks rather
than sources.
Management decisions are key to maintaining wetlands as carbon sinks. In Vermont, over 35%
of wetlands have been lost, mainly due to agricultural development (Dahl, 1990). Wetland
drainage and alteration exposes the soils, liberating and releasing carbon into the atmosphere,
turning a major carbon storage tank into a source instead. Newly created freshwater wetlands
can take decades to centuries to become a carbon sink due to methane emissions, as roots
and microbes accumulate (Moomaw et al., 2018). Wetland degradation has other far-reaching
consequences, such as habitat loss for plants and wildlife, and functions for water supply,
water quality, and flood control are also impaired.
3.5.4 Algae and Cyanobacteria Blooms Key Point: Climate change creates favorable conditions for cyanobacteria blooms, which impact recreation, public health, and wildlife.
Nutrients feed algae growth in water bodies, which reduces water clarity and oxygen levels.
Heavy precipitation produces large runoff events that carry these nutrients, particularly
phosphorus, into Vermont’s waterways. Combined with warming temperatures, climate change
could support the warm, nutrient-enriched environment that algae thrive in at the expense of
fish and wildlife (LCBP, 2015).
Some algae are very dangerous to consume or come into contact with (see Human Health
chapter). Cyanobacteria, or blue-green algae, are common lake organisms, but some produce
cyanotoxins. Cyanobacteria blooms, or harmful algal blooms, are dense accumulations of
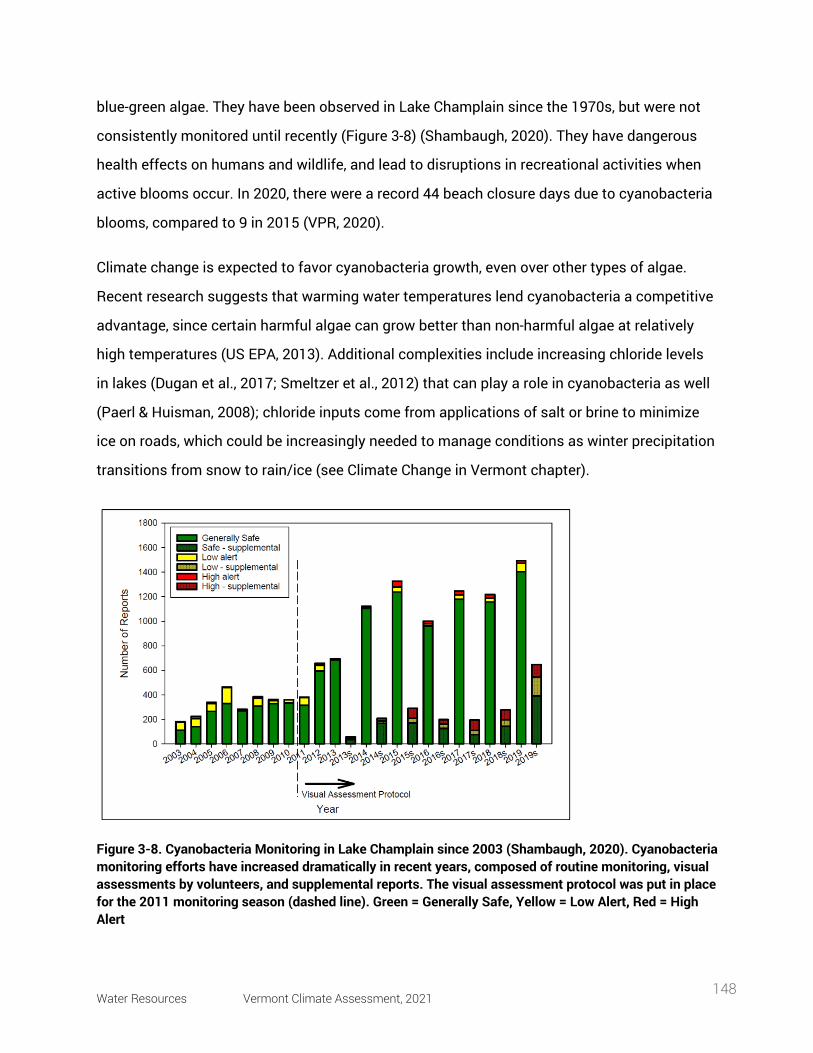
Water Resources Vermont Climate Assessment, 2021 148
blue-green algae. They have been observed in Lake Champlain since the 1970s, but were not
consistently monitored until recently (Figure 3-8) (Shambaugh, 2020). They have dangerous
health effects on humans and wildlife, and lead to disruptions in recreational activities when
active blooms occur. In 2020, there were a record 44 beach closure days due to cyanobacteria
blooms, compared to 9 in 2015 (VPR, 2020).
Climate change is expected to favor cyanobacteria growth, even over other types of algae.
Recent research suggests that warming water temperatures lend cyanobacteria a competitive
advantage, since certain harmful algae can grow better than non-harmful algae at relatively
high temperatures (US EPA, 2013). Additional complexities include increasing chloride levels
in lakes (Dugan et al., 2017; Smeltzer et al., 2012) that can play a role in cyanobacteria as well
(Paerl & Huisman, 2008); chloride inputs come from applications of salt or brine to minimize
ice on roads, which could be increasingly needed to manage conditions as winter precipitation
transitions from snow to rain/ice (see Climate Change in Vermont chapter).
Figure 3-8. Cyanobacteria Monitoring in Lake Champlain since 2003 (Shambaugh, 2020). Cyanobacteria monitoring efforts have increased dramatically in recent years, composed of routine monitoring, visual assessments by volunteers, and supplemental reports. The visual assessment protocol was put in place for the 2011 monitoring season (dashed line). Green = Generally Safe, Yellow = Low Alert, Red = High Alert
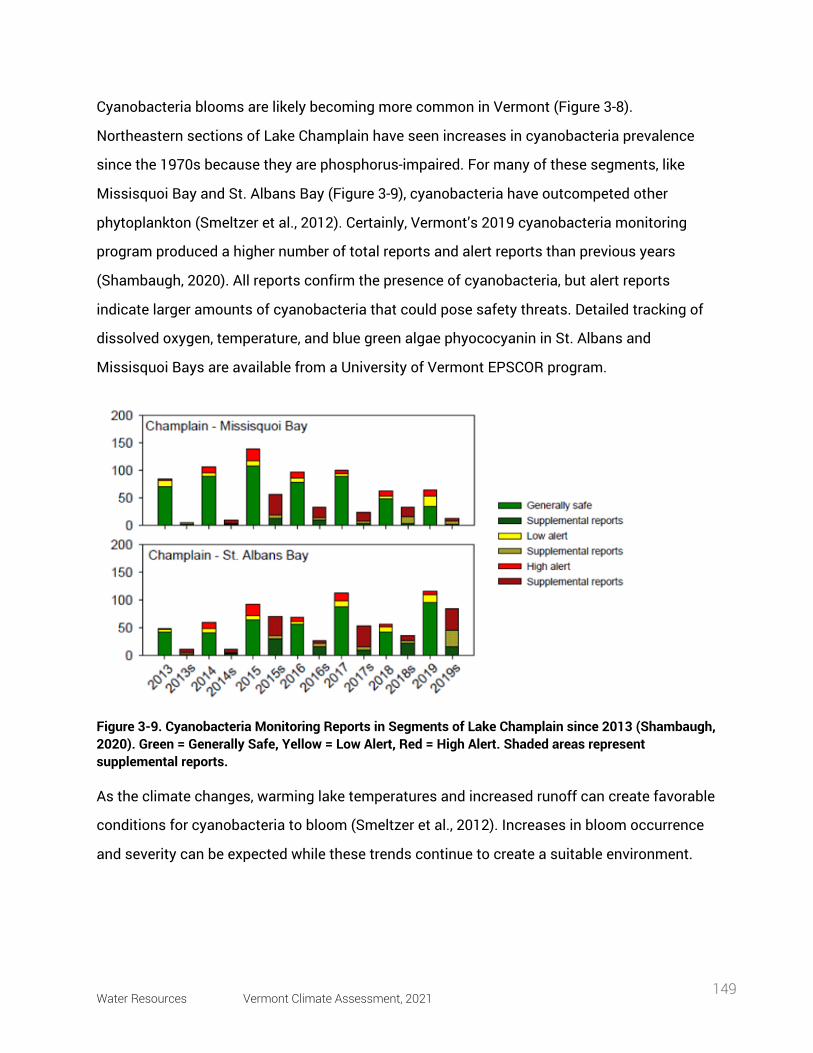
Water Resources Vermont Climate Assessment, 2021 149
Cyanobacteria blooms are likely becoming more common in Vermont (Figure 3-8).
Northeastern sections of Lake Champlain have seen increases in cyanobacteria prevalence
since the 1970s because they are phosphorus-impaired. For many of these segments, like
Missisquoi Bay and St. Albans Bay (Figure 3-9), cyanobacteria have outcompeted other
phytoplankton (Smeltzer et al., 2012). Certainly, Vermont’s 2019 cyanobacteria monitoring
program produced a higher number of total reports and alert reports than previous years
(Shambaugh, 2020). All reports confirm the presence of cyanobacteria, but alert reports
indicate larger amounts of cyanobacteria that could pose safety threats. Detailed tracking of
dissolved oxygen, temperature, and blue green algae phyococyanin in St. Albans and
Missisquoi Bays are available from a University of Vermont EPSCOR program.
Figure 3-9. Cyanobacteria Monitoring Reports in Segments of Lake Champlain since 2013 (Shambaugh, 2020). Green = Generally Safe, Yellow = Low Alert, Red = High Alert. Shaded areas represent supplemental reports.
As the climate changes, warming lake temperatures and increased runoff can create favorable
conditions for cyanobacteria to bloom (Smeltzer et al., 2012). Increases in bloom occurrence
and severity can be expected while these trends continue to create a suitable environment.
Water Resources Vermont Climate Assessment, 2021 150
3.6 flooding
Key Point: Damage from high flows is the single most costly type of disaster in Vermont, primarily due to the erosive power of water. Many roads and culverts are in conflict with the room needed by streams and rivers. River corridor and floodplain protection is critical to maintain floodplain function.
The most common recurring hazard event in Vermont is flooding. Damage is usually
associated with the rise of river or lake levels and fluvial erosion, in which streambed and
streambank erosion result in physical changes to the width and depth of the channel. Flash
flooding can occur in small areas when a large amount of precipitation falls in a short period of
time, often due to rapid rise of river levels with runoff from entrained thunderstorms. Over 75%
of monetary flooding damages are due to fluvial erosion in Vermont (VT Emergency
Management, 2018). Roads, crossings, homes, and businesses have been damaged and lives
have been lost (State of Vermont, 2021).
Vermont has already seen increases in precipitation and streamflow that produce flooding
conditions. Now a decade since the 2011 flooding events, it is important to not forget the
insight gained. First, in the spring of 2011, high temperatures and rain brought on rapid melting
of a deeper-than-average snowpack leading to widespread flooding in Lake Champlain
tributaries in western Vermont and in the eastern Adirondacks. Though flood was not
necessarily severe in any one tributary (with exceptions), it was the widespread nature of
flooding in so many of the Lake Champlain tributaries that caused Lake Champlain to rise
rapidly and to a high stage-- a record-breaking 103 ft above sea level, remaining above flooding
level (100 ft above sea level) for two months (Betts, 2017; International Lake Champlain-
Richelieu River Study Board, 2019; LCBP, 2013). A summary of this flooding event and
suggestions for flood preparation are provided by the International Lake Champlain-Richelieu
River Study Board (International Lake Champlain-Richelieu River Study Board, 2020).
This major flooding event was subsequently overshadowed by what followed in August:
Tropical Storm Irene. High spring-summer precipitation and streamflow levels, combined with
soils that were already very wet, allowed for severe flooding and damage across central and
Water Resources Vermont Climate Assessment, 2021 151
southern Vermont (Betts, 2017). Tropical Storm Irene led to over $1 billion in flood-related
losses, 1500 displaced families, and 3500 residences damaged (Gourevitch et al., 2020).
Flooding exceeded the 1% annual occurrence threshold, or a 1% probability that a flood of that
magnitude would occur in a given year, in most areas affected and even the 0.2% value in
some areas (Anderson et al., 2017).
The flooding events of 2011 will occur again, like the Great Vermont Flood of 1927 or the 1938
New England hurricane. There has already been an observed increase in watershed discharges
(LCBP, 2015; Schiff et al., 2015) and, by design, the best contemporary Flood Insurance Rate
Maps do not characterize likely future flooding conditions. Under likely climate conditions,
augmented precipitation and runoff are anticipated (Guilbert et al., 2014). Rapid snowmelt in
the spring, if there is substantial snowpack, can increase flooding conditions. As snow loading
diminishes, frozen soil conditions will affect traditional spring flooding patterns including rapid
river ice-melt. As high-magnitude storms are expected to occur more frequently, there is higher
risk of costly, recurring flooding (Guilbert et al., 2015). The flooding events of 2011 may serve
as a warning for what is to come and emphasize the need for action.
3.6.1 Floodplains and River Corridors Key Point: Restoring and maintaining functional floodplains and river corridors are important in terms of climate-change induced flooding vulnerability and water quality.
Floodplain integrity is extremely important to flood mitigation in Vermont (Box 3.2). Currently
only a third of communities in Vermont protect River Corridors and/or floodplains from
adverse impacts, and very few have established protections for woody riparian buffers along
banks (State of Vermont, 2021). Forested watersheds offer multiple benefits in terms of
flooding mitigation by intercepting rainfall and detaining snowmelt. Forests promote gradual
groundwater infiltration and return water to the atmosphere, whereas deforested landscapes
allow fast runoff that leads to earlier storm peaks and damaging flows (see Climate Change in
Forests chapter) (State of Vermont, 2021). In developing areas, where impervious surface is
increasing, most communities in Vermont do not account for increases in offsite storm
discharge in their development standards. Flood damage avoidance in Vermont requires more
Water Resources Vermont Climate Assessment, 2021 152
widespread adoption of “no adverse impact” standards to support the natural and beneficial
functions of river corridors and floodplains.
As the climate changes and heavy precipitation increases, along with extreme events like
Tropical Storm Irene, river corridor and floodplain protections are the least costly opportunity
to avoid the loss of existing floodplain functions and heightened damages. In some locations,
opportunities for disaster risk reduction may combine both the removal of buildings at risk as
well as the re-connection of floodplains to restore ecological services. Many floodplain
restoration operations employ functional floodplain connectivity measures and revegetation.
Reconnecting floodplains will lead to improved accessibility between the stream and
floodplain, such that sediments, and nutrients can be deposited. Revegetation aims to
increase bank stability, reducing erosion, and it allows less runoff of sediments and nutrients
into the stream (Singh et al., 2018). The assessment and prioritization of these restoration
investments should consider both the protection of existing floodplain functions as well as the
likely long-term value.
3.6.2 Wetlands and Flood Resilience Key Point: Wetland conservation and restoration result in many ecosystem services and increase flood resilience.
Wetlands are critical points of flow reduction; they temporarily store stormwater and
floodwater, then release them gradually, dampening high discharge. Wetlands decrease flood
peaks by as much as 80% (VT DEC, n.d.). As aforementioned, over 35% of wetlands in Vermont
have been lost, mainly due to agricultural development (Dahl, 1990). Complete removal of
wetlands can result in a 200% increase in peak flows (Watson et al., 2016).
Therefore, wetland mitigation and restoration has become increasingly prioritized in federal
and state policies. For example, in Vermont, for the period 2010-2012, 48.2 wetland acres were
impacted or destroyed, requiring 323.2 acres mitigated for permits under the US Clean Water
Act (Adusumilli, 2015). Restored ecosystem services were valued at about $140,000 per acre
mitigated per year in the state of Vermont, totaling almost $2.75 million throughout the United
Water Resources Vermont Climate Assessment, 2021 153
States (Adusumilli, 2015). This calculation takes into account restored water functions -
supply, quality, and flood control - as well as recreational and commercial value, but excludes
carbon sequestration.
However, created and restored wetlands may not be functionally equivalent to natural
wetlands (Junk et al., 2013). After all, one acre of wetland loss in Vermont requires mitigation
for almost six times the area (Adusumilli, 2015), incentivizing preservation over restoration.
This is especially important for carbon sequestration. The protection of peatlands is the most
relevant for carbon sequestration in Vermont. It can take thousands of years to accumulate
the organic matter again. It is necessary to maintain original wetlands, while pursuing
restoration and enhancement for areas that have been lost and degraded, especially for areas
that provide the most services.
Box 3.2 Quantifying Flood Mitigation Services: The economic value of Otter Creek wetlands and floodplains to Middlebury VT Watson et al., 2016
Amidst all the ecosystem services offered by functional floodplains and wetlands,
they are some of the most powerful mitigation tools there are to reduce flood risk in
the face of a changing climate. The Otter Creek case study is a valuable example.
Otter Creek runs north through a large wetland complex and wide floodplain from
Rutland to Middlebury, Vermont. In 2011, Tropical Storm Irene devastated areas
across the state. Rutland experienced its highest peak flow on record on August
28th, suffering extensive damages and flooding for the following five days.
Downstream, Middlebury had a much lower peak and minor flooding (Figure 3-10).
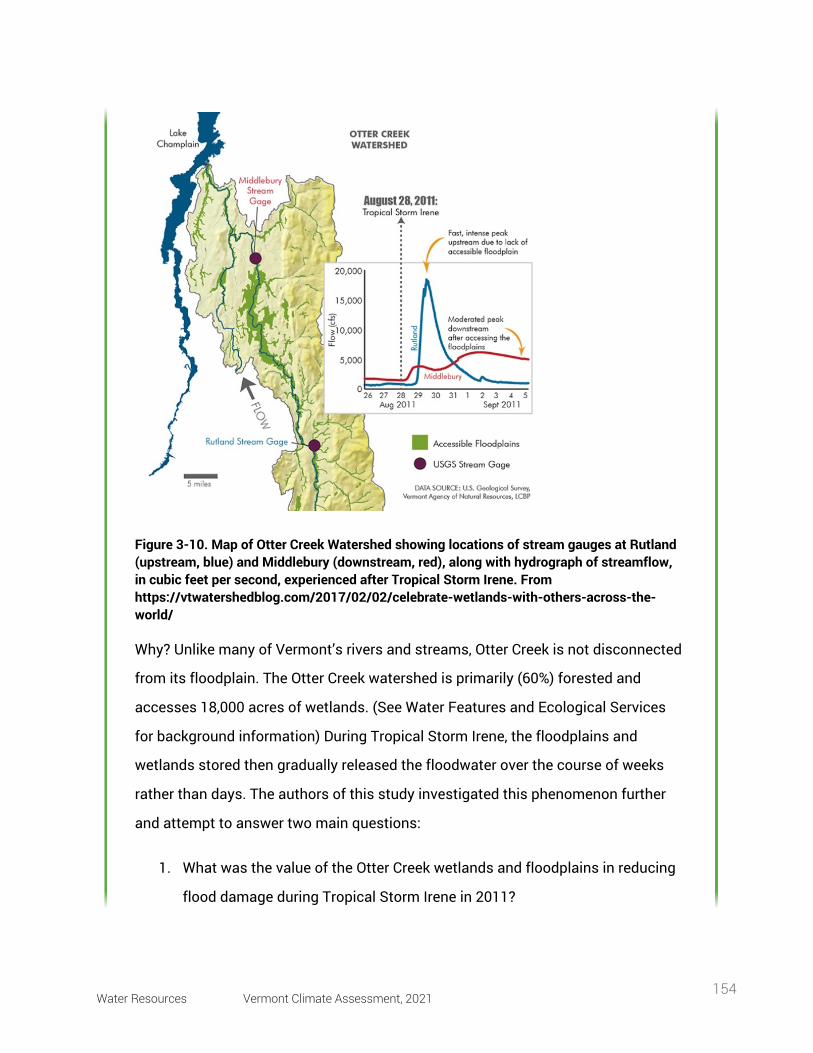
Water Resources Vermont Climate Assessment, 2021 154
Figure 3-10. Map of Otter Creek Watershed showing locations of stream gauges at Rutland (upstream, blue) and Middlebury (downstream, red), along with hydrograph of streamflow, in cubic feet per second, experienced after Tropical Storm Irene. From https://vtwatershedblog.com/2017/02/02/celebrate-wetlands-with-others-across-the-world/
Why? Unlike many of Vermont’s rivers and streams, Otter Creek is not disconnected
from its floodplain. The Otter Creek watershed is primarily (60%) forested and
accesses 18,000 acres of wetlands. (See Water Features and Ecological Services
for background information) During Tropical Storm Irene, the floodplains and
wetlands stored then gradually released the floodwater over the course of weeks
rather than days. The authors of this study investigated this phenomenon further
and attempt to answer two main questions:
1. What was the value of the Otter Creek wetlands and floodplains in reducing
flood damage during Tropical Storm Irene in 2011?
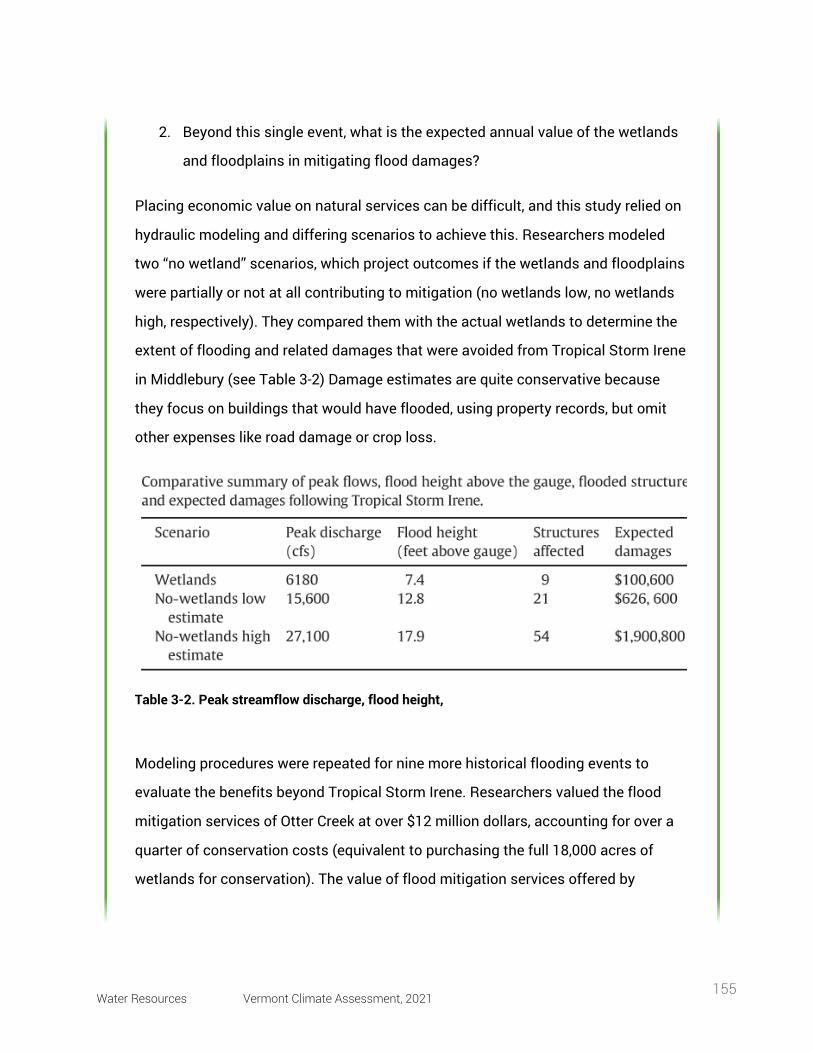
Water Resources Vermont Climate Assessment, 2021 155
2. Beyond this single event, what is the expected annual value of the wetlands
and floodplains in mitigating flood damages?
Placing economic value on natural services can be difficult, and this study relied on
hydraulic modeling and differing scenarios to achieve this. Researchers modeled
two “no wetland” scenarios, which project outcomes if the wetlands and floodplains
were partially or not at all contributing to mitigation (no wetlands low, no wetlands
high, respectively). They compared them with the actual wetlands to determine the
extent of flooding and related damages that were avoided from Tropical Storm Irene
in Middlebury (see Table 3-2) Damage estimates are quite conservative because
they focus on buildings that would have flooded, using property records, but omit
other expenses like road damage or crop loss.
Table 3-2. Peak streamflow discharge, flood height,
Modeling procedures were repeated for nine more historical flooding events to
evaluate the benefits beyond Tropical Storm Irene. Researchers valued the flood
mitigation services of Otter Creek at over $12 million dollars, accounting for over a
quarter of conservation costs (equivalent to purchasing the full 18,000 acres of
wetlands for conservation). The value of flood mitigation services offered by
Water Resources Vermont Climate Assessment, 2021 156
3.6.3 Social Vulnerability, Flooding and Disaster Risk Reduction Ned Swanberg
Key Point: Development in flood hazard areas endangers those structures and the citizens that use them. This risk is unequally distributed within Vermont spatially, and skews toward socially vulnerable groups.
In Vermont over ten thousand structures are located within a high-risk Special Flood Hazard
Area (SFHA) (State of Vermont, 2021). These flood risk areas, as mapped for the National
Flood Insurance Program (NFIP), indicate areas with a one percent annual chance of flooding.
Over the period of a thirty-year mortgage this represents more than a 1 in 4 chance of
experiencing flooding at the site. Within the area are portions that experience more frequent
flooding. Less frequent and larger floods will also occur and reach beyond the mapped
boundaries.
Most of the damage due to flooding in Vermont is not well characterized by these data. The
actual damage in Vermont is often due to the erosive power of moving water, not so much by
saturation. Hence, a considerable amount of work is underway in Vermont to protect river
corridors both to avoid direct damage from erosion as well as to accommodate the room
needed by the channel to avoid incision, maintain functional floodplains, and to diminish and
delay flood peaks.
Special Flood Hazard Areas in Vermont were first mapped in the 1970s and became the basis
for municipal regulation and participation in the National Flood Insurance Program
wetland and floodplains are likely to increase with climate change, as intense
precipitation events are already becoming more common.
Water Resources Vermont Climate Assessment, 2021 157
(www.msc.fema.gov). The most recent map update was in Bennington County (effective
12/2015) and portions of other counties with Digital Flood Insurance Rate Maps received
updated detailed studies. Notably, none of these recent maps reflect the Vermont flood
discharges of 2011. All these mapped areas include some areas with detailed engineered
studies and other areas with approximate studies. Currently FEMA is undertaking flood hazard
map updates in many Vermont watersheds. If funded, these maps may become generally
effective around 2025.
Under FEMA mapping guidelines, the maps show the flood levels based on past flood
discharges. Since the 1970s precipitation has increased, and precipitation patterns have been
altered. At their best, the boundaries of the mapped Special Flood Hazard Areas portray the
past and do not adequately represent the current or future conditions and risks associated
with inundation.
The flood risk in the maps and data below reflect best available data from both officially
digitized together with rough non-official digital maps of effective Special Flood Hazard Areas
and e-911 site location data in Vermont. While these data have considerable error-bands they
do allow us to broadly examine the distribution and character of flood risk in Vermont.
In Vermont, approximately 4% of all structures are within a high-risk Special Flood Hazard
Area. This varies by community and can be viewed in expanded community reports. Also, very
few structures within the SFHA are carrying any level of flood insurance. This level has
declined to 15% after reaching a peak of nearly 25% in 2013. This decline in flood insurance
uptake may reflect several factors: flood amnesia, people dropping insurance when it is not
specifically required by a lender, and the rising cost of flood insurance premiums and
fees. Several private insurance companies have recently begun to offer flood insurance in
Vermont. In October 2021 FEMA rolled out a fundamentally new method of calculating flood
insurance premiums as Risk Rating 2.0. These changes may significantly change flood
insurance uptake, household resilience and community flood recovery.
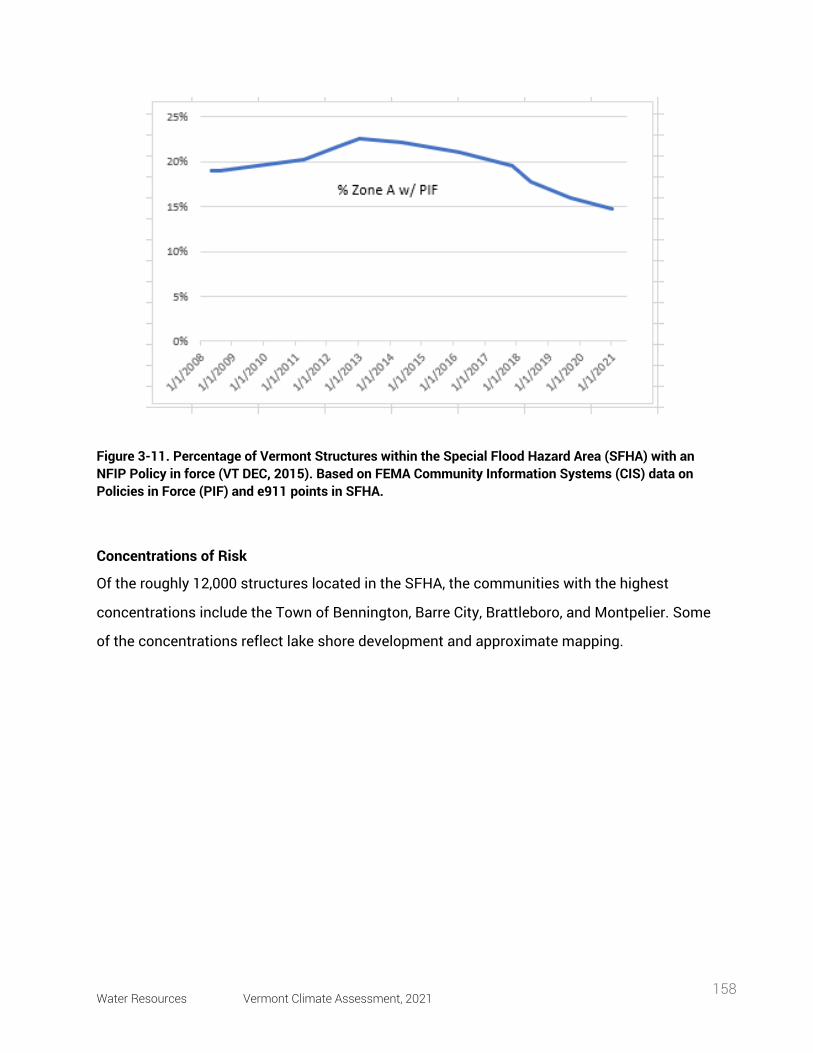
Water Resources Vermont Climate Assessment, 2021 158
Figure 3-11. Percentage of Vermont Structures within the Special Flood Hazard Area (SFHA) with an NFIP Policy in force (VT DEC, 2015). Based on FEMA Community Information Systems (CIS) data on Policies in Force (PIF) and e911 points in SFHA.
Concentrations of Risk
Of the roughly 12,000 structures located in the SFHA, the communities with the highest
concentrations include the Town of Bennington, Barre City, Brattleboro, and Montpelier. Some
of the concentrations reflect lake shore development and approximate mapping.
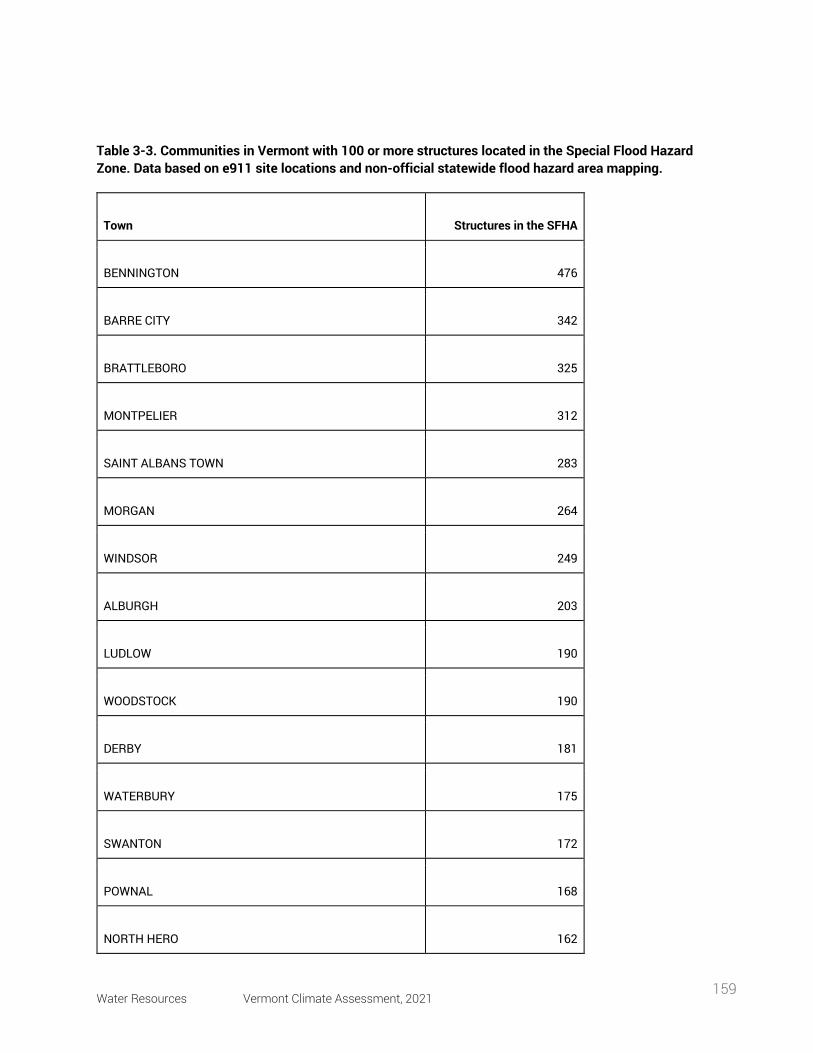
Water Resources Vermont Climate Assessment, 2021 159
Table 3-3. Communities in Vermont with 100 or more structures located in the Special Flood Hazard Zone. Data based on e911 site locations and non-official statewide flood hazard area mapping.
Town Structures in the SFHA
BENNINGTON 476
BARRE CITY 342
BRATTLEBORO 325
MONTPELIER 312
SAINT ALBANS TOWN 283
MORGAN 264
WINDSOR 249
ALBURGH 203
LUDLOW 190
WOODSTOCK 190
DERBY 181
WATERBURY 175
SWANTON 172
POWNAL 168
NORTH HERO 162
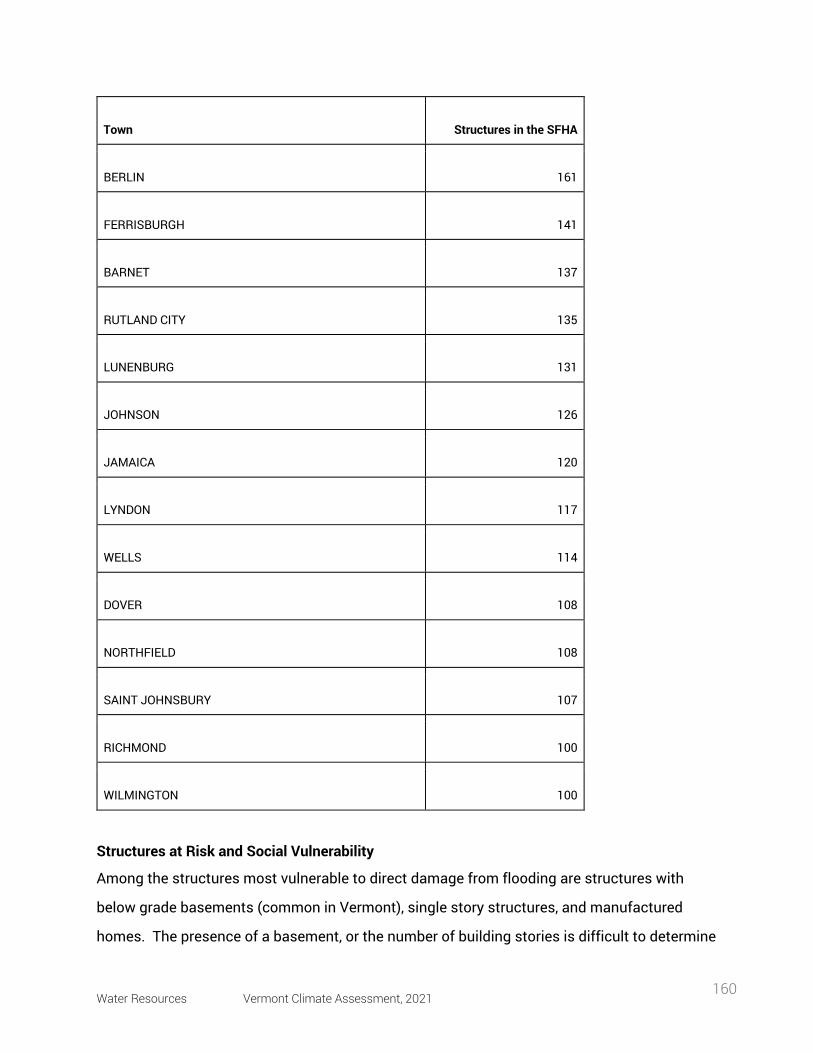
Water Resources Vermont Climate Assessment, 2021 160
Town Structures in the SFHA
BERLIN 161
FERRISBURGH 141
BARNET 137
RUTLAND CITY 135
LUNENBURG 131
JOHNSON 126
JAMAICA 120
LYNDON 117
WELLS 114
DOVER 108
NORTHFIELD 108
SAINT JOHNSBURY 107
RICHMOND 100
WILMINGTON 100
Structures at Risk and Social Vulnerability
Among the structures most vulnerable to direct damage from flooding are structures with
below grade basements (common in Vermont), single story structures, and manufactured
homes. The presence of a basement, or the number of building stories is difficult to determine
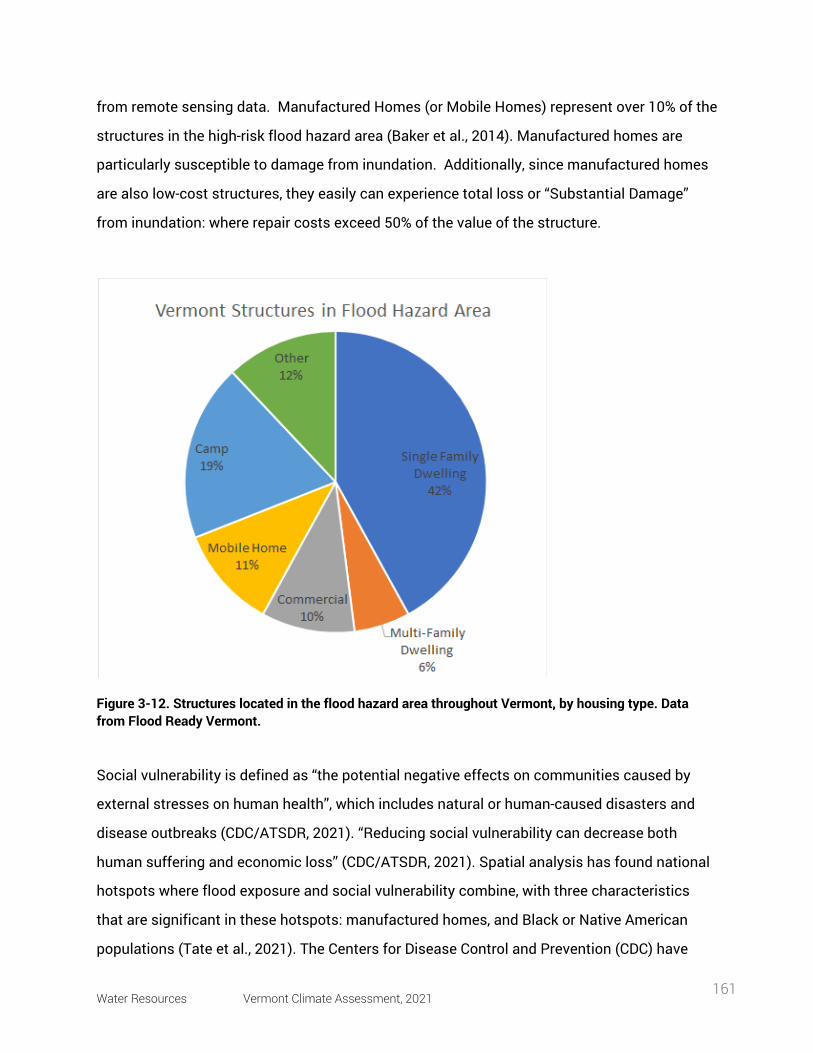
Water Resources Vermont Climate Assessment, 2021 161
from remote sensing data. Manufactured Homes (or Mobile Homes) represent over 10% of the
structures in the high-risk flood hazard area (Baker et al., 2014). Manufactured homes are
particularly susceptible to damage from inundation. Additionally, since manufactured homes
are also low-cost structures, they easily can experience total loss or “Substantial Damage”
from inundation: where repair costs exceed 50% of the value of the structure.
Figure 3-12. Structures located in the flood hazard area throughout Vermont, by housing type. Data from Flood Ready Vermont.
Social vulnerability is defined as “the potential negative effects on communities caused by
external stresses on human health”, which includes natural or human-caused disasters and
disease outbreaks (CDC/ATSDR, 2021). “Reducing social vulnerability can decrease both
human suffering and economic loss” (CDC/ATSDR, 2021). Spatial analysis has found national
hotspots where flood exposure and social vulnerability combine, with three characteristics
that are significant in these hotspots: manufactured homes, and Black or Native American
populations (Tate et al., 2021). The Centers for Disease Control and Prevention (CDC) have
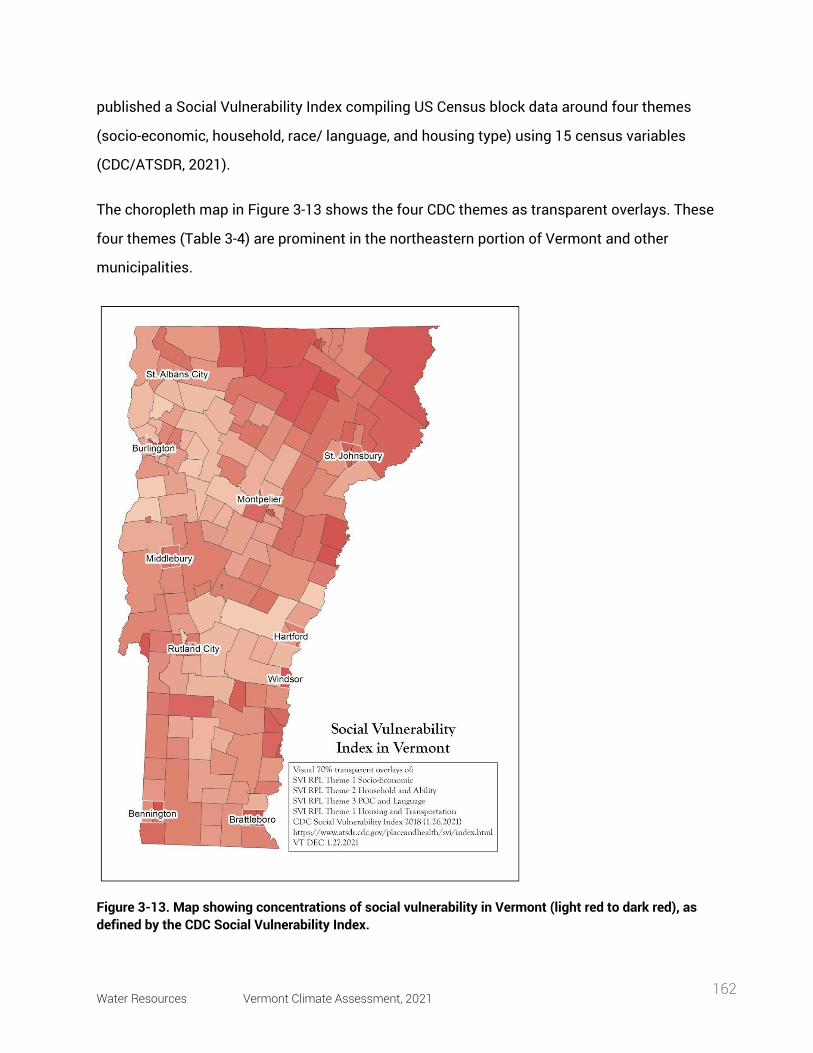
Water Resources Vermont Climate Assessment, 2021 162
published a Social Vulnerability Index compiling US Census block data around four themes
(socio-economic, household, race/ language, and housing type) using 15 census variables
(CDC/ATSDR, 2021).
The choropleth map in Figure 3-13 shows the four CDC themes as transparent overlays. These
four themes (Table 3-4) are prominent in the northeastern portion of Vermont and other
municipalities.
Figure 3-13. Map showing concentrations of social vulnerability in Vermont (light red to dark red), as defined by the CDC Social Vulnerability Index.
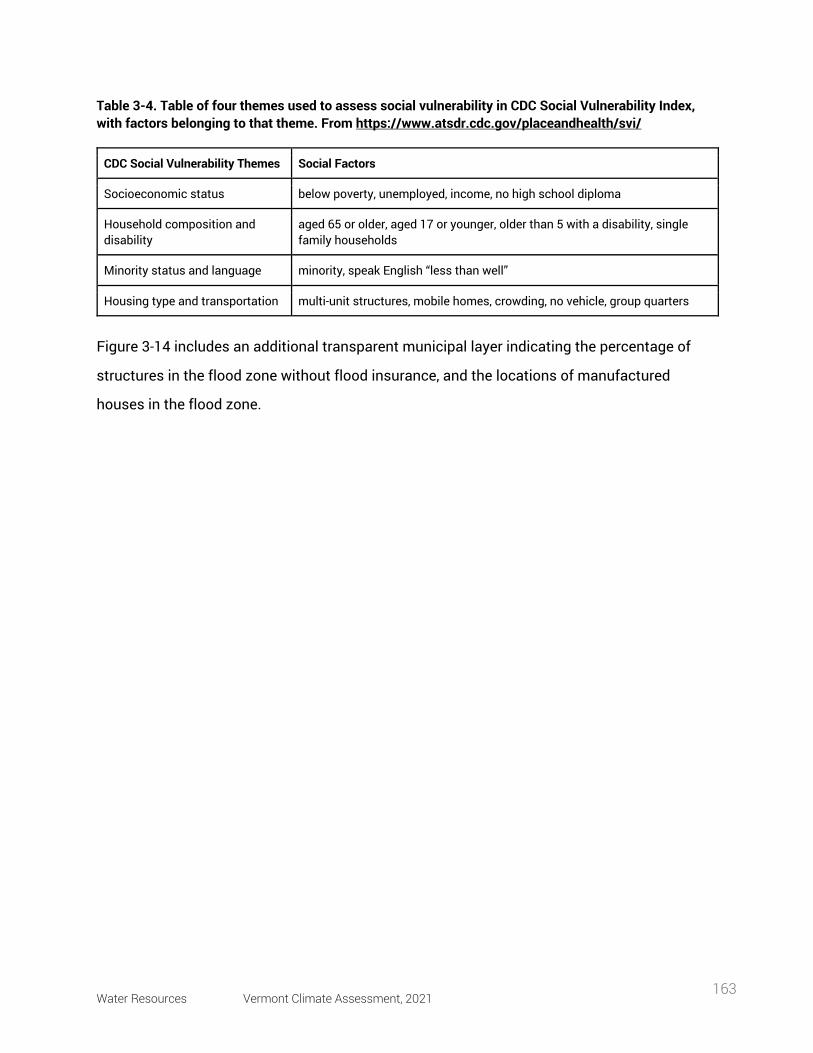
Water Resources Vermont Climate Assessment, 2021 163
Table 3-4. Table of four themes used to assess social vulnerability in CDC Social Vulnerability Index, with factors belonging to that theme. From https://www.atsdr.cdc.gov/placeandhealth/svi/
CDC Social Vulnerability Themes Social Factors
Socioeconomic status below poverty, unemployed, income, no high school diploma
Household composition and disability
aged 65 or older, aged 17 or younger, older than 5 with a disability, single family households
Minority status and language minority, speak English “less than well”
Housing type and transportation multi-unit structures, mobile homes, crowding, no vehicle, group quarters
Figure 3-14 includes an additional transparent municipal layer indicating the percentage of
structures in the flood zone without flood insurance, and the locations of manufactured
houses in the flood zone.
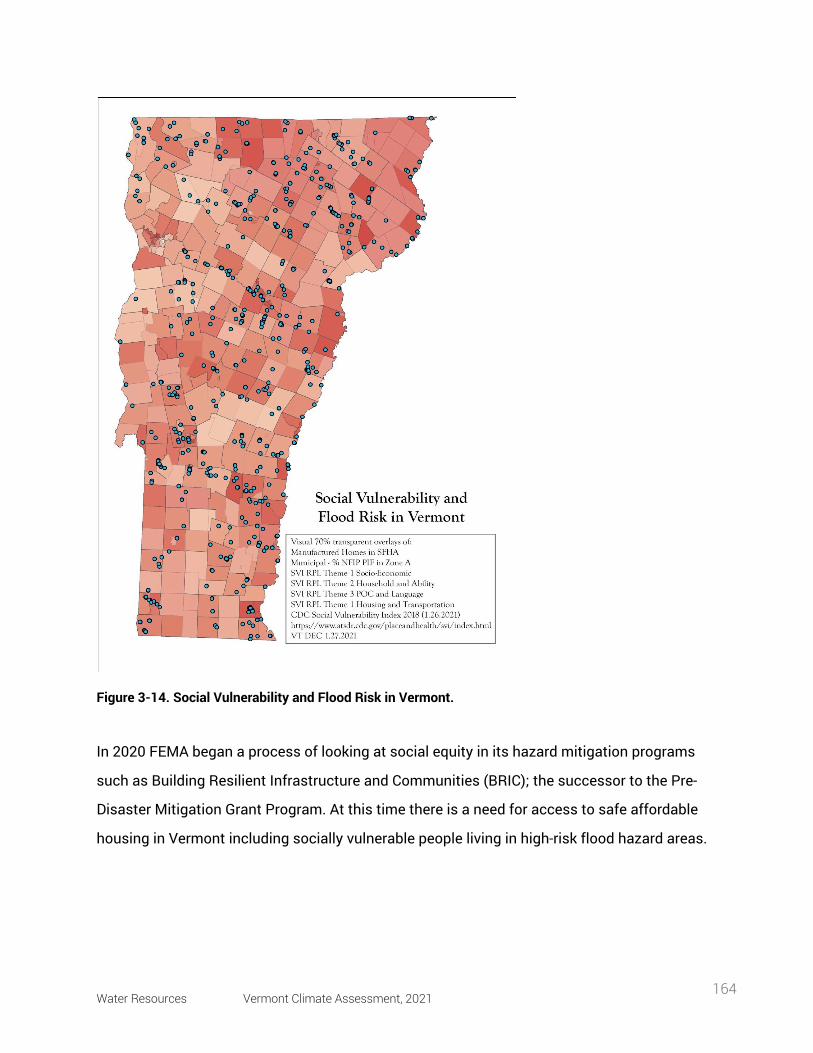
Water Resources Vermont Climate Assessment, 2021 164
Figure 3-14. Social Vulnerability and Flood Risk in Vermont.
In 2020 FEMA began a process of looking at social equity in its hazard mitigation programs
such as Building Resilient Infrastructure and Communities (BRIC); the successor to the Pre-
Disaster Mitigation Grant Program. At this time there is a need for access to safe affordable
housing in Vermont including socially vulnerable people living in high-risk flood hazard areas.
Water Resources Vermont Climate Assessment, 2021 165
Box 3.3 Spatial targeting of floodplain restoration to equitably mitigate flood risk Gourevitch et al., 2020
Floodplain restoration enhances communities’ resilience to flooding and climate
change. It can be difficult to determine where to implement it, and budgets are limited,
so localized flooding data at fine spatial scales supports targeted decision-making. A
second challenge is incorporating social vulnerability to ensure equitably distributed
benefits from restoration projects and risk of flood exposure.
Lewis Creek is a small watershed in eastern Vermont that is vulnerable to flooding due
to mountains upstream. 41 properties are located in the SFHA, many of which are
manufactured or mobile homes. Flood damages were estimated based on hydraulic
modeling for 1%, 4%, 10%, and 50% annual chance flood intervals. They are heavily
skewed towards lower-income properties, with the bottom quartile incurring >90% of
damages and 25 mobile homes incurring damages 5x their appraised value. A range of
restoration scenarios were identified to account for varying budgets.
199 potential restoration sites were identified, but benefits could be maximized by
revegetation of wetlands or floodplains in only a few of them. This demonstrates the
benefits of spatially-targeted data in terms of ecosystem services. However, the
distribution of avoided damages tended to favor more expensive buildings/ higher-
income property owners, and giving more weight to equity in choosing restoration
projects does not highly change the outcome for this case study. The authors suggest
that this may not be the same everywhere, and compensatory mechanisms should be
in place so lower-income property owners can be compensated for damages and value
of avoided damages. Overall, this case study is an excellent example of the inequitable
weight of flood exposure in Vermont communities.
Water Resources Vermont Climate Assessment, 2021 166
3.6.4 Stream-Crossing Infrastructure Key Point: Stream-crossing infrastructure suffers extensive damage due to flooding. Bridges and culverts are vulnerable to failure during high-flow conditions, especially when outdated or undersized.
Road-stream crossing infrastructure is some of the most vulnerable to flooding damage
because these structures intersect the river corridor. Depending upon the structure design,
stream crossings and their road approaches can impound floodwaters, constrict flows, and
induce debris jams.
During Tropical Storm Irene in 2011, about 480 bridges and 960 culverts were damaged, in
addition to >2500 miles of road (VT Emergency Management, 2018). Since then, the State of
Vermont has modified stream crossing standards for culverts and bridges to accommodate
the bank-full discharge and consider the geomorphic condition of the reach. Statewide
assessments of crossing structure dimensions and conditions has led to systematic and
ongoing efforts to bring vulnerable structures into a compatible condition.
Small under-the-road culverts (away from streams) are also vulnerable to damage from high
flows including localized thunderstorms. Undersized and clogged culverts can lead to
considerable road damage. Many Vermont roads were located in immediate proximity to
streams and rivers following historical patterns including those of early lumber operations that
straightened steep mountain brooks (Kline & Cahoon, 2010). This legacy pattern leaves hilly
Vermont particularly exposed to considerable damage at crossing structures, roads, and
nearby buildings from all sizes of high flows and flash floods.
Some sites are simply poorly located to host a stream crossing (Bates & Kirn, 2009; Gillespie
et al., 2014). Planners should determine the necessity of a structure when planning to build or
replace it; critical structures include those with high-volume traffic or emergency service
routes (Austin & McKinley, n.d.). For more information on criticality and flood vulnerability in
the state transportation network, see VTrans Statewide Highway Flood Vulnerability and Risk
Map in Resources.
Water Resources Vermont Climate Assessment, 2021 167
3.6.5 Flood Risk for Structures Keeping in mind how critical a structure is, there are further issues considering heightened risk
of flood exposure: outdated structures, undersized structures, and resilient engineering
standards.
Outdated Infrastructure
Outdated stream-crossing infrastructure is common in Vermont and throughout New England.
Over 20% of Vermont’s bridges are functionally obsolete and do not meet current engineering
standards. With increases in precipitation, high flows, and severe storm events due to climate
change, these outdated features are vulnerable to failure. Many bridges and culverts have
reached the end of their useful life, and are not built to modern higher-resilience standards.
With limited funding, they can exceed their intended lifespan by decades, while incurring
repetitive costs for maintenance, operations, and repairs (American Society of Civil Engineers
Vermont Section, 2019). While the oldest structures are not necessarily the ones that need
immediate repair or replacement, this analysis stays relevant for incoming decades as
Vermont evaluates how to build flood mitigation features into its transportation network.
Many of Vermont’s bridges were built from the 1930s to 1970s; they were designed for a
useful life of 50 years (American Society of Civil Engineers Vermont Section, 2019). A culvert’s
useful life is more variable depending on building material and environmental factors, from 25
to over 100 years. A typical steel culvert using the traditional hydraulic design approach tends
to last 25-50 years (Gillespie et al., 2014). In New York State, for example, the average useful
life of a culvert is 56 years (Molinas & Mommandi, 2009).
Current inspection information for bridges and culverts was used to produce Figures 3-15 and
3-16. This inventory is maintained by the Vermont Department of Transportation, but does not
always stay up to date or include every municipality. The year built is divided into equal
intervals based on the useful life of the structure (i.e. a structure built before 1970 with a
useful life of 50 years has reached the end of it by 2020). If the structure was replaced, the
year of reconstruction was used to accurately reflect the age of the structure. Short structures
(6-20 feet in length) are primarily culverts, while long structures (>20 feet) tend to be bridges.
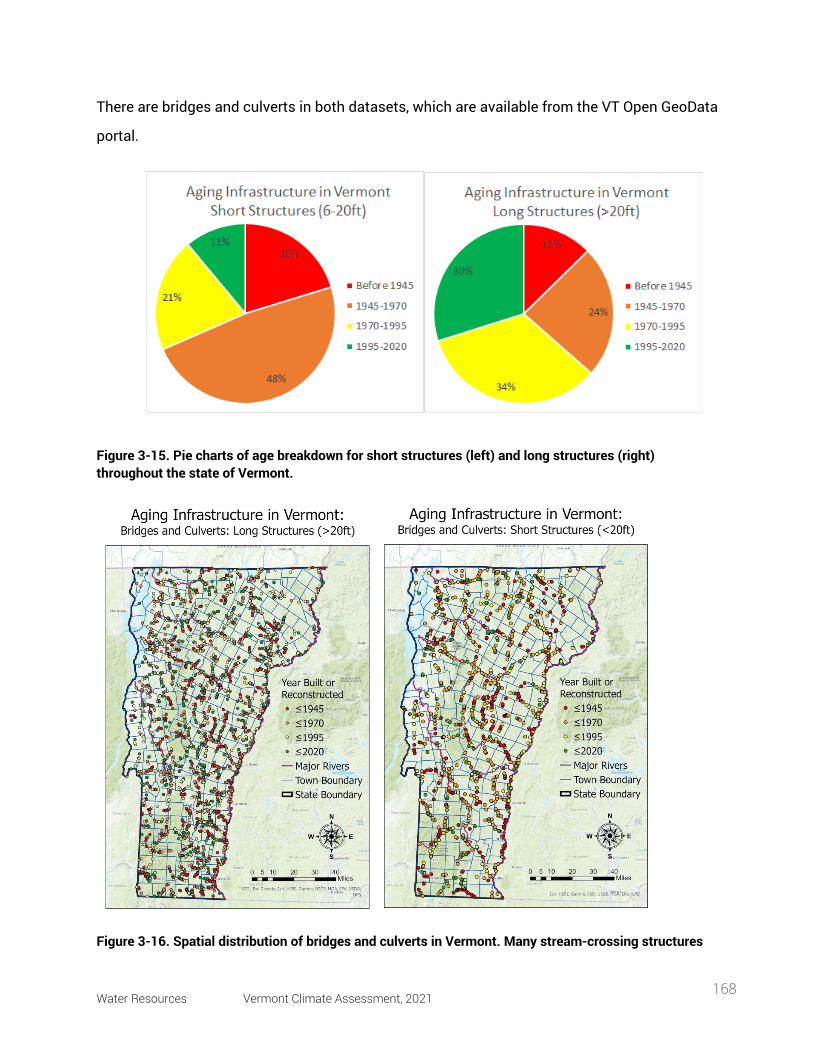
Water Resources Vermont Climate Assessment, 2021 168
There are bridges and culverts in both datasets, which are available from the VT Open GeoData
portal.
Figure 3-15. Pie charts of age breakdown for short structures (left) and long structures (right) throughout the state of Vermont.
Figure 3-16. Spatial distribution of bridges and culverts in Vermont. Many stream-crossing structures
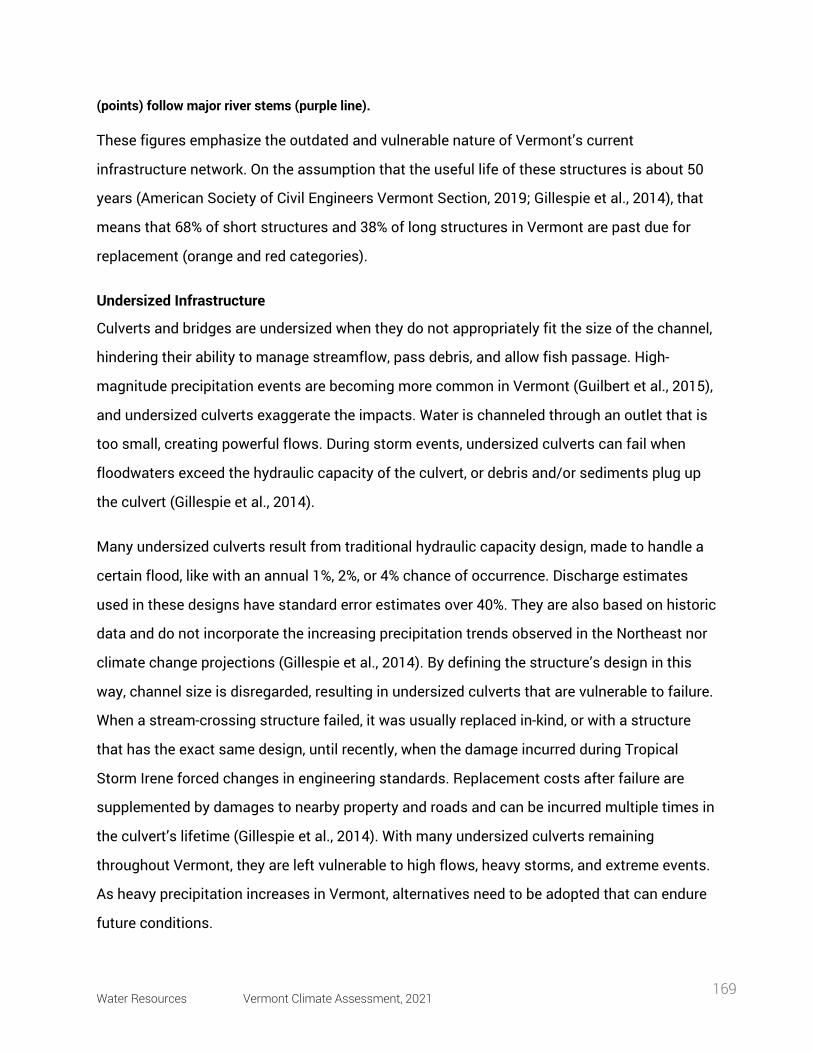
Water Resources Vermont Climate Assessment, 2021 169
(points) follow major river stems (purple line).
These figures emphasize the outdated and vulnerable nature of Vermont’s current
infrastructure network. On the assumption that the useful life of these structures is about 50
years (American Society of Civil Engineers Vermont Section, 2019; Gillespie et al., 2014), that
means that 68% of short structures and 38% of long structures in Vermont are past due for
replacement (orange and red categories).
Undersized Infrastructure
Culverts and bridges are undersized when they do not appropriately fit the size of the channel,
hindering their ability to manage streamflow, pass debris, and allow fish passage. High-
magnitude precipitation events are becoming more common in Vermont (Guilbert et al., 2015),
and undersized culverts exaggerate the impacts. Water is channeled through an outlet that is
too small, creating powerful flows. During storm events, undersized culverts can fail when
floodwaters exceed the hydraulic capacity of the culvert, or debris and/or sediments plug up
the culvert (Gillespie et al., 2014).
Many undersized culverts result from traditional hydraulic capacity design, made to handle a
certain flood, like with an annual 1%, 2%, or 4% chance of occurrence. Discharge estimates
used in these designs have standard error estimates over 40%. They are also based on historic
data and do not incorporate the increasing precipitation trends observed in the Northeast nor
climate change projections (Gillespie et al., 2014). By defining the structure’s design in this
way, channel size is disregarded, resulting in undersized culverts that are vulnerable to failure.
When a stream-crossing structure failed, it was usually replaced in-kind, or with a structure
that has the exact same design, until recently, when the damage incurred during Tropical
Storm Irene forced changes in engineering standards. Replacement costs after failure are
supplemented by damages to nearby property and roads and can be incurred multiple times in
the culvert’s lifetime (Gillespie et al., 2014). With many undersized culverts remaining
throughout Vermont, they are left vulnerable to high flows, heavy storms, and extreme events.
As heavy precipitation increases in Vermont, alternatives need to be adopted that can endure
future conditions.
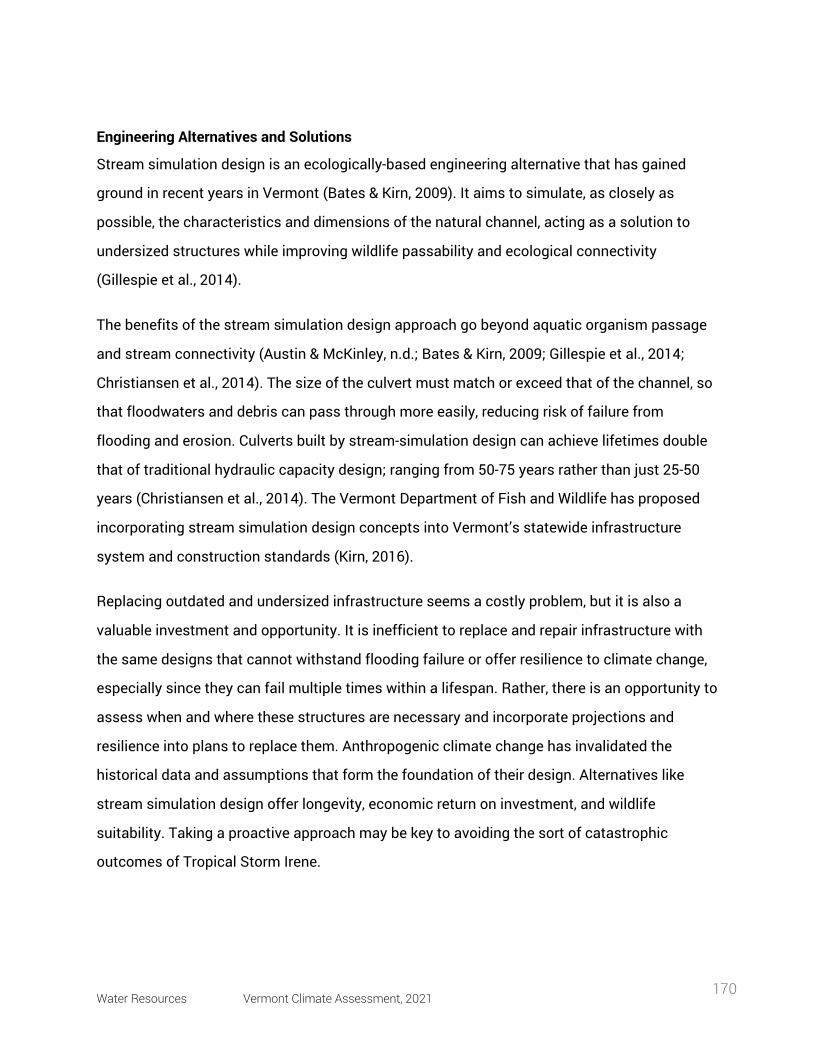
Water Resources Vermont Climate Assessment, 2021 170
Engineering Alternatives and Solutions
Stream simulation design is an ecologically-based engineering alternative that has gained
ground in recent years in Vermont (Bates & Kirn, 2009). It aims to simulate, as closely as
possible, the characteristics and dimensions of the natural channel, acting as a solution to
undersized structures while improving wildlife passability and ecological connectivity
(Gillespie et al., 2014).
The benefits of the stream simulation design approach go beyond aquatic organism passage
and stream connectivity (Austin & McKinley, n.d.; Bates & Kirn, 2009; Gillespie et al., 2014;
Christiansen et al., 2014). The size of the culvert must match or exceed that of the channel, so
that floodwaters and debris can pass through more easily, reducing risk of failure from
flooding and erosion. Culverts built by stream-simulation design can achieve lifetimes double
that of traditional hydraulic capacity design; ranging from 50-75 years rather than just 25-50
years (Christiansen et al., 2014). The Vermont Department of Fish and Wildlife has proposed
incorporating stream simulation design concepts into Vermont’s statewide infrastructure
system and construction standards (Kirn, 2016).
Replacing outdated and undersized infrastructure seems a costly problem, but it is also a
valuable investment and opportunity. It is inefficient to replace and repair infrastructure with
the same designs that cannot withstand flooding failure or offer resilience to climate change,
especially since they can fail multiple times within a lifespan. Rather, there is an opportunity to
assess when and where these structures are necessary and incorporate projections and
resilience into plans to replace them. Anthropogenic climate change has invalidated the
historical data and assumptions that form the foundation of their design. Alternatives like
stream simulation design offer longevity, economic return on investment, and wildlife
suitability. Taking a proactive approach may be key to avoiding the sort of catastrophic
outcomes of Tropical Storm Irene.
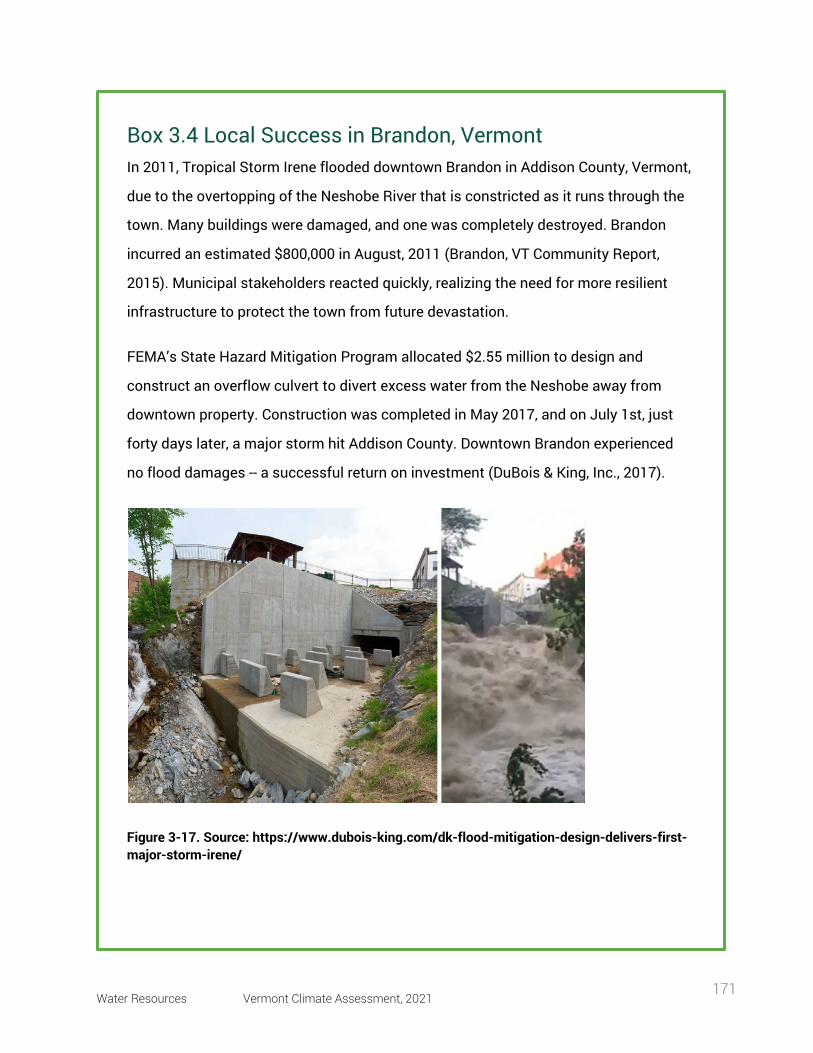
Water Resources Vermont Climate Assessment, 2021 171
Box 3.4 Local Success in Brandon, Vermont In 2011, Tropical Storm Irene flooded downtown Brandon in Addison County, Vermont,
due to the overtopping of the Neshobe River that is constricted as it runs through the
town. Many buildings were damaged, and one was completely destroyed. Brandon
incurred an estimated $800,000 in August, 2011 (Brandon, VT Community Report,
2015). Municipal stakeholders reacted quickly, realizing the need for more resilient
infrastructure to protect the town from future devastation.
FEMA’s State Hazard Mitigation Program allocated $2.55 million to design and
construct an overflow culvert to divert excess water from the Neshobe away from
downtown property. Construction was completed in May 2017, and on July 1st, just
forty days later, a major storm hit Addison County. Downtown Brandon experienced
no flood damages -- a successful return on investment (DuBois & King, Inc., 2017).
Figure 3-17. Source: https://www.dubois-king.com/dk-flood-mitigation-design-delivers-first-major-storm-irene/
Water Resources Vermont Climate Assessment, 2021 172
3.7 resources for community members and planners
These are Vermont resources for interested parties to find hyper-local information. Many of
these resources allow one to search by address or municipality to get specific information that
is most relevant to them. These resources do not always have complete data coverage or are
not always up to date. However, these resources allow a user to apply the kinds of information
presented in the VCA 2021 at fine spatial scales.
3.7.1 Building in the Floodplain National Flood Insurance Program, Floodplain Management Requirements. Accessed online 21 May 2021 at https://www.fema.gov/pdf/floodplain/nfip_sg_unit_5.pdf
State of Vermont, Flood Training Protection Tools, Build it Safe. Accessed online 31 May 2021 at https://floodtraining.vermont.gov/protection-tools/build-safe
State of Vermont, Vermont Flood Hazard Area and River Coordinator Rule. Access online 31 May 2021 at https://dec.vermont.gov/sites/dec/files/documents/wsmd-fha-and-rc-rule-adopted-2014-10-24.pdf
3.7.2 Flood Vulnerability State of Vermont, Flood Ready Atlas (maps.vermont.gov). Accessed online 31 May 2021 at tinyurl.com/floodreadyatlas
• Flood hazard areas (from FEMA) • Participating communities in insurance programs
U.S. Government, FEMA Flood Maps. Access online 31 May 2021 at https://msc.fema.gov/portal/home
• FEMA maps for localized flood data • Search by address • Problem: many flood hazard maps are outdated, and some areas that are mapped
outside the flood zone are still at risk (as with Hurricane Irene)
State of Vermont, Flood Ready Vermont Community Reports. Accessed online 31 May 2021 at https://floodready.vermont.gov/assessment/community_reports#Expanded
Use Flood Ready Vermont Community Reports to generate information on your community’s:
Water Resources Vermont Climate Assessment, 2021 173
• Insurance information and participation in ERAF incentive program • Number of structures in the flood zone • Compliance with road and bridge standards • Compliance with river corridor protections
State of Vermont, Flood Training. Accessed online 31 May 2021 at https://floodtraining.vermont.gov/
This provides in-depth, yet accessible, explanations of key flooding concepts like:
• Floodplains and River Corridors • Special Flood Hazard Areas • No Adverse Impact
International Joint Commission, International Lake Champlain-Richelieu River Study Board at https://www.ijc.org/en/lcrr
This is an ongoing project to assess causes, impacts, risks and potential solutions to flooding in the Lake Champlain-Richelieu River Basin.
3.7.3 Infrastructure State of Vermont, Department of Environmental Conservation. River Management Principles, Practice, and Training. Accessed online 2 October 2021 at https://dec.vermont.gov/watershed/rivers/river-management#principles
State of Vermont, Agency of Transportation. Statewide Highway Flood Vulnerability and Risk. Accessed online 31 May 2021 at https://vtrans.vermont.gov/planning/transportation-resilience/statewide
• Flood vulnerability: culverts, bridges, and road embankments that are vulnerable to erosion, deposition, and inundation
• Transportation criticality: travel demand and how important that structure is to the transportation network
• Flood Risk: combines vulnerability and criticality to prioritize action items
State of Vermont, Vermont Culverts. Accessed online 31 May 2021 at vtculverts.org. Allows users to access an interactive map interface. Find culvert and bridge structures current conditions (i.e. failures).
Vermont Fish and Wildlife Stream Crossing Handbook https://vtfishandwildlife.com/sites/fishandwildlife/files/documents/Learn%20More/Library/REPORTS%20AND%20DOCUMENTS/AOP/AOP%20HANDBOOK.pdf
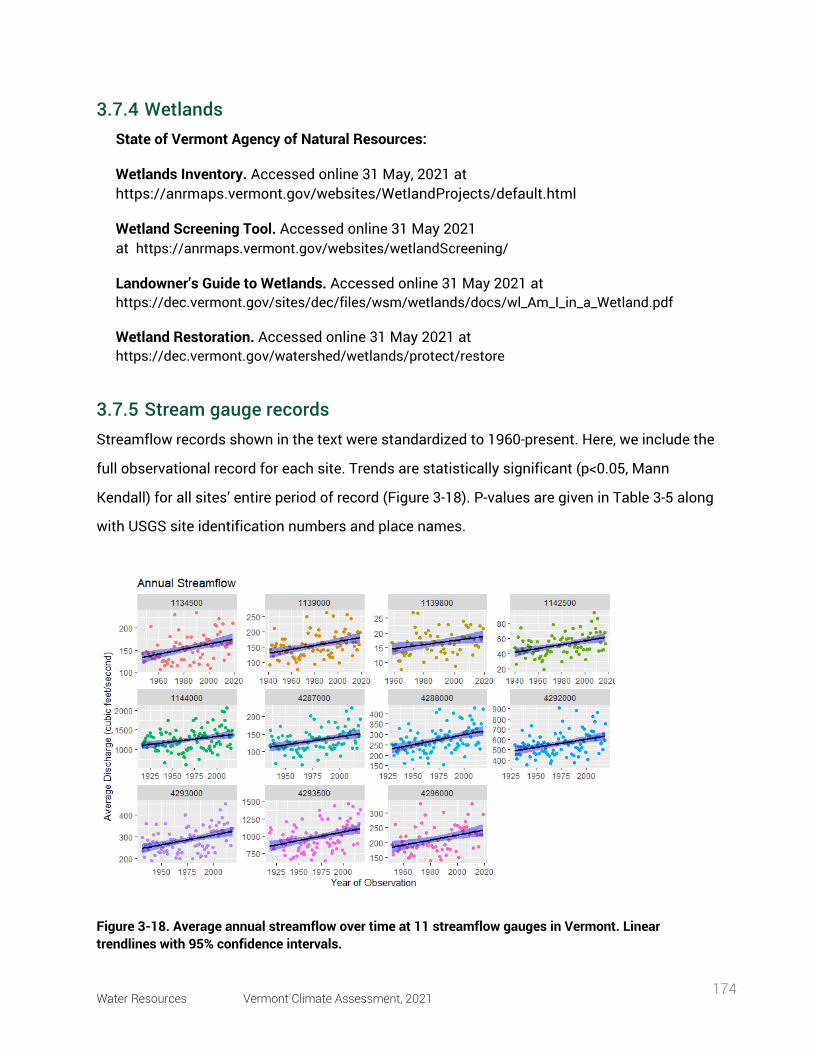
Water Resources Vermont Climate Assessment, 2021 174
3.7.4 Wetlands State of Vermont Agency of Natural Resources:
Wetlands Inventory. Accessed online 31 May, 2021 at https://anrmaps.vermont.gov/websites/WetlandProjects/default.html
Wetland Screening Tool. Accessed online 31 May 2021 at https://anrmaps.vermont.gov/websites/wetlandScreening/
Landowner’s Guide to Wetlands. Accessed online 31 May 2021 at https://dec.vermont.gov/sites/dec/files/wsm/wetlands/docs/wl_Am_I_in_a_Wetland.pdf
Wetland Restoration. Accessed online 31 May 2021 at https://dec.vermont.gov/watershed/wetlands/protect/restore
3.7.5 Stream gauge records Streamflow records shown in the text were standardized to 1960-present. Here, we include the
full observational record for each site. Trends are statistically significant (p<0.05, Mann
Kendall) for all sites’ entire period of record (Figure 3-18). P-values are given in Table 3-5 along
with USGS site identification numbers and place names.
Figure 3-18. Average annual streamflow over time at 11 streamflow gauges in Vermont. Linear trendlines with 95% confidence intervals.
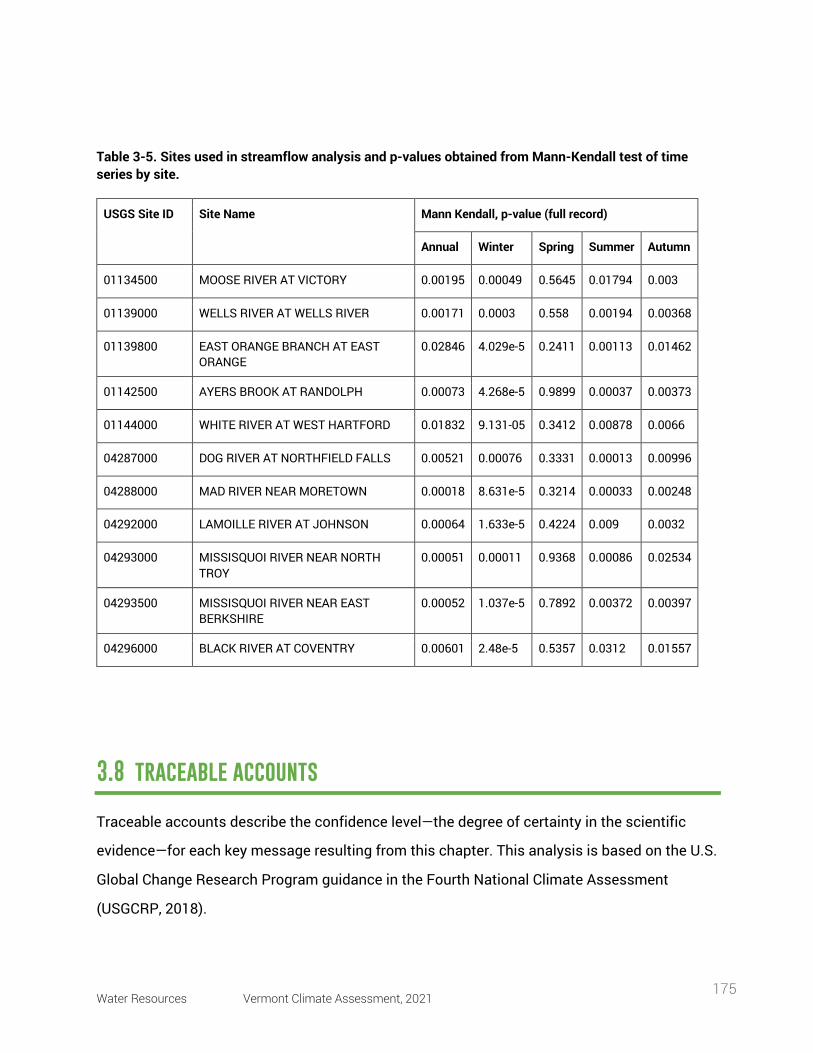
Water Resources Vermont Climate Assessment, 2021 175
Table 3-5. Sites used in streamflow analysis and p-values obtained from Mann-Kendall test of time series by site.
USGS Site ID Site Name Mann Kendall, p-value (full record)
Annual Winter Spring Summer Autumn
01134500 MOOSE RIVER AT VICTORY 0.00195 0.00049 0.5645 0.01794 0.003
01139000 WELLS RIVER AT WELLS RIVER 0.00171 0.0003 0.558 0.00194 0.00368
01139800 EAST ORANGE BRANCH AT EAST ORANGE
0.02846 4.029e-5 0.2411 0.00113 0.01462
01142500 AYERS BROOK AT RANDOLPH 0.00073 4.268e-5 0.9899 0.00037 0.00373
01144000 WHITE RIVER AT WEST HARTFORD 0.01832 9.131-05 0.3412 0.00878 0.0066
04287000 DOG RIVER AT NORTHFIELD FALLS 0.00521 0.00076 0.3331 0.00013 0.00996
04288000 MAD RIVER NEAR MORETOWN 0.00018 8.631e-5 0.3214 0.00033 0.00248
04292000 LAMOILLE RIVER AT JOHNSON 0.00064 1.633e-5 0.4224 0.009 0.0032
04293000 MISSISQUOI RIVER NEAR NORTH TROY
0.00051 0.00011 0.9368 0.00086 0.02534
04293500 MISSISQUOI RIVER NEAR EAST BERKSHIRE
0.00052 1.037e-5 0.7892 0.00372 0.00397
04296000 BLACK RIVER AT COVENTRY 0.00601 2.48e-5 0.5357 0.0312 0.01557
3.8 traceable accounts
Traceable accounts describe the confidence level—the degree of certainty in the scientific
evidence—for each key message resulting from this chapter. This analysis is based on the U.S.
Global Change Research Program guidance in the Fourth National Climate Assessment
(USGCRP, 2018).
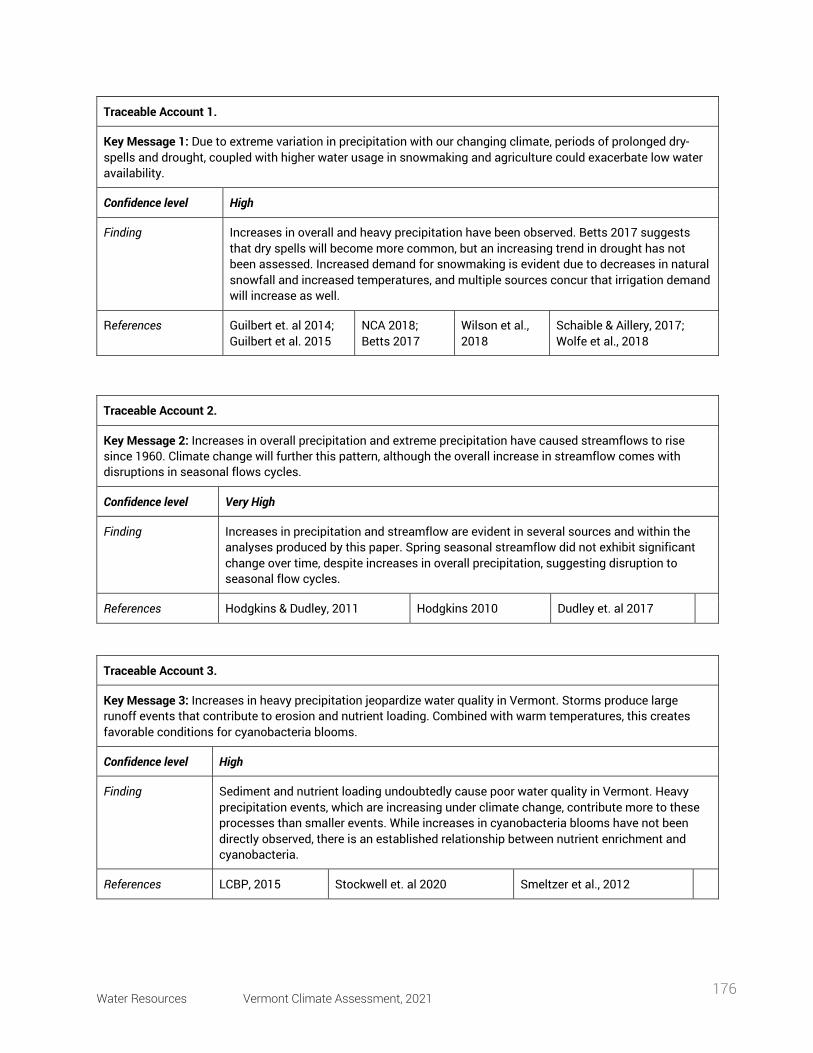
Water Resources Vermont Climate Assessment, 2021 176
Traceable Account 1.
Key Message 1: Due to extreme variation in precipitation with our changing climate, periods of prolonged dry-spells and drought, coupled with higher water usage in snowmaking and agriculture could exacerbate low water availability.
Confidence level High
Finding Increases in overall and heavy precipitation have been observed. Betts 2017 suggests that dry spells will become more common, but an increasing trend in drought has not been assessed. Increased demand for snowmaking is evident due to decreases in natural snowfall and increased temperatures, and multiple sources concur that irrigation demand will increase as well.
References Guilbert et. al 2014; Guilbert et al. 2015
NCA 2018; Betts 2017
Wilson et al., 2018
Schaible & Aillery, 2017; Wolfe et al., 2018
Traceable Account 2.
Key Message 2: Increases in overall precipitation and extreme precipitation have caused streamflows to rise since 1960. Climate change will further this pattern, although the overall increase in streamflow comes with disruptions in seasonal flows cycles.
Confidence level Very High
Finding Increases in precipitation and streamflow are evident in several sources and within the analyses produced by this paper. Spring seasonal streamflow did not exhibit significant change over time, despite increases in overall precipitation, suggesting disruption to seasonal flow cycles.
References Hodgkins & Dudley, 2011 Hodgkins 2010 Dudley et. al 2017
Traceable Account 3.
Key Message 3: Increases in heavy precipitation jeopardize water quality in Vermont. Storms produce large runoff events that contribute to erosion and nutrient loading. Combined with warm temperatures, this creates favorable conditions for cyanobacteria blooms.
Confidence level High
Finding Sediment and nutrient loading undoubtedly cause poor water quality in Vermont. Heavy precipitation events, which are increasing under climate change, contribute more to these processes than smaller events. While increases in cyanobacteria blooms have not been directly observed, there is an established relationship between nutrient enrichment and cyanobacteria.
References LCBP, 2015 Stockwell et. al 2020 Smeltzer et al., 2012
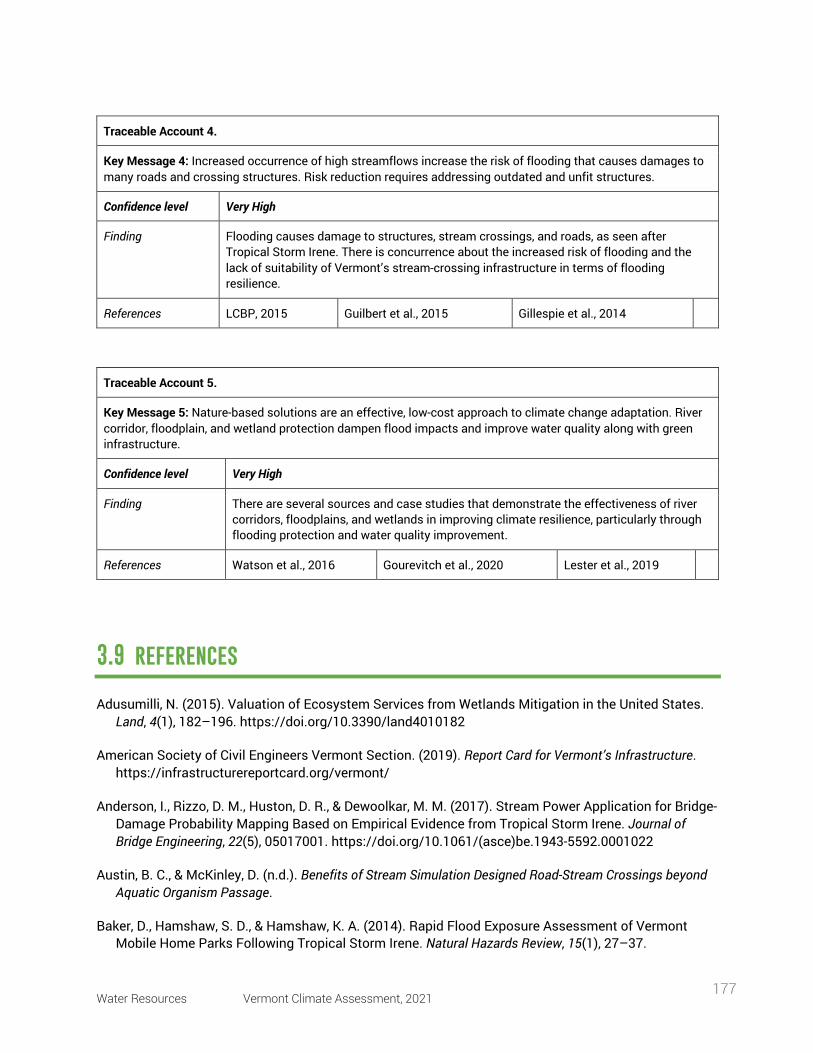
Water Resources Vermont Climate Assessment, 2021 177
Traceable Account 4.
Key Message 4: Increased occurrence of high streamflows increase the risk of flooding that causes damages to many roads and crossing structures. Risk reduction requires addressing outdated and unfit structures.
Confidence level Very High
Finding Flooding causes damage to structures, stream crossings, and roads, as seen after Tropical Storm Irene. There is concurrence about the increased risk of flooding and the lack of suitability of Vermont’s stream-crossing infrastructure in terms of flooding resilience.
References LCBP, 2015 Guilbert et al., 2015 Gillespie et al., 2014
Traceable Account 5.
Key Message 5: Nature-based solutions are an effective, low-cost approach to climate change adaptation. River corridor, floodplain, and wetland protection dampen flood impacts and improve water quality along with green infrastructure.
Confidence level Very High
Finding There are several sources and case studies that demonstrate the effectiveness of river corridors, floodplains, and wetlands in improving climate resilience, particularly through flooding protection and water quality improvement.
References Watson et al., 2016 Gourevitch et al., 2020 Lester et al., 2019
3.9 references
Adusumilli, N. (2015). Valuation of Ecosystem Services from Wetlands Mitigation in the United States. Land, 4(1), 182–196. https://doi.org/10.3390/land4010182
American Society of Civil Engineers Vermont Section. (2019). Report Card for Vermont’s Infrastructure. https://infrastructurereportcard.org/vermont/
Anderson, I., Rizzo, D. M., Huston, D. R., & Dewoolkar, M. M. (2017). Stream Power Application for Bridge-Damage Probability Mapping Based on Empirical Evidence from Tropical Storm Irene. Journal of Bridge Engineering, 22(5), 05017001. https://doi.org/10.1061/(asce)be.1943-5592.0001022
Austin, B. C., & McKinley, D. (n.d.). Benefits of Stream Simulation Designed Road-Stream Crossings beyond Aquatic Organism Passage.
Baker, D., Hamshaw, S. D., & Hamshaw, K. A. (2014). Rapid Flood Exposure Assessment of Vermont Mobile Home Parks Following Tropical Storm Irene. Natural Hazards Review, 15(1), 27–37.
Water Resources Vermont Climate Assessment, 2021 178
https://doi.org/10.1061/(ASCE)NH.1527-6996.0000112
Bates, K. K., & Kirn, R. (2009). Guidelines for the Design of Stream/Road Crossings for Passage of Aquatic Organisms in Vermont. https://vtfishandwildlife.com/sites/fishandwildlife/files/documents/Learn%20More/Library/REPORTS%20AND%20DOCUMENTS/AOP/GUIDESLINES%20FOR%20DESIGN.pdf
Betts, A.K. (2017). Climate Change in Vermont. Vermont Climate Change Report for the Governor’s Vermont Climate Action Commission. DOI:10.13140/RG.2.2.30544.81920
Brandon, VT Community Report. (2015). Vermont Economic Resiliency Initiative, p. 90. VT Agency of Commerce & Community Development.
Brattleboro Public Works Department. (n.d.). Water Supply. Brattleboro Vermont. Retrieved June 29, 2021, from https://www.brattleboro.org/index.asp?SEC=11941994-4574-4A69-AAA6-11CE2C045D00&Type=B_BASIC
Brooks, R. T. (2009). Potential impacts of global climate change on the hydrology and ecology of ephemeral freshwater systems of the forests of the northeastern United States. https://doi.org/10.1007/S10584-008-9531-9
Carr, E. W., Shirazi, Y., Parsons, G., Hoagland, P., & Sommerfield, C. K. (n.d.). Modeling the Economic Value of Carbon Sequestration by Wetlands in the Delaware Estuary: Historic Estimates and Future Projections.
CDC/ATSDR. (2021). Centers for Disease Control and Prevention (CDC) and Agency for Toxic Substances and Disease Registry (ATSDR). Social Vulnerability Index. https://www.atsdr.cdc.gov/placeandhealth/svi/index.html
Christiansen, C., Filer, A., Landi, M., O’Shaughnessy, E., Palmer, M., & Schwartz, T. (2014). Cost-benefit analysis of stream-simulation culverts. http://www.lafollette.wisc.edu/images/publications/cba/2014-culvert.pdf
Dahl, T.E. (1990). Wetlands losses in the United States 1780’s to 1980’s (p. 13). U.S. Department of Interior, Fish and Wildlife Service.
Dawson, J., & Scott, D. (2007). Climate Change Vulnerability of the Vermont Ski Tourism Industry. Annals of Leisure Research, 10, 550–572. https://doi.org/10.1080/11745398.2007.9686781
DuBois & King, Inc. (2017). Flood Mitigation Designs Deliver in First Major Storm After Irene. https://www.dubois-king.com/dk-flood-mitigation-design-delivers-first-major-storm-irene/
Dudley, R. W., & Hodgkins, G. A. (2013). Historical Groundwater Trends in Northern New England and Relations with Streamflow and Climatic Variables. JAWRA Journal of the American Water Resources Association, 49(5), 1198–1212. https://doi.org/10.1111/jawr.12080
Dudley, R. W., Hodgkins, G. A., McHale, M. R., Kolian, M. J., & Renard, B. (2017). Trends in snowmelt-related streamflow timing in the conterminous United States. Journal of Hydrology, 547, 208–221. https://doi.org/10.1016/j.jhydrol.2017.01.051
Dugan, H. A., Summers, J. C., Skaff, N. K., Krivak-Tetley, F. E., Doubek, J. P., Burke, S. M., Bartlett, S. L.,
Water Resources Vermont Climate Assessment, 2021 179
Arvola, L., Jarjanazi, H., Korponai, J., Kleeberg, A., Monet, G., Monteith, D., Moore, K., Rogora, M., Hanson, P. C., & Weathers, K. C. (2017). Long-term chloride concentrations in North American and European freshwater lakes. Scientific Data, 4(1), 170101. https://doi.org/10.1038/sdata.2017.101
Dupigny-Giroux, L.-A., Mecray, E., Lemcke-Stampone, M., Hodgkins, G. A., Lentz, E. E., Mills, K. E., Lane, E. D., Miller, R., Hollinger, D., Solecki, W. D., Wellenius, G. A., Sheffield, P. E., MacDonald, A. B., & Caldwell, C. (2018). Chapter 18: Northeast. Impacts, Risks, and Adaptation in the United States: The Fourth National Climate Assessment, Volume II. U.S. Global Change Research Program. https://doi.org/10.7930/NCA4.2018.CH18
Farmland Information Center. (2016). Vermont Data and Statistics. Farmland Information Center. https://farmlandinfo.org/statistics/vermont-statistics/
Gillespie, N., Unthank, A., Campbell, L., Anderson, P., Gubernick, R., Weinhold, M., Cenderelli, D., Austin, B., McKinley, D., Wells, S., Rowan, J., Orvis, C., Hudy, M., Bowden, A., Singler, A., Fretz, E., Levine, J., & Kirn, R. (2014). Flood effects on road–stream crossing infrastructure: Economic and ecological benefits of stream simulation designs. Fisheries, 39(2), 62–76. https://doi.org/10.1080/03632415.2013.874527
Gourevitch, J. D., Singh, N. K., Minot, J., Raub, K. B., Wemple, B. C., Ricketts, T. H., & Rizzo, D. M. (2020). Spatial targeting of floodplain restoration to equitably mitigate flood risk. Global Environmental Change, 61(February), 102050. https://doi.org/10.1016/j.gloenvcha.2020.102050
Guilbert, J., Beckage, B., Winter, J. M., Horton, R. M., Perkins, T., & Bomblies, A. (2014). Impacts of projected climate change over the Lake Champlain basin in Vermont. Journal of Applied Meteology and Climatology, 53, 1861–1875. https://doi.org/10.1175/JAMC-D-13-0338.1
Guilbert, J., Betts, A. K., Rizzo, D. M., Beckage, B., & Bomblies, A. (2015). Characterization of increased persistence and intensity of precipitation in the northeastern United States. Geophysical Research Letters, 42(6), 1888–1893. https://doi.org/10.1002/2015GL063124
Henzel, L. (2016). Living in harmony with streams: A citizen’s handbook to how streams work (p. 48). https://floodready.vermont.gov/sites/floodready/files/documents/Stream%20Guide%2011-16-2016.pdf
Hodgkins, G. (2010). Trends in Streamflow Characteristics at Selected Stream gauges in Vermont.
Hodgkins, G. A., & Dudley, R. W. (2011). Historical summer base flow and stormflow trends for New England rivers. Water Resources Research, 47(7). https://doi.org/10.1029/2010WR009109
International Lake Champlain-Richelieu River Study Board. (2019). The causes and impacts of past floods in the Lake Champlain-Richelieu River Basin (p. 108). https://www.ijc.org/sites/default/files/2020-03/9056-CMI%20Rapport%20public%20EN-FINAL-HR.pdf
International Lake Champlain-Richelieu River Study Board. (2020). Lake Champlain-Richelieu River Basin: Understanding past floods to prepare for the future (p. 16). https://www.ijc.org/sites/default/files/2020-03/9092-CMI-BROCHURE-WEB-AN.pdf
Junk, W. J., An, S., Finlayson, C. M., Gopal, B., Květ, J., Mitchell, S. A., Mitsch, W. J., & Robarts, R. D. (2013). Current state of knowledge regarding the world’s wetlands and their future under global
Water Resources Vermont Climate Assessment, 2021 180
climate change: A synthesis. Aquatic Sciences, 75(1), 151–167. https://doi.org/10.1007/s00027-012-0278-z
Kaushal, S. S., Likens, G. E., Jaworski, N. A., Pace, M. L., Sides, A. M., Seekell, D., Belt, K. T., Secor, D. H., & Wingate, R. L. (2010). Rising stream and river temperatures in the United States. Frontiers in Ecology and the Environment, 8(9), 461–466. https://doi.org/10.1890/090037
Kirn, R. (2016, June 22). Stream Crossings I: Stream Sim Lite: Incorporating Stream Simulation Concepts into Vermont Statewide Culvert Design and Construction Standards. International Conference on Engineering and Ecohydrology for Fish Passage.
Kline, M. (2016). Giving Our Rivers Room To Move: A New Strategy and Contribution to Protecting Vermont’s Communities and Ensuring Clean Water. Vermont Journal of Environmental Law, 17(4), 733–765.
Kline, M., & Cahoon, B. (2010). Protecting River Corridors in Vermont. JAWRA Journal of the American Water Resources Association, 46(2), 227–236. https://doi.org/10.1111/j.1752-1688.2010.00417.x
Lang, V. (1999). Questions and Answers on the New England Flow Policy (p. 22). U.S. Fish and Wildlife.
LCBP. (2013). Flood resilience in the Lake Champlain Basin and Upper Richelieu River (p. 93). http://www.lcbp.org/wp-content/uploads/2013/04/FloodReport2013_en.pdf
LCBP. (2015). Climate Change and Stormwater Management in the Lake Champlain Basin (No. 80). http://www.lcbp.org/wp-content/uploads/2013/03/80_LCBP_ClimateChange_StormwaterMangement.pdf
LCBP. (2018). State of the Lake and Ecosystem Indicators Report (p. 36). Lake Champlain Basin Program. https://sol.lcbp.org/en/
LCBP, New England Interstate Water Pollution Control Commission, & Organisme de basin versant de la baie Missisquoi. (n.d.). Nutrient Loading and Impacts in Lake Champlain, Missisquoi Bay, and the Richelieu River. International Joint Commission. Retrieved April 22, 2021, from https://ijc.org/sites/default/files/2019-11/20191114_Missisquoi%20Bay%20Lit%20Review_LCBP_OBVBM_FR.pdf
Lester, S. E., Singh, N. K., Gourevitch, J. D., Wemple, B. C., Watson, K. B., & Rizzo, D. M. (2019). Optimizing wetland restoration to improve water quality at a regional scale.
Milligan, G., Poulos, H. M., Gilmore, M. S., Berlyn, G. P., Milligan, J., & Chernoff, B. (2019). Estimation of short-term C-fixation in a New England temperate tidal freshwater wetland. Heliyon, 5(5), e01782. https://doi.org/10.1016/j.heliyon.2019.e01782
Molinas, A., & Mommandi, A. (2009). Development of New Corrosion/Abrasion Guidelines for Selection of Culvert Pipe Materials.
Moomaw, W. R., Chmura, G. L., Davies, G. T., Finlayson, C. M., Middleton, B. A., Natali, S. M., Perry, J. E., Roulet, N., & Sutton-Grier, A. E. (2018). Wetlands In a Changing Climate: Science, Policy and Management. Wetlands, 38(2), 183–205. https://doi.org/10.1007/s13157-018-1023-8
Water Resources Vermont Climate Assessment, 2021 181
Nahlik, A. M., & Fennessy, M. S. (2016). Carbon storage in US wetlands. Nature Communications, 7(1), 13835. https://doi.org/10.1038/ncomms13835
Paerl, H. W., & Huisman, J. (2008). Blooms Like It Hot. Science, 320(5872), 57. https://doi.org/10.1126/science.1155398
Ross, D. S., Wemple, B. C., Willson, L. J., Balling, C. M., Underwood, K. L., & Hamshaw, S. D. (2019). Impact of an Extreme Storm Event on River Corridor Bank Erosion and Phosphorus Mobilization in a Mountainous Watershed in the Northeastern United States. Journal of Geophysical Research: Biogeosciences, 124(1), 18–32. https://doi.org/10.1029/2018JG004497
Rousseau, Alain N. (2020). Watershed Storage: Assessment of the Role of Wetlands, Temporary Flooding of Farmlands and Potentially Developing Welands on Flows and Water Levels in the LCRR Basin. Lake Champlain-Richelieu River Study Technical Webinars. November 5. https://www.ijc.org/en/lcrr/watershed-storage-webinar-presentation
Schaible, G. D., & Aillery, M. P. (2017). Chapter 2.1.1—Challenges for US Irrigated Agriculture in the Face of Emerging Demands and Climate Change. In J. R. Ziolkowska & J. M. Peterson (Eds.), Competition for Water Resources (pp. 44–79). Elsevier. https://doi.org/10.1016/B978-0-12-803237-4.00004-5
Schiff, R., Bighinatti, S., Fitzgerald, E., Wahlund, N., Carlton, D., Church, A., Louisos, J., & Cote, B. (2015). Evaluating the costs and benefits of floodplain protections activities in Waterbury, Vermont and Willsboro, New York, Lake Champlain Basin, U.S.A. (Technical Report No. 78; p. 137). Lake Champlain Basin Program. http://www.lcbp.org/wp-content/uploads/2013/03/78_CostsBenefitsFloodplains.pdf
Shambaugh, A. (2020). Cyanobacteria Monitoring on Lake Champlain and Vermont Inland Lakes Summer 2019.
Singh, N. K., Wemple, B. C., Bomblies, A., & Ricketts, T. H. (2018). Simulating stream response to floodplain connectivity and revegetation from reach to watershed scales: Implications for stream management. Science of The Total Environment, 633, 716–727. https://doi.org/10.1016/j.scitotenv.2018.03.198
Smeltzer, E., Shambaugh, A. D., & Stangel, P. (2012). Environmental change in Lake Champlain revealed by long-term monitoring. Journal of Great Lakes Research, 38(1), 6–18. https://doi.org/10.1016/j.jglr.2012.01.002
State of Vermont. (2021). Flood Ready Vermont. https://floodready.vermont.gov/
Stockwell, J. D., Doubek, J. P., Adrian, R., Anneville, O., Carey, C. C., Carvalho, L., Domis, L. N. D. S., Dur, G., Frassl, M. A., Grossart, H.-P., Ibelings, B. W., Lajeunesse, M. J., Lewandowska, A. M., Llames, M. E., Matsuzaki, S.-I. S., Nodine, E. R., Nõges, P., Patil, V. P., Pomati, F., … Wilson, H. L. (2020). Storm impacts on phytoplankton community dynamics in lakes. Global Change Biology, 26(5), 2756–2784. https://doi.org/10.1111/gcb.15033
Tate, E., Rahman, M. A., Emrich, C. T., & Sampson, C. C. (2021). Flood exposure and social vulnerability in the United States. Natural Hazards, 106(1), 435–457. https://doi.org/10.1007/s11069-020-04470-2
US EPA. (2016). Phosphorus TMDLs for Vermont Segments of Lake Champlain (p. 72).
Water Resources Vermont Climate Assessment, 2021 182
US EPA, O. (2013). Impacts of Climate Change on the Occurrence of Harmful Algal Blooms (EPA 820-S-13-001; p. 3).
USGCRP. (2018). Impacts, Risks, and Adaptation in the United States: Fourth National Climate Assessment, Volume II: [Reidmiller, D.R., C.W. Avery, D.R. Easterling, K.E. Kunkel, K.L.M. Lewis, T.K. Maycock, and B.C. Stewart (eds.)]. U.S. Global Change Research Program, Washington, DC, USA, 1515 pp. doi: 10.7930/NCA4.2018.
USGS. (n.d.). Trends in Water Use in the United States, 1950 to 2015. USGS Water Science School. https://www.usgs.gov/special-topic/water-science-school/science/trends-water-use-united-states-1950-2015?qt-science_center_objects=0#qt-science_center_objects
USGS. (2021). Vermont Water Use. New England Water Science Center. https://www.usgs.gov/centers/new-england-water/science/vermont-water-use?qt-science_center_objects=0#qt-science_center_objects
Voigt, B., Lees, Julia, & Erickson, Jon. (2015). An Assessment of the Economic Value of Clean Water in Lake Champlain. (Technical Report No. 81; p. 53). Lake Champlain Basin Program. https://www.lcbp.org/publications/assessment-economic-value-clean-water-lake-champlain/
VPR. (2020). A Boom Year For Blooms: Toxic Algae Closes Beaches, Raises Concern About Water Supplies. October 25. In Vermont Public Radio. https://www.vpr.org/vpr-news/2020-10-25/a-boom-year-for-blooms-toxic-algae-closes-beaches-raises-concern-about-water-supplies
VT ANR. (1996). Water Withdrawals for Snowmaking (pp. 1–7). Vermont Agency of Natural Resources. https://dec.vermont.gov/sites/dec/files/documents/wsmd-water-withdrawal-snow-rule-1996-02-15.pdf
VT ANR, & VT DEC. (2018). State of Vermont Water Quality Integrated Assessment Report. https://dec.vermont.gov/sites/dec/files/documents/WaterQualityAssessmentReport_305b_2018.pdf
VT DEC. (n.d.). Wetland Functions and Values. Department of Conservation. Retrieved April 5, 2021, from https://dec.vermont.gov/watershed/wetlands/functions
VT DEC. (2015). FEMA Community Information Systems data on Policies in Force and e911 points in SFHA.
VT DEC. (2018). Vermont Groundwater Management Plan. https://dec.vermont.gov/sites/dec/files/dwgwp/DW/2018%20Groundwater%20Management%20Plan.pdf
VT DEC, V. W. P. (2019). Wetlands 101. https://dec.vermont.gov/sites/dec/files/wsm/wetlands/docs/2014_Wetlands%20101.pdf
VT Emergency Management. (2018). 2018 Vermont State Hazard Mitigation Plan. https://vem.vermont.gov/sites/demhs/files/documents/2018%20Vermont%20State%20Hazard%20Mitigation%20Plan%20-%20Final%20Adopted_Interactive.pdf
Watson, K. B., Ricketts, T., Galford, G., Polasky, S., & O’Niel-Dunne, J. (2016). Quantifying flood mitigation
Water Resources Vermont Climate Assessment, 2021 183
services: The economic value of Otter Creek wetlands and floodplains to Middlebury, VT. Ecological Economics, 130, 16–24. https://doi.org/10.1016/j.ecolecon.2016.05.015
Wilson, G., Green, M., & Mack, K. (2018). Historical Climate Warming in the White Mountains of New Hampshire (USA): Implications for Snowmaking Water Needs at Ski Areas. Mountain Research and Development, 38(2), 164–171. https://doi.org/10.1659/MRD-JOURNAL-D-17-00117
Wironen, M., Bennett, E., & Erickson, J. (2018). Phosphorus flows and legacy accumulation in an animal-dominated agricultural region from 1925 to 2012. Global Environmental Change, 50, 88–99. https://doi.org/10.1016/j.gloenvcha.2018.02.017
Wolfe, D. W., DeGaetano, A. T., Peck, G. M., Carey, M., Ziska, L. H., Lea-Cox, J., Kemanian, A. R., Hoffmann, M. P., & Hollinger, D. Y. (2018). Unique challenges and opportunities for northeastern US crop production in a changing climate. Climatic Change, 146(1–2), 231–245. https://doi.org/10.1007/s10584-017-2109-7
Fish and Wildlife in Vermont Vermont Climate Assessment, 2021 184
4 fish and wildlife in vermont
Recommended Citation for Chapter Faccio, S., Morse, J., Ni, G., 2021. Fish and Wildlife in Vermont. In Galford, G.L., Faulkner, J. et al. (Eds), The Vermont Climate Assessment 2021. Burlington, Vermont: Gund Institute for Environment at the University of Vermont. On the web: https://vtclimate.org
George Ni Biology Department, University of Vermont, Burlington, VT 05405
Joshua Morse Rubenstein School of Natural Resources and Environment, University of Vermont, Burlington, VT 05405 Gund Institute for Environment, University of Vermont
Steve Faccio Senior Conservation Biologist, Vermont Center for Ecostudies, White River Junction, VT 05001
Fish and Wildlife in Vermont Vermont Climate Assessment, 2021 185
4.1 key messages
1. As climate change worsens, 92 bird species of Vermont, including the iconic common
loon and hermit thrush, are expected to disappear from the landscape within the next
25 years.
2. Increasing warming trends are expected to result in an increase in white-tailed deer
population and a mirrored decrease in moose population, which may have long-term
impacts on Vermont’s forest composition. Managing social systems (e.g. hunting) to
account for changing public tolerance and demand for deer may provide one avenue to
minimize this risk if undertaken proactively.
3. As warming trends reduce the severity of winters, the subsequent warming waters will
have adverse effects on lake and river systems, including increased risk for harmful
algal blooms (HABs) and reduced overall biodiversity and health in lake ecosystems.
4.2 background
Anthropogenic climate change has had a warming influence on the planet since the 1750s that
has resulted in increased global mean temperature. As a result, Earth has seen shifts in annual
precipitation, average seasonality, and a host of other changes. These shifts affect the
environment in several ways, and the complex interactions that occur can often seem opaque.
This is especially true when considering how climate change may affect organisms other than
humans. Without proper monitoring and study of organisms, it is difficult to parse out the full
effect that climate change may have on different species, as well as the full impact that policy
plans or management strategies may have as a proactive plan to buffer those shifts. Current
research is attempting to address these issues, and many important interactions have been
documented and observed to link climate change to organism behavior and survival. A few of
these interactions are listed below as they are often important indicators for fish and wildlife.
Fish and Wildlife in Vermont Vermont Climate Assessment, 2021 186
4.2.1 Annual Precipitation and Rainfall Events Reports and monitoring efforts across Vermont have recorded ever-increasing levels of
precipitation annually since the early 1900s, with average annual precipitation across all
seasons seeing significant positive trends. Since 1960, summer precipitation in Vermont has
seen the fastest increase with 0.5 inches per decade, winter and fall each with 0.3 inches per
decade, and spring with 0.2 inches per decade (see Climate Change in Vermont chapter). This
impacts a variety of aquatic and terrestrial organisms that rely on Vermont’s riverine and lake
systems for shelter, reproductive cycles, and resources.
4.2.2 Increasing Annual Mean Temperature and Winter/Spring Seasonality Based on current climate projections, winter temperatures will gradually increase, reducing
winter severity and shortening the winter season itself. This will have a negative effect on the
total ice cover of water bodies. Changes in winter seasonality have also resulted in shifts in
animal community structures to more warm-adapted species. Vermont’s annual average
temperature has increased by almost 2℉ since 1900, but winter temperatures have increased
2.5 times faster than annual temperatures over the last 60 years (see Climate Change in
Vermont chapter).
4.2.3 Land-Use Changes As organisms are intrinsically tied to their habitat, anthropogenic climate change through
urbanization, forest clearings, and reforestation post-agricultural abandonment has a direct
effect on their overall fitness and ability to survive in their natural habitats. Increasing
urbanization in montane areas and undeveloped land leads to issues of habitat loss and
habitat fragmentation, both of which heavily impact biodiversity and ecological processes
within a given ecosystem. This applies to both terrestrial and aquatic species, with road and
dam infrastructures resulting in a variety of consequences for vulnerable species.
4.2.4 Phenological Interactions In response to large-scale warming of their environments, many organisms are forced to shift
Fish and Wildlife in Vermont Vermont Climate Assessment, 2021 187
their distributions and seasonal interactions, such as phenological events of flowering,
breeding, migrating, or growing. Vermont is already experiencing increased temperatures, with
average winter temperatures increasing 3.08℉ since the 1960s (see Climate Change in
Vermont chapter). Historical observations show the freeze-free period (number of consecutive
days with minimum temperature above 28ºF) has increased by 9.0 days per decade since the
1990s (see Climate Change in Vermont chapter). Increases in winter temperature and overall
reduction in winter severity can lead to dramatic shifts in seasonality, which can be a
considerable obstacle for wildlife with life histories that closely follow local climate patterns.
Issues with phenological interactions may occur in species with narrow breeding times or
migration patterns, as they are often reliant on complex interactions with organisms from
other trophic levels in order to function properly. Migratory birds rely on booms in insect
populations during the spring to recover from the physical strains of traveling and to support
reproductive strategies. When the timing of insect emergence does not coincide with the
arrival of migratory birds, this can often lead to phenological mismatch, where those birds are
unable to take full advantage of the insect boom and may starve or fail to reproduce. As such,
birds, insects, and fish are often susceptible to shifts in phenology.
4.3 insects: pollinators and forest pests
Insects are often overlooked when studying climate change, whether that is due to the
difficulties in gathering appropriate data on such small organisms, or preconceptions that
insects play less of a role or are less valuable compared to larger, more charismatic species
like birds and larger ungulates (Polgar et al., 2013). In fact, insects can provide a variety of
ecosystem functions that largely go unnoticed by humans. Gardens and fields are heavily
reliant on pollinators to initiate the growth of flowers and fruit-bearing plants, and caterpillars
are the primary source of food for migratory birds recovering after their long flights. Insects
are also extremely responsive to changes in their environment, and climate change effects
have drastic impacts on their survival. In order to fully capture the extent of climate change, it
is important to acknowledge the widespread effects that it will have and how it might affect
humans.
Fish and Wildlife in Vermont Vermont Climate Assessment, 2021 188
4.3.1 Pollinators: Bees Worldwide, bees are considered one of the most important pollinators, as they provide crucial
pollination to fruit-bearing plants and flowers, and have an immense impact on agriculture and
food systems. Within Vermont, close to 275 species of bees have been found, with most of
them “solitary bees” that do not have colonies like honey bees but still serve as pollinators.
These native bees are often more valuable as pollinators compared to the more well-known
honey bee due to their wider visitation range and pollination activity. Their contribution has
widespread effects on wildlife that rely on fruits, such as turkey, moose, and deer.
Concerns for bees stem from recent reports of commercial honey bee colony collapses.
Current studies in Vermont have corroborated many of the indications by population trends:
that pollinators are declining nationwide and are at risk of disappearing. A bumble bee survey
conducted in 2012 found that of the 17 major bumble bee species commonly found in
Vermont, 4 were not detected and 4 showed significant declines (Richardson et al., 2017). One
major factor for these declines is anthropogenic impacts on bee species, especially
agriculture.
Agricultural practices can disrupt bee populations on multiple different scales, from habitat
degradation, farm management practices, pathogens, and climate change. Bee communities
are heavily influenced by the surrounding landscape and the management practices employed
there. Intensive farm management practices can often intensify the negative effects of
landscape simplification (Nicholson et al., 2017). Less intensively managed farms had more
instances of bee visitations and more diverse communities of bee species.
On a larger scale, climate change is also having adverse effects on bees. Warming
temperature trends are predicted to affect bees through phenological mismatch. As the
warming seasons result in earlier spring times, there may be a disconnect that occurs between
the bees and the plants, as the bees may become active later in the season compared to the
plants they would have visited (Memmott et al., 2007). Figure 4-1 highlights the impact that
warmer temperatures under climate change may have on phenological mismatching.
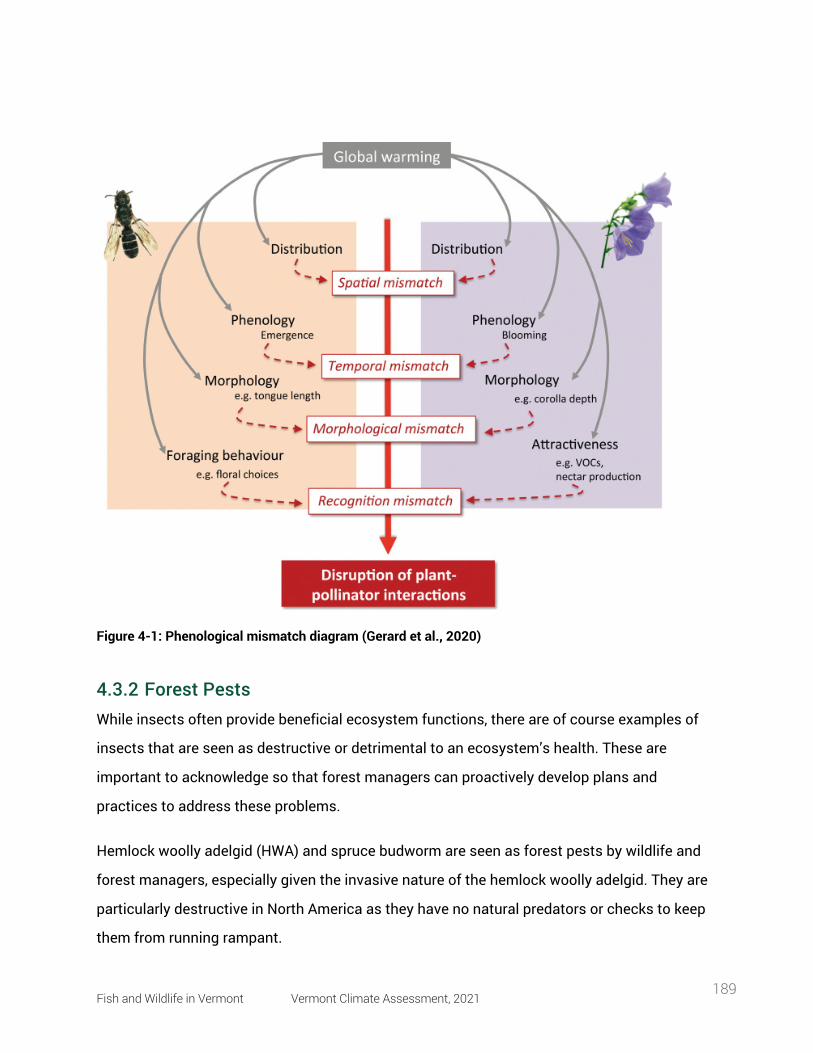
Fish and Wildlife in Vermont Vermont Climate Assessment, 2021 189
Figure 4-1: Phenological mismatch diagram (Gerard et al., 2020)
4.3.2 Forest Pests While insects often provide beneficial ecosystem functions, there are of course examples of
insects that are seen as destructive or detrimental to an ecosystem’s health. These are
important to acknowledge so that forest managers can proactively develop plans and
practices to address these problems.
Hemlock woolly adelgid (HWA) and spruce budworm are seen as forest pests by wildlife and
forest managers, especially given the invasive nature of the hemlock woolly adelgid. They are
particularly destructive in North America as they have no natural predators or checks to keep
them from running rampant.
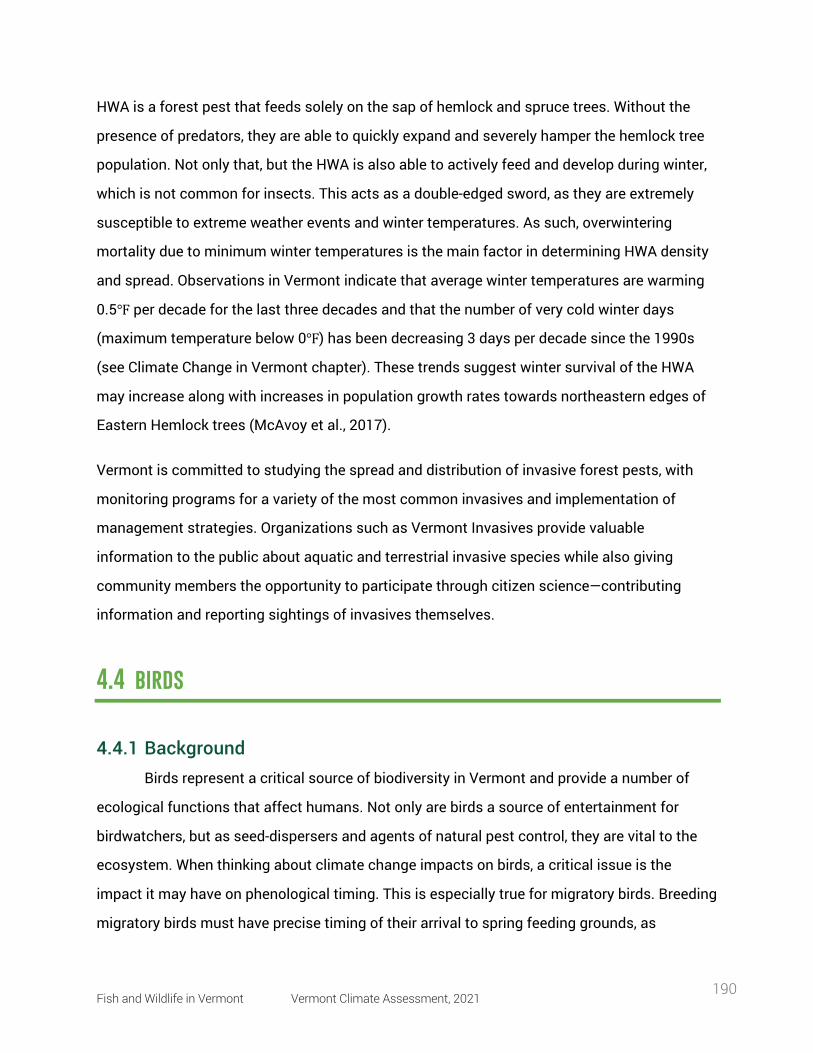
Fish and Wildlife in Vermont Vermont Climate Assessment, 2021 190
HWA is a forest pest that feeds solely on the sap of hemlock and spruce trees. Without the
presence of predators, they are able to quickly expand and severely hamper the hemlock tree
population. Not only that, but the HWA is also able to actively feed and develop during winter,
which is not common for insects. This acts as a double-edged sword, as they are extremely
susceptible to extreme weather events and winter temperatures. As such, overwintering
mortality due to minimum winter temperatures is the main factor in determining HWA density
and spread. Observations in Vermont indicate that average winter temperatures are warming
0.5℉ per decade for the last three decades and that the number of very cold winter days
(maximum temperature below 0℉) has been decreasing 3 days per decade since the 1990s
(see Climate Change in Vermont chapter). These trends suggest winter survival of the HWA
may increase along with increases in population growth rates towards northeastern edges of
Eastern Hemlock trees (McAvoy et al., 2017).
Vermont is committed to studying the spread and distribution of invasive forest pests, with
monitoring programs for a variety of the most common invasives and implementation of
management strategies. Organizations such as Vermont Invasives provide valuable
information to the public about aquatic and terrestrial invasive species while also giving
community members the opportunity to participate through citizen science—contributing
information and reporting sightings of invasives themselves.
4.4 birds
4.4.1 Background Birds represent a critical source of biodiversity in Vermont and provide a number of
ecological functions that affect humans. Not only are birds a source of entertainment for
birdwatchers, but as seed-dispersers and agents of natural pest control, they are vital to the
ecosystem. When thinking about climate change impacts on birds, a critical issue is the
impact it may have on phenological timing. This is especially true for migratory birds. Breeding
migratory birds must have precise timing of their arrival to spring feeding grounds, as
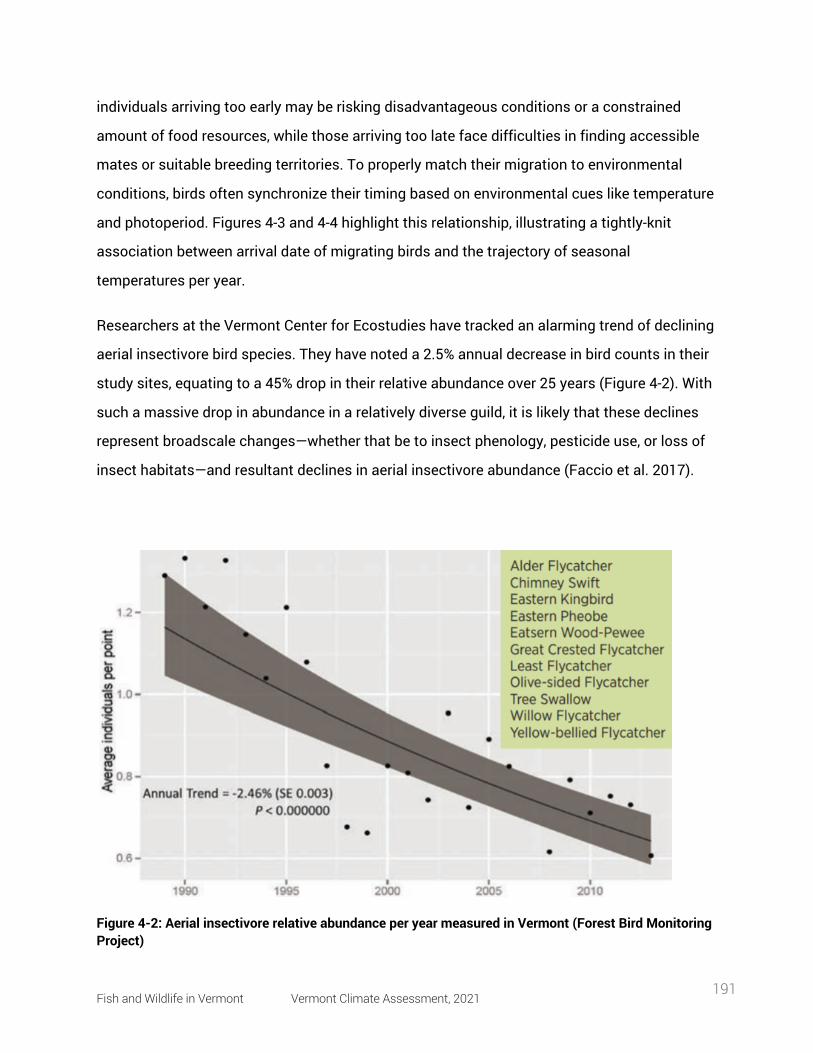
Fish and Wildlife in Vermont Vermont Climate Assessment, 2021 191
individuals arriving too early may be risking disadvantageous conditions or a constrained
amount of food resources, while those arriving too late face difficulties in finding accessible
mates or suitable breeding territories. To properly match their migration to environmental
conditions, birds often synchronize their timing based on environmental cues like temperature
and photoperiod. Figures 4-3 and 4-4 highlight this relationship, illustrating a tightly-knit
association between arrival date of migrating birds and the trajectory of seasonal
temperatures per year.
Researchers at the Vermont Center for Ecostudies have tracked an alarming trend of declining
aerial insectivore bird species. They have noted a 2.5% annual decrease in bird counts in their
study sites, equating to a 45% drop in their relative abundance over 25 years (Figure 4-2). With
such a massive drop in abundance in a relatively diverse guild, it is likely that these declines
represent broadscale changes—whether that be to insect phenology, pesticide use, or loss of
insect habitats—and resultant declines in aerial insectivore abundance (Faccio et al. 2017).
Figure 4-2: Aerial insectivore relative abundance per year measured in Vermont (Forest Bird Monitoring Project)
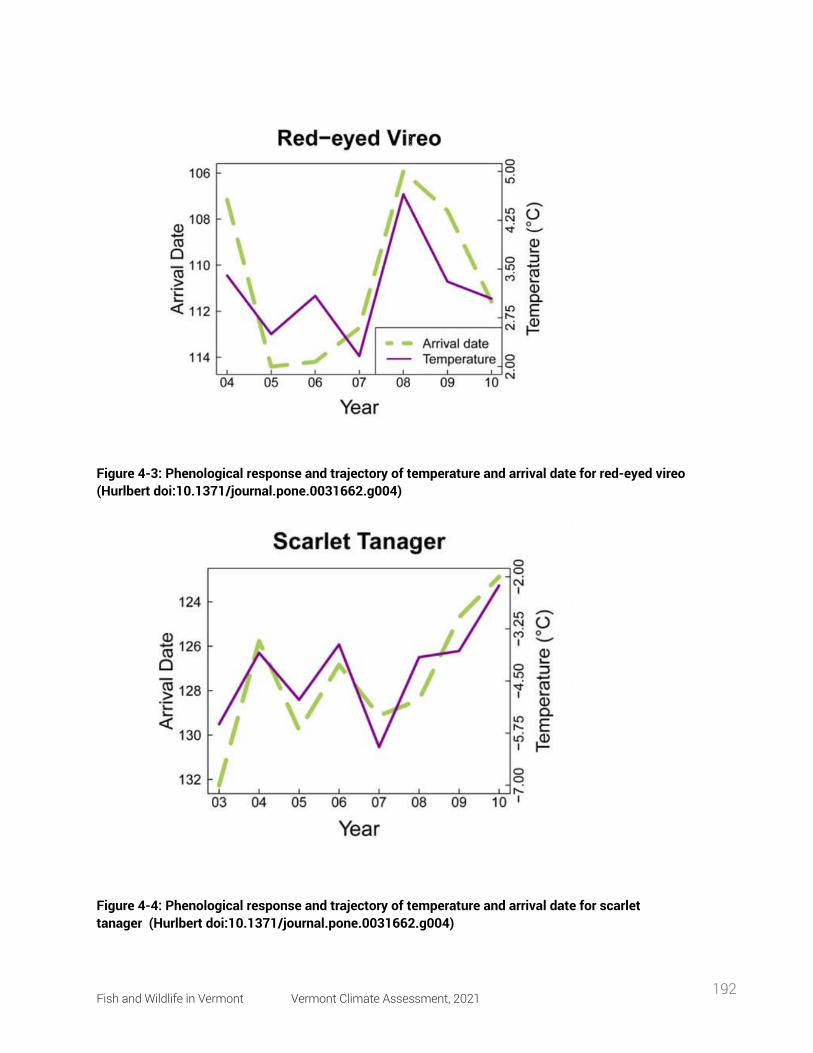
Fish and Wildlife in Vermont Vermont Climate Assessment, 2021 192
Figure 4-3: Phenological response and trajectory of temperature and arrival date for red-eyed vireo (Hurlbert doi:10.1371/journal.pone.0031662.g004)
Figure 4-4: Phenological response and trajectory of temperature and arrival date for scarlet tanager (Hurlbert doi:10.1371/journal.pone.0031662.g004)
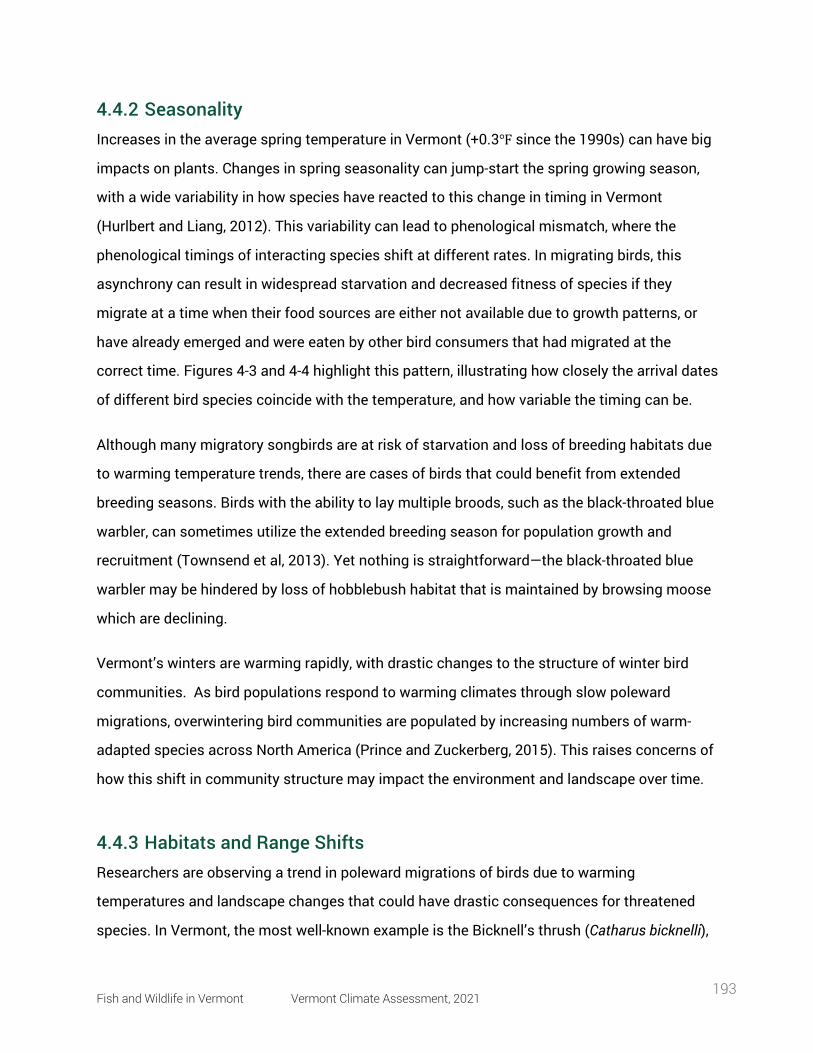
Fish and Wildlife in Vermont Vermont Climate Assessment, 2021 193
4.4.2 Seasonality Increases in the average spring temperature in Vermont (+0.3℉ since the 1990s) can have big
impacts on plants. Changes in spring seasonality can jump-start the spring growing season,
with a wide variability in how species have reacted to this change in timing in Vermont
(Hurlbert and Liang, 2012). This variability can lead to phenological mismatch, where the
phenological timings of interacting species shift at different rates. In migrating birds, this
asynchrony can result in widespread starvation and decreased fitness of species if they
migrate at a time when their food sources are either not available due to growth patterns, or
have already emerged and were eaten by other bird consumers that had migrated at the
correct time. Figures 4-3 and 4-4 highlight this pattern, illustrating how closely the arrival dates
of different bird species coincide with the temperature, and how variable the timing can be.
Although many migratory songbirds are at risk of starvation and loss of breeding habitats due
to warming temperature trends, there are cases of birds that could benefit from extended
breeding seasons. Birds with the ability to lay multiple broods, such as the black-throated blue
warbler, can sometimes utilize the extended breeding season for population growth and
recruitment (Townsend et al, 2013). Yet nothing is straightforward—the black-throated blue
warbler may be hindered by loss of hobblebush habitat that is maintained by browsing moose
which are declining.
Vermont’s winters are warming rapidly, with drastic changes to the structure of winter bird
communities. As bird populations respond to warming climates through slow poleward
migrations, overwintering bird communities are populated by increasing numbers of warm-
adapted species across North America (Prince and Zuckerberg, 2015). This raises concerns of
how this shift in community structure may impact the environment and landscape over time.
4.4.3 Habitats and Range Shifts Researchers are observing a trend in poleward migrations of birds due to warming
temperatures and landscape changes that could have drastic consequences for threatened
species. In Vermont, the most well-known example is the Bicknell’s thrush (Catharus bicknelli),
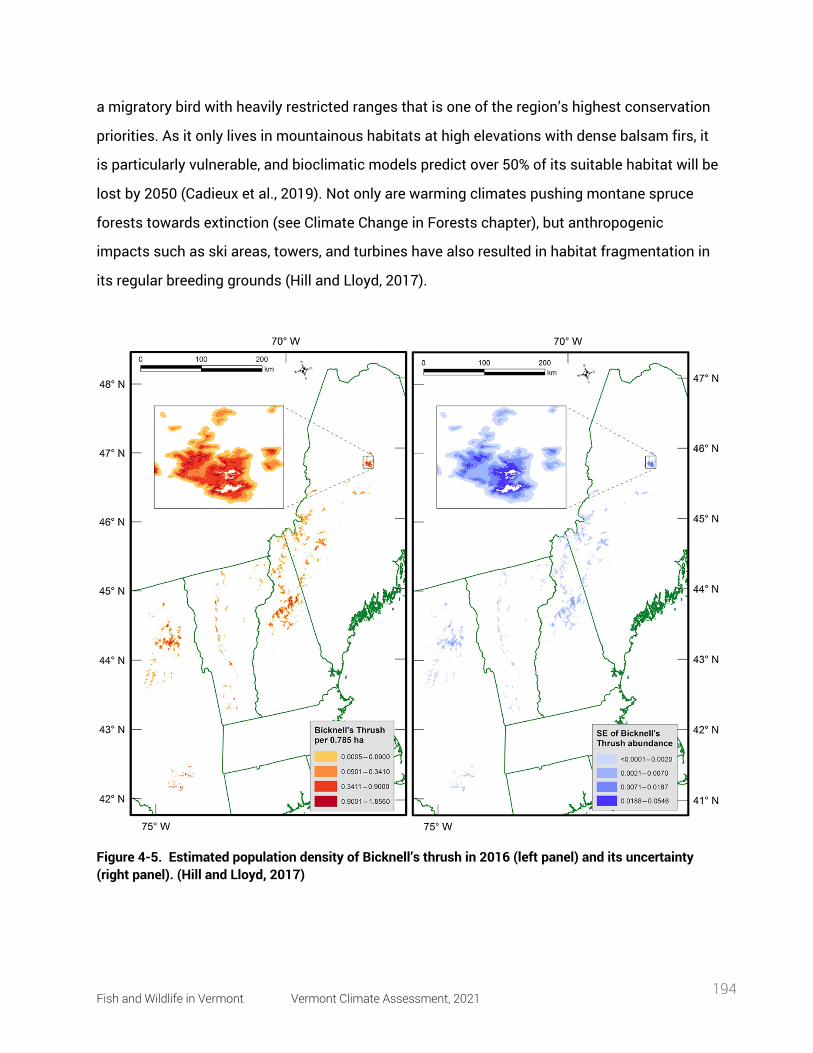
Fish and Wildlife in Vermont Vermont Climate Assessment, 2021 194
a migratory bird with heavily restricted ranges that is one of the region’s highest conservation
priorities. As it only lives in mountainous habitats at high elevations with dense balsam firs, it
is particularly vulnerable, and bioclimatic models predict over 50% of its suitable habitat will be
lost by 2050 (Cadieux et al., 2019). Not only are warming climates pushing montane spruce
forests towards extinction (see Climate Change in Forests chapter), but anthropogenic
impacts such as ski areas, towers, and turbines have also resulted in habitat fragmentation in
its regular breeding grounds (Hill and Lloyd, 2017).
Figure 4-5. Estimated population density of Bicknell’s thrush in 2016 (left panel) and its uncertainty (right panel). (Hill and Lloyd, 2017)
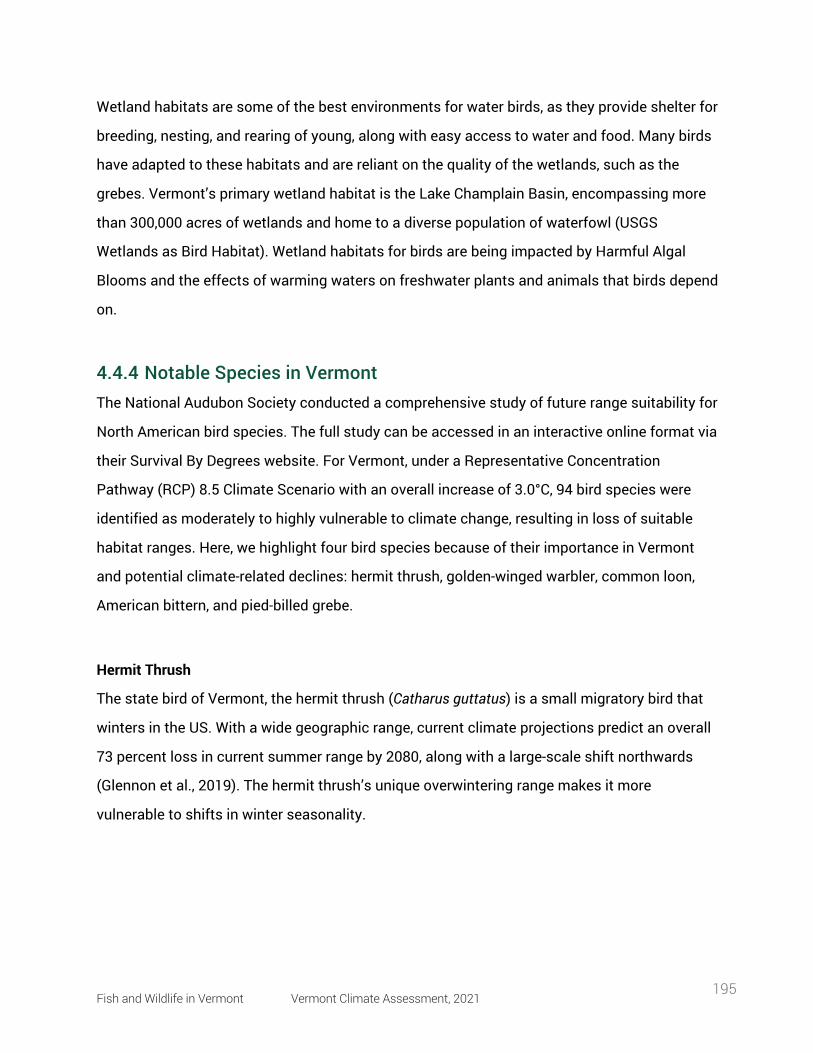
Fish and Wildlife in Vermont Vermont Climate Assessment, 2021 195
Wetland habitats are some of the best environments for water birds, as they provide shelter for
breeding, nesting, and rearing of young, along with easy access to water and food. Many birds
have adapted to these habitats and are reliant on the quality of the wetlands, such as the
grebes. Vermont’s primary wetland habitat is the Lake Champlain Basin, encompassing more
than 300,000 acres of wetlands and home to a diverse population of waterfowl (USGS
Wetlands as Bird Habitat). Wetland habitats for birds are being impacted by Harmful Algal
Blooms and the effects of warming waters on freshwater plants and animals that birds depend
on.
4.4.4 Notable Species in Vermont The National Audubon Society conducted a comprehensive study of future range suitability for
North American bird species. The full study can be accessed in an interactive online format via
their Survival By Degrees website. For Vermont, under a Representative Concentration
Pathway (RCP) 8.5 Climate Scenario with an overall increase of 3.0°C, 94 bird species were
identified as moderately to highly vulnerable to climate change, resulting in loss of suitable
habitat ranges. Here, we highlight four bird species because of their importance in Vermont
and potential climate-related declines: hermit thrush, golden-winged warbler, common loon,
American bittern, and pied-billed grebe.
Hermit Thrush
The state bird of Vermont, the hermit thrush (Catharus guttatus) is a small migratory bird that
winters in the US. With a wide geographic range, current climate projections predict an overall
73 percent loss in current summer range by 2080, along with a large-scale shift northwards
(Glennon et al., 2019). The hermit thrush’s unique overwintering range makes it more
vulnerable to shifts in winter seasonality.
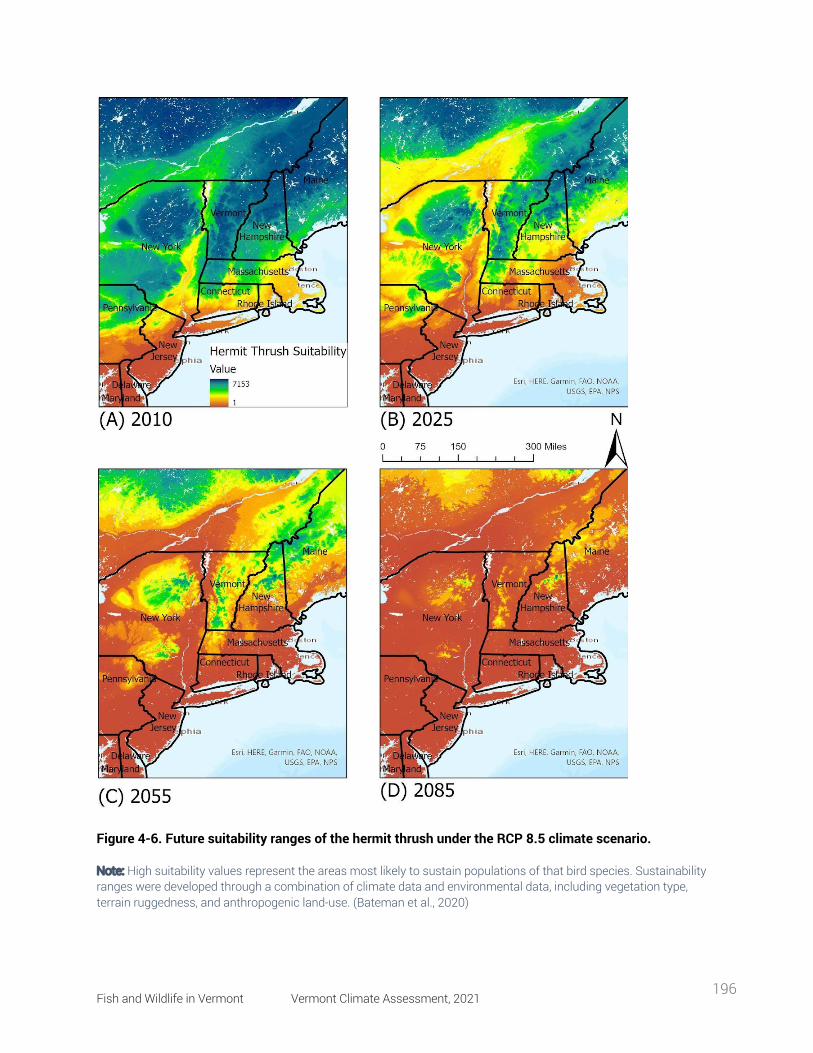
Fish and Wildlife in Vermont Vermont Climate Assessment, 2021 196
Figure 4-6. Future suitability ranges of the hermit thrush under the RCP 8.5 climate scenario.
Note: High suitability values represent the areas most likely to sustain populations of that bird species. Sustainability ranges were developed through a combination of climate data and environmental data, including vegetation type, terrain ruggedness, and anthropogenic land-use. (Bateman et al., 2020)
Fish and Wildlife in Vermont Vermont Climate Assessment, 2021 197
Golden-Winged Warbler
The golden-winged warbler (Vermivora chrysoptera) is an interesting bird as an early
successional species, requiring habitats with shrubs, sparse trees, and grass understories (see
Climate Change in Forests chapter). As a result of increased human development and
successive stages towards more forested areas, many of its ranges have been lost, and
populations have dwindled. Currently, Vermont is the only New England state that hosts a
population of golden-winged warblers (REF Audubon Center). Due to its specific habitat
requirements, the golden-winged warbler can find some suitable habitats within Vermont at
this point, but it is predicted that by 2055 much of the suitable ranges in the northeast will
shift northwards (Figure 4-7).
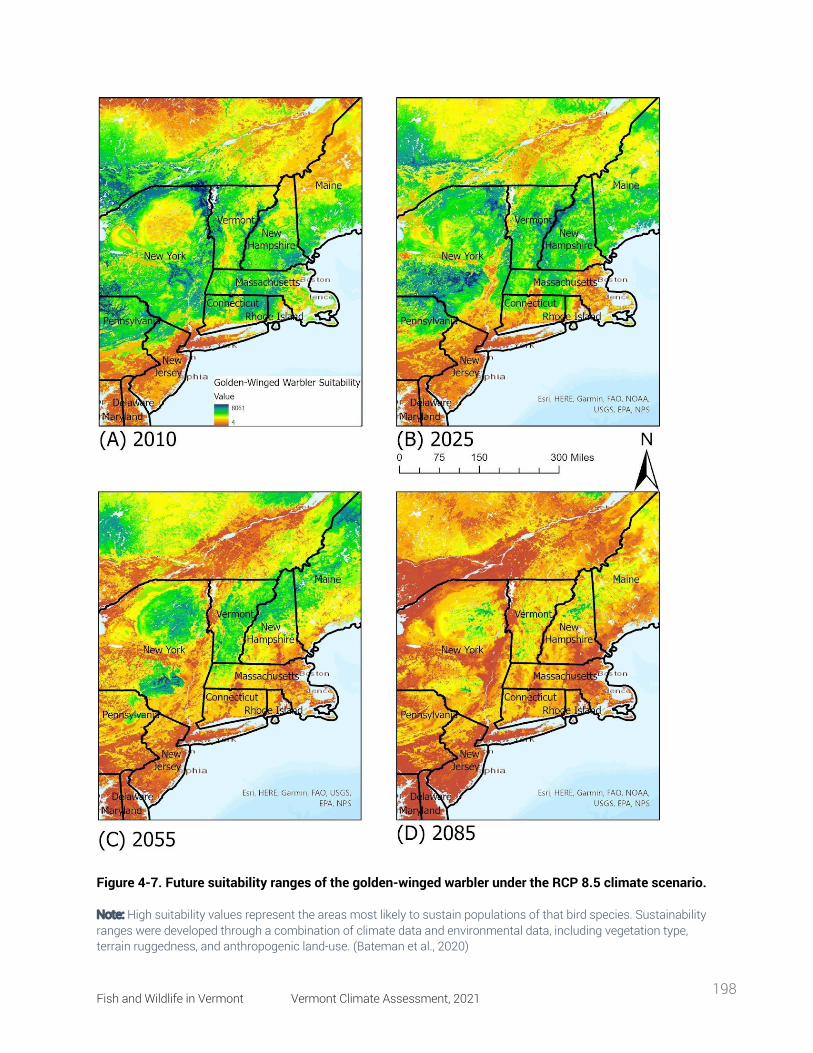
Fish and Wildlife in Vermont Vermont Climate Assessment, 2021 198
Figure 4-7. Future suitability ranges of the golden-winged warbler under the RCP 8.5 climate scenario. Note: High suitability values represent the areas most likely to sustain populations of that bird species. Sustainability ranges were developed through a combination of climate data and environmental data, including vegetation type, terrain ruggedness, and anthropogenic land-use. (Bateman et al., 2020)
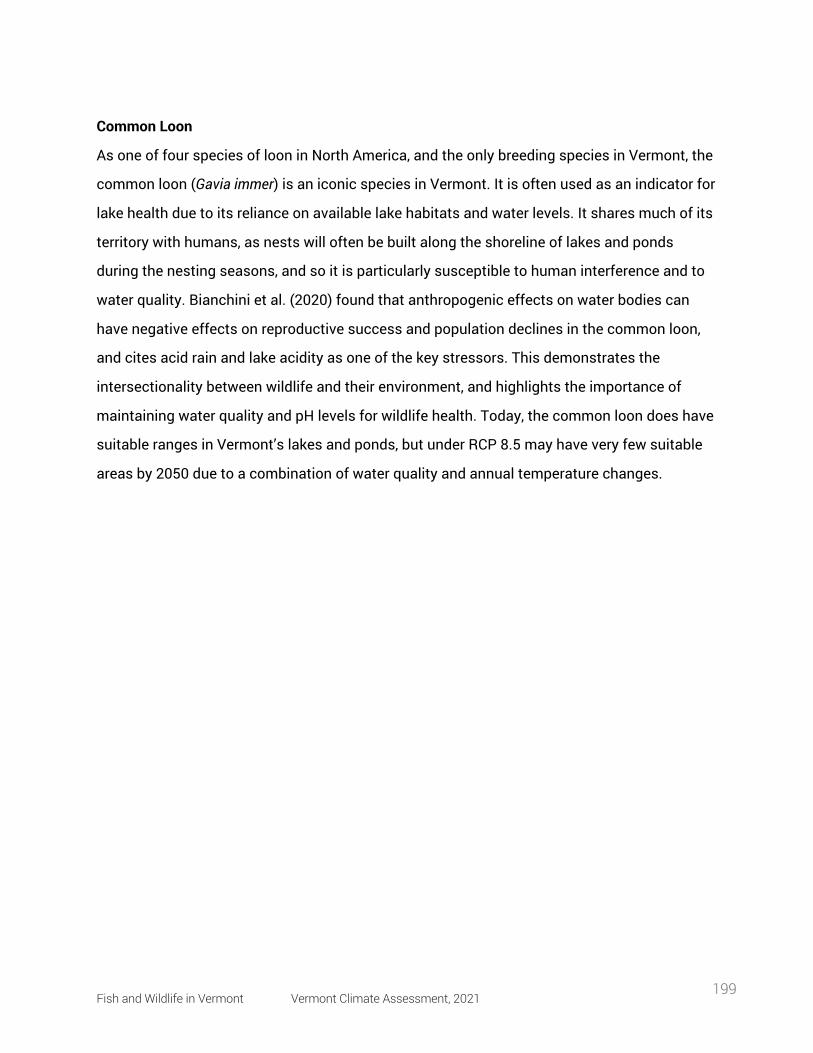
Fish and Wildlife in Vermont Vermont Climate Assessment, 2021 199
Common Loon
As one of four species of loon in North America, and the only breeding species in Vermont, the
common loon (Gavia immer) is an iconic species in Vermont. It is often used as an indicator for
lake health due to its reliance on available lake habitats and water levels. It shares much of its
territory with humans, as nests will often be built along the shoreline of lakes and ponds
during the nesting seasons, and so it is particularly susceptible to human interference and to
water quality. Bianchini et al. (2020) found that anthropogenic effects on water bodies can
have negative effects on reproductive success and population declines in the common loon,
and cites acid rain and lake acidity as one of the key stressors. This demonstrates the
intersectionality between wildlife and their environment, and highlights the importance of
maintaining water quality and pH levels for wildlife health. Today, the common loon does have
suitable ranges in Vermont’s lakes and ponds, but under RCP 8.5 may have very few suitable
areas by 2050 due to a combination of water quality and annual temperature changes.
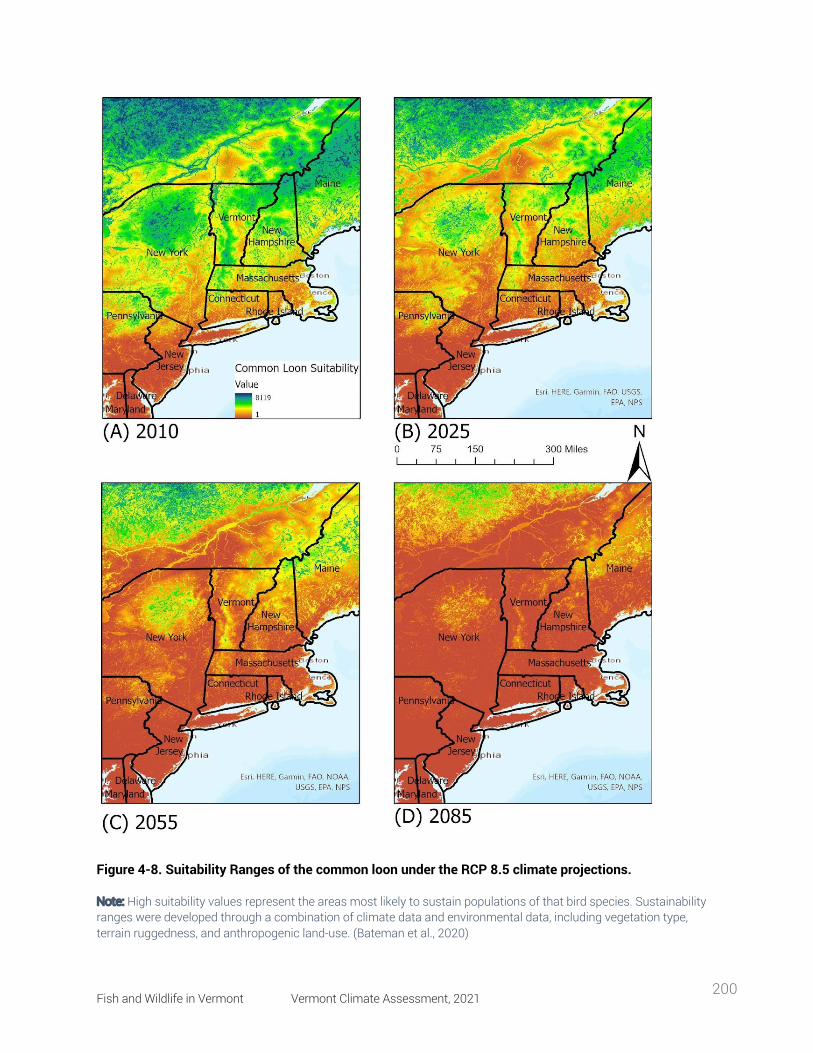
Fish and Wildlife in Vermont Vermont Climate Assessment, 2021 200
Figure 4-8. Suitability Ranges of the common loon under the RCP 8.5 climate projections. Note: High suitability values represent the areas most likely to sustain populations of that bird species. Sustainability ranges were developed through a combination of climate data and environmental data, including vegetation type, terrain ruggedness, and anthropogenic land-use. (Bateman et al., 2020)
Fish and Wildlife in Vermont Vermont Climate Assessment, 2021 201
American Bittern
A medium-sized, solitary heron, the American bittern is a common sight in freshwater marshes
and wetlands, often hunting for fish and aquatic life in the shallow water. Its main nesting and
foraging grounds are marshes and reedy lakes during both summer and winter, and
occasionally it may feed in dry grass fields. On a national scale, the American bittern has
experienced serious declines in the Southern portions of its breeding ranges, largely due to
loss of available habitats and its reliance on large marshes. In Vermont, the American bittern
has its suitable ranges located near water bodies such as lakes and ponds, much like the
common loon. By 2085, under the RCP 8.5 scenario, its available ranges in the New England
area will see an overall shift northwards as annual temperatures and seasonality shifts (Figure
4-9).
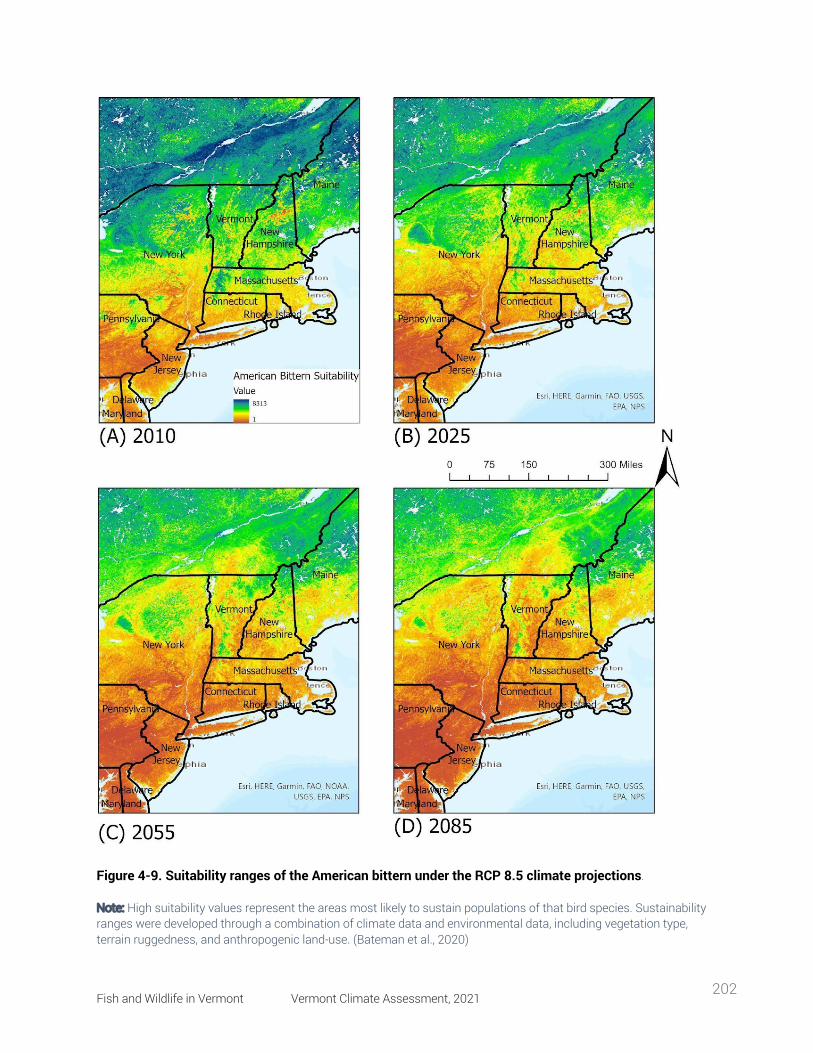
Fish and Wildlife in Vermont Vermont Climate Assessment, 2021 202
Figure 4-9. Suitability ranges of the American bittern under the RCP 8.5 climate projections. Note: High suitability values represent the areas most likely to sustain populations of that bird species. Sustainability ranges were developed through a combination of climate data and environmental data, including vegetation type, terrain ruggedness, and anthropogenic land-use. (Bateman et al., 2020)
Fish and Wildlife in Vermont Vermont Climate Assessment, 2021 203
Pied-Billed Grebe
The pied-billed grebe is a common bird species found in temperate climates in North America
in ponds, lakes, and marshes. Their diet consists of insects, fish, and other aquatic life. As they
are reliant on water bodies and appropriate marsh habitats, pied-billed grebe in Vermont are
most often seen around Lake Champlain and similar water bodies. Under the RCP 8.5 climate
scenario, available suitable habitat for the pied-billed grebe is expected to decrease over time
due to a variety of factors, including invasive aquatic plants and degradation of existing
aquatic ecosystems. By 2085, they may be largely limited to lowland areas and the Champlain
Valley of Vermont (Figure 4-10).
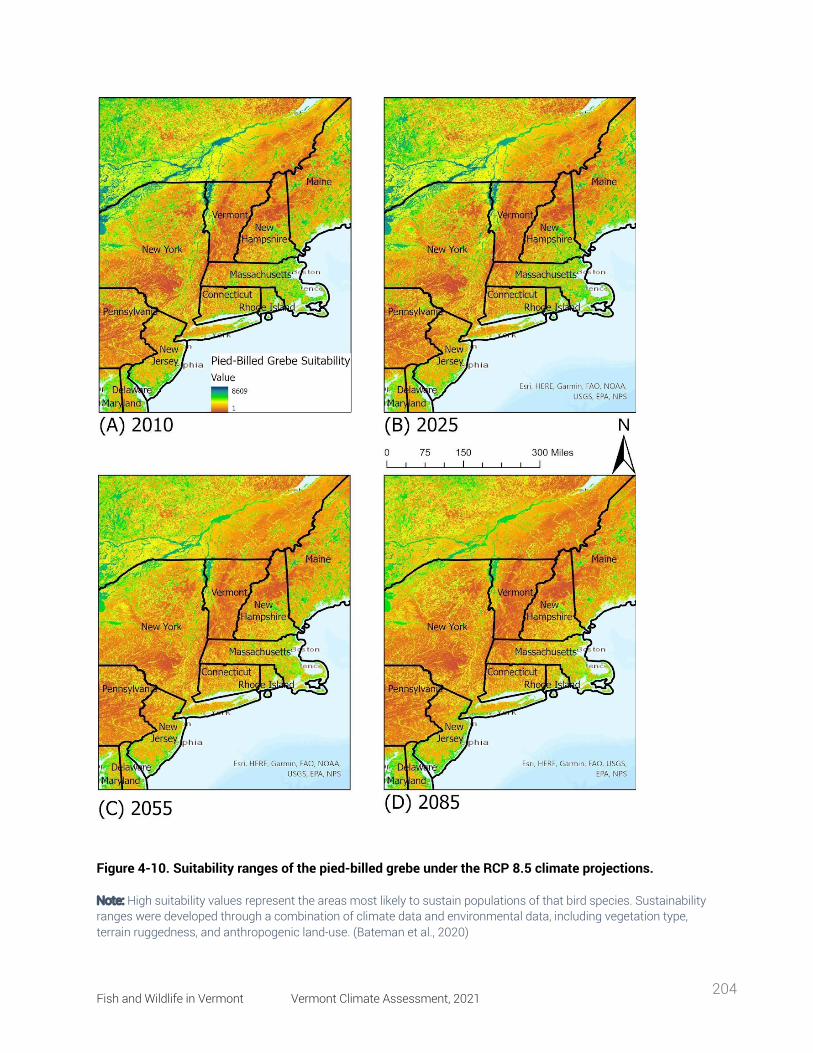
Fish and Wildlife in Vermont Vermont Climate Assessment, 2021 204
Figure 4-10. Suitability ranges of the pied-billed grebe under the RCP 8.5 climate projections.
Note: High suitability values represent the areas most likely to sustain populations of that bird species. Sustainability ranges were developed through a combination of climate data and environmental data, including vegetation type, terrain ruggedness, and anthropogenic land-use. (Bateman et al., 2020)
Fish and Wildlife in Vermont Vermont Climate Assessment, 2021 205
4.5 bats
Like birds, many bat species are aerial insectivores and face similar challenges due to climate
change. Vermont is currently home to 9 species of bats, with 3 of them being migratory tree
bats that travel to the Southern US, Central America, and South America for winter. Like birds,
phenological timing during migration and reproductive timing is critical to their success. There
have been studies done across the United States that attempt to study climate and weather
impacts on bat migrations (Luncan et al. 2013), which can provide insight as to their
conditions in Vermont. Studies done on the Indiana bat (Myotis sodalis) have found that
warming temperatures have had a prominent effect on habitat suitability, and increased
warming may lead to potential range shifts and large-scale movement patterns northward,
with the potential of new bat species roosting in Vermont (Loeb and Winters, 2012).
The main issue that bats face in Vermont at this point in time is the fallout from the arrival of
white-nose syndrome in 2006, which has resulted in the loss of more than 5.7 million bats in
the Northeastern United States. The two most common species in Vermont, the little brown
bat (Myotis lucifugus) and the northern-long-eared bat (Myotis septentrionalis), have seen a 90%
decline in population. Commonly contracted due to exposure to a fungus inside bat
hibernacula (Pseudogymnoacscus destructans), this disease results in attacks on the bare skin
of hibernating bats and can cause abnormal behavior that can result in early mortality. With
such drastic declines, Vermont is losing out on a number of critical services supplied by bats,
and an important component of the food web is also missing.
It is uncertain how the impacts of climate change will interact with that of climate change.
While microclimate conditions have been shown to affect the growth of the fungus, it is
difficult to predict how climate change and the white-nose syndrome epidemic will interact on
a large scale. Further research is required to understand the effect that rises in temperature
and variation in cave microclimate(humidity) will have on bat infection rates and mortality
(Maher et al, 2012).
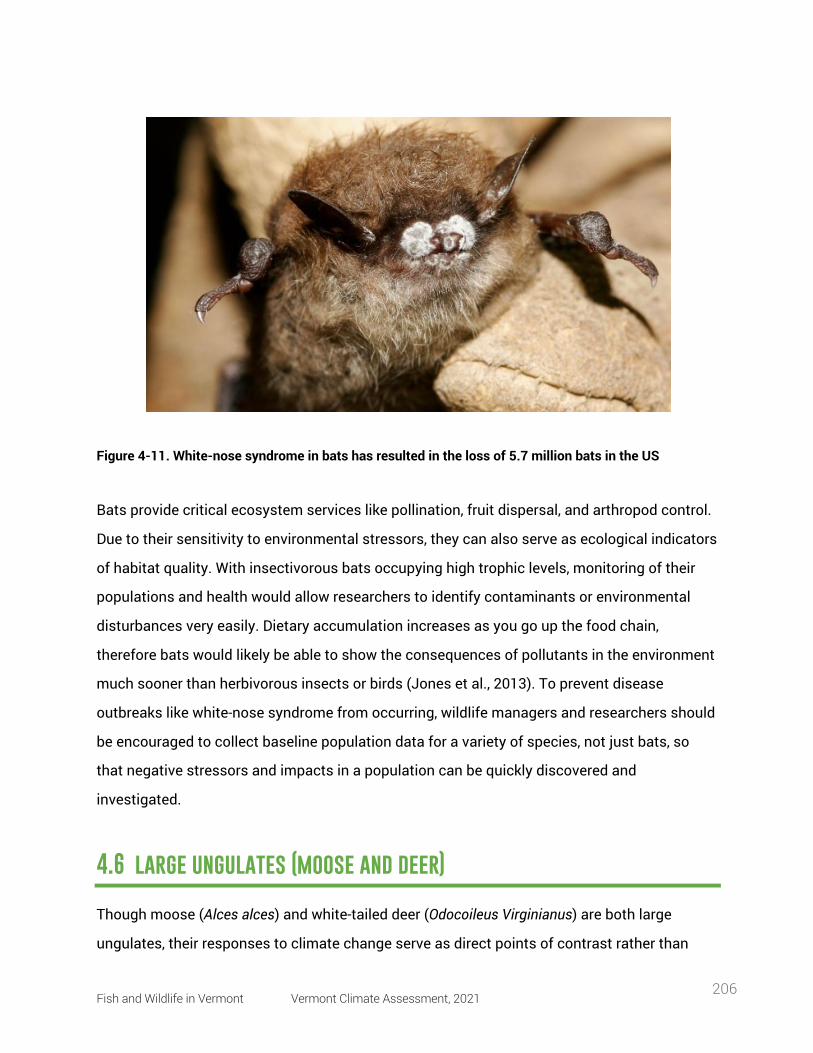
Fish and Wildlife in Vermont Vermont Climate Assessment, 2021 206
Figure 4-11. White-nose syndrome in bats has resulted in the loss of 5.7 million bats in the US
Bats provide critical ecosystem services like pollination, fruit dispersal, and arthropod control.
Due to their sensitivity to environmental stressors, they can also serve as ecological indicators
of habitat quality. With insectivorous bats occupying high trophic levels, monitoring of their
populations and health would allow researchers to identify contaminants or environmental
disturbances very easily. Dietary accumulation increases as you go up the food chain,
therefore bats would likely be able to show the consequences of pollutants in the environment
much sooner than herbivorous insects or birds (Jones et al., 2013). To prevent disease
outbreaks like white-nose syndrome from occurring, wildlife managers and researchers should
be encouraged to collect baseline population data for a variety of species, not just bats, so
that negative stressors and impacts in a population can be quickly discovered and
investigated.
4.6 large ungulates (moose and deer)
Though moose (Alces alces) and white-tailed deer (Odocoileus Virginianus) are both large
ungulates, their responses to climate change serve as direct points of contrast rather than
Fish and Wildlife in Vermont Vermont Climate Assessment, 2021 207
comparison. Moose are generally anticipated to become physiologically stressed in response
to warming temperature trends and deer have clear survival advantages due to the warmer
temperature and decreased snowpack. So, while not in direct competition, their population
trends do follow opposing directions in response to warming climate patterns.
White-tailed deer distribution and abundance are heavily affected by winter severity, which is
often measured by two variables, ambient temperature and snow depth (high confidence).
Winter snow depth can affect body conditions of deer and increase movement costs, primarily
affecting maternal body condition and reducing future reproductive success. Deer are often
reported to have a thermal tolerance close to 19.4°F (-7°C), below which begins the potential
for physiological and behavioral responses. Average annual winter temperatures are trending
to be greater than this thermal tolerance and extremes are changing—extremely cold days
(max. temperature <0°F) are decreasing and warm winter days (>50°F) are increasing (see
Climate Change in Vermont chapter). More variation within the winter season could bring
unexpected physiological or behavior changes (e.g., shedding, foraging). Snow depth affects
deer but can be a problematic measurement, as snow drifts skew measurements at particular
locations or times and can lead to inconsistencies. Snowfall, while not a perfect proxy for
snow depth, is a more accurate measure of snow, and has been decreasing for the last 60
years in Vermont (see Climate Change in Vermont chapter) but is greater than when
measurements began in the 1930s. As such, the near-term outlook is that snow, and therefore
snow depth, may not change substantially in the coming decades but could be seriously
reduced beyond 50 years in the future. These winter conditions can directly affect deer
populations through survival effects, as well as indirectly by impacting reproduction and
fecundity of females (Weiskopf et al., 2019)
Substantial evidence has been collected to indicate that increasing temperature conditions
and decreased winter severity leads to increased abundance of white-tailed deer; changes in
migratory behavior; altered foraging, habitat selection, or behavior; and a potential increase in
hemorrhagic disease outbreaks (Weiskopf et al., 2019). There are complexities to this situation
that should be considered. One example is the potential loss of hemlock trees, an important
thermal shelter for deer, due to warming winters and the invasion of the HWA. These changes
Fish and Wildlife in Vermont Vermont Climate Assessment, 2021 208
to forest composition could result in near-term difficulties for deer during this shifting
temperature regime (McClure, 1990).
Range shifts in deer may occur due to warming temperatures and as a result of climate-
induced habitat changes in the northern U.S. For example, oak species (Quercus spp.) are
predicted to increase in both range and abundance in some areas of Northern Wisconsin and
Upper Michigan, providing increased mast production that serves as high-energy food sources
for deer. This could encourage a steady shift in deer population northwards into previously
unsuitable habitats; however, deer can also browse oak heavily enough to limit the survival of
regenerating stands. There may be a cyclical dynamic between deer and oak abundance as
oak species try to shift northward.
In Vermont, hunting has always been a major component of human interaction with the
landscape. Annual harvests are tracked by the Vermont Fish and Wildlife Department. Deer
harvests across Vermont have been steadily increasing in the more northern region of
Vermont in the past few decades (Figure 4-11), although this could reflect either a change in
population or in hunter effort. Figures 4-12 and 4-13 represent mean deer harvests by town per
decade in a southern and northern county, respectively, illustrating an overarching pattern
where deer harvests are observed in increasing numbers northwards over time. Wildlife
managers should take these shifts into account when developing landscape management
plans, as well as the predicted boom in deer population as ambient winter temperature
increases per year. Increased hunting interest or success rates and higher bag limits are major
reasons for these observed spikes in harvest, which serve an important role in controlling the
population of deer and moose.
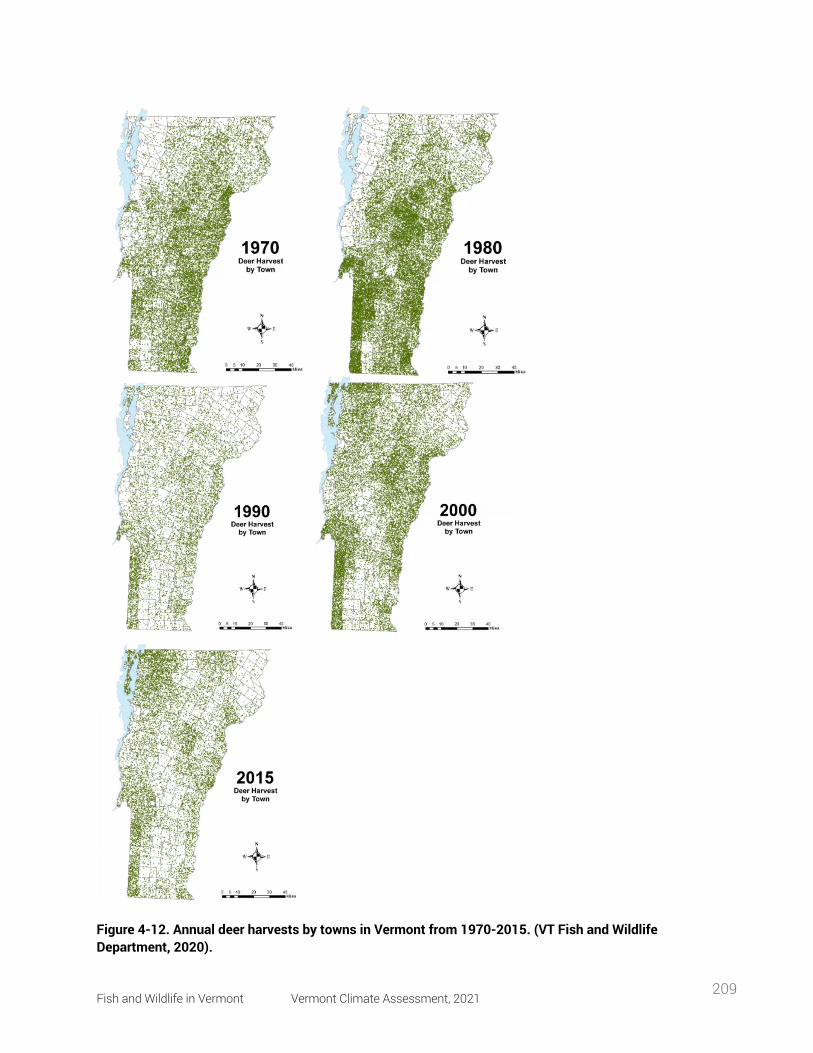
Fish and Wildlife in Vermont Vermont Climate Assessment, 2021 209
Figure 4-12. Annual deer harvests by towns in Vermont from 1970-2015. (VT Fish and Wildlife Department, 2020).
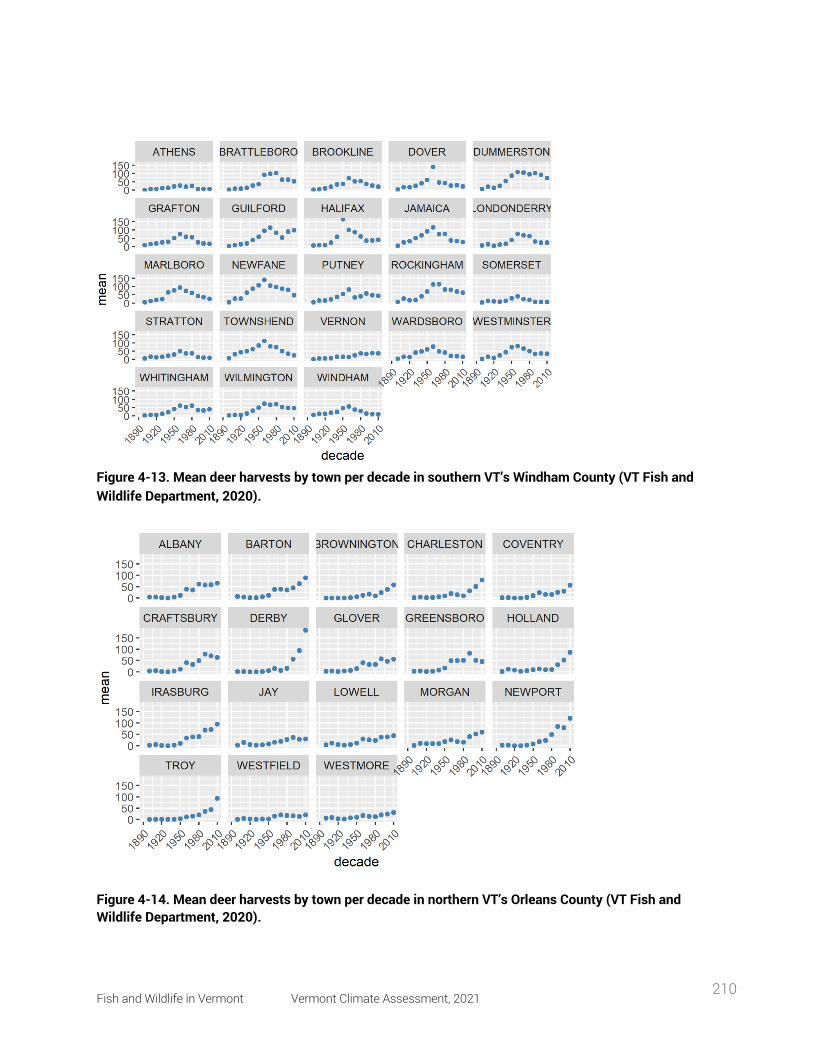
Fish and Wildlife in Vermont Vermont Climate Assessment, 2021 210
Figure 4-13. Mean deer harvests by town per decade in southern VT’s Windham County (VT Fish and Wildlife Department, 2020).
Figure 4-14. Mean deer harvests by town per decade in northern VT’s Orleans County (VT Fish and Wildlife Department, 2020).
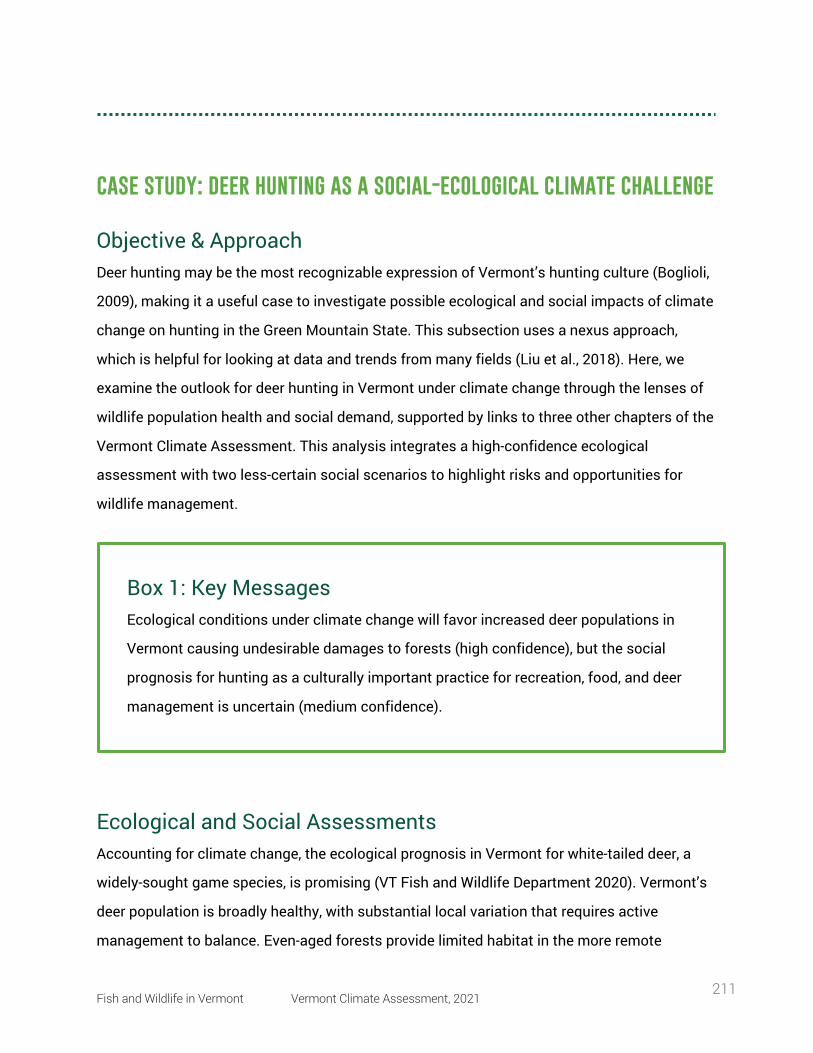
Fish and Wildlife in Vermont Vermont Climate Assessment, 2021 211
case study: deer hunting as a social-ecological climate challenge
Objective & Approach Deer hunting may be the most recognizable expression of Vermont’s hunting culture (Boglioli,
2009), making it a useful case to investigate possible ecological and social impacts of climate
change on hunting in the Green Mountain State. This subsection uses a nexus approach,
which is helpful for looking at data and trends from many fields (Liu et al., 2018). Here, we
examine the outlook for deer hunting in Vermont under climate change through the lenses of
wildlife population health and social demand, supported by links to three other chapters of the
Vermont Climate Assessment. This analysis integrates a high-confidence ecological
assessment with two less-certain social scenarios to highlight risks and opportunities for
wildlife management.
Ecological and Social Assessments Accounting for climate change, the ecological prognosis in Vermont for white-tailed deer, a
widely-sought game species, is promising (VT Fish and Wildlife Department 2020). Vermont’s
deer population is broadly healthy, with substantial local variation that requires active
management to balance. Even-aged forests provide limited habitat in the more remote
Box 1: Key Messages Ecological conditions under climate change will favor increased deer populations in
Vermont causing undesirable damages to forests (high confidence), but the social
prognosis for hunting as a culturally important practice for recreation, food, and deer
management is uncertain (medium confidence).
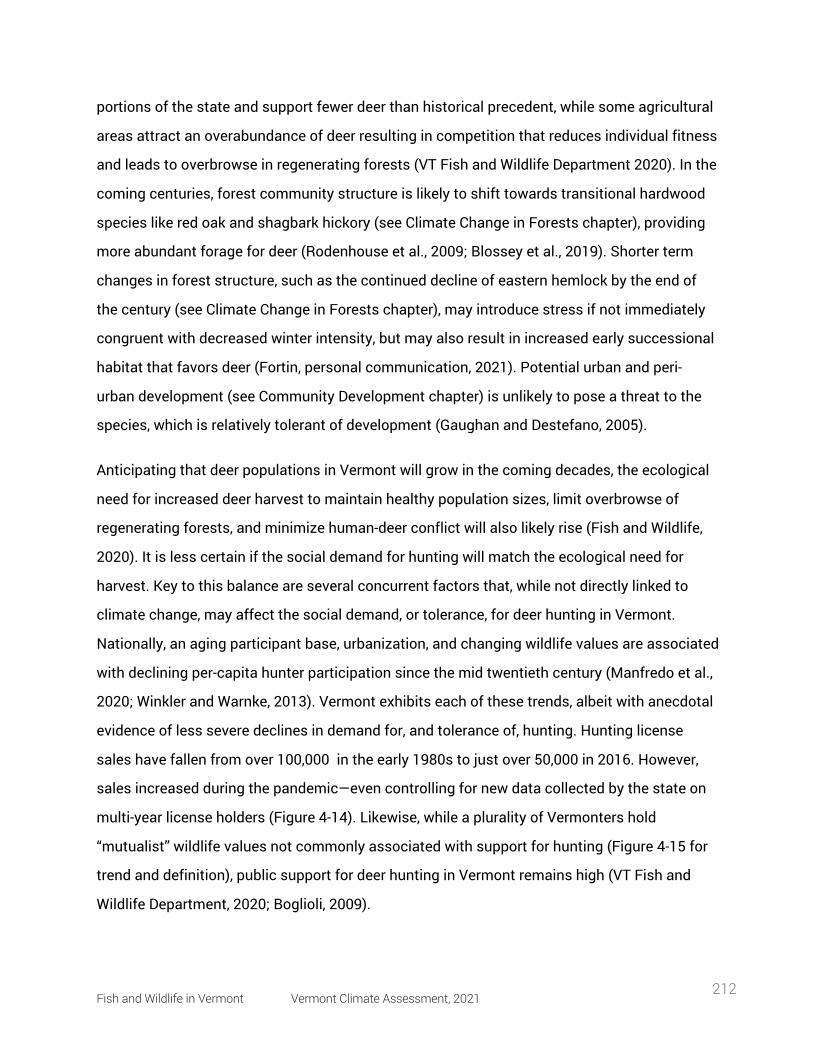
Fish and Wildlife in Vermont Vermont Climate Assessment, 2021 212
portions of the state and support fewer deer than historical precedent, while some agricultural
areas attract an overabundance of deer resulting in competition that reduces individual fitness
and leads to overbrowse in regenerating forests (VT Fish and Wildlife Department 2020). In the
coming centuries, forest community structure is likely to shift towards transitional hardwood
species like red oak and shagbark hickory (see Climate Change in Forests chapter), providing
more abundant forage for deer (Rodenhouse et al., 2009; Blossey et al., 2019). Shorter term
changes in forest structure, such as the continued decline of eastern hemlock by the end of
the century (see Climate Change in Forests chapter), may introduce stress if not immediately
congruent with decreased winter intensity, but may also result in increased early successional
habitat that favors deer (Fortin, personal communication, 2021). Potential urban and peri-
urban development (see Community Development chapter) is unlikely to pose a threat to the
species, which is relatively tolerant of development (Gaughan and Destefano, 2005).
Anticipating that deer populations in Vermont will grow in the coming decades, the ecological
need for increased deer harvest to maintain healthy population sizes, limit overbrowse of
regenerating forests, and minimize human-deer conflict will also likely rise (Fish and Wildlife,
2020). It is less certain if the social demand for hunting will match the ecological need for
harvest. Key to this balance are several concurrent factors that, while not directly linked to
climate change, may affect the social demand, or tolerance, for deer hunting in Vermont.
Nationally, an aging participant base, urbanization, and changing wildlife values are associated
with declining per-capita hunter participation since the mid twentieth century (Manfredo et al.,
2020; Winkler and Warnke, 2013). Vermont exhibits each of these trends, albeit with anecdotal
evidence of less severe declines in demand for, and tolerance of, hunting. Hunting license
sales have fallen from over 100,000 in the early 1980s to just over 50,000 in 2016. However,
sales increased during the pandemic—even controlling for new data collected by the state on
multi-year license holders (Figure 4-14). Likewise, while a plurality of Vermonters hold
“mutualist” wildlife values not commonly associated with support for hunting (Figure 4-15 for
trend and definition), public support for deer hunting in Vermont remains high (VT Fish and
Wildlife Department, 2020; Boglioli, 2009).
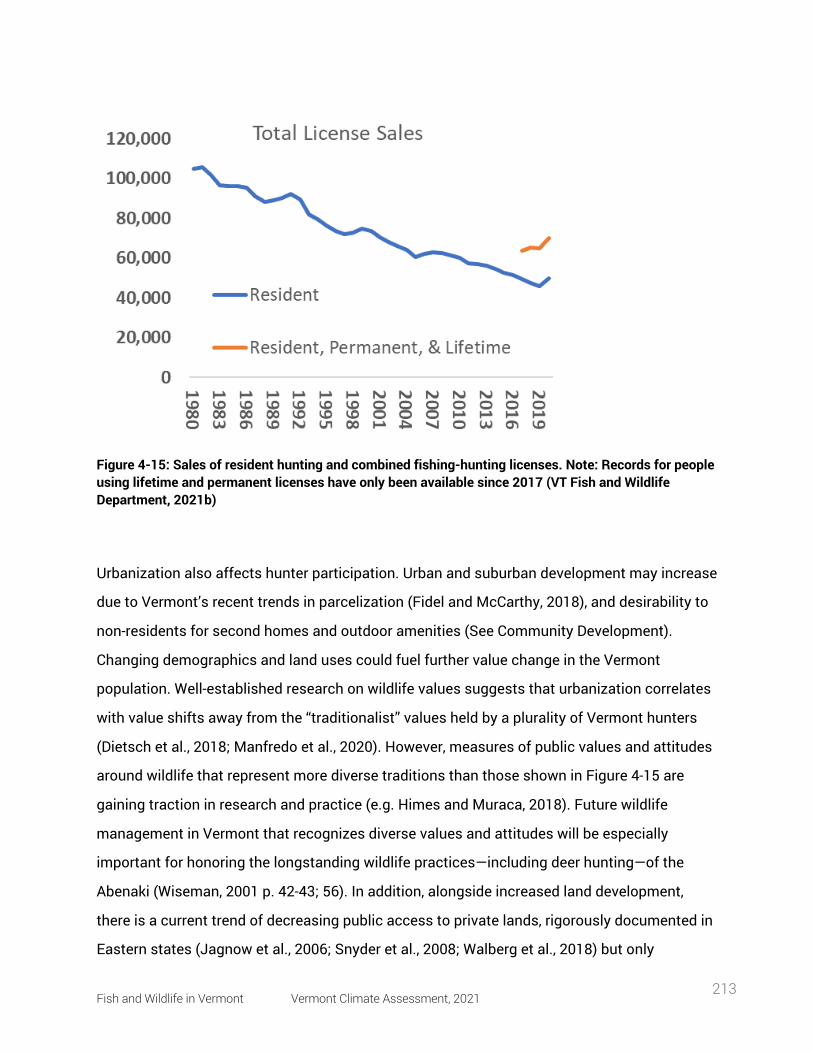
Fish and Wildlife in Vermont Vermont Climate Assessment, 2021 213
Figure 4-15: Sales of resident hunting and combined fishing-hunting licenses. Note: Records for people using lifetime and permanent licenses have only been available since 2017 (VT Fish and Wildlife Department, 2021b)
Urbanization also affects hunter participation. Urban and suburban development may increase
due to Vermont’s recent trends in parcelization (Fidel and McCarthy, 2018), and desirability to
non-residents for second homes and outdoor amenities (See Community Development).
Changing demographics and land uses could fuel further value change in the Vermont
population. Well-established research on wildlife values suggests that urbanization correlates
with value shifts away from the “traditionalist” values held by a plurality of Vermont hunters
(Dietsch et al., 2018; Manfredo et al., 2020). However, measures of public values and attitudes
around wildlife that represent more diverse traditions than those shown in Figure 4-15 are
gaining traction in research and practice (e.g. Himes and Muraca, 2018). Future wildlife
management in Vermont that recognizes diverse values and attitudes will be especially
important for honoring the longstanding wildlife practices—including deer hunting—of the
Abenaki (Wiseman, 2001 p. 42-43; 56). In addition, alongside increased land development,
there is a current trend of decreasing public access to private lands, rigorously documented in
Eastern states (Jagnow et al., 2006; Snyder et al., 2008; Walberg et al., 2018) but only
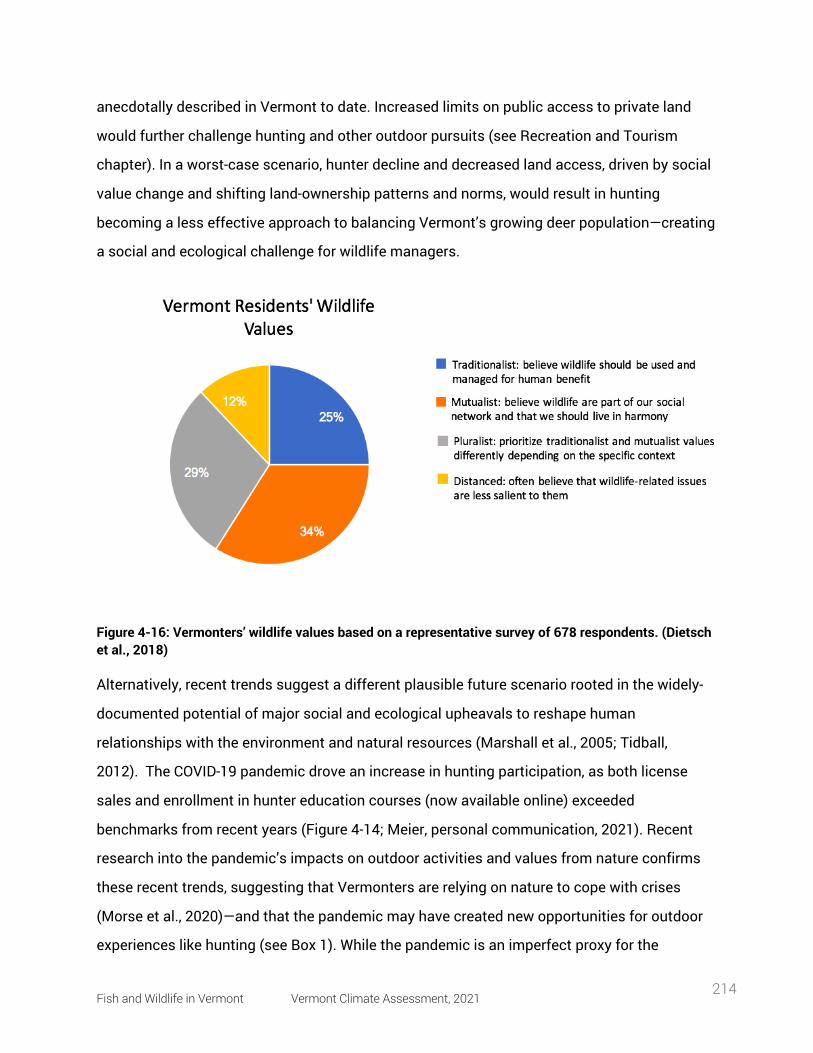
Fish and Wildlife in Vermont Vermont Climate Assessment, 2021 214
anecdotally described in Vermont to date. Increased limits on public access to private land
would further challenge hunting and other outdoor pursuits (see Recreation and Tourism
chapter). In a worst-case scenario, hunter decline and decreased land access, driven by social
value change and shifting land-ownership patterns and norms, would result in hunting
becoming a less effective approach to balancing Vermont’s growing deer population—creating
a social and ecological challenge for wildlife managers.
Figure 4-16: Vermonters’ wildlife values based on a representative survey of 678 respondents. (Dietsch et al., 2018)
Alternatively, recent trends suggest a different plausible future scenario rooted in the widely-
documented potential of major social and ecological upheavals to reshape human
relationships with the environment and natural resources (Marshall et al., 2005; Tidball,
2012). The COVID-19 pandemic drove an increase in hunting participation, as both license
sales and enrollment in hunter education courses (now available online) exceeded
benchmarks from recent years (Figure 4-14; Meier, personal communication, 2021). Recent
research into the pandemic’s impacts on outdoor activities and values from nature confirms
these recent trends, suggesting that Vermonters are relying on nature to cope with crises
(Morse et al., 2020)—and that the pandemic may have created new opportunities for outdoor
experiences like hunting (see Box 1). While the pandemic is an imperfect proxy for the
Fish and Wildlife in Vermont Vermont Climate Assessment, 2021 215
sustained social changes brought by climate change, it does illustrate the possibility of
resurgent social demand for hunting, consistent with the literature of nature engagement in
response to upheaval (Tidball, 2012). Maintaining this momentum as the pandemic recedes,
and nurturing it in the face of future upheavals, will require a multi-pronged effort tapping into
both traditional and emerging veins of public support for, and interest in, hunting. The Vermont
Land Trust’s efforts to include access for hunting on conservation easements and Vermont
Fish and Wildlife’s “Wild Kitchen” programming, which connects diverse hunting and locavore
communities, are examples of two such initiatives (VT Fish and Wildlife Department, 2021a;
Slayton, 2019). Emerging research suggests pathways to augment this work. Future efforts
could engage with rapidly emerging affinity groups in the hunting community—through
organizations like Hunters of Color, Artemis Sportswomen, and Backcountry Hunters and
Anglers—and university students to connect new hunters with land and resources and could
continue to tie into Vermont’s strong local food ethic to appeal to these stakeholders (Vayer et
al., 2021). With proactive engagement, a best-case scenario could match a growing deer
population with sustained or increased social demand for hunting.
Box 2: New Hunters, the Pandemic, and Cultural Relevance “I grew up accompanying my dad hunting occasionally, but lost that connection when he
died when I was twenty. I have been interested for a number of years, especially thinking
about connection to land and the animals we eat, but felt there were just enough barriers
to keep me from getting (re)started. This past fall was when I first started hunting in
earnest. Thinking about it, a number of things coincided at the right time to make it
possible for me to get over the hump. Crossbows being allowed for all hunters, hunters
safety courses being online, having access to land, having lots of time because of the
pandemic, and having friends to help me get through the myriad questions one needs
answered to just get started. Certainly, I don't think I would be hunting if not for the
pandemic. I ended up spending a good part of last year in a rural place and with lots of
Fish and Wildlife in Vermont Vermont Climate Assessment, 2021 216
Synthesis This case study finds potential to meet the ecological challenge of an expanding deer herd
under climate change with increased hunter participation. However, this best case outcome is
not set in stone. Active effort will likely be required to support and sustain any new social
demand for hunting that arises in response to future crises. Absent a proactive approach to
both the ecological challenges facing—and social dimension affecting—Vermont’s deer herd
and hunting culture, a misalignment between deer population and social demand for hunting
could occur if value change and shifting patterns of land ownership and access are
exacerbated by climate change. With this in mind, sustaining deer hunting in Vermont during
an era of climate change will require collaborative engagement from ecologists, social
scientists, community planners, and a wide variety of stakeholders.
4.7 aquatic species
As global mean temperature continues to increase annually, subsequent warming of water
bodies will also have a profound impact on the ecosystem. As aquatic species are exposed to
time on my hands, and so was able to give foraging, fishing, and hunting the many hundreds
of hours needed to start. During deer season in October and November, I felt I was able to
catch up on the many hours of 'five years hunting with a dad' that some hunters are lucky to
receive.”
-Kristian Brevik (33), Burlington Vermont
Fish and Wildlife in Vermont Vermont Climate Assessment, 2021 217
new thermal habitats, community structures and trait distributions may see radical reshuffling
as organisms respond to warming climates.
4.7.1 Riverine and Stream Ecosystems Warming climate trends will have a variety of effects on physical aspects of riverine systems,
with major consequences to organisms living in the system (Ficke et al., 2007). Increased
water temperature reduces the amount of available oxygen in the system, potentially leading
to the creation of hypoxic/anoxic zones where there is very little oxygen in the water, often
causing health issues and mortality in aquatic species living there. Common fish species such
as trout and salmon, and warm-water fish like smallmouth bass rely on groundwater
discharges for cooler refuges during summer seasons. These refugia will decrease in
availability as groundwater temperature is expected to increase over time (Ficke et al.,
2007). Rivers will also see changes to the timing and amount of precipitation seen throughout
the year. Warming temperatures will likely lead to reduced snowpack—decreasing spring flows
and negatively affecting fish species. Increased temperature may also lead to increased
toxicity of pollutants in the system, as common pollutants such as heavy metals and
organophosphates become more toxic with rising temperatures.
Within riverine systems, many species of freshwater fish are expected to migrate due to shifts
in water temperature. These migrations will result in compositional shifts and loss of
ecosystem services, as freshwater fish communities shift from cold-water species to more
warm-water species. Fluctuations in ambient water temperature may also result in shifts in
seasonal flow and potential changes to growth rates of aquatic species (Xu et al., 2010).
Biswas et al. found that freshwater lake communities in Ontario, Canada, are predicted to see
an increase in species richness of 60-81% due to this migration, but a subsequent decline in
functional diversity. Jones et al. also made similar predictions, finding that in the US on a
national level, current climate projections and increased air temperature will lead to increased
water temperature, rendering some fish habitats unsuitable for native species. As cold-water
fish species such as trout are more susceptible to changes in thermal habitats, the loss of
available cold-water fish habitats may result in considerable economic loss. This would have
Fish and Wildlife in Vermont Vermont Climate Assessment, 2021 218
dramatic impacts on the present distribution of sport and commercially valuable fish and
cause considerable losses in commercial and recreational fisheries.
Fish Passage and Ecological Connectivity
Similar to terrestrial animals, fish are heavily reliant on their physical landscape and
connectivity in order to migrate, move through different environments at different life stages,
and take advantage of multiple habitat types. Habitat fragmentation is a key issue that has
widespread impacts on fish, such as salmonids like the Eastern brook trout, and overall
aquatic diversity (Hudy et al., 2008). Infrastructure such as roads and dams have severely
hampered the mobility of aquatic species, and current road-stream crossing designs have
proven ineffective in most cases. Heller (2007) has demonstrated that in many water bodies of
the US, over half to two thirds of current road-stream crossings serve as a form of barrier for
fish migrating and for fish seeking cold refugia during hot spells. During flooding and storm
events, road-stream crossings and culverts are particularly susceptible to damming as the
floodwater may exceed capacity and clog it with debris and sediment. Climate change is
already affecting not only water temperatures but also frequency of abnormal weather events
such as heavy rainfall events (see Climate Change in Vermont chapter) and increased stream-
flows (see Water Resources chapter). As Vermont’s annual precipitation has been increasing
by 7.5 inches since the 1900s, precipitation across all seasons is expected to increase and put
strain on the infrastructure, creating more issues for wildlife expected to utilize them (see
Climate Change in Vermont chapter).
Brook Trout
Brook trout (Salvelinus fontinalis), Vermont’s state fish, are an important component of
Vermont’s aquatic fisheries—they make up a large portion of Vermont’s cold-water fishery
resources, along with brown and rainbow trout. Together these three species are the most
popular fish for open water anglers (Responsive Management 2021); although Vermont
anglers have reported less time is spent on brook trout fishing than in previous decades,
declining from 79% of anglers in 1990, to 67% in 2010 and a statistically significant decrease
to 58% in 2020 (Responsive Management 2021).
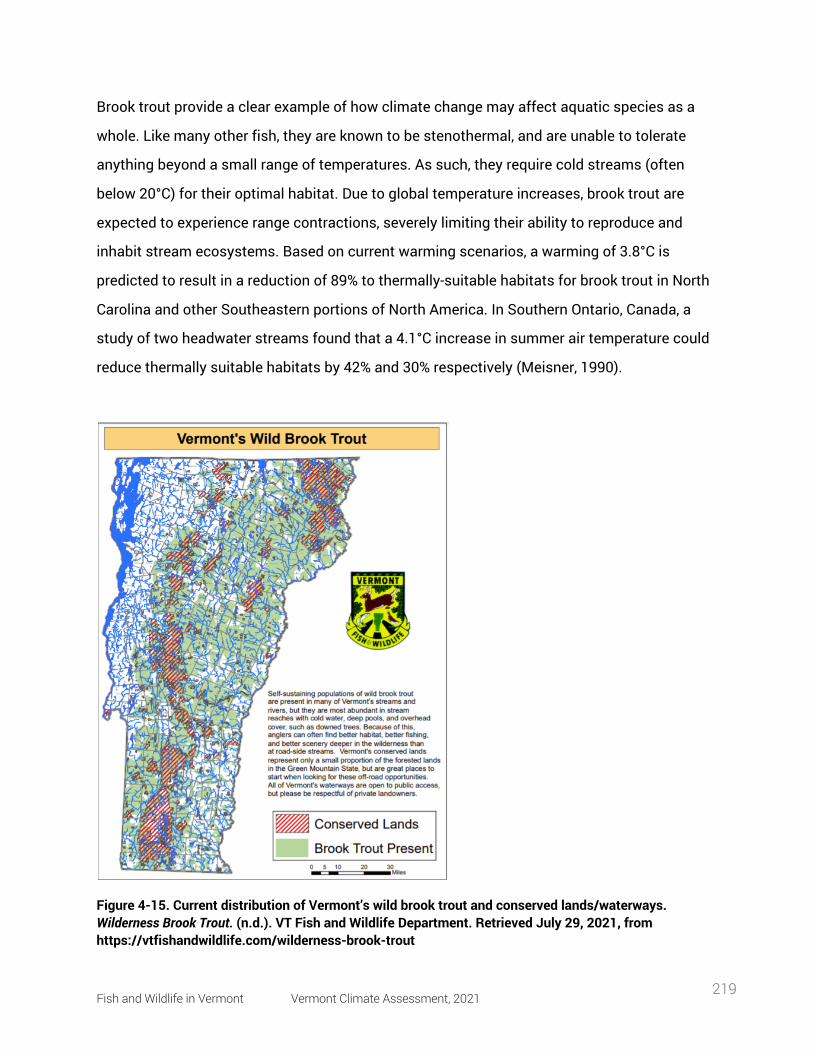
Fish and Wildlife in Vermont Vermont Climate Assessment, 2021 219
Brook trout provide a clear example of how climate change may affect aquatic species as a
whole. Like many other fish, they are known to be stenothermal, and are unable to tolerate
anything beyond a small range of temperatures. As such, they require cold streams (often
below 20°C) for their optimal habitat. Due to global temperature increases, brook trout are
expected to experience range contractions, severely limiting their ability to reproduce and
inhabit stream ecosystems. Based on current warming scenarios, a warming of 3.8°C is
predicted to result in a reduction of 89% to thermally-suitable habitats for brook trout in North
Carolina and other Southeastern portions of North America. In Southern Ontario, Canada, a
study of two headwater streams found that a 4.1°C increase in summer air temperature could
reduce thermally suitable habitats by 42% and 30% respectively (Meisner, 1990).
Figure 4-15. Current distribution of Vermont’s wild brook trout and conserved lands/waterways. Wilderness Brook Trout. (n.d.). VT Fish and Wildlife Department. Retrieved July 29, 2021, from https://vtfishandwildlife.com/wilderness-brook-trout
Fish and Wildlife in Vermont Vermont Climate Assessment, 2021 220
4.7.2 Lake Systems Climate Change impacts on algal blooms (HABs)
Lake ecosystems are an attractive environment for both humans and wildlife, with many of
Vermont’s lakes serving important biological functions for nesting birds and aquatic species
that live there, as well as offering recreational and economic benefits for humans. The
projected changes to water and air temperature raise concerns about the general health of the
lake ecosystem and possible consequences that wildlife and landscape managers should be
aware of.
One of the main climate change concerns is eutrophication and the health of water bodies in
Vermont. Eutrophication is the process where water bodies become heavily enriched with
nutrients (e.g., nitrogen, phosphorus) that feed plant and algae material in the water. The
nutrients typically come from human activities, such as excess urban and agricultural runoff.
The enrichment of nutrients causes increased macrophyte and algal growth. Increases in
macrophytes can stimulate algal blooms that lay on the water surface, blocking sunlight and
limiting the growth potential of underwater plants while also being a nuisance for many lake-
goers. Once these algal blooms die, they are decomposed by bacteria that use up the available
dissolved oxygen within the water. This leads to more hypoxic and anoxic zones where
dissolved oxygen levels are so low and unsuitable for fish habitability that it can even lead to
mortality (with large incidents of mortality known as fish kills). In temperate lakes, this shift
towards eutrophic systems can often result in the extirpation of economically important
species such as salmonids in favor of small species like cyprinids and gizzard shad. (Jones et
al., 2013). These have little to no economic value from a fisheries perspective, and would want
to be avoided at all cost by fishery managers.
Climate change is predicted to play a larger role over time as increased temperatures will
result in lower stream flows—increasing residence times of water and reducing the flushing of
nutrients from the water, which increases trophic statuses. This uptick in nutrients and
minerals often leads to the presence of algal blooms; these blooms are not only a visible
nuisance for humans, but can also result in harmful ecological effects.
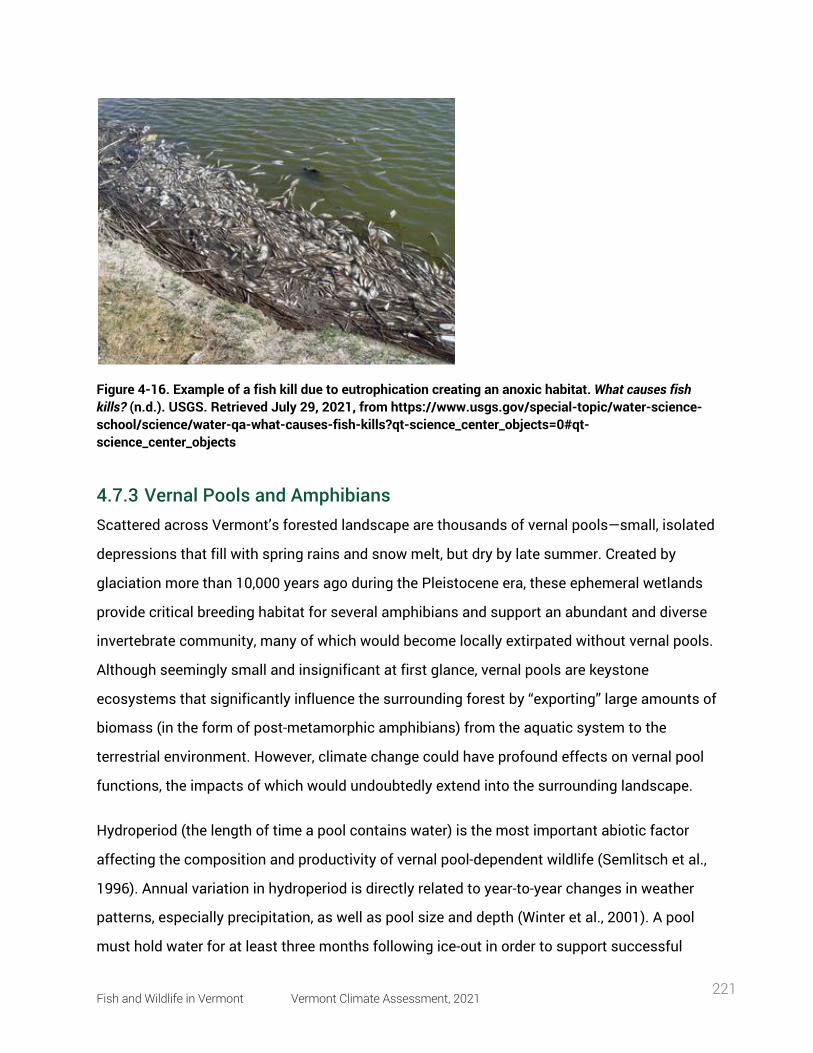
Fish and Wildlife in Vermont Vermont Climate Assessment, 2021 221
Figure 4-16. Example of a fish kill due to eutrophication creating an anoxic habitat. What causes fish kills? (n.d.). USGS. Retrieved July 29, 2021, from https://www.usgs.gov/special-topic/water-science-school/science/water-qa-what-causes-fish-kills?qt-science_center_objects=0#qt-science_center_objects
4.7.3 Vernal Pools and Amphibians Scattered across Vermont’s forested landscape are thousands of vernal pools—small, isolated
depressions that fill with spring rains and snow melt, but dry by late summer. Created by
glaciation more than 10,000 years ago during the Pleistocene era, these ephemeral wetlands
provide critical breeding habitat for several amphibians and support an abundant and diverse
invertebrate community, many of which would become locally extirpated without vernal pools.
Although seemingly small and insignificant at first glance, vernal pools are keystone
ecosystems that significantly influence the surrounding forest by “exporting” large amounts of
biomass (in the form of post-metamorphic amphibians) from the aquatic system to the
terrestrial environment. However, climate change could have profound effects on vernal pool
functions, the impacts of which would undoubtedly extend into the surrounding landscape.
Hydroperiod (the length of time a pool contains water) is the most important abiotic factor
affecting the composition and productivity of vernal pool-dependent wildlife (Semlitsch et al.,
1996). Annual variation in hydroperiod is directly related to year-to-year changes in weather
patterns, especially precipitation, as well as pool size and depth (Winter et al., 2001). A pool
must hold water for at least three months following ice-out in order to support successful
Fish and Wildlife in Vermont Vermont Climate Assessment, 2021 222
breeding of wood frog (Lithobates sylvaticus) and four months to support successful breeding
of mole salamanders (Ambystoma spp.) (Brooks, 2004). At the same time, a pool must dry
occasionally to exclude fish populations that could predate on these larval amphibians that
evolved in fishless environments. Under current climate change scenarios of earlier and
stronger evapotranspiration during the growing season, combined with frequent droughts and
shifts in the timing of precipitation, it is likely that many pools will dry earlier and remain dry
longer, resulting in an increase in the frequency of pool-breeding amphibian reproductive
failures. While these species are well-adapted to a “boom-bust” cycle of recruitment, where
partial or complete reproductive failures are offset by large cohorts in “boom” years, an
increase in the frequency of “bust” years could limit the viability of many populations.
In Vermont, the majority (90%) of pools studied were less than ¼-acre in size and shallower
than 2-feet in depth (Faccio et al., 2013). These small, shallow, abundant pools would be
disproportionately affected by climate-induced changes to hydroperiod, resulting in the
increased isolation of the larger, remaining pools that could serve as hydrologic refugia
(Cartwright et al. 2021). Such isolation would affect the ability of juvenile amphibians to
disperse between pools, impact genetic connectivity of populations, and limit the
recolonization of pools where breeding populations have been extirpated—all of which are
critical to the long-term viability of metapopulations.
Pool-breeding salamanders in the genus Ambystoma, including spotted, Jefferson, and blue-
spotted, are fossorial outside of the brief egg-laying period in spring. Although it would seem
that spending most of their lives underground would buffer them from the effects of climate
change, a recent study in Ontario showed that body condition of spotted salamanders declined
over a 12-year monitoring period (2008–2019) due, at least in-part, to increased summer and
autumn temperatures (Moldowan et al. 2021).
Additionally, a reduction in snowpack could lead to increased winter mortality of several
species of frogs, including wood frog, spring peeper (Pseudacris crucifer), and grey treefrog
(Hyla versicolor). All three species hibernate just below the leaf litter on the forest floor. As the
temperature drops below freezing, they flood their bloodstream with glucose—which serves as
Fish and Wildlife in Vermont Vermont Climate Assessment, 2021 223
an antifreeze to protect their cells from damage, even while the frogs freeze solid and their
hearts stop beating. However, the glucose only provides protection down to about 20°F, so
they are completely reliant on an insulating blanket of snow to keep them alive on frigid winter
nights (O’Connor and Rittenhouse, 2016).
Building Resilience
From a landscape perspective, Vermont is particularly focused on maintaining ecological
functions and connectivity within its forests and waters, with many conservation biologists
and landscape ecologists agreeing that development of a resilient ecosystem network can
alleviate the effects of habitat fragmentation and climate change. In the face of rapid climate
change, populations of species will likely shift their geographic ranges to landscapes with the
least amount of habitat fragmentation. In order to develop a more resilient network, landscape
management strategies such as development of wildlife corridors and riparian zones near
water bodies are currently being maintained and introduced to Vermont’s ecosystems
(Interview with Robert Zaino of VT Fish and Wildlife Department-Interviewed by George Ni,
11/3/2020).
4.8 traceable accounts
Traceable accounts describe the confidence level—the degree of certainty in the scientific
evidence—for each key message resulting from this chapter. This analysis is based on the U.S.
Global Change Research Program guidance in the Fourth National Climate Assessment
(USGCRP, 2018).
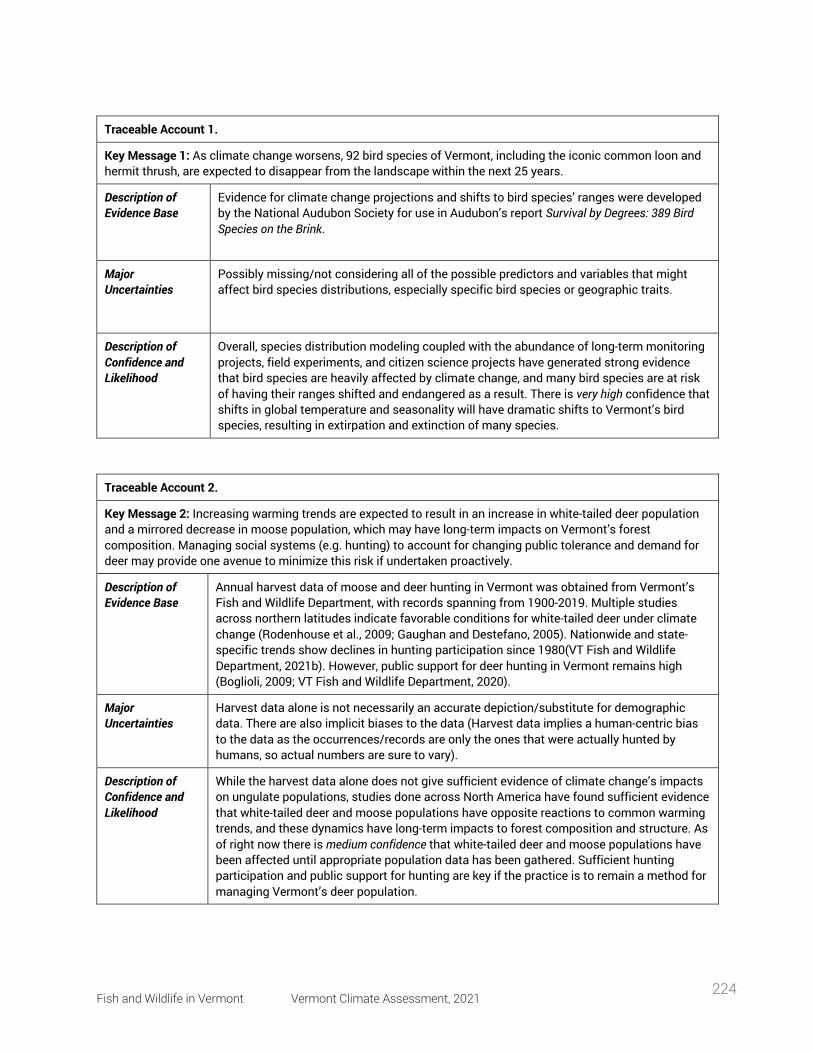
Fish and Wildlife in Vermont Vermont Climate Assessment, 2021 224
Traceable Account 1.
Key Message 1: As climate change worsens, 92 bird species of Vermont, including the iconic common loon and hermit thrush, are expected to disappear from the landscape within the next 25 years.
Description of Evidence Base
Evidence for climate change projections and shifts to bird species’ ranges were developed by the National Audubon Society for use in Audubon’s report Survival by Degrees: 389 Bird Species on the Brink.
Major Uncertainties
Possibly missing/not considering all of the possible predictors and variables that might affect bird species distributions, especially specific bird species or geographic traits.
Description of Confidence and Likelihood
Overall, species distribution modeling coupled with the abundance of long-term monitoring projects, field experiments, and citizen science projects have generated strong evidence that bird species are heavily affected by climate change, and many bird species are at risk of having their ranges shifted and endangered as a result. There is very high confidence that shifts in global temperature and seasonality will have dramatic shifts to Vermont’s bird species, resulting in extirpation and extinction of many species.
Traceable Account 2.
Key Message 2: Increasing warming trends are expected to result in an increase in white-tailed deer population and a mirrored decrease in moose population, which may have long-term impacts on Vermont’s forest composition. Managing social systems (e.g. hunting) to account for changing public tolerance and demand for deer may provide one avenue to minimize this risk if undertaken proactively.
Description of Evidence Base
Annual harvest data of moose and deer hunting in Vermont was obtained from Vermont’s Fish and Wildlife Department, with records spanning from 1900-2019. Multiple studies across northern latitudes indicate favorable conditions for white-tailed deer under climate change (Rodenhouse et al., 2009; Gaughan and Destefano, 2005). Nationwide and state-specific trends show declines in hunting participation since 1980(VT Fish and Wildlife Department, 2021b). However, public support for deer hunting in Vermont remains high (Boglioli, 2009; VT Fish and Wildlife Department, 2020).
Major Uncertainties
Harvest data alone is not necessarily an accurate depiction/substitute for demographic data. There are also implicit biases to the data (Harvest data implies a human-centric bias to the data as the occurrences/records are only the ones that were actually hunted by humans, so actual numbers are sure to vary).
Description of Confidence and Likelihood
While the harvest data alone does not give sufficient evidence of climate change’s impacts on ungulate populations, studies done across North America have found sufficient evidence that white-tailed deer and moose populations have opposite reactions to common warming trends, and these dynamics have long-term impacts to forest composition and structure. As of right now there is medium confidence that white-tailed deer and moose populations have been affected until appropriate population data has been gathered. Sufficient hunting participation and public support for hunting are key if the practice is to remain a method for managing Vermont’s deer population.

Fish and Wildlife in Vermont Vermont Climate Assessment, 2021 225
Traceable Account 3.
Key Message 3: As warming trends reduce the severity of winters, the subsequent warming waters will have adverse effects on lake and river systems, including increased risk for harmful algal blooms (HABs) and reduced overall biodiversity and health in lake ecosystems.
Description of Evidence Base
Evidence of warming lake temperatures come from numerous studies on Lake Champlain and other water bodies that have been conducted on climate change’s impacts on aquatic ecosystems and limnology (Smetzer, 2012; Kaushal, 2012).
Major Uncertainties
Trends and annual water temperatures of Vermont’s lakes and rivers are consistent and monitored through both government agencies and citizen science efforts. The full impact of these trends on overall aquatic health is unclear, as the creation of HABs is only partially affected by the annual water temperature.
Description of Confidence and Likelihood
Current efforts to monitor HABs in Vermont’s lakes (Lake Champlain Basin Program) are keeping vigilant watch and recording data. There is high confidence that warming trends will result in overall increases in summer surface water temperatures, as well as increased precipitation and runoff events. According to the available research on HABs, it is possible that HABs may increase in frequency and intensity due to the flushing of nutrients into Vermont’s waterways as well as increases in water temperature.
4.9 references
Adams, R., & Hayes, M. (2021). The Importance of Water Availability to Bats: Climate Warming and
Increasing Global Aridity (pp. 105–120). https://doi.org/10.1007/978-3-030-54727-1_7
Austin, B. C., & McKinley, D. (n.d.). Benefits of Stream Simulation Designed Road-Stream Crossings beyond Aquatic Organism Passage. 29.
Austin, J. (n.d.). Fish and Wildlife Conservation and Climate Change Adaptation in Vermont. 7.
Baldigo, B. P., Lawrence, G. B., Bode, R. W., Simonin, H. A., Roy, K. M., & Smith, A. J. (2009). Impacts of acidification on macroinvertebrate communities in streams of the western Adirondack Mountains, New York, USA. In Ecological Indicators (Vol. 9, Issue 2, p. 14). https://doi.org/10.1016/j.ecolind.2008.04.004
Bartomeus, I., Ascher, J. S., Wagner, D., Danforth, B. N., Colla, S., Kornbluth, S., & Winfree, R. (2011). Climate-associated phenological advances in bee pollinators and bee-pollinated plants. Proceedings of the National Academy of Sciences, 108(51), 20645–20649. https://doi.org/10.1073/pnas.1115559108
Bartomeus, I., Park, M. G., Gibbs, J., Danforth, B. N., Lakso, A. N., & Winfree, R. (2013). Biodiversity ensures plant-pollinator phenological synchrony against climate change. Ecology Letters, 16(11), 1331–1338. https://doi.org/10.1111/ele.12170
Fish and Wildlife in Vermont Vermont Climate Assessment, 2021 226
Bateman, B. L., Wilsey, C., Taylor, L., Wu, J., LeBaron, G. S., & Langham, G. (2020). North American birds require mitigation and adaptation to reduce vulnerability to climate change. Conservation Science and Practice, 2(8), e242. https://doi.org/10.1111/csp2.242
Bee_Basics_North_American_Bee_ID.pdf. (n.d.). Retrieved July 7, 2021, from https://efotg.sc.egov.usda.gov/references/public/SC/Bee_Basics_North_American_Bee_ID.pdf
Betts, A. K. (2011). Vermont Climate Change Indicators. Weather, Climate, and Society, 3(2), 106–115. https://doi.org/10.1175/2011WCAS1096.1
Bianchini, K., Tozer, D. C., Alvo, R., Bhavsar, S. P., & Mallory, M. (2020). Drivers of declines in common loon (Gavia immer) productivity in Ontario, Canada. The Science of the Total Environment. https://doi.org/10.1016/j.scitotenv.2020.139724
Biswas, S. R., Vogt, R. J., & Sharma, S. (2017). Projected compositional shifts and loss of ecosystem services in freshwater fish communities under climate change scenarios. Hydrobiologia, 799(1), 135–149. https://doi.org/10.1007/s10750-017-3208-1
Block, K., Molyneaux, R., Gibbs, L., Alkemade, N., Baker, E., MacDougall, C., Ireton, G., & Forbes, D. (2019). The role of the natural environment in disaster recovery: “We live here because we love the bush.” Health & Place, 57, 61–69. https://doi.org/10.1016/j.healthplace.2019.03.007
Blossey, B., Curtis, P., Boulanger, J., & Dávalos, A. (2019). Red oak seedlings as indicators of deer browse pressure: Gauging the outcome of different white-tailed deer management approaches. Ecology and Evolution, 9(23), 13085–13103. https://doi.org/10.1002/ece3.5729
Boglioli, M. (2009). A Matter of Life and Death: Hunting in Contemporary Vermont. Univ of Massachusetts Press.
Brittain, J. E. (2008). Mayflies, Biodiversity and Climate Change. In F. R.Hauer & A. Welch (Eds.), International Advances in the Ecology, Zoogeography, and Systematics of Mayflies and Stoneflies (pp. 1–14). University of California Press. https://doi.org/10.1525/california/9780520098688.003.0001
Brook-Trout-Conserved-Lands-Map.pdf. (n.d.). Retrieved July 29, 2021, from https://vtfishandwildlife.com/sites/fishandwildlife/files/documents/Fish/Brook-Trout-Conserved-Lands-Map.pdf
Bumble bee ( Bombus ) distribution and diversity in Vermont, USA: a century of change | SpringerLink. (n.d.). Retrieved July 7, 2021, from https://link.springer.com/article/10.1007%2Fs10841-018-0113-5
Cadieux, P., Boulanger, Y., Cyr, D., Taylor, A. R., Price, D. T., & Tremblay, J. A. (2019). Spatially explicit climate change projections for the recovery planning of threatened species: The Bicknell’s Thrush (Catharus Bicknelli) as a case study. Global Ecology and Conservation, 17, e00530. https://doi.org/10.1016/j.gecco.2019.e00530
Cartwright, J., T.L. Morelli, and E.H. Campbell Grant. 2021. Identifying climate-resistant vernal pools: hydrologic refugia for amphibian reproduction under droughts and climate change. Ecohydrology https://doi.org/10.1002/eco.2354
Chen, I.-C., Hill, J. K., Ohlemüller, R., Roy, D. B., & Thomas, C. D. (2011). Rapid Range Shifts of Species
Fish and Wildlife in Vermont Vermont Climate Assessment, 2021 227
Associated with High Levels of Climate Warming. Science, 333(6045), 1024–1026. https://doi.org/10.1126/science.1206432
Cooke, B. J., & Carroll, A. L. (2017). Predicting the risk of mountain pine beetle spread to eastern pine forests: Considering uncertainty in uncertain times. Forest Ecology and Management, 396, 11–25. https://doi.org/10.1016/j.foreco.2017.04.008
Covino, K. M., Horton, K. G., & Morris, S. R. (2020). Seasonally specific changes in migration phenology across 50 years in the Black-throated Blue Warbler. The Auk, 137(ukz080). https://doi.org/10.1093/auk/ukz080
Dawe, K. L., & Boutin, S. (2016). Climate change is the primary driver of white-tailed deer (Odocoileus virginianus) range expansion at the northern extent of its range; land use is secondary. Ecology and Evolution, 6(18), 6435–6451. https://doi.org/10.1002/ece3.2316
Dennis, D. F. (1993). An Empirical Study of Posting Private Nonindustrial Forests. Wildlife Society Bulletin (1973-2006), 21(1), 6–10.
Diefenbach, D. R., Rathbun, S. L., Vreeland, J. K., Grove, D., & Kanapaux, W. J. (2016). Evidence for Range Contraction of Snowshoe Hare in Pennsylvania. Northeastern Naturalist, 23(2), 229–248. https://doi.org/10.1656/045.023.0205
Dietsch, A. M., A. W. Don Carlos, M. J. Manfredo, T. L. Teel, and L. Sullivan. 2018. Vermont State Report. America’s Wildlife Values, Colorado State University, Department of Human Dimensions of Natural Resources, Fort Collins, CO.
Ellis, D., & Vokoun, J. C. (2009). Earlier Spring Warming of Coastal Streams and Implications for Alewife Migration Timing. North American Journal of Fisheries Management, 29(6), 1584–1589. https://doi.org/10.1577/M08-181.1
Faccio, S.D., M. Lew-Smith, and A. Worthley. 2013. Vermont Vernal Pool Mapping Project, 2009 – 2012. Final Report to the Vermont Fish and Wildlife Natural Heritage Information Project. Vermont Center for Ecostudies, Norwich, VT. 40 pages https://val.vtecostudies.org/projects/vermont-vernal-pool-atlas/vermont-vernal-pool-atlas-results/.
Faccio, S.D., J.D. Lambert, and J.D. Lloyd. 2017. The status of Vermont forest birds: A quarter century of monitoring. Vermont Center for Ecostudies, Norwich, VT. 32 pages https://vtecostudies.org/projects/forests/vermont-forest-bird-monitoring-program/results/.
Ficke, A. D., Myrick, C. A., & Hansen, L. J. (2007). Potential impacts of global climate change on freshwater fisheries. Reviews in Fish Biology and Fisheries, 17(4), 581–613. https://doi.org/10.1007/s11160-007-9059-5
Frick, W. F., Stepanian, P. M., Kelly, J. F., Howard, K. W., Kuster, C. M., Kunz, T. H., & Chilson, P. B. (2012). Climate and Weather Impact Timing of Emergence of Bats. PLOS ONE, 7(8), e42737. https://doi.org/10.1371/journal.pone.0042737
Garroway, C. J., & Broders, H. (2005). The quantitative effects of population density and winter weather on the body condition of white- tailed deer (Odocoileus virginianus) in Nova Scotia, Canada. https://doi.org/10.1139/Z05-118
Fish and Wildlife in Vermont Vermont Climate Assessment, 2021 228
Gaughan, C. R., & Destefano, S. (2005). Collaboration for community-based wildlife management. Urban Ecosystems, 8(2), 191. https://doi.org/10.1007/s11252-005-3265-5
GCB.Townsend.pdf. (n.d.). Retrieved March 15, 2021, from http://canuck.dnr.cornell.edu/research/pubs/pdf/GCB.Townsend.pdf
Geluso, K., Lemen, C., Freeman, P., Andersen, B., White, J., & Johnson, H. (2019). Variation in Reproductive Timing for the Northern Long-Eared Myotis (Myotis septentrionalis) Across Nebraska. Western North American Naturalist, 79, 581. https://doi.org/10.3398/064.079.0411
Geographic distribution of plant pathogens in response to climate change—Shaw—2011—Plant Pathology—Wiley Online Library. (n.d.). Retrieved February 27, 2021, from https://bsppjournals.onlinelibrary.wiley.com/doi/10.1111/j.1365-3059.2010.02407.x
Gérard, M., Vanderplanck, M., Wood, T., & Michez, D. (2020). Global warming and plant–pollinator mismatches. Emerging Topics in Life Sciences, 4(1), 77–86. https://doi.org/10.1042/ETLS20190139
Gillespie, N., Unthank, A., Campbell, L., Anderson, P., Gubernick, R., Weinhold, M., Cenderelli, D., Austin, B., McKinley, D., Wells, S., Rowan, J., Orvis, C., Hudy, M., Bowden, A., Singler, A., Fretz, E., Levine, J., & Kirn, R. (2014). Flood Effects on Road–Stream Crossing Infrastructure: Economic and Ecological Benefits of Stream Simulation Designs. Fisheries, 39(2), 62–76. https://doi.org/10.1080/03632415.2013.874527
Glennon, M. J., Langdon, S. F., Rubenstein, M. A., & Cross, M. S. (2019). Temporal changes in avian community composition in lowland conifer habitats at the southern edge of the boreal zone in the Adirondack Park, NY. PLOS ONE, 14(8), e0220927. https://doi.org/10.1371/journal.pone.0220927
Hamilton, A. T. (2010). Vulnerability of biological metrics and multimetric indices to effects of climate change. Freshwater Science, 29(4), 1379–1396. https://doi.org/10.1899/10-053.1
Hayhoe, K., Wake, C. P., Huntington, T. G., Luo, L., Schwartz, M. D., Sheffield, J., Wood, E., Anderson, B., Bradbury, J., DeGaetano, A., Troy, T. J., & Wolfe, D. (2007). Past and future changes in climate and hydrological indicators in the US Northeast. In Climate Dynamics (Vol. 28, Issue 4, p. 27). https://doi.org/10.1007/s00382-006-0187-8
Hill, J. M., & Lloyd, J. D. (2017). A fine-scale U.S. population estimate of a montane spruce–fir bird species of conservation concern. Ecosphere, 8(8), e01921. https://doi.org/10.1002/ecs2.1921
Himes, A., & Muraca, B. (2018). Relational values: The key to pluralistic valuation of ecosystem services. Current Opinion in Environmental Sustainability, 35, 1–7. https://doi.org/10.1016/j.cosust.2018.09.005
Huang, M., Ding, L., Wang, J., Ding, C., & Tao, J. (2021). The impacts of climate change on fish growth: A summary of conducted studies and current knowledge. Ecological Indicators, 121, 106976. https://doi.org/10.1016/j.ecolind.2020.106976
Hudy, M., Hanson, T., Gillespie, N., & Smith, E. (2008). Distribution, Status, and Land Use Characteristics of Subwatersheds within the Native Range of Brook Trout in the Eastern United States. North American Journal of Fisheries Management, 28, 1069–1085. https://doi.org/10.1577/M07-017.1
Hurlbert, A. H., & Liang, Z. (2012). Spatiotemporal Variation in Avian Migration Phenology: Citizen
Fish and Wildlife in Vermont Vermont Climate Assessment, 2021 229
Science Reveals Effects of Climate Change. PLoS ONE, 7(2), e31662. https://doi.org/10.1371/journal.pone.0031662
Influence of climate and reproductive timing on demography of little brown myotis Myotis lucifugus—Frick—2010—Journal of Animal Ecology—Wiley Online Library. (n.d.). Retrieved March 12, 2021, from https://besjournals.onlinelibrary.wiley.com/doi/10.1111/j.1365-2656.2009.01615.x
Jagnow, C. P., Stedman, R. C., Luloff, A. E., Julian, G. J. S., Finley, J. C., & Steele, J. (2006). Why Landowners in Pennsylvania Post Their Property against Hunting. Human Dimensions of Wildlife, 11(1), 15–26. https://doi.org/10.1080/10871200500470944
Jones, R., Travers, C., Rodgers, C., Lazar, B., English, E., Lipton, J., Vogel, J., Strzepek, K., & Martinich, J. (2013). Climate change impacts on freshwater recreational fishing in the United States. Mitigation and Adaptation Strategies for Global Change, 18(6), 731–758. https://doi.org/10.1007/s11027-012-9385-3
Kennedy-Slaney, L., Bowman, J., Walpole, A. A., & Pond, B. A. (2018). Northward bound: The distribution of white-tailed deer in Ontario under a changing climate. Wildlife Research, 45(3), 220–228. https://doi.org/10.1071/WR17106
LCB_Invasive_Species_Guide.pdf. (n.d.). Retrieved April 7, 2021, from http://www.lcbp.org/wp-content/uploads/2012/08/LCB_Invasive_Species_Guide.pdf
Lee, K. V., Steinhauer, N., Rennich, K., Wilson, M. E., Tarpy, D. R., Caron, D. M., Rose, R., Delaplane, K. S., Baylis, K., Lengerich, E. J., Pettis, J., Skinner, J. A., Wilkes, J. T., Sagili, R., vanEngelsdorp, D., & for the Bee Informed Partnership. (2015). A national survey of managed honey bee 2013–2014 annual colony losses in the USA. Apidologie, 46(3), 292–305. https://doi.org/10.1007/s13592-015-0356-z
Liu, Z., He, C., & Wu, J. (2016). The Relationship between Habitat Loss and Fragmentation during Urbanization: An Empirical Evaluation from 16 World Cities. PLOS ONE, 11(4), e0154613. https://doi.org/10.1371/journal.pone.0154613
Loeb, S. C., & Winters, E. A. (2013). Indiana bat summer maternity distribution: Effects of current and future climates. Ecology and Evolution, 3(1), 103–114. https://doi.org/10.1002/ece3.440
Maher, S. P., Kramer, A. M., Pulliam, J. T., Zokan, M. A., Bowden, S. E., Barton, H. D., Magori, K., & Drake, J. M. (2012). Spread of white-nose syndrome on a network regulated by geography and climate. Nature Communications, 3(1), 1306. https://doi.org/10.1038/ncomms2301
Manfredo, M. J., Teel, T. L., Berl, R. E. W., Bruskotter, J. T., & Kitayama, S. (2020). Social value shift in favour of biodiversity conservation in the United States. Nature Sustainability, 1–8. https://doi.org/10.1038/s41893-020-00655-6
McAvoy, T. J., Régnière, J., St-Amant, R., Schneeberger, N. F., & Salom, S. M. (2017). Mortality and Recovery of Hemlock Woolly Adelgid (Adelges tsugae) in Response to Winter Temperatures and Predictions for the Future. Forests, 8(12), 497. https://doi.org/10.3390/f8120497
McClure, C. J. W., Rolek, B. W., McDonald, K., & Hill, G. E. (2012). Climate change and the decline of a once common bird. Ecology and Evolution, 2(2), 370–378. https://doi.org/10.1002/ece3.95
Fish and Wildlife in Vermont Vermont Climate Assessment, 2021 230
McClure, M. S. (1990). Role of Wind, Birds, Deer, and Humans in the Dispersal of Hemlock Woolly Adelgid (Homoptera: Adelgidae). Environmental Entomology, 19(1), 36–43. https://doi.org/10.1093/ee/19.1.36
Memmott, J., Craze, P. G., Waser, N. M., & Price, M. V. (2007). Global warming and the disruption of plant-pollinator interactions. Ecology Letters, 10(8), 710–717. https://doi.org/10.1111/j.1461-0248.2007.01061.x
Meyer, G. A., Senulis, J. A., & Reinartz, J. A. (2016). Effects of temperature and availability of insect prey on bat emergence from hibernation in spring. Journal of Mammalogy, 97(6), 1623–1633. https://doi.org/10.1093/jmammal/gyw126
Moldowan, P.D., G.J. Tattersall, and N. Rollinson. (2021). Climate-associated decline of body condition in a fossorial salamander. Global Change Biology DOI: 10.1111/gcb.15766.
More total precipitation | Climate Change in Vermont. (n.d.). Retrieved April 12, 2021, from https://climatechange.vermont.gov/our-changing-climate/dashboard/more-annual-precipitation
Morse, J. W., Gladkikh, T. M., Hackenburg, D. M., & Gould, R. K. (2020). COVID-19 and human-nature relationships: Vermonters’ activities in nature and associated nonmaterial values during the pandemic. PLOS ONE, 15(12), e0243697. https://doi.org/10.1371/journal.pone.0243697
Nicholson, C. C., Koh, I., Richardson, L. L., Beauchemin, A., & Ricketts, T. H. (2017a). Farm and landscape factors interact to affect the supply of pollination services. Agriculture, Ecosystems & Environment, 250, 113–122. https://doi.org/10.1016/j.agee.2017.08.030
Nicholson, C. C., Koh, I., Richardson, L. L., Beauchemin, A., & Ricketts, T. H. (2017b). Farm and landscape factors interact to affect the supply of pollination services. Agriculture, Ecosystems & Environment, 250, 113–122. https://doi.org/10.1016/j.agee.2017.08.030
Nicholson, C. C., & Ricketts, T. H. (2019). Wild pollinators improve production, uniformity, and timing of blueberry crops. Agriculture, Ecosystems & Environment, 272, 29–37. https://doi.org/10.1016/j.agee.2018.10.018
O’Shea, T. J., Cryan, P. M., Hayman, D. T. S., Plowright, R. K., & Streicker, D. G. (2016). Multiple mortality events in bats: A global review. Mammal Review, 46(3), 175–190. https://doi.org/10.1111/mam.12064
Pankhurst, N. W., & Munday, P. L. (2011). Effects of climate change on fish reproduction and early life history stages. Marine and Freshwater Research, 62(9), 1015. https://doi.org/10.1071/MF10269
Pearman-Gillman, S. B., Katz, J. E., Mickey, R. M., Murdoch, J. D., & Donovan, T. M. (2020). Predicting wildlife distribution patterns in New England USA with expert elicitation techniques. Global Ecology and Conservation, 21, e00853. https://doi.org/10.1016/j.gecco.2019.e00853
Peterson, M. N. (2004). An approach for demonstrating the social legitimacy of hunting. Wildlife Society Bulletin, 32(2), 310–321. https://doi.org/10.2193/0091-7648(2004)32[310:AAFDTS]2.0.CO;2
Polgar, C. A., Primack, R. B., Williams, E. H., Stichter, S., & Hitchcock, C. (2013). Climate effects on the flight period of Lycaenid butterflies in Massachusetts. Biological Conservation, 160, 25–31. https://doi.org/10.1016/j.biocon.2012.12.024
Fish and Wildlife in Vermont Vermont Climate Assessment, 2021 231
Potential effects of climate change on birds of the Northeast | SpringerLink. (n.d.). Retrieved February 22, 2021, from https://link.springer.com/article/10.1007/s11027-007-9126-1
Potratz, E. J., Brown, J. S., Gallo, T., Anchor, C., & Santymire, R. M. (2019). Effects of demography and urbanization on stress and body condition in urban white-tailed deer. Urban Ecosystems, 22(5), 807–816. https://doi.org/10.1007/s11252-019-00856-8
Princé, K., & Zuckerberg, B. (2015). Climate change in our backyards: The reshuffling of North America’s winter bird communities. Global Change Biology, 21(2), 572–585. https://doi.org/10.1111/gcb.12740
RAM, J. L., FONG, P., CROLL, R. P., NICHOLS, S. J., & WALL, D. (1992). The zebra mussel (Dreissena polymorpha), a new pest in North America: Reproductive mechanisms as possible targets of control strategies. Invertebrate Reproduction & Development, 22(1–3), 77–86. https://doi.org/10.1080/07924259.1992.9672259
Regniere, J., Saint-Amant, R., & Duval, P. (2010). Predicting insect distributions under climate change from physiological responses: Spruce budworm as an example. Biological Invasions, 14, 1–16. https://doi.org/10.1007/s10530-010-9918-1
Richardson, L. L., McFarland, K. P., Zahendra, S., & Hardy, S. (2019). Bumble bee (Bombus) distribution and diversity in Vermont, USA: A century of change. Journal of Insect Conservation, 23(1), 45–62. https://doi.org/10.1007/s10841-018-0113-5
Rodenhouse, N. L. R. L., Christenson, L. M. C. M., Parry, D. P., & Green, L. E. G. E. (2009). Climate change effects on native fauna of northeastern forests. Canadian Journal of Forest Research. https://doi.org/10.1139/X08-160
Rustad, L., Campbell, J., Dukes, J. S., Huntington, T., Fallon Lambert, K., Mohan, J., & Rodenhouse, Nicholas. (2012). Changing climate, changing forests: The impacts of climate change on forests of the northeastern United States and eastern Canada (NRS-GTR-99; p. NRS-GTR-99). U.S. Department of Agriculture, Forest Service, Northern Research Station. https://doi.org/10.2737/NRS-GTR-99
Schlesinger, M. D., Corser, J. D., Perkins, K. A., & White, E. L. (n.d.). Vulnerability of At-risk Species to Climate Change in New York. 67.
Schwartz, T. (2014). Cost-Benefit Analysis of Stream-Simulation Culvert. 101.
Slayton, T. (2019, March 20). Hunting helps Vermont’s Forests. Vermont Land Trust. https://vlt.org/forests-wildlife-nature/hunting-helps-forests
Snyder, S. A., Kilgore, M. A., Taff, S. J., & Schertz, J. M. (2008). Estimating a Family Forest Landowner’s Likelihood of Posting against Trespass. Northern Journal of Applied Forestry, 25(4), 180–185. https://doi.org/10.1093/njaf/25.4.180
Townsend, A. K., Sillett, T. S., Lany, N. K., Kaiser, S. A., Rodenhouse, N. L., Webster, M. S., & Holmes, R. T. (2013). Warm springs, early lay dates, and double brooding in a North American migratory songbird, the black-throated blue warbler. PloS One, 8(4), e59467. https://doi.org/10.1371/journal.pone.0059467
Trombly, J. & 2019. (2019, December 29). Vermont tradition in decline: Hunting falls victim to
Fish and Wildlife in Vermont Vermont Climate Assessment, 2021 232
demographic shifts. VTDigger. https://vtdigger.org/2019/12/29/vermont-tradition-in-decline-hunting-falls-victim-to-demographic-shifts/
USGCRP (2018). Impacts, Risks, and Adaptation in the United States: Fourth National Climate Assessment, Volume II: [Reidmiller, D.R., C.W. Avery, D.R. Easterling, K.E. Kunkel, K.L.M. Lewis, T.K. Maycock, and B.C. Stewart (eds.)]. U.S. Global Change Research Program, Washington, DC, USA, 1515 pp. doi: 10.7930/NCA4.2018.
Vayer, V. R., Larson, L. R., Peterson, M. N., Lee, K. J., Furstenberg, R. V., Choi, D. Y., Stevenson, K., Ahlers, A. A., Anhalt-Depies, C., Bethke, T., Bruskotter, J., Chizinski, C. J., Clark, B., Dayer, A. A., Ghasemi, B., Gigliotti, L., Graefe, A., Irwin, K., Keith, S. J., … Woosnam, K. M. (n.d.). Diverse University Students Across the United States Reveal Promising Pathways to Hunter Recruitment and Retention. The Journal of Wildlife Management, n/a(n/a). https://doi.org/10.1002/jwmg.22055
VBBS final report to VFWD 2016. (n.d.). Google Docs. Retrieved July 7, 2021, from https://docs.google.com/document/d/1KOcucBOPyJH7YwWX0uBGCawqBHOKbETLLKlYQN7qL10/edit?usp=sharing&usp=embed_facebook
VT Fish and Wildlife Department. (2020). Big Game Management Plan 2020-2030. Agency of Natural Resources.
VT Fish and Wildlife Department. (2021a). Abenaki Chef Jessee Lawyer to Join Vermont Wild Kitchen March 18 | Agency of Natural Resources. State of Vermont: Agency of Natural Resources. https://anr.vermont.gov/content/abenaki-chef-jessee-lawyer-join-vermont-wild-kitchen-march-18
VT Fish and Wildlife Department. (2021b). Hunting License Sales Dataset 1980-2020. Agency of Natural Resources. Accessed July 27th, 2021.
Walberg, E., Cornicelli, L., & Fulton, D. C. (2018). Factors impacting hunter access to private lands in southeast Minnesota. Human Dimensions of Wildlife, 23(2), 101–114. https://doi.org/10.1080/10871209.2018.1396510
Water Q&A: What causes fish kills? (n.d.). Retrieved July 29, 2021, from https://www.usgs.gov/special-topic/water-science-school/science/water-qa-what-causes-fish-kills?qt-science_center_objects=0#qt-science_center_objects
Weiskopf, S. R., Ledee, O. E., & Thompson, L. M. (2019). Climate change effects on deer and moose in the Midwest. The Journal of Wildlife Management, 83(4), 769–781. https://doi.org/10.1002/jwmg.21649
Wells, M. L., Trainer, V. L., Smayda, T. J., Karlson, B. S. O., Trick, C. G., Kudela, R. M., Ishikawa, A., Bernard, S., Wulff, A., Anderson, D. M., & Cochlan, W. P. (2015). Harmful algal blooms and climate change: Learning from the past and present to forecast the future. Harmful Algae, 49, 68–93. https://doi.org/10.1016/j.hal.2015.07.009
Wetlands as Bird Habitat. (n.d.). Retrieved July 7, 2021, from https://water.usgs.gov/nwsum/WSP2425/birdhabitat.html
Wilderness brook trout | Vermont Fish & Wildlife Department. (n.d.). Retrieved July 29, 2021, from https://vtfishandwildlife.com/wilderness-brook-trout
Fish and Wildlife in Vermont Vermont Climate Assessment, 2021 233
Wilson, E. C., Shipley, A. A., Zuckerberg, B., Peery, M. Z., & Pauli, J. N. (2019). An experimental translocation identifies habitat features that buffer camouflage mismatch in snowshoe hares. Conservation Letters, 12(2), e12614. https://doi.org/10.1111/conl.12614
Winkler, R., & Warnke, K. (2013). The future of hunting: An age-period-cohort analysis of deer hunter decline. Population and Environment, 34(4), 460–480. https://doi.org/10.1007/s11111-012-0172-6
Wiseman, F. M. (2001). The Voice of the Dawn: An Autohistory of the Abenaki Nation. UPNE.
Xu, C., Letcher, B. H., & Nislow, K. H. (2010). Context-specific influence of water temperature on brook trout growth rates in the field. Freshwater Biology, 55(11), 2253–2264. https://doi.org/10.1111/j.1365-2427.2010.02430.x
Zebra Mussels | Vermont Fish & Wildlife Department. (n.d.). Retrieved April 7, 2021, from https://vtfishandwildlife.com/learn-more/landowner-resources/liep-invasive-species-program/aquatic-invasive-animals/zebra-mussels
Zebra Mussels | Vermont Invasives. (n.d.). Retrieved April 7, 2021, from https://vtinvasives.org/invasive/zebra-mussels
Zuckerberg, B., Bonter, D. N., Hochachka, W. M., Koenig, W. D., DeGaetano, A. T., & Dickinson, J. L. (2011). Climatic constraints on wintering bird distributions are modified by urbanization and weather. Journal of Animal Ecology, 80(2), 403–413. https://doi.org/10.1111/j.1365-2656.2010.01780.x
Agriculture and Food Systems Vermont Climate Assessment, 2021 234
5 agriculture and food systems
Recommended Citation for Chapter Claro, J., Faulkner, J., Isbell, C., Ruggiero, R., White, A., 2021. Agriculture and Food Systems. In Galford, G.L., Faulkner, J. et al. (Eds), The Vermont Climate Assessment 2021. Burlington, Vermont: Gund Institute for Environment at the University of Vermont. On the web: https://vtclimate.org
Ryan Ruggiero Department of Plant and Soil Science, University of Vermont, Burlington, VT 05405
Joshua Faulkner Department of Plant and Soil Science, University of Vermont, Burlington, VT 05405; Department of Civil and Environmental Engineering, University of Vermont; Farming and Climate Change Program, University of Vermont Extension; Gund Institute for Environment, University of Vermont
Alissa White Department of Plant and Soil Science, University of Vermont, Burlington, VT 05405; Gund Institute for Environment, University of Vermont
Jake Claro Farm to Plate, Vermont Sustainable Jobs Fund, Montpelier, VT 05602
Carina Isbell Department of Community Development and Applied Economics, University of Vermont, Burlington, VT 05405
Agriculture and Food Systems Vermont Climate Assessment, 2021 235
5.1 key messages
1. Vermont’s climate is already changing in ways that benefit its agricultural system,
including longer growing periods (freeze-free periods lengthened twenty-one days since
early 1900s) and milder temperatures (annual average temperature increase of 2°F
(1.1°C) since the 1990s), allowing farmers to experiment with new crops or practices
not previously viable in Vermont.
2. The changing climate also brings agricultural setbacks, such as negative impacts on
fruit-bearing species like apple trees that require a sufficient over-wintering period for
success in the next growing season. The maple syrup industry is also at risk due to
variations in winter temperatures.
3. Climate models predict tougher growing conditions due to greater variability in
temperature and precipitation, including heavy precipitation and dry spells.
4. Vermont’s average annual precipitation has increased 6.7 inches since the 1960s.
Summer precipitation has increased most (additional 2.6 inches since 1960s) and is
characterized by more heavy precipitation events (defined as more than one inch of
precipitation in one day), although spring precipitation has also increased notably
(additional 2.11 inches/year since 1960s, and 0.8 days/year with heavy precipitation).
Spring precipitation accumulates in the soil and can make farm operations difficult.
While precipitation during the growing season is trending upward, precipitation falls in
fewer, more extreme events and is coupled with longer periods of no rain at times when
crop water requirements are still high; thus, irrigation may become increasingly
important.
5. At the Earth’s surface, increasing concentrations of carbon dioxide may benefit yields
in crops that utilize the C3 photosynthetic pathway (i.e., many of Vermont’s forages) if
conditions are otherwise ideal. Conversely, an increase in surface-level ozone
concentrations may reduce crop productivity.
6. Extreme events are expected to increase. More periods of flooding and drought will
lead to more crop damage or failure. Stormwater and irrigation infrastructure will be
crucial in mitigating these effects.
Agriculture and Food Systems Vermont Climate Assessment, 2021 236
7. Agriculture and food systems may play an important role in mitigating climate change,
if mitigation provides financial opportunities, are distributed fairly and accurately, and
are implemented with careful monitoring, reporting, and verification. Urban and
suburban areas in Vermont have the potential to improve adaptation and mitigation of
climate change by growing food closer to where it is consumed.
5.2 overview
Agriculture has been, and remains, a defining characteristic of Vermont’s landscape, culture,
and economy. The state’s food system has experienced tremendous growth over the past
decade, as evidenced by the expansion of the food system’s economic output by 48% from
2011 to 2020 (Kavet, 2020). By 2017, 13.9% of all in-state food purchases were comprised of
Vermont’s farm and food products (Willard et al., 2020). Despite this growth, climate change
has the potential to significantly disrupt farm and food system profitability and viability.
Multiple climate shocks are possible within single growing seasons, and climate change
impacts occurring elsewhere in the country can have ripple effects in Vermont. Resilience
measures are critical across this sector, but they will vary based on the specific type of
enterprise or production system. Farmers and food system workers are not unfamiliar with
challenges and change, and they have already demonstrated instances of successful and
ingenious adaptation. As the data in this chapter show, individuals and businesses must
operate and move forward knowing that they cannot plan for what was once known as
“normal.”
5.3 agriculture and food systems in a changing climate
Impending climate change will increase precipitation and temperature variability and extreme
events. These changes have the potential to both positively and negatively affect production
agriculture and food systems in Vermont. Potential benefits and drawbacks are discussed in
the following sections.
Agriculture and Food Systems Vermont Climate Assessment, 2021 237
5.3.1 Freeze-Free Period The freeze-free period is defined as the number of consecutive days in which the minimum
temperature does not go below 28°F (-2.2°C). The length of the freeze-free period is not the
same as the length of the growing season. The freeze-free period is used to assess how
climate change will affect production agriculture. Statewide data from climate stations (see
Climate Change in Vermont chapter) show a significant increasing trend in the length of the
freeze-free period across the state. From 1960 to 2020, the freeze-free period increased at an
average rate of 4.4 days per decade and accelerated to 9.0 days per decade since 1990 (Figure
5-1). Since the 1990s, the most dramatic freeze-free increase is observed in the Southern and
East/Northeastern portions of the state (increase of 17 days and 18 days, respectively); the
Western portion has increased 10 days. Farmers in Western Vermont (i.e., Champlain Valley)
have experienced relatively modest changes, whereas farmers east of the Green Mountains
and to the south are dealing with conditions that are quite different from what was “normal”
thirty to fifty years ago. The historical observations suggest a strong trend that may continue
over the next several decades. With continued climate change, the entire state can expect
longer average freeze-free periods. However, farms— depending on their location—will have
more pronounced impacts.
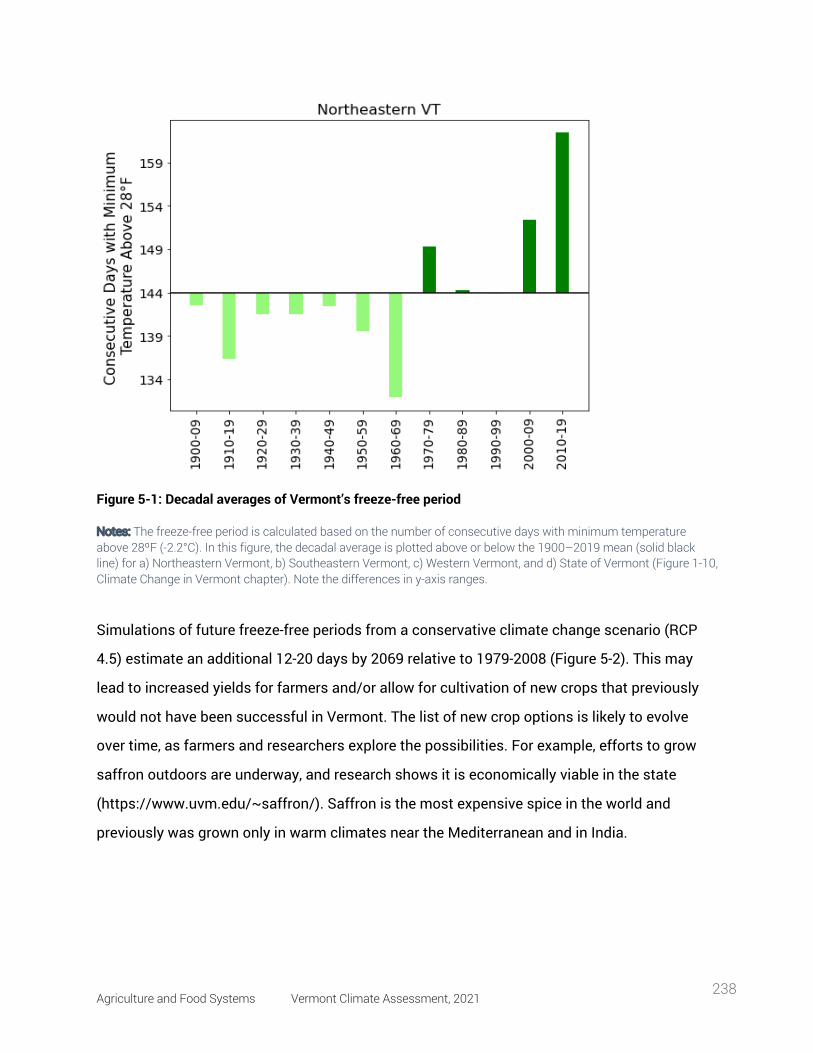
Agriculture and Food Systems Vermont Climate Assessment, 2021 238
Figure 5-1: Decadal averages of Vermont’s freeze-free period
Notes: The freeze-free period is calculated based on the number of consecutive days with minimum temperature above 28ºF (-2.2°C). In this figure, the decadal average is plotted above or below the 1900–2019 mean (solid black line) for a) Northeastern Vermont, b) Southeastern Vermont, c) Western Vermont, and d) State of Vermont (Figure 1-10, Climate Change in Vermont chapter). Note the differences in y-axis ranges.
Simulations of future freeze-free periods from a conservative climate change scenario (RCP
4.5) estimate an additional 12-20 days by 2069 relative to 1979-2008 (Figure 5-2). This may
lead to increased yields for farmers and/or allow for cultivation of new crops that previously
would not have been successful in Vermont. The list of new crop options is likely to evolve
over time, as farmers and researchers explore the possibilities. For example, efforts to grow
saffron outdoors are underway, and research shows it is economically viable in the state
(https://www.uvm.edu/~saffron/). Saffron is the most expensive spice in the world and
previously was grown only in warm climates near the Mediterranean and in India.
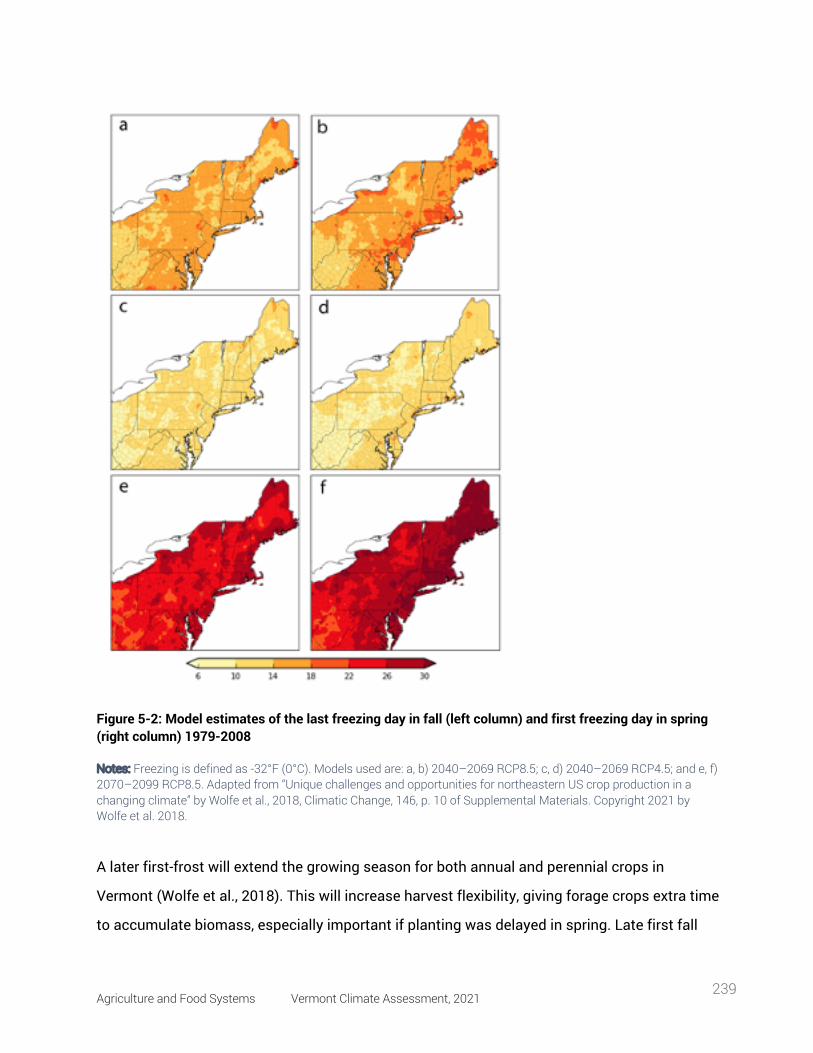
Agriculture and Food Systems Vermont Climate Assessment, 2021 239
Figure 5-2: Model estimates of the last freezing day in fall (left column) and first freezing day in spring (right column) 1979-2008
Notes: Freezing is defined as -32°F (0°C). Models used are: a, b) 2040–2069 RCP8.5; c, d) 2040–2069 RCP4.5; and e, f) 2070–2099 RCP8.5. Adapted from “Unique challenges and opportunities for northeastern US crop production in a changing climate” by Wolfe et al., 2018, Climatic Change, 146, p. 10 of Supplemental Materials. Copyright 2021 by Wolfe et al. 2018.
A later first-frost will extend the growing season for both annual and perennial crops in
Vermont (Wolfe et al., 2018). This will increase harvest flexibility, giving forage crops extra time
to accumulate biomass, especially important if planting was delayed in spring. Late first fall
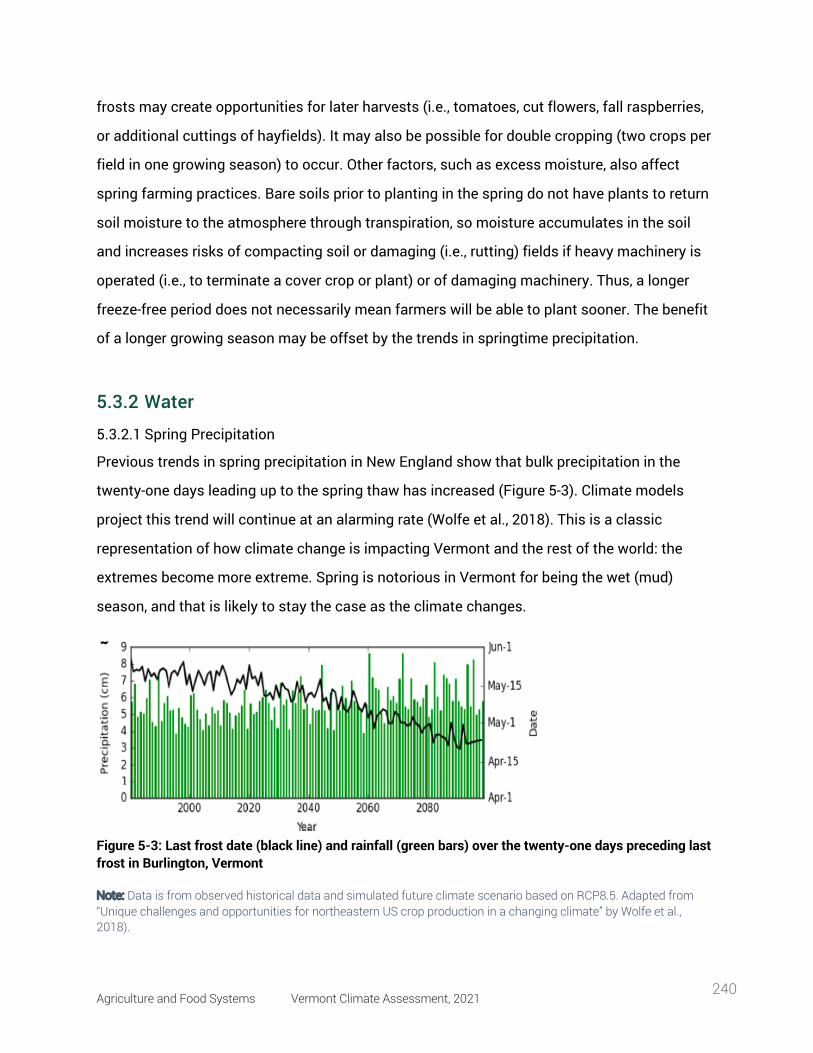
Agriculture and Food Systems Vermont Climate Assessment, 2021 240
frosts may create opportunities for later harvests (i.e., tomatoes, cut flowers, fall raspberries,
or additional cuttings of hayfields). It may also be possible for double cropping (two crops per
field in one growing season) to occur. Other factors, such as excess moisture, also affect
spring farming practices. Bare soils prior to planting in the spring do not have plants to return
soil moisture to the atmosphere through transpiration, so moisture accumulates in the soil
and increases risks of compacting soil or damaging (i.e., rutting) fields if heavy machinery is
operated (i.e., to terminate a cover crop or plant) or of damaging machinery. Thus, a longer
freeze-free period does not necessarily mean farmers will be able to plant sooner. The benefit
of a longer growing season may be offset by the trends in springtime precipitation.
5.3.2 Water
5.3.2.1 Spring Precipitation
Previous trends in spring precipitation in New England show that bulk precipitation in the
twenty-one days leading up to the spring thaw has increased (Figure 5-3). Climate models
project this trend will continue at an alarming rate (Wolfe et al., 2018). This is a classic
representation of how climate change is impacting Vermont and the rest of the world: the
extremes become more extreme. Spring is notorious in Vermont for being the wet (mud)
season, and that is likely to stay the case as the climate changes.
Figure 5-3: Last frost date (black line) and rainfall (green bars) over the twenty-one days preceding last frost in Burlington, Vermont
Note: Data is from observed historical data and simulated future climate scenario based on RCP8.5. Adapted from “Unique challenges and opportunities for northeastern US crop production in a changing climate” by Wolfe et al., 2018).
Agriculture and Food Systems Vermont Climate Assessment, 2021 241
5.3.2.2 Tile Drainage
Farmers in Vermont have adapted to the wet conditions in spring by using artificial subsurface
tile drainage. Originally used to drain wetlands in the midwestern United States, tile drains are
perforated plastic pipes that are installed to a depth of one meter to remove excess water from
the soil, thereby improving farm operations and crop productivity (Madramootoo, 1999).
Vermont farmers who have not tiled their fields may do so to adapt to climate change. Usually
tile drains are used on finely textured, poorly drained soils that are at risk for low yield and soil
compaction because of excess moisture. Many of the farms in the Champlain Valley are
located on these types of soils, and tile drainage has been shown to be an effective method for
improving trafficability and growing conditions in field crops and vegetable systems (King et
al., 2015). Tile drainage systems also have been shown to transport nutrients more rapidly
through the subsurface, raising water quality concerns. To address these concerns, alternative
soil and nutrient management practices can be implemented, or tile drainage systems can be
modified with drainage water management structures to control the height of the water table
in fields. Some studies have found that these structures reduce nutrient and sediment loss
during extreme events (Tan and Zhang, 2011). Other methods of removing excess water
include surface-grading and ditching fields. Research regarding the environmental impacts of
tile drainage systems is ongoing in Vermont (Moore, 2016).
5.3.2.3 Water Stress and Irrigation
As discussed in the Climate Change in Vermont chapter of this report, summer precipitation
has increased in recent decades, but it has also become increasingly variable. Timing of
precipitation during summer months is and will continue to be irregular. It is likely that heavy
precipitation events (greater than one inch of precipitation per day) will supply much of
summer precipitation, which means farmers will need to adjust their stormwater infrastructure
for larger runoff events. Farmers can work with state and federal agencies to engineer, permit,
and cost-share stormwater infrastructure improvements.
Farmers also need to prepare for increased frequency of prolonged dry spells or droughts.
Even if farmers invest more in irrigation infrastructure, there might be limitations on water
access. While summer stream low flow has not shown any significant decreasing trend in
Agriculture and Food Systems Vermont Climate Assessment, 2021 242
Vermont (see Water Resources chapter), reduced pond storage and dry wells may occur in
years of drought, and stream base flow may be reduced. It is worth noting that most wells in
Vermont are not on highly desirable geology; that is, they are not apt to be high producing
water sources for future water needs (see Water Resources chapter). Farmers cannot make
surface withdrawals from streams when flow rates fall below the threshold set for preserving
wildlife (Armstrong et al., 2001). While it is difficult to anticipate the timing of individual farms’
water stress, periods of crop water stress are likely to occur for farms simultaneously
throughout a region. Farmers can prepare for low water availability by using seasonal potential
evapotranspiration (PET) computer simulation models, staying current with the Vermont
drought conditions monitor (https://www.drought.gov/states/vermont/), and working with
other farms to strategically plan water delivery services. Farmers should also consider using
remotely monitored soil moisture sensors to understand how stressed their crops are in real
time. Cost share programs would be beneficial to allow farmers to employ this equipment
without as much financial and operational burden.
Water for irrigation may remain sufficient for Vermont producers; however, the temporal
distribution and disruptions of future precipitation are subject to much variation. Recent
trends show increasing precipitation in all seasons, with the greatest rate of increase in
summer precipitation, and they show increased variability and frequency of dry spells (see
Climate Change in Vermont chapter). Increasing precipitation does not mean farmers will
require less irrigation; in fact, sprinkler irrigation in Vermont has increased from 1985 to 2015
at the same time precipitation increased (Figure 5-4) (USGS, 2021b; see Climate Change in
Vermont chapter). It is likely the need for irrigation will continue to increase because of
increasingly variable precipitation. Heavy precipitation events are expected to bring much of
any given season's total precipitation, which is not as helpful during the growing season as
frequent, smaller precipitation events. The length of dry periods will also increase, which may
force farmers to irrigate (Trenberth, 2011). Climate models suggest that by 2050 the amount of
monthly precipitation during the growing season (summer) will be less on average than in the
period 1980-1999 (Figure 5-5) (USGS, 2021a).
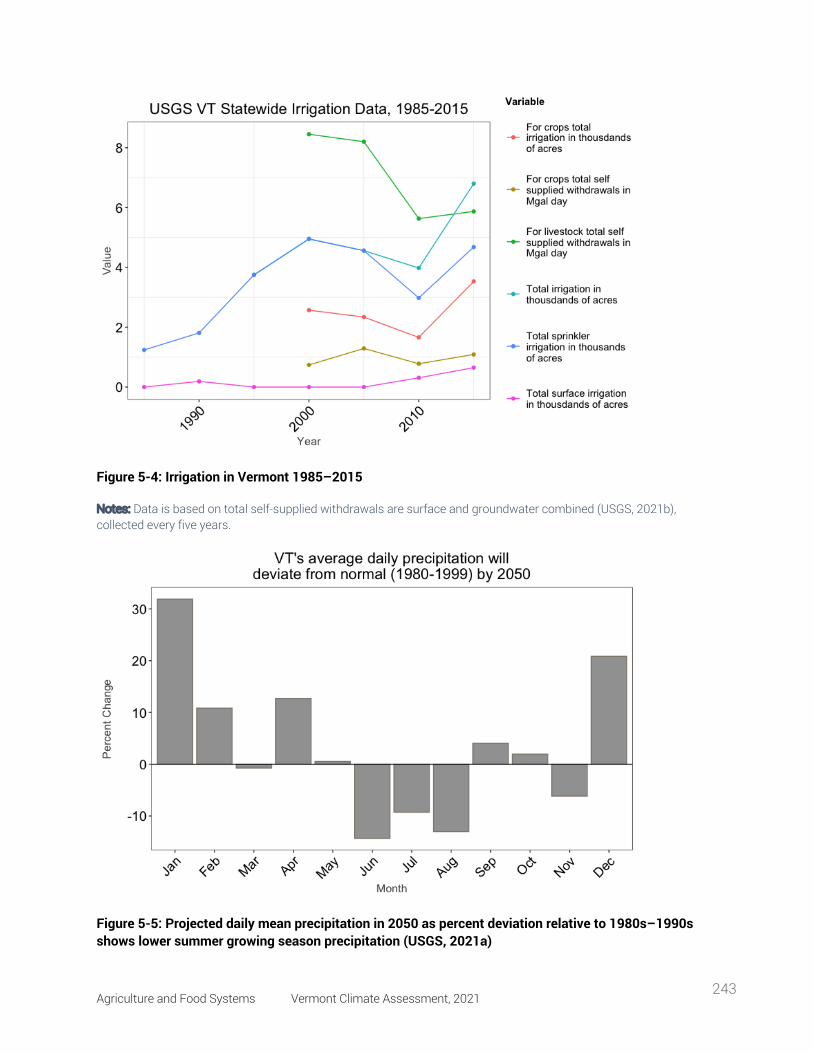
Agriculture and Food Systems Vermont Climate Assessment, 2021 243
Figure 5-4: Irrigation in Vermont 1985–2015
Notes: Data is based on total self-supplied withdrawals are surface and groundwater combined (USGS, 2021b), collected every five years.
Figure 5-5: Projected daily mean precipitation in 2050 as percent deviation relative to 1980s–1990s shows lower summer growing season precipitation (USGS, 2021a)
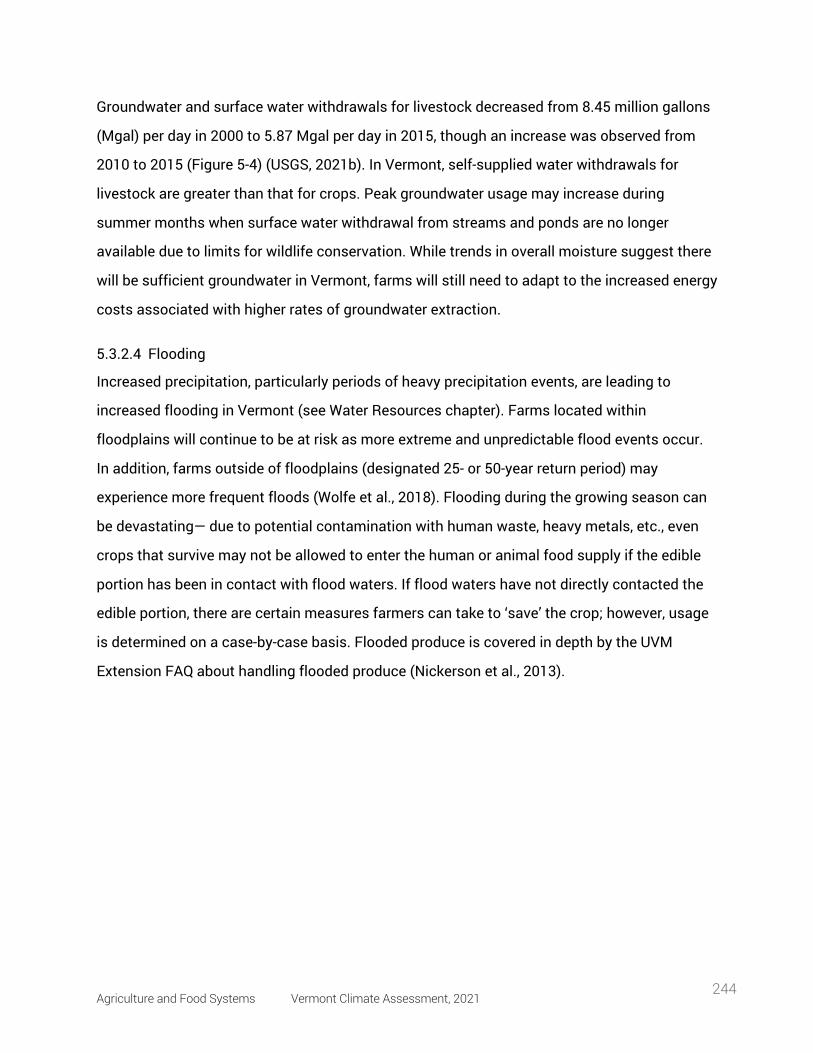
Agriculture and Food Systems Vermont Climate Assessment, 2021 244
Groundwater and surface water withdrawals for livestock decreased from 8.45 million gallons
(Mgal) per day in 2000 to 5.87 Mgal per day in 2015, though an increase was observed from
2010 to 2015 (Figure 5-4) (USGS, 2021b). In Vermont, self-supplied water withdrawals for
livestock are greater than that for crops. Peak groundwater usage may increase during
summer months when surface water withdrawal from streams and ponds are no longer
available due to limits for wildlife conservation. While trends in overall moisture suggest there
will be sufficient groundwater in Vermont, farms will still need to adapt to the increased energy
costs associated with higher rates of groundwater extraction.
5.3.2.4 Flooding
Increased precipitation, particularly periods of heavy precipitation events, are leading to
increased flooding in Vermont (see Water Resources chapter). Farms located within
floodplains will continue to be at risk as more extreme and unpredictable flood events occur.
In addition, farms outside of floodplains (designated 25- or 50-year return period) may
experience more frequent floods (Wolfe et al., 2018). Flooding during the growing season can
be devastating— due to potential contamination with human waste, heavy metals, etc., even
crops that survive may not be allowed to enter the human or animal food supply if the edible
portion has been in contact with flood waters. If flood waters have not directly contacted the
edible portion, there are certain measures farmers can take to ‘save’ the crop; however, usage
is determined on a case-by-case basis. Flooded produce is covered in depth by the UVM
Extension FAQ about handling flooded produce (Nickerson et al., 2013).
Agriculture and Food Systems Vermont Climate Assessment, 2021 245
5.3.2.5 Water Stress
Drought conditions will become more variable, with water deficits occurring and accumulating
during the non-growing season when soils and surface waters are typically recharged.
Droughts often carry over from one year to the next, or a drought may begin in the winter, such
as in parts of Vermont in 2002, 2012, 2013, 2015, and 2017. As of May 2021, 75% of the state
was in moderate drought, and the entire state was classified as abnormally dry (National
Integrated Drought Information System, n.d.). Droughts also occurred in much of the state
during the 2016, 2018, and 2020 growing seasons. In 2020, farmers in at least ten Vermont
counties were eligible for federal aid for crop loss due to the drought; losses were estimated at
$27 million (McCallum, 2020).
Box 5.1: Halloween 2019 Floods in Vermont A 2019 Halloween storm created major agriculture losses, even though the event
occurred outside of the major growing season. For example, Maple Wind Farm in
Richmond lost 2,000 turkeys and chickens (unfortunate timing due to the
approaching Thanksgiving holiday) when the Winooski River rose at an astonishing
rate. This contributed to a significant loss of income during the winter season. Other
farms, like Boston Post Dairy Farm, had haybales displaced and contaminated by
floodwaters.
However, impacts were minimal at the Intervale Farm, where farmers gathered last
minute support from the Burlington community to mass harvest remaining frost-
hardy crops before the flood hit. As this area is within the known Winooski floodplain,
farmers there are accustomed to watching the river hydrograph for rising
floodwaters. All farms in floodplains could benefit from flood mitigation protocols like
those used at the Intervale.
Agriculture and Food Systems Vermont Climate Assessment, 2021 246
5.3.3 Warmer Temperatures and Temperature Variation During the growing season, warmer temperatures, including heat waves and warmer overnight
temperatures, are expected (see Climate Change in Vermont chapter). Warmer temperatures
benefit existing crops, offer success with new crops, and may make double cropping possible.
Dairy farmers may be able to plant more productive field crop varieties as well. Warmer
temperatures will also result in increased livestock stress and a need for additional cooling
infrastructure, including shade structures for pasture-based operations. Warmer temperatures
also promote evapotranspiration and can stress crops at vulnerable times.
Crop stress is likely to increase during the spring because of increased variation in springtime
temperatures and will have the greatest impact on cash crops. Once fruiting crops meet their
winter chilling requirements, they will bud once temperatures warm, but cold temperatures
following a warm period can damage buds or even cause crop failures (Stafne, 2020). Warm
winter days, defined as days with temperatures of greater than 50°F (10°C), in Vermont have
increased by 1.82 days between the 1960s and 2020. Cold winter nights, defined as a
minimum temperature of 0°F (-17.8°C), have decreased more substantially, by10.01 days (see
Climate Change in Vermont chapter). Trends suggest warmer winters will continue in Vermont,
although it may be several decades before crops like apples (which has one of the strongest
chilling requirements of fruiting bearing species) will suffer the effects of insufficient
overwintering. This may be a problem first in southern Vermont, where warming trends are
more pronounced. The most pressing issue all farmers will have to deal with is fluctuations in
late winter/early spring temperatures that result in budding with subsequent frost periods.
This can be devastating for crops that respond more rapidly to brief periods of warming, so
farmers will have to adapt by selecting varieties that tolerate temperature fluctuations better
(Wolfe et al., 2018). Also see the following section on pest pressures.
5.3.4 Changing atmospheric conditions and pest pressures Globally, pest pressures on agriculture are changing with climate, providing clues to the
challenges Vermont may face. Despite improvements to pest and disease management
technology, global crop production loss due to pathogens is estimated at 1016% (Chakraborty
Agriculture and Food Systems Vermont Climate Assessment, 2021 247
and Newton, 2011). A challenge caused by climate change is shifting atmospheric conditions,
specifically concentrations of CO2 and ozone that can affect crop diseases and productivity.
Pests and diseases with expanded range, increased competitiveness, or other advantages are
expected to put increasing pressure on crops as well. A lack in genetic diversity of cash crops
means they will fatigue quicker than weeds, pests, and diseases, which can mutate and adapt
more rapidly to climate change (Raza et al., 2019).
Continued increases in atmospheric CO2 concentrations can enhance photosynthesis and may
result in higher yields for crops (i.e., high quality forages). The benefits from increased CO2 may
be offset by the damage occurring from increased surface-level ozone, which can increase
disease expression and thus decrease crop productivity (Eastburn et al., 2010). Ozone-related
damage and decreased productivity varies with crop species—many Vermont crops are
considered ozone-sensitive, including forages, fruit bushes, grapes, lettuce, potato, spinach,
tomato, and watermelon. In contrast, certain vegetable crops like strawberries and tomatoes
grown in the presence of elevated ozone had increased concentrations of nutrients like
vitamin C and β-carotene, respectively (Moretti et al., 2010).
The impact climate change will have on pests is a function of the expected increase in CO2
concentrations and temperatures. One plant response to increased CO2 is an increase in foliar
carbon:nitrogen ratios. For example, reduced foliar nitrogen in bell pepper plants due to
elevated CO2 concentrations caused reproduction setbacks for phloem-feeding insects by 37%,
yet their feeding was unaffected (Dáder et al., 2016). While some leaf-chewing insects have
been found to suffer reproduction setbacks up to 34%, other insects in this category may
benefit (Robinson et al., 2012). For hemipterian species (also known as “true bugs”) that feed
on plant sap, increased CO2 resulted in both increased and decreased animal counts,
depending on the hay and garden crops and the different species of this order (Guo et al.,
2014; Oehme et al., 2013). These studies indicate that some pests will have reproductive
setbacks, but others may benefit.
Temperature changes may impact insects' life cycles and activities. Some insect orders
cannot reproduce beyond a certain temperature threshold, so increased temperatures will
Agriculture and Food Systems Vermont Climate Assessment, 2021 248
result in reduced populations. However, insects may be able to adapt their reproductive
window or increase their temperature thresholds if change occurs gradually (Debarro and
Maelzer, 1993). Insects also have an upper temperature threshold for flight, which will
ultimately affect migration and daily activity (Trębicki and Finlay, 2018). Temperature changes
also can influence the number of generations and species distribution (Trębicki and Finlay,
2018).
Insects in Vermont are likely to be impacted in the same physiological ways; however, the
degree of pest adaptation is still unknown. Vermont can expect an increase in new pest and
disease species that formerly were limited to southern latitudes; this already has been the
case with more mild non-growing season conditions in the forest sector (see Climate Change
in Forests chapter). More research and a holistic approach to pest and disease management
are required for Vermont to best adapt to climate change.
The uncertainty around pest changes is similar for disease changes. For example, the threat of
fire blight caused by the bacteria (Erwinia amylovora) increases with warmer spring
temperatures, resulting in greater risk of earlier blooming during rain events for crops such as
apples and pears. After entering the plant via the flower, fire blight kills vascular plant tissue,
leading to a loss of limbs or whole tree mortality. In Switzerland, Hirschi et al. (2012) showed
that the effect of earlier blooming on fire blight was offset by changing trends in spring
precipitation in some regions of the country, while the southern regions had significant
increases in fire blight. As a sporadic and climate-related disease, the impact of fire blight may
be erratic in Vermont, but it is known to occur increasingly in New England (Bradshaw, 2016).
5.4 mitigation, resilience, and adaptation
This section discusses how the agricultural and food systems in Vermont can adapt to climate
change, informed by how other systems around the world have and continue to adapt.
Agriculture and Food Systems Vermont Climate Assessment, 2021 249
5.4.1 Food Systems in a Climate-Conscious State Vermont’s food system is critical to its economy, identity, and quality of life. While food is
rightfully associated with farming, the food system in its entirety encompasses a complex
network of resources, activities, and people that extend beyond our farmland. The food
system, in addition to farmers and farmland, includes processing; distribution; various market
channels and their consumers (e.g., farmer’s markets, institutions, grocery stores,
restaurants); food waste management; the support system of nonprofits, government
agencies, educational institutions, and funders and investors; and the people (e.g., farmers,
food workers, policy makers, consumers) involved in all these activities. From an economic
perspective, these interacting pieces generate $11.3 billion and employ more than 64,000
Vermonters. In one way or another, we are all participants in the Vermont food system.
Given the significant footprint of the food system in Vermont; its importance in contributing to
the state’s and region’s food security; and its far reaching influence on our economy,
environment, and culture; Vermont’s ability to successfully mitigate and adapt to climate
change requires an integrated understanding of the myriad ways in which the food system
contributes to, is affected by, and can provide mitigative, adaptive, and resilient climate
solutions for Vermont in what is an era of increasing climate disruption. Developing a climate-
smart food system cannot solely rely on policies, innovation, and management focused on the
farm gate—though farm-based climate solutions are necessary—but it also must account for
and address interdependencies among inputs, production, processing, distribution, point of
sale (i.e., markets), consumption, and waste management. For example, in examining where
food is coming from and what is coming from elsewhere, the state can begin to imagine and
plan for scenarios in which food access decreases or is at risk due to food chain disruptions in
other parts of the country (due to crop failures, labor shortages, damaged infrastructure etc.).
The food flows analysis provides a window into the complexity of America’s food system and
Vermont’s (and New England’s) reliance on certain regions or states (Figure 5-6).
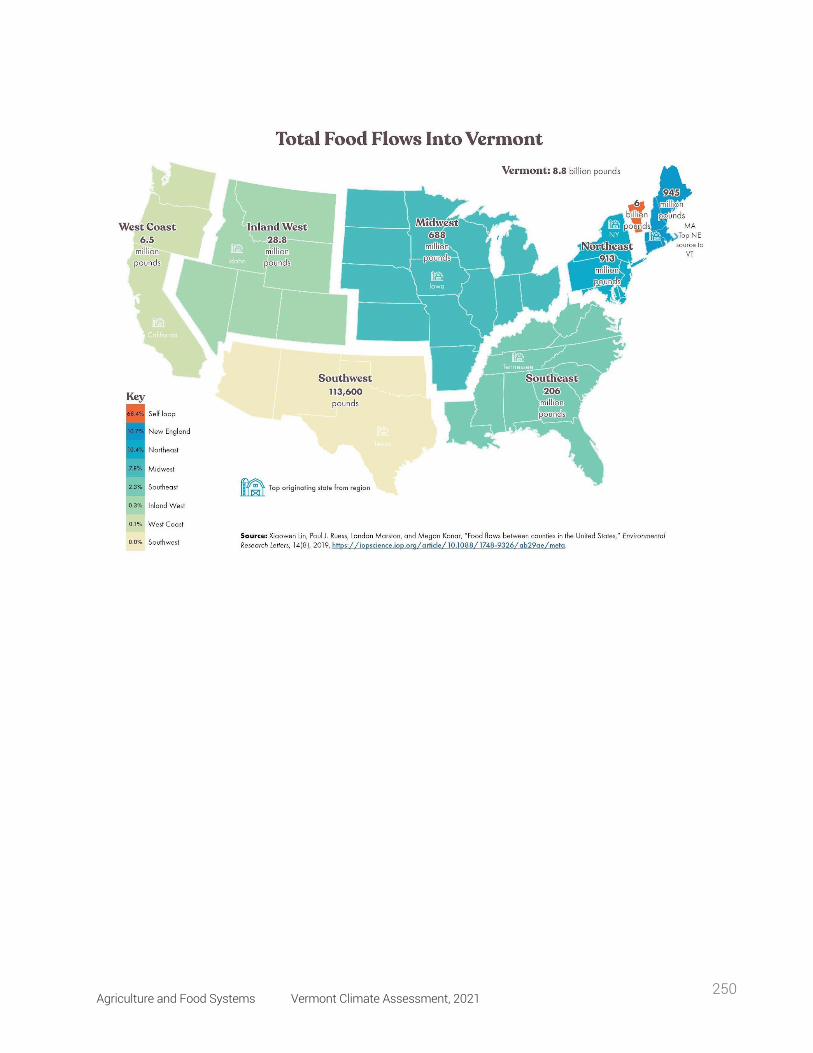
Agriculture and Food Systems Vermont Climate Assessment, 2021 250
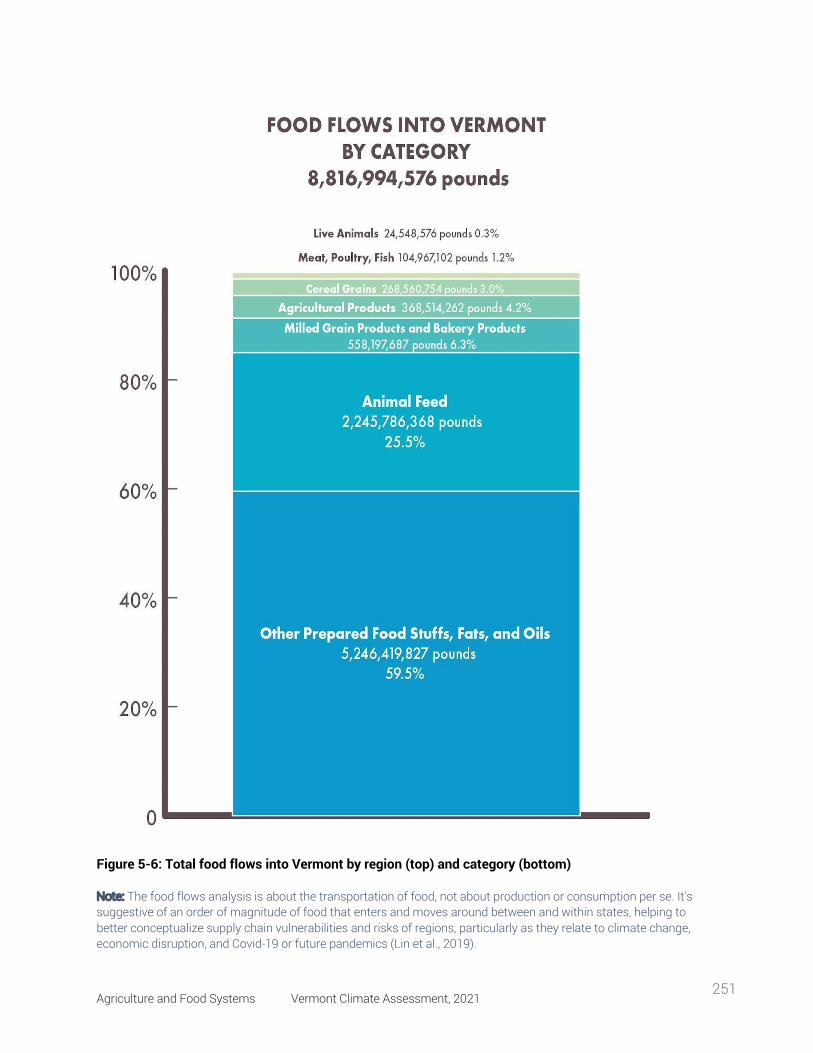
Agriculture and Food Systems Vermont Climate Assessment, 2021 251
Figure 5-6: Total food flows into Vermont by region (top) and category (bottom)
Note: The food flows analysis is about the transportation of food, not about production or consumption per se. It's suggestive of an order of magnitude of food that enters and moves around between and within states, helping to better conceptualize supply chain vulnerabilities and risks of regions, particularly as they relate to climate change, economic disruption, and Covid-19 or future pandemics (Lin et al., 2019).
Agriculture and Food Systems Vermont Climate Assessment, 2021 252
Each component of the food systems supply chain has a part to play in mitigating climate
change, but each component also must be prepared to adapt to and withstand the impacts of
climate to ensure the viability and security of the food supply. For example, food
manufacturing—Vermont’s second largest manufacturing industry—can improve mitigative
capacity by adopting more energy-efficient processes and technologies and utilizing
renewable energy. Planning and investment are also needed to increase the industry’s
adaptive capacity through: making facilities more resilient to extreme weather (particularly
flooding), improved packaging that reduces waste and maintains quality and safety
(particularly in extreme heat), and diversifying ingredient suppliers through local and regional
supply chain development to reduce over-reliance on global supply chains that will face
climate disruption. This is one example; of course, there are many more examples to draw
from and questions that arise as the entire food supply chain is examined. For example, how
can transportation emissions be reduced through accelerated adoption of electric vehicles and
more efficient aggregation and storage infrastructure? How can distribution be more adaptive
and resilient to climate disruption through greater logistics coordination? How can roads
themselves be improved to withstand extreme weather to limit delivery delays to both
commercial and charitable food sites? In what ways can energy use, particularly for
refrigeration, be more efficient? What kind of additional incentives, technical and business
support services, and training are needed to help farm and food businesses address these
issues?
These are all critical questions to answer, yet beyond farming there is a relative dearth of
available data regarding baseline food system emissions and potential for emission
reductions and little evaluation of the preparedness and adaptive capacity of food processing,
distribution, point of sale, and waste management systems. However, Vermont’s Agriculture
and Food System Strategic Plan 2021-2030 provides a roadmap to address these questions in
a systemic way by articulating the vision, goals, and strategies that aim to put the state on a
path to developing a climate-smart food system by 2030 (Willard et al., 2020). To do so, priority
strategies from the Plan emphasize the need for increased, improved, and energy-efficient
Agriculture and Food Systems Vermont Climate Assessment, 2021 253
processing infrastructure; greater aggregation and distribution coordination and
infrastructure; increased incentives and research for climate-adaptive practices; food security
planning that ensures the Vermont food supply is sufficient to withstand global or national
food supply chain disruptions caused by climate change; food system mapping that accounts
for predicted climate impacts in order to aid state and municipal planning and investments;
and increased professional development for technical assistance and business planning
providers in order to help their farm and food business clients address and integrate climate
change issues into management decisions and long-term planning.
5.4.2 Adaptation Though farmers in Vermont have some options when it comes to adapting to climate change,
economics emerges as a major barrier to adaptation, as it currently is cheaper for farmers to
operate in a business-as-usual manner. Many farmers are climate conscious because they
understand the impact climate has on their bottom line (Figure 5-7) (USDA FSA). Cost sharing,
or government payments to help install conservation practices, is a way farmers can
experiment with well researched best management practices (BMP) that will increase
resilience to and mitigation of climate change with less of a financial burden. Farmers would
rather preserve the environment than put it in jeopardy, but they only can adopt practices if
they are able to financially.
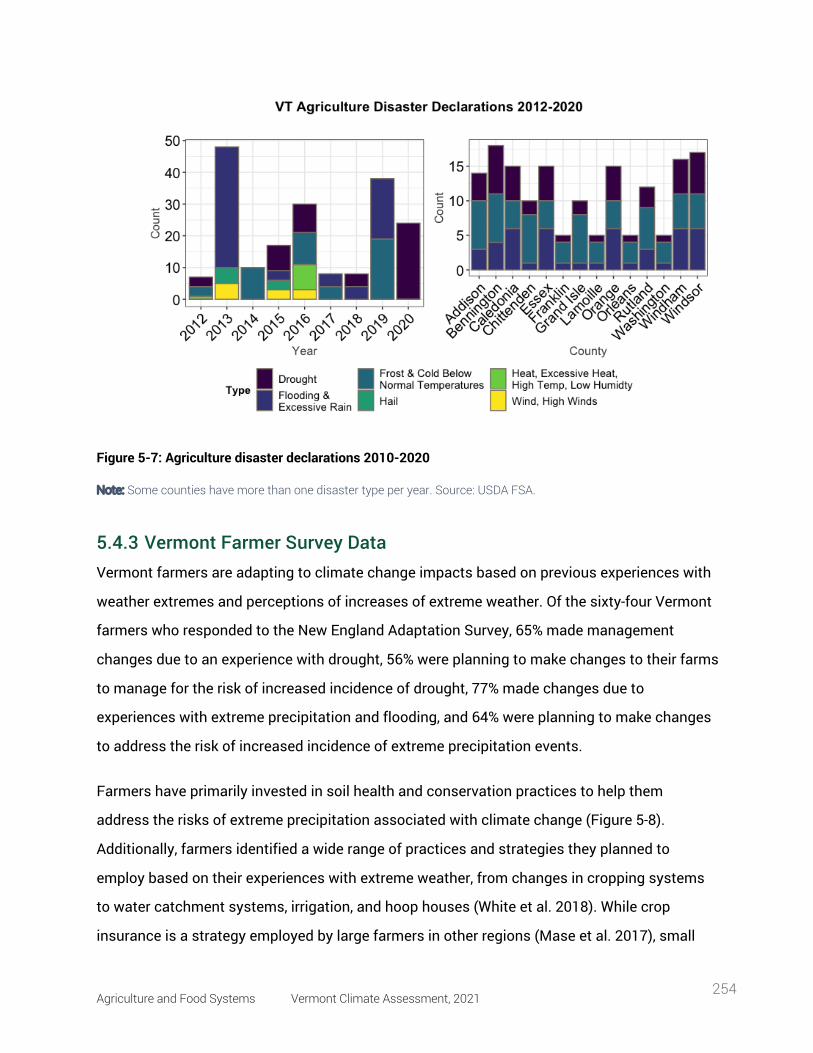
Agriculture and Food Systems Vermont Climate Assessment, 2021 254
Figure 5-7: Agriculture disaster declarations 2010-2020
Note: Some counties have more than one disaster type per year. Source: USDA FSA.
5.4.3 Vermont Farmer Survey Data Vermont farmers are adapting to climate change impacts based on previous experiences with
weather extremes and perceptions of increases of extreme weather. Of the sixty-four Vermont
farmers who responded to the New England Adaptation Survey, 65% made management
changes due to an experience with drought, 56% were planning to make changes to their farms
to manage for the risk of increased incidence of drought, 77% made changes due to
experiences with extreme precipitation and flooding, and 64% were planning to make changes
to address the risk of increased incidence of extreme precipitation events.
Farmers have primarily invested in soil health and conservation practices to help them
address the risks of extreme precipitation associated with climate change (Figure 5-8).
Additionally, farmers identified a wide range of practices and strategies they planned to
employ based on their experiences with extreme weather, from changes in cropping systems
to water catchment systems, irrigation, and hoop houses (White et al. 2018). While crop
insurance is a strategy employed by large farmers in other regions (Mase et al. 2017), small
Agriculture and Food Systems Vermont Climate Assessment, 2021 255
and diversified farms in Vermont report low rates of crop insurance use to address weather
extremes (Figure 5-8).
Most farmers in the region understand their vulnerability to the extreme weather associated
with climate change, but they report that they lack the technical skills and financial capacity to
adequately address climate-related risks and invest in adaptation (White et al. 2018). Research
in Vermont identifies a gap in access to consistent and committed financial tools to support
farmers' capacity to adapt to climate change (White, 2021; White et al., 2018). In focus groups,
producers identified alternative financial safety nets such as community-supported agriculture
groups and emergency relief funds as critical to supporting financial viability of their small and
diversified farms (White and Pankoff, 2019). Farmers have also identified interest and
willingness to participate in payment for ecosystem services (PES) schemes to address both
climate adaptation and mitigation (White, 2021; White and Faulkner, 2019). In the last few
years, a wide range of stakeholders has put effort into exploring the real potential for a healthy
soils PES system to meet multiple goals, including resilience to climate change, increased
carbon sequestration, and enhanced water quality (VAAFM, 2020). A legislature-mandated
working group currently is working to make recommendations for a PES program.
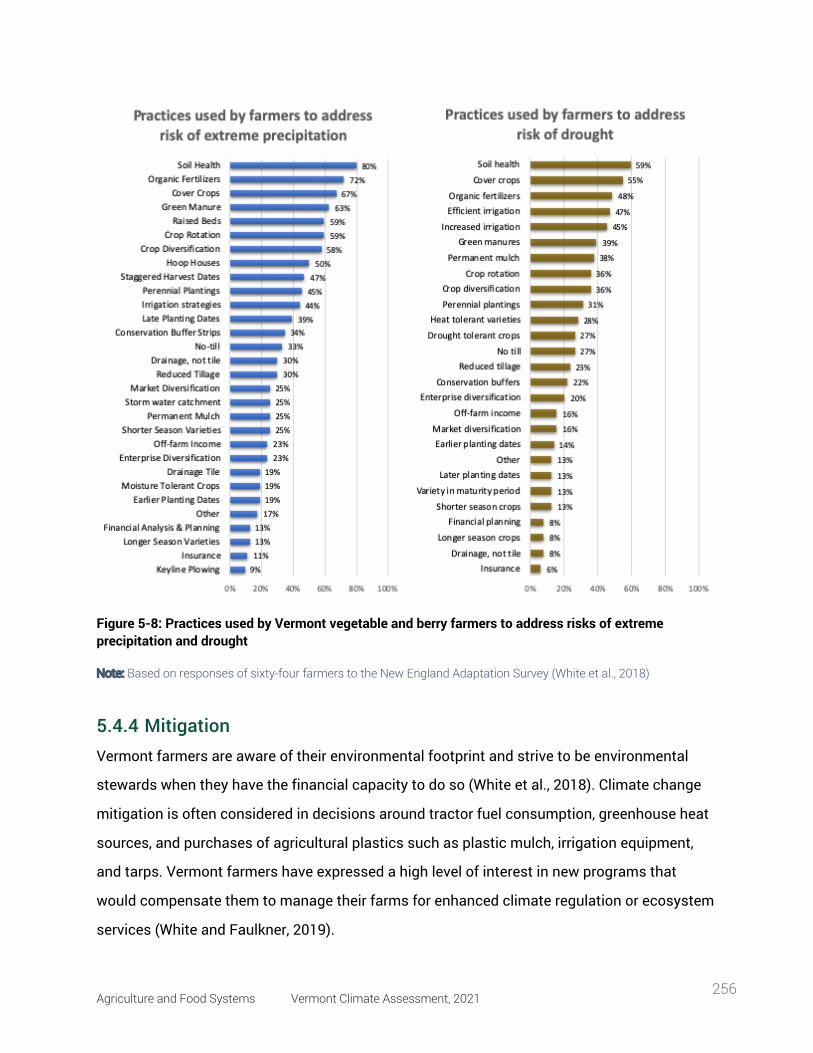
Agriculture and Food Systems Vermont Climate Assessment, 2021 256
Figure 5-8: Practices used by Vermont vegetable and berry farmers to address risks of extreme precipitation and drought
Note: Based on responses of sixty-four farmers to the New England Adaptation Survey (White et al., 2018)
5.4.4 Mitigation Vermont farmers are aware of their environmental footprint and strive to be environmental
stewards when they have the financial capacity to do so (White et al., 2018). Climate change
mitigation is often considered in decisions around tractor fuel consumption, greenhouse heat
sources, and purchases of agricultural plastics such as plastic mulch, irrigation equipment,
and tarps. Vermont farmers have expressed a high level of interest in new programs that
would compensate them to manage their farms for enhanced climate regulation or ecosystem
services (White and Faulkner, 2019).
Agriculture and Food Systems Vermont Climate Assessment, 2021 257
5.4.5 Seed Systems Seed systems (formal or informal activities related to production, dissemination, and access to
seeds) present a critical entry point from which broad-ranging food system challenges can be
addressed. In middle- and low-income countries, informal seed systems maintained by farmers
often house higher degrees of crop intra- and inter-specific diversity (Croft et al., 2018) The
diversity of seeds supplies essential ecosystem services and can act as a buffer in the face of
climate risks. Such ecosystem services include disease and pest suppression, resilience to
climate variability, and agrobiodiversity conservation (Pautasso et al., 2013). Moreover,
through continued on-farm cultivation and subsequent saving and sharing of important
traditional varieties and landraces, informal seed systems allow for the continued evolution
and adaptation of crops to local conditions and to changing climatic pressures (Bellon et al.,
2018).
In contrast, formal seed systems are dominated by commercial seed companies and are often
marked by high degrees of vertical integration, regulation, and uniformity (Gill et al., 2013).
Particularly prominent in high-income countries such as the U.S., formal seed systems often
perpetuate conventional agricultural practices whereby producers try to alter agricultural
landscapes to model the lab conditions (fertilizers, pesticides, irrigation) in which the seeds
were bred. This inadvertently leads to environmental issues (Evenson, 2003) and hinders the
ability of crops to interact with symbiotic organisms (Kiers et al., 2007; Pérez-Jaramillo et al.,
2019; Porter and Sachs, 2020). Seeds that flow through these systems also are often bred for
specific traits, such as high yield (i.e., high yield varieties, HYV), and other traits that focus on
short-term profit and lead to reduced diversity (Bellon et al., 2017). Furthermore, seeds grown
in lab conditions can contribute to biotic and abiotic stress in the field because of the spatial
disconnect between where they are bred (centralized location) and where they are grown (wide
distribution). Continued use of formal seed systems in a changing climate will thus require
more intense breeding cycles (Atlin et al., 2017). However, other models of formal seed
systems do exist, in which seed companies such as High Mowing Organic Seeds in Vermont
represent an alternative to conventional formal seed systems and specialize in organic and
open-pollinated varieties (Helicke, 2015).
Agriculture and Food Systems Vermont Climate Assessment, 2021 258
While it is true that formal systems predominate in the U.S., informal systems continue to
persist in various pockets across the country (Campbell, 2012; Soleri, 2018; Veteto, 2014).
Vermont is no exception, as evidenced by the prevalence of seed libraries and seed-saving
groups. The Vermont Seed Systems survey showed “robust” informal seed systems in
Vermont, such as the Upper Valley Seed Savers (Figure 5-9) (Baxley et al., 2020). Vermont is
also home to the High Mowing Organic Seeds company, which is a prime example of a resilient
and non-GMO formal seed system relative to industry giants like Monsanto. Furthermore,
recent evidence indicates that non-commercial seed growers such as gardeners and seed
savers may be maintaining a high degree of crop diversity (Baxley et al., 2020). As such,
although public and private research communities often have centered their attention around
formal systems (Otieno et al., 2017; Scoones and Thompson, 2011), informal seed systems in
Vermont provide a promising agricultural area that, if supported, can provide valuable
ecosystem services, bolster food security (Fess et al., 2011; Khoury et al., 2014), and assist in
adapting to climate change (Ismail et al., 2013). Also, UVM is planning on saving seeds for
backup and recognizes that continued cultivation and use of informal seed systems is an
important way to adapt to climate change.
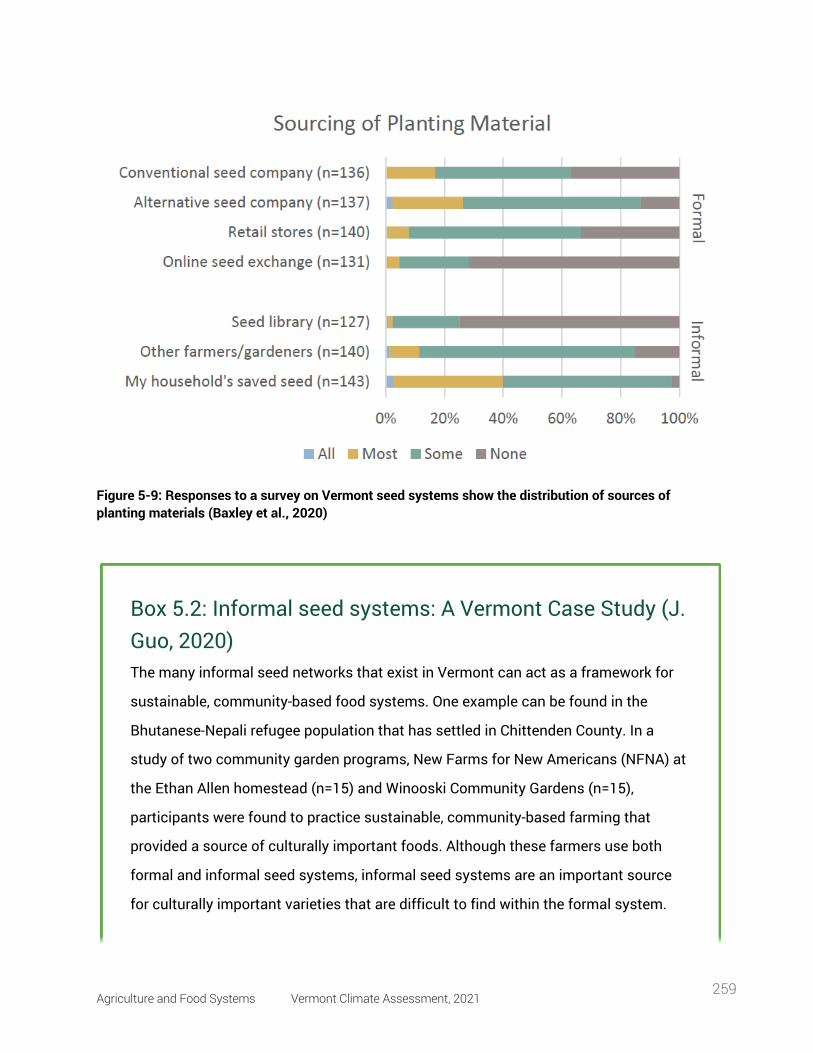
Agriculture and Food Systems Vermont Climate Assessment, 2021 259
Figure 5-9: Responses to a survey on Vermont seed systems show the distribution of sources of planting materials (Baxley et al., 2020)
Box 5.2: Informal seed systems: A Vermont Case Study (J. Guo, 2020) The many informal seed networks that exist in Vermont can act as a framework for
sustainable, community-based food systems. One example can be found in the
Bhutanese-Nepali refugee population that has settled in Chittenden County. In a
study of two community garden programs, New Farms for New Americans (NFNA) at
the Ethan Allen homestead (n=15) and Winooski Community Gardens (n=15),
participants were found to practice sustainable, community-based farming that
provided a source of culturally important foods. Although these farmers use both
formal and informal seed systems, informal seed systems are an important source
for culturally important varieties that are difficult to find within the formal system.
Agriculture and Food Systems Vermont Climate Assessment, 2021 260
5.5 traceable accounts
Traceable accounts describe the confidence level—the degree of certainty in the scientific
evidence—for each key message resulting from this chapter. This analysis is based on the U.S.
Global Change Research Program guidance in the Fourth National Climate Assessment
(USGCRP, 2018).
Moreover, informal seed systems help maintain social relationships between family
members and friends. Indeed, many NFNA farmers share seeds among each other
and can take advantage of greenhouses and their own homes to extend the growing
season and grow crops that are not well adapted to Vermont’s relatively short
growing season. Thus, Bhutanese-Nepali refugees are not only maintaining a valuable
cultural and genetic diversity through their production and subsequent seed saving
but they are also adapting crops to Vermont and diversifying the gardening
landscape of Chittenden County.
There are many examples of how the Bhutanese-Nepali farmers have adapted to
relatively Vermont’s short growing season. In their native countries, the growing
season allows for some varieties of long-growing pumpkins to grow to maturity; while
in Vermont they eat the leaves and shoots from such pumpkins throughout the
growing season though the gourd may not reach maturity by the time the growing
season ends. The community has also experimented with a traditional crop called
tukruke. One farmer tried it out in Vermont, made the necessary adjustments, and
then shared his seeds and knowledge with others; now it is common in the
Bhutanese-Nepali plots at both the Ethan Allen and Winooski gardens.
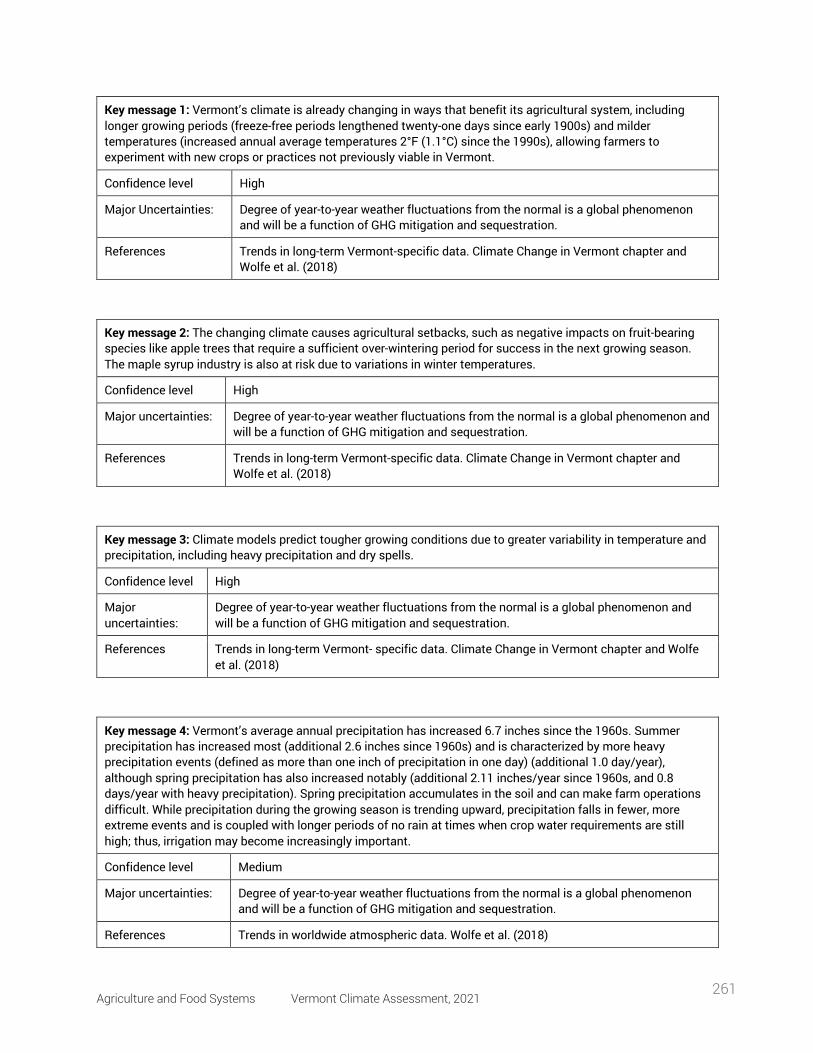
Agriculture and Food Systems Vermont Climate Assessment, 2021 261
Key message 1: Vermont’s climate is already changing in ways that benefit its agricultural system, including longer growing periods (freeze-free periods lengthened twenty-one days since early 1900s) and milder temperatures (increased annual average temperatures 2°F (1.1°C) since the 1990s), allowing farmers to experiment with new crops or practices not previously viable in Vermont.
Confidence level High
Major Uncertainties: Degree of year-to-year weather fluctuations from the normal is a global phenomenon and will be a function of GHG mitigation and sequestration.
References Trends in long-term Vermont-specific data. Climate Change in Vermont chapter and Wolfe et al. (2018)
Key message 2: The changing climate causes agricultural setbacks, such as negative impacts on fruit-bearing species like apple trees that require a sufficient over-wintering period for success in the next growing season. The maple syrup industry is also at risk due to variations in winter temperatures.
Confidence level High
Major uncertainties: Degree of year-to-year weather fluctuations from the normal is a global phenomenon and will be a function of GHG mitigation and sequestration.
References Trends in long-term Vermont-specific data. Climate Change in Vermont chapter and Wolfe et al. (2018)
Key message 3: Climate models predict tougher growing conditions due to greater variability in temperature and precipitation, including heavy precipitation and dry spells.
Confidence level High
Major uncertainties:
Degree of year-to-year weather fluctuations from the normal is a global phenomenon and will be a function of GHG mitigation and sequestration.
References Trends in long-term Vermont- specific data. Climate Change in Vermont chapter and Wolfe et al. (2018)
Key message 4: Vermont’s average annual precipitation has increased 6.7 inches since the 1960s. Summer precipitation has increased most (additional 2.6 inches since 1960s) and is characterized by more heavy precipitation events (defined as more than one inch of precipitation in one day) (additional 1.0 day/year), although spring precipitation has also increased notably (additional 2.11 inches/year since 1960s, and 0.8 days/year with heavy precipitation). Spring precipitation accumulates in the soil and can make farm operations difficult. While precipitation during the growing season is trending upward, precipitation falls in fewer, more extreme events and is coupled with longer periods of no rain at times when crop water requirements are still high; thus, irrigation may become increasingly important.
Confidence level Medium
Major uncertainties: Degree of year-to-year weather fluctuations from the normal is a global phenomenon and will be a function of GHG mitigation and sequestration.
References Trends in worldwide atmospheric data. Wolfe et al. (2018)
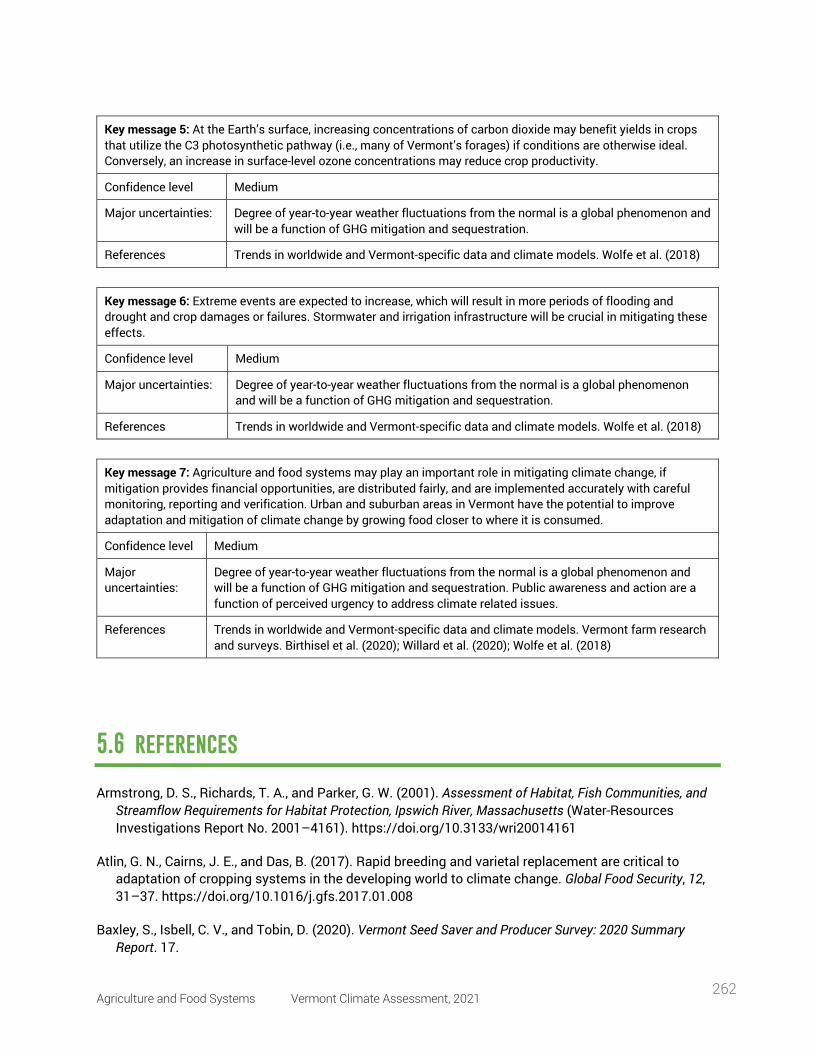
Agriculture and Food Systems Vermont Climate Assessment, 2021 262
Key message 5: At the Earth’s surface, increasing concentrations of carbon dioxide may benefit yields in crops that utilize the C3 photosynthetic pathway (i.e., many of Vermont’s forages) if conditions are otherwise ideal. Conversely, an increase in surface-level ozone concentrations may reduce crop productivity.
Confidence level Medium
Major uncertainties: Degree of year-to-year weather fluctuations from the normal is a global phenomenon and will be a function of GHG mitigation and sequestration.
References Trends in worldwide and Vermont-specific data and climate models. Wolfe et al. (2018)
Key message 6: Extreme events are expected to increase, which will result in more periods of flooding and drought and crop damages or failures. Stormwater and irrigation infrastructure will be crucial in mitigating these effects.
Confidence level Medium
Major uncertainties: Degree of year-to-year weather fluctuations from the normal is a global phenomenon and will be a function of GHG mitigation and sequestration.
References Trends in worldwide and Vermont-specific data and climate models. Wolfe et al. (2018)
Key message 7: Agriculture and food systems may play an important role in mitigating climate change, if mitigation provides financial opportunities, are distributed fairly, and are implemented accurately with careful monitoring, reporting and verification. Urban and suburban areas in Vermont have the potential to improve adaptation and mitigation of climate change by growing food closer to where it is consumed.
Confidence level Medium
Major uncertainties:
Degree of year-to-year weather fluctuations from the normal is a global phenomenon and will be a function of GHG mitigation and sequestration. Public awareness and action are a function of perceived urgency to address climate related issues.
References Trends in worldwide and Vermont-specific data and climate models. Vermont farm research and surveys. Birthisel et al. (2020); Willard et al. (2020); Wolfe et al. (2018)
5.6 references
Armstrong, D. S., Richards, T. A., and Parker, G. W. (2001). Assessment of Habitat, Fish Communities, and Streamflow Requirements for Habitat Protection, Ipswich River, Massachusetts (Water-Resources Investigations Report No. 2001–4161). https://doi.org/10.3133/wri20014161
Atlin, G. N., Cairns, J. E., and Das, B. (2017). Rapid breeding and varietal replacement are critical to adaptation of cropping systems in the developing world to climate change. Global Food Security, 12, 31–37. https://doi.org/10.1016/j.gfs.2017.01.008
Baxley, S., Isbell, C. V., and Tobin, D. (2020). Vermont Seed Saver and Producer Survey: 2020 Summary Report. 17.
Agriculture and Food Systems Vermont Climate Assessment, 2021 263
Bellon, M. R., Dulloo, E., Sardos, J., Thormann, I., and Burdon, J. J. (2017). In situ conservation-harnessing natural and human-derived evolutionary forces to ensure future crop adaptation. Evolutionary Applications, 10(10), 965–977. https://doi.org/10.1111/eva.12521
Bellon, M. R., Mastretta-Yanes, A., Ponce-Mendoza, A., Ortiz-Santamaría, D., Oliveros-Galindo, O., Perales, H., Acevedo, F., and Sarukhán, J. (2018). Evolutionary and food supply implications of ongoing maize domestication by Mexican campesinos. Proceedings of the Royal Society B: Biological Sciences, 285(1885), 20181049. https://doi.org/10.1098/rspb.2018.1049
Birthisel, S. K., Eastman, B. A., Soucy, A. R., Paul, M., Clements, R. S., White, A., Acquafredda, M. P., Errickson, W., Zhu, L.-H., Allen, M. C., Mills, S. A., Dimmig, G., and Dittmer, K. M. (2020). Convergence, continuity, and community: A framework for enabling emerging leaders to build climate solutions in agriculture, forestry, and aquaculture. Climatic Change, 162(4), 2181–2195. https://doi.org/10.1007/s10584-020-02844-w
Bradshaw, T. (2016, June 8). Fire blight symptoms appearing in area orchards. UVM Fruit Blog. https://blog.uvm.edu/fruit/2016/06/08/fire-blight-symptoms-appearing-in-area-orchards/
Campbell, B. (2012). Open-Pollinated Seed Exchange: Renewed Ozark Tradition as Agricultural Biodiversity Conservation. Journal of Sustainable Agriculture, 36(5), 500–522. https://doi.org/10.1080/10440046.2011.630776
Chakraborty, S., and Newton, A. C. (2011). Climate change, plant diseases and food security: An overview: Climate change and food security. Plant Pathology, 60(1), 2–14. https://doi.org/10.1111/j.1365-3059.2010.02411.x
City and County of Honolulu. (2019). Ola: O’ahu Resilience Strategy. https://resilientcitiesnetwork.org/downloadable_resources/Network/Honolulu-Resilience-Strategy-English.pdf
City of Oakland. (2016). Resilient Oakland: It takes a town to thrive. https://resilientcitiesnetwork.org/downloadable_resources/Network/Oakland-Resilience-Strategy-English.pdf
Croft, M. M., Marshall, M. I., Odendo, M., Ndinya, C., Ondego, N. N., Obura, P., and Hallett, S. G. (2018). Formal and Informal Seed Systems in Kenya: Supporting Indigenous Vegetable Seed Quality. The Journal of Development Studies, 54(4), 758–775. https://doi.org/10.1080/00220388.2017.1308487
Dáder, B., Fereres, A., Moreno, A., and Trębicki, P. (2016). Elevated CO2 impacts bell pepper growth with consequences to Myzus persicae life history, feeding behaviour and virus transmission ability. Scientific Reports, 6(1), 19120. https://doi.org/10.1038/srep19120
Debarro, P., and Maelzer, D. (1993). Influence of High-Temperatures on the Survival of Rhopalosiphum-Padi (L) (Hemiptera, Aphididae) in Irrigated Perennial Grass Pastures in South-Australia. Australian Journal of Zoology, 41(2), 123. https://doi.org/10.1071/ZO9930123
Eastburn, D. M., Degennaro, M. M., Delucia, E. H., Dermody, O., and Mcelrone, A. J. (2010). Elevated atmospheric carbon dioxide and ozone alter soybean diseases at SoyFACE: Atmospheric change alters diseases at SoyFACE. Global Change Biology, 16(1), 320–330. https://doi.org/10.1111/j.1365-2486.2009.01978.x
Agriculture and Food Systems Vermont Climate Assessment, 2021 264
Evenson, R. E. (2003). Assessing the Impact of the Green Revolution, 1960 to 2000. Science, 300(5620), 758–762. https://doi.org/10.1126/science.1078710
Fess, T. L., Kotcon, J. B., and Benedito, V. A. (2011). Crop Breeding for Low Input Agriculture: A Sustainable Response to Feed a Growing World Population. Sustainability, 3(10), 1742–1772. https://doi.org/10.3390/su3101742
Gill, T., Bates, R., Bicksler, A., Burnette, R., Ricciardi, V., and Yoder, L. (2013). Strengthening Informal Seed Systems to Enhance Food Security in Southeast Asia. Journal of Agriculture, Food Systems, and Community Development, 139–153. https://doi.org/10.5304/jafscd.2013.033.005
Guo, H., Sun, Y., Li, Y., Liu, X., Zhang, W., and Ge, F. (2014). Elevated CO 2 decreases the response of the ethylene signaling pathway in Medicago truncatula and increases the abundance of the pea aphid. New Phytologist, 201(1), 279–291. https://doi.org/10.1111/nph.12484
Guo, J. (2020). Seed Systems of Bhutanese-Nepali Refugee Gardeners: Making Place in Chittenden County, Vermont [MS]. UVM.
Helicke, N. A. (2015). Seed exchange networks and food system resilience in the United States. Journal of Environmental Studies and Sciences, 5(4), 636–649. https://doi.org/10.1007/s13412-015-0346-5
Hirschi, M., Stoeckli, S., Dubrovsky, M., Spirig, C., Calanca, P., Rotach, M. W., Fischer, A. M., Duffy, B., and Samietz, J. (2012). Downscaling climate change scenarios for apple pest and disease modeling in Switzerland. Earth System Dynamics, 3(1), 33–47. https://doi.org/10.5194/esd-3-33-2012
Ismail, A. M., Singh, U. S., Singh, S., Dar, M. H., and Mackill, D. J. (2013). The contribution of submergence-tolerant (Sub1) rice varieties to food security in flood-prone rainfed lowland areas in Asia. Field Crops Research, 152, 83–93. https://doi.org/10.1016/j.fcr.2013.01.007
Kavet. (2020). The Vermont Farming, Food Production, and Food Distribution Industries, 2020 Update.
Khoury, C. K., Bjorkman, A. D., Dempewolf, H., Ramirez-Villegas, J., Guarino, L., Jarvis, A., Rieseberg, L. H., and Struik, P. C. (2014). Increasing homogeneity in global food supplies and the implications for food security. Proceedings of the National Academy of Sciences, 111(11), 4001–4006. https://doi.org/10.1073/pnas.1313490111
Kiers, E. T., Hutton, M. G., and Denison, R. F. (2007). Human selection and the relaxation of legume defences against ineffective rhizobia. Proceedings of the Royal Society B: Biological Sciences, 274(1629), 3119–3126. https://doi.org/10.1098/rspb.2007.1187
King, K. W., Williams, M. R., Macrae, M. L., Fausey, N. R., Frankenberger, J., Smith, D. R., Kleinman, P. J. A., and Brown, L. C. (2015). Phosphorus Transport in Agricultural Subsurface Drainage: A Review. Journal of Environmental Quality, 44(2), 467–485. https://doi.org/10.2134/jeq2014.04.0163
Lin, X., Ruess, P. J., Marston, L., and Konar, M. (2019). Food flows between counties in the United States. Environmental Research Letters, 14(8), 084011. https://doi.org/10.1088/1748-9326/ab29ae
Madramootoo, C. A. (1999). Planning and Design of Drainage Systems. In R. W. Skaggs and J. van Schilfgaarde (Eds.), Agronomy Monographs (pp. 871–892). American Society of Agronomy, Crop Science Society of America, Soil Science Society of America.
Agriculture and Food Systems Vermont Climate Assessment, 2021 265
https://doi.org/10.2134/agronmonogr38.c26
Mase, A. S., Gramig, B. M., and Prokopy, L. S. (2017). Climate change beliefs, risk perceptions, and adaptation behavior among Midwestern U.S. crop farmers. Climate Risk Management, 15, 8–17. https://doi.org/10.1016/j.crm.2016.11.004
McCallum, K. (2020). Drought Disaster Declared for 10 Vermont Counties | Off Message [News]. Seven Days VT. https://www.sevendaysvt.com/OffMessage/archives/2020/11/17/drought-disaster-declared-for-10-vermont-counties
Moore, J. (2016). Literature Review: Tile Drainage and Phosphorus Losses from Agricultural Land (Technical Report No. 83; p. 79). Stone Environmental.
Moretti, C. L., Mattos, L. M., Calbo, A. G., and Sargent, S. A. (2010). Climate changes and potential impacts on postharvest quality of fruit and vegetable crops: A review. Food Research International, 43(7), 1824–1832. https://doi.org/10.1016/j.foodres.2009.10.013
National Integrated Drought Information System. (n.d.). Drought in Vermont from 2000-Present. National Integrated Drought Information System. Retrieved March 12, 2021, from https://www.drought.gov/states/vermont#:~:text=Drought%20in%20Vermontandtext=The%20U.S.%20Drought%20Monitor%20started,affected%2029.39%25%20of%20Vermont%20land
Nickerson, G., Grunbinger, V., Nwadike, L., and Blevins, L. (2013). Frequently asked questions about handling flooded produce (p. 8). University of Vermont.
Oehme, V., Högy, P., Zebitz, C. P. W., and Fangmeier, A. (2013). Effects of elevated atmospheric CO 2 concentrations on phloem sap composition of spring crops and aphid performance. Journal of Plant Interactions, 8(1), 74–84. https://doi.org/10.1080/17429145.2012.736200
Otieno, G. A., Reynolds, T. W., Karasapan, A., and Noriega, I. L. (2017). Implications of Seed Policies for On-Farm Agro-Biodiversity in Ethiopia and Uganda. Sustainable Agriculture Research, 6(4), 12. https://doi.org/10.5539/sar.v6n4p12
Pautasso, M., Aistara, G., Barnaud, A., Caillon, S., Clouvel, P., Coomes, O. T., Delêtre, M., Demeulenaere, E., De Santis, P., Döring, T., Eloy, L., Emperaire, L., Garine, E., Goldringer, I., Jarvis, D., Joly, H. I., Leclerc, C., Louafi, S., Martin, P., … Tramontini, S. (2013). Seed exchange networks for agrobiodiversity conservation. A review. Agronomy for Sustainable Development, 33(1), 151–175. https://doi.org/10.1007/s13593-012-0089-6
Pérez-Jaramillo, J. E., de Hollander, M., Ramírez, C. A., Mendes, R., Raaijmakers, J. M., and Carrión, V. J. (2019). Deciphering rhizosphere microbiome assembly of wild and modern common bean (Phaseolus vulgaris) in native and agricultural soils from Colombia. Microbiome, 7(1), 114. https://doi.org/10.1186/s40168-019-0727-1
Porter, S. S., and Sachs, J. L. (2020). Agriculture and the Disruption of Plant–Microbial Symbiosis. Trends in Ecology and Evolution, 35(5), 426–439. https://doi.org/10.1016/j.tree.2020.01.006
Raza, A., Razzaq, A., Mehmood, S., Zou, X., Zhang, X., Lv, Y., and Xu, J. (2019). Impact of Climate Change on Crops Adaptation and Strategies to Tackle Its Outcome: A Review. Plants, 8(2), 34. https://doi.org/10.3390/plants8020034
Agriculture and Food Systems Vermont Climate Assessment, 2021 266
Robinson, E. A., Ryan, G. D., and Newman, J. A. (2012). A meta-analytical review of the effects of elevated CO2 on plant–arthropod interactions highlights the importance of interacting environmental and biological variables. New Phytologist, 194(2), 321–336. https://doi.org/10.1111/j.1469-8137.2012.04074.x
Scoones, I., and Thompson, J. (2011). The Politics of Seed in Africa’s Green Revolution: Alternative Narratives and Competing Pathways. IDS Bulletin, 42(4), 1–23. https://doi.org/10.1111/j.1759-5436.2011.00232.x
Soleri, D. (2018). Civic seeds: new institutions for seed systems and communities—a 2016 survey of California seed libraries. Agriculture and Human Values, 35(2), 331–347. https://doi.org/10.1007/s10460-017-9826-4
Stafne, E. T. (2020). Chilling-Hour Requirements of Fruit Crops. 2.
Tan, C. S., and Zhang, T. Q. (2011). Surface runoff and sub-surface drainage phosphorus losses under regular free drainage and controlled drainage with sub-irrigation systems in southern Ontario. Canadian Journal of Soil Science, 91(3), 349–359. https://doi.org/10.4141/cjss09086
Trębicki, P., and Finlay, K. (2018). Pests and Diseases under Climate Change; Its Threat to Food Security. In S. S. Yadav, R. J. Redden, J. L. Hatfield, A. W. Ebert, and D. Hunter, Food Security and Climate Change (pp. 229–249). John Wiley and Sons, Ltd. https://doi.org/10.1002/9781119180661.ch11
Trenberth, K. (2011). Changes in precipitation with climate change. Climate Research, 47(1), 123–138. https://doi.org/10.3354/cr00953
USGCRP. (2018). Impacts, Risks, and Adaptation in the United States: Fourth National Climate Assessment, Volume II: [Reidmiller, D.R., C.W. Avery, D.R. Easterling, K.E. Kunkel, K.L.M. Lewis, T.K. Maycock, and B.C. Stewart (eds.)]. U.S. Global Change Research Program, Washington, DC, USA, 1515 pp. doi: 10.7930/NCA4.2018.
USGCRP (2018). Impacts, Risks, and Adaptation in the United States: Fourth National Climate Assessment, Volume II: [Reidmiller, D.R., C.W. Avery, D.R. Easterling, K.E. Kunkel, K.L.M. Lewis, T.K. Maycock, and B.C. Stewart (eds.)]. U.S. Global Change Research Program, Washington, DC, USA, 1515 pp. doi: 10.7930/NCA4.2018.
USGS. (2021a). Downscaled Climate Change Modeling for the Conterminous United States (National Assessment). https://www.usgs.gov/centers/casc-sc/science/downscaled-climate-change-modeling-conterminous-united-states-national?qt-science_center_objects=0#qt-science_center_objects
USGS. (2021b). USGS Current Water Data for Vermont. https://waterdata.usgs.gov/vt/nwis/rt
VAAFM (Vermont Agency of Agriculture, Food and Markets). (2020). Soil conservation practices and payment for ecosystem services working group report. Prepared for the Vermont General Assembly in Accordance with Act No. 83, Section 3 (p. 44). Vermont Agency of Agriculture, Food and Markets.
Veteto, J. R. (2014). Seeds of Persistence: Agrobiodiversity in the American Mountain South. Culture, Agriculture, Food and Environment, 36(1), 17–27. https://doi.org/10.1111/cuag.12026
Agriculture and Food Systems Vermont Climate Assessment, 2021 267
White, A. (2021, December 19). The Use of Crop Insurance for Climate Resilience on Vegetable and Fruit Farms in the Northeast: Insights from the New England Adaptation Survey. https://na.eventscloud.com/file_uploads/a1665c86ae3c21daf15709fc882284ef_White_NEAdaptationSurveyWaterSymposium1.pdf
White, A., and Faulkner, J. (2019). Enhancing participation in payment for ecosystem services programs: Understanding farmer perspectives. https://www.uvm.edu/sites/default/files/The-Center-for-Sustainable-Agriculture/farmer_perspectives_on_PES_AW_JF_working_version.pdf
White, A., Faulkner, J., Sims, S., Tucker, P., and Weatherhogg, K. (2018). The 2017-2018 New England Adaptation Survey for Vegetable and Fruit Growers: Preliminary Results (p. 38) [Survey]. University of Vermont.
White, A., and Pankoff, A. (2019). Resources for climate resilience: Listening tour with 173 farmers from Pennsylvania to Prince Edward Island [Unpublished Raw Data].
Willard, A., Harris, K., Kahler, E., Claro, J., Danly, S., and Warren, B. (2020). Vermont Agriculture and Food System Plan: 2020. 110. https://agriculture.vermont.gov/document/vermont-agriculture-and-food-system-plan-2020
Wolfe, D. W., DeGaetano, A. T., Peck, G. M., Carey, M., Ziska, L. H., Lea-Cox, J., Kemanian, A. R., Hoffmann, M. P., and Hollinger, D. Y. (2018). Unique challenges and opportunities for northeastern US crop production in a changing climate. Climatic Change, 146(1–2), 231–245. https://doi.org/10.1007/s10584-017-2109-7
Energy Vermont Climate Assessment, 2021 268
6 energy
Recommended Citation for Chapter Kelly-Gorham, M., 2021. Energy. In Galford, G.L., Faulkner, J. et al. (Eds), The Vermont Climate Assessment 2021. Burlington, Vermont: Gund Institute for Environment at the University of Vermont. On the web: https://vtclimate.org
Molly Rose Kelly-Gorham Department of Electrical and Biomedical Engineering, IGERT Trainee, Gund Institute for the Environment, University of Vermont, Burlington, VT 05401
Energy Vermont Climate Assessment, 2021 269
6.1 key messages
1. Vermont drivers have the highest average miles traveled per capita in the Northeast
United States. Transportation is the largest source of greenhouse gas emissions in
Vermont. Thermal energy use is a close second to the largest source of greenhouse
gas emissions in Vermont, and the largest use of energy. Reducing energy use in these
sectors by choosing more efficient vehicles, selecting heat sources with less
emissions, and weatherizing homes will help Vermont meet its energy goals.
2. The electricity in Vermont has the lowest carbon intensity in the country. Electrifying
transportation and thermal energy use will significantly reduce Vermont’s carbon
footprint.
3. In the short term, there is extra power line capacity to serve significantly more load in
Vermont; however, some areas of Vermont have limited capacity to support further
renewable energy generation. Areas where there is limited generation hosting capacity
could be prioritized to shift local energy use to electricity to reduce congestion on local
transmission lines. The priority in areas with extra generation hosting capacity can be
two-fold: building new renewable generation and electrifying local energy use.
4. The storms that cause the most frequent power outages are expected to become more
intense in the future, increasing the frequency of power outages, particularly in winter.
Vermont can increase its energy resilience with distributed solar and storage,
secondary heating systems (e.g., wood), and community buildings with resilient
heating solutions.
6.2 background/overview
Climate change and energy use are interdependent. The release of greenhouse gases (GHGs)
into the atmosphere from the use of fossil fuels drives climate change (see Climate Change in
Vermont chapter), and conversely the changing climate heavily impacts energy infrastructure
Energy Vermont Climate Assessment, 2021 270
by increasing storm intensities and weather variability. Changing climate patterns—such as
the warming arctic leading to lower wind speeds and increasing temperatures—decrease wind
and solar production efficiency (Solaun and Cerdá, 2019), decrease the capacity of electric
power lines, and increase the need for cooling in thermal power plants. More frequent periods
of drought induced by climate change can impact water supplies available for hydro
generation and thermal generator cooling needs (Zhou et al., 2020). Climate change also
impacts energy use in varying ways, increasing the cooling needs in the summer, while
creating large variability in winter heating, making needs harder to predict beyond short-term
temperature estimates.
Historical decisions made within the energy sector have had a negative impact on the
environment and human health. Now, balancing the immediate needs of communities
(thermal, transportation, etc.) with the need to address climate change is a challenge faced
across sectors. As shown in Figure 6-1, energy use (which includes thermal, transportation,
and electricity) was responsible for 76% of Vermont’s GHG emissions in 2018. Those
emissions are not yet decreasing at the rate needed to reach Vermont’s climate goals.
Increases in the use of low/no greenhouse emission energy sources for transportation and
thermal energy uses and improvements in the efficiency of transportation and thermal energy
uses have the best potential to greatly reduce greenhouse gas emissions in the state.
One way to reduce total emissions is to look across sectors for wasted energy, so that wasted
energy in one sector that can be captured for use in different sectors. Consider, for example,
Vermont’s “cow power” program, which reduces methane production from manure by
capturing it and burning it as a biofuel to produce electricity (Levine 2013). While CO2 is
produced when methane is burned, methane has about eight times the global warming
potential of CO2; additionally, GHG emissions are offset by producing usable energy that would
otherwise have been generated another way. This program reduces net GHG emissions by
using emissions from the agriculture sector for use in the electricity or thermal sectors.
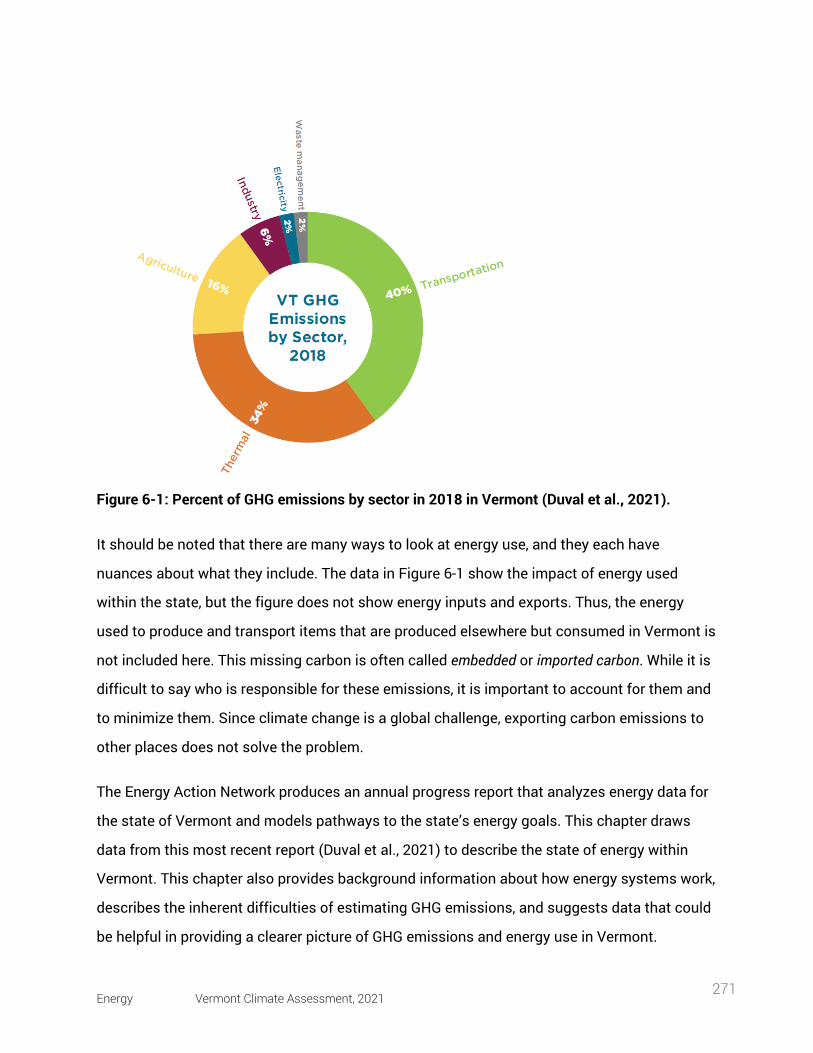
Energy Vermont Climate Assessment, 2021 271
Figure 6-1: Percent of GHG emissions by sector in 2018 in Vermont (Duval et al., 2021).
It should be noted that there are many ways to look at energy use, and they each have
nuances about what they include. The data in Figure 6-1 show the impact of energy used
within the state, but the figure does not show energy inputs and exports. Thus, the energy
used to produce and transport items that are produced elsewhere but consumed in Vermont is
not included here. This missing carbon is often called embedded or imported carbon. While it is
difficult to say who is responsible for these emissions, it is important to account for them and
to minimize them. Since climate change is a global challenge, exporting carbon emissions to
other places does not solve the problem.
The Energy Action Network produces an annual progress report that analyzes energy data for
the state of Vermont and models pathways to the state’s energy goals. This chapter draws
data from this most recent report (Duval et al., 2021) to describe the state of energy within
Vermont. This chapter also provides background information about how energy systems work,
describes the inherent difficulties of estimating GHG emissions, and suggests data that could
be helpful in providing a clearer picture of GHG emissions and energy use in Vermont.
Energy Vermont Climate Assessment, 2021 272
The remainder of the chapter is laid out as follows. Section 6.3 describes energy uses in
Vermont, followed by a high-level overview of the energy planning process and equity of
energy use in section 6.4. Finally, section 6.5 describes how expected climate change impacts
are likely to effect energy infrastructure and offers potential pathways toward resilient energy
systems.
6.3 energy use in vermont
Delivering the energy whenever someone decides to turn on a lightbulb, fill a car’s gas tank or
battery, and turn up the heat takes enormous preparation, large networks of interdependent
infrastructure, and constant monitoring. The energy in each of these examples is considered
site energy, as opposed to primary or source energy. Primary or source energy includes energy
losses during the transportation and conversion (as is the case with electricity) of the energy.
This section gives an overview of the use of energy within Vermont, covering the primary
sources of energy, the flow and conversion of that energy into usable forms, and the end uses
of energy.
Figure 6-2 shows the flow chart for Vermont’s energy use in 2014 (top) and 2018 (bottom),
capturing the whole system from the sources of energy to the end uses. In light gray is the
rejected energy, which is energy available in the resource (included in the source energy) but
not captured in the conversion to usable energy. The dark grey bands depict energy services,
which include all the energy that was used for the intended purpose, be that heating a home,
powering lights, or accelerating a car. The estimated rejected energy— energy available in the
resource but not captured into usable energy—is accounted for. The conversion into electricity
and the flow from the source to different users is shown through the charts’ many
connections. It is worth noting that accounting for energy use in Vermont is inexact, since it is
difficult to accurately model the primary energy sources of electricity that are imported and
the GHG emissions associated with manufacturing, transportation of products sold within the
state, and other embedded and imported emissions (Davis & Caldeira, 2010).
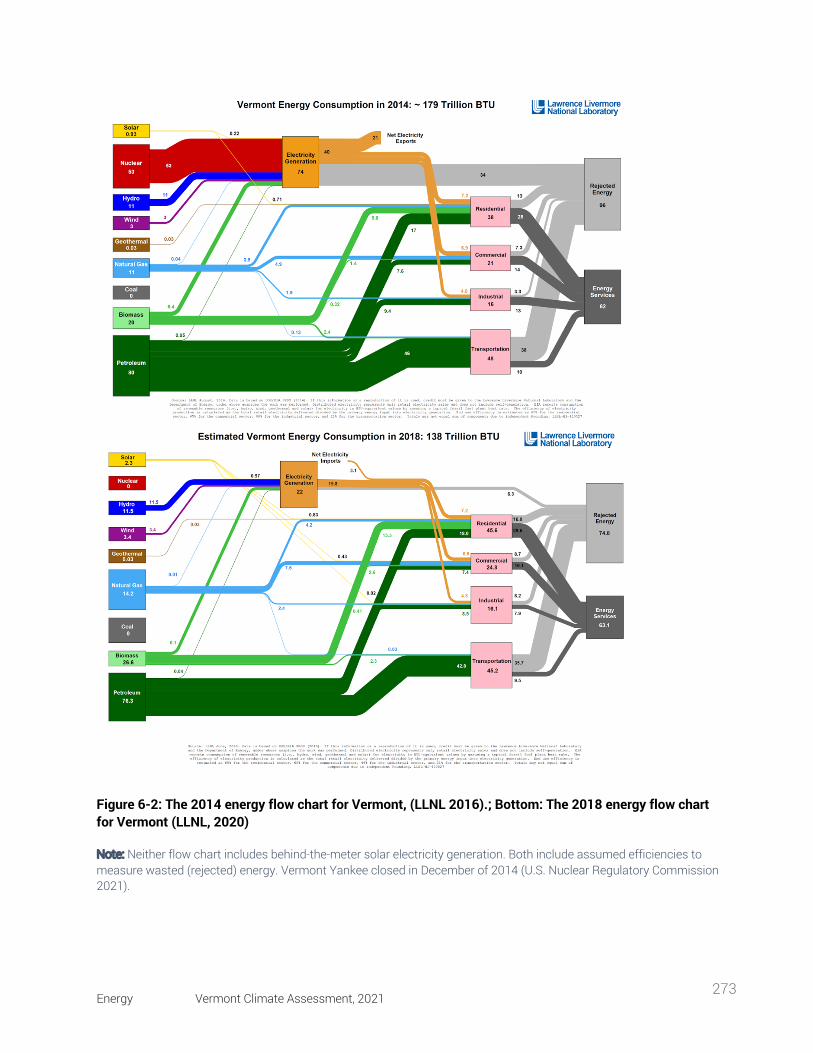
Energy Vermont Climate Assessment, 2021 273
Figure 6-2: The 2014 energy flow chart for Vermont, (LLNL 2016).; Bottom: The 2018 energy flow chart for Vermont (LLNL, 2020)
Note: Neither flow chart includes behind-the-meter solar electricity generation. Both include assumed efficiencies to measure wasted (rejected) energy. Vermont Yankee closed in December of 2014 (U.S. Nuclear Regulatory Commission 2021).
Energy Vermont Climate Assessment, 2021 274
6.3.1 Primary Energy Sources Primary energy sources include not only energy that is used in the state of Vermont, but also
the energy that is lost in the process of mining, transporting, converting, and using that energy.
Sometimes called source energy, primary energy sources come straight from mines, fracking
wells, dams, solar radiance, etc. The source energy attributed to Vermont in 2014 and 2018 is
displayed in Figure 6-3.
The sources of energy that were used in Vermont in 2014 include solar, nuclear, hydro, wind,
geothermal, natural gas, biomass, and petroleum. In 2014 Vermont Yankee was closed for
good, and the difference between the top and bottom images in Figure 6-2 illustrates the large
effect of the closure in the reduction in wasted energy, labeled rejected energy in the flow
chart, and the switch from 21 BTU equivalent electricity exports to 3.1 BTU equivalent
electricity imports.
Vermont’s sources of energy in 2018 included solar, hydro, wind, geothermal, natural gas,
biomass, and petroleum, in addition to energy sources imported from other states and Canada
to serve Vermont’s electric load. The Water Resources chapter of this report discusses
changes in water usage from the shutdown of Vermont Yankee. Many state policies have
interacted to lead to the transition seen in the energy generation in the state, this is discussed
further later in this chapter.
Not only does the state import electricity, but most of the energy that is used within the state
is imported. Source energy can be broken down into sectors, as shown in the top row of the
chart in Figure 6-3. Transportation and heating account for most of the energy use in the state
and the lion’s share of the nonrenewable energy use in the state. Also shown in Figure 6-3 is
the site energy—e.g., the gas pumped into a car or the electricity used by an electric kettle to
boil water—which still includes some of the rejected energy shown in Figure 6-2. There is a
significant amount of waste heat produced by internal combustion engine vehicles, and even
an electric kettle wastes some electricity into waste heat. However, to become categorized as
site energy, the primary source energy must first arrive in the expected form on site.
Energy Vermont Climate Assessment, 2021 275
6.3.2 Energy Flow and Conversion Whether energy comes from a mine, a dam, or a wind/solar farm, it must be both converted
and transported, sometimes multiple times, in order to arrive in a useful form at its end-use
location. The process of transporting energy can occur before or after converting. Petroleum
products must go through a facility to separate the components; natural gas is often
transported through pipelines. Various energy sources are converted into electricity and
transported in that form through the transmission network. Vermont’s electric network is a
small part of the Eastern interconnect, which covers the continental U.S. east of the
Mississippi River. There are losses during the transportation and conversion of energy, and
there are limitations on the capacity of pipelines to store and transfer petroleum or natural gas
and of electric grid wires to provide power.
Vermont is unique in that almost all its energy flows from sources outside the state. There are
no fossil fuel mines in the state, so all petroleum products—i.e., gasoline, fuel oil, and natural
gas—used within the state are imported. The infrastructure in the state is shown in Figure 6-4.
In 2014, the state was exporting electricity to other states for 73% of the hours in the year, but
in 2015, Vermont was importing electricity for 84% of the hours in the year (VELCO, 2021). In
other words, the state switched from exporting power during the majority of the year to
importing power during the majority of the year. The wood harvested for thermal energy each
year is about 50% of the new growth in the state (Burlington Electric Department 2019).
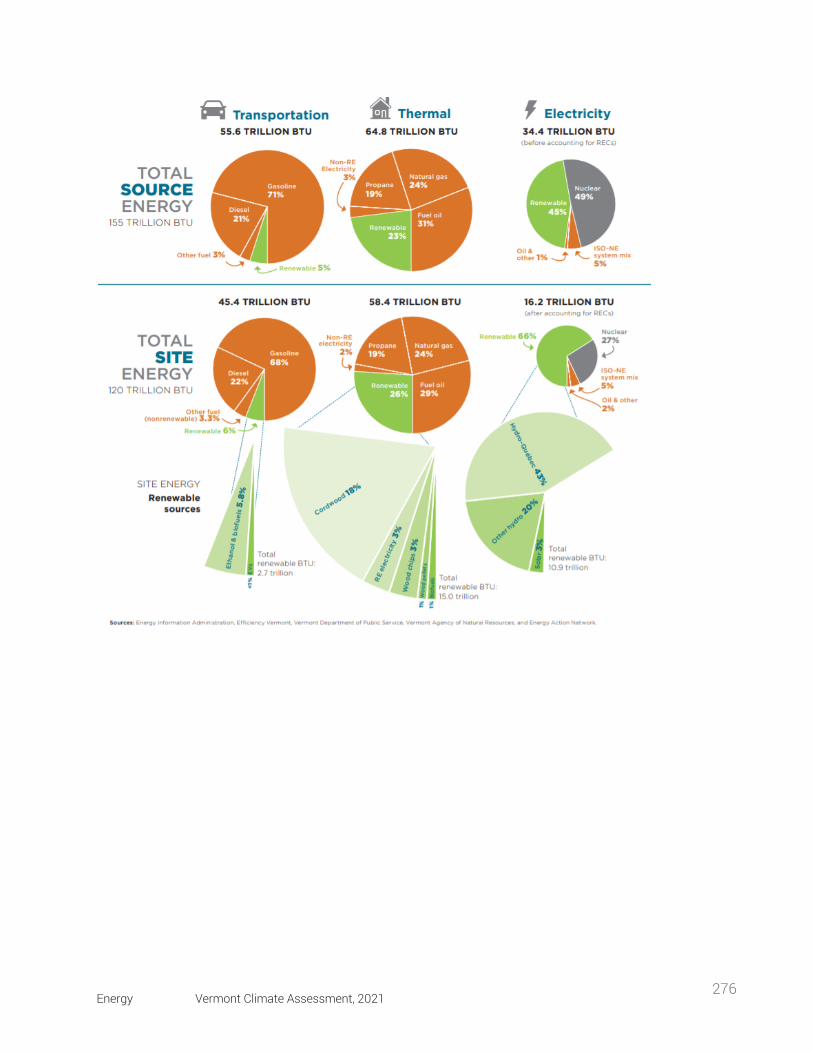
Energy Vermont Climate Assessment, 2021 276
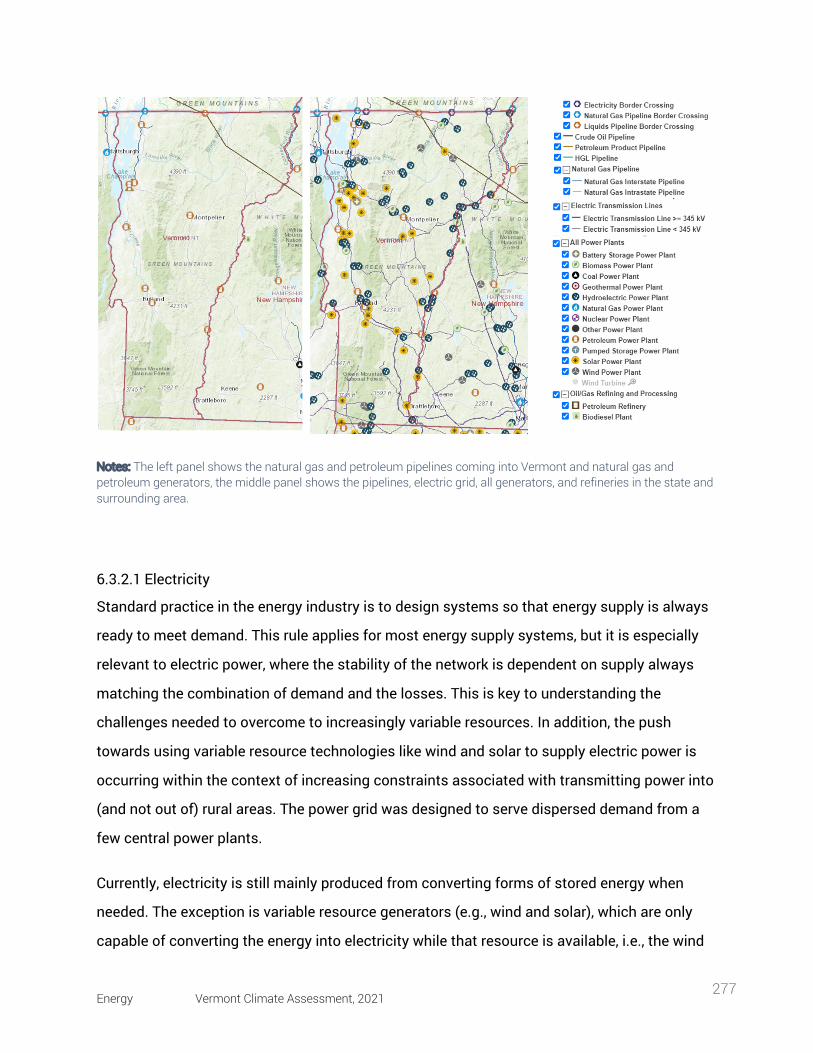
Energy Vermont Climate Assessment, 2021 277
Notes: The left panel shows the natural gas and petroleum pipelines coming into Vermont and natural gas and petroleum generators, the middle panel shows the pipelines, electric grid, all generators, and refineries in the state and surrounding area.
6.3.2.1 Electricity
Standard practice in the energy industry is to design systems so that energy supply is always
ready to meet demand. This rule applies for most energy supply systems, but it is especially
relevant to electric power, where the stability of the network is dependent on supply always
matching the combination of demand and the losses. This is key to understanding the
challenges needed to overcome to increasingly variable resources. In addition, the push
towards using variable resource technologies like wind and solar to supply electric power is
occurring within the context of increasing constraints associated with transmitting power into
(and not out of) rural areas. The power grid was designed to serve dispersed demand from a
few central power plants.
Currently, electricity is still mainly produced from converting forms of stored energy when
needed. The exception is variable resource generators (e.g., wind and solar), which are only
capable of converting the energy into electricity while that resource is available, i.e., the wind
Energy Vermont Climate Assessment, 2021 278
is blowing where wind generators are located, the sun is shining on solar panels, and the water
is flowing in rivers with run-of-river hydro generation. The forms of stored energy used to
generate electricity when there is electric demand include hydro (with large dams), biomass,
natural gas, and petroleum. There are losses in the transmission of electricity from the
generators to the end users. However, those losses are small compared with conversion
losses that result in waste heat. If not considering embedded emissions, Vermont’s electricity
is currently responsible for the lowest GHG emissions of any United States state’s electricity
profile (Duval et al., 2021). It is worth noting that any GHG emissions that occurred from
energy sources designated renewable are not considered.
6.3.2.2 Natural Gas
Vermont Gas is the only natural gas supplier in the state. It imports gas from Canada to
Chittenden, Franklin, and Addison counties. Natural gas is supplied through underground
pipelines to personal residences and businesses. Natural gas mainly supports the thermal
sector. Energy from natural gas that has been converted into electricity (outside the state) is
imported with the regional electric grid system mix and used to supply the state’s electricity
demand. The impact of using natural gas to heat depends on the efficiency of the heater and
the weatherization of the building.
6.3.2.3 Other Transported Energy
Wood, oil, propane, gasoline, diesel, and biofuels are all transported by pipelines, cargo ships,
trains, and vehicles to homes and businesses before being converted from chemically stored
energy into usable and waste heat energy used for our thermal, transportation, and electricity
needs. Vermont only has one petroleum pipeline coming through the northeast corner of the
state (Figure 6-4), so our fuel comes from ports on Lake Champlain, cargo trains, and trucks
into the state.
6.3.3 End Uses and Impacts As seen in Figure 6-3, thermal uses the most energy in Vermont, followed closely by
transportation. However, transportation is responsible for 40% of the state's GHG emissions,
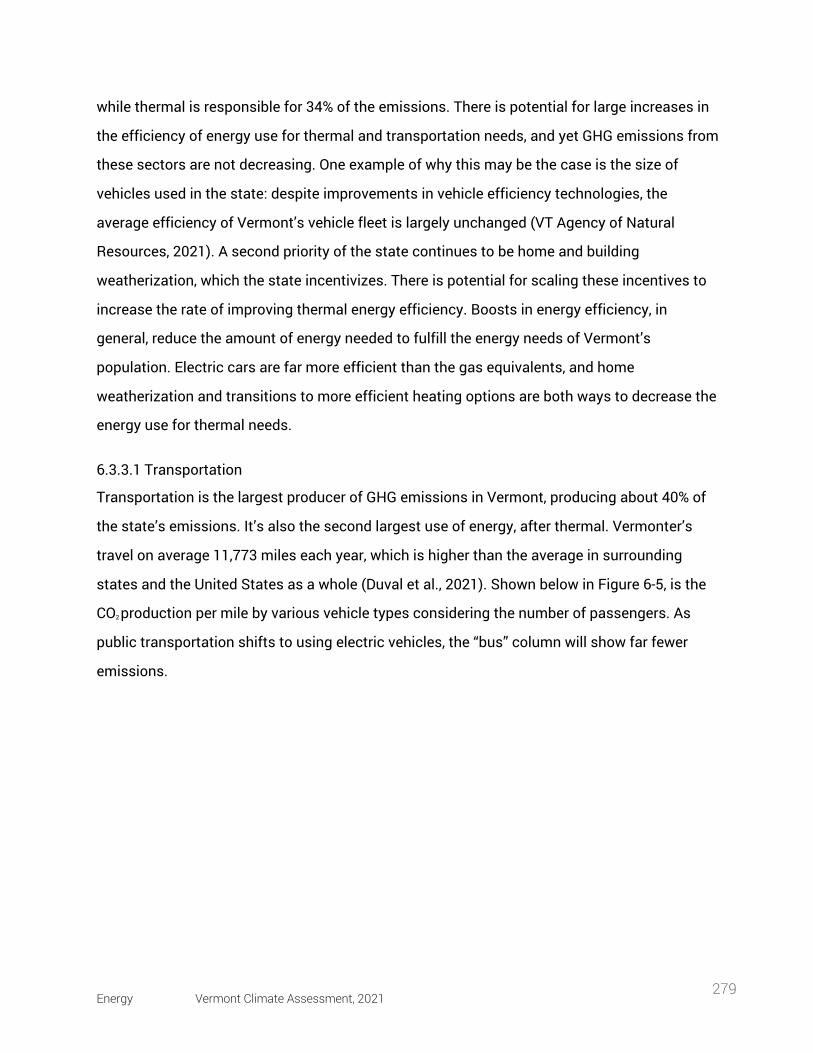
Energy Vermont Climate Assessment, 2021 279
while thermal is responsible for 34% of the emissions. There is potential for large increases in
the efficiency of energy use for thermal and transportation needs, and yet GHG emissions from
these sectors are not decreasing. One example of why this may be the case is the size of
vehicles used in the state: despite improvements in vehicle efficiency technologies, the
average efficiency of Vermont’s vehicle fleet is largely unchanged (VT Agency of Natural
Resources, 2021). A second priority of the state continues to be home and building
weatherization, which the state incentivizes. There is potential for scaling these incentives to
increase the rate of improving thermal energy efficiency. Boosts in energy efficiency, in
general, reduce the amount of energy needed to fulfill the energy needs of Vermont’s
population. Electric cars are far more efficient than the gas equivalents, and home
weatherization and transitions to more efficient heating options are both ways to decrease the
energy use for thermal needs.
6.3.3.1 Transportation
Transportation is the largest producer of GHG emissions in Vermont, producing about 40% of
the state’s emissions. It’s also the second largest use of energy, after thermal. Vermonter’s
travel on average 11,773 miles each year, which is higher than the average in surrounding
states and the United States as a whole (Duval et al., 2021). Shown below in Figure 6-5, is the
CO2 production per mile by various vehicle types considering the number of passengers. As
public transportation shifts to using electric vehicles, the “bus” column will show far fewer
emissions.
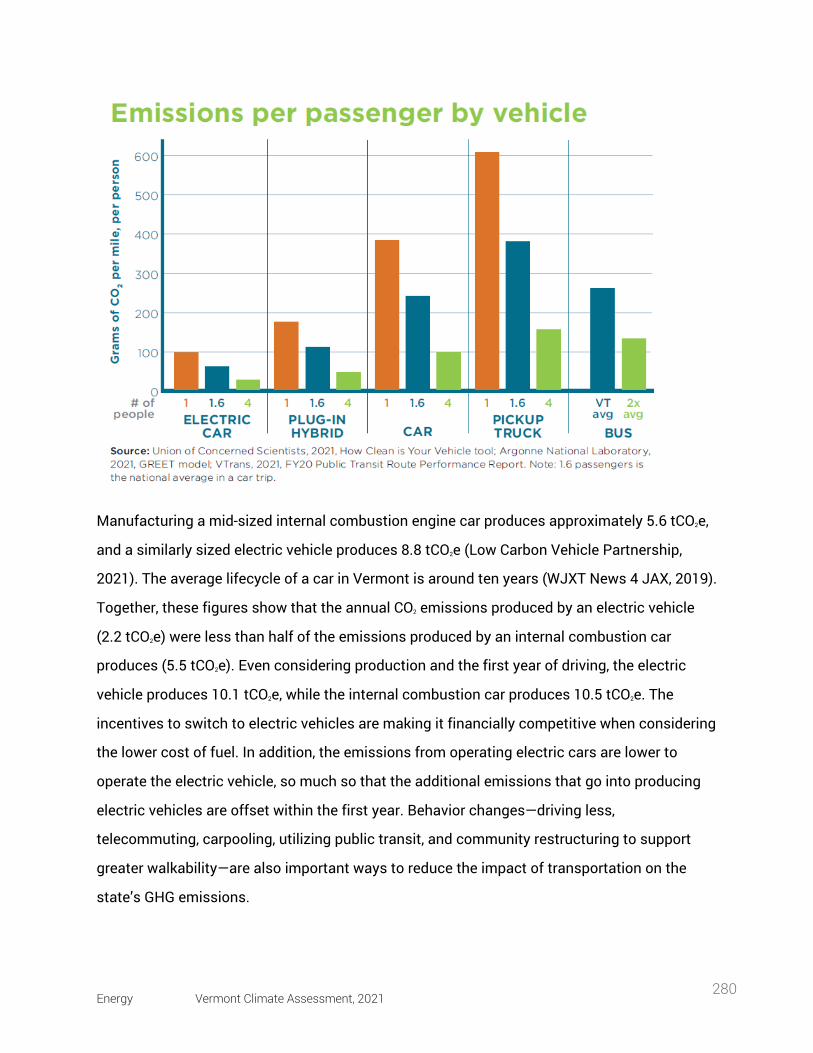
Energy Vermont Climate Assessment, 2021 280
Manufacturing a mid-sized internal combustion engine car produces approximately 5.6 tCO2e,
and a similarly sized electric vehicle produces 8.8 tCO2e (Low Carbon Vehicle Partnership,
2021). The average lifecycle of a car in Vermont is around ten years (WJXT News 4 JAX, 2019).
Together, these figures show that the annual CO2 emissions produced by an electric vehicle
(2.2 tCO2e) were less than half of the emissions produced by an internal combustion car
produces (5.5 tCO2e). Even considering production and the first year of driving, the electric
vehicle produces 10.1 tCO2e, while the internal combustion car produces 10.5 tCO2e. The
incentives to switch to electric vehicles are making it financially competitive when considering
the lower cost of fuel. In addition, the emissions from operating electric cars are lower to
operate the electric vehicle, so much so that the additional emissions that go into producing
electric vehicles are offset within the first year. Behavior changes—driving less,
telecommuting, carpooling, utilizing public transit, and community restructuring to support
greater walkability—are also important ways to reduce the impact of transportation on the
state’s GHG emissions.
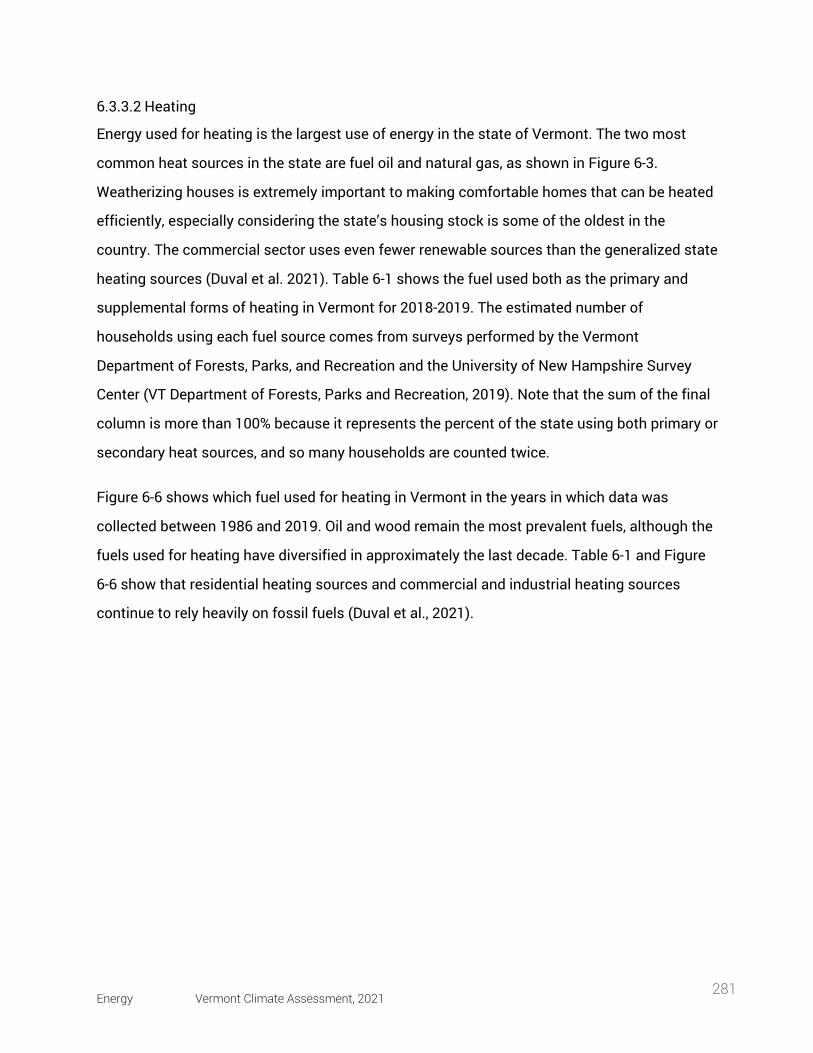
Energy Vermont Climate Assessment, 2021 281
6.3.3.2 Heating
Energy used for heating is the largest use of energy in the state of Vermont. The two most
common heat sources in the state are fuel oil and natural gas, as shown in Figure 6-3.
Weatherizing houses is extremely important to making comfortable homes that can be heated
efficiently, especially considering the state’s housing stock is some of the oldest in the
country. The commercial sector uses even fewer renewable sources than the generalized state
heating sources (Duval et al. 2021). Table 6-1 shows the fuel used both as the primary and
supplemental forms of heating in Vermont for 2018-2019. The estimated number of
households using each fuel source comes from surveys performed by the Vermont
Department of Forests, Parks, and Recreation and the University of New Hampshire Survey
Center (VT Department of Forests, Parks and Recreation, 2019). Note that the sum of the final
column is more than 100% because it represents the percent of the state using both primary or
secondary heat sources, and so many households are counted twice.
Figure 6-6 shows which fuel used for heating in Vermont in the years in which data was
collected between 1986 and 2019. Oil and wood remain the most prevalent fuels, although the
fuels used for heating have diversified in approximately the last decade. Table 6-1 and Figure
6-6 show that residential heating sources and commercial and industrial heating sources
continue to rely heavily on fossil fuels (Duval et al., 2021).
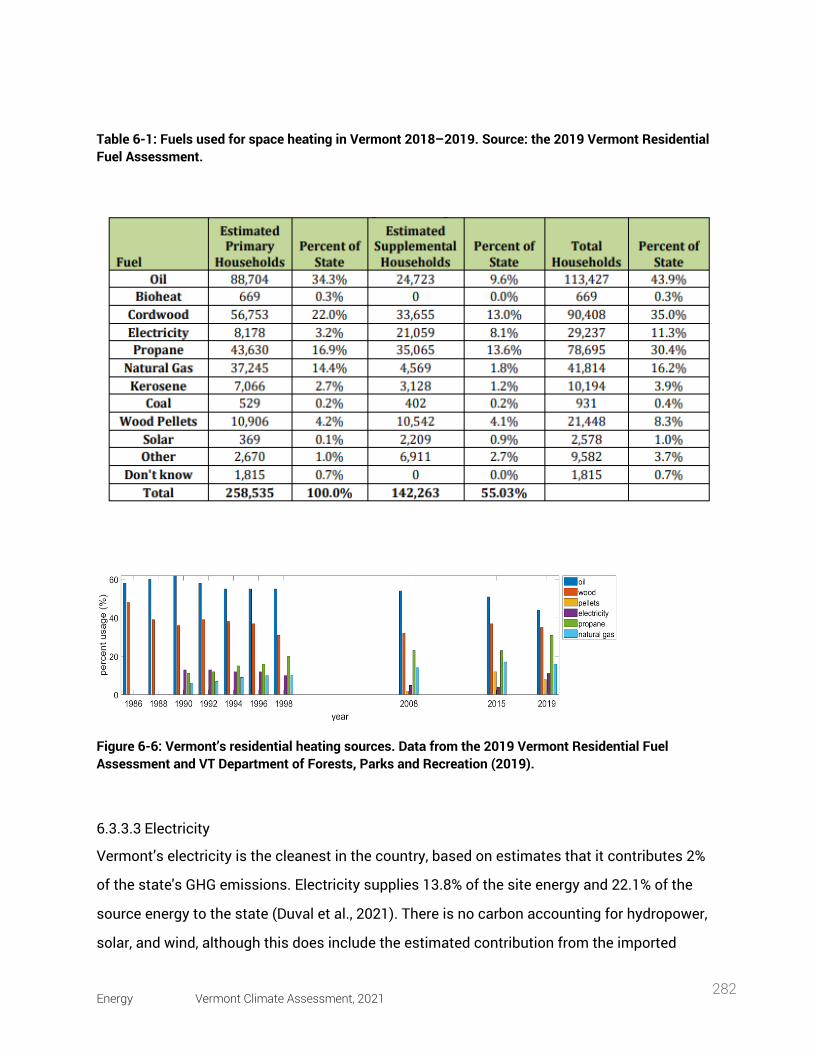
Energy Vermont Climate Assessment, 2021 282
Table 6-1: Fuels used for space heating in Vermont 2018–2019. Source: the 2019 Vermont Residential Fuel Assessment.
Figure 6-6: Vermont’s residential heating sources. Data from the 2019 Vermont Residential Fuel Assessment and VT Department of Forests, Parks and Recreation (2019).
6.3.3.3 Electricity
Vermont’s electricity is the cleanest in the country, based on estimates that it contributes 2%
of the state's GHG emissions. Electricity supplies 13.8% of the site energy and 22.1% of the
source energy to the state (Duval et al., 2021). There is no carbon accounting for hydropower,
solar, and wind, although this does include the estimated contribution from the imported

Energy Vermont Climate Assessment, 2021 283
electricity attributed to fossil fuel sources. There are carbon emissions from the flooding
process involved in creating the dams used in hydropower, and Hydro-Québec does produce
carbon from this process (VT Agency of Natural Resources, 2021). Whether Canada should be
quantifying the GHGs produced by Hydro-Québec on a land use basis or an electricity
production basis is being debated (Gokee, 2020). There are also carbon emissions associated
with the manufacturing, transportation, and installation of solar and wind resources. Life-cycle
assessments on renewable resources for potential generation sites are needed to optimize
both where resources are placed and what type of generation resources will lead to minimum
net greenhouse gas emissions. Including diverse information on the potential impacts is also
important in siting renewable resources to ensure that other important ecosystem services,
such as diversity and water storage, are not accidentally compromised.
6.4 energy planning and equity
Energy policy can protect vulnerable communities and impact energy sources and energy use
in Vermont. For example, Vermont’s electricity sources are estimated to have the lowest GHG
emissions of any state in the United States (Duval et al., 2021), and the biggest changes in
emissions from the electricity sector occurred after policies strongly incentivized the
development of renewable energy.
6.4.1 State Level Energy Planning There are many players and actors in energy planning. In the electricity sector, actors include
the independent system operator for New England, ISO-NE; the transmission operators and
planners in Vermont, VELCO: the Vermont Department of Public Service; and the Vermont
Public Utility Commission (PUC). Further, actions need to be approved at either the federal or
state level, depending on the type of action. At the federal level, the Federal Energy Reliability
Council makes the rulebook for interstate wholesale power sales. At the regional level, ISO-NE
must approve transmission planning. At the state level, the Vermont PUC must approve retail
Energy Vermont Climate Assessment, 2021 284
rate changes, siting new resources, and renewable planning (Vermont Business Magazine,
2021; VT Department of Public Service, 2021).
In large part due to the work of Efficiency Vermont, electric energy consumption in Vermont is
relatively stagnant, even decreasing slightly from 2014 to 2018, as shown in the charts in
Figure 6-2. Vermont’s electricity sector has shown capacity to react to new policies. Several
state policies—including the Sustainably Priced Energy for Economic Development (SPEED)
program, net metering, standard offer, and the renewable energy standard—have helped the
electricity sector transition to a more renewable energy portfolio (VT Department of Public
Service, 2021). Since new transmission and distribution (T&D) investments are expensive and
time-consuming projects that impact local landscapes, stakeholders in Vermont minimize the
amount of new T&D construction. The slow increase of electric rates in Vermont can be seen
in these decisions as well, because T&D investments can result in large increases to customer
electric rates. Yet, enabling a rapid transition to renewable energy will require that new
renewable energy projects be rapidly approved and connected to the grid where the power is
needed. There are many challenges in that process, including land use disputes, choosing
plant locations that aren’t sequestering carbon, placing energy resources in an equitable way,
and placing and sizing resources where the grid has capacity for the power.
6.4.1.1 Global Warming Solutions Act
The Global Warming Solutions Act (GWSA) is a state bill that adds enforceable targets to
Vermont’s goal of reducing carbon emissions. The bill also requires that the pathways utilized
to get to the required emission reductions reduce energy burden. Energy burden is related to
the amount of money a person spends on energy resources compared with their income; a
high energy burden would occur if a large percent of a household’s income goes towards the
energy use of the household. Figure 6-7 shows carbon emissions by sector and a potential
pathway to meet each of the required GHG reduction benchmarks in the act. This policy makes
the state accountable for achieving these goals. The figure shows how transportation, thermal
energy, electricity, agriculture, industrial processes, and waste management have contributed
to the GHG emissions of the state over time and how they must reduce emissions to reach
GWSA targets. It is clear how the electricity sector has reduced emissions, with support from
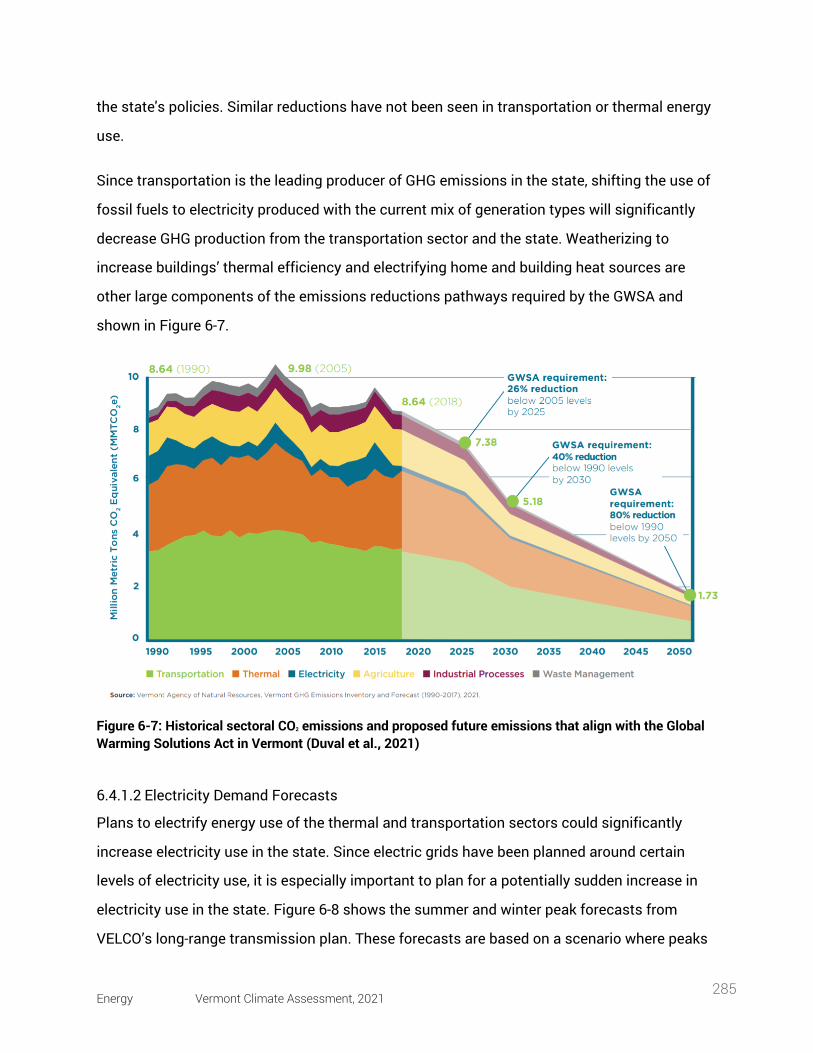
Energy Vermont Climate Assessment, 2021 285
the state's policies. Similar reductions have not been seen in transportation or thermal energy
use.
Since transportation is the leading producer of GHG emissions in the state, shifting the use of
fossil fuels to electricity produced with the current mix of generation types will significantly
decrease GHG production from the transportation sector and the state. Weatherizing to
increase buildings’ thermal efficiency and electrifying home and building heat sources are
other large components of the emissions reductions pathways required by the GWSA and
shown in Figure 6-7.
Figure 6-7: Historical sectoral CO2 emissions and proposed future emissions that align with the Global Warming Solutions Act in Vermont (Duval et al., 2021)
6.4.1.2 Electricity Demand Forecasts
Plans to electrify energy use of the thermal and transportation sectors could significantly
increase electricity use in the state. Since electric grids have been planned around certain
levels of electricity use, it is especially important to plan for a potentially sudden increase in
electricity use in the state. Figure 6-8 shows the summer and winter peak forecasts from
VELCO’s long-range transmission plan. These forecasts are based on a scenario where peaks
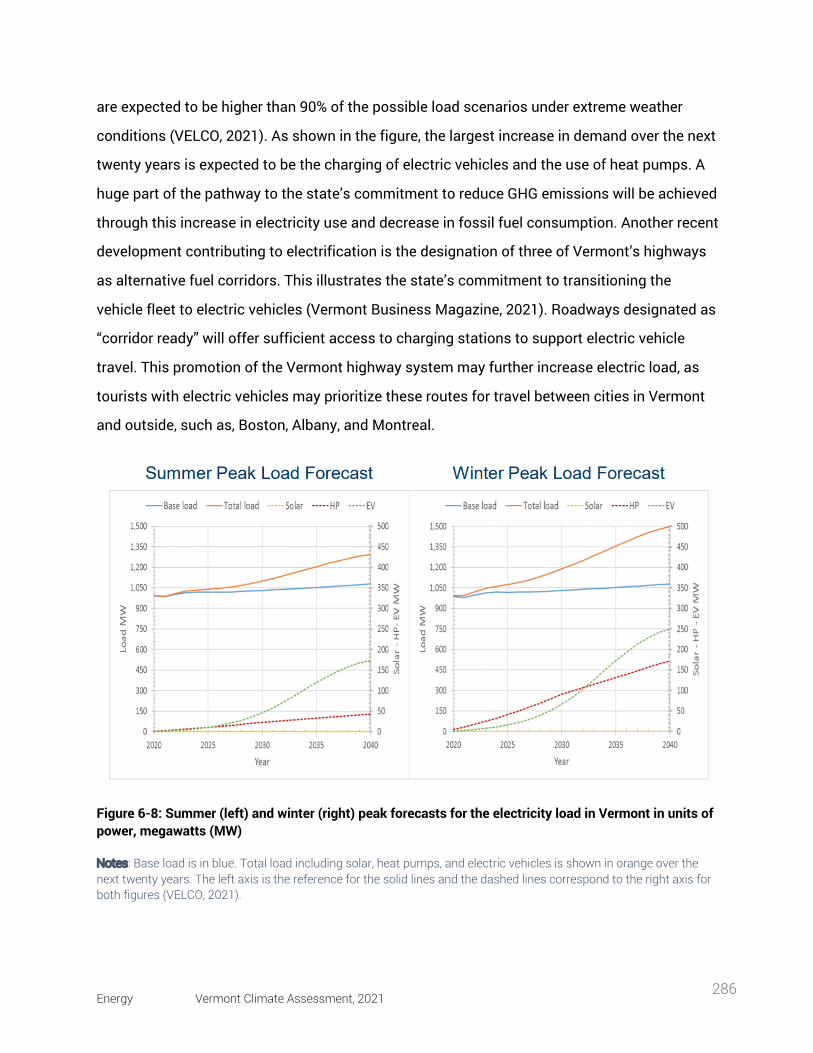
Energy Vermont Climate Assessment, 2021 286
are expected to be higher than 90% of the possible load scenarios under extreme weather
conditions (VELCO, 2021). As shown in the figure, the largest increase in demand over the next
twenty years is expected to be the charging of electric vehicles and the use of heat pumps. A
huge part of the pathway to the state’s commitment to reduce GHG emissions will be achieved
through this increase in electricity use and decrease in fossil fuel consumption. Another recent
development contributing to electrification is the designation of three of Vermont’s highways
as alternative fuel corridors. This illustrates the state’s commitment to transitioning the
vehicle fleet to electric vehicles (Vermont Business Magazine, 2021). Roadways designated as
“corridor ready” will offer sufficient access to charging stations to support electric vehicle
travel. This promotion of the Vermont highway system may further increase electric load, as
tourists with electric vehicles may prioritize these routes for travel between cities in Vermont
and outside, such as, Boston, Albany, and Montreal.
Figure 6-8: Summer (left) and winter (right) peak forecasts for the electricity load in Vermont in units of power, megawatts (MW)
Notes: Base load is in blue. Total load including solar, heat pumps, and electric vehicles is shown in orange over the next twenty years. The left axis is the reference for the solid lines and the dashed lines correspond to the right axis for both figures (VELCO, 2021).
Energy Vermont Climate Assessment, 2021 287
6.4.1.3 Land Use Changes
Land use is a complex issue that has implications beyond each parcel of land. Some land
provides services outside its boundaries, such as clean water from the mountains, local food
grown on and harvested from farms, and beautiful outdoor spaces and carbon sequestration
from forests. Depending on the management of land and changes in the uses of land, these
services can be compromised or developed. For example, as a forest shifts to developed land,
many ecosystem services are compromised. Or as a capped landfill changes its land use to
electricity production with the installation of solar energy resources, an energy service of that
land is developed. Increasing renewable energy generation in the state will result in significant
land use change across the state. However, with the state’s low population density, currently
less than 1% of the state’s land use would need to change to supply the state’s electricity
usage with renewable generators (Thomas and Racherla, 2020). Of course, that is not to say
there won’t be disputes over land use in the transition to renewable energy (Davis, 2015).
Careful planning will be required to ensure an equitable and efficient placement of resources.
Converting land can be controversial, and there are carbon sequestration benefits for some
land that could be lost if converted to electricity production, for example, when removing a
forest to put in solar panels involves lost carbon sequestration from the trees. Chinnery (2021)
estimates that this scenario may lead to the emission of 11.6 tCO2e; however, Chinnery (2021)
also calculates that that panel is expected to produce emission-free electricity for many years,
offsetting GHG emissions from where that electricity would be produced otherwise. The same
study found that the GHG emissions cost of cutting down one tree and installing a solar panel
are about an order of magnitude less (10 times less) than the expected emissions offset by the
electricity produced by the panel (Chinnery, 2021). On one hand, more than one panel could be
installed by removing the shade from a whole tree, creating a more favorable case for
installing the energy resource. On the other hand, with the state’s relatively low carbon
electricity profile, the case in Vermont would likely favor the tree more than the estimation
calculated in Chinnery (2021). It is also important to remember the current land use and the
cost of changing land use in siting decisions. For example, building roads where there were
none to install energy resources comes with a cost of carbon emissions. While cutting down a
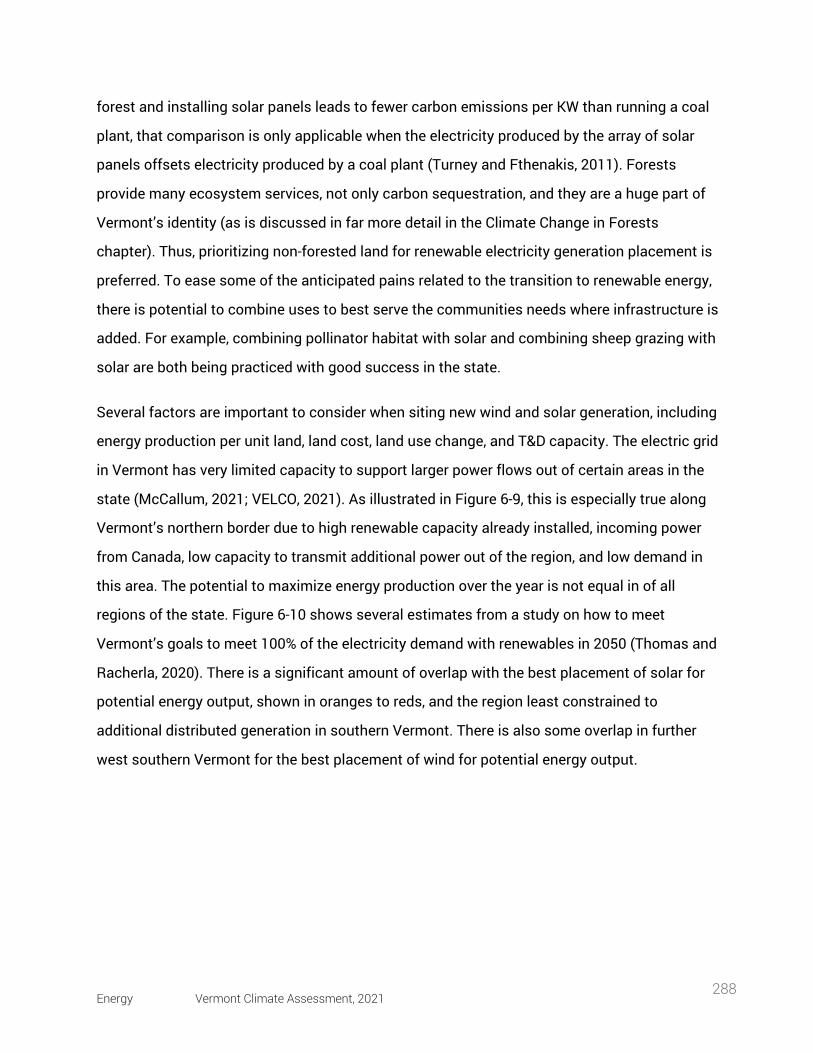
Energy Vermont Climate Assessment, 2021 288
forest and installing solar panels leads to fewer carbon emissions per KW than running a coal
plant, that comparison is only applicable when the electricity produced by the array of solar
panels offsets electricity produced by a coal plant (Turney and Fthenakis, 2011). Forests
provide many ecosystem services, not only carbon sequestration, and they are a huge part of
Vermont’s identity (as is discussed in far more detail in the Climate Change in Forests
chapter). Thus, prioritizing non-forested land for renewable electricity generation placement is
preferred. To ease some of the anticipated pains related to the transition to renewable energy,
there is potential to combine uses to best serve the communities needs where infrastructure is
added. For example, combining pollinator habitat with solar and combining sheep grazing with
solar are both being practiced with good success in the state.
Several factors are important to consider when siting new wind and solar generation, including
energy production per unit land, land cost, land use change, and T&D capacity. The electric grid
in Vermont has very limited capacity to support larger power flows out of certain areas in the
state (McCallum, 2021; VELCO, 2021). As illustrated in Figure 6-9, this is especially true along
Vermont’s northern border due to high renewable capacity already installed, incoming power
from Canada, low capacity to transmit additional power out of the region, and low demand in
this area. The potential to maximize energy production over the year is not equal in of all
regions of the state. Figure 6-10 shows several estimates from a study on how to meet
Vermont’s goals to meet 100% of the electricity demand with renewables in 2050 (Thomas and
Racherla, 2020). There is a significant amount of overlap with the best placement of solar for
potential energy output, shown in oranges to reds, and the region least constrained to
additional distributed generation in southern Vermont. There is also some overlap in further
west southern Vermont for the best placement of wind for potential energy output.
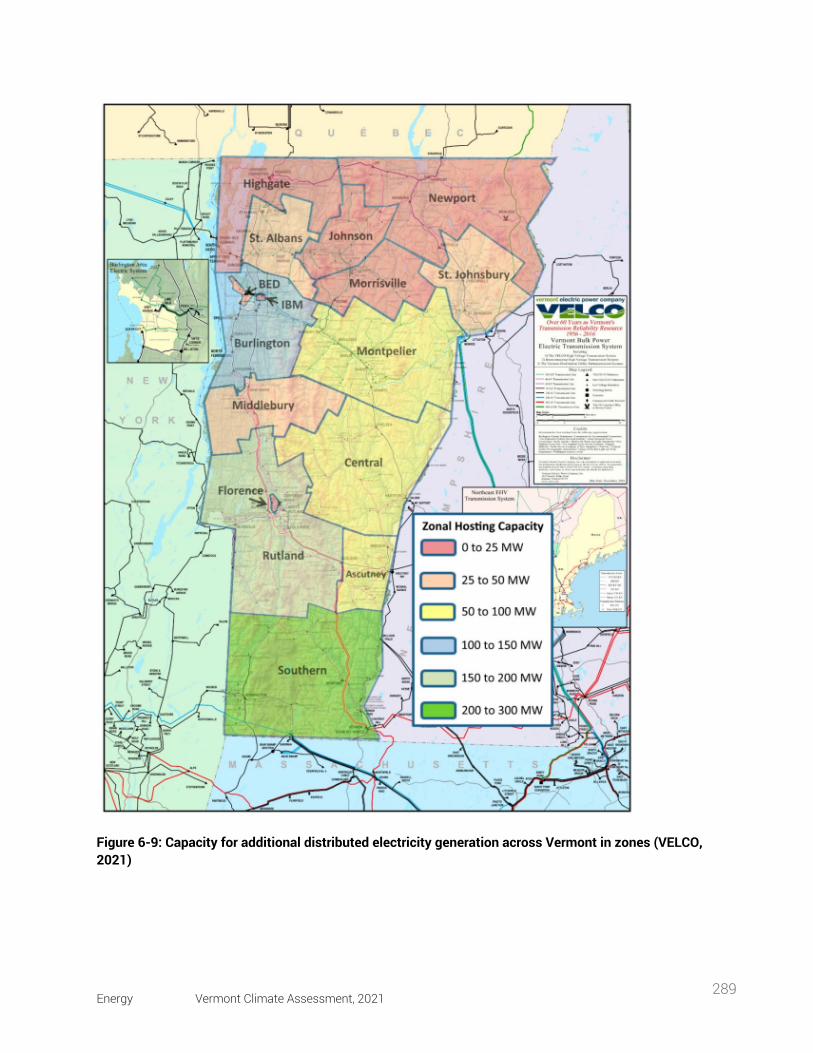
Energy Vermont Climate Assessment, 2021 289
Figure 6-9: Capacity for additional distributed electricity generation across Vermont in zones (VELCO, 2021)
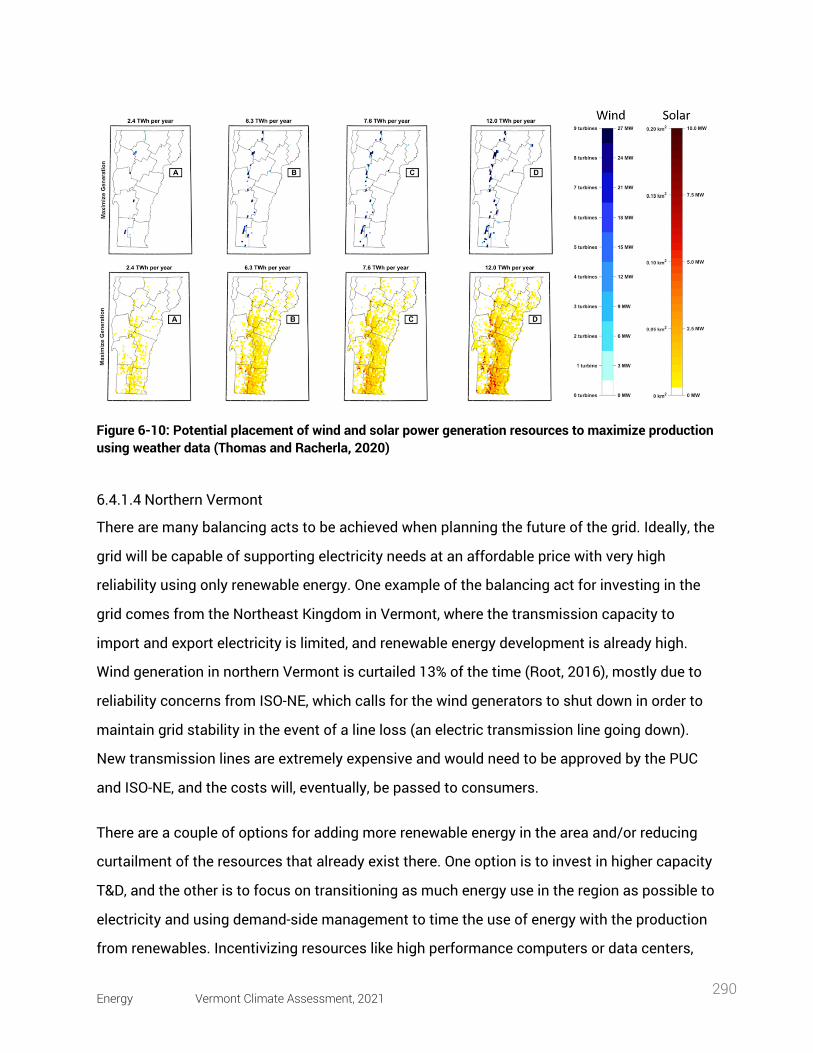
Energy Vermont Climate Assessment, 2021 290
Figure 6-10: Potential placement of wind and solar power generation resources to maximize production using weather data (Thomas and Racherla, 2020)
6.4.1.4 Northern Vermont
There are many balancing acts to be achieved when planning the future of the grid. Ideally, the
grid will be capable of supporting electricity needs at an affordable price with very high
reliability using only renewable energy. One example of the balancing act for investing in the
grid comes from the Northeast Kingdom in Vermont, where the transmission capacity to
import and export electricity is limited, and renewable energy development is already high.
Wind generation in northern Vermont is curtailed 13% of the time (Root, 2016), mostly due to
reliability concerns from ISO-NE, which calls for the wind generators to shut down in order to
maintain grid stability in the event of a line loss (an electric transmission line going down).
New transmission lines are extremely expensive and would need to be approved by the PUC
and ISO-NE, and the costs will, eventually, be passed to consumers.
There are a couple of options for adding more renewable energy in the area and/or reducing
curtailment of the resources that already exist there. One option is to invest in higher capacity
T&D, and the other is to focus on transitioning as much energy use in the region as possible to
electricity and using demand-side management to time the use of energy with the production
from renewables. Incentivizing resources like high performance computers or data centers,
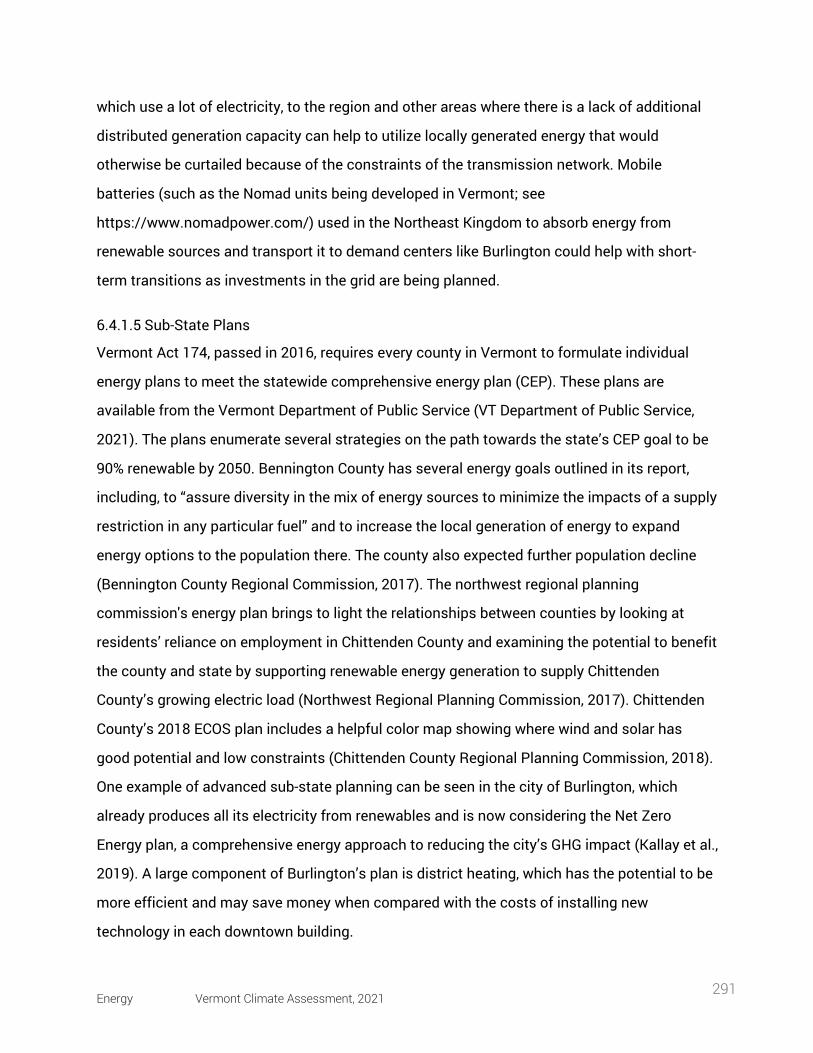
Energy Vermont Climate Assessment, 2021 291
which use a lot of electricity, to the region and other areas where there is a lack of additional
distributed generation capacity can help to utilize locally generated energy that would
otherwise be curtailed because of the constraints of the transmission network. Mobile
batteries (such as the Nomad units being developed in Vermont; see
https://www.nomadpower.com/) used in the Northeast Kingdom to absorb energy from
renewable sources and transport it to demand centers like Burlington could help with short-
term transitions as investments in the grid are being planned.
6.4.1.5 Sub-State Plans
Vermont Act 174, passed in 2016, requires every county in Vermont to formulate individual
energy plans to meet the statewide comprehensive energy plan (CEP). These plans are
available from the Vermont Department of Public Service (VT Department of Public Service,
2021). The plans enumerate several strategies on the path towards the state’s CEP goal to be
90% renewable by 2050. Bennington County has several energy goals outlined in its report,
including, to “assure diversity in the mix of energy sources to minimize the impacts of a supply
restriction in any particular fuel” and to increase the local generation of energy to expand
energy options to the population there. The county also expected further population decline
(Bennington County Regional Commission, 2017). The northwest regional planning
commission's energy plan brings to light the relationships between counties by looking at
residents’ reliance on employment in Chittenden County and examining the potential to benefit
the county and state by supporting renewable energy generation to supply Chittenden
County’s growing electric load (Northwest Regional Planning Commission, 2017). Chittenden
County’s 2018 ECOS plan includes a helpful color map showing where wind and solar has
good potential and low constraints (Chittenden County Regional Planning Commission, 2018).
One example of advanced sub-state planning can be seen in the city of Burlington, which
already produces all its electricity from renewables and is now considering the Net Zero
Energy plan, a comprehensive energy approach to reducing the city’s GHG impact (Kallay et al.,
2019). A large component of Burlington’s plan is district heating, which has the potential to be
more efficient and may save money when compared with the costs of installing new
technology in each downtown building.
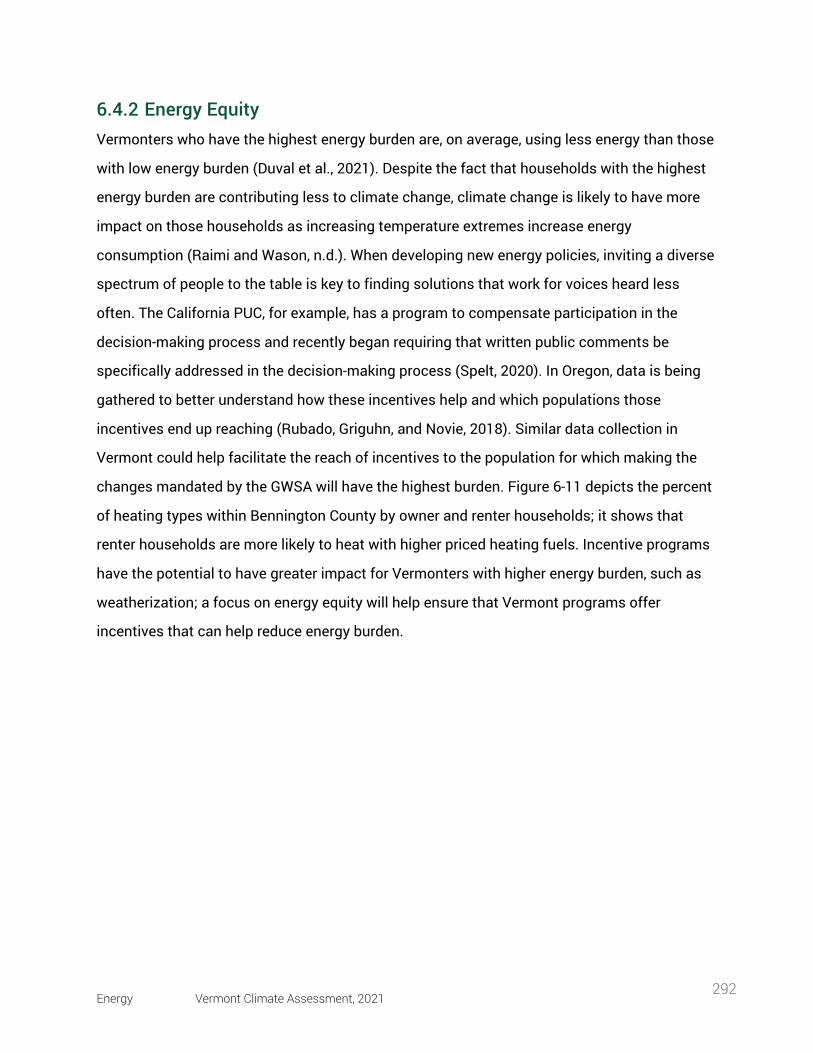
Energy Vermont Climate Assessment, 2021 292
6.4.2 Energy Equity Vermonters who have the highest energy burden are, on average, using less energy than those
with low energy burden (Duval et al., 2021). Despite the fact that households with the highest
energy burden are contributing less to climate change, climate change is likely to have more
impact on those households as increasing temperature extremes increase energy
consumption (Raimi and Wason, n.d.). When developing new energy policies, inviting a diverse
spectrum of people to the table is key to finding solutions that work for voices heard less
often. The California PUC, for example, has a program to compensate participation in the
decision-making process and recently began requiring that written public comments be
specifically addressed in the decision-making process (Spelt, 2020). In Oregon, data is being
gathered to better understand how these incentives help and which populations those
incentives end up reaching (Rubado, Griguhn, and Novie, 2018). Similar data collection in
Vermont could help facilitate the reach of incentives to the population for which making the
changes mandated by the GWSA will have the highest burden. Figure 6-11 depicts the percent
of heating types within Bennington County by owner and renter households; it shows that
renter households are more likely to heat with higher priced heating fuels. Incentive programs
have the potential to have greater impact for Vermonters with higher energy burden, such as
weatherization; a focus on energy equity will help ensure that Vermont programs offer
incentives that can help reduce energy burden.
Energy Vermont Climate Assessment, 2021 293
Figure 6-11: Types of heat used in Bennington County, Vermont by rented and owned housing and the percent of cost (Bennington County Regional Commission, 2017). Note: By comparing heat sources where the percent of use is lower than the percent of cost, the figure shows that renters, who have more limited control over the heating option, use a greater percent of the heat sources that come with higher costs.
Energy Vermont Climate Assessment, 2021 294
6.5 impacts of climate change on energy infrastructure and solutions
Not only are the sources of energy we use driving climate change, but climate change is
driving how and when we consume energy and increasing the risk of damage to infrastructure
from weather events. Increasing temperature will lead to increased air conditioning load in the
summer and shoulder seasons. However, as shown in Figure 6-8, the base load is not expected
to rise for a few years. Additionally, cold climate heat pumps, which can be used for both
heating and cooling, are expected to increase cooling load on the grid. In other words, heat
pumps are not expected to replace central cooling systems in most cases; instead,
Vermonters will add climate heat pumps to their existing systems (VELCO, 2021). On average,
warmer winters will lead to less energy used to heat homes, but the large variability in winter
temperatures may mean that Vermonters prepare for the coldest cases. Not only are “normal”
weather patterns changing, but the energy in storms also is increasing, which means that
more intense storms are expected in the future (VELCO, 2021). These changes are leading to a
public and policy focus on resilience of infrastructure, which prioritizes preparation for and
mitigation of high impact, low probability events.
Electrifying heating and transportation within the state puts more pressure on the electric grid
to be reliable and resilient. The exceptionally cold weather in February, 2021 in Texas illustrate
the effects that more extreme weather events can have on infrastructure, and these significant
infrastructure failures can result in deaths (Englund, 2021). Hurricane Irene caused widespread
damage in Vermont, and damaged millions of dollars of infrastructure (Hewitt, 2016). Large
events tend to expose often neglected interdependencies among infrastructure systems. For
example, damage to the transportation system can increase the time it takes to repair
damaged electricity infrastructure. Conversely, electricity outages can cause traffic lights to
go out, grocery store coolers to go down, water treatment plants to malfunction, etc.
Figure 6-12 (top) shows weather events in Vermont for the past eleven years by month and
event type (thunderstorm wind, ice, wet snow, and gradient wind). Weather analysis for future
climate scenarios in the draft of the latest long-term transmission plan from VELCO concludes
Energy Vermont Climate Assessment, 2021 295
that flooding and high precipitation events are occurring at higher intensities and conditions
for more intense storms will continue to be prevalent, especially in the late fall. Figure 6-12
(bottom) shows the cumulative hours in which customers' electricity went unserved in the
Green Mountain Power service zone by event type and month from 2008 to 2019. The clear
outlier are the outages occurring in October, November, and December, which by far have the
most unserved customer hours. Electricity outages are often caused by tree limbs falling or
tree failures during severe weather events, and large trees falling onto electric lines cause long
and costly outages (Green Mountain Power, 2019).Thus, an essential part of the resilience
strategy for reliable and resilient electricity supply is maintaining rights-of-way with consistent
tree trimming.
While not a requirement, ensuring backup systems for heating in Vermont households is
suggested. Most heating options will not operate under prolonged electricity outages. The
options that do not fail are far more limited, the most common of them are traditional wood
stoves. Another option is developing microgrids that combine backup batteries and solar
energy to provide a backup option for power outages. While it may not be feasible for every
household to have a back-up wood stove for heating and solar plus storage for transportation,
a community building with a wood stove and solar plus storage back-up for emergency
purposes is a more efficient option that can increase the resilience of the community to
extreme weather events (see Community Development chapter). Backup electricity storage,
especially when paired with solar, also has the potential to make many systems more resilient
to electricity outages. Homes, hospitals, grocery stores, and water treatment plants could use
the backup electricity storage. Undergrounding electric lines can prevent some outages from
occurring, especially due to wind, ice, and snow; however, underground lines are far more
expensive and, if they do need to be repaired, repair times take significantly longer.
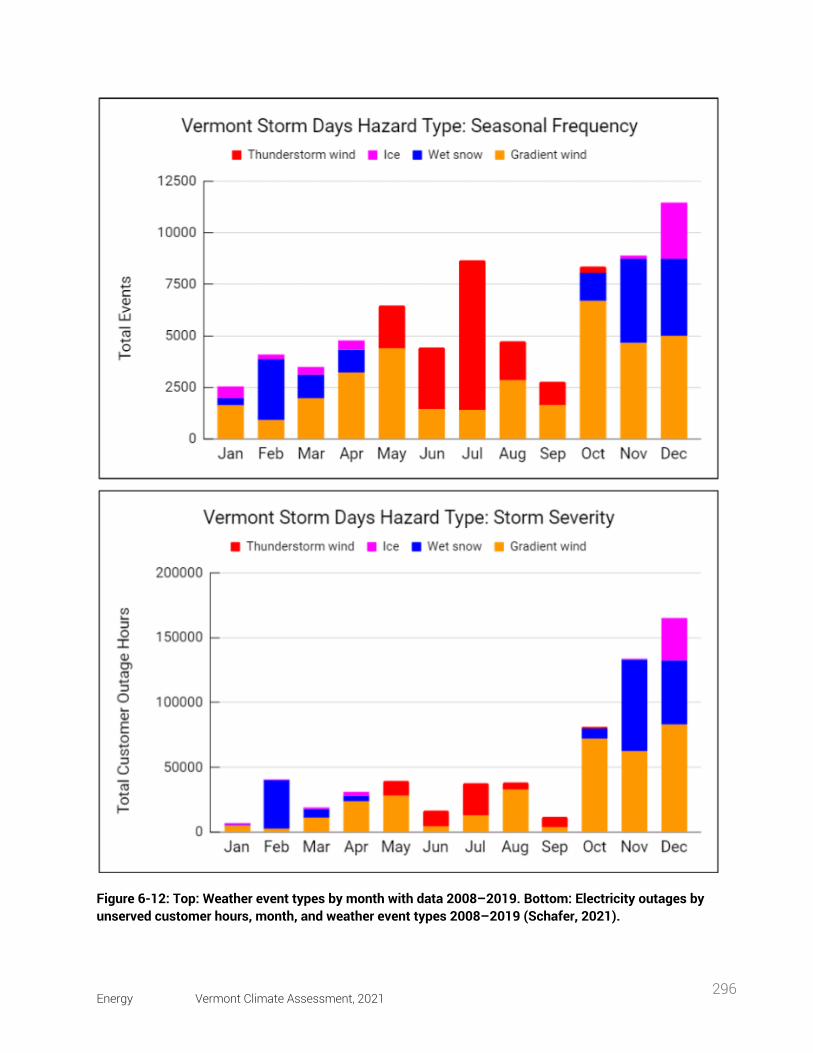
Energy Vermont Climate Assessment, 2021 296
Figure 6-12: Top: Weather event types by month with data 2008–2019. Bottom: Electricity outages by unserved customer hours, month, and weather event types 2008–2019 (Schafer, 2021).
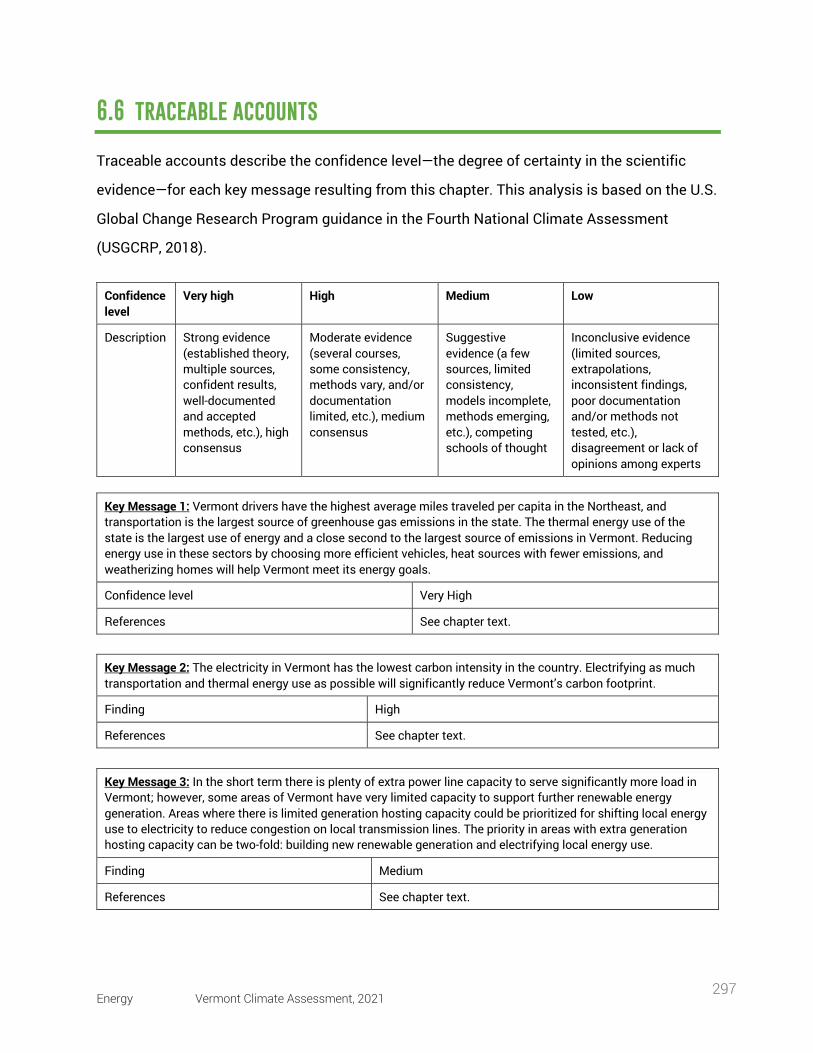
Energy Vermont Climate Assessment, 2021 297
6.6 traceable accounts
Traceable accounts describe the confidence level—the degree of certainty in the scientific
evidence—for each key message resulting from this chapter. This analysis is based on the U.S.
Global Change Research Program guidance in the Fourth National Climate Assessment
(USGCRP, 2018).
Confidence level
Very high High Medium Low
Description Strong evidence (established theory, multiple sources, confident results, well-documented and accepted methods, etc.), high consensus
Moderate evidence (several courses, some consistency, methods vary, and/or documentation limited, etc.), medium consensus
Suggestive evidence (a few sources, limited consistency, models incomplete, methods emerging, etc.), competing schools of thought
Inconclusive evidence (limited sources, extrapolations, inconsistent findings, poor documentation and/or methods not tested, etc.), disagreement or lack of opinions among experts
Key Message 1: Vermont drivers have the highest average miles traveled per capita in the Northeast, and transportation is the largest source of greenhouse gas emissions in the state. The thermal energy use of the state is the largest use of energy and a close second to the largest source of emissions in Vermont. Reducing energy use in these sectors by choosing more efficient vehicles, heat sources with fewer emissions, and weatherizing homes will help Vermont meet its energy goals.
Confidence level Very High
References See chapter text.
Key Message 2: The electricity in Vermont has the lowest carbon intensity in the country. Electrifying as much transportation and thermal energy use as possible will significantly reduce Vermont’s carbon footprint.
Finding High
References See chapter text.
Key Message 3: In the short term there is plenty of extra power line capacity to serve significantly more load in Vermont; however, some areas of Vermont have very limited capacity to support further renewable energy generation. Areas where there is limited generation hosting capacity could be prioritized for shifting local energy use to electricity to reduce congestion on local transmission lines. The priority in areas with extra generation hosting capacity can be two-fold: building new renewable generation and electrifying local energy use.
Finding Medium
References See chapter text.
Energy Vermont Climate Assessment, 2021 298
Key Message 4: The storms that cause the most frequent power outages will become more, increasing the frequency of power outages, particularly in winter. Vermont can increase resilience with distributed solar and storage, secondary heating systems (e.g., wood), and community buildings with resilient heating solutions.
Finding Medium
References See chapter text.
6.7 acknowledgements
I would like to acknowledge Jay Schafer of Northview Weather for the contribution of his
analysis on electricity outages during storm days in Vermont. I would also like to thank Ed
McNamara, Jared Duval, and Paul Hines for taking the time to review this chapter, and Gillian
Galford and Laura Edling for the opportunity to collaborate on the Vermont Climate
Assessment.
6.8 references
Bennington County Regional Commission. (2017). Bennington County Regional Energy Plan. Vermont Department of Public Service. https://publicservice.vermont.gov/sites/dps/files/documents/Pubs_Plans_Reports/Act_174/BCRC/BCRC%20Energy%20Plan.pdf.
Burlington Electric Department. (2019). 2020 Long-Term Electric Energy and Demand Forecast Report. Burlington, VT: Burlington Electric Department / Itron Inc.
Chinnery, L. (2021). “Should You Cut down Trees to Go Solar?” Energy Sage. https://news.energysage.com/should-you-cut-down-trees-to-go-solar/.
Chittenden County Regional Planning Commission. (2018). 2018 Chittenden County ECOS Plan. https://publicservice.vermont.gov/sites/dps/files/documents/Pubs_Plans_Reports/Act_174/CCRPC/ECOSPlan_MainPiece_FinalDraft_20180611.pdf.
Davis, M. (2015). “Irasburg Howls Over Wind Turbine Plan.” Seven Days. https://www.sevendaysvt.com/vermont/irasburg-howls-over-wind-turbine-plan/Content?oid=3053275.
Davis, S.J., and Caldeira, K. (2010). “Consumption-Based Accounting of CO2 Emissions.” Proceedings of the National Academy of Sciences, 107(12): 5687.
Duval, J., Butler, M., Robechek, C., Wesley, C., and Seddon, L. (2021). Annual Progres Report for Vermont
Energy Vermont Climate Assessment, 2021 299
2020/2021. Annual Progress Report. Montpelier, VT: Energy Action Network. https://www.eanvt.org/wp-content/uploads/2021/06/EAN-APR2020-21_finalJune2.pdf.
Englund, W. (2021). “Colonial Shutdown Shows How Americans Pay the Price of Efficiency.” The Washington Post. https://www.washingtonpost.com/business/2021/05/15/energy-cost-cutting-price.
Gokee, A. (2020). “Study: More Reliance on Electricity Can Create Local Jobs, Save Money.” VT Digger. https://vtdigger.org/2020/12/24/study-more-reliance-on-electricity-can-create-local-jobs-save-money/.
Green Mountain Power. (2019). 2018 Integrated Vegetation Management Plan. Green Mountain Power. https://outside.vermont.gov/agency/agriculture/vpac/Other%20VPAC%20Documents/Rights-of-Way-ROWs/2020_Permit_applications/GMP%202020-Distribution/2018%20GMP%20Dist%20Veg%20Mgmt%20Plan%203-18-19.pdf (August 11, 2021).
Hewitt, E. (2016). “Five Years after Irene, Vermont Has Rebuilt, but Marks Remain.” VTDigger. https://vtdigger.org/2016/08/25/five-years-after-irene-vermont-has-rebuilt-but-marks-remain/ (April 27, 2021).
Kallay, J., Hopkins, A., Frost, J., Napolean, A., Takahashi, K., Slason, J., Freeman, J., Grover, D., Swanson, B. (2019). Net Zero Energy Roadmap for the City of Burlington, Vermont. Prepared for the Burlington Electric Department. https://www.burlingtonelectric.com/sites/default/files/inline-files/NetZeroEnergy-Roadmap.pdf.
Levine, S. (2013). “Cow Power, the Vermont Brand Electricity.” Rutland Herald / Times Argus. https://www.clf.org/blog/cow-power-the-vermont-brand-electricity/.
LLNL. (2016). “Vermont Energy Consumption in 2014 Based on DOE/EIA SEDS.” Lawrence Livermore National Library. https://flowcharts.llnl.gov/content/assets/images/charts/Energy/Energy_2014_United-States_VT.png (August 11, 2021).
LLNL. (2020). “Vermont Energy Consumption in 2018 Based on DOE/EIA SEDS.” Lawrence Livermore National Library. https://flowcharts.llnl.gov/content/assets/images/charts/Energy/Energy_2018_United-States_VT.png (August 11, 2021).
Low Carbon Vehicle Partnership. (2021). Lifecycle Emissions from Cars. Low Carbon Vehicle Partnership. https://www.zemo.org.uk/assets/workingdocuments/MC-P-11-15a%20Lifecycle%20emissions%20report.pdf.
McCallum, K. (2021). “Grid Block: Vermont’s Aging Transmission Network Can’t Keep Pace With Green Power Projects.” Seven Days. https://www.sevendaysvt.com/vermont/grid-block-vermonts-aging-transmission-network-cant-keep-pace-with-green-power-projects/Content?oid=32560538.
Northwest Regional Planning Commission. (2017). Regional Energy Plan. https://publicservice.vermont.gov/sites/dps/files/documents/Pubs_Plans_Reports/Act_174/NRPC/NRPC%20Energy%20Plan.pdf.
Energy Vermont Climate Assessment, 2021 300
Raimi, D, and Wason, E. (n.d.) “Defining, Measuring, and Addressing Energy Poverty, with Tony Reames.” https://www.resources.org/resources-radio/defining-measuring-and-addressing-energy-poverty-with-tony-reames/.
Root, C. (2016). “Northern VT Limits and Potential Solutions.” https://opcom.velco.com/library/document/download/5352/VII%20N%20VT%20Limits%20and%20Potential%20Solutions.pdf.
Rubado, D., Griguhn, A., and Novie, A. (2018). 2018 Diversity, Equity and Inclusion Data and Baseline Analysis. Energy Trust of Oregon. https://www.energytrust.org/wp-content/uploads/2018/12/2018_DEI_Data_Baseline_Analysis.pdf.
Schafer, J. (2021). Analysis provided by Northview Weather with support from VELCO.
Solaun, K., and Cerdá, E. (2019). “Climate Change Impacts on Renewable Energy Generation. A Review of Quantitative Projections.” Renewable and Sustainable Energy Reviews 116: 109415.
Spelt, M. (2020). “Democratizing California’s Most Powerful Regulator.” The Equation. https://blog.ucsusa.org/mark-specht/democratizing-californias-most-powerful-regulator/.
Thomas, A., and Racherla, P. (2020). “Constructing Statutory Energy Goal Compliant Wind and Solar PV Infrastructure Pathways.” Renewable Energy, Elsevier 161(C): 1–19.
Turney, D., and Fthenakis, V. (2011). “Environmental Impacts from the Installation and Operation of Large-Scale Solar Power Plants.” Renewable and Sustainable Energy Reviews 15(6): 3261–70.
U.S. Energy Information Administration. (2021). “U.S. Energy Mapping System.” https://www.eia.gov/state/maps.php?src=home-f3 (August 11, 2021).
USGCRP. (2018). Impacts, Risks, and Adaptation in the United States: Fourth National Climate Assessment, Volume II: [Reidmiller, D.R., C.W. Avery, D.R. Easterling, K.E. Kunkel, K.L.M. Lewis, T.K. Maycock, and B.C. Stewart (eds.)]. U.S. Global Change Research Program, Washington, DC, USA, 1515 pp. doi: 10.7930/NCA4.2018.
U.S. Nuclear Regulatory Commission. (2021). “Vermont Yankee Nuclear Power Station.” Decommissioning Sites by Location of Name. https://www.nrc.gov/info-finder/decommissioning/power-reactor/vermont-yankee.html (August 11, 2021).
VELCO. (2021). Vermont Long-Range Transmission Plan. April 12, 2021 draft. Available: https://www.vermontspc.com/assets/documents/2021Plan_publicreviewdraft.pdf
Vermont Business Magazine. (2021). “Vermont Receives Federal Designation for Alternative Fuel Corridors.” Vermont Business Magazine. https://vermontbiz.com/news/2021/may/20/vermont-receives-federal-designation-alternative-fuel-corridors (July 12, 2021).
VT Agency of Natural Resources. (2021). Vermont Greenhouse Gas Emissions Inventory and Forecast: 1990 – 2017. Agency of Natural Resources: Air and Climate Division. https://dec.vermont.gov/sites/dec/files/aqc/climate-change/documents/_Vermont_Greenhouse_Gas_Emissions_Inventory_Update_1990-2017_Final.pdf (July 21, 2021).
Energy Vermont Climate Assessment, 2021 301
VT Department of Forests, Parks and Recreation. (2019). Vermont Residential Fuel Assessment for the 2018-2019 Heating Season. Vermont Department of Forests, Parks, and Recreation. https://fpr.vermont.gov/sites/fpr/files/Forest_and_Forestry/Wood_Biomass_Energy/Library/2019%20VT%20Residential%20Fuel%20Assessment%20Report%20FINAL.pdf (July 12, 2021).
VT Department of Public Service. (2021). “Act 174 Recommendations and Determination Standards.” https://publicservice.vermont.gov/content/act-174-recommendations-and-determination-standards (August 11, 2021).
WJXT News 4 JAX. (2019). “Money Matters: Average Car Lifespan in U.S. Nearly 12 Years.” https://www.news4jax.com/consumer/2019/06/28/money-matters-average-car-lifespan-in-us-nearly-12-years/#:~:text=Montana%20was%20found%20to%20have,than%20heavier%20vehicles%20like%20trucks (July 12, 2021).
Zhou, Y., Panteli, M., Wang, B., and Mancarella, P. (2020). “Quantifying the System-Level Resilience of Thermal Power Generation to Extreme Temperatures and Water Scarcity.” IEEE Systems Journal 14(1): 749–59.
Recreation and Tourism Vermont Climate Assessment, 2021 302
7 recreation and tourism
Recommended Citation for Chapter Hoag, F., Raimondi, S., Zencey, D., 2021. Recreation and Tourism. In Galford, G.L., Faulkner, J. et al. (Eds), The Vermont Climate Assessment 2021. Burlington, Vermont: Gund Institute for Environment at the University of Vermont. On the web: https://vtclimate.org
Franni Hoag (co-lead author) Rubenstein School of Environment and Natural Resources and Gund Institute for Environment, University of Vermont Burlington, Vermont 05405
Sarah T. Raimondi (co-lead author) Rubenstein School of Environment and Natural Resources and Gund Institute for Environment, University of Vermont Burlington, Vermont 05405
Daphne D. Zencey (co-lead author) Rubenstein School of Environment and Natural Resources and Gund Institute for Environment, University of Vermont Burlington, Vermont 05405
Recreation and Tourism Vermont Climate Assessment, 2021 303
7.1 key messages
Winter
• Downhill skiing, with the help of snowmaking, will likely remain largely viable in
Vermont up until approximately 2050. By 2080, the Vermont ski season will be
shortened by two weeks (under a low emissions scenario) or by a whole month (under
a high emissions scenario), and some ski areas will remain viable.
• Winter temperatures are increasing in Vermont, reducing the length of season for most
snow sports.
• February Median Flow, a measurement used by ski areas to collect water for
snowmaking, has steadily increased across Vermont.
Summer
• Summer recreation activities in Vermont will continue to be popular, with water-based
activities likely to increase in interest as air temperatures rise. However, water quality
issues will also become more prevalent.
• Vermont may see an increase in summer “seasonal climate refugees” as the rise in
temperatures nationwide draws visitors looking to escape extreme heat.
• Vermont has the potential to increase tourism revenue via gastrotourism and
agritourism as the growing seasons lengthen.
Fall/Spring
• Transition seasons are becoming more important for tourism and recreation as
Vermont is already experiencing warmer temperatures in fall and spring.
• Trees, particularly sugar maples, are an important aspect of many fall/spring recreation
activities (leaf peeping, maple syrup, apple picking), but may be negatively affected by
warmer temperatures.
Recreation and Tourism Vermont Climate Assessment, 2021 304
• Fall and spring seasons offer new opportunities for lower-cost recreation and tourism
opportunities that attract a wider range of potential visitors.
7.2 introduction
As stated in the 2014 Vermont Climate Assessment (VCA), “Recreation and Tourism go
together in Vermont.” Vermont’s rich and mountainous settings and its cooling lakes and
streams offer opportunities for a wide variety of recreational activities across the seasons,
drawing visitors from all over the country and internationally. With the exception of the year
2020, which was ravaged by the COVID-19 pandemic, the Vermont tourism industry generates
nearly $3.0 billion a year (Vermont Agency of Commerce and Community Development, 2021),
making recreation and tourism one of the most lucrative industries in the state. Outdoor
recreation, as a top driver of Vermont’s economy, offers the potential for a wide variety of
satisfying careers, thus encouraging college graduates and other young people to remain in
Vermont and drawing others to the state.
Currently, Vermont tourists mainly come from the Northeastern states (Vermont Department
of Tourism and Marketing, 2018), but with climate change leading to elevated temperatures,
Vermont may see an increase in visitors from other areas looking to escape the extreme
summer heat. Likewise, as global temperatures increase, Vermont’s transitional seasons of
spring and fall are expected to lengthen as rising temperatures result in shortened winter
overall (see Climate Change in Vermont chapter). Given the seasonality of most of Vermont’s
outdoor recreation opportunities, climate change is likely to affect each recreation-based
sector in a unique and challenging way. The Vermont ski industry will need to adjust to new
snowmaking requirements, syrup makers will be forced to tap maples earlier, and hiking trails
will degrade more quickly due to extended hiking seasons and/or increased erosion. It is
undeniable, however, that climate change will have lasting effects on the way Vermonters and
tourists recreate.
Recreation activities and tourism opportunities in Vermont range from high-priced to free, with
seasonal variation. Participation also varies across socioeconomic and demographic
Recreation and Tourism Vermont Climate Assessment, 2021 305
categories. Some sports and outdoor activities (skiing, boating, snowmobiling) tend to be
more exclusive: they draw a wealthier group of participants because of the costs associated
with participation. Other activities (more likely to be those in the spring, summer, and fall
seasons) are lower in cost or even free: sightseeing, hiking, walking for pleasure, birdwatching,
fishing, and other group and individual activities. Decades of recreation research have shown
that racial demographic groups are differentially represented in outdoor recreation, sports, and
tourism activities, and this is also true in Vermont, where the state population is reported to be
about 94 percent white (US Census Bureau, 2019). The effects of climate change may have
implications for this lack of diversity, however, as more out-of-state visitors from more diverse
parts of the country (Mid-Atlantic and Central regions, for instance) may be drawn to Vermont,
especially during longer summer and shoulder seasons. More climate change refugees may
also see Vermont as a haven for new residences. In short, climate change offers Vermont new
opportunities to diversify and offers new challenges to become a more inclusive state.
For the purpose of the 2020 Vermont Climate Assessment, the effects of climate change on
Vermont’s recreation sectors will be identified based on the predominant recreation seasons:
winter and summer are each discussed individually below, with fall and spring combined given
the similarities in recreation opportunities for the two transitional seasons.
Box 7.1: COVID-19 and Recreation in Vermont According to the Vermont Department of Forests, Parks and Recreation, the most
important outdoor recreation issue in 2020 was an increase in outdoor participation.
Given restrictions enacted during the COVID-19 pandemic, more Vermonters sought
outdoor experiences and new outdoor activities. There was a noticeable increase in
trail user days for hiking and mountain biking; Nordic and backcountry skiing surged;
the number of hunting and fishing licenses issued increased; campgrounds were at
capacity; and a myriad of other activities done for the sole purpose of spending time
outside all had a rise in participation. These types of recreation opportunities have in
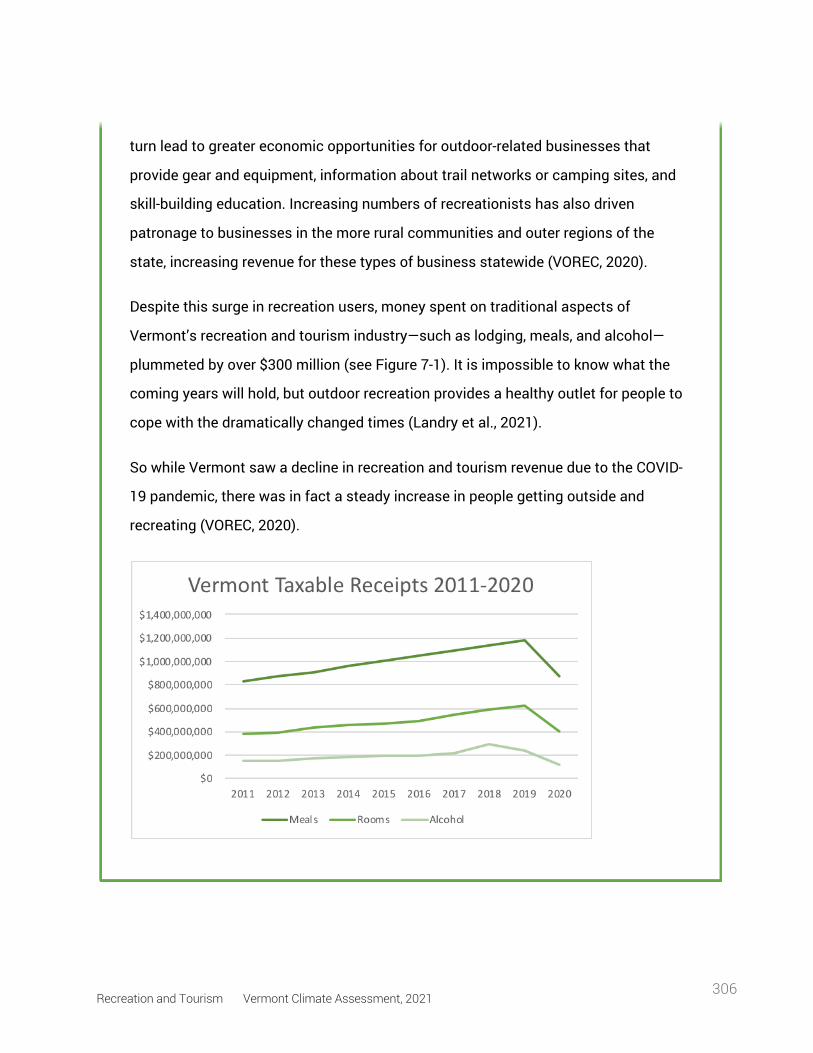
Recreation and Tourism Vermont Climate Assessment, 2021 306
turn lead to greater economic opportunities for outdoor-related businesses that
provide gear and equipment, information about trail networks or camping sites, and
skill-building education. Increasing numbers of recreationists has also driven
patronage to businesses in the more rural communities and outer regions of the
state, increasing revenue for these types of business statewide (VOREC, 2020).
Despite this surge in recreation users, money spent on traditional aspects of
Vermont’s recreation and tourism industry—such as lodging, meals, and alcohol—
plummeted by over $300 million (see Figure 7-1). It is impossible to know what the
coming years will hold, but outdoor recreation provides a healthy outlet for people to
cope with the dramatically changed times (Landry et al., 2021).
So while Vermont saw a decline in recreation and tourism revenue due to the COVID-
19 pandemic, there was in fact a steady increase in people getting outside and
recreating (VOREC, 2020).
Figure 7-1: Taxable receipts 2011–2020, data collected from the Vermont Agency of Administration
Recreation and Tourism Vermont Climate Assessment, 2021 307
7.3 winter
Winter recreation is an integral part of Vermont’s identity as well as a significant money-maker
for the state economy (Vermont Department of Tourism and Marketing, 2018). Yet Vermont’s
traditional winter season will certainly be shortened due to climate change. Despite this, skiing
– which attracts millions of tourists to the state each year – will most likely be viable through
nearly the end of the century. Winter sports that generate less revenue than skiing and that
have fewer options for climate change mitigation, such as snowmobiling and pond hockey, will
be particularly vulnerable to warming temperatures and variable precipitation in the coming
decades. Nordic skiing may be able to maintain the length of its season by implementing
creative snow preservation tactics, but an adequate amount of snow will have to fall and be
collected.
Winter precipitation in Vermont has increased over the past century. Snowfall, an integral
aspect of many winter recreational activities, peaked in the 1960s and 1970s and has declined
since, especially in southern Vermont (see Climate Change in Vermont chapter). In one New
Hampshire study, the “backyard hypothesis,” which states that urban skiers are more likely to
head to the mountains on days that they see snow in their own backyards, was proven to be
true (Hamilton et al., 2007). If Vermont continues to receive adequate amounts of snow, or if
resorts can make enough snow to operate ski mountains, increasingly strong marketing
campaigns will be needed to draw visitors from states with less regular or productive
snowfalls.
Along with precipitation, temperature is also predicted to increase over the next century in
Vermont (see Climate Change in Vermont chapter). If temperatures generally remain under 32
degrees Fahrenheit, this could mean an increase in annual snowfall. Average winter
temperatures in Vermont are generally well below 32 degrees Fahrenheit (see Figures 7-2, 7-3,
7-4) but have steadily increased by roughly 3.3 degrees Fahrenheit since the early
1900s.Winter temperature variability also is significant, as temperatures may range more
widely during the winter season (see Climate Change in Vermont chapter).
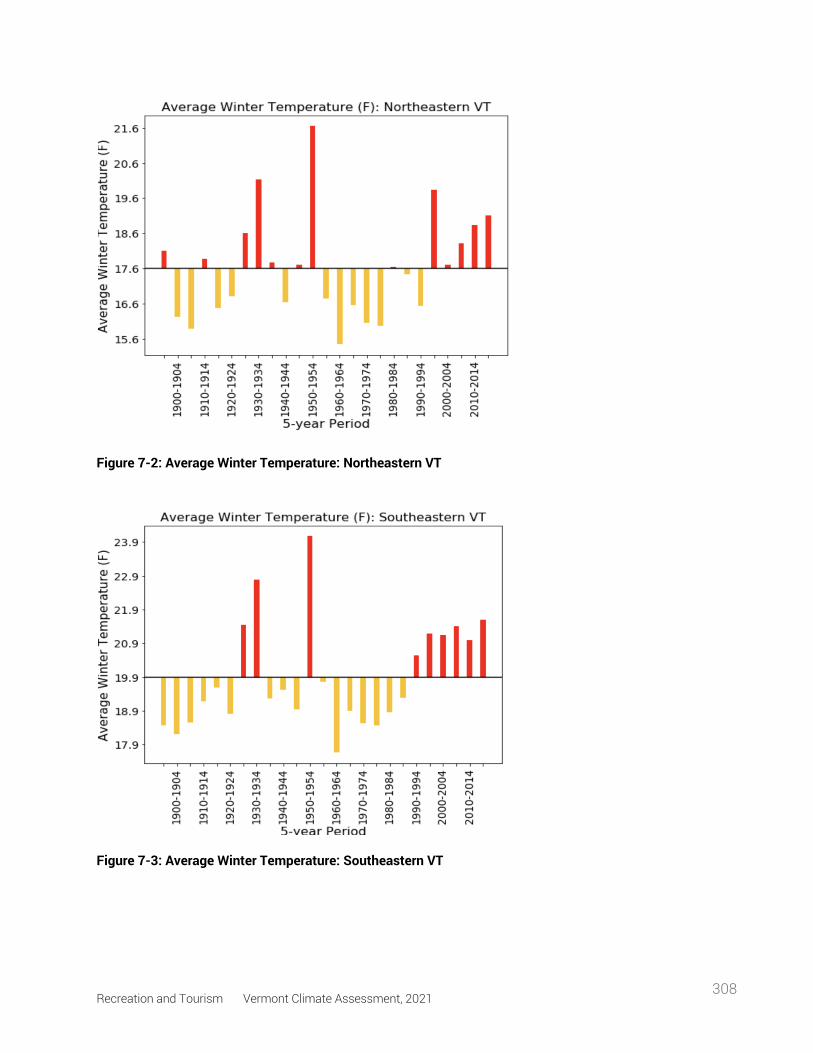
Recreation and Tourism Vermont Climate Assessment, 2021 308
Figure 7-2: Average Winter Temperature: Northeastern VT
Figure 7-3: Average Winter Temperature: Southeastern VT
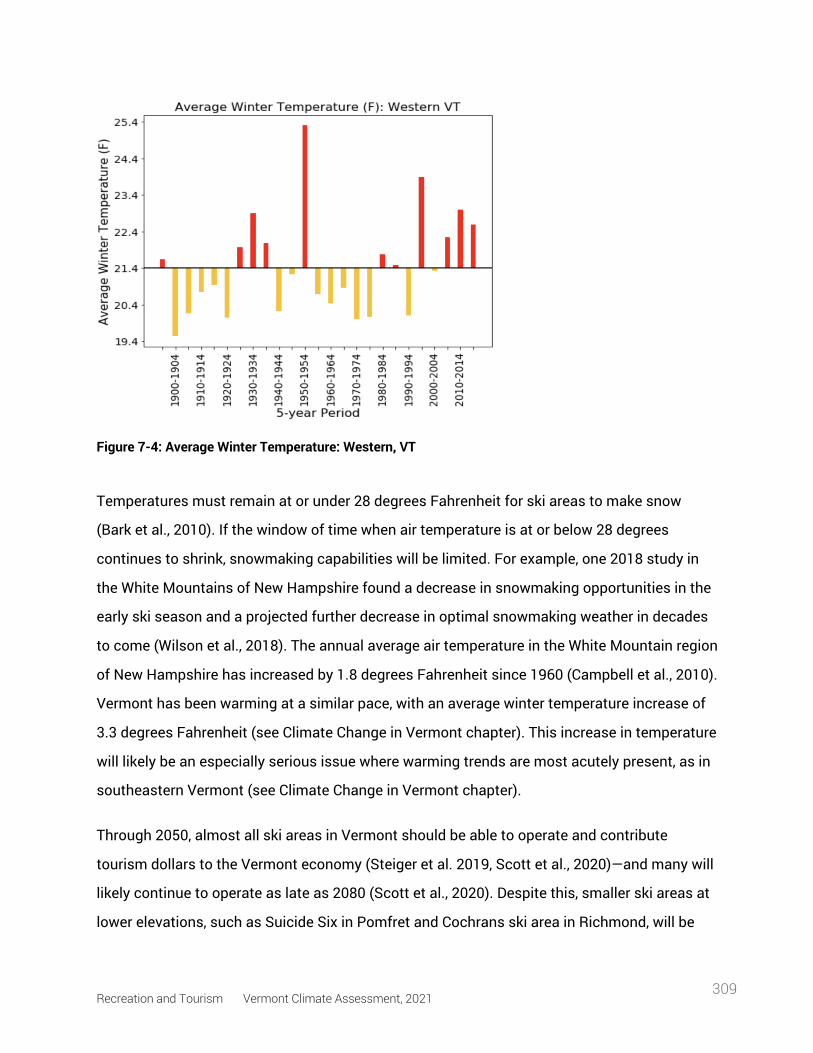
Recreation and Tourism Vermont Climate Assessment, 2021 309
Figure 7-4: Average Winter Temperature: Western, VT
Temperatures must remain at or under 28 degrees Fahrenheit for ski areas to make snow
(Bark et al., 2010). If the window of time when air temperature is at or below 28 degrees
continues to shrink, snowmaking capabilities will be limited. For example, one 2018 study in
the White Mountains of New Hampshire found a decrease in snowmaking opportunities in the
early ski season and a projected further decrease in optimal snowmaking weather in decades
to come (Wilson et al., 2018). The annual average air temperature in the White Mountain region
of New Hampshire has increased by 1.8 degrees Fahrenheit since 1960 (Campbell et al., 2010).
Vermont has been warming at a similar pace, with an average winter temperature increase of
3.3 degrees Fahrenheit (see Climate Change in Vermont chapter). This increase in temperature
will likely be an especially serious issue where warming trends are most acutely present, as in
southeastern Vermont (see Climate Change in Vermont chapter).
Through 2050, almost all ski areas in Vermont should be able to operate and contribute
tourism dollars to the Vermont economy (Steiger et al. 2019, Scott et al., 2020)—and many will
likely continue to operate as late as 2080 (Scott et al., 2020). Despite this, smaller ski areas at
lower elevations, such as Suicide Six in Pomfret and Cochrans ski area in Richmond, will be
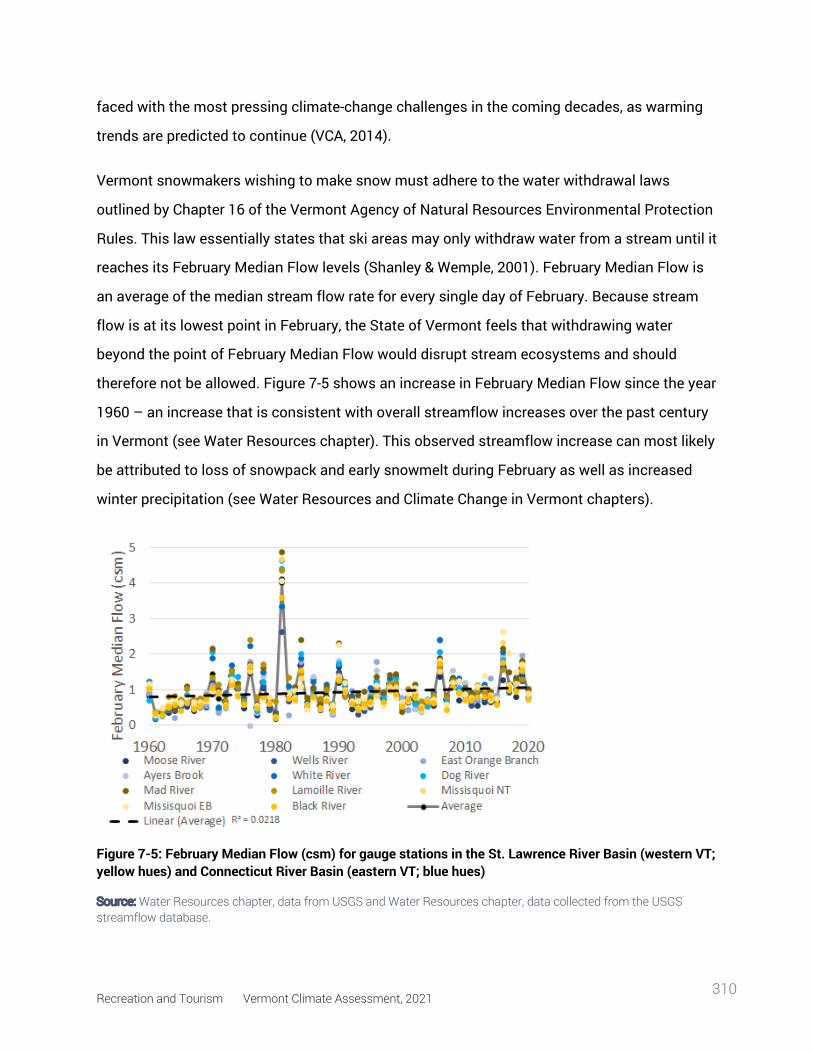
Recreation and Tourism Vermont Climate Assessment, 2021 310
faced with the most pressing climate-change challenges in the coming decades, as warming
trends are predicted to continue (VCA, 2014).
Vermont snowmakers wishing to make snow must adhere to the water withdrawal laws
outlined by Chapter 16 of the Vermont Agency of Natural Resources Environmental Protection
Rules. This law essentially states that ski areas may only withdraw water from a stream until it
reaches its February Median Flow levels (Shanley & Wemple, 2001). February Median Flow is
an average of the median stream flow rate for every single day of February. Because stream
flow is at its lowest point in February, the State of Vermont feels that withdrawing water
beyond the point of February Median Flow would disrupt stream ecosystems and should
therefore not be allowed. Figure 7-5 shows an increase in February Median Flow since the year
1960 – an increase that is consistent with overall streamflow increases over the past century
in Vermont (see Water Resources chapter). This observed streamflow increase can most likely
be attributed to loss of snowpack and early snowmelt during February as well as increased
winter precipitation (see Water Resources and Climate Change in Vermont chapters).
Figure 7-5: February Median Flow (csm) for gauge stations in the St. Lawrence River Basin (western VT; yellow hues) and Connecticut River Basin (eastern VT; blue hues) Source: Water Resources chapter, data from USGS and Water Resources chapter, data collected from the USGS streamflow database.
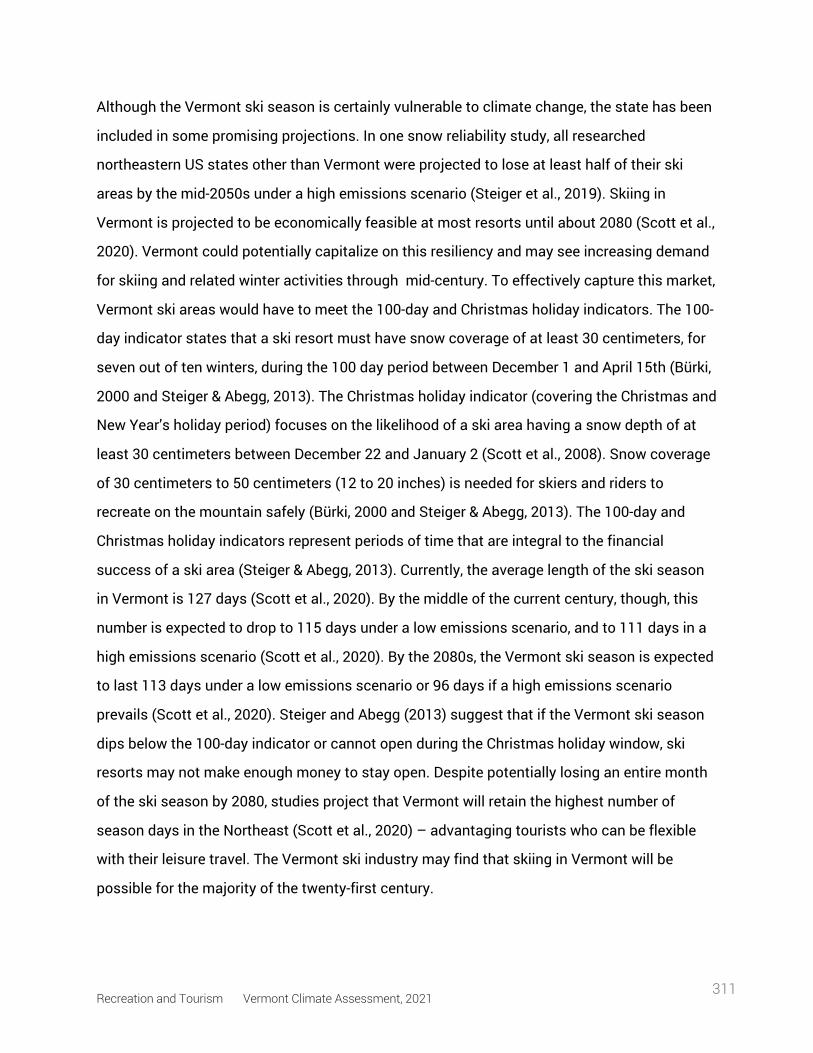
Recreation and Tourism Vermont Climate Assessment, 2021 311
Although the Vermont ski season is certainly vulnerable to climate change, the state has been
included in some promising projections. In one snow reliability study, all researched
northeastern US states other than Vermont were projected to lose at least half of their ski
areas by the mid-2050s under a high emissions scenario (Steiger et al., 2019). Skiing in
Vermont is projected to be economically feasible at most resorts until about 2080 (Scott et al.,
2020). Vermont could potentially capitalize on this resiliency and may see increasing demand
for skiing and related winter activities through mid-century. To effectively capture this market,
Vermont ski areas would have to meet the 100-day and Christmas holiday indicators. The 100-
day indicator states that a ski resort must have snow coverage of at least 30 centimeters, for
seven out of ten winters, during the 100 day period between December 1 and April 15th (Bürki,
2000 and Steiger & Abegg, 2013). The Christmas holiday indicator (covering the Christmas and
New Year’s holiday period) focuses on the likelihood of a ski area having a snow depth of at
least 30 centimeters between December 22 and January 2 (Scott et al., 2008). Snow coverage
of 30 centimeters to 50 centimeters (12 to 20 inches) is needed for skiers and riders to
recreate on the mountain safely (Bürki, 2000 and Steiger & Abegg, 2013). The 100-day and
Christmas holiday indicators represent periods of time that are integral to the financial
success of a ski area (Steiger & Abegg, 2013). Currently, the average length of the ski season
in Vermont is 127 days (Scott et al., 2020). By the middle of the current century, though, this
number is expected to drop to 115 days under a low emissions scenario, and to 111 days in a
high emissions scenario (Scott et al., 2020). By the 2080s, the Vermont ski season is expected
to last 113 days under a low emissions scenario or 96 days if a high emissions scenario
prevails (Scott et al., 2020). Steiger and Abegg (2013) suggest that if the Vermont ski season
dips below the 100-day indicator or cannot open during the Christmas holiday window, ski
resorts may not make enough money to stay open. Despite potentially losing an entire month
of the ski season by 2080, studies project that Vermont will retain the highest number of
season days in the Northeast (Scott et al., 2020) – advantaging tourists who can be flexible
with their leisure travel. The Vermont ski industry may find that skiing in Vermont will be
possible for the majority of the twenty-first century.
Recreation and Tourism Vermont Climate Assessment, 2021 312
In addition to its effects on downhill skiing, climate change will necessitate adaptations from
other winter sports in Vermont. According to a study conducted at the University of Vermont,
snowmobilers in Vermont have already reduced their hours of participation in the activity in
response to climate change (Perry et al., 2018). This study found that 44.7% of snowmobilers
surveyed have observed a shortening of the winter snowmobiling season, and in response,
30.7% of these respondents now snowmobile less often (Perry et al, 2018). Snowmobiling in
Vermont has a length of season threshold, or number of days with adequate snow cover. This
length of season threshold in Vermont is approximately 79 days; any season with over 79 days
will most likely report an increase in snowmobiling, whereas any season under 79 days will
tend to report a decrease in snowmobiling (Perry et al., 2018). Unless Vermont continues to
have adequate snow cover for 79 days or more, snowmobiling in the state will lose
participants. Unlike ski mountains, snowmobile trails do not have snowmaking to help produce
snow coverage. The reliance on adequate snow cover across a vast terrain, along with the
current climate change trends, means that snowmobiling may be unsustainable in Vermont in
the coming decades (Perry et al., 2018). This research also aligns with a nationwide study of
outdoor recreation activities that predicts that snowmobiling is one of the winter activities
most vulnerable to climate change (Bower and Askew, 2018).
In addition to the statewide increases in precipitation and temperature, some Vermont lakes
have been thawing slightly earlier as a result of climate change (see Climate Change in
Vermont chapter). Ice-out refers to when lakes and ponds begin to lose their winter ice cover
(Hodgkins et al., 2002). Earlier annual ice-out dates have negative implications for ice-related
recreation activities, including ice fishing, and outdoor ice hockey and ice skating. If the ice is
not thick enough throughout a winter, or only viable for a short period of time, participation in
outdoor ice-related recreational activities will decline. Further, winter drowning deaths might
increase. In a recent study of 10 countries in the Northern Hemisphere, researchers found that
winter drowning incidents typically occurred when the air temperature hovered between 0
degrees Celsius (32 degrees Fahrenheit) and -5 degree Celsius (23 degrees Fahrenheit)
(Sharma et al., 2020). This range of temperatures coincides with Vermont’s average winter
temperature range (see Climate Change in Vermont chapter). Rates of drowning were highest
Recreation and Tourism Vermont Climate Assessment, 2021 313
late in the winter season, when the ice becomes unstable (Sharma et al., 2020). As Vermont’s
temperatures continue to increase, locations that offer recreational ice use should pay close
attention to ice conditions when air temperature rises above 23 degrees Fahrenheit, and
frequently update the public about changes in ice thickness.
The Pond Hockey Classic, a tournament first established at New Hampshire’s Lake
Winnipesaukee, must be increasingly attentive to ice conditions in the future. The Pond
Hockey Classic occurs at several locations across the Northeastern United States, including
Lake Champlain. The Classic has had to cancel its events several times in the 2010s due to
warm weather (Fairley et al., 2015). This event, which brings hundreds of participants to
Colchester each year, typically prepares backup plans if the original host location is deemed
unsafe – yet in some years, such as 2011, even the ice at backup locations failed to provide a
space for recreation (Fairley et al., 2015). As Vermont winters continue to warm, the Pond
Hockey Classic and similar events may need to move to indoor skating rinks.
Recreation and Tourism Vermont Climate Assessment, 2021 314
7.4 summer
As found in the 2014 VCA, increased temperatures due to climate change are likely to extend
the length of the summer recreation and tourism season. Vermont summer temperatures have
already risen an average of 1.84 degrees Fahrenheit since 1960 (see Climate Change in
Vermont chapter). In comparison to the negative effect that increased temperatures will have
on winter recreation in the state, it is believed that the extended summer season will benefit
Vermont’s summer tourism and recreation industries and economy. In Vermont, direct
spending by users of outdoor retailers and service providers totals $2.8 billion annually.
(Nationally, the outdoor recreation industry comes in at $646 billion, and is being measured as
part of the nation’s gross national product.) Historically, summer sees the most recreation
Box 7.2: Nordic Skiing and Snow Storage: Creative Climate Change Solutions Between the years of 2018 and 2020, UVM master’s student Hannah Weiss conducted
a study in Craftsbury, VT, to assess how storing snow piles over the summer may help
extend the Nordic ski season there. In her experiment, two 200 m3 piles of snow were
collected and protected under layers of wood chips (Weiss, 2021). Volume changes in
the snow pile were observed through laser scanning. The snow piles maintained most
of their mass when covered with wood chips and a reflective sheet. Hannah and her
team used this information to then create an even larger snow pile of 9300 m3 in the
summer of 2019, once again protecting the snow with wood chips and a reflective
sheet. The snow pile ended up retaining 60% of its original snowmass, which was
enough snow for the Craftsbury Outdoors Center to open their facilities on time for
that season (Weiss, 2021). The results of this study declared this method of snow
storage technically, financially and environmentally feasible for this location in
Vermont, and could potentially help extend the length of the Nordic season in other
northern locations.
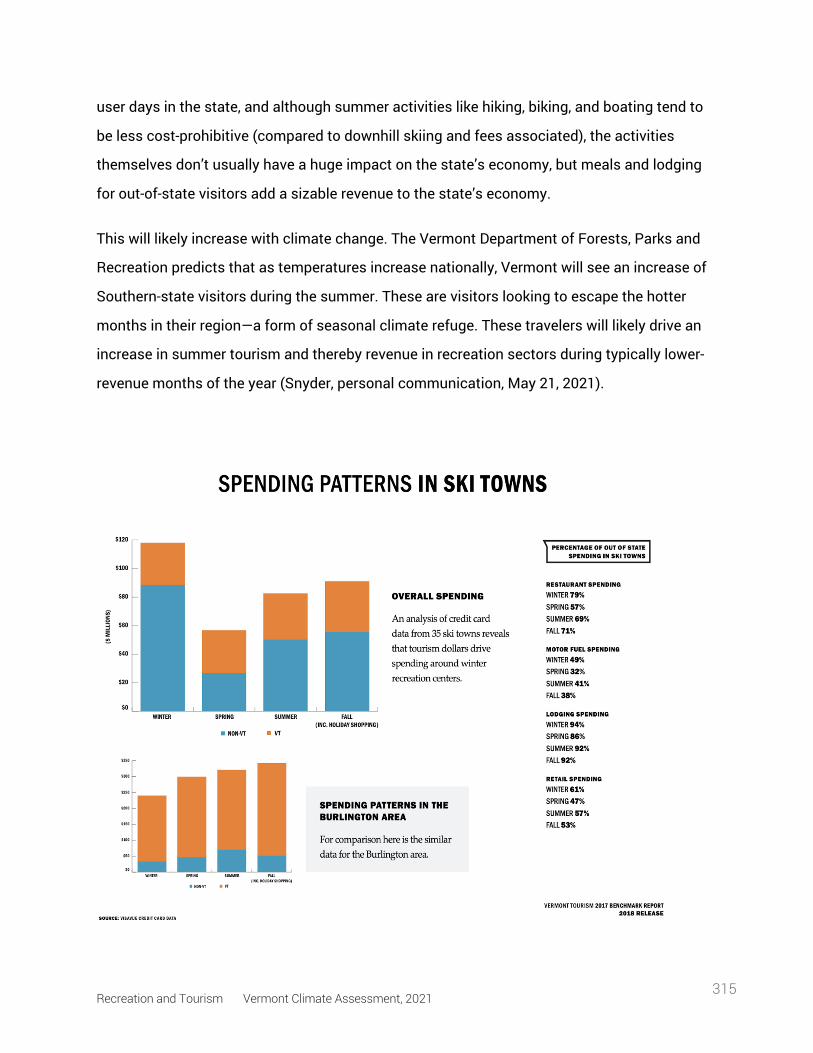
Recreation and Tourism Vermont Climate Assessment, 2021 315
user days in the state, and although summer activities like hiking, biking, and boating tend to
be less cost-prohibitive (compared to downhill skiing and fees associated), the activities
themselves don’t usually have a huge impact on the state’s economy, but meals and lodging
for out-of-state visitors add a sizable revenue to the state’s economy.
This will likely increase with climate change. The Vermont Department of Forests, Parks and
Recreation predicts that as temperatures increase nationally, Vermont will see an increase of
Southern-state visitors during the summer. These are visitors looking to escape the hotter
months in their region—a form of seasonal climate refuge. These travelers will likely drive an
increase in summer tourism and thereby revenue in recreation sectors during typically lower-
revenue months of the year (Snyder, personal communication, May 21, 2021).
Recreation and Tourism Vermont Climate Assessment, 2021 316
In addition to the effects of warming temperatures, the COVID-19 pandemic also created an
overall uptick in Vermont residents seeking summer recreation. According to the 2020
Vermont Outdoor Recreation Economic Collaborative Report, many recreation locations
(trailheads, beaches, campgrounds, etc.) were above capacity for much of the 2020 summer.
With an increase in new users accessing these areas, there appeared to be a general lack of
knowledge about best practices and ethics that caused higher than average levels of
degradation within trail systems, waterways, and on recreating infrastructure. Because of this,
the $2 trillion Coronavirus Aid, Relief, and Economic Security (CARES) Act included funding to
improve public access to the outdoors. Vermont received $1.6 million which will include
upgrades to many fishing and boating access areas; road and trail maintenance at Wildlife
Management Areas; as well as a mobile app that will assist the public by educating about
outdoor recreation best practices, thereby continuing to make safe places to recreate in
Vermont (VOREC, 2020).
The Vermont Department of Forests, Parks and Recreation noted that in order to be more
resilient to overuse, Vermont could benefit from a more robust portfolio of accessible state
lands, which would in turn provide more diversified opportunities for recreation (Snyder,
personal communication, May 21, 2021). An added benefit of this would be a need for
recreation staff, creating more jobs for Vermonters. Additionally, creating more recreation-
friendly state land would also create opportunities to work in partnership with various
government and local non-profit organizations, further bolstering the economy and workforce.
Recreation and Tourism Vermont Climate Assessment, 2021 317
With longer and hotter summers predicted, farms and growers will have an extended growing
season (see Agriculture and Food Systems chapter) and agritourism and beer tourism are
likely to see an increase in recreation users because of this. A recent survey conducted by
UVM in 2019 and 2020 amongst licensed agritourism farms indicated that over half (59%) of
the farms surveyed plan on expanding their agritourism services, and almost half (43%) intend
to invest more in buildings or equipment to provide a richer agritourism experience (Chase et
al., 2021). Similarly, as of 2019, the state of Vermont had a total of 68 craft breweries, ranking
it first in the nation for per capita breweries (Vermontbrewers.com). It is no secret that
Vermont’s breweries bring tourists from near and far, often to visit in conjunction with hiking,
biking, camping, or other recreation-based trips. Additionally, many of Vermont’s breweries
focus on sourcing ingredients locally, making a longer growing season beneficial for sourcing
local hops and other farmed elements of beer production.
Box 7.3: Impacts of Climate Change on Vermont Mountain Biking Abby Long, the Executive Director of Kingdom Trails in East Burke, VT, noted that while
an extended summer biking season will mean more users and revenue, it also means
having to re-allocate budget line items and extend the need for staff. Yet at this phase
of climate change it’s still rather unpredictable, which makes it hard for her to make
these decisions. She also mentions that extreme drought and catastrophic rain events
both have indelible effects on a trail’s health for the foreseeable seasons, and new
users may not know trail etiquette designed to maintain healthy and usable trails
(Long, personal communication, March 12, 2021). The Vermont Department of
Forestry, Parks and Recreation echoed this concern: “With wetter summers overall, our
trails are seeing more impact from use over longer periods of time each year and with
infrastructure that wasn’t built with that amount of use and water or erosion in mind
(Snyder, personal communication, May 21, 2021).”
Recreation and Tourism Vermont Climate Assessment, 2021 318
Lake Champlain’s 490 square miles of surface and 587 miles of shore, along with Vermont’s
numerous ponds, rivers, and streams, make Vermont an ideal water-based recreation oasis.
The Vermont Department of Forestry, Parks and Recreation predicts that with the higher
summer temperatures due to climate change, more people will pursue water-based recreation
at higher rates than in the past (Snyder, personal communication, May 21, 2021). However, the
issue of water quality and quantity continues to be a driving concern with stakeholders across
the board. With increased air temperature comes increased water temperature, leading to
water quality issues—specifically in the form of invasive species and algae blooms (see Water
Resources and Fish and Wildlife in Vermont chapters)—often forcing popular beaches to close
and creating areas for boaters and water enthusiasts to avoid. The recent COVID-19 pandemic
also drove a boost in boat sales in the state, ranging from small watercraft like kayaks, canoes,
and stand-up paddleboards to larger, motorized craft. Robert Hensley, the general manager at
the new Burlington Harbor Marina, notes that new boaters are on the rise in the Burlington
area and with that comes increased boater traffic and often less-informed boaters (Hensley,
personal communication, July 3, 2021).
Although hunting and fishing licenses in the state have seen a steady decline since 1980, the
desire to be outside and connect with the land during the COVID-19 pandemic saw a drastic
bump in the amount of hunting and fishing licenses purchased, reaching levels not seen in
decades (VT Fish and Wildlife Performance Based Budget Report, 2020). Prior to the
pandemic, in 2019 nearly 72,000 resident anglers were estimated to have fished for almost 1.8
million days, and nearly 37,000 nonresident anglers fished for approximately 369,000 days.
Unfortunately, data from the same year shows that stream temperatures continued to increase
Box 7.4: Clean Water=Clean Beer! After the Trump administration’s rollback on EPA protections of the Clean Waters Act,
craft brewers across the nation, including many in Vermont, signed a petition imploring
the new Biden administration to reverse that action to ensure the nation has access to
clean drinking water—and clean ingredients for beer!
Recreation and Tourism Vermont Climate Assessment, 2021 319
in July, August and September, threatening the health of rivers and affecting their biodiversity
and their fisheries. In an interview, President of the Central Vermont Chapter of Trout Unlimited
Chase Whiting mentioned that to help mitigate the effects of climate change on Vermont rivers
and streams, the state needs to first work with the Clean Waterways Act to address the
amount of pollutants that enter the Vermont waterways through runoff. Secondly, Vermont
needs to ensure that there is good riparian health along the banks. He also stressed the need
for a plan to remove aging dams, which will reconnect rivers with their flood plains. Aging
dams also have the potential to collapse in the event of catastrophic rainfall, causing severe
flash-flood potential (Whiting, personal communication, March 14, 2021).
1.2 shoulder seasons: fall and spring
Fall and spring activities are aggregated here because these are transition seasons in
Vermont—not only in terms of temperature variation, but also relative to participation in
recreation and tourism activities. What patterns of climate change suggest is that annually, as
the winter season becomes shorter, the bordering fall and spring recreation opportunities will
increase. Currently, outdoor activities done in fall and spring bring less revenue to Vermont
Box 7.5: 2019 Angler Revenue in Vermont Anglers make a significant contribution to recreation and tourism in Vermont; the
bulk of their spending is on food, lodging, and related trip expenses. The economic
impact of sport fishing in Vermont was estimated to be $147.1 million in retail
sales—providing 2,420 jobs and $16.0 million in state and local tax revenues (2020
Department of Fish and Wildlife Budget Report). However, the increase in air and
water temperatures could affect the native fisheries in Vermont, thereby decreasing
spending in the decades to come (see Water Resources chapter).
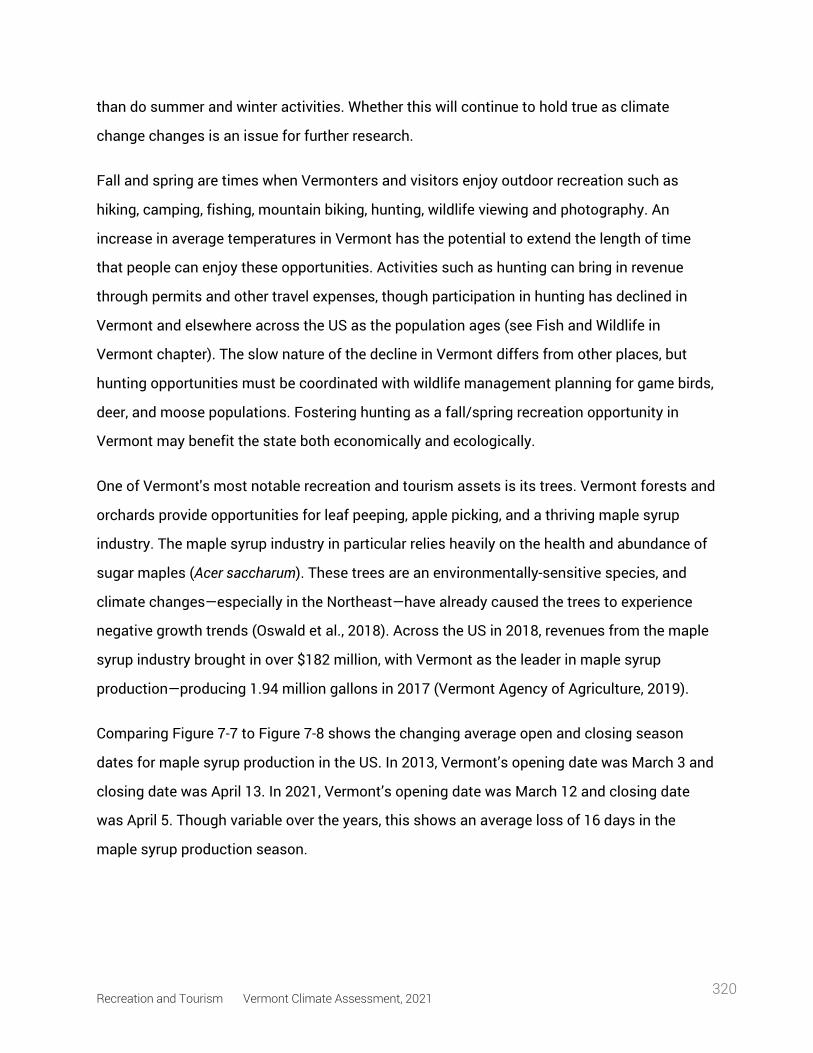
Recreation and Tourism Vermont Climate Assessment, 2021 320
than do summer and winter activities. Whether this will continue to hold true as climate
change changes is an issue for further research.
Fall and spring are times when Vermonters and visitors enjoy outdoor recreation such as
hiking, camping, fishing, mountain biking, hunting, wildlife viewing and photography. An
increase in average temperatures in Vermont has the potential to extend the length of time
that people can enjoy these opportunities. Activities such as hunting can bring in revenue
through permits and other travel expenses, though participation in hunting has declined in
Vermont and elsewhere across the US as the population ages (see Fish and Wildlife in
Vermont chapter). The slow nature of the decline in Vermont differs from other places, but
hunting opportunities must be coordinated with wildlife management planning for game birds,
deer, and moose populations. Fostering hunting as a fall/spring recreation opportunity in
Vermont may benefit the state both economically and ecologically.
One of Vermont's most notable recreation and tourism assets is its trees. Vermont forests and
orchards provide opportunities for leaf peeping, apple picking, and a thriving maple syrup
industry. The maple syrup industry in particular relies heavily on the health and abundance of
sugar maples (Acer saccharum). These trees are an environmentally-sensitive species, and
climate changes—especially in the Northeast—have already caused the trees to experience
negative growth trends (Oswald et al., 2018). Across the US in 2018, revenues from the maple
syrup industry brought in over $182 million, with Vermont as the leader in maple syrup
production—producing 1.94 million gallons in 2017 (Vermont Agency of Agriculture, 2019).
Comparing Figure 7-7 to Figure 7-8 shows the changing average open and closing season
dates for maple syrup production in the US. In 2013, Vermont’s opening date was March 3 and
closing date was April 13. In 2021, Vermont’s opening date was March 12 and closing date
was April 5. Though variable over the years, this shows an average loss of 16 days in the
maple syrup production season.
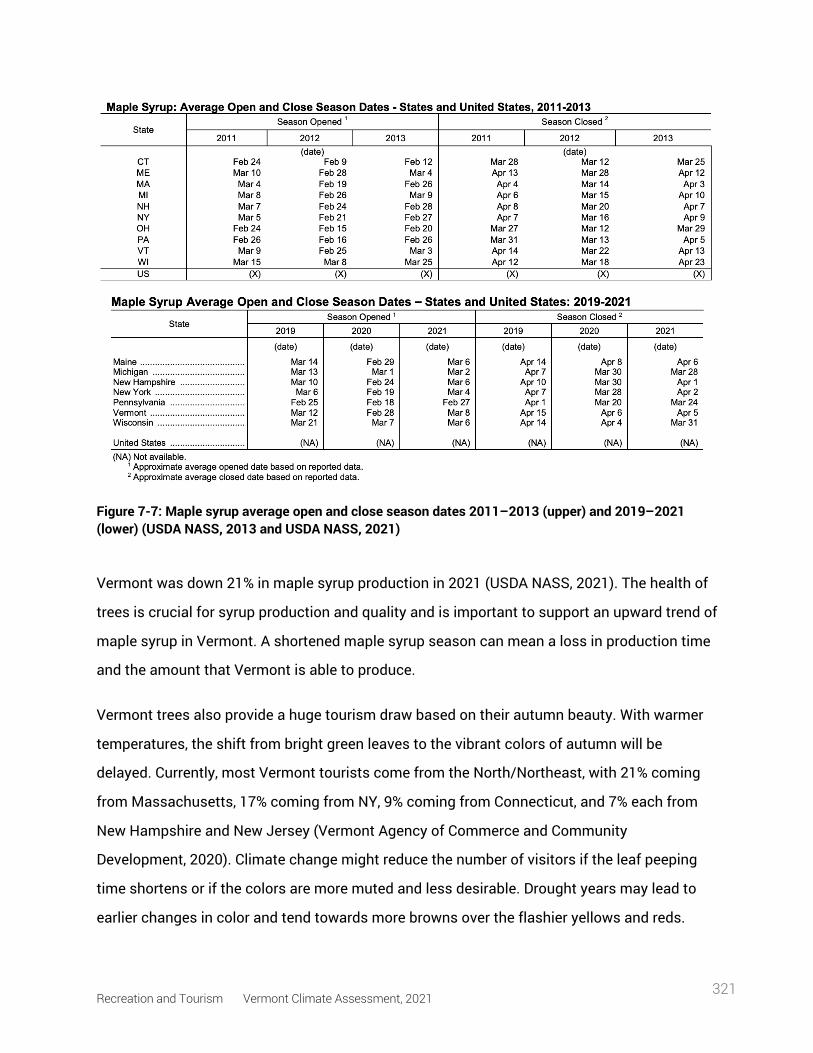
Recreation and Tourism Vermont Climate Assessment, 2021 321
Figure 7-7: Maple syrup average open and close season dates 2011–2013 (upper) and 2019–2021 (lower) (USDA NASS, 2013 and USDA NASS, 2021)
Vermont was down 21% in maple syrup production in 2021 (USDA NASS, 2021). The health of
trees is crucial for syrup production and quality and is important to support an upward trend of
maple syrup in Vermont. A shortened maple syrup season can mean a loss in production time
and the amount that Vermont is able to produce.
Vermont trees also provide a huge tourism draw based on their autumn beauty. With warmer
temperatures, the shift from bright green leaves to the vibrant colors of autumn will be
delayed. Currently, most Vermont tourists come from the North/Northeast, with 21% coming
from Massachusetts, 17% coming from NY, 9% coming from Connecticut, and 7% each from
New Hampshire and New Jersey (Vermont Agency of Commerce and Community
Development, 2020). Climate change might reduce the number of visitors if the leaf peeping
time shortens or if the colors are more muted and less desirable. Drought years may lead to
earlier changes in color and tend towards more browns over the flashier yellows and reds.
Recreation and Tourism Vermont Climate Assessment, 2021 322
Apple picking in the fall is an opportunity for friends and family to spend quality time together
in Vermont's orchards. Apple tree species require cool winters for productive growth and fruit
production. The warming temperatures consistent with climate change may cause some of
these species to expand into more northern territories (State of Vermont, 2021). The reduction
in colder months, though, may affect soil health and thus threaten the productivity of apple
tree species. Apples may face new challenges from diseases related to spring precipitation
while the trees are in bloom, potentially creating lower grade fruits due to scabbing or
damaging whole trees (see Agriculture and Food Systems chapter).
Other factors, though, may accompany longer shoulder seasons (and summer). Ticks and
seasonal pests will be a factor as climate becomes increasingly habitable for them (see
Human Health chapter). When temperatures are below freezing, tick populations decline;
however, with warmer overall temperatures and an increased number of days with average
temperatures above freezing, tick populations will increase (Vermont Department of Health,
2018). Warmer temperatures especially increase the abundance of black-legged ticks which
expand their territories northward and survive through warmer winter seasons. Increases in
tick borne illnesses, like Lyme disease and Anaplasmosis, are likely to occur due to a higher
density of ticks in Vermont (Vermont Department of Health, 2018). Lyme disease is the most
common tick-borne illness and in 2017, Vermont reported the highest number of probable
cases in the U.S. There is an increased risk for tick bites in wooded areas and areas with tall
grass and brush. These consequences may impact recreationists involved in outdoor activities
such as hiking, camping, and mountain biking (Vermont Department of Health, 2018). Vermont
has already seen an increase in Lyme disease cases over the recent years (Figure 7-8 shows
probable and confirmed cases from 2005-2018).
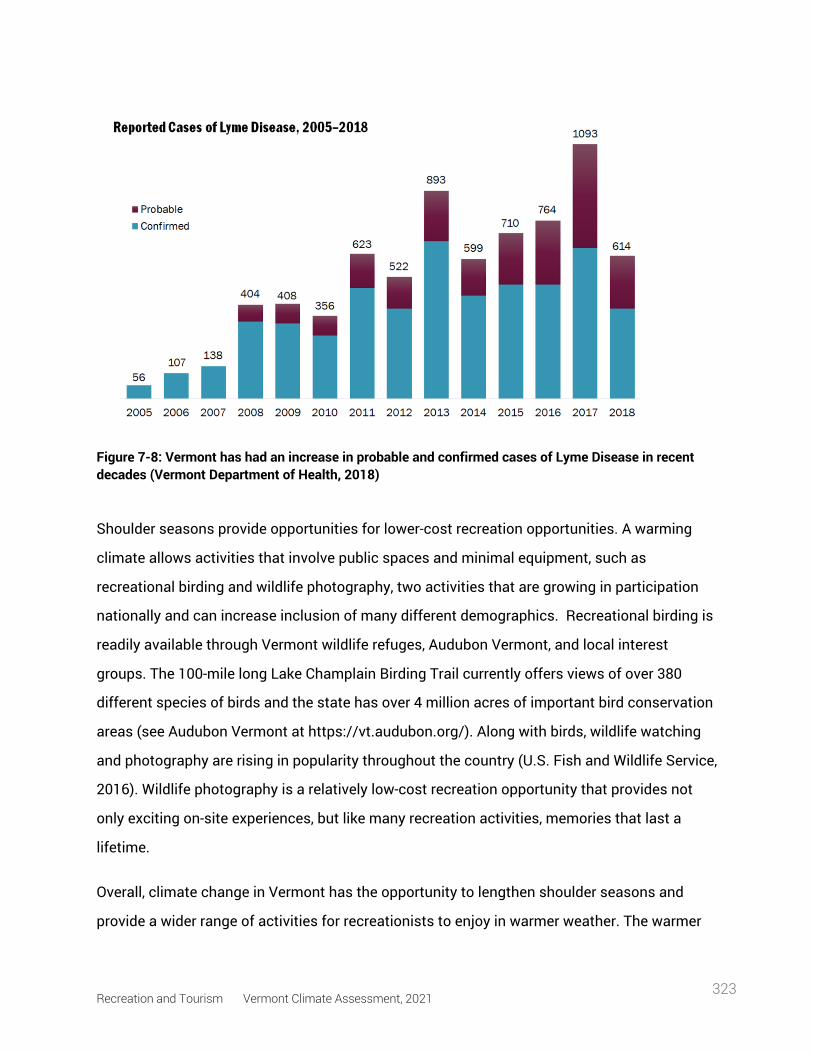
Recreation and Tourism Vermont Climate Assessment, 2021 323
Figure 7-8: Vermont has had an increase in probable and confirmed cases of Lyme Disease in recent decades (Vermont Department of Health, 2018)
Shoulder seasons provide opportunities for lower-cost recreation opportunities. A warming
climate allows activities that involve public spaces and minimal equipment, such as
recreational birding and wildlife photography, two activities that are growing in participation
nationally and can increase inclusion of many different demographics. Recreational birding is
readily available through Vermont wildlife refuges, Audubon Vermont, and local interest
groups. The 100-mile long Lake Champlain Birding Trail currently offers views of over 380
different species of birds and the state has over 4 million acres of important bird conservation
areas (see Audubon Vermont at https://vt.audubon.org/). Along with birds, wildlife watching
and photography are rising in popularity throughout the country (U.S. Fish and Wildlife Service,
2016). Wildlife photography is a relatively low-cost recreation opportunity that provides not
only exciting on-site experiences, but like many recreation activities, memories that last a
lifetime.
Overall, climate change in Vermont has the opportunity to lengthen shoulder seasons and
provide a wider range of activities for recreationists to enjoy in warmer weather. The warmer
Recreation and Tourism Vermont Climate Assessment, 2021 324
weather also provides challenges, as it has major effects on Vermont's trees as well as its pest
population, which has implications for recreation endeavors.
7.5 conclusions
Climate change in Vermont will present distinct challenges and opportunities for the tourism
and recreation industry. Currently, winter brings in the most money for the state with the prices
and involvement costs of the ski industry. Downhill skiing will be available for recreationists
for most of the twenty-first century, but Vermont will need to shift focus to the other seasons
as the climate continues to warm. Other winter sports, such as Nordic skiing and
snowmobiling, are more vulnerable to climate change and will probably be highly impacted by
the changing climate. Pond hockey and skating outdoors on ponds will also face extreme
challenges in the coming decades as ice-out dates occur earlier and ice thickness varies. As
climate warms and the winter season inevitably gets shorter, the state needs to look for other
ways to bring in revenue for warmer seasons.
Participation in warm-weather activities, such as water sports, hiking, mountain and road
biking, and fishing will likely increase with warming temperatures and lengthened shoulder
seasons. Increased use will require managers of warm weather recreation sites to be mindful
of their resources and educate visitors with best-use practices in order to prevent trail erosion
and water pollution. One promising aspect of recreation in the face of climate change would
be the relative ease of summer sports. Less expensive gear is typically needed for summer
recreational activities. Going for a hike in a state park is a cost-effective alternative to more
expensive pursuits. Many summer outdoor recreation areas in Vermont do not charge for
access, so anyone with means of transportation could visit. If Vermont continues to
experience warming trends, the extended warm weather season bodes well for people of any
financial background looking to spend time outside in our state. Managers of winter recreation
sites, however, will need to continue to find creative ways to make money during the warmer
months. Alternative forms of tourism and recreation, such as mountain biking, guided hiking
tours, music festivals, and food and beverage events may offset some of the money lost from
Recreation and Tourism Vermont Climate Assessment, 2021 325
a shorter winter season; many of these solutions have been implemented by Vermont resorts
in the past. Agritourism as well as other forms of food and beverage-related tourism also offer
opportunities for Vermont to increase summer revenue, as Vermont continues to make a name
for itself in the gastronomy world.
According to the State of Vermont Agency of Commerce and Community Development,
Vermont receives over 13 million visitors each year. Many of these visitors participate in some
sort of recreational activity during their stay in our state. Community leaders, business owners,
and public land managers need to adapt to climate change swiftly and creatively for Vermont
to continue to be a hub for recreationists across the globe.
7.6 references
Abegg, B., Morin, S., Demiroglu, O. C., François, H., Rothleitner, M., & Strasser, U. (2020). Overloaded! Critical revision and a new conceptual approach for snow indicators in ski tourism. International Journal of Biometeorology, 1-11.
Bowker, J. M., & Askew, A. (2012). US outdoor recreation participation projections to 2060. In: Cordell, HK ed. 2012. Outdoor Recreation Trends and Futures: A technical document supporting the Forest Service 2010 Resources Planning Act Assessment. Gen. Tech. Rep. SRS-150. Asheville, NC: US Department of Agriculture Forest Service, Southern Research Station. 105-124., 150, 105-124.
Bürki, R. (2000). Klimaänderung und Anpassungsprozesse im Wintertourismus (Vol. 6). Ostschweizerische Geographische Gesellschaft. Page 42.
Campbell, J. L., Ollinger, S. V., Flerchinger, G. N., Wicklein, H., Hayhoe, K., & Bailey, A. S. (2010). Past and projected future changes in snowpack and soil frost at the Hubbard Brook Experimental Forest, New Hampshire, USA. Hydrological Processes, 24(17), 2465-2
Chase, L., Wang W., Bartlett R., Conner D., Quella L., & Hollas C. (April 2021). Agritourism and On-Farm Direct Sales Survey: Results for Vermont. University of Vermont. https://www.uvm.edu/sites/default/files/Vermont-Agritourism-Collaborative/VT_Survey_Report.pdf
Fairley, S., Ruhanen, L., Lovegrove, H. (2015). On frozen ponds: The impact of climate change on hosting pond hockey tournaments. Sport Management Review. 18 (2015) 618–626.
Hamilton, L. C., Brown, C., & Keim, B. D. (2007). Ski areas, weather and climate: time series models for New England case studies. International Journal of Climatology: A Journal of the Royal Meteorological Society, 27(15), 2113-2124.
Recreation and Tourism Vermont Climate Assessment, 2021 326
Hensely, R. (2021). Personal Communication. 03 July 2021.
Hodgkins, G. A., James, I. C., & Huntington, T. G. (2002). Historical changes in lake ice-out dates as indicators of climate change in New England, 1850–2000. International Journal of Climatology: A Journal of the Royal Meteorological Society, 22(15), 1819-1827.
Jones, K. (2018). 2017 Benchmark Report, Tourism in Vermont. Vermont Department of Tourism and Marketing.
Landry, C. E., Bergstrom, J., Salazar, J., & Turner, D. (2021). How Has the COVID-19 Pandemic Affected Outdoor Recreation in the US? A Revealed Preference Approach. Applied Economic Perspectives and Policy, 43(1), 443-457.
Long, A. (2021). Personal Communication. 13 March 2021.
Oswald, E. M., Pontius, J., Rayback, S. A., Schaberg, P. G., Wilmot, S. H., & Dupigny-Giroux, L. A. (2018). The complex relationship between climate and sugar maple health: Climate change implications in Vermont for a key northern hardwood species. Forest Ecologand Management, 422, 303-312.
Perry, E., Manning, R., Xiao, X., Valliere, W., & Reigner, N. (2018). Social Climate Change: The Advancing Extirpation of Snowmobilers in Vermont. Journal of Park & Recreation Administration, 36(2).
Scott, D., Dawson, J., & Jones, B. (2008). Climate change vulnerability of the US Northeast winter recreation–tourism sector. Mitigation and adaptation strategies for global change, 13(5), 577-596.
Scott, D., Steiger, R., Knowles, N., & Fang, Y. (2020). Regional ski tourism risk to climate change: An inter-comparison of Eastern Canada and US Northeast markets, Journal of Sustainable Tourism, 28(4), 568-586
Shanley, J. B., & Wemple, B. (2001). Water quantity and quality in the mountain environment. Vt. L. Rev., 26, 717.
Sharma, S., Blagrave, K., Watson, S., O’Reilly, C., Batt, R., Magnuson, J., Clemens, T., Denfeld, B., Flaim, G., Grinberga, L., Hori, Y., Laas, A., Knoll, L., Stralie, D., Takamura, N., and Weyhenmeyer, G. (2020). Increased winter drownings in ice-covered regions with warmer winters. PloS One, 15(11).
Snyder, M. (2021). Personal Communication. 21 May 2021.
State of Vermont. (2021). Climate Change in Vermont. https://climatechange.vermont.gov/our-changing-climate/what-it-means/farms-forests
Steiger & Abegg. (2013). The Sensitivity of Austrian Ski Areas to Climate Change. Tourism Planning & Development. 10:4, 480-493.
Steiger, R., Scott, D., Abegg, B., Pons, M., & Aall, C. (2019). A critical review of climatchange risk for ski tourism. Current Issues in Tourism, 22(11), 1343-1379.
State of Vermont Agency of Commerce and Community Development. (2021). Tourism and Marketing. https://accd.vermont.gov/tourism
Recreation and Tourism Vermont Climate Assessment, 2021 327
US Census Bureau. (2019). https://www.census.gov/quickfacts/fact/table/VT/RHI125219
United States Department of Agriculture: National Agricultural Statistics Service. (2013). https://www.uvm.edu/sites/default/files/Agriculture/maple-nass-2013.pdf
United States Department of Agriculture: National Agricultural Statistics Service. (2019). https://www.nass.usda.gov/Statistics_by_State/Pennsylvania/Publications/Survey_Results/2019/Maple%20Syrup%202019.pdf
United States Department of Agriculture: National Agricultural Statistics Service. (2021).https://www.nass.usda.gov/Statistics_by_State/New_England_includes/Publications/Current_News_Release/2021/Vermont%202021%20Maple%20Production.pdf
U.S. Geological Survey (2021). USGS Current Water Data for Vermont. National Water Information System. Accessed online 06/06/21 at https://waterdata.usgs.gov/vt/nwis/rt.
Vermont Agency of Commerce and Community Development. (2020) .https://accd.vermont.gov/tourism/research
Vermont Agency of Natural Resources. (1996). Environmental Protection Rules Chapter 16 Water Withdrawals for Snowmaking
Vermont Brewers Association (2019). https://www.vermontbrewers.com/about/economic-impact.
Vermont Department of Fish and Wildlife (2020). Performance-Based Budget 2020 Report. https://vtfishandwildlife.com/sites/fishandwildlife/files/documents/About%20Us/Budget%20and%20Planning/VT-Fish-Wildlife-2020-Performance-Based-Report.pdf.
Vermont Department of Fish and Wildlife (2016). National Service of Fishing, Hunting, and Wildlife- Associated Recreation. https://www.fws.gov/wsfrprograms/Subpages/NationalSurvey/nat_survey2016.pdf
Vermont Department of Forests, Parks and Recreation. (2020). 2020 Annual Report to the Governor, Vermont Outdoor Recreation Economic Collaborative. https://fpr.vermont.gov/sites/fpr/files/2020%20VOREC%20Report%20and%20Recommendations.pdf.
Vermont Department of Health. (2018). Climate Change, Lyme Disease, and Other Tick Borne Diseases in Vermonthttps://www.healthvermont.gov/disease-control/tickborne-diseases/lyme-disease
Vermont Department of Tourism and Marketing. (2018). 2017 Benchmark Report, Tourism in Vermont. https://accd.vermont.gov/sites/accdnew/files/documents/VDTM/BenchmarkStudy/VDTM-Research-2017BenchmarkStudyExecutiveSummary.pdf.
Weiss, H. S. (2021). The Feasibility of Over-Summer Snow Storage at the Craftsbury Outdoor Center, Craftsbury VT. Graduate College Dissertations and Theses. 1345. https://scholarworks.uvm.edu/graddis/1345
Whiting, C. (2021). Personal Communication. 14 March 2021.
Human Health Vermont Climate Assessment, 2021 328
8 human health
Recommended Citation for Chapter Clement, S., Mezzacapo, M.,, 2021. Human Health. In Galford, G.L., Faulkner, J. et al. (Eds), The Vermont Climate Assessment 2021. Burlington, Vermont: Gund Institute for Environment at the University of Vermont. On the web: https://vtclimate.org
Stephanie Clement Lead author; Program Manager at One Tree Planted
Michael Mezzacapo Contributing author to Food and Water section; Environmental Analyst, Agency of Natural Resources, State of Vermont
Human Health Vermont Climate Assessment, 2021 329
8.1 key messages
• Climate change affects human health by exacerbating existing health problems and
amplifying conditions for new health problems.
• Individuals who are children, over 65 years of age, of low socioeconomic status,
Indigenous, or have previous health issues are more vulnerable to the health effects of
climate change.
• Warmer and more moist temperatures in Vermont are likely to create more habitat for
disease-carrying ticks and mosquitoes.
• Increases in the number and severity of natural disasters in Vermont will likely increase
the risk of injury, illness, and death.
• Climate change could affect the quality and safety of food and water, which could lead
to increases in food and water-borne illnesses.
• Decreases in air quality will exacerbate existing chronic diseases and decrease water
quality.
• Mental health is inextricably linked with environmental health. Impacts from climate
change could contribute to mental health challenges.
8.2 introduction: climate change and health
The myriad effects of climate change impact every part of the human body in one way or
another, and climate change effects also disrupt health systems, supply chains, and health
infrastructure (Salas et al., 2019; Lancet Countdown, 2020). Many changes are expected in
Vermont, and all of these will have subsequent health impacts. For instance, increased heat
waves, poor air quality days, and extreme weather lead to health-related impacts such as more
emergency department (ED) visits, higher risk of respiratory illnesses, and increased
occurrence of tick-borne diseases. Human health is, and will continue to be, detrimentally
affected by the changes in climate (Figure 8-1). Particularly vulnerable populations to climate
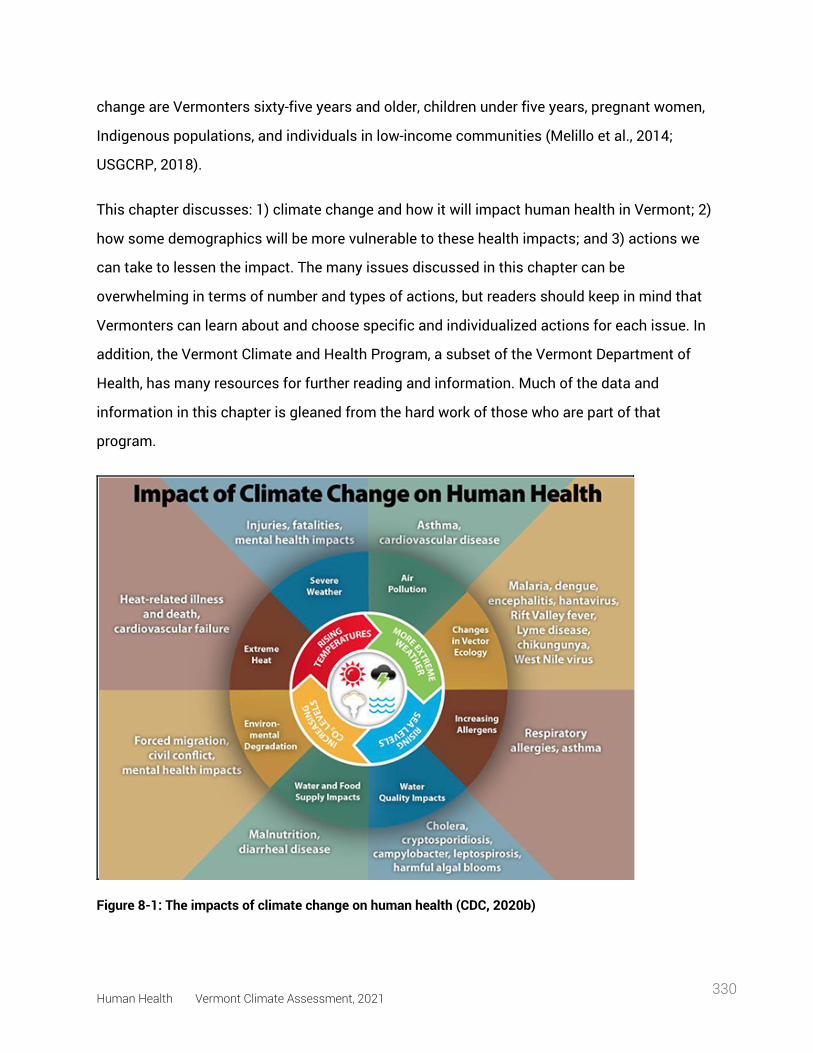
Human Health Vermont Climate Assessment, 2021 330
change are Vermonters sixty-five years and older, children under five years, pregnant women,
Indigenous populations, and individuals in low-income communities (Melillo et al., 2014;
USGCRP, 2018).
This chapter discusses: 1) climate change and how it will impact human health in Vermont; 2)
how some demographics will be more vulnerable to these health impacts; and 3) actions we
can take to lessen the impact. The many issues discussed in this chapter can be
overwhelming in terms of number and types of actions, but readers should keep in mind that
Vermonters can learn about and choose specific and individualized actions for each issue. In
addition, the Vermont Climate and Health Program, a subset of the Vermont Department of
Health, has many resources for further reading and information. Much of the data and
information in this chapter is gleaned from the hard work of those who are part of that
program.
Figure 8-1: The impacts of climate change on human health (CDC, 2020b)
Human Health Vermont Climate Assessment, 2021 331
8.3 temperature and human health
Vermont, as a northern latitude state, experiences a wide range of temperatures throughout
the year. The summers are warm and humid, and the winters are cold and dry. In the past,
Vermonters generally have known what to expect from each season. However, in recent years,
Vermont has begun to experience heat waves—prolonged abnormally high temperatures of
several days or more—more frequently than ever before, as evidenced by three separate heat
waves in the summer of 2020 alone (NOAA NWS Burlington, 2021). There has been an increase
in the average annual minimum and maximum temperatures over time (see Climate Change in
Vermont chapter), and these changes can have direct impacts on human health. Vermont
already is seeing more heat stroke and dehydration from high temperatures and an associated
increase in heat-related ED visits since 2003. With warming temperatures, the number of heat-
related ED visits is expected to continue to rise, as discussed later in this chapter. In addition
to an overall increase in temperature, other factors such as humidity, lack of wind, and
physical exertion affect heat’s impact on human health. These impacts can include heat
exhaustion and heat stroke, dehydration, cramping, sunburn, heat rash, and more.
8.3.1 Changes in Temperature from Climate Change One way to understand changes in temperature is to track the number of extreme heat days,
defined as days over 90°F (32°C). Since the 1960s, Vermont has experienced an average
increase of 0.5 days over 90°F (32°C) per decade (see Climate Change in Vermont chapter).
Warm summer nights are more frequent as well, with a trend of 0.5 more nights per decade
above 70°F since the 1990s resulting in a net gain of 1.5 more warm nights per year since the
1960s (Figure 8-2) (Galford et al., 2014). In addition, three of the ten heat waves since 2010
occurred in 2020 (Figure 8-3), and, as of this writing (August 2021), two heat waves have
occurred so far in 2021 (NOAA NWS Burlington, 2021). Compared to an average of seven
extreme heat days per year in the early 2000s, climate scientists predict that Vermont is likely
to experience 15–20 extreme heat days each year by 2050 and 20–34 extreme heat days each
year by 2100 (VT Dept. Health, 2016a).
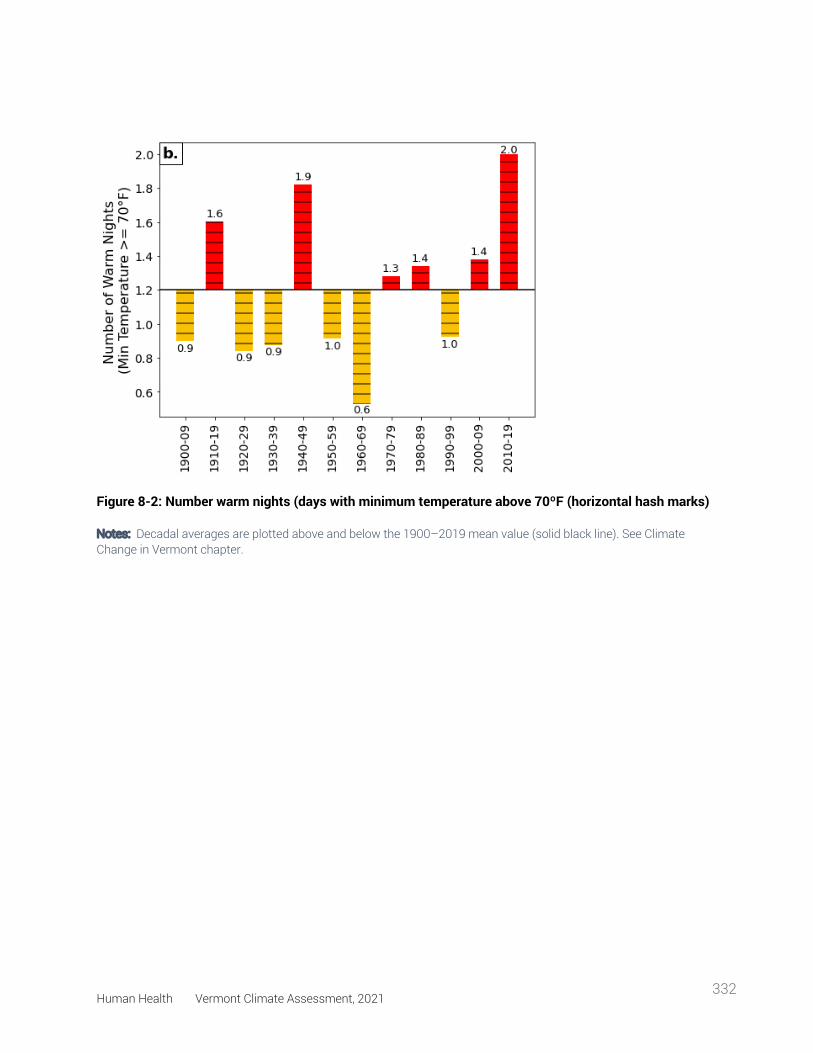
Human Health Vermont Climate Assessment, 2021 332
Figure 8-2: Number warm nights (days with minimum temperature above 70ºF (horizontal hash marks)
Notes: Decadal averages are plotted above and below the 1900–2019 mean value (solid black line). See Climate Change in Vermont chapter.
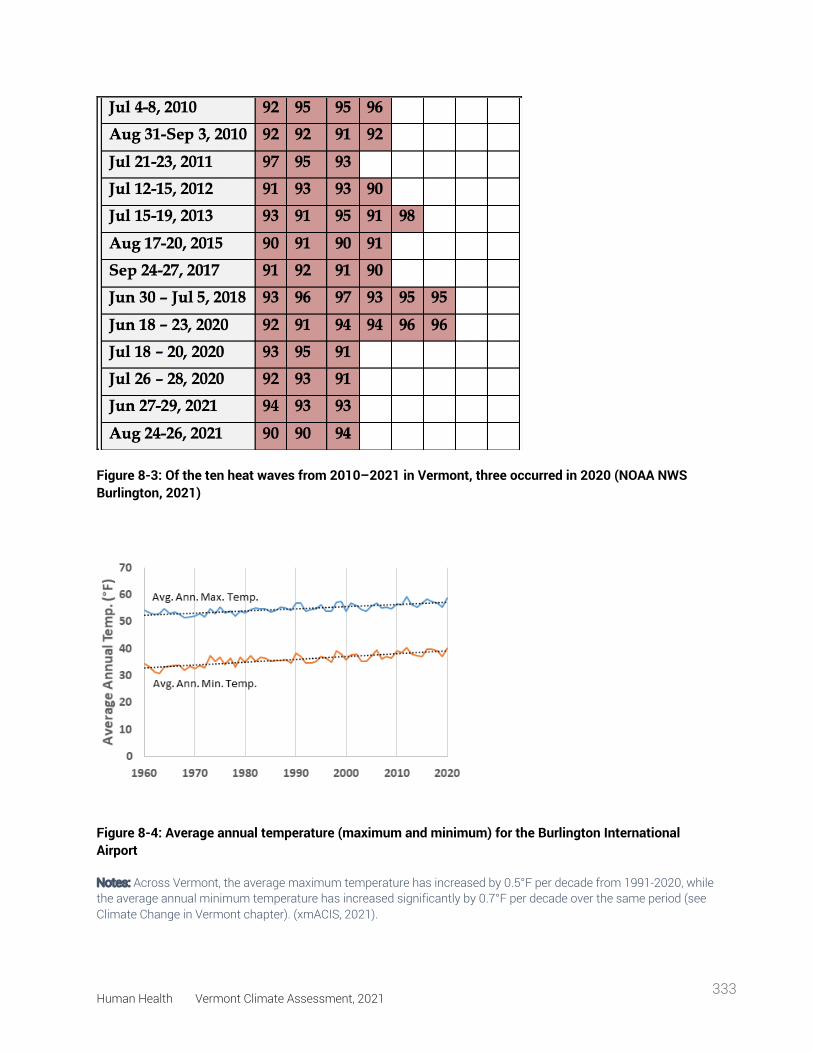
Human Health Vermont Climate Assessment, 2021 333
Figure 8-3: Of the ten heat waves from 2010–2021 in Vermont, three occurred in 2020 (NOAA NWS Burlington, 2021)
Figure 8-4: Average annual temperature (maximum and minimum) for the Burlington International Airport
Notes: Across Vermont, the average maximum temperature has increased by 0.5°F per decade from 1991-2020, while the average annual minimum temperature has increased significantly by 0.7°F per decade over the same period (see Climate Change in Vermont chapter). (xmACIS, 2021).
Human Health Vermont Climate Assessment, 2021 334
While the increase in extreme heat days impacts Vermont summers, winters are also
changing. The average minimum temperature in Vermont has increased by 2.6℉ (1.4°C) from
the 1960s to the 2010s (Figure 8-4) (Galford et al., 2014; Vermont Emergency Management,
2018). This means that as the highest temperatures increase, so do the minimum
temperatures. This impacts cold-weather crops, such as field corn, wheat, oats, blueberries,
and apples, which experience lower yields as temperatures increase (Dunnington, 2010). Milk
production also decreases when temperatures are above 75°F (24°C), as ideal milking
temperatures range from 40°–75°F (4–24°C) (Dunnington, 2010). The potential decline in
yields of these staple foods could lead not only to negative economic impacts, but also to food
shortages and subsequent health impacts related to the lack of available food.
While the absolute amount of degree change in average temperature over time in Vermont
may seem small, climate change will have surprising impacts on extreme weather, the growing
season, precipitation, water and air quality, and more (VT ANR, 2021). Impacts secondary to
extreme heat events are discussed below.
8.3.2 Impacts of Heat on Human Health and the Environment Nationally, extreme heat is characterized by high heat and humidity and temperatures that
exceed 90°F (32°C) for two to three days or more. Extreme heat is responsible for the highest
number of annual deaths among all weather-related hazards (ready.gov, 2021). In Vermont
extreme heat is considered 87°F (31°C) or higher. The health impacts of extreme heat can be
very severe as the body works hard to maintain normal temperatures. Heat can have serious
impacts on Vermonters’ health, especially extreme heat (VT Dept. Health, 2016a). Vermonters
are particularly at risk to extreme heat due in part to Vermonters’ physiological adaptation to
cooler climates. Such adaptation means that the threshold temperature above which mortality
increases is lower than in warmer climates (Kovats & Hajat, 2008). When the human body
cannot cool itself down properly, a person can be at risk for heat illnesses. Heat illnesses
include strokes, cramps, fainting, heat exhaustion, and heat stroke, which is life-threatening. In
Human Health Vermont Climate Assessment, 2021 335
addition, vulnerable Vermonters, such as those who are more exposed to hot conditions, those
who are older or more sensitive to heat, and those who have limited resources, may be at a
higher risk during heat waves, especially if they do not have means to cool down. Extreme heat
can also exacerbate certain environmental conditions and pre-existing health conditions,
rendering individuals more vulnerable to heat-related illnesses (VT Dept. Health, 2021c).
According to the Vermont Department of Health (VDH), Vermont is not uniformly impacted by
heat waves; rather, “the highest risk areas for heat illness were located in the northeastern
counties of Orleans and Essex, along with the urbanized areas of Bennington, Montpelier,
Rutland, St. Albans, and Vergennes” (VT Dept. Health, 2016a). This disparity in risk can be seen
in the VDH’s vulnerability index maps, where each district and/or county is rated on its
vulnerability to climate change based on several different factors: population size,
environmental factors, acclimatization ability, socioeconomic status, health status, and heat
emergencies (VT Dept. Health, 2016c). Overall, the highest vulnerabilities exist in northeast
and southwest Vermont (Figure 8-5). Essex and Orleans counties, located in the far northeast
of the state, also have the lowest incomes, with average annual incomes approximately $7,000
and $9,000 less per capita than the state average (U.S. Census Bureau, 2019).
Many residents of the main cities in Vermont are at higher heat illness vulnerability to climate
change than other residents in their counties. This is likely due to factors such as the age of
the population (where vulnerable individuals are under five and over sixty-five years old) and
environmental factors such as dense housing, high proportion of paved areas, and lack of tree
cover (VT Dept. Health, 2016c).
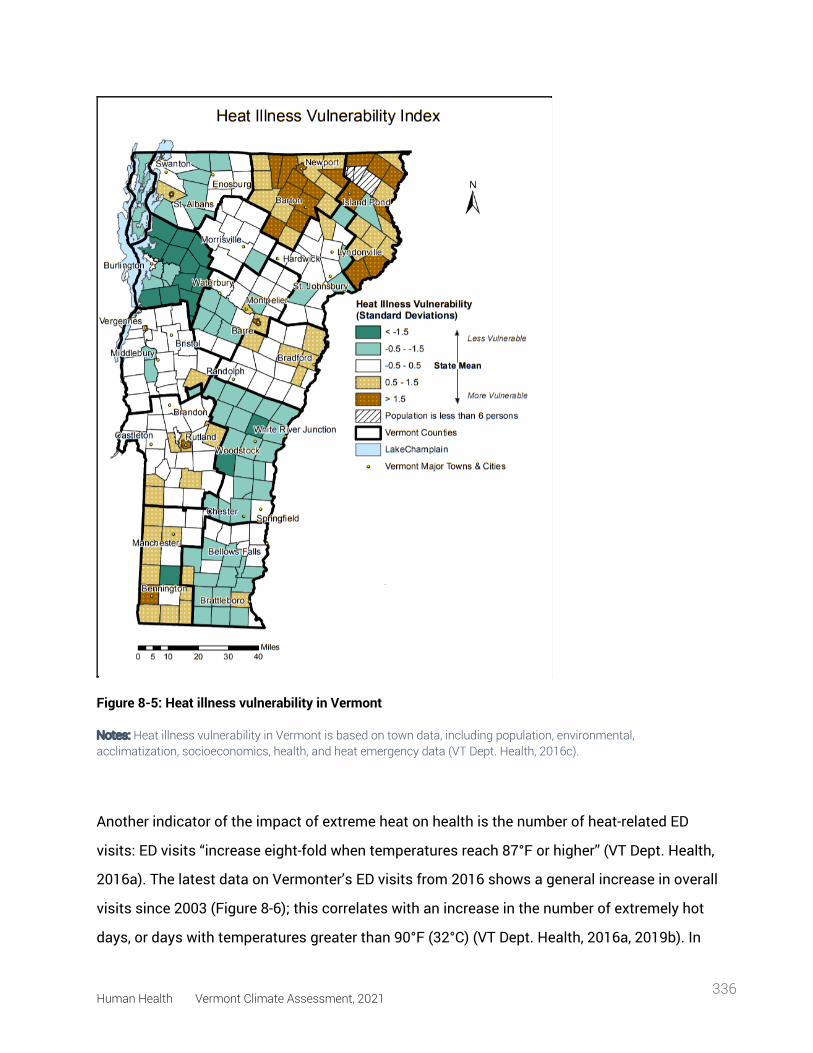
Human Health Vermont Climate Assessment, 2021 336
Figure 8-5: Heat illness vulnerability in Vermont
Notes: Heat illness vulnerability in Vermont is based on town data, including population, environmental, acclimatization, socioeconomics, health, and heat emergency data (VT Dept. Health, 2016c).
Another indicator of the impact of extreme heat on health is the number of heat-related ED
visits: ED visits “increase eight-fold when temperatures reach 87°F or higher” (VT Dept. Health,
2016a). The latest data on Vermonter’s ED visits from 2016 shows a general increase in overall
visits since 2003 (Figure 8-6); this correlates with an increase in the number of extremely hot
days, or days with temperatures greater than 90°F (32°C) (VT Dept. Health, 2016a, 2019b). In
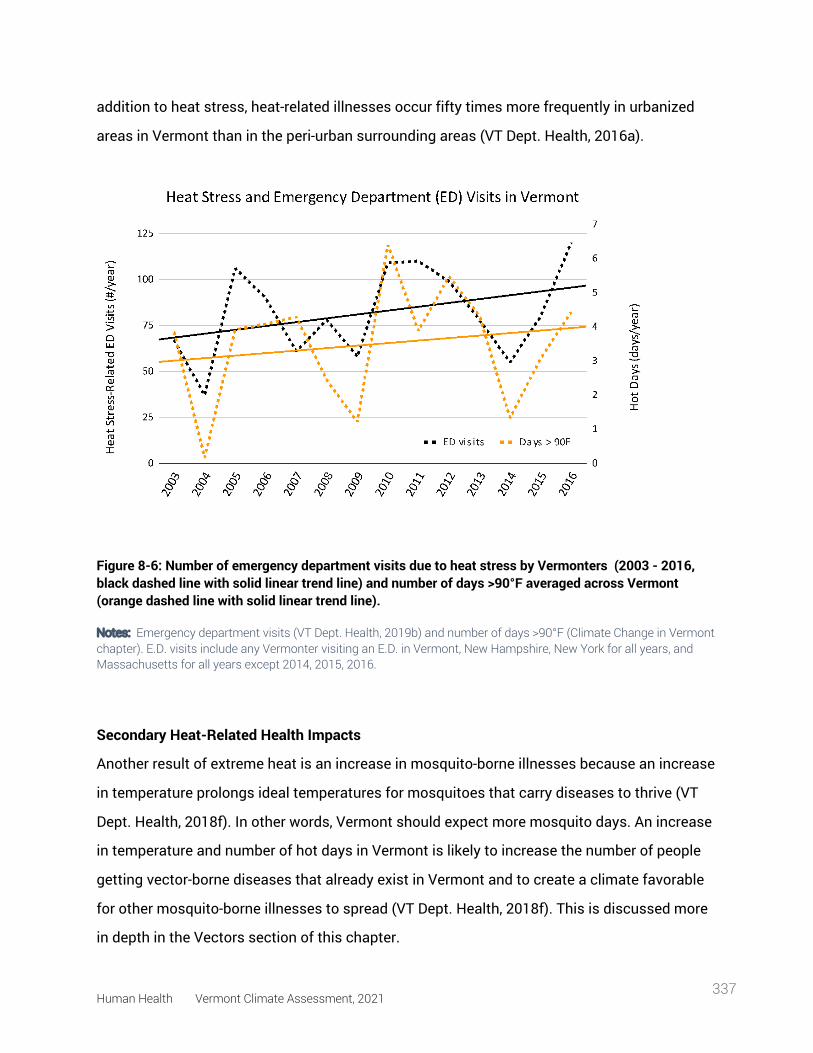
Human Health Vermont Climate Assessment, 2021 337
addition to heat stress, heat-related illnesses occur fifty times more frequently in urbanized
areas in Vermont than in the peri-urban surrounding areas (VT Dept. Health, 2016a).
Figure 8-6: Number of emergency department visits due to heat stress by Vermonters (2003 - 2016, black dashed line with solid linear trend line) and number of days >90°F averaged across Vermont (orange dashed line with solid linear trend line).
Notes: Emergency department visits (VT Dept. Health, 2019b) and number of days >90°F (Climate Change in Vermont chapter). E.D. visits include any Vermonter visiting an E.D. in Vermont, New Hampshire, New York for all years, and Massachusetts for all years except 2014, 2015, 2016.
Secondary Heat-Related Health Impacts
Another result of extreme heat is an increase in mosquito-borne illnesses because an increase
in temperature prolongs ideal temperatures for mosquitoes that carry diseases to thrive (VT
Dept. Health, 2018f). In other words, Vermont should expect more mosquito days. An increase
in temperature and number of hot days in Vermont is likely to increase the number of people
getting vector-borne diseases that already exist in Vermont and to create a climate favorable
for other mosquito-borne illnesses to spread (VT Dept. Health, 2018f). This is discussed more
in depth in the Vectors section of this chapter.
Human Health Vermont Climate Assessment, 2021 338
Higher temperatures also mean changes to the water systems in Vermont. In Lake Champlain,
for instance, there are algal blooms that shut down public beaches and make the water
hazardous to swim in each year. Cyanobacteria, commonly called blue-green algae, is found
naturally in freshwater. However, with consistent hot weather, cyanobacteria can flourish and
multiply to create a green scummy film over the top of a body of water; this is called a bloom
(VT Dept. Health, 2018e). Cyanobacteria have toxins called cyanotoxins that, at high levels
such as during an algal bloom, are a hazard to human health as they can cause stomach pain,
diarrhea, liver damage, skin rashes, runny noses, and sore throats (VT Dept. Health, 2018e).
This is discussed further in the “Food and Water” section of this chapter.
Heat events impact air quality and worsen air pollution. Heat waves create stagnant air that
traps pollution particles that are then breathed in. Increased temperatures also increase the
likelihood for drought, which dries out vegetation. This vegetation is then more susceptible to
wildfire, which also releases pollutants into the air (Peterson et al., 2014). Vermont’s growing
season is lengthening (see Climate Change in Vermont and Agriculture and Food Systems
chapters), which may impact the timing and duration of pollen (VT Dept. Health, 2018g). The
combination of increased average temperatures and decreased air quality can change
people’s engagement in outdoor activities and recreation, which may be associated with
increased rate of obesity and cardiovascular disease. Even with increased indoor exercise,
people may have reduced access to restorative emotional benefits of time spent outside.
The impacts of increasing temperatures on air quality clearly have a myriad of health impacts.
Worsening air quality exacerbates respiratory illnesses such as asthma and lung cancer, and,
as seen above, can impact general cardiovascular health. These impacts are discussed further
in the Air Quality section of this chapter.
8.3.3 Impacts of Cold on Human Health and the Environment In Vermont, winter weather can cause icy roads and disrupt power supply, which in turn can
lead to dangerous conditions such as car accidents and leaving Vermonters without heat. In
addition, cold can lead to hypothermia and frostbite. Frostbite “is an injury caused by freezing
Human Health Vermont Climate Assessment, 2021 339
of the skin and underlying tissues. First your skin becomes very cold and red, then numb, hard
and pale. Frostbite is most common on the fingers, toes, nose, ears, cheeks, and chin. Exposed
skin in cold, windy weather is most vulnerable to frostbite. But frostbite can occur on skin
covered by gloves or other clothing" (Mayo Clinic, 2019). Shoveling snow can “stress [the]
heart and lead to a heart attack” (VT Dept. Health, 2021e). An increase in minimum
temperatures in Vermont may have the positive effect of potentially decreasing the number of
cold-related illnesses and deaths, although by 2050 Vermont may experience more icy
conditions (see Climate Change in Vermont chapter), which pose different risks. Any winter
warming benefits could be outweighed by an increase in heat-related illnesses and deaths (Ebi
& Mills, 2013). Further, warmer winters may bring less precipitation falling as snow and more
as ice or lead to spring recreation on dangerously cold-water bodies.
8.3.4 What You Can Do Individuals and Outdoor Workers
While extreme heat events can be detrimental to health, there are still many ways to reduce the
impacts of extreme heat. For individuals working or recreating outside, it is a good idea to
develop a safety plan to address extreme heat days (VT Dept. Health, 2021c). The Centers for
Disease Control and Prevention (CDC) and the National Institute for Occupational Safety and
Health (NIOSH) have guidelines that workers can follow to protect their health and safety
during hot days (NIOSH, 2016). Some of these suggestions include: implement a buddy
system to keep an eye on indicators of heat stress, provide and drink plenty of cool water,
increase airflow of an area, implement a heat alert system for extreme heat days, take frequent
rests in the shade, implement a heat-related training program, and train workers on heat-
related first aid (NIOSH, 2016; VT Dept. Health, 2021c).
In addition, there are technological tools to aid in heat-related events. One of these tools is the
Heat Safety Tool mobile app sponsored by the Occupational Safety and Health Administration
(OSHA) and NIOSH. While the tool is aimed towards individuals who work outside, it can be
beneficial for anyone who enjoys being outdoors in warm weather or is particularly vulnerable
to the effects of extreme heat. OSHA uses the heat index to “calculate the heat index and get
Human Health Vermont Climate Assessment, 2021 340
associated risk level worksite recommendations” (NIOSH, 2016). In other words, it helps
workers and companies take the appropriate safety actions according to the heat, humidity,
and wind factors at their workplace.
Cities and Communities
While it is important to respond to heat events on the individual level, acting as a community is
also essential for community and individual well-being and health. Similar to creating a work
safety plan, communities and cities can create community response plans that specify
particular actions to take on extreme heat days (VT Dept. Health, 2021c). One such plan is the
Vermont Hazard Mitigation Plan (Vermont Emergency Management, 2018), which discusses
changes in temperature and ideas for mitigation. However, having individualized plans for
specific communities can be extremely beneficial, as each community has its own needs and
resources.
Communities can also open cooling centers. These centers can be “any air-conditioned
building that can be opened to the public, such as a library, town hall, or senior center,” (VT
Dept. Health, 2021a). These centers include air conditioning, water access, seating, restrooms,
and more, and can allow access to anyone (VT Dept. Health, 2021a). Along with cooling
centers, communities can make sure to mobilize their care networks in order to make sure that
those most vulnerable are being taken care of (VT Dept. Health, 2021a, 2021c).
Ensuring that buildings are energy-efficient is another action that communities can take to
help reduce the impact of heat on human health (VT Dept. Health, 2021c). In addition,
communities can encourage tree and shrub planting, thereby reducing the paved surface area
that receives direct sun and contributes to urban areas being warmer than rural areas
(Vermont Emergency Management, 2018; VT Dept. Health, 2021c, 2021a).
Homeowners and Landlords
Many of the above actions are short-term responses to heat events, not long-term actions.
Homeowners and landlords can improve buildings to not only provide shelter from heat, but
also improve the standards of living for many people at risk of heat illness. Homeowners and
Human Health Vermont Climate Assessment, 2021 341
landlords may modify ventilation systems to increase flow of cool air, seal air leaks,
weatherize the building properly, replace old lights with LED bulbs, install cooling devices such
as air conditioners, and use light-colored construction materials to reflect light and heat (Hot
Weather VDH, 2020). As mentioned previously, planting shrubs, vines, and trees can also be a
longer-term solution to providing shade and preventing excessive urban heat (Vermont
Emergency Management, 2018; VT Dept. Health, 2021c, 2021a).
8.3.5 Resources for Further Reading 1. Vermont Department of Health Heat Webpage (https://www.healthvermont.gov/health-
environment/climate-health/hot-weather) (2021) provides detailed information about
heat events in Vermont and actions individuals can take.
2. Vermont Department of Health Heat Vulnerability Index
(http://healthvermont.gov/sites/default/files/documents/2016/12/ENV_EPHT_heat_vulner
ability_in_VT_0.pdf) (2016) provides specific district-level information about
vulnerability to heat in Vermont.
3. Heat Waves in Burlington, Vermont
(https://www.weather.gov/media/btv/climo/extremes/heatwave.pdf ) (2020) lists heat
waves from 1886 to present.
4. Vermont Emergency Alert (https://vem.vermont.gov/vtalert) (2021) is where you can sign
up to receive emergency alerts.
5. Vermont Hot Weather Media Toolkit
(https://www.healthvermont.gov/sites/default/files/documents/pdf/ENV_CH_HotWeather
_MediaToolkit.pdf ) (2020) gives detailed information on heat changes in Vermont, the
impacts, and the tools available for individual and collective action.
8.4 air quality, pollution, and health impacts
Climate change has a direct impact on air quality, as increased temperature and moisture
levels in the atmosphere contribute to the distribution of allergens, pollutants, and irritants in
the air (Dean & Green, 2018), and human activities simultaneously contribute to climate
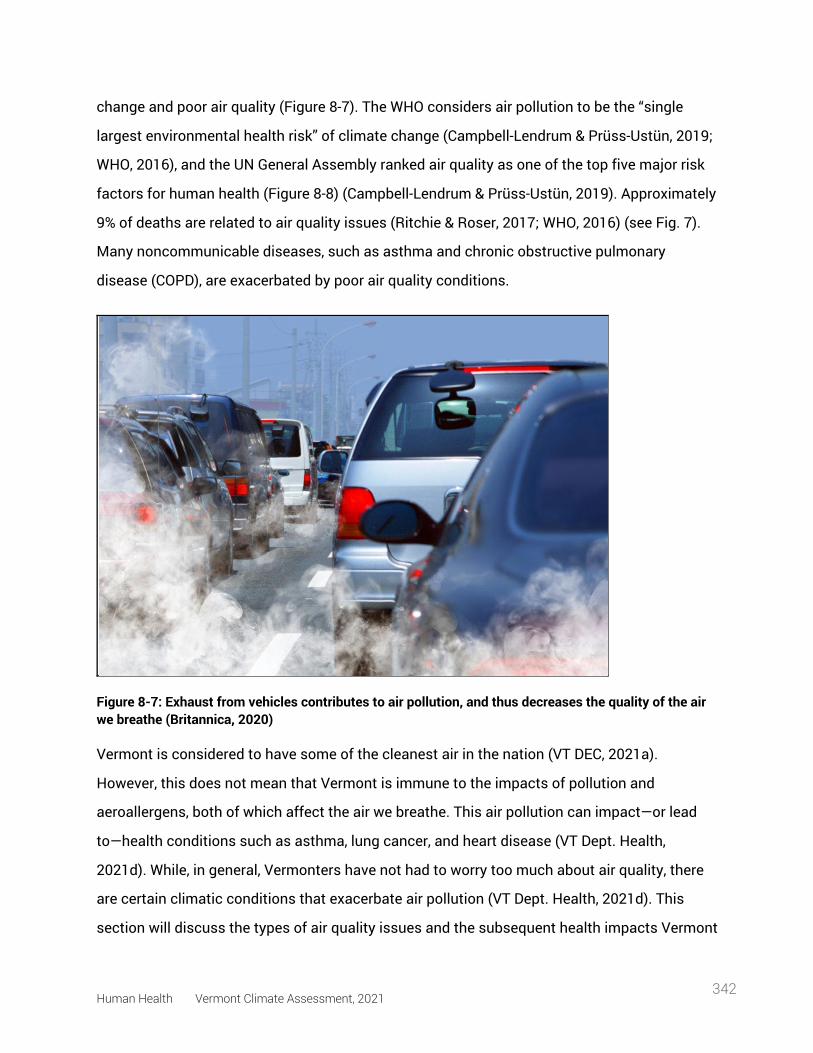
Human Health Vermont Climate Assessment, 2021 342
change and poor air quality (Figure 8-7). The WHO considers air pollution to be the “single
largest environmental health risk” of climate change (Campbell-Lendrum & Prüss-Ustün, 2019;
WHO, 2016), and the UN General Assembly ranked air quality as one of the top five major risk
factors for human health (Figure 8-8) (Campbell-Lendrum & Prüss-Ustün, 2019). Approximately
9% of deaths are related to air quality issues (Ritchie & Roser, 2017; WHO, 2016) (see Fig. 7).
Many noncommunicable diseases, such as asthma and chronic obstructive pulmonary
disease (COPD), are exacerbated by poor air quality conditions.
Figure 8-7: Exhaust from vehicles contributes to air pollution, and thus decreases the quality of the air we breathe (Britannica, 2020)
Vermont is considered to have some of the cleanest air in the nation (VT DEC, 2021a).
However, this does not mean that Vermont is immune to the impacts of pollution and
aeroallergens, both of which affect the air we breathe. This air pollution can impact—or lead
to—health conditions such as asthma, lung cancer, and heart disease (VT Dept. Health,
2021d). While, in general, Vermonters have not had to worry too much about air quality, there
are certain climatic conditions that exacerbate air pollution (VT Dept. Health, 2021d). This
section will discuss the types of air quality issues and the subsequent health impacts Vermont
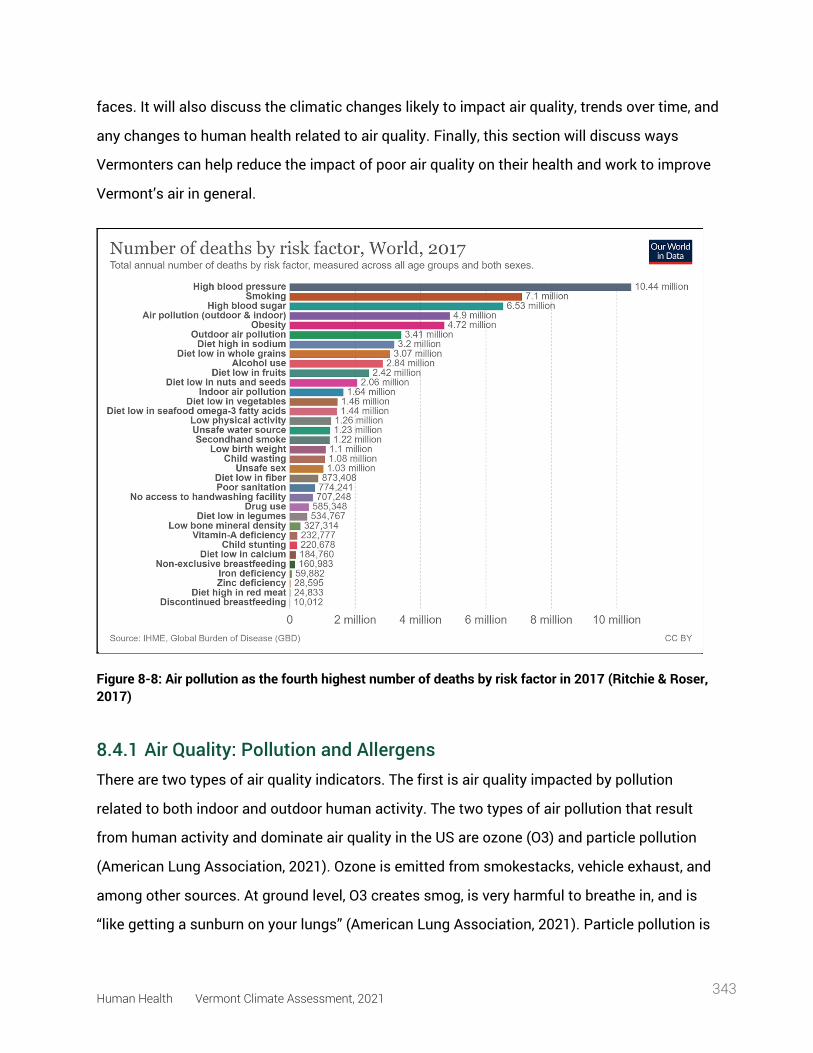
Human Health Vermont Climate Assessment, 2021 343
faces. It will also discuss the climatic changes likely to impact air quality, trends over time, and
any changes to human health related to air quality. Finally, this section will discuss ways
Vermonters can help reduce the impact of poor air quality on their health and work to improve
Vermont’s air in general.
Figure 8-8: Air pollution as the fourth highest number of deaths by risk factor in 2017 (Ritchie & Roser, 2017)
8.4.1 Air Quality: Pollution and Allergens There are two types of air quality indicators. The first is air quality impacted by pollution
related to both indoor and outdoor human activity. The two types of air pollution that result
from human activity and dominate air quality in the US are ozone (O3) and particle pollution
(American Lung Association, 2021). Ozone is emitted from smokestacks, vehicle exhaust, and
among other sources. At ground level, O3 creates smog, is very harmful to breathe in, and is
“like getting a sunburn on your lungs” (American Lung Association, 2021). Particle pollution is
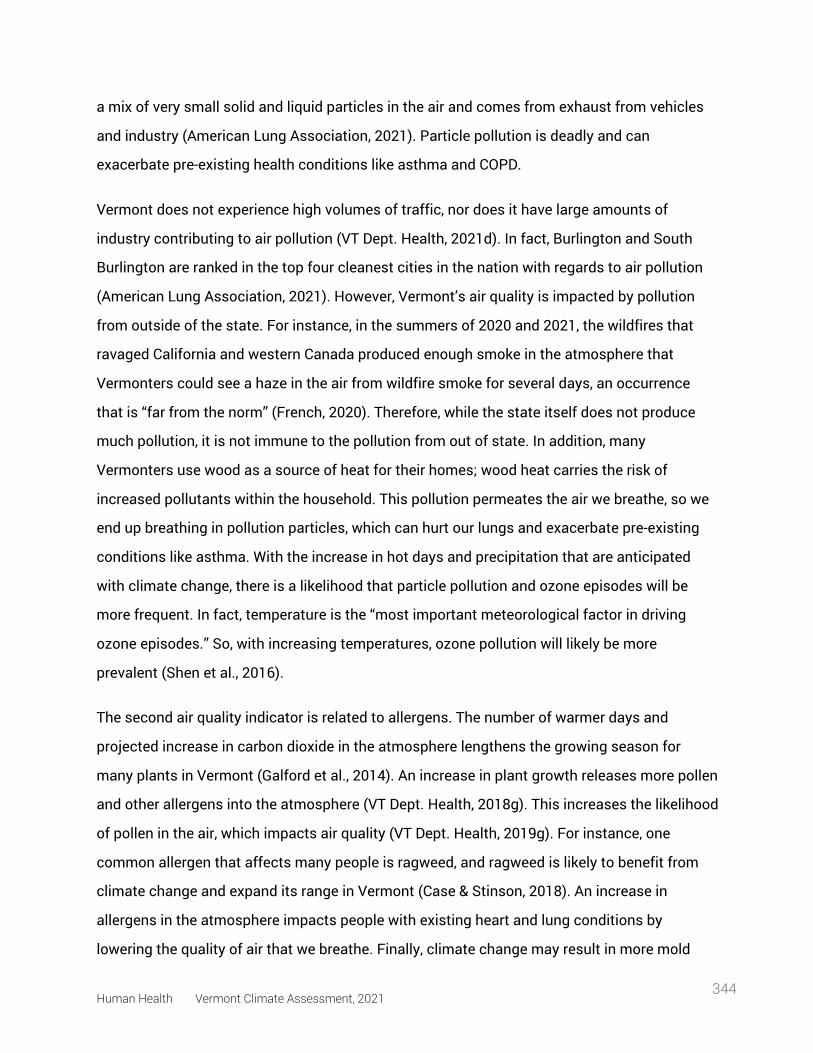
Human Health Vermont Climate Assessment, 2021 344
a mix of very small solid and liquid particles in the air and comes from exhaust from vehicles
and industry (American Lung Association, 2021). Particle pollution is deadly and can
exacerbate pre-existing health conditions like asthma and COPD.
Vermont does not experience high volumes of traffic, nor does it have large amounts of
industry contributing to air pollution (VT Dept. Health, 2021d). In fact, Burlington and South
Burlington are ranked in the top four cleanest cities in the nation with regards to air pollution
(American Lung Association, 2021). However, Vermont’s air quality is impacted by pollution
from outside of the state. For instance, in the summers of 2020 and 2021, the wildfires that
ravaged California and western Canada produced enough smoke in the atmosphere that
Vermonters could see a haze in the air from wildfire smoke for several days, an occurrence
that is “far from the norm” (French, 2020). Therefore, while the state itself does not produce
much pollution, it is not immune to the pollution from out of state. In addition, many
Vermonters use wood as a source of heat for their homes; wood heat carries the risk of
increased pollutants within the household. This pollution permeates the air we breathe, so we
end up breathing in pollution particles, which can hurt our lungs and exacerbate pre-existing
conditions like asthma. With the increase in hot days and precipitation that are anticipated
with climate change, there is a likelihood that particle pollution and ozone episodes will be
more frequent. In fact, temperature is the “most important meteorological factor in driving
ozone episodes.” So, with increasing temperatures, ozone pollution will likely be more
prevalent (Shen et al., 2016).
The second air quality indicator is related to allergens. The number of warmer days and
projected increase in carbon dioxide in the atmosphere lengthens the growing season for
many plants in Vermont (Galford et al., 2014). An increase in plant growth releases more pollen
and other allergens into the atmosphere (VT Dept. Health, 2018g). This increases the likelihood
of pollen in the air, which impacts air quality (VT Dept. Health, 2019g). For instance, one
common allergen that affects many people is ragweed, and ragweed is likely to benefit from
climate change and expand its range in Vermont (Case & Stinson, 2018). An increase in
allergens in the atmosphere impacts people with existing heart and lung conditions by
lowering the quality of air that we breathe. Finally, climate change may result in more mold
Human Health Vermont Climate Assessment, 2021 345
growth in homes, which also impacts air quality (VT Dept. Health, 2018g).
8.4.2 Air Quality and Health Impacts Particle Pollution
Respiratory illnesses and allergies are greatly impacted by air quality. Poor air quality can lead
to issues such as lung cancer, asthma, and heart disease (Figure 8-9; VT Dept. Health, 2021d).
In 2019, the EPA concluded that particle pollution:
1. Causes early death from both long- and short-term exposure.
2. Causes cardiovascular damage, including heart attacks, heart disease, and strokes.
3. Likely worsens diseases such as asthma and COPD.
4. Likely causes cancer and nervous system harm, as well as developmental harm.
(American Lung Association, 2021)
In 2013 and again in 2020, the EPA concluded that O3 exposure:
1. Causes worsening of pre-existing conditions like asthma and COPD.
2. Likely causes early death from both long- and short-term exposure.
3. Likely causes cardiovascular damage, including heart attacks, heart disease, and
strokes.
4. May cause nervous system and reproductive and developmental harm. (American Lung
Association, 2021; U.S. EPA, 2013, 2020).
As these conclusions indicate, air quality has a direct impact on several aspects of human
health. Not only do air pollutants cause damage in and of themselves, but they also
exacerbate pre-existing conditions like asthma.
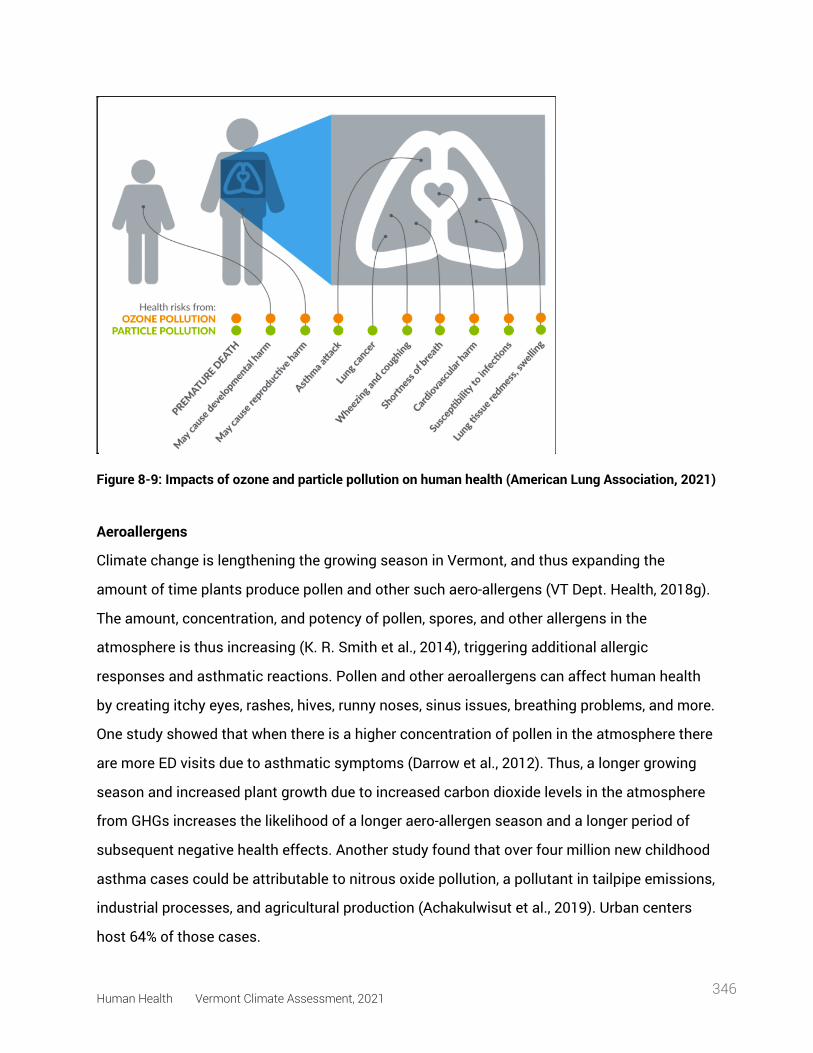
Human Health Vermont Climate Assessment, 2021 346
Figure 8-9: Impacts of ozone and particle pollution on human health (American Lung Association, 2021)
Aeroallergens
Climate change is lengthening the growing season in Vermont, and thus expanding the
amount of time plants produce pollen and other such aero-allergens (VT Dept. Health, 2018g).
The amount, concentration, and potency of pollen, spores, and other allergens in the
atmosphere is thus increasing (K. R. Smith et al., 2014), triggering additional allergic
responses and asthmatic reactions. Pollen and other aeroallergens can affect human health
by creating itchy eyes, rashes, hives, runny noses, sinus issues, breathing problems, and more.
One study showed that when there is a higher concentration of pollen in the atmosphere there
are more ED visits due to asthmatic symptoms (Darrow et al., 2012). Thus, a longer growing
season and increased plant growth due to increased carbon dioxide levels in the atmosphere
from GHGs increases the likelihood of a longer aero-allergen season and a longer period of
subsequent negative health effects. Another study found that over four million new childhood
asthma cases could be attributable to nitrous oxide pollution, a pollutant in tailpipe emissions,
industrial processes, and agricultural production (Achakulwisut et al., 2019). Urban centers
host 64% of those cases.
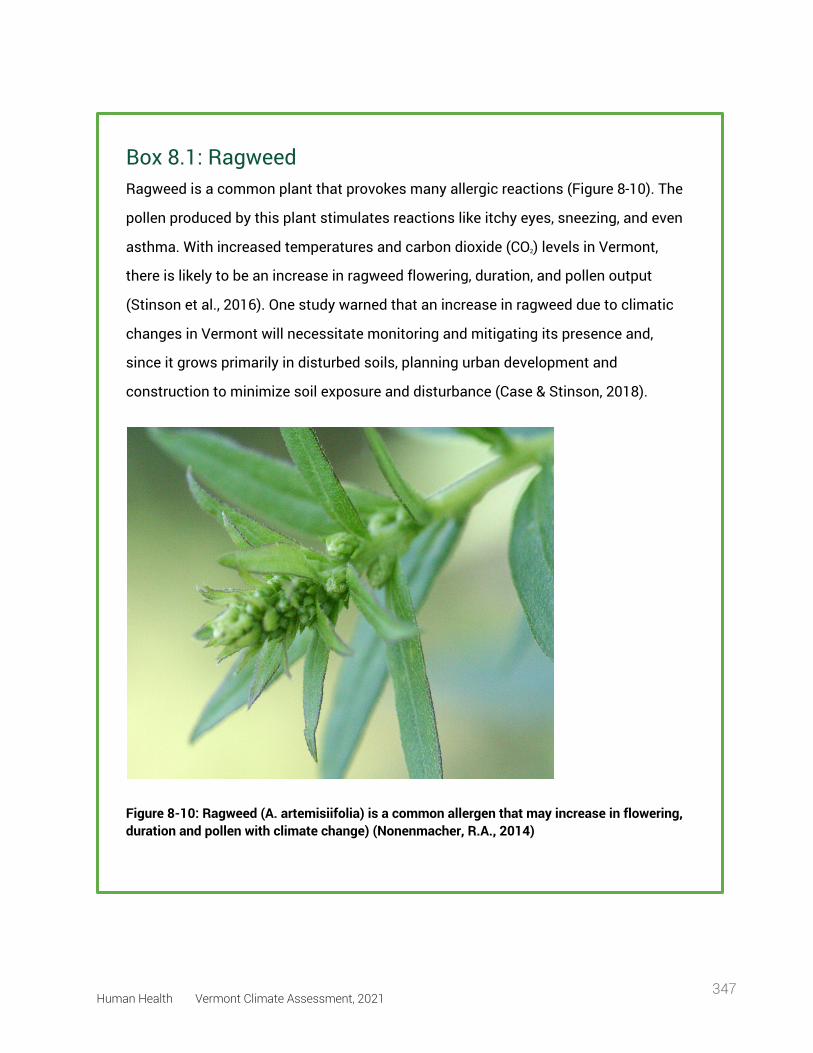
Human Health Vermont Climate Assessment, 2021 347
Box 8.1: Ragweed Ragweed is a common plant that provokes many allergic reactions (Figure 8-10). The
pollen produced by this plant stimulates reactions like itchy eyes, sneezing, and even
asthma. With increased temperatures and carbon dioxide (CO2) levels in Vermont,
there is likely to be an increase in ragweed flowering, duration, and pollen output
(Stinson et al., 2016). One study warned that an increase in ragweed due to climatic
changes in Vermont will necessitate monitoring and mitigating its presence and,
since it grows primarily in disturbed soils, planning urban development and
construction to minimize soil exposure and disturbance (Case & Stinson, 2018).
Figure 8-10: Ragweed (A. artemisiifolia) is a common allergen that may increase in flowering, duration and pollen with climate change) (Nonenmacher, R.A., 2014)
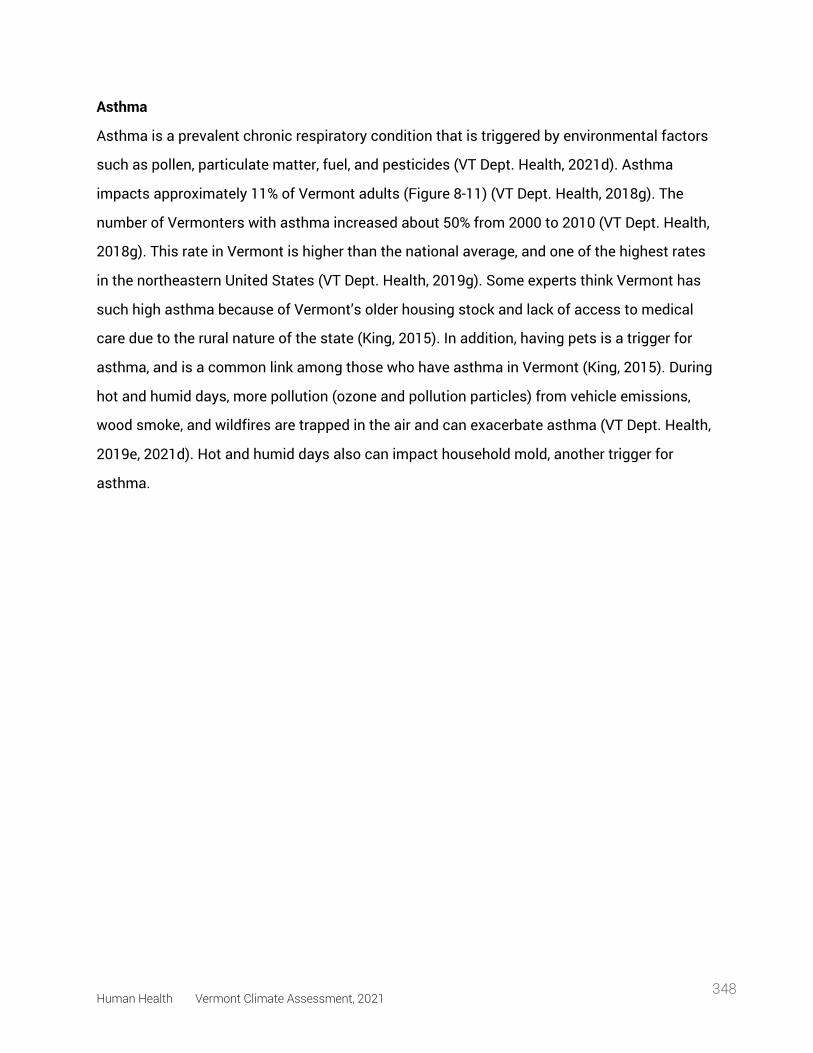
Human Health Vermont Climate Assessment, 2021 348
Asthma
Asthma is a prevalent chronic respiratory condition that is triggered by environmental factors
such as pollen, particulate matter, fuel, and pesticides (VT Dept. Health, 2021d). Asthma
impacts approximately 11% of Vermont adults (Figure 8-11) (VT Dept. Health, 2018g). The
number of Vermonters with asthma increased about 50% from 2000 to 2010 (VT Dept. Health,
2018g). This rate in Vermont is higher than the national average, and one of the highest rates
in the northeastern United States (VT Dept. Health, 2019g). Some experts think Vermont has
such high asthma because of Vermont’s older housing stock and lack of access to medical
care due to the rural nature of the state (King, 2015). In addition, having pets is a trigger for
asthma, and is a common link among those who have asthma in Vermont (King, 2015). During
hot and humid days, more pollution (ozone and pollution particles) from vehicle emissions,
wood smoke, and wildfires are trapped in the air and can exacerbate asthma (VT Dept. Health,
2019e, 2021d). Hot and humid days also can impact household mold, another trigger for
asthma.
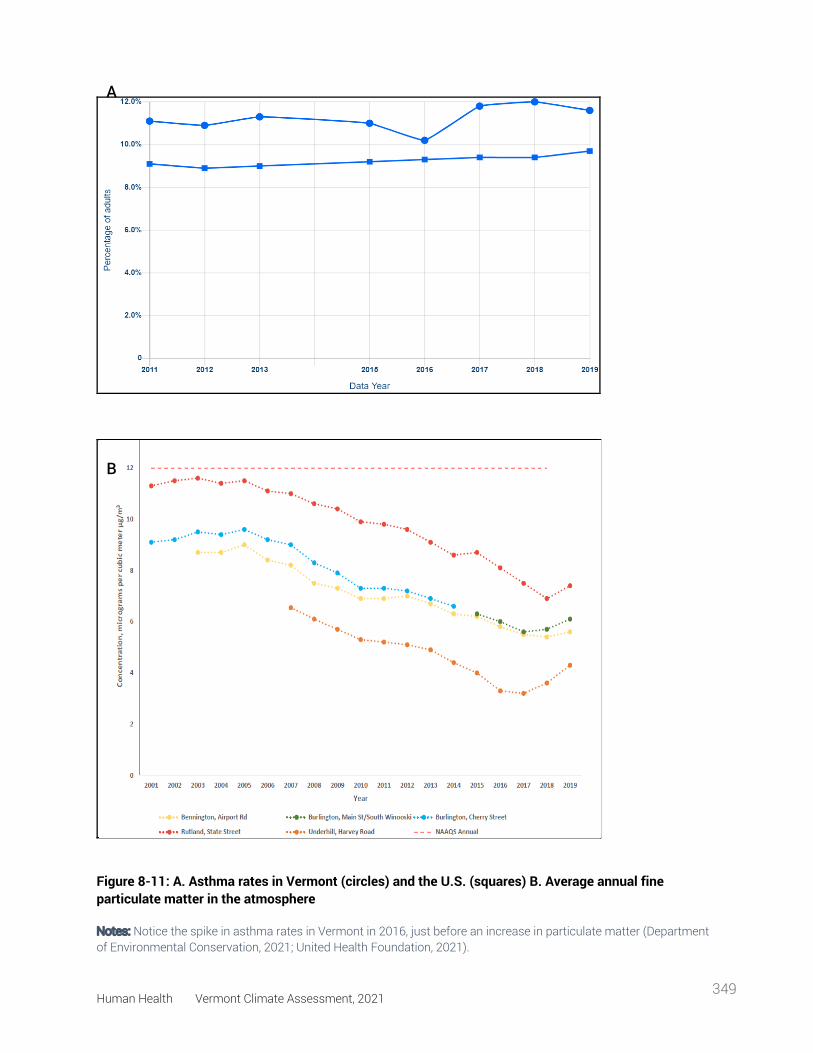
Human Health Vermont Climate Assessment, 2021 349
Figure 8-11: A. Asthma rates in Vermont (circles) and the U.S. (squares) B. Average annual fine particulate matter in the atmosphere
Notes: Notice the spike in asthma rates in Vermont in 2016, just before an increase in particulate matter (Department of Environmental Conservation, 2021; United Health Foundation, 2021).
A
B
Human Health Vermont Climate Assessment, 2021 350
Asthma disproportionately affects people in lower socioeconomic groups. Among lower
socioeconomic groups, the prevalence of asthma is 20%, compared to the statewide average
of around 11% (VT Dept. Health, 2016b). This is due not only to potential environmental air
quality factors, but also to increased risks of other comorbidities, low income housing, and
smoking (VT Dept. Health, 2016b). A study in 2016 found that about four in ten lower income
Vermonters were exposed to at least four or more negative environmental factors that
exacerbate asthma (VT Dept. Health, 2016b). A state study found that smoking is almost twice
as prevalent among Medicaid-insured Vermonters than other Vermonters, so these
Vermonters and their families are more exposed to indoor smoke from cigarettes (VT Dept.
Health, 2016b). This data points to socioeconomic disparities within Vermont that can be
exacerbated by the burden of asthma, thus leading to even greater disparities.
Box 8.2: COVID-19 and Asthma There is concern that individuals with asthma have increased risk of serious cases
of COVID-19. Studies have shown that if asthma is well-managed, asthmatic
individuals infected with COVID-19 have similar hospitalization rates as the general
public (Terry et al., 2021). However, asthmatic individuals with moderate or severe
asthma and are unable to manage their asthma are at a higher risk for
hospitalization from a COVID-19 infection (CDC, 2021b). Because of the high rate of
asthma in Vermont, the state has targets for decreasing and managing asthma in
individuals. This would, in turn, help decrease the likelihood of hospitalizations from
infections like COVID-19. The Respiratory Score Card indicates Vermont’s asthma
goals and achievements (VT Dept. Health, 2019f).
Human Health Vermont Climate Assessment, 2021 351
8.4.3 What You Can Do While air quality and air pollution are huge issues that are difficult to pinpoint or address
singularly, Vermonters can take many actions to prevent poor air quality and thus address the
subsequent health issues that arise.
Indoor Air Quality
There are three main factors to improving indoor air quality: improved ventilation, source
control, and air cleaning (U.S. EPA, 2020). To act, Vermonters should examine sources of air
pollution in the home (such as wood-burning stoves, gas stoves, old insulation, and moldy
basements) and implement measures to address them, like cleaning wood stove chimneys,
updating insulation, cleaning up mold, and making sure the home is well ventilated when using
chemicals such as cleaning supplies. Installing carbon monoxide detectors or air filters also
help with indoor air quality. To learn more about how to address these issues, go to the
Vermont Department of Health’s Healthy Homes webpage (Figure 8-12) (VT Dept. Health,
2021b).
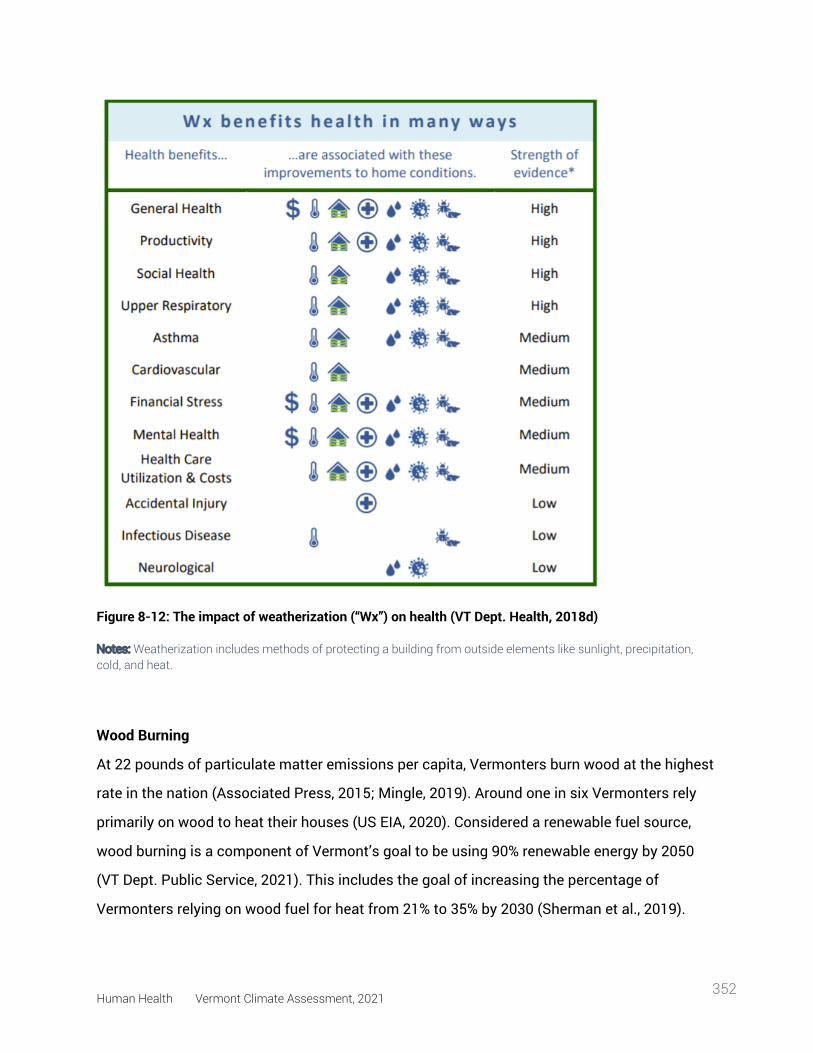
Human Health Vermont Climate Assessment, 2021 352
Figure 8-12: The impact of weatherization (“Wx”) on health (VT Dept. Health, 2018d)
Notes: Weatherization includes methods of protecting a building from outside elements like sunlight, precipitation, cold, and heat.
Wood Burning
At 22 pounds of particulate matter emissions per capita, Vermonters burn wood at the highest
rate in the nation (Associated Press, 2015; Mingle, 2019). Around one in six Vermonters rely
primarily on wood to heat their houses (US EIA, 2020). Considered a renewable fuel source,
wood burning is a component of Vermont’s goal to be using 90% renewable energy by 2050
(VT Dept. Public Service, 2021). This includes the goal of increasing the percentage of
Vermonters relying on wood fuel for heat from 21% to 35% by 2030 (Sherman et al., 2019).
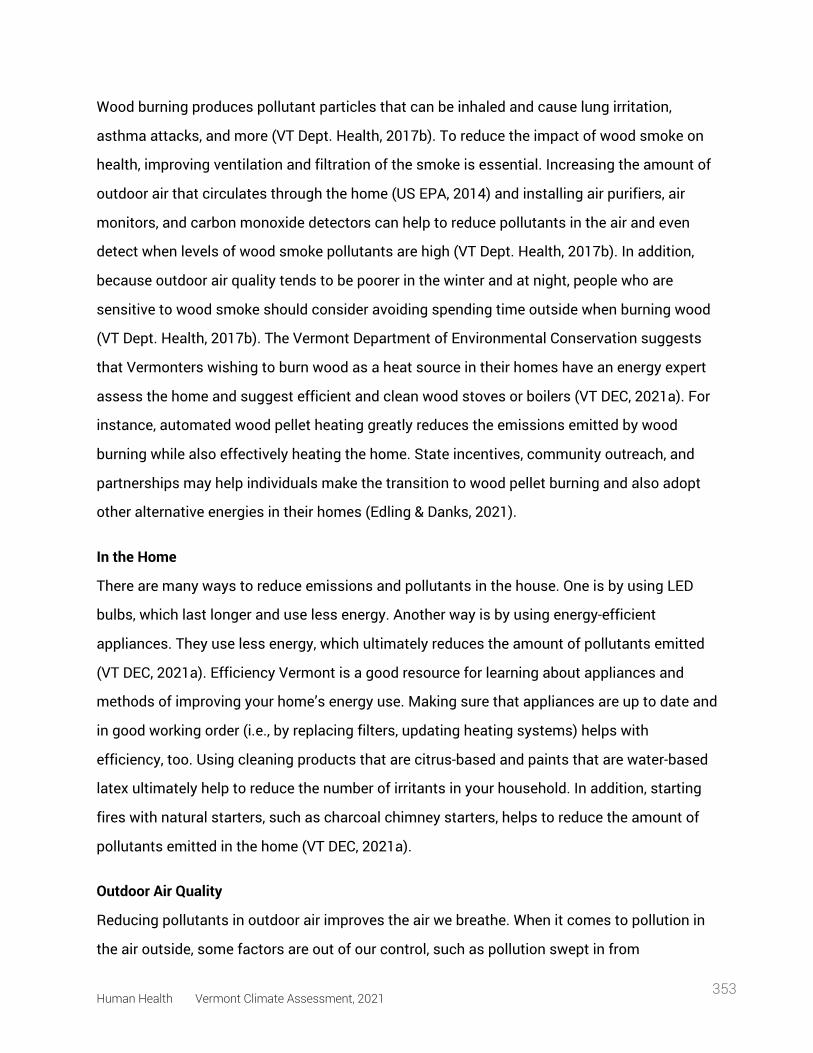
Human Health Vermont Climate Assessment, 2021 353
Wood burning produces pollutant particles that can be inhaled and cause lung irritation,
asthma attacks, and more (VT Dept. Health, 2017b). To reduce the impact of wood smoke on
health, improving ventilation and filtration of the smoke is essential. Increasing the amount of
outdoor air that circulates through the home (US EPA, 2014) and installing air purifiers, air
monitors, and carbon monoxide detectors can help to reduce pollutants in the air and even
detect when levels of wood smoke pollutants are high (VT Dept. Health, 2017b). In addition,
because outdoor air quality tends to be poorer in the winter and at night, people who are
sensitive to wood smoke should consider avoiding spending time outside when burning wood
(VT Dept. Health, 2017b). The Vermont Department of Environmental Conservation suggests
that Vermonters wishing to burn wood as a heat source in their homes have an energy expert
assess the home and suggest efficient and clean wood stoves or boilers (VT DEC, 2021a). For
instance, automated wood pellet heating greatly reduces the emissions emitted by wood
burning while also effectively heating the home. State incentives, community outreach, and
partnerships may help individuals make the transition to wood pellet burning and also adopt
other alternative energies in their homes (Edling & Danks, 2021).
In the Home
There are many ways to reduce emissions and pollutants in the house. One is by using LED
bulbs, which last longer and use less energy. Another way is by using energy-efficient
appliances. They use less energy, which ultimately reduces the amount of pollutants emitted
(VT DEC, 2021a). Efficiency Vermont is a good resource for learning about appliances and
methods of improving your home’s energy use. Making sure that appliances are up to date and
in good working order (i.e., by replacing filters, updating heating systems) helps with
efficiency, too. Using cleaning products that are citrus-based and paints that are water-based
latex ultimately help to reduce the number of irritants in your household. In addition, starting
fires with natural starters, such as charcoal chimney starters, helps to reduce the amount of
pollutants emitted in the home (VT DEC, 2021a).
Outdoor Air Quality
Reducing pollutants in outdoor air improves the air we breathe. When it comes to pollution in
the air outside, some factors are out of our control, such as pollution swept in from
Human Health Vermont Climate Assessment, 2021 354
neighboring areas. However, there are many things that Vermonters can do to improve local
outdoor air quality, reduce emissions that contribute to greenhouse gas (GHG) emissions, and
ultimately mitigate climate change. By doing these actions, Vermonters are not only protecting
their health and the health of those they care for, but also helping Vermont meet its GHG
reduction goals.
Travelling
Transportation is the largest contributor to GHG emissions in Vermont, which impacts climate
change and the air we breathe (Figure 8-13) (Bureau of Transportation Statistics, 2017). While
we rely heavily on fossil fuel-powered vehicles to get from one place to another, there are
several ways to travel and reduce vehicle exhaust emissions. One is to ride a bike. This has the
dual benefit of reducing GHG emissions and improving individual health through exercise.
Public transportation is another option, as is carpooling. While the latter two options emit
GHGs into the atmosphere, sharing transportation reduces total GHG emissions and thus
reduces the amount of pollution in the air. Vermont has several resources related to public
transport and signing up to carpool with others.
Figure 8-13: Energy use by sector in Vermont in 2016
Notes: The transportation consumes the most energy (in Btu—British Thermal Units) in Vermont. By walking, carpooling, and taking public transport, Vermonters can contribute to decreasing these numbers (Bureau of Transportation Statistics, 2017).
Human Health Vermont Climate Assessment, 2021 355
If it is necessary to use a car, the Vermont Department of Environmental Conservation
suggests that people connect with others to share rides, limit idling in the car, and ensure your
vehicle is up to date on maintenance (VT DEC, 2021g). In addition, keeping car tires fully
inflated helps reduce gas usage, and avoiding topping up on gas can help prevent gas spillage
(VT DEC, 2021g). Finally, switching to an electric or fuel-efficient vehicle has the multiple
benefits of reducing emissions while conserving energy and saving you money. In Vermont,
there are several incentives from the state, utilities companies, federal government, etc., to
switch to electric vehicles (EVs) (Drive Electric Vermont, 2021). Drive Electric Vermont has
more information on these incentives, including a calculator. Not only do these interventions
help to improve air quality, they also help Vermont achieve its goal to reduce GHG levels to
40% below 1990 levels (State of Vermont, 2021b). Because personal transportation (i.e., cars,
motorcycles, trucks) makes up about 45% of Vermont’s total GHG emissions, cutting down on
driving can make a huge impact on GHG reduction and air quality (State of Vermont, 2021b).
Recreating
Before exercising outside, consider checking the air quality index and the allergen forecast. Air
quality can also be found via TV, radio, and newspapers. When pollution levels are high, avoid
exercising outside. In addition, try to exercise away from busy roads or in high traffic areas, as
these areas tend to have higher concentrations of pollutants from vehicles (American Lung
Association, 2021).
8.5 extreme weather events
Extreme weather events—heat, storms, floods, and heavy rainfall, which are becoming more
severe and frequent in the Northeast, including Vermont—increase the risk of injury, illness,
and death (K. R. Smith et al., 2014; USGCRP, 2018). Precipitation events and flooding are the
extreme weather events that pose the largest public health threat in Vermont. Hurricanes and
tropical storms increasingly threaten the state, as seen by the devastation caused by Tropical
Storm Irene on August 28, 2011 (Figure 8-14). Irene caused record flooding and severe damage
to Vermont’s landscape, infrastructure, and economy, and it caused six deaths and many more
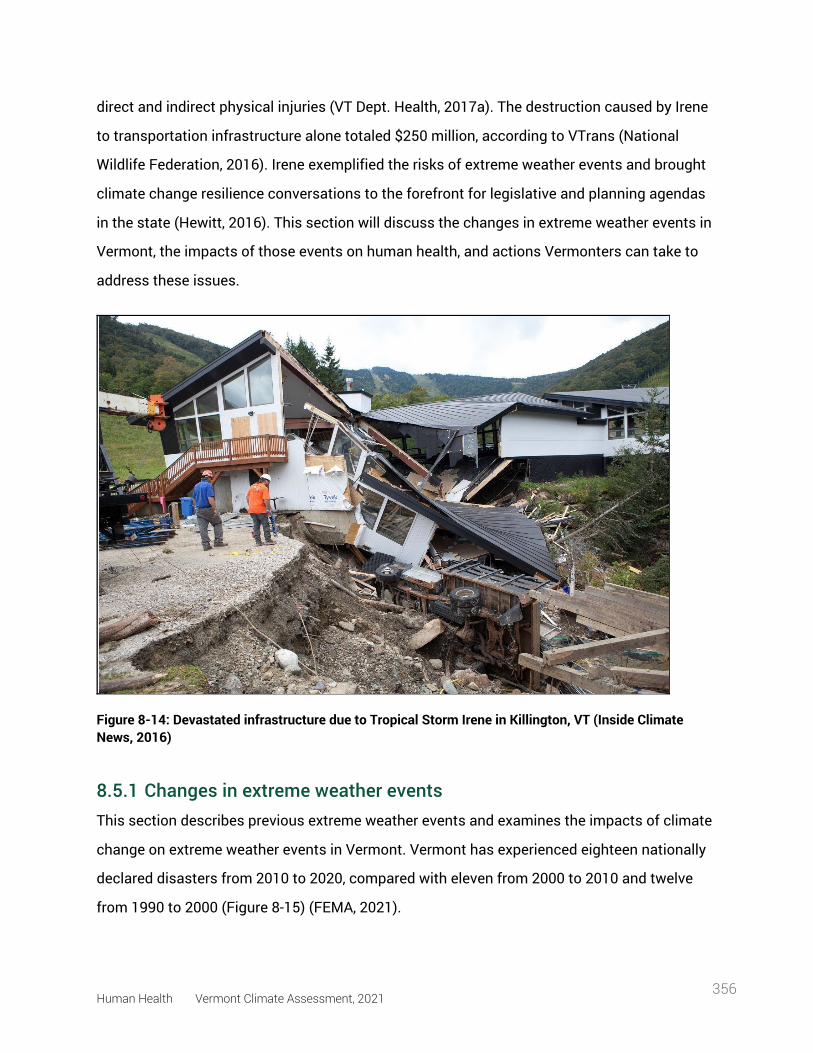
Human Health Vermont Climate Assessment, 2021 356
direct and indirect physical injuries (VT Dept. Health, 2017a). The destruction caused by Irene
to transportation infrastructure alone totaled $250 million, according to VTrans (National
Wildlife Federation, 2016). Irene exemplified the risks of extreme weather events and brought
climate change resilience conversations to the forefront for legislative and planning agendas
in the state (Hewitt, 2016). This section will discuss the changes in extreme weather events in
Vermont, the impacts of those events on human health, and actions Vermonters can take to
address these issues.
Figure 8-14: Devastated infrastructure due to Tropical Storm Irene in Killington, VT (Inside Climate News, 2016)
8.5.1 Changes in extreme weather events This section describes previous extreme weather events and examines the impacts of climate
change on extreme weather events in Vermont. Vermont has experienced eighteen nationally
declared disasters from 2010 to 2020, compared with eleven from 2000 to 2010 and twelve
from 1990 to 2000 (Figure 8-15) (FEMA, 2021).
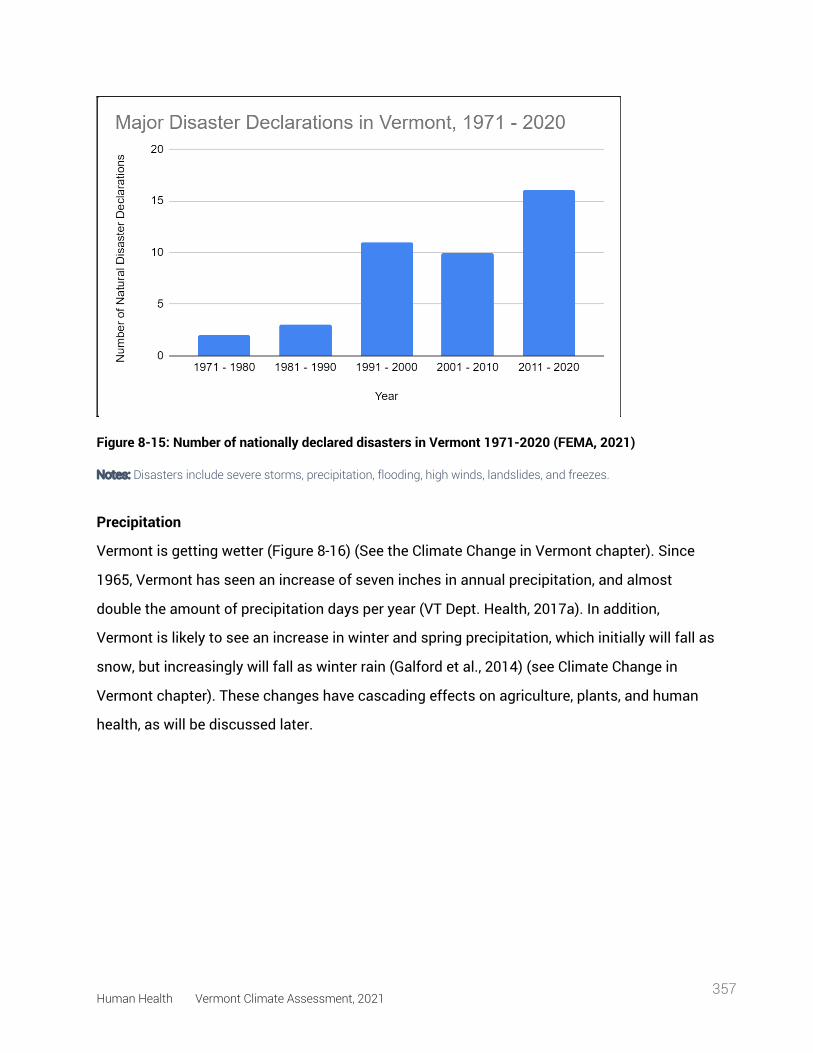
Human Health Vermont Climate Assessment, 2021 357
Figure 8-15: Number of nationally declared disasters in Vermont 1971-2020 (FEMA, 2021)
Notes: Disasters include severe storms, precipitation, flooding, high winds, landslides, and freezes.
Precipitation
Vermont is getting wetter (Figure 8-16) (See the Climate Change in Vermont chapter). Since
1965, Vermont has seen an increase of seven inches in annual precipitation, and almost
double the amount of precipitation days per year (VT Dept. Health, 2017a). In addition,
Vermont is likely to see an increase in winter and spring precipitation, which initially will fall as
snow, but increasingly will fall as winter rain (Galford et al., 2014) (see Climate Change in
Vermont chapter). These changes have cascading effects on agriculture, plants, and human
health, as will be discussed later.
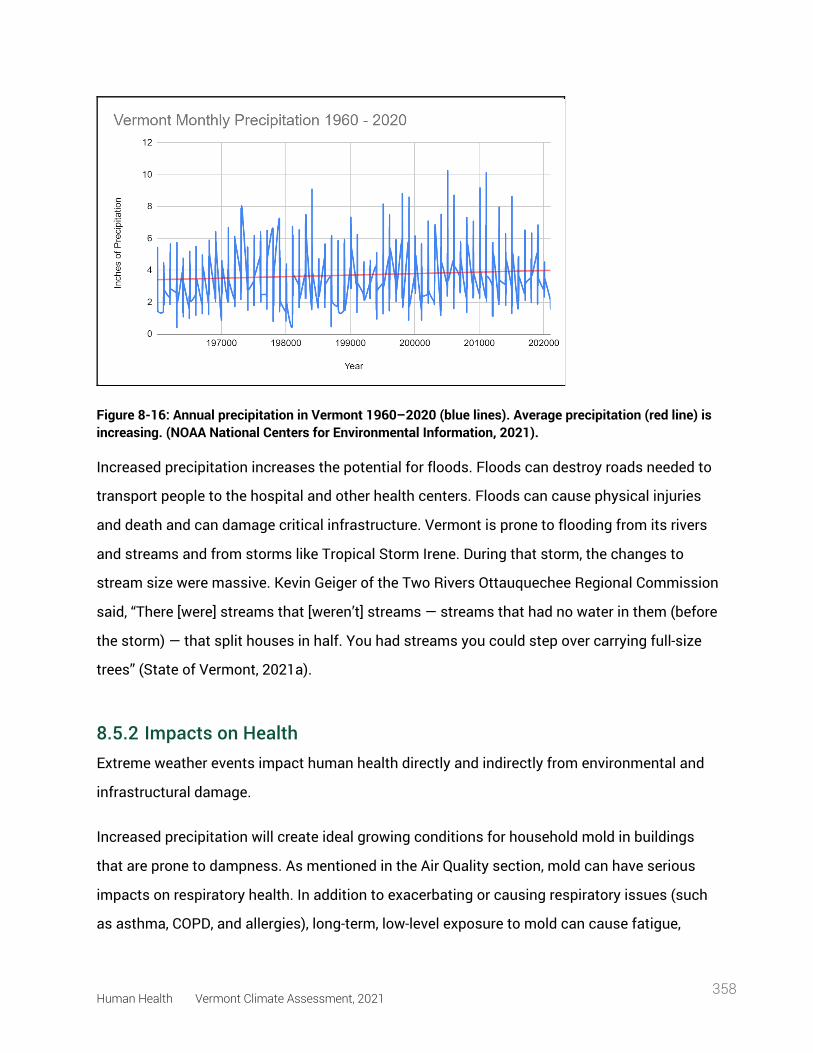
Human Health Vermont Climate Assessment, 2021 358
Figure 8-16: Annual precipitation in Vermont 1960–2020 (blue lines). Average precipitation (red line) is increasing. (NOAA National Centers for Environmental Information, 2021).
Increased precipitation increases the potential for floods. Floods can destroy roads needed to
transport people to the hospital and other health centers. Floods can cause physical injuries
and death and can damage critical infrastructure. Vermont is prone to flooding from its rivers
and streams and from storms like Tropical Storm Irene. During that storm, the changes to
stream size were massive. Kevin Geiger of the Two Rivers Ottauquechee Regional Commission
said, “There [were] streams that [weren’t] streams — streams that had no water in them (before
the storm) — that split houses in half. You had streams you could step over carrying full-size
trees” (State of Vermont, 2021a).
8.5.2 Impacts on Health Extreme weather events impact human health directly and indirectly from environmental and
infrastructural damage.
Increased precipitation will create ideal growing conditions for household mold in buildings
that are prone to dampness. As mentioned in the Air Quality section, mold can have serious
impacts on respiratory health. In addition to exacerbating or causing respiratory issues (such
as asthma, COPD, and allergies), long-term, low-level exposure to mold can cause fatigue,
Human Health Vermont Climate Assessment, 2021 359
depression, concentration issues, and low immune responses (American Lung Association,
2021).
Damaged critical infrastructure—such as electricity, refrigeration, health care, and sanitation
and water treatment—causes health risks. These include heat or cold issues from power
outages, illness from spoiled food or water contamination, and mental health issues such as
post-traumatic stress disorder (PTSD)(VT Dept. Health, 2017a; Wang et al., 2019). In addition,
damaged infrastructure can disrupt medical treatment, especially problematic for those with
chronic illnesses (see Box 8.3).
PTSD, anxiety, depression, and exacerbation of existing mental health issues are common
during and after severe storms, such as Tropical Storm Irene (Wang et al., 2019). For instance,
in town meetings in the town of Rochester immediately after Tropical Storm Irene, first one,
then nine, then twenty-five residents were identified as needing urgent medical care or support
for both mental and physical ailments (Shulins, 2014). When interviewed three years after the
storm, multiple residents reported long-term emotional disturbances including anxiety,
sadness, fear, and stress (Buschman et al., 2014).
BOX 8.3: Rebuilding Mental Health Support After Tropical Storm Irene The mental health impacts of Tropical Storm Irene persisted much longer than it took
to rebuild much of the devastated infrastructure. After the destruction wreaked by
Irene, including the damage of Vermont’s main mental health facility in Waterbury, the
state had to scramble to provide mental health services and support to those
impacted (Buschman et al., 2014). Irene brought to the forefront major issues within
Vermont’s centralized mental health system, and Vermont has since restructured
much of its mental health delivery to be based more on community-support than
hospitalization (Hewitt, 2016). The storm catalyzed a state-level response to change
the existing system to support individuals and fostered a strengthening of community
closeness, support, and pride (Buschman et al., 2014).
Human Health Vermont Climate Assessment, 2021 360
Risks of infectious diseases increase with increased precipitation and storms, especially when
people are exposed to overrun sewage systems and have skin wounds (REF: Rudolph &
Harrison, 2016). An increase in vector-borne diseases (see Vectors section) is also possible, as
often there is an increase in mosquitoes, and thus an increase in the risk of those mosquitoes
carrying disease, after heavy storms and precipitation (REF: Rudolph & Harrison, 2016). While
in Vermont there are now very few mosquito-borne illnesses, with increased temperatures and
precipitation that is likely to change (see Vectors section).
8.5.3 What You Can Do While extreme weather events can be devastating, there are things that individuals,
communities, and the state can do to plan for them and reduce their impact. For more
information on community resilience, see the Community Development chapter.
Infrastructure Improvement
Vermont has notoriously old infrastructure. In 2019, Vermont received a C letter grade for its
infrastructure by the American Society of Civil Engineers (ASCE), with particularly bad grades
for stormwater and wastewater infrastructure (both of which received a D+) (American Society
of Civil Engineers Vermont Section, 2019). Old infrastructure leads to health risks, including air
quality problems and physical danger from unsafe structures. When roads, buildings, bridges,
and other infrastructure are not up to standards, they are more easily damaged by storms like
Irene. This issue requires a multi-pronged solution that focuses on leadership, investment, and
resilience at the state and federal levels. The ASCE suggests Congress fully fund infrastructure
programs and fix the Highway Trust Fund (American Society of Civil Engineers Vermont
Section, 2019). It also suggests that leadership focus on leveraging proven and emerging
technologies to bolster infrastructure projects, make use of limited resources, scale up the use
of natural or “green” infrastructure to enhance the resilience of various infrastructure sectors,
and inventory state stormwater assets (American Society of Civil Engineers Vermont Section,
2019).
Human Health Vermont Climate Assessment, 2021 361
In Vermont, green infrastructure partnerships like the Green Infrastructure Collaborative aim to
maintain and enhance the natural and environmental spaces within communities and cities.
These partnerships emphasize the essential roles that natural spaces play in various sectors
of society (e.g. increasing property values, rendering ecological services, and promoting
human health and well-being) (VT DEC, 2021b). As previously mentioned, having tree cover
within urban areas helps reduce the impact of extreme heat on health. In order to preserve
these spaces, Vermonters can join the conversation, sign up for listservs, and volunteer to
plant trees or other green infrastructure initiatives through Vermont Urban and Community
Forestry’s webpage (https://vtcommunityforestry.org/programs) (VT UCF, 2021).
To learn more about green infrastructure, visit Vermont Urban and Community Forestry’s paper
(https://vtcommunityforestry.org/sites/default/files/pictures/Resource/greeninfrastructure.p
df) on green infrastructure’s roots and applications (VPIC, 2012). See also the green
infrastructure section of the Community Development chapter.
Community Hazard Mitigation Planning
Risk Assessment: Understanding the risks that communities face is an important tool in
planning for how to respond to these potential risks. One tool created after Tropical Storm
Irene by Flood Ready Vermont is the Vermont Flood Ready Atlas
(https://floodready.vermont.gov/assessment/vt_floodready_atlas) (State of Vermont, 2021c),
which overlays information on flood hazard areas on a map in order to visualize places at risk
of flooding. This mapping tool helps to identify communities and residences that are within
flood-prone areas in Vermont. Second, as of 2015, approximately 90% of Vermont’s
communities participate in the National Flood Insurance Plan (NFIP), which insures buildings
and communities in case of flooding (State of Vermont, 2021c). Yet another tool to assess
communities’ status on flood preparedness and resilience is also from Flood Ready Vermont:
community hazard reports. These reports are updated by communities around Vermont to
assess: the level of flood risk, the status of certain infrastructure and the status of local
mitigation action plans (State of Vermont, 2021c). According to the Vermont Economic
Resilience Initiative (VERI), thirty-four towns were identified as economic centers that have
high infrastructural and non-residential vulnerability to flooding. The ten towns with the most
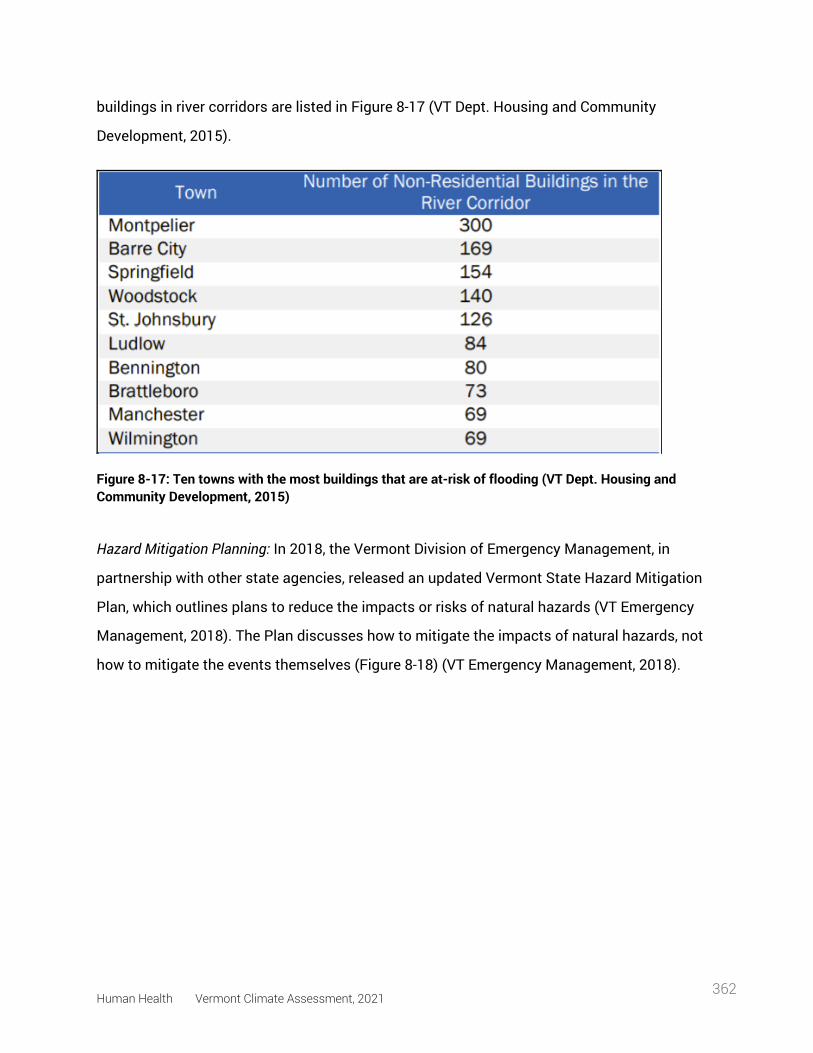
Human Health Vermont Climate Assessment, 2021 362
buildings in river corridors are listed in Figure 8-17 (VT Dept. Housing and Community
Development, 2015).
Figure 8-17: Ten towns with the most buildings that are at-risk of flooding (VT Dept. Housing and Community Development, 2015)
Hazard Mitigation Planning: In 2018, the Vermont Division of Emergency Management, in
partnership with other state agencies, released an updated Vermont State Hazard Mitigation
Plan, which outlines plans to reduce the impacts or risks of natural hazards (VT Emergency
Management, 2018). The Plan discusses how to mitigate the impacts of natural hazards, not
how to mitigate the events themselves (Figure 8-18) (VT Emergency Management, 2018).
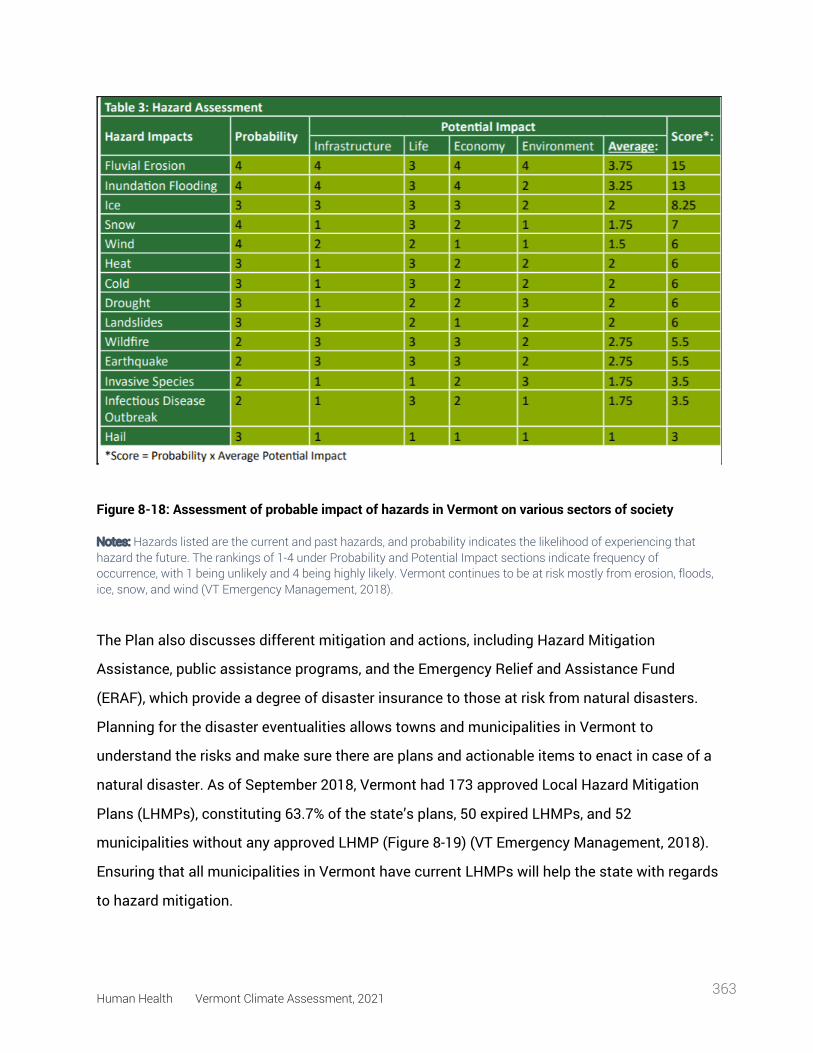
Human Health Vermont Climate Assessment, 2021 363
Figure 8-18: Assessment of probable impact of hazards in Vermont on various sectors of society
Notes: Hazards listed are the current and past hazards, and probability indicates the likelihood of experiencing that hazard the future. The rankings of 1-4 under Probability and Potential Impact sections indicate frequency of occurrence, with 1 being unlikely and 4 being highly likely. Vermont continues to be at risk mostly from erosion, floods, ice, snow, and wind (VT Emergency Management, 2018).
The Plan also discusses different mitigation and actions, including Hazard Mitigation
Assistance, public assistance programs, and the Emergency Relief and Assistance Fund
(ERAF), which provide a degree of disaster insurance to those at risk from natural disasters.
Planning for the disaster eventualities allows towns and municipalities in Vermont to
understand the risks and make sure there are plans and actionable items to enact in case of a
natural disaster. As of September 2018, Vermont had 173 approved Local Hazard Mitigation
Plans (LHMPs), constituting 63.7% of the state’s plans, 50 expired LHMPs, and 52
municipalities without any approved LHMP (Figure 8-19) (VT Emergency Management, 2018).
Ensuring that all municipalities in Vermont have current LHMPs will help the state with regards
to hazard mitigation.
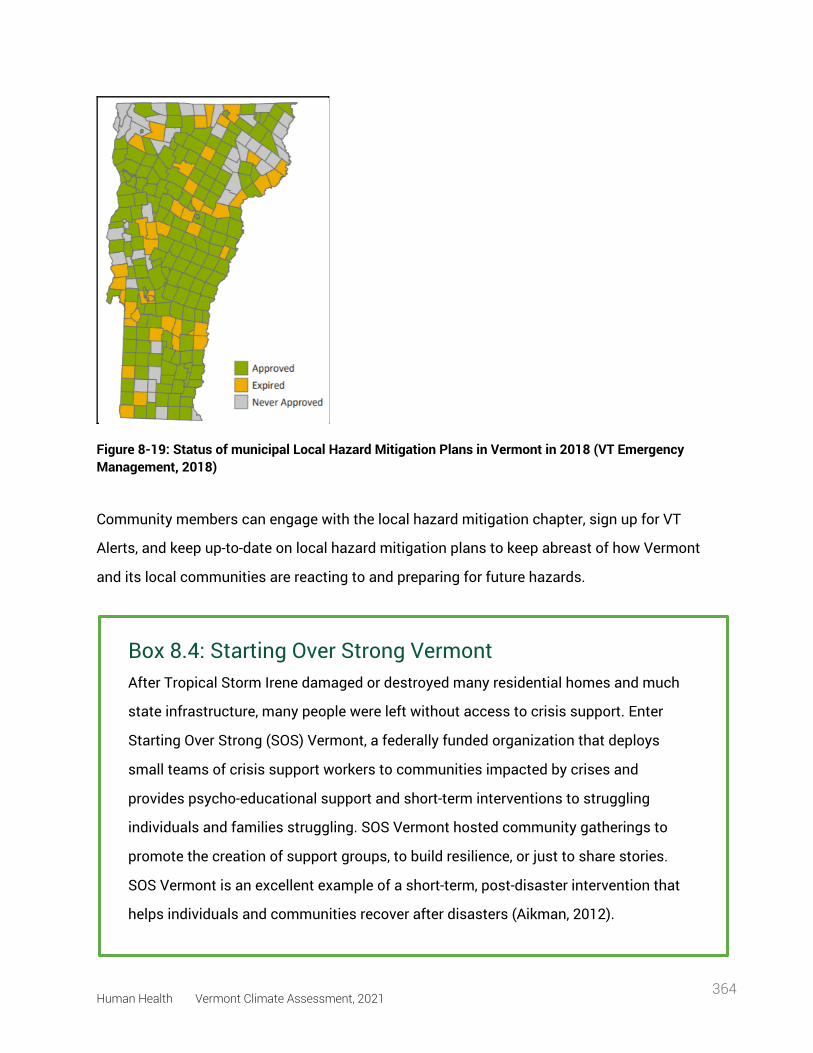
Human Health Vermont Climate Assessment, 2021 364
Figure 8-19: Status of municipal Local Hazard Mitigation Plans in Vermont in 2018 (VT Emergency Management, 2018)
Community members can engage with the local hazard mitigation chapter, sign up for VT
Alerts, and keep up-to-date on local hazard mitigation plans to keep abreast of how Vermont
and its local communities are reacting to and preparing for future hazards.
Box 8.4: Starting Over Strong Vermont After Tropical Storm Irene damaged or destroyed many residential homes and much
state infrastructure, many people were left without access to crisis support. Enter
Starting Over Strong (SOS) Vermont, a federally funded organization that deploys
small teams of crisis support workers to communities impacted by crises and
provides psycho-educational support and short-term interventions to struggling
individuals and families struggling. SOS Vermont hosted community gatherings to
promote the creation of support groups, to build resilience, or just to share stories.
SOS Vermont is an excellent example of a short-term, post-disaster intervention that
helps individuals and communities recover after disasters (Aikman, 2012).
Human Health Vermont Climate Assessment, 2021 365
8.6 vectors
Climate change is increasing the spread of vector-borne diseases across the United States
and around the world (Githeko et al., 2000; Rocklöv & Dubrow, 2020; K. R. Smith et al., 2014).
Briefly, warmer temperatures are more ideal environments for organisms such as mosquitoes
and ticks, insects that can spread diseases like malaria, Lyme, chikungunya, Zika, etc. (Rocklöv
& Dubrow, 2020). Because Vermont is likely to experience a warmer environment as the
climate changes, there is likely to be an increase in the diseases spread by vectors. This
section will discuss the changes in vector ecology (study of disease-bearing organisms) and
tick-borne and mosquito-borne diseases, how Vermonters are impacted by these changes, and
what Vermonters can do to address these changes.
Vector-borne diseases are particularly responsive to climate change for several reasons
(Figure 8-20). Climate change may shift the geographic range where the vector may live;
reduce natural controls (such as die-off caused by winter freezing) on vectors and hosts;
influence the life cycle of a pathogen; or affect the incubation time of a pathogen within its
vector, leading to an increase in reproductive and biting rates (Patz, 2003; Patz et al., 1996,
2000; Patz & Frumkin, 2016; USGCRP, 2018). Hotter summers and warmer winters will allow
tick-borne diseases, such as Lyme disease, Anaplasmosis, and Babesiosis, to flourish. Other
vector-borne diseases, such as West Nile Virus and Eastern Equine Encephalitis, will also
increase. All these factors lead to an increased risk of contracting a vector-borne disease,
especially for populations already living in or near the geographic area where the diseases are
present (K. R. Smith et al., 2014). Monitoring and controlling vectors like ticks and mosquitoes
in Vermont will become an extremely important task as the climate continues to warm.
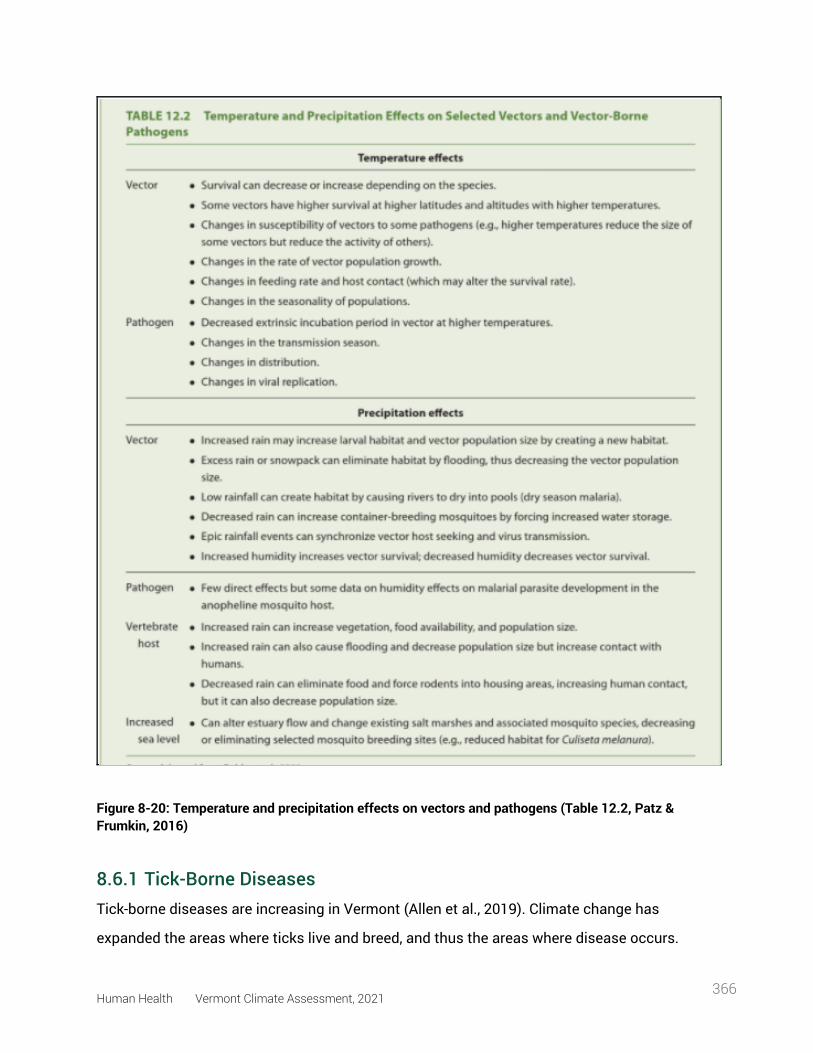
Human Health Vermont Climate Assessment, 2021 366
Figure 8-20: Temperature and precipitation effects on vectors and pathogens (Table 12.2, Patz & Frumkin, 2016)
8.6.1 Tick-Borne Diseases Tick-borne diseases are increasing in Vermont (Allen et al., 2019). Climate change has
expanded the areas where ticks live and breed, and thus the areas where disease occurs.
Human Health Vermont Climate Assessment, 2021 367
Diseases from vectors such as ticks that have not been seen in Vermont will start to become
prevalent, and those that are already here will become more pervasive. In Vermont, tick-borne
diseases are generally most prevalent in southern counties, but the trend could move
northward with climate change. Longer summers not only could change vector distribution
and biology, but also could lengthen the prime transmission period for these diseases (Figure
8-21). The Vermont Department of Health states succinctly:
Ticks can only live in areas where the climate is suitable for them, having the right
temperature and the right amount of moisture. Warming temperatures due to climate change,
especially during the winter months, may make Vermont more hospitable to blacklegged
ticks. Warmer winters can also help the survival of important hosts for ticks, like white-footed
mice. This could result in tick populations increasing in areas where they are already present,
and the introduction of ticks to areas that were not previously infested, such as colder,
northern areas and areas at higher elevations [...] Ticks are typically not active at
temperatures below freezing. Warming temperatures due to climate change mean more days
when ticks are active and looking for blood meals, which means a greater risk of ticks biting
people. (VT Dept. Health, 2018c).
Additionally, ticks prefer warm, moist weather, which is likely to become more prevalent in New
England as global temperatures increase (Polhamus, 2017). In Vermont, there are fourteen
known types of ticks, four of which carry disease. The most abundant is the blacklegged tick,
or deer tick, which is responsible for over 99% of all tick-related diseases, including Lyme,
babesiosis, and anaplasmosis (VT Agency of Agriculture, Food and Markets, 2021b; VT Dept.
Health, 2018c). The spread of tick-borne diseases depends on three factors: how many ticks
are in the area, how many ticks are infected, and how often people encounter those ticks (VT
Dept. Health, 2018c).
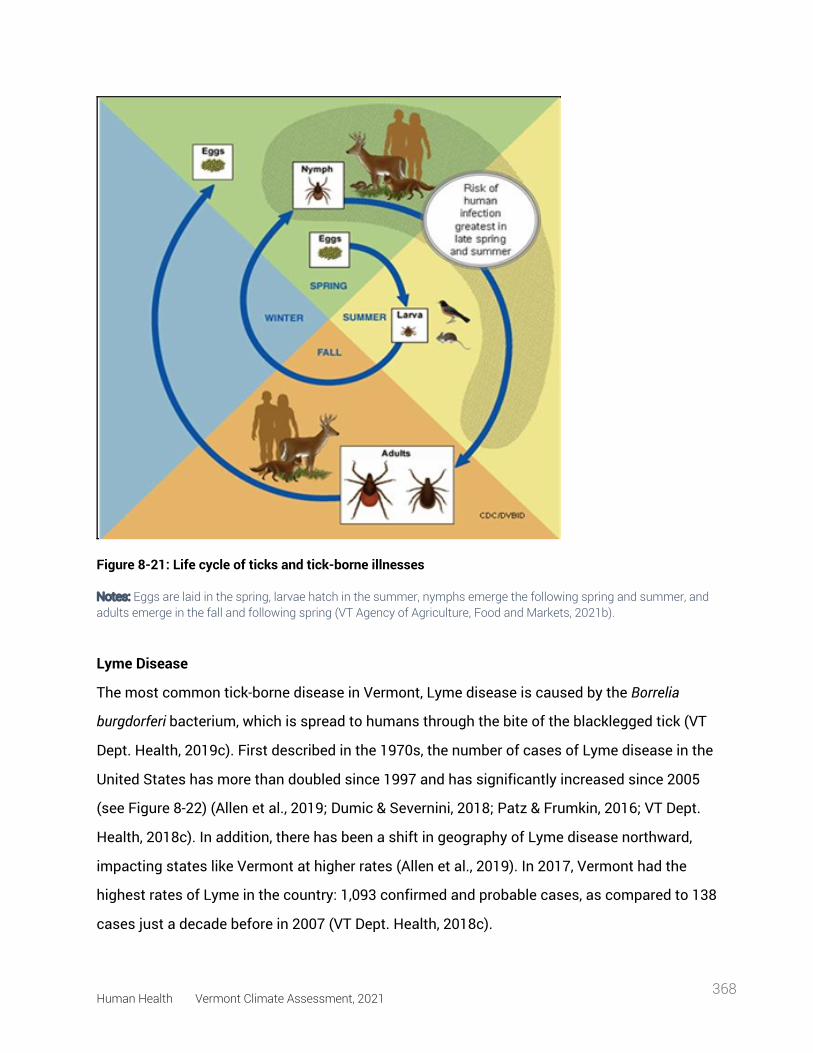
Human Health Vermont Climate Assessment, 2021 368
Figure 8-21: Life cycle of ticks and tick-borne illnesses
Notes: Eggs are laid in the spring, larvae hatch in the summer, nymphs emerge the following spring and summer, and adults emerge in the fall and following spring (VT Agency of Agriculture, Food and Markets, 2021b).
Lyme Disease
The most common tick-borne disease in Vermont, Lyme disease is caused by the Borrelia
burgdorferi bacterium, which is spread to humans through the bite of the blacklegged tick (VT
Dept. Health, 2019c). First described in the 1970s, the number of cases of Lyme disease in the
United States has more than doubled since 1997 and has significantly increased since 2005
(see Figure 8-22) (Allen et al., 2019; Dumic & Severnini, 2018; Patz & Frumkin, 2016; VT Dept.
Health, 2018c). In addition, there has been a shift in geography of Lyme disease northward,
impacting states like Vermont at higher rates (Allen et al., 2019). In 2017, Vermont had the
highest rates of Lyme in the country: 1,093 confirmed and probable cases, as compared to 138
cases just a decade before in 2007 (VT Dept. Health, 2018c).
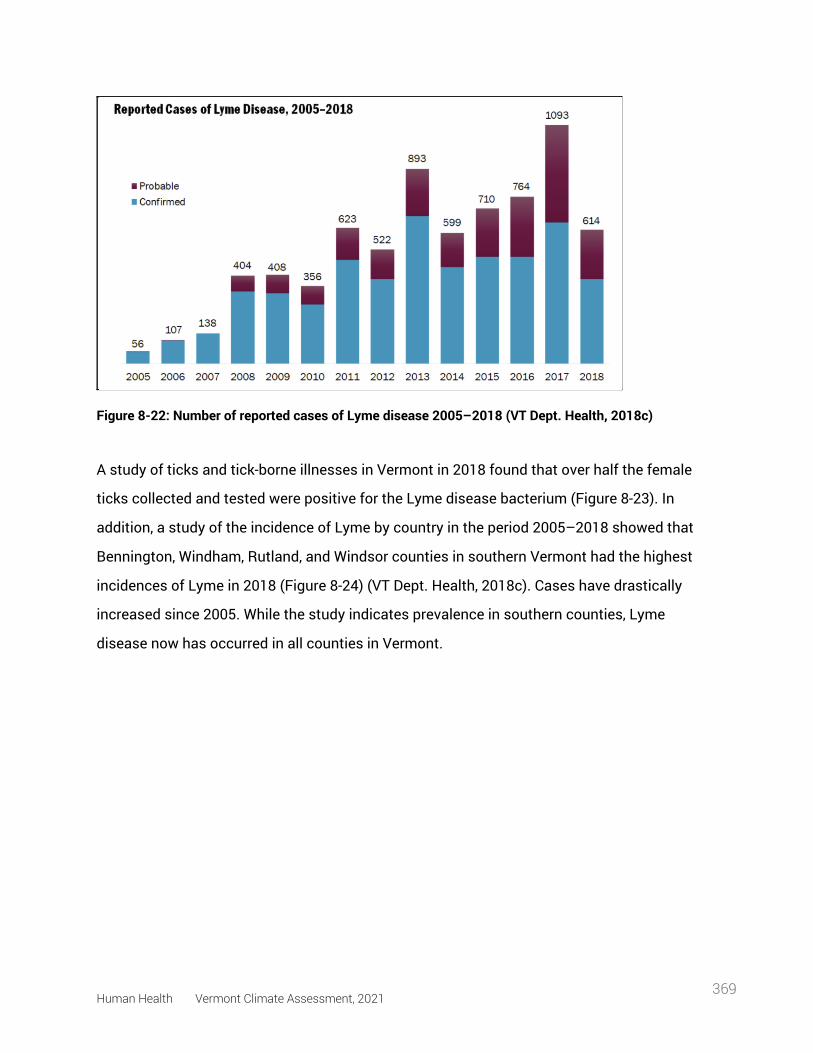
Human Health Vermont Climate Assessment, 2021 369
Figure 8-22: Number of reported cases of Lyme disease 2005–2018 (VT Dept. Health, 2018c)
A study of ticks and tick-borne illnesses in Vermont in 2018 found that over half the female
ticks collected and tested were positive for the Lyme disease bacterium (Figure 8-23). In
addition, a study of the incidence of Lyme by country in the period 2005–2018 showed that
Bennington, Windham, Rutland, and Windsor counties in southern Vermont had the highest
incidences of Lyme in 2018 (Figure 8-24) (VT Dept. Health, 2018c). Cases have drastically
increased since 2005. While the study indicates prevalence in southern counties, Lyme
disease now has occurred in all counties in Vermont.
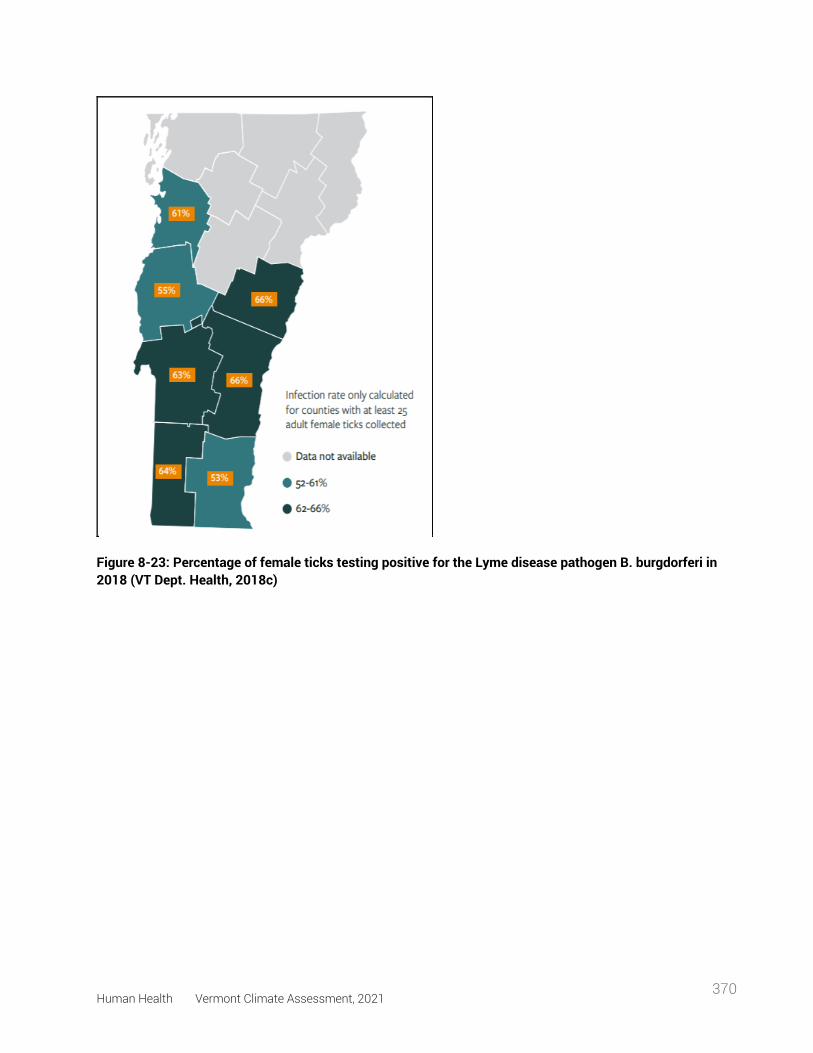
Human Health Vermont Climate Assessment, 2021 370
Figure 8-23: Percentage of female ticks testing positive for the Lyme disease pathogen B. burgdorferi in 2018 (VT Dept. Health, 2018c)
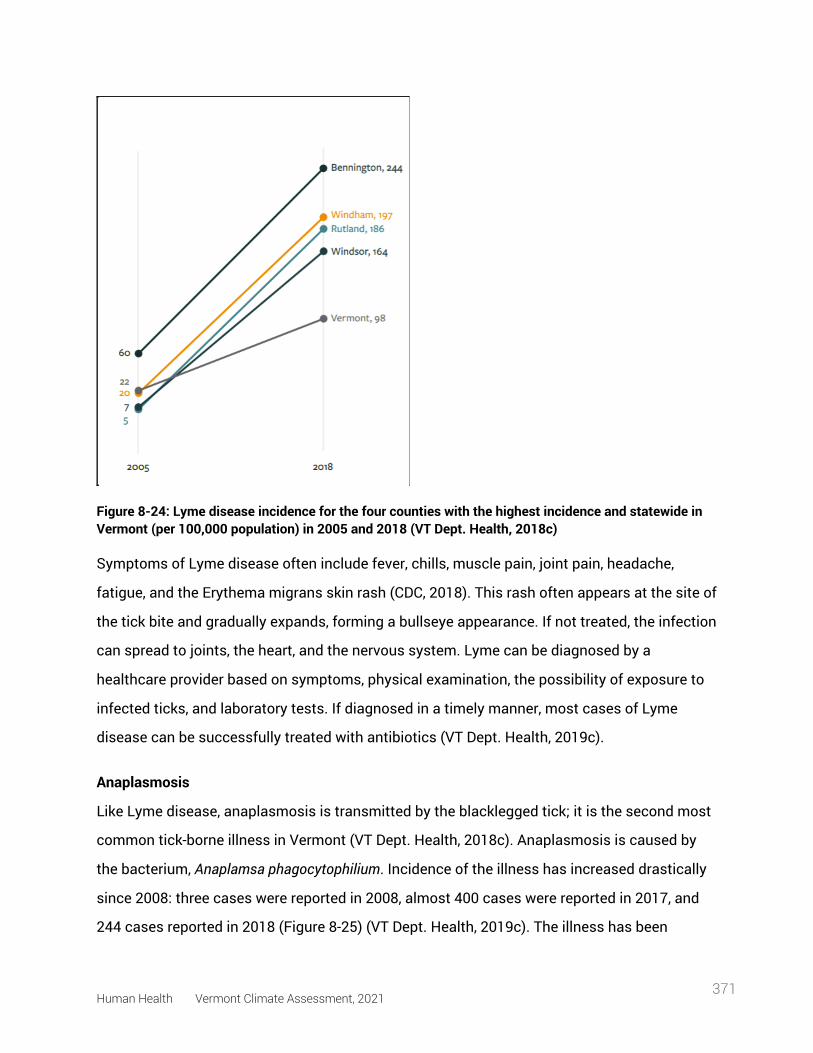
Human Health Vermont Climate Assessment, 2021 371
Figure 8-24: Lyme disease incidence for the four counties with the highest incidence and statewide in Vermont (per 100,000 population) in 2005 and 2018 (VT Dept. Health, 2018c)
Symptoms of Lyme disease often include fever, chills, muscle pain, joint pain, headache,
fatigue, and the Erythema migrans skin rash (CDC, 2018). This rash often appears at the site of
the tick bite and gradually expands, forming a bullseye appearance. If not treated, the infection
can spread to joints, the heart, and the nervous system. Lyme can be diagnosed by a
healthcare provider based on symptoms, physical examination, the possibility of exposure to
infected ticks, and laboratory tests. If diagnosed in a timely manner, most cases of Lyme
disease can be successfully treated with antibiotics (VT Dept. Health, 2019c).
Anaplasmosis
Like Lyme disease, anaplasmosis is transmitted by the blacklegged tick; it is the second most
common tick-borne illness in Vermont (VT Dept. Health, 2018c). Anaplasmosis is caused by
the bacterium, Anaplamsa phagocytophilium. Incidence of the illness has increased drastically
since 2008: three cases were reported in 2008, almost 400 cases were reported in 2017, and
244 cases reported in 2018 (Figure 8-25) (VT Dept. Health, 2019c). The illness has been
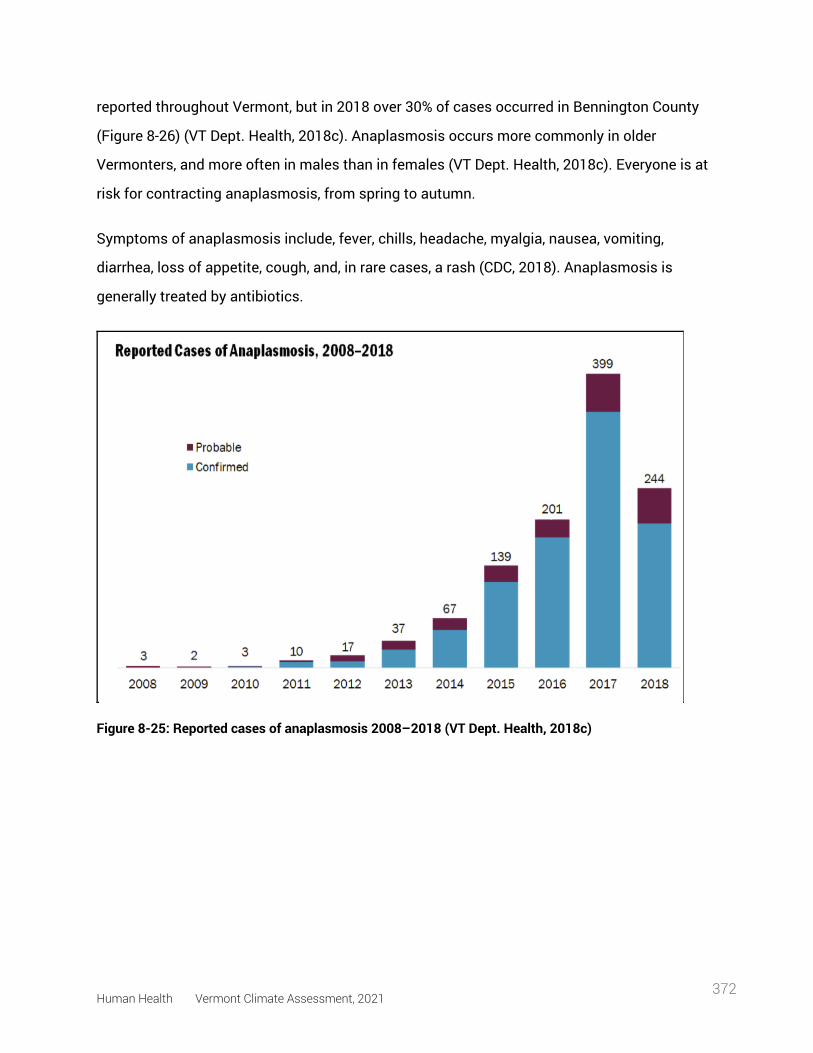
Human Health Vermont Climate Assessment, 2021 372
reported throughout Vermont, but in 2018 over 30% of cases occurred in Bennington County
(Figure 8-26) (VT Dept. Health, 2018c). Anaplasmosis occurs more commonly in older
Vermonters, and more often in males than in females (VT Dept. Health, 2018c). Everyone is at
risk for contracting anaplasmosis, from spring to autumn.
Symptoms of anaplasmosis include, fever, chills, headache, myalgia, nausea, vomiting,
diarrhea, loss of appetite, cough, and, in rare cases, a rash (CDC, 2018). Anaplasmosis is
generally treated by antibiotics.
Figure 8-25: Reported cases of anaplasmosis 2008–2018 (VT Dept. Health, 2018c)
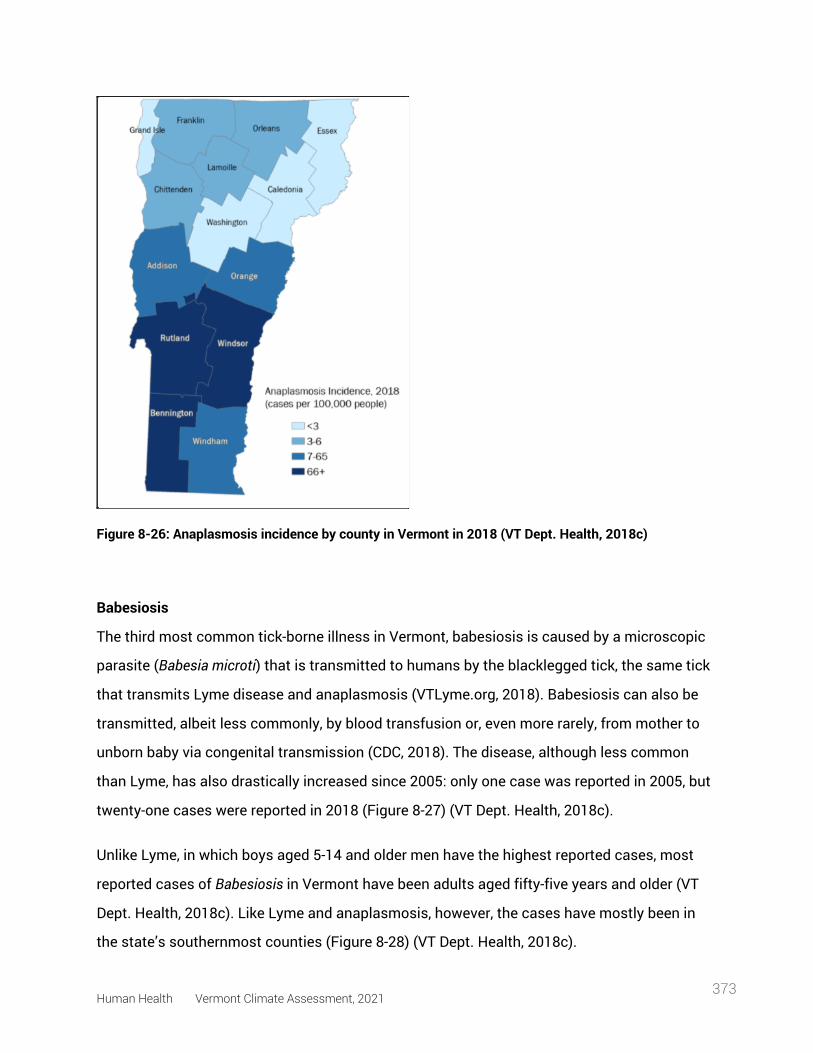
Human Health Vermont Climate Assessment, 2021 373
Figure 8-26: Anaplasmosis incidence by county in Vermont in 2018 (VT Dept. Health, 2018c)
Babesiosis
The third most common tick-borne illness in Vermont, babesiosis is caused by a microscopic
parasite (Babesia microti) that is transmitted to humans by the blacklegged tick, the same tick
that transmits Lyme disease and anaplasmosis (VTLyme.org, 2018). Babesiosis can also be
transmitted, albeit less commonly, by blood transfusion or, even more rarely, from mother to
unborn baby via congenital transmission (CDC, 2018). The disease, although less common
than Lyme, has also drastically increased since 2005: only one case was reported in 2005, but
twenty-one cases were reported in 2018 (Figure 8-27) (VT Dept. Health, 2018c).
Unlike Lyme, in which boys aged 5-14 and older men have the highest reported cases, most
reported cases of Babesiosis in Vermont have been adults aged fifty-five years and older (VT
Dept. Health, 2018c). Like Lyme and anaplasmosis, however, the cases have mostly been in
the state’s southernmost counties (Figure 8-28) (VT Dept. Health, 2018c).
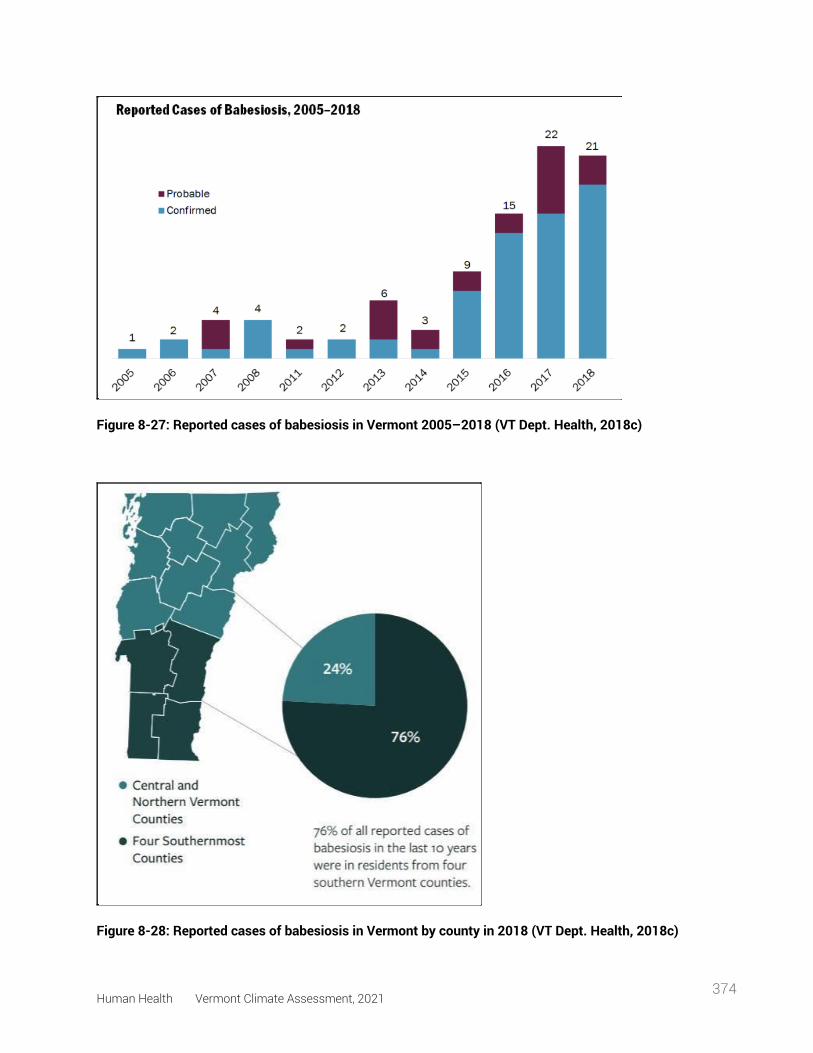
Human Health Vermont Climate Assessment, 2021 374
Figure 8-27: Reported cases of babesiosis in Vermont 2005–2018 (VT Dept. Health, 2018c)
Figure 8-28: Reported cases of babesiosis in Vermont by county in 2018 (VT Dept. Health, 2018c)
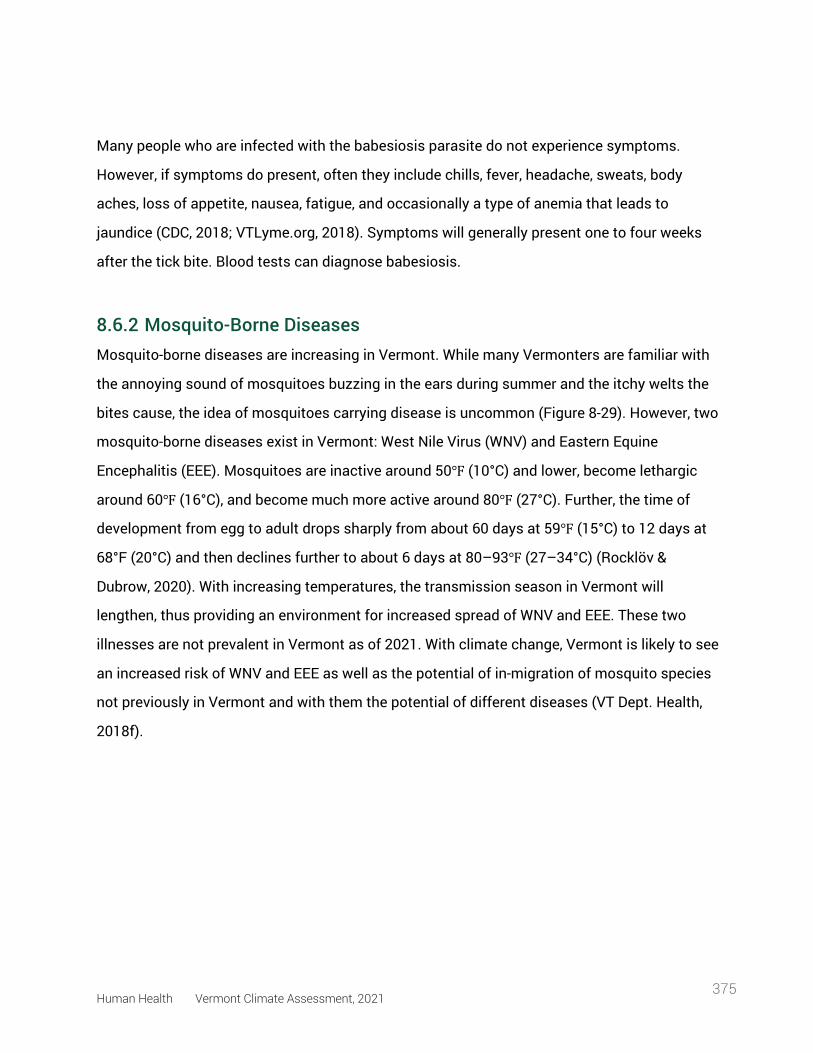
Human Health Vermont Climate Assessment, 2021 375
Many people who are infected with the babesiosis parasite do not experience symptoms.
However, if symptoms do present, often they include chills, fever, headache, sweats, body
aches, loss of appetite, nausea, fatigue, and occasionally a type of anemia that leads to
jaundice (CDC, 2018; VTLyme.org, 2018). Symptoms will generally present one to four weeks
after the tick bite. Blood tests can diagnose babesiosis.
8.6.2 Mosquito-Borne Diseases Mosquito-borne diseases are increasing in Vermont. While many Vermonters are familiar with
the annoying sound of mosquitoes buzzing in the ears during summer and the itchy welts the
bites cause, the idea of mosquitoes carrying disease is uncommon (Figure 8-29). However, two
mosquito-borne diseases exist in Vermont: West Nile Virus (WNV) and Eastern Equine
Encephalitis (EEE). Mosquitoes are inactive around 50℉ (10°C) and lower, become lethargic
around 60℉ (16°C), and become much more active around 80℉ (27°C). Further, the time of
development from egg to adult drops sharply from about 60 days at 59℉ (15°C) to 12 days at
68°F (20°C) and then declines further to about 6 days at 80–93℉ (27–34°C) (Rocklöv &
Dubrow, 2020). With increasing temperatures, the transmission season in Vermont will
lengthen, thus providing an environment for increased spread of WNV and EEE. These two
illnesses are not prevalent in Vermont as of 2021. With climate change, Vermont is likely to see
an increased risk of WNV and EEE as well as the potential of in-migration of mosquito species
not previously in Vermont and with them the potential of different diseases (VT Dept. Health,
2018f).
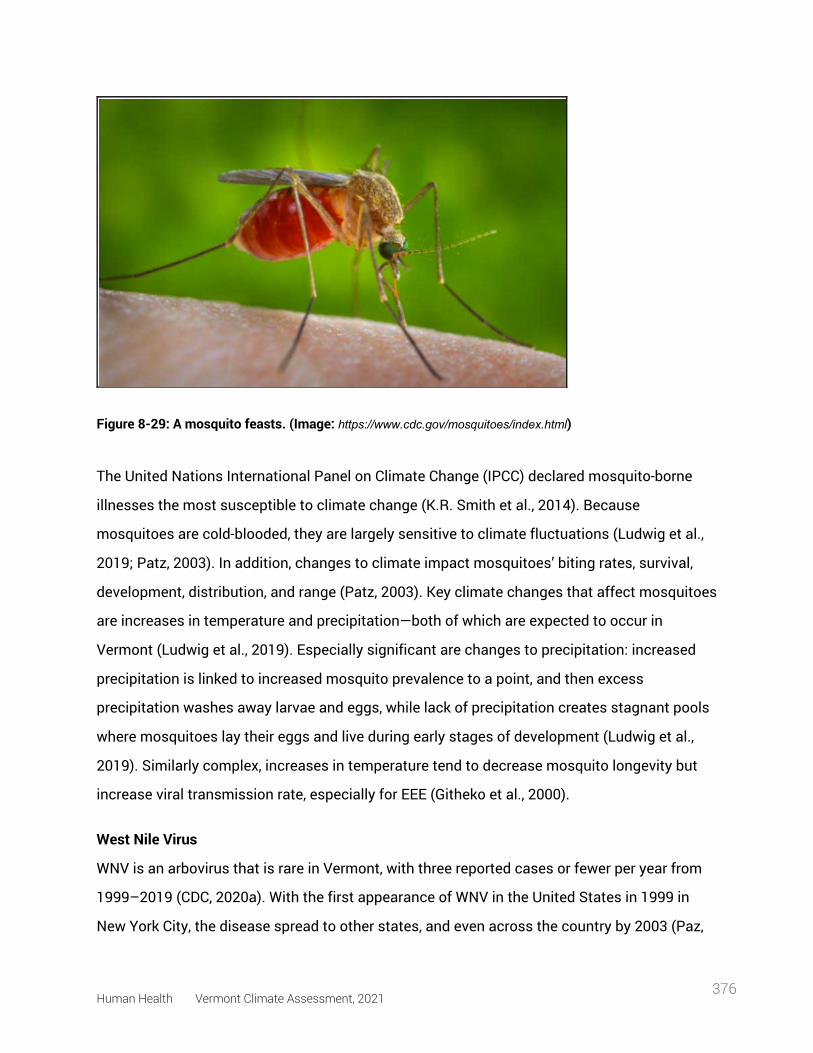
Human Health Vermont Climate Assessment, 2021 376
Figure 8-29: A mosquito feasts. (Image: https://www.cdc.gov/mosquitoes/index.html)
The United Nations International Panel on Climate Change (IPCC) declared mosquito-borne
illnesses the most susceptible to climate change (K.R. Smith et al., 2014). Because
mosquitoes are cold-blooded, they are largely sensitive to climate fluctuations (Ludwig et al.,
2019; Patz, 2003). In addition, changes to climate impact mosquitoes’ biting rates, survival,
development, distribution, and range (Patz, 2003). Key climate changes that affect mosquitoes
are increases in temperature and precipitation—both of which are expected to occur in
Vermont (Ludwig et al., 2019). Especially significant are changes to precipitation: increased
precipitation is linked to increased mosquito prevalence to a point, and then excess
precipitation washes away larvae and eggs, while lack of precipitation creates stagnant pools
where mosquitoes lay their eggs and live during early stages of development (Ludwig et al.,
2019). Similarly complex, increases in temperature tend to decrease mosquito longevity but
increase viral transmission rate, especially for EEE (Githeko et al., 2000).
West Nile Virus
WNV is an arbovirus that is rare in Vermont, with three reported cases or fewer per year from
1999–2019 (CDC, 2020a). With the first appearance of WNV in the United States in 1999 in
New York City, the disease spread to other states, and even across the country by 2003 (Paz,
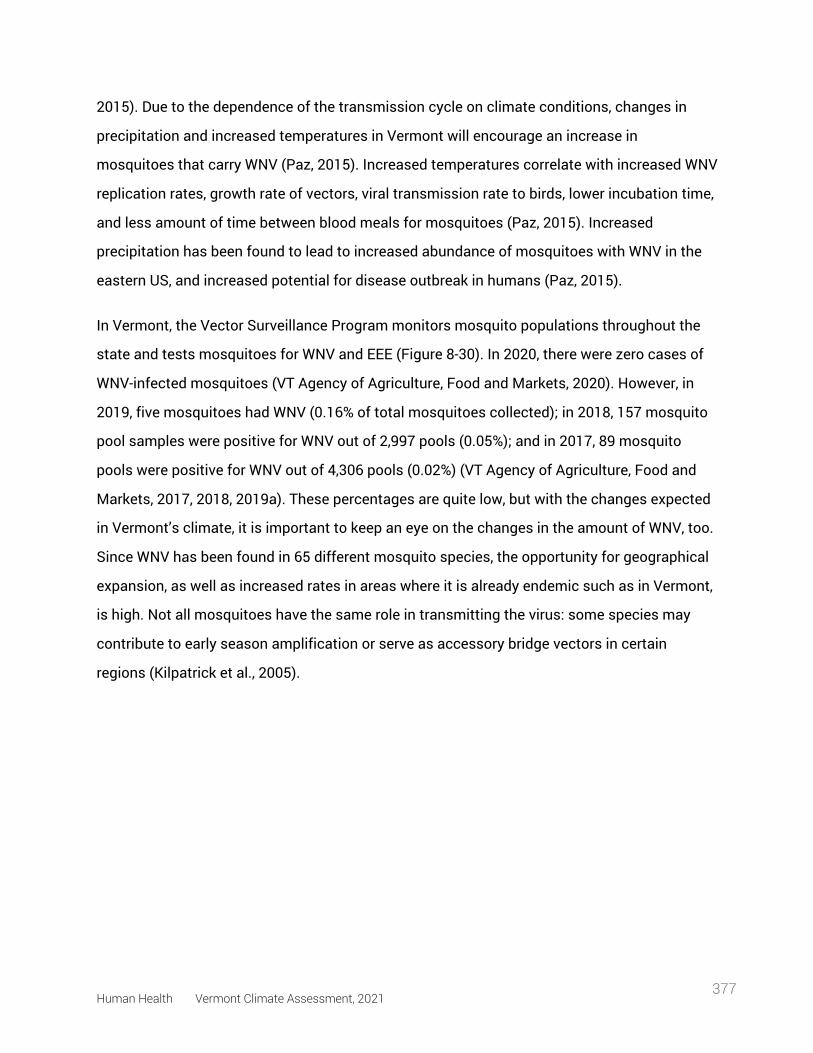
Human Health Vermont Climate Assessment, 2021 377
2015). Due to the dependence of the transmission cycle on climate conditions, changes in
precipitation and increased temperatures in Vermont will encourage an increase in
mosquitoes that carry WNV (Paz, 2015). Increased temperatures correlate with increased WNV
replication rates, growth rate of vectors, viral transmission rate to birds, lower incubation time,
and less amount of time between blood meals for mosquitoes (Paz, 2015). Increased
precipitation has been found to lead to increased abundance of mosquitoes with WNV in the
eastern US, and increased potential for disease outbreak in humans (Paz, 2015).
In Vermont, the Vector Surveillance Program monitors mosquito populations throughout the
state and tests mosquitoes for WNV and EEE (Figure 8-30). In 2020, there were zero cases of
WNV-infected mosquitoes (VT Agency of Agriculture, Food and Markets, 2020). However, in
2019, five mosquitoes had WNV (0.16% of total mosquitoes collected); in 2018, 157 mosquito
pool samples were positive for WNV out of 2,997 pools (0.05%); and in 2017, 89 mosquito
pools were positive for WNV out of 4,306 pools (0.02%) (VT Agency of Agriculture, Food and
Markets, 2017, 2018, 2019a). These percentages are quite low, but with the changes expected
in Vermont’s climate, it is important to keep an eye on the changes in the amount of WNV, too.
Since WNV has been found in 65 different mosquito species, the opportunity for geographical
expansion, as well as increased rates in areas where it is already endemic such as in Vermont,
is high. Not all mosquitoes have the same role in transmitting the virus: some species may
contribute to early season amplification or serve as accessory bridge vectors in certain
regions (Kilpatrick et al., 2005).
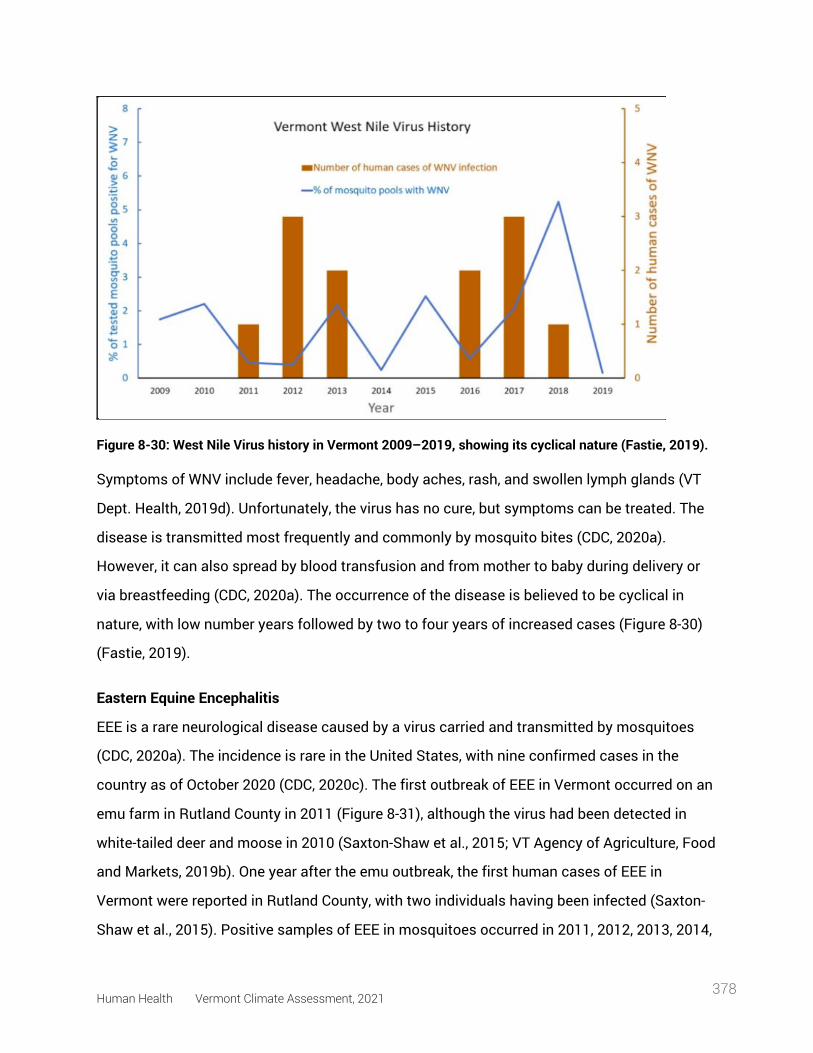
Human Health Vermont Climate Assessment, 2021 378
Figure 8-30: West Nile Virus history in Vermont 2009–2019, showing its cyclical nature (Fastie, 2019).
Symptoms of WNV include fever, headache, body aches, rash, and swollen lymph glands (VT
Dept. Health, 2019d). Unfortunately, the virus has no cure, but symptoms can be treated. The
disease is transmitted most frequently and commonly by mosquito bites (CDC, 2020a).
However, it can also spread by blood transfusion and from mother to baby during delivery or
via breastfeeding (CDC, 2020a). The occurrence of the disease is believed to be cyclical in
nature, with low number years followed by two to four years of increased cases (Figure 8-30)
(Fastie, 2019).
Eastern Equine Encephalitis
EEE is a rare neurological disease caused by a virus carried and transmitted by mosquitoes
(CDC, 2020a). The incidence is rare in the United States, with nine confirmed cases in the
country as of October 2020 (CDC, 2020c). The first outbreak of EEE in Vermont occurred on an
emu farm in Rutland County in 2011 (Figure 8-31), although the virus had been detected in
white-tailed deer and moose in 2010 (Saxton-Shaw et al., 2015; VT Agency of Agriculture, Food
and Markets, 2019b). One year after the emu outbreak, the first human cases of EEE in
Vermont were reported in Rutland County, with two individuals having been infected (Saxton-
Shaw et al., 2015). Positive samples of EEE in mosquitoes occurred in 2011, 2012, 2013, 2014,
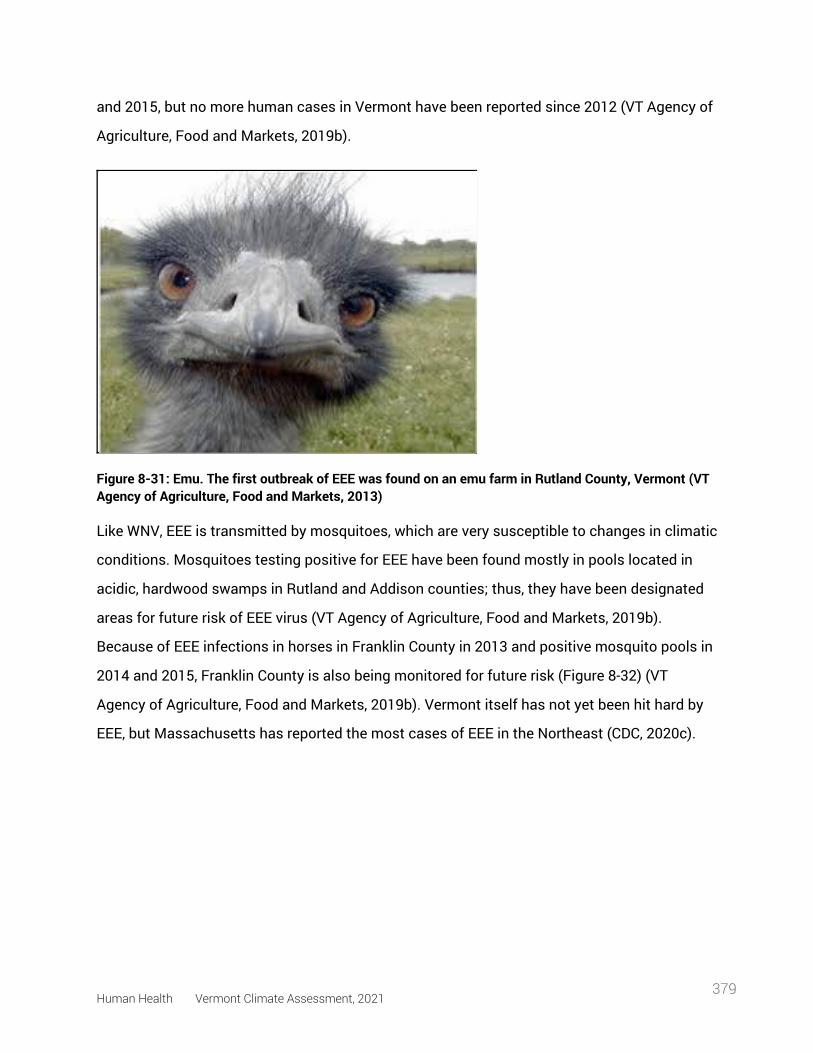
Human Health Vermont Climate Assessment, 2021 379
and 2015, but no more human cases in Vermont have been reported since 2012 (VT Agency of
Agriculture, Food and Markets, 2019b).
Figure 8-31: Emu. The first outbreak of EEE was found on an emu farm in Rutland County, Vermont (VT Agency of Agriculture, Food and Markets, 2013)
Like WNV, EEE is transmitted by mosquitoes, which are very susceptible to changes in climatic
conditions. Mosquitoes testing positive for EEE have been found mostly in pools located in
acidic, hardwood swamps in Rutland and Addison counties; thus, they have been designated
areas for future risk of EEE virus (VT Agency of Agriculture, Food and Markets, 2019b).
Because of EEE infections in horses in Franklin County in 2013 and positive mosquito pools in
2014 and 2015, Franklin County is also being monitored for future risk (Figure 8-32) (VT
Agency of Agriculture, Food and Markets, 2019b). Vermont itself has not yet been hit hard by
EEE, but Massachusetts has reported the most cases of EEE in the Northeast (CDC, 2020c).
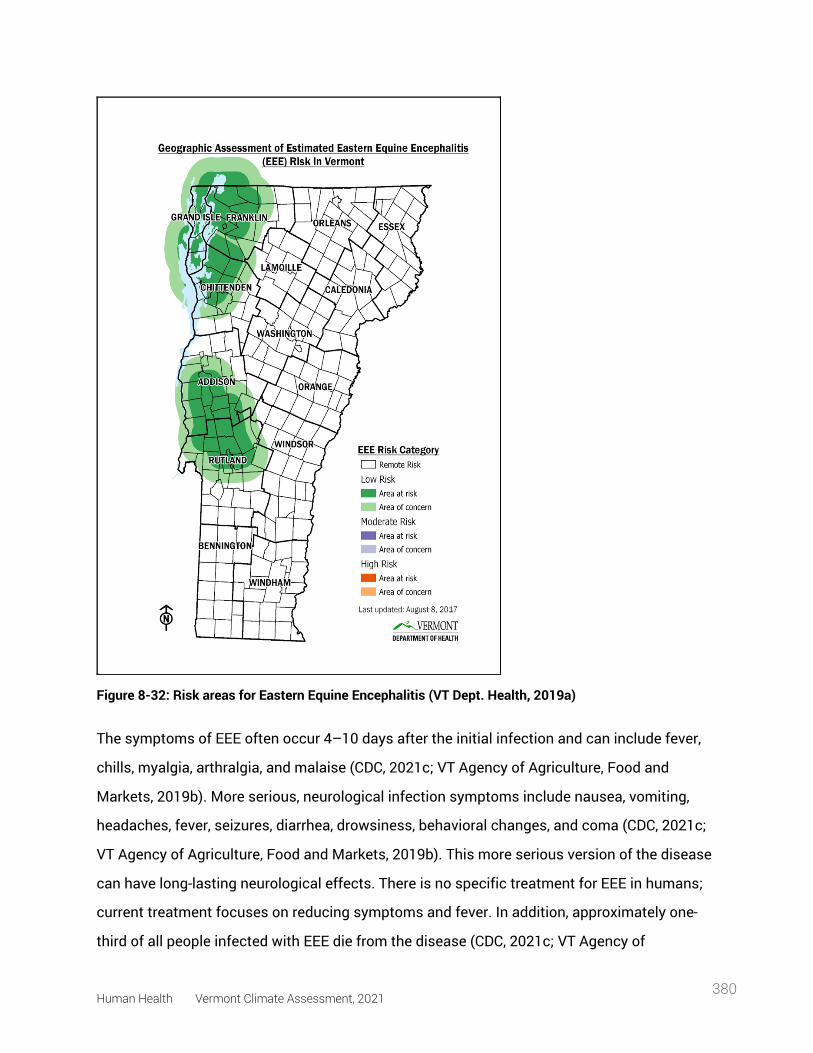
Human Health Vermont Climate Assessment, 2021 380
Figure 8-32: Risk areas for Eastern Equine Encephalitis (VT Dept. Health, 2019a)
The symptoms of EEE often occur 4–10 days after the initial infection and can include fever,
chills, myalgia, arthralgia, and malaise (CDC, 2021c; VT Agency of Agriculture, Food and
Markets, 2019b). More serious, neurological infection symptoms include nausea, vomiting,
headaches, fever, seizures, diarrhea, drowsiness, behavioral changes, and coma (CDC, 2021c;
VT Agency of Agriculture, Food and Markets, 2019b). This more serious version of the disease
can have long-lasting neurological effects. There is no specific treatment for EEE in humans;
current treatment focuses on reducing symptoms and fever. In addition, approximately one-
third of all people infected with EEE die from the disease (CDC, 2021c; VT Agency of
Human Health Vermont Climate Assessment, 2021 381
Agriculture, Food and Markets, 2019b). People who engage in outdoor work and recreational
activities in endemic areas are most vulnerable to contracting EEE. The individuals most
vulnerable to developing EEE are individuals under the age of 15 and over the age of 50 (VT
Dept. Health, 2019a).
8.6.3 Impact of Vector-Borne Diseases on Health Increases in vector-borne illnesses in Vermont will burden the individuals affected and the
health care system. As there has been an increase in emergency room visits from heat-related
health issues, the increased incidence of vector-borne illnesses will likely put more strain on
Vermont’s health-care system.
8.6.4 What You Can Do This section explains how and what can be and is being done to address the changes in vector
ecology in Vermont.
Ticks
The best way to prevent tick-borne diseases is to prevent tick bites. If you find a tick on your
Box 8.5: Eastern Equine Encephalitis (EEE) In 2019, there were twenty cases and nine deaths of EEE in Massachusetts,
Connecticut, and Rhode Island (Fastie, 2019). Despite this spike in cases in
neighboring states, Vermont did not have a single case, nor were any positive
mosquitoes identified in any of the 3,217 sites tested in the state. New Hampshire
and New York also did not have any human cases, but EEE-positive mosquitoes
were identified in both states (Fastie, 2019). While, like WNV, EEE is thought to be
cyclical, it is unclear why Vermont avoided both human EEE cases and lack of EEE-
positive mosquitoes.
Human Health Vermont Climate Assessment, 2021 382
body, remove it quickly to reduce the risk of contracting Lyme disease. See a health care
provider if you get sick or if you find a tick on you and are concerned about contracting Lyme.
Lyme disease is treatable if caught early. Early diagnosis and treatment are important to avoid
health problems related to Lyme disease (VT Dept. Health, 2019c).
Mosquitoes
The best way to prevent mosquito-borne illnesses is to prevent mosquito bites. Wearing long-
sleeved garments and high socks and using sprays help prevent mosquito bites. In addition,
avoid going outside during times when mosquitoes are most active: at dawn and dusk.
Surveillance efforts in Vermont are informative about the prevalence of mosquitoes carrying
diseases. The Vermont Department of Agriculture, Food, and Markets teamed up with other
agencies in Vermont and tests thousands of mosquitoes every summer to understand trends
of mosquito-borne illness prevalence in the state. The reports for each year since 2003 can be
found on their website (https://agriculture.vermont.gov/public-health-agricultural-resource-
management-division/plant-health-and-pest-management-2 ) (VT Agency of Agriculture, Food
and Markets, 2021a).
Box 8.6: One Health The One Health concept recognizes that the health of humans is connected to the
health of animals and the environment. One Health has been used worldwide to
address spillover of zoonotic diseases to humans, antibiotic-resistant bacteria, and
more. The CDC uses a One Health approach by working with physicians, ecologists,
veterinarians, and others to monitor and control public health threats and learn how
diseases spread across animal, plant, vector, and human spheres (CDC, 2020b).
State vector-borne disease prevention is an excellent opportunity to put a One Health
approach into action. Vermont’s Department of Health and Agency of Agriculture are
Human Health Vermont Climate Assessment, 2021 383
8.7 Water and Food
With contributions from Michael Mezzacapo
In this section, the general trends in changes to water and food in Vermont, how that impacts
human health, and what can be done to protect water and food in the context of climate
change is discussed.
8.7.1 Changes to Water and Food Measurable impacts from climate change already are altering the amount, timing, and quality
of available water across the globe (Union of Concerned Scientists, 2010). Climate change and
impacts to vital resources such as water are likely to negatively affect the four dimensions of
food security—availability, access, utilization, and stability—and likely have a profound impact
on human health (IPCC, 2019). Clean, adequate water access and healthy food supplies are
essential to our well-being. Many view Vermont as a place with green pastures dotted with
small farms nestled in rolling mountains and forest land for tree production and recreation
(Figure 8-33). Working landscapes, including healthy farms and healthy forests, require proper
stewardship and will need to be resilient in the face of a changing climate. Climate change will
increase the negative impacts to both those that rely on natural resources for income and all
citizens who choose to make Vermont their home.
already involved with veterinarians, physicians, and ecologists to monitor and control
Lyme, WNV, and EEE. This collaboration could be strengthened by including these
actors when updating the next version of the Vermont Arbovirus Surveillance and
Response Plan. Specifically, coordination with Department of Conservation ecological
restoration projects could reduce mosquito habitat by accounting for farmers’ roles in
reducing habitat and early detection of diseases and could increase accounting for
climate change effects in future planning.
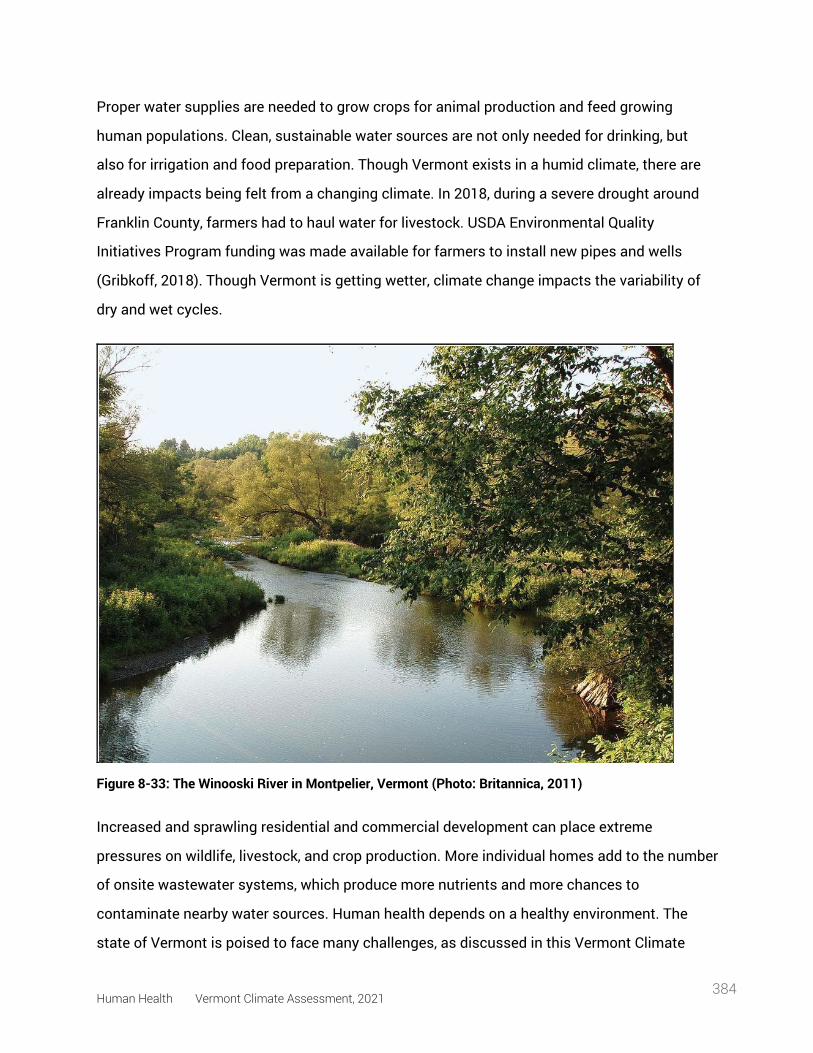
Human Health Vermont Climate Assessment, 2021 384
Proper water supplies are needed to grow crops for animal production and feed growing
human populations. Clean, sustainable water sources are not only needed for drinking, but
also for irrigation and food preparation. Though Vermont exists in a humid climate, there are
already impacts being felt from a changing climate. In 2018, during a severe drought around
Franklin County, farmers had to haul water for livestock. USDA Environmental Quality
Initiatives Program funding was made available for farmers to install new pipes and wells
(Gribkoff, 2018). Though Vermont is getting wetter, climate change impacts the variability of
dry and wet cycles.
Figure 8-33: The Winooski River in Montpelier, Vermont (Photo: Britannica, 2011)
Increased and sprawling residential and commercial development can place extreme
pressures on wildlife, livestock, and crop production. More individual homes add to the number
of onsite wastewater systems, which produce more nutrients and more chances to
contaminate nearby water sources. Human health depends on a healthy environment. The
state of Vermont is poised to face many challenges, as discussed in this Vermont Climate
Human Health Vermont Climate Assessment, 2021 385
Assessment; however, basic survival and stability is predicated by access to clean water and
the availability of healthy food. This section will briefly discuss how climate change can
impact elements of water supplies, food production, and human health.
8.7.2 Water Water distribution/quality
Climate change will continue to impact how precipitation is distributed around the state,
though Vermont is getting wetter overall (see Climate Change in Vermont chapter). Extreme
rainfall runoff causes soil erosion and flooding incidents, which impact water quality and can
damage crops (USGS, 2021). Equally problematic are periods of extended drought, resulting in
drinking water shortages and impacts to overall water quality in drinking and recreational
waters (VT Dept. Health, 2017a). Drought periods followed by heavy rains can worsen pollution
impacts because the soil is less absorbent, causing the rain to flow more easily off the surface
(VT Dept. Health, 2017a). Stormwater runoff carries pollution such as fertilizers, toxins,
sediment, animal wastes, wastewater, and other nutrient-rich materials quickly into rivers and
lakes (VT DEC, 2018, 2021e). Human health is then compromised when these waters are used
for recreation, drinking water, or irrigation of food crops.
Approximately 30% of the population in Vermont relies on a private drinking water source (VT
Dept. Health, 2018b). These sources are not required to be tested regularly for contaminants,
like nitrates. Both public and private drinking water wells can be subject to contamination from
stormwater runoff (classified as nonpoint source pollution) (US EPA, 2015b). There is concern
that excessive stormwater runoff from farms may be impacting nearby private drinking water
wells. From 2007 to 2017, the Department of Agriculture tested 1,068 wells and found 63
private drinking water wells on or near farms that exceeded the state and federal drinking
water standards for nitrate pollution, and 146 wells were at or over preventative action levels
(Corwin, 2017).
Water-borne diseases/toxins
Many areas in Vermont have aging wastewater infrastructure and limited capital to invest in
Human Health Vermont Climate Assessment, 2021 386
mitigation technologies, such as separated sewers, that can combat climate change impacts
to these systems. Outdated wastewater systems can release sewage and stormwater into the
environment after extreme rainfall events. Many drinking water sources in Vermont rely on
surface water with these outfalls. The USGS estimates that in 2005, 440 million gallons of
water were withdrawn every day in Vermont. Most withdrawals (88%) were from surface water
sources, while the remaining (12%) were from groundwater sources (Medalie & Horn, 2010). As
temperatures in Vermont increase, so will water temperatures. Warmer water temperatures will
provide more favorable conditions for reproduction of waterborne pathogens and toxins (VT
Dept. Health, 2017a). Several examples of impacts to human health are listed below.
E. coli is a specific type of bacteria that comes from fecal waste, including waste from
humans, pets, livestock, birds, and wildlife (Lake Champlain Basin Program, 2021). Most types
of E. coli are harmless, but certain strains can cause severe illness in humans, including
diarrhea, stomach pain, nausea, and vomiting (Mayo Clinic, 2020). Exposure pathways include
eating contaminated food, drinking untreated water, swimming near contaminated beaches,
and contact with cattle or the feces of infected individuals (NY Dept. of Health, 2017). Because
E. coli is ubiquitous in the environment, it can be difficult to understand future risks from E.
coli. Recent research at the University of Guelph, Ontario, Canada concluded that climate
change may trigger changes in bacteria to enable certain strains of E.coli to survive better in
warmer soil and water conditions (van Elsas et al., 2011). As the climate warms in Vermont,
environmental conditions could become more favorable for certain strains of E. coli to produce
toxins and spread more easily, causing gastrointestinal illness and, in severe cases, death. In
Vermont, E. coli presence in recreational water, such as Lake Champlain, is a common cause
of beach closures. Closures typically occur after rainstorms flush sediment, bacteria, and
pollutants into the lake (Figure 8-34) (Lake Champlain Basin Program, 2021). According to the
Lake Champlain Basin Program, dog droppings are one of the leading causes of E. coli
pollution. They offer suggestions on cleanup and how to keep dog feces from polluting the
lake, including owners just picking it up where and when it happens.
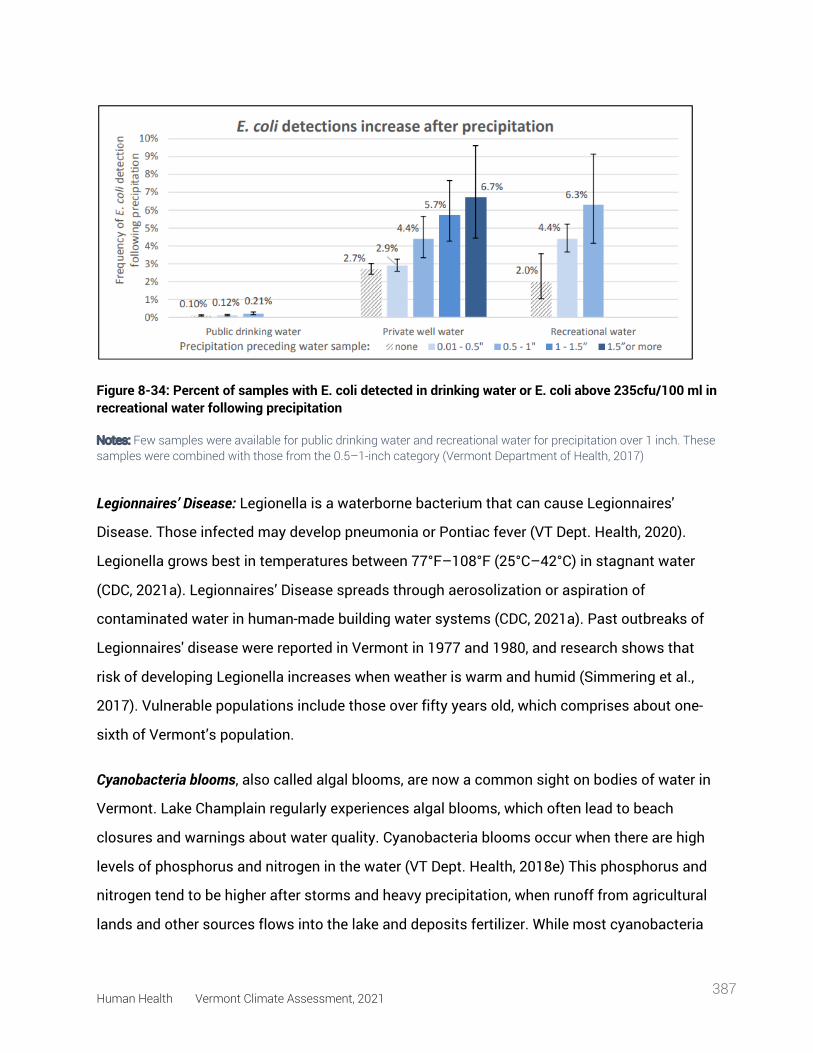
Human Health Vermont Climate Assessment, 2021 387
Figure 8-34: Percent of samples with E. coli detected in drinking water or E. coli above 235cfu/100 ml in recreational water following precipitation
Notes: Few samples were available for public drinking water and recreational water for precipitation over 1 inch. These samples were combined with those from the 0.5–1-inch category (Vermont Department of Health, 2017)
Legionnaires’ Disease: Legionella is a waterborne bacterium that can cause Legionnaires'
Disease. Those infected may develop pneumonia or Pontiac fever (VT Dept. Health, 2020).
Legionella grows best in temperatures between 77°F–108°F (25°C–42°C) in stagnant water
(CDC, 2021a). Legionnaires’ Disease spreads through aerosolization or aspiration of
contaminated water in human-made building water systems (CDC, 2021a). Past outbreaks of
Legionnaires' disease were reported in Vermont in 1977 and 1980, and research shows that
risk of developing Legionella increases when weather is warm and humid (Simmering et al.,
2017). Vulnerable populations include those over fifty years old, which comprises about one-
sixth of Vermont’s population.
Cyanobacteria blooms, also called algal blooms, are now a common sight on bodies of water in
Vermont. Lake Champlain regularly experiences algal blooms, which often lead to beach
closures and warnings about water quality. Cyanobacteria blooms occur when there are high
levels of phosphorus and nitrogen in the water (VT Dept. Health, 2018e) This phosphorus and
nitrogen tend to be higher after storms and heavy precipitation, when runoff from agricultural
lands and other sources flows into the lake and deposits fertilizer. While most cyanobacteria
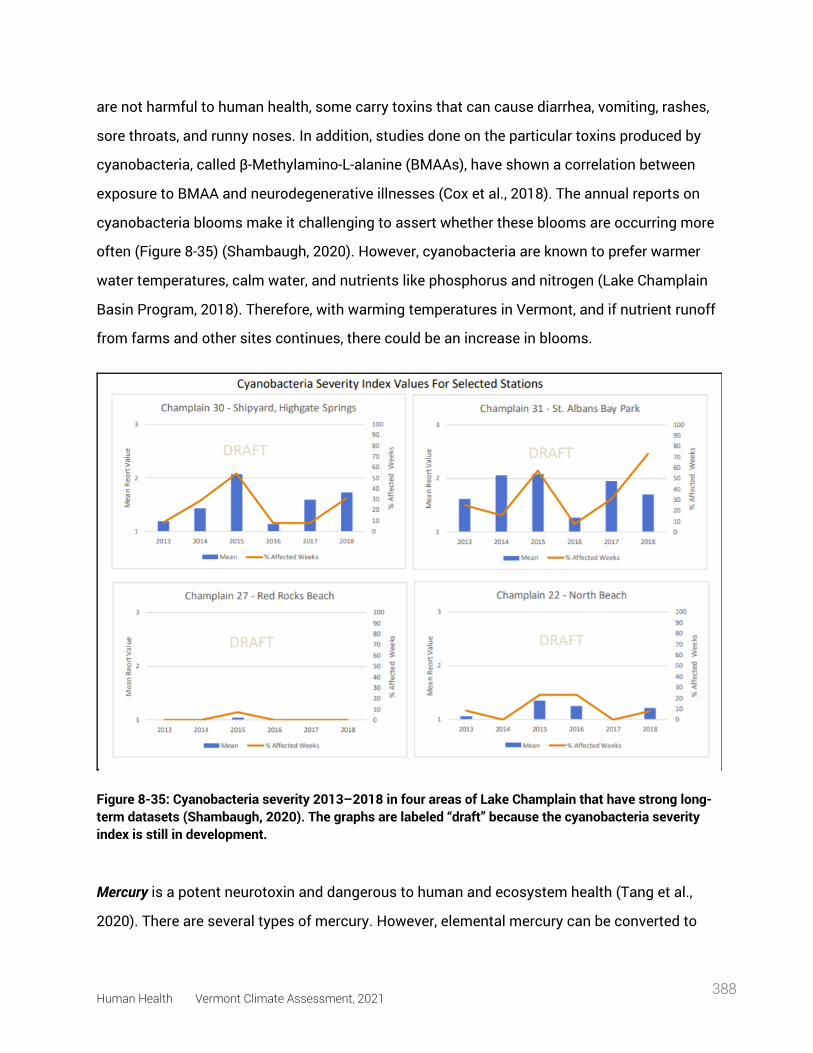
Human Health Vermont Climate Assessment, 2021 388
are not harmful to human health, some carry toxins that can cause diarrhea, vomiting, rashes,
sore throats, and runny noses. In addition, studies done on the particular toxins produced by
cyanobacteria, called β-Methylamino-L-alanine (BMAAs), have shown a correlation between
exposure to BMAA and neurodegenerative illnesses (Cox et al., 2018). The annual reports on
cyanobacteria blooms make it challenging to assert whether these blooms are occurring more
often (Figure 8-35) (Shambaugh, 2020). However, cyanobacteria are known to prefer warmer
water temperatures, calm water, and nutrients like phosphorus and nitrogen (Lake Champlain
Basin Program, 2018). Therefore, with warming temperatures in Vermont, and if nutrient runoff
from farms and other sites continues, there could be an increase in blooms.
Figure 8-35: Cyanobacteria severity 2013–2018 in four areas of Lake Champlain that have strong long-term datasets (Shambaugh, 2020). The graphs are labeled “draft” because the cyanobacteria severity index is still in development. Mercury is a potent neurotoxin and dangerous to human and ecosystem health (Tang et al.,
2020). There are several types of mercury. However, elemental mercury can be converted to
Human Health Vermont Climate Assessment, 2021 389
methylmercury in the methylation process through microbial activity in aquatic environments
and easily be ingested and stored by aquatic plants, fish, and wildlife. Higher water
temperatures from climate change can allow for more mercury methylation, which increases
the amount of mercury in fish and animals that consume the fish, including humans (Stager &
Thill, 2010). Fishing is widely practiced in the state. According to a 2020 Department of Fish
and Wildlife annual angler survey, about 72,000 resident anglers fished for almost 1.8 million
days. Fish are a healthy source of protein and Omega-3 fatty acids (American Heart
Association, 2017). Increases in mercury levels may trigger more fish consumption advisories
across the state and impact the health of vulnerable populations, including pregnant or
nursing women and children. Many factors can impact mercury levels in the environment,
including changes to fish communities and extreme climatic events. Further study is needed
to identify future scenarios to better protect human health (Swinton & Nierzwicki-Bauer, 2020).
More studies in Vermont are needed to evaluate wild fish consumption patterns among
Indigenous communities, such as the Abenaki who have a long-standing tradition of hunting
and fishing in Vermont, and recreational anglers to better evaluate total fish intake and human
health risks from mercury.
Box 8.7: Mercury in Lake Champlain Fish Recent research discovered mercury levels in Lake Champlain fish increased in the
period 2011–2017, whereas levels previously had been steadily decreasing (Swinton
& Nierzwicki-Bauer, 2020). Several reasons cause the increase in mercury, including
“atmospheric deposition, lake temperature, chlorophyll-a, fishery dynamics, lake
flooding and loading of total suspended solids” (Swinton & Nierzwicki-Bauer, 2020).
Because of the toxicity of mercury and previous problems with pollution from
atmospheric sources, the State of Vermont has monitored levels of mercury in fish
tissue since 1987 and detected measurable concentrations in 95% of the samples
collected from both lakes and rivers (VT DEC, 2021c, 2021d).
Human Health Vermont Climate Assessment, 2021 390
8.7.3 Food Food production/security
A warmer climate can have variable impacts on crop production. According to the World Bank,
a 3.6°F (2°C) increase in temperature puts around 100–400 million people at risk of hunger
worldwide (Clayton et al., 2017; Friel & Marmot, 2011; McMichael, 2013). Equally important is
the amount of land available for agriculture. Recently, Vermont has seen a decrease in
available farmland. According to a 2018 report by the University of Vermont Extension and the
Vermont Housing & Conservation Board, Vermont lost the equivalent of three Camel’s Hump
State Parks, roughly 64,000 acres total, in agricultural land between 1997 and 2012 (U.
Vermont Extension & VT Housing & Conservation Board, 2018).
Aside from having favorable climatic conditions and available land to produce food, food
production methods are important to food security and human health. Highly industrialized
methods have cumulative effects on the environment, including contributing to climate
change (Flesher, 2020). Future changes in Vermont’s climate, such as warming temperatures
or increased precipitation, along with production practices like wide-scale chemical fertilizer or
pesticide applications may increase human exposure and cause diseases such as non-
Hodgkin lymphoma and leukemias (Bassil et al., 2007). Farmers may use more pesticides to
control agricultural nuisances because warmer temperatures can cause insect metabolism to
rise and weeds to outcompete food crops (Deutsch et al., 2018). These chemicals often make
it into the environment or our food supplies. One such pesticide widely used in Vermont is
atrazine. Atrazine is a “restricted-use” pesticide used to control grassy weeds (Agency for
Toxic Substances and Disease Registry, 2003). Because of its classification, it must be applied
by licensed applicators and has restrictions on how close it can be applied near bodies of
water. Studies have indicated that atrazine is a known endocrine-disruptor and can impact
reproductive health (Sass & Colangelo, 2006). Atrazine is also highly mobile in the environment
and can easily enter water, where it takes a long time to break down (Donley, 2019).
Human Health Vermont Climate Assessment, 2021 391
Climate change impacts can also disrupt food access by reducing production. Research
shows that cold-weather crop production may be the most at risk from rising temperatures
(US Global Change Research Program, 2010). Items such as field corn, wheat, and oats don’t
produce well when summer temperatures increase. This is even though the growing season
may be six to eight weeks longer in 2067 (Ready-Campbell, 2017). Even warm weather crops
like tomatoes and peppers can be severely impacted if temperatures exceed 90°F during
certain parts of their life cycle (Dunnington, 2010; Frumhoff et al., 2008). Food insecurity has
many negative associations with human health, including increased risks of some birth
defects, anemia, lower nutrient intakes, cognitive problems, aggression, and anxiety
(Gundersen & Ziliak, 2015).
The amount of food grown in Vermont may be reduced by climate change. For example, higher
temperatures create small reductions in milk production in cows (Pragna et al., 2016). Even if
citizens have adequate access to food, research has shown that nutritional values of the food
can be impacted by rising CO2 and temperatures (Myers et al., 2014; M. R. Smith & Myers,
2018). For instance, higher CO2 concentrations lower the levels of protein and essential
Box 8.8: Food Insecurity In 2020, researchers at the University of Vermont conducted surveys to assess food
insecurity. The results surprised researchers. Insecurity rose from 18.3% to 24.3%
during the COVID-19 pandemic, or to nearly one in four Vermonters (Niles et al., 2021).
This is nearly triple the levels of 2018. Respondents adopted coping strategies to
address food access challenges, including buying foods that had a longer shelf life
(77%), cheaper foods (66%), and even eating less (66%) (Niles et al., 2021). Food
insecurity is compounded by other factors, including economic impacts or disease
outbreaks, as witnessed in 2020-2021.
Human Health Vermont Climate Assessment, 2021 392
minerals of staple crops such as wheat, rice, and potatoes (Ziska et al., 2016). With lower
levels of nutrients, people may be unable to meet their required intake of healthy food, and
those who are already food insecure may be hit hardest. Lack of proper nutrition leads to many
health issues, including diabetes, scurvy, anemia, general malnutrition, and developmental
problems in children.
Food-borne Illness
Increased air temperatures provide more opportunity for dangerous pathogens to spread on
crops and in food production. Additionally, warmer temperatures experienced in winter may
also reduce the typical winter kill of pathogens (VT Dept. Health, 2017a).
8.7.4 Impact on health As mentioned above, many other water quality-related health issues can arise including
diarrhea, vomiting, liver damage, nerve damage, etc., depending on the issues in water. One
example discussed in depth in this chapter is mercury. Mercury is a potent neurotoxin that can
easily cross the blood-brain and placental barriers (VT DEC, 2021c). Impacts from mercury
exposure include damage to the brain and kidneys, and impacts can be especially problematic
in the fetus, children, and pregnant and nursing mothers (US EPA, 2015a). Mercury exposure
can display severe, subtle, or no symptoms, depending on the form, amount, and length of
exposure to the mercury consumed, and the current health of the individual (US EPA, 2015a).
Exposed children may display differences in cognitive abilities, attention, language, fine motor
skills, and visual spatial skills (US EPA, 2015a). Methylmercury poisoning (the most common
type from consumption of fish) symptoms in adults may include (US EPA, 2015a):
1. Loss of peripheral vision.
2. "Pins and needles" feelings, usually in the hands, feet, and around the mouth.
3. Lack of coordination of movements.
4. Impairment of speech, hearing, walking; and/or
5. Muscle weakness.
Human Health Vermont Climate Assessment, 2021 393
Other food- and waterborne illnesses in Vermont include salmonella, campylobacteriosis,
cryptosporidiosis, hepatitis A, shigellosis, and norovirus. A full description of all these illnesses
can be found on the Vermont Department of Health’s Climate Change and Food and
Waterborne Illnesses page (https://www.healthvermont.gov/health-environment/climate-
health/water-foodborne-diseases) (VT Dept. Health, 2016d).
8.7.5 What You Can Do The Lake Champlain Committee (LCC) involves citizen scientists to monitor and report
cyanobacteria blooms. This information is then used to update weekly the Cyanobacteria
Tracker Map, which is managed by the Vermont Departments of Health and of Environmental
Conservation (VT DEC, 2021f). Volunteering with the LCC can increase your awareness of the
activities being done to monitor water quality, fix lakeside infrastructure, and generally clean
up Lake Champlain.
Keeping current on beach closings or water advisories can help prevent exposure to toxins and
bacteria when levels are unsafe. In addition, anglers who enjoy eating the caught fish should
follow the Vermont Department of Conservation’s advice on mercury levels in fish, which can
be helpful in determining your potential exposure to mercury (Figure 8-36).
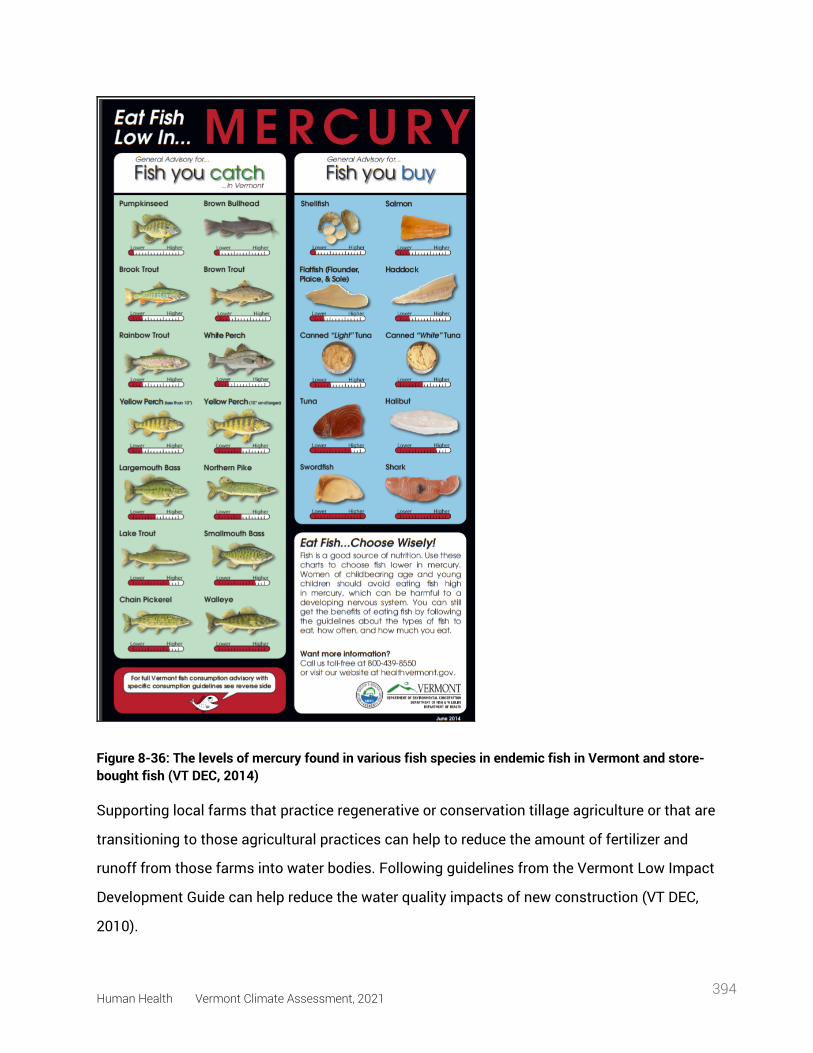
Human Health Vermont Climate Assessment, 2021 394
Figure 8-36: The levels of mercury found in various fish species in endemic fish in Vermont and store-bought fish (VT DEC, 2014)
Supporting local farms that practice regenerative or conservation tillage agriculture or that are
transitioning to those agricultural practices can help to reduce the amount of fertilizer and
runoff from those farms into water bodies. Following guidelines from the Vermont Low Impact
Development Guide can help reduce the water quality impacts of new construction (VT DEC,
2010).
Human Health Vermont Climate Assessment, 2021 395
8.8 mental health
“Climate change is a human-caused problem, which is more difficult to cope with [mentally]
than disasters that are beyond human control,” says Thomas Doherty, PsyD, in a
comprehensive report by the American Psychological Association, Climate for Health, and
ecoAmerica on the impacts of climate change on mental health (Clayton et al., 2017). This
report was written because most of the literature on climate change and health addresses the
physical health impacts primarily and mental health impacts secondarily (Clayton et al., 2017).
However, more and more there are clear links between changes to the climate and
environment and mental health. This section outlines changes being observed in mental
health, including climate-induced anxiety and suggests some ways to address these issues.
8.8.1 Changes in mental health Well-being is intricately linked to the environment. Climate change has brought changes to
mental well-being, both directly (e.g., through natural disasters like floods and storms) and
indirectly (e.g., weakened and unstable infrastructure, rising sea levels, and forced migration)
(Berry et al., 2010; Clayton et al., 2017; Schlanger, 2017). Impacts include increased anxiety,
depression, shock, post-traumatic stress disorder (PTSD), compounded or chronic stress, and
substance abuse (Figure 8-37). Other changes to mental health and behavior related to climate
change include increased aggression and violence, increased senses of fatalism and
hopelessness, and more mental health emergencies (Clayton et al., 2017; Schlanger, 2017).
Luckily, the dialogue around climate change’s impact on mental health has become more
common in the past few years, which has led to new terms such as “eco-anxiety” to describe
the fear, existential angst, and emotions surrounding climate change (Schlanger, 2017).
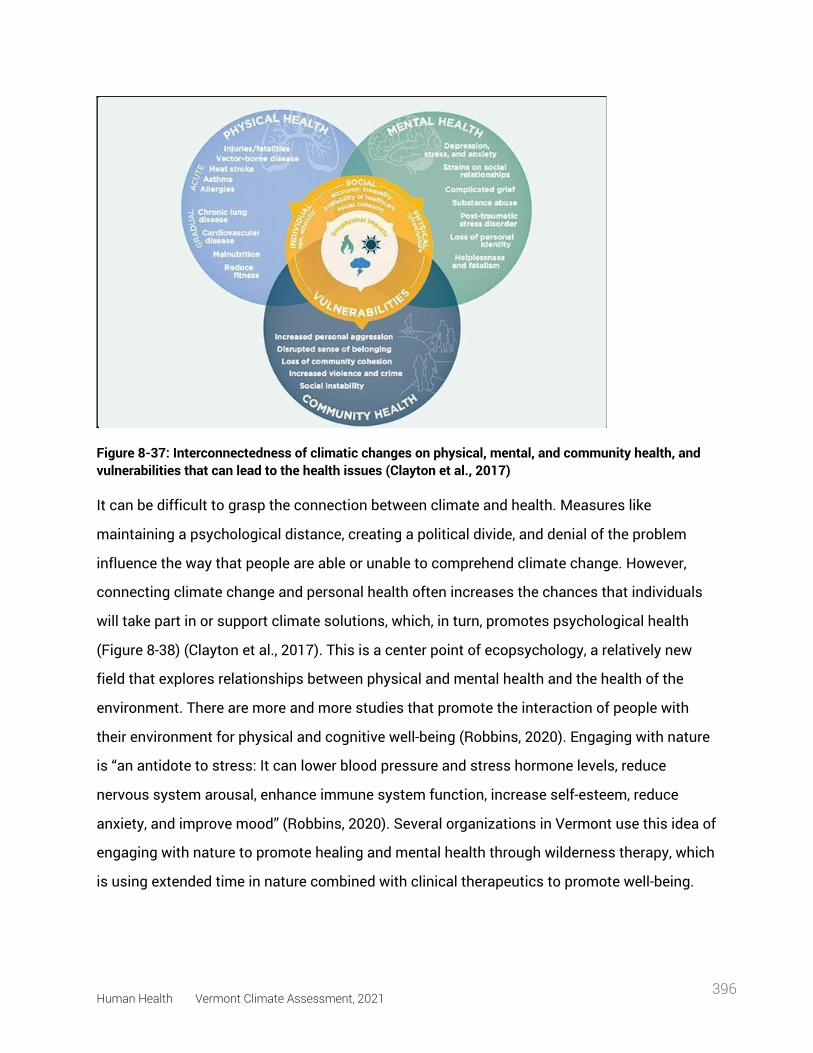
Human Health Vermont Climate Assessment, 2021 396
Figure 8-37: Interconnectedness of climatic changes on physical, mental, and community health, and vulnerabilities that can lead to the health issues (Clayton et al., 2017)
It can be difficult to grasp the connection between climate and health. Measures like
maintaining a psychological distance, creating a political divide, and denial of the problem
influence the way that people are able or unable to comprehend climate change. However,
connecting climate change and personal health often increases the chances that individuals
will take part in or support climate solutions, which, in turn, promotes psychological health
(Figure 8-38) (Clayton et al., 2017). This is a center point of ecopsychology, a relatively new
field that explores relationships between physical and mental health and the health of the
environment. There are more and more studies that promote the interaction of people with
their environment for physical and cognitive well-being (Robbins, 2020). Engaging with nature
is “an antidote to stress: It can lower blood pressure and stress hormone levels, reduce
nervous system arousal, enhance immune system function, increase self-esteem, reduce
anxiety, and improve mood” (Robbins, 2020). Several organizations in Vermont use this idea of
engaging with nature to promote healing and mental health through wilderness therapy, which
is using extended time in nature combined with clinical therapeutics to promote well-being.
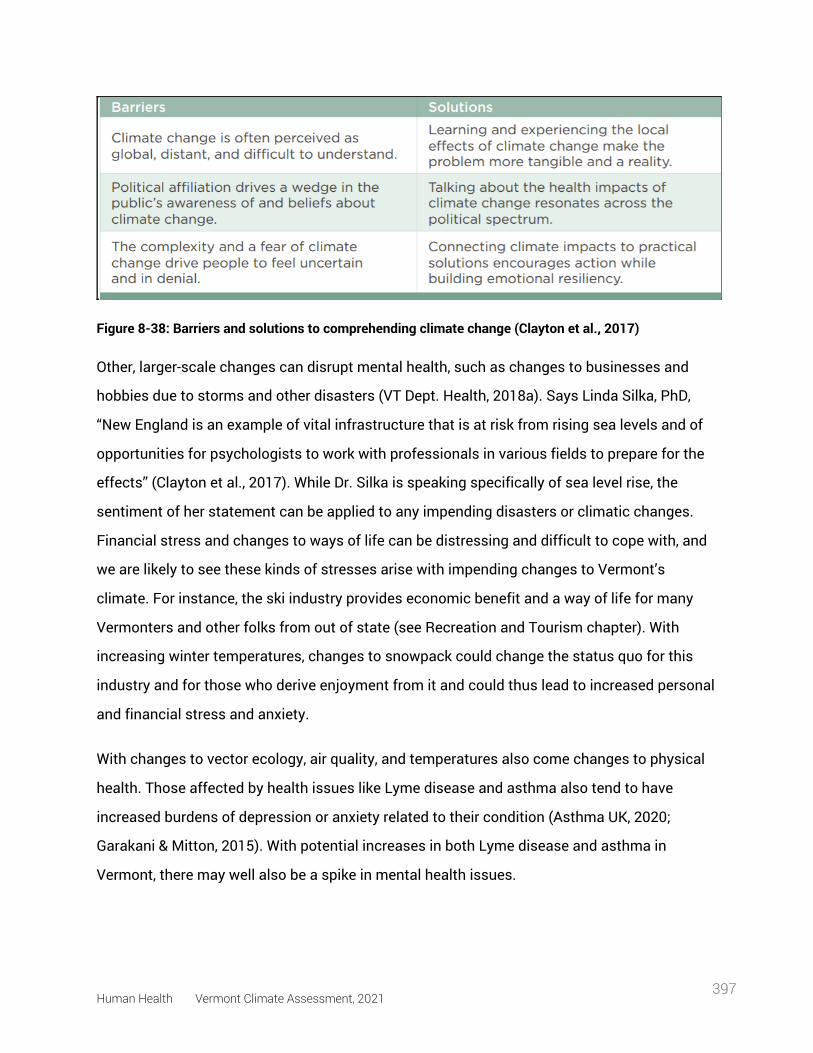
Human Health Vermont Climate Assessment, 2021 397
Figure 8-38: Barriers and solutions to comprehending climate change (Clayton et al., 2017) Other, larger-scale changes can disrupt mental health, such as changes to businesses and
hobbies due to storms and other disasters (VT Dept. Health, 2018a). Says Linda Silka, PhD,
“New England is an example of vital infrastructure that is at risk from rising sea levels and of
opportunities for psychologists to work with professionals in various fields to prepare for the
effects” (Clayton et al., 2017). While Dr. Silka is speaking specifically of sea level rise, the
sentiment of her statement can be applied to any impending disasters or climatic changes.
Financial stress and changes to ways of life can be distressing and difficult to cope with, and
we are likely to see these kinds of stresses arise with impending changes to Vermont’s
climate. For instance, the ski industry provides economic benefit and a way of life for many
Vermonters and other folks from out of state (see Recreation and Tourism chapter). With
increasing winter temperatures, changes to snowpack could change the status quo for this
industry and for those who derive enjoyment from it and could thus lead to increased personal
and financial stress and anxiety.
With changes to vector ecology, air quality, and temperatures also come changes to physical
health. Those affected by health issues like Lyme disease and asthma also tend to have
increased burdens of depression or anxiety related to their condition (Asthma UK, 2020;
Garakani & Mitton, 2015). With potential increases in both Lyme disease and asthma in
Vermont, there may well also be a spike in mental health issues.
Human Health Vermont Climate Assessment, 2021 398
Economically disadvantaged populations, those living with chronic diseases or pre-existing
disabilities, and those living in unequal socioeconomic, geographic, and demographic
locations tend to be particularly vulnerable to mental health issues (Clayton et al., 2017). Areas
of increased vulnerability can be seen in the Vermont Department of Health’s Social
Vulnerability Index map (Figure 8-39). It would be beneficial to update the data to see if/how
the social vulnerability index has changed since 2015, but this tool is useful to predict
potential areas where mental health resilience may be lower. Because lower socioeconomic
status often positively correlates with increased mental health issues, understanding what
parts of Vermont are particularly vulnerable in terms of economics, demographics, and more,
can indicate where there might be more issues with mental health, and thus where the state
can allocate its resources (Hudson, 2005; Reiss et al., 2019).
Box 8.9: Mental Health Access for Kids The COVID-19 pandemic has thrown into relief the need for increased mental health
infrastructure and access for children under the age of eighteen. Generally, there is an
increase in demand for mental health care during the spring semester of the school
year, and with social isolation and “skyrocketing anxiety” from the pandemic, demand
for mental health care has grown even more. A decrease in available inpatient beds
during the pandemic led to individuals waiting in emergency departments for hours.
There is a seven-month waitlist to see a child psychiatrist at the University of Vermont
Medical Center. If nothing else, the pandemic—like Tropical Storm Irene—has
highlighted the need for improved mental health infrastructure and care, especially for
children.
An experimental model called Pediatric Urgent Care for Kids has reduced the amount of
youth ED visits by 33%. Launched in 2018 by United Counseling Service and
Southwestern Medical Center in Bennington, this could be a model for the rest of the
state to follow (Jickling, 2021).
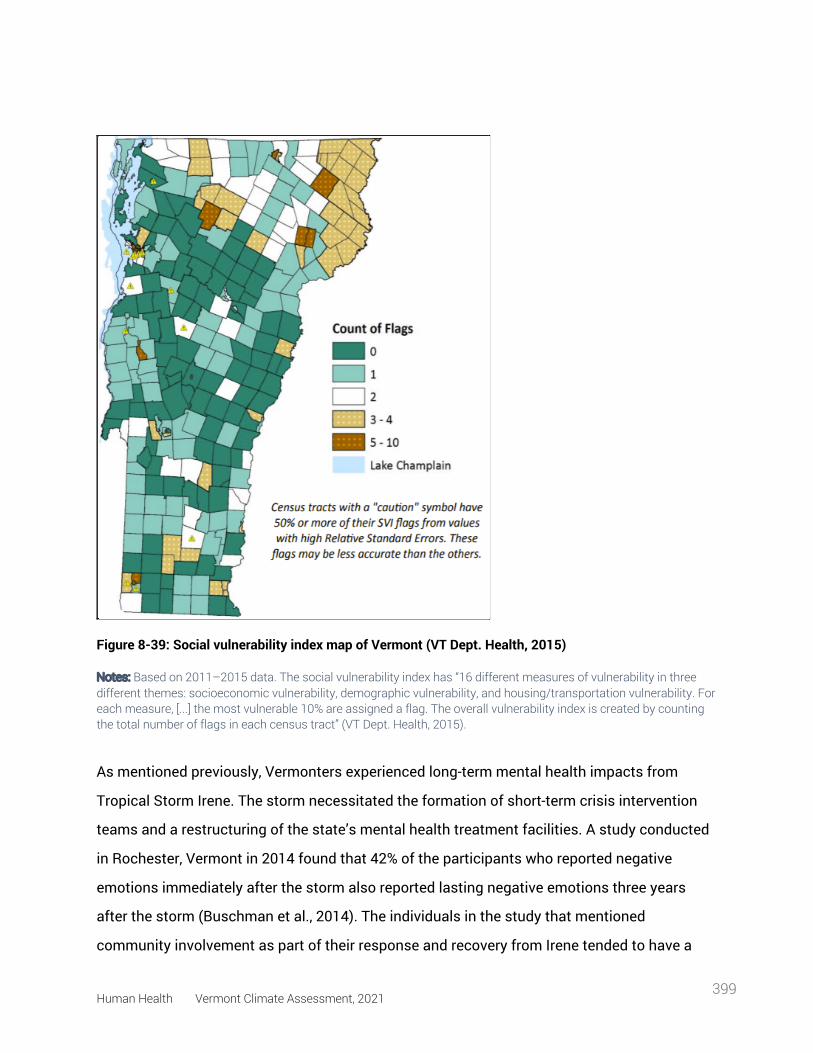
Human Health Vermont Climate Assessment, 2021 399
Figure 8-39: Social vulnerability index map of Vermont (VT Dept. Health, 2015)
Notes: Based on 2011–2015 data. The social vulnerability index has “16 different measures of vulnerability in three different themes: socioeconomic vulnerability, demographic vulnerability, and housing/transportation vulnerability. For each measure, [...] the most vulnerable 10% are assigned a flag. The overall vulnerability index is created by counting the total number of flags in each census tract” (VT Dept. Health, 2015).
As mentioned previously, Vermonters experienced long-term mental health impacts from
Tropical Storm Irene. The storm necessitated the formation of short-term crisis intervention
teams and a restructuring of the state’s mental health treatment facilities. A study conducted
in Rochester, Vermont in 2014 found that 42% of the participants who reported negative
emotions immediately after the storm also reported lasting negative emotions three years
after the storm (Buschman et al., 2014). The individuals in the study that mentioned
community involvement as part of their response and recovery from Irene tended to have a
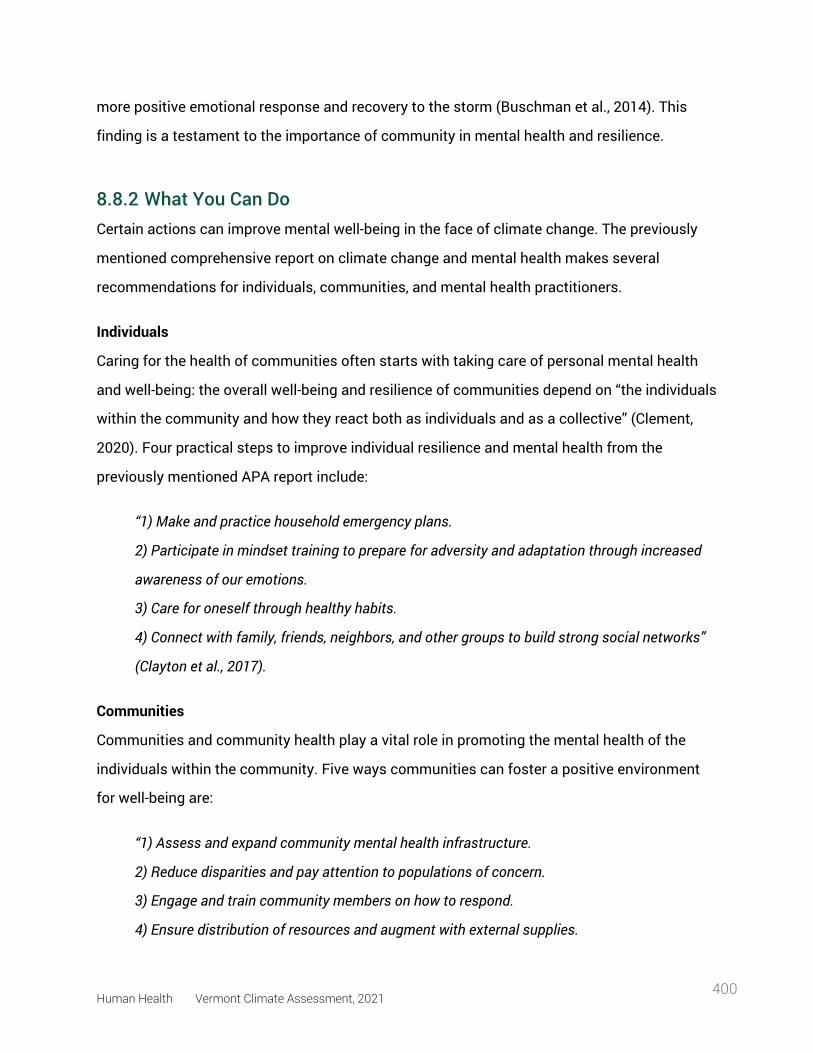
Human Health Vermont Climate Assessment, 2021 400
more positive emotional response and recovery to the storm (Buschman et al., 2014). This
finding is a testament to the importance of community in mental health and resilience.
8.8.2 What You Can Do Certain actions can improve mental well-being in the face of climate change. The previously
mentioned comprehensive report on climate change and mental health makes several
recommendations for individuals, communities, and mental health practitioners.
Individuals
Caring for the health of communities often starts with taking care of personal mental health
and well-being: the overall well-being and resilience of communities depend on “the individuals
within the community and how they react both as individuals and as a collective” (Clement,
2020). Four practical steps to improve individual resilience and mental health from the
previously mentioned APA report include:
“1) Make and practice household emergency plans.
2) Participate in mindset training to prepare for adversity and adaptation through increased
awareness of our emotions.
3) Care for oneself through healthy habits.
4) Connect with family, friends, neighbors, and other groups to build strong social networks”
(Clayton et al., 2017).
Communities
Communities and community health play a vital role in promoting the mental health of the
individuals within the community. Five ways communities can foster a positive environment
for well-being are:
“1) Assess and expand community mental health infrastructure.
2) Reduce disparities and pay attention to populations of concern.
3) Engage and train community members on how to respond.
4) Ensure distribution of resources and augment with external supplies.
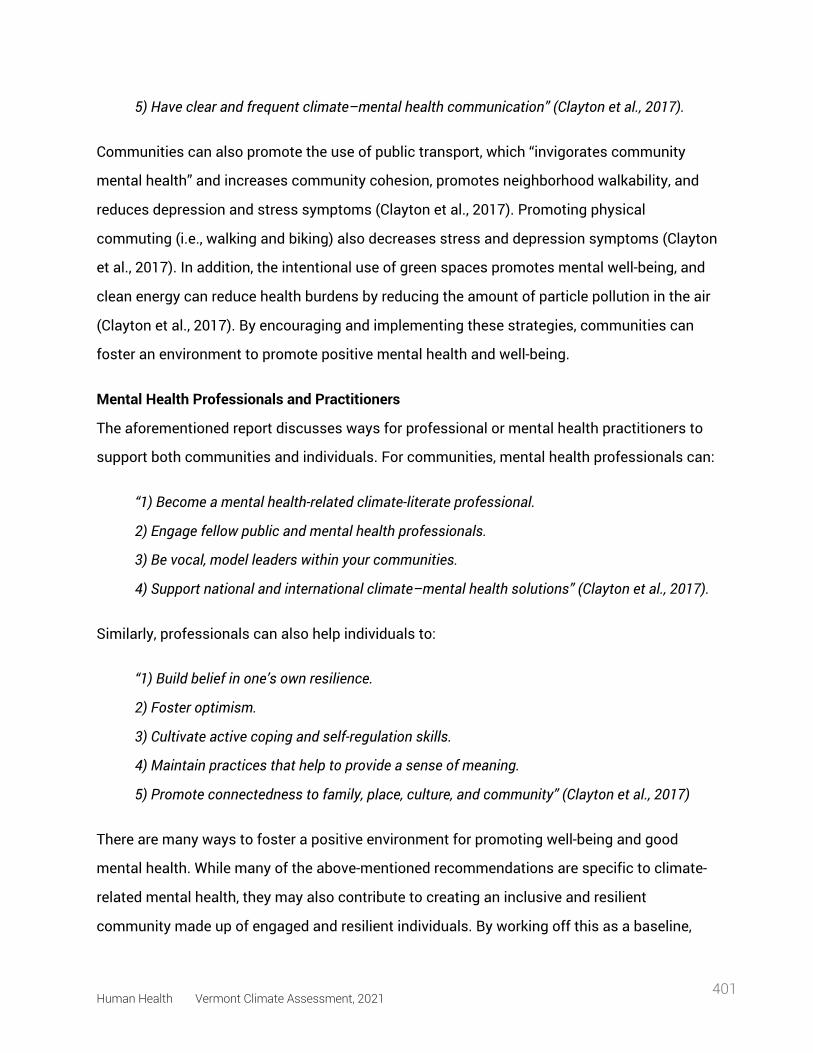
Human Health Vermont Climate Assessment, 2021 401
5) Have clear and frequent climate–mental health communication” (Clayton et al., 2017).
Communities can also promote the use of public transport, which “invigorates community
mental health” and increases community cohesion, promotes neighborhood walkability, and
reduces depression and stress symptoms (Clayton et al., 2017). Promoting physical
commuting (i.e., walking and biking) also decreases stress and depression symptoms (Clayton
et al., 2017). In addition, the intentional use of green spaces promotes mental well-being, and
clean energy can reduce health burdens by reducing the amount of particle pollution in the air
(Clayton et al., 2017). By encouraging and implementing these strategies, communities can
foster an environment to promote positive mental health and well-being.
Mental Health Professionals and Practitioners
The aforementioned report discusses ways for professional or mental health practitioners to
support both communities and individuals. For communities, mental health professionals can:
“1) Become a mental health-related climate-literate professional.
2) Engage fellow public and mental health professionals.
3) Be vocal, model leaders within your communities.
4) Support national and international climate–mental health solutions” (Clayton et al., 2017).
Similarly, professionals can also help individuals to:
“1) Build belief in one’s own resilience.
2) Foster optimism.
3) Cultivate active coping and self-regulation skills.
4) Maintain practices that help to provide a sense of meaning.
5) Promote connectedness to family, place, culture, and community” (Clayton et al., 2017)
There are many ways to foster a positive environment for promoting well-being and good
mental health. While many of the above-mentioned recommendations are specific to climate-
related mental health, they may also contribute to creating an inclusive and resilient
community made up of engaged and resilient individuals. By working off this as a baseline,
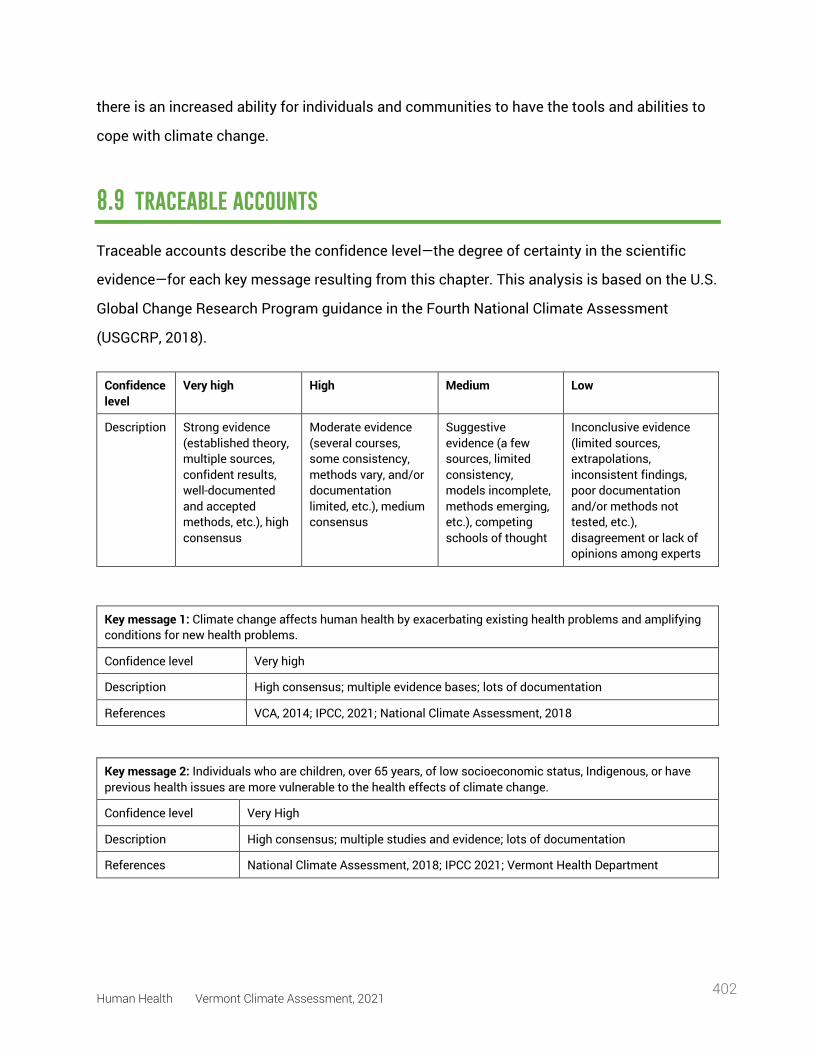
Human Health Vermont Climate Assessment, 2021 402
there is an increased ability for individuals and communities to have the tools and abilities to
cope with climate change.
8.9 traceable accounts
Traceable accounts describe the confidence level—the degree of certainty in the scientific
evidence—for each key message resulting from this chapter. This analysis is based on the U.S.
Global Change Research Program guidance in the Fourth National Climate Assessment
(USGCRP, 2018).
Confidence level
Very high High Medium Low
Description Strong evidence (established theory, multiple sources, confident results, well-documented and accepted methods, etc.), high consensus
Moderate evidence (several courses, some consistency, methods vary, and/or documentation limited, etc.), medium consensus
Suggestive evidence (a few sources, limited consistency, models incomplete, methods emerging, etc.), competing schools of thought
Inconclusive evidence (limited sources, extrapolations, inconsistent findings, poor documentation and/or methods not tested, etc.), disagreement or lack of opinions among experts
Key message 1: Climate change affects human health by exacerbating existing health problems and amplifying conditions for new health problems.
Confidence level Very high
Description High consensus; multiple evidence bases; lots of documentation
References VCA, 2014; IPCC, 2021; National Climate Assessment, 2018
Key message 2: Individuals who are children, over 65 years, of low socioeconomic status, Indigenous, or have previous health issues are more vulnerable to the health effects of climate change.
Confidence level Very High
Description High consensus; multiple studies and evidence; lots of documentation
References National Climate Assessment, 2018; IPCC 2021; Vermont Health Department
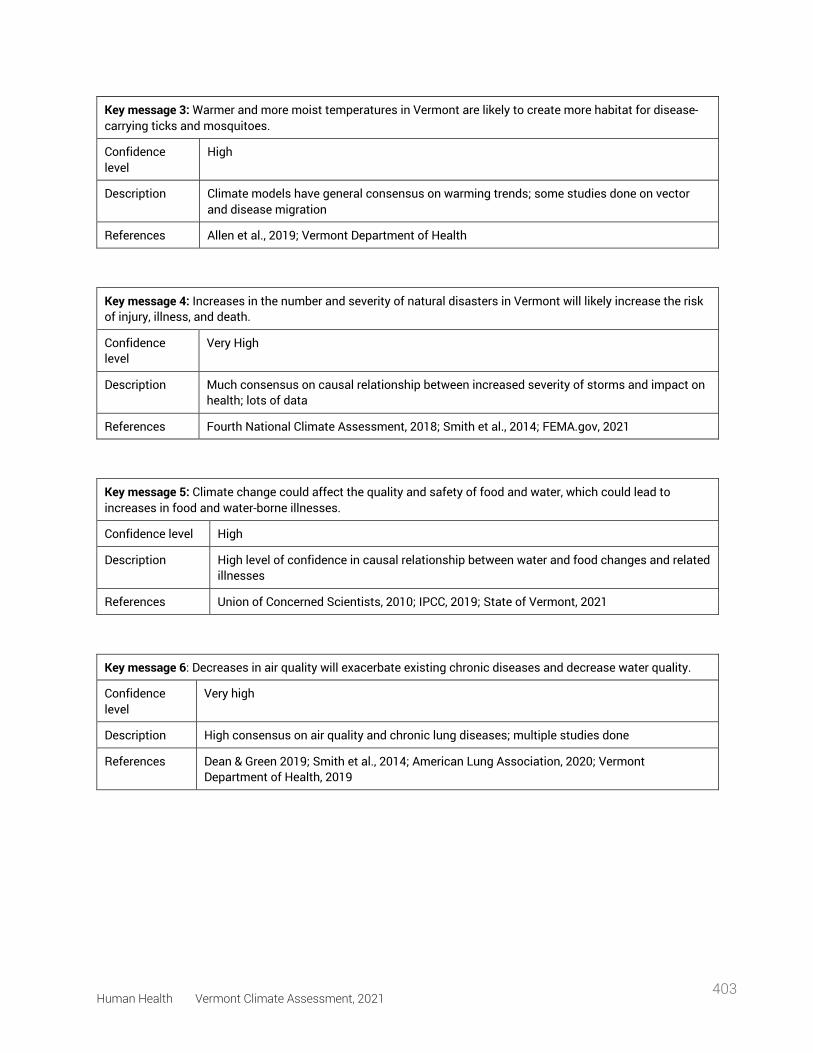
Human Health Vermont Climate Assessment, 2021 403
Key message 3: Warmer and more moist temperatures in Vermont are likely to create more habitat for disease-carrying ticks and mosquitoes.
Confidence level
High
Description Climate models have general consensus on warming trends; some studies done on vector and disease migration
References Allen et al., 2019; Vermont Department of Health
Key message 4: Increases in the number and severity of natural disasters in Vermont will likely increase the risk of injury, illness, and death.
Confidence level
Very High
Description Much consensus on causal relationship between increased severity of storms and impact on health; lots of data
References Fourth National Climate Assessment, 2018; Smith et al., 2014; FEMA.gov, 2021
Key message 5: Climate change could affect the quality and safety of food and water, which could lead to increases in food and water-borne illnesses.
Confidence level High
Description High level of confidence in causal relationship between water and food changes and related illnesses
References Union of Concerned Scientists, 2010; IPCC, 2019; State of Vermont, 2021
Key message 6: Decreases in air quality will exacerbate existing chronic diseases and decrease water quality.
Confidence level
Very high
Description High consensus on air quality and chronic lung diseases; multiple studies done
References Dean & Green 2019; Smith et al., 2014; American Lung Association, 2020; Vermont Department of Health, 2019
Human Health Vermont Climate Assessment, 2021 404
Key message 7: Mental health is inextricably linked with environmental health. Impacts from climate change could contribute to mental health challenges.
Confidence level Very high
Description High consensus on environment and mental health; multiple studies done; increasing documentation
References Berry et al., 2010; Clayton et al., 2017; Schlanger, 2017; Robbins, 2020
8.10 acknowledgements
This chapter is the product of many different people, all of whom played important roles in
bringing it to the finish line. First, I would like to thank Dan Quinlan without whom I would
never have learned of the Vermont Climate Assessment, and who provided essential feedback
and resources to enhance the chapter. Thanks for your continued commitment to climate and
health, Dan. Second, thank you to Gillian Galford, who spearheaded this whole project and
brought me onto the team. Additional big thanks goes to Christine Vatovec and Jared Ulmer,
who provided timely and detailed feedback on the contents of this chapter, and who contribute
greatly to research and communication around climate change and human health. Thanks to
the VCA team, who were supportive and provided feedback and different perspectives for the
chapter, and to Michael Mezzacapo for taking on a part of the Food and Water section of this
chapter. Finally, a huge thank you to my friends and family who listened to my ramblings about
climate change and human health and provided insight, support, and feedback when needed.
8.11 references
Achakulwisut, P., Brauer, M., Hystad, P., & Anenberg, S. C. (2019). Global, national, and urban burdens of paediatric asthma incidence attributable to ambient NO2 pollution: Estimates from global datasets. The Lancet Planetary Health, 3(4), e166–e178. https://doi.org/10.1016/S2542-5196(19)30046-4
Agency for Toxic Substances and Disease Registry. (2003). Atrazine (CAS No. 1912-24–9; p. 6). CDC. https://www.atsdr.cdc.gov/toxprofiles/tp153-c1-b.pdf
Aikman, C. (2012, February 27). Starting Over Strong Vermont: Building resilience through community events. VTDigger. https://vtdigger.org/2012/02/27/starting-over-strong-vermont-building-resilience-through-community-events/
Allen, D., Borgmann-Winter, B., Bashor, L., & Ward, J. (2019). The Density of the Lyme Disease Vector
Human Health Vermont Climate Assessment, 2021 405
Ixodes scapularis (Blacklegged Tick) Differs between the Champlain Valley and Green Mountains, Vermont. Northeastern Naturalist, 26(3), 545. https://doi.org/10.1656/045.026.0307
American Heart Association. (2017). Fish and Omega-3 Fatty Acids. Eat Smart. https://www.heart.org/en/healthy-living/healthy-eating/eat-smart/fats/fish-and-omega-3-fatty-acids
American Lung Association. (2021). State of the Air. State of the Air. https://www.stateoftheair.org/
American Society of Civil Engineers Vermont Section. (2019). Report Card for Vermont’s Infrastructure. https://infrastructurereportcard.org/vermont/
Associated Press. (2015). Top states for residential wood burning, by emissions. Federal News Network. https://federalnewsnetwork.com/health-news/2015/03/top-states-for-residential-wood-burning-by-emissions/
Asthma U. K. (2020). Wellbeing for people with severe asthma. Mental Health and Severe Asthma. https://www.asthma.org.uk/advice/severe-asthma/making-life-easier-with-severe-asthma/mental-health-severe-asthma/
Bassil, K. L., Vakil, C., Sanborn, M., Cole, D. C., Kaur, J. S., & Kerr, K. J. (2007). Cancer health effects of pesticides: Systematic review. Canadian Family Physician, 53(10), 1705–1711.
Berry, H., Bowen, K., & Kjellstrom, T. (2010). Climate change and mental health: A causal pathways framework. International Journal of Public Health, 55, 123–132. https://doi.org/10.1007/s00038-009-0112-0
Britannica. (2011). Winooski River. https://www.britannica.com/place/Winooski-River
Britannica. (2020). Air Pollution: Effects, Causes, Definition, & Facts. Air Pollution. https://www.britannica.com/science/air-pollution
Bureau of Transportation Statistics. (2017). Vermont: Transportation by the numbers (p. 2). US Dept. of Transportation, Bureau of Transportation Statistics. https://www.bts.dot.gov/sites/bts.dot.gov/files/legacy/Vermont.pdf
Buschman, V., Fernandes, C., Guth, S., Mullen, A., & Rosales-Underbrink, P. (2014). Tropical Storm Irene: A Retrospective on Mental and Emotional Impacts on Vermont Communities, Three Years Later [Environmental Studies Senior Capstone, Middlebury College]. http://www.middlebury.edu/media/view/490671/original/dm_irenerochester_final_dec152014_no_names.pdf
Campbell-Lendrum, D., & Prüss-Ustün, A. (2019). Climate change, air pollution and noncommunicable diseases. Bulletin of the World Health Organization, 97(2), 160–161. https://doi.org/10.2471/BLT.18.224295
Case, M. J., & Stinson, K. A. (2018). Climate change impacts on the distribution of the allergenic plant, common ragweed (Ambrosia artemisiifolia) in the eastern United States. PLOS ONE, 13(10), e0205677. https://doi.org/10.1371/journal.pone.0205677
CDC. (2018). Tickborne Diseases of the United States: A Reference Manual for Health Care Providers (5th
Human Health Vermont Climate Assessment, 2021 406
ed.). U.S. Department of Health and Human Services, Centers for Disease Control and Prevention. https://www.cdc.gov/ticks/tickbornediseases/TickborneDiseases-P.pdf
CDC. (2020a, June 3). West Nile virus. https://www.cdc.gov/westnile/index.html
CDC. (2020b, October 15). One Health Basics. One Health. https://www.cdc.gov/onehealth/basics/index.html
CDC. (2020c, November 18). Eastern Equine Encephalitis (Statistics & Maps). Statistics & Maps. https://www.cdc.gov/easternequineencephalitis/tech/epi.html
CDC. (2021a). Legionnaires Disease Cause and Spread. Legionella (Legionnaires’ Disease and Pontiac Fever). https://www.cdc.gov/legionella/about/causes-transmission.html
CDC. (2021b, May 13). People with certain medical conditions. COVID-19. https://www.cdc.gov/coronavirus/2019-ncov/need-extra-precautions/people-with-medical-conditions.html
CDC. (2021c, August 9). Eastern Equine Encephalitis. https://www.cdc.gov/easternequineencephalitis/index.html
Clayton, S., Manning, C., College, M., Krygsman, K., Speiser, M., Cunsolo, A., Derr, V., Doherty, T., Fery, P., Haase, E., Kotcher, J., Silka, L., & Tabola, J. (2017). Mental health and our changing climate: Impacts, implications, and guidance (p. 70). American Psychological Association and ecoAmerica.
Clement, S. (2020). "COVID-19’s Impact on Climate Change Research and Institutional Resilience in Higher Education in Vermont and Tanzania". Capstone Collection. 3225. https://digitalcollections.sit.edu/capstones/3225
Corwin, E. (2017, December 15). When Farm Runoff Threatens Well Water, The State’s Response Is Lacking. In Vermont Public Radio. https://www.vpr.org/vpr-news/2017-12-15/when-farm-runoff-threatens-well-water-the-states-response-is-lacking
Cox, P. A., Kostrzewa, R. M., & Guillemin, G. J. (2018). BMAA and Neurodegenerative Illness. Neurotoxicity Research, 33(1), 178–183. https://doi.org/10.1007/s12640-017-9753-6
Darrow, L. A., Hess, J., Rogers, C. A., Tolbert, P. E., Klein, M., & Sarnat, S. E. (2012). Ambient pollen concentrations and emergency department visits for asthma and wheeze. Journal of Allergy and Clinical Immunology, 130(3), 630-638.
Dean, A., & Green, D. (2018). Climate change, air pollution and human health in Sydney, Australia: A review of the literature. Environ. Res. Lett., 16.
Department of Environmental Conservation. (2021). Data Summary Graphs [State of Vermont]. Air Quality Monitoring. https://dec.vermont.gov/air-quality/monitoring/data-summary-graphs
Deutsch, C. A., Tewksbury, J. J., Tigchelaar, M., Battisti, D. S., Merrill, S. C., Huey, R. B., & Naylor, R. L. (2018). Increase in crop losses to insect pests in a warming climate. Science (New York, N.Y.), 361(6405), 916–919. https://doi.org/10.1126/science.aat3466
Human Health Vermont Climate Assessment, 2021 407
Donley, N. (2019). The USA lags behind other agricultural nations in banning harmful pesticides. Environmental Health, 18(1), 44. https://doi.org/10.1186/s12940-019-0488-0
Drive Electric Vermont. (2021). Purchase Incentives. https://www.driveelectricvt.com/why-go-electric/purchase-incentives
Dumic, I., & Severnini, E. (2018). “Ticking Bomb”: The Impact of Climate Change on the Incidence of Lyme Disease. Canadian Journal of Infectious Diseases and Medical Microbiology, 2018, e5719081. https://doi.org/10.1155/2018/5719081
Dunnington, G. (2010). The Potential Impacts of Climate Change on Agriculture in Vermont (Climate Change Adaptation White Paper Series, p. 6). VT Agency of Natural Resources. https://climatechange.vermont.gov/sites/climate/files/documents/Data/VTCCAdaptAgriculture.pdf
Ebi, K. L., & Mills, D. (2013). Winter mortality in a warming climate: A reassessment. WIREs Climate Change, 4(3), 203–212. https://doi.org/10.1002/wcc.211
Edling, L., & Danks, C. (2021). Supporting actors: The role of state policy and private programs in advancing local and renewable heating technology. Energy Policy, 153, 112266. https://doi.org/10.1016/j.enpol.2021.112266
Fastie, C. (2019). Vermont avoids New England’s big year for EEE. Moosalamoo Woods & Waters. http://mwwvt.org/arbo/2019-eee/
FEMA. (2021). Declared Disasters. Disasters & Assistance. https://www.fema.gov/disasters/disaster-declarations?field_dv2_state_territory_tribal_value=VT&field_year_value=All&field_dv2_declaration_type_value=DR&field_dv2_incident_type_target_id_selective=All&page=0
Flesher, J. (2020, February 6). Factory farms provide abundant food, but environment suffers. PBS NewsHour. https://www.pbs.org/newshour/economy/factory-farms-provide-abundant-food-but-environment-suffers
French, E. (2020, September 17). Hazy Vermont skies a result of West Coast fires; now, the haze is moving out. VTDigger. https://vtdigger.org/2020/09/17/hazy-vermont-skies-a-result-of-west-coast-fires-now-the-haze-is-moving-out/
Friel, S., & Marmot, M. G. (2011). Action on the Social Determinants of Health and Health Inequities Goes Global. Annual Review of Public Health, 32(1), 225–236. https://doi.org/10.1146/annurev-publhealth-031210-101220
Frumhoff, P. C., McCarthy, J. J., Melillo, J. M., Moser, S. C., Wuebbles, D. J., Wake, C., & Spanger-Siegfried, E. (2008). An integrated climate change assessment for the Northeast United States. Mitigation and Adaptation Strategies for Global Change, 13(5–6), 419–423. https://doi.org/10.1007/s11027-007-9138-x
Galford, G., Hoogenboom, Ann, Carlson, Sam, Ford, Sarah, Nash, Julie, Palchak, Elizabeth, Pears, Sarah, Underwood, Kristin, & Baker, Daniel V. (2014). Considering Vermont’s Future in a Changing Climate: The First Vermont Climate Assessment (p. 219). Gund Institute for Ecological Economics.
Garakani, A., & Mitton, A. G. (2015). New-Onset Panic, Depression with Suicidal Thoughts, and Somatic
Human Health Vermont Climate Assessment, 2021 408
Symptoms in a Patient with a History of Lyme Disease. Case Reports in Psychiatry, 2015. https://doi.org/10.1155/2015/457947
Githeko, A. K., Lindsay, S. W., Confalonieri, U. E., & Patz, J. A. (2000). Climate change and vector-borne diseases: A regional analysis. Bulletin of the World Health Organization, 12.
Gribkoff, E. (2018, October 11). Drought continues to plague northern Vermont, leaving farms and wells dry. VTDigger. https://vtdigger.org/2018/10/11/drought-continues-plague-northern-vermont-leaving-farms-wells-dry/
Gundersen, C., & Ziliak, J. P. (2015). Food Insecurity and Health Outcomes. Health Affairs (Project Hope), 34(11), 1830–1839. https://doi.org/10.1377/hlthaff.2015.0645
Hewitt, E. (2016, August 25). Five years after Irene, Vermont has rebuilt, but marks remain. VTDigger. https://vtdigger.org/2016/08/25/five-years-after-irene-vermont-has-rebuilt-but-marks-remain/
Hudson, C. G. (2005). Socioeconomic Status and Mental Illness: Tests of the Social Causation and Selection Hypotheses. American Journal of Orthopsychiatry, 75(1), 3–18. https://doi.org/10.1037/0002-9432.75.1.3
Inside Climate News. (2016, September 1). Five Years After Hurricane Irene, Vermont Still Striving for Resilience. Inside Climate News. https://insideclimatenews.org/news/01092016/five-years-after-hurricane-irene-2011-effects-flooding-vermont-damage-resilience-climate-change/
IPCC. (2019). Climate Change and Land: An IPCC special report on climate change, desertification, land degradation, sustainable land management, food security and greenhouse gas fluxes in terrestrial ecosystems (p. 874) [IPCC Special Report]. International Panel on Climate Change. https://www.ipcc.ch/site/assets/uploads/2019/11/SRCCL-Full-Report-Compiled-191128.pdf
Jickling, K. (2021, April 27). ‘A crisis’: Kids seeking mental health care are waiting for days in emergency rooms—VTDigger. VT Digger. https://vtdigger.org/2021/04/27/a-crisis-kids-seeking-mental-health-care-are-waiting-for-days-in-emergency-rooms/
Kilpatrick, A. M., Kramer, L. D., Campbell, S. R., Alleyne, E. O., Dobson, A. P., & Daszak, P. (2005). West Nile Virus Risk Assessment and the Bridge Vector Paradigm. Emerging Infectious Diseases, 11(3), 425–429. https://doi.org/10.3201/eid1103.040364
King, M. (2015, January 8). Vermont Asthma Rates Among the Highest in the U.S. UVM Outreach. https://learn.uvm.edu/blog/blog-health/asthma-rates-in-vermont
Kovats, R. S., & Hajat, S. (2008). Heat Stress and Public Health: A Critical Review. Annual Review of Public Health, 29(1), 41–55. https://doi.org/10.1146/annurev.publhealth.29.020907.090843
Lancet Countdown on Health and Climate Change. (2020). https://www.thelancet.com/countdown-health-climate
Lake Champlain Basin Program. (2018). 2018 State of the Lake and Ecosystem Indicators Report. https://sol.lcbp.org/en/
Lake Champlain Basin Program. (2021). Swimming. Fishable, Swimmable, Drinkable.
Human Health Vermont Climate Assessment, 2021 409
https://www.lcbp.org/our-goals/clean-water/fishable-swimmable-drinkable/swimming-2/
Ludwig, A., Zheng, H., Vrbova, L., Drebot, M., Iranpour, M., & Lindsay, L. (2019). Increased risk of endemic mosquito-borne diseases in Canada due to climate change. Canada Communicable Disease Report, 45(4), 91–97. https://doi.org/10.14745/ccdr.v45i04a03
Mayo Clinic. (2020). E. coli—Symptoms and causes. E. Coli. https://www.mayoclinic.org/diseases-conditions/e-coli/symptoms-causes/syc-20372058
McMichael, A. J. (2013). Globalization, Climate Change, and Human Health. New England Journal of Medicine, 368(14), 1335–1343. https://doi.org/10.1056/NEJMra1109341
Medalie, L., & Horn, M. A. (2010). Estimated Water Withdrawals and Return Flows in Vermont in 2005 and 2020 (No. 2010–5053; U.S. Geological Survey Scientific Investigations Report, p. 62). https://pubs.usgs.gov/sir/2010/5053/pdf/sir2010-5053.pdf
Melillo, J. M., Richmond, T. (T. C.), & Yohe, G. W. (2014). Climate Change Impacts in the United States: The Third National Climate Assessment. U.S. Global Change Research Program. https://doi.org/10.7930/J0Z31WJ2
Mingle, J. (2019, November 26). Vermont Doubles Down on Wood Burning, with Consequences for Climate and Health. Inside Climate News. https://insideclimatenews.org/news/26112019/wood-burning-climate-health-consequences-vermont-forest-energy-plan/
Myers, S. S., Zanobetti, A., Kloog, I., Huybers, P., Leakey, A. D. B., Bloom, A. J., Carlisle, E., Dietterich, L. H., Fitzgerald, G., Hasegawa, T., Holbrook, N. M., Nelson, R. L., Ottman, M. J., Raboy, V., Sakai, H., Sartor, K. A., Schwartz, J., Seneweera, S., Tausz, M., & Usui, Y. (2014). Increasing CO2 threatens human nutrition. Nature, 510(7503), 139–142. https://doi.org/10.1038/nature13179
National Wildlife Federation. (2016, August 8). Learning From Tropical Storm Irene. The National Wildlife Federation Blog. https://blog.nwf.org/2016/08/learning-from-tropical-storm-irene/
Niles, M. T., Josephson, A. L., Bertmann, F., Belarmino, E. H., & Ne, R. (2021). COVID-19 and food insecurity impacts: A follow-up Vermont Study—Food insecurity remains high and food assistance program use increases significantly. 3.
NIOSH. (2016). NIOSH criteria for a recommended standard: Occupational exposure to heat and hot environments (No. 2016–106; p. 192). U.S. Dept. of Health and Human Services, Centers for Disease Control and Prevention, National Institute for Occupational Safety and Health, DHHS (NIOHS). https://www.cdc.gov/niosh/topics/heatstress/recommendations.html
NOAA National Centers for Environmental Information. (2021). Climate at a Glance: Statewide Time Series. https://www.ncdc.noaa.gov/cag/statewide/time-series/43/tmin/ann/12/1971-2021?trend=true&trend_base=10&begtrendyear=1971&endtrendyear=2021
NOAA NWS Burlington. (2021). Heatwave.pdf. Burlington, Vermont Heat Waves. https://www.weather.gov/media/btv/climo/extremes/heatwave.pdf
Nonenmacher, R.A. (2014). Ambrosia artemisiifolia [Photo]. https://upload.wikimedia.org/wikipedia/commons/b/b4/Ambrosia_artemisiifolia_9389.jpg
Human Health Vermont Climate Assessment, 2021 410
NY Dept. of Health. (2017). E. coli O157:H7 Infection Fact Sheet. E. Coli Infection. https://www.health.ny.gov/diseases/communicable/e_coli/o157.htm
Patz, J. A. (2003). Climate change and health: new research challenges. In Managing for healthy ecosystems (pp. 77–86). CRC Press.
Patz, J. A., Epstein, P. R., Burke, T. A., & Balbus, J. M. (1996). Global Climate Change and Emerging Infectious Diseases. JAMA, 275(3), 217–223. https://doi.org/10.1001/jama.1996.03530270057032
Patz, J. A., & Frumkin, H. (2016). Climate Change and Human Health. John Wiley & Sons.
Patz, J. A., Graczyk, T. K., Geller, N., & Vittor, A. Y. (2000). Effects of environmental change on emerging parasitic diseases. International Journal for Parasitology, 30(12), 1395–1405. https://doi.org/10.1016/S0020-7519(00)00141-7
Paz, S. (2015). Climate change impacts on West Nile virus transmission in a global context. Philosophical Transactions of the Royal Society B: Biological Sciences, 370(1665). https://doi.org/10.1098/rstb.2013.0561
Peterson, T. C., Karl, T. R., Kossin, J. P., Kunkel, K. E., Lawrimore, J. H., McMahon, J. R., Vose, R. S., & Yin, X. (2014). Changes in weather and climate extremes: State of knowledge relevant to air and water quality in the United States. Journal of the Air & Waste Management Association, 64(2), 184–197. https://doi.org/10.1080/10962247.2013.851044
Polhamus, M. (2017, October 22). State experts predict uptick in tick-borne diseases will continue. VTDigger. https://vtdigger.org/2017/10/22/state-experts-predict-uptick-tick-borne-diseases-will-continue/
Pragna, P., Archana, P. R., Aleena, J., Sejian, V., Krishnan, G., Bagath, M., Manimaran, A., Beena, V., Kurien, E. K., Varma, G., & Bhatta, R. (2016). Heat Stress and Dairy Cow: Impact on Both Milk Yield and Composition. International Journal of Dairy Science, 12(1), 1–11. https://doi.org/10.3923/ijds.2017.1.11
Ready-Campbell, C. (September 22, 2017). Experts: Dairy’s future in Vermont sweeter than maple’s. VTDigger. https://vtdigger.org/2017/09/22/experts-dairys-future-vermont-sweeter-maples/
Reiss, F., Meyrose, A.-K., Otto, C., Lampert, T., Klasen, F., & Ravens-Sieberer, U. (2019). Socioeconomic status, stressful life situations and mental health problems in children and adolescents: Results of the German BELLA cohort-study. PLoS ONE, 14(3). https://doi.org/10.1371/journal.pone.0213700
Ritchie, H., & Roser, M. (2017). Air Pollution. Our World in Data. https://ourworldindata.org/air-pollution
Robbins, J. (2020, January 9). Ecopsychology: How Immersion in Nature Benefits Your Health. Yale E360. https://e360.yale.edu/features/ecopsychology-how-immersion-in-nature-benefits-your-health
Rocklöv, J., & Dubrow, R. (2020). Climate change: An enduring challenge for vector-borne disease prevention and control. Nature Immunology, 21(5), 479–483. https://doi.org/10.1038/s41590-020-0648-y
Rudolph, L & Harrison, C. (2016). A Physician’s Guide to Climate Change, Health and Equity. Public
Human Health Vermont Climate Assessment, 2021 411
Health Institute. Oakland, CA. https://climatehealthconnect.org/wp-content/uploads/2016/09/FullGuideTEMP.pdf
Salas, R. N., Malina, D., & Solomon, C. G. (2019). Prioritizing Health in a Changing Climate. New England Journal of Medicine. https://doi.org/10.1056/NEJMe1909957
Sass, J. B., & Colangelo, A. (2006). European Union Bans Atrazine, While the United States Negotiates Continued Use. International Journal of Occupational and Environmental Health, 12(3), 260–267. https://doi.org/10.1179/oeh.2006.12.3.260
Saxton-Shaw, K. D., Ledermann, J. P., Kenney, J. L., Berl, E., Graham, A. C., Russo, J. M., Powers, A. M., & Mutebi, J.-P. (2015). The First Outbreak of Eastern Equine Encephalitis in Vermont: Outbreak Description and Phylogenetic Relationships of the Virus Isolate. PLOS ONE, 10(6), e0128712. https://doi.org/10.1371/journal.pone.0128712
Schlanger, Z. (2017). Climate change is causing PTSD, anxiety, and depression on a mass scale. Quartz. https://qz.com/948909/ecoanxiety-the-american-psychological-association-says-climate-change-is-causing-ptsd-anxiety-and-depression-on-a-mass-scale/
Shambaugh, A. (2020). Cyanobacteria Monitoring on Lake Champlain and Vermont Inland Lakes Summer 2019.
Shen, L., Mickley, L. J., & Gilleland, E. (2016). Impact of increasing heat waves on U.S. ozone episodes in the 2050s: Results from a multimodal analysis using extreme value theory. Geophysical Research Letters, 43(8), 4017–4025. https://doi.org/10.1002/2016GL068432
Sherman, A., Juillerat, J., & Roberts, D. (2019). 2018 Vermont Wood Fuel Supply Study (Vermont Wood Fuel Supply Study, p. 44). VT Dept of Forests, Parks and Recreation. https://fpr.vermont.gov/sites/fpr/files/Forest_and_Forestry/Wood_Biomass_Energy/Library/2018%20VWFSS%20Final%20Report%20with%20Letter.pdf
Shulins, N. (2014, November 2). After Irene, Vermont shows us what climate resilience looks like. Grist. https://grist.org/climate-energy/after-irene-vermont-shows-us-what-climate-resilience-looks-like/
Simmering, J. E., Polgreen, L. A., Hornick, D. B., Sewell, D. K., & Polgreen, P. M. (2017). Weather-Dependent Risk for Legionnaires’ Disease, United States. Emerging Infectious Diseases, 23(11), 1843–1851. https://doi.org/10.3201/eid2311.170137
Smith, K. R., Woodward, A., Campbell-Lendrum, D., Chadee, D. D., Honda, Y., Liu, Q., Olwoch, J. M., Revich, B., & Sauerborn, R. (2014). Human Health: Impacts, Adaptation, and Co-Benefits. In C. B. Field, V. R. Barros, D. J. Dokken, K. J. Mach, M. D. Mastrandrea, T. E. Bilir, M. Chatterjee, K. Ebi, Y. O. Estrada, R. C. Genova, B. Girma, E. S. Kissel, A. N. Levy, S. MacCracken, P. R. Mastrandrea, & L. L. White (Eds.), Climate Change 2014: Impacts, Adaptation, and Vulnerability. Part A: Global and Sectoral Aspects. Contribution of Working Group II to the Fifth Assessment Report of the Intergovernmental Panel on Climate Change (p. 46). Cambridge University Press.
Smith, M. R., & Myers, S. S. (2018). Impact of anthropogenic CO2 emissions on global human nutrition. Nature Climate Change, 8(9), 834–839. https://doi.org/10.1038/s41558-018-0253-3
Stager, C., & Thill, M. (2010). Climate Change in the Champlain Basin (p. 44) [Technical and
Human Health Vermont Climate Assessment, 2021 412
Demonstration]. The Nature Conservancy. https://www.lcbp.org/publications/climate-change-champlain-basin/
State of Vermont. (2021a). Climate change effects: Flooding. Climate Change in Vermont. https://climatechange.vermont.gov/our-changing-climate/what-it-means/flooding
State of Vermont. (2021b). Emissions & Goals. Climate Change in Vermont. https://climatechange.vermont.gov/climate-pollution-goals
State of Vermont. (2021c). Welcome to Flood Ready Vermont. Flood Ready Vermont. https://floodready.vermont.gov/
Stinson, K. A., Albertine, J. M., Hancock, L. M. S., Seidler, T. G., & Rogers, C. A. (2016). Northern ragweed ecotypes flower earlier and longer in response to elevated CO2: What are you sneezing at? Oecologia, 182(2), 587–594. https://doi.org/10.1007/s00442-016-3670-x
Swinton, M. W., & Nierzwicki-Bauer, S. A. (2020). Mercury increase in Lake Champlain fish: Links to fishery dynamics and extreme climatic events. Ecotoxicology, 29(10), 1750–1761. https://doi.org/10.1007/s10646-019-02148-5
Tang, W.-L., Liu, Y.-R., Guan, W.-Y., Zhong, H., Qu, X.-M., & Zhang, T. (2020). Understanding mercury methylation in the changing environment: Recent advances in assessing microbial methylators and mercury bioavailability. Science of The Total Environment, 714, 136827. https://doi.org/10.1016/j.scitotenv.2020.136827
Terry, P. D., Heidel, R. E., & Dhand, R. (2021). Asthma in Adult Patients with COVID-19. Prevalence and Risk of Severe Disease. American Journal of Respiratory and Critical Care Medicine, 203(7), 893–905. https://doi.org/10.1164/rccm.202008-3266OC
U. Vermont Extension, & VT Housing & Conservation Board. (2018). A 2018 exploration of the future of Vermont agriculture: Ideas to seed a conversation and a call to action (p. 8). University of Vermont. https://www.uvm.edu/sites/default/files/media/Future-of-VT-Ag-Report-2018-Final_5.pdf
Union of Concerned Scientists. (2010). Water and Climate Change. https://www.ucsusa.org/resources/water-and-climate-change
United Health Foundation. (2021). America’s Health Rankings: Asthma & Vermont [Annual Report]. United Health Foundation. https://www.americashealthrankings.org/explore/annual/measure/Asthma_a/state/VT
U.S. Census Bureau. (2019). Population and Housing Unit Estimates. Population Estimates Program (PEP).
US EIA. (2020). Vermont State Energy Profile. US Energy Information Administration. https://www.eia.gov/state/print.php?sid=VT
U.S. EPA. (2013). Integrated Science Assessment (ISA) for Ozone and Related Photochemical Oxidants (EPA/600/R-10/076F; p. 1251). U.S. Environmental Protection Agency, Office of Research and Development, National Center for Environmental Assessment-RTP Division. https://cfpub.epa.gov/ncea/isa/recordisplay.cfm?deid=247492
Human Health Vermont Climate Assessment, 2021 413
U.S. EPA. (2020). Integrated Science Assessment (ISA) for Ozone and Related Photochemical Oxidants (EPA/600/R-20/012). U.S. Environmental Protection Agency, Office of Research and Development, National Center for Environmental Assessment-RTP Division. https://cfpub.epa.gov/ncea/isa/recordisplay.cfm?deid=348522
US EPA, O. (2014, September 3). Improving Indoor Air Quality [Overviews and Factsheets]. US EPA. https://www.epa.gov/indoor-air-quality-iaq/improving-indoor-air-quality
US EPA, O. (2015a, September 3). Health Effects of Exposures to Mercury [Overviews and Factsheets]. https://www.epa.gov/mercury/health-effects-exposures-mercury
US EPA, O. (2015b, September 15). Basic Information about Nonpoint Source (NPS) Pollution [Overviews and Factsheets]. https://www.epa.gov/nps/basic-information-about-nonpoint-source-nps-pollution
US Global Change Research Program. (2010). Agriculture (Global Climate Change Impacts in the US, p. 8) [National Climate Assessment]. USGCRP. https://downloads.globalchange.gov/usimpacts/pdfs/agriculture.pdf
USGCRP (2018). Impacts, Risks, and Adaptation in the United States: Fourth National Climate Assessment, Volume II: [Reidmiller, D.R., C.W. Avery, D.R. Easterling, K.E. Kunkel, K.L.M. Lewis, T.K. Maycock, and B.C. Stewart (eds.)]. U.S. Global Change Research Program, Washington, DC, USA, 1515 pp. doi: 10.7930/NCA4.2018.
USGS. (2021). Surface Runoff and the Water Cycle. Water Science School. https://www.usgs.gov/special-topic/water-science-school/science/surface-runoff-and-water-cycle?qt-science_center_objects=0#qt-science_center_objects
van Elsas, J. D., Semenov, A. V., Costa, R., & Trevors, J. T. (2011). Survival of Escherichia coli in the environment: Fundamental and public health aspects. The ISME Journal, 5(2), 173–183. https://doi.org/10.1038/ismej.2010.80
Vermont Emergency Management. (2018). 2018 Vermont State Hazard Mitigation Plan: Making Vermont safer and more resilient in the face of climate change and natural disasters. https://vem.vermont.gov/sites/demhs/files/documents/2018%20Vermont%20State%20Hazard%20Mitigation%20Plan%20-%20Final%20Adopted_Interactive.pdf
VPIC. (2012). Green Infrastructure (Vermont Land Use Education & Training Collaborative). https://vtcommunityforestry.org/sites/default/files/pictures/Resource/greeninfrastructure.pdf
VT Agency of Agriculture, Food and Markets. (2013, February). Eastern equine encephalitis virus in Vermont: Update for the Vermont legislature. https://legislature.vermont.gov/Documents/2014/WorkGroups/Senate%20Health%20and%20Welfare/Eastern%20Equine%20Encephalitis/W~Harry%20Chen~Eastern%20Equine%20Encephalitis%20Virus%20in%20Vermont~2-28-2013.pdf
VT Agency of Agriculture, Food and Markets. (2017). 2017 Mosquito Surveillance Report (p. 9). Vermont Agency of Agriculture, Food & Markets. https://agriculture.vermont.gov/sites/agriculture/files/documents/PHARM/MosquitoTick/2017%20Mosquito%20Report.pdf
Human Health Vermont Climate Assessment, 2021 414
VT Agency of Agriculture, Food and Markets. (2018). 2018 Mosquito Surveillance Report (p. 9). VT Agency of Agriculture, Food and Markets. https://agriculture.vermont.gov/sites/agriculture/files/documents/PHARM/MosquitoTick/photos/2018%20Mosquito%20Report.pdf
VT Agency of Agriculture, Food and Markets. (2019a). 2019 Mosquito Surveillance Report (p. 7). VT Agency of Agriculture, Food and Markets. https://agriculture.vermont.gov/sites/agriculture/files/documents/PHARM/MosquitoTick/2019%20Mosquito%20Surveillance%20Report_Revised121319.pdf
VT Agency of Agriculture, Food and Markets. (2019b). State of Vermont Arbovirus Surveillance and Response Plan (p. 20). Agency of Agriculture, Food & Markets, Department of Health. https://www.healthvermont.gov/sites/default/files/documents/pdf/HS_ID_VT_Arbovirus_%20Plan_2017.pdf
VT Agency of Agriculture, Food and Markets. (2020). 2020 Vermont Mosquito Surveillance Report (p. 7). VT Agency of Agriculture, Food and Markets. https://agriculture.vermont.gov/sites/agriculture/files/documents/PHARM/MosquitoTick/2020%20Vermont%20Mosquito%20Surveillance%20Report_Revised120820.pdf
VT Agency of Agriculture, Food and Markets. (2021a). Annual Mosquito Reports. Annual Mosquito Reports. https://agriculture.vermont.gov/public-health-agricultural-resource-management-division/plant-health-and-pest-management-2
VT Agency of Agriculture, Food and Markets. (2021b). Ticks. Public Health & Agricultural Resource Management. https://agriculture.vermont.gov/public-health-agricultural-resource-management-division/plant-health-and-pest-management/ticks
VT ANR. (2021). What Changes are Occurring? | Climate Change in Vermont. https://climatechange.vermont.gov/content/what-changes-are-occurring
VT DEC. (2010). Vermont low impact development guide for residential and small sites (p. 54). State of Vermont Department of Environmental Conservation. https://dec.vermont.gov/sites/dec/files/wsm/stormwater/docs/Resources/sw_LID%20Guide.pdf
VT DEC. (2014). Mercury in fish advisory card (p. 2). VT DEC. https://dec.vermont.gov/sites/dec/files/wmp/SolidWaste/Documents/fishadvisorycard.pdf
VT DEC. (2018). 2018 303(d) List of impaired waters (p. 59). State of Vermont Department of Environmental Conservation. https://www.epa.gov/sites/default/files/2019-02/documents/2018-vt-303d-list-report.pdf
VT DEC. (2021a). Air Pollutants and Health. https://dec.vermont.gov/air-quality/pollutants-health
VT DEC. (2021b). Green Infrastructure. Water Solutions. https://dec.vermont.gov/water-investment/cwi/solutions/developed-lands/green-infrastructure
VT DEC. (2021c). Mercury and Other Persistent Pollutants. Watershed Management. https://dec.vermont.gov/watershed/lakes-ponds/learn/mercury
Human Health Vermont Climate Assessment, 2021 415
VT DEC. (2021d). Mercury in Fish. Waste Management and Prevention. https://dec.vermont.gov/waste-management/solid/product-stewardship/mercury/fish
VT DEC. (2021e). Stormwater Impaired Waters. Watershed Management. https://dec.vermont.gov/watershed/stormwater/impaired-waters
VT DEC. (2021f). Vermont Cyanobacteria (Blue-Green Algae) Tracker. https://ahs-vt.maps.arcgis.com/apps/webappviewer/index.html?id=a46d42c05e864a198ab5dc152f9d09b9
VT DEC. (2021g). What You Can Do. Air Quality & Climate. https://dec.vermont.gov/air-quality/what-you-can-do
VT Dept. Health. (2015). Social Vulnerability Index: A User’s Guide (p. 4). State of Vermont, Dept. of Health. https://www.healthvermont.gov/sites/default/files/documents/2016/12/ENV_EPHT_SocialVulnerabilityIndex.pdf
VT Dept. Health. (2016a). Heat Vulnerability in Vermont (Environmental Health, p. 44). VT Dept. of Health. https://www.healthvermont.gov/sites/default/files/documents/2016/12/ENV_EPHT_heat_vulnerability_in_VT_0.pdf
VT Dept. Health. (2016b). The disparate burden of asthma among the Medicaid insured in Vermont—2016 (p. 4). VT Dept. of Health. https://www.healthvermont.gov/sites/default/files/documents/2016/12/data_brief_asthma_medicaid.pdf
VT Dept. Health. (2016c). Vermont Heat Vulnerability Index (p. 2). https://www.healthvermont.gov/sites/default/files/documents/2016/12/ENV_EPHT_heat_vulnerability_index.pdf
VT Dept. Health. (2016d, July 18). Climate Change and Waterborne and Foodborne Diseases. Vermont Department of Health. https://www.healthvermont.gov/health-environment/climate-health/water-foodborne-diseases
VT Dept. Health. (2017a). Climate Change and Health in Vermont (Climate Change Adaptation White Paper Series, p. 26). VT Dept. of Health and Agency of Natural Resources. https://www.healthvermont.gov/sites/default/files/documents/pdf/ENV_CH_WhitePaper.pdf
VT Dept. Health. (2017b). Wood heat and indoor air quality (p. 2). VT Dept. of Health. https://www.healthvermont.gov/sites/default/files/documents/pdf/ENV_CH_WoodHeat%26IndoorAirQuality.pdf
VT Dept. Health. (2018a). Climate Change and Mental Health. Vermont Department of Health. https://www.healthvermont.gov/health-environment/climate-health/mental-health
VT Dept. Health. (2018b). Private drinking water: A user’s guide (p. 2) [Environmental Health Spotlight]. VT Dept. of Health, Environmental and Public Health Tracking. https://www.healthvermont.gov/sites/default/files/documents/pdf/ENV_EPHT_PrivateDrinkingWaterSpotlight.pdf
VT Dept. Health. (2018c). Vermont Tickborne Disease Program (2018 Report; p. 7). VT Dept. of Health.
Human Health Vermont Climate Assessment, 2021 416
https://www.healthvermont.gov/sites/default/files/documents/pdf/HS-ID-2018-Tickborne-Disease-Annual-Report.pdf
VT Dept. Health. (2018d). Weatherization + Health: Health and climate change co-benefits of home weatherization in Vermont (p. 47). VT Dept. of Health, Climate & Health Program. https://www.healthvermont.gov/sites/default/files/documents/pdf/ENV_CH_WxHealthReport.pdf
VT Dept. Health. (2018e, December 24). Climate Change and Cyanobacteria (Blue-Green Algae). Climate & Health. https://www.healthvermont.gov/health-environment/climate-health/cyanobacteria
VT Dept. Health. (2018f, December 24). Climate Change and Mosquito-Borne Diseases. Climate & Health. https://www.healthvermont.gov/health-environment/climate-health/mosquito-borne-diseases
VT Dept. Health. (2018g, December 24). Climate Change and Pollen, Mold and Air Quality. Climate & Health. https://www.healthvermont.gov/health-environment/climate-health/pollen-and-air-quality
VT Dept. Health. (2019a). Eastern Equine Encephalitis. Mosquito-Borne Diseases. https://www.healthvermont.gov/disease-control/mosquito-borne-diseases/eastern-equine-encephalitis
VT Dept. Health. (2019b). Emergency Department Visits Related to Heat Stress Dataset on the Vermont Tracking Public Portal 2003-2016 (Dataset EPHTN Metadata Record ID: VT6; VT Environmental Health Tracking Program). VT Dept. of Health. https://apps.health.vermont.gov/ias/querytool?Topic=EPHT
VT Dept. Health. (2019c). Lyme Disease. Vermont Department of Health. https://www.healthvermont.gov/disease-control/tickborne-diseases/lyme-disease
VT Dept. Health. (2019d). West Nile Virus. Disease Control: Mosquito Borne Diseases. https://www.healthvermont.gov/disease-control/mosquito-borne-diseases/west-nile-virus
VT Dept. Health. (2019e, April 2). Tracking air quality in Vermont. Vermont Department of Health. https://www.healthvermont.gov/tracking/air-quality
VT Dept. Health. (2019f, August 8). Respiratory Disease Scorecard. Vermont Department of Health- How Are We Doing? Performance Scorecards. https://www.healthvermont.gov/scorecard-respiratory-disease
VT Dept. Health. (2019g, December 18). Asthma surveillance in Vermont. Health Statistics & Vital Records. https://www.healthvermont.gov/health-statistics-vital-records/surveillance-reporting-topic/asthma
VT Dept. Health. (2020, January 22). Legionnaires’ Disease. Vermont Department of Health. https://www.healthvermont.gov/immunizations-infectious-disease/other-reportable-diseases/legionnaires-disease
VT Dept. Health. (2021a). Community Cooling Center Guidance (p. 2). VT Dept. of Health. https://www.healthvermont.gov/sites/default/files/documents/pdf/ENV-CH-community-cooling-center-guidance.pdf
VT Dept. Health. (2021b). Healthy Homes. Health & the Environment.
Human Health Vermont Climate Assessment, 2021 417
https://www.healthvermont.gov/environment/home
VT Dept. Health. (2021c). Hot weather and health impacts. Climate & Health. https://www.healthvermont.gov/health-environment/climate-health/hot-weather
VT Dept. Health. (2021d). Tracking air quality in Vermont (Data Explorer). State of Vermont, Dept. of Health. https://apps.health.vermont.gov/ias/querytool?Topic=EPHT&Theme1=Air
VT Dept. Health. (2021e, February 18). Winter Weather. Climate & Health. https://www.healthvermont.gov/environment/climate/winter-weather
VT Dept. Housing and Community Development. (2015). Vermont Economic Resiliency Initiative (p. 728). VT Agency of Commerce & Community Development, Dept. of Housing and Community Development. https://accd.vermont.gov/sites/accdnew/files/documents/CD/CPR/CPR-VERI-FinalReport.pdf
VT Dept. Public Service. (2021). Total Energy Study. Energy Resources. https://publicservice.vermont.gov/publications-resources/publications/total_energy_study
VT Emergency Management. (2018). 2018 Vermont State Hazard Mitigation Plan. https://vem.vermont.gov/sites/demhs/files/documents/2018%20Vermont%20State%20Hazard%20Mitigation%20Plan%20-%20Final%20Adopted_Interactive.pdf
VT UCF. (2021). Tree Canopy Assessments. Vermont Urban and Community Forestry Inventories and Management Plans. https://vtcommunityforestry.org/resources/inventories-management-plans/tree-canopy-assessments
VTLyme.org. (2018). Symptoms of different tick-borne diseases in Vermont (p. 2). VT Lyme. https://vtlyme.org/wp-content/uploads/2018/03/Printable-Symptoms-of-Different-Tick-borne-diseases-in-Vermont.pdf
Wang, Z., Wu, X., Dai, W., Kaminga, A. C., Wu, X., Pan, X., Liu, Z., Wen, S., Hu, S., & Liu, A. (2019). The Prevalence of Posttraumatic Stress Disorder Among Survivors After a Typhoon or Hurricane: A Systematic Review and Meta-Analysis. Disaster Medicine and Public Health Preparedness, 13(5–6), 1065–1073. https://doi.org/10.1017/dmp.2019.26
WHO. (2016). Ambient air pollution: A global assessment of exposure and burden of disease (p. 121). United Nations World Health Organization. https://apps.who.int/iris/handle/10665/250141
xmACIS. (2021, January 24). Applied Climate Information System NOAA Regional Climate Centers. http://xmacis.rcc-acis.org/
Community Development Vermont Climate Assessment, 2021 418
9 community development
Recommended Citation for Chapter Raub, K., Bose, P., 2021. Community Development. In Galford, G.L., Faulkner, J. et al. (Eds), The Vermont Climate Assessment 2021. Burlington, Vermont: Gund Institute for Environment at the University of Vermont. On the web: https://vtclimate.org
Kristin B. Raub Department of Homeland Security Flood Apex Post-Doc, Consortium of Universities for the Advancement of Hydrologic Science Inc. (CUAHSI); Affiliate, Rubenstein School of Environment and Natural Resources, University of Vermont
Pablo S. Bose Contributing author to the Climate Migration section; Department of Geography, Gund Institute for Environment, University of Vermont
Community Development Vermont Climate Assessment, 2021 419
9.1 key messages
1. Flooding is the most likely natural disaster to occur in Vermont and should be
accounted for in all community development and planning efforts in the state; however,
extremes will become more common, so community development and planning efforts
should also account for chronic hazards, such as drought.
2. Systems interconnections are essential to consider in community development and
planning of future climate change scenarios, particularly in the context of disasters.
3. Vermont is expected to continue to have a favorable climate under future climate
change projections, however, there is very little information to predict if the state will
face an influx of climate migration.
4. Engaging in planning is essential for Vermont communities to access federal funding
and to prepare for current and future climate change impacts, including population
growth, flooding, and droughts.
5. Climate change will not impact all communities equally; the needs and capacity of
vulnerable populations should be considered with all community planning efforts.
9.2 introduction
Vermont encompasses 9,216.66 square miles (U.S. Census Bureau, 2010), has a population of
623,989 (U.S. Census Bureau, 2019), and is known for natural beauty and rural character.
Vermont is composed of 251 cities, towns, and villages. Like in much of New England, local
government occurs at the town level, not the county level, and many of the elected officials
serve in a voluntary capacity (Paul & Milman, 2017). Over the years, the state has designed
many efforts to combat development pressures, such as from an influx of second home
buyers that threatened farmland and open space (DeWeese-Boyd, 2005).
This chapter applies a resilience thinking lens to community development (Table 9-1). At its
core, community development can be thought of as the participatory processes and decision-
making needed to make progress in a community. Or, as defined by Lotz (1971, p. 315),
Community Development Vermont Climate Assessment, 2021 420
“community development is a general name to define the complex processes of socio-
economic development and change.” Resilience thinking views communities as social-
ecological systems (e.g., human communities are heavily interlinked with the natural
environment) that, when faced with a disturbance (in this case, climate change and
subsequent disasters), will either persist, adapt, or transform (Folke et al., 2010). Additionally,
resilience thinking views social-ecological systems (i.e., communities) in terms of complexity
theory, which emphasizes cross-scale interactions and integrated systems (Folke, 2006). By
applying a resilience thinking lens to community development in the context of climate
change, this chapter seeks to understand the likely ways climate change will cause
disturbances in communities; to identify efforts the state of Vermont and its communities can
undertake to persist, adapt, and/or transform; and to utilize community development
strategies that form a holistic perspective to break down systemic silos.
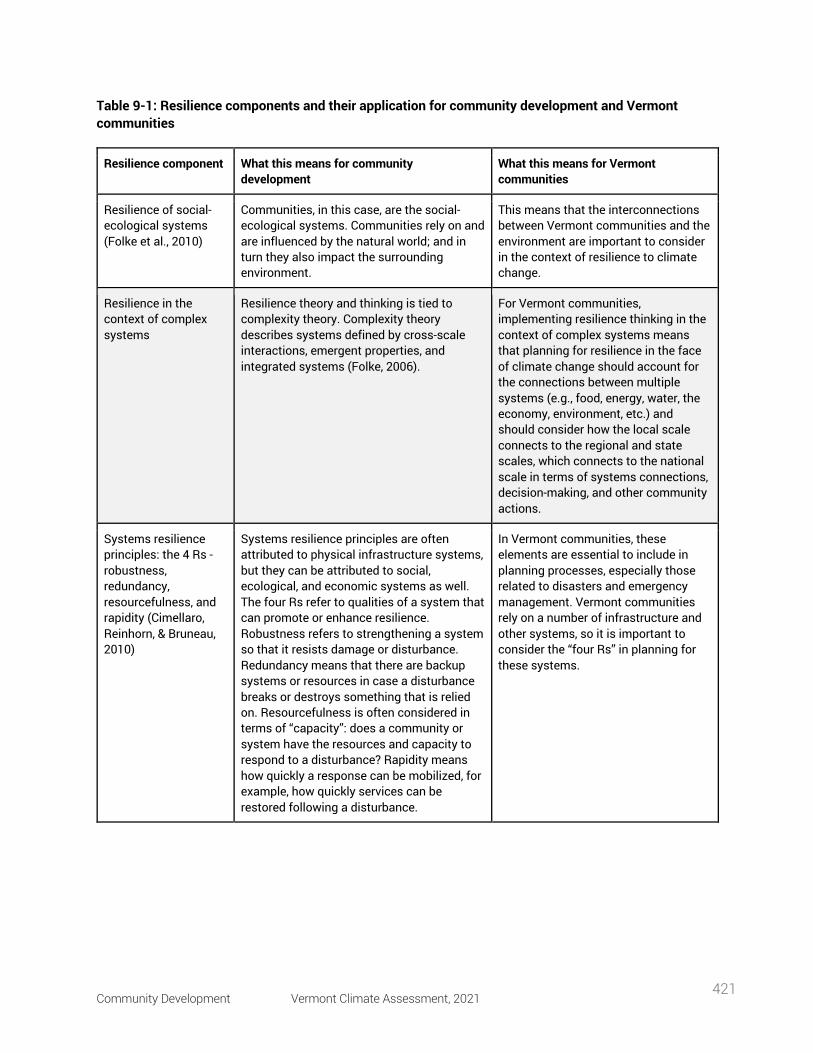
Community Development Vermont Climate Assessment, 2021 421
Table 9-1: Resilience components and their application for community development and Vermont communities
Resilience component What this means for community development
What this means for Vermont communities
Resilience of social-ecological systems (Folke et al., 2010)
Communities, in this case, are the social-ecological systems. Communities rely on and are influenced by the natural world; and in turn they also impact the surrounding environment.
This means that the interconnections between Vermont communities and the environment are important to consider in the context of resilience to climate change.
Resilience in the context of complex systems
Resilience theory and thinking is tied to complexity theory. Complexity theory describes systems defined by cross-scale interactions, emergent properties, and integrated systems (Folke, 2006).
For Vermont communities, implementing resilience thinking in the context of complex systems means that planning for resilience in the face of climate change should account for the connections between multiple systems (e.g., food, energy, water, the economy, environment, etc.) and should consider how the local scale connects to the regional and state scales, which connects to the national scale in terms of systems connections, decision-making, and other community actions.
Systems resilience principles: the 4 Rs - robustness, redundancy, resourcefulness, and rapidity (Cimellaro, Reinhorn, & Bruneau, 2010)
Systems resilience principles are often attributed to physical infrastructure systems, but they can be attributed to social, ecological, and economic systems as well. The four Rs refer to qualities of a system that can promote or enhance resilience. Robustness refers to strengthening a system so that it resists damage or disturbance. Redundancy means that there are backup systems or resources in case a disturbance breaks or destroys something that is relied on. Resourcefulness is often considered in terms of “capacity”: does a community or system have the resources and capacity to respond to a disturbance? Rapidity means how quickly a response can be mobilized, for example, how quickly services can be restored following a disturbance.
In Vermont communities, these elements are essential to include in planning processes, especially those related to disasters and emergency management. Vermont communities rely on a number of infrastructure and other systems, so it is important to consider the “four Rs” in planning for these systems.
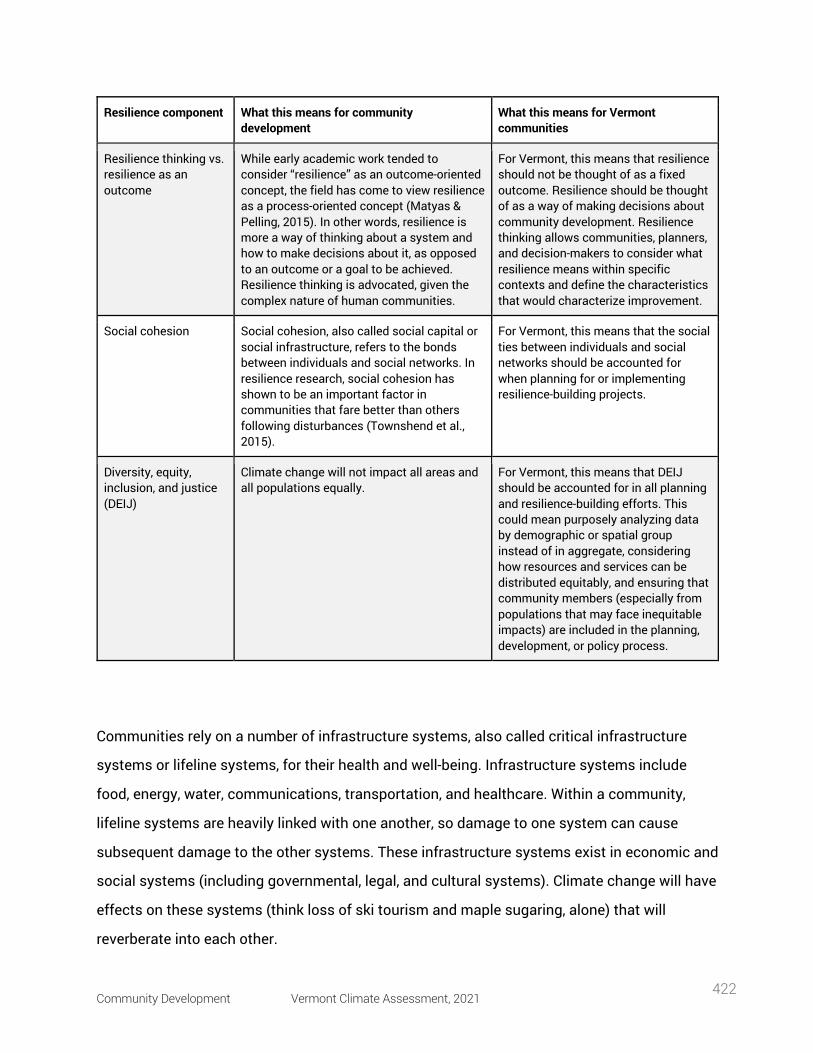
Community Development Vermont Climate Assessment, 2021 422
Resilience component What this means for community development
What this means for Vermont communities
Resilience thinking vs. resilience as an outcome
While early academic work tended to consider “resilience” as an outcome-oriented concept, the field has come to view resilience as a process-oriented concept (Matyas & Pelling, 2015). In other words, resilience is more a way of thinking about a system and how to make decisions about it, as opposed to an outcome or a goal to be achieved. Resilience thinking is advocated, given the complex nature of human communities.
For Vermont, this means that resilience should not be thought of as a fixed outcome. Resilience should be thought of as a way of making decisions about community development. Resilience thinking allows communities, planners, and decision-makers to consider what resilience means within specific contexts and define the characteristics that would characterize improvement.
Social cohesion Social cohesion, also called social capital or social infrastructure, refers to the bonds between individuals and social networks. In resilience research, social cohesion has shown to be an important factor in communities that fare better than others following disturbances (Townshend et al., 2015).
For Vermont, this means that the social ties between individuals and social networks should be accounted for when planning for or implementing resilience-building projects.
Diversity, equity, inclusion, and justice (DEIJ)
Climate change will not impact all areas and all populations equally.
For Vermont, this means that DEIJ should be accounted for in all planning and resilience-building efforts. This could mean purposely analyzing data by demographic or spatial group instead of in aggregate, considering how resources and services can be distributed equitably, and ensuring that community members (especially from populations that may face inequitable impacts) are included in the planning, development, or policy process.
Communities rely on a number of infrastructure systems, also called critical infrastructure
systems or lifeline systems, for their health and well-being. Infrastructure systems include
food, energy, water, communications, transportation, and healthcare. Within a community,
lifeline systems are heavily linked with one another, so damage to one system can cause
subsequent damage to the other systems. These infrastructure systems exist in economic and
social systems (including governmental, legal, and cultural systems). Climate change will have
effects on these systems (think loss of ski tourism and maple sugaring, alone) that will
reverberate into each other.
Community Development Vermont Climate Assessment, 2021 423
This chapter will explore how climate change is already, or likely to, impact Vermont
communities and the interconnected systems upon which they rely. The other chapters within
this Vermont Climate Assessment provide in-depth coverage of the impact climate change will
have on individual systems and sectors. This chapter builds from the material covered in the
other chapters, so the reader is encouraged to peruse those chapters for more information on
individual systems.
This chapter will first detail the climate change impacts that are most relevant to Vermont in
the context of community development and present some adaptation and mitigation
strategies for each. Next is a discussion of how climate change is likely to impact the “lifeline”
systems that Vermont communities rely on so that community or regional planners can take
into consideration these systems interconnections when making development decisions.
Finally, this chapter details community- and state-level planning efforts in progress and
provides examples of other efforts being undertaken in various cities in the United States that
Vermont could consider.
9.3 climate change impacts relevant to community development
Key steps to increase resilience, especially resilience as applied to community planning, are to
identify likely future scenarios and threats and then ensure that there is a plan in place to both
mitigate the effects of those scenarios and recover from events quickly. In that vein, this
section will summarize a few likely threats that Vermont should account for in planning
efforts: disaster declarations, flood events, droughts, and potential impacts from climate
migration. This is not an exhaustive list.
9.3.1 Disaster Declarations Disasters in Vermont previously declared by the Federal Emergency Management Agency
(FEMA) indicate which kinds of hazards Vermont should account for in community
development decisions and planning efforts (Table 9-2).
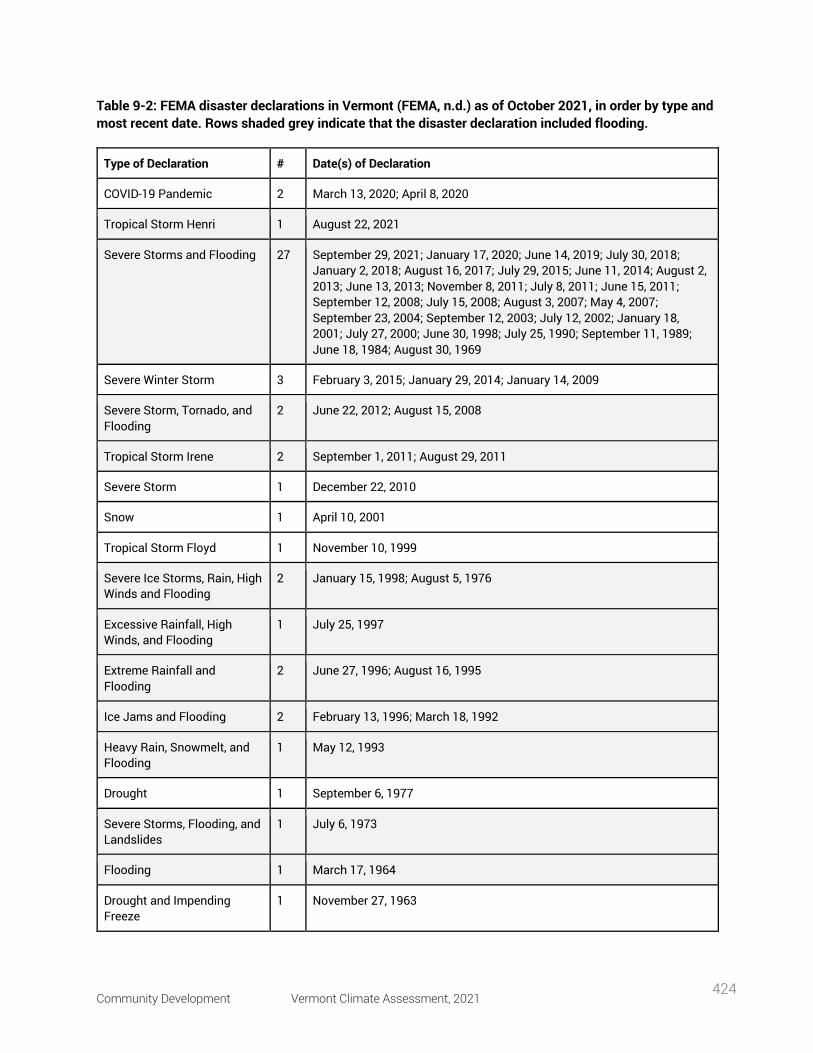
Community Development Vermont Climate Assessment, 2021 424
Table 9-2: FEMA disaster declarations in Vermont (FEMA, n.d.) as of October 2021, in order by type and most recent date. Rows shaded grey indicate that the disaster declaration included flooding.
Type of Declaration # Date(s) of Declaration
COVID-19 Pandemic 2 March 13, 2020; April 8, 2020
Tropical Storm Henri 1 August 22, 2021
Severe Storms and Flooding 27 September 29, 2021; January 17, 2020; June 14, 2019; July 30, 2018; January 2, 2018; August 16, 2017; July 29, 2015; June 11, 2014; August 2, 2013; June 13, 2013; November 8, 2011; July 8, 2011; June 15, 2011; September 12, 2008; July 15, 2008; August 3, 2007; May 4, 2007; September 23, 2004; September 12, 2003; July 12, 2002; January 18, 2001; July 27, 2000; June 30, 1998; July 25, 1990; September 11, 1989; June 18, 1984; August 30, 1969
Severe Winter Storm 3 February 3, 2015; January 29, 2014; January 14, 2009
Severe Storm, Tornado, and Flooding
2 June 22, 2012; August 15, 2008
Tropical Storm Irene 2 September 1, 2011; August 29, 2011
Severe Storm 1 December 22, 2010
Snow 1 April 10, 2001
Tropical Storm Floyd 1 November 10, 1999
Severe Ice Storms, Rain, High Winds and Flooding
2 January 15, 1998; August 5, 1976
Excessive Rainfall, High Winds, and Flooding
1 July 25, 1997
Extreme Rainfall and Flooding
2 June 27, 1996; August 16, 1995
Ice Jams and Flooding 2 February 13, 1996; March 18, 1992
Heavy Rain, Snowmelt, and Flooding
1 May 12, 1993
Drought 1 September 6, 1977
Severe Storms, Flooding, and Landslides
1 July 6, 1973
Flooding 1 March 17, 1964
Drought and Impending Freeze
1 November 27, 1963
Community Development Vermont Climate Assessment, 2021 425
As shown in Table 9-2, forty-two of the fifty-two FEMA disaster declarations since 1963 have
included flooding. Nine of the fifty declarations have been related to winter storms, snow, or
ice storms and two of the fifty were for drought. Based on this history, it is clear that people
involved in community development, especially planners, should include severe storms and
flooding in all future scenarios and planning efforts. More prolonged dry spells and drought are
expected in coming decades, so they should also be considered in planning and community
development (see the Climate Change in Vermont chapter and Water Resources chapter).
9.3.2 Flooding As exemplified by Tropical Storm Irene and the majority of disaster declarations since 1963,
Vermont has a history of flooding, and climate change is projected to increase the frequency
and severity of flood events in the state. The Water Resources chapter and Climate Change in
Vermont chapter discuss the causes and impacts of flooding across the state of Vermont.
This section will focus on flooding in the context of human communities: what has been done
and can be done to reduce the impacts of flooding on Vermonters and their communities.
9.3.2.1 Flood Mitigation Strategies
Since Vermont has already experienced flooding and is projected to face increased threats of
flooding in the future, this section describes some strategies to build resilience to flooding.
The “International Lake Champlain-Richelieu River Study Board” is conducting a study to better
understand the “the causes, impacts, risks and potential solutions to flooding in the basin”
(International Joint Commission, 2020). A summary report (International Lake Champlain-
Richelieu River Study Board, n.d.) and full report (International Lake Champlain-Richelieu River
Study Board, 2019) are available. The report cites natural geographical and meteorological
factors that affect flooding (e.g., physical geography, changes in weather patterns, the
baseline lake level, and vegetation within the Richelieu River), but it also cites anthropogenic
changes. These anthropogenic changes include population growth and land use changes
(such as development in the floodplain, wetlands loss, and impervious surfaces), channel
alterations and instream construction, and flood storage reservoirs (International Lake
Champlain-Richelieu River Study Board, 2019). These anthropogenic factors mean that
Community Development Vermont Climate Assessment, 2021 426
community development and planning decisions can affect future flood impacts, and therefore
development decisions should be carefully considered.
A key flood mitigation resource in the state and to environmental justice, Flood Ready Vermont
(State of Vermont, 2021g) is a resource to support community planning. It provides
information on flood impacts to the state, strategies to mitigate flood risk and impacts, and
planning resources. Importantly, it notes that flood impacts are not shared equally among
Vermont residents. For example, Tropical Storm Irene and the spring flooding of 2011
destroyed 154 mobile homes in parks in Vermont, and 12% of mobile home parks in the state
are located in floodplains (Baker et al., 2014).
Flood mitigation resources and strategies are described below.
• Community Rating System: Currently, seven Vermont communities are receiving
discounts on their National Flood Insurance Program (NFIP) premiums through their
communities’ participation in the Community Rating System (CRS) (FEMA, 2019). CRS
is a program through which communities receive increasing discounts in flood
insurance premiums by demonstrating how they have undertaken certain flood risk
reduction actions. These actions range from education and outreach through posting
information at risk areas to participating in buyout programs to remove properties from
the floodplain. As this program can be complicated, a Community Rating System Green
Guide was released in 2017 to aid communities in undertaking some of the more
environmentally friendly actions (Association of State Floodplain Managers, 2021).
• Emergency Relief and Assistance Fund (ERAF): ERAF provides state funding as a
match for federal funding received after federally declared disasters (State of Vermont,
2021c). Through ERAF, the state will pay additional amounts if the damage occurs
when a community has taken certain protective or preventative actions. The Lake
Champlain Sea Grant has summarized these actions through Watershed Scorecards,
such as for the Lamoille, Missisquoi, and Winooski Watersheds (Lake Champlain Sea
Community Development Vermont Climate Assessment, 2021 427
Grant, 2021). Additionally, participation in the Community Rating System can help
communities qualify for ERAF.
• Buy-outs and Encroachment Removal: Buyouts and encroachment removal refer to
when the state or federal government purchase properties in a floodplain (often
repetitive loss properties) and remove the structures from the floodplain. Buyouts and
open space preservation are actions specified to increase a community’s rating within
the Community Rating System. In Vermont, buying out homes in vulnerable areas as a
flood mitigation strategy began after the flooding from Tropical Storm Irene (Davis,
2017). Vermont is pursuing the buyout of 130 residences with funding through the
FEMA Hazard Mitigation Grant Program with a Housing and Urban Development
Community Development Block Grant match portion (State of Vermont, 2021f).
• Flood-proofing and Elevating: Another flood mitigation strategy is to flood-proof and
elevate structures, such as through elevating the bottom floor of the structure,
elevating utilities (e.g., electricity), switching from a basement to an above-grade crawl
space, and providing vents so that flood water can enter and exit a space freely (State
of Vermont, 2021b).
• Floodplain, Wetland, and River Corridor Restoration: A key flood mitigation strategy is
to preserve and restore floodplains and river corridors. These ecosystems can buffer
communities from negative flood and other climate change impacts. A study of the
Otter Creek wetlands and floodplains in Middlebury, Vermont estimated that upstream
flood mitigation by wetlands and floodplains would provide damage reductions of 84–
95% during Tropical Storm Irene and 54–78% in reductions averaged across ten other
flood events (Watson et al., 2016). In a study of the Lake Champlain-Richelieu River
Watershed, wetlands were shown to be an important part of the watershed, and the
study recommended they be maintained as storage areas in the upper parts of the
watershed (Rousseau, 2020).
Community Development Vermont Climate Assessment, 2021 428
• Planning and Funding: Vermont and Vermont communities are engaging in many
planning efforts and have leveraged federal funding sources. These will be described
below in the section “Vermont Planning in the Face of Climate Change.”
9.3.2.2 Stormwater Management via Green Stormwater Infrastructure
Another flood mitigation strategy is to improve the stormwater management system.
Stormwater management refers to the systems that deal with water from rainfall, flooding, and
other water-related events to reduce potential damages from increased water levels. Green
infrastructure (GI) is a type of stormwater management and flood mitigation strategy that
involves the use of environmentally friendly or natural materials (e.g., green roofs, rain
gardens, bioswales). GI has been used in Vermont’s urban areas long before state and United
States Environmental Protection Agency (EPA) stormwater standards were made available. In
Vermont, the 2017 Vermont Stormwater Management Manual Rule and Design Guidance
added green infrastructure strategies into the design requirements for certain projects
(Vermont Agency of Natural Resources, 2017) and the state supports a GI manual for
homeowners (Vermont DEC, 2018b). The Green Infrastructure Collaborative is a partnership
between the Lake Champlain Sea Grant and the Vermont Department of Environmental
Conservation that promotes GI practices in Vermont. The state strongly supports GI, as
evidenced by this explanation: “Humans rely on GI for a variety of ecological goods and
services, such as clean water and air, carbon sequestration, flood control, and climate change
mitigation. GI can also increase property values, enhance tourism and recreational
opportunities, create jobs, and improve human health and well-being” (State of Vermont,
2021d). Nature-based solutions for stormwater management also utilize wetlands and forests
to retain water during extreme water highs and lows. Groups like The Nature Conservancy
Vermont protect land and thus provide these nature-based solutions. Other groups working on
nature-based solutions for water management (e.g., riparian tree planting) include the new
Watershed Forestry Program with Lake Champlain Sea Grant, the Natural Resource
Conservation Service, the Intervale, multiple local watershed groups, and American Forests.
Several United States cities have resilience plans that deploy green infrastructure. These plans
can serve as examples for Vermont communities seeking to integrate GI into their flood
Community Development Vermont Climate Assessment, 2021 429
mitigation and stormwater management strategies. Following are strategies communities
have used to increase GI.
• Integration into Street/transportation Projects: Recognizing the ability of GI to create
multiple benefits, especially as compared to traditional stormwater management
techniques, some cities are targeting GI implementation in conjunction with street
improvement projects (e.g., City of Berkeley, 2016, p. 34).
• Demonstration Projects: Demonstration projects can raise public awareness and
garner public support for GI implementation (e.g., City of New Orleans, 2015, p. 39).
• Green Infrastructure and Stormwater Management Plans: Several United States cities
have developed plans dedicated to implementing GI and stormwater management (e.g.,
Oakland, CA has both a GI plan and a stormwater management plan) (City of Oakland,
2016).
• Dedicated Funding to Green Infrastructure: Cities have dedicated funding sources for
the implementation of GI projects (e.g., Honolulu, HI has a stormwater enterprise fund)
(City and County of Honolulu, 2019).
• Education and Outreach: Lake Champlain Sea Grant has a stormwater management
curriculum (GI focus) for middle and high school students and builds capacity for
teachers to teach the topic (accessible online at go.uvm.edu/stormwatered)
(Stepenuck & Eaton, 2020).
• GI Certification Programs: There is a national GI certification program that could be
adopted in Vermont (EnviroCert International, Inc., 2021). Lake Champlain Sea Grant is
considering a state certification program that would include GI maintenance, such as
has been done in New Hampshire at the Stormwater Center (University of New
Hampshire, 2021).
It is worth noting that many GI projects or programs are suited to municipal activities. While
some GI projects can be implemented by businesses or residences (e.g., green roofs, rain
Community Development Vermont Climate Assessment, 2021 430
gardens), the materials or installation may be cost-prohibitive (e.g., renting a backhoe for rain
garden development) and therefore more limited in scope without wider programming or
support.
9.3.3 Drought While drought was only declared as a FEMA disaster twice in the past fifty-five years, Vermont
will experience greater variability in water-related extremes: an increase in overall precipitation
yet more frequent dry-spells and drought. More information on how climate change may
increase droughts in Vermont is found in the Extreme Events section of the Climate Change in
Vermont chapter. In the context of community development, it is important to consider the
variability in precipitation that the state will experience. The state is projected to have an
overall increase in the amount of annual precipitation and experience periods of drought. This
variable presents planning challenges for communities.
Droughts can impact Vermont communities in terms of agricultural production, water supply,
impacts to forestry and wildlife, and ultimately, human health. As stated in the Water Stress
section of the Agriculture and Food Systems chapter, drought conditions in Vermont will
become more variable and directly impact growing seasons. For example, the state
experienced droughts for much of the 2016, 2018, and 2020 growing seasons, and as of May
2021, 75% of the state is in moderate drought (NOAA & National Integrated Drought
Information System, n.d.). In 2020, farmers reported at least $27 million in crop losses from
the drought (McCallum & Picard, 2020).
Three out of ten Vermont households get their drinking water from private wells (Vermont
Department of Health, 2021a), and about 60% of Vermonters rely on groundwater for drinking
(VT DEC, 2018b). Drought can limit these households' access to water supply. Towns with
already limited water supply will be further stressed by drought conditions. Efficient water use
and water systems are increasingly necessary (see the Water Resources chapter). For
example, the company Fresh Water Haulers in Underhill has seen an increase in the number of
dry wells they have been asked to replenish. They reported, “I’ve seen this going on for about
Community Development Vermont Climate Assessment, 2021 431
six years now. Every year it gets a little drier” (McCallum & Picard, 2020).
On a brighter note, the stormwater management strategies listed above may be able to
decrease flooding and increase access to water during times of drought (McCallum & Picard,
2020). For more information, see the Water Supply section of the Water Resources chapter.
9.3.4 Climate Migration Climate change is a slow and steady process punctuated by severe events. Consequently,
people may decide to move to more favorable locations either slowly as long-term decisions or
quickly and in larger pulses in response to disasters. In Vermont, there are two kinds of
impacts of climate-induced changes and migration. The first are the direct results of climate
change – for example increased flooding or droughts that may leave certain parts of the state
less habitable than previously and lead to migration to other areas. The second are the more
indirect effects of a changing climate and potential in-migration from other regions both
nationally and internationally. Thus, while Vermont itself may not be exposed to certain risks,
other communities that find themselves vulnerable to climate change impacts like extreme
heat (Winkler & Rouleau, 2020) and coastal sea level rise (Hauer, 2017) may look for safer
options. Some scholars have speculated that populations in at-risk regions may consider
migrating to safer, less vulnerable areas (Hauer, 2017). Some climate projection maps indicate
that Vermont may remain a “favorable” location under future conditions (Shaw et al., 2020). An
example of climate migration is a family who “moved to Vermont last year from Richmond, Va.,
where they had a small farm with chickens and rabbits. [...] they had considered installing
solar panels on their property and going off the grid, but southern Virginia's increasingly hot
summers, combined with the bleak ecological prognosis, compelled them to go north instead.
[...] ‘We figured that people are going to be on the move in the decades to come, so we wanted
to move to a state that had already done some work as far as renewables are concerned,’ [the
family] said” (Edgar, 2021).
Such speculation has led to questions for policymakers, government officials, and local
communities about how and whether to plan for an influx of climate migrants. There is
Community Development Vermont Climate Assessment, 2021 432
currently no data to suggest that any such in-migration is on the immediate horizon. Indeed,
while Vermont has a long history of both labor migration and a robust refugee resettlement
program, both are relatively small in scale and concentrated in the northern parts of the state.
In fact, for well over a century, Vermont has grappled with an out-migration dynamic, especially
of youth, that state leaders have attempted to address (Bolduc & Kessel, 2015). The main
population growth centers in Vermont are primarily in Chittenden County and the metropolitan
area surrounding its main city of Burlington; it is here that the majority of both international
and national migrants to Vermont settle. Issues of transportation access, housing and
employment availability, and a lack of diversity in rural areas have contributed to these spatial
settlement patterns (Bose, 2014). Studies of resettled refugees, mainly from Bhutan, Bosnia,
Burma, Congo, Iraq, Somalia, Sudan, and Vietnam, within Chittenden County (where nearly all
have been placed) suggest that integration has been largely a success, with strong levels of
employment, home ownership, entrepreneurship, and educational outcomes (Bose, 2020).
Climate migration brings into question the agency of those moving to new locations; climate
migration can occur voluntarily and involuntarily. For example, Tacy, Hanson, and Poulin
(2020) conducted an assessment of climate migration in Vermont and concluded that the
largest group of people migrating to Vermont will likely be voluntary “amenity migrants” (e.g.,
white, wealthy, and making an intentional decision to move to the state). The next most
common groups likely to move to Vermont are those in search of work due to collapsed
industries and disaster migrants (i.e., those fleeing a disaster in another region) (Tacy, Hanson,
& Poulin, 2020). If climate migrants do come to Vermont, they are likely to settle in Chittenden
County and smaller towns with “amenity value” (Tacy, Hanson, & Poulin, 2020), continuing
trends seen during the in-migration patterns during the COVID-19 pandemic. Involuntary
climate migrants may be fleeing a disaster that destroyed homes and have no choice other
than to move. Involuntary migrants also may include refugees who may have had no choice
but to settle in Vermont. Considering the agency of migrants brings into question: just
because amenity migrants are most likely to move to Vermont, is this equitable? Should the
state consider programming and services to ensure that those most impacted by climate
change and climate change-induced disasters (both in-state and out of state) have the same
Community Development Vermont Climate Assessment, 2021 433
opportunity to move to more favorable climatic conditions?
One thing is clear when it comes to how climate migration will impact Vermont: there is a lot of
uncertainty, many questions remain, and there are many important avenues for future
research. Questions remain as to what kind of infrastructure and planning is needed to provide
appropriate support to potential climate migrants. for example, what kinds of support in terms
of housing and employment should be considered for migrants from other parts of the United
States? For international migrants, what language or cultural support might be available? What
kinds of capacities—numbers of in-migrants and available resources—should local
communities plan for? What kinds of community planning strategies (e.g., low-impact
development, smart growth strategies, changes to zoning and land use regulations) should be
in place to prevent amenity migrants from buying undeveloped land that could otherwise serve
flood mitigation or carbon sequestration services? Future research could investigate trends in
home sales following hurricanes, wildfires, or other climate change-related disasters to better
understand what kinds of migration pulses could be expected due to extreme events.
9.3.4.1 Migration Associated with COVID-19
Migration due to the COVID-19 pandemic could shed light on the potential impacts of climate-
induced migration. The pandemic spurred “urban flight,” in which residents of urban areas
moved to more suburban or rural areas with lower population densities and (perceived or
actual) lower rates of COVID-19 transmission. Vermont saw a 38% increase in residential
property sales to out-of-state buyers in 2020 (Figure 9-1), with over 1,000 more property sales
in 2020 than in 2019 (VCGI, 2021). Stowe had the highest number of out-of-state residential
property buyers in 2020, with $132,100,000 in sales (VCGI, 2021). Overall, sales were greatest
in southern Vermont, the Mad River Valley, and Lamoille and Chittenden counties (Petenko,
2021).
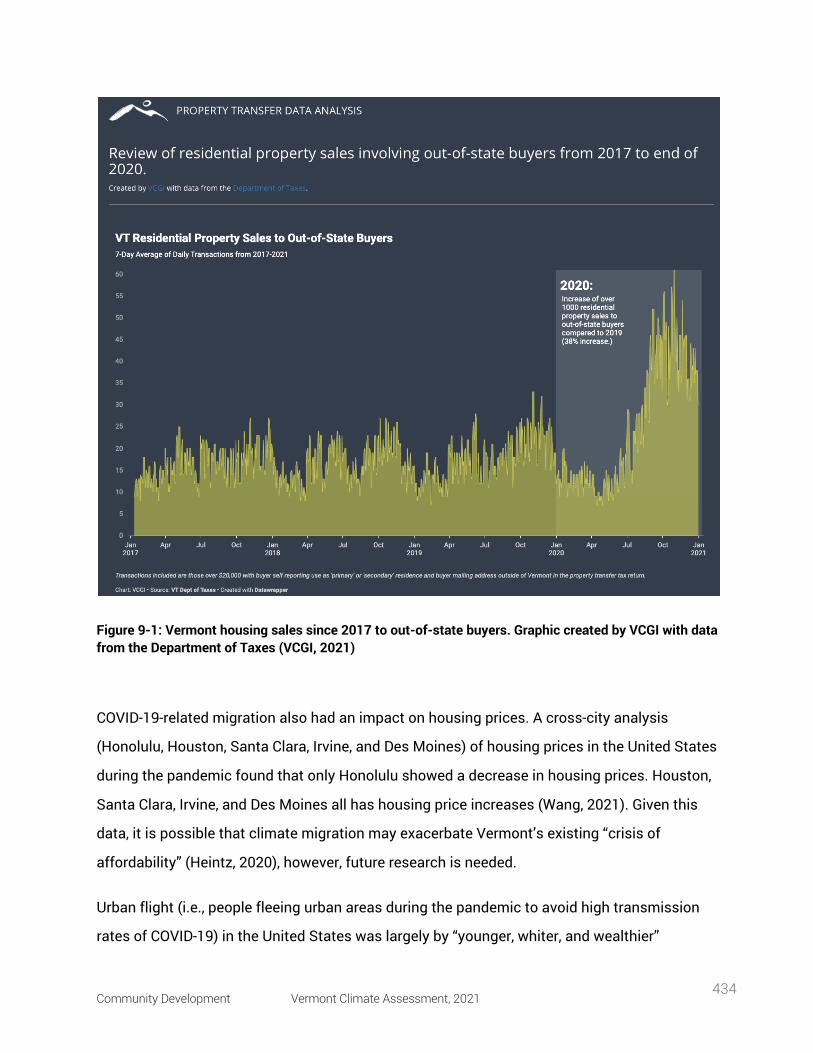
Community Development Vermont Climate Assessment, 2021 434
Figure 9-1: Vermont housing sales since 2017 to out-of-state buyers. Graphic created by VCGI with data from the Department of Taxes (VCGI, 2021)
COVID-19-related migration also had an impact on housing prices. A cross-city analysis
(Honolulu, Houston, Santa Clara, Irvine, and Des Moines) of housing prices in the United States
during the pandemic found that only Honolulu showed a decrease in housing prices. Houston,
Santa Clara, Irvine, and Des Moines all has housing price increases (Wang, 2021). Given this
data, it is possible that climate migration may exacerbate Vermont’s existing “crisis of
affordability” (Heintz, 2020), however, future research is needed.
Urban flight (i.e., people fleeing urban areas during the pandemic to avoid high transmission
rates of COVID-19) in the United States was largely by “younger, whiter, and wealthier”
Community Development Vermont Climate Assessment, 2021 435
populations fleeing to areas to which they were socially connected (e.g., sheltering with family
and friends or in second homes) (Coven et al., 2020, p. 1). Consequently, the regions receiving
pandemic-migrants were shown to have higher cases of COVID-19, which suggests that “urban
flight was a vector of disease spread” (Coven et al., 2020, p. 1).
Both the pandemic’s impact on housing prices and urban flight raise questions of equity about
who is able to purchase a home and who is able to move out of more at-risk areas. Both
questions are key to future planning surrounding climate change and climate migration. A
Vermont Public Radio interview described how Vermont has too few homes for sale and how
the uptick in home sales during the pandemic have led to affordability concerns (Wertlieb &
Smith, 2021). The interview reported that buyers who were “super strong financially” and “out-
of-state buyers who may be able to put more cash down, for example, than somebody who’s
[already living] in-state” were often winning bids (Wertlieb & Smith, 2021). Higher-income
populations were also more easily able to move out of less-desirable urban areas during the
pandemic, and as a result, communities of color, who often had less agency and ability pick up
and leave less-desirable circumstances, were impacted disproportionately by the pandemic
(Golestaneh et al., 2020).
Vermont could consider the COVID-19 pandemic a glimpse into future climate migration
events. Climate change does not often create brand-new challenges, it more often exacerbates
existing challenges and inequities. Many questions and uncertainties remain about how
climate migration will impact Vermont, so the pandemic could serve as a starting point for
planning and future research.
infrastructure systems and their interconnections in the context of climate change
Vermont communities rely on infrastructure systems for their well-being. These systems, also
called lifeline or critical infrastructure systems, are projected to be negatively impacted by
climate change. This section applies a nexus approach to community development in
Vermont. A nexus approach is a methodology in which systems’ interconnections are
Community Development Vermont Climate Assessment, 2021 436
intentionally accounted for or investigated in the context of any research or planning endeavor,
in this case, community development in the context of climate change. Applying a nexus
approach in the context of implementing climate change adaptation and resiliency planning is
important because the infrastructure systems on which communities rely do not operate in
isolation; they have many interdependencies. The key infrastructure systems to consider in the
context of community development and planning and climate change are water,
transportation, communications, energy, food, and healthcare infrastructure. The following
subsections highlight the key climate change impacts to each infrastructure system and the
interconnections between systems that are most relevant to the state of Vermont.
Other Vermont Climate Assessment chapters cover individual systems in greater depth; the
purpose here is to focus on aspects of the infrastructure systems relevant to community
development and planning and introduce key infrastructure interconnections. Please refer to
the Water Resources, Energy, Agriculture and Food Systems, and Human Health chapters for
more information. Additionally, resources on flood resilience and critical infrastructure are
available from the Department of Homeland Security (Department of Homeland Security, n.d.).
9.3.5 Water Infrastructure In Vermont, 30% of households obtain drinking water from private wells (Vermont Department
of Health, 2021a). Aside from newly dug wells, these water sources are not regulated by the
state of Vermont or EPA. According to the 2019 Vermont Infrastructure Report Card, the
state’s drinking water system received a score of C- (mediocre), the stormwater system
received a score of D+ (poor), the dams received a score of C (mediocre), and the wastewater
system received a score of D+ (poor) (ASCE, 2019).
Following are concrete examples of how water infrastructure is critical to other infrastructures
in the state.
• Water - Health: Water and water quality are essential for human health and well-being.
Disasters or flooding can disrupt the municipal water system, which can leave
communities without water or without safe drinking water. For example, after Tropical
Community Development Vermont Climate Assessment, 2021 437
Storm Irene, many Vermonters were concerned about whether the flood waters and
stormwater runoff had contaminated their well water. Neither the state nor EPA
regulate well water testing, so it is important for individuals to be proactive about
procuring testing (Vermont Department of Health, 2021a).
• Water - Energy: The energy system often requires water for hydropower generation or
geothermal ground source heating (Renewable Energy Vermont, 2021). Eighty-five
hydroelectric generation facilities currently operate in Vermont and on its borders
(State of Vermont, 2021e).
• Water - Economy: A recent study found that phosphorus reduction in Lake Champlain
would benefit the economy by increasing tourism and the value of real estate
(Gourevitch et al., 2021). At Missisquoi Bay, alone the study estimates that eliminating
phosphorus inputs would benefit tourism by $28.5 million and property sales by $11.2
million (Gourevitch et al., 2021).
• Water - Recreation: Harmful algal blooms, which thrive under the warmer temperatures
projected in Vermont under climate change, negatively impact lake tourism. As
discussed further in the Water Resources chapter, harmful algal blooms cause many
industries to shut down, and many tourist establishments cannot operate (e.g., an
increase in the number of beach closure days).
9.3.6 Transportation Infrastructure According to the 2019 Vermont Infrastructure Report Card, the state's bridges and roads each
received a score of C+, which equates to mediocre (ASCE, 2019). As of 2017, Vermont had
14,174 miles of local and state roadways, 806 miles of the National Highway System, 2,709
miles of the State Highway System, and 139 miles of Class 1 town highways (ASCE, 2019). The
damage from Tropical Storm Irene highlighted the vulnerabilities of the state’s transportation
system and inspired the Vermont Agency of Transportation (VTrans) to create the Vermont
Transportation Resilience Planning Tool (TRPT) in 2019 (Esri et al., 2019). The Vermont TRPT
seeks, “to improve the resilience of Vermont's highway network to floods and erosion by
Community Development Vermont Climate Assessment, 2021 438
providing data and tools to inform planning and investment decisions.” Instead of only trying
to recovery from damages as quickly as possible, the tool can be used to identify
vulnerabilities to proactively reduce or avoid damages in the future (Schliff et al., 2018, p. 1).
Following are examples of how other infrastructure systems depend on the transportation
infrastructure system.
• Transportation - Food: The food system relies on the transportation system to distribute
agriculture products and to resupply grocery stores, and the transportation system
limits access to food when severe snow storms or extreme weather events block roads,
and therefore access to food. Reflection of the deep connections between the food
system and the transportation system makes it clear that there is an urgent need to
examine supply chains in the context of climate change. Many cities and states rely on
national and global supply chains, which can be threatened by climate change (Heard
et al., 2017). As stated in the Vermont Agriculture and Food System Strategic Plan
2021–2030, “Bolstering short and reliable regional food supply chains will reduce our
exposure to global food system disruptions and meet the needs of our most vulnerable
communities” (Claro et al., 2021, p. 7). More information on the food system in Vermont
is available in the Agriculture and Food Systems chapter.
• Transportation - Health: Transportation infrastructure is linked to health in terms of the
improved air quality potential resulting from switching to electric vehicles (EVs) and
other alternative fuels to reduce emissions. Transportation is also critical to health in
terms of ensuring transportation along supply chains of pharmaceuticals and other
medical supplies and via access to healthcare facilities during a natural hazard or
disaster.
• Transportation - Energy: Blocked roads and damaged bridges following a disaster can
limit the ability of response teams to reach and repair downed power lines and other
energy system disruptions. A Seven Days article interviewed people in towns that had
been cut off from transportation and energy during Tropical Storm Irene. One person
Community Development Vermont Climate Assessment, 2021 439
reported, “‘Bath told me she was supposed to start student teaching on Monday, but
without electricity or a phone or a reliable way to get off the mountain, she's in a
holding pattern.’” And, “‘We're so cut off here. It could be a month before our electricity
comes back on. It could be three days,’ she said. ‘It's just totally overwhelming.’”(Ober,
2011a).
• Transportation - Economy: During disasters, particularly flood events, it is common for
roadways to become impassible due to damage or blocked by debris. Employees may
not be able to reach their workplaces due to transportation system disruptions, and
supply chains can also be disrupted. For example, Tropical Storm Irene damaged the
roads and bridges around the state and as a Seven Days article stated, “roads in and
around Killington were swept away, isolating residents and businesses for weeks”
(Levitt, 2012).
• Transportation - Environment: In Vermont, the transportation sector is the leading source
of GHG emissions, mostly from private cars. In 2010, transportation was responsible
for 51% of the city of Burlington's GHG emissions (Kelley, 2013).
9.3.7 Communications Infrastructure • Many people in Vermont have access to broadband and internet, but a “digital divide”
remains: currently, 60,000 homes lack broadband (McCallum, 2021b). Vermont is
currently developing a ten-year telecommunications plan (State of Vermont, 2021a)
that meets the new requirements for broadband deployment established by Act 79
(Vermont Pub. L. No. 79, H.513, 2019). Communications infrastructure can be impacted
by climate change in several ways, including: increases in temperature and
precipitation can impact wireless transmissions through reduced signal range and
weakened quality, and disasters slow response and recovery by limiting access to
infrastructure to conduct repairs. On the other hand, it is possible that climate change
could stimulate innovation and “accelerate the rate of technology change” (Ospina et
al., 2014, p. 23).
Community Development Vermont Climate Assessment, 2021 440
• Communications - Health and Emergency Preparedness: Lack of communications can
leave communities without the ability to request help, which can put health and safety
in jeopardy. Lack of communications can also interrupt response and recovery efforts
following a disaster. Conversely, a study of healthcare workers in Vermont and New
York following Tropical Storm Irene and Hurricane Sandy reported that “response and
service organizations had to counter false information, rumor, and speculation while
attempting to reach populations that lacked electricity, internet, and phone service. A
noted dual challenge was how to provide continuous, needed information from a
source that could be accessible should utilities go out and how to ensure that the
public knew about this information source ahead of the disaster” (Walsh et al., 2015, p.
157). According to a Seven Days article, “After [Tropical Storm Irene], many Bethel
residents were unable to access emergency information about their town, Nikolaidis
explains. Her own family didn't have power or telephone service for five days; cut off
from town by the washed-out road, they knew little about what was happening in the
village” (Picard, 2014). In response, the Vermont Council on Rural Development
launched the Digital Economy Project, which aims to build resilience through providing
digital infrastructure to Vermont towns that previously lacked it (Picard, 2014; Vermont
Council on Rural Development, n.d.-d). The Digital Economy Project has “delivered
Front Porch Forum to every town in Vermont, created twenty-six free Wi-Fi
zones/hotspots and twenty-five new municipal websites, and advised over 120
nonprofits and 260 small businesses” (Vermont Council on Rural Development, n.d.-d).
• Communications - Economy: As the pandemic showed, many jobs, representing a strong
portion of the economy, rely on communications infrastructure. Additionally, having an
online business presence, such as a website, can increase businesses’ resiliency. For
example, Rochester, Vermont was isolated with no power or services for a week
following Tropical Storm Irene. Beth Frock, owner of Boysenberry Smart Clothes in
Rochester, found no outside traffic, even once basic services had been restored. This
caused Frock to obtain a part-time job to make ends meet (Ripley, n.d.). In response,
the Vermont Small Business Development Center, a partner in the Vermont Digital
Community Development Vermont Climate Assessment, 2021 441
Economy Project, assisted Frock in creating a website for Boysenberry Smart Clothes
so that her company can remain competitive even when there are local disruptions
(Ripley, n.d.).
9.3.8 Energy Infrastructure The connections between the energy system and climate change are clear: energy sources are
a significant contributor of CO2 emissions. There are three types of electric utilities in Vermont:
investor-owned, municipal electric departments, and member-owned rural electric
cooperatives (State of Vermont, 2017). According to the 2019 Vermont Infrastructure Report
Card, the state's energy system received a score of B-, which equates to good (ASCE, 2019).
Current transmission lines are not able to accommodate the increases in renewable energy
sources that are being deployed across the state, a key challenge (McCallum, 2021a).
• Energy - Food: Most Vermonters purchase food from food retailers such as grocery
stores. These retailers rely on the energy system to operate the buildings and
refrigerate fresh and frozen food. With the projected increase in storm events, a loss of
power can result in the closure of food retailers and consequent food spoilage. A Seven
Days guide to preparing for Hurricane Sandy recommends, “Set your refrigerator and
freezer to their coldest settings (remember to reset them back to normal once power is
restored). During an outage, do not open the refrigerator or freezer door unnecessarily.
Food can stay cold in a full refrigerator for up to twenty-four hours and in a well-packed
freezer for forty-eight hours (twenty-four hours if it is half-packed)” (Picard, 2012).
• Energy - Water: Power outages can cause disruptions in water treatment plants and the
ability to pump water, including from private wells. A Seven Days guide to preparing for
Hurricane Sandy suggests, “If your water supply could be affected by a power outage (a
well-water pump system), fill your bathtub and spare containers with water. Water in
the bathtub should be used for sanitation purposes only, not as drinking water. Pouring
a pail of water from the tub directly into the bowl can flush a toilet” (Picard, 2012).
Community Development Vermont Climate Assessment, 2021 442
• Energy - Transportation: A power outage can disrupt traffic signals and charging
infrastructure for electric vehicles. Also, power is required to pump fuel at gas stations,
so lack of power can disrupt the ability to operate vehicles. For more information about
the links between energy and transportation, see the discussion of vehicle
electrification in the Energy chapter.
• Energy - Health: Increasing adoption of renewable energy sources and energy efficiency
technologies will help reduce GHG emissions and improve air quality. Also, many
services that are critical to health (such as hospitals, food retailers, and water
treatment facilities) rely on power to function. Loss of power to these critical facilities
can lead to food and waterborne illnesses and limit access to health care. Loss of
power in winter can cause hypothermia. Loss of power in summer heat can lead to heat
exhaustion. For more information on the health impacts related to the energy system
and GHG emissions, see the Human Health chapter.
• Energy - Communications: Power outages can disable or disrupt communications
systems, such as internet access and cell service. The lack of digital communication
can impact emergency response. In a study of the multifunctionality of country stores
in Vermont, interviewees noted that their local country stores served as central hubs.
With power out for almost a week during Tropical Storm Irene, people could not get
information without power or internet, so the stores ran generators and served as
important hubs (Morse, 2018).
• Energy - Environment: Non-renewable forms of energy generation impacts the
environment through GHG emissions. Switching to renewable sources of energy has
environmental co-benefits in terms of air quality improvements and GHG reductions.
Additionally, the energy system can have additional negative impacts to the
environment during disasters. For example, flooding caused by Tropical Storm Irene
ruptured a fuel tank in a municipal office building in Waterbury, turning “the basement
into an oily pool” (Remsen, 2015).
Community Development Vermont Climate Assessment, 2021 443
• Energy - Economy: Vermont has seen an increase in solar panel and array deployment,
benefitting the environment through reduced GHG emissions and supporting the
economy. Kelley and Flagge (2014) summarize, “Vermont's solar sector also rests on a
firm foundation: the net-metering program that the legislature put in place seventeen
years ago. Net metering enables users of renewable energy to get credit for the excess
power their systems contribute to the state's electrical grid. Solar currently accounts
for more than 90% of the energy homes and businesses are selling back to utilities.”
9.3.9 Food Infrastructure The Agriculture and Food Systems chapter discusses the food system in detail primarily in
terms of production. The focus in this Community Development chapter is the impact of
climate change on food retailers, known as critical commercial services in academic literature.
There is a strong culture of prioritizing locally grown and made products, which represent
13.9% of food purchases in Vermont (Claro et al., 2021, p. 5). The Vermont Agriculture and
Food System Strategic Plan 2021–2030, released in February 2021, “confirms the need to
prioritize our agricultural land base, infrastructure, and food security in order to increase
Vermont farm and food system resilience to the impacts of climate change” (Claro et al., 2021,
p. 7).
• Food + Water - Health: Vermonters do not just rely on food broadly, they require access
to fresh, healthy food for their well-being. The food system is linked to health in terms
of power outages limiting refrigeration and water treatment during extreme events,
which can lead to food and waterborne illness (Romero-Lankao & Norton, 2018).
• Food - Economy: Vermont is America’s leading producer of maple syrup. A report by the
United States Department of Agriculture shows that Vermont’s maple syrup production
was 21% lower in 2021 than in 2020, a result of weather changes related to climate
change (National Agricultural Statistics Service et al., 2021).
• Food - Environment: Agricultural runoff and GHG emissions can negatively impact the
environment. The Vermont Agriculture and Food System Strategic Plan 2021–2030
Community Development Vermont Climate Assessment, 2021 444
provides goals and objectives for how to improve farm stewardship to improve water
quality. For example, there are specific methods and targets to ensure that agricultural
pollutants do not exceed the Total Maximum Daily Load (TMDL) of phosphorus runoff
into Lake Champlain (Claro et al., 2021).
• Food - Energy: One way to reduce GHG emissions and increase renewable energy
sources is to use waste from food and agriculture as organic material for biofuel
generation. For example, the Energy chapter describes how Vermont has a “Cow
Power” program, which seeks to capture methane produced from manure to burn as
biofuel to generate electricity (Green Mountain Power, 2020).
9.3.10 Healthcare Infrastructure & Health The Vermont Department of Health summarizes hospital infrastructure in the state: “There are
fourteen non-profit hospitals and network of health care systems spread throughout Vermont
including: eight small critical access hospitals, five mid-size rural hospitals, two academic
medical centers, a Veterans Administration hospital, and five designated psychiatric inpatient
facilities” (Vermont Department of Health, 2021b). Vermont hospitals and other healthcare
facilities are susceptible to flood damage and rely on other systems to remain operational,
including transportation for people to access the facilities, energy and water systems to run
the facilities, and food to feed patients. Severe weather events can cause a breakdown in
these infrastructures. For example, during Tropical Storm Irene, the state complex was
inundated by flood waters, which “forced the emergency evacuation of fifty-one psychiatric
patients—but not before they spent the night in the dark on the top floors of the state hospital
with emergency fire alarms blaring for hours” (Remsen, 2015).
• Health - Environment: Health can be impacted by air quality, increased heat, increased
disease vectors (e.g., ticks and mosquitos), increased harmful algal blooms, and
threats to drinking water from flood damage or hazardous spills. See the Human Health
chapter for more detailed information on how the changing environment will impact the
health of Vermonters.
Community Development Vermont Climate Assessment, 2021 445
• Health - Economy: The economy depends on a healthy workforce. Additionally,
healthcare is the most prominent industry in Vermont, employing approximately 50,000
residents (International Lake Champlain-Richelieu River Study Board, 2019).
9.3.11 The Economic System Climate change-related disasters have varied effects on the economy. For example, following
Tropical Storm Irene, “jobless claims nearly doubled in the first two weeks after the storm,
peaking at 1,179 on September 3. Hard-hit Killington Resort initially filed a mass claim for 300
displaced employees but was able to put many of them back to work within a few weeks … .
[...] On the other hand, the devastation created a surge in demand for construction work—the
industry hardest hit during the recession in Vermont. Between 2007 and 2010, almost a fifth of
all construction jobs in the state disappeared. Labor officials estimate 400 workers are
presently employed rebuilding roads, bridges and flood-damaged structures” (Bromage, 2011).
A “Stuck in Vermont” broadcast from Seven Days reporting on Wilmington, Vermont one month
after Tropical Storm Irene found that the small town had more than forty flood-damaged
businesses and 120 flood-related job losses; for such a small town, Irene nearly destroyed its
economic center (Sollberger, 2011).
• Economy - Water Quality: Harmful algal blooms, a proliferation of cyanobacteria that
causes poor (or dangerous) water quality, reduced property values for shoreline
properties in St. Albans Bay. The town of Georgia lowered the property values of thirty-
seven lakefront properties by $50,000 each due to the blue green algae found in their
waterfront (Hallenbeck, 2015). Harmful algal blooms can leave the lake unusable for
recreation, which reduces the appeal of lakefront living (Hallenbeck, 2015). For more
information on the health impacts of harmful algal blooms, see the Human Health
chapter and for more information on water quality, see the Water Resources chapter.
• Economy - Floodplains: A study of Otter Creek wetlands and floodplains in Middlebury,
Vermont found that the floodplains reduce flood damages by 54–78%, with an annual
Community Development Vermont Climate Assessment, 2021 446
value of flood mitigation services between $126,000 and $450,000 (Watson et al.,
2016).
• Economy - Crop Production: A United States Department of Agriculture report on crop
production shows that Vermont’s maple syrup production is down 21% compared to
2020 due to climate-related changes (NASS, 2021).
• Economy - Disaster Displacement: In an economic impact assessment of Tropical Storm
Irene, it was estimated that Washington County would lose $32.7 million in income
from the decrease of spending within the county due to relocated workers (U.S.
Department of Commerce, 2012).
9.3.12 Social infrastructure Social infrastructure, also called civic infrastructure or social cohesion, has been shown to
strengthen communities and be a key contributor to community resilience (Chriest & Niles,
2018). Social infrastructure, or social capital, is classified as either “bridging” or “bonding.”
Bridging social capital improves intergroup linkages, where bonding social capital benefits
intragroup linkages (Manyena et al., 2019). Project 14 is an initiative through the University of
Vermont that connects student researchers with local newspapers with the goal of improving
local news coverage and information-sharing in target areas throughout the state (University
of Vermont, n.d.). Reilly (2021) describes a strong basis for information-sharing in the state:
“Vermont already has many of the pieces in place for these efforts to make an impact, from
strong media organizations like VPR, VTDigger and Seven Days, to active local governments,
one of the highest rates of citizen volunteerism in the country, and a legislature and governor
who are willing to work together to solve our challenges.” Vermont author Bill McKibben
credits Vermont’s social cohesion as a reason that residents were initially receptive of
economic closures and social precautions of the COVID-19 pandemic. He writes, “Vermonters
entered the pandemic with remarkably high levels of social trust,” and notes, “The state motto
is ‘Freedom and Unity,’ and there’s no question that, for the duration, Vermont’s emphasis is on
the latter” (McKibben, 2020).
Community Development Vermont Climate Assessment, 2021 447
• Social infrastructure - Economy: A 2013 report on civic health and the economy states
that factors such as social cohesion were predictors of a community’s ability to
withstand unemployment, such as during a recession (Levine & Kawashima-Ginsberg,
2013) or after a flood. Likewise, social cohesion can be useful in times of climate-
related disasters (e.g., floods).
• Social infrastructure - Disaster Recovery: A study of social capital following Tropical
Storm Irene in Vermont revealed that “the strength and success of Vermont’s recovery
can be attributed to the combination and coordination between different types of social
capital inherent of informal community efforts and the formal disaster framework”
(Consoer & Milman, 2016, p. 171). For example, after over 700 residences had been
destroyed or damaged by Irene flood waters, at least sixty second homeowners offered
their vacation homes or condos to flood victims (Ober, 2011b).
• Social infrastructure - Food Security: A study of social capital in rural Vermont following
Tropical Storm Irene found that “rural communities with high levels of social capital
display resilience and adaptation to food insecurity after extreme weather events”
(Chriest & Niles, 2018). For example, residents of Moretown, Vermont organized a “meal
train” in the aftermath of Tropical Storm Irene to help feed flood victims (Ober, 2011c).
9.3.13 Systems Interconnections as Co-Benefits There are not only potential negative, cascading impacts between different systems; it is also
important to consider potential positive “co-benefits” that can result between connected
systems. Many resilience, adaptation, sustainability, or mitigation efforts can provide benefits
far beyond the initial action or project. Considering the co-benefits of an effort can help
actualize the true return on investment.
9.3.13.1 Example: Urban Forestry
Systems interconnections can be viewed as both negative, cascading impacts (as described
above) where damage to one system negatively impacts the other systems to which it is
connected and as positive co-benefits, in which changes to one system will benefit or improve
Community Development Vermont Climate Assessment, 2021 448
the other systems to which it is connected. In the context of community development, urban
forestry is a great example of how changes in one system (here, forestry) can provide positive
changes in other systems.
Tree cover has been shown to improve air quality, help with the negative impacts of increased
or extreme heat (such as the urban heat island effect), reduce flood impacts and improve
water quality, and reduce energy costs through increased shading (see the Climate Change in
Forests chapter for more information). Additionally, forests and tree cover have been shown to
connect to diversity, equity, inclusion, and justice in that lower-income communities are more
often associated with less tree cover, which deprives them of the many benefits listed in the
prior sentence. As such, several cities in the United States have designed actions to build
resilience around forests and tree cover; some examples are described below.
• Trees for water quality: Honolulu has an action entitled, “Minimize Economic and
Property Risk within the Ala Wai Canal Watershed” (City and County of Honolulu, 2019,
p. 100), which includes protecting forests as a method of addressing water quality and
ecosystem health.
• Trees for urban cooling: To promote cooling, Honolulu has an action entitled, “Keep O
‘ahu Cool by Maintaining and Enhancing the Community Forest” (City and County of
Honolulu, 2019, p. 98), and Los Angeles has an action entitled, “Develop and launch a
neighborhood retrofit pilot program to test cooling strategies that prepare for higher
temperatures” (City of Los Angeles, 2018, p. 70), which seeks to promote cooling
through increased vegetation and tree plantings.
• Trees for equity: To ensure that the benefits of tree cover are equitably distributed, Los
Angeles has an action entitled, “Plant trees in communities with fewer trees to grow a
more equitable tree canopy by 2028” (City of Los Angeles, 2018, p. 73) and another
entitled, “Increase access to open space in underserved neighborhoods” (City of Los
Angeles, 2018, p. 80).
In summary, several cities highlight the importance of forests and tree cover to increasing
Community Development Vermont Climate Assessment, 2021 449
community resilience in the context of climate change. Vermont should consider community
tree cover (increasing it, conserving it, ensuring its equitable distribution) as a method of
improving air and water quality, reducing flood impacts, and reducing energy use through tree
cover shading (which reduces use of air conditioners). Increasingly these strategies may be
developed at the local level with support from state agencies or non-governmental
organizations (see Climate Change in Forests Chapter).
9.3.13.2 Example: Food-Energy-Water Nexus
A classic example of co-benefits is the potential benefits associated with linking food, energy,
and water systems (known as the food-energy-water nexus in academic literature). For
example, prior to Magic Hat Brewing’s move from South Burlington to New York, the brewery
had installed a digester that was able to turn waste from the beer-making process (food) into
energy through the use of a biodigester (McCallum, 2021a). Recently, an article by Seven Days
(McCallum, 2021a) described how Franklin Foods plant, which produced Hahn’s, a cream
cheese, was looking into using the protein-laden wastewater from the cheese making process
in an on-site digester to create methane, an energy source. With Franklin Foods, the potential
lies in reusing protein-rich wastewater that the local wastewater treatment system did not
have the capacity to treat and creating a local renewable energy source. The limitation was
that the energy grid was not able to sustain another source of renewable energy.
9.3.13.3 Example: Vermont Council on Rural Development’s Climate Economy Initiative
The Vermont Council on Rural Development (VCRD) has a Climate Economy Initiative, which
seeks to promote the economic opportunity that results from the need for strategies that
reduce energy use and carbon emissions (Vermont Council on Rural Development, n.d.-c). The
initiative postulates that the climate change challenge of needing to reduce energy use and
the associated carbon emissions can produce co-benefits in terms of stimulating green
economic growth. For example, Grassroots Solar and Harry Hunt Architects are two Vermont
businesses that embrace green economic growth as a co-benefit to climate action. Grassroots
Solar, a solar company in Dorset, Vermont, seeks to help customers achieve energy
independence through solar installations. Harry Hunt Architects, an architecture firm in Stowe,
Vermont designs low-carbon homes ,so that less energy is needed for heating and cooling
Community Development Vermont Climate Assessment, 2021 450
(Vermont Council on Rural Development, n.d.-a, n.d.-b). For more information, there is a
“Progress for Vermont” report and action plan from the Vermont Climate Change Economy
Council, which was founded by the VCRD (Vermont Climate Change Economy Council, 2016).
This report makes recommendations for how the state can stimulate economic activity while
addressing climate change.
9.3.13.4 Example: Water Quality Benefits to Implementing Flood Mitigation
A classic example of co-benefits is ecosystem services, the natural, non-monetary benefits
associated with ecosystems and the natural environment. Protecting and conserving
floodplains, wetlands, and forests (all examples of natural infrastructures) serve to both
mitigate flood impacts and improve water quality (Singh et al., 2018). For example, wetlands
provide ecosystem services in the form of flood attenuation and carbon storage, and they
absorb phosphorus that can lead to degraded water quality (Singh et al., 2019). Additionally, in
a study of open space protection and flood mitigation in the United States, open space
preservation improve flood mitigation and improve water quality, and property values were
increased along the perimeter of the preserved areas (Brody & Highfield, 2013).
9.3.14 Infrastructure Interconnections in the Context of Disasters As described above, one of the most likely climate change impacts to face the state of
Vermont is an increase in the frequency and severity of flood events. Given this likely scenario,
this section describes systems interdependencies that have been noted in academic literature
during flood and hurricane events. The objective is to demonstrate how systems
interdependencies are relevant to Vermont and how they should be accounted for in relevant
state, regional, or community planning.
The literature has highlighted how damage to the energy (de Bruijn et al., 2019) and
transportation systems during a flood or other acute event will negatively impact nearly all
other systems to which they are connected (Raub, Stepenuck, & Panikkar, 2021). For example,
during the 2013 flood in Boulder, Colorado, six of the seven key roads adjacent to creeks
became impassable, and the flood waters damaged the energy system, causing a power
Community Development Vermont Climate Assessment, 2021 451
outage (Romero-Lankao & Norton, 2018). The lack of power resulted in many Boulder residents
throwing away spoiled food due to the lack of refrigeration, and the damaged transportation
system prevented deliveries, resulting in food shortages in the flooded area (Romero-Lankao &
Norton, 2018). In a study of a hypothetical flood event in Florida, blocked roads were shown to
limit access to food, reduce access to downed power lines for repair, and prevent the
evacuation of those in severely impacted areas (de Bruijn et al., 2019). Food and water were
also shown to impact health in that the lack of power for refrigeration and sanitation increased
the prevalence of food and waterborne illnesses (Romero-Lankao & Norton, 2018).
Some mitigating factors in Boulder included use of radios and landlines when the
communications system went down due to the power outage and use of a backup generator in
a wastewater treatment plant that otherwise had lost power due to the power outage (Romero-
Lankao & Norton, 2018). In a simulated hurricane, intentionally increasing the inventory at
grocery stores and other critical commercial services in anticipation of a medium-scale
(Category 3) hurricane event can reduce disruptions to food access in the surrounding
community (Ni et al., 2019).
In Vermont, Tropical Storm Irene demonstrated the vulnerability of each infrastructure system
cited as examples of interdependencies above. Tropical Storm Irene occurred on August 28,
2011 and caused extreme flood damage in Vermont, impacting 225 of Vermont’s 251 towns
(Anderson et al., 2020). Most notable was the damage to over 300 long-span bridges
(Anderson et al., 2020). Additional damages included to state highway, municipal roads, and
railroads, power outages to about 73,000 customers, Boil Water Notices in thirty public water
systems, and hazardous waste and fuel spills (Pealer, 2012). The main office for Vermont
Emergency Management in Waterbury was flooded, and thirteen communities were left with
no passable roads to enter or exit the town (Pealer, 2012). Mobile home parks in the state were
particularly hard hit; 154 mobile homes in parks were destroyed (Baker et al., 2014).
Prior studies demonstrate that pre-disaster planning and policy “result in lower disaster losses
and serve to enhance community resilience” (Kim & Marcouiller, 2020, p. 1). A cost-benefit
analysis of hazard mitigation found that $4 in future savings results from every $1 spent on
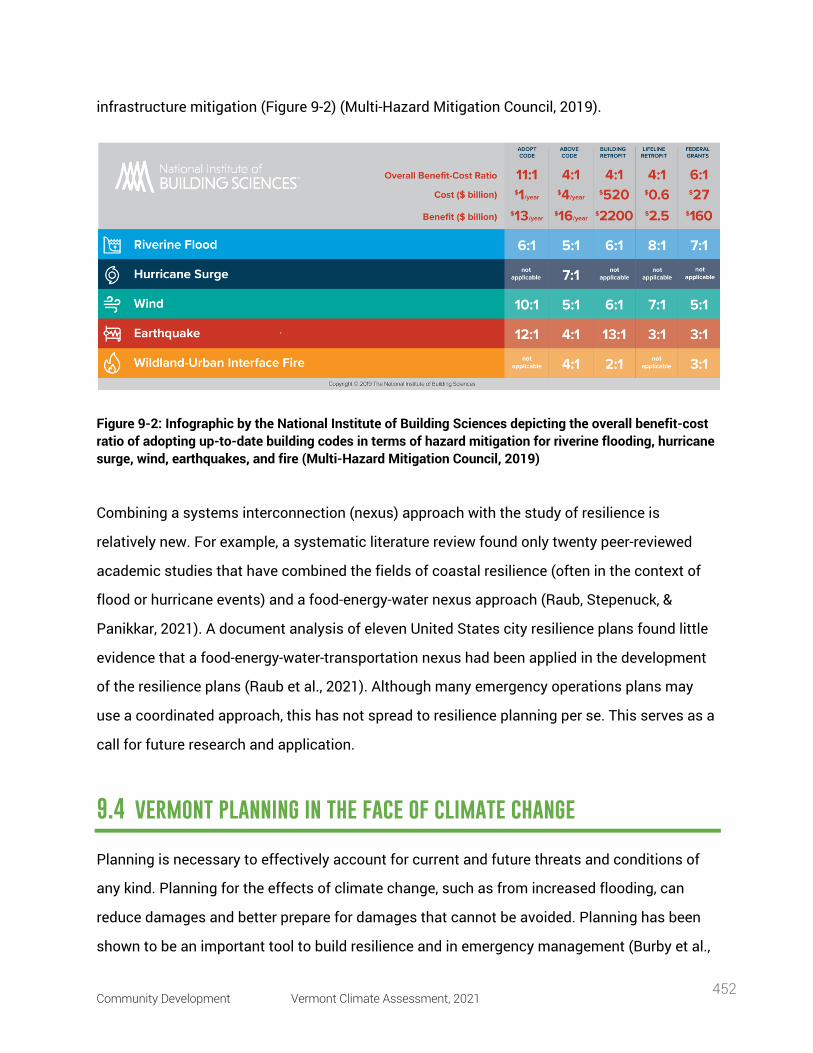
Community Development Vermont Climate Assessment, 2021 452
infrastructure mitigation (Figure 9-2) (Multi-Hazard Mitigation Council, 2019).
Figure 9-2: Infographic by the National Institute of Building Sciences depicting the overall benefit-cost ratio of adopting up-to-date building codes in terms of hazard mitigation for riverine flooding, hurricane surge, wind, earthquakes, and fire (Multi-Hazard Mitigation Council, 2019)
Combining a systems interconnection (nexus) approach with the study of resilience is
relatively new. For example, a systematic literature review found only twenty peer-reviewed
academic studies that have combined the fields of coastal resilience (often in the context of
flood or hurricane events) and a food-energy-water nexus approach (Raub, Stepenuck, &
Panikkar, 2021). A document analysis of eleven United States city resilience plans found little
evidence that a food-energy-water-transportation nexus had been applied in the development
of the resilience plans (Raub et al., 2021). Although many emergency operations plans may
use a coordinated approach, this has not spread to resilience planning per se. This serves as a
call for future research and application.
9.4 vermont planning in the face of climate change
Planning is necessary to effectively account for current and future threats and conditions of
any kind. Planning for the effects of climate change, such as from increased flooding, can
reduce damages and better prepare for damages that cannot be avoided. Planning has been
shown to be an important tool to build resilience and in emergency management (Burby et al.,
Community Development Vermont Climate Assessment, 2021 453
1999; Cucuzza, Stoll, & Leslie, 2020; Nelson & French, 2002). The state and its communities are
currently undertaking a variety of planning efforts in response to climate change. This section
will cover the planning efforts at the state level, state and local-level land use planning, local-
level hazard mitigation planning, and, finally, resilience planning and efforts to build
community resilience.
9.4.1.1 Statewide Emergency Plans
Planning in Vermont occurs at multiple scales: state, regional, and local or community. At the
statewide scale, Vermont has a State Emergency Management Plan and a State Mitigation
Plan.
• The State Emergency Management Plan can be found here:
https://vem.vermont.gov/plans/state.
• The 2018 FEMA-approved State Hazard Mitigation Plan (Vermont Emergency
Management, 2018) can be found here https://vem.vermont.gov/plans/SHMP.
9.4.2 State and Local Level: Land Use Planning and Implementation In Vermont, land use planning occurs at both the state and local levels, as described by Claro
et al. (2021): “Vermont is divided among eleven regional planning commissions (RPCs), each
with a regional land use plan, and as of 2017, 84% of Vermont municipalities had also adopted
a municipal plan. State planning statutes require regional and municipal plans to include a
land-use map and policies for preservation of natural and scenic resources, as well as sections
on other topics related to the food system such as economic development, flood resilience,
housing, and transportation” (p. 167). Land use planning is important in the context of climate
change, as it can promote environmentally friendly outcomes and it can be essential in
mitigating community flood risk. At the state level, Act 250 is the seminal land use regulation,
and the state planning goals found in 24 VSA section 4302 are the main state land use
regulations. Municipal plans and zoning and subdivision regulations are key to land use
planning implementation at the local level. Increasing fragmentation of forests is a concern of
many Vermonters, as discussed in the Climate Change in Forests chapter.
Community Development Vermont Climate Assessment, 2021 454
9.4.2.1 State Level: Act 250
Act 250 is the state-level Land Use and Development Law in Vermont. Act 250 was passed in
1970 with the intent to preserve the “environmental, social, and aesthetic character of the
state in the face of development pressure” (Smith, Sandler, & Goralnik, 2013). This act requires
that developers of projects of a certain size (e.g., commercial greater than ten acres) or
number of housing units (e.g., residential with more than ten units within a five-mile radius)
obtain a Land Use Permit from the District Environmental Commission, in addition to any local
or subdivision permits (Geiger, n.d.). Small developments, including single homes on small
parcels, may not be subject to Act 250 restrictions (see the Climate Change in Forests chapter
for more on land use change). Act 250 requires development projects to meet ten criteria as
related to (State of Vermont Natural Resources Board, 2021):
1. Water and air pollution
2. Water supply
3. Impact on water supply
4. Erosion and capacity of soil to hold water
5. Transportation
6. Educational services
7. Municipal services
8. Aesthetics, scenic, and natural beauty
9. Conforms to development and land use plans
10. Local and regional plans
9.4.2.2 Smart Growth Development
Smart Growth Development promotes compact development of settlements and urban centers
that are separated by rural countryside, thus combating urban sprawl. Dense development can
reduce total impervious surface in a municipality, reducing flood runoff. However, if not done
well, stormwater concerns in urbanized areas can create local flash floods. Concentrating
development in existing centers in Vermont also must be done with flooding in mind, as many
of our developed areas were in flood-prone areas and continuing to invest in some of these
areas is not prudent under increasing flooding.
Community Development Vermont Climate Assessment, 2021 455
• Vermont Smart Growth Collaborative: The Vermont Smart Growth Collaborative
(Vermont Natural Resources Council, 2012) released the State of Vermont Smart
Growth 2007 Progress Report, which examined state policies and spending between
2003 and 2006 (Levine et al., 2007). The 2021 update to the 2007 progress report will
be available later in 2021 and will examine state policies and spending between 2013
and 2019 (Vermont Natural Resources Council, 2021).
• Vermont Natural Resource Council efforts on smart growth: The Vermont Natural
Resources Council (VNRC) “promotes land use planning that creates communities that
are environmentally sustainable, economically viable, and resilient” using smart growth
principles. VNRC is in the Vermont Smart Growth Collaborative along with Conservation
Law Foundation, Preservation Trust of Vermont, and others.
9.4.2.3 Local Level: Zoning
Planning can be implemented through the use of local zoning ordinances. For example, a
study of zoning ordinances in 32 United States communities (of which, Burlington, Vermont
was included) found that communities that included sustainability principles within their
zoning ordinances were more likely to achieve sustainability than those that did not (Jepson &
Haines, 2014). More specifically, zoning is an important tool to mitigate flood risk by
regulating development in flood-prone areas. Zoning, often through ordinances, can “regulate
the development of flood-prone areas, introduce building codes, convert built up areas to
nature, relocate buildings, and raise public awareness, in order to lower flood risk” (Hudson &
Botzen, 2019, p. 2). Zoning ordinances typically occur at the town level.
9.4.3 Local Hazard Mitigation and Local Emergency Management Planning To be eligible for some federal grant funding through FEMA, communities can participate in
the National Flood Insurance Program and adopt Local Hazard Mitigation Plans. Currently,
Vermont communities have a total of thirty FEMA-approved Local Hazard Mitigation Plans
(Two Rivers Ottauquechee Regional Commission, n.d.).
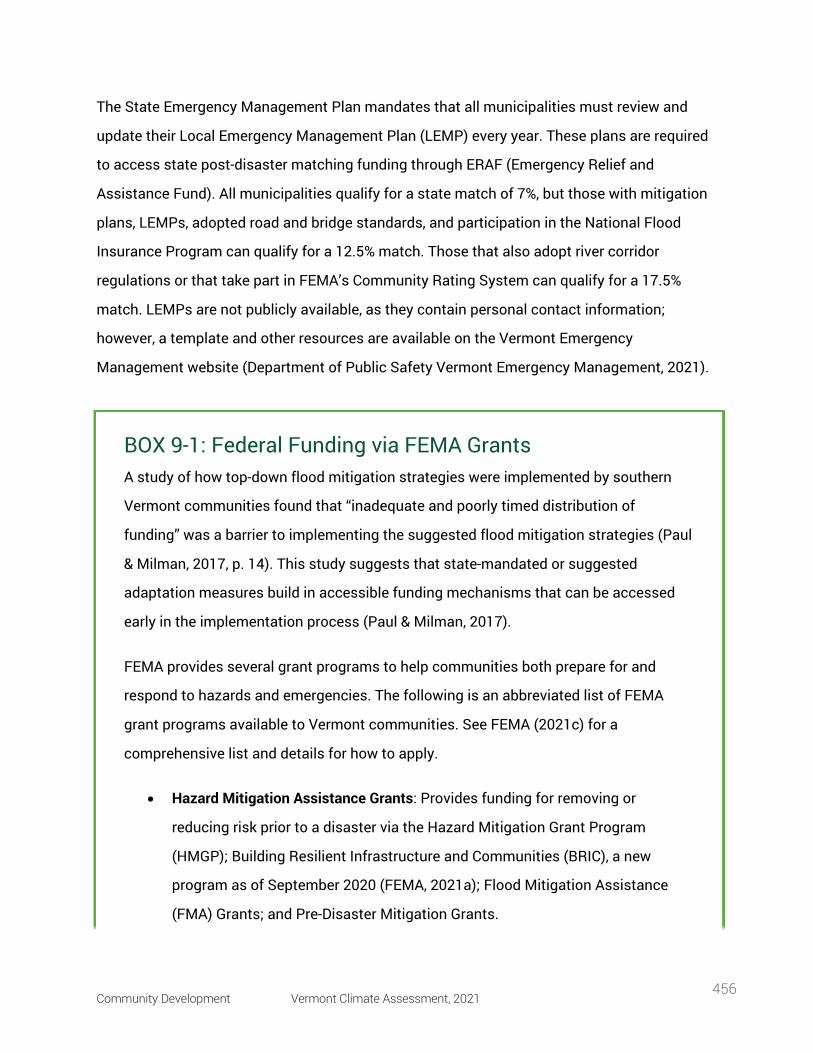
Community Development Vermont Climate Assessment, 2021 456
The State Emergency Management Plan mandates that all municipalities must review and
update their Local Emergency Management Plan (LEMP) every year. These plans are required
to access state post-disaster matching funding through ERAF (Emergency Relief and
Assistance Fund). All municipalities qualify for a state match of 7%, but those with mitigation
plans, LEMPs, adopted road and bridge standards, and participation in the National Flood
Insurance Program can qualify for a 12.5% match. Those that also adopt river corridor
regulations or that take part in FEMA’s Community Rating System can qualify for a 17.5%
match. LEMPs are not publicly available, as they contain personal contact information;
however, a template and other resources are available on the Vermont Emergency
Management website (Department of Public Safety Vermont Emergency Management, 2021).
BOX 9-1: Federal Funding via FEMA Grants A study of how top-down flood mitigation strategies were implemented by southern
Vermont communities found that “inadequate and poorly timed distribution of
funding” was a barrier to implementing the suggested flood mitigation strategies (Paul
& Milman, 2017, p. 14). This study suggests that state-mandated or suggested
adaptation measures build in accessible funding mechanisms that can be accessed
early in the implementation process (Paul & Milman, 2017).
FEMA provides several grant programs to help communities both prepare for and
respond to hazards and emergencies. The following is an abbreviated list of FEMA
grant programs available to Vermont communities. See FEMA (2021c) for a
comprehensive list and details for how to apply.
• Hazard Mitigation Assistance Grants: Provides funding for removing or
reducing risk prior to a disaster via the Hazard Mitigation Grant Program
(HMGP); Building Resilient Infrastructure and Communities (BRIC), a new
program as of September 2020 (FEMA, 2021a); Flood Mitigation Assistance
(FMA) Grants; and Pre-Disaster Mitigation Grants.
Community Development Vermont Climate Assessment, 2021 457
9.4.4 Efforts to Build Community Resilience and Resilience Planning Many communities across the United States have written, or are currently writing, plans
forhow they will build resilience against climate change and other shocks and stresses. While
Vermont does not currently have a state resilience plan, it has undertaken several resilience
building or measuring efforts and could consider writing a plan in the future. The state does
have a Hazard Mitigation Plan, which has many of the characteristics of a natural hazard
resilience plan (Vermont Emergency Management, 2018). “Climate change” is mentioned forty-
seven times in the state plan. Climate change is not considered a direct hazard, but rather a
driver of hazards such as floods, drought, ice-storms, etc.
Also, as is common in the emergency management field, planning and preparing for one
disaster, if done well and holistically, increases resilience to other forms of disaster. For
example, planning for structural collapse prepares for flood damage to homes. Preparing for
structural fire prepares for post-flood fires (a common occurrence with woody debris and
spilled fuel tanks). So, while a community may not be directly confronting climate change, it
most likely is doing many resilience actions under another name. Lastly, good community
planning creates resilience in that it is building community dialogue skills and a system for
• Preparedness Grants: These funds are for non-disaster-related efforts and
include the Emergency Management Performance Grant Program, Assistance
to Firefighters Grants Program, Homeland Security Grant Program, and many
more (FEMA, 2021e).
• Resilience Grants: Available for dam safety and earthquake preparedness.
• Emergency Food and Shelter Program: This program provides assistance to
ongoing local efforts to provide food, shelter, and other support services to
those at risk of, or who are currently experiencing, hunger or homelessness
(FEMA, 2021b).
Community Development Vermont Climate Assessment, 2021 458
public information and decision-making. These are as essential as subject-specific plans in
effective community planning.
9.4.4.1 Resilience Resources for Vermont Communities
• Flood Resilience Checklist for Vermont Communities: This checklist was created for
those engaging in Municipal Plan updates, Hazard Mitigation Plans, and other planning
efforts. Its objective is to increase a community’s resilience (Vermont Department of
Housing and Community Development, 2016).
• Resilient Communities Scorecard: The VNRC developed the Resilient Communities
Scorecard (https://vnrc.org/community-planning-toolbox/tools/resilient-communities-
scorecard/#:~:text=The%20Resilient%20Communities%20Scorecard%20helps,energy%
2C%20and%20healthy%20community%20design) (Vermont Natural Resources Council,
2013) to be a tool for Vermont communities to use in building resilient communities.
• Resilient Vermont: The Resilient Vermont Network “is a new collaboration of
organizations and agencies in Vermont that are working to advance climate resilience.
The Network is working to improve alignment, coordination, communication, and
strategic impact across a range of issues related to climate resilience” (Resilient
Vermont, n.d.). Resilient Vermont released a report entitled “Vermont’s Roadmap to
Resilience” that provides recommendations for how to build resilience to climate
change (Institute for Sustainable Communities, 2013).
• Act 16 Flood Resilient Planning: In 2013, Vermont created a flood resilience goal
(V.S.A. 24, section 4302(c)14) and a flood resilience element for regional plans (V.S.A.
24, section 4348a(a)11) and municipal plans (V.S.A. 24, section 4382(a)12) through Act
16 (Vermont H. 401 Act 16, 2013). For plans adopted after July 1, 2014, Act 16 specifies
that a flood resilience element must be incorporated within all municipal plans, and
regional plans must meet the flood resilience elements and goals. Municipal plans
seeking regional approval must also meet the state planning goal (V.S.A. 24, section
2450).
Community Development Vermont Climate Assessment, 2021 459
• Flood Resilience Planning Resources: The Central Vermont Regional Planning
Commission provides a list of resources for flood resilience planning, including
information for municipal plans, floodplain fact sheets, and fluvial erosion hazard maps
and language (Central Vermont Regional Planning Commission, 2021).
• Flood Ready Vermont: Flood Ready Vermont provides a list of resources for
municipalities seeking to write or update their Municipal Plans to include a flood
resilience element (Flood Ready Vermont, 2021).
• Vermont Planning Manual (https://accd.vermont.gov/community-development/town-
future/municipal-planning-manual): This is the main manual for municipal planning in
Vermont. Many of the concepts of municipal planning, especially land use, natural
resources, and capital budgeting, make a community resilient (State of Vermont
Agency of Commerce and Community Development, 2021).
• FEMA’s Hazard Mitigation Planning: FEMA has developed a process for planning to
lessen the effects of natural hazards through the development of mitigation plans. This
process is designed to meet federal guidelines for such a plan (FEMA, 2021d).
• Vermont Department of Environmental Conservation Hazard Area Bylaws: These are
model bylaws available for communities that “have been pre-reviewed by FEMA and
meet or exceed the requirements of the National Flood Insurance Program” (Vermont
DEC, 2021).
9.5 traceable accounts
Traceable accounts describe the confidence level—the degree of certainty in the scientific
evidence—for each key message resulting from this chapter. This analysis is based on the U.S.
Global Change Research Program guidance in the Fourth National Climate Assessment
(USGCRP, 2018).
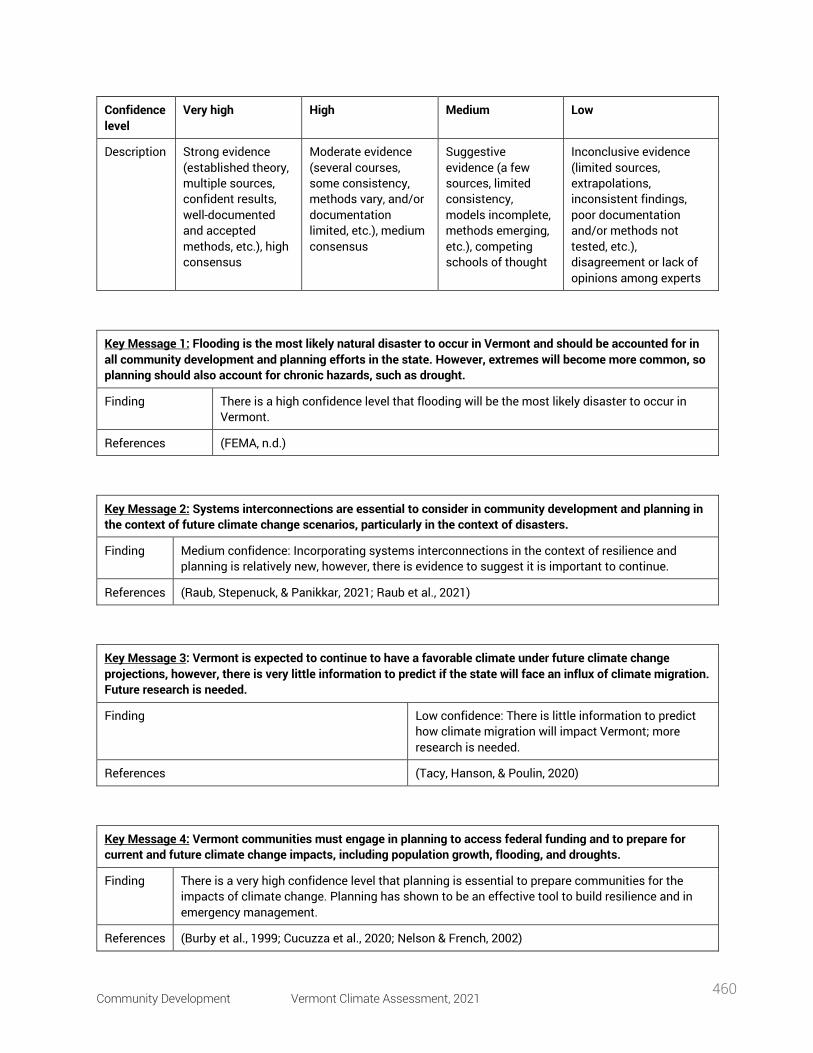
Community Development Vermont Climate Assessment, 2021 460
Confidence level
Very high High Medium Low
Description Strong evidence (established theory, multiple sources, confident results, well-documented and accepted methods, etc.), high consensus
Moderate evidence (several courses, some consistency, methods vary, and/or documentation limited, etc.), medium consensus
Suggestive evidence (a few sources, limited consistency, models incomplete, methods emerging, etc.), competing schools of thought
Inconclusive evidence (limited sources, extrapolations, inconsistent findings, poor documentation and/or methods not tested, etc.), disagreement or lack of opinions among experts
Key Message 1: Flooding is the most likely natural disaster to occur in Vermont and should be accounted for in all community development and planning efforts in the state. However, extremes will become more common, so planning should also account for chronic hazards, such as drought.
Finding There is a high confidence level that flooding will be the most likely disaster to occur in Vermont.
References (FEMA, n.d.)
Key Message 2: Systems interconnections are essential to consider in community development and planning in the context of future climate change scenarios, particularly in the context of disasters.
Finding Medium confidence: Incorporating systems interconnections in the context of resilience and planning is relatively new, however, there is evidence to suggest it is important to continue.
References (Raub, Stepenuck, & Panikkar, 2021; Raub et al., 2021)
Key Message 3: Vermont is expected to continue to have a favorable climate under future climate change projections, however, there is very little information to predict if the state will face an influx of climate migration. Future research is needed.
Finding Low confidence: There is little information to predict how climate migration will impact Vermont; more research is needed.
References (Tacy, Hanson, & Poulin, 2020)
Key Message 4: Vermont communities must engage in planning to access federal funding and to prepare for current and future climate change impacts, including population growth, flooding, and droughts.
Finding There is a very high confidence level that planning is essential to prepare communities for the impacts of climate change. Planning has shown to be an effective tool to build resilience and in emergency management.
References (Burby et al., 1999; Cucuzza et al., 2020; Nelson & French, 2002)
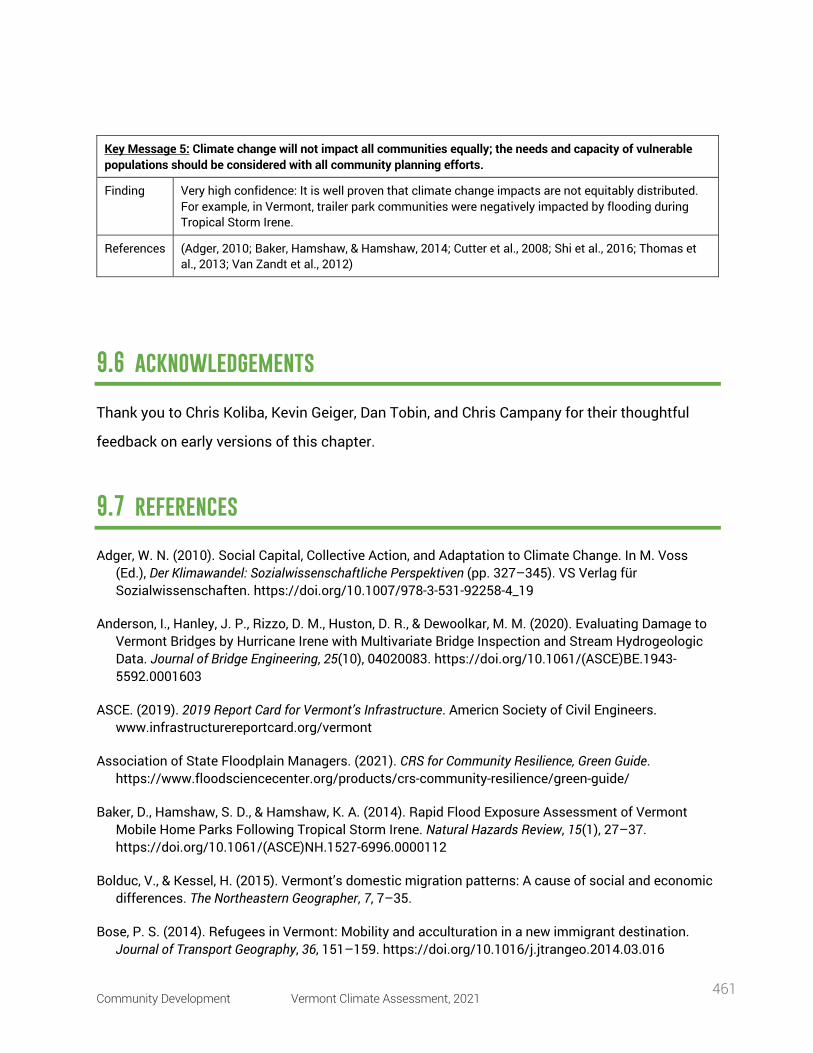
Community Development Vermont Climate Assessment, 2021 461
Key Message 5: Climate change will not impact all communities equally; the needs and capacity of vulnerable populations should be considered with all community planning efforts.
Finding Very high confidence: It is well proven that climate change impacts are not equitably distributed. For example, in Vermont, trailer park communities were negatively impacted by flooding during Tropical Storm Irene.
References (Adger, 2010; Baker, Hamshaw, & Hamshaw, 2014; Cutter et al., 2008; Shi et al., 2016; Thomas et al., 2013; Van Zandt et al., 2012)
9.6 acknowledgements
Thank you to Chris Koliba, Kevin Geiger, Dan Tobin, and Chris Campany for their thoughtful
feedback on early versions of this chapter.
9.7 references
Adger, W. N. (2010). Social Capital, Collective Action, and Adaptation to Climate Change. In M. Voss (Ed.), Der Klimawandel: Sozialwissenschaftliche Perspektiven (pp. 327–345). VS Verlag für Sozialwissenschaften. https://doi.org/10.1007/978-3-531-92258-4_19
Anderson, I., Hanley, J. P., Rizzo, D. M., Huston, D. R., & Dewoolkar, M. M. (2020). Evaluating Damage to Vermont Bridges by Hurricane Irene with Multivariate Bridge Inspection and Stream Hydrogeologic Data. Journal of Bridge Engineering, 25(10), 04020083. https://doi.org/10.1061/(ASCE)BE.1943-5592.0001603
ASCE. (2019). 2019 Report Card for Vermont’s Infrastructure. Americn Society of Civil Engineers. www.infrastructurereportcard.org/vermont
Association of State Floodplain Managers. (2021). CRS for Community Resilience, Green Guide. https://www.floodsciencecenter.org/products/crs-community-resilience/green-guide/
Baker, D., Hamshaw, S. D., & Hamshaw, K. A. (2014). Rapid Flood Exposure Assessment of Vermont Mobile Home Parks Following Tropical Storm Irene. Natural Hazards Review, 15(1), 27–37. https://doi.org/10.1061/(ASCE)NH.1527-6996.0000112
Bolduc, V., & Kessel, H. (2015). Vermont’s domestic migration patterns: A cause of social and economic differences. The Northeastern Geographer, 7, 7–35.
Bose, P. S. (2014). Refugees in Vermont: Mobility and acculturation in a new immigrant destination. Journal of Transport Geography, 36, 151–159. https://doi.org/10.1016/j.jtrangeo.2014.03.016
Community Development Vermont Climate Assessment, 2021 462
Bose, P. S. (2020). Refugees in New Destinations and Small Cities: Resettlement in Vermont. Palgrave MacMillan.
Brody, S. D., & Highfield, W. E. (2013). Open space protection and flood mitigation: A national study. Land Use Policy, 32, 89–95. https://doi.org/10.1016/j.landusepol.2012.10.017
Bromage, A. (2011). Is Irene to Blame for Vermont’s Rising Unemployment? Yes and No. Seven Days. https://www.sevendaysvt.com/vermont/is-irene-to-blame-for-vermonts-rising-unemployment-yes-and-no/Content?oid=2144603
Burby, R. J., Beatley, T., Berke, P. R., Deyle, R. E., French, S. P., Godschalk, D. R., Kaiser, E. J., Kartez, J. D., May, P. J., Olshansky, R., Paterson, R. G., & Platt, R. H. (1999). Unleashing the Power of Planning to Create Disaster-Resistant Communities. Journal of the American Planning Association, 65(3), 247–258. https://doi.org/10.1080/01944369908976055
Central Vermont Regional Planning Commission. (2021). Flood Resilience Planning. Hazard Mitigation Planning. https://centralvtplanning.org/programs/hazard-mitigation-planning/flood-resiliency/
Chriest, A., & Niles, M. (2018). The role of community social capital for food security following an extreme weather event. Journal of Rural Studies, 64, 80–90. https://doi.org/10.1016/j.jrurstud.2018.09.019
Cimellaro, G. P., Reinhorn, A. M., & Bruneau, M. (2010). Seismic resilience of a hospital system. Structure and Infrastructure Engineering, 6(1–2), 127–144. https://doi.org/10.1080/15732470802663847
City and County of Honolulu. (2019). Ola: O’ahu Resilience Strategy. https://resilientcitiesnetwork.org/downloadable_resources/Network/Honolulu-Resilience-Strategy-English.pdf
City of Berkeley. (2016). Berkeley Resilience Strategy: A strategic preparedness plan for Berkeley, a community known for inclusiveness and innovation. https://resilientcitiesnetwork.org/downloadable_resources/Network/Berkeley-Resilience-Strategy-English.pdf
City of Los Angeles. (2018). Resilient Los Angeles. https://resilientcitiesnetwork.org/downloadable_resources/Network/Los-Angeles-Resilience-Strategy-English.pdf
City of New Orleans. (2015). Resilient New Orleans: Strategic actions to shape our future city. https://resilientcitiesnetwork.org/downloadable_resources/Network/New-Orleans-Resilience-Strategy-English.pdf
City of Oakland. (2016). Resilient Oakland: It takes a town to thrive. https://resilientcitiesnetwork.org/downloadable_resources/Network/Oakland-Resilience-Strategy-English.pdf
Claro, J., Danly, S., Warren, B., Kahler, E., Willard, A., & Harris, K. (2021). Vermont Agriculture and Food System Strategic Plan 2021—2030. Vermont Sustainable Jobs Fund; Farm to Plate Network; Vermont Agency of Agriculture, Food and Markets. https://www.vtfarmtoplate.com/assets/resource/files/Vermont%20Agriculture%20and%20Food%20
Community Development Vermont Climate Assessment, 2021 463
System%20Strategic%20Plan%202021-2030.pdf
Consoer, M., & Milman, A. (2016). The dynamic process of social capital during recovery from Tropical Storm Irene in Vermont. Natural Hazards, 84(1), 155–174. https://doi.org/10.1007/s11069-016-2412-z
Coven, J., Gupta, A., & Yao, I. (2020). Urban Flight Seeded the COVID-19 Pandemic Across the United States. SSRN Electronic Journal. https://doi.org/10.2139/ssrn.3711737
Cucuzza, M., Stoll, J. S., & Leslie, H. M. (2020). Comprehensive plans as tools for enhancing coastal community resilience. Journal of Environmental Planning and Management, 63(11), 2022–2041. https://doi.org/10.1080/09640568.2019.1700943
Cutter, S. L., Barnes, L., Berry, M., Burton, C., Evans, E., Tate, E., & Webb, J. (2008). Community and regional resilience: Perspectives from hazards, disasters, and emergency management (CARRI Research Report No. 1). Community & Regional Resilience Institute.
Davis, M. (2017). One Way to Avoid Storm Damage: Knock Down Flood-Prone Homes. Seven Days. https://www.sevendaysvt.com/vermont/one-way-to-avoid-storm-damage-knock-down-flood-prone-homes/Content?oid=8079035
de Bruijn, K. M., Maran, C., Zygnerski, M., Jurado, J., Burzel, A., Jeuken, C., & Obeysekera, J. (2019). Flood Resilience of Critical Infrastructure: Approach and Method Applied to Fort Lauderdale, Florida. Water, 11(3), 517. https://doi.org/10.3390/w11030517
Department of Homeland Security. (n.d.). Flood Apex Program. Community and Infrastructure Resilience. Retrieved August 3, 2021, from https://www.dhs.gov/science-and-technology/flood-apex
Department of Public Safety Vermont Emergency Management. (2021). Local Emergency Management Plan. Local and State Plans. https://vem.vermont.gov/plans/lemp
DeWeese-Boyd, M. (2005). Community versus development? Land use and development policy in Vermont as a tool toward community viability. Community Development Journal, 41(3), 334–351. https://doi.org/10.1093/cdj/bsi060
Edgar, C. (2021). Vermonters Respond to the Climate Crisis with Grief and Action. Seven Days. https://www.sevendaysvt.com/vermont/vermonters-respond-to-the-climate-crisis-with-grief-and-action/Content?oid=29469235
EnviroCert International, Inc. (2021). About The National Green Infrastructure Certification Program. https://ngicp.org/about/
Esri, HERE, Garmin, FAO, USGS, EPA, & NPS. (2019). Vermont Transportation Flood Resilience Tool. Vermont Department of Transportation. https://roadfloodresilience.vermont.gov/#/map
FEMA. (n.d.). Declared Disasters, Vermont. Federal Emergency Management Agency. Retrieved August 2, 2021, from https://www.fema.gov/disaster/declarations?field_dv2_declaration_type_value=All&field_dv2_incident_type_target_id_selective=All&field_dv2_state_territory_tribal_value=VT&field_year_value=All&page=0
Community Development Vermont Climate Assessment, 2021 464
FEMA. (2019). CRS Insurance Savings Report, Vermont. Federal Emergency Management Agency.https://floodready.vermont.gov/sites/floodready/files/documents/cisrpt_6.18.19.PDF
FEMA. (2021a). Building Resilient Infrastructure and Communities. Hazard Mitigation Assistance Grants. Federal Emergency Management Agency. https://www.fema.gov/grants/mitigation/building-resilient-infrastructure-communities
FEMA. (2021b). Emergency Food and Shelter Program. FEMA Grants. Federal Emergency Management Agency. https://www.fema.gov/grants/emergency-food-and-shelter-program
FEMA. (2021c). FEMA Grants. Federal Emergency Management Agency. https://www.fema.gov/grants
FEMA. (2021d). Hazard Mitigation Planning. Emergency Management. Federal Emergency Management Agency.https://www.fema.gov/emergency-managers/risk-management/hazard-mitigation-planning
FEMA. (2021e). Preparedness Grants. FEMA Grants. Federal Emergency Management Agency. https://www.fema.gov/grants/preparedness
Flood Ready Vermont. (2021). Flood Resilience Element. Update Your Plans. https://floodready.vermont.gov/update_plans/municipal_plan/flood_resilience
Folke, C. (2006). Resilience: The emergence of a perspective for social–ecological systems analyses. Global Environmental Change, 16(3), 253–267. https://doi.org/10.1016/j.gloenvcha.2006.04.002
Folke, C., Carpenter, S. R., Walker, B., Scheffer, M., Chapin, T., & Rockström, J. (2010). Resilience Thinking: Integrating Resilience, Adaptability and Transformability. Ecology and Society, 15(4). https://doi.org/10.5751/ES-03610-150420
Geiger, K. (n.d.). Act 250. Two Rivers-Ottauquechee Regional Commission. Retrieved August 11, 2021, from https://www.trorc.org/act-250-and-other-permitting/
Golestaneh, L., Neugarten, J., Fisher, M., Billett, H. H., Gil, M. R., Johns, T., Yunes, M., Mokrzycki, M. H., Coco, M., Norris, K. C., Perez, H. R., Scott, S., Kim, R. S., & Bellin, E. (2020). The association of race and COVID-19 mortality. EClinicalMedicine, 25. https://doi.org/10.1016/j.eclinm.2020.100455
Gourevitch, J. D., Koliba, C., Rizzo, D. M., Zia, A., & Ricketts, T. H. (2021). Quantifying the social benefits and costs of reducing phosphorus pollution under climate change. Journal of Environmental Management, 293. https://doi.org/10.1016/j.jenvman.2021.112838
Green Mountain Power. (2020). Cow Power. https://greenmountainpower.com/help/cow-power/
Hallenbeck, T. (2015). Will Lower Property Values be the Trend Along Lake Champlain? Seven Days. https://www.sevendaysvt.com/OffMessage/archives/2015/07/03/will-lower-property-values-be-the-trend-along-lake-champlain
Hauer, M. E. (2017). Migration induced by sea-level rise could reshape the US population landscape. Nature Climate Change, 7(5), 321–325. https://doi.org/10.1038/nclimate3271
Community Development Vermont Climate Assessment, 2021 465
Heard, B. R., Miller, S. A., Liang, S., & Xu, M. (2017). Emerging challenges and opportunities for the food–energy–water nexus in urban systems. Current Opinion in Chemical Engineering, 17, 48–53. https://doi.org/10.1016/j.coche.2017.06.006
Heintz, P. (2020). Has Phil Scott Made Vermont More Affordable? Seven Days. https://www.sevendaysvt.com/vermont/has-phil-scott-made-vermont-more-affordable/Content?oid=31373137
Hudson, P., & Botzen, W. J. W. (2019). Cost–benefit analysis of flood-zoning policies: A review of current practice. WIREs Water, 6(6). https://doi.org/10.1002/wat2.1387
Institute for Sustainable Communities. (2013). Vermont’s Roadmap to Resilience: Preparing for Natural Disasters and the Effects of Climate Change in the Green Mountain State. https://resilientvt.files.wordpress.com/2013/12/vermonts-roadmap-to-resilience-web.pdf
International Joint Commission. (2020). International Lake Champlain-Richelieu River Study Board. https://www.ijc.org/en/lcrr
International Lake Champlain-Richelieu River Study Board. (n.d.). Lake Champlain Richelieu River Flood Study 2017/2021 [Brochure]. Retrieved August 2, 2021, from https://www.ijc.org/sites/default/files/vF_EN_LCRR%20Brochure_0318.pdf
International Lake Champlain-Richelieu River Study Board. (2019). The Causes and Impacts of Past Floods in the Lake Champlain-Richelieu River Basin: Historical Information on Flooding. https://www.ijc.org/sites/default/files/2020-03/9056-CMI%20Rapport%20public%20EN-FINAL-HR.pdf
Jepson, E. J., & Haines, A. L. (2014). Zoning for Sustainability: A Review and Analysis of the Zoning Ordinances of 32 Cities in the United States. Journal of the American Planning Association, 80(3), 239–252. https://doi.org/10.1080/01944363.2014.981200
Kelley, K. J. (2013). Burlington Climate-Change Study Fails to Address City’s No. 1 Culprit. Seven Days. https://www.sevendaysvt.com/OffMessage/archives/2013/09/10/burlington-climate-change-study-fails-to-address-citys-no-1-culprit
Kelley, K. J., & Flagg, K. (2014). Here Comes the Sun: Solar is Hot in Chilly Vermont. Seven Days. https://www.sevendaysvt.com/vermont/here-comes-the-sun-solar-is-hot-in-chilly-vermont/Content?oid=2472187
Kim, H., & Marcouiller, D. W. (2020). Making sense of resilience planning and policy in the pursuit of sustainable development and disaster risk reduction. Climate and Development, 12(3), 228–240. https://doi.org/10.1080/17565529.2019.1613215
Lake Champlain Sea Grant. (2021). Flood Resiliency & Shoreline Protection. https://www.uvm.edu/seagrant/outreach/flood-resiliency-shoreline-protection#watershedscore
Levine, P., & Kawashima-Ginsberg, K. (2013). Civic Health and the Economy: Making the Connection. National Conference on Citizenship; the Center for Information and Research on Civic Learning and Engagement (CIRCLE) at Tufts University; The John S. and James L. Knight Foundation; and the Corporation for National and Community Service (CNCS). https://www.ca-
Community Development Vermont Climate Assessment, 2021 466
ilg.org/sites/main/files/file-attachments/civic_health_and_the_economy.pdf
Levine, S., MacKay, N., Shupe, B., Dunkiel, B., Barry Lampke, & Mandell, B. (2007). State of Vermont Smart Growth 2007 Progress Report. Vermont Smart Growth Collaborative. https://www.vtsmartgrowth.org/fileadmin/files/Collaborative/SMARTGROWTH_PROG_REPORT.pdf
Levitt, A. (2012). A Full Plate: A year after Irene, how do Vermont’s affected eateries and farms fare? Seven Days. https://www.sevendaysvt.com/vermont/a-full-plate/Content?oid=2184653
Lotz, J. (1971). Community Development—A World View. Canadian Journal of Public Health /, 62(4), 314–319.
Manyena, B., Machingura, F., & O’Keefe, P. (2019). Disaster Resilience Integrated Framework for Transformation (DRIFT): A new approach to theorising and operationalising resilience. World Development, 123, 104587. https://doi.org/10.1016/j.worlddev.2019.06.011
Matyas, D., & Pelling, M. (2015). Positioning resilience for 2015: The role of resistance, incremental adjustment, and transformation in disaster risk management policy. Disasters, 39(s1), s1–s18. https://doi.org/10.1111/disa.12107
McCallum, K. (2021a). Grid Block: Vermont’s Aging Transmission Network Can’t Keep Pace with Green Power Projects. Seven Days. https://www.sevendaysvt.com/vermont/grid-block-vermonts-aging-transmission-network-cant-keep-pace-with-green-power-projects/Content?oid=32560538
McCallum, K. (2021b). Vermont Considers Giving Communities More Say in Building Out Broadband. Seven Days. https://www.sevendaysvt.com/vermont/vermont-considers-giving-communities-more-say-in-building-out-broadband/Content?oid=32713705&_ga=2.75691925.1493791857.1624296574-1169944042.1620934538
McCallum, K., & Picard, K. (2020). Trickle to Torrent: The Climate Crisis Brings Both Deluges and Droughts to Vermont. Seven Days. https://www.sevendaysvt.com/vermont/trickle-to-torrent-the-climate-crisis-brings-both-deluges-and-droughts-to-vermont/Content?oid=31477092
McKibben, B. (2020). What Vermont and its History Might Teach the Nation About Handling the Coronavirus. The New Yorker. https://www.newyorker.com/news/daily-comment/what-vermont-and-its-history-might-teach-the-nation-about-handling-the-coronavirus
Morse, C. (2018). The Multifunctionality of Country Stores: Insights on Resilience from Rural Vermont. Geographical Review, 108(3), 457–475. https://doi.org/10.1111/gere.12264
Multi-Hazard Mitigation Council. (2019). Natural Hazard Mitigation Saves: 2019 Report. National Institute of Building Sciences. https://www.nibs.org/files/pdfs/NIBS_MMC_MitigationSaves_2019.pdf
National Agricultural Statistics Service, Agricultural Statistics Board, & United States Department of Agriculture. (2021). Crop Production (No. 1936–3737). U.S. Department of Agriculture. https://downloads.usda.library.cornell.edu/usda-esmis/files/tm70mv177/1544ck71q/0c484d82x/crop0621.pdf
Community Development Vermont Climate Assessment, 2021 467
Nelson, A. C., & French, S. P. (2002). Plan Quality and Mitigating Damage from Natural Disasters: A Case Study of the Northridge Earthquake with Planning Policy Considerations. Journal of the American Planning Association, 68(2), 194–207. https://doi.org/10.1080/01944360208976265
Ni, N., Little, R. G., Sharkey, T. C., & Wallace, W. (2019). Modelling the recovery of critical commercial services and their interdependencies on civil infrastructures. International Journal of Critical Infrastructures, 15(4), 355–382.
NOAA, & National Integrated Drought Information System. (n.d.). Current U.S. Drought Monitor Conditions for Vermont. Retrieved August 3, 2021, from https://www.drought.gov/states/vermont/
Ober, L. (2011a). No, You Really Can’t Get There from Here—A Reporter’s Irene Notebook. Seven Days. https://www.sevendaysvt.com/vermont/no-you-really-cant-get-there-from-here-a-reporters-irene-notebook-photos/Content?oid=2180512
Ober, L. (2011b). Shelter From the Storm. Seven Days. https://www.sevendaysvt.com/vermont/shelter-from-the-storm/Content?oid=2144411
Ober, L. (2011c). Meals that Heal: After the flood, a community comes together to feed its own. Seven Days. https://www.sevendaysvt.com/vermont/meals-that-heal/Content?oid=2144476
Ospina, A. V., Faulkner, D., & Dickerson, K. (2014). Resilient Pathways: The adaptation of the ICT sector to climate change. ITU; T-Mobile; UNESCO. https://www.itu.int/en/ITU-T/climatechange/Documents/Publications/Resilient_Pathways-E.PDF
Paul, M., & Milman, A. (2017). A question of ‘fit’: Local perspectives on top-down flood mitigation policies in Vermont. Journal of Environmental Planning and Management, 60(12), 2217–2233. https://doi.org/10.1080/09640568.2017.1283298
Pealer, S. (2012). Lessons from Irene: Building resiliency as we rebuild. Vermont Agency of Natural Resources. https://anr.vermont.gov/sites/anr/files/specialtopics/climate/documents/factsheets/Irene_Facts.pdf
Petenko, E. (2021). Home sales to out-of-state buyers spiked in 2020, data show. VTDigger. https://vtdigger.org/2021/04/19/home-sales-to-out-of-state-buyers-spiked-in-2020-data-show/
Picard, K. (2012). What to Expect from Hurricane Sandy—A Seven Days Preparedness Guide. Seven Days. https://www.sevendaysvt.com/OffMessage/archives/2012/10/29/what-to-expect-from-hurricane-sandy-a-seven-days-preparedness-guide
Picard, K. (2014). Irene’s Silicon Lining: Has wiring Bethel changed it for good? Seven Days. https://www.sevendaysvt.com/vermont/irenes-silicon-lining-has-wiring-bethel-changed-it-for-good/Content?oid=2460279
Raub, K. B., Stepenuck, K. F., & Panikkar, B. (2021). Exploring the Food-Energy-Water Nexus Approach to Enhance Coastal Community Resilience Research and Planning. Global Sustainability, Accepted with revision.
Community Development Vermont Climate Assessment, 2021 468
Raub, K. B., Stepenuck, K. F., Panikkar, B., & Stephens, J. C. (2021). An Analysis of Resilience Planning at the Nexus of Food, Energy, Water and Transportation in Coastal US Cities. Sustainability, 13(6316), 1–21. https://doi.org/10.3390/su13116316
Reilly, M.L. (2021). Reilly & Watts: Vermont Can Lead the Way Towards Healing Democracy. VTDigger. https://vtdigger.org/2021/06/20/reilly-watts-vermont-can-lead-the-way-toward-healing-democracy/
Remsen, N. (2015). Waterbury Works: Completing a Town’s Post-Irene Comeback. Seven Days. https://www.sevendaysvt.com/vermont/waterbury-works-completing-a-towns-post-irene-comeback/Content?oid=2851581
Renewable Energy Vermont. (2021). Go Renewable: Ground Source Heating. Geothermal. https://www.revermont.org/go-renewable/heating-cooling/geothermal/
Resilient Vermont. (n.d.). The Resilient Vermont Project. Retrieved August 13, 2021, from https://resilientvt.org/
Ripley, P. (n.d.). Vermont Clothing Company Stays Resilient with New Website. Vermont Council on Rural Development. Retrieved July 9, 2021, from https://www.vtrural.org/programs/digital-economy/updates/boysenberry
Romero-Lankao, P., & Norton, R. (2018). Interdependencies and Risk to People and Critical Food, Energy, and Water Systems: 2013 Flood, Boulder, Colorado, USA. Earth’s Future, 6(11), 1616–1629. https://doi.org/10.1029/2018EF000984
Rousseau, A. (2020). Assessment of the Role of Wetlands, Temporary Flooding of Farmlands and Potentially Developing Wetlands on Flows and Water Levels in the LCRR Basin. Technical Webinar - Watershed Storage, International Lake Champlain-Richelieu River Study Board. https://www.ijc.org/en/lcrr/watershed-storage-webinar-presentation
Schliff, R., Fitzgerald, E., Boardman, E., Gibson, L., Marshall, N., Padilla, L., & Segale, J. (2018). The Vermont Transportation Resilience Screening Tool (TRPT) (https://roadfloodresilience.vermont.gov/). Prepared by Milone & MacBroom, Inc., Fitzgerald Environmental Associates, DuBois & King, Smart Mobility, and Stone Environmental for and in collaboration with the Vermont Agency of Transportation, Montpelier, VT. https://vtrans.vermont.gov/sites/aot/files/planning/documents/planning/TRPT%20User%20Guide%201.0.pdf
Shaw, A., Lustgarten, A., ProPublica, & Goldsmith, J. W. (2020). New Climate Maps Show a Transformed United States. ProPublica. https://projects.propublica.org/climate-migration/
Shi, L., Chu, E., Anguelovski, I., Aylett, A., Debats, J., Goh, K., Schenk, T., Seto, K. C., Dodman, D., Roberts, D., Roberts, J. T., & VanDeveer, S. D. (2016). Roadmap towards justice in urban climate adaptation research. Nature Climate Change, 6(2), 131–137. https://doi.org/10.1038/nclimate2841
Singh, N. K., Gourevitch, J. D., Wemple, B. C., Watson, K. B., Rizzo, D. M., Polasky, S., & Ricketts, T. H. (2019). Optimizing wetland restoration to improve water quality at a regional scale. Environmental Research Letters, 14(6). https://doi.org/10.1088/1748-9326/ab1827
Community Development Vermont Climate Assessment, 2021 469
Singh, N. K., Wemple, B. C., Bomblies, A., & Ricketts, T. H. (2018). Simulating stream response to floodplain connectivity and revegetation from reach to watershed scales: Implications for stream management. Science of The Total Environment, 633, 716–727. https://doi.org/10.1016/j.scitotenv.2018.03.198
Smith, G., Sandler, D., & Goralnik, M. (2013). Assessing State Policy Linking Disaster Recovery, Smart Growth, and Resilience in Vermont Following Tropical Storm Irene. Vermont Journal of Environmental Law, 15(1), 66. https://doi.org/10.2307/vermjenvilaw.15.1.66
Sollberger, E. (2011). Wilmington, One Month After Irene. Seven Days. https://www.sevendaysvt.com/vermont/wilmington-one-month-after-irene-241/Content?oid=2291617
State of Vermont. (2017). Electric. Department of Public Service. https://web.archive.org/web/20170121235950/http:/publicservice.vermont.gov/electric
State of Vermont. (2021a). 10-Year Telecommunications Plan. Department of Public Service. https://publicservice.vermont.gov/content/10-year-telecommunications-plan
State of Vermont. (2021b). Adapt Buildings and Critical Infrastructure. Flood Ready Vermont. https://floodready.vermont.gov/improve_infrastructure/adapt_infrastructure
State of Vermont. (2021c). Emergency Relief and Assistance Fund. Flood Ready Vermont. https://floodready.vermont.gov/find_funding/emergency_relief_assistance
State of Vermont. (2021d). Green Infrastructure. Vermont Agency of Natural Resources, Department of Environmental Conservation. https://dec.vermont.gov/water-investment/cwi/solutions/developed-lands/green-infrastructure
State of Vermont. (2021e). Hydroelectric Power. Agency of Natural Resources, Department of Environmental Conservation. https://dec.vermont.gov/watershed/rivers/streamflow-protection/hydroelectric
State of Vermont. (2021f). New Map Tool: Acquisitions of Buildings in Flood Hazard Zones. Flood Ready Vermont. https://floodready.vermont.gov/node/772
State of Vermont. (2021g). Welcome to Flood Ready Vermont. Flood Ready Vermont. https://floodready.vermont.gov/
State of Vermont Agency of Commerce and Community Development. (2021). Municipal Planning Manual. Community Development. https://accd.vermont.gov/community-development/town-future/municipal-planning-manual
State of Vermont Natural Resources Board. (2021). Act 250 Criteria (overview). Act 250 Permit Application. https://nrb.vermont.gov/act250-permit/criteria
Stepenuck, K. F., & Eaton, A. (2020). Stormwater Education Methods. https://sites.google.com/view/stormwatereducationmethods/home
Community Development Vermont Climate Assessment, 2021 470
Tacy, R., Hanson, S., & Poulin, J. (2020). Climate Migration in Vermont: Receiving Areas, Key Demographics, and Potential Impacts on Natural and Social Resources.
Thomas, D. S. K., Phillips, B. D., Lovekamp, W. E., & Fothergill, A. (2013). Social vulnerability to disasters. http://search.ebscohost.com/login.aspx?direct=true&scope=site&db=nlebk&db=nlabk&AN=1728756
Townshend, I., Awosoga, O., Kulig, J., & Fan, H. (2015). Social cohesion and resilience across communities that have experienced a disaster. Natural Hazards, 76(2), 913–938. https://doi.org/10.1007/s11069-014-1526-4
Two Rivers Ottauquechee Regional Commission. (n.d.). Local Emergency and Hazard Plans. Emergency Management. Retrieved August 11, 2021, from https://www.trorc.org/programs/emergency/plans/
University of New Hampshire. (2021). Stormwater Management Certificate. https://training.unh.edu/Stormwater
University of Vermont. (n.d.). Local Democracy Project: Building civic infrastructure for more informed, engaged, and equitable Vermont communities. Project 14. Retrieved August 4, 2021, from https://www.project14.net
U.S. Census Bureau. (2010). Data file from Geography Division based on the TIGER/Geographic Identification Code Scheme (TIGER/GICS) computer file. Geography/TIGER; American FactFinder.
U.S. Census Bureau. (2019). Population and Housing Unit Estimates. Population Estimates Program (PEP).
U.S. Department of Commerce. (2012). Economic Impact Assessment, Economic Recovery Support Function (Vermont DR-4022). http://www.lcbp.org/wp-content/uploads/2013/03/VT-Economic-Impact-Irene-2012.pdf
USGCRP. (2018). Impacts, Risks, and Adaptation in the United States: Fourth National Climate Assessment, Volume II: [Reidmiller, D.R., C.W. Avery, D.R. Easterling, K.E. Kunkel, K.L.M. Lewis, T.K. Maycock, and B.C. Stewart (eds.)]. U.S. Global Change Research Program, Washington, DC, USA, 1515 pp. doi: 10.7930/NCA4.2018.
Van Zandt, S., Peacock, W. G., Henry, D. W., Grover, H., Highfield, W. E., & Brody, S. D. (2012). Mapping social vulnerability to enhance housing and neighborhood resilience. Housing Policy Debate, 22(1), 29–55. https://doi.org/10.1080/10511482.2011.624528
VCGI. (2021). Review of residential property sales involving out-of-state buyers from 2017 to end of 2020. Property Transfer Data Analysis. Vermont Center for Geographic Information. https://ptt.mapvt.com/
Vermont Agency of Natural Resources. (2017). 2017 Vermont Stormwater Management Manual Rule and Design Guidance. Vermont Agency of Natural Resources.
Vermont Climate Change Economy Council. (2016). Progress for Vermont: Advancing our economic future in an age of climate change. Vermont Council on Rural Development. https://www.vtrural.org/sites/default/files/content/ClimateEconomy/ProgressForVermont.pdf
Community Development Vermont Climate Assessment, 2021 471
Vermont Council on Rural Development. (n.d.-a). Solar = Business and Job Opportunities for Vermont. Climate Economy. Retrieved August 4, 2021, from https://www.vtrural.org/programs/climate-economy/innovator/GrassrootsSolar
Vermont Council on Rural Development. (n.d.-b). The Right House. Climate Economy. Retrieved August 4, 2021, from https://www.vtrural.org/programs/climate-economy/innovator/Hunt
Vermont Council on Rural Development. (n.d.-c). Vermont Climate Economy Initiative. Climate Economy. Retrieved August 4, 2021, from https://www.vtrural.org/programs/climate-economy
Vermont Council on Rural Development. (n.d.-d). Vermont Digital Economy Project. Retrieved August 4, 2021, from https://www.vtrural.org/programs/digital-economy
Vermont DEC. (2021). Municipal Assistance. Watershed Management. Vermont Department of Environmental Conservation. https://dec.vermont.gov/watershed/rivers/river-corridor-and-floodplain-protection/municipal-assistance
Vermont DEC. (2018a). Vermont Groundwater Management Plan. Vermont Department of Environmental Conservation. https://dec.vermont.gov/sites/dec/files/dwgwp/DW/2018%20Groundwater%20Management%20Plan.pdf
Vermont DEC. (2018b). Vermont Guide to Stormwater Management for Homeowners and Small Businesses. Vermont Department of Environmental Conservation. https://dec.vermont.gov/sites/dec/files/wsm/erp/docs/2018-06-14%20VT_Guide_to_Stormwater_for_Homeowners.pdf
Vermont Department of Health. (2021a). Drinking Water. Health & The Environment. https://www.healthvermont.gov/environment/drinking-water
Vermont Department of Health. (2021b). Hospitals & Health Systems. Health Professionals & Systems. https://www.healthvermont.gov/systems/hospitals
Vermont Department of Housing and Community Development. (2016). Flood Resilience Checklist for Vermont Communities. https://accd.vermont.gov/sites/accdnew/files/documents/CD/CPR/CPR-Flood_Resilience_Checklist_FORM_distributed.pdf
Vermont Emergency Management. (2018). 2018 Vermont State Hazard Mitigation Plan: Making Vermont safer and more resilient in the face of climate change and natural disasters. https://vem.vermont.gov/sites/demhs/files/documents/2018%20Vermont%20State%20Hazard%20Mitigation%20Plan%20-%20Final%20Adopted_Interactive.pdf
Vermont H. 401 Act 16. (2013). An act relating to municipal and regional planning and flood resilience. https://legislature.vermont.gov/Documents/2014/Docs/ACTS/ACT016/ACT016%20As%20Enacted.pdf
Vermont Natural Resources Council. (2012). Welcome. Vermont Smart Growth Collaborative. https://www.vtsmartgrowth.org/#:~:text=The%20Vermont%20Smart%20Growth%20Collaborative,while%20protecting%20Vermont's%20open%20landscape
Community Development Vermont Climate Assessment, 2021 472
Vermont Natural Resources Council. (2013). Resilient Communities Scorecard. https://vnrc.org/community-planning-toolbox/tools/resilient-communities-scorecard/
Vermont Natural Resources Council. (2021). Smart Growth Report Card. https://vnrc.org/smart-growth/report-card/
Vermont Pub. L. No. 79, H.513. (2019). An act relating to broadband deployment throughout Vermont, https://legislature.vermont.gov/Documents/2020/Docs/ACTS/ACT079/ACT079%20As%20Enacted.pdf
Walsh, L., Craddock, H. A., Strauss-Riggs, K., & Schor, K. (2015). Learning Needs in Disaster Recovery: Perceptions of Community Health Recovery After Hurricanes Irene and Sandy: Learning Needs in Disaster Recovery. Risk, Hazards & Crisis in Public Policy, 6(2), 145–163. https://doi.org/10.1002/rhc3.12082
Wang, B. (2021). How Does COVID-19 Affect House Prices? A Cross-City Analysis. Journal of Risk and Financial Management, 14(2), 47. https://doi.org/10.3390/jrfm14020047
Watson, K. B., Ricketts, T., Galford, G., Polasky, S., & O’Niel-Dunne, J. (2016). Quantifying flood mitigation services: The economic value of Otter Creek wetlands and floodplains to Middlebury, VT. Ecological Economics, 130, 16–24. https://doi.org/10.1016/j.ecolecon.2016.05.015
Wertlieb, M., & Smith, M. F. (2021). Limited Inventory, Many Out-of-state Buyers Keep Vermont Home Sales Unattainably Brisk. Vermont Public Radio. https://www.vpr.org/post/limited-inventory-many-out-state-buyers-keep-vermont-home-sales-unattainably-brisk#stream/0
Winkler, R. L., & Rouleau, M. D. (2020). Amenities or disamenities? Estimating the impacts of extreme heat and wildfire on domestic US migration. Population and Environment. https://doi.org/10.1007/s11111-020-00364-4
Carbon Sequestration in Agricultural Soils Vermont Climate Assessment, 2021 473
10 carbon sequestration in agricultural soils
Recommended Citation for Chapter Horner, C., Roy, E., 2021. Carbon Sequestration in Agricultural Soils. In Galford, G.L., Faulkner, J. et al. (Eds), The Vermont Climate Assessment 2021. Burlington, Vermont: Gund Institute for Environment at the University of Vermont. On the web: https://vtclimate.org
Eric D. Roy Rubenstein School of Environment and Natural Resources, Department of Civil and Environmental Engineering, and Gund Institute for Environment, University of Vermont, Burlington, Vermont 05405
Catherine E. Horner Department of Plant and Soil Science, and Gund Institute for Environment, University of Vermont, Burlington, Vermont 05405
Carbon Sequestration in Agricultural Soils Vermont Climate Assessment, 2021 474
10.1 key messages
1. The soil carbon sequestration potential of agricultural management practices in
Vermont is uncertain and likely mediated by site-specific factors such as soil type,
geography, land use history, and weather. Climate change mitigation benefits are
possible but not guaranteed from the use of common practices implemented to
sequester carbon (such as cover cropping, conservation tillage, no-till, and rotational
grazing) on Vermont agricultural lands. There is evidence, however, that these
practices can improve soil health and increase farm resilience to climate change.
2. Assigning carbon offsets or payments for climate mitigation services provided by
Vermont agricultural lands based on practice adoption alone currently lacks a strong
scientific foundation. Further investigation and monitoring is needed to improve
understanding of management practices and soil carbon sequestration, including field
studies and modeling. Well-calibrated models, validated for application in Vermont,
have potential for identifying relationships between management change(s) and
carbon dynamics. Participatory research that engages the expertise and needs of
farmers is necessary to assess the local impacts of best management practices and
make projections into the future.
3. Whole-system accounting is required to assess potential trade-offs and to determine
net climate change mitigation benefits of soil management strategies. Changes in soil
carbon stocks at a given location are only one piece in climate mitigation accounting.
In all cases where offsite carbon sources are being used to boost soil organic carbon, a
broader life cycle assessment extending beyond the farm gate is needed that considers
offsite carbon source removal, transport, and processing; alternative end uses of the
carbon source; interactions with other soil GHG-producing processes; and synergies
between the soil amendments and the input of in situ plant-derived carbon. It is critical
to keep in mind the primary objective: increase the net transfer of CO2-equivalents from
Carbon Sequestration in Agricultural Soils Vermont Climate Assessment, 2021 475
atmosphere to land. Only strategies achieving this primary objective should be
considered climate mitigation. Failing to account for other fluxes of carbon and
greenhouse gases could result in unintended consequences due to trade-offs.
10.2 additional summary points
• It is imperative to ground statewide climate mitigation efforts in Vermont firmly within
the most recent scientific evidence and to highlight key scientific uncertainties and
knowledge gaps that have policy implications.
• The soil carbon sequestration potential of agricultural management practices is
inconsistent across the literature and is mediated by site-specific factors such as soil
type, geography, land use history, and weather.
• More research is needed to improve understanding of how management practices
affect both shallow (0-30 cm) and deeper (>30 cm) soil layers.
• Climate change mitigation benefits are possible but not guaranteed from the use of
common practices implemented to sequester carbon (such as cover cropping,
conservation tillage, no-till, and rotational grazing) on Vermont agricultural lands.
However, there is consistent evidence that these practices improve soil health and
increase farm resilience to climate change.
• Monitoring is necessary to quantify climate mitigation benefits of specific practices
applied across multiple Vermont agricultural contexts.
• Well-calibrated models, validated using local data, hold promising potential to identify
relationships between management change(s) in a particular context and ensuing
change(s) in net C fluxes, but such models do not yet exist for application in Vermont.
• Assigning carbon offsets or payments for climate mitigation services provided by
Vermont agricultural lands based on practice adoption alone currently lacks a reliable
and consistent scientific foundation.
• Changes in soil carbon stocks are only one piece in climate mitigation accounting.
Whole-system accounting is required to assess potential trade-offs and to determine
net climate change mitigation benefits of soil management strategies.
Carbon Sequestration in Agricultural Soils Vermont Climate Assessment, 2021 476
• Farm resilience is vital, and farmers should be supported in implementing best
management practices for improving financial and ecological resilience.
• Participatory research that engages the expertise and needs of farmers is necessary to
assess the local impacts of best management practices and make projections into the
future.
10.3 introduction
Agricultural soil health has become an increasingly popular topic in Vermont and other New
England states in the past 10 years. From scholarship (Jemison et al., 2019; Kersbergen, 2012;
Bakelaar et al., 2016; Adair et al., 2019) to popular news coverage (Foster, 2021; Leslie, 2020),
the topic is receiving considerable attention. Amidst the growing interest in soil health, there is
a particular focus on the potential for agricultural soils to sequester atmospheric carbon and
thereby contribute to the mitigation of climate change. In the State of Vermont’s 2021
legislative session, bills were proposed to: establish a statewide definition of and commitment
to soil health and implement carbon sequestration tax credits as part of a statewide payment
for ecosystem services program. Interest in soil carbon was also evident in a 2020 survey
administered as part of the UVM-ARS partnership. Survey respondents identified soil organic
matter and active carbon as two of the five most important metrics for assessing soil health
on Vermont’s small- and medium-sized farms. Similarly, respondents identified interactions
between soil health and climate as one of the top three research and outreach priorities for the
University of Vermont (Neher et al., 2021).
Interest in agricultural soil carbon sequestration in Vermont is likely influenced by large-scale
policies and initiatives established elsewhere. This includes the “4 per 1000 Initiative” for
increasing soil organic carbon stocks, also known as “4 per mille” or “4‰,” which was
launched by the French Ministry of Agriculture in 2015 for the 21st Conference of Parties of
the United Nations Framework Convention on Climate Change (UNFCCC). This initiative
aspires to increase global soil organic carbon stocks by 0.4% per year to offset the global
emissions of greenhouse gases (GHGs) by anthropogenic sources. The initiative mainly
Carbon Sequestration in Agricultural Soils Vermont Climate Assessment, 2021 477
focuses on agricultural soils with relatively low levels of soil organic carbon and encourages
farm management practices that preserve and increase soil organic carbon stocks while
limiting carbon trade-offs (Rumpel et al., 2020). While the goals of climate change mitigation
and increasing soil organic carbon are certainly laudable, the 4 per 1000 Initiative has received
significant criticism from several scientists (Poulton et al., 2018; Rumpel et al., 2020). The
potential for “regenerative agriculture,” which has been defined in various ways (Newton et al.,
2020), to sequester carbon in soils and thereby serve as a climate mitigation tool has also
been the focus of intense scientific debate. For example, the World Resources Institute
recently posted a blog entitled “Regenerative Agriculture: Good for Soil Health, but Limited
Potential to Mitigate Climate Change” (Ranganathan et al., 2020), which engendered both
support (Powlson et al., 2020) and criticism (Paustian et al., 2020) from well-respected
scientists. While these debates are particularly intense at the moment, they are not entirely
new (e.g., Schlesinger, 2000).
It is imperative to ground climate mitigation efforts in Vermont firmly within the most recent
scientific evidence and to highlight key scientific uncertainties and knowledge gaps that have
policy implications. In this chapter, we first briefly describe the underlying biogeochemistry
relevant to climate mitigation by agricultural soils. Second, we review evidence linking
practices associated with “conservation agriculture” or “regenerative agriculture” with climate
mitigation outcomes (carbon emissions, soil carbon storage, nitrogen emissions). Third, we
discuss challenges related to measurement and potential payment schemes. Finally, we close
with recommendations for future efforts in Vermont.
10.4 the biogeochemistry of climate mitigation by agricultural soils
Soils’ physical, chemical, and biological properties and processes are interconnected and can
all be considered aspects of “soil health” (Moebius-Clune, 2016). This is especially important in
the context of climate mitigation, for which the cycling of carbon and nitrogen is key.
Biogeochemistry is a systems science related to the field of ecosystem ecology that
Carbon Sequestration in Agricultural Soils Vermont Climate Assessment, 2021 478
integrates physics, chemistry, biology, and geology (Schlesinger and Bernhardt, 2013),
providing a powerful lens for examining potential climate mitigation by agricultural soils. Using
this lens, some key facts relevant to the assessment of climate mitigation by agricultural soils
are:
• Changes in soil organic carbon storage are driven by the balance between carbon
inputs to and losses from the soil. Carbon inputs to soils can include plant litter
(shoots and roots), root exudates, and exogenous soil amendments (e.g., manure,
compost, or biochar) (Basile-Doelsch et al., 2020). Carbon loss from soils mainly occurs
as CO2 resulting from autotrophic (roots) and heterotrophic (microorganisms and
fauna) respiration, but can also include CH4 emissions that result from methanogenesis
under anaerobic conditions, leaching of dissolved organic carbon, and erosion (Basile-
Doelsch et al., 2020).
• There are two primary levers to increase soil organic carbon storage – increase C
inputs and/or decrease C losses. Increases in carbon inputs to agricultural soils can
potentially be driven by improved crop rotations and increased crop residues, use of
cover crops, conversion to perennial grasses or legumes, additions of manure,
compost, or biochar, or improved grazing land management (Paustian et al., 2019).
Decreases in carbon losses can potentially result from conversion to perennial grasses
or legumes, using conservation or no tillage, or rewetting soils (Paustian et al., 2019).
• Soil organic carbon storage does not necessarily increase linearly with increased C
inputs – and there are limits. While some long-term agricultural field studies have
observed soil C stocks that appear linearly related to the amount of C returned to the
system, others show little or no change in soil organic carbon in response to varying C
input levels, or decreased soil organic carbon stabilization efficiency in high carbon
soils compared to low carbon soils for the same treatment (Stewart et al., 2007).
Saturation limits to soil organic carbon pools have been proposed or observed by
various researchers with emphasis on certain mechanisms (Hassink, 1997; Baldock &
Skjemstad, 2000; Stewart et al., 2007; Owen et al., 2015; Poulton et al., 2018). It may be
possible to shift a soil’s effective C stabilization capacity to some degree through
Carbon Sequestration in Agricultural Soils Vermont Climate Assessment, 2021 479
changes in soil management (Stewart et al., 2007) and more research is needed to
better understand the related mechanisms that determine limits on soil organic carbon
storage (Basile-Doelsch et al., 2020). Despite this uncertainty, it is generally agreed that
the greatest potential for soil carbon sequestration exists on degraded soils with
relatively depleted soil organic carbon (Lal, 2018; Amelung et al., 2020).
• The cycling of other elements, particularly nitrogen and phosphorus, affects soil carbon
storage and greenhouse gas emissions. Nitrogen addition stimulates plant growth
when N availability is a limiting factor and thereby increases C inputs to the soil (Huang
et al., 2020). The same is true for phosphorus. These two elements (and others) must
be available in the soil in adequate amounts to maintain crop productivity and resultant
C inputs to the soil, which has led some to caution that ambitious global goals for
carbon sequestration in agricultural soils will require vast inputs of N and P to soils
(Van Groenigen et al., 2017; Spohn, 2020). Furthermore, nitrogen can be lost from
agricultural soils as nitrous oxide (N2O), an important greenhouse gas, which must be
considered along with soil carbon storage and carbon emissions (CO2, CH4) in the
determination of net climate mitigation benefits (Owen et al., 2015; Guenet et al.,
2020).
10.5 the available evidence linking practices to climate mitigation
10.5.1 Croplands The Nature Conservancy has recently created AgEvidence, a web-based tool to explore the
impact of agricultural practices on crops and the environment (http://www.agevidence.org/,
doi:10.5063/Z31X15). AgEvidence compiles evidence from numerous peer-reviewed field
studies conducted in the US Midwest between 1980 and 2020 that focus on the links between
agricultural practices and in-field response variables. All field trials included in AgEvidence
focused on corn (including sweet corn), soybean, or both. For climate mitigation, AgEvidence
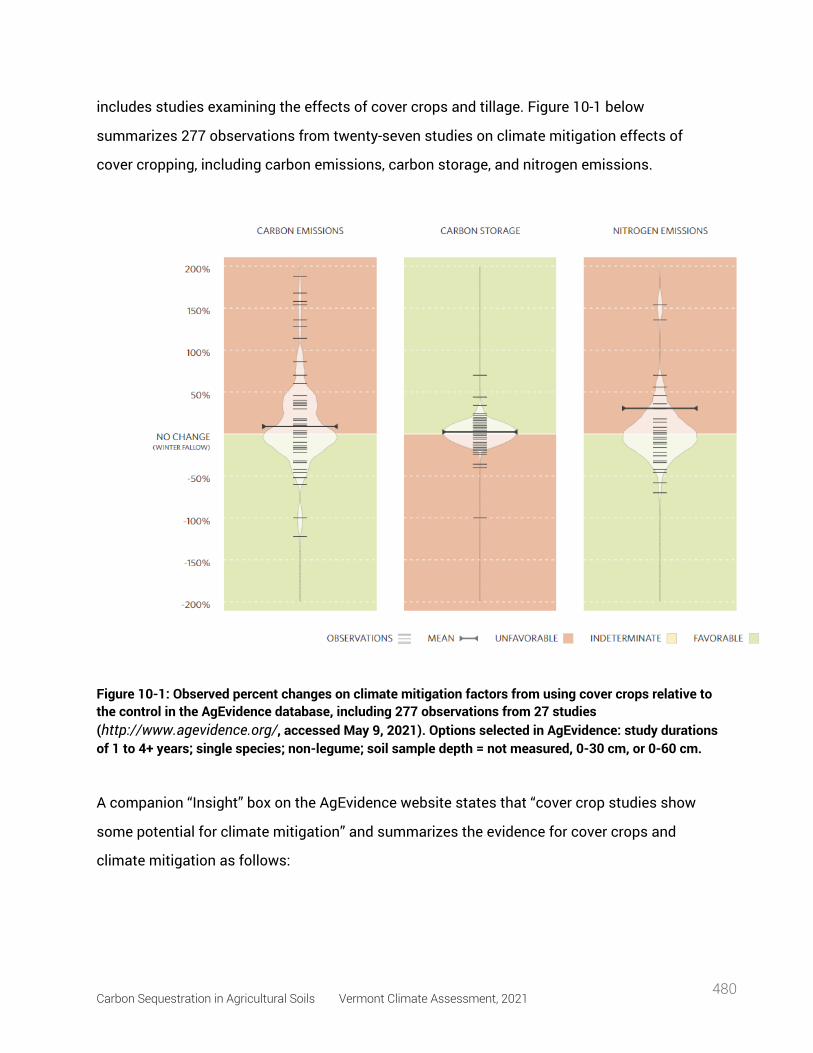
Carbon Sequestration in Agricultural Soils Vermont Climate Assessment, 2021 480
includes studies examining the effects of cover crops and tillage. Figure 10-1 below
summarizes 277 observations from twenty-seven studies on climate mitigation effects of
cover cropping, including carbon emissions, carbon storage, and nitrogen emissions.
Figure 10-1: Observed percent changes on climate mitigation factors from using cover crops relative to the control in the AgEvidence database, including 277 observations from 27 studies (http://www.agevidence.org/, accessed May 9, 2021). Options selected in AgEvidence: study durations of 1 to 4+ years; single species; non-legume; soil sample depth = not measured, 0-30 cm, or 0-60 cm.
A companion “Insight” box on the AgEvidence website states that “cover crop studies show
some potential for climate mitigation” and summarizes the evidence for cover crops and
climate mitigation as follows:
Carbon Sequestration in Agricultural Soils Vermont Climate Assessment, 2021 481
• The use of single species, non-leguminous cover crops is associated with a 3%
increase relative to the control for soil carbon on average. (Note: there are far fewer
observations associated with multiple species cover cropping systems in AgEvidence).
• Soil carbon increases linked to cover crops are greater in topsoil (0-30 cm), whereas
when the 0-60 cm depth was analyzed, changes in soil carbon linked to cover crops
were neutral to slightly negative.
• Caution is warranted when interpreting nitrogen and carbon emissions in Figure 10-1.
Further inspection of the data (see Figure 10-2 below) shows that cover crop usage is
associated with no change in year-round N2O emissions, while growing season
measurements show an increase in N2O with cover crops largely due to results from a
single study where irrigation was present, which is known to increase N2O emissions.
Offseason N2O emissions are also slightly increased with cover crops; however, this
result was strongly influenced by a single study from a manure impacted soil. The
study with irrigation also drives the pattern of higher CH4 emissions with cover crops.
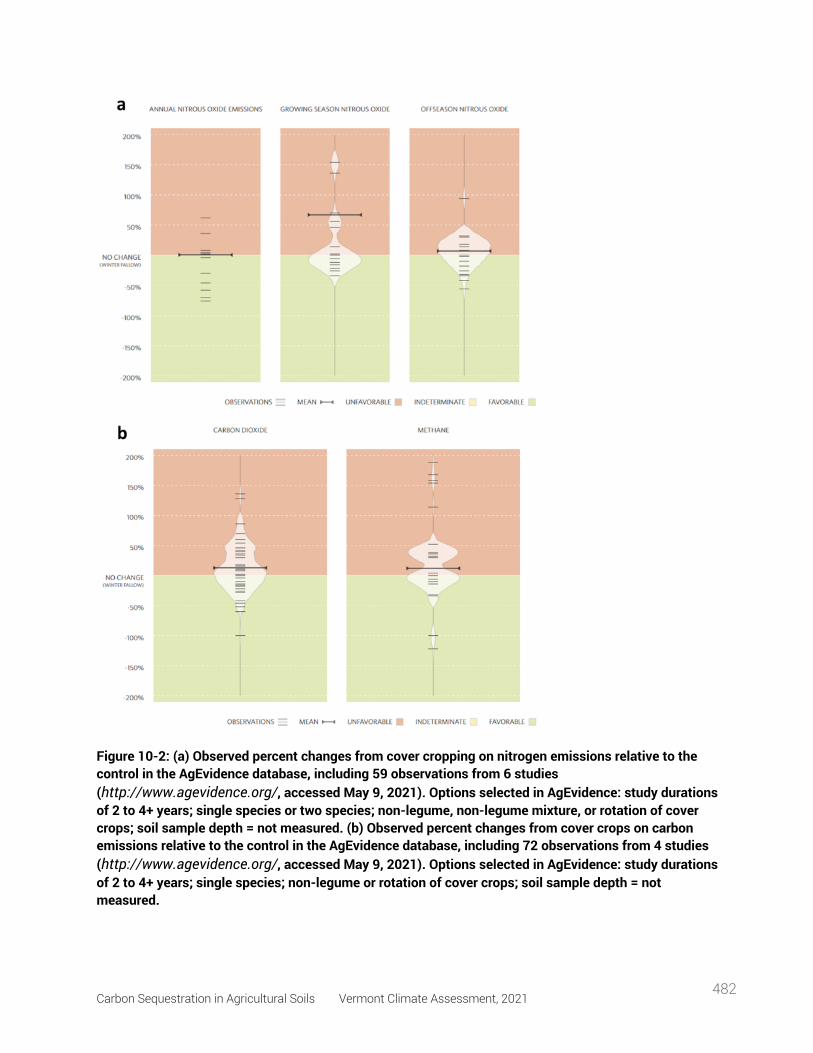
Carbon Sequestration in Agricultural Soils Vermont Climate Assessment, 2021 482
Figure 10-2: (a) Observed percent changes from cover cropping on nitrogen emissions relative to the control in the AgEvidence database, including 59 observations from 6 studies (http://www.agevidence.org/, accessed May 9, 2021). Options selected in AgEvidence: study durations of 2 to 4+ years; single species or two species; non-legume, non-legume mixture, or rotation of cover crops; soil sample depth = not measured. (b) Observed percent changes from cover crops on carbon emissions relative to the control in the AgEvidence database, including 72 observations from 4 studies (http://www.agevidence.org/, accessed May 9, 2021). Options selected in AgEvidence: study durations of 2 to 4+ years; single species; non-legume or rotation of cover crops; soil sample depth = not measured.
Carbon Sequestration in Agricultural Soils Vermont Climate Assessment, 2021 483
Some recently published global meta-analyses provide favorable results for the effect of cover
crops on soil carbon storage. Poeplau and Don (2015) found that cover crop treatments had
significantly higher soil organic carbon stocks compared to reference croplands, with an
annual increase of 0.32 ± 0.08 Mg C ha-1 yr-1. These findings have recently been used as the
basis for large-scale estimates of climate mitigation by cover crops in Canada (Drever et al.,
2021). However, the mean soil depth of sampling in the studies considered by Poeplau and
Don (2015) was only 22 cm, indicating that their assessment could be optimistic given the less
promising results in AgEvidence when deeper soils were included. Furthermore, many of the
studies considered by Poeplau and Don were short-term (2-3 years), which is generally an
insufficient time duration to assess changes in stable forms of soil organic carbon (Smith,
2004). Jian et al. (2020) found that including cover crops in rotations significantly increased
soil organic carbon in near-surface soils by 15.5% and investigate the influence of climatic
region, soil texture, cover crop types, cash crop types, and soil sampling depths. For example,
they report that soil organic carbon increases were greatest for fine-textured soils. However,
Jian et al.’s (2020) meta-analysis results were also largely influenced by short-term (< 5 years)
studies of surface soils (0-30 cm), which suggests their conclusions could also be optimistic.
More research is needed to clearly demonstrate the long-term effects of cover crops on soil
carbon storage generally and within Vermont specifically.
Figure 10-3 below summarizes observations of tillage effects on climate mitigation, including
carbon emissions, carbon storage, and nitrogen emissions. Effects of conservation tillage
(Figure 10-3a) and no-till (Figure 10-3b) are shown separately. As with cover crops, a wide
range in effects of conservation tillage or no tillage spanning from unfavorable to favorable
has been reported in the peer-reviewed literature, with generally favorable mean changes
relative to conventional tillage.
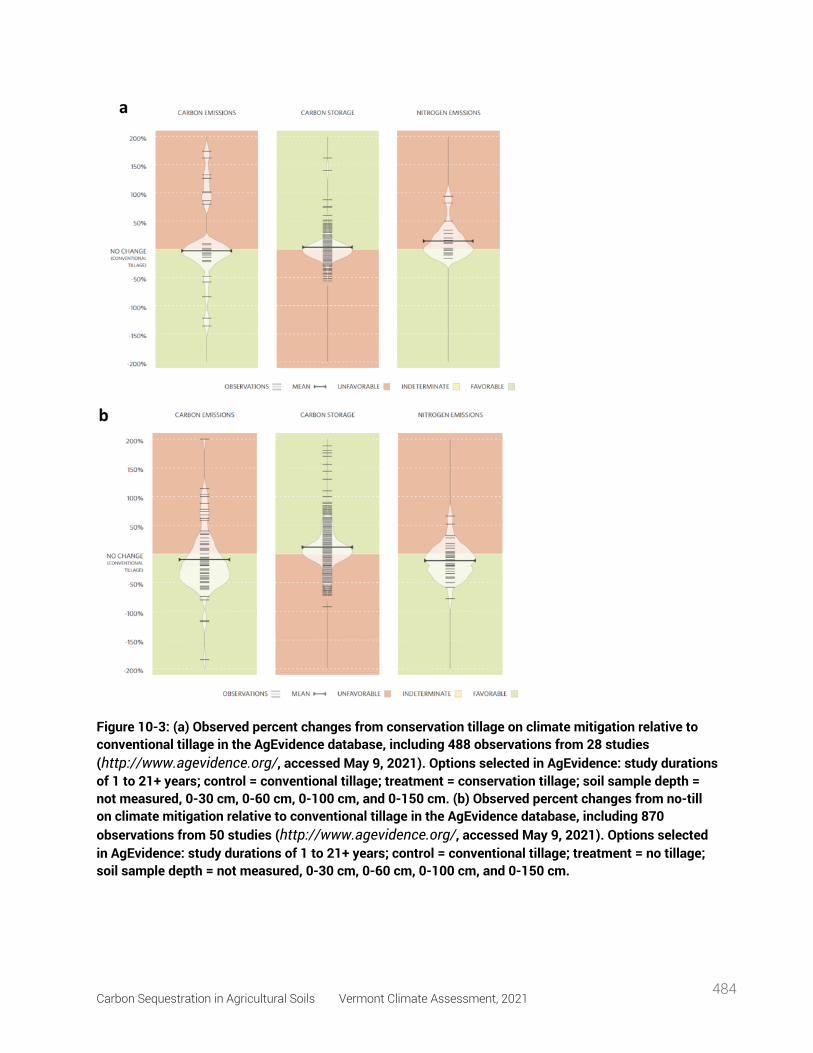
Carbon Sequestration in Agricultural Soils Vermont Climate Assessment, 2021 484
Figure 10-3: (a) Observed percent changes from conservation tillage on climate mitigation relative to conventional tillage in the AgEvidence database, including 488 observations from 28 studies (http://www.agevidence.org/, accessed May 9, 2021). Options selected in AgEvidence: study durations of 1 to 21+ years; control = conventional tillage; treatment = conservation tillage; soil sample depth = not measured, 0-30 cm, 0-60 cm, 0-100 cm, and 0-150 cm. (b) Observed percent changes from no-till on climate mitigation relative to conventional tillage in the AgEvidence database, including 870 observations from 50 studies (http://www.agevidence.org/, accessed May 9, 2021). Options selected in AgEvidence: study durations of 1 to 21+ years; control = conventional tillage; treatment = no tillage; soil sample depth = not measured, 0-30 cm, 0-60 cm, 0-100 cm, and 0-150 cm.
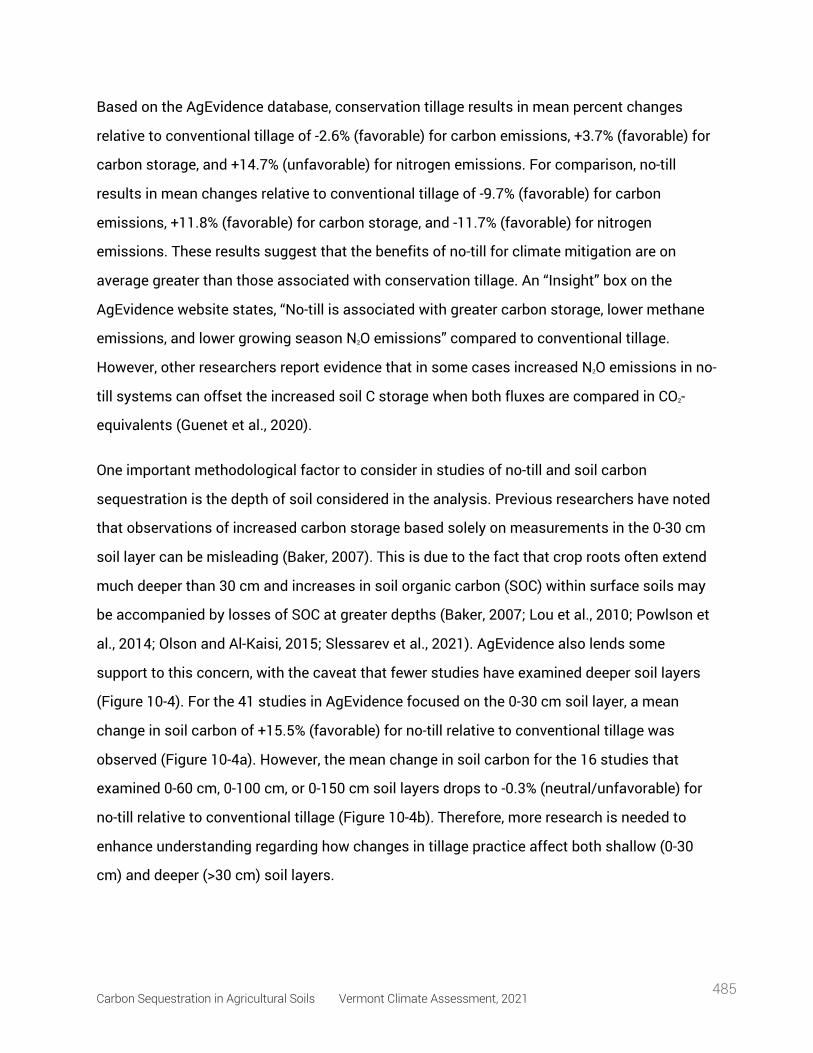
Carbon Sequestration in Agricultural Soils Vermont Climate Assessment, 2021 485
Based on the AgEvidence database, conservation tillage results in mean percent changes
relative to conventional tillage of -2.6% (favorable) for carbon emissions, +3.7% (favorable) for
carbon storage, and +14.7% (unfavorable) for nitrogen emissions. For comparison, no-till
results in mean changes relative to conventional tillage of -9.7% (favorable) for carbon
emissions, +11.8% (favorable) for carbon storage, and -11.7% (favorable) for nitrogen
emissions. These results suggest that the benefits of no-till for climate mitigation are on
average greater than those associated with conservation tillage. An “Insight” box on the
AgEvidence website states, “No-till is associated with greater carbon storage, lower methane
emissions, and lower growing season N2O emissions” compared to conventional tillage.
However, other researchers report evidence that in some cases increased N2O emissions in no-
till systems can offset the increased soil C storage when both fluxes are compared in CO2-
equivalents (Guenet et al., 2020).
One important methodological factor to consider in studies of no-till and soil carbon
sequestration is the depth of soil considered in the analysis. Previous researchers have noted
that observations of increased carbon storage based solely on measurements in the 0-30 cm
soil layer can be misleading (Baker, 2007). This is due to the fact that crop roots often extend
much deeper than 30 cm and increases in soil organic carbon (SOC) within surface soils may
be accompanied by losses of SOC at greater depths (Baker, 2007; Lou et al., 2010; Powlson et
al., 2014; Olson and Al-Kaisi, 2015; Slessarev et al., 2021). AgEvidence also lends some
support to this concern, with the caveat that fewer studies have examined deeper soil layers
(Figure 10-4). For the 41 studies in AgEvidence focused on the 0-30 cm soil layer, a mean
change in soil carbon of +15.5% (favorable) for no-till relative to conventional tillage was
observed (Figure 10-4a). However, the mean change in soil carbon for the 16 studies that
examined 0-60 cm, 0-100 cm, or 0-150 cm soil layers drops to -0.3% (neutral/unfavorable) for
no-till relative to conventional tillage (Figure 10-4b). Therefore, more research is needed to
enhance understanding regarding how changes in tillage practice affect both shallow (0-30
cm) and deeper (>30 cm) soil layers.
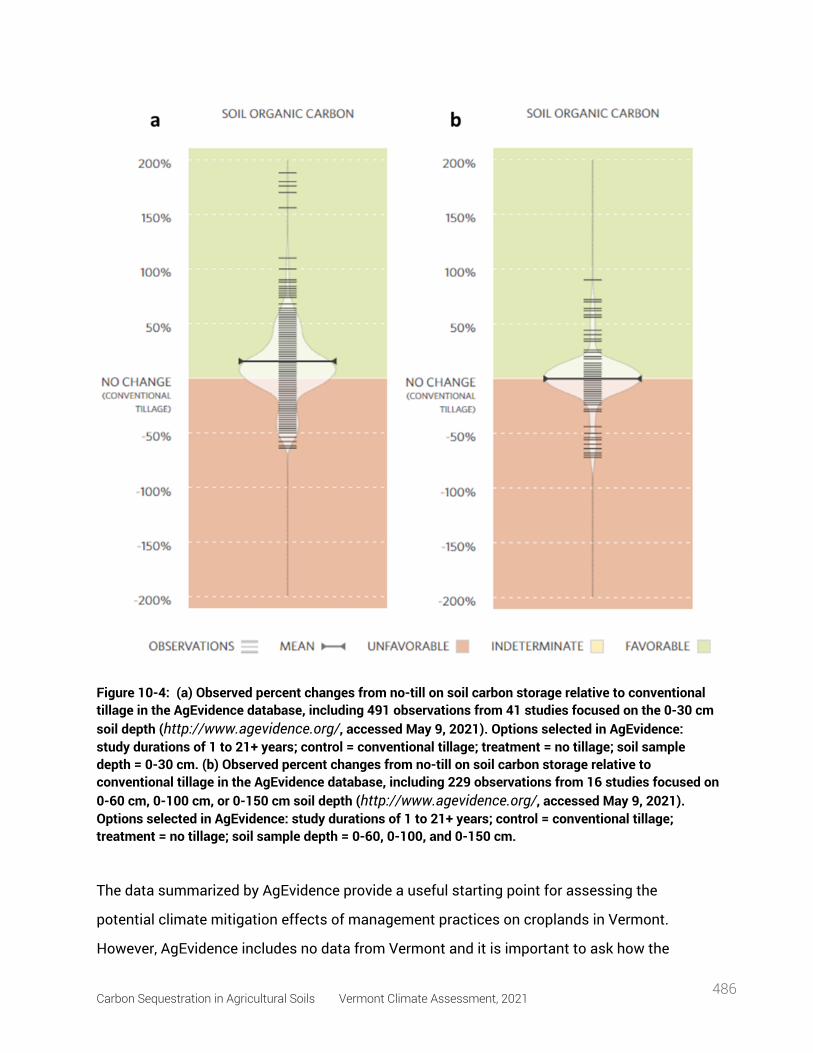
Carbon Sequestration in Agricultural Soils Vermont Climate Assessment, 2021 486
Figure 10-4: (a) Observed percent changes from no-till on soil carbon storage relative to conventional tillage in the AgEvidence database, including 491 observations from 41 studies focused on the 0-30 cm soil depth (http://www.agevidence.org/, accessed May 9, 2021). Options selected in AgEvidence: study durations of 1 to 21+ years; control = conventional tillage; treatment = no tillage; soil sample depth = 0-30 cm. (b) Observed percent changes from no-till on soil carbon storage relative to conventional tillage in the AgEvidence database, including 229 observations from 16 studies focused on 0-60 cm, 0-100 cm, or 0-150 cm soil depth (http://www.agevidence.org/, accessed May 9, 2021). Options selected in AgEvidence: study durations of 1 to 21+ years; control = conventional tillage; treatment = no tillage; soil sample depth = 0-60, 0-100, and 0-150 cm.
The data summarized by AgEvidence provide a useful starting point for assessing the
potential climate mitigation effects of management practices on croplands in Vermont.
However, AgEvidence includes no data from Vermont and it is important to ask how the
Carbon Sequestration in Agricultural Soils Vermont Climate Assessment, 2021 487
differences between Vermont and the Midwest, in terms of climate, soils, and other factors,
might affect the climate change mitigation potential of various management practices.
Unfortunately, we do not have enough local data to answer that question at this time. A search
of peer-reviewed literature using Web-of-Science (terms: Vermont* soil* carbon*) on May 9,
2021, returned only one local agricultural field study. Dittmer et al. (2020) tested the effects of
different management practices on GHG emissions in Alburgh, Vermont, over three growing
seasons and found that: (a) no-till reduced CO2 emissions but had no impact on N2O emissions
relative to vertical till, and (b) manure injection increased N2O and CO2 emissions, with the
magnitude of this effect being greatest for 1 month post-application. We recommend that
additional Vermont data be collected and systematically assessed in the future.
In summary, the evidence reviewed here collectively indicates that climate mitigation benefits
are possible but not guaranteed from the use of common conservation practices (cover
cropping, conservation tillage, no-till) on Vermont croplands. Inconsistency in the effects of
practices on climate mitigation outcomes across studies could be influenced by numerous
site-specific factors (time duration, weather, soils, other environmental factors, land
management, and/or sampling methodology). The paucity of peer-reviewed Vermont evidence
further increases uncertainty in the potential for climate mitigation from conservation
practices on croplands in the state. Therefore, in the opinion of the authors, assigning carbon
offsets or payments for climate mitigation services provided by croplands based on practice
adoption alone in Vermont currently lacks a scientific foundation and should therefore be avoided
unless new evidence becomes available. Monitoring is necessary to verify climate mitigation
benefits. More discussion of monitoring is presented below.
Another potential strategy to boost soil organic carbon on Vermont croplands is the input of
manure, compost, or biochar. It is clearly possible to build soil organic carbon in a field
through the addition of manure or other organic amendments, which contain carbon
themselves as well as nutrients that can stimulate plant growth resulting in conversion of
atmospheric CO2 into plant biomass C (e.g., Liang and MacKenzie, 1992; Poulton et al., 2018).
However, taking a broader view beyond a single field, this practice does not necessarily result
in a net sink for C in soils (i.e., additional transfer of carbon from atmosphere to soil)
Carbon Sequestration in Agricultural Soils Vermont Climate Assessment, 2021 488
(Schlesinger, 2000). Adding more manure or compost to one field typically means adding less
to another, thereby representing a reallocation of C between terrestrial locations. Biochar
shows some promise for enhancing soil carbon sequestration in agriculture; however, biochar
supply, cost, and uncertainty or time lags for climate mitigation benefits remain hurdles both
locally and globally (Woolf et al., 2010; Shackley et al., 2014; Smith, 2016; Campbell et al.,
2018). In all cases where off-site C sources are being used to boost soil organic carbon, a
broader life cycle assessment extending beyond the farm gate is needed that considers off-
site C source removal, transport, and processing; alternative end uses of the C source;
interactions with other soil GHG-producing processes; and synergies between the soil
amendments and the input of in situ plant-derived C (Paustian et al., 2016). It is critical to keep
in mind the primary objective: increase the net transfer of CO2-equivalents from atmosphere to land
– only strategies achieving this primary objective should be considered climate mitigation.
10.5.2 Grazing Lands Grazing strategies, especially rotational grazing, are receiving increasing national and
global interest as potential tools to sequester soil organic carbon and enhance soil health
more broadly (Derner et al., 2016; Schulz et al., 2016), with ongoing debate centered on the
potential benefits of grazing management to improve agricultural production and ecological
outcomes (Roche et al., 2015). Rotational grazing strategies include, for example, high-
intensity short duration grazing, “mob” grazing, and management-intensive grazing (Byrnes et
al., 2018). Byrnes et al. (2018) conducted a global meta-analysis including 64 research articles
to examine the effects of grazing strategy (i.e., no grazing, continuous grazing, rotational
grazing), grazing intensity (light, moderate, heavy grazing), and site-specific environmental
factors on three important aspects of soil health: soil carbon, nitrogen, and bulk density. Their
results can be summarized as follows (Byrnes et al., 2018):
• Increased soil compaction occurs under all grazing strategies and intensities relative to
no grazing.
• Rotational grazing strategies improved soil organic carbon and bulk density conditions
over continuous grazing strategies.
Carbon Sequestration in Agricultural Soils Vermont Climate Assessment, 2021 489
• Greater continuous grazing intensity levels can negatively affect soil organic carbon.
• Site specific environmental factors underpin soil function and health responses to
management.
Others have found that stocking rate, coupled with effective livestock distribution, is the single
most important management variable influencing production and conservation goals in grazed
ecosystems, outweighing other aspects of grazing strategy (Briske et al., 2011).
More research is needed to evaluate the climate mitigation potential of regenerative grazing
systems, especially considering the multiple grazing approaches currently being explored by
producers (e.g., holistic, adaptive, and other variants of rotational grazing). One challenge with
such research is that adaptive grazing systems, by definition, are dynamic in response to
varying weather and other environmental conditions that affect grassland productivity. It is
therefore difficult to set up traditional replicated field experiments to compare different
grazing systems at the landscape scale (Paustian et al., 2019; Teague et al., 2013).
Some recent evaluations find that climate mitigation estimates for regenerative grazing
systems have been exaggerated (e.g., Nordborg, 2016), and others suggest some short-term
promising results (Stanley et al., 2018; Mosier et al., 2021). A recent study by Rowntree et al.
(2020) examined the ecosystem impacts and productive capacity of a multi-species pastured
rotation (MSPR) livestock system at the well-known regenerative White Oak Pastures farm in
Georgia, and report results that highlight some key points:
• First, implementation of the MSPR system on degraded cropland resulted in
substantial soil carbon sequestration (a 5-fold increase in SOC stocks over 20 years)
(Rowntree et al., 2020). While this is impressive, soil carbon gains following conversion
of degraded cropland to pasture is not necessarily surprising given what is known
about relative carbon storage across ecosystem types (Amelung et al., 2020).
Furthermore, others have argued that, from a global perspective, opportunity to convert
annual cropland to grazing is limited by the growing need for annual crops, noting that
Carbon Sequestration in Agricultural Soils Vermont Climate Assessment, 2021 490
even if diet changes or yield gains could free up cropland, that land could sequester
more carbon if restored to forest (Searchinger and Ranganathan, 2020).
• Second, when incorporating soil carbon sequestration, life cycle assessment indicated
that the MSPR system emitted 4.1 kg CO2-equivalent per kg of carcass weight, 66%
lower than the comparative conventional commodity system (Rowntree et al., 2020).
Although this constitutes a substantial reduction, the net GHG footprint of this MSPR
system is still positive, drawing into question previous claims that the MSPR system
has a ‘carbon negative footprint’ (White Oaks Pastures, 2019).
• Third, the MSPR system required 2.5 times more land compared to a conventional
commodity system to produce the same amount of meat on a per carcass weight basis
(Rowntree et al., 2020). The authors point out that the MSPR is well-suited for marginal
lands, rather than productive lands suitable for higher value and more nutrient dense
crops (Rowntree et al., 2020). However, it is again important to note the fact that such
marginal lands could also be suitable for restoration to non-agricultural ecosystems
that provide numerous ecological benefits (forests, wetlands). Agroforestry systems
could be explored as well.
In a recent article entitled “Soil carbon sequestration in grazing systems: managing
expectations,” Godde et al. (2020) summarizes the state of knowledge on grazing systems and
climate mitigation as follows:
• Grazing systems emit greenhouse gases, which can be partly or entirely offset by soil
carbon sequestration under specific agro-ecological conditions.
• Any soil carbon sequestration in grazing systems is time-limited and reversible.
• Protecting large carbon stocks in grazing lands is essential in order to avoid further CO2
release.
• Soil carbon sequestration in grazing lands should be promoted in cases where it
delivers environmental and agronomic benefits, including on degraded land.
Carbon Sequestration in Agricultural Soils Vermont Climate Assessment, 2021 491
• Caution should be applied for estimates of climate mitigation by C sequestration in
grazing systems due to large uncertainties and dependence on economics, feasibility
of implementation, and time frame considered.
10.6 monitoring and considerations for payment schemes
Despite the fact that measurement of soil carbon stocks in a single soil core sample is
relatively straightforward, there are considerable challenges to accurately estimating changes
in soil organic carbon stocks at field and farm scales. These include high spatial variability,
changes in bulk density with changes in soil management, potential for redistribution of soil
organic carbon between surface soils and deeper soils, and the slow rate of changes in bulk
soil carbon (Smith et al., 2020; Slessarev et al., 2021). If feasible, soil organic carbon
monitoring should include analysis of soils to at least 60 cm depth, and ideally to 100 cm
depth (Liebig et al., 2010; Slessarev et al., 2021). However, measuring below 30 cm (the
minimum recommended depth by IPCC; Ogle et al., 2019) can increase cost and require
specialized equipment. It is not currently possible to verify sequestration rates that increase
soil organic carbon stocks by <1% on an annual basis using direct soil measurements
(Paustian et al., 2016; Smith et al., 2020). Therefore, longer study periods (ideally > 5 years)
that extend beyond the timeline of most research grants are required to track changes in soil
organic carbon (Smith et al., 2004). Measurement of total organic carbon by dry combustion is
recommended, with steps taken to subtract any inorganic C present (Liebig et al., 2010; Nelson
and Sommers, 1996). Researchers also commonly estimate soil organic matter using the loss
on ignition (LOI) method (Nelson and Sommers, 1996). However, the relationship between LOI
and soil organic carbon varies across soils and conversions between LOI and soil organic
carbon should be validated using location- or soil-specific data (Konen et al., 2002).
There are some promising spectral methods emerging for direct point measurements in the
field and lab (Smith et al., 2020). These include methods for measuring SOC concentration
based on the reflectance of light on soil in the infrared region, where the organic bonds and
Carbon Sequestration in Agricultural Soils Vermont Climate Assessment, 2021 492
minerals in the soil absorb light at specific wavelengths and SOC is predicted using a
statistical model based on a spectral library (Smith et al., 2020 and citations within). In
addition, laboratory costs could be reduced by using Fourier transform mid-infrared diffuse
reflectance spectroscopy for estimation of total carbon, organic carbon, clay content, and
sand fraction (Wijewardane et al., 2018). Remote sensing methods could also potentially be
employed at scales not feasible with traditional or point spectral methods (Ge et al., 2011;
Mulder et al., 2011). However, there are limitations of remote sensing, including limited
penetration depth, limited duration of bare soil, and cloud cover (Smith et al., 2020).
Furthermore, soil bulk density is a critical measure when estimating soil organic carbon stocks
and cannot be estimated using remote sensing. Some techniques have been developed for
estimating bulk density using gamma-ray attenuation and visible-near infrared spectroscopy
on cores in the field to reduce costs and errors associated with transport, handling, oven-
drying, and laboratory measurements (Lobsey and Rossel, 2016). Considering field study
results discussed above, any approach taken will ideally need to be capable of characterizing
bulk density in deeper soils (> 30 cm in depth) for tracking soil carbon stock changes.
Combining traditional field/lab methods (including sample compositing schemes to reduce
cost) with emerging spectral methods could help expand the areal extent of monitoring
feasible at reasonable cost and should be explored further (Smith et al., 2020; Slessarev et al.,
2021).
Another approach that can be employed in the tracking of soil organic carbon is modeling.
Many models exist that estimate soil organic carbon dynamics; however, calibration and
validation of such models is difficult and not all relevant biogeochemical processes are
represented (Smith et al., 2020 and citations within). Some existing modeling tools, such as
the Cool Farm tool and the COMET-Farm tool, have existing platforms that can be used to
estimate net GHG emissions changes based on farm practices (Cool Farm Alliance, 2019;
NREL, 2019). We recommend that the use of models be explored in Vermont as a means of
increasing the spatial extent for which soil organic carbon accounting can take place, with one
essential caveat: models must be properly calibrated using local data to establish confidence in
the model results provided. This inevitably requires field and lab measurements to establish
Carbon Sequestration in Agricultural Soils Vermont Climate Assessment, 2021 493
acceptable statistical relationships between modeled and measured values from (a) local
benchmark sites undergoing long-term experiments to inform model parameterization, and (b)
well-characterized chronosequences or paired sampling sites (Smith et al., 2020). It could be
prohibitively expensive to set up benchmark sites covering all possible combinations of land
use, climate, soil type, and management practice, so models will likely need to be tested
across the full range of parameter space to allow reliable simulation of soil organic carbon
(Smith et al., 2020). Without such grounding, models remain unverified abstractions of reality
based on untested assumptions, and therefore should not be trusted. This becomes especially
concerning in a situation where financial payments or carbon offsets are being determined for
climate mitigation services. Well-calibrated models, supported by local measurements, could
eventually be used to establish relationships between a management change in a particular context
(soil, climate, land use, management) and a change in net C fluxes, including estimates of
uncertainty, allowing management data reported by farmers to become adequate for reporting and
reduce the need for direct measurements (Fitton et al., 2017; Smith et al., 2020). In the views of the
authors, this is not yet currently possible in Vermont.
Additionally, whole systems accounting is needed in order to assess potential trade-offs
caused by management strategies and to determine net climate mitigation benefits. Changes
in soil carbon stocks are only one piece in climate mitigation accounting: GHG emissions (CO2,
CH4, N2O) from soils, livestock, manure management systems, transportation, and farm
infrastructure need to be considered as well, as do land requirements and implications for
water quality. A narrow focus on soil organic carbon in certain locations could potentially
cause net negative consequences for climate and the local environment from a broader
perspective. Life cycle assessment (LCA) is an important tool in this context, and useful
frameworks exist that can be considered in future Vermont-based efforts using local data
(Rowntree et al., 2020; Terlouw et al., 2021).
Stakeholders in Vermont are currently exploring Payment for Ecosystem Services (PES)
schemes that could potentially include soil carbon. Based on our assessment of the evidence
and literature presented in this chapter, we can answer some important questions that need to
be addressed in PES design as follows:
Carbon Sequestration in Agricultural Soils Vermont Climate Assessment, 2021 494
• Are some Vermont farms sequestering carbon from the atmosphere into soils?
o YES, this is very likely given the evidence in TNC’s AgEvidence and the number
of producers using conservation practices in Vermont.
• Should these farmers be rewarded for their carbon stewardship?
o YES, we think some mechanism is needed to reward and incentivize carbon
stewardship in agriculture.
• Can we assume that certain practices will increase permanent C sequestration?
o NO, the existing evidence indicates that results will vary for practices based on
site-specific factors, and that any carbon sequestered may be reintroduced to
the atmosphere due to future management or climatic factors.
• Is it possible to accurately estimate or model C sequestration without measurements?
o NO, models need to be tested against local data to build confidence in their
predictions.
• Should soil carbon sequestration be paid for to offset GHG emissions from other
sectors (e.g., fossil fuel use)?
o NO, it would be unwise to invest in offsetting the more certain impact of GHG
emissions with the uncertain and reversible C sequestration associated with
agricultural soil management.
On the last question, we concur with scholars who suggest that targets and accounting for
negative emissions technologies, including agricultural soil carbon sequestration, should be
managed separately from existing and future targets for emissions reduction (McLaren et al.,
2019). Efforts to balance emissions and offsets within a single accounting scheme to move
towards “net-zero” could potentially deter or delay GHG emissions reduction, and therefore
negative emissions technologies should be pursued in addition to rapid emissions reduction
(McLaren et al., 2019). A recent report covering protocols for soil carbon sequestration
concludes that:
“Consistent accounting and verification of direct emission reductions during
agricultural production — reduced nitrous oxide emissions via improved nutrient
Carbon Sequestration in Agricultural Soils Vermont Climate Assessment, 2021 495
management, reduced carbon dioxide emissions via reduced tractor use and
reduced methane emissions from improved manure management — and from
avoided land conversion is a less risky and permanent climate solution [as
compared to soil carbon sequestration] for supply chain and other public
investment.” (Oldfield et al., 2021)
10.7 recommendations for next steps in vermont
Agricultural soil carbon sequestration deserves increased attention in Vermont. However,
more research is needed to strengthen the scientific evidence for agricultural soil carbon
sequestration in the state, which is currently weak. As mentioned previously, this research
could include local benchmark sites undergoing long-term experiments, well-characterized
chronosequences or paired sampling sites, and testing the abilities of models to adequately
replicate local field and lab data (Smith et al., 2020). Without this research, pursuing carbon
offsets or payments associated with soil organic carbon storage on working agricultural lands
in Vermont could fail to achieve desired outcomes due to the existing uncertainty concerning
climate mitigation benefits, and could in some cases even be counterproductive. Verification
of changes in soil organic carbon storage will be critical for any PES program and monitoring
can include a combination of direct measurements and models that have been well-calibrated
to local agroecosystems. The latter will be necessary for inclusion of GHG fluxes and offsite C
impacts, which should be considered in concert with onsite soil organic carbon changes to
avoid unintended climate and environmental consequences caused by trade-offs. A challenge
will be keeping such monitoring programs cost-effective and manageable. Furthermore, it is
important to establish consistent protocols for soil organic carbon estimation and
quantification of net GHG emissions reductions in Vermont. Variation in protocols employed
would make it difficult to ensure net climate benefits have been achieved and the resulting
lack of comparability and standardization would be especially problematic in carbon
accounting schemes (Oldfield et al., 2021).
Carbon Sequestration in Agricultural Soils Vermont Climate Assessment, 2021 496
There are several critical knowledge gaps and programmatic questions that need to be
answered before launching a large-scale program in Vermont focused on soil carbon
sequestration on working agricultural lands (Box 10-1). Equally important is continuing and
expanding soil management strategies that maintain existing soil carbon, especially
considering the relatively high organic matter levels observed in many Vermont soils.
Box 10-1: Recommendations for research in Vermont to inform future soil carbon sequestration efforts on working agricultural lands in the state, derived from Rumpel et al. (2020) and Amelung et al. (2020).
• Assessment of current soil organic carbon stocks and soil degradation
status.
• Assessment of yield gaps and reliable predictions of yield changes with soil
organic carbon increases.
• Assessment of soil organic carbon changes by practice and the soil organic
carbon storage potential using long-term observations, experimental farm
plots, existing state soils data, and appropriate chronosequences.
• Estimation of additional nutrient (N and P) requirements for sustainable C
sequestration at the level desired.
• Assessment of the vulnerability of soil organic carbon stocks to determine
permanence of carbon storage.
• Selection of methods to account for full life-cycle GHG emissions in farming
systems and transfers of organic material that may reduce stored carbon
elsewhere.
• Broad ensemble of policies and bottom-up approaches including farmer
incentives, standards, and actions to scale up adoption of C sequestering
practices.
Carbon Sequestration in Agricultural Soils Vermont Climate Assessment, 2021 497
While the existing evidence for consistent soil organic carbon gains for conservation practices
reviewed here is weak, there is more substantial and consistent evidence that many practices
recommended for sequestering carbon improve soil aggregation and water infiltration and
retention (Dabney, 1998; Jones et al., 1994; Palm et al., 2014). For example, reducing tillage is
consistently found to improve soil aggregation (Nunes et al., 2020; Karlen et al., 2019; Mann et
al., 2019) which contributes to improved water infiltration and reduced surface runoff.
Similarly, cover crops can improve soil water infiltration capacity and aggregation (Magdoff &
Van Es, 2009). Implementing conservation practices as strategies for adapting to climate
change and improving farm resilience can likely offer immediate benefits while also providing
opportunities to systematically assess the carbon sequestration potential of practices across
a range of soil types and farm business models.
Systematic assessment of carbon sequestration potential on agricultural lands in Vermont will
require participatory research conducted in partnership with farmers and land managers. We
advocate for designing future research that builds on the questions, experiences, and
observations of producers who are implementing carbon-focused management practices.
Incorporating the complementary expertise of farmers, scientists, and agricultural service
providers will be necessary to parse the complex dynamics involved in soil carbon
sequestration specifically and the interactions between agricultural soils and a changing
climate more broadly. It is important to note, however, that a participatory, long-term approach
to soil research may require shifts in the expectations and limitations imposed by current
funding mechanisms.
10.8 traceable accounts
Traceable accounts describe the confidence level—the degree of certainty in the scientific
evidence—for each key message resulting from this chapter. This analysis is based on the U.S.
Global Change Research Program guidance in the Fourth National Climate Assessment
(USGCRP, 2018).
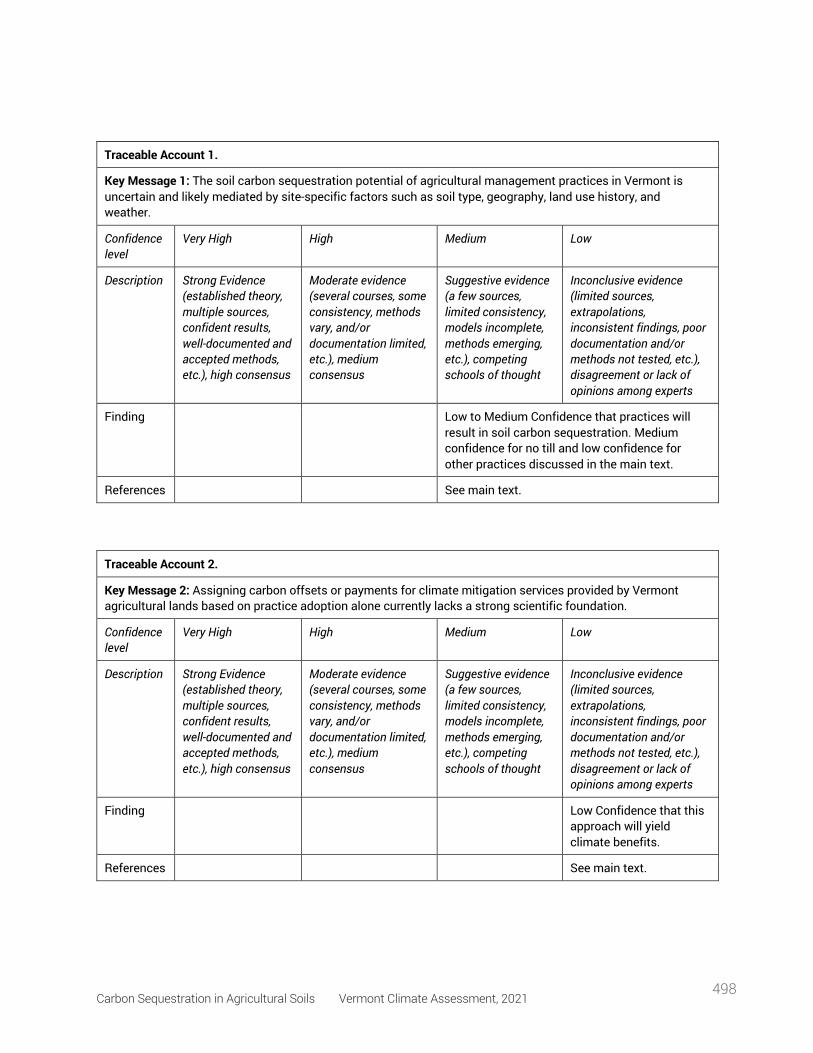
Carbon Sequestration in Agricultural Soils Vermont Climate Assessment, 2021 498
Traceable Account 1.
Key Message 1: The soil carbon sequestration potential of agricultural management practices in Vermont is uncertain and likely mediated by site-specific factors such as soil type, geography, land use history, and weather.
Confidence level
Very High High Medium Low
Description Strong Evidence (established theory, multiple sources, confident results, well-documented and accepted methods, etc.), high consensus
Moderate evidence (several courses, some consistency, methods vary, and/or documentation limited, etc.), medium consensus
Suggestive evidence (a few sources, limited consistency, models incomplete, methods emerging, etc.), competing schools of thought
Inconclusive evidence (limited sources, extrapolations, inconsistent findings, poor documentation and/or methods not tested, etc.), disagreement or lack of opinions among experts
Finding
Low to Medium Confidence that practices will result in soil carbon sequestration. Medium confidence for no till and low confidence for other practices discussed in the main text.
References
See main text.
Traceable Account 2.
Key Message 2: Assigning carbon offsets or payments for climate mitigation services provided by Vermont agricultural lands based on practice adoption alone currently lacks a strong scientific foundation.
Confidence level
Very High High Medium Low
Description Strong Evidence (established theory, multiple sources, confident results, well-documented and accepted methods, etc.), high consensus
Moderate evidence (several courses, some consistency, methods vary, and/or documentation limited, etc.), medium consensus
Suggestive evidence (a few sources, limited consistency, models incomplete, methods emerging, etc.), competing schools of thought
Inconclusive evidence (limited sources, extrapolations, inconsistent findings, poor documentation and/or methods not tested, etc.), disagreement or lack of opinions among experts
Finding
Low Confidence that this approach will yield climate benefits.
References
See main text.
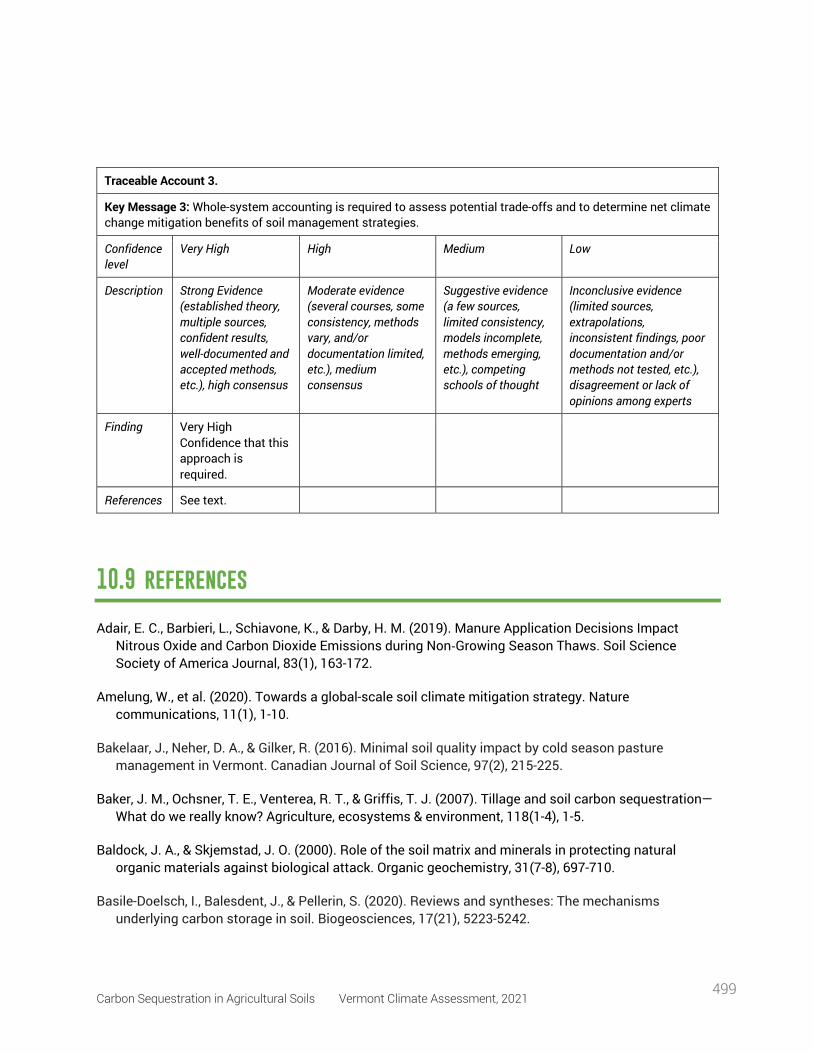
Carbon Sequestration in Agricultural Soils Vermont Climate Assessment, 2021 499
Traceable Account 3.
Key Message 3: Whole-system accounting is required to assess potential trade-offs and to determine net climate change mitigation benefits of soil management strategies.
Confidence level
Very High High Medium Low
Description Strong Evidence (established theory, multiple sources, confident results, well-documented and accepted methods, etc.), high consensus
Moderate evidence (several courses, some consistency, methods vary, and/or documentation limited, etc.), medium consensus
Suggestive evidence (a few sources, limited consistency, models incomplete, methods emerging, etc.), competing schools of thought
Inconclusive evidence (limited sources, extrapolations, inconsistent findings, poor documentation and/or methods not tested, etc.), disagreement or lack of opinions among experts
Finding Very High Confidence that this approach is required.
References See text.
10.9 references
Adair, E. C., Barbieri, L., Schiavone, K., & Darby, H. M. (2019). Manure Application Decisions Impact Nitrous Oxide and Carbon Dioxide Emissions during Non-Growing Season Thaws. Soil Science Society of America Journal, 83(1), 163-172.
Amelung, W., et al. (2020). Towards a global-scale soil climate mitigation strategy. Nature communications, 11(1), 1-10.
Bakelaar, J., Neher, D. A., & Gilker, R. (2016). Minimal soil quality impact by cold season pasture management in Vermont. Canadian Journal of Soil Science, 97(2), 215-225.
Baker, J. M., Ochsner, T. E., Venterea, R. T., & Griffis, T. J. (2007). Tillage and soil carbon sequestration—What do we really know? Agriculture, ecosystems & environment, 118(1-4), 1-5.
Baldock, J. A., & Skjemstad, J. O. (2000). Role of the soil matrix and minerals in protecting natural organic materials against biological attack. Organic geochemistry, 31(7-8), 697-710.
Basile-Doelsch, I., Balesdent, J., & Pellerin, S. (2020). Reviews and syntheses: The mechanisms underlying carbon storage in soil. Biogeosciences, 17(21), 5223-5242.
Carbon Sequestration in Agricultural Soils Vermont Climate Assessment, 2021 500
Briske, D. D., Derner, J. D., Milchunas, D. G., & Tate, K. W. (2011). An evidence-based assessment of prescribed grazing practices. Conservation benefits of rangeland practices: Assessment, recommendations, and knowledge gaps, 21-74.
Byrnes, R. C., Eastburn, D. J., Tate, K. W., & Roche, L. M. (2018). A global meta-analysis of grazing impacts on soil health indicators. Journal of environmental quality, 47(4), 758-765.
Campbell, J. L., Sessions, J., Smith, D., & Trippe, K. (2018). Potential carbon storage in biochar made from logging residue: Basic principles and Southern Oregon case studies. PloS one, 13(9), e0203475.
Cool Farm Alliance. Cool Farm Tool https://coolfarmtool.org/ retrieved: 6/13/2019
Dabney, S.M. 1998. Cover crop impacts on watershed hydrology. Journal of Soil and Water Conservation. 53 (3) 207-213.
Derner, J. D., Stanley, C. C., & Ellis, C. (2016). Usable science: Soil health. Rangelands, 38(2), 64-67.
Dittmer, K. M., Darby, H. M., Goeschel, T. R., & Adair, E. C. (2020). Benefits and tradeoffs of reduced tillage and manure application methods in a Zea mays silage system. Journal of Environmental Quality 49: 1236-1250.
Drever et al. (2021). Natural climate solutions for Canada. Science Advances 7: eabd6034.
Fitton, N., Datta, A., Cloy, J.M., Rees, R.M., Topp, C.F.E., Bell, M.J., Cardenas, L.M., Williams, J., Smith, K., Thorman, R. and Watson, C.J., 2017. Modelling spatial and inter-annual variations of nitrous oxide emissions from UK cropland and grasslands using DailyDayCent. Agriculture, Ecosystems & Environment, 250, pp.1-11.
Foster, B. (2021, February 26). Vermont farmers are covering good ground for soil health. VTDigger. www.vtdigger.org.
Ge, Y., Thomasson, J. A., & Sui, R. (2011). Remote sensing of soil properties in precision agriculture: A review. Frontiers of Earth Science, 5(3), 229-238.
Godde, C. M., et al. (2020). Soil carbon sequestration in grazing systems: managing expectations. Climatic Change, 1-7.
Guenet, B., et al. (2021). Can N2O emissions offset the benefits from soil organic carbon storage?. Global Change Biology, 27(2), 237-256.
Hassink, J. (1997). The capacity of soils to preserve organic C and N by their association with clay and silt particles. Plant and soil, 191(1), 77-87.
Huang, X., Terrer, C., Dijkstra, F. A., Hungate, B. A., Zhang, W., & van Groenigen, K. J. (2020). New soil carbon sequestration with nitrogen enrichment: a meta-analysis. Plant and Soil, 454(1), 299-310.
Jemison Jr, J. M., Kersbergen, R., Majewski, C., & Brinton, W. (2019). Soil health of recently converted no-till corn fields in Maine. Communications in Soil Science and Plant Analysis, 50(19), 2384-2396.
Jian, J., Du, X., Reiter, M. S., & Stewart, R. D. (2020). A meta-analysis of global cropland soil carbon
Carbon Sequestration in Agricultural Soils Vermont Climate Assessment, 2021 501
changes due to cover cropping. Soil Biology and Biochemistry, 143, 107735.
Jones, O. R., Hauser, V. L. & Popham, T. W. No-tillage effects on infiltration and water conservation on dryland. Transactions of ASAE 37, 473–479 (1994).
Karlen, D. L., Veum, K. S., Sudduth, K. A., Obrycki, J. F., & Nunes, M. R. (2019). Soil health assessment: Past accomplishments, current activities, and future opportunities. Soil and Tillage Research, 195, 104365.
Kersbergen, R. 2012. Reducing fuel and fertilizer costs for corn silage in the Northeast with cover crops and no-till. Final report for NLE-09-287. Sustainable Agriculture Research and Extension. https://projects.sare.org/projectreports/lne09-287/.
Konen, M. E., Jacobs, P. M., Burras, C. L., Talaga, B. J., & Mason, J. A. (2002). Equations for predicting soil organic carbon using loss-on-ignition for north central US soils. Soil Science Society of America Journal, 66(6), 1878-1881.
Lal, R. (2018). Digging deeper: A holistic perspective of factors affecting soil organic carbon sequestration in agroecosystems. Global Change Biology, 24(8), 3285-3301.
Leslie, S. (2020, December 20). Why Vermont needs a healthy soils act. VTDigger. www.vtdigger.org.
Liang, B. C., & Mackenzie, A. F. (1992). Changes in soil organic carbon and nitrogen after six years of corn production. Soil Science, 153(4), 307-313.
Liebig, M. A., G. Varvel, and W. Honeycutt. (2010). Chapter 1: Guidelines for site description and soil sampling, processing, analysis, and archiving. GRACEnet Protocols. https://www.ars.usda.gov/anrds/gracenet/gracenet-protocols/
Lobsey, C. R., & Viscarra Rossel, R. A. (2016). Sensing of soil bulk density for more accurate carbon accounting. European Journal of Soil Science, 67(4), 504-513.
Magdoff, F., & Van Es, H. (2009). Building Soils for Better Soil: Sustainable Soil Management, Chapter 4: The Living Soil.
Mann, C., Lynch, D., Fillmore, S., & Mills, A. (2019). Relationships between field management, soil health, and microbial community composition. Applied Soil Ecology, 144, 12-21.
McLaren, D. P., Tyfield, D. P., Willis, R., Szerszynski, B., & Markusson, N. O. (2019). Beyond “net-zero”: a case for separate targets for emissions reduction and negative emissions. Frontiers in Climate, 1, 4.
Moebius-Clune, B. N. (2016). Comprehensive assessment of soil health: The Cornell framework manual. Cornell University.
Mosier, S., Apfelbaum, S., Byck, P., Calderon, F., Teague, R., Thompson, R., & Cotrufo, M. F. (2021). Adaptive multi-paddock grazing enhances soil carbon and nitrogen stocks and stabilization through mineral association in southeastern US grazing lands. Journal of Environmental Management, 288, 112409.
Carbon Sequestration in Agricultural Soils Vermont Climate Assessment, 2021 502
Mulder, V. L., De Bruin, S., Schaepman, M. E., & Mayr, T. R. (2011). The use of remote sensing in soil and terrain mapping—A review. Geoderma, 162(1-2), 1-19.
NREL (National Renewable Energy Lab), Colorado State University and USDA. COMET-farm http://cometfarm.nrel.colostate.edu/ retrieved: 6/13/2019
Neher, Deborah; Horner, Katie; von Wettberg, Eric Bishop; Scarborough, Matt; Harris, Jeanne; Darby, Heather M.; Badireddy, Appala Raju; Roy, Eric D.; Farley, Joshua C.; Faulkner, Joshua; and White, Alissa, "Resilient Soils for Resilient Farms: An Integrative Approach to Assess, Promote and Value Soil Health for Small- and Medium-Size Farms" (2021). USDA Agricultural Research Service (ARS) Center. 7. https://scholarworks.uvm.edu/arsfoodsystems/7
Nelson, D.W., and L.E. Sommers. 1996. Total carbon, organic carbon, and organic matter. p. 961-1010. In: Sparks, D.L. (ed.) Methods of soil analysis. Part 3. Chemical methods. SSSA Book Series No. 5. SSSA and ASA, Madison, WI.
Newton, P., Civita, N., Frankel-Goldwater, L., Bartel, K., & Johns, C. (2020). What Is Regenerative Agriculture? A Review of Scholar and Practitioner Definitions Based on Processes and Outcomes. Frontiers in Sustainable Food Systems, 4, 194.
Nordborg M (2016) Holistic management – a critical review of Allan Savory’s grazing method. SLU/EPOK – Centre for Organic Food & Farming & Chalmers, Uppsala.
Nunes, M. R., Karlen, D. L., Veum, K. S., Moorman, T. B., & Cambardella, C. A. (2020). Biological soil health indicators respond to tillage intensity: A US meta-analysis. Geoderma, 369, 114335.
Ogle, S.M., et al. (2019). Ch. 5 - Cropland. In: 2019 Refinement to the IPCC Guidelines for National Greenhouse Gas Inventories. https://www.ipcc-nggip.iges.or.jp/public/2019rf/vol4.html
Oldfield, E.E., A.J. Eagle, R.L Rubin, J. Rudek, J. Sanderman, D.R. Gordon. 2021. Agricultural soil carbon credits: Making sense of protocols for carbon sequestration and net greenhouse gas removals. Environmental Defense Fund, New York, New York. edf.org/sites/default/files/content/agricultural-soil-carbon-credits-protocolsynthesis.pdf.
Olson, K. R., & Al-Kaisi, M. M. (2015). The importance of soil sampling depth for accurate account of soil organic carbon sequestration, storage, retention and loss. Catena, 125, 33-37.
Owen, J. J., Parton, W. J., & Silver, W. L. (2015). Long-term impacts of manure amendments on carbon and greenhouse gas dynamics of rangelands. Global change biology, 21(12), 4533-4547.
Palm, S., Blanco-Canqui, H., DeClerck, F., Gatere, L. & Grace, P. Conservation agriculture and ecosystem services: an overview. Agriculture, Ecosystems and Environment 187, 87–105 (2014).
Paustian, K., Lehmann, J., Ogle, S., Reay, D., Robertson, G. P., & Smith, P. (2016). Climate-smart soils. Nature, 532(7597), 49-57.
Paustian, K., Larson, E., Kent, J., Marx, E., & Swan, A. (2019). Soil C sequestration as a biological negative emission strategy. Frontiers in Climate, 1, 8.
Carbon Sequestration in Agricultural Soils Vermont Climate Assessment, 2021 503
Paustian, K., C. Chenu, R. Conant, F. Cotrufo, R. Lal, P. Smith, J.F. Soussana. (2020). Climate mitigation potential of regenerative agriculture is significant! https://static1.squarespace.com/static/5c3780907c9327dc2a2e8c64/t/5ee0ed849bd3430a15121b12/1591799173373/Regen+Ag+pdf+061020.pdf
Poeplau, C., & Don, A. (2015). Carbon sequestration in agricultural soils via cultivation of cover crops–A meta-analysis. Agriculture, Ecosystems & Environment, 200, 33-41.
Poulton, P., Johnston, J., Macdonald, A., White, R., & Powlson, D. (2018). Major limitations to achieving “4 per 1000” increases in soil organic carbon stock in temperate regions: Evidence from long-term experiments at Rothamsted Research, United Kingdom. Global Change Biology, 24(6), 2563-2584.
Powlson, D. S., Stirling, C. M., Jat, M. L., Gerard, B. G., Palm, C. A., Sanchez, P. A., & Cassman, K. G. (2014). Limited potential of no-till agriculture for climate change mitigation. Nature Climate Change, 4(8), 678-683.
Powlson, D., R. Boddey, K. Cassman, P. Chivenge, K. Giller, K. Goulding, C. van Kessel, C. Palm, and J.W. van Groenigen. (2020). Letter to World Resources Institute Regarding Soil Carbon Sequestration. https://scholar.princeton.edu/sites/default/files/tsearchi/files/letter_from_powlson_et_al._to_wri_in_support_of_soil_carbon_chapter_august_2020_.pdf
Ranganathan, J., Waite, R., Searchinger, T., & Zionts, J. (2020). Regenerative Agriculture: Good for Soil Health, but Limited Potential to Mitigate Climate Change. Washington, DC: World Resources Institute.
Roche, L. M., Cutts, B. B., Derner, J. D., Lubell, M. N., & Tate, K. W. (2015). On-ranch grazing strategies: context for the rotational grazing dilemma. Rangeland Ecology & Management, 68(3), 248-256.
Rowntree, J. E., Stanley, P. L., Maciel, I. C., Thorbecke, M., Rosenzweig, S. T., Hancock, D. W., Guzman, A., & Raven, M. R. (2020). Ecosystem Impacts and Productive Capacity of a Multi-Species Pastured Livestock System. Frontiers in Sustainable Food Systems, 4, 232.
Rumpel, C., et al. (2020). The 4p1000 initiative: Opportunities, limitations and challenges for implementing soil organic carbon sequestration as a sustainable development strategy. Ambio, 49(1), 350-360.
Shackley, S., Hammond, J., Gaunt, J., & Ibarrola, R. (2011). The feasibility and costs of biochar deployment in the UK. Carbon Management, 2(3), 335-356.
Schlesinger, W. H. (2000). Carbon sequestration in soils: some cautions amidst optimism. Agriculture, Ecosystems & Environment, 82(1-3), 121-127.
Schlesinger, W. H., & Bernhardt, E. S. (2013). Biogeochemistry: An Analysis of Global Change. Academic Press.
Schulz, K., Voigt, K., Beusch, C., Almeida-Cortez, J. S., Kowarik, I., Walz, A., & Cierjacks, A. (2016). Grazing deteriorates the soil carbon stocks of Caatinga forest ecosystems in Brazil. Forest Ecology and Management, 367, 62-70.
Carbon Sequestration in Agricultural Soils Vermont Climate Assessment, 2021 504
Searchinger, T. and J. Ranganathan. (2020). INSIDER: Further Explanation on the Potential Contribution of Soil Carbon Sequestration on Working Agricultural Lands to Climate Change Mitigation. World Resources Institute. https://www.wri.org/insights/insider-further-explanation-potential-contribution-soil-carbon-sequestration-working
E Slessarev, J Zelikova, J Hamman, D Cullenward, J Freeman (2021) “Depth matters for soil carbon accounting” CarbonPlan. https://carbonplan.org/research/soil-depth-sampling
Smith, P. (2016). Soil carbon sequestration and biochar as negative emission technologies. Global change biology, 22(3), 1315-1324.
Smith, P. (2004). How long before a change in soil organic carbon can be detected?. Global Change Biology, 10(11), 1878-1883.
Smith, P., et al. (2020). How to measure, report and verify soil carbon change to realize the potential of soil carbon sequestration for atmospheric greenhouse gas removal. Global Change Biology, 26(1), 219-241.
Spohn, M. (2020). Increasing the organic carbon stocks in mineral soils sequesters large amounts of phosphorus. Global change biology, 26(8), 4169-4177.
Stewart, C. E., Paustian, K., Conant, R. T., Plante, A. F., & Six, J. (2007). Soil carbon saturation: concept, evidence and evaluation. Biogeochemistry, 86(1), 19-31.
Teague, R., Provenza, F., Kreuter, U., Steffens, T., & Barnes, M. (2013). Multi-paddock grazing on rangelands: why the perceptual dichotomy between research results and rancher experience?. Journal of Environmental management, 128, 699-717.
Terlouw, T., Bauer, C., Rosa, L., & Mazzotti, M. (2021). Life cycle assessment of carbon dioxide removal technologies: A critical review. Energy & Environmental Science, 14(4), 1701-1721.
USGCRP. (2018). Impacts, Risks, and Adaptation in the United States: Fourth National Climate Assessment, Volume II: [Reidmiller, D.R., C.W. Avery, D.R. Easterling, K.E. Kunkel, K.L.M. Lewis, T.K. Maycock, and B.C. Stewart (eds.)]. U.S. Global Change Research Program, Washington, DC, USA, 1515 pp. doi: 10.7930/NCA4.2018.
van Groenigen, J. W., van Kessel, C., Hungate, B. A., Oenema, O., Powlson, D. S., & van Groenigen, K. J. (2017). Sequestering Soil Organic Carbon: A Nitrogen Dilemma. Environmental science & technology, 51(9), 4738.
White Oaks Pastures. (2019). Study: White Oak Pastures Beef Reduces Atmospheric Carbon. https://blog.whiteoakpastures.com/blog/carbon-negative-grassfed-beef
Wijewardane, N. K., Ge, Y., Wills, S., & Libohova, Z. (2018). Predicting physical and chemical properties of US soils with a mid-infrared reflectance spectral library. Soil Science Society of America Journal, 82(3), 722-731.
Woolf, D., Amonette, J. E., Street-Perrott, F. A., Lehmann, J., & Joseph, S. (2010). Sustainable biochar to mitigate global climate change. Nature communications, 1(1), 1-9.


![TFG - UPM [Blogs]](https://img.pdfslide.net/doc/110x75/6349b95b6a929719c204478d/tfg-upm-blogs.jpg)