Embed Size (px)
Citation preview
International Business Review 23 (2014) 429–439
Absorptive capacity from foreign direct investment in Spanishmanufacturing firms§
Pedro Sanchez-Sellero a,*, Jorge Rosell-Martınez a,b,1, Jose Manuel Garcıa-Vazquez c,2
a Universidad de Zaragoza, Department of Business Administration, Edificio Betancourt, Campus Rıo Ebro, 50018 Zaragoza, Spainb Centro Universitario de la Defensa de Zaragoza, Academia General Militar, 50090 Zaragoza, Spainc Universidad de Vigo, Department of Business Administration, Campus Lagoas Marcosende, 36310 Vigo, Spain
A R T I C L E I N F O
Article history:
Received 15 March 2012
Received in revised form 24 June 2013
Accepted 26 June 2013
Keywords:
Absorptive capacity
Foreign direct investment
Productivity
Internationalization
Dynamic capabilities
A B S T R A C T
This paper deals with the determinants of absorptive capacity from foreign direct investment (FDI)
spillovers. We study how firm behavior, capabilities, and structure drive absorptive capacity such as
research and development (R&D) activities and expenditures, R&D results, internal organization of
innovation, external relationships of innovation, human-capital quality, family management, business
complexity, and market concentration. Our results enhance and complement previous evidence of the
determinants of absorptive capacity, particularly with different approaches to innovative activities as
mediators of the capability.
� 2013 The Authors. Published by Elsevier Ltd. All rights reserved.
Contents lists available at ScienceDirect
International Business Review
jo u rn al h om epag e: ww w.els evier .c o m/lo cat e/ ibu s rev
1. Introduction
Spillovers within an industry are improvements in productivitythat local firms learn from foreign companies operating in thesame sector. Similarly, spillovers from foreign direct investment(FDI) arise from transactions outside specific markets, in whichresources – and particularly knowledge – spread without anycontractual relationship (Meyer, 2004). Spillovers in developingcountries are widely studied; however, empirical evidence fordeveloped countries is less common.
The capacity for absorption refers to a company’s ability toapply knowledge from competitors via these spillovers (Cohen &Levinthal, 1989). This paper analyzes the capabilities to absorbspillovers from FDI, measured as technical progress in Spanishmanufacturing firms. We focus on how firm behavior, capabilities,and structure drive this absorptive capacity of FDI. However, doingso requires asking why a company’s resources and capabilitiesaffect the absorptive capacity of FDI in the first place. The approach
§ This is an open-access article distributed under the terms of the Creative
Commons Attribution-NonCommercial-No Derivative Works License, which
permits non-commercial use, distribution, and reproduction in any medium,
provided the original author and source are credited.
* Corresponding author. Tel.: +34 976761000; fax: +34 976762189.
E-mail addresses: [email protected] (P. Sanchez-Sellero), [email protected]
(J. Rosell-Martınez), [email protected] (J.M. Garcıa-Vazquez).1 Tel.: +34 976761000; fax: +34 976762189.2 Tel.: +34 986812488; fax: +34 986812401.
0969-5931/$ – see front matter � 2013 The Authors. Published by Elsevier Ltd. All rig
http://dx.doi.org/10.1016/j.ibusrev.2013.06.006
of resources and capabilities proposes that valuable, rare, imper-fectly imitable, and imperfectly substitutable resources arenecessary, making them a key source of competitive advantage(Barney, 1991).
This study furthers the understanding of the dynamiccapabilities of a firm (Teece, Pisano, & Shuen, 1997), particularlyregarding the factors that limit or enhance the ability to absorb andcapitalize on knowledge spillover. Firm-specific idiosyncrasies,distinctive institutional and industrial environment drive foreigninvestments (Wang, Hong, Kafouros, & Boateng, 2012b), and withthis in mind, we focus on absorptive capacity, which is a resource, acapability, and a good source of sustainable competitive advantageover time (Cohen & Levinthal, 1990).
In Spain, research evaluates the effect of FDI and R&D ontechnical progress at the industrial level (Rosell-Martınez &Sanchez-Sellero, 2012). Barrios, Dimelis, Louri, and Strobl (2004)also use the survey of business strategies (ESEE) to study theabsorptive capacity of spillovers from FDI in Spanish manufactur-ing firms. Alvarez and Molero (2005) use ESEE to identifyhorizontal spillovers from FDI in Spanish manufacturing industriesaccording to their high, medium, or low technological content.Similar to Barrios et al. (2004), Alvarez and Molero (2005), andRodrıguez and Pallas (2008), we use the ESEE in relation to FDI butextend its application to the factors determining the behavior, thecapabilities and the structure of the firm which are drivingabsorptive capacity, such as research and development (R&D)activities, results of R&D, internal organization of innovation,external relationships of innovation, quality of human capital,
hts reserved.
P. Sanchez-Sellero et al. / International Business Review 23 (2014) 429–439430
family involvement, complexity of the business, and marketconcentration.
Our conclusions are relevant for managers and policy makers. Inparticular, if a firm knows what determines its capacity to absorbFDI spillovers, then firm managers can make better decisionsregarding efficiency and performance improvement. Policy makerscan also identify which industries will benefit most from FDIspillovers and adjust their fiscal incentives accordingly.
The paper is structured as follows. Section 2 looks at thecapacity for absorbing FDI in the strict sense; Section 3 investigatesthe factors in the capacity to absorb FDI; Section 4 presents themodels, data, and methodology for explaining the factors in thecapacity to absorb FDI. The final section concludes.
2. Absorptive capacity and foreign direct investment
Some studies of FDI spillovers evaluate the absorptive capacityof local firms (Dimelis, 2005). The results of such absorption arevery hard to copy, which makes the process of absorption acompetitive advantage in and of itself (Peteraf, 1993). Accordingly,businesses make investments that increase their ability to absorb,and the more externalities that are in their environments, thegreater the incentive to invest in improving the capacity forabsorption (Cohen & Levinthal, 1990).
Absorptive capability is a process involving four diverse andcomplementary stages or dimensions: acquisition, assimilation,transformation, and exploitation (Zahra & George, 2002). Itrequires a business to evaluate, assimilate, and apply knowledgetransmitted from another (Lane & Lubatkin, 1998). The academicliterature widely covers the capacity to absorb from FDI anddefines absorptive capability as the ability to identify, assimilate,and apply knowledge from external sources (Cohen & Levinthal,1990) for commercial purposes.
In particular, companies can absorb foreign technology throughcompetitive rivalry, worker mobility, or the demonstration effect(Mody, 1989). FDI increases competition, allowing local businessesto absorb technological novelties and effective processes fromforeign firms, thus raises their productivity (Rugman & Verbeke,2003).
Taking advantage of the spillovers from FDI, however, againdepends on the capacity to absorb them (Cohen & Levinthal, 1990).A capacity to absorb (Rugman & Verbeke, 2001) largely depends ontechnological abilities (Ben Hamida, 2006; Narula & Marin, 2003)but varies with the sectors in which receptor firms operate. This iswhy companies in certain sectors, depending upon the degree ofconcentration in the sector, are more susceptible to developingabilities, a flow of knowledge, technological advances and,consequently, the capacity for absorption (Deeds, De Carolis, &Coombs, 2000).
Previously, Barrios and Strobl (2002) find that in Spain onlydomestic firms with the appropriate ‘‘absorptive capacity’’ canapply the positive externalities often associated with FDI. Wang,Deng, Kafouros, and Chen (2012a) find that the pace of foreignentry and the irregularity of foreign entry have a moderate effecton the relationship between the level of foreign presence andthe productivity of host-country firms. Also, they analyze how theintensity of R&D affects the pace of foreign entry and theirregularity of foreign entry. We contribute to the literature bystudying the determinants of the behavior, firm capabilities, andfirm structure that affect absorptive capacity of spillovers from FDI.
3. Factors determining absorptive capacity from foreign directinvestment
Lane and Lubatkin (1998) and Van den Bosch, Volberda, and deBoer (1999) are some of the first to study the factors determining
absorptive capacity. Barrios et al. (2004) and Wang et al. (2012a)also analyze how well firms absorb technical advances arising outof spillovers from a foreign presence in their sector. We add to thisby including the moderating effect of a number of determinants ofspillover absorption.
3.1. R&D activities and expenditures
3.1.1. R&D activities
The intensity of R&D, total intangible assets per worker, andtechnological gaps determine how well local firms absorb FDIspillover (Liu, Siler, Wang, & Wei, 2000; Dimelis, 2005). Innovation,therefore, can improve absorptive capacity (Veugelers, 1997).However, businesses do not tend to undertake R&D activities ifthey can simply glean technological knowledge from outsidesources (Nieto & Quevedo, 2005).
In this way, a capacity for absorption is relevant in acquiring newtechnology that spills over from FDI, and it therefore affects theproductivity of local firms (Caves, 1974). The effects may includecreating, diffusing, and commercializing technological innovations(Gugler & Dunning, 1994). The absorptive capacity of an enterprise,however, comes through acquiring, assimilating, and propagatingnew knowledge gleaned from outside the firm; more overall R&D inan industry enhances it (Liao, Welsch, & Stoica, 2003).
In sum, R&D activities prompt technological change, expandnew knowledge, and improve how people assimilate suchknowledge. All of this improves a firm’s absorptive capacity(Cohen & Levinthal, 1990). Consequently, our hypothesis is
Hypothesis 1. R&D activity increases a firm’s ability to absorbspillovers.
3.1.2. R&D expenditures
Because R&D spending may create competitive advantages, itencourages companies to absorb technological spillovers fromexternal sources (Veugelers, 1997). In turn, R&D expendituresimply that companies are willing to assimilate routines andprocesses, thereby increasing their stock of knowledge andimproving their capacity for absorption (Mowery, Oxley, &Silverman, 1996), which improves and sustains overall companyperformance (Todorova & Durisin, 2007). In a country-levelanalysis of host countries, R&D expenditures favor the absorptionof technological knowledge from FDI (Bodman & Le, 2013). Overallthen, we expect R&D expenditures to increase absorptive capacityof spillovers from FDI at the firm level. Accordingly, whereasHypothesis 1 proposes that R&D activities favor absorption,Hypothesis 2 proposes that R&D intensity increases absorption.
Hypothesis 2. A local company’s R&D costs divided by its stock ofcapital has a positive relation to a company’s capacity to absorbspillovers
3.2. R&D results: Patents, product innovations, and process
innovations
Beyond the development of R&D activities (Hypothesis 1) andR&D intensity (Hypothesis 2), we test whether R&D results(patents, product innovations, and process innovations) increaseabsorptive capacity. One type of R&D result in particular, patents, isa determinant of absorptive capacity (Coombs & Bierly, 2006)—particularly technology licenses (Atuahene-Gima, 1992). In thissense, the number and importance of patents signals absorptivecapacity (Baum, Calabrese, & Silverman, 2000; Zucker, Darby, &Armstrong, 2002).
However, the existence of patents in an enterprise may becommon practice in its sector, which makes appropriating
P. Sanchez-Sellero et al. / International Business Review 23 (2014) 429–439 431
innovations more difficult and favors protecting innovation withinan industry (Cohen & Levinthal, 1990). Thus, patents shouldmitigate spillovers and the absorption of knowledge associatedwith those patents. Furthermore, when a local firm owns a patent,it is exploiting a competitive advantage and likely has no interest inusing innovations or improvements from other companies.
Local companies can imitate innovative foreign firms (Meyer,2003), and their capacity for technological absorption can bemeasured through their innovations in products and processes(Narula & Marin, 2003; Ben Hamida, 2007). Furthermore, the capacityto absorb innovation improves when there is a greater quantity andquality of outside technological knowledge (Cohen & Levinthal,1990). The process of developing new products also improvesabsorptive capacity, and this capacity improves efficiency andproductivity (Atuahene-Gima, 1992; Stock, Greis, & Fischer, 2001).
Ben Hamida and Gugler (2009) show that using foreignknowledge efficiently requires mid-level technological capability.They measure technological capability through product andprocess innovation for Swiss manufacturing and services/con-struction local firms.
We test whether a firm that obtains R&D results can apply andproduce knowledge (patents, product innovations, and processinnovations). This is the absorptive capacity of external knowl-edge. On the basis of all these arguments and to capture thediffering behaviors of patents, product innovations, and processinnovations, we propose the following two hypotheses:
Hypothesis 3. There is a significant relationship between thenumber of patents a local firm owns and its ability to absorbspillovers.
Hypothesis 4. The number of product and process innovations in alocal business improves its ability to absorb spillovers.
3.3. Internal organization of innovation
We expect the transfer of information among departments (i.e.,effective internal communication of information that companiesassimilate and use) to increase the capacity for absorption (Vanden Bosch et al., 1999). To maximize this communication, the firmmust design flexible formal and informal organizational structures(Liao et al., 2003), it must create multidisciplinary teams and closelinks between the R&D department and other departments (Gupta& Govindarajan, 2000; Meeus, Oerlemans, & Hage, 2001), and itmust encourage innovation (Jones & Craven, 2001).
A culture of innovation stimulates knowledge, improvesexecution, has effective problem resolution, and encouragessuggestions and continuous learning, because these thingsincrease the capacity for absorption (Davenport, De Long, & Beers,1998, Lenox & King, 2004). Also, the formal existence of an R&Ddepartment in a firm increases its absorptive capacity (Veugelers,1997; Cassiman & Veugelers, 2002). Together, these things createsustainable competitive advantages (Lane, Salk, & Lyles, 2001; Tsai,2001). Our hypothesis, therefore, is as follows:
Hypothesis 5. The number of actions a firm takes in relation tointernal organization of innovation has a positive relation with itsability to absorb spillovers.
3.4. The external relationships of innovation
3.4.1. R&D activities: Internalization and externalization
Companies with strong, structured, internal R&D activitiesglean results from external sources more easily (Cohen & Levinthal,1990; Veugelers, 1997; Lowe & Taylor, 1998). External R&Dactivities also increase absorptive capacity, but only if an
organization already has absorptive capacity (Griffith, Redding,& Reenen, 2004).
Contrary to frequent conjectures, import-embodied R&D doesnot seem to improve the technological base of the host economies(Bodman & Le, 2013). There is some evidence that externalizedR&D activities strengthen the capacity to absorb spillovers fromforeign companies (Veugelers, 1997; Lowe & Taylor, 1998).However, our hypothesis is that outsourcing R&D obtains onlyminor product and process innovations. Thus, firms are more likelyto outsource R&D when they are less efficient in R&D than suppliercompanies are. Whereas the supplier of R&D get economies doingR&D, has not specific assets for R&D development and their R&D isrelatively standardized. Accordingly, we include in our modelother variables related to R&D intensity and R&D results. Weexpect a negative coefficient between outsourcing R&D activitiesand absorptive capacity of spillovers from FDI.
Hypothesis 6. Outsourcing R&D activities has a negative effect onabsorptive capacity from FDI.
3.4.2. External collaboration for innovation
Cooperation with universities, research and technology centers,engineering and consultancy business, suppliers, clients, andcompetitors may enhance a firm’s capacity for absorption. In turn,subsidiaries of multinational enterprises transfer local technologyand information by cooperating with local firms (Park, 2012). Theabsorptive capacity of the knowledge transferred has intensifiedover the last few years in cooperative networks for innovation(Tether, 2002).
Park and Ghauri (2011) maintain that collaborative support fromknowledge transferors is a prerequisite to help organizations toabsorb technological capabilities, and Miozzo and Grimshaw (2008)show that absorptive capacity improves the transfer of knowledgeabout information technology. We consider effects of relationshipswith clients, universities, technology centers, suppliers, competi-tors, joint ventures, and other innovative entities on the absorptivecapacity of spillovers from FDI in manufacturing firms.
In addition, the closer the relationship among firms, the greaterthe absorptive capacity of tacit knowledge (Dyer & Nobeoka, 2000).Not all firm relationships improve absorptive capacity, however. Infact, interorganizational agreements for acquiring external tech-nology might reduce absorptive capacity (Lei & Hitt, 1995). Inshort, our hypothesis is as follows:
Hypothesis 7. The number of actions a local business takes inrelation to external collaboration for innovation has a positiveeffect on the firm’s ability to absorb spillovers.
3.4.3. Relationships with the state in innovation
Financial resources affect the capacity to absorb, because theyprovide the means for carrying out R&D activities, for reachingcooperation agreements with other firms and institutions, and foremploying suitably trained staff, among other things (Ghoshal &Bartlett, 1988; Kamien & Zang, 2000). Publicly funded R&D producesdifferent results, however (David, Hall, & Toole, 2000). Some studiesfind positive effects from publicly funding R&D (Aerts & Schmidt,2008) and others find insignificant or negative effects (Lach, 2002).
The advantages of public funding for R&D include more fundingand better organizational capabilities (Buisseret, Cameron, &Georgiou, 1995; Trajtenberg, 2001). However, publicly fundingR&D is less effective than privately funding it (Griliches, 1986). Aninterpretation of second order about the sign of this relationship isrelated to the design of the public-funding program in the analyzedgeographic area. A negative relationship between public fundingand absorptive capacity suggests the existence of an adverseselection problem. That is, public funding programs fail to support
P. Sanchez-Sellero et al. / International Business Review 23 (2014) 429–439432
the most valuable R&D projects. In addition, public fundingprovides financial resources to R&D projects that are not able to getprivate funding. Hence, the hypothesis is as follows:
Hypothesis 8. There is a significant relationship between thepercentage of public funding in R&D expenditures in local firmsand the ability of those firms to absorb spillovers.
National governments may attempt to attract FDI, principallybecause they hope it will lead to positive spillovers for localbusinesses (Narula & Dunning, 2000). Further, these governmentsmay adopt measures that favor innovation in local firms so thatthey will be in a position to absorb knowledge from foreignenterprises. Some of these decisions may include stimulating theentry of FDI, reducing obstacles to FDI, supporting investments,offering tax incentives, adjusting patent regulation, and so forth(Dunning & Gugler, 2008; Oxelheim & Ghauri, 2003).
Public policies aimed at attracting FDI should be directed towardsupporting private enterprises, but also universities, researchcenters, and industrial associations (Padilla-Perez, 2008). Accord-ingly, firms that collaborate with the public sector in innovation gainan advantage by developing absorptive capacity (Zucker et al., 2002;Fabrizio, 2009). Consequently, we propose the following hypothesis:
Hypothesis 9. The number of innovation links between local firmsand the public sector has a positive effect on the ability of localfirms to absorb spillovers.
3.5. Quality of human capital
Absorption occurs through the interaction and transfer ofknowledge among skilled staff members (Criscuolo, 2005). Hence,personnel who have the abilities, training, and experience toabsorb new knowledge are necessary (Nonaka & Takeuchi, 1995).Companies with specialists, qualified technicians, scientists,engineers, and staff with experience in specific areas in turn havemore absorptive capacity (Gupta & Govindarajan, 2000; Zahra &George, 2002). Skilled workers from businesses entering themarket through FDI may decide to work for local firms and thusmay also transfer their knowledge from a foreign to a localenterprise (Kaufmann, 1997). Employees’ absorptive capacityvaries with the level of effort they put in (Kim, 1998), theenterprises’ formalization of policies procedures, the level ofcoordination among members, and the existence of sharedideology (Van den Bosch et al., 1999).
As we can see, human capital directly affects the capacity forabsorption. Learning processes in receptor companies (Cohen &Levinthal, 1990; Kim, 1998; Meeus et al., 2001) include improvingworkers’ skills (as a factor of production), but also include theability to learn from the foreign technological base (Bodman & Le,2013). Accordingly, we hypothesize the following:
Hypothesis 10. There is a positive relation between the proportionof university graduates in a company’s staff and the company’sability to absorb spillovers from FDI.
3.6. Family management of businesses
Family management affects firms’ financial behavior (Schleifer& Vishny, 1997), as well as their productivity (Palia & Lichtenberg,1999). In particular, the concentrated ownership structureencourages managers to control and reduce agency costs relatedto the separation of ownership and management (Schleifer &Vishny, 1997). Consequently, family firms have an advantagebecause their concentrated ownership structures allow closesupervision of management (Berle & Means, 1932).
However, family management can also have negative effects ontechnical progress and absorptive capacity. Restricted investmentin R&D and new technologies, for example, can be a result of familymanagers using resources to finance their own lifestyles (Chandler,1990). Additionally, family managers may be excessively tolerantof inadequate performance of other family members (Pollack,1985). The pool from which family managers come is very limitedand much smaller than the pool of professional managers, after all,so their talents are less extensive and can jeopardize productivity(Burkart, Panunzi, & Shleifer, 2002). Similarly, excessive controlcan impede changes in management styles, staffing policies, orother matters, also limiting productivity (Gulbrandsen, 2005) andthe acquisition of external knowledge.
On the basis of these statements, we propose the followinghypothesis:
Hypothesis 11. Family management has a significant (positive ornegative) influence on absorptive capacity.
3.7. Complexity of a business: Differentiated products and complex
production process
The entry of FDI may encourage the most competitive localfirms to develop proactive strategies that apply their full range oftechnological resources and capabilities and thus help themexploit technological knowledge, bring new products to market,and improve production processes (Zack, 1999). Technical andmanagerial competence is crucial to absorbing knowledge(Szulanski, 1996), and having differentiated products or complexproduction processes enhances that (Pittaway, Robertson, Munir,Denyer, & Neely, 2004; Kaminski, de Oliveira, & Lopes, 2008). Inturn, we make the following hypothesis:
Hypothesis 12. The more differentiated a firm’s products are andthe more complex its production process are, the greater its abilityto absorb spillovers.
3.8. Market concentration
In the literature, industry concentration creates ambiguousresults. On one hand, it encourages collusion, which underminestechnological progress (Davies & Caves, 1987). On the other hand,firms in concentrated industries are in a better position to fixmonopoly prices, which increases the added value per employee(Kokko, 1994).
Furthermore, market competition discourages relationshipsbetween foreign firms and local actors due to the risks ofunintended knowledge spillovers to rivals (Santangelo, 2012).This suggests that firms can use relationships with competitors toimprove their absorptive capacity from FDI.
In addition, the literature analyzes market concentration inrelation to the productive efficiency of industry. The outcome isthat economies of scale improve specialization, market power,production efficiency (Blomstrom, 1986). Accordingly, the hypoth-esis is as follows:
Hypothesis 13. There is a positive relation between market con-centration and absorptive capacity.
4. Model, data, and methodology
4.1. Data
We analyze homogenous information at the individual businesslevel for 20 manufacturing sectors over 13 years, from 1994 to2006. The information is from the survey of business strategies
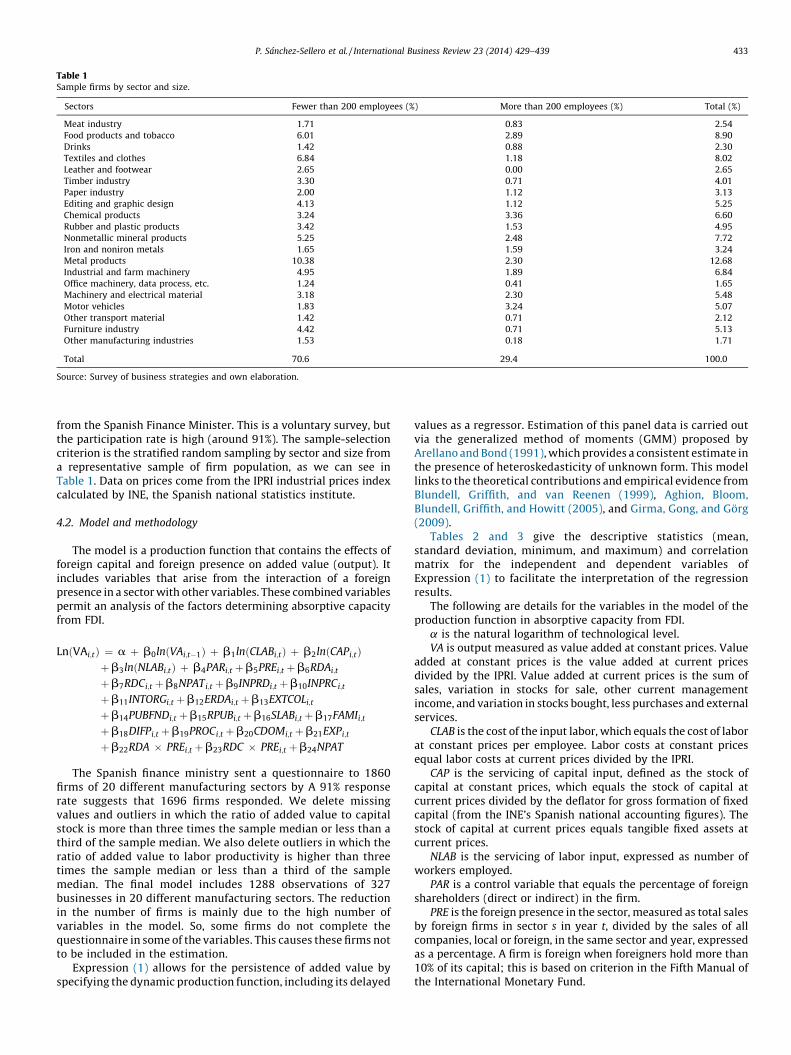
Table 1Sample firms by sector and size.
Sectors Fewer than 200 employees (%) More than 200 employees (%) Total (%)
Meat industry 1.71 0.83 2.54
Food products and tobacco 6.01 2.89 8.90
Drinks 1.42 0.88 2.30
Textiles and clothes 6.84 1.18 8.02
Leather and footwear 2.65 0.00 2.65
Timber industry 3.30 0.71 4.01
Paper industry 2.00 1.12 3.13
Editing and graphic design 4.13 1.12 5.25
Chemical products 3.24 3.36 6.60
Rubber and plastic products 3.42 1.53 4.95
Nonmetallic mineral products 5.25 2.48 7.72
Iron and noniron metals 1.65 1.59 3.24
Metal products 10.38 2.30 12.68
Industrial and farm machinery 4.95 1.89 6.84
Office machinery, data process, etc. 1.24 0.41 1.65
Machinery and electrical material 3.18 2.30 5.48
Motor vehicles 1.83 3.24 5.07
Other transport material 1.42 0.71 2.12
Furniture industry 4.42 0.71 5.13
Other manufacturing industries 1.53 0.18 1.71
Total 70.6 29.4 100.0
Source: Survey of business strategies and own elaboration.
P. Sanchez-Sellero et al. / International Business Review 23 (2014) 429–439 433
from the Spanish Finance Minister. This is a voluntary survey, butthe participation rate is high (around 91%). The sample-selectioncriterion is the stratified random sampling by sector and size froma representative sample of firm population, as we can see inTable 1. Data on prices come from the IPRI industrial prices indexcalculated by INE, the Spanish national statistics institute.
4.2. Model and methodology
The model is a production function that contains the effects offoreign capital and foreign presence on added value (output). Itincludes variables that arise from the interaction of a foreignpresence in a sector with other variables. These combined variablespermit an analysis of the factors determining absorptive capacityfrom FDI.
LnðVAi;tÞ ¼ a þ b0lnðVAi;t�1Þ þ b1lnðCLABi;tÞ þ b2lnðCAPi;tÞþ b3lnðNLABi;tÞ þ b4PARi;t þ b5PREi;t þ b6RDAi;t
þ b7RDCi;t þ b8NPATi;t þ b9INPRDi;t þ b10INPRCi;t
þ b11INTORGi;t þ b12ERDAi;t þ b13EXTCOLi;t
þ b14PUBFNDi;t þ b15RPUBi;t þ b16SLABi;t þ b17FAMIi;t
þ b18DIFPi;t þ b19PROCi;t þ b20CDOMi;t þ b21EXPi;t
þ b22RDA � PREi;t þ b23RDC � PREi;t þ b24NPAT
The Spanish finance ministry sent a questionnaire to 1860firms of 20 different manufacturing sectors by A 91% responserate suggests that 1696 firms responded. We delete missingvalues and outliers in which the ratio of added value to capitalstock is more than three times the sample median or less than athird of the sample median. We also delete outliers in which theratio of added value to labor productivity is higher than threetimes the sample median or less than a third of the samplemedian. The final model includes 1288 observations of 327businesses in 20 different manufacturing sectors. The reductionin the number of firms is mainly due to the high number ofvariables in the model. So, some firms do not complete thequestionnaire in some of the variables. This causes these firms notto be included in the estimation.
Expression (1) allows for the persistence of added value byspecifying the dynamic production function, including its delayed
values as a regressor. Estimation of this panel data is carried outvia the generalized method of moments (GMM) proposed byArellano and Bond (1991), which provides a consistent estimate inthe presence of heteroskedasticity of unknown form. This modellinks to the theoretical contributions and empirical evidence fromBlundell, Griffith, and van Reenen (1999), Aghion, Bloom,Blundell, Griffith, and Howitt (2005), and Girma, Gong, and Gorg(2009).
Tables 2 and 3 give the descriptive statistics (mean,standard deviation, minimum, and maximum) and correlationmatrix for the independent and dependent variables ofExpression (1) to facilitate the interpretation of the regressionresults.
The following are details for the variables in the model of theproduction function in absorptive capacity from FDI.
a is the natural logarithm of technological level.VA is output measured as value added at constant prices. Value
added at constant prices is the value added at current pricesdivided by the IPRI. Value added at current prices is the sum ofsales, variation in stocks for sale, other current managementincome, and variation in stocks bought, less purchases and externalservices.
CLAB is the cost of the input labor, which equals the cost of laborat constant prices per employee. Labor costs at constant pricesequal labor costs at current prices divided by the IPRI.
CAP is the servicing of capital input, defined as the stock ofcapital at constant prices, which equals the stock of capital atcurrent prices divided by the deflator for gross formation of fixedcapital (from the INE’s Spanish national accounting figures). Thestock of capital at current prices equals tangible fixed assets atcurrent prices.
NLAB is the servicing of labor input, expressed as number ofworkers employed.
PAR is a control variable that equals the percentage of foreignshareholders (direct or indirect) in the firm.
PRE is the foreign presence in the sector, measured as total salesby foreign firms in sector s in year t, divided by the sales of allcompanies, local or foreign, in the same sector and year, expressedas a percentage. A firm is foreign when foreigners hold more than10% of its capital; this is based on criterion in the Fifth Manual ofthe International Monetary Fund.
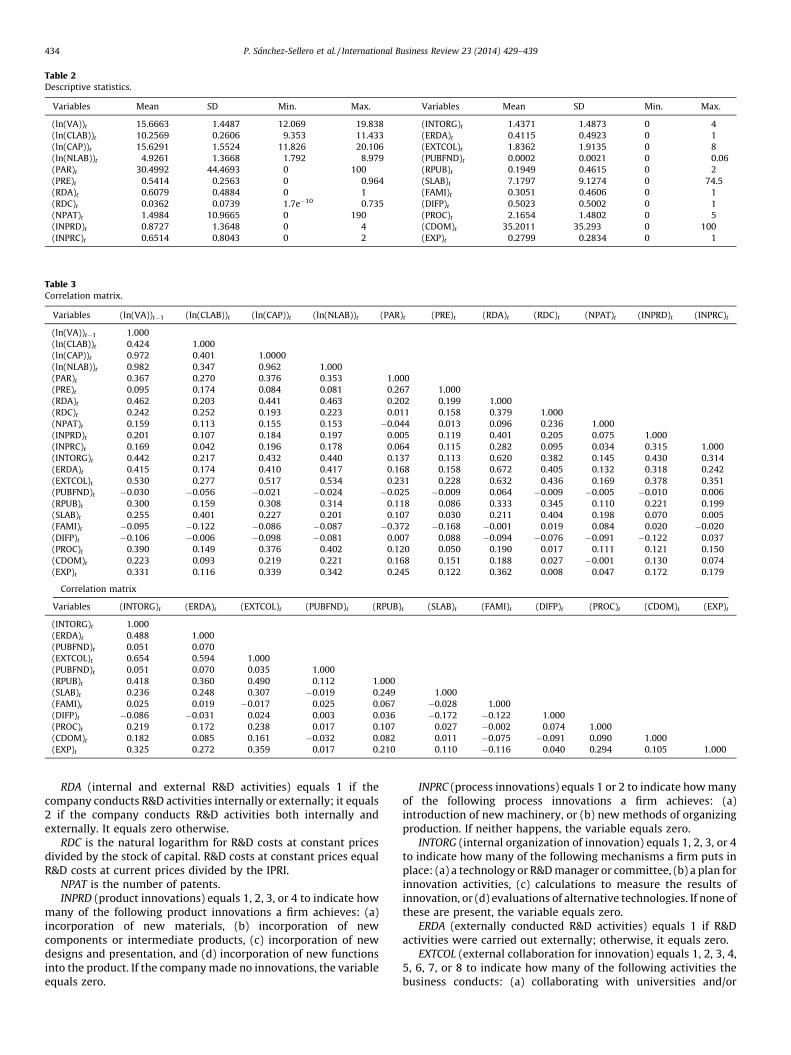
Table 2Descriptive statistics.
Variables Mean SD Min. Max. Variables Mean SD Min. Max.
(ln(VA))t 15.6663 1.4487 12.069 19.838 (INTORG)t 1.4371 1.4873 0 4
(ln(CLAB))t 10.2569 0.2606 9.353 11.433 (ERDA)t 0.4115 0.4923 0 1
(ln(CAP))t 15.6291 1.5524 11.826 20.106 (EXTCOL)t 1.8362 1.9135 0 8
(ln(NLAB))t 4.9261 1.3668 1.792 8.979 (PUBFND)t 0.0002 0.0021 0 0.06
(PAR)t 30.4992 44.4693 0 100 (RPUB)t 0.1949 0.4615 0 2
(PRE)t 0.5414 0.2563 0 0.964 (SLAB)t 7.1797 9.1274 0 74.5
(RDA)t 0.6079 0.4884 0 1 (FAMI)t 0.3051 0.4606 0 1
(RDC)t 0.0362 0.0739 1.7e�10 0.735 (DIFP)t 0.5023 0.5002 0 1
(NPAT)t 1.4984 10.9665 0 190 (PROC)t 2.1654 1.4802 0 5
(INPRD)t 0.8727 1.3648 0 4 (CDOM)t 35.2011 35.293 0 100
(INPRC)t 0.6514 0.8043 0 2 (EXP)t 0.2799 0.2834 0 1
Table 3Correlation matrix.
Variables (ln(VA))t�1 (ln(CLAB))t (ln(CAP))t (ln(NLAB))t (PAR)t (PRE)t (RDA)t (RDC)t (NPAT)t (INPRD)t (INPRC)t
(ln(VA))t�1 1.000
(ln(CLAB))t 0.424 1.000
(ln(CAP))t 0.972 0.401 1.0000
(ln(NLAB))t 0.982 0.347 0.962 1.000
(PAR)t 0.367 0.270 0.376 0.353 1.000
(PRE)t 0.095 0.174 0.084 0.081 0.267 1.000
(RDA)t 0.462 0.203 0.441 0.463 0.202 0.199 1.000
(RDC)t 0.242 0.252 0.193 0.223 0.011 0.158 0.379 1.000
(NPAT)t 0.159 0.113 0.155 0.153 �0.044 0.013 0.096 0.236 1.000
(INPRD)t 0.201 0.107 0.184 0.197 0.005 0.119 0.401 0.205 0.075 1.000
(INPRC)t 0.169 0.042 0.196 0.178 0.064 0.115 0.282 0.095 0.034 0.315 1.000
(INTORG)t 0.442 0.217 0.432 0.440 0.137 0.113 0.620 0.382 0.145 0.430 0.314
(ERDA)t 0.415 0.174 0.410 0.417 0.168 0.158 0.672 0.405 0.132 0.318 0.242
(EXTCOL)t 0.530 0.277 0.517 0.534 0.231 0.228 0.632 0.436 0.169 0.378 0.351
(PUBFND)t �0.030 �0.056 �0.021 �0.024 �0.025 �0.009 0.064 �0.009 �0.005 �0.010 0.006
(RPUB)t 0.300 0.159 0.308 0.314 0.118 0.086 0.333 0.345 0.110 0.221 0.199
(SLAB)t 0.255 0.401 0.227 0.201 0.107 0.030 0.211 0.404 0.198 0.070 0.005
(FAMI)t �0.095 �0.122 �0.086 �0.087 �0.372 �0.168 �0.001 0.019 0.084 0.020 �0.020
(DIFP)t �0.106 �0.006 �0.098 �0.081 0.007 0.088 �0.094 �0.076 �0.091 �0.122 0.037
(PROC)t 0.390 0.149 0.376 0.402 0.120 0.050 0.190 0.017 0.111 0.121 0.150
(CDOM)t 0.223 0.093 0.219 0.221 0.168 0.151 0.188 0.027 �0.001 0.130 0.074
(EXP)t 0.331 0.116 0.339 0.342 0.245 0.122 0.362 0.008 0.047 0.172 0.179
Correlation matrix
Variables (INTORG)t (ERDA)t (EXTCOL)t (PUBFND)t (RPUB)t (SLAB)t (FAMI)t (DIFP)t (PROC)t (CDOM)t (EXP)t
(INTORG)t 1.000
(ERDA)t 0.488 1.000
(PUBFND)t 0.051 0.070
(EXTCOL)t 0.654 0.594 1.000
(PUBFND)t 0.051 0.070 0.035 1.000
(RPUB)t 0.418 0.360 0.490 0.112 1.000
(SLAB)t 0.236 0.248 0.307 �0.019 0.249 1.000
(FAMI)t 0.025 0.019 �0.017 0.025 0.067 �0.028 1.000
(DIFP)t �0.086 �0.031 0.024 0.003 0.036 �0.172 �0.122 1.000
(PROC)t 0.219 0.172 0.238 0.017 0.107 0.027 �0.002 0.074 1.000
(CDOM)t 0.182 0.085 0.161 �0.032 0.082 0.011 �0.075 �0.091 0.090 1.000
(EXP)t 0.325 0.272 0.359 0.017 0.210 0.110 �0.116 0.040 0.294 0.105 1.000
P. Sanchez-Sellero et al. / International Business Review 23 (2014) 429–439434
RDA (internal and external R&D activities) equals 1 if thecompany conducts R&D activities internally or externally; it equals2 if the company conducts R&D activities both internally andexternally. It equals zero otherwise.
RDC is the natural logarithm for R&D costs at constant pricesdivided by the stock of capital. R&D costs at constant prices equalR&D costs at current prices divided by the IPRI.
NPAT is the number of patents.INPRD (product innovations) equals 1, 2, 3, or 4 to indicate how
many of the following product innovations a firm achieves: (a)incorporation of new materials, (b) incorporation of newcomponents or intermediate products, (c) incorporation of newdesigns and presentation, and (d) incorporation of new functionsinto the product. If the company made no innovations, the variableequals zero.
INPRC (process innovations) equals 1 or 2 to indicate how manyof the following process innovations a firm achieves: (a)introduction of new machinery, or (b) new methods of organizingproduction. If neither happens, the variable equals zero.
INTORG (internal organization of innovation) equals 1, 2, 3, or 4to indicate how many of the following mechanisms a firm puts inplace: (a) a technology or R&D manager or committee, (b) a plan forinnovation activities, (c) calculations to measure the results ofinnovation, or (d) evaluations of alternative technologies. If none ofthese are present, the variable equals zero.
ERDA (externally conducted R&D activities) equals 1 if R&Dactivities were carried out externally; otherwise, it equals zero.
EXTCOL (external collaboration for innovation) equals 1, 2, 3, 4,5, 6, 7, or 8 to indicate how many of the following activities thebusiness conducts: (a) collaborating with universities and/or
P. Sanchez-Sellero et al. / International Business Review 23 (2014) 429–439 435
technology centers, (b) collaborating technologically with clients,(c) collaborating technologically with suppliers, (d) collaboratingtechnologically with competitors, (e) having technological coop-eration agreements (joint ventures), (f) owning shares ofbusinesses developing technological innovations, (g) employingrecent college graduates, especially those with degrees in science,engineering, or technology, or (h) recruiting personnel with R&Dexperience in a business context. If the business conducts none ofthese activities, the variable equals zero.
PUBFND is the amount of public funding for R&D divided bytotal R&D costs.
RPUB (relationship with the public sector for innovation) equals1 or 2 to indicate how many of the following activities a firmundertakes: (a) financing innovation with subsidized credit, or (b)participating in European Union (E.U.) research programs. Ifneither happen, the variable equals zero.
SLAB is the number of employees holding college degrees as apercentage of the staff.
FAMI (family control) equals 1 if a family group participatesactively in the control or management of the enterprise; it equalszero otherwise.
DIFP (differentiated products) equals 1 if the firm’s products aredifferentiated and zero if they are standard generics.
PROC (complex production process) equals 1, 2, 3, 4, or 5 toindicate how many of the following processes a company uses inproduction: (a) numerically controlled, computerized machinetools, (b) robotics, (c) computer-aided design (CAD), (d) acombination of any of those items via a computer-aidedmanufacturing, flexible manufacturing systems, or other centralcomputer, or (e) local-area networking (LAN) in manufacturingactivities. If the company uses none of the listed techniques, thevalue is zero.
CDOM is concentration in the principal (domestic) market,measured as the market share of the leading four firms in thatmarket.
EXP is the exports divided by sales.P
bS � SECTi,t,s In this summation, SECTi,t,s equals 1 if firm i inyear t belonged to sector s. In any other case, it equals zero. Thecoefficient bS represents the effect associated with sector s.
ei,t is the error term. Errors are taken to be independent andidentically distributed.
Table 4Regression results.
Dependent variable: (ln(VA))t Coefficient p Value
(a)t �0.0013 0.716
(ln(VA))t�1 0.0902 0.269
(ln(CLAB))t 0.4497 0.000***
(ln(CAP))t 0.1445 0.000***
(RDA)t �0.0372 0.334
(RDC)t �0.3098 0.327
(NPAT)t 0.0001 0.910
(INPRD)t 0.0083 0.400
(INPRC)t �0.0277 0.090*
(INTORG)t �0.0078 0.574
(ERDA)t 0.0538 0.194
(EXTCOL)t 0.0037 0.754
(PUBFND)t 8.6462 0.060*
(RPUB)t 0.0339 0.281
(SLAB)t �0.0005 0.739
(FAMI)t – –
(DIFP)t 0.0076 0.786
(PROC)t �0.0199 0.051*
(CDOM)t 0.0003 0.534
(EXP)t 0.0726 0.446
Sector coefficients Yes –
Wald test 983.97 –
Sargan test (chi squared) 72.42 0.2464
Notes: Figures with *, **, and *** indicate a level of significance of 10%, 5%, and 1%, res
Multiplying certain variables by foreign presence (PRE) isolatesthe moderation effect of those variables on the absorption of FDIspillovers. This construct of the model identifies:
� The effect of FDI in the sector on the firm’s technical progress.� The effect of foreign ownership on its technical progress.� The effect of every determinant on the firm’s technical progress.� The effect of every determinant on the firm’s capacity to absorb
spillovers.
The degree to which domestic receptors themselves aremultinationalized affects their absorptive capacity. For this reason,we include two control variables of technical progress: export andabsorptive capacity of export (export multiplied by foreign presence).Labor cost acts as a control variable in the same production functionbecause variation in the relative costs of inputs affects the relativedemand for production inputs (labor and capital). This of courseaffects absorptive capacity. Thus, we introduce sector variables as acontrol variable of technical progress.
5. Estimation and discussion
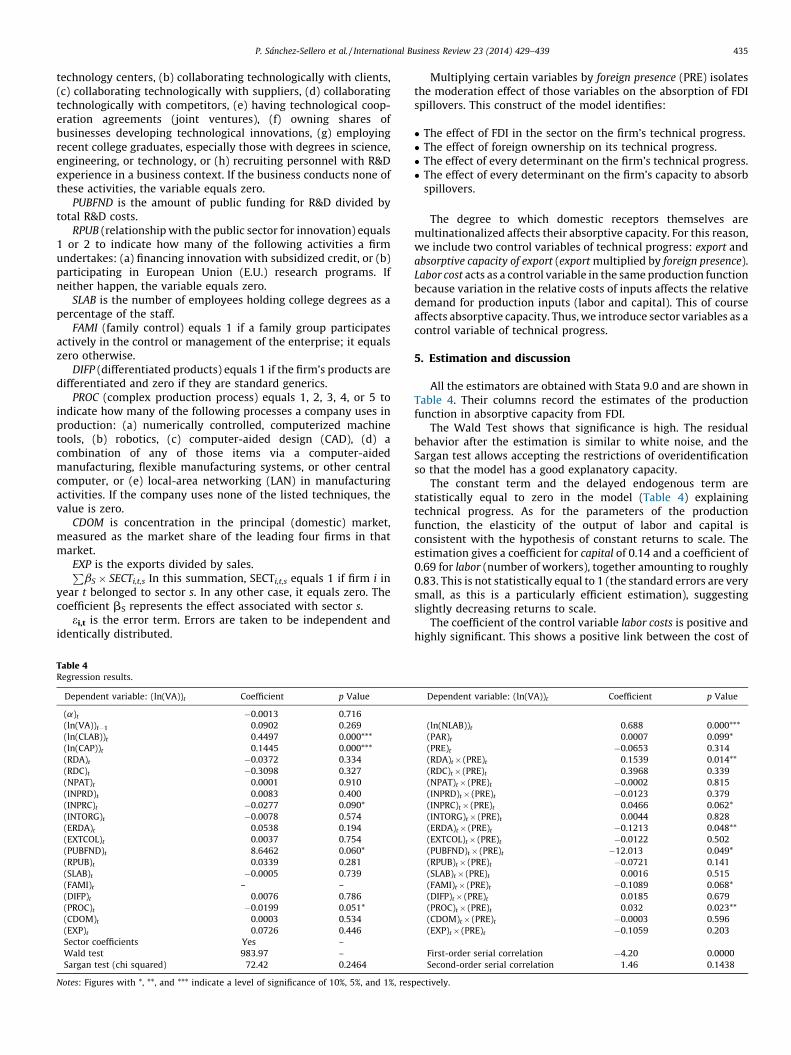
All the estimators are obtained with Stata 9.0 and are shown inTable 4. Their columns record the estimates of the productionfunction in absorptive capacity from FDI.
The Wald Test shows that significance is high. The residualbehavior after the estimation is similar to white noise, and theSargan test allows accepting the restrictions of overidentificationso that the model has a good explanatory capacity.
The constant term and the delayed endogenous term arestatistically equal to zero in the model (Table 4) explainingtechnical progress. As for the parameters of the productionfunction, the elasticity of the output of labor and capital isconsistent with the hypothesis of constant returns to scale. Theestimation gives a coefficient for capital of 0.14 and a coefficient of0.69 for labor (number of workers), together amounting to roughly0.83. This is not statistically equal to 1 (the standard errors are verysmall, as this is a particularly efficient estimation), suggestingslightly decreasing returns to scale.
The coefficient of the control variable labor costs is positive andhighly significant. This shows a positive link between the cost of
Dependent variable: (ln(VA))t Coefficient p Value
(ln(NLAB))t 0.688 0.000***
(PAR)t 0.0007 0.099*
(PRE)t �0.0653 0.314
(RDA)t� (PRE)t 0.1539 0.014**
(RDC)t� (PRE)t 0.3968 0.339
(NPAT)t� (PRE)t �0.0002 0.815
(INPRD)t� (PRE)t �0.0123 0.379
(INPRC)t� (PRE)t 0.0466 0.062*
(INTORG)t� (PRE)t 0.0044 0.828
(ERDA)t� (PRE)t �0.1213 0.048**
(EXTCOL)t� (PRE)t �0.0122 0.502
(PUBFND)t� (PRE)t �12.013 0.049*
(RPUB)t� (PRE)t �0.0721 0.141
(SLAB)t� (PRE)t 0.0016 0.515
(FAMI)t� (PRE)t �0.1089 0.068*
(DIFP)t� (PRE)t 0.0185 0.679
(PROC)t� (PRE)t 0.032 0.023**
(CDOM)t� (PRE)t �0.0003 0.596
(EXP)t� (PRE)t �0.1059 0.203
First-order serial correlation �4.20 0.0000
Second-order serial correlation 1.46 0.1438
pectively.
P. Sanchez-Sellero et al. / International Business Review 23 (2014) 429–439436
this input and output, with a value of 0.45. The control variablepercentage of foreign participation thus has a positive influence ontechnical progress, as the estimated value of the coefficient is0.0006528, being moderately significant. This implies that firmswith more foreign capital make more technical progress than thosewhose capital is predominantly local. This is consistent with earlierstudies, such as Rosell-Martınez and Sanchez-Sellero (2012),which find that FDI improves productivity in the manufacturingsector the year after the investment takes place.
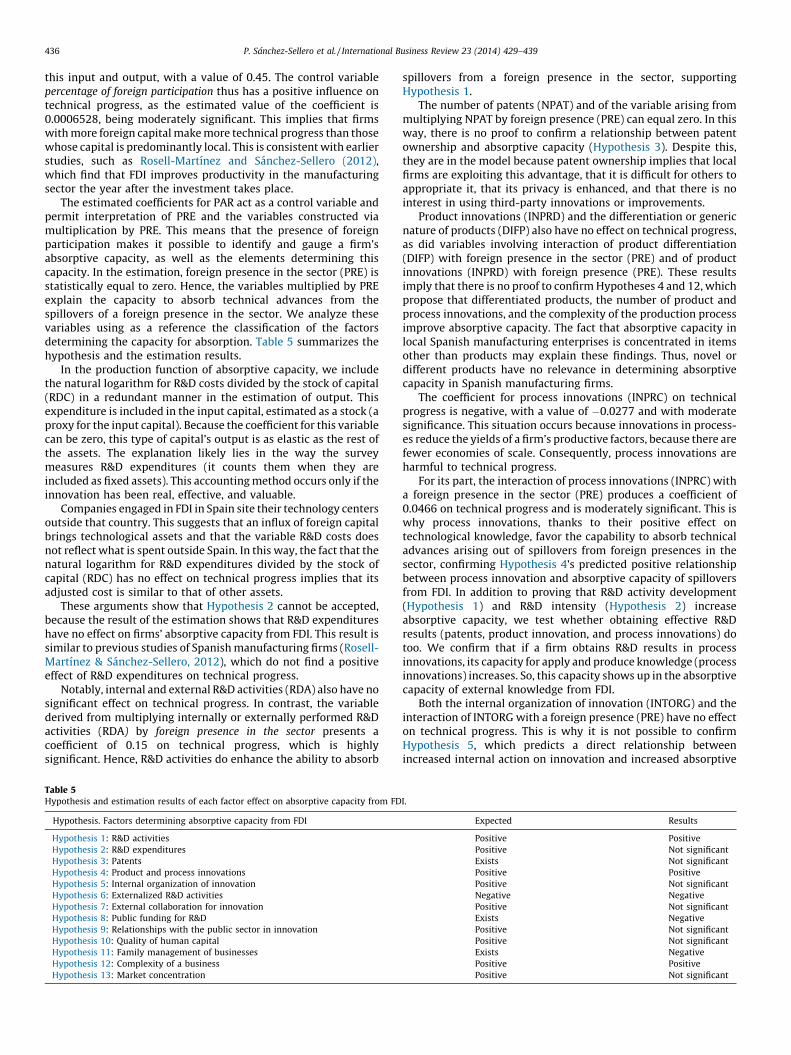
The estimated coefficients for PAR act as a control variable andpermit interpretation of PRE and the variables constructed viamultiplication by PRE. This means that the presence of foreignparticipation makes it possible to identify and gauge a firm’sabsorptive capacity, as well as the elements determining thiscapacity. In the estimation, foreign presence in the sector (PRE) isstatistically equal to zero. Hence, the variables multiplied by PREexplain the capacity to absorb technical advances from thespillovers of a foreign presence in the sector. We analyze thesevariables using as a reference the classification of the factorsdetermining the capacity for absorption. Table 5 summarizes thehypothesis and the estimation results.
In the production function of absorptive capacity, we includethe natural logarithm for R&D costs divided by the stock of capital(RDC) in a redundant manner in the estimation of output. Thisexpenditure is included in the input capital, estimated as a stock (aproxy for the input capital). Because the coefficient for this variablecan be zero, this type of capital’s output is as elastic as the rest ofthe assets. The explanation likely lies in the way the surveymeasures R&D expenditures (it counts them when they areincluded as fixed assets). This accounting method occurs only if theinnovation has been real, effective, and valuable.
Companies engaged in FDI in Spain site their technology centersoutside that country. This suggests that an influx of foreign capitalbrings technological assets and that the variable R&D costs doesnot reflect what is spent outside Spain. In this way, the fact that thenatural logarithm for R&D expenditures divided by the stock ofcapital (RDC) has no effect on technical progress implies that itsadjusted cost is similar to that of other assets.
These arguments show that Hypothesis 2 cannot be accepted,because the result of the estimation shows that R&D expenditureshave no effect on firms’ absorptive capacity from FDI. This result issimilar to previous studies of Spanish manufacturing firms (Rosell-Martınez & Sanchez-Sellero, 2012), which do not find a positiveeffect of R&D expenditures on technical progress.
Notably, internal and external R&D activities (RDA) also have nosignificant effect on technical progress. In contrast, the variablederived from multiplying internally or externally performed R&Dactivities (RDA) by foreign presence in the sector presents acoefficient of 0.15 on technical progress, which is highlysignificant. Hence, R&D activities do enhance the ability to absorb
Table 5Hypothesis and estimation results of each factor effect on absorptive capacity from FD
Hypothesis. Factors determining absorptive capacity from FDI
Hypothesis 1: R&D activities
Hypothesis 2: R&D expenditures
Hypothesis 3: Patents
Hypothesis 4: Product and process innovations
Hypothesis 5: Internal organization of innovation
Hypothesis 6: Externalized R&D activities
Hypothesis 7: External collaboration for innovation
Hypothesis 8: Public funding for R&D
Hypothesis 9: Relationships with the public sector in innovation
Hypothesis 10: Quality of human capital
Hypothesis 11: Family management of businesses
Hypothesis 12: Complexity of a business
Hypothesis 13: Market concentration
spillovers from a foreign presence in the sector, supportingHypothesis 1.
The number of patents (NPAT) and of the variable arising frommultiplying NPAT by foreign presence (PRE) can equal zero. In thisway, there is no proof to confirm a relationship between patentownership and absorptive capacity (Hypothesis 3). Despite this,they are in the model because patent ownership implies that localfirms are exploiting this advantage, that it is difficult for others toappropriate it, that its privacy is enhanced, and that there is nointerest in using third-party innovations or improvements.
Product innovations (INPRD) and the differentiation or genericnature of products (DIFP) also have no effect on technical progress,as did variables involving interaction of product differentiation(DIFP) with foreign presence in the sector (PRE) and of productinnovations (INPRD) with foreign presence (PRE). These resultsimply that there is no proof to confirm Hypotheses 4 and 12, whichpropose that differentiated products, the number of product andprocess innovations, and the complexity of the production processimprove absorptive capacity. The fact that absorptive capacity inlocal Spanish manufacturing enterprises is concentrated in itemsother than products may explain these findings. Thus, novel ordifferent products have no relevance in determining absorptivecapacity in Spanish manufacturing firms.
The coefficient for process innovations (INPRC) on technicalprogress is negative, with a value of �0.0277 and with moderatesignificance. This situation occurs because innovations in process-es reduce the yields of a firm’s productive factors, because there arefewer economies of scale. Consequently, process innovations areharmful to technical progress.
For its part, the interaction of process innovations (INPRC) witha foreign presence in the sector (PRE) produces a coefficient of0.0466 on technical progress and is moderately significant. This iswhy process innovations, thanks to their positive effect ontechnological knowledge, favor the capability to absorb technicaladvances arising out of spillovers from foreign presences in thesector, confirming Hypothesis 4’s predicted positive relationshipbetween process innovation and absorptive capacity of spilloversfrom FDI. In addition to proving that R&D activity development(Hypothesis 1) and R&D intensity (Hypothesis 2) increaseabsorptive capacity, we test whether obtaining effective R&Dresults (patents, product innovation, and process innovations) dotoo. We confirm that if a firm obtains R&D results in processinnovations, its capacity for apply and produce knowledge (processinnovations) increases. So, this capacity shows up in the absorptivecapacity of external knowledge from FDI.
Both the internal organization of innovation (INTORG) and theinteraction of INTORG with a foreign presence (PRE) have no effecton technical progress. This is why it is not possible to confirmHypothesis 5, which predicts a direct relationship betweenincreased internal action on innovation and increased absorptive
I.
Expected Results
Positive Positive
Positive Not significant
Exists Not significant
Positive Positive
Positive Not significant
Negative Negative
Positive Not significant
Exists Negative
Positive Not significant
Positive Not significant
Exists Negative
Positive Positive
Positive Not significant
P. Sanchez-Sellero et al. / International Business Review 23 (2014) 429–439 437
capacity from FDI. One possible explanation is that Spanishmanufacturing enterprises have many and varied forms of internalorganization for innovation. This may make internal organizationirrelevant to changes in absorptive capacity.
For its part, externally conducted R&D activities (ERDA) alsohave no effect. In contrast, the interaction of ERDA with a foreignpresence in the sector (PRE) has a significant negative coefficient of�0.12 on technical progress. This negative coefficient supportHypothesis 6 concerning the negative effects of externalized R&Dactivities on absorptive capacity from FDI. The existing lowabsorptive capacity (Griffith et al., 2004) and high level of R&Dimport (Bodman & Le, 2013) of Spanish manufacturing firms mayexplain this.
It is worth pointing out that the results for Hypothesis 6(externalized R&D activities have a negative effect on absorptivecapacity) and for Hypothesis 1 (R&D activities increase absorptivecapacity) suggest that internal R&D activities have a positive effecton absorptive capacity and that external R&D activities have anegative effect. This finding supports other evidence in theliterature.
External collaboration for innovation (EXTCOL) and EXTCOLmultiplied by foreign presence (PRE) have no effect on technicalprogress either. This estimation does not confirm Hypothesis 7(increases in external collaboration increase absorptive capacity).This result occurs because when local businesses collaborate withoutsiders for innovation, they are already exploiting the advan-tages that this gives and have no interest in making use of otheradvances from other companies.
Public funding for R&D (PUBFND) has a positive coefficient of8.65 on technical progress, with a moderate significance of 0.06.This suggests that public funding for R&D favors technical progress.However, the coefficient for the variable multiplying public R&Dfunding (PUBFND) with the foreign presence in the sector (PRE) hasa negative value of �12.01 with moderate significance of 0.05. Forthis reason, we accept Hypothesis 8, which predicts a negativerelationship between public financing of R&D and absorptivecapacity from FDI. Considering these results with the fact thatpublic financing of R&D is less effective than private (Griliches,1986), we can infer that businesses that privately fund R&D are in abetter position to absorb spillovers from FDI in their sectors. In thehypothesis, we suggest that a negative coefficient indicatesadverse selection in public funding. However, our results show anegative effect on absorptive capacity and a positive effect onproductivity. In conclusion, we reject adverse selection.
Both the relationship with the public sector for innovation(RPUB) and the interaction of RPUB with foreign presence (PRE) arestatistically equal to zero. Thus, we cannot confirm Hypothesis 9,which predicts a link between improvements in public sectorinnovation and absorptive capacity from FDI. This result may bedue to the same motive behind external collaboration forinnovation: the advantages of public sector relationships ininnovation might be a motive to lose interest in absorbingspillovers from a foreign presence.
The influence of the percentage of graduate engineers and otherdegree holders in the total personnel figure for a firm (SLAB) ontechnical progress is nil. The same occurs when multiplying thepercentage of such graduates in a firm’s staff (SLAB) with foreignpresence (PRE). These results give no indications that confirmHypothesis 10, which states that the quality of human capitalimproves absorptive capacity from FDI. This may be so because thequality of human capital in Spanish manufacturing firms is notsufficiently high to be a major element in the capacity forabsorption of spillovers from foreign companies.
The variable representing the interaction of family control(FAMI) with foreign presence in the sector (PRE) has a negativecoefficient of �0.11 on technical progress. The significance is
moderate, with a value of 0.068. Hence, Hypothesis 11 can beaccepted. Moreover, this relationship is negative. In other words,family control reduces absorptive capacity from FDI. Companiesmanaged by non-family members are better able to absorb thespillovers from FDI mentioned.
The complexity of the production process (PROC) affectstechnical progress negatively (�0.0199 with moderate signifi-cance). Consequently, complex production processes have nega-tive effects on technical advances. Thus, the more complex aproduction process is, the smaller the yield from the firm’sproduction factors, because the economies of scale decrease.
In contrast, the interaction of the complexity of the productionprocess (PROC) with foreign presence in the sector (PRE) reaches asignificant coefficient of 0.032 on technical progress. This resultsupports the predicted positive relationship between complexproduction processes and absorptive capacity as shown inHypothesis 12. In this way, because foreign firms that implementFDI usually have more complex production processes than do localenterprises, local businesses with similarly complex productionprocesses may be better able to glean technical knowledge fromforeign companies through spillovers.
The degree of concentration in the main market (CDOM) has noeffect on technical progress, and neither does the variable arisingfrom multiplying CDOM with foreign presence (PRE). Thisestimation provides no support for Hypothesis 13, which suggeststhat market concentration favors absorptive capacity from FDI.This outcome may be due to the fact that market concentration inSpain is similar to that of other markets in which foreign firmsoperate. Hence, local market concentration would not havesufficient weight to affect absorptive capacity from FDI.
Wang et al. (2012a) shows that local firms in low-technologyindustries (measured by the ratio of R&D to sales) are better ataccommodating and absorbing rapid entrances of foreign compe-titors in the same industry. Whereas our results show that R&Dactivity and complex, innovative production processes increaseabsorptive capacity of foreign and local firms from FDI. Thissuggests that, firms in high-technology industries improve theirabsorptive capacity when foreign competitors enter the industryslowly.
6. Concluding remarks
Absorptive capacity of spillovers from FDI is a source oftechnical progress, and our results align with previous studies.Because we consider the determinants that affect technicalprogress and its relationship with absorptive capacity from FDI,we update and extend the literature to the factors determining thefirm behavior, capabilities, and structures that drive absorptivecapacity from FDI in Spanish manufacturing firms.
We estimate a model on the basis of a production function toexplain the factors determining absorptive capacity from FDI andthe effect of each of these factors individually on added value(output). We use GMM estimation for panel data at the firm level in20 industries over 13 years.
We add to the Barrios and Strobl (2002) proposed productionfunction, which includes the effects of foreign capital and foreignpresence on added value (output). We add the effects of R&Dactivities and expenditures, R&D results, the internal organizationof innovation, the external links for innovation, the quality ofhuman capital, family management, and the complexity ofbusinesses and market concentration. In turn, our model considerseach of these items in light of foreign presence. These combina-tions determine absorptive capacity from FDI.
Specifically, we find that R&D activities boost the generation ofnew knowledge and absorptive capacity from FDI. Internal R&Dactivities have the most positive effect; externalized activities have
P. Sanchez-Sellero et al. / International Business Review 23 (2014) 429–439438
a negative impact. This explains the decision to outsource R&D forminor innovations that require nonspecific investments; it makesonly a minor contribution to the absorptive capacity of the firm.
We also find a negative link between public funding andabsorptive capacity from FDI. This result is consistent with the factthat public financing of R&D is less effective than private funding(Griliches, 1986), and it supports the notion that the companiesthat manage to find private financial resources are more capable ofabsorbing spillovers from FDI.
Additionally, we find a negative relationship between familymanagement and absorptive capacity. This is why companies runby people who are not members of the same family are better atabsorbing the spillovers from FDI.
Other factors determining absorptive capacity from FDI arecomplexity and production-process innovations. Complex andinnovative production processes makes more and better toolsavailable for absorbing the spillovers from FDI. This is because thefirms implementing FDI usually have more complex, innovativeproduction processes than local companies, which helps theabsorb more from similarly complex, innovative foreign firms. Weconfirm that a firm with a complex, innovative productionprocesses has capacity for apply and produce knowledge. So, thiscapacity shows up in the absorptive capacity of externalknowledge from FDI.
Despite these significant contributions to the literature, severalconstraints should be taken into account. First, it is possible toinclude the relationship between absorptive capacity from FDI andsubcontracted/outsourced manufacturing. Outsourcing may affectabsorptive capacity depending on, for example, the type of activityor the communication flow. Second, this study can be extended toinclude geographical location of foreign firms relative to localcompanies. Distance determinants such as culture, physicallocation, or institutional differences may influence absorptivecapacity from FDI. Third, further research could incorporate thevertical relationships of industries and businesses (that is, withsuppliers and clients). This relationship may influence absorptivecapacity from FDI depending on the type of vendor agreement,product supplied, or negotiation power.
Acknowledgments
The authors acknowledge the funding received from MICINN-FEDER through the research project ECO2009-09623.
References
Aerts, K., & Schmidt, T. (2008). Two for the price of one? Additionality effects of R&Dsubsidies: a comparison between Flanders and Germany. Research Policy, 37(5),806–822.
Aghion, P., Bloom, N., Blundell, R., Griffith, R., & Howitt, P. (2005). Competition andinnovation: an inverted U relationship. Quarterly Journal of Economics, 120, 701–728.
Alvarez, I., & Molero, J. (2005). Technology and the generation of internationalknowledge spillovers: an application to Spanish manufacturing firms. ResearchPolicy, 34, 1440–1452.
Arellano, M., & Bond, S. (1991). Some tests of specification for panel data: Monte Carloevidence and an application to employment equations. Review of Economic Studies,58, 277–297.
Atuahene-Gima, K. (1992). Inward technology licensing as an alternative to internalR&D in new product development: a conceptual framework. Journal of ProductInnovation Management, 9(2), 156–167.
Barney, J. (1991). Firm resources and sustained competitive advantage. Journal ofManagement, 17(1), 99–120.
Barrios, S., & Strobl, E. (2002). Foreign direct investment and productivity spillovers:evidence from the Spanish experience. Review of World Economics, 138(3), 459–481.
Barrios, S., Dimelis, S., Louri, H., & Strobl, E. (2004). Efficiency spillovers from foreigndirect investment in the EU periphery: a comparative study of Greece, Ireland andSpain. Review of World Economics, 140(4), 688–705.
Baum, J. A. C., Calabrese, T., & Silverman, B. S. (2000). Don’t go it alone: alliance networkcomposition and startups’ performance in Canadian biotechnology. Strategic Man-agement Journal, 21, 267–294.
Ben Hamida, L.(2006). Intra-industry spillovers from inward FDI: an evolutionarymodel. In: Proceedings of EIBA conference, regional and national divers of businesslocation and competitiveness.
Ben Hamida, L. (2007). Inward foreign direct investment and intra-industry spillovers: theSwiss case. Ph.D. Dissertation. Switzerland, University of Fribourg.
Ben Hamida, L., & Gugler, P. (2009). Are there demonstration-related spillovers fromFDI? Evidence from Switzerland. International Business Review, 18, 494–508.
Berle, A., & Means, G. (1932). The modern corporation and private property. New York:Macmillan.
Blomstrom, M. (1986). Foreign investment and productive efficiency: the case ofMexico. Journal of Industrial Economics, 35(1), 97–112.
Blundell, R., Griffith, R., & van Reenen, J. (1999). Market share, market value andinnovation in a panel of British manufacturing firms. Review of Economic Studies, 66,529–554.
Bodman, P., & Le, T. (2013). Assessing the roles that absorptive capacity and economicdistance play in the foreign direct investment–productivity growth nexus. AppliedEconomics, 45(8), 1027–1039.
Buisseret, T. J., Cameron, H. M., & Georgiou, L. (1995). What difference does it make?Additionality in the public support of R&D in large firms?. Evaluation of Researchand Innovation, 10(4–6), 587–600.
Burkart, M., Panunzi, F., Shleifer, A. (2002) Family firms. Working paper 8776. Cam-bridge, MA, USA: National Bureau of Economic Research.
Cassiman, B., & Veugelers, R. (2002). R&D cooperation and spillovers: some empiricalevidence from Belgium. American Economic Review, 92(4), 1169–1184.
Caves, R. E. (1974). Multinational firms, competition, and productivity in host countrymarkets. Economica, 41(1), 176–193.
Chandler, A. D. (1990). Scale and scope the dynamics of industrial capitalism. Cambridge,MA: Harvard/Belknap.
Cohen, W. M., & Levinthal, D. A. (1989). Innovation and learning: the two faces of R&D.Economic Journal, 99, 569–596.
Cohen, W. M., & Levinthal, D. A. (1990). Absorptive capacity: a new perspective onlearning and innovation. Administrative Science Quarterly, 35, 128–152.
Coombs, J., & Bierly, B. (2006). Measuring technological capability and performance.R&D Management, 36(4), 421–438.
Criscuolo, P. (2005). On the road again: research mobility inside the R&D network.Research Policy, 34, 1350–1365.
Davenport, T. H., De Long, D. W., & Beers, M. C. (1998). Successful knowledgemanagement projects. Sloan Management Review, 39, 3–57.
David, P., Hall, B., & Toole, A. (2000). Is public R&D a complement or substitute for privateR&D? A review of the econometric evidence. Research Policy, 29(4–5), 497–529.
Davies, S., & Caves, R. E. (1987). Britain’s productivity gap. Cambridge: CambridgeUniversity Press.
Deeds, D., De Carolis, D., & Coombs, J. (2000). Dynamic capabilities and new productdevelopment in high technology ventures: an empirical analysis of new biotech-nology firms. Journal of Business Venturing, 15(3), 211–229.
Dimelis, S. P. (2005). Spillovers from foreign direct investment and firm growth:technological, financial and market structure effects. International Journal of theEconomics of Business, 12(1), 85–104.
Dunning, J. H., & Gugler, P. (2008). Foreign direct investment, location and competitive-ness. Oxford: Elsevier.
Dyer, J. H., & Nobeoka, K. (2000). Creating and managing a high-performance knowledge-sharing network: the Toyota case. Strategic Management Journal, 21(3), 345–367.
Fabrizio, K. R. (2009). Absorptive capacity and the search for innovation. ResearchPolicy, 38, 255–267.
Ghoshal, S., & Bartlett, C. A. (1988). Creation, adoption and diffusion of innovations bysubsidiaries of multinational corporations. Journal of International Business Studies,19(3), 365–368.
Girma, S., Gong, Y., & Gorg, H. (2009). What determines innovation activity in Chinesestate-owned enterprises? The role of foreign direct investment. World Develop-ment, 37(4), 866–873.
Griffith, R., Redding, S., & Reenen, J. V. (2004). Mapping the two faces of R&D:productivity grow thin a panel of OECD Industries. Review of Economics andStatistics, 86, 883–895.
Griliches, Z. (1986). Productivity, R&D and basic research at the firm level in the 1970s.American Economic Review, 76, 141–154.
Gugler, P., & Dunning, J. H. (1994). Technology based cross-border alliances. In: J. J.David (Ed.). Technology and business enterprise. UK: Edward Elgar.
Gulbrandsen, T. (2005). Flexibility in Norwegian family-owned enterprises. FamilyBusiness Review, 18(1), 57–76.
Gupta, A. K., & Govindarajan, V. (2000). Knowledge flows within multinational cor-porations. Strategic Management Journal, 21, 473–496.
Jones, O., & Craven, M. (2001). Expanding capabilities in mature manufacturing firm:absorptive capacity and the TCS. International Small Business Journal, 19, 39–55.
Kamien, M. I., & Zang, I. (2000). Meet me halfway: research joint ventures andabsorptive capacity. International Journal of Industrial Organization, 18, 995–1012.
Kaminski, P. C., de Oliveira, A. C., & Lopes, T. M. (2008). Knowledge transfer in productdevelopment processes: a case study in small and medium enterprises (SMEs) ofthe metal-mechanic sector from Sao Paulo, Brazil. Technovation, 28(1–2), 29–36.
Kaufmann, L. (1997). A model of spillovers through labor recruitment. InternationalEconomic Journal, 11, 13–33.
Kim, L. (1998). Crisis construction and organizational learning: capability building incatching-up at Hyundai Motor. Organization Science, 9(4), 506–521.
Kokko, A. (1994). Technology, market characteristics and spillovers. Journal of Devel-opment Economics, 43(2), 279–293.
Lach, S. (2002). Do R&D subsidies stimulate or displace private R&D evidence fromIsrael. Journal of Industrial Economy, 50(4), 369–390.
P. Sanchez-Sellero et al. / International Business Review 23 (2014) 429–439 439
Lane, P. J., & Lubatkin, M. (1998). Relative absorptive capacity and interorganizationallearning. Strategic Management Journal, 19, 461–477.
Lane, P. J., Salk, J. E., & Lyles, M. A. (2001). Absorptive capacity, learning and perfor-mance in international joint ventures. Strategic Management Journal, 22(12), 1139–1161.
Lei, D., & Hitt, M. A. (1995). Strategic restructuring and outsourcing—the effect ofmergers and acquisitions and LBOs on building firm skills and capabilities. Journalof Management, 21(5), 835–859.
Lenox, M., & King, A. (2004). Prospects for developing absorptive capacity throughinternal information provision. Strategic Management Journal, 25, 331–345.
Liao, J., Welsch, H., & Stoica, M. (2003). Organizational absorptive capacity andresponsiveness: an empirical investigation of growth-oriented SMEs. Entre-preneurship: Theory & Practice, 28(1), 63–86.
Liu, X., Siler, P., Wang, C., & Wei, Y. (2000). Productivity spillovers from foreign directinvestment: evidence from UK industry level panel data. Journal of InternationalBusiness Studies, 31(3), 407–425.
Lowe, J., & Taylor, P. (1998). R&D and technology purchase through license agreements:complementary strategies and complementary assets. R&D Management, 28(4),263–278.
Meeus, M. T. H., Oerlemans, L. A. G., & Hage, J. (2001). Patterns of interactive learning ina high-tech region! Organization Studies, 22(1), 145–172.
Meyer, K.(2003). FDI spillovers in emerging markets: a literature review and new per-spectives. Working paper 15. Copenhagen Business School.
Meyer, K. (2004). Perspectives on multinational enterprises in emerging economies.Journal of International Business Studies, 35, 259–276.
Miozzo, M., & Grimshaw, D. (2008). Service multinationals and forward linkages withclient firms: the case of IT outsourcing in Argentina and Brazil. InternationalBusiness Review, 17, 8–27.
Mody, A. (1989). Strategies for developing information industries. In: C. Cooper & R.Kaplinsky (Eds.). Technology and development in the third industrial revolution.London: Routledge.
Mowery, D., Oxley, J., & Silverman, B. (1996). Strategic alliances and interfirm knowl-edge transfer. Strategic Management Journal, 17, 77–91.
Narula, R., & Dunning, J. H. (2000). Industrial development, globalization and multina-tional enterprises: new realities for developing countries. Oxford DevelopmentStudies, 28(2), 141–167.
Narula, R. & Marin, A. (2003). FDI spillovers, absorptive capacities and human capitaldevelopment: evidence from Argentina. Working paper no. 2003–016. TheNetherlands: Maastricht Economic Research Institute on Innovation and Technology.
Nieto, M., & Quevedo, P. (2005). Variables estructurales, capacidad de absorcion yesfuerzo innovador en las empresas manufactureras espanolas. Revista Europea deDireccion y Economıa de la Empresa, 14(1), 25–44.
Nonaka, I., & Takeuchi, H. (1995). The knowledge creating company: how Japanesecompanies create the dynamics of innovation. Oxford University Press: New York.
Oxelheim, L., & Ghauri, P. (2003). European Union and the race for foreign directinvestment in Europe. Oxford: Elsevier.
Padilla-Perez, R. (2008). A regional approach to study technology transfer throughforeign direct investment: the electronics industry in two Mexican regions.Research Policy, 37, 849–860.
Palia, D., & Lichtenberg, F. (1999). Managerial ownership and firm performance: areexamination using productivity measurement. Journal of Corporate Finance, 5,323–339.
Park, B. I., & Ghauri, P. N. (2011). Key factors affecting acquisition of technologicalcapabilities from foreign acquiring firms by small and medium sized local firms.Journal of World Business, 46, 116–125.
Park, B. I. (2012). What changes the rules of the game in wholly owned subsidiaries?Determinants of knowledge acquisition from parent firms. International BusinessReview, 21, 547–557.
Peteraf, M. A. (1993). The cornerstones of competitive advantage: a resource based-view. Strategic Management Journal, 14(3), 179–191.
Pittaway, L., Robertson, M., Munir, K., Denyer, D., & Neely, A. (2004). Networking andinnovation: a systematic review of the evidence. International Journal of Manage-ment Reviews, 5/6(3/4), 137–168.
Pollack, R. A. (1985). A transaction cost approach to families and households. Journal ofEconomic Literature, 23, 581–608.
Rodrıguez, X. A., & Pallas, J. (2008). Determinants of foreign direct investment in Spain.Applied Economics, 40, 2443–2450.
Rosell-Martınez, J., & Sanchez-Sellero, P. (2012). Foreign direct investment and tech-nical progress in Spanish manufacturing. Applied Economics, 44(19), 2473–2489.
Rugman, A. M., & Verbeke, A. (2001). Subsidiary specific advantages in multinationalenterprises. Strategic Management Journal, 22, 237–250.
Rugman, A. M., & Verbeke, A. (2003). Multinational enterprises and clusters: anorganizing framework. Management International Review, 43(3), 151–169.
Santangelo, G. D. (2012). The tension of information sharing: effects on subsidiaryembeddedness. International Business Review, 21, 180–195.
Schleifer, A., & Vishny, R. W. (1997). A survey of corporate governance. Journal ofFinance, 52, 737–783.
Stock, G. N., Greis, N. P., & Fischer, W. A. (2001). Absorptive capacity and new productdevelopment. The Journal of High Technology Management Research, 12, 77–91.
Szulanski, G. (1996). Exploring stickiness: impediments to the transfer of best practicewithin the firm. Strategic Management Journal, 17, 27–43.
Teece, D.J., Pisano, G., & Shuen, A. (1997). Dynamic capabilities and strategic manage-ment. Strategic Management Journal, 18.
Tether, B. (2002). Who co-operates for innovation and why: an empirical analysis.Research Policy, 31, 947–967.
Todorova, G., & Durisin, B. (2007). Absorptive capacity: valuing a reconceptualization.Academy of Management Review, 32(3), 774–786.
Trajtenberg, M. (2001). Innovation in Israel 1968–1997: a comparative analysis usingpatent data. Research Policy, 30, 363–389.
Tsai, W. (2001). Knowledge transfer in intra-organizational networks: effects ofnetwork position and absorptive capacity on business unit innovation and perfor-mance. Academy of Management Journal, 44, 996–1004.
Van den Bosch, F. A. J., Volberda, H. W., & de Boer, M. (1999). Coevolution of firmabsorptive and knowledge environment: organizational forms and combinativecapabilities. Organization Science, 10, 551–568.
Veugelers, R. (1997). Internal R&D expenditures and external technology sourcing.Research Policy, 26(3), 305–315.
Wang, C., Deng, Z., Kafouros, M. I., & Chen, Y. (2012). Reconceptualizing the spillovereffects of foreign direct investment: a process-dependent approach. InternationalBusiness Review, 21, 452–464.
Wang, C., Hong, J., Kafouros, M., & Boateng, A. (2012). What drives outward FDI ofChinese firms? Testing the explanatory power of three theoretical frameworks.International Business Review, 21, 425–438.
Zack, M. H. (1999). Managing codified knowledge. Sloan Management Review, 40(4), 45–58.
Zahra, S. A., & George, G. (2002). Absorptive capacity: a review, reconceptualization andextension. Academy of Management Review, 27(2), 185–203.
Zucker, L. G., Darby, M. R., & Armstrong, J. S. (2002). Commercializing knowledge:university science, knowledge capture, and firm performance in biotechnology.Management Science, 48(1), 138–152.


