Embed Size (px)
Citation preview

An ESRC Research Group
Exporting from manufacturing firms in Sub-Saharan Africa
GPRG-WPS-036
Neil Rankin, Måns Söderbom and Francis Teal
Global Poverty Research Group
Website: http://www.gprg.org/
The support of the Economic and Social Research Council (ESRC) is gratefully acknowledged. The work was part of the
programme of the ESRC Global Poverty Research Group.

2
Exporting from manufacturing firms in Sub-Saharan Africa
Neil Rankin
School of Economic & Business Sciences University of the Witwatersrand, South Africa
Måns Söderbom and Francis Teal
Centre for the Study of African Economies Department of Economics University of Oxford, UK
December 2005
Abstract
The poor performance of many African economies has been associated with low growth of exports in general and of manufacturing exports in particular. In this paper we draw on micro evidence of manufacturing firms in five African countries - Kenya, Ghana, Tanzania, South Africa and Nigeria - to investigate the causes of poor exporting performance. We exploit a data set which has a much longer panel dimension than has been used before to assess the relative importance of self-selection based on efficiency and firm size as determinants of export participation. We show that firm size is a robust determinant of the decision to export. It is not a proxy for efficiency, for capital intensity, for sector or for time-invariant unobservables. In contrast the evidence for self-selection into exporting is very weak. Finally our use of a longer run panel than has been available before has allowed us to separate out the roles of ownership and skills as possible determinants of participation in exporting. We find that both foreign ownership and skills are significant determinants of exporting.
This paper draws on data collected as part of the Regional Program on Enterprise Development (RPED), organised by the World Bank and funded by the Belgian, British, Canadian, Dutch, French and Swedish governments. Extensions to this data for Ghana were collected by a team from the Centre for the Study of African Economies, Oxford and the Ghana Statistical Office (GSO), Accra over a period from 1992 to 2003. The surveys have been funded by the Department for International Development of the UK government. The Kenyan, Nigerian and Tanzanian data collection was funded by both DFID and UNIDO. Work on this project was funded by the Economic and Social Research Council of the UK as part of the Global Poverty Research Group. We are greatly indebted to numerous collaborators for enabling this comparative data to be assembled.

3
1 Introduction
There is a finding across virtually all micro firm-level data sets that exporting and efficiency are
positively correlated. Much work has focused on how this correlation is to be interpreted. Work
on countries outside of Africa, reviewed in Bigsten et al (2004), has found more evidence that
causation runs from efficiency to exporting - there is self-selectivity into exporting - rather than
from exporting to efficiency - implying firms learn from exporting.1 For sub-Saharan Africa
Bigsten et al (2004) present evidence for sub-Saharan Africa firms of learning by exporting. In
their study there is little evidence for an efficiency effect by which firms self-select into
exporting. However they note that �this may be due to the co-linearity between some of the
regressors in the export probit.� (page 133) The time dimension is short, three years, and with
such data it is difficult to assess convincingly the importance of efficiency as a determinant of
exporting while allowing for firm heterogeneity and the presence of sunk costs with a dynamic
specification.
While the focus of much of the literature to date has been on distinguishing learning from
exporting and self-selection into exporting a common finding across all the work on African firms
has been a strong correlation between firm size and exporting, Söderbom and Teal (2000, 2003),
Bigsten et al (2004), and van Biesebroeck (2005). The finding in Bigsten et al (2004, page 128) is
that firm size is a robust determinant of export participation across specifications which allow for
certain forms of firm heterogeneity and dynamics. In this paper we exploit a data set which has a
much longer panel dimension than has been used before to assess the relative importance of self-
selection based on efficiency and firm size as determinants of export participation.
One interpretation of the size effect is that it is really a disguised element of efficiency in
that larger firms benefit from increasing returns to scale. The evidence to date is strongly against
this interpretation. Söderbom and Teal (2004) use a longer run of the Ghana data, from 1991 to
1997, to show that constant returns to scale is readily accepted by the data. Rankin (2004) has a
similar finding for comparative data across the same countries used in this study. A second
interpretation of the size effect is that it can be explained by the presence of fixed costs. However
this interpretation is difficult to reconcile with the robust significance of the size variable when
there are controls for sunk costs in the form of a lagged dependent variable (see Bigsten et al
1 Tybout and Westbrook (1995) on Mexico; Clerides, Lach and Tybout (1998) on Mexico, Colombia and Morocco; Kraay (1999) on China; Aw et al. (2000) on the Republic of Korea and Taiwan; Isgut (2001) on Colombia; and Fafchamps et al. (2002) on Morocco.

4
(2004, p. 128)). It also seems to be the case that size is not capturing sectoral differences in
technology as size remains highly significant with sectoral controls in the equation. There
remains the possibility, which none of the regressions in either Söderbom and Teal (2003) or
Bigsten et al (2004) can rule out, that size is simply a proxy for some time-invariant aspect of the
firm correlated with the other regressors. If larger firms simply have more skilled labour and that
is the key to exporting then size has no causal role in affecting the ability to export. If this is the
case then the association between exporting and size implies that it is not the size of the firm that
matters for policy but some unobserved aspect of large firms - the most obvious being their skills
broadly interpreted - which matters for understanding the ability of firms to participate in the
export market. To distinguish convincingly between these alternatives the longer time series
dimension to our data is vital.
The relative importance of these factors is of importance for understanding the factors
that determine the export behaviour of African firms. African firms are in general very small and
the focus of small firms on the domestic market ensures that, in aggregate, their growth is limited
by the growth of domestic incomes. If size is related to a firm�s participation in the export market
this may reflect a strategy of successful growth - limited domestic demand ensures that the only
way for firms to expand is for them to grow into the export market. As a first step to investigating
this hypothesis we ask if changes in firm size, measured as the log of employment, change the
probability of a firm participating in the export market in the future.
In the next section we set out our general modelling framework which allows a clear
identification of the relative importance of these efficiency and size effects on export
participation. In section 3 we present a comparative data set, which includes firms across a wide
range of sizes, of five African countries - Ghana, Kenya, Tanzania, Nigeria and South Africa -
that allows us to investigate these issues over the period from 1993 to 2003. As we have panel
data we can address the issues of time-invariant heterogeneity in a way that has not been possible
before for firms in sub-Saharan Africa. In section 4 we present the results of this modelling
exercise focusing on allowing for the importance of unobservables in affecting our view as to the
determinants of exports. The possible roles of ownership and skills are discussed in section 5. A
final section concludes.
2 The modelling framework: the determinants of export participation
The modelling framework is designed to allow us to address the respective roles of size and
technical efficiency in exporting from manufacturing firms in Africa in as general framework as

5
possible. Technical efficiency is represented as the residuals, or unexplained part, of a production
function. However, instead of using a two step process, the first step of which is to estimate the
production function to obtain the residuals and the second to insert these residuals into the export
participation function, we chose instead to manipulate the production function and to substitute
the components of the production function into the export function. Equation (1) below shows
this substitution and the resulting export participation function:
1 1 1
1 1 1
' '1 1 1 1
' ' '1 1 1
( , , , , )
( )
( ) ( ) ( )
it it it i i it
it z it B i a i X it
it i i z it z it B i a i X it
it a i B i z z it X it
X f z B a Xz B a X
y a B z z B a X
y a B z X
η
η
η η η η
ηξ η ξ ξ ξ ξ
ξ φ θ ξ ξ ξ ξ
ξ ξ ξ ξ ξ φ ξ ξ θ ξ
− − −
− − −
− − − −
− − −
′=′ ′= + + + +
′ ′= − − − + + + +
= + − + − + − +
[1]
We assume that current export participation, (Xit), is a function of lagged efficiency (ηit-1), lagged
factor inputs (zit-1), past export participation (Xit-1) and unchanging firm-specific effects divided
into observed (Bi) and unobserved characteristics (ai). We use lagged values of factor inputs and
efficiency because we are interested in investigating whether there is Granger-causality from
factor inputs and/or efficiency to export participation.
As can be seen from equation (1) the impact of efficiency on export participation is
measured by (ξη), the coefficient on lagged output per unit of labour (yit-1). Equation (1) also
shows that the coefficients on the observed firm specific effects and factor inputs are a
combination of two effects. The first of these effects is the efficiency effect (ξη). This efficiency
effect has the opposite sign to the coefficient on yit-1. (i.e. if there is a positive efficiency effect
and no second effect, this will show up as a negative coefficient on the factor inputs and firm
specific effects). This efficiency effect is scaled by the coefficient on the variable in the
production function (i.e. θz� in the case of the factor inputs and φ in the case of the observed firm
characteristics).
The second effect present in the coefficients is the direct effect of that variable on export
participation (ξz). By using this one-step technique we cannot isolate the direct effect unless the
coefficient on the variable in the production function is equal to zero. The interaction between the
productivity (efficiency) effect and the direct effect, and the impact on the coefficient in the
export participation function can be better understood with an example. Suppose that there is a
positive efficiency effect (ξη) and that there is also a positive direct effect of capital intensity (ξk)
on export participation. If a firm increases its capital stock, whilst everything else remains
6
constant, this reduces productivity which in turn reduces the probability of exporting. However, at
the same time it increases the probability of exporting through the direct effect because the firm is
now more capital intensive. Thus the estimated coefficient on capital intensity in the export
participation equation is measuring these two, and in this case opposite, effects.
In the case of constant returns to scale in the production function the coefficient on labour
(θl in the θz� vector of factor inputs) will be equal to zero. This implies that there will be no
efficiency effect present in the coefficient on labour and the coefficient on labour can then be
interpreted as a pure size effect. As already noted there is considerable evidence for these firms
that they are characterised by constant returns to scale, see Söderbom and Teal (2003, 2004) and
Rankin (2004). In this paper we use the assumption of constant returns to scale to enable us to
identify separately the two dimensions of the determinants of exports on which we wish to focus,
efficiency and size. In the next section we introduce the data that will enable us to isolate the
efficiency and size effects from the time-invariant unobservables determining exports.
3. Export participation and the characteristics of firms
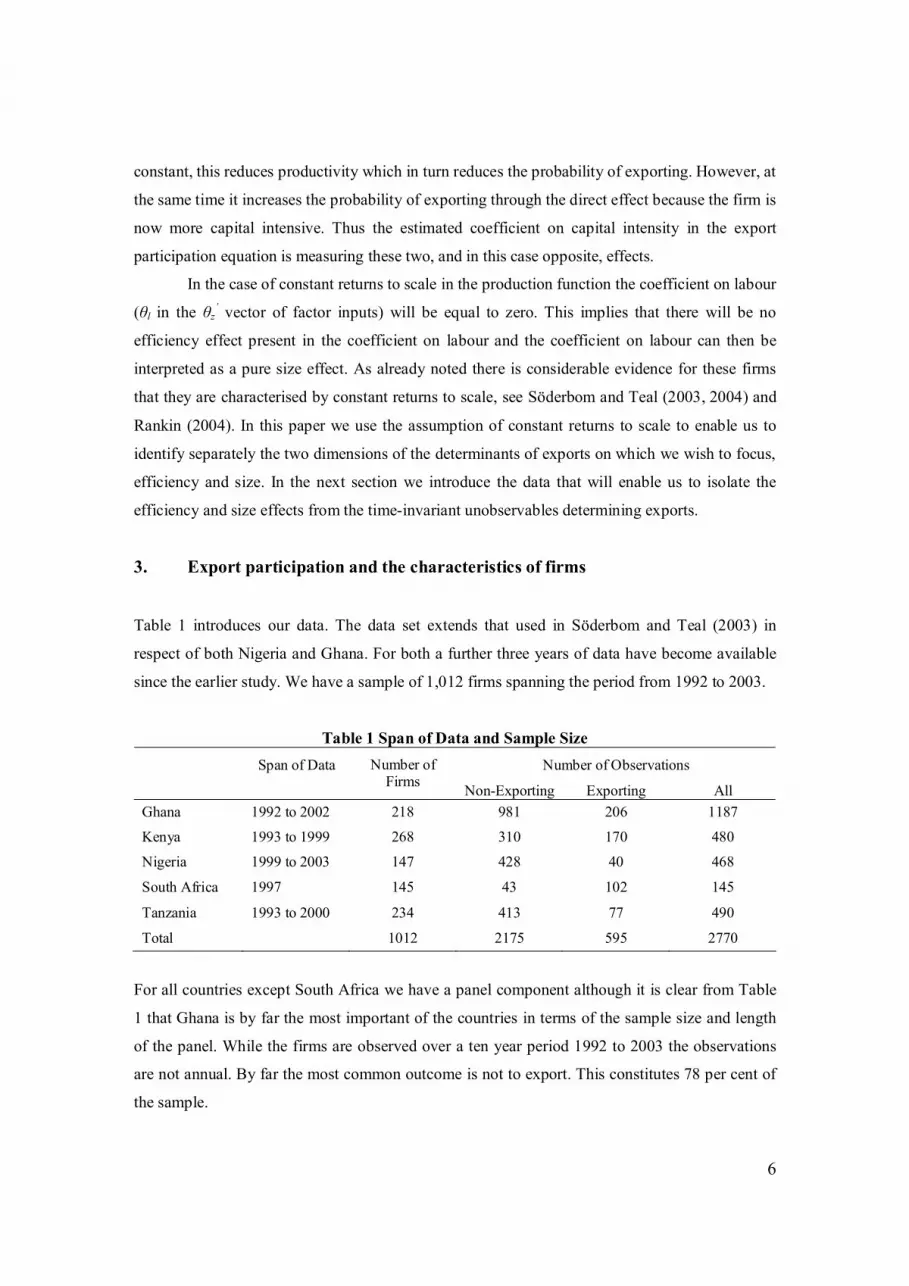
Table 1 introduces our data. The data set extends that used in Söderbom and Teal (2003) in
respect of both Nigeria and Ghana. For both a further three years of data have become available
since the earlier study. We have a sample of 1,012 firms spanning the period from 1992 to 2003.
Table 1 Span of Data and Sample Size Span of Data Number of Observations
Number of Firms Non-Exporting Exporting All
Ghana 1992 to 2002 218 981 206 1187
Kenya 1993 to 1999 268 310 170 480
Nigeria 1999 to 2003 147 428 40 468
South Africa 1997 145 43 102 145
Tanzania 1993 to 2000 234 413 77 490
Total 1012 2175 595 2770
For all countries except South Africa we have a panel component although it is clear from Table
1 that Ghana is by far the most important of the countries in terms of the sample size and length
of the panel. While the firms are observed over a ten year period 1992 to 2003 the observations
are not annual. By far the most common outcome is not to export. This constitutes 78 per cent of
the sample.

7
Table 2 Employment, Productivity, Capital Intensity, Age and Ownership Non Exporting Exporting All Mean Std Mean Std Mean Std Ghana Employment 45 107 220 287 76 167
Ln (Output/Employee) 7.99 1.25 8.68 0.99 8.11 1.23 Ln(Capital/Employee) 6.73 1.94 8.56 1.44 7.05 1.98
Firm Age 18.95 11.89 22.03 12.76 19.49 12.10
Any foreign Ownership 0.13 0.34 0.48 0.50 0.19 0.39
Kenya Employment 46 103 241 390 115 263
Ln (Output/Employee) 8.51 1.17 9.58 1.10 8.89 1.25 Ln(Capital/Employee) 8.02 1.66 9.54 1.19 8.56 1.68
Firm Age 20.96 14.40 21.54 11.34 21.17 13.38
Any foreign Ownership 0.11 0.31 0.35 0.48 0.19 0.39
Nigeria Employment 132 355 755 1525 185 583
Ln Output/Employee) 9.17 1.45 9.53 0.91 9.20 1.42 Ln(Capital/Employee) 8.17 2.07 8.94 1.82 8.23 2.06
Firm Age 22.43 10.75 27.90 10.65 22.90 10.84
Any foreign ownership 0.19 0.39 0.30 0.46 0.20 0.40
South Africa Employment 149 272 268 352 233 334
Ln Output/Employee) 10.38 0.57 10.78 0.67 10.66 0.67 Ln(Capital/Employee) 9.53 1.24 9.57 1.24 9.56 1.23
Firm Age 17.35 16.13 22.56 17.53 21.01 17.24
Any foreign ownership 0.14 0.35 0.28 0.45 0.24 0.43
Tanzania Employment 58 215 241 432 87 269
Ln Output/Employee) 7.94 1.29 9.01 1.32 8.11 1.35 Ln(Capital/Employee) 7.12 1.86 8.98 1.68 7.41 1.96
Firm Age 16.19 11.47 19.51 14.17 16.71 11.98
Any foreign ownership 0.15 0.36 0.35 0.48 0.18 0.39 All Employment 67 207 273 535 111 320
Ln Output/Employee) 8.34 1.39 9.40 1.25 8.57 1.43 Ln(Capital/Employee) 7.33 2.02 9.09 1.47 7.71 2.05
Firm Age 19.37 12.25 22.05 13.47 19.94 12.57
Any foreign ownership 0.14 0.35 0.38 0.49 0.19 0.40 See next page for definitions.

8
Notes: Employment is the total number of employees in the firm. Output, capital, raw material and indirect costs are all in 1991 US$. The deflation procedure used for Ghana, Kenya and Tanzania was to deflate the nominal values into constant price domestic and then convert into 1991/92 US$ using the exchange rate in 1991/92. The deflation for both Ghana and Tanzania used firm based price indices while for Kenya sector level deflators were used. In the case of Nigeria and South Africa the nominal values were deflated by consumer prices, producer prices being unavailable, then converted in US$ using the exchange rate for the base period. These US$ numbers were then deflated by the US GDP deflator to 1991 values. Firm age is in years and any foreign ownership is a dummy which takes the value 1 if the firm has any element of foreign ownership and zero otherwise.
In Table 2 we present the data for key variables for all five countries broken down by
whether or not the firm exports. Larger firms are far more likely to export. Across all five
countries the average size of firm which is not exporting at all is 67 employees, this increases to
273 for exporting firms. Across all countries there are other clear similarities � exporters have
higher levels of labour productivity, are more capital intensive, tend to be older and more likely to
be foreign owned. While these differences between exporters and non-exporters are not unique to
African firms (see for example Bernard and Jensen, 1995, 1999 (a,b) Clerides, Lach and Tybout,
1998, Aw, Chen and Roberts, 2001 for results from other countries) they point to the potential
importance of size as a factor in explaining African manufacturing poor performance. There are
relatively few large firms in Africa and this characteristic of the industrial structure is a clear
difference between Africa and non-African developing countries. A further potential problem
highlighted by the data is that while labour productivity is uniformly higher in exporting than
non-exporting firms so is capital intensity. In the next section we first investigate the relative
importance of size and underlying efficiency in determining exporting using the panel dimension
of the data to assess in particular the potential importance of firm level heterogeneity in
explaining export outcomes. We then ask which factors are of importance in understanding how
time-invariant factors, such as ownership and sector, may impact on export performance.
4. Exporting: Firm efficiency, size and heterogeneity
The top part of Table 3 below presents the results from four separate specifications of export
participation. Column [1] is the linear probability model, column [2] a probit, column [3] a
random effects probit and column [4] a dynamic version of the probit. All the regressions use data
pooled across the five countries and time periods and all contain controls for sectors and time
dummies. The later are not reported to conserve space. The bottom part of Table 3 reports the
marginal effects of the explanatory variables on the probability of export participation, evaluated

9
Table 3 The Determinants of Export Participation (the LPM and Probit Specifications) (1) (2) (3) (4) Linear
Probability Model (LPM)
Probit Random Effects Probit
Dynamic Probit
Ln (Output/ 0.066 0.303 0.425 0.185 Employee)(t-1) (3.17)** (2.99)** (2.75)** (1.58)
Ln (Capital/ 0.017 0.129 0.211 0.088 Employee)(t-1) (2.40)* (3.06)** (3.63)** (2.57)*
Ln (Raw materials/ -0.033 -0.154 -0.129 -0.046 Employee)(t-1) (2.08)* (2.06)* (1.11) (0.56)
Ln (Indirect Costs/ -0.011 -0.035 -0.083 -0.083 Employee)(t-1) (1.17) (0.69) (1.17) (1.63)
Ln(Employment)(t-1) 0.076 0.336 0.652 0.170 (8.41)** (7.66)** (9.47)** (3.67)**
Export(t-1) 2.729 (26.14)**
Any Foreign 0.032 0.079 0.307 0.171 Ownership (0.91) (0.61) (1.47) (1.44)
Firm Age -0.001 -0.003 -0.003 -0.002 (0.76) (0.77) (0.50) (0.68)
Constant -0.410 -4.843 -8.729 -4.825 (5.01)** (9.32)** (8.44)** (8.28)** Observations 2770 2770 2770 2770 R-squared 0.36 Number of firms 1012 Robust t statistics in parentheses * significant at 5%; ** significant at 1%
Marginal Effects Evaluated at the Means Ln (Output/ 0.064 0.029 Employee)(t-1)
Ln (Capital/ 0.027 0.014 Employee)(t-1)
Ln (Raw materials/ -0.032 -0.007 Employee)(t-1)
Ln (Indirect Costs/ -0.007 -0.013 Employee)(t-1)
Ln(Employment)(t-1) 0.071 0.027
Export(t-1) 0.756
Any Foreign 0.017 0.029 Ownership
Firm Age -0.001 -0.000

10
at their means, for both the static and dynamic probits. These marginal effects can be directly
compared with the coefficients on the linear probability model to assess whether the functional
form is affecting our view as to the relative importance of firm size and efficiency as
determinants of exporting.
The results for the probit regressions are very similar to those reported in Bigsten et al
(2004). Once we allow for the presence of sunk costs by means of a dynamic specification there
is no evidence of a significant effect of efficiency onto exporting, column [4].2 In the context of
the gross output production function Bigsten et al (2004) find this result to be robust to a translog
specification of the production function and to a more general specification of how the firm
effects were distributed. As already noted this result must be treated with caution due to the
problems of interpreting coefficients on efficiency when regressors which are highly collinear
with output per employee are included in the equation. In terms of the point estimates in Table 3
both the static and dynamic probits suggest that the quantitative importance of firm size as
measured by the log of employment and efficiency are of very similar magnitude as determinants
of the probability of export participation. Further the size of the marginal effects from the static
probit is very similar to the estimates from the linear probability model in column [1].
As the descriptive statistics in Table 2 show exporting firms have an average employment
of 535 while non-exporting firms have 67 employees, a nearly ten fold difference in size. The
point estimates from Table 3 imply that if a firm grows from 67 to 535 employees the probability
of being in the export market increases by 15 percentage points. As the average propensity to
export in our sample is 21 per cent (Table 1) this is clearly a very large rise indeed. How much of
this rise is actually due to the size of the firm and how much due to factors associated with size
like foreign ownership and skills?
To date that question has been addressed by allowing for unobservables by means of
random effects models. In Table 3 column [3] we report the random effects probit which suggests
that if the assumptions on which this is based are correct, then the unobservables are biasing
2 The model shown in column [4] assumes that there is no unobserved time invariant heterogeneity across firms. We have considered adding to the dynamic probit controls for unobserved firm specific random effects. It is well known (Heckman, 1981a,b) that in such a model the presence of a lagged dependent variable among the explanatory variables may create an initial conditions problem (the problem is essentially that the first observation on exports is treated as exogenous, and thus uncorrelated with the firm specific random effect, which may be restrictive). Following Heckman, and more recently Roberts and Tybout (1997), we attempted to address this problem by explicitly modelling the initial condition as a function of observed firm variables and the unobserved firm specific effect. In doing so, we consistently found that the estimated variance of the random effect tended towards zero, indicating that our dynamic probit without controls for random effects in column [4] is not a mis-specification. We therefore do not report these results from the dynamic random effects probit, but they are available on request from the authors.

11
down the point estimates on efficiency and size. Both remain highly significant once allowance is
made for firm heterogeneity by means of a random effects model. However the consistency of the
estimates for the random effects probit depend on assuming the regressors are independent of the
unobservables, Wooldridge (2002, page 485). If management and skills are key factors
determining exports and these are correlated with size, both rather plausible assumptions, then the
independence assumption required for the random effects estimator to be consistent will be
violated. Testing this has not been possible before as the time variation in the data has been too
limited. The advantage of our extended data set is that the range of time variation is greater and
we can estimate both a fixed effects version of the linear probability model and a conditional logit
model where we can obtain a consistent estimator of the coefficients without any assumption as
to how the unobservables are related to the regressors, Wooldridge (2002, page 490). This we do
in Table 4.
Table 4 The Determinants of Export Participation (Fixed Effects Specifications) (1) (2) (3) (4) Linear Probability Model (with
fixed effects) Conditional
Logit Ln (Output/ 0.011 0.010 0.462 0.362 Employee)(t-1) (0.51) (0.95) (1.04) (1.66)
Ln (Capital/ 0.012 0.466 Employee)(t-1) (0.52) (0.83)
Ln (Raw materials/ -0.001 -0.096 Employee)(t-1) (0.07) (0.30)
Ln (Indirect Costs/ -0.002 -0.021 Employee)(t-1) (0.20) (0.12)
Ln(Employment)(t-1) 0.037 0.027 1.470 1.049 (1.42) (1.73)+ (2.17)* (2.44)*
Firm Age -0.003 -0.003 -0.101 -0.088 (0.86) (0.81) (1.99)* (1.94)
Constant -0.115 -0.07 (0.84) (0.90) Observations 2770 2770 375 375 Number of firms 1012 1012 Absolute value of t statistics in parentheses + significant at 10%, * significant at 5%; ** significant at 1% The standard errors underlying the t statistics reported in columns (1) and (2) are robust to heteroscedasticity and clustering at the firm level.
Two specifications of the fixed effect LPM and the conditional logit model are presented in Table
4. In columns [1] and [3] we use the full set of time varying regressors from Table 3. As even

12
with our larger data set the time variation is still limited (we have only 375 observations of firms
which change status) this is asking a lot of the data. So in columns [2] and [4] we limit the
regressors to output per employee, firm size and age. The results are rather striking in that the size
effect on export participation is remarkably robust across these models while the efficiency effect
is not. In the fixed effects LPM of column [2] the size effect is significance at the 10 per cent
level and in the conditional logit models of columns [3] and [4] is significant at the 5 per cent
level in both. Further in the model of column [2] the point estimates on size and efficiency as
modelled by the log of employment and the log of output per employee are now very different.
The effect from firm size is three times larger than that for efficiency, although the effect of size
on exporting it is now about half that implied by the regressions reported in Table 3.
5. Firm Ownership and Skills
The results from Table 4 suggest that size does matter for the ability to enter the export market, it
is not simply that larger firms have more skills or better management. However the question
remains of the importance of the time invariant dimensions of the firm for affecting the ability to
participate in exporting. In this section we extend the analysis by considering the role of firm
ownership and the skills of the firm by extracting the fixed effects from Table 4 column [1] and
regressing them first on ownership and then, in addition, on a direct measure of skills which is
available for three of the countries - Ghana, Kenya and Tanzania. The results are reported in
Table 5.
Table 5 The Determinants of the Fixed Effects (1) (2) Any Foreign Ownership 0.147 0.187 (4.57)** (4.64)** Weighted Years of Education of Workers in the Firm 0.016
(2.78)** Observations 1012 685 R-squared 0.27 0.22 Robust t statistics in parentheses *significant at 5%; ** significant at 1% Both regressions contain controls for sectors and countries.

13
The first column of Table 5 shows that the amount of foreign ownership now has a highly
significant effect on the ability to export. In column [2] we include the weighted years of
education of workers in the firm as a measure of skills. This is the same measure of human capital
as that used in Söderbom and Teal (2004). It is obtained by weighting the levels of education of
workers by occupational category where the level of education is measured from labour force
interviews with workers conducted in parallel with the firm interviews. While strictly this is time-
varying as the occupational composition of the firm changes over time in practice there is little
time variation in the variable.3 As can be seen from Table 5 column [2] both skills and ownership
are significant determinants of the fixed effects from the LPM model of the determinants of
exporting. While the results need to be qualified by the possibility that there are problems with
this functional form they provide some evidence that the insignificance of ownership in the probit
results of Table 3 is the result of bias from the correlation of ownership with unobserved fixed
effects. The results also provide some evidence that one aspect of these unobserved effects is the
skills in the firms.
6. Summary and Conclusions
The central finding of this paper is that while exploiting simply cross-sectional variation in the
data supports the hypothesis of self-section into exporting through efficiency effects this result is
not robust to allowing either for unobserved fixed effects or for the possibility of dynamics in the
specification. There is no significant effect from productivity onto the probability of exporting in
either the fixed-effects LPM, the conditional logit or the dynamic probit. It might well be thought
that such a finding simply shows that the time-series variation in the data is too noisy to pick up
any efficiency effect one exports. However in contrast to the distinctly weak evidence for the
effects of efficiency is the strong and robust evidence that size plays a role in the export decision.
Further this size effect is not an efficiency effect. Larger firms do have higher levels of labour
productivity but, controlling for this, size still matters. Further, this size effect is not due to any
sector composition of exports, it is not due to the fact that size is correlated with capital intensity
and, as already noted, it remains significant when we control for fixed effects and dynamics. In
3 The weighted average of years of education of workers in the firms in the sample is 9 with a standard deviation of 2.5. The point estimates in Table 5 imply that moving from 6 to 12 years of average education in the firm would increase the probability of exporting by nearly 10 percentage points.

14
other words we have evidence that size is not proxying some aspect of the firm correlated with
size which is a time-invariant unobservable.
What can explain these results and what are their implications? Our result on size as we
have tried to show is remarkably robust. The most obvious explanation is that in a context where
domestic markets are limited growth implies expanding into the export market. If this is so it has
important policy implications. A process of successful firm growth will necessarily need to be
linked to exporting. Our evidence suggests that this size effect is far more important than any
self-selection into exporting based on efficiency.
Finally our use of a longer run panel than has been available before has allowed us to
separate out the roles of ownership and skills as possible determinants of participation in
exporting. We have found that both foreign ownership and skills are significant determinants of
exporting.

15
References
Aw, B., X. Chen and M. Roberts, 2001, �Firm-Level Evidence on Productivity Differentials,
Turnover, and Exports in Taiwanese Manufacturing,� Journal of Development
Economics, 66(1), 51-86.
Bernard, A.B. and J.B. Jansen, 1995, �Exporters, Jobs and Wages in US Manufacturing 1976-87,�
Brookings Papers on Economic Activity Microeconomics: 67-119.
Bernard, A.B. and J.B. Jansen, 1999a, �Exporting and Productivity,� National Bureau of
Economic Research Working Paper: 7135.
Bernard, A.B. and J.B. Jansen, 1999b, �Exceptional Exporter Performance: Cause, Effect, or
Both?� Journal of International Economics, 47: 1-25.
Bernard, A.B and J.B Jensen, 2001, �Why Some Firms Export,� National Bureau of Economic
Research Working Paper: 8349.
Bigsten, A., P. Collier. S. Dercon, M. Fafchamps, B. Gauthier, J.W. Gunning, J. Haraburema, A.
Oduro, R. Oostendorp, C. Pattillo, M. Söderbom, F. Teal and A. Zeufack, 2004, �Do
African Manufacturing Firms Learn from Exporting?� Centre for the Study of African
Economies Working Paper, Journal of Development Studies, 40 (3): 115-141.
Clerides, S., S. Lach and J. Tybout, 1998, �Is Learning by Exporting Important? Micro-Dynamic
Evidence from Colombia, Mexico and Morocco,� Quarterly Journal of Economics,
113(3): 903-948.
Das, S., M. Roberts and J. Tybout, 2001, �Market Entry Costs, Producer Heterogeneity, and
Export Dynamics, Pennsylvania State University, mimeo,
http://econ.la.psu.edu/~jtybout/drtfinal1.pdf.
Fafchamps, M., S. El Hamine and A. Zeufack, 2002, �Learning to Export: Evidence from
Moroccan Manufacturing,� CSAE Working Paper WPS/2002-02. Oxford: Centre for the
Study of African Economies, Oxford University.
Heckman, J. J., 1981a, �Statistical Models for Discrete Panel Data,� in Structural Analysis of
Discrete Data with Econometric Applications, edited by C. F. Manski and D. McFadden.
Cambridge, Massachusetts: The MIT Press.
___________ 1981b, �The Incidental Parameters Problem and the Problem of Initial Conditions
in Estimating a Discrete Time-Discrete Data Stochastic Process,� in Structural Analysis
of Discrete Data with Econometric Applications, edited by C. F. Manski and D.
McFadden. Cambridge, Massachusetts: The MIT Press.

16
Isgut, A. E., 2001, �What�s Different about Exporters? Evidence from Colombian
Manufacturing,� Journal of Development Studies 37, pp. 57-82.
Kraay, A., 1999, �Exportations et performances economiques: Etude d'un panel d'entreprises
chinoises, Revue d'Economie du Developpement 0: 183-207.
Rankin, N., 2004, �The Determinants of Manufacturing Exports from Sub-Saharan Africa� DPhil
Thesis, University of Oxford.
Roberts, M. and J. Tybout, 1997, �The Decision to Export in Colombia: An Empirical Model of
Entry with Sunk Costs,� American Economic Review, 87(4): 545-564.
Söderbom, M. and F. Teal, 2000, �Skills, Investment and Exports from Manufacturing firms in
Africa,� Journal of Development Studies, 37(2): 13-43.
Söderbom, M. and F. Teal, 2003, �Are manufacturing exports the key to economic success in
Africa?� Journal of African Economies, 12(1): 1-29.
Söderbom, M. and F. Teal, 2004, �Size and efficiency in African manufacturing firms: evidence
from firm-level panel data.� Journal of Development Economics, 73: 369-394.
Tybout, J. R. and M. D. Westbrook, 1995, �Trade Liberalization and the Dimensions of
Efficiency Change in Mexican Manufacturing Industries,� Journal of International
Economics 39, pp. 53-78.
Van Biesebroeck, Johannes. 2005. �Exporting raises productivity in sub-Saharan African
manufacturing firms,� Journal of International Economics 67, 373-391.
Wooldridge, J., 2002, Econometric Analysis of Cross Section and Panel Data, the MIT Press,
Cambridge, Massachusetts.


