Embed Size (px)
Citation preview

International Business Review xxx (2015) xxx–xxx
G Model
IBR-1180; No. of Pages 14
Technological strategies and learning-by-exporting: The case ofBrazilian manufacturing firms, 2006–2008
Bruno Cesar Araujo a,b,1, Mario Sergio Salerno a,*a University of Sao Paulo, Polytechnic School, Production Engineering Department, Av. Prof. Almeida Prado, travessa 2, n. 128, 05508070 Sao Paulo, SP, Brazilb The Institute for Applied Economic Research (Ipea), SBS Qd. 1, Bloco J, Ed. BNDES/Ipea, 11th floor, 70076-900 Brasılia, DF, Brazil
A R T I C L E I N F O
Article history:
Received 23 December 2013
Received in revised form 4 November 2014
Accepted 7 January 2015
Available online xxx
Keywords:
Brazilian industry
Innovation
Learning by exporting
Technological strategies
A B S T R A C T
This article assesses the relationship between learning by exporting and technological strategies for
Brazilian manufacturing firms from 2006 to 2008. Technological strategies are characterised by the
importance placed on innovation activities, sources of information and cooperation for innovation, and
the location of these sources. Combining factor analysis with regression analysis, we find that (i) new
exporters become more productive and larger than non-exporters; (ii) technological strategies improve
the productivity and size of all firms; and (iii) the differentiated technological strategies of new exporters
are generally not correlated with learning by exporting. Learning by exporting might be related to factors
that are not captured by the Brazilian Technological Innovation Survey, and the absence of correlation
between learning by exporting and technological strategies might reflect some missed opportunities for
technological learning from international trade.
� 2015 Elsevier Ltd. All rights reserved.
Contents lists available at ScienceDirect
International Business Review
jo u rn al h om epag e: ww w.els evier .c o m/lo cat e/ ibu s rev
1. Introduction
Economics and business literature has dedicated much atten-tion to international trade studies at firm level, in order to improvethe comprehension regarding motivations for internationalisationand firms’ productive and technological dynamics when firmsdecide to engage into international markets. This literature hasgiven rise to a number of stylised facts. One of them is thatexporting firms are larger, more productive and sell more in thedomestic market; in sum, they have more favourable competitive-ness indicators than do non-exporting firms (Tybout, 2003).Furthermore, these differences appear to be greater in developingcountries, as shown in Table 1.
There are two non-mutually exclusive hypotheses to explainwhy exporting firms perform better than non-exporters (Wagner,2007). The first is that only larger and more productive firms beginto export. The reason is that exporting involves entry costs such astransportation costs, distribution, specialised personnel to handleinternational distribution networks and even the cost of adaptingexisting products to international standards (Wagner, 2007). Inthis sense, many size, efficiency, and productivity gains occur
* Corresponding author. Tel.: +55 11 30915363x484; fax: +55 11 30915399.
E-mail addresses: [email protected] (B.C. Araujo), [email protected]
(M.S. Salerno).1 Tel.: +55 11 30915363x484/61 3315 5341; fax: +55 11 30915399.
Please cite this article in press as: Araujo, B. C., & Salerno, M. S. Technomanufacturing firms, 2006–2008. International Business Review (201
http://dx.doi.org/10.1016/j.ibusrev.2015.01.004
0969-5931/� 2015 Elsevier Ltd. All rights reserved.
before a firm starts to export. Hence, most competitive firms self-select in exporting activity. In fact, self-selection of better firms inexporting is a well-documented phenomenon in literature (Lopez,2005; Wagner, 2007).
The second hypothesis for differences between exporters andnon-exporters is that exporters may become even more competi-tive after the entry in international markets. The literature definesthese ex-post gains as learning-by-exporting (in analogy to thelearning-by-doing type learning), which may derive from severalsources:
� Economies of scale fostered by exports;� Higher competitive pressure in international markets, which
leads to production and management improvements;� Quality improvements, either to meet international customers’
demands or due to better access to state-of-art machinery andinputs;� The improvement of innovation capabilities, due to better access
to technology and the possibility of cooperation with foreignfirms in the productive chain (Aw & Hwang, 1995; Clerides,Lauch, & Tybout, 1998; Wortzel & Wortzel, 1981; World Bank,1993). Moreover, economies of scale derived from internationaltrade dilutes fixed costs of innovation, especially R&D projects(Aw, Roberts, & Xu, 2008).
Nevertheless, international business literature has dedicatedattention to knowledge-seeking motivation for internationalisation,
logical strategies and learning-by-exporting: The case of Brazilian5), http://dx.doi.org/10.1016/j.ibusrev.2015.01.004

Table 1Differences between exporters and non-exporters: Brazil and selected countries (in %).
Brazila Sub-Saharan Africab United Statesb Germanyb Colombiab
Average wages 16.3 34.1 9.3 1.7 17.3
Labour productivity 50.2 56.0 15.8 21.6 46.1
Total sales 169.1 312 110 95.7 123.7
Employment 83.5 212.6 93.6 71.7 197.2
Number of observations 45,996 3,800 190,000 4,200 70,000
Sources: (a) Araujo (2006); (b) Onwards: Van Biesebroeck (2005), Bernard and Jensen (1999), Bernard and Wagner (1998), and Isgut (2001).
All differences are significant at 1%.
1 It should be clarified that IPEA is not the owner of these databases and must
comply with many confidentiality clauses. In fact, the access to the data for this
study took place at IBGE. Consequently, the authors do not have the merged
database.
B.C. Araujo, M.S. Salerno / International Business Review xxx (2015) xxx–xxx2
G Model
IBR-1180; No. of Pages 14
either by interacting with foreign firms or even by merges andacquisitions (Garcıa, Avella, & Fernandes, 2012; Kogut & Chang,1991; Shan & Song, 1997).
An overview of literature supports the conclusion that morecompetitive firms become exporters, but exporters do notnecessarily become more competitive (Lopez, 2005; Wagner,2007). Learning effects following entry into the internationalmarket, when they exist at all, tend to occur only in developingcountries. One possible explanation is that learning effects may bemarginally more important in developing countries, where accessfirms tend to be further from the technological frontier (Blalock &Gertler, 2004).
In any case, the relationship between the possible learningeffects of exportation through innovation is not a very commonresearch agenda. In other words, there are many articles that testthe export–productivity link, some test the export–innovation link,but very few test the export–innovation–productivity link. Somearticles of the latter type are works of Crespi, Criscuolo, & Haskel(2008), Love and Ganotakis (2013), and Salomon and Shaver(2005). Crespi et al. (2008) reported that UK firms that haveexported in the past and used their overseas customers as aninformation source for innovation experienced faster productivitygrowth. Studying a panel of Spanish firms between 1990 and 1997,Salomon and Shaver (2005) found that firms that had exported inthe recent past tended to introduce more product innovations andfile more patents. More recently, Love and Ganotakis (2013)studied the effects of exportation on subsequent innovation insmall and medium-sized high-tech companies in the UK. The basicargument of these papers is that exports induce innovation, andinnovation fosters productivity. However, the problem is that it isvery difficult to identify how much of the impact of innovation onproductivity is in fact induced by foreign trade.
Hence, the main contribution of this article is the directassessment of the relationship between exports, performance andtechnological strategies, in a large emerging country such as Brazil.This is done through a regression model whose specificationassesses three hypotheses:
H1: Is there learning-by-exporting in Brazil 2006–2008, i.e., doBrazilian new exporters become larger and more productivethan a comparable sample of non-exporters?H2: Are some technological strategies – expressed by innova-tion activities, information sources for innovation and cooper-ation – related to firms’ productivity, size and market share?H3: Whether learning-by-exporting is verified (H1), aredifferentiated technological strategies (H2) adopted by newexporters behind size and productivity gains?
Using data from different sources on Brazilian manufacturingfirms, in this article we compare the trajectory and technologicalstrategies of new exporters to non-exporters with similarcharacteristics in the period 2006–2008. We used a quasi-experimental selection on observables technique to ensure thecomparability between both groups. Technological strategies arecharacterised using factor analysis.
Please cite this article in press as: Araujo, B. C., & Salerno, M. S. Technomanufacturing firms, 2006–2008. International Business Review (201
The remainder of the paper is as follows. The next sectiondescribes the data and defines the variables, and Section 3 detailsthe empirical strategy. Section 4 brings the factor analysis thatcharacterises technological strategies, and Section 5 details thecontrol of the self-selection of entrants. Section 6 discusses theregression results, and the conclusions of the paper are in Section 7.
2. Data and description of variables
We used data from several sources (Portuguese acronyms inparenthesis): Annual Industrial Survey (PIA) and TechnologicalInnovation Survey (PINTEC), both from the Brazilian Institute ofGeography and Statistics (IBGE); Foreign Trade database from theMinistry of Development, Industry and Foreign Trade (SECEX/MDIC); and the Annual List of Social Information (RAIS), an annualcensus of all formal employees provided by the Ministry of Labourand Employment (MTE). The merging process of all thesedatabases was possible due to a single tax identification code(CNPJ) for each firm. These datasets were linked by the Institute forApplied Economic Research (IPEA).1
It should be noticed, however, that the most importantdatabase for the purposes of this is study is the Brazilian innovationsurvey (PINTEC), whose fourth edition covers the 2006–2008period. The CNPJ was used to recover firm’s previous export historyin the SECEX database, and also to pick variables such asproductivity in the 2005 in the PIA database and the number oftechnical-scientific employees and firms’ age in the RAIS database.All these variables are necessary to define new exporters and toestimate the logit model in Section 5. Finding firms in RAIS andSECEX databases was not a major restriction since these databasescomprise administrative records; in turn, the need to mergePINTEC to PIA effectively restricted the analysis to companies withmore than 30 employees.
Firms were classified as entrants in exporting activity if theyentered in 2004 or 2005, exported for at least two consecutiveyears after the entry, and if they were non-exporters in the twoprevious years (2002–2003). Our analysis is restricted to innova-tive manufacturing firms during the 2006–2008 period, whetherthey were entrants or non-exporters during that period.
Only technological innovators responded to the part of thePINTEC questionnaire that allowed us to characterise thetechnological strategies: the importance of innovation activities,the importance of sources of information and cooperation forinnovation, as well as the location of these sources. From PINTECdata, it is not possible to assess the importance of sources ofinformation for innovation for non-innovators, for example. Thisrestriction implies that learning-by-exporting through innovationcould not be analysed for non-innovators in our research design.After all these concerns, our analysis refers to 18,977 firms, ofwhich 892 (4.9%) are entrants according to the above definition.
logical strategies and learning-by-exporting: The case of Brazilian5), http://dx.doi.org/10.1016/j.ibusrev.2015.01.004

B.C. Araujo, M.S. Salerno / International Business Review xxx (2015) xxx–xxx 3
G Model
IBR-1180; No. of Pages 14
The PINTEC variables used to characterise firms’ technologicallearning strategies are the importance of innovation activities,sources of information for innovation and cooperation, as well asthe location of these sources of information and cooperation.PINTEC questionnaire is comparable, for example, to the Commu-nity Innovation Survey (CIS) because it follows the Oslo Manual(OECD, 2005) for innovation surveys. In all cases, importance isassessed in a 1–4 Likert scale.
The positive effects of entry of industrial firms onto theinternational market were evaluated on productivity, employ-ment, net sales revenue (NSR) and market share. We used threeproductivity measures. The first measure is labour productivity,which is simply the ratio between the aggregated value and theaverage number of employees in the year – i.e., a measure ofvalue added per worker. The other two are measures or TotalFactor Productivity (TFP). Both measures of TFP are firm-levelresiduals of the estimation of modified versions of Cobb–Douglasfunctions, which is a standard procedure in the literature(Bernard & Jensen, 1999; Delgado, Farinas, & Ruano, 2002; Garcıaet al., 2012). The first measure is based on a fixed-effects OLSregression of value-added on labour and physical capital,including sector and year dummies (TFP-FE). The secondmeasure is based on the algorithm suggested by Levinsohnand Petrin (2003) (TFP-LP). The basic difference between thesetwo estimation techniques of production functions is thatLevinsohn and Petrin (2003) algorithm tackles the endogeneitybetween the choice of inputs usage and unobserved productivityshocks: since the latter are computed as residuals in productionfunctions, and consequently, as TFP, they must be correlatedwith input levels because firms expand inputs usage in responseto positive productivity shocks. Levinsohn and Petrin (2003)proposed to use intermediate inputs as a proxy for theseproductivity shocks.
The turnover of the firm was represented as NSR. This variablewas also used to construct the market share variable at three-digitNational Classification of Economic Activities (CNAE) sector level.The creation of the market share variable preceded the restrictionof the database to innovative companies: that is, market sharerefers to industry totals.
All financial variables such as NSR and value added weredeflated by Wholesale Price Index – Global Supply (IPA-OG), fromGetulio Vargas Foundation (FGV), at CNAE three-digit level.Whenever there was not a three-digit deflator, the two-digitdeflator was used instead. Special attention was devoted to thedeflation procedure, because the terms-of-trade appreciation ofBrazilian exports during the first decade of the 2000s could misleadus in considering as learning-by-exporting pure export priceeffects.
The descriptive statistics of the impact variables are in Table 2.At first glance, entrant firms are already larger and moreproductive than non-entrants in the entry year, suggesting someself-selection. Furthermore, entrants seem to grow faster, increasetheir productivity, and expand their market share at higher ratesthan non-entrants, suggesting some learning-by exporting. Moreprecisely, entrants’ productivity grew 16.5 pp (percentage points)faster than that of non-entrants. The differences in growth rates innet sales revenue (NSR) and number of employees among entrantsand non-entrants are 34.5 pp and 12.5 pp, respectively. As a result,differences between entrants and non-entrants were even higherin 2008.
In turn, the outcome indicators for innovation (product orprocess innovation for the company or market) indicate that non-entrant innovative companies innovated more for themselves byintroducing products that already existed on the internationalmarket; conversely, they showed a smaller proportion of new-to-the-market innovation than did the entrants.
Please cite this article in press as: Araujo, B. C., & Salerno, M. S. Technomanufacturing firms, 2006–2008. International Business Review (201
It should be noted, however, that all of these differences will beexamined in more detail in Section 6, because part of this result isdue to the inherent self-selection of exporters.
3. Empirical strategy
We test the relationship between technological strategies andlearning by exporting using a regression model:
Per formancei ¼ b0 þ b1 ex porti þ activitiesiba þ sourcesibs
þ locationibl þ cooperationibc þ ex porti
� activitiesibea þ ex porti � sourcesibes
þ ex porti � locationibel þ ex porti
� cooperationibec þ ei (1)
where performancei is the performance variable (productivity,employment, NSR, or market share), exporti is a binary variable (0or 1) for entrant; activitiesi is the set of factors or variables whichrepresents the importance of innovation activities; sourcesi is theset of factor or variables concerning the importance of the sourcesof information for innovation; locationi is the set of factors orvariables regarding the location of sources; and cooperationi is theset of factors or variables regarding cooperation to innovation. Thechoice of these factors and variables that represent technologicalstrategies is detailed in the next section. ba, bs, bl and bc are thecoefficient vectors for the factors or variables of innovationactivities, sources, location and cooperation, respectively; whereasbea, bes, bel and bec are the coefficient vectors for the interactionbetween these factors or variables and the export dummy.
This model should be interpreted as correlation tests: if factorsor variables’ coefficients are significant, then they have somecorrelation with dependent variable. The interpretation of thecoefficients is as follows:
(i) The coefficient b1, that of the entry dummy, relates to thehypothesis of learning by exporting. If it is positive andsignificant, the interpretation is that entering exportingpositively affects the performance variable of interest(productivity, NSR, employment or market share);
(ii) The coefficients in ba, bs, bl and bc indicate whethertechnological strategies expressed by factors or variableshave an overall relationship with the performance variable inboth entrant and non-entrant firms;
(iii) The coefficients in bea, bes, bel and bec indicate whether thereis any statistical correlation between technological strategiesand performance that is specific to entrants. In other words,these coefficients indicate if learning by exporting has anyrelationship with technological strategies.
However, as previously mentioned better firms self-select toexporting activity. In this sense, the correlation tests provided by(1) may be biased because entrants were already better than non-entrants even before they began to export. One must take this self-selection into the estimation of (1).
Whenever the determinants of self-selection are known andsufficient – in this case, if we know which variables lead a firm toenter the export market, we can employ quasi-natural experi-ments techniques. We employ a ‘‘selection on observables’’technique called inverse probability weighting – IPW (Wooldridge,2002, chapter 18).
The IPW consists in weighting Eq. (1) by the following factor:
wi ¼ex porti
pðXiÞþ 1 � ex porti
1 � pðXiÞ(2)
logical strategies and learning-by-exporting: The case of Brazilian5), http://dx.doi.org/10.1016/j.ibusrev.2015.01.004

Table 2Differences between innovative entrant and non-entrant companies in international trade: Brazil, 2005–2008.
Variable Non-entrants Entrants
Number of companies 18,085 892
Average number of employees – 2005 71.96 208.47
Growth in the number of employees – 2005–2008 3.07% 15.63%
Average NSR (2010 thousand R$)—2005 8,652.30 47,837.89
Growth in NSR—2005–2008 5.75% 40.32%
Labour productivity (Added value/employee – 2010 BRL thousands) – 2005 42.46 102.49
Growth in labour productivity—2005–2008 8.99% 25.52%
Average market share (CNAE3) —2005 0.08% 0.31%
Growth in market share (CNAE3) —2005–2008 �8.09% 16.43%
Share of the net sales which is exported (2005) – 7.63%
Share of the net sales which is exported (2008) – 8.98%
New-to-the-firm product innovation 40.5% 36.8%
New-to-the-market product innovation 6.96% 21.17%
New-to-the-firm process innovation 72.42% 69.82%
New-to-the-market process innovation 5.23% 8.56%
Source: Prepared from Pintec, PIA and Secex.
B.C. Araujo, M.S. Salerno / International Business Review xxx (2015) xxx–xxx4
G Model
IBR-1180; No. of Pages 14
where exporti is as defined above and p(Xi) denotes the estimatedprobability of entry. Intuitively, greater weights are given to firmsthat did not enter the market in spite of their high estimatedprobability of doing so – good counterfactuals for the entrants –and firms that did enter the market in spite of their lowprobabilities – good counterfactuals for non-entrants (Abadie,2005; Hirano & Imbens, 2001).
Thus, the first step to the IPW correction of self-selection is toestimate a model for p(Xi), the probability of becoming an exporter.As a selection on observables technique, one basic hypothesis ofIPW is that the determinants of exporting activity are known andsufficient. Literature suggests some determinants of exportingactivity at firm level: productivity, size, technology, sectoralfactors, location and other determinants such as network factors(for example, being a multinational company) and firm age, forexample. These determinants derive from economic theoryregarding international trade, and the interested reader shouldread Greenaway and Kneller’s (2007) survey on firm-levelglobalisation strategies and micro-determinants of exports. Wemade the best effort with the data in hand to include thedeterminants of exporting activity in the logit model in Section 5,but we acknowledge that some determinants – for instance,managers’ strategic orientation to foreign trade – may be missingdue to data limitations.2
4. The characterisation of technological strategies throughfactor analysis
The PINTEC questionnaire is divided into sections that allow thecharacterisation of how firms make innovation, in terms of theirinnovation activities, their sources of information and cooperationfor innovation.
Originally, there are 7 variables to reflect the importance ofinnovation activities, 14 to reflect the importance of sources ofinformation and 8 sources for cooperation. Still, there are,respectively, 12 and 8 variables regarding the location of sourcesof information and cooperation. Thus, we sought a condensation ofthese variables in order to:
(i) Facilitate the characterisation and interpretation of differenttechnological strategies as latent constructs such as ‘‘R&D-driven innovation’’, ‘‘Formal sources innovation’’ and others;
(ii) Reduce the number of variables in the econometric model, evenbecause many of these variables have low frequencies in thesample – for example, few firms cooperate with agentsoverseas, and this frequency is even lower if we break down
2 We are grateful to one of the anonymous referees for this point.
Please cite this article in press as: Araujo, B. C., & Salerno, M. S. Technomanufacturing firms, 2006–2008. International Business Review (201
this cooperation overseas by type agent. The technique to makethis condensation is common factor analysis.
In the specific case, factor analysis involves some technicalaspects. The first aspect is that our data are either ordinal or binary,which violates the continuity and normality of variables. This datastructure requires the use of polychoric correlation matrices(Joreskog & Moustaki, 2001), which take the inherent latentstructure of the data into consideration (Holgado-Tello, Chacon-Moscoso, Barbero-Garcıa, & Vila-Abad, 2010). In practice, poly-choric correlations matrices showed more relevant correlationsthan the Pearson correlations matrices, and therefore the quality ofthe factor analysis improved substantially. A comparison betweencorrelation matrices for the importance of innovation activities isavailable at the Appendix A, and polychoric correlation matricesfor the other sets of variables are in Appendix B.
The second aspect is the choice between principal componentsand common factor analysis. The difference is that principalcomponents analysis takes into consideration the total variance ofvariables in the factor extraction, whilst common factor extractiontakes into consideration only the common variance amongvariables. In practice, in common factor analysis, the main diagonalof the correlation matrix to be factored is composed of somemeasure of commonality between variables, such as the square ofthe multiple correlation (SMC), for example. In principal compo-nents analysis, this main diagonal is composed by 1’s.
According to Hair, Black, Babin, Anderson, & Tatham (2005,chapter 3), although the literature is not conclusive about thechoice between component and common factors analysis, com-mon factor analysis may be appropriate when the researcher isinterested in identifying latent constructs in a data set and/or haslittle knowledge about the distribution of the variables’ variancesbetween common, specific and error components. In any case,Velicer and Jackson (1990) argue that empirical research hasshown analogous results between component and common factoranalysis in many situations.
Notwithstanding, the interpretation of common factor analysishas some particularities. Since factors aim at explaining only thecommon variance of variables in a data set, popular criteria for thechoice of the number of factors – such as Eigenvalues greater thanone – may not fit in common factor analysis. Moreover, negativeEigenvalues for the factors are quite usual. The reason is that thecorrelation matrix is not necessarily full rank or positive-definite,since the elements on the main diagonal are communality measuresthat are less than 1. These negative Eigenvalues may be interpretedas a limit for the dimensionality of latent constructs. For example, ifthe third factor onwards have negative Eigenvalues, than one shouldonly consider two constructs in his/her common factor analysis.
logical strategies and learning-by-exporting: The case of Brazilian5), http://dx.doi.org/10.1016/j.ibusrev.2015.01.004

Table 3Factor analysis of the importance of innovation activities.
Importance of innovation activities (1–4 Scale) Factor loadings after
iteration of principal axis
Factor loadings after
Varimax rotation
Communalities
Factor 1 Factor 2 Factor 1 Factor 2
Intramural R&D 0.692 �0.363 0.781 �0.035 0.611
Extramural R&D 0.587 �0.276 0.649 �0.001 0.421
Acquisition of other external knowledge 0.311 �0.010 0.286 0.123 0.097
Acquisition of machinery and equipment 0.185 0.411 �0.007 0.451 0.203
Training 0.614 0.738 0.244 0.929 0.923
Market introduction of innovations 0.515 �0.157 0.533 0.076 0.290
Industrial Project 0.424 �0.077 0.417 0.110 0.186
Sum of Eigenvalues after iteration of principal axis 2.730 �Eigenvalues of factors 1.778 0.953 1.630 1.101 –
Proportion of the common variance explained by the factor 65.1% 34.9% 59.7% 40.3% –
Standardised Cronbach’s Alpha – – 0.693 0.830 –
Source: PINTEC.
Factor loadings above 0.40 are displayed in bold letters.
B.C. Araujo, M.S. Salerno / International Business Review xxx (2015) xxx–xxx 5
G Model
IBR-1180; No. of Pages 14
After all these concerns, factor analysis was applied to threevariable sets: (i) importance of innovation activities; (ii) importanceof sources of information for innovation; (iii) the location of thesesources of information. Cooperation for innovation was treatedseparately. In all factor analysis, the extraction method of factorswas the iterated principal axis, the communality measure was thesquared multiple correlations (SMC) and we applied a Varimaxorthogonal rotation. The number of factors is, at first, limited bynegative Eigenvalues; then we chose the number of factors amongthose with positive Eigenvalues according to the scree plot.
4.1. The importance of innovation activities
The 7 PINTEC variables that capture the importance ofinnovation activities are originally in a 1–4 Likert scale. Thepolychoric correlation matrix (Table 2A in Appendix A) shows thatthere are two sets of correlated variables (>0.40): one of them iscomposed by intramural and external R&D and market introduc-tion of innovations, and the other set is composed by acquisition ofmachinery and equipment and training. Kaiser’s Measure ofSample Adequacy (MSA) is 0.65 on average, thus above therecommended 0.5 cut-off (Hair et al., 2005).
We chose two factors to condense the importance of innovationactivities (preliminary Eigenvalues and scree plots are in theAppendix B). These factors are summarised in Table 3:
� The first factor may be named ‘‘R&D-driven innovation’’, since itis highly correlated with intramural and external R&D, marketintroduction of innovations and industrial project. This factorindicates a strategy to develop new products or processesendogenously or from the purchase of R&D, and then invest inindustrial projects for further release of these innovations on themarket;� The second factor may be named ‘‘machinery-driven innova-
tion’’, since it is highly correlated with the importance attributedto the acquisition of machinery and equipment and training. Thisfactor reflects a strategy of acquiring embodied technology inmachinery and equipment and training employees to operatethese machines, which enables the convergence towards thetechnological frontier of the sector.
We built factor scores from the rotated factor loadings, whichare simply the product between the factor loadings and the originalvalues of variables for each observation. It means that we createdtwo variables that summarise the importance of innovationactivities. However, a final assessment of the reliability of thesenew variables is necessary. One popular measure of reliability isCronbach’s Alpha (Hair et al., 2005). The variable created from the
Please cite this article in press as: Araujo, B. C., & Salerno, M. S. Technomanufacturing firms, 2006–2008. International Business Review (201
first factor was practically at the recommended lower bound of0.70, and the second factor originated a variable whose standar-dised Cronbach’s Alpha was 0.83.
4.2. The importance of sources of information
First, from the original 14 sources of information variables atPINTEC, the effect of four of them – intramural R&D, other internalsources, other enterprise of the same group and machinery andequipment suppliers – is already captured by the importance ofinnovation activities. Patents were not an important source ofinformation for any firm in the sample. Moreover, the importanceof clients and customers and competitors as sources of informationfor innovation were excluded from the factor analysis, becausethese variables are not correlated with any other variable. Thesevariables enter as separate regressors in the regression models.
Therefore, from the remaining 7 variables, there are two sets ofcorrelated variables. The first set is related to formal sources ofknowledge (universities, research centres, training and testinginstitutions), whilst the second set is related to informal sources(conferences, fairs and computerised information networks).Kaiser’s Measure of Sample Adequacy (MSA) is 0.82 on average.
Two factors characterise the importance of the sources ofinformation for innovation, according to Table 4:
� The first factor may be named ‘‘Formal sources of information’’and is related to universities, testing institutions, training centresand consulting firms, in this order of importance. The Standar-dised Cronbach’s Alpha for this factor is 0.80;� The second factor may be named ‘‘Informal sources of informa-
tion’’ and it is related to trade fairs, conferences and networks ofelectronic information networks. The Standardised Cronbach’sAlpha for this factor is 0.83.
4.3. The importance of sources of information abroad
PINTEC brings the location of sources of information forinnovation, whether in Brazil or abroad. It is interesting to knowif entrants use more information sources abroad than non-exporters, and the possible impacts of these sources abroad ontheir performance variables.
Thus, we created a dummy interaction variable such that thisvariable is 1 if the firm attributes medium or high importance to aparticular source of information and this source is located abroad,and 0 otherwise.
As discussed above, there are several sources of information,and in principle there is an interaction variable for each source.However, few sources located abroad were used in a relevant way.
logical strategies and learning-by-exporting: The case of Brazilian5), http://dx.doi.org/10.1016/j.ibusrev.2015.01.004

Table 4Factor analysis of the importance of sources of information of innovation.
Importance of innovation activities (1–4 Scale) Factor loadings after
iteration of principal axis
Factor loadings after
Varimax rotation
Communalities
Factor 1 Factor 2 Factor 1 Factor 2
Consultants 0.544 0.544 0.590 0.132 0.365
Universities 0.744 0.744 0.755 0.246 0.630
Training centres 0.706 0.706 0.701 0.253 0.555
Testing institutions 0.698 0.698 0.730 0.204 0.575
Conferences 0.718 0.718 0.400 0.651 0.584
Trade fairs 0.640 0.640 0.087 0.919 0.852
Electronic information networks 0.468 0.468 0.218 0.477 0.275
Sum of Eigenvalues after iteration of principal axis 3.836 –
Eigenvalues of factors 2.979 0.858 2.157 1.68 –
Proportion of the common variance explained by the factor 77.7% 22.3% 56.2% 43.8% –
Standardised Cronbach’s Alpha – – 0.808 0.834 –
Source: PINTEC.
Factor loadings above 0.40 are displayed in bold letters.
Table 5Factor analysis of the importance of sources of information abroad.
High or medium importance of the
source located abroad (binary)
Factor loadings
after iteration
of principal axis
Communalities
Machinery and equipment supplier 0.505 0.255
Conferences 0.879 0.772
Trade fairs 0.815 0.665
Electronic information networks 0.728 0.530
Factor Eigenvalue 2.221 –
Standardised Cronbach’s Alpha 0.79 –
Source: PINTEC.
Factor loadings above 0.40 are displayed in bold letters.
B.C. Araujo, M.S. Salerno / International Business Review xxx (2015) xxx–xxx6
G Model
IBR-1180; No. of Pages 14
In fact, when located overseas, only the machinery and equipmentsuppliers, competitors, conferences, trade fairs and electronicinformation networks were used by more than 200 firms in thesample. Among these variables, competitors had Kaiser’s MSAbelow 0.40, so it was excluded from the factor analysis.
Therefore, the four remaining variables form only one factor(since the other three factors have negative Eigenvalues), which isa general one and related to all the variables. It is not possible torotate only one factor. The Standardised Cronbach’s Alpha of thissingle factor is 0.79 (Table 5).
4.4. Cooperation for innovation
Very few companies assigned high or medium importance tothe various cooperation arrangements for innovation. Thus, inorder to represent cooperation for innovation we chose to use adummy indicating whether the firm had any cooperationagreement for innovation or not. In total, 1816 firms hadcooperation agreements. PINTEC also brings information aboutcooperation abroad. However, only 21 firms cooperated abroad.
4.5. Descriptive statistics
Table 6 below shows the averages and 10% confidence intervalsof the factors, by entrants and non-exporters. It may be noticedthat entrants have higher factors than non-exporters, and thisdifference is not 10% significant only for the ‘‘Machinery-driveninnovation’’ factor (this is the only factor for which confidenceintervals cross between entrants and non-exporters). Regardingcooperation, entrants tend to have more cooperation agreementsthan non-exporters, although the number of firms that havecooperation agreements abroad is very low (9 non-exporters and12 exporters). Table 6 shows that, on average, entrants have moreproactive technological strategies than non-exporters.
5. Control of self-selection of entrants
Before proceeding to the regression analysis that relates entryon the international market to technological strategies, it isnecessary to present the results of the logit model used to controlself-selection.
In the model presented in Table 7, entering the export businessin 2004 or 2005 and continuing to export for at least twoconsecutive years is regressed on the logarithm of employees andproductivity, the age of the firm (quadratic form), the log oftechnical scientific employees, the market share in quadratic formand whether the company has foreign or mixed capital. Sectoralcontrols were also added to the model (firms were categorised
Please cite this article in press as: Araujo, B. C., & Salerno, M. S. Technomanufacturing firms, 2006–2008. International Business Review (201
according to Organisation for Economic Co-operation and Devel-opment (OECD) categories of technological intensity – labourintensive, natural resources, low, medium and high technologicalintensity), as well as regional controls (North, Northeast, Midwest,Southeast and South). These sectoral and regional controls are notreported in Table 7. All variables are in 2005 values. Thisspecification relies upon the literature of micro-determinants ofexports (Greenaway & Kneller, 2007).
Technical-scientific employees – that is, employees in techni-cal-scientific occupations according the Brazilian Classification ofOccupations – are a good proxy for investment in technology, sinceits high correlation with firms’ R&D (Araujo, Cavalcante, & Alves,2009). Age and market share are in quadratic form because theliterature argues that older companies are more likely to enter theinternational market than younger companies are, but only to acertain point. The same reasoning applies to market share: a highermarket share means larger scale, but a very large market sharemeans little competitive pressure, which can create a disincentiveto seek foreign markets. In both cases, a positive sign is expectedfor the coefficient for variable in level and a negative sign of thecoefficient of the squared variable, which indicates the existence ofa maximum point.
In general, model coefficients were as expected. Productivityand size positively affected the likelihood of a company to engageinto international trade, and so did the log of technical-scientificemployees. However, age had no relationship with entering inforeign markets, and market share seemed to affect negatively theprobability of becoming an exporter, even though only one of thecoefficients is significant at 10%. Transnational companies hadhigher probability of becoming exporters, whilst the oppositehappened to mixed capital firms (national and foreign).
The Wald test indicates that the model as a whole wasstatistically significant, and the acceptance of the null hypothesisof the Hosmer–Lemeshow test indicates that the model predictsthe distribution of entrants and non-exporters adequately. Indeed,
logical strategies and learning-by-exporting: The case of Brazilian5), http://dx.doi.org/10.1016/j.ibusrev.2015.01.004

Table 6Descriptive statistics of factors: entrants vs. non-exporters.
Factors Average Confidence interval
Lower 95% limit Upper 95% limit
Non-exporters
R&D-driven innovation 4.39 4.33 4.45
Machinery-driven innovation 4.29 4.22 4.36
Formal sources of innovation 6.06 5.96 6.16
Informal sources of innovation 6.44 6.34 6.53
Sources of information abroad 0.06 0.05 0.07
% of firms that cooperate for innovation 9.33% – –
% of firms that cooperate abroad 0.05% – –
Entrants
R&D-driven innovation 5.02 4.82 5.22
Machinery-driven innovation 4.44 4.26 4.62
Formal sources of innovation 6.46 6.19 6.74
Informal sources of innovation 7.30 7.07 7.53
Sources of information abroad 0.26 0.20 0.33
% of firms that cooperate for innovationa 14.35% – –
% of firms that cooperate abroada 1.35% – –
Source: PINTEC.a Chi-squared tests of the distribution of cooperating firms among entrants and non-exporters reject the null hypothesis at 1% significance
level, which indicates that entrants tended to cooperate more than non-exporters.
Table 7Logit model of the probability of entering international trade in 2004 or 2005.
Independent variables Coefficient Standard Error Significance
Intercept �10.533* 1.1533 <.0001
Log (employees) 0.390* 0.0948 <.0001
Log (productivity) 0.618* 0.0850 <.0001
Age 0.003n.s. 0.0172 0.8767
Age^2 0.000n.s. 0.0003 0.3512
Log (technical–scientific employees)t 0.508* 0.1302 <.0001
Market share �30.221*** 16.7778 0.0717
Market share^2 103.600n.s. 107.8000 0.3367
Foreign capital company 1.244* 0.4423 0.0049
National and foreign capital company �1.557** 0.7312 0.0332
N (without sampling weights) 1959 – –
�2 Log Likelihood – all variables 1,342.77 – –
�2 Log Likelihood – intercept only 1,592.95
Wald test (H0: all coefficients are null) 196.45 – <.0001
Pseudo R2 0.157 – –
Hosmer–Lemeshow test 5.60 0.69
Percent concordant 77.3 – –
Source: PINTEC, PIA and SECEX.
The balancing condition was satisfied: dividing the sample according to five quintiles of estimated probability, the model variables for entrants
and non-entrants were not significantly different at the 5% level of significance, meaning that the groups are comparable. The common support
condition resulted in limiting the sample of regression models to firms whose p(X) was between 0.0042223 and 0.7346017.
n.s., Not significant at 10%.* Significant at 1%.** Significant at 5%.*** Significant at 10%.
B.C. Araujo, M.S. Salerno / International Business Review xxx (2015) xxx–xxx 7
G Model
IBR-1180; No. of Pages 14
the percent concordant statistic – an informal test indicating howmany companies with a probability of more than 0.5 actuallybegan exporting and vice versa – is 77.3%.
Having obtained the estimated probabilities, we proceed to theregression analysis using IPW. Six models of weighted regressionwere estimated with the logarithms of the 2007–2008 averages oflabour productivity, the two measures of Total Factor Productivity,net sales revenue, number of employees, and the market share (notin logs) being the dependent variable. Such models did not includecontrols by sector or by region, as they are in the first stage.
6. Regression models: is learning-by-exporting related totechnological strategies?
6.1. Productivity
The regression models are displayed in Table 8, and the firstthree columns show the productivity models (labour productivity,TFP-LP and TFP-FE).
Please cite this article in press as: Araujo, B. C., & Salerno, M. S. Technomanufacturing firms, 2006–2008. International Business Review (201
One may notice that the R2, a traditional goodness-of-fit measure,is rather low in all models. There are two explanations for this. Thefirst is that typically microeconometric models have low R2 –generally heterogeneity of individuals rise as the number ofobservations increases, and micro-level databases have thousands(sometimes, millions) of observations. The second reason is that ourmodels are very parsimonious: dimensions such as productivity andrevenue are ‘‘explained’’ only by exports and some innovationvariables. For example, if we tried to ‘‘explain’’ revenue by inputssuch as raw materials, capital and labour, one would expect the R2 toraise substantially; however, estimating production functions is notthe aim of the paper. In any case, models in Table 8 are statisticallyvalid, because the F test under the null hypothesis that thecoefficients are not significantly different from zero was rejectedat less than 0.1% significance. We focus our analysis on thesignificance of coefficients, which indicates the correlation betweenfirms’ performance variables and technological strategies.
The first set of results, concerning the entry in foreign marketsdummy, indicates a general learning by exporting effect of 67.4%
logical strategies and learning-by-exporting: The case of Brazilian5), http://dx.doi.org/10.1016/j.ibusrev.2015.01.004
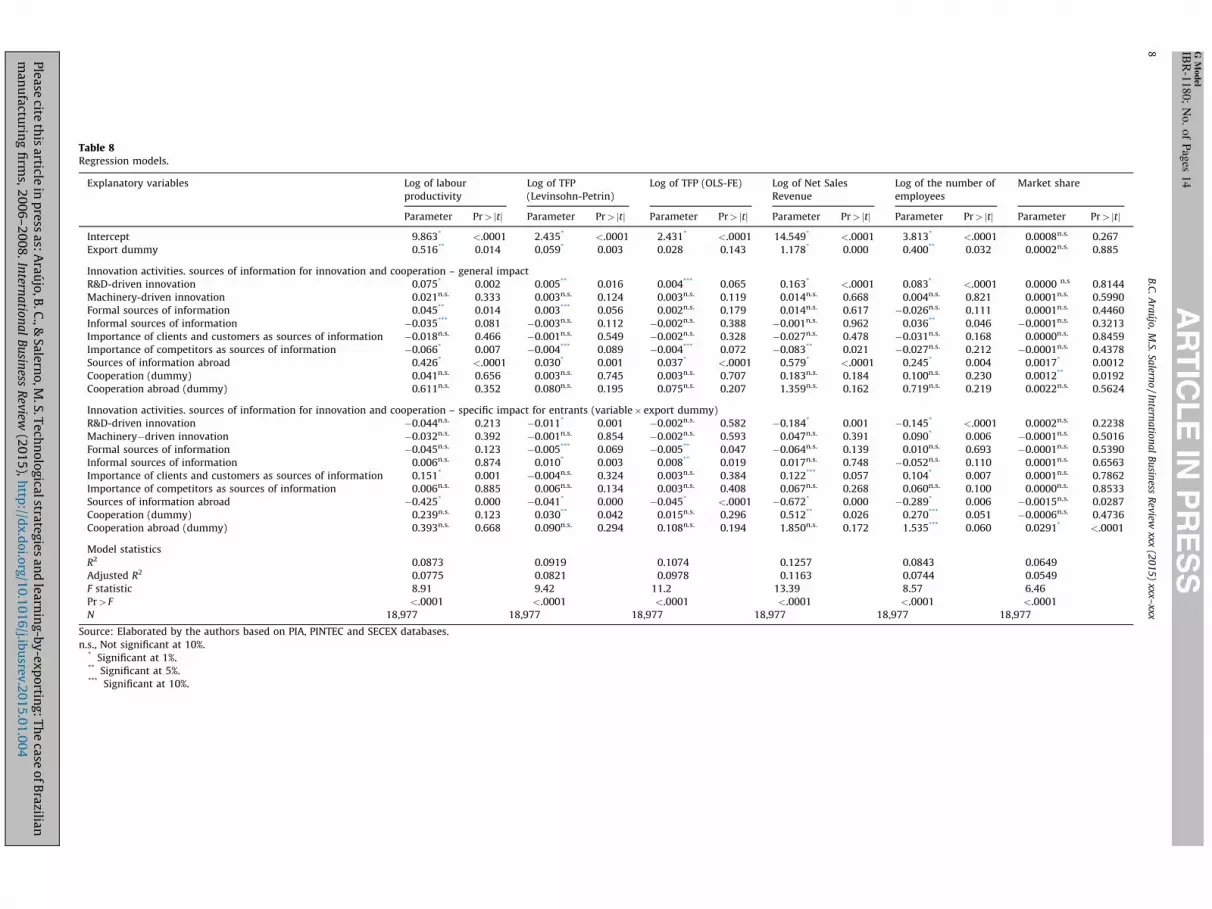
Table 8Regression models.
Explanatory variables Log of labour
productivity
Log of TFP
(Levinsohn-Petrin)
Log of TFP (OLS-FE) Log of Net Sales
Revenue
Log of the number of
employees
Market share
Parameter Pr> jtj Parameter Pr> jtj Parameter Pr> jtj Parameter Pr> jtj Parameter Pr> jtj Parameter Pr> jtj
Intercept 9.863* <.0001 2.435* <.0001 2.431* <.0001 14.549* <.0001 3.813* <.0001 0.0008n.s. 0.267
Export dummy 0.516** 0.014 0.059* 0.003 0.028 0.143 1.178* 0.000 0.400** 0.032 0.0002n.s. 0.885
Innovation activities. sources of information for innovation and cooperation – general impact
R&D-driven innovation 0.075* 0.002 0.005** 0.016 0.004*** 0.065 0.163* <.0001 0.083* <.0001 0.0000 n.s 0.8144
Machinery-driven innovation 0.021n.s. 0.333 0.003n.s. 0.124 0.003n.s. 0.119 0.014n.s. 0.668 0.004n.s. 0.821 0.0001n.s. 0.5990
Formal sources of information 0.045** 0.014 0.003*** 0.056 0.002n.s. 0.179 0.014n.s. 0.617 �0.026n.s. 0.111 0.0001n.s. 0.4460
Informal sources of information �0.035*** 0.081 �0.003n.s. 0.112 �0.002n.s. 0.388 �0.001n.s. 0.962 0.036** 0.046 �0.0001n.s. 0.3213
Importance of clients and customers as sources of information �0.018n.s. 0.466 �0.001n.s. 0.549 �0.002n.s. 0.328 �0.027n.s. 0.478 �0.031n.s. 0.168 0.0000n.s. 0.8459
Importance of competitors as sources of information �0.066* 0.007 �0.004*** 0.089 �0.004*** 0.072 �0.083** 0.021 �0.027n.s. 0.212 �0.0001n.s. 0.4378
Sources of information abroad 0.426* <.0001 0.030* 0.001 0.037* <.0001 0.579* <.0001 0.245* 0.004 0.0017* 0.0012
Cooperation (dummy) 0.041n.s. 0.656 0.003n.s. 0.745 0.003n.s. 0.707 0.183n.s. 0.184 0.100n.s. 0.230 0.0012** 0.0192
Cooperation abroad (dummy) 0.611n.s. 0.352 0.080n.s. 0.195 0.075n.s. 0.207 1.359n.s. 0.162 0.719n.s. 0.219 0.0022n.s. 0.5624
Innovation activities. sources of information for innovation and cooperation – specific impact for entrants (variable� export dummy)
R&D-driven innovation �0.044n.s. 0.213 �0.011* 0.001 �0.002n.s. 0.582 �0.184* 0.001 �0.145* <.0001 0.0002n.s. 0.2238
Machinery�driven innovation �0.032n.s. 0.392 �0.001n.s. 0.854 �0.002n.s. 0.593 0.047n.s. 0.391 0.090* 0.006 �0.0001n.s. 0.5016
Formal sources of information �0.045n.s. 0.123 �0.005*** 0.069 �0.005** 0.047 �0.064n.s. 0.139 0.010n.s. 0.693 �0.0001n.s. 0.5390
Informal sources of information 0.006n.s. 0.874 0.010* 0.003 0.008** 0.019 0.017n.s. 0.748 �0.052n.s. 0.110 0.0001n.s. 0.6563
Importance of clients and customers as sources of information 0.151* 0.001 �0.004n.s. 0.324 0.003n.s. 0.384 0.122*** 0.057 0.104* 0.007 0.0001n.s. 0.7862
Importance of competitors as sources of information 0.006n.s. 0.885 0.006n.s. 0.134 0.003n.s. 0.408 0.067n.s. 0.268 0.060n.s. 0.100 0.0000n.s. 0.8533
Sources of information abroad �0.425* 0.000 �0.041* 0.000 �0.045* <.0001 �0.672* 0.000 �0.289* 0.006 �0.0015n.s. 0.0287
Cooperation (dummy) 0.239n.s. 0.123 0.030** 0.042 0.015n.s. 0.296 0.512** 0.026 0.270*** 0.051 �0.0006n.s. 0.4736
Cooperation abroad (dummy) 0.393n.s. 0.668 0.090n.s. 0.294 0.108n.s. 0.194 1.850n.s. 0.172 1.535*** 0.060 0.0291* <.0001
Model statistics
R2 0.0873 0.0919 0.1074 0.1257 0.0843 0.0649
Adjusted R2 0.0775 0.0821 0.0978 0.1163 0.0744 0.0549
F statistic 8.91 9.42 11.2 13.39 8.57 6.46
Pr> F <.0001 <.0001 <.0001 <.0001 <.0001 <.0001
N 18,977 18,977 18,977 18,977 18,977 18,977
Source: Elaborated by the authors based on PIA, PINTEC and SECEX databases.
n.s., Not significant at 10%.* Significant at 1%.** Significant at 5%.*** Significant at 10%.
B.C
. A
rau
jo,
M.S.
Salern
o /
Intern
atio
na
l B
usin
ess R
eview
xxx (2
01
5)
xxx–xxx
8 G M
od
el
IBR
-11
80
; N
o.
of
Pag
es 1
4
Ple
ase
cite th
is a
rticle in
pre
ss a
s: A
rau
jo,
B.
C.,
& S
ale
rno
, M
. S
. T
ech
no
log
ical
strate
gie
s a
nd
lea
rnin
g-b
y-e
xp
ortin
g:
Th
e ca
se o
f B
razilia
nm
an
ufa
cturin
g fi
rms,
20
06
–2
00
8.
Intern
atio
na
l B
usin
ess R
eview
(20
15
), h
ttp://d
x.d
oi.o
rg/1
0.1
01
6/j.ib
usre
v.2
01
5.0
1.0
04
B.C. Araujo, M.S. Salerno / International Business Review xxx (2015) xxx–xxx 9
G Model
IBR-1180; No. of Pages 14
on labour productivity and 6.1% in TFP-LP. This percentagedifference is not exactly equal to the coefficient of the modelbecause the variable in log is being regressed on a dummy variable.Thus, to find the percentage difference it is necessary to apply thetransformation exp(b)-1. However, the dummy coefficient was notsignificant in the case of TFP by OLS-FE technique.
The second set of results concerns the impact of technologicalstrategies on productivity, regardless of whether the firm is anentrant or not. Regarding innovative activities, the ‘‘R&D-driveninnovation’’ is always positive and significant at 10% in the threemodels. It means that technological strategies that rely onendogenous capability building, such as intramural R&D, havesome correlation with firm’s productivity. Conversely, the coeffi-cients of the ‘‘Machinery-driven innovation’’ factor is not signifi-cant in the three models.
Regarding the sources of information for innovation, the factorthat indicates the importance of formal sources is significant in themodels for simple labour productivity and TFP-LP, whilst the‘‘informal sources of information’’ factor is significant only insimple labour productivity model, with a negative sign. Theimportance of clients and customers as information sources wasnot significant in any of the models (in fact, this source is notsignificant in any of the models of this article) and the use ofcompetitors as a source of information and showed a significantnegative sign in all estimated productivity models. One possibleexplanation for these negative signs is that perhaps firms thatattribute high importance to competitors as sources of informationare those in less favourable competitive position, needing toconverge to the technological frontier of the industry.
The use of information sources abroad positively affectsproductivity, since the coefficient related to this general factor ispositive and significant to 1% for all models productivity.Nevertheless, this factor is significant in all models of the article,denoting the positive association between performance and thesearch for information for innovation abroad. In turn, cooperation,even with agents located abroad, was not significant in any of theproductivity models.
The third set of results – one related to the interaction betweenthe innovation factors and variables and the entry dummy – pointto different directions. In general, factors related to innovationactivities were not significant, except for the ‘‘R&D-driveninnovation’’ factor in the model for TFP-LP, negative and significantat 1% coefficient.
The coefficients of the sources of information were notsignificant in the model of labour productivity, but the first factor(formal sources) had negative and significant coefficient in bothTFP models. Conversely, the second factor (informal sources)showed a positive and significant sign in these TFP models.
The use of clients and customers as sources of information forinnovation was only significant in the model for labour productiv-ity, with a positive sign. The interaction between the use ofcompetitors as an information source and exporting activity wasnot significant in any of the models.
For entrants, the coefficient relating to sources of informationabroad is negative. This virtually offsets the positive overall effectobserved for all firms. Finally, cooperation had positive effect toentrants only in the model TFP-LF, and cooperation abroad had norelationship with the productivity of entrants in any of theestimated models.
In sum, there are productivity gains for entrants in two of thethree models estimated. In all firms, these gains were related toinnovative activities, to the use of sources of information forinnovation, especially those knowledge-intensive activities (suchas R&D), and to the use of formal sources for innovation, such asuniversities and research centres. In addition, the use of informa-tion sources abroad had positive relationship with productivity.
Please cite this article in press as: Araujo, B. C., & Salerno, M. S. Technomanufacturing firms, 2006–2008. International Business Review (201
However, there seemed to be no special relationship betweentechnological strategies of entrants and productivity gains. Thus,the hypothesis of learning-by-exporting via technological learningwas not confirmed, at least with regard to productivity measures.
6.2. Size: net sales revenue and number of employees
Regression models of the two size measures – net sales revenue(NSR) and the number of employees – are in the fourth and fifthcolumns of Table 8. In both cases, entry positively affects firms’size: the 2007–2008 average of NSR of entrants is 224% higher thannon-exporters’. The number of employees is 50% higher. It shouldbe noticed that revenue grows faster than employment, whichhelps to explain the labour productivity gain shown in the previoussection.
With respect to the general influence of technological strategieson size, the first factor of innovative activities (R&D-driveninnovation) showed a positive and significant sign, whilst thesecond factor (Machinery-driven innovation) was not statisticallysignificant. Formal sources of information did not significantlyaffect the scale, whilst informal sources affected only the numberof employees. The importance of clients and customers as sourcesof information for innovation was not significant in both models,and the use of competitors as sources of information affectednegatively and significantly the NSR. As above, the use ofinformation sources abroad positively affects firms’ size in bothmodels, but cooperation variables were not significant in any ofthem.
With specific regard to the effect of technological strategieson entrants, on two variables negative and significant signs offsetthe positive effects for firms in general: the R&D-driveninnovation factor and the use of sources of information forinnovation abroad. The use of clients and customers as sources ofinformation for innovation positively affect the scale of entrants,yet it does not affect the scale of firms in general. Finally,cooperation positively affect entrants’ size, and cooperationagreements abroad have positive and significant relationshipwith the number of employees.
Therefore, the specific effect of technological strategiesentrants’ size is ambiguous. On the one hand, the general positiveeffects of technological strategies such as investment in R&D andthe use of informal sources of information were offset by negativecoefficients specific to entrants. On the other hand, cooperation forinnovation is positively related to entrants’ size. This pattern doesnot support the hypothesis that differentiated technologicallearning strategies by entrants are behind scale gains that derivefrom the entry on international markets.
6.3. Market share
Table 8, on the last column, displays the regression model forthe market share of firms. As the calculation of the market sharevariable is prior to the restriction of the database to innovativefirms, not necessarily entrants’ revenue growth due to exportsimplies increased market share. Put another way, the modelcaptures the effects of entry in the international market onindustry’s conditions of competition as a whole.
Nevertheless, the model indicates that entry in the internation-al market does not significantly alter the firms’ market share in thedomestic market. Furthermore, the innovation factors and vari-ables do not seem to have a very strong relationship with thisgrowth. The only significant coefficient for firms in general is thatof sources of information abroad (1% significance) and thecooperation dummy (5% significance). Specifically to the entrants,the only significant variable was the interaction between thecooperation agreements abroad and the export dummy.
logical strategies and learning-by-exporting: The case of Brazilian5), http://dx.doi.org/10.1016/j.ibusrev.2015.01.004

B.C. Araujo, M.S. Salerno / International Business Review xxx (2015) xxx–xxx10
G Model
IBR-1180; No. of Pages 14
7. Discussion and conclusions
This article tested three hypothesis, namely:
H1: Is there learning-by-exporting in Brazil 2006–2008?H2: Are some technological strategies – expressed by innova-tion activities, information sources for innovation and cooper-ation – related to firms’ productivity, size and market share?H3: Whether learning-by-exporting is verified (H1), aredifferentiated technological strategies (H2) adopted by newexporters behind size and productivity gains?
In order to answer these questions, entrants in foreign marketsin 2004–2005 were compared to non-exporting innovators in2006–2008 in terms of performance and innovation variables. Thiscomparison took into account self-selection of entrants. Learning-by-exporting was measured on three measures of productivity,sales, number of employees, and market share.
First, results of this paper are in line with the literature fordeveloping countries in what concerns learning-by-exporting.Productivity differentials in comparison to non-exporters intwo of three measures were of 6.1% (TFP-LP) and 67.4%(labour productivity). Net sales revenue differentials were224% and the difference on the number of employees was50%. Summing up, exporters are more productive, presentgreater revenues and are larger than non-exporters – thus, H1was verified. However, we did not find significant differences inthe domestic market share between entrants in internationaltrade and non-exporters.
Second, technological strategies such as the reliance onendogenous knowledge creation through intramural R&D andthe extensive use of formal (universities, research centres etc.)and informal (conferences, trade fairs etc.) sources of informa-tion for innovation had positive impact on the performanceof all firms. Nevertheless, this impact was even higher whenfirms seek for this information abroad. Hence, H2 was alsoverified.
This is, however, a general result for all firms. By analysing thespecific impact of technological strategies of entrants, there is noevidence of additional impacts – on the contrary, in some cases,this specific impact was negative. Thus, learning-by-exporting wasnot related to differentiated technological strategies of entrants inBrazil 2006–2008, and H3 was not verified.
There are two ways to discuss these findings. The first is to try tounderstand what was behind learning-by-exporting that could notbe captured by the innovation survey. One possibility may beefficiency improvements. These efficiency improvements mayresult from scale efficiency gains – in our case, revenue growsmuch faster than employment, which may indicate improvedeconomies of scale, or from the adoption of better managementtechniques and adequacy to international standards – improvedproduction efficiency, which may result from international trade.Unfortunately, these effects are not captured by innovationsurveys if they do not involve production or process technologicalinnovation.
The second way is to understand why technological strategiesdid not matter for learning-by-exporting of entrants. One possibleexplanation is that the time span of the analysis might be too shortto capture relevant changes of new exporters’ technologicalstrategies. In this sense, the absence of correlation betweentechnological strategies and learning-by-exporting may be amatter of timing. Unfortunately, this short time span is anunavoidable problem of the Brazilian innovation survey, since apanel of more than one edition of the survey would have only largefirms (more than 500 employees).
Please cite this article in press as: Araujo, B. C., & Salerno, M. S. Technomanufacturing firms, 2006–2008. International Business Review (201
Another possible explanation is that this article’s sample isrestricted to innovative firms, in order to verify differences intechnological learning strategies – in other words, how entrantsinnovate. It would be necessary to investigate further the effects ofexporting activity on the decision to innovate and the ex-post
impacts of innovation on productivity, taking special care inidentifying the export-innovation-productivity link.
Literature states that the technological dimension of learning-by-exporting is related to knowledge spillovers from theinteraction with foreign agents, the access to state-of-arttechnology, better equipment and materials, and the possibilityof technological cooperation with other firms. These mechanismsmay be even more important in today’s international tradescenario, characterised by the emergence of global value chains(GVCs), which correspond to more than a half of global trade, eventaking into account double counting in GVCs’ trade (UNCTAD,2013).
Therefore, a third possible explanation relates to Brazil’s lowinsertion in GVCs’ trade. The impacts of GVCs’ trade oninnovation capabilities should be objective of future research.According to UNCTAD (2013), in spite of being the fourthlargest FDI host in 2011, Brazil is only the 22nd of 25 emergingcountries in terms of firms’ insertion in GVCs. One explanationfor this is some inconsistencies between trade and investmentpolicies. Brazil poses little restriction to FDI, but is a relativelyclosed country when compared to its WTO counterparts.One may argue that protection fosters FDI that targets atexploring the domestic market, but it may backfire the insertioninto GVCs.
Thus, one policy message of this discussion is that Brazil shouldreview its context conditions for international trade. Brazilianfirms face high tariffs even for some intermediate goods used inexported goods. Additionally, there are problems in infrastructurefor international trade, and a very complex tax system makesimpossible the deduction of all domestic taxes in exports. Ofcourse, Brazil should improve its tariff policy, infrastructure andthe tax system not only to foster innovation through trade inindustrial firms; indeed, it would bring major benefits to theeconomic structure as a whole.
Deeper insertion of Brazilian firms in GVCs may result inknowledge spillovers, but as Garcıa et al. (2012) point out, this isespecially true when firms have capabilities to absorb theseknowledge spillovers. UNCTAD (2013) warns that GVCs trade maylock firms in low value-added stages if they are not able to moveforward along the productive chain. In this sense, strengtheningthe national innovation system arises as a policy recommendation,even though, again, it brings other benefits than preparing firms tolearn from exporting.
Finally, results also bring managerial implications. It is clearthat internationalisation helps to improve firms’ performance.Notwithstanding it is also clear that Brazilian firms anchorinternational trade on commodities, like mineral ore, agro andbasic industrial products. A managerial approach to take betteradvantage of international insertion should focus on the improve-ment of innovation capabilities, in association with the search forthe insertion in GVCs in better positions.
Acknowledgements
The authors acknowledge the valuable comments of threeanonymous referees, and those of Fernanda De Negri, JorgeArbache, Donald Pianto, Maria Aparecida Gouveia and otherparticipants in a seminar at IPEA, on May 14, 2014. Authors are alsograteful for the statistical assistance of Glaucia Ferreira andLeandro Justino. The remaining errors are solely the responsibilityof the authors.
logical strategies and learning-by-exporting: The case of Brazilian5), http://dx.doi.org/10.1016/j.ibusrev.2015.01.004

Appendix A. Pearson and polychoric correlation matrices for the importance of innovation activities
See Table 1A.
Appendix B. Polychoric correlation matrices, preliminary Eigenvalues of common factor analysis and Scree Plots
See Tables 1B–5B.
See Graphs 1 and 2.
Table 1APearson correlation matrix – Importance of innovation activities.
Importance of innovation
activities (1–4 Scale)
Intramural
R&D (1)
Extramural
R&D (2)
Acquisition of other
external knowledge (3)
Acquisition of machinery
and equipment (4)
Training (5) Market introduction
of innovations (6)
Industrial
Project (7)
Average 1.365 1.111 1.394 3.159 2.885 1.859 2.063
Std. deviation 0.948 0.538 0.954 1.190 1.270 1.225 1.304
N 2411 2411 2411 2411 2411 2411 2411
(1) 1(2) 0.25 1(3) 0.06 0.08 1(4) �0.01 0.02 0.01 1(5) 0.10 0.05 0.11 0.30 1(6) 0.25 0.11 0.12 0.01 0.15 1(7) 0.16 0.09 0.09 0.02 0.14 0.20 1
Source: PINTEC.
Table 1BPolychoric correlation matrix – Importance of sources of information for innovation.
Importance of the
source (1–4 Scale)
Importancia das fontes de informacao
Clients and
customers (1)
Comp-
etitors (2)
Cons-
ultants (3)
Univer-
sities (4)
Training
centres (5)
Testing institu-
tions (6)
Conf-
erences (7)
Trade
fairs (8)
Electronic
information
networks (9)
Average 2.994 2.357 1.779 1.494 1.723 1.767 2.114 2.698 3.094
Std. deviation 1.199 1.209 1.142 0.971 1.106 1.146 1.218 1.234 1.150
N 2411 2411 2411 2411 2411 2411 2411 2411 2411
(1) 1 – – – – – – – –
(2) 0.40 1 – – – – – – –
(3) 0.20 0.26 1 0.26 0.18 0.11 0.03 0.00 �0.02
(4) 0.30 0.29 0.50 1 0.25 0.29 0.15 0.00 0.04
(5) 0.32 0.31 0.46 0.58 1 0.30 0.03 0.06 0.12
(6) 0.33 0.30 0.43 0.59 0.58 1 0.23 �0.12 0.02
(7) 0.25 0.27 0.31 0.47 0.41 0.46 1 0.54 0.07
(8) 0.24 0.25 0.19 0.29 0.30 0.23 0.64 1.00 0.29
(9) 0.28 0.26 0.17 0.28 0.31 0.24 0.39 0.46 1
A priori communalities (SMC) – – 0.31 0.50 0.46 0.47 0.53 0.46 0.25
Kaiser’s Measure of sample adequacy (MSA) – – 0.88 0.85 0.86 0.83 0.77 0.69 0.86
Source: PINTEC.
Table 2APolychoric correlation matrix – importance of innovation activities.a
Importance of innovation
activities (1–4 Scale)
Intramural
R&D (1)
Extramural
R&D (2)
Acquisition of other
external knowledge (3)
Acquisition of machinery
and equipment (4)
Training (5) Market introduction
of innovations (6)
Industrial
Project (7)
Average 1.365 1.111 1.394 3.159 2.885 1.859 2.063
Std. deviation 0.948 0.538 0.954 1.190 1.270 1.225 1.304
N 2411 2411 2411 2411 2411 2411 2411
(1) 1 0.49 �0.08 �0.12 0.12 0.29 0.12
(2) 0.55 1 0.18 0.07 �0.03 0.02 0.08
(3) 0.13 0.23 1 �0.06 0.15 0.13 0.06
(4) �0.04 0.04 0.02 1 0.44 �0.02 �0.02
(5) 0.18 0.14 0.19 0.42 1 0.08 0.11
(6) 0.42 0.28 0.21 0.02 0.19 1 0.16
(7) 0.29 0.25 0.16 0.04 0.20 0.29 1
A priori communalities
(SMC)
0.41 0.34 0.11 0.20 0.26 0.23 0.15
Kaiser’s Measure of sample
adequacy (MSA)
0.62 0.65 0.67 0.46 0.58 0.75 0.82
Source: PINTEC.a In polychoric correlation matrices, partial correlations controlling all other variables are displayed above the main diagonal.
B.C. Araujo, M.S. Salerno / International Business Review xxx (2015) xxx–xxx 11
G Model
IBR-1180; No. of Pages 14
Please cite this article in press as: Araujo, B. C., & Salerno, M. S. Technological strategies and learning-by-exporting: The case of Brazilianmanufacturing firms, 2006–2008. International Business Review (2015), http://dx.doi.org/10.1016/j.ibusrev.2015.01.004

Table 2BTetrachoric correlation matrix – Importance of sources of information abroad.
High or medium importance of
the source located abroad (binary)
Machine and equipment
suppliers (1)
Conferences
(2)
Trade
fairs (3)
Electronic information
networks (4)
Average 0.037 0.019 0.041 0.082
Std. deviation 0.190 0.138 0.198 0.275
N 2411 2411 2411 2411
(1) 1 0.16 0.11 0.13
(2) 0.43 1 0.54 0.35
(3) 0.40 0.73 1 0.22
(4) 0.39 0.64 0.59 1
A priori communalities (SMC) 0.22 0.61 0.56 0.45
Kaiser’s Measure of sample adequacy (MSA) 0.90 0.72 0.75 0.83
Source: PINTEC.
Table 3BPreliminary Eigenvalues of the importance of innovation activities.
Eigenvalue Difference Proportion Cumulative
1 1.59 1.01 0.94 0.94
2 0.59 0.50 0.35 1.29
3 0.09 0.07 0.05 1.34
4 0.02 0.11 0.01 1.35
5 �0.10 0.10 �0.06 1.30
6 �0.20 0.10 �0.12 1.18
7 �0.30 �0.18 1.00
Source: PINTEC.
Preliminary Eigenvalues: total = 1.689.
Average = 0.241.
Table 4BPreliminary Eigenvalues of the importance of sources of information.
Eigenvalue Difference Proportion Cumulative
1 2.86 2.21 0.96 0.96
2 0.64 0.64 0.22 1.17
3 0.00 0.04 0.00 1.17
4 �0.04 0.08 �0.01 1.16
5 �0.12 0.03 �0.04 1.12
6 �0.15 0.06 �0.05 1.07
7 �0.21 �0.07 1.00
Preliminary Eigenvalues: total = 2.980.
Average = 0.426.
Table 5BPreliminary Eigenvalues of the importance of sources of information abroad.
Eigenvalue Difference Proportion Cumulative
1 2.11 2.15 1.15 1.15
2 �0.04 0.05 �0.02 1.13
3 �0.09 0.06 �0.05 1.08
4 �0.15 �0.08 1.00
Source: PINTEC.
Preliminary Eigenvalues: total = 1.826.
Average = 0.457.
B.C. Araujo, M.S. Salerno / International Business Review xxx (2015) xxx–xxx12
G Model
IBR-1180; No. of Pages 14
Please cite this article in press as: Araujo, B. C., & Salerno, M. S. Technological strategies and learning-by-exporting: The case of Brazilianmanufacturing firms, 2006–2008. International Business Review (2015), http://dx.doi.org/10.1016/j.ibusrev.2015.01.004

-0.50
0.00
0.50
1.00
1.50
2.00
1 2 3 4 5 6 7
Graph 1. Scree plot of preliminary Eigenvalues of factors – innovation activities.
Source: PINTEC.
-0.50
0.00
0.50
1.00
1.50
2.00
2.50
3.00
3.50
1 2 3 4 5 6 7
Graph 2. Scree plot of preliminary Eigenvalues of factors – sources of information for innovation.
Source: PINTEC.
B.C. Araujo, M.S. Salerno / International Business Review xxx (2015) xxx–xxx 13
G Model
IBR-1180; No. of Pages 14
References
Abadie, A. (2005). Semiparametric difference-in-differences estimators. Review ofEconomic Studies, 72, 1–19.
Araujo, B. C. (2006). Analise Empırica dos Efeitos ex-post das Exportacoes sobre aProdutividade, o Emprego e a Renda das Empresas Brasileiras. In J. De Negri et al.(Eds.), Tecnologia, Exportacao e Emprego (pp. 51–68). Brasılia: IPEA.
Araujo, B. C., Cavalcante, L. R., & Alves, P. (2009). Variaveis proxy para os gastosempresariais em inovacao com base no pessoal ocupado tecnico-cientıfico dis-ponıvel na Relacao Anual de Informacoes Sociais (RAIS). Radar: tecnologia, producaoe comercio exterior, Ipea, 5, 16–21.
Aw, B. Y., & Hwang, A. R. (1995). Productivity and the export market: A firm-levelanalysis. Journal of Development Economics, 47, 313–332.
Aw, B. Y., Roberts, M. J., & Xu, D. Y. (2008). R&D investments, exporting, and theevolution of firm productivity. American Economic Review, 98, 451–456.
Bernard, A. B., & Jensen, B. (1999). Exceptional exporter performance: Cause, effect orboth? Journal of International Economics, 47, 1–25.
Bernard, A., & Wagner, J. (1998). Export entry and exit by German firms, NBER Workingpaper 6.538, Cambridge, MA.
Blalock, G., & Gertler, P. J. (2004). Learning from exporting revisited in a less developedcountry. Journal of Development Economics, 75, 397–416.
Clerides, S., Lauch, S., & Tybout, J. R. (1998). Is learning by exporting important? Micro-dynamic evidence from Colombia, Mexico and Morocco. The Quarterly Journal ofEconomics, 113(3), 903–947.
Crespi, G., Criscuolo, C., & Haskel, J. (2008). Productivity, exporting and the learning byexporting hypothesis: Direct evidence from UK firms. Canadian Journal of Econom-ics, 41(2), 619–638.
Delgado, M., Farinas, J., & Ruano, S. (2002). Firm productivity and export markets: Anon-parametric approach. Journal of International Economics, 57, 397–422.
Please cite this article in press as: Araujo, B. C., & Salerno, M. S. Technomanufacturing firms, 2006–2008. International Business Review (201
Garcıa, F., Avella, L., & Fernandes, F. (2012). Learning from exporting: The moderatingeffect of technological capabilities. International Business Review, 21, 1099–1111.http://dx.doi.org/10.1016/j.ibusrev.2011.12.001
Greenaway, D., & Kneller, R. (2007). Firm heterogeneity, exporting and foreign directinvestment. The Economic Journal, 117, F134–F161. http://dx.doi.org/10.1111/j.1468-0297.2007.02018.x
Hair, J. F., Black, W., Babin, B., Anderson, R. E., & Tatham, R. L. (2005). Multivariate dataanalysis (6th ed.). Upper Saddle River, NJ: Prentice Hall.
Hirano, K., & Imbens, G. (2001). Estimation of causal effects using propensity scoreweighting: An application to data on right heart catheterization. Health Services &Outcomes Research Methodology, 2, 259–278.
Holgado-Tello, F., Chacon-Moscoso, S., Barbero-Garcıa, I., & Vila-Abad, E. (2010).Polychoric versus Pearson correlations in exploratory and confirmatory factoranalysis of ordinal variables. Quality and Quantity, 44(1), 153–166.
Isgut, A. E. (2001). What is different about exporters? Evidence from Colombianmanufacturing. Journal of Development Studies, 37(5), 53–73.
Joreskog, K. G., & Moustaki, I. (2001). Factor analysis of ordinal variables: A comparisonof three approaches. Multivariate Behavioral Research, 36, 347–387.
Kogut, B., & Chang, S. J. (1991). Technological capabilities and Japanese foreign directinvestment in the United States. The Review of Economics and Statistics, 73(3), 401–413.
Levinsohn, J., & Petrin, A. (2003). Estimating production functions using inputs tocontrol for unobservables. Review of Economic Studies, 70(2), 317–341.
Lopez, R. A. (2005). Trade and growth: Reconciling the macroeconomic and microeco-nomic evidence. Journal of Economic Surveys, 19(4), 623–648.
Love, J. H., & Ganotakis, P. (2013). Learning by exporting: Lessons from high-technologySMEs. International Business Review, 22, 1–17.
Organization for Economic Cooperation and Development (OECD) (2005). Oslo manual:Guidelines for collecting and interpreting innovation data (3rd ed.). Paris: OECD.
logical strategies and learning-by-exporting: The case of Brazilian5), http://dx.doi.org/10.1016/j.ibusrev.2015.01.004

B.C. Araujo, M.S. Salerno / International Business Review xxx (2015) xxx–xxx14
G Model
IBR-1180; No. of Pages 14
Salomon, R., & Shaver, J. M. (2005). Learning by exporting: New insights from examin-ing firm innovation. Journal of Economics and Management Strategy, 14(2), 431–460.
Shan, W., & Song, J. (1997). Foreign direct investment and the sourcing of technologicaladvantage: Evidence from the biotechnology industry. Journal of InternationalBusiness Studies, 28, 267–284.
Tybout, J. R. (2003). Plant- and firm-level evidence on ‘‘new’’ trade theories. In K. Choi &J. Harrigan (Eds.), Handbook of international trade (pp. 1243–1278). Oxford: BasilBlackwell.
UNCTAD (2013). World investment report 2013: Global value chains: Investment and tradefor development. Geneva: UNCTAD. Available at: http://vi.unctad.org/digital-library/?task=dl_doc&doc_name=873-world-invest
Please cite this article in press as: Araujo, B. C., & Salerno, M. S. Technomanufacturing firms, 2006–2008. International Business Review (201
Van Biesebroeck, J. (2005). Exporting raises productivity in sub-Saharan Africanmanufacturing firms. Journal of International Economics, 67, 373–391.
Velicer, W. F., & Jackson, D. N. (1990). Component analysis versus common factor-analysis– some further observations. Multivariate Behavioral Research, 25(1), 97–114.
Wagner, J. (2007). Exports and productivity: A survey of the evidence from firm-leveldata. The World Economy, 30(1), 60–82.
Wooldridge, J. M. (2002). Econometric analysis of cross section and panel data. Cam-bridge, MA: MIT Press.
World Bank (1993). The East Asian miracle. New York: Oxford University Press.Wortzel, L. H., & Wortzel, H. V. (1981). Export marketing strategies for NIC and LDC-
based firms. Columbia Journal of World Business, 16(1), 51–60.
logical strategies and learning-by-exporting: The case of Brazilian5), http://dx.doi.org/10.1016/j.ibusrev.2015.01.004


