Embed Size (px)
Citation preview
01-02 July 2013
Acoustic emissions
Prof. Giovanni Ferrara [email protected]
1S&I acoustic emissions – Prof. G. Ferrara
S&I acoustic emissions – Prof. G. Ferrara
• Noise radiated by ICE is mainly due to:– Combustion noise
• Sharp pressure increase in the cylinder: the impact on the piston spread through the engine structure which vibrates and produces noise
– Mechanical noise• Main engine kinematic couplings produce shocks of mechanical nature (piston
oscillation, valve-seat Shock, gears motion, etc.)– Gasdynamic noise
• Cyclic process of suction and discharge of the fluid This process yields to pressure oscillations along suction and exhaust systems. The oscillations at the open ends radiate sound
Introduction
Fundamentals of acoustics• Noise
– Body vibrations (acoustic source) which spread through the elasticsurrounding means
– Propagation of waves (at the speed of sound of the means)
• Different sound waves– Plane waves: waves in which any acoustic variable at a given time is a
constant on any plane perpendicular to the direction of propagation(vibrating diaphragm). Such waves can propagate in a duct when thewavelength λ is much larger than the diameter of the duct D
– Spherical waves: a sphere that expands and contracts harmonically withspherical symmetry. Such a wave propagates at exhaust open end.
3S&I acoustic emissions – Prof. G. Ferrara
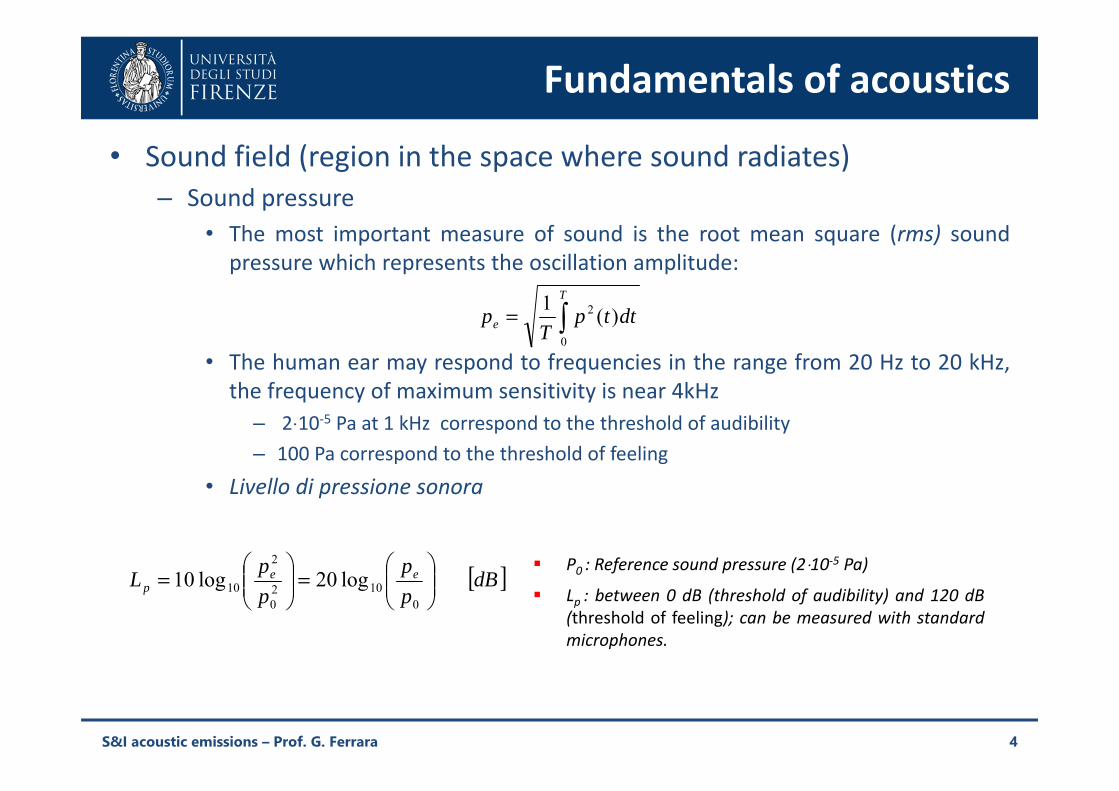
Fundamentals of acoustics• Sound field (region in the space where sound radiates)
– Sound pressure• The most important measure of sound is the root mean square (rms) sound
pressure which represents the oscillation amplitude:
• The human ear may respond to frequencies in the range from 20 Hz to 20 kHz,the frequency of maximum sensitivity is near 4kHz
– 2⋅10-5 Pa at 1 kHz correspond to the threshold of audibility– 100 Pa correspond to the threshold of feeling
• Livello di pressione sonora
4
=T
e dttpT
p0
2 )(1
[ ]dBpp
ppL ee
p
=
=
0102
0
2
10 log20log10 P0 : Reference sound pressure (2⋅10-5 Pa)
Lp : between 0 dB (threshold of audibility) and 120 dB(threshold of feeling); can be measured with standardmicrophones.
S&I acoustic emissions – Prof. G. Ferrara
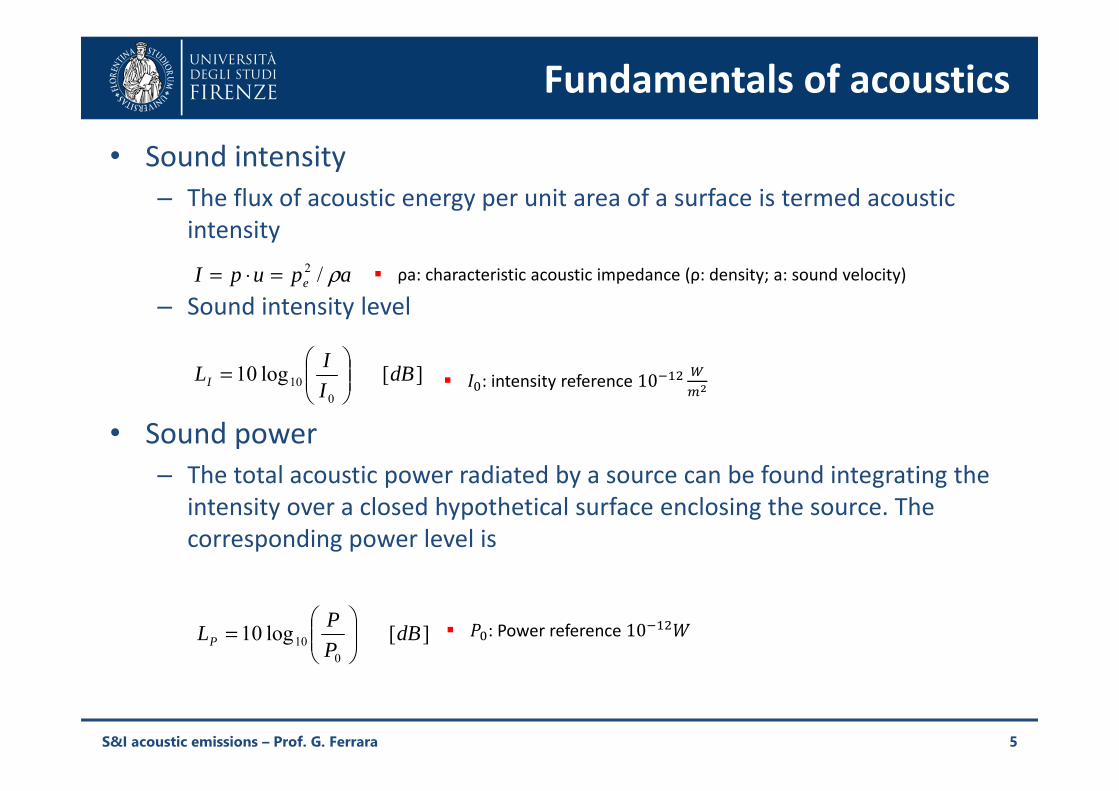
Fundamentals of acoustics• Sound intensity
– The flux of acoustic energy per unit area of a surface is termed acoustic intensity
– Sound intensity level
• Sound power– The total acoustic power radiated by a source can be found integrating the
intensity over a closed hypothetical surface enclosing the source. The corresponding power level is
5
apupI e ρ/2=⋅= ρa: characteristic acoustic impedance (ρ: density; a: sound velocity)
][log100
10 dBIILI
= : intensity reference 10
][log100
10 dBPPLP
= : Power reference 10
S&I acoustic emissions – Prof. G. Ferrara
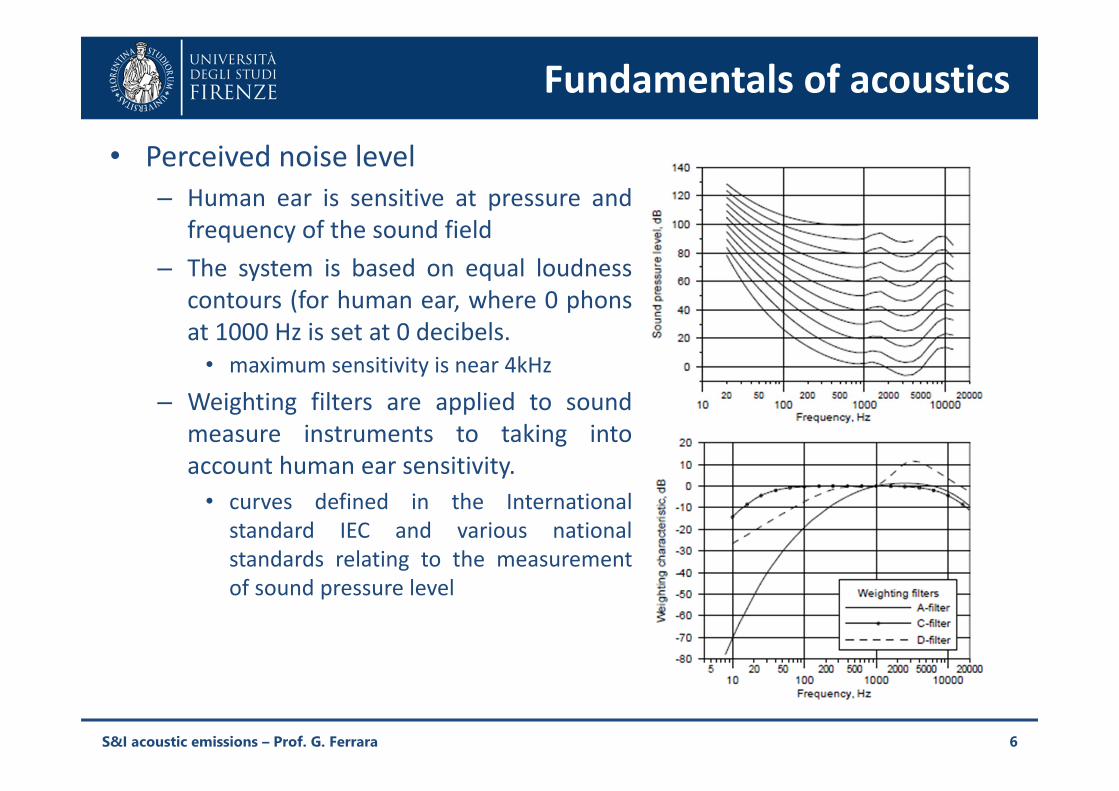
Fundamentals of acoustics• Perceived noise level
– Human ear is sensitive at pressure andfrequency of the sound field
– The system is based on equal loudnesscontours (for human ear, where 0 phonsat 1000 Hz is set at 0 decibels.
• maximum sensitivity is near 4kHz– Weighting filters are applied to sound
measure instruments to taking intoaccount human ear sensitivity.
• curves defined in the Internationalstandard IEC and various nationalstandards relating to the measurementof sound pressure level
6S&I acoustic emissions – Prof. G. Ferrara
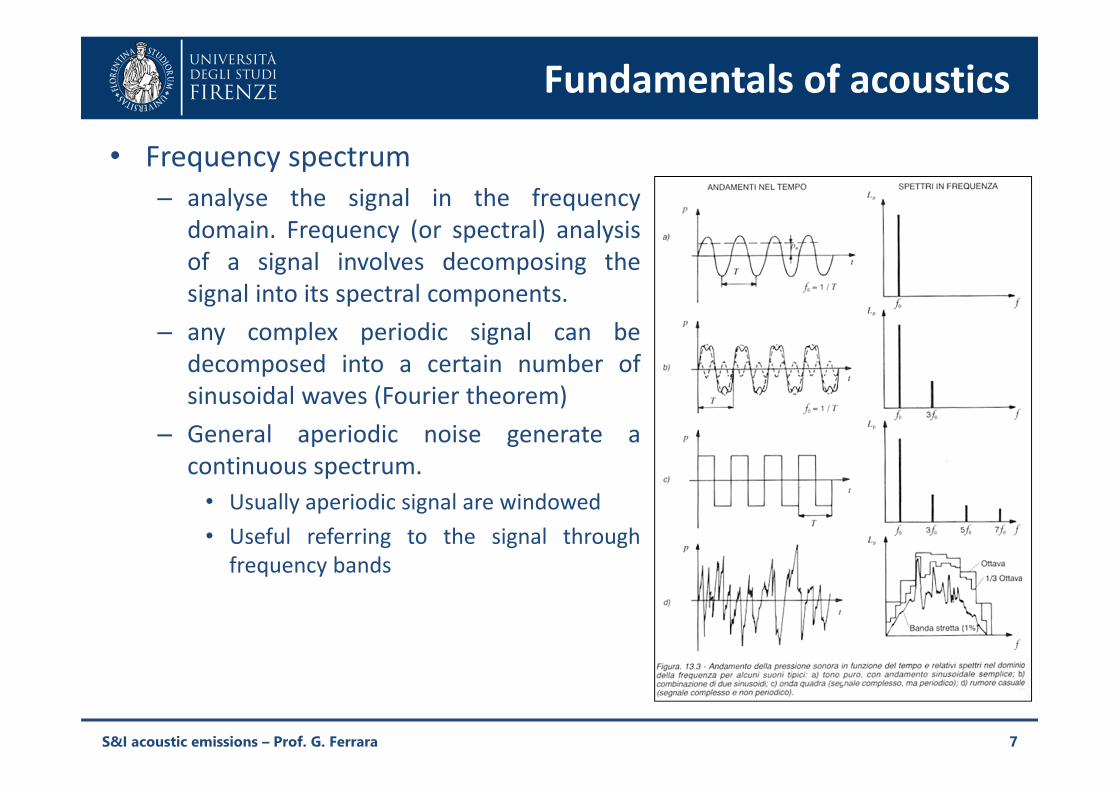
Fundamentals of acoustics• Frequency spectrum
– analyse the signal in the frequencydomain. Frequency (or spectral) analysisof a signal involves decomposing thesignal into its spectral components.
– any complex periodic signal can bedecomposed into a certain number ofsinusoidal waves (Fourier theorem)
– General aperiodic noise generate acontinuous spectrum.
• Usually aperiodic signal are windowed• Useful referring to the signal through
frequency bands
7S&I acoustic emissions – Prof. G. Ferrara
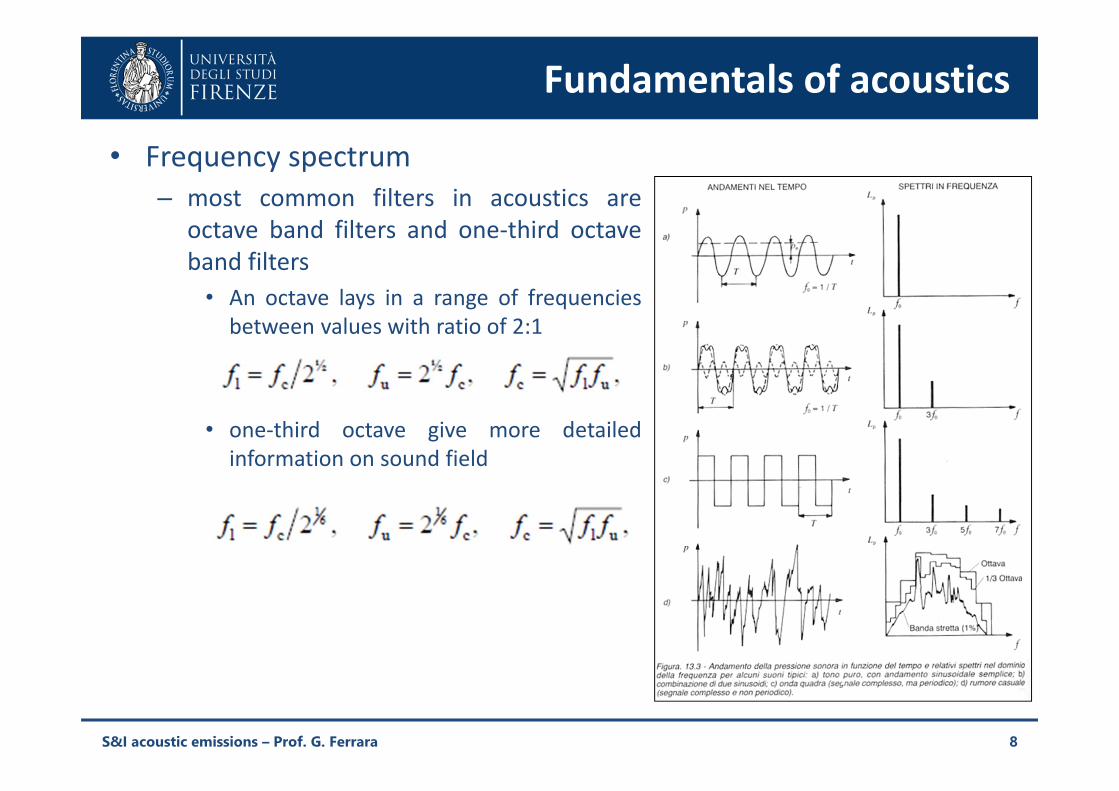
Fundamentals of acoustics• Frequency spectrum
– most common filters in acoustics areoctave band filters and one-third octaveband filters
• An octave lays in a range of frequenciesbetween values with ratio of 2:1
• one-third octave give more detailedinformation on sound field
8S&I acoustic emissions – Prof. G. Ferrara
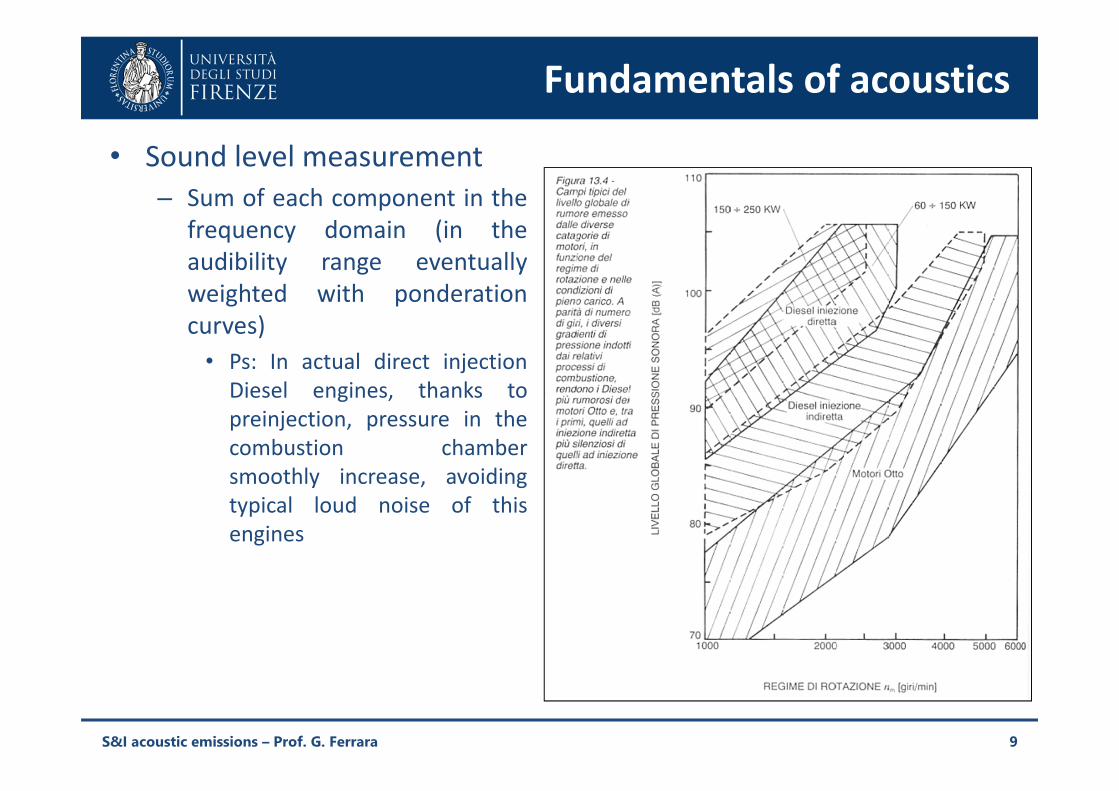
Fundamentals of acoustics• Sound level measurement
– Sum of each component in thefrequency domain (in theaudibility range eventuallyweighted with ponderationcurves)
• Ps: In actual direct injectionDiesel engines, thanks topreinjection, pressure in thecombustion chambersmoothly increase, avoidingtypical loud noise of thisengines
9S&I acoustic emissions – Prof. G. Ferrara
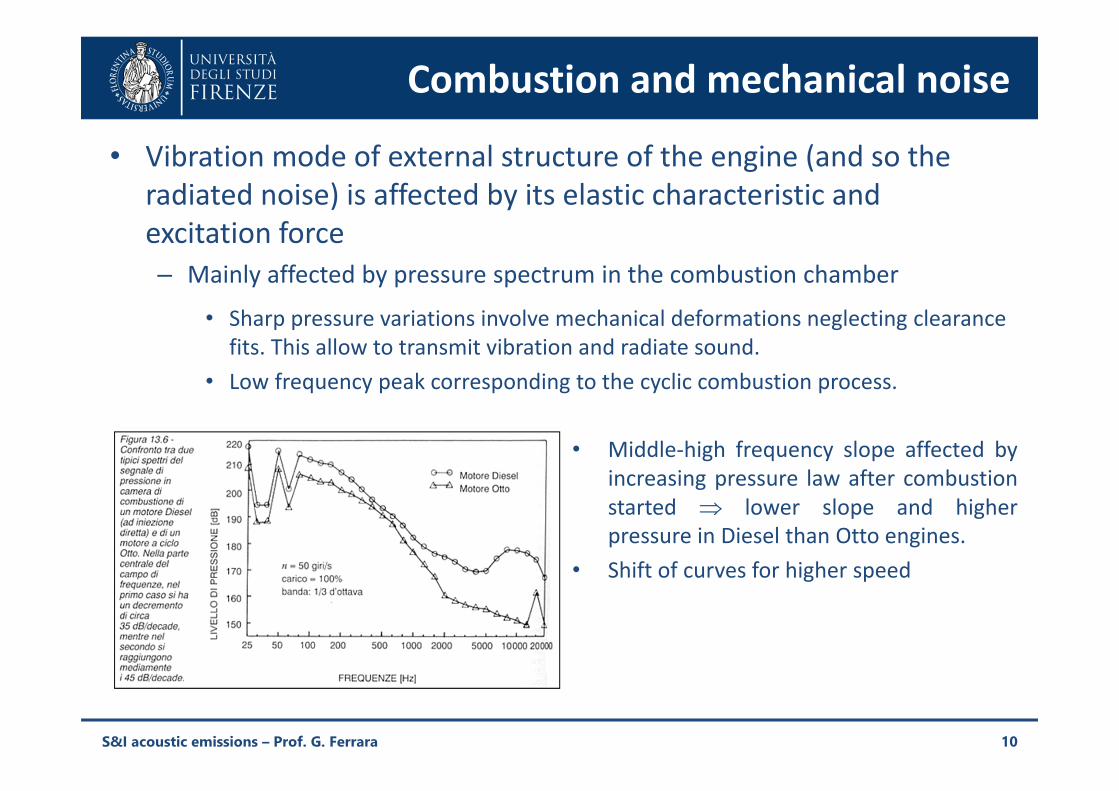
Combustion and mechanical noise• Vibration mode of external structure of the engine (and so the
radiated noise) is affected by its elastic characteristic and excitation force– Mainly affected by pressure spectrum in the combustion chamber
• Sharp pressure variations involve mechanical deformations neglecting clearance fits. This allow to transmit vibration and radiate sound.
• Low frequency peak corresponding to the cyclic combustion process.
10
• Middle-high frequency slope affected byincreasing pressure law after combustionstarted lower slope and higherpressure in Diesel than Otto engines.
• Shift of curves for higher speed
S&I acoustic emissions – Prof. G. Ferrara
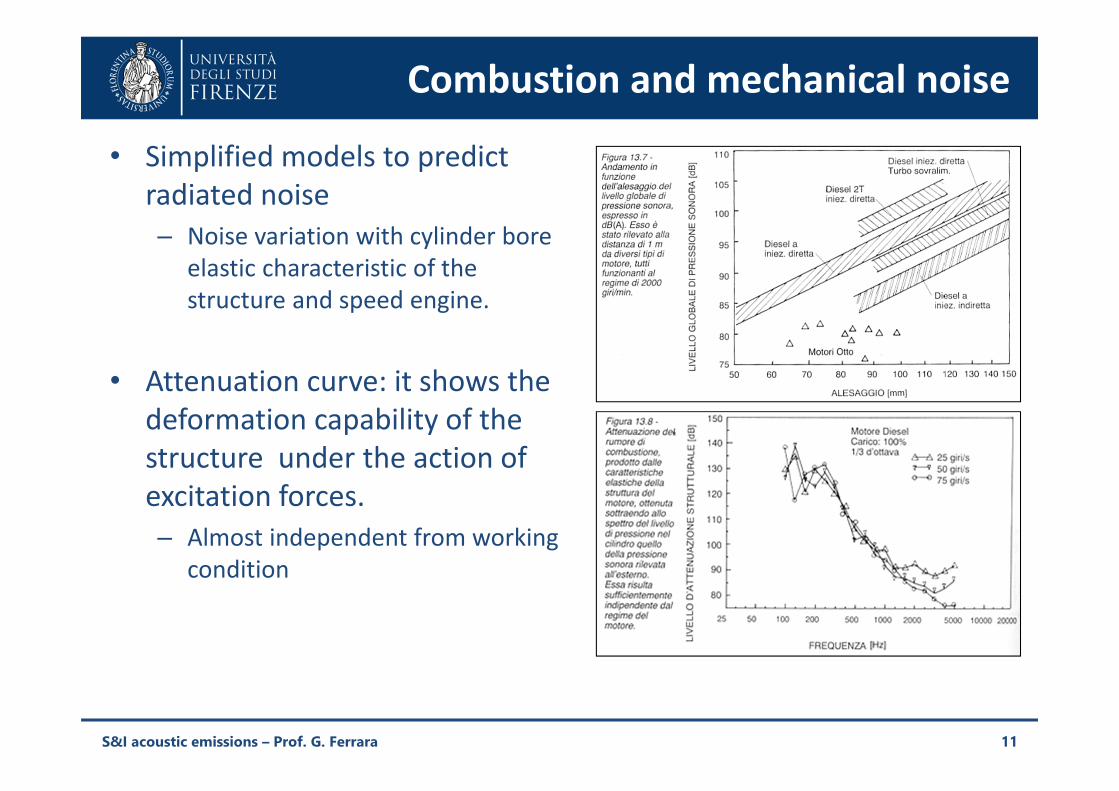
Combustion and mechanical noise• Simplified models to predict
radiated noise– Noise variation with cylinder bore
elastic characteristic of the structure and speed engine.
• Attenuation curve: it shows the deformation capability of the structure under the action of excitation forces.– Almost independent from working
condition
11S&I acoustic emissions – Prof. G. Ferrara
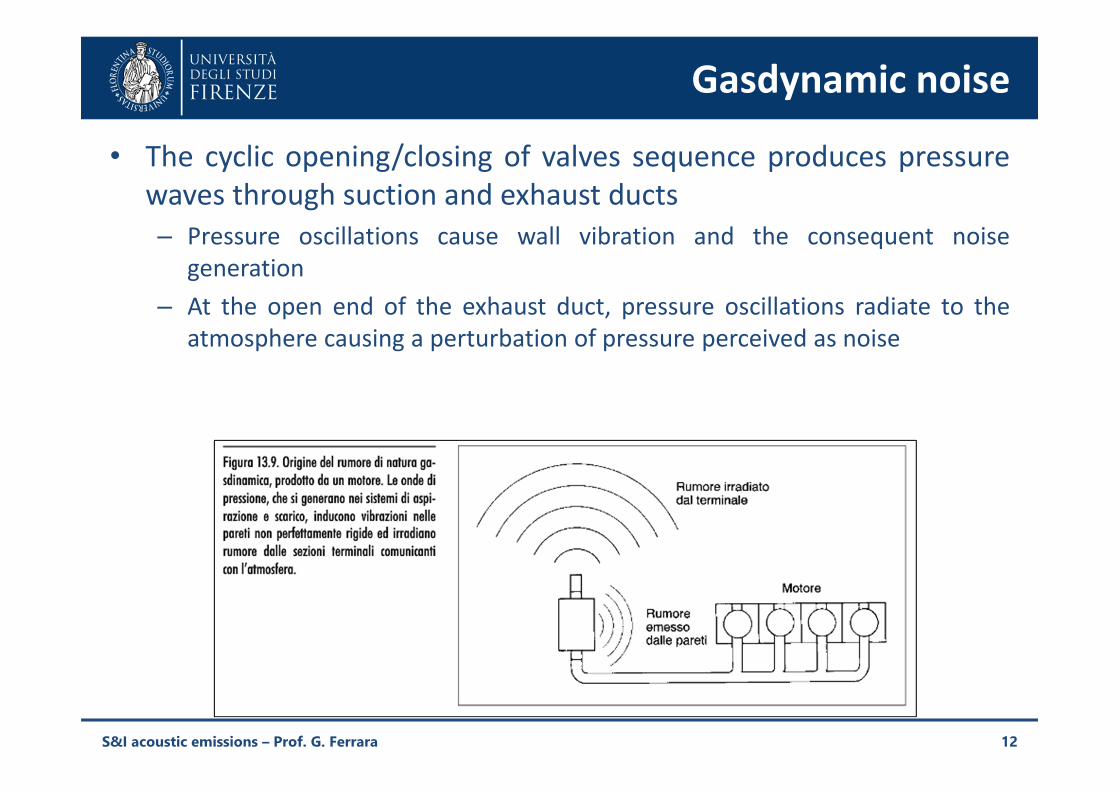
Gasdynamic noise• The cyclic opening/closing of valves sequence produces pressure
waves through suction and exhaust ducts– Pressure oscillations cause wall vibration and the consequent noise
generation– At the open end of the exhaust duct, pressure oscillations radiate to the
atmosphere causing a perturbation of pressure perceived as noise
12S&I acoustic emissions – Prof. G. Ferrara
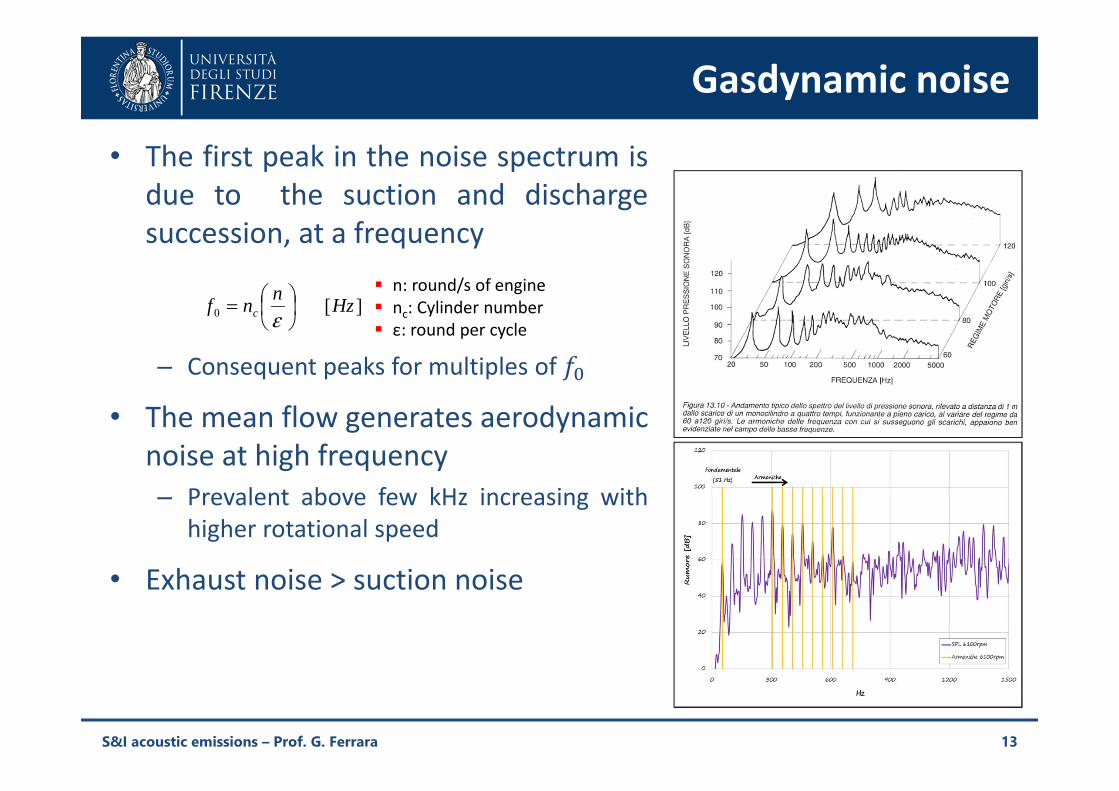
Gasdynamic noise• The first peak in the noise spectrum is
due to the suction and dischargesuccession, at a frequency
– Consequent peaks for multiples of
• The mean flow generates aerodynamicnoise at high frequency– Prevalent above few kHz increasing with
higher rotational speed
• Exhaust noise > suction noise
13
][0 Hznnf c
=
ε
n: round/s of engine nc: Cylinder number ε: round per cycle
S&I acoustic emissions – Prof. G. Ferrara
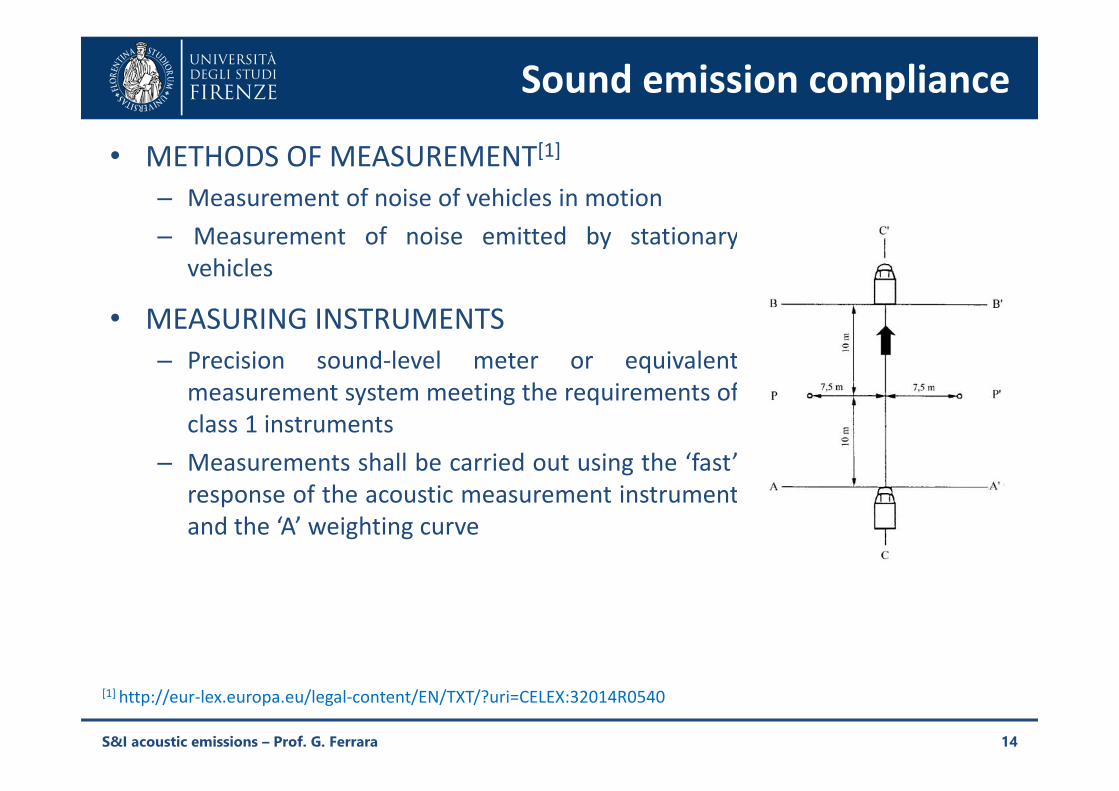
Sound emission compliance• METHODS OF MEASUREMENT[1]
– Measurement of noise of vehicles in motion– Measurement of noise emitted by stationary
vehicles
• MEASURING INSTRUMENTS– Precision sound-level meter or equivalent
measurement system meeting the requirements ofclass 1 instruments
– Measurements shall be carried out using the ‘fast’response of the acoustic measurement instrumentand the ‘A’ weighting curve
14S&I acoustic emissions – Prof. G. Ferrara
[1] http://eur-lex.europa.eu/legal-content/EN/TXT/?uri=CELEX:32014R0540
Sound emission compliance
15S&I acoustic emissions – Prof. G. Ferrara
[1] http://eur-lex.europa.eu/legal-content/EN/TXT/?uri=CELEX:32014R0540
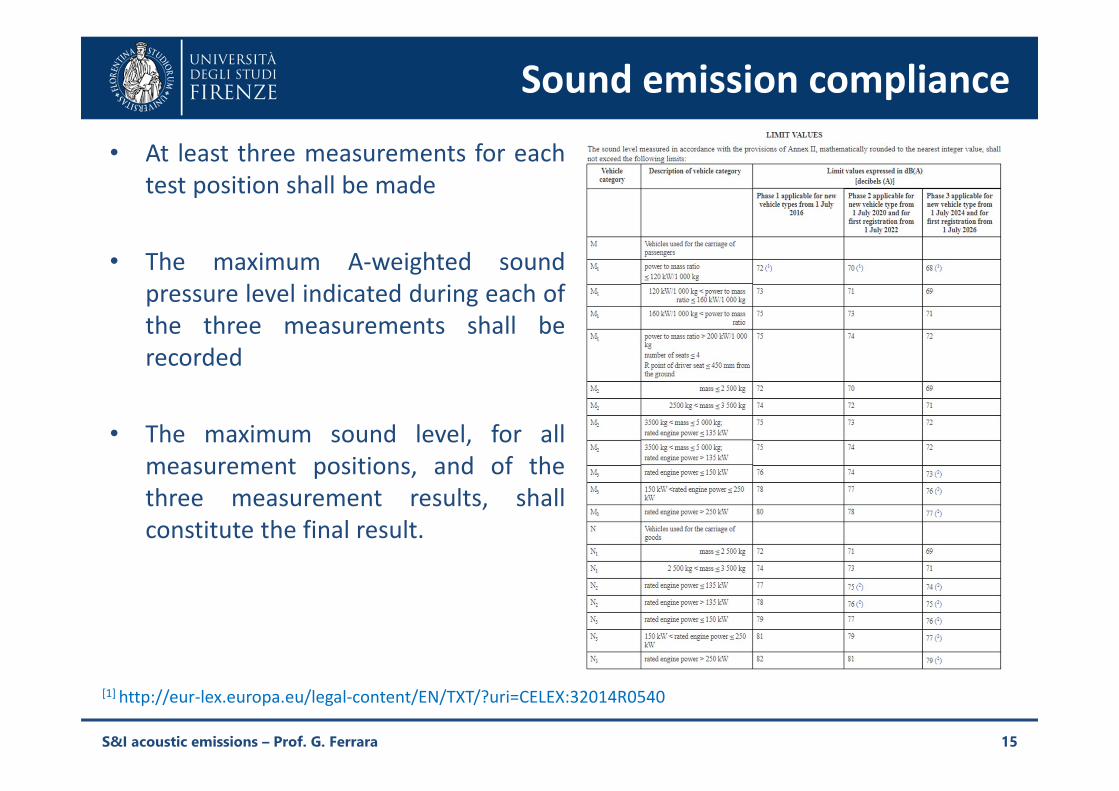
• At least three measurements for eachtest position shall be made
• The maximum A-weighted soundpressure level indicated during each ofthe three measurements shall berecorded
• The maximum sound level, for allmeasurement positions, and of thethree measurement results, shallconstitute the final result.
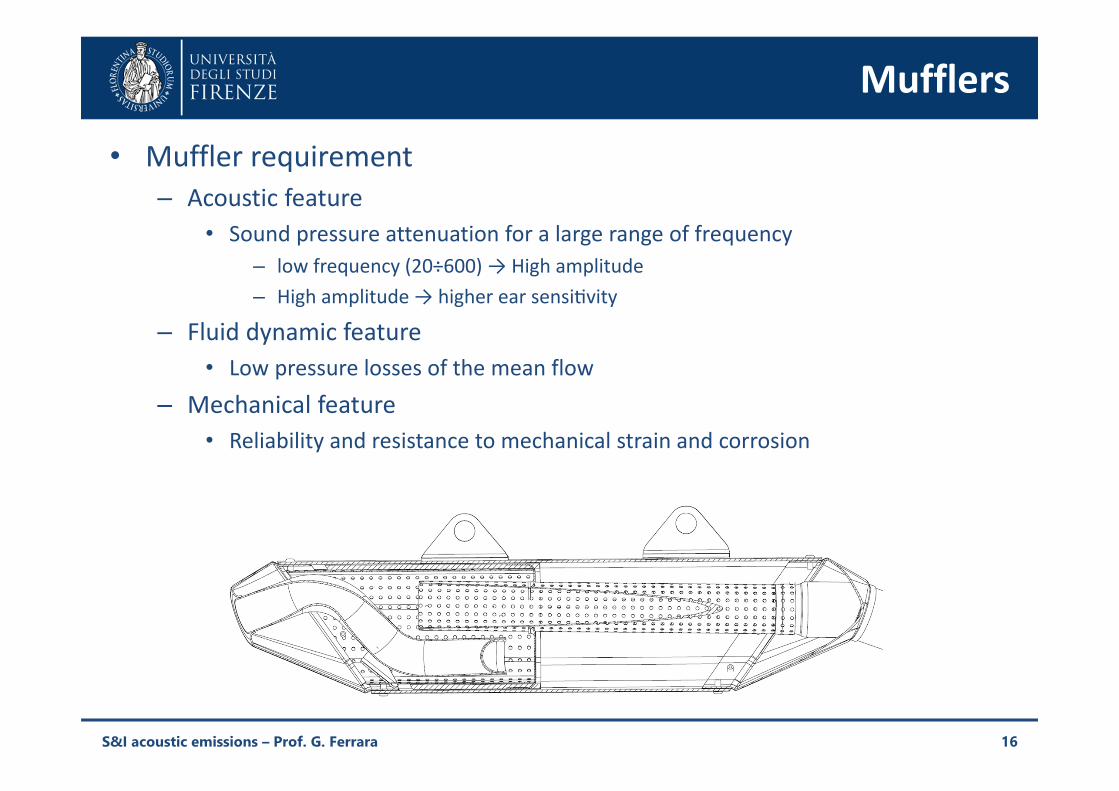
Mufflers• Muffler requirement
– Acoustic feature• Sound pressure attenuation for a large range of frequency
– low frequency (20÷600) → High amplitude– High amplitude → higher ear sensi vity
– Fluid dynamic feature• Low pressure losses of the mean flow
– Mechanical feature• Reliability and resistance to mechanical strain and corrosion
16S&I acoustic emissions – Prof. G. Ferrara
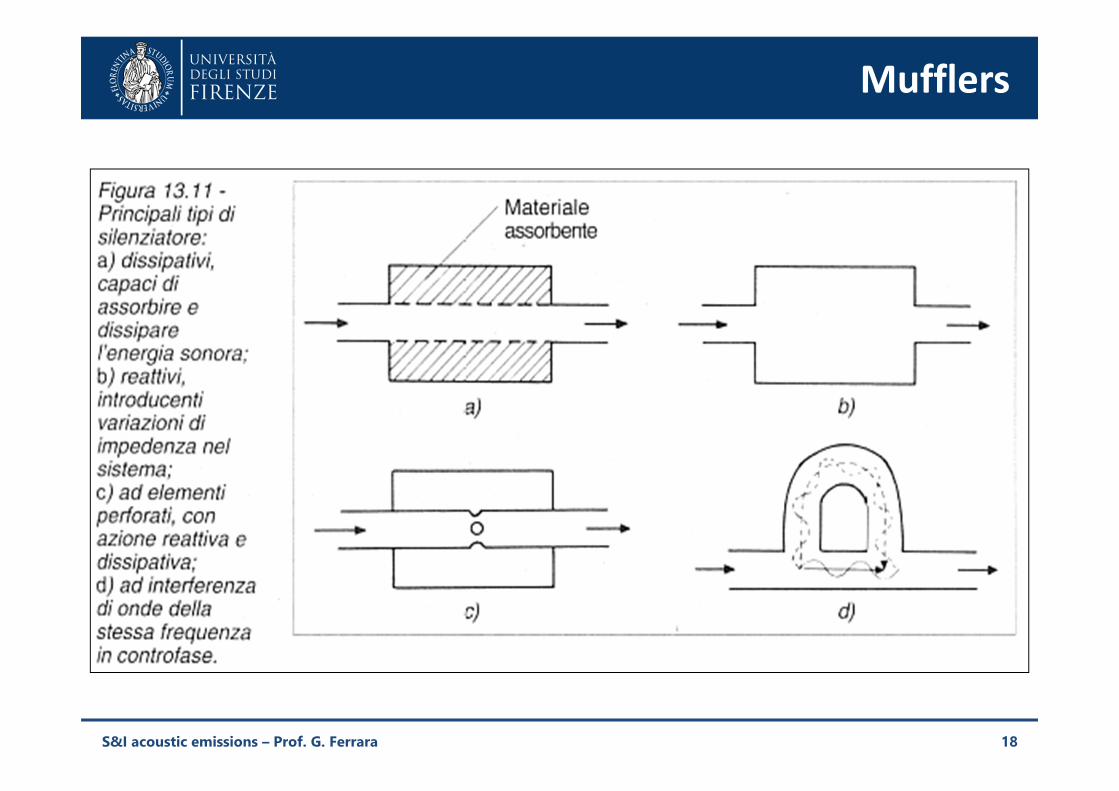
Mufflers• Absorptive muffler
– Sound waves are reduced as their energy is converted in the heat in theabsorptive material
• straight, circular and perforated pipe that is encased in a larger steel housingfilled with sound absorptive material
• Less back pressure than reactive mufflers• reduces noise considerably over the entire spectrum and more so at higher
frequencies
• Reactive muffler– Elements react to the wave absorbing energy and delivering it with another
phase. If the phase is favourable oscillation is reduced. The behaviour depends on the impedance element (function of geometry)
• Suitable for low frequencies• Generally higher volumes work better on lower frequency.• Properly work on certain range of frequency
17S&I acoustic emissions – Prof. G. Ferrara
Mufflers
18S&I acoustic emissions – Prof. G. Ferrara
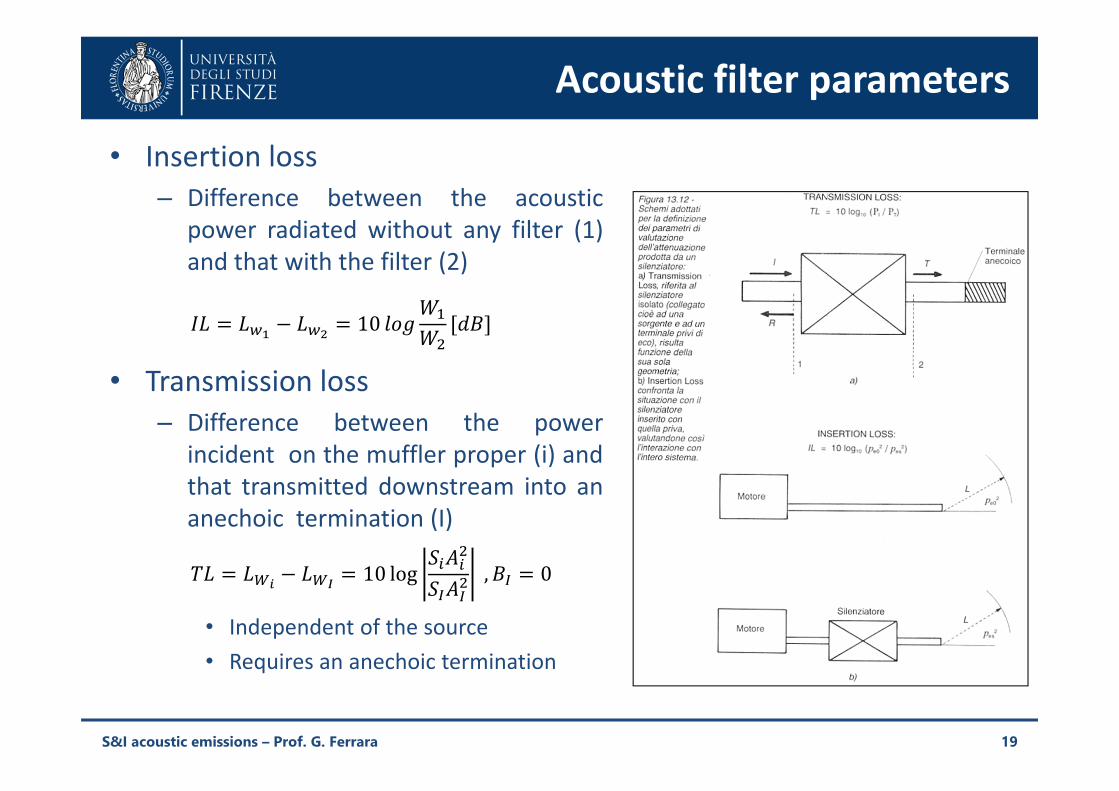
Acoustic filter parameters• Insertion loss
– Difference between the acousticpower radiated without any filter (1)and that with the filter (2)
• Transmission loss– Difference between the power
incident on the muffler proper (i) andthat transmitted downstream into ananechoic termination (I)
• Independent of the source• Requires an anechoic termination
19
10
10 log , 0
S&I acoustic emissions – Prof. G. Ferrara
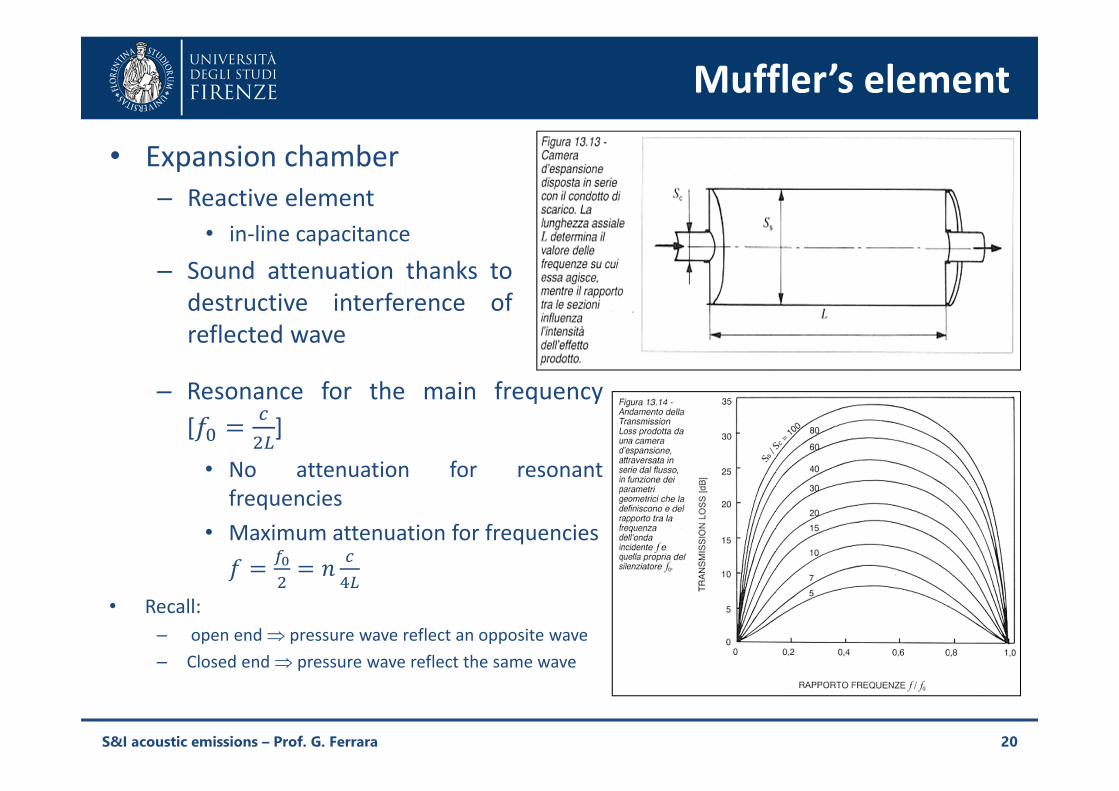
Muffler’s element• Expansion chamber
– Reactive element• in-line capacitance
– Sound attenuation thanks todestructive interference ofreflected wave
20
– Resonance for the main frequency[ ]
• No attenuation for resonantfrequencies
• Maximum attenuation for frequencies
• Recall:– open end pressure wave reflect an opposite wave– Closed end pressure wave reflect the same wave
S&I acoustic emissions – Prof. G. Ferrara
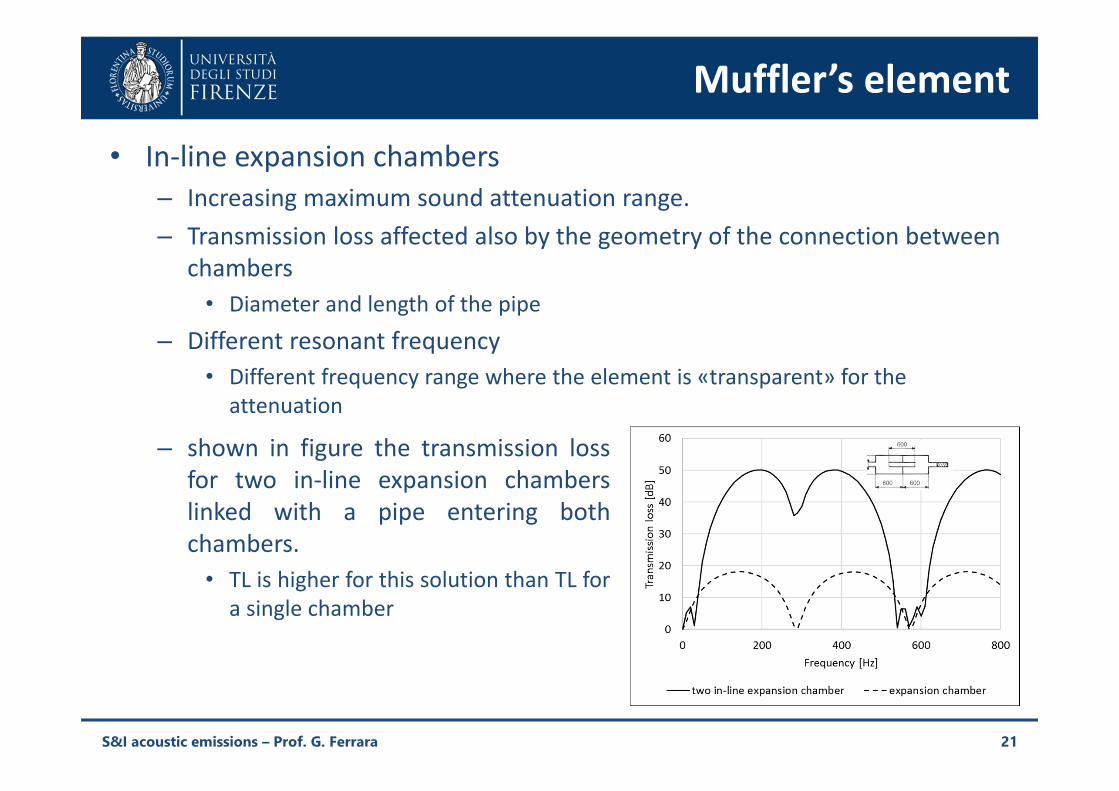
Muffler’s element• In-line expansion chambers
– Increasing maximum sound attenuation range.– Transmission loss affected also by the geometry of the connection between
chambers• Diameter and length of the pipe
– Different resonant frequency• Different frequency range where the element is «transparent» for the
attenuation
21
– shown in figure the transmission lossfor two in-line expansion chamberslinked with a pipe entering bothchambers.
• TL is higher for this solution than TL fora single chamber
S&I acoustic emissions – Prof. G. Ferrara
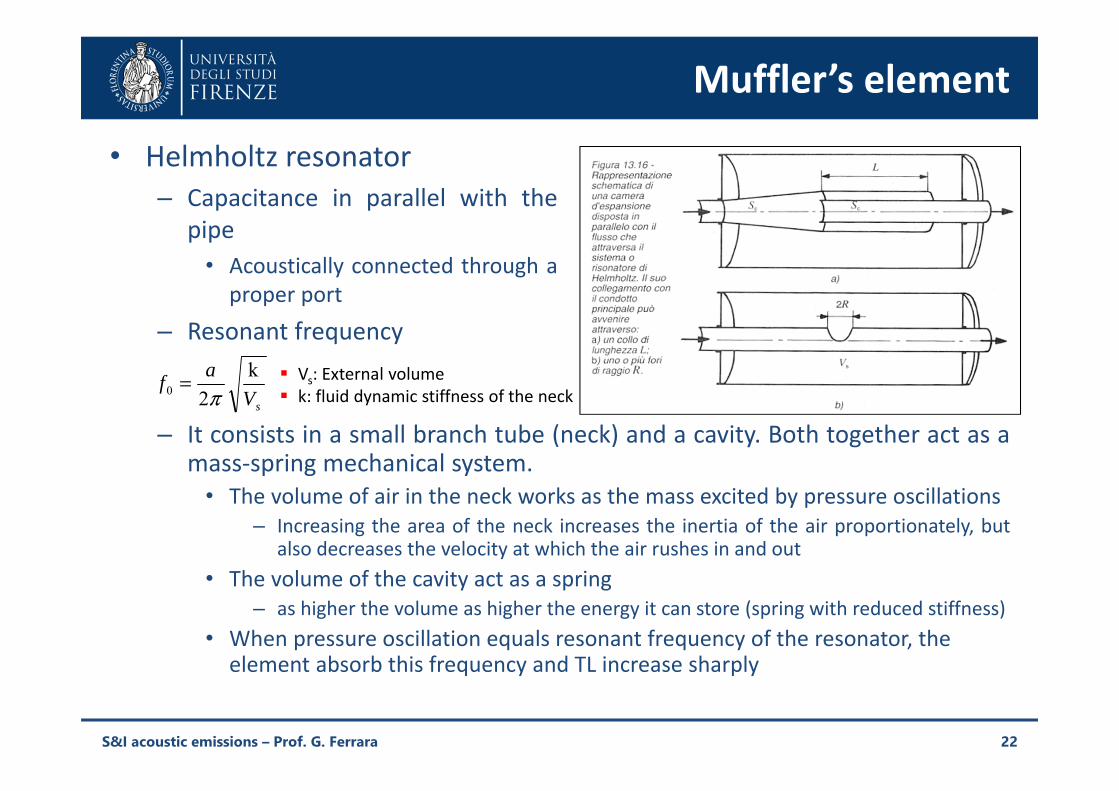
Muffler’s element• Helmholtz resonator
– Capacitance in parallel with thepipe
• Acoustically connected through aproper port
– Resonant frequency
22
sVaf k20 π
= Vs: External volume k: fluid dynamic stiffness of the neck
– It consists in a small branch tube (neck) and a cavity. Both together act as amass-spring mechanical system.
• The volume of air in the neck works as the mass excited by pressure oscillations– Increasing the area of the neck increases the inertia of the air proportionately, but
also decreases the velocity at which the air rushes in and out• The volume of the cavity act as a spring
– as higher the volume as higher the energy it can store (spring with reduced stiffness)• When pressure oscillation equals resonant frequency of the resonator, the
element absorb this frequency and TL increase sharply
S&I acoustic emissions – Prof. G. Ferrara
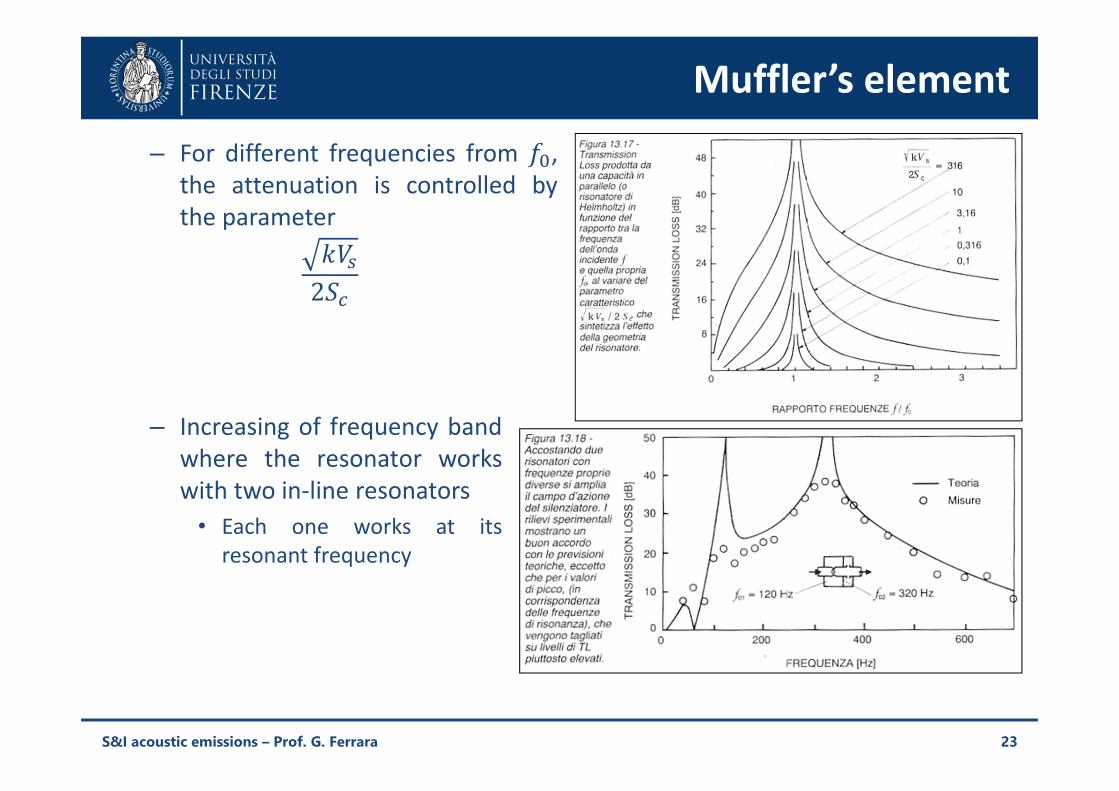
Muffler’s element– For different frequencies from ,
the attenuation is controlled bythe parameter
2
23
– Increasing of frequency bandwhere the resonator workswith two in-line resonators
• Each one works at itsresonant frequency
S&I acoustic emissions – Prof. G. Ferrara
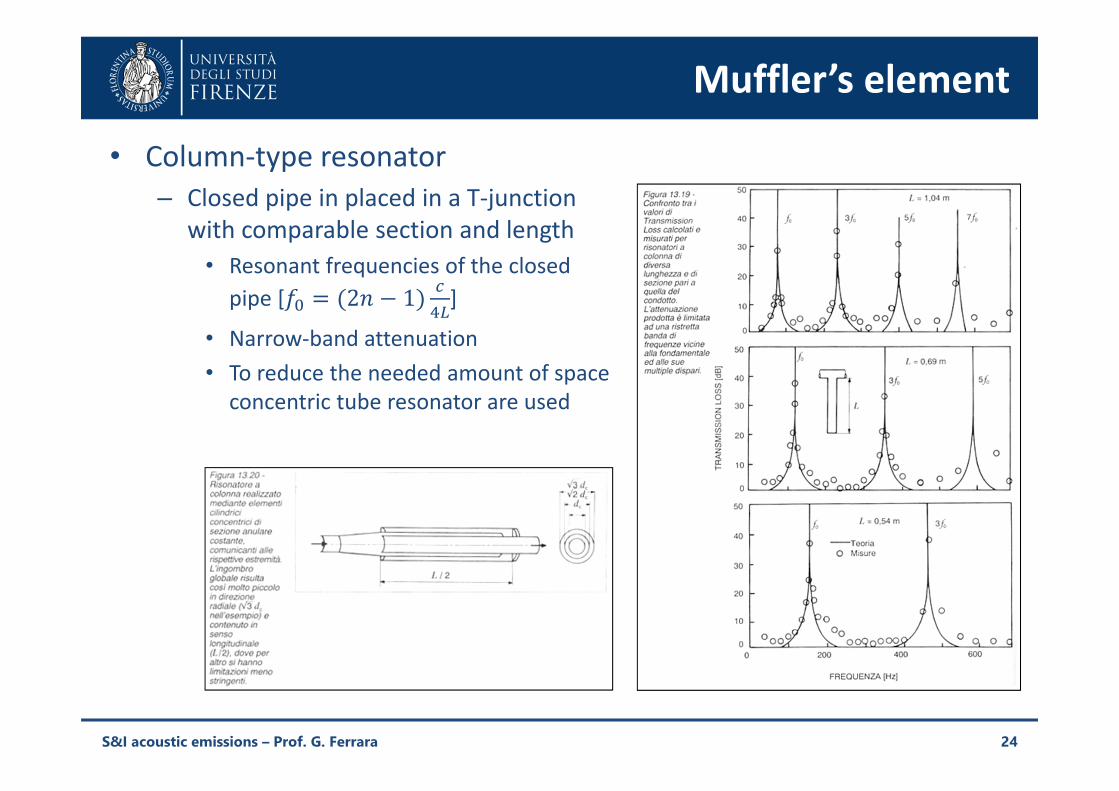
Muffler’s element• Column-type resonator
– Closed pipe in placed in a T-junction with comparable section and length
• Resonant frequencies of the closed pipe [ 2 1 ]
• Narrow-band attenuation• To reduce the needed amount of space
concentric tube resonator are used
24S&I acoustic emissions – Prof. G. Ferrara
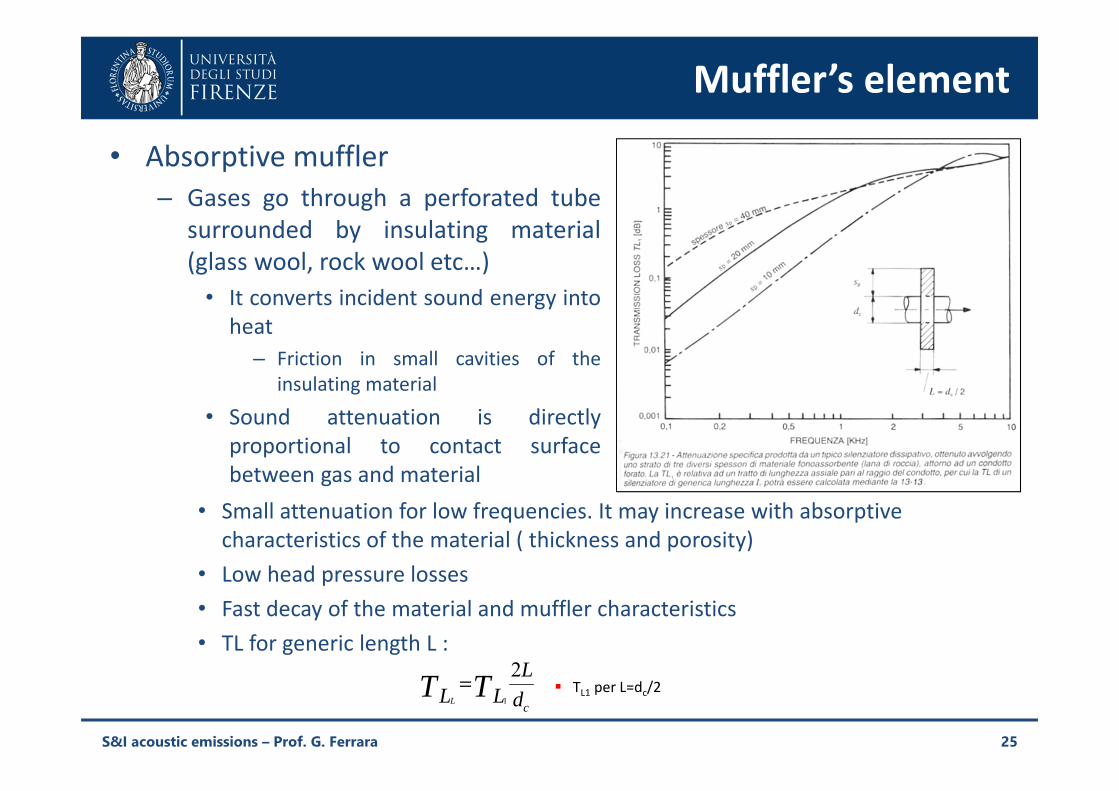
Muffler’s element• Absorptive muffler
– Gases go through a perforated tubesurrounded by insulating material(glass wool, rock wool etc…)
• It converts incident sound energy intoheat
– Friction in small cavities of theinsulating material
• Sound attenuation is directlyproportional to contact surfacebetween gas and material
25
• Small attenuation for low frequencies. It may increase with absorptive characteristics of the material ( thickness and porosity)
• Low head pressure losses• Fast decay of the material and muffler characteristics• TL for generic length L :
cdL
LL TTL
21
= TL1 per L=dc/2
S&I acoustic emissions – Prof. G. Ferrara
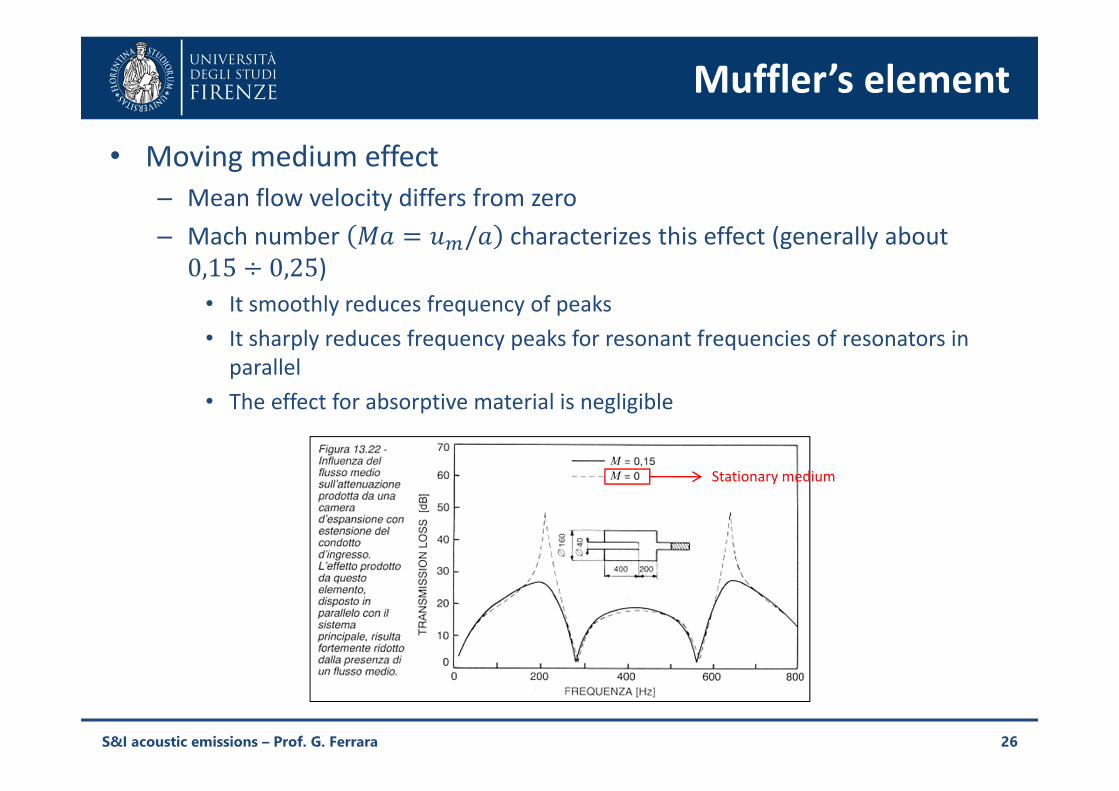
Muffler’s element• Moving medium effect
– Mean flow velocity differs from zero– Mach number / characterizes this effect (generally about 0,15 0,25)
• It smoothly reduces frequency of peaks• It sharply reduces frequency peaks for resonant frequencies of resonators in
parallel• The effect for absorptive material is negligible
26
Stationary medium
S&I acoustic emissions – Prof. G. Ferrara
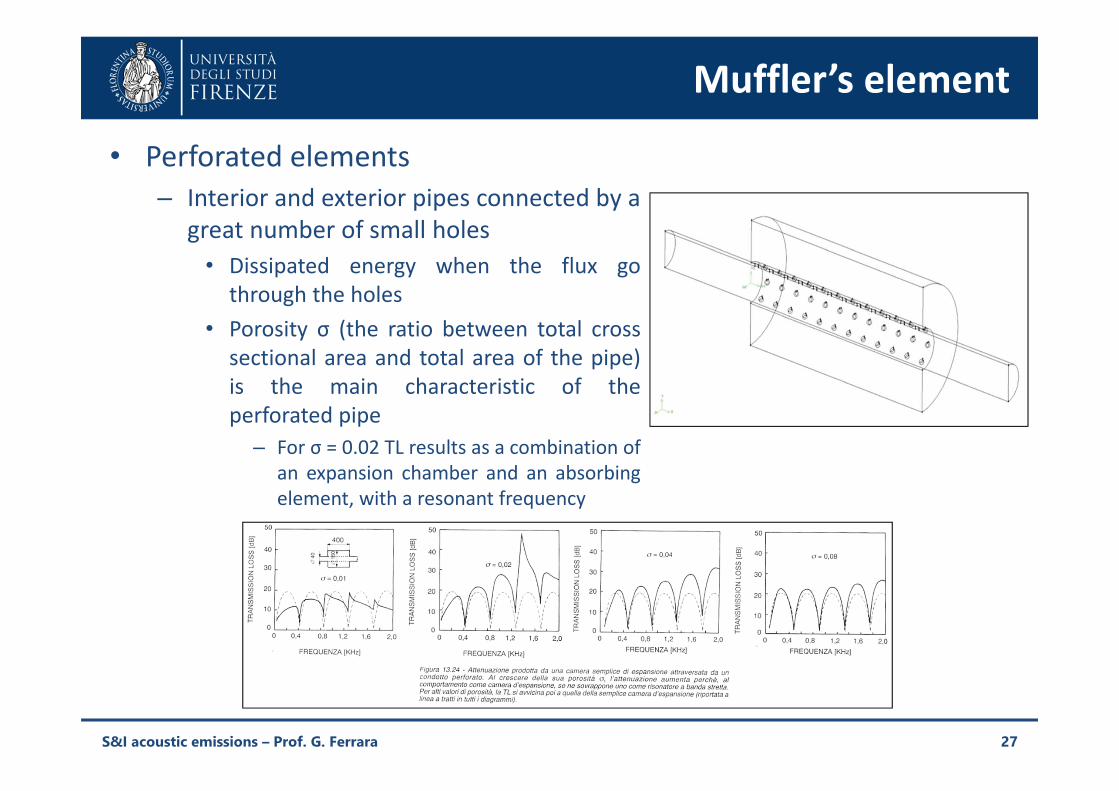
Muffler’s element• Perforated elements
– Interior and exterior pipes connected by agreat number of small holes
• Dissipated energy when the flux gothrough the holes
• Porosity σ (the ratio between total crosssectional area and total area of the pipe)is the main characteristic of theperforated pipe
– For σ = 0.02 TL results as a combination ofan expansion chamber and an absorbingelement, with a resonant frequency
27S&I acoustic emissions – Prof. G. Ferrara
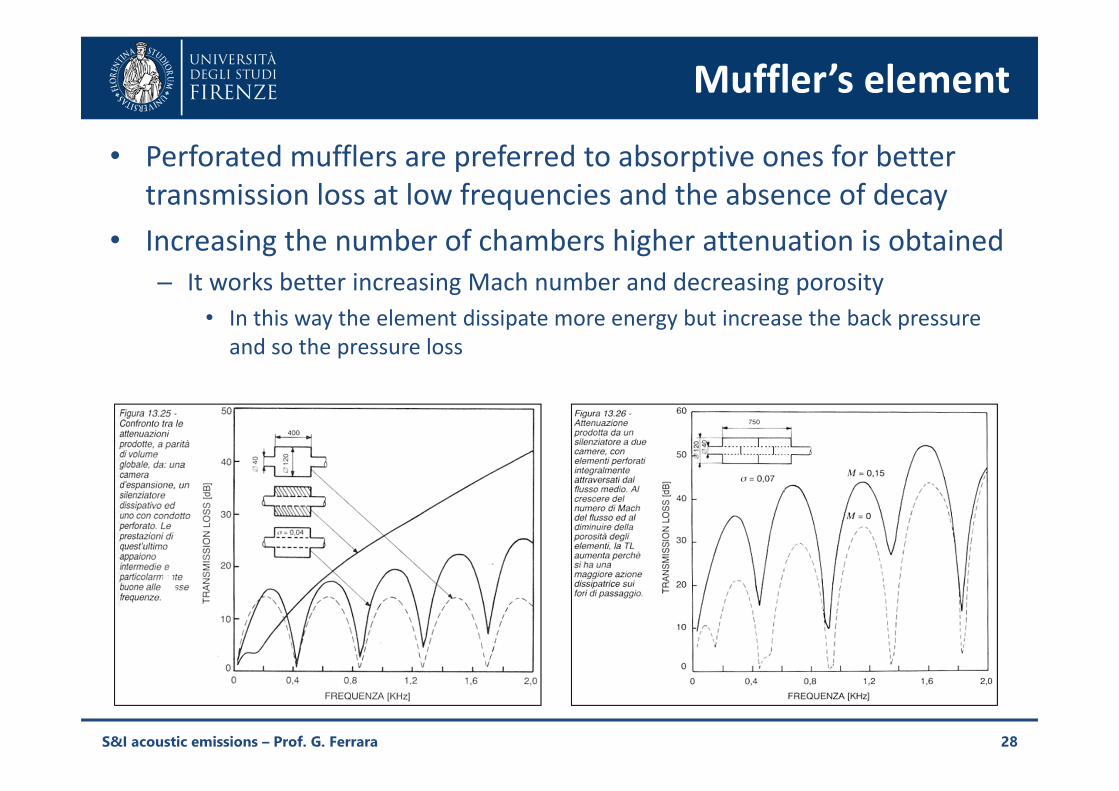
Muffler’s element• Perforated mufflers are preferred to absorptive ones for better
transmission loss at low frequencies and the absence of decay• Increasing the number of chambers higher attenuation is obtained
– It works better increasing Mach number and decreasing porosity• In this way the element dissipate more energy but increase the back pressure
and so the pressure loss
28S&I acoustic emissions – Prof. G. Ferrara
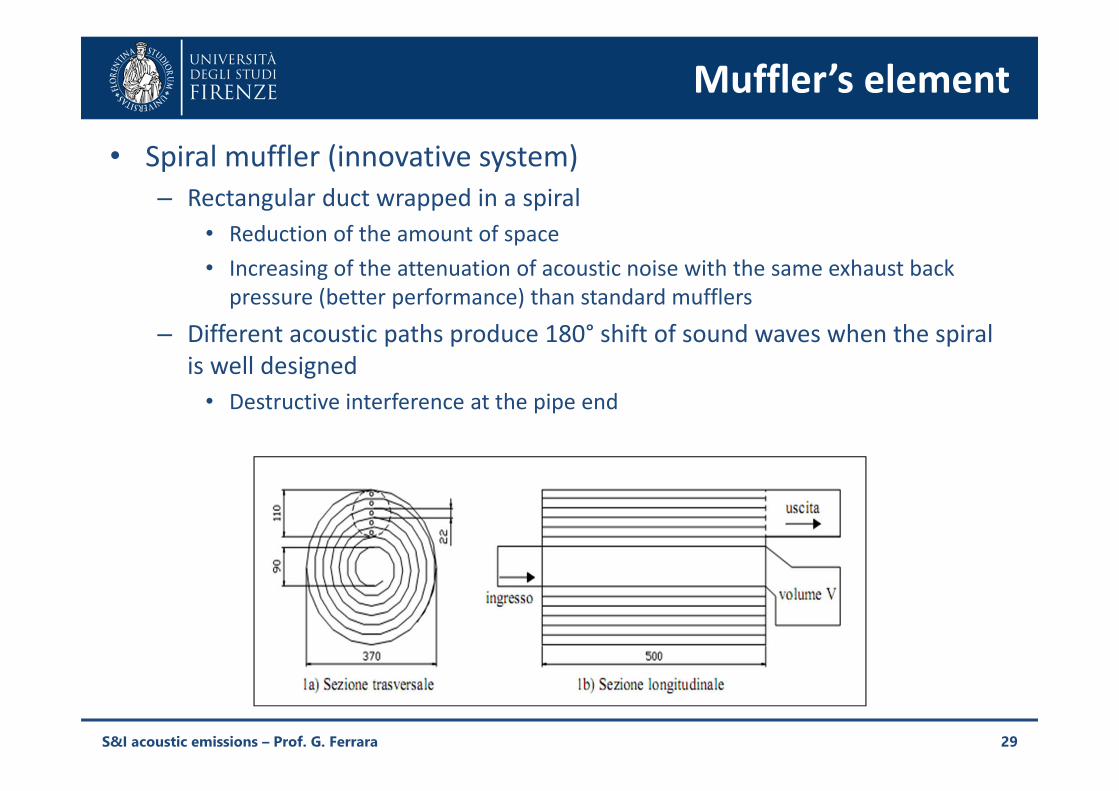
Muffler’s element• Spiral muffler (innovative system)
– Rectangular duct wrapped in a spiral• Reduction of the amount of space• Increasing of the attenuation of acoustic noise with the same exhaust back
pressure (better performance) than standard mufflers– Different acoustic paths produce 180° shift of sound waves when the spiral
is well designed• Destructive interference at the pipe end
29S&I acoustic emissions – Prof. G. Ferrara
Design parameter• Suction: expansion chamber
– Where the air filter is placed
• Exhaust: one or more different mufflers– Reactive elements for low frequencies– Absorptive and perforated elements for high frequencies
• Restriction on head loss– Performance
• The muffler have to attenuate sound without interfere withpressure waves which support scavenging and volumetricefficiency– This phenomena are generally controlled by the closest element to the
engine (air filter and first muffler element)
30S&I acoustic emissions – Prof. G. Ferrara
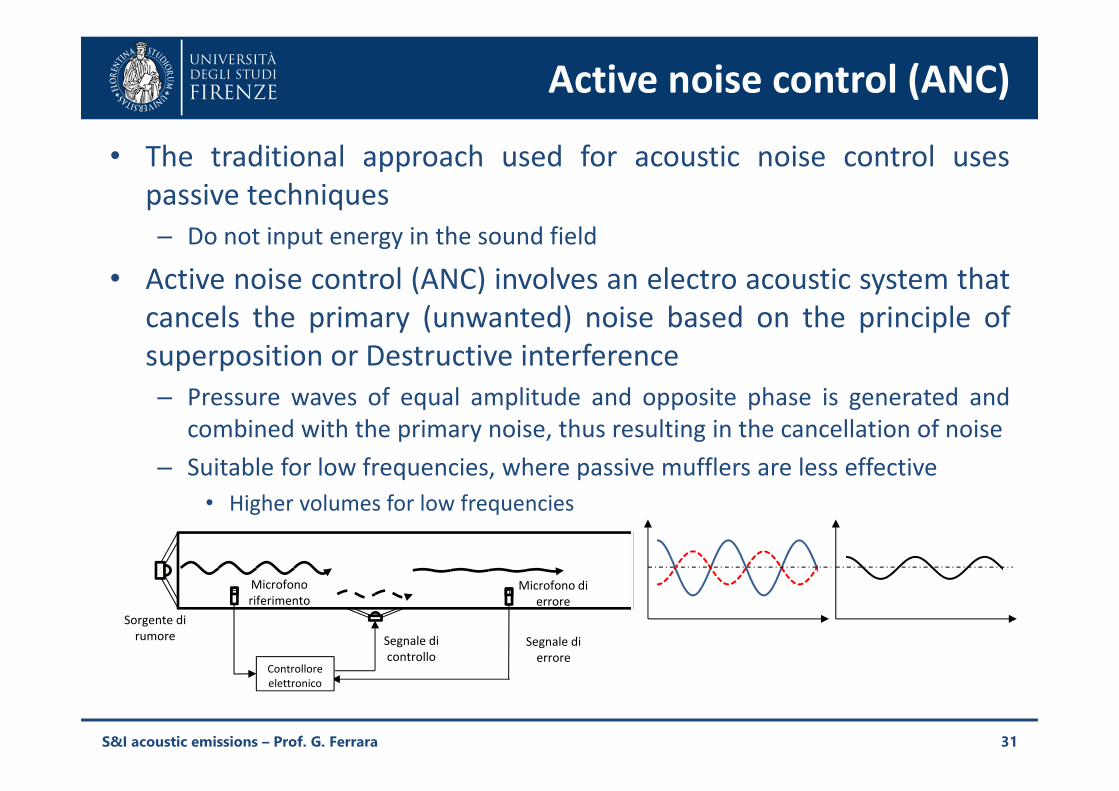
Active noise control (ANC)• The traditional approach used for acoustic noise control uses
passive techniques– Do not input energy in the sound field
• Active noise control (ANC) involves an electro acoustic system thatcancels the primary (unwanted) noise based on the principle ofsuperposition or Destructive interference– Pressure waves of equal amplitude and opposite phase is generated and
combined with the primary noise, thus resulting in the cancellation of noise– Suitable for low frequencies, where passive mufflers are less effective
• Higher volumes for low frequencies
31
Controllore elettronico
Sorgente di rumore
Microfono riferimento
Microfono di errore
Segnale di controllo
Segnale di errore
S&I acoustic emissions – Prof. G. Ferrara
01-02 July 2013
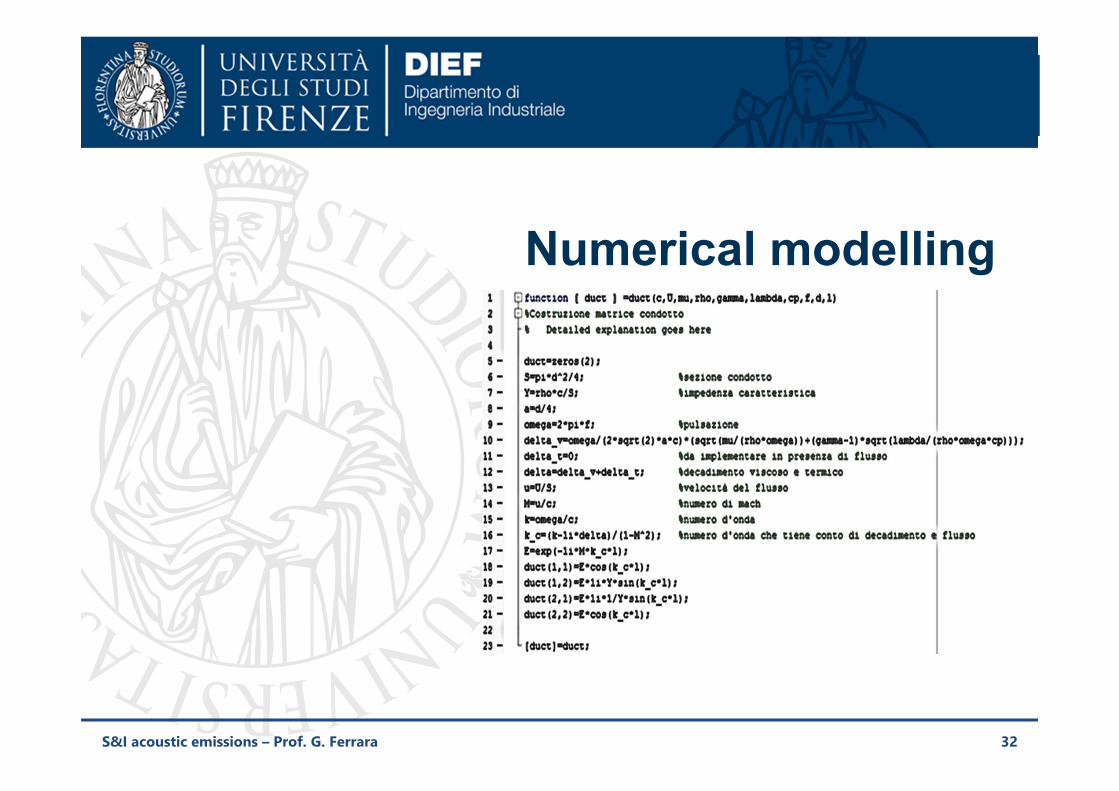
Numerical modelling
32S&I acoustic emissions – Prof. G. Ferrara
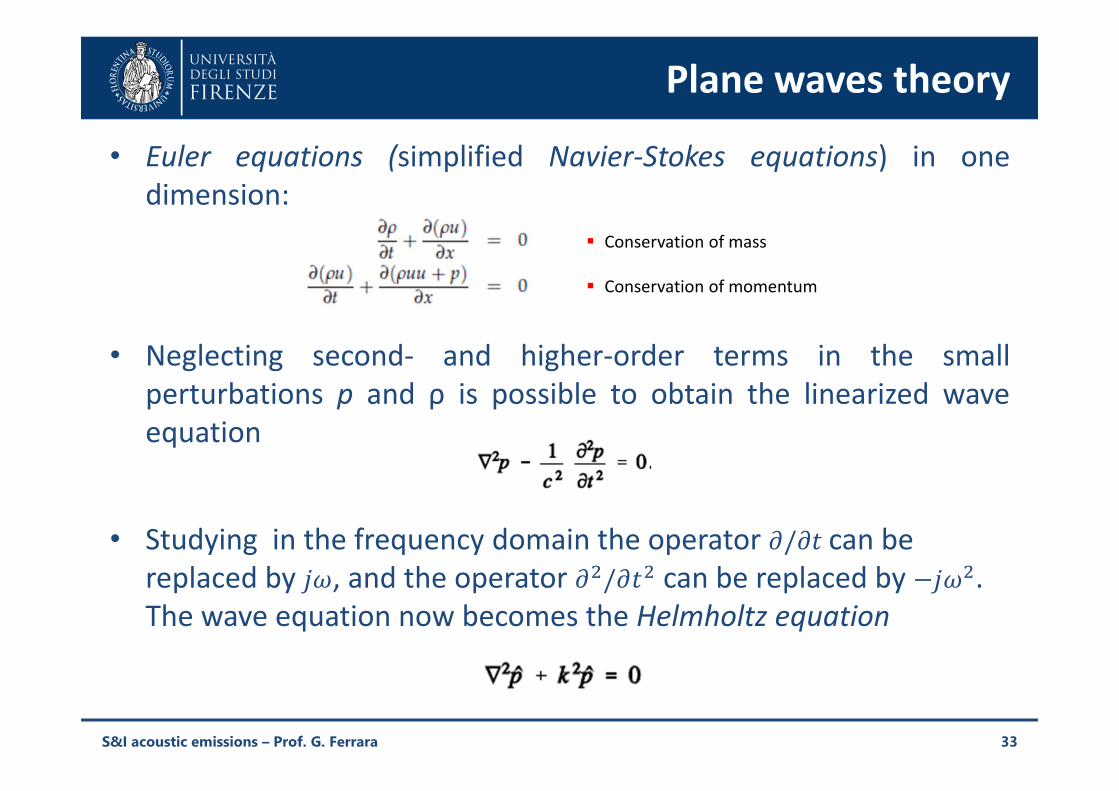
Plane waves theory• Euler equations (simplified Navier-Stokes equations) in one
dimension:
• Neglecting second- and higher-order terms in the smallperturbations p and ρ is possible to obtain the linearized waveequation
• Studying in the frequency domain the operator / can be replaced by , and the operator / can be replaced by . The wave equation now becomes the Helmholtz equation
33
Conservation of mass
Conservation of momentum
S&I acoustic emissions – Prof. G. Ferrara
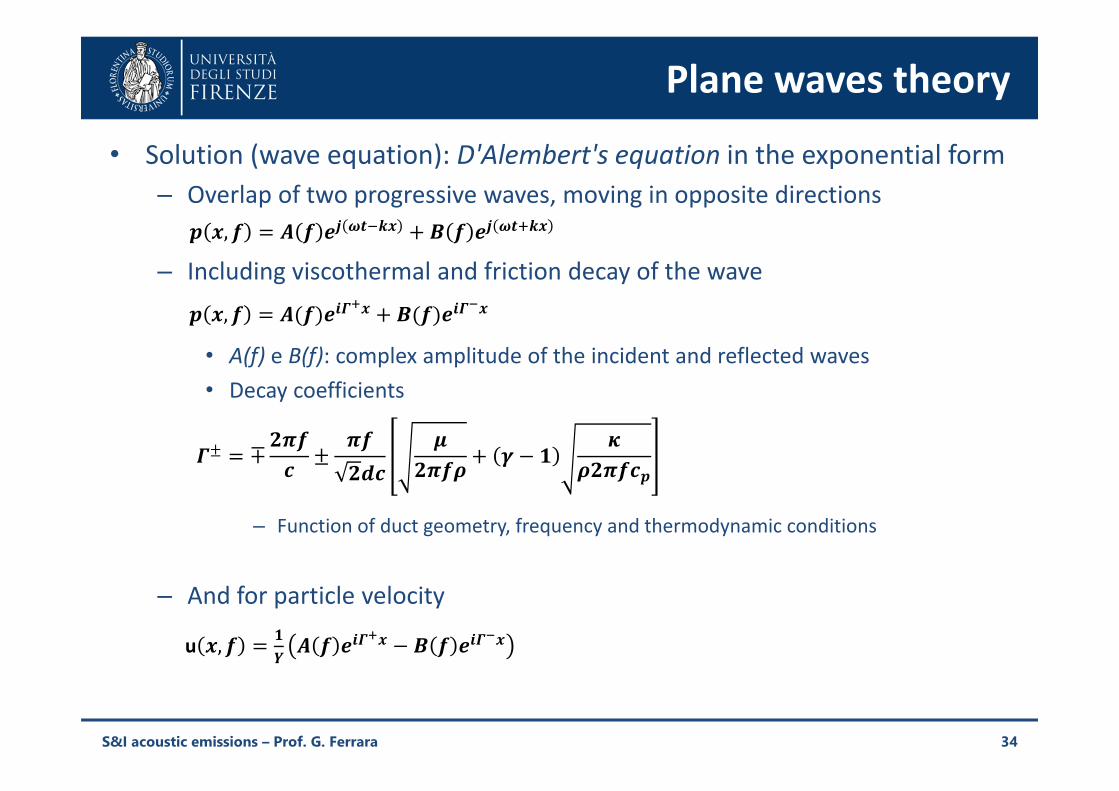
Plane waves theory• Solution (wave equation): D'Alembert's equation in the exponential form
– Overlap of two progressive waves, moving in opposite directions
– Including viscothermal and friction decay of the wave
• A(f) e B(f): complex amplitude of the incident and reflected waves• Decay coefficients
– Function of duct geometry, frequency and thermodynamic conditions
– And for particle velocity
34
,,
∓
u ,S&I acoustic emissions – Prof. G. Ferrara
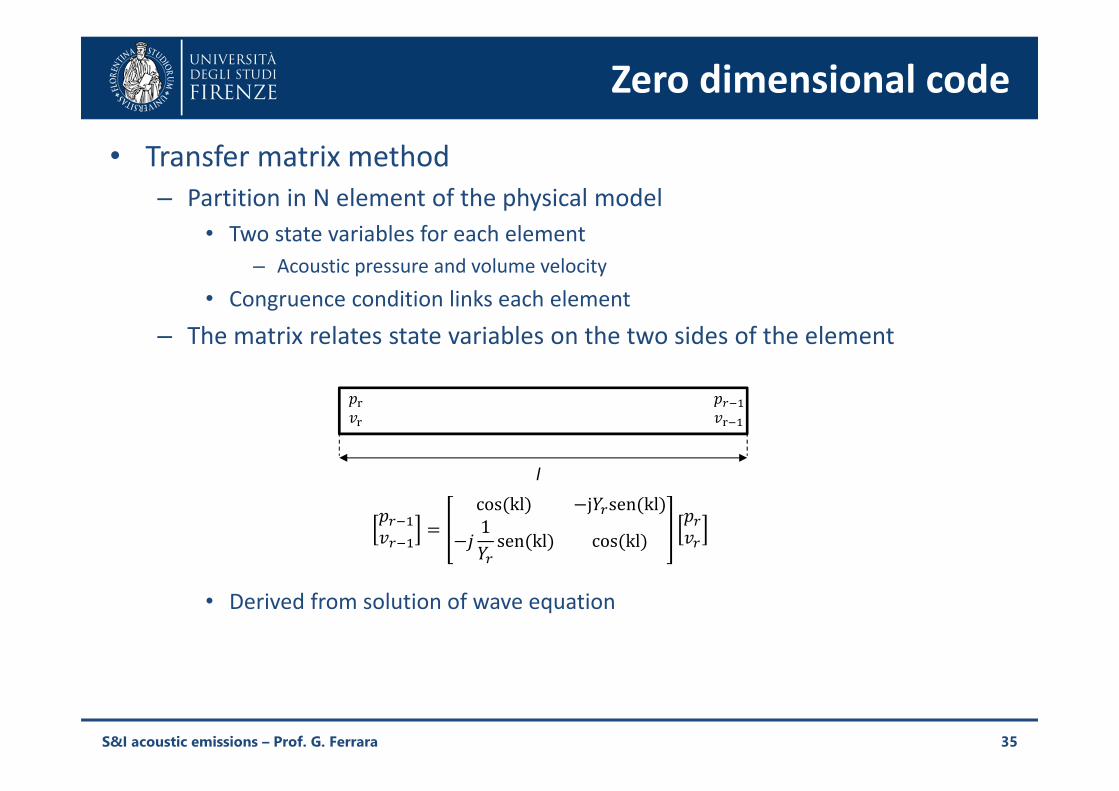
Zero dimensional code• Transfer matrix method
– Partition in N element of the physical model• Two state variables for each element
– Acoustic pressure and volume velocity• Congruence condition links each element
– The matrix relates state variables on the two sides of the element
• Derived from solution of wave equation
35
l cos kl j sen kl1 sen kl cos kl
S&I acoustic emissions – Prof. G. Ferrara
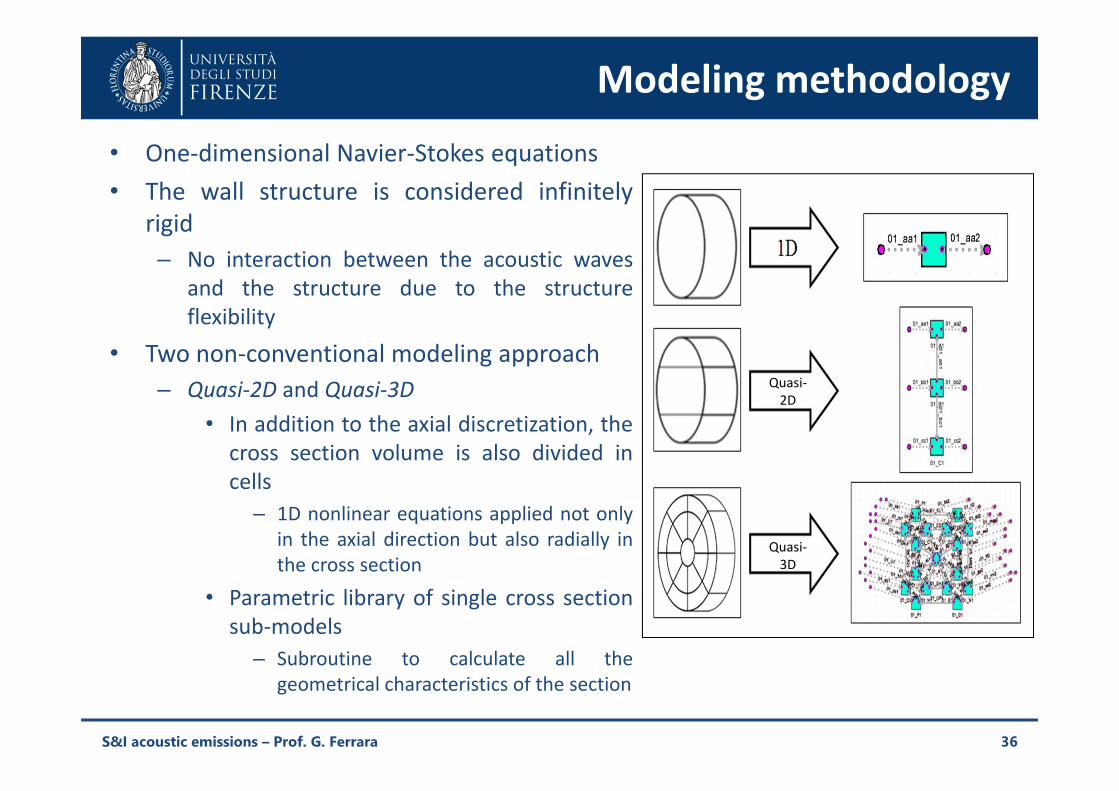
Modeling methodology• One-dimensional Navier-Stokes equations• The wall structure is considered infinitely
rigid– No interaction between the acoustic waves
and the structure due to the structureflexibility
• Two non-conventional modeling approach– Quasi-2D and Quasi-3D
• In addition to the axial discretization, thecross section volume is also divided incells
– 1D nonlinear equations applied not onlyin the axial direction but also radially inthe cross section
• Parametric library of single cross sectionsub-models
– Subroutine to calculate all thegeometrical characteristics of the section
36
Quasi-2D
Quasi-3D
S&I acoustic emissions – Prof. G. Ferrara
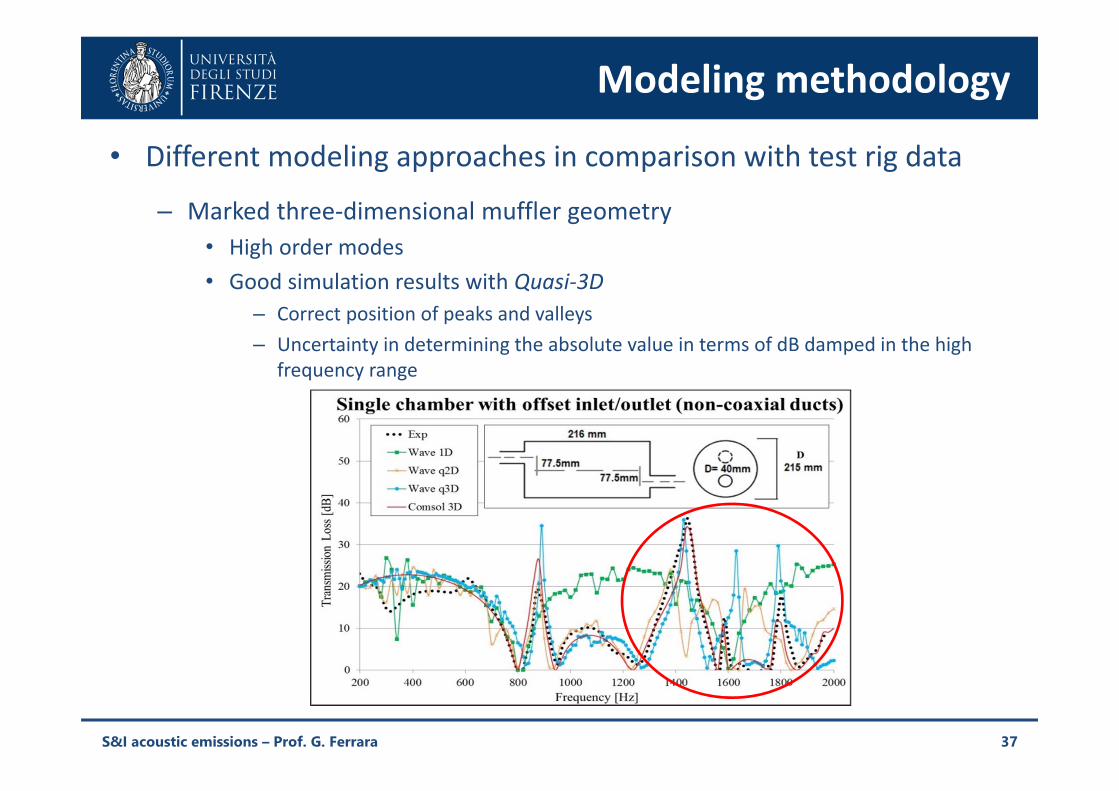
Modeling methodology• Different modeling approaches in comparison with test rig data
37
– Marked three-dimensional muffler geometry• High order modes• Good simulation results with Quasi-3D
– Correct position of peaks and valleys– Uncertainty in determining the absolute value in terms of dB damped in the high
frequency range
S&I acoustic emissions – Prof. G. Ferrara
01-02 July 2013
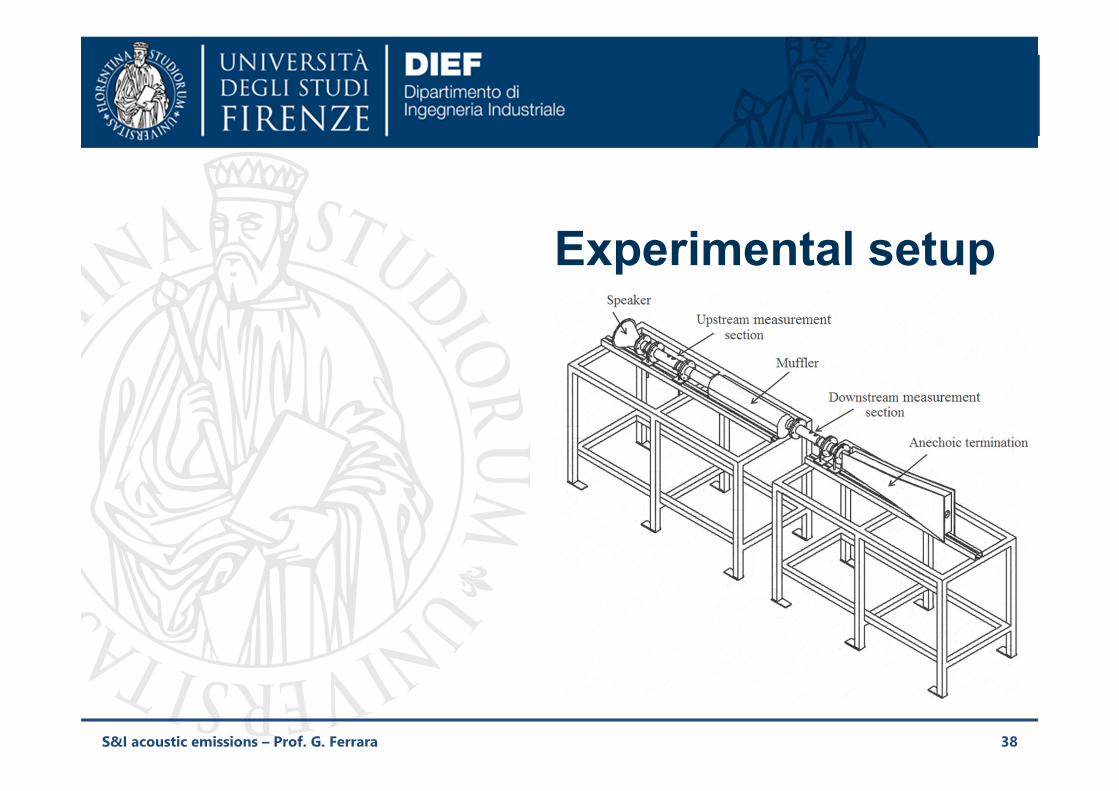
Experimental setup
38S&I acoustic emissions – Prof. G. Ferrara
introduction
39
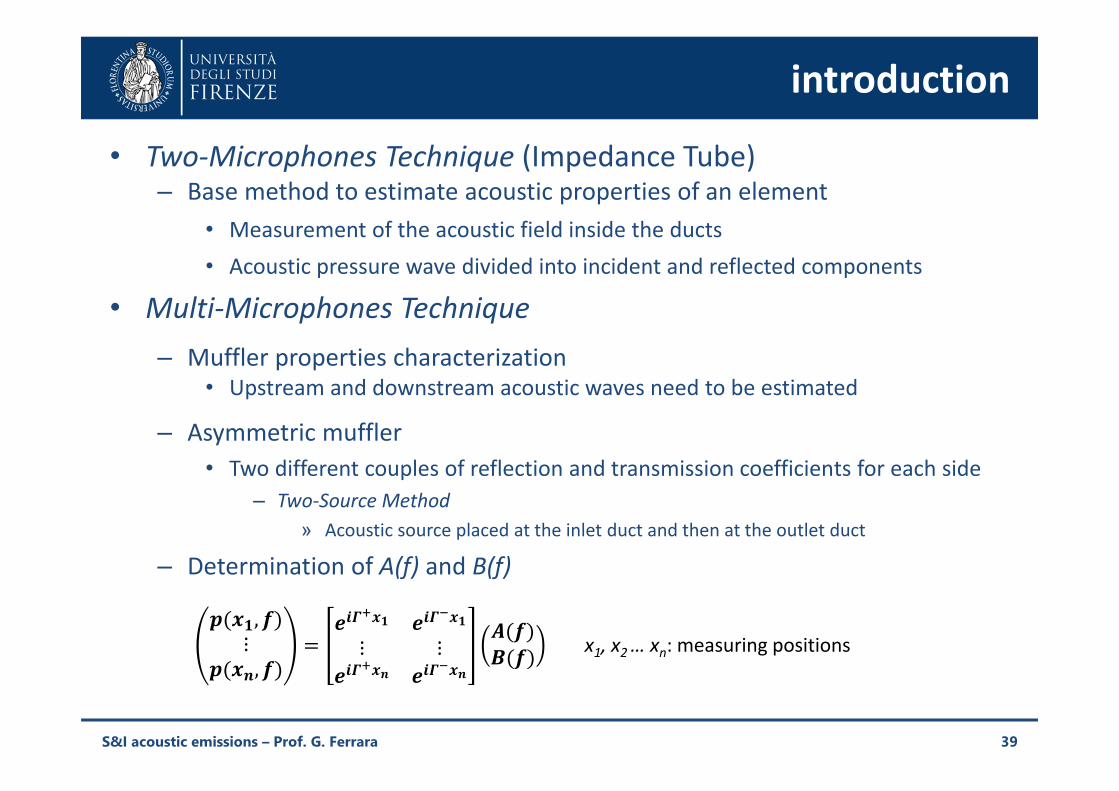
• Two-Microphones Technique (Impedance Tube)– Base method to estimate acoustic properties of an element
• Measurement of the acoustic field inside the ducts• Acoustic pressure wave divided into incident and reflected components
• Multi-Microphones Technique– Muffler properties characterization
• Upstream and downstream acoustic waves need to be estimated
– Asymmetric muffler• Two different couples of reflection and transmission coefficients for each side
– Two-Source Method» Acoustic source placed at the inlet duct and then at the outlet duct
– Determination of A(f) and B(f),⋮ , ⋮ ⋮ x1, x2 … xn: measuring positions
S&I acoustic emissions – Prof. G. Ferrara
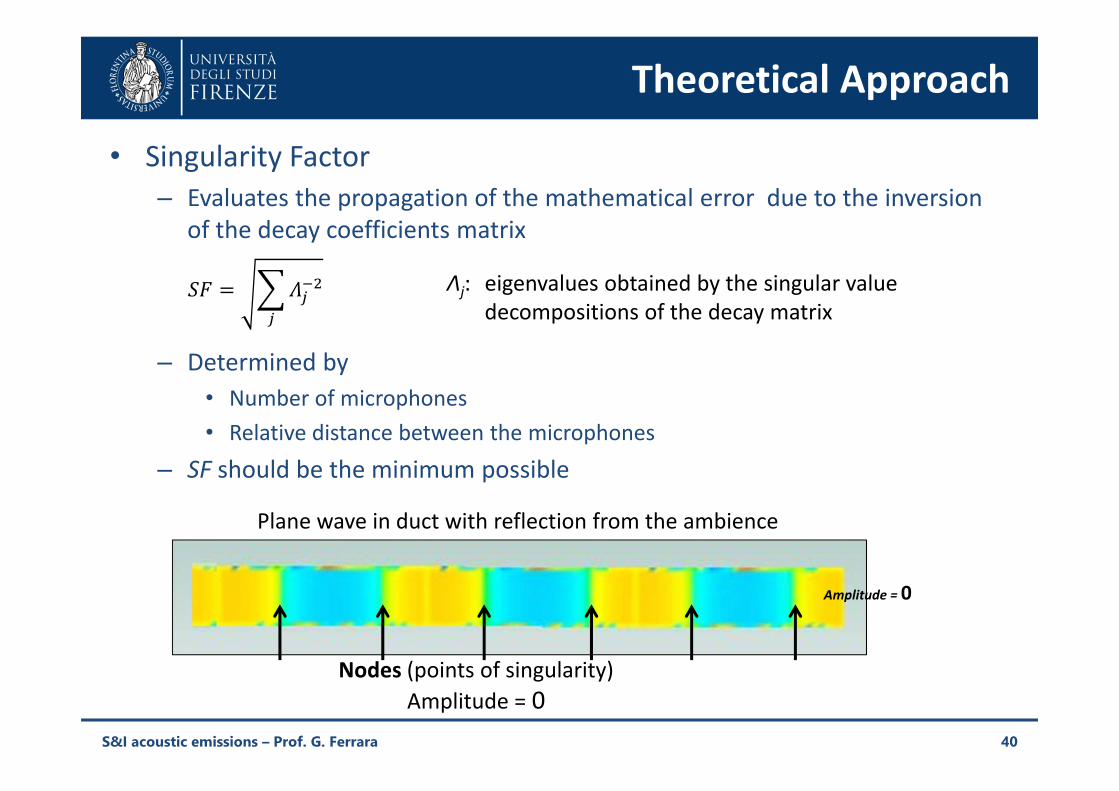
Theoretical Approach• Singularity Factor
– Evaluates the propagation of the mathematical error due to the inversion of the decay coefficients matrix
– Determined by• Number of microphones• Relative distance between the microphones
– SF should be the minimum possible
40
Λj: eigenvalues obtained by the singular value decompositions of the decay matrix
Plane wave in duct with reflection from the ambience
Nodes (points of singularity)Amplitude = 0
Amplitude = 0
S&I acoustic emissions – Prof. G. Ferrara
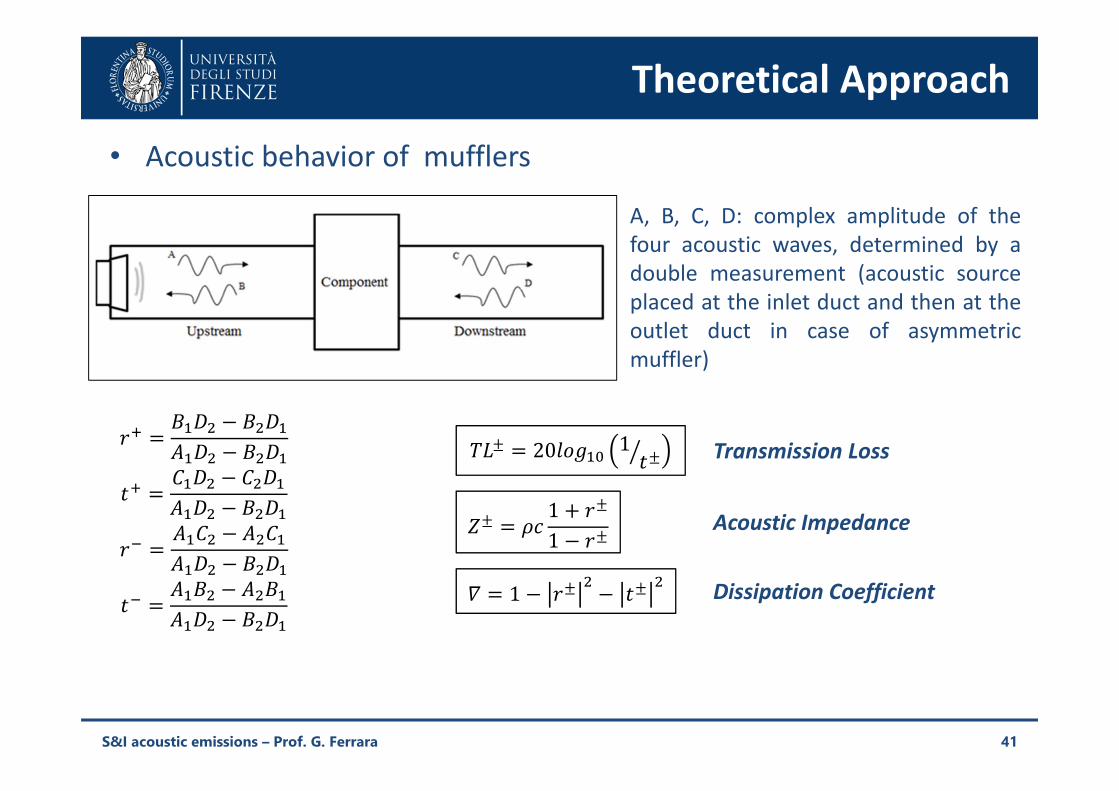
Theoretical Approach• Acoustic behavior of mufflers
41
20 1111
Transmission Loss
Acoustic Impedance
Dissipation Coefficient
A, B, C, D: complex amplitude of thefour acoustic waves, determined by adouble measurement (acoustic sourceplaced at the inlet duct and then at theoutlet duct in case of asymmetricmuffler)
S&I acoustic emissions – Prof. G. Ferrara
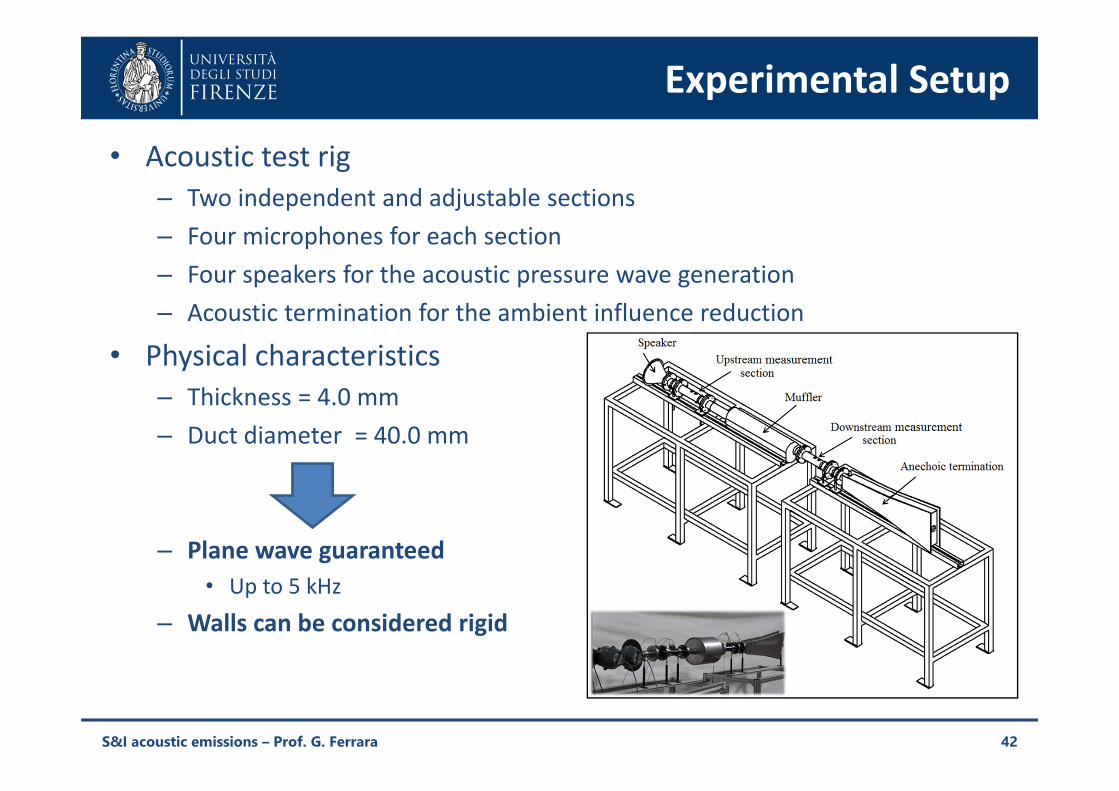
Experimental Setup• Acoustic test rig
– Two independent and adjustable sections– Four microphones for each section– Four speakers for the acoustic pressure wave generation– Acoustic termination for the ambient influence reduction
• Physical characteristics– Thickness = 4.0 mm– Duct diameter = 40.0 mm
– Plane wave guaranteed• Up to 5 kHz
– Walls can be considered rigid
42S&I acoustic emissions – Prof. G. Ferrara
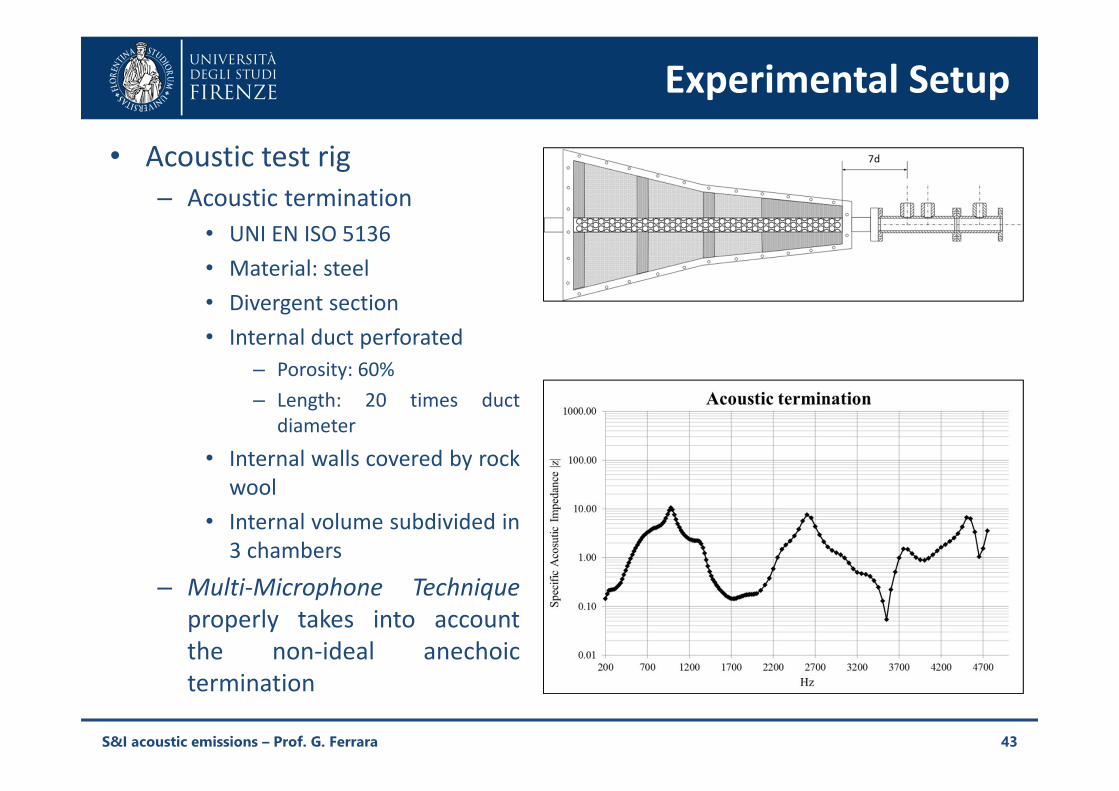
Experimental Setup• Acoustic test rig
– Acoustic termination• UNI EN ISO 5136• Material: steel• Divergent section• Internal duct perforated
– Porosity: 60%– Length: 20 times duct
diameter• Internal walls covered by rock
wool• Internal volume subdivided in
3 chambers– Multi-Microphone Technique
properly takes into accountthe non-ideal anechoictermination
43S&I acoustic emissions – Prof. G. Ferrara
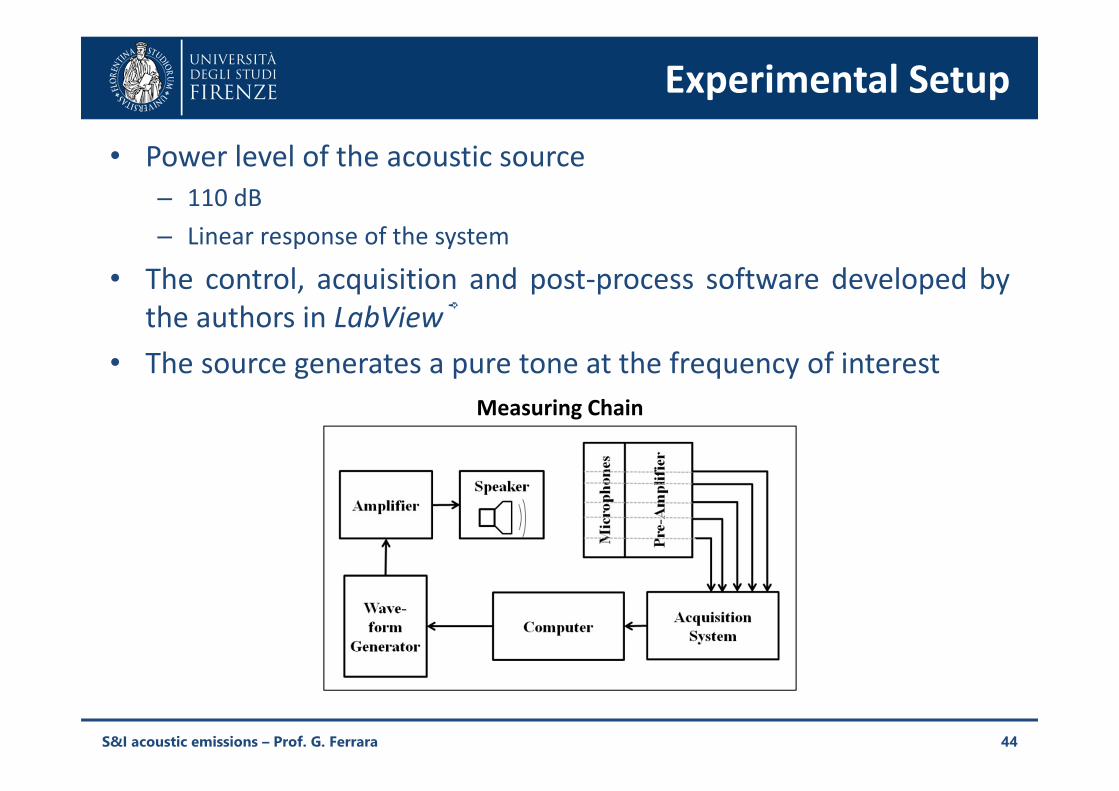
Experimental Setup• Power level of the acoustic source
– 110 dB– Linear response of the system
• The control, acquisition and post-process software developed bythe authors in LabView®
• The source generates a pure tone at the frequency of interest
44
Measuring Chain
S&I acoustic emissions – Prof. G. Ferrara
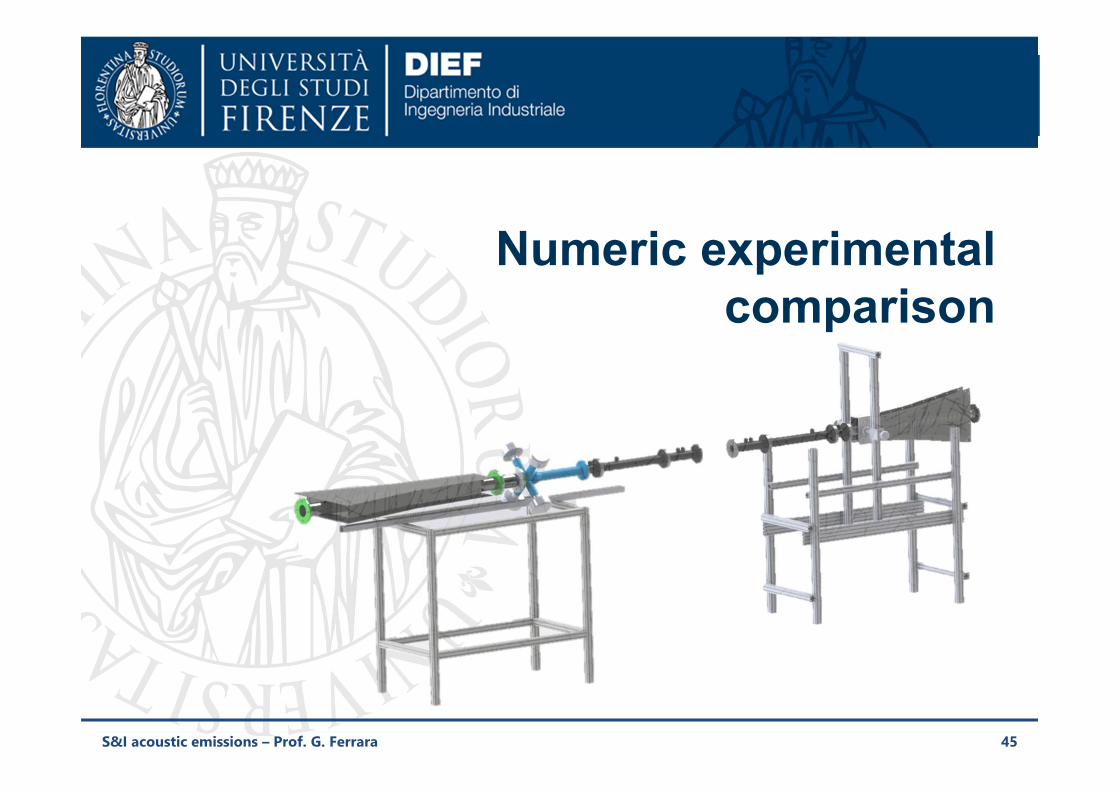
01-02 July 2013
Numeric experimental comparison
45S&I acoustic emissions – Prof. G. Ferrara
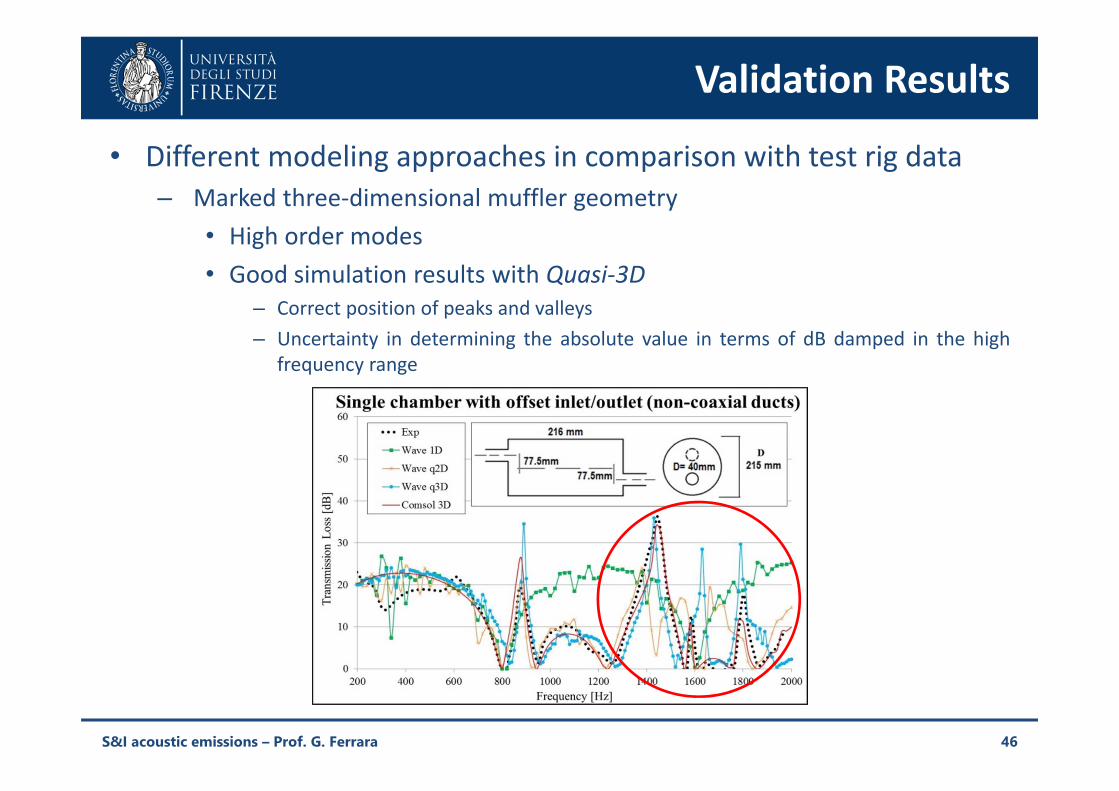
Validation Results• Different modeling approaches in comparison with test rig data
– Marked three-dimensional muffler geometry• High order modes• Good simulation results with Quasi-3D
– Correct position of peaks and valleys– Uncertainty in determining the absolute value in terms of dB damped in the high
frequency range
46S&I acoustic emissions – Prof. G. Ferrara

Validation Results• Influence of the structure rigidity
– Double chamber muffler• Two different internal septum
– 2.0 mm - Stainless Steel– 0.8 mm - Aluminum
• Best matching with the more rigid septum (2.0 mm)
47S&I acoustic emissions – Prof. G. Ferrara
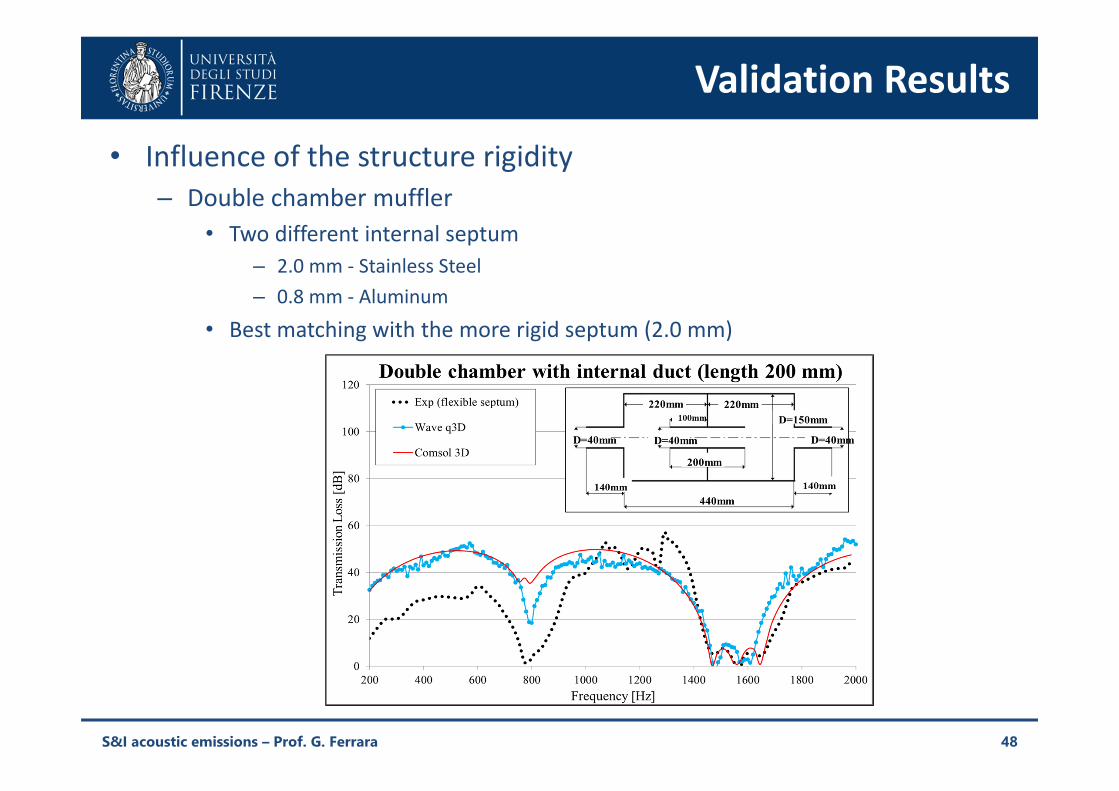
Validation Results• Influence of the structure rigidity
– Double chamber muffler• Two different internal septum
– 2.0 mm - Stainless Steel– 0.8 mm - Aluminum
• Best matching with the more rigid septum (2.0 mm)
48S&I acoustic emissions – Prof. G. Ferrara
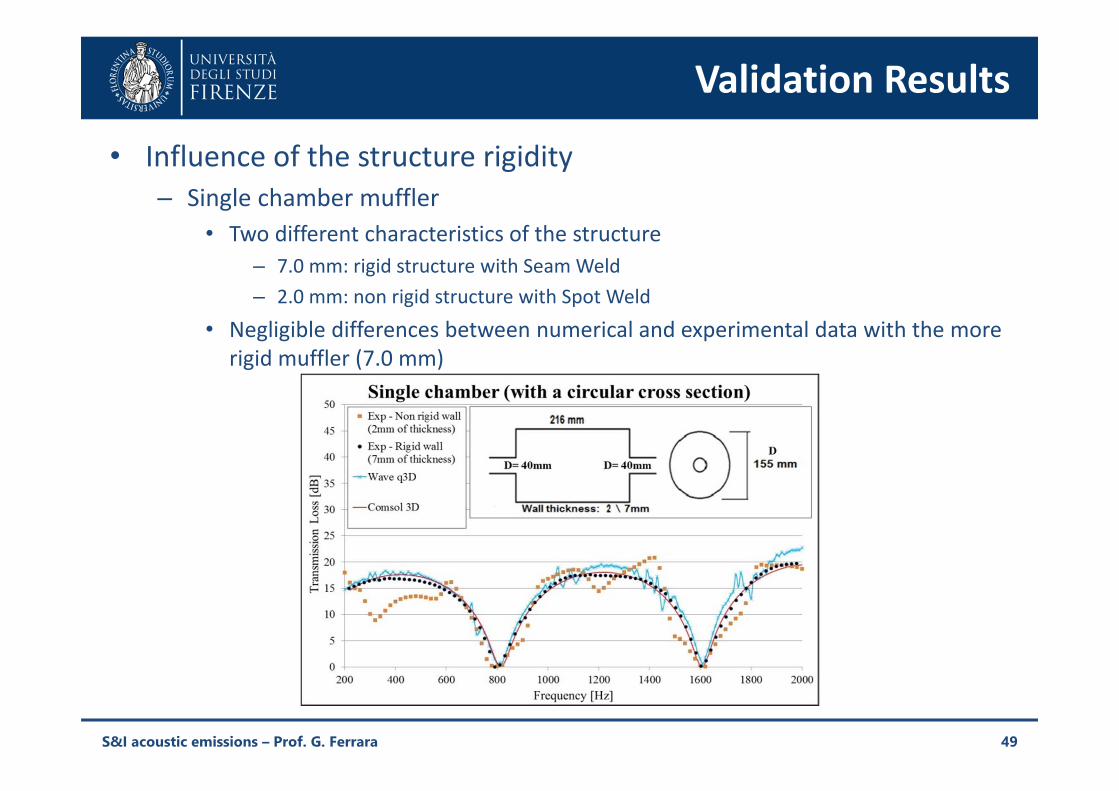
Validation Results• Influence of the structure rigidity
– Single chamber muffler• Two different characteristics of the structure
– 7.0 mm: rigid structure with Seam Weld– 2.0 mm: non rigid structure with Spot Weld
• Negligible differences between numerical and experimental data with the more rigid muffler (7.0 mm)
49S&I acoustic emissions – Prof. G. Ferrara


