Embed Size (px)
Citation preview
Howard University
Mean Comparisons August 2009
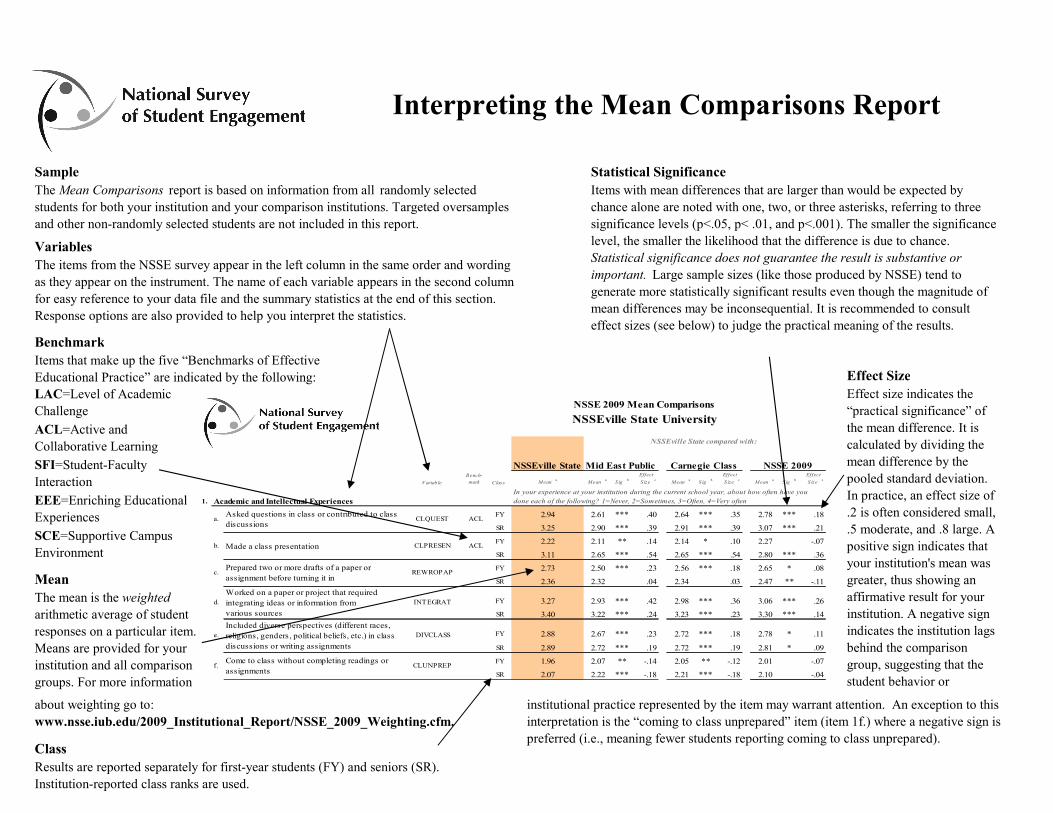
Interpreting the Mean Comparisons Report
Sample Statistical Significance The Mean Comparisons report is based on information from all randomly selected Items with mean differences that are larger than would be expected by students for both your institution and your comparison institutions. Targeted oversamples chance alone are noted with one, two, or three asterisks, referring to three and other non-randomly selected students are not included in this report. significance levels (p<.05, p< .01, and p<.001). The smaller the significance
level, the smaller the likelihood that the difference is due to chance. Variables Statistical significance does not guarantee the result is substantive or The items from the NSSE survey appear in the left column in the same order and wording important. Large sample sizes (like those produced by NSSE) tend to as they appear on the instrument. The name of each variable appears in the second column generate more statistically significant results even though the magnitude of for easy reference to your data file and the summary statistics at the end of this section. mean differences may be inconsequential. It is recommended to consult Response options are also provided to help you interpret the statistics. effect sizes (see below) to judge the practical meaning of the results.
Benchmark
In your experience at your institution during the current school year, about how often have you
Items that make up the five “Benchmarks of Effective Educational Practice” are
S ig c
Academic and Intellectual Experiences
FY 2.94
SR 3.25
2.22
3.11
2.73
SR 2.36
FY 3.27
SR 3.40
2.88
2.89
1.96
2.07
Included diverse perspectives (different races,
a. Asked questions in class or contributed to class
e.
INTEGRAT
discussions ACL CLQUEST
indicated by the following: Effect Size LAC=Level of Academic Effect size indicates the
NSSE 2009 Mean Comparisons Challenge “practical significance” of
NSSEville State University ACL=Active and the mean difference. It is
NSSEville State compared with: calculated by dividing the
SFI=Student-Faculty NSSEville State Mid East Public Carnegie Class NSSE 2009 mean difference by the Collaborative Learning
B ench- Effect Effect Effect
V ariab le mark Class M ean M ean S ig S ize M ean S ig S ize M ean S ize a a b c a b c a b pooled standard deviation. Interaction
In practice, an effect size of EEE=Enriching Educational 1. done each of the following? 1=Never, 2=Sometimes, 3=Often, 4=Very often
2.61 *** .40 2.64 *** .35 2.78 *** .18 .2 is often considered small, Experiences 2.90 *** .39 2.91 *** .39 3.07 *** .21 .5 moderate, and .8 large. ASCE=Supportive Campus FY 2.11 ** .14 2.14 * .10 2.27 -.07
b. Made a class presentation CLPRESEN ACL positive sign indicates that Environment SR 2.65 *** .54 2.65 *** .54 2.80 *** .36
Prepared two or more drafts of a paper or FY your institution's mean was 2.50 *** .23 2.56 *** .18 2.65 * .08 c. REWROPAP assignment before turning it in Mean 2.32 .04 2.34 .03 2.47 ** -.11 greater, thus showing an Worked on a paper or project that required affirmative result for your
arithmetic average of student The mean is the weighted 2.93 *** .42 2.98 *** .36 3.06 *** .26 d. integrating ideas or information from
various sources 3.22 *** .24 3.23 *** .23 3.30 *** .14 institution. A negative sign FY 2.67 *** .23 2.72 *** .18 2.78 * .11 indicates the institution lags
discussions or writing assignments SR
responses on a particular item. religions, genders, political beliefs, etc.) in class DIVCLASS
2.72 *** .19 2.72 *** .19 2.81 * .09 behind the comparison Come to class without completing readings or FY
Means are provided for your 2.07 ** -.14 2.05 ** -.12 2.01 -.07
f. CLUNPREP group, suggesting that the institution and all comparison assignments SR 2.22 *** -.18 2.21 *** -.18 2.10 -.04 student behavior or
about weighting go to: institutional practice represented by the item may warrant attention. An exception to this www.nsse.iub.edu/2009_Institutional_Report/NSSE_2009_Weighting.cfm. interpretation is the “coming to class unprepared” item (item 1f.) where a negative sign is
preferred (i.e., meaning fewer students reporting coming to class unprepared).
groups. For more information
Class Results are reported separately for first-year students (FY) and seniors (SR). Institution-reported class ranks are used.
Variable
Bench-mark Class Mean a Mean a Sig b
Effect
Size c Mean a Sig b
Effect
Size c Mean a Sig b
Effect
Size c
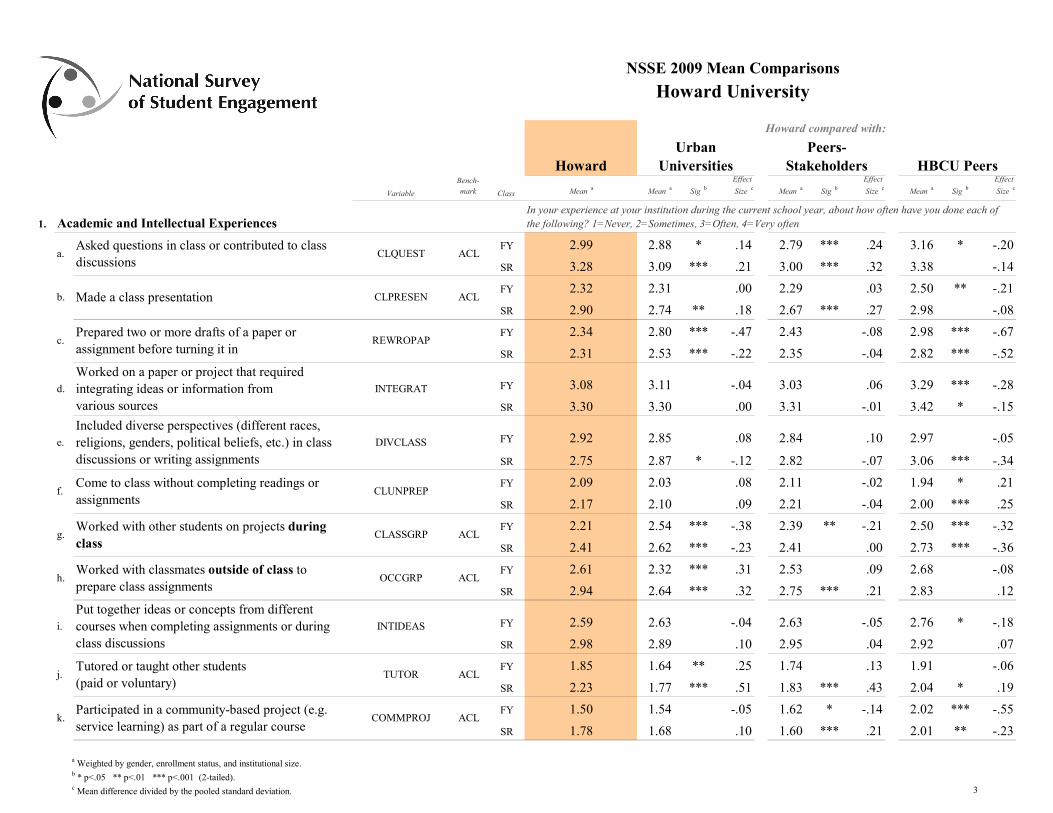
1. Academic and Intellectual Experiences
FY 2.99 2.88 * .14 2.79 *** .24 3.16 * -.20
SR 3.28 3.09 *** .21 3.00 *** .32 3.38 -.14
FY 2.32 2.31 .00 2.29 .03 2.50 ** -.21
SR 2.90 2.74 ** .18 2.67 *** .27 2.98 -.08
FY 2.34 2.80 *** -.47 2.43 -.08 2.98 *** -.67
SR 2.31 2.53 *** -.22 2.35 -.04 2.82 *** -.52
FY 3.08 3.11 -.04 3.03 .06 3.29 *** -.28
SR 3.30 3.30 .00 3.31 -.01 3.42 * -.15
FY 2.92 2.85 .08 2.84 .10 2.97 -.05
SR 2.75 2.87 * -.12 2.82 -.07 3.06 *** -.34
FY 2.09 2.03 .08 2.11 -.02 1.94 * .21
SR 2.17 2.10 .09 2.21 -.04 2.00 *** .25
FY 2.21 2.54 *** -.38 2.39 ** -.21 2.50 *** -.32
SR 2.41 2.62 *** -.23 2.41 .00 2.73 *** -.36
FY 2.61 2.32 *** .31 2.53 .09 2.68 -.08
SR 2.94 2.64 *** .32 2.75 *** .21 2.83 .12
FY 2.59 2.63 -.04 2.63 -.05 2.76 * -.18
SR 2.98 2.89 .10 2.95 .04 2.92 .07
FY 1.85 1.64 ** .25 1.74 .13 1.91 -.06
SR 2.23 1.77 *** .51 1.83 *** .43 2.04 * .19
FY 1.50 1.54 -.05 1.62 * -.14 2.02 *** -.55
SR 1.78 1.68 .10 1.60 *** .21 2.01 ** -.23
NSSE 2009 Mean Comparisons
ACL
ACL
ACL
ACL
ACL
ACL
CLQUEST
INTEGRAT
Come to class without completing readings or assignments
CLUNPREP
Worked with other students on projects during class
CLASSGRP
Worked with classmates outside of class to prepare class assignments
OCCGRP
Included diverse perspectives (different races, religions, genders, political beliefs, etc.) in class discussions or writing assignments
DIVCLASS
In your experience at your institution during the current school year, about how often have you done each of the following? 1=Never, 2=Sometimes, 3=Often, 4=Very often
HBCU Peers Howard
Howard compared with:
Urban Universities
Made a class presentation CLPRESEN
Peers-Stakeholders
Worked on a paper or project that required integrating ideas or information from various sources
i.
j.
k.
Put together ideas or concepts from different courses when completing assignments or during class discussions
INTIDEAS
d.
e.
f.
g.
Howard University
a.
b.
c.
Asked questions in class or contributed to class discussions
h.
Prepared two or more drafts of a paper or assignment before turning it in
REWROPAP
TUTOR
Participated in a community-based project (e.g. service learning) as part of a regular course
COMMPROJ
Tutored or taught other students (paid or voluntary)
a Weighted by gender, enrollment status, and institutional size. b * p<.05 ** p<.01 *** p<.001 (2-tailed). c Mean difference divided by the pooled standard deviation. 3
c Variable
l.
m.
n.
o.
p.
q.
r.
s.
t.
u.
v.
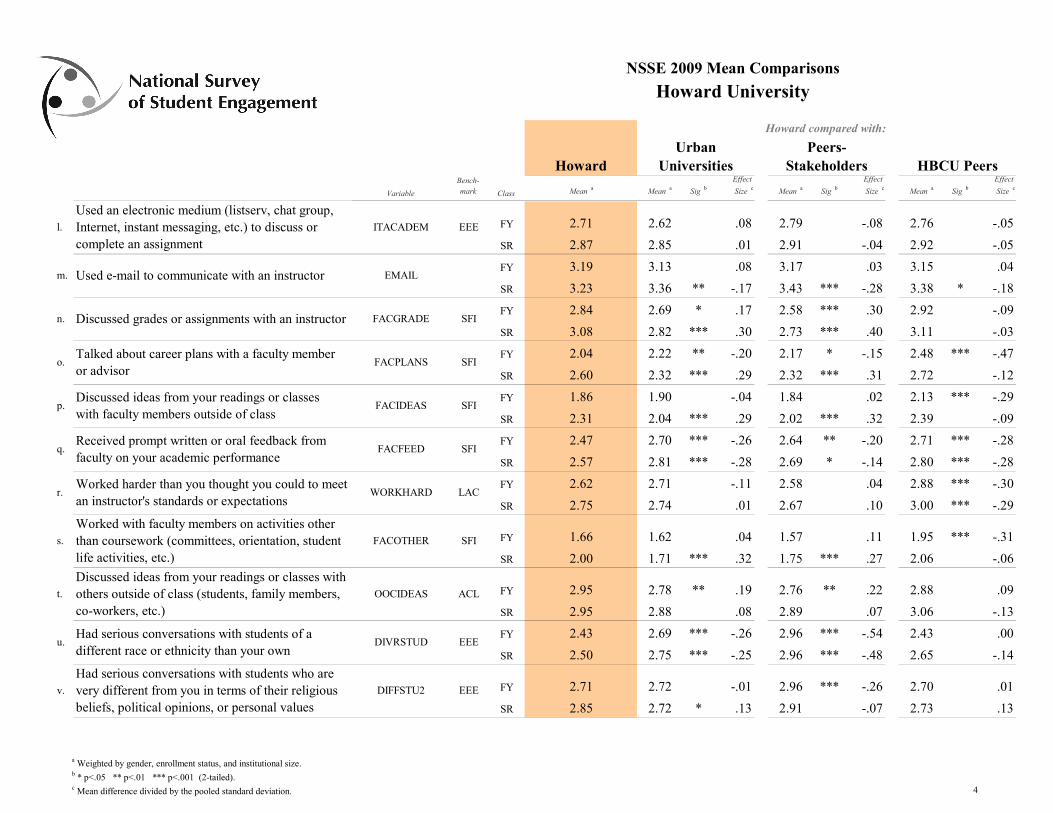
FY 2.71 2.62 .08 2.79 -.08 2.76 -.05
SR 2.87 2.85 .01 2.91 -.04 2.92 -.05
FY 3.19 3.13 .08 3.17 .03 3.15 .04
SR 3.23 3.36 ** -.17 3.43 *** -.28 3.38 * -.18
FY 2.84 2.69 * .17 2.58 *** .30 2.92 -.09
SR 3.08 2.82 *** .30 2.73 *** .40 3.11 -.03
FY 2.04 2.22 ** -.20 2.17 * -.15 2.48 *** -.47
SR 2.60 2.32 *** .29 2.32 *** .31 2.72 -.12
FY 1.86 1.90 -.04 1.84 .02 2.13 *** -.29
SR 2.31 2.04 *** .29 2.02 *** .32 2.39 -.09
FY 2.47 2.70 *** -.26 2.64 ** -.20 2.71 *** -.28
SR 2.57 2.81 *** -.28 2.69 * -.14 2.80 *** -.28
FY 2.62 2.71 -.11 2.58 .04 2.88 *** -.30
SR 2.75 2.74 .01 2.67 .10 3.00 *** -.29
FY 1.66 1.62 .04 1.57 .11 1.95 *** -.31
SR 2.00 1.71 *** .32 1.75 *** .27 2.06 -.06
FY 2.95 2.78 ** .19 2.76 ** .22 2.88 .09
SR 2.95 2.88 .08 2.89 .07 3.06 -.13
life activities, etc.)
Talked about career plans with a faculty member
complete an assignment
FY 2.43 2.69 *** -.26 2.96 *** -.54 2.43 .00
SR 2.50 2.75 *** -.25 2.96 *** -.48 2.65 -.14
FY 2.71 2.72 -.01 2.96 *** -.26 2.70 .01
beliefs, political opinions, or personal values SR 2.85 2.72 * .13 2.91 -.07 2.73 .13
EEE DIVRSTUD
EEE
SFI
LAC WORKHARD
FACFEED
SFI
others outside of class (students, family members, OOCIDEAS ACL
SFI FACPLANS
SFI
Discussed grades or assignments with an instructor SFI
Internet, instant messaging, etc.) to discuss or EEE
Worked with faculty members on activities other than coursework (committees, orientation, student FACOTHER
Discussed ideas from your readings or classes with
co-workers, etc.)
Had serious conversations with students of a different race or ethnicity than your own
ITACADEM
FACGRADE
or advisor
Used e-mail to communicate with an instructor
Had serious conversations with students who are
faculty on your academic performance
an instructor's standards or expectations
with faculty members outside of class
Used an electronic medium (listserv, chat group,
very different from you in terms of their religious DIFFSTU2
Received prompt written or oral feedback from
Worked harder than you thought you could to meet
Discussed ideas from your readings or classes FACIDEAS
a Weighted by gender, enrollment status, and institutional size. b * p<.05 ** p<.01 *** p<.001 (2-tailed). c Mean difference divided by the pooled standard deviation.
NSSE 2009 Mean Comparisons
Howard University
Howard compared with:
Urban Peers-Howard Universities Stakeholders HBCU Peers
Effect Effect Effect Bench-a a a ac cmark Class Mean Mean Sig b Size Mean Sig b Size Mean Sig b Size
4
c
NSSE 2009 Mean Comparisons
Howard University
Howard compared with:
Urban Peers-Howard Universities Stakeholders HBCU Peers
Effect Effect Effect Bench-a a a ac c
Variable mark Class Mean Mean Sig b Size Mean Sig b Size Mean Sig b Size
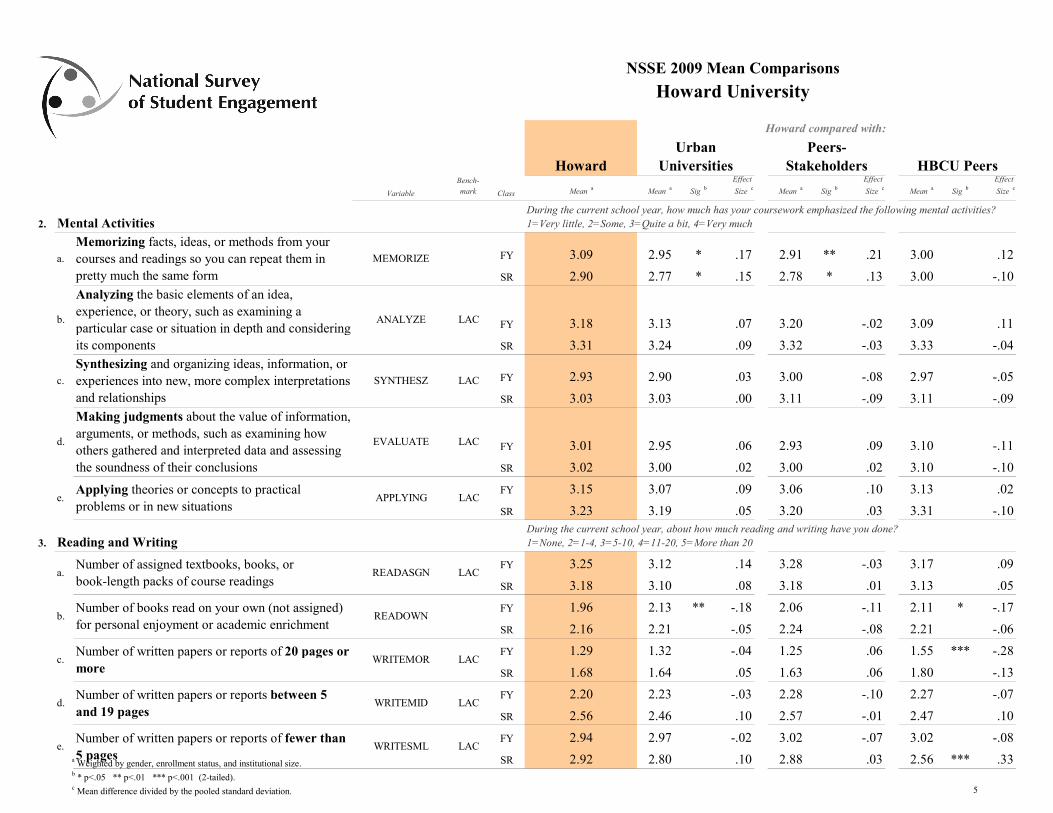
During the current school year, how much has your coursework emphasized the following mental activities? 2. Mental Activities 1=Very little, 2=Some, 3=Quite a bit, 4=Very much
3.
FY 3.09 2.95 * .17 2.91 ** .21 3.00 .12
SR 2.90 2.77 * .15 2.78 * .13 3.00 -.10
FY 3.18 3.13 .07 3.20 -.02 3.09 .11
SR 3.31 3.24 .09 3.32 -.03 3.33 -.04
FY 2.93 2.90 .03 3.00 -.08 2.97 -.05
SR 3.03 3.03 .00 3.11 -.09 3.11 -.09
FY 3.01 2.95 .06 2.93 .09 3.10 -.11
SR 3.02 3.00 .02 3.00 .02 3.10 -.10
FY 3.15 3.07 .09 3.06 .10 3.13 .02
SR 3.23 3.19 .05 3.20 .03 3.31 -.10
Reading and Writing
FY 3.25 3.12 .14 3.28 -.03 3.17 .09
SR 3.18 3.10 .08 3.18 .01 3.13 .05
FY 1.96 2.13 ** -.18 2.06 -.11 2.11 * -.17
SR 2.16 2.21 -.05 2.24 -.08 2.21 -.06
FY 1.29 1.32 -.04 1.25 .06 1.55 *** -.28
SR 1.68 1.64 .05 1.63 .06 1.80 -.13
FY 2.20 2.23 -.03 2.28 -.10 2.27 -.07
SR 2.56 2.46 .10 2.57 -.01 2.47 .10
FY 2.94 2.97 -.02 3.02 -.07 3.02 -.08
SR 2.92 2.80 .10 2.88 .03 2.56 *** .33
LAC
LAC
LAC
During the current school year, about how much reading and writing have you done? 1=None, 2=1-4, 3=5-10, 4=11-20, 5=More than 20
LAC
LAC
LAC
LAC
LAC
Number of written papers or reports of fewer than 5 pages
WRITESML
Applying theories or concepts to practical problems or in new situations
APPLYING
Number of books read on your own (not assigned) for personal enjoyment or academic enrichment
READOWN
Number of written papers or reports of 20 pages or more
WRITEMOR
Number of written papers or reports between 5 and 19 pages
WRITEMID
Number of assigned textbooks, books, or book-length packs of course readings
READASGN
Memorizing facts, ideas, or methods from your courses and readings so you can repeat them in pretty much the same form
MEMORIZE
Analyzing the basic elements of an idea, experience, or theory, such as examining a particular case or situation in depth and considering its components
ANALYZE
Synthesizing and organizing ideas, information, or experiences into new, more complex interpretations and relationships
SYNTHESZ
Making judgments about the value of information, arguments, or methods, such as examining how others gathered and interpreted data and assessing the soundness of their conclusions
EVALUATE
b.
a.
c.
d.
e.
a.
b.
c.
d.
e. a Weighted by gender, enrollment status, and institutional size. b * p<.05 ** p<.01 *** p<.001 (2-tailed). c Mean difference divided by the pooled standard deviation. 5
c
NSSE 2009 Mean Comparisons
Howard University
Howard compared with:
Urban Peers-Howard Universities Stakeholders HBCU Peers
Effect Effect Effect Bench-a a a ac c
Variable mark Class Mean Mean Sig b Size Mean Sig b Size Mean Sig b Size
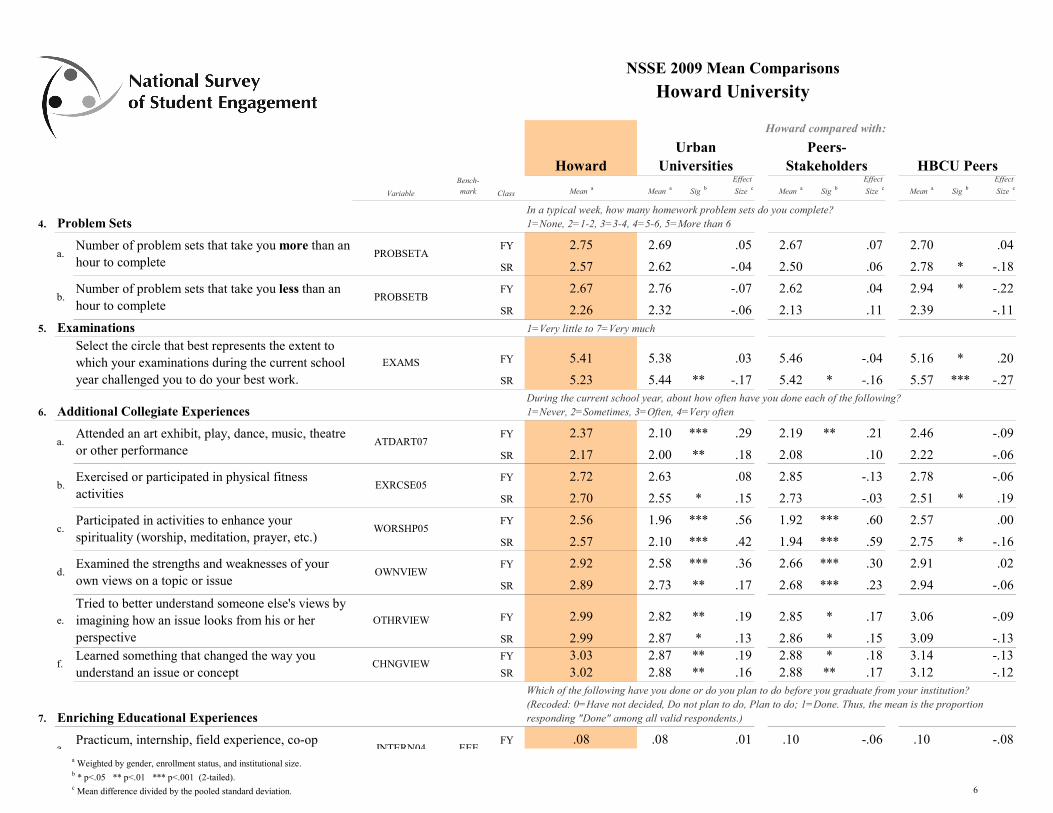
In a typical week, how many homework problem sets do you complete? 4. Problem Sets 1=None, 2=1-2, 3=3-4, 4=5-6, 5=More than 6
FY 2.75 2.69 .05 2.67 .07 2.70 .04
SR 2.57 2.62 -.04 2.50 .06 2.78 * -.18
FY 2.67 2.76 -.07 2.62 .04 2.94 * -.22
SR 2.26 2.32 -.06 2.13 .11 2.39 -.11 5. Examinations 1=Very little to 7=Very much
FY 5.41 5.38 .03 5.46 -.04 5.16 * .20
SR 5.23 5.44 ** -.17 5.42 * -.16 5.57 *** -.27
6. Additional Collegiate Experiences
FY 2.37 2.10 *** .29 2.19 ** .21 2.46 -.09
SR 2.17 2.00 ** .18 2.08 .10 2.22 -.06
FY 2.72 2.63 .08 2.85 -.13 2.78 -.06
SR 2.70 2.55 * .15 2.73 -.03 2.51 * .19
FY 2.56 1.96 *** .56 1.92 *** .60 2.57 .00
SR 2.57 2.10 *** .42 1.94 *** .59 2.75 * -.16
FY 2.92 2.58 *** .36 2.66 *** .30 2.91 .02
SR 2.89 2.73 ** .17 2.68 *** .23 2.94 -.06
FY 2.99 2.82 ** .19 2.85 * .17 3.06 -.09
SR 2.99 2.87 * .13 2.86 * .15 3.09 -.13 FY 3.03 2.87 ** .19 2.88 * .18 3.14 -.13 SR 3.02 2.88 ** .16 2.88 ** .17 3.12 -.12
7. Enriching Educational Experiences
.10 -.06 .10 -.08
Attended an art exhibit, play, dance, music, theatre or other performance
f. Learned something that changed the way you understand an issue or concept
CHNGVIEW
Select the circle that best represents the extent to which your examinations during the current school year challenged you to do your best work.
Participated in activities to enhance your spirituality (worship, meditation, prayer, etc.)
WORSHP05
EXAMS
EXRCSE05
ATDART07
OTHRVIEW
d. Examined the strengths and weaknesses of your own views on a topic or issue
OWNVIEW
e.
Tried to better understand someone else's views by imagining how an issue looks from his or her perspective
Which of the following have you done or do you plan to do before you graduate from your institution? (Recoded: 0=Have not decided, Do not plan to do, Plan to do; 1=Done. Thus, the mean is the proportion responding "Done" among all valid respondents.)
During the current school year, about how often have you done each of the following? 1=Never, 2=Sometimes, 3=Often, 4=Very often
b. Exercised or participated in physical fitness activities
Number of problem sets that take you more than an hour to complete
PROBSETA
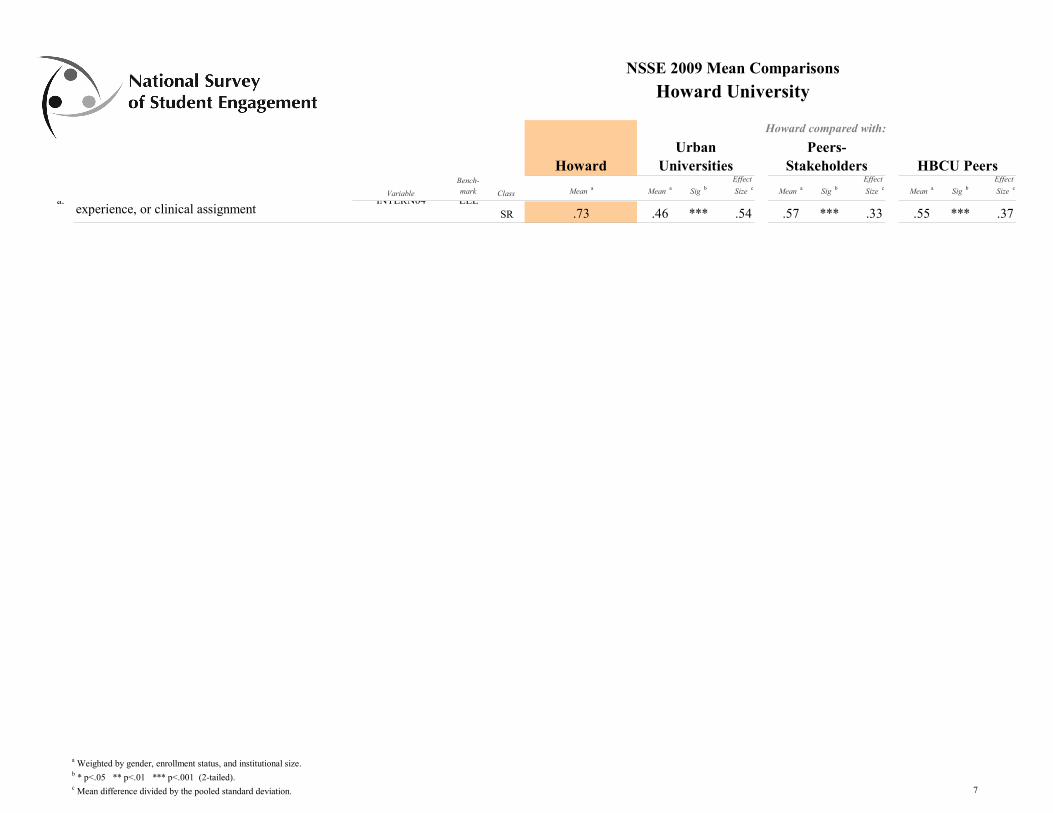
Practicum, internship, field experience, co-op
Number of problem sets that take you less than an hour to complete
PROBSETB
a.
b.
a.
c.
a Weighted by gender, enrollment status, and institutional size. b * p<.05 ** p<.01 *** p<.001 (2-tailed). c Mean difference divided by the pooled standard deviation. 6
FY .08 .08 .01 EEE INTERN04 a.
c
NSSE 2009 Mean Comparisons
Howard University
Howard compared with:
Urban Peers-Howard Universities Stakeholders HBCU Peers
Effect Effect Effect Bench-a a a ac c
Variable mark Class Mean Mean Sig b Size Mean Sig b Size Mean Sig b Size a. INTERN04 EEE
experience, or clinical assignment SR .73 .46 *** .54 .57 *** .33 .55 *** .37
a Weighted by gender, enrollment status, and institutional size. b * p<.05 ** p<.01 *** p<.001 (2-tailed). c Mean difference divided by the pooled standard deviation. 7
c
NSSE 2009 Mean Comparisons
Howard University
Howard compared with:
Urban Peers-Howard Universities Stakeholders HBCU Peers
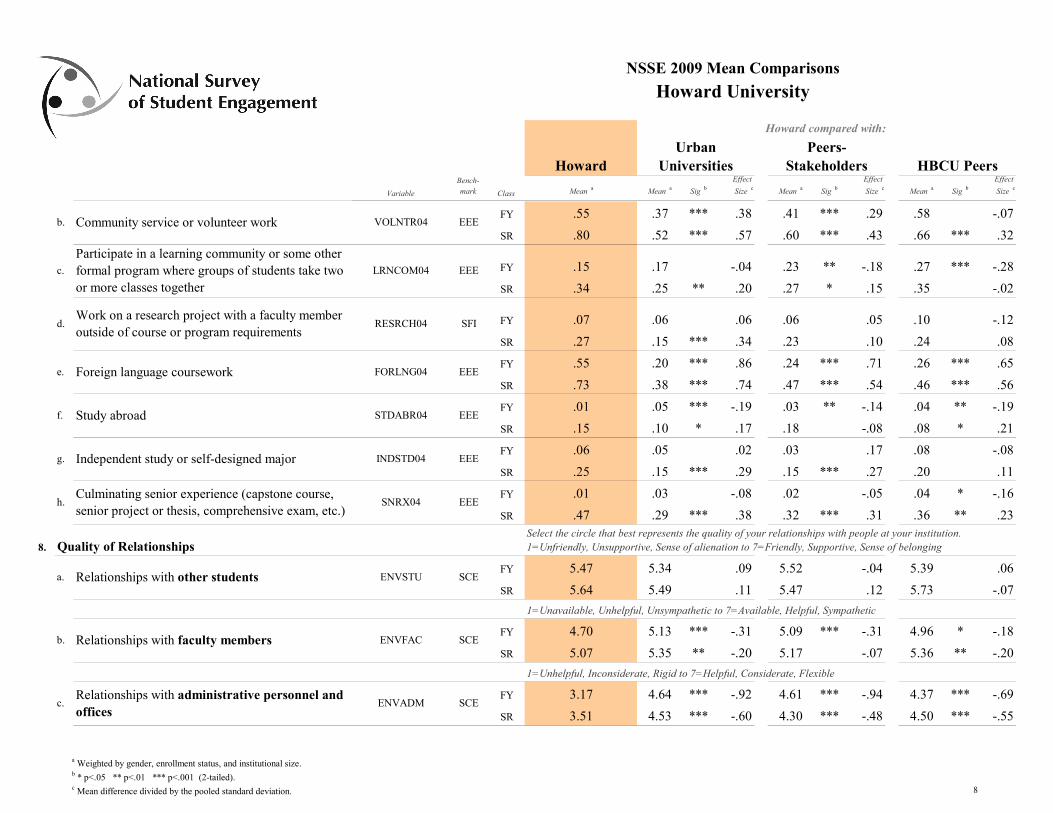
FY .55 .37 *** .38 .41 *** .29 .58 -.07
SR .80 .52 *** .57 .60 *** .43 .66 *** .32
FY .15 .17 -.04 .23 ** -.18 .27 *** -.28
SR .34 .25 ** .20 .27 * .15 .35 -.02
FY .07 .06 .06 .06 .05 .10 -.12
SR .27 .15 *** .34 .23 .10 .24 .08
FY .55 .20 *** .86 .24 *** .71 .26 *** .65
SR .73 .38 *** .74 .47 *** .54 .46 *** .56
FY .01 .05 *** -.19 .03 ** -.14 .04 ** -.19
SR .15 .10 * .17 .18 -.08 .08 * .21
FY .06 .05 .02 .03 .17 .08 -.08
SR .25 .15 *** .29 .15 *** .27 .20 .11
FY .01 .03 -.08 .02 -.05 .04 * -.16
SR .47 .29 *** .38 .32 *** .31 .36 ** .23
8. Quality of Relationships
FY 5.47 5.34 .09 5.52 -.04 5.39 .06
SR 5.64 5.49 .11 5.47 .12 5.73 -.07
FY 4.70 5.13 *** -.31 5.09 *** -.31 4.96 * -.18
SR 5.07 5.35 ** -.20 5.17 -.07 5.36 ** -.20
FY 3.17 4.64 *** -.92 4.61 *** -.94 4.37 *** -.69
SR 3.51 4.53 *** -.60 4.30 *** -.48 4.50 *** -.55
SCE
EEE
EEE
EEE
1=Unavailable, Unhelpful, Unsympathetic to 7=Available, Helpful, Sympathetic
Select the circle that best represents the quality of your relationships with people at your institution. 1=Unfriendly, Unsupportive, Sense of alienation to 7=Friendly, Supportive, Sense of belonging
1=Unhelpful, Inconsiderate, Rigid to 7=Helpful, Considerate, Flexible
SFI
EEE
EEE
EEE
SCE
SCE
ENVFAC
Relationships with other students ENVSTU
Relationships with faculty members
Relationships with administrative personnel and offices
ENVADM
Foreign language coursework FORLNG04
Study abroad STDABR04
Culminating senior experience (capstone course, senior project or thesis, comprehensive exam, etc.)
SNRX04
Independent study or self-designed major INDSTD04
Community service or volunteer work VOLNTR04
Participate in a learning community or some other formal program where groups of students take two or more classes together
LRNCOM04
Work on a research project with a faculty member outside of course or program requirements
RESRCH04
b.
c.
d.
e.
h.
c.
a.
b.
f.
g.
Effect Effect Effect Bench-a a a ac c
Variable mark Class Mean Mean Sig b Size Mean Sig b Size Mean Sig b Size
a Weighted by gender, enrollment status, and institutional size. b * p<.05 ** p<.01 *** p<.001 (2-tailed). c Mean difference divided by the pooled standard deviation. 8
c
NSSE 2009 Mean Comparisons
Howard University
Howard compared with:
Urban Peers-Howard Universities Stakeholders HBCU Peers
Effect Effect Effect Bench-a a a ac c
Variable mark Class Mean Mean Sig b Size Mean Sig b Size Mean Sig b Size
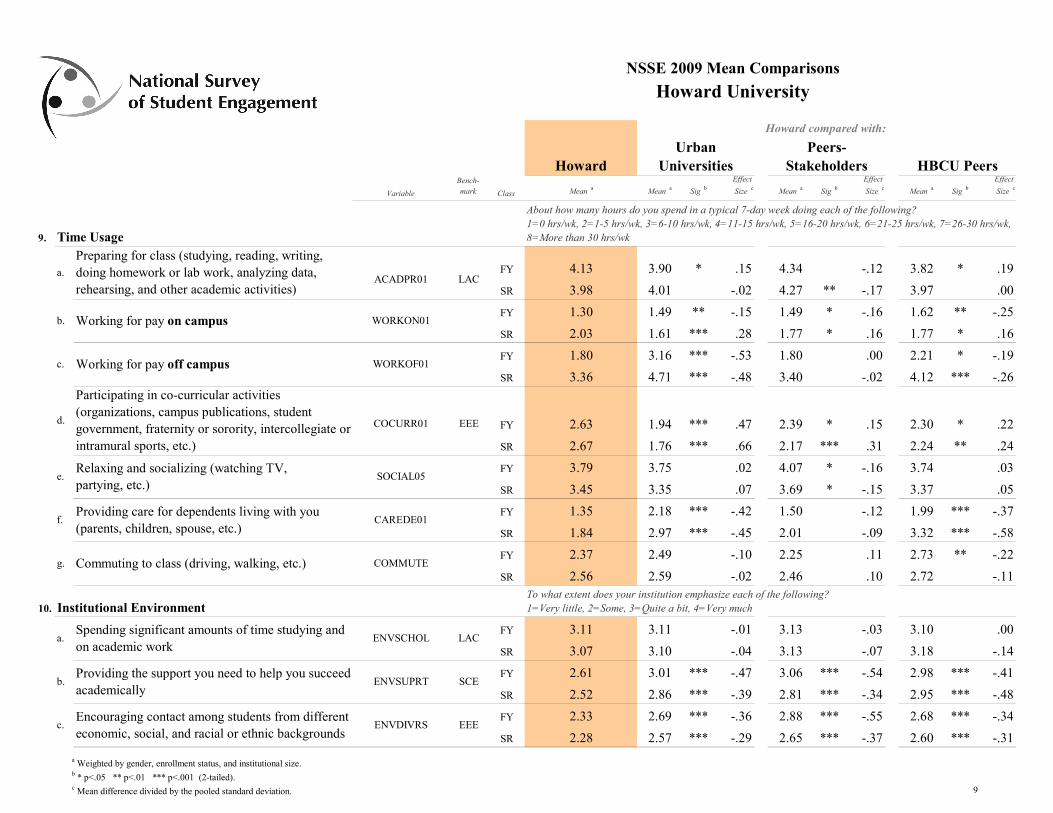
About how many hours do you spend in a typical 7-day week doing each of the following? 1=0 hrs/wk, 2=1-5 hrs/wk, 3=6-10 hrs/wk, 4=11-15 hrs/wk, 5=16-20 hrs/wk, 6=21-25 hrs/wk, 7=26-30 hrs/wk,
9. Time Usage 8=More than 30 hrs/wk
FY 4.13 3.90 * .15 4.34 -.12 3.82 * .19
SR 3.98 4.01 -.02 4.27 ** -.17 3.97 .00
FY 1.30 1.49 ** -.15 1.49 * -.16 1.62 ** -.25
SR 2.03 1.61 *** .28 1.77 * .16 1.77 * .16
FY 1.80 3.16 *** -.53 1.80 .00 2.21 * -.19
SR 3.36 4.71 *** -.48 3.40 -.02 4.12 *** -.26
COCURR01 EEE FY 2.63 1.94 *** .47 2.39 * .15 2.30 * .22
SR 2.67 1.76 *** .66 2.17 *** .31 2.24 ** .24
FY 3.79 3.75 .02 4.07 * -.16 3.74 .03
SR 3.45 3.35 .07 3.69 * -.15 3.37 .05
FY 1.35 2.18 *** -.42 1.50 -.12 1.99 *** -.37
SR 1.84 2.97 *** -.45 2.01 -.09 3.32 *** -.58
FY 2.37 2.49 -.10 2.25 .11 2.73 ** -.22
SR 2.56 2.59 -.02 2.46 .10 2.72 -.11
10. Institutional Environment
FY 3.11 3.11 -.01 3.13 -.03 3.10 .00
SR 3.07 3.10 -.04 3.13 -.07 3.18 -.14
FY 2.61 3.01 *** -.47 3.06 *** -.54 2.98 *** -.41
SR 2.52 2.86 *** -.39 2.81 *** -.34 2.95 *** -.48
FY 2.33 2.69 *** -.36 2.88 *** -.55 2.68 *** -.34
SR 2.28 2.57 *** -.29 2.65 *** -.37 2.60 *** -.31
To what extent does your institution emphasize each of the following? 1=Very little, 2=Some, 3=Quite a bit, 4=Very much
LAC
SCE
EEE
LAC
COMMUTE
Spending significant amounts of time studying and on academic work
ENVSCHOL
Providing the support you need to help you succeed academically
ENVSUPRT
Providing care for dependents living with you (parents, children, spouse, etc.)
CAREDE01
Commuting to class (driving, walking, etc.)
Encouraging contact among students from different economic, social, and racial or ethnic backgrounds
ENVDIVRS
Relaxing and socializing (watching TV, partying, etc.)
SOCIAL05
Working for pay on campus WORKON01
Working for pay off campus WORKOF01
Participating in co-curricular activities (organizations, campus publications, student government, fraternity or sorority, intercollegiate or intramural sports, etc.)
Preparing for class (studying, reading, writing, doing homework or lab work, analyzing data, rehearsing, and other academic activities)
ACADPR01
c.
a.
b.
f.
c.
b.
a.
d.
e.
g.
a Weighted by gender, enrollment status, and institutional size. b * p<.05 ** p<.01 *** p<.001 (2-tailed). c Mean difference divided by the pooled standard deviation. 9
c
NSSE 2009 Mean Comparisons
Howard University
Howard compared with:
Urban Peers-Howard Universities Stakeholders HBCU Peers
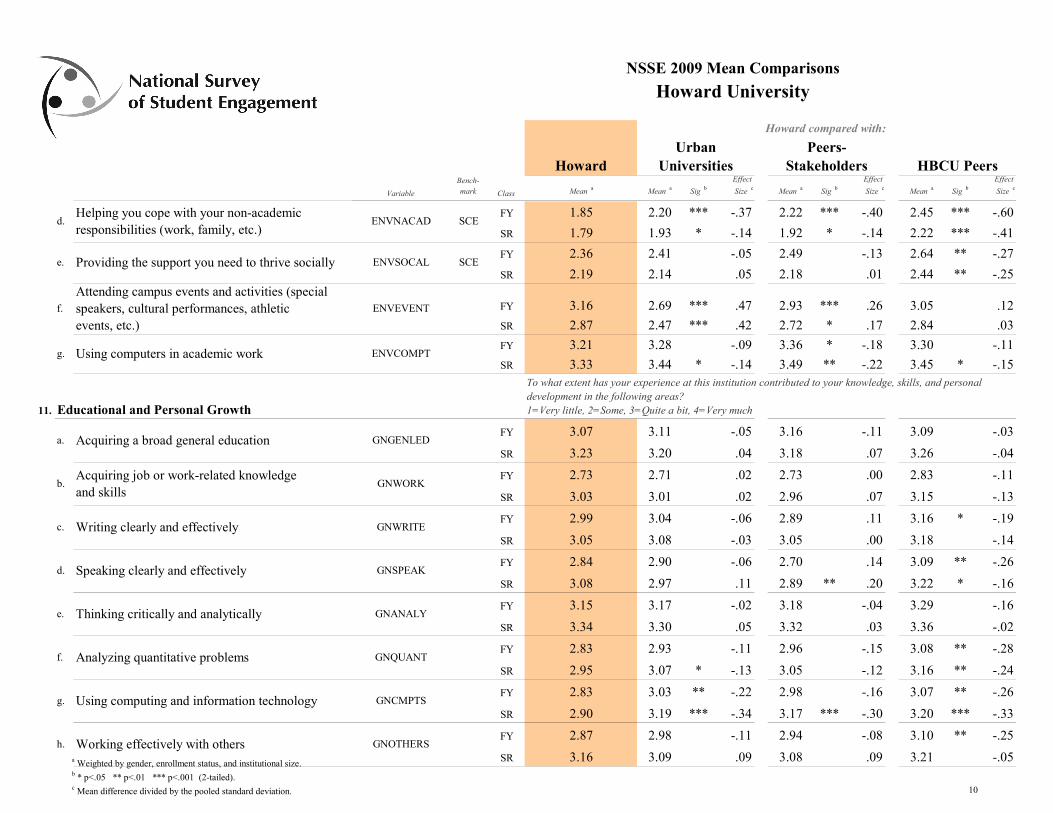
FY 1.85 2.20 *** -.37 2.22 *** -.40 2.45 *** -.60
SR 1.79 1.93 * -.14 1.92 * -.14 2.22 *** -.41
FY 2.36 2.41 -.05 2.49 -.13 2.64 ** -.27
SR 2.19 2.14 .05 2.18 .01 2.44 ** -.25
FY 3.16 2.69 *** .47 2.93 *** .26 3.05 .12
SR 2.87 2.47 *** .42 2.72 * .17 2.84 .03
FY 3.21 3.28 -.09 3.36 * -.18 3.30 -.11
SR 3.33 3.44 * -.14 3.49 ** -.22 3.45 * -.15
11. Educational and Personal Growth
FY 3.07 3.11 -.05 3.16 -.11 3.09 -.03
SR 3.23 3.20 .04 3.18 .07 3.26 -.04
FY 2.73 2.71 .02 2.73 .00 2.83 -.11
SR 3.03 3.01 .02 2.96 .07 3.15 -.13
FY 2.99 3.04 -.06 2.89 .11 3.16 * -.19
SR 3.05 3.08 -.03 3.05 .00 3.18 -.14
FY 2.84 2.90 -.06 2.70 .14 3.09 ** -.26
SR 3.08 2.97 .11 2.89 ** .20 3.22 * -.16
FY 3.15 3.17 -.02 3.18 -.04 3.29 -.16
SR 3.34 3.30 .05 3.32 .03 3.36 -.02
FY 2.83 2.93 -.11 2.96 -.15 3.08 ** -.28
SR 2.95 3.07 * -.13 3.05 -.12 3.16 ** -.24
FY 2.83 3.03 ** -.22 2.98 -.16 3.07 ** -.26
SR 2.90 3.19 *** -.34 3.17 *** -.30 3.20 *** -.33
FY 2.87 2.98 -.11 2.94 -.08 3.10 ** -.25
SR 3.16 3.09 .09 3.08 .09 3.21 -.05
To what extent has your experience at this institution contributed to your knowledge, skills, and personal development in the following areas? 1=Very little, 2=Some, 3=Quite a bit, 4=Very much
SCE
SCE
Using computers in academic work
Acquiring a broad general education
ENVEVENT
ENVCOMPT
Providing the support you need to thrive socially ENVSOCAL
Attending campus events and activities (special speakers, cultural performances, athletic events, etc.)
Using computing and information technology GNCMPTS
GNGENLED
Acquiring job or work-related knowledge and skills
GNWORK
Writing clearly and effectively
Working effectively with others GNOTHERS
Speaking clearly and effectively GNSPEAK
Thinking critically and analytically GNANALY
Analyzing quantitative problems GNQUANT
GNWRITE
Helping you cope with your non-academic responsibilities (work, family, etc.)
ENVNACAD
f.
d.
e.
f.
g.
g.
h.
d.
e.
a.
b.
c.
a Weighted by gender, enrollment status, and institutional size.
Effect Effect Effect Bench-a a a ac c
Variable mark Class Mean Mean Sig b Size Mean Sig b Size Mean Sig b Size
b * p<.05 ** p<.01 *** p<.001 (2-tailed). c Mean difference divided by the pooled standard deviation. 10
NSSE 2009 Mean Comparisons
Howard University
Howard compared with:
Urban Peers-Howard Universities Stakeholders HBCU Peers
Variable
Bench-mark Class Mean a Mean a Sig b
Effect
Size c Mean a Sig b
Effect
Size c Mean a Sig b
Effect
Size c
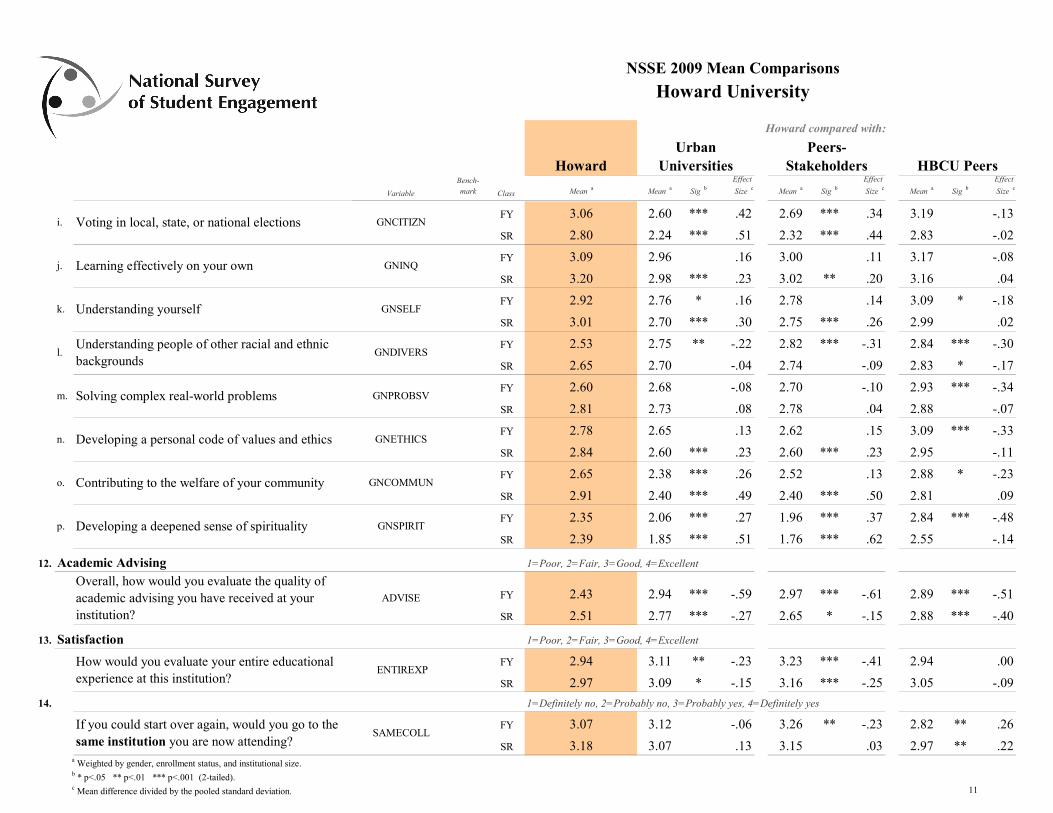
FY 3.06 2.60 *** .42 2.69 *** .34 3.19 -.13
SR 2.80 2.24 *** .51 2.32 *** .44 2.83 -.02
FY 3.09 2.96 .16 3.00 .11 3.17 -.08
SR 3.20 2.98 *** .23 3.02 ** .20 3.16 .04
FY 2.92 2.76 * .16 2.78 .14 3.09 * -.18
SR 3.01 2.70 *** .30 2.75 *** .26 2.99 .02
FY 2.53 2.75 ** -.22 2.82 *** -.31 2.84 *** -.30
SR 2.65 2.70 -.04 2.74 -.09 2.83 * -.17
FY 2.60 2.68 -.08 2.70 -.10 2.93 *** -.34
SR 2.81 2.73 .08 2.78 .04 2.88 -.07
FY 2.78 2.65 .13 2.62 .15 3.09 *** -.33
SR 2.84 2.60 *** .23 2.60 *** .23 2.95 -.11
FY 2.65 2.38 *** .26 2.52 .13 2.88 * -.23
SR 2.91 2.40 *** .49 2.40 *** .50 2.81 .09
FY 2.35 2.06 *** .27 1.96 *** .37 2.84 *** -.48
SR 2.39 1.85 *** .51 1.76 *** .62 2.55 -.14
12. Academic Advising 1=Poor, 2=Fair, 3=Good, 4=Excellent
FY 2.43 2.94 *** -.59 2.97 *** -.61 2.89 *** -.51
SR 2.51 2.77 *** -.27 2.65 * -.15 2.88 *** -.40
13. Satisfaction 1=Poor, 2=Fair, 3=Good, 4=Excellent
FY 2.94 3.11 ** -.23 3.23 *** -.41 2.94 .00
SR 2.97 3.09 * -.15 3.16 *** -.25 3.05 -.09
14. 1=Definitely no, 2=Probably no, 3=Probably yes, 4=Definitely yes
FY 3.07 3.12 -.06 3.26 ** -.23 2.82 ** .26
SR 3.18 3.07 .13 3.15 .03 2.97 ** .22
Contributing to the welfare of your community GNCOMMUN
Solving complex real-world problems
p. Developing a deepened sense of spirituality GNSPIRIT
GNPROBSV
Voting in local, state, or national elections GNCITIZN
Learning effectively on your own GNINQ
Developing a personal code of values and ethics GNETHICS
Understanding yourself GNSELF
Understanding people of other racial and ethnic backgrounds
GNDIVERS l.
i.
j.
n.
m.
o.
k.
Overall, how would you evaluate the quality of academic advising you have received at your institution?
ADVISE
ENTIREXP
If you could start over again, would you go to the same institution you are now attending?
SAMECOLL
How would you evaluate your entire educational experience at this institution?
a Weighted by gender, enrollment status, and institutional size. b * p<.05 ** p<.01 *** p<.001 (2-tailed). c Mean difference divided by the pooled standard deviation. 11
NSSE 2009 Mean Comparisons
Howard University
Variable
Bench-mark Class
Howard aMean
Urban Universities
Effect a cMean Sig b Size
Howard compared with:
Peers-Stakeholders
Effect a cMean Sig b Size
HBCU Peers Effect
a cMean Sig b Size
IPEDS: 131520
a Weighted by gender, enrollment status, and institutional size. b * p<.05 ** p<.01 *** p<.001 (2-tailed). c Mean difference divided by the pooled standard deviation. 12
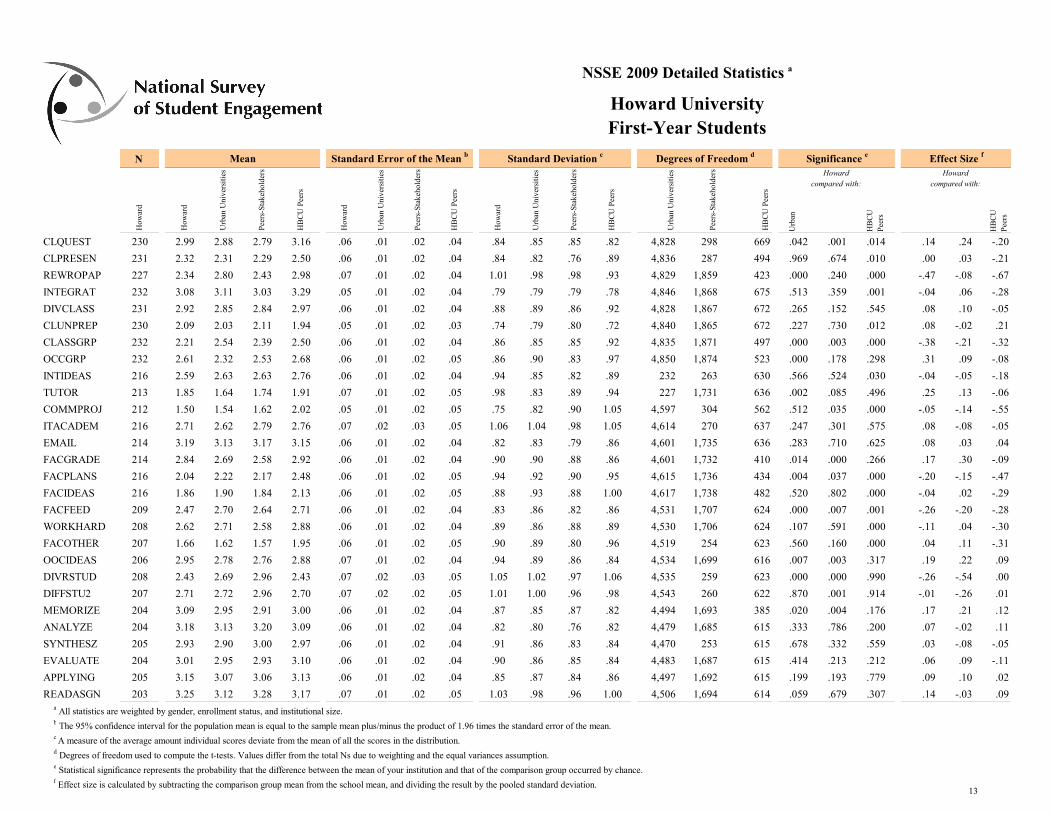
NSSE 2009 Detailed Statistics a
Howard University First-Year Students
CLQUEST
CLPRESEN
REWROPAP
INTEGRAT
DIVCLASS
CLUNPREP
CLASSGRP
OCCGRP
INTIDEAS
TUTOR
COMMPROJ
ITACADEM
FACGRADE
FACPLANS
FACIDEAS
FACFEED
WORKHARD
FACOTHER
OOCIDEAS
DIVRSTUD
DIFFSTU2
MEMORIZE
ANALYZE
SYNTHESZ
EVALUATE
APPLYING
READASGN
N
Urb
an
HB
CU
Pee
rs
HB
CU
Pee
rs
230 2.99 2.88 2.79 3.16 .06 .01 .02 .04 .84 .85 .85 .82 4,828 298 669 .042 .001 .014 .14 .24 -.20
231 2.32 2.31 2.29 2.50 .06 .01 .02 .04 .84 .82 .76 .89 4,836 287 494 .969 .674 .010 .00 .03 -.21
227 2.34 2.80 2.43 2.98 .07 .01 .02 .04 1.01 .98 .98 .93 4,829 1,859 423 .000 .240 .000 -.47 -.08 -.67
232 3.08 3.11 3.03 3.29 .05 .01 .02 .04 .79 .79 .79 .78 4,846 1,868 675 .513 .359 .001 -.04 .06 -.28
231 2.92 2.85 2.84 2.97 .06 .01 .02 .04 .88 .89 .86 .92 4,828 1,867 672 .265 .152 .545 .08 .10 -.05
230 2.09 2.03 2.11 1.94 .05 .01 .02 .03 .74 .79 .80 .72 4,840 1,865 672 .227 .730 .012 .08 -.02 .21
232 2.21 2.54 2.39 2.50 .06 .01 .02 .04 .86 .85 .85 .92 4,835 1,871 497 .000 .003 .000 -.38 -.21 -.32
232 2.61 2.32 2.53 2.68 .06 .01 .02 .05 .86 .90 .83 .97 4,850 1,874 523 .000 .178 .298 .31 .09 -.08
216 2.59 2.63 2.63 2.76 .06 .01 .02 .04 .94 .85 .82 .89 232 263 630 .566 .524 .030 -.04 -.05 -.18
213 1.85 1.64 1.74 1.91 .07 .01 .02 .05 .98 .83 .89 .94 227 1,731 636 .002 .085 .496 .25 .13 -.06
212 1.50 1.54 1.62 2.02 .05 .01 .02 .05 .75 .82 .90 1.05 4,597 304 562 .512 .035 .000 -.05 -.14 -.55
216 2.71 2.62 2.79 2.76 .07 .02 .03 .05 1.06 1.04 .98 1.05 4,614 270 637 .247 .301 .575 .08 -.08 -.05
214 3.19 3.13 3.17 3.15 .06 .01 .02 .04 .82 .83 .79 .86 4,601 1,735 636 .283 .710 .625 .08 .03 .04
214 2.84 2.69 2.58 2.92 .06 .01 .02 .04 .90 .90 .88 .86 4,601 1,732 410 .014 .000 .266 .17 .30 -.09
216 2.04 2.22 2.17 2.48 .06 .01 .02 .05 .94 .92 .90 .95 4,615 1,736 434 .004 .037 .000 -.20 -.15 -.47
216 1.86 1.90 1.84 2.13 .06 .01 .02 .05 .88 .93 .88 1.00 4,617 1,738 482 .520 .802 .000 -.04 .02 -.29
209 2.47 2.70 2.64 2.71 .06 .01 .02 .04 .83 .86 .82 .86 4,531 1,707 624 .000 .007 .001 -.26 -.20 -.28
208 2.62 2.71 2.58 2.88 .06 .01 .02 .04 .89 .86 .88 .89 4,530 1,706 624 .107 .591 .000 -.11 .04 -.30
207 1.66 1.62 1.57 1.95 .06 .01 .02 .05 .90 .89 .80 .96 4,519 254 623 .560 .160 .000 .04 .11 -.31
206 2.95 2.78 2.76 2.88 .07 .01 .02 .04 .94 .89 .86 .84 4,534 1,699 616 .007 .003 .317 .19 .22 .09
208 2.43 2.69 2.96 2.43 .07 .02 .03 .05 1.05 1.02 .97 1.06 4,535 259 623 .000 .000 .990 -.26 -.54 .00
207 2.71 2.72 2.96 2.70 .07 .02 .02 .05 1.01 1.00 .96 .98 4,543 260 622 .870 .001 .914 -.01 -.26 .01
204 3.09 2.95 2.91 3.00 .06 .01 .02 .04 .87 .85 .87 .82 4,494 1,693 385 .020 .004 .176 .17 .21 .12
204 3.18 3.13 3.20 3.09 .06 .01 .02 .04 .82 .80 .76 .82 4,479 1,685 615 .333 .786 .200 .07 -.02 .11
205 2.93 2.90 3.00 2.97 .06 .01 .02 .04 .91 .86 .83 .84 4,470 253 615 .678 .332 .559 .03 -.08 -.05
204 3.01 2.95 2.93 3.10 .06 .01 .02 .04 .90 .86 .85 .84 4,483 1,687 615 .414 .213 .212 .06 .09 -.11
205 3.15 3.07 3.06 3.13 .06 .01 .02 .04 .85 .87 .84 .86 4,497 1,692 615 .199 .193 .779 .09 .10 .02
203 3.25 3.12 3.28 3.17 .07 .01 .02 .05 1.03 .98 .96 1.00 4,506 1,694 614 .059 .679 .307 .14 -.03 .09
Urb
an U
nive
rsit
ies
Urb
an U
nive
rsit
ies
Urb
an U
nive
rsit
ies
Pee
rs-S
take
hold
ers
Significance e
Howard compared with:
HB
CU
Pee
rs
Urb
an U
nive
rsit
ies
How
ard
Howard compared with:
How
ard
HB
CU
Pee
rs
How
ard
Pee
rs-S
take
hold
ers
HB
CU
Pee
rs
How
ard
Effect Size fMean Standard Error of the Mean b Standard Deviation c Degrees of Freedom d
HB
CU
Pee
rs
Pee
rs-S
take
hold
ers
Pee
rs-S
take
hold
ers
a All statistics are weighted by gender, enrollment status, and institutional size. b The 95% confidence interval for the population mean is equal to the sample mean plus/minus the product of 1.96 times the standard error of the mean. c A measure of the average amount individual scores deviate from the mean of all the scores in the distribution. d Degrees of freedom used to compute the t-tests. Values differ from the total Ns due to weighting and the equal variances assumption. e Statistical significance represents the probability that the difference between the mean of your institution and that of the comparison group occurred by chance. f Effect size is calculated by subtracting the comparison group mean from the school mean, and dividing the result by the pooled standard deviation.
13
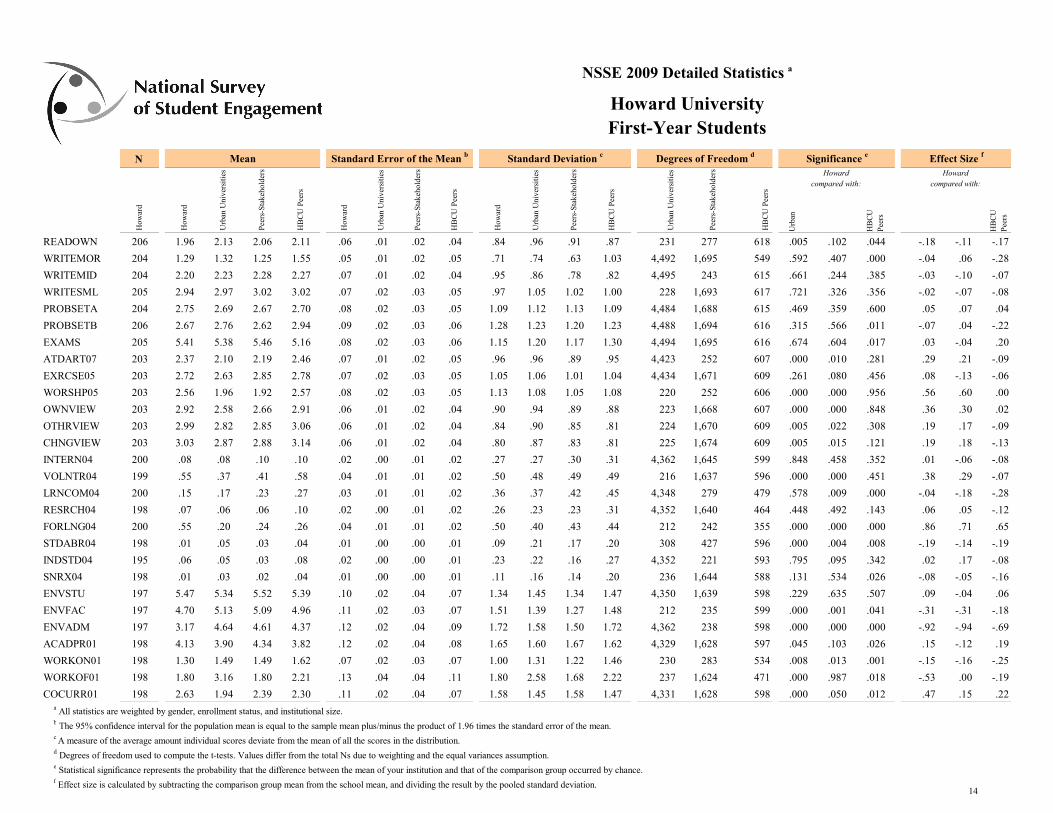
NSSE 2009 Detailed Statistics a
Howard University First-Year Students
N
Urb
an
HB
CU
Pee
rs
HB
CU
Pee
rs
Urb
an U
nive
rsit
ies
Urb
an U
nive
rsit
ies
Urb
an U
nive
rsit
ies
Pee
rs-S
take
hold
ers
Significance e
Howard compared with:
HB
CU
Pee
rs
Urb
an U
nive
rsit
ies
How
ard
Howard compared with:
How
ard
HB
CU
Pee
rs
How
ard
Pee
rs-S
take
hold
ers
HB
CU
Pee
rs
How
ard
Effect Size fMean Standard Error of the Mean b Standard Deviation c Degrees of Freedom d
HB
CU
Pee
rs
Pee
rs-S
take
hold
ers
Pee
rs-S
take
hold
ers
206 1.96 2.13 2.06 2.11 .06 .01 .02 .04 .84 .96 .91 .87 231 277 618 .005 .102 .044 -.18 -.11 -.17
204 1.29 1.32 1.25 1.55 .05 .01 .02 .05 .71 .74 .63 1.03 4,492 1,695 549 .592 .407 .000 -.04 .06 -.28
204 2.20 2.23 2.28 2.27 .07 .01 .02 .04 .95 .86 .78 .82 4,495 243 615 .661 .244 .385 -.03 -.10 -.07
205 2.94 2.97 3.02 3.02 .07 .02 .03 .05 .97 1.05 1.02 1.00 228 1,693 617 .721 .326 .356 -.02 -.07 -.08
204 2.75 2.69 2.67 2.70 .08 .02 .03 .05 1.09 1.12 1.13 1.09 4,484 1,688 615 .469 .359 .600 .05 .07 .04
206 2.67 2.76 2.62 2.94 .09 .02 .03 .06 1.28 1.23 1.20 1.23 4,488 1,694 616 .315 .566 .011 -.07 .04 -.22
205 5.41 5.38 5.46 5.16 .08 .02 .03 .06 1.15 1.20 1.17 1.30 4,494 1,695 616 .674 .604 .017 .03 -.04 .20
203 2.37 2.10 2.19 2.46 .07 .01 .02 .05 .96 .96 .89 .95 4,423 252 607 .000 .010 .281 .29 .21 -.09
203 2.72 2.63 2.85 2.78 .07 .02 .03 .05 1.05 1.06 1.01 1.04 4,434 1,671 609 .261 .080 .456 .08 -.13 -.06
203 2.56 1.96 1.92 2.57 .08 .02 .03 .05 1.13 1.08 1.05 1.08 220 252 606 .000 .000 .956 .56 .60 .00
203 2.92 2.58 2.66 2.91 .06 .01 .02 .04 .90 .94 .89 .88 223 1,668 607 .000 .000 .848 .36 .30 .02
203 2.99 2.82 2.85 3.06 .06 .01 .02 .04 .84 .90 .85 .81 224 1,670 609 .005 .022 .308 .19 .17 -.09
203 3.03 2.87 2.88 3.14 .06 .01 .02 .04 .80 .87 .83 .81 225 1,674 609 .005 .015 .121 .19 .18 -.13
200 .08 .08 .10 .10 .02 .00 .01 .02 .27 .27 .30 .31 4,362 1,645 599 .848 .458 .352 .01 -.06 -.08
199 .55 .37 .41 .58 .04 .01 .01 .02 .50 .48 .49 .49 216 1,637 596 .000 .000 .451 .38 .29 -.07
200 .15 .17 .23 .27 .03 .01 .01 .02 .36 .37 .42 .45 4,348 279 479 .578 .009 .000 -.04 -.18 -.28
198 .07 .06 .06 .10 .02 .00 .01 .02 .26 .23 .23 .31 4,352 1,640 464 .448 .492 .143 .06 .05 -.12
200 .55 .20 .24 .26 .04 .01 .01 .02 .50 .40 .43 .44 212 242 355 .000 .000 .000 .86 .71 .65
198 .01 .05 .03 .04 .01 .00 .00 .01 .09 .21 .17 .20 308 427 596 .000 .004 .008 -.19 -.14 -.19
195 .06 .05 .03 .08 .02 .00 .00 .01 .23 .22 .16 .27 4,352 221 593 .795 .095 .342 .02 .17 -.08
198 .01 .03 .02 .04 .01 .00 .00 .01 .11 .16 .14 .20 236 1,644 588 .131 .534 .026 -.08 -.05 -.16
197 5.47 5.34 5.52 5.39 .10 .02 .04 .07 1.34 1.45 1.34 1.47 4,350 1,639 598 .229 .635 .507 .09 -.04 .06
197 4.70 5.13 5.09 4.96 .11 .02 .03 .07 1.51 1.39 1.27 1.48 212 235 599 .000 .001 .041 -.31 -.31 -.18
197 3.17 4.64 4.61 4.37 .12 .02 .04 .09 1.72 1.58 1.50 1.72 4,362 238 598 .000 .000 .000 -.92 -.94 -.69
198 4.13 3.90 4.34 3.82 .12 .02 .04 .08 1.65 1.60 1.67 1.62 4,329 1,628 597 .045 .103 .026 .15 -.12 .19
198 1.30 1.49 1.49 1.62 .07 .02 .03 .07 1.00 1.31 1.22 1.46 230 283 534 .008 .013 .001 -.15 -.16 -.25
198 1.80 3.16 1.80 2.21 .13 .04 .04 .11 1.80 2.58 1.68 2.22 237 1,624 471 .000 .987 .018 -.53 .00 -.19
198 2.63 1.94 2.39 2.30 .11 .02 .04 .07 1.58 1.45 1.58 1.47 4,331 1,628 598 .000 .050 .012 .47 .15 .22
14
READOWN
WRITEMOR
WRITEMID
WRITESML
PROBSETA
PROBSETB
EXAMS
ATDART07
EXRCSE05
WORSHP05
OWNVIEW
OTHRVIEW
CHNGVIEW
INTERN04
VOLNTR04
LRNCOM04
RESRCH04
FORLNG04
STDABR04
INDSTD04
SNRX04
ENVSTU
ENVFAC
ENVADM
ACADPR01
WORKON01
WORKOF01
COCURR01 a All statistics are weighted by gender, enrollment status, and institutional size. b The 95% confidence interval for the population mean is equal to the sample mean plus/minus the product of 1.96 times the standard error of the mean. c A measure of the average amount individual scores deviate from the mean of all the scores in the distribution. d Degrees of freedom used to compute the t-tests. Values differ from the total Ns due to weighting and the equal variances assumption. e Statistical significance represents the probability that the difference between the mean of your institution and that of the comparison group occurred by chance. f Effect size is calculated by subtracting the comparison group mean from the school mean, and dividing the result by the pooled standard deviation.
NSSE 2009 Detailed Statistics a
Howard University First-Year Students
N
Urb
an
HB
CU
Pee
rs
HB
CU
Pee
rs
Urb
an U
nive
rsit
ies
Urb
an U
nive
rsit
ies
Urb
an U
nive
rsit
ies
Pee
rs-S
take
hold
ers
Significance e
Howard compared with:
HB
CU
Pee
rs
Urb
an U
nive
rsit
ies
How
ard
Howard compared with:
How
ard
HB
CU
Pee
rs
How
ard
Pee
rs-S
take
hold
ers
HB
CU
Pee
rs
How
ard
Effect Size fMean Standard Error of the Mean b Standard Deviation c Degrees of Freedom d
HB
CU
Pee
rs
Pee
rs-S
take
hold
ers
Pee
rs-S
take
hold
ers
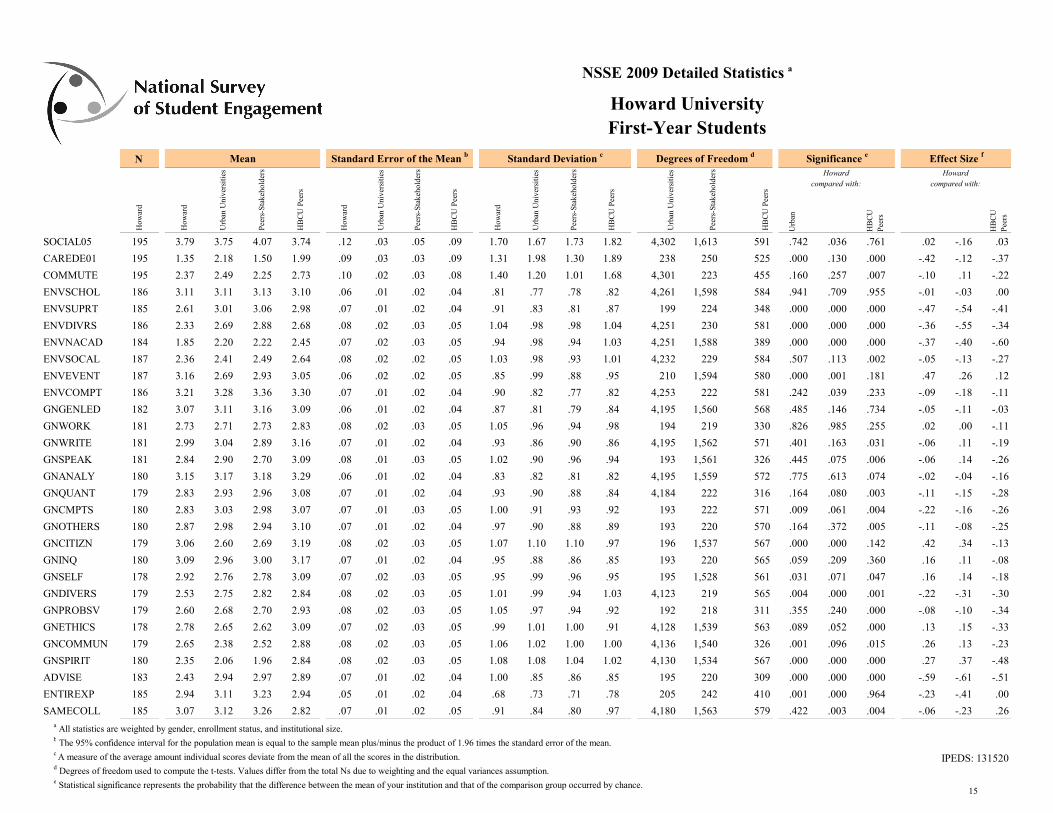
195 3.79 3.75 4.07 3.74 .12 .03 .05 .09 1.70 1.67 1.73 1.82 4,302 1,613 591 .742 .036 .761 .02 -.16 .03
195 1.35 2.18 1.50 1.99 .09 .03 .03 .09 1.31 1.98 1.30 1.89 238 250 525 .000 .130 .000 -.42 -.12 -.37
195 2.37 2.49 2.25 2.73 .10 .02 .03 .08 1.40 1.20 1.01 1.68 4,301 223 455 .160 .257 .007 -.10 .11 -.22
186 3.11 3.11 3.13 3.10 .06 .01 .02 .04 .81 .77 .78 .82 4,261 1,598 584 .941 .709 .955 -.01 -.03 .00
185 2.61 3.01 3.06 2.98 .07 .01 .02 .04 .91 .83 .81 .87 199 224 348 .000 .000 .000 -.47 -.54 -.41
186 2.33 2.69 2.88 2.68 .08 .02 .03 .05 1.04 .98 .98 1.04 4,251 230 581 .000 .000 .000 -.36 -.55 -.34
184 1.85 2.20 2.22 2.45 .07 .02 .03 .05 .94 .98 .94 1.03 4,251 1,588 389 .000 .000 .000 -.37 -.40 -.60
187 2.36 2.41 2.49 2.64 .08 .02 .02 .05 1.03 .98 .93 1.01 4,232 229 584 .507 .113 .002 -.05 -.13 -.27
187 3.16 2.69 2.93 3.05 .06 .02 .02 .05 .85 .99 .88 .95 210 1,594 580 .000 .001 .181 .47 .26 .12
186 3.21 3.28 3.36 3.30 .07 .01 .02 .04 .90 .82 .77 .82 4,253 222 581 .242 .039 .233 -.09 -.18 -.11
182 3.07 3.11 3.16 3.09 .06 .01 .02 .04 .87 .81 .79 .84 4,195 1,560 568 .485 .146 .734 -.05 -.11 -.03
181 2.73 2.71 2.73 2.83 .08 .02 .03 .05 1.05 .96 .94 .98 194 219 330 .826 .985 .255 .02 .00 -.11
181 2.99 3.04 2.89 3.16 .07 .01 .02 .04 .93 .86 .90 .86 4,195 1,562 571 .401 .163 .031 -.06 .11 -.19
181 2.84 2.90 2.70 3.09 .08 .01 .03 .05 1.02 .90 .96 .94 193 1,561 326 .445 .075 .006 -.06 .14 -.26
180 3.15 3.17 3.18 3.29 .06 .01 .02 .04 .83 .82 .81 .82 4,195 1,559 572 .775 .613 .074 -.02 -.04 -.16
179 2.83 2.93 2.96 3.08 .07 .01 .02 .04 .93 .90 .88 .84 4,184 222 316 .164 .080 .003 -.11 -.15 -.28
180 2.83 3.03 2.98 3.07 .07 .01 .03 .05 1.00 .91 .93 .92 193 222 571 .009 .061 .004 -.22 -.16 -.26
180 2.87 2.98 2.94 3.10 .07 .01 .02 .04 .97 .90 .88 .89 193 220 570 .164 .372 .005 -.11 -.08 -.25
179 3.06 2.60 2.69 3.19 .08 .02 .03 .05 1.07 1.10 1.10 .97 196 1,537 567 .000 .000 .142 .42 .34 -.13
180 3.09 2.96 3.00 3.17 .07 .01 .02 .04 .95 .88 .86 .85 193 220 565 .059 .209 .360 .16 .11 -.08
178 2.92 2.76 2.78 3.09 .07 .02 .03 .05 .95 .99 .96 .95 195 1,528 561 .031 .071 .047 .16 .14 -.18
179 2.53 2.75 2.82 2.84 .08 .02 .03 .05 1.01 .99 .94 1.03 4,123 219 565 .004 .000 .001 -.22 -.31 -.30
179 2.60 2.68 2.70 2.93 .08 .02 .03 .05 1.05 .97 .94 .92 192 218 311 .355 .240 .000 -.08 -.10 -.34
178 2.78 2.65 2.62 3.09 .07 .02 .03 .05 .99 1.01 1.00 .91 4,128 1,539 563 .089 .052 .000 .13 .15 -.33
179 2.65 2.38 2.52 2.88 .08 .02 .03 .05 1.06 1.02 1.00 1.00 4,136 1,540 326 .001 .096 .015 .26 .13 -.23
180 2.35 2.06 1.96 2.84 .08 .02 .03 .05 1.08 1.08 1.04 1.02 4,130 1,534 567 .000 .000 .000 .27 .37 -.48
183 2.43 2.94 2.97 2.89 .07 .01 .02 .04 1.00 .85 .86 .85 195 220 309 .000 .000 .000 -.59 -.61 -.51
185 2.94 3.11 3.23 2.94 .05 .01 .02 .04 .68 .73 .71 .78 205 242 410 .001 .000 .964 -.23 -.41 .00
185 3.07 3.12 3.26 2.82 .07 .01 .02 .05 .91 .84 .80 .97 4,180 1,563 579 .422 .003 .004 -.06 -.23 .26
SOCIAL05
CAREDE01
COMMUTE
ENVSCHOL
ENVSUPRT
ENVDIVRS
ENVNACAD
ENVSOCAL
ENVEVENT
ENVCOMPT
GNGENLED
GNWORK
GNWRITE
GNSPEAK
GNANALY
GNQUANT
GNCMPTS
GNOTHERS
GNCITIZN
GNINQ
GNSELF
GNDIVERS
GNPROBSV
GNETHICS
GNCOMMUN
GNSPIRIT
ADVISE
ENTIREXP
SAMECOLL a All statistics are weighted by gender, enrollment status, and institutional size. b The 95% confidence interval for the population mean is equal to the sample mean plus/minus the product of 1.96 times the standard error of the mean. c A measure of the average amount individual scores deviate from the mean of all the scores in the distribution. IPEDS: 131520 d Degrees of freedom used to compute the t-tests. Values differ from the total Ns due to weighting and the equal variances assumption. e Statistical significance represents the probability that the difference between the mean of your institution and that of the comparison group occurred by chance.
15
NSSE 2009 Detailed Statistics a
Howard University First-Year Students
N
Urb
an
HB
CU
Pee
rs
HB
CU
Pee
rs
Urb
an U
nive
rsit
ies
Urb
an U
nive
rsit
ies
Urb
an U
nive
rsit
ies
Pee
rs-S
take
hold
ers
Significance e
Howard compared with:
HB
CU
Pee
rs
Urb
an U
nive
rsit
ies
How
ard
Howard compared with:
How
ard
HB
CU
Pee
rs
How
ard
Pee
rs-S
take
hold
ers
HB
CU
Pee
rs
How
ard
Effect Size fMean Standard Error of the Mean b Standard Deviation c Degrees of Freedom d
HB
CU
Pee
rs
Pee
rs-S
take
hold
ers
Pee
rs-S
take
hold
ers
f Effect size is calculated by subtracting the comparison group mean from the school mean, and dividing the result by the pooled standard deviation.
16
NSSE 2009 Detailed Statistics a
Howard University Seniors
CLQUEST
CLPRESEN
REWROPAP
INTEGRAT
DIVCLASS
CLUNPREP
CLASSGRP
OCCGRP
INTIDEAS
TUTOR
COMMPROJ
ITACADEM
FACGRADE
FACPLANS
FACIDEAS
FACFEED
WORKHARD
FACOTHER
OOCIDEAS
DIVRSTUD
DIFFSTU2
MEMORIZE
ANALYZE
SYNTHESZ
EVALUATE
APPLYING
READASGN a All statistics are weighted by gender, enrollment status, and institutional size.
N
Urb
an
HB
CU
Pee
rs
HB
CU
Pee
rs
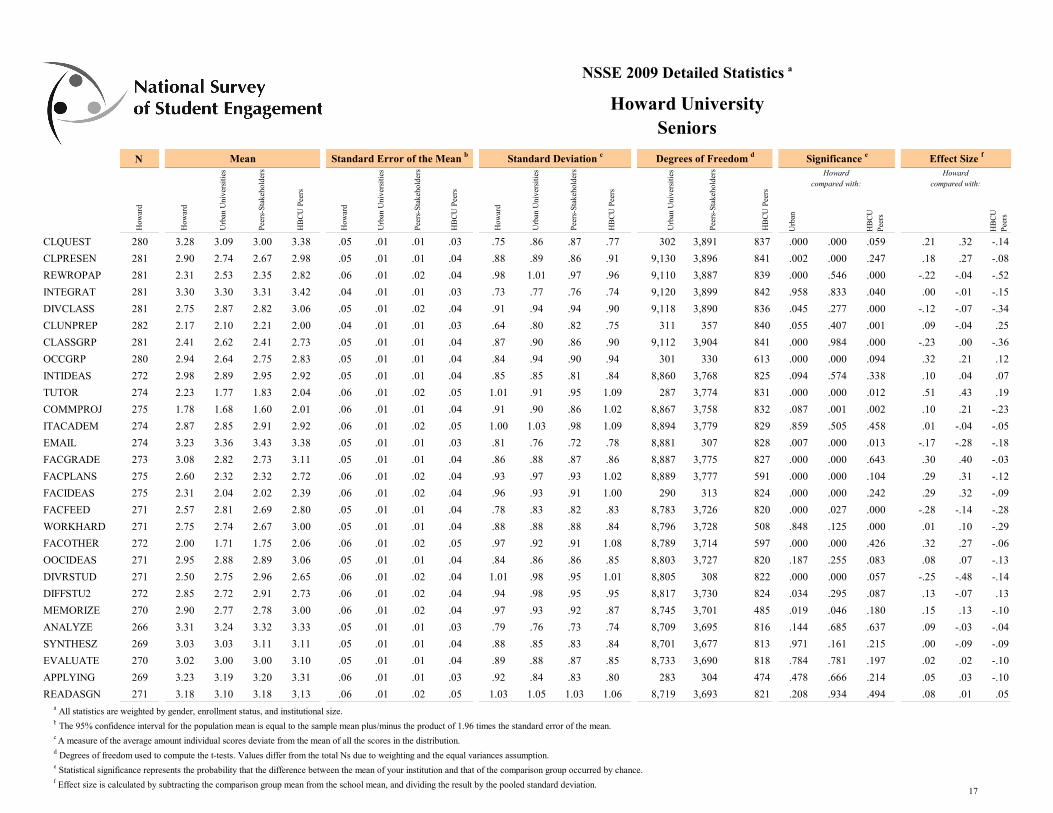
280 3.28 3.09 3.00 3.38 .05 .01 .01 .03 .75 .86 .87 .77 302 3,891 837 .000 .000 .059 .21 .32 -.14
281 2.90 2.74 2.67 2.98 .05 .01 .01 .04 .88 .89 .86 .91 9,130 3,896 841 .002 .000 .247 .18 .27 -.08
281 2.31 2.53 2.35 2.82 .06 .01 .02 .04 .98 1.01 .97 .96 9,110 3,887 839 .000 .546 .000 -.22 -.04 -.52
281 3.30 3.30 3.31 3.42 .04 .01 .01 .03 .73 .77 .76 .74 9,120 3,899 842 .958 .833 .040 .00 -.01 -.15
281 2.75 2.87 2.82 3.06 .05 .01 .02 .04 .91 .94 .94 .90 9,118 3,890 836 .045 .277 .000 -.12 -.07 -.34
282 2.17 2.10 2.21 2.00 .04 .01 .01 .03 .64 .80 .82 .75 311 357 840 .055 .407 .001 .09 -.04 .25
281 2.41 2.62 2.41 2.73 .05 .01 .01 .04 .87 .90 .86 .90 9,112 3,904 841 .000 .984 .000 -.23 .00 -.36
280 2.94 2.64 2.75 2.83 .05 .01 .01 .04 .84 .94 .90 .94 301 330 613 .000 .000 .094 .32 .21 .12
272 2.98 2.89 2.95 2.92 .05 .01 .01 .04 .85 .85 .81 .84 8,860 3,768 825 .094 .574 .338 .10 .04 .07
274 2.23 1.77 1.83 2.04 .06 .01 .02 .05 1.01 .91 .95 1.09 287 3,774 831 .000 .000 .012 .51 .43 .19
275 1.78 1.68 1.60 2.01 .06 .01 .01 .04 .91 .90 .86 1.02 8,867 3,758 832 .087 .001 .002 .10 .21 -.23
274 2.87 2.85 2.91 2.92 .06 .01 .02 .05 1.00 1.03 .98 1.09 8,894 3,779 829 .859 .505 .458 .01 -.04 -.05
274 3.23 3.36 3.43 3.38 .05 .01 .01 .03 .81 .76 .72 .78 8,881 307 828 .007 .000 .013 -.17 -.28 -.18
273 3.08 2.82 2.73 3.11 .05 .01 .01 .04 .86 .88 .87 .86 8,887 3,775 827 .000 .000 .643 .30 .40 -.03
275 2.60 2.32 2.32 2.72 .06 .01 .02 .04 .93 .97 .93 1.02 8,889 3,777 591 .000 .000 .104 .29 .31 -.12
275 2.31 2.04 2.02 2.39 .06 .01 .02 .04 .96 .93 .91 1.00 290 313 824 .000 .000 .242 .29 .32 -.09
271 2.57 2.81 2.69 2.80 .05 .01 .01 .04 .78 .83 .82 .83 8,783 3,726 820 .000 .027 .000 -.28 -.14 -.28
271 2.75 2.74 2.67 3.00 .05 .01 .01 .04 .88 .88 .88 .84 8,796 3,728 508 .848 .125 .000 .01 .10 -.29
272 2.00 1.71 1.75 2.06 .06 .01 .02 .05 .97 .92 .91 1.08 8,789 3,714 597 .000 .000 .426 .32 .27 -.06
271 2.95 2.88 2.89 3.06 .05 .01 .01 .04 .84 .86 .86 .85 8,803 3,727 820 .187 .255 .083 .08 .07 -.13
271 2.50 2.75 2.96 2.65 .06 .01 .02 .04 1.01 .98 .95 1.01 8,805 308 822 .000 .000 .057 -.25 -.48 -.14
272 2.85 2.72 2.91 2.73 .06 .01 .02 .04 .94 .98 .95 .95 8,817 3,730 824 .034 .295 .087 .13 -.07 .13
270 2.90 2.77 2.78 3.00 .06 .01 .02 .04 .97 .93 .92 .87 8,745 3,701 485 .019 .046 .180 .15 .13 -.10
266 3.31 3.24 3.32 3.33 .05 .01 .01 .03 .79 .76 .73 .74 8,709 3,695 816 .144 .685 .637 .09 -.03 -.04
269 3.03 3.03 3.11 3.11 .05 .01 .01 .04 .88 .85 .83 .84 8,701 3,677 813 .971 .161 .215 .00 -.09 -.09
270 3.02 3.00 3.00 3.10 .05 .01 .01 .04 .89 .88 .87 .85 8,733 3,690 818 .784 .781 .197 .02 .02 -.10
269 3.23 3.19 3.20 3.31 .06 .01 .01 .03 .92 .84 .83 .80 283 304 474 .478 .666 .214 .05 .03 -.10
271 3.18 3.10 3.18 3.13 .06 .01 .02 .05 1.03 1.05 1.03 1.06 8,719 3,693 821 .208 .934 .494 .08 .01 .05
Howard compared with:
Howard
Mean Standard Error of the Mean b Standard Deviation c
How
ard
Pee
rs-S
take
hold
ers
HB
CU
Pee
rs
compared with:
Pee
rs-S
take
hold
ers
Pee
rs-S
take
hold
ers
How
ard
Urb
an U
nive
rsit
ies
Urb
an U
nive
rsit
ies
Urb
an U
nive
rsit
ies
HB
CU
Pee
rs
HB
CU
Pee
rs
HB
CU
Pee
rs
How
ard
Pee
rs-S
take
hold
ers
Urb
an U
nive
rsit
ies
How
ard
Degrees of Freedom d Effect Size fSignificance e
b The 95% confidence interval for the population mean is equal to the sample mean plus/minus the product of 1.96 times the standard error of the mean. c A measure of the average amount individual scores deviate from the mean of all the scores in the distribution. d Degrees of freedom used to compute the t-tests. Values differ from the total Ns due to weighting and the equal variances assumption. e Statistical significance represents the probability that the difference between the mean of your institution and that of the comparison group occurred by chance. f Effect size is calculated by subtracting the comparison group mean from the school mean, and dividing the result by the pooled standard deviation.
17
NSSE 2009 Detailed Statistics a
Howard University Seniors
N
Urb
an
HB
CU
Pee
rs
HB
CU
Pee
rs
Howard compared with:
How
ard
Pee
rs-S
take
hold
ers
HB
CU
Pee
rs
Howard compared with:
Pee
rs-S
take
hold
ers
Pee
rs-S
take
hold
ers
How
ard
Urb
an U
nive
rsit
ies
Urb
an U
nive
rsit
ies
Urb
an U
nive
rsit
ies
HB
CU
Pee
rs
HB
CU
Pee
rs
Mean
HB
CU
Pee
rs
How
ard
Pee
rs-S
take
hold
ers
Urb
an U
nive
rsit
ies
How
ard
Degrees of Freedom dStandard Error of the Mean b Standard Deviation c Effect Size fSignificance e
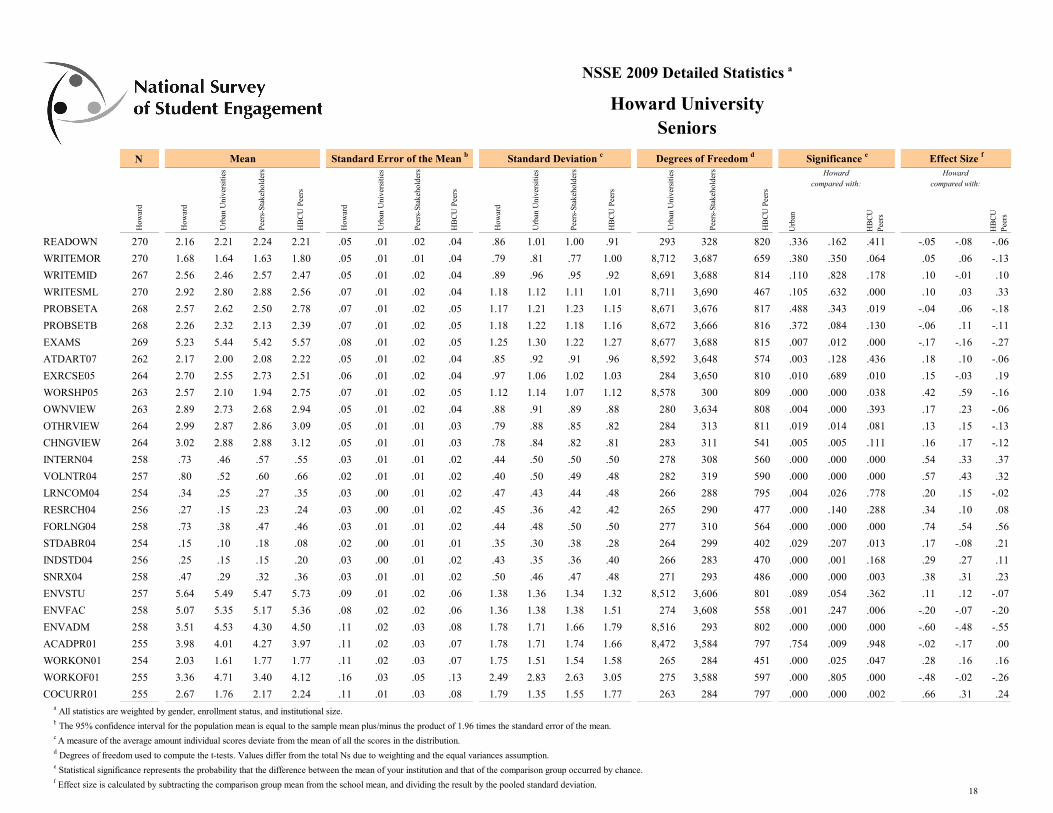
270 2.16 2.21 2.24 2.21 .05 .01 .02 .04 .86 1.01 1.00 .91 293 328 820 .336 .162 .411 -.05 -.08 -.06
270 1.68 1.64 1.63 1.80 .05 .01 .01 .04 .79 .81 .77 1.00 8,712 3,687 659 .380 .350 .064 .05 .06 -.13
267 2.56 2.46 2.57 2.47 .05 .01 .02 .04 .89 .96 .95 .92 8,691 3,688 814 .110 .828 .178 .10 -.01 .10
270 2.92 2.80 2.88 2.56 .07 .01 .02 .04 1.18 1.12 1.11 1.01 8,711 3,690 467 .105 .632 .000 .10 .03 .33
268 2.57 2.62 2.50 2.78 .07 .01 .02 .05 1.17 1.21 1.23 1.15 8,671 3,676 817 .488 .343 .019 -.04 .06 -.18
268 2.26 2.32 2.13 2.39 .07 .01 .02 .05 1.18 1.22 1.18 1.16 8,672 3,666 816 .372 .084 .130 -.06 .11 -.11
269 5.23 5.44 5.42 5.57 .08 .01 .02 .05 1.25 1.30 1.22 1.27 8,677 3,688 815 .007 .012 .000 -.17 -.16 -.27
262 2.17 2.00 2.08 2.22 .05 .01 .02 .04 .85 .92 .91 .96 8,592 3,648 574 .003 .128 .436 .18 .10 -.06
264 2.70 2.55 2.73 2.51 .06 .01 .02 .04 .97 1.06 1.02 1.03 284 3,650 810 .010 .689 .010 .15 -.03 .19
263 2.57 2.10 1.94 2.75 .07 .01 .02 .05 1.12 1.14 1.07 1.12 8,578 300 809 .000 .000 .038 .42 .59 -.16
263 2.89 2.73 2.68 2.94 .05 .01 .02 .04 .88 .91 .89 .88 280 3,634 808 .004 .000 .393 .17 .23 -.06
264 2.99 2.87 2.86 3.09 .05 .01 .01 .03 .79 .88 .85 .82 284 313 811 .019 .014 .081 .13 .15 -.13
264 3.02 2.88 2.88 3.12 .05 .01 .01 .03 .78 .84 .82 .81 283 311 541 .005 .005 .111 .16 .17 -.12
258 .73 .46 .57 .55 .03 .01 .01 .02 .44 .50 .50 .50 278 308 560 .000 .000 .000 .54 .33 .37
257 .80 .52 .60 .66 .02 .01 .01 .02 .40 .50 .49 .48 282 319 590 .000 .000 .000 .57 .43 .32
254 .34 .25 .27 .35 .03 .00 .01 .02 .47 .43 .44 .48 266 288 795 .004 .026 .778 .20 .15 -.02
256 .27 .15 .23 .24 .03 .00 .01 .02 .45 .36 .42 .42 265 290 477 .000 .140 .288 .34 .10 .08
258 .73 .38 .47 .46 .03 .01 .01 .02 .44 .48 .50 .50 277 310 564 .000 .000 .000 .74 .54 .56
254 .15 .10 .18 .08 .02 .00 .01 .01 .35 .30 .38 .28 264 299 402 .029 .207 .013 .17 -.08 .21
256 .25 .15 .15 .20 .03 .00 .01 .02 .43 .35 .36 .40 266 283 470 .000 .001 .168 .29 .27 .11
258 .47 .29 .32 .36 .03 .01 .01 .02 .50 .46 .47 .48 271 293 486 .000 .000 .003 .38 .31 .23
257 5.64 5.49 5.47 5.73 .09 .01 .02 .06 1.38 1.36 1.34 1.32 8,512 3,606 801 .089 .054 .362 .11 .12 -.07
258 5.07 5.35 5.17 5.36 .08 .02 .02 .06 1.36 1.38 1.38 1.51 274 3,608 558 .001 .247 .006 -.20 -.07 -.20
258 3.51 4.53 4.30 4.50 .11 .02 .03 .08 1.78 1.71 1.66 1.79 8,516 293 802 .000 .000 .000 -.60 -.48 -.55
255 3.98 4.01 4.27 3.97 .11 .02 .03 .07 1.78 1.71 1.74 1.66 8,472 3,584 797 .754 .009 .948 -.02 -.17 .00
254 2.03 1.61 1.77 1.77 .11 .02 .03 .07 1.75 1.51 1.54 1.58 265 284 451 .000 .025 .047 .28 .16 .16
255 3.36 4.71 3.40 4.12 .16 .03 .05 .13 2.49 2.83 2.63 3.05 275 3,588 597 .000 .805 .000 -.48 -.02 -.26
255 2.67 1.76 2.17 2.24 .11 .01 .03 .08 1.79 1.35 1.55 1.77 263 284 797 .000 .000 .002 .66 .31 .24
18
READOWN
WRITEMOR
WRITEMID
WRITESML
PROBSETA
PROBSETB
EXAMS
ATDART07
EXRCSE05
WORSHP05
OWNVIEW
OTHRVIEW
CHNGVIEW
INTERN04
VOLNTR04
LRNCOM04
RESRCH04
FORLNG04
STDABR04
INDSTD04
SNRX04
ENVSTU
ENVFAC
ENVADM
ACADPR01
WORKON01
WORKOF01
COCURR01 a All statistics are weighted by gender, enrollment status, and institutional size. b The 95% confidence interval for the population mean is equal to the sample mean plus/minus the product of 1.96 times the standard error of the mean. c A measure of the average amount individual scores deviate from the mean of all the scores in the distribution. d Degrees of freedom used to compute the t-tests. Values differ from the total Ns due to weighting and the equal variances assumption. e Statistical significance represents the probability that the difference between the mean of your institution and that of the comparison group occurred by chance. f Effect size is calculated by subtracting the comparison group mean from the school mean, and dividing the result by the pooled standard deviation.

NSSE 2009 Detailed Statistics a
Howard University Seniors
N
Urb
an
HB
CU
Pee
rs
HB
CU
Pee
rs
Howard compared with:
How
ard
Pee
rs-S
take
hold
ers
HB
CU
Pee
rs
Howard compared with:
Pee
rs-S
take
hold
ers
Pee
rs-S
take
hold
ers
How
ard
Urb
an U
nive
rsit
ies
Urb
an U
nive
rsit
ies
Urb
an U
nive
rsit
ies
HB
CU
Pee
rs
HB
CU
Pee
rs
Mean
HB
CU
Pee
rs
How
ard
Pee
rs-S
take
hold
ers
Urb
an U
nive
rsit
ies
How
ard
Degrees of Freedom dStandard Error of the Mean b Standard Deviation c Effect Size fSignificance e
255 3.45 3.35 3.69 3.37 .10 .02 .03 .07 1.63 1.47 1.59 1.58 267 3,579 792 .317 .022 .529 .07 -.15 .05
255 1.84 2.97 2.01 3.32 .12 .03 .03 .12 1.91 2.54 1.91 2.78 283 3,570 692 .000 .181 .000 -.45 -.09 -.58
256 2.56 2.59 2.46 2.72 .09 .01 .02 .06 1.40 1.13 1.05 1.49 265 277 796 .781 .252 .153 -.02 .10 -.11
254 3.07 3.10 3.13 3.18 .05 .01 .01 .03 .80 .80 .78 .81 8,392 3,559 792 .577 .273 .073 -.04 -.07 -.14
252 2.52 2.86 2.81 2.95 .05 .01 .02 .04 .87 .86 .86 .90 8,365 3,546 788 .000 .000 .000 -.39 -.34 -.48
253 2.28 2.57 2.65 2.60 .06 .01 .02 .05 .97 1.00 1.00 1.09 269 3,542 550 .000 .000 .000 -.29 -.37 -.31
254 1.79 1.93 1.92 2.22 .05 .01 .02 .05 .87 .96 .92 1.09 8,367 3,542 611 .023 .034 .000 -.14 -.14 -.41
252 2.19 2.14 2.18 2.44 .06 .01 .02 .04 .98 .94 .93 1.04 266 287 521 .429 .870 .001 .05 .01 -.25
253 2.87 2.47 2.72 2.84 .06 .01 .02 .04 .92 .97 .92 .99 269 3,550 523 .000 .010 .687 .42 .17 .03
252 3.33 3.44 3.49 3.45 .05 .01 .01 .03 .83 .77 .73 .79 8,383 281 789 .034 .003 .049 -.14 -.22 -.15
248 3.23 3.20 3.18 3.26 .05 .01 .01 .03 .78 .83 .83 .81 8,273 3,506 782 .489 .309 .626 .04 .07 -.04
248 3.03 3.01 2.96 3.15 .06 .01 .02 .04 .93 .94 .94 .93 8,267 3,521 785 .749 .260 .081 .02 .07 -.13
248 3.05 3.08 3.05 3.18 .05 .01 .02 .04 .85 .87 .87 .88 8,289 3,516 783 .679 .997 .064 -.03 .00 -.14
248 3.08 2.97 2.89 3.22 .06 .01 .02 .04 .88 .91 .93 .89 8,268 3,512 784 .075 .002 .039 .11 .20 -.16
248 3.34 3.30 3.32 3.36 .05 .01 .01 .03 .80 .78 .77 .79 8,286 3,503 782 .444 .704 .805 .05 .03 -.02
247 2.95 3.07 3.05 3.16 .06 .01 .02 .04 .90 .89 .90 .88 8,261 3,491 779 .038 .078 .002 -.13 -.12 -.24
249 2.90 3.19 3.17 3.20 .06 .01 .02 .04 .93 .87 .89 .89 8,299 3,518 785 .000 .000 .000 -.34 -.30 -.33
249 3.16 3.09 3.08 3.21 .05 .01 .02 .04 .86 .88 .86 .87 8,293 3,511 783 .184 .171 .502 .09 .09 -.05
244 2.80 2.24 2.32 2.83 .07 .01 .02 .05 1.15 1.10 1.09 1.15 8,204 3,480 777 .000 .000 .753 .51 .44 -.02
245 3.20 2.98 3.02 3.16 .06 .01 .02 .04 .90 .92 .89 .92 8,193 3,484 778 .000 .003 .610 .23 .20 .04
243 3.01 2.70 2.75 2.99 .07 .01 .02 .05 1.02 1.04 1.01 1.04 258 3,476 777 .000 .000 .785 .30 .26 .02
246 2.65 2.70 2.74 2.83 .07 .01 .02 .05 1.03 1.00 .96 1.06 8,197 279 780 .498 .199 .029 -.04 -.09 -.17
245 2.81 2.73 2.78 2.88 .06 .01 .02 .04 .98 .98 .95 1.00 8,200 3,481 777 .204 .591 .377 .08 .04 -.07
244 2.84 2.60 2.60 2.95 .07 .01 .02 .04 1.02 1.07 1.03 1.03 260 3,480 778 .000 .000 .165 .23 .23 -.11
247 2.91 2.40 2.40 2.81 .06 .01 .02 .05 1.00 1.04 1.02 1.10 262 3,480 517 .000 .000 .221 .49 .50 .09
247 2.39 1.85 1.76 2.55 .07 .01 .02 .05 1.10 1.06 1.02 1.17 260 279 505 .000 .000 .059 .51 .62 -.14
248 2.51 2.77 2.65 2.88 .06 .01 .02 .04 .93 .96 .98 .94 8,302 3,520 786 .000 .024 .000 -.27 -.15 -.40
248 2.97 3.09 3.16 3.05 .05 .01 .01 .03 .79 .76 .74 .79 8,301 3,519 786 .020 .000 .234 -.15 -.25 -.09
247 3.18 3.07 3.15 2.97 .06 .01 .02 .04 .97 .87 .86 .96 258 276 784 .080 .683 .005 .13 .03 .22
SOCIAL05
CAREDE01
COMMUTE
ENVSCHOL
ENVSUPRT
ENVDIVRS
ENVNACAD
ENVSOCAL
ENVEVENT
ENVCOMPT
GNGENLED
GNWORK
GNWRITE
GNSPEAK
GNANALY
GNQUANT
GNCMPTS
GNOTHERS
GNCITIZN
GNINQ
GNSELF
GNDIVERS
GNPROBSV
GNETHICS
GNCOMMUN
GNSPIRIT
ADVISE
ENTIREXP
SAMECOLL a All statistics are weighted by gender, enrollment status, and institutional size. b The 95% confidence interval for the population mean is equal to the sample mean plus/minus the product of 1.96 times the standard error of the mean. c A measure of the average amount individual scores deviate from the mean of all the scores in the distribution. IPEDS: 131520 d Degrees of freedom used to compute the t-tests. Values differ from the total Ns due to weighting and the equal variances assumption. e Statistical significance represents the probability that the difference between the mean of your institution and that of the comparison group occurred by chance.
19
NSSE 2009 Detailed Statistics a
Howard University Seniors
N
Urb
an
HB
CU
Pee
rs
HB
CU
Pee
rs
Howard compared with:
How
ard
Pee
rs-S
take
hold
ers
HB
CU
Pee
rs
Howard compared with:
Pee
rs-S
take
hold
ers
Pee
rs-S
take
hold
ers
How
ard
Urb
an U
nive
rsit
ies
Urb
an U
nive
rsit
ies
Urb
an U
nive
rsit
ies
HB
CU
Pee
rs
HB
CU
Pee
rs
Mean
HB
CU
Pee
rs
How
ard
Pee
rs-S
take
hold
ers
Urb
an U
nive
rsit
ies
How
ard
Degrees of Freedom dStandard Error of the Mean b Standard Deviation c Effect Size fSignificance e
f Effect size is calculated by subtracting the comparison group mean from the school mean, and dividing the result by the pooled standard deviation.
20
NSSE 2009 Mean Comparisons a
Urban Universities Consortium
Howard University Howard compared with
Urban Universities Urban Universities Consortium Questions
Refer to the Urban Universities consortium codebook for response option values. Variable Class Mean Mean Sig b Effect size
Howard
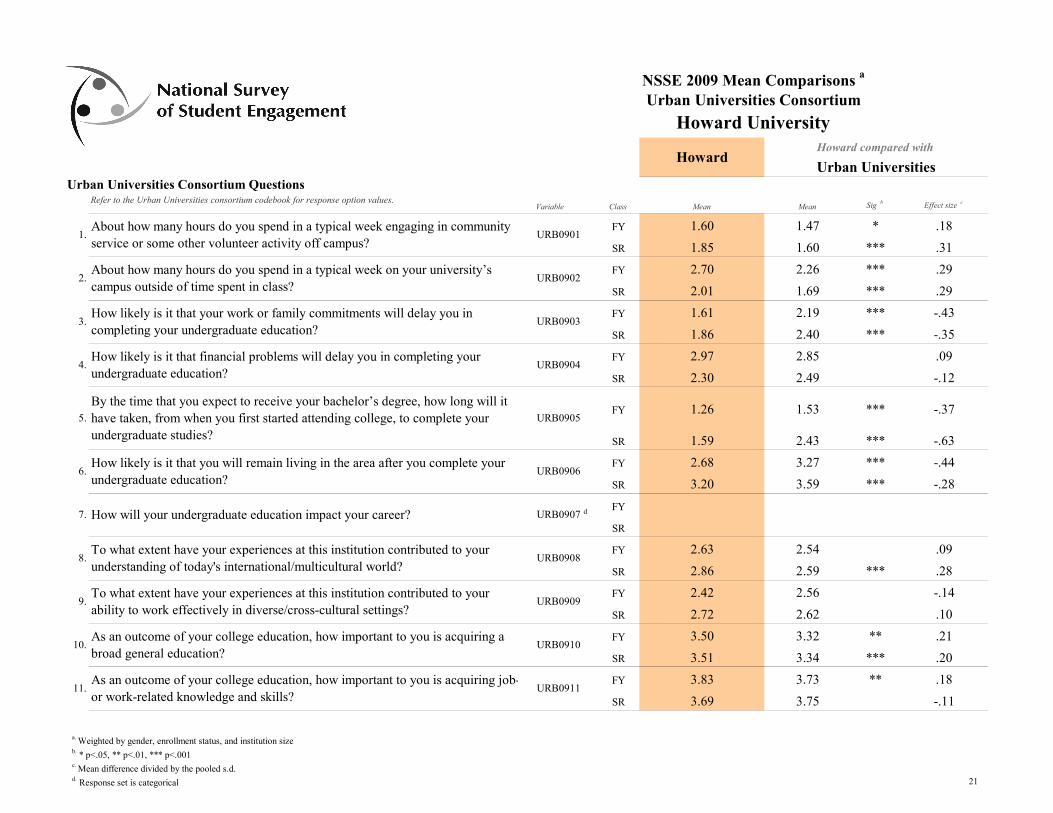
About how many hours do you spend in a typical week engaging in community FY 1.60 1.47 * .18 1. URB0901
service or some other volunteer activity off campus? SR 1.85 1.60 *** .31
About how many hours do you spend in a typical week on your university’s FY 2.70 2.26 *** .29 2. URB0902
campus outside of time spent in class? SR 2.01 1.69 *** .29
How likely is it that your work or family commitments will delay you in FY 1.61 2.19 *** -.43 3. URB0903
completing your undergraduate education? SR 1.86 2.40 *** -.35
How likely is it that financial problems will delay you in completing your FY 2.97 2.85 .09 4. URB0904
undergraduate education? SR 2.30 2.49 -.12
By the time that you expect to receive your bachelor’s degree, how long will it FY 1.26 1.53 *** -.37
5. have taken, from when you first started attending college, to complete your URB0905
undergraduate studies? SR 1.59 2.43 *** -.63
How likely is it that you will remain living in the area after you complete your FY 2.68 3.27 *** -.44 6. URB0906
undergraduate education? SR 3.20 3.59 *** -.28
7. How will your undergraduate education impact your career? URB0907 d FY
SR
To what extent have your experiences at this institution contributed to your FY 2.63 2.54 .09 8. URB0908
understanding of today's international/multicultural world? SR 2.86 2.59 *** .28
To what extent have your experiences at this institution contributed to your FY 2.42 2.56 -.14 9. URB0909
ability to work effectively in diverse/cross-cultural settings? SR 2.72 2.62 .10
As an outcome of your college education, how important to you is acquiring a FY 3.50 3.32 ** .21 10. URB0910
broad general education? SR 3.51 3.34 *** .20
As an outcome of your college education, how important to you is acquiring job- FY 3.83 3.73 ** .18 11. URB0911
or work-related knowledge and skills? SR 3.69 3.75 -.11
a. Weighted by gender, enrollment status, and institution size b. * p<.05, ** p<.01, *** p<.001 c. Mean difference divided by the pooled s.d. d. Response set is categorical
c
21
NSSE 2009 Mean Comparisons a
Urban Universities Consortium
Howard University Howard compared with
Howard Urban Universities
Urban Universities Consortium Questions Refer to the Urban Universities consortium codebook for response option values.
Variable Class Mean Mean Sig b Effect size
12.
13.
14.
15.
16.
17.
18.
19.
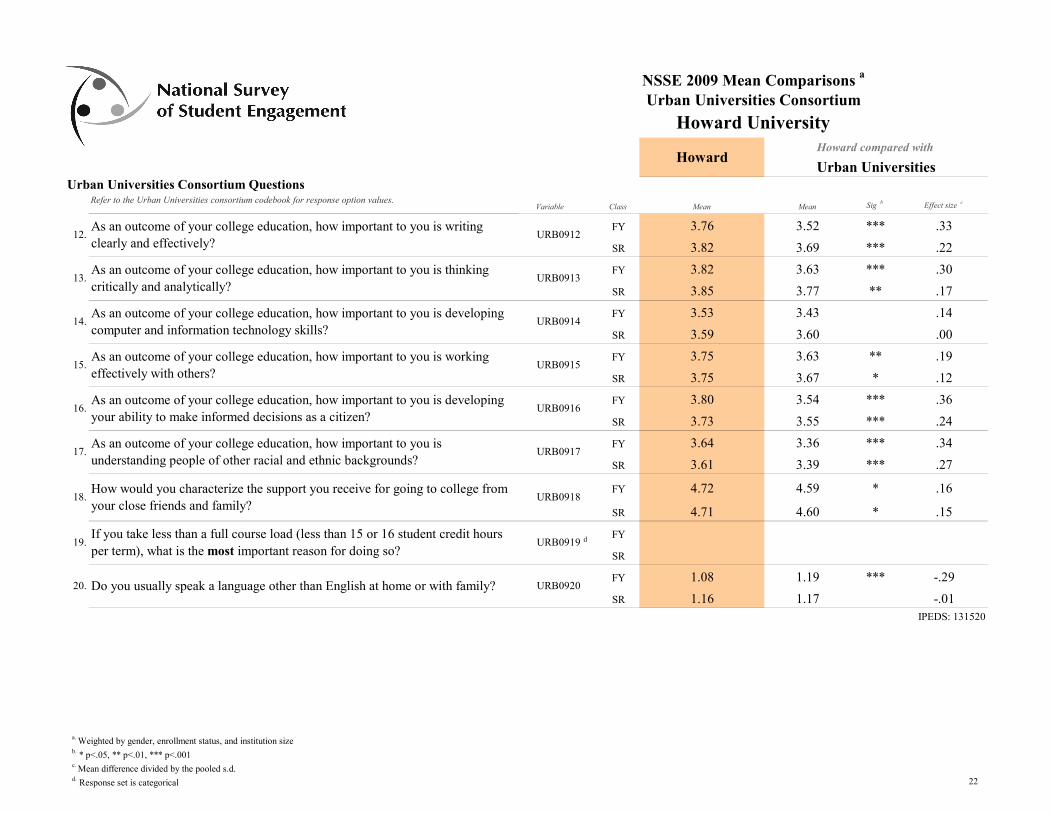
As an outcome of your college education, how important to you is writing clearly and effectively?
URB0912 FY
SR
3.76
3.82
3.52
3.69
***
***
.33
.22
As an outcome of your college education, how important to you is thinking critically and analytically?
URB0913 FY
SR
3.82
3.85
3.63
3.77
***
**
.30
.17
As an outcome of your college education, how important to you is developing computer and information technology skills?
URB0914 FY
SR
3.53
3.59
3.43
3.60
.14
.00
As an outcome of your college education, how important to you is working effectively with others?
URB0915 FY
SR
3.75
3.75
3.63
3.67
**
*
.19
.12
As an outcome of your college education, how important to you is developing your ability to make informed decisions as a citizen?
URB0916 FY
SR
3.80
3.73
3.54
3.55
***
***
.36
.24
As an outcome of your college education, how important to you is understanding people of other racial and ethnic backgrounds?
URB0917 FY
SR
3.64
3.61
3.36
3.39
***
***
.34
.27
How would you characterize the support you receive for going to college from your close friends and family?
URB0918 FY
SR
4.72
4.71
4.59
4.60
*
*
.16
.15
If you take less than a full course load (less than 15 or 16 student credit hours per term), what is the most important reason for doing so?
URB0919 d FY
SR
20. Do you usually speak a language other than English at home or with family? URB0920 FY
SR
1.08
1.16
1.19
1.17
*** -.29
-.01 IPEDS: 131520
a. Weighted by gender, enrollment status, and institution size b. * p<.05, ** p<.01, *** p<.001 c. Mean difference divided by the pooled s.d. d. Response set is categorical
c
22
NSSE 2009 Detailed Statisticsa
Urban Universities Consortium
Howard University
First-Year Students Seniors
Standard Error Standard Effect
N Mean of the Mean b deviation c DF d Sig. e size f
How
ard
How
ard
Urb
an
How
ard
Urb
an
How
ard
Urb
an
Urb
an
Howard compared with Urban
N DF d Sig. e
Effect
size fMean
Standard Error
of the Mean b
Standard
deviation c
How
ard
How
ard
Urb
an
How
ard
Urb
an
How
ard
Urb
an
Urb
an
Howard compared with Urban
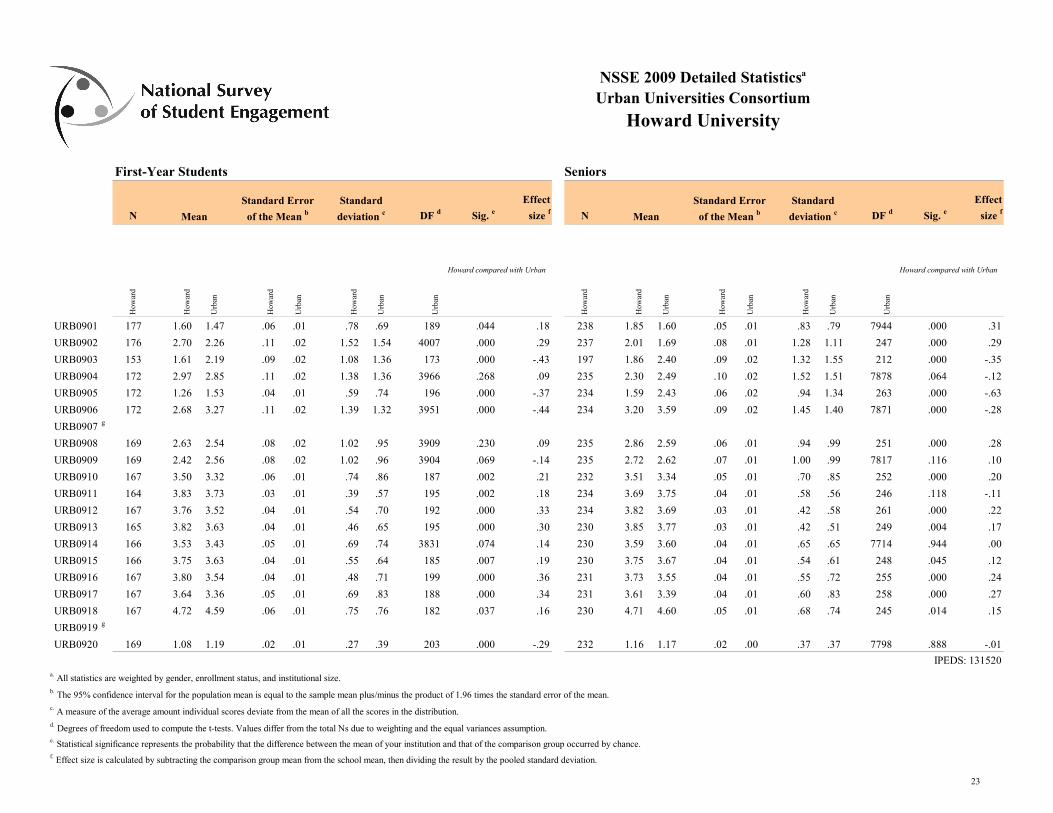
URB0901 177 1.60 1.47 .06 .01 .78 .69 189 .044 .18 238 1.85 1.60 .05 .01 .83 .79 7944 .000 .31
URB0902 176 2.70 2.26 .11 .02 1.52 1.54 4007 .000 .29 237 2.01 1.69 .08 .01 1.28 1.11 247 .000 .29
URB0903 153 1.61 2.19 .09 .02 1.08 1.36 173 .000 -.43 197 1.86 2.40 .09 .02 1.32 1.55 212 .000 -.35
URB0904 172 2.97 2.85 .11 .02 1.38 1.36 3966 .268 .09 235 2.30 2.49 .10 .02 1.52 1.51 7878 .064 -.12
URB0905 172 1.26 1.53 .04 .01 .59 .74 196 .000 -.37 234 1.59 2.43 .06 .02 .94 1.34 263 .000 -.63
URB0906 172 2.68 3.27 .11 .02 1.39 1.32 3951 .000 -.44 234 3.20 3.59 .09 .02 1.45 1.40 7871 .000 -.28
URB0907 g
URB0908 169 2.63 2.54 .08 .02 1.02 .95 3909 .230 .09 235 2.86 2.59 .06 .01 .94 .99 251 .000 .28
URB0909 169 2.42 2.56 .08 .02 1.02 .96 3904 .069 -.14 235 2.72 2.62 .07 .01 1.00 .99 7817 .116 .10
URB0910 167 3.50 3.32 .06 .01 .74 .86 187 .002 .21 232 3.51 3.34 .05 .01 .70 .85 252 .000 .20
URB0911 164 3.83 3.73 .03 .01 .39 .57 195 .002 .18 234 3.69 3.75 .04 .01 .58 .56 246 .118 -.11
URB0912 167 3.76 3.52 .04 .01 .54 .70 192 .000 .33 234 3.82 3.69 .03 .01 .42 .58 261 .000 .22
URB0913 165 3.82 3.63 .04 .01 .46 .65 195 .000 .30 230 3.85 3.77 .03 .01 .42 .51 249 .004 .17
URB0914 166 3.53 3.43 .05 .01 .69 .74 3831 .074 .14 230 3.59 3.60 .04 .01 .65 .65 7714 .944 .00
URB0915 166 3.75 3.63 .04 .01 .55 .64 185 .007 .19 230 3.75 3.67 .04 .01 .54 .61 248 .045 .12
URB0916 167 3.80 3.54 .04 .01 .48 .71 199 .000 .36 231 3.73 3.55 .04 .01 .55 .72 255 .000 .24
URB0917 167 3.64 3.36 .05 .01 .69 .83 188 .000 .34 231 3.61 3.39 .04 .01 .60 .83 258 .000 .27
URB0918 167 4.72 4.59 .06 .01 .75 .76 182 .037 .16 230 4.71 4.60 .05 .01 .68 .74 245 .014 .15
URB0919 g
URB0920 169 1.08 1.19 .02 .01 .27 .39 203 .000 -.29 232 1.16 1.17 .02 .00 .37 .37 7798 .888 -.01
IPEDS: 131520 a. All statistics are weighted by gender, enrollment status, and institutional size. b. The 95% confidence interval for the population mean is equal to the sample mean plus/minus the product of 1.96 times the standard error of the mean. c. A measure of the average amount individual scores deviate from the mean of all the scores in the distribution. d. Degrees of freedom used to compute the t-tests. Values differ from the total Ns due to weighting and the equal variances assumption. e. Statistical significance represents the probability that the difference between the mean of your institution and that of the comparison group occurred by chance. f. Effect size is calculated by subtracting the comparison group mean from the school mean, then dividing the result by the pooled standard deviation.
23

g. Response set is categorical.
24
Howard University
Frequency Distributions August 2009
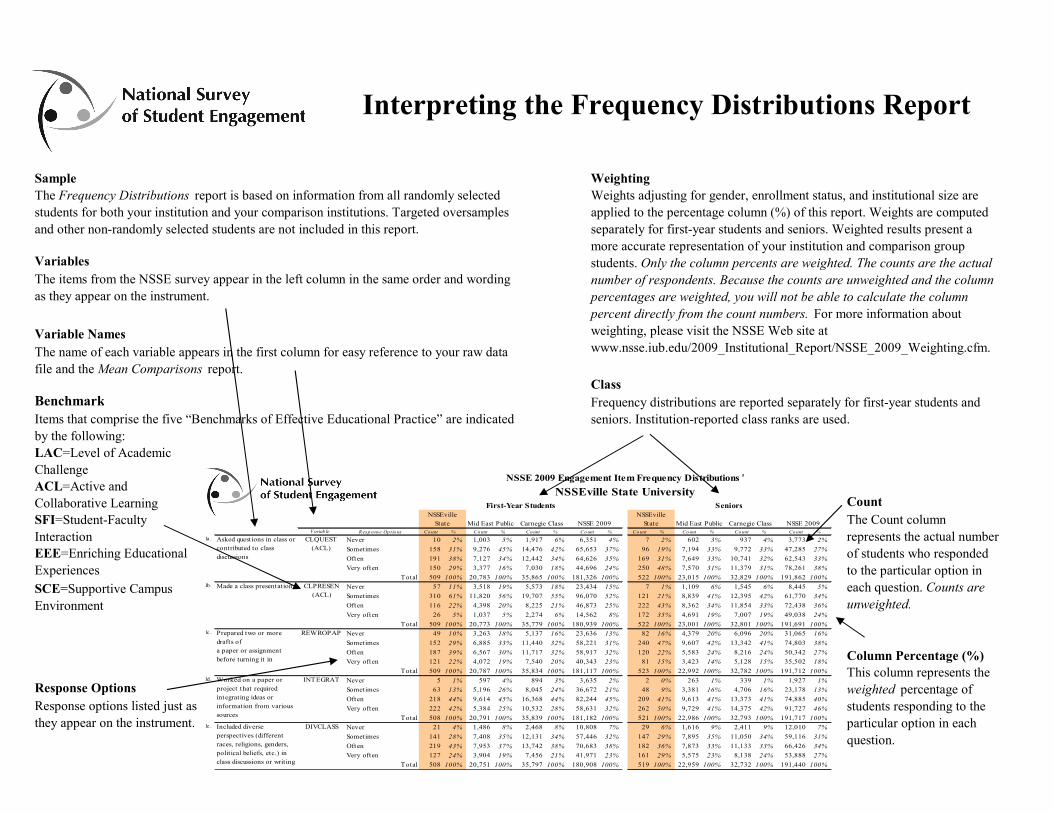
Interpreting the Frequency Distributions Report
Sample Weighting The Frequency Distributions report is based on information from all randomly selected Weights adjusting for gender, enrollment status, and institutional size are students for both your institution and your comparison institutions. Targeted oversamples applied to the percentage column (%) of this report. Weights are computed and other non-randomly selected students are not included in this report. separately for first-year students and seniors. Weighted results present a
more accurate representation of your institution and comparison group Variables students. Only the column percents are weighted. The counts are the actual The items from the NSSE survey appear in the left column in the same order and wording number of respondents. Because the counts are unweighted and the column as they appear on the instrument. percentages are weighted, you will not be able to calculate the column
percent directly from the count numbers. For more information about weighting, please visit the NSSE Web site at Variable Names www.nsse.iub.edu/2009_Institutional_Report/NSSE_2009_Weighting.cfm.The name of each variable appears in the first column for easy reference to your raw data
file and the Mean Comparisons report. Class
Benchmark Frequency distributions are reported separately for first-year students and Items that comprise the five “Benchmarks of Effective Educational Practice” are indicated seniors. Institution-reported class ranks are used. by the following: LAC=Level of Academic Challenge
NSSE 2009 Engagement Item Frequency Distributions a
ACL=Active and NSSEville State University Collaborative Learning First-Year Students Seniors Count
NSSEville NSSEville SFI=Student-Faculty State Mid East Public Carnegie Class NSSE 2009 State Mid East Public Carnegie Class NSSE 2009 The Count column V ariab le R esp onse Optio ns Count % Count % Count % Count % Count % Count % Count % Count
discussions
1a . represents the actual number Interaction Asked quest ions in class or CLQUEST Never 10 2% 1,003 5% 1,917 6% 6,351 4% %
7 2% 602 3% 937 4% 3,773 2% contributed to class (ACL) Sometimes 158 31% 9,276 45% 14,476 42% 65,653 37% 96 19% 7,194 33% 9,772 33% 47,285 27% EEE=Enriching Educational of students who responded Often 191 38% 7,127 34% 12,442 34% 64,626 35% 169 31% 7,649 33% 10,741 32% 62,543 33%
Very often 150 29% 3,377 16% 7,030 18% 44,696 24% 250 48% 7,570 31% 11,379 31% 78,261 38% Experiences to the particular option in Total 509 100% 20,783 100% 35,865 100% 181,326 100% 522 100% 23,015 100% 32,829 100% 191,862 100%
Made a class presentation CLPRESEN Never 57 11% 3,518 19% 5,573 18% 23,434 15% 7 1% 1,109 6% 1,545 6% 8,445 5% each question. Counts are SCE=Supportive Campus 1b.
(ACL) Sometimes 310 61% 11,820 56% 19,707 55% 96,070 52% 121 21% 8,839 41% 12,395 42% 61,770 34%
Often 116 22% 4,398 20% 8,225 21% 46,873 25% 222 43% 8,362 34% 11,854 33% 72,438 36% unweighted. Environment Very often 26 5% 1,037 5% 2,274 6% 14,562 8% 172 35% 4,691 19% 7,007 19% 49,038 24%
Total 509 100% 20,773 100% 35,779 100% 180,939 100% 522 100% 23,001 100% 32,801 100% 191,691 100% 1c . Prepared two or more REWROPAP Never 49 10% 3,263 18% 5,137 16% 23,636 13% 82 16% 4,379 20% 6,096 20% 31,065 16%
drafts of Sometimes 152 29% 6,885 33% 11,440 32% 58,221 31% 240 47% 9,607 42% 13,342 41% 74,803 38% a paper or assignment Often 187 39% 6,567 30% 11,717 32% 58,917 32% 120 22% 5,583 24% 8,216 24% 50,342 27% before turning it in Column Percentage (%)
Very often 121 22% 4,072 19% 7,540 20% 40,343 23% 81 15% 3,423 14% 5,128 15% 35,502 18%
Total 509 100% 20,787 100% 35,834 100% 181,117 100% 523 100% 22,992 100% 32,782 100% 191,712 100% This column represents the 1d. Worked on a paper or INTEGRAT Never 5 1% 597 4% 894 3% 3,635 2% 2 0% 263 1% 339 1% 1,927 1%
project that required Sometimes 63 13% 5,196 26% 8,045 24% 36,672 21% 48 9% 3,381 16% 4,706 16% 23,178 13% weighted percentage of integrating ideas or
Response Options Often 218 44% 9,614 45% 16,368 44% 82,244 45% 209 41% 9,613 41% 13,373 41% 74,885 40%
information from various Response options listed just as students responding to the Very often 222 42% 5,384 25% 10,532 28% 58,631 32% 262 50% 9,729 41% 14,375 42% 91,727 46% sources Total 508 100% 20,791 100% 35,839 100% 181,182 100% 521 100% 22,986 100% 32,793 100% 191,717 100% they appear on the instrument. particular option in each 1e . Included diverse DIVCLASS Never 21 4% 1,486 8% 2,468 8% 10,808 7% 29 6% 1,616 9% 2,411 9% 12,010 7% perspectives (different Sometimes 141 28% 7,408 35% 12,131 34% 57,446 32% 147 29% 7,895 35% 11,050 34% 59,116 31% races, religions, genders, question.
Often 219 43% 7,953 37% 13,742 38% 70,683 38% 182 36% 7,873 33% 11,133 33% 66,426 34% political beliefs, etc.) in Very often 127 24% 3,904 19% 7,456 21% 41,971 23% 161 29% 5,575 23% 8,138 24% 53,888 27% class discussions or writing Total 508 100% 20,751 100% 35,797 100% 180,908 100% 519 100% 22,959 100% 32,732 100% 191,440 100%
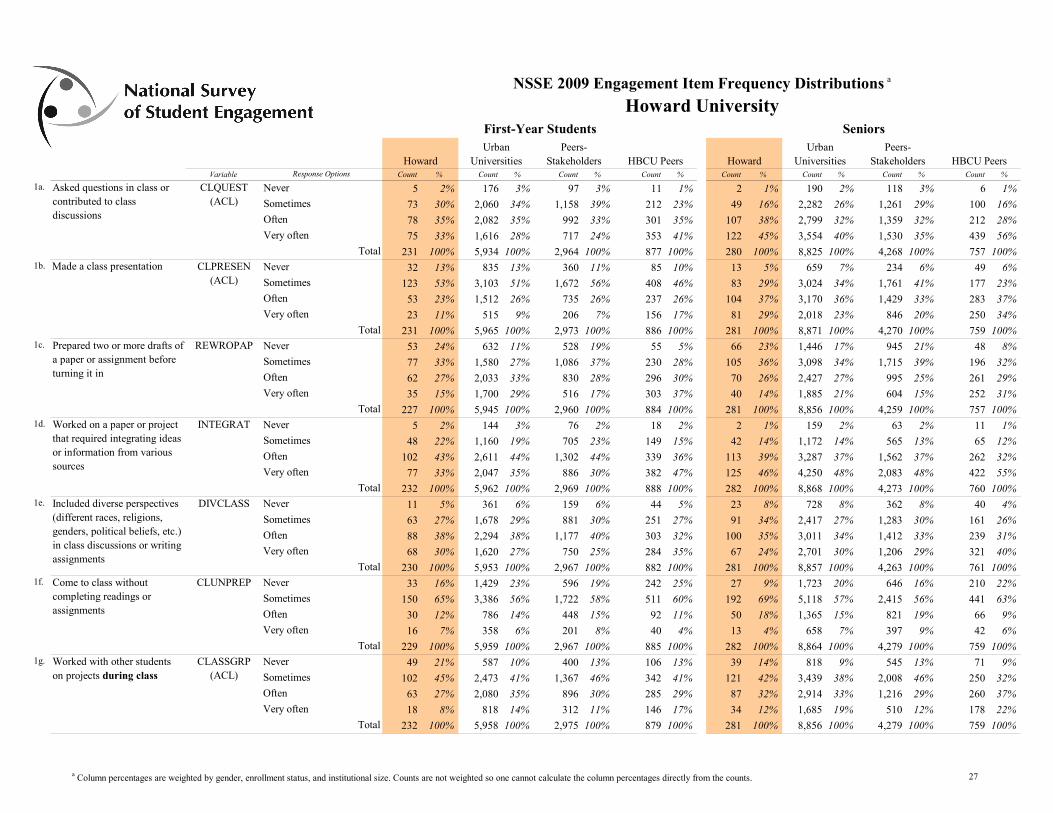
NSSE 2009 Engagement Item Frequency Distributions a
Howard University First-Year Students Seniors Urban Peers- Urban Peers-
Howard Universities Stakeholders HBCU Peers Howard Universities Stakeholders HBCU Peers
1a.
1b.
1c.
1d.
1e.
1f.
1g.
Variable Response Options Count % Count % Count % Count % Count % Count % Count % Count %
Never 5 2% 176 3% 97 3% 11 1% 2 1% 190 2% 118 3% 6 1%
Sometimes 73 30% 2,060 34% 1,158 39% 212 23% 49 16% 2,282 26% 1,261 29% 100 16%
Often 78 35% 2,082 35% 992 33% 301 35% 107 38% 2,799 32% 1,359 32% 212 28%
Very often 75 33% 1,616 28% 717 24% 353 41% 122 45% 3,554 40% 1,530 35% 439 56%
Total 231 100% 5,934 100% 2,964 100% 877 100% 280 100% 8,825 100% 4,268 100% 757 100%
Never 32 13% 835 13% 360 11% 85 10% 13 5% 659 7% 234 6% 49 6%
Sometimes 123 53% 3,103 51% 1,672 56% 408 46% 83 29% 3,024 34% 1,761 41% 177 23%
Often 53 23% 1,512 26% 735 26% 237 26% 104 37% 3,170 36% 1,429 33% 283 37%
Very often 23 11% 515 9% 206 7% 156 17% 81 29% 2,018 23% 846 20% 250 34%
Total 231 100% 5,965 100% 2,973 100% 886 100% 281 100% 8,871 100% 4,270 100% 759 100%
Never 53 24% 632 11% 528 19% 55 5% 66 23% 1,446 17% 945 21% 48 8%
Sometimes 77 33% 1,580 27% 1,086 37% 230 28% 105 36% 3,098 34% 1,715 39% 196 32%
Often 62 27% 2,033 33% 830 28% 296 30% 70 26% 2,427 27% 995 25% 261 29%
Very often 35 15% 1,700 29% 516 17% 303 37% 40 14% 1,885 21% 604 15% 252 31%
Total 227 100% 5,945 100% 2,960 100% 884 100% 281 100% 8,856 100% 4,259 100% 757 100%
Never 5 2% 144 3% 76 2% 18 2% 2 1% 159 2% 63 2% 11 1%
Sometimes 48 22% 1,160 19% 705 23% 149 15% 42 14% 1,172 14% 565 13% 65 12%
Often 102 43% 2,611 44% 1,302 44% 339 36% 113 39% 3,287 37% 1,562 37% 262 32%
Very often 77 33% 2,047 35% 886 30% 382 47% 125 46% 4,250 48% 2,083 48% 422 55%
Total 232 100% 5,962 100% 2,969 100% 888 100% 282 100% 8,868 100% 4,273 100% 760 100%
Never 11 5% 361 6% 159 6% 44 5% 23 8% 728 8% 362 8% 40 4%
Sometimes 63 27% 1,678 29% 881 30% 251 27% 91 34% 2,417 27% 1,283 30% 161 26%
Often 88 38% 2,294 38% 1,177 40% 303 32% 100 35% 3,011 34% 1,412 33% 239 31%
Very often 68 30% 1,620 27% 750 25% 284 35% 67 24% 2,701 30% 1,206 29% 321 40%
Total 230 100% 5,953 100% 2,967 100% 882 100% 281 100% 8,857 100% 4,263 100% 761 100%
Never 33 16% 1,429 23% 596 19% 242 25% 27 9% 1,723 20% 646 16% 210 22%
Sometimes 150 65% 3,386 56% 1,722 58% 511 60% 192 69% 5,118 57% 2,415 56% 441 63%
Often 30 12% 786 14% 448 15% 92 11% 50 18% 1,365 15% 821 19% 66 9%
Very often 16 7% 358 6% 201 8% 40 4% 13 4% 658 7% 397 9% 42 6%
Total 229 100% 5,959 100% 2,967 100% 885 100% 282 100% 8,864 100% 4,279 100% 759 100%
Never 49 21% 587 10% 400 13% 106 13% 39 14% 818 9% 545 13% 71 9%
Sometimes 102 45% 2,473 41% 1,367 46% 342 41% 121 42% 3,439 38% 2,008 46% 250 32%
Often 63 27% 2,080 35% 896 30% 285 29% 87 32% 2,914 33% 1,216 29% 260 37%
Very often 18 8% 818 14% 312 11% 146 17% 34 12% 1,685 19% 510 12% 178 22%
Total 232 100% 5,958 100% 2,975 100% 879 100% 281 100% 8,856 100% 4,279 100% 759 100%
Made a class presentation
Prepared two or more drafts of a paper or assignment before turning it in
Worked with other students on projects during class
CLQUEST (ACL)
CLASSGRP (ACL)
Asked questions in class or contributed to class discussions
Worked on a paper or project that required integrating ideas or information from various sources
Included diverse perspectives (different races, religions, genders, political beliefs, etc.) in class discussions or writing assignments
Come to class without completing readings or assignments
CLUNPREP
CLPRESEN (ACL)
REWROPAP
INTEGRAT
DIVCLASS
a Column percentages are weighted by gender, enrollment status, and institutional size. Counts are not weighted so one cannot calculate the column percentages directly from the counts. 27
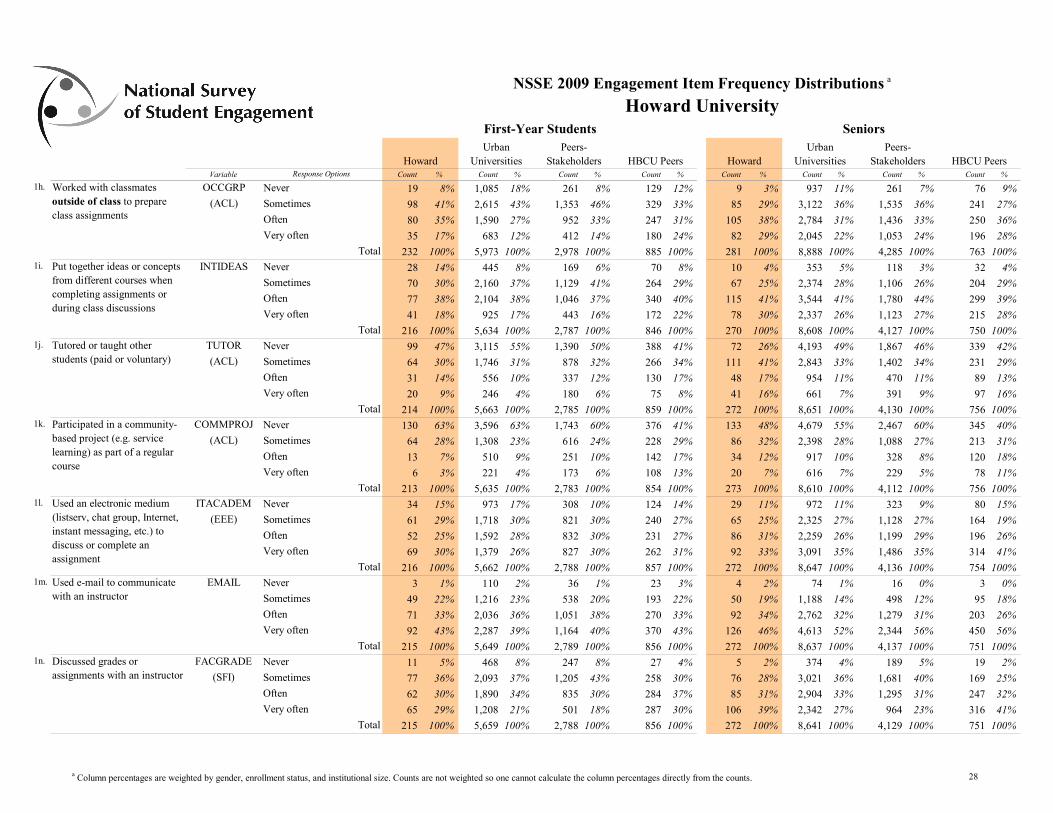
NSSE 2009 Engagement Item Frequency Distributions a
Howard University First-Year Students Seniors Urban Peers- Urban Peers-
Universities Stakeholders HBCU Peers Universities Stakeholders Variable Response Options Count % Count % Count % Count % Count
1h.
1i.
1j.
1k.
1l.
1m.
1n.
Count % Count % % Count %
HBCU Peers Howard Howard
OCCGRP Never 19 8% 1,085 18% 261 8% 129 12% 9 3% 937 11% 261 7% 76 9% (ACL) Sometimes 98 41% 2,615 43% 1,353 46% 329 33% 85 29% 3,122 36% 1,535 36% 241 27%
Often 80 35% 1,590 27% 952 33% 247 31% 105 38% 2,784 31% 1,436 33% 250 36%
Very often 35 17% 683 12% 412 14% 180 24% 82 29% 2,045 22% 1,053 24% 196 28%
Total 232 100% 5,973 100% 2,978 100% 885 100% 281 100% 8,888 100% 4,285 100% 763 100% INTIDEAS Never 28 14% 445 8% 169 6% 70 8% 10 4% 353 5% 118 3% 32 4%
Sometimes 70 30% 2,160 37% 1,129 41% 264 29% 67 25% 2,374 28% 1,106 26% 204 29%
Often 77 38% 2,104 38% 1,046 37% 340 40% 115 41% 3,544 41% 1,780 44% 299 39%
Very often 41 18% 925 17% 443 16% 172 22% 78 30% 2,337 26% 1,123 27% 215 28%
Total 216 100% 5,634 100% 2,787 100% 846 100% 270 100% 8,608 100% 4,127 100% 750 100% TUTOR Never 99 47% 3,115 55% 1,390 50% 388 41% 72 26% 4,193 49% 1,867 46% 339 42% (ACL) Sometimes 64 30% 1,746 31% 878 32% 266 34% 111 41% 2,843 33% 1,402 34% 231 29%
Often 31 14% 556 10% 337 12% 130 17% 48 17% 954 11% 470 11% 89 13%
Very often 20 9% 246 4% 180 6% 75 8% 41 16% 661 7% 391 9% 97 16%
Total 214 100% 5,663 100% 2,785 100% 859 100% 272 100% 8,651 100% 4,130 100% 756 100% COMMPROJ Never 130 63% 3,596 63% 1,743 60% 376 41% 133 48% 4,679 55% 2,467 60% 345 40%
(ACL) Sometimes 64 28% 1,308 23% 616 24% 228 29% 86 32% 2,398 28% 1,088 27% 213 31%
Often 13 7% 510 9% 251 10% 142 17% 34 12% 917 10% 328 8% 120 18%
Very often 6 3% 221 4% 173 6% 108 13% 20 7% 616 7% 229 5% 78 11%
Total 213 100% 5,635 100% 2,783 100% 854 100% 273 100% 8,610 100% 4,112 100% 756 100%
Worked with classmates
ITACADEM Never 34 15% 973 17% 308 10% 124 14% 29 11% 972 11% 323 9% 80 15% (listserv, chat group, Internet, (EEE) Sometimes 61 29% 1,718 30% 821 30% 240 27% 65 25% 2,325 27% 1,128 27% 164 19%
Often 52 25% 1,592 28% 832 30% 231 27% 86 31% 2,259 26% 1,199 29% 196 26%
Very often 69 30% 1,379 26% 827 30% 262 31% 92 33% 3,091 35% 1,486 35% 314 41%
Total 216 100% 5,662 100% 2,788 100% 857 100% 272 100% 8,647 100% 4,136 100% 754 100% Used e-mail to communicate EMAIL Never 3 1% 110 2% 36 1% 23 3% 4 2% 74 1% 16 0% 3 0%
Sometimes 49 22% 1,216 23% 538 20% 193 22% 50 19% 1,188 14% 498 12% 95 18%
Often 71 33% 2,036 36% 1,051 38% 270 33% 92 34% 2,762 32% 1,279 31% 203 26%
Very often 92 43% 2,287 39% 1,164 40% 370 43% 126 46% 4,613 52% 2,344 56% 450 56%
Total 215 100% 5,649 100% 2,789 100% 856 100% 272 100% 8,637 100% 4,137 100% 751 100% Discussed grades or FACGRADE Never 11 5% 468 8% 247 8% 27 4% 5 2% 374 4% 189 5% 19 2%
(SFI) Sometimes 77 36% 2,093 37% 1,205 43% 258 30% 76 28% 3,021 36% 1,681 40% 169 25%
Often 62 30% 1,890 34% 835 30% 284 37% 85 31% 2,904 33% 1,295 31% 247 32%
Very often 65 29% 1,208 21% 501 18% 287 30% 106 39% 2,342 27% 964 23% 316 41%
Total 215 100% 5,659 100% 2,788 100% 856 100% 272 100% 8,641 100% 4,129 100% 751 100%
with an instructor
outside of class to prepare class assignments
Put together ideas or concepts from different courses when completing assignments or during class discussions
Tutored or taught other students (paid or voluntary)
Participated in a community-based project (e.g. service learning) as part of a regular course
Used an electronic medium
instant messaging, etc.) to discuss or complete an assignment
assignments with an instructor
a Column percentages are weighted by gender, enrollment status, and institutional size. Counts are not weighted so one cannot calculate the column percentages directly from the counts. 28
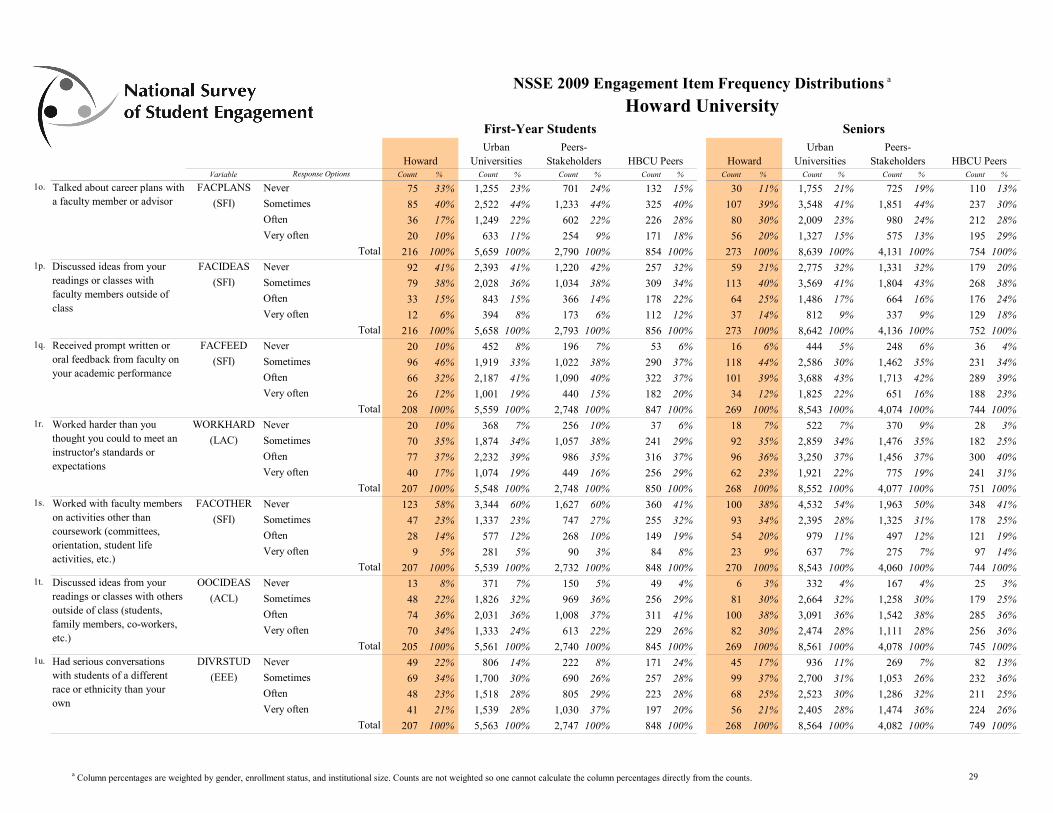
NSSE 2009 Engagement Item Frequency Distributions a
Howard University First-Year Students Seniors Urban Peers- Urban Peers-
Universities Stakeholders HBCU Peers Universities Stakeholders Variable Response Options Count % Count % Count % Count % Count
1o.
1p.
1q.
1r.
1s.
1t.
1u.
Count % Count % % Count %
HBCU Peers Howard Howard
FACPLANS Never 75 33% 1,255 23% 701 24% 132 15% 30 11% 1,755 21% 725 19% 110 13% (SFI) Sometimes 85 40% 2,522 44% 1,233 44% 325 40% 107 39% 3,548 41% 1,851 44% 237 30%
Often 36 17% 1,249 22% 602 22% 226 28% 80 30% 2,009 23% 980 24% 212 28%
Very often 20 10% 633 11% 254 9% 171 18% 56 20% 1,327 15% 575 13% 195 29%
Total 216 100% 5,659 100% 2,790 100% 854 100% 273 100% 8,639 100% 4,131 100% 754 100% FACIDEAS Never 92 41% 2,393 41% 1,220 42% 257 32% 59 21% 2,775 32% 1,331 32% 179 20%
(SFI) Sometimes 79 38% 2,028 36% 1,034 38% 309 34% 113 40% 3,569 41% 1,804 43% 268 38%
Often 33 15% 843 15% 366 14% 178 22% 64 25% 1,486 17% 664 16% 176 24%
Very often 12 6% 394 8% 173 6% 112 12% 37 14% 812 9% 337 9% 129 18%
Total 216 100% 5,658 100% 2,793 100% 856 100% 273 100% 8,642 100% 4,136 100% 752 100% FACFEED Never 20 10% 452 8% 196 7% 53 6% 16 6% 444 5% 248 6% 36 4%
(SFI) Sometimes 96 46% 1,919 33% 1,022 38% 290 37% 118 44% 2,586 30% 1,462 35% 231 34%
Often 66 32% 2,187 41% 1,090 40% 322 37% 101 39% 3,688 43% 1,713 42% 289 39%
Very often 26 12% 1,001 19% 440 15% 182 20% 34 12% 1,825 22% 651 16% 188 23%
Total 208 100% 5,559 100% 2,748 100% 847 100% 269 100% 8,543 100% 4,074 100% 744 100% WORKHARD Never 20 10% 368 7% 256 10% 37 6% 18 7% 522 7% 370 9% 28 3%
(LAC) Sometimes 70 35% 1,874 34% 1,057 38% 241 29% 92 35% 2,859 34% 1,476 35% 182 25%
Often 77 37% 2,232 39% 986 35% 316 37% 96 36% 3,250 37% 1,456 37% 300 40%
Very often 40 17% 1,074 19% 449 16% 256 29% 62 23% 1,921 22% 775 19% 241 31%
Total 207 100% 5,548 100% 2,748 100% 850 100% 268 100% 8,552 100% 4,077 100% 751 100%
Worked harder than you
Discussed ideas from your
Talked about career plans with
FACOTHER Never 123 58% 3,344 60% 1,627 60% 360 41% 100 38% 4,532 54% 1,963 50% 348 41% on activities other than (SFI) Sometimes 47 23% 1,337 23% 747 27% 255 32% 93 34% 2,395 28% 1,325 31% 178 25%
Often 28 14% 577 12% 268 10% 149 19% 54 20% 979 11% 497 12% 121 19%
Very often 9 5% 281 5% 90 3% 84 8% 23 9% 637 7% 275 7% 97 14%
Total 207 100% 5,539 100% 2,732 100% 848 100% 270 100% 8,543 100% 4,060 100% 744 100% Discussed ideas from your OOCIDEAS Never 13 8% 371 7% 150 5% 49 4% 6 3% 332 4% 167 4% 25 3%
(ACL) Sometimes 48 22% 1,826 32% 969 36% 256 29% 81 30% 2,664 32% 1,258 30% 179 25%
Often 74 36% 2,031 36% 1,008 37% 311 41% 100 38% 3,091 36% 1,542 38% 285 36%
Very often 70 34% 1,333 24% 613 22% 229 26% 82 30% 2,474 28% 1,111 28% 256 36%
Total 205 100% 5,561 100% 2,740 100% 845 100% 269 100% 8,561 100% 4,078 100% 745 100% Had serious conversations DIVRSTUD Never 49 22% 806 14% 222 8% 171 24% 45 17% 936 11% 269 7% 82 13%
(EEE) Sometimes 69 34% 1,700 30% 690 26% 257 28% 99 37% 2,700 31% 1,053 26% 232 36%
Often 48 23% 1,518 28% 805 29% 223 28% 68 25% 2,523 30% 1,286 32% 211 25%
Very often 41 21% 1,539 28% 1,030 37% 197 20% 56 21% 2,405 28% 1,474 36% 224 26%
Total 207 100% 5,563 100% 2,747 100% 848 100% 268 100% 8,564 100% 4,082 100% 749 100%
instructor's standards or expectations
coursework (committees, orientation, student life activities, etc.)
readings or classes with others outside of class (students, family members, co-workers, etc.)
with students of a different race or ethnicity than your own
thought you could to meet an
Worked with faculty members
readings or classes with faculty members outside of class
Received prompt written or oral feedback from faculty on your academic performance
a faculty member or advisor
a Column percentages are weighted by gender, enrollment status, and institutional size. Counts are not weighted so one cannot calculate the column percentages directly from the counts. 29

NSSE 2009 Engagement Item Frequency Distributions a
Howard University First-Year Students Seniors Urban Peers- Urban Peers-
Universities Stakeholders HBCU Peers Universities Stakeholders Variable Response Options Count % Count % Count % Count % Count
1v.
2a.
2b.
2c.
2d.
2e.
3a.
Count % Count % % Count %
HBCU Peers Howard Howard
DIFFSTU2 Never 25 13% 693 12% 190 7% 118 12% 18 7% 927 11% 275 8% 84 10% (EEE) Sometimes 66 31% 1,718 31% 719 27% 280 31% 87 31% 2,815 33% 1,119 28% 251 32%
Often 62 29% 1,631 30% 794 28% 234 31% 84 31% 2,493 30% 1,284 31% 217 33%
Very often 54 28% 1,531 27% 1,047 37% 215 25% 81 30% 2,339 27% 1,403 34% 198 25%
Total 207 100% 5,573 100% 2,750 100% 847 100% 270 100% 8,574 100% 4,081 100% 750 100% MEMORIZE Very little 5 3% 290 5% 151 6% 29 3% 23 9% 744 9% 346 8% 48 5%
Some 46 25% 1,324 24% 722 26% 220 26% 70 26% 2,440 29% 1,251 31% 192 25%
Quite a bit 68 33% 2,267 42% 1,077 40% 330 41% 81 31% 3,156 37% 1,422 35% 269 38%
Very much 84 40% 1,638 29% 779 28% 262 31% 94 34% 2,164 25% 1,028 26% 233 33%
Total 203 100% 5,519 100% 2,729 100% 841 100% 268 100% 8,504 100% 4,047 100% 742 100% ANALYZE Very little 5 2% 161 3% 45 2% 20 3% 7 3% 132 2% 49 1% 10 1%
(LAC) Some 36 19% 1,009 18% 426 15% 178 21% 34 13% 1,248 15% 478 12% 113 13%
Quite a bit 74 37% 2,364 43% 1,176 44% 365 41% 98 36% 3,566 42% 1,591 40% 298 37%
Very much 88 42% 1,965 36% 1,067 39% 274 36% 126 49% 3,537 42% 1,925 47% 322 48%
Total 203 100% 5,499 100% 2,714 100% 837 100% 265 100% 8,483 100% 4,043 100% 743 100% SYNTHESZ Very little 13 6% 295 5% 92 3% 37 3% 10 4% 343 4% 120 3% 28 4%
(LAC) Some 52 27% 1,494 27% 647 24% 231 26% 68 26% 1,880 22% 791 20% 141 17%
Quite a bit 73 36% 2,207 40% 1,135 42% 331 40% 89 33% 3,384 40% 1,597 40% 306 42%
Very much 66 32% 1,498 28% 843 31% 241 30% 100 37% 2,856 34% 1,513 37% 267 37%
Total 204 100% 5,494 100% 2,717 100% 840 100% 267 100% 8,463 100% 4,021 100% 742 100% Coursework emphasizes:
Had serious conversations
EVALUATE Very little 10 4% 282 5% 142 5% 33 3% 13 5% 438 5% 217 5% 26 4% Making judgments about the (LAC) Some 54 27% 1,349 24% 687 25% 182 22% 62 24% 1,889 22% 896 22% 151 20%
Quite a bit 64 33% 2,216 41% 1,137 42% 313 38% 99 36% 3,326 39% 1,581 40% 277 38%
Very much 75 36% 1,655 30% 754 28% 308 37% 94 35% 2,833 33% 1,341 33% 288 38%
Total 203 100% 5,502 100% 2,720 100% 836 100% 268 100% 8,486 100% 4,035 100% 742 100% Coursework emphasizes: APPLYING Very little 6 2% 238 5% 103 4% 28 3% 15 7% 241 3% 133 3% 17 2% Applying theories or concepts (LAC) Some 42 23% 1,136 21% 556 21% 192 23% 36 13% 1,463 18% 682 17% 110 14%
Quite a bit 67 33% 2,166 38% 1,076 41% 306 33% 85 31% 3,067 36% 1,441 36% 274 33%
Very much 89 42% 1,976 36% 991 35% 315 41% 131 49% 3,727 43% 1,789 44% 341 50%
Total 204 100% 5,516 100% 2,726 100% 841 100% 267 100% 8,498 100% 4,045 100% 742 100% Number of assigned READASGN None 1 0% 92 2% 32 1% 13 1% 3 1% 173 2% 58 2% 16 2% textbooks, books, or book- (LAC) 1-4 50 25% 1,384 26% 484 19% 259 26% 75 28% 2,585 31% 1,056 27% 224 29%
5-10 82 41% 2,296 42% 1,159 42% 330 41% 103 39% 3,143 36% 1,509 38% 271 38%
11-20 32 16% 1,122 19% 714 25% 132 18% 47 18% 1,405 17% 827 20% 125 15%
More than 20 37 17% 626 11% 340 12% 106 13% 40 15% 1,176 14% 588 14% 108 15%
Total 202 100% 5,520 100% 2,729 100% 840 100% 268 100% 8,482 100% 4,038 100% 744 100%
length packs of course readings
value of information, arguments, or methods
with students who are very different from you in terms of their religious beliefs, political opinions, or personal values
Coursework emphasizes: Memorizing facts, ideas, or methods from your courses and readings
Coursework emphasizes: Analyzing the basic elements of an idea, experience, or theory
Coursework emphasizes: Synthesizing and organizing ideas, information, or experiences
to practical problems or in new situations
a Column percentages are weighted by gender, enrollment status, and institutional size. Counts are not weighted so one cannot calculate the column percentages directly from the counts. 30
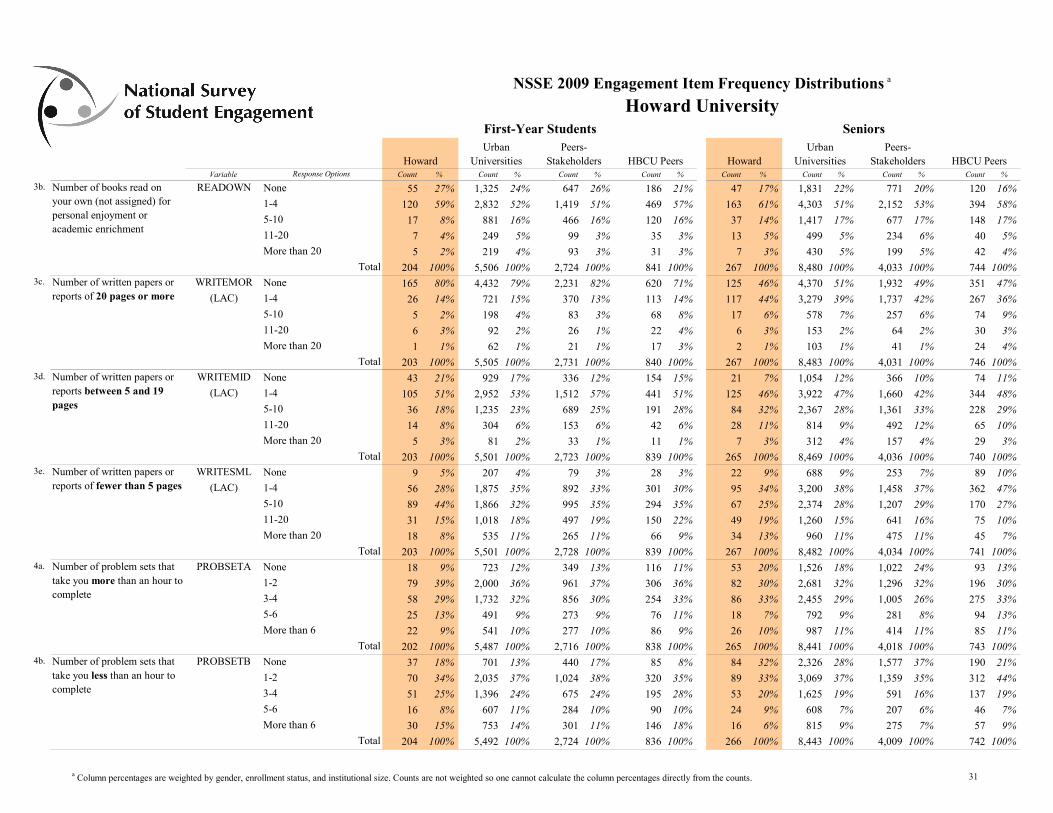
NSSE 2009 Engagement Item Frequency Distributions a
Howard University First-Year Students Seniors Urban Peers- Urban Peers-
Universities Stakeholders HBCU Peers Universities Stakeholders Variable Response Options Count % Count % Count % Count % Count
3b.
3c.
3d.
3e.
4a.
4b.
Count % Count % % Count %
HBCU Peers Howard Howard
READOWN None 55 27% 1,325 24% 647 26% 186 21% 47 17% 1,831 22% 771 20% 120 16%
1-4 120 59% 2,832 52% 1,419 51% 469 57% 163 61% 4,303 51% 2,152 53% 394 58%
5-10 17 8% 881 16% 466 16% 120 16% 37 14% 1,417 17% 677 17% 148 17%
11-20 7 4% 249 5% 99 3% 35 3% 13 5% 499 5% 234 6% 40 5%
More than 20 5 2% 219 4% 93 3% 31 3% 7 3% 430 5% 199 5% 42 4%
Total 204 100% 5,506 100% 2,724 100% 841 100% 267 100% 8,480 100% 4,033 100% 744 100% WRITEMOR None 165 80% 4,432 79% 2,231 82% 620 71% 125 46% 4,370 51% 1,932 49% 351 47%
(LAC) 1-4 26 14% 721 15% 370 13% 113 14% 117 44% 3,279 39% 1,737 42% 267 36%
5-10 5 2% 198 4% 83 3% 68 8% 17 6% 578 7% 257 6% 74 9%
11-20 6 3% 92 2% 26 1% 22 4% 6 3% 153 2% 64 2% 30 3%
More than 20 1 1% 62 1% 21 1% 17 3% 2 1% 103 1% 41 1% 24 4%
Total 203 100% 5,505 100% 2,731 100% 840 100% 267 100% 8,483 100% 4,031 100% 746 100% WRITEMID None 43 21% 929 17% 336 12% 154 15% 21 7% 1,054 12% 366 10% 74 11%
(LAC) 1-4 105 51% 2,952 53% 1,512 57% 441 51% 125 46% 3,922 47% 1,660 42% 344 48%
5-10 36 18% 1,235 23% 689 25% 191 28% 84 32% 2,367 28% 1,361 33% 228 29%
11-20 14 8% 304 6% 153 6% 42 6% 28 11% 814 9% 492 12% 65 10%
More than 20 5 3% 81 2% 33 1% 11 1% 7 3% 312 4% 157 4% 29 3%
Total 203 100% 5,501 100% 2,723 100% 839 100% 265 100% 8,469 100% 4,036 100% 740 100% WRITESML None 9 5% 207 4% 79 3% 28 3% 22 9% 688 9% 253 7% 89 10%
(LAC) 1-4 56 28% 1,875 35% 892 33% 301 30% 95 34% 3,200 38% 1,458 37% 362 47%
5-10 89 44% 1,866 32% 995 35% 294 35% 67 25% 2,374 28% 1,207 29% 170 27%
11-20 31 15% 1,018 18% 497 19% 150 22% 49 19% 1,260 15% 641 16% 75 10%
More than 20 18 8% 535 11% 265 11% 66 9% 34 13% 960 11% 475 11% 45 7%
Total 203 100% 5,501 100% 2,728 100% 839 100% 267 100% 8,482 100% 4,034 100% 741 100%
Number of written papers or
Number of books read on
PROBSETA None 18 9% 723 12% 349 13% 116 11% 53 20% 1,526 18% 1,022 24% 93 13% take you more than an hour to 1-2 79 39% 2,000 36% 961 37% 306 36% 82 30% 2,681 32% 1,296 32% 196 30%
3-4 58 29% 1,732 32% 856 30% 254 33% 86 33% 2,455 29% 1,005 26% 275 33%
5-6 25 13% 491 9% 273 9% 76 11% 18 7% 792 9% 281 8% 94 13%
More than 6 22 9% 541 10% 277 10% 86 9% 26 10% 987 11% 414 11% 85 11%
Total 202 100% 5,487 100% 2,716 100% 838 100% 265 100% 8,441 100% 4,018 100% 743 100% Number of problem sets that PROBSETB None 37 18% 701 13% 440 17% 85 8% 84 32% 2,326 28% 1,577 37% 190 21% take you less than an hour to 1-2 70 34% 2,035 37% 1,024 38% 320 35% 89 33% 3,069 37% 1,359 35% 312 44%
3-4 51 25% 1,396 24% 675 24% 195 28% 53 20% 1,625 19% 591 16% 137 19%
5-6 16 8% 607 11% 284 10% 90 10% 24 9% 608 7% 207 6% 46 7%
More than 6 30 15% 753 14% 301 11% 146 18% 16 6% 815 9% 275 7% 57 9%
Total 204 100% 5,492 100% 2,724 100% 836 100% 266 100% 8,443 100% 4,009 100% 742 100%
reports of 20 pages or more
Number of written papers or reports between 5 and 19 pages
Number of problem sets that
complete
complete
your own (not assigned) for personal enjoyment or academic enrichment
Number of written papers or reports of fewer than 5 pages
a Column percentages are weighted by gender, enrollment status, and institutional size. Counts are not weighted so one cannot calculate the column percentages directly from the counts. 31
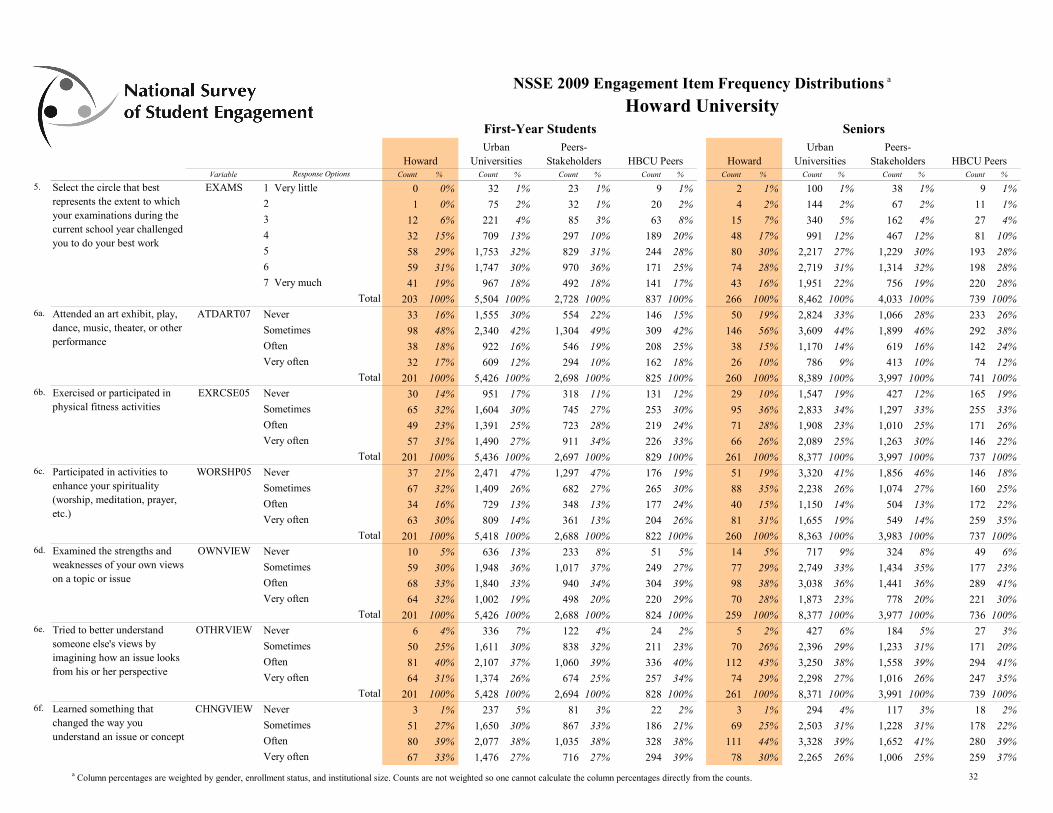
NSSE 2009 Engagement Item Frequency Distributions a
Howard University First-Year Students Seniors Urban Peers- Urban Peers-
Universities Stakeholders HBCU Peers Universities Stakeholders HBCU Peers Variable Response Options Count % Count % Count % Count % Count % Count %Count % Count %
Howard Howard
5. Select the circle that best EXAMS 1 Very little 0 0% 32 1% 23 1% 9 1% 2 1% 100 1% 38 1% 9 1% represents the extent to which 2 1 0% 75 2% 32 1% 20 2% 4 2% 144 2% 67 2% 11 1% your examinations during the 3 12 6% 221 4% 85 3% 63 8% 15 7% 340 5% 162 4% 27 4% current school year challenged
4 32 15% 709 13% 297 10% 189 20% 48 17% 991 12% 467 12% 81 10% you to do your best work
5 58 29% 1,753 32% 829 31% 244 28% 80 30% 2,217 27% 1,229 30% 193 28%
6 59 31% 1,747 30% 970 36% 171 25% 74 28% 2,719 31% 1,314 32% 198 28%
7 Very much 41 19% 967 18% 492 18% 141 17% 43 16% 1,951 22% 756 19% 220 28%
Total 203 100% 5,504 100% 2,728 100% 837 100% 266 100% 8,462 100% 4,033 100% 739 100% 6a. Attended an art exhibit, play, ATDART07 Never 33 16% 1,555 30% 554 22% 146 15% 50 19% 2,824 33% 1,066 28% 233 26%
dance, music, theater, or other Sometimes 98 48% 2,340 42% 1,304 49% 309 42% 146 56% 3,609 44% 1,899 46% 292 38% performance Often 38 18% 922 16% 546 19% 208 25% 38 15% 1,170 14% 619 16% 142 24%
Very often 32 17% 609 12% 294 10% 162 18% 26 10% 786 9% 413 10% 74 12%
Total 201 100% 5,426 100% 2,698 100% 825 100% 260 100% 8,389 100% 3,997 100% 741 100% 6b. Exercised or participated in EXRCSE05 Never 30 14% 951 17% 318 11% 131 12% 29 10% 1,547 19% 427 12% 165 19%
physical fitness activities Sometimes 65 32% 1,604 30% 745 27% 253 30% 95 36% 2,833 34% 1,297 33% 255 33%
Often 49 23% 1,391 25% 723 28% 219 24% 71 28% 1,908 23% 1,010 25% 171 26%
Very often 57 31% 1,490 27% 911 34% 226 33% 66 26% 2,089 25% 1,263 30% 146 22%
Total 201 100% 5,436 100% 2,697 100% 829 100% 261 100% 8,377 100% 3,997 100% 737 100% 6c. Participated in activities to WORSHP05 Never 37 21% 2,471 47% 1,297 47% 176 19% 51 19% 3,320 41% 1,856 46% 146 18%
enhance your spirituality Sometimes 67 32% 1,409 26% 682 27% 265 30% 88 35% 2,238 26% 1,074 27% 160 25% (worship, meditation, prayer, Often 34 16% 729 13% 348 13% 177 24% 40 15% 1,150 14% 504 13% 172 22% etc.)
Very often 63 30% 809 14% 361 13% 204 26% 81 31% 1,655 19% 549 14% 259 35%
Total 201 100% 5,418 100% 2,688 100% 822 100% 260 100% 8,363 100% 3,983 100% 737 100% 6d. Examined the strengths and OWNVIEW Never 10 5% 636 13% 233 8% 51 5% 14 5% 717 9% 324 8% 49 6%
weaknesses of your own views Sometimes 59 30% 1,948 36% 1,017 37% 249 27% 77 29% 2,749 33% 1,434 35% 177 23% on a topic or issue Often 68 33% 1,840 33% 940 34% 304 39% 98 38% 3,038 36% 1,441 36% 289 41%
Very often 64 32% 1,002 19% 498 20% 220 29% 70 28% 1,873 23% 778 20% 221 30%
Total 201 100% 5,426 100% 2,688 100% 824 100% 259 100% 8,377 100% 3,977 100% 736 100% 6e. Tried to better understand OTHRVIEW Never 6 4% 336 7% 122 4% 24 2% 5 2% 427 6% 184 5% 27 3%
someone else's views by Sometimes 50 25% 1,611 30% 838 32% 211 23% 70 26% 2,396 29% 1,233 31% 171 20% imagining how an issue looks Often 81 40% 2,107 37% 1,060 39% 336 40% 112 43% 3,250 38% 1,558 39% 294 41% from his or her perspective
Very often 64 31% 1,374 26% 674 25% 257 34% 74 29% 2,298 27% 1,016 26% 247 35%
Total 201 100% 5,428 100% 2,694 100% 828 100% 261 100% 8,371 100% 3,991 100% 739 100% 6f. Learned something that CHNGVIEW Never 3 1% 237 5% 81 3% 22 2% 3 1% 294 4% 117 3% 18 2%
changed the way you Sometimes 51 27% 1,650 30% 867 33% 186 21% 69 25% 2,503 31% 1,228 31% 178 22% understand an issue or concept Often 80 39% 2,077 38% 1,035 38% 328 38% 111 44% 3,328 39% 1,652 41% 280 39%
Very often 67 33% 1,476 27% 716 27% 294 39% 78 30% 2,265 26% 1,006 25% 259 37%
a Column percentages are weighted by gender, enrollment status, and institutional size. Counts are not weighted so one cannot calculate the column percentages directly from the counts. 32
Count %
Howard Variable Response Options Count % Count % Count % Count % Count % Count % Count %
HBCU Peers
Seniors
HBCU Peers Howard
NSSE 2009 Engagement Item Frequency Distributions a
Howard University
Peers-Stakeholders
Urban Universities
First-Year Students Urban
Universities Peers-
Stakeholders
Total 5,440 100% 2,699 100% 830 100% 261 100% 8,390 100% 4,003 100% 735 100%
201 100%
a Column percentages are weighted by gender, enrollment status, and institutional size. Counts are not weighted so one cannot calculate the column percentages directly from the counts. 33
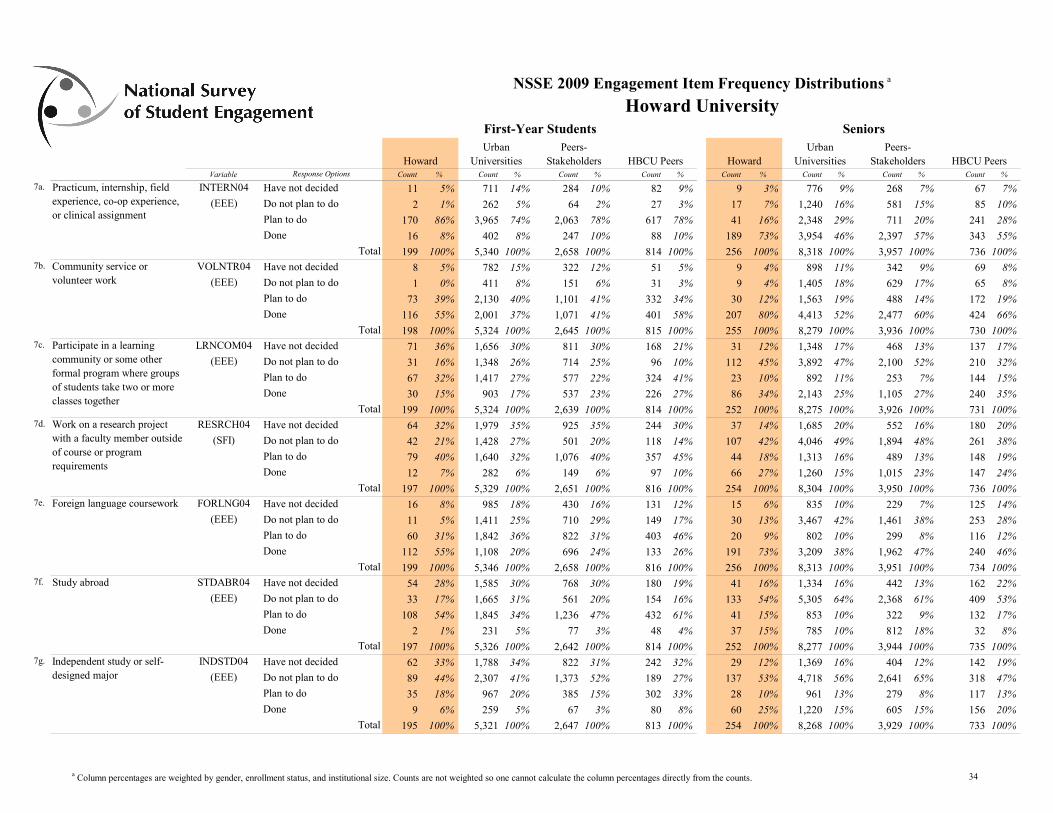
NSSE 2009 Engagement Item Frequency Distributions a
Howard University First-Year Students Seniors Urban Peers- Urban Peers-
Universities Stakeholders HBCU Peers Universities Stakeholders Variable Response Options Count % Count % Count % Count % Count
7a.
7b.
7c.
7d.
7e.
7f.
7g.
Count % Count % % Count %
HBCU Peers Howard Howard
INTERN04 Have not decided 11 5% 711 14% 284 10% 82 9% 9 3% 776 9% 268 7% 67 7% (EEE) Do not plan to do 2 1% 262 5% 64 2% 27 3% 17 7% 1,240 16% 581 15% 85 10%
Plan to do 170 86% 3,965 74% 2,063 78% 617 78% 41 16% 2,348 29% 711 20% 241 28%
Done 16 8% 402 8% 247 10% 88 10% 189 73% 3,954 46% 2,397 57% 343 55%
Total 199 100% 5,340 100% 2,658 100% 814 100% 256 100% 8,318 100% 3,957 100% 736 100% VOLNTR04 Have not decided 8 5% 782 15% 322 12% 51 5% 9 4% 898 11% 342 9% 69 8%
(EEE) Do not plan to do 1 0% 411 8% 151 6% 31 3% 9 4% 1,405 18% 629 17% 65 8%
Plan to do 73 39% 2,130 40% 1,101 41% 332 34% 30 12% 1,563 19% 488 14% 172 19%
Done 116 55% 2,001 37% 1,071 41% 401 58% 207 80% 4,413 52% 2,477 60% 424 66%
Total 198 100% 5,324 100% 2,645 100% 815 100% 255 100% 8,279 100% 3,936 100% 730 100% LRNCOM04 Have not decided 71 36% 1,656 30% 811 30% 168 21% 31 12% 1,348 17% 468 13% 137 17%
(EEE) Do not plan to do 31 16% 1,348 26% 714 25% 96 10% 112 45% 3,892 47% 2,100 52% 210 32%
Plan to do 67 32% 1,417 27% 577 22% 324 41% 23 10% 892 11% 253 7% 144 15%
Done 30 15% 903 17% 537 23% 226 27% 86 34% 2,143 25% 1,105 27% 240 35%
Total 199 100% 5,324 100% 2,639 100% 814 100% 252 100% 8,275 100% 3,926 100% 731 100% RESRCH04 Have not decided 64 32% 1,979 35% 925 35% 244 30% 37 14% 1,685 20% 552 16% 180 20%
(SFI) Do not plan to do 42 21% 1,428 27% 501 20% 118 14% 107 42% 4,046 49% 1,894 48% 261 38%
Plan to do 79 40% 1,640 32% 1,076 40% 357 45% 44 18% 1,313 16% 489 13% 148 19%
Done 12 7% 282 6% 149 6% 97 10% 66 27% 1,260 15% 1,015 23% 147 24%
Total 197 100% 5,329 100% 2,651 100% 816 100% 254 100% 8,304 100% 3,950 100% 736 100%
Practicum, internship, field
FORLNG04 Have not decided 16 8% 985 18% 430 16% 131 12% 15 6% 835 10% 229 7% 125 14% (EEE) Do not plan to do 11 5% 1,411 25% 710 29% 149 17% 30 13% 3,467 42% 1,461 38% 253 28%
Plan to do 60 31% 1,842 36% 822 31% 403 46% 20 9% 802 10% 299 8% 116 12%
Done 112 55% 1,108 20% 696 24% 133 26% 191 73% 3,209 38% 1,962 47% 240 46%
Total 199 100% 5,346 100% 2,658 100% 816 100% 256 100% 8,313 100% 3,951 100% 734 100% STDABR04 Have not decided 54 28% 1,585 30% 768 30% 180 19% 41 16% 1,334 16% 442 13% 162 22%
(EEE) Do not plan to do 33 17% 1,665 31% 561 20% 154 16% 133 54% 5,305 64% 2,368 61% 409 53%
Plan to do 108 54% 1,845 34% 1,236 47% 432 61% 41 15% 853 10% 322 9% 132 17%
Done 2 1% 231 5% 77 3% 48 4% 37 15% 785 10% 812 18% 32 8%
Total 197 100% 5,326 100% 2,642 100% 814 100% 252 100% 8,277 100% 3,944 100% 735 100%
Study abroad
INDSTD04 Have not decided 62 33% 1,788 34% 822 31% 242 32% 29 12% 1,369 16% 404 12% 142 19% (EEE) Do not plan to do 89 44% 2,307 41% 1,373 52% 189 27% 137 53% 4,718 56% 2,641 65% 318 47%
Plan to do 35 18% 967 20% 385 15% 302 33% 28 10% 961 13% 279 8% 117 13%
Done 9 6% 259 5% 67 3% 80 8% 60 25% 1,220 15% 605 15% 156 20%
Total 195 100% 5,321 100% 2,647 100% 813 100% 254 100% 8,268 100% 3,929 100% 733 100%
experience, co-op experience, or clinical assignment
Community service or volunteer work
Participate in a learning community or some other formal program where groups of students take two or more classes together
Work on a research project with a faculty member outside of course or program requirements
Foreign language coursework
Independent study or self-designed major
a Column percentages are weighted by gender, enrollment status, and institutional size. Counts are not weighted so one cannot calculate the column percentages directly from the counts. 34

NSSE 2009 Engagement Item Frequency Distributions a
Howard University First-Year Students Seniors
7h.
8a.
8b.
8c.
Variable Response Options Count % Count % Count % Count % Count % Count % Count % Count %
HBCU Peers HBCU Peers Howard Howard Peers-
Stakeholders Urban
Universities Urban
Universities Peers-
Stakeholders
SNRX04 Have not decided 58 29% 1,992 37% 950 36% 207 23% 9 4% 1,095 13% 382 11% 119 13% (EEE) Do not plan to do 11 5% 685 13% 266 10% 67 7% 26 10% 1,724 21% 1,265 31% 127 17%
Plan to do 126 64% 2,517 47% 1,389 52% 503 66% 104 40% 3,026 37% 948 26% 290 34%
Done 3 1% 140 3% 50 2% 41 4% 117 47% 2,461 29% 1,362 32% 199 36%
Total 198 100% 5,334 100% 2,655 100% 818 100% 256 100% 8,306 100% 3,957 100% 735 100% ENVSTU
(SCE) 1 Unfriendly,
Unsupportive, Sense of alienation 1 0% 71 2% 30 1% 16 1% 5 2% 71 1% 33 1% 8 1%
2 8 3% 157 3% 58 2% 20 2% 5 2% 217 3% 110 3% 15 2%
3 10 5% 338 6% 120 5% 76 9% 8 3% 416 5% 190 5% 32 4%
4 27 14% 832 15% 319 12% 123 13% 31 13% 1,035 13% 437 12% 85 11%
5 39 18% 1,163 22% 572 21% 170 22% 49 18% 1,883 23% 887 23% 144 19%
6 67 36% 1,542 28% 864 32% 173 23% 77 31% 2,498 29% 1,296 32% 195 28% 7 Friendly, Supportive,
Sense of belonging 44 24% 1,232 24% 688 26% 238 30% 80 32% 2,175 27% 1,003 24% 254 36%
Total 196 100% 5,335 100% 2,651 100% 816 100% 255 100% 8,295 100% 3,956 100% 733 100% ENVFAC
(SCE) 1 Unavailable, Unhelpful,
Unsympathetic 7 3% 63 1% 25 1% 18 2% 2 1% 112 1% 64 2% 16 2%
2 6 4% 158 4% 66 3% 51 5% 15 5% 230 3% 120 3% 24 4%
3 25 12% 376 7% 172 7% 88 10% 18 7% 473 6% 277 7% 52 8%
4 52 25% 995 18% 480 18% 174 19% 38 14% 1,165 14% 638 16% 98 14%
5 45 23% 1,411 25% 836 32% 172 25% 82 33% 2,009 24% 1,056 26% 150 21%
6 38 20% 1,441 27% 749 28% 158 22% 68 27% 2,515 30% 1,151 29% 183 24%
7 Available, Helpful, Sympathetic
23 13% 889 17% 325 12% 157 17% 33 14% 1,790 22% 652 17% 211 29%
Total 196 100% 5,333 100% 2,653 100% 818 100% 256 100% 8,294 100% 3,958 100% 734 100% ENVADM
(SCE) 1 Unhelpful,
Inconsiderate, Rigid 37 19% 204 4% 89 3% 57 7% 42 16% 439 6% 245 6% 41 6%
2 46 23% 359 7% 153 6% 70 8% 44 17% 695 9% 404 10% 83 12%
3 39 19% 571 10% 300 11% 118 14% 47 18% 964 12% 578 14% 78 10%
4 33 17% 1,305 24% 710 27% 195 22% 53 21% 1,789 20% 893 22% 139 21%
5 22 11% 1,187 23% 617 23% 158 22% 33 13% 1,752 22% 848 21% 142 18%
6 10 5% 997 18% 502 19% 103 12% 20 8% 1,520 18% 609 16% 114 16%
7 Helpful, Considerate, Flexible
9 6% 707 13% 277 11% 114 14% 17 7% 1,134 14% 378 10% 136 17%
Total 196 100% 5,330 100% 2,648 100% 815 100% 256 100% 8,293 100% 3,955 100% 733 100%
Quality of relationships with administrative personnel and offices
Quality of relationships with other students
Quality of relationships with faculty members
Culminating senior experience (capstone course, senior project or thesis, comprehensive exam, etc.)
a Column percentages are weighted by gender, enrollment status, and institutional size. Counts are not weighted so one cannot calculate the column percentages directly from the counts. 35
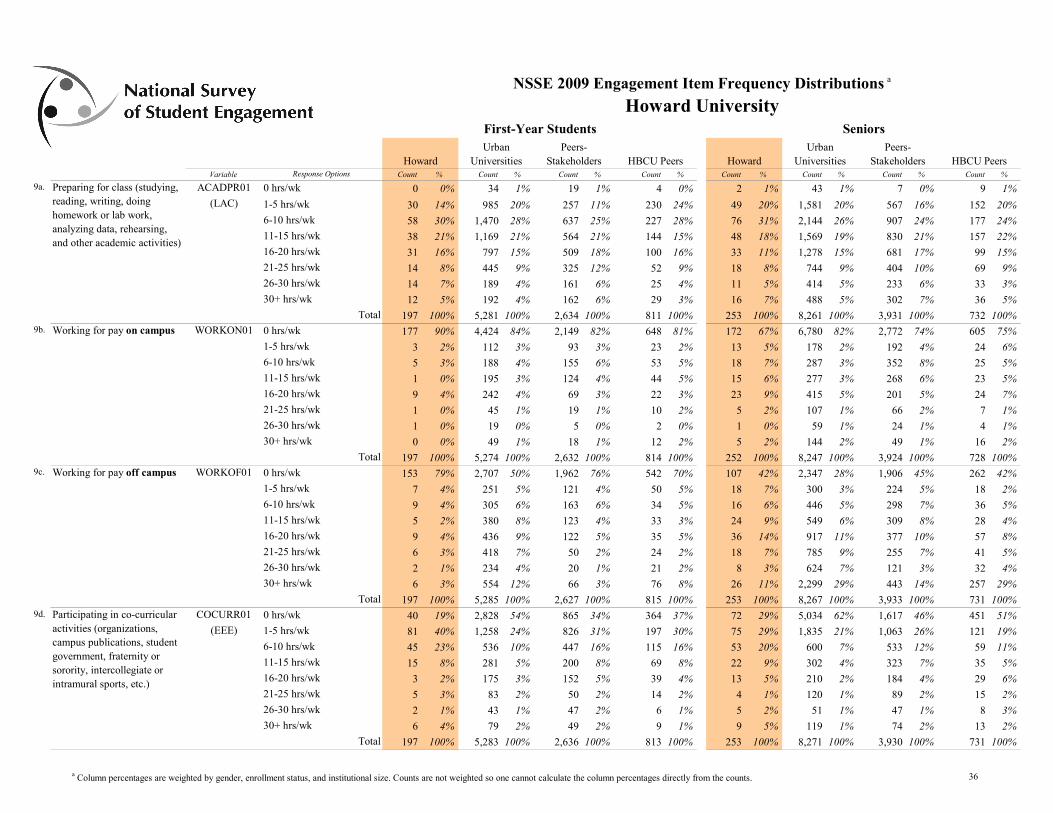
NSSE 2009 Engagement Item Frequency Distributions a
Howard University First-Year Students Seniors Urban Peers- Urban Peers-
Universities Stakeholders HBCU Peers Universities Stakeholders Variable Response Options Count % Count % Count % Count % Count
9a.
9b.
9c.
9d.
Count % Count % % Count %
HBCU Peers Howard Howard
ACADPR01 0 hrs/wk 0 0% 34 1% 19 1% 4 0% 2 1% 43 1% 7 0% 9 1% (LAC) 1-5 hrs/wk 30 14% 985 20% 257 11% 230 24% 49 20% 1,581 20% 567 16% 152 20%
6-10 hrs/wk 58 30% 1,470 28% 637 25% 227 28% 76 31% 2,144 26% 907 24% 177 24%
11-15 hrs/wk 38 21% 1,169 21% 564 21% 144 15% 48 18% 1,569 19% 830 21% 157 22%
16-20 hrs/wk 31 16% 797 15% 509 18% 100 16% 33 11% 1,278 15% 681 17% 99 15%
21-25 hrs/wk 14 8% 445 9% 325 12% 52 9% 18 8% 744 9% 404 10% 69 9%
26-30 hrs/wk 14 7% 189 4% 161 6% 25 4% 11 5% 414 5% 233 6% 33 3%
30+ hrs/wk 12 5% 192 4% 162 6% 29 3% 16 7% 488 5% 302 7% 36 5%
Total 197 100% 5,281 100% 2,634 100% 811 100% 253 100% 8,261 100% 3,931 100% 732 100% WORKON01 0 hrs/wk 177 90% 4,424 84% 2,149 82% 648 81% 172 67% 6,780 82% 2,772 74% 605 75%
1-5 hrs/wk 3 2% 112 3% 93 3% 23 2% 13 5% 178 2% 192 4% 24 6%
6-10 hrs/wk 5 3% 188 4% 155 6% 53 5% 18 7% 287 3% 352 8% 25 5%
11-15 hrs/wk 1 0% 195 3% 124 4% 44 5% 15 6% 277 3% 268 6% 23 5%
16-20 hrs/wk 9 4% 242 4% 69 3% 22 3% 23 9% 415 5% 201 5% 24 7%
21-25 hrs/wk 1 0% 45 1% 19 1% 10 2% 5 2% 107 1% 66 2% 7 1%
26-30 hrs/wk 1 0% 19 0% 5 0% 2 0% 1 0% 59 1% 24 1% 4 1%
30+ hrs/wk 0 0% 49 1% 18 1% 12 2% 5 2% 144 2% 49 1% 16 2%
Total 197 100% 5,274 100% 2,632 100% 814 100% 252 100% 8,247 100% 3,924 100% 728 100% WORKOF01 0 hrs/wk 153 79% 2,707 50% 1,962 76% 542 70% 107 42% 2,347 28% 1,906 45% 262 42%
1-5 hrs/wk 7 4% 251 5% 121 4% 50 5% 18 7% 300 3% 224 5% 18 2%
6-10 hrs/wk 9 4% 305 6% 163 6% 34 5% 16 6% 446 5% 298 7% 36 5%
11-15 hrs/wk 5 2% 380 8% 123 4% 33 3% 24 9% 549 6% 309 8% 28 4%
16-20 hrs/wk 9 4% 436 9% 122 5% 35 5% 36 14% 917 11% 377 10% 57 8%
21-25 hrs/wk 6 3% 418 7% 50 2% 24 2% 18 7% 785 9% 255 7% 41 5%
26-30 hrs/wk 2 1% 234 4% 20 1% 21 2% 8 3% 624 7% 121 3% 32 4%
30+ hrs/wk 6 3% 554 12% 66 3% 76 8% 26 11% 2,299 29% 443 14% 257 29%
Total 197 100% 5,285 100% 2,627 100% 815 100% 253 100% 8,267 100% 3,933 100% 731 100%
Working for pay off campus
Working for pay on campus
Preparing for class (studying,
COCURR01 0 hrs/wk 40 19% 2,828 54% 865 34% 364 37% 72 29% 5,034 62% 1,617 46% 451 51% activities (organizations, (EEE) 1-5 hrs/wk 81 40% 1,258 24% 826 31% 197 30% 75 29% 1,835 21% 1,063 26% 121 19%
6-10 hrs/wk 45 23% 536 10% 447 16% 115 16% 53 20% 600 7% 533 12% 59 11%
11-15 hrs/wk 15 8% 281 5% 200 8% 69 8% 22 9% 302 4% 323 7% 35 5%
16-20 hrs/wk 3 2% 175 3% 152 5% 39 4% 13 5% 210 2% 184 4% 29 6%
21-25 hrs/wk 5 3% 83 2% 50 2% 14 2% 4 1% 120 1% 89 2% 15 2%
26-30 hrs/wk 2 1% 43 1% 47 2% 6 1% 5 2% 51 1% 47 1% 8 3%
30+ hrs/wk 6 4% 79 2% 49 2% 9 1% 9 5% 119 1% 74 2% 13 2%
Total 197 100% 5,283 100% 2,636 100% 813 100% 253 100% 8,271 100% 3,930 100% 731 100%
Participating in co-curricular
campus publications, student government, fraternity or sorority, intercollegiate or intramural sports, etc.)
reading, writing, doing homework or lab work, analyzing data, rehearsing, and other academic activities)
a Column percentages are weighted by gender, enrollment status, and institutional size. Counts are not weighted so one cannot calculate the column percentages directly from the counts. 36
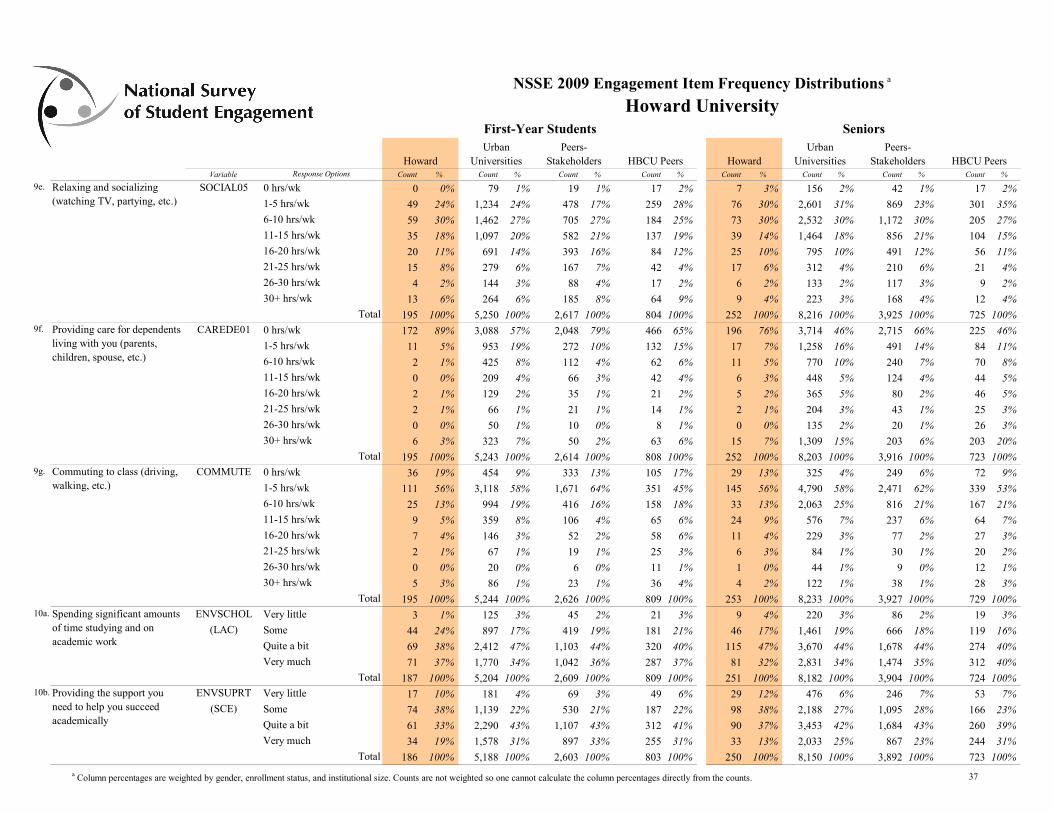
NSSE 2009 Engagement Item Frequency Distributions a
Howard University First-Year Students Seniors Urban Peers- Urban Peers-
9e.
9f.
9g.
10a.
10b.
Variable Response Options Count % Count % Count % Count % Count % Count % Count % Count %
HBCU Peers HBCU Peers Howard Howard Stakeholders Universities Universities Stakeholders
SOCIAL05 0 hrs/wk 0 0% 79 1% 19 1% 17 2% 7 3% 156 2% 42 1% 17 2%
1-5 hrs/wk 49 24% 1,234 24% 478 17% 259 28% 76 30% 2,601 31% 869 23% 301 35%
6-10 hrs/wk 59 30% 1,462 27% 705 27% 184 25% 73 30% 2,532 30% 1,172 30% 205 27%
11-15 hrs/wk 35 18% 1,097 20% 582 21% 137 19% 39 14% 1,464 18% 856 21% 104 15%
16-20 hrs/wk 20 11% 691 14% 393 16% 84 12% 25 10% 795 10% 491 12% 56 11%
21-25 hrs/wk 15 8% 279 6% 167 7% 42 4% 17 6% 312 4% 210 6% 21 4%
26-30 hrs/wk 4 2% 144 3% 88 4% 17 2% 6 2% 133 2% 117 3% 9 2%
30+ hrs/wk 13 6% 264 6% 185 8% 64 9% 9 4% 223 3% 168 4% 12 4%
Total 195 100% 5,250 100% 2,617 100% 804 100% 252 100% 8,216 100% 3,925 100% 725 100% CAREDE01 0 hrs/wk 172 89% 3,088 57% 2,048 79% 466 65% 196 76% 3,714 46% 2,715 66% 225 46%
1-5 hrs/wk 11 5% 953 19% 272 10% 132 15% 17 7% 1,258 16% 491 14% 84 11%
6-10 hrs/wk 2 1% 425 8% 112 4% 62 6% 11 5% 770 10% 240 7% 70 8%
11-15 hrs/wk 0 0% 209 4% 66 3% 42 4% 6 3% 448 5% 124 4% 44 5%
16-20 hrs/wk 2 1% 129 2% 35 1% 21 2% 5 2% 365 5% 80 2% 46 5%
21-25 hrs/wk 2 1% 66 1% 21 1% 14 1% 2 1% 204 3% 43 1% 25 3%
26-30 hrs/wk 0 0% 50 1% 10 0% 8 1% 0 0% 135 2% 20 1% 26 3%
30+ hrs/wk 6 3% 323 7% 50 2% 63 6% 15 7% 1,309 15% 203 6% 203 20%
Total 195 100% 5,243 100% 2,614 100% 808 100% 252 100% 8,203 100% 3,916 100% 723 100% COMMUTE 0 hrs/wk 36 19% 454 9% 333 13% 105 17% 29 13% 325 4% 249 6% 72 9%
1-5 hrs/wk 111 56% 3,118 58% 1,671 64% 351 45% 145 56% 4,790 58% 2,471 62% 339 53%
6-10 hrs/wk 25 13% 994 19% 416 16% 158 18% 33 13% 2,063 25% 816 21% 167 21%
11-15 hrs/wk 9 5% 359 8% 106 4% 65 6% 24 9% 576 7% 237 6% 64 7%
16-20 hrs/wk 7 4% 146 3% 52 2% 58 6% 11 4% 229 3% 77 2% 27 3%
21-25 hrs/wk 2 1% 67 1% 19 1% 25 3% 6 3% 84 1% 30 1% 20 2%
26-30 hrs/wk 0 0% 20 0% 6 0% 11 1% 1 0% 44 1% 9 0% 12 1%
30+ hrs/wk 5 3% 86 1% 23 1% 36 4% 4 2% 122 1% 38 1% 28 3%
Total 195 100% 5,244 100% 2,626 100% 809 100% 253 100% 8,233 100% 3,927 100% 729 100% ENVSCHOL Very little 3 1% 125 3% 45 2% 21 3% 9 4% 220 3% 86 2% 19 3%
(LAC) Some 44 24% 897 17% 419 19% 181 21% 46 17% 1,461 19% 666 18% 119 16%
Quite a bit 69 38% 2,412 47% 1,103 44% 320 40% 115 47% 3,670 44% 1,678 44% 274 40%
Very much 71 37% 1,770 34% 1,042 36% 287 37% 81 32% 2,831 34% 1,474 35% 312 40%
Total 187 100% 5,204 100% 2,609 100% 809 100% 251 100% 8,182 100% 3,904 100% 724 100% ENVSUPRT Very little 17 10% 181 4% 69 3% 49 6% 29 12% 476 6% 246 7% 53 7%
(SCE) Some 74 38% 1,139 22% 530 21% 187 22% 98 38% 2,188 27% 1,095 28% 166 23%
Quite a bit 61 33% 2,290 43% 1,107 43% 312 41% 90 37% 3,453 42% 1,684 43% 260 39%
Very much 34 19% 1,578 31% 897 33% 255 31% 33 13% 2,033 25% 867 23% 244 31%
Total 186 100% 5,188 100% 2,603 100% 803 100% 250 100% 8,150 100% 3,892 100% 723 100%
Relaxing and socializing (watching TV, partying, etc.)
Spending significant amounts of time studying and on academic work
Providing the support you need to help you succeed academically
Providing care for dependents living with you (parents, children, spouse, etc.)
Commuting to class (driving, walking, etc.)
a Column percentages are weighted by gender, enrollment status, and institutional size. Counts are not weighted so one cannot calculate the column percentages directly from the counts. 37
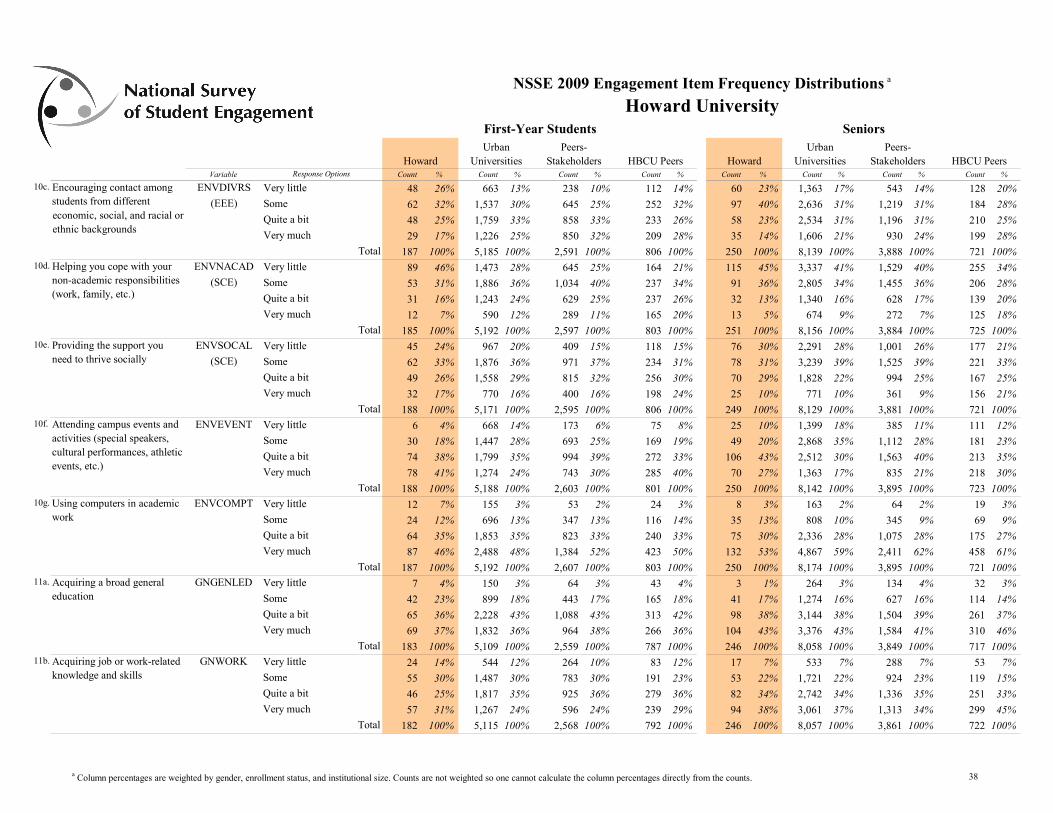
NSSE 2009 Engagement Item Frequency Distributions a
Howard University First-Year Students Seniors Urban Peers- Urban Peers-
Universities Stakeholders HBCU Peers Universities Stakeholders Variable Response Options Count % Count % Count % Count % Count
10c.
10d.
10e.
10f.
10g.
11a.
11b.
Count % Count % % Count %
HBCU Peers Howard Howard
ENVDIVRS Very little 48 26% 663 13% 238 10% 112 14% 60 23% 1,363 17% 543 14% 128 20% (EEE) Some 62 32% 1,537 30% 645 25% 252 32% 97 40% 2,636 31% 1,219 31% 184 28%
Quite a bit 48 25% 1,759 33% 858 33% 233 26% 58 23% 2,534 31% 1,196 31% 210 25%
Very much 29 17% 1,226 25% 850 32% 209 28% 35 14% 1,606 21% 930 24% 199 28%
Total 187 100% 5,185 100% 2,591 100% 806 100% 250 100% 8,139 100% 3,888 100% 721 100% ENVNACAD Very little 89 46% 1,473 28% 645 25% 164 21% 115 45% 3,337 41% 1,529 40% 255 34%
(SCE) Some 53 31% 1,886 36% 1,034 40% 237 34% 91 36% 2,805 34% 1,455 36% 206 28%
Quite a bit 31 16% 1,243 24% 629 25% 237 26% 32 13% 1,340 16% 628 17% 139 20%
Very much 12 7% 590 12% 289 11% 165 20% 13 5% 674 9% 272 7% 125 18%
Total 185 100% 5,192 100% 2,597 100% 803 100% 251 100% 8,156 100% 3,884 100% 725 100% ENVSOCAL Very little 45 24% 967 20% 409 15% 118 15% 76 30% 2,291 28% 1,001 26% 177 21%
(SCE) Some 62 33% 1,876 36% 971 37% 234 31% 78 31% 3,239 39% 1,525 39% 221 33%
Quite a bit 49 26% 1,558 29% 815 32% 256 30% 70 29% 1,828 22% 994 25% 167 25%
Very much 32 17% 770 16% 400 16% 198 24% 25 10% 771 10% 361 9% 156 21%
Total 188 100% 5,171 100% 2,595 100% 806 100% 249 100% 8,129 100% 3,881 100% 721 100% ENVEVENT Very little 6 4% 668 14% 173 6% 75 8% 25 10% 1,399 18% 385 11% 111 12%
Some 30 18% 1,447 28% 693 25% 169 19% 49 20% 2,868 35% 1,112 28% 181 23%
Quite a bit 74 38% 1,799 35% 994 39% 272 33% 106 43% 2,512 30% 1,563 40% 213 35%
Very much 78 41% 1,274 24% 743 30% 285 40% 70 27% 1,363 17% 835 21% 218 30%
Total 188 100% 5,188 100% 2,603 100% 801 100% 250 100% 8,142 100% 3,895 100% 723 100%
Helping you cope with your
Encouraging contact among
ENVCOMPT Very little 12 7% 155 3% 53 2% 24 3% 8 3% 163 2% 64 2% 19 3%
Some 24 12% 696 13% 347 13% 116 14% 35 13% 808 10% 345 9% 69 9%
Quite a bit 64 35% 1,853 35% 823 33% 240 33% 75 30% 2,336 28% 1,075 28% 175 27%
Very much 87 46% 2,488 48% 1,384 52% 423 50% 132 53% 4,867 59% 2,411 62% 458 61%
Total 187 100% 5,192 100% 2,607 100% 803 100% 250 100% 8,174 100% 3,895 100% 721 100% Acquiring a broad general GNGENLED Very little 7 4% 150 3% 64 3% 43 4% 3 1% 264 3% 134 4% 32 3%
Some 42 23% 899 18% 443 17% 165 18% 41 17% 1,274 16% 627 16% 114 14%
Quite a bit 65 36% 2,228 43% 1,088 43% 313 42% 98 38% 3,144 38% 1,504 39% 261 37%
Very much 69 37% 1,832 36% 964 38% 266 36% 104 43% 3,376 43% 1,584 41% 310 46%
Total 183 100% 5,109 100% 2,559 100% 787 100% 246 100% 8,058 100% 3,849 100% 717 100% Acquiring job or work-related GNWORK Very little 24 14% 544 12% 264 10% 83 12% 17 7% 533 7% 288 7% 53 7%
Some 55 30% 1,487 30% 783 30% 191 23% 53 22% 1,721 22% 924 23% 119 15%
Quite a bit 46 25% 1,817 35% 925 36% 279 36% 82 34% 2,742 34% 1,336 35% 251 33%
Very much 57 31% 1,267 24% 596 24% 239 29% 94 38% 3,061 37% 1,313 34% 299 45%
Total 182 100% 5,115 100% 2,568 100% 792 100% 246 100% 8,057 100% 3,861 100% 722 100%
education
non-academic responsibilities (work, family, etc.)
Providing the support you need to thrive socially
knowledge and skills
Using computers in academic work
Attending campus events and activities (special speakers, cultural performances, athletic events, etc.)
students from different economic, social, and racial or ethnic backgrounds
a Column percentages are weighted by gender, enrollment status, and institutional size. Counts are not weighted so one cannot calculate the column percentages directly from the counts. 38
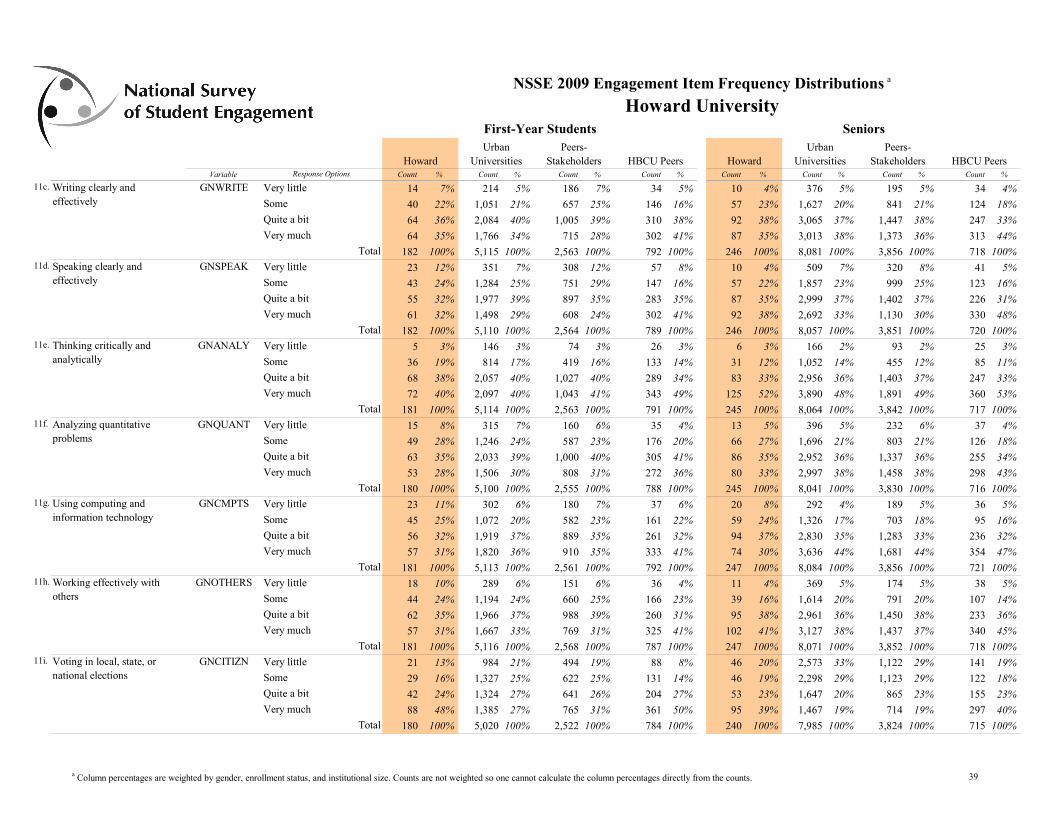
NSSE 2009 Engagement Item Frequency Distributions a
Howard University First-Year Students Seniors Urban Peers- Urban Peers-
Universities Stakeholders HBCU Peers Universities Stakeholders HBCU Peers Variable Response Options Count % Count % Count % Count % Count % Count %Count % Count %
Howard Howard
11c. Writing clearly and GNWRITE Very little 14 7% 214 5% 186 7% 34 5% 10 4% 376 5% 195 5% 34 4% effectively Some 40 22% 1,051 21% 657 25% 146 16% 57 23% 1,627 20% 841 21% 124 18%
Quite a bit 64 36% 2,084 40% 1,005 39% 310 38% 92 38% 3,065 37% 1,447 38% 247 33%
Very much 64 35% 1,766 34% 715 28% 302 41% 87 35% 3,013 38% 1,373 36% 313 44%
Total 182 100% 5,115 100% 2,563 100% 792 100% 246 100% 8,081 100% 3,856 100% 718 100% 11d. Speaking clearly and GNSPEAK Very little 23 12% 351 7% 308 12% 57 8% 10 4% 509 7% 320 8% 41 5%
effectively Some 43 24% 1,284 25% 751 29% 147 16% 57 22% 1,857 23% 999 25% 123 16%
Quite a bit 55 32% 1,977 39% 897 35% 283 35% 87 35% 2,999 37% 1,402 37% 226 31%
Very much 61 32% 1,498 29% 608 24% 302 41% 92 38% 2,692 33% 1,130 30% 330 48%
Total 182 100% 5,110 100% 2,564 100% 789 100% 246 100% 8,057 100% 3,851 100% 720 100% 11e. Thinking critically and GNANALY Very little 5 3% 146 3% 74 3% 26 3% 6 3% 166 2% 93 2% 25 3%
analytically Some 36 19% 814 17% 419 16% 133 14% 31 12% 1,052 14% 455 12% 85 11%
Quite a bit 68 38% 2,057 40% 1,027 40% 289 34% 83 33% 2,956 36% 1,403 37% 247 33%
Very much 72 40% 2,097 40% 1,043 41% 343 49% 125 52% 3,890 48% 1,891 49% 360 53%
Total 181 100% 5,114 100% 2,563 100% 791 100% 245 100% 8,064 100% 3,842 100% 717 100% 11f. Analyzing quantitative GNQUANT Very little 15 8% 315 7% 160 6% 35 4% 13 5% 396 5% 232 6% 37 4%
problems Some 49 28% 1,246 24% 587 23% 176 20% 66 27% 1,696 21% 803 21% 126 18%
Quite a bit 63 35% 2,033 39% 1,000 40% 305 41% 86 35% 2,952 36% 1,337 36% 255 34%
Very much 53 28% 1,506 30% 808 31% 272 36% 80 33% 2,997 38% 1,458 38% 298 43%
Total 180 100% 5,100 100% 2,555 100% 788 100% 245 100% 8,041 100% 3,830 100% 716 100% 11g. Using computing and GNCMPTS Very little 23 11% 302 6% 180 7% 37 6% 20 8% 292 4% 189 5% 36 5%
information technology Some 45 25% 1,072 20% 582 23% 161 22% 59 24% 1,326 17% 703 18% 95 16%
Quite a bit 56 32% 1,919 37% 889 35% 261 32% 94 37% 2,830 35% 1,283 33% 236 32%
Very much 57 31% 1,820 36% 910 35% 333 41% 74 30% 3,636 44% 1,681 44% 354 47%
Total 181 100% 5,113 100% 2,561 100% 792 100% 247 100% 8,084 100% 3,856 100% 721 100% 11h. Working effectively with GNOTHERS Very little 18 10% 289 6% 151 6% 36 4% 11 4% 369 5% 174 5% 38 5%
others Some 44 24% 1,194 24% 660 25% 166 23% 39 16% 1,614 20% 791 20% 107 14%
Quite a bit 62 35% 1,966 37% 988 39% 260 31% 95 38% 2,961 36% 1,450 38% 233 36%
Very much 57 31% 1,667 33% 769 31% 325 41% 102 41% 3,127 38% 1,437 37% 340 45%
Total 181 100% 5,116 100% 2,568 100% 787 100% 247 100% 8,071 100% 3,852 100% 718 100% 11i. Voting in local, state, or GNCITIZN Very little 21 13% 984 21% 494 19% 88 8% 46 20% 2,573 33% 1,122 29% 141 19%
national elections Some 29 16% 1,327 25% 622 25% 131 14% 46 19% 2,298 29% 1,123 29% 122 18%
Quite a bit 42 24% 1,324 27% 641 26% 204 27% 53 23% 1,647 20% 865 23% 155 23%
Very much 88 48% 1,385 27% 765 31% 361 50% 95 39% 1,467 19% 714 19% 297 40%
Total 180 100% 5,020 100% 2,522 100% 784 100% 240 100% 7,985 100% 3,824 100% 715 100%
a Column percentages are weighted by gender, enrollment status, and institutional size. Counts are not weighted so one cannot calculate the column percentages directly from the counts. 39
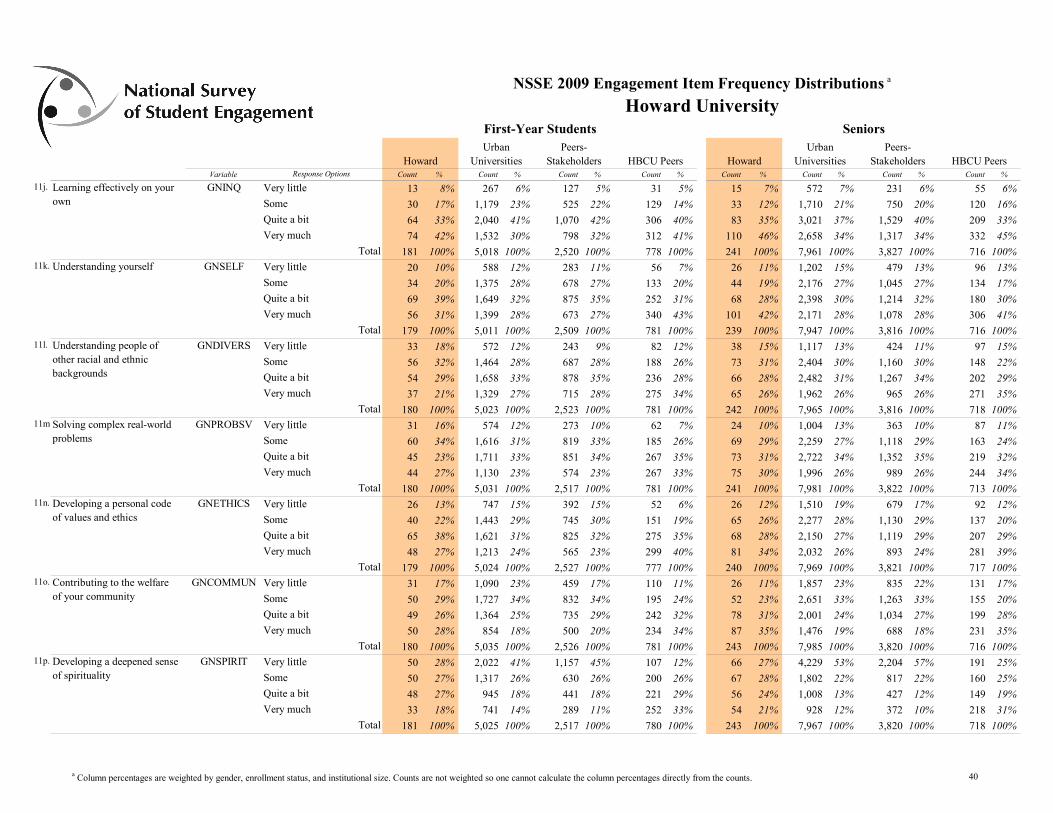
NSSE 2009 Engagement Item Frequency Distributions a
Howard University First-Year Students Seniors Urban Peers- Urban Peers-
Universities Stakeholders HBCU Peers Universities Stakeholders HBCU Peers Variable Response Options Count % Count % Count % Count % Count % Count %Count % Count %
Howard Howard
11j. Learning effectively on your GNINQ Very little 13 8% 267 6% 127 5% 31 5% 15 7% 572 7% 231 6% 55 6% own Some 30 17% 1,179 23% 525 22% 129 14% 33 12% 1,710 21% 750 20% 120 16%
Quite a bit 64 33% 2,040 41% 1,070 42% 306 40% 83 35% 3,021 37% 1,529 40% 209 33%
Very much 74 42% 1,532 30% 798 32% 312 41% 110 46% 2,658 34% 1,317 34% 332 45%
Total 181 100% 5,018 100% 2,520 100% 778 100% 241 100% 7,961 100% 3,827 100% 716 100% 11k. Understanding yourself GNSELF Very little 20 10% 588 12% 283 11% 56 7% 26 11% 1,202 15% 479 13% 96 13%
Some 34 20% 1,375 28% 678 27% 133 20% 44 19% 2,176 27% 1,045 27% 134 17%
Quite a bit 69 39% 1,649 32% 875 35% 252 31% 68 28% 2,398 30% 1,214 32% 180 30%
Very much 56 31% 1,399 28% 673 27% 340 43% 101 42% 2,171 28% 1,078 28% 306 41%
Total 179 100% 5,011 100% 2,509 100% 781 100% 239 100% 7,947 100% 3,816 100% 716 100% 11l. Understanding people of GNDIVERS Very little 33 18% 572 12% 243 9% 82 12% 38 15% 1,117 13% 424 11% 97 15%
other racial and ethnic Some 56 32% 1,464 28% 687 28% 188 26% 73 31% 2,404 30% 1,160 30% 148 22% backgrounds Quite a bit 54 29% 1,658 33% 878 35% 236 28% 66 28% 2,482 31% 1,267 34% 202 29%
Very much 37 21% 1,329 27% 715 28% 275 34% 65 26% 1,962 26% 965 26% 271 35%
Total 180 100% 5,023 100% 2,523 100% 781 100% 242 100% 7,965 100% 3,816 100% 718 100% 11m.Solving complex real-world GNPROBSV Very little 31 16% 574 12% 273 10% 62 7% 24 10% 1,004 13% 363 10% 87 11%
problems Some 60 34% 1,616 31% 819 33% 185 26% 69 29% 2,259 27% 1,118 29% 163 24%
Quite a bit 45 23% 1,711 33% 851 34% 267 35% 73 31% 2,722 34% 1,352 35% 219 32%
Very much 44 27% 1,130 23% 574 23% 267 33% 75 30% 1,996 26% 989 26% 244 34%
Total 180 100% 5,031 100% 2,517 100% 781 100% 241 100% 7,981 100% 3,822 100% 713 100% 11n. Developing a personal code GNETHICS Very little 26 13% 747 15% 392 15% 52 6% 26 12% 1,510 19% 679 17% 92 12%
of values and ethics Some 40 22% 1,443 29% 745 30% 151 19% 65 26% 2,277 28% 1,130 29% 137 20%
Quite a bit 65 38% 1,621 31% 825 32% 275 35% 68 28% 2,150 27% 1,119 29% 207 29%
Very much 48 27% 1,213 24% 565 23% 299 40% 81 34% 2,032 26% 893 24% 281 39%
Total 179 100% 5,024 100% 2,527 100% 777 100% 240 100% 7,969 100% 3,821 100% 717 100% 11o. Contributing to the welfare GNCOMMUN Very little 31 17% 1,090 23% 459 17% 110 11% 26 11% 1,857 23% 835 22% 131 17%
of your community Some 50 29% 1,727 34% 832 34% 195 24% 52 23% 2,651 33% 1,263 33% 155 20%
Quite a bit 49 26% 1,364 25% 735 29% 242 32% 78 31% 2,001 24% 1,034 27% 199 28%
Very much 50 28% 854 18% 500 20% 234 34% 87 35% 1,476 19% 688 18% 231 35%
Total 180 100% 5,035 100% 2,526 100% 781 100% 243 100% 7,985 100% 3,820 100% 716 100% 11p. Developing a deepened sense GNSPIRIT Very little 50 28% 2,022 41% 1,157 45% 107 12% 66 27% 4,229 53% 2,204 57% 191 25%
of spirituality Some 50 27% 1,317 26% 630 26% 200 26% 67 28% 1,802 22% 817 22% 160 25%
Quite a bit 48 27% 945 18% 441 18% 221 29% 56 24% 1,008 13% 427 12% 149 19%
Very much 33 18% 741 14% 289 11% 252 33% 54 21% 928 12% 372 10% 218 31%
Total 181 100% 5,025 100% 2,517 100% 780 100% 243 100% 7,967 100% 3,820 100% 718 100%
a Column percentages are weighted by gender, enrollment status, and institutional size. Counts are not weighted so one cannot calculate the column percentages directly from the counts. 40
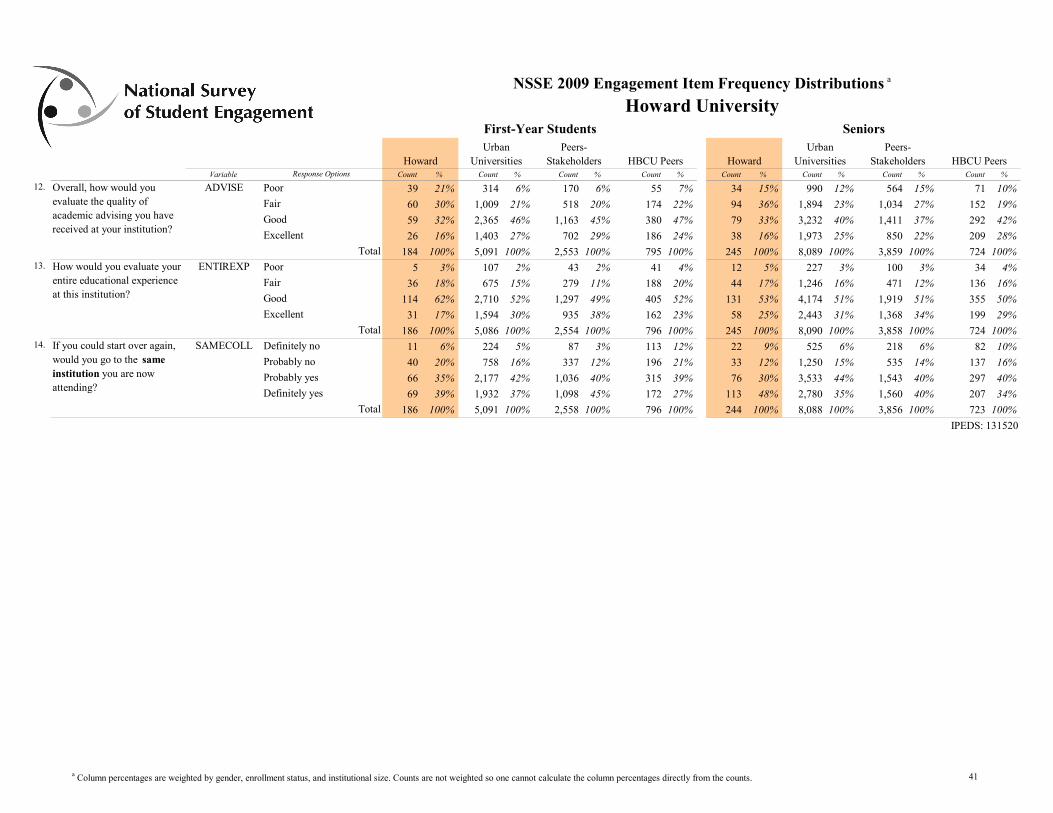
12. Overall, how would you ADVISE Poor 39 21% 314 6% 170 6% 55 7% 34 15% 990 12% 564 15% 71 10% evaluate the quality of Fair 60 30% 1,009 21% 518 20% 174 22% 94 36% 1,894 23% 1,034 27% 152 19% academic advising you have Good 59 32% 2,365 46% 1,163 45% 380 47% 79 33% 3,232 40% 1,411 37% 292 42% received at your institution?
Excellent 26 16% 1,403 27% 702 29% 186 24% 38 16% 1,973 25% 850 22% 209 28%
Total 184 100% 5,091 100% 2,553 100% 795 100% 245 100% 8,089 100% 3,859 100% 724 100% 13. How would you evaluate your ENTIREXP Poor 5 3% 107 2% 43 2% 41 4% 12 5% 227 3% 100 3% 34 4%
entire educational experience Fair 36 18% 675 15% 279 11% 188 20% 44 17% 1,246 16% 471 12% 136 16% at this institution? Good 114 62% 2,710 52% 1,297 49% 405 52% 131 53% 4,174 51% 1,919 51% 355 50%
Excellent 31 17% 1,594 30% 935 38% 162 23% 58 25% 2,443 31% 1,368 34% 199 29%
Total 186 100% 5,086 100% 2,554 100% 796 100% 245 100% 8,090 100% 3,858 100% 724 100% 14. If you could start over again, SAMECOLL Definitely no 11 6% 224 5% 87 3% 113 12% 22 9% 525 6% 218 6% 82 10%
would you go to the same Probably no 40 20% 758 16% 337 12% 196 21% 33 12% 1,250 15% 535 14% 137 16% institution you are now Probably yes 66 35% 2,177 42% 1,036 40% 315 39% 76 30% 3,533 44% 1,543 40% 297 40% attending? Definitely yes 69 39% 1,932 37% 1,098 45% 172 27% 113 48% 2,780 35% 1,560 40% 207 34%
Total 186 100% 5,091 100% 2,558 100% 796 100% 244 100% 8,088 100% 3,856 100% 723 100%
IPEDS: 131520
Count % Count %
Howard Howard
NSSE 2009 Engagement Item Frequency Distributions a
Howard University First-Year Students Seniors Urban Peers- Urban Peers-
Universities Stakeholders HBCU Peers Universities Stakeholders HBCU Peers Variable Response Options Count % Count % Count % Count % Count % Count %
a Column percentages are weighted by gender, enrollment status, and institutional size. Counts are not weighted so one cannot calculate the column percentages directly from the counts. 41
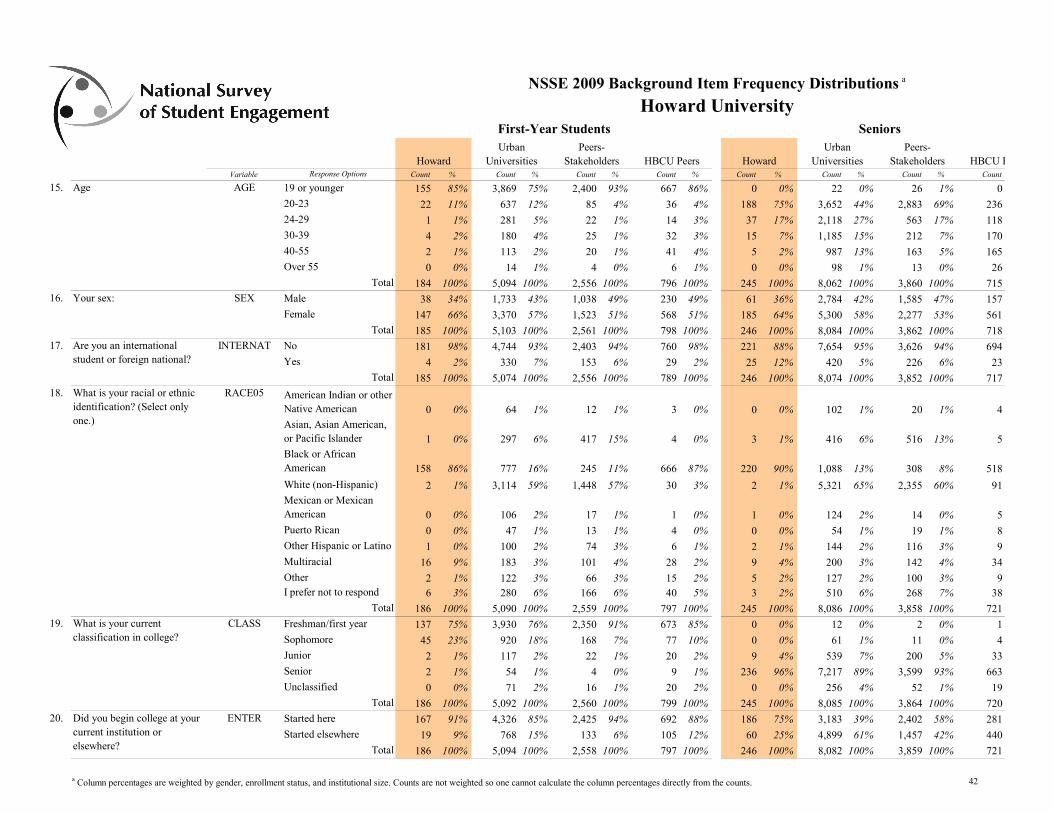
NSSE 2009 Background Item Frequency Distributions a
Howard University First-Year Students Seniors Urban Peers- Urban Peers-
Howard Universities Stakeholders HBCU Peers Howard Universities Stakeholders HBCU P Variable Response Options Count % Count % Count % Count %
15. Age AGE 19 or younger 155 85% 3,869 75% 2,400 93% 667 86%
20-23 22 11% 637 12% 85 4% 36 4%
24-29 1 1% 281 5% 22 1% 14 3%
30-39 4 2% 180 4% 25 1% 32 3%
40-55 2 1% 113 2% 20 1% 41 4%
Over 55 0 0% 14 1% 4 0% 6 1%
Total 184 100% 5,094 100% 2,556 100% 796 100% 16. Your sex: SEX Male 38 34% 1,733 43% 1,038 49% 230 49%
Female 147 66% 3,370 57% 1,523 51% 568 51%
Total 185 100% 5,103 100% 2,561 100% 798 100% 17. Are you an international INTERNAT No 181 98% 4,744 93% 2,403 94% 760 98%
student or foreign national? Yes 4 2% 330 7% 153 6% 29 2%
Total 185 100% 5,074 100% 2,556 100% 789 100% 18. What is your racial or ethnic RACE05 American Indian or other
identification? (Select only Native American 0 0% 64 1% 12 1% 3 0% one.) Asian, Asian American,
or Pacific Islander 1 0% 297 6% 417 15% 4 0% Black or African American 158 86% 777 16% 245 11% 666 87%
White (non-Hispanic) 2 1% 3,114 59% 1,448 57% 30 3% Mexican or Mexican American 0 0% 106 2% 17 1% 1 0%
Puerto Rican 0 0% 47 1% 13 1% 4 0%
Other Hispanic or Latino 1 0% 100 2% 74 3% 6 1%
Multiracial 16 9% 183 3% 101 4% 28 2%
Other 2 1% 122 3% 66 3% 15 2% I prefer not to respond 6 3% 280 6% 166 6% 40 5%
Total 186 100% 5,090 100% 2,559 100% 797 100%
Count % Count % Count % Count
0 0% 22 0% 26 1% 0
188 75% 3,652 44% 2,883 69% 236
37 17% 2,118 27% 563 17% 118
15 7% 1,185 15% 212 7% 170
5 2% 987 13% 163 5% 165
0 0% 98 1% 13 0% 26
245 100% 8,062 100% 3,860 100% 715
61 36% 2,784 42% 1,585 47% 157
185 64% 5,300 58% 2,277 53% 561
246 100% 8,084 100% 3,862 100% 718
221 88% 7,654 95% 3,626 94% 694
25 12% 420 5% 226 6% 23
246 100% 8,074 100% 3,852 100% 717
0 0% 102 1% 20 1% 4
3 1% 416 6% 516 13% 5
220 90% 1,088 13% 308 8% 518
2 1% 5,321 65% 2,355 60% 91
1 0% 124 2% 14 0% 5
0 0% 54 1% 19 1% 8
2 1% 144 2% 116 3% 9
9 4% 200 3% 142 4% 34
5 2% 127 2% 100 3% 9 3 2% 510 6% 268 7% 38
245 100% 8,086 100% 3,858 100% 721 19. What is your current CLASS Freshman/first year 137 75% 3,930 76% 2,350 91% 673 85% 0 0% 12 0% 2 0% 1
classification in college? Sophomore 45 23% 920 18% 168 7% 77 10% 0 0% 61 1% 11 0% 4
Junior 2 1% 117 2% 22 1% 20 2% 9 4% 539 7% 200 5% 33
Senior 2 1% 54 1% 4 0% 9 1% 236 96% 7,217 89% 3,599 93% 663
Unclassified 0 0% 71 2% 16 1% 20 2% 0 0% 256 4% 52 1% 19
Total 186 100% 5,092 100% 2,560 100% 799 100% 245 100% 8,085 100% 3,864 100% 720 20. Did you begin college at your ENTER Started here 167 91% 4,326 85% 2,425 94% 692 88% 186 75% 3,183 39% 2,402 58% 281
current institution or Started elsewhere 19 9% 768 15% 133 6% 105 12% 60 25% 4,899 61% 1,457 42% 440 elsewhere? Total 186 100% 5,094 100% 2,558 100% 797 100% 246 100% 8,082 100% 3,859 100% 721
a Column percentages are weighted by gender, enrollment status, and institutional size. Counts are not weighted so one cannot calculate the column percentages directly from the counts. 42
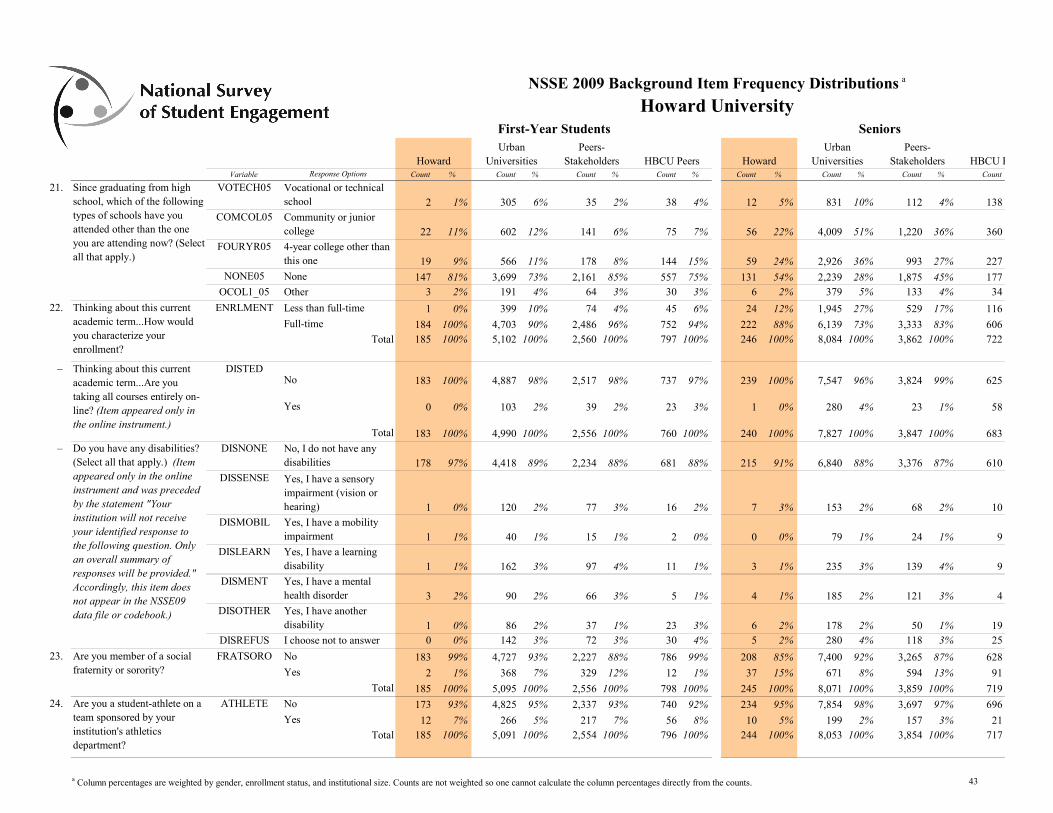
NSSE 2009 Background Item Frequency Distributions a
Howard University First-Year Students Seniors Urban Peers- Urban Peers-
Universities Stakeholders HBCU Peers Universities Stakeholders HBCU P Variable Response Options Count % Count % Count % Count % Count % Count
21.
22.
–
–
23.
24.
Count % Count %
Howard Howard
VOTECH05 Vocational or technical school 2 1% 305 6% 35 2% 38 4% 12 5% 831 10% 112 4% 138
COMCOL05 Community or junior college 22 11% 602 12% 141 6% 75 7% 56 22% 4,009 51% 1,220 36% 360
FOURYR05 4-year college other than this one 19 9% 566 11% 178 8% 144 15% 59 24% 2,926 36% 993 27% 227
NONE05 None 147 81% 3,699 73% 2,161 85% 557 75% 131 54% 2,239 28% 1,875 45% 177 OCOL1_05 Other 3 2% 191 4% 64 3% 30 3% 6 2% 379 5% 133 4% 34
ENRLMENT Less than full-time 1 0% 399 10% 74 4% 45 6% 24 12% 1,945 27% 529 17% 116
Full-time 184 100% 4,703 90% 2,486 96% 752 94% 222 88% 6,139 73% 3,333 83% 606 Total 185 100% 5,102 100% 2,560 100% 797 100% 246 100% 8,084 100% 3,862 100% 722
DISTED No 183 100% 4,887 98% 2,517 98% 737 97% 239 100% 7,547 96% 3,824 99% 625
Yes 0 0% 103 2% 39 2% 23 3% 1 0% 280 4% 23 1% 58
Total 183 100% 4,990 100% 2,556 100% 760 100% 240 100% 7,827 100% 3,847 100% 683 DISNONE No, I do not have any
disabilities 178 97% 4,418 89% 2,234 88% 681 88% 215 91% 6,840 88% 3,376 87% 610 DISSENSE Yes, I have a sensory
impairment (vision or hearing) 1 0% 120 2% 77 3% 16 2% 7 3% 153 2% 68 2% 10
DISMOBIL Yes, I have a mobility impairment 1 1% 40 1% 15 1% 2 0% 0 0% 79 1% 24 1% 9
DISLEARN Yes, I have a learning disability 1 1% 162 3% 97 4% 11 1% 3 1% 235 3% 139 4% 9
DISMENT Yes, I have a mental health disorder 3 2% 90 2% 66 3% 5 1% 4 1% 185 2% 121 3% 4
DISOTHER Yes, I have another disability 1 0% 86 2% 37 1% 23 3% 6 2% 178 2% 50 1% 19
DISREFUS I choose not to answer 0 0% 142 3% 72 3% 30 4% 5 2% 280 4% 118 3% 25
Since graduating from high school, which of the following types of schools have you
FRATSORO No 183 99% 4,727 93% 2,227 88% 786 99% 208 85% 7,400 92% 3,265 87% 628
Yes 2 1% 368 7% 329 12% 12 1% 37 15% 671 8% 594 13% 91
Total 185 100% 5,095 100% 2,556 100% 798 100% 245 100% 8,071 100% 3,859 100% 719 Are you a student-athlete on a ATHLETE No 173 93% 4,825 95% 2,337 93% 740 92% 234 95% 7,854 98% 3,697 97% 696 team sponsored by your Yes 12 7% 266 5% 217 7% 56 8% 10 5% 199 2% 157 3% 21
Total 185 100% 5,091 100% 2,554 100% 796 100% 244 100% 8,053 100% 3,854 100% 717
attended other than the one you are attending now? (Select all that apply.)
institution's athletics department?
Are you member of a social fraternity or sorority?
Do you have any disabilities? (Select all that apply.) (Item appeared only in the online instrument and was preceded by the statement "Your institution will not receive your identified response to the following question. Only an overall summary of responses will be provided." Accordingly, this item does not appear in the NSSE09 data file or codebook.)
Thinking about this current academic term...Are you taking all courses entirely on-line? (Item appeared only in the online instrument.)
Thinking about this current academic term...How would you characterize your enrollment?
a Column percentages are weighted by gender, enrollment status, and institutional size. Counts are not weighted so one cannot calculate the column percentages directly from the counts. 43
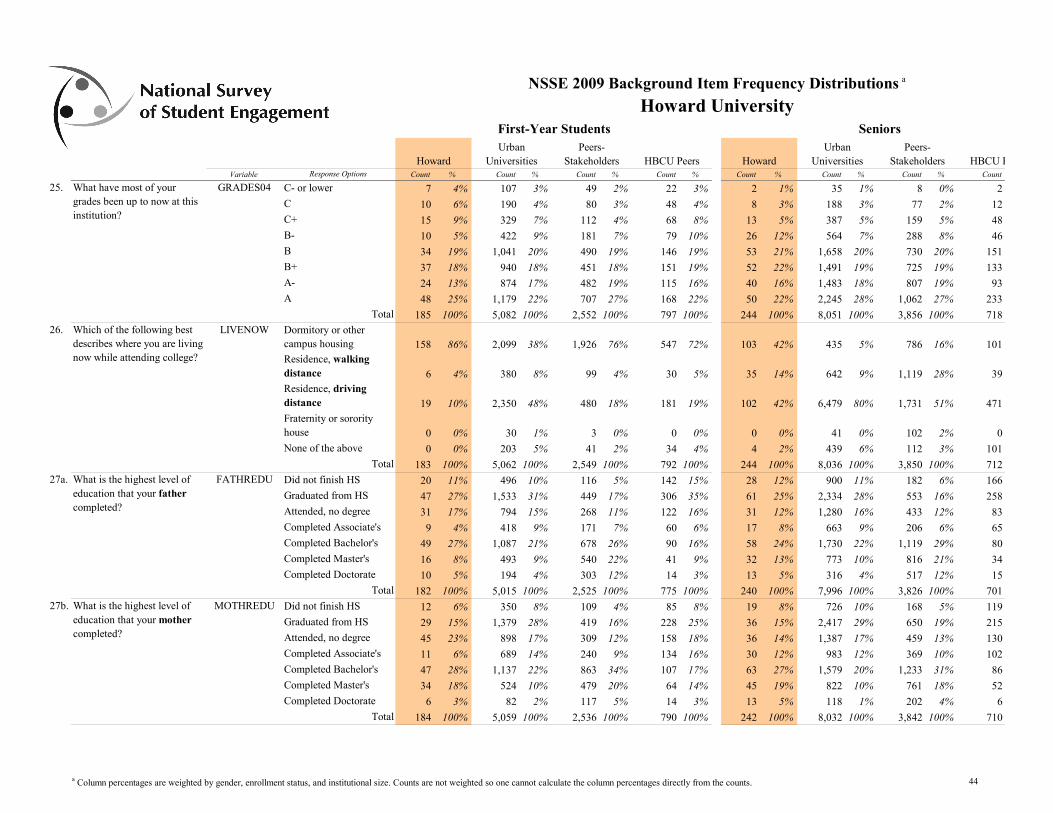
25. What have most of your GRADES04 C- or lower 7 4% 107 3% 49 2% 22 3% 2 1% 35 1% 8 0% 2 grades been up to now at this C 10 6% 190 4% 80 3% 48 4% 8 3% 188 3% 77 2% 12 institution? C+ 15 9% 329 7% 112 4% 68 8% 13 5% 387 5% 159 5% 48
B- 10 5% 422 9% 181 7% 79 10% 26 12% 564 7% 288 8% 46
B 34 19% 1,041 20% 490 19% 146 19% 53 21% 1,658 20% 730 20% 151
B+ 37 18% 940 18% 451 18% 151 19% 52 22% 1,491 19% 725 19% 133
A- 24 13% 874 17% 482 19% 115 16% 40 16% 1,483 18% 807 19% 93
A 48 25% 1,179 22% 707 27% 168 22% 50 22% 2,245 28% 1,062 27% 233
Total 185 100% 5,082 100% 2,552 100% 797 100% 244 100% 8,051 100% 3,856 100% 718
NSSE 2009 Background Item Frequency Distributions a
Howard University First-Year Students Seniors Urban Peers- Urban Peers-
Universities Stakeholders HBCU Peers Universities Stakeholders HBCU P Variable Response Options Count % Count % Count % Count % Count % Count Count % Count %
Howard Howard
26. Which of the following best LIVENOW Dormitory or other describes where you are living campus housing 158 86% 2,099 38% 1,926 76% 547 72% 103 42% 435 5% 786 16% 101 now while attending college? Residence, walking
distance 6 4% 380 8% 99 4% 30 5% 35 14% 642 9% 1,119 28% 39 Residence, driving distance 19 10% 2,350 48% 480 18% 181 19% 102 42% 6,479 80% 1,731 51% 471 Fraternity or sorority house 0 0% 30 1% 3 0% 0 0% 0 0% 41 0% 102 2% 0
None of the above 0 0% 203 5% 41 2% 34 4% 4 2% 439 6% 112 3% 101
Total 183 100% 5,062 100% 2,549 100% 792 100% 244 100% 8,036 100% 3,850 100% 712 27a. What is the highest level of FATHREDU Did not finish HS 20 11% 496 10% 116 5% 142 15% 28 12% 900 11% 182 6% 166
education that your father Graduated from HS 47 27% 1,533 31% 449 17% 306 35% 61 25% 2,334 28% 553 16% 258 completed? Attended, no degree 31 17% 794 15% 268 11% 122 16% 31 12% 1,280 16% 433 12% 83
Completed Associate's 9 4% 418 9% 171 7% 60 6% 17 8% 663 9% 206 6% 65
Completed Bachelor's 49 27% 1,087 21% 678 26% 90 16% 58 24% 1,730 22% 1,119 29% 80
Completed Master's 16 8% 493 9% 540 22% 41 9% 32 13% 773 10% 816 21% 34
Completed Doctorate 10 5% 194 4% 303 12% 14 3% 13 5% 316 4% 517 12% 15
Total 182 100% 5,015 100% 2,525 100% 775 100% 240 100% 7,996 100% 3,826 100% 701 27b. What is the highest level of MOTHREDU Did not finish HS 12 6% 350 8% 109 4% 85 8% 19 8% 726 10% 168 5% 119
education that your mother Graduated from HS 29 15% 1,379 28% 419 16% 228 25% 36 15% 2,417 29% 650 19% 215 completed? Attended, no degree 45 23% 898 17% 309 12% 158 18% 36 14% 1,387 17% 459 13% 130
Completed Associate's 11 6% 689 14% 240 9% 134 16% 30 12% 983 12% 369 10% 102
Completed Bachelor's 47 28% 1,137 22% 863 34% 107 17% 63 27% 1,579 20% 1,233 31% 86
Completed Master's 34 18% 524 10% 479 20% 64 14% 45 19% 822 10% 761 18% 52
Completed Doctorate 6 3% 82 2% 117 5% 14 3% 13 5% 118 1% 202 4% 6
Total 184 100% 5,059 100% 2,536 100% 790 100% 242 100% 8,032 100% 3,842 100% 710
a Column percentages are weighted by gender, enrollment status, and institutional size. Counts are not weighted so one cannot calculate the column percentages directly from the counts. 44
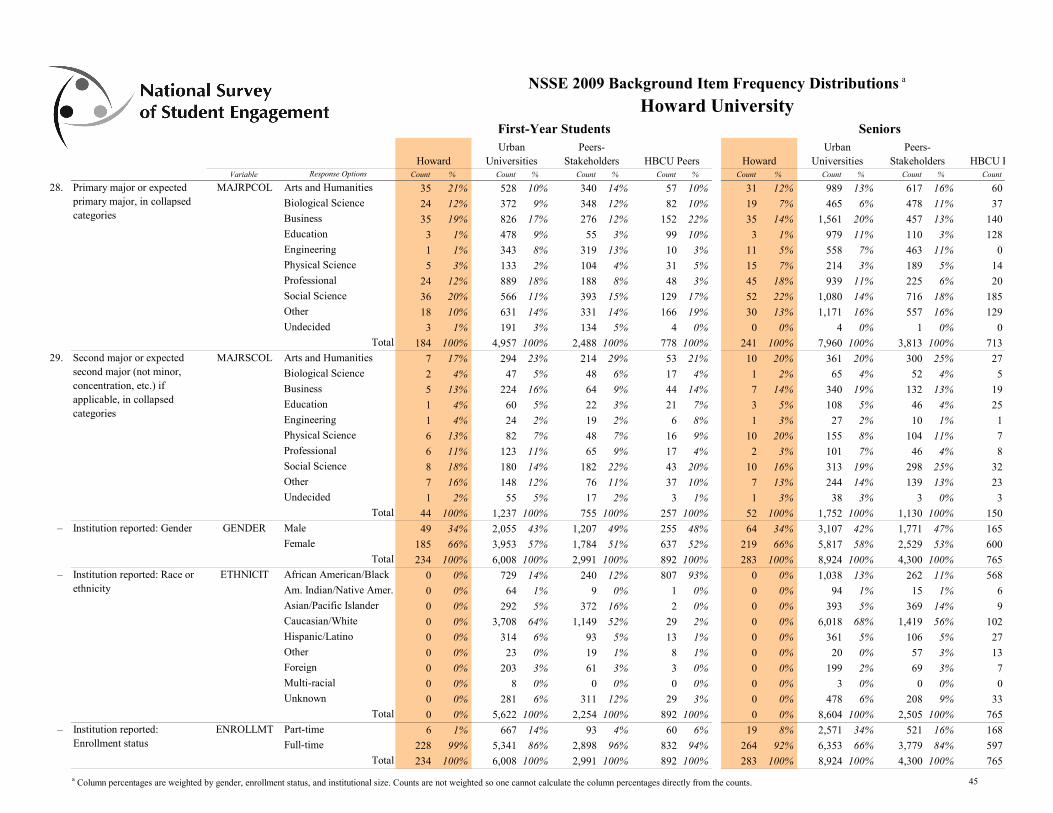
NSSE 2009 Background Item Frequency Distributions a
Howard University First-Year Students Seniors Urban Peers- Urban Peers-
Universities Stakeholders HBCU Peers Universities Stakeholders HBCU P Variable Response Options Count % Count % Count % Count % Count % Count Count % Count %
Howard Howard
28. Primary major or expected MAJRPCOL Arts and Humanities 35 21% 528 10% 340 14% 57 10% 31 12% 989 13% 617 16% 60 primary major, in collapsed Biological Science 24 12% 372 9% 348 12% 82 10% 19 7% 465 6% 478 11% 37 categories Business 35 19% 826 17% 276 12% 152 22% 35 14% 1,561 20% 457 13% 140
Education 3 1% 478 9% 55 3% 99 10% 3 1% 979 11% 110 3% 128 Engineering 1 1% 343 8% 319 13% 10 3% 11 5% 558 7% 463 11% 0 Physical Science 5 3% 133 2% 104 4% 31 5% 15 7% 214 3% 189 5% 14 Professional 24 12% 889 18% 188 8% 48 3% 45 18% 939 11% 225 6% 20 Social Science 36 20% 566 11% 393 15% 129 17% 52 22% 1,080 14% 716 18% 185 Other 18 10% 631 14% 331 14% 166 19% 30 13% 1,171 16% 557 16% 129 Undecided 3 1% 191 3% 134 5% 4 0% 0 0% 4 0% 1 0% 0
Total 184 100% 4,957 100% 2,488 100% 778 100% 241 100% 7,960 100% 3,813 100% 713 29. Second major or expected MAJRSCOL Arts and Humanities 7 17% 294 23% 214 29% 53 21% 10 20% 361 20% 300 25% 27
second major (not minor, Biological Science 2 4% 47 5% 48 6% 17 4% 1 2% 65 4% 52 4% 5 concentration, etc.) if Business 5 13% 224 16% 64 9% 44 14% 7 14% 340 19% 132 13% 19 applicable, in collapsed Education 1 4% 60 5% 22 3% 21 7% 3 5% 108 5% 46 4% 25 categories
Engineering 1 4% 24 2% 19 2% 6 8% 1 3% 27 2% 10 1% 1 Physical Science 6 13% 82 7% 48 7% 16 9% 10 20% 155 8% 104 11% 7 Professional 6 11% 123 11% 65 9% 17 4% 2 3% 101 7% 46 4% 8 Social Science 8 18% 180 14% 182 22% 43 20% 10 16% 313 19% 298 25% 32 Other 7 16% 148 12% 76 11% 37 10% 7 13% 244 14% 139 13% 23 Undecided 1 2% 55 5% 17 2% 3 1% 1 3% 38 3% 3 0% 3
Total 44 100% 1,237 100% 755 100% 257 100% 52 100% 1,752 100% 1,130 100% 150 – Institution reported: Gender GENDER Male 49 34% 2,055 43% 1,207 49% 255 48% 64 34% 3,107 42% 1,771 47% 165
Female 185 66% 3,953 57% 1,784 51% 637 52% 219 66% 5,817 58% 2,529 53% 600 Total 234 100% 6,008 100% 2,991 100% 892 100% 283 100% 8,924 100% 4,300 100% 765
– Institution reported: Race or ETHNICIT African American/Black 0 0% 729 14% 240 12% 807 93% 0 0% 1,038 13% 262 11% 568 ethnicity Am. Indian/Native Amer. 0 0% 64 1% 9 0% 1 0% 0 0% 94 1% 15 1% 6
Asian/Pacific Islander 0 0% 292 5% 372 16% 2 0% 0 0% 393 5% 369 14% 9 Caucasian/White 0 0% 3,708 64% 1,149 52% 29 2% 0 0% 6,018 68% 1,419 56% 102 Hispanic/Latino 0 0% 314 6% 93 5% 13 1% 0 0% 361 5% 106 5% 27 Other 0 0% 23 0% 19 1% 8 1% 0 0% 20 0% 57 3% 13 Foreign 0 0% 203 3% 61 3% 3 0% 0 0% 199 2% 69 3% 7 Multi-racial 0 0% 8 0% 0 0% 0 0% 0 0% 3 0% 0 0% 0 Unknown 0 0% 281 6% 311 12% 29 3% 0 0% 478 6% 208 9% 33
Total 0 0% 5,622 100% 2,254 100% 892 100% 0 0% 8,604 100% 2,505 100% 765 – Institution reported: ENROLLMT Part-time 6 1% 667 14% 93 4% 60 6% 19 8% 2,571 34% 521 16% 168
Enrollment status Full-time 228 99% 5,341 86% 2,898 96% 832 94% 264 92% 6,353 66% 3,779 84% 597 Total 234 100% 6,008 100% 2,991 100% 892 100% 283 100% 8,924 100% 4,300 100% 765
a Column percentages are weighted by gender, enrollment status, and institutional size. Counts are not weighted so one cannot calculate the column percentages directly from the counts. 45
NSSE 2009 Background Item Frequency Distributions a
Howard University First-Year Students Seniors Urban Peers- Urban Peers-
Universities Stakeholders HBCU Peers Universities Stakeholders HBCU P Variable Response Options Count % Count % Count % Count % Count % Count Count % Count %
Howard Howard
IPEDS: 1
a Column percentages are weighted by gender, enrollment status, and institutional size. Counts are not weighted so one cannot calculate the column percentages directly from the counts. 46

%
0%
48%
14%
18%
17%
3%
100%
Peers
37%
63%
100%
97%
3%
100%
0%
0%
77%
10%
1%
1%
1%
4%
1% 5%
100%
0%
0%
4%
94%
2%
100%
51%
49%
100%
a Column percentages are weighted by gender, enrollment status, and institutional size. Counts are not weighted so one cannot calculate the column percentages directly from the counts. 47
Peers %
16%
39%
30%
36% 4%
14%
86% 100%
93%
7%
100%
90%
2%
1%
1%
0%
2% 3%
87%
13%
100%
97%
3% 100%
a Column percentages are weighted by gender, enrollment status, and institutional size. Counts are not weighted so one cannot calculate the column percentages directly from the counts. 48
Peers %
0%
2%
7%
7%
23%
19%
14%
27%
100%
16%
11%
62%
0%
10%
100%
19%
35%
11%
9%
14%
8%
4%
100%
13%
27%
20%
14%
16%
10%
1%
100%
a Column percentages are weighted by gender, enrollment status, and institutional size. Counts are not weighted so one cannot calculate the column percentages directly from the counts. 49
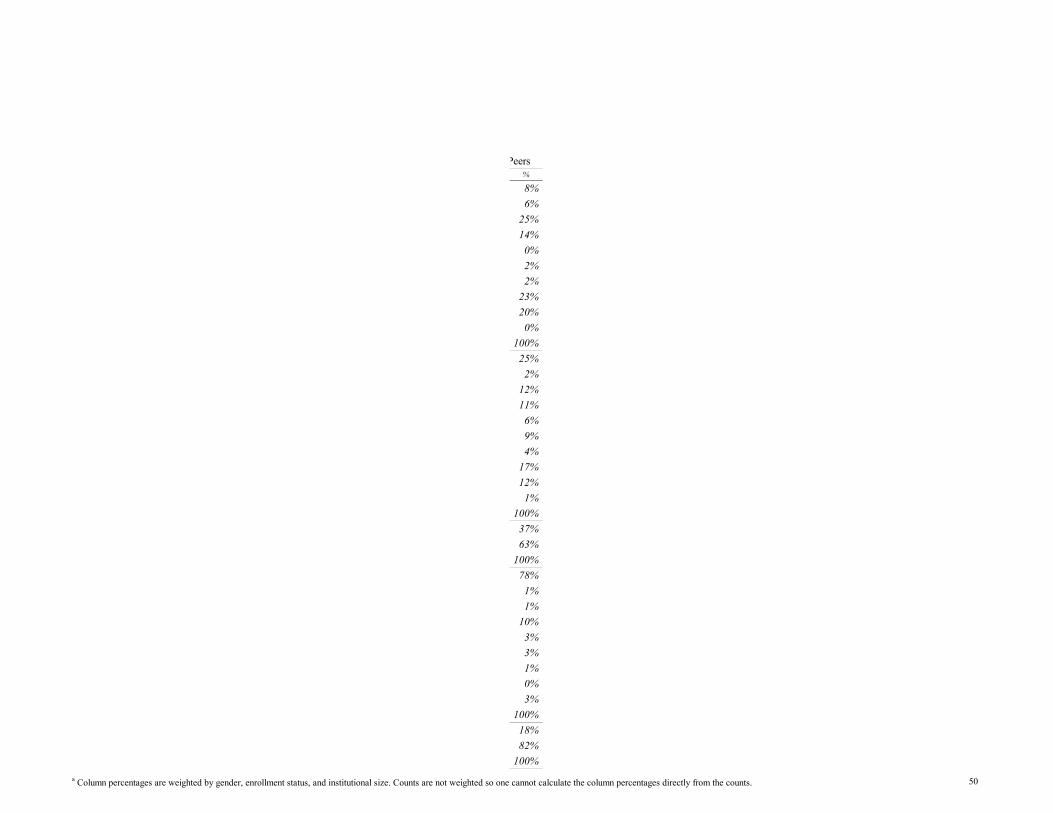
Peers %
8%
6%
25%
14%
0%
2%
2%
23%
20%
0%
100%
25%
2%
12%
11%
6%
9%
4%
17%
12%
1%
100%
37%
63%
100%
78%
1%
1%
10%
3%
3%
1%
0%
3%
100%
18%
82%
100%
a Column percentages are weighted by gender, enrollment status, and institutional size. Counts are not weighted so one cannot calculate the column percentages directly from the counts. 50
Peers %
131520
a Column percentages are weighted by gender, enrollment status, and institutional size. Counts are not weighted so one cannot calculate the column percentages directly from the counts. 51
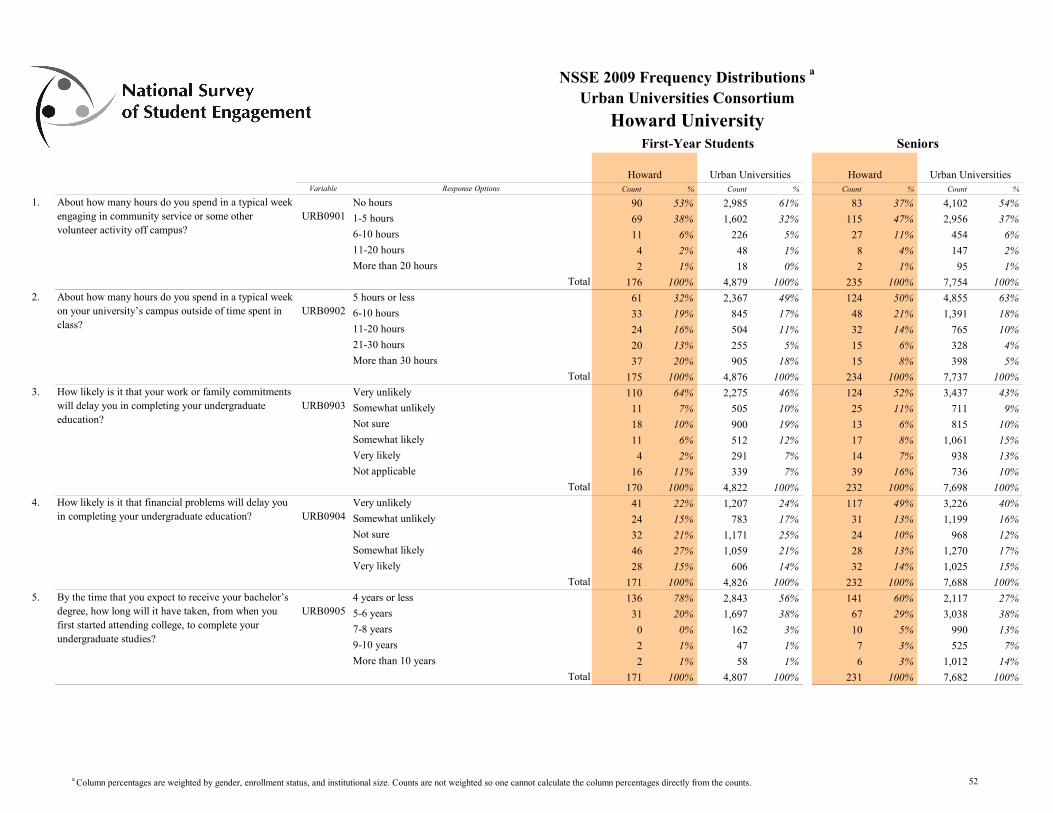
NSSE 2009 Frequency Distributions a
Urban Universities Consortium
Howard University First-Year Students Seniors
Howard Urban Universities Howard Urban Universities Variable Response Options Count % Count % Count % Count %
1. About how many hours do you spend in a typical week engaging in community service or some other volunteer activity off campus?
URB0901 No hours
1-5 hours
6-10 hours
90
69
11
53%
38%
6%
2,985
1,602
226
61%
32%
5%
83
115
27
37%
47%
11%
4,102
2,956
454
54%
37%
6%
11-20 hours 4 2% 48 1% 8 4% 147 2%
More than 20 hours 2 1% 18 0% 2 1% 95 1%
Total 176 100% 4,879 100% 235 100% 7,754 100% 2. About how many hours do you spend in a typical week
on your university’s campus outside of time spent in class?
URB0902 5 hours or less
6-10 hours
11-20 hours
61
33
24
32%
19%
16%
2,367
845
504
49%
17%
11%
124
48
32
50%
21%
14%
4,855
1,391
765
63%
18%
10%
21-30 hours 20 13% 255 5% 15 6% 328 4%
More than 30 hours 37 20% 905 18% 15 8% 398 5%
Total 175 100% 4,876 100% 234 100% 7,737 100% 3. How likely is it that your work or family commitments
will delay you in completing your undergraduate education?
URB0903 Very unlikely
Somewhat unlikely
Not sure
110
11
18
64%
7%
10%
2,275
505
900
46%
10%
19%
124
25
13
52%
11%
6%
3,437
711
815
43%
9%
10%
Somewhat likely 11 6% 512 12% 17 8% 1,061 15%
Very likely 4 2% 291 7% 14 7% 938 13%
Not applicable 16 11% 339 7% 39 16% 736 10%
Total 170 100% 4,822 100% 232 100% 7,698 100% 4. How likely is it that financial problems will delay you
in completing your undergraduate education? URB0904 Very unlikely
Somewhat unlikely
41
24
22%
15%
1,207
783
24%
17%
117
31
49%
13%
3,226
1,199
40%
16%
Not sure 32 21% 1,171 25% 24 10% 968 12%
Somewhat likely 46 27% 1,059 21% 28 13% 1,270 17%
Very likely 28 15% 606 14% 32 14% 1,025 15%
Total 171 100% 4,826 100% 232 100% 7,688 100% 5. By the time that you expect to receive your bachelor’s
degree, how long will it have taken, from when you first started attending college, to complete your undergraduate studies?
URB0905 4 years or less
5-6 years
7-8 years
9-10 years
136
31
0
2
78%
20%
0%
1%
2,843
1,697
162
47
56%
38%
3%
1%
141
67
10
7
60%
29%
5%
3%
2,117
3,038
990
525
27%
38%
13%
7%
More than 10 years 2 1% 58 1% 6 3% 1,012 14%
Total 171 100% 4,807 100% 231 100% 7,682 100%
a Column percentages are weighted by gender, enrollment status, and institutional size. Counts are not weighted so one cannot calculate the column percentages directly from the counts. 52
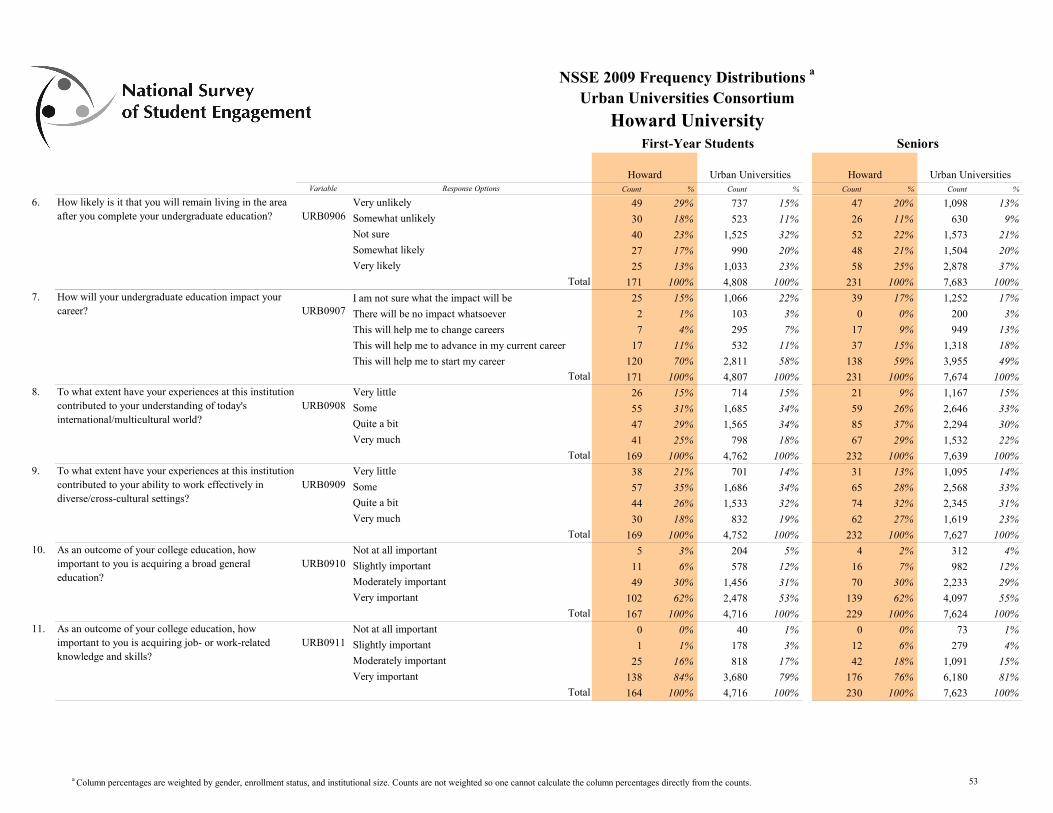
Variable Response Options Count % Count % Count % Count %
NSSE 2009 Frequency Distributions a
Urban Universities Consortium
Howard University First-Year Students Seniors
Howard Urban Universities Howard Urban Universities
6. How likely is it that you will remain living in the area Very unlikely 49 29% 737 15% 47 20% 1,098 13% after you complete your undergraduate education? URB0906 Somewhat unlikely 30 18% 523 11% 26 11% 630 9%
Not sure 40 23% 1,525 32% 52 22% 1,573 21%
Somewhat likely 27 17% 990 20% 48 21% 1,504 20%
Very likely 25 13% 1,033 23% 58 25% 2,878 37%
Total 171 100% 4,808 100% 231 100% 7,683 100% 7. How will your undergraduate education impact your I am not sure what the impact will be 25 15% 1,066 22% 39 17% 1,252 17%
career? URB0907 There will be no impact whatsoever 2 1% 103 3% 0 0% 200 3%
This will help me to change careers 7 4% 295 7% 17 9% 949 13%
This will help me to advance in my current career 17 11% 532 11% 37 15% 1,318 18%
This will help me to start my career 120 70% 2,811 58% 138 59% 3,955 49%
Total 171 100% 4,807 100% 231 100% 7,674 100% 8. To what extent have your experiences at this institution Very little 26 15% 714 15% 21 9% 1,167 15%
contributed to your understanding of today's URB0908 Some 55 31% 1,685 34% 59 26% 2,646 33% international/multicultural world? Quite a bit 47 29% 1,565 34% 85 37% 2,294 30%
Very much 41 25% 798 18% 67 29% 1,532 22%
Total 169 100% 4,762 100% 232 100% 7,639 100% 9. To what extent have your experiences at this institution Very little 38 21% 701 14% 31 13% 1,095 14%
contributed to your ability to work effectively in URB0909 Some 57 35% 1,686 34% 65 28% 2,568 33% diverse/cross-cultural settings? Quite a bit 44 26% 1,533 32% 74 32% 2,345 31%
Very much 30 18% 832 19% 62 27% 1,619 23%
Total 169 100% 4,752 100% 232 100% 7,627 100% 10. As an outcome of your college education, how Not at all important 5 3% 204 5% 4 2% 312 4%
important to you is acquiring a broad general URB0910 Slightly important 11 6% 578 12% 16 7% 982 12% education? Moderately important 49 30% 1,456 31% 70 30% 2,233 29%
Very important 102 62% 2,478 53% 139 62% 4,097 55%
Total 167 100% 4,716 100% 229 100% 7,624 100% 11. As an outcome of your college education, how Not at all important 0 0% 40 1% 0 0% 73 1%
important to you is acquiring job- or work-related URB0911 Slightly important 1 1% 178 3% 12 6% 279 4% knowledge and skills? Moderately important 25 16% 818 17% 42 18% 1,091 15%
Very important 138 84% 3,680 79% 176 76% 6,180 81%
Total 164 100% 4,716 100% 230 100% 7,623 100%
a Column percentages are weighted by gender, enrollment status, and institutional size. Counts are not weighted so one cannot calculate the column percentages directly from the counts. 53
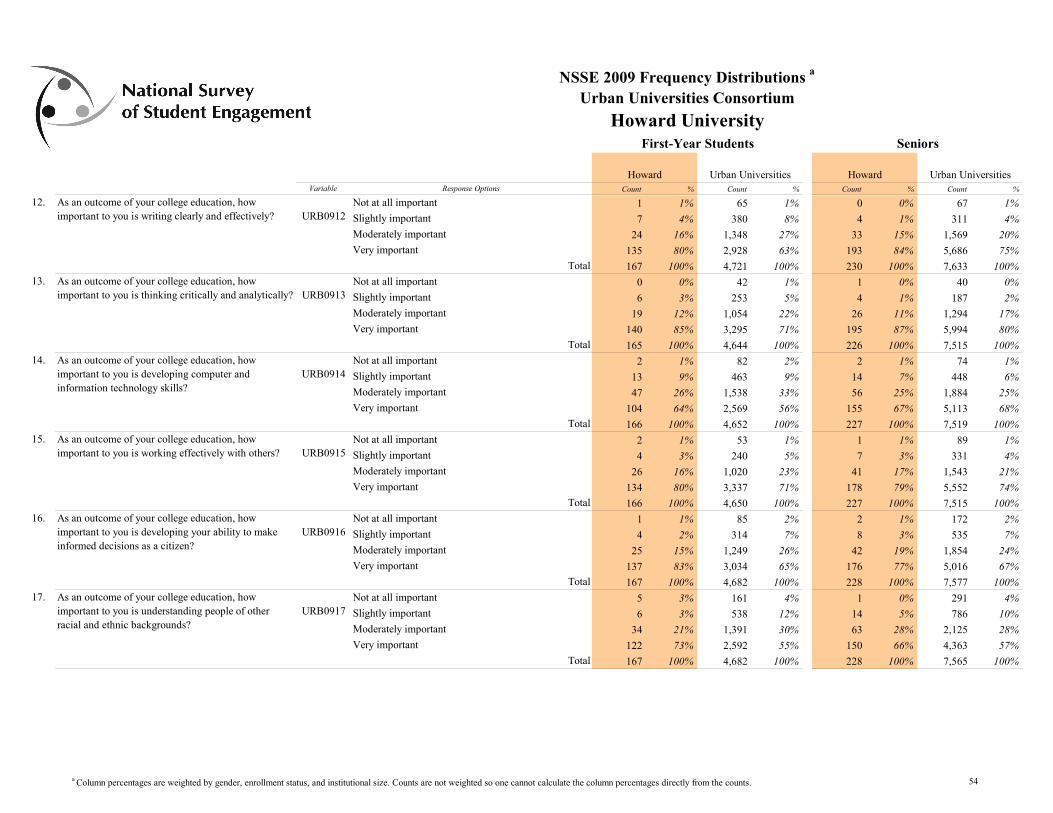
Variable Response Options Count % Count % Count % Count %
NSSE 2009 Frequency Distributions a
Urban Universities Consortium
Howard University First-Year Students Seniors
Howard Urban Universities Howard Urban Universities
12. As an outcome of your college education, how Not at all important 1 1% 65 1% 0 0% 67 1% important to you is writing clearly and effectively? URB0912 Slightly important 7 4% 380 8% 4 1% 311 4%
Moderately important 24 16% 1,348 27% 33 15% 1,569 20%
Very important 135 80% 2,928 63% 193 84% 5,686 75%
Total 167 100% 4,721 100% 230 100% 7,633 100% 13. As an outcome of your college education, how Not at all important 0 0% 42 1% 1 0% 40 0%
important to you is thinking critically and analytically? URB0913 Slightly important 6 3% 253 5% 4 1% 187 2%
Moderately important 19 12% 1,054 22% 26 11% 1,294 17%
Very important 140 85% 3,295 71% 195 87% 5,994 80%
Total 165 100% 4,644 100% 226 100% 7,515 100% 14. As an outcome of your college education, how Not at all important 2 1% 82 2% 2 1% 74 1%
important to you is developing computer and URB0914 Slightly important 13 9% 463 9% 14 7% 448 6% information technology skills? Moderately important 47 26% 1,538 33% 56 25% 1,884 25%
Very important 104 64% 2,569 56% 155 67% 5,113 68%
Total 166 100% 4,652 100% 227 100% 7,519 100% 15. As an outcome of your college education, how Not at all important 2 1% 53 1% 1 1% 89 1%
important to you is working effectively with others? URB0915 Slightly important 4 3% 240 5% 7 3% 331 4%
Moderately important 26 16% 1,020 23% 41 17% 1,543 21%
Very important 134 80% 3,337 71% 178 79% 5,552 74%
Total 166 100% 4,650 100% 227 100% 7,515 100% 16. As an outcome of your college education, how Not at all important 1 1% 85 2% 2 1% 172 2%
important to you is developing your ability to make URB0916 Slightly important 4 2% 314 7% 8 3% 535 7% informed decisions as a citizen? Moderately important 25 15% 1,249 26% 42 19% 1,854 24%
Very important 137 83% 3,034 65% 176 77% 5,016 67%
Total 167 100% 4,682 100% 228 100% 7,577 100% 17. As an outcome of your college education, how Not at all important 5 3% 161 4% 1 0% 291 4%
important to you is understanding people of other URB0917 Slightly important 6 3% 538 12% 14 5% 786 10% racial and ethnic backgrounds? Moderately important 34 21% 1,391 30% 63 28% 2,125 28%
Very important 122 73% 2,592 55% 150 66% 4,363 57%
Total 167 100% 4,682 100% 228 100% 7,565 100%
a Column percentages are weighted by gender, enrollment status, and institutional size. Counts are not weighted so one cannot calculate the column percentages directly from the counts. 54
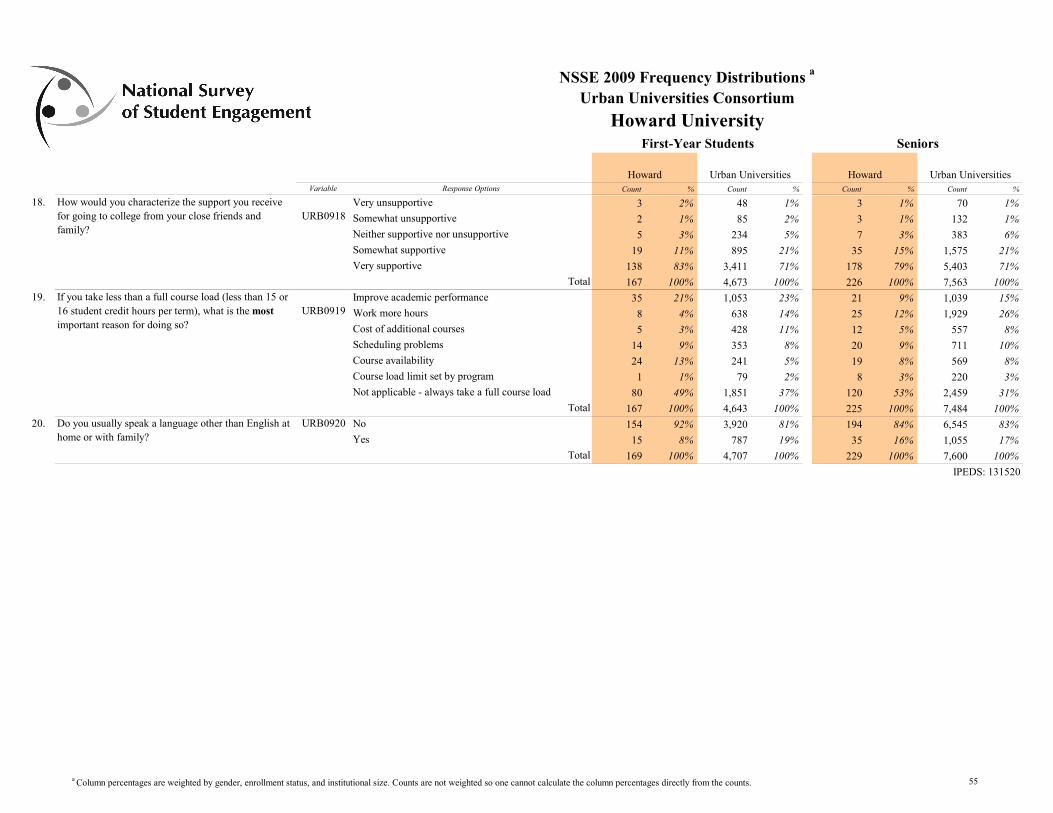
NSSE 2009 Frequency Distributions a
Urban Universities Consortium
Howard University First-Year Students Seniors
18.
19.
20.
Variable Response Options Count % Count % Count % Count %
Howard Urban Universities Howard Urban Universities
3 1% 70 1%
3 1% 132 1%
7 3% 383 6%
35 15% 1,575 21%
178 79% 5,403 71%
226 100% 7,563 100%
21 9% 1,039 15%
25 12% 1,929 26%
12 5% 557 8%
20 9% 711 10%
19 8% 569 8%
8 3% 220 3%
120 53% 2,459 31%
225 100% 7,484 100%
194 84% 6,545 83%
35 16% 1,055 17%
229 100% 7,600 100%
Very unsupportive 3 2% 48 1%
Somewhat unsupportive 2 1% 85 2%
Neither supportive nor unsupportive 5 3% 234 5%
Somewhat supportive 19 11% 895 21%
Very supportive 138 83% 3,411 71%
Total 167 100% 4,673 100%
Improve academic performance 35 21% 1,053 23%
Work more hours 8 4% 638 14%
Cost of additional courses 5 3% 428 11%
Scheduling problems 14 9% 353 8%
Course availability 24 13% 241 5%
Course load limit set by program 1 1% 79 2%
Not applicable - always take a full course load 80 49% 1,851 37%
Total 167 100% 4,643 100% URB0920 No 154 92% 3,920 81%
Yes 15 8% 787 19%
Total 169 100% 4,707 100%
If you take less than a full course load (less than 15 or 16 student credit hours per term), what is the most important reason for doing so?
URB0919
Do you usually speak a language other than English at home or with family?
How would you characterize the support you receive for going to college from your close friends and family?
URB0918
IPEDS: 131520
a Column percentages are weighted by gender, enrollment status, and institutional size. Counts are not weighted so one cannot calculate the column percentages directly from the counts. 55


