Embed Size (px)
Citation preview

1
Adduct Formation in Quantitative Bioanalysis: Effect of
Ionization Conditions on Paclitaxel
Running title: Ionization and adduct formation of paclitaxel
Kjell A. Mortier, Guo-Fang Zhang, Carlos H. Van Peteghem and Willy E. Lambert
Laboratory of Toxicology, Ghent University, Harelbekestraat 72, B-9000 Ghent, Belgium
*Reprint requests to: Prof. Dr. W. Lambert
Laboratory of Toxicology, Ghent University
Harelbekestraat 72
B-9000 Ghent
Belgium
Phone: 32 9 264 81 35
Fax: 32 9 264 81 83
E-mail: [email protected]

2
Abstract
Quantitative analysis of target compounds with liquid chromatography atmospheric pressure
ionization mass spectrometry is sometimes hampered by adduct formation. In these situations,
cationization with alkali metal ions instead of proton addition is often observed in the positive
mode. This work studies the process of adduct formation and investigates potential strategies
to control this phenomenon. Paclitaxel, a pharmaceutical chemotherapeutic agent, was used as
a model compound. Electrospray (ESI), atmospheric pressure chemical ionization (APCI) and
sonic spray ionization (SSI) are evaluated and compared. The work was performed on two
different instruments, allowing to evaluate different ionization behavior for different source
design for electrospray, if any. Different mobile phase additives were compared, including
acetic acid, formic acid, ammonium formate and a range of primary amines. Continuous
infusion was used for a fast screening, to detect optimal conditions. These were then further
investigated in detail by LC-MS. The results indicate that electrospray is the more sensitive
interface for this compound on the investigated apparatus. Unacceptable quantitative data
were acquired without additives in the mobile phase. Generally, additives increased the
reproducibility significantly. A response of mainly one ion was achieved with
dodecylamine/acetic acid and acetic acid/sodium acetate. The data also point out the
importance of evaluating adduct formation for compounds prone to this phenomenon during
method development, especially in view of accurate quantitation.

3
Due to recent advances in atmospheric pressure ionization (API) techniques, liquid
chromatography mass spectrometry (LC-MS) has opened a new chapter in today’s analytical
chemistry. Many companies and institutes are successfully using LC-MS for high throughput
analysis of lowly concentrated target compounds. Nevertheless, some challenges still remain
when performing quantitative LC-MS. An important issue is matrix suppression, a less
efficient ionization of the target compound in the presence of other molecules. This
phenomenon is well recognized and described in an increasing number of publications [1-4].
Another complexity in quantitative LC-MS is adduct formation. Generally, electrospray (ESI)
or atmospheric pressure chemical ionization (APCI) result in protonated [M + H]+ molecules
in the positive mode or deprotonated [M – H]- molecules in the negative mode. However, for
some molecules undergoing ionization in the positive mode, adduct ions like [M + Na]+, [M +
K]+ or [M + NH3]+ are abundant in the spectra [5-11]. The exact mechanism of adduct
formation still has to be elucidated. In some cases at least, carboxyl or carbonyl ether or ester
groups in a molecule are believed to be responsible for the binding to alkali metal ions.
Difficulties arise when developing quantitative LC-API-MS procedures. What adduct ion to
use for the traditional multiple reaction monitoring (MRM) and is the adduct process
reproducible are key questions when a quantitative assay is required. Multiple approaches
have been described in literature. A first theoretical approach is to ignore the different adduct
forms and measure the adduct with the highest response. When measuring only the [M +
NH3]+ in the presence of other adducts, Li and co-workers obtained a relative standard
deviation (RSD) of 17% for a quantitative assay of ginkgolides and bilobalide [5]. Summation
of all adduct ions significantly improved the situation to an acceptable RSD of 6%. This
shows that adduct formation can give rise to large variations and unreliable results when the
process is not controlled. Summation, however, complicates MS/MS experiments, thus
compromising selectivity. Although performing MRM on the different adducts

4
simultaneously can be considered, it is impractical to add the responses of the different
MS/MS traces. In addition, summation assumes that the response factor for all adduct ions is
equal, which has not been demonstrated to our knowledge. A convenient solution to this
problem would be to use an isotopic labeled internal standard, as this compound would most
probably produce a similar adduct distribution, and at least partly compensate for variations in
adduct formation. Unfortunately, the availability of such compounds is sometimes
problematic. Obtaining a pronounced and reproducible formation of a single ion is of course
the ideal situation regarding to sensitivity as well as reproducibility. Successful attempts have
been made to replace all adducts by one desired adduct ion with primary amines [6-8].
Another approach involved the addition of alkali metal complexation products, such as crown
ethers [9]. In oligonucleotide analysis, the addition of imidazole and triethylamine or
piperidine has proven to be successful to reduce the number of adducted cations. Another
well documented approach in this research area is the ethanol precipitation in the presence of
ammonia acetate [10]. One could also try to exclude sodium from the ionization process by
using ultra pure, thoroughly deionized water. This seems quite laborious due to the ubiquitous
presence of sodium, often originating from the glassware, stainless steel and/or as impurity in
chemicals or solvents. The opposite approach, the use of sodium adducts for quantification by
the addition of sodium acetate to the mobile phase, has also been described [11].
The goal of this study is to evaluate various ionization parameters and sources to obtain a
reproducible ionization when adduct ion formation is observed. Especially the use of different
ionization techniques and mobile phase additives were considered. Paclitaxel (PAC), a
widespread drug used for the treatment of several types of cancer, was selected for this
purpose. Paclitaxel has a high molecular weight and is a very hydrophobic molecule
(Structure I). It is a natural compound present in the bark of Taxus brevifolia. To the best of
our knowledge, this is the first paper investigating adduct ion formation of paclitaxel. In

5
literature, quantitative analysis of paclitaxel by the analysis of [PAC + H]+ has been reported
with acetic acid as mobile phase additive [12]. Nevertheless we observed strong adduct
formation of paclitaxel with sodium and potassium under such conditions. Possibly, different
instrumentation design accounts at least partly for some differences. Although adduct
formation is compound and instrument dependent, we believe that our experimental approach
and results can be useful for method development for other substances liable to adduct
formation.

6
Experimental
Instrumentation
The following instrumentation was used: a LaChrom separation module (Merck, Darmstadt,
Germany) including a L-7100 Low-Pressure Gradient Pump, L-7200 Autosampler and a D-
7000 interface module. The module was controlled by LC/3DQ-MS System Manager
Software under Windows NT 4.0 and connected to a M-8000 ion-trap based mass
spectrometer equipped with an ESI, APCI and SSI (sonic spray ionization) source (Merck-
Hitachi, Darmstadt, Germany). General conditions on M-8000: focus: 30V, drift: 30V,
multiplier voltage: 400V. Nitrogen was used as nebulizing gas and high purity helium was
used as buffer gas to trap ions in the mass analyzer at 300 kPa. Scan range from m/z 90 –
1100, the accumulation time was automatically adjusted by a variation in the ion abundance
with ‘Automatic Sensitivity Control’ (ASC) with a maximum of 500 ms. Specific operating
conditions for SSI; plate temp.: 250°C, aperture 1 temp.: 140°C, aperture 2 temp.: 120°C and
ESI; aux gas heater: 400°C, aperture 1 temp.: 150°C, aperture 2 temp.: 120°C, needle: 3kV.
A second system consisted of a Waters Alliance 2790 Separation Module (Milford, MA)
controlled by Masslynx software from Micromass (Manchester, UK). Mass spectrometric
detection on this system was performed on a quadrupole time of flight (QTOF) mass
spectrometer with an ESI and APCI Z-spray? source (Micromass, Manchester, UK). ESI
conditions on QTOF: needle: 3kV, cone: 25 or 40V, source block temp.: 120°C, desolvation
temp.: 320°C and APCI conditions: corona: 2500V, cone: 25 or 40 V, source temp.: 120°C,
APCI probe temp.: 500°C.
A syringe pump (Harvard, Quebec, Canada) with a 500-µL syringe, (Hamilton, Bonaduz,
Switzerland) was used for direct infusion at 200 µL/min. HPLC column: Synergy MAX-RP 4
µm, 80A, 150 x 2.00 mm (Phenomenex, CA).

7
Reagents and standards
All solvents and reagents were obtained from VWR (Leuven, Belgium) or Sigma (Bornem,
Belgium). Stock solutions of paclitaxel (Sigma-Aldrich, Bornem, Belgium) were prepared by
accurately weighing 10 mg powder and dissolving in 10 ml of methanol.
Methods
Two experimental setups were developed. Initially, for a screening of additives, a mixture of
paclitaxel and the respective additives was infused with a syringe into the MS. The paclitaxel
concentration amounted 0.5 µg/mL and the flow was set at 0.2 mL/min. Using this solution,
the interfaces were tuned to optimum sensitivity for the paclitaxel sodium adduct [PAC +
Na]+. Acetic acid, formic acid and ammonium formate at pH 5 and 7 were evaluated at 10
mM, primary amines were introduced at 1 mM with acetic acid (1 mM) to lower the pH.
Results are calculated by the signal height at different points (n = 3).
After infusion, chromatographic evaluation of adduct formation was performed with a
chromatographic method with methanol/water (70/30 by vol.) and the respective additives as
mobile phase. Three samples with an equal concentration of paclitaxel (1 µg/mL) were cross
injected (n = 8). NaCl (17mM) was added the first sample (S + NaCl), KCl (4mM) to the
second (S + KCl) , and to the third nothing was added (S), this to mimic real samples with
varying concentrations of alkali metals. This allowed to observe the effect of alkali metals in
the sample on adduct formation. The results are expressed as absolute response (response) i.e.
the response of the adduct ion in arbitrary units (or peak area for chromatography) or relative
response (%response) i.e. the response of one adduct ion divided by the sum of responses of
all adduct ion forms times 100.
8
Results and discussion
Infusion experiments with traditional additives
Continuous infusion was performed on the M-8000 ion trap based LC-MS (Merck-Hitachi)
equipped with ESI, SSI and APCI and on the quadrupole Time-of-Flight (QTOF) from
Micromass equipped with ESI and APCI interface. The APCI interface on the M-8000 did not
generate a significant response for paclitaxel under various conditions, so this interface was
excluded for further experiments. The optimized infusion conditions (see experimental
section) of the remaining four interfaces (ESI, SSI on M-8000; ESI, APCI on QTOF) were
applied to observe the response with some common LC-MS additives (see experimental), of
which the results are depicted in Table 1.
On the M-8000, both ESI and SSI resulted in spectra dominated by the [PAC + Na]+ and
[PAC + K]+ ion. No [PAC + H]+ was observed with any of the additives. Changing from pH 5
to pH 7 did not have a remarkable influence on the ionization. All additives (except acetic
acid) caused a lower signal intensity, probably due to ion suppression by the additive.
On the QTOF, the spectra are again dominated by sodium and potassium adduct ions. For the
APCI source, this is somewhat surprising, as it is often observed that ionization with this
interface results in less adduct formation [13]. Electrospray ionization on the QTOF resulted
in substantial quantities of [PAC + H]+ in the presence of ammonium formate. The addition of
formic or acetic acid on the other hand, did not show such a noticeable formation of [PAC +
H]+. Considering the large pH difference between these acids and ammonium formate pH 7, it
is evident that a low pH is not a critical factor for the production of [PAC + H]+. A probable
assumption is that [PAC + NH3]+ is formed by the presence of ammonium ions, which then
fragments into [PAC + H]+ and NH3. Similar observations have also been described for
digitoxin by Zhou and Hamburger [14].

9
Cone voltage has a remarkable influence on the response observed for [PAC + H]+ and [PAC
+ Na]+ on the QTOF. A cone voltage of 25V gives a maximal response for [PAC + H]+ while
a cone voltage of 40V results in a maximal signal for [PAC + Na]+. A great loss of signal is
observed for [PAC + H]+ at this higher cone voltage, due to up front fragmentation. This
implies that different adduct ions of a given molecule should be viewed as ions with separate
optimum ionization settings. Different behavior of adduct ions of a given molecule are also
observed with sources from other manufacturers [11].
On all sources, acetic acid provided a more efficient ionization as compared to formic acid.
Finally, none of the additives provided a pronounced formation of one ion, on any of the
interfaces. Based on these infusion experiments, the tested common LC-MS additives were
not suitable for a pronounced ionization to one single ion.
Infusion experiments with primary amines
Another option explored with infusion consisted of the addition of primary amines (PrAm) to
the liquid phase. A range of primary amines was selected, some based on literature reports
and some to obtain a distribution of primary amines with varying chain lengths. The following
compounds were evaluated: methylamine, propylamine, hexylamine, nonylamine,
dodecylamine and octadecylamine. These are all quite strong basic compounds, with pKa’s of
approximately 10.7 (calculated using ACD software Solaris V4.67). As such compounds
could cause column deterioration and paclitaxel breakdown, an acid had to be added to lower
the pH. Initial experiments established 1 mM of the primary amine and 1 mM acetic acid in
the infusion liquid (resulting pH 8) as a relevant concentration for evaluation. The
experiments were again conducted on all four interfaces. The results are shown in Table 2.
The use of octadecylamine was only partly investigated (data not shown). Aside from the
worse results as compared to dodecylamine (ESI), octadecylamine was mainly avoided
because of long retention in the mass spectrometer, even after short infusion experiments.

10
Therefore, we did not further consider this compound useful for continuous introduction in
the MS with the mobile phase. All interfaces were able to generate primary amine adduct ions
[PAC + PrAm]+. Nevertheless, some differences were perceptible.
Infusion with primary amines on the M-8000
For the M-8000 LC-MS system with SSI interface, the percentage of amine adduct increased
with increasing chain length, except for methylamine, the most polar primary amine (Table
2). The most pronounced formation of a primary amine adduct was observed with the most
non-polar one, i.e. dodecylamine (DDA).
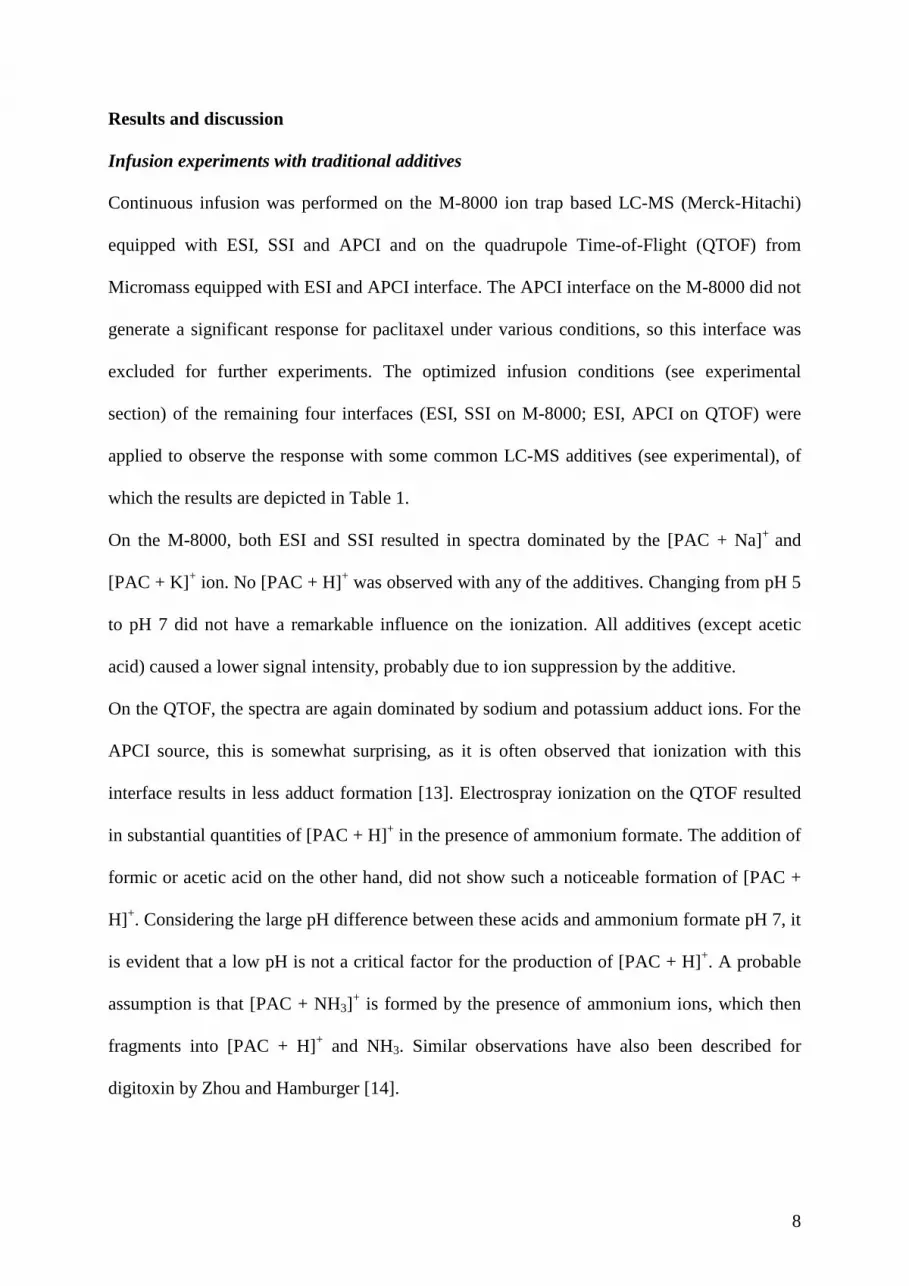
The electrospray results on the same instrument (M-8000) resulted in higher signal intensity
compared to SSI. Methylamine this time did not produce a higher percentage of the amine
adduct than propylamine. Similar to SSI, dodecylamine gave the highest relative response
(76%) as primary amine adduct ion (Table 2). This condition resulted in the most preferred
situation for the M-8000 and was further optimized. Different concentrations were tested
(Figure 1). As expected, a gradual decrease in sensitivity was noticed with increasing
concentration of the additive. Simultaneously, a small increase in percentage of the amine
adduct ion was noticed up to 0.5 mM. A good compromise was established at a concentration
of 0.1 mM. The ratio with between dodecylamine and acetic acid was also considered as a
parameter to optimize (Figure 2). A 1:1 ratio seemed comparable to an excess of
dodecylamine, but the former was preferred for reasons of stability of the column and
compound. An excess of acetic acid yielded decreased sensitivity and relative response of the
amine adduct ion. In addition, 15-crown-5 ether, imidazole, piperidine, EDTA and
triethylamine were also evaluated by infusion experiments on the M-8000 with ESI, but none
resulted in a pronounced signal for paclitaxel or any of its adduct ions. Infusion experiments
with small amounts of sodium acetate/acetic acid (0.7/9.3 mM and 3.6/6.4 mM) to produce
the sodium adduct in a reproducible way were carried out, but intense cluster ions

11
[(CH3COONa)n + Na]+ appeared. Furthermore, the potassium adduct was still present in the
spectrum.
Infusion with primary amines on the QTOF
On the QTOF system, the ESI interface gave similar results as on the M-8000. It has to be
mentioned that all experiments (ESI as well as APCI) on this system made use of cone gas for
ionization. This was supported by experiments, which indicated that amine adducts were
preferentially formed in this way.
Increasing the carbon tail of the primary amine results in a higher relative response for the
[PAC + PrAm]+ ion up to nonylamine (Table 2). As electrospray ionization produces ions
mainly in the liquid phase, we believe that an explanation therefore should be based on liquid
phase processes. We suggest two theories that do not exclude one another. On the one hand,
the very hydrophobic paclitaxel molecule could have a high affinity for hydrophobic, longer
chain primary amines in the electrospray droplets, leading to more paclitaxel primary amine
complexes amenable to ionization. On the other hand, the complexes with long chain primary
amines (hydrophobic tail) could have a higher affinity for the air-liquid interface of the ESI
droplets, due to enhanced surface activity. As the fraction of complexes on this droplet
surface increases, the response should simultaneously increase. The latter has been suggested
by Cech and Enke, who described that tripeptides with a more hydrophobic side-chain gave
better ionization, probably due to increased surface activity [15].
Based on the results in Table 2, dodecylamine at a concentration of 1.0 mM gives a lower
absolute and relative response as [PAC + PrAm]+ than nonylamine and hexylamine at first
sight. At a concentration of 0.1 mM primary amine, however (Figure 3), dodecylamine results
in the same or even better sensitivity than nonylamine, but gives a slightly higher relative
response (83.5 vs. 78.4%). We believe that the more rapid decreasing absolute response of
[PAC + PrAm]+ at increasing concentrations of primary amine is caused by steric hindrance at

12
the droplet surface. Assuming this, and knowing that steric hindrance is more likely to occur
with the larger molecule dodecylamine, it seems evident that lowering the concentration of
dodecylamine reduces steric hindrance and results in similar or even superior ionization
efficiency as compared to nonylamine. Therefore, dodecylamine at a concentration of 0.1 mM
(with acetic acid 0.1 mM) was considered as the preferred primary amine for addition to the
mobile phase.
Finally, the APCI source on the QTOF was evaluated for its suitability to generate primary
amine adduct ions (Table 2). The ionization efficiency of APCI was inferior to ESI. In
addition, the relative response of the adduct ion never exceeded 30%, and only a minor trend
towards and increased response of [PAC + PrAm]+ with increasing chain length of the
primary amine was observed. This supports the statement that adduct formation of paclitaxel
with primary amines is mainly a liquid phase process. As APCI is more a gas phase process,
enhanced “surface activity” on the ESI droplet does not necessarily increase the response with
this type of ionization. Evidently, we considered the combination of APCI and primary
amines less suitable for our application. We concluded from these experiments that ESI is
preferred to APCI for the creation of primary amine adduct ions and focused our attention to
this interface for further experiments.
Chromatographic evaluation with LC-ESI-MS
The results obtained by infusion were evaluated by LC-ESI-MS on both the M-8000 and
QTOF. This approach allows to verify whether the results obtained by the infusion can be
extrapolated to a more real-life situation, i.e. the LC-ESI-MS analysis of samples of varying
composition. The following experiment was therefore designed. Paclitaxel was diluted to
1000 ng/mL from stock solutions in mobile phase and this solution was divided into three
portions. NaCl (17mM) was added the first sample (S + NaCl), KCl (4 mM) to the second (S
+ KCl) , and to the third nothing was added (S), this to mimic real samples containing varying

13
amounts sodium and potassium chloride. The samples were eight times cross injected (5 µL
or 5 ng on-column) onto the column. In this way, the retained paclitaxel (capacity factor k’ =
3.6) was separated from unretained substances like minerals and the added alkali metals. This
experiment was repeated with different mobile phases. The main consideration was a
reproducible formation of one ion, despite this variable salt concentration in the sample.
Chromatographic evaluation with LC-ESI-MS on M-8000
The results of this LC-ESI-MS experiments on the M-8000 are represented in Figure 4. Three
different mobile phase were compared: (i) MeOH/water (70/30 by vol.) without additive (No
add), (ii) acetic acid (1.7 mM) as additive (AA) and (iii) acetic acid/dodecylamine (0.1 mM/
0.1 mM) as additive (DDA/AA). Aside from the sodium and potassium adduct, another
unkwown adduct at m/z 974 was noted and further named [PAC + Y]+. Although MS/MS
experiments indicate that this ion consists of paclitaxel with at least two sodium ions attached
(fragmentation of m/z 974 to 898 i.e. [PAC + 2Na –H]+) we could not determine the exact
origin of it. Without additive in the mobile phase, a large variability in response between
samples is noted. Analysis of the alkalimetal free sample (S) and the sample spiked with NaCl
(S + NaCl) results in 72% of all paclitaxel ions present in the form of [PAC + Na]+, while for
the sample containing potassium (S + KCl), only 32% of the total paclitaxel ions consisted of
[PAC + Na]+. The amount of potassium in the sample had a great influence and resulted in
58% [PAC + K]+ of the total response. Despite the chromatographic separation, the presence
of different types of alkali metals in the sample gave different patterns of adduct formation.
Such conditions are not suitable for quantitative analysis.
A mobile phase containing dodecylamine/acetic acid (0.1mM/0.1mM) provides much better
results. When comparing the different samples, both absolute and relative responses of the
base peak [PAC + DDA]+ were closely related, with confidence intervals overlapping and of
the same order of magnitude. With acetic acid alone in the mobile phase (1.7 mM), a

14
pronounced formation of [PAC + Na]+ was observed. Here, the absolute and relative response
of [PAC + Na]+ are again of the same order. The results of this chromatographic evaluation
are somewhat conflicting with the infusion experiments for acetic acid. More potassium
adduct was noted with the infusion method. Perhaps, the potassium was originating from the
standard solution or the syringe, and is less present in the mobile phase used for
chromatography. This points out that infusion might not be the only way to evaluate adduct
formation and chromatography can definitely modify the adduct formation. Eventually, we
consider both MeOH/water (70/30, by vol) with acetic acid (1.7 mM) or with
dodecylamine/acetic acid (0.1mM/0.1mM) acceptable mobile phases for quantitation on the
M-8000 with the ESI interface.
Chromatographic evaluation with LC-ESI-MS on QTOF
A more comprehensive evaluation of mobile phases by LC-ESI-MS was performed on the
QTOF (Figure 5). The same strategy was followed, so again different mobile phases were
used to analyze the three samples (S + NaCl, S + KCl, S) with the same paclitaxel
concentration but with varying alkalimetal content. Without additive in the mobile phase
(MeOH/water, 70/30 by vol.) the results were again not suitable for quantitation. The adduct
ion with the most pronounced response was again [PAC + Na]+, but large variations in
relative response between samples were observed.
Adding dodecylamine/acetic acid to the mobile phase got the reproducibility to a level
acceptable for quantitation, with more than 94.9% of all paclitaxel ions present in the form of
[PAC + DDA]+ in all three samples.
When adding only acetic acid to the mobile phase (1.7mM), the signal was divided over two
main adduct ions. Between 38% and 39.3% of all paclitaxel ions originated from [PAC + H]+
and about 55% was present in the form of [PAC + Na]+, and this in a reproducible way,
within and between the different samples. Only a small amount (6%), was present in the form

15
of [PAC + K]+. Comparing these results obtained by LC-ESI-MS to the results obtained by
syringe infusion again revealed some differences in adduct formation. Infusion from a syringe
resulted in much more potassium adduct ion (24%), so the chromatographic separation
diminished the potassium adduct ion to about 6%. Again, these chromatographic conditions
decreased the effect of potassium but not of sodium on the ionization. Nevertheless, a
situation where the response is divided into two signals is not favorable for sensitive MS/MS
analysis. An attempt was made to enhance the signal of [PAC + H]+ by switching to
ammonium acetate (1.6 mM; pH 4.75) or ammonium formate (1.6 mM; pH 3.75) as additive.
This enhanced the relative signal intensity of [PAC + H]+ only slightly (ammonium acetate
47%, ammonium formate: 50%). Another effort to increase the signal intensity of [PAC + H]+
was the use of ultradistilled water (with Millipore Synergy 185) and rinsing of the glassware
containing the mobile phase with concentrated formic acid. With ammonium formate as
additive, the combination of these alterations enhanced the relative response of [PAC + H]+ to
61%. Although reproducible, a more pronounced relative response would be desirable, but
was not achieved. A more pronounced ionization of another ion, namely the [PAC + Na]+ ion,
was strived for by the addition of 20µM sodium acetate to 1.7 mM acetic acid. Relative
responses of around 88% were reached for all samples with excellent reproducibilities. This
low amount of the non-volatile sodium acetate did not produce any source contamination.
In conclusion, for the ESI-QTOF, different mobile phases enabled to obtain reproducible
results. The use of additives in the mobile phase again appeared to be a necessity. All
additives improved the reproducibility between samples considerably, but some also resulted
in a pronounced formation of one single ion. The highest relative response noticed for [PAC +
H]+ amounted to 61%. A pronounced relative response occurred with of dodecylamine/acetic
acid as [PAC + DDA]+ and with acetic acid/sodium acetate as [PAC + Na]+.

16
Conclusion
Adduct formation of paclitaxel was studied under various conditions. Infusion with a syringe
and LC-MS analysis were both used for the evaluation of adduct formation. After comparison
of these techniques, it became clear that LC-MS gives closer representation of the real
situation. Although fast and easy and therefore still useful for an initial screening, infusion
could not eliminate the influence of residual alkali metals coming from syringe or sample.
Higher quantities of [PAC + K]+ were often observed with syringe infusion. LC on the other
hand was more influenced by residual sodium in the system and as a result gave higher signal
for [PAC + Na]+. Two different MS systems (M-8000 and QTOF) were compared which
demonstrated similar trends but at the same time notable differences. Electrospray seemed to
be the most suitable source for our application on both instruments. With ammonium formate
as additive on the QTOF, electrospray sometimes resulted in [PAC + H]+ while this was never
the case on the M-8000. With primary amines as additive, increasing chain length resulted in
higher relative responses [PAC + PrAm]+ on both instruments. Experiments using
chromatography clearly showed that additives are a necessity; without additive in the mobile
phase, paclitaxel adduct formation was strongly influenced by the alkali metal content of the
sample, despite the chromatographic process. Addition of the selected primary amine,
dodecylamine, to the mobile phase proved to be successful to convert almost all paclitaxel
adduct ions to [PAC + DDA]+ on both instruments. The more common additives like acetic
acid, ammonium formate and ammonium acetate resulted in a partition of the signal between
[PAC + H]+ and [PAC + Na]+ on the QTOF. Reproducible and pronounced formation of one
ion the QTOF was noticed with dodecylamine/acetic acid and with acetic acid/sodium acetate.
These results show that different mobile phase additives can be used and can result in
different ions. Thus, several suitable possibilities exist to develop a quantitative method.

17
Furthermore, the presented work also illustrates the importance of evaluating any variability
in adduct formation during method development.
Acknowledgements
This work was supported by grant GOA99-120501.99 and a grant from the “Centrum voor
Studie en Behandeling van Gezwelziekten, Gent”. The authors thank Ms. Sofie Vande
Casteele for technical assistance and gratefully acknowledge assistance from Merck KGaA
Darmstadt and support from VWR Belgium.

18
References
1 Matuszewski, B. K.; Constanzer, M. L.; Chavez-Eng, C. M. Matrix effect in
quantitative LC/MS/MS analyses of biological fluids: A method for determination of finasteride in human plasma at picogram per milliliter concentrations. Analytical Chemistry 1998, 70, 882-889.
2 Mei, H.; Hsieh, Y. S.; Nardo, C.; Xu, X. Y.; Wang, S. Y.; Ng, K.; Korfmacher, W. A. Investigation of matrix effects in bioanalytical high- performance liquid chromatography/tandem mass spectrometric assays: application to drug discovery. Rapid Communications in Mass Spectrometry 2003, 17, 97-103.
3 Bonfiglio, R.; King, R. C.; Olah, T. V.; Merkle, K. The effects of sample preparation methods on the variability of the electrospray ionization response for model drug compounds. Rapid Communications in Mass Spectrometry 1999, 13, 1175-1185.
4 Choi, B. K.; Gusev, A. I.; Hercules, D. M. Postcolumn introduction of an internal standard for quantitative LC-MS analysis. Analytical Chemistry 1999, 71, 4107-4110.
5 Li, X. F.; Ma, M. S.; Scherban, K.; Tam, Y. K. Liquid chromatography-electrospray mass spectrometric studies of ginkgolides and bilobalide using simultaneous monitoring of proton, ammonium and sodium adducts. Analyst 2002, 127, 641-646.
6 Ortelli, D.; Rudaz, S.; Cognard, E.; Veuthey, J. L. Analysis of dihydroartemisinin in plasma by liquid chromatography mass spectrometry. Chromatographia 2000, 52, 445-450.
7 Teshima, K.; Kondo, T.; Maeda, C.; Oda, T.; Hagimoto, T.; Tsukuda, R.; Yoshimura, Y. Application of 1-alkylamines to a liquid chromatographic/turbo ionspray tandem mass spectrometric method for quantifying metabolites of a new bone anabolic agent, TAK-778, in human serum. Journal of Mass Spectrometry 2002, 37, 631-638.
8 Stefansson, M.; Sjoberg, P. J. R.; Markides, K. E. Regulation of multimer formation in electrospray mass spectrometry. Analytical Chemistry 1996, 68, 1792-1797.
9 Lopes, N. P.; Stark, C. B. W.; Hong, H.; Gates, P. J.; Staunton, J. Z. A study of the effect of pH, solvent system, cone potential and the addition of crown ethers on the formation of the monensin protonated parent ion in electrospray mass spectrometry. Analyst 2001, 126, 1630-1632.
10 Greig, M.; Griffey, R. H. Utility of Organic-Bases for Improved Electrospray Mass- Spectrometry of Oligonucleotides. Rapid Communications in Mass Spectrometry 1995, 9, 97-102.
11 Jemal, M.; Almond, R. B.; Teitz, D. S. Quantitative bioanalysis utilizing high-performance liquid chromatography electrospray mass spectrometry via selected-ion monitoring of the sodium ion adduct [M+Na](+). Rapid Communications in Mass Spectrometry 1997, 11, 1083-1088.
12 Alexander, M. S.; Kiser, M. M.; Culley, T.; Kern, J. R.; Dolan, J. W.; McChesney, J. D.; Zygmunt, J.; Bannister, S. J. Measurement of paclitaxel in biological matrices: high- throughput liquid chromatographic-tandem mass spectrometric quantification of paclitaxel and metabolites in human and dog plasma. Journal of Chromatography B-Analytical Technologies in the Biomedical and Life Sciences 2003, 785, 253-261.
13 Thurman, E. M.; Ferrer, I.; Barcelo, D. Choosing between atmospheric pressure chemical ionization and electrospray ionization interfaces for the HPLC/MS analysis of pesticides. Analytical Chemistry 2001, 73, 5441-5449.

19
14 Zhou, S. L.; Hamburger, M. Effects of solvent composition on molecular ion response in electrospray mass spectrometry: Investigation of the ionization processes. Rapid Communications in Mass Spectrometry 1995, 9, 1516-1521.
15 Cech, N. B.; Enke, C. G. Relating electrospray ionization response to nonpolar character of small peptides. Analytical Chemistry 2000, 72, 2717-2723.

20
Table 1:
M-8000
ESI MeOH AA FA Am FA, pH 5 Am FA, pH 7
PAC + Na 130000 115000 90000 35000 50000
PAC + K 35000 65000 55000 28000 25000
SSI MeOH AA FA Am FA, pH 5 Am FA, pH 7
PAC + Na 86600 51000 27600 10500 12000
PAC + K 103000 85300 40000 8800 15100
QTOF
ESI MeOH AA FA Am FA, pH 5 Am FA, pH 7
PAC + H 20 30 30 260 240
PAC + Na 3400 3900 3200 1200 2300
PAC + K 2500 1250 900 450 900
APCI MeOH AA FA Am FA, pH 5 Am FA, pH 7
PAC + H 10 10 10 15 15
PAC + Na 2600 1000 800 1000 800
PAC + K 800 750 580 400 400
Absolute response of paclitaxel adduct ions (in Arbitrary Units, M-8000 and QTOF units are
not comparable) after infusion with common additives. MeOH: MeOH/Water 70/30 by vol.,
AA: acetic acid, FA: formic acid, Am FA: ammonium formate, all at 10 mM. Cone voltage
QTOF: 40 V.

21
Table 2:
M-8000 MA1/AA1 PA1/AA1 HX1/AA1 NA1/AA1 DDA1/AA1
ESI 62183 (40%) 107167 (51%) 95800 (55%) 147767 (73%) 130600 (76%)
SSI 12267 (41%) 20000 (28%) 39167 (34%) 27278 (71%) 31933 (74%)
QTOF MA1/AA1 PA1/AA1 HX1/AA1 NA1/AA1 DDA1/AA1
ESI 476 (35%) 1437 (50%) 2013 (71%) 2210 (77%) 1867 (69%)
APCI 70 (8%) 130 (16%) 200 (23%) 210 (24%) 250 (29%)
Absolute (in Arbitrary Units, M-8000 and QTOF units are not comparable) and relative
response (response of primary amine adduct divided by total response of all paclitaxel adduct
ions times 100, between brackets) of the paclitaxel primary amine adduct after paclitaxel
infusion with primary amines (1mM) and acetic acid (1mM). Cone voltage QTOF: 40V. MA:
methylamine, PA: propylamine, HX: hexylamine, NA: nonylamine, DDA: dodecylamine,
AA: acetic acid.

22
NH
O
O
OO
O
OO
O
O
HO
O
H3COH
CH3
CH3
OH
H3C
CH3H3C
OH
Structure I: paclitaxel (molecular weight: 853)
23
0
100000
200000
300000
400000
500000
600000
DDA/AA 0.02 mM DDA/AA 0.1 mM DDA/AA 0.5 mM DDA/AA 1.0 mM
Response
0
20
40
60
80
100
%Response[PAC + Na]+ [PAC + K]+[PAC + DDA]+ %[PAC + DDA]+
Figure 1. Effect of concentration of DDA/AA on the absolute and relative response and of the
paclitaxel adduct ions on the M-8000 after infusion. Error bars indicate 2 x standard deviation
(n = 3).

24
0
100000
200000
300000
400000
500000
DDA 0.1 /AA 0.02 DDA 0.1/ AA 0.1 DDA 0.1 /AA 0.2
Response
0
20
40
60
80
100
%Response[PAC + Na]+ [PAC + K]+
[PAC + DDA]+ %[PAC + DDA]+
Figure 2. Effect of varying ratio dodecylamine (DDA) and acetic acid (AA) on the absolute
and relative response of the paclitaxel adduct ions after infusion (M-8000). Error bars indicate
2 x standard deviation (n = 3). Concentrations DDA and AA are given in mM.

25
0
1000
2000
3000
4000
5000
6000
7000
0.05 0.1 0.5 1 0.05 0.1 0.5 1
NA DDA
Conc:
Response
0
20
40
60
80
100%Response[PAC + Na]+ [PAC + K]+
[PAC + PrAm]+ %[PAC + PrAm]+
Figure 3: Effect of concentration primary amine/acetic acid (mM) on the absolute and relative
response of paclitaxel ion adducts for nonylamine (NA) and dodecylamine (DDA) after
infusion (QTOF). Error bars indicate 2 x standard deviation (n = 3).

26
0
10
20
30
40
50
60
70
80
90
100
NaCl KCl X NaCl KCl X NaCl KCl X
No add AA DDA/AA
Sample:
M Phase:
%Response %[PAC + Na]+%[PAC + K]+%[PAC + Y]+%[PAC + DDA]+
Figure 4: Effect of mobile phase and salts in the sample on the absolute response and
reproducibility of paclitaxel adduct ions after LC-MS (ESI - M-8000). Error bars indicate 2 x
standard deviation (n = 8).

27
0.0
20.0
40.0
60.0
80.0
100.0
S +
NaC
l
S +
KC
l S
S +
NaC
l
S +
KC
l S
S +
NaC
l
S +
KC
l S
S +
NaC
l
S +
KC
l S
S +
NaC
l
S +
KC
l S
S +
NaC
l
S +
KC
l S
S +
NaC
l
S +
KC
l S
No Add AA DDA/AA AmAc AmFo AmfoMillipore
AmAc + Naacetate
Sample:
Mobile Phase:
%Response %[PAC + H]+%[PAC + Na]+%[PAC + K]+%[PAC + DDA]+
Figure 5: Effect of mobile phase and salts in the sample on the relative response of paclitaxel
adduct ions after LC-MS (ESI - QTOF).


