Embed Size (px)
Citation preview

www.transonc.com
Trans la t iona l Onco logy Volume 7 Number 6 December 2014 pp. 681–686 681
Advanced 3D-SonographicImaging as a Precise Techniqueto Evaluate Tumor Volume
R. Pflanzer*,1, M. Hofmann*,1, A. Shelke†,A.Habib†,W.Derwich‡, T. Schmitz-Rixen‡, A. Bernd*,R. Kaufmann* and J. Bereiter-Hahn†
*Dept. of Dermatology, Venerology and Allergology, GoetheUniversity Frankfurt, 60590 Frankfurt/Main, Germany;†Institute for Cell Biology and Neurosciences, GoetheUniversity, 60439 Frankfurt/Main, Germany; ‡Dept. ofVascular and Endovascular Surgery, Goethe UniversityFrankfurt, 60590 Frankfurt/Main, Germany
AbstractDetermination of tumor volume in subcutaneously inoculated xenograft models is a standard procedure for clinicaland preclinical evaluation of tumor response to treatment. Practitioners frequently use a hands-on caliper methodin conjunction with a simplified formula to assess tumor volume. Non-invasive and more precise techniques asinvestigation by MR or (μ)CT exist but come with various adverse effects in terms of radiation, complex setup orelevated cost of investigations. Therefore, we propose an advanced three-dimensional sonographic imagingtechnique to determine small tumor volumes in xenografts with high precision and minimized observer variability.We present a study on xenograft carcinoma tumors from which volumes and shapes were calculated with thestandard caliper method as well as with a clinically available three-dimensional ultrasound scanner andsubsequent processing software. Statistical analysis reveals the suitability of this non-invasive approach for thepurpose of a quick and precise calculation of tumor volume in small rodents.
Translational Oncology (2014) 7, 681–686
Address all correspondence to: Matthias Hofmann, PhD, Dept. of Dermatology,Venereology and Allergology, University Hospital Frankfurt, Theodor-Stern Kai 7, D-60590 Frankfurt/M, Germany.E-mail: [email protected] authors contributed equally to this work.Received 12 June 2014; Revised 15 September 2014; Accepted 19 September 2014
© 2014 Neoplasia Press, Inc. Published by Elsevier Inc. This is an open access articleunder the CC BY-NC-ND license (http://creativecommons.org/licenses/by-nc-nd/3.0/).1936-5233/14http://dx.doi.org/10.1016/j.tranon.2014.09.013
IntroductionFor a couple of years and despite most recent advances in tumorresearch, still the display of tumor growth as a clinically and pre-clinicallyrelevant factor for prognosis and development of a cancerous diseasesremains important. A decrease or increase in tumor size is in most casesdirectly linked to a response or non-response to tumor treatment [1].Conventionally, growth of solid tumors is followed under various
conditions, e.g. different treatment regimes, and then assessed byregularly tracking increase in volume of the xenografts that are initiallycreated by subcutaneously injecting tumor cells in immune-deficientsmall rodents like mice. However, the methods for volumemeasurement used by practitioners is involving a mere mechanicalin vivo calipermeasurement of length andwidth directly on anaesthetizedtumor-bearing mice, and a subsequent calculation of an approximatetumor volumewith a formula derived fromGeran et al. [2]. This widelyused equation is an altered version of the calculation used fordetermination of an ellipsoid volume: π/6 w(idth) d(epth) l(ength)and, assuming the depth to be approximately the same as the width, itbecomes π/6 w w l or π/6 (short axis) (short axis) (long axis).The main disadvantage of this method evidently becomes clear: it
is imprecise because tumors, especially human xenograft lines
transplanted and grown in mice, often undergo shape changes thatconsiderably deviate from an ellipsoid volume. Additionally, themeasurement overestimates tumor size because the uppermost skinlayers (dermis and epidermis) above the tumor hull are not takeninto consideration. Furthermore, the method of measuring withcalipers in the sub-millimeter range on tumors which tend toperform evasive subcutaneous movements is also highly influencedby intra-observer variabilities.
In contrast to the study of Ayers et al. [3] our method does notnecessarily require the excision of the tumors to determine the tumor

682 Advanced 3D sonographic imaging to evaluate tumor volume Pflanzer et al. Translational Oncology Vol. 7, No. 6, 2014
volume. Furthermore, there have been a number of studies trying tocircumvent this problem by using ultrasound in a 2D-segmentationalanalysis as a non-invasive tool to determine exact tumor volume [4].Many of these investigations focused on clinical questions, regardinge.g. the high frequency sonographic imaging of small animals forpathogenesis and embryonic development of mice [5,6]. Also, twodimensional imaging modalities as ultrasound bio-microscopy(UBM) and scanning acoustic microscopy (SAM) have been usedto investigate tumors in a non-invasive fashion [4,7]. Earlier studiesshed light on the suitability of ultrasound in quantifying tumorvolume, first on phantom models in 3D ultrasound compared with a2D ultrasound approach [8]. As the technique progressed, 3Dultrasound became more widely used, as in a clinical setting on smallmetastatic nodular tumor entities [9] or as a common tool to visualizeorgans in different orientations [10]. However, none of these so farused the possibilities which 3D-ultrasound combined with speckletracking has to offer. Not only is it possible to generate a completethree-dimensional rendering of the tumor, but the integrated softwarewith a speckle tracking detection and wall motion tracking algorithmmakes precise volume determination possible. At a sonographicfrequency of 2.5 MHz or higher, the approximate wavelength of 0.4to 0.6 mm is sufficient for imaging the typical tumor dimensions oflarger subcutaneous and hypertensed tumors in the range of 4 to 6 cmlength. Due to the attenuation not being directly proportional tofourth power of frequency like in solid materials [11], but rather itbeing in the range of f^1 to f^2 [12], the low frequency of 2.5 to4 MHz used here does still not suffer significantly from the typicalwave attenuation in soft tissues. High frequency approaches(e.g. UBM and SAM performed between 5 to 30 MHz, or higher)are thus limited in the depth of penetration of the ultrasonic waves.
In the present study we propose a 3D sonographical approach at4 MHz to determine exact tumor volume, without employingmicrobubbles or similar binding-agent techniques on 11 vulva-carcinoma A431 tumors. Accuracy and results of this method arehence compared to the results of conventional caliper measurementsas well as to the procedure of determining volume by weighing withgeneral tissue density assumptions. The latter one can be consideredas the gold standard method, as displayed in Ayers et al. [3]. We showthat the ultrasound method used is suitable for ex vivo transplants andyields highly reliable tumor volume representations, considering ourtechnology as applicable for in vivo measurements as well. This data,in turn, can be used in non-invasive ultrasound studies onbiomechanical parameters such as TIFP to facilitate data processingand visualize even small changes in tumor volume due to the release orincrease of internal tumor pressure.
Materials and Methods
Cell CultureVulva-carcinoma derived epithelial A431 cells were cultured in
low-glucose DMEM medium with 10 % FCS (fetal calf serum) and1% PS (penicilline/streptomycine) at 37°C under 5% CO2
atmosphere. When a cell density of 1 × 10⁷ cells per flask wasreached, cells were harvested and diluted in PBS (phosphate-bufferedsaline) solution for tumor cell inoculation.
Animal Experiments5 × 106 cells were subcutaneously injected into both flanks of six to
eight weeks old immune-compromised female NMRI (Naval Medical
Research Institute) nu/nu mice. Food and water were givenad libitum. In total, 12 mice were used and 18 tumors were assessedin the different experiments. In some animals only one tumor wasused for measurements due to increased growth compared to thesecond implanted tumor. Caliper measurements of tumor length andwidth were performed at three-day intervals with Vernier calipers(digital 6”/150 mm steel calipers with 0.01 mm resolution; NeikoTools, USA)(Supplementary Table 1). Mice were anaesthetized withIsoflurane® (Abbott GmbH, Wiesbaden, Germany; 2% vaporized inoxygen). Tumors were grown for 14 to 21 days depending on thegrowth rate of individual tumors but not exceeding 20% of totalbodyweights of the animals. Mice were sacrificed with tumors left inplace for immediate in vivo ultrasonic investigation and later carefullyexcised for ex vivo ultrasonic investigation. All animal experimentswere conducted and approved in accordance with the German animalwelfare regulations (Regierungspräsidium Darmstadt, F79/47).
Ultrasonic InvestigationFor ex vivo ultrasonic investigation, all tumors were placed in a water
bath (Aqua dest.) at 25°C. Three-dimensional ultrasonic measurementswere conducted using a commercial 3D sonographic instrument(ARTIDA Systems) developed by Toshiba Medical Systems Company(Tochigi, Japan). The probe was installed in a stand-off device duringdata acquisition (Suppl. Figure 1). Ex vivo image acquisition wereperformed using 3D transducers at 4 MHz center frequency. The highresolution images (DICOM format) were acquired by dividing thetumor into six virtual segments at 1 Hz time synchronization frequencywith a line density of the synchronized segmentation at 3000 samplingpoints. The frame numbers were optimized at 12 frames/secondbecause, as the tumors were static, the lower resolution in time leads to ahigher spatial resolution. As the acoustic impedance mismatch betweenwater and tumor results in a pronounced gray scale contrast along theboundaries, this threshold contrast could be used to detect them alongthe coupling fluid/tissue interface.
Signal Analysis and 3D Data ProcessingTo generate 3D representations of the tumors, speckle tracking and
a 3D wall motion tracking (3D-WMT) algorithm with an output of36 × 36 data points in radial and longitudinal directions wasimplemented. The speckle density was determined in 1 cm3 blocksand an 8-node block matching speckle tracking algorithm was usedwith an image resolution of 0.43 mm/pixel. The algorithm wasimplemented on two mutually orthogonal sections of the tumor andthree longitudinal sections as shown exemplarily for the in situsituation of an A431 tumor in Supplementary Figure 2.
It generates three dimensional Cartesian coordinates along thegeometry of the tumor which can be visualized in a standardultrasonic contrast image (Figure 1A) as well as in a “plastic bag”wireframe display (Figure 1B), which are also suited for a subsequentimport in MATLAB (MathWorks, R2012a) software. The visuali-zation facilitates rendering in space and the evaluation of tumorinhomogeneity. The final volume of the tumor was calculated byproduct of the cross section area of the radial slices and the thicknessof the corresponding longitudinal section.
Statistical AnalysisStatistics were performed with one- and two-way ANOVA
standard tests for analysis of significance. Confidence levels werechosen at 95% confidence-interval.

Figure 1. Tumor imaging utilizing the 4 MHz ultrasound ARTIDA scanning system. A) Volumetric representations of ten experimentalA431 tumors. B) Stress load mesh volumes (“plasticbag” wireframe) of ten experimental A431 tumors.
Translational Oncology Vol. 7, No. 6, 2014 Advanced 3D sonographic imaging to evaluate tumor volume Pflanzer et al. 683
Results
Tumor Volume Determination Using a SpeckleTracking AlgorithmThe main purpose of this work was to investigate how accurate 3D-
ultrasound with a new speckle tracking algorithm can obtainreasonable tumor volume estimates in comparison to the standardtechnique conventionally based on caliper measurements and volumecalculation with the formula derived from Geran et al. [2]. For tenexemplary tumors in our studies, the live B-Mode grey imageacquisition window in x-y plane direction is shown in Figure 1A,including the superimposed semi-automatic outline path whichmarks individual tumor boundaries. The dotted, innermost signalline, colored in yellow, was taken to indicate and interpolate the mostprobable boundary between tumor tissue and signal reflections fromthe surroundings. Density from tissue (tumor and microenviron-ment) makes for the main grey value contrast whereas backscattering
of the signal at the bottom of the plane and the tumor/plane interfacescreates noise distortions, as can be seen in the sagittal cut portions ofthe display. In cases where the loop path ends could not be fullyclosed at one tip of the tumor, the remaining path was interpolatedautomatically with minimized error. The resulting volumetricrepresentations for the exact same 10 experimental tumors, includinga hypothetical estimate on potential circumferential strain loads, areshown in a so-called “plastic bag” simulation (Figure 1B). Thepotential strain loads, assumed automatically by the software, can beneglected in all cases, as we did not load the tissues with any prestress.Interestingly, a wide variety of tumor hull geometries can beidentified in an otherwise homogenous set of these subcutaneoussamples of A431-tumors.
VolumeMeasurements for Tumors are Established andComparedIn order to corroborate the differences we expected to find between
the two methods—tumor volume acquisition by ultrasound

684 Advanced 3D sonographic imaging to evaluate tumor volume Pflanzer et al. Translational Oncology Vol. 7, No. 6, 2014
compared to tumor volume estimation by calipers—a reference (goldstandard) method had to be employed to determine an assumed truetumor volume. The true tumor volume was calculated according tothe established method by Ayers et al. [3] by determining tumorweight and calculating volume with a known or expected tissuedensity according to:
Tumor volume VTð Þ ¼ tumor mass MTð Þ=tissue density ρð Þ:
The average value for tissue density assumed with our calculationswas ρ = 0.85 g/cm3, and assumed from the literature as given in [13],it was ρ = 1 g/cm3, resulting in tumor volumes Vw or VL,respectively. Table 1 shows the results for tumor volume measure-ments on seven A431 tumors, indicating next to both gold standardvolumes (Vw, VL) the caliper/formula derived volume VE and theARTIDA-calculated volume VA for each individual tumor.
TIFP Pressure Values Correlate in Part with Tumor VolumesAn intrinsic phenomenon on most solid tumors, generated by the
chaotic nature of their blood vessel supply and dysfunctional lymphdrainage in the tumor, is an elevated tumor interstitial fluid pressure(TIFP). It can account for upholding a large portion of the finaltumor volume and shape. Supplementary Figure 3 shows TIFPvalues measured via the wick-in-needle technique in relation torespective (ARTIDA calculated) tumor volumes for a larger set ofA431 tumors, reaching volumes up to 3300 mm3 and TIFP valuesup to 11 mmHg. Measurements were performed as describedpreviously [1]. Though, a strictly linear correlation between fluidpressure and tumor volume cannot be identified, a general increase ofinterstitial fluid pressure with a rising volume can be reasonablyassumed and observed for most cases. A lot of data points tend toaccumulate around certain volume/TIFP values, such as seen herebetween volume values around V = 800 to 1200 mm3 and TIFPvalues around 4 to 5 mm Hg.
Tumor Volumes Are More Accurately Assessed by Ultrasound/ARTIDA Than by Caliper/Formula
Tumor volumes have been calculated for all A431 tumors by theconventional caliper/formula method and by ultrasound with theARTIDA system. Comparing ARTIDA-calculated tumor volumes tothe volumes derived from the caliper/ellipsoid formula calculationsand referenced to the gold standard volume determination method(with literature density values), as it is shown in Figure 2A. Thedifference of VA volumes to the true tumor volume VL is considerablysmaller than the significant difference of VE to VL volumes. Moreover,the same observation is made in the case when we use the otherestimation for tumor tissue density from our own calculations as thetrue tumor volume (Vw), as displayed in Figure 2B. Though the
Table 1. Volume measurement on a subset of seven A431 tumorsTable indicating tumor volumes obtained by a) calculation from fresh weight with weight-derived density estimacaliper determination (VE) and c) estimation by ARTIDA-speckle tracking algorithm at 4 MHz (VA)
Code Origin, treatment Volume [mm3] VW
Tumor 1 A431, none 875.9Tumor 2 A431, none 847.0Tumor 3 A431, none 657.2Tumor 4 A431, none 470.0Tumor 5 A431, none 351.4Tumor 6 A431, none 801.1Tumor 7 A431, none 1073.3
differences between VA and VE are smaller than in Figure 2A, still itcan be considered that ARTIDA-calculated volumes VA are closerto the true tumor volume VW than the ellipsoid/caliper-calculatedvolumes VE. Additionally, a Bland-Altman plot reveals differencesin volume estimations for both methods around the range of 1 SD(1 SD =396 mm3), and accumulating around the distribution oftumor volumes between 350 and 750 mm3 (Figure 2C). Similardifferences between the two methods are revealed by thecorresponding correlation curve to the Bland-Altman plot(Figure 2D). The resulting linearly fitted correlation curveconsiderably deviates from the hypothetical normal 45°-angledcorrelation curve for the case of ideal fit.
These findings are clarified furthermore by displaying the extentand the direction of the differences of tumor volume calculations bythe two methods, individually for each tumor displayed in Table 1(Figure 2E). Figure 2E shows, that independent of the direction of theestimation (positive range meaning overestimation, negative rangemeaning underestimation), in five out of seven cases the ultrasoundmethod proves superior over the caliper/formula method. This is truefor both kinds of density estimations on the reference method, whenlooking at the left half or right half of the figure separately. Especiallyin the case of large tumor volume differences, e.g. for tumor 6, theultrasound method produces better estimates.
DiscussionOne of the most important predictors for clinical and preclinicaltreatment outcome and an experimentally, on first glance, “easy-to-follow” aspect in tumor biology is the speed of tumor growth and theassociated tumor volume increase. In many solid tumors, this increasein volume is not only attributed to an increase in tissue “material” ona cellular level, but also to an elevated tumor interstitial fluid pressure(TIFP) [1,14–17]. The TIFP is also partly responsible for creating thetension upholding the individual tumor shape, which in “ideal” case isa spherical/ellipsoid form.
Tumor volume studies have had a big impact on clinical as well aspreclinical studies, because influences of tumor treatment are directlyassociated with tumor volume changes and can be easily followed inanimal experiments. Volume measurement methods used bypractitioners working with tumor-bearing mice though often lackthe desired precision, as they are conducted by using steel orelectronic calipers. The tumor volume is then calculated with thestandard ellipsoid formula π/6 w(idth) d(epth) l(ength). Moreover,this method lacks reproducibility which is tried to overcome byrepeated measurements and use of mean values for these measure-ments. One additional disadvantage of the hands-on procedure is notonly its dependency on the user skills (the same holds true for the useof UBM on-screen-calipers, as shown by Cheung et al. [4], but as well
tion (VW) and density estimation with literature value (VL) (Gold standards VW and VL) b) ellipsoid formula/
Volume [mm3] VL Volume [mm3] VE Volume [mm3] VA
743.6 811.9 690719.1 704.6 720558.0 405.5 650399.0 481.2 180291.4 388.0 340680.1 2012.6 910911.2 1468.7 1250
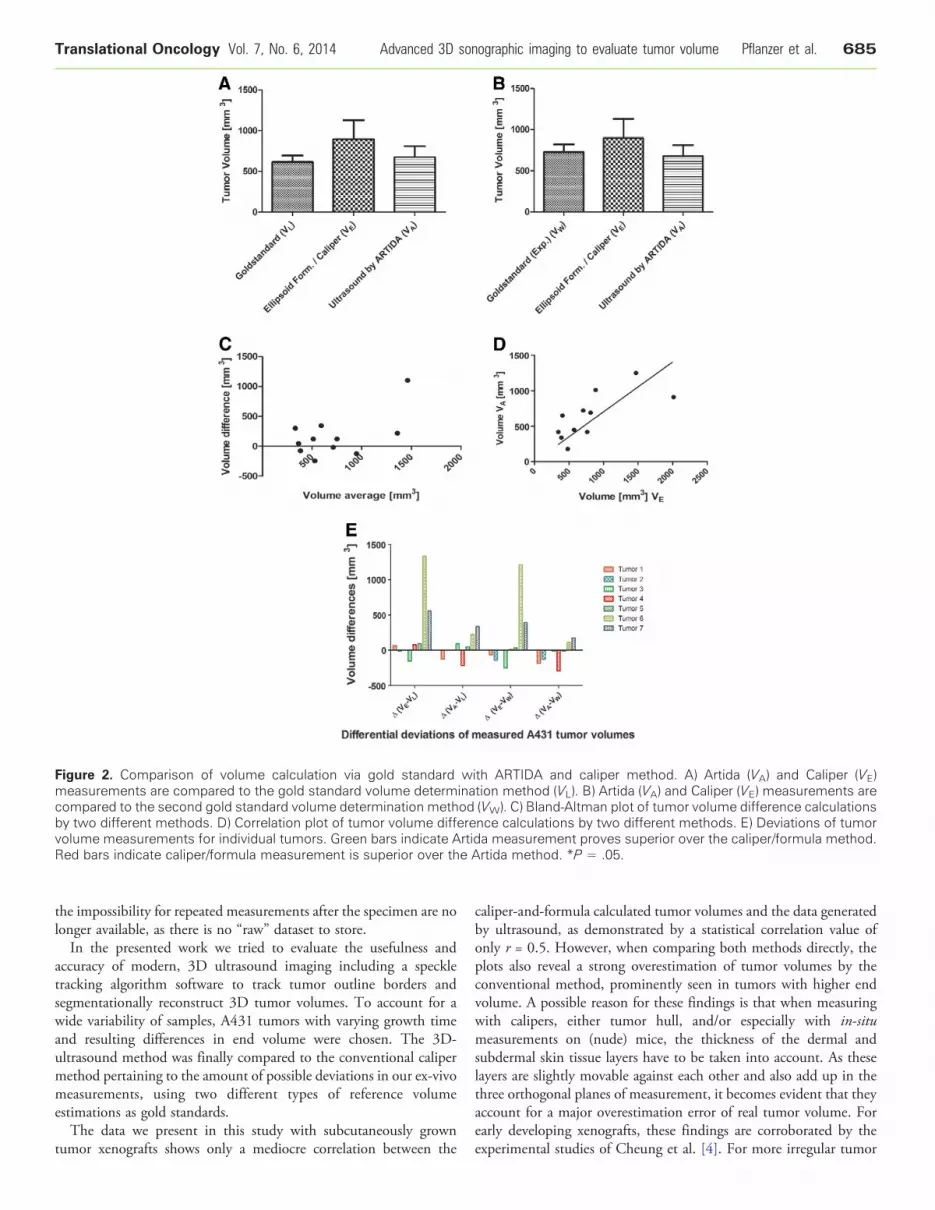
Figure 2. Comparison of volume calculation via gold standard with ARTIDA and caliper method. A) Artida (VA) and Caliper (VE)measurements are compared to the gold standard volume determination method (VL). B) Artida (VA) and Caliper (VE) measurements arecompared to the second gold standard volume determination method (VW). C) Bland-Altman plot of tumor volume difference calculationsby two different methods. D) Correlation plot of tumor volume difference calculations by two different methods. E) Deviations of tumorvolume measurements for individual tumors. Green bars indicate Artida measurement proves superior over the caliper/formula method.Red bars indicate caliper/formula measurement is superior over the Artida method. *P = .05.
Translational Oncology Vol. 7, No. 6, 2014 Advanced 3D sonographic imaging to evaluate tumor volume Pflanzer et al. 685
the impossibility for repeated measurements after the specimen are nolonger available, as there is no “raw” dataset to store.In the presented work we tried to evaluate the usefulness and
accuracy of modern, 3D ultrasound imaging including a speckletracking algorithm software to track tumor outline borders andsegmentationally reconstruct 3D tumor volumes. To account for awide variability of samples, A431 tumors with varying growth timeand resulting differences in end volume were chosen. The 3D-ultrasound method was finally compared to the conventional calipermethod pertaining to the amount of possible deviations in our ex-vivomeasurements, using two different types of reference volumeestimations as gold standards.The data we present in this study with subcutaneously grown
tumor xenografts shows only a mediocre correlation between the
caliper-and-formula calculated tumor volumes and the data generatedby ultrasound, as demonstrated by a statistical correlation value ofonly r = 0.5. However, when comparing both methods directly, theplots also reveal a strong overestimation of tumor volumes by theconventional method, prominently seen in tumors with higher endvolume. A possible reason for these findings is that when measuringwith calipers, either tumor hull, and/or especially with in-situmeasurements on (nude) mice, the thickness of the dermal andsubdermal skin tissue layers have to be taken into account. As theselayers are slightly movable against each other and also add up in thethree orthogonal planes of measurement, it becomes evident that theyaccount for a major overestimation error of real tumor volume. Forearly developing xenografts, these findings are corroborated by theexperimental studies of Cheung et al. [4]. For more irregular tumor

686 Advanced 3D sonographic imaging to evaluate tumor volume Pflanzer et al. Translational Oncology Vol. 7, No. 6, 2014
shapes, which commonly appear in a large part of tumor inoculationexperiments, we expect this problem to be even more pronounced.
Tumor volume estimation via 3D-ultrasound seems to generate farmore accurate results than the conventional method which is prone tointra-observer variability. The differences to the widespread conven-tional caliper method are pronounced even for the majority of tumorswhich do not exceed the end volume of 900 mm3 and more. In casesof higher tumor end volume, the ultrasound method seems to workeven better, as the cases of tumor 6 and 7 show in exemplary fashion(Figure 2E). Of course, studies of these kinds find their limitations inthe high heterogeneity in tumor end volumes even when generatedfrom the same initial amount of cells and from the same tumor entityin a controlled set of mice.
There were various attempts to non-invasively quantify tumorvolume of subcutaneously grown tumors in small animals before, oneof them being the use of mesoscopic epi-fluorescence tomography andepi-illumination reflectance imaging, as recently shown by Abou-Elkacem et al. [18]. However, these methods make use of specificfluorescence labeling and require injection of green/red fluorescentsubstances into the tumor tissue.
In conclusion we identified that three-dimensional sonographicimaging, as carried out in this study in conjunction with a speckletracking algorithm, is a suited technology to non-invasively assess tumorvolume in subcutaneous tumors. Moreover, it was shown that thistechnology produces more reliable tumor volume estimates in a certainvariety of tumor types and volume ranges than conventional techniques.The technology is relatively easy to handle (hazard-free) and requiresonly standard medical-type of ultrasound transducers, which mightopen access of 3D-ultrasound from daily patient-oriented medicalscenarios to encompass a wider preclinical and research use.
Supplementary data to this article can be found online at http://dx.doi.org/10.1016/j.tranon.2014.09.013.
AcknowledgmentR. Pflanzer and M. Hofmann contributed equally to this work. Thisresearch was supported by the LOEWE PräBionik network of thestate of Hesse (to RP, MH, AS, AH, WD, TSR, RS, BH).
References
[1] Hofmann M, Guschel M, Bernd A, Bereiter-Hahn J, Kaufmann R, Tandi C,Wiig H, and Kippenberger S (2006). Lowering of tumor interstitial fluid pressurereduces tumor cell proliferation in a xenograft tumor model. Neoplasia 8, 89–95.
[2] Geran RI, Greenberg NH, Macdonald MM, Schumacher AM, and Abbott BJ(1972). Protocols for screening chemical agents and natural products againstanimal tumors and other biological systems. Cancer Chemother Rep 3,1–103.
[3] Ayers GD, McKinley ET, Zhao P, Fritz JM, Metry RE, Deal BC, Adlerz KM,Coffey RJ, and Manning HC (2010). Volume of preclinical xenograft tumors ismore accurately assessed by ultrasound imaging than manual caliper measure-ments. J Ultrasound Med 29, 891–901.
[4] Cheung AM, Brown AS, Hastie LA, Cucevic V, Roy M, Lacefield JC, Fenster A,and Foster FS (2005). Three-dimensional ultrasound biomicroscopy forxenograft growth analysis. Ultrasound Med Biol 31, 865–870.
[5] Foster FS, Zhang MY, Zhou YQ, Liu G, Mehi J, Cherin E, Harasiewicz KA,Starkoski BG, Zan L, and Knapik DA, et al (2002). A new ultrasound instrumentfor in vivo microimaging of mice. Ultrasound Med Biol 28, 1165–1172.
[6] Goertz DE, Yu JL, Kerbel RS, Burns PN, and Foster FS (2002). High-frequencyDoppler ultrasound monitors the effects of antivascular therapy on tumor bloodflow. Cancer Res 62(22), 6371–6375.
[7] Pflanzer R, Shelke A, Bereiter-Hahn J, and Hofmann M (2012). Ultrasonicquantification of tumor interstitial fluid pressure through scanning acousticmicroscopy. In: Nowicki A, Litniewski J, Kujawska T, editors. Acousticalimaging 31. Berlin, Germany: Springer; 2012. p. 291–299.
[8] Riccabona M, Nelson TR, and Pretorius DH (1996). Three-dimensionalultrasound: accuracy of distance and volume measurements. Ultrasound ObstetGynecol 7, 429–434.
[9] Kim HC, Han MH, Do KH, Kim KH, Choi HJ, Kim AY, Sung MW, andChang KH (2002). Volume of cervical lymph nodes using 3D ultrasonography.Differentiation of metastatic from reactive lymphadenopathy in primary headand neck malignancy. Acta Radiol 43, 571–574.
[10] Fenster A and Downey DB (2000). Three-dimensional ultrasound imaging.Annu Rev Biomed Eng 2, 457–475.
[11] Mason WP and McSkimin HJ (1947). Attenuation and scattering of highfrequency sound waves in metals and glasses. J Acoust Soc Am 19, 464–473.
[12] Cooper TE and Trezek GJ (1972). A probe technique for determining thethermal conductivity of tissue. J Heat Transfer 94, 133–140.
[13] Salomonsson G and Björkman L (1985). Investigation of methods to estimateultrasonic attenuation of soft tissue. IEEE Trans Biomed Eng 32, 583–591.
[14] Jain RK (1989). Delivery of novel therapeutic agents in tumors: physiologicalbarriers and strategies. J Natl Cancer Inst 81, 570–576.
[15] Heldin CH, Rubin K, Pietras K, and Ostman A (2004). High interstitial fluidpressure – an obstacle in cancer therapy. Nat Rev Cancer 4, 806–813.
[16] Hofmann M, Schultz M, Bernd A, Bereiter-Hahn J, Kaufmann R, andKippenberger S (2007). Long-term lowering of tumor interstitial fluid pressurereduces Ki-67 expression. J Biomech 40, 2324–2329.
[17] Hofmann M, McCormack E, Mujic M, Rossberg M, Bernd A, Bereiter-Hahn J,Gjertsen BT, Wiig H, and Kippenberger S (2009). Increased plasma colloidosmotic pressure facilitates the uptake of therapeutic macromolecules in axenograft tumor model. Neoplasia 11, 812–822.
[18] Abou-Elkacem L, Björn S, Doleschel D, Ntziachristos V, Schulz R, Hoffman RM,Kiessling F, and Lederle W (2012). High accuracy of mesoscopic epi-fluorescencetomography for non-invasive quantitative volume determination of fluorescentprotein-expressing tumours in mice. Eur Radiol 9, 1955–1962.


