Embed Size (px)
Citation preview
Meeting LocationDeKalb Municipal Building
City Council Chambers - 2nd Floor 200 S. Fourth StreetDeKalb, Illinois 60115
AGENDASpecial Committee of the Whole Meeting
August 21, 20185:00 p.m.
Roll Call
Public Participation
Considerations
FY2017 Comprehensive Annual Financial Report, Audit Report, and Management Letter.
CAFR FY 2017 Presentation FINAL.pdf
Actuarial Reports for Police and Fire Pension Funds.
Actuary Report Presentation FINAL.pdf
Five-Year Financial Plan 2019-2023.
Five-Year Financial Plan 2019-2023.pdf
Adjournment
Notice of a Special Meeting of the City Council of the City of DeKalb for August 21, 2018, at 5:00
p.m., called pursuant to Chapter 2 “City Council ”, Section 2.05 “Special Meetings ”, of the
Municipal Code of the City of DeKalb, Illinois.
Assistive services available upon request.
Hearing assistance devices are available in the Information & Technology Office,
which is located on the right, just before entering Council Chambers.
A.
B.
C.
C.1.
Documents:
C.2.
Documents:
C.3.
Documents:
D.
DATE: August 16, 2018 TO: Honorable Mayor Jerry Smith City Council FROM: Molly Talkington, Interim City Manager Robert Miller, Acting Finance Director SUBJECT: FY2017 Comprehensive Annual Financial Report, Audit Report, and
Management Letter. I. Summary
Sikich, LLP has completed the FY2017 audit and presented the Comprehensive Annual Financial Report (CAFR) to the Finance Advisory Committee on August 7, 2018 and will be presenting it to the City Council at the August 21, 2018 Budget Workshop. II. Background
Prior Council Action On January 8, 2018, City Council supported a new budget process for the FY2019
Budget to clearly tie the City Council’s goals to budget action plans. On January 24 and February 20, 2018, City Council identified and prioritized goals to
set five short-term goals to be completed in 12 to 18 months and five long-term goals that extend beyond 18 months.
Between March 20, 2018 and June 18, 2018, all City departments completed a service level and a Fiscal Year 2018 line item review.
On March 26, 2018, Finance Director Talkington presented City Council with several
options for incorporating a review of the FY2018 Budget as part of the FY2019 Budget Workshops.
The Budget Basics video was debuted at the April 17, 2018 Special Council meeting.
This video is an overview of what services the City of DeKalb provides and how an annual budget is created to provide those services.
On July 10, 2018, City Council reviewed the Five-Year Financial Plan.
P a g e | 2
Comprehensive Annual Financial Report The CAFR for the fiscal year ended December 31, 2017, was submitted to Council on June 25, 2018 as mandated by both local ordinances and state statutes. Management assumes full responsibility for the completeness and reliability of the information contained in this report, based upon a comprehensive framework of internal controls it has established for this purpose. Because the cost of internal controls should not exceed anticipated benefits, the objective is to provide reasonable, rather than absolute, assurance that the financial statements are free of any material misstatements. Sikich, LLP have issued an unmodified ("clean") opinion on the City's financial statements for the year ended December 31, 2017. The independent auditor's report is located at the front of the financial section of this report. Management's discussion and analysis (MD&A) immediately follows the independent auditor's report and provides a narrative introduction, overview, and analysis of the basic financial statements. The MD&A complements this letter of transmittal and should be read in conjunction with it. Also included is the Management Letter, which includes comments and suggestions from Sikich, LLP that are designed to assist in effecting improvements in internal controls and procedures. There were no new comments added during FY2018. Sikich, LLP also provides an assessment of the DeKalb Public Library since it is a component unit of the City of DeKalb. A component unit is a legally separate organization (DeKalb Public Library Board) for which the elected officials of the primary government (City of DeKalb City Council) are financially accountable. There was a significant deficiency identified for the Library related to year end financial close and reporting. Library staff with accounting functions turned over this year and a new firm was hired to handle the accounting for the Library. This should not be a continuing issue once the auditor’s recommendations are implemented.
III. Community Groups/Interested Parties Contacted
City staff worked with DeKalb County to pull together some of the statistical data provided at the end of this report. Confirmation letters were also sent to all applicable financial institutions and other vendors that the audit team needed third party verification of, which included the City’s Balance Sheet and Income Statement ending balances. The Government Finance Officers Association of the United States and Canada (GFOA) awarded a Certificate of Achievement for Excellence in Financial Reporting to the City for its CAFR for the fiscal year ended December 31, 2016. This was the 24th consecutive year that the City has achieved this prestigious award. In order to be awarded a Certificate of Achievement, the City must publish an easily readable and efficiently organized CAFR. This report must satisfy both generally accepted accounting principles and applicable legal requirements.
P a g e | 3
A Certificate of Achievement is valid for a period of one year only. It is thought that the City’s current CAFR continues to meet the Certificate of Achievement Program's requirements and it will be submitted it to the GFOA to determine its eligibility for another certificate. IV. Legal Impact Local ordinances and state statutes require the City to issue a report of its financial position and activity annually, and that this report be audited by an independent firm of certified public accountants, which the City has complied with during the audit process. V. Financial Impact This is strictly a report for fiscal year ending December 31, 2017, and has no financial impact on the City: Listed below are some of the processes utilized by the City to accomplish its long-term financial planning.
1. The City began implementing a 10-year Strategic Plan to ensure that its long-term goals are reviewed, updated and implemented on a continual basis.
2. The City has established several key written financial policies including a Budget policy, a Reserve and Fund Balance policy, a Revenue and Expenditure policy, an Accounting, Auditing and Financial Reporting policy, a Debt Management policy, and an Investment policy.
3. The City adopted a new Purchasing Manual to establish guidelines for City staff in procuring goods and materials in a manner that is consistent with the highest standards of public service in obtaining quality goods and services at the lowest possible price.
4. The City adopted a 10-year capital improvement plan for the Water Fund and structured the necessary fees in order to maintain the Water Division’s capital equipment and infrastructure, and maintain or enhance the current levels of service.
5. The City adopted a five-year Capital Improvement Plan during the FY2017 budget process for the General Capital Infrastructure of Streets, Fleet and Equipment. Funding to implement this plan will continue to be reviewed during each budget process.
6. The City attempts to maintain a diversified and stable revenue system to shelter it from short-term fluctuations in any one revenue source. All fees and charges are in the process of being reviewed.
VI. Recommendation Staff recommends the City Council review the CAFR.
P a g e | 4
Attachments – A) Comprehensive Annual Financial Report Year Ended December 31, 2017 B) City of DeKalb Management Letter C) DeKalb Public Library Management Letter
Comprehensive Annual Financial Report
Year Ended December 31, 2017
City of DeKalb, Illinois
CITY OF DEKALB, ILLINOIS
COMPREHENSIVE ANNUAL
FINANCIAL REPORT
For the Year Ended
December 31, 2017
Prepared by the City of DeKalb Finance Department
CITY OF DEKALB, ILLINOIS
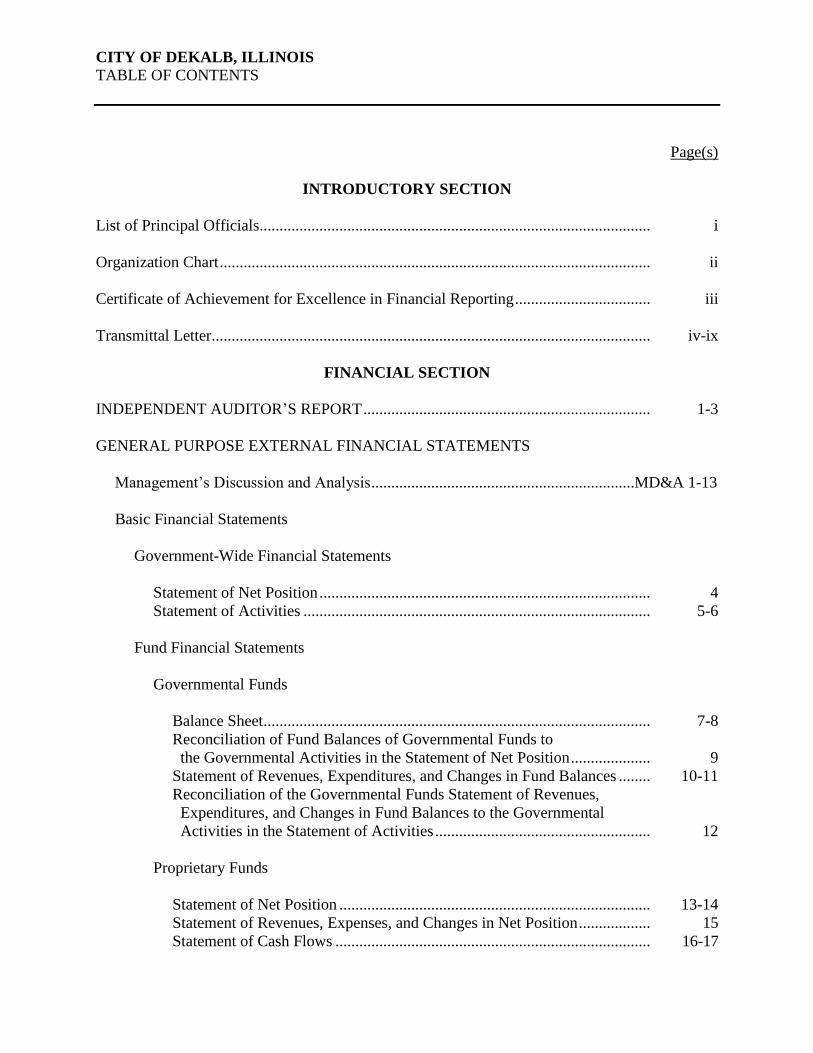
TABLE OF CONTENTS
Page(s)
INTRODUCTORY SECTION
List of Principal Officials.................................................................................................. i
Organization Chart ............................................................................................................ ii
Certificate of Achievement for Excellence in Financial Reporting .................................. iii
Transmittal Letter.............................................................................................................. iv-ix
FINANCIAL SECTION
INDEPENDENT AUDITOR’S REPORT ........................................................................ 1-3
GENERAL PURPOSE EXTERNAL FINANCIAL STATEMENTS
Management’s Discussion and Analysis ..................................................................MD&A 1-13
Basic Financial Statements
Government-Wide Financial Statements
Statement of Net Position ................................................................................... 4
Statement of Activities ....................................................................................... 5-6
Fund Financial Statements
Governmental Funds
Balance Sheet ................................................................................................. 7-8
Reconciliation of Fund Balances of Governmental Funds to
the Governmental Activities in the Statement of Net Position .................... 9
Statement of Revenues, Expenditures, and Changes in Fund Balances ........ 10-11
Reconciliation of the Governmental Funds Statement of Revenues,
Expenditures, and Changes in Fund Balances to the Governmental
Activities in the Statement of Activities ...................................................... 12
Proprietary Funds
Statement of Net Position .............................................................................. 13-14
Statement of Revenues, Expenses, and Changes in Net Position .................. 15
Statement of Cash Flows ............................................................................... 16-17
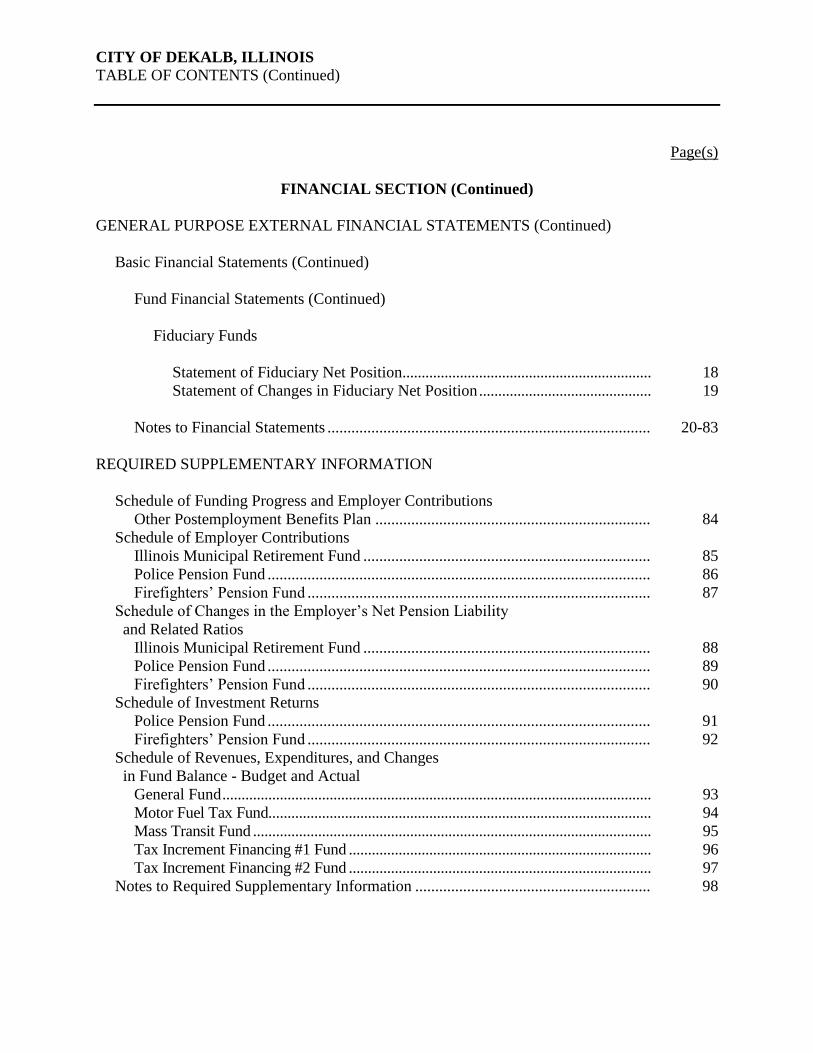
CITY OF DEKALB, ILLINOIS
TABLE OF CONTENTS (Continued)
Page(s)
FINANCIAL SECTION (Continued)
GENERAL PURPOSE EXTERNAL FINANCIAL STATEMENTS (Continued)
Basic Financial Statements (Continued)
Fund Financial Statements (Continued)
Fiduciary Funds
Statement of Fiduciary Net Position ................................................................. 18
Statement of Changes in Fiduciary Net Position ............................................. 19
Notes to Financial Statements ................................................................................. 20-83
REQUIRED SUPPLEMENTARY INFORMATION
Schedule of Funding Progress and Employer Contributions
Other Postemployment Benefits Plan ..................................................................... 84
Schedule of Employer Contributions
Illinois Municipal Retirement Fund ........................................................................ 85
Police Pension Fund ................................................................................................ 86
Firefighters’ Pension Fund ...................................................................................... 87
Schedule of Changes in the Employer’s Net Pension Liability
and Related Ratios
Illinois Municipal Retirement Fund ........................................................................ 88
Police Pension Fund ................................................................................................ 89
Firefighters’ Pension Fund ...................................................................................... 90
Schedule of Investment Returns
Police Pension Fund ................................................................................................ 91
Firefighters’ Pension Fund ...................................................................................... 92
Schedule of Revenues, Expenditures, and Changes
in Fund Balance - Budget and Actual
General Fund ................................................................................................................ 93
Motor Fuel Tax Fund.................................................................................................... 94
Mass Transit Fund ........................................................................................................ 95
Tax Increment Financing #1 Fund ............................................................................... 96
Tax Increment Financing #2 Fund ............................................................................... 97
Notes to Required Supplementary Information ........................................................... 98
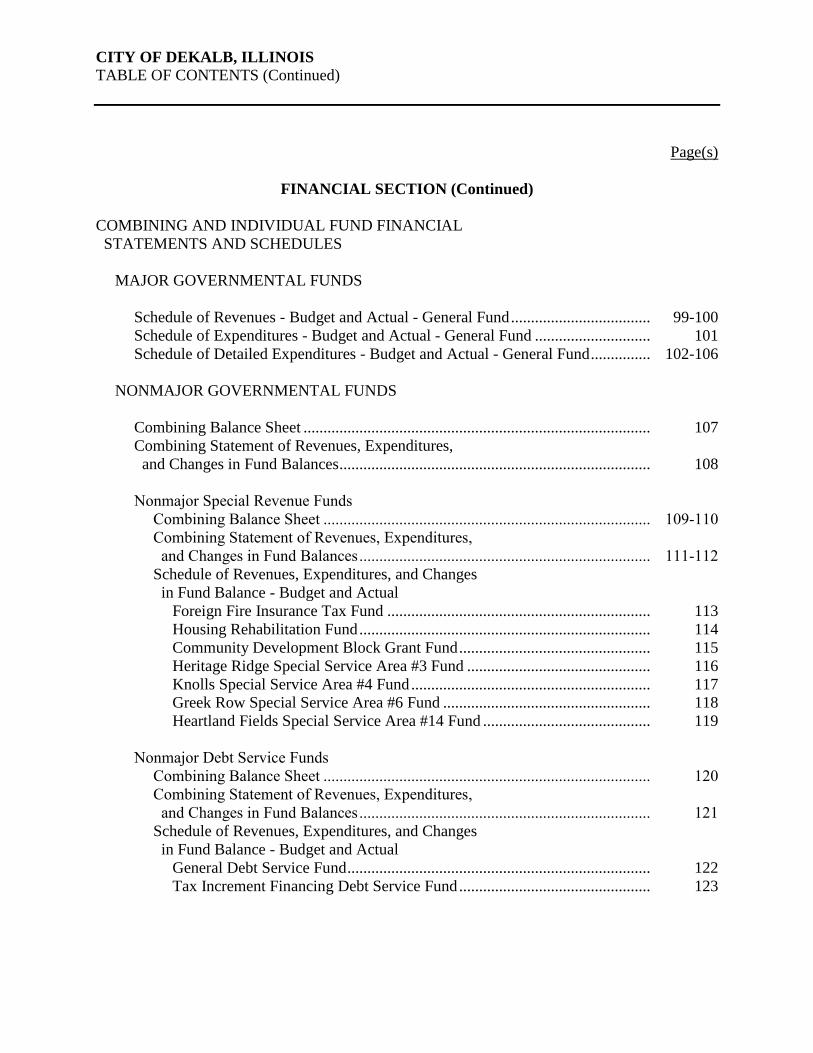
CITY OF DEKALB, ILLINOIS
TABLE OF CONTENTS (Continued)
Page(s)
FINANCIAL SECTION (Continued)
COMBINING AND INDIVIDUAL FUND FINANCIAL
STATEMENTS AND SCHEDULES
MAJOR GOVERNMENTAL FUNDS
Schedule of Revenues - Budget and Actual - General Fund ................................... 99-100
Schedule of Expenditures - Budget and Actual - General Fund ............................. 101
Schedule of Detailed Expenditures - Budget and Actual - General Fund ............... 102-106
NONMAJOR GOVERNMENTAL FUNDS
Combining Balance Sheet ....................................................................................... 107
Combining Statement of Revenues, Expenditures,
and Changes in Fund Balances .............................................................................. 108
Nonmajor Special Revenue Funds
Combining Balance Sheet .................................................................................. 109-110
Combining Statement of Revenues, Expenditures,
and Changes in Fund Balances ......................................................................... 111-112
Schedule of Revenues, Expenditures, and Changes
in Fund Balance - Budget and Actual
Foreign Fire Insurance Tax Fund .................................................................. 113
Housing Rehabilitation Fund ......................................................................... 114
Community Development Block Grant Fund ................................................ 115
Heritage Ridge Special Service Area #3 Fund .............................................. 116
Knolls Special Service Area #4 Fund ............................................................ 117
Greek Row Special Service Area #6 Fund .................................................... 118
Heartland Fields Special Service Area #14 Fund .......................................... 119
Nonmajor Debt Service Funds
Combining Balance Sheet .................................................................................. 120
Combining Statement of Revenues, Expenditures,
and Changes in Fund Balances ......................................................................... 121
Schedule of Revenues, Expenditures, and Changes
in Fund Balance - Budget and Actual
General Debt Service Fund ............................................................................ 122
Tax Increment Financing Debt Service Fund ................................................ 123
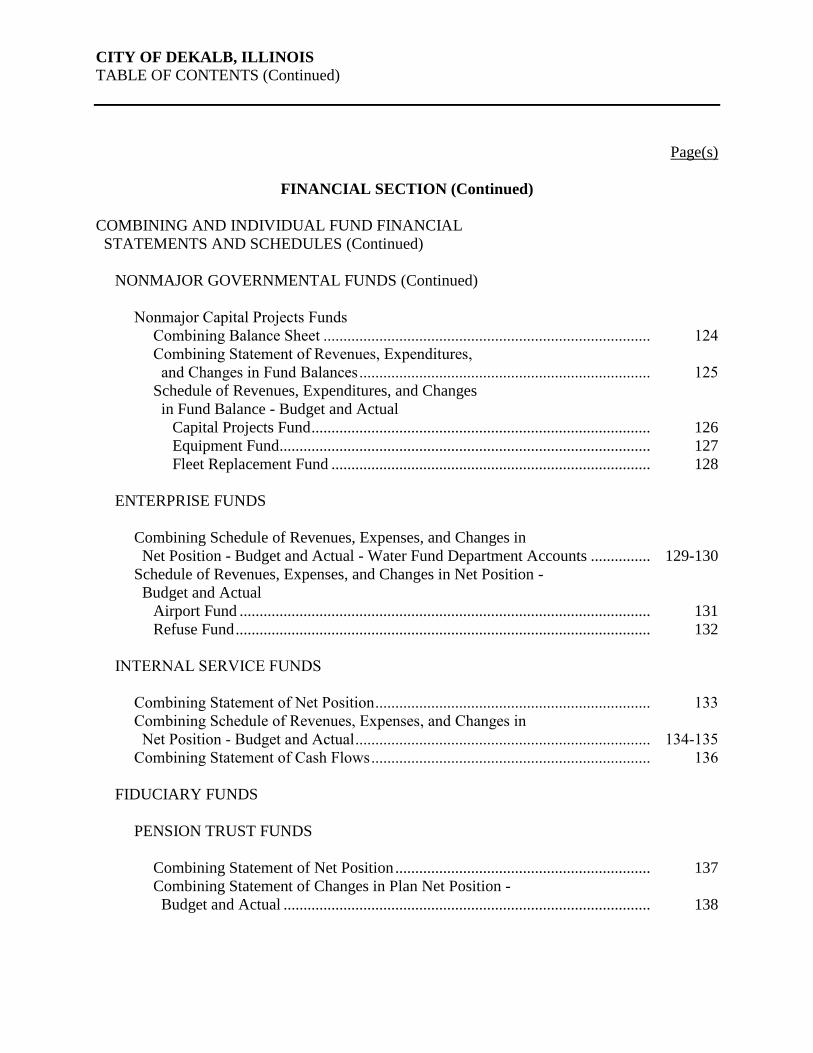
CITY OF DEKALB, ILLINOIS
TABLE OF CONTENTS (Continued)
Page(s)
FINANCIAL SECTION (Continued)
COMBINING AND INDIVIDUAL FUND FINANCIAL
STATEMENTS AND SCHEDULES (Continued)
NONMAJOR GOVERNMENTAL FUNDS (Continued)
Nonmajor Capital Projects Funds
Combining Balance Sheet .................................................................................. 124
Combining Statement of Revenues, Expenditures,
and Changes in Fund Balances ......................................................................... 125
Schedule of Revenues, Expenditures, and Changes
in Fund Balance - Budget and Actual
Capital Projects Fund ..................................................................................... 126
Equipment Fund ............................................................................................. 127
Fleet Replacement Fund ................................................................................ 128
ENTERPRISE FUNDS
Combining Schedule of Revenues, Expenses, and Changes in
Net Position - Budget and Actual - Water Fund Department Accounts ............... 129-130
Schedule of Revenues, Expenses, and Changes in Net Position -
Budget and Actual
Airport Fund ....................................................................................................... 131
Refuse Fund ........................................................................................................ 132
INTERNAL SERVICE FUNDS
Combining Statement of Net Position ..................................................................... 133
Combining Schedule of Revenues, Expenses, and Changes in
Net Position - Budget and Actual .......................................................................... 134-135
Combining Statement of Cash Flows ...................................................................... 136
FIDUCIARY FUNDS
PENSION TRUST FUNDS
Combining Statement of Net Position ................................................................ 137
Combining Statement of Changes in Plan Net Position -
Budget and Actual ............................................................................................ 138
CITY OF DEKALB, ILLINOIS
TABLE OF CONTENTS (Continued)
Page(s)
FINANCIAL SECTION (Continued)
COMBINING AND INDIVIDUAL FUND FINANCIAL
STATEMENTS AND SCHEDULES (Continued)
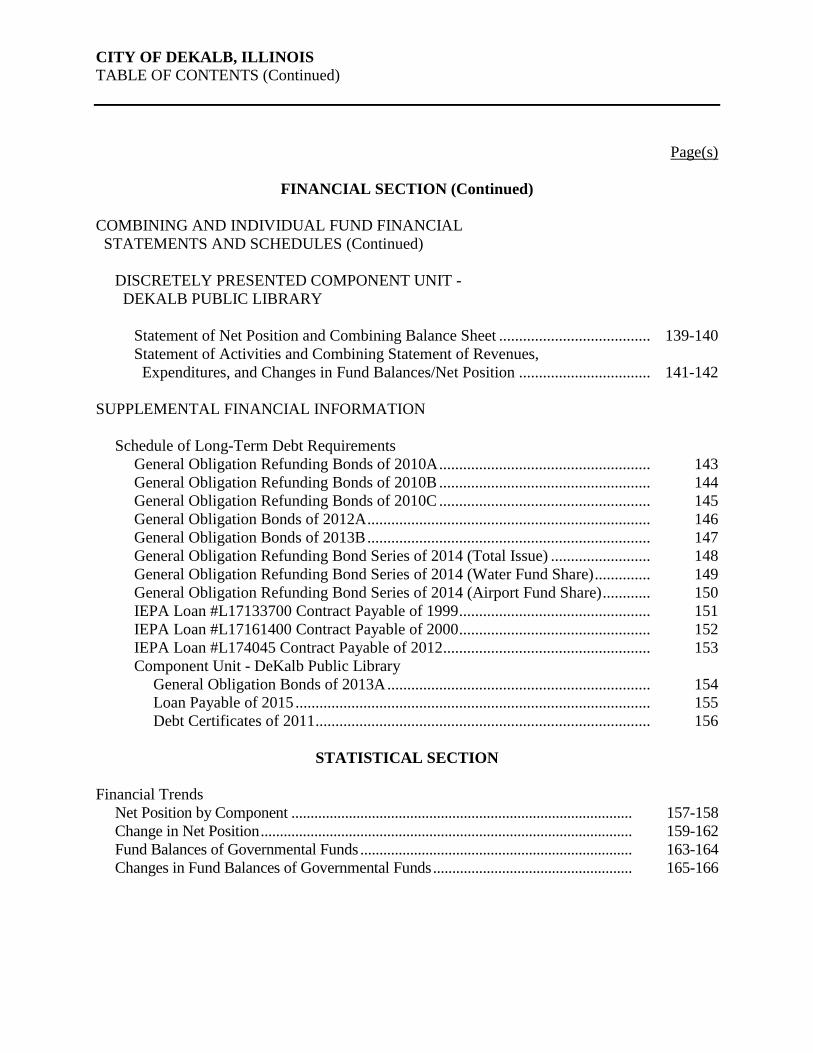
DISCRETELY PRESENTED COMPONENT UNIT -
DEKALB PUBLIC LIBRARY
Statement of Net Position and Combining Balance Sheet ...................................... 139-140
Statement of Activities and Combining Statement of Revenues,
Expenditures, and Changes in Fund Balances/Net Position ................................. 141-142
SUPPLEMENTAL FINANCIAL INFORMATION
Schedule of Long-Term Debt Requirements
General Obligation Refunding Bonds of 2010A ..................................................... 143
General Obligation Refunding Bonds of 2010B ..................................................... 144
General Obligation Refunding Bonds of 2010C ..................................................... 145
General Obligation Bonds of 2012A ....................................................................... 146
General Obligation Bonds of 2013B ....................................................................... 147
General Obligation Refunding Bond Series of 2014 (Total Issue) ......................... 148
General Obligation Refunding Bond Series of 2014 (Water Fund Share) .............. 149
General Obligation Refunding Bond Series of 2014 (Airport Fund Share) ............ 150
IEPA Loan #L17133700 Contract Payable of 1999 ................................................ 151
IEPA Loan #L17161400 Contract Payable of 2000 ................................................ 152
IEPA Loan #L174045 Contract Payable of 2012 .................................................... 153
Component Unit - DeKalb Public Library
General Obligation Bonds of 2013A .................................................................. 154
Loan Payable of 2015 ......................................................................................... 155
Debt Certificates of 2011 .................................................................................... 156
STATISTICAL SECTION
Financial Trends
Net Position by Component ......................................................................................... 157-158
Change in Net Position ................................................................................................. 159-162
Fund Balances of Governmental Funds ....................................................................... 163-164
Changes in Fund Balances of Governmental Funds .................................................... 165-166
CITY OF DEKALB, ILLINOIS
TABLE OF CONTENTS (Continued)
Page(s)
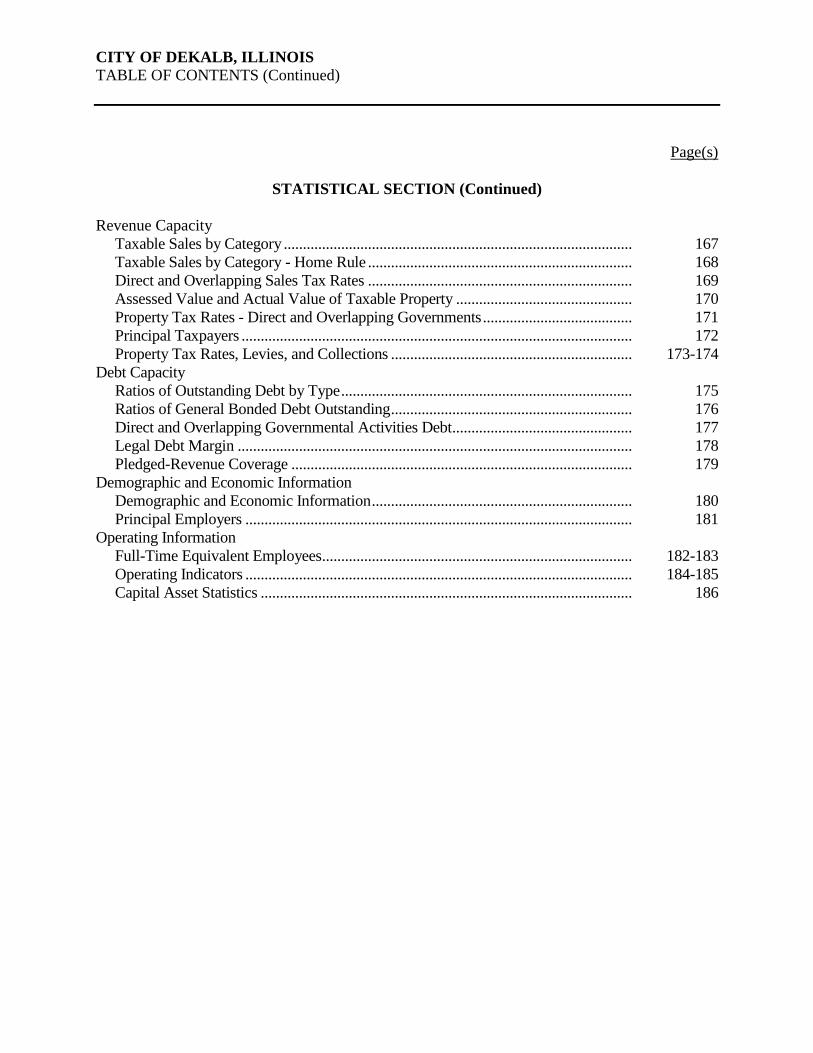
STATISTICAL SECTION (Continued)
Revenue Capacity
Taxable Sales by Category ........................................................................................... 167
Taxable Sales by Category - Home Rule ..................................................................... 168
Direct and Overlapping Sales Tax Rates ..................................................................... 169
Assessed Value and Actual Value of Taxable Property .............................................. 170
Property Tax Rates - Direct and Overlapping Governments ....................................... 171
Principal Taxpayers ...................................................................................................... 172
Property Tax Rates, Levies, and Collections ............................................................... 173-174
Debt Capacity
Ratios of Outstanding Debt by Type ............................................................................ 175
Ratios of General Bonded Debt Outstanding ............................................................... 176
Direct and Overlapping Governmental Activities Debt ............................................... 177
Legal Debt Margin ....................................................................................................... 178
Pledged-Revenue Coverage ......................................................................................... 179
Demographic and Economic Information
Demographic and Economic Information .................................................................... 180
Principal Employers ..................................................................................................... 181
Operating Information
Full-Time Equivalent Employees................................................................................. 182-183
Operating Indicators ..................................................................................................... 184-185
Capital Asset Statistics ................................................................................................. 186

INTRODUCTORY SECTION
- i -
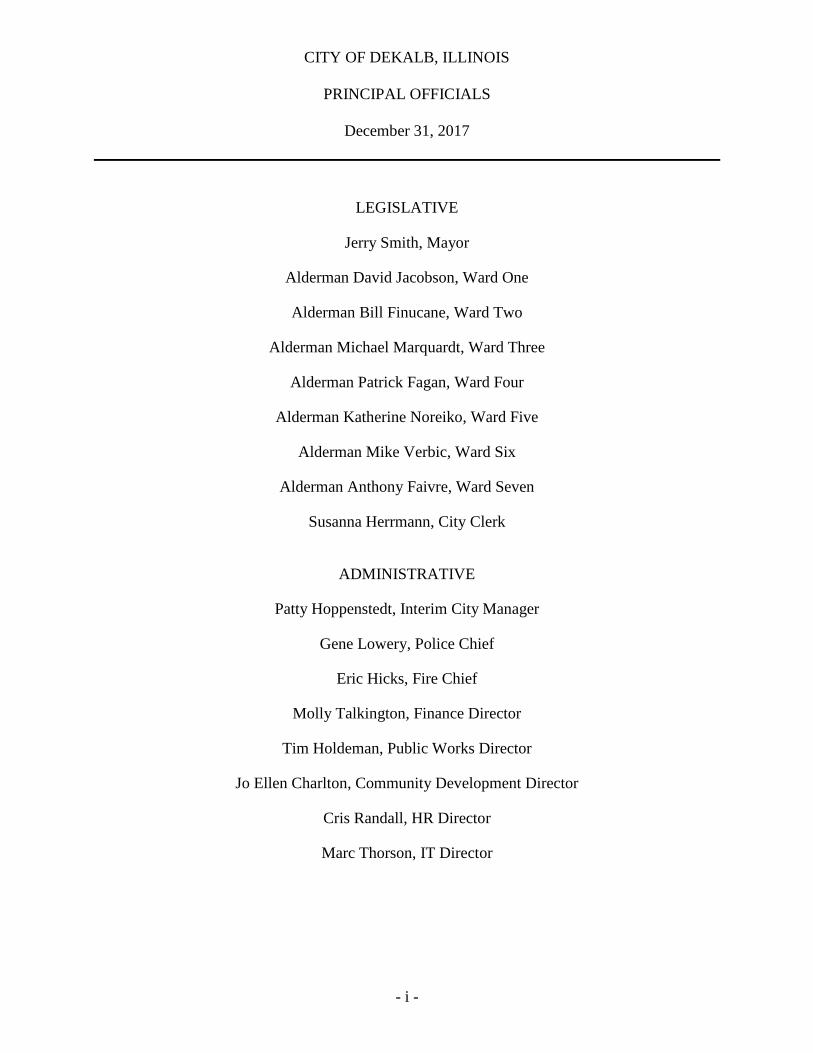
CITY OF DEKALB, ILLINOIS
PRINCIPAL OFFICIALS
December 31, 2017
LEGISLATIVE
Jerry Smith, Mayor
Alderman David Jacobson, Ward One
Alderman Bill Finucane, Ward Two
Alderman Michael Marquardt, Ward Three
Alderman Patrick Fagan, Ward Four
Alderman Katherine Noreiko, Ward Five
Alderman Mike Verbic, Ward Six
Alderman Anthony Faivre, Ward Seven
Susanna Herrmann, City Clerk
ADMINISTRATIVE
Patty Hoppenstedt, Interim City Manager
Gene Lowery, Police Chief
Eric Hicks, Fire Chief
Molly Talkington, Finance Director
Tim Holdeman, Public Works Director
Jo Ellen Charlton, Community Development Director
Cris Randall, HR Director
Marc Thorson, IT Director
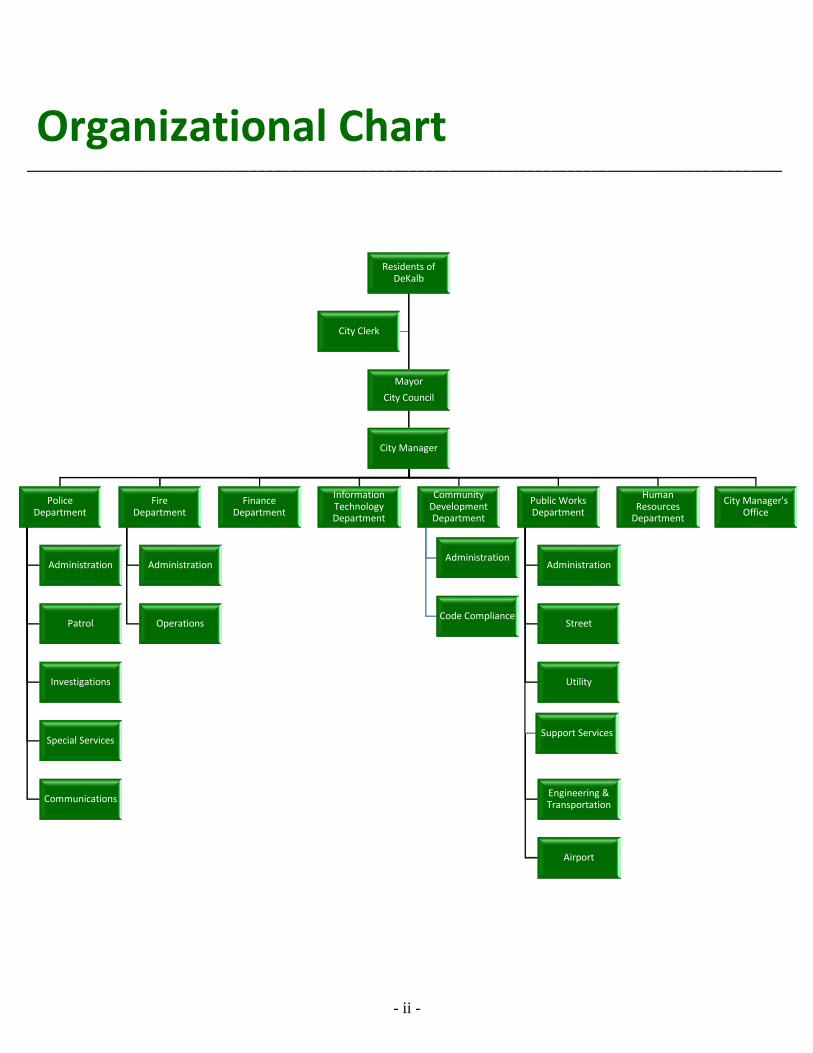
Organizational Chart _______________________________________________________________________________________________
Residents of DeKalb
Mayor City Council
City Manager
Police Department
Administration
Patrol
Investigations
Special Services
Communications
Fire Department
Administration
Operations
Finance Department
Information Technology Department
Community Development Department
Administration
Code Compliance
Public Works Department
Administration
Street
Utility
Support Services
Engineering & Transportation
Airport
Human Resources
Department
City Manager's Office
City Clerk
- ii -
- iii -
iv
June 15, 2018
Mayor Jerry Smith
Members of the DeKalb City Council
Interim City Manager Patty Hoppenstedt
Residents of the City of DeKalb
The Comprehensive Annual Financial Report of the City of DeKalb for the fiscal year ended
December 31, 2017 is hereby submitted as mandated by both local ordinances and state statutes.
These ordinances and statutes require that the City of DeKalb issue annually a report of its financial
position and activity, and that this report be audited by an independent firm of certified public
accountants.
Management assumes full responsibility for the completeness and reliability of the information
contained in this report, based upon a comprehensive framework of internal controls that it has
established for this purpose. Because the cost of internal controls should not exceed anticipated
benefits, the objective is to provide reasonable, rather than absolute, assurance that the financial
statements are free of any material misstatements.
Sikich, LLP, have issued an unmodified ("clean") opinion on the City of DeKalb’s financial
statements for the year ended December 31, 2017. The independent auditor's report is located at
the front of the financial section of this report.
Management’s discussion and analysis (MD&A) immediately follows the independent auditor’s
report and provides a narrative introduction, overview, and analysis of the basic financial
statements. The MD&A complements this letter of transmittal and should be read in conjunction
with it.
Profile of the City of DeKalb
The City of DeKalb was incorporated in 1856 and is located in the center of DeKalb County
Illinois. Located 60 miles west of Chicago, the City of DeKalb’s current land area is 15.55 square
miles and approximately 130 miles of streets. Despite its proximity to the Chicago region, the
City remains apart, maintaining its own unique character as a rapidly growing university
community with both urban and rural roots. Many of its older neighborhoods have brick paved
streets and well-kept historic homes while the edge of the City bustles with new residential and
commercial development. The City of DeKalb has a 2017 population estimate of 44,030, therefore
the City is a home rule community because its population exceeds 25,000. Home rule communities
P a g e | v
in the State of Illinois have greater control of their finances because of additional revenue
generating abilities afforded to home rule communities. As a home-rule unit of government under
the 1970 Illinois Constitution, the City has no tax rate limit or debt limit, nor is it required to seek
referendum approval to raise its tax rate or to issue debt.
In 1961, a Council-Manager form of government was adopted by the City of DeKalb. Seven
aldermen are elected, one in each of the seven wards, and aldermanic elections are held every two
years, at which time half of the City Council is elected. The Mayor is elected, at large, every four
years. The City Manager is appointed by the City Council and all other employees are appointed
by the City Manager. The elected officials determine policy while professional appointed officials
implement policy.
The City provides a full range of services including: public safety (police and fire protection); the
construction and maintenance of highways, streets, and infrastructure; municipal airport services;
water production, treatment and distribution; planning and zoning; and general administrative
services.
The financial reporting entity (the City) includes all the funds of the primary government (i.e., the
City of DeKalb, DeKalb County, Illinois), as well as all its component units. The DeKalb Public
Library is considered a component unit of government which, although a legally separate entity,
is in substance a part of the primary government’s operations and included as part of the primary
government. Therefore, in the CAFR, the Library’s audited financial data is presented in a separate
column in the entity-wide financial statements to differentiate their financial position and results
of operations from those of the primary government.
The City Council is required to adopt a budget for each fiscal year by no later than the close of the
prior fiscal year. This annual budget serves as the foundation for the City of DeKalb’s financial
planning and control. These controls are intended to ensure that there is compliance with the legal
provisions of the annual budget approved by the Mayor and City Council. Activities of the
governmental and proprietary funds are included in the approved annual budget. The City also
maintains an encumbrance accounting system as one technique of accomplishing budgetary
control.
Local Economy
The local economy is still being impacted by regional, state and national economic conditions.
However, the City’s three largest sources of revenue have started to show signs of economic
vitality. These three largest sources of revenue are property taxes received from the county, sales
taxes, both municipal and home rule, and income tax. The EAV has shown an increase over the
last couple of years and the unemployment rate has dropped as well. The City’s total rate setting
EAV increased by 7.64% compared to the small increase from the previous year of 0.67%. Prior
to the small increase in 2015 the EAV dropped drastically for six years in a row due to the downturn
in the economy.
P a g e | vi
The City’s income tax revenue has trended upward slightly from FY16.5. This per-capita revenue
source is based more on the state’s economy and unemployment rate rather than the local economy.
The State of Illinois’ unemployment rate peaked to 11.50% in December 2009 and has dropped to
4.40% in March 2018.
The state portion of sales tax revenue remained consistent with the comparable six-months of
FY16.5. The home rule portion continues to show a downward trend which could be offset by the
increase being seen in Local Use Tax. Combined these actual revenue dollars came in above
budgeted parameters by over $101,100. Signs of economic vitality for the City are Local Use Tax
and Restaurant & Bar Tax as both came in above budgeted parameters.
As a result, the General Fund unrestricted fund balance ended at $8,271,793 or 23.68% of annual
expenditures, including transfers. This is $103,171 lower than FY16.5 yet continues to be the
strongest the General Fund balance reserves have been in the past decade.
Long-term Financial Planning
The following processes are utilized by the City to accomplish its long-term financial planning:
1. The City implemented a 10-year strategic plan in 2015 to ensure that its long-term goals are
reviewed, updated and implemented to continue to address the City’s mission of “Deliver high
quality municipal services to those who live, work, learn in, or visit our community.” All
elected officials, appointed board and commission chairpersons, executive team members, and
DeKalb residents participated in the planning sessions that helped to create this final 2025
Strategic Plan Document.
2. The City has established several key written financial policies including a Budget policy, a
Reserve & Fund Balance Policy, a Revenue & Expenditure policy, an Accounting, Auditing
& Financial Reporting policy, a Debt Management policy and an Investment policy. The
General Fund unassigned fund balance policy is currently 25% of the total General Fund
annual expenditures to provide financing for unanticipated expenditures and revenue shortfalls
and possible delays and changes in state distribution of shared revenues.
3. The City adopted a new Purchasing Manual in 2015 to establish guidelines for City staff in
procuring goods and materials in a manner that is consistent with the highest standards of
public service in obtaining quality goods and services at the lowest possible price.
4. The City adopted a 10-year capital improvement plan for the Water Fund and structured the
necessary fees in order to maintain the Water Divisions capital equipment and infrastructure,
and maintain or enhance the current levels of service.
5. The City Adopted a 5-year Capital Improvement Plan during the FY17 budget process for the
General Capital Infrastructure of Streets, Fleet and Equipment. Funding to implement this plan
is being reviewed during the FY18 budget process.
P a g e | vii
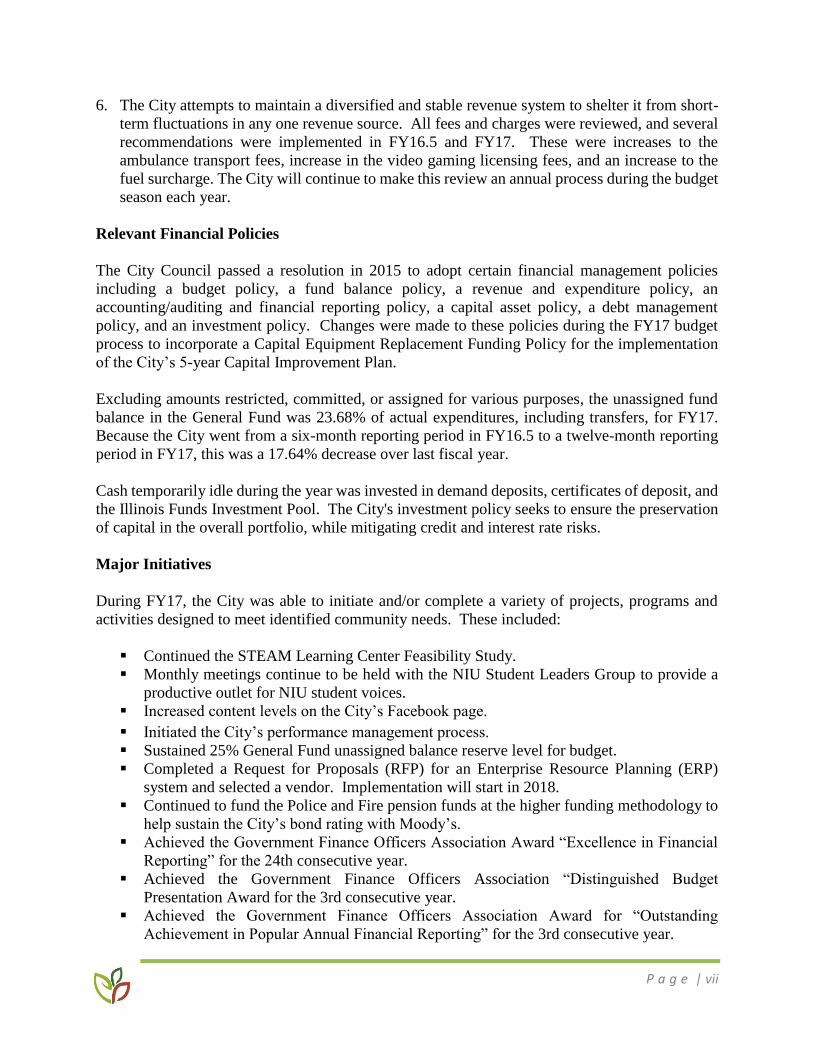
6. The City attempts to maintain a diversified and stable revenue system to shelter it from short-
term fluctuations in any one revenue source. All fees and charges were reviewed, and several
recommendations were implemented in FY16.5 and FY17. These were increases to the
ambulance transport fees, increase in the video gaming licensing fees, and an increase to the
fuel surcharge. The City will continue to make this review an annual process during the budget
season each year.
Relevant Financial Policies
The City Council passed a resolution in 2015 to adopt certain financial management policies
including a budget policy, a fund balance policy, a revenue and expenditure policy, an
accounting/auditing and financial reporting policy, a capital asset policy, a debt management
policy, and an investment policy. Changes were made to these policies during the FY17 budget
process to incorporate a Capital Equipment Replacement Funding Policy for the implementation
of the City’s 5-year Capital Improvement Plan.
Excluding amounts restricted, committed, or assigned for various purposes, the unassigned fund
balance in the General Fund was 23.68% of actual expenditures, including transfers, for FY17.
Because the City went from a six-month reporting period in FY16.5 to a twelve-month reporting
period in FY17, this was a 17.64% decrease over last fiscal year.
Cash temporarily idle during the year was invested in demand deposits, certificates of deposit, and
the Illinois Funds Investment Pool. The City's investment policy seeks to ensure the preservation
of capital in the overall portfolio, while mitigating credit and interest rate risks.
Major Initiatives
During FY17, the City was able to initiate and/or complete a variety of projects, programs and
activities designed to meet identified community needs. These included:
▪ Continued the STEAM Learning Center Feasibility Study.
▪ Monthly meetings continue to be held with the NIU Student Leaders Group to provide a
productive outlet for NIU student voices.
▪ Increased content levels on the City’s Facebook page.
▪ Initiated the City’s performance management process.
▪ Sustained 25% General Fund unassigned balance reserve level for budget.
▪ Completed a Request for Proposals (RFP) for an Enterprise Resource Planning (ERP)
system and selected a vendor. Implementation will start in 2018.
▪ Continued to fund the Police and Fire pension funds at the higher funding methodology to
help sustain the City’s bond rating with Moody’s.
▪ Achieved the Government Finance Officers Association Award “Excellence in Financial
Reporting” for the 24th consecutive year.
▪ Achieved the Government Finance Officers Association “Distinguished Budget
Presentation Award for the 3rd consecutive year.
▪ Achieved the Government Finance Officers Association Award for “Outstanding
Achievement in Popular Annual Financial Reporting” for the 3rd consecutive year.
P a g e | viii
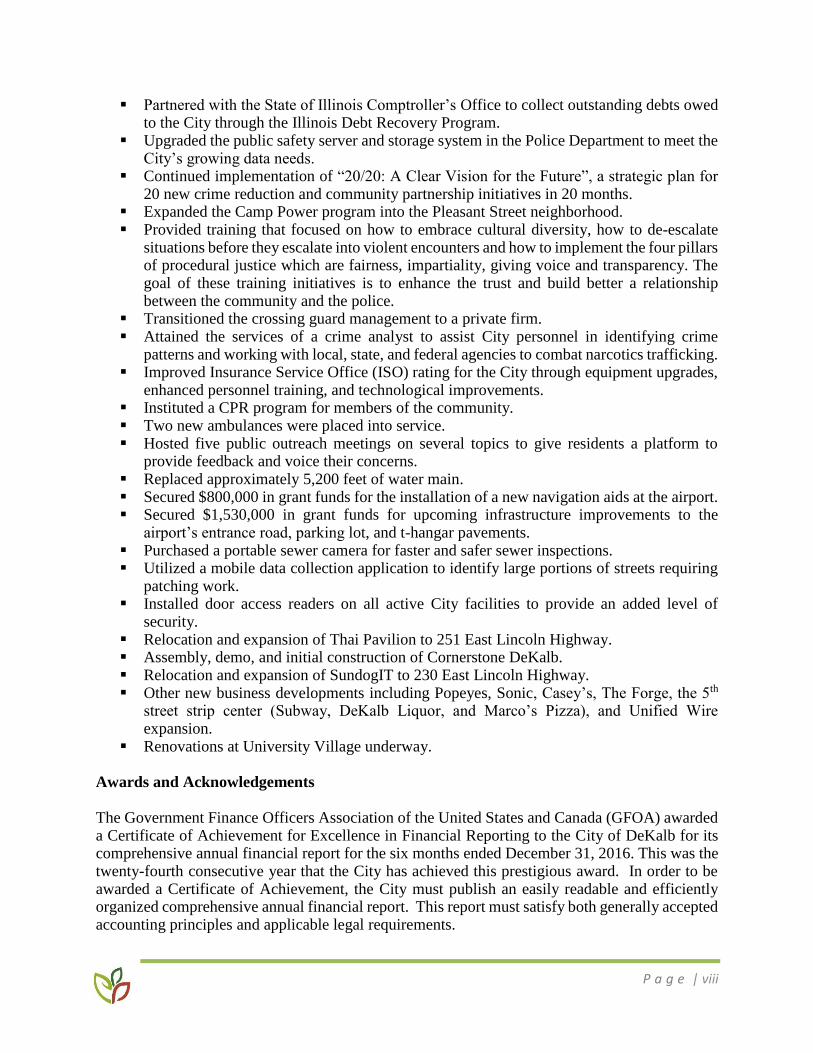
▪ Partnered with the State of Illinois Comptroller’s Office to collect outstanding debts owed to the City through the Illinois Debt Recovery Program.
▪ Upgraded the public safety server and storage system in the Police Department to meet the City’s growing data needs.
▪ Continued implementation of “20/20: A Clear Vision for the Future”, a strategic plan for 20 new crime reduction and community partnership initiatives in 20 months.
▪ Expanded the Camp Power program into the Pleasant Street neighborhood. ▪ Provided training that focused on how to embrace cultural diversity, how to de-escalate
situations before they escalate into violent encounters and how to implement the four pillars of procedural justice which are fairness, impartiality, giving voice and transparency. The goal of these training initiatives is to enhance the trust and build better a relationship between the community and the police.
▪ Transitioned the crossing guard management to a private firm. ▪ Attained the services of a crime analyst to assist City personnel in identifying crime
patterns and working with local, state, and federal agencies to combat narcotics trafficking. ▪ Improved Insurance Service Office (ISO) rating for the City through equipment upgrades,
enhanced personnel training, and technological improvements. ▪ Instituted a CPR program for members of the community. ▪ Two new ambulances were placed into service. ▪ Hosted five public outreach meetings on several topics to give residents a platform to
provide feedback and voice their concerns. ▪ Replaced approximately 5,200 feet of water main. ▪ Secured $800,000 in grant funds for the installation of a new navigation aids at the airport. ▪ Secured $1,530,000 in grant funds for upcoming infrastructure improvements to the
airport’s entrance road, parking lot, and t-hangar pavements. ▪ Purchased a portable sewer camera for faster and safer sewer inspections. ▪ Utilized a mobile data collection application to identify large portions of streets requiring
patching work. ▪ Installed door access readers on all active City facilities to provide an added level of
security. ▪ Relocation and expansion of Thai Pavilion to 251 East Lincoln Highway. ▪ Assembly, demo, and initial construction of Cornerstone DeKalb. ▪ Relocation and expansion of SundogIT to 230 East Lincoln Highway. ▪ Other new business developments including Popeyes, Sonic, Casey’s, The Forge, the 5th
street strip center (Subway, DeKalb Liquor, and Marco’s Pizza), and Unified Wire expansion.
▪ Renovations at University Village underway.
Awards and Acknowledgements The Government Finance Officers Association of the United States and Canada (GFOA) awarded a Certificate of Achievement for Excellence in Financial Reporting to the City of DeKalb for its comprehensive annual financial report for the six months ended December 31, 2016. This was the twenty-fourth consecutive year that the City has achieved this prestigious award. In order to be awarded a Certificate of Achievement, the City must publish an easily readable and efficiently organized comprehensive annual financial report. This report must satisfy both generally accepted accounting principles and applicable legal requirements.
P a g e | ix
A Certificate of Achievement is valid for a period of one year only. We believe that our current
comprehensive annual financial report continues to meet the Certificate of Achievement Program’s
requirements and we are submitting it to the GFOA to determine its eligibility for another
certificate.
In addition, the GFOA has given an Award for Outstanding Achievement in Popular Annual
Financial Reporting to the City of DeKalb for its Popular Annual Financial Report for the fiscal
year ended June 30, 2016. This is the third year the City has received this award. The Award for
Outstanding Achievement in Popular Annual Financial Reporting is a prestigious national award
recognizing conformance with the highest standards for preparation of state and local government
popular reports. In order to receive an Award for Outstanding Achievement in Popular Annual
Financial Reporting, the City must publish a Popular Annual Financial Report, whose contents
conform to program standards of creativity, presentation, understandability, and reader appeal.
Finally, the GFOA has presented to the City of DeKalb the Distinguished Budget Presentation
Award for the FY17 Budget document. This is the third year the City has received this award.
The GFOA established the Distinguished Budget Presentation Awards Program (Budget Awards
Program) in 1984 to encourage and assist state and local governments to prepare budget documents
of the very highest quality that reflect both the guidelines established by the National Advisory
Council on State and Local Budgeting and the GFOA’s best practices on budgeting and then to
recognize individual governments that succeed in achieving that goal.
The preparation of this Comprehensive Annual Financial Report was made possible by the
efficient and dedicated service of the entire staff of the City’s Finance Department. Each member
of the department has my sincere appreciation for the contributions made in the preparation of this
report. My appreciation is also expressed to the Mayor, City Council, the City Manager’s Office,
and all other City Departments for their dedication and support in maintaining the highest
standards of professionalism in the management of the City of DeKalb’s finances.
Respectfully submitted,
Molly Talkington
Finance Director

FINANCIAL SECTION
1415 West Diehl Road, Suite 400
Naperville, IL 60563
630.566.8400
INDEPENDENT AUDITOR’S REPORT
The Honorable Mayor
Members of the City Council
City of DeKalb, Illinois
We have audited the accompanying financial statements of the governmental activities, the
business-type activities, the discretely presented component unit, each major fund, and the
aggregate remaining fund information of the City of DeKalb, Illinois (the City), as of and for the
year ended December 31, 2017, and the related notes to financial statements, which collectively
comprise the City’s basic financial statements as listed in the table of contents.
Management’s Responsibility for the Financial Statements
Management is responsible for the preparation and fair presentation of these financial statements
in accordance with accounting principles generally accepted in the United States of America; this
includes the design, implementation, and maintenance of internal control relevant to the
preparation and fair presentation of financial statements that are free from material misstatement,
whether due to fraud or error.
Auditor’s Responsibility
Our responsibility is to express opinions on these financial statements based on our audit. We
conducted our audit in accordance with auditing standards generally accepted in the United
States of America and the standards applicable to financial audits in Government Auditing
Standards , issued by the Comptroller General of the United States. The financial statements of
the DeKalb Public Library were not audited in accordance with Government Auditing Standards.
Those standards require that we plan and perform the audit to obtain reasonable assurance about
whether the financial statements are free of material misstatement.
An audit involves performing procedures to obtain audit evidence about the amounts and
disclosures in the financial statements. The procedures selected depend on the auditor’s
judgment, including the assessment of the risks of material misstatement of the financial
statements, whether due to fraud or error. In making those risk assessments, the auditor considers
internal control relevant to the City’s preparation and fair presentation of the financial statements
in order to design audit procedures that are appropriate in the circumstances, but not for the
purpose of expressing an opinion on the effectiveness of the City’s internal control. Accordingly,
we express no such opinion. An audit also includes evaluating the appropriateness of accounting
policies used and the reasonableness of significant accounting estimates made by management,
as well as evaluating the overall presentation of the financial statements.
- 1 -
- 2 -
We believe that the audit evidence we have obtained is sufficient and appropriate to provide a
basis for our audit opinions.
Opinions
In our opinion, the basic financial statements referred to above present fairly, in all material
respects, the respective financial position of the governmental activities, the business-type
activities, the discretely presented component unit, each major fund, and the aggregate remaining
fund information of the City of DeKalb, Illinois as of December 31, 2017, and the respective
changes in financial position and cash flows, where applicable, thereof, for the year then ended
in conformity with accounting principles generally accepted in the United States of America.
Other Matters
Required Supplementary Information
Accounting principles generally accepted in the United States of America require that the
management’s discussion and analysis and other required supplementary information be
presented to supplement the basic financial statements. Such information, although not a part of
the basic financial statements, is required by the Governmental Accounting Standards Board,
who considers it to be an essential part of financial reporting for placing the basic financial
statements in an appropriate operational, economic, or historical context. We have applied
certain limited procedures to the required supplementary information in accordance with auditing
standards generally accepted in the United States of America, which consisted of inquiries of
management about the methods of preparing the information and comparing the information for
consistency with management’s responses to our inquiries, the basic financial statements, and
other knowledge we obtained during our audit of the basic financial statements. We do not
express an opinion or provide any assurance on the information because the limited procedures
do not provide us with sufficient evidence to express an opinion or provide any assurance.
Other Information
Our audit was conducted for the purpose of forming opinions on the financial statements that
collectively comprise the City’s basic financial statements. The introductory section, combining
and individual fund financial statements and schedules, supplemental financial information, and
statistical section in the table of contents are presented for purposes of additional analysis and are
not a required part of the basic financial statements. The combining and individual fund financial
statements and schedules are the responsibility of management and were derived from and relate
directly to the underlying accounting and other records used to prepare the basic financial
statements. The information has been subjected to the auditing procedures applied in the audit of
the basic financial statements and certain additional procedures, including comparing and
reconciling such information directly to the underlying accounting and other records used to
prepare the basic financial statements or to the basic financial statements themselves, and other
additional procedures in accordance with auditing standards generally accepted in the United
States of America. In our opinion, the information is fairly stated in all material respects in
relation to the basic financial statements as a whole. The introductory section, supplemental
financial information, and statistical section have not been subjected to the auditing procedures
applied in the audit of the basic financial statements and, accordingly, we do not express an
opinion or provide any assurance on them.
- 2 -
- 3 -
Other Reporting Required by Government Auditing Standards
In accordance with Government Auditing Standards, we have also issued a report dated June 15,
2018 on our consideration of the City’s internal control over financial reporting and our tests of
its compliance with certain provisions of laws, regulations, contracts and grants agreements, and
other matters. The purpose of that report is to describe the scope of our testing of internal control
over financial reporting and compliance and the results of that testing, and not to provide an
opinion on the internal control over financial reporting or on compliance. That report is an
integral part of an audit performed in accordance with Government Auditing Standards in
considering the City’s internal control over financial reporting and compliance.
Naperville, Illinois
June 15, 2018
- 3 -
GENERAL PURPOSE EXTERNAL
FINANCIAL STATEMENTS
(See independent auditor’s report)
MD&A 1
CITY OF DEKALB, ILLINOIS
MANAGEMENT’S DISCUSSION AND ANALYSIS
December 31, 2017
As the management of the City of DeKalb (the “City”), we offer readers of the City’s financial statements this narrative overview and analysis of the financial activities of the City for the fiscal year ended December 31, 2017. We encourage readers to consider the information presented here in conjunction with additional information that we have furnished in our letter of transmittal included earlier in this report.
USING THE FINANCIAL SECTION OF THIS COMPREHENSIVE ANNUAL REPORT
Government-Wide Financial Statements
The government-wide financial statements are designed to provide readers with a broad overview
of the City’s finances, in a manner similar to a private-sector business.
The Statement of Net Position presents information on all of the City’s assets, deferred outflows
of resources, liabilities, and deferred inflows of resources, with the difference between them
reported as net position. Over time, increases or decreases in net position may serve as a useful
indicator of whether the financial position of the City is improving or deteriorating.
The Statement of Activities presents information showing how the government’s net position
changed during the most recent fiscal year. All changes in net position are reported as soon as the
underlying event giving rise to the change occurs, regardless of the timing of the cash flows. Thus,
revenues and expenses are reported in this statement for some items that will only result in cash
flows in future fiscal periods (e.g., earned but unused sick leave).
Both of the government-wide financial statements distinguish functions of the City that are
principally supported by taxes and intergovernmental revenues (governmental activities) from
other functions that are intended to recover all or a significant portion of their costs through user
fees and charges (business-type activities). The governmental activities of the City include general
government, public safety, highways and streets, and community development. The business-type
activities of the City include a water system, a municipal airport, and refuse services.
The government-wide financial statements can be found on pages 4 through 6 of this report.
Fund Financial Statements A fund is a grouping of related accounts that is used to maintain control over resources that have been segregated for specific activities or objectives. The City, like other state and local governments, uses fund accounting to ensure and demonstrate compliance with finance-related legal requirements. All the funds of the City can be divided into three categories: governmental funds, proprietary funds, and fiduciary funds.
CITY OF DEKALB, ILLINOIS
MANAGEMENT’S DISCUSSION AND ANALYSIS (continued)
(See independent auditor’s report)
MD&A 2
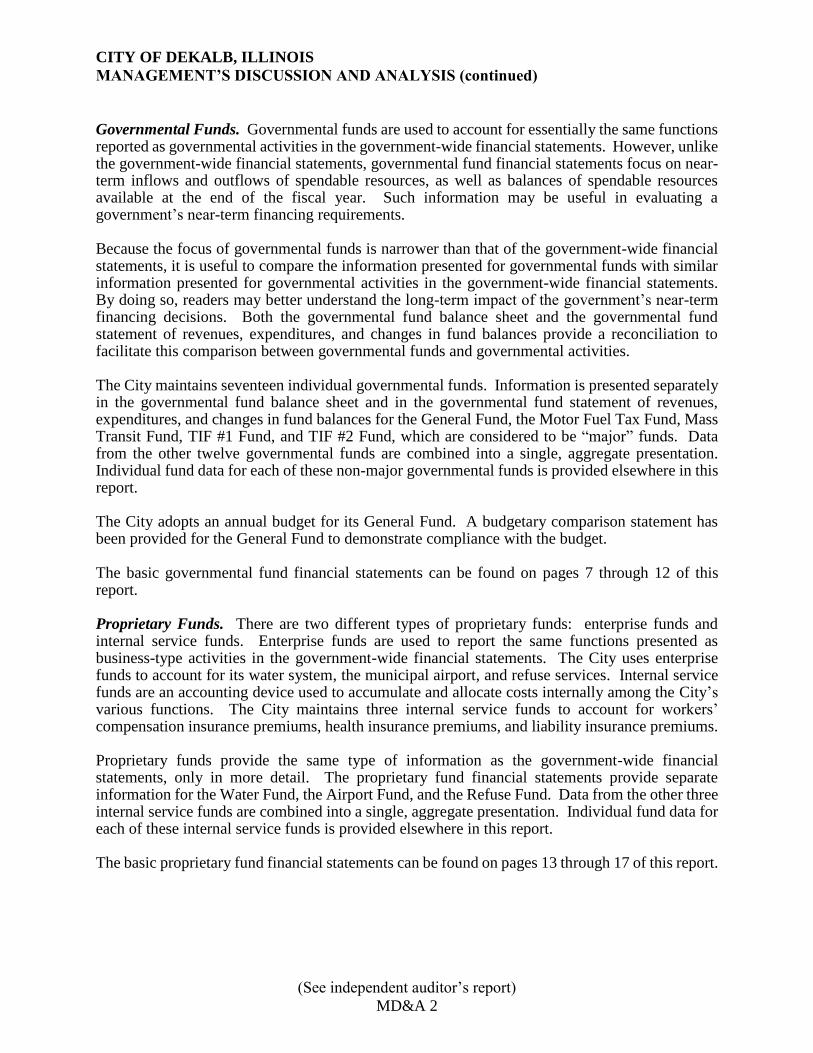
Governmental Funds. Governmental funds are used to account for essentially the same functions reported as governmental activities in the government-wide financial statements. However, unlike the government-wide financial statements, governmental fund financial statements focus on near-term inflows and outflows of spendable resources, as well as balances of spendable resources available at the end of the fiscal year. Such information may be useful in evaluating a government’s near-term financing requirements. Because the focus of governmental funds is narrower than that of the government-wide financial statements, it is useful to compare the information presented for governmental funds with similar information presented for governmental activities in the government-wide financial statements. By doing so, readers may better understand the long-term impact of the government’s near-term financing decisions. Both the governmental fund balance sheet and the governmental fund statement of revenues, expenditures, and changes in fund balances provide a reconciliation to facilitate this comparison between governmental funds and governmental activities. The City maintains seventeen individual governmental funds. Information is presented separately in the governmental fund balance sheet and in the governmental fund statement of revenues, expenditures, and changes in fund balances for the General Fund, the Motor Fuel Tax Fund, Mass Transit Fund, TIF #1 Fund, and TIF #2 Fund, which are considered to be “major” funds. Data from the other twelve governmental funds are combined into a single, aggregate presentation. Individual fund data for each of these non-major governmental funds is provided elsewhere in this report. The City adopts an annual budget for its General Fund. A budgetary comparison statement has been provided for the General Fund to demonstrate compliance with the budget. The basic governmental fund financial statements can be found on pages 7 through 12 of this report. Proprietary Funds. There are two different types of proprietary funds: enterprise funds and internal service funds. Enterprise funds are used to report the same functions presented as business-type activities in the government-wide financial statements. The City uses enterprise funds to account for its water system, the municipal airport, and refuse services. Internal service funds are an accounting device used to accumulate and allocate costs internally among the City’s various functions. The City maintains three internal service funds to account for workers’ compensation insurance premiums, health insurance premiums, and liability insurance premiums. Proprietary funds provide the same type of information as the government-wide financial statements, only in more detail. The proprietary fund financial statements provide separate information for the Water Fund, the Airport Fund, and the Refuse Fund. Data from the other three internal service funds are combined into a single, aggregate presentation. Individual fund data for each of these internal service funds is provided elsewhere in this report. The basic proprietary fund financial statements can be found on pages 13 through 17 of this report.
CITY OF DEKALB, ILLINOIS
MANAGEMENT’S DISCUSSION AND ANALYSIS (continued)
(See independent auditor’s report)
MD&A 3
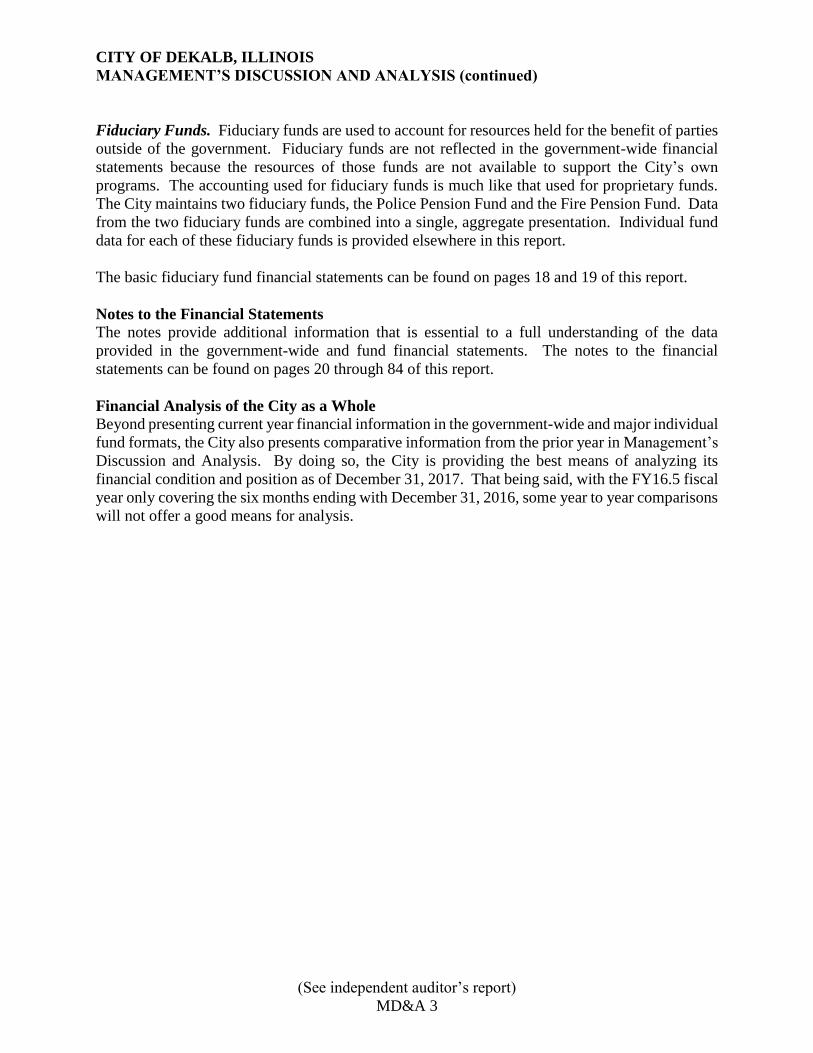
Fiduciary Funds. Fiduciary funds are used to account for resources held for the benefit of parties
outside of the government. Fiduciary funds are not reflected in the government-wide financial
statements because the resources of those funds are not available to support the City’s own
programs. The accounting used for fiduciary funds is much like that used for proprietary funds.
The City maintains two fiduciary funds, the Police Pension Fund and the Fire Pension Fund. Data
from the two fiduciary funds are combined into a single, aggregate presentation. Individual fund
data for each of these fiduciary funds is provided elsewhere in this report.
The basic fiduciary fund financial statements can be found on pages 18 and 19 of this report.
Notes to the Financial Statements
The notes provide additional information that is essential to a full understanding of the data
provided in the government-wide and fund financial statements. The notes to the financial
statements can be found on pages 20 through 84 of this report.
Financial Analysis of the City as a Whole
Beyond presenting current year financial information in the government-wide and major individual
fund formats, the City also presents comparative information from the prior year in Management’s
Discussion and Analysis. By doing so, the City is providing the best means of analyzing its
financial condition and position as of December 31, 2017. That being said, with the FY16.5 fiscal
year only covering the six months ending with December 31, 2016, some year to year comparisons
will not offer a good means for analysis.
CITY OF DEKALB, ILLINOIS
MANAGEMENT’S DISCUSSION AND ANALYSIS (continued)
(See independent auditor’s report)
MD&A 4
GOVERNMENT-WIDE STATEMENTS
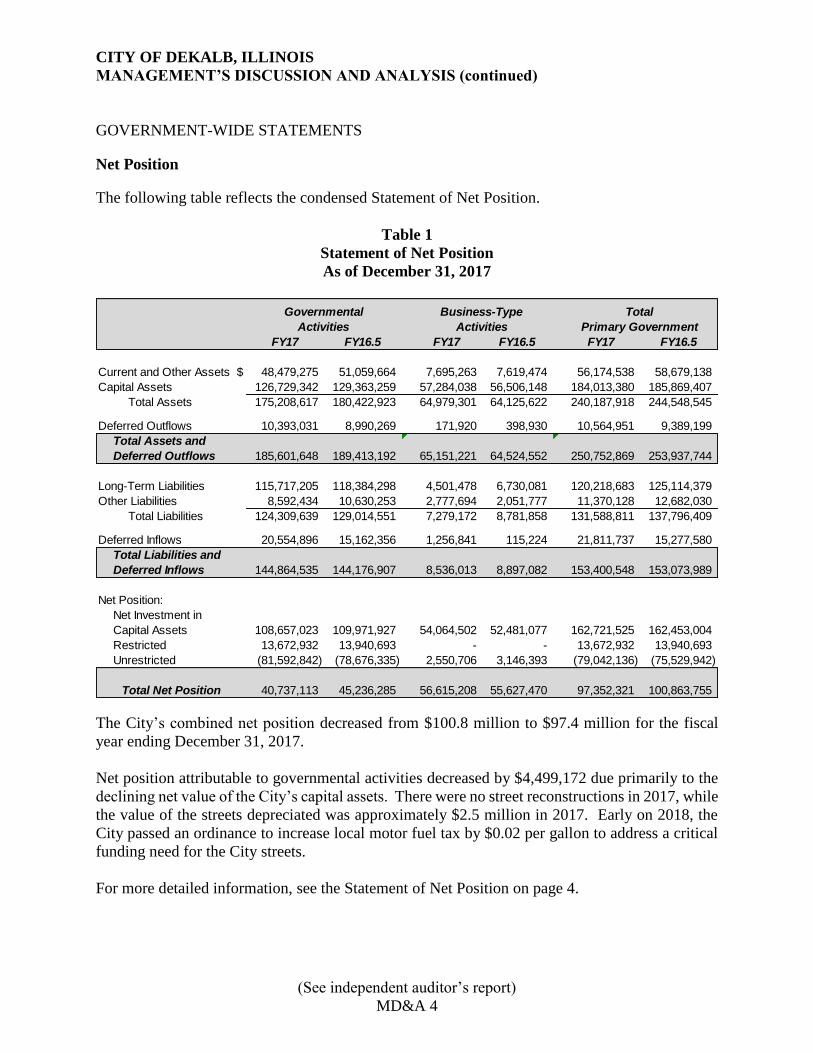
Net Position
The following table reflects the condensed Statement of Net Position.
Table 1
Statement of Net Position
As of December 31, 2017
The City’s combined net position decreased from $100.8 million to $97.4 million for the fiscal
year ending December 31, 2017.
Net position attributable to governmental activities decreased by $4,499,172 due primarily to the
declining net value of the City’s capital assets. There were no street reconstructions in 2017, while
the value of the streets depreciated was approximately $2.5 million in 2017. Early on 2018, the
City passed an ordinance to increase local motor fuel tax by $0.02 per gallon to address a critical
funding need for the City streets.
For more detailed information, see the Statement of Net Position on page 4.
FY17 FY16.5 FY17 FY16.5 FY17 FY16.5
Current and Other Assets $ 48,479,275 51,059,664 7,695,263 7,619,474 56,174,538 58,679,138 Capital Assets 126,729,342 129,363,259 57,284,038 56,506,148 184,013,380 185,869,407
Total Assets 175,208,617 180,422,923 64,979,301 64,125,622 240,187,918 244,548,545
Deferred Outflows 10,393,031 8,990,269 171,920 398,930 10,564,951 9,389,199
185,601,648 189,413,192 65,151,221 64,524,552 250,752,869 253,937,744
Long-Term Liabilities 115,717,205 118,384,298 4,501,478 6,730,081 120,218,683 125,114,379 Other Liabilities 8,592,434 10,630,253 2,777,694 2,051,777 11,370,128 12,682,030
Total Liabilities 124,309,639 129,014,551 7,279,172 8,781,858 131,588,811 137,796,409
Deferred Inflows 20,554,896 15,162,356 1,256,841 115,224 21,811,737 15,277,580
144,864,535 144,176,907 8,536,013 8,897,082 153,400,548 153,073,989
Net Position:
108,657,023 109,971,927 54,064,502 52,481,077 162,721,525 162,453,004 Restricted 13,672,932 13,940,693 - - 13,672,932 13,940,693 Unrestricted (81,592,842) (78,676,335) 2,550,706 3,146,393 (79,042,136) (75,529,942)
40,737,113 45,236,285 56,615,208 55,627,470 97,352,321 100,863,755
Business-Type
Activities Activities Primary Government
Total
Total Assets and
Deferred Outflows
Net Investment in Capital Assets
Total Liabilities and
Deferred Inflows
Total Net Position
Governmental
CITY OF DEKALB, ILLINOIS
MANAGEMENT’S DISCUSSION AND ANALYSIS (continued)
(See independent auditor’s report)
MD&A 5
Activities
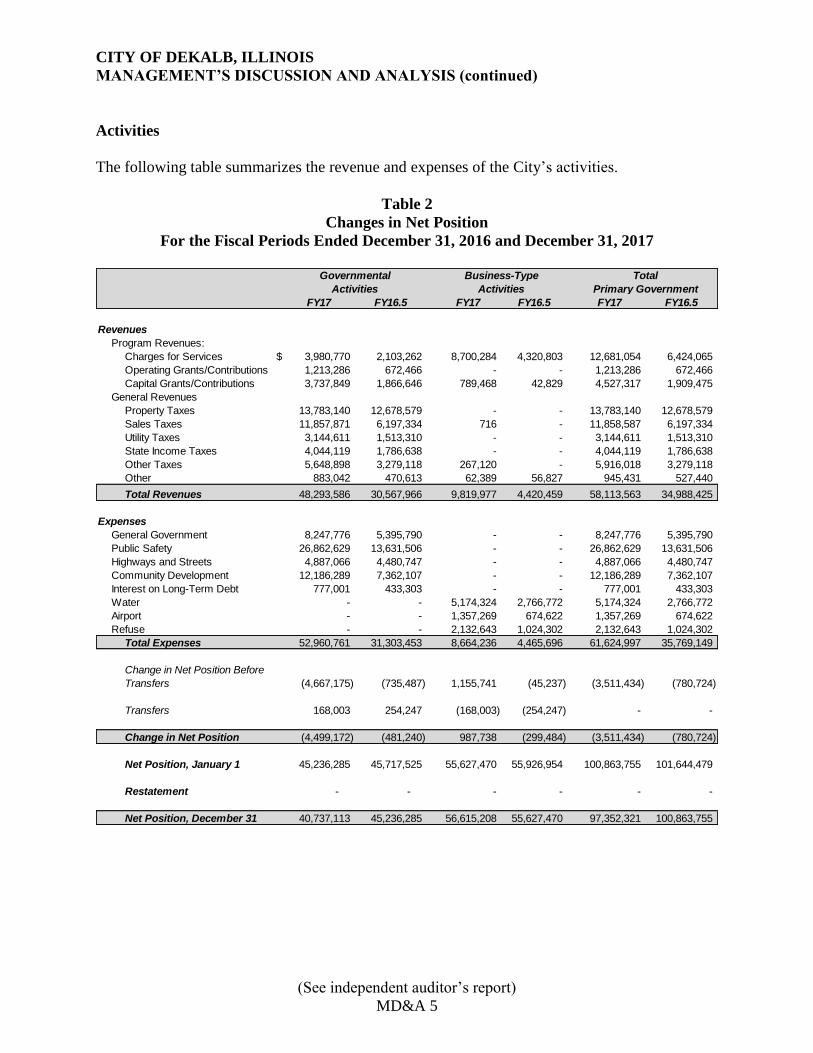
The following table summarizes the revenue and expenses of the City’s activities.
Table 2
Changes in Net Position
For the Fiscal Periods Ended December 31, 2016 and December 31, 2017
FY17 FY16.5 FY17 FY16.5 FY17 FY16.5
Revenues
Program Revenues:Charges for Services $ 3,980,770 2,103,262 8,700,284 4,320,803 12,681,054 6,424,065 Operating Grants/Contributions 1,213,286 672,466 - - 1,213,286 672,466 Capital Grants/Contributions 3,737,849 1,866,646 789,468 42,829 4,527,317 1,909,475
General RevenuesProperty Taxes 13,783,140 12,678,579 - - 13,783,140 12,678,579 Sales Taxes 11,857,871 6,197,334 716 - 11,858,587 6,197,334 Utility Taxes 3,144,611 1,513,310 - - 3,144,611 1,513,310 State Income Taxes 4,044,119 1,786,638 - - 4,044,119 1,786,638 Other Taxes 5,648,898 3,279,118 267,120 - 5,916,018 3,279,118 Other 883,042 470,613 62,389 56,827 945,431 527,440 Total Revenues 48,293,586 30,567,966 9,819,977 4,420,459 58,113,563 34,988,425
Expenses
General Government 8,247,776 5,395,790 - - 8,247,776 5,395,790 Public Safety 26,862,629 13,631,506 - - 26,862,629 13,631,506 Highways and Streets 4,887,066 4,480,747 - - 4,887,066 4,480,747 Community Development 12,186,289 7,362,107 - - 12,186,289 7,362,107 Interest on Long-Term Debt 777,001 433,303 - - 777,001 433,303 Water - - 5,174,324 2,766,772 5,174,324 2,766,772 Airport - - 1,357,269 674,622 1,357,269 674,622 Refuse - - 2,132,643 1,024,302 2,132,643 1,024,302
Total Expenses 52,960,761 31,303,453 8,664,236 4,465,696 61,624,997 35,769,149
(4,667,175) (735,487) 1,155,741 (45,237) (3,511,434) (780,724)
Transfers 168,003 254,247 (168,003) (254,247) - -
Change in Net Position (4,499,172) (481,240) 987,738 (299,484) (3,511,434) (780,724)
Net Position, January 1 45,236,285 45,717,525 55,627,470 55,926,954 100,863,755 101,644,479
Restatement - - - - - -
Net Position, December 31 40,737,113 45,236,285 56,615,208 55,627,470 97,352,321 100,863,755
Change in Net Position Before
Transfers
Governmental Business-Type Total
Activities Activities Primary Government
CITY OF DEKALB, ILLINOIS
MANAGEMENT’S DISCUSSION AND ANALYSIS (continued)
(See independent auditor’s report)
MD&A 6
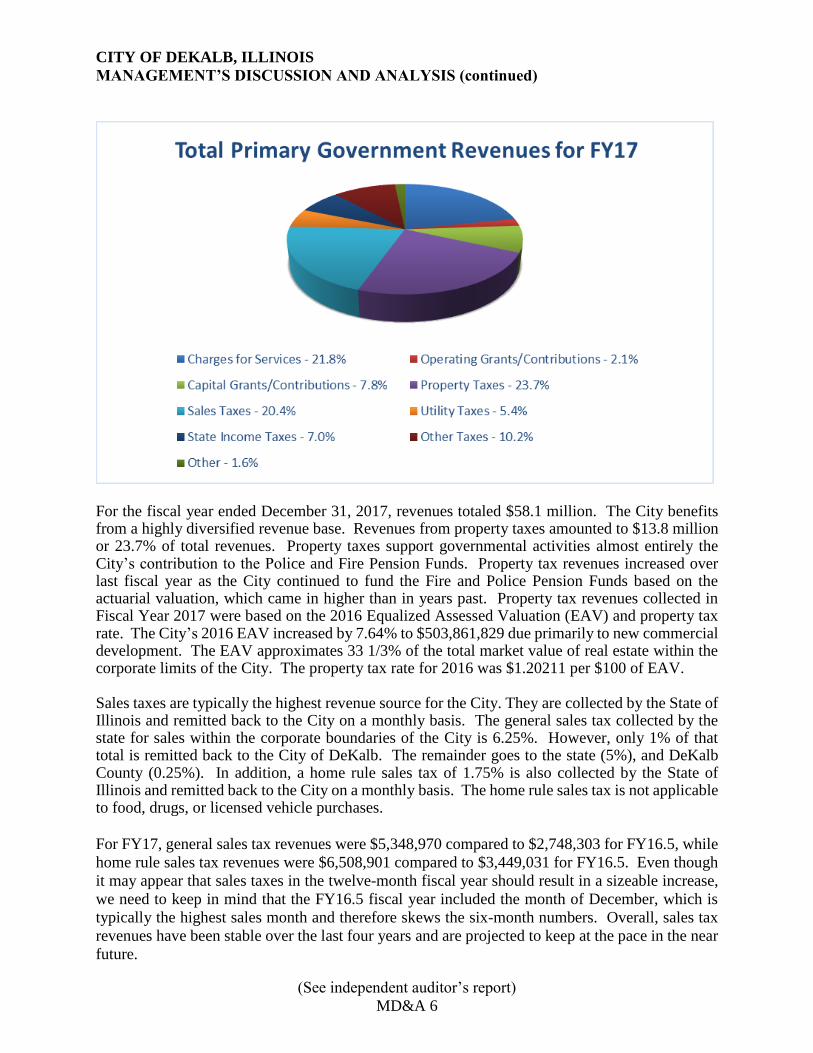
For the fiscal year ended December 31, 2017, revenues totaled $58.1 million. The City benefits from a highly diversified revenue base. Revenues from property taxes amounted to $13.8 million or 23.7% of total revenues. Property taxes support governmental activities almost entirely the City’s contribution to the Police and Fire Pension Funds. Property tax revenues increased over last fiscal year as the City continued to fund the Fire and Police Pension Funds based on the actuarial valuation, which came in higher than in years past. Property tax revenues collected in Fiscal Year 2017 were based on the 2016 Equalized Assessed Valuation (EAV) and property tax rate. The City’s 2016 EAV increased by 7.64% to $503,861,829 due primarily to new commercial development. The EAV approximates 33 1/3% of the total market value of real estate within the corporate limits of the City. The property tax rate for 2016 was $1.20211 per $100 of EAV. Sales taxes are typically the highest revenue source for the City. They are collected by the State of Illinois and remitted back to the City on a monthly basis. The general sales tax collected by the state for sales within the corporate boundaries of the City is 6.25%. However, only 1% of that total is remitted back to the City of DeKalb. The remainder goes to the state (5%), and DeKalb County (0.25%). In addition, a home rule sales tax of 1.75% is also collected by the State of Illinois and remitted back to the City on a monthly basis. The home rule sales tax is not applicable to food, drugs, or licensed vehicle purchases.
For FY17, general sales tax revenues were $5,348,970 compared to $2,748,303 for FY16.5, while
home rule sales tax revenues were $6,508,901 compared to $3,449,031 for FY16.5. Even though
it may appear that sales taxes in the twelve-month fiscal year should result in a sizeable increase,
we need to keep in mind that the FY16.5 fiscal year included the month of December, which is
typically the highest sales month and therefore skews the six-month numbers. Overall, sales tax
revenues have been stable over the last four years and are projected to keep at the pace in the near
future.
CITY OF DEKALB, ILLINOIS
MANAGEMENT’S DISCUSSION AND ANALYSIS (continued)
(See independent auditor’s report)
MD&A 7
Income taxes are shared with municipalities by the state on a per-capita basis. The City’s income
tax revenue was $4,044,119 in FY17 compared to $1,786,638 in FY16.5. This per-capita revenue
source is based more on the state’s economy and unemployment rate rather than the local economy.
The State of Illinois’ unemployment rate peaked to 11.50% in December 2009 and has dropped to
4.40% in March 2018.
Telecommunications taxes are collected by the state and remitted back to the City on a monthly
basis. The City’s telecommunications tax rate is 6%. A total of $672,303 was collected in FY17
compared to $373,735 that was collected in FY16.5. This revenue source is expected to decrease
slightly over the next several years as more residents convert to internet telephone service or
cellular telephone service as their primary source of communication and eliminate landline service.
Also, the option to package and bundle programs has brought down the consumer costs of cell
phones and therefore has dropped this tax revenue source.
Use tax is a tax imposed on the privilege of using, in the State of Illinois, any item of tangible
personal property that is purchased anywhere at retail. This revenue source is collected by the
State and forwarded to the City on a per capita basis. For FY17, $1,138,904 was collected
compared to the $564,630 collected in FY16.5. This revenue source is expected to increase further
next year due to the state’s increased collection efforts which include a separate line for use taxes
on the state income tax return form along with the increase in internet sales that are considered use
tax revenue depending on the purchase
The major revenue component of the “charges for services” classification is fees from the City’s
water utility. Water related revenue was $5,762,896 in FY17 compared to $2,929,368 in FY16.5.
In the case of the Water Fund, the economy is still having an impact on water revenue.
Foreclosures, closed businesses, and a tendency to conserve water are still contributing factors that
continue to drive down the City’s water sales. In addition, the general trend towards using water-
saving fixtures and toilets is reducing water consumption.
Capital grants and contributions revenue were $4,527,317 in FY17 and $1,909,475 in FY16.5.
The City’s Mass Transit Fund incorporates the majority of the FY17 capital grant revenue with
$3,444,703. Most of the grant revenue is paid to a third party to provide transit services for the
City. However, the City used $463,104 in grant funds to purchase nine new transit vans in order
to upgrade the fleet. Airport related capital grants and contributions increased from $42,829 in
FY16.5 to $789,468 in FY17. Progression on several airport projects, including construction of a
new hangar approach, a taxiway rehab, and some drainage improvements, led to the recognition
of federal and state contributions on those projects.
CITY OF DEKALB, ILLINOIS
MANAGEMENT’S DISCUSSION AND ANALYSIS (continued)
(See independent auditor’s report)
MD&A 8
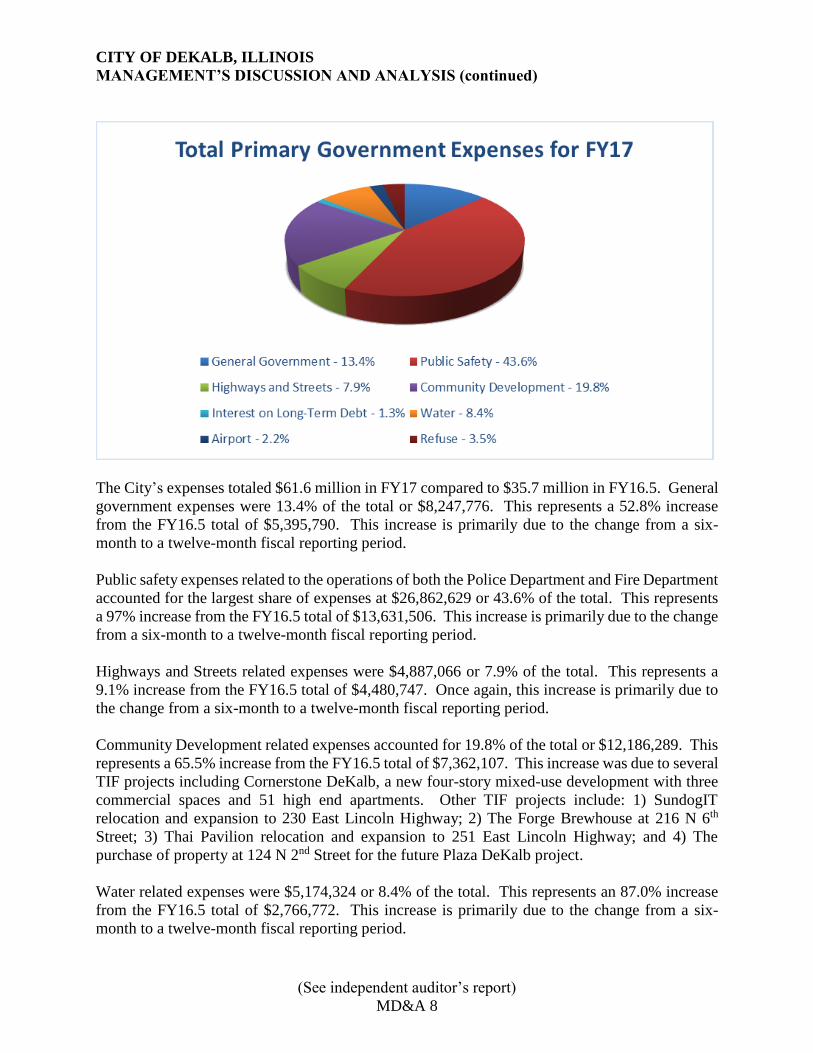
The City’s expenses totaled $61.6 million in FY17 compared to $35.7 million in FY16.5. General
government expenses were 13.4% of the total or $8,247,776. This represents a 52.8% increase
from the FY16.5 total of $5,395,790. This increase is primarily due to the change from a six-
month to a twelve-month fiscal reporting period.
Public safety expenses related to the operations of both the Police Department and Fire Department
accounted for the largest share of expenses at $26,862,629 or 43.6% of the total. This represents
a 97% increase from the FY16.5 total of $13,631,506. This increase is primarily due to the change
from a six-month to a twelve-month fiscal reporting period.
Highways and Streets related expenses were $4,887,066 or 7.9% of the total. This represents a
9.1% increase from the FY16.5 total of $4,480,747. Once again, this increase is primarily due to
the change from a six-month to a twelve-month fiscal reporting period.
Community Development related expenses accounted for 19.8% of the total or $12,186,289. This
represents a 65.5% increase from the FY16.5 total of $7,362,107. This increase was due to several
TIF projects including Cornerstone DeKalb, a new four-story mixed-use development with three
commercial spaces and 51 high end apartments. Other TIF projects include: 1) SundogIT
relocation and expansion to 230 East Lincoln Highway; 2) The Forge Brewhouse at 216 N 6th
Street; 3) Thai Pavilion relocation and expansion to 251 East Lincoln Highway; and 4) The
purchase of property at 124 N 2nd Street for the future Plaza DeKalb project.
Water related expenses were $5,174,324 or 8.4% of the total. This represents an 87.0% increase
from the FY16.5 total of $2,766,772. This increase is primarily due to the change from a six-
month to a twelve-month fiscal reporting period.
CITY OF DEKALB, ILLINOIS
MANAGEMENT’S DISCUSSION AND ANALYSIS (continued)
(See independent auditor’s report)
MD&A 9
Airport related expenses were $1,357,269 or 2.2% of the total. This represents a 101.2% increase
from the FY16.5 total of $674,622.
The Refuse Fund ($2,132,643 or 3.5% of total expenses) and interest on long-term debt ($777,001
or 1.3% of total expenses) account for the balance of the FY17 expenses.
FINANCIAL ANALYSIS OF THE CITY’S FUNDS
At December 31, 2017, the governmental funds had a combined fund balance of $23,109,919.
This reflects a $927,707 or 3.9% decrease from the prior fiscal year. The General Fund balance
decreased by $155,321 or 1.7%. Originally the General Fund was budgeted to have a $609,862
increase in its fund balance for FY17. This difference between the budgeted and actual General
Fund balance can be attributed to revenues coming in lower than budgeted parameters. The Motor
Fuel Tax Fund balance increased by $268,739 or 8.3%. Two improvement projects that were
budgeted for in FY17 were not done. The TIF District Funds fund balances decreased by $469,064
or 4.5%. The TIF projects that were completed in 2017, that were mentioned earlier, were the
reason for the large fund balance decrease. Finally, the fund balances of non-major governmental
funds decreased by $572,061. Funds typically are being spent on projects in the Foreign Fire
Insurance Fund, Housing Rehabilitation Fund, Community Development Block Grant Fund,
Special Service Area Funds, and the Capital Project Funds. With the shortened fiscal year for
FY16.5, several equipment items that were budgeted for in FY16.5 did not get purchased until
2017. This caused the fund balances at fiscal year ending December 31, 2016 to be higher than
normal. Since those projects did get completed in FY17, the corresponding fund balances dropped
as well.
CITY OF DEKALB, ILLINOIS
MANAGEMENT’S DISCUSSION AND ANALYSIS (continued)
(See independent auditor’s report)
MD&A 10
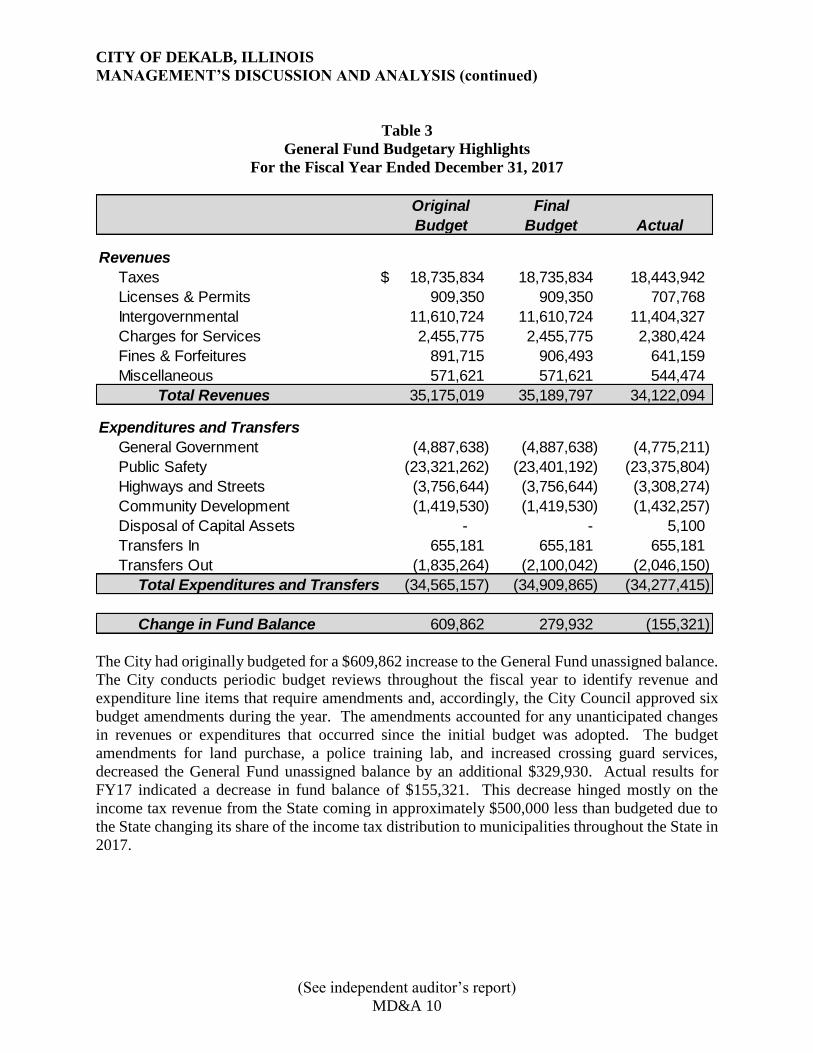
Table 3
General Fund Budgetary Highlights
For the Fiscal Year Ended December 31, 2017
The City had originally budgeted for a $609,862 increase to the General Fund unassigned balance.
The City conducts periodic budget reviews throughout the fiscal year to identify revenue and
expenditure line items that require amendments and, accordingly, the City Council approved six
budget amendments during the year. The amendments accounted for any unanticipated changes
in revenues or expenditures that occurred since the initial budget was adopted. The budget
amendments for land purchase, a police training lab, and increased crossing guard services,
decreased the General Fund unassigned balance by an additional $329,930. Actual results for
FY17 indicated a decrease in fund balance of $155,321. This decrease hinged mostly on the
income tax revenue from the State coming in approximately $500,000 less than budgeted due to
the State changing its share of the income tax distribution to municipalities throughout the State in
2017.
Final
Budget Actual
Revenues
Taxes $ 18,735,834 18,735,834 18,443,942 Licenses & Permits 909,350 909,350 707,768 Intergovernmental 11,610,724 11,610,724 11,404,327 Charges for Services 2,455,775 2,455,775 2,380,424 Fines & Forfeitures 891,715 906,493 641,159 Miscellaneous 571,621 571,621 544,474
Total Revenues 35,175,019 35,189,797 34,122,094
Expenditures and Transfers
General Government (4,887,638) (4,887,638) (4,775,211) Public Safety (23,321,262) (23,401,192) (23,375,804) Highways and Streets (3,756,644) (3,756,644) (3,308,274) Community Development (1,419,530) (1,419,530) (1,432,257) Disposal of Capital Assets - - 5,100 Transfers In 655,181 655,181 655,181 Transfers Out (1,835,264) (2,100,042) (2,046,150)
Total Expenditures and Transfers (34,565,157) (34,909,865) (34,277,415)
Change in Fund Balance 609,862 279,932 (155,321)
Original
Budget
CITY OF DEKALB, ILLINOIS
MANAGEMENT’S DISCUSSION AND ANALYSIS (continued)
(See independent auditor’s report)
MD&A 11
With respect to the business-type activities, the Water Fund had an increase in Net Position due to
a lower IMRF net pension liability for the year ending December 31, 2017. The Municipal Airport
Fund also showed an increase in Net Position at the end of FY17. This is due to the fact that the
City diverted one and one-half cents ($0.015) per gallon of home rule motor fuel tax revenue to
help support the Municipal Airport Fund starting in 2017. The City has established a fund balance
policy for these funds to ensure reserves are available for operations first before committing any
funds to capital projects.
Capital Assets
The following schedule reflects the City’s capital asset balances as of December 31, 2017 and
December 31, 2016.
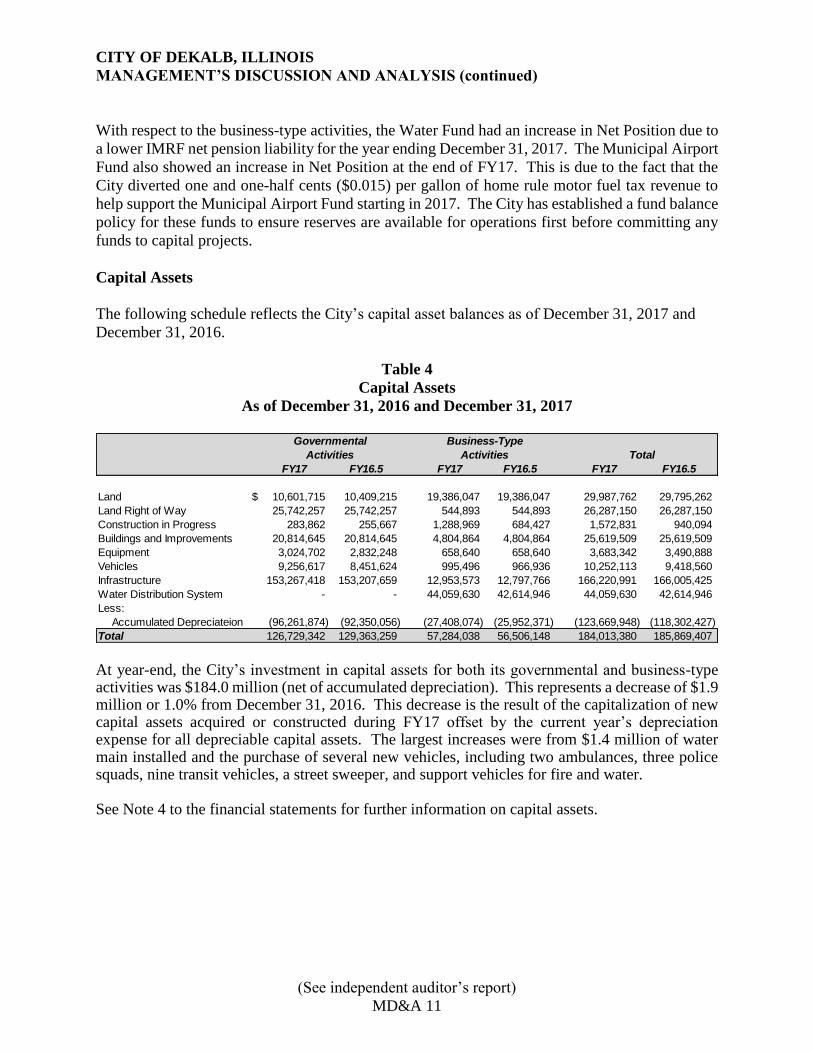
Table 4
Capital Assets
As of December 31, 2016 and December 31, 2017
At year-end, the City’s investment in capital assets for both its governmental and business-type activities was $184.0 million (net of accumulated depreciation). This represents a decrease of $1.9 million or 1.0% from December 31, 2016. This decrease is the result of the capitalization of new capital assets acquired or constructed during FY17 offset by the current year’s depreciation expense for all depreciable capital assets. The largest increases were from $1.4 million of water main installed and the purchase of several new vehicles, including two ambulances, three police squads, nine transit vehicles, a street sweeper, and support vehicles for fire and water. See Note 4 to the financial statements for further information on capital assets.
FY17 FY16.5 FY17 FY16.5 FY17 FY16.5
Land $ 10,601,715 10,409,215 19,386,047 19,386,047 29,987,762 29,795,262 Land Right of Way 25,742,257 25,742,257 544,893 544,893 26,287,150 26,287,150 Construction in Progress 283,862 255,667 1,288,969 684,427 1,572,831 940,094 Buildings and Improvements 20,814,645 20,814,645 4,804,864 4,804,864 25,619,509 25,619,509 Equipment 3,024,702 2,832,248 658,640 658,640 3,683,342 3,490,888 Vehicles 9,256,617 8,451,624 995,496 966,936 10,252,113 9,418,560 Infrastructure 153,267,418 153,207,659 12,953,573 12,797,766 166,220,991 166,005,425 Water Distribution System - - 44,059,630 42,614,946 44,059,630 42,614,946 Less:
Accumulated Depreciateion (96,261,874) (92,350,056) (27,408,074) (25,952,371) (123,669,948) (118,302,427) Total 126,729,342 129,363,259 57,284,038 56,506,148 184,013,380 185,869,407
Governmental Business-Type
Activities Activities Total
CITY OF DEKALB, ILLINOIS
MANAGEMENT’S DISCUSSION AND ANALYSIS (continued)
(See independent auditor’s report)
MD&A 12
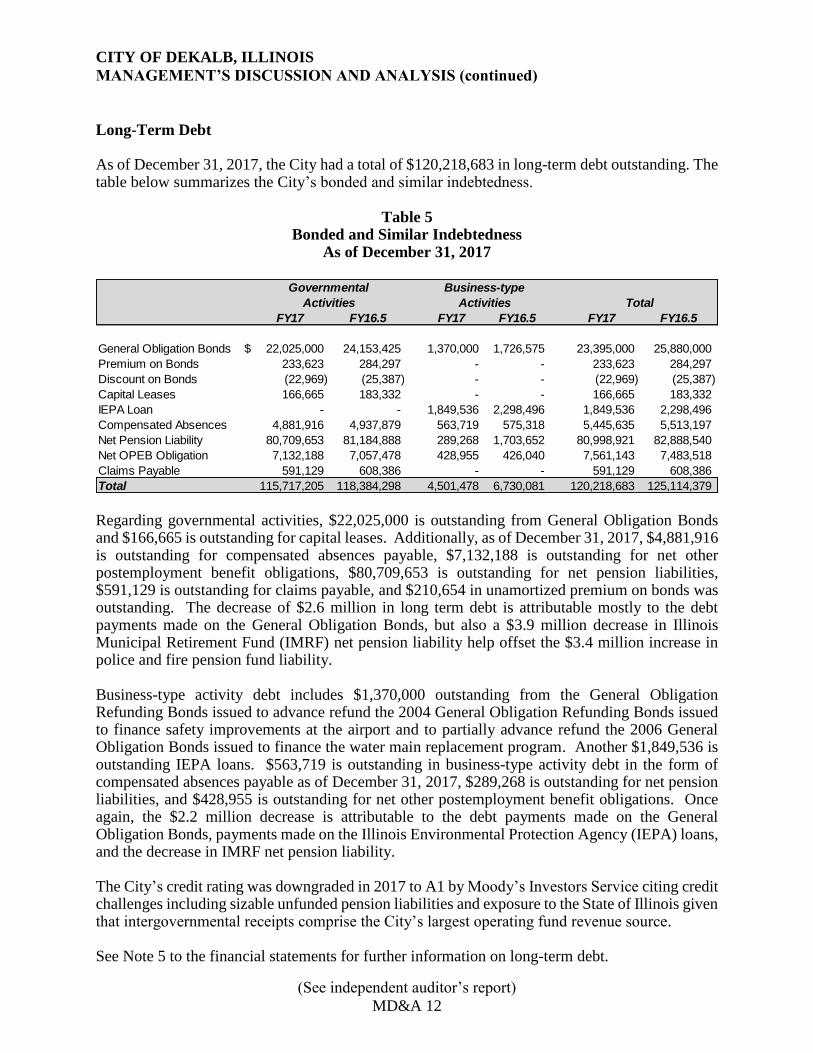
Long-Term Debt As of December 31, 2017, the City had a total of $120,218,683 in long-term debt outstanding. The table below summarizes the City’s bonded and similar indebtedness.
Table 5 Bonded and Similar Indebtedness
As of December 31, 2017
Regarding governmental activities, $22,025,000 is outstanding from General Obligation Bonds and $166,665 is outstanding for capital leases. Additionally, as of December 31, 2017, $4,881,916 is outstanding for compensated absences payable, $7,132,188 is outstanding for net other postemployment benefit obligations, $80,709,653 is outstanding for net pension liabilities, $591,129 is outstanding for claims payable, and $210,654 in unamortized premium on bonds was outstanding. The decrease of $2.6 million in long term debt is attributable mostly to the debt payments made on the General Obligation Bonds, but also a $3.9 million decrease in Illinois Municipal Retirement Fund (IMRF) net pension liability help offset the $3.4 million increase in police and fire pension fund liability. Business-type activity debt includes $1,370,000 outstanding from the General Obligation Refunding Bonds issued to advance refund the 2004 General Obligation Refunding Bonds issued to finance safety improvements at the airport and to partially advance refund the 2006 General Obligation Bonds issued to finance the water main replacement program. Another $1,849,536 is outstanding IEPA loans. $563,719 is outstanding in business-type activity debt in the form of compensated absences payable as of December 31, 2017, $289,268 is outstanding for net pension liabilities, and $428,955 is outstanding for net other postemployment benefit obligations. Once again, the $2.2 million decrease is attributable to the debt payments made on the General Obligation Bonds, payments made on the Illinois Environmental Protection Agency (IEPA) loans, and the decrease in IMRF net pension liability. The City’s credit rating was downgraded in 2017 to A1 by Moody’s Investors Service citing credit challenges including sizable unfunded pension liabilities and exposure to the State of Illinois given that intergovernmental receipts comprise the City’s largest operating fund revenue source. See Note 5 to the financial statements for further information on long-term debt.
FY17 FY16.5 FY17 FY16.5 FY17 FY16.5
General Obligation Bonds $ 22,025,000 24,153,425 1,370,000 1,726,575 23,395,000 25,880,000 Premium on Bonds 233,623 284,297 - - 233,623 284,297 Discount on Bonds (22,969) (25,387) - - (22,969) (25,387) Capital Leases 166,665 183,332 - - 166,665 183,332 IEPA Loan - - 1,849,536 2,298,496 1,849,536 2,298,496 Compensated Absences 4,881,916 4,937,879 563,719 575,318 5,445,635 5,513,197 Net Pension Liability 80,709,653 81,184,888 289,268 1,703,652 80,998,921 82,888,540 Net OPEB Obligation 7,132,188 7,057,478 428,955 426,040 7,561,143 7,483,518 Claims Payable 591,129 608,386 - - 591,129 608,386 Total 115,717,205 118,384,298 4,501,478 6,730,081 120,218,683 125,114,379
Governmental Business-type
Activities Activities Total
CITY OF DEKALB, ILLINOIS
MANAGEMENT’S DISCUSSION AND ANALYSIS (continued)
(See independent auditor’s report)
MD&A 13
Economic Factors Although, the City’s property tax base is primarily residential, the commercial and industrial tax base continues to be an important component in the diversification of the City’s tax base. In 2017, the equalized assessed valuation (EAV) for residential properties was $305,785,673 or 57.74% of the total EAV. Commercial EAV was $164,843,724 or 31.12% of the total EAV. Farm, industrial and other EAV was $59,000,067 or 11.14% of the total EAV. EAV approximates 33 1/3% of the market value of real property within the City’s corporate limits. Property taxes imposed on property within the City’s corporate limits provide a stable revenue source. Because the City is a home rule municipality, it is not subject to the Property Tax Extension Limitation Law.
While the City receives revenue from a variety of sources, it closely monitors its sales tax revenue,
income tax revenue, and development and construction related revenue such as building permits,
water connection fees, and impact fees. In FY17, most revenue sources increased from the
previous fiscal year due to the change from a six-month to a twelve-month reporting period. These
revenues and all other revenue sources will continue to be monitored during 2018 to ensure that
the City addresses any significant variations in revenues in a timely fashion. The 2012-2016 American Community Survey released by the U.S. Census Bureau found that 85.3% of residential properties in the City had a value of $100,000 or more. The median value was $166,400 and the median income of families living in the City was $59,285. The 2010 census found that the City’s population was 43,862 which is an increase of 12.4% over the 2000 census population of 39,018. The City’s population estimate for 2017 is 44,030. Due to the increase in population over the years, the City has experienced increased per capita revenue from the State of Illinois for income taxes, motor fuel taxes, and use taxes.
CONTACTING THE CITY’S FINANCIAL MANAGEMENT This financial report is designed to provide our citizens, customers, investors and creditors with a general overview of the City’s finances and to demonstrate the City’s accountability for the money it receives. Questions concerning this report or requests for additional financial information should be directed to Molly Talkington, Finance Director, City of DeKalb, 200 S Fourth St, DeKalb, Illinois 60115.
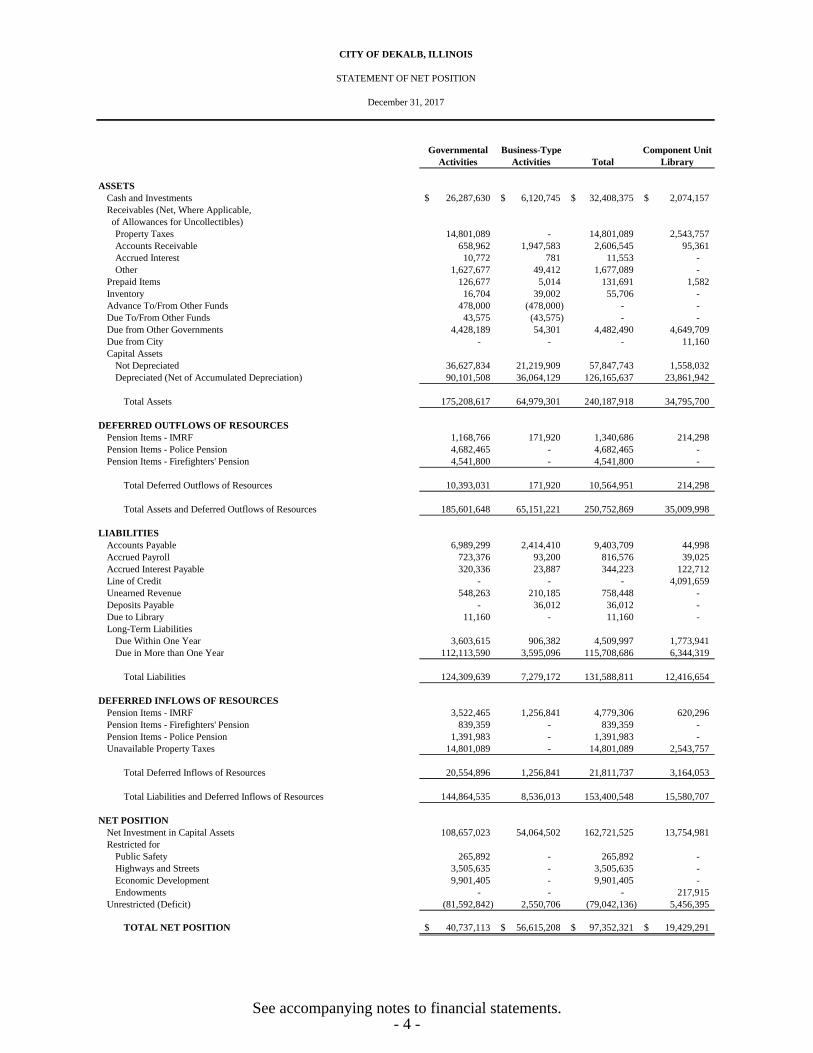
Governmental Business-Type Component Unit
Activities Activities Total Library
ASSETS
Cash and Investments 26,287,630$ 6,120,745$ 32,408,375$ 2,074,157$
Receivables (Net, Where Applicable,
of Allowances for Uncollectibles)
Property Taxes 14,801,089 - 14,801,089 2,543,757
Accounts Receivable 658,962 1,947,583 2,606,545 95,361
Accrued Interest 10,772 781 11,553 -
Other 1,627,677 49,412 1,677,089 -
Prepaid Items 126,677 5,014 131,691 1,582
Inventory 16,704 39,002 55,706 -
Advance To/From Other Funds 478,000 (478,000) - -
Due To/From Other Funds 43,575 (43,575) - -
Due from Other Governments 4,428,189 54,301 4,482,490 4,649,709
Due from City - - - 11,160
Capital Assets
Not Depreciated 36,627,834 21,219,909 57,847,743 1,558,032
Depreciated (Net of Accumulated Depreciation) 90,101,508 36,064,129 126,165,637 23,861,942
Total Assets 175,208,617 64,979,301 240,187,918 34,795,700
DEFERRED OUTFLOWS OF RESOURCES
Pension Items - IMRF 1,168,766 171,920 1,340,686 214,298
Pension Items - Police Pension 4,682,465 - 4,682,465 -
Pension Items - Firefighters' Pension 4,541,800 - 4,541,800 -
Total Deferred Outflows of Resources 10,393,031 171,920 10,564,951 214,298
Total Assets and Deferred Outflows of Resources 185,601,648 65,151,221 250,752,869 35,009,998
LIABILITIES
Accounts Payable 6,989,299 2,414,410 9,403,709 44,998
Accrued Payroll 723,376 93,200 816,576 39,025
Accrued Interest Payable 320,336 23,887 344,223 122,712
Line of Credit - - - 4,091,659
Unearned Revenue 548,263 210,185 758,448 -
Deposits Payable - 36,012 36,012 -
Due to Library 11,160 - 11,160 -
Long-Term Liabilities
Due Within One Year 3,603,615 906,382 4,509,997 1,773,941
Due in More than One Year 112,113,590 3,595,096 115,708,686 6,344,319
Total Liabilities 124,309,639 7,279,172 131,588,811 12,416,654
DEFERRED INFLOWS OF RESOURCES
Pension Items - IMRF 3,522,465 1,256,841 4,779,306 620,296
Pension Items - Firefighters' Pension 839,359 - 839,359 -
Pension Items - Police Pension 1,391,983 - 1,391,983 -
Unavailable Property Taxes 14,801,089 - 14,801,089 2,543,757
Total Deferred Inflows of Resources 20,554,896 1,256,841 21,811,737 3,164,053
Total Liabilities and Deferred Inflows of Resources 144,864,535 8,536,013 153,400,548 15,580,707
NET POSITION
Net Investment in Capital Assets 108,657,023 54,064,502 162,721,525 13,754,981
Restricted for
Public Safety 265,892 - 265,892 -
Highways and Streets 3,505,635 - 3,505,635 -
Economic Development 9,901,405 - 9,901,405 -
Endowments - - - 217,915
Unrestricted (Deficit) (81,592,842) 2,550,706 (79,042,136) 5,456,395
TOTAL NET POSITION 40,737,113$ 56,615,208$ 97,352,321$ 19,429,291$
CITY OF DEKALB, ILLINOIS
STATEMENT OF NET POSITION
December 31, 2017
See accompanying notes to financial statements.- 4 -
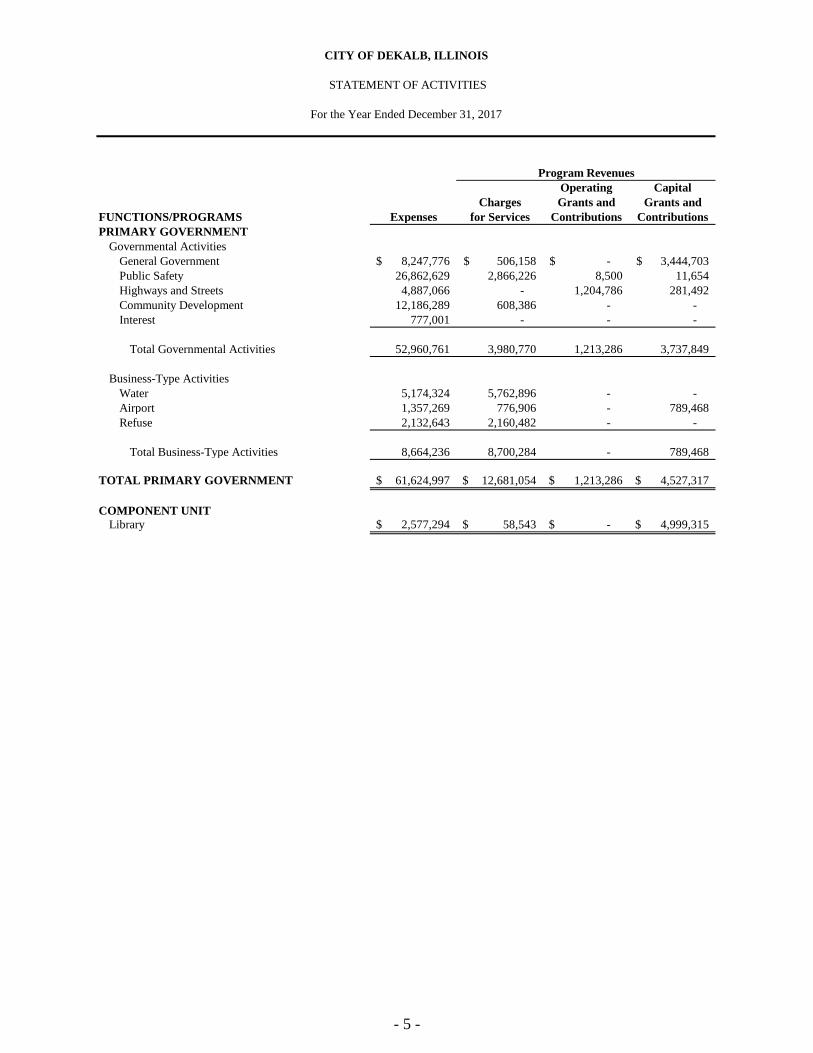
Operating Capital
Charges Grants and Grants and
FUNCTIONS/PROGRAMS Expenses for Services Contributions Contributions
PRIMARY GOVERNMENT
Governmental Activities
General Government 8,247,776$ 506,158$ -$ 3,444,703$
Public Safety 26,862,629 2,866,226 8,500 11,654
Highways and Streets 4,887,066 - 1,204,786 281,492
Community Development 12,186,289 608,386 - -
Interest 777,001 - - -
Total Governmental Activities 52,960,761 3,980,770 1,213,286 3,737,849
Business-Type Activities
Water 5,174,324 5,762,896 - -
Airport 1,357,269 776,906 - 789,468
Refuse 2,132,643 2,160,482 - -
Total Business-Type Activities 8,664,236 8,700,284 - 789,468
TOTAL PRIMARY GOVERNMENT 61,624,997$ 12,681,054$ 1,213,286$ 4,527,317$
COMPONENT UNIT
Library 2,577,294$ 58,543$ -$ 4,999,315$
Program Revenues
CITY OF DEKALB, ILLINOIS
STATEMENT OF ACTIVITIES
For the Year Ended December 31, 2017
- 5 -
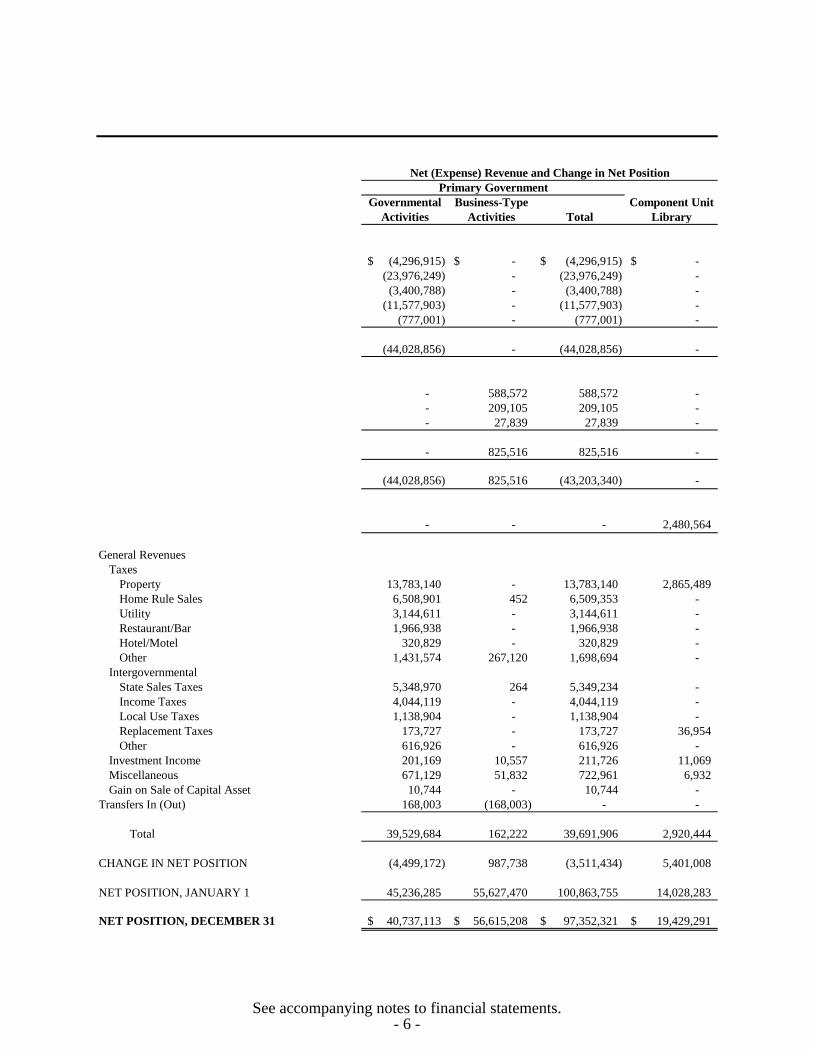
Governmental Business-Type Component Unit
Activities Activities Total Library
(4,296,915)$ -$ (4,296,915)$ -$
(23,976,249) - (23,976,249) -
(3,400,788) - (3,400,788) -
(11,577,903) - (11,577,903) -
(777,001) - (777,001) -
(44,028,856) - (44,028,856) -
- 588,572 588,572 -
- 209,105 209,105 -
- 27,839 27,839 -
- 825,516 825,516 -
(44,028,856) 825,516 (43,203,340) -
- - - 2,480,564
General Revenues
Taxes
Property 13,783,140 - 13,783,140 2,865,489
Home Rule Sales 6,508,901 452 6,509,353 -
Utility 3,144,611 - 3,144,611 -
Restaurant/Bar 1,966,938 - 1,966,938 -
Hotel/Motel 320,829 - 320,829 -
Other 1,431,574 267,120 1,698,694 -
Intergovernmental
State Sales Taxes 5,348,970 264 5,349,234 -
Income Taxes 4,044,119 - 4,044,119 -
Local Use Taxes 1,138,904 - 1,138,904 -
Replacement Taxes 173,727 - 173,727 36,954
Other 616,926 - 616,926 -
Investment Income 201,169 10,557 211,726 11,069
Miscellaneous 671,129 51,832 722,961 6,932
Gain on Sale of Capital Asset 10,744 - 10,744 -
Transfers In (Out) 168,003 (168,003) - -
Total 39,529,684 162,222 39,691,906 2,920,444
CHANGE IN NET POSITION (4,499,172) 987,738 (3,511,434) 5,401,008
NET POSITION, JANUARY 1 45,236,285 55,627,470 100,863,755 14,028,283
NET POSITION, DECEMBER 31 40,737,113$ 56,615,208$ 97,352,321$ 19,429,291$
Net (Expense) Revenue and Change in Net Position
Primary Government
See accompanying notes to financial statements.- 6 -
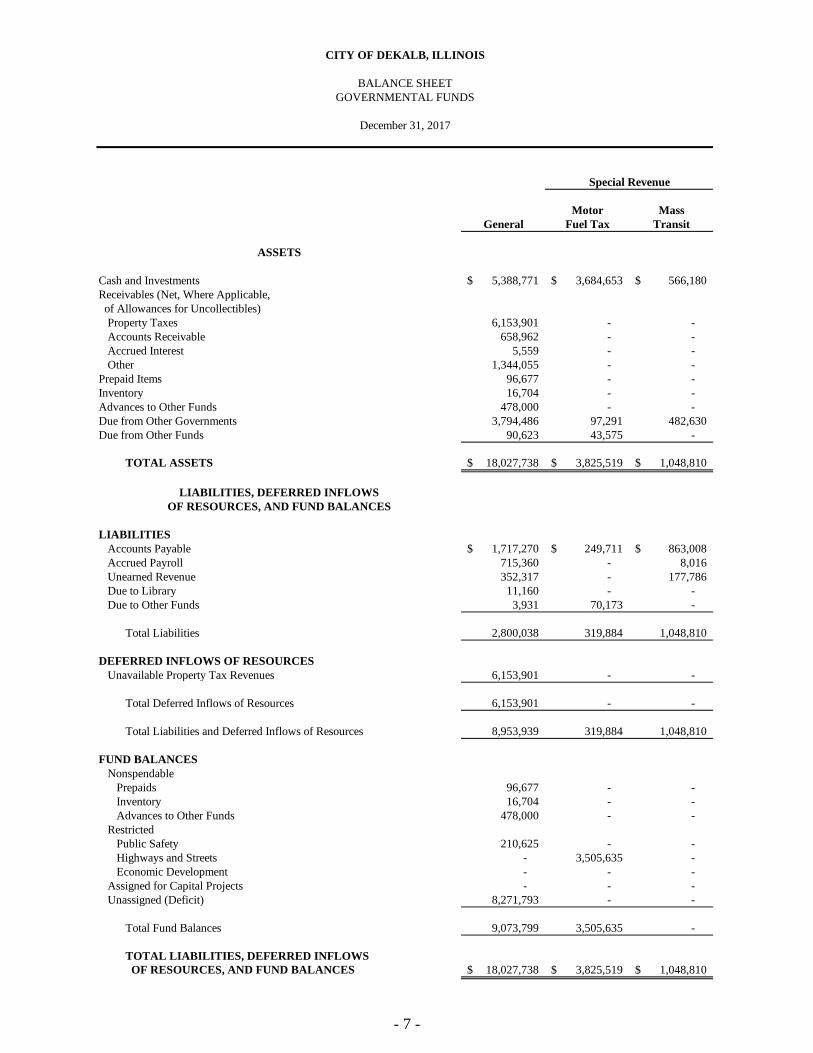
Motor Mass
General Fuel Tax Transit
ASSETS
Cash and Investments 5,388,771$ 3,684,653$ 566,180$
Receivables (Net, Where Applicable,
of Allowances for Uncollectibles)
Property Taxes 6,153,901 - -
Accounts Receivable 658,962 - -
Accrued Interest 5,559 - -
Other 1,344,055 - -
Prepaid Items 96,677 - -
Inventory 16,704 - -
Advances to Other Funds 478,000 - -
Due from Other Governments 3,794,486 97,291 482,630
Due from Other Funds 90,623 43,575 -
TOTAL ASSETS 18,027,738$ 3,825,519$ 1,048,810$
LIABILITIES
Accounts Payable 1,717,270$ 249,711$ 863,008$
Accrued Payroll 715,360 - 8,016
Unearned Revenue 352,317 - 177,786
Due to Library 11,160 - -
Due to Other Funds 3,931 70,173 -
Total Liabilities 2,800,038 319,884 1,048,810
DEFERRED INFLOWS OF RESOURCES
Unavailable Property Tax Revenues 6,153,901 - -
Total Deferred Inflows of Resources 6,153,901 - -
Total Liabilities and Deferred Inflows of Resources 8,953,939 319,884 1,048,810
FUND BALANCES
Nonspendable
Prepaids 96,677 - -
Inventory 16,704 - -
Advances to Other Funds 478,000 - -
Restricted
Public Safety 210,625 - -
Highways and Streets - 3,505,635 -
Economic Development - - -
Assigned for Capital Projects - - -
Unassigned (Deficit) 8,271,793 - -
Total Fund Balances 9,073,799 3,505,635 -
TOTAL LIABILITIES, DEFERRED INFLOWS
OF RESOURCES, AND FUND BALANCES 18,027,738$ 3,825,519$ 1,048,810$
OF RESOURCES, AND FUND BALANCES
LIABILITIES, DEFERRED INFLOWS
Special Revenue
CITY OF DEKALB, ILLINOIS
BALANCE SHEET
GOVERNMENTAL FUNDS
December 31, 2017
- 7 -
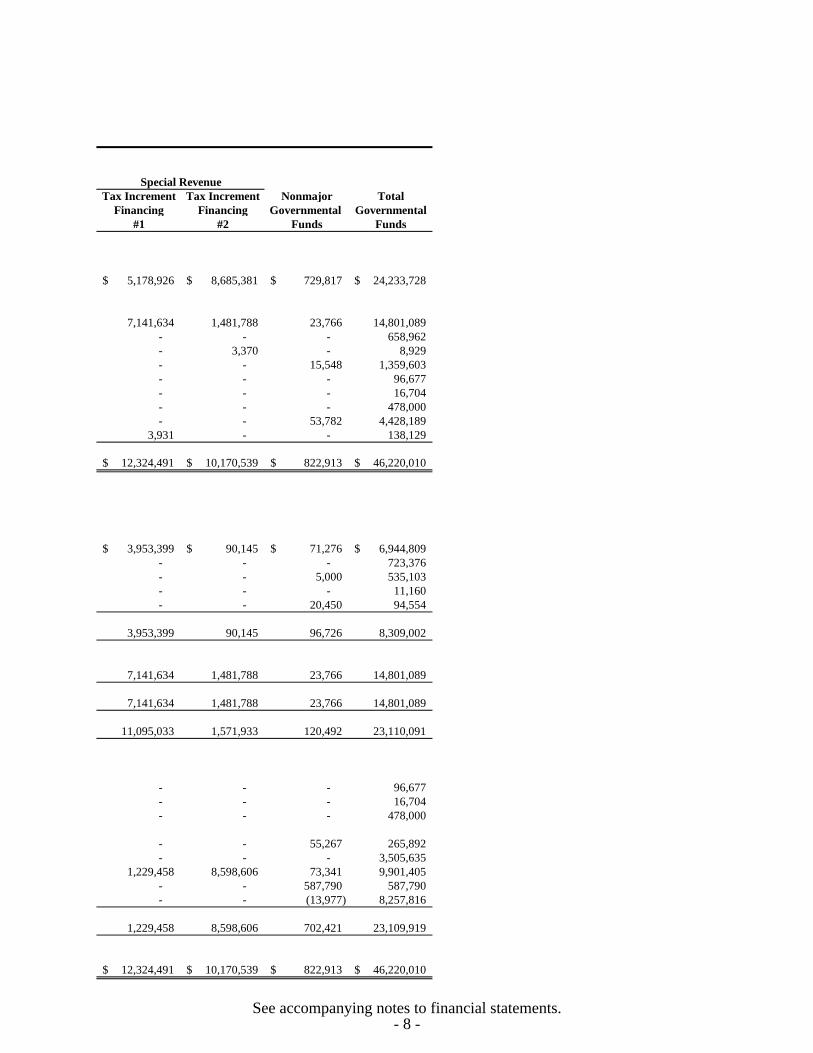
Tax Increment Tax Increment Nonmajor Total
Financing Financing Governmental Governmental
#1 #2 Funds Funds
5,178,926$ 8,685,381$ 729,817$ 24,233,728$
7,141,634 1,481,788 23,766 14,801,089
- - - 658,962
- 3,370 - 8,929
- - 15,548 1,359,603
- - - 96,677
- - - 16,704
- - - 478,000
- - 53,782 4,428,189
3,931 - - 138,129
12,324,491$ 10,170,539$ 822,913$ 46,220,010$
3,953,399$ 90,145$ 71,276$ 6,944,809$
- - - 723,376
- - 5,000 535,103
- - - 11,160
- - 20,450 94,554
3,953,399 90,145 96,726 8,309,002
7,141,634 1,481,788 23,766 14,801,089
7,141,634 1,481,788 23,766 14,801,089
11,095,033 1,571,933 120,492 23,110,091
- - - 96,677
- - - 16,704
- - - 478,000
- - 55,267 265,892
- - - 3,505,635
1,229,458 8,598,606 73,341 9,901,405
- - 587,790 587,790
- - (13,977) 8,257,816
1,229,458 8,598,606 702,421 23,109,919
12,324,491$ 10,170,539$ 822,913$ 46,220,010$
Special Revenue
See accompanying notes to financial statements.- 8 -
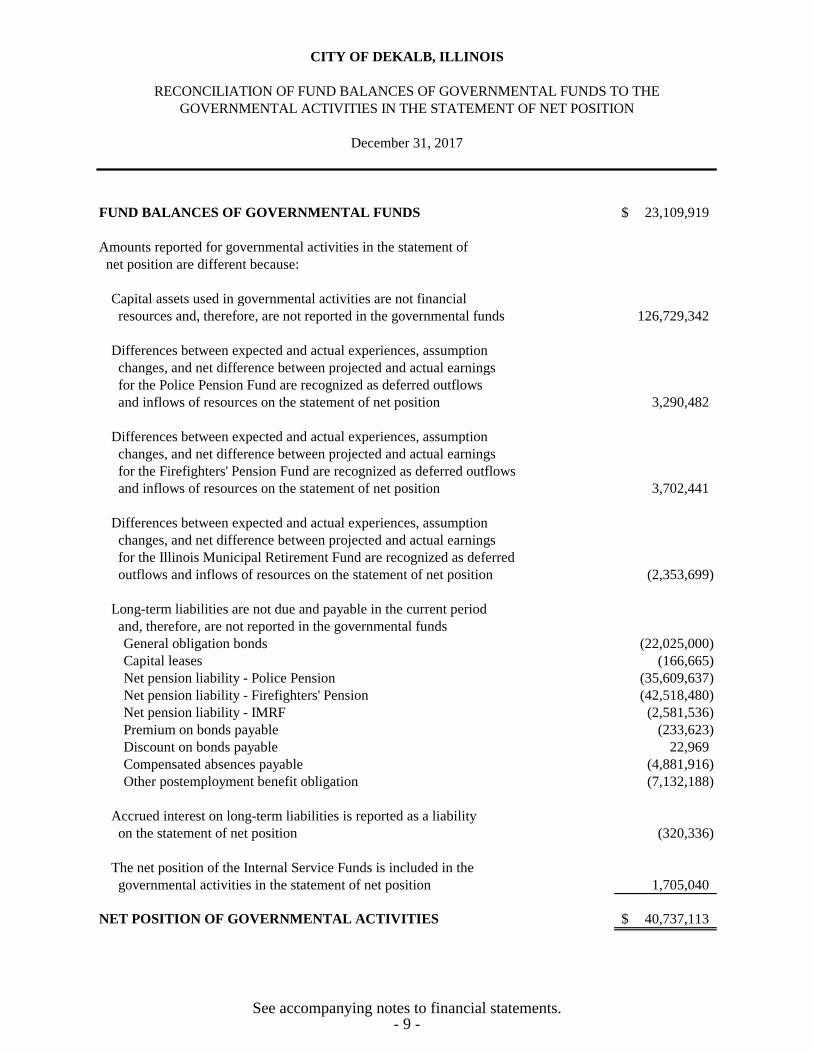
FUND BALANCES OF GOVERNMENTAL FUNDS 23,109,919$
Amounts reported for governmental activities in the statement of
net position are different because:
Capital assets used in governmental activities are not financial
resources and, therefore, are not reported in the governmental funds 126,729,342
Differences between expected and actual experiences, assumption
changes, and net difference between projected and actual earnings
for the Police Pension Fund are recognized as deferred outflows
and inflows of resources on the statement of net position 3,290,482
Differences between expected and actual experiences, assumption
changes, and net difference between projected and actual earnings
for the Firefighters' Pension Fund are recognized as deferred outflows
and inflows of resources on the statement of net position 3,702,441
Differences between expected and actual experiences, assumption
changes, and net difference between projected and actual earnings
for the Illinois Municipal Retirement Fund are recognized as deferred
outflows and inflows of resources on the statement of net position (2,353,699)
Long-term liabilities are not due and payable in the current period
and, therefore, are not reported in the governmental funds
General obligation bonds (22,025,000)
Capital leases (166,665)
Net pension liability - Police Pension (35,609,637)
Net pension liability - Firefighters' Pension (42,518,480)
Net pension liability - IMRF (2,581,536)
Premium on bonds payable (233,623)
Discount on bonds payable 22,969
Compensated absences payable (4,881,916)
Other postemployment benefit obligation (7,132,188)
Accrued interest on long-term liabilities is reported as a liability
on the statement of net position (320,336)
The net position of the Internal Service Funds is included in the
governmental activities in the statement of net position 1,705,040
NET POSITION OF GOVERNMENTAL ACTIVITIES 40,737,113$
December 31, 2017
CITY OF DEKALB, ILLINOIS
RECONCILIATION OF FUND BALANCES OF GOVERNMENTAL FUNDS TO THE
GOVERNMENTAL ACTIVITIES IN THE STATEMENT OF NET POSITION
See accompanying notes to financial statements.- 9 -
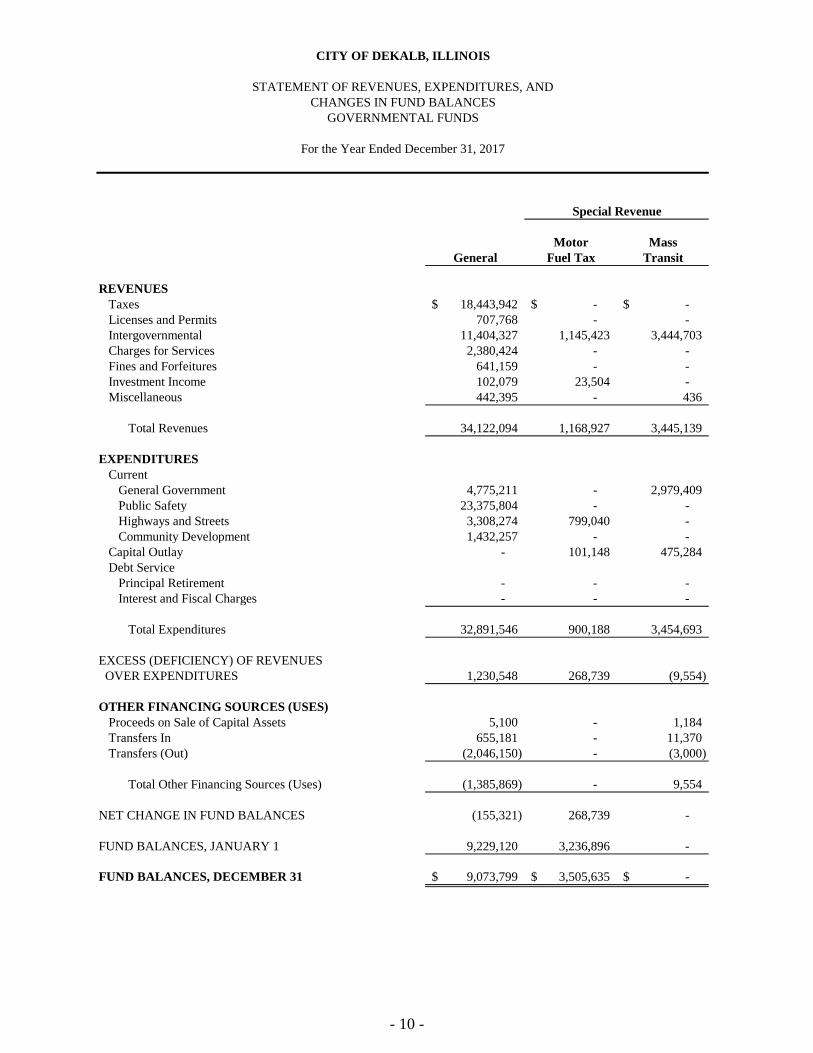
Motor Mass
General Fuel Tax Transit
REVENUES
Taxes 18,443,942$ -$ -$
Licenses and Permits 707,768 - -
Intergovernmental 11,404,327 1,145,423 3,444,703
Charges for Services 2,380,424 - -
Fines and Forfeitures 641,159 - -
Investment Income 102,079 23,504 -
Miscellaneous 442,395 - 436
Total Revenues 34,122,094 1,168,927 3,445,139
EXPENDITURES
Current
General Government 4,775,211 - 2,979,409
Public Safety 23,375,804 - -
Highways and Streets 3,308,274 799,040 -
Community Development 1,432,257 - -
Capital Outlay - 101,148 475,284
Debt Service
Principal Retirement - - -
Interest and Fiscal Charges - - -
Total Expenditures 32,891,546 900,188 3,454,693
EXCESS (DEFICIENCY) OF REVENUES
OVER EXPENDITURES 1,230,548 268,739 (9,554)
OTHER FINANCING SOURCES (USES)
Proceeds on Sale of Capital Assets 5,100 - 1,184
Transfers In 655,181 - 11,370
Transfers (Out) (2,046,150) - (3,000)
Total Other Financing Sources (Uses) (1,385,869) - 9,554
NET CHANGE IN FUND BALANCES (155,321) 268,739 -
FUND BALANCES, JANUARY 1 9,229,120 3,236,896 -
FUND BALANCES, DECEMBER 31 9,073,799$ 3,505,635$ -$
Special Revenue
CITY OF DEKALB, ILLINOIS
STATEMENT OF REVENUES, EXPENDITURES, AND
CHANGES IN FUND BALANCES
GOVERNMENTAL FUNDS
For the Year Ended December 31, 2017
- 10 -
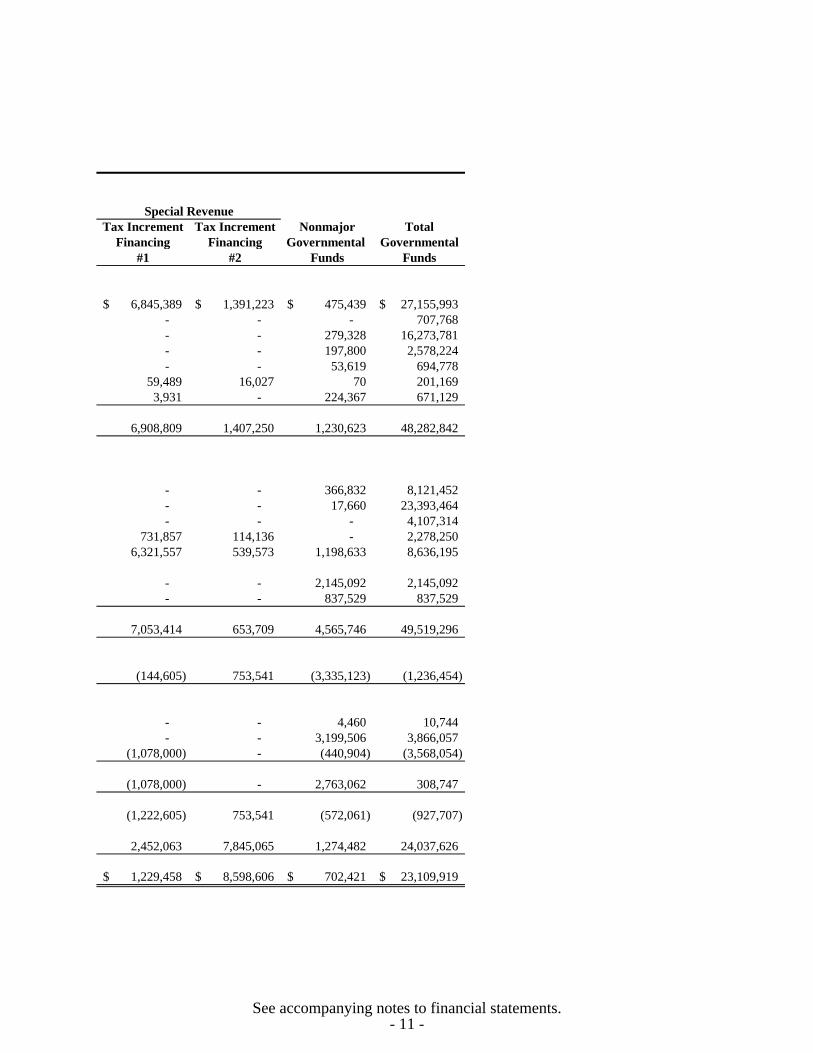
Tax Increment Tax Increment Nonmajor Total
Financing Financing Governmental Governmental
#1 #2 Funds Funds
6,845,389$ 1,391,223$ 475,439$ 27,155,993$
- - - 707,768
- - 279,328 16,273,781
- - 197,800 2,578,224
- - 53,619 694,778
59,489 16,027 70 201,169
3,931 - 224,367 671,129
6,908,809 1,407,250 1,230,623 48,282,842
- - 366,832 8,121,452
- - 17,660 23,393,464
- - - 4,107,314
731,857 114,136 - 2,278,250
6,321,557 539,573 1,198,633 8,636,195
- - 2,145,092 2,145,092
- - 837,529 837,529
7,053,414 653,709 4,565,746 49,519,296
(144,605) 753,541 (3,335,123) (1,236,454)
- - 4,460 10,744
- - 3,199,506 3,866,057
(1,078,000) - (440,904) (3,568,054)
(1,078,000) - 2,763,062 308,747
(1,222,605) 753,541 (572,061) (927,707)
2,452,063 7,845,065 1,274,482 24,037,626
1,229,458$ 8,598,606$ 702,421$ 23,109,919$
Special Revenue
See accompanying notes to financial statements.- 11 -
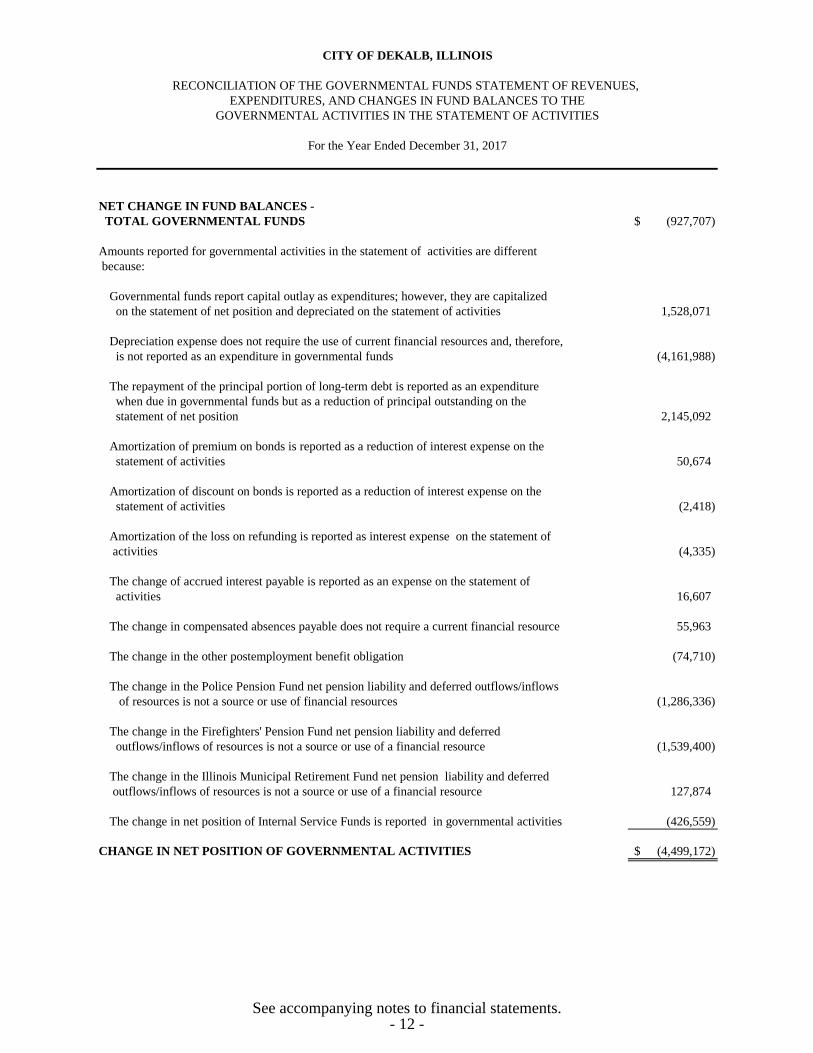
NET CHANGE IN FUND BALANCES -
TOTAL GOVERNMENTAL FUNDS (927,707)$
Amounts reported for governmental activities in the statement of activities are different
because:
Governmental funds report capital outlay as expenditures; however, they are capitalized
on the statement of net position and depreciated on the statement of activities 1,528,071
Depreciation expense does not require the use of current financial resources and, therefore,
is not reported as an expenditure in governmental funds (4,161,988)
The repayment of the principal portion of long-term debt is reported as an expenditure
when due in governmental funds but as a reduction of principal outstanding on the
statement of net position 2,145,092
Amortization of premium on bonds is reported as a reduction of interest expense on the
statement of activities 50,674
Amortization of discount on bonds is reported as a reduction of interest expense on the
statement of activities (2,418)
Amortization of the loss on refunding is reported as interest expense on the statement of
activities (4,335)
The change of accrued interest payable is reported as an expense on the statement of
activities 16,607
The change in compensated absences payable does not require a current financial resource 55,963
The change in the other postemployment benefit obligation (74,710)
The change in the Police Pension Fund net pension liability and deferred outflows/inflows
of resources is not a source or use of financial resources (1,286,336)
The change in the Firefighters' Pension Fund net pension liability and deferred
outflows/inflows of resources is not a source or use of a financial resource (1,539,400)
The change in the Illinois Municipal Retirement Fund net pension liability and deferred
outflows/inflows of resources is not a source or use of a financial resource 127,874
The change in net position of Internal Service Funds is reported in governmental activities (426,559)
CHANGE IN NET POSITION OF GOVERNMENTAL ACTIVITIES (4,499,172)$
For the Year Ended December 31, 2017
CITY OF DEKALB, ILLINOIS
RECONCILIATION OF THE GOVERNMENTAL FUNDS STATEMENT OF REVENUES,
GOVERNMENTAL ACTIVITIES IN THE STATEMENT OF ACTIVITIES
EXPENDITURES, AND CHANGES IN FUND BALANCES TO THE
See accompanying notes to financial statements.- 12 -
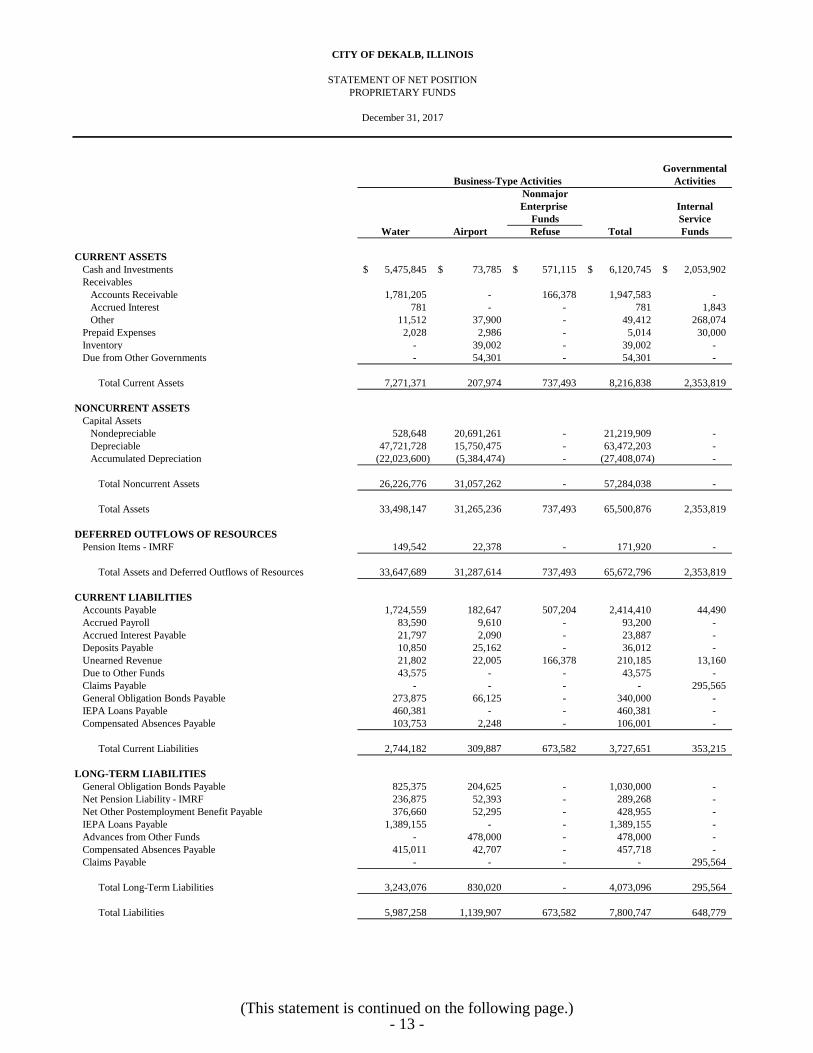
Governmental
Business-Type Activities Activities
Nonmajor
Enterprise Internal
Funds Service
Water Airport Refuse Total Funds
CURRENT ASSETS
Cash and Investments 5,475,845$ 73,785$ 571,115$ 6,120,745$ 2,053,902$
Receivables
Accounts Receivable 1,781,205 - 166,378 1,947,583 -
Accrued Interest 781 - - 781 1,843
Other 11,512 37,900 - 49,412 268,074
Prepaid Expenses 2,028 2,986 - 5,014 30,000
Inventory - 39,002 - 39,002 -
Due from Other Governments - 54,301 - 54,301 -
Total Current Assets 7,271,371 207,974 737,493 8,216,838 2,353,819
NONCURRENT ASSETS
Capital Assets
Nondepreciable 528,648 20,691,261 - 21,219,909 -
Depreciable 47,721,728 15,750,475 - 63,472,203 -
Accumulated Depreciation (22,023,600) (5,384,474) - (27,408,074) -
Total Noncurrent Assets 26,226,776 31,057,262 - 57,284,038 -
Total Assets 33,498,147 31,265,236 737,493 65,500,876 2,353,819
DEFERRED OUTFLOWS OF RESOURCES
Pension Items - IMRF 149,542 22,378 - 171,920 -
Total Assets and Deferred Outflows of Resources 33,647,689 31,287,614 737,493 65,672,796 2,353,819
CURRENT LIABILITIES
Accounts Payable 1,724,559 182,647 507,204 2,414,410 44,490
Accrued Payroll 83,590 9,610 - 93,200 -
Accrued Interest Payable 21,797 2,090 - 23,887 -
Deposits Payable 10,850 25,162 - 36,012 -
Unearned Revenue 21,802 22,005 166,378 210,185 13,160
Due to Other Funds 43,575 - - 43,575 -
Claims Payable - - - - 295,565
General Obligation Bonds Payable 273,875 66,125 - 340,000 -
IEPA Loans Payable 460,381 - - 460,381 -
Compensated Absences Payable 103,753 2,248 - 106,001 -
Total Current Liabilities 2,744,182 309,887 673,582 3,727,651 353,215
LONG-TERM LIABILITIES
General Obligation Bonds Payable 825,375 204,625 - 1,030,000 -
Net Pension Liability - IMRF 236,875 52,393 - 289,268 -
Net Other Postemployment Benefit Payable 376,660 52,295 - 428,955 -
IEPA Loans Payable 1,389,155 - - 1,389,155 -
Advances from Other Funds - 478,000 - 478,000 -
Compensated Absences Payable 415,011 42,707 - 457,718 -
Claims Payable - - - - 295,564
Total Long-Term Liabilities 3,243,076 830,020 - 4,073,096 295,564
Total Liabilities 5,987,258 1,139,907 673,582 7,800,747 648,779
CITY OF DEKALB, ILLINOIS
STATEMENT OF NET POSITION
PROPRIETARY FUNDS
December 31, 2017
(This statement is continued on the following page.)- 13 -
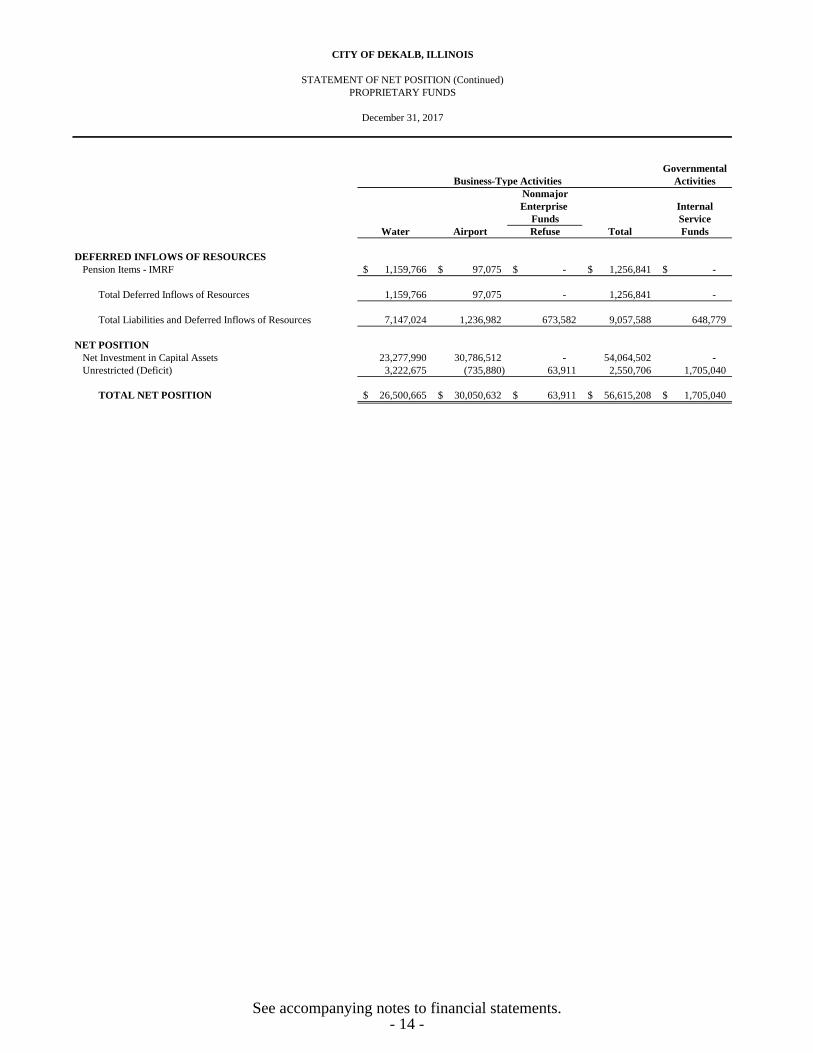
Governmental
Business-Type Activities Activities
Nonmajor
Enterprise Internal
Funds Service
Water Airport Refuse Total Funds
DEFERRED INFLOWS OF RESOURCES
Pension Items - IMRF 1,159,766$ 97,075$ -$ 1,256,841$ -$
Total Deferred Inflows of Resources 1,159,766 97,075 - 1,256,841 -
Total Liabilities and Deferred Inflows of Resources 7,147,024 1,236,982 673,582 9,057,588 648,779
NET POSITION
Net Investment in Capital Assets 23,277,990 30,786,512 - 54,064,502 -
Unrestricted (Deficit) 3,222,675 (735,880) 63,911 2,550,706 1,705,040
TOTAL NET POSITION 26,500,665$ 30,050,632$ 63,911$ 56,615,208$ 1,705,040$
STATEMENT OF NET POSITION (Continued)
PROPRIETARY FUNDS
December 31, 2017
CITY OF DEKALB, ILLINOIS
See accompanying notes to financial statements.- 14 -
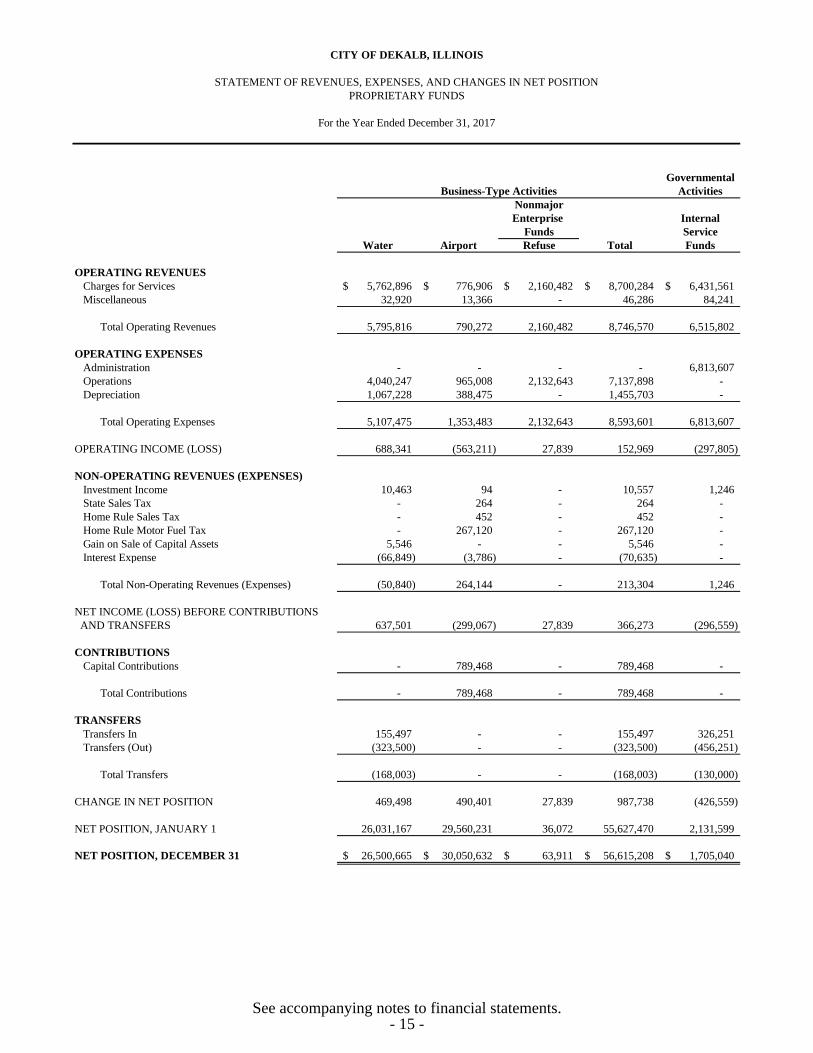
CITY OF DEKALB, ILLINOIS
STATEMENT OF REVENUES, EXPENSES, AND CHANGES IN NET POSITION
PROPRIETARY FUNDS
For the Year Ended December 31, 2017
Governmental
Business-Type Activities Activities
Nonmajor
Enterprise Internal
Funds Service
Water Airport Refuse Total Funds
OPERATING REVENUES
Charges for Services 5,762,896$ 776,906$ 2,160,482$ 8,700,284$ 6,431,561$
Miscellaneous 32,920 13,366 - 46,286 84,241
Total Operating Revenues 5,795,816 790,272 2,160,482 8,746,570 6,515,802
OPERATING EXPENSES
Administration - - - - 6,813,607
Operations 4,040,247 965,008 2,132,643 7,137,898 -
Depreciation 1,067,228 388,475 - 1,455,703 -
Total Operating Expenses 5,107,475 1,353,483 2,132,643 8,593,601 6,813,607
OPERATING INCOME (LOSS) 688,341 (563,211) 27,839 152,969 (297,805)
NON-OPERATING REVENUES (EXPENSES)
Investment Income 10,463 94 - 10,557 1,246
State Sales Tax - 264 - 264 -
Home Rule Sales Tax - 452 - 452 -
Home Rule Motor Fuel Tax - 267,120 - 267,120 -
Gain on Sale of Capital Assets 5,546 - - 5,546 -
Interest Expense (66,849) (3,786) - (70,635) -
Total Non-Operating Revenues (Expenses) (50,840) 264,144 - 213,304 1,246
NET INCOME (LOSS) BEFORE CONTRIBUTIONS
AND TRANSFERS 637,501 (299,067) 27,839 366,273 (296,559)
CONTRIBUTIONS
Capital Contributions - 789,468 - 789,468 -
Total Contributions - 789,468 - 789,468 -
TRANSFERS
Transfers In 155,497 - - 155,497 326,251
Transfers (Out) (323,500) - - (323,500) (456,251)
Total Transfers (168,003) - - (168,003) (130,000)
CHANGE IN NET POSITION 469,498 490,401 27,839 987,738 (426,559)
NET POSITION, JANUARY 1 26,031,167 29,560,231 36,072 55,627,470 2,131,599
NET POSITION, DECEMBER 31 26,500,665$ 30,050,632$ 63,911$ 56,615,208$ 1,705,040$
See accompanying notes to financial statements.- 15 -
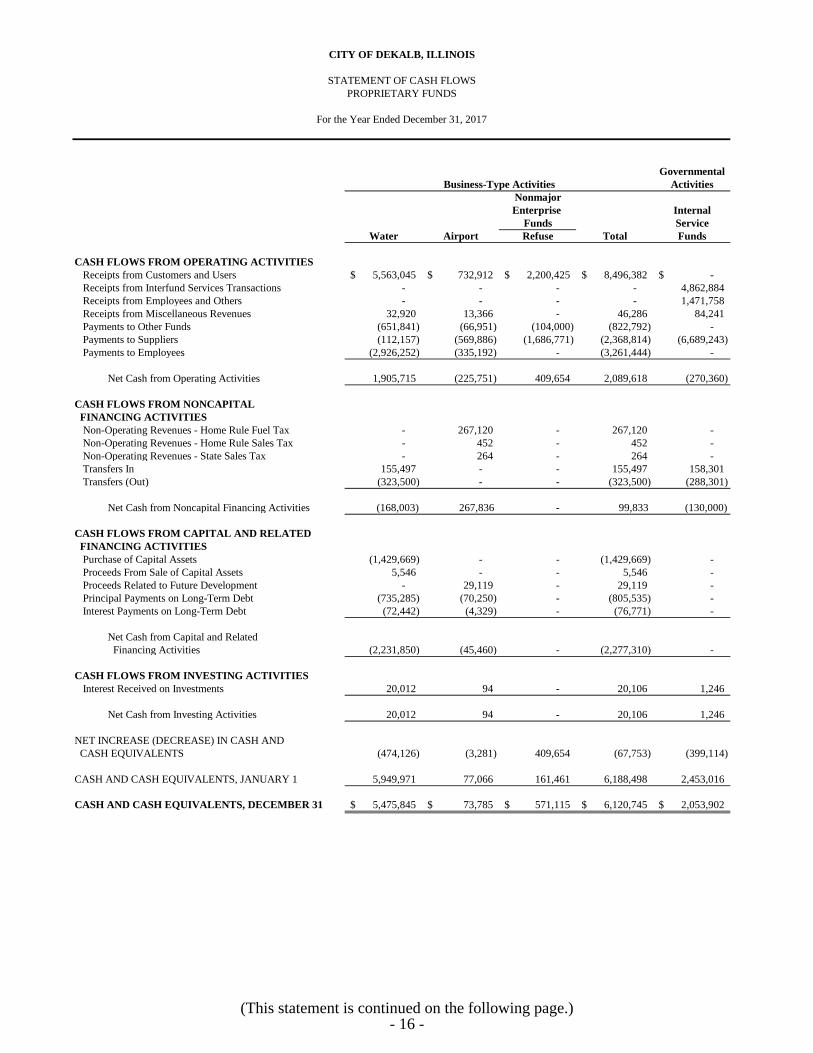
CITY OF DEKALB, ILLINOIS
STATEMENT OF CASH FLOWS
PROPRIETARY FUNDS
For the Year Ended December 31, 2017
Governmental
Business-Type Activities Activities
Nonmajor
Enterprise Internal
Funds Service
Water Airport Refuse Total Funds
CASH FLOWS FROM OPERATING ACTIVITIES
Receipts from Customers and Users 5,563,045$ 732,912$ 2,200,425$ 8,496,382$ -$
Receipts from Interfund Services Transactions - - - - 4,862,884
Receipts from Employees and Others - - - - 1,471,758
Receipts from Miscellaneous Revenues 32,920 13,366 - 46,286 84,241
Payments to Other Funds (651,841) (66,951) (104,000) (822,792) -
Payments to Suppliers (112,157) (569,886) (1,686,771) (2,368,814) (6,689,243)
Payments to Employees (2,926,252) (335,192) - (3,261,444) -
Net Cash from Operating Activities 1,905,715 (225,751) 409,654 2,089,618 (270,360)
CASH FLOWS FROM NONCAPITAL
FINANCING ACTIVITIES
Non-Operating Revenues - Home Rule Fuel Tax - 267,120 - 267,120 -
Non-Operating Revenues - Home Rule Sales Tax - 452 - 452 -
Non-Operating Revenues - State Sales Tax - 264 - 264 -
Transfers In 155,497 - - 155,497 158,301
Transfers (Out) (323,500) - - (323,500) (288,301)
Net Cash from Noncapital Financing Activities (168,003) 267,836 - 99,833 (130,000)
CASH FLOWS FROM CAPITAL AND RELATED
FINANCING ACTIVITIES
Purchase of Capital Assets (1,429,669) - - (1,429,669) -
Proceeds From Sale of Capital Assets 5,546 - - 5,546 -
Proceeds Related to Future Development - 29,119 - 29,119 -
Principal Payments on Long-Term Debt (735,285) (70,250) - (805,535) -
Interest Payments on Long-Term Debt (72,442) (4,329) - (76,771) -
Net Cash from Capital and Related
Financing Activities (2,231,850) (45,460) - (2,277,310) -
CASH FLOWS FROM INVESTING ACTIVITIES
Interest Received on Investments 20,012 94 - 20,106 1,246
Net Cash from Investing Activities 20,012 94 - 20,106 1,246
NET INCREASE (DECREASE) IN CASH AND
CASH EQUIVALENTS (474,126) (3,281) 409,654 (67,753) (399,114)
CASH AND CASH EQUIVALENTS, JANUARY 1 5,949,971 77,066 161,461 6,188,498 2,453,016
CASH AND CASH EQUIVALENTS, DECEMBER 31 5,475,845$ 73,785$ 571,115$ 6,120,745$ 2,053,902$
(This statement is continued on the following page.)- 16 -
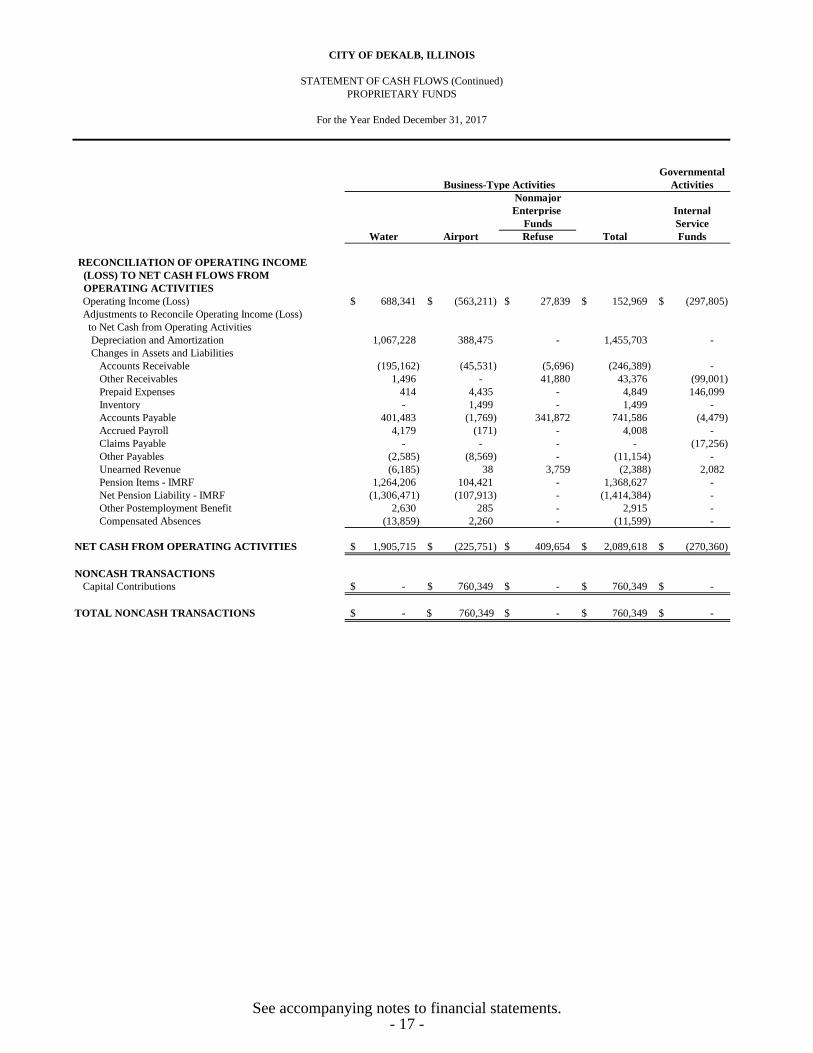
CITY OF DEKALB, ILLINOIS
STATEMENT OF CASH FLOWS (Continued)
PROPRIETARY FUNDS
For the Year Ended December 31, 2017
Governmental
Business-Type Activities Activities
Nonmajor
Enterprise Internal
Funds Service
Water Airport Refuse Total Funds
RECONCILIATION OF OPERATING INCOME
(LOSS) TO NET CASH FLOWS FROM
OPERATING ACTIVITIES
Operating Income (Loss) 688,341$ (563,211)$ 27,839$ 152,969$ (297,805)$
Adjustments to Reconcile Operating Income (Loss)
to Net Cash from Operating Activities
Depreciation and Amortization 1,067,228 388,475 - 1,455,703 -
Changes in Assets and Liabilities
Accounts Receivable (195,162) (45,531) (5,696) (246,389) -
Other Receivables 1,496 - 41,880 43,376 (99,001)
Prepaid Expenses 414 4,435 - 4,849 146,099
Inventory - 1,499 - 1,499 -
Accounts Payable 401,483 (1,769) 341,872 741,586 (4,479)
Accrued Payroll 4,179 (171) - 4,008 -
Claims Payable - - - - (17,256)
Other Payables (2,585) (8,569) - (11,154) -
Unearned Revenue (6,185) 38 3,759 (2,388) 2,082
Pension Items - IMRF 1,264,206 104,421 - 1,368,627 -
Net Pension Liability - IMRF (1,306,471) (107,913) - (1,414,384) -
Other Postemployment Benefit 2,630 285 - 2,915 -
Compensated Absences (13,859) 2,260 - (11,599) -
NET CASH FROM OPERATING ACTIVITIES 1,905,715$ (225,751)$ 409,654$ 2,089,618$ (270,360)$
NONCASH TRANSACTIONS
Capital Contributions -$ 760,349$ -$ 760,349$ -$
TOTAL NONCASH TRANSACTIONS -$ $ 760,349 -$ 760,349$ -$
See accompanying notes to financial statements.- 17 -
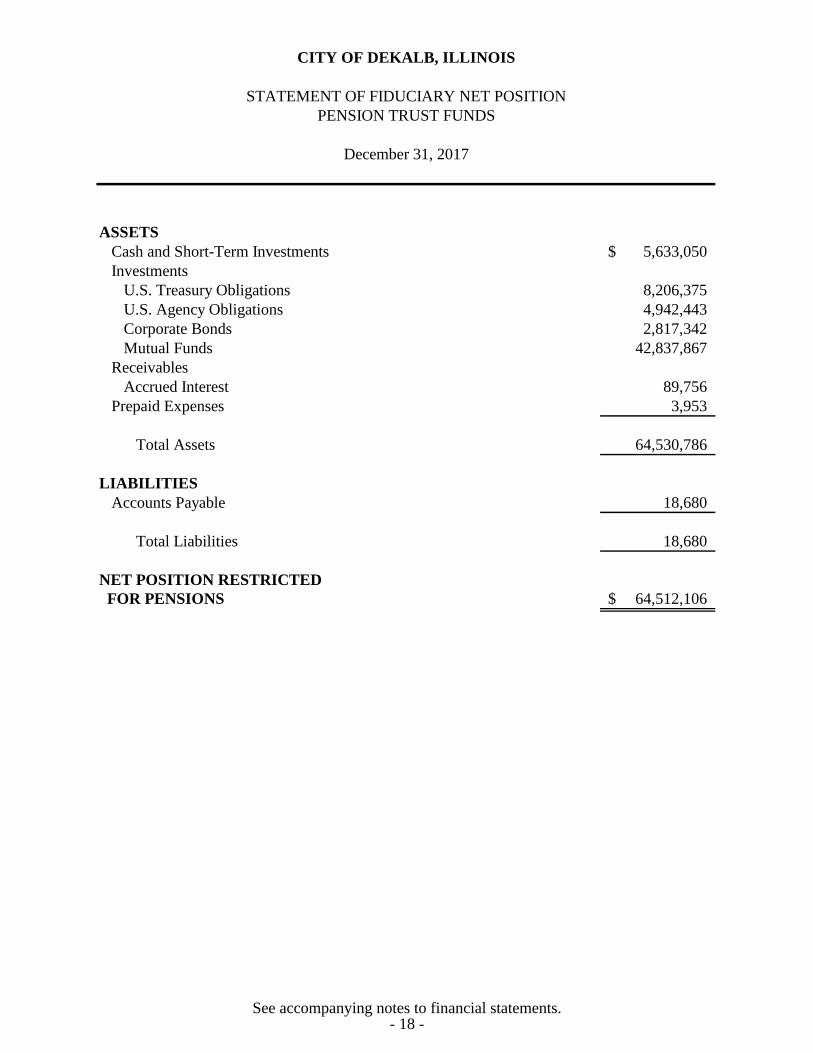
PENSION TRUST FUNDS
ASSETS
Cash and Short-Term Investments 5,633,050$
Investments
U.S. Treasury Obligations 8,206,375
U.S. Agency Obligations 4,942,443
Corporate Bonds 2,817,342
Mutual Funds 42,837,867
Receivables
Accrued Interest 89,756
Prepaid Expenses 3,953
Total Assets 64,530,786
LIABILITIES
Accounts Payable 18,680
Total Liabilities 18,680
NET POSITION RESTRICTED
FOR PENSIONS 64,512,106$
CITY OF DEKALB, ILLINOIS
STATEMENT OF FIDUCIARY NET POSITION
December 31, 2017
See accompanying notes to financial statements.- 18 -
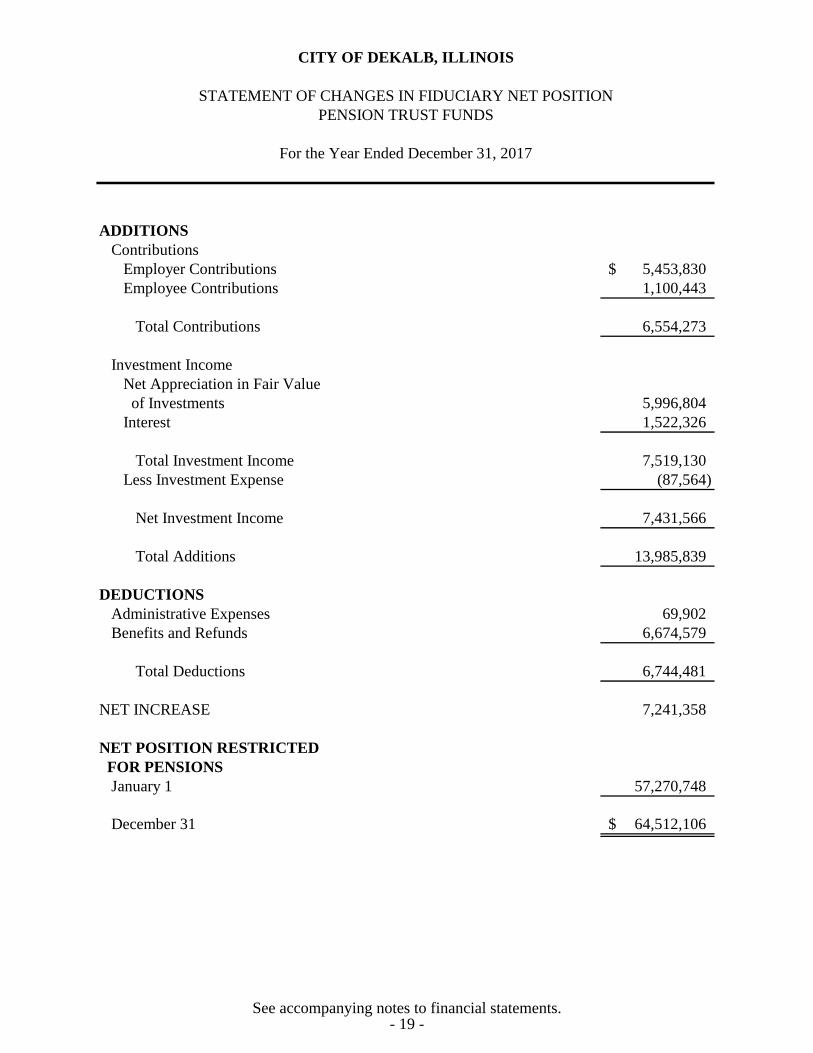
CITY OF DEKALB, ILLINOIS
STATEMENT OF CHANGES IN FIDUCIARY NET POSITION
PENSION TRUST FUNDS
For the Year Ended December 31, 2017
ADDITIONS
Contributions
Employer Contributions 5,453,830$
Employee Contributions 1,100,443
Total Contributions 6,554,273
Investment Income
Net Appreciation in Fair Value
of Investments 5,996,804
Interest 1,522,326
Total Investment Income 7,519,130
Less Investment Expense (87,564)
Net Investment Income 7,431,566
Total Additions 13,985,839
DEDUCTIONS
Administrative Expenses 69,902
Benefits and Refunds 6,674,579
Total Deductions 6,744,481
NET INCREASE 7,241,358
NET POSITION RESTRICTED
FOR PENSIONS
January 1 57,270,748
December 31 64,512,106$
See accompanying notes to financial statements.- 19 -
- 20 -
CITY OF DEKALB, ILLINOIS
NOTES TO FINANCIAL STATEMENTS
December 31, 2017
1. SUMMARY OF SIGNIFICANT ACCOUNTING POLICIES
The financial statements of the City of DeKalb (the City) have been prepared in conformity
with accounting principles generally accepted in the United States of America, as
applicable to governments (hereinafter referred to as generally accepted accounting
principles (GAAP)). The Governmental Accounting Standards Board (GASB) is the
accepted standard-setting body for establishing governmental accounting and financial
reporting principles. The following is a summary of the more significant policies:
A. Reporting Entity
The City is a municipal corporation governed by an elected mayor and council. As
defined by GAAP established by GASB, the financial reporting entity consists of the
primary government, as well as its component units, which are legally separate
organizations for which the elected officials of the primary government are
financially accountable. Financial accountability is defined as:
1) Appointment of a voting majority of the component unit’s board and either (a)
the ability to impose will by the primary government or (b) the possibility that
the component unit will provide a financial benefit to or impose a financial
burden on the primary government; or
2) Fiscal dependency on the primary government.
Based on the above criteria, the City has one component unit.
Discretely Presented Component Unit
The component unit column in the basic financial statements includes the financial
data of the City’s component unit. It is reported in a separate column to emphasize
that it is legally separate from the City.
The DeKalb Public Library
The DeKalb Public Library (the Library) operates and maintains the City’s public
library facilities. The Library’s Board is appointed by the Mayor with the consent of
the City Council. The Library may not issue bonded debt, and its annual budget and
property tax levy requests are subject to the City Council’s approval. Separate
financial statements for the Library are not available.
- 20 -
CITY OF DEKALB, ILLINOIS
NOTES TO FINANCIAL STATEMENTS (Continued)
- 21 -
1. SUMMARY OF SIGNIFICANT ACCOUNTING POLICIES (Continued)
B. Fund Accounting
The City uses funds to report on its financial position and the change in its financial
position. Fund accounting is designed to demonstrate legal compliance and to aid
financial management by segregating transactions related to certain government
functions or activities.
A fund is a separate accounting entity with a self-balancing set of accounts. The
minimum number of funds are maintained consistent with legal and managerial
requirements.
Funds are classified into the following categories: governmental, proprietary, and
fiduciary.
Governmental funds are used to account for all or most of the City’s general
activities, including the collection and disbursement of committed, restricted,
or assigned monies (special revenue funds), the funds committed, restricted, or
assigned for the acquisition or construction of capital assets (capital projects
funds), and the funds committed, restricted, or assigned for the servicing of
long-term debt (debt service funds). The General Fund is used to account for
all activities of the City not accounted for in some other fund.
Proprietary funds are used to account for activities similar to those found in the
private sector, where the determination of net income is necessary or useful to
sound financial administration. Goods or services from such activities can be
provided either to outside parties (enterprise funds) or to other departments or
agencies primarily within the City (internal service funds).
Fiduciary funds are used to account for assets held on behalf of outside parties,
including other governments, or on behalf of other funds within the City. The
City utilizes pension trust funds which are generally used to account for assets
that the City holds in a fiduciary capacity.
C. Government-Wide and Fund Financial Statements
The government-wide financial statements (i.e., the statement of net position and the
statement of activities) report information on all of the nonfiduciary activities of the
City. The effect of material interfund activity has been eliminated from these
statements. Interfund services provided and used are not eliminated on these
statements. Governmental activities, which normally are supported by taxes and
intergovernmental revenues, are reported separately from business-type activities,
which rely to a significant extent on fees and charges for support.
- 21 -

CITY OF DEKALB, ILLINOIS
NOTES TO FINANCIAL STATEMENTS (Continued)
- 22 -
1. SUMMARY OF SIGNIFICANT ACCOUNTING POLICIES (Continued)
C. Government-Wide and Fund Financial Statements (Continued)
The statement of activities demonstrates the degree to which the direct expenses of a
given function, segment, or program are offset by program revenues. Direct expenses
are those that are clearly identifiable with a specific function or segment. Program
revenues include (1) charges to customers or applicants who purchase, use, or directly
benefit from goods, services, or privileges provided by a given function or segment and
(2) grants and contributions that are restricted to meeting the operational or capital
requirements of a particular function or segment. Taxes and other items not properly
included among program revenues are reported instead as general revenues.
Separate financial statements are provided for governmental funds, proprietary funds,
and fiduciary funds, even though the latter are excluded from the government-wide
financial statements. Major individual governmental funds and major individual
enterprise funds are reported as separate columns in the fund financial statements.
The City reports the following major governmental funds:
The General Fund is the City’s primary operating fund. It accounts for all
financial resources of the general government, except those required to be
accounted for in another fund.
The Motor Fuel Tax Fund accounts for the operations of street maintenance
programs and capital projects as authorized by the Illinois Department of
Transportation. Financing is provided by the City’s share of gasoline taxes. The
City has elected to report the Motor Fuel Tax Fund as major.
The Mass Transit Fund accounts for the restricted grant revenues for the two
community mass transit services: Northern Illinois University’s Huskies Line and
Voluntary Action Center’s Trans Vac Service. The City has elected to report the
Mass Transit Fund as major.
The Tax Increment Financing #1 Fund accounts for the restricted property taxes
for the redevelopment activities within a defined area of the community in order
to eliminate blighted conditions in that area.
The Tax Increment Financing #2 Fund accounts for the restricted property taxes
for the redevelopment activities within another defined area of the community in
order to eliminate blighted conditions in that area.
- 22 -
CITY OF DEKALB, ILLINOIS
NOTES TO FINANCIAL STATEMENTS (Continued)
- 23 -
1. SUMMARY OF SIGNIFICANT ACCOUNTING POLICIES (Continued)
C. Government-Wide and Fund Financial Statements (Continued)
The City reports the following major proprietary funds:
The Water Fund accounts for the provision of water service to the residents of the
City. All activity necessary to provide such services is accounted for in this fund
including, but not limited to, administration, operation, maintenance, financing
and related debt service, and billing and collection.
The Airport Fund is used to account for the operation of the Taylor Municipal
Airport. Financing may be provided from a number of sources including user
fees as well as property taxes.
Additionally, the City reports the following Internal Service Fund:
Internal Service Funds account for the City’s self-insured property, casualty,
workers’ compensation, and health insurance programs provided to other
departments or agencies of the City on a cost reimbursement basis. These are
reported as part of the governmental activities on the government-wide financial
statements as they provide services to the City’s governmental funds/activities.
The City reports pension trust funds as fiduciary funds to account for the Police Pension
Fund and Firefighters’ Pension Fund.
D. Measurement Focus, Basis of Accounting, and Financial Statement Presentation
The government-wide financial statements are reported using the economic resources
measurement focus and the accrual basis of accounting, as are the proprietary fund and
fiduciary fund financial statements. Revenues and additions are recorded when earned
and expenses and deductions are recorded when a liability is incurred. Property taxes
are recognized as revenues in the year for which they are levied (i.e., intended to
finance). Grants and similar items are recognized as revenue as soon as all eligibility
requirements imposed by the provider have been met. Operating revenues and expenses
are directly attributable to the operation of the proprietary funds. Non-operating
revenue/expenses are incidental to the operations of these funds.
Governmental fund financial statements are reported using the current financial
resources measurement focus and the modified accrual basis of accounting. Under
the modified accrual basis of accounting, revenues are recognized when susceptible
to accrual (i.e., when they become both measurable and available). “Measurable”
means the amount of the transaction can be determined and “available” means
- 23 -
CITY OF DEKALB, ILLINOIS
NOTES TO FINANCIAL STATEMENTS (Continued)
- 24 -
1. SUMMARY OF SIGNIFICANT ACCOUNTING POLICIES (Continued)
D. Measurement Focus, Basis of Accounting, and Financial Statement Presentation
(Continued)
collectible within the current period or soon enough thereafter to be used to pay
liabilities of the current period, generally 60 days except for sales taxes and
telecommunication taxes which use 90 days. The City recognizes property taxes
when they become both measurable and available in the year for which they are
levied (i.e., intended to finance). Expenditures are recorded when the related fund
liability is incurred. Principal and interest on general long-term debt are recorded as
expenditures when due.
Property taxes, sales taxes owed from the state at year end, franchise taxes, licenses,
charges for services, restaurant and bar taxes and investment income associated with
the current fiscal period are all considered to be susceptible to accrual and are
recognized as revenues of the current fiscal period. Fines and permits revenues are
not susceptible to accrual because generally they are not measurable until received in
cash.
In applying the susceptible to accrual concept to intergovernmental revenues (e.g.,
federal and state grants), the legal and contractual requirements of the numerous
individual programs are used as guidelines. There are; however, essentially two types
of revenues. In one, monies must be expended on the specific purpose or project
before any amounts will be paid to the City; therefore, revenues are recognized based
upon the expenditures recorded. In the other, monies are virtually unrestricted as to
purpose of expenditure and are generally revocable only for failure to comply with
prescribed eligibility requirements, such as equal employment opportunity. These
resources are reflected as revenues at the time of receipt or earlier if they meet the
availability criterion.
The City reports unearned revenue and deferred/unavailable revenue on its financial
statements. Deferred/unavailable revenues arise when a potential revenue does not
meet both the available criteria for recognition in the current period, under the
modified accrual basis of accounting. Unearned revenue arises when a revenue is
measurable but not earned under the accrual basis of accounting. Unearned revenues
also arise when resources are received by the City before it has a legal claim to them
or prior to the provision of services, as when grant monies are received prior to the
incurrence of qualifying expenditures. In subsequent periods, when both revenue
recognition criteria are met, or when the City has a legal claim to the resources, the
liability or deferred inflows of resource for unearned and deferred/unavailable
revenue are removed from the financial statements and revenue is recognized.
- 24 -
CITY OF DEKALB, ILLINOIS
NOTES TO FINANCIAL STATEMENTS (Continued)
- 25 -
1. SUMMARY OF SIGNIFICANT ACCOUNTING POLICIES (Continued)
E. Cash and Investments
For purposes of the statement of cash flows, the City’s proprietary funds considers
cash and cash equivalents to include cash on hand, demand deposits, and short-term
investments with original maturities of three months or less from the date of
acquisition.
Investments with a maturity of one year or less when purchased and all non-
negotiable certificates of deposit are stated at cost or amortized cost. Investments
with a maturity greater than one year when purchased are reported at fair value. All
investments of the pension trust funds, regardless of length of maturity, are reported
at fair value. Fair value is the price that would be received to sell an asset or paid to
transfer a liability in an orderly transaction between market participants at the
measurement date.
The City categorizes its fair value measurements within the fair value hierarchy
established by generally accepted accounting principles. The hierarchy is based on
the valuation inputs used to measure the fair value of the asset. Level 1 inputs are
quoted prices in active markets for identical assets; Level 2 inputs are significant
other observable inputs; and Level 3 inputs are significant unobservable inputs.
F. Interfund Receivables/Payables
Transactions between funds that are representative of lending/borrowing
arrangements outstanding at the end of the fiscal year are referred to as either
“interfund receivables/payables” (current portion of interfund loans) or “advances
to/from other funds” (noncurrent portion of interfund loans). All other outstanding
balances between funds are reported as “due to/from other funds.”
Advances are offset by nonspendable fund balance in applicable governmental funds.
Interfund service transactions are accounted for as revenues, expenditures, or
expenses.
Transactions that constitute reimbursements to a fund for expenditures/expenses
initially made from it that are properly applicable to another fund are recorded as
expenditures/expenses in the reimbursing fund and as reductions of
expenditures/expenses in the fund that is reimbursed. All other interfund transactions
are reported as transfers.
- 25 -
CITY OF DEKALB, ILLINOIS
NOTES TO FINANCIAL STATEMENTS (Continued)
- 26 -
1. SUMMARY OF SIGNIFICANT ACCOUNTING POLICIES (Continued)
G. Property Taxes
Property taxes for 2016 are levied in December 2016 and attach as an enforceable
lien on the property on January 1, 2016. Tax bills are prepared by the County and
issued on or about May 1, 2017 and August 1, 2017, and are due and collectible on
or about June 1, 2017 and September 1, 2017. The County collects the taxes and
remits them periodically to the City. Those 2016 taxes were intended to finance the
fiscal year ending December 31, 2017. The 2017 levy, which attached as a lien on
property as January 1, 2017, is intended to finance the 2018 fiscal year and is not
considered available or earned for current operations and are, therefore, reported as
deferred/unavailable revenue.
H. Inventories and Prepaid Items/Expenses
Inventories are valued at cost, which approximates market, using the first-in/first-out
(FIFO) method. The costs of governmental fund inventories are recorded as
expenditures when consumed rather than when purchased.
Payments made to vendors for services that will benefit periods beyond the date of
this report are recorded as prepaid items/expenses. Prepaid items/expenses are
recorded as expenditures/expenses when consumed rather than when purchased.
I. Capital Assets
Capital assets, which include property, plant, equipment, and infrastructure assets (e.g.,
roads and bridges) are reported in the applicable governmental or business-type
activities columns in the government-wide financial statements. Capital assets are
defined by the City as assets with an initial, individual cost in excess of $25,000 and an
estimated useful life in excess of one year. Such assets are recorded at historical cost or
estimated historical cost if purchased or constructed. Donated capital assets are
recorded at estimated acquisition value at the date of donation.
The costs of normal maintenance and repairs that do not add to the value of the asset or
materially extend asset lives are not capitalized. Major outlays for capital assets and
improvements are capitalized as projects are constructed. Interest incurred during the
construction phase of capital assets of business-type activities is included as part of the
capitalized value of the assets constructed.
- 26 -
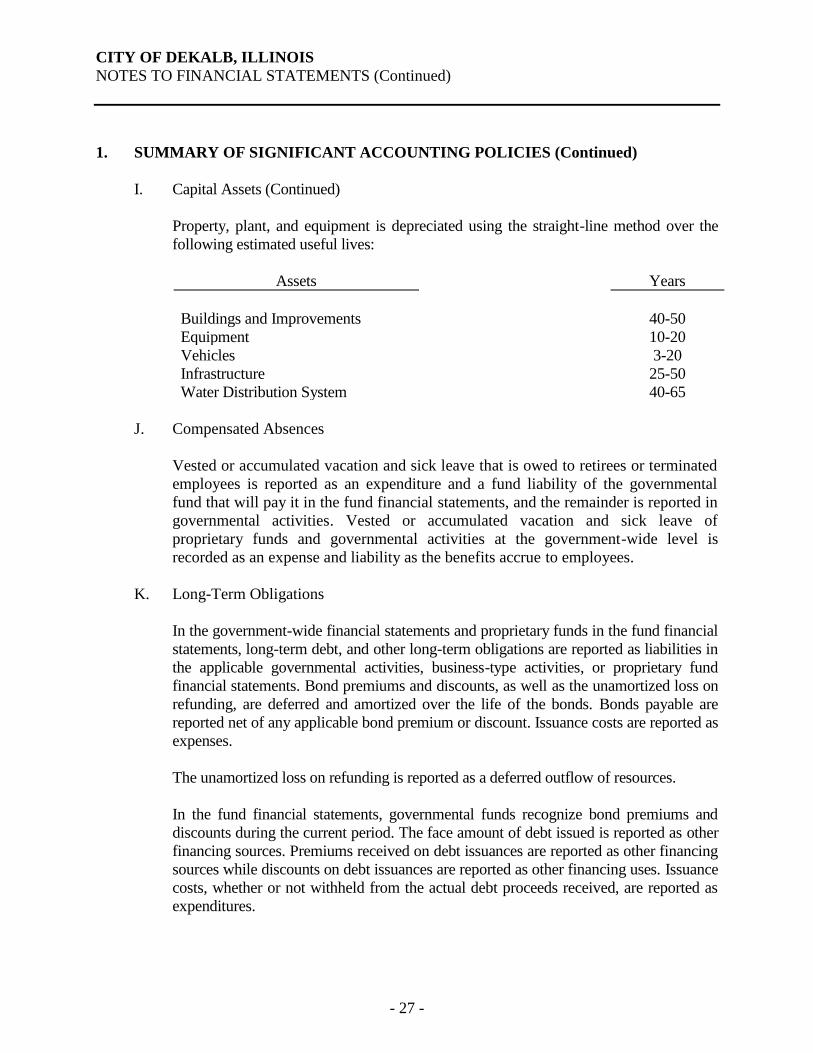
CITY OF DEKALB, ILLINOIS
NOTES TO FINANCIAL STATEMENTS (Continued)
- 27 -
1. SUMMARY OF SIGNIFICANT ACCOUNTING POLICIES (Continued)
I. Capital Assets (Continued)
Property, plant, and equipment is depreciated using the straight-line method over the
following estimated useful lives:
Assets Years
Buildings and Improvements 40-50
Equipment 10-20
Vehicles 3-20
Infrastructure 25-50
Water Distribution System 40-65
J. Compensated Absences
Vested or accumulated vacation and sick leave that is owed to retirees or terminated
employees is reported as an expenditure and a fund liability of the governmental
fund that will pay it in the fund financial statements, and the remainder is reported in
governmental activities. Vested or accumulated vacation and sick leave of
proprietary funds and governmental activities at the government-wide level is
recorded as an expense and liability as the benefits accrue to employees.
K. Long-Term Obligations
In the government-wide financial statements and proprietary funds in the fund financial
statements, long-term debt, and other long-term obligations are reported as liabilities in
the applicable governmental activities, business-type activities, or proprietary fund
financial statements. Bond premiums and discounts, as well as the unamortized loss on
refunding, are deferred and amortized over the life of the bonds. Bonds payable are
reported net of any applicable bond premium or discount. Issuance costs are reported as
expenses.
The unamortized loss on refunding is reported as a deferred outflow of resources.
In the fund financial statements, governmental funds recognize bond premiums and
discounts during the current period. The face amount of debt issued is reported as other
financing sources. Premiums received on debt issuances are reported as other financing
sources while discounts on debt issuances are reported as other financing uses. Issuance
costs, whether or not withheld from the actual debt proceeds received, are reported as
expenditures.
- 27 -
CITY OF DEKALB, ILLINOIS
NOTES TO FINANCIAL STATEMENTS (Continued)
- 28 -
1. SUMMARY OF SIGNIFICANT ACCOUNTING POLICIES (Continued)
L. Deferred Outflows/Inflows of Resources
In addition to assets, the statement of net position will sometimes report a separate
section for deferred outflows of resources. This separate financial statement element,
deferred outflows of resources, represents a consumption of net assets that applies to
a future period(s) and so will not be recognized as an outflow of resources
(expense/expenditure) until then. In addition to liabilities, the statement of financial
position will sometimes report a separate section for deferred inflows of resources.
This separate financial statement element, deferred inflows of resources, represents
an acquisition of net assets that applies to a future period(s) and so will not be
recognized as an inflow of resources (revenue) until that time.
M. Fund Balance/Net Position
In the fund financial statements, governmental funds report nonspendable fund
balance for amounts that are either not in spendable form or legally or contractually
required to be maintained intact. Restrictions of fund balance are reported for
amounts constrained by legal restrictions from outside parties for a specific purpose,
or externally imposed by outside entities. None of the restricted fund balance
resulted from enabling legislation adopted by the City. Committed fund balance is
constrained by formal actions of the City Council, which is considered the City’s
highest level of decision-making authority. Formal actions include ordinances
approved by the City Council. Assigned fund balance represents amounts
constrained by the City’s intent to use them for a specific purpose. The authority to
assign fund balance has been delegated to the City Manager through the fund balance
policy adopted by the City Council. Any residual fund balance of the General Fund
is reported as unassigned. Deficit fund balances of other governmental funds are also
reported as unassigned.
The City has established a fund balance reserve policy for several of its funds. The
policy requires unassigned fund balances to be maintained in the General Fund
equivalent to 25% of the fund’s annual operating expenditures. The Tax Increment
Financing Funds should be self-supporting and should maintain a fund balance
equivalent to meet the planned improvements identified in a multi-year capital
schedule. The Capital Projects Fund should maintain a fund balance of the planned
improvements for the current fiscal year. The Special Revenue Funds should
maintain the least fund balance necessary to cover current fiscal year expenditures,
plus an amount to pay for those expenditures of the subsequent fiscal year needed to
avoid a cash deficit position. The Water Fund unrestricted net position will be
maintained at a minimum level equal to 25% of the annual budgeted operating
expenses, plus the budged capital improvements. The unrestricted net position of the
- 28 -
CITY OF DEKALB, ILLINOIS
NOTES TO FINANCIAL STATEMENTS (Continued)
- 29 -
1. SUMMARY OF SIGNIFICANT ACCOUNTING POLICIES (Continued)
M. Fund Balance/Net Position (Continued)
Airport Fund will be maintained at a minimum level equal to 25% of annual
budgeted operational expenses, plus the budgeted capital improvements for the
current fiscal year. The Health Insurance Fund should maintain unrestricted net
position of one month of IPBC premiums. The Workers’ Compensation Fund should
maintain unrestricted net position of $1,000,000 collectively. The Liability/Property
Insurance Fund should maintain unrestricted net position of approximately 25% of
annual budgeted expenses. The Fleet Replacement Fund should maintain unrestricted
net position of the planned replacements for the current fiscal year. The Equipment
Fund should maintain unrestricted net position of the planned replacements for the
current fiscal year.
The City’s flow of funds assumption prescribes that the funds with the highest level
of constraint are expended first. If restricted or unrestricted funds are available for
spending, the restricted funds are spent first. Additionally, if different levels of
unrestricted funds are available for spending the City considers committed funds to
be expended first followed by assigned and then unassigned funds.
In the government-wide financial statements, restricted net positions are legally
restricted by outside parties for a specific purpose. Net investment in capital assets
represents the book value of capital assets less any outstanding long-term debt issued
to acquire or construct the capital assets.
N. Use of Estimates
The preparation of financial statements in conformity with generally accepted
accounting principles requires management to make estimates and assumptions that
affect the reported amounts of assets, deferred outflows of resources, liabilities, and
deferred inflows of resources, and disclosure of contingent assets and liabilities at the
date of the financial statements and the reported amounts of revenues and
expenditures/expenses during the reporting period. Actual results could differ from
those estimates.
2. DEPOSITS AND INVESTMENTS
The City maintains a cash and investment pool that is available for use by all funds, except
the pension trust funds. Each fund’s portion of this pool is displayed on the financial
statements as “cash and investments.” In addition, investments are separately held by several
of the City’s funds. The deposits and investments of the pension trust fund are held separately
from those of other funds.
- 29 -
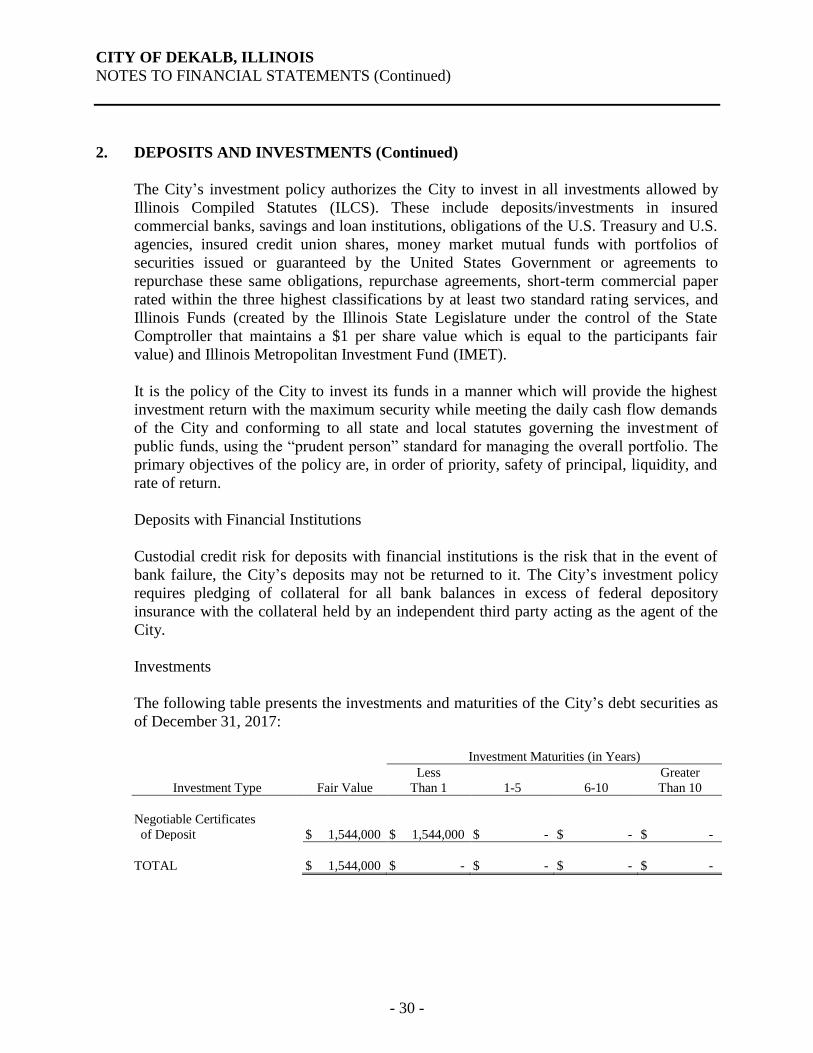
CITY OF DEKALB, ILLINOIS
NOTES TO FINANCIAL STATEMENTS (Continued)
- 30 -
2. DEPOSITS AND INVESTMENTS (Continued)
The City’s investment policy authorizes the City to invest in all investments allowed by
Illinois Compiled Statutes (ILCS). These include deposits/investments in insured
commercial banks, savings and loan institutions, obligations of the U.S. Treasury and U.S.
agencies, insured credit union shares, money market mutual funds with portfolios of
securities issued or guaranteed by the United States Government or agreements to
repurchase these same obligations, repurchase agreements, short-term commercial paper
rated within the three highest classifications by at least two standard rating services, and
Illinois Funds (created by the Illinois State Legislature under the control of the State
Comptroller that maintains a $1 per share value which is equal to the participants fair
value) and Illinois Metropolitan Investment Fund (IMET).
It is the policy of the City to invest its funds in a manner which will provide the highest
investment return with the maximum security while meeting the daily cash flow demands
of the City and conforming to all state and local statutes governing the investment of
public funds, using the “prudent person” standard for managing the overall portfolio. The
primary objectives of the policy are, in order of priority, safety of principal, liquidity, and
rate of return.
Deposits with Financial Institutions
Custodial credit risk for deposits with financial institutions is the risk that in the event of
bank failure, the City’s deposits may not be returned to it. The City’s investment policy
requires pledging of collateral for all bank balances in excess of federal depository
insurance with the collateral held by an independent third party acting as the agent of the
City.
Investments
The following table presents the investments and maturities of the City’s debt securities as
of December 31, 2017:
Investment Maturities (in Years)
Investment Type
Fair Value
Less
Than 1
1-5
6-10
Greater
Than 10
Negotiable Certificates
of Deposit
$ 1,544,000
$ 1,544,000
$ -
$ -
$ -
TOTAL $ 1,544,000 $ - $ - $ - $ -
- 30 -
CITY OF DEKALB, ILLINOIS
NOTES TO FINANCIAL STATEMENTS (Continued)
- 31 -
2. DEPOSITS AND INVESTMENTS (Continued)
Investments (Continued)
The City categorizes its fair value measurements within the fair value hierarchy established
by general accepted accounting principles. The hierarchy is based on the valuation inputs
used to measure the fair value of the asset. Level 1 inputs are quoted prices in active
markets for identical assets; Level 2 inputs are significant other observable inputs; and
Level 3 inputs are significant unobservable inputs.
The City has the following recurring fair value measurements as of December 31, 2017:
negotiable certificates of deposit of $1,544,000 are significant other observable inputs and
are part of a limited secondary market (Level 2 inputs).
Interest rate risk is the risk that changes in interest rates will adversely affect the market
value of an investment. In accordance with its investment policy, the City limits its
exposure to interest rate risk by structuring the portfolio so that securities mature to meet
cash requirements for ongoing operations, thereby avoiding the need to sell securities on
the open market prior to maturity and by investing operating funds primarily in short-term
securities.
The City limits its exposure to credit risk, the risk that the issuer of a debt security will not
pay its par value upon maturity, by requiring that deposits with financial institutions in
excess of FDIC coverage be collateralized with collateral in excess of the uninsured
deposits with the collateral held by a third party acting as the agent of the City. At the end
of the year, the City’s investments in Illinois Funds were rated AAA by Standard and
Poor’s.
The Illinois Public Treasurers’ Investment Pool, known as The Illinois Funds, operates as a
qualified external investment pool in accordance with the criteria established in GASB
Statement No. 79, Certain External Investment Pools and Pool Participants, and thus,
reports all investments at amortized cost rather than market value. The investment in The
Illinois Funds by participants is also reported at amortized cost. The Illinois Funds does not
have any limitations or restrictions on participant withdrawals. The Illinois Treasurer’s
Office issues a separate financial report for The Illinois Funds which may be obtained by
contacting the Administrative Office at Illinois Business Center, 400 West Monroe Street,
Suite 401, Springfield, Illinois 62704.
Custodial credit risk for investments is the risk that, in the event of the failure of the
counterparty to the investment, the City will not be able to recover the value of its
investments that are in possession of an outside party. To limit its exposure, the City’s
investment policy requires all security transactions that are exposed to custodial credit risk
to be processed on a delivery versus payment (DVP) basis with the underlying investments
held in a custodial account with the trust department of an approved financial institution.
Illinois Funds are not subject to custodial credit risk.
- 31 -
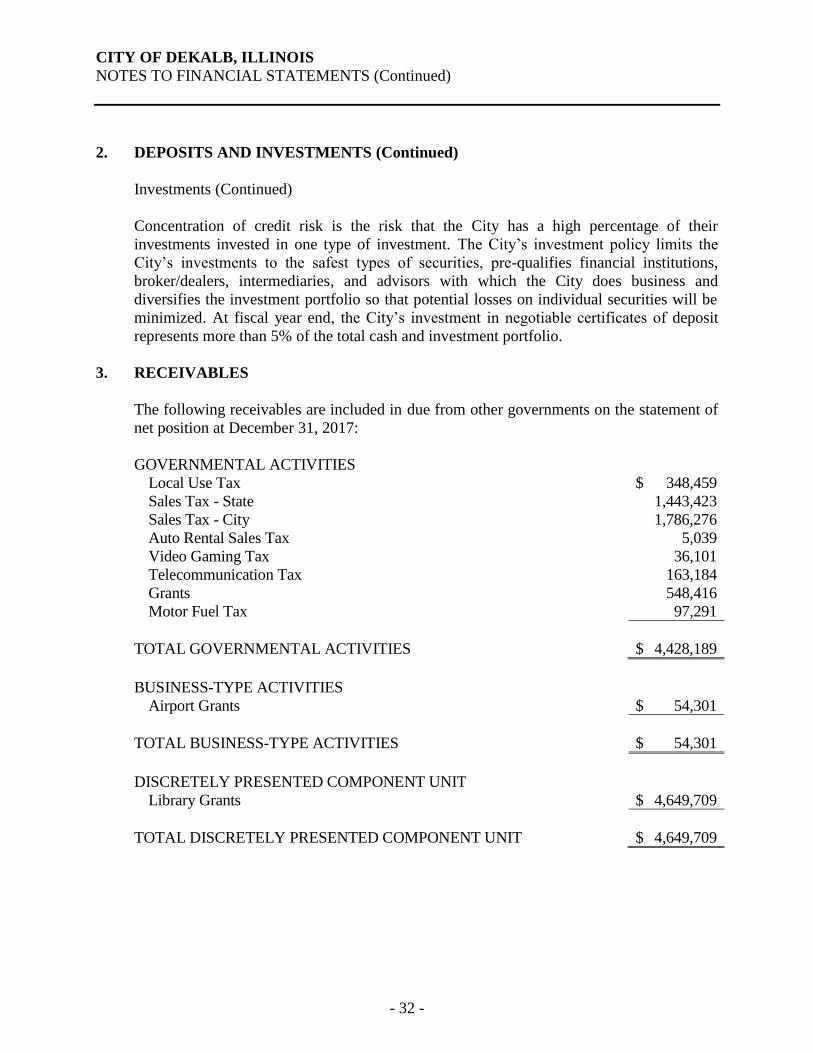
CITY OF DEKALB, ILLINOIS
NOTES TO FINANCIAL STATEMENTS (Continued)
- 32 -
2. DEPOSITS AND INVESTMENTS (Continued)
Investments (Continued)
Concentration of credit risk is the risk that the City has a high percentage of their
investments invested in one type of investment. The City’s investment policy limits the
City’s investments to the safest types of securities, pre-qualifies financial institutions,
broker/dealers, intermediaries, and advisors with which the City does business and
diversifies the investment portfolio so that potential losses on individual securities will be
minimized. At fiscal year end, the City’s investment in negotiable certificates of deposit
represents more than 5% of the total cash and investment portfolio.
3. RECEIVABLES
The following receivables are included in due from other governments on the statement of
net position at December 31, 2017:
GOVERNMENTAL ACTIVITIES
Local Use Tax $ 348,459
Sales Tax - State 1,443,423
Sales Tax - City 1,786,276
Auto Rental Sales Tax 5,039
Video Gaming Tax 36,101
Telecommunication Tax 163,184
Grants 548,416
Motor Fuel Tax 97,291
TOTAL GOVERNMENTAL ACTIVITIES $ 4,428,189
BUSINESS-TYPE ACTIVITIES
Airport Grants $ 54,301
TOTAL BUSINESS-TYPE ACTIVITIES $ 54,301
DISCRETELY PRESENTED COMPONENT UNIT
Library Grants $ 4,649,709
TOTAL DISCRETELY PRESENTED COMPONENT UNIT $ 4,649,709
- 32 -
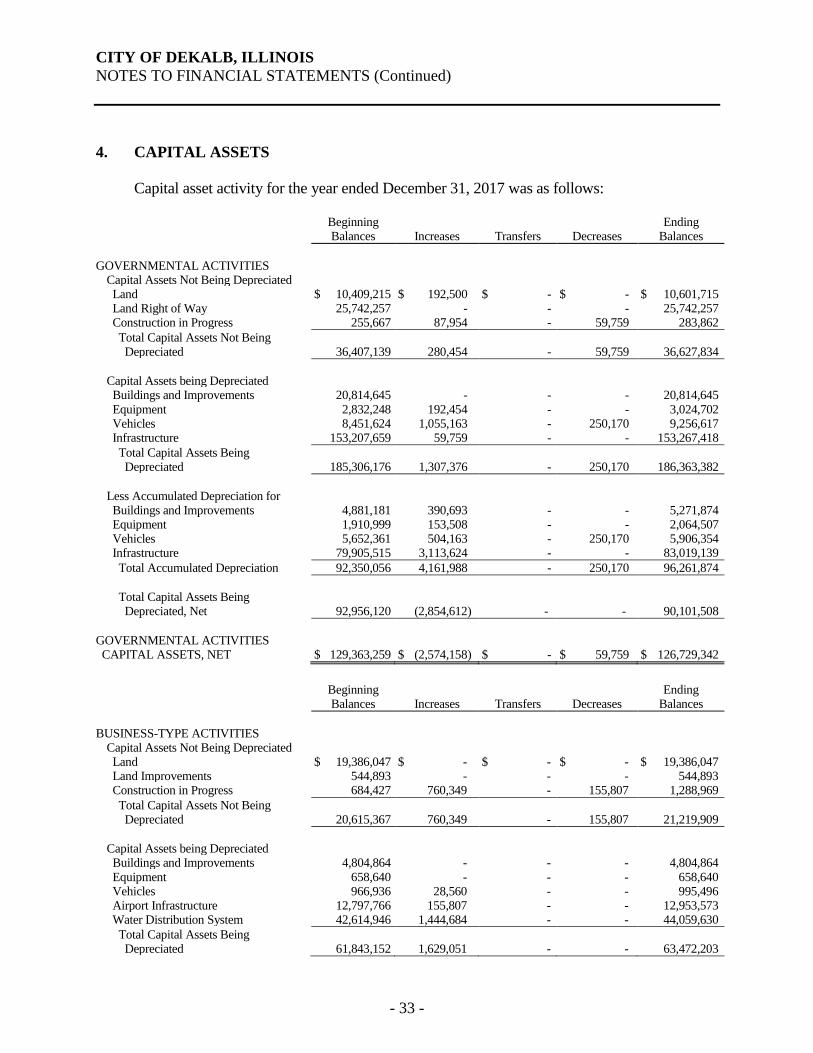
CITY OF DEKALB, ILLINOIS
NOTES TO FINANCIAL STATEMENTS (Continued)
- 33 -
4. CAPITAL ASSETS
Capital asset activity for the year ended December 31, 2017 was as follows: Beginning
Balances
Increases
Transfers
Decreases Ending
Balances
GOVERNMENTAL ACTIVITIES Capital Assets Not Being Depreciated Land $ 10,409,215 $ 192,500 $ - $ - $ 10,601,715 Land Right of Way 25,742,257 - - - 25,742,257 Construction in Progress 255,667 87,954 - 59,759 283,862
Total Capital Assets Not Being Depreciated
36,407,139
280,454
-
59,759
36,627,834
Capital Assets being Depreciated Buildings and Improvements 20,814,645 - - - 20,814,645
Equipment 2,832,248 192,454 - - 3,024,702 Vehicles 8,451,624 1,055,163 - 250,170 9,256,617 Infrastructure 153,207,659 59,759 - - 153,267,418
Total Capital Assets Being Depreciated
185,306,176
1,307,376
-
250,170
186,363,382
Less Accumulated Depreciation for Buildings and Improvements 4,881,181 390,693 - - 5,271,874 Equipment 1,910,999 153,508 - - 2,064,507 Vehicles 5,652,361 504,163 - 250,170 5,906,354 Infrastructure 79,905,515 3,113,624 - - 83,019,139
Total Accumulated Depreciation 92,350,056 4,161,988 - 250,170 96,261,874
Total Capital Assets Being Depreciated, Net
92,956,120
(2,854,612)
-
-
90,101,508
GOVERNMENTAL ACTIVITIES CAPITAL ASSETS, NET $ 129,363,259 $ (2,574,158) $ - $ 59,759 $ 126,729,342
Beginning
Balances
Increases
Transfers
Decreases Ending
Balances
BUSINESS-TYPE ACTIVITIES Capital Assets Not Being Depreciated Land $ 19,386,047 $ - $ - $ - $ 19,386,047 Land Improvements 544,893 - - - 544,893 Construction in Progress 684,427 760,349 - 155,807 1,288,969
Total Capital Assets Not Being Depreciated
20,615,367
760,349
-
155,807
21,219,909
Capital Assets being Depreciated Buildings and Improvements 4,804,864 - - - 4,804,864
Equipment 658,640 - - - 658,640 Vehicles 966,936 28,560 - - 995,496 Airport Infrastructure 12,797,766 155,807 - - 12,953,573 Water Distribution System 42,614,946 1,444,684 - - 44,059,630
Total Capital Assets Being Depreciated
61,843,152
1,629,051
-
-
63,472,203
- 33 -
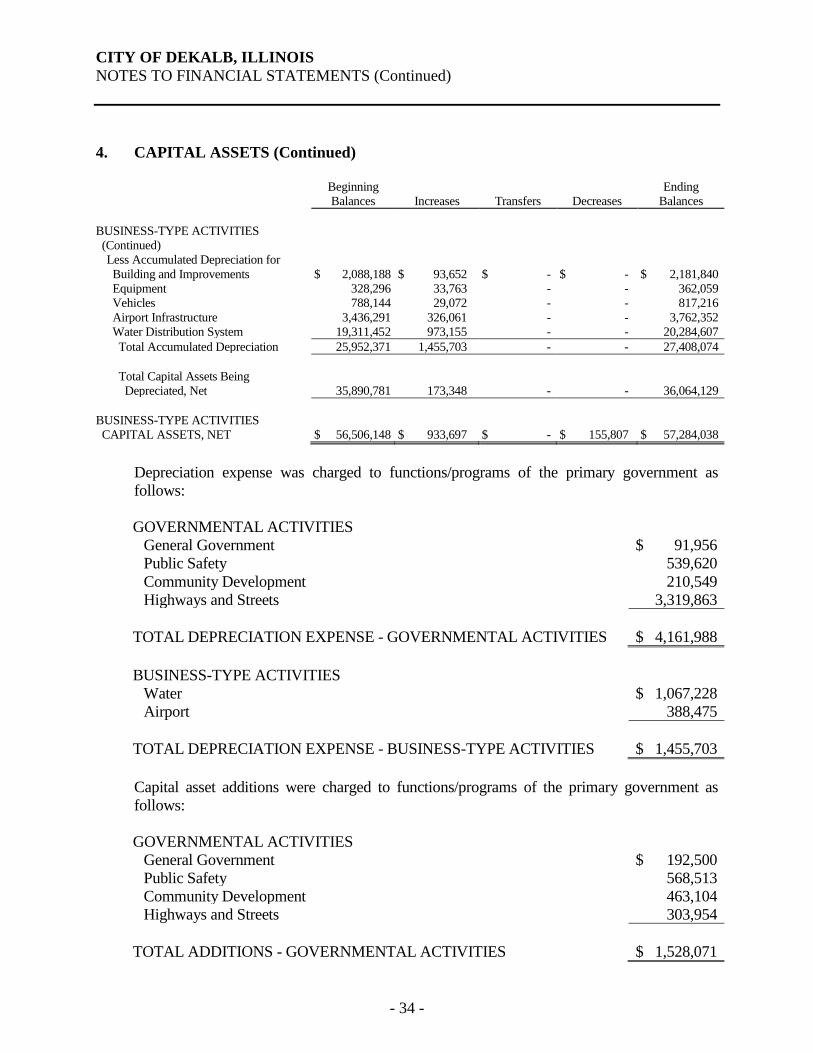
CITY OF DEKALB, ILLINOIS
NOTES TO FINANCIAL STATEMENTS (Continued)
- 34 -
4. CAPITAL ASSETS (Continued)
Beginning
Balances
Increases
Transfers
Decreases
Ending
Balances
BUSINESS-TYPE ACTIVITIES
(Continued)
Less Accumulated Depreciation for
Building and Improvements $ 2,088,188 $ 93,652 $ - $ - $ 2,181,840
Equipment 328,296 33,763 - - 362,059
Vehicles 788,144 29,072 - - 817,216
Airport Infrastructure 3,436,291 326,061 - - 3,762,352
Water Distribution System 19,311,452 973,155 - - 20,284,607
Total Accumulated Depreciation 25,952,371 1,455,703 - - 27,408,074
Total Capital Assets Being
Depreciated, Net
35,890,781
173,348
-
-
36,064,129
BUSINESS-TYPE ACTIVITIES
CAPITAL ASSETS, NET $ 56,506,148 $ 933,697 $ - $ 155,807 $ 57,284,038
Depreciation expense was charged to functions/programs of the primary government as
follows:
GOVERNMENTAL ACTIVITIES
General Government $ 91,956
Public Safety 539,620
Community Development 210,549
Highways and Streets 3,319,863
TOTAL DEPRECIATION EXPENSE - GOVERNMENTAL ACTIVITIES $ 4,161,988
BUSINESS-TYPE ACTIVITIES
Water $ 1,067,228
Airport 388,475
TOTAL DEPRECIATION EXPENSE - BUSINESS-TYPE ACTIVITIES $ 1,455,703
Capital asset additions were charged to functions/programs of the primary government as
follows:
GOVERNMENTAL ACTIVITIES
General Government $ 192,500
Public Safety 568,513
Community Development 463,104
Highways and Streets 303,954
TOTAL ADDITIONS - GOVERNMENTAL ACTIVITIES $ 1,528,071
- 34 -
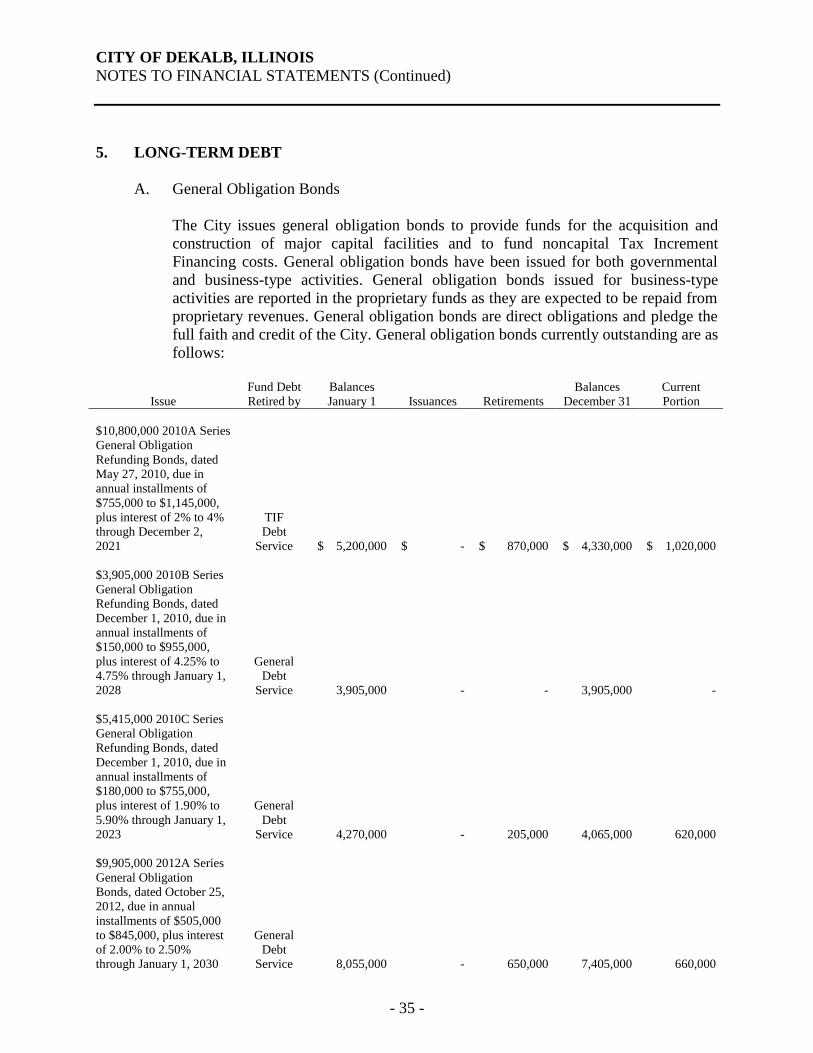
CITY OF DEKALB, ILLINOIS
NOTES TO FINANCIAL STATEMENTS (Continued)
- 35 -
5. LONG-TERM DEBT
A. General Obligation Bonds
The City issues general obligation bonds to provide funds for the acquisition and
construction of major capital facilities and to fund noncapital Tax Increment
Financing costs. General obligation bonds have been issued for both governmental
and business-type activities. General obligation bonds issued for business-type
activities are reported in the proprietary funds as they are expected to be repaid from
proprietary revenues. General obligation bonds are direct obligations and pledge the
full faith and credit of the City. General obligation bonds currently outstanding are as
follows:
Issue
Fund Debt
Retired by
Balances
January 1
Issuances
Retirements
Balances
December 31
Current
Portion
$10,800,000 2010A Series
General Obligation
Refunding Bonds, dated
May 27, 2010, due in
annual installments of
$755,000 to $1,145,000,
plus interest of 2% to 4%
through December 2,
2021
TIF
Debt
Service
$ 5,200,000
$ -
$ 870,000
$ 4,330,000
$ 1,020,000
$3,905,000 2010B Series
General Obligation
Refunding Bonds, dated
December 1, 2010, due in
annual installments of
$150,000 to $955,000,
plus interest of 4.25% to
4.75% through January 1,
2028
General
Debt
Service
3,905,000
-
-
3,905,000
-
$5,415,000 2010C Series
General Obligation
Refunding Bonds, dated
December 1, 2010, due in
annual installments of
$180,000 to $755,000,
plus interest of 1.90% to
5.90% through January 1,
2023
General
Debt
Service
4,270,000
-
205,000
4,065,000
620,000
$9,905,000 2012A Series
General Obligation
Bonds, dated October 25,
2012, due in annual
installments of $505,000
to $845,000, plus interest
of 2.00% to 2.50%
through January 1, 2030
General
Debt
Service
8,055,000
-
650,000
7,405,000
660,000
- 35 -
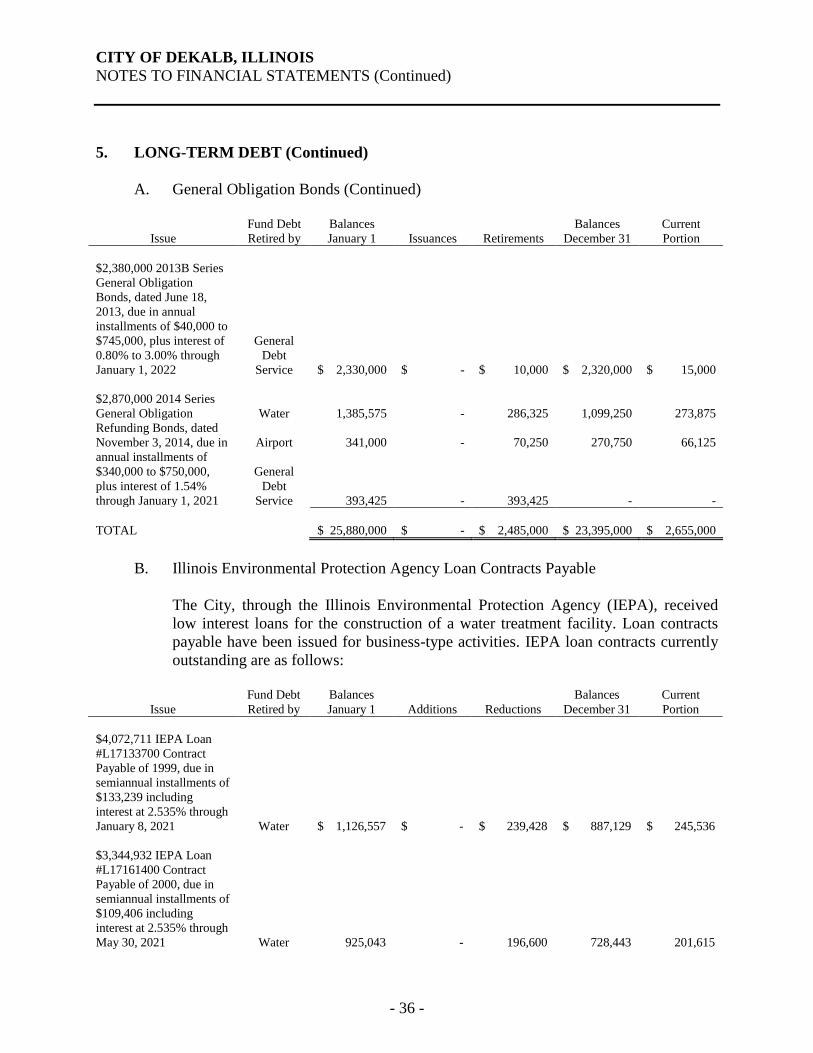
CITY OF DEKALB, ILLINOIS
NOTES TO FINANCIAL STATEMENTS (Continued)
- 36 -
5. LONG-TERM DEBT (Continued)
A. General Obligation Bonds (Continued)
Issue
Fund Debt
Retired by
Balances
January 1
Issuances
Retirements
Balances
December 31
Current
Portion
$2,380,000 2013B Series
General Obligation
Bonds, dated June 18,
2013, due in annual
installments of $40,000 to
$745,000, plus interest of
0.80% to 3.00% through
January 1, 2022
General
Debt
Service
$ 2,330,000
$ -
$ 10,000
$ 2,320,000
$ 15,000
$2,870,000 2014 Series
General Obligation
Refunding Bonds, dated
November 3, 2014, due in
annual installments of
$340,000 to $750,000,
plus interest of 1.54%
through January 1, 2021
Water
Airport
General
Debt
Service
1,385,575
341,000
393,425
-
-
-
286,325
70,250
393,425
1,099,250
270,750
-
273,875
66,125
-
TOTAL $ 25,880,000 $ - $ 2,485,000 $ 23,395,000 $ 2,655,000
B. Illinois Environmental Protection Agency Loan Contracts Payable
The City, through the Illinois Environmental Protection Agency (IEPA), received
low interest loans for the construction of a water treatment facility. Loan contracts
payable have been issued for business-type activities. IEPA loan contracts currently
outstanding are as follows:
Issue
Fund Debt
Retired by
Balances
January 1
Additions
Reductions
Balances
December 31
Current
Portion
$4,072,711 IEPA Loan
#L17133700 Contract
Payable of 1999, due in
semiannual installments of
$133,239 including
interest at 2.535% through
January 8, 2021
Water
$ 1,126,557
$ -
$ 239,428
$ 887,129
$ 245,536
$3,344,932 IEPA Loan
#L17161400 Contract
Payable of 2000, due in
semiannual installments of
$109,406 including
interest at 2.535% through
May 30, 2021
Water
925,043
-
196,600
728,443
201,615
- 36 -
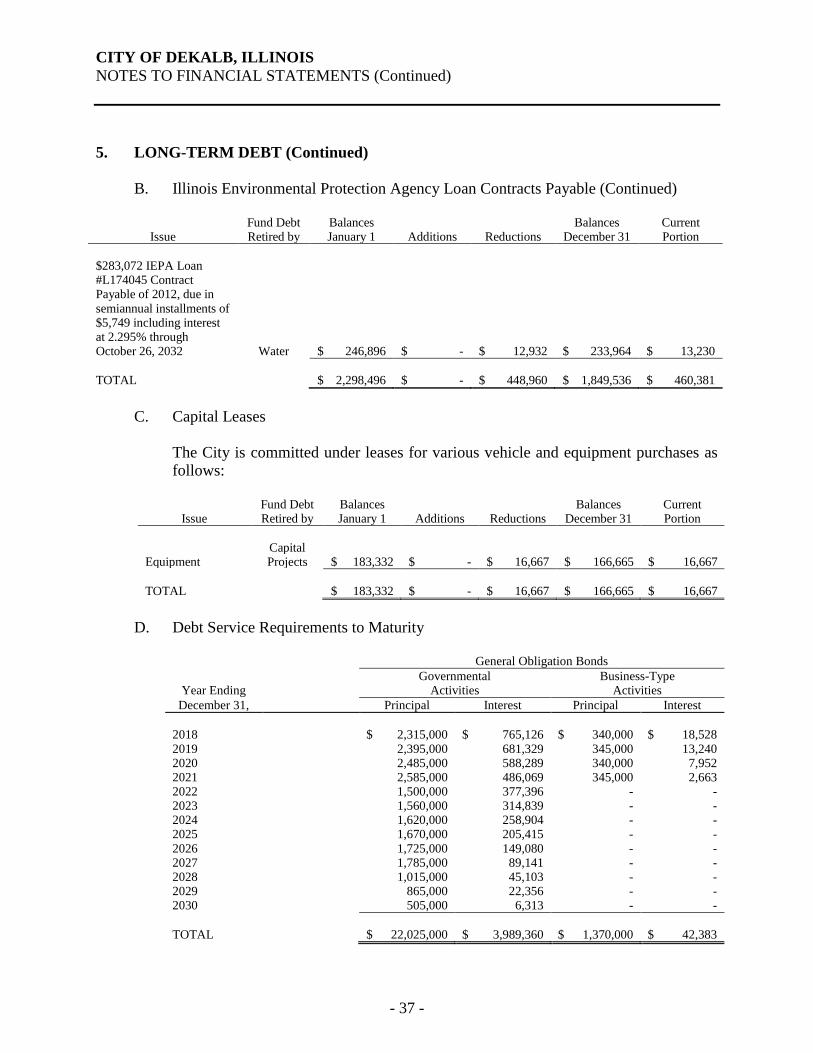
CITY OF DEKALB, ILLINOIS
NOTES TO FINANCIAL STATEMENTS (Continued)
- 37 -
5. LONG-TERM DEBT (Continued)
B. Illinois Environmental Protection Agency Loan Contracts Payable (Continued)
Issue Fund Debt Retired by
Balances January 1
Additions
Reductions
Balances December 31
Current Portion
$283,072 IEPA Loan #L174045 Contract Payable of 2012, due in
semiannual installments of $5,749 including interest at 2.295% through October 26, 2032
Water
$ 246,896
$ -
$ 12,932
$ 233,964
$ 13,230
TOTAL $ 2,298,496 $ - $ 448,960 $ 1,849,536 $ 460,381
C. Capital Leases The City is committed under leases for various vehicle and equipment purchases as
follows:
Issue
Fund Debt Retired by
Balances January 1
Additions
Reductions
Balances December 31
Current Portion
Capital Equipment Projects $ 183,332 $ - $ 16,667 $ 166,665 $ 16,667
TOTAL $ 183,332 $ - $ 16,667 $ 166,665 $ 16,667
D. Debt Service Requirements to Maturity
General Obligation Bonds
Year Ending
Governmental Activities
Business-Type Activities
December 31, Principal Interest Principal Interest
2018 $ 2,315,000 $ 765,126 $ 340,000 $ 18,528
2019 2,395,000 681,329 345,000 13,240 2020 2,485,000 588,289 340,000 7,952 2021 2,585,000 486,069 345,000 2,663 2022 1,500,000 377,396 - - 2023 1,560,000 314,839 - - 2024 1,620,000 258,904 - - 2025 1,670,000 205,415 - -
2026 1,725,000 149,080 - - 2027 1,785,000 89,141 - - 2028 1,015,000 45,103 - - 2029 865,000 22,356 - - 2030 505,000 6,313 - -
TOTAL $ 22,025,000 $ 3,989,360 $ 1,370,000 $ 42,383
- 37 -
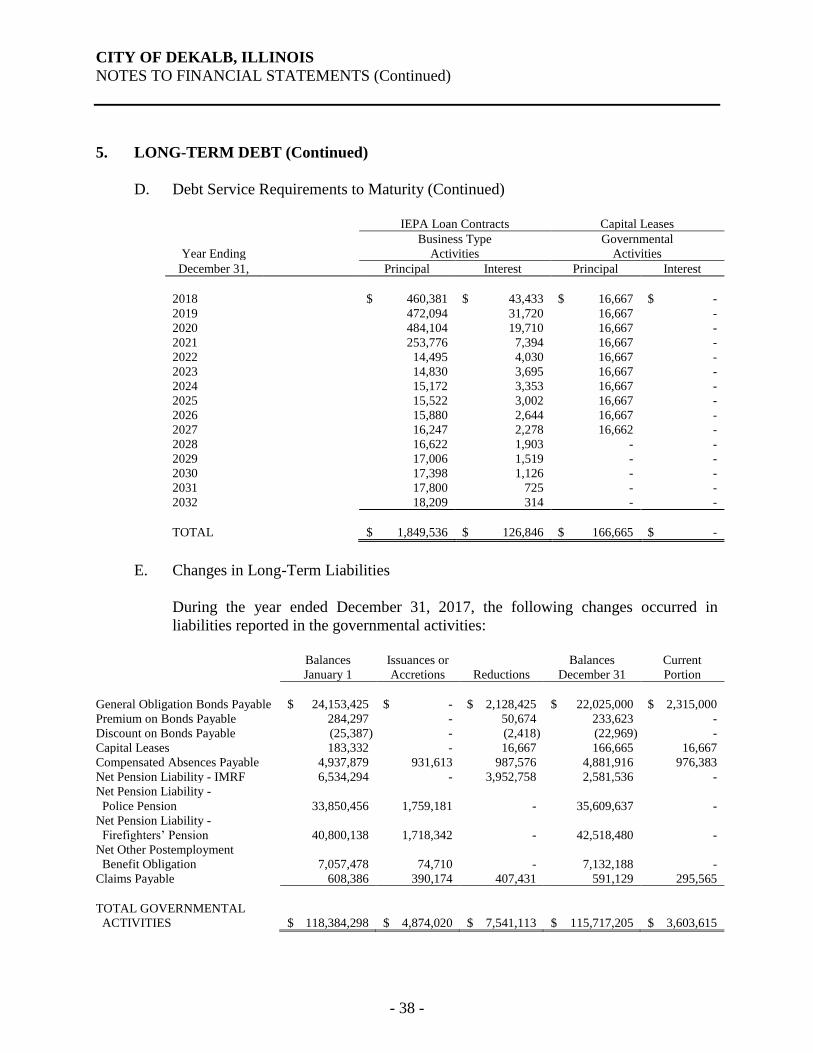
CITY OF DEKALB, ILLINOIS
NOTES TO FINANCIAL STATEMENTS (Continued)
- 38 -
5. LONG-TERM DEBT (Continued)
D. Debt Service Requirements to Maturity (Continued)
IEPA Loan Contracts Capital Leases
Year Ending
Business Type
Activities
Governmental
Activities
December 31, Principal Interest Principal Interest
2018 $ 460,381 $ 43,433 $ 16,667 $ -
2019 472,094 31,720 16,667 -
2020 484,104 19,710 16,667 -
2021 253,776 7,394 16,667 -
2022 14,495 4,030 16,667 -
2023 14,830 3,695 16,667 -
2024 15,172 3,353 16,667 -
2025 15,522 3,002 16,667 -
2026 15,880 2,644 16,667 -
2027 16,247 2,278 16,662 -
2028 16,622 1,903 - -
2029 17,006 1,519 - -
2030 17,398 1,126 - -
2031 17,800 725 - -
2032 18,209 314 - -
TOTAL $ 1,849,536 $ 126,846 $ 166,665 $ -
E. Changes in Long-Term Liabilities
During the year ended December 31, 2017, the following changes occurred in
liabilities reported in the governmental activities:
Balances
January 1
Issuances or
Accretions
Reductions
Balances
December 31
Current
Portion
General Obligation Bonds Payable $ 24,153,425 $ - $ 2,128,425 $ 22,025,000 $ 2,315,000
Premium on Bonds Payable 284,297 - 50,674 233,623 -
Discount on Bonds Payable (25,387) - (2,418) (22,969) -
Capital Leases 183,332 - 16,667 166,665 16,667
Compensated Absences Payable 4,937,879 931,613 987,576 4,881,916 976,383
Net Pension Liability - IMRF 6,534,294 - 3,952,758 2,581,536 -
Net Pension Liability -
Police Pension
33,850,456
1,759,181
-
35,609,637
-
Net Pension Liability -
Firefighters’ Pension
40,800,138
1,718,342
-
42,518,480
-
Net Other Postemployment
Benefit Obligation
7,057,478
74,710
-
7,132,188
-
Claims Payable 608,386 390,174 407,431 591,129 295,565
TOTAL GOVERNMENTAL
ACTIVITIES $ 118,384,298 $ 4,874,020 $ 7,541,113 $ 115,717,205 $ 3,603,615
- 38 -
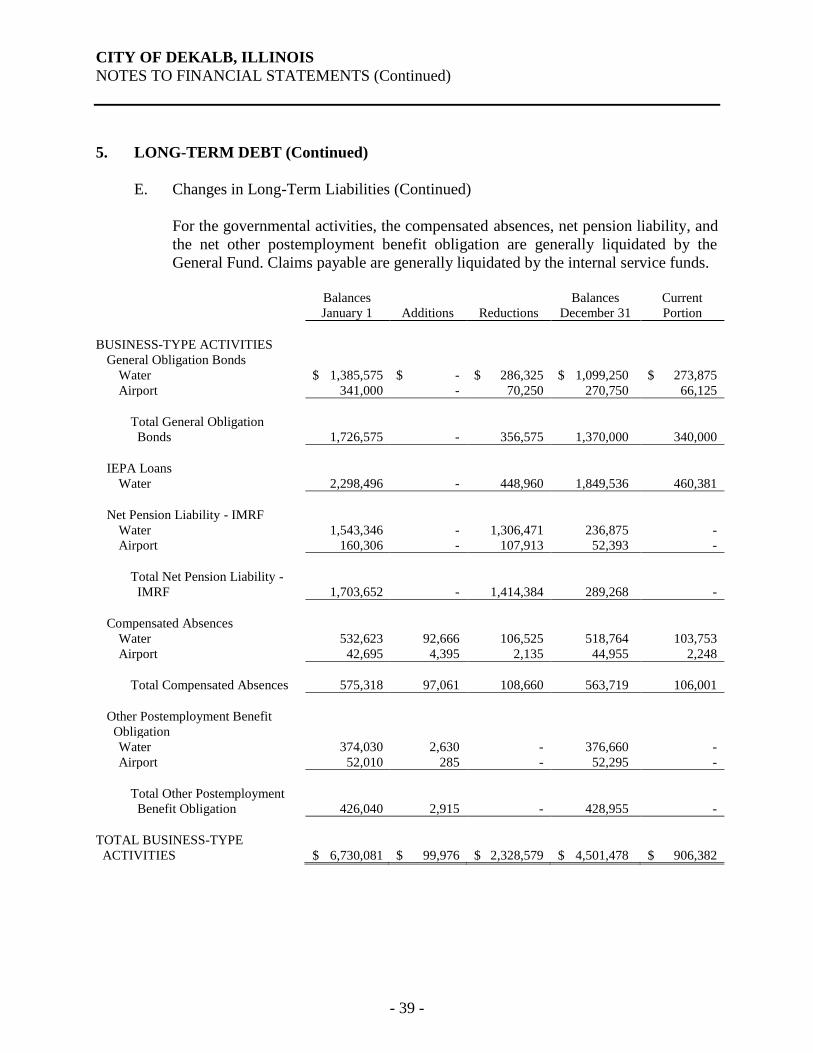
CITY OF DEKALB, ILLINOIS
NOTES TO FINANCIAL STATEMENTS (Continued)
- 39 -
5. LONG-TERM DEBT (Continued)
E. Changes in Long-Term Liabilities (Continued)
For the governmental activities, the compensated absences, net pension liability, and
the net other postemployment benefit obligation are generally liquidated by the
General Fund. Claims payable are generally liquidated by the internal service funds.
Balances
January 1
Additions
Reductions
Balances
December 31
Current
Portion
BUSINESS-TYPE ACTIVITIES
General Obligation Bonds
Water $ 1,385,575 $ - $ 286,325 $ 1,099,250 $ 273,875
Airport 341,000 - 70,250 270,750 66,125
Total General Obligation
Bonds
1,726,575
-
356,575
1,370,000
340,000
IEPA Loans
Water 2,298,496 - 448,960 1,849,536 460,381
Net Pension Liability - IMRF
Water 1,543,346 - 1,306,471 236,875 -
Airport 160,306 - 107,913 52,393 -
Total Net Pension Liability -
IMRF
1,703,652
-
1,414,384
289,268
-
Compensated Absences
Water 532,623 92,666 106,525 518,764 103,753
Airport 42,695 4,395 2,135 44,955 2,248
Total Compensated Absences 575,318 97,061 108,660 563,719 106,001
Other Postemployment Benefit
Obligation
Water 374,030 2,630 - 376,660 -
Airport 52,010 285 - 52,295 -
Total Other Postemployment
Benefit Obligation 426,040 2,915 - 428,955 -
TOTAL BUSINESS-TYPE
ACTIVITIES
$ 6,730,081
$ 99,976
$ 2,328,579
$ 4,501,478
$ 906,382
- 39 -
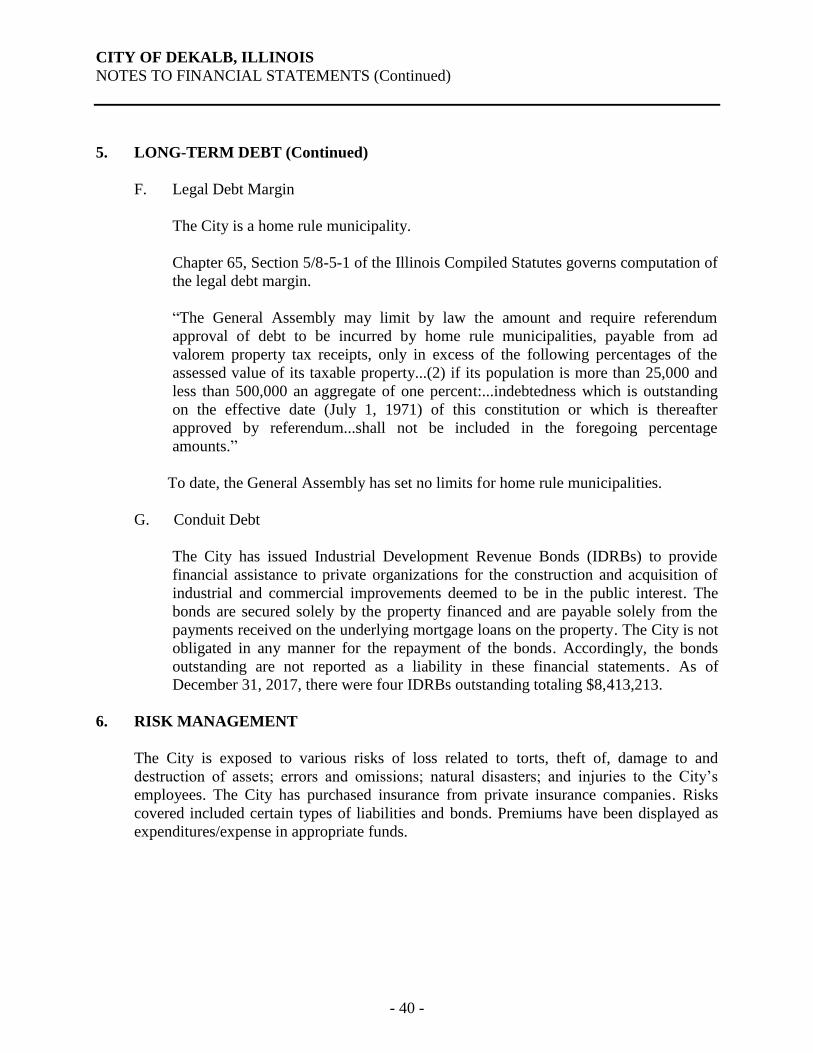
CITY OF DEKALB, ILLINOIS
NOTES TO FINANCIAL STATEMENTS (Continued)
- 40 -
5. LONG-TERM DEBT (Continued)
F. Legal Debt Margin
The City is a home rule municipality.
Chapter 65, Section 5/8-5-1 of the Illinois Compiled Statutes governs computation of
the legal debt margin.
“The General Assembly may limit by law the amount and require referendum
approval of debt to be incurred by home rule municipalities, payable from ad
valorem property tax receipts, only in excess of the following percentages of the
assessed value of its taxable property...(2) if its population is more than 25,000 and
less than 500,000 an aggregate of one percent:...indebtedness which is outstanding
on the effective date (July 1, 1971) of this constitution or which is thereafter
approved by referendum...shall not be included in the foregoing percentage
amounts.”
To date, the General Assembly has set no limits for home rule municipalities.
G. Conduit Debt
The City has issued Industrial Development Revenue Bonds (IDRBs) to provide
financial assistance to private organizations for the construction and acquisition of
industrial and commercial improvements deemed to be in the public interest. The
bonds are secured solely by the property financed and are payable solely from the
payments received on the underlying mortgage loans on the property. The City is not
obligated in any manner for the repayment of the bonds. Accordingly, the bonds
outstanding are not reported as a liability in these financial statements. As of
December 31, 2017, there were four IDRBs outstanding totaling $8,413,213.
6. RISK MANAGEMENT
The City is exposed to various risks of loss related to torts, theft of, damage to and
destruction of assets; errors and omissions; natural disasters; and injuries to the City’s
employees. The City has purchased insurance from private insurance companies. Risks
covered included certain types of liabilities and bonds. Premiums have been displayed as
expenditures/expense in appropriate funds.
- 40 -
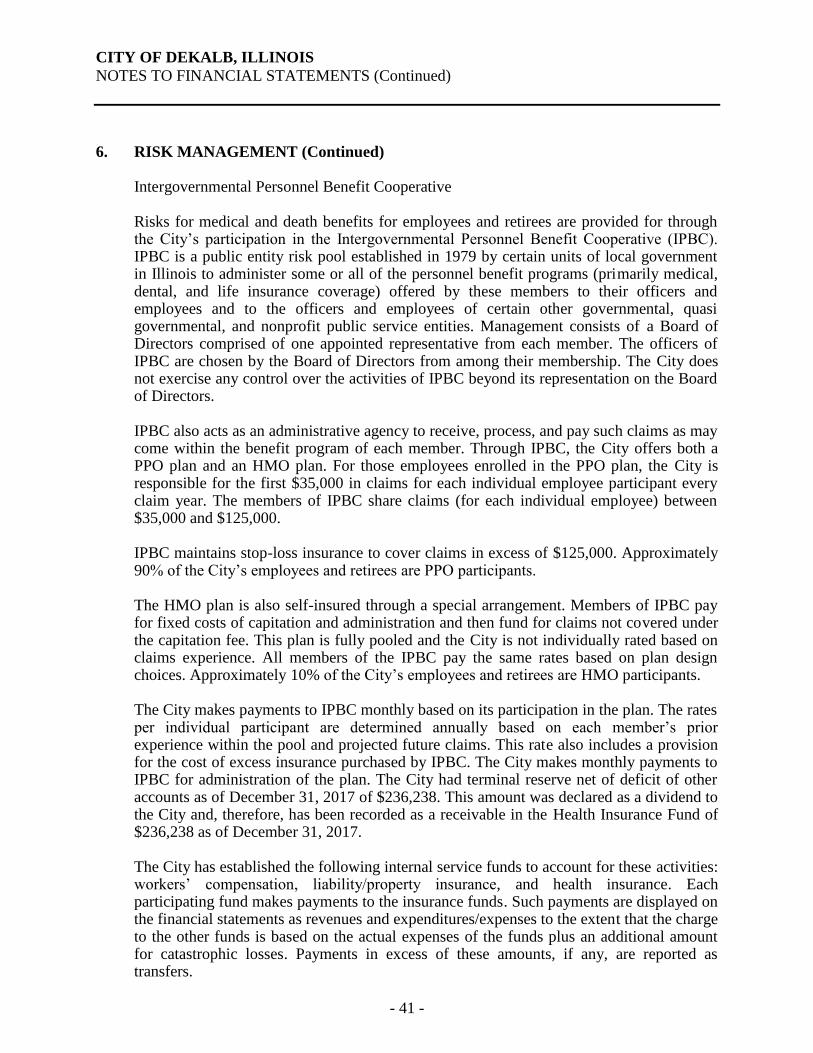
CITY OF DEKALB, ILLINOIS
NOTES TO FINANCIAL STATEMENTS (Continued)
- 41 -
6. RISK MANAGEMENT (Continued) Intergovernmental Personnel Benefit Cooperative Risks for medical and death benefits for employees and retirees are provided for through
the City’s participation in the Intergovernmental Personnel Benefit Cooperative (IPBC). IPBC is a public entity risk pool established in 1979 by certain units of local government in Illinois to administer some or all of the personnel benefit programs (primarily medical, dental, and life insurance coverage) offered by these members to their officers and employees and to the officers and employees of certain other governmental, quasi governmental, and nonprofit public service entities. Management consists of a Board of Directors comprised of one appointed representative from each member. The officers of IPBC are chosen by the Board of Directors from among their membership. The City does not exercise any control over the activities of IPBC beyond its representation on the Board of Directors.
IPBC also acts as an administrative agency to receive, process, and pay such claims as may
come within the benefit program of each member. Through IPBC, the City offers both a PPO plan and an HMO plan. For those employees enrolled in the PPO plan, the City is responsible for the first $35,000 in claims for each individual employee participant every claim year. The members of IPBC share claims (for each individual employee) between $35,000 and $125,000. IPBC maintains stop-loss insurance to cover claims in excess of $125,000. Approximately 90% of the City’s employees and retirees are PPO participants.
The HMO plan is also self-insured through a special arrangement. Members of IPBC pay
for fixed costs of capitation and administration and then fund for claims not covered under the capitation fee. This plan is fully pooled and the City is not individually rated based on claims experience. All members of the IPBC pay the same rates based on plan design choices. Approximately 10% of the City’s employees and retirees are HMO participants.
The City makes payments to IPBC monthly based on its participation in the plan. The rates
per individual participant are determined annually based on each member’s prior experience within the pool and projected future claims. This rate also includes a provision for the cost of excess insurance purchased by IPBC. The City makes monthly payments to IPBC for administration of the plan. The City had terminal reserve net of deficit of other accounts as of December 31, 2017 of $236,238. This amount was declared as a dividend to the City and, therefore, has been recorded as a receivable in the Health Insurance Fund of $236,238 as of December 31, 2017. The City has established the following internal service funds to account for these activities: workers’ compensation, liability/property insurance, and health insurance. Each participating fund makes payments to the insurance funds. Such payments are displayed on the financial statements as revenues and expenditures/expenses to the extent that the charge to the other funds is based on the actual expenses of the funds plus an additional amount for catastrophic losses. Payments in excess of these amounts, if any, are reported as transfers.
- 41 -
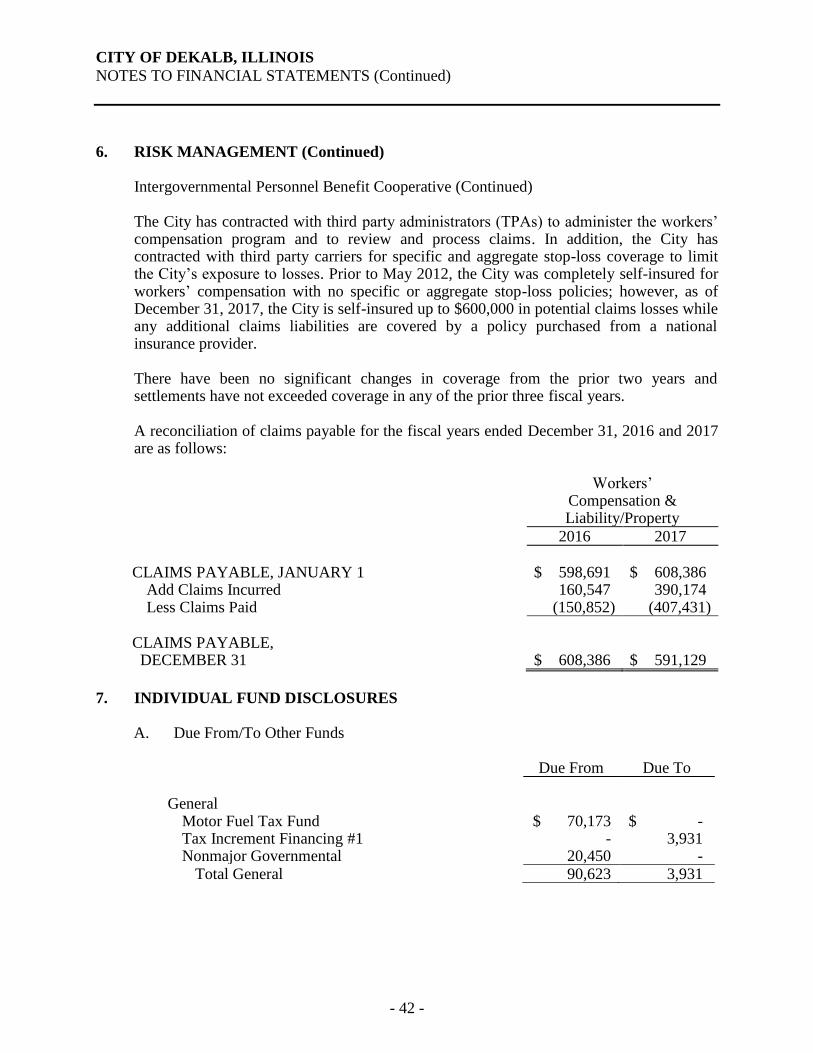
CITY OF DEKALB, ILLINOIS
NOTES TO FINANCIAL STATEMENTS (Continued)
- 42 -
6. RISK MANAGEMENT (Continued) Intergovernmental Personnel Benefit Cooperative (Continued) The City has contracted with third party administrators (TPAs) to administer the workers’
compensation program and to review and process claims. In addition, the City has contracted with third party carriers for specific and aggregate stop-loss coverage to limit the City’s exposure to losses. Prior to May 2012, the City was completely self-insured for workers’ compensation with no specific or aggregate stop-loss policies; however, as of December 31, 2017, the City is self-insured up to $600,000 in potential claims losses while any additional claims liabilities are covered by a policy purchased from a national insurance provider.
There have been no significant changes in coverage from the prior two years and
settlements have not exceeded coverage in any of the prior three fiscal years.
A reconciliation of claims payable for the fiscal years ended December 31, 2016 and 2017 are as follows: Workers’
Compensation & Liability/Property
2016 2017
CLAIMS PAYABLE, JANUARY 1 $ 598,691 $ 608,386 Add Claims Incurred 160,547 390,174 Less Claims Paid (150,852) (407,431) CLAIMS PAYABLE, DECEMBER 31
$ 608,386
$ 591,129
7. INDIVIDUAL FUND DISCLOSURES
A. Due From/To Other Funds
Due From Due To
General Motor Fuel Tax Fund $ 70,173 $ - Tax Increment Financing #1 - 3,931 Nonmajor Governmental 20,450 - Total General 90,623 3,931
- 42 -
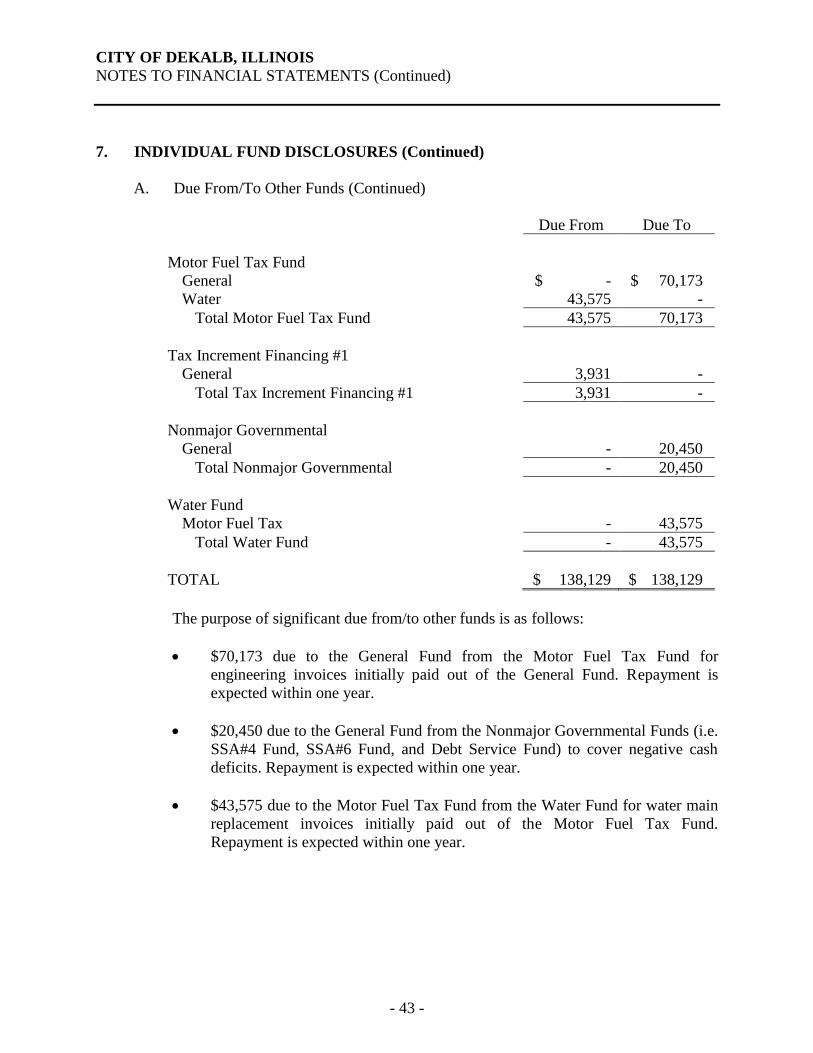
CITY OF DEKALB, ILLINOIS
NOTES TO FINANCIAL STATEMENTS (Continued)
- 43 -
7. INDIVIDUAL FUND DISCLOSURES (Continued)
A. Due From/To Other Funds (Continued)
Due From Due To
Motor Fuel Tax Fund
General $ - $ 70,173
Water 43,575 -
Total Motor Fuel Tax Fund 43,575 70,173
Tax Increment Financing #1
General 3,931 -
Total Tax Increment Financing #1 3,931 -
Nonmajor Governmental
General - 20,450
Total Nonmajor Governmental - 20,450
Water Fund
Motor Fuel Tax - 43,575
Total Water Fund - 43,575
TOTAL $ 138,129 $ 138,129
The purpose of significant due from/to other funds is as follows:
• $70,173 due to the General Fund from the Motor Fuel Tax Fund for
engineering invoices initially paid out of the General Fund. Repayment is
expected within one year.
• $20,450 due to the General Fund from the Nonmajor Governmental Funds (i.e.
SSA#4 Fund, SSA#6 Fund, and Debt Service Fund) to cover negative cash
deficits. Repayment is expected within one year.
• $43,575 due to the Motor Fuel Tax Fund from the Water Fund for water main
replacement invoices initially paid out of the Motor Fuel Tax Fund.
Repayment is expected within one year.
- 43 -
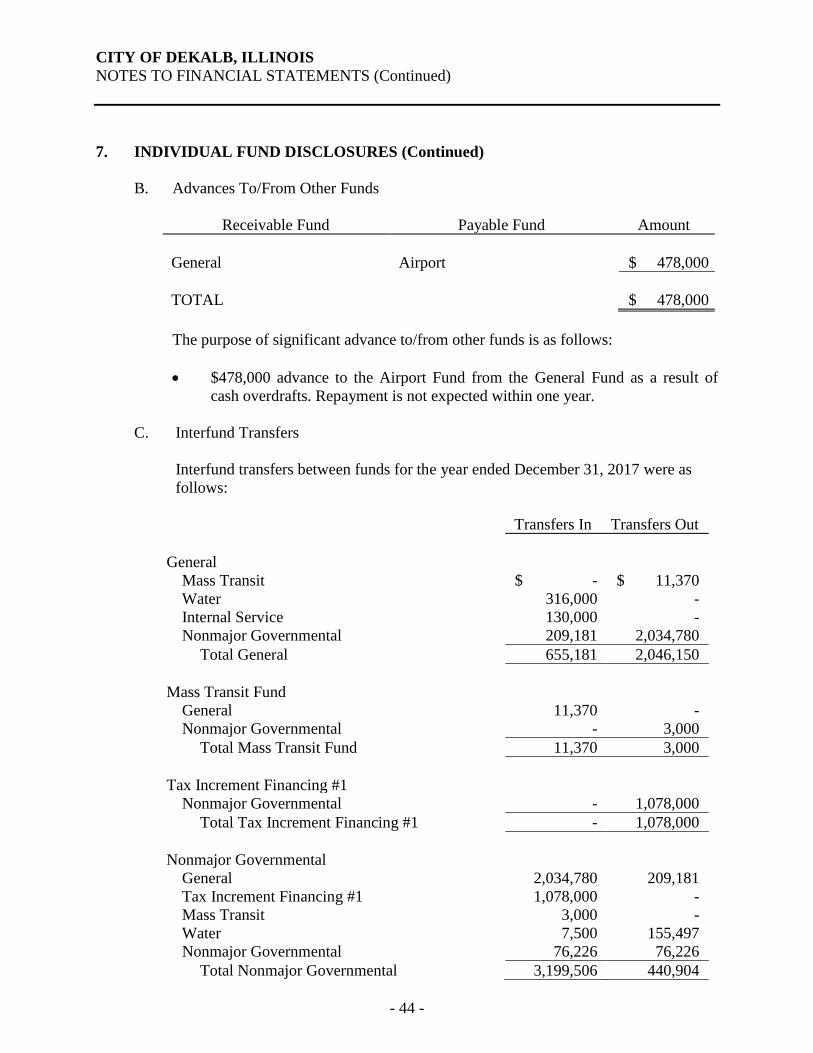
CITY OF DEKALB, ILLINOIS
NOTES TO FINANCIAL STATEMENTS (Continued)
- 44 -
7. INDIVIDUAL FUND DISCLOSURES (Continued)
B. Advances To/From Other Funds
Receivable Fund Payable Fund Amount
General Airport $ 478,000
TOTAL $ 478,000
The purpose of significant advance to/from other funds is as follows:
• $478,000 advance to the Airport Fund from the General Fund as a result of
cash overdrafts. Repayment is not expected within one year.
C. Interfund Transfers
Interfund transfers between funds for the year ended December 31, 2017 were as
follows:
Transfers In Transfers Out
General
Mass Transit $ - $ 11,370
Water 316,000 -
Internal Service 130,000 -
Nonmajor Governmental 209,181 2,034,780
Total General 655,181 2,046,150
Mass Transit Fund
General 11,370 -
Nonmajor Governmental - 3,000
Total Mass Transit Fund 11,370 3,000
Tax Increment Financing #1
Nonmajor Governmental - 1,078,000
Total Tax Increment Financing #1 - 1,078,000
Nonmajor Governmental
General 2,034,780 209,181
Tax Increment Financing #1 1,078,000 -
Mass Transit 3,000 -
Water 7,500 155,497
Nonmajor Governmental 76,226 76,226
Total Nonmajor Governmental 3,199,506 440,904
- 44 -
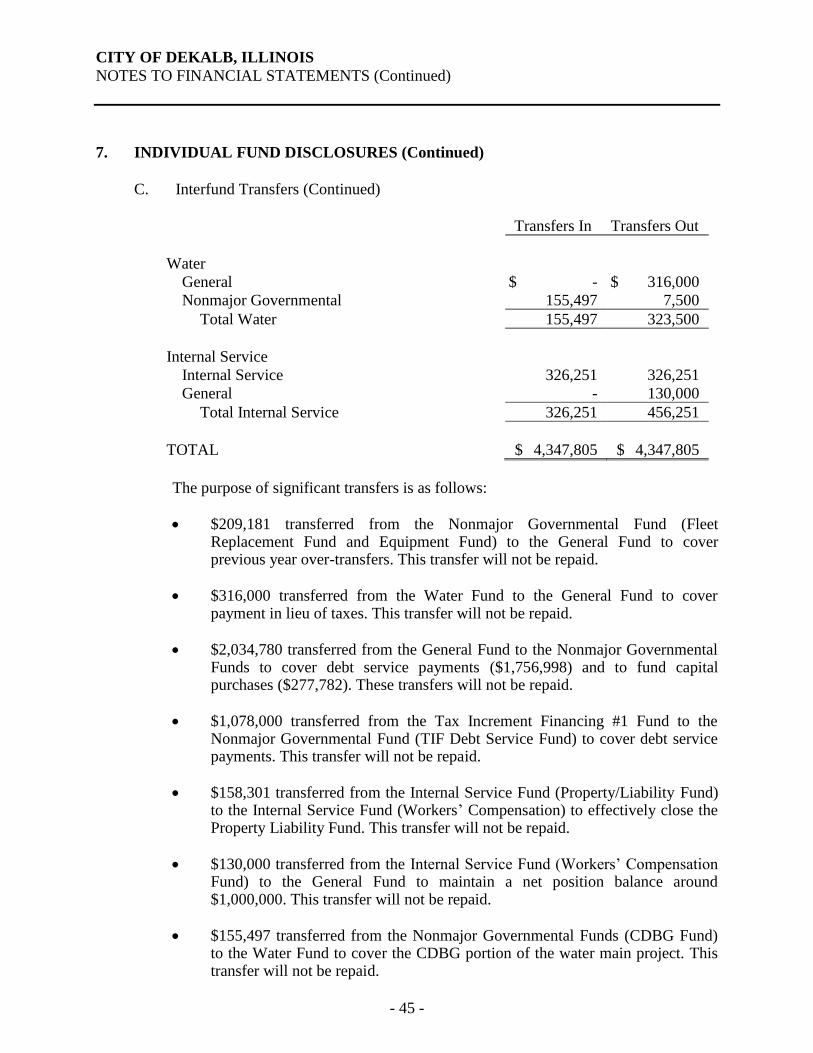
CITY OF DEKALB, ILLINOIS
NOTES TO FINANCIAL STATEMENTS (Continued)
- 45 -
7. INDIVIDUAL FUND DISCLOSURES (Continued)
C. Interfund Transfers (Continued)
Transfers In Transfers Out
Water
General $ - $ 316,000
Nonmajor Governmental 155,497 7,500
Total Water 155,497 323,500
Internal Service
Internal Service 326,251 326,251
General - 130,000
Total Internal Service 326,251 456,251
TOTAL $ 4,347,805 $ 4,347,805
The purpose of significant transfers is as follows:
• $209,181 transferred from the Nonmajor Governmental Fund (Fleet Replacement Fund and Equipment Fund) to the General Fund to cover previous year over-transfers. This transfer will not be repaid.
• $316,000 transferred from the Water Fund to the General Fund to cover payment in lieu of taxes. This transfer will not be repaid.
• $2,034,780 transferred from the General Fund to the Nonmajor Governmental Funds to cover debt service payments ($1,756,998) and to fund capital purchases ($277,782). These transfers will not be repaid.
• $1,078,000 transferred from the Tax Increment Financing #1 Fund to the Nonmajor Governmental Fund (TIF Debt Service Fund) to cover debt service payments. This transfer will not be repaid.
• $158,301 transferred from the Internal Service Fund (Property/Liability Fund) to the Internal Service Fund (Workers’ Compensation) to effectively close the Property Liability Fund. This transfer will not be repaid.
• $130,000 transferred from the Internal Service Fund (Workers’ Compensation Fund) to the General Fund to maintain a net position balance around $1,000,000. This transfer will not be repaid.
• $155,497 transferred from the Nonmajor Governmental Funds (CDBG Fund) to the Water Fund to cover the CDBG portion of the water main project. This transfer will not be repaid.
- 45 -
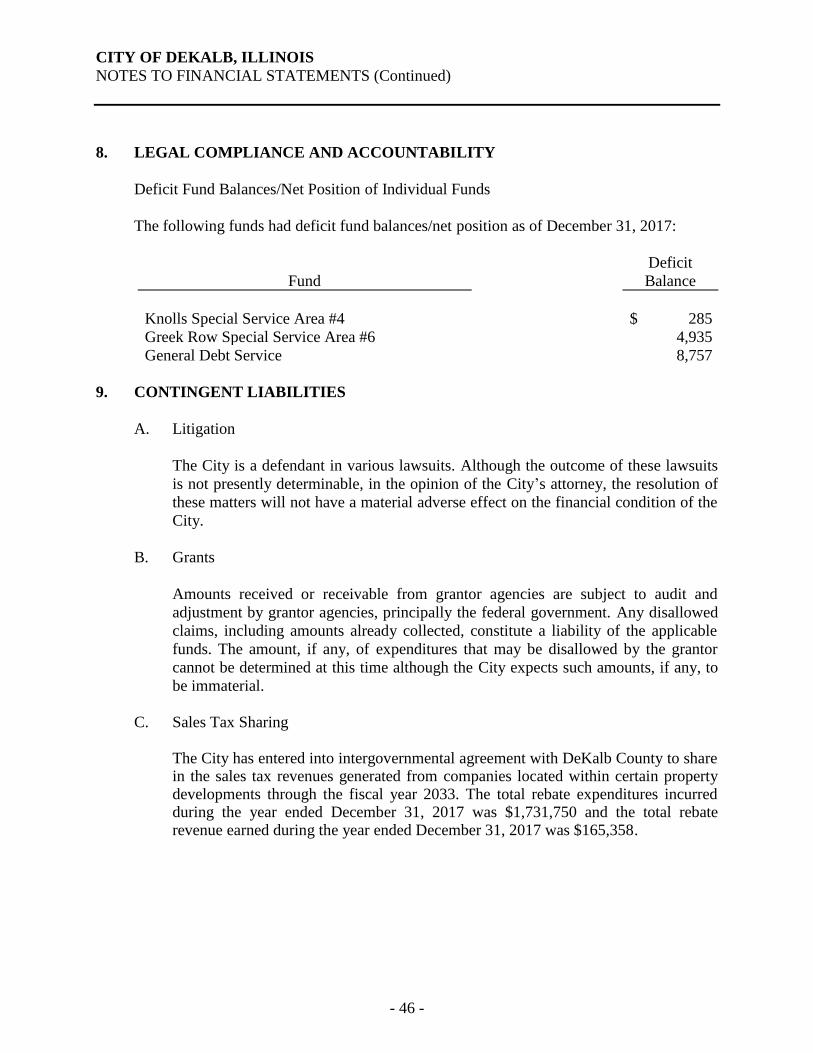
CITY OF DEKALB, ILLINOIS
NOTES TO FINANCIAL STATEMENTS (Continued)
- 46 -
8. LEGAL COMPLIANCE AND ACCOUNTABILITY
Deficit Fund Balances/Net Position of Individual Funds
The following funds had deficit fund balances/net position as of December 31, 2017:
Fund
Deficit
Balance
Knolls Special Service Area #4 $ 285
Greek Row Special Service Area #6 4,935
General Debt Service 8,757
9. CONTINGENT LIABILITIES
A. Litigation
The City is a defendant in various lawsuits. Although the outcome of these lawsuits
is not presently determinable, in the opinion of the City’s attorney, the resolution of
these matters will not have a material adverse effect on the financial condition of the
City.
B. Grants
Amounts received or receivable from grantor agencies are subject to audit and
adjustment by grantor agencies, principally the federal government. Any disallowed
claims, including amounts already collected, constitute a liability of the applicable
funds. The amount, if any, of expenditures that may be disallowed by the grantor
cannot be determined at this time although the City expects such amounts, if any, to
be immaterial.
C. Sales Tax Sharing The City has entered into intergovernmental agreement with DeKalb County to share
in the sales tax revenues generated from companies located within certain property developments through the fiscal year 2033. The total rebate expenditures incurred during the year ended December 31, 2017 was $1,731,750 and the total rebate revenue earned during the year ended December 31, 2017 was $165,358.
- 46 -
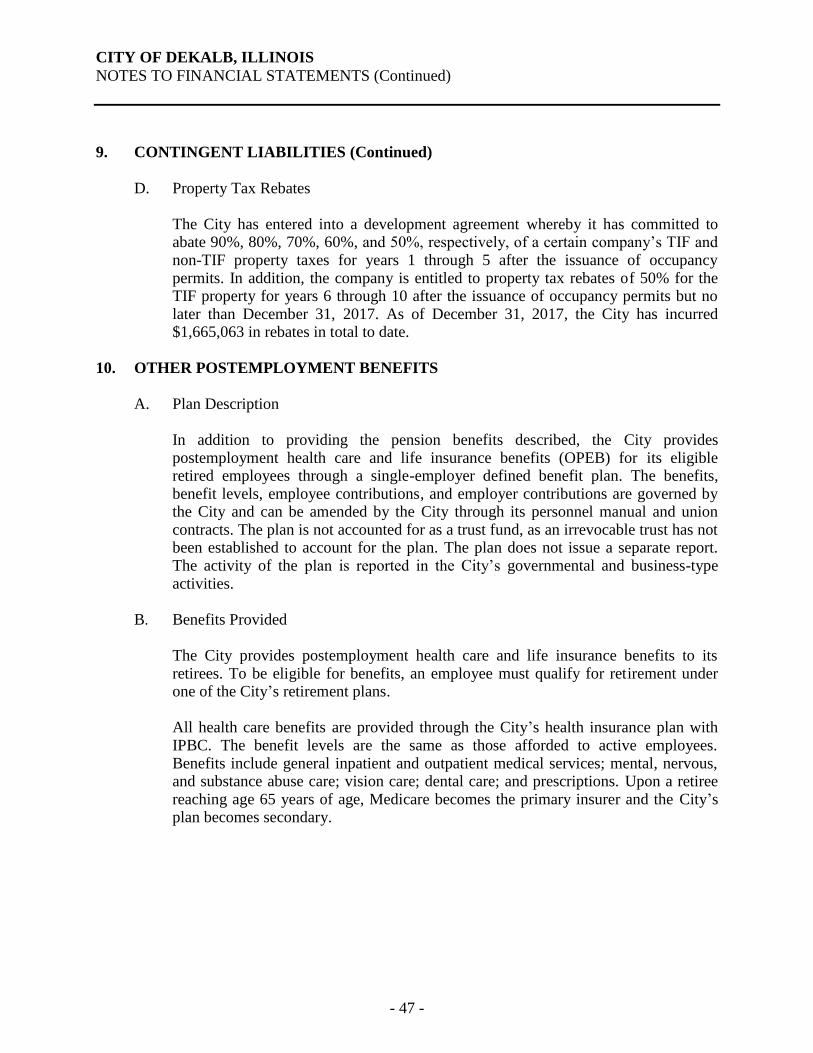
CITY OF DEKALB, ILLINOIS
NOTES TO FINANCIAL STATEMENTS (Continued)
- 47 -
9. CONTINGENT LIABILITIES (Continued)
D. Property Tax Rebates The City has entered into a development agreement whereby it has committed to
abate 90%, 80%, 70%, 60%, and 50%, respectively, of a certain company’s TIF and non-TIF property taxes for years 1 through 5 after the issuance of occupancy permits. In addition, the company is entitled to property tax rebates of 50% for the TIF property for years 6 through 10 after the issuance of occupancy permits but no later than December 31, 2017. As of December 31, 2017, the City has incurred $1,665,063 in rebates in total to date.
10. OTHER POSTEMPLOYMENT BENEFITS
A. Plan Description In addition to providing the pension benefits described, the City provides
postemployment health care and life insurance benefits (OPEB) for its eligible retired employees through a single-employer defined benefit plan. The benefits, benefit levels, employee contributions, and employer contributions are governed by the City and can be amended by the City through its personnel manual and union contracts. The plan is not accounted for as a trust fund, as an irrevocable trust has not been established to account for the plan. The plan does not issue a separate report. The activity of the plan is reported in the City’s governmental and business-type activities.
B. Benefits Provided The City provides postemployment health care and life insurance benefits to its
retirees. To be eligible for benefits, an employee must qualify for retirement under one of the City’s retirement plans.
All health care benefits are provided through the City’s health insurance plan with
IPBC. The benefit levels are the same as those afforded to active employees. Benefits include general inpatient and outpatient medical services; mental, nervous, and substance abuse care; vision care; dental care; and prescriptions. Upon a retiree reaching age 65 years of age, Medicare becomes the primary insurer and the City’s plan becomes secondary.
- 47 -
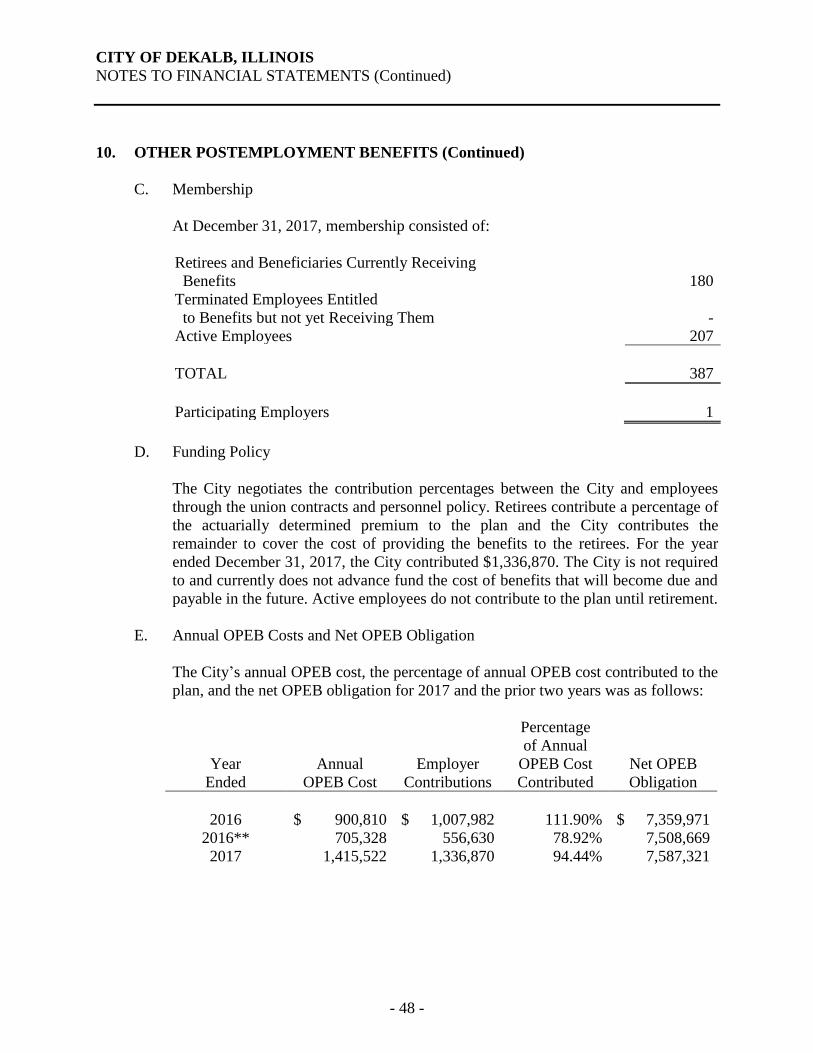
CITY OF DEKALB, ILLINOIS
NOTES TO FINANCIAL STATEMENTS (Continued)
- 48 -
10. OTHER POSTEMPLOYMENT BENEFITS (Continued)
C. Membership
At December 31, 2017, membership consisted of:
Retirees and Beneficiaries Currently Receiving
Benefits 180
Terminated Employees Entitled
to Benefits but not yet Receiving Them -
Active Employees 207
TOTAL 387
Participating Employers 1
D. Funding Policy
The City negotiates the contribution percentages between the City and employees
through the union contracts and personnel policy. Retirees contribute a percentage of
the actuarially determined premium to the plan and the City contributes the
remainder to cover the cost of providing the benefits to the retirees. For the year
ended December 31, 2017, the City contributed $1,336,870. The City is not required
to and currently does not advance fund the cost of benefits that will become due and
payable in the future. Active employees do not contribute to the plan until retirement.
E. Annual OPEB Costs and Net OPEB Obligation
The City’s annual OPEB cost, the percentage of annual OPEB cost contributed to the
plan, and the net OPEB obligation for 2017 and the prior two years was as follows:
Year
Ended
Annual
OPEB Cost
Employer
Contributions
Percentage
of Annual
OPEB Cost
Contributed
Net OPEB
Obligation
2016 $ 900,810 $ 1,007,982 111.90% $ 7,359,971
2016** 705,328 556,630 78.92% 7,508,669
2017 1,415,522 1,336,870 94.44% 7,587,321
- 48 -
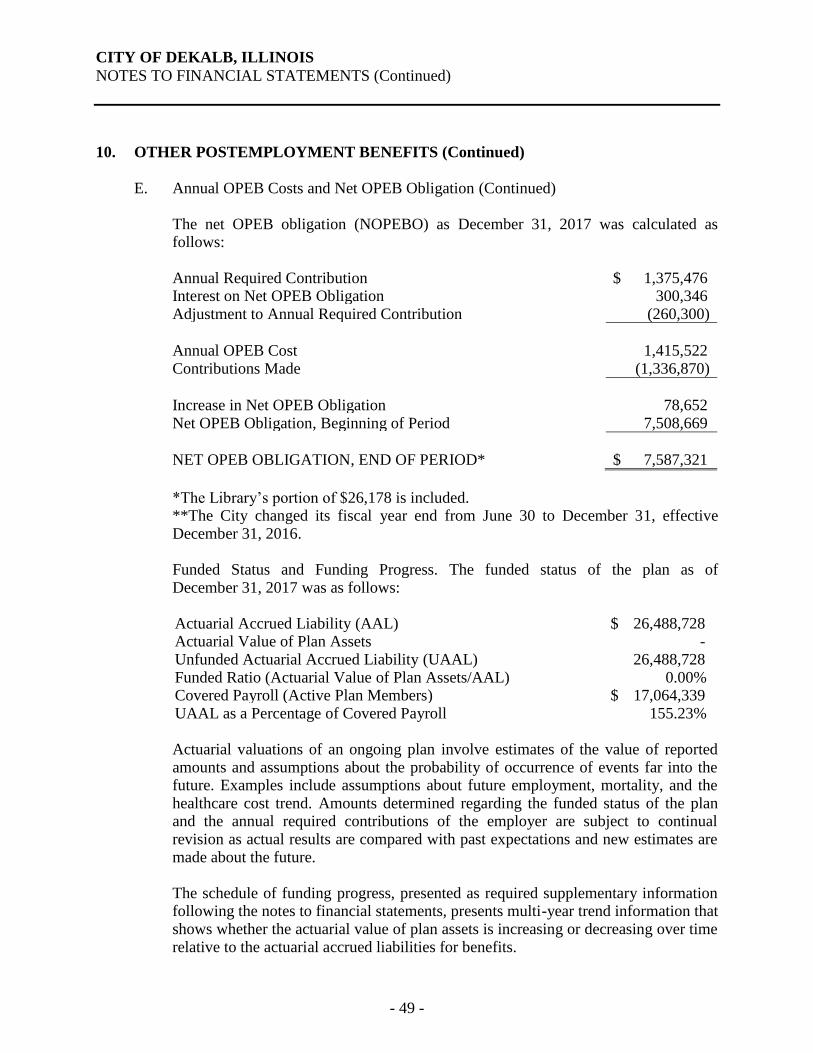
CITY OF DEKALB, ILLINOIS
NOTES TO FINANCIAL STATEMENTS (Continued)
- 49 -
10. OTHER POSTEMPLOYMENT BENEFITS (Continued)
E. Annual OPEB Costs and Net OPEB Obligation (Continued) The net OPEB obligation (NOPEBO) as December 31, 2017 was calculated as
follows:
Annual Required Contribution $ 1,375,476 Interest on Net OPEB Obligation 300,346 Adjustment to Annual Required Contribution (260,300)
Annual OPEB Cost 1,415,522 Contributions Made (1,336,870)
Increase in Net OPEB Obligation 78,652 Net OPEB Obligation, Beginning of Period 7,508,669
NET OPEB OBLIGATION, END OF PERIOD* $ 7,587,321
*The Library’s portion of $26,178 is included. **The City changed its fiscal year end from June 30 to December 31, effective
December 31, 2016. Funded Status and Funding Progress. The funded status of the plan as of
December 31, 2017 was as follows:
Actuarial Accrued Liability (AAL) $ 26,488,728 Actuarial Value of Plan Assets - Unfunded Actuarial Accrued Liability (UAAL) 26,488,728 Funded Ratio (Actuarial Value of Plan Assets/AAL) 0.00% Covered Payroll (Active Plan Members) $ 17,064,339 UAAL as a Percentage of Covered Payroll 155.23%
Actuarial valuations of an ongoing plan involve estimates of the value of reported
amounts and assumptions about the probability of occurrence of events far into the future. Examples include assumptions about future employment, mortality, and the healthcare cost trend. Amounts determined regarding the funded status of the plan and the annual required contributions of the employer are subject to continual revision as actual results are compared with past expectations and new estimates are made about the future.
The schedule of funding progress, presented as required supplementary information
following the notes to financial statements, presents multi-year trend information that shows whether the actuarial value of plan assets is increasing or decreasing over time relative to the actuarial accrued liabilities for benefits.
- 49 -
CITY OF DEKALB, ILLINOIS
NOTES TO FINANCIAL STATEMENTS (Continued)
- 50 -
10. OTHER POSTEMPLOYMENT BENEFITS (Continued)
E. Annual OPEB Costs and Net OPEB Obligation (Continued)
Actuarial methods and assumptions involve the projections of benefits for financial
reporting purposes are based on the substantive plan (the plan as understood by the
employer and plan members) and include the types of benefits provided at the time
of each valuation and the historical pattern of sharing of benefit costs between the
employer and plan members to that point. The actuarial methods and assumptions
used include techniques that are designed to reduce short-term volatility in actuarial
accrued liabilities and the actuarial value of assets, consistent with the long-term
perspective of the calculations.
In the December 31, 2017, the entry-age actuarial cost method was used. The
actuarial assumptions included a 4.00% investment rate of return and an annual
healthcare cost trend rate of 8.50% initially, reduced by decrements to an ultimate
rate of 4.00%. Both rates include a 2.50% inflation assumption. The actuarial value
of assets was not determined as the City has not advance funded its obligation. The
plan’s unfunded actuarial accrued liability is being amortized as a level percentage of
projected payroll on a 30-year open basis.
11. DEFINED BENEFIT PENSION PLANS
The City contributes to three defined benefit pension plans, the Illinois Municipal
Retirement Fund (IMRF), an agent multiple-employer public employee retirement system;
the Police Pension Plan, which is a single-employer pension plan; and the Firefighters’
Pension Plan, which is also a single-employer pension plan. The benefits, benefit levels,
employee contributions, and employer contributions for all three plans are governed by
ILCS and can only be amended by the Illinois General Assembly. IMRF issues a publicly
available report that includes financial statements and supplementary information for the
plan as a whole, but not for individual employers. That report can be obtained from IMRF,
2211 York Road, Suite 500, Oak Brook, Illinois 60523 or at www.imrf.org. The Police and
Firefighters’ Pension Plans do not issue separate reports.
A. Plan Descriptions
Illinois Municipal Retirement Fund
Plan Administration
All employees (other than those covered by the Police and Firefighters’ Pension
Plans) hired in positions that meet or exceed the prescribed annual hourly standard
must be enrolled in IMRF as participating members.
- 50 -
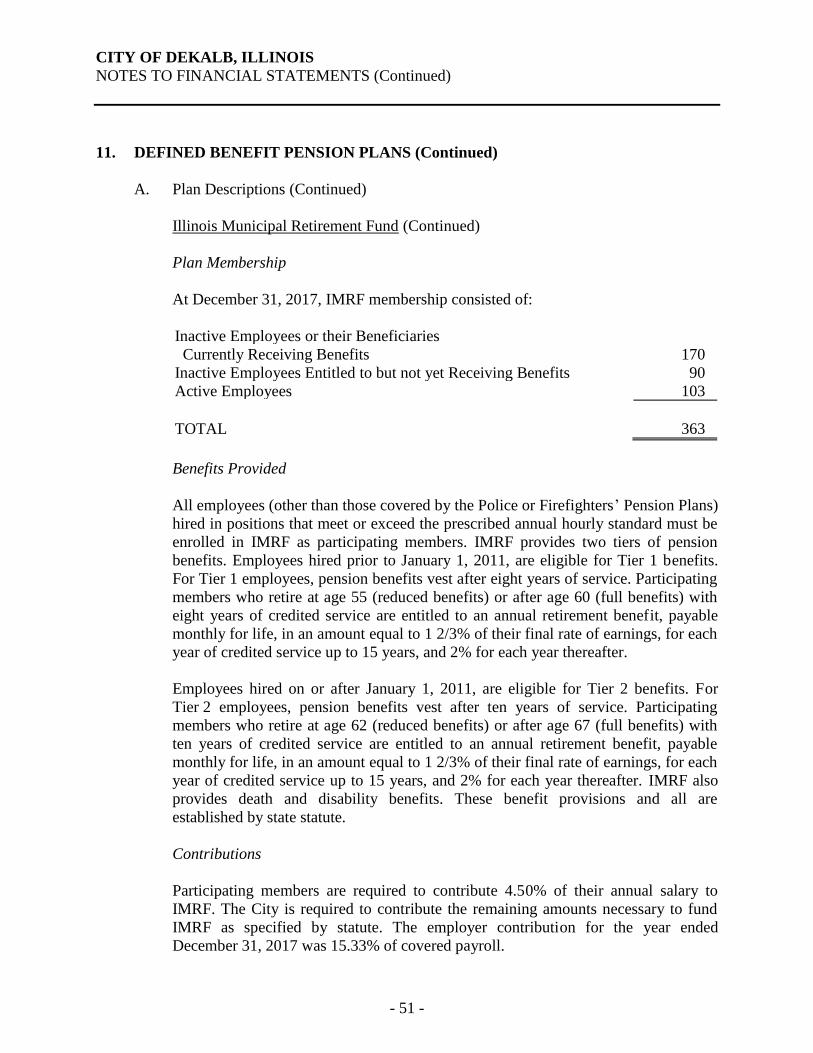
CITY OF DEKALB, ILLINOIS
NOTES TO FINANCIAL STATEMENTS (Continued)
- 51 -
11. DEFINED BENEFIT PENSION PLANS (Continued)
A. Plan Descriptions (Continued)
Illinois Municipal Retirement Fund (Continued)
Plan Membership
At December 31, 2017, IMRF membership consisted of:
Inactive Employees or their Beneficiaries
Currently Receiving Benefits 170
Inactive Employees Entitled to but not yet Receiving Benefits 90
Active Employees 103
TOTAL 363
Benefits Provided
All employees (other than those covered by the Police or Firefighters’ Pension Plans)
hired in positions that meet or exceed the prescribed annual hourly standard must be
enrolled in IMRF as participating members. IMRF provides two tiers of pension
benefits. Employees hired prior to January 1, 2011, are eligible for Tier 1 benefits.
For Tier 1 employees, pension benefits vest after eight years of service. Participating
members who retire at age 55 (reduced benefits) or after age 60 (full benefits) with
eight years of credited service are entitled to an annual retirement benefit, payable
monthly for life, in an amount equal to 1 2/3% of their final rate of earnings, for each
year of credited service up to 15 years, and 2% for each year thereafter.
Employees hired on or after January 1, 2011, are eligible for Tier 2 benefits. For
Tier 2 employees, pension benefits vest after ten years of service. Participating
members who retire at age 62 (reduced benefits) or after age 67 (full benefits) with
ten years of credited service are entitled to an annual retirement benefit, payable
monthly for life, in an amount equal to 1 2/3% of their final rate of earnings, for each
year of credited service up to 15 years, and 2% for each year thereafter. IMRF also
provides death and disability benefits. These benefit provisions and all are
established by state statute.
Contributions
Participating members are required to contribute 4.50% of their annual salary to
IMRF. The City is required to contribute the remaining amounts necessary to fund
IMRF as specified by statute. The employer contribution for the year ended
December 31, 2017 was 15.33% of covered payroll.
- 51 -
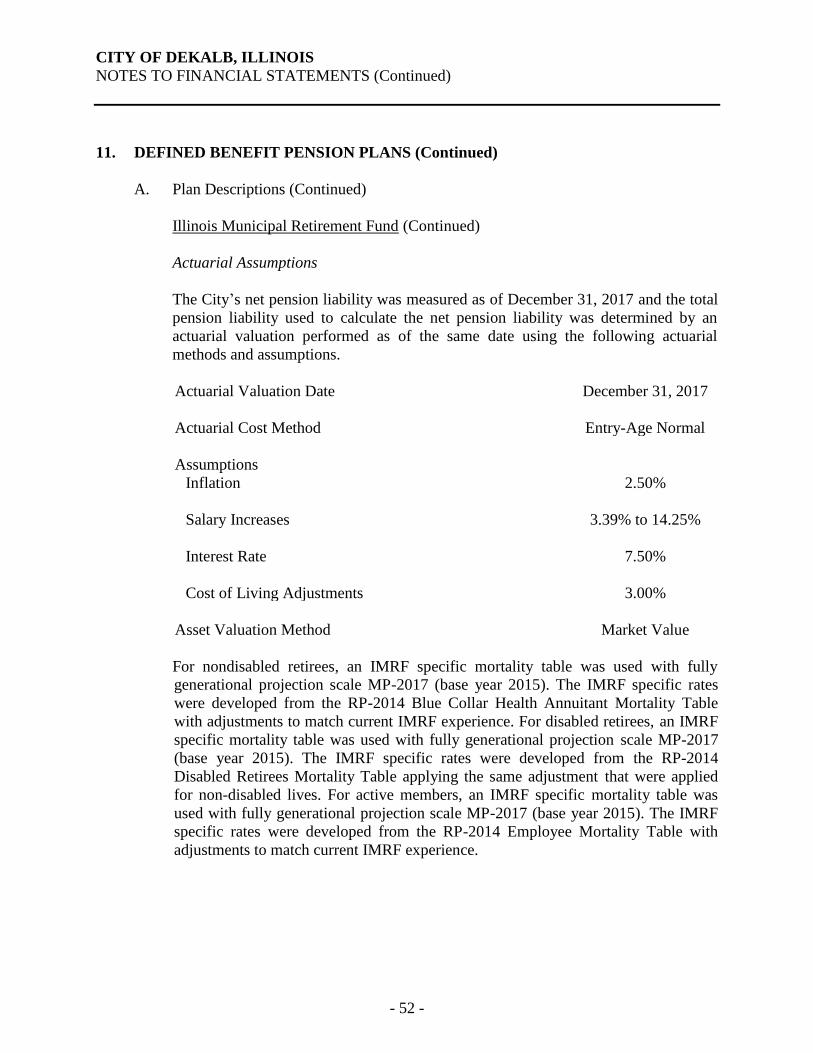
CITY OF DEKALB, ILLINOIS
NOTES TO FINANCIAL STATEMENTS (Continued)
- 52 -
11. DEFINED BENEFIT PENSION PLANS (Continued)
A. Plan Descriptions (Continued)
Illinois Municipal Retirement Fund (Continued)
Actuarial Assumptions
The City’s net pension liability was measured as of December 31, 2017 and the total
pension liability used to calculate the net pension liability was determined by an
actuarial valuation performed as of the same date using the following actuarial
methods and assumptions.
Actuarial Valuation Date December 31, 2017
Actuarial Cost Method Entry-Age Normal
Assumptions
Inflation 2.50%
Salary Increases 3.39% to 14.25%
Interest Rate 7.50%
Cost of Living Adjustments 3.00%
Asset Valuation Method Market Value
For nondisabled retirees, an IMRF specific mortality table was used with fully
generational projection scale MP-2017 (base year 2015). The IMRF specific rates
were developed from the RP-2014 Blue Collar Health Annuitant Mortality Table
with adjustments to match current IMRF experience. For disabled retirees, an IMRF
specific mortality table was used with fully generational projection scale MP-2017
(base year 2015). The IMRF specific rates were developed from the RP-2014
Disabled Retirees Mortality Table applying the same adjustment that were applied
for non-disabled lives. For active members, an IMRF specific mortality table was
used with fully generational projection scale MP-2017 (base year 2015). The IMRF
specific rates were developed from the RP-2014 Employee Mortality Table with
adjustments to match current IMRF experience.
- 52 -
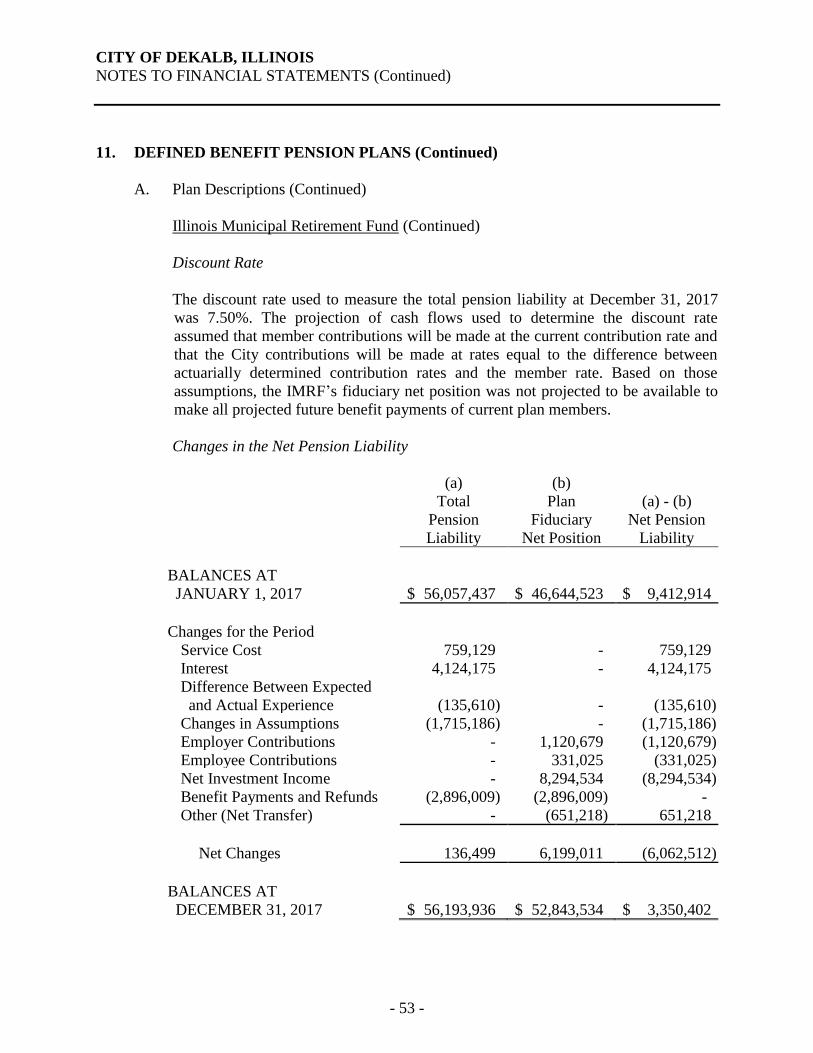
CITY OF DEKALB, ILLINOIS
NOTES TO FINANCIAL STATEMENTS (Continued)
- 53 -
11. DEFINED BENEFIT PENSION PLANS (Continued)
A. Plan Descriptions (Continued)
Illinois Municipal Retirement Fund (Continued)
Discount Rate
The discount rate used to measure the total pension liability at December 31, 2017
was 7.50%. The projection of cash flows used to determine the discount rate
assumed that member contributions will be made at the current contribution rate and
that the City contributions will be made at rates equal to the difference between
actuarially determined contribution rates and the member rate. Based on those
assumptions, the IMRF’s fiduciary net position was not projected to be available to
make all projected future benefit payments of current plan members.
Changes in the Net Pension Liability
(a)
Total
Pension
(b)
Plan
Fiduciary
(a) - (b)
Net Pension
Liability Net Position Liability
BALANCES AT
JANUARY 1, 2017
$ 56,057,437
$ 46,644,523
$ 9,412,914
Changes for the Period
Service Cost 759,129 - 759,129
Interest 4,124,175 - 4,124,175
Difference Between Expected
and Actual Experience (135,610) - (135,610)
Changes in Assumptions (1,715,186) - (1,715,186)
Employer Contributions - 1,120,679 (1,120,679)
Employee Contributions - 331,025 (331,025)
Net Investment Income - 8,294,534 (8,294,534)
Benefit Payments and Refunds (2,896,009) (2,896,009) -
Other (Net Transfer) - (651,218) 651,218
Net Changes 136,499 6,199,011 (6,062,512)
BALANCES AT
DECEMBER 31, 2017
$ 56,193,936
$ 52,843,534
$ 3,350,402
- 53 -
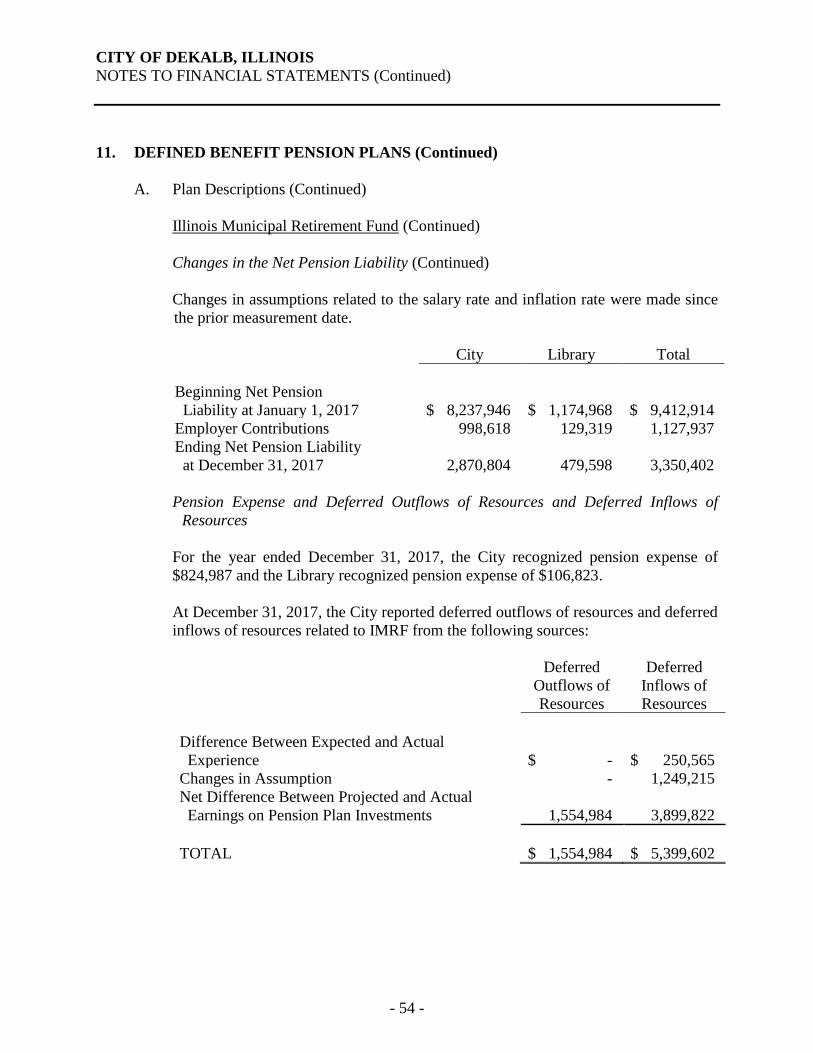
CITY OF DEKALB, ILLINOIS
NOTES TO FINANCIAL STATEMENTS (Continued)
- 54 -
11. DEFINED BENEFIT PENSION PLANS (Continued)
A. Plan Descriptions (Continued)
Illinois Municipal Retirement Fund (Continued)
Changes in the Net Pension Liability (Continued)
Changes in assumptions related to the salary rate and inflation rate were made since
the prior measurement date.
City Library Total
Beginning Net Pension
Liability at January 1, 2017
$ 8,237,946
$ 1,174,968
$ 9,412,914
Employer Contributions 998,618 129,319 1,127,937
Ending Net Pension Liability
at December 31, 2017
2,870,804
479,598
3,350,402
Pension Expense and Deferred Outflows of Resources and Deferred Inflows of
Resources
For the year ended December 31, 2017, the City recognized pension expense of
$824,987 and the Library recognized pension expense of $106,823.
At December 31, 2017, the City reported deferred outflows of resources and deferred
inflows of resources related to IMRF from the following sources:
Deferred
Outflows of
Deferred
Inflows of
Resources Resources
Difference Between Expected and Actual
Experience
$ -
$ 250,565
Changes in Assumption - 1,249,215
Net Difference Between Projected and Actual
Earnings on Pension Plan Investments 1,554,984 3,899,822
TOTAL $ 1,554,984 $ 5,399,602
- 54 -
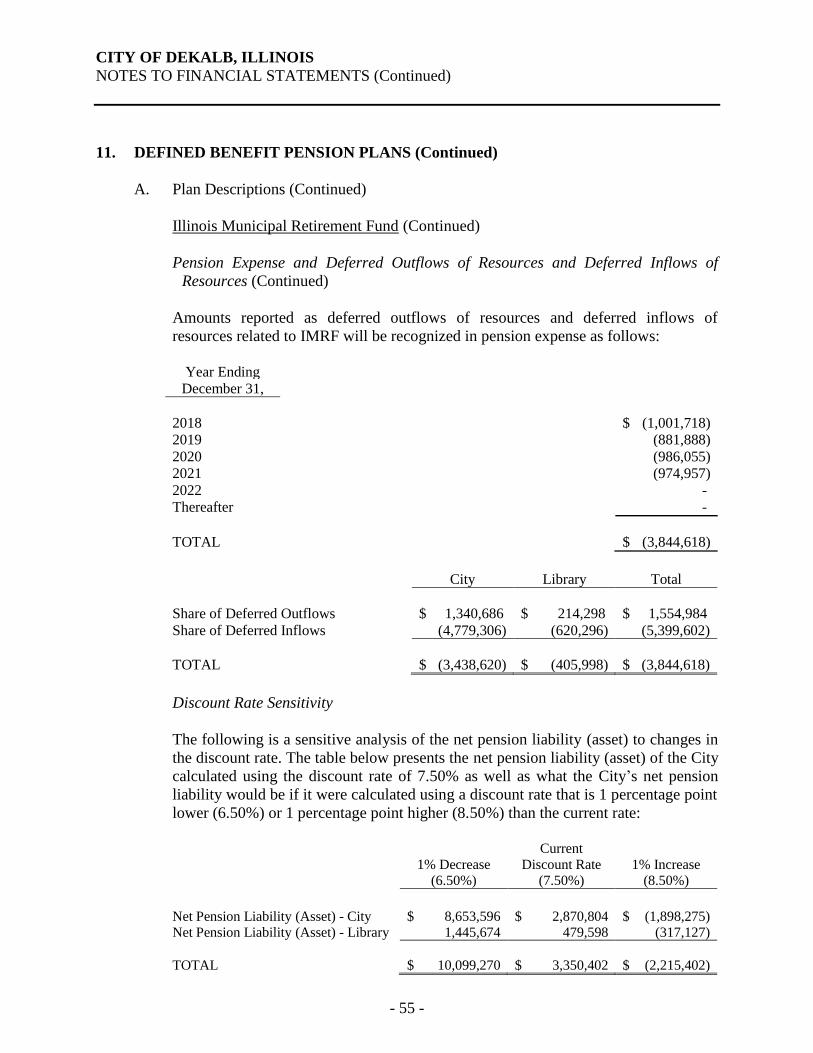
CITY OF DEKALB, ILLINOIS
NOTES TO FINANCIAL STATEMENTS (Continued)
- 55 -
11. DEFINED BENEFIT PENSION PLANS (Continued)
A. Plan Descriptions (Continued)
Illinois Municipal Retirement Fund (Continued)
Pension Expense and Deferred Outflows of Resources and Deferred Inflows of
Resources (Continued)
Amounts reported as deferred outflows of resources and deferred inflows of
resources related to IMRF will be recognized in pension expense as follows:
Year Ending
December 31,
2018 $ (1,001,718)
2019 (881,888)
2020 (986,055)
2021 (974,957)
2022 -
Thereafter -
TOTAL $ (3,844,618)
City Library Total
Share of Deferred Outflows $ 1,340,686 $ 214,298 $ 1,554,984
Share of Deferred Inflows (4,779,306) (620,296) (5,399,602)
TOTAL $ (3,438,620) $ (405,998) $ (3,844,618)
Discount Rate Sensitivity
The following is a sensitive analysis of the net pension liability (asset) to changes in
the discount rate. The table below presents the net pension liability (asset) of the City
calculated using the discount rate of 7.50% as well as what the City’s net pension
liability would be if it were calculated using a discount rate that is 1 percentage point
lower (6.50%) or 1 percentage point higher (8.50%) than the current rate:
1% Decrease
Current
Discount Rate
1% Increase
(6.50%) (7.50%) (8.50%)
Net Pension Liability (Asset) - City $ 8,653,596 $ 2,870,804 $ (1,898,275)
Net Pension Liability (Asset) - Library 1,445,674 479,598 (317,127)
TOTAL $ 10,099,270 $ 3,350,402 $ (2,215,402)
- 55 -
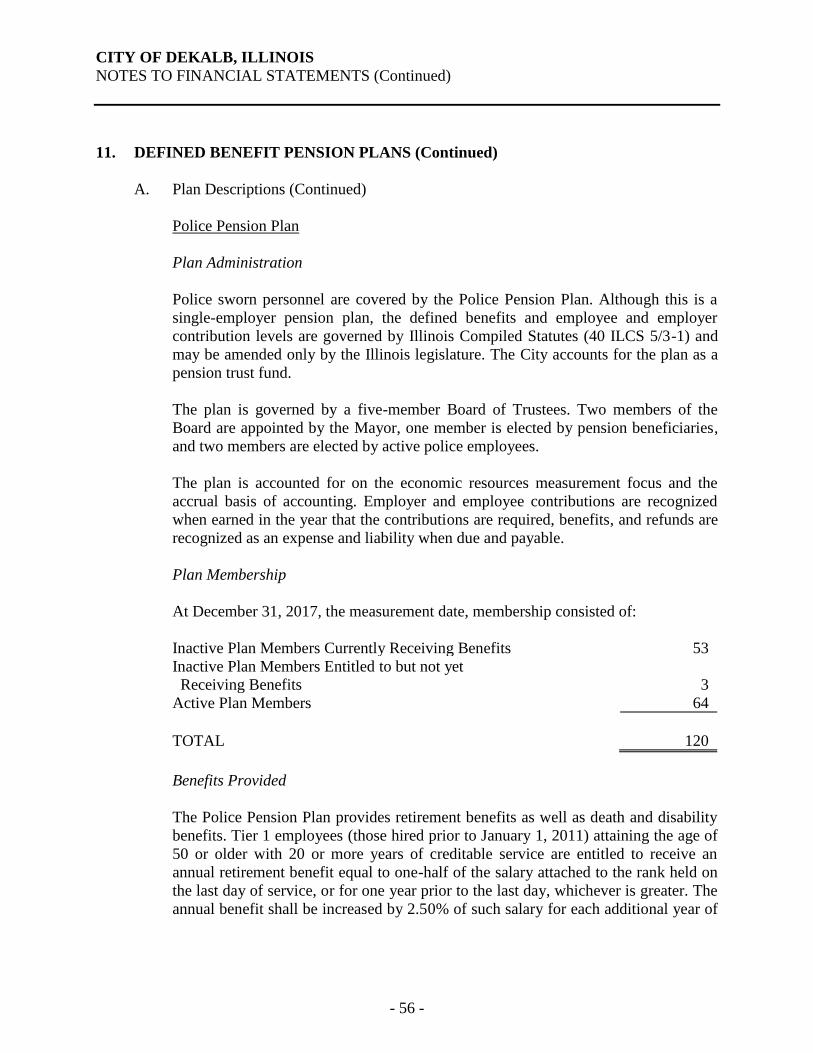
CITY OF DEKALB, ILLINOIS
NOTES TO FINANCIAL STATEMENTS (Continued)
- 56 -
11. DEFINED BENEFIT PENSION PLANS (Continued)
A. Plan Descriptions (Continued)
Police Pension Plan
Plan Administration
Police sworn personnel are covered by the Police Pension Plan. Although this is a
single-employer pension plan, the defined benefits and employee and employer
contribution levels are governed by Illinois Compiled Statutes (40 ILCS 5/3-1) and
may be amended only by the Illinois legislature. The City accounts for the plan as a
pension trust fund.
The plan is governed by a five-member Board of Trustees. Two members of the
Board are appointed by the Mayor, one member is elected by pension beneficiaries,
and two members are elected by active police employees.
The plan is accounted for on the economic resources measurement focus and the
accrual basis of accounting. Employer and employee contributions are recognized
when earned in the year that the contributions are required, benefits, and refunds are
recognized as an expense and liability when due and payable.
Plan Membership
At December 31, 2017, the measurement date, membership consisted of:
Inactive Plan Members Currently Receiving Benefits 53
Inactive Plan Members Entitled to but not yet
Receiving Benefits 3
Active Plan Members 64
TOTAL 120
Benefits Provided
The Police Pension Plan provides retirement benefits as well as death and disability
benefits. Tier 1 employees (those hired prior to January 1, 2011) attaining the age of
50 or older with 20 or more years of creditable service are entitled to receive an
annual retirement benefit equal to one-half of the salary attached to the rank held on
the last day of service, or for one year prior to the last day, whichever is greater. The
annual benefit shall be increased by 2.50% of such salary for each additional year of
- 56 -
CITY OF DEKALB, ILLINOIS
NOTES TO FINANCIAL STATEMENTS (Continued)
- 57 -
11. DEFINED BENEFIT PENSION PLANS (Continued)
A. Plan Descriptions (Continued)
Police Pension Plan (Continued)
Benefits Provided (Continued)
service over 20 years up to 30 years to a maximum of 75% of such salary.
Employees with at least eight years but less than 20 years of credited service may
retire at or after age 60 and receive 2.50% of salary for each year of service. The
monthly benefit shall be increased annually, following the first anniversary date of
retirement and be paid upon reaching the age of at least 55 years, by 3% of the
original pension, and 3% compounded annually thereafter.
Tier 2 employees (those hired on or after January 1, 2011) attaining the age of 55 or
older with ten or more years of creditable service are entitled to receive an annual
retirement benefit equal to the average monthly salary obtained by dividing the total
salary of the police officer during the 96 consecutive months of service within the
last 120 months of service in which the total salary was the highest by the number of
months of service in that period. Police officers’ salary for pension purposes is
capped at $106,800, plus the lesser of ½ of the annual change in the Consumer Price
Index or 3% compounded. The annual benefit shall be increased by 2.50% of such
salary for each additional year of service over 20 years up to 30 years to a maximum
of 75% of such salary. Employees with at least ten years may retire at or after age 50
and receive a reduced benefit (i.e., ½% for each month under 55). The monthly
benefit of a Tier 2 police officer shall be increased annually at age 60 on the
January 1st after the police officer retires, or the first anniversary of the pension
starting date, whichever is later.
Contributions
Employees are required by ILCS to contribute 9.91% of their base salary to the
Police Pension Plan. If an employee leaves covered employment with less than 20
years of service, accumulated employee contributions may be refunded without
accumulated interest. The City is required to contribute the remaining amounts
necessary to finance the plan and the administrative costs as actuarially determined
by an enrolled actuary. Effective January 1, 2011, the City has until the year 2040 to
fund 90% of the past service cost for the Police Pension Plan. The City has chosen a
policy to fund 100% of the past service costs by 2040. For the year ended
December 31, 2017, the City’s contribution was 42.62% of covered payroll.
- 57 -
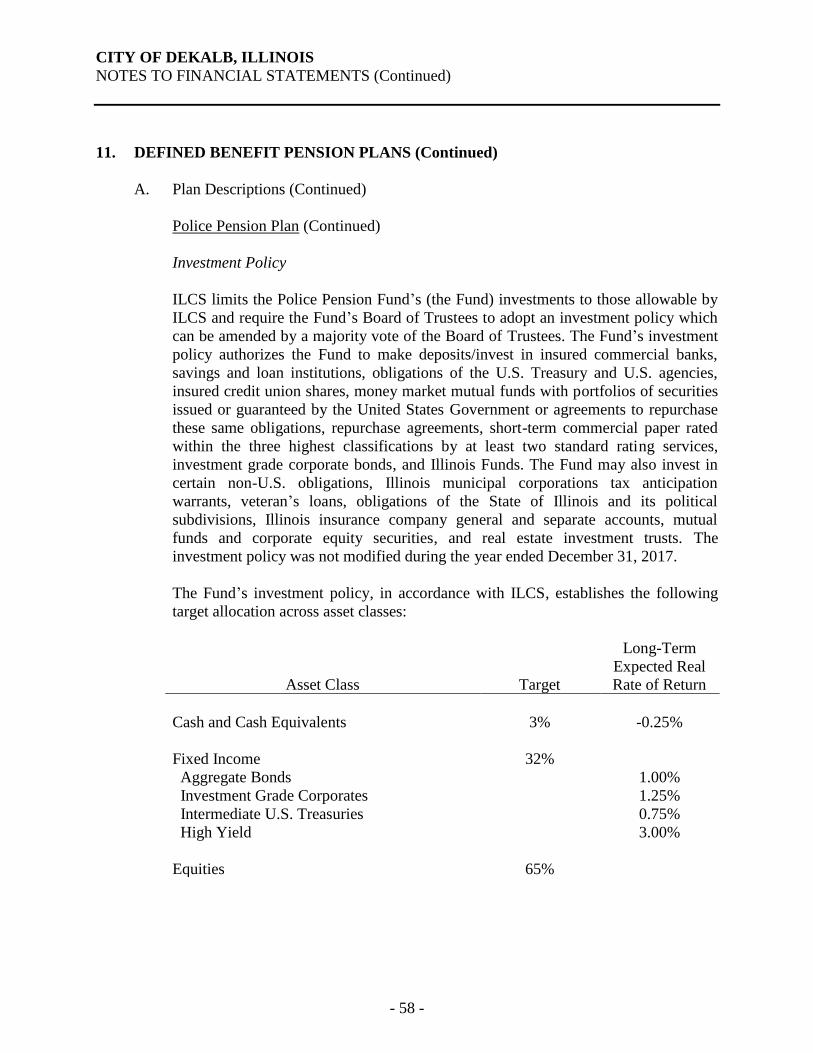
CITY OF DEKALB, ILLINOIS
NOTES TO FINANCIAL STATEMENTS (Continued)
- 58 -
11. DEFINED BENEFIT PENSION PLANS (Continued)
A. Plan Descriptions (Continued)
Police Pension Plan (Continued)
Investment Policy
ILCS limits the Police Pension Fund’s (the Fund) investments to those allowable by
ILCS and require the Fund’s Board of Trustees to adopt an investment policy which
can be amended by a majority vote of the Board of Trustees. The Fund’s investment
policy authorizes the Fund to make deposits/invest in insured commercial banks,
savings and loan institutions, obligations of the U.S. Treasury and U.S. agencies,
insured credit union shares, money market mutual funds with portfolios of securities
issued or guaranteed by the United States Government or agreements to repurchase
these same obligations, repurchase agreements, short-term commercial paper rated
within the three highest classifications by at least two standard rating services,
investment grade corporate bonds, and Illinois Funds. The Fund may also invest in
certain non-U.S. obligations, Illinois municipal corporations tax anticipation
warrants, veteran’s loans, obligations of the State of Illinois and its political
subdivisions, Illinois insurance company general and separate accounts, mutual
funds and corporate equity securities, and real estate investment trusts. The
investment policy was not modified during the year ended December 31, 2017.
The Fund’s investment policy, in accordance with ILCS, establishes the following
target allocation across asset classes:
Asset Class
Target
Long-Term
Expected Real
Rate of Return
Cash and Cash Equivalents 3% -0.25%
Fixed Income 32%
Aggregate Bonds 1.00%
Investment Grade Corporates 1.25%
Intermediate U.S. Treasuries 0.75%
High Yield 3.00%
Equities 65%
- 58 -
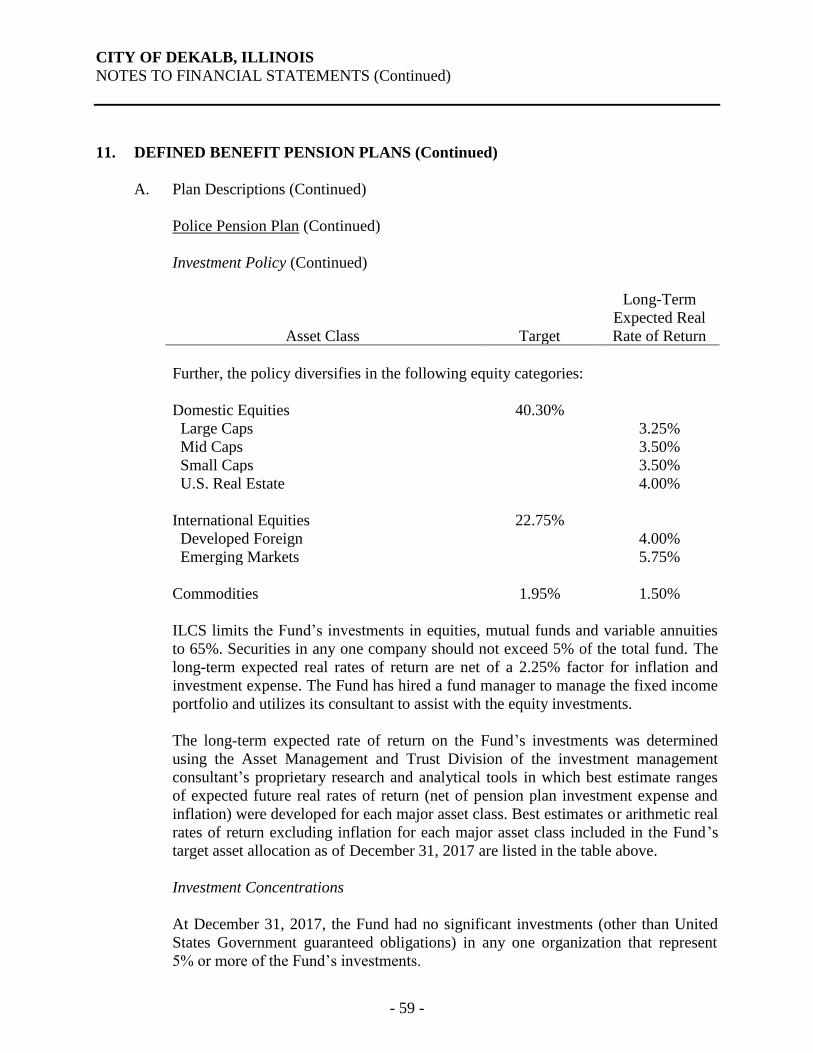
CITY OF DEKALB, ILLINOIS
NOTES TO FINANCIAL STATEMENTS (Continued)
- 59 -
11. DEFINED BENEFIT PENSION PLANS (Continued)
A. Plan Descriptions (Continued)
Police Pension Plan (Continued)
Investment Policy (Continued)
Asset Class
Target
Long-Term
Expected Real
Rate of Return
Further, the policy diversifies in the following equity categories:
Domestic Equities 40.30%
Large Caps 3.25%
Mid Caps 3.50%
Small Caps 3.50%
U.S. Real Estate 4.00%
International Equities 22.75%
Developed Foreign 4.00%
Emerging Markets 5.75%
Commodities 1.95% 1.50%
ILCS limits the Fund’s investments in equities, mutual funds and variable annuities
to 65%. Securities in any one company should not exceed 5% of the total fund. The
long-term expected real rates of return are net of a 2.25% factor for inflation and
investment expense. The Fund has hired a fund manager to manage the fixed income
portfolio and utilizes its consultant to assist with the equity investments.
The long-term expected rate of return on the Fund’s investments was determined
using the Asset Management and Trust Division of the investment management
consultant’s proprietary research and analytical tools in which best estimate ranges
of expected future real rates of return (net of pension plan investment expense and
inflation) were developed for each major asset class. Best estimates or arithmetic real
rates of return excluding inflation for each major asset class included in the Fund’s
target asset allocation as of December 31, 2017 are listed in the table above.
Investment Concentrations
At December 31, 2017, the Fund had no significant investments (other than United
States Government guaranteed obligations) in any one organization that represent
5% or more of the Fund’s investments.
- 59 -
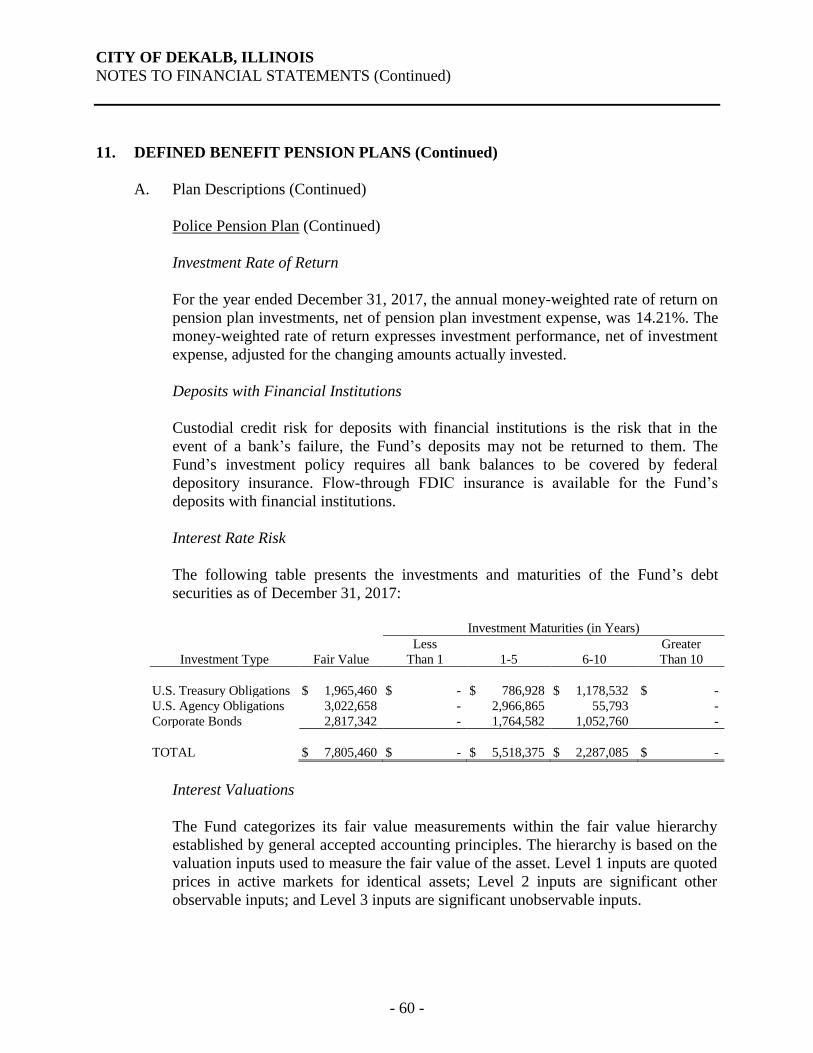
CITY OF DEKALB, ILLINOIS
NOTES TO FINANCIAL STATEMENTS (Continued)
- 60 -
11. DEFINED BENEFIT PENSION PLANS (Continued)
A. Plan Descriptions (Continued)
Police Pension Plan (Continued)
Investment Rate of Return
For the year ended December 31, 2017, the annual money-weighted rate of return on
pension plan investments, net of pension plan investment expense, was 14.21%. The
money-weighted rate of return expresses investment performance, net of investment
expense, adjusted for the changing amounts actually invested.
Deposits with Financial Institutions
Custodial credit risk for deposits with financial institutions is the risk that in the
event of a bank’s failure, the Fund’s deposits may not be returned to them. The
Fund’s investment policy requires all bank balances to be covered by federal
depository insurance. Flow-through FDIC insurance is available for the Fund’s
deposits with financial institutions.
Interest Rate Risk
The following table presents the investments and maturities of the Fund’s debt
securities as of December 31, 2017:
Investment Maturities (in Years)
Investment Type
Fair Value
Less
Than 1
1-5
6-10
Greater
Than 10
U.S. Treasury Obligations $ 1,965,460 $ - $ 786,928 $ 1,178,532 $ -
U.S. Agency Obligations 3,022,658 - 2,966,865 55,793 -
Corporate Bonds 2,817,342 - 1,764,582 1,052,760 -
TOTAL $ 7,805,460 $ - $ 5,518,375 $ 2,287,085 $ -
Interest Valuations
The Fund categorizes its fair value measurements within the fair value hierarchy
established by general accepted accounting principles. The hierarchy is based on the
valuation inputs used to measure the fair value of the asset. Level 1 inputs are quoted
prices in active markets for identical assets; Level 2 inputs are significant other
observable inputs; and Level 3 inputs are significant unobservable inputs.
- 60 -
CITY OF DEKALB, ILLINOIS
NOTES TO FINANCIAL STATEMENTS (Continued)
- 61 -
11. DEFINED BENEFIT PENSION PLANS (Continued)
A. Plan Descriptions (Continued)
Police Pension Plan (Continued)
Interest Valuations (Continued)
The Fund has the following recurring fair value measurements as of December 31,
2017: Mutual funds of $23,923,959, are valued using quoted market prices (Level 1
inputs); U.S. Treasury obligations, U.S. agency obligations and corporate bonds of
$7,805,460 are significant other observable inputs and are part of a limited secondary
market (Level 2 inputs).
Interest rate risk is the risk that changes in interest rates will adversely affect the fair
value of an investment. In accordance with its investment policy, the Fund limits its
exposure to interest rate risk by structuring the portfolio to provide liquidity for
operating funds and maximizing yields for funds not needed for expected current
cash flows. The investment policy does not limit the maximum maturity length of
investments in the Fund.
Credit Risk
The Fund limits its exposure to credit risk, the risk that the issuer of a debt security
will not pay its par value upon maturity, by primarily investing in securities issued
by the United States Government and/or its agencies that are implicitly guaranteed
by the United States Government and corporate bonds in the top three investment
classes by a national rating agency. The corporate bonds are rated AA- to AA+, and
the U.S. agencies and treasuries are rated AA+ by Standard and Poor’s.
Custodial Credit Risk
Custodial credit risk for investments is the risk that, in the event of the failure of the
counterparty to the investment, the Fund will not be able to recover the value of its
investments that are in possession of an outside party. To limit its exposure, the Fund
requires all security transactions that are exposed to custodial credit risk to be
processed on a delivery versus payment (DVP) basis with the underlying investments
held by a third party acting as the Fund’s agent separate from where the investment
was purchased in the Fund’s name. The money market mutual funds and equity
mutual funds are not subject to custodial credit risk.
- 61 -
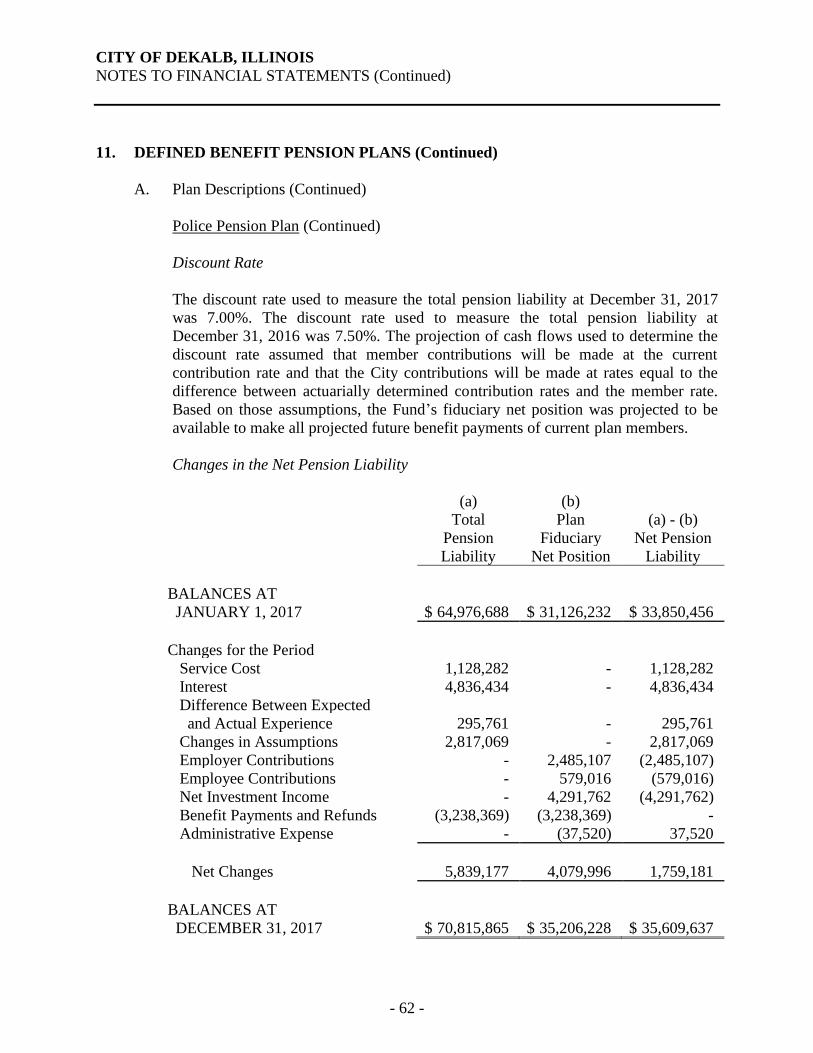
CITY OF DEKALB, ILLINOIS
NOTES TO FINANCIAL STATEMENTS (Continued)
- 62 -
11. DEFINED BENEFIT PENSION PLANS (Continued)
A. Plan Descriptions (Continued)
Police Pension Plan (Continued)
Discount Rate
The discount rate used to measure the total pension liability at December 31, 2017
was 7.00%. The discount rate used to measure the total pension liability at
December 31, 2016 was 7.50%. The projection of cash flows used to determine the
discount rate assumed that member contributions will be made at the current
contribution rate and that the City contributions will be made at rates equal to the
difference between actuarially determined contribution rates and the member rate.
Based on those assumptions, the Fund’s fiduciary net position was projected to be
available to make all projected future benefit payments of current plan members.
Changes in the Net Pension Liability
(a)
Total
Pension
(b)
Plan
Fiduciary
(a) - (b)
Net Pension
Liability Net Position Liability
BALANCES AT
JANUARY 1, 2017
$ 64,976,688
$ 31,126,232
$ 33,850,456
Changes for the Period
Service Cost 1,128,282 - 1,128,282
Interest 4,836,434 - 4,836,434
Difference Between Expected
and Actual Experience 295,761 - 295,761
Changes in Assumptions 2,817,069 - 2,817,069
Employer Contributions - 2,485,107 (2,485,107)
Employee Contributions - 579,016 (579,016)
Net Investment Income - 4,291,762 (4,291,762)
Benefit Payments and Refunds (3,238,369) (3,238,369) -
Administrative Expense - (37,520) 37,520
Net Changes 5,839,177 4,079,996 1,759,181
BALANCES AT
DECEMBER 31, 2017
$ 70,815,865
$ 35,206,228
$ 35,609,637
- 62 -
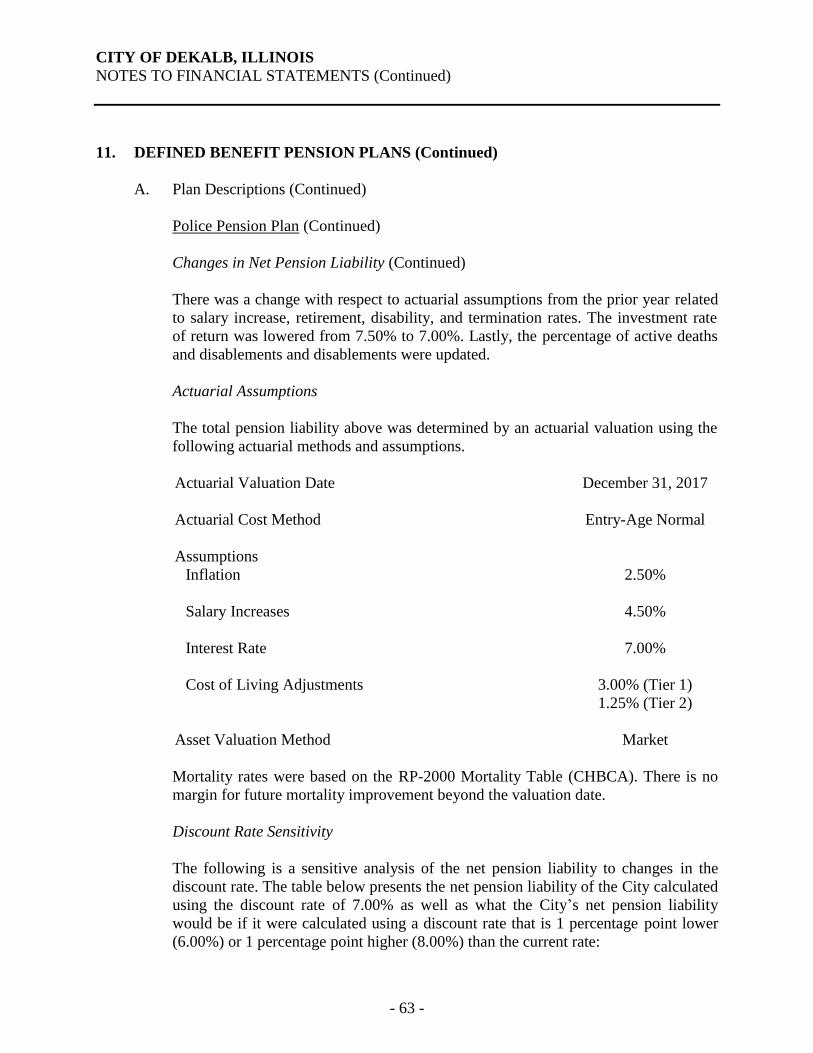
CITY OF DEKALB, ILLINOIS
NOTES TO FINANCIAL STATEMENTS (Continued)
- 63 -
11. DEFINED BENEFIT PENSION PLANS (Continued)
A. Plan Descriptions (Continued)
Police Pension Plan (Continued)
Changes in Net Pension Liability (Continued)
There was a change with respect to actuarial assumptions from the prior year related
to salary increase, retirement, disability, and termination rates. The investment rate
of return was lowered from 7.50% to 7.00%. Lastly, the percentage of active deaths
and disablements and disablements were updated.
Actuarial Assumptions
The total pension liability above was determined by an actuarial valuation using the
following actuarial methods and assumptions.
Actuarial Valuation Date December 31, 2017
Actuarial Cost Method Entry-Age Normal
Assumptions
Inflation 2.50%
Salary Increases 4.50%
Interest Rate 7.00%
Cost of Living Adjustments 3.00% (Tier 1)
1.25% (Tier 2)
Asset Valuation Method Market
Mortality rates were based on the RP-2000 Mortality Table (CHBCA). There is no
margin for future mortality improvement beyond the valuation date.
Discount Rate Sensitivity
The following is a sensitive analysis of the net pension liability to changes in the
discount rate. The table below presents the net pension liability of the City calculated
using the discount rate of 7.00% as well as what the City’s net pension liability
would be if it were calculated using a discount rate that is 1 percentage point lower
(6.00%) or 1 percentage point higher (8.00%) than the current rate:
- 63 -
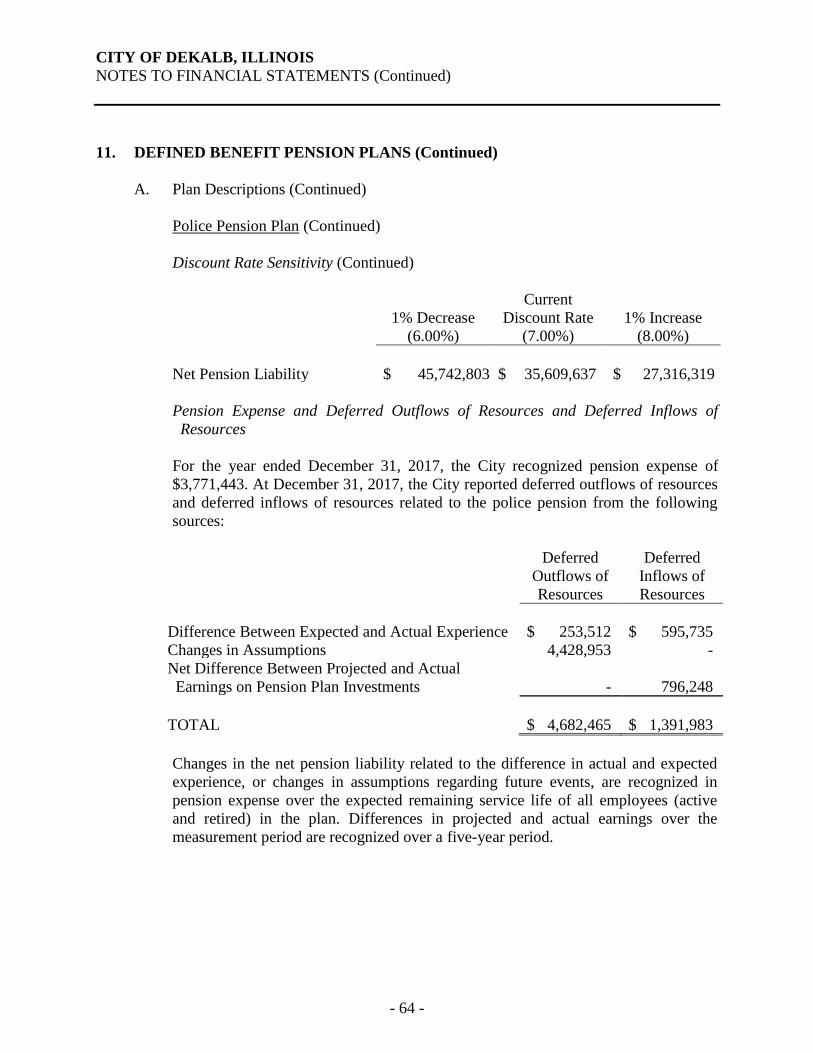
CITY OF DEKALB, ILLINOIS
NOTES TO FINANCIAL STATEMENTS (Continued)
- 64 -
11. DEFINED BENEFIT PENSION PLANS (Continued)
A. Plan Descriptions (Continued)
Police Pension Plan (Continued)
Discount Rate Sensitivity (Continued)
1% Decrease
Current
Discount Rate
1% Increase
(6.00%) (7.00%) (8.00%)
Net Pension Liability $ 45,742,803 $ 35,609,637 $ 27,316,319
Pension Expense and Deferred Outflows of Resources and Deferred Inflows of
Resources
For the year ended December 31, 2017, the City recognized pension expense of
$3,771,443. At December 31, 2017, the City reported deferred outflows of resources
and deferred inflows of resources related to the police pension from the following
sources:
Deferred
Outflows of
Deferred
Inflows of
Resources Resources
Difference Between Expected and Actual Experience $ 253,512 $ 595,735
Changes in Assumptions 4,428,953 -
Net Difference Between Projected and Actual
Earnings on Pension Plan Investments - 796,248
TOTAL $ 4,682,465 $ 1,391,983
Changes in the net pension liability related to the difference in actual and expected
experience, or changes in assumptions regarding future events, are recognized in
pension expense over the expected remaining service life of all employees (active
and retired) in the plan. Differences in projected and actual earnings over the
measurement period are recognized over a five-year period.
- 64 -
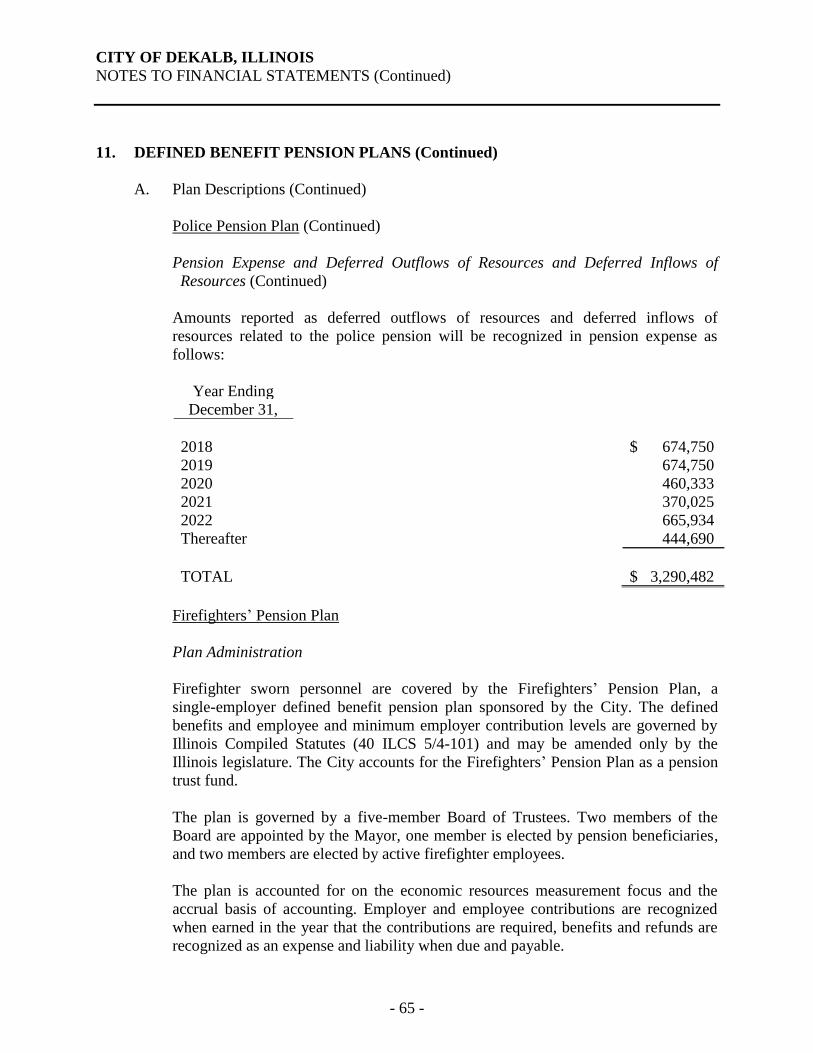
CITY OF DEKALB, ILLINOIS
NOTES TO FINANCIAL STATEMENTS (Continued)
- 65 -
11. DEFINED BENEFIT PENSION PLANS (Continued)
A. Plan Descriptions (Continued)
Police Pension Plan (Continued)
Pension Expense and Deferred Outflows of Resources and Deferred Inflows of
Resources (Continued)
Amounts reported as deferred outflows of resources and deferred inflows of
resources related to the police pension will be recognized in pension expense as
follows:
Year Ending
December 31,
2018 $ 674,750
2019 674,750
2020 460,333
2021 370,025
2022 665,934
Thereafter 444,690
TOTAL $ 3,290,482
Firefighters’ Pension Plan
Plan Administration
Firefighter sworn personnel are covered by the Firefighters’ Pension Plan, a
single-employer defined benefit pension plan sponsored by the City. The defined
benefits and employee and minimum employer contribution levels are governed by
Illinois Compiled Statutes (40 ILCS 5/4-101) and may be amended only by the
Illinois legislature. The City accounts for the Firefighters’ Pension Plan as a pension
trust fund.
The plan is governed by a five-member Board of Trustees. Two members of the
Board are appointed by the Mayor, one member is elected by pension beneficiaries,
and two members are elected by active firefighter employees.
The plan is accounted for on the economic resources measurement focus and the
accrual basis of accounting. Employer and employee contributions are recognized
when earned in the year that the contributions are required, benefits and refunds are
recognized as an expense and liability when due and payable.
- 65 -
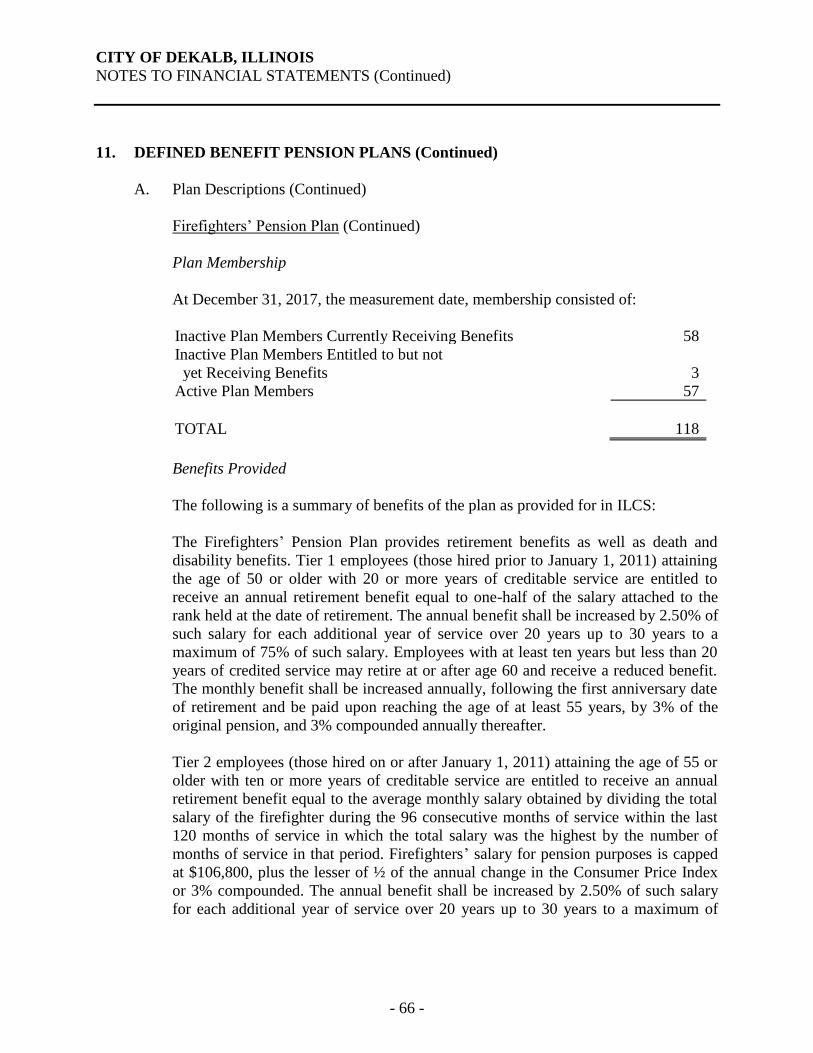
CITY OF DEKALB, ILLINOIS
NOTES TO FINANCIAL STATEMENTS (Continued)
- 66 -
11. DEFINED BENEFIT PENSION PLANS (Continued)
A. Plan Descriptions (Continued)
Firefighters’ Pension Plan (Continued)
Plan Membership
At December 31, 2017, the measurement date, membership consisted of:
Inactive Plan Members Currently Receiving Benefits 58
Inactive Plan Members Entitled to but not
yet Receiving Benefits 3
Active Plan Members 57
TOTAL 118
Benefits Provided
The following is a summary of benefits of the plan as provided for in ILCS:
The Firefighters’ Pension Plan provides retirement benefits as well as death and
disability benefits. Tier 1 employees (those hired prior to January 1, 2011) attaining
the age of 50 or older with 20 or more years of creditable service are entitled to
receive an annual retirement benefit equal to one-half of the salary attached to the
rank held at the date of retirement. The annual benefit shall be increased by 2.50% of
such salary for each additional year of service over 20 years up to 30 years to a
maximum of 75% of such salary. Employees with at least ten years but less than 20
years of credited service may retire at or after age 60 and receive a reduced benefit.
The monthly benefit shall be increased annually, following the first anniversary date
of retirement and be paid upon reaching the age of at least 55 years, by 3% of the
original pension, and 3% compounded annually thereafter.
Tier 2 employees (those hired on or after January 1, 2011) attaining the age of 55 or
older with ten or more years of creditable service are entitled to receive an annual
retirement benefit equal to the average monthly salary obtained by dividing the total
salary of the firefighter during the 96 consecutive months of service within the last
120 months of service in which the total salary was the highest by the number of
months of service in that period. Firefighters’ salary for pension purposes is capped
at $106,800, plus the lesser of ½ of the annual change in the Consumer Price Index
or 3% compounded. The annual benefit shall be increased by 2.50% of such salary
for each additional year of service over 20 years up to 30 years to a maximum of
- 66 -
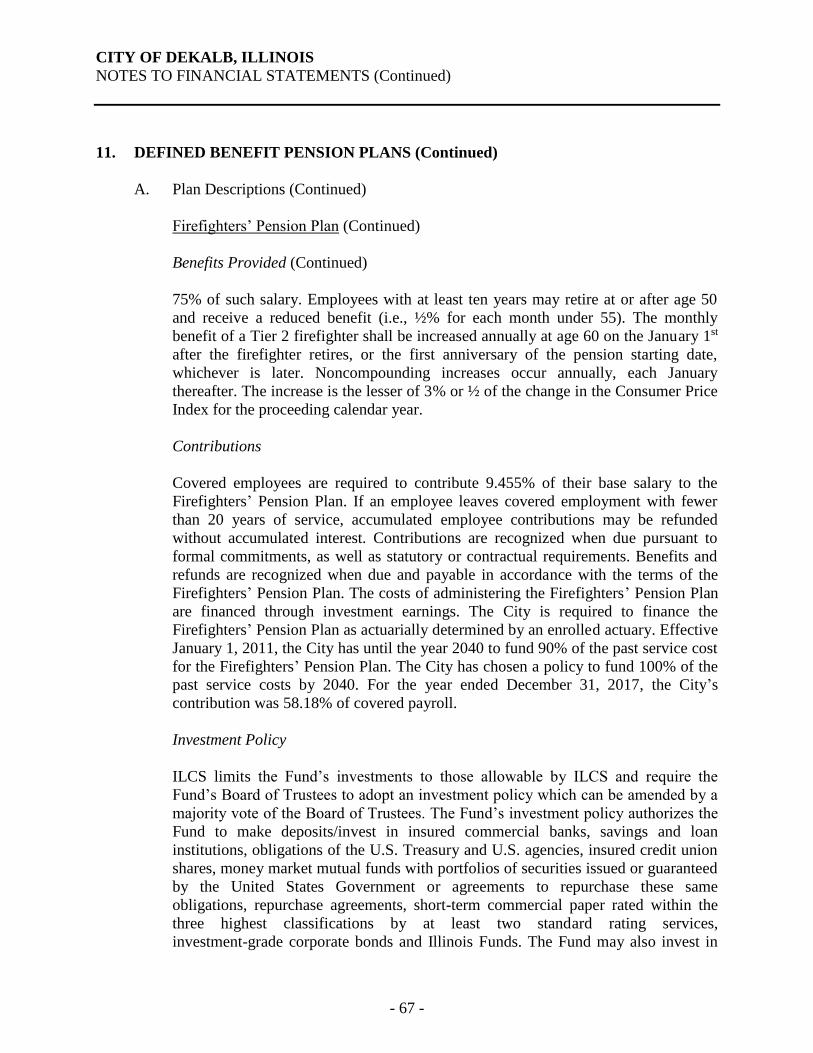
CITY OF DEKALB, ILLINOIS
NOTES TO FINANCIAL STATEMENTS (Continued)
- 67 -
11. DEFINED BENEFIT PENSION PLANS (Continued)
A. Plan Descriptions (Continued)
Firefighters’ Pension Plan (Continued)
Benefits Provided (Continued)
75% of such salary. Employees with at least ten years may retire at or after age 50
and receive a reduced benefit (i.e., ½% for each month under 55). The monthly
benefit of a Tier 2 firefighter shall be increased annually at age 60 on the January 1st
after the firefighter retires, or the first anniversary of the pension starting date,
whichever is later. Noncompounding increases occur annually, each January
thereafter. The increase is the lesser of 3% or ½ of the change in the Consumer Price
Index for the proceeding calendar year.
Contributions
Covered employees are required to contribute 9.455% of their base salary to the
Firefighters’ Pension Plan. If an employee leaves covered employment with fewer
than 20 years of service, accumulated employee contributions may be refunded
without accumulated interest. Contributions are recognized when due pursuant to
formal commitments, as well as statutory or contractual requirements. Benefits and
refunds are recognized when due and payable in accordance with the terms of the
Firefighters’ Pension Plan. The costs of administering the Firefighters’ Pension Plan
are financed through investment earnings. The City is required to finance the
Firefighters’ Pension Plan as actuarially determined by an enrolled actuary. Effective
January 1, 2011, the City has until the year 2040 to fund 90% of the past service cost
for the Firefighters’ Pension Plan. The City has chosen a policy to fund 100% of the
past service costs by 2040. For the year ended December 31, 2017, the City’s
contribution was 58.18% of covered payroll.
Investment Policy
ILCS limits the Fund’s investments to those allowable by ILCS and require the
Fund’s Board of Trustees to adopt an investment policy which can be amended by a
majority vote of the Board of Trustees. The Fund’s investment policy authorizes the
Fund to make deposits/invest in insured commercial banks, savings and loan
institutions, obligations of the U.S. Treasury and U.S. agencies, insured credit union
shares, money market mutual funds with portfolios of securities issued or guaranteed
by the United States Government or agreements to repurchase these same
obligations, repurchase agreements, short-term commercial paper rated within the
three highest classifications by at least two standard rating services,
investment-grade corporate bonds and Illinois Funds. The Fund may also invest in
- 67 -
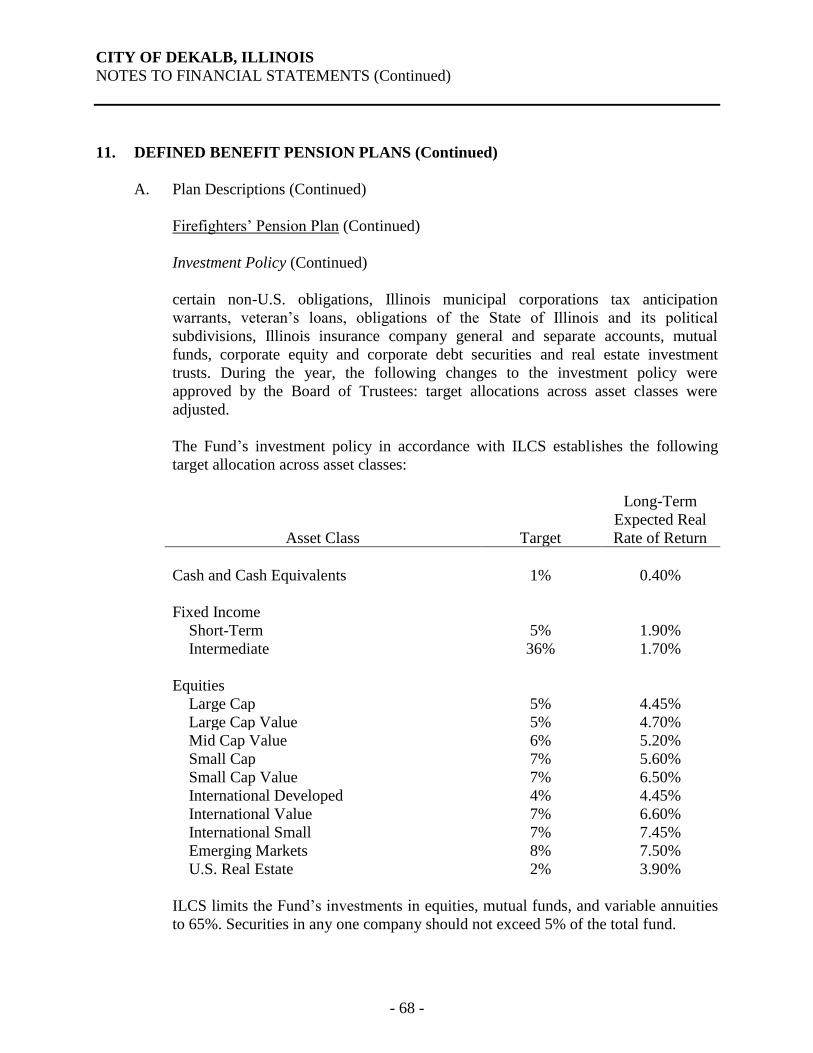
CITY OF DEKALB, ILLINOIS
NOTES TO FINANCIAL STATEMENTS (Continued)
- 68 -
11. DEFINED BENEFIT PENSION PLANS (Continued)
A. Plan Descriptions (Continued)
Firefighters’ Pension Plan (Continued)
Investment Policy (Continued)
certain non-U.S. obligations, Illinois municipal corporations tax anticipation
warrants, veteran’s loans, obligations of the State of Illinois and its political
subdivisions, Illinois insurance company general and separate accounts, mutual
funds, corporate equity and corporate debt securities and real estate investment
trusts. During the year, the following changes to the investment policy were
approved by the Board of Trustees: target allocations across asset classes were
adjusted.
The Fund’s investment policy in accordance with ILCS establishes the following
target allocation across asset classes:
Asset Class
Target
Long-Term
Expected Real
Rate of Return
Cash and Cash Equivalents 1% 0.40%
Fixed Income
Short-Term 5% 1.90%
Intermediate 36% 1.70%
Equities
Large Cap 5% 4.45%
Large Cap Value 5% 4.70%
Mid Cap Value 6% 5.20%
Small Cap 7% 5.60%
Small Cap Value 7% 6.50%
International Developed 4% 4.45%
International Value 7% 6.60%
International Small 7% 7.45%
Emerging Markets 8% 7.50%
U.S. Real Estate 2% 3.90%
ILCS limits the Fund’s investments in equities, mutual funds, and variable annuities
to 65%. Securities in any one company should not exceed 5% of the total fund.
- 68 -
CITY OF DEKALB, ILLINOIS
NOTES TO FINANCIAL STATEMENTS (Continued)
- 69 -
11. DEFINED BENEFIT PENSION PLANS (Continued)
A. Plan Descriptions (Continued)
Firefighters’ Pension Plan (Continued)
Investment Policy (Continued)
The long-term expected real rates of return are net of a 3% factor for inflation and
investment expense. The long-term expected rates of return are the best estimate
ranges of expected future real rates of return (net of pension plan investment expense
and inflation) for each major assets class. Best estimates or geometric real rates of
return excluding inflation for each major asset class included in the Fund’s target
asset allocation as of December 31, 2017 are listed in the table above.
Concentrations
At December 31, 2017, the Fund had one investment that represent 5% or more of
the Fund’s investments (U.S. Treasury Security).
Investment Rate of Return
For the year ended December 31, 2017, the annual money-weighted rate of return on
pension plan investments, net of pension plan investment expense, was 12.26%. The
money-weighted rate of return expresses investment performance, net of investment
expense, adjusted for the changing amounts actually invested.
Deposits with Financial Institutions
Custodial credit risk for deposits with financial institutions is the risk that in the
event of a bank’s failure, the Fund’s deposits may not be returned to them. The
Fund’s investment policy requires all bank balances to be covered by federal
depository insurance. Flow-through FDIC insurance is available for the Fund’s
deposits with financial institutions.
- 69 -
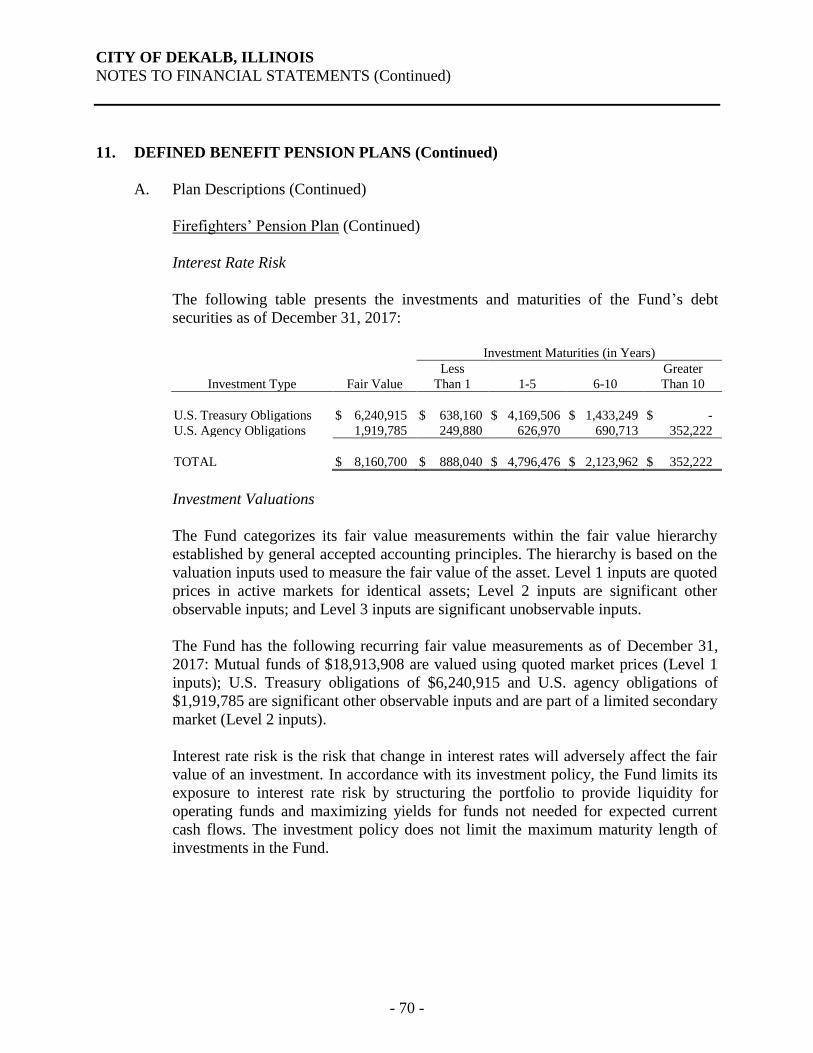
CITY OF DEKALB, ILLINOIS
NOTES TO FINANCIAL STATEMENTS (Continued)
- 70 -
11. DEFINED BENEFIT PENSION PLANS (Continued)
A. Plan Descriptions (Continued)
Firefighters’ Pension Plan (Continued)
Interest Rate Risk
The following table presents the investments and maturities of the Fund’s debt
securities as of December 31, 2017:
Investment Maturities (in Years)
Investment Type
Fair Value
Less
Than 1
1-5
6-10
Greater
Than 10
U.S. Treasury Obligations $ 6,240,915 $ 638,160 $ 4,169,506 $ 1,433,249 $ -
U.S. Agency Obligations 1,919,785 249,880 626,970 690,713 352,222
TOTAL $ 8,160,700 $ 888,040 $ 4,796,476 $ 2,123,962 $ 352,222
Investment Valuations
The Fund categorizes its fair value measurements within the fair value hierarchy
established by general accepted accounting principles. The hierarchy is based on the
valuation inputs used to measure the fair value of the asset. Level 1 inputs are quoted
prices in active markets for identical assets; Level 2 inputs are significant other
observable inputs; and Level 3 inputs are significant unobservable inputs.
The Fund has the following recurring fair value measurements as of December 31,
2017: Mutual funds of $18,913,908 are valued using quoted market prices (Level 1
inputs); U.S. Treasury obligations of $6,240,915 and U.S. agency obligations of
$1,919,785 are significant other observable inputs and are part of a limited secondary
market (Level 2 inputs).
Interest rate risk is the risk that change in interest rates will adversely affect the fair
value of an investment. In accordance with its investment policy, the Fund limits its
exposure to interest rate risk by structuring the portfolio to provide liquidity for
operating funds and maximizing yields for funds not needed for expected current
cash flows. The investment policy does not limit the maximum maturity length of
investments in the Fund.
- 70 -
CITY OF DEKALB, ILLINOIS
NOTES TO FINANCIAL STATEMENTS (Continued)
- 71 -
11. DEFINED BENEFIT PENSION PLANS (Continued)
A. Plan Descriptions (Continued)
Firefighters’ Pension Plan (Continued)
Credit Risk
The Fund limits its exposure to credit risk, the risk that the issuer of a debt security
will not pay its par value upon maturity, by primarily investing in securities issued
by the United States Government and/or its agencies that are implicitly guaranteed
by the United States Government. The U.S. agencies and treasuries are rated AAA
by Standard and Poor’s.
Custodial Credit Risk
Custodial credit risk for investments is the risk that, in the event of the failure of the
counterparty to the investment, the Fund will not be able to recover the value of its
investments that are in possession of an outside party. To limit its exposure, the Fund
requires all security transactions that are exposed to custodial credit risk to be
processed on a delivery versus payment (DVP) basis with the underlying investments
held by a third party acting as the Fund’s agent separate from where the investment
was purchased in the Fund’s name. The money market mutual funds and equity
mutual funds are not subject to custodial credit risk.
Discount Rate
The discount rate used to measure the total pension liability was 7.00%. The
projection of cash flows used to determine the discount rate assumed that member
contributions will be made at the current contribution rate and that the City
contributions will be made at rates equal to the difference between actuarially
determined contribution rates and the member rate. Based on those assumptions, the
Fund’s fiduciary net position was projected to be available to make all projected
future benefit payments of current plan members.
- 71 -
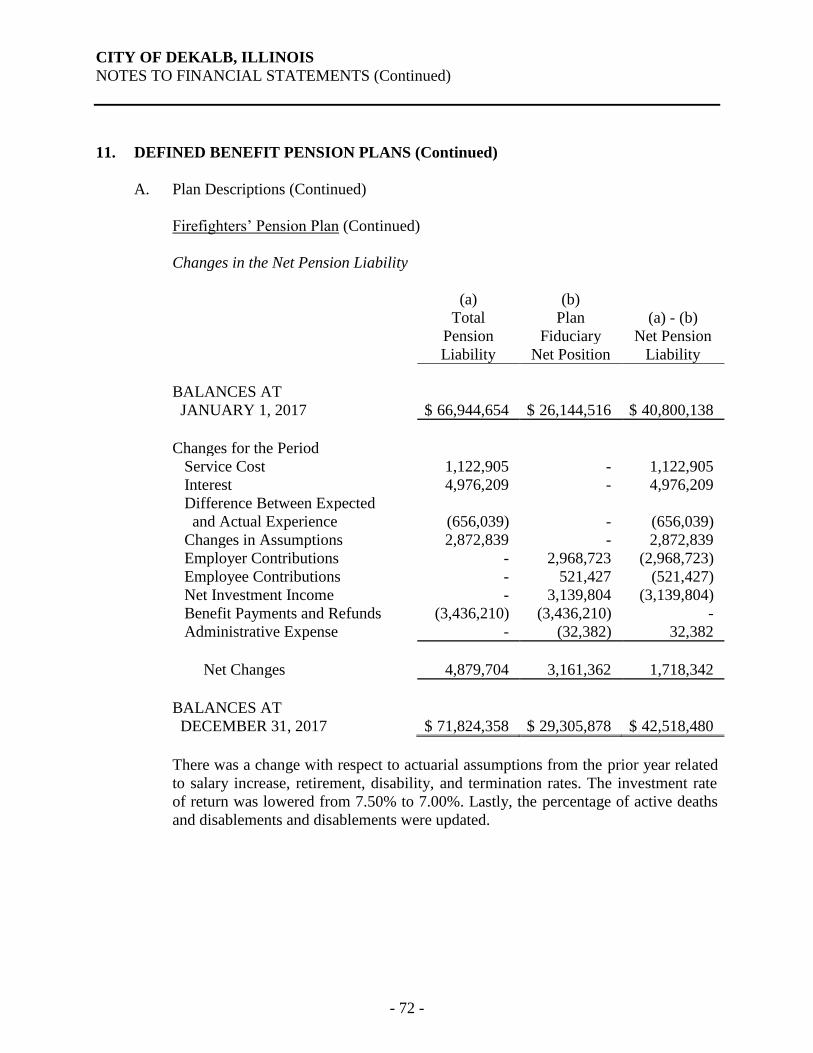
CITY OF DEKALB, ILLINOIS
NOTES TO FINANCIAL STATEMENTS (Continued)
- 72 -
11. DEFINED BENEFIT PENSION PLANS (Continued)
A. Plan Descriptions (Continued)
Firefighters’ Pension Plan (Continued)
Changes in the Net Pension Liability
(a)
Total
Pension
(b)
Plan
Fiduciary
(a) - (b)
Net Pension
Liability Net Position Liability
BALANCES AT
JANUARY 1, 2017
$ 66,944,654
$ 26,144,516
$ 40,800,138
Changes for the Period
Service Cost 1,122,905 - 1,122,905
Interest 4,976,209 - 4,976,209
Difference Between Expected
and Actual Experience (656,039) - (656,039)
Changes in Assumptions 2,872,839 - 2,872,839
Employer Contributions - 2,968,723 (2,968,723)
Employee Contributions - 521,427 (521,427)
Net Investment Income - 3,139,804 (3,139,804)
Benefit Payments and Refunds (3,436,210) (3,436,210) -
Administrative Expense - (32,382) 32,382
Net Changes 4,879,704 3,161,362 1,718,342
BALANCES AT
DECEMBER 31, 2017
$ 71,824,358
$ 29,305,878
$ 42,518,480
There was a change with respect to actuarial assumptions from the prior year related
to salary increase, retirement, disability, and termination rates. The investment rate
of return was lowered from 7.50% to 7.00%. Lastly, the percentage of active deaths
and disablements and disablements were updated.
- 72 -
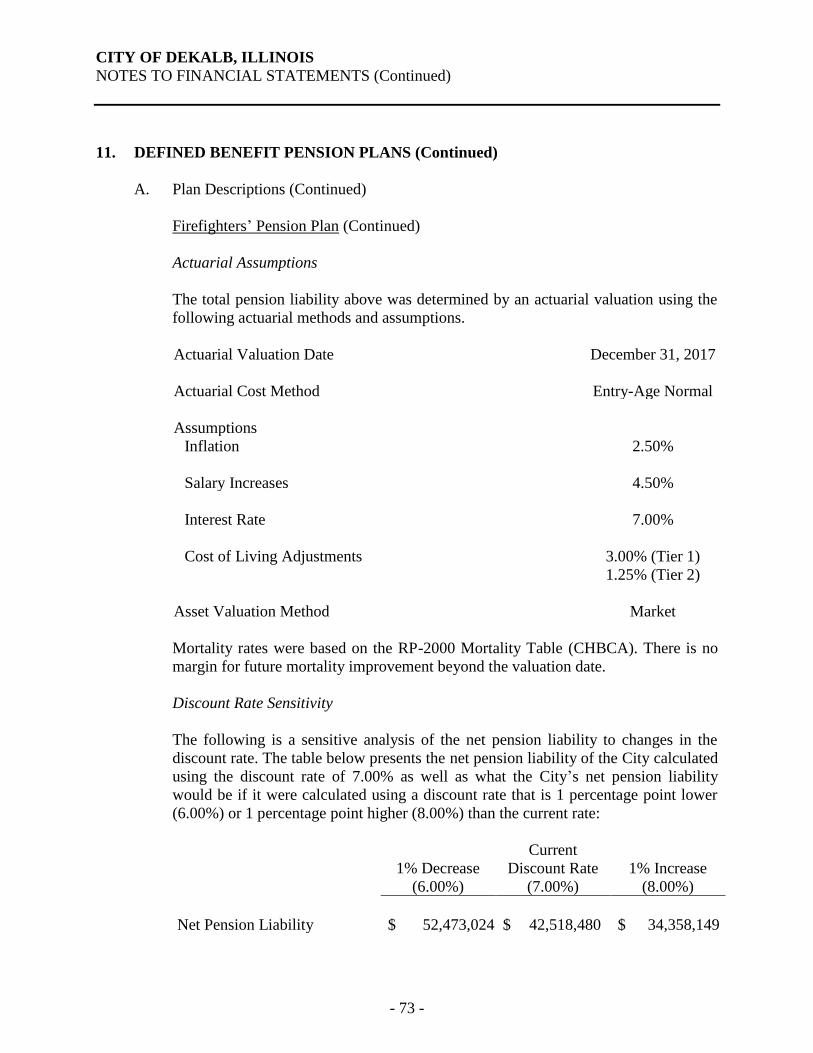
CITY OF DEKALB, ILLINOIS
NOTES TO FINANCIAL STATEMENTS (Continued)
- 73 -
11. DEFINED BENEFIT PENSION PLANS (Continued)
A. Plan Descriptions (Continued)
Firefighters’ Pension Plan (Continued)
Actuarial Assumptions
The total pension liability above was determined by an actuarial valuation using the
following actuarial methods and assumptions.
Actuarial Valuation Date December 31, 2017
Actuarial Cost Method Entry-Age Normal
Assumptions
Inflation 2.50%
Salary Increases 4.50%
Interest Rate 7.00%
Cost of Living Adjustments 3.00% (Tier 1)
1.25% (Tier 2)
Asset Valuation Method Market
Mortality rates were based on the RP-2000 Mortality Table (CHBCA). There is no
margin for future mortality improvement beyond the valuation date.
Discount Rate Sensitivity
The following is a sensitive analysis of the net pension liability to changes in the
discount rate. The table below presents the net pension liability of the City calculated
using the discount rate of 7.00% as well as what the City’s net pension liability
would be if it were calculated using a discount rate that is 1 percentage point lower
(6.00%) or 1 percentage point higher (8.00%) than the current rate:
1% Decrease
Current
Discount Rate
1% Increase
(6.00%) (7.00%) (8.00%)
Net Pension Liability $ 52,473,024 $ 42,518,480 $ 34,358,149
- 73 -
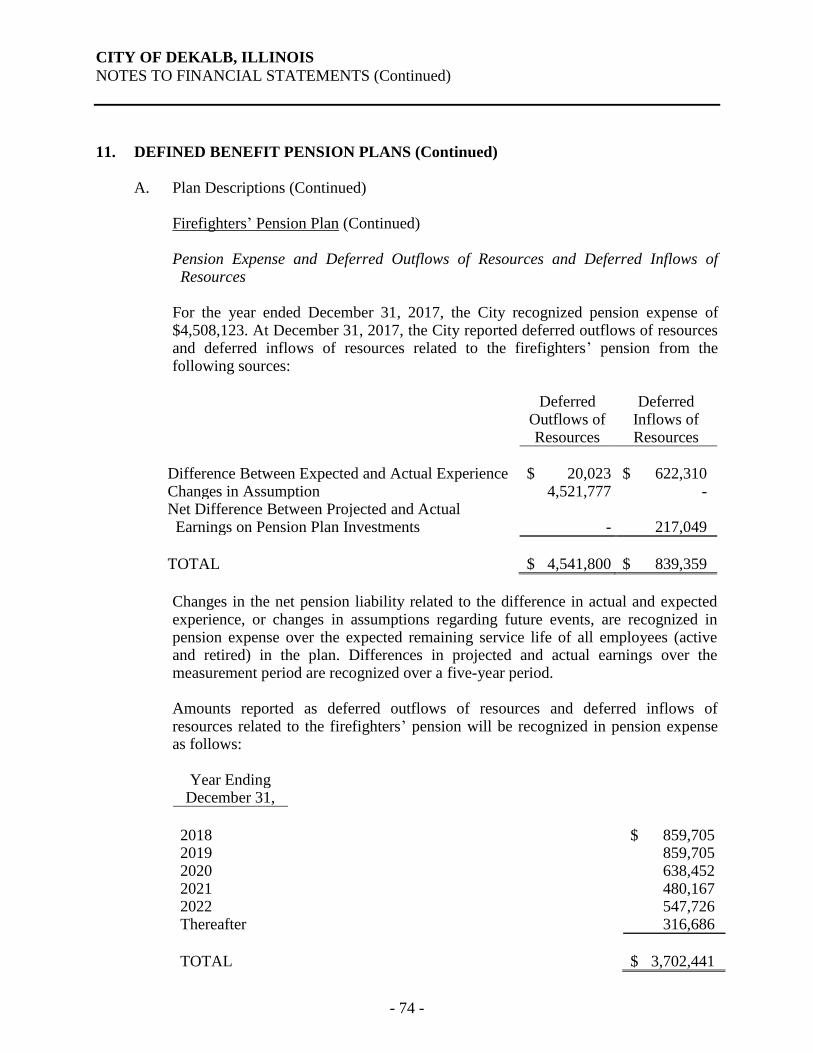
CITY OF DEKALB, ILLINOIS
NOTES TO FINANCIAL STATEMENTS (Continued)
- 74 -
11. DEFINED BENEFIT PENSION PLANS (Continued) A. Plan Descriptions (Continued) Firefighters’ Pension Plan (Continued)
Pension Expense and Deferred Outflows of Resources and Deferred Inflows of Resources For the year ended December 31, 2017, the City recognized pension expense of $4,508,123. At December 31, 2017, the City reported deferred outflows of resources and deferred inflows of resources related to the firefighters’ pension from the following sources:
Deferred Outflows of
Deferred Inflows of
Resources Resources
Difference Between Expected and Actual Experience $ 20,023 $ 622,310 Changes in Assumption 4,521,777 - Net Difference Between Projected and Actual Earnings on Pension Plan Investments - 217,049
TOTAL $ 4,541,800 $ 839,359
Changes in the net pension liability related to the difference in actual and expected experience, or changes in assumptions regarding future events, are recognized in pension expense over the expected remaining service life of all employees (active and retired) in the plan. Differences in projected and actual earnings over the measurement period are recognized over a five-year period. Amounts reported as deferred outflows of resources and deferred inflows of resources related to the firefighters’ pension will be recognized in pension expense as follows:
Year Ending December 31,
2018 $ 859,705 2019 859,705 2020 638,452 2021 480,167 2022 547,726 Thereafter 316,686
TOTAL $ 3,702,441
- 74 -
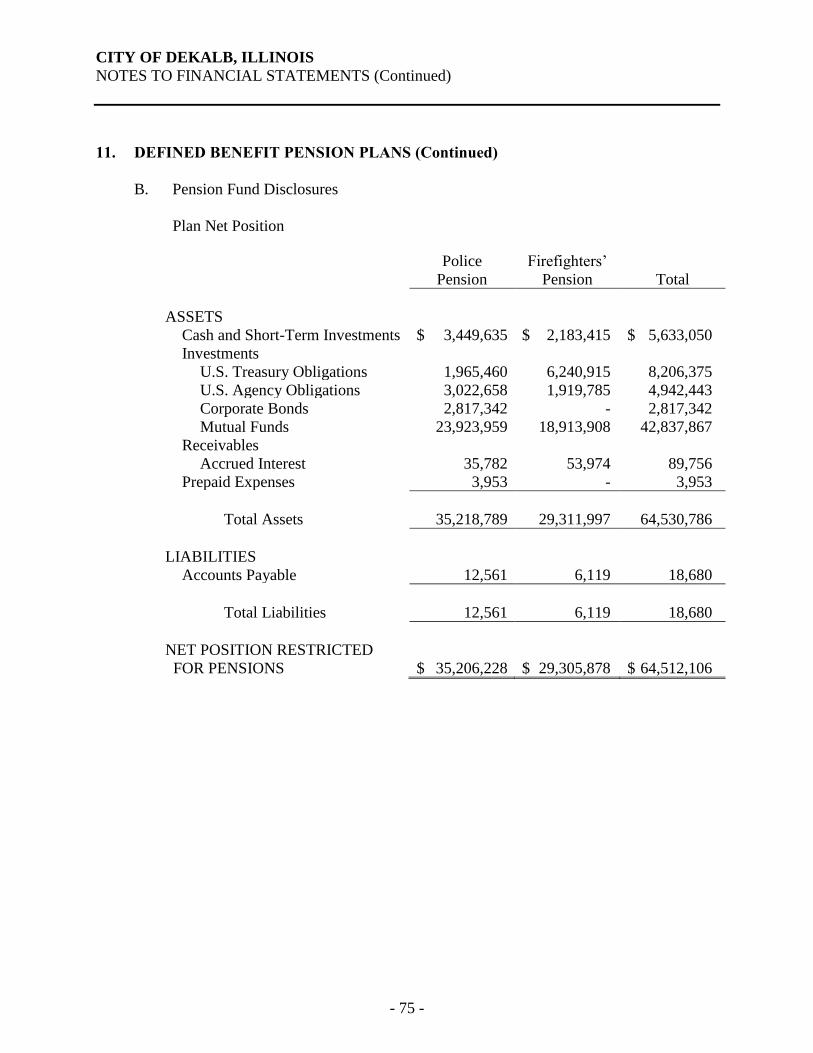
CITY OF DEKALB, ILLINOIS
NOTES TO FINANCIAL STATEMENTS (Continued)
- 75 -
11. DEFINED BENEFIT PENSION PLANS (Continued)
B. Pension Fund Disclosures
Plan Net Position
Police
Pension
Firefighters’
Pension
Total
ASSETS
Cash and Short-Term Investments $ 3,449,635 $ 2,183,415 $ 5,633,050
Investments
U.S. Treasury Obligations 1,965,460 6,240,915 8,206,375
U.S. Agency Obligations 3,022,658 1,919,785 4,942,443
Corporate Bonds 2,817,342 - 2,817,342
Mutual Funds 23,923,959 18,913,908 42,837,867
Receivables
Accrued Interest 35,782 53,974 89,756
Prepaid Expenses 3,953 - 3,953
Total Assets 35,218,789 29,311,997 64,530,786
LIABILITIES
Accounts Payable 12,561 6,119 18,680
Total Liabilities 12,561 6,119 18,680
NET POSITION RESTRICTED
FOR PENSIONS
$ 35,206,228
$ 29,305,878
$ 64,512,106
- 75 -
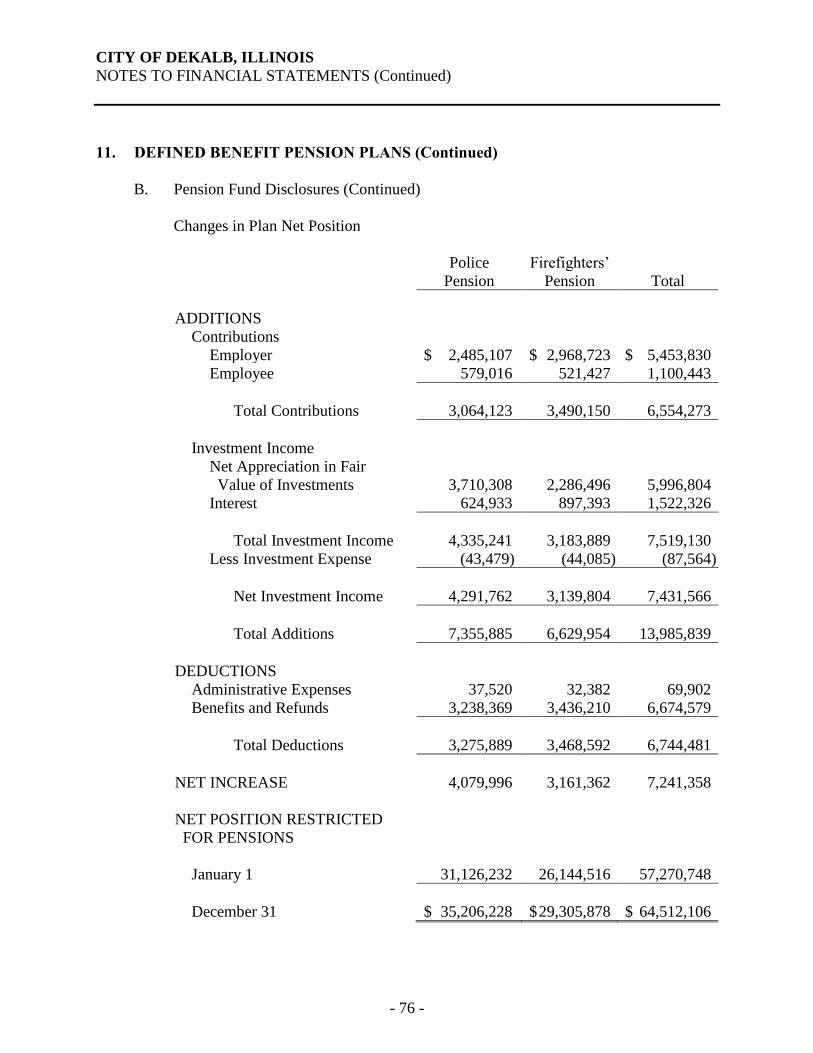
CITY OF DEKALB, ILLINOIS
NOTES TO FINANCIAL STATEMENTS (Continued)
- 76 -
11. DEFINED BENEFIT PENSION PLANS (Continued)
B. Pension Fund Disclosures (Continued)
Changes in Plan Net Position
Police
Pension
Firefighters’
Pension
Total
ADDITIONS
Contributions
Employer $ 2,485,107 $ 2,968,723 $ 5,453,830
Employee 579,016 521,427 1,100,443
Total Contributions 3,064,123 3,490,150 6,554,273
Investment Income
Net Appreciation in Fair
Value of Investments
3,710,308
2,286,496
5,996,804
Interest 624,933 897,393 1,522,326
Total Investment Income 4,335,241 3,183,889 7,519,130
Less Investment Expense (43,479) (44,085) (87,564)
Net Investment Income 4,291,762 3,139,804 7,431,566
Total Additions 7,355,885 6,629,954 13,985,839
DEDUCTIONS
Administrative Expenses 37,520 32,382 69,902
Benefits and Refunds 3,238,369 3,436,210 6,674,579
Total Deductions 3,275,889 3,468,592 6,744,481
NET INCREASE 4,079,996 3,161,362 7,241,358
NET POSITION RESTRICTED
FOR PENSIONS
January 1 31,126,232 26,144,516 57,270,748
December 31 $ 35,206,228 $ 29,305,878 $ 64,512,106
- 76 -
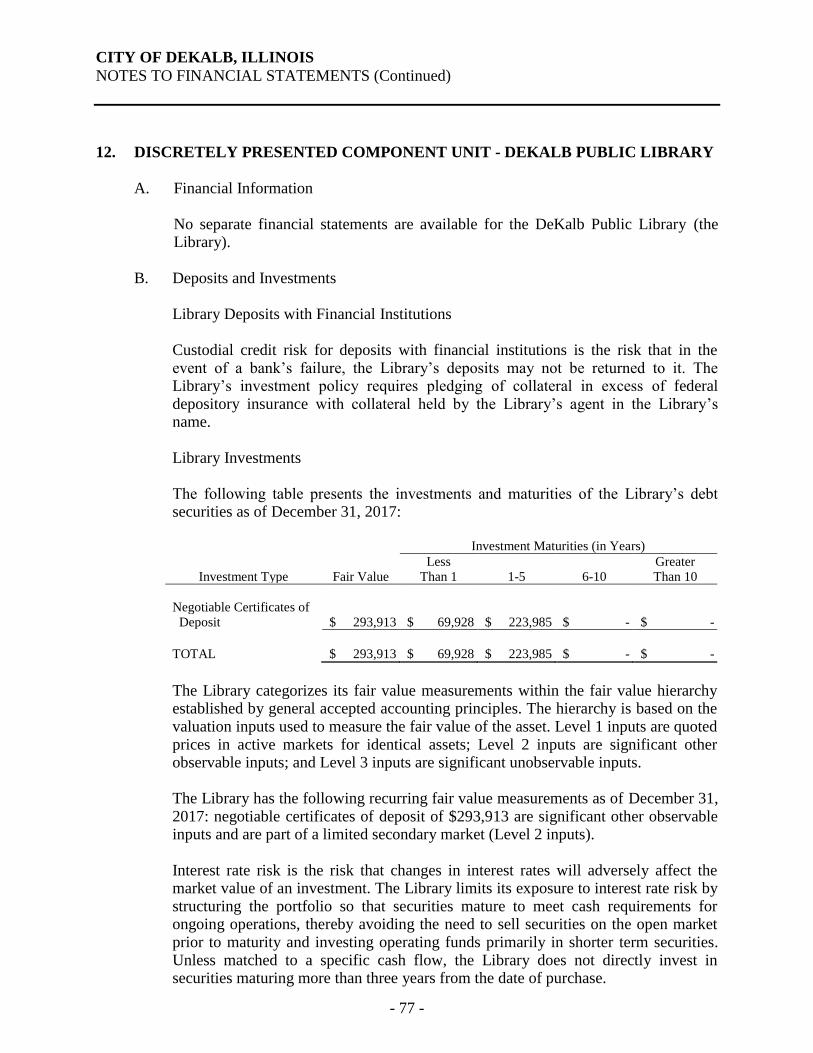
CITY OF DEKALB, ILLINOIS
NOTES TO FINANCIAL STATEMENTS (Continued)
- 77 -
12. DISCRETELY PRESENTED COMPONENT UNIT - DEKALB PUBLIC LIBRARY
A. Financial Information No separate financial statements are available for the DeKalb Public Library (the
Library). B. Deposits and Investments Library Deposits with Financial Institutions Custodial credit risk for deposits with financial institutions is the risk that in the
event of a bank’s failure, the Library’s deposits may not be returned to it. The Library’s investment policy requires pledging of collateral in excess of federal depository insurance with collateral held by the Library’s agent in the Library’s name.
Library Investments The following table presents the investments and maturities of the Library’s debt
securities as of December 31, 2017:
Investment Maturities (in Years)
Investment Type
Fair Value
Less Than 1
1-5
6-10
Greater Than 10
Negotiable Certificates of Deposit $ 293,913 $ 69,928 $ 223,985 $ - $ -
TOTAL $ 293,913 $ 69,928 $ 223,985 $ - $ -
The Library categorizes its fair value measurements within the fair value hierarchy
established by general accepted accounting principles. The hierarchy is based on the valuation inputs used to measure the fair value of the asset. Level 1 inputs are quoted prices in active markets for identical assets; Level 2 inputs are significant other observable inputs; and Level 3 inputs are significant unobservable inputs.
The Library has the following recurring fair value measurements as of December 31,
2017: negotiable certificates of deposit of $293,913 are significant other observable inputs and are part of a limited secondary market (Level 2 inputs).
Interest rate risk is the risk that changes in interest rates will adversely affect the
market value of an investment. The Library limits its exposure to interest rate risk by structuring the portfolio so that securities mature to meet cash requirements for ongoing operations, thereby avoiding the need to sell securities on the open market prior to maturity and investing operating funds primarily in shorter term securities. Unless matched to a specific cash flow, the Library does not directly invest in securities maturing more than three years from the date of purchase.
- 77 -
CITY OF DEKALB, ILLINOIS
NOTES TO FINANCIAL STATEMENTS (Continued)
- 78 -
12. DISCRETELY PRESENTED COMPONENT UNIT - DEKALB PUBLIC LIBRARY
(Continued)
B. Deposits and Investments (Continued)
Library Investments (Continued)
The Library limits its exposure to credit risk, the risk that the issuer of a debt security
will not pay its par value upon maturity, by primarily investing in negotiable
certificates of deposit.
Custodial credit risk for investments is the risk that, in the event of the failure of the
counterparty to the investment, the Library will not be able to recover the value of its
investments that are in possession of an outside party. To limit its exposure, the
Library’s investment policy requires all security transactions that are exposed to
custodial credit risk to be processed on a delivery versus payment (DVP) basis with
the underlying investments held by a third party acting as the Library’s agent in the
Library’s name, separate from where the investment was purchased.
Concentration of credit risk is the risk that the Library has a high percentage of their
investments invested in one type of investment. The Library attempts to diversify its
investments appropriate to the nature of the funds, purpose for the funds, and the
amount available to invest.
C. Receivables
Property taxes for 2016 are levied in December 2016 and attach as an enforceable
lien on the property on January 1, 2016. Tax bills are prepared by the County and
issued on or about May 1, 2017 and August 1, 2017, and are due and collectible on
or about June 1, 2017 and September 1, 2017. The County collects the taxes and
remits them periodically to the City. Those 2016 taxes were intended to finance the
year ending December 31, 2017. The 2017 levy, which attached as a lien on property
as January 1, 2017, is intended to finance the 2018 fiscal year and is not considered
available or earned for current operations and are, therefore, reported as
deferred/unavailable revenue.
- 78 -
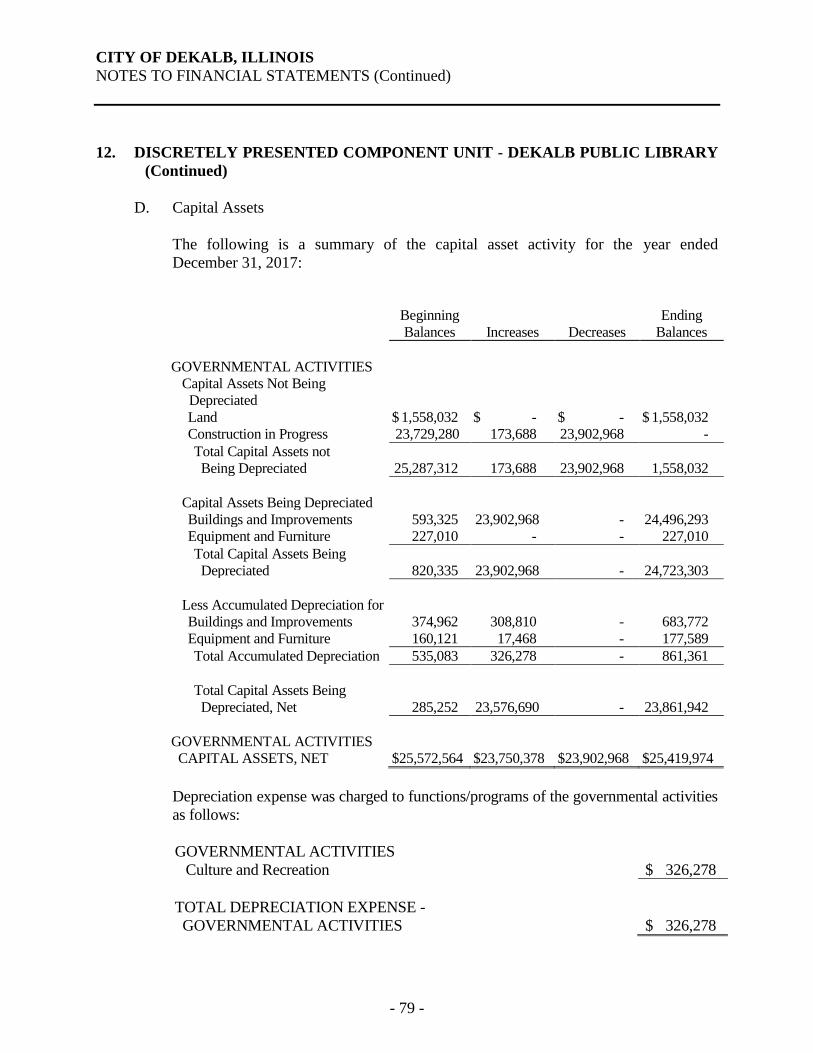
CITY OF DEKALB, ILLINOIS
NOTES TO FINANCIAL STATEMENTS (Continued)
- 79 -
12. DISCRETELY PRESENTED COMPONENT UNIT - DEKALB PUBLIC LIBRARY
(Continued)
D. Capital Assets
The following is a summary of the capital asset activity for the year ended
December 31, 2017:
Beginning
Balances
Increases
Decreases
Ending
Balances
GOVERNMENTAL ACTIVITIES
Capital Assets Not Being
Depreciated
Land $ 1,558,032 $ - $ - $ 1,558,032
Construction in Progress 23,729,280 173,688 23,902,968 -
Total Capital Assets not
Being Depreciated
25,287,312
173,688
23,902,968
1,558,032
Capital Assets Being Depreciated
Buildings and Improvements 593,325 23,902,968 - 24,496,293
Equipment and Furniture 227,010 - - 227,010
Total Capital Assets Being
Depreciated
820,335
23,902,968
-
24,723,303
Less Accumulated Depreciation for
Buildings and Improvements 374,962 308,810 - 683,772
Equipment and Furniture 160,121 17,468 - 177,589
Total Accumulated Depreciation 535,083 326,278 - 861,361
Total Capital Assets Being
Depreciated, Net
285,252
23,576,690
-
23,861,942
GOVERNMENTAL ACTIVITIES
CAPITAL ASSETS, NET $25,572,564 $23,750,378 $23,902,968 $25,419,974
Depreciation expense was charged to functions/programs of the governmental activities
as follows:
GOVERNMENTAL ACTIVITIES
Culture and Recreation $ 326,278
TOTAL DEPRECIATION EXPENSE -
GOVERNMENTAL ACTIVITIES
$ 326,278
- 79 -
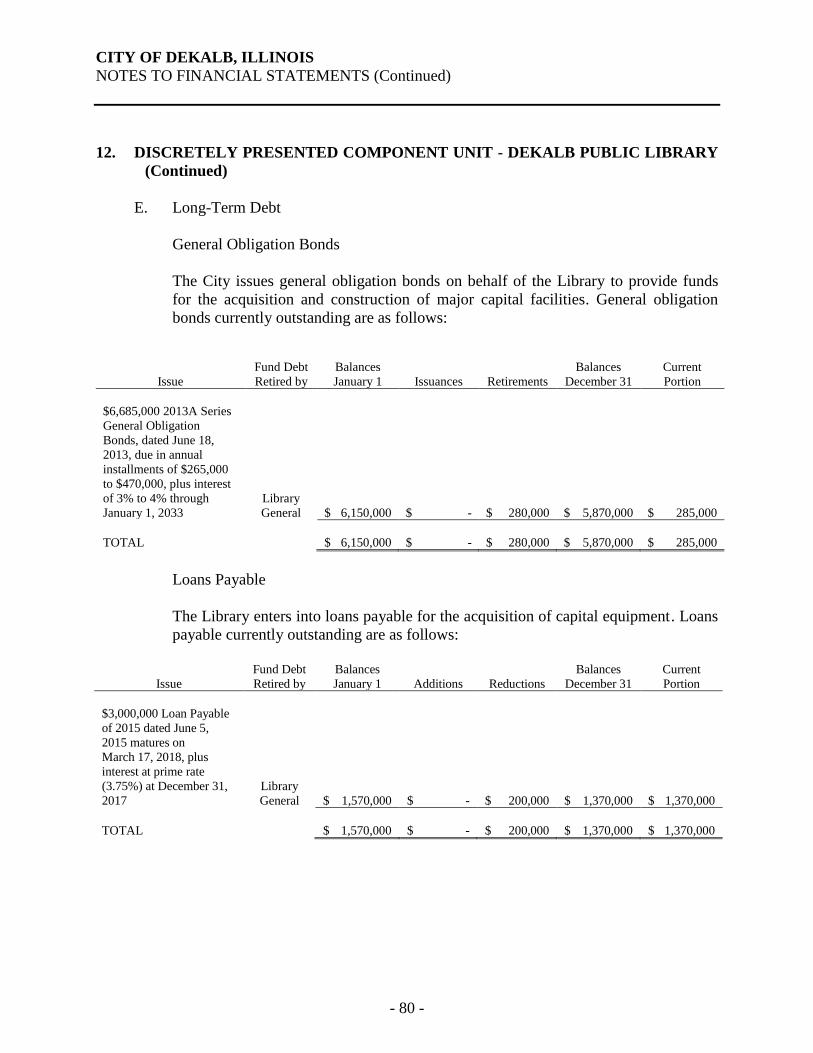
CITY OF DEKALB, ILLINOIS
NOTES TO FINANCIAL STATEMENTS (Continued)
- 80 -
12. DISCRETELY PRESENTED COMPONENT UNIT - DEKALB PUBLIC LIBRARY
(Continued)
E. Long-Term Debt
General Obligation Bonds
The City issues general obligation bonds on behalf of the Library to provide funds
for the acquisition and construction of major capital facilities. General obligation
bonds currently outstanding are as follows:
Issue
Fund Debt
Retired by
Balances
January 1
Issuances
Retirements
Balances
December 31
Current
Portion
$6,685,000 2013A Series
General Obligation
Bonds, dated June 18,
2013, due in annual
installments of $265,000
to $470,000, plus interest
of 3% to 4% through
January 1, 2033
Library
General
$ 6,150,000
$ -
$ 280,000
$ 5,870,000
$ 285,000
TOTAL $ 6,150,000 $ - $ 280,000 $ 5,870,000 $ 285,000
Loans Payable
The Library enters into loans payable for the acquisition of capital equipment. Loans
payable currently outstanding are as follows:
Issue
Fund Debt
Retired by
Balances
January 1
Additions
Reductions
Balances
December 31
Current
Portion
$3,000,000 Loan Payable
of 2015 dated June 5,
2015 matures on
March 17, 2018, plus
interest at prime rate
(3.75%) at December 31,
2017
Library
General
$ 1,570,000
$ -
$ 200,000
$ 1,370,000
$ 1,370,000
TOTAL $ 1,570,000 $ - $ 200,000 $ 1,370,000 $ 1,370,000
- 80 -
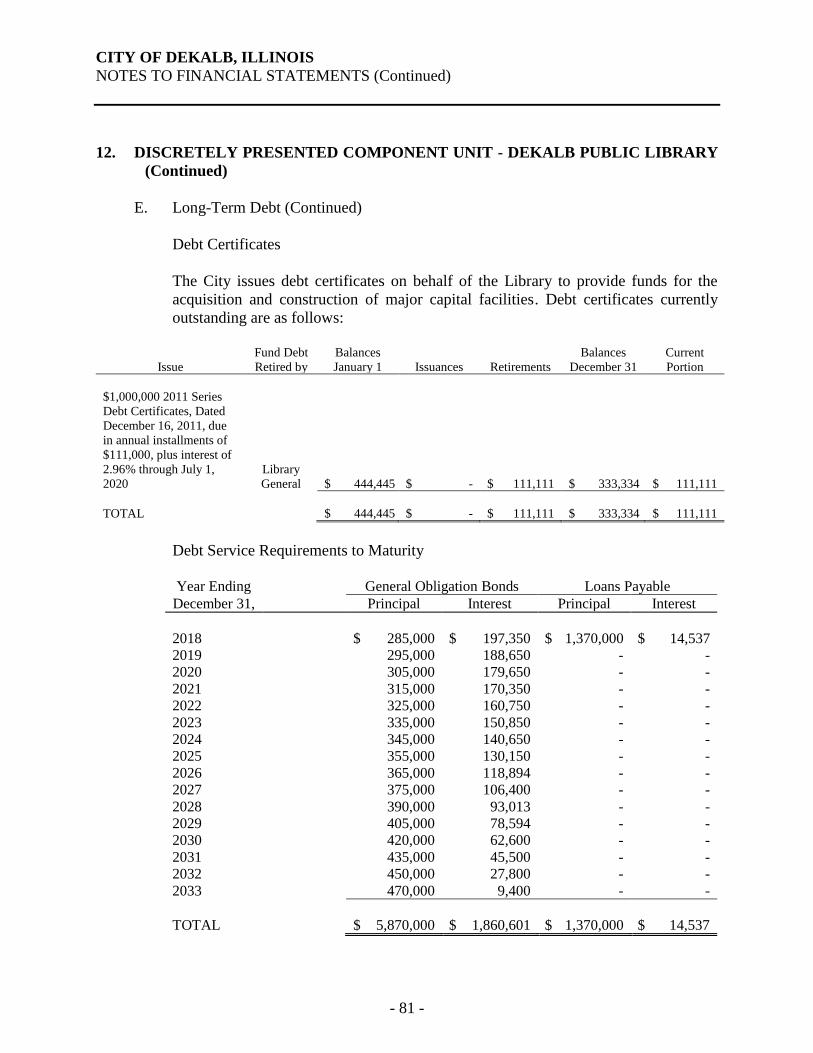
CITY OF DEKALB, ILLINOIS
NOTES TO FINANCIAL STATEMENTS (Continued)
- 81 -
12. DISCRETELY PRESENTED COMPONENT UNIT - DEKALB PUBLIC LIBRARY
(Continued)
E. Long-Term Debt (Continued)
Debt Certificates
The City issues debt certificates on behalf of the Library to provide funds for the
acquisition and construction of major capital facilities. Debt certificates currently
outstanding are as follows:
Issue
Fund Debt
Retired by
Balances
January 1
Issuances
Retirements
Balances
December 31
Current
Portion
$1,000,000 2011 Series
Debt Certificates, Dated
December 16, 2011, due
in annual installments of
$111,000, plus interest of
2.96% through July 1,
2020
Library
General
$ 444,445
$ -
$ 111,111
$ 333,334
$ 111,111
TOTAL $ 444,445 $ - $ 111,111 $ 333,334 $ 111,111
Debt Service Requirements to Maturity
Year Ending General Obligation Bonds Loans Payable
December 31, Principal Interest Principal Interest
2018 $ 285,000 $ 197,350 $ 1,370,000 $ 14,537
2019 295,000 188,650 - -
2020 305,000 179,650 - -
2021 315,000 170,350 - -
2022 325,000 160,750 - -
2023 335,000 150,850 - -
2024 345,000 140,650 - -
2025 355,000 130,150 - -
2026 365,000 118,894 - -
2027 375,000 106,400 - -
2028 390,000 93,013 - -
2029 405,000 78,594 - -
2030 420,000 62,600 - -
2031 435,000 45,500 - -
2032 450,000 27,800 - -
2033 470,000 9,400 - -
TOTAL $ 5,870,000 $ 1,860,601 $ 1,370,000 $ 14,537
- 81 -
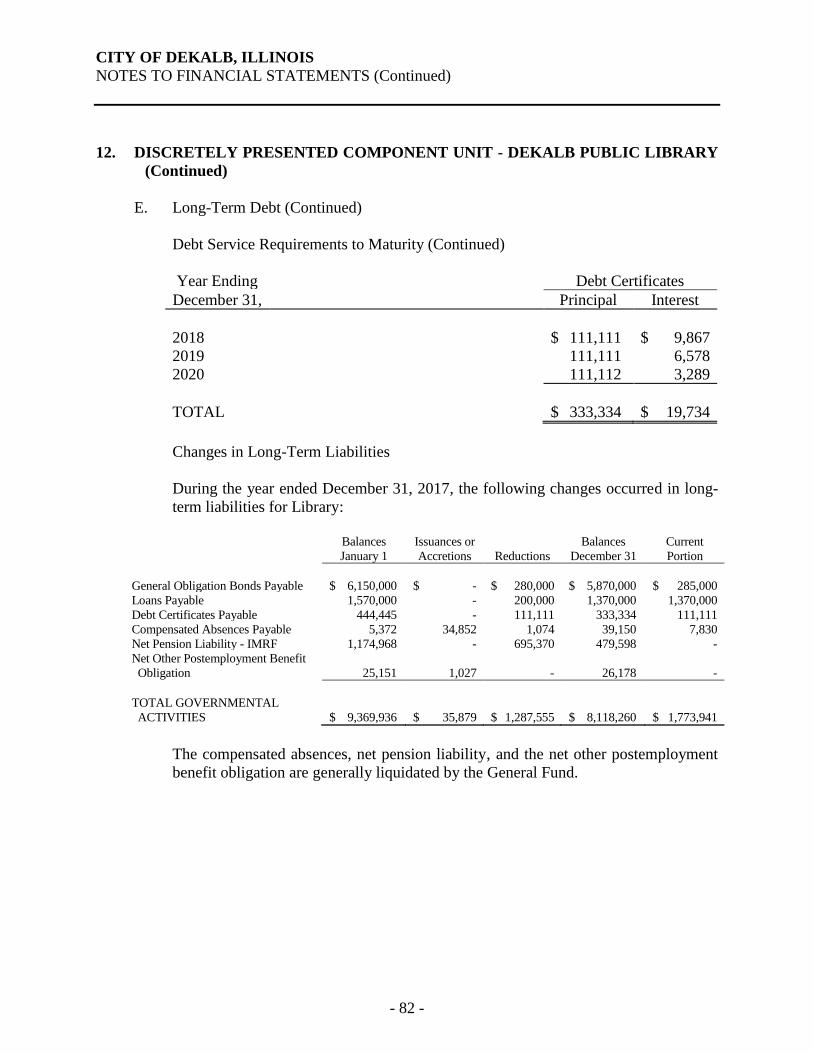
CITY OF DEKALB, ILLINOIS
NOTES TO FINANCIAL STATEMENTS (Continued)
- 82 -
12. DISCRETELY PRESENTED COMPONENT UNIT - DEKALB PUBLIC LIBRARY
(Continued)
E. Long-Term Debt (Continued)
Debt Service Requirements to Maturity (Continued)
Year Ending Debt Certificates
December 31, Principal Interest
2018 $ 111,111 $ 9,867
2019 111,111 6,578
2020 111,112 3,289
TOTAL $ 333,334 $ 19,734
Changes in Long-Term Liabilities
During the year ended December 31, 2017, the following changes occurred in long-
term liabilities for Library:
Balances
January 1
Issuances or
Accretions
Reductions
Balances
December 31
Current
Portion
General Obligation Bonds Payable $ 6,150,000 $ - $ 280,000 $ 5,870,000 $ 285,000
Loans Payable 1,570,000 - 200,000 1,370,000 1,370,000
Debt Certificates Payable 444,445 - 111,111 333,334 111,111
Compensated Absences Payable 5,372 34,852 1,074 39,150 7,830
Net Pension Liability - IMRF 1,174,968 - 695,370 479,598 -
Net Other Postemployment Benefit
Obligation
25,151
1,027
-
26,178
-
TOTAL GOVERNMENTAL
ACTIVITIES $ 9,369,936 $ 35,879 $ 1,287,555 $ 8,118,260 $ 1,773,941
The compensated absences, net pension liability, and the net other postemployment
benefit obligation are generally liquidated by the General Fund.
- 82 -
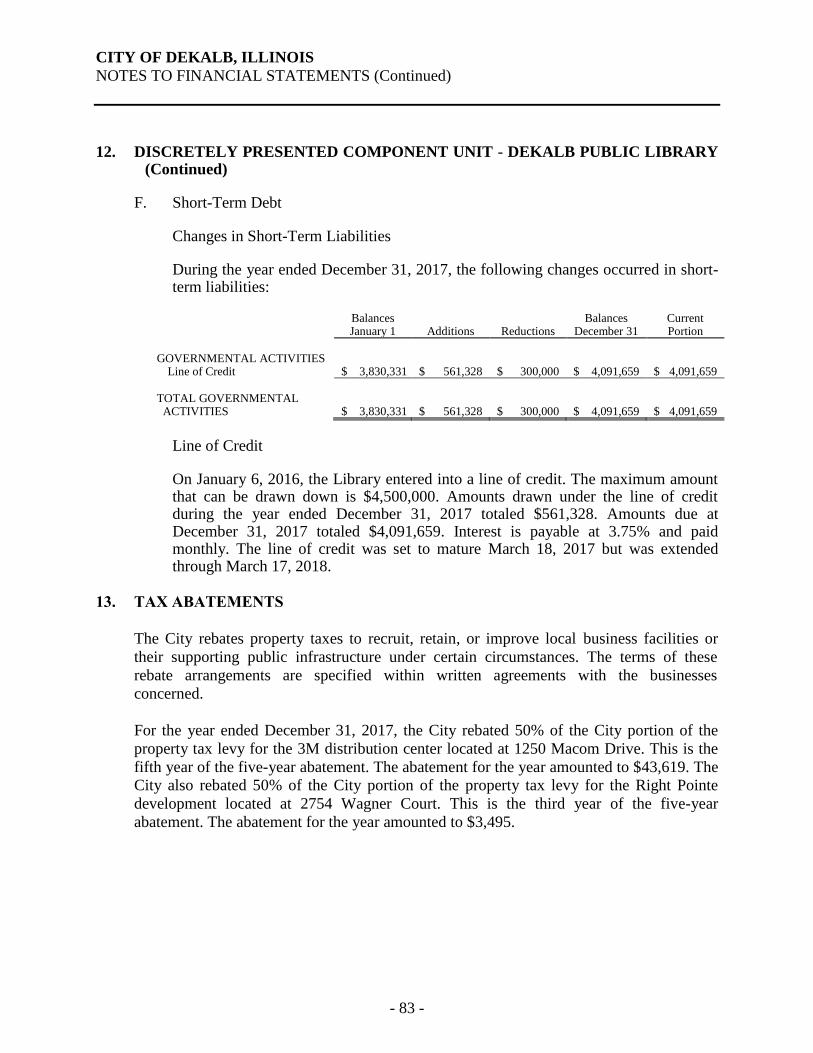
CITY OF DEKALB, ILLINOIS
NOTES TO FINANCIAL STATEMENTS (Continued)
- 83 -
12. DISCRETELY PRESENTED COMPONENT UNIT - DEKALB PUBLIC LIBRARY (Continued)
F. Short-Term Debt
Changes in Short-Term Liabilities
During the year ended December 31, 2017, the following changes occurred in short-term liabilities:
Balances
January 1
Additions
Reductions Balances
December 31 Current Portion
GOVERNMENTAL ACTIVITIES Line of Credit $ 3,830,331 $ 561,328 $ 300,000 $ 4,091,659 $ 4,091,659
TOTAL GOVERNMENTAL ACTIVITIES $ 3,830,331 $ 561,328 $ 300,000 $ 4,091,659 $ 4,091,659
Line of Credit
On January 6, 2016, the Library entered into a line of credit. The maximum amount that can be drawn down is $4,500,000. Amounts drawn under the line of credit during the year ended December 31, 2017 totaled $561,328. Amounts due at December 31, 2017 totaled $4,091,659. Interest is payable at 3.75% and paid monthly. The line of credit was set to mature March 18, 2017 but was extended through March 17, 2018.
13. TAX ABATEMENTS
The City rebates property taxes to recruit, retain, or improve local business facilities or
their supporting public infrastructure under certain circumstances. The terms of these
rebate arrangements are specified within written agreements with the businesses
concerned.
For the year ended December 31, 2017, the City rebated 50% of the City portion of the
property tax levy for the 3M distribution center located at 1250 Macom Drive. This is the
fifth year of the five-year abatement. The abatement for the year amounted to $43,619. The
City also rebated 50% of the City portion of the property tax levy for the Right Pointe
development located at 2754 Wagner Court. This is the third year of the five-year
abatement. The abatement for the year amounted to $3,495.
- 83 -
REQUIRED SUPPLEMENTARY INFORMATION
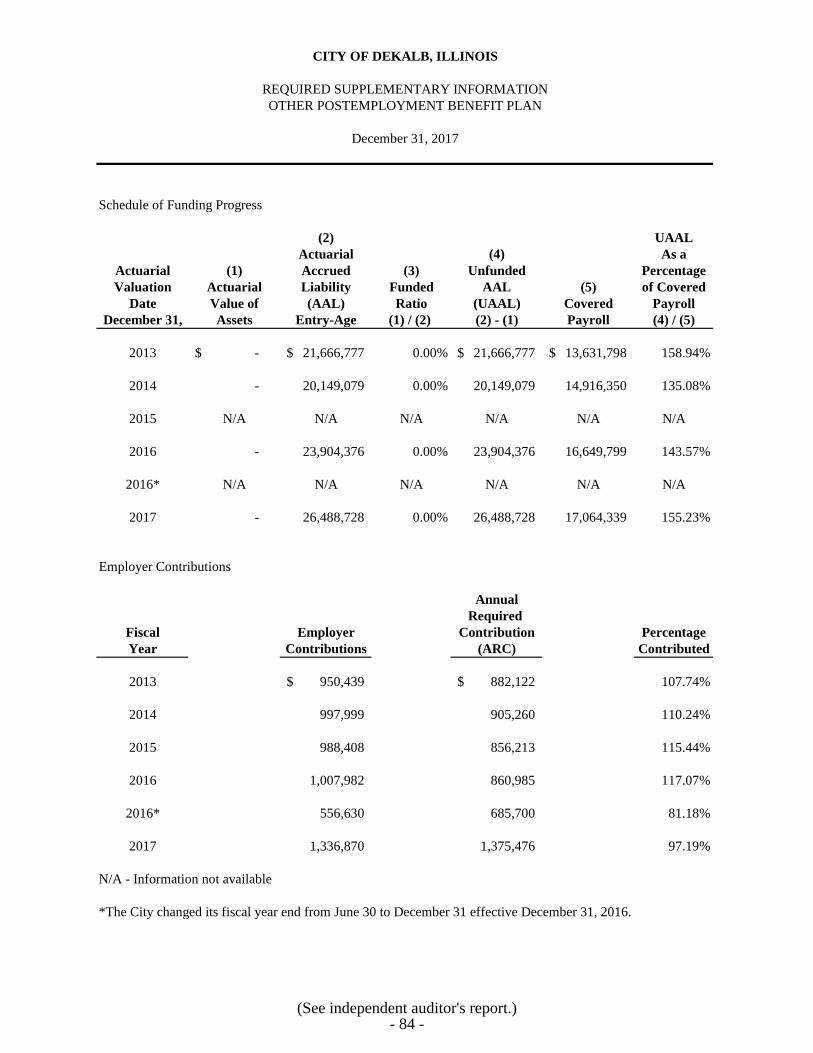
Schedule of Funding Progress
(2) UAAL
Actuarial (4) As a
Actuarial (1) Accrued (3) Unfunded Percentage
Valuation Actuarial Liability Funded AAL (5) of Covered
Date Value of (AAL) Ratio (UAAL) Covered Payroll
December 31, Assets Entry-Age (1) / (2) (2) - (1) Payroll (4) / (5)
2013 -$ 21,666,777$ 0.00% 21,666,777$ 13,631,798$ 158.94%
2014 - 20,149,079 0.00% 20,149,079 14,916,350 135.08%
2015 N/A N/A N/A N/A N/A N/A
2016 - 23,904,376 0.00% 23,904,376 16,649,799 143.57%
2016* N/A N/A N/A N/A N/A N/A
2017 - 26,488,728 0.00% 26,488,728 17,064,339 155.23%
Employer Contributions
Annual
Required
Fiscal Employer Contribution Percentage
Year Contributions (ARC) Contributed
2013 950,439$ 882,122$ 107.74%
2014 997,999 905,260 110.24%
2015 988,408 856,213 115.44%
2016 1,007,982 860,985 117.07%
2016* 556,630 685,700 81.18%
2017 1,336,870 1,375,476 97.19%
N/A - Information not available
*The City changed its fiscal year end from June 30 to December 31 effective December 31, 2016.
December 31, 2017
CITY OF DEKALB, ILLINOIS
REQUIRED SUPPLEMENTARY INFORMATION
OTHER POSTEMPLOYMENT BENEFIT PLAN
(See independent auditor's report.)- 84 -
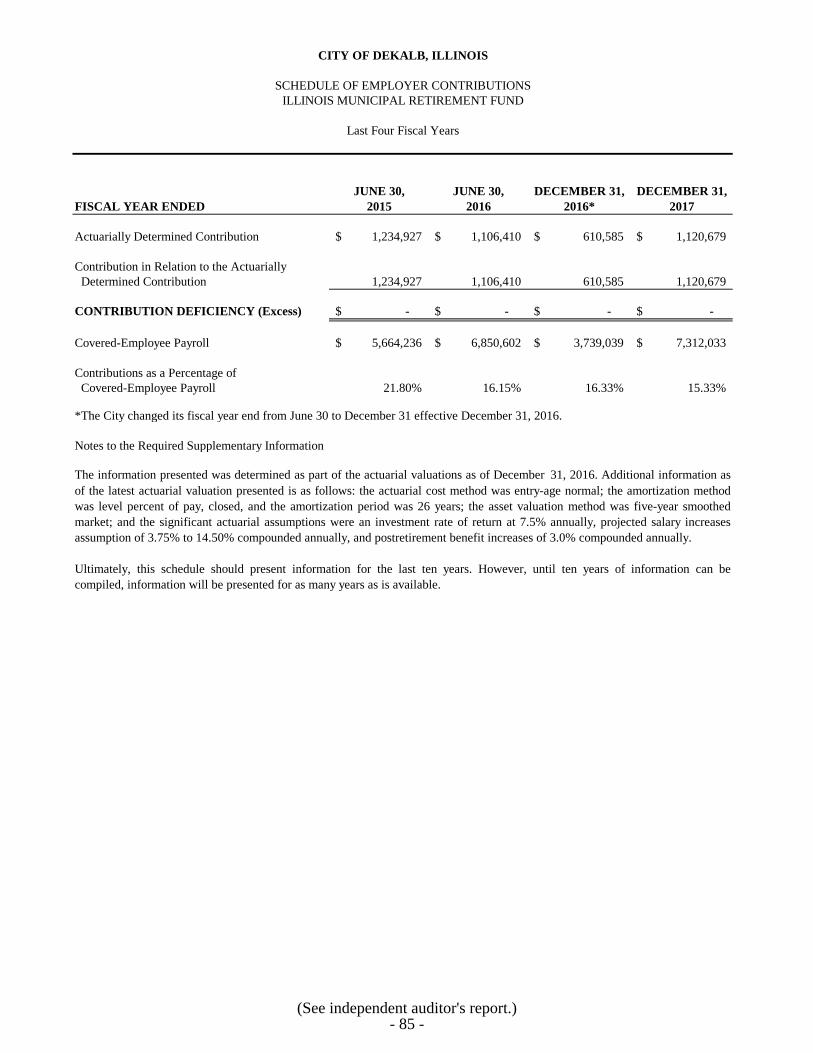
JUNE 30, JUNE 30, DECEMBER 31, DECEMBER 31,
FISCAL YEAR ENDED 2015 2016 2016* 2017
Actuarially Determined Contribution 1,234,927$ 1,106,410$ 610,585$ 1,120,679$
Contribution in Relation to the Actuarially
Determined Contribution 1,234,927 1,106,410 610,585 1,120,679
CONTRIBUTION DEFICIENCY (Excess) -$ -$ -$ -$
Covered-Employee Payroll 5,664,236$ 6,850,602$ 3,739,039$ 7,312,033$
Contributions as a Percentage of
Covered-Employee Payroll 21.80% 16.15% 16.33% 15.33%
*The City changed its fiscal year end from June 30 to December 31 effective December 31, 2016.
Notes to the Required Supplementary Information
Ultimately, this schedule should present information for the last ten years. However, until ten years of information can be
compiled, information will be presented for as many years as is available.
CITY OF DEKALB, ILLINOIS
SCHEDULE OF EMPLOYER CONTRIBUTIONS
ILLINOIS MUNICIPAL RETIREMENT FUND
Last Four Fiscal Years
The information presented was determined as part of the actuarial valuations as of December 31, 2016. Additional information as
of the latest actuarial valuation presented is as follows: the actuarial cost method was entry-age normal; the amortization method
was level percent of pay, closed, and the amortization period was 26 years; the asset valuation method was five-year smoothed
market; and the significant actuarial assumptions were an investment rate of return at 7.5% annually, projected salary increases
assumption of 3.75% to 14.50% compounded annually, and postretirement benefit increases of 3.0% compounded annually.
(See independent auditor's report.)- 85 -
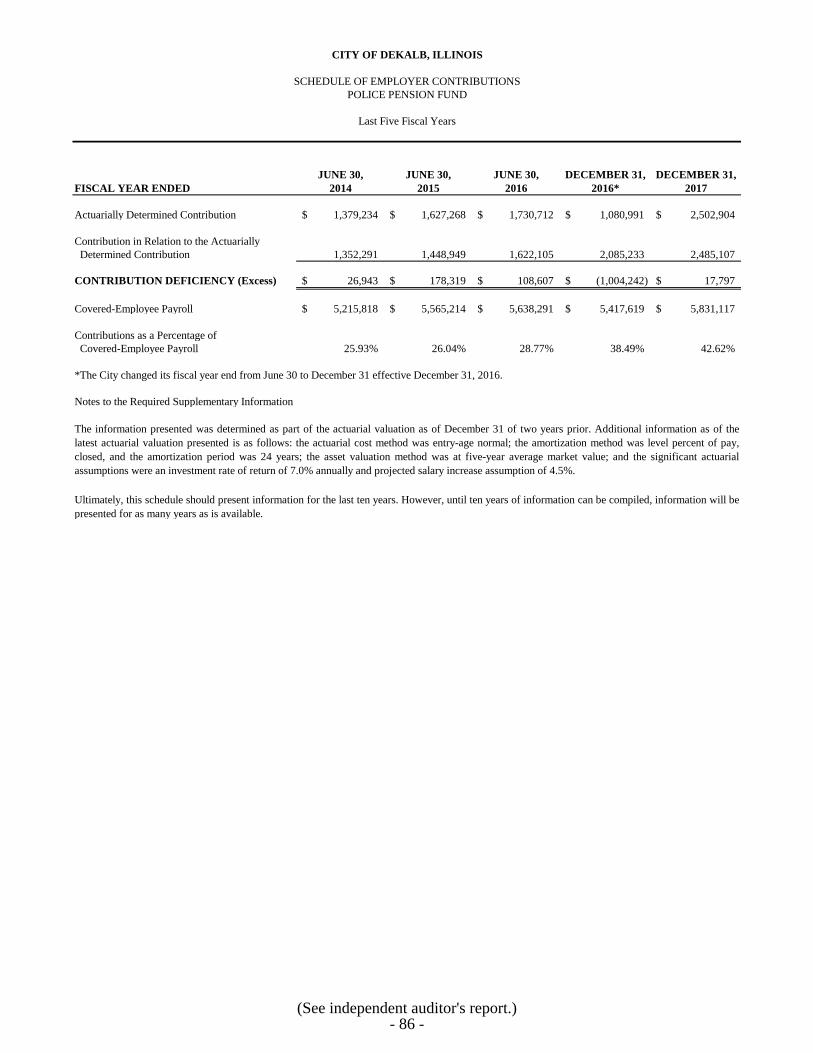
JUNE 30, JUNE 30, JUNE 30, DECEMBER 31, DECEMBER 31,
FISCAL YEAR ENDED 2014 2015 2016 2016* 2017
Actuarially Determined Contribution 1,379,234$ 1,627,268$ 1,730,712$ 1,080,991$ 2,502,904$
Contribution in Relation to the Actuarially
Determined Contribution 1,352,291 1,448,949 1,622,105 2,085,233 2,485,107
CONTRIBUTION DEFICIENCY (Excess) 26,943$ 178,319$ 108,607$ (1,004,242)$ 17,797$
Covered-Employee Payroll 5,215,818$ 5,565,214$ 5,638,291$ 5,417,619$ 5,831,117$
Contributions as a Percentage of
Covered-Employee Payroll 25.93% 26.04% 28.77% 38.49% 42.62%
*The City changed its fiscal year end from June 30 to December 31 effective December 31, 2016.
Notes to the Required Supplementary Information
Ultimately, this schedule should present information for the last ten years. However, until ten years of information can be compiled, information will be
presented for as many years as is available.
The information presented was determined as part of the actuarial valuation as of December 31 of two years prior. Additional information as of the
latest actuarial valuation presented is as follows: the actuarial cost method was entry-age normal; the amortization method was level percent of pay,
closed, and the amortization period was 24 years; the asset valuation method was at five-year average market value; and the significant actuarial
assumptions were an investment rate of return of 7.0% annually and projected salary increase assumption of 4.5%.
CITY OF DEKALB, ILLINOIS
SCHEDULE OF EMPLOYER CONTRIBUTIONS
POLICE PENSION FUND
Last Five Fiscal Years
(See independent auditor's report.)- 86 -
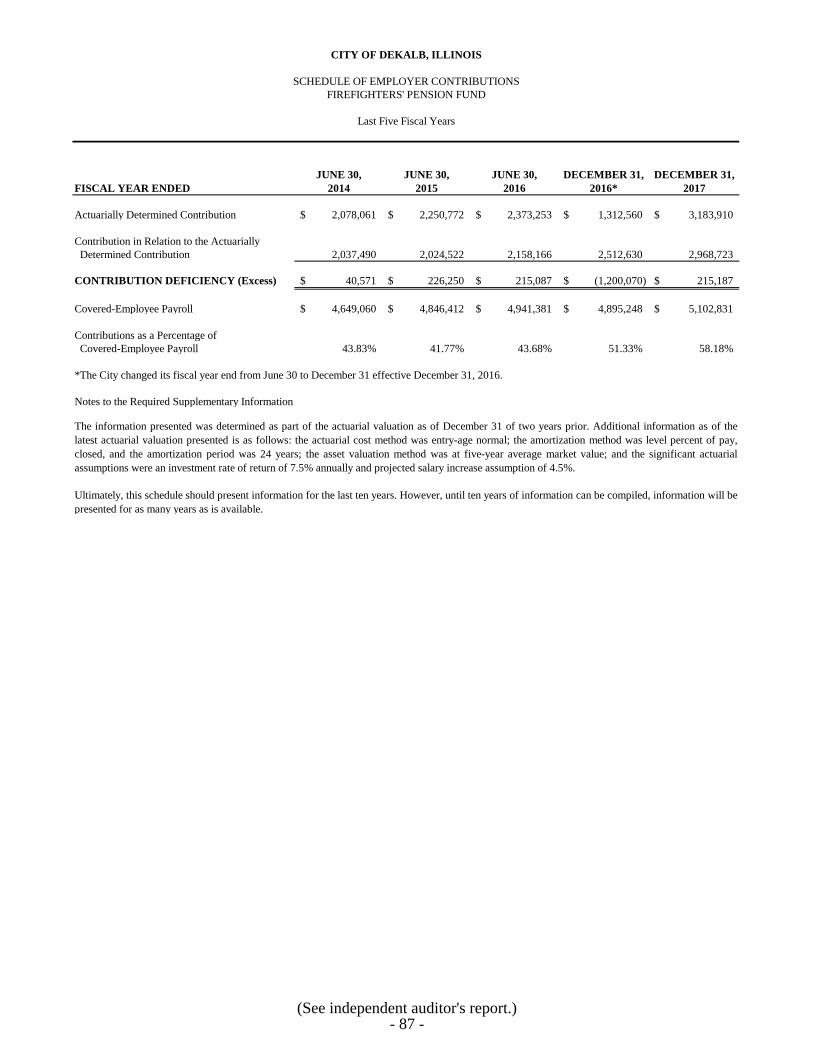
JUNE 30, JUNE 30, JUNE 30, DECEMBER 31, DECEMBER 31,
FISCAL YEAR ENDED 2014 2015 2016 2016* 2017
Actuarially Determined Contribution 2,078,061$ 2,250,772$ 2,373,253$ 1,312,560$ 3,183,910$
Contribution in Relation to the Actuarially
Determined Contribution 2,037,490 2,024,522 2,158,166 2,512,630 2,968,723
CONTRIBUTION DEFICIENCY (Excess) 40,571$ 226,250$ 215,087$ (1,200,070)$ 215,187$
Covered-Employee Payroll 4,649,060$ 4,846,412$ 4,941,381$ 4,895,248$ 5,102,831$
Contributions as a Percentage of
Covered-Employee Payroll 43.83% 41.77% 43.68% 51.33% 58.18%
*The City changed its fiscal year end from June 30 to December 31 effective December 31, 2016.
Notes to the Required Supplementary Information
Ultimately, this schedule should present information for the last ten years. However, until ten years of information can be compiled, information will be
presented for as many years as is available.
CITY OF DEKALB, ILLINOIS
FIREFIGHTERS' PENSION FUND
SCHEDULE OF EMPLOYER CONTRIBUTIONS
Last Five Fiscal Years
The information presented was determined as part of the actuarial valuation as of December 31 of two years prior. Additional information as of the
latest actuarial valuation presented is as follows: the actuarial cost method was entry-age normal; the amortization method was level percent of pay,
closed, and the amortization period was 24 years; the asset valuation method was at five-year average market value; and the significant actuarial
assumptions were an investment rate of return of 7.5% annually and projected salary increase assumption of 4.5%.
(See independent auditor's report.)- 87 -
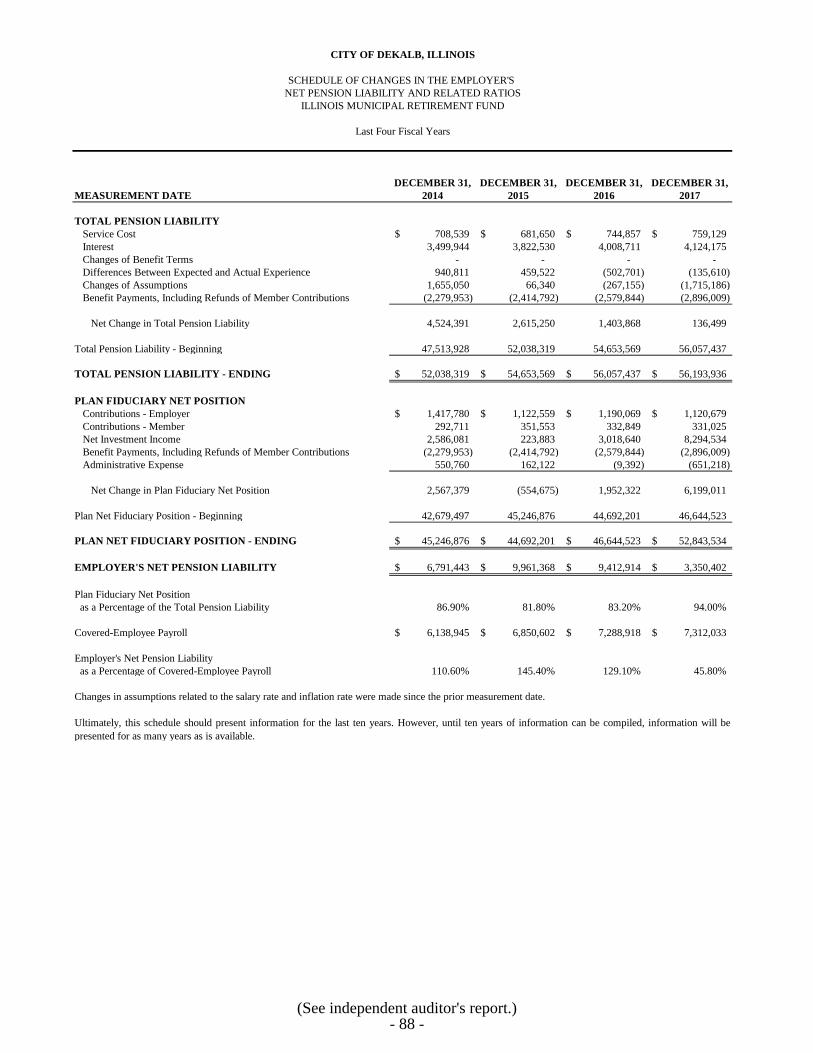
DECEMBER 31, DECEMBER 31, DECEMBER 31, DECEMBER 31,
MEASUREMENT DATE 2014 2015 2016 2017
TOTAL PENSION LIABILITY
Service Cost 708,539$ 681,650$ 744,857$ 759,129$
Interest 3,499,944 3,822,530 4,008,711 4,124,175
Changes of Benefit Terms - - - -
Differences Between Expected and Actual Experience 940,811 459,522 (502,701) (135,610)
Changes of Assumptions 1,655,050 66,340 (267,155) (1,715,186)
Benefit Payments, Including Refunds of Member Contributions (2,279,953) (2,414,792) (2,579,844) (2,896,009)
Net Change in Total Pension Liability 4,524,391 2,615,250 1,403,868 136,499
Total Pension Liability - Beginning 47,513,928 52,038,319 54,653,569 56,057,437
TOTAL PENSION LIABILITY - ENDING 52,038,319$ 54,653,569$ 56,057,437$ 56,193,936$
PLAN FIDUCIARY NET POSITION
Contributions - Employer 1,417,780$ 1,122,559$ 1,190,069$ 1,120,679$
Contributions - Member 292,711 351,553 332,849 331,025
Net Investment Income 2,586,081 223,883 3,018,640 8,294,534
Benefit Payments, Including Refunds of Member Contributions (2,279,953) (2,414,792) (2,579,844) (2,896,009)
Administrative Expense 550,760 162,122 (9,392) (651,218)
Net Change in Plan Fiduciary Net Position 2,567,379 (554,675) 1,952,322 6,199,011
Plan Net Fiduciary Position - Beginning 42,679,497 45,246,876 44,692,201 46,644,523
PLAN NET FIDUCIARY POSITION - ENDING 45,246,876$ 44,692,201$ 46,644,523$ 52,843,534$
EMPLOYER'S NET PENSION LIABILITY 6,791,443$ 9,961,368$ 9,412,914$ 3,350,402$
Plan Fiduciary Net Position
as a Percentage of the Total Pension Liability 86.90% 81.80% 83.20% 94.00%
Covered-Employee Payroll 6,138,945$ 6,850,602$ 7,288,918$ 7,312,033$
Employer's Net Pension Liability
as a Percentage of Covered-Employee Payroll 110.60% 145.40% 129.10% 45.80%
Ultimately, this schedule should present information for the last ten years. However, until ten years of information can be compiled, information will be
presented for as many years as is available.
Changes in assumptions related to the salary rate and inflation rate were made since the prior measurement date.
CITY OF DEKALB, ILLINOIS
SCHEDULE OF CHANGES IN THE EMPLOYER'S
NET PENSION LIABILITY AND RELATED RATIOS
ILLINOIS MUNICIPAL RETIREMENT FUND
Last Four Fiscal Years
(See independent auditor's report.)- 88 -
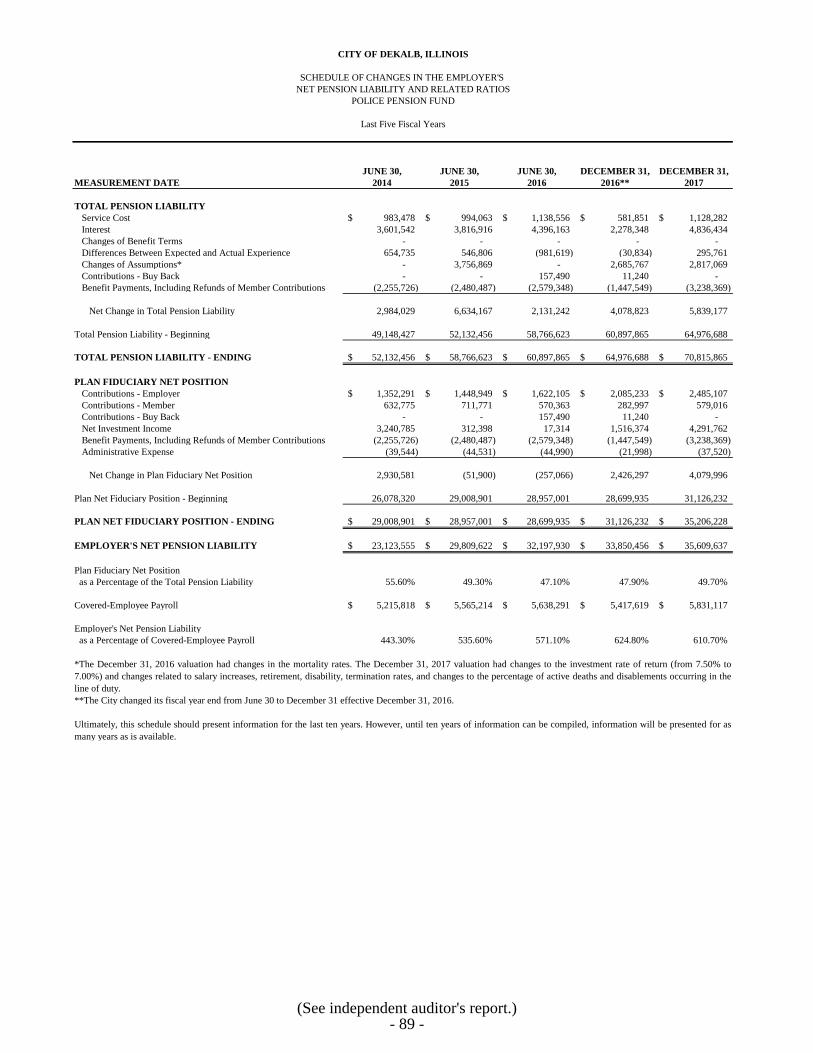
JUNE 30, JUNE 30, JUNE 30, DECEMBER 31, DECEMBER 31,
MEASUREMENT DATE 2014 2015 2016 2016** 2017
TOTAL PENSION LIABILITY
Service Cost 983,478$ 994,063$ 1,138,556$ 581,851$ 1,128,282$
Interest 3,601,542 3,816,916 4,396,163 2,278,348 4,836,434
Changes of Benefit Terms - - - - -
Differences Between Expected and Actual Experience 654,735 546,806 (981,619) (30,834) 295,761
Changes of Assumptions* - 3,756,869 - 2,685,767 2,817,069
Contributions - Buy Back - - 157,490 11,240 -
Benefit Payments, Including Refunds of Member Contributions (2,255,726) (2,480,487) (2,579,348) (1,447,549) (3,238,369)
Net Change in Total Pension Liability 2,984,029 6,634,167 2,131,242 4,078,823 5,839,177
Total Pension Liability - Beginning 49,148,427 52,132,456 58,766,623 60,897,865 64,976,688
TOTAL PENSION LIABILITY - ENDING 52,132,456$ 58,766,623$ 60,897,865$ 64,976,688$ 70,815,865$
PLAN FIDUCIARY NET POSITION
Contributions - Employer 1,352,291$ 1,448,949$ 1,622,105$ 2,085,233$ 2,485,107$
Contributions - Member 632,775 711,771 570,363 282,997 579,016
Contributions - Buy Back - - 157,490 11,240 -
Net Investment Income 3,240,785 312,398 17,314 1,516,374 4,291,762
Benefit Payments, Including Refunds of Member Contributions (2,255,726) (2,480,487) (2,579,348) (1,447,549) (3,238,369)
Administrative Expense (39,544) (44,531) (44,990) (21,998) (37,520)
Net Change in Plan Fiduciary Net Position 2,930,581 (51,900) (257,066) 2,426,297 4,079,996
Plan Net Fiduciary Position - Beginning 26,078,320 29,008,901 28,957,001 28,699,935 31,126,232
PLAN NET FIDUCIARY POSITION - ENDING 29,008,901$ 28,957,001$ 28,699,935$ 31,126,232$ 35,206,228$
EMPLOYER'S NET PENSION LIABILITY 23,123,555$ 29,809,622$ 32,197,930$ 33,850,456$ 35,609,637$
Plan Fiduciary Net Position
as a Percentage of the Total Pension Liability 55.60% 49.30% 47.10% 47.90% 49.70%
Covered-Employee Payroll 5,215,818$ 5,565,214$ 5,638,291$ 5,417,619$ 5,831,117$
Employer's Net Pension Liability
as a Percentage of Covered-Employee Payroll 443.30% 535.60% 571.10% 624.80% 610.70%
**The City changed its fiscal year end from June 30 to December 31 effective December 31, 2016.
Ultimately, this schedule should present information for the last ten years. However, until ten years of information can be compiled, information will be presented for as
many years as is available.
CITY OF DEKALB, ILLINOIS
SCHEDULE OF CHANGES IN THE EMPLOYER'S
NET PENSION LIABILITY AND RELATED RATIOS
POLICE PENSION FUND
Last Five Fiscal Years
*The December 31, 2016 valuation had changes in the mortality rates. The December 31, 2017 valuation had changes to the investment rate of return (from 7.50% to
7.00%) and changes related to salary increases, retirement, disability, termination rates, and changes to the percentage of active deaths and disablements occurring in the
line of duty.
(See independent auditor's report.)- 89 -

JUNE 30, JUNE 30, JUNE 30, DECEMBER 31, DECEMBER 31,
MEASUREMENT DATE 2014 2015 2016 2016** 2017
TOTAL PENSION LIABILITY
Service Cost 1,033,286$ 1,077,550$ 1,103,489$ 560,373$ 1,122,905$
Interest 3,857,132 4,102,276 4,495,233 2,345,602 4,976,209
Changes of Benefit Terms - - - - -
Differences Between Expected and Actual Experience 1,330,700 (477,382) (102,841) 26,697 (656,039)
Changes of Assumptions* - 2,460,941 - 2,745,788 2,872,839
Contributions - Buy Back - - - 80,812 -
Benefit Payments, Including Refunds of Member Contributions (2,922,598) (2,982,470) (3,072,413) (1,607,243) (3,436,210)
Net Change in Total Pension Liability 3,298,520 4,180,915 2,423,468 4,152,029 4,879,704
Total pension liability - beginning 52,889,722 56,188,242 60,369,157 62,792,625 66,944,654
TOTAL PENSION LIABILITY - ENDING 56,188,242$ 60,369,157$ 62,792,625$ 66,944,654$ 71,824,358$
PLAN FIDUCIARY NET POSITION
Contributions - Employer 2,037,490$ 2,024,522$ 2,158,156$ 2,512,630$ 2,968,723$
Contributions - Member 420,534 466,475 477,022 257,245 521,427
Contributions - Buy Back - - - 80,812 -
Net Investment Income 3,075,655 126,661 (403,920) 1,447,151 3,139,804
Benefit Payments, Including Refunds of Member Contributions (2,922,598) (2,982,470) (3,072,413) (1,607,243) (3,436,210)
Administrative Expense (34,562) (43,547) (41,613) (17,540) (32,382)
Net Change in Plan Fiduciary Net Position 2,576,519 (408,359) (882,768) 2,673,055 3,161,362
Plan Net Fiduciary Position - Beginning 22,186,069 24,762,588 24,354,229 23,471,461 26,144,516
PLAN NET FIDUCIARY POSITION - ENDING 24,762,588$ 24,354,229$ 23,471,461$ 26,144,516$ 29,305,878$
EMPLOYER'S NET PENSION LIABILITY 31,425,654$ 36,014,928$ 39,321,164$ 40,800,138$ 42,518,480$
Plan Fiduciary Net Position
as a Percentage of the Total Pension Liability 44.10% 40.30% 37.40% 39.10% 40.80%
Covered-Employee Payroll 4,649,060$ 4,846,412$ 4,941,381$ 4,895,248$ 5,102,831$
Employer's Net Pension Liability
as a Percentage of Covered-Employee Payroll 676.00% 743.10% 795.80% 833.50% 833.20%
**The City changed its fiscal year end from June 30 to December 31 effective December 31, 2016.
Ultimately, this schedule should present information for the last ten years. However, until ten years of information can be compiled, information will be presented for as many
years as is available.
CITY OF DEKALB, ILLINOIS
SCHEDULE OF CHANGES IN THE EMPLOYER'S
NET PENSION LIABILITY AND RELATED RATIOS
FIREFIGHTERS' PENSION FUND
Last Five Fiscal Years
*The December 31, 2016 valuation had changes in the mortality rates. The December 31, 2017 valuation had changes in the interest rate assumption (from 7.50% to 7.00%)
and changes related to salary increases, retirement, disability, termination rates, and changes to the percentage of active deaths and disablements occurring in the line of duty.
(See independent auditor's report.)- 90 -
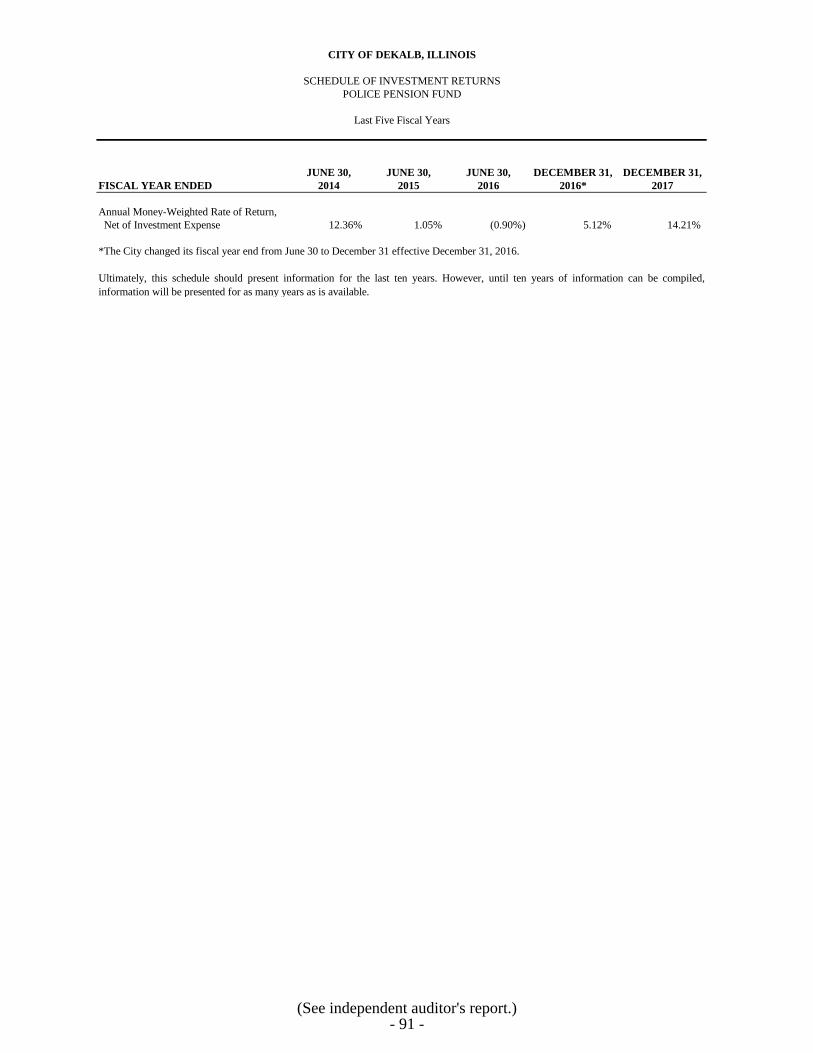
JUNE 30, JUNE 30, JUNE 30, DECEMBER 31, DECEMBER 31,
FISCAL YEAR ENDED 2014 2015 2016 2016* 2017
Annual Money-Weighted Rate of Return,
Net of Investment Expense 12.36% 1.05% (0.90%) 5.12% 14.21%
*The City changed its fiscal year end from June 30 to December 31 effective December 31, 2016.
CITY OF DEKALB, ILLINOIS
SCHEDULE OF INVESTMENT RETURNS
POLICE PENSION FUND
Last Five Fiscal Years
Ultimately, this schedule should present information for the last ten years. However, until ten years of information can be compiled,
information will be presented for as many years as is available.
(See independent auditor's report.)- 91 -
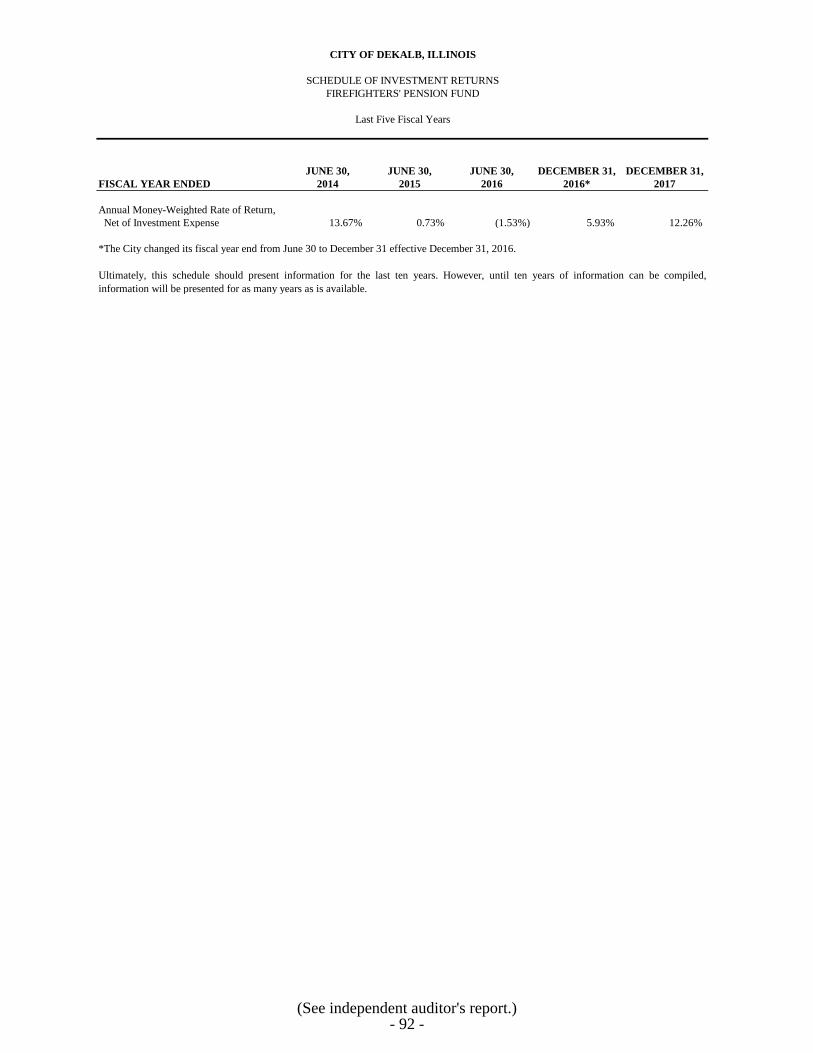
JUNE 30, JUNE 30, JUNE 30, DECEMBER 31, DECEMBER 31,
FISCAL YEAR ENDED 2014 2015 2016 2016* 2017
Annual Money-Weighted Rate of Return,
Net of Investment Expense 13.67% 0.73% (1.53%) 5.93% 12.26%
*The City changed its fiscal year end from June 30 to December 31 effective December 31, 2016.
CITY OF DEKALB, ILLINOIS
SCHEDULE OF INVESTMENT RETURNS
FIREFIGHTERS' PENSION FUND
Last Five Fiscal Years
Ultimately, this schedule should present information for the last ten years. However, until ten years of information can be compiled,
information will be presented for as many years as is available.
(See independent auditor's report.)- 92 -
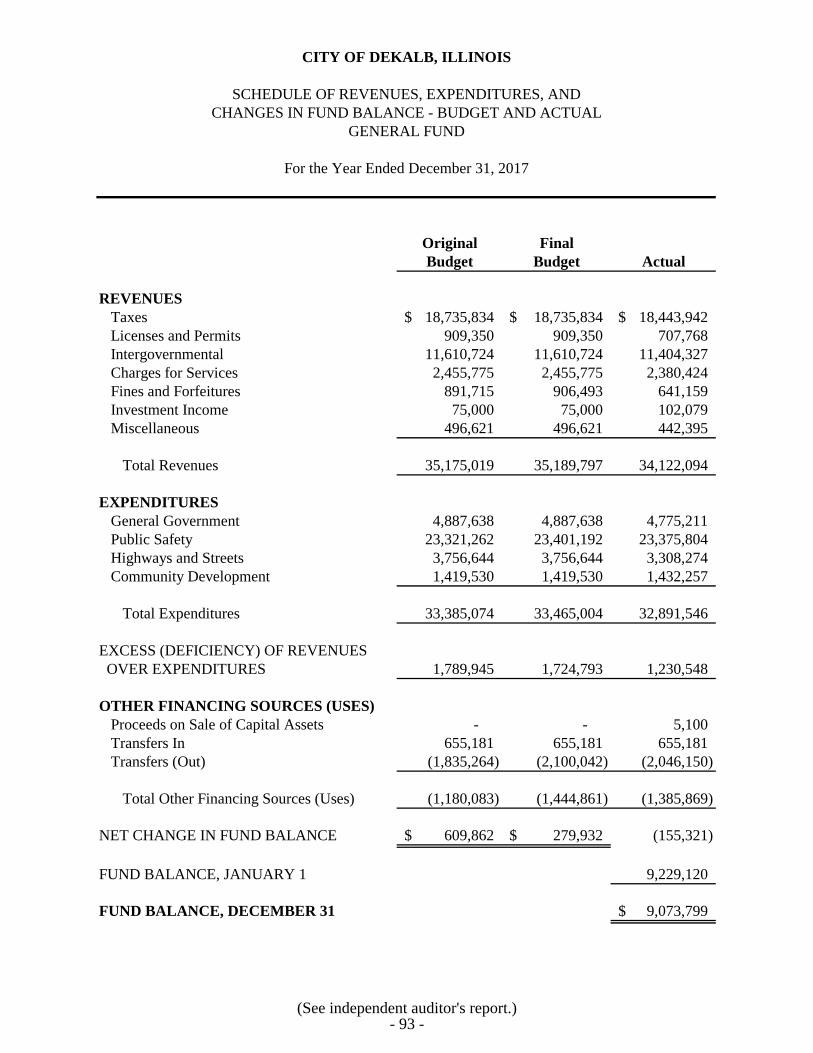
CITY OF DEKALB, ILLINOIS
SCHEDULE OF REVENUES, EXPENDITURES, AND
CHANGES IN FUND BALANCE - BUDGET AND ACTUAL
GENERAL FUND
For the Year Ended December 31, 2017
Original Final
Budget Budget Actual
REVENUES
Taxes 18,735,834$ 18,735,834$ 18,443,942$
Licenses and Permits 909,350 909,350 707,768
Intergovernmental 11,610,724 11,610,724 11,404,327
Charges for Services 2,455,775 2,455,775 2,380,424
Fines and Forfeitures 891,715 906,493 641,159
Investment Income 75,000 75,000 102,079
Miscellaneous 496,621 496,621 442,395
Total Revenues 35,175,019 35,189,797 34,122,094
EXPENDITURES
General Government 4,887,638 4,887,638 4,775,211
Public Safety 23,321,262 23,401,192 23,375,804
Highways and Streets 3,756,644 3,756,644 3,308,274
Community Development 1,419,530 1,419,530 1,432,257
Total Expenditures 33,385,074 33,465,004 32,891,546
EXCESS (DEFICIENCY) OF REVENUES
OVER EXPENDITURES 1,789,945 1,724,793 1,230,548
OTHER FINANCING SOURCES (USES)
Proceeds on Sale of Capital Assets - - 5,100
Transfers In 655,181 655,181 655,181
Transfers (Out) (1,835,264) (2,100,042) (2,046,150)
Total Other Financing Sources (Uses) (1,180,083) (1,444,861) (1,385,869)
NET CHANGE IN FUND BALANCE 609,862$ 279,932$ (155,321)
FUND BALANCE, JANUARY 1 9,229,120
FUND BALANCE, DECEMBER 31 9,073,799$
(See independent auditor's report.)- 93 -
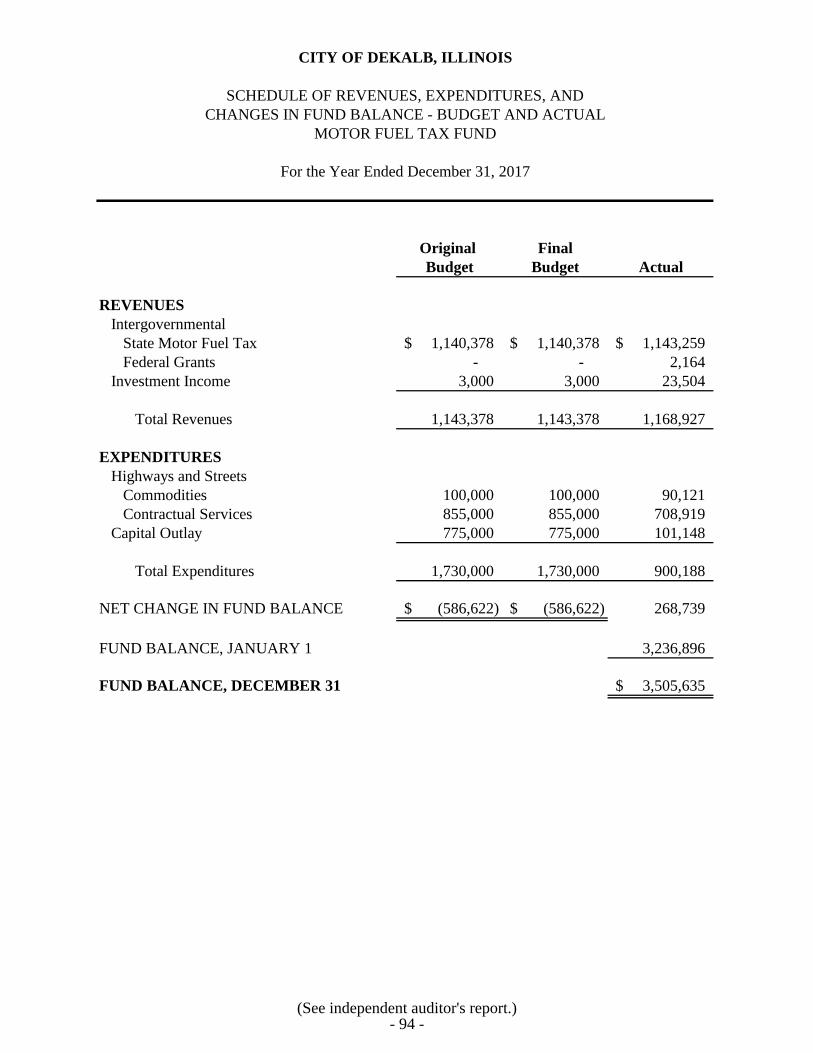
CITY OF DEKALB, ILLINOIS
SCHEDULE OF REVENUES, EXPENDITURES, AND
CHANGES IN FUND BALANCE - BUDGET AND ACTUAL
MOTOR FUEL TAX FUND
For the Year Ended December 31, 2017
Original Final
Budget Budget Actual
REVENUES
Intergovernmental
State Motor Fuel Tax 1,140,378$ 1,140,378$ 1,143,259$
Federal Grants - - 2,164
Investment Income 3,000 3,000 23,504
Total Revenues 1,143,378 1,143,378 1,168,927
EXPENDITURES
Highways and Streets
Commodities 100,000 100,000 90,121
Contractual Services 855,000 855,000 708,919
Capital Outlay 775,000 775,000 101,148
Total Expenditures 1,730,000 1,730,000 900,188
NET CHANGE IN FUND BALANCE (586,622)$ (586,622)$ 268,739
FUND BALANCE, JANUARY 1 3,236,896
FUND BALANCE, DECEMBER 31 3,505,635$
(See independent auditor's report.)- 94 -
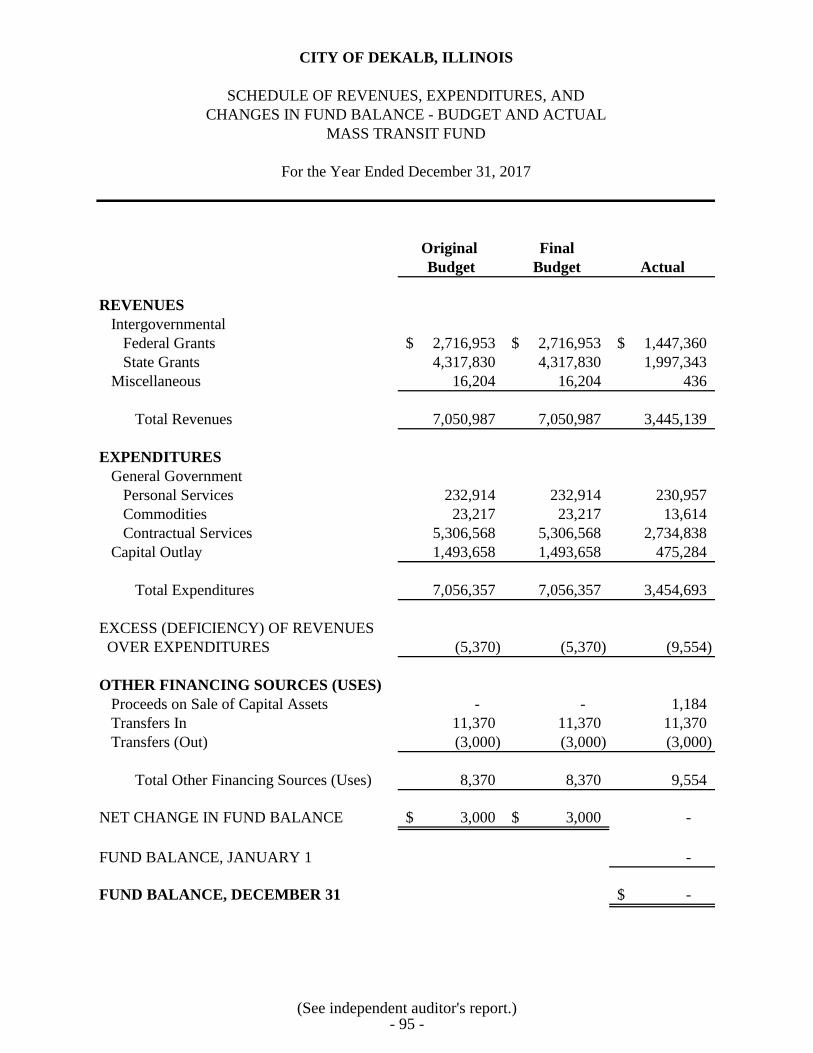
CITY OF DEKALB, ILLINOIS
SCHEDULE OF REVENUES, EXPENDITURES, AND
CHANGES IN FUND BALANCE - BUDGET AND ACTUAL
MASS TRANSIT FUND
For the Year Ended December 31, 2017
Original Final
Budget Budget Actual
REVENUES
Intergovernmental
Federal Grants 2,716,953$ 2,716,953$ 1,447,360$
State Grants 4,317,830 4,317,830 1,997,343
Miscellaneous 16,204 16,204 436
Total Revenues 7,050,987 7,050,987 3,445,139
EXPENDITURES
General Government
Personal Services 232,914 232,914 230,957
Commodities 23,217 23,217 13,614
Contractual Services 5,306,568 5,306,568 2,734,838
Capital Outlay 1,493,658 1,493,658 475,284
Total Expenditures 7,056,357 7,056,357 3,454,693
EXCESS (DEFICIENCY) OF REVENUES
OVER EXPENDITURES (5,370) (5,370) (9,554)
OTHER FINANCING SOURCES (USES)
Proceeds on Sale of Capital Assets - - 1,184
Transfers In 11,370 11,370 11,370
Transfers (Out) (3,000) (3,000) (3,000)
Total Other Financing Sources (Uses) 8,370 8,370 9,554
NET CHANGE IN FUND BALANCE 3,000$ 3,000$ -
FUND BALANCE, JANUARY 1 -
FUND BALANCE, DECEMBER 31 -$
(See independent auditor's report.)- 95 -
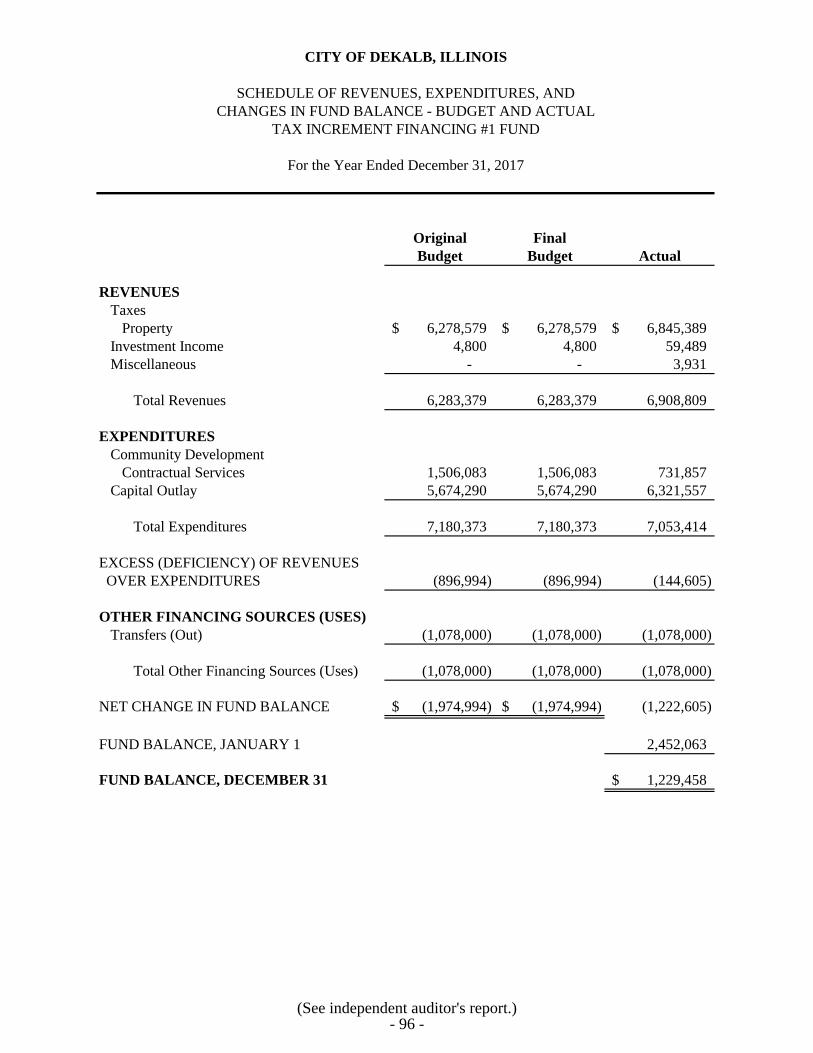
CITY OF DEKALB, ILLINOIS
SCHEDULE OF REVENUES, EXPENDITURES, AND
CHANGES IN FUND BALANCE - BUDGET AND ACTUAL
TAX INCREMENT FINANCING #1 FUND
For the Year Ended December 31, 2017
Original Final
Budget Budget Actual
REVENUES
Taxes
Property 6,278,579$ 6,278,579$ 6,845,389$
Investment Income 4,800 4,800 59,489
Miscellaneous - - 3,931
Total Revenues 6,283,379 6,283,379 6,908,809
EXPENDITURES
Community Development
Contractual Services 1,506,083 1,506,083 731,857
Capital Outlay 5,674,290 5,674,290 6,321,557
Total Expenditures 7,180,373 7,180,373 7,053,414
EXCESS (DEFICIENCY) OF REVENUES
OVER EXPENDITURES (896,994) (896,994) (144,605)
OTHER FINANCING SOURCES (USES)
Transfers (Out) (1,078,000) (1,078,000) (1,078,000)
Total Other Financing Sources (Uses) (1,078,000) (1,078,000) (1,078,000)
NET CHANGE IN FUND BALANCE (1,974,994)$ (1,974,994)$ (1,222,605)
FUND BALANCE, JANUARY 1 2,452,063
FUND BALANCE, DECEMBER 31 1,229,458$
(See independent auditor's report.)- 96 -
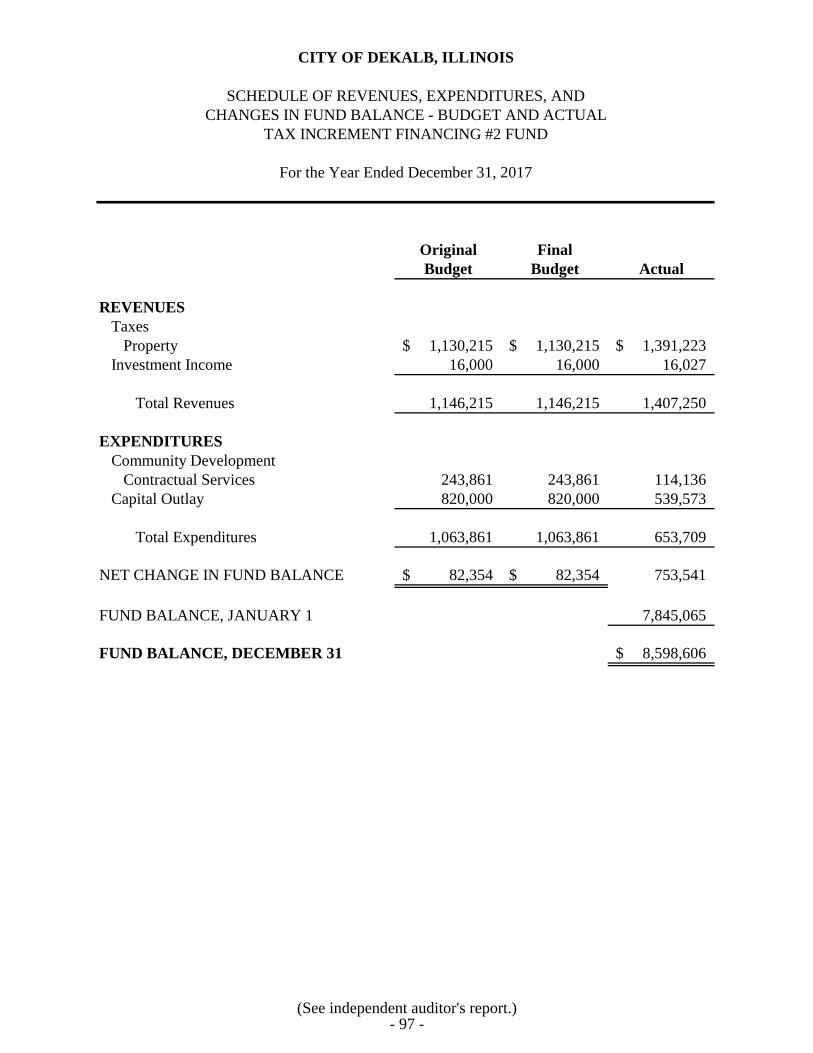
CITY OF DEKALB, ILLINOIS
SCHEDULE OF REVENUES, EXPENDITURES, AND
CHANGES IN FUND BALANCE - BUDGET AND ACTUAL
TAX INCREMENT FINANCING #2 FUND
For the Year Ended December 31, 2017
Original Final
Budget Budget Actual
REVENUES
Taxes
Property 1,130,215$ 1,130,215$ 1,391,223$
Investment Income 16,000 16,000 16,027
Total Revenues 1,146,215 1,146,215 1,407,250
EXPENDITURES
Community Development
Contractual Services 243,861 243,861 114,136
Capital Outlay 820,000 820,000 539,573
Total Expenditures 1,063,861 1,063,861 653,709
NET CHANGE IN FUND BALANCE 82,354$ 82,354$ 753,541
FUND BALANCE, JANUARY 1 7,845,065
FUND BALANCE, DECEMBER 31 8,598,606$
(See independent auditor's report.)- 97 -
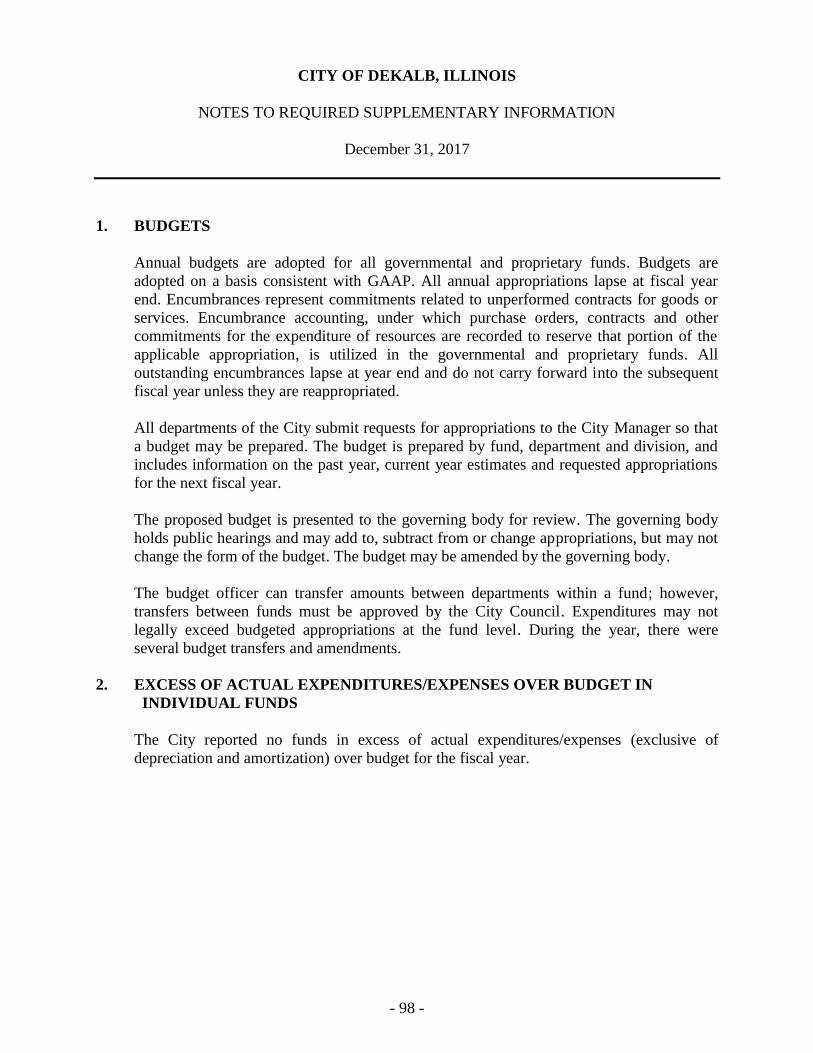
- 97 -
CITY OF DEKALB, ILLINOIS
NOTES TO REQUIRED SUPPLEMENTARY INFORMATION
December 31, 2017
1. BUDGETS
Annual budgets are adopted for all governmental and proprietary funds. Budgets are
adopted on a basis consistent with GAAP. All annual appropriations lapse at fiscal year
end. Encumbrances represent commitments related to unperformed contracts for goods or
services. Encumbrance accounting, under which purchase orders, contracts and other
commitments for the expenditure of resources are recorded to reserve that portion of the
applicable appropriation, is utilized in the governmental and proprietary funds. All
outstanding encumbrances lapse at year end and do not carry forward into the subsequent
fiscal year unless they are reappropriated.
All departments of the City submit requests for appropriations to the City Manager so that
a budget may be prepared. The budget is prepared by fund, department and division, and
includes information on the past year, current year estimates and requested appropriations
for the next fiscal year.
The proposed budget is presented to the governing body for review. The governing body
holds public hearings and may add to, subtract from or change appropriations, but may not
change the form of the budget. The budget may be amended by the governing body.
The budget officer can transfer amounts between departments within a fund; however,
transfers between funds must be approved by the City Council. Expenditures may not
legally exceed budgeted appropriations at the fund level. During the year, there were
several budget transfers and amendments.
2. EXCESS OF ACTUAL EXPENDITURES/EXPENSES OVER BUDGET IN
INDIVIDUAL FUNDS
The City reported no funds in excess of actual expenditures/expenses (exclusive of
depreciation and amortization) over budget for the fiscal year.
- 98 -

COMBINING AND INDIVIDUAL FUND FINANCIAL
STATEMENTS AND SCHEDULES
MAJOR GOVERNMENTAL FUNDS
GENERAL FUND
The General Fund accounts for all financial resources except those required to be accounted for in
another fund.
SPECIAL REVENUE FUNDS
The Motor Fuel Tax Fund is used to account for the operations of street maintenance programs
and capital projects as authorized by the Illinois Department of Transportation. Financing is
provided by the City’s share of gasoline taxes.
The Mass Transit Fund is used to account for the tow community mass transit services: Northern
Illinois University Huskies Line and Voluntary Action Center’s Trans Vac Service.
The Tax Increment Financing #1 Fund is used to account for redevelopment activities within
another defined area of the community in order to eliminate blighted conditions in that area.
The Tax Increment Financing #2 Fund is used to account for redevelopment activities within
another defined area of the community in order to eliminate blighted conditions in that area.
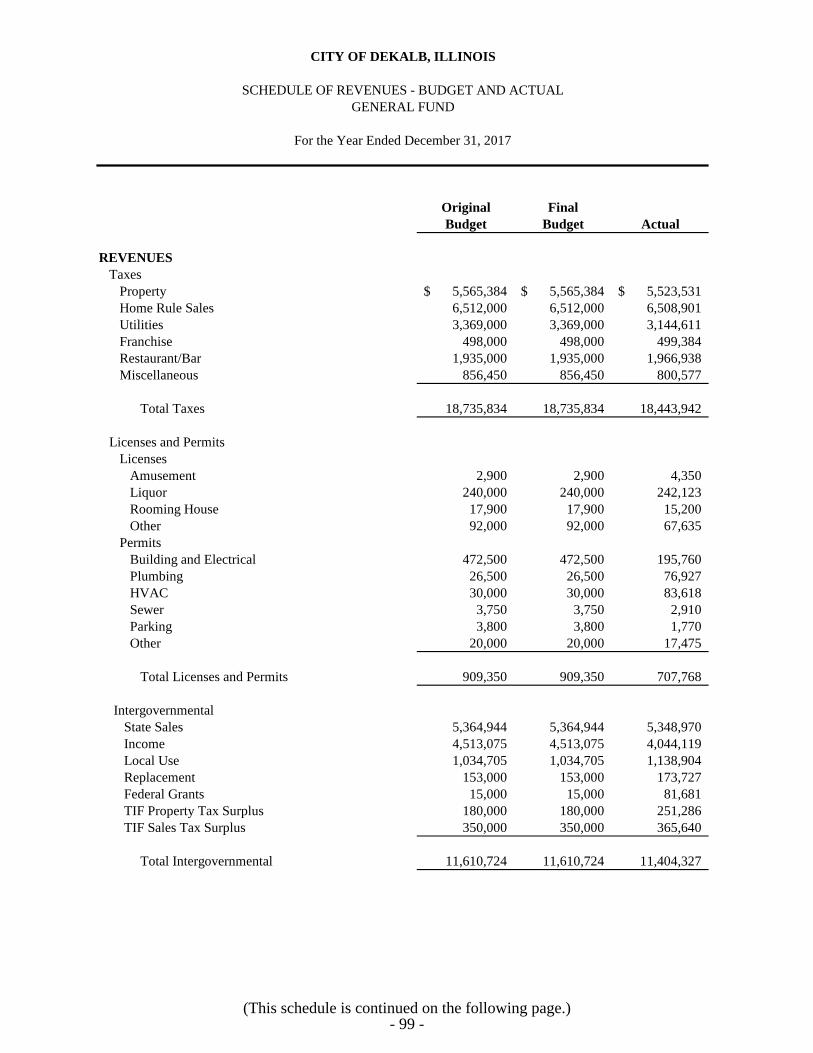
SCHEDULE OF REVENUES - BUDGET AND ACTUAL
Original Final
Budget Budget Actual
REVENUES
Taxes
Property 5,565,384$ 5,565,384$ 5,523,531$
Home Rule Sales 6,512,000 6,512,000 6,508,901
Utilities 3,369,000 3,369,000 3,144,611
Franchise 498,000 498,000 499,384
Restaurant/Bar 1,935,000 1,935,000 1,966,938
Miscellaneous 856,450 856,450 800,577
Total Taxes 18,735,834 18,735,834 18,443,942
Licenses and Permits
Licenses
Amusement 2,900 2,900 4,350
Liquor 240,000 240,000 242,123
Rooming House 17,900 17,900 15,200
Other 92,000 92,000 67,635
Permits
Building and Electrical 472,500 472,500 195,760
Plumbing 26,500 26,500 76,927
HVAC 30,000 30,000 83,618
Sewer 3,750 3,750 2,910
Parking 3,800 3,800 1,770
Other 20,000 20,000 17,475
Total Licenses and Permits 909,350 909,350 707,768
Intergovernmental
State Sales 5,364,944 5,364,944 5,348,970
Income 4,513,075 4,513,075 4,044,119
Local Use 1,034,705 1,034,705 1,138,904
Replacement 153,000 153,000 173,727
Federal Grants 15,000 15,000 81,681
TIF Property Tax Surplus 180,000 180,000 251,286
TIF Sales Tax Surplus 350,000 350,000 365,640
Total Intergovernmental 11,610,724 11,610,724 11,404,327
CITY OF DEKALB, ILLINOIS
GENERAL FUND
For the Year Ended December 31, 2017
(This schedule is continued on the following page.)- 99 -
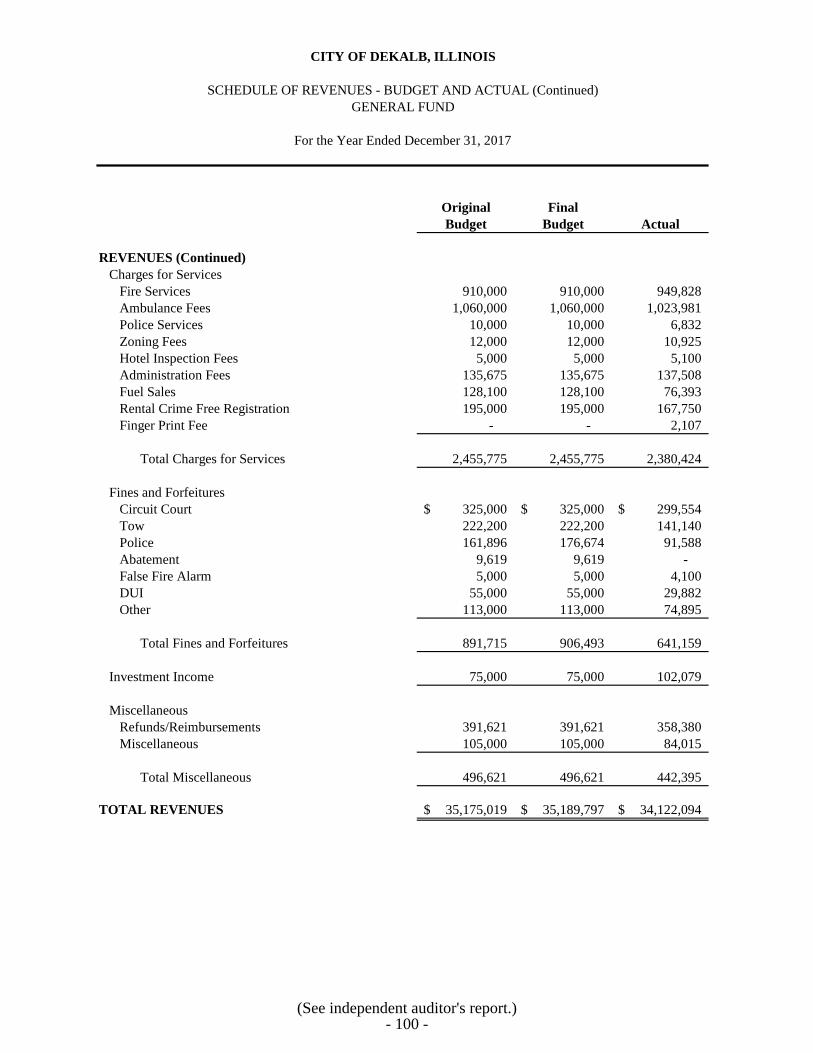
CITY OF DEKALB, ILLINOIS
SCHEDULE OF REVENUES - BUDGET AND ACTUAL (Continued)
GENERAL FUND
For the Year Ended December 31, 2017
Original Final
Budget Budget Actual
REVENUES (Continued)
Charges for Services
Fire Services 910,000 910,000 949,828
Ambulance Fees 1,060,000 1,060,000 1,023,981
Police Services 10,000 10,000 6,832
Zoning Fees 12,000 12,000 10,925
Hotel Inspection Fees 5,000 5,000 5,100
Administration Fees 135,675 135,675 137,508
Fuel Sales 128,100 128,100 76,393
Rental Crime Free Registration 195,000 195,000 167,750
Finger Print Fee - - 2,107
Total Charges for Services 2,455,775 2,455,775 2,380,424
Fines and Forfeitures
Circuit Court 325,000$ 325,000$ 299,554$
Tow 222,200 222,200 141,140
Police 161,896 176,674 91,588
Abatement 9,619 9,619 -
False Fire Alarm 5,000 5,000 4,100
DUI 55,000 55,000 29,882
Other 113,000 113,000 74,895
Total Fines and Forfeitures 891,715 906,493 641,159
Investment Income 75,000 75,000 102,079
Miscellaneous
Refunds/Reimbursements 391,621 391,621 358,380
Miscellaneous 105,000 105,000 84,015
Total Miscellaneous 496,621 496,621 442,395
TOTAL REVENUES 35,175,019$ 35,189,797$ 34,122,094$
(See independent auditor's report.)- 100 -
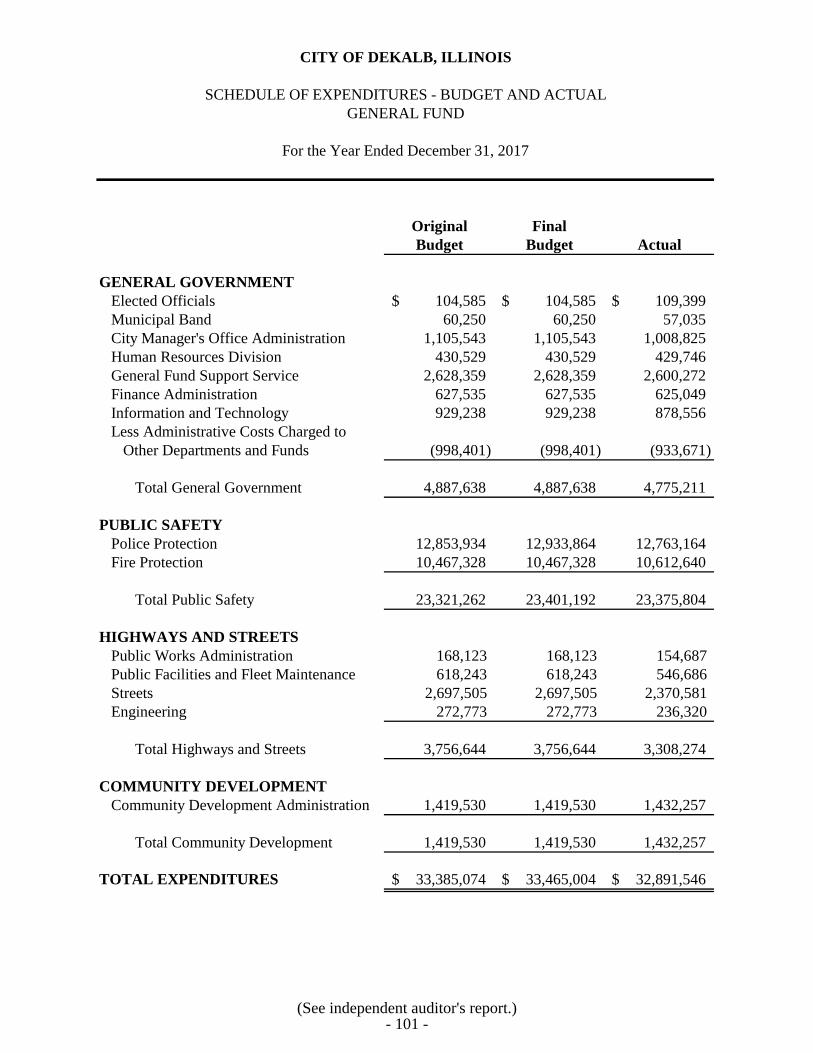
CITY OF DEKALB, ILLINOIS
SCHEDULE OF EXPENDITURES - BUDGET AND ACTUAL
GENERAL FUND
For the Year Ended December 31, 2017
Original Final
Budget Budget Actual
GENERAL GOVERNMENT
Elected Officials 104,585$ 104,585$ 109,399$
Municipal Band 60,250 60,250 57,035
City Manager's Office Administration 1,105,543 1,105,543 1,008,825
Human Resources Division 430,529 430,529 429,746
General Fund Support Service 2,628,359 2,628,359 2,600,272
Finance Administration 627,535 627,535 625,049
Information and Technology 929,238 929,238 878,556
Less Administrative Costs Charged to
Other Departments and Funds (998,401) (998,401) (933,671)
Total General Government 4,887,638 4,887,638 4,775,211
PUBLIC SAFETY
Police Protection 12,853,934 12,933,864 12,763,164
Fire Protection 10,467,328 10,467,328 10,612,640
Total Public Safety 23,321,262 23,401,192 23,375,804
HIGHWAYS AND STREETS
Public Works Administration 168,123 168,123 154,687
Public Facilities and Fleet Maintenance 618,243 618,243 546,686
Streets 2,697,505 2,697,505 2,370,581
Engineering 272,773 272,773 236,320
Total Highways and Streets 3,756,644 3,756,644 3,308,274
COMMUNITY DEVELOPMENT
Community Development Administration 1,419,530 1,419,530 1,432,257
Total Community Development 1,419,530 1,419,530 1,432,257
TOTAL EXPENDITURES 33,385,074$ 33,465,004$ 32,891,546$
(See independent auditor's report.)- 101 -
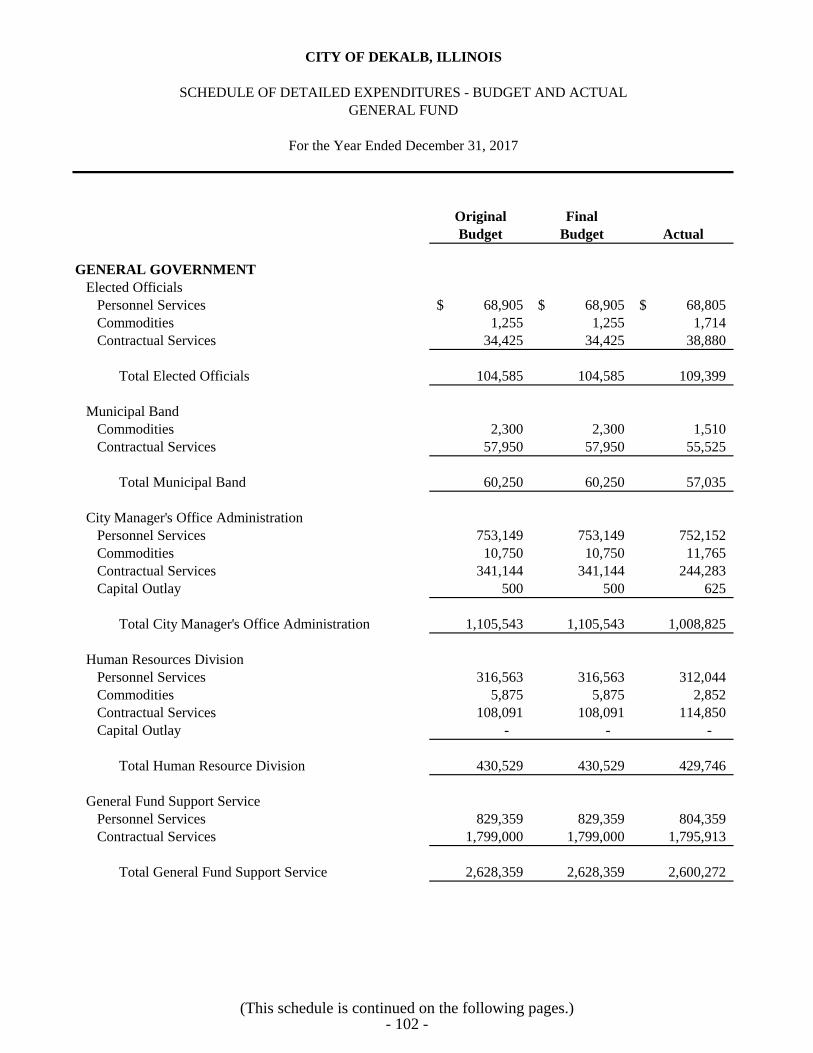
CITY OF DEKALB, ILLINOIS
SCHEDULE OF DETAILED EXPENDITURES - BUDGET AND ACTUAL
GENERAL FUND
For the Year Ended December 31, 2017
Original Final
Budget Budget Actual
GENERAL GOVERNMENT
Elected Officials
Personnel Services 68,905$ 68,905$ 68,805$
Commodities 1,255 1,255 1,714
Contractual Services 34,425 34,425 38,880
Total Elected Officials 104,585 104,585 109,399
Municipal Band
Commodities 2,300 2,300 1,510
Contractual Services 57,950 57,950 55,525
Total Municipal Band 60,250 60,250 57,035
City Manager's Office Administration
Personnel Services 753,149 753,149 752,152
Commodities 10,750 10,750 11,765
Contractual Services 341,144 341,144 244,283
Capital Outlay 500 500 625
Total City Manager's Office Administration 1,105,543 1,105,543 1,008,825
Human Resources Division
Personnel Services 316,563 316,563 312,044
Commodities 5,875 5,875 2,852
Contractual Services 108,091 108,091 114,850
Capital Outlay - - -
Total Human Resource Division 430,529 430,529 429,746
General Fund Support Service
Personnel Services 829,359 829,359 804,359
Contractual Services 1,799,000 1,799,000 1,795,913
Total General Fund Support Service 2,628,359 2,628,359 2,600,272
(This schedule is continued on the following pages.)- 102 -
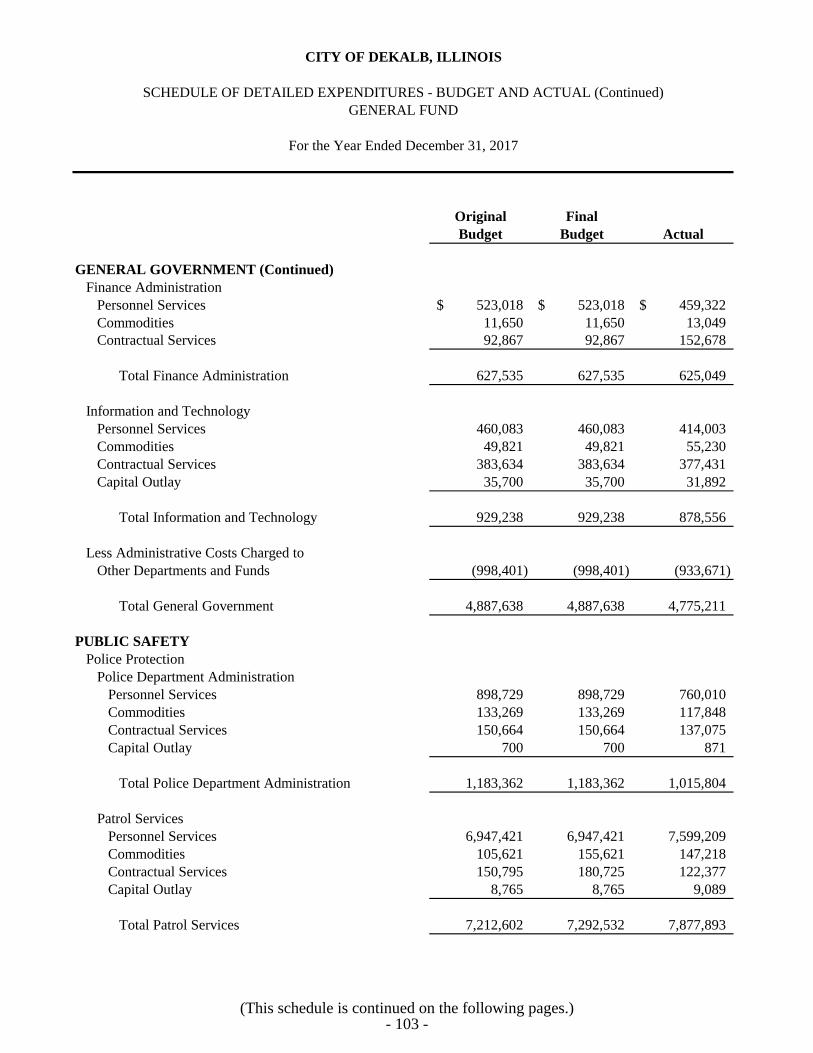
CITY OF DEKALB, ILLINOIS
SCHEDULE OF DETAILED EXPENDITURES - BUDGET AND ACTUAL (Continued)
GENERAL FUND
For the Year Ended December 31, 2017
Original Final
Budget Budget Actual
GENERAL GOVERNMENT (Continued)
Finance Administration
Personnel Services 523,018$ 523,018$ 459,322$
Commodities 11,650 11,650 13,049
Contractual Services 92,867 92,867 152,678
Total Finance Administration 627,535 627,535 625,049
Information and Technology
Personnel Services 460,083 460,083 414,003
Commodities 49,821 49,821 55,230
Contractual Services 383,634 383,634 377,431
Capital Outlay 35,700 35,700 31,892
Total Information and Technology 929,238 929,238 878,556
Less Administrative Costs Charged to
Other Departments and Funds (998,401) (998,401) (933,671)
Total General Government 4,887,638 4,887,638 4,775,211
PUBLIC SAFETY
Police Protection
Police Department Administration
Personnel Services 898,729 898,729 760,010
Commodities 133,269 133,269 117,848
Contractual Services 150,664 150,664 137,075
Capital Outlay 700 700 871
Total Police Department Administration 1,183,362 1,183,362 1,015,804
Patrol Services
Personnel Services 6,947,421 6,947,421 7,599,209
Commodities 105,621 155,621 147,218
Contractual Services 150,795 180,725 122,377
Capital Outlay 8,765 8,765 9,089
Total Patrol Services 7,212,602 7,292,532 7,877,893
(This schedule is continued on the following pages.)- 103 -
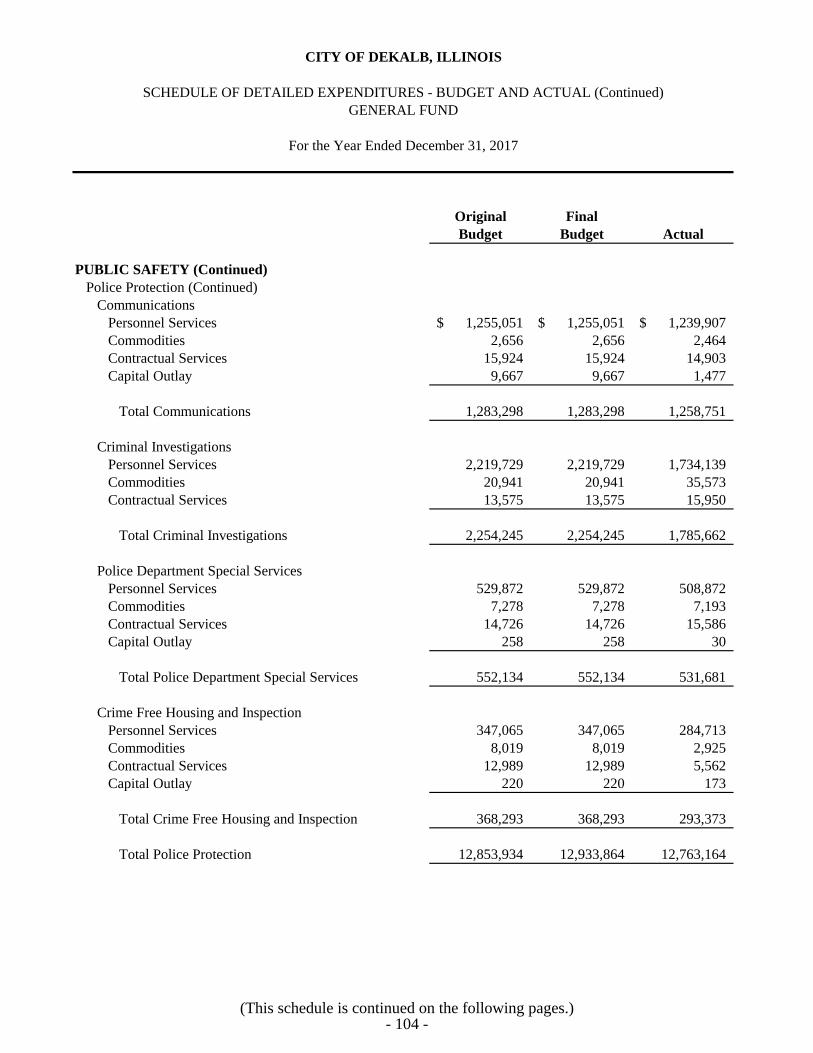
CITY OF DEKALB, ILLINOIS
SCHEDULE OF DETAILED EXPENDITURES - BUDGET AND ACTUAL (Continued)
GENERAL FUND
For the Year Ended December 31, 2017
Original Final
Budget Budget Actual
PUBLIC SAFETY (Continued)
Police Protection (Continued)
Communications
Personnel Services 1,255,051$ 1,255,051$ 1,239,907$
Commodities 2,656 2,656 2,464
Contractual Services 15,924 15,924 14,903
Capital Outlay 9,667 9,667 1,477
Total Communications 1,283,298 1,283,298 1,258,751
Criminal Investigations
Personnel Services 2,219,729 2,219,729 1,734,139
Commodities 20,941 20,941 35,573
Contractual Services 13,575 13,575 15,950
Total Criminal Investigations 2,254,245 2,254,245 1,785,662
Police Department Special Services
Personnel Services 529,872 529,872 508,872
Commodities 7,278 7,278 7,193
Contractual Services 14,726 14,726 15,586
Capital Outlay 258 258 30
Total Police Department Special Services 552,134 552,134 531,681
Crime Free Housing and Inspection
Personnel Services 347,065 347,065 284,713
Commodities 8,019 8,019 2,925
Contractual Services 12,989 12,989 5,562
Capital Outlay 220 220 173
Total Crime Free Housing and Inspection 368,293 368,293 293,373
Total Police Protection 12,853,934 12,933,864 12,763,164
(This schedule is continued on the following pages.)- 104 -
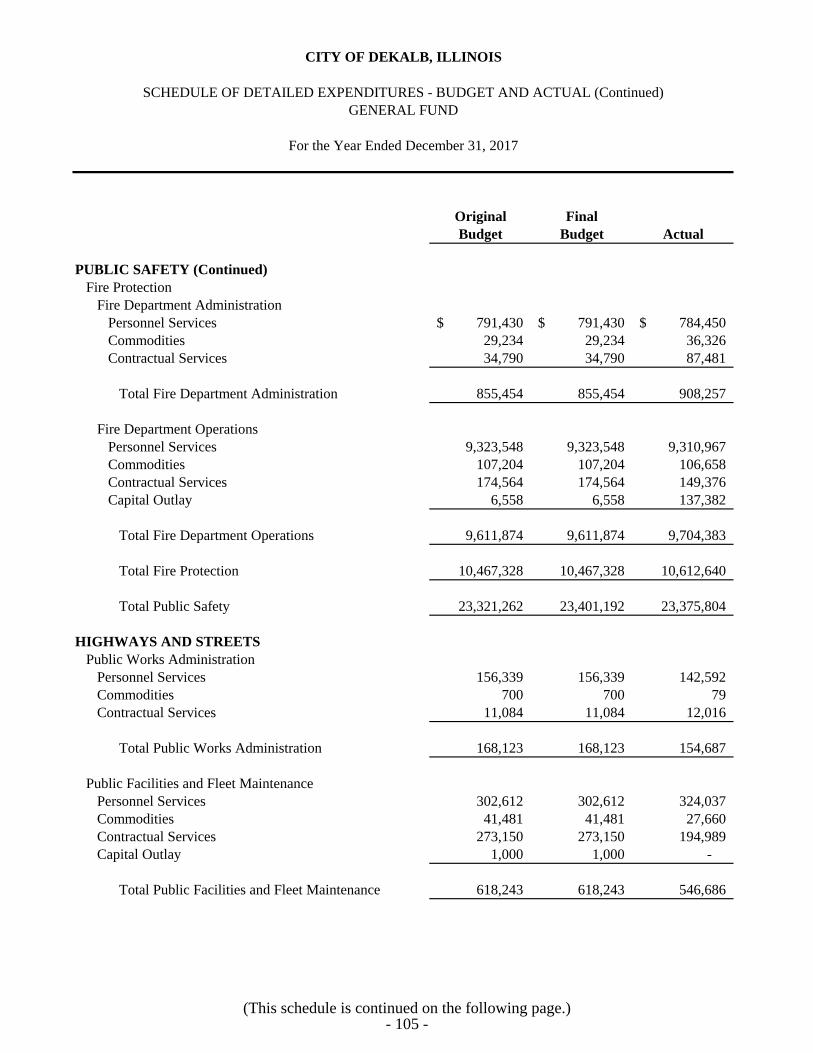
CITY OF DEKALB, ILLINOIS
SCHEDULE OF DETAILED EXPENDITURES - BUDGET AND ACTUAL (Continued)
GENERAL FUND
For the Year Ended December 31, 2017
Original Final
Budget Budget Actual
PUBLIC SAFETY (Continued)
Fire Protection
Fire Department Administration
Personnel Services 791,430$ 791,430$ 784,450$
Commodities 29,234 29,234 36,326
Contractual Services 34,790 34,790 87,481
Total Fire Department Administration 855,454 855,454 908,257
Fire Department Operations
Personnel Services 9,323,548 9,323,548 9,310,967
Commodities 107,204 107,204 106,658
Contractual Services 174,564 174,564 149,376
Capital Outlay 6,558 6,558 137,382
Total Fire Department Operations 9,611,874 9,611,874 9,704,383
Total Fire Protection 10,467,328 10,467,328 10,612,640
Total Public Safety 23,321,262 23,401,192 23,375,804
HIGHWAYS AND STREETS
Public Works Administration
Personnel Services 156,339 156,339 142,592
Commodities 700 700 79
Contractual Services 11,084 11,084 12,016
Total Public Works Administration 168,123 168,123 154,687
Public Facilities and Fleet Maintenance
Personnel Services 302,612 302,612 324,037
Commodities 41,481 41,481 27,660
Contractual Services 273,150 273,150 194,989
Capital Outlay 1,000 1,000 -
Total Public Facilities and Fleet Maintenance 618,243 618,243 546,686
(This schedule is continued on the following page.)- 105 -
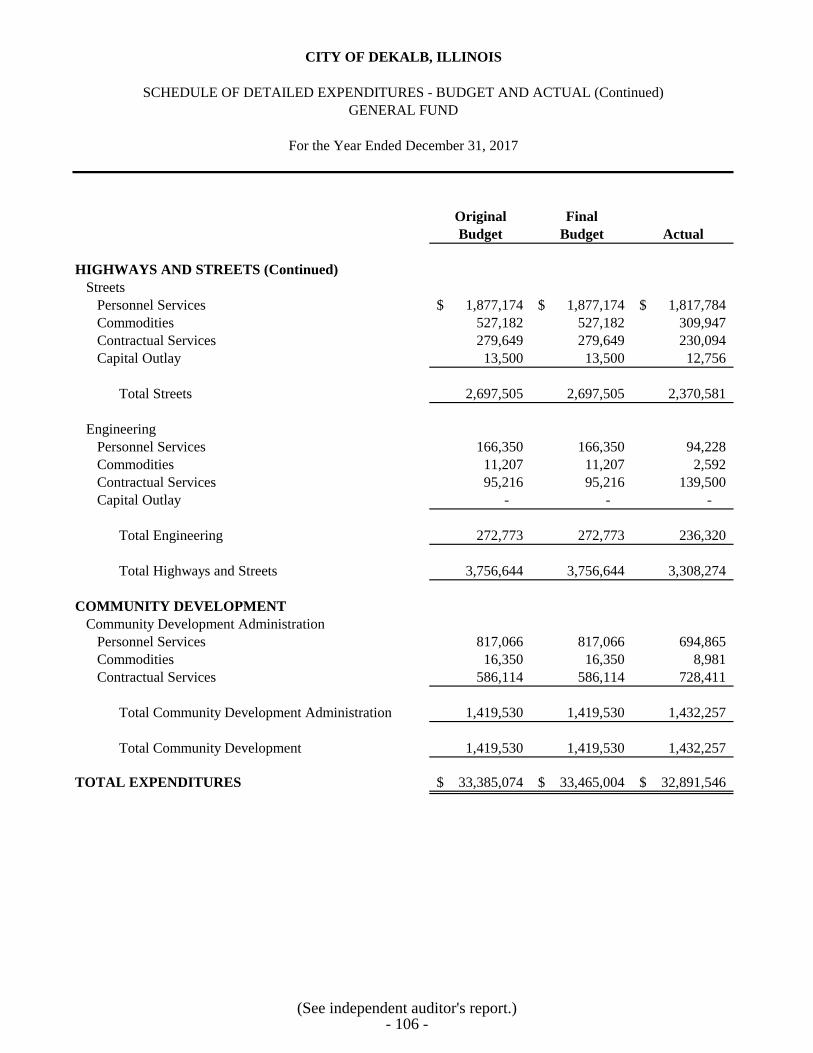
CITY OF DEKALB, ILLINOIS
SCHEDULE OF DETAILED EXPENDITURES - BUDGET AND ACTUAL (Continued)
GENERAL FUND
For the Year Ended December 31, 2017
Original Final
Budget Budget Actual
HIGHWAYS AND STREETS (Continued)
Streets
Personnel Services 1,877,174$ 1,877,174$ 1,817,784$
Commodities 527,182 527,182 309,947
Contractual Services 279,649 279,649 230,094
Capital Outlay 13,500 13,500 12,756
Total Streets 2,697,505 2,697,505 2,370,581
Engineering
Personnel Services 166,350 166,350 94,228
Commodities 11,207 11,207 2,592
Contractual Services 95,216 95,216 139,500
Capital Outlay - - -
Total Engineering 272,773 272,773 236,320
Total Highways and Streets 3,756,644 3,756,644 3,308,274
COMMUNITY DEVELOPMENT
Community Development Administration
Personnel Services 817,066 817,066 694,865
Commodities 16,350 16,350 8,981
Contractual Services 586,114 586,114 728,411
Total Community Development Administration 1,419,530 1,419,530 1,432,257
Total Community Development 1,419,530 1,419,530 1,432,257
TOTAL EXPENDITURES 33,385,074$ 33,465,004$ 32,891,546$
(See independent auditor's report.)- 106 -
NONMAJOR GOVERNMENTAL FUNDS
SPECIAL REVENUE FUNDS
The Foreign Fire Insurance Tax Fund is used to account for certain fire department related
expenditures. Financing is provided by taxes on out-of-state insurance companies.
The Housing Rehabilitation Fund is used to account for federal and state grants received through
1983 that were targeted for low interest housing rehabilitation loans to income qualified properties.
The Community Development Block Grant Fund is used to account for the receipts and
disbursement of community development grant funds.
The Heritage Ridge Special Service Area #3 Fund is used to account for the accumulation of
resources for improvements for Special Service Area #3.
The Knolls Special Service Area #4 Fund is used to account for the accumulation of resources for
improvements for Special Service Area #4.
The Greek Row Special Service Area #6 Fund is used to account for the accumulation of resources
for improvements for Special Service Area #6.
The Heartland Fields Special Service Area #14 Fund is used to account for the accumulation of
resources for improvements for Special Service Area #14.
DEBT SERVICE FUNDS
The General Debt Service Fund is used to account for the accumulation of resources and payment
of bond principal and interest on debt other than tax increment financing debt.
The TIF Debt Service Fund is used to account for the accumulation of resources and payment of
bond principal and interest on the tax increment financing areas.
NONMAJOR GOVERNMENTAL FUNDS (Continued)
CAPITAL PROJECTS FUNDS
The Capital Projects Fund is used to account for the City’s general infrastructure improvements
including street (re)construction, storm water management, public buildings, street lighting,
sidewalk repairs, as well as the purchase of vehicles and equipment.
The Equipment Fund is used to account for major equipment purchases which cost in excess of
$5,000 and have a useful life expectancy of three years or more.
The Fleet Replacement Fund is used to account for revenues and expenditures associated with the
acquisition of City vehicles and major equipment (i.e. trailers and plows). This fund was closed as
of December 31, 2017.
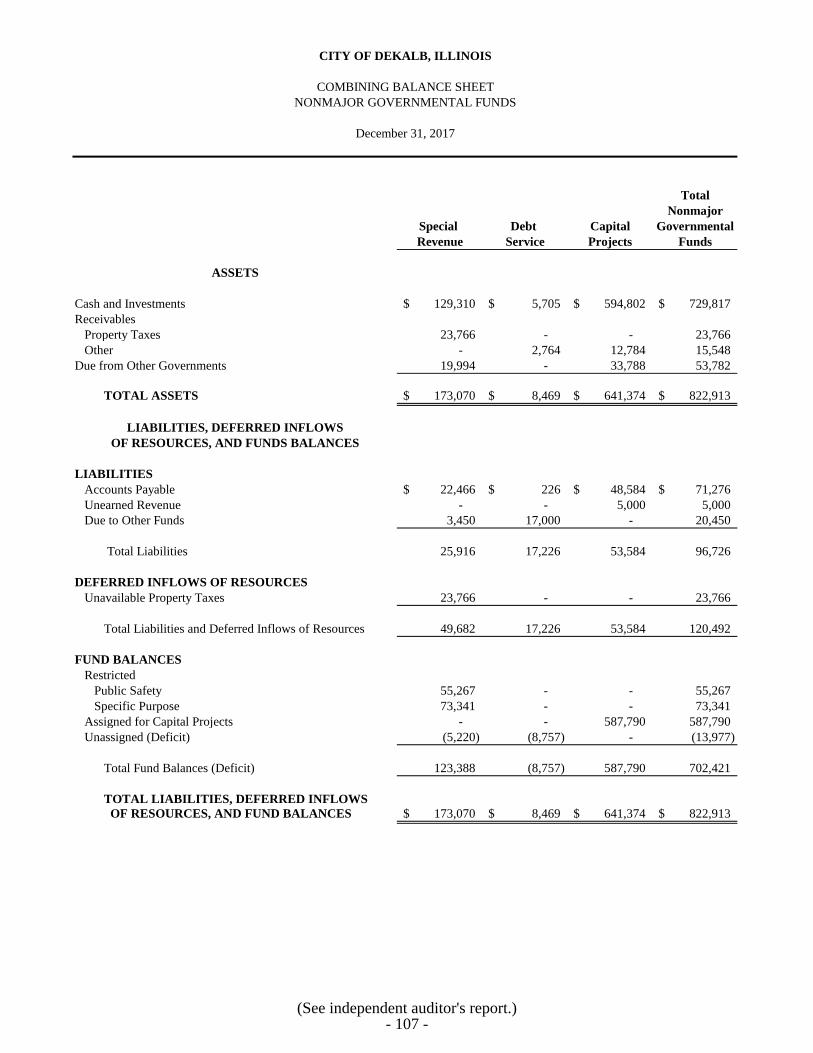
CITY OF DEKALB, ILLINOIS
COMBINING BALANCE SHEET
NONMAJOR GOVERNMENTAL FUNDS
December 31, 2017
Total
Nonmajor
Special Debt Capital Governmental
Revenue Service Projects Funds
ASSETS
Cash and Investments 129,310$ 5,705$ 594,802$ 729,817$
Receivables
Property Taxes 23,766 - - 23,766
Other - 2,764 12,784 15,548
Due from Other Governments 19,994 - 33,788 53,782
TOTAL ASSETS 173,070$ 8,469$ 641,374$ 822,913$
LIABILITIES, DEFERRED INFLOWS
OF RESOURCES, AND FUNDS BALANCES
LIABILITIES
Accounts Payable 22,466$ 226$ 48,584$ 71,276$
Unearned Revenue - - 5,000 5,000
Due to Other Funds 3,450 17,000 - 20,450
Total Liabilities 25,916 17,226 53,584 96,726
DEFERRED INFLOWS OF RESOURCES
Unavailable Property Taxes 23,766 - - 23,766
Total Liabilities and Deferred Inflows of Resources 49,682 17,226 53,584 120,492
FUND BALANCES
Restricted
Public Safety 55,267 - - 55,267
Specific Purpose 73,341 - - 73,341
Assigned for Capital Projects - - 587,790 587,790
Unassigned (Deficit) (5,220) (8,757) - (13,977)
Total Fund Balances (Deficit) 123,388 (8,757) 587,790 702,421
TOTAL LIABILITIES, DEFERRED INFLOWS
OF RESOURCES, AND FUND BALANCES 173,070$ 8,469$ 641,374$ 822,913$
(See independent auditor's report.)- 107 -
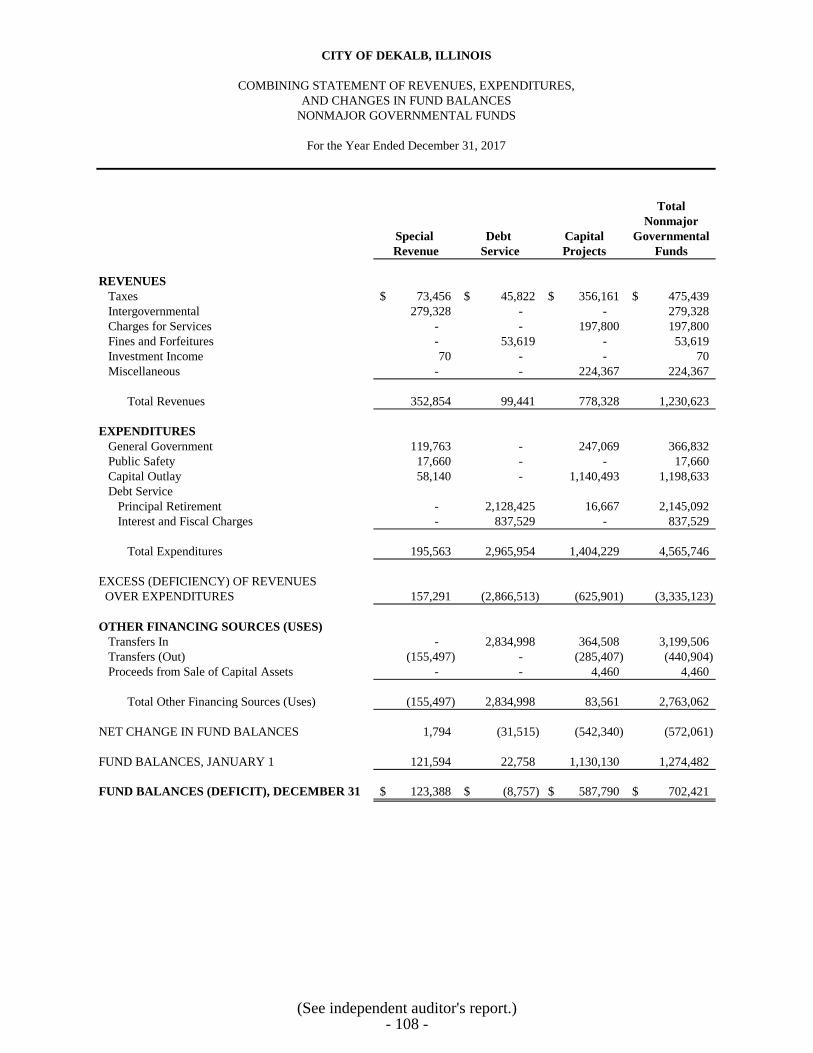
CITY OF DEKALB, ILLINOIS
COMBINING STATEMENT OF REVENUES, EXPENDITURES,
AND CHANGES IN FUND BALANCES
NONMAJOR GOVERNMENTAL FUNDS
For the Year Ended December 31, 2017
Total
Nonmajor
Special Debt Capital Governmental
Revenue Service Projects Funds
REVENUES
Taxes 73,456$ 45,822$ 356,161$ 475,439$
Intergovernmental 279,328 - - 279,328
Charges for Services - - 197,800 197,800
Fines and Forfeitures - 53,619 - 53,619
Investment Income 70 - - 70
Miscellaneous - - 224,367 224,367
Total Revenues 352,854 99,441 778,328 1,230,623
EXPENDITURES
General Government 119,763 - 247,069 366,832
Public Safety 17,660 - - 17,660
Capital Outlay 58,140 - 1,140,493 1,198,633
Debt Service
Principal Retirement - 2,128,425 16,667 2,145,092
Interest and Fiscal Charges - 837,529 - 837,529
Total Expenditures 195,563 2,965,954 1,404,229 4,565,746
EXCESS (DEFICIENCY) OF REVENUES
OVER EXPENDITURES 157,291 (2,866,513) (625,901) (3,335,123)
OTHER FINANCING SOURCES (USES)
Transfers In - 2,834,998 364,508 3,199,506
Transfers (Out) (155,497) - (285,407) (440,904)
Proceeds from Sale of Capital Assets - - 4,460 4,460
Total Other Financing Sources (Uses) (155,497) 2,834,998 83,561 2,763,062
NET CHANGE IN FUND BALANCES 1,794 (31,515) (542,340) (572,061)
FUND BALANCES, JANUARY 1 121,594 22,758 1,130,130 1,274,482
FUND BALANCES (DEFICIT), DECEMBER 31 123,388$ (8,757)$ 587,790$ 702,421$
(See independent auditor's report.)- 108 -
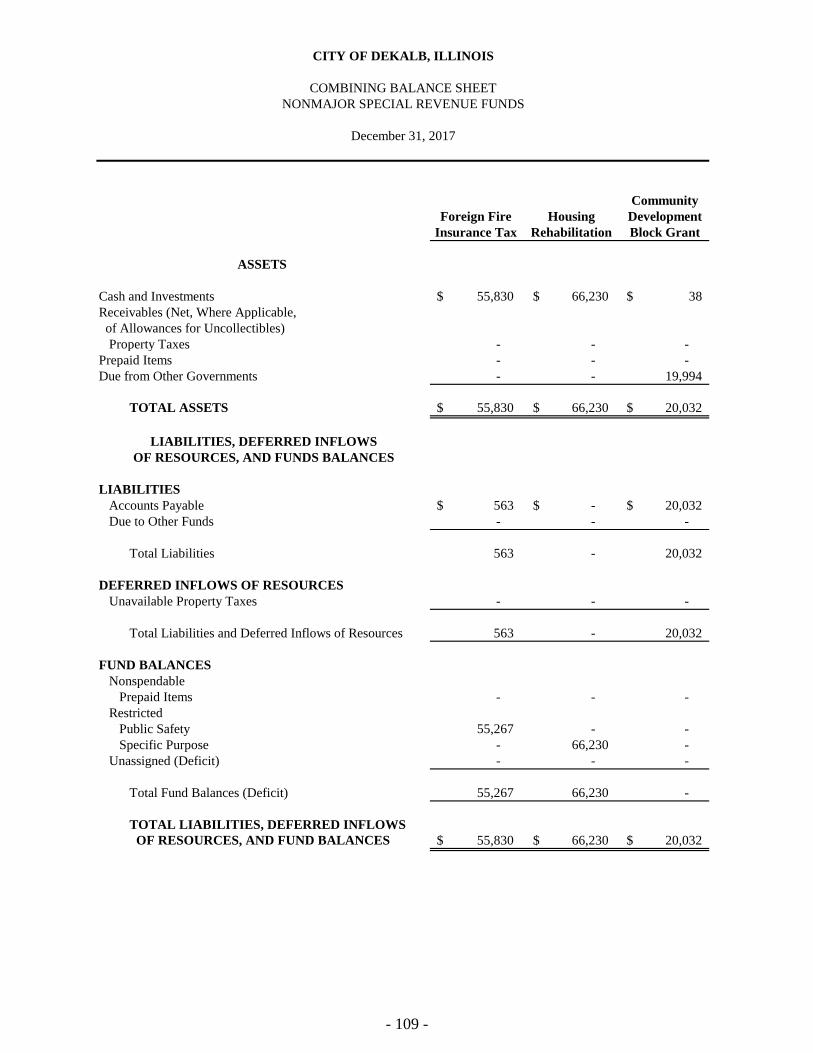
Community
Foreign Fire Housing Development
Insurance Tax Rehabilitation Block Grant
ASSETS
Cash and Investments 55,830$ 66,230$ 38$
Receivables (Net, Where Applicable,
of Allowances for Uncollectibles)
Property Taxes - - -
Prepaid Items - - -
Due from Other Governments - - 19,994
TOTAL ASSETS 55,830$ 66,230$ 20,032$
LIABILITIES, DEFERRED INFLOWS
OF RESOURCES, AND FUNDS BALANCES
LIABILITIES
Accounts Payable 563$ -$ 20,032$
Due to Other Funds - - -
Total Liabilities 563 - 20,032
DEFERRED INFLOWS OF RESOURCES
Unavailable Property Taxes - - -
Total Liabilities and Deferred Inflows of Resources 563 - 20,032
FUND BALANCES
Nonspendable
Prepaid Items - - -
Restricted
Public Safety 55,267 - -
Specific Purpose - 66,230 -
Unassigned (Deficit) - - -
Total Fund Balances (Deficit) 55,267 66,230 -
TOTAL LIABILITIES, DEFERRED INFLOWS
OF RESOURCES, AND FUND BALANCES 55,830$ 66,230$ 20,032$
CITY OF DEKALB, ILLINOIS
COMBINING BALANCE SHEET
NONMAJOR SPECIAL REVENUE FUNDS
December 31, 2017
- 109 -
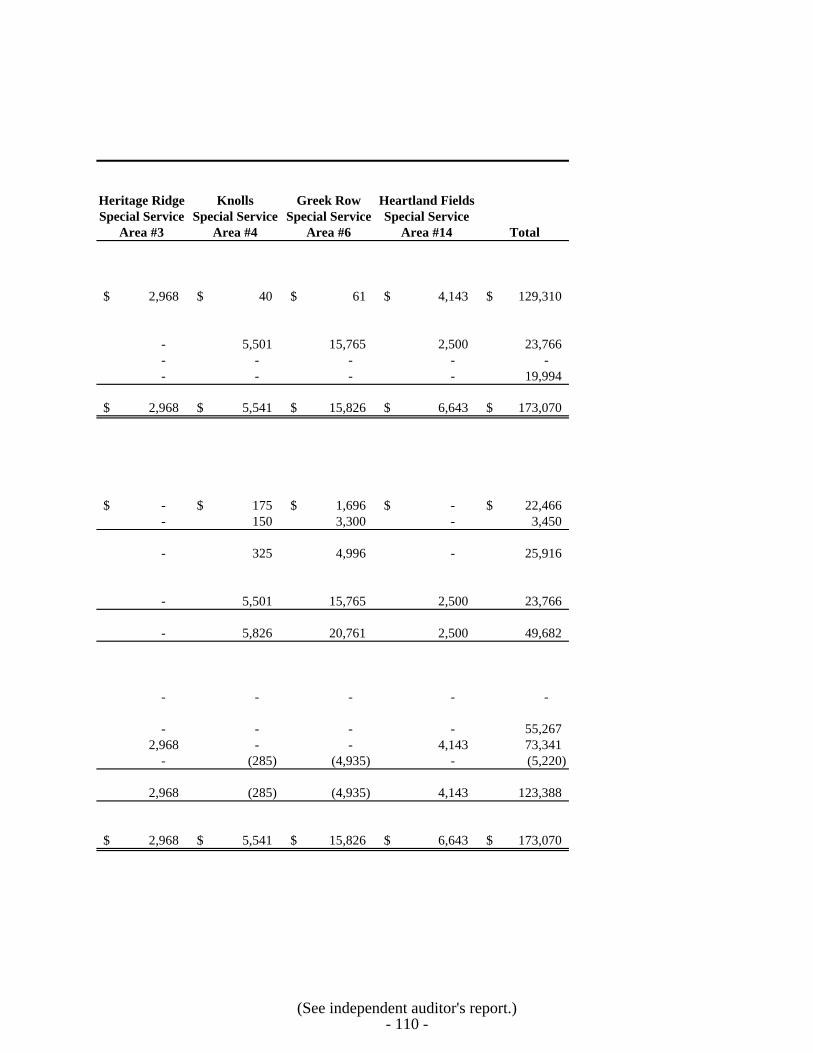
Heritage Ridge Knolls Greek Row Heartland Fields
Special Service Special Service Special Service Special Service
Area #3 Area #4 Area #6 Area #14 Total
2,968$ 40$ 61$ 4,143$ 129,310$
- 5,501 15,765 2,500 23,766
- - - - -
- - - - 19,994
2,968$ 5,541$ 15,826$ 6,643$ 173,070$
-$ 175$ 1,696$ -$ 22,466$
- 150 3,300 - 3,450
- 325 4,996 - 25,916
- 5,501 15,765 2,500 23,766
- 5,826 20,761 2,500 49,682
- - - - -
- - - - 55,267
2,968 - - 4,143 73,341
- (285) (4,935) - (5,220)
2,968 (285) (4,935) 4,143 123,388
2,968$ 5,541$ 15,826$ 6,643$ 173,070$
(See independent auditor's report.)- 110 -
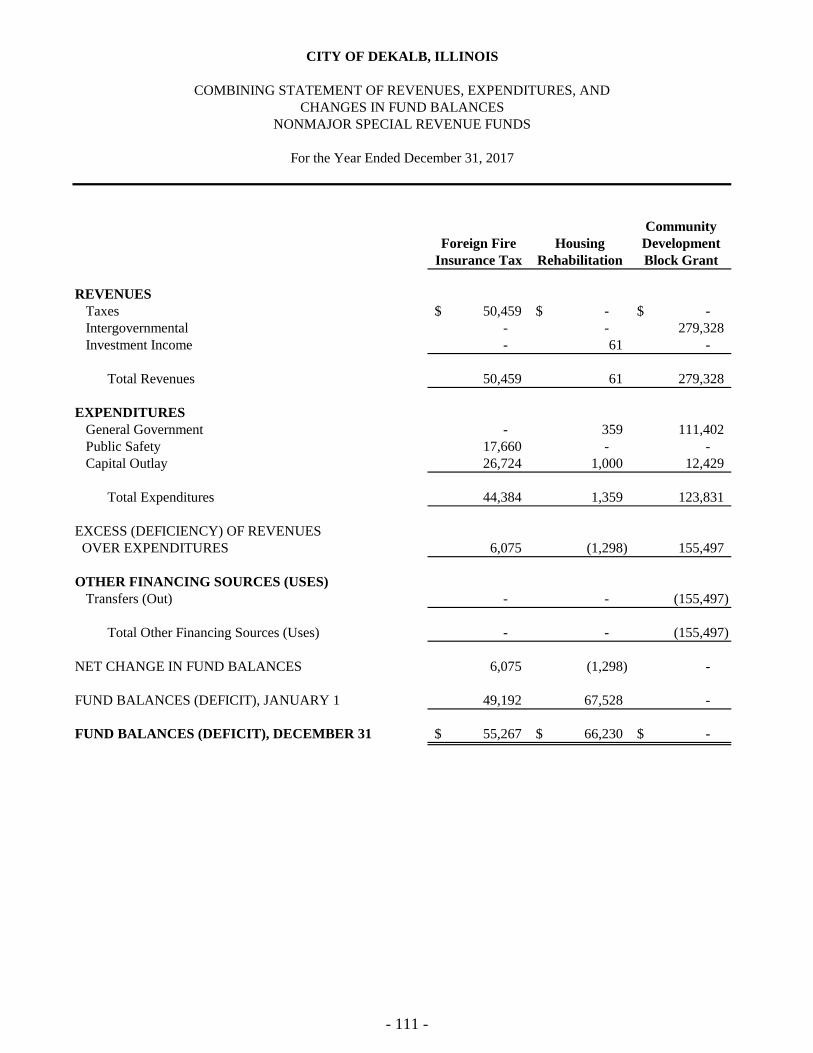
Community
Foreign Fire Housing Development
Insurance Tax Rehabilitation Block Grant
REVENUES
Taxes 50,459$ -$ -$
Intergovernmental - - 279,328
Investment Income - 61 -
Total Revenues 50,459 61 279,328
EXPENDITURES
General Government - 359 111,402
Public Safety 17,660 - -
Capital Outlay 26,724 1,000 12,429
Total Expenditures 44,384 1,359 123,831
EXCESS (DEFICIENCY) OF REVENUES
OVER EXPENDITURES 6,075 (1,298) 155,497
OTHER FINANCING SOURCES (USES)
Transfers (Out) - - (155,497)
Total Other Financing Sources (Uses) - - (155,497)
NET CHANGE IN FUND BALANCES 6,075 (1,298) -
FUND BALANCES (DEFICIT), JANUARY 1 49,192 67,528 -
FUND BALANCES (DEFICIT), DECEMBER 31 55,267$ 66,230$ -$
CITY OF DEKALB, ILLINOIS
COMBINING STATEMENT OF REVENUES, EXPENDITURES, AND
CHANGES IN FUND BALANCES
NONMAJOR SPECIAL REVENUE FUNDS
For the Year Ended December 31, 2017
- 111 -
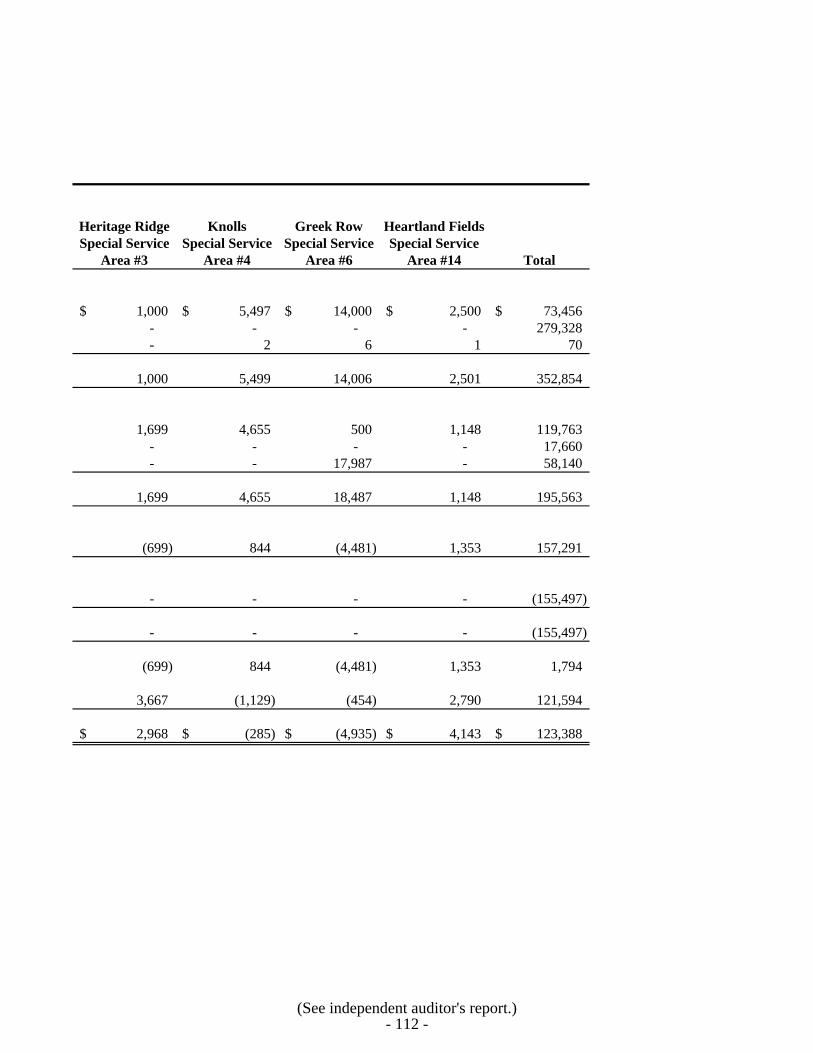
Heritage Ridge Knolls Greek Row Heartland Fields
Special Service Special Service Special Service Special Service
Area #3 Area #4 Area #6 Area #14 Total
1,000$ 5,497$ 14,000$ 2,500$ 73,456$
- - - - 279,328
- 2 6 1 70
1,000 5,499 14,006 2,501 352,854
1,699 4,655 500 1,148 119,763
- - - - 17,660
- - 17,987 - 58,140
1,699 4,655 18,487 1,148 195,563
(699) 844 (4,481) 1,353 157,291
- - - - (155,497)
- - - - (155,497)
(699) 844 (4,481) 1,353 1,794
3,667 (1,129) (454) 2,790 121,594
2,968$ (285)$ (4,935)$ 4,143$ 123,388$
(See independent auditor's report.)- 112 -
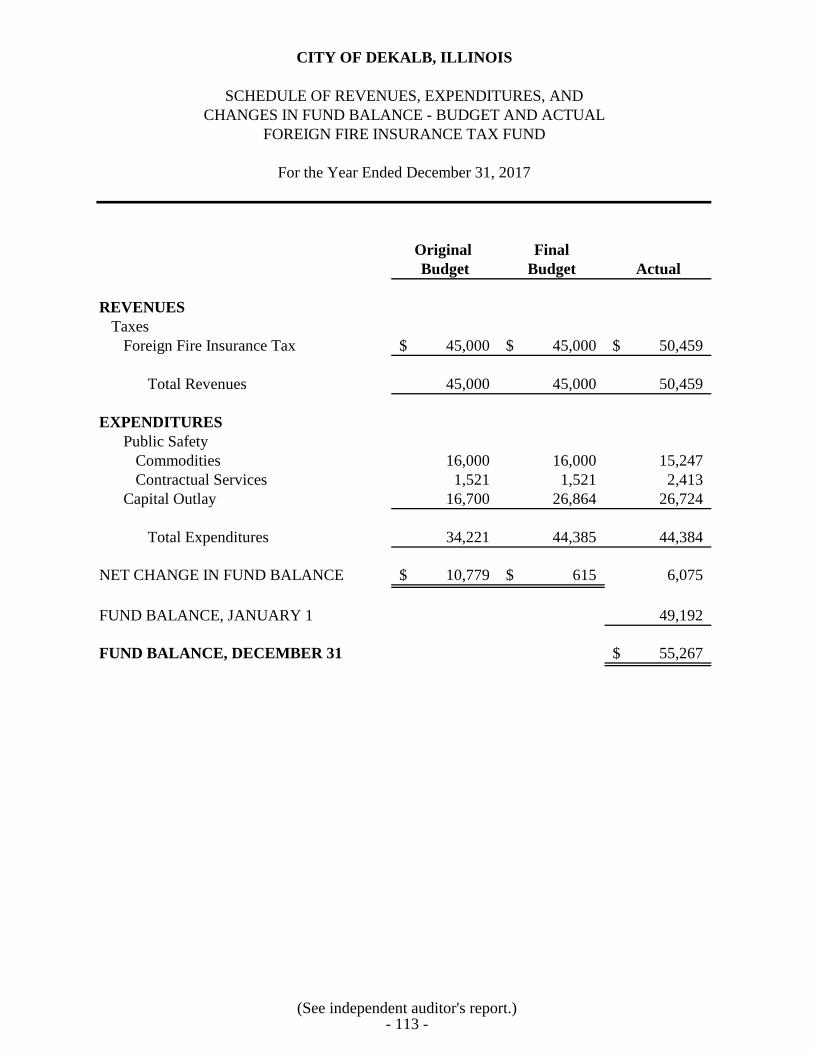
CITY OF DEKALB, ILLINOIS
SCHEDULE OF REVENUES, EXPENDITURES, AND
CHANGES IN FUND BALANCE - BUDGET AND ACTUAL
FOREIGN FIRE INSURANCE TAX FUND
For the Year Ended December 31, 2017
Original Final
Budget Budget Actual
REVENUES
Taxes
Foreign Fire Insurance Tax 45,000$ 45,000$ 50,459$
Total Revenues 45,000 45,000 50,459
EXPENDITURES
Public Safety
Commodities 16,000 16,000 15,247
Contractual Services 1,521 1,521 2,413
Capital Outlay 16,700 26,864 26,724
Total Expenditures 34,221 44,385 44,384
NET CHANGE IN FUND BALANCE 10,779$ 615$ 6,075
FUND BALANCE, JANUARY 1 49,192
FUND BALANCE, DECEMBER 31 55,267$
(See independent auditor's report.)- 113 -
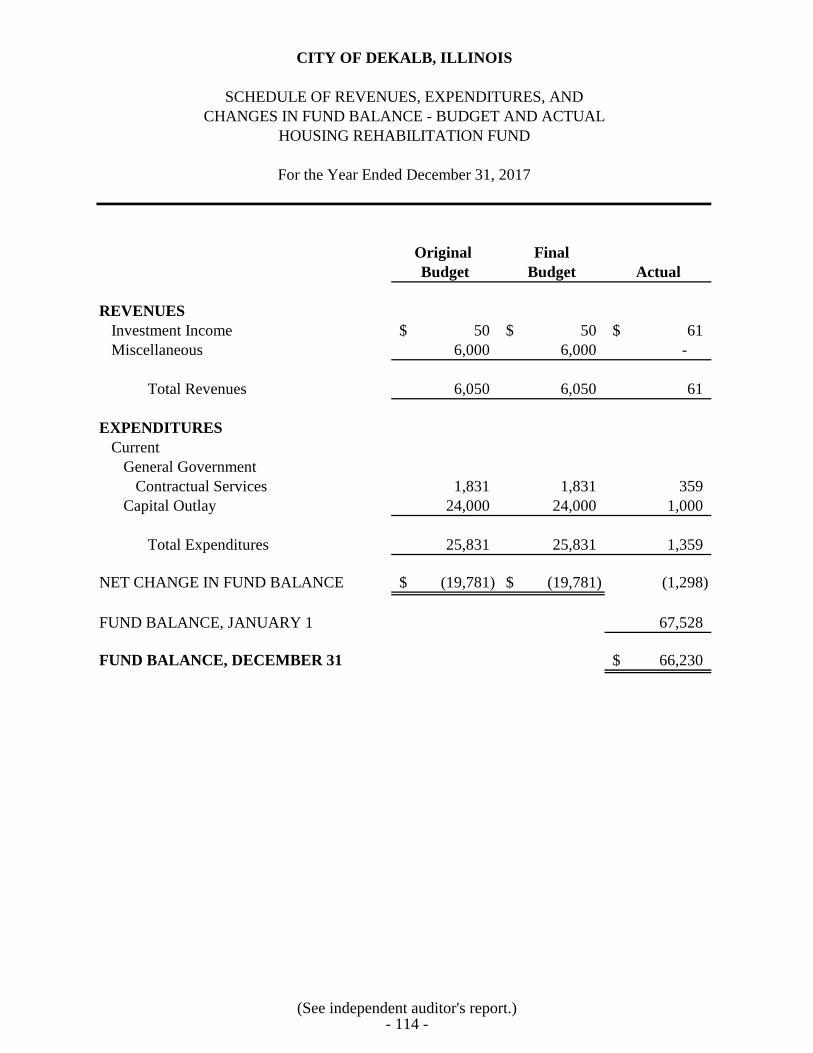
CITY OF DEKALB, ILLINOIS
SCHEDULE OF REVENUES, EXPENDITURES, AND
CHANGES IN FUND BALANCE - BUDGET AND ACTUAL
HOUSING REHABILITATION FUND
For the Year Ended December 31, 2017
Original Final
Budget Budget Actual
REVENUES
Investment Income 50$ 50$ 61$
Miscellaneous 6,000 6,000 -
Total Revenues 6,050 6,050 61
EXPENDITURES
Current
General Government
Contractual Services 1,831 1,831 359
Capital Outlay 24,000 24,000 1,000
Total Expenditures 25,831 25,831 1,359
NET CHANGE IN FUND BALANCE (19,781)$ (19,781)$ (1,298)
FUND BALANCE, JANUARY 1 67,528
FUND BALANCE, DECEMBER 31 66,230$
(See independent auditor's report.)- 114 -
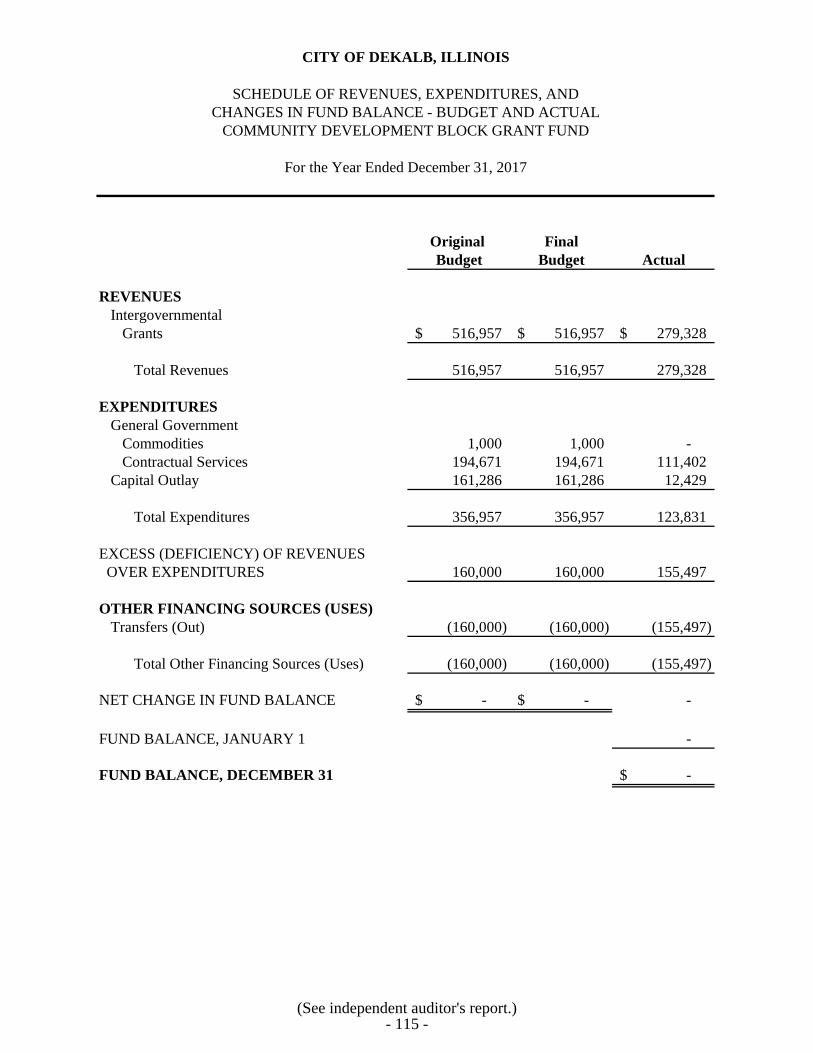
CITY OF DEKALB, ILLINOIS
SCHEDULE OF REVENUES, EXPENDITURES, AND
CHANGES IN FUND BALANCE - BUDGET AND ACTUAL
COMMUNITY DEVELOPMENT BLOCK GRANT FUND
For the Year Ended December 31, 2017
Original Final
Budget Budget Actual
REVENUES
Intergovernmental
Grants 516,957$ 516,957$ 279,328$
Total Revenues 516,957 516,957 279,328
EXPENDITURES
General Government
Commodities 1,000 1,000 -
Contractual Services 194,671 194,671 111,402
Capital Outlay 161,286 161,286 12,429
Total Expenditures 356,957 356,957 123,831
EXCESS (DEFICIENCY) OF REVENUES
OVER EXPENDITURES 160,000 160,000 155,497
OTHER FINANCING SOURCES (USES)
Transfers (Out) (160,000) (160,000) (155,497)
Total Other Financing Sources (Uses) (160,000) (160,000) (155,497)
NET CHANGE IN FUND BALANCE -$ -$ -
FUND BALANCE, JANUARY 1 -
FUND BALANCE, DECEMBER 31 -$
(See independent auditor's report.)- 115 -
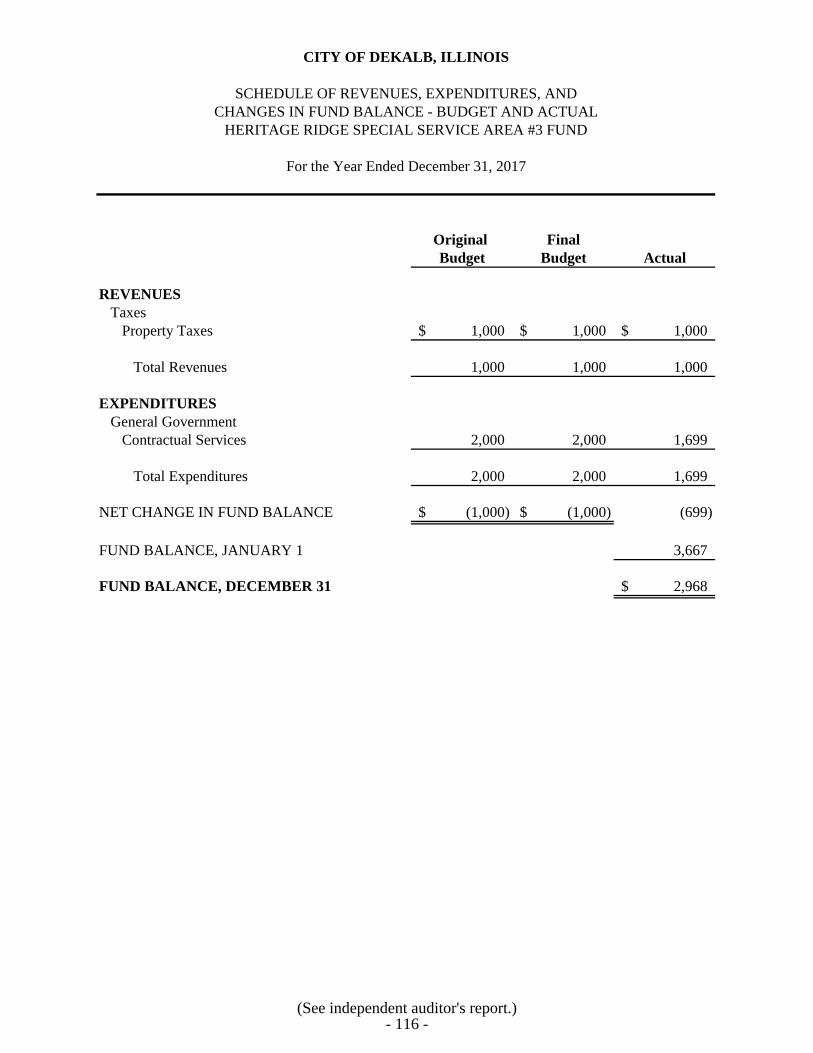
CITY OF DEKALB, ILLINOIS
SCHEDULE OF REVENUES, EXPENDITURES, AND
CHANGES IN FUND BALANCE - BUDGET AND ACTUAL
HERITAGE RIDGE SPECIAL SERVICE AREA #3 FUND
For the Year Ended December 31, 2017
Original Final
Budget Budget Actual
REVENUES
Taxes
Property Taxes 1,000$ 1,000$ 1,000$
Total Revenues 1,000 1,000 1,000
EXPENDITURES
General Government
Contractual Services 2,000 2,000 1,699
Total Expenditures 2,000 2,000 1,699
NET CHANGE IN FUND BALANCE (1,000)$ (1,000)$ (699)
FUND BALANCE, JANUARY 1 3,667
FUND BALANCE, DECEMBER 31 2,968$
(See independent auditor's report.)- 116 -
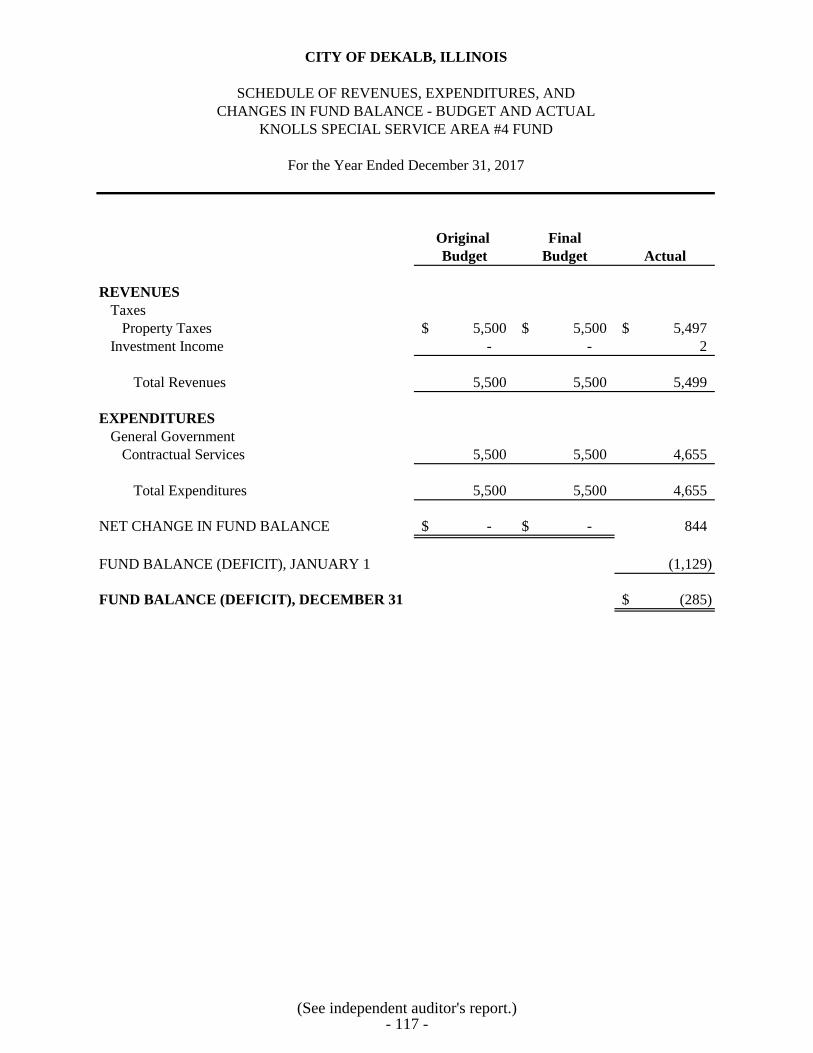
CITY OF DEKALB, ILLINOIS
SCHEDULE OF REVENUES, EXPENDITURES, AND
CHANGES IN FUND BALANCE - BUDGET AND ACTUAL
KNOLLS SPECIAL SERVICE AREA #4 FUND
For the Year Ended December 31, 2017
Original Final
Budget Budget Actual
REVENUES
Taxes
Property Taxes 5,500$ 5,500$ 5,497$
Investment Income - - 2
Total Revenues 5,500 5,500 5,499
EXPENDITURES
General Government
Contractual Services 5,500 5,500 4,655
Total Expenditures 5,500 5,500 4,655
NET CHANGE IN FUND BALANCE -$ -$ 844
FUND BALANCE (DEFICIT), JANUARY 1 (1,129)
FUND BALANCE (DEFICIT), DECEMBER 31 (285)$
(See independent auditor's report.)- 117 -
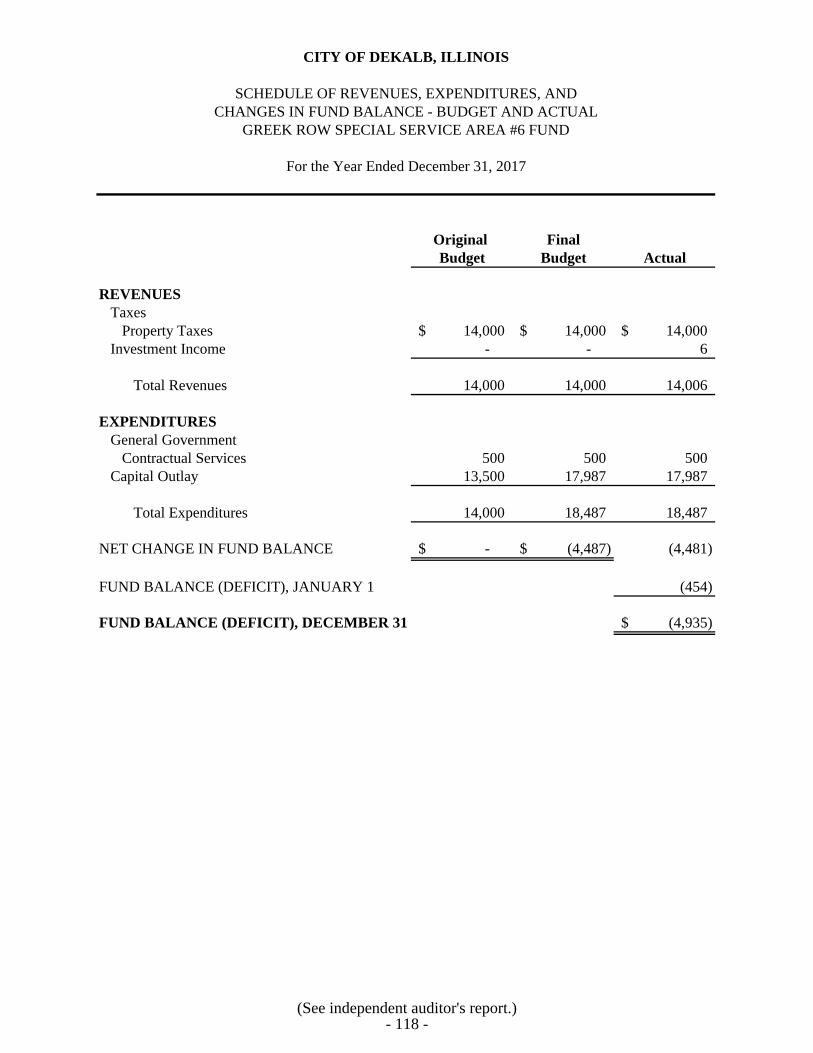
CITY OF DEKALB, ILLINOIS
SCHEDULE OF REVENUES, EXPENDITURES, AND
CHANGES IN FUND BALANCE - BUDGET AND ACTUAL
GREEK ROW SPECIAL SERVICE AREA #6 FUND
For the Year Ended December 31, 2017
Original Final
Budget Budget Actual
REVENUES
Taxes
Property Taxes 14,000$ 14,000$ 14,000$
Investment Income - - 6
Total Revenues 14,000 14,000 14,006
EXPENDITURES
General Government
Contractual Services 500 500 500
Capital Outlay 13,500 17,987 17,987
Total Expenditures 14,000 18,487 18,487
NET CHANGE IN FUND BALANCE -$ (4,487)$ (4,481)
FUND BALANCE (DEFICIT), JANUARY 1 (454)
FUND BALANCE (DEFICIT), DECEMBER 31 (4,935)$
(See independent auditor's report.)- 118 -
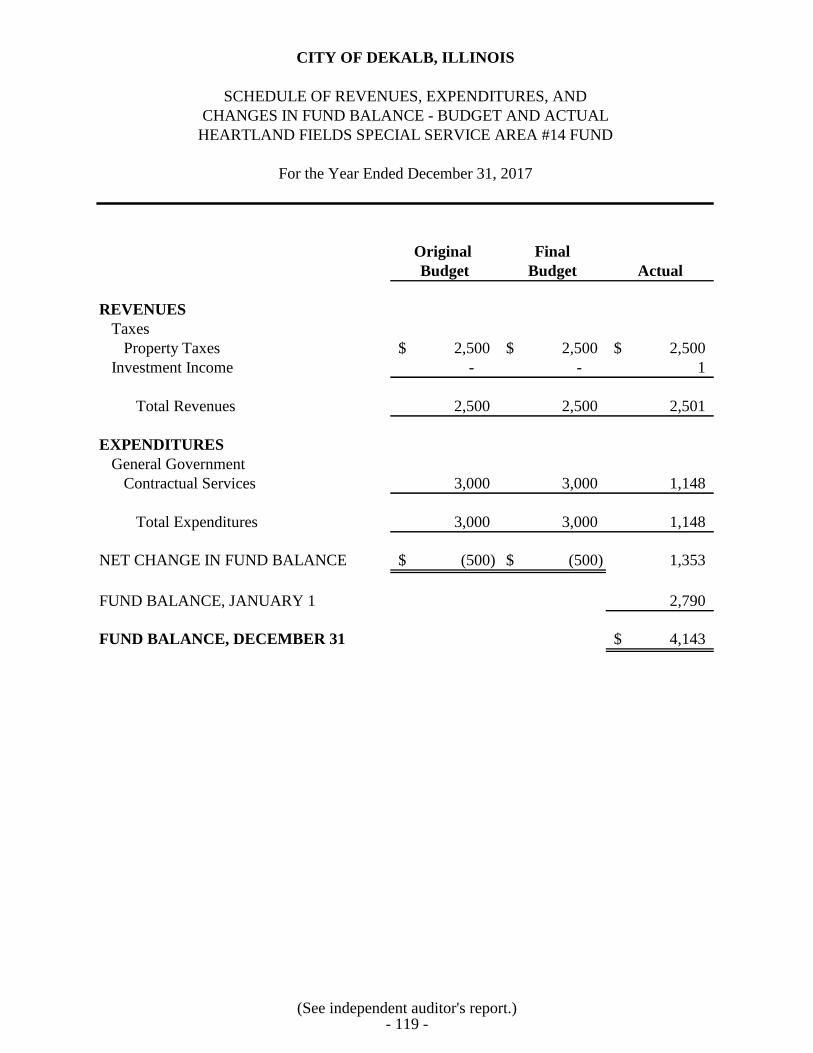
CITY OF DEKALB, ILLINOIS
SCHEDULE OF REVENUES, EXPENDITURES, AND
CHANGES IN FUND BALANCE - BUDGET AND ACTUAL
HEARTLAND FIELDS SPECIAL SERVICE AREA #14 FUND
For the Year Ended December 31, 2017
Original Final
Budget Budget Actual
REVENUES
Taxes
Property Taxes 2,500$ 2,500$ 2,500$
Investment Income - - 1
Total Revenues 2,500 2,500 2,501
EXPENDITURES
General Government
Contractual Services 3,000 3,000 1,148
Total Expenditures 3,000 3,000 1,148
NET CHANGE IN FUND BALANCE (500)$ (500)$ 1,353
FUND BALANCE, JANUARY 1 2,790
FUND BALANCE, DECEMBER 31 4,143$
(See independent auditor's report.)- 119 -
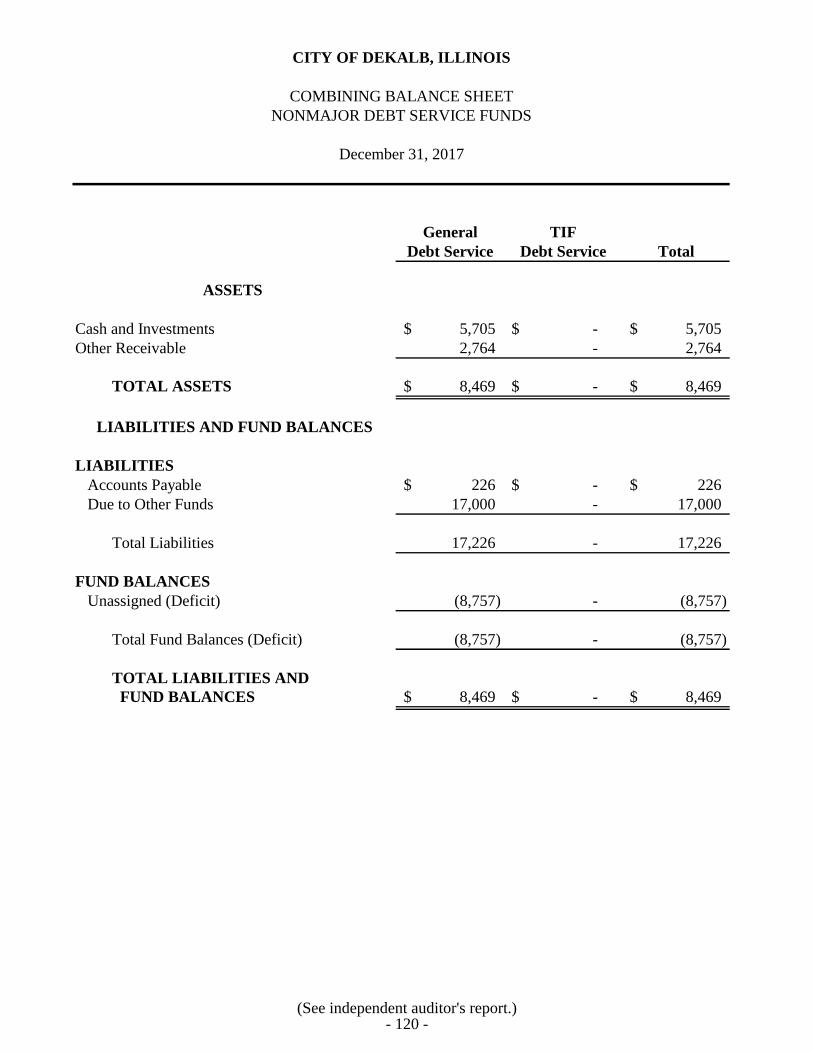
CITY OF DEKALB, ILLINOIS
COMBINING BALANCE SHEET
NONMAJOR DEBT SERVICE FUNDS
December 31, 2017
General TIF
Debt Service Debt Service Total
ASSETS
Cash and Investments 5,705$ -$ 5,705$
Other Receivable 2,764 - 2,764
TOTAL ASSETS 8,469$ -$ 8,469$
LIABILITIES AND FUND BALANCES
LIABILITIES
Accounts Payable 226$ -$ 226$
Due to Other Funds 17,000 - 17,000
Total Liabilities 17,226 - 17,226
FUND BALANCES
Unassigned (Deficit) (8,757) - (8,757)
Total Fund Balances (Deficit) (8,757) - (8,757)
TOTAL LIABILITIES AND
FUND BALANCES 8,469$ -$ 8,469$
(See independent auditor's report.)- 120 -
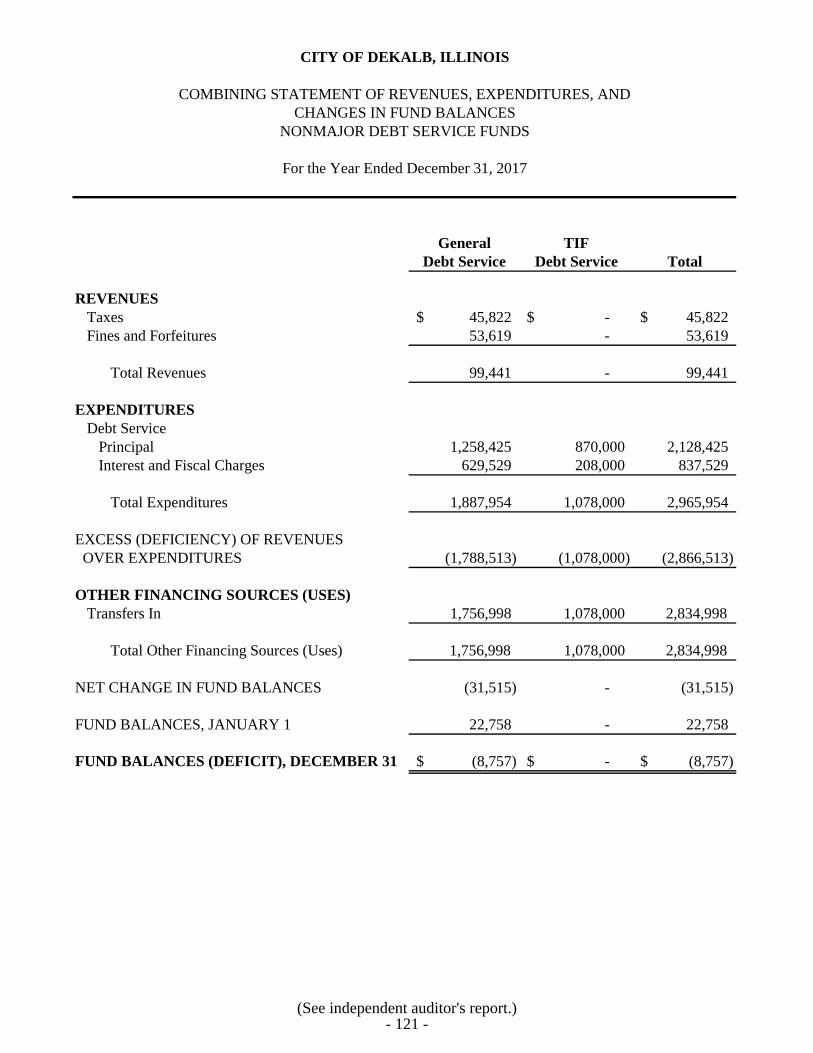
CITY OF DEKALB, ILLINOIS
COMBINING STATEMENT OF REVENUES, EXPENDITURES, AND
CHANGES IN FUND BALANCES
NONMAJOR DEBT SERVICE FUNDS
For the Year Ended December 31, 2017
General TIF
Debt Service Debt Service Total
REVENUES
Taxes 45,822$ -$ 45,822$
Fines and Forfeitures 53,619 - 53,619
Total Revenues 99,441 - 99,441
EXPENDITURES
Debt Service
Principal 1,258,425 870,000 2,128,425
Interest and Fiscal Charges 629,529 208,000 837,529
Total Expenditures 1,887,954 1,078,000 2,965,954
EXCESS (DEFICIENCY) OF REVENUES
OVER EXPENDITURES (1,788,513) (1,078,000) (2,866,513)
OTHER FINANCING SOURCES (USES)
Transfers In 1,756,998 1,078,000 2,834,998
Total Other Financing Sources (Uses) 1,756,998 1,078,000 2,834,998
NET CHANGE IN FUND BALANCES (31,515) - (31,515)
FUND BALANCES, JANUARY 1 22,758 - 22,758
FUND BALANCES (DEFICIT), DECEMBER 31 (8,757)$ -$ (8,757)$
(See independent auditor's report.)- 121 -
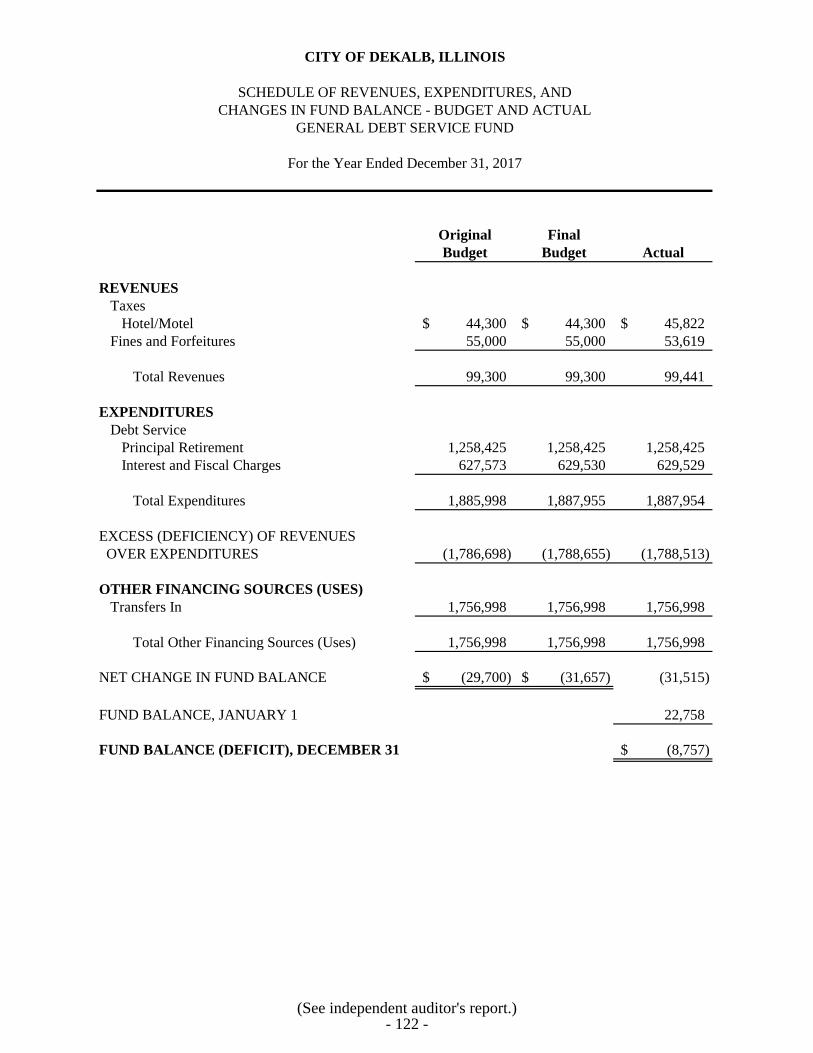
CITY OF DEKALB, ILLINOIS
SCHEDULE OF REVENUES, EXPENDITURES, AND
CHANGES IN FUND BALANCE - BUDGET AND ACTUAL
GENERAL DEBT SERVICE FUND
For the Year Ended December 31, 2017
Original Final
Budget Budget Actual
REVENUES
Taxes
Hotel/Motel 44,300$ 44,300$ 45,822$
Fines and Forfeitures 55,000 55,000 53,619
Total Revenues 99,300 99,300 99,441
EXPENDITURES
Debt Service
Principal Retirement 1,258,425 1,258,425 1,258,425
Interest and Fiscal Charges 627,573 629,530 629,529
Total Expenditures 1,885,998 1,887,955 1,887,954
EXCESS (DEFICIENCY) OF REVENUES
OVER EXPENDITURES (1,786,698) (1,788,655) (1,788,513)
OTHER FINANCING SOURCES (USES)
Transfers In 1,756,998 1,756,998 1,756,998
Total Other Financing Sources (Uses) 1,756,998 1,756,998 1,756,998
NET CHANGE IN FUND BALANCE (29,700)$ (31,657)$ (31,515)
FUND BALANCE, JANUARY 1 22,758
FUND BALANCE (DEFICIT), DECEMBER 31 (8,757)$
(See independent auditor's report.)- 122 -
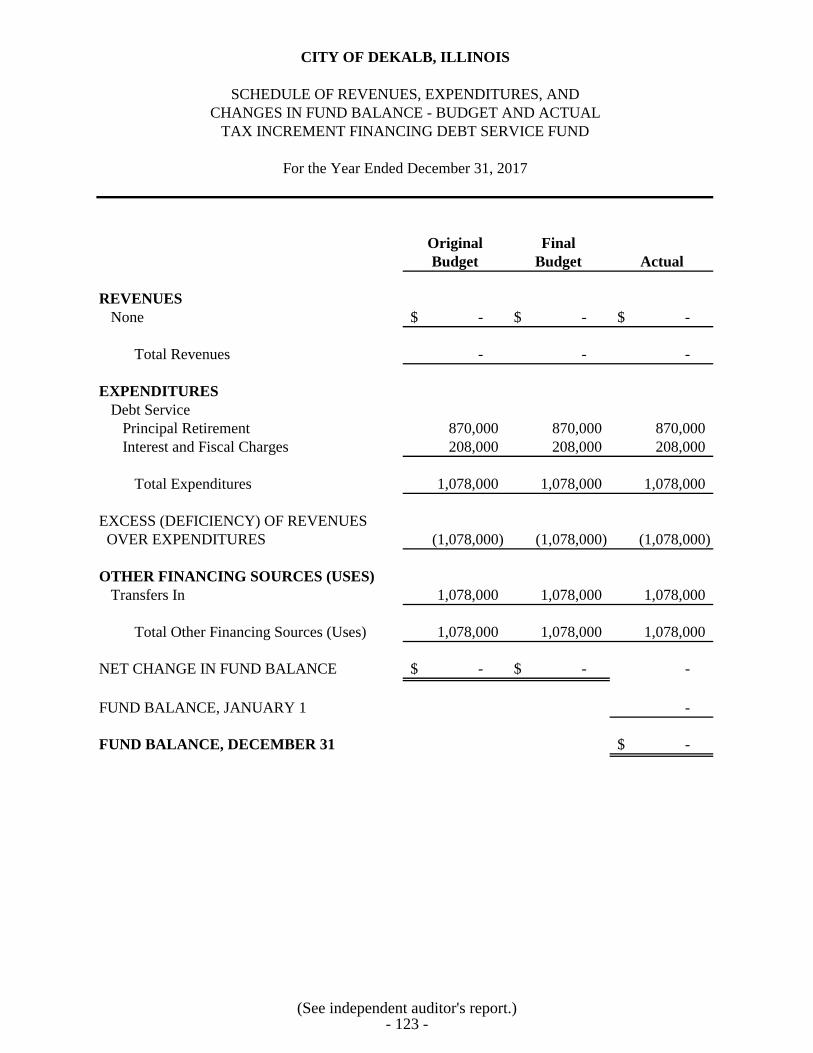
CITY OF DEKALB, ILLINOIS
SCHEDULE OF REVENUES, EXPENDITURES, AND
CHANGES IN FUND BALANCE - BUDGET AND ACTUAL
TAX INCREMENT FINANCING DEBT SERVICE FUND
For the Year Ended December 31, 2017
Original Final
Budget Budget Actual
REVENUES
None -$ -$ -$
Total Revenues - - -
EXPENDITURES
Debt Service
Principal Retirement 870,000 870,000 870,000
Interest and Fiscal Charges 208,000 208,000 208,000
Total Expenditures 1,078,000 1,078,000 1,078,000
EXCESS (DEFICIENCY) OF REVENUES
OVER EXPENDITURES (1,078,000) (1,078,000) (1,078,000)
OTHER FINANCING SOURCES (USES)
Transfers In 1,078,000 1,078,000 1,078,000
Total Other Financing Sources (Uses) 1,078,000 1,078,000 1,078,000
NET CHANGE IN FUND BALANCE -$ -$ -
FUND BALANCE, JANUARY 1 -
FUND BALANCE, DECEMBER 31 -$
(See independent auditor's report.)- 123 -
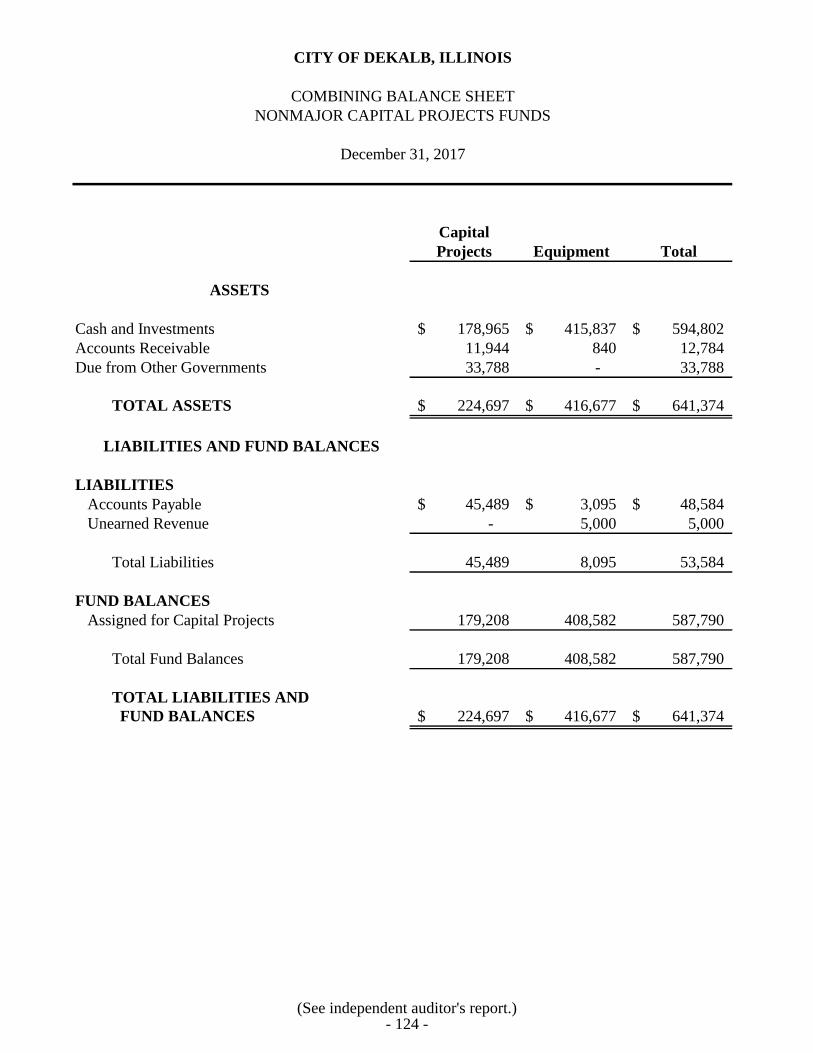
CITY OF DEKALB, ILLINOIS
COMBINING BALANCE SHEET
NONMAJOR CAPITAL PROJECTS FUNDS
December 31, 2017
Capital
Projects Equipment Total
ASSETS
Cash and Investments 178,965$ 415,837$ 594,802$
Accounts Receivable 11,944 840 12,784
Due from Other Governments 33,788 - 33,788
TOTAL ASSETS 224,697$ 416,677$ 641,374$
LIABILITIES AND FUND BALANCES
LIABILITIES
Accounts Payable 45,489$ 3,095$ 48,584$
Unearned Revenue - 5,000 5,000
Total Liabilities 45,489 8,095 53,584
FUND BALANCES
Assigned for Capital Projects 179,208 408,582 587,790
Total Fund Balances 179,208 408,582 587,790
TOTAL LIABILITIES AND
FUND BALANCES 224,697$ 416,677$ 641,374$
(See independent auditor's report.)- 124 -
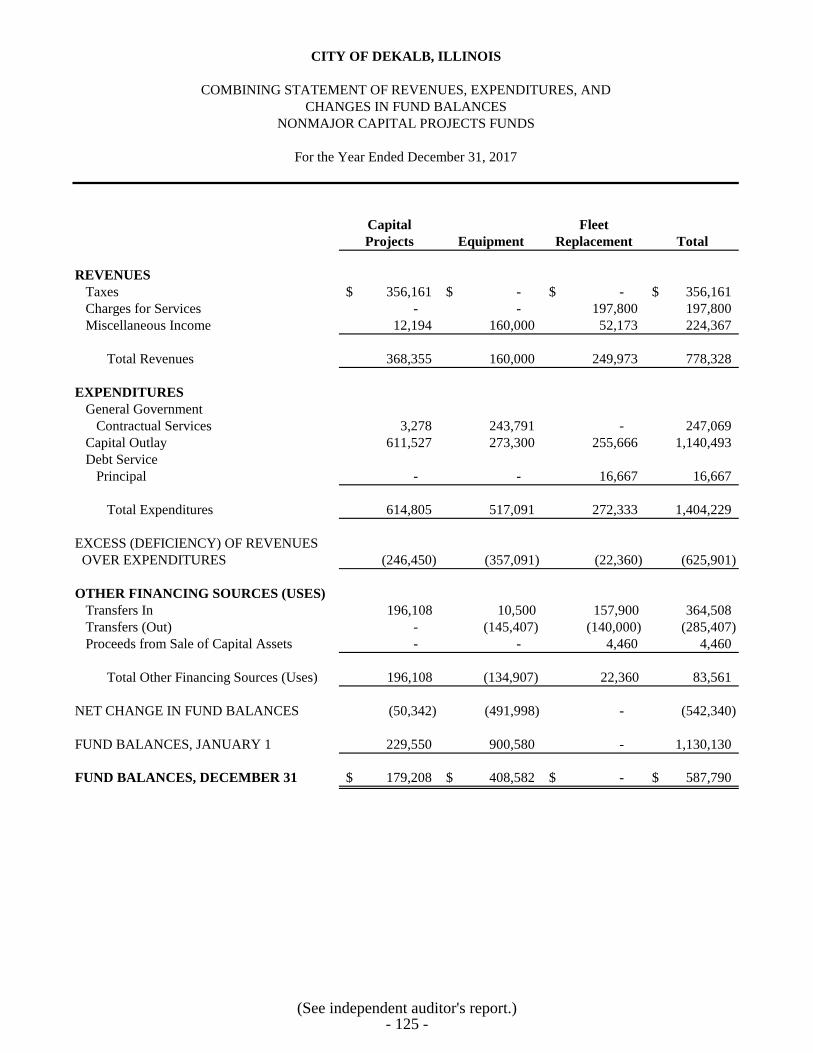
CITY OF DEKALB, ILLINOIS
COMBINING STATEMENT OF REVENUES, EXPENDITURES, AND
CHANGES IN FUND BALANCES
NONMAJOR CAPITAL PROJECTS FUNDS
For the Year Ended December 31, 2017
Capital Fleet
Projects Equipment Replacement Total
REVENUES
Taxes 356,161$ -$ -$ 356,161$
Charges for Services - - 197,800 197,800
Miscellaneous Income 12,194 160,000 52,173 224,367
Total Revenues 368,355 160,000 249,973 778,328
EXPENDITURES
General Government
Contractual Services 3,278 243,791 - 247,069
Capital Outlay 611,527 273,300 255,666 1,140,493
Debt Service
Principal - - 16,667 16,667
Total Expenditures 614,805 517,091 272,333 1,404,229
EXCESS (DEFICIENCY) OF REVENUES
OVER EXPENDITURES (246,450) (357,091) (22,360) (625,901)
OTHER FINANCING SOURCES (USES)
Transfers In 196,108 10,500 157,900 364,508
Transfers (Out) - (145,407) (140,000) (285,407)
Proceeds from Sale of Capital Assets - - 4,460 4,460
Total Other Financing Sources (Uses) 196,108 (134,907) 22,360 83,561
NET CHANGE IN FUND BALANCES (50,342) (491,998) - (542,340)
FUND BALANCES, JANUARY 1 229,550 900,580 - 1,130,130
FUND BALANCES, DECEMBER 31 179,208$ 408,582$ -$ 587,790$
(See independent auditor's report.)- 125 -
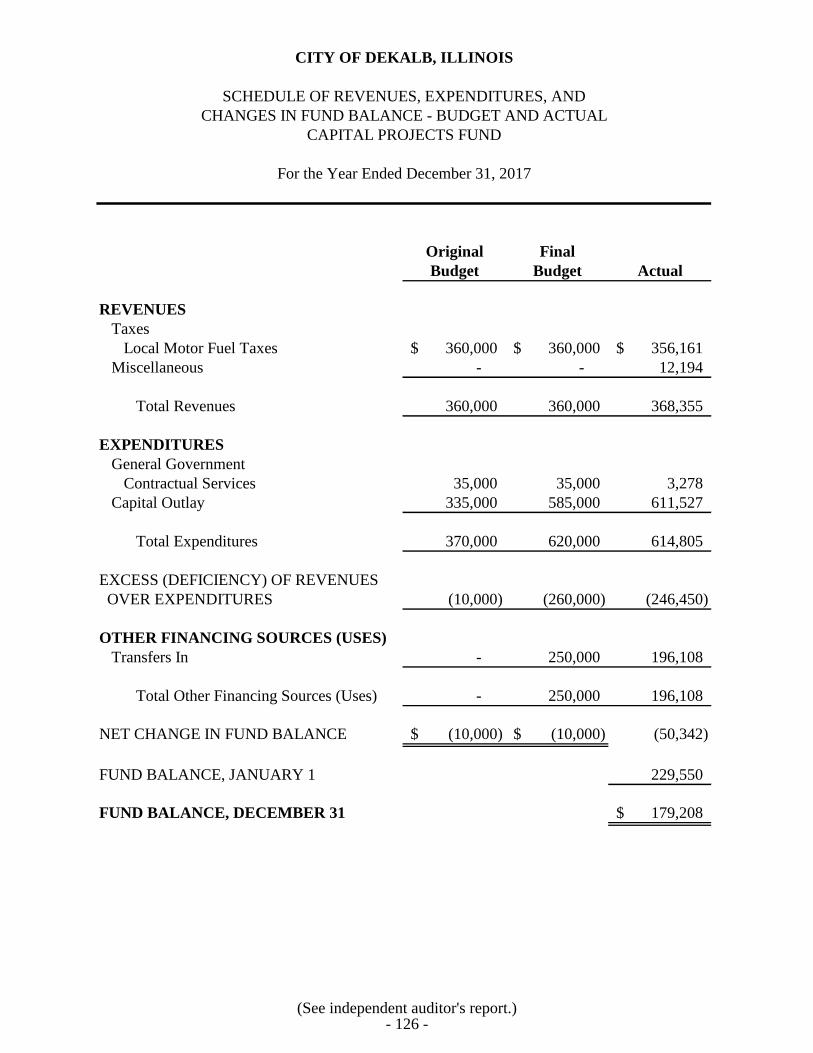
CITY OF DEKALB, ILLINOIS
SCHEDULE OF REVENUES, EXPENDITURES, AND
CHANGES IN FUND BALANCE - BUDGET AND ACTUAL
CAPITAL PROJECTS FUND
For the Year Ended December 31, 2017
Original Final
Budget Budget Actual
REVENUES
Taxes
Local Motor Fuel Taxes 360,000$ 360,000$ 356,161$
Miscellaneous - - 12,194
Total Revenues 360,000 360,000 368,355
EXPENDITURES
General Government
Contractual Services 35,000 35,000 3,278
Capital Outlay 335,000 585,000 611,527
Total Expenditures 370,000 620,000 614,805
EXCESS (DEFICIENCY) OF REVENUES
OVER EXPENDITURES (10,000) (260,000) (246,450)
OTHER FINANCING SOURCES (USES)
Transfers In - 250,000 196,108
Total Other Financing Sources (Uses) - 250,000 196,108
NET CHANGE IN FUND BALANCE (10,000)$ (10,000)$ (50,342)
FUND BALANCE, JANUARY 1 229,550
FUND BALANCE, DECEMBER 31 179,208$
(See independent auditor's report.)- 126 -
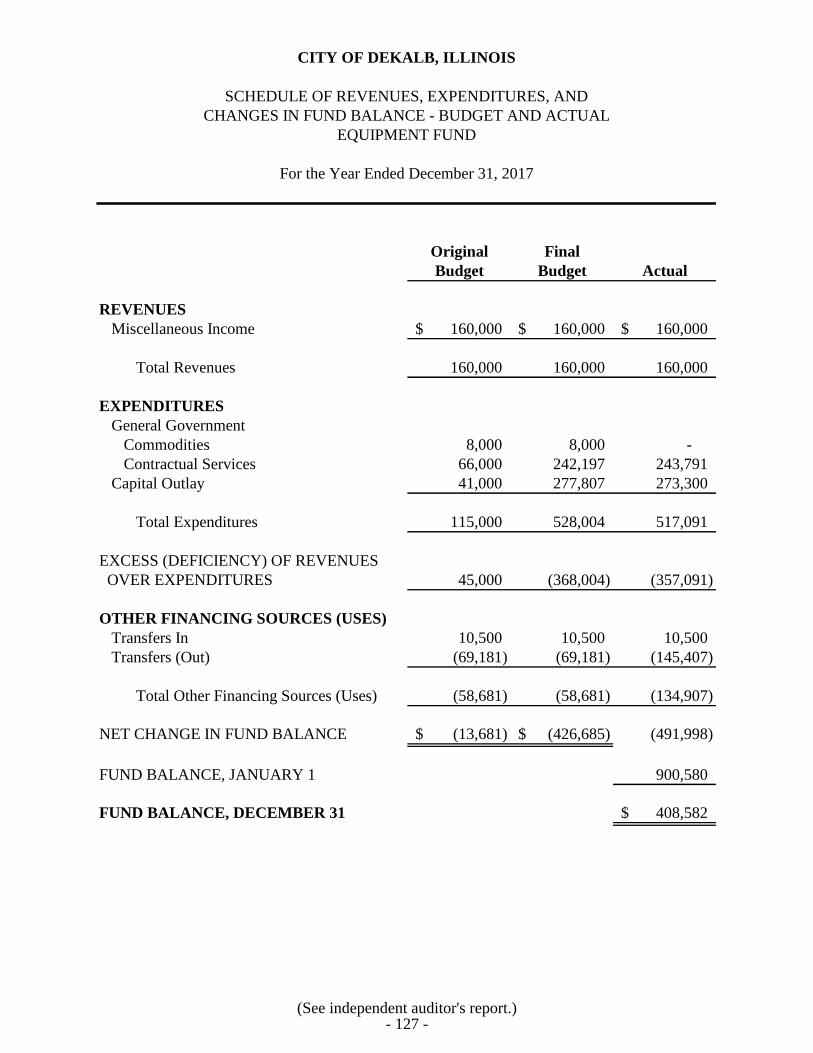
CITY OF DEKALB, ILLINOIS
SCHEDULE OF REVENUES, EXPENDITURES, AND
CHANGES IN FUND BALANCE - BUDGET AND ACTUAL
EQUIPMENT FUND
For the Year Ended December 31, 2017
Original Final
Budget Budget Actual
REVENUES
Miscellaneous Income 160,000$ 160,000$ 160,000$
Total Revenues 160,000 160,000 160,000
EXPENDITURES
General Government
Commodities 8,000 8,000 -
Contractual Services 66,000 242,197 243,791
Capital Outlay 41,000 277,807 273,300
Total Expenditures 115,000 528,004 517,091
EXCESS (DEFICIENCY) OF REVENUES
OVER EXPENDITURES 45,000 (368,004) (357,091)
OTHER FINANCING SOURCES (USES)
Transfers In 10,500 10,500 10,500
Transfers (Out) (69,181) (69,181) (145,407)
Total Other Financing Sources (Uses) (58,681) (58,681) (134,907)
NET CHANGE IN FUND BALANCE (13,681)$ (426,685)$ (491,998)
FUND BALANCE, JANUARY 1 900,580
FUND BALANCE, DECEMBER 31 408,582$
(See independent auditor's report.)- 127 -
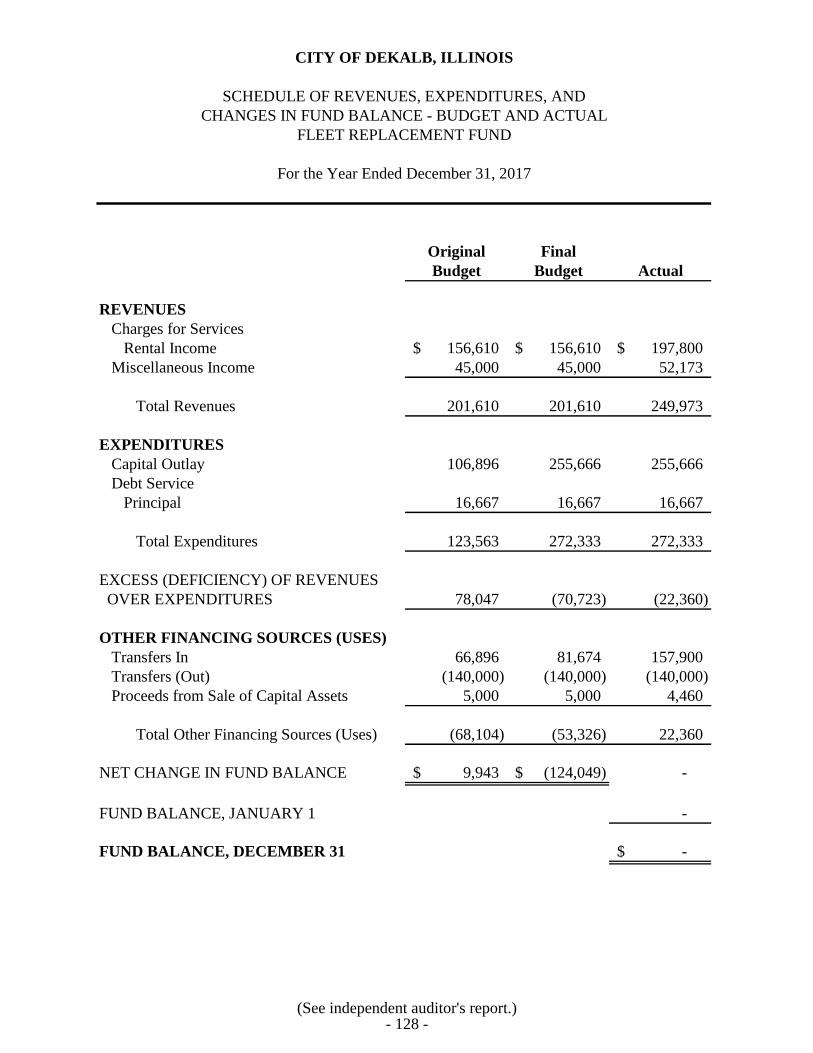
CITY OF DEKALB, ILLINOIS
SCHEDULE OF REVENUES, EXPENDITURES, AND
CHANGES IN FUND BALANCE - BUDGET AND ACTUAL
FLEET REPLACEMENT FUND
For the Year Ended December 31, 2017
Original Final
Budget Budget Actual
REVENUES
Charges for Services
Rental Income 156,610$ 156,610$ 197,800$
Miscellaneous Income 45,000 45,000 52,173
Total Revenues 201,610 201,610 249,973
EXPENDITURES
Capital Outlay 106,896 255,666 255,666
Debt Service
Principal 16,667 16,667 16,667
Total Expenditures 123,563 272,333 272,333
EXCESS (DEFICIENCY) OF REVENUES
OVER EXPENDITURES 78,047 (70,723) (22,360)
OTHER FINANCING SOURCES (USES)
Transfers In 66,896 81,674 157,900
Transfers (Out) (140,000) (140,000) (140,000)
Proceeds from Sale of Capital Assets 5,000 5,000 4,460
Total Other Financing Sources (Uses) (68,104) (53,326) 22,360
NET CHANGE IN FUND BALANCE 9,943$ (124,049)$ -
FUND BALANCE, JANUARY 1 -
FUND BALANCE, DECEMBER 31 -$
(See independent auditor's report.)- 128 -
MAJOR ENTERPRISE FUNDS
The Water Fund is used to account for the provision of water service to the residents of the City.
All activity necessary to provide such services is accounted for in this fund including, but not
limited to, administration, operation, maintenance, financing and related debt service, and billing
and collection.
The Airport Fund is used to account for the operations of the Taylor Municipal Airport. Financing
may be provided from a number of sources including user fees as well as property taxes.
NONMAJOR ENTERPRISE FUNDS
The Refuse Fund is used to account for the billing, collection, and payment of refuse collection.
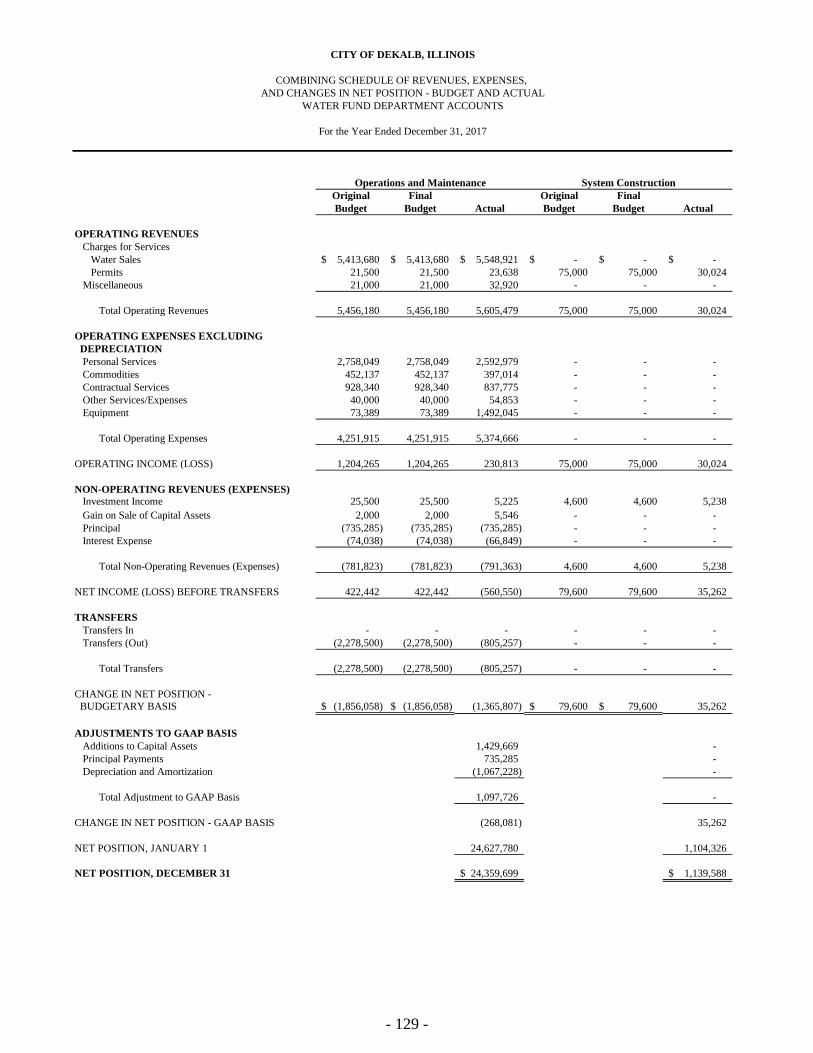
Original Final Original Final
Budget Budget Actual Budget Budget Actual
OPERATING REVENUES
Charges for Services
Water Sales 5,413,680$ 5,413,680$ 5,548,921$ -$ -$ -$
Permits 21,500 21,500 23,638 75,000 75,000 30,024
Miscellaneous 21,000 21,000 32,920 - - -
Total Operating Revenues 5,456,180 5,456,180 5,605,479 75,000 75,000 30,024
OPERATING EXPENSES EXCLUDING
DEPRECIATION
Personal Services 2,758,049 2,758,049 2,592,979 - - -
Commodities 452,137 452,137 397,014 - - -
Contractual Services 928,340 928,340 837,775 - - -
Other Services/Expenses 40,000 40,000 54,853 - - -
Equipment 73,389 73,389 1,492,045 - - -
Total Operating Expenses 4,251,915 4,251,915 5,374,666 - - -
OPERATING INCOME (LOSS) 1,204,265 1,204,265 230,813 75,000 75,000 30,024
NON-OPERATING REVENUES (EXPENSES)
Investment Income 25,500 25,500 5,225 4,600 4,600 5,238
Gain on Sale of Capital Assets 2,000 2,000 5,546 - - -
Principal (735,285) (735,285) (735,285) - - -
Interest Expense (74,038) (74,038) (66,849) - - -
Total Non-Operating Revenues (Expenses) (781,823) (781,823) (791,363) 4,600 4,600 5,238
NET INCOME (LOSS) BEFORE TRANSFERS 422,442 422,442 (560,550) 79,600 79,600 35,262
TRANSFERS
Transfers In - - - - - -
Transfers (Out) (2,278,500) (2,278,500) (805,257) - - -
Total Transfers (2,278,500) (2,278,500) (805,257) - - -
CHANGE IN NET POSITION -
BUDGETARY BASIS (1,856,058)$ (1,856,058)$ (1,365,807) 79,600$ 79,600$ 35,262
ADJUSTMENTS TO GAAP BASIS
Additions to Capital Assets 1,429,669 -
Principal Payments 735,285 -
Depreciation and Amortization (1,067,228) -
Total Adjustment to GAAP Basis 1,097,726 -
CHANGE IN NET POSITION - GAAP BASIS (268,081) 35,262
NET POSITION, JANUARY 1 24,627,780 1,104,326
NET POSITION, DECEMBER 31 24,359,699$ 1,139,588$
Operations and Maintenance System Construction
CITY OF DEKALB, ILLINOIS
COMBINING SCHEDULE OF REVENUES, EXPENSES,
AND CHANGES IN NET POSITION - BUDGET AND ACTUAL
WATER FUND DEPARTMENT ACCOUNTS
For the Year Ended December 31, 2017
- 129 -
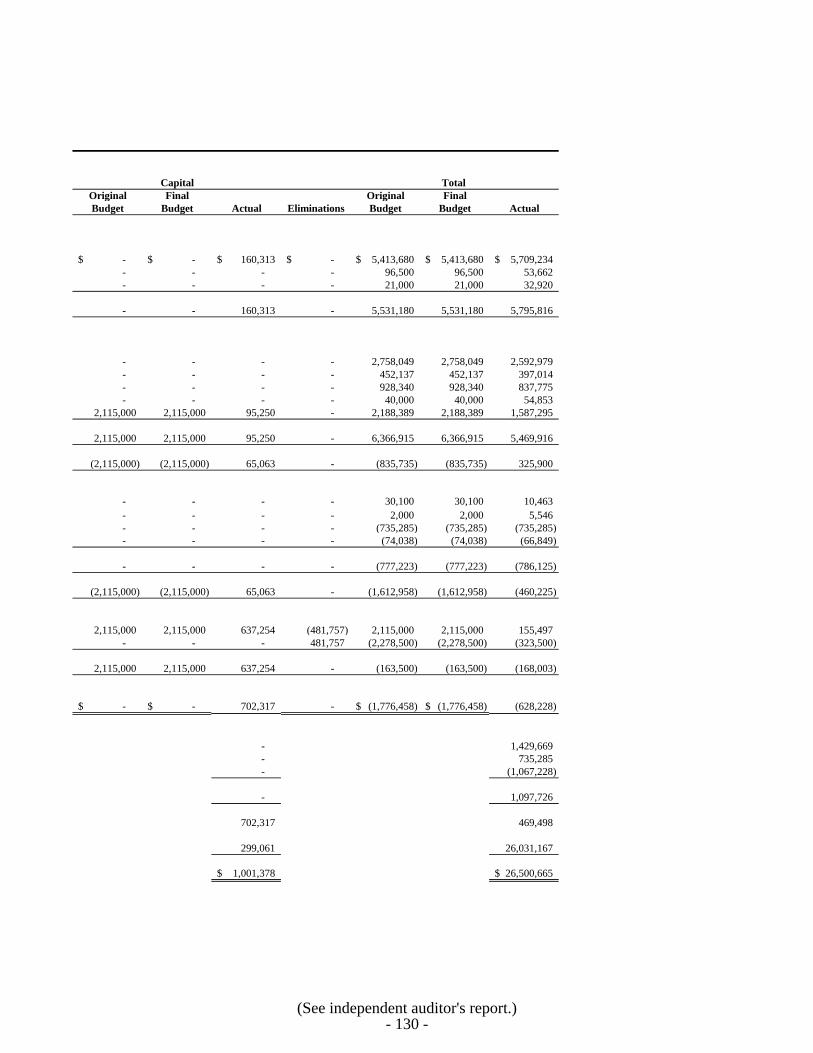
Original Final Original Final
Budget Budget Actual Eliminations Budget Budget Actual
-$ -$ 160,313$ -$ 5,413,680$ 5,413,680$ 5,709,234$
- - - - 96,500 96,500 53,662
- - - - 21,000 21,000 32,920
- - 160,313 - 5,531,180 5,531,180 5,795,816
- - - - 2,758,049 2,758,049 2,592,979
- - - - 452,137 452,137 397,014
- - - - 928,340 928,340 837,775
- - - - 40,000 40,000 54,853
2,115,000 2,115,000 95,250 - 2,188,389 2,188,389 1,587,295
2,115,000 2,115,000 95,250 - 6,366,915 6,366,915 5,469,916
(2,115,000) (2,115,000) 65,063 - (835,735) (835,735) 325,900
- - - - 30,100 30,100 10,463
- - - - 2,000 2,000 5,546
- - - - (735,285) (735,285) (735,285)
- - - - (74,038) (74,038) (66,849)
- - - - (777,223) (777,223) (786,125)
(2,115,000) (2,115,000) 65,063 - (1,612,958) (1,612,958) (460,225)
2,115,000 2,115,000 637,254 (481,757) 2,115,000 2,115,000 155,497
- - - 481,757 (2,278,500) (2,278,500) (323,500)
2,115,000 2,115,000 637,254 - (163,500) (163,500) (168,003)
-$ -$ 702,317 - (1,776,458)$ (1,776,458)$ (628,228)
- 1,429,669
- 735,285
- (1,067,228)
- 1,097,726
702,317 469,498
299,061 26,031,167
1,001,378$ 26,500,665$
Total Capital
(See independent auditor's report.)- 130 -
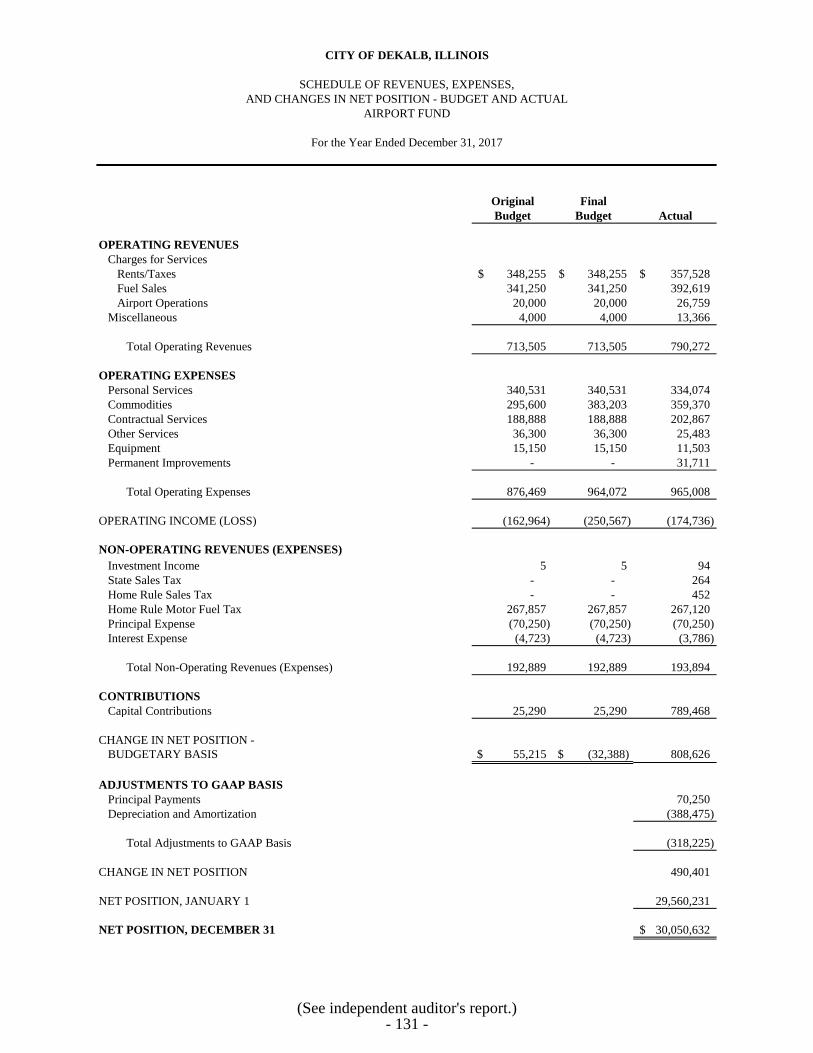
CITY OF DEKALB, ILLINOIS
SCHEDULE OF REVENUES, EXPENSES,
AND CHANGES IN NET POSITION - BUDGET AND ACTUAL
AIRPORT FUND
For the Year Ended December 31, 2017
Original Final
Budget Budget Actual
OPERATING REVENUES
Charges for Services
Rents/Taxes 348,255$ 348,255$ 357,528$
Fuel Sales 341,250 341,250 392,619
Airport Operations 20,000 20,000 26,759
Miscellaneous 4,000 4,000 13,366
Total Operating Revenues 713,505 713,505 790,272
OPERATING EXPENSES
Personal Services 340,531 340,531 334,074
Commodities 295,600 383,203 359,370
Contractual Services 188,888 188,888 202,867
Other Services 36,300 36,300 25,483
Equipment 15,150 15,150 11,503
Permanent Improvements - - 31,711
Total Operating Expenses 876,469 964,072 965,008
OPERATING INCOME (LOSS) (162,964) (250,567) (174,736)
NON-OPERATING REVENUES (EXPENSES)
Investment Income 5 5 94
State Sales Tax - - 264
Home Rule Sales Tax - - 452
Home Rule Motor Fuel Tax 267,857 267,857 267,120
Principal Expense (70,250) (70,250) (70,250)
Interest Expense (4,723) (4,723) (3,786)
Total Non-Operating Revenues (Expenses) 192,889 192,889 193,894
CONTRIBUTIONS
Capital Contributions 25,290 25,290 789,468
CHANGE IN NET POSITION -
BUDGETARY BASIS $ 55,215 $ (32,388) 808,626
ADJUSTMENTS TO GAAP BASIS
Principal Payments 70,250
Depreciation and Amortization (388,475)
Total Adjustments to GAAP Basis (318,225)
CHANGE IN NET POSITION 490,401
NET POSITION, JANUARY 1 29,560,231
NET POSITION, DECEMBER 31 30,050,632$
(See independent auditor's report.)- 131 -
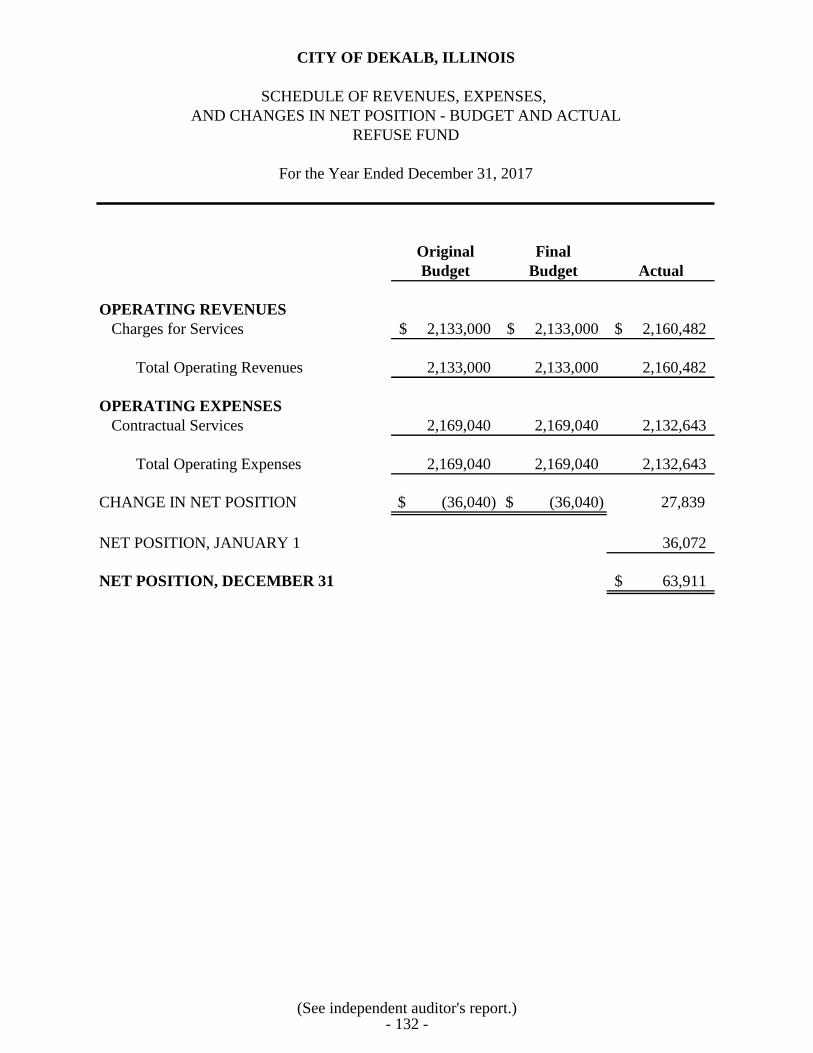
CITY OF DEKALB, ILLINOIS
SCHEDULE OF REVENUES, EXPENSES,
AND CHANGES IN NET POSITION - BUDGET AND ACTUAL
REFUSE FUND
For the Year Ended December 31, 2017
Original Final
Budget Budget Actual
OPERATING REVENUES
Charges for Services 2,133,000$ 2,133,000$ 2,160,482$
Total Operating Revenues 2,133,000 2,133,000 2,160,482
OPERATING EXPENSES
Contractual Services 2,169,040 2,169,040 2,132,643
Total Operating Expenses 2,169,040 2,169,040 2,132,643
CHANGE IN NET POSITION $ (36,040) $ (36,040) 27,839
NET POSITION, JANUARY 1 36,072
NET POSITION, DECEMBER 31 63,911$
(See independent auditor's report.)- 132 -
INTERNAL SERVICE FUNDS
Workers’ Compensation Fund - to account for payment of workers’ compensation insurance
premiums. Financing is provided by contributions from other funds.
Health Insurance Fund - to account for payment of health insurance premiums. Financing is
provided by contributions from employees, retirees, and other funds.
Liability/Property Insurance Fund - to account for payment of liability insurance premiums.
Financing is provided by contributions from other funds. This fund was closed as of
December 31, 2017.
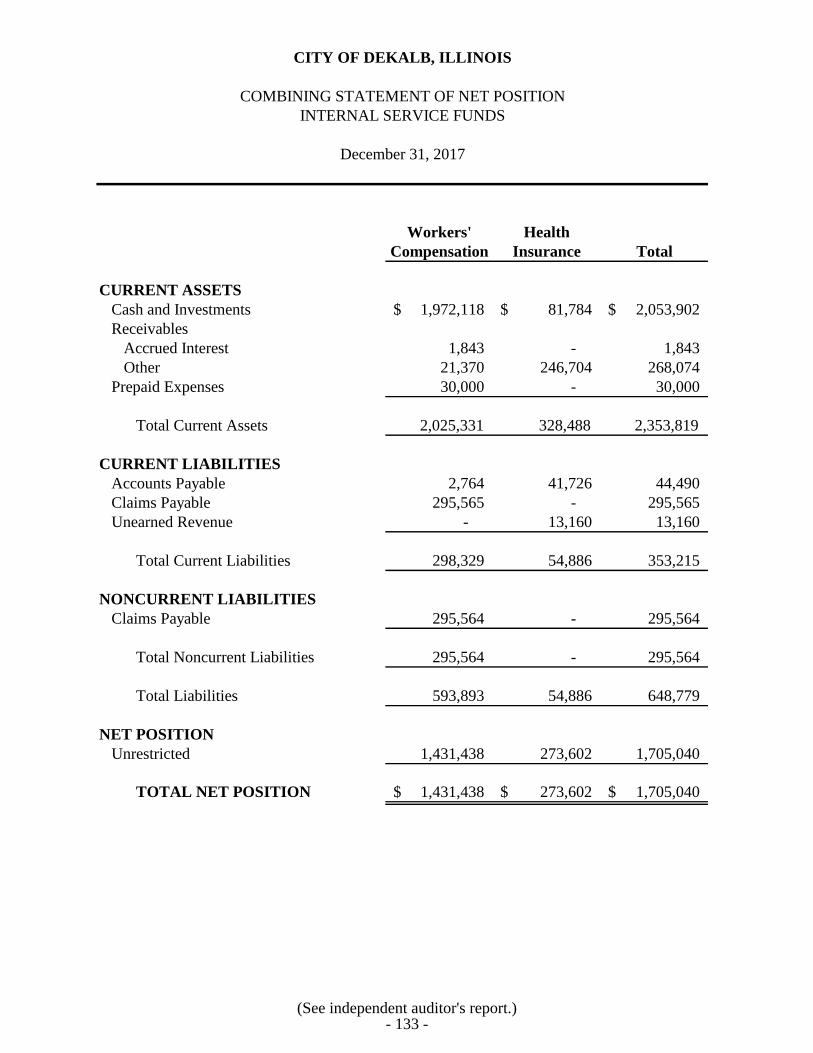
CITY OF DEKALB, ILLINOIS
COMBINING STATEMENT OF NET POSITION
INTERNAL SERVICE FUNDS
December 31, 2017
Workers' Health
Compensation Insurance Total
CURRENT ASSETS
Cash and Investments 1,972,118$ 81,784$ 2,053,902$
Receivables
Accrued Interest 1,843 - 1,843
Other 21,370 246,704 268,074
Prepaid Expenses 30,000 - 30,000
Total Current Assets 2,025,331 328,488 2,353,819
CURRENT LIABILITIES
Accounts Payable 2,764 41,726 44,490
Claims Payable 295,565 - 295,565
Unearned Revenue - 13,160 13,160
Total Current Liabilities 298,329 54,886 353,215
NONCURRENT LIABILITIES
Claims Payable 295,564 - 295,564
Total Noncurrent Liabilities 295,564 - 295,564
Total Liabilities 593,893 54,886 648,779
NET POSITION
Unrestricted 1,431,438 273,602 1,705,040
TOTAL NET POSITION 1,431,438$ 273,602$ 1,705,040$
(See independent auditor's report.)- 133 -
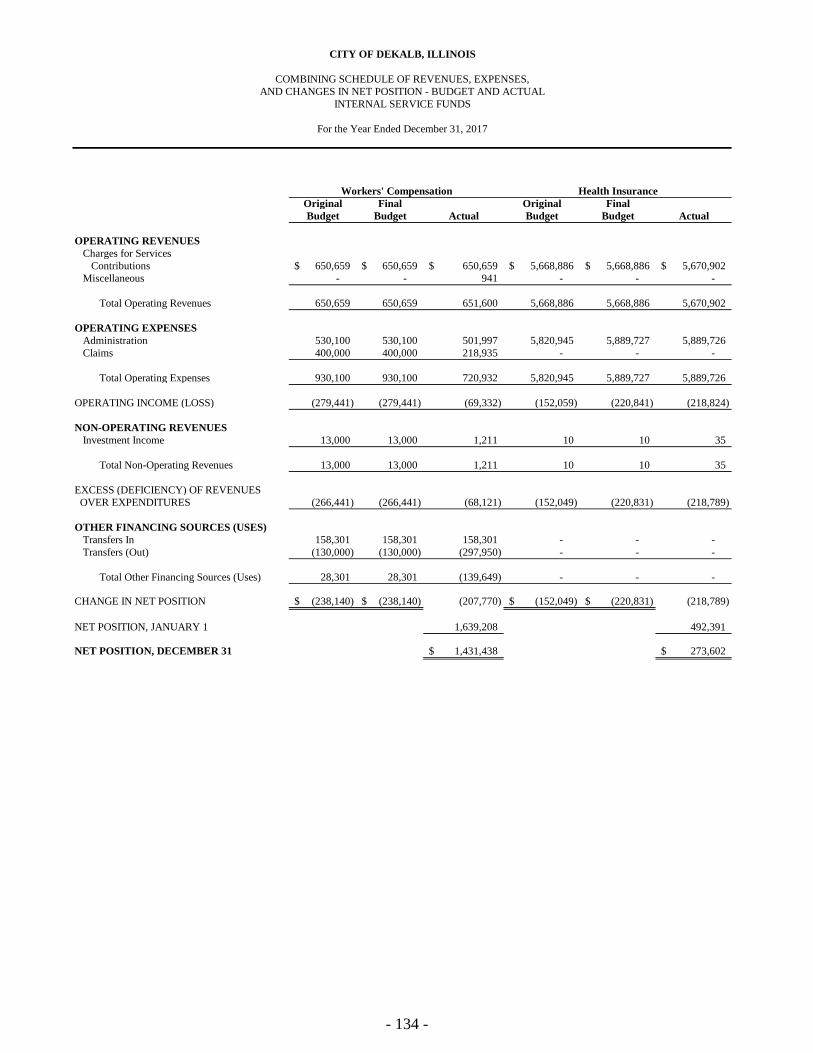
Liability/
Workers' Compensation Health Insurance Property Insurance
Original Final Original Final
Budget Budget Actual Budget Budget Actual
OPERATING REVENUES
Charges for Services
Contributions 650,659$ 650,659$ 650,659$ 5,668,886$ 5,668,886$ 5,670,902$
Miscellaneous - - 941 - - -
Total Operating Revenues 650,659 650,659 651,600 5,668,886 5,668,886 5,670,902
OPERATING EXPENSES
Administration 530,100 530,100 501,997 5,820,945 5,889,727 5,889,726
Claims 400,000 400,000 218,935 - - -
Total Operating Expenses 930,100 930,100 720,932 5,820,945 5,889,727 5,889,726
OPERATING INCOME (LOSS) (279,441) (279,441) (69,332) (152,059) (220,841) (218,824)
NON-OPERATING REVENUES
Investment Income 13,000 13,000 1,211 10 10 35
Total Non-Operating Revenues 13,000 13,000 1,211 10 10 35
EXCESS (DEFICIENCY) OF REVENUES
OVER EXPENDITURES (266,441) (266,441) (68,121) (152,049) (220,831) (218,789)
OTHER FINANCING SOURCES (USES)
Transfers In 158,301 158,301 158,301 - - -
Transfers (Out) (130,000) (130,000) (297,950) - - -
Total Other Financing Sources (Uses) 28,301 28,301 (139,649) - - -
CHANGE IN NET POSITION (238,140)$ (238,140)$ (207,770) (152,049)$ (220,831)$ (218,789)
NET POSITION, JANUARY 1 1,639,208 492,391
NET POSITION, DECEMBER 31 1,431,438$ 273,602$
For the Year Ended December 31, 2017
CITY OF DEKALB, ILLINOIS
COMBINING SCHEDULE OF REVENUES, EXPENSES,
AND CHANGES IN NET POSITION - BUDGET AND ACTUAL
INTERNAL SERVICE FUNDS
- 134 -
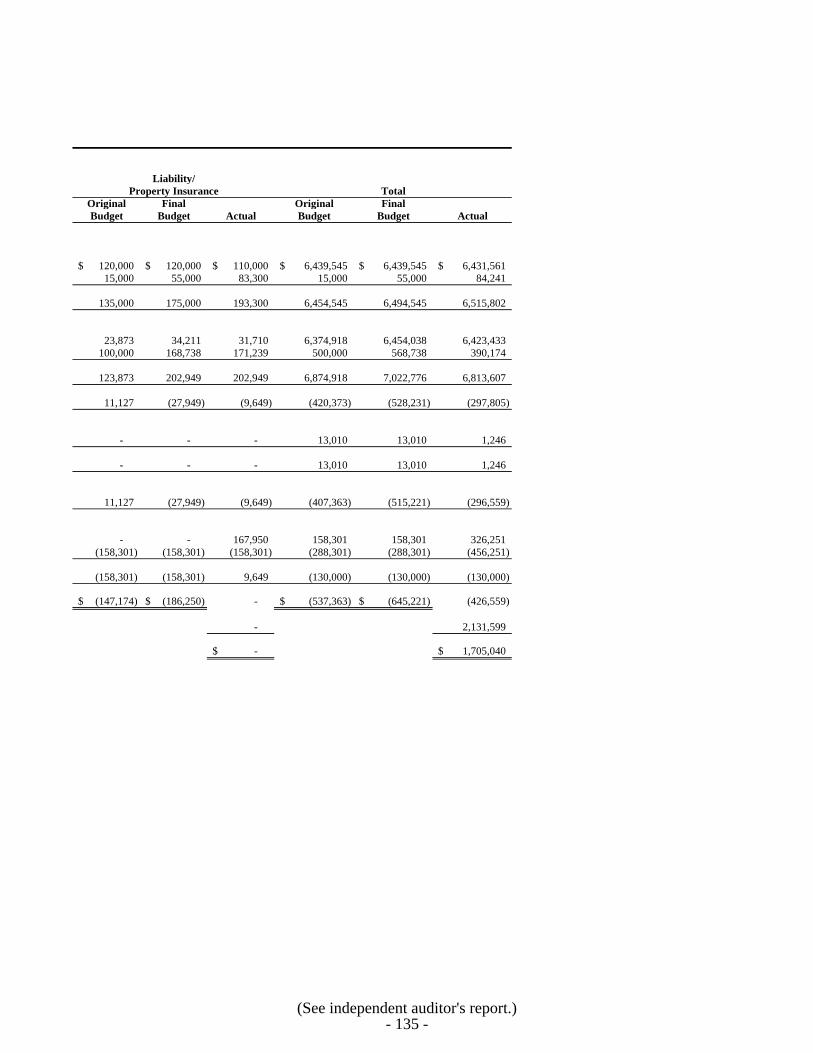
Liability/
Property Insurance Total
Original Final Original Final
Budget Budget Actual Budget Budget Actual
120,000$ 120,000$ 110,000$ 6,439,545$ 6,439,545$ 6,431,561$
15,000 55,000 83,300 15,000 55,000 84,241
135,000 175,000 193,300 6,454,545 6,494,545 6,515,802
23,873 34,211 31,710 6,374,918 6,454,038 6,423,433
100,000 168,738 171,239 500,000 568,738 390,174
123,873 202,949 202,949 6,874,918 7,022,776 6,813,607
11,127 (27,949) (9,649) (420,373) (528,231) (297,805)
- - - 13,010 13,010 1,246
- - - 13,010 13,010 1,246
11,127 (27,949) (9,649) (407,363) (515,221) (296,559)
- - 167,950 158,301 158,301 326,251
(158,301) (158,301) (158,301) (288,301) (288,301) (456,251)
(158,301) (158,301) 9,649 (130,000) (130,000) (130,000)
(147,174)$ (186,250)$ - (537,363)$ (645,221)$ (426,559)
- 2,131,599
-$ 1,705,040$
(See independent auditor's report.)- 135 -
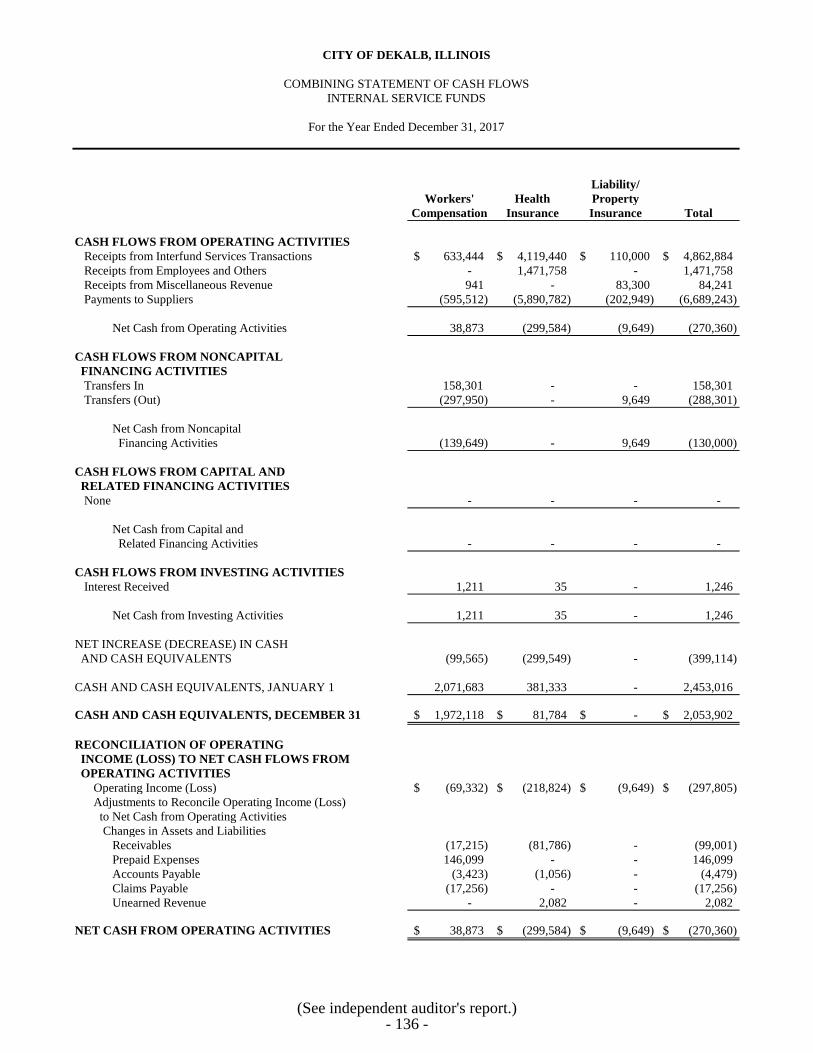
CITY OF DEKALB, ILLINOIS
COMBINING STATEMENT OF CASH FLOWS
INTERNAL SERVICE FUNDS
For the Year Ended December 31, 2017
Liability/
Workers' Health Property
Compensation Insurance Insurance Total
CASH FLOWS FROM OPERATING ACTIVITIES
Receipts from Interfund Services Transactions 633,444$ 4,119,440$ 110,000$ 4,862,884$
Receipts from Employees and Others - 1,471,758 - 1,471,758
Receipts from Miscellaneous Revenue 941 - 83,300 84,241
Payments to Suppliers (595,512) (5,890,782) (202,949) (6,689,243)
Net Cash from Operating Activities 38,873 (299,584) (9,649) (270,360)
CASH FLOWS FROM NONCAPITAL
FINANCING ACTIVITIES
Transfers In 158,301 - - 158,301
Transfers (Out) (297,950) - 9,649 (288,301)
Net Cash from Noncapital
Financing Activities (139,649) - 9,649 (130,000)
CASH FLOWS FROM CAPITAL AND
RELATED FINANCING ACTIVITIES
None - - - -
Net Cash from Capital and
Related Financing Activities - - - -
CASH FLOWS FROM INVESTING ACTIVITIES
Interest Received 1,211 35 - 1,246
Net Cash from Investing Activities 1,211 35 - 1,246
NET INCREASE (DECREASE) IN CASH
AND CASH EQUIVALENTS (99,565) (299,549) - (399,114)
CASH AND CASH EQUIVALENTS, JANUARY 1 2,071,683 381,333 - 2,453,016
CASH AND CASH EQUIVALENTS, DECEMBER 31 1,972,118$ 81,784$ -$ 2,053,902$
RECONCILIATION OF OPERATING
INCOME (LOSS) TO NET CASH FLOWS FROM
OPERATING ACTIVITIES
Operating Income (Loss) (69,332)$ (218,824)$ (9,649)$ (297,805)$
Adjustments to Reconcile Operating Income (Loss)
to Net Cash from Operating Activities
Changes in Assets and Liabilities
Receivables (17,215) (81,786) - (99,001)
Prepaid Expenses 146,099 - - 146,099
Accounts Payable (3,423) (1,056) - (4,479)
Claims Payable (17,256) - - (17,256)
Unearned Revenue - 2,082 - 2,082
NET CASH FROM OPERATING ACTIVITIES 38,873$ (299,584)$ (9,649)$ (270,360)$
(See independent auditor's report.)- 136 -
FIDUCIARY FUNDS
PENSION TRUST FUNDS
The Police Pension Fund is used to account for the accumulation of resources to be used for
retirement annuity payments to employees on the police force at appropriate amounts and times in
the future. Resources are contributed by employees at rates fixed by law and by the City at amounts
determined by an annual actuarial study.
The Firefighters’ Pension Fund is used to account for the accumulation of resources to be used for
retirement annuity payments to employees on the fire department at appropriate amounts and times
in the future. Resources are contributed by employees at rates fixed by law and by the City at
amounts determined by an annual actuarial study.
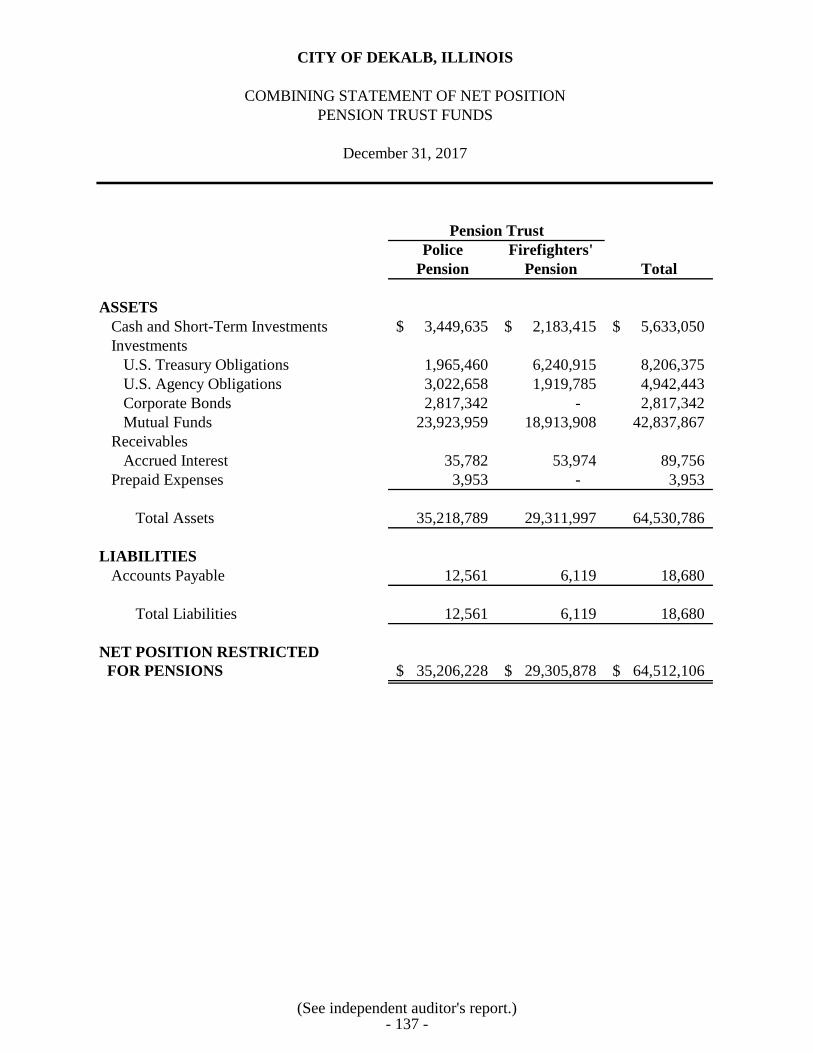
CITY OF DEKALB, ILLINOIS
COMBINING STATEMENT OF NET POSITION
PENSION TRUST FUNDS
December 31, 2017
Pension Trust
Police Firefighters'
Pension Pension Total
ASSETS
Cash and Short-Term Investments 3,449,635$ 2,183,415$ 5,633,050$
Investments
U.S. Treasury Obligations 1,965,460 6,240,915 8,206,375
U.S. Agency Obligations 3,022,658 1,919,785 4,942,443
Corporate Bonds 2,817,342 - 2,817,342
Mutual Funds 23,923,959 18,913,908 42,837,867
Receivables
Accrued Interest 35,782 53,974 89,756
Prepaid Expenses 3,953 - 3,953
Total Assets 35,218,789 29,311,997 64,530,786
LIABILITIES
Accounts Payable 12,561 6,119 18,680
Total Liabilities 12,561 6,119 18,680
NET POSITION RESTRICTED
FOR PENSIONS 35,206,228$ 29,305,878$ 64,512,106$
(See independent auditor's report.)- 137 -
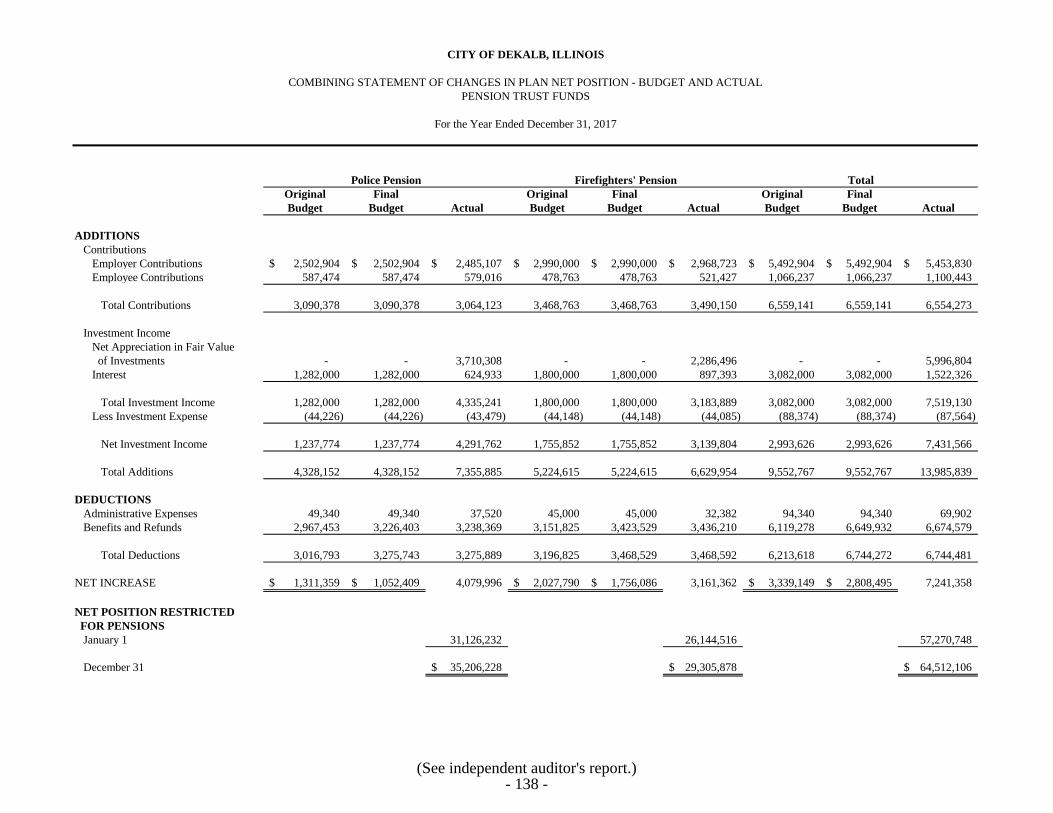
CITY OF DEKALB, ILLINOIS
COMBINING STATEMENT OF CHANGES IN PLAN NET POSITION - BUDGET AND ACTUAL
PENSION TRUST FUNDS
For the Year Ended December 31, 2017
Police Pension Firefighters' Pension Total
Original Final Original Final Original Final
Budget Budget Actual Budget Budget Actual Budget Budget Actual
ADDITIONS
Contributions
Employer Contributions 2,502,904$ 2,502,904$ 2,485,107$ 2,990,000$ 2,990,000$ 2,968,723$ 5,492,904$ 5,492,904$ 5,453,830$
Employee Contributions 587,474 587,474 579,016 478,763 478,763 521,427 1,066,237 1,066,237 1,100,443
Total Contributions 3,090,378 3,090,378 3,064,123 3,468,763 3,468,763 3,490,150 6,559,141 6,559,141 6,554,273
Investment Income
Net Appreciation in Fair Value
of Investments - - 3,710,308 - - 2,286,496 - - 5,996,804
Interest 1,282,000 1,282,000 624,933 1,800,000 1,800,000 897,393 3,082,000 3,082,000 1,522,326
Total Investment Income 1,282,000 1,282,000 4,335,241 1,800,000 1,800,000 3,183,889 3,082,000 3,082,000 7,519,130
Less Investment Expense (44,226) (44,226) (43,479) (44,148) (44,148) (44,085) (88,374) (88,374) (87,564)
Net Investment Income 1,237,774 1,237,774 4,291,762 1,755,852 1,755,852 3,139,804 2,993,626 2,993,626 7,431,566
Total Additions 4,328,152 4,328,152 7,355,885 5,224,615 5,224,615 6,629,954 9,552,767 9,552,767 13,985,839
DEDUCTIONS
Administrative Expenses 49,340 49,340 37,520 45,000 45,000 32,382 94,340 94,340 69,902
Benefits and Refunds 2,967,453 3,226,403 3,238,369 3,151,825 3,423,529 3,436,210 6,119,278 6,649,932 6,674,579
Total Deductions 3,016,793 3,275,743 3,275,889 3,196,825 3,468,529 3,468,592 6,213,618 6,744,272 6,744,481
NET INCREASE 1,311,359$ 1,052,409$ 4,079,996 2,027,790$ 1,756,086$ 3,161,362 3,339,149$ 2,808,495$ 7,241,358
NET POSITION RESTRICTED
FOR PENSIONS
January 1 31,126,232 26,144,516 57,270,748
December 31 35,206,228$ 29,305,878$ 64,512,106$
(See independent auditor's report.)- 138 -
DISCRETELY PRESENTED
COMPONENT UNIT - DEKALB PUBLIC LIBRARY
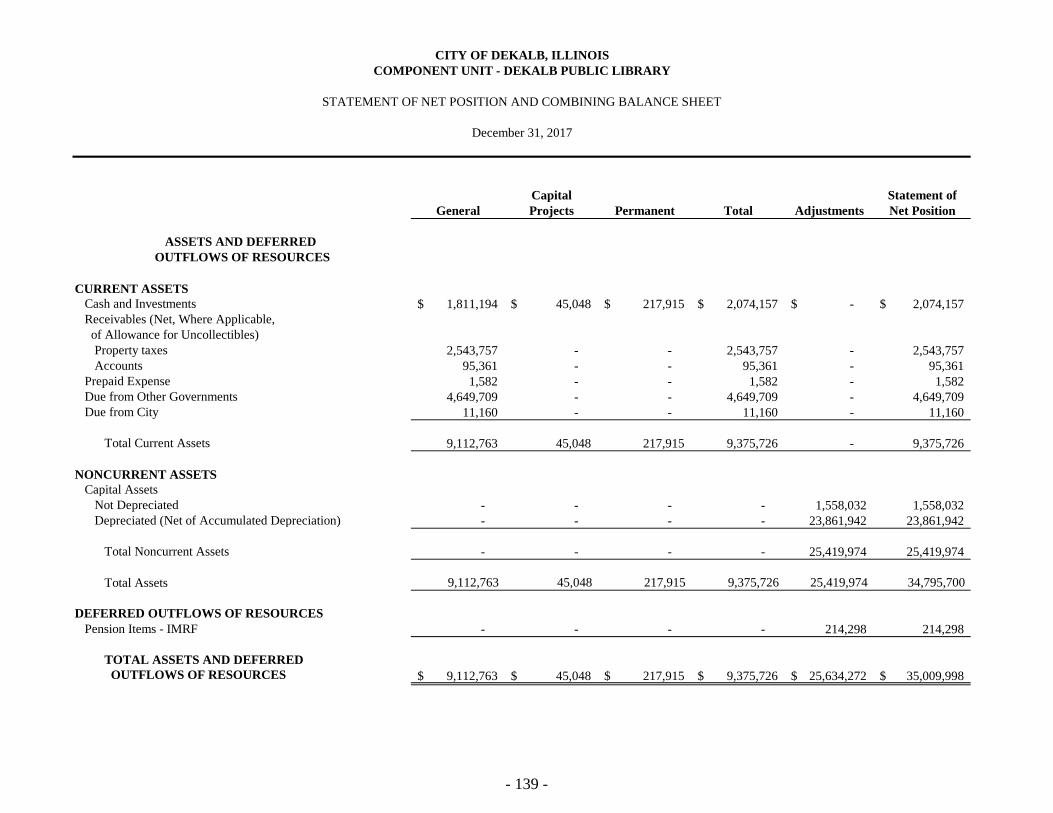
Capital Statement of
General Projects Permanent Total Adjustments Net Position
CURRENT ASSETS
Cash and Investments 1,811,194$ 45,048$ 217,915$ 2,074,157$ -$ 2,074,157$
Receivables (Net, Where Applicable,
of Allowance for Uncollectibles)
Property taxes 2,543,757 - - 2,543,757 - 2,543,757
Accounts 95,361 - - 95,361 - 95,361
Prepaid Expense 1,582 - - 1,582 - 1,582
Due from Other Governments 4,649,709 - - 4,649,709 - 4,649,709
Due from City 11,160 - - 11,160 - 11,160
Total Current Assets 9,112,763 45,048 217,915 9,375,726 - 9,375,726
NONCURRENT ASSETS
Capital Assets
Not Depreciated - - - - 1,558,032 1,558,032
Depreciated (Net of Accumulated Depreciation) - - - - 23,861,942 23,861,942
Total Noncurrent Assets - - - - 25,419,974 25,419,974
Total Assets 9,112,763 45,048 217,915 9,375,726 25,419,974 34,795,700
DEFERRED OUTFLOWS OF RESOURCES
Pension Items - IMRF - - - - 214,298 214,298
TOTAL ASSETS AND DEFERRED
OUTFLOWS OF RESOURCES 9,112,763$ 45,048$ 217,915$ 9,375,726$ 25,634,272$ 35,009,998$
CITY OF DEKALB, ILLINOIS
COMPONENT UNIT - DEKALB PUBLIC LIBRARY
December 31, 2017
STATEMENT OF NET POSITION AND COMBINING BALANCE SHEET
ASSETS AND DEFERRED
OUTFLOWS OF RESOURCES
- 139 -
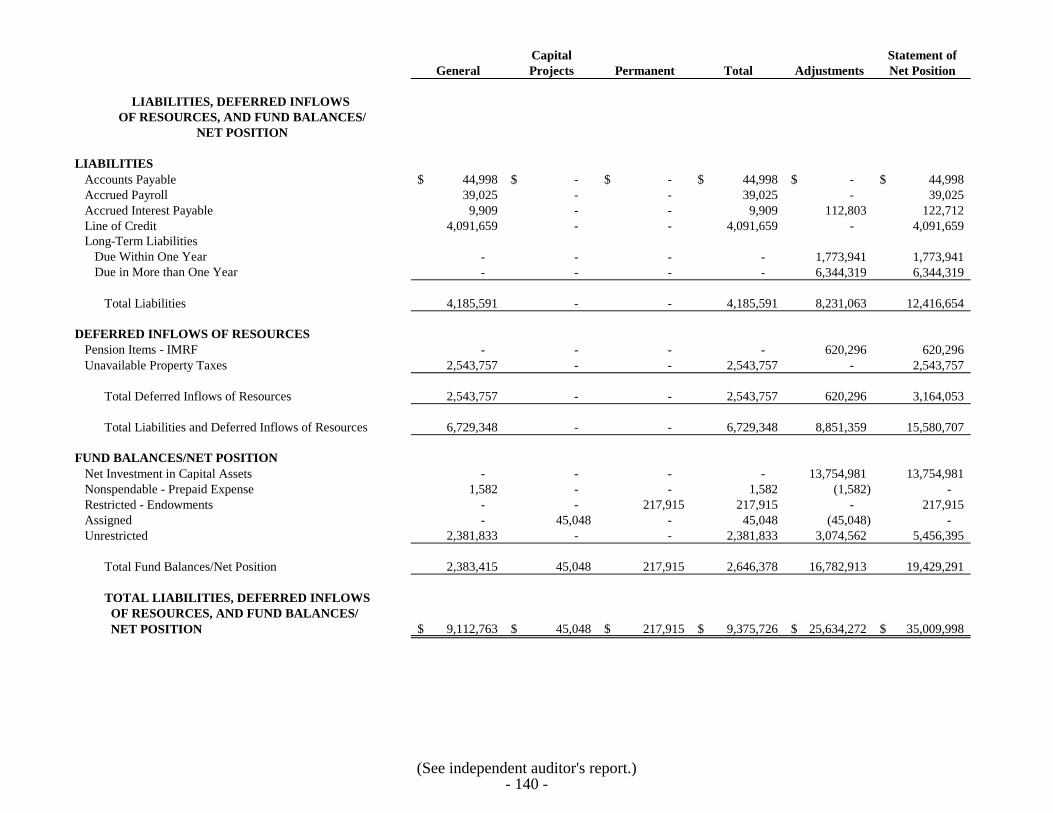
Capital Statement of
General Projects Permanent Total Adjustments Net Position
Accounts Payable 44,998$ -$ -$ 44,998$ -$ 44,998$
Accrued Payroll 39,025 - - 39,025 - 39,025
Accrued Interest Payable 9,909 - - 9,909 112,803 122,712
Line of Credit 4,091,659 - - 4,091,659 - 4,091,659
Long-Term Liabilities
Due Within One Year - - - - 1,773,941 1,773,941
Due in More than One Year - - - - 6,344,319 6,344,319
Total Liabilities 4,185,591 - - 4,185,591 8,231,063 12,416,654
Pension Items - IMRF - - - - 620,296 620,296
Unavailable Property Taxes 2,543,757 - - 2,543,757 - 2,543,757
Total Deferred Inflows of Resources 2,543,757 - - 2,543,757 620,296 3,164,053
Total Liabilities and Deferred Inflows of Resources 6,729,348 - - 6,729,348 8,851,359 15,580,707
Net Investment in Capital Assets - - - - 13,754,981 13,754,981
Nonspendable - Prepaid Expense 1,582 - - 1,582 (1,582) -
Restricted - Endowments - - 217,915 217,915 - 217,915
Assigned - 45,048 - 45,048 (45,048) -
Unrestricted 2,381,833 - - 2,381,833 3,074,562 5,456,395
Total Fund Balances/Net Position 2,383,415 45,048 217,915 2,646,378 16,782,913 19,429,291
TOTAL LIABILITIES, DEFERRED INFLOWS
OF RESOURCES, AND FUND BALANCES/
NET POSITION 9,112,763$ 45,048$ 217,915$ 9,375,726$ 25,634,272$ 35,009,998$
FUND BALANCES/NET POSITION
LIABILITIES
DEFERRED INFLOWS OF RESOURCES
NET POSITION
OF RESOURCES, AND FUND BALANCES/
LIABILITIES, DEFERRED INFLOWS
(See independent auditor's report.)- 140 -
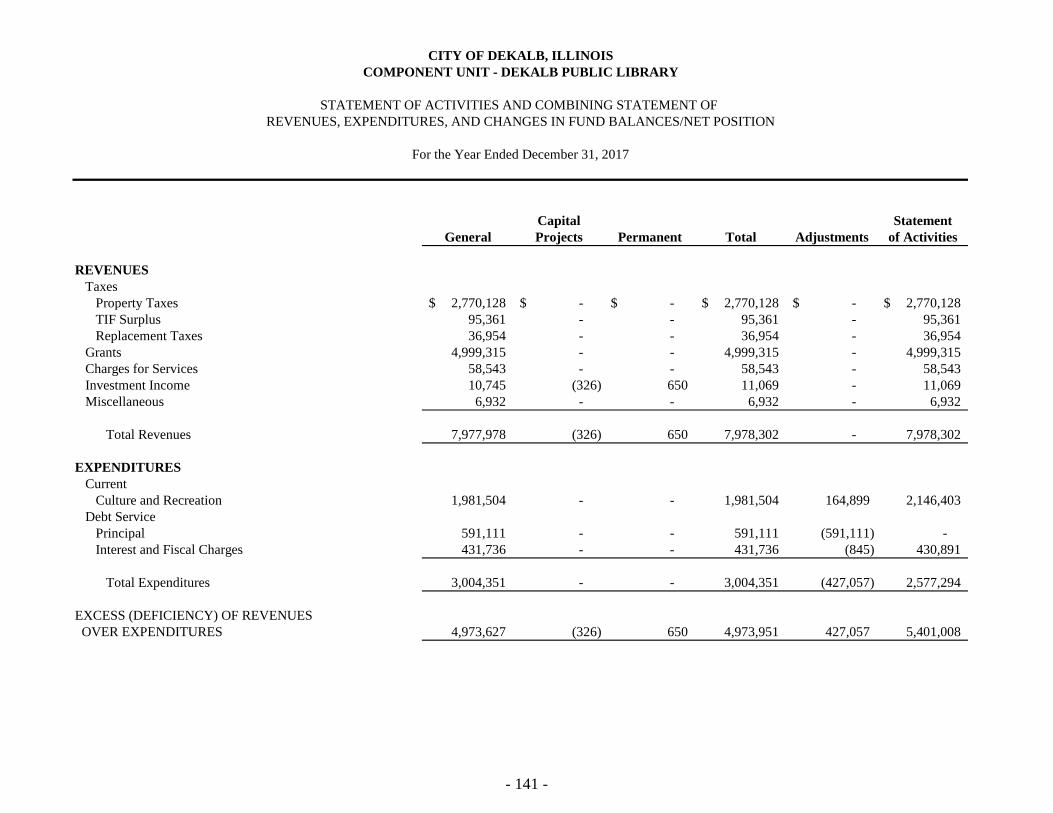
CITY OF DEKALB, ILLINOIS
COMPONENT UNIT - DEKALB PUBLIC LIBRARY
STATEMENT OF ACTIVITIES AND COMBINING STATEMENT OF
REVENUES, EXPENDITURES, AND CHANGES IN FUND BALANCES/NET POSITION
For the Year Ended December 31, 2017
Capital Statement
General Projects Permanent Total Adjustments of Activities
REVENUES
Taxes
Property Taxes 2,770,128$ -$ -$ 2,770,128$ -$ 2,770,128$
TIF Surplus 95,361 - - 95,361 - 95,361
Replacement Taxes 36,954 - - 36,954 - 36,954
Grants 4,999,315 - - 4,999,315 - 4,999,315
Charges for Services 58,543 - - 58,543 - 58,543
Investment Income 10,745 (326) 650 11,069 - 11,069
Miscellaneous 6,932 - - 6,932 - 6,932
Total Revenues 7,977,978 (326) 650 7,978,302 - 7,978,302
EXPENDITURES
Current
Culture and Recreation 1,981,504 - - 1,981,504 164,899 2,146,403
Debt Service
Principal 591,111 - - 591,111 (591,111) -
Interest and Fiscal Charges 431,736 - - 431,736 (845) 430,891
Total Expenditures 3,004,351 - - 3,004,351 (427,057) 2,577,294
EXCESS (DEFICIENCY) OF REVENUES
OVER EXPENDITURES 4,973,627 (326) 650 4,973,951 427,057 5,401,008
- 141 -
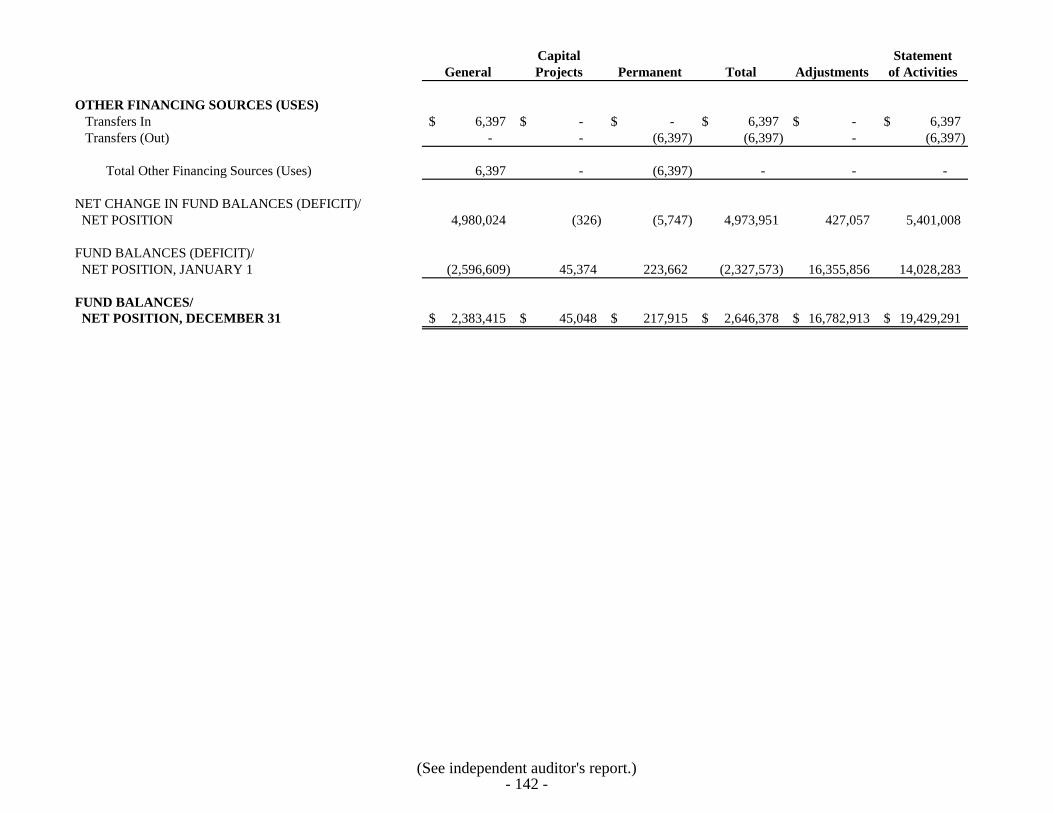
Capital Statement
General Projects Permanent Total Adjustments of Activities
OTHER FINANCING SOURCES (USES)
Transfers In 6,397$ -$ -$ 6,397$ -$ 6,397$
Transfers (Out) - - (6,397) (6,397) - (6,397)
Total Other Financing Sources (Uses) 6,397 - (6,397) - - -
NET CHANGE IN FUND BALANCES (DEFICIT)/
NET POSITION 4,980,024 (326) (5,747) 4,973,951 427,057 5,401,008
FUND BALANCES (DEFICIT)/
NET POSITION, JANUARY 1 (2,596,609) 45,374 223,662 (2,327,573) 16,355,856 14,028,283
FUND BALANCES/
NET POSITION, DECEMBER 31 2,383,415$ 45,048$ 217,915$ 2,646,378$ 16,782,913$ 19,429,291$
(See independent auditor's report.)- 142 -
SUPPLEMENTAL FINANCIAL INFORMATION
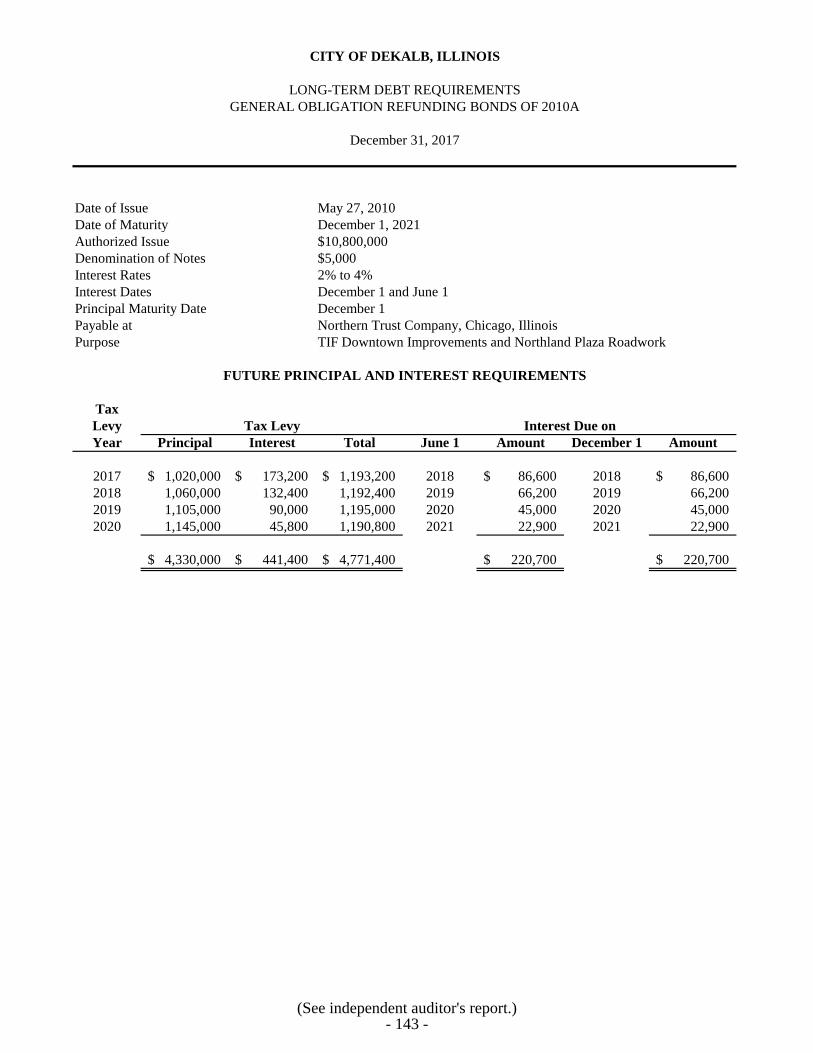
Date of Issue May 27, 2010
Date of Maturity December 1, 2021
Authorized Issue $10,800,000
Denomination of Notes $5,000
Interest Rates 2% to 4%
Interest Dates December 1 and June 1
Principal Maturity Date December 1
Payable at Northern Trust Company, Chicago, Illinois
Purpose TIF Downtown Improvements and Northland Plaza Roadwork
Tax
Levy
Year Principal Interest Total June 1 Amount December 1 Amount
2017 1,020,000$ 173,200$ 1,193,200$ 2018 86,600$ 2018 86,600$
2018 1,060,000 132,400 1,192,400 2019 66,200 2019 66,200
2019 1,105,000 90,000 1,195,000 2020 45,000 2020 45,000
2020 1,145,000 45,800 1,190,800 2021 22,900 2021 22,900
4,330,000$ 441,400$ 4,771,400$ 220,700$ 220,700$
FUTURE PRINCIPAL AND INTEREST REQUIREMENTS
Tax Levy Interest Due on
CITY OF DEKALB, ILLINOIS
LONG-TERM DEBT REQUIREMENTS
GENERAL OBLIGATION REFUNDING BONDS OF 2010A
December 31, 2017
(See independent auditor's report.)- 143 -
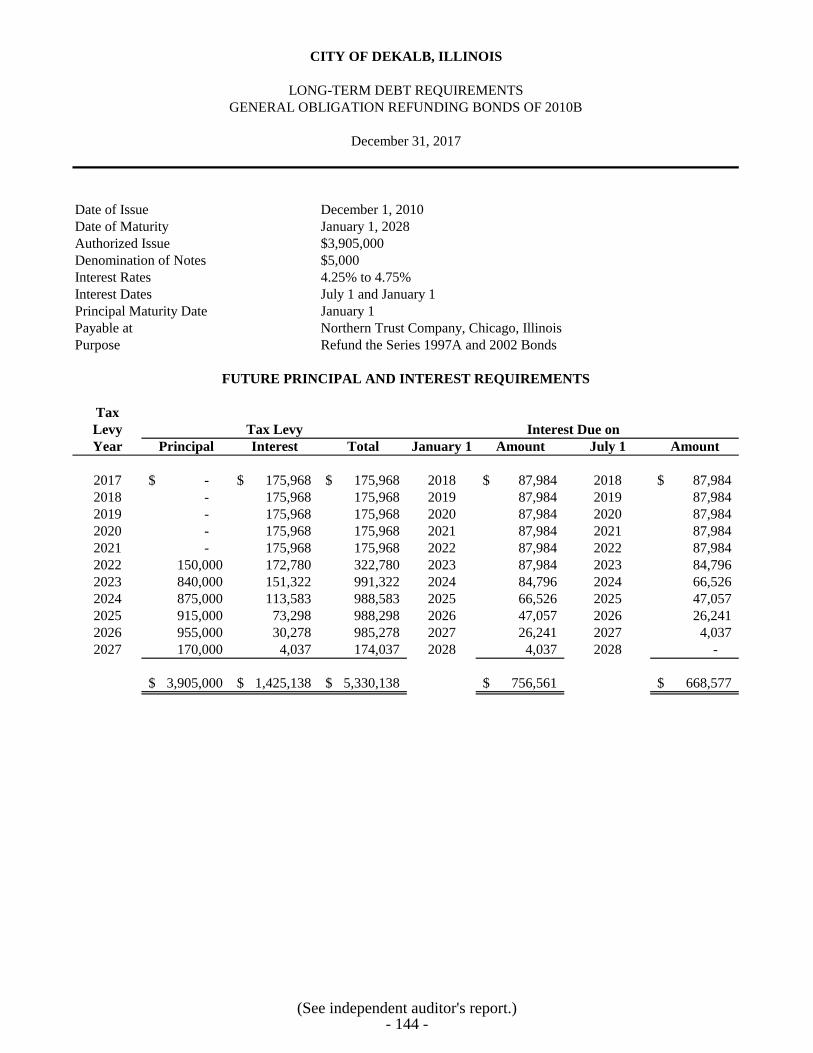
Date of Issue December 1, 2010
Date of Maturity January 1, 2028
Authorized Issue $3,905,000
Denomination of Notes $5,000
Interest Rates 4.25% to 4.75%
Interest Dates July 1 and January 1
Principal Maturity Date January 1
Payable at Northern Trust Company, Chicago, Illinois
Purpose Refund the Series 1997A and 2002 Bonds
Tax
Levy
Year Principal Interest Total January 1 Amount July 1 Amount
2017 -$ 175,968$ 175,968$ 2018 87,984$ 2018 87,984$
2018 - 175,968 175,968 2019 87,984 2019 87,984
2019 - 175,968 175,968 2020 87,984 2020 87,984
2020 - 175,968 175,968 2021 87,984 2021 87,984
2021 - 175,968 175,968 2022 87,984 2022 87,984
2022 150,000 172,780 322,780 2023 87,984 2023 84,796
2023 840,000 151,322 991,322 2024 84,796 2024 66,526
2024 875,000 113,583 988,583 2025 66,526 2025 47,057
2025 915,000 73,298 988,298 2026 47,057 2026 26,241
2026 955,000 30,278 985,278 2027 26,241 2027 4,037
2027 170,000 4,037 174,037 2028 4,037 2028 -
3,905,000$ 1,425,138$ 5,330,138$ 756,561$ 668,577$
FUTURE PRINCIPAL AND INTEREST REQUIREMENTS
Tax Levy Interest Due on
CITY OF DEKALB, ILLINOIS
LONG-TERM DEBT REQUIREMENTS
GENERAL OBLIGATION REFUNDING BONDS OF 2010B
December 31, 2017
(See independent auditor's report.)- 144 -
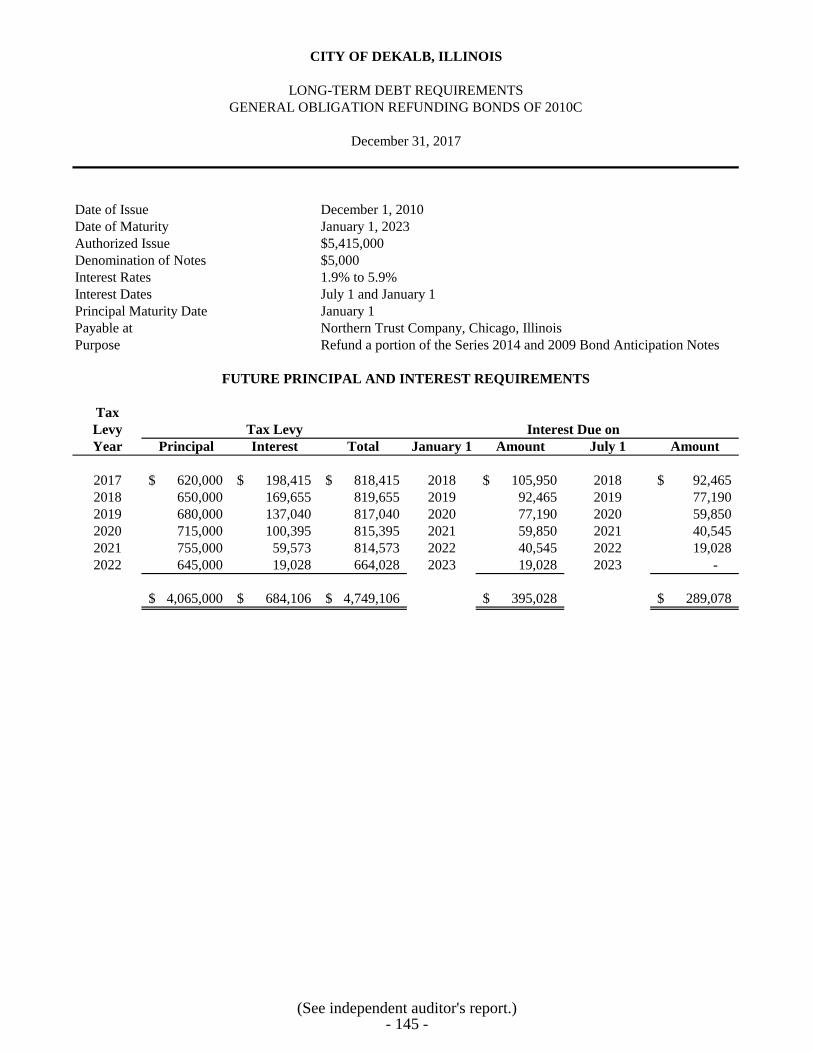
Date of Issue December 1, 2010
Date of Maturity January 1, 2023
Authorized Issue $5,415,000
Denomination of Notes $5,000
Interest Rates 1.9% to 5.9%
Interest Dates July 1 and January 1
Principal Maturity Date January 1
Payable at Northern Trust Company, Chicago, Illinois
Purpose Refund a portion of the Series 2014 and 2009 Bond Anticipation Notes
Tax
Levy
Year Principal Interest Total January 1 Amount July 1 Amount
2017 620,000$ 198,415$ 818,415$ 2018 105,950$ 2018 92,465$
2018 650,000 169,655 819,655 2019 92,465 2019 77,190
2019 680,000 137,040 817,040 2020 77,190 2020 59,850
2020 715,000 100,395 815,395 2021 59,850 2021 40,545
2021 755,000 59,573 814,573 2022 40,545 2022 19,028
2022 645,000 19,028 664,028 2023 19,028 2023 -
4,065,000$ 684,106$ 4,749,106$ 395,028$ 289,078$
FUTURE PRINCIPAL AND INTEREST REQUIREMENTS
Tax Levy Interest Due on
CITY OF DEKALB, ILLINOIS
LONG-TERM DEBT REQUIREMENTS
GENERAL OBLIGATION REFUNDING BONDS OF 2010C
December 31, 2017
(See independent auditor's report.)- 145 -
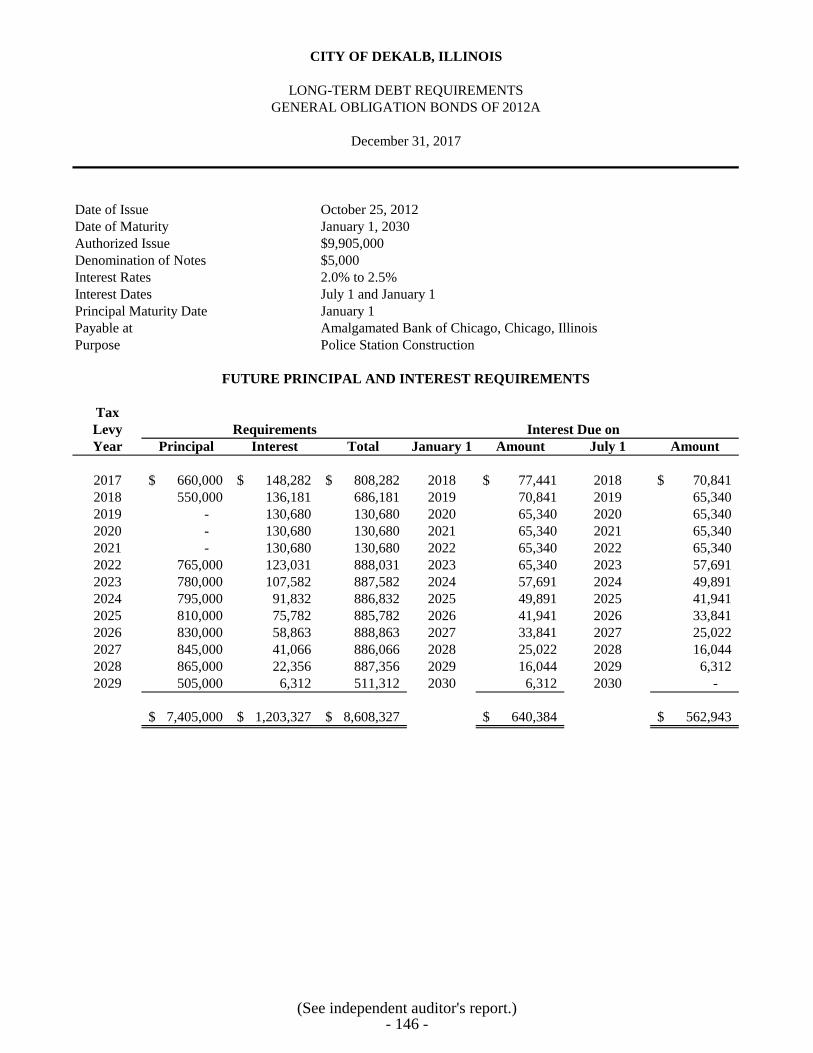
Date of Issue October 25, 2012
Date of Maturity January 1, 2030
Authorized Issue $9,905,000
Denomination of Notes $5,000
Interest Rates 2.0% to 2.5%
Interest Dates July 1 and January 1
Principal Maturity Date January 1
Payable at Amalgamated Bank of Chicago, Chicago, Illinois
Purpose Police Station Construction
Tax
Levy
Year Principal Interest Total January 1 Amount July 1 Amount
2017 660,000$ 148,282$ 808,282$ 2018 77,441$ 2018 70,841$
2018 550,000 136,181 686,181 2019 70,841 2019 65,340
2019 - 130,680 130,680 2020 65,340 2020 65,340
2020 - 130,680 130,680 2021 65,340 2021 65,340
2021 - 130,680 130,680 2022 65,340 2022 65,340
2022 765,000 123,031 888,031 2023 65,340 2023 57,691
2023 780,000 107,582 887,582 2024 57,691 2024 49,891
2024 795,000 91,832 886,832 2025 49,891 2025 41,941
2025 810,000 75,782 885,782 2026 41,941 2026 33,841
2026 830,000 58,863 888,863 2027 33,841 2027 25,022
2027 845,000 41,066 886,066 2028 25,022 2028 16,044
2028 865,000 22,356 887,356 2029 16,044 2029 6,312
2029 505,000 6,312 511,312 2030 6,312 2030 -
7,405,000$ 1,203,327$ 8,608,327$ 640,384$ 562,943$
FUTURE PRINCIPAL AND INTEREST REQUIREMENTS
Requirements Interest Due on
CITY OF DEKALB, ILLINOIS
LONG-TERM DEBT REQUIREMENTS
GENERAL OBLIGATION BONDS OF 2012A
December 31, 2017
(See independent auditor's report.)- 146 -
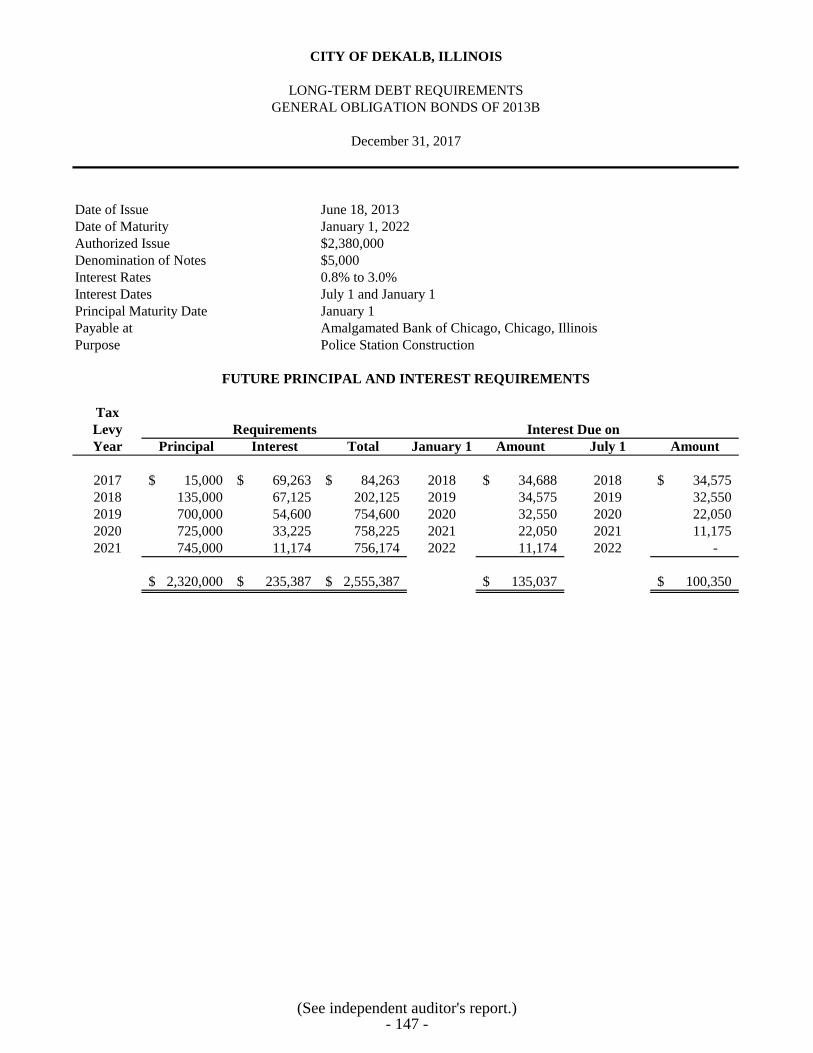
Date of Issue June 18, 2013
Date of Maturity January 1, 2022
Authorized Issue $2,380,000
Denomination of Notes $5,000
Interest Rates 0.8% to 3.0%
Interest Dates July 1 and January 1
Principal Maturity Date January 1
Payable at Amalgamated Bank of Chicago, Chicago, Illinois
Purpose Police Station Construction
Tax
Levy
Year Principal Interest Total January 1 Amount July 1 Amount
2017 15,000$ 69,263$ 84,263$ 2018 34,688$ 2018 34,575$
2018 135,000 67,125 202,125 2019 34,575 2019 32,550
2019 700,000 54,600 754,600 2020 32,550 2020 22,050
2020 725,000 33,225 758,225 2021 22,050 2021 11,175
2021 745,000 11,174 756,174 2022 11,174 2022 -
2,320,000$ 235,387$ 2,555,387$ 135,037$ 100,350$
FUTURE PRINCIPAL AND INTEREST REQUIREMENTS
Requirements Interest Due on
CITY OF DEKALB, ILLINOIS
LONG-TERM DEBT REQUIREMENTS
GENERAL OBLIGATION BONDS OF 2013B
December 31, 2017
(See independent auditor's report.)- 147 -
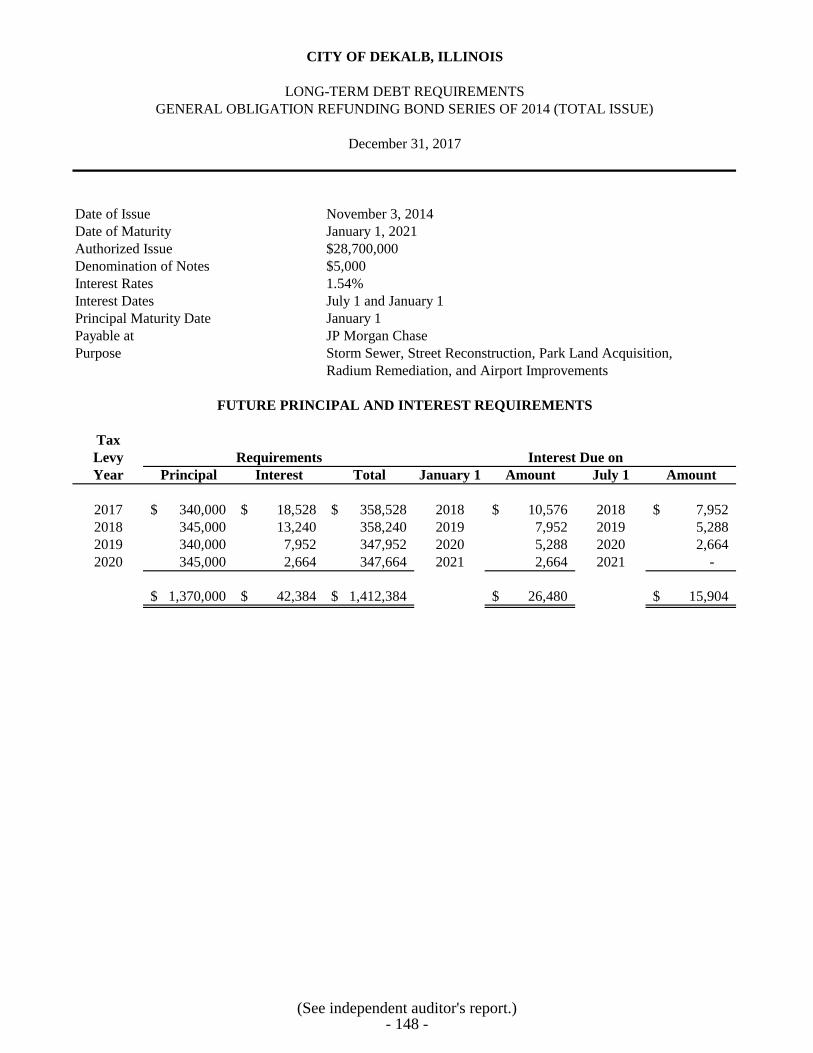
Date of Issue November 3, 2014
Date of Maturity January 1, 2021
Authorized Issue $28,700,000
Denomination of Notes $5,000
Interest Rates 1.54%
Interest Dates July 1 and January 1
Principal Maturity Date January 1
Payable at JP Morgan Chase
Purpose Storm Sewer, Street Reconstruction, Park Land Acquisition,
Radium Remediation, and Airport Improvements
Tax
Levy
Year Principal Interest Total January 1 Amount July 1 Amount
2017 340,000$ 18,528$ 358,528$ 2018 10,576$ 2018 7,952$
2018 345,000 13,240 358,240 2019 7,952 2019 5,288
2019 340,000 7,952 347,952 2020 5,288 2020 2,664
2020 345,000 2,664 347,664 2021 2,664 2021 -
1,370,000$ 42,384$ 1,412,384$ 26,480$ 15,904$
FUTURE PRINCIPAL AND INTEREST REQUIREMENTS
Requirements Interest Due on
CITY OF DEKALB, ILLINOIS
LONG-TERM DEBT REQUIREMENTS
GENERAL OBLIGATION REFUNDING BOND SERIES OF 2014 (TOTAL ISSUE)
December 31, 2017
(See independent auditor's report.)- 148 -
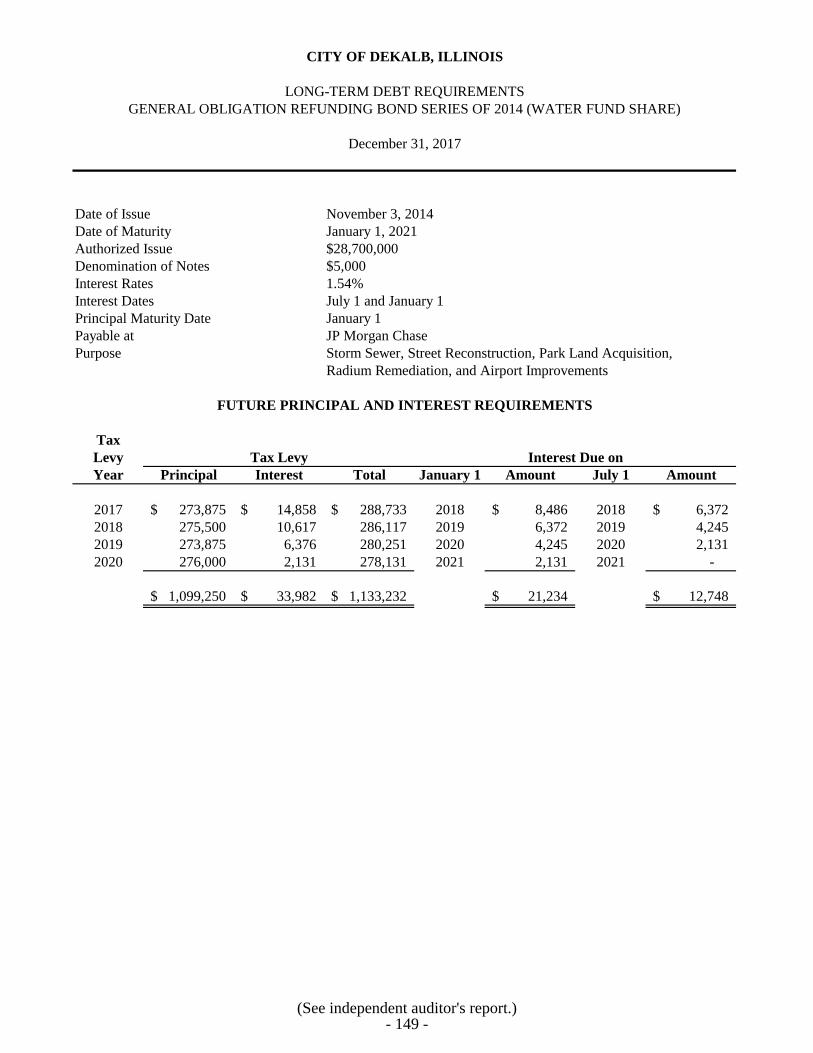
Date of Issue November 3, 2014
Date of Maturity January 1, 2021
Authorized Issue $28,700,000
Denomination of Notes $5,000
Interest Rates 1.54%
Interest Dates July 1 and January 1
Principal Maturity Date January 1
Payable at JP Morgan Chase
Purpose Storm Sewer, Street Reconstruction, Park Land Acquisition,
Radium Remediation, and Airport Improvements
Tax
Levy
Year Principal Interest Total January 1 Amount July 1 Amount
2017 273,875$ 14,858$ 288,733$ 2018 8,486$ 2018 6,372$
2018 275,500 10,617 286,117 2019 6,372 2019 4,245
2019 273,875 6,376 280,251 2020 4,245 2020 2,131
2020 276,000 2,131 278,131 2021 2,131 2021 -
1,099,250$ 33,982$ 1,133,232$ 21,234$ 12,748$
FUTURE PRINCIPAL AND INTEREST REQUIREMENTS
Tax Levy Interest Due on
CITY OF DEKALB, ILLINOIS
LONG-TERM DEBT REQUIREMENTS
GENERAL OBLIGATION REFUNDING BOND SERIES OF 2014 (WATER FUND SHARE)
December 31, 2017
(See independent auditor's report.)- 149 -
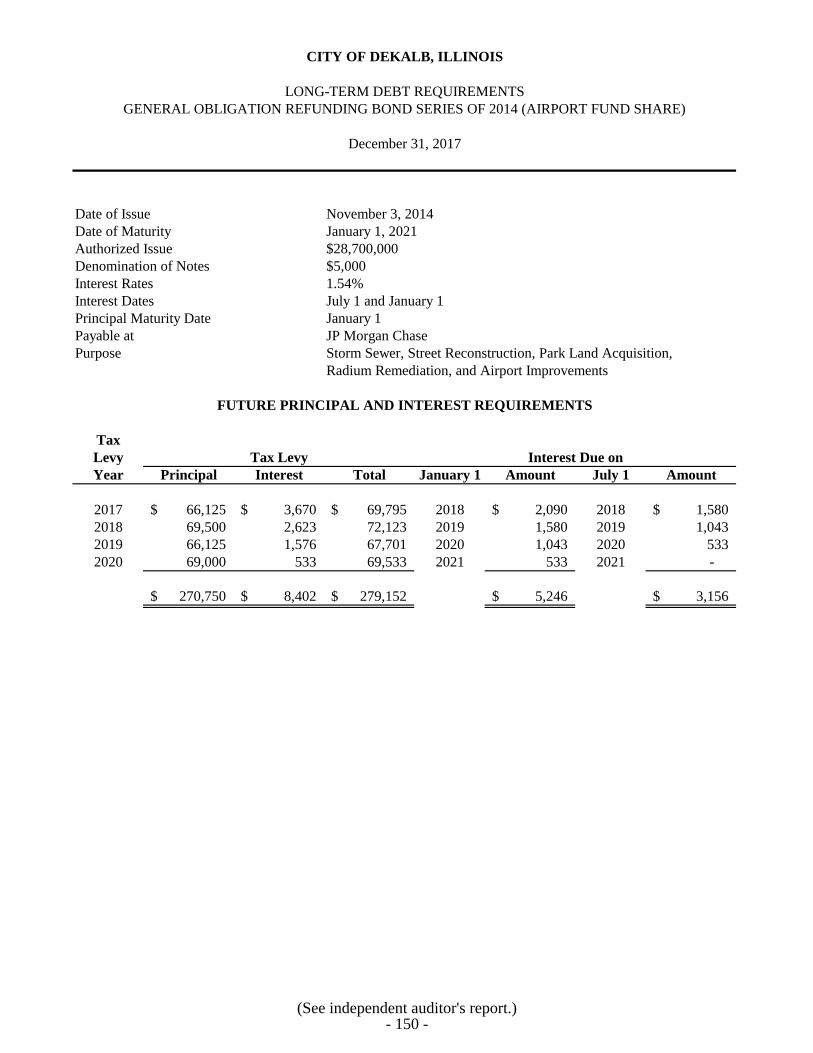
Date of Issue November 3, 2014
Date of Maturity January 1, 2021
Authorized Issue $28,700,000
Denomination of Notes $5,000
Interest Rates 1.54%
Interest Dates July 1 and January 1
Principal Maturity Date January 1
Payable at JP Morgan Chase
Purpose Storm Sewer, Street Reconstruction, Park Land Acquisition,
Radium Remediation, and Airport Improvements
Tax
Levy
Year Principal Interest Total January 1 Amount July 1 Amount
2017 66,125$ 3,670$ 69,795$ 2018 2,090$ 2018 1,580$
2018 69,500 2,623 72,123 2019 1,580 2019 1,043
2019 66,125 1,576 67,701 2020 1,043 2020 533
2020 69,000 533 69,533 2021 533 2021 -
270,750$ 8,402$ 279,152$ 5,246$ 3,156$
FUTURE PRINCIPAL AND INTEREST REQUIREMENTS
Tax Levy Interest Due on
CITY OF DEKALB, ILLINOIS
LONG-TERM DEBT REQUIREMENTS
GENERAL OBLIGATION REFUNDING BOND SERIES OF 2014 (AIRPORT FUND SHARE)
December 31, 2017
(See independent auditor's report.)- 150 -
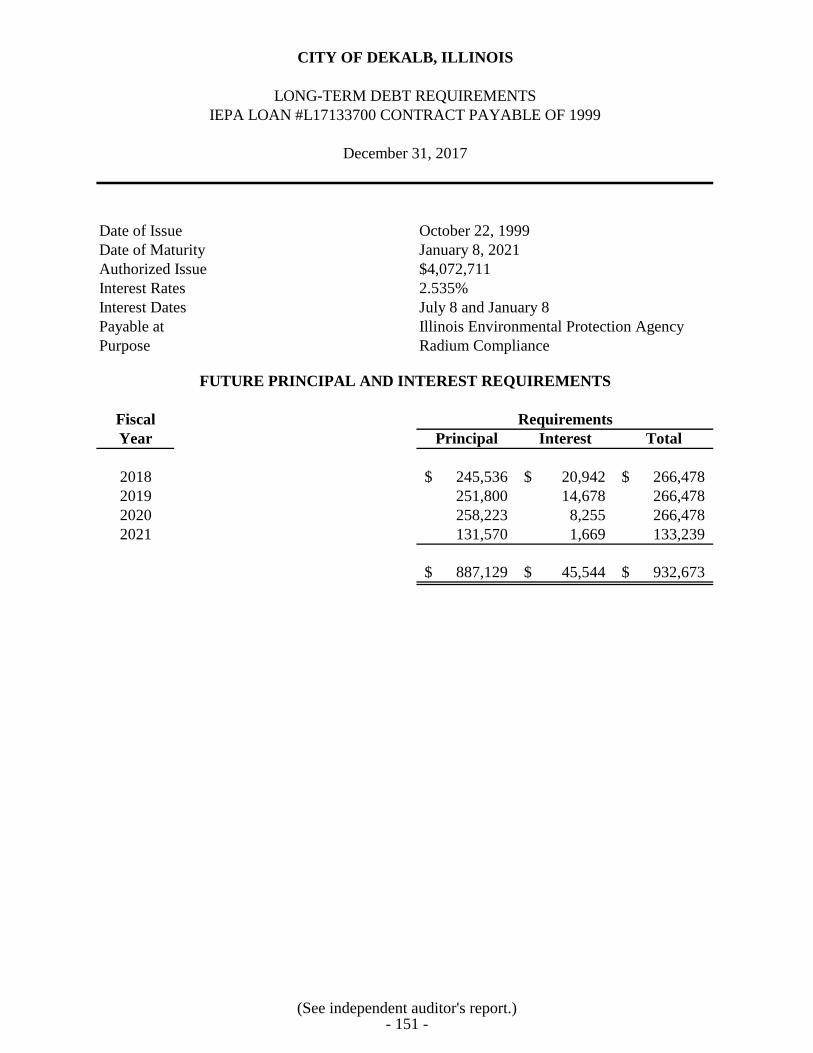
Date of Issue October 22, 1999
Date of Maturity January 8, 2021
Authorized Issue $4,072,711
Interest Rates 2.535%
Interest Dates July 8 and January 8
Payable at Illinois Environmental Protection Agency
Purpose Radium Compliance
Fiscal
Year Principal Interest Total
2018 245,536$ 20,942$ 266,478$
2019 251,800 14,678 266,478
2020 258,223 8,255 266,478
2021 131,570 1,669 133,239
887,129$ 45,544$ 932,673$
Requirements
CITY OF DEKALB, ILLINOIS
LONG-TERM DEBT REQUIREMENTS
IEPA LOAN #L17133700 CONTRACT PAYABLE OF 1999
December 31, 2017
FUTURE PRINCIPAL AND INTEREST REQUIREMENTS
(See independent auditor's report.)- 151 -
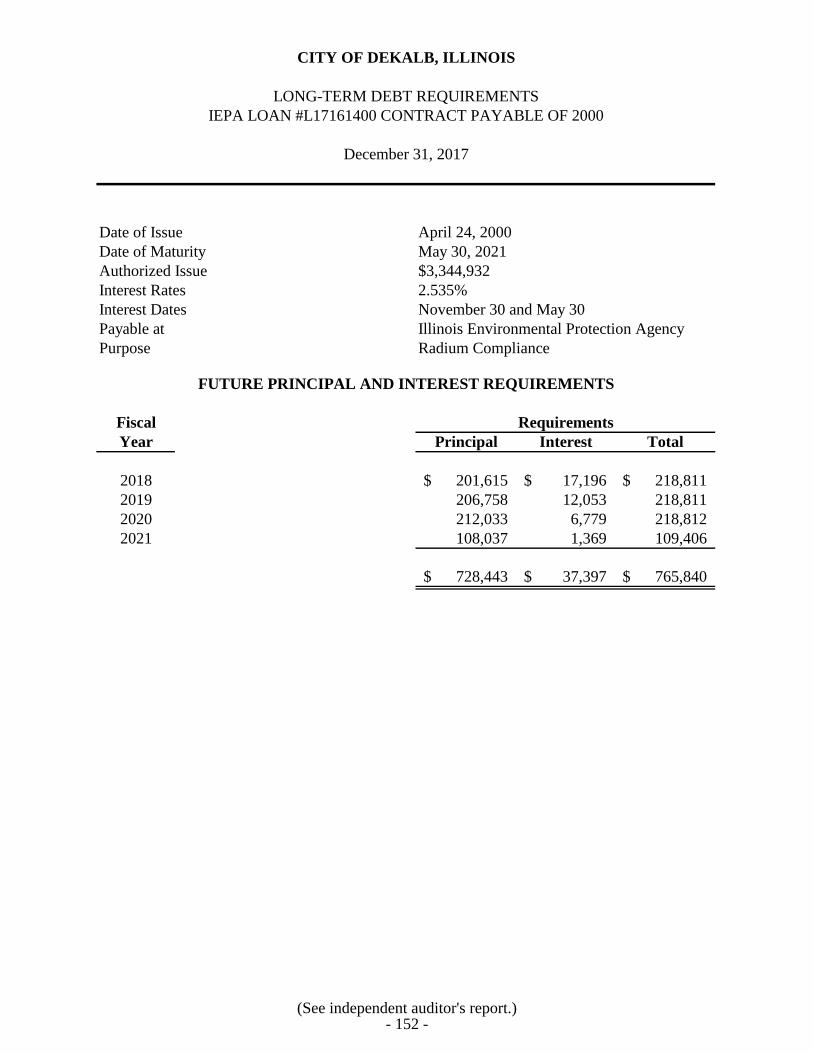
Date of Issue April 24, 2000
Date of Maturity May 30, 2021
Authorized Issue $3,344,932
Interest Rates 2.535%
Interest Dates November 30 and May 30
Payable at Illinois Environmental Protection Agency
Purpose Radium Compliance
Fiscal
Year Principal Interest Total
2018 201,615$ 17,196$ 218,811$
2019 206,758 12,053 218,811
2020 212,033 6,779 218,812
2021 108,037 1,369 109,406
728,443$ 37,397$ 765,840$
Requirements
CITY OF DEKALB, ILLINOIS
LONG-TERM DEBT REQUIREMENTS
IEPA LOAN #L17161400 CONTRACT PAYABLE OF 2000
December 31, 2017
FUTURE PRINCIPAL AND INTEREST REQUIREMENTS
(See independent auditor's report.)- 152 -
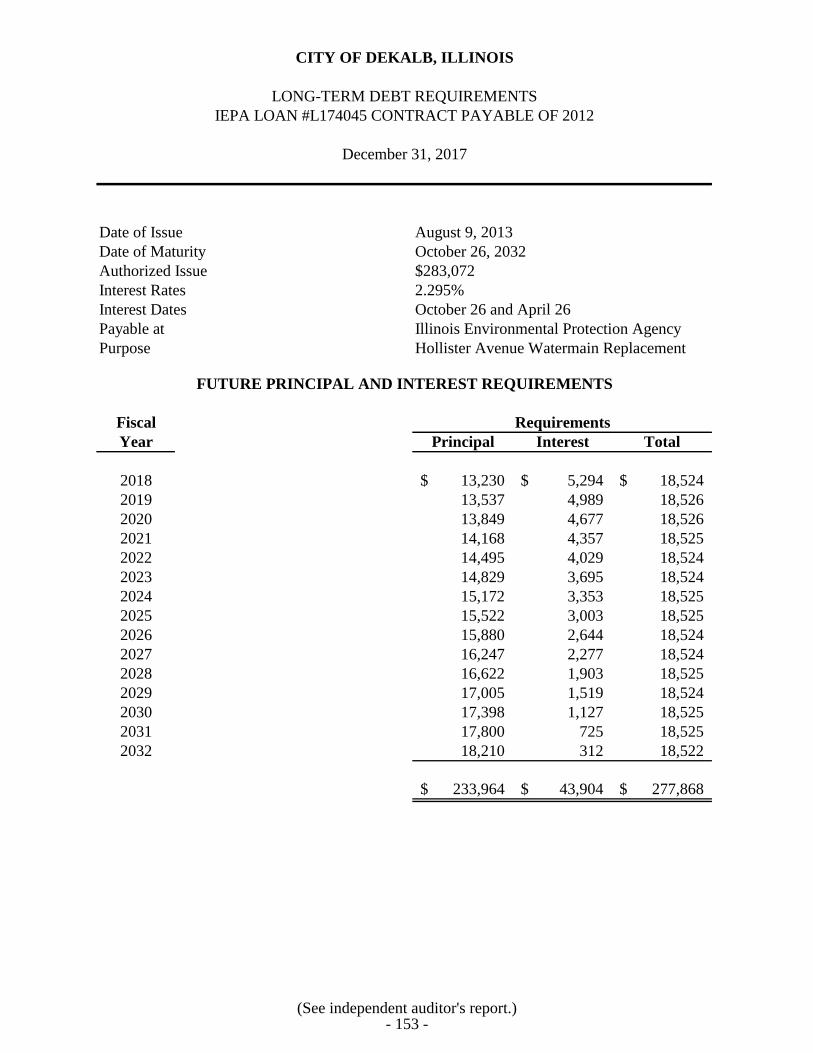
Date of Issue August 9, 2013
Date of Maturity October 26, 2032
Authorized Issue $283,072
Interest Rates 2.295%
Interest Dates October 26 and April 26
Payable at Illinois Environmental Protection Agency
Purpose Hollister Avenue Watermain Replacement
Fiscal
Year Principal Interest Total
2018 13,230$ 5,294$ 18,524$
2019 13,537 4,989 18,526
2020 13,849 4,677 18,526
2021 14,168 4,357 18,525
2022 14,495 4,029 18,524
2023 14,829 3,695 18,524
2024 15,172 3,353 18,525
2025 15,522 3,003 18,525
2026 15,880 2,644 18,524
2027 16,247 2,277 18,524
2028 16,622 1,903 18,525
2029 17,005 1,519 18,524
2030 17,398 1,127 18,525
2031 17,800 725 18,525
2032 18,210 312 18,522
233,964$ 43,904$ 277,868$
Requirements
CITY OF DEKALB, ILLINOIS
LONG-TERM DEBT REQUIREMENTS
IEPA LOAN #L174045 CONTRACT PAYABLE OF 2012
December 31, 2017
FUTURE PRINCIPAL AND INTEREST REQUIREMENTS
(See independent auditor's report.)- 153 -
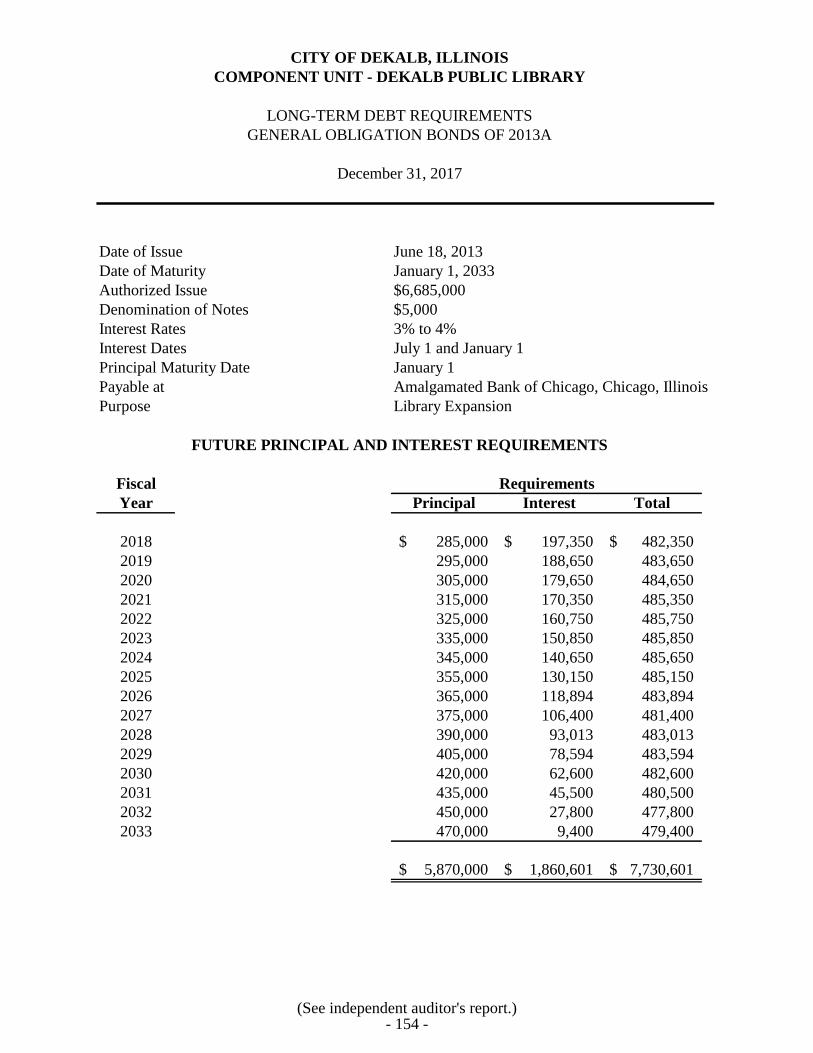
Date of Issue June 18, 2013
Date of Maturity January 1, 2033
Authorized Issue $6,685,000
Denomination of Notes $5,000
Interest Rates 3% to 4%
Interest Dates July 1 and January 1
Principal Maturity Date January 1
Payable at Amalgamated Bank of Chicago, Chicago, Illinois
Purpose Library Expansion
Fiscal
Year Principal Interest Total
2018 285,000$ 197,350$ 482,350$
2019 295,000 188,650 483,650
2020 305,000 179,650 484,650
2021 315,000 170,350 485,350
2022 325,000 160,750 485,750
2023 335,000 150,850 485,850
2024 345,000 140,650 485,650
2025 355,000 130,150 485,150
2026 365,000 118,894 483,894
2027 375,000 106,400 481,400
2028 390,000 93,013 483,013
2029 405,000 78,594 483,594
2030 420,000 62,600 482,600
2031 435,000 45,500 480,500
2032 450,000 27,800 477,800
2033 470,000 9,400 479,400
5,870,000$ 1,860,601$ 7,730,601$
Requirements
CITY OF DEKALB, ILLINOIS
COMPONENT UNIT - DEKALB PUBLIC LIBRARY
LONG-TERM DEBT REQUIREMENTS
GENERAL OBLIGATION BONDS OF 2013A
December 31, 2017
FUTURE PRINCIPAL AND INTEREST REQUIREMENTS
(See independent auditor's report.)- 154 -
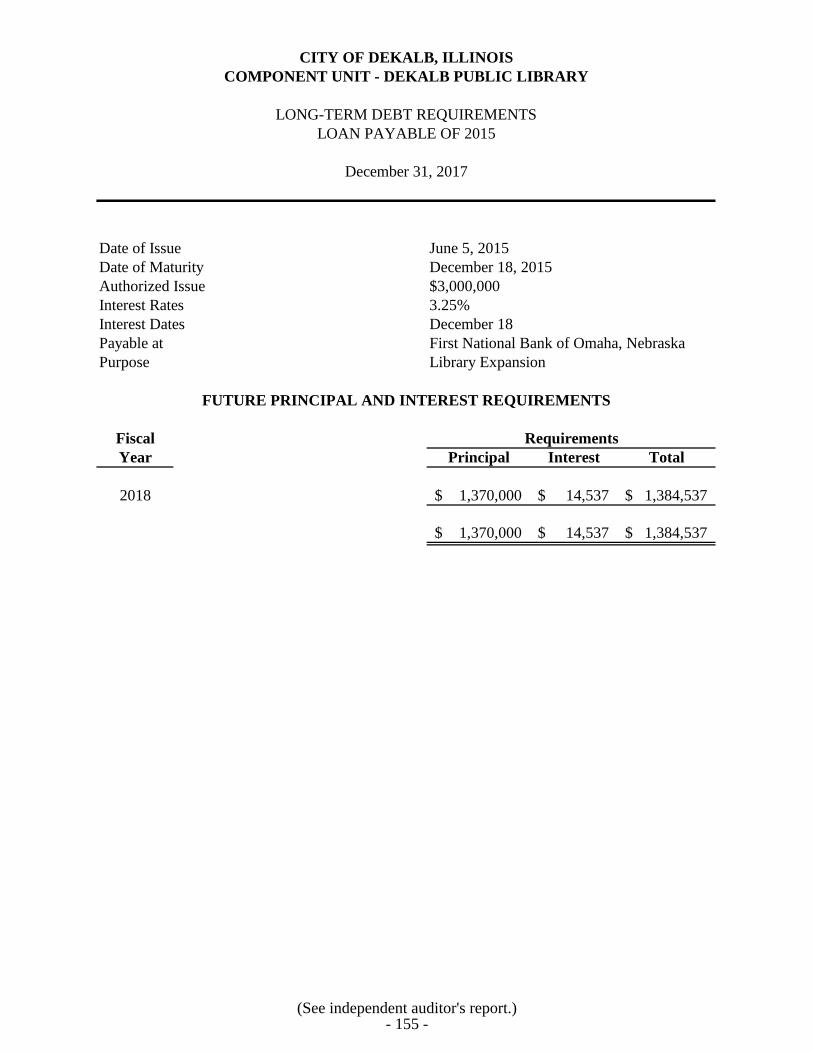
Date of Issue June 5, 2015
Date of Maturity December 18, 2015
Authorized Issue $3,000,000
Interest Rates 3.25%
Interest Dates December 18
Payable at First National Bank of Omaha, Nebraska
Purpose Library Expansion
Fiscal
Year Principal Interest Total
2018 1,370,000$ 14,537$ 1,384,537$
1,370,000$ 14,537$ 1,384,537$
Requirements
CITY OF DEKALB, ILLINOIS
COMPONENT UNIT - DEKALB PUBLIC LIBRARY
LONG-TERM DEBT REQUIREMENTS
LOAN PAYABLE OF 2015
December 31, 2017
FUTURE PRINCIPAL AND INTEREST REQUIREMENTS
(See independent auditor's report.)- 155 -
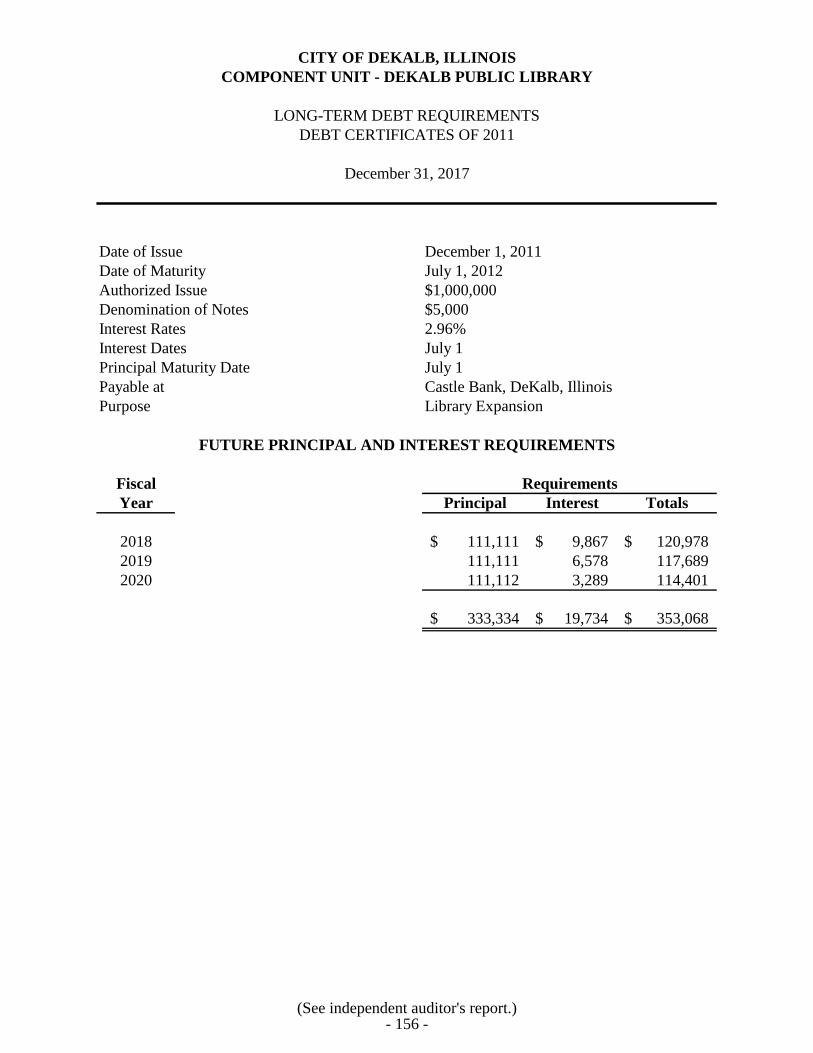
Date of Issue December 1, 2011
Date of Maturity July 1, 2012
Authorized Issue $1,000,000
Denomination of Notes $5,000
Interest Rates 2.96%
Interest Dates July 1
Principal Maturity Date July 1
Payable at Castle Bank, DeKalb, Illinois
Purpose Library Expansion
Fiscal
Year Principal Interest Totals
2018 111,111$ 9,867$ 120,978$
2019 111,111 6,578 117,689
2020 111,112 3,289 114,401
333,334$ 19,734$ 353,068$
Requirements
CITY OF DEKALB, ILLINOIS
COMPONENT UNIT - DEKALB PUBLIC LIBRARY
LONG-TERM DEBT REQUIREMENTS
DEBT CERTIFICATES OF 2011
December 31, 2017
FUTURE PRINCIPAL AND INTEREST REQUIREMENTS
(See independent auditor's report.)- 156 -
STATISTICAL SECTION
This part of the City of DeKalb, Illinois’ comprehensive annual financial report presents detailed
information as a context for understanding what the information in the financial statements, note
disclosures, and required supplementary information says about the City’s overall financial health.
Contents Page(s)
Financial Trends
These schedules contain trend information to help the reader
understand how the City’s financial performance and well-being have
changed over time.
157-166
Revenue Capacity
These schedules contain information to help the reader assess the City’s
most significant local revenue source, the sales tax.
167-174
Debt Capacity
These schedules present information to help the reader assess the
affordability of the City’s current levels of outstanding debt and the
City’s ability to issue additional debt in the future.
175-179
Demographic and Economic Information
These schedules offer demographic and economic indicators to help the
reader understand the environment within which the City’s financial
activities take place.
180-181
Operating Information
These schedules contain service and infrastructure data to help the
reader understand how the information in the City’s financial report
relates to the services the City provides and the activities it performs.
182-186
Sources: Unless otherwise noted, the information in these schedules is derived from the
comprehensive annual financial reports for the relevant year.
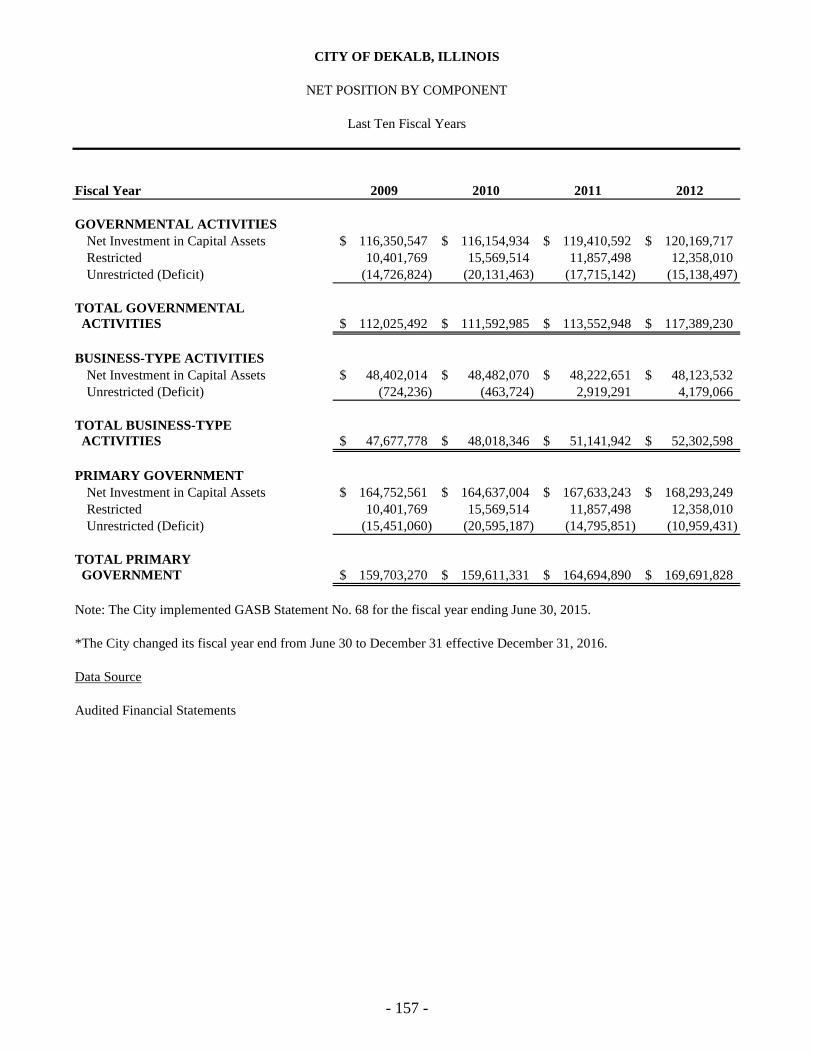
Fiscal Year 2009 2010 2011 2012
GOVERNMENTAL ACTIVITIES
Net Investment in Capital Assets 116,350,547$ 116,154,934$ 119,410,592$ 120,169,717$
Restricted 10,401,769 15,569,514 11,857,498 12,358,010
Unrestricted (Deficit) (14,726,824) (20,131,463) (17,715,142) (15,138,497)
TOTAL GOVERNMENTAL
ACTIVITIES 112,025,492$ 111,592,985$ 113,552,948$ 117,389,230$
BUSINESS-TYPE ACTIVITIES
Net Investment in Capital Assets 48,402,014$ 48,482,070$ 48,222,651$ 48,123,532$
Unrestricted (Deficit) (724,236) (463,724) 2,919,291 4,179,066
TOTAL BUSINESS-TYPE
ACTIVITIES 47,677,778$ 48,018,346$ 51,141,942$ 52,302,598$
PRIMARY GOVERNMENT
Net Investment in Capital Assets 164,752,561$ 164,637,004$ 167,633,243$ 168,293,249$
Restricted 10,401,769 15,569,514 11,857,498 12,358,010
Unrestricted (Deficit) (15,451,060) (20,595,187) (14,795,851) (10,959,431)
TOTAL PRIMARY
GOVERNMENT 159,703,270$ 159,611,331$ 164,694,890$ 169,691,828$
Note: The City implemented GASB Statement No. 68 for the fiscal year ending June 30, 2015.
*The City changed its fiscal year end from June 30 to December 31 effective December 31, 2016.
Data Source
Audited Financial Statements
CITY OF DEKALB, ILLINOIS
NET POSITION BY COMPONENT
Last Ten Fiscal Years
- 157 -
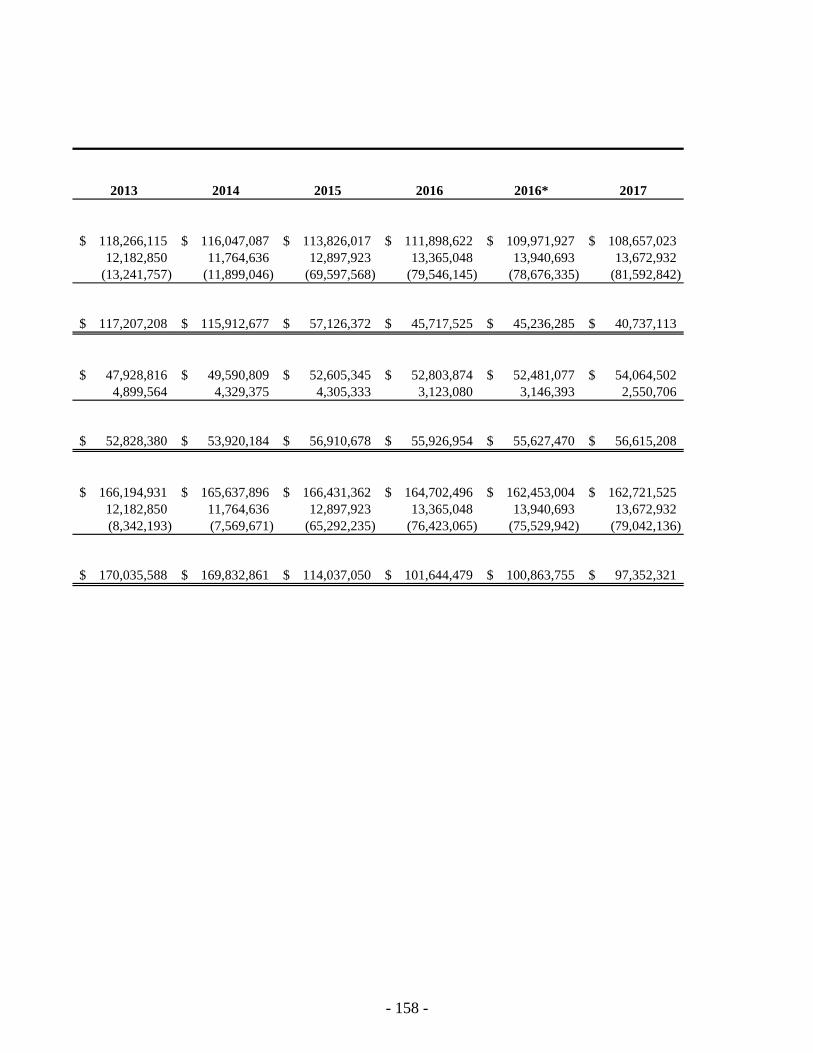
2013 2014 2015 2016 2016* 2017
118,266,115$ 116,047,087$ 113,826,017$ 111,898,622$ 109,971,927$ 108,657,023$
12,182,850 11,764,636 12,897,923 13,365,048 13,940,693 13,672,932
(13,241,757) (11,899,046) (69,597,568) (79,546,145) (78,676,335) (81,592,842)
117,207,208$ 115,912,677$ 57,126,372$ 45,717,525$ 45,236,285$ 40,737,113$
47,928,816$ 49,590,809$ 52,605,345$ 52,803,874$ 52,481,077$ 54,064,502$
4,899,564 4,329,375 4,305,333 3,123,080 3,146,393 2,550,706
52,828,380$ 53,920,184$ 56,910,678$ 55,926,954$ 55,627,470$ 56,615,208$
166,194,931$ 165,637,896$ 166,431,362$ 164,702,496$ 162,453,004$ 162,721,525$
12,182,850 11,764,636 12,897,923 13,365,048 13,940,693 13,672,932
(8,342,193) (7,569,671) (65,292,235) (76,423,065) (75,529,942) (79,042,136)
170,035,588$ 169,832,861$ 114,037,050$ 101,644,479$ 100,863,755$ 97,352,321$
- 158 -
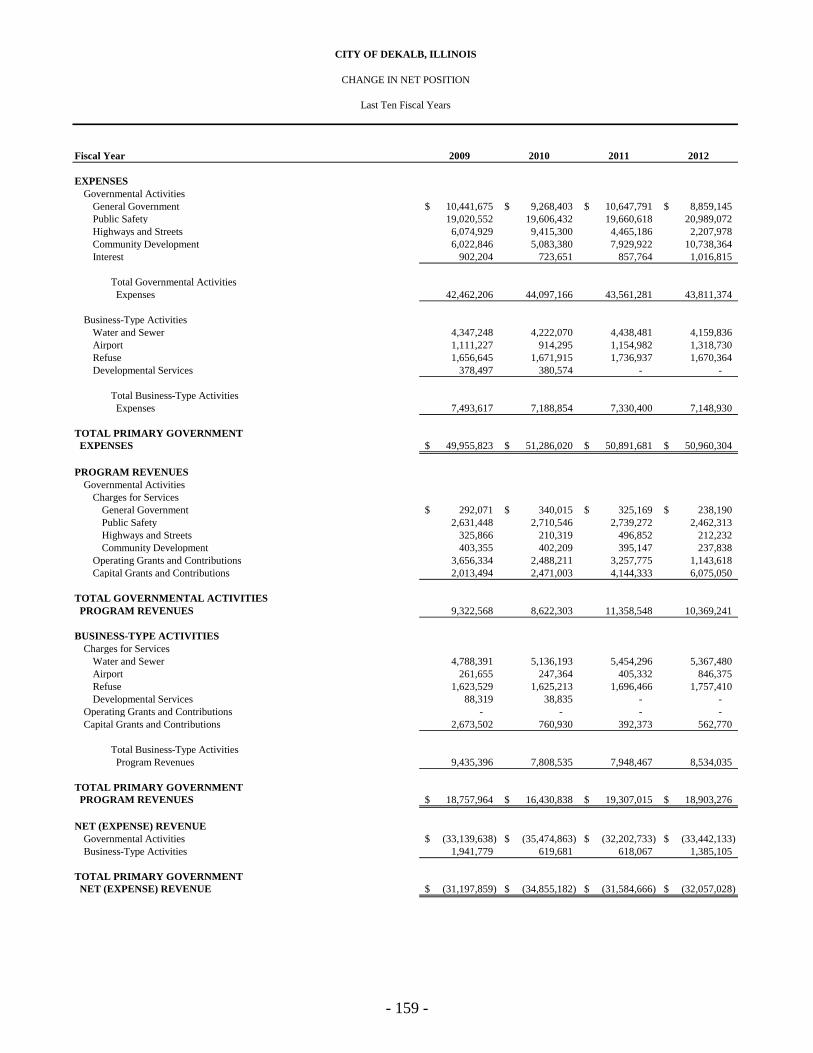
Fiscal Year 2009 2010 2011 2012
EXPENSES
Governmental Activities
General Government 10,441,675$ 9,268,403$ 10,647,791$ 8,859,145$
Public Safety 19,020,552 19,606,432 19,660,618 20,989,072
Highways and Streets 6,074,929 9,415,300 4,465,186 2,207,978
Community Development 6,022,846 5,083,380 7,929,922 10,738,364
Interest 902,204 723,651 857,764 1,016,815
Total Governmental Activities
Expenses 42,462,206 44,097,166 43,561,281 43,811,374
Business-Type Activities
Water and Sewer 4,347,248 4,222,070 4,438,481 4,159,836
Airport 1,111,227 914,295 1,154,982 1,318,730
Refuse 1,656,645 1,671,915 1,736,937 1,670,364
Developmental Services 378,497 380,574 - -
Total Business-Type Activities
Expenses 7,493,617 7,188,854 7,330,400 7,148,930
TOTAL PRIMARY GOVERNMENT
EXPENSES 49,955,823$ 51,286,020$ 50,891,681$ 50,960,304$
PROGRAM REVENUES
Governmental Activities
Charges for Services
General Government 292,071$ 340,015$ 325,169$ 238,190$
Public Safety 2,631,448 2,710,546 2,739,272 2,462,313
Highways and Streets 325,866 210,319 496,852 212,232
Community Development 403,355 402,209 395,147 237,838
Operating Grants and Contributions 3,656,334 2,488,211 3,257,775 1,143,618
Capital Grants and Contributions 2,013,494 2,471,003 4,144,333 6,075,050
TOTAL GOVERNMENTAL ACTIVITIES
PROGRAM REVENUES 9,322,568 8,622,303 11,358,548 10,369,241
BUSINESS-TYPE ACTIVITIES
Charges for Services
Water and Sewer 4,788,391 5,136,193 5,454,296 5,367,480
Airport 261,655 247,364 405,332 846,375
Refuse 1,623,529 1,625,213 1,696,466 1,757,410
Developmental Services 88,319 38,835 - -
Operating Grants and Contributions - - - -
Capital Grants and Contributions 2,673,502 760,930 392,373 562,770
Total Business-Type Activities
Program Revenues 9,435,396 7,808,535 7,948,467 8,534,035
TOTAL PRIMARY GOVERNMENT
PROGRAM REVENUES 18,757,964$ 16,430,838$ 19,307,015$ 18,903,276$
NET (EXPENSE) REVENUE
Governmental Activities (33,139,638)$ (35,474,863)$ (32,202,733)$ (33,442,133)$
Business-Type Activities 1,941,779 619,681 618,067 1,385,105
TOTAL PRIMARY GOVERNMENT
NET (EXPENSE) REVENUE (31,197,859)$ (34,855,182)$ (31,584,666)$ (32,057,028)$
CITY OF DEKALB, ILLINOIS
CHANGE IN NET POSITION
Last Ten Fiscal Years
- 159 -
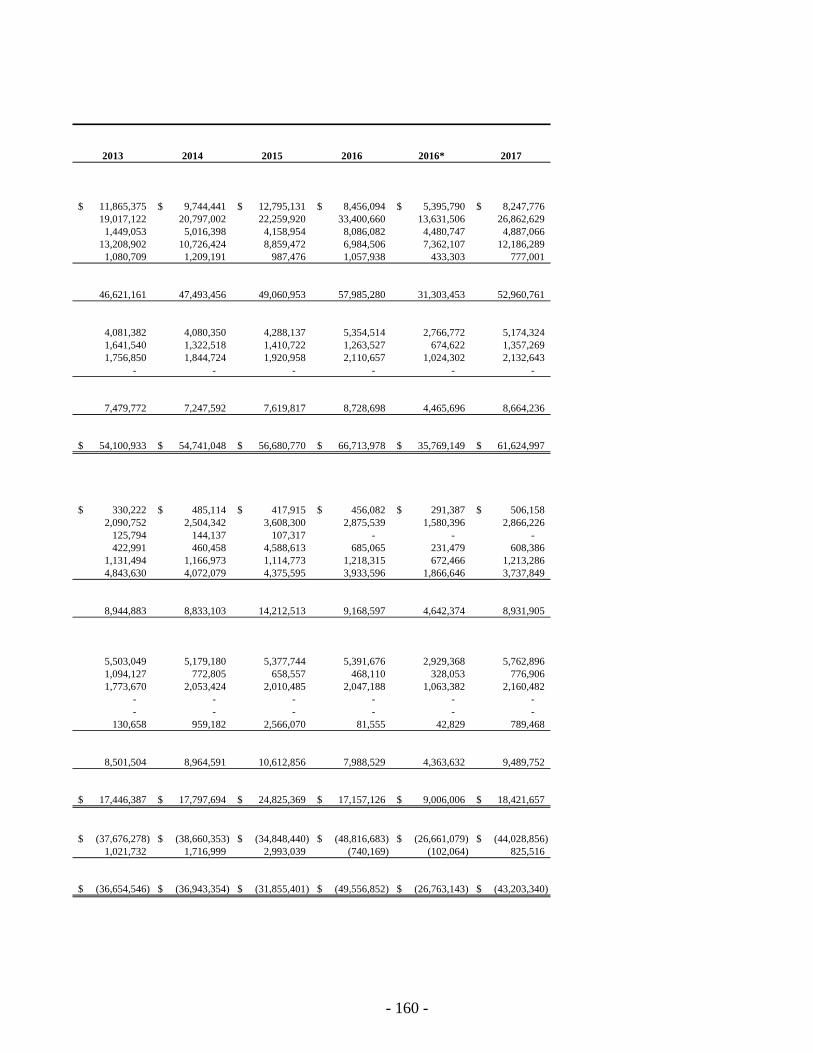
2013 2014 2015 2016 2016* 2017
11,865,375$ 9,744,441$ 12,795,131$ 8,456,094$ 5,395,790$ 8,247,776$
19,017,122 20,797,002 22,259,920 33,400,660 13,631,506 26,862,629
1,449,053 5,016,398 4,158,954 8,086,082 4,480,747 4,887,066
13,208,902 10,726,424 8,859,472 6,984,506 7,362,107 12,186,289
1,080,709 1,209,191 987,476 1,057,938 433,303 777,001
46,621,161 47,493,456 49,060,953 57,985,280 31,303,453 52,960,761
4,081,382 4,080,350 4,288,137 5,354,514 2,766,772 5,174,324
1,641,540 1,322,518 1,410,722 1,263,527 674,622 1,357,269
1,756,850 1,844,724 1,920,958 2,110,657 1,024,302 2,132,643
- - - - - -
7,479,772 7,247,592 7,619,817 8,728,698 4,465,696 8,664,236
54,100,933$ 54,741,048$ 56,680,770$ 66,713,978$ 35,769,149$ 61,624,997$
330,222$ 485,114$ 417,915$ 456,082$ 291,387$ 506,158$
2,090,752 2,504,342 3,608,300 2,875,539 1,580,396 2,866,226
125,794 144,137 107,317 - - -
422,991 460,458 4,588,613 685,065 231,479 608,386
1,131,494 1,166,973 1,114,773 1,218,315 672,466 1,213,286
4,843,630 4,072,079 4,375,595 3,933,596 1,866,646 3,737,849
8,944,883 8,833,103 14,212,513 9,168,597 4,642,374 8,931,905
5,503,049 5,179,180 5,377,744 5,391,676 2,929,368 5,762,896
1,094,127 772,805 658,557 468,110 328,053 776,906
1,773,670 2,053,424 2,010,485 2,047,188 1,063,382 2,160,482
- - - - - -
- - - - - -
130,658 959,182 2,566,070 81,555 42,829 789,468
8,501,504 8,964,591 10,612,856 7,988,529 4,363,632 9,489,752
17,446,387$ 17,797,694$ 24,825,369$ 17,157,126$ 9,006,006$ 18,421,657$
(37,676,278)$ (38,660,353)$ (34,848,440)$ (48,816,683)$ (26,661,079)$ (44,028,856)$
1,021,732 1,716,999 2,993,039 (740,169) (102,064) 825,516
(36,654,546)$ (36,943,354)$ (31,855,401)$ (49,556,852)$ (26,763,143)$ (43,203,340)$
- 160 -
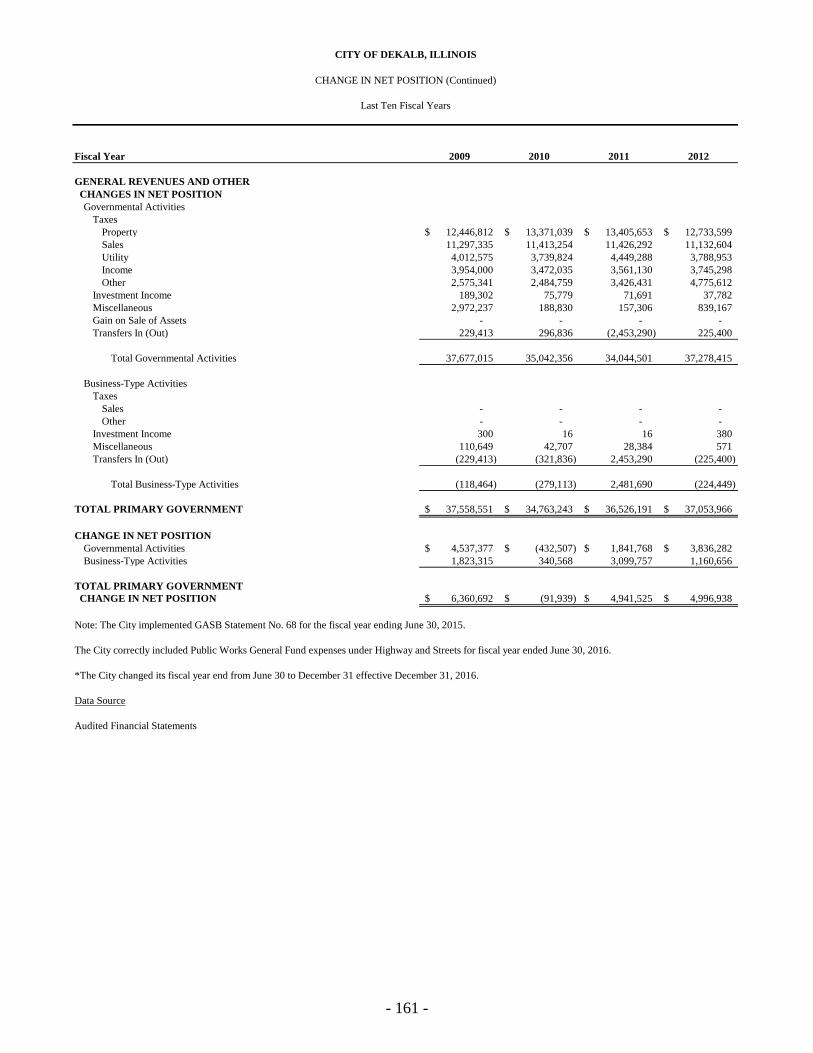
Fiscal Year 2009 2010 2011 2012
GENERAL REVENUES AND OTHER
CHANGES IN NET POSITION
Governmental Activities
Taxes
Property 12,446,812$ 13,371,039$ 13,405,653$ 12,733,599$
Sales 11,297,335 11,413,254 11,426,292 11,132,604
Utility 4,012,575 3,739,824 4,449,288 3,788,953
Income 3,954,000 3,472,035 3,561,130 3,745,298
Other 2,575,341 2,484,759 3,426,431 4,775,612
Investment Income 189,302 75,779 71,691 37,782
Miscellaneous 2,972,237 188,830 157,306 839,167
Gain on Sale of Assets - - - -
Transfers In (Out) 229,413 296,836 (2,453,290) 225,400
Total Governmental Activities 37,677,015 35,042,356 34,044,501 37,278,415
Business-Type Activities
Taxes
Sales - - - -
Other - - - -
Investment Income 300 16 16 380
Miscellaneous 110,649 42,707 28,384 571
Transfers In (Out) (229,413) (321,836) 2,453,290 (225,400)
Total Business-Type Activities (118,464) (279,113) 2,481,690 (224,449)
TOTAL PRIMARY GOVERNMENT 37,558,551$ 34,763,243$ 36,526,191$ 37,053,966$
CHANGE IN NET POSITION
Governmental Activities 4,537,377$ (432,507)$ 1,841,768$ 3,836,282$
Business-Type Activities 1,823,315 340,568 3,099,757 1,160,656
TOTAL PRIMARY GOVERNMENT
CHANGE IN NET POSITION 6,360,692$ (91,939)$ 4,941,525$ 4,996,938$
Note: The City implemented GASB Statement No. 68 for the fiscal year ending June 30, 2015.
*The City changed its fiscal year end from June 30 to December 31 effective December 31, 2016.
Data Source
Audited Financial Statements
The City correctly included Public Works General Fund expenses under Highway and Streets for fiscal year ended June 30, 2016.
Last Ten Fiscal Years
CITY OF DEKALB, ILLINOIS
CHANGE IN NET POSITION (Continued)
- 161 -
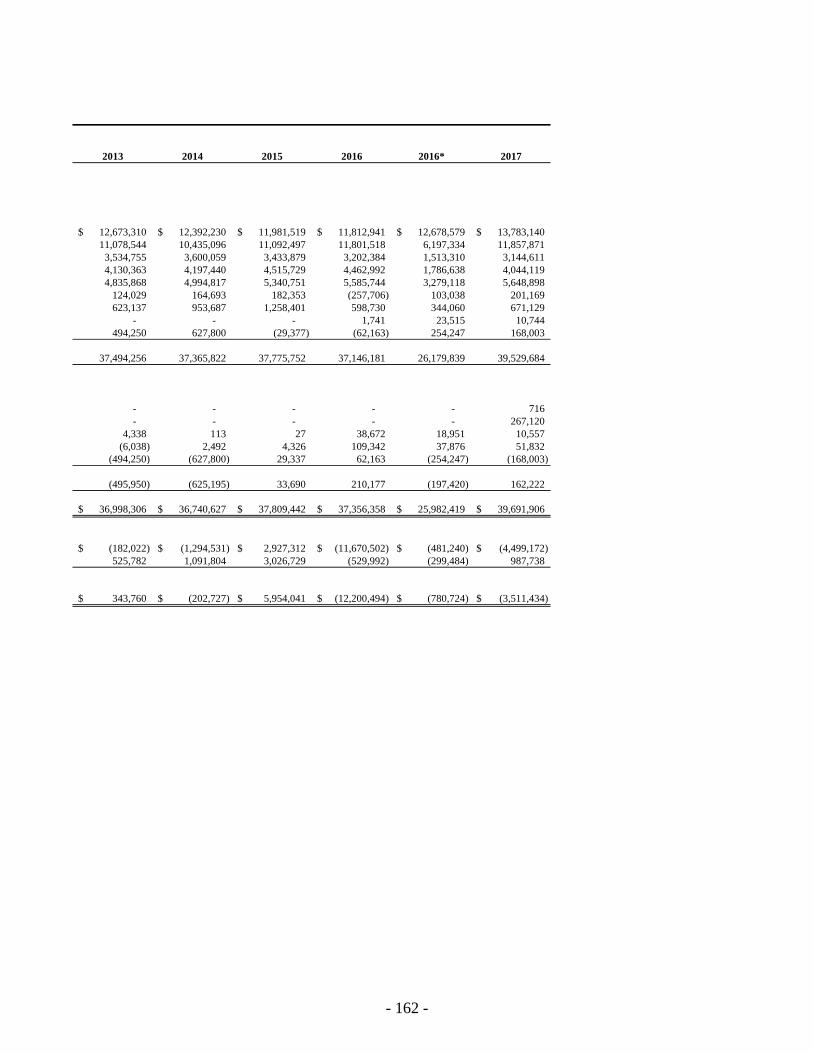
2013 2014 2015 2016 2016* 2017
12,673,310$ 12,392,230$ 11,981,519$ 11,812,941$ 12,678,579$ 13,783,140$
11,078,544 10,435,096 11,092,497 11,801,518 6,197,334 11,857,871
3,534,755 3,600,059 3,433,879 3,202,384 1,513,310 3,144,611
4,130,363 4,197,440 4,515,729 4,462,992 1,786,638 4,044,119
4,835,868 4,994,817 5,340,751 5,585,744 3,279,118 5,648,898
124,029 164,693 182,353 (257,706) 103,038 201,169
623,137 953,687 1,258,401 598,730 344,060 671,129
- - - 1,741 23,515 10,744
494,250 627,800 (29,377) (62,163) 254,247 168,003
37,494,256 37,365,822 37,775,752 37,146,181 26,179,839 39,529,684
- - - - - 716
- - - - - 267,120
4,338 113 27 38,672 18,951 10,557
(6,038) 2,492 4,326 109,342 37,876 51,832
(494,250) (627,800) 29,337 62,163 (254,247) (168,003)
(495,950) (625,195) 33,690 210,177 (197,420) 162,222
36,998,306$ 36,740,627$ 37,809,442$ 37,356,358$ 25,982,419$ 39,691,906$
(182,022)$ (1,294,531)$ 2,927,312$ (11,670,502)$ (481,240)$ (4,499,172)$
525,782 1,091,804 3,026,729 (529,992) (299,484) 987,738
343,760$ (202,727)$ 5,954,041$ (12,200,494)$ (780,724)$ (3,511,434)$
- 162 -
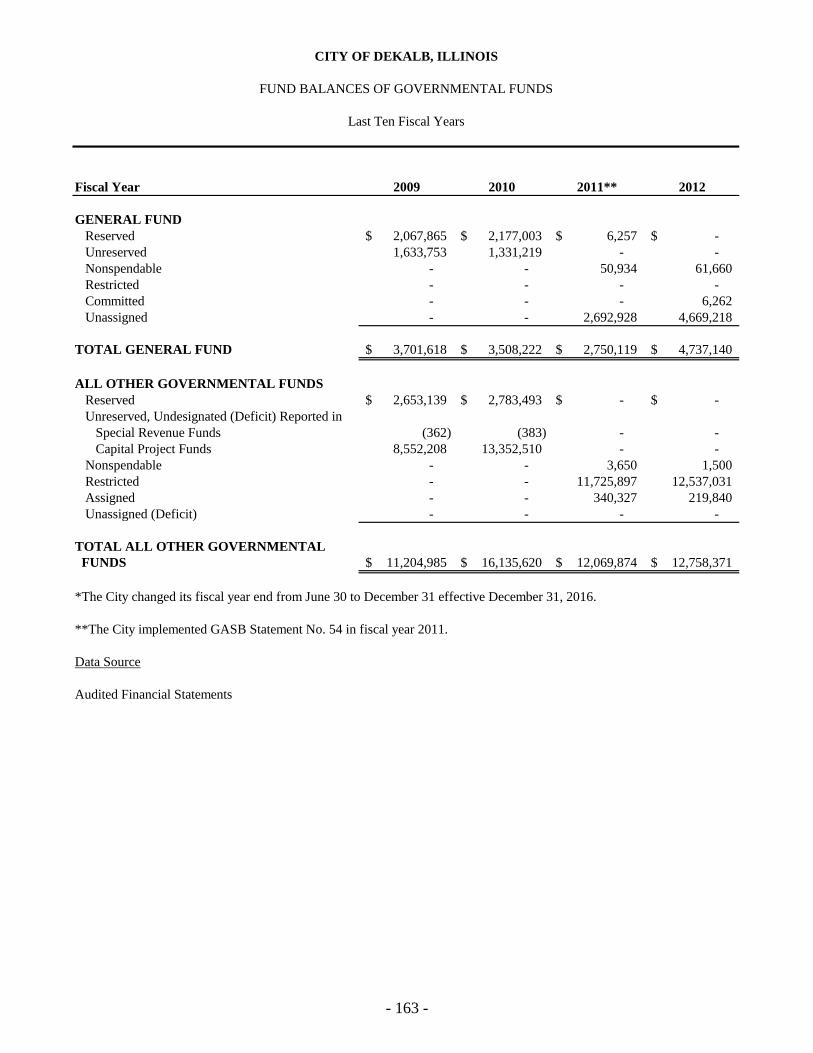
Fiscal Year 2009 2010 2011** 2012
GENERAL FUND
Reserved 2,067,865$ 2,177,003$ 6,257$ -$
Unreserved 1,633,753 1,331,219 - -
Nonspendable - - 50,934 61,660
Restricted - - - -
Committed - - - 6,262
Unassigned - - 2,692,928 4,669,218
TOTAL GENERAL FUND 3,701,618$ 3,508,222$ 2,750,119$ 4,737,140$
ALL OTHER GOVERNMENTAL FUNDS
Reserved 2,653,139$ 2,783,493$ -$ -$
Unreserved, Undesignated (Deficit) Reported in
Special Revenue Funds (362) (383) - -
Capital Project Funds 8,552,208 13,352,510 - -
Nonspendable - - 3,650 1,500
Restricted - - 11,725,897 12,537,031
Assigned - - 340,327 219,840
Unassigned (Deficit) - - - -
TOTAL ALL OTHER GOVERNMENTAL
FUNDS 11,204,985$ 16,135,620$ 12,069,874$ 12,758,371$
*The City changed its fiscal year end from June 30 to December 31 effective December 31, 2016.
**The City implemented GASB Statement No. 54 in fiscal year 2011.
Data Source
Audited Financial Statements
CITY OF DEKALB, ILLINOIS
FUND BALANCES OF GOVERNMENTAL FUNDS
Last Ten Fiscal Years
- 163 -
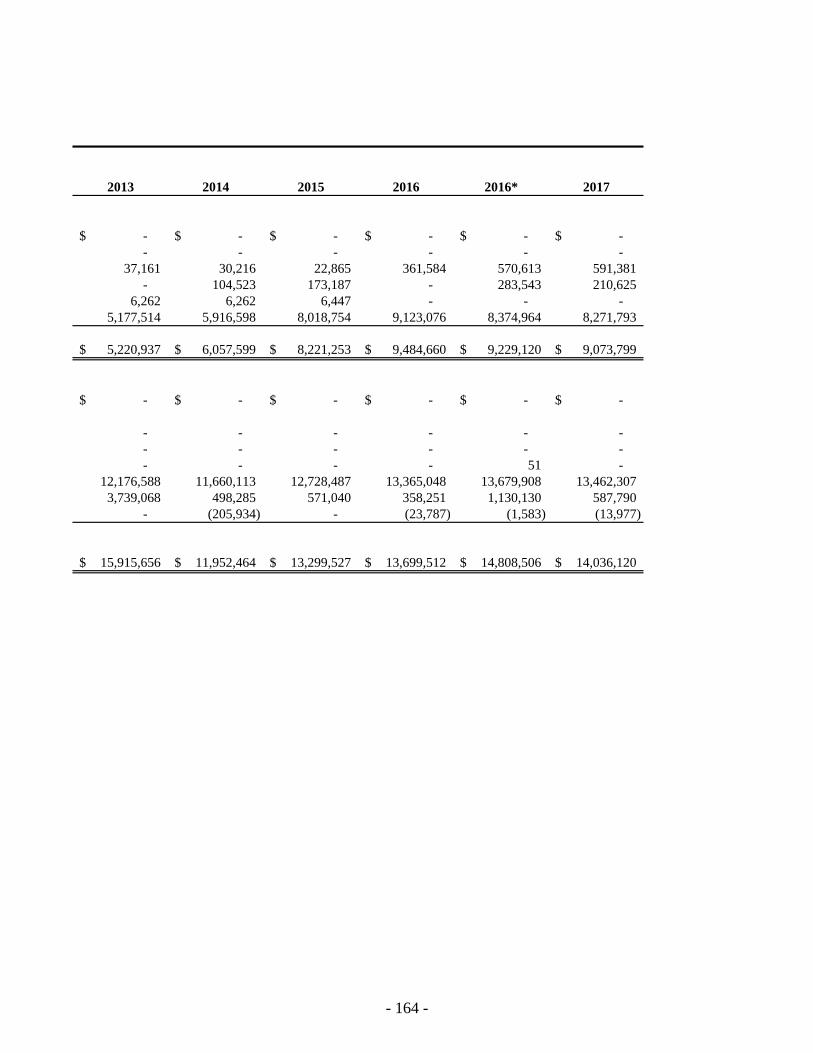
2013 2014 2015 2016 2016* 2017
-$ -$ -$ -$ -$ -$
- - - - - -
37,161 30,216 22,865 361,584 570,613 591,381
- 104,523 173,187 - 283,543 210,625
6,262 6,262 6,447 - - -
5,177,514 5,916,598 8,018,754 9,123,076 8,374,964 8,271,793
5,220,937$ 6,057,599$ 8,221,253$ 9,484,660$ 9,229,120$ 9,073,799$
-$ -$ -$ -$ -$ -$
- - - - - -
- - - - - -
- - - - 51 -
12,176,588 11,660,113 12,728,487 13,365,048 13,679,908 13,462,307
3,739,068 498,285 571,040 358,251 1,130,130 587,790
- (205,934) - (23,787) (1,583) (13,977)
15,915,656$ 11,952,464$ 13,299,527$ 13,699,512$ 14,808,506$ 14,036,120$
- 164 -
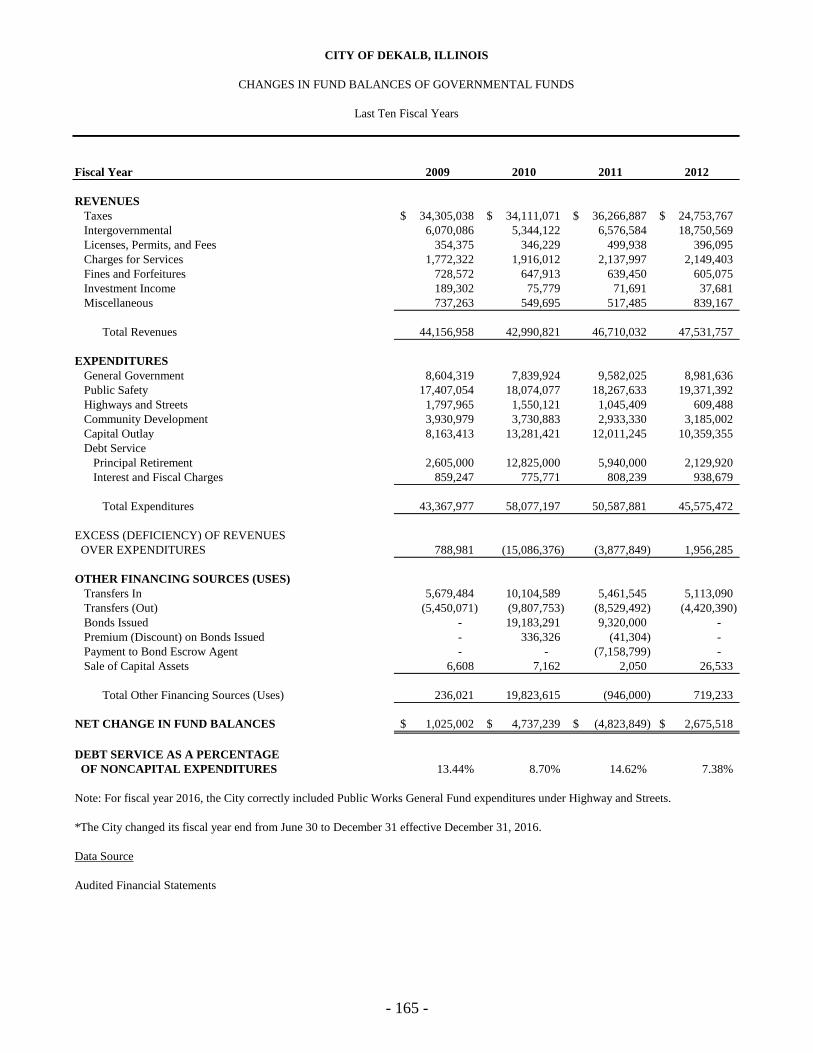
Fiscal Year 2009 2010 2011 2012
REVENUES
Taxes 34,305,038$ 34,111,071$ 36,266,887$ 24,753,767$
Intergovernmental 6,070,086 5,344,122 6,576,584 18,750,569
Licenses, Permits, and Fees 354,375 346,229 499,938 396,095
Charges for Services 1,772,322 1,916,012 2,137,997 2,149,403
Fines and Forfeitures 728,572 647,913 639,450 605,075
Investment Income 189,302 75,779 71,691 37,681
Miscellaneous 737,263 549,695 517,485 839,167
Total Revenues 44,156,958 42,990,821 46,710,032 47,531,757
EXPENDITURES
General Government 8,604,319 7,839,924 9,582,025 8,981,636
Public Safety 17,407,054 18,074,077 18,267,633 19,371,392
Highways and Streets 1,797,965 1,550,121 1,045,409 609,488
Community Development 3,930,979 3,730,883 2,933,330 3,185,002
Capital Outlay 8,163,413 13,281,421 12,011,245 10,359,355
Debt Service
Principal Retirement 2,605,000 12,825,000 5,940,000 2,129,920
Interest and Fiscal Charges 859,247 775,771 808,239 938,679
Total Expenditures 43,367,977 58,077,197 50,587,881 45,575,472
EXCESS (DEFICIENCY) OF REVENUES
OVER EXPENDITURES 788,981 (15,086,376) (3,877,849) 1,956,285
OTHER FINANCING SOURCES (USES)
Transfers In 5,679,484 10,104,589 5,461,545 5,113,090
Transfers (Out) (5,450,071) (9,807,753) (8,529,492) (4,420,390)
Bonds Issued - 19,183,291 9,320,000 -
Premium (Discount) on Bonds Issued - 336,326 (41,304) -
Payment to Bond Escrow Agent - - (7,158,799) -
Sale of Capital Assets 6,608 7,162 2,050 26,533
Total Other Financing Sources (Uses) 236,021 19,823,615 (946,000) 719,233
NET CHANGE IN FUND BALANCES 1,025,002$ 4,737,239$ (4,823,849)$ 2,675,518$
DEBT SERVICE AS A PERCENTAGE
OF NONCAPITAL EXPENDITURES 13.44% 8.70% 14.62% 7.38%
*The City changed its fiscal year end from June 30 to December 31 effective December 31, 2016.
Data Source
Audited Financial Statements
CITY OF DEKALB, ILLINOIS
CHANGES IN FUND BALANCES OF GOVERNMENTAL FUNDS
Last Ten Fiscal Years
Note: For fiscal year 2016, the City correctly included Public Works General Fund expenditures under Highway and Streets.
- 165 -
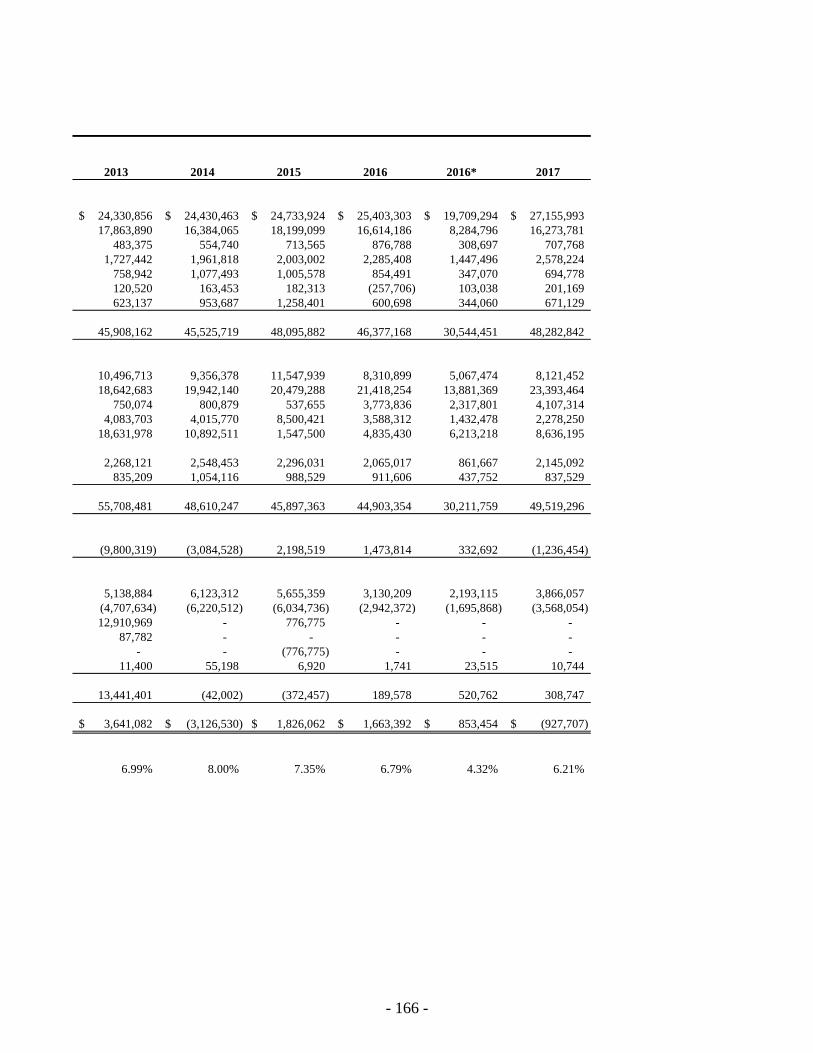
2013 2014 2015 2016 2016* 2017
24,330,856$ 24,430,463$ 24,733,924$ 25,403,303$ 19,709,294$ 27,155,993$
17,863,890 16,384,065 18,199,099 16,614,186 8,284,796 16,273,781
483,375 554,740 713,565 876,788 308,697 707,768
1,727,442 1,961,818 2,003,002 2,285,408 1,447,496 2,578,224
758,942 1,077,493 1,005,578 854,491 347,070 694,778
120,520 163,453 182,313 (257,706) 103,038 201,169
623,137 953,687 1,258,401 600,698 344,060 671,129
45,908,162 45,525,719 48,095,882 46,377,168 30,544,451 48,282,842
10,496,713 9,356,378 11,547,939 8,310,899 5,067,474 8,121,452
18,642,683 19,942,140 20,479,288 21,418,254 13,881,369 23,393,464
750,074 800,879 537,655 3,773,836 2,317,801 4,107,314
4,083,703 4,015,770 8,500,421 3,588,312 1,432,478 2,278,250
18,631,978 10,892,511 1,547,500 4,835,430 6,213,218 8,636,195
2,268,121 2,548,453 2,296,031 2,065,017 861,667 2,145,092
835,209 1,054,116 988,529 911,606 437,752 837,529
55,708,481 48,610,247 45,897,363 44,903,354 30,211,759 49,519,296
(9,800,319) (3,084,528) 2,198,519 1,473,814 332,692 (1,236,454)
5,138,884 6,123,312 5,655,359 3,130,209 2,193,115 3,866,057
(4,707,634) (6,220,512) (6,034,736) (2,942,372) (1,695,868) (3,568,054)
12,910,969 - 776,775 - - -
87,782 - - - - -
- - (776,775) - - -
11,400 55,198 6,920 1,741 23,515 10,744
13,441,401 (42,002) (372,457) 189,578 520,762 308,747
3,641,082$ (3,126,530)$ 1,826,062$ 1,663,392$ 853,454$ (927,707)$
6.99% 8.00% 7.35% 6.79% 4.32% 6.21%
- 166 -
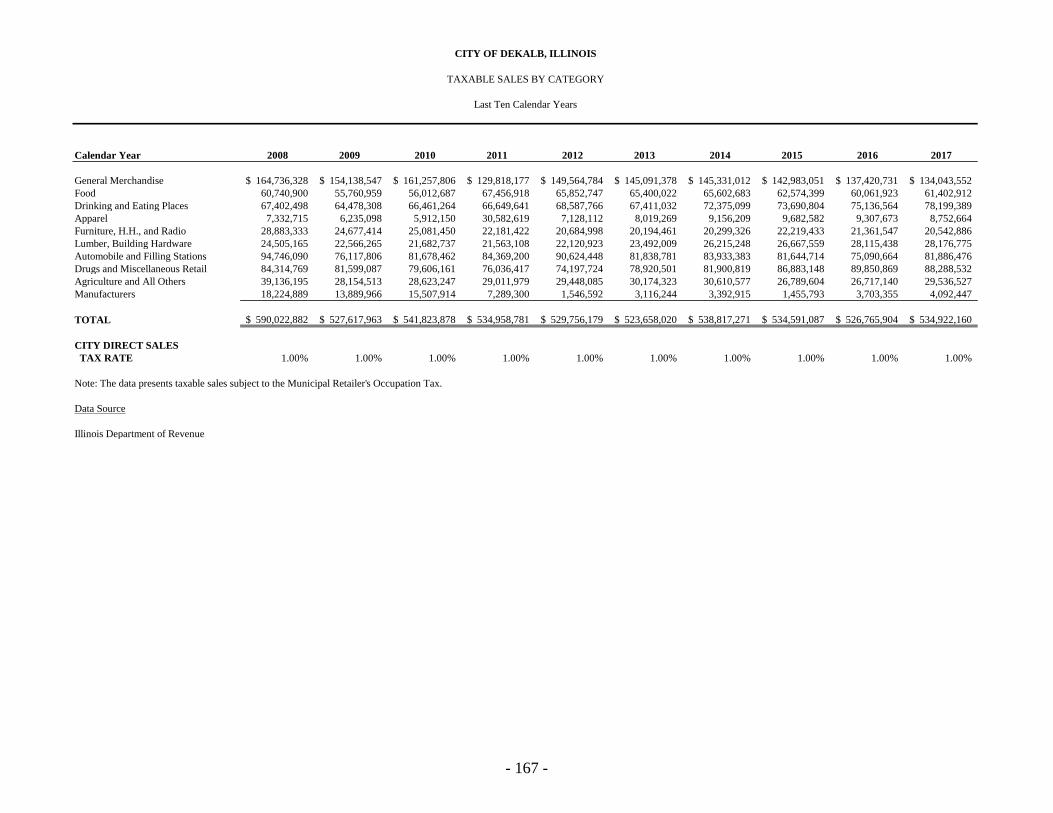
Calendar Year 2008 2009 2010 2011 2012 2013 2014 2015 2016 2017
General Merchandise 164,736,328$ 154,138,547$ 161,257,806$ 129,818,177$ 149,564,784$ 145,091,378$ 145,331,012$ 142,983,051$ 137,420,731$ 134,043,552$
Food 60,740,900 55,760,959 56,012,687 67,456,918 65,852,747 65,400,022 65,602,683 62,574,399 60,061,923 61,402,912
Drinking and Eating Places 67,402,498 64,478,308 66,461,264 66,649,641 68,587,766 67,411,032 72,375,099 73,690,804 75,136,564 78,199,389
Apparel 7,332,715 6,235,098 5,912,150 30,582,619 7,128,112 8,019,269 9,156,209 9,682,582 9,307,673 8,752,664
Furniture, H.H., and Radio 28,883,333 24,677,414 25,081,450 22,181,422 20,684,998 20,194,461 20,299,326 22,219,433 21,361,547 20,542,886
Lumber, Building Hardware 24,505,165 22,566,265 21,682,737 21,563,108 22,120,923 23,492,009 26,215,248 26,667,559 28,115,438 28,176,775
Automobile and Filling Stations 94,746,090 76,117,806 81,678,462 84,369,200 90,624,448 81,838,781 83,933,383 81,644,714 75,090,664 81,886,476
Drugs and Miscellaneous Retail 84,314,769 81,599,087 79,606,161 76,036,417 74,197,724 78,920,501 81,900,819 86,883,148 89,850,869 88,288,532
Agriculture and All Others 39,136,195 28,154,513 28,623,247 29,011,979 29,448,085 30,174,323 30,610,577 26,789,604 26,717,140 29,536,527
Manufacturers 18,224,889 13,889,966 15,507,914 7,289,300 1,546,592 3,116,244 3,392,915 1,455,793 3,703,355 4,092,447
TOTAL 590,022,882$ 527,617,963$ 541,823,878$ 534,958,781$ 529,756,179$ 523,658,020$ 538,817,271$ 534,591,087$ 526,765,904$ 534,922,160$
CITY DIRECT SALES
TAX RATE 1.00% 1.00% 1.00% 1.00% 1.00% 1.00% 1.00% 1.00% 1.00% 1.00%
Note: The data presents taxable sales subject to the Municipal Retailer's Occupation Tax.
Data Source
Illinois Department of Revenue
CITY OF DEKALB, ILLINOIS
TAXABLE SALES BY CATEGORY
Last Ten Calendar Years
- 167 -
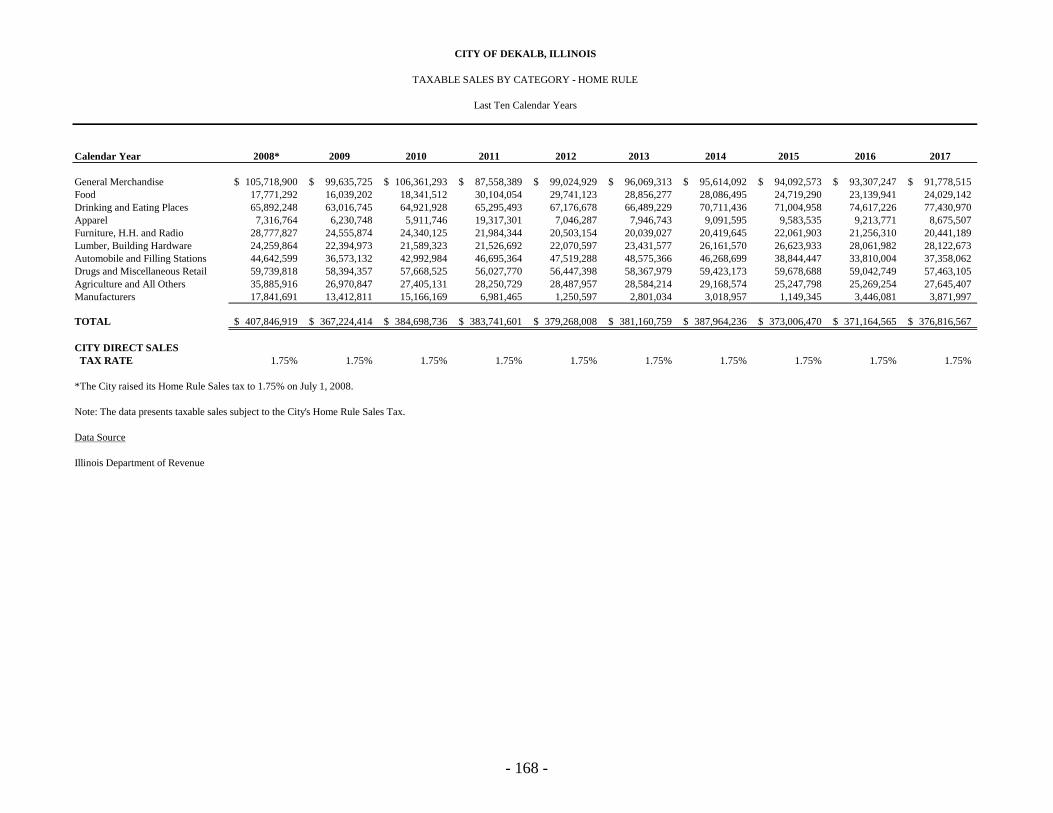
Calendar Year 2008* 2009 2010 2011 2012 2013 2014 2015 2016 2017
General Merchandise 105,718,900$ 99,635,725$ 106,361,293$ 87,558,389$ 99,024,929$ 96,069,313$ 95,614,092$ 94,092,573$ 93,307,247$ 91,778,515$
Food 17,771,292 16,039,202 18,341,512 30,104,054 29,741,123 28,856,277 28,086,495 24,719,290 23,139,941 24,029,142
Drinking and Eating Places 65,892,248 63,016,745 64,921,928 65,295,493 67,176,678 66,489,229 70,711,436 71,004,958 74,617,226 77,430,970
Apparel 7,316,764 6,230,748 5,911,746 19,317,301 7,046,287 7,946,743 9,091,595 9,583,535 9,213,771 8,675,507
Furniture, H.H. and Radio 28,777,827 24,555,874 24,340,125 21,984,344 20,503,154 20,039,027 20,419,645 22,061,903 21,256,310 20,441,189
Lumber, Building Hardware 24,259,864 22,394,973 21,589,323 21,526,692 22,070,597 23,431,577 26,161,570 26,623,933 28,061,982 28,122,673
Automobile and Filling Stations 44,642,599 36,573,132 42,992,984 46,695,364 47,519,288 48,575,366 46,268,699 38,844,447 33,810,004 37,358,062
Drugs and Miscellaneous Retail 59,739,818 58,394,357 57,668,525 56,027,770 56,447,398 58,367,979 59,423,173 59,678,688 59,042,749 57,463,105
Agriculture and All Others 35,885,916 26,970,847 27,405,131 28,250,729 28,487,957 28,584,214 29,168,574 25,247,798 25,269,254 27,645,407
Manufacturers 17,841,691 13,412,811 15,166,169 6,981,465 1,250,597 2,801,034 3,018,957 1,149,345 3,446,081 3,871,997
TOTAL 407,846,919$ 367,224,414$ 384,698,736$ 383,741,601$ 379,268,008$ 381,160,759$ 387,964,236$ 373,006,470$ 371,164,565$ 376,816,567$
CITY DIRECT SALES
TAX RATE 1.75% 1.75% 1.75% 1.75% 1.75% 1.75% 1.75% 1.75% 1.75% 1.75%
*The City raised its Home Rule Sales tax to 1.75% on July 1, 2008.
Note: The data presents taxable sales subject to the City's Home Rule Sales Tax.
Data Source
Illinois Department of Revenue
CITY OF DEKALB, ILLINOIS
TAXABLE SALES BY CATEGORY - HOME RULE
Last Ten Calendar Years
- 168 -
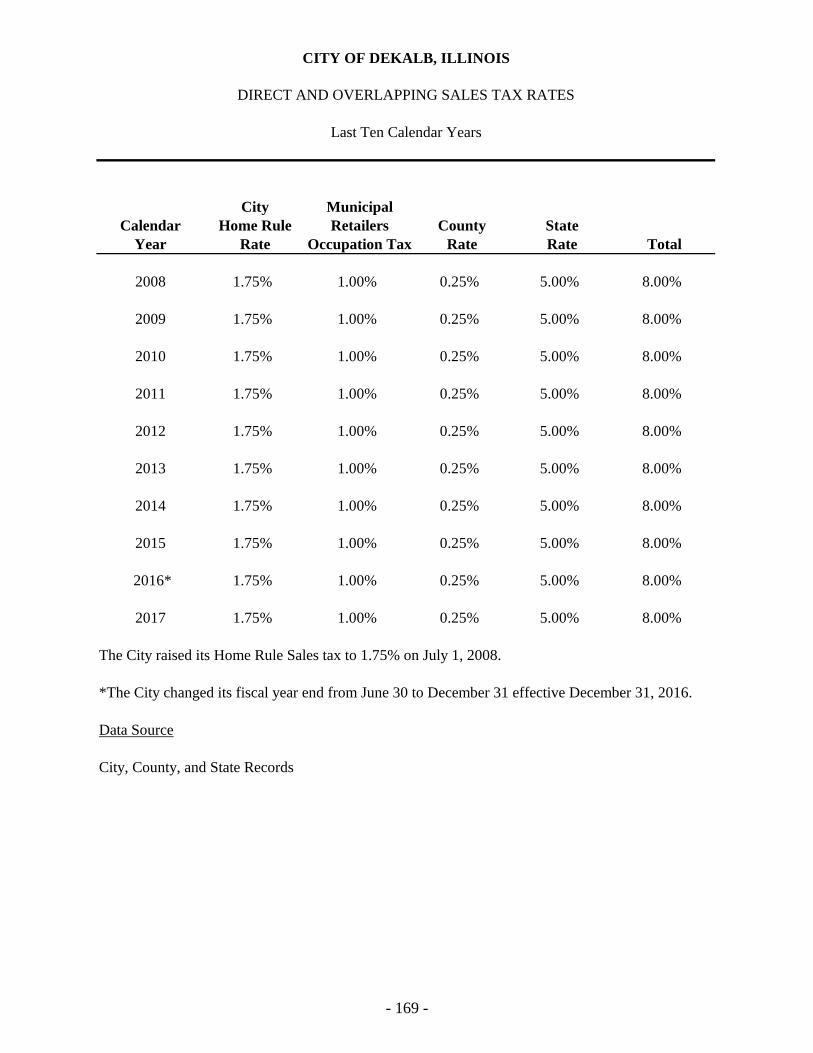
CITY OF DEKALB, ILLINOIS
DIRECT AND OVERLAPPING SALES TAX RATES
Last Ten Calendar Years
City Municipal
Calendar Home Rule Retailers County State
Year Rate Occupation Tax Rate Rate Total
2008 1.75% 1.00% 0.25% 5.00% 8.00%
2009 1.75% 1.00% 0.25% 5.00% 8.00%
2010 1.75% 1.00% 0.25% 5.00% 8.00%
2011 1.75% 1.00% 0.25% 5.00% 8.00%
2012 1.75% 1.00% 0.25% 5.00% 8.00%
2013 1.75% 1.00% 0.25% 5.00% 8.00%
2014 1.75% 1.00% 0.25% 5.00% 8.00%
2015 1.75% 1.00% 0.25% 5.00% 8.00%
2016* 1.75% 1.00% 0.25% 5.00% 8.00%
2017 1.75% 1.00% 0.25% 5.00% 8.00%
The City raised its Home Rule Sales tax to 1.75% on July 1, 2008.
*The City changed its fiscal year end from June 30 to December 31 effective December 31, 2016.
Data Source
City, County, and State Records
- 169 -
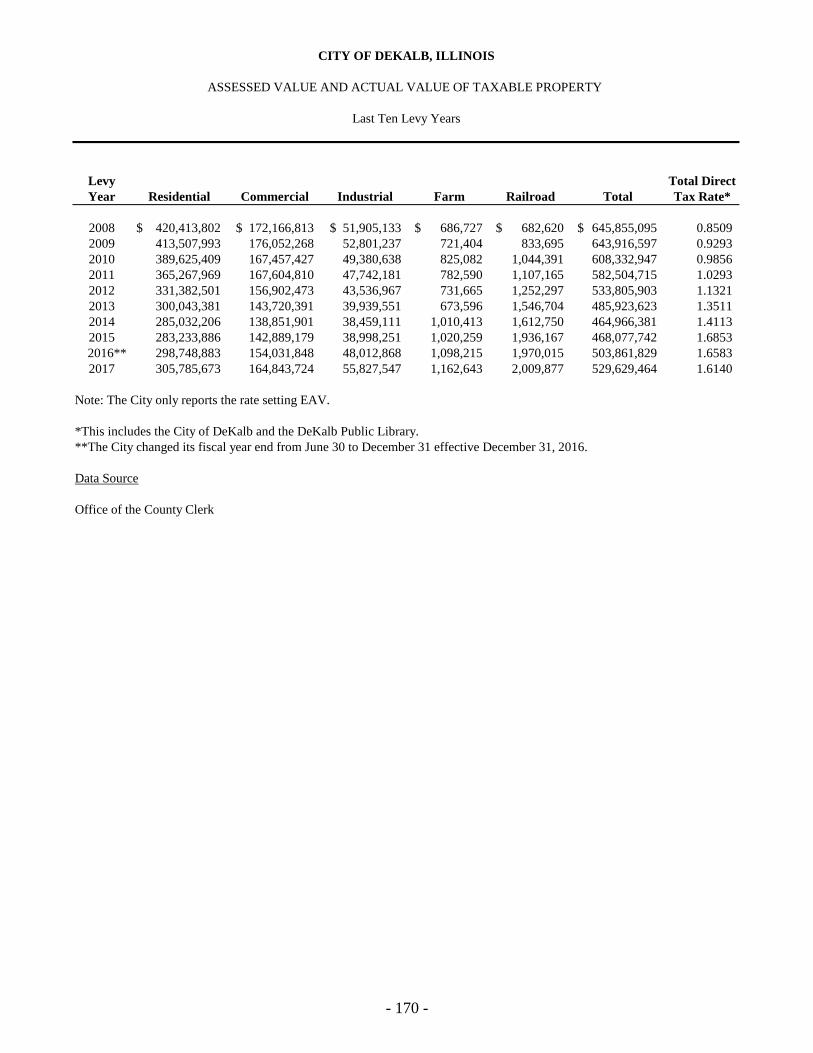
Levy Total Direct
Year Residential Commercial Industrial Farm Railroad Total Tax Rate*
2008 420,413,802$ 172,166,813$ 51,905,133$ 686,727$ 682,620$ 645,855,095$ 0.8509
2009 413,507,993 176,052,268 52,801,237 721,404 833,695 643,916,597 0.9293
2010 389,625,409 167,457,427 49,380,638 825,082 1,044,391 608,332,947 0.9856
2011 365,267,969 167,604,810 47,742,181 782,590 1,107,165 582,504,715 1.0293
2012 331,382,501 156,902,473 43,536,967 731,665 1,252,297 533,805,903 1.1321
2013 300,043,381 143,720,391 39,939,551 673,596 1,546,704 485,923,623 1.3511
2014 285,032,206 138,851,901 38,459,111 1,010,413 1,612,750 464,966,381 1.4113
2015 283,233,886 142,889,179 38,998,251 1,020,259 1,936,167 468,077,742 1.6853
2016** 298,748,883 154,031,848 48,012,868 1,098,215 1,970,015 503,861,829 1.6583
2017 305,785,673 164,843,724 55,827,547 1,162,643 2,009,877 529,629,464 1.6140
Note: The City only reports the rate setting EAV.
*This includes the City of DeKalb and the DeKalb Public Library.
**The City changed its fiscal year end from June 30 to December 31 effective December 31, 2016.
Data Source
Office of the County Clerk
CITY OF DEKALB, ILLINOIS
ASSESSED VALUE AND ACTUAL VALUE OF TAXABLE PROPERTY
Last Ten Levy Years
- 170 -
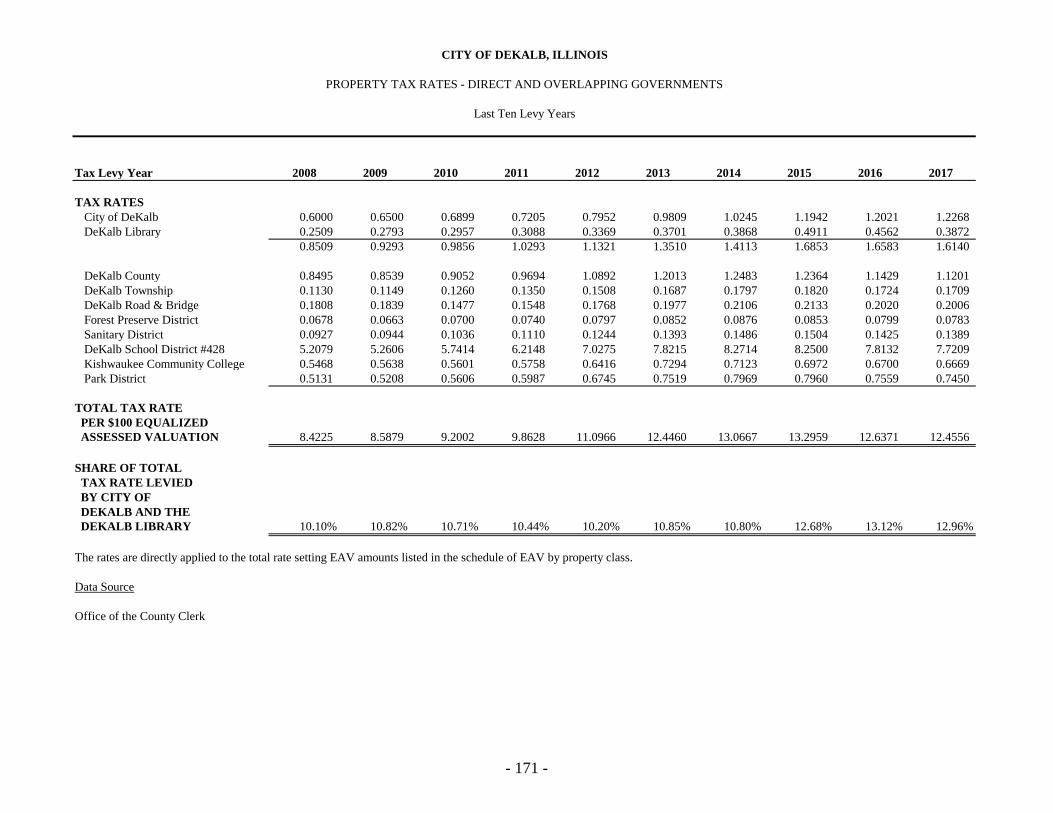
Tax Levy Year 2008 2009 2010 2011 2012 2013 2014 2015 2016 2017
TAX RATES
City of DeKalb 0.6000 0.6500 0.6899 0.7205 0.7952 0.9809 1.0245 1.1942 1.2021 1.2268
DeKalb Library 0.2509 0.2793 0.2957 0.3088 0.3369 0.3701 0.3868 0.4911 0.4562 0.3872
0.8509 0.9293 0.9856 1.0293 1.1321 1.3510 1.4113 1.6853 1.6583 1.6140
DeKalb County 0.8495 0.8539 0.9052 0.9694 1.0892 1.2013 1.2483 1.2364 1.1429 1.1201
DeKalb Township 0.1130 0.1149 0.1260 0.1350 0.1508 0.1687 0.1797 0.1820 0.1724 0.1709
DeKalb Road & Bridge 0.1808 0.1839 0.1477 0.1548 0.1768 0.1977 0.2106 0.2133 0.2020 0.2006
Forest Preserve District 0.0678 0.0663 0.0700 0.0740 0.0797 0.0852 0.0876 0.0853 0.0799 0.0783
Sanitary District 0.0927 0.0944 0.1036 0.1110 0.1244 0.1393 0.1486 0.1504 0.1425 0.1389
DeKalb School District #428 5.2079 5.2606 5.7414 6.2148 7.0275 7.8215 8.2714 8.2500 7.8132 7.7209
Kishwaukee Community College 0.5468 0.5638 0.5601 0.5758 0.6416 0.7294 0.7123 0.6972 0.6700 0.6669
Park District 0.5131 0.5208 0.5606 0.5987 0.6745 0.7519 0.7969 0.7960 0.7559 0.7450
TOTAL TAX RATE
PER $100 EQUALIZED
ASSESSED VALUATION 8.4225 8.5879 9.2002 9.8628 11.0966 12.4460 13.0667 13.2959 12.6371 12.4556
SHARE OF TOTAL
TAX RATE LEVIED
BY CITY OF
DEKALB AND THE
DEKALB LIBRARY 10.10% 10.82% 10.71% 10.44% 10.20% 10.85% 10.80% 12.68% 13.12% 12.96%
The rates are directly applied to the total rate setting EAV amounts listed in the schedule of EAV by property class.
Data Source
Office of the County Clerk
CITY OF DEKALB, ILLINOIS
PROPERTY TAX RATES - DIRECT AND OVERLAPPING GOVERNMENTS
Last Ten Levy Years
- 171 -
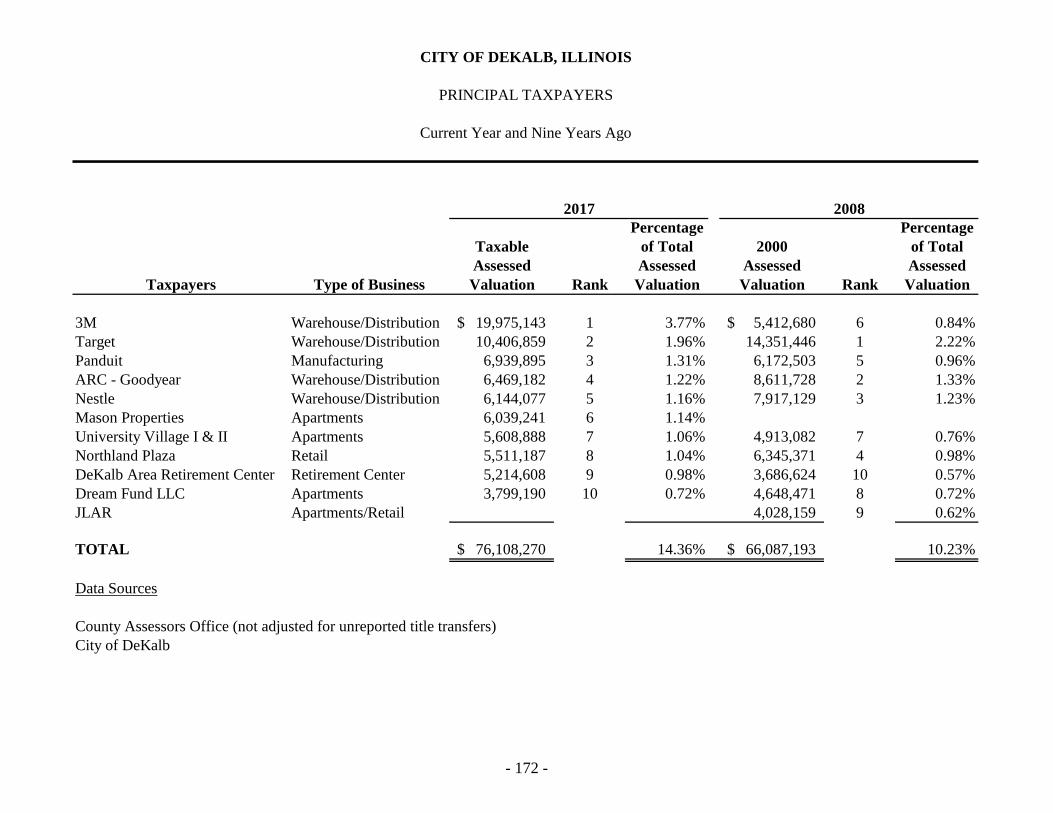
Percentage Percentage
Taxable of Total 2000 of Total
Assessed Assessed Assessed Assessed
Taxpayers Type of Business Valuation Rank Valuation Valuation Rank Valuation
3M Warehouse/Distribution 19,975,143$ 1 3.77% 5,412,680$ 6 0.84%
Target Warehouse/Distribution 10,406,859 2 1.96% 14,351,446 1 2.22%
Panduit Manufacturing 6,939,895 3 1.31% 6,172,503 5 0.96%
ARC - Goodyear Warehouse/Distribution 6,469,182 4 1.22% 8,611,728 2 1.33%
Nestle Warehouse/Distribution 6,144,077 5 1.16% 7,917,129 3 1.23%
Mason Properties Apartments 6,039,241 6 1.14%
University Village I & II Apartments 5,608,888 7 1.06% 4,913,082 7 0.76%
Northland Plaza Retail 5,511,187 8 1.04% 6,345,371 4 0.98%
DeKalb Area Retirement Center Retirement Center 5,214,608 9 0.98% 3,686,624 10 0.57%
Dream Fund LLC Apartments 3,799,190 10 0.72% 4,648,471 8 0.72%
JLAR Apartments/Retail 4,028,159 9 0.62%
TOTAL 76,108,270$ 14.36% 66,087,193$ 10.23%
Data Sources
County Assessors Office (not adjusted for unreported title transfers)
City of DeKalb
CITY OF DEKALB, ILLINOIS
PRINCIPAL TAXPAYERS
Current Year and Nine Years Ago
2017 2008
- 172 -
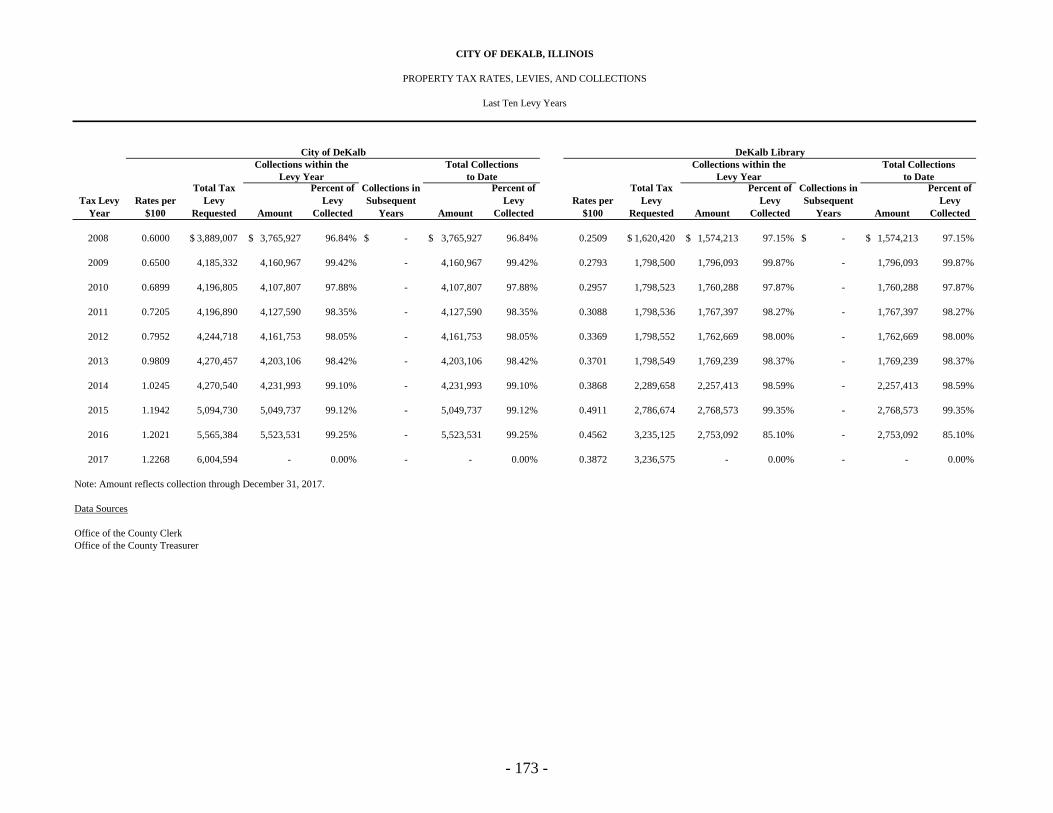
Tax Levy
Year
Rates per
$100
Total Tax
Levy
Requested Amount
Percent of
Levy
Collected
Collections in
Subsequent
Years Amount
Percent of
Levy
Collected
Rates per
$100
Total Tax
Levy
Requested Amount
Percent of
Levy
Collected
Collections in
Subsequent
Years Amount
Percent of
Levy
Collected
2008 0.6000 3,889,007$ 3,765,927$ 96.84% -$ 3,765,927$ 96.84% 0.2509 1,620,420$ 1,574,213$ 97.15% -$ 1,574,213$ 97.15%
2009 0.6500 4,185,332 4,160,967 99.42% - 4,160,967 99.42% 0.2793 1,798,500 1,796,093 99.87% - 1,796,093 99.87%
2010 0.6899 4,196,805 4,107,807 97.88% - 4,107,807 97.88% 0.2957 1,798,523 1,760,288 97.87% - 1,760,288 97.87%
2011 0.7205 4,196,890 4,127,590 98.35% - 4,127,590 98.35% 0.3088 1,798,536 1,767,397 98.27% - 1,767,397 98.27%
2012 0.7952 4,244,718 4,161,753 98.05% - 4,161,753 98.05% 0.3369 1,798,552 1,762,669 98.00% - 1,762,669 98.00%
2013 0.9809 4,270,457 4,203,106 98.42% - 4,203,106 98.42% 0.3701 1,798,549 1,769,239 98.37% - 1,769,239 98.37%
2014 1.0245 4,270,540 4,231,993 99.10% - 4,231,993 99.10% 0.3868 2,289,658 2,257,413 98.59% - 2,257,413 98.59%
2015 1.1942 5,094,730 5,049,737 99.12% - 5,049,737 99.12% 0.4911 2,786,674 2,768,573 99.35% - 2,768,573 99.35%
2016 1.2021 5,565,384 5,523,531 99.25% - 5,523,531 99.25% 0.4562 3,235,125 2,753,092 85.10% - 2,753,092 85.10%
2017 1.2268 6,004,594 - 0.00% - - 0.00% 0.3872 3,236,575 - 0.00% - - 0.00%
Note: Amount reflects collection through December 31, 2017.
Data Sources
Office of the County Clerk
Office of the County Treasurer
CITY OF DEKALB, ILLINOIS
PROPERTY TAX RATES, LEVIES, AND COLLECTIONS
Last Ten Levy Years
Collections within the
Levy Year
Collections within the
Levy Year
Total Collections
to Date
Total Collections
to Date
DeKalb LibraryCity of DeKalb
- 173 -
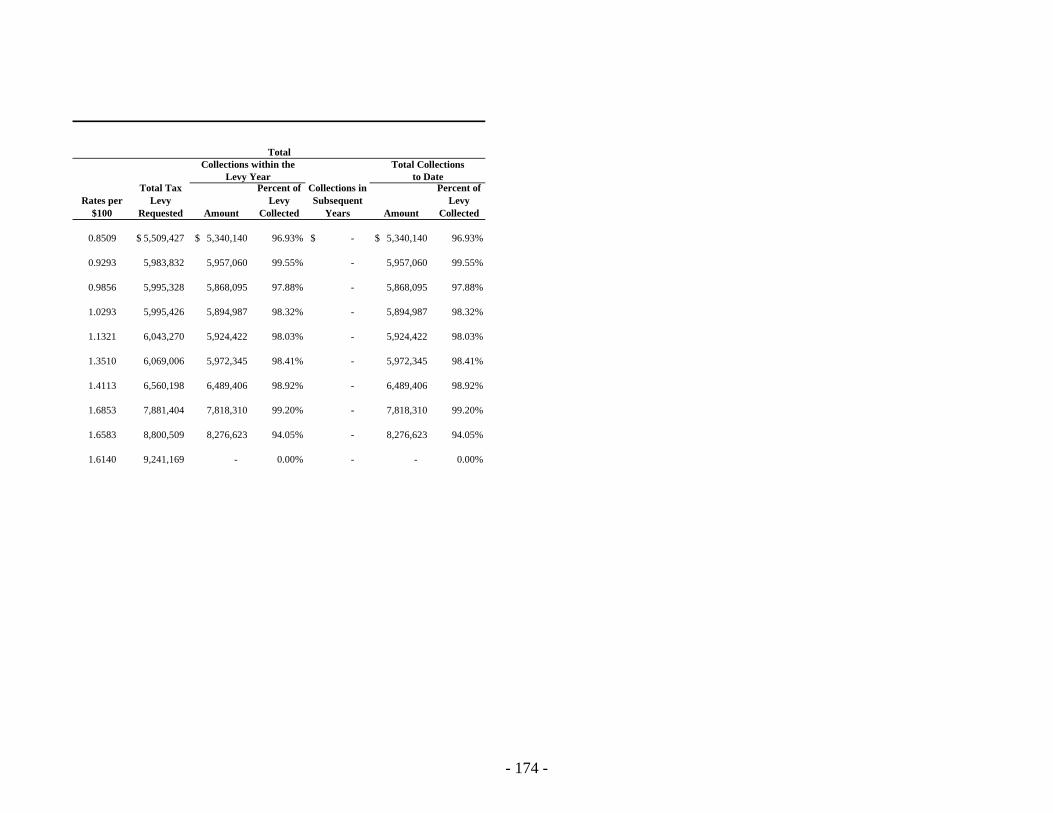
Rates per
$100
Total Tax
Levy
Requested Amount
Percent of
Levy
Collected
Collections in
Subsequent
Years Amount
Percent of
Levy
Collected
0.8509 5,509,427$ 5,340,140$ 96.93% -$ 5,340,140$ 96.93%
0.9293 5,983,832 5,957,060 99.55% - 5,957,060 99.55%
0.9856 5,995,328 5,868,095 97.88% - 5,868,095 97.88%
1.0293 5,995,426 5,894,987 98.32% - 5,894,987 98.32%
1.1321 6,043,270 5,924,422 98.03% - 5,924,422 98.03%
1.3510 6,069,006 5,972,345 98.41% - 5,972,345 98.41%
1.4113 6,560,198 6,489,406 98.92% - 6,489,406 98.92%
1.6853 7,881,404 7,818,310 99.20% - 7,818,310 99.20%
1.6583 8,800,509 8,276,623 94.05% - 8,276,623 94.05%
1.6140 9,241,169 - 0.00% - - 0.00%
Total Collections
to Date
Total
Collections within the
Levy Year
- 174 -
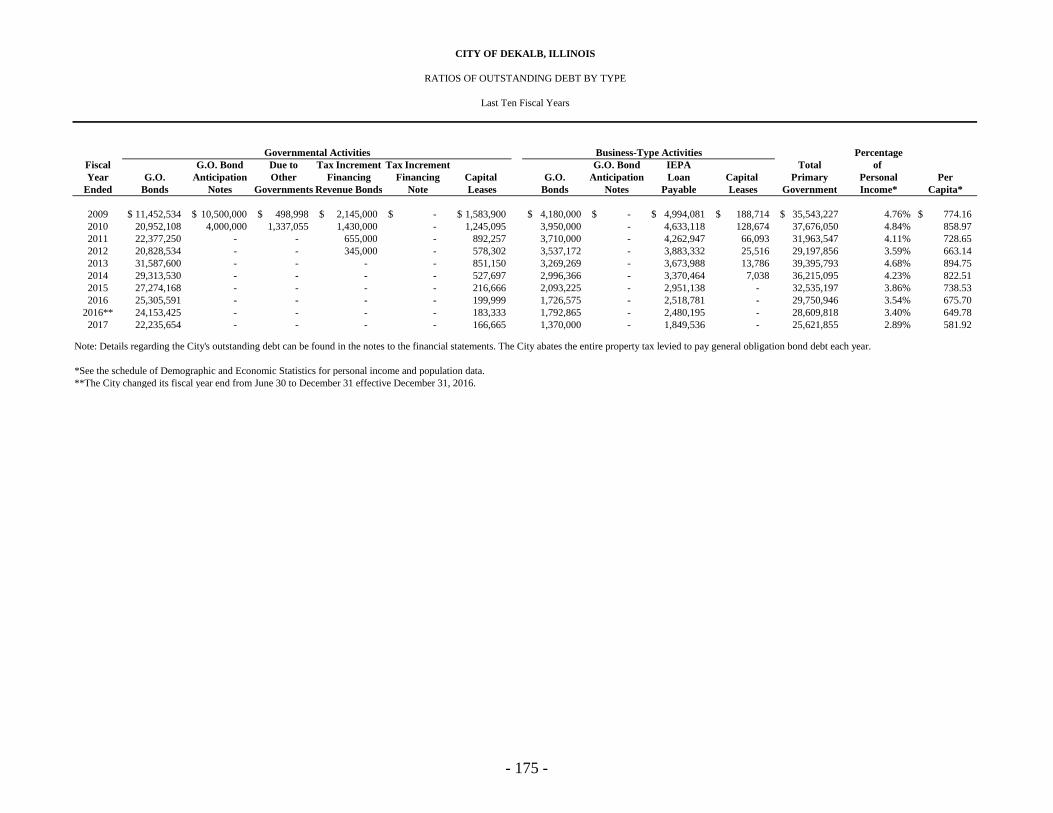
Percentage
Fiscal G.O. Bond Due to Tax Increment Tax Increment G.O. Bond IEPA Total of
Year G.O. Anticipation Other Financing Financing Capital G.O. Anticipation Loan Capital Primary Personal Per
Ended Bonds Notes Governments Revenue Bonds Note Leases Bonds Notes Payable Leases Government Income* Capita*
2009 11,452,534$ 10,500,000$ 498,998$ 2,145,000$ -$ 1,583,900$ 4,180,000$ -$ 4,994,081$ 188,714$ 35,543,227$ 4.76% 774.16$
2010 20,952,108 4,000,000 1,337,055 1,430,000 - 1,245,095 3,950,000 - 4,633,118 128,674 37,676,050 4.84% 858.97
2011 22,377,250 - - 655,000 - 892,257 3,710,000 - 4,262,947 66,093 31,963,547 4.11% 728.65
2012 20,828,534 - - 345,000 - 578,302 3,537,172 - 3,883,332 25,516 29,197,856 3.59% 663.14
2013 31,587,600 - - - - 851,150 3,269,269 - 3,673,988 13,786 39,395,793 4.68% 894.75
2014 29,313,530 - - - - 527,697 2,996,366 - 3,370,464 7,038 36,215,095 4.23% 822.51
2015 27,274,168 - - - - 216,666 2,093,225 - 2,951,138 - 32,535,197 3.86% 738.53
2016 25,305,591 - - - - 199,999 1,726,575 - 2,518,781 - 29,750,946 3.54% 675.70
2016** 24,153,425 - - - - 183,333 1,792,865 - 2,480,195 - 28,609,818 3.40% 649.78
2017 22,235,654 - - - - 166,665 1,370,000 - 1,849,536 - 25,621,855 2.89% 581.92
*See the schedule of Demographic and Economic Statistics for personal income and population data.
**The City changed its fiscal year end from June 30 to December 31 effective December 31, 2016.
Note: Details regarding the City's outstanding debt can be found in the notes to the financial statements. The City abates the entire property tax levied to pay general obligation bond debt each year.
CITY OF DEKALB, ILLINOIS
RATIOS OF OUTSTANDING DEBT BY TYPE
Last Ten Fiscal Years
Governmental Activities Business-Type Activities
- 175 -
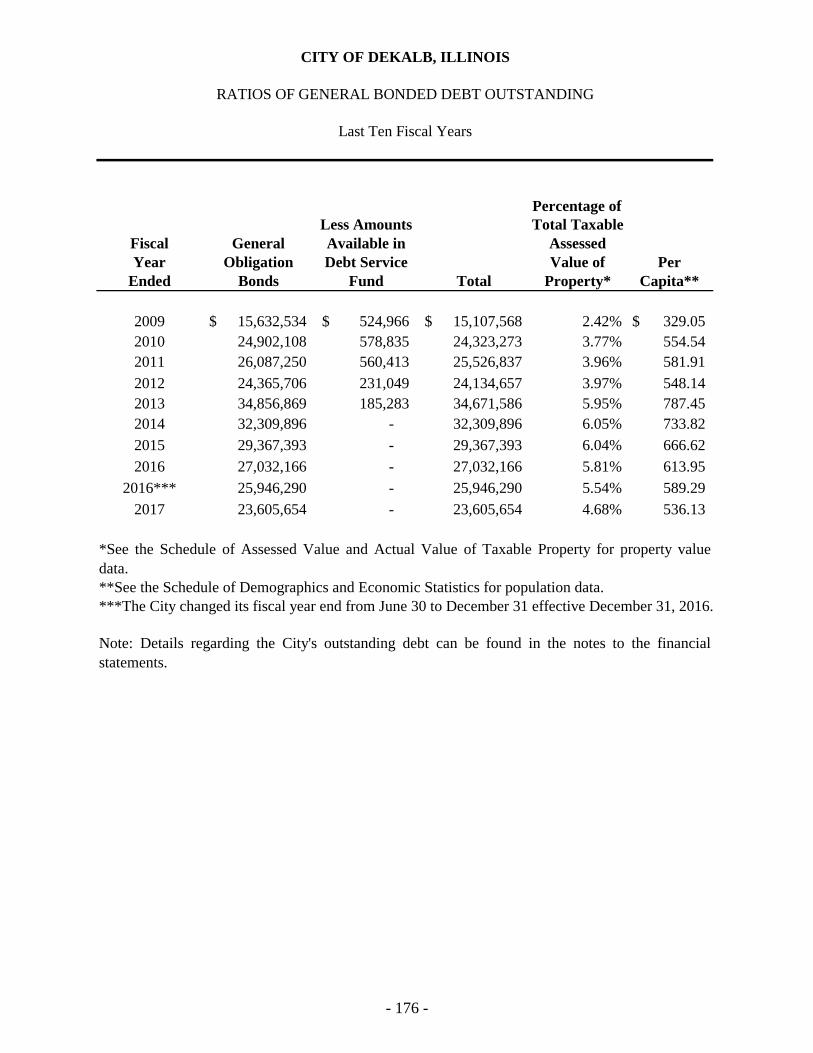
Percentage of
Less Amounts Total Taxable
Fiscal General Available in Assessed
Year Obligation Debt Service Value of Per
Ended Bonds Fund Total Property* Capita**
2009 15,632,534$ 524,966$ 15,107,568$ 2.42% 329.05$
2010 24,902,108 578,835 24,323,273 3.77% 554.54
2011 26,087,250 560,413 25,526,837 3.96% 581.91
2012 24,365,706 231,049 24,134,657 3.97% 548.14
2013 34,856,869 185,283 34,671,586 5.95% 787.45
2014 32,309,896 - 32,309,896 6.05% 733.82
2015 29,367,393 - 29,367,393 6.04% 666.62
2016 27,032,166 - 27,032,166 5.81% 613.95
2016*** 25,946,290 - 25,946,290 5.54% 589.29
2017 23,605,654 - 23,605,654 4.68% 536.13
***The City changed its fiscal year end from June 30 to December 31 effective December 31, 2016.
Note: Details regarding the City's outstanding debt can be found in the notes to the financial
statements.
CITY OF DEKALB, ILLINOIS
RATIOS OF GENERAL BONDED DEBT OUTSTANDING
Last Ten Fiscal Years
**See the Schedule of Demographics and Economic Statistics for population data.
*See the Schedule of Assessed Value and Actual Value of Taxable Property for property value
data.
- 176 -
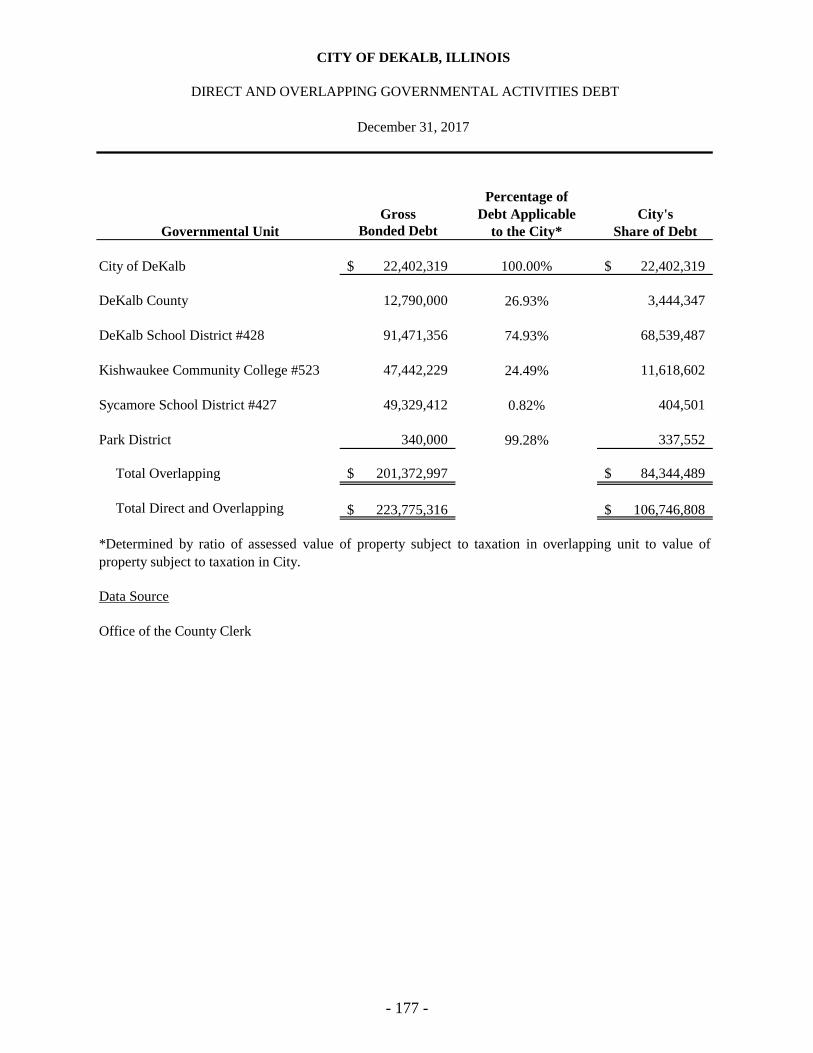
CITY OF DEKALB, ILLINOIS
December 31, 2017
Percentage of
Gross Debt Applicable City's
Governmental Unit Bonded Debt to the City* Share of Debt
City of DeKalb 22,402,319$ 100.00% 22,402,319$
DeKalb County 12,790,000 26.93% 3,444,347
DeKalb School District #428 91,471,356 74.93% 68,539,487
Kishwaukee Community College #523 47,442,229 24.49% 11,618,602
Sycamore School District #427 49,329,412 0.82% 404,501
Park District 340,000 99.28% 337,552
Total Overlapping 201,372,997$ 84,344,489$
Total Direct and Overlapping 223,775,316$ 106,746,808$
Data Source
Office of the County Clerk
*Determined by ratio of assessed value of property subject to taxation in overlapping unit to value of
property subject to taxation in City.
DIRECT AND OVERLAPPING GOVERNMENTAL ACTIVITIES DEBT
- 177 -
CITY OF DEKALB, ILLINOIS
LEGAL DEBT MARGIN
December 31, 2017
The City is a home rule municipality.
To date the General Assembly has set no limits for home rule municipalities.
Article VII, Section 6(k) of the 1970 Illinois Constitution governs computation of the legal debt
margin.
"The General Assembly may limit by law the amount and require referendum approval of debt
to be incurred by home rule municipalities, payable from ad valorem property tax receipts, only
in excess of the following percentages of the assessed value of its taxable property... (2) if its
population is more than 25,000 and less than 500,000 an aggregate of one percent:
…indebtedness which is outstanding on the effective date (July 1, 1971) of this constitution or
which is thereafter approved by referendum…shall not be included in the foregoing percentage
amounts."
- 178 -
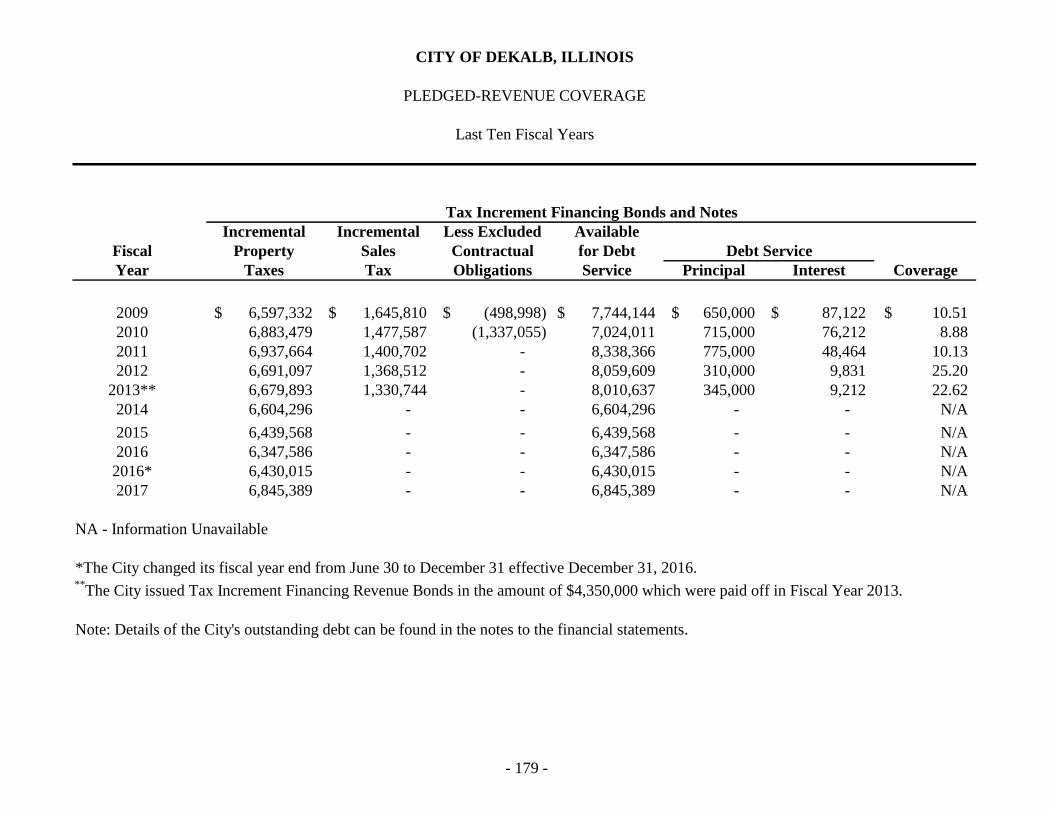
CITY OF DEKALB, ILLINOIS
PLEDGED-REVENUE COVERAGE
Last Ten Fiscal Years
Incremental Incremental Less Excluded Available
Fiscal Property Sales Contractual for Debt Debt Service
Year Taxes Tax Obligations Service Principal Interest Coverage
2009 6,597,332$ 1,645,810$ (498,998)$ 7,744,144$ 650,000$ 87,122$ 10.51$
2010 6,883,479 1,477,587 (1,337,055) 7,024,011 715,000 76,212 8.88
2011 6,937,664 1,400,702 - 8,338,366 775,000 48,464 10.13
2012 6,691,097 1,368,512 - 8,059,609 310,000 9,831 25.20
2013** 6,679,893 1,330,744 - 8,010,637 345,000 9,212 22.62
2014 6,604,296 - - 6,604,296 - - N/A
2015 6,439,568 - - 6,439,568 - - N/A
2016 6,347,586 - - 6,347,586 - - N/A
2016* 6,430,015 - - 6,430,015 - - N/A
2017 6,845,389 - - 6,845,389 - - N/A
NA - Information Unavailable
*The City changed its fiscal year end from June 30 to December 31 effective December 31, 2016. **
The City issued Tax Increment Financing Revenue Bonds in the amount of $4,350,000 which were paid off in Fiscal Year 2013.
Note: Details of the City's outstanding debt can be found in the notes to the financial statements.
Tax Increment Financing Bonds and Notes
- 179 -
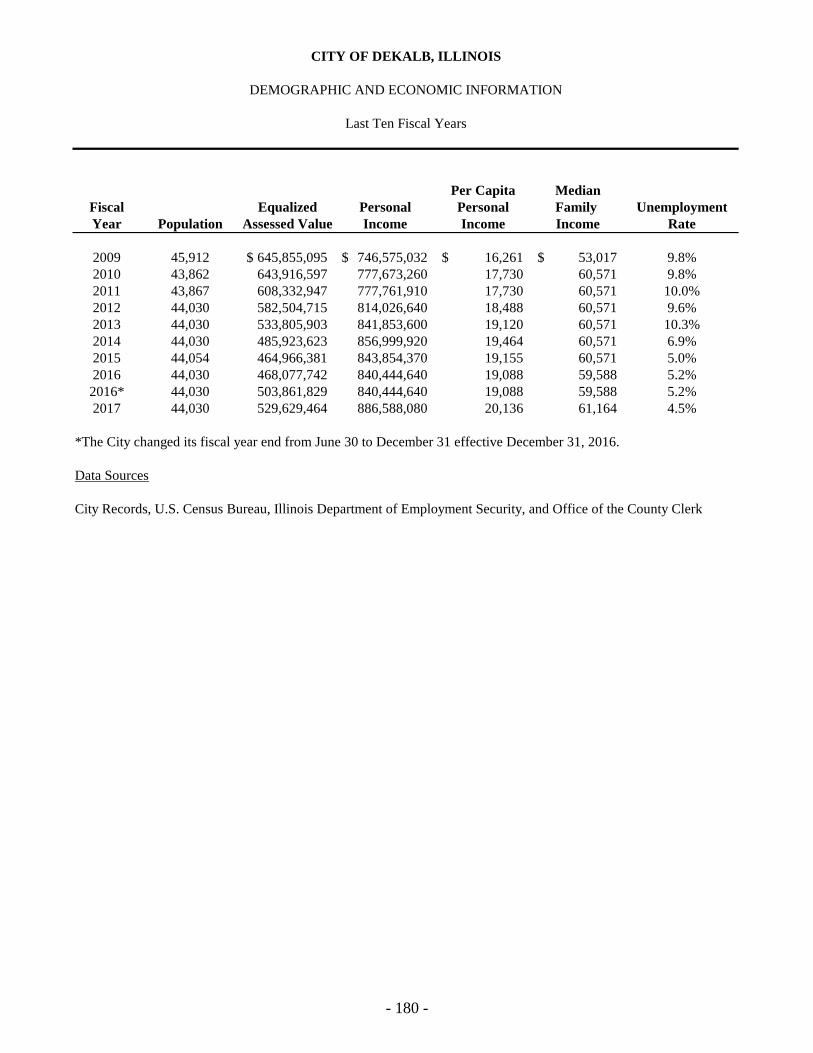
Per Capita Median
Fiscal Equalized Personal Personal Family Unemployment
Year Population Assessed Value Income Income Income Rate
2009 45,912 645,855,095$ 746,575,032$ 16,261$ 53,017$ 9.8%
2010 43,862 643,916,597 777,673,260 17,730 60,571 9.8%
2011 43,867 608,332,947 777,761,910 17,730 60,571 10.0%
2012 44,030 582,504,715 814,026,640 18,488 60,571 9.6%
2013 44,030 533,805,903 841,853,600 19,120 60,571 10.3%
2014 44,030 485,923,623 856,999,920 19,464 60,571 6.9%
2015 44,054 464,966,381 843,854,370 19,155 60,571 5.0%
2016 44,030 468,077,742 840,444,640 19,088 59,588 5.2%
2016* 44,030 503,861,829 840,444,640 19,088 59,588 5.2%
2017 44,030 529,629,464 886,588,080 20,136 61,164 4.5%
*The City changed its fiscal year end from June 30 to December 31 effective December 31, 2016.
Data Sources
City Records, U.S. Census Bureau, Illinois Department of Employment Security, and Office of the County Clerk
Last Ten Fiscal Years
DEMOGRAPHIC AND ECONOMIC INFORMATION
CITY OF DEKALB, ILLINOIS
- 180 -
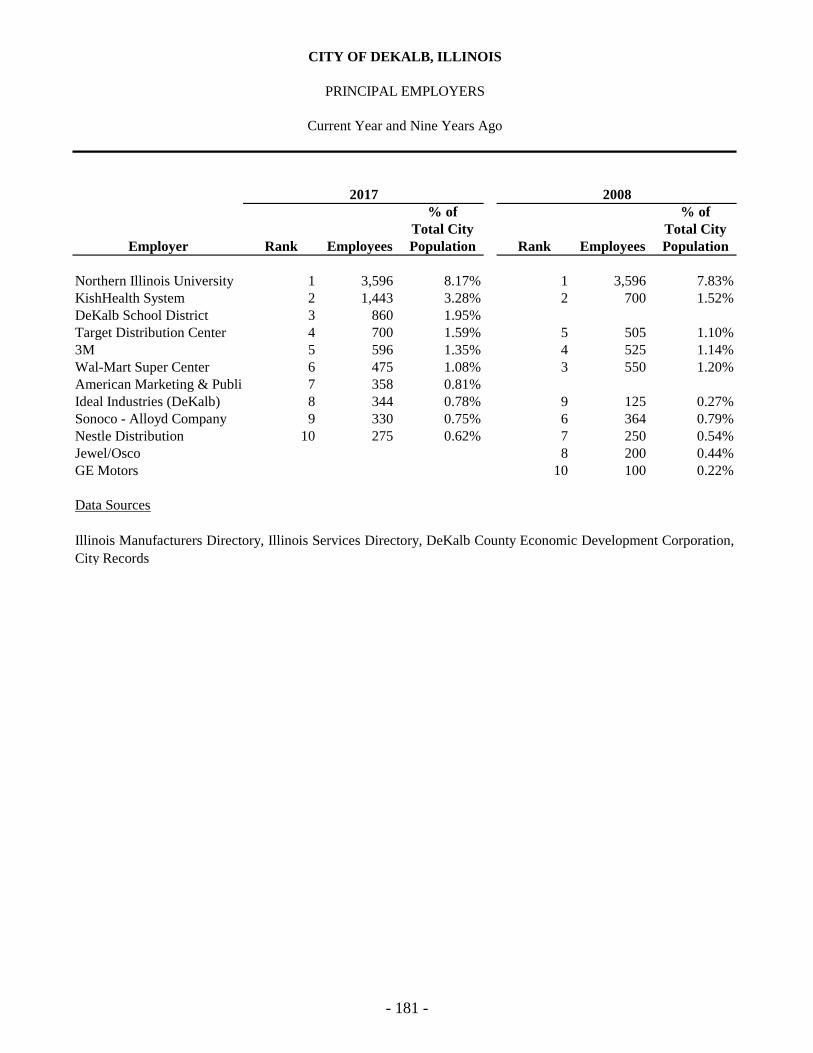
% of % of
Total City Total City
Employer Rank Employees Population Rank Employees Population
Northern Illinois University 1 3,596 8.17% 1 3,596 7.83%
KishHealth System 2 1,443 3.28% 2 700 1.52%
DeKalb School District 3 860 1.95%
Target Distribution Center 4 700 1.59% 5 505 1.10%
3M 5 596 1.35% 4 525 1.14%
Wal-Mart Super Center 6 475 1.08% 3 550 1.20%
American Marketing & Publishing 7 358 0.81%
Ideal Industries (DeKalb) 8 344 0.78% 9 125 0.27%
Sonoco - Alloyd Company 9 330 0.75% 6 364 0.79%
Nestle Distribution 10 275 0.62% 7 250 0.54%
Jewel/Osco 8 200 0.44%
GE Motors 10 100 0.22%
Data Sources
Illinois Manufacturers Directory, Illinois Services Directory, DeKalb County Economic Development Corporation,
City Records
2008
CITY OF DEKALB, ILLINOIS
PRINCIPAL EMPLOYERS
Current Year and Nine Years Ago
2017
- 181 -
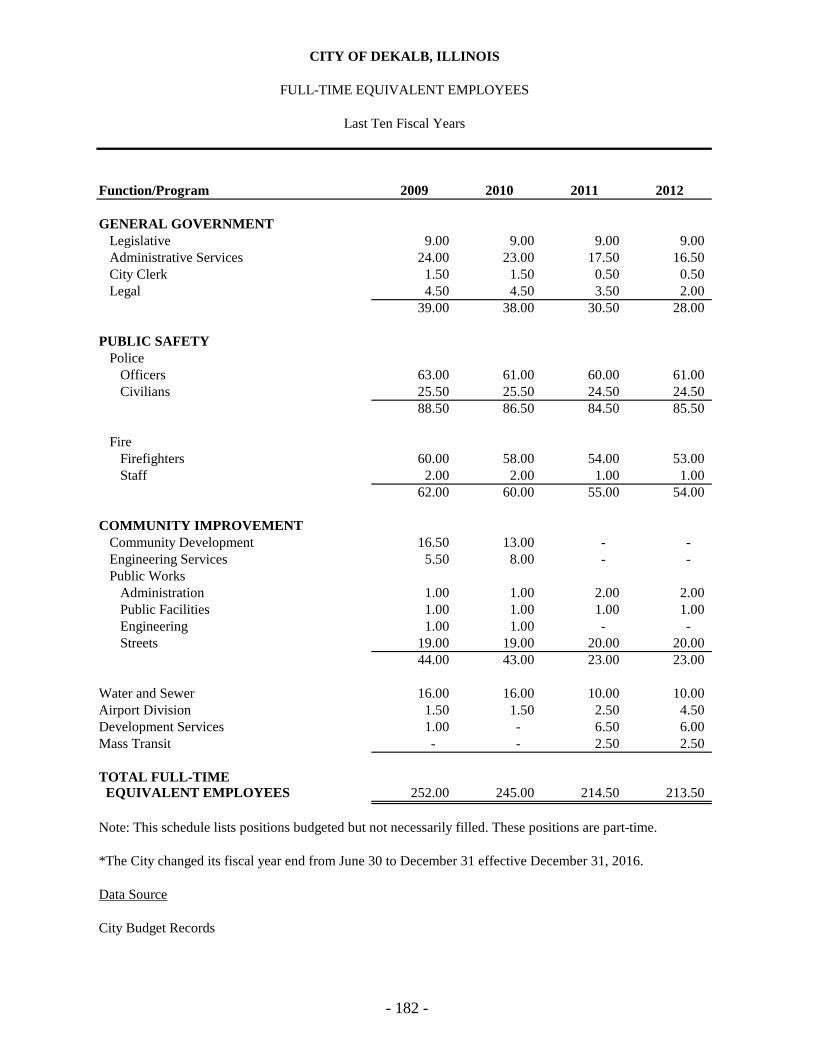
Function/Program 2009 2010 2011 2012
GENERAL GOVERNMENT
Legislative 9.00 9.00 9.00 9.00
Administrative Services 24.00 23.00 17.50 16.50
City Clerk 1.50 1.50 0.50 0.50
Legal 4.50 4.50 3.50 2.00
39.00 38.00 30.50 28.00
PUBLIC SAFETY
Police
Officers 63.00 61.00 60.00 61.00
Civilians 25.50 25.50 24.50 24.50
88.50 86.50 84.50 85.50
Fire
Firefighters 60.00 58.00 54.00 53.00
Staff 2.00 2.00 1.00 1.00
62.00 60.00 55.00 54.00
COMMUNITY IMPROVEMENT
Community Development 16.50 13.00 - -
Engineering Services 5.50 8.00 - -
Public Works
Administration 1.00 1.00 2.00 2.00
Public Facilities 1.00 1.00 1.00 1.00
Engineering 1.00 1.00 - -
Streets 19.00 19.00 20.00 20.00
44.00 43.00 23.00 23.00
Water and Sewer 16.00 16.00 10.00 10.00
Airport Division 1.50 1.50 2.50 4.50
Development Services 1.00 - 6.50 6.00
Mass Transit - - 2.50 2.50
TOTAL FULL-TIME
EQUIVALENT EMPLOYEES 252.00 245.00 214.50 213.50
*The City changed its fiscal year end from June 30 to December 31 effective December 31, 2016.
Data Source
City Budget Records
Note: This schedule lists positions budgeted but not necessarily filled. These positions are part-time.
CITY OF DEKALB, ILLINOIS
FULL-TIME EQUIVALENT EMPLOYEES
Last Ten Fiscal Years
- 182 -
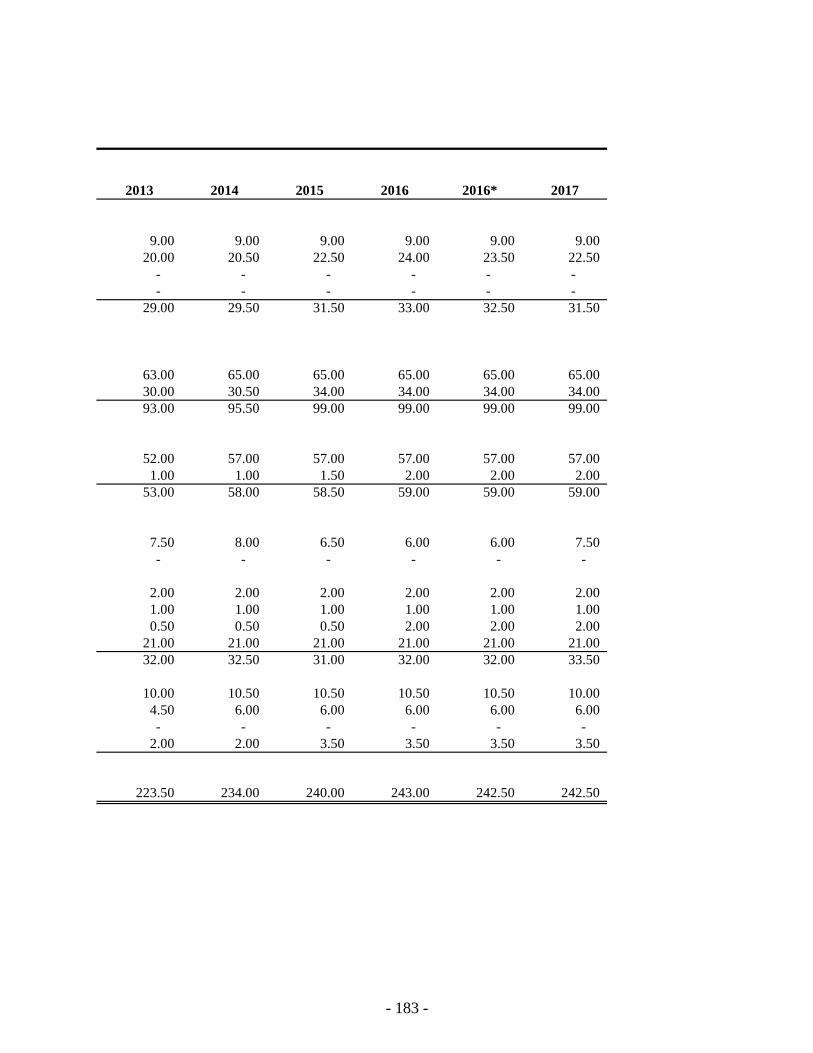
2013 2014 2015 2016 2016* 2017
9.00 9.00 9.00 9.00 9.00 9.00
20.00 20.50 22.50 24.00 23.50 22.50
- - - - - -
- - - - - -
29.00 29.50 31.50 33.00 32.50 31.50
63.00 65.00 65.00 65.00 65.00 65.00
30.00 30.50 34.00 34.00 34.00 34.00
93.00 95.50 99.00 99.00 99.00 99.00
52.00 57.00 57.00 57.00 57.00 57.00
1.00 1.00 1.50 2.00 2.00 2.00
53.00 58.00 58.50 59.00 59.00 59.00
7.50 8.00 6.50 6.00 6.00 7.50
- - - - - -
2.00 2.00 2.00 2.00 2.00 2.00
1.00 1.00 1.00 1.00 1.00 1.00
0.50 0.50 0.50 2.00 2.00 2.00
21.00 21.00 21.00 21.00 21.00 21.00
32.00 32.50 31.00 32.00 32.00 33.50
10.00 10.50 10.50 10.50 10.50 10.00
4.50 6.00 6.00 6.00 6.00 6.00
- - - - - -
2.00 2.00 3.50 3.50 3.50 3.50
223.50 234.00 240.00 243.00 242.50 242.50
- 183 -
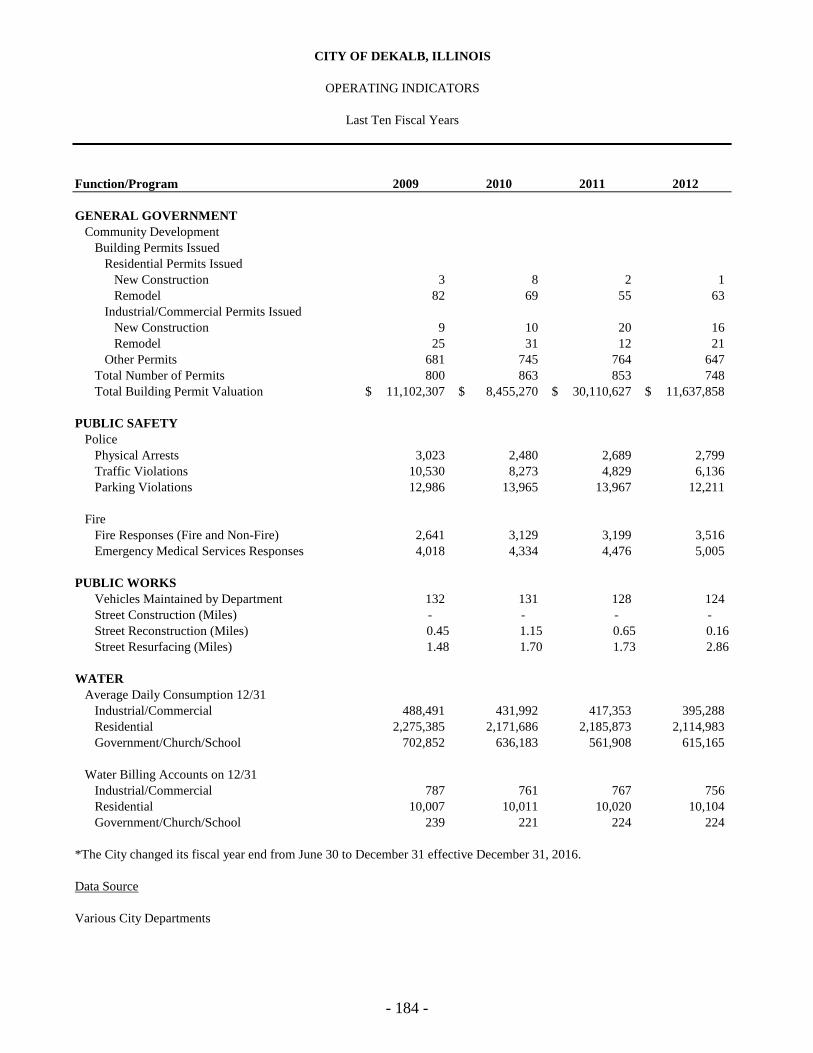
Function/Program 2009 2010 2011 2012
GENERAL GOVERNMENT
Community Development
Building Permits Issued
Residential Permits Issued
New Construction 3 8 2 1
Remodel 82 69 55 63
Industrial/Commercial Permits Issued
New Construction 9 10 20 16
Remodel 25 31 12 21
Other Permits 681 745 764 647
Total Number of Permits 800 863 853 748
Total Building Permit Valuation 11,102,307$ 8,455,270$ 30,110,627$ 11,637,858$
PUBLIC SAFETY
Police
Physical Arrests 3,023 2,480 2,689 2,799
Traffic Violations 10,530 8,273 4,829 6,136
Parking Violations 12,986 13,965 13,967 12,211
Fire
Fire Responses (Fire and Non-Fire) 2,641 3,129 3,199 3,516
Emergency Medical Services Responses 4,018 4,334 4,476 5,005
PUBLIC WORKS
Vehicles Maintained by Department 132 131 128 124
Street Construction (Miles) - - - -
Street Reconstruction (Miles) 0.45 1.15 0.65 0.16
Street Resurfacing (Miles) 1.48 1.70 1.73 2.86
WATER
Average Daily Consumption 12/31
Industrial/Commercial 488,491 431,992 417,353 395,288
Residential 2,275,385 2,171,686 2,185,873 2,114,983
Government/Church/School 702,852 636,183 561,908 615,165
Water Billing Accounts on 12/31
Industrial/Commercial 787 761 767 756
Residential 10,007 10,011 10,020 10,104
Government/Church/School 239 221 224 224
*The City changed its fiscal year end from June 30 to December 31 effective December 31, 2016.
Data Source
Various City Departments
CITY OF DEKALB, ILLINOIS
OPERATING INDICATORS
Last Ten Fiscal Years
- 184 -
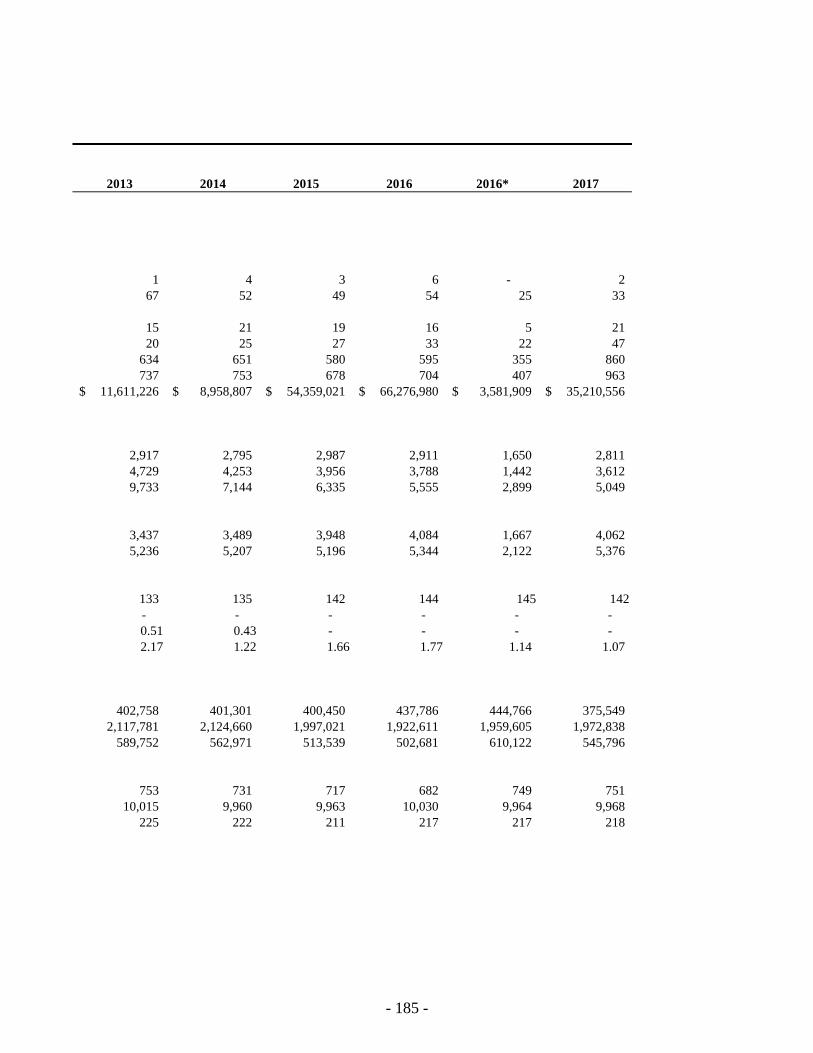
2013 2014 2015 2016 2016* 2017
1 4 3 6 - 2
67 52 49 54 25 33
15 21 19 16 5 21
20 25 27 33 22 47
634 651 580 595 355 860
737 753 678 704 407 963
11,611,226$ 8,958,807$ 54,359,021$ 66,276,980$ 3,581,909$ 35,210,556$
2,917 2,795 2,987 2,911 1,650 2,811
4,729 4,253 3,956 3,788 1,442 3,612
9,733 7,144 6,335 5,555 2,899 5,049
3,437 3,489 3,948 4,084 1,667 4,062
5,236 5,207 5,196 5,344 2,122 5,376
133 135 142 144 145 142
- - - - - -
0.51 0.43 - - - -
2.17 1.22 1.66 1.77 1.14 1.07
402,758 401,301 400,450 437,786 444,766 375,549
2,117,781 2,124,660 1,997,021 1,922,611 1,959,605 1,972,838
589,752 562,971 513,539 502,681 610,122 545,796
753 731 717 682 749 751
10,015 9,960 9,963 10,030 9,964 9,968
225 222 211 217 217 218
- 185 -
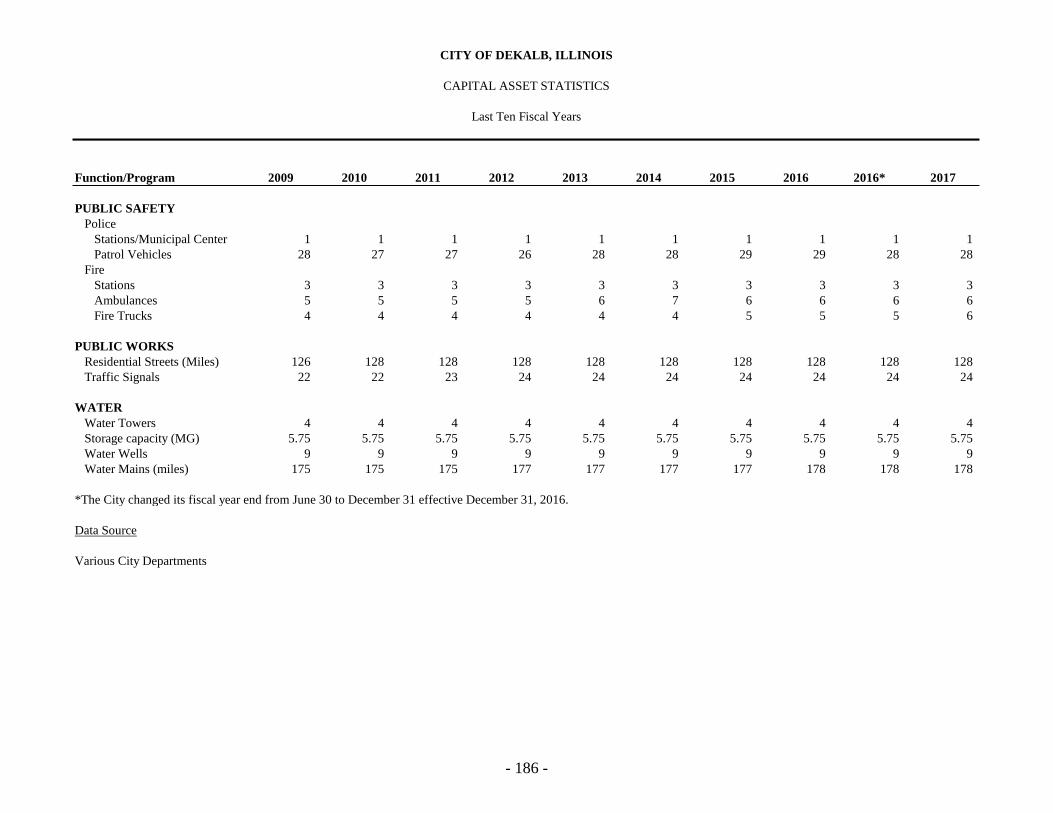
Function/Program 2009 2010 2011 2012 2013 2014 2015 2016 2016* 2017
PUBLIC SAFETY
Police
Stations/Municipal Center 1 1 1 1 1 1 1 1 1 1
Patrol Vehicles 28 27 27 26 28 28 29 29 28 28
Fire
Stations 3 3 3 3 3 3 3 3 3 3
Ambulances 5 5 5 5 6 7 6 6 6 6
Fire Trucks 4 4 4 4 4 4 5 5 5 6
PUBLIC WORKS
Residential Streets (Miles) 126 128 128 128 128 128 128 128 128 128
Traffic Signals 22 22 23 24 24 24 24 24 24 24
WATER
Water Towers 4 4 4 4 4 4 4 4 4 4
Storage capacity (MG) 5.75 5.75 5.75 5.75 5.75 5.75 5.75 5.75 5.75 5.75
Water Wells 9 9 9 9 9 9 9 9 9 9
Water Mains (miles) 175 175 175 177 177 177 177 178 178 178
*The City changed its fiscal year end from June 30 to December 31 effective December 31, 2016.
Data Source
Various City Departments
Last Ten Fiscal Years
CAPITAL ASSET STATISTICS
CITY OF DEKALB, ILLINOIS
- 186 -
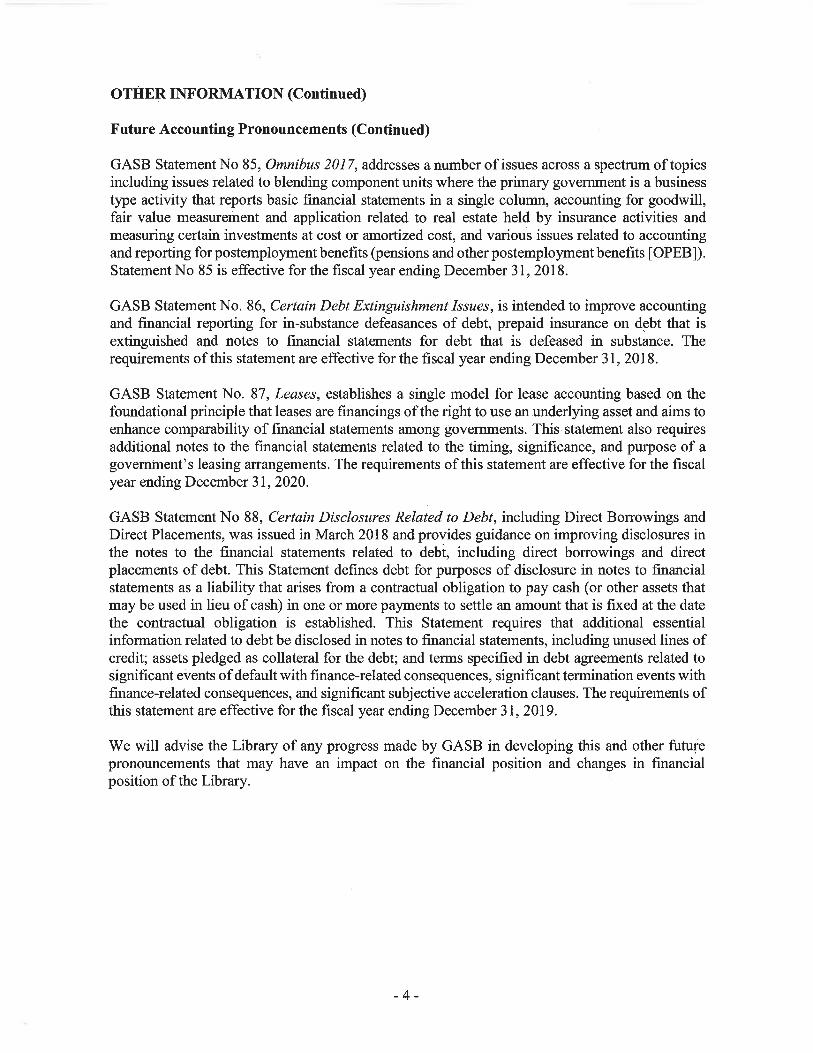
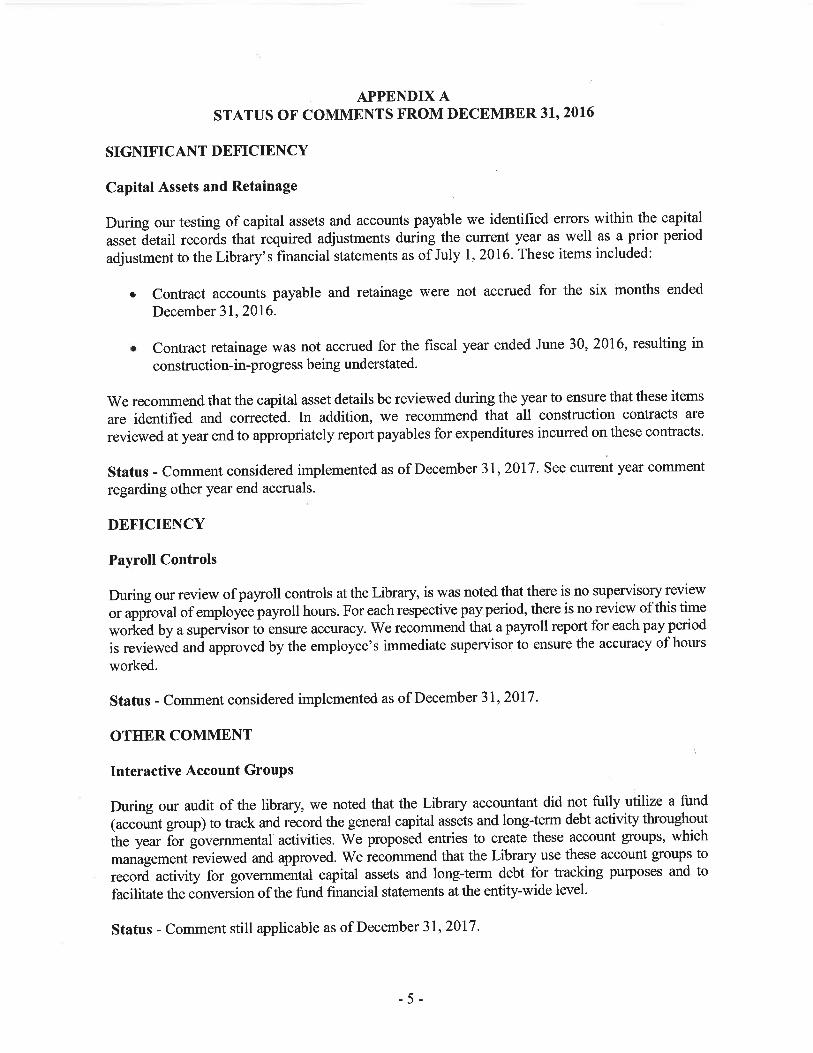
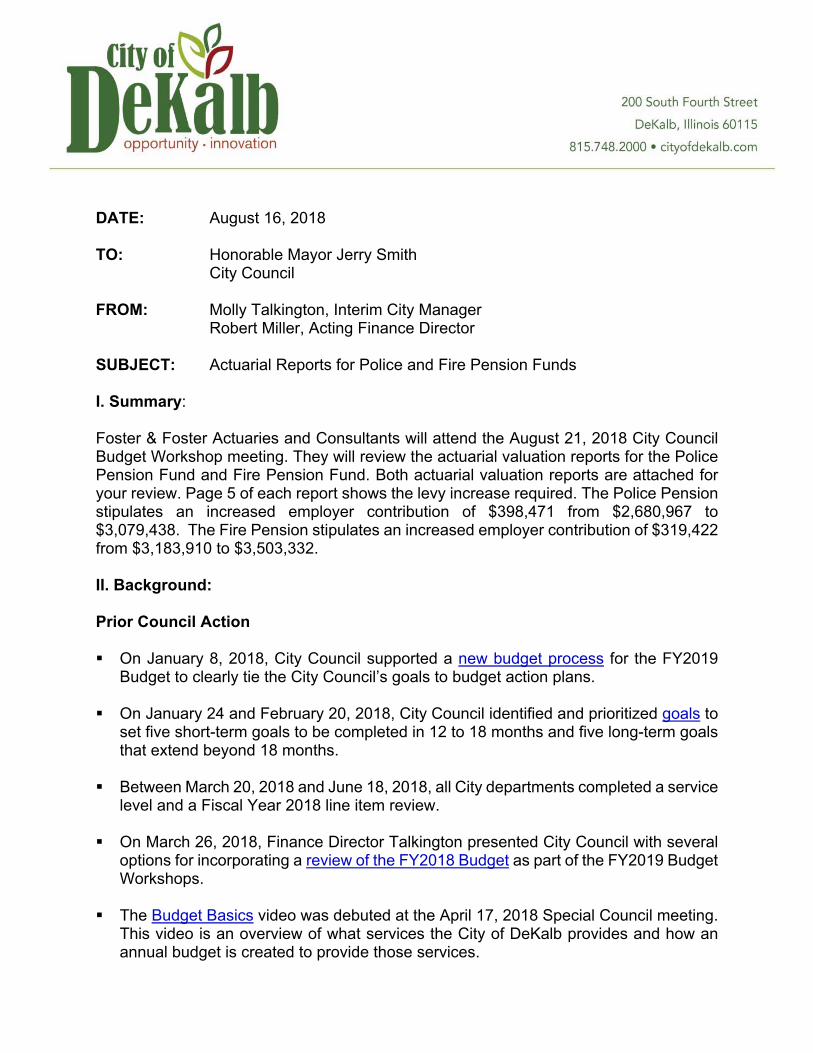
DATE: August 16, 2018 TO: Honorable Mayor Jerry Smith City Council FROM: Molly Talkington, Interim City Manager Robert Miller, Acting Finance Director SUBJECT: Actuarial Reports for Police and Fire Pension Funds
I. Summary: Foster & Foster Actuaries and Consultants will attend the August 21, 2018 City Council Budget Workshop meeting. They will review the actuarial valuation reports for the Police Pension Fund and Fire Pension Fund. Both actuarial valuation reports are attached for your review. Page 5 of each report shows the levy increase required. The Police Pension stipulates an increased employer contribution of $398,471 from $2,680,967 to $3,079,438. The Fire Pension stipulates an increased employer contribution of $319,422 from $3,183,910 to $3,503,332. II. Background: Prior Council Action On January 8, 2018, City Council supported a new budget process for the FY2019
Budget to clearly tie the City Council’s goals to budget action plans. On January 24 and February 20, 2018, City Council identified and prioritized goals to
set five short-term goals to be completed in 12 to 18 months and five long-term goals that extend beyond 18 months.
Between March 20, 2018 and June 18, 2018, all City departments completed a service level and a Fiscal Year 2018 line item review.
On March 26, 2018, Finance Director Talkington presented City Council with several
options for incorporating a review of the FY2018 Budget as part of the FY2019 Budget Workshops.
The Budget Basics video was debuted at the April 17, 2018 Special Council meeting.
This video is an overview of what services the City of DeKalb provides and how an annual budget is created to provide those services.
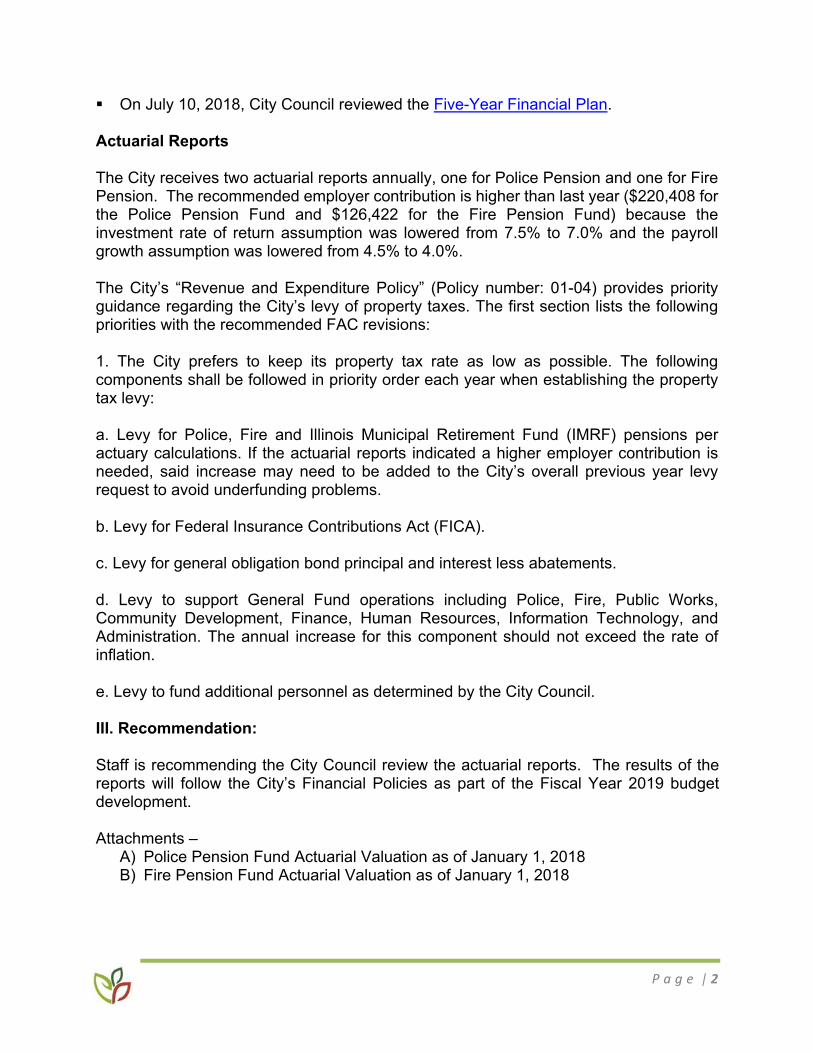
P a g e | 2
On July 10, 2018, City Council reviewed the Five-Year Financial Plan. Actuarial Reports The City receives two actuarial reports annually, one for Police Pension and one for Fire Pension. The recommended employer contribution is higher than last year ($220,408 for the Police Pension Fund and $126,422 for the Fire Pension Fund) because the investment rate of return assumption was lowered from 7.5% to 7.0% and the payroll growth assumption was lowered from 4.5% to 4.0%. The City’s “Revenue and Expenditure Policy” (Policy number: 01-04) provides priority guidance regarding the City’s levy of property taxes. The first section lists the following priorities with the recommended FAC revisions: 1. The City prefers to keep its property tax rate as low as possible. The following components shall be followed in priority order each year when establishing the property tax levy: a. Levy for Police, Fire and Illinois Municipal Retirement Fund (IMRF) pensions per actuary calculations. If the actuarial reports indicated a higher employer contribution is needed, said increase may need to be added to the City’s overall previous year levy request to avoid underfunding problems. b. Levy for Federal Insurance Contributions Act (FICA). c. Levy for general obligation bond principal and interest less abatements. d. Levy to support General Fund operations including Police, Fire, Public Works, Community Development, Finance, Human Resources, Information Technology, and Administration. The annual increase for this component should not exceed the rate of inflation. e. Levy to fund additional personnel as determined by the City Council. III. Recommendation: Staff is recommending the City Council review the actuarial reports. The results of the reports will follow the City’s Financial Policies as part of the Fiscal Year 2019 budget development. Attachments –
A) Police Pension Fund Actuarial Valuation as of January 1, 2018 B) Fire Pension Fund Actuarial Valuation as of January 1, 2018
CITY OF DEKALB POLICE PENSION FUND
ACTUARIAL VALUATION AS OF JANUARY 1, 2018
CONTRIBUTIONS APPLICABLE TO THE PLAN/FISCAL YEAR ENDING DECEMBER 31, 2019
GASB 67/68 DISCLOSURE INFORMATION AS OF DECEMBER 31, 2017
184 Shuman Blvd, Suite 305 Naperville, IL 60563 · (630) 620-0200 · Fax (239) 481-0634 · www.foster-foster.com
April 11, 2018
City of DeKalb
c/o Robert Miller, Assistant Finance Director
200 South Fourth Street
DeKalb, IL 60115
Re: Actuarial Valuation Report (including GASB Statements No. 67 and No. 68) – City of DeKalb
Police Pension Fund
Dear Mr. Miller:
We are pleased to present to the City this report of the annual actuarial valuation of the City of DeKalb
Police Pension Fund. Included are the related results for GASB Statements No. 67 and No. 68. The
funding valuation was performed to determine whether the assets and contributions are sufficient to
provide the prescribed benefits and to develop the appropriate funding requirements for the applicable
plan year. The calculation of the liability for GASB results was performed for the purpose of satisfying
the requirements of GASB Statements No. 67 and No. 68. Use of the results for other purposes may not
be applicable and produce significantly different results.
The valuation has been conducted in accordance with generally accepted actuarial principles and
practices, including the applicable Actuarial Standards of Practice as issued by the Actuarial Standards
Board, and reflects laws and regulations issued to date pursuant to the provisions of Article 3, Illinois
Pension Code, as well as applicable federal laws and regulations. In our opinion, the assumptions used
in this valuation, as adopted by the Board of Trustees, represent reasonable expectations of anticipated
plan experience. Future actuarial measurements may differ significantly from the current measurements
presented in this report for a variety of reasons including: changes in applicable laws, changes in plan
provisions, changes in assumptions, or plan experience differing from expectations.
In conducting the valuation, we have relied on personnel, plan design, and asset information supplied
by the City, financial reports prepared by the custodian bank and the actuarial assumptions and methods
described in the Actuarial Assumptions section of this report. While we cannot verify the accuracy of
all this information, the supplied information was reviewed for consistency and reasonableness. As a
result of this review, we have no reason to doubt the substantial accuracy of the information and believe
that it has produced appropriate results. This information, along with any adjustments or modifications,
is summarized in various sections of this report.
The total pension liability, net pension liability, and certain sensitivity information shown in the GASB
results are based on an actuarial valuation performed as of the valuation date.
Certain schedules should include a 10-year history of information. As provided for in GASB Statements
No. 67 and No. 68, this historical information is only presented for the years in which the information
was measured. This conforms to the requirements of GASB Statements No. 67 and No. 68.
The undersigned is familiar with the immediate and long-term aspects of pension valuations and meets
the Qualification Standards of the American Academy of Actuaries necessary to render the actuarial
opinions contained herein. All of the sections of this report are considered an integral part of the
actuarial opinions.
To our knowledge, no associate of Foster & Foster, Inc. working on valuations of the program has any
direct financial interest or indirect material interest in the City of DeKalb, nor does anyone at Foster &
Foster, Inc. act as a member of the Board of Trustees of the City of DeKalb Police Pension Fund. Thus,
there is no relationship existing that might affect our capacity to prepare and certify this actuarial report.
If there are any questions, concerns, or comments about any of the items contained in this report, please
contact us at 630-620-0200.
Respectfully submitted,
Foster & Foster, Inc.
By: ______________________________
Jason L. Franken
Enrolled Actuary #17-6888
JLF/lke
Enclosures
TABLE OF CONTENTS
Section Title Page I Introduction
a. Summary of Report 5 b. Changes Since Prior Valuation 7
c. Comparative Summary of Principal
Valuation Results 8 II Valuation Information
a. Development of Amortization Payment 14
b. Detailed Actuarial (Gain)/Loss Analysis 15
c. Reconciliation of Changes in Contribution Requirement 16
d. Statutory Minimum Required Contribution 17
e. Projection of Benefit Payments 18 f. Actuarial Assumptions and Methods 19
g. Glossary 21
III Trust Fund 22 IV Member Statistics
a. Statistical Data 26 b. Age and Service Distribution 27 c. Valuation Participant Reconciliation 28
V Summary of Current Plan 29 VI Governmental Accounting Standards Board Statements No. 67 and No. 68 Disclosure Information 32
City of DeKalb Police Pension Fund FOSTER & FOSTER | 4
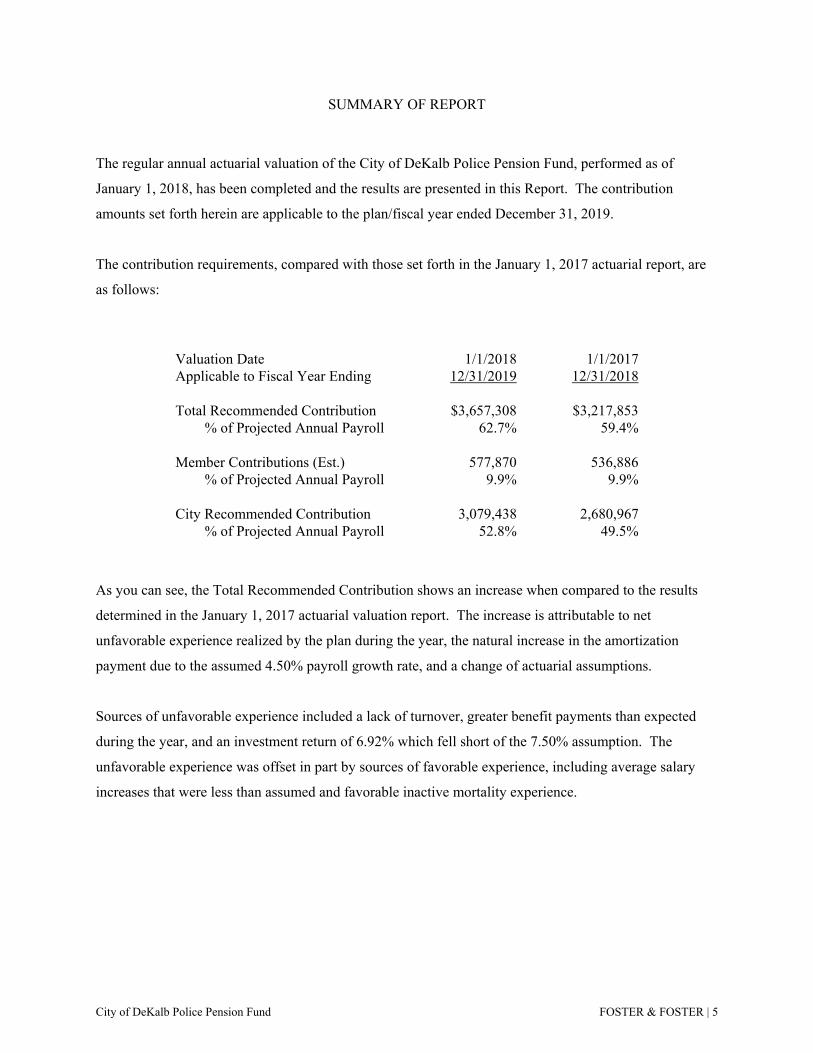
SUMMARY OF REPORT
The regular annual actuarial valuation of the City of DeKalb Police Pension Fund, performed as of
January 1, 2018, has been completed and the results are presented in this Report. The contribution
amounts set forth herein are applicable to the plan/fiscal year ended December 31, 2019.
The contribution requirements, compared with those set forth in the January 1, 2017 actuarial report, are
as follows:
Valuation Date 1/1/2018 1/1/2017 Applicable to Fiscal Year Ending 12/31/2019 12/31/2018
Total Recommended Contribution $3,657,308 $3,217,853 % of Projected Annual Payroll 62.7% 59.4%
Member Contributions (Est.) 577,870 536,886 % of Projected Annual Payroll 9.9% 9.9%
City Recommended Contribution 3,079,438 2,680,967 % of Projected Annual Payroll 52.8% 49.5%
As you can see, the Total Recommended Contribution shows an increase when compared to the results
determined in the January 1, 2017 actuarial valuation report. The increase is attributable to net
unfavorable experience realized by the plan during the year, the natural increase in the amortization
payment due to the assumed 4.50% payroll growth rate, and a change of actuarial assumptions.
Sources of unfavorable experience included a lack of turnover, greater benefit payments than expected
during the year, and an investment return of 6.92% which fell short of the 7.50% assumption. The
unfavorable experience was offset in part by sources of favorable experience, including average salary
increases that were less than assumed and favorable inactive mortality experience.
City of DeKalb Police Pension Fund FOSTER & FOSTER | 5
The balance of this Report presents additional details of the actuarial valuation and the general operation
of the Fund. The undersigned would be pleased to meet with the City to discuss the Report and answer
any pending questions concerning its contents.
Respectfully submitted,
FOSTER & FOSTER, INC.
By: ______________________________ Jason L. Franken, FSA, EA, MAAA
City of DeKalb Police Pension Fund FOSTER & FOSTER | 6
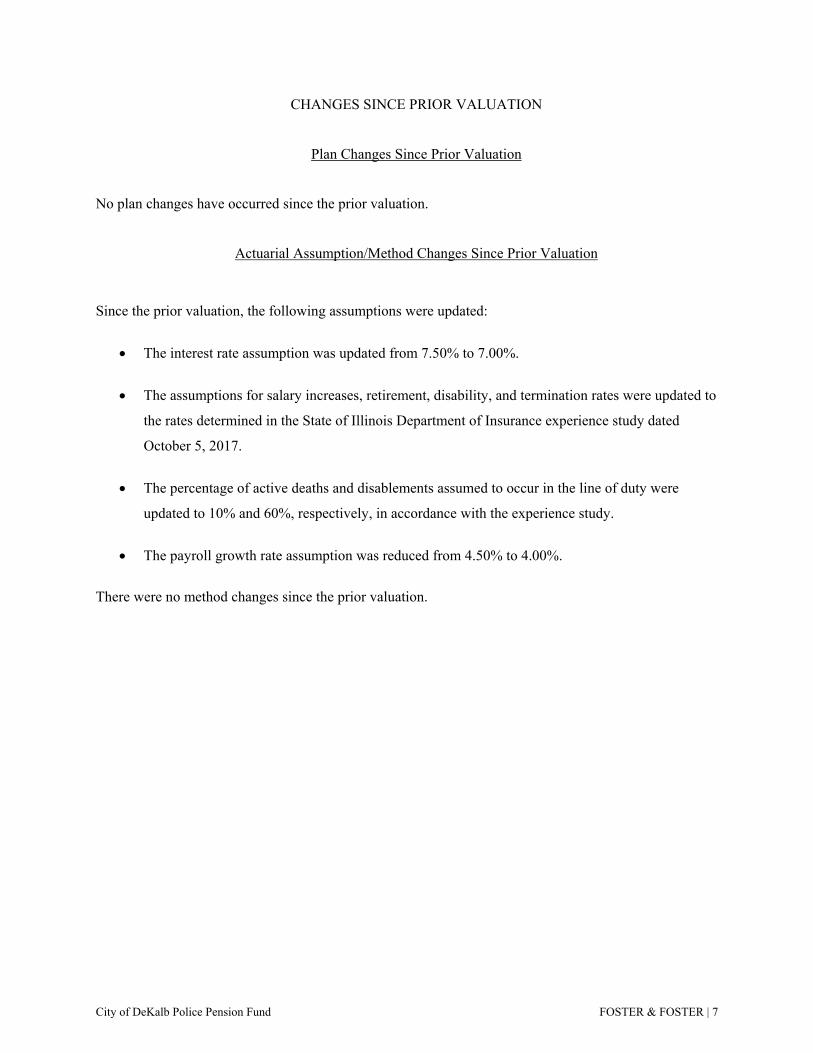
CHANGES SINCE PRIOR VALUATION
Plan Changes Since Prior Valuation
No plan changes have occurred since the prior valuation.
Actuarial Assumption/Method Changes Since Prior Valuation
Since the prior valuation, the following assumptions were updated:
The interest rate assumption was updated from 7.50% to 7.00%.
The assumptions for salary increases, retirement, disability, and termination rates were updated to
the rates determined in the State of Illinois Department of Insurance experience study dated
October 5, 2017.
The percentage of active deaths and disablements assumed to occur in the line of duty were
updated to 10% and 60%, respectively, in accordance with the experience study.
The payroll growth rate assumption was reduced from 4.50% to 4.00%.
There were no method changes since the prior valuation.
City of DeKalb Police Pension Fund FOSTER & FOSTER | 7
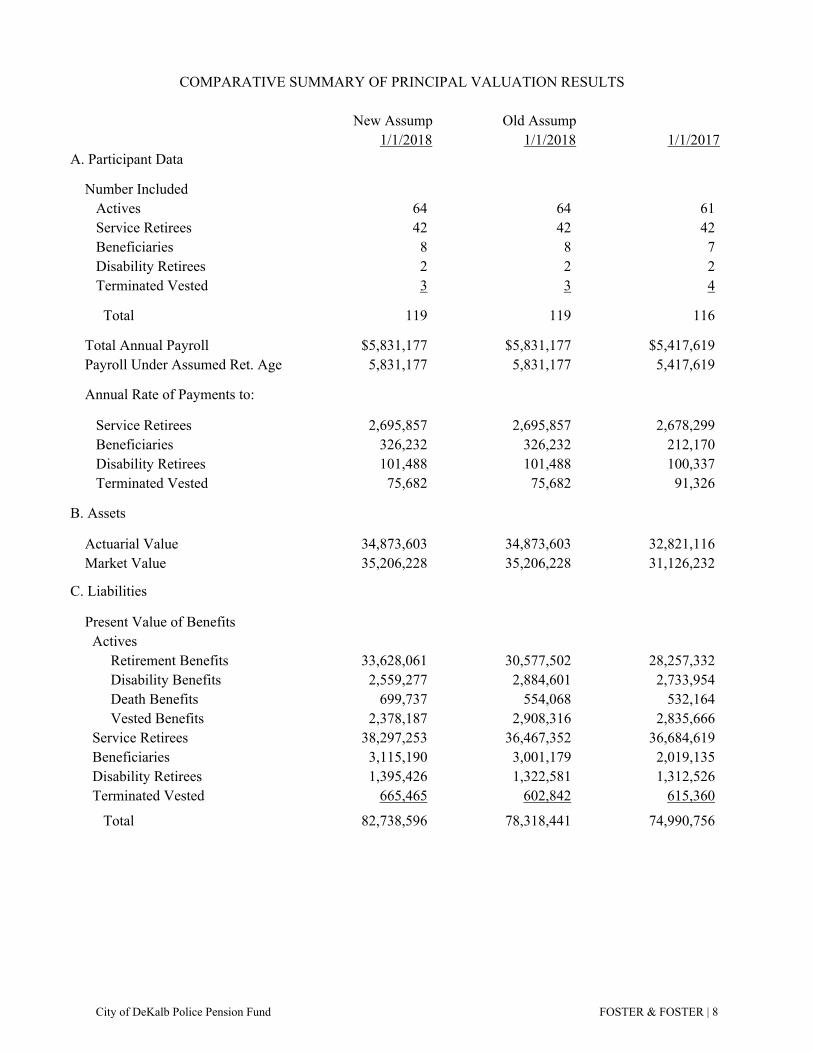
COMPARATIVE SUMMARY OF PRINCIPAL VALUATION RESULTS
New Assump Old Assump1/1/2018 1/1/2018 1/1/2017
A. Participant Data
Number Included Actives 64 64 61 Service Retirees 42 42 42 Beneficiaries 8 8 7 Disability Retirees 2 2 2 Terminated Vested 3 3 4
Total 119 119 116
Total Annual Payroll $5,831,177 $5,831,177 $5,417,619 Payroll Under Assumed Ret. Age 5,831,177 5,831,177 5,417,619
Annual Rate of Payments to:
Service Retirees 2,695,857 2,695,857 2,678,299 Beneficiaries 326,232 326,232 212,170 Disability Retirees 101,488 101,488 100,337 Terminated Vested 75,682 75,682 91,326
B. Assets
Actuarial Value 34,873,603 34,873,603 32,821,116Market Value 35,206,228 35,206,228 31,126,232
C. Liabilities
Present Value of Benefits Actives Retirement Benefits 33,628,061 30,577,502 28,257,332 Disability Benefits 2,559,277 2,884,601 2,733,954 Death Benefits 699,737 554,068 532,164 Vested Benefits 2,378,187 2,908,316 2,835,666 Service Retirees 38,297,253 36,467,352 36,684,619 Beneficiaries 3,115,190 3,001,179 2,019,135 Disability Retirees 1,395,426 1,322,581 1,312,526 Terminated Vested 665,465 602,842 615,360
Total 82,738,596 78,318,441 74,990,756
City of DeKalb Police Pension Fund FOSTER & FOSTER | 8
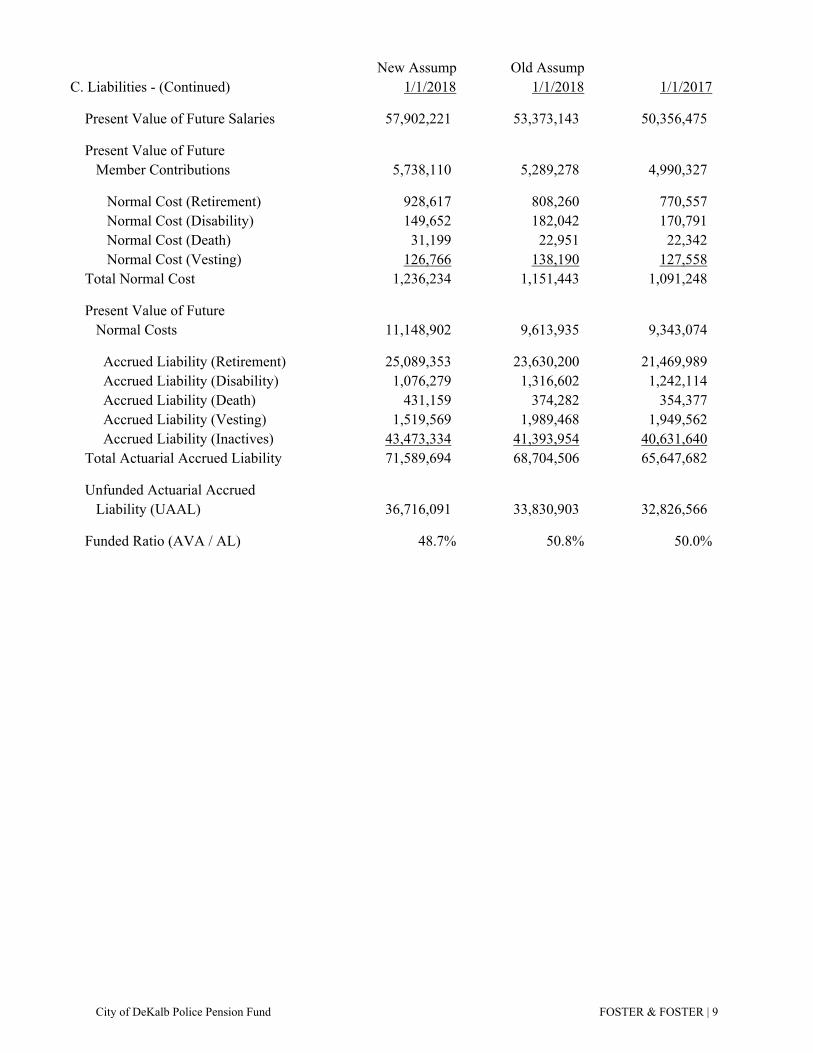
New Assump Old AssumpC. Liabilities - (Continued) 1/1/2018 1/1/2018 1/1/2017
Present Value of Future Salaries 57,902,221 53,373,143 50,356,475
Present Value of Future Member Contributions 5,738,110 5,289,278 4,990,327
Normal Cost (Retirement) 928,617 808,260 770,557 Normal Cost (Disability) 149,652 182,042 170,791 Normal Cost (Death) 31,199 22,951 22,342 Normal Cost (Vesting) 126,766 138,190 127,558 Total Normal Cost 1,236,234 1,151,443 1,091,248
Present Value of Future Normal Costs 11,148,902 9,613,935 9,343,074
Accrued Liability (Retirement) 25,089,353 23,630,200 21,469,989 Accrued Liability (Disability) 1,076,279 1,316,602 1,242,114 Accrued Liability (Death) 431,159 374,282 354,377 Accrued Liability (Vesting) 1,519,569 1,989,468 1,949,562 Accrued Liability (Inactives) 43,473,334 41,393,954 40,631,640 Total Actuarial Accrued Liability 71,589,694 68,704,506 65,647,682
Unfunded Actuarial Accrued Liability (UAAL) 36,716,091 33,830,903 32,826,566
Funded Ratio (AVA / AL) 48.7% 50.8% 50.0%
City of DeKalb Police Pension Fund FOSTER & FOSTER | 9
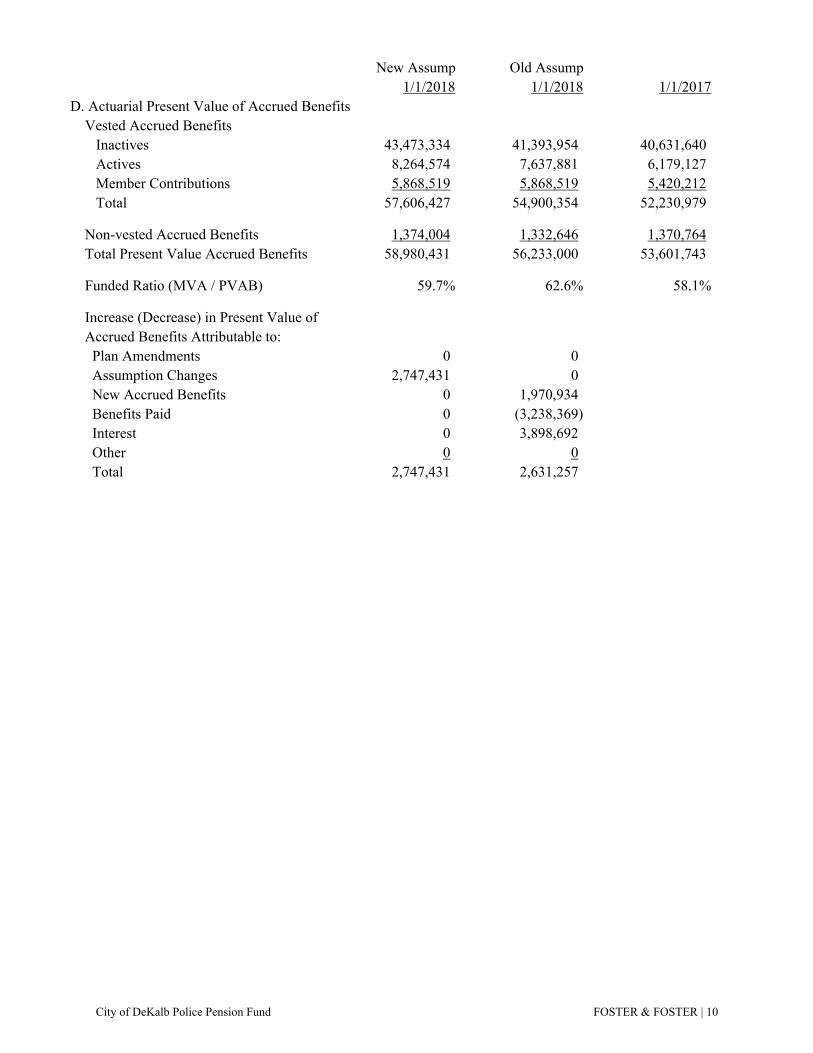
New Assump Old Assump1/1/2018 1/1/2018 1/1/2017
D. Actuarial Present Value of Accrued Benefits Vested Accrued Benefits Inactives 43,473,334 41,393,954 40,631,640 Actives 8,264,574 7,637,881 6,179,127 Member Contributions 5,868,519 5,868,519 5,420,212 Total 57,606,427 54,900,354 52,230,979
Non-vested Accrued Benefits 1,374,004 1,332,646 1,370,764 Total Present Value Accrued Benefits 58,980,431 56,233,000 53,601,743
Funded Ratio (MVA / PVAB) 59.7% 62.6% 58.1%
Increase (Decrease) in Present Value of Accrued Benefits Attributable to: Plan Amendments 0 0 Assumption Changes 2,747,431 0 New Accrued Benefits 0 1,970,934 Benefits Paid 0 (3,238,369) Interest 0 3,898,692 Other 0 0 Total 2,747,431 2,631,257
City of DeKalb Police Pension Fund FOSTER & FOSTER | 10
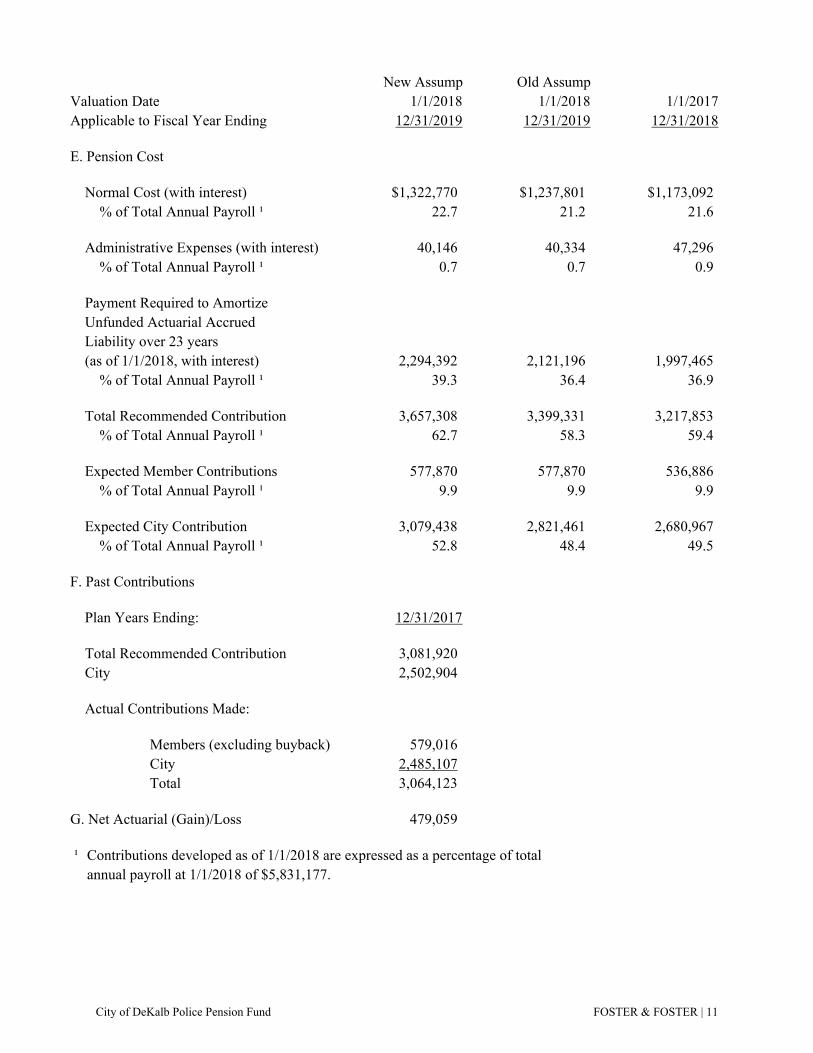
New Assump Old AssumpValuation Date 1/1/2018 1/1/2018 1/1/2017Applicable to Fiscal Year Ending 12/31/2019 12/31/2019 12/31/2018
E. Pension Cost
Normal Cost (with interest) $1,322,770 $1,237,801 $1,173,092 % of Total Annual Payroll ¹ 22.7 21.2 21.6
Administrative Expenses (with interest) 40,146 40,334 47,296 % of Total Annual Payroll ¹ 0.7 0.7 0.9
Payment Required to Amortize Unfunded Actuarial Accrued Liability over 23 years (as of 1/1/2018, with interest) 2,294,392 2,121,196 1,997,465 % of Total Annual Payroll ¹ 39.3 36.4 36.9
Total Recommended Contribution 3,657,308 3,399,331 3,217,853 % of Total Annual Payroll ¹ 62.7 58.3 59.4
Expected Member Contributions 577,870 577,870 536,886 % of Total Annual Payroll ¹ 9.9 9.9 9.9
Expected City Contribution 3,079,438 2,821,461 2,680,967 % of Total Annual Payroll ¹ 52.8 48.4 49.5
F. Past Contributions
Plan Years Ending: 12/31/2017
Total Recommended Contribution 3,081,920 City 2,502,904
Actual Contributions Made:
Members (excluding buyback) 579,016City 2,485,107Total 3,064,123
G. Net Actuarial (Gain)/Loss 479,059
¹ Contributions developed as of 1/1/2018 are expressed as a percentage of totalannual payroll at 1/1/2018 of $5,831,177.
City of DeKalb Police Pension Fund FOSTER & FOSTER | 11
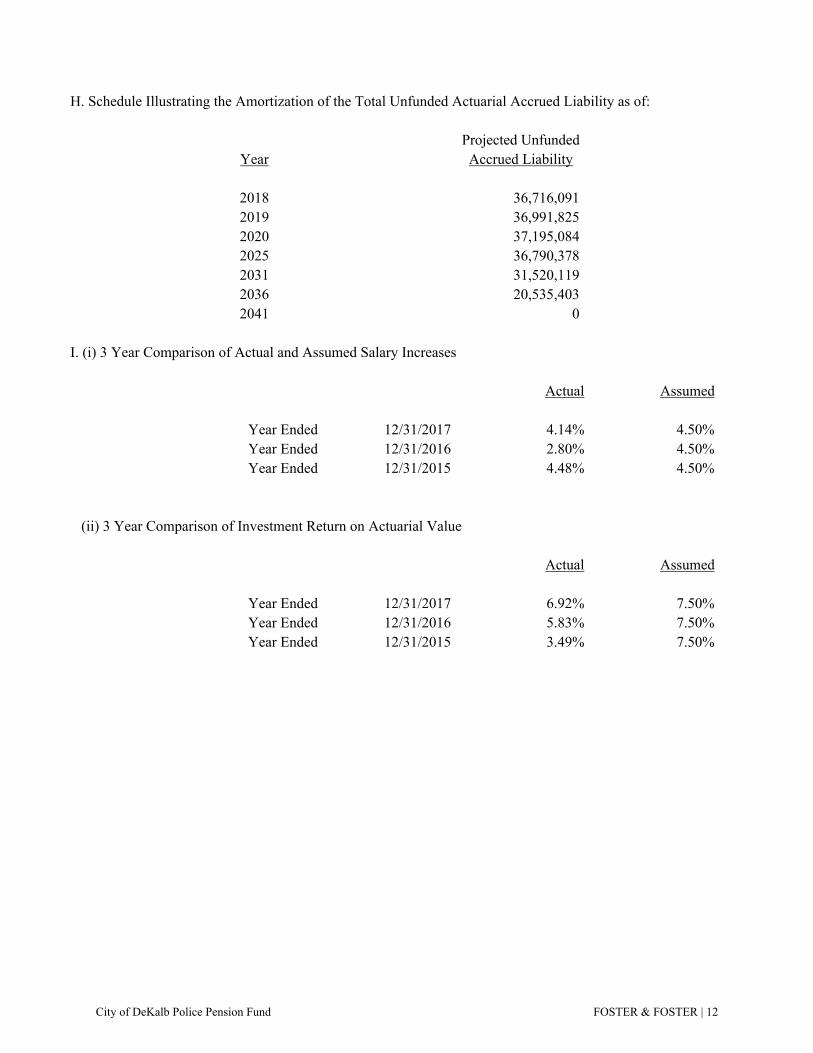
H. Schedule Illustrating the Amortization of the Total Unfunded Actuarial Accrued Liability as of:
Projected UnfundedYear Accrued Liability
2018 36,716,0912019 36,991,8252020 37,195,0842025 36,790,378 2031 31,520,1192036 20,535,4032041 0
I. (i) 3 Year Comparison of Actual and Assumed Salary Increases
Actual Assumed
Year Ended 12/31/2017 4.14% 4.50%Year Ended 12/31/2016 2.80% 4.50%Year Ended 12/31/2015 4.48% 4.50%
(ii) 3 Year Comparison of Investment Return on Actuarial Value
Actual Assumed
Year Ended 12/31/2017 6.92% 7.50%Year Ended 12/31/2016 5.83% 7.50%Year Ended 12/31/2015 3.49% 7.50%
City of DeKalb Police Pension Fund FOSTER & FOSTER | 12
STATEMENT BY ENROLLED ACTUARY
This actuarial valuation was prepared and completed by me or under my direct supervision, and I acknowledge responsibility for the results. To the best of my knowledge, the results are complete and ac-curate, and in my opinion, the techniques and assumptions used are reasonable and meet the requirements and intent of the Illinois Pension Code and adhere to the Actuarial Standards of Practice. There is no ben-efit or expense to be provided by the plan and/or paid from the plan's assets for which liabilities or current costs have not been established or otherwise taken into account in the valuation. All known events or trends which may require a material increase in plan costs or recommended contribution rates have been taken into account in the valuation.
________________________ Jason L. Franken, FSA, EA, MAAA Enrolled Actuary #17-6888
City of DeKalb Police Pension Fund FOSTER & FOSTER | 13
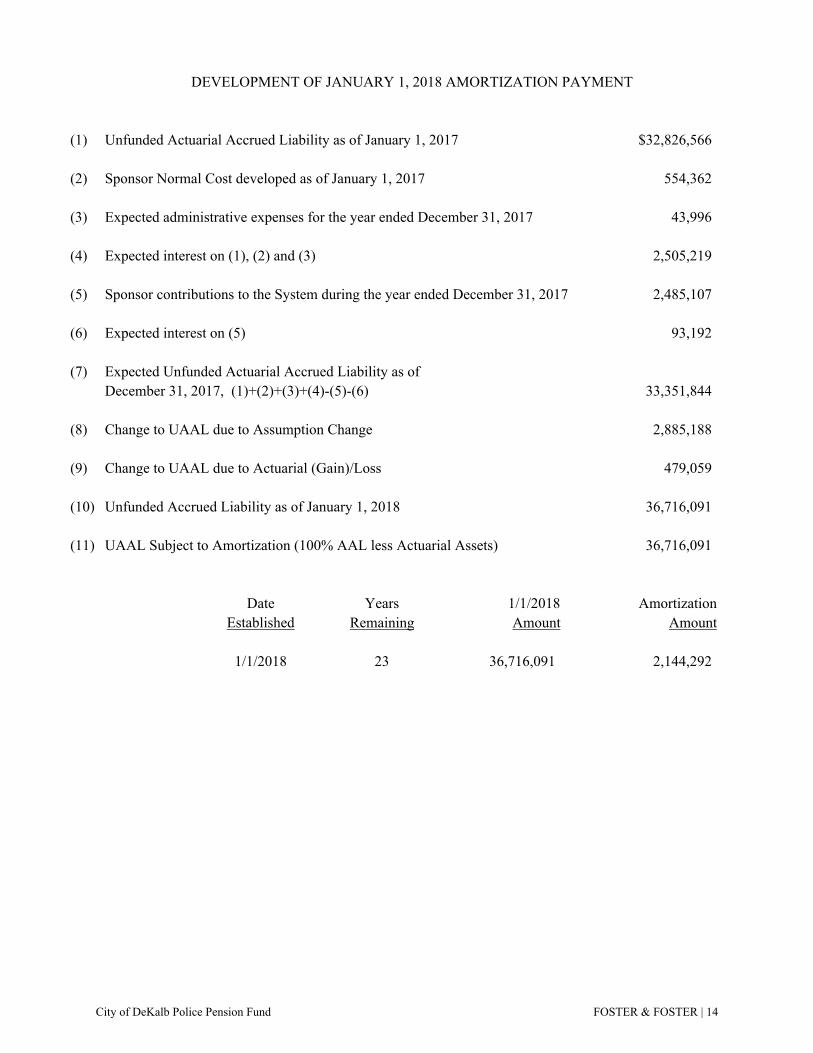
DEVELOPMENT OF JANUARY 1, 2018 AMORTIZATION PAYMENT
(1) Unfunded Actuarial Accrued Liability as of January 1, 2017 $32,826,566
(2) Sponsor Normal Cost developed as of January 1, 2017 554,362
(3) Expected administrative expenses for the year ended December 31, 2017 43,996
(4) Expected interest on (1), (2) and (3) 2,505,219
(5) Sponsor contributions to the System during the year ended December 31, 2017 2,485,107
(6) Expected interest on (5) 93,192
(7) Expected Unfunded Actuarial Accrued Liability as ofDecember 31, 2017, (1)+(2)+(3)+(4)-(5)-(6) 33,351,844
(8) Change to UAAL due to Assumption Change 2,885,188
(9) Change to UAAL due to Actuarial (Gain)/Loss 479,059
(10) Unfunded Accrued Liability as of January 1, 2018 36,716,091
(11) UAAL Subject to Amortization (100% AAL less Actuarial Assets) 36,716,091
Date Years 1/1/2018 AmortizationEstablished Remaining Amount Amount
1/1/2018 23 36,716,091 2,144,292
City of DeKalb Police Pension Fund FOSTER & FOSTER | 14
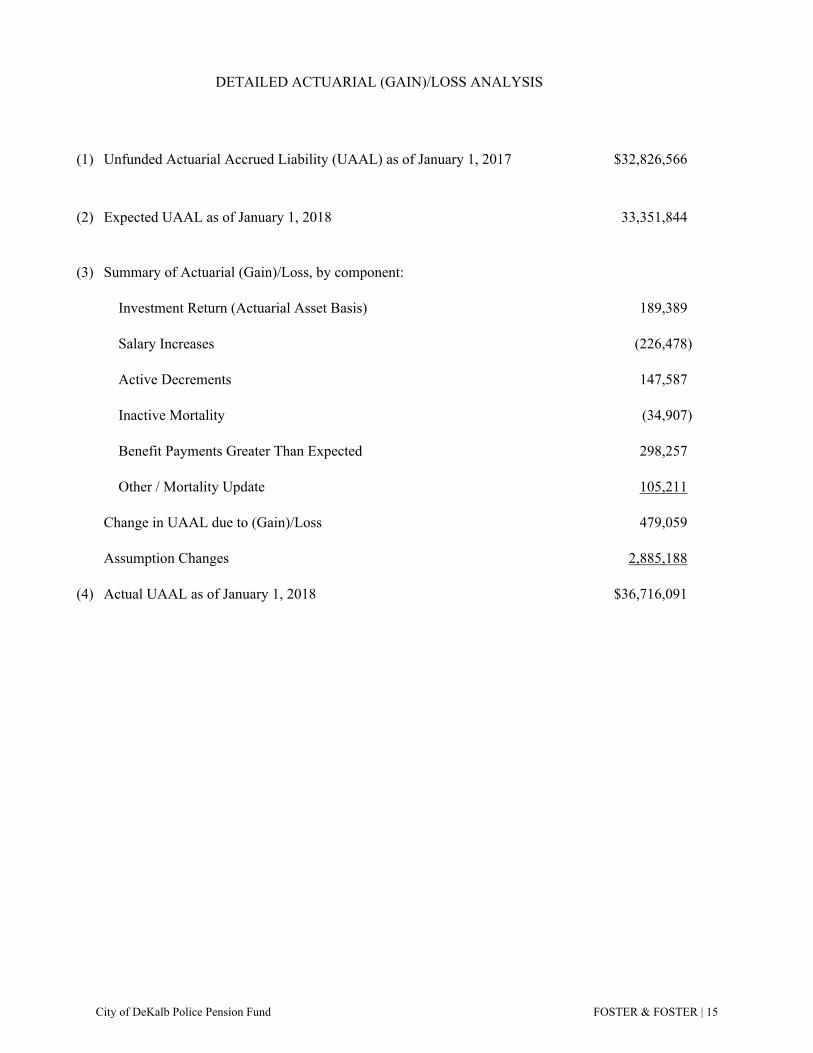
(1) Unfunded Actuarial Accrued Liability (UAAL) as of January 1, 2017 $32,826,566
(2) Expected UAAL as of January 1, 2018 33,351,844
(3) Summary of Actuarial (Gain)/Loss, by component:
Investment Return (Actuarial Asset Basis) 189,389
Salary Increases (226,478)
Active Decrements 147,587
Inactive Mortality (34,907)
Benefit Payments Greater Than Expected 298,257
Other / Mortality Update 105,211
Change in UAAL due to (Gain)/Loss 479,059
Assumption Changes 2,885,188
(4) Actual UAAL as of January 1, 2018 $36,716,091
DETAILED ACTUARIAL (GAIN)/LOSS ANALYSIS
City of DeKalb Police Pension Fund FOSTER & FOSTER | 15
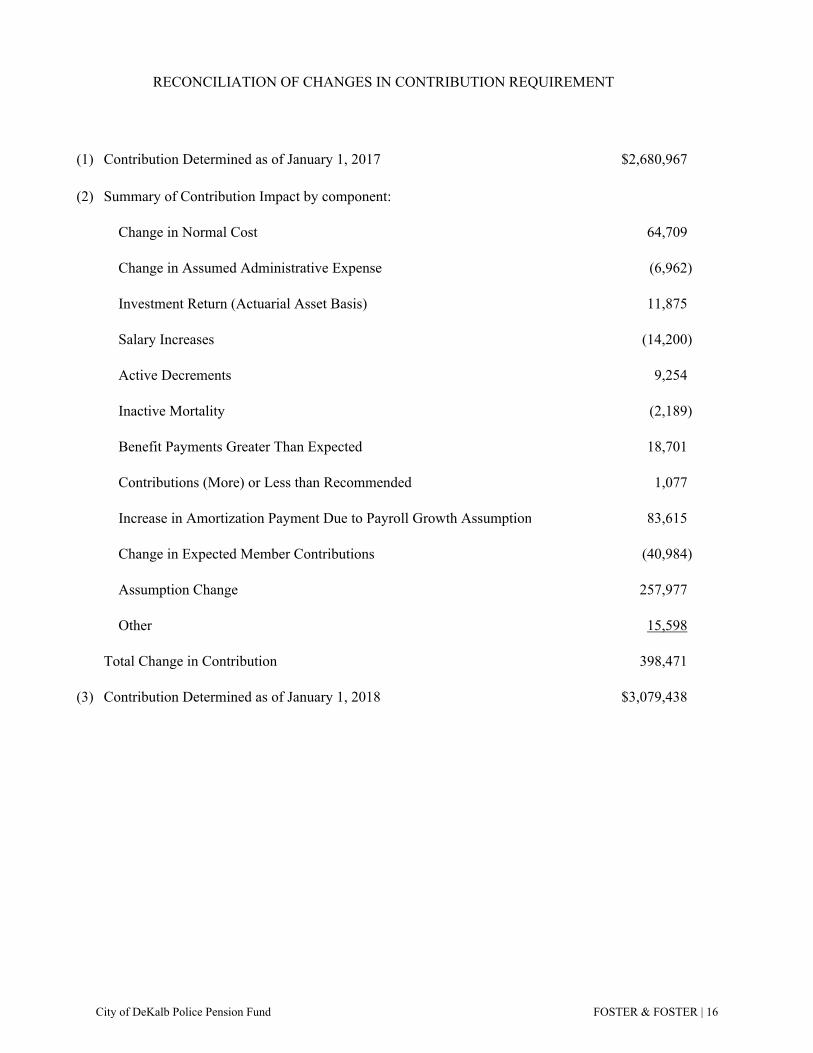
(1) Contribution Determined as of January 1, 2017 $2,680,967
(2) Summary of Contribution Impact by component:
Change in Normal Cost 64,709
Change in Assumed Administrative Expense (6,962)
Investment Return (Actuarial Asset Basis) 11,875
Salary Increases (14,200)
Active Decrements 9,254
Inactive Mortality (2,189)
Benefit Payments Greater Than Expected 18,701
Contributions (More) or Less than Recommended 1,077
Increase in Amortization Payment Due to Payroll Growth Assumption 83,615
Change in Expected Member Contributions (40,984)
Assumption Change 257,977
Other 15,598
Total Change in Contribution 398,471
(3) Contribution Determined as of January 1, 2018 $3,079,438
RECONCILIATION OF CHANGES IN CONTRIBUTION REQUIREMENT
City of DeKalb Police Pension Fund FOSTER & FOSTER | 16
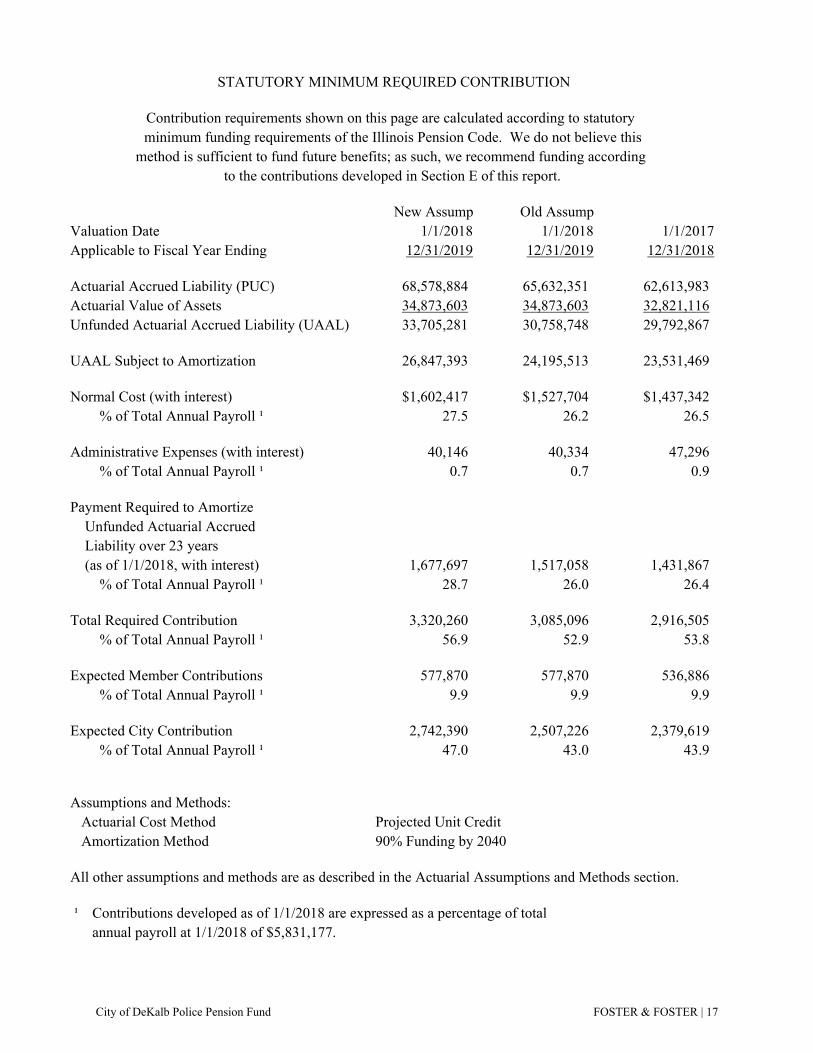
New Assump Old AssumpValuation Date 1/1/2018 1/1/2018 1/1/2017Applicable to Fiscal Year Ending 12/31/2019 12/31/2019 12/31/2018
Actuarial Accrued Liability (PUC) 68,578,884 65,632,351 62,613,983Actuarial Value of Assets 34,873,603 34,873,603 32,821,116Unfunded Actuarial Accrued Liability (UAAL) 33,705,281 30,758,748 29,792,867
UAAL Subject to Amortization 26,847,393 24,195,513 23,531,469
Normal Cost (with interest) $1,602,417 $1,527,704 $1,437,342 % of Total Annual Payroll ¹ 27.5 26.2 26.5
Administrative Expenses (with interest) 40,146 40,334 47,296 % of Total Annual Payroll ¹ 0.7 0.7 0.9
Payment Required to Amortize Unfunded Actuarial Accrued Liability over 23 years (as of 1/1/2018, with interest) 1,677,697 1,517,058 1,431,867 % of Total Annual Payroll ¹ 28.7 26.0 26.4
Total Required Contribution 3,320,260 3,085,096 2,916,505 % of Total Annual Payroll ¹ 56.9 52.9 53.8
Expected Member Contributions 577,870 577,870 536,886 % of Total Annual Payroll ¹ 9.9 9.9 9.9
Expected City Contribution 2,742,390 2,507,226 2,379,619 % of Total Annual Payroll ¹ 47.0 43.0 43.9
Assumptions and Methods: Actuarial Cost Method Projected Unit Credit Amortization Method 90% Funding by 2040
All other assumptions and methods are as described in the Actuarial Assumptions and Methods section.
¹ Contributions developed as of 1/1/2018 are expressed as a percentage of totalannual payroll at 1/1/2018 of $5,831,177.
STATUTORY MINIMUM REQUIRED CONTRIBUTION
Contribution requirements shown on this page are calculated according to statutory minimum funding requirements of the Illinois Pension Code. We do not believe this
method is sufficient to fund future benefits; as such, we recommend funding according to the contributions developed in Section E of this report.
City of DeKalb Police Pension Fund FOSTER & FOSTER | 17
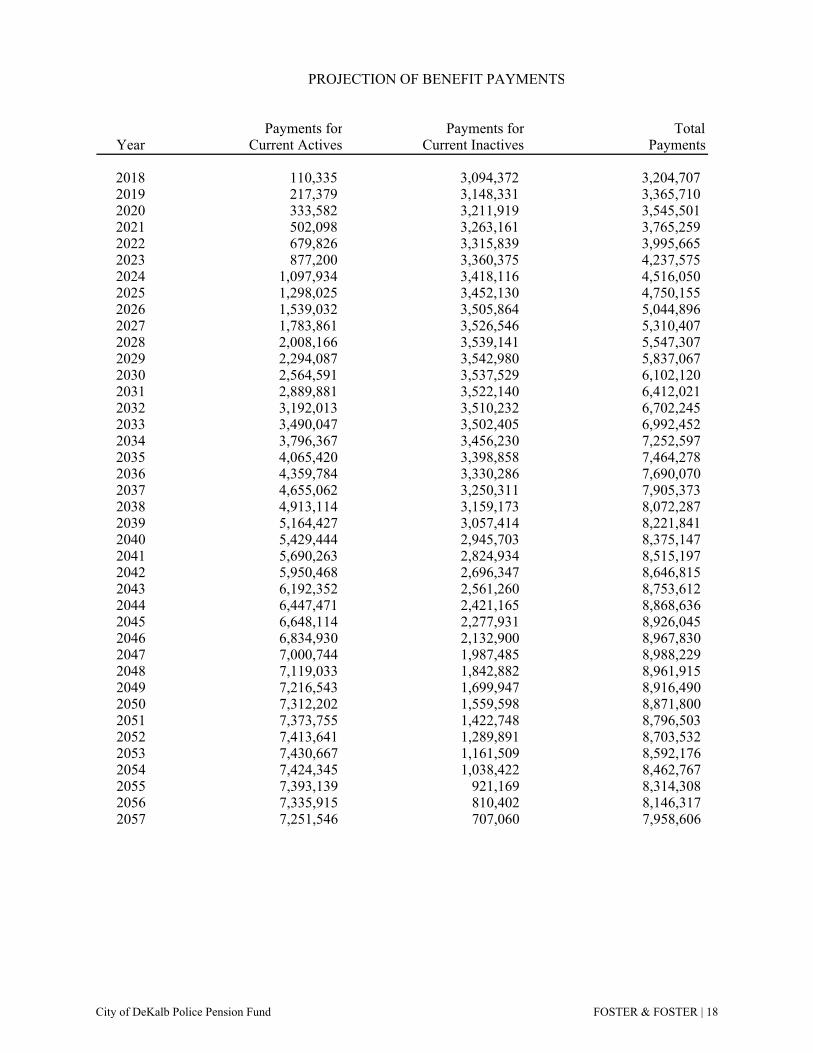
PROJECTION OF BENEFIT PAYMENTS
Payments for Payments for TotalYear Current Actives Current Inactives Payments
2018 110,335 3,094,372 3,204,7072019 217,379 3,148,331 3,365,7102020 333,582 3,211,919 3,545,5012021 502,098 3,263,161 3,765,2592022 679,826 3,315,839 3,995,6652023 877,200 3,360,375 4,237,5752024 1,097,934 3,418,116 4,516,0502025 1,298,025 3,452,130 4,750,1552026 1,539,032 3,505,864 5,044,8962027 1,783,861 3,526,546 5,310,4072028 2,008,166 3,539,141 5,547,3072029 2,294,087 3,542,980 5,837,0672030 2,564,591 3,537,529 6,102,1202031 2,889,881 3,522,140 6,412,0212032 3,192,013 3,510,232 6,702,2452033 3,490,047 3,502,405 6,992,4522034 3,796,367 3,456,230 7,252,5972035 4,065,420 3,398,858 7,464,2782036 4,359,784 3,330,286 7,690,0702037 4,655,062 3,250,311 7,905,3732038 4,913,114 3,159,173 8,072,2872039 5,164,427 3,057,414 8,221,8412040 5,429,444 2,945,703 8,375,1472041 5,690,263 2,824,934 8,515,1972042 5,950,468 2,696,347 8,646,8152043 6,192,352 2,561,260 8,753,6122044 6,447,471 2,421,165 8,868,6362045 6,648,114 2,277,931 8,926,0452046 6,834,930 2,132,900 8,967,8302047 7,000,744 1,987,485 8,988,2292048 7,119,033 1,842,882 8,961,9152049 7,216,543 1,699,947 8,916,4902050 7,312,202 1,559,598 8,871,8002051 7,373,755 1,422,748 8,796,5032052 7,413,641 1,289,891 8,703,5322053 7,430,667 1,161,509 8,592,1762054 7,424,345 1,038,422 8,462,7672055 7,393,139 921,169 8,314,3082056 7,335,915 810,402 8,146,3172057 7,251,546 707,060 7,958,606
City of DeKalb Police Pension Fund FOSTER & FOSTER | 18
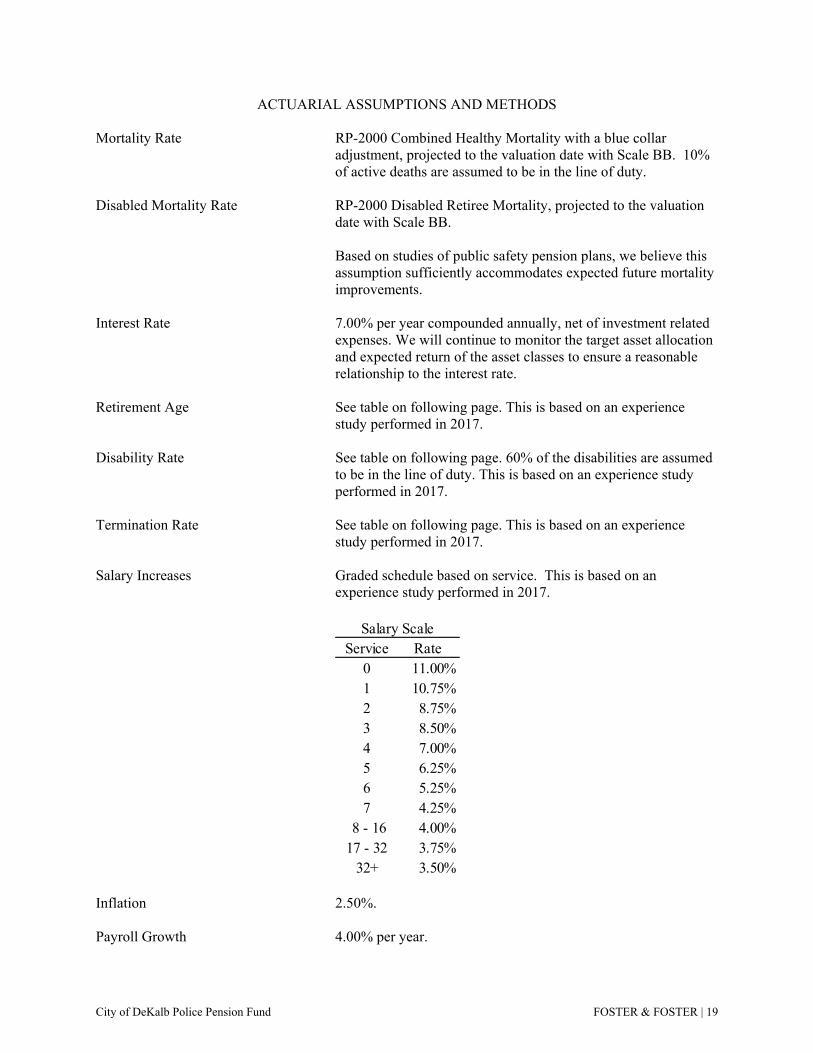
ACTUARIAL ASSUMPTIONS AND METHODS
Mortality Rate RP-2000 Combined Healthy Mortality with a blue collar adjustment, projected to the valuation date with Scale BB. 10% of active deaths are assumed to be in the line of duty.
Disabled Mortality Rate RP-2000 Disabled Retiree Mortality, projected to the valuation date with Scale BB.
Based on studies of public safety pension plans, we believe this assumption sufficiently accommodates expected future mortality improvements.
Interest Rate 7.00% per year compounded annually, net of investment related expenses. We will continue to monitor the target asset allocation and expected return of the asset classes to ensure a reasonable relationship to the interest rate.
Retirement Age See table on following page. This is based on an experience study performed in 2017.
Disability Rate See table on following page. 60% of the disabilities are assumed to be in the line of duty. This is based on an experience study performed in 2017.
Termination Rate See table on following page. This is based on an experience study performed in 2017.
Salary Increases Graded schedule based on service. This is based on an experience study performed in 2017.
Inflation
Payroll Growth
2.50%.
4.00% per year.
Salary ScaleService Rate
0 11.00%1 10.75%2 8.75%3 8.50%4 7.00%5 6.25%6 5.25%7 4.25%
8 - 16 4.00%17 - 32 3.75%
32+ 3.50%
City of DeKalb Police Pension Fund FOSTER & FOSTER | 19
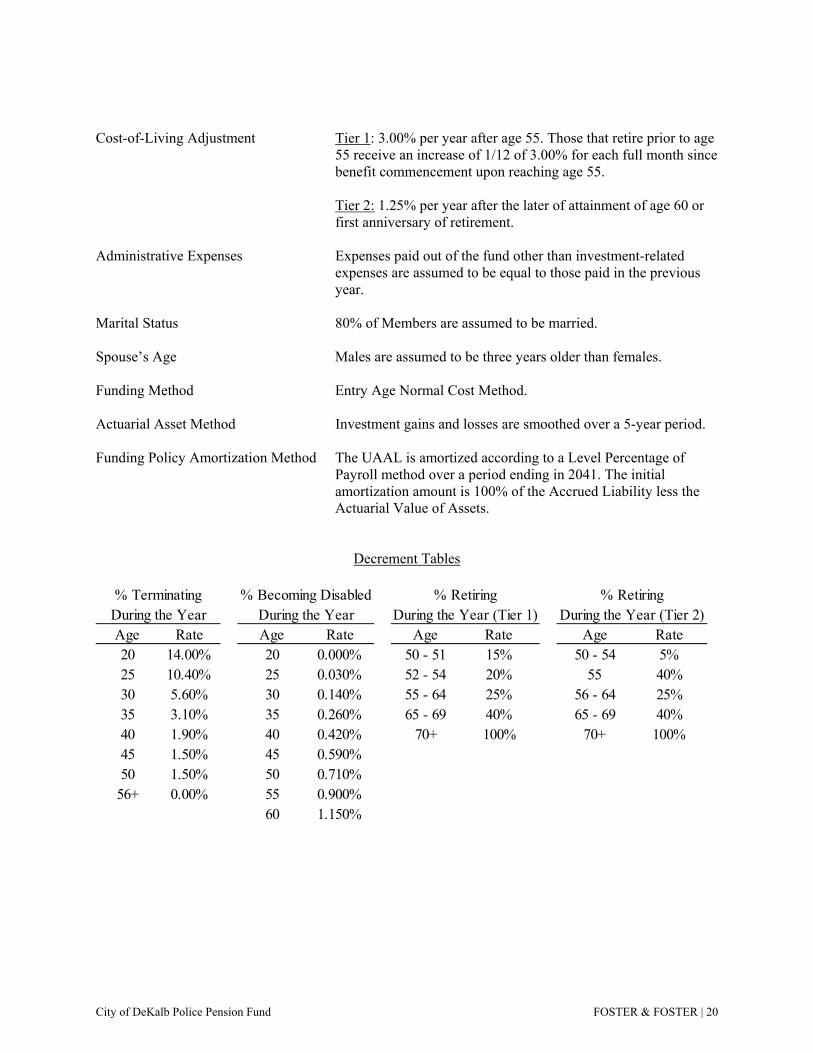
Cost-of-Living Adjustment Tier 1: 3.00% per year after age 55. Those that retire prior to age
55 receive an increase of 1/12 of 3.00% for each full month since benefit commencement upon reaching age 55. Tier 2: 1.25% per year after the later of attainment of age 60 or first anniversary of retirement.
Administrative Expenses Expenses paid out of the fund other than investment-related
expenses are assumed to be equal to those paid in the previous year.
Marital Status 80% of Members are assumed to be married. Spouse’s Age Males are assumed to be three years older than females. Funding Method Entry Age Normal Cost Method. Actuarial Asset Method Investment gains and losses are smoothed over a 5-year period. Funding Policy Amortization Method The UAAL is amortized according to a Level Percentage of
Payroll method over a period ending in 2041. The initial amortization amount is 100% of the Accrued Liability less the Actuarial Value of Assets.
Decrement Tables
% Terminating % Becoming Disabled % Retiring % RetiringDuring the Year During the Year During the Year (Tier 1) During the Year (Tier 2)Age Rate Age Rate Age Rate Age Rate20 14.00% 20 0.000% 50 - 51 15% 50 - 54 5%25 10.40% 25 0.030% 52 - 54 20% 55 40%30 5.60% 30 0.140% 55 - 64 25% 56 - 64 25%35 3.10% 35 0.260% 65 - 69 40% 65 - 69 40%40 1.90% 40 0.420% 70+ 100% 70+ 100%45 1.50% 45 0.590%50 1.50% 50 0.710%
56+ 0.00% 55 0.900%60 1.150%
City of DeKalb Police Pension Fund FOSTER & FOSTER | 20
GLOSSARY
Total Annual Payroll is the projected annual rate of pay for the fiscal year following the valuation date of
all covered members.
Present Value of Benefits is the single sum value on the valuation date of all future benefits to be paid to
current Members, Retirees, Beneficiaries, Disability Retirees and Vested Terminations.
Normal (Current Year's) Cost is the current year's cost for benefits yet to be funded.
Unfunded Accrued Liability is a liability which arises when a pension plan is initially established or
improved and such establishment or improvement is applicable to all years of past service.
Total Recommended Contribution is equal to the Normal Cost plus an amount sufficient to amortize the
Unfunded Accrued Liability over a period ending in 2041. The recommended amount is adjusted for
interest according to the timing of contributions during the year.
Entry Age Normal Cost Method - Under this method, the normal cost is the sum of the individual normal
costs for all active participants. For an active participant, the normal cost is the participant’s normal cost
accrual rate, multiplied by the participant’s current compensation.
(a) The normal cost accrual rate equals:
(i) the present value of future benefits for the participant, determined as of the
participant’s entry age, divided by
(ii) the present value of the compensation expected to be paid to the participant for each
year of the participant’s anticipated future service, determined as of the participant’s
entry age.
(b) In calculating the present value of future compensation, the salary scale is applied both
retrospectively and prospectively to estimate compensation in years prior to and subsequent to the
valuation year based on the compensation used for the valuation.
(c) The accrued liability is the sum of the individual accrued liabilities for all participants and
beneficiaries. A participant’s accrued liability equals the present value, at the participant’s
attained age, of future benefits less the present value at the participant’s attained age of the
individual normal costs payable in the future. A beneficiary’s accrued liability equals the present
value, at the beneficiary’s attained age, of future benefits. The unfunded accrued liability equals
the total accrued liability less the actuarial value of assets.
(d) Under this method, the entry age used for each active participant is the participant’s age at the
time he or she would have commenced participation if the plan had always been in existence
under current terms, or the age as of which he or she first earns service credits for purposes of
benefit accrual under the current terms of the plan.
City of DeKalb Police Pension Fund FOSTER & FOSTER | 21
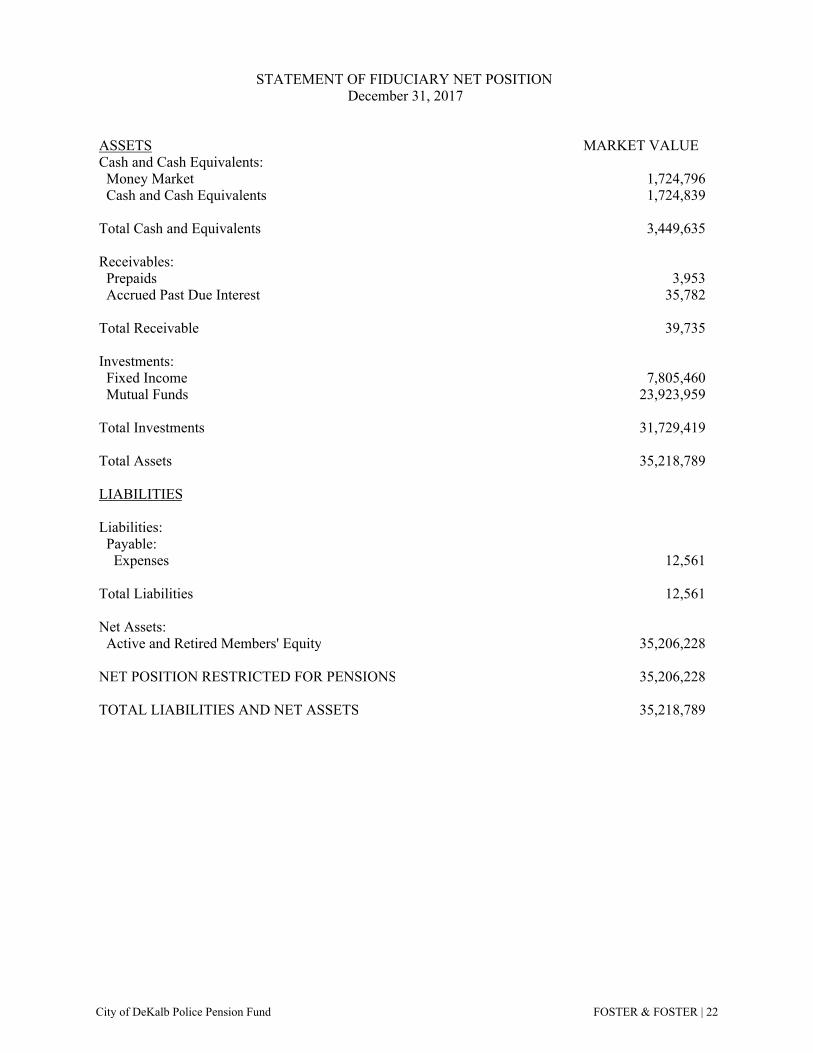
STATEMENT OF FIDUCIARY NET POSITION December 31, 2017
ASSETS MARKET VALUECash and Cash Equivalents: Money Market 1,724,796 Cash and Cash Equivalents 1,724,839
Total Cash and Equivalents 3,449,635
Receivables: Prepaids 3,953 Accrued Past Due Interest 35,782
Total Receivable 39,735
Investments: Fixed Income 7,805,460 Mutual Funds 23,923,959
Total Investments 31,729,419
Total Assets 35,218,789
LIABILITIES
Liabilities: Payable: Expenses 12,561
Total Liabilities 12,561
Net Assets: Active and Retired Members' Equity 35,206,228
NET POSITION RESTRICTED FOR PENSIONS 35,206,228
TOTAL LIABILITIES AND NET ASSETS 35,218,789
City of DeKalb Police Pension Fund FOSTER & FOSTER | 22
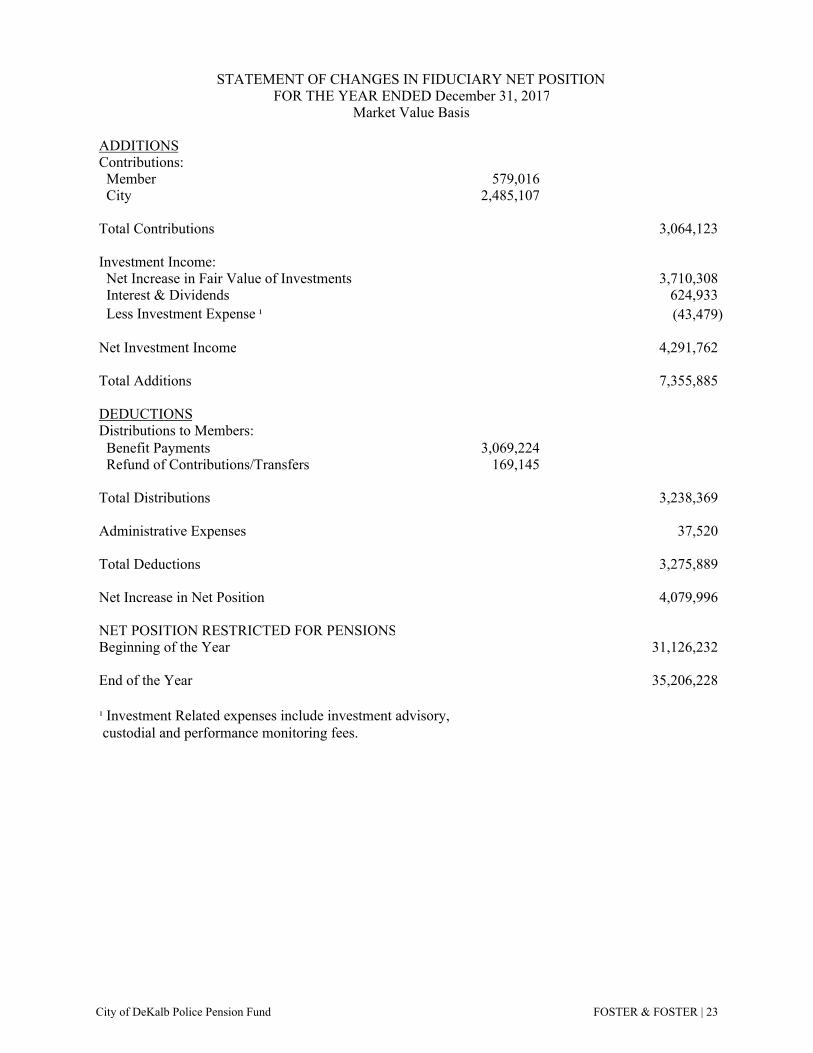
STATEMENT OF CHANGES IN FIDUCIARY NET POSITION FOR THE YEAR ENDED December 31, 2017
Market Value Basis
ADDITIONSContributions: Member 579,016 City 2,485,107
Total Contributions 3,064,123
Investment Income: Net Increase in Fair Value of Investments 3,710,308 Interest & Dividends 624,933 Less Investment Expense ¹ (43,479)
Net Investment Income 4,291,762
Total Additions 7,355,885
DEDUCTIONSDistributions to Members: Benefit Payments 3,069,224 Refund of Contributions/Transfers 169,145
Total Distributions 3,238,369
Administrative Expenses 37,520
Total Deductions 3,275,889
Net Increase in Net Position 4,079,996
NET POSITION RESTRICTED FOR PENSIONSBeginning of the Year 31,126,232
End of the Year 35,206,228
¹ Investment Related expenses include investment advisory, custodial and performance monitoring fees.
City of DeKalb Police Pension Fund FOSTER & FOSTER | 23
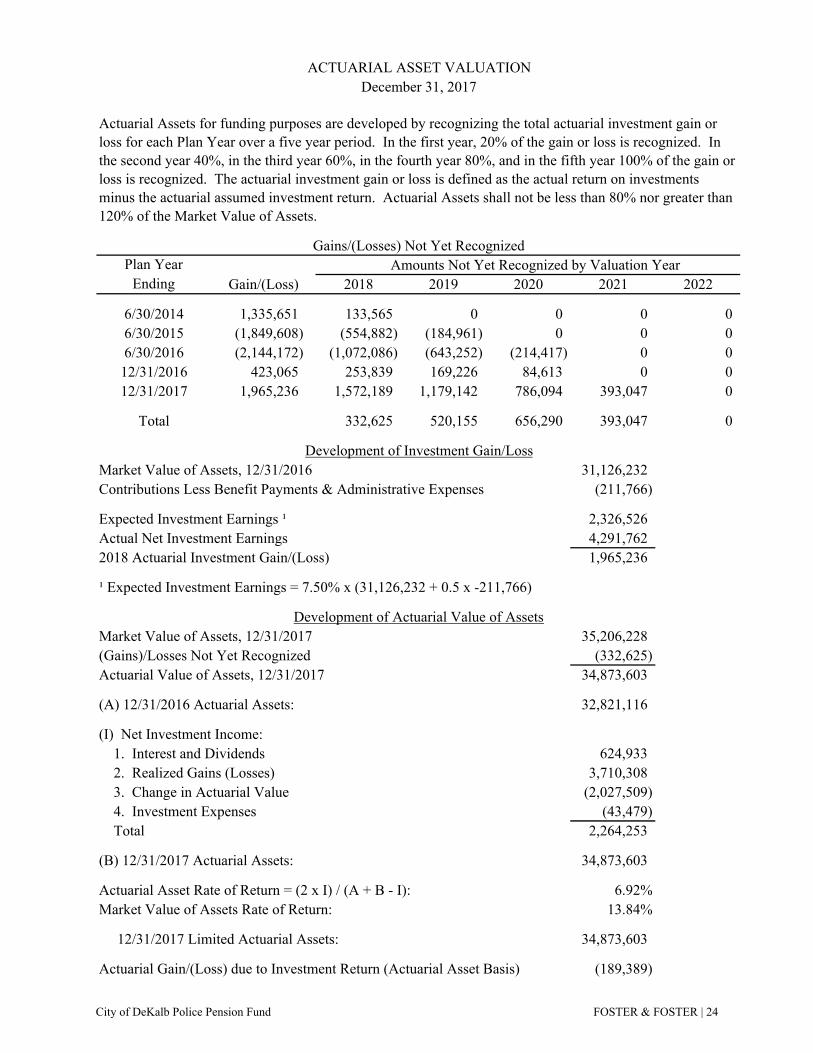
Plan YearEnding Gain/(Loss) 2018 2019 2020 2021 2022
6/30/2014 1,335,651 133,565 0 0 0 06/30/2015 (1,849,608) (554,882) (184,961) 0 0 06/30/2016 (2,144,172) (1,072,086) (643,252) (214,417) 0 012/31/2016 423,065 253,839 169,226 84,613 0 012/31/2017 1,965,236 1,572,189 1,179,142 786,094 393,047 0
Total 332,625 520,155 656,290 393,047 0
Market Value of Assets, 12/31/2016 31,126,232Contributions Less Benefit Payments & Administrative Expenses (211,766)
Expected Investment Earnings ¹ 2,326,526Actual Net Investment Earnings 4,291,7622018 Actuarial Investment Gain/(Loss) 1,965,236
¹ Expected Investment Earnings = 7.50% x (31,126,232 + 0.5 x -211,766)
Market Value of Assets, 12/31/2017 35,206,228(Gains)/Losses Not Yet Recognized (332,625)Actuarial Value of Assets, 12/31/2017 34,873,603
(A) 12/31/2016 Actuarial Assets: 32,821,116
(I) Net Investment Income: 1. Interest and Dividends 624,933 2. Realized Gains (Losses) 3,710,308 3. Change in Actuarial Value (2,027,509) 4. Investment Expenses (43,479) Total 2,264,253
(B) 12/31/2017 Actuarial Assets: 34,873,603
Actuarial Asset Rate of Return = (2 x I) / (A + B - I): 6.92%Market Value of Assets Rate of Return: 13.84%
12/31/2017 Limited Actuarial Assets: 34,873,603
Actuarial Gain/(Loss) due to Investment Return (Actuarial Asset Basis) (189,389)
Amounts Not Yet Recognized by Valuation Year
Development of Investment Gain/Loss
Development of Actuarial Value of Assets
ACTUARIAL ASSET VALUATIONDecember 31, 2017
Actuarial Assets for funding purposes are developed by recognizing the total actuarial investment gain or loss for each Plan Year over a five year period. In the first year, 20% of the gain or loss is recognized. In the second year 40%, in the third year 60%, in the fourth year 80%, and in the fifth year 100% of the gain or loss is recognized. The actuarial investment gain or loss is defined as the actual return on investments minus the actuarial assumed investment return. Actuarial Assets shall not be less than 80% nor greater than 120% of the Market Value of Assets.
Gains/(Losses) Not Yet Recognized
City of DeKalb Police Pension Fund FOSTER & FOSTER | 24
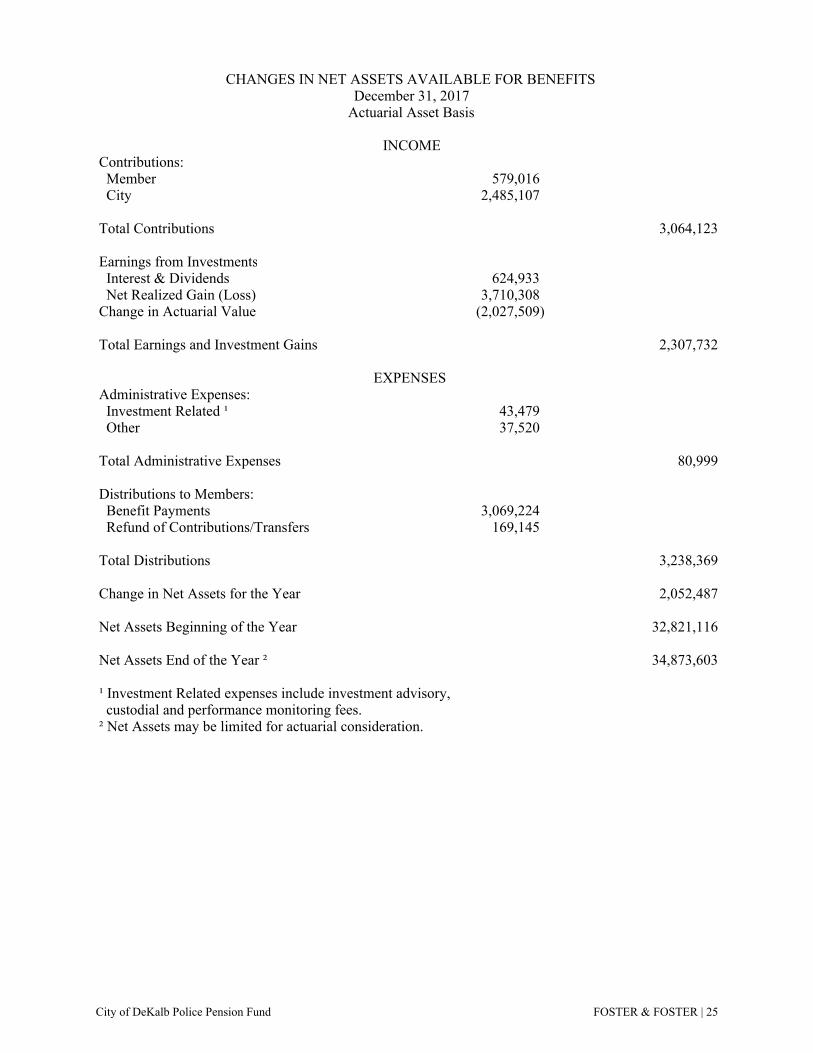
CHANGES IN NET ASSETS AVAILABLE FOR BENEFITS December 31, 2017
Actuarial Asset Basis
INCOMEContributions: Member 579,016 City 2,485,107
Total Contributions 3,064,123
Earnings from Investments Interest & Dividends 624,933 Net Realized Gain (Loss) 3,710,308Change in Actuarial Value (2,027,509)
Total Earnings and Investment Gains 2,307,732
EXPENSES Administrative Expenses: Investment Related ¹ 43,479 Other 37,520
Total Administrative Expenses 80,999
Distributions to Members: Benefit Payments 3,069,224 Refund of Contributions/Transfers 169,145
Total Distributions 3,238,369
Change in Net Assets for the Year 2,052,487
Net Assets Beginning of the Year 32,821,116
Net Assets End of the Year ² 34,873,603
¹ Investment Related expenses include investment advisory, custodial and performance monitoring fees.² Net Assets may be limited for actuarial consideration.
City of DeKalb Police Pension Fund FOSTER & FOSTER | 25
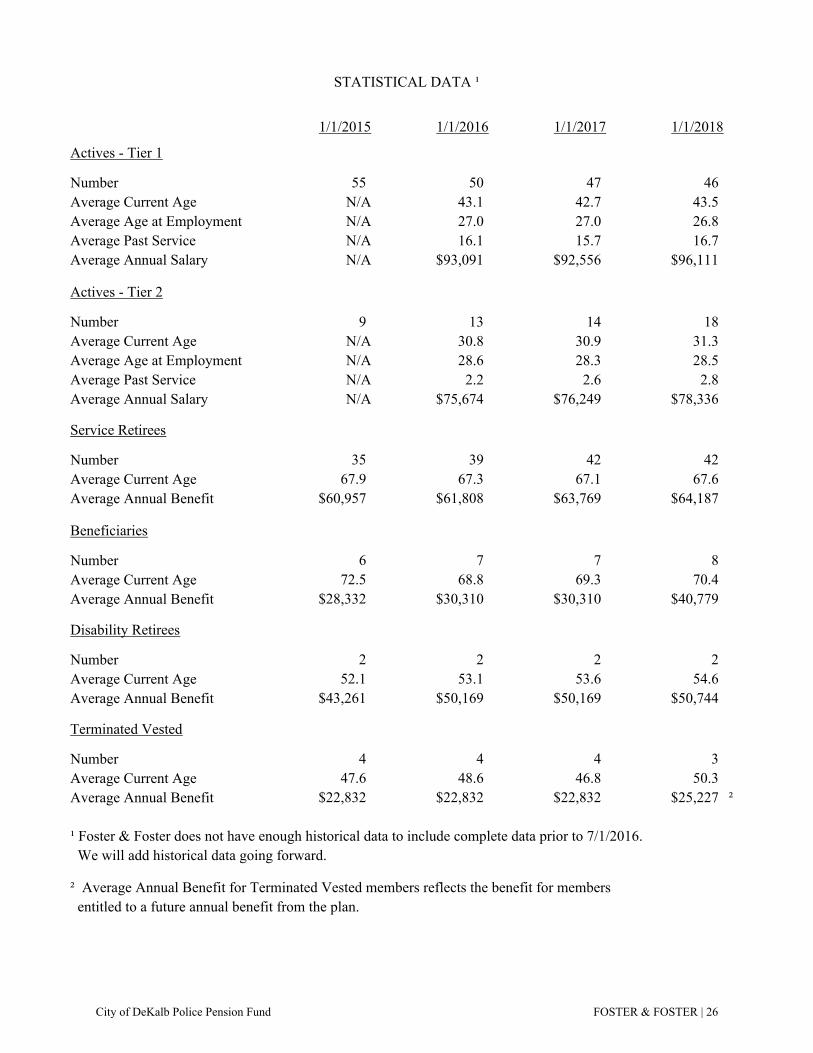
STATISTICAL DATA ¹
1/1/2015 1/1/2016 1/1/2017 1/1/2018
Actives - Tier 1
Number 55 50 47 46Average Current Age N/A 43.1 42.7 43.5Average Age at Employment N/A 27.0 27.0 26.8Average Past Service N/A 16.1 15.7 16.7Average Annual Salary N/A $93,091 $92,556 $96,111
Actives - Tier 2
Number 9 13 14 18Average Current Age N/A 30.8 30.9 31.3Average Age at Employment N/A 28.6 28.3 28.5Average Past Service N/A 2.2 2.6 2.8Average Annual Salary N/A $75,674 $76,249 $78,336
Service Retirees
Number 35 39 42 42Average Current Age 67.9 67.3 67.1 67.6Average Annual Benefit $60,957 $61,808 $63,769 $64,187
Beneficiaries
Number 6 7 7 8Average Current Age 72.5 68.8 69.3 70.4Average Annual Benefit $28,332 $30,310 $30,310 $40,779
Disability Retirees
Number 2 2 2 2Average Current Age 52.1 53.1 53.6 54.6Average Annual Benefit $43,261 $50,169 $50,169 $50,744
Terminated Vested
Number 4 4 4 3Average Current Age 47.6 48.6 46.8 50.3Average Annual Benefit $22,832 $22,832 $22,832 $25,227 ²
¹ Foster & Foster does not have enough historical data to include complete data prior to 7/1/2016. We will add historical data going forward.
² Average Annual Benefit for Terminated Vested members reflects the benefit for members entitled to a future annual benefit from the plan.
City of DeKalb Police Pension Fund FOSTER & FOSTER | 26
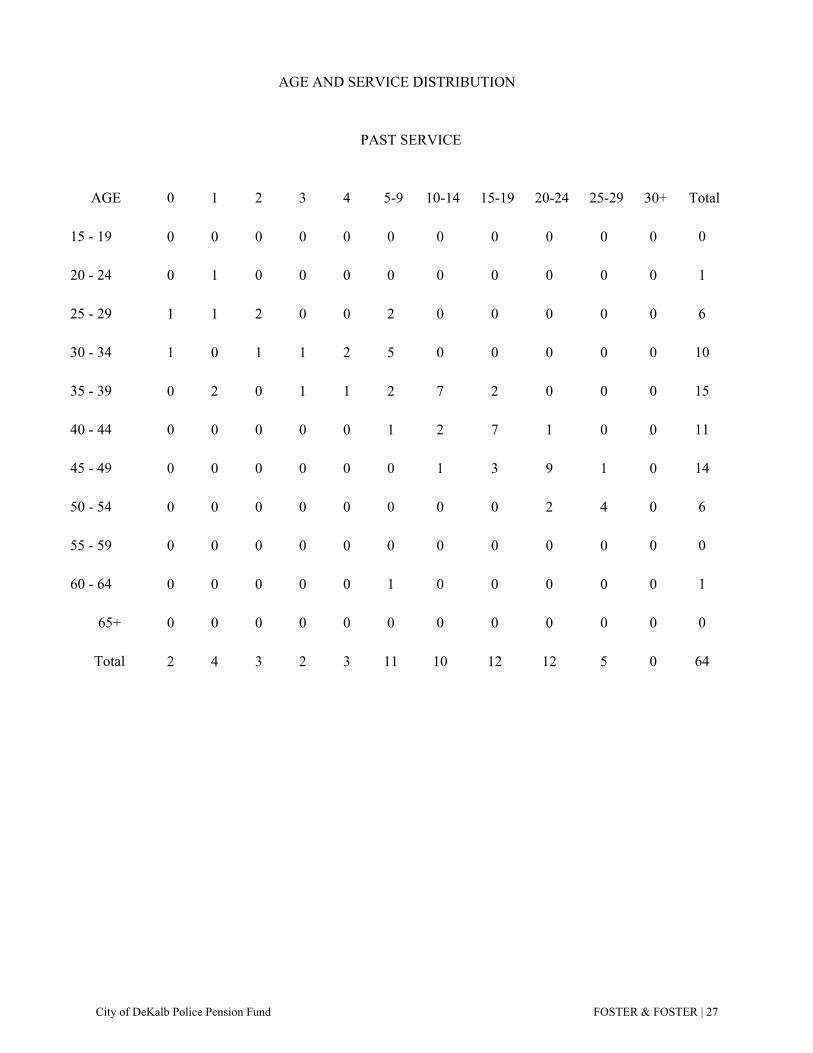
AGE AND SERVICE DISTRIBUTION
PAST SERVICE
AGE 0 1 2 3 4 5-9 10-14 15-19 20-24 25-29 30+ Total
15 - 19 0 0 0 0 0 0 0 0 0 0 0 0
20 - 24 0 1 0 0 0 0 0 0 0 0 0 1
25 - 29 1 1 2 0 0 2 0 0 0 0 0 6
30 - 34 1 0 1 1 2 5 0 0 0 0 0 10
35 - 39 0 2 0 1 1 2 7 2 0 0 0 15
40 - 44 0 0 0 0 0 1 2 7 1 0 0 11
45 - 49 0 0 0 0 0 0 1 3 9 1 0 14
50 - 54 0 0 0 0 0 0 0 0 2 4 0 6
55 - 59 0 0 0 0 0 0 0 0 0 0 0 0
60 - 64 0 0 0 0 0 1 0 0 0 0 0 1
65+ 0 0 0 0 0 0 0 0 0 0 0 0
Total 2 4 3 2 3 11 10 12 12 5 0 64
City of DeKalb Police Pension Fund FOSTER & FOSTER | 27
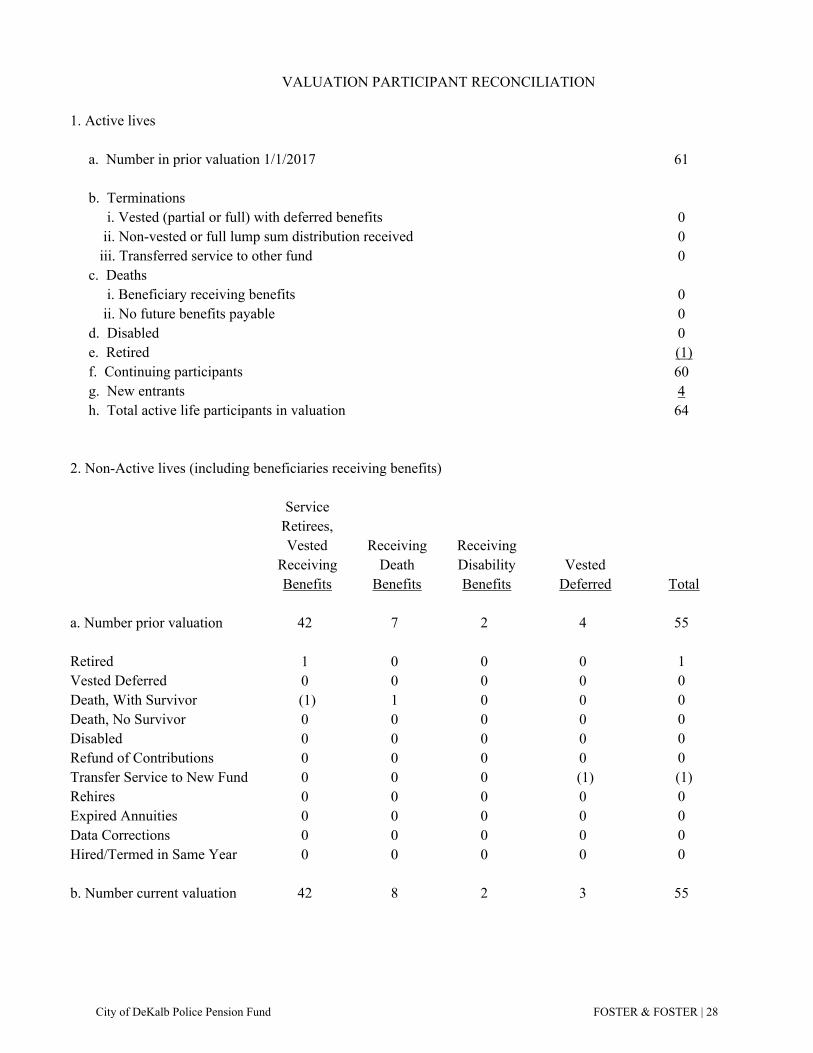
VALUATION PARTICIPANT RECONCILIATION
1. Active lives
a. Number in prior valuation 1/1/2017 61
b. Terminations i. Vested (partial or full) with deferred benefits 0 ii. Non-vested or full lump sum distribution received 0 iii. Transferred service to other fund 0 c. Deaths i. Beneficiary receiving benefits 0 ii. No future benefits payable 0 d. Disabled 0 e. Retired (1) f. Continuing participants 60 g. New entrants 4 h. Total active life participants in valuation 64
2. Non-Active lives (including beneficiaries receiving benefits)
ServiceRetirees,Vested Receiving Receiving
Receiving Death Disability VestedBenefits Benefits Benefits Deferred Total
a. Number prior valuation 42 7 2 4 55
Retired 1 0 0 0 1Vested Deferred 0 0 0 0 0Death, With Survivor (1) 1 0 0 0Death, No Survivor 0 0 0 0 0Disabled 0 0 0 0 0Refund of Contributions 0 0 0 0 0Transfer Service to New Fund 0 0 0 (1) (1)Rehires 0 0 0 0 0Expired Annuities 0 0 0 0 0Data Corrections 0 0 0 0 0Hired/Termed in Same Year 0 0 0 0 0
b. Number current valuation 42 8 2 3 55
City of DeKalb Police Pension Fund FOSTER & FOSTER | 28
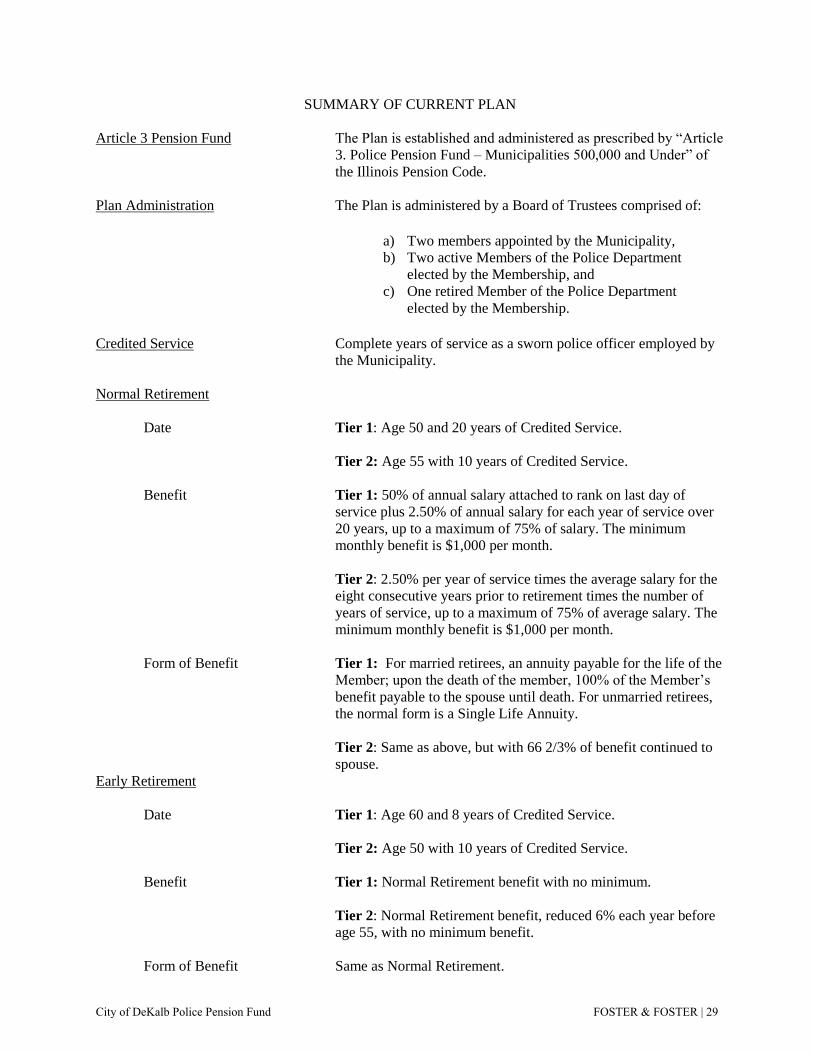
SUMMARY OF CURRENT PLAN
Article 3 Pension Fund The Plan is established and administered as prescribed by “Article
3. Police Pension Fund – Municipalities 500,000 and Under” of
the Illinois Pension Code.
Plan Administration The Plan is administered by a Board of Trustees comprised of:
a) Two members appointed by the Municipality,
b) Two active Members of the Police Department
elected by the Membership, and
c) One retired Member of the Police Department
elected by the Membership.
Credited Service Complete years of service as a sworn police officer employed by
the Municipality.
Normal Retirement
Date Tier 1: Age 50 and 20 years of Credited Service.
Tier 2: Age 55 with 10 years of Credited Service.
Benefit Tier 1: 50% of annual salary attached to rank on last day of
service plus 2.50% of annual salary for each year of service over
20 years, up to a maximum of 75% of salary. The minimum
monthly benefit is $1,000 per month.
Tier 2: 2.50% per year of service times the average salary for the
eight consecutive years prior to retirement times the number of
years of service, up to a maximum of 75% of average salary. The
minimum monthly benefit is $1,000 per month.
Form of Benefit Tier 1: For married retirees, an annuity payable for the life of the
Member; upon the death of the member, 100% of the Member’s
benefit payable to the spouse until death. For unmarried retirees,
the normal form is a Single Life Annuity.
Tier 2: Same as above, but with 66 2/3% of benefit continued to
spouse.
Early Retirement
Date Tier 1: Age 60 and 8 years of Credited Service.
Tier 2: Age 50 with 10 years of Credited Service.
Benefit Tier 1: Normal Retirement benefit with no minimum.
Tier 2: Normal Retirement benefit, reduced 6% each year before
age 55, with no minimum benefit.
Form of Benefit Same as Normal Retirement.
City of DeKalb Police Pension Fund FOSTER & FOSTER | 29
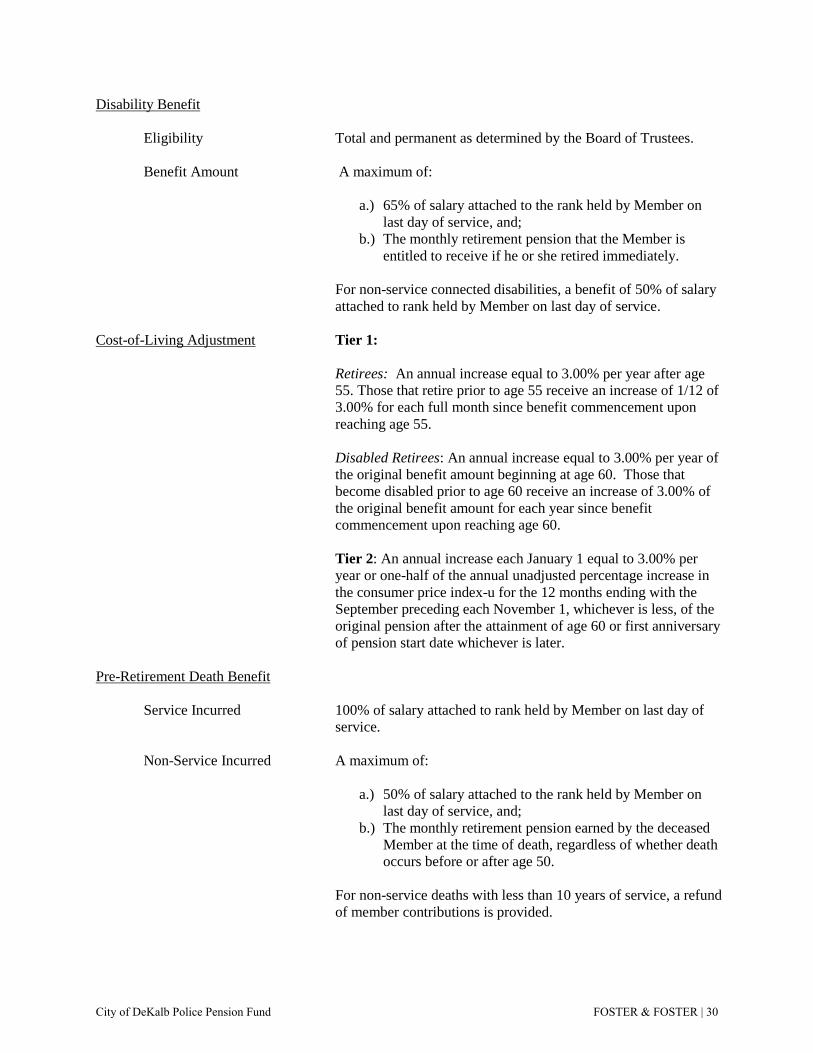
Disability Benefit
Eligibility Total and permanent as determined by the Board of Trustees.
Benefit Amount A maximum of:
a.) 65% of salary attached to the rank held by Member on
last day of service, and;
b.) The monthly retirement pension that the Member is
entitled to receive if he or she retired immediately.
For non-service connected disabilities, a benefit of 50% of salary
attached to rank held by Member on last day of service.
Cost-of-Living Adjustment Tier 1:
Retirees: An annual increase equal to 3.00% per year after age
55. Those that retire prior to age 55 receive an increase of 1/12 of
3.00% for each full month since benefit commencement upon
reaching age 55.
Disabled Retirees: An annual increase equal to 3.00% per year of
the original benefit amount beginning at age 60. Those that
become disabled prior to age 60 receive an increase of 3.00% of
the original benefit amount for each year since benefit
commencement upon reaching age 60.
Tier 2: An annual increase each January 1 equal to 3.00% per
year or one-half of the annual unadjusted percentage increase in
the consumer price index-u for the 12 months ending with the
September preceding each November 1, whichever is less, of the
original pension after the attainment of age 60 or first anniversary
of pension start date whichever is later.
Pre-Retirement Death Benefit
Service Incurred 100% of salary attached to rank held by Member on last day of
service.
Non-Service Incurred A maximum of:
a.) 50% of salary attached to the rank held by Member on
last day of service, and;
b.) The monthly retirement pension earned by the deceased
Member at the time of death, regardless of whether death
occurs before or after age 50.
For non-service deaths with less than 10 years of service, a refund
of member contributions is provided.
City of DeKalb Police Pension Fund FOSTER & FOSTER | 30
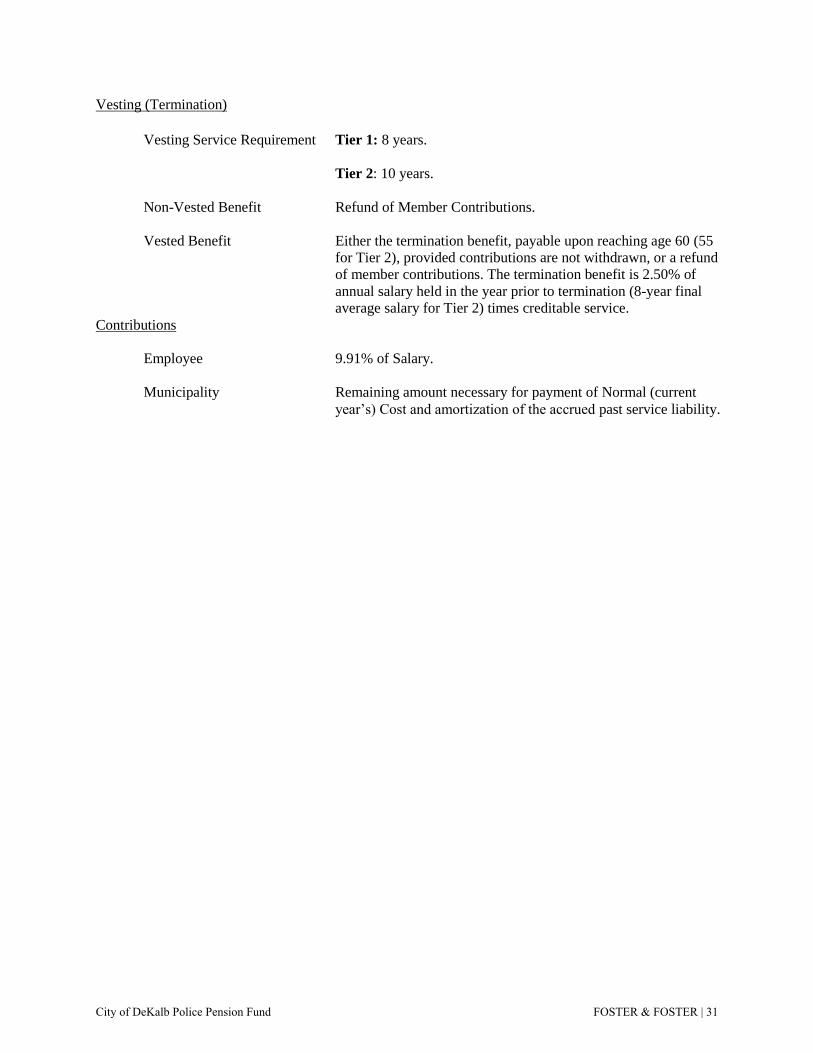
Vesting (Termination)
Vesting Service Requirement Tier 1: 8 years.
Tier 2: 10 years.
Non-Vested Benefit Refund of Member Contributions.
Vested Benefit Either the termination benefit, payable upon reaching age 60 (55
for Tier 2), provided contributions are not withdrawn, or a refund
of member contributions. The termination benefit is 2.50% of
annual salary held in the year prior to termination (8-year final
average salary for Tier 2) times creditable service.
Contributions
Employee 9.91% of Salary.
Municipality Remaining amount necessary for payment of Normal (current
year’s) Cost and amortization of the accrued past service liability.
City of DeKalb Police Pension Fund FOSTER & FOSTER | 31
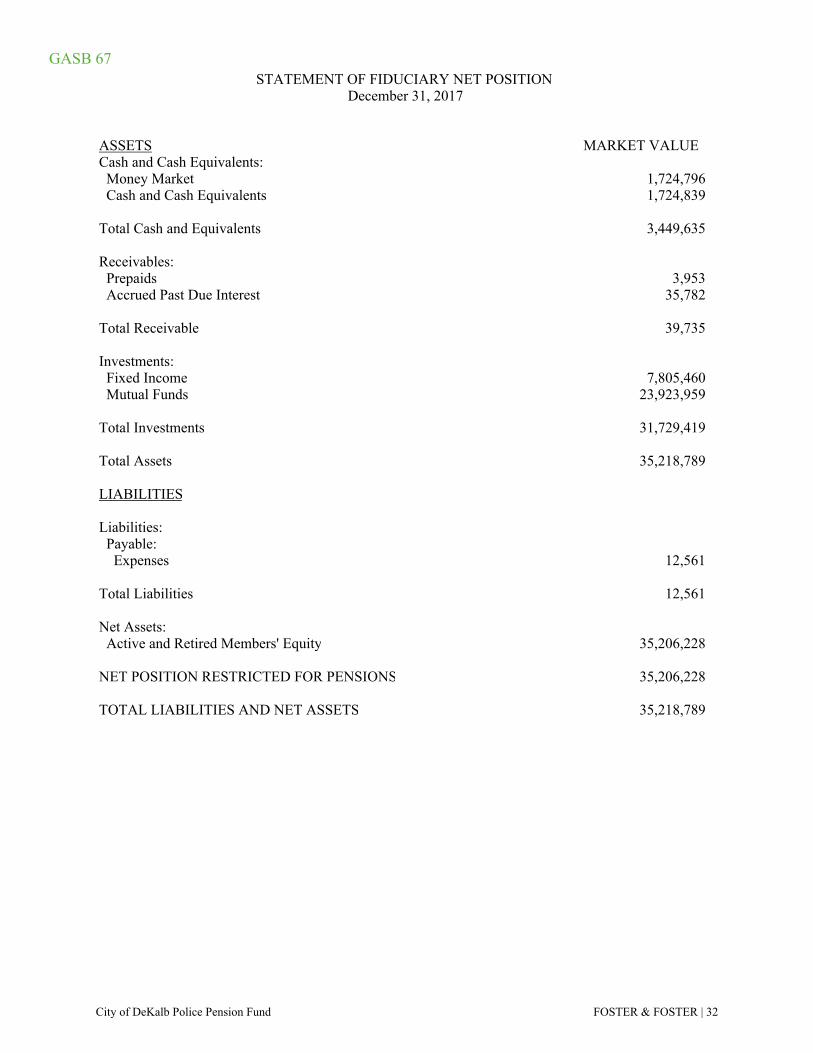
STATEMENT OF FIDUCIARY NET POSITION December 31, 2017
ASSETS MARKET VALUECash and Cash Equivalents: Money Market 1,724,796 Cash and Cash Equivalents 1,724,839
Total Cash and Equivalents 3,449,635
Receivables: Prepaids 3,953 Accrued Past Due Interest 35,782
Total Receivable 39,735
Investments: Fixed Income 7,805,460 Mutual Funds 23,923,959
Total Investments 31,729,419
Total Assets 35,218,789
LIABILITIES
Liabilities: Payable: Expenses 12,561
Total Liabilities 12,561
Net Assets: Active and Retired Members' Equity 35,206,228
NET POSITION RESTRICTED FOR PENSIONS 35,206,228
TOTAL LIABILITIES AND NET ASSETS 35,218,789
GASB 67
City of DeKalb Police Pension Fund FOSTER & FOSTER | 32
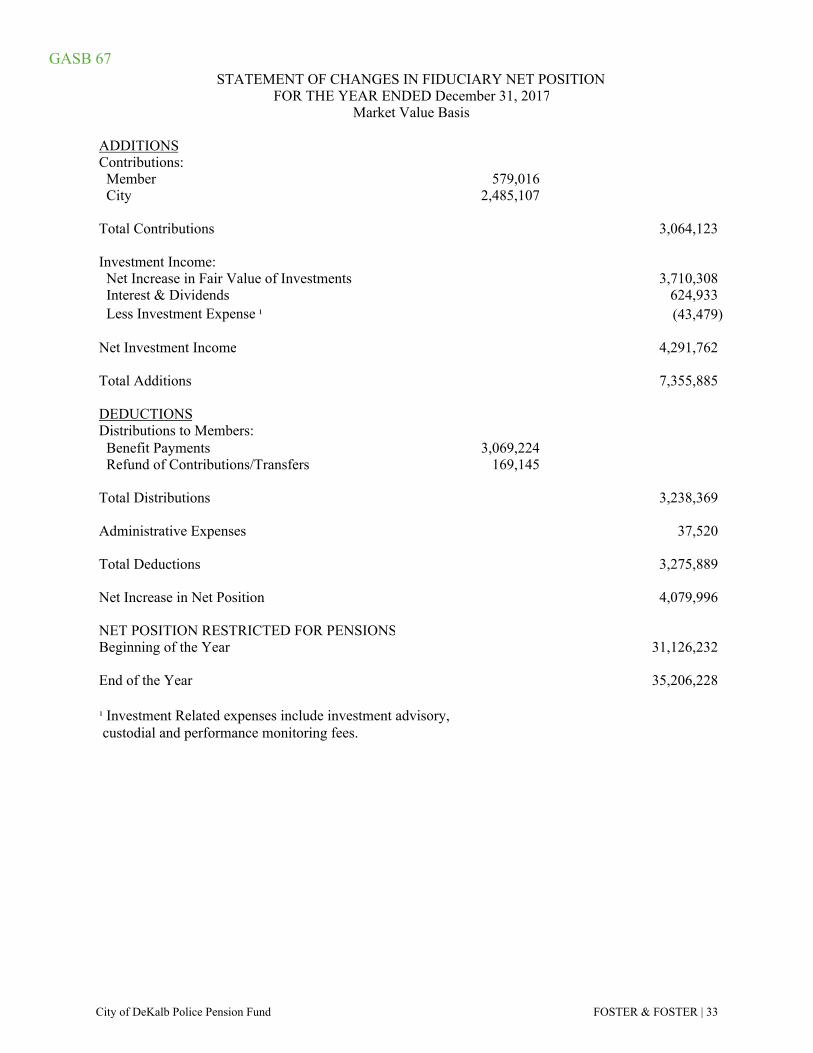
STATEMENT OF CHANGES IN FIDUCIARY NET POSITION FOR THE YEAR ENDED December 31, 2017
Market Value Basis
ADDITIONSContributions: Member 579,016 City 2,485,107
Total Contributions 3,064,123
Investment Income: Net Increase in Fair Value of Investments 3,710,308 Interest & Dividends 624,933 Less Investment Expense ¹ (43,479)
Net Investment Income 4,291,762
Total Additions 7,355,885
DEDUCTIONSDistributions to Members: Benefit Payments 3,069,224 Refund of Contributions/Transfers 169,145
Total Distributions 3,238,369
Administrative Expenses 37,520
Total Deductions 3,275,889
Net Increase in Net Position 4,079,996
NET POSITION RESTRICTED FOR PENSIONSBeginning of the Year 31,126,232
End of the Year 35,206,228
¹ Investment Related expenses include investment advisory, custodial and performance monitoring fees.
GASB 67
City of DeKalb Police Pension Fund FOSTER & FOSTER | 33
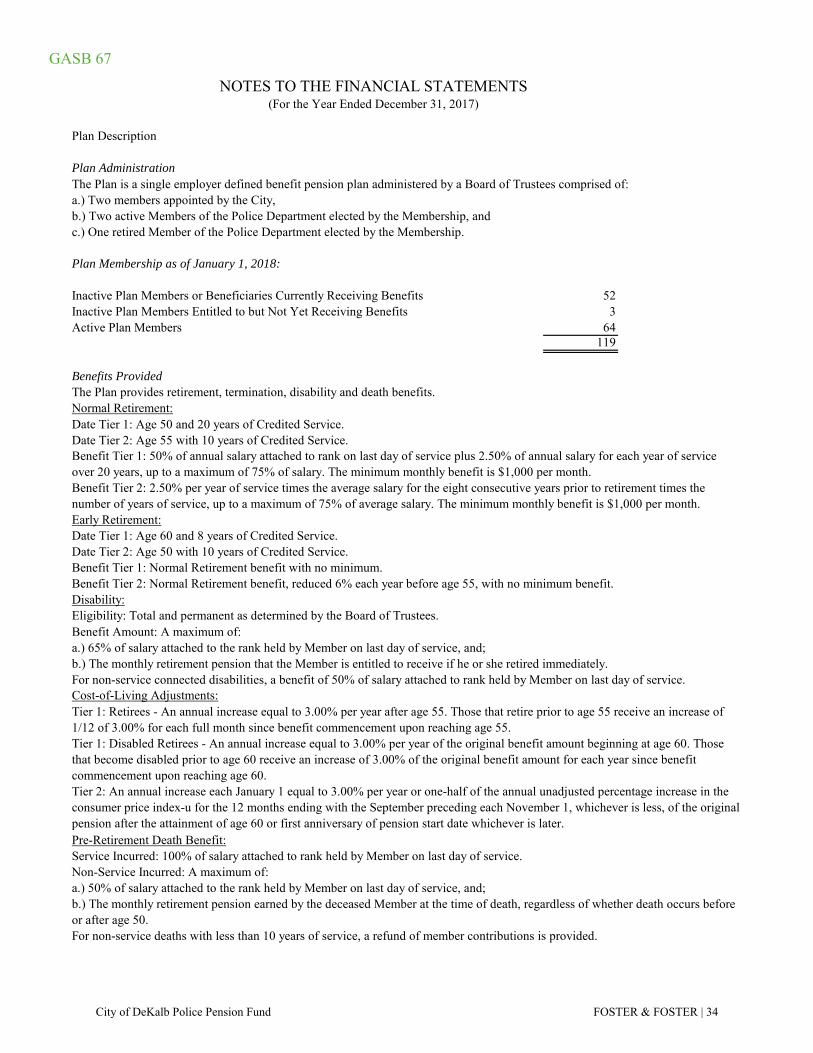
GASB 67
Plan Description
Plan Administration
a.) Two members appointed by the City,b.) Two active Members of the Police Department elected by the Membership, andc.) One retired Member of the Police Department elected by the Membership.
Plan Membership as of January 1, 2018:
Inactive Plan Members or Beneficiaries Currently Receiving Benefits 52Inactive Plan Members Entitled to but Not Yet Receiving Benefits 3Active Plan Members 64
119
Benefits Provided
Normal Retirement:
Early Retirement:Date Tier 1: Age 60 and 8 years of Credited Service.Date Tier 2: Age 50 with 10 years of Credited Service.
Disability:
Date Tier 2: Age 55 with 10 years of Credited Service.Date Tier 1: Age 50 and 20 years of Credited Service.
Eligibility: Total and permanent as determined by the Board of Trustees.
Benefit Tier 1: Normal Retirement benefit with no minimum.
Benefit Tier 1: 50% of annual salary attached to rank on last day of service plus 2.50% of annual salary for each year of service over 20 years, up to a maximum of 75% of salary. The minimum monthly benefit is $1,000 per month.
Benefit Amount: A maximum of:
Cost-of-Living Adjustments:
Pre-Retirement Death Benefit:Service Incurred: 100% of salary attached to rank held by Member on last day of service.Non-Service Incurred: A maximum of:a.) 50% of salary attached to the rank held by Member on last day of service, and;b.) The monthly retirement pension earned by the deceased Member at the time of death, regardless of whether death occurs before or after age 50.For non-service deaths with less than 10 years of service, a refund of member contributions is provided.
NOTES TO THE FINANCIAL STATEMENTS(For the Year Ended December 31, 2017)
The Plan provides retirement, termination, disability and death benefits.
The Plan is a single employer defined benefit pension plan administered by a Board of Trustees comprised of:
Benefit Tier 2: 2.50% per year of service times the average salary for the eight consecutive years prior to retirement times the number of years of service, up to a maximum of 75% of average salary. The minimum monthly benefit is $1,000 per month.
Benefit Tier 2: Normal Retirement benefit, reduced 6% each year before age 55, with no minimum benefit.
a.) 65% of salary attached to the rank held by Member on last day of service, and;b.) The monthly retirement pension that the Member is entitled to receive if he or she retired immediately.For non-service connected disabilities, a benefit of 50% of salary attached to rank held by Member on last day of service.
Tier 1: Disabled Retirees - An annual increase equal to 3.00% per year of the original benefit amount beginning at age 60. Those that become disabled prior to age 60 receive an increase of 3.00% of the original benefit amount for each year since benefit commencement upon reaching age 60.
Tier 1: Retirees - An annual increase equal to 3.00% per year after age 55. Those that retire prior to age 55 receive an increase of 1/12 of 3.00% for each full month since benefit commencement upon reaching age 55.
Tier 2: An annual increase each January 1 equal to 3.00% per year or one-half of the annual unadjusted percentage increase in the consumer price index-u for the 12 months ending with the September preceding each November 1, whichever is less, of the original pension after the attainment of age 60 or first anniversary of pension start date whichever is later.
City of DeKalb Police Pension Fund FOSTER & FOSTER | 34
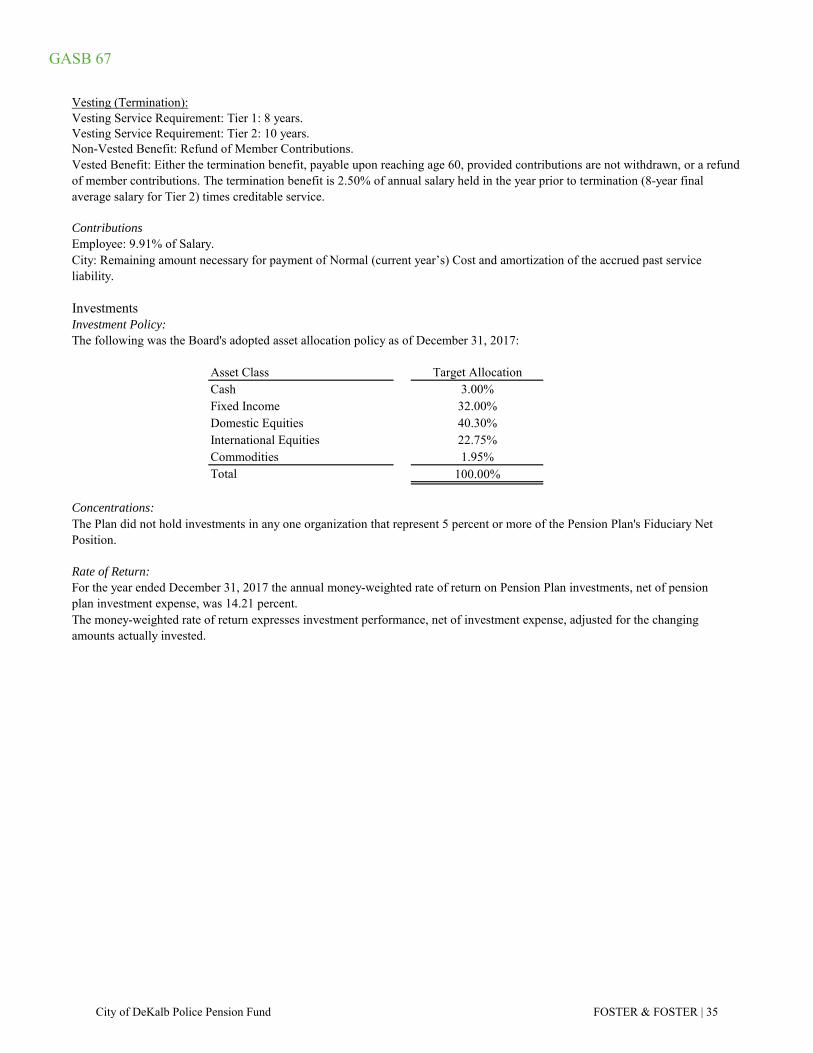
GASB 67
Vesting (Termination):
ContributionsEmployee: 9.91% of Salary.
InvestmentsInvestment Policy:The following was the Board's adopted asset allocation policy as of December 31, 2017:
Asset Class Target AllocationCash 3.00%Fixed Income 32.00%Domestic Equities 40.30%International Equities 22.75%Commodities 1.95%Total 100.00%
Concentrations:
Rate of Return:For the year ended December 31, 2017 the annual money-weighted rate of return on Pension Plan investments, net of pensionplan investment expense, was 14.21 percent. The money-weighted rate of return expresses investment performance, net of investment expense, adjusted for the changing amounts actually invested.
City: Remaining amount necessary for payment of Normal (current year’s) Cost and amortization of the accrued past service liability.
The Plan did not hold investments in any one organization that represent 5 percent or more of the Pension Plan's Fiduciary Net Position.
Vesting Service Requirement: Tier 1: 8 years.Vesting Service Requirement: Tier 2: 10 years.Non-Vested Benefit: Refund of Member Contributions.Vested Benefit: Either the termination benefit, payable upon reaching age 60, provided contributions are not withdrawn, or a refund of member contributions. The termination benefit is 2.50% of annual salary held in the year prior to termination (8-year final average salary for Tier 2) times creditable service.
City of DeKalb Police Pension Fund FOSTER & FOSTER | 35
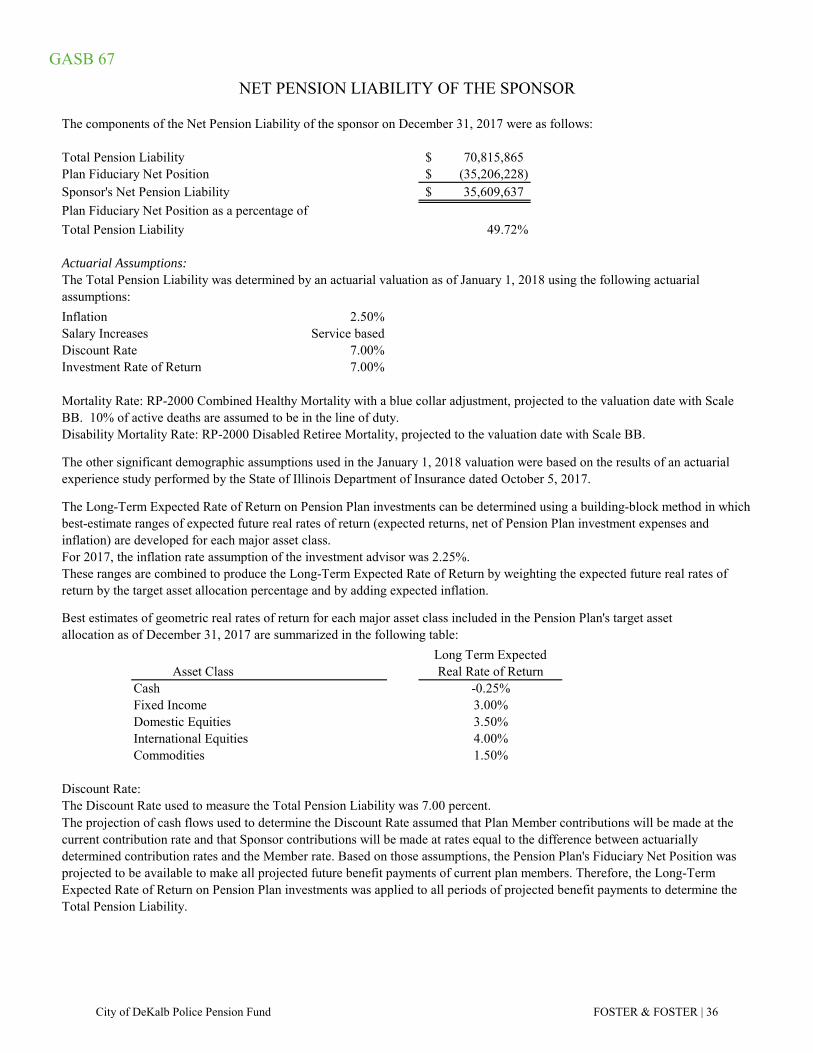
GASB 67
The components of the Net Pension Liability of the sponsor on December 31, 2017 were as follows:
Total Pension Liability 70,815,865$ Plan Fiduciary Net Position (35,206,228)$ Sponsor's Net Pension Liability 35,609,637$
Plan Fiduciary Net Position as a percentage of
Total Pension Liability 49.72%
Actuarial Assumptions:
Inflation 2.50%Salary Increases Service basedDiscount Rate 7.00%Investment Rate of Return 7.00%
Best estimates of geometric real rates of return for each major asset class included in the Pension Plan's target assetallocation as of December 31, 2017 are summarized in the following table:
CashFixed IncomeDomestic EquitiesInternational EquitiesCommodities
Discount Rate:The Discount Rate used to measure the Total Pension Liability was 7.00 percent.
NET PENSION LIABILITY OF THE SPONSOR
The projection of cash flows used to determine the Discount Rate assumed that Plan Member contributions will be made at the current contribution rate and that Sponsor contributions will be made at rates equal to the difference between actuarially determined contribution rates and the Member rate. Based on those assumptions, the Pension Plan's Fiduciary Net Position was projected to be available to make all projected future benefit payments of current plan members. Therefore, the Long-Term Expected Rate of Return on Pension Plan investments was applied to all periods of projected benefit payments to determine the Total Pension Liability.
The other significant demographic assumptions used in the January 1, 2018 valuation were based on the results of an actuarial experience study performed by the State of Illinois Department of Insurance dated October 5, 2017.
Mortality Rate: RP-2000 Combined Healthy Mortality with a blue collar adjustment, projected to the valuation date with Scale BB. 10% of active deaths are assumed to be in the line of duty.Disability Mortality Rate: RP-2000 Disabled Retiree Mortality, projected to the valuation date with Scale BB.
The Total Pension Liability was determined by an actuarial valuation as of January 1, 2018 using the following actuarial assumptions:
-0.25%3.00%3.50%4.00%1.50%
Asset Class
For 2017, the inflation rate assumption of the investment advisor was 2.25%.
The Long-Term Expected Rate of Return on Pension Plan investments can be determined using a building-block method in which best-estimate ranges of expected future real rates of return (expected returns, net of Pension Plan investment expenses and inflation) are developed for each major asset class.
These ranges are combined to produce the Long-Term Expected Rate of Return by weighting the expected future real rates of return by the target asset allocation percentage and by adding expected inflation.
Long Term Expected Real Rate of Return
City of DeKalb Police Pension Fund FOSTER & FOSTER | 36
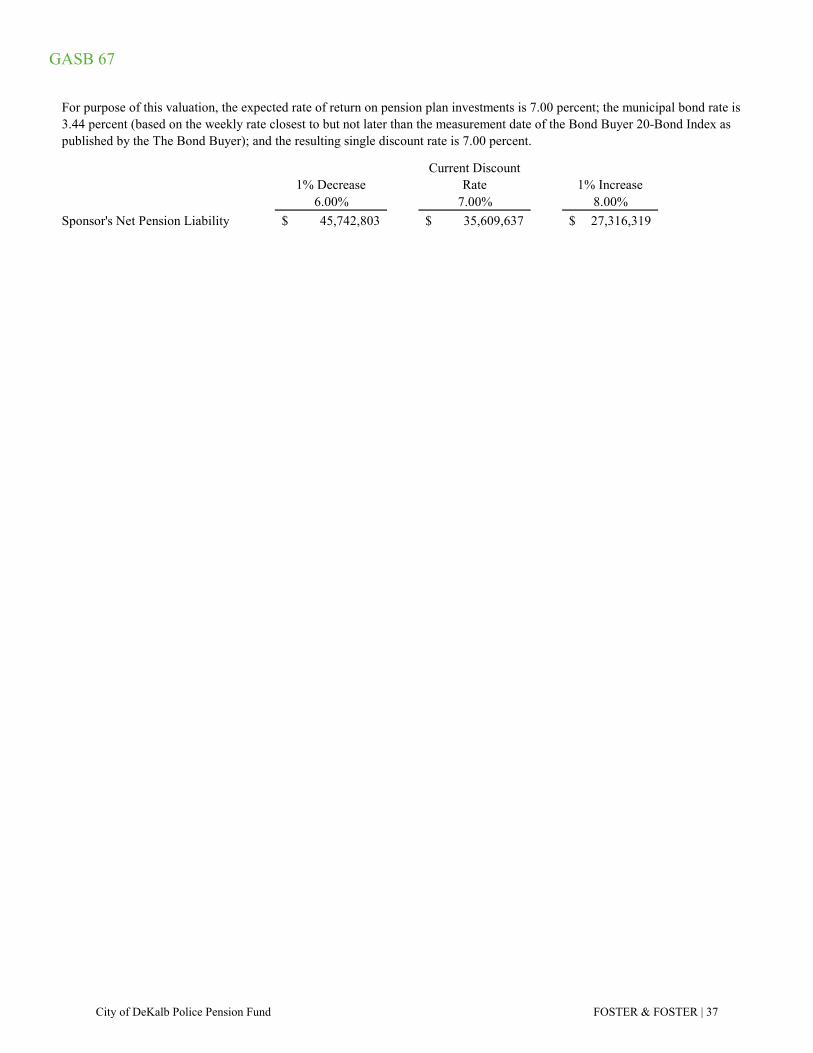
GASB 67
1% Decrease Current Discount
Rate 1% Increase 6.00% 7.00% 8.00%
Sponsor's Net Pension Liability 45,742,803$ 35,609,637$ 27,316,319$
For purpose of this valuation, the expected rate of return on pension plan investments is 7.00 percent; the municipal bond rate is 3.44 percent (based on the weekly rate closest to but not later than the measurement date of the Bond Buyer 20-Bond Index as published by the The Bond Buyer); and the resulting single discount rate is 7.00 percent.
City of DeKalb Police Pension Fund FOSTER & FOSTER | 37
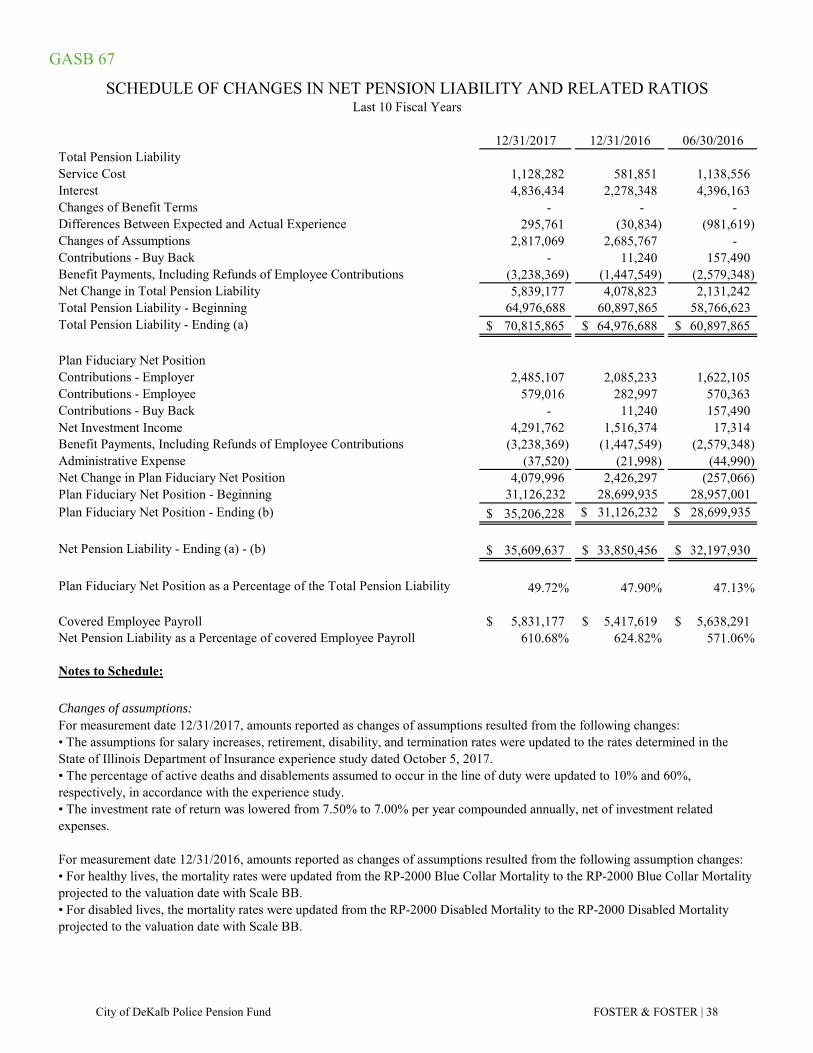
GASB 67
12/31/2017 12/31/2016 06/30/2016Total Pension LiabilityService Cost 1,128,282 581,851 1,138,556 Interest 4,836,434 2,278,348 4,396,163 Changes of Benefit Terms - - - Differences Between Expected and Actual Experience 295,761 (30,834) (981,619) Changes of Assumptions 2,817,069 2,685,767 - Contributions - Buy Back - 11,240 157,490 Benefit Payments, Including Refunds of Employee Contributions (3,238,369) (1,447,549) (2,579,348) Net Change in Total Pension Liability 5,839,177 4,078,823 2,131,242 Total Pension Liability - Beginning 64,976,688 60,897,865 58,766,623 Total Pension Liability - Ending (a) 70,815,865$ 64,976,688$ 60,897,865$
Plan Fiduciary Net PositionContributions - Employer 2,485,107 2,085,233 1,622,105 Contributions - Employee 579,016 282,997 570,363 Contributions - Buy Back - 11,240 157,490 Net Investment Income 4,291,762 1,516,374 17,314 Benefit Payments, Including Refunds of Employee Contributions (3,238,369) (1,447,549) (2,579,348) Administrative Expense (37,520) (21,998) (44,990) Net Change in Plan Fiduciary Net Position 4,079,996 2,426,297 (257,066) Plan Fiduciary Net Position - Beginning 31,126,232 28,699,935 28,957,001 Plan Fiduciary Net Position - Ending (b) 35,206,228$ $ 31,126,232 $ 28,699,935
Net Pension Liability - Ending (a) - (b) 35,609,637$ 33,850,456$ 32,197,930$
Plan Fiduciary Net Position as a Percentage of the Total Pension Liability 49.72% 47.90% 47.13%
Covered Employee Payroll 5,831,177$ 5,417,619$ 5,638,291$ Net Pension Liability as a Percentage of covered Employee Payroll 610.68% 624.82% 571.06%
Notes to Schedule:
Changes of assumptions:For measurement date 12/31/2017, amounts reported as changes of assumptions resulted from the following changes:
SCHEDULE OF CHANGES IN NET PENSION LIABILITY AND RELATED RATIOSLast 10 Fiscal Years
• The assumptions for salary increases, retirement, disability, and termination rates were updated to the rates determined in the State of Illinois Department of Insurance experience study dated October 5, 2017.
• For disabled lives, the mortality rates were updated from the RP-2000 Disabled Mortality to the RP-2000 Disabled Mortality projected to the valuation date with Scale BB.
• The investment rate of return was lowered from 7.50% to 7.00% per year compounded annually, net of investment related expenses.
For measurement date 12/31/2016, amounts reported as changes of assumptions resulted from the following assumption changes:• For healthy lives, the mortality rates were updated from the RP-2000 Blue Collar Mortality to the RP-2000 Blue Collar Mortality projected to the valuation date with Scale BB.
• The percentage of active deaths and disablements assumed to occur in the line of duty were updated to 10% and 60%, respectively, in accordance with the experience study.
City of DeKalb Police Pension Fund FOSTER & FOSTER | 38
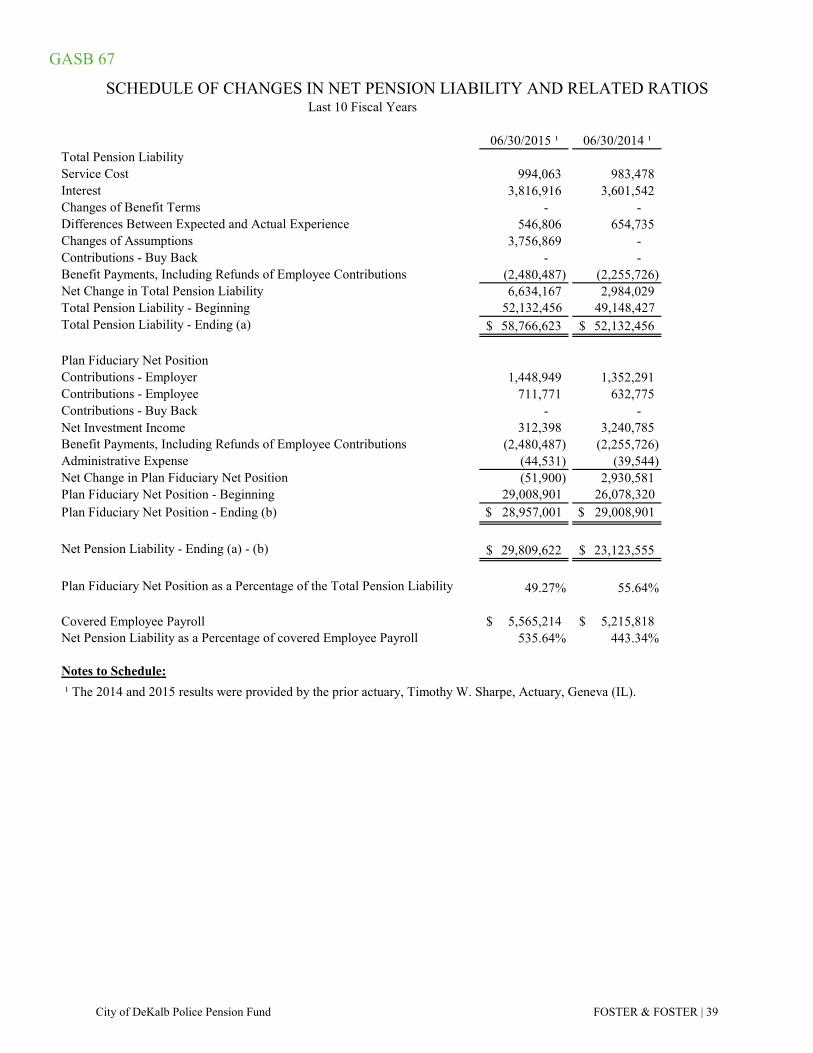
GASB 67
06/30/2015 ¹ 06/30/2014 ¹Total Pension LiabilityService Cost 994,063 983,478 Interest 3,816,916 3,601,542 Changes of Benefit Terms - - Differences Between Expected and Actual Experience 546,806 654,735 Changes of Assumptions 3,756,869 - Contributions - Buy Back - - Benefit Payments, Including Refunds of Employee Contributions (2,480,487) (2,255,726) Net Change in Total Pension Liability 6,634,167 2,984,029 Total Pension Liability - Beginning 52,132,456 49,148,427 Total Pension Liability - Ending (a) 58,766,623$ 52,132,456$
Plan Fiduciary Net PositionContributions - Employer 1,448,949 1,352,291 Contributions - Employee 711,771 632,775 Contributions - Buy Back - - Net Investment Income 312,398 3,240,785 Benefit Payments, Including Refunds of Employee Contributions (2,480,487) (2,255,726) Administrative Expense (44,531) (39,544) Net Change in Plan Fiduciary Net Position (51,900) 2,930,581 Plan Fiduciary Net Position - Beginning 29,008,901 26,078,320 Plan Fiduciary Net Position - Ending (b) $ 28,957,001 $ 29,008,901
Net Pension Liability - Ending (a) - (b) 29,809,622$ 23,123,555$
Plan Fiduciary Net Position as a Percentage of the Total Pension Liability 49.27% 55.64%
Covered Employee Payroll 5,565,214$ 5,215,818$ Net Pension Liability as a Percentage of covered Employee Payroll 535.64% 443.34%
Notes to Schedule:
SCHEDULE OF CHANGES IN NET PENSION LIABILITY AND RELATED RATIOSLast 10 Fiscal Years
¹ The 2014 and 2015 results were provided by the prior actuary, Timothy W. Sharpe, Actuary, Geneva (IL).
City of DeKalb Police Pension Fund FOSTER & FOSTER | 39
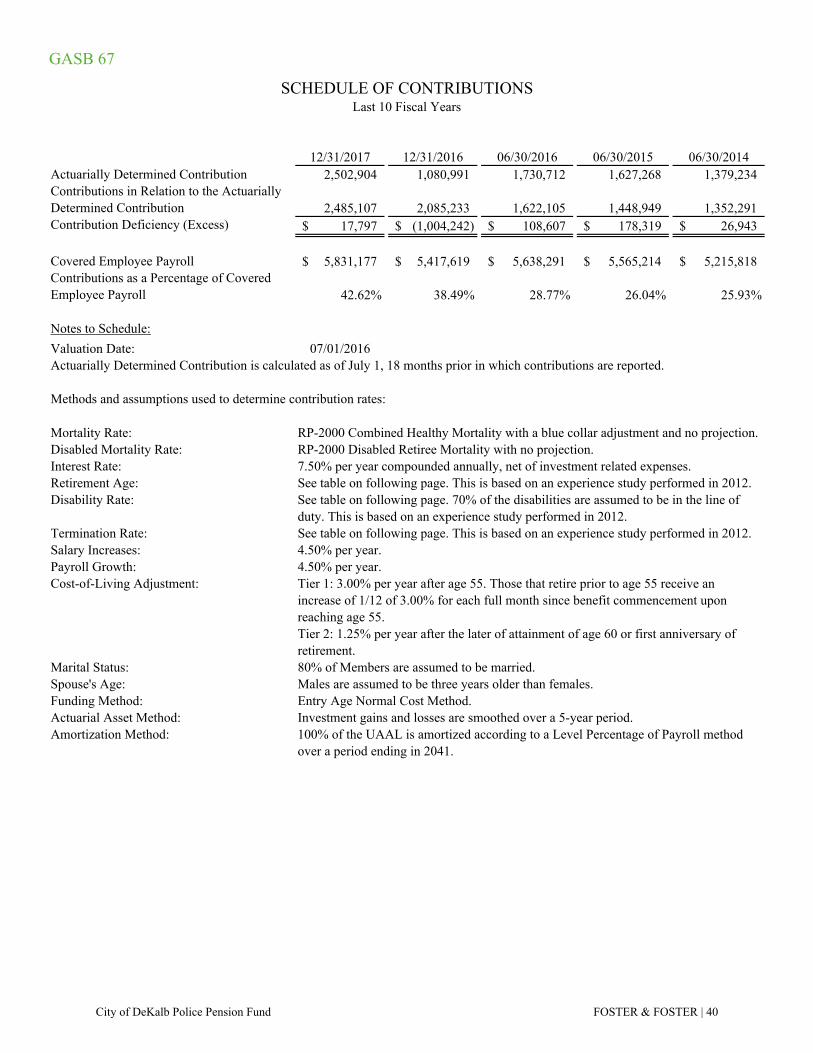
GASB 67
12/31/2017 12/31/2016 06/30/2016 06/30/2015 06/30/2014Actuarially Determined Contribution 2,502,904 1,080,991 1,730,712 1,627,268 1,379,234 Contributions in Relation to the Actuarially Determined Contribution 2,485,107 2,085,233 1,622,105 1,448,949 1,352,291 Contribution Deficiency (Excess) 17,797$ (1,004,242)$ 108,607$ 178,319$ 26,943$
Covered Employee Payroll 5,831,177$ 5,417,619$ 5,638,291$ 5,565,214$ 5,215,818$ Contributions as a Percentage of Covered Employee Payroll 42.62% 38.49% 28.77% 26.04% 25.93%
Notes to Schedule:
Valuation Date: 07/01/2016
Methods and assumptions used to determine contribution rates:
Mortality Rate: RP-2000 Combined Healthy Mortality with a blue collar adjustment and no projection.Disabled Mortality Rate: RP-2000 Disabled Retiree Mortality with no projection.Interest Rate: 7.50% per year compounded annually, net of investment related expenses.Retirement Age: See table on following page. This is based on an experience study performed in 2012.Disability Rate:
Termination Rate: See table on following page. This is based on an experience study performed in 2012.Salary Increases: 4.50% per year.Payroll Growth: 4.50% per year.Cost-of-Living Adjustment:
Marital Status: 80% of Members are assumed to be married.Spouse's Age: Males are assumed to be three years older than females.Funding Method: Entry Age Normal Cost Method.Actuarial Asset Method: Investment gains and losses are smoothed over a 5-year period.Amortization Method:
Actuarially Determined Contribution is calculated as of July 1, 18 months prior in which contributions are reported.
SCHEDULE OF CONTRIBUTIONSLast 10 Fiscal Years
See table on following page. 70% of the disabilities are assumed to be in the line of duty. This is based on an experience study performed in 2012.
Tier 1: 3.00% per year after age 55. Those that retire prior to age 55 receive an increase of 1/12 of 3.00% for each full month since benefit commencement upon reaching age 55.Tier 2: 1.25% per year after the later of attainment of age 60 or first anniversary of retirement.
100% of the UAAL is amortized according to a Level Percentage of Payroll method over a period ending in 2041.
City of DeKalb Police Pension Fund FOSTER & FOSTER | 40
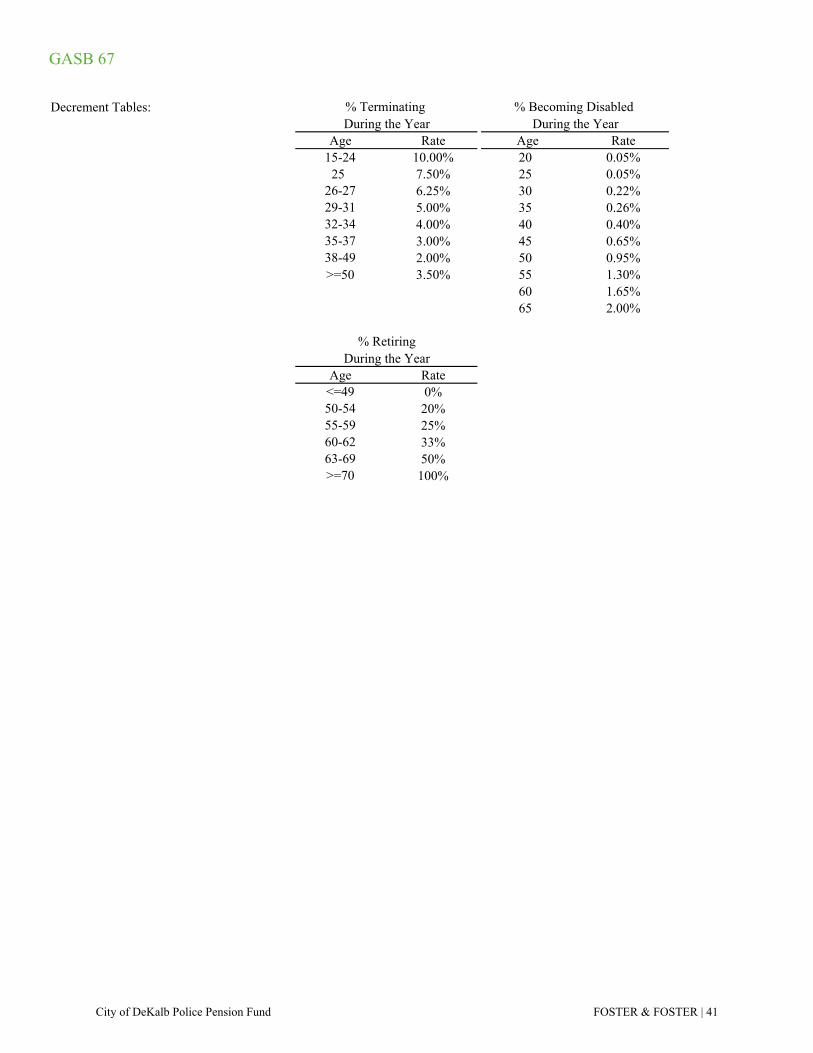
GASB 67
Decrement Tables:
Age Rate Age Rate15-24 10.00% 20 0.05%
25 7.50% 25 0.05%26-27 6.25% 30 0.22%29-31 5.00% 35 0.26%32-34 4.00% 40 0.40%35-37 3.00% 45 0.65%38-49 2.00% 50 0.95%>=50 3.50% 55 1.30%
60 1.65%65 2.00%
Age Rate<=49 0%50-54 20%55-59 25%60-62 33%63-69 50%>=70 100%
% RetiringDuring the Year
% Terminating During the Year
% Becoming Disabled During the Year
City of DeKalb Police Pension Fund FOSTER & FOSTER | 41
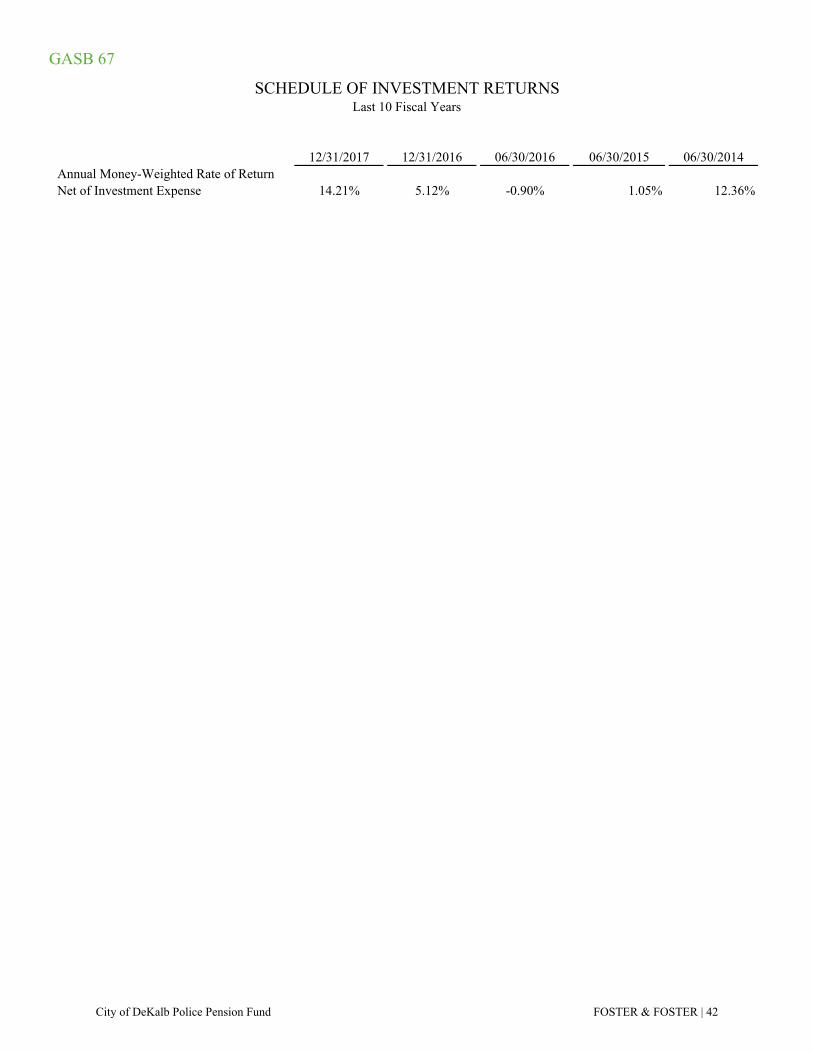
GASB 67
12/31/2017 12/31/2016 06/30/2016 06/30/2015 06/30/2014Annual Money-Weighted Rate of ReturnNet of Investment Expense 14.21% 5.12% -0.90% 1.05% 12.36%
SCHEDULE OF INVESTMENT RETURNSLast 10 Fiscal Years
City of DeKalb Police Pension Fund FOSTER & FOSTER | 42
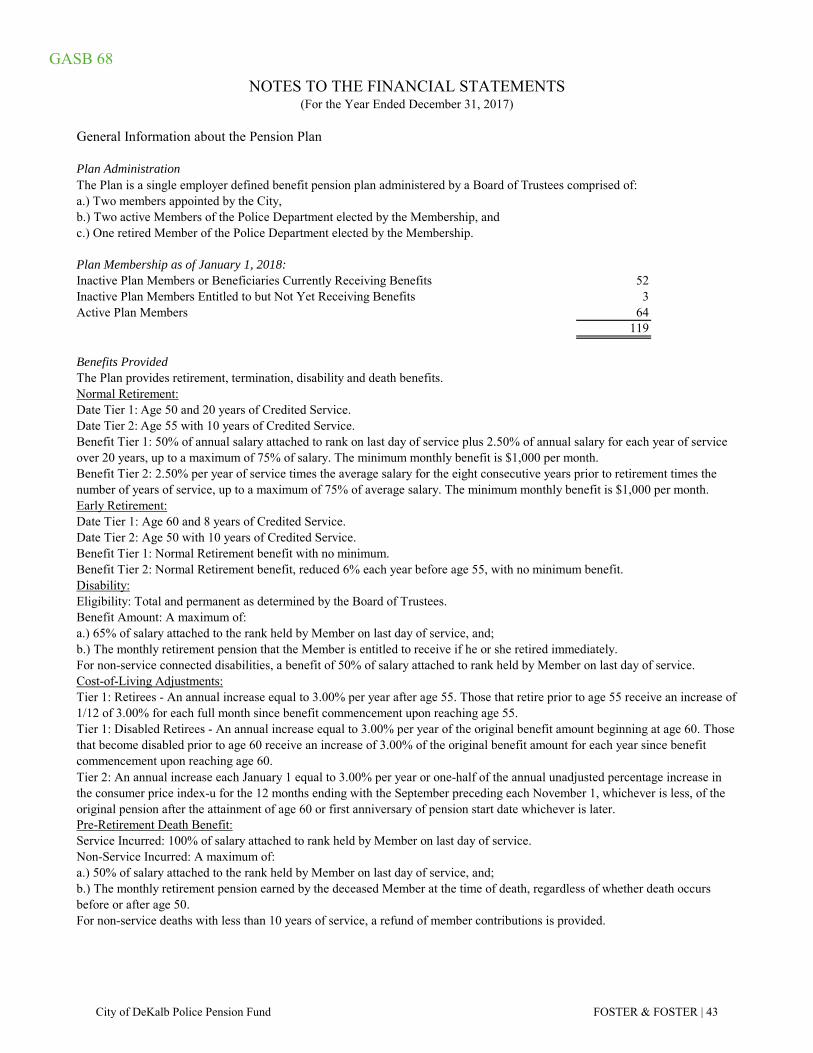
GASB 68
General Information about the Pension Plan
Plan Administration The Plan is a single employer defined benefit pension plan administered by a Board of Trustees comprised of:
a.) Two members appointed by the City,b.) Two active Members of the Police Department elected by the Membership, andc.) One retired Member of the Police Department elected by the Membership.
Plan Membership as of January 1, 2018:Inactive Plan Members or Beneficiaries Currently Receiving Benefits 52Inactive Plan Members Entitled to but Not Yet Receiving Benefits 3Active Plan Members 64
119
Benefits Provided
Normal Retirement: Date Tier 1: Age 50 and 20 years of Credited Service. Date Tier 2: Age 55 with 10 years of Credited Service.
Early Retirement:Date Tier 1: Age 60 and 8 years of Credited Service.Date Tier 2: Age 50 with 10 years of Credited Service.Benefit Tier 1: Normal Retirement benefit with no minimum.Benefit Tier 2: Normal Retirement benefit, reduced 6% each year before age 55, with no minimum benefit.Disability:Eligibility: Total and permanent as determined by the Board of Trustees.Benefit Amount: A maximum of:a.) 65% of salary attached to the rank held by Member on last day of service, and;b.) The monthly retirement pension that the Member is entitled to receive if he or she retired immediately.For non-service connected disabilities, a benefit of 50% of salary attached to rank held by Member on last day of service.Cost-of-Living Adjustments:
Pre-Retirement Death Benefit:Service Incurred: 100% of salary attached to rank held by Member on last day of service.Non-Service Incurred: A maximum of:a.) 50% of salary attached to the rank held by Member on last day of service, and;
For non-service deaths with less than 10 years of service, a refund of member contributions is provided.
NOTES TO THE FINANCIAL STATEMENTS(For the Year Ended December 31, 2017)
The Plan provides retirement, termination, disability and death benefits.
Benefit Tier 1: 50% of annual salary attached to rank on last day of service plus 2.50% of annual salary for each year of service over 20 years, up to a maximum of 75% of salary. The minimum monthly benefit is $1,000 per month.
Tier 1: Retirees - An annual increase equal to 3.00% per year after age 55. Those that retire prior to age 55 receive an increase of 1/12 of 3.00% for each full month since benefit commencement upon reaching age 55.Tier 1: Disabled Retirees - An annual increase equal to 3.00% per year of the original benefit amount beginning at age 60. Those that become disabled prior to age 60 receive an increase of 3.00% of the original benefit amount for each year since benefit commencement upon reaching age 60.Tier 2: An annual increase each January 1 equal to 3.00% per year or one-half of the annual unadjusted percentage increase in the consumer price index-u for the 12 months ending with the September preceding each November 1, whichever is less, of the original pension after the attainment of age 60 or first anniversary of pension start date whichever is later.
b.) The monthly retirement pension earned by the deceased Member at the time of death, regardless of whether death occurs before or after age 50.
Benefit Tier 2: 2.50% per year of service times the average salary for the eight consecutive years prior to retirement times the number of years of service, up to a maximum of 75% of average salary. The minimum monthly benefit is $1,000 per month.
City of DeKalb Police Pension Fund FOSTER & FOSTER | 43
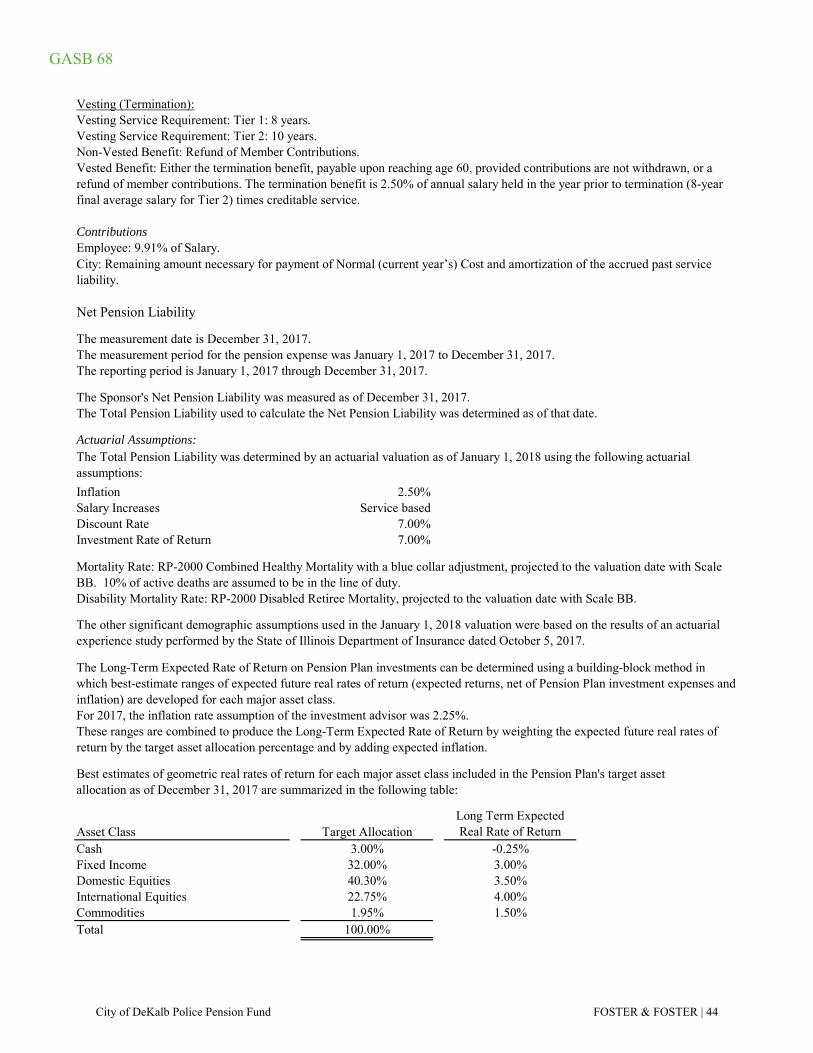
GASB 68
Vesting (Termination):Vesting Service Requirement: Tier 1: 8 years.Vesting Service Requirement: Tier 2: 10 years.
ContributionsEmployee: 9.91% of Salary.
Net Pension Liability
The measurement date is December 31, 2017.The measurement period for the pension expense was January 1, 2017 to December 31, 2017.The reporting period is January 1, 2017 through December 31, 2017.
The Sponsor's Net Pension Liability was measured as of December 31, 2017.The Total Pension Liability used to calculate the Net Pension Liability was determined as of that date.
Actuarial Assumptions:
Inflation 2.50%Salary Increases Service basedDiscount Rate 7.00%Investment Rate of Return 7.00%
Asset Class Target AllocationLong Term Expected Real Rate of Return
Cash 3.00% -0.25%Fixed Income 32.00% 3.00%Domestic Equities 40.30% 3.50%International Equities 22.75% 4.00%Commodities 1.95% 1.50%Total 100.00%
Mortality Rate: RP-2000 Combined Healthy Mortality with a blue collar adjustment, projected to the valuation date with Scale BB. 10% of active deaths are assumed to be in the line of duty.
The Total Pension Liability was determined by an actuarial valuation as of January 1, 2018 using the following actuarial assumptions:
Non-Vested Benefit: Refund of Member Contributions.Vested Benefit: Either the termination benefit, payable upon reaching age 60, provided contributions are not withdrawn, or a refund of member contributions. The termination benefit is 2.50% of annual salary held in the year prior to termination (8-year final average salary for Tier 2) times creditable service.
City: Remaining amount necessary for payment of Normal (current year’s) Cost and amortization of the accrued past service liability.
Disability Mortality Rate: RP-2000 Disabled Retiree Mortality, projected to the valuation date with Scale BB.
The other significant demographic assumptions used in the January 1, 2018 valuation were based on the results of an actuarial experience study performed by the State of Illinois Department of Insurance dated October 5, 2017.
These ranges are combined to produce the Long-Term Expected Rate of Return by weighting the expected future real rates of return by the target asset allocation percentage and by adding expected inflation.
Best estimates of geometric real rates of return for each major asset class included in the Pension Plan's target assetallocation as of December 31, 2017 are summarized in the following table:
The Long-Term Expected Rate of Return on Pension Plan investments can be determined using a building-block method in which best-estimate ranges of expected future real rates of return (expected returns, net of Pension Plan investment expenses and inflation) are developed for each major asset class.For 2017, the inflation rate assumption of the investment advisor was 2.25%.
City of DeKalb Police Pension Fund FOSTER & FOSTER | 44
GASB 68
Discount Rate:The Discount Rate used to measure the Total Pension Liability was 7.00 percent.
For purpose of this valuation, the expected rate of return on pension plan investments is 7.00 percent; the municipal bond rate is 3.44 percent (based on the weekly rate closest to but not later than the measurement date of the Bond Buyer 20-Bond Index as published by the The Bond Buyer); and the resulting single discount rate is 7.00 percent.
The projection of cash flows used to determine the Discount Rate assumed that Plan Member contributions will be made at the current contribution rate and that Sponsor contributions will be made at rates equal to the difference between actuarially determined contribution rates and the Member rate. Based on those assumptions, the Pension Plan's Fiduciary Net Position was projected to be available to make all projected future benefit payments of current plan members. Therefore, the Long-Term Expected Rate of Return on Pension Plan investments was applied to all periods of projected benefit payments to determine the Total Pension Liability.
City of DeKalb Police Pension Fund FOSTER & FOSTER | 45
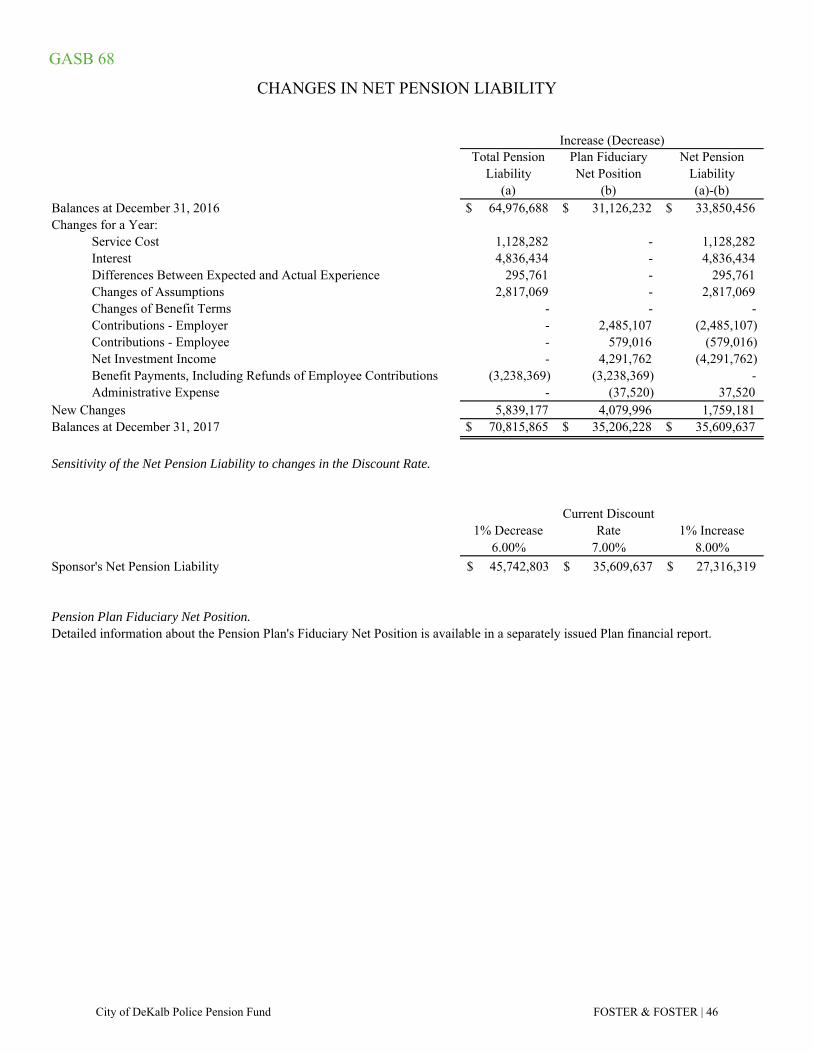
GASB 68
Total Pension Liability
Plan Fiduciary Net Position
Net Pension Liability
(a) (b) (a)-(b)Balances at December 31, 2016 $ 64,976,688 $ 31,126,232 $ 33,850,456 Changes for a Year:
Service Cost 1,128,282 - 1,128,282Interest 4,836,434 - 4,836,434Differences Between Expected and Actual Experience 295,761 - 295,761Changes of Assumptions 2,817,069 - 2,817,069Changes of Benefit Terms - - - Contributions - Employer - 2,485,107 (2,485,107)Contributions - Employee - 579,016 (579,016)Net Investment Income - 4,291,762 (4,291,762)Benefit Payments, Including Refunds of Employee Contributions (3,238,369) (3,238,369) - Administrative Expense - (37,520) 37,520
New Changes 5,839,177 4,079,996 1,759,181 Balances at December 31, 2017 $ 70,815,865 $ 35,206,228 $ 35,609,637
Sensitivity of the Net Pension Liability to changes in the Discount Rate.
1% Decrease Current Discount
Rate 1% Increase 6.00% 7.00% 8.00%
Sponsor's Net Pension Liability 45,742,803$ 35,609,637$ 27,316,319$
Pension Plan Fiduciary Net Position. Detailed information about the Pension Plan's Fiduciary Net Position is available in a separately issued Plan financial report.
Increase (Decrease)
CHANGES IN NET PENSION LIABILITY
City of DeKalb Police Pension Fund FOSTER & FOSTER | 46
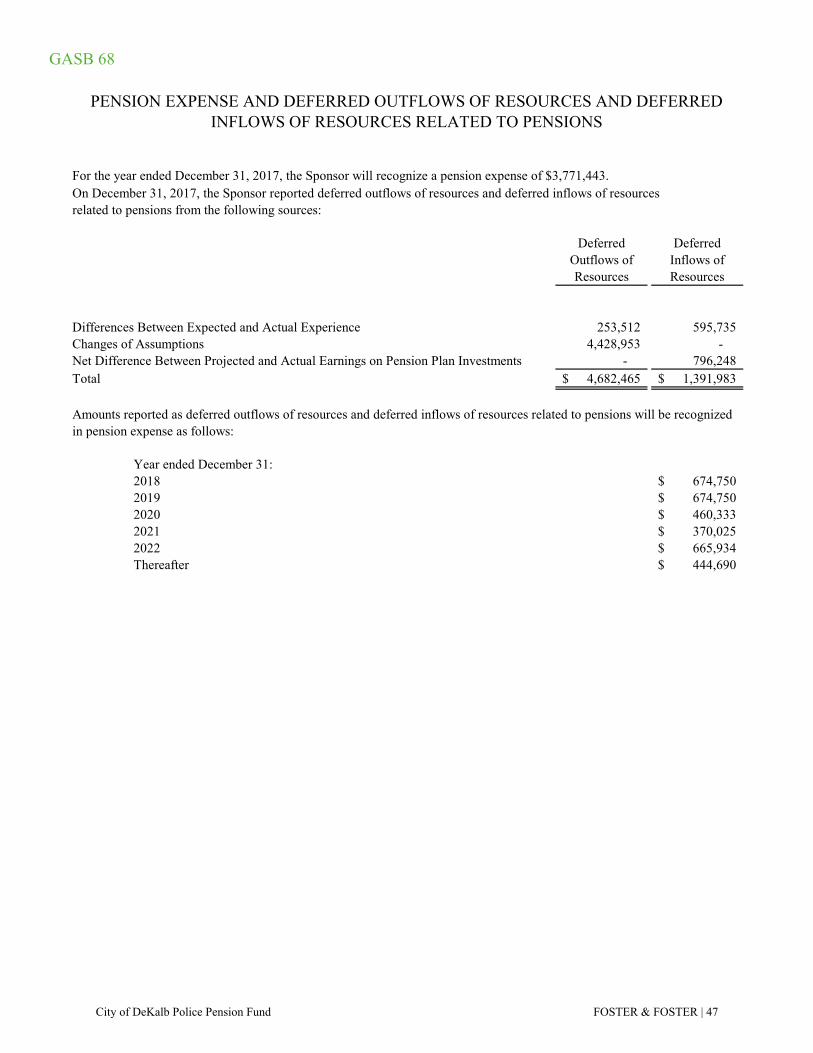
GASB 68
For the year ended December 31, 2017, the Sponsor will recognize a pension expense of $3,771,443.On December 31, 2017, the Sponsor reported deferred outflows of resources and deferred inflows of resourcesrelated to pensions from the following sources:
Deferred Outflows of Resources
Deferred Inflows of Resources
Differences Between Expected and Actual Experience 253,512 595,735 Changes of Assumptions 4,428,953 - Net Difference Between Projected and Actual Earnings on Pension Plan Investments - 796,248 Total 4,682,465$ 1,391,983$
OUTFLOW INFLOWYear ended December 31:2018 674,750$ 2019 674,750$ 2020 460,333$ 2021 370,025$ 2022 665,934$ Thereafter 444,690$
PENSION EXPENSE AND DEFERRED OUTFLOWS OF RESOURCES AND DEFERRED INFLOWS OF RESOURCES RELATED TO PENSIONS
Amounts reported as deferred outflows of resources and deferred inflows of resources related to pensions will be recognized in pension expense as follows:
City of DeKalb Police Pension Fund FOSTER & FOSTER | 47
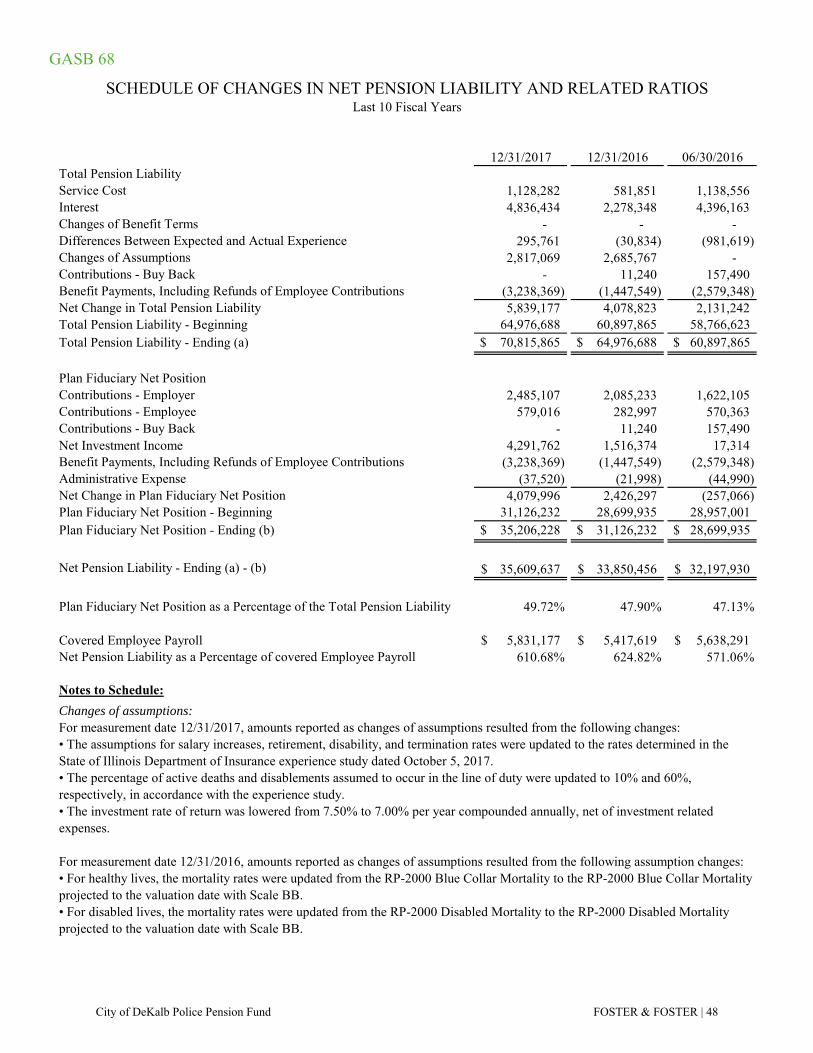
GASB 68
12/31/2017 12/31/2016 06/30/2016Total Pension LiabilityService Cost 1,128,282 581,851 1,138,556 Interest 4,836,434 2,278,348 4,396,163 Changes of Benefit Terms - - - Differences Between Expected and Actual Experience 295,761 (30,834) (981,619) Changes of Assumptions 2,817,069 2,685,767 - Contributions - Buy Back - 11,240 157,490 Benefit Payments, Including Refunds of Employee Contributions (3,238,369) (1,447,549) (2,579,348) Net Change in Total Pension Liability 5,839,177 4,078,823 2,131,242 Total Pension Liability - Beginning 64,976,688 60,897,865 58,766,623 Total Pension Liability - Ending (a) $ 70,815,865 $ 64,976,688 $ 60,897,865
Plan Fiduciary Net PositionContributions - Employer 2,485,107 2,085,233 1,622,105 Contributions - Employee 579,016 282,997 570,363 Contributions - Buy Back - 11,240 157,490 Net Investment Income 4,291,762 1,516,374 17,314 Benefit Payments, Including Refunds of Employee Contributions (3,238,369) (1,447,549) (2,579,348) Administrative Expense (37,520) (21,998) (44,990) Net Change in Plan Fiduciary Net Position 4,079,996 2,426,297 (257,066) Plan Fiduciary Net Position - Beginning 31,126,232 28,699,935 28,957,001 Plan Fiduciary Net Position - Ending (b) $ 35,206,228 $ 31,126,232 $ 28,699,935
Net Pension Liability - Ending (a) - (b) 35,609,637$ 33,850,456$ 32,197,930$
Plan Fiduciary Net Position as a Percentage of the Total Pension Liability 49.72% 47.90% 47.13%
Covered Employee Payroll 5,831,177$ 5,417,619$ 5,638,291$ Net Pension Liability as a Percentage of covered Employee Payroll 610.68% 624.82% 571.06%
Notes to Schedule:
Changes of assumptions:For measurement date 12/31/2017, amounts reported as changes of assumptions resulted from the following changes:
• The percentage of active deaths and disablements assumed to occur in the line of duty were updated to 10% and 60%, respectively, in accordance with the experience study.
SCHEDULE OF CHANGES IN NET PENSION LIABILITY AND RELATED RATIOSLast 10 Fiscal Years
• The assumptions for salary increases, retirement, disability, and termination rates were updated to the rates determined in the State of Illinois Department of Insurance experience study dated October 5, 2017.
• The investment rate of return was lowered from 7.50% to 7.00% per year compounded annually, net of investment related expenses.
For measurement date 12/31/2016, amounts reported as changes of assumptions resulted from the following assumption changes:• For healthy lives, the mortality rates were updated from the RP-2000 Blue Collar Mortality to the RP-2000 Blue Collar Mortality projected to the valuation date with Scale BB.• For disabled lives, the mortality rates were updated from the RP-2000 Disabled Mortality to the RP-2000 Disabled Mortality projected to the valuation date with Scale BB.
City of DeKalb Police Pension Fund FOSTER & FOSTER | 48
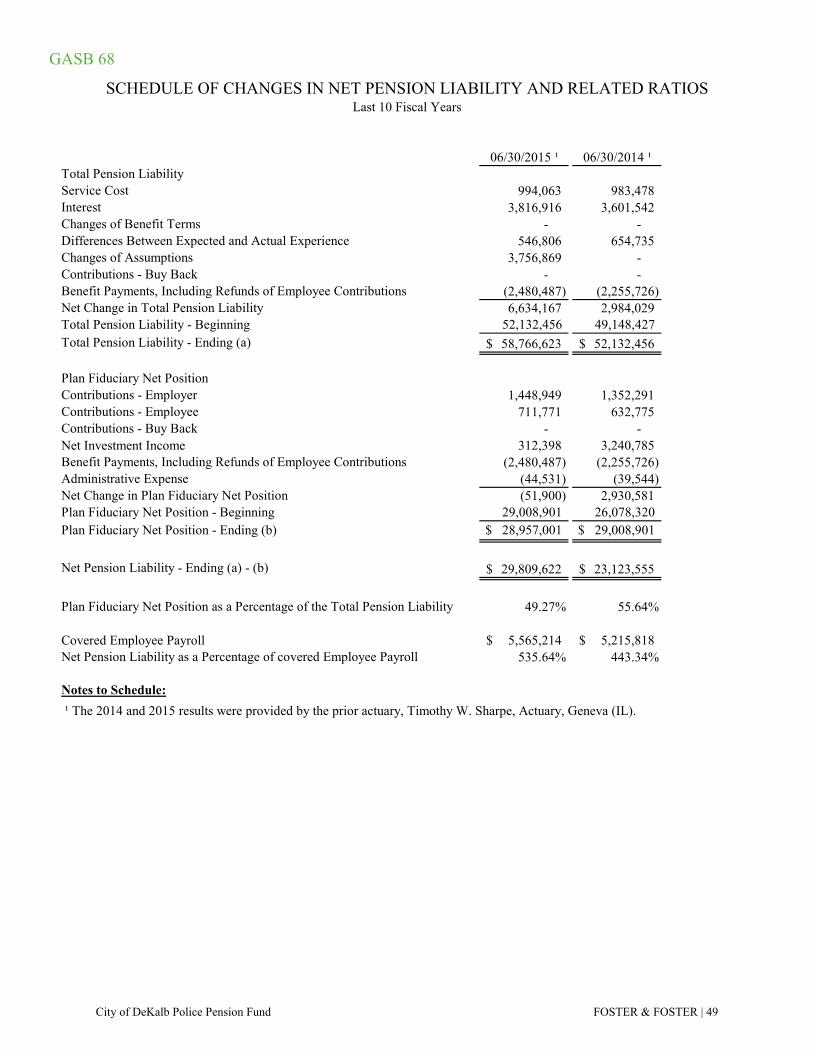
GASB 68
06/30/2015 ¹ 06/30/2014 ¹Total Pension LiabilityService Cost 994,063 983,478 Interest 3,816,916 3,601,542 Changes of Benefit Terms - - Differences Between Expected and Actual Experience 546,806 654,735 Changes of Assumptions 3,756,869 - Contributions - Buy Back - - Benefit Payments, Including Refunds of Employee Contributions (2,480,487) (2,255,726) Net Change in Total Pension Liability 6,634,167 2,984,029 Total Pension Liability - Beginning 52,132,456 49,148,427 Total Pension Liability - Ending (a) 58,766,623$ 52,132,456$
Plan Fiduciary Net PositionContributions - Employer 1,448,949 1,352,291 Contributions - Employee 711,771 632,775 Contributions - Buy Back - - Net Investment Income 312,398 3,240,785 Benefit Payments, Including Refunds of Employee Contributions (2,480,487) (2,255,726) Administrative Expense (44,531) (39,544) Net Change in Plan Fiduciary Net Position (51,900) 2,930,581 Plan Fiduciary Net Position - Beginning 29,008,901 26,078,320 Plan Fiduciary Net Position - Ending (b) $ 28,957,001 $ 29,008,901
Net Pension Liability - Ending (a) - (b) 29,809,622$ 23,123,555$
Plan Fiduciary Net Position as a Percentage of the Total Pension Liability 49.27% 55.64%
Covered Employee Payroll 5,565,214$ 5,215,818$ Net Pension Liability as a Percentage of covered Employee Payroll 535.64% 443.34%
Notes to Schedule:
¹ The 2014 and 2015 results were provided by the prior actuary, Timothy W. Sharpe, Actuary, Geneva (IL).
SCHEDULE OF CHANGES IN NET PENSION LIABILITY AND RELATED RATIOSLast 10 Fiscal Years
City of DeKalb Police Pension Fund FOSTER & FOSTER | 49
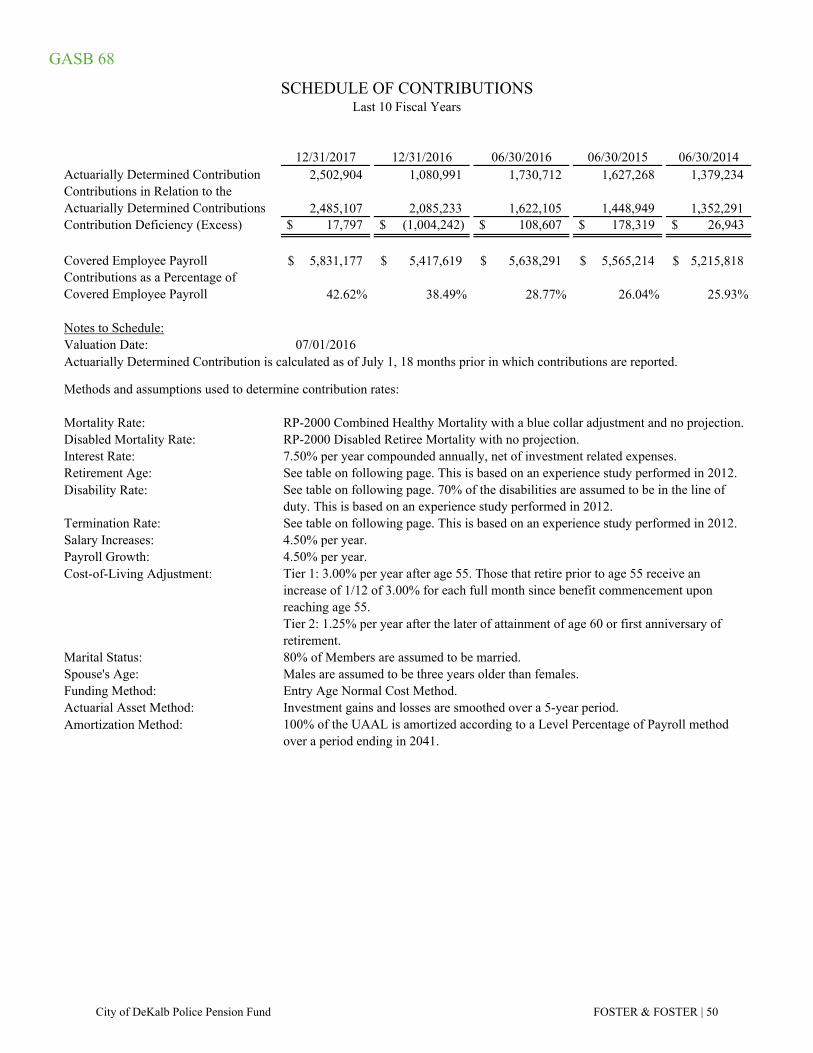
GASB 68
12/31/2017 12/31/2016 06/30/2016 06/30/2015 06/30/2014Actuarially Determined Contribution 2,502,904 1,080,991 1,730,712 1,627,268 1,379,234 Contributions in Relation to the Actuarially Determined Contributions 2,485,107 2,085,233 1,622,105 1,448,949 1,352,291 Contribution Deficiency (Excess) $ 17,797 $ (1,004,242) $ 108,607 $ 178,319 $ 26,943
Covered Employee Payroll 5,831,177$ 5,417,619$ 5,638,291$ 5,565,214$ 5,215,818$ Contributions as a Percentage of Covered Employee Payroll 42.62% 38.49% 28.77% 26.04% 25.93%
Notes to Schedule:Valuation Date: 07/01/2016
Methods and assumptions used to determine contribution rates:
Mortality Rate: RP-2000 Combined Healthy Mortality with a blue collar adjustment and no projection.Disabled Mortality Rate: RP-2000 Disabled Retiree Mortality with no projection.Interest Rate: 7.50% per year compounded annually, net of investment related expenses.Retirement Age: See table on following page. This is based on an experience study performed in 2012.Disability Rate:
Termination Rate: See table on following page. This is based on an experience study performed in 2012.Salary Increases: 4.50% per year.Payroll Growth: 4.50% per year.Cost-of-Living Adjustment:
Marital Status: 80% of Members are assumed to be married.Spouse's Age: Males are assumed to be three years older than females.Funding Method: Entry Age Normal Cost Method.Actuarial Asset Method: Investment gains and losses are smoothed over a 5-year period.Amortization Method:
Tier 2: 1.25% per year after the later of attainment of age 60 or first anniversary of retirement.
See table on following page. 70% of the disabilities are assumed to be in the line of duty. This is based on an experience study performed in 2012.
SCHEDULE OF CONTRIBUTIONSLast 10 Fiscal Years
Actuarially Determined Contribution is calculated as of July 1, 18 months prior in which contributions are reported.
Tier 1: 3.00% per year after age 55. Those that retire prior to age 55 receive an increase of 1/12 of 3.00% for each full month since benefit commencement upon reaching age 55.
100% of the UAAL is amortized according to a Level Percentage of Payroll method over a period ending in 2041.
City of DeKalb Police Pension Fund FOSTER & FOSTER | 50
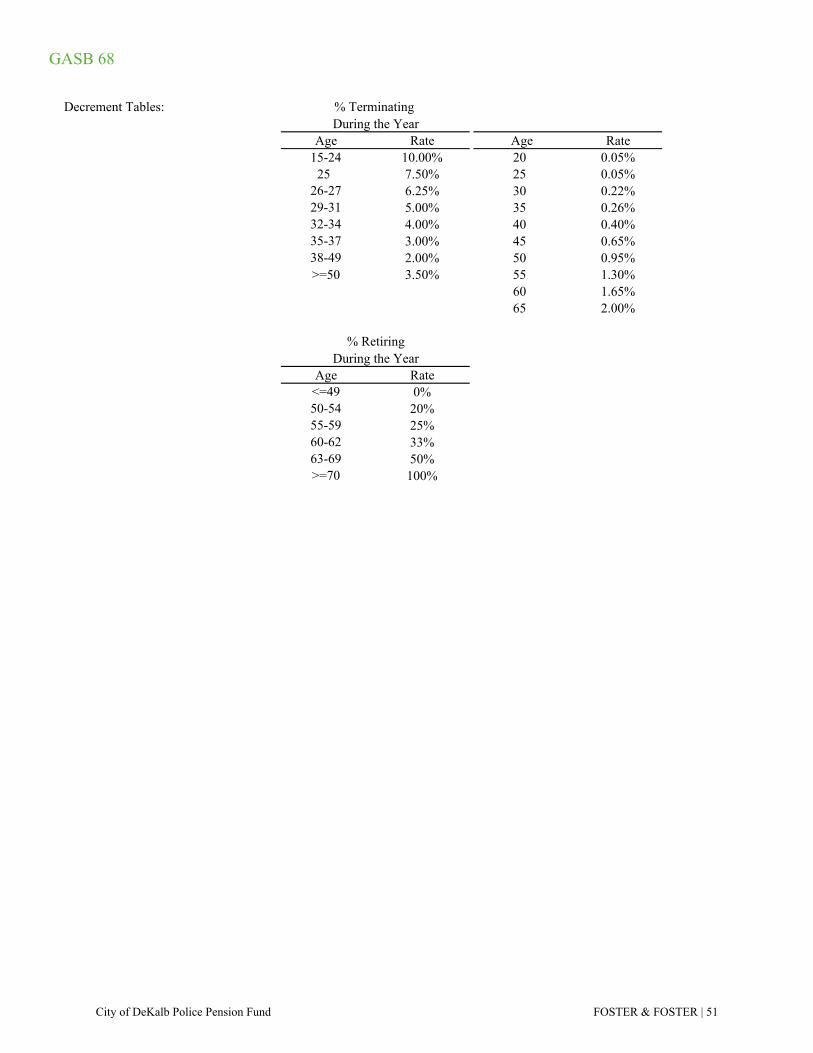
GASB 68
Decrement Tables:
Age Rate Age Rate15-24 10.00% 20 0.05%
25 7.50% 25 0.05%26-27 6.25% 30 0.22%29-31 5.00% 35 0.26%32-34 4.00% 40 0.40%35-37 3.00% 45 0.65%38-49 2.00% 50 0.95%>=50 3.50% 55 1.30%
60 1.65%65 2.00%
Age Rate<=49 0%50-54 20%55-59 25%60-62 33%63-69 50%>=70 100%
% RetiringDuring the Year
% Terminating During the Year
City of DeKalb Police Pension Fund FOSTER & FOSTER | 51
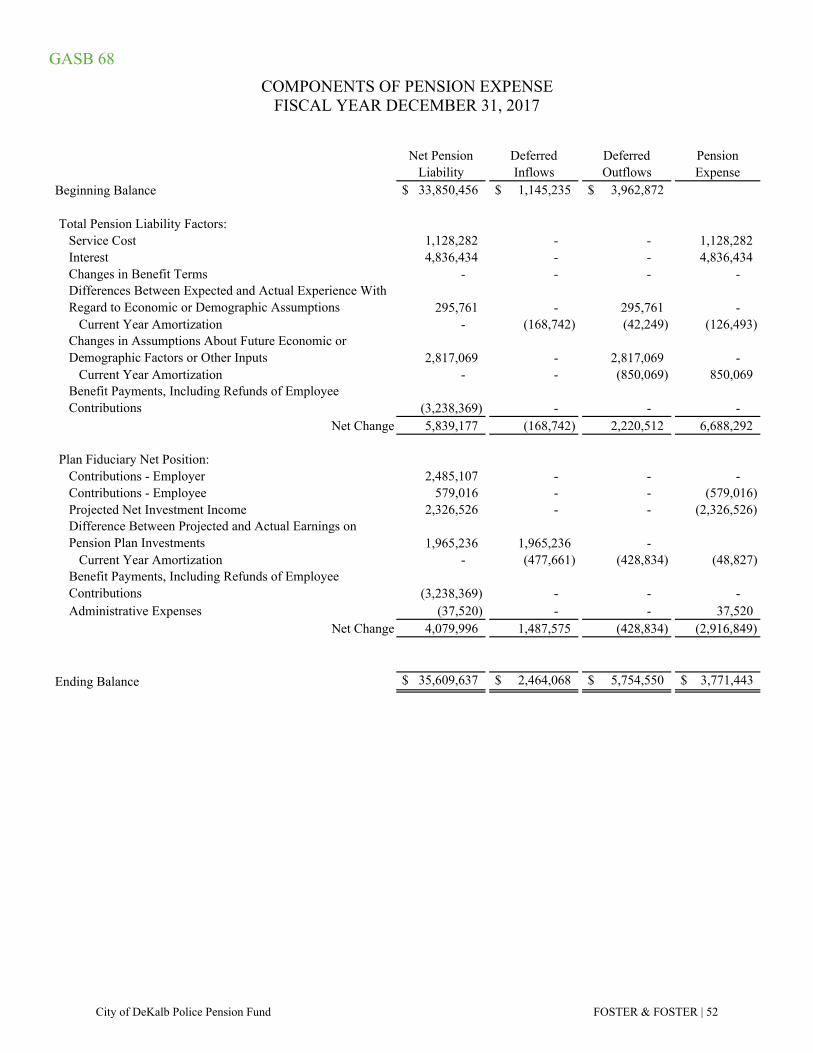
GASB 68
Net Pension Liability
Deferred Inflows
Deferred Outflows
Pension Expense
Beginning Balance $ 33,850,456 $ 1,145,235 $ 3,962,872
Total Pension Liability Factors:Service Cost 1,128,282 - - 1,128,282 Interest 4,836,434 - - 4,836,434 Changes in Benefit Terms - - - - Differences Between Expected and Actual Experience With Regard to Economic or Demographic Assumptions 295,761 - 295,761 -
Current Year Amortization - (168,742) (42,249) (126,493) Changes in Assumptions About Future Economic or Demographic Factors or Other Inputs 2,817,069 - 2,817,069 -
Current Year Amortization - - (850,069) 850,069 Benefit Payments, Including Refunds of Employee Contributions (3,238,369) - - -
Net Change 5,839,177 (168,742) 2,220,512 6,688,292
Plan Fiduciary Net Position:Contributions - Employer 2,485,107 - - - Contributions - Employee 579,016 - - (579,016) Projected Net Investment Income 2,326,526 - - (2,326,526) Difference Between Projected and Actual Earnings on Pension Plan Investments 1,965,236 1,965,236 -
Current Year Amortization - (477,661) (428,834) (48,827) Benefit Payments, Including Refunds of Employee Contributions (3,238,369) - - - Administrative Expenses (37,520) - - 37,520
Net Change 4,079,996 1,487,575 (428,834) (2,916,849)
Ending Balance $ 35,609,637 $ 2,464,068 $ 5,754,550 $ 3,771,443
COMPONENTS OF PENSION EXPENSEFISCAL YEAR DECEMBER 31, 2017
City of DeKalb Police Pension Fund FOSTER & FOSTER | 52
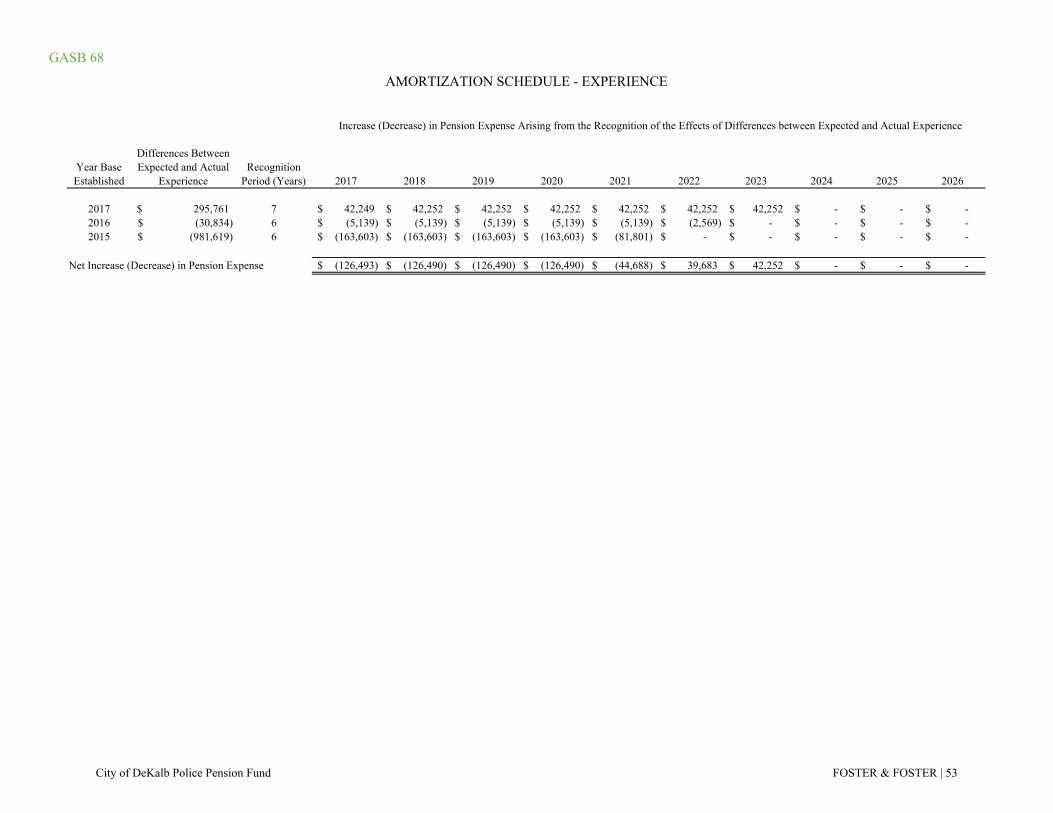
GASB 68
Year Base Established
Differences Between Expected and Actual
ExperienceRecognition
Period (Years) 2017 2018 2019 2020 2021 2022 2023 2024 2025 2026
2017 295,761$ 7 42,249$ 42,252$ 42,252$ 42,252$ 42,252$ 42,252$ 42,252$ -$ -$ -$ 2016 (30,834)$ 6 (5,139)$ (5,139)$ (5,139)$ (5,139)$ (5,139)$ (2,569)$ -$ -$ -$ -$ 2015 (981,619)$ 6 (163,603)$ (163,603)$ (163,603)$ (163,603)$ (81,801)$ -$ -$ -$ -$ -$
Net Increase (Decrease) in Pension Expense (126,493)$ (126,490)$ (126,490)$ (126,490)$ (44,688)$ 39,683$ 42,252$ -$ -$ -$
AMORTIZATION SCHEDULE - EXPERIENCE
Increase (Decrease) in Pension Expense Arising from the Recognition of the Effects of Differences between Expected and Actual Experience
City of DeKalb Police Pension Fund FOSTER & FOSTER | 53
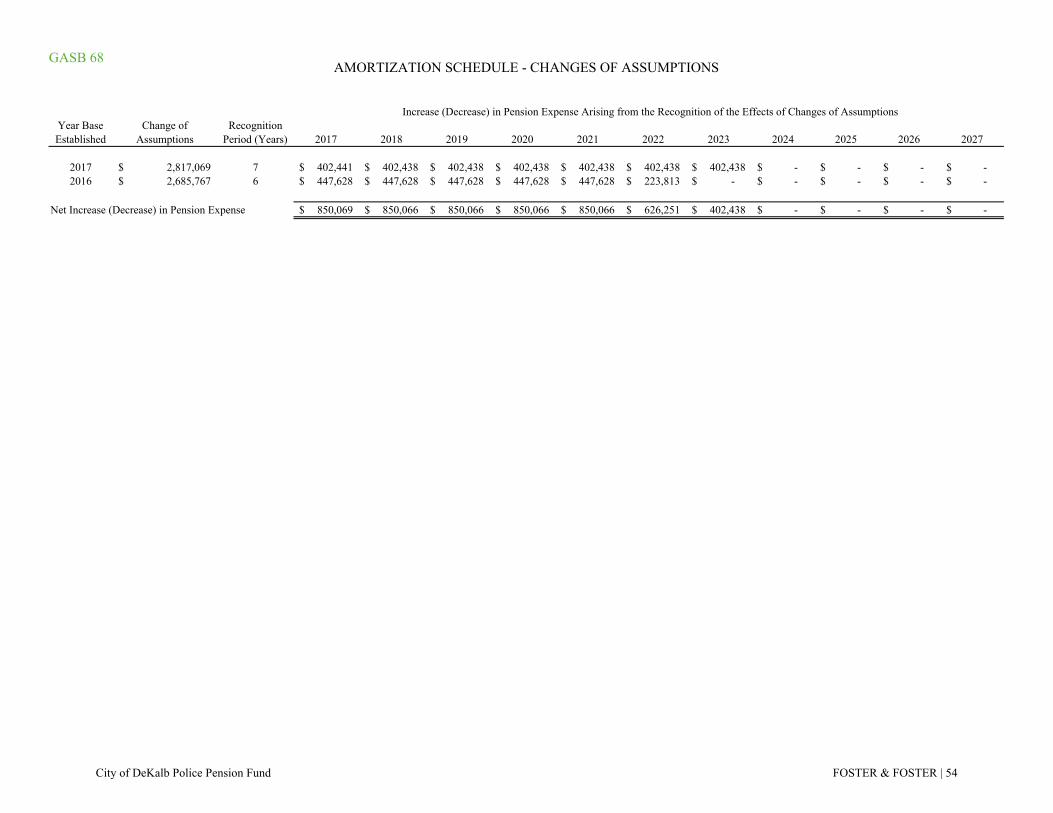
GASB 68
Year Base Established
Change of Assumptions
Recognition Period (Years) 2017 2018 2019 2020 2021 2022 2023 2024 2025 2026 2027
2017 2,817,069$ 7 402,441$ 402,438$ 402,438$ 402,438$ 402,438$ 402,438$ 402,438$ -$ -$ -$ -$ 2016 2,685,767$ 6 447,628$ 447,628$ 447,628$ 447,628$ 447,628$ 223,813$ -$ -$ -$ -$ -$
Net Increase (Decrease) in Pension Expense 850,069$ 850,066$ 850,066$ 850,066$ 850,066$ 626,251$ 402,438$ -$ -$ -$ -$
Increase (Decrease) in Pension Expense Arising from the Recognition of the Effects of Changes of Assumptions
AMORTIZATION SCHEDULE - CHANGES OF ASSUMPTIONS
City of DeKalb Police Pension Fund FOSTER & FOSTER | 54
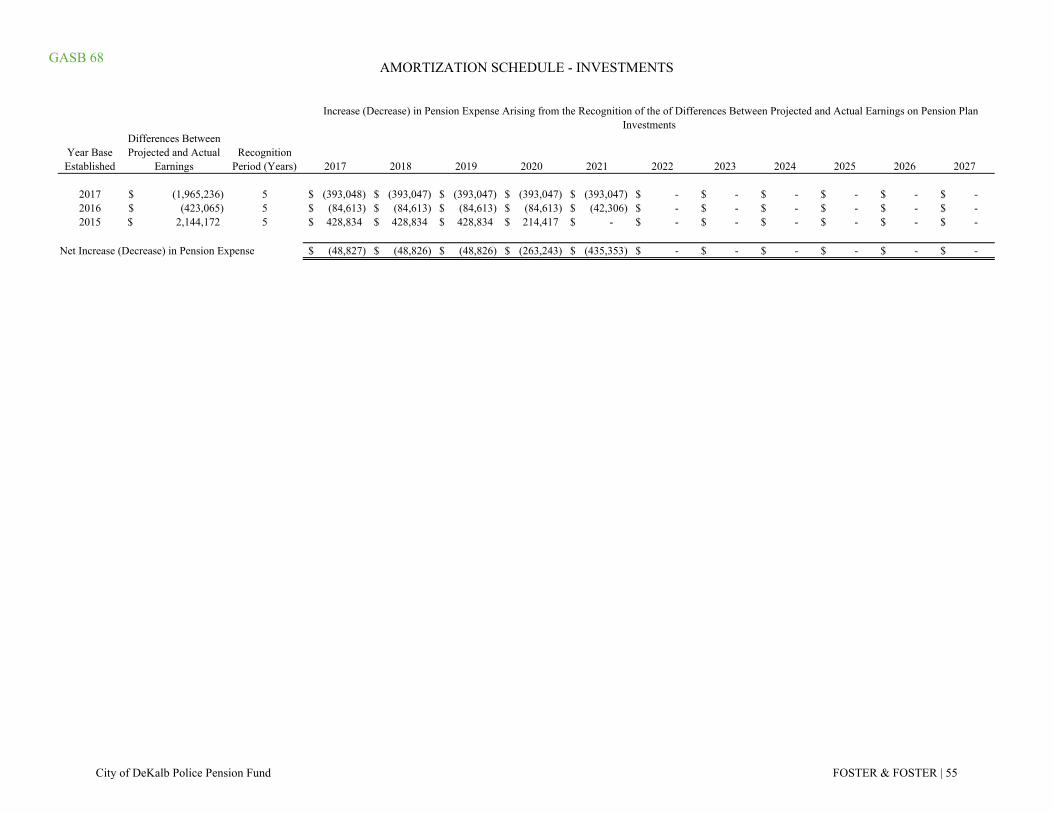
GASB 68
Year Base Established
Differences Between Projected and Actual
EarningsRecognition
Period (Years) 2017 2018 2019 2020 2021 2022 2023 2024 2025 2026 2027
2017 (1,965,236)$ 5 (393,048)$ (393,047)$ (393,047)$ (393,047)$ (393,047)$ -$ -$ -$ -$ -$ -$ 2016 (423,065)$ 5 (84,613)$ (84,613)$ (84,613)$ (84,613)$ (42,306)$ -$ -$ -$ -$ -$ -$ 2015 2,144,172$ 5 428,834$ 428,834$ 428,834$ 214,417$ -$ -$ -$ -$ -$ -$ -$
Net Increase (Decrease) in Pension Expense (48,827)$ (48,826)$ (48,826)$ (263,243)$ (435,353)$ -$ -$ -$ -$ -$ -$
Increase (Decrease) in Pension Expense Arising from the Recognition of the of Differences Between Projected and Actual Earnings on Pension Plan Investments
AMORTIZATION SCHEDULE - INVESTMENTS
City of DeKalb Police Pension Fund FOSTER & FOSTER | 55

CITY OF DEKALB FIREFIGHTERS’ PENSION FUND
ACTUARIAL VALUATION AS OF JANUARY 1, 2018
CONTRIBUTIONS APPLICABLE TO THE PLAN/FISCAL YEAR ENDING DECEMBER 31, 2019
GASB 67/68 DISCLOSURE INFORMATION AS OF DECEMBER 31, 2017
184 Shuman Blvd, Suite 305 Naperville, IL 60563 · (630) 620-0200 · Fax (239) 481-0634 · www.foster-foster.com
April 20, 2018
City of DeKalb c/o Robert Miller, Assistant Finance Director 200 South Fourth Street DeKalb, IL 60115
Re: Actuarial Valuation Report (including GASB Statements No. 67 and No. 68) – City of DeKalb Firefighters’ Pension Fund
Dear Mr. Miller:
We are pleased to present to the City this report of the annual actuarial valuation of the City of DeKalb Firefighters’ Pension Fund. Included are the related results for GASB Statements No. 67 and No. 68. The funding valuation was performed to determine whether the assets and contributions are sufficient to provide the prescribed benefits and to develop the appropriate funding requirements for the applicable plan year. The calculation of the liability for GASB results was performed for the purpose of satisfying the requirements of GASB Statements No. 67 and No. 68. Use of the results for other purposes may not be applicable and produce significantly different results.
The valuation has been conducted in accordance with generally accepted actuarial principles and practices, including the applicable Actuarial Standards of Practice as issued by the Actuarial Standards Board, and reflects laws and regulations issued to date pursuant to the provisions of Article 4, Illinois Pension Code, as well as applicable federal laws and regulations. In our opinion, the assumptions used in this valuation, as adopted by the Board of Trustees, represent reasonable expectations of anticipated plan experience. Future actuarial measurements may differ significantly from the current measurements presented in this report for a variety of reasons including: changes in applicable laws, changes in plan provisions, changes in assumptions, or plan experience differing from expectations.
In conducting the valuation, we have relied on personnel, plan design, and asset information supplied by the City, financial reports prepared by the custodian bank and the actuarial assumptions and methods described in the Actuarial Assumptions section of this report. While we cannot verify the accuracy of all this information, the supplied information was reviewed for consistency and reasonableness. As a result of this review, we have no reason to doubt the substantial accuracy of the information and believe that it has produced appropriate results. This information, along with any adjustments or modifications, is summarized in various sections of this report.
The total pension liability, net pension liability, and certain sensitivity information shown in the GASB results are based on an actuarial valuation performed as of the valuation date.
Certain schedules should include a 10-year history of information. As provided for in GASB Statements No. 67 and No. 68, this historical information is only presented for the years in which the information was measured. This conforms to the requirements of GASB Statements No. 67 and No. 68.
The undersigned is familiar with the immediate and long-term aspects of pension valuations and meets the Qualification Standards of the American Academy of Actuaries necessary to render the actuarial opinions contained herein. All of the sections of this report are considered an integral part of the actuarial opinions. To our knowledge, no associate of Foster & Foster, Inc. working on valuations of the program has any direct financial interest or indirect material interest in the City of DeKalb, nor does anyone at Foster & Foster, Inc. act as a member of the Board of Trustees of the City of DeKalb Firefighters’ Pension Fund. Thus, there is no relationship existing that might affect our capacity to prepare and certify this actuarial report. If there are any questions, concerns, or comments about any of the items contained in this report, please contact us at 630-620-0200. Respectfully submitted, Foster & Foster, Inc. By: ______________________________
Jason L. Franken Enrolled Actuary #17-6888
JLF/lke Enclosures
TABLE OF CONTENTS
Section Title Page I Introduction
a. Summary of Report 5 b. Changes Since Prior Valuation 7
c. Comparative Summary of Principal
Valuation Results 8 II Valuation Information
a. Development of Amortization Payment 14
b. Detailed Actuarial (Gain)/Loss Analysis 15
c. Reconciliation of Changes in Contribution Requirement 16
d. Statutory Minimum Required Contribution 17
e. Projection of Benefit Payments 18 f. Actuarial Assumptions and Methods 19
g. Glossary 21
III Trust Fund 22 IV Member Statistics
a. Statistical Data 26 b. Age and Service Distribution 27 c. Valuation Participant Reconciliation 28
V Summary of Current Plan 29 VI Governmental Accounting Standards Board Statements No. 67 and No. 68 Disclosure Information 32
City of DeKalb Firefighters' Pension Fund FOSTER & FOSTER | 4
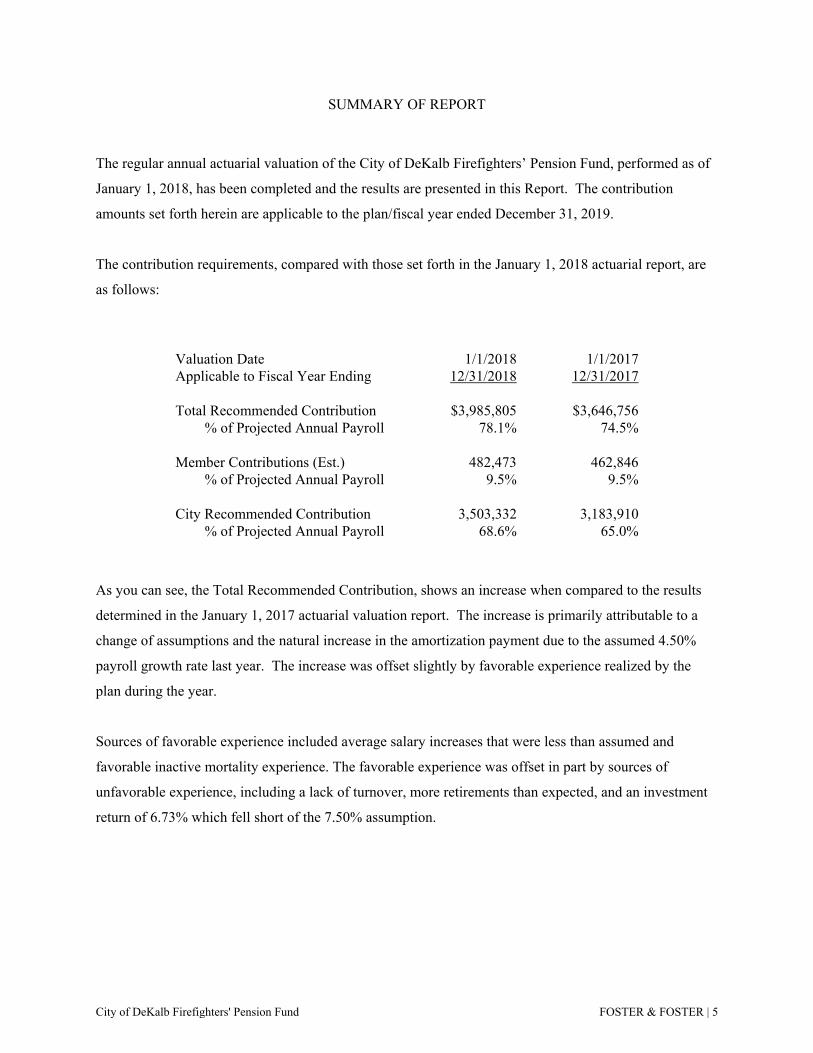
SUMMARY OF REPORT
The regular annual actuarial valuation of the City of DeKalb Firefighters’ Pension Fund, performed as of
January 1, 2018, has been completed and the results are presented in this Report. The contribution
amounts set forth herein are applicable to the plan/fiscal year ended December 31, 2019.
The contribution requirements, compared with those set forth in the January 1, 2018 actuarial report, are
as follows:
Valuation Date 1/1/2018 1/1/2017 Applicable to Fiscal Year Ending 12/31/2018 12/31/2017
Total Recommended Contribution $3,985,805 $3,646,756 % of Projected Annual Payroll 78.1% 74.5%
Member Contributions (Est.) 482,473 462,846 % of Projected Annual Payroll 9.5% 9.5%
City Recommended Contribution 3,503,332 3,183,910 % of Projected Annual Payroll 68.6% 65.0%
As you can see, the Total Recommended Contribution, shows an increase when compared to the results
determined in the January 1, 2017 actuarial valuation report. The increase is primarily attributable to a
change of assumptions and the natural increase in the amortization payment due to the assumed 4.50%
payroll growth rate last year. The increase was offset slightly by favorable experience realized by the
plan during the year.
Sources of favorable experience included average salary increases that were less than assumed and
favorable inactive mortality experience. The favorable experience was offset in part by sources of
unfavorable experience, including a lack of turnover, more retirements than expected, and an investment
return of 6.73% which fell short of the 7.50% assumption.
City of DeKalb Firefighters' Pension Fund FOSTER & FOSTER | 5
The balance of this Report presents additional details of the actuarial valuation and the general operation
of the Fund. The undersigned would be pleased to meet with the Board of Trustees to discuss the Report
and answer any pending questions concerning its contents.
Respectfully submitted, FOSTER & FOSTER, INC.
By: ______________________________ Jason L. Franken, FSA, EA, MAAA
City of DeKalb Firefighters' Pension Fund FOSTER & FOSTER | 6
CHANGES SINCE PRIOR VALUATION
Plan Changes Since Prior Valuation
No plan changes have occurred since the prior valuation.
Actuarial Assumption/Method Changes Since Prior Valuation
Since the prior valuation, the following assumptions were updated:
• The interest rate assumption was updated from 7.50% to 7.00%.
• The assumptions for salary increases, retirement, disability, and termination rates were updated to
the rates determined in the State of Illinois Department of Insurance experience study dated
October 5, 2017.
• The percentage of active deaths and disablements assumed to occur in the line of duty were
updated to 20% and 80%, respectively, in accordance with the experience study.
• The payroll growth rate assumption was reduced from 4.50% to 4.00%.
There were no method changes since the prior valuation.
City of DeKalb Firefighters' Pension Fund FOSTER & FOSTER | 7
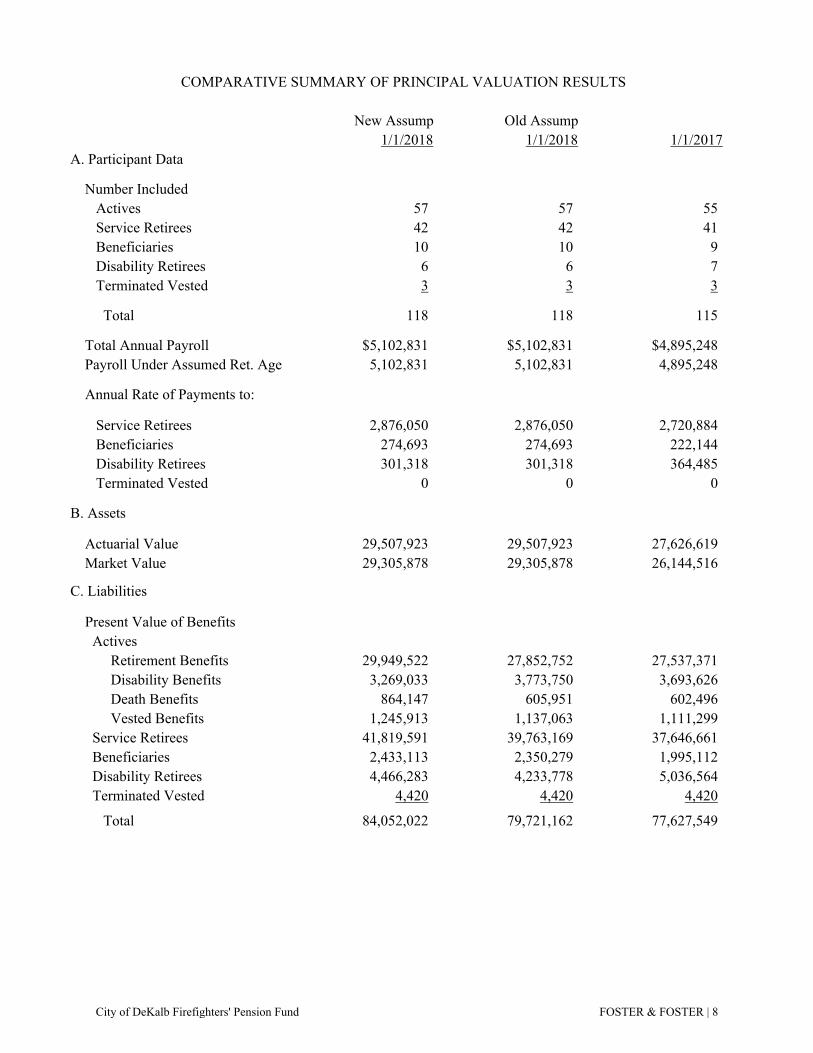
COMPARATIVE SUMMARY OF PRINCIPAL VALUATION RESULTS
New Assump Old Assump1/1/2018 1/1/2018 1/1/2017
A. Participant Data
Number Included Actives 57 57 55 Service Retirees 42 42 41 Beneficiaries 10 10 9 Disability Retirees 6 6 7 Terminated Vested 3 3 3
Total 118 118 115
Total Annual Payroll $5,102,831 $5,102,831 $4,895,248 Payroll Under Assumed Ret. Age 5,102,831 5,102,831 4,895,248
Annual Rate of Payments to:
Service Retirees 2,876,050 2,876,050 2,720,884 Beneficiaries 274,693 274,693 222,144 Disability Retirees 301,318 301,318 364,485 Terminated Vested 0 0 0
B. Assets
Actuarial Value 29,507,923 29,507,923 27,626,619 Market Value 29,305,878 29,305,878 26,144,516
C. Liabilities
Present Value of Benefits Actives Retirement Benefits 29,949,522 27,852,752 27,537,371 Disability Benefits 3,269,033 3,773,750 3,693,626 Death Benefits 864,147 605,951 602,496 Vested Benefits 1,245,913 1,137,063 1,111,299 Service Retirees 41,819,591 39,763,169 37,646,661 Beneficiaries 2,433,113 2,350,279 1,995,112 Disability Retirees 4,466,283 4,233,778 5,036,564 Terminated Vested 4,420 4,420 4,420
Total 84,052,022 79,721,162 77,627,549
City of DeKalb Firefighters' Pension Fund FOSTER & FOSTER | 8
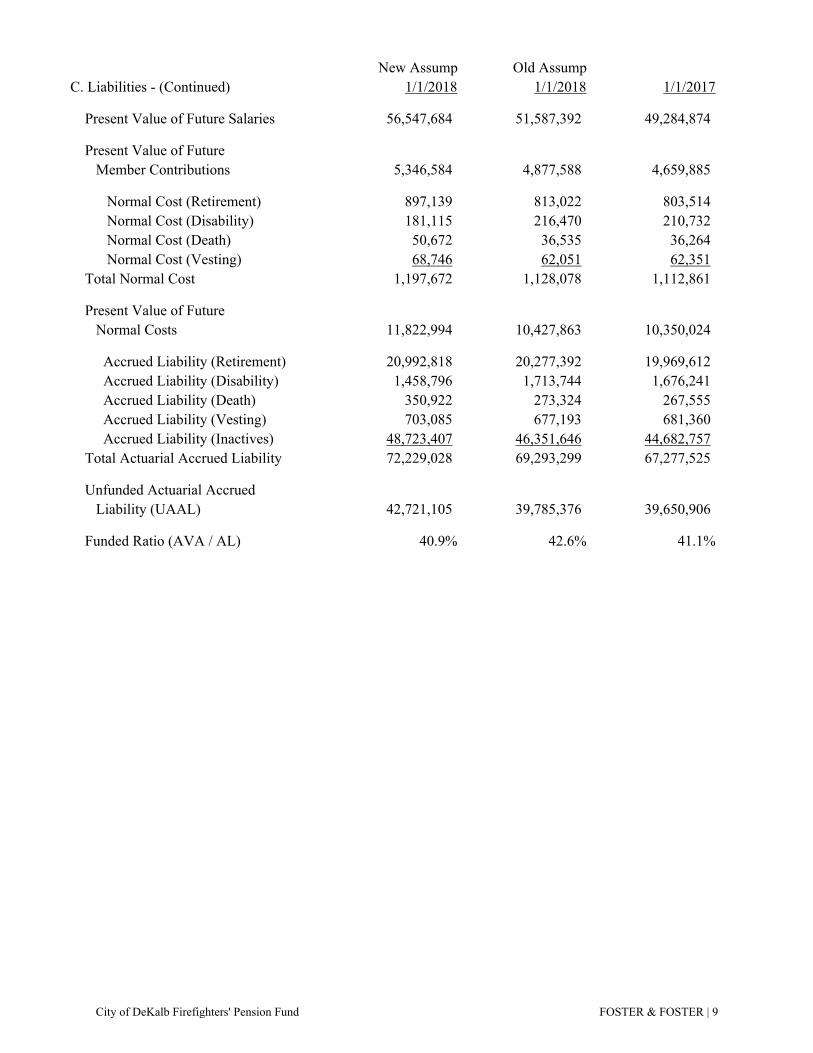
New Assump Old AssumpC. Liabilities - (Continued) 1/1/2018 1/1/2018 1/1/2017
Present Value of Future Salaries 56,547,684 51,587,392 49,284,874
Present Value of Future Member Contributions 5,346,584 4,877,588 4,659,885
Normal Cost (Retirement) 897,139 813,022 803,514 Normal Cost (Disability) 181,115 216,470 210,732 Normal Cost (Death) 50,672 36,535 36,264 Normal Cost (Vesting) 68,746 62,051 62,351 Total Normal Cost 1,197,672 1,128,078 1,112,861
Present Value of Future Normal Costs 11,822,994 10,427,863 10,350,024
Accrued Liability (Retirement) 20,992,818 20,277,392 19,969,612 Accrued Liability (Disability) 1,458,796 1,713,744 1,676,241 Accrued Liability (Death) 350,922 273,324 267,555 Accrued Liability (Vesting) 703,085 677,193 681,360 Accrued Liability (Inactives) 48,723,407 46,351,646 44,682,757 Total Actuarial Accrued Liability 72,229,028 69,293,299 67,277,525
Unfunded Actuarial Accrued Liability (UAAL) 42,721,105 39,785,376 39,650,906
Funded Ratio (AVA / AL) 40.9% 42.6% 41.1%
City of DeKalb Firefighters' Pension Fund FOSTER & FOSTER | 9

New Assump Old Assump1/1/2018 1/1/2018 1/1/2017
D. Actuarial Present Value of Accrued Benefits Vested Accrued Benefits Inactives 48,723,407 46,351,646 44,682,757 Actives 8,404,750 7,871,912 8,433,691 Member Contributions 4,692,033 4,692,033 4,501,882 Total 61,820,190 58,915,591 57,618,330
Non-vested Accrued Benefits 457,268 612,644 678,531 Total Present Value Accrued Benefits 62,277,458 59,528,235 58,296,861
Funded Ratio (MVA / PVAB) 47.1% 49.2% 44.8%
Increase (Decrease) in Present Value of Accrued Benefits Attributable to: Plan Amendments 0 0 Assumption Changes 2,749,223 0 New Accrued Benefits 0 424,177 Benefits Paid 0 (3,436,210) Interest 0 4,243,407 Other 0 0 Total 2,749,223 1,231,374
City of DeKalb Firefighters' Pension Fund FOSTER & FOSTER | 10
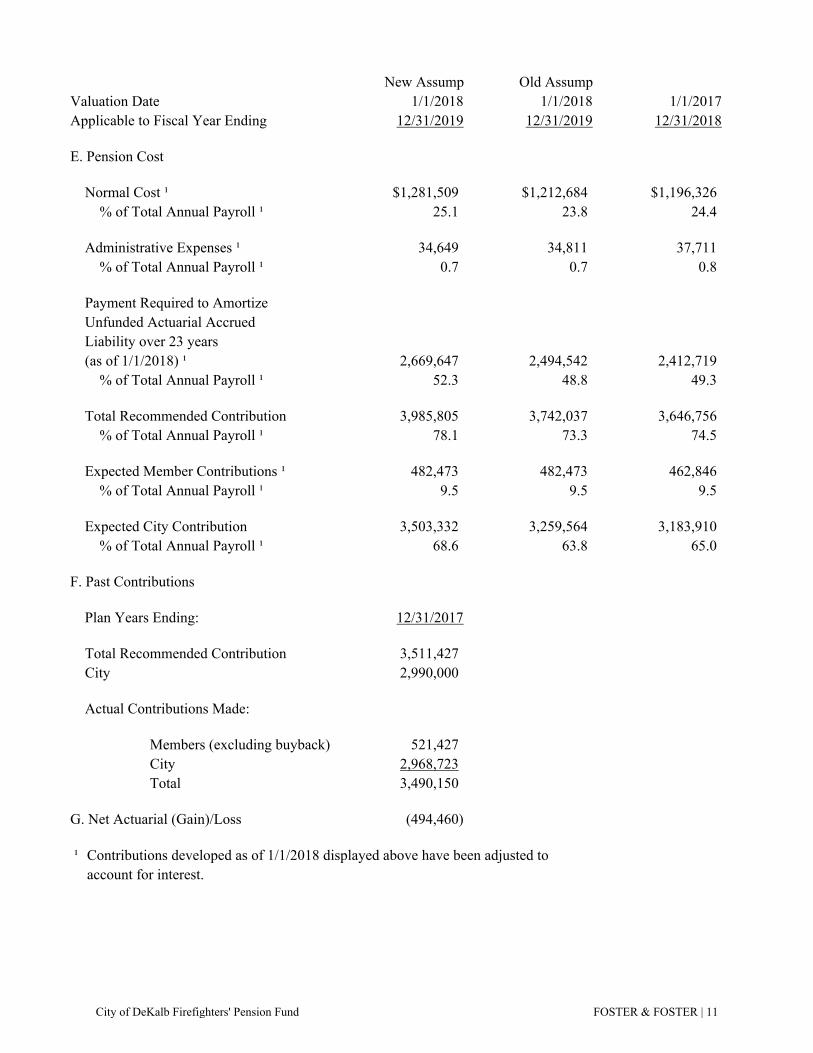
New Assump Old AssumpValuation Date 1/1/2018 1/1/2018 1/1/2017Applicable to Fiscal Year Ending 12/31/2019 12/31/2019 12/31/2018
E. Pension Cost
Normal Cost ¹ $1,281,509 $1,212,684 $1,196,326 % of Total Annual Payroll ¹ 25.1 23.8 24.4
Administrative Expenses ¹ 34,649 34,811 37,711 % of Total Annual Payroll ¹ 0.7 0.7 0.8
Payment Required to Amortize Unfunded Actuarial Accrued Liability over 23 years (as of 1/1/2018) ¹ 2,669,647 2,494,542 2,412,719 % of Total Annual Payroll ¹ 52.3 48.8 49.3
Total Recommended Contribution 3,985,805 3,742,037 3,646,756 % of Total Annual Payroll ¹ 78.1 73.3 74.5
Expected Member Contributions ¹ 482,473 482,473 462,846 % of Total Annual Payroll ¹ 9.5 9.5 9.5
Expected City Contribution 3,503,332 3,259,564 3,183,910 % of Total Annual Payroll ¹ 68.6 63.8 65.0
F. Past Contributions
Plan Years Ending: 12/31/2017
Total Recommended Contribution 3,511,427 City 2,990,000
Actual Contributions Made:
Members (excluding buyback) 521,427City 2,968,723Total 3,490,150
G. Net Actuarial (Gain)/Loss (494,460)
¹ Contributions developed as of 1/1/2018 displayed above have been adjusted toaccount for interest.
City of DeKalb Firefighters' Pension Fund FOSTER & FOSTER | 11

H. Schedule Illustrating the Amortization of the Total Unfunded Actuarial Accrued Liability as of:
Projected UnfundedYear Accrued Liability
2018 42,721,1052019 43,041,9362020 43,278,4392025 42,807,546 2031 36,675,3362036 23,894,0642041 0
I. (i) 3 Year Comparison of Actual and Assumed Salary Increases
Actual Assumed
Year Ended 12/31/2017 3.46% 4.50%Year Ended 12/31/2016 6.46% 4.50%Year Ended 12/31/2015 3.76% 4.50%
(ii) 3 Year Comparison of Investment Return on Actuarial Value
Actual Assumed
Year Ended 12/31/2017 6.73% 7.50%Year Ended 12/31/2016 6.27% 7.50%Year Ended 12/31/2015 4.46% 7.50%
City of DeKalb Firefighters' Pension Fund FOSTER & FOSTER | 12

STATEMENT BY ENROLLED ACTUARY This actuarial valuation was prepared and completed by me or under my direct supervision, and I acknowledge responsibility for the results. To the best of my knowledge, the results are complete and ac-curate, and in my opinion, the techniques and assumptions used are reasonable and meet the requirements and intent of the Illinois Pension Code and adhere to the Actuarial Standards of Practice. There is no ben-efit or expense to be provided by the plan and/or paid from the plan's assets for which liabilities or current costs have not been established or otherwise taken into account in the valuation. All known events or trends which may require a material increase in plan costs or recommended contribution rates have been taken into account in the valuation.
________________________ Jason L. Franken, FSA, EA, MAAA Enrolled Actuary #17-6888
City of DeKalb Firefighters' Pension Fund FOSTER & FOSTER | 13
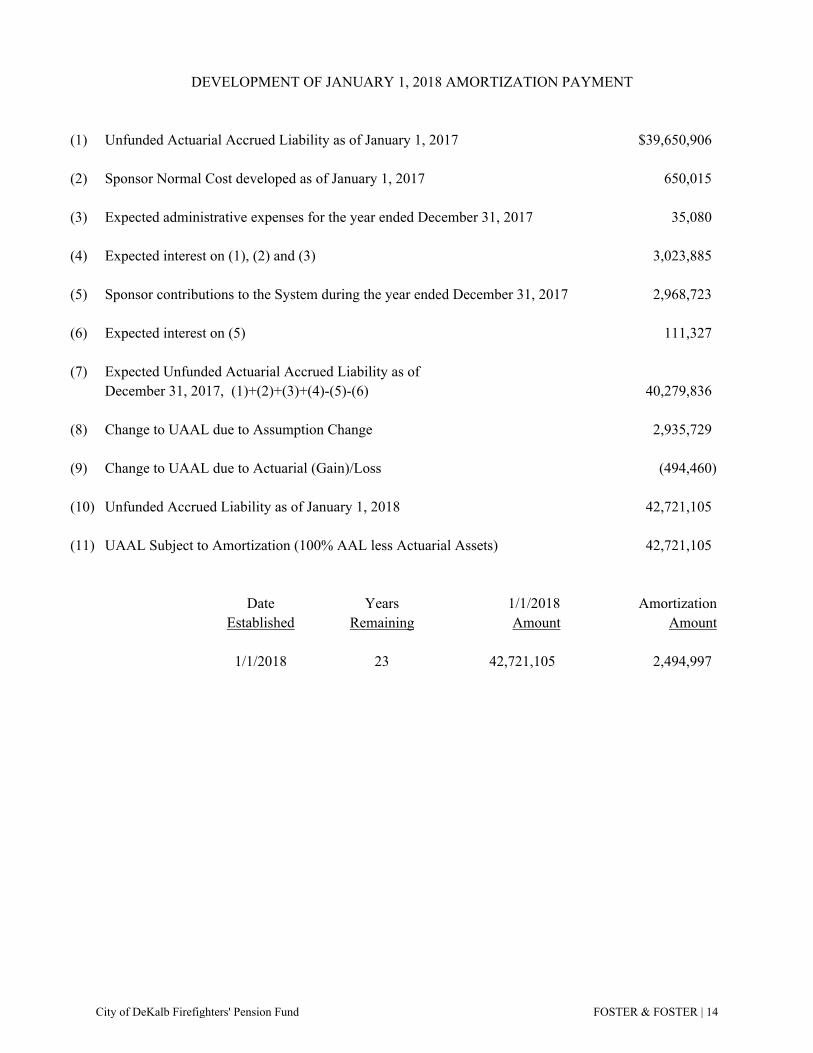
DEVELOPMENT OF JANUARY 1, 2018 AMORTIZATION PAYMENT
(1) Unfunded Actuarial Accrued Liability as of January 1, 2017 $39,650,906
(2) Sponsor Normal Cost developed as of January 1, 2017 650,015
(3) Expected administrative expenses for the year ended December 31, 2017 35,080
(4) Expected interest on (1), (2) and (3) 3,023,885
(5) Sponsor contributions to the System during the year ended December 31, 2017 2,968,723
(6) Expected interest on (5) 111,327
(7) Expected Unfunded Actuarial Accrued Liability as ofDecember 31, 2017, (1)+(2)+(3)+(4)-(5)-(6) 40,279,836
(8) Change to UAAL due to Assumption Change 2,935,729
(9) Change to UAAL due to Actuarial (Gain)/Loss (494,460)
(10) Unfunded Accrued Liability as of January 1, 2018 42,721,105
(11) UAAL Subject to Amortization (100% AAL less Actuarial Assets) 42,721,105
Date Years 1/1/2018 AmortizationEstablished Remaining Amount Amount
1/1/2018 23 42,721,105 2,494,997
City of DeKalb Firefighters' Pension Fund FOSTER & FOSTER | 14
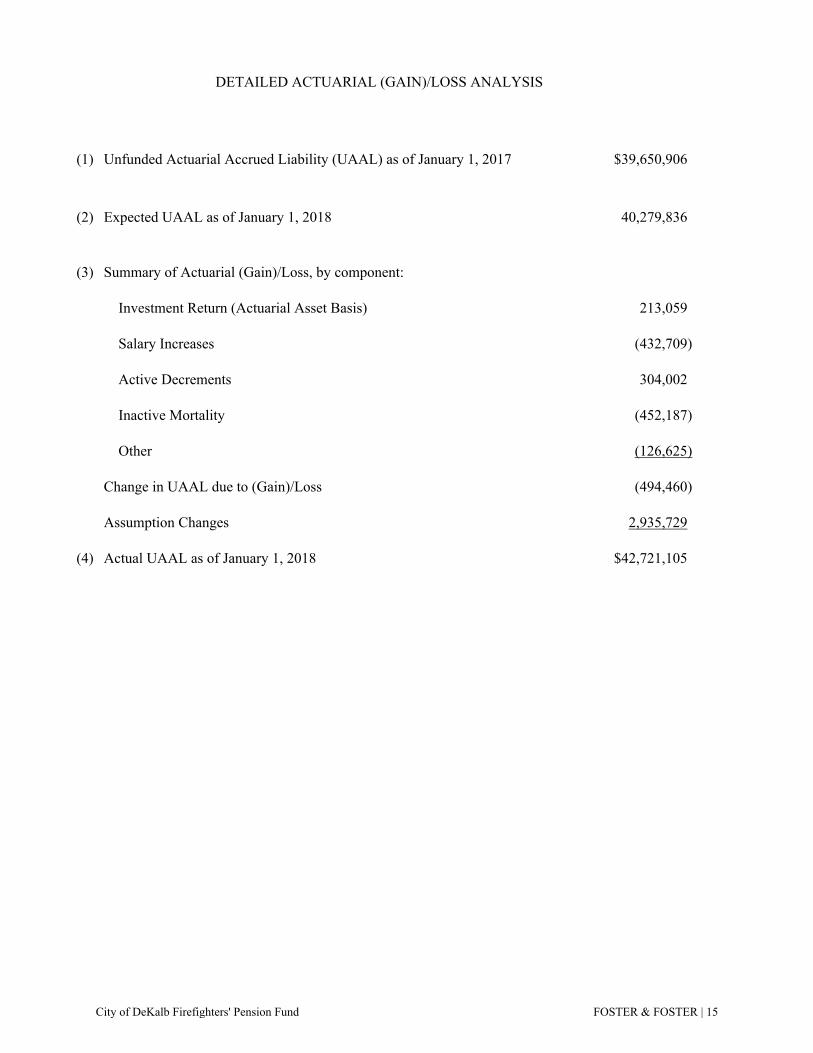
(1) Unfunded Actuarial Accrued Liability (UAAL) as of January 1, 2017 $39,650,906
(2) Expected UAAL as of January 1, 2018 40,279,836
(3) Summary of Actuarial (Gain)/Loss, by component:
Investment Return (Actuarial Asset Basis) 213,059
Salary Increases (432,709)
Active Decrements 304,002
Inactive Mortality (452,187)
Other (126,625)
Change in UAAL due to (Gain)/Loss (494,460)
Assumption Changes 2,935,729
(4) Actual UAAL as of January 1, 2018 $42,721,105
DETAILED ACTUARIAL (GAIN)/LOSS ANALYSIS
City of DeKalb Firefighters' Pension Fund FOSTER & FOSTER | 15
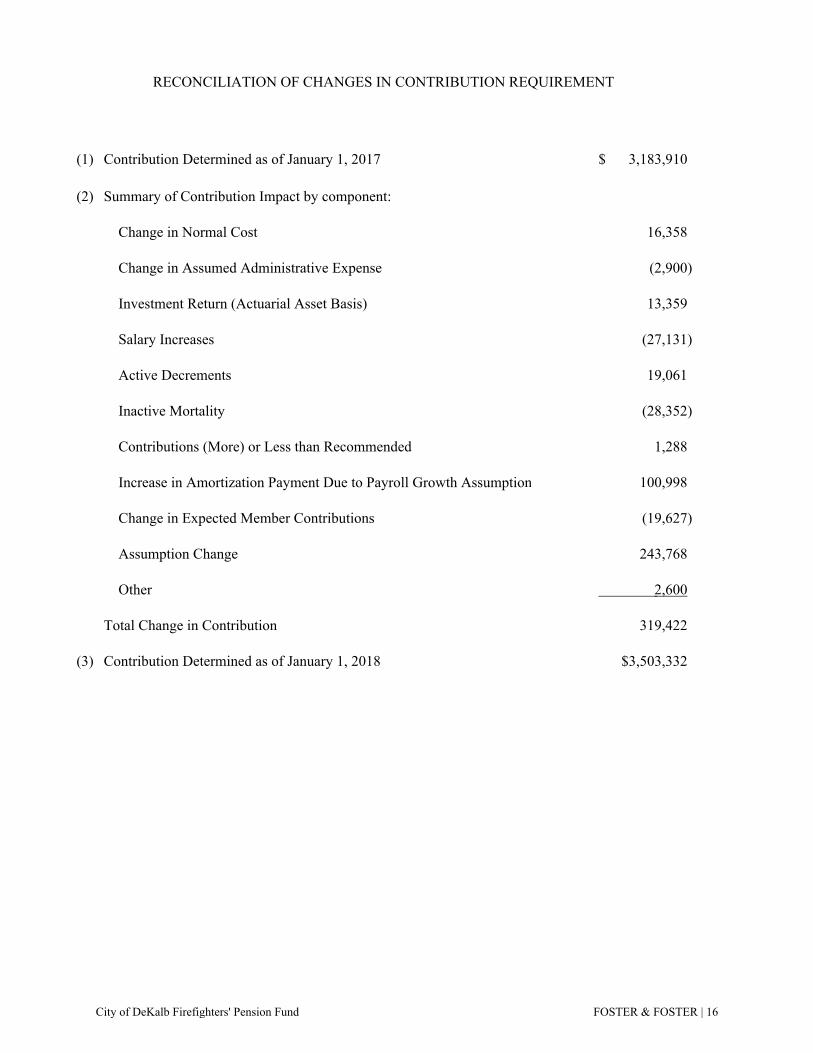
(1) Contribution Determined as of January 1, 2017 3,183,910$
(2) Summary of Contribution Impact by component:
Change in Normal Cost 16,358
Change in Assumed Administrative Expense (2,900)
Investment Return (Actuarial Asset Basis) 13,359
Salary Increases (27,131)
Active Decrements 19,061
Inactive Mortality (28,352)
Contributions (More) or Less than Recommended 1,288
Increase in Amortization Payment Due to Payroll Growth Assumption 100,998
Change in Expected Member Contributions (19,627)
Assumption Change 243,768
Other 2,600
Total Change in Contribution 319,422
(3) Contribution Determined as of January 1, 2018 $3,503,332
RECONCILIATION OF CHANGES IN CONTRIBUTION REQUIREMENT
City of DeKalb Firefighters' Pension Fund FOSTER & FOSTER | 16
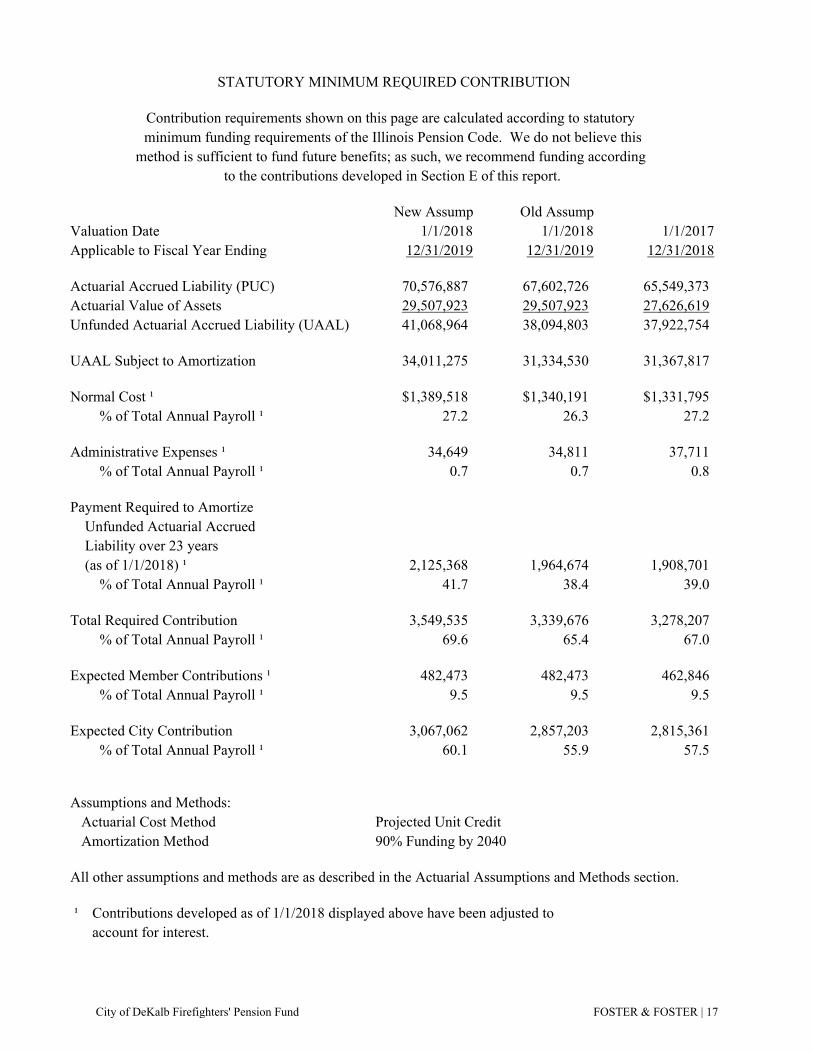
New Assump Old AssumpValuation Date 1/1/2018 1/1/2018 1/1/2017Applicable to Fiscal Year Ending 12/31/2019 12/31/2019 12/31/2018
Actuarial Accrued Liability (PUC) 70,576,887 67,602,726 65,549,373Actuarial Value of Assets 29,507,923 29,507,923 27,626,619Unfunded Actuarial Accrued Liability (UAAL) 41,068,964 38,094,803 37,922,754
UAAL Subject to Amortization 34,011,275 31,334,530 31,367,817
Normal Cost ¹ $1,389,518 $1,340,191 $1,331,795 % of Total Annual Payroll ¹ 27.2 26.3 27.2
Administrative Expenses ¹ 34,649 34,811 37,711 % of Total Annual Payroll ¹ 0.7 0.7 0.8
Payment Required to Amortize Unfunded Actuarial Accrued Liability over 23 years (as of 1/1/2018) ¹ 2,125,368 1,964,674 1,908,701 % of Total Annual Payroll ¹ 41.7 38.4 39.0
Total Required Contribution 3,549,535 3,339,676 3,278,207 % of Total Annual Payroll ¹ 69.6 65.4 67.0
Expected Member Contributions ¹ 482,473 482,473 462,846 % of Total Annual Payroll ¹ 9.5 9.5 9.5
Expected City Contribution 3,067,062 2,857,203 2,815,361 % of Total Annual Payroll ¹ 60.1 55.9 57.5
Assumptions and Methods: Actuarial Cost Method Projected Unit Credit Amortization Method 90% Funding by 2040
All other assumptions and methods are as described in the Actuarial Assumptions and Methods section.
¹ Contributions developed as of 1/1/2018 displayed above have been adjusted toaccount for interest.
STATUTORY MINIMUM REQUIRED CONTRIBUTION
Contribution requirements shown on this page are calculated according to statutory minimum funding requirements of the Illinois Pension Code. We do not believe this
method is sufficient to fund future benefits; as such, we recommend funding according to the contributions developed in Section E of this report.
City of DeKalb Firefighters' Pension Fund FOSTER & FOSTER | 17
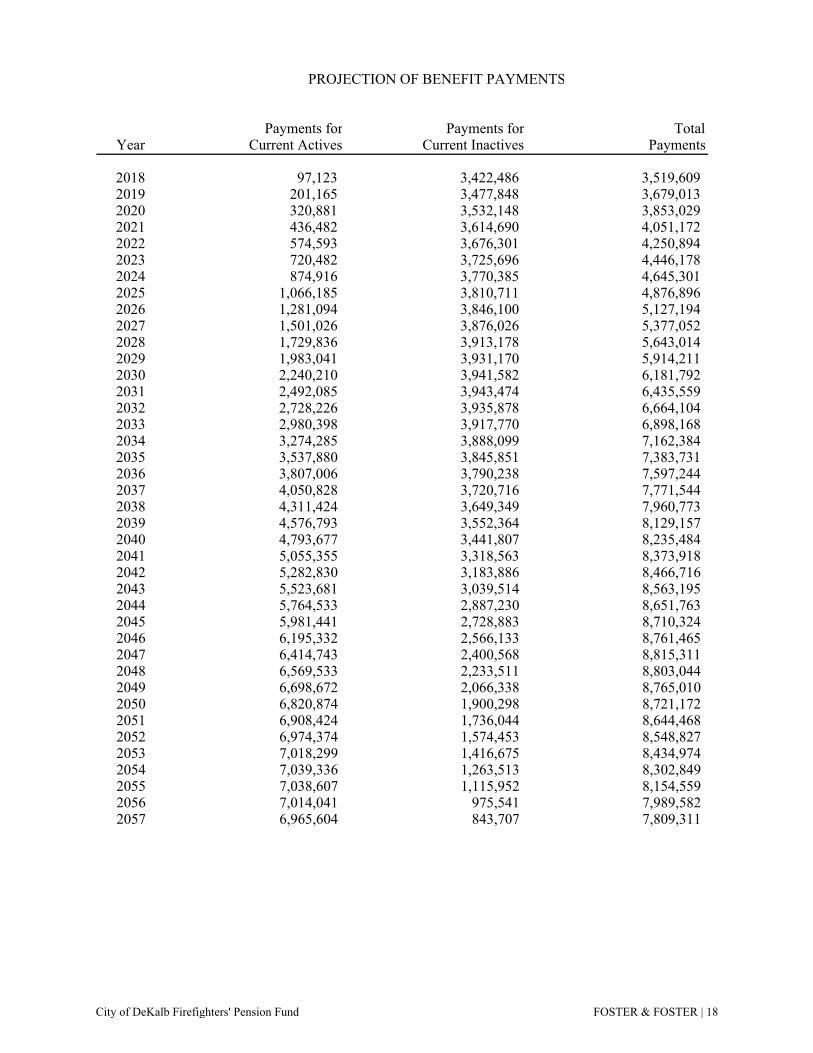
PROJECTION OF BENEFIT PAYMENTS
Payments for Payments for TotalYear Current Actives Current Inactives Payments
2018 97,123 3,422,486 3,519,6092019 201,165 3,477,848 3,679,0132020 320,881 3,532,148 3,853,0292021 436,482 3,614,690 4,051,1722022 574,593 3,676,301 4,250,8942023 720,482 3,725,696 4,446,1782024 874,916 3,770,385 4,645,3012025 1,066,185 3,810,711 4,876,8962026 1,281,094 3,846,100 5,127,1942027 1,501,026 3,876,026 5,377,0522028 1,729,836 3,913,178 5,643,0142029 1,983,041 3,931,170 5,914,2112030 2,240,210 3,941,582 6,181,7922031 2,492,085 3,943,474 6,435,5592032 2,728,226 3,935,878 6,664,1042033 2,980,398 3,917,770 6,898,1682034 3,274,285 3,888,099 7,162,3842035 3,537,880 3,845,851 7,383,7312036 3,807,006 3,790,238 7,597,2442037 4,050,828 3,720,716 7,771,5442038 4,311,424 3,649,349 7,960,7732039 4,576,793 3,552,364 8,129,1572040 4,793,677 3,441,807 8,235,4842041 5,055,355 3,318,563 8,373,9182042 5,282,830 3,183,886 8,466,7162043 5,523,681 3,039,514 8,563,1952044 5,764,533 2,887,230 8,651,7632045 5,981,441 2,728,883 8,710,3242046 6,195,332 2,566,133 8,761,4652047 6,414,743 2,400,568 8,815,3112048 6,569,533 2,233,511 8,803,0442049 6,698,672 2,066,338 8,765,0102050 6,820,874 1,900,298 8,721,1722051 6,908,424 1,736,044 8,644,4682052 6,974,374 1,574,453 8,548,8272053 7,018,299 1,416,675 8,434,9742054 7,039,336 1,263,513 8,302,8492055 7,038,607 1,115,952 8,154,5592056 7,014,041 975,541 7,989,5822057 6,965,604 843,707 7,809,311
City of DeKalb Firefighters' Pension Fund FOSTER & FOSTER | 18
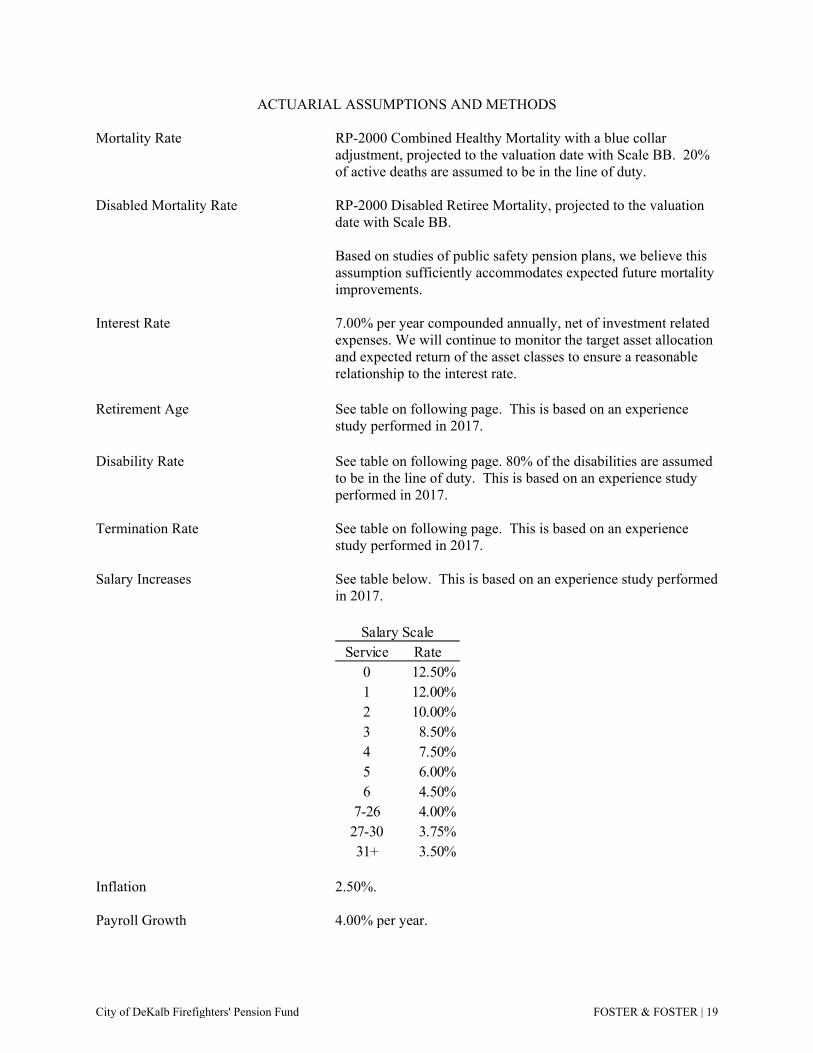
ACTUARIAL ASSUMPTIONS AND METHODS
Mortality Rate RP-2000 Combined Healthy Mortality with a blue collar adjustment, projected to the valuation date with Scale BB. 20% of active deaths are assumed to be in the line of duty.
Disabled Mortality Rate RP-2000 Disabled Retiree Mortality, projected to the valuation
date with Scale BB. Based on studies of public safety pension plans, we believe this assumption sufficiently accommodates expected future mortality improvements.
Interest Rate 7.00% per year compounded annually, net of investment related
expenses. We will continue to monitor the target asset allocation and expected return of the asset classes to ensure a reasonable relationship to the interest rate.
Retirement Age See table on following page. This is based on an experience study performed in 2017.
Disability Rate See table on following page. 80% of the disabilities are assumed to be in the line of duty. This is based on an experience study performed in 2017.
Termination Rate See table on following page. This is based on an experience
study performed in 2017. Salary Increases See table below. This is based on an experience study performed
in 2017.
Inflation 2.50%. Payroll Growth 4.00% per year.
Salary ScaleService Rate
0 12.50%1 12.00%2 10.00%3 8.50%4 7.50%5 6.00%6 4.50%
7-26 4.00%27-30 3.75%31+ 3.50%
City of DeKalb Firefighters' Pension Fund FOSTER & FOSTER | 19
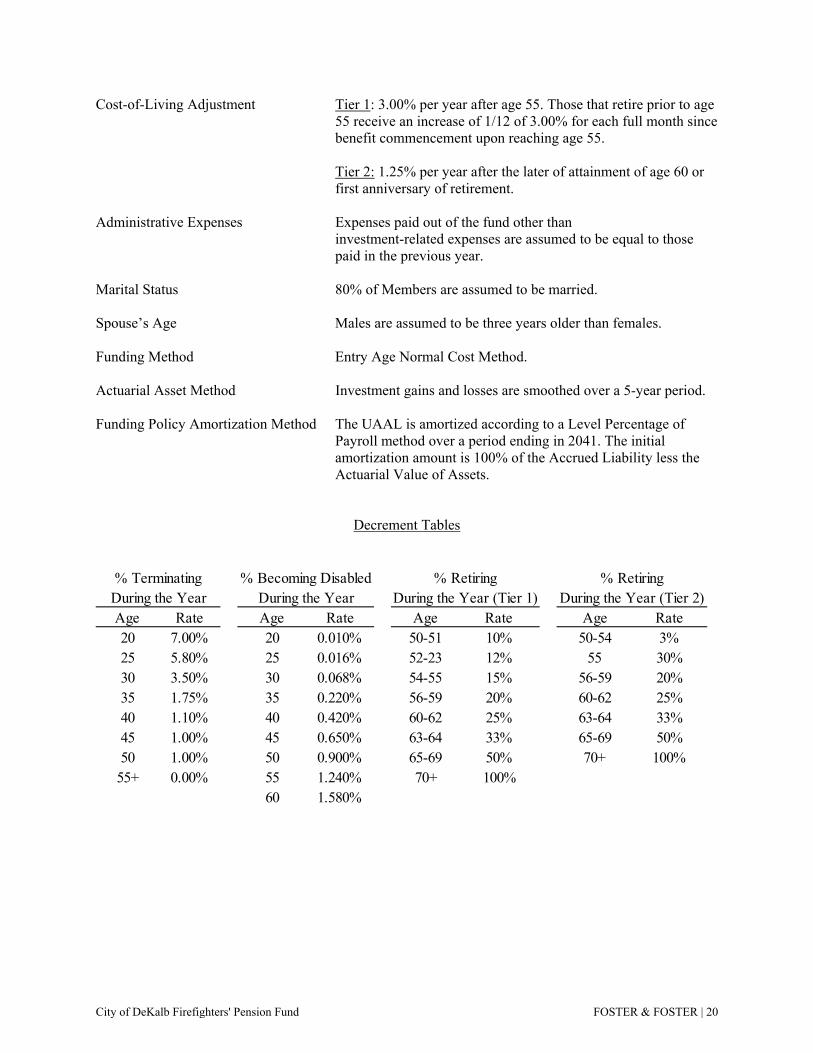
Cost-of-Living Adjustment Tier 1: 3.00% per year after age 55. Those that retire prior to age 55 receive an increase of 1/12 of 3.00% for each full month since benefit commencement upon reaching age 55.
Tier 2: 1.25% per year after the later of attainment of age 60 or first anniversary of retirement.
Administrative Expenses Expenses paid out of the fund other than
investment-related expenses are assumed to be equal to those paid in the previous year.
Marital Status 80% of Members are assumed to be married. Spouse’s Age Males are assumed to be three years older than females. Funding Method Entry Age Normal Cost Method. Actuarial Asset Method Investment gains and losses are smoothed over a 5-year period. Funding Policy Amortization Method The UAAL is amortized according to a Level Percentage of
Payroll method over a period ending in 2041. The initial amortization amount is 100% of the Accrued Liability less the Actuarial Value of Assets.
Decrement Tables
% Terminating % Becoming Disabled % Retiring % RetiringDuring the Year During the Year During the Year (Tier 1) During the Year (Tier 2)Age Rate Age Rate Age Rate Age Rate20 7.00% 20 0.010% 50-51 10% 50-54 3%25 5.80% 25 0.016% 52-23 12% 55 30%30 3.50% 30 0.068% 54-55 15% 56-59 20%35 1.75% 35 0.220% 56-59 20% 60-62 25%40 1.10% 40 0.420% 60-62 25% 63-64 33%45 1.00% 45 0.650% 63-64 33% 65-69 50%50 1.00% 50 0.900% 65-69 50% 70+ 100%
55+ 0.00% 55 1.240% 70+ 100%60 1.580%
City of DeKalb Firefighters' Pension Fund FOSTER & FOSTER | 20
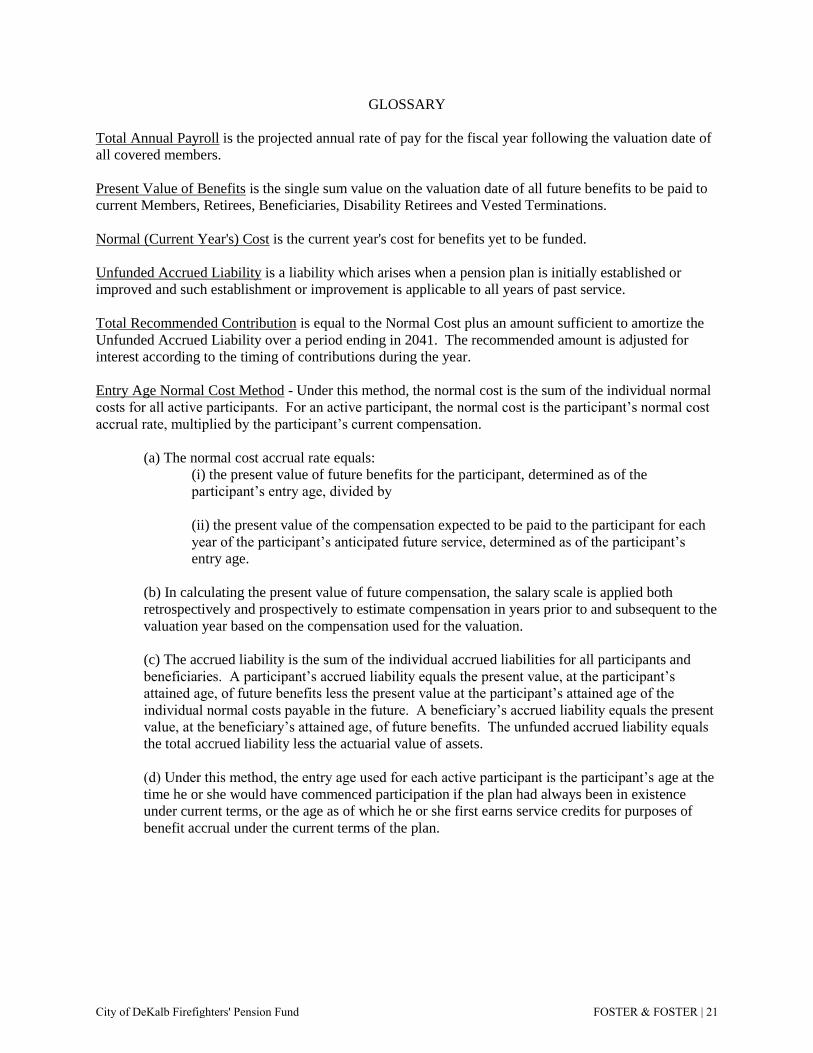
GLOSSARY
Total Annual Payroll is the projected annual rate of pay for the fiscal year following the valuation date of
all covered members.
Present Value of Benefits is the single sum value on the valuation date of all future benefits to be paid to
current Members, Retirees, Beneficiaries, Disability Retirees and Vested Terminations.
Normal (Current Year's) Cost is the current year's cost for benefits yet to be funded.
Unfunded Accrued Liability is a liability which arises when a pension plan is initially established or
improved and such establishment or improvement is applicable to all years of past service.
Total Recommended Contribution is equal to the Normal Cost plus an amount sufficient to amortize the
Unfunded Accrued Liability over a period ending in 2041. The recommended amount is adjusted for
interest according to the timing of contributions during the year.
Entry Age Normal Cost Method - Under this method, the normal cost is the sum of the individual normal
costs for all active participants. For an active participant, the normal cost is the participant’s normal cost
accrual rate, multiplied by the participant’s current compensation.
(a) The normal cost accrual rate equals:
(i) the present value of future benefits for the participant, determined as of the
participant’s entry age, divided by
(ii) the present value of the compensation expected to be paid to the participant for each
year of the participant’s anticipated future service, determined as of the participant’s
entry age.
(b) In calculating the present value of future compensation, the salary scale is applied both
retrospectively and prospectively to estimate compensation in years prior to and subsequent to the
valuation year based on the compensation used for the valuation.
(c) The accrued liability is the sum of the individual accrued liabilities for all participants and
beneficiaries. A participant’s accrued liability equals the present value, at the participant’s
attained age, of future benefits less the present value at the participant’s attained age of the
individual normal costs payable in the future. A beneficiary’s accrued liability equals the present
value, at the beneficiary’s attained age, of future benefits. The unfunded accrued liability equals
the total accrued liability less the actuarial value of assets.
(d) Under this method, the entry age used for each active participant is the participant’s age at the
time he or she would have commenced participation if the plan had always been in existence
under current terms, or the age as of which he or she first earns service credits for purposes of
benefit accrual under the current terms of the plan.
City of DeKalb Firefighters' Pension Fund FOSTER & FOSTER | 21
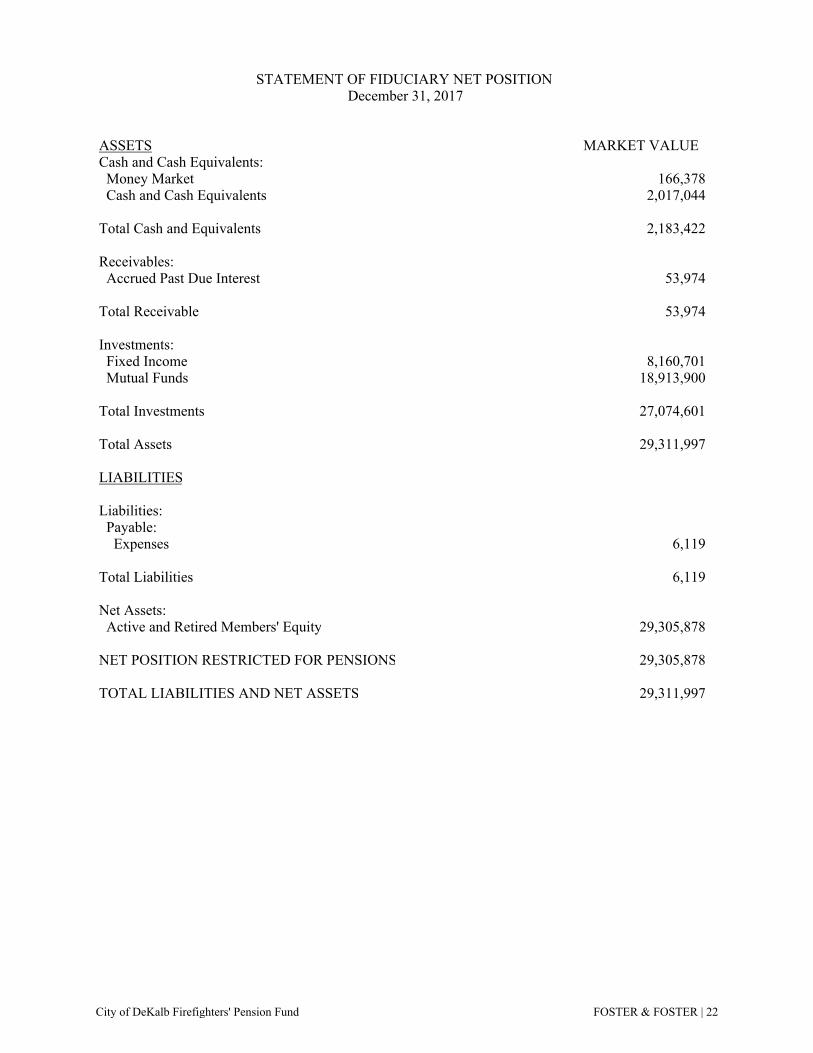
STATEMENT OF FIDUCIARY NET POSITION December 31, 2017
ASSETS MARKET VALUECash and Cash Equivalents: Money Market 166,378 Cash and Cash Equivalents 2,017,044
Total Cash and Equivalents 2,183,422
Receivables: Accrued Past Due Interest 53,974
Total Receivable 53,974
Investments: Fixed Income 8,160,701 Mutual Funds 18,913,900
Total Investments 27,074,601
Total Assets 29,311,997
LIABILITIES
Liabilities: Payable: Expenses 6,119
Total Liabilities 6,119
Net Assets: Active and Retired Members' Equity 29,305,878
NET POSITION RESTRICTED FOR PENSIONS 29,305,878
TOTAL LIABILITIES AND NET ASSETS 29,311,997
City of DeKalb Firefighters' Pension Fund FOSTER & FOSTER | 22
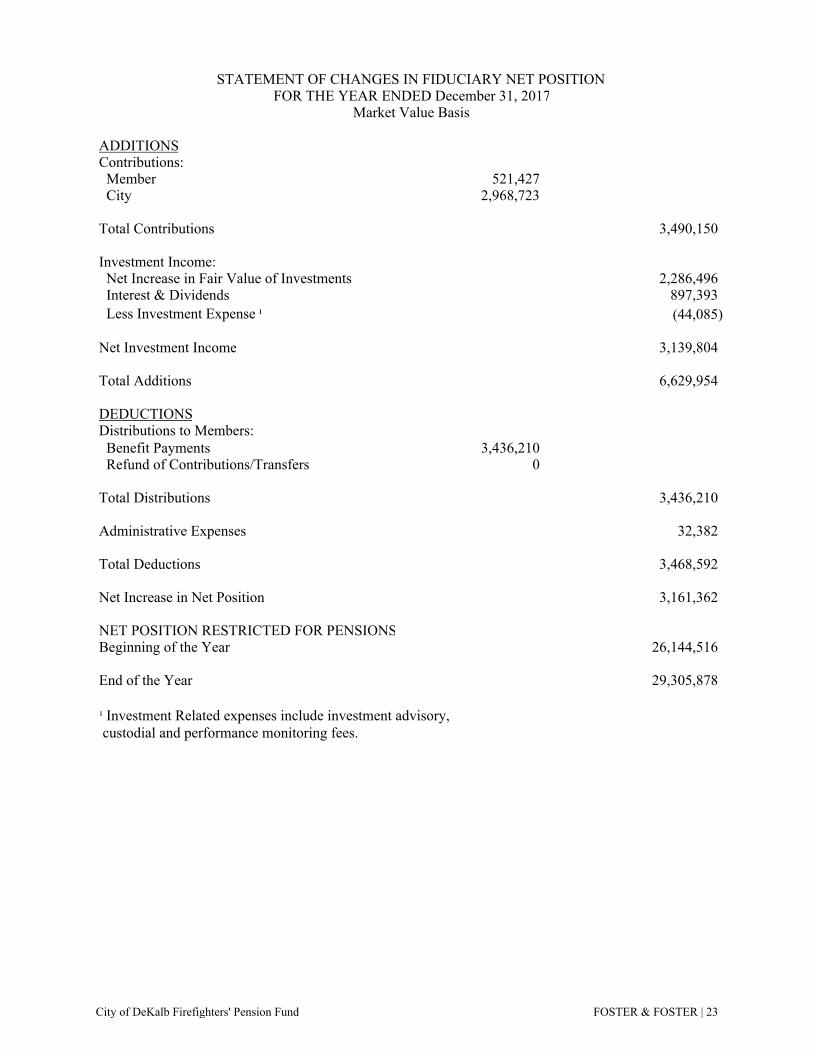
STATEMENT OF CHANGES IN FIDUCIARY NET POSITION FOR THE YEAR ENDED December 31, 2017
Market Value Basis
ADDITIONSContributions: Member 521,427 City 2,968,723
Total Contributions 3,490,150
Investment Income: Net Increase in Fair Value of Investments 2,286,496 Interest & Dividends 897,393 Less Investment Expense ¹ (44,085)
Net Investment Income 3,139,804
Total Additions 6,629,954
DEDUCTIONSDistributions to Members: Benefit Payments 3,436,210 Refund of Contributions/Transfers 0
Total Distributions 3,436,210
Administrative Expenses 32,382
Total Deductions 3,468,592
Net Increase in Net Position 3,161,362
NET POSITION RESTRICTED FOR PENSIONSBeginning of the Year 26,144,516
End of the Year 29,305,878
¹ Investment Related expenses include investment advisory, custodial and performance monitoring fees.
City of DeKalb Firefighters' Pension Fund FOSTER & FOSTER | 23

Plan YearEnding Gain/(Loss) 2018 2019 2020 2021 2022
6/30/2014 1,484,434 148,443 0 0 0 06/30/2015 (1,710,469) (513,141) (171,047) 0 0 06/30/2016 (2,212,531) (1,106,265) (663,759) (221,253) 0 012/31/2016 543,986 326,392 217,594 108,797 0 012/31/2017 1,178,157 942,526 706,894 471,263 235,631 0
Total (202,045) 89,682 358,807 235,631 0
Market Value of Assets, 12/31/2016 26,144,516Contributions Less Benefit Payments & Administrative Expenses 21,558
Expected Investment Earnings ¹ 1,961,647Actual Net Investment Earnings 3,139,8042018 Actuarial Investment Gain/(Loss) 1,178,157
¹ Expected Investment Earnings = 7.50% x (26,144,516 + 0.5 x 21,558)
Market Value of Assets, 12/31/2017 29,305,878(Gains)/Losses Not Yet Recognized 202,045Actuarial Value of Assets, 12/31/2017 29,507,923
(A) 12/31/2016 Actuarial Assets: 27,626,619
(I) Net Investment Income: 1. Interest and Dividends 897,393 2. Realized Gains (Losses) 2,286,496 3. Change in Actuarial Value (1,280,058) 4. Investment Expenses (44,085) Total 1,859,746
(B) 12/31/2017 Actuarial Assets: 29,507,923
Actuarial Asset Rate of Return = (2 x I) / (A + B - I): 6.73%Market Value of Assets Rate of Return: 12.00%
12/31/2017 Limited Actuarial Assets: 29,507,923
Actuarial Gain/(Loss) due to Investment Return (Actuarial Asset Basis) (213,059)
Amounts Not Yet Recognized by Valuation Year
Development of Investment Gain/Loss
Development of Actuarial Value of Assets
ACTUARIAL ASSET VALUATIONDecember 31, 2017
Actuarial Assets for funding purposes are developed by recognizing the total actuarial investment gain or loss for each Plan Year over a five year period. In the first year, 20% of the gain or loss is recognized. In the second year 40%, in the third year 60%, in the fourth year 80%, and in the fifth year 100% of the gain or loss is recognized. The actuarial investment gain or loss is defined as the actual return on investments minus the actuarial assumed investment return. Actuarial Assets shall not be less than 80% nor greater than 120% of the Market Value of Assets.
Gains/(Losses) Not Yet Recognized
City of DeKalb Firefighters' Pension Fund FOSTER & FOSTER | 24

CHANGES IN NET ASSETS AVAILABLE FOR BENEFITS December 31, 2017
Actuarial Asset Basis
INCOMEContributions: Member 521,427 City 2,968,723
Total Contributions 3,490,150
Earnings from Investments Interest & Dividends 897,393 Net Realized Gain (Loss) 2,286,496Change in Actuarial Value (1,280,058)
Total Earnings and Investment Gains 1,903,831
EXPENSES Administrative Expenses: Investment Related ¹ 44,085 Other 32,382
Total Administrative Expenses 76,467
Distributions to Members: Benefit Payments 3,436,210 Refund of Contributions/Transfers 0
Total Distributions 3,436,210
Change in Net Assets for the Year 1,881,304
Net Assets Beginning of the Year 27,626,619
Net Assets End of the Year ² 29,507,923
¹ Investment Related expenses include investment advisory, custodial and performance monitoring fees.² Net Assets may be limited for actuarial consideration.
City of DeKalb Firefighters' Pension Fund FOSTER & FOSTER | 25
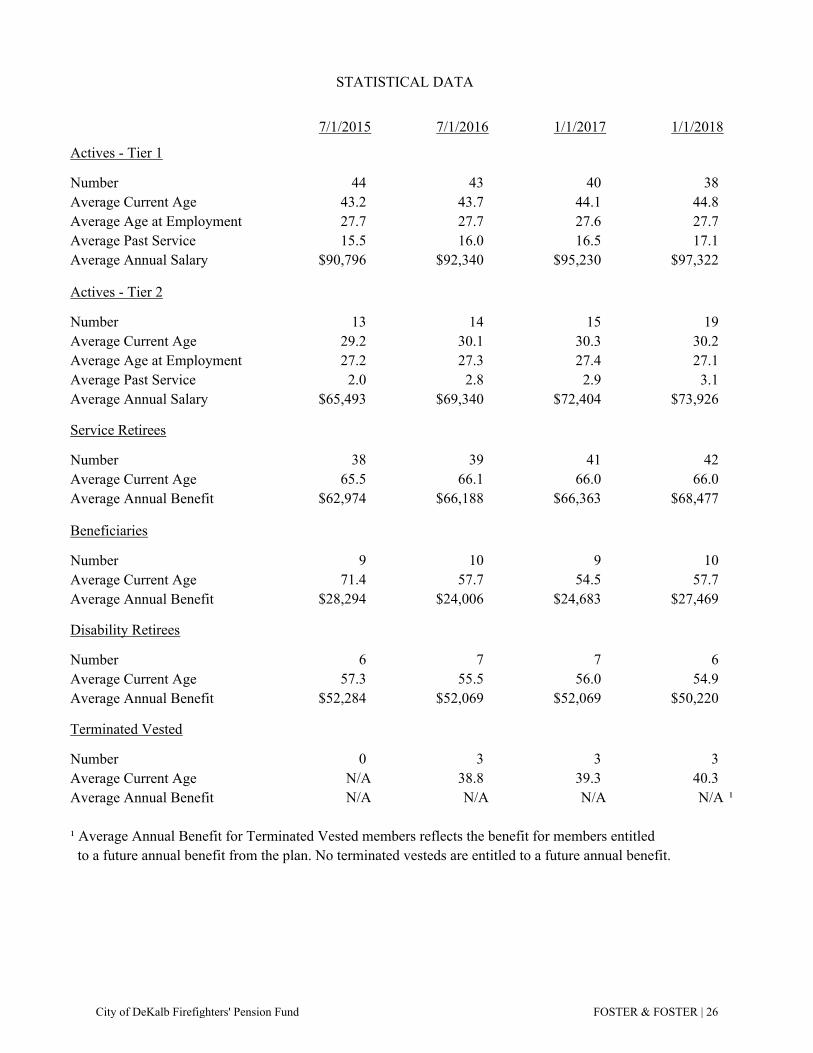
STATISTICAL DATA
7/1/2015 7/1/2016 1/1/2017 1/1/2018
Actives - Tier 1
Number 44 43 40 38Average Current Age 43.2 43.7 44.1 44.8Average Age at Employment 27.7 27.7 27.6 27.7Average Past Service 15.5 16.0 16.5 17.1Average Annual Salary $90,796 $92,340 $95,230 $97,322
Actives - Tier 2
Number 13 14 15 19Average Current Age 29.2 30.1 30.3 30.2Average Age at Employment 27.2 27.3 27.4 27.1Average Past Service 2.0 2.8 2.9 3.1Average Annual Salary $65,493 $69,340 $72,404 $73,926
Service Retirees
Number 38 39 41 42Average Current Age 65.5 66.1 66.0 66.0Average Annual Benefit $62,974 $66,188 $66,363 $68,477
Beneficiaries
Number 9 10 9 10Average Current Age 71.4 57.7 54.5 57.7Average Annual Benefit $28,294 $24,006 $24,683 $27,469
Disability Retirees
Number 6 7 7 6Average Current Age 57.3 55.5 56.0 54.9Average Annual Benefit $52,284 $52,069 $52,069 $50,220
Terminated Vested
Number 0 3 3 3Average Current Age N/A 38.8 39.3 40.3Average Annual Benefit N/A N/A N/A N/A ¹
¹ Average Annual Benefit for Terminated Vested members reflects the benefit for members entitled to a future annual benefit from the plan. No terminated vesteds are entitled to a future annual benefit.
City of DeKalb Firefighters' Pension Fund FOSTER & FOSTER | 26
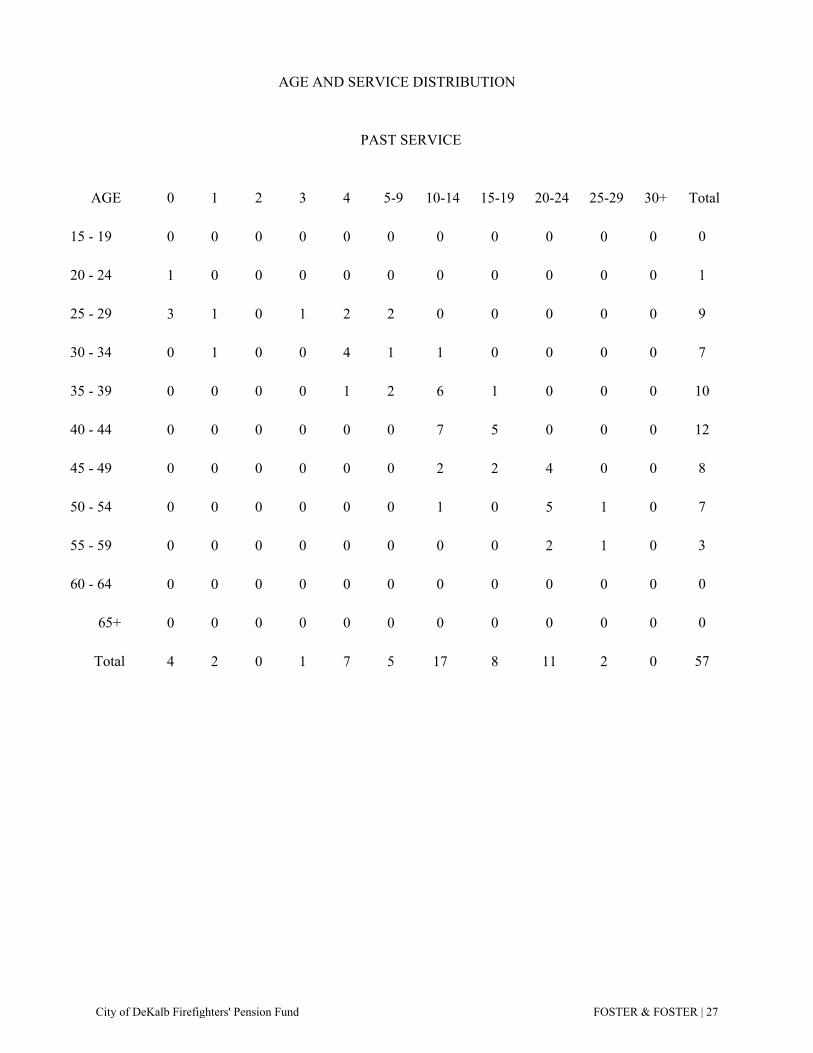
AGE AND SERVICE DISTRIBUTION
PAST SERVICE
AGE 0 1 2 3 4 5-9 10-14 15-19 20-24 25-29 30+ Total
15 - 19 0 0 0 0 0 0 0 0 0 0 0 0
20 - 24 1 0 0 0 0 0 0 0 0 0 0 1
25 - 29 3 1 0 1 2 2 0 0 0 0 0 9
30 - 34 0 1 0 0 4 1 1 0 0 0 0 7
35 - 39 0 0 0 0 1 2 6 1 0 0 0 10
40 - 44 0 0 0 0 0 0 7 5 0 0 0 12
45 - 49 0 0 0 0 0 0 2 2 4 0 0 8
50 - 54 0 0 0 0 0 0 1 0 5 1 0 7
55 - 59 0 0 0 0 0 0 0 0 2 1 0 3
60 - 64 0 0 0 0 0 0 0 0 0 0 0 0
65+ 0 0 0 0 0 0 0 0 0 0 0 0
Total 4 2 0 1 7 5 17 8 11 2 0 57
City of DeKalb Firefighters' Pension Fund FOSTER & FOSTER | 27
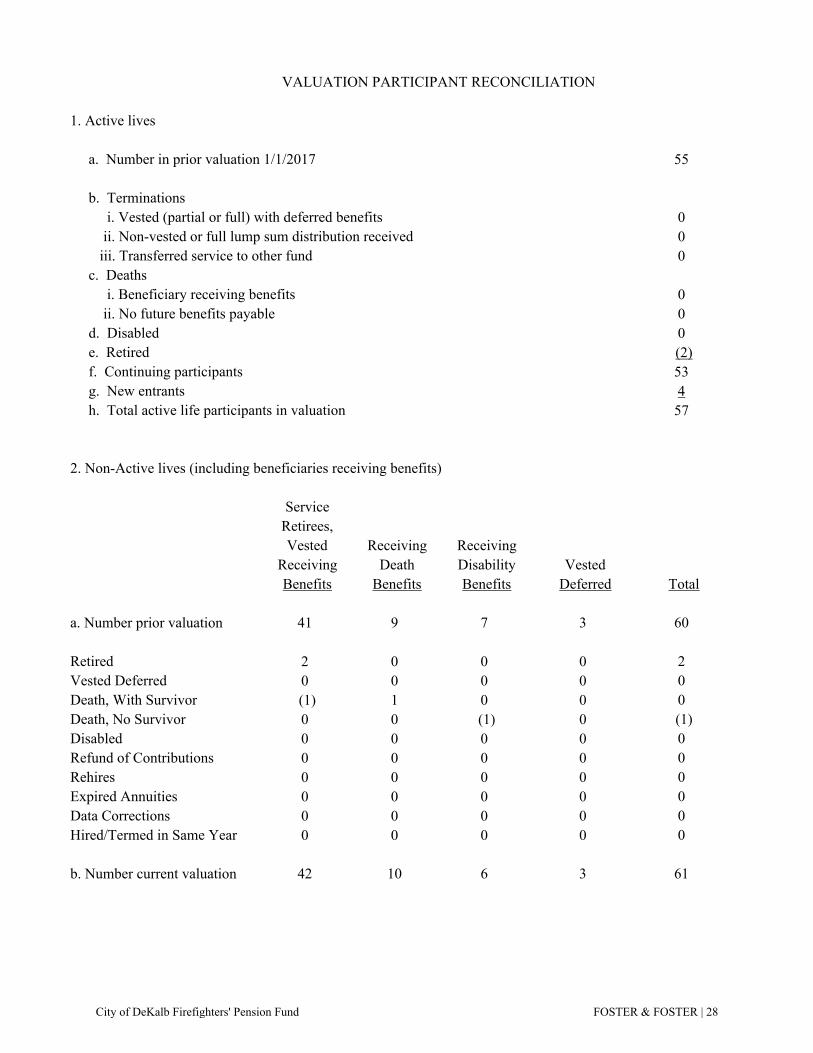
VALUATION PARTICIPANT RECONCILIATION
1. Active lives
a. Number in prior valuation 1/1/2017 55
b. Terminations i. Vested (partial or full) with deferred benefits 0 ii. Non-vested or full lump sum distribution received 0 iii. Transferred service to other fund 0 c. Deaths i. Beneficiary receiving benefits 0 ii. No future benefits payable 0 d. Disabled 0 e. Retired (2) f. Continuing participants 53 g. New entrants 4 h. Total active life participants in valuation 57
2. Non-Active lives (including beneficiaries receiving benefits)
ServiceRetirees,Vested Receiving Receiving
Receiving Death Disability VestedBenefits Benefits Benefits Deferred Total
a. Number prior valuation 41 9 7 3 60
Retired 2 0 0 0 2Vested Deferred 0 0 0 0 0Death, With Survivor (1) 1 0 0 0Death, No Survivor 0 0 (1) 0 (1)Disabled 0 0 0 0 0Refund of Contributions 0 0 0 0 0Rehires 0 0 0 0 0Expired Annuities 0 0 0 0 0Data Corrections 0 0 0 0 0Hired/Termed in Same Year 0 0 0 0 0
b. Number current valuation 42 10 6 3 61
City of DeKalb Firefighters' Pension Fund FOSTER & FOSTER | 28
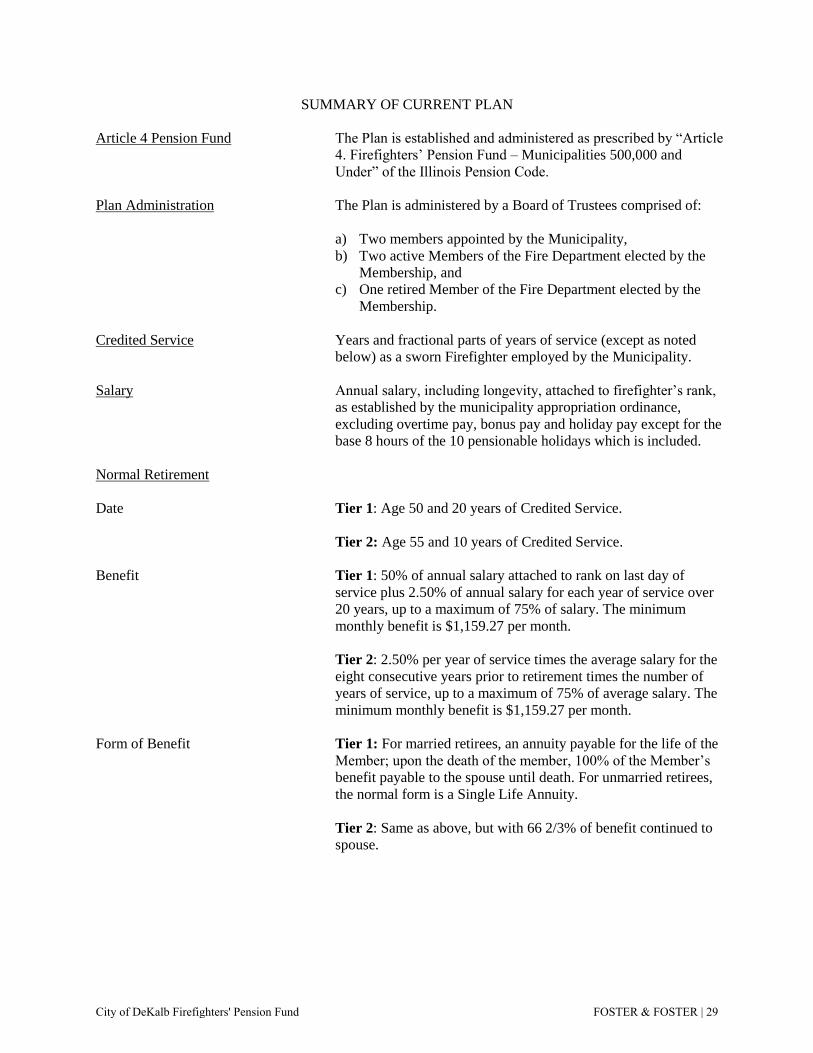
SUMMARY OF CURRENT PLAN
Article 4 Pension Fund The Plan is established and administered as prescribed by “Article
4. Firefighters’ Pension Fund – Municipalities 500,000 and
Under” of the Illinois Pension Code.
Plan Administration The Plan is administered by a Board of Trustees comprised of:
a) Two members appointed by the Municipality,
b) Two active Members of the Fire Department elected by the
Membership, and
c) One retired Member of the Fire Department elected by the
Membership.
Credited Service Years and fractional parts of years of service (except as noted
below) as a sworn Firefighter employed by the Municipality.
Salary Annual salary, including longevity, attached to firefighter’s rank,
as established by the municipality appropriation ordinance,
excluding overtime pay, bonus pay and holiday pay except for the
base 8 hours of the 10 pensionable holidays which is included.
Normal Retirement
Date Tier 1: Age 50 and 20 years of Credited Service.
Tier 2: Age 55 and 10 years of Credited Service.
Benefit Tier 1: 50% of annual salary attached to rank on last day of
service plus 2.50% of annual salary for each year of service over
20 years, up to a maximum of 75% of salary. The minimum
monthly benefit is $1,159.27 per month.
Tier 2: 2.50% per year of service times the average salary for the
eight consecutive years prior to retirement times the number of
years of service, up to a maximum of 75% of average salary. The
minimum monthly benefit is $1,159.27 per month.
Form of Benefit Tier 1: For married retirees, an annuity payable for the life of the
Member; upon the death of the member, 100% of the Member’s
benefit payable to the spouse until death. For unmarried retirees,
the normal form is a Single Life Annuity.
Tier 2: Same as above, but with 66 2/3% of benefit continued to
spouse.
City of DeKalb Firefighters' Pension Fund FOSTER & FOSTER | 29
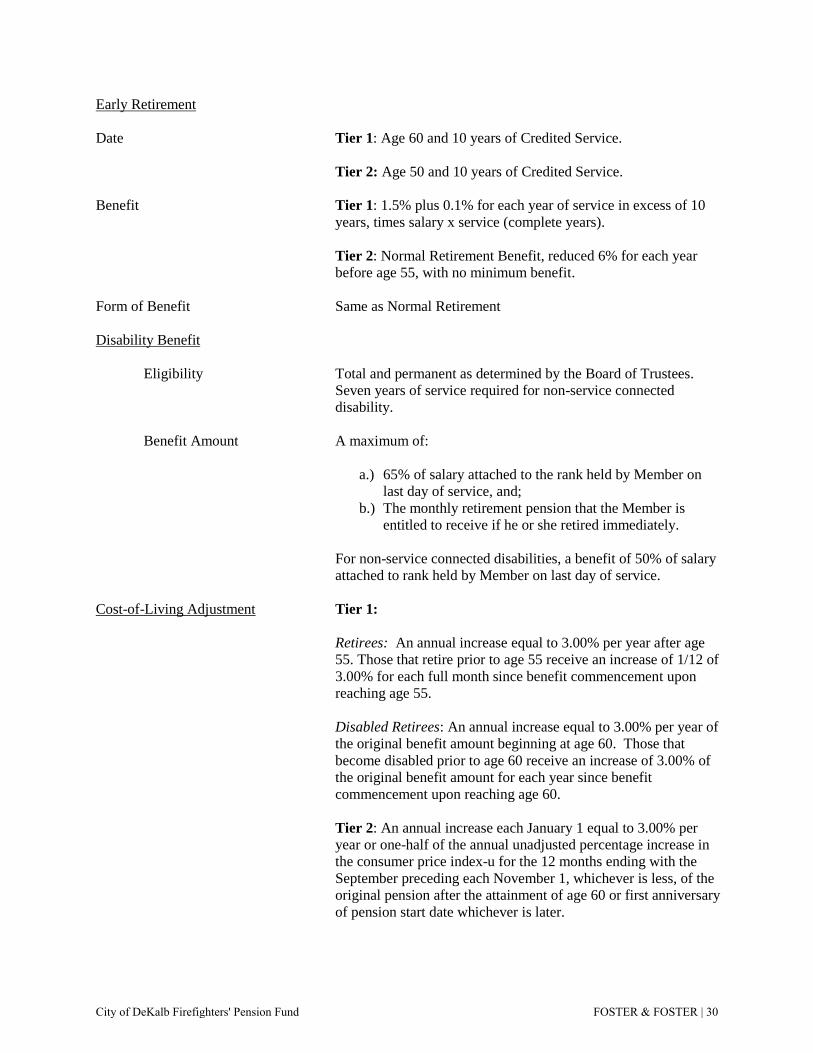
Early Retirement
Date Tier 1: Age 60 and 10 years of Credited Service.
Tier 2: Age 50 and 10 years of Credited Service.
Benefit Tier 1: 1.5% plus 0.1% for each year of service in excess of 10
years, times salary x service (complete years).
Tier 2: Normal Retirement Benefit, reduced 6% for each year
before age 55, with no minimum benefit.
Form of Benefit Same as Normal Retirement
Disability Benefit
Eligibility Total and permanent as determined by the Board of Trustees.
Seven years of service required for non-service connected
disability.
Benefit Amount A maximum of:
a.) 65% of salary attached to the rank held by Member on
last day of service, and;
b.) The monthly retirement pension that the Member is
entitled to receive if he or she retired immediately.
For non-service connected disabilities, a benefit of 50% of salary
attached to rank held by Member on last day of service.
Cost-of-Living Adjustment Tier 1:
Retirees: An annual increase equal to 3.00% per year after age
55. Those that retire prior to age 55 receive an increase of 1/12 of
3.00% for each full month since benefit commencement upon
reaching age 55.
Disabled Retirees: An annual increase equal to 3.00% per year of
the original benefit amount beginning at age 60. Those that
become disabled prior to age 60 receive an increase of 3.00% of
the original benefit amount for each year since benefit
commencement upon reaching age 60.
Tier 2: An annual increase each January 1 equal to 3.00% per
year or one-half of the annual unadjusted percentage increase in
the consumer price index-u for the 12 months ending with the
September preceding each November 1, whichever is less, of the
original pension after the attainment of age 60 or first anniversary
of pension start date whichever is later.
City of DeKalb Firefighters' Pension Fund FOSTER & FOSTER | 30
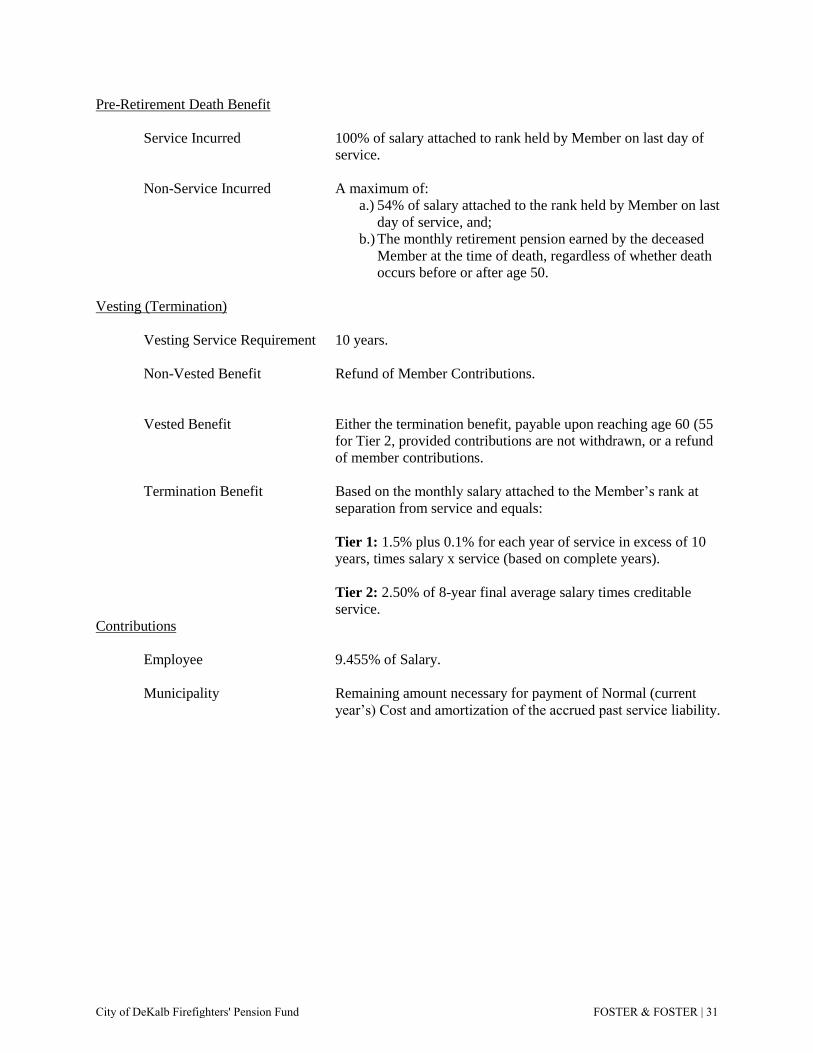
Pre-Retirement Death Benefit
Service Incurred 100% of salary attached to rank held by Member on last day of
service.
Non-Service Incurred A maximum of:
a.) 54% of salary attached to the rank held by Member on last
day of service, and;
b.) The monthly retirement pension earned by the deceased
Member at the time of death, regardless of whether death
occurs before or after age 50.
Vesting (Termination)
Vesting Service Requirement 10 years.
Non-Vested Benefit Refund of Member Contributions.
Vested Benefit Either the termination benefit, payable upon reaching age 60 (55
for Tier 2, provided contributions are not withdrawn, or a refund
of member contributions.
Termination Benefit Based on the monthly salary attached to the Member’s rank at
separation from service and equals:
Tier 1: 1.5% plus 0.1% for each year of service in excess of 10
years, times salary x service (based on complete years).
Tier 2: 2.50% of 8-year final average salary times creditable
service.
Contributions
Employee 9.455% of Salary.
Municipality Remaining amount necessary for payment of Normal (current
year’s) Cost and amortization of the accrued past service liability.
City of DeKalb Firefighters' Pension Fund FOSTER & FOSTER | 31
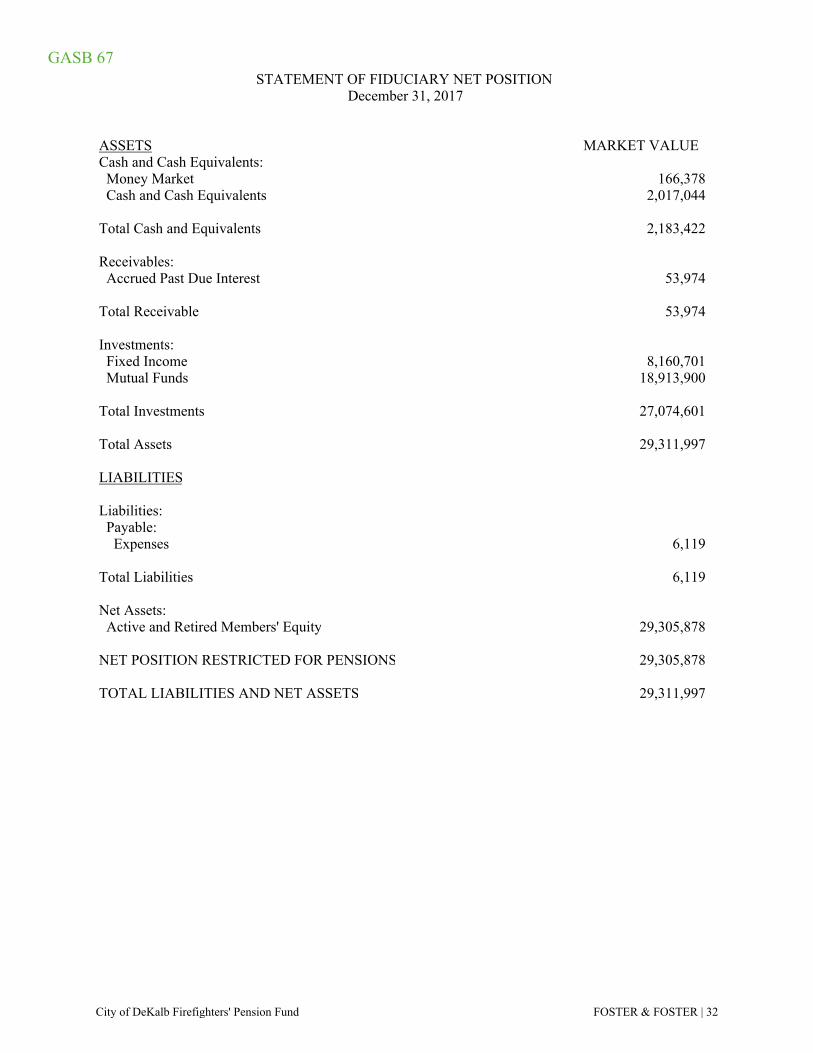
STATEMENT OF FIDUCIARY NET POSITION December 31, 2017
ASSETS MARKET VALUECash and Cash Equivalents: Money Market 166,378 Cash and Cash Equivalents 2,017,044
Total Cash and Equivalents 2,183,422
Receivables: Accrued Past Due Interest 53,974
Total Receivable 53,974
Investments: Fixed Income 8,160,701 Mutual Funds 18,913,900
Total Investments 27,074,601
Total Assets 29,311,997
LIABILITIES
Liabilities: Payable: Expenses 6,119
Total Liabilities 6,119
Net Assets: Active and Retired Members' Equity 29,305,878
NET POSITION RESTRICTED FOR PENSIONS 29,305,878
TOTAL LIABILITIES AND NET ASSETS 29,311,997
GASB 67
City of DeKalb Firefighters' Pension Fund FOSTER & FOSTER | 32
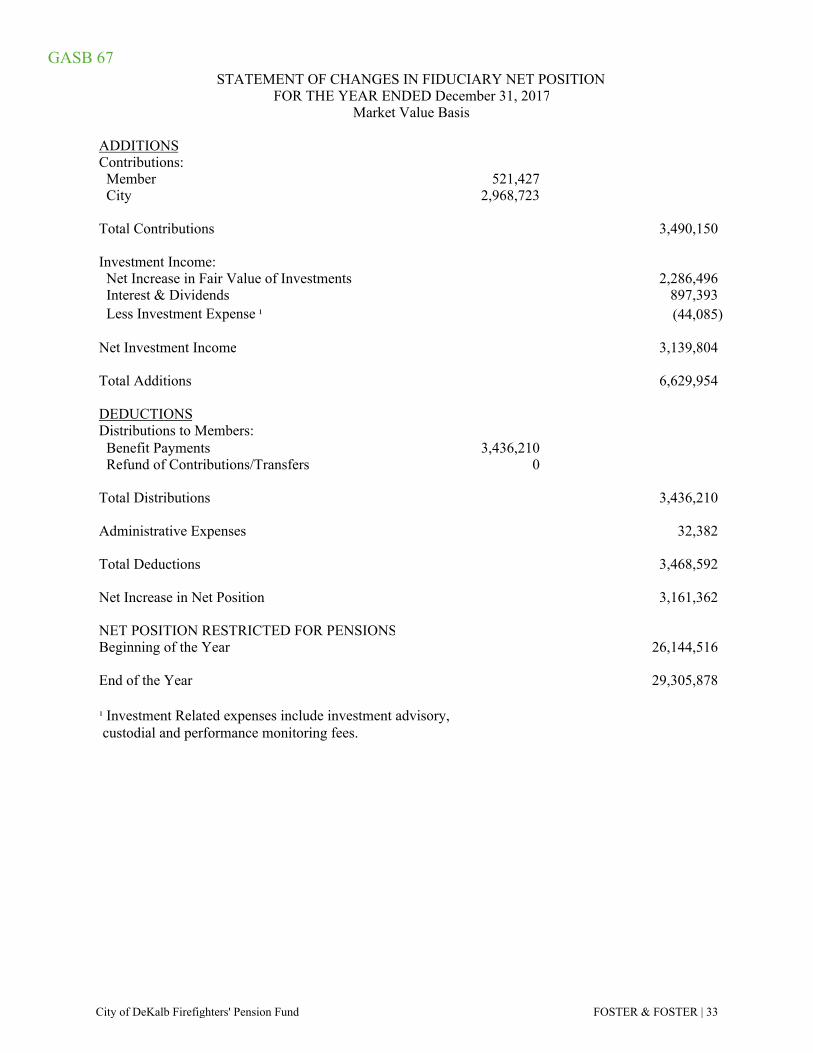
STATEMENT OF CHANGES IN FIDUCIARY NET POSITION FOR THE YEAR ENDED December 31, 2017
Market Value Basis
ADDITIONSContributions: Member 521,427 City 2,968,723
Total Contributions 3,490,150
Investment Income: Net Increase in Fair Value of Investments 2,286,496 Interest & Dividends 897,393 Less Investment Expense ¹ (44,085)
Net Investment Income 3,139,804
Total Additions 6,629,954
DEDUCTIONSDistributions to Members: Benefit Payments 3,436,210 Refund of Contributions/Transfers 0
Total Distributions 3,436,210
Administrative Expenses 32,382
Total Deductions 3,468,592
Net Increase in Net Position 3,161,362
NET POSITION RESTRICTED FOR PENSIONSBeginning of the Year 26,144,516
End of the Year 29,305,878
¹ Investment Related expenses include investment advisory, custodial and performance monitoring fees.
GASB 67
City of DeKalb Firefighters' Pension Fund FOSTER & FOSTER | 33
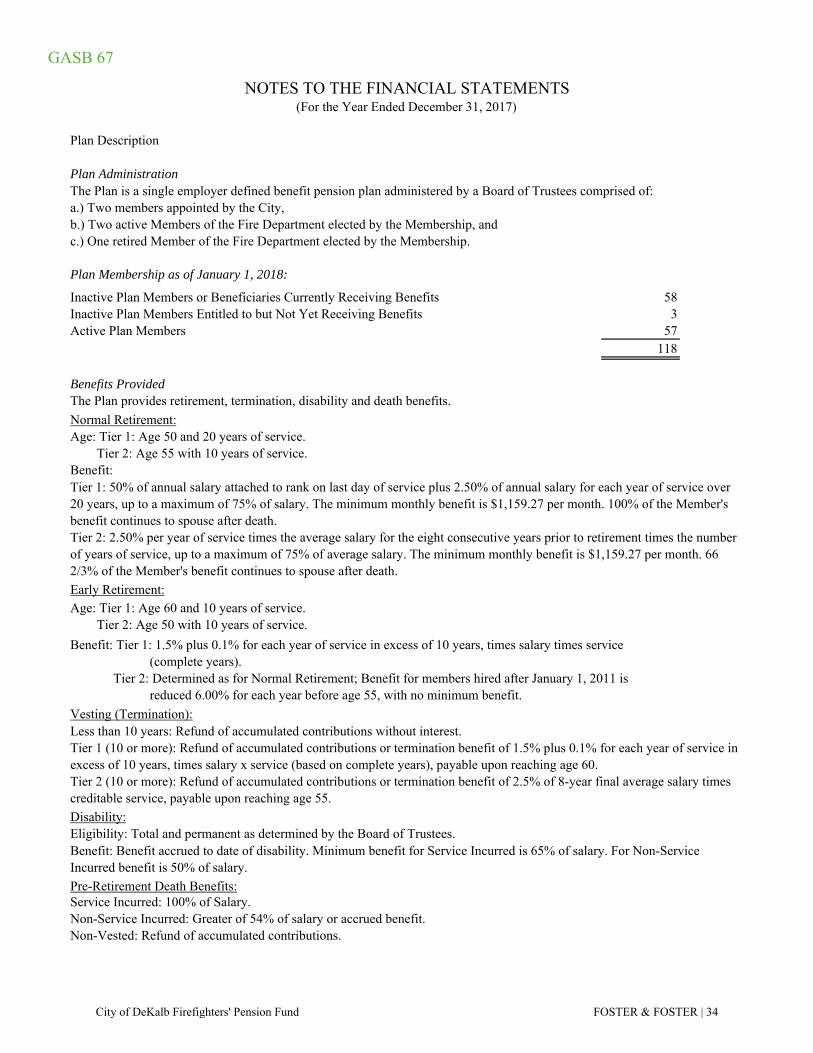
GASB 67
Plan Description
Plan Administration
a.) Two members appointed by the City,b.) Two active Members of the Fire Department elected by the Membership, andc.) One retired Member of the Fire Department elected by the Membership.
Plan Membership as of January 1, 2018:
Inactive Plan Members or Beneficiaries Currently Receiving Benefits 58Inactive Plan Members Entitled to but Not Yet Receiving Benefits 3Active Plan Members 57
118
Benefits Provided
Normal Retirement:
Early Retirement:
NOTES TO THE FINANCIAL STATEMENTS(For the Year Ended December 31, 2017)
The Plan provides retirement, termination, disability and death benefits.
Age: Tier 1: Age 50 and 20 years of service. Tier 2: Age 55 with 10 years of service.
Age: Tier 1: Age 60 and 10 years of service. Tier 2: Age 50 with 10 years of service.
Eligibility: Total and permanent as determined by the Board of Trustees.
Service Incurred: 100% of Salary.Non-Service Incurred: Greater of 54% of salary or accrued benefit.
Less than 10 years: Refund of accumulated contributions without interest.
Disability:
Benefit: Benefit accrued to date of disability. Minimum benefit for Service Incurred is 65% of salary. For Non-Service Incurred benefit is 50% of salary.
Non-Vested: Refund of accumulated contributions.
Tier 1 (10 or more): Refund of accumulated contributions or termination benefit of 1.5% plus 0.1% for each year of service in excess of 10 years, times salary x service (based on complete years), payable upon reaching age 60.
The Plan is a single employer defined benefit pension plan administered by a Board of Trustees comprised of:
Benefit:
Benefit: Tier 1: 1.5% plus 0.1% for each year of service in excess of 10 years, times salary times service(complete years).
Tier 2: Determined as for Normal Retirement; Benefit for members hired after January 1, 2011 isreduced 6.00% for each year before age 55, with no minimum benefit.
Vesting (Termination):
Pre-Retirement Death Benefits:
Tier 1: 50% of annual salary attached to rank on last day of service plus 2.50% of annual salary for each year of service over 20 years, up to a maximum of 75% of salary. The minimum monthly benefit is $1,159.27 per month. 100% of the Member's benefit continues to spouse after death.Tier 2: 2.50% per year of service times the average salary for the eight consecutive years prior to retirement times the number of years of service, up to a maximum of 75% of average salary. The minimum monthly benefit is $1,159.27 per month. 66 2/3% of the Member's benefit continues to spouse after death.
Tier 2 (10 or more): Refund of accumulated contributions or termination benefit of 2.5% of 8-year final average salary times creditable service, payable upon reaching age 55.
City of DeKalb Firefighters' Pension Fund FOSTER & FOSTER | 34
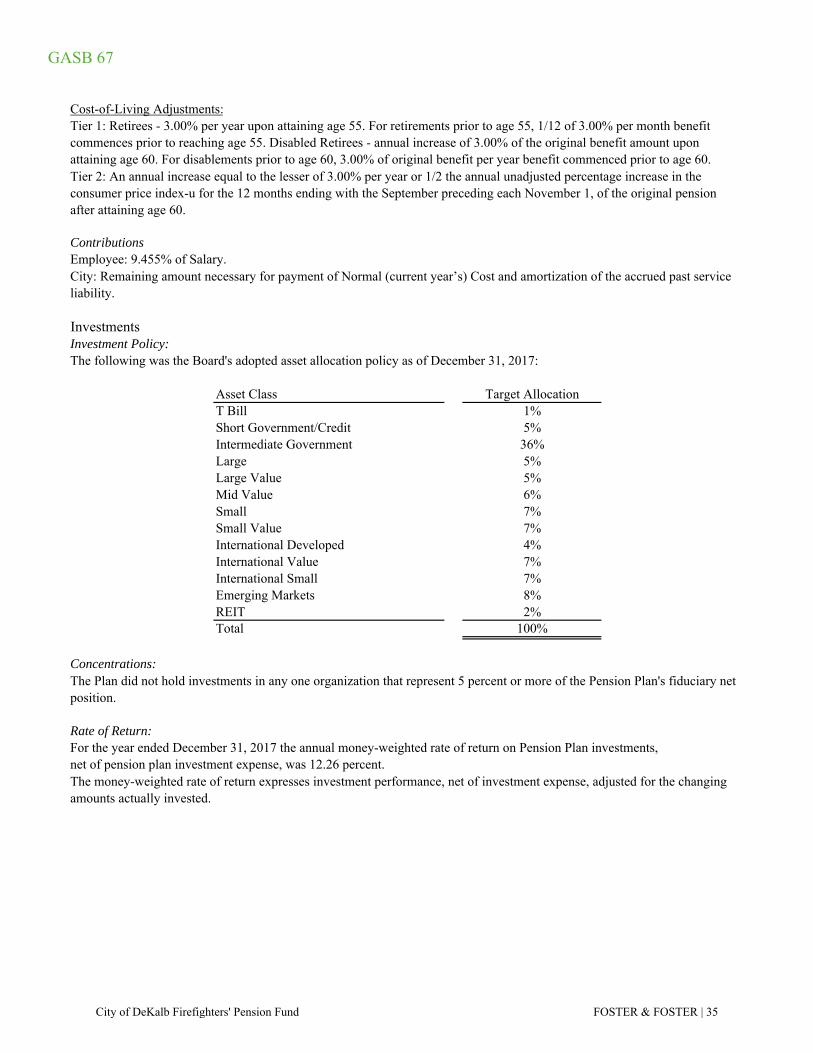
GASB 67
ContributionsEmployee: 9.455% of Salary.
InvestmentsInvestment Policy:The following was the Board's adopted asset allocation policy as of December 31, 2017:
Asset Class Target AllocationT Bill 1%Short Government/Credit 5%Intermediate Government 36%Large 5%Large Value 5%Mid Value 6%Small 7%Small Value 7%International Developed 4%International Value 7%International Small 7%Emerging Markets 8%REIT 2%Total 100%
Concentrations:
Rate of Return:For the year ended December 31, 2017 the annual money-weighted rate of return on Pension Plan investments,net of pension plan investment expense, was 12.26 percent.
The Plan did not hold investments in any one organization that represent 5 percent or more of the Pension Plan's fiduciary net position.
Cost-of-Living Adjustments:Tier 1: Retirees - 3.00% per year upon attaining age 55. For retirements prior to age 55, 1/12 of 3.00% per month benefit commences prior to reaching age 55. Disabled Retirees - annual increase of 3.00% of the original benefit amount upon attaining age 60. For disablements prior to age 60, 3.00% of original benefit per year benefit commenced prior to age 60.
The money-weighted rate of return expresses investment performance, net of investment expense, adjusted for the changing amounts actually invested.
Tier 2: An annual increase equal to the lesser of 3.00% per year or 1/2 the annual unadjusted percentage increase in the consumer price index-u for the 12 months ending with the September preceding each November 1, of the original pension after attaining age 60.
City: Remaining amount necessary for payment of Normal (current year’s) Cost and amortization of the accrued past service liability.
City of DeKalb Firefighters' Pension Fund FOSTER & FOSTER | 35
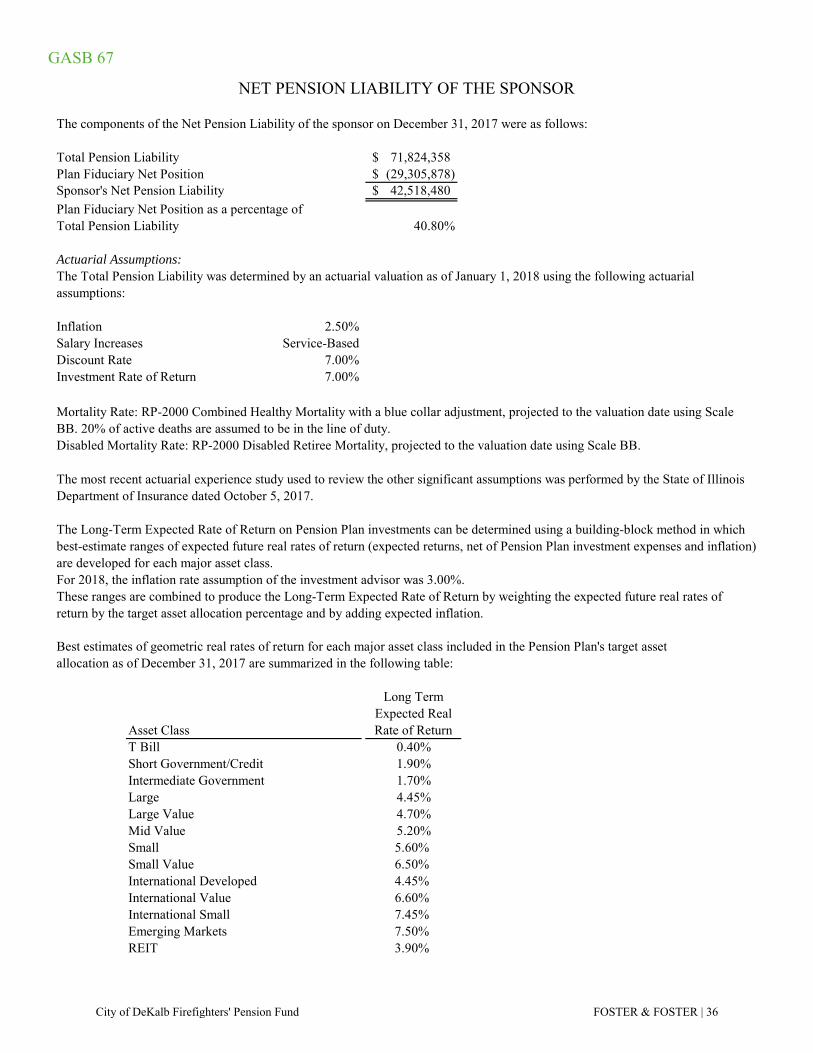
GASB 67
The components of the Net Pension Liability of the sponsor on December 31, 2017 were as follows:
Total Pension Liability 71,824,358$ Plan Fiduciary Net Position (29,305,878)$ Sponsor's Net Pension Liability 42,518,480$
Plan Fiduciary Net Position as a percentage ofTotal Pension Liability 40.80%
Actuarial Assumptions:
Inflation 2.50%Salary Increases Service-BasedDiscount Rate 7.00%Investment Rate of Return 7.00%
Best estimates of geometric real rates of return for each major asset class included in the Pension Plan's target assetallocation as of December 31, 2017 are summarized in the following table:
T BillShort Government/CreditIntermediate GovernmentLargeLarge ValueMid ValueSmall 5.60%Small Value 6.50%International Developed 4.45%International Value 6.60%International Small 7.45%Emerging Markets 7.50%REIT 3.90%
NET PENSION LIABILITY OF THE SPONSOR
Mortality Rate: RP-2000 Combined Healthy Mortality with a blue collar adjustment, projected to the valuation date using Scale BB. 20% of active deaths are assumed to be in the line of duty.
The most recent actuarial experience study used to review the other significant assumptions was performed by the State of Illinois Department of Insurance dated October 5, 2017.
The Long-Term Expected Rate of Return on Pension Plan investments can be determined using a building-block method in which best-estimate ranges of expected future real rates of return (expected returns, net of Pension Plan investment expenses and inflation) are developed for each major asset class.For 2018, the inflation rate assumption of the investment advisor was 3.00%.
1.70%4.45%4.70%5.20%
The Total Pension Liability was determined by an actuarial valuation as of January 1, 2018 using the following actuarial assumptions:
Disabled Mortality Rate: RP-2000 Disabled Retiree Mortality, projected to the valuation date using Scale BB.
These ranges are combined to produce the Long-Term Expected Rate of Return by weighting the expected future real rates of return by the target asset allocation percentage and by adding expected inflation.
Long Term Expected Real Rate of Return
0.40%1.90%
Asset Class
City of DeKalb Firefighters' Pension Fund FOSTER & FOSTER | 36
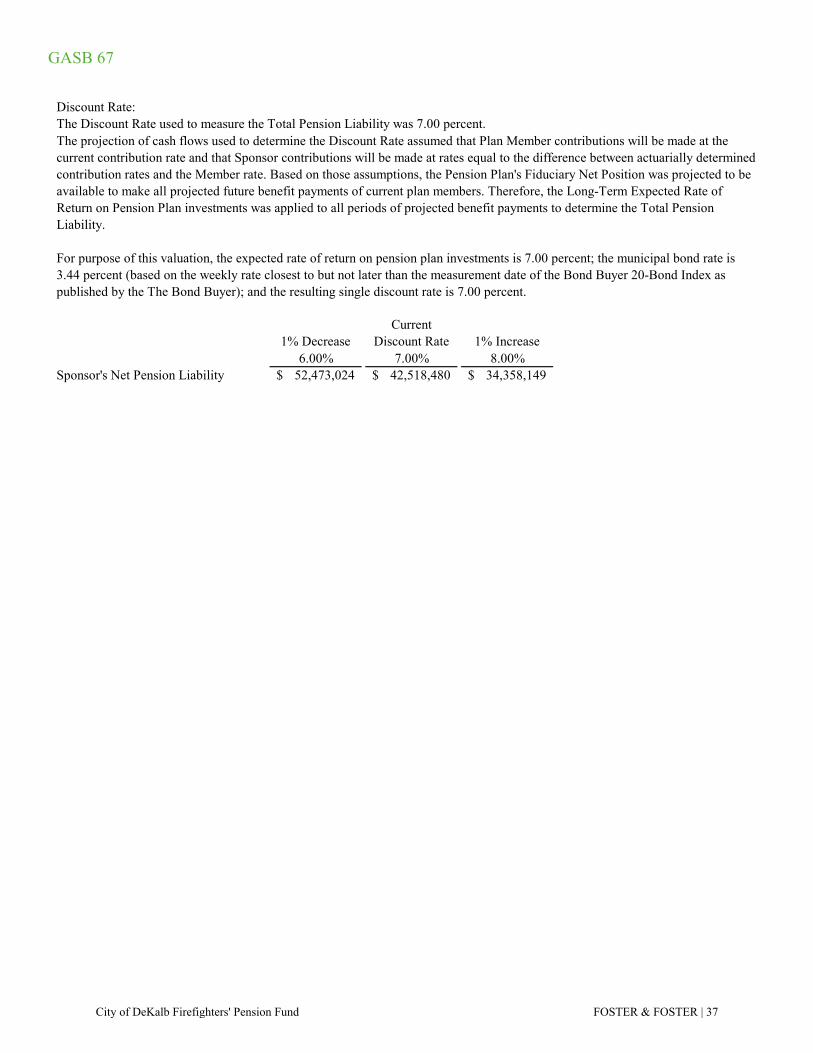
GASB 67
Discount Rate:The Discount Rate used to measure the Total Pension Liability was 7.00 percent.
1% Decrease Current
Discount Rate 1% Increase 6.00% 7.00% 8.00%
Sponsor's Net Pension Liability 52,473,024$ 42,518,480$ 34,358,149$
The projection of cash flows used to determine the Discount Rate assumed that Plan Member contributions will be made at the current contribution rate and that Sponsor contributions will be made at rates equal to the difference between actuarially determined contribution rates and the Member rate. Based on those assumptions, the Pension Plan's Fiduciary Net Position was projected to be available to make all projected future benefit payments of current plan members. Therefore, the Long-Term Expected Rate of Return on Pension Plan investments was applied to all periods of projected benefit payments to determine the Total Pension Liability.
For purpose of this valuation, the expected rate of return on pension plan investments is 7.00 percent; the municipal bond rate is 3.44 percent (based on the weekly rate closest to but not later than the measurement date of the Bond Buyer 20-Bond Index as published by the The Bond Buyer); and the resulting single discount rate is 7.00 percent.
City of DeKalb Firefighters' Pension Fund FOSTER & FOSTER | 37
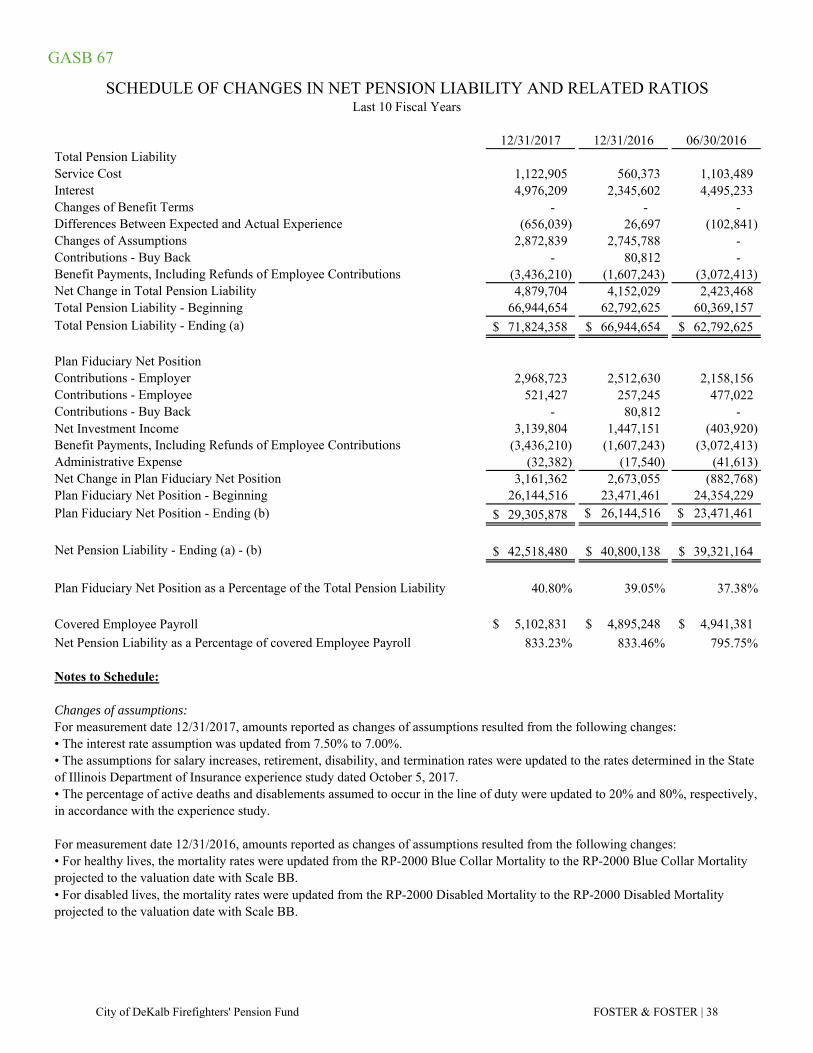
GASB 67
12/31/2017 12/31/2016 06/30/2016Total Pension LiabilityService Cost 1,122,905 560,373 1,103,489 Interest 4,976,209 2,345,602 4,495,233 Changes of Benefit Terms - - - Differences Between Expected and Actual Experience (656,039) 26,697 (102,841) Changes of Assumptions 2,872,839 2,745,788 - Contributions - Buy Back - 80,812 - Benefit Payments, Including Refunds of Employee Contributions (3,436,210) (1,607,243) (3,072,413) Net Change in Total Pension Liability 4,879,704 4,152,029 2,423,468 Total Pension Liability - Beginning 66,944,654 62,792,625 60,369,157 Total Pension Liability - Ending (a) 71,824,358$ 66,944,654$ 62,792,625$
Plan Fiduciary Net PositionContributions - Employer 2,968,723 2,512,630 2,158,156 Contributions - Employee 521,427 257,245 477,022 Contributions - Buy Back - 80,812 - Net Investment Income 3,139,804 1,447,151 (403,920) Benefit Payments, Including Refunds of Employee Contributions (3,436,210) (1,607,243) (3,072,413) Administrative Expense (32,382) (17,540) (41,613) Net Change in Plan Fiduciary Net Position 3,161,362 2,673,055 (882,768) Plan Fiduciary Net Position - Beginning 26,144,516 23,471,461 24,354,229 Plan Fiduciary Net Position - Ending (b) 29,305,878$ $ 26,144,516 $ 23,471,461
Net Pension Liability - Ending (a) - (b) 42,518,480$ 40,800,138$ 39,321,164$
Plan Fiduciary Net Position as a Percentage of the Total Pension Liability 40.80% 39.05% 37.38%
Covered Employee Payroll 5,102,831$ 4,895,248$ 4,941,381$
Net Pension Liability as a Percentage of covered Employee Payroll 833.23% 833.46% 795.75%
Notes to Schedule:
Changes of assumptions:For measurement date 12/31/2017, amounts reported as changes of assumptions resulted from the following changes:• The interest rate assumption was updated from 7.50% to 7.00%.
For measurement date 12/31/2016, amounts reported as changes of assumptions resulted from the following changes:
• For disabled lives, the mortality rates were updated from the RP-2000 Disabled Mortality to the RP-2000 Disabled Mortality projected to the valuation date with Scale BB.
SCHEDULE OF CHANGES IN NET PENSION LIABILITY AND RELATED RATIOSLast 10 Fiscal Years
• For healthy lives, the mortality rates were updated from the RP-2000 Blue Collar Mortality to the RP-2000 Blue Collar Mortality projected to the valuation date with Scale BB.
• The assumptions for salary increases, retirement, disability, and termination rates were updated to the rates determined in the State of Illinois Department of Insurance experience study dated October 5, 2017.• The percentage of active deaths and disablements assumed to occur in the line of duty were updated to 20% and 80%, respectively, in accordance with the experience study.
City of DeKalb Firefighters' Pension Fund FOSTER & FOSTER | 38
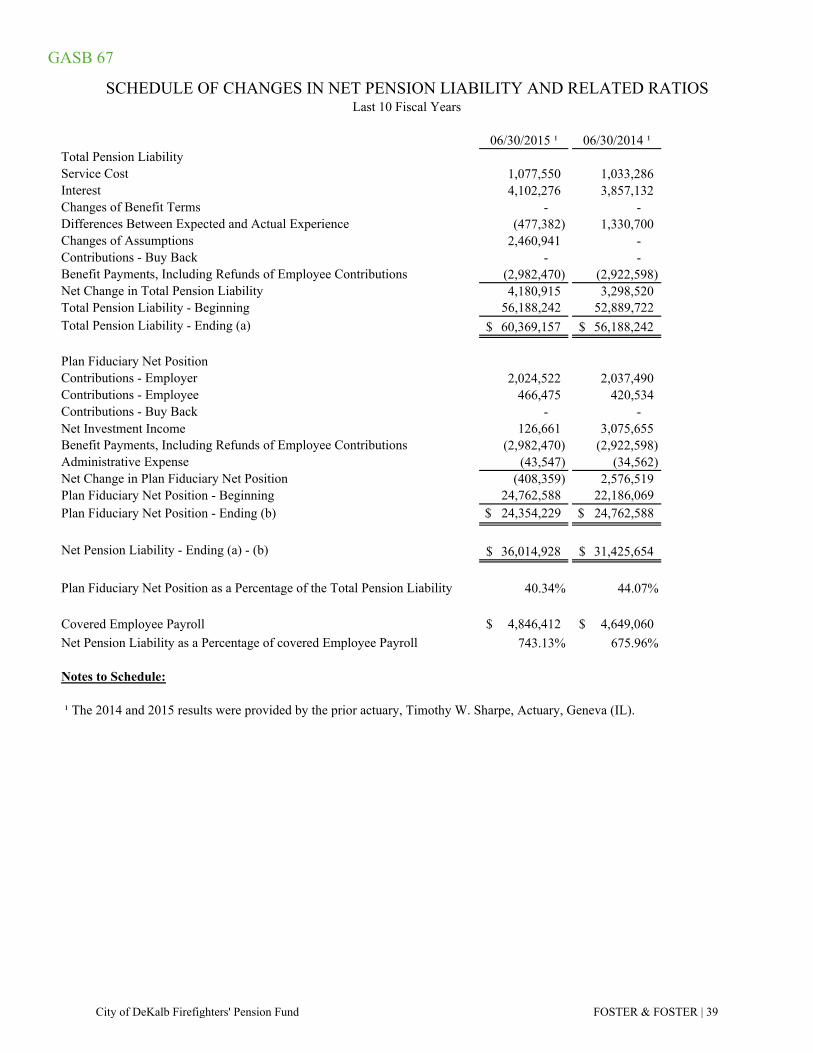
GASB 67
06/30/2015 ¹ 06/30/2014 ¹Total Pension LiabilityService Cost 1,077,550 1,033,286 Interest 4,102,276 3,857,132 Changes of Benefit Terms - - Differences Between Expected and Actual Experience (477,382) 1,330,700 Changes of Assumptions 2,460,941 - Contributions - Buy Back - - Benefit Payments, Including Refunds of Employee Contributions (2,982,470) (2,922,598) Net Change in Total Pension Liability 4,180,915 3,298,520 Total Pension Liability - Beginning 56,188,242 52,889,722 Total Pension Liability - Ending (a) 60,369,157$ 56,188,242$
Plan Fiduciary Net PositionContributions - Employer 2,024,522 2,037,490 Contributions - Employee 466,475 420,534 Contributions - Buy Back - - Net Investment Income 126,661 3,075,655 Benefit Payments, Including Refunds of Employee Contributions (2,982,470) (2,922,598) Administrative Expense (43,547) (34,562) Net Change in Plan Fiduciary Net Position (408,359) 2,576,519 Plan Fiduciary Net Position - Beginning 24,762,588 22,186,069 Plan Fiduciary Net Position - Ending (b) $ 24,354,229 $ 24,762,588
Net Pension Liability - Ending (a) - (b) 36,014,928$ 31,425,654$
Plan Fiduciary Net Position as a Percentage of the Total Pension Liability 40.34% 44.07%
Covered Employee Payroll 4,846,412$ 4,649,060$
Net Pension Liability as a Percentage of covered Employee Payroll 743.13% 675.96%
Notes to Schedule:
¹ The 2014 and 2015 results were provided by the prior actuary, Timothy W. Sharpe, Actuary, Geneva (IL).
SCHEDULE OF CHANGES IN NET PENSION LIABILITY AND RELATED RATIOSLast 10 Fiscal Years
City of DeKalb Firefighters' Pension Fund FOSTER & FOSTER | 39
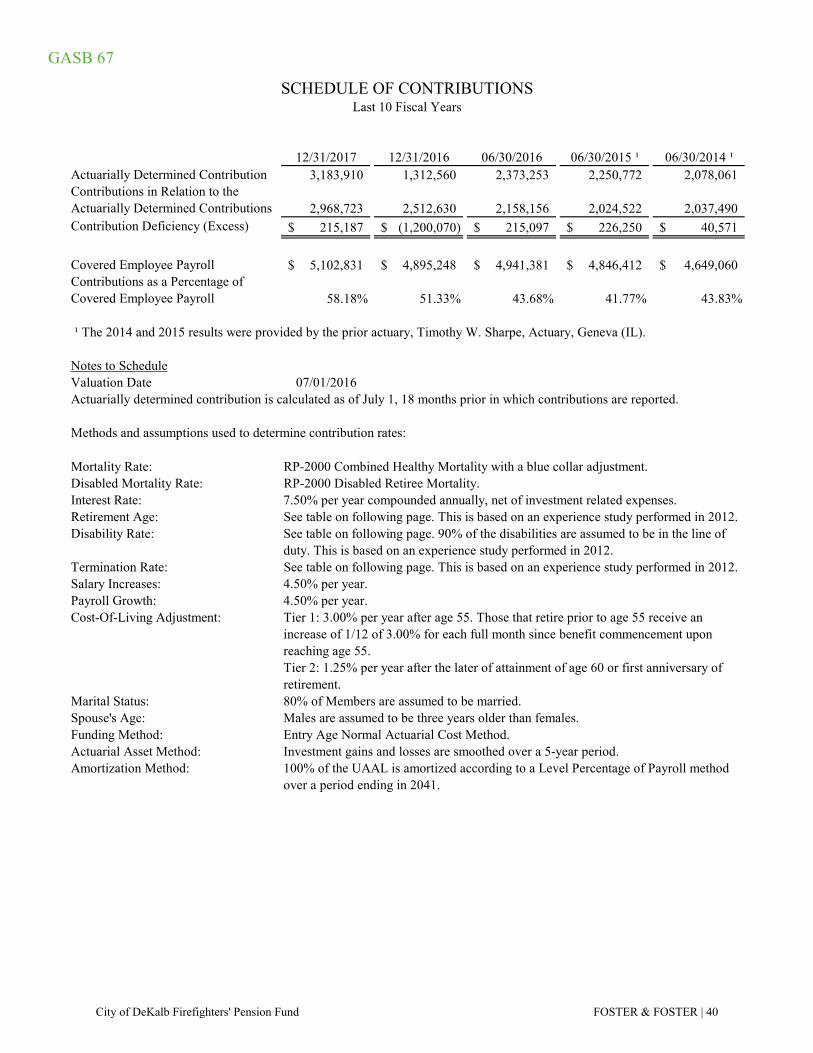
GASB 67
12/31/2017 12/31/2016 06/30/2016 06/30/2015 ¹ 06/30/2014 ¹Actuarially Determined Contribution 3,183,910 1,312,560 2,373,253 2,250,772 2,078,061 Contributions in Relation to the Actuarially Determined Contributions 2,968,723 2,512,630 2,158,156 2,024,522 2,037,490 Contribution Deficiency (Excess) 215,187$ (1,200,070)$ 215,097$ 226,250$ 40,571$
Covered Employee Payroll 5,102,831$ 4,895,248$ 4,941,381$ 4,846,412$ 4,649,060$ Contributions as a Percentage of Covered Employee Payroll 58.18% 51.33% 43.68% 41.77% 43.83%
¹ The 2014 and 2015 results were provided by the prior actuary, Timothy W. Sharpe, Actuary, Geneva (IL).
Notes to ScheduleValuation Date 07/01/2016
Methods and assumptions used to determine contribution rates:
Mortality Rate: RP-2000 Combined Healthy Mortality with a blue collar adjustment.Disabled Mortality Rate: RP-2000 Disabled Retiree Mortality.Interest Rate: 7.50% per year compounded annually, net of investment related expenses.Retirement Age: See table on following page. This is based on an experience study performed in 2012.Disability Rate:
Termination Rate: See table on following page. This is based on an experience study performed in 2012.Salary Increases:Payroll Growth:Cost-Of-Living Adjustment:
Marital Status:Spouse's Age:Funding Method:Actuarial Asset Method:Amortization Method:
Entry Age Normal Actuarial Cost Method.Investment gains and losses are smoothed over a 5-year period.100% of the UAAL is amortized according to a Level Percentage of Payroll method over a period ending in 2041.
4.50% per year.Tier 1: 3.00% per year after age 55. Those that retire prior to age 55 receive an increase of 1/12 of 3.00% for each full month since benefit commencement upon reaching age 55.Tier 2: 1.25% per year after the later of attainment of age 60 or first anniversary of retirement.80% of Members are assumed to be married.Males are assumed to be three years older than females.
SCHEDULE OF CONTRIBUTIONSLast 10 Fiscal Years
Actuarially determined contribution is calculated as of July 1, 18 months prior in which contributions are reported.
See table on following page. 90% of the disabilities are assumed to be in the line of duty. This is based on an experience study performed in 2012.
4.50% per year.
City of DeKalb Firefighters' Pension Fund FOSTER & FOSTER | 40
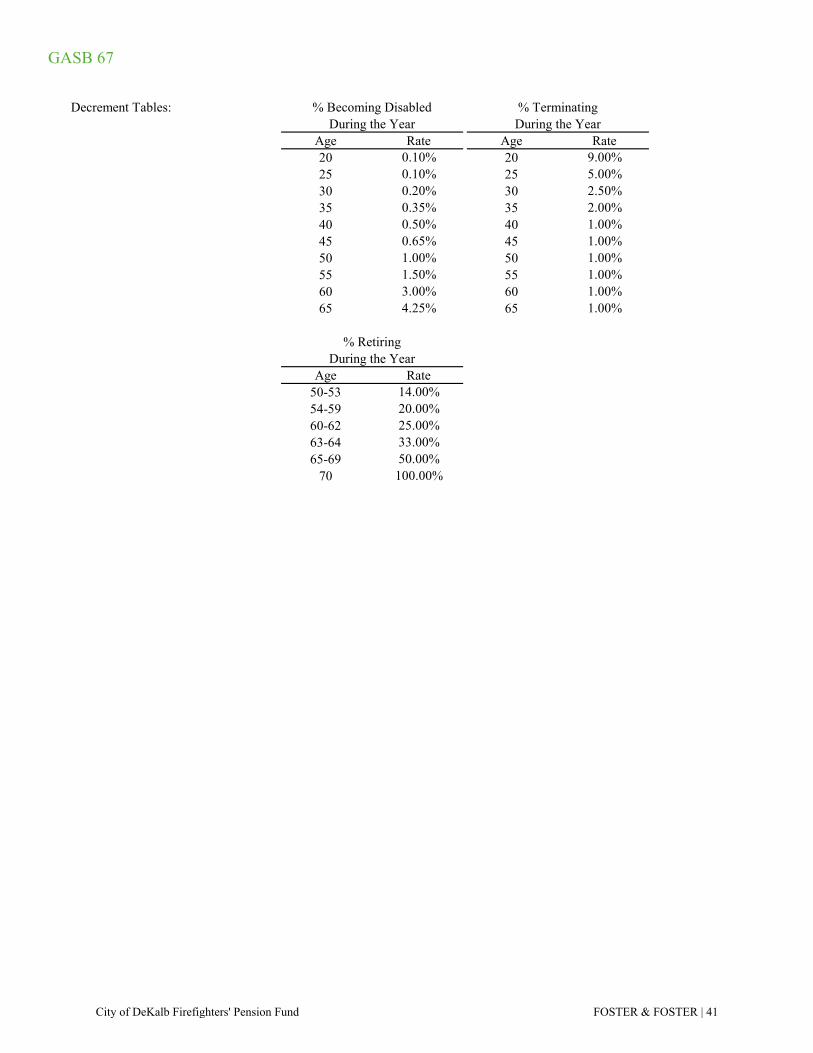
GASB 67
Decrement Tables:
Age Rate Age Rate20 0.10% 20 9.00%25 0.10% 25 5.00%30 0.20% 30 2.50%35 0.35% 35 2.00%40 0.50% 40 1.00%45 0.65% 45 1.00%50 1.00% 50 1.00%55 1.50% 55 1.00%60 3.00% 60 1.00%65 4.25% 65 1.00%
Age Rate50-53 14.00%54-59 20.00%60-62 25.00%63-64 33.00%65-69 50.00%
70 100.00%
During the Year
% Becoming DisabledDuring the Year During the Year
% Terminating
% Retiring
City of DeKalb Firefighters' Pension Fund FOSTER & FOSTER | 41
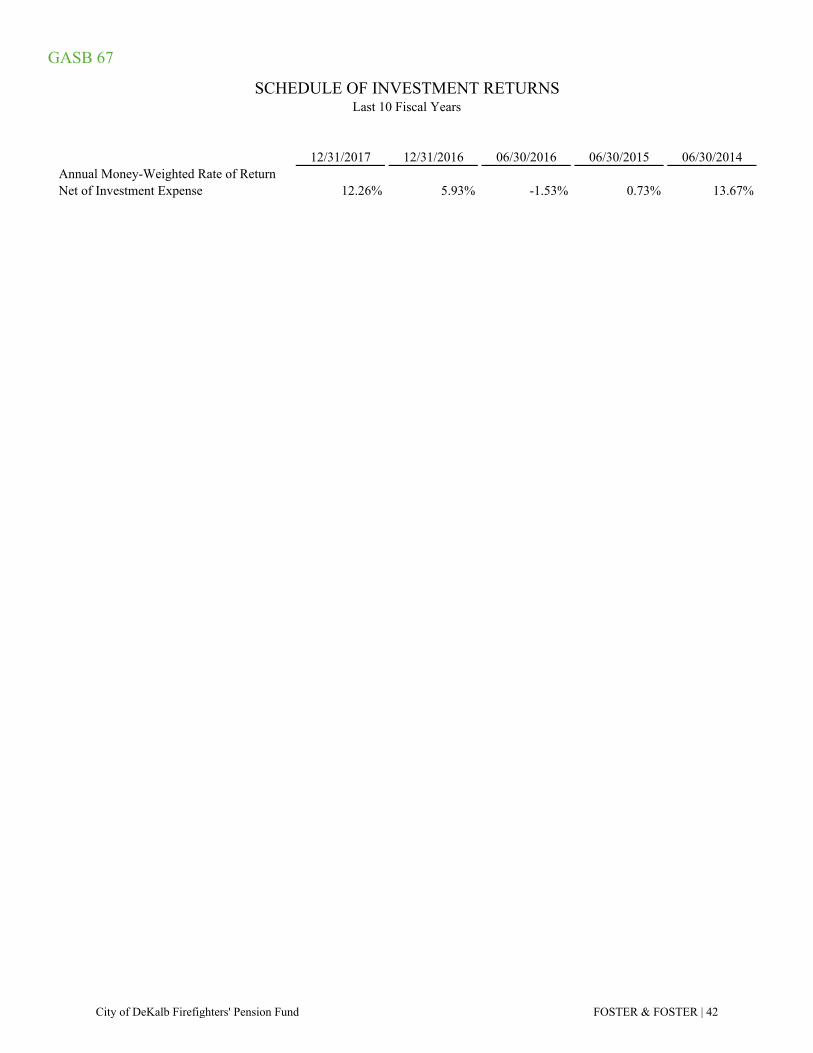
GASB 67
12/31/2017 12/31/2016 06/30/2016 06/30/2015 06/30/2014Annual Money-Weighted Rate of ReturnNet of Investment Expense 12.26% 5.93% -1.53% 0.73% 13.67%
SCHEDULE OF INVESTMENT RETURNSLast 10 Fiscal Years
City of DeKalb Firefighters' Pension Fund FOSTER & FOSTER | 42
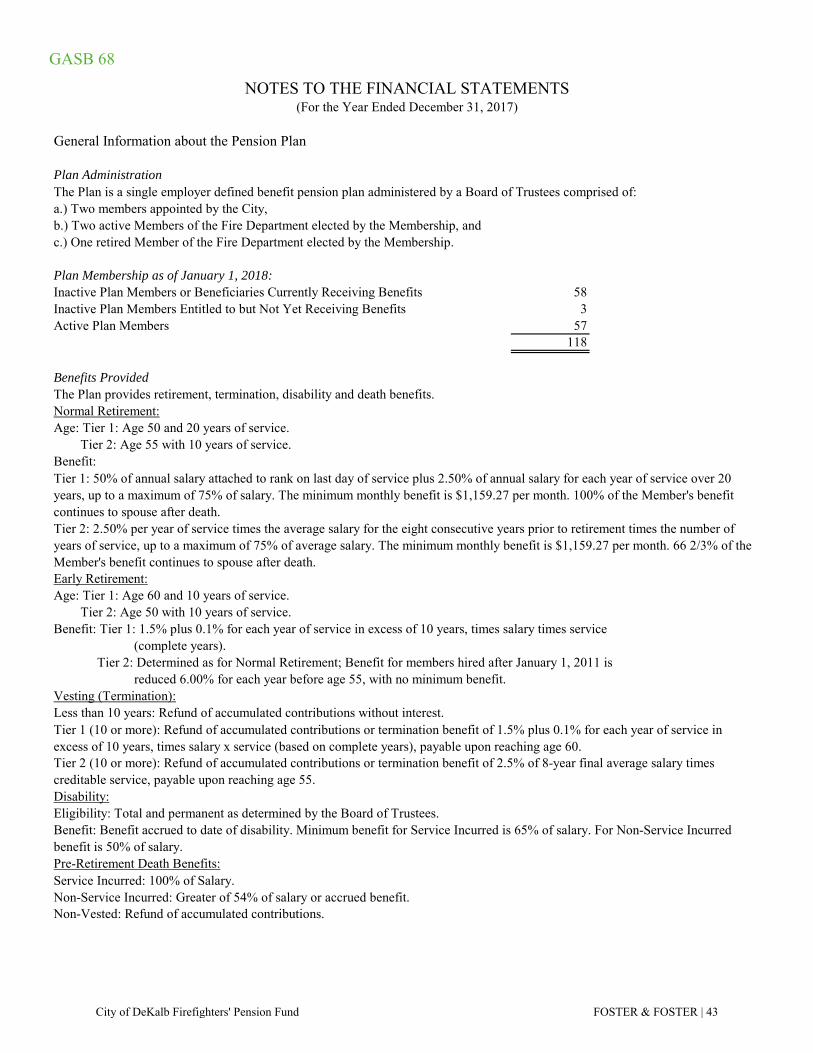
GASB 68
General Information about the Pension Plan
Plan Administration The Plan is a single employer defined benefit pension plan administered by a Board of Trustees comprised of:
b.) Two active Members of the Fire Department elected by the Membership, andc.) One retired Member of the Fire Department elected by the Membership.
Plan Membership as of January 1, 2018:Inactive Plan Members or Beneficiaries Currently Receiving Benefits 58Inactive Plan Members Entitled to but Not Yet Receiving Benefits 3Active Plan Members 57
118
Benefits Provided
Normal Retirement:
Early Retirement:
Non-Vested: Refund of accumulated contributions.
Disability:
Less than 10 years: Refund of accumulated contributions without interest.
NOTES TO THE FINANCIAL STATEMENTS(For the Year Ended December 31, 2017)
The Plan provides retirement, termination, disability and death benefits.
Age: Tier 1: Age 50 and 20 years of service. Tier 2: Age 55 with 10 years of service.Benefit:Tier 1: 50% of annual salary attached to rank on last day of service plus 2.50% of annual salary for each year of service over 20 years, up to a maximum of 75% of salary. The minimum monthly benefit is $1,159.27 per month. 100% of the Member's benefit continues to spouse after death.Tier 2: 2.50% per year of service times the average salary for the eight consecutive years prior to retirement times the number of years of service, up to a maximum of 75% of average salary. The minimum monthly benefit is $1,159.27 per month. 66 2/3% of the Member's benefit continues to spouse after death.
Tier 2 (10 or more): Refund of accumulated contributions or termination benefit of 2.5% of 8-year final average salary times creditable service, payable upon reaching age 55.
Vesting (Termination):
Benefit: Tier 1: 1.5% plus 0.1% for each year of service in excess of 10 years, times salary times service (complete years). Tier 2: Determined as for Normal Retirement; Benefit for members hired after January 1, 2011 is reduced 6.00% for each year before age 55, with no minimum benefit.
Age: Tier 1: Age 60 and 10 years of service. Tier 2: Age 50 with 10 years of service.
Tier 1 (10 or more): Refund of accumulated contributions or termination benefit of 1.5% plus 0.1% for each year of service in excess of 10 years, times salary x service (based on complete years), payable upon reaching age 60.
a.) Two members appointed by the City,
Eligibility: Total and permanent as determined by the Board of Trustees.
Pre-Retirement Death Benefits:Service Incurred: 100% of Salary.Non-Service Incurred: Greater of 54% of salary or accrued benefit.
Benefit: Benefit accrued to date of disability. Minimum benefit for Service Incurred is 65% of salary. For Non-Service Incurred benefit is 50% of salary.
City of DeKalb Firefighters' Pension Fund FOSTER & FOSTER | 43
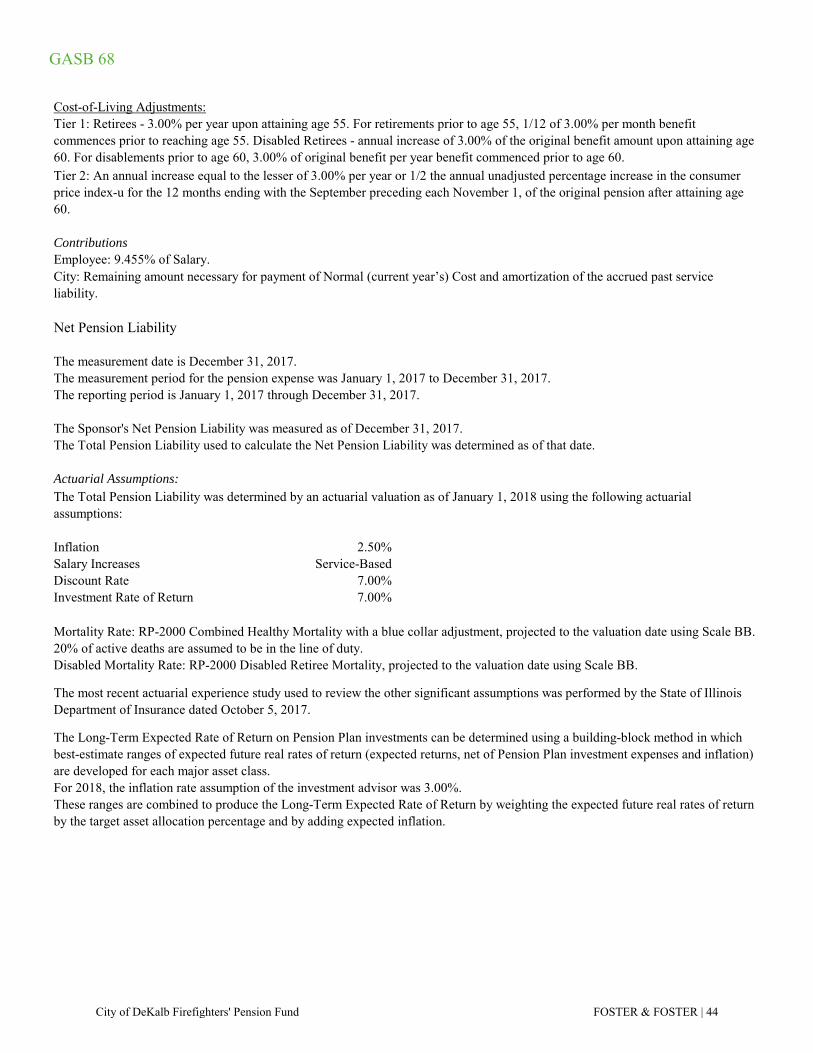
GASB 68
ContributionsEmployee: 9.455% of Salary.
Net Pension Liability
The measurement date is December 31, 2017.The measurement period for the pension expense was January 1, 2017 to December 31, 2017.The reporting period is January 1, 2017 through December 31, 2017.
The Sponsor's Net Pension Liability was measured as of December 31, 2017.The Total Pension Liability used to calculate the Net Pension Liability was determined as of that date.
Actuarial Assumptions:
Inflation 2.50%Salary Increases Service-BasedDiscount Rate 7.00%Investment Rate of Return 7.00%
For 2018, the inflation rate assumption of the investment advisor was 3.00%.
Mortality Rate: RP-2000 Combined Healthy Mortality with a blue collar adjustment, projected to the valuation date using Scale BB. 20% of active deaths are assumed to be in the line of duty.
The Total Pension Liability was determined by an actuarial valuation as of January 1, 2018 using the following actuarial assumptions:
Tier 1: Retirees - 3.00% per year upon attaining age 55. For retirements prior to age 55, 1/12 of 3.00% per month benefit commences prior to reaching age 55. Disabled Retirees - annual increase of 3.00% of the original benefit amount upon attaining age 60. For disablements prior to age 60, 3.00% of original benefit per year benefit commenced prior to age 60.
Cost-of-Living Adjustments:
Tier 2: An annual increase equal to the lesser of 3.00% per year or 1/2 the annual unadjusted percentage increase in the consumerprice index-u for the 12 months ending with the September preceding each November 1, of the original pension after attaining age60.
City: Remaining amount necessary for payment of Normal (current year’s) Cost and amortization of the accrued past service liability.
Disabled Mortality Rate: RP-2000 Disabled Retiree Mortality, projected to the valuation date using Scale BB.
These ranges are combined to produce the Long-Term Expected Rate of Return by weighting the expected future real rates of return by the target asset allocation percentage and by adding expected inflation.
The most recent actuarial experience study used to review the other significant assumptions was performed by the State of Illinois Department of Insurance dated October 5, 2017.
The Long-Term Expected Rate of Return on Pension Plan investments can be determined using a building-block method in which best-estimate ranges of expected future real rates of return (expected returns, net of Pension Plan investment expenses and inflation) are developed for each major asset class.
City of DeKalb Firefighters' Pension Fund FOSTER & FOSTER | 44
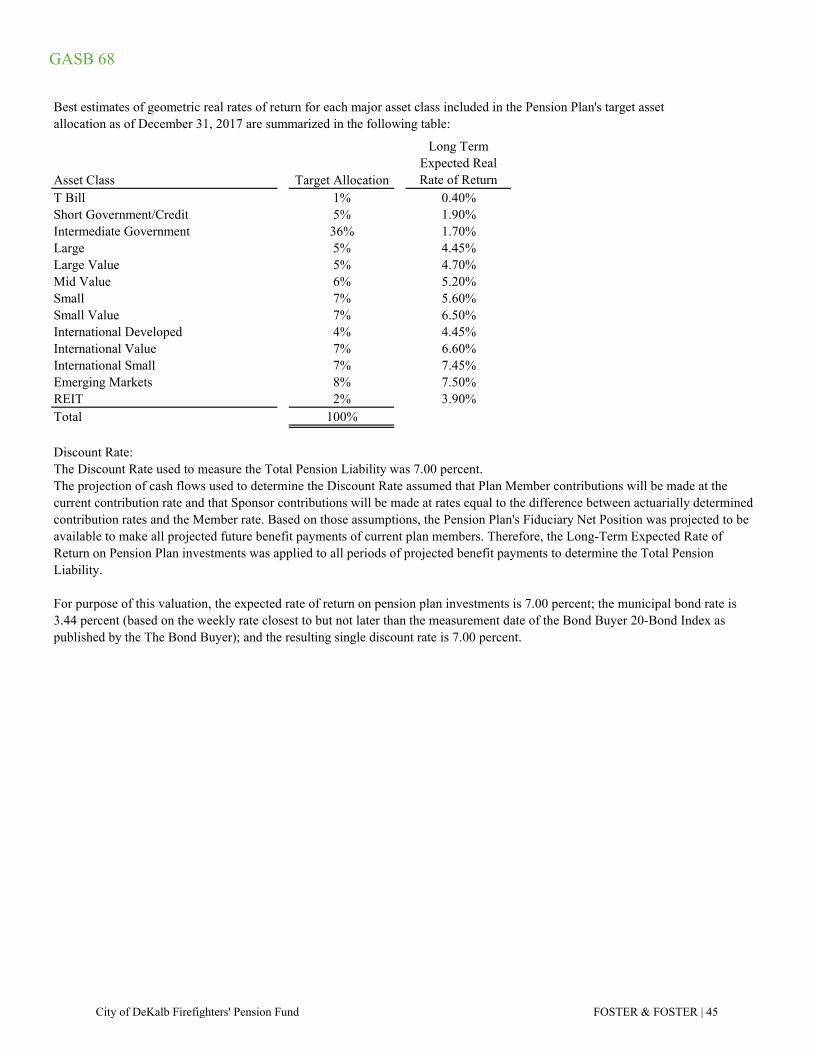
GASB 68
Best estimates of geometric real rates of return for each major asset class included in the Pension Plan's target assetallocation as of December 31, 2017 are summarized in the following table:
Asset Class Target Allocation
Long Term Expected Real Rate of Return
T Bill 1% 0.40%Short Government/Credit 5% 1.90%Intermediate Government 36% 1.70%Large 5% 4.45%Large Value 5% 4.70%Mid Value 6% 5.20%Small 7% 5.60%Small Value 7% 6.50%International Developed 4% 4.45%International Value 7% 6.60%International Small 7% 7.45%Emerging Markets 8% 7.50%REIT 2% 3.90%Total 100%
Discount Rate:The Discount Rate used to measure the Total Pension Liability was 7.00 percent.The projection of cash flows used to determine the Discount Rate assumed that Plan Member contributions will be made at the current contribution rate and that Sponsor contributions will be made at rates equal to the difference between actuarially determined contribution rates and the Member rate. Based on those assumptions, the Pension Plan's Fiduciary Net Position was projected to be available to make all projected future benefit payments of current plan members. Therefore, the Long-Term Expected Rate of Return on Pension Plan investments was applied to all periods of projected benefit payments to determine the Total Pension Liability.
For purpose of this valuation, the expected rate of return on pension plan investments is 7.00 percent; the municipal bond rate is 3.44 percent (based on the weekly rate closest to but not later than the measurement date of the Bond Buyer 20-Bond Index as published by the The Bond Buyer); and the resulting single discount rate is 7.00 percent.
City of DeKalb Firefighters' Pension Fund FOSTER & FOSTER | 45
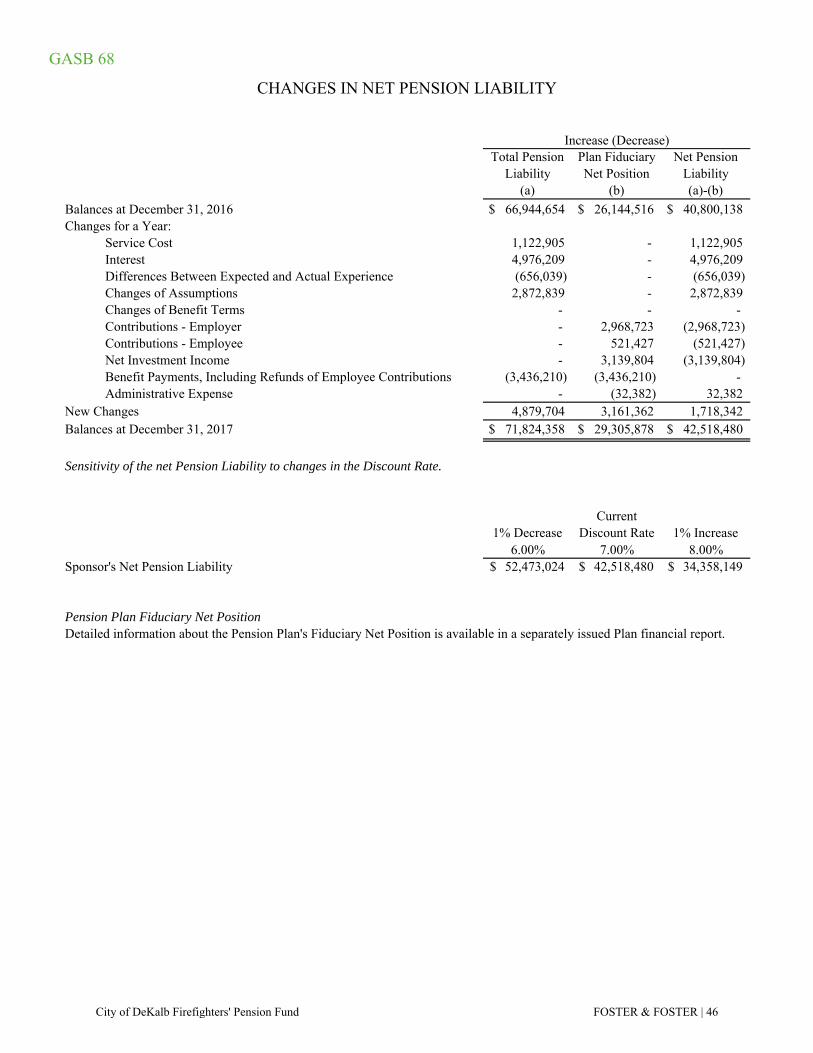
GASB 68
Total Pension Liability
Plan Fiduciary Net Position
Net Pension Liability
(a) (b) (a)-(b)
Balances at December 31, 2016 $ 66,944,654 $ 26,144,516 $ 40,800,138 Changes for a Year:
Service Cost 1,122,905 - 1,122,905 Interest 4,976,209 - 4,976,209 Differences Between Expected and Actual Experience (656,039) - (656,039)Changes of Assumptions 2,872,839 - 2,872,839 Changes of Benefit Terms - - - Contributions - Employer - 2,968,723 (2,968,723)Contributions - Employee - 521,427 (521,427)Net Investment Income - 3,139,804 (3,139,804)Benefit Payments, Including Refunds of Employee Contributions (3,436,210) (3,436,210) - Administrative Expense - (32,382) 32,382
New Changes 4,879,704 3,161,362 1,718,342 Balances at December 31, 2017 $ 71,824,358 $ 29,305,878 $ 42,518,480
Sensitivity of the net Pension Liability to changes in the Discount Rate.
1% Decrease Current
Discount Rate 1% Increase 6.00% 7.00% 8.00%
Sponsor's Net Pension Liability 52,473,024$ 42,518,480$ 34,358,149$
Pension Plan Fiduciary Net Position Detailed information about the Pension Plan's Fiduciary Net Position is available in a separately issued Plan financial report.
Increase (Decrease)
CHANGES IN NET PENSION LIABILITY
City of DeKalb Firefighters' Pension Fund FOSTER & FOSTER | 46
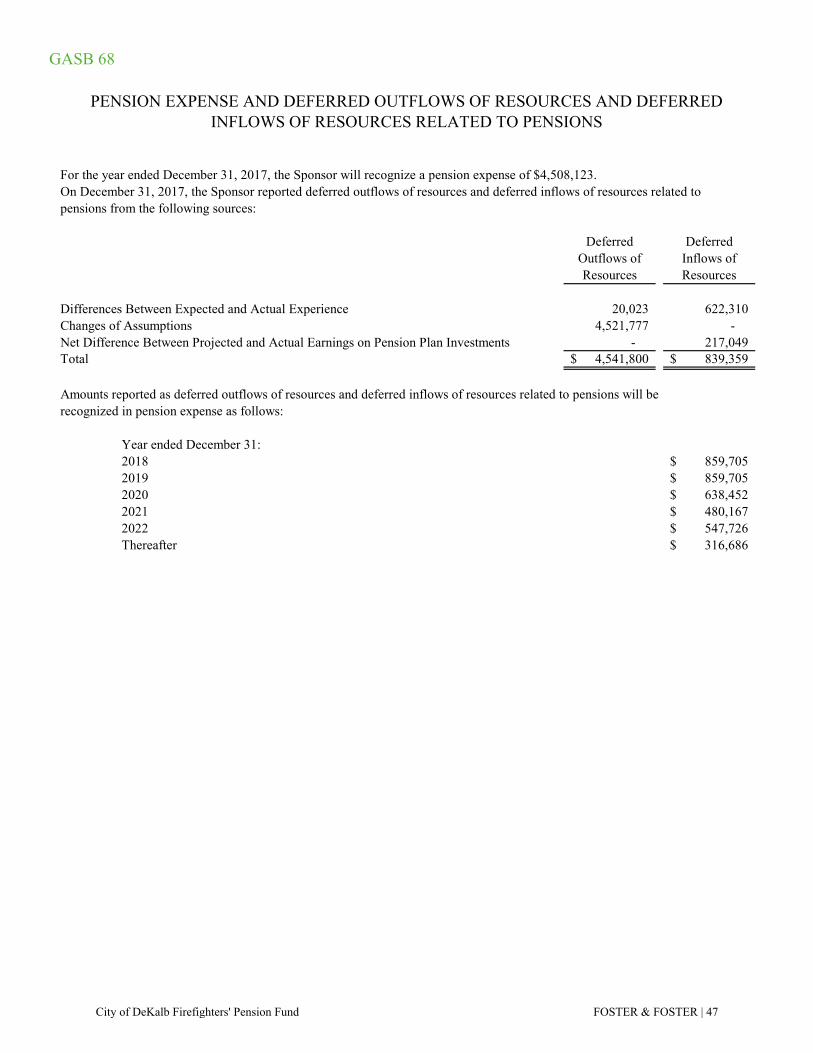
GASB 68
For the year ended December 31, 2017, the Sponsor will recognize a pension expense of $4,508,123.On December 31, 2017, the Sponsor reported deferred outflows of resources and deferred inflows of resources related topensions from the following sources:
Deferred Outflows of Resources
Deferred Inflows of Resources
Differences Between Expected and Actual Experience 20,023 622,310 Changes of Assumptions 4,521,777 - Net Difference Between Projected and Actual Earnings on Pension Plan Investments - 217,049 Total 4,541,800$ 839,359$
Amounts reported as deferred outflows of resources and deferred inflows of resources related to pensions will be recognized in pension expense as follows:
OUTFLOW INFLOWYear ended December 31:2018 859,705$ 2019 859,705$ 2020 638,452$ 2021 480,167$ 2022 547,726$ Thereafter 316,686$
PENSION EXPENSE AND DEFERRED OUTFLOWS OF RESOURCES AND DEFERRED INFLOWS OF RESOURCES RELATED TO PENSIONS
City of DeKalb Firefighters' Pension Fund FOSTER & FOSTER | 47
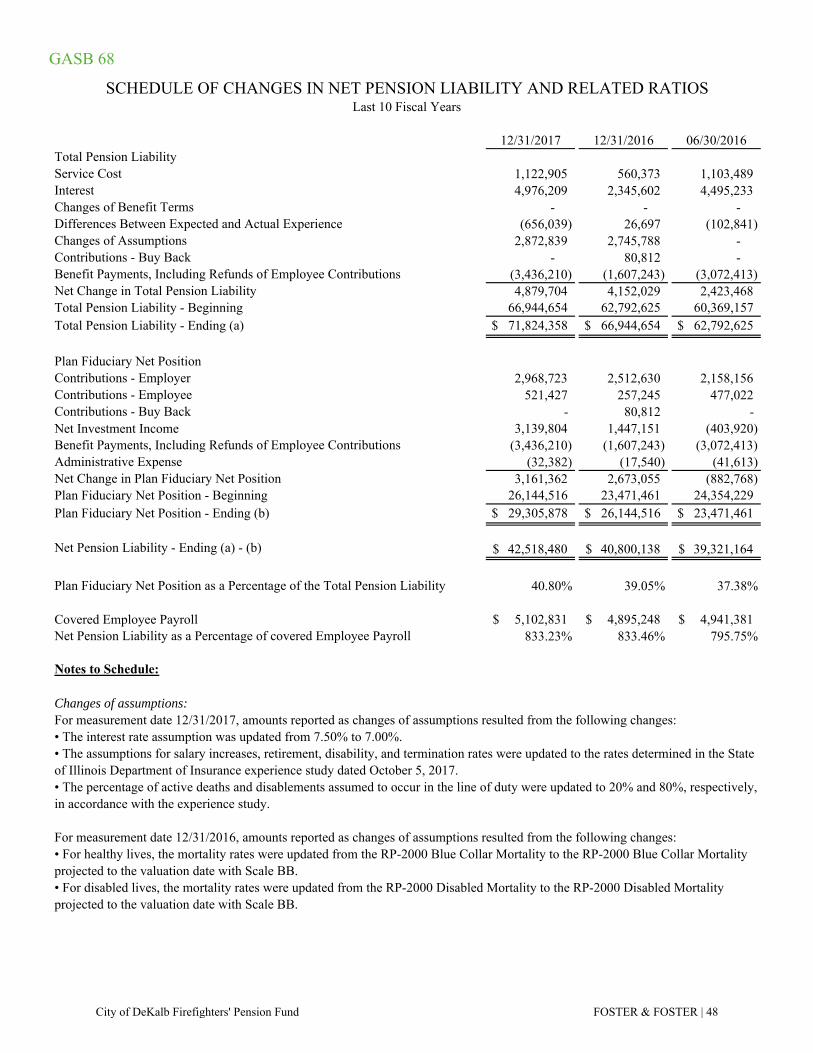
GASB 68
12/31/2017 12/31/2016 06/30/2016Total Pension LiabilityService Cost 1,122,905 560,373 1,103,489 Interest 4,976,209 2,345,602 4,495,233 Changes of Benefit Terms - - - Differences Between Expected and Actual Experience (656,039) 26,697 (102,841) Changes of Assumptions 2,872,839 2,745,788 - Contributions - Buy Back - 80,812 - Benefit Payments, Including Refunds of Employee Contributions (3,436,210) (1,607,243) (3,072,413) Net Change in Total Pension Liability 4,879,704 4,152,029 2,423,468 Total Pension Liability - Beginning 66,944,654 62,792,625 60,369,157 Total Pension Liability - Ending (a) $ 71,824,358 $ 66,944,654 $ 62,792,625
Plan Fiduciary Net PositionContributions - Employer 2,968,723 2,512,630 2,158,156 Contributions - Employee 521,427 257,245 477,022 Contributions - Buy Back - 80,812 - Net Investment Income 3,139,804 1,447,151 (403,920) Benefit Payments, Including Refunds of Employee Contributions (3,436,210) (1,607,243) (3,072,413) Administrative Expense (32,382) (17,540) (41,613) Net Change in Plan Fiduciary Net Position 3,161,362 2,673,055 (882,768) Plan Fiduciary Net Position - Beginning 26,144,516 23,471,461 24,354,229 Plan Fiduciary Net Position - Ending (b) $ 29,305,878 $ 26,144,516 $ 23,471,461
Net Pension Liability - Ending (a) - (b) 42,518,480$ 40,800,138$ 39,321,164$
Plan Fiduciary Net Position as a Percentage of the Total Pension Liability 40.80% 39.05% 37.38%
Covered Employee Payroll 5,102,831$ 4,895,248$ 4,941,381$ Net Pension Liability as a Percentage of covered Employee Payroll 833.23% 833.46% 795.75%
Notes to Schedule:
Changes of assumptions:For measurement date 12/31/2017, amounts reported as changes of assumptions resulted from the following changes:• The interest rate assumption was updated from 7.50% to 7.00%.
For measurement date 12/31/2016, amounts reported as changes of assumptions resulted from the following changes:
SCHEDULE OF CHANGES IN NET PENSION LIABILITY AND RELATED RATIOSLast 10 Fiscal Years
• For healthy lives, the mortality rates were updated from the RP-2000 Blue Collar Mortality to the RP-2000 Blue Collar Mortality projected to the valuation date with Scale BB.• For disabled lives, the mortality rates were updated from the RP-2000 Disabled Mortality to the RP-2000 Disabled Mortality projected to the valuation date with Scale BB.
• The assumptions for salary increases, retirement, disability, and termination rates were updated to the rates determined in the State of Illinois Department of Insurance experience study dated October 5, 2017.• The percentage of active deaths and disablements assumed to occur in the line of duty were updated to 20% and 80%, respectively, in accordance with the experience study.
City of DeKalb Firefighters' Pension Fund FOSTER & FOSTER | 48

GASB 68
06/30/2015 ¹ 06/30/2014 ¹Total Pension LiabilityService Cost 1,077,550 1,033,286 Interest 4,102,276 3,857,132 Changes of Benefit Terms - - Differences Between Expected and Actual Experience (477,382) 1,330,700 Changes of Assumptions 2,460,941 - Contributions - Buy Back - - Benefit Payments, Including Refunds of Employee Contributions (2,982,470) (2,922,598) Net Change in Total Pension Liability 4,180,915 3,298,520 Total Pension Liability - Beginning 56,188,242 52,889,722 Total Pension Liability - Ending (a) 60,369,157$ 56,188,242$
Plan Fiduciary Net PositionContributions - Employer 2,024,522 2,037,490 Contributions - Employee 466,475 420,534 Contributions - Buy Back - - Net Investment Income 126,661 3,075,655 Benefit Payments, Including Refunds of Employee Contributions (2,982,470) (2,922,598) Administrative Expense (43,547) (34,562) Net Change in Plan Fiduciary Net Position (408,359) 2,576,519 Plan Fiduciary Net Position - Beginning 24,762,588 22,186,069 Plan Fiduciary Net Position - Ending (b) $ 24,354,229 $ 24,762,588
Net Pension Liability - Ending (a) - (b) 36,014,928$ 31,425,654$
Plan Fiduciary Net Position as a Percentage of the Total Pension Liability 40.34% 44.07%
Covered Employee Payroll 4,846,412$ 4,649,060$ Net Pension Liability as a Percentage of covered Employee Payroll 743.13% 675.96%
Notes to Schedule:
SCHEDULE OF CHANGES IN NET PENSION LIABILITY AND RELATED RATIOSLast 10 Fiscal Years
¹ The 2014 and 2015 results were provided by the prior actuary, Timothy W. Sharpe, Actuary, Geneva (IL).
City of DeKalb Firefighters' Pension Fund FOSTER & FOSTER | 49
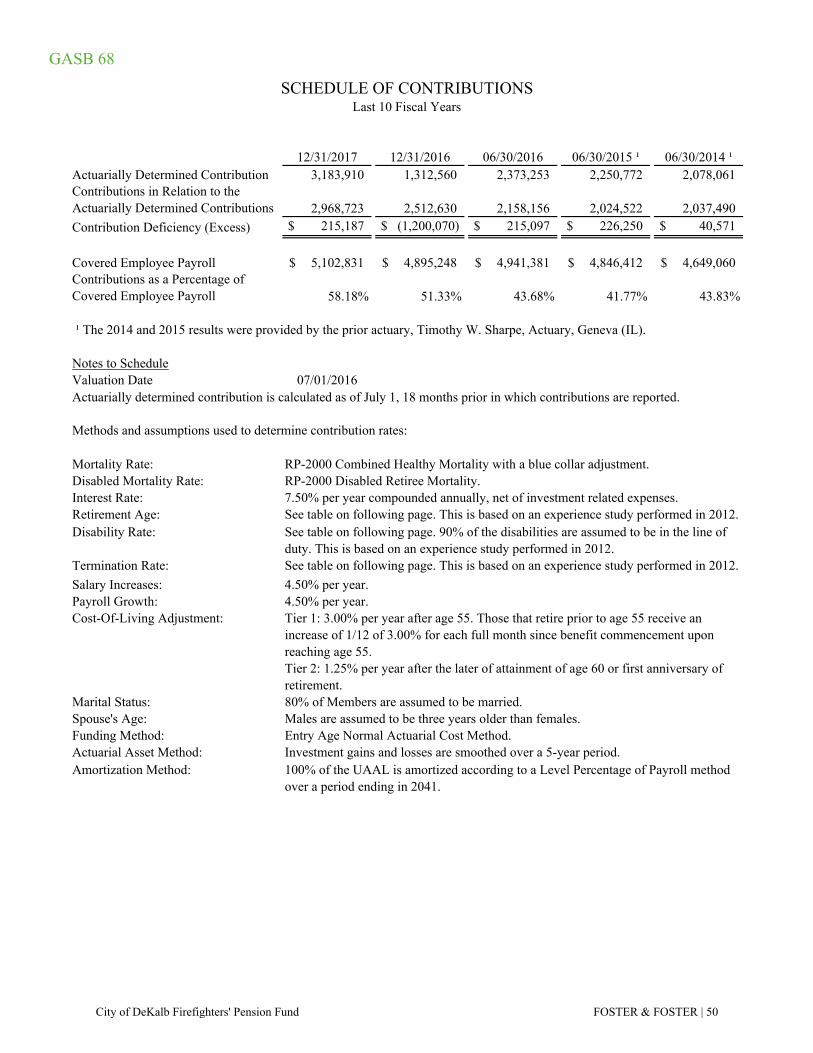
GASB 68
12/31/2017 12/31/2016 06/30/2016 06/30/2015 ¹ 06/30/2014 ¹Actuarially Determined Contribution 3,183,910 1,312,560 2,373,253 2,250,772 2,078,061 Contributions in Relation to the Actuarially Determined Contributions 2,968,723 2,512,630 2,158,156 2,024,522 2,037,490
Contribution Deficiency (Excess) $ 215,187 $ (1,200,070) $ 215,097 $ 226,250 $ 40,571
Covered Employee Payroll 5,102,831$ 4,895,248$ 4,941,381$ 4,846,412$ 4,649,060$ Contributions as a Percentage of Covered Employee Payroll 58.18% 51.33% 43.68% 41.77% 43.83%
¹ The 2014 and 2015 results were provided by the prior actuary, Timothy W. Sharpe, Actuary, Geneva (IL).
Notes to ScheduleValuation Date 07/01/2016
Methods and assumptions used to determine contribution rates:
Mortality Rate:Disabled Mortality Rate:Interest Rate:Retirement Age:Disability Rate:
Termination Rate:
Salary Increases: 4.50% per year.Payroll Growth: 4.50% per year.Cost-Of-Living Adjustment:
Marital Status:Spouse's Age:Funding Method:Actuarial Asset Method:Amortization Method:
Investment gains and losses are smoothed over a 5-year period.100% of the UAAL is amortized according to a Level Percentage of Payroll method over a period ending in 2041.
Tier 1: 3.00% per year after age 55. Those that retire prior to age 55 receive an increase of 1/12 of 3.00% for each full month since benefit commencement upon reaching age 55.Tier 2: 1.25% per year after the later of attainment of age 60 or first anniversary of retirement.80% of Members are assumed to be married.Males are assumed to be three years older than females.Entry Age Normal Actuarial Cost Method.
7.50% per year compounded annually, net of investment related expenses.See table on following page. This is based on an experience study performed in 2012.See table on following page. 90% of the disabilities are assumed to be in the line of duty. This is based on an experience study performed in 2012.See table on following page. This is based on an experience study performed in 2012.
SCHEDULE OF CONTRIBUTIONSLast 10 Fiscal Years
Actuarially determined contribution is calculated as of July 1, 18 months prior in which contributions are reported.
RP-2000 Combined Healthy Mortality with a blue collar adjustment.RP-2000 Disabled Retiree Mortality.
City of DeKalb Firefighters' Pension Fund FOSTER & FOSTER | 50
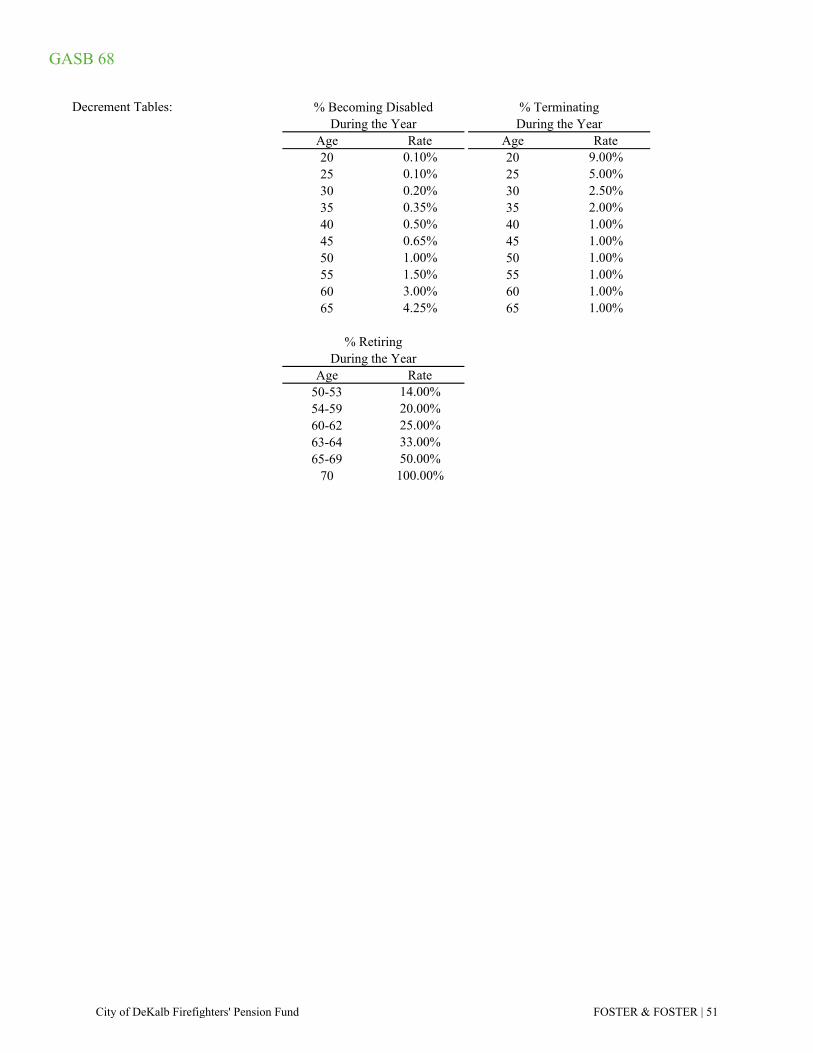
GASB 68
Decrement Tables:
Age Rate Age Rate20 0.10% 20 9.00%25 0.10% 25 5.00%30 0.20% 30 2.50%35 0.35% 35 2.00%40 0.50% 40 1.00%45 0.65% 45 1.00%50 1.00% 50 1.00%55 1.50% 55 1.00%60 3.00% 60 1.00%65 4.25% 65 1.00%
Age Rate50-53 14.00%54-59 20.00%60-62 25.00%63-64 33.00%65-69 50.00%
70 100.00%
% RetiringDuring the Year
% TerminatingDuring the Year
% Becoming DisabledDuring the Year
City of DeKalb Firefighters' Pension Fund FOSTER & FOSTER | 51
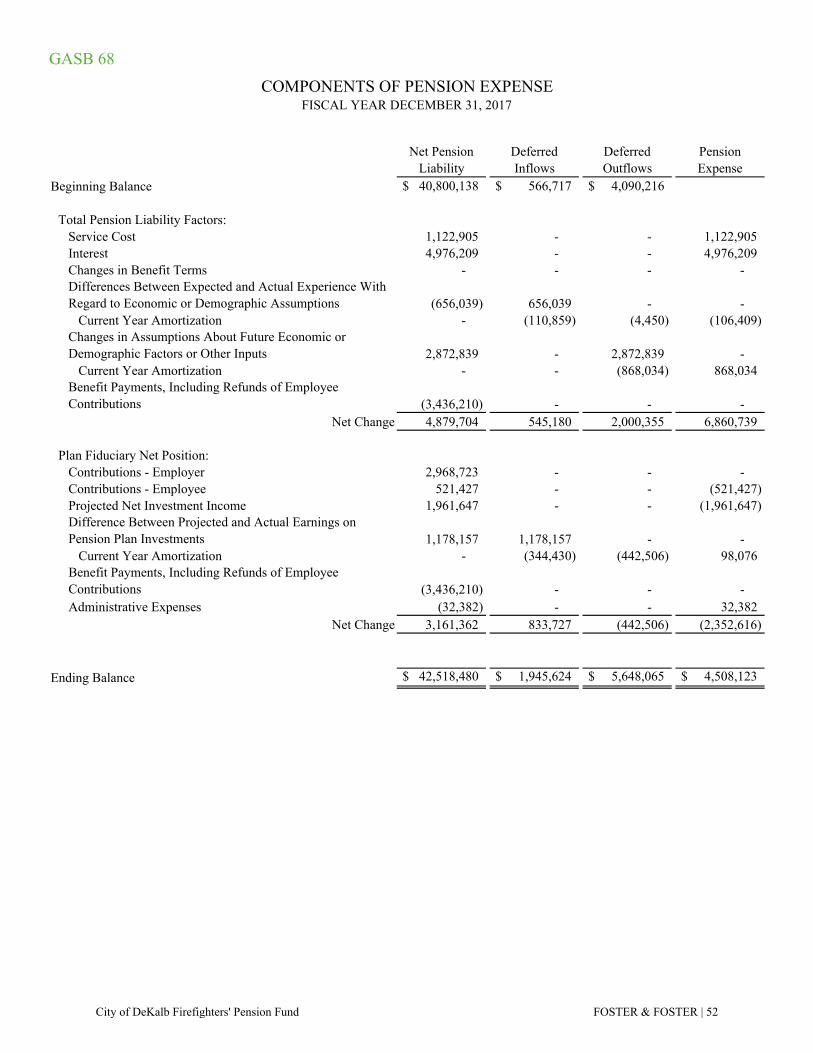
GASB 68
Net Pension Liability
Deferred Inflows
Deferred Outflows
Pension Expense
Beginning Balance $ 40,800,138 $ 566,717 $ 4,090,216
Total Pension Liability Factors:Service Cost 1,122,905 - - 1,122,905 Interest 4,976,209 - - 4,976,209 Changes in Benefit Terms - - - - Differences Between Expected and Actual Experience With Regard to Economic or Demographic Assumptions (656,039) 656,039 - -
Current Year Amortization - (110,859) (4,450) (106,409) Changes in Assumptions About Future Economic or Demographic Factors or Other Inputs 2,872,839 - 2,872,839 -
Current Year Amortization - - (868,034) 868,034 Benefit Payments, Including Refunds of Employee Contributions (3,436,210) - - -
Net Change 4,879,704 545,180 2,000,355 6,860,739
Plan Fiduciary Net Position:Contributions - Employer 2,968,723 - - - Contributions - Employee 521,427 - - (521,427) Projected Net Investment Income 1,961,647 - - (1,961,647) Difference Between Projected and Actual Earnings on Pension Plan Investments 1,178,157 1,178,157 - -
Current Year Amortization - (344,430) (442,506) 98,076 Benefit Payments, Including Refunds of Employee Contributions (3,436,210) - - - Administrative Expenses (32,382) - - 32,382
Net Change 3,161,362 833,727 (442,506) (2,352,616)
Ending Balance $ 42,518,480 $ 1,945,624 $ 5,648,065 $ 4,508,123
COMPONENTS OF PENSION EXPENSEFISCAL YEAR DECEMBER 31, 2017
City of DeKalb Firefighters' Pension Fund FOSTER & FOSTER | 52
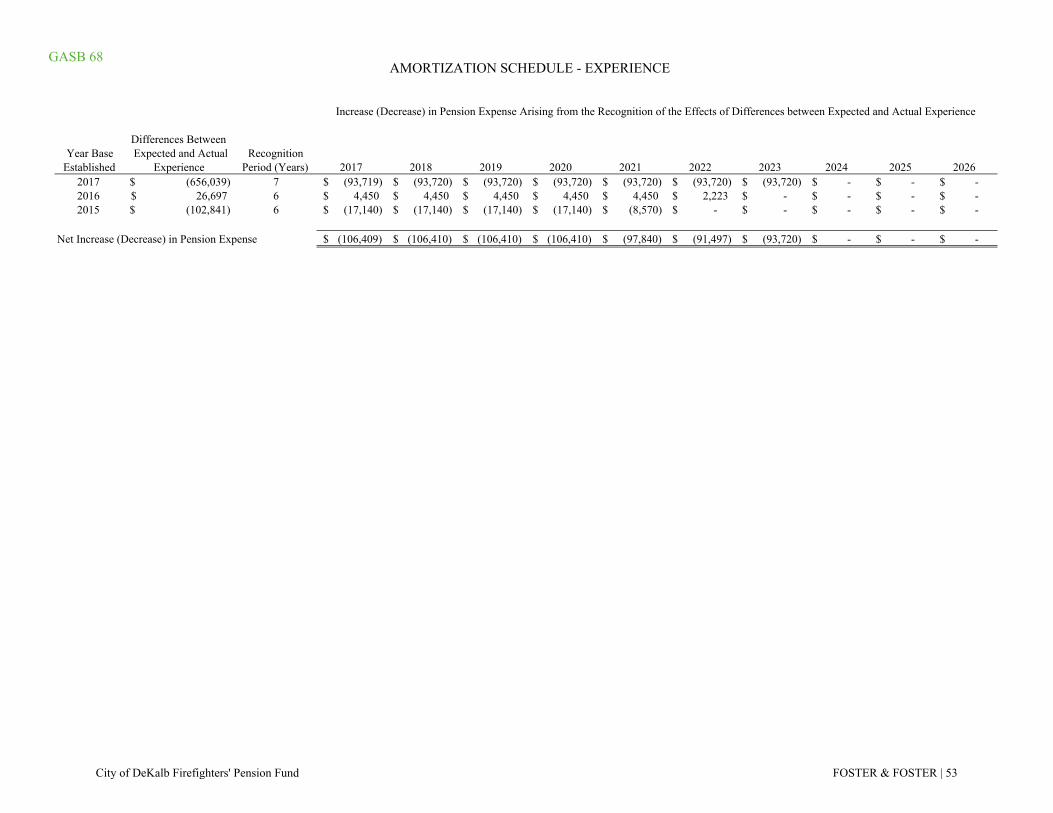
GASB 68
Year Base Established
Differences Between Expected and Actual
ExperienceRecognition
Period (Years) 2017 2018 2019 2020 2021 2022 2023 2024 2025 20262017 (656,039)$ 7 (93,719)$ (93,720)$ (93,720)$ (93,720)$ (93,720)$ (93,720)$ (93,720)$ -$ -$ -$ 2016 26,697$ 6 4,450$ 4,450$ 4,450$ 4,450$ 4,450$ 2,223$ -$ -$ -$ -$ 2015 (102,841)$ 6 (17,140)$ (17,140)$ (17,140)$ (17,140)$ (8,570)$ -$ -$ -$ -$ -$
Net Increase (Decrease) in Pension Expense (106,409)$ (106,410)$ (106,410)$ (106,410)$ (97,840)$ (91,497)$ (93,720)$ -$ -$ -$
AMORTIZATION SCHEDULE - EXPERIENCE
Increase (Decrease) in Pension Expense Arising from the Recognition of the Effects of Differences between Expected and Actual Experience
City of DeKalb Firefighters' Pension Fund FOSTER & FOSTER | 53
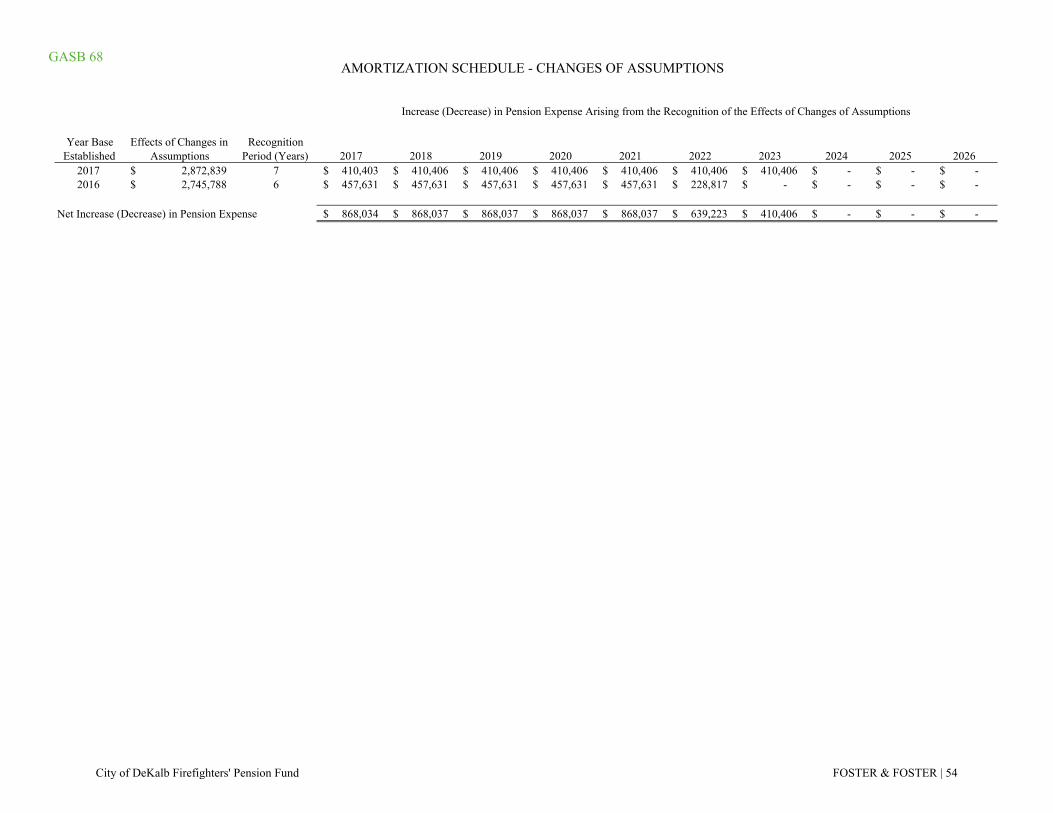
GASB 68
Year Base Established
Effects of Changes in Assumptions
Recognition Period (Years) 2017 2018 2019 2020 2021 2022 2023 2024 2025 2026
2017 2,872,839$ 7 410,403$ 410,406$ 410,406$ 410,406$ 410,406$ 410,406$ 410,406$ -$ -$ -$ 2016 2,745,788$ 6 457,631$ 457,631$ 457,631$ 457,631$ 457,631$ 228,817$ -$ -$ -$ -$
Net Increase (Decrease) in Pension Expense 868,034$ 868,037$ 868,037$ 868,037$ 868,037$ 639,223$ 410,406$ -$ -$ -$
Increase (Decrease) in Pension Expense Arising from the Recognition of the Effects of Changes of Assumptions
AMORTIZATION SCHEDULE - CHANGES OF ASSUMPTIONS
City of DeKalb Firefighters' Pension Fund FOSTER & FOSTER | 54
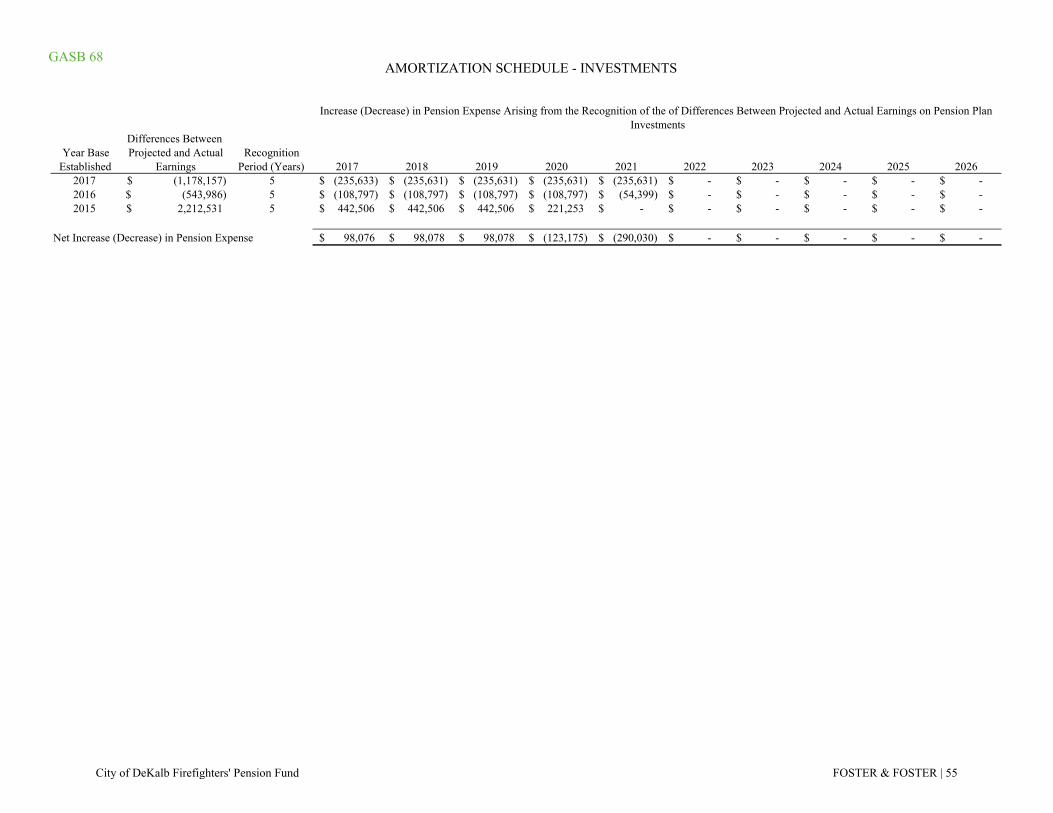
GASB 68
Year Base Established
Differences Between Projected and Actual
EarningsRecognition
Period (Years) 2017 2018 2019 2020 2021 2022 2023 2024 2025 20262017 (1,178,157)$ 5 (235,633)$ (235,631)$ (235,631)$ (235,631)$ (235,631)$ -$ -$ -$ -$ -$ 2016 (543,986)$ 5 (108,797)$ (108,797)$ (108,797)$ (108,797)$ (54,399)$ -$ -$ -$ -$ -$ 2015 2,212,531$ 5 442,506$ 442,506$ 442,506$ 221,253$ -$ -$ -$ -$ -$ -$
Net Increase (Decrease) in Pension Expense 98,076$ 98,078$ 98,078$ (123,175)$ (290,030)$ -$ -$ -$ -$ -$
Increase (Decrease) in Pension Expense Arising from the Recognition of the of Differences Between Projected and Actual Earnings on Pension Plan Investments
AMORTIZATION SCHEDULE - INVESTMENTS
City of DeKalb Firefighters' Pension Fund FOSTER & FOSTER | 55
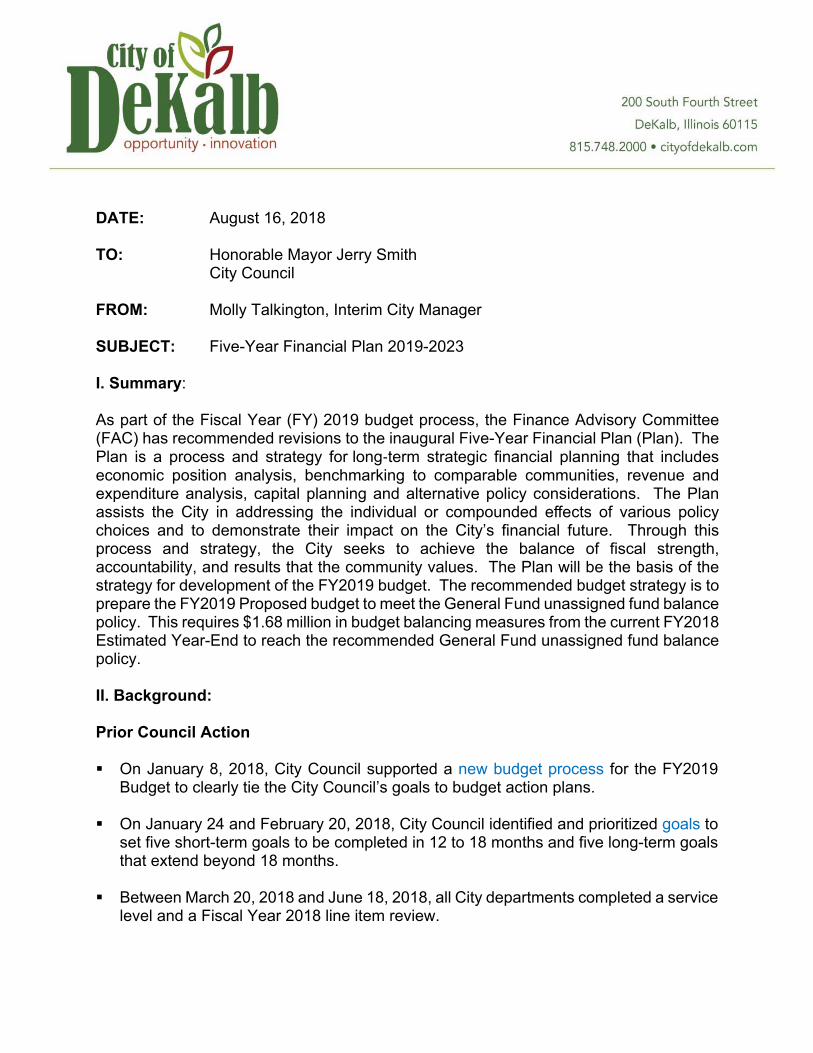
DATE:
TO:
FROM:
SUBJECT:
August 16, 2018
Honorable Mayor Jerry Smith City Council
Molly Talkington, Interim City Manager
Five-Year Financial Plan 2019-2023
I. Summary:
As part of the Fiscal Year (FY) 2019 budget process, the Finance Advisory Committee (FAC) has recommended revisions to the inaugural Five-Year Financial Plan (Plan). The Plan is a process and strategy for long-term strategic financial planning that includes economic position analysis, benchmarking to comparable communities, revenue and expenditure analysis, capital planning and alternative policy considerations. The Plan assists the City in addressing the individual or compounded effects of various policy choices and to demonstrate their impact on the City’s financial future. Through this process and strategy, the City seeks to achieve the balance of fiscal strength, accountability, and results that the community values. The Plan will be the basis of the strategy for development of the FY2019 budget. The recommended budget strategy is to prepare the FY2019 Proposed budget to meet the General Fund unassigned fund balance policy. This requires $1.68 million in budget balancing measures from the current FY2018 Estimated Year-End to reach the recommended General Fund unassigned fund balance policy.
II. Background:
Prior Council Action
On January 8, 2018, City Council supported a new budget process for the FY2019Budget to clearly tie the City Council’s goals to budget action plans.
On January 24 and February 20, 2018, City Council identified and prioritized goals toset five short-term goals to be completed in 12 to 18 months and five long-term goalsthat extend beyond 18 months.
Between March 20, 2018 and June 18, 2018, all City departments completed a servicelevel and a Fiscal Year 2018 line item review.
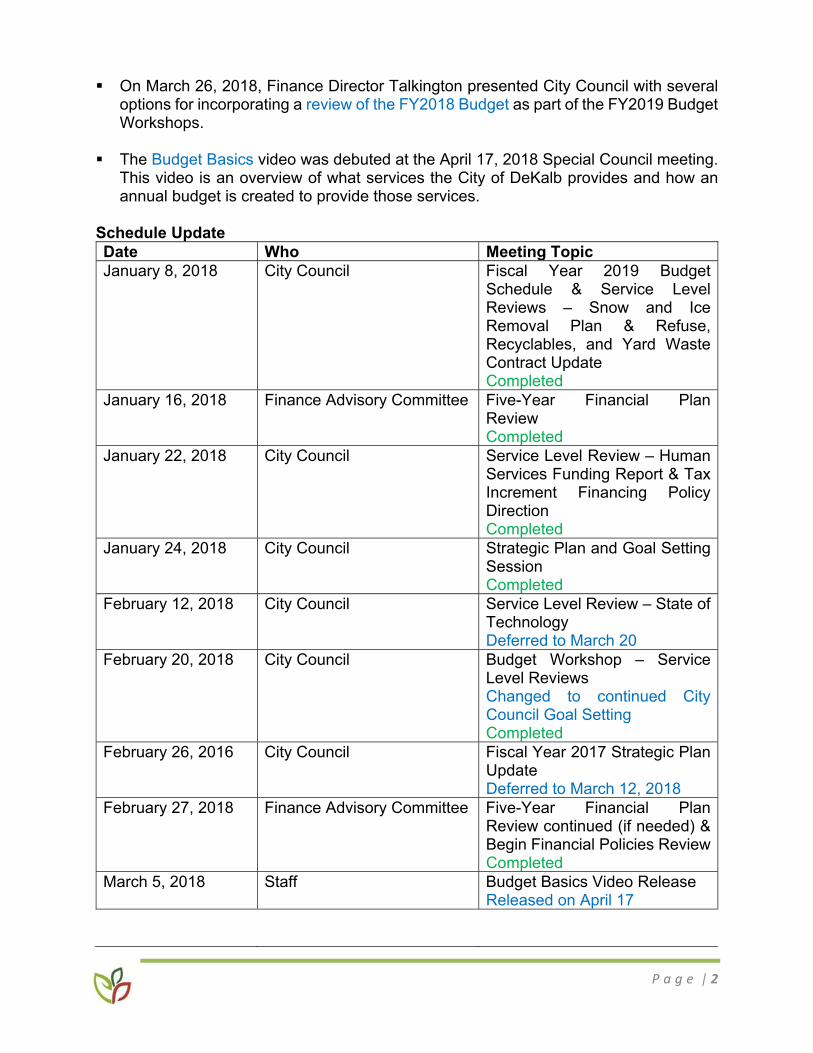
P a g e | 2
On March 26, 2018, Finance Director Talkington presented City Council with several options for incorporating a review of the FY2018 Budget as part of the FY2019 Budget Workshops.
The Budget Basics video was debuted at the April 17, 2018 Special Council meeting.
This video is an overview of what services the City of DeKalb provides and how an annual budget is created to provide those services.
Schedule Update Date Who Meeting Topic January 8, 2018 City Council Fiscal Year 2019 Budget
Schedule & Service Level Reviews – Snow and Ice Removal Plan & Refuse, Recyclables, and Yard Waste Contract Update Completed
January 16, 2018 Finance Advisory Committee Five-Year Financial Plan Review Completed
January 22, 2018 City Council Service Level Review – Human Services Funding Report & Tax Increment Financing Policy Direction Completed
January 24, 2018 City Council Strategic Plan and Goal Setting Session Completed
February 12, 2018 City Council Service Level Review – State of Technology Deferred to March 20
February 20, 2018 City Council Budget Workshop – Service Level Reviews Changed to continued City Council Goal Setting Completed
February 26, 2016 City Council Fiscal Year 2017 Strategic Plan Update Deferred to March 12, 2018
February 27, 2018 Finance Advisory Committee Five-Year Financial Plan Review continued (if needed) & Begin Financial Policies Review Completed
March 5, 2018 Staff Budget Basics Video Release Released on April 17
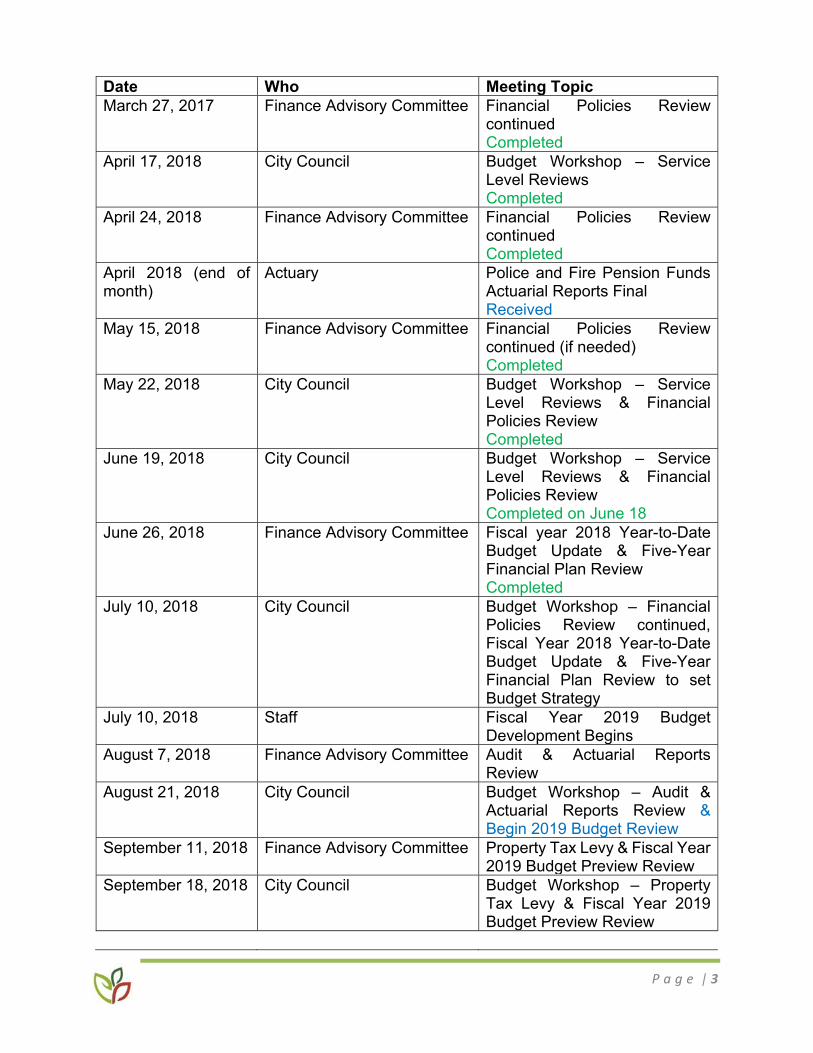
P a g e | 3
Date Who Meeting Topic March 27, 2017 Finance Advisory Committee Financial Policies Review
continued Completed
April 17, 2018 City Council Budget Workshop – Service Level Reviews Completed
April 24, 2018 Finance Advisory Committee Financial Policies Review continued Completed
April 2018 (end of month)
Actuary Police and Fire Pension Funds Actuarial Reports Final Received
May 15, 2018 Finance Advisory Committee Financial Policies Review continued (if needed) Completed
May 22, 2018 City Council Budget Workshop – Service Level Reviews & Financial Policies Review Completed
June 19, 2018 City Council Budget Workshop – Service Level Reviews & Financial Policies Review Completed on June 18
June 26, 2018 Finance Advisory Committee Fiscal year 2018 Year-to-Date Budget Update & Five-Year Financial Plan Review Completed
July 10, 2018 City Council Budget Workshop – Financial Policies Review continued, Fiscal Year 2018 Year-to-Date Budget Update & Five-Year Financial Plan Review to set Budget Strategy
July 10, 2018 Staff Fiscal Year 2019 Budget Development Begins
August 7, 2018 Finance Advisory Committee Audit & Actuarial Reports Review
August 21, 2018 City Council Budget Workshop – Audit & Actuarial Reports Review & Begin 2019 Budget Review
September 11, 2018 Finance Advisory Committee Property Tax Levy & Fiscal Year 2019 Budget Preview Review
September 18, 2018 City Council Budget Workshop – Property Tax Levy & Fiscal Year 2019 Budget Preview Review
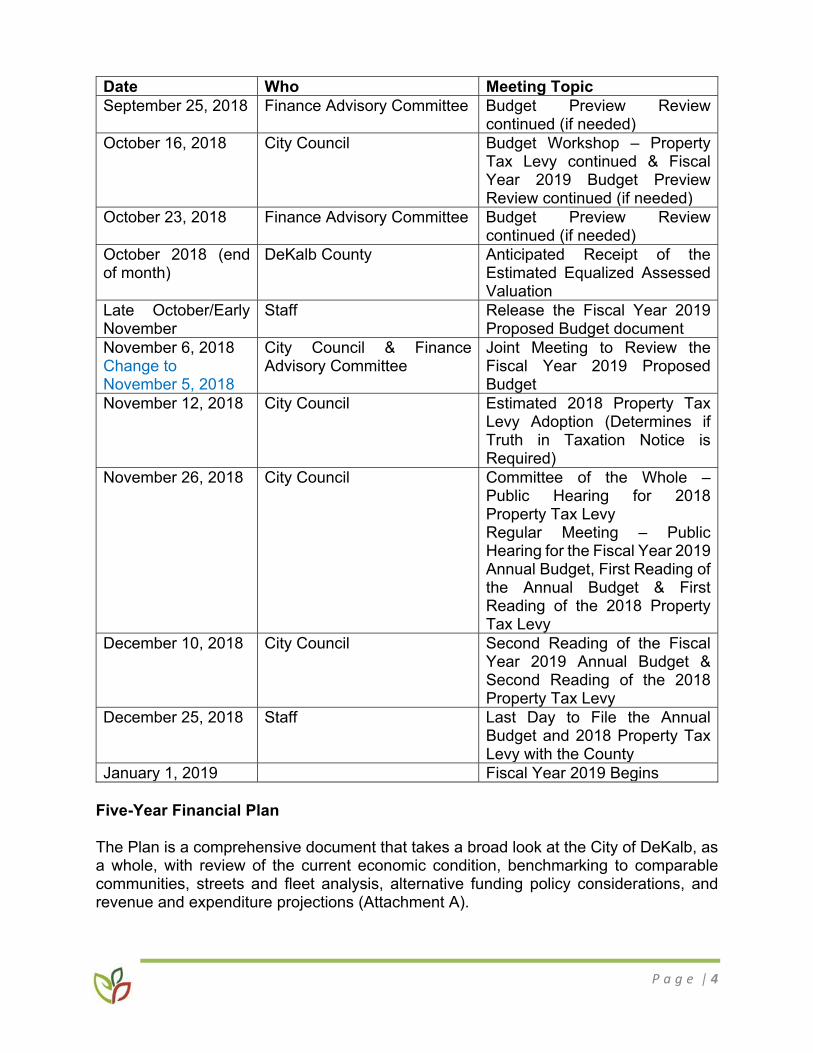
P a g e | 4
Date Who Meeting Topic September 25, 2018 Finance Advisory Committee Budget Preview Review
continued (if needed) October 16, 2018 City Council Budget Workshop – Property
Tax Levy continued & Fiscal Year 2019 Budget Preview Review continued (if needed)
October 23, 2018 Finance Advisory Committee Budget Preview Review continued (if needed)
October 2018 (end of month)
DeKalb County Anticipated Receipt of the Estimated Equalized Assessed Valuation
Late October/Early November
Staff Release the Fiscal Year 2019 Proposed Budget document
November 6, 2018 Change to November 5, 2018
City Council & Finance Advisory Committee
Joint Meeting to Review the Fiscal Year 2019 Proposed Budget
November 12, 2018 City Council Estimated 2018 Property Tax Levy Adoption (Determines if Truth in Taxation Notice is Required)
November 26, 2018 City Council Committee of the Whole – Public Hearing for 2018 Property Tax Levy Regular Meeting – Public Hearing for the Fiscal Year 2019 Annual Budget, First Reading of the Annual Budget & First Reading of the 2018 Property Tax Levy
December 10, 2018 City Council Second Reading of the Fiscal Year 2019 Annual Budget & Second Reading of the 2018 Property Tax Levy
December 25, 2018 Staff Last Day to File the Annual Budget and 2018 Property Tax Levy with the County
January 1, 2019 Fiscal Year 2019 Begins
Five-Year Financial Plan The Plan is a comprehensive document that takes a broad look at the City of DeKalb, as a whole, with review of the current economic condition, benchmarking to comparable communities, streets and fleet analysis, alternative funding policy considerations, and revenue and expenditure projections (Attachment A).
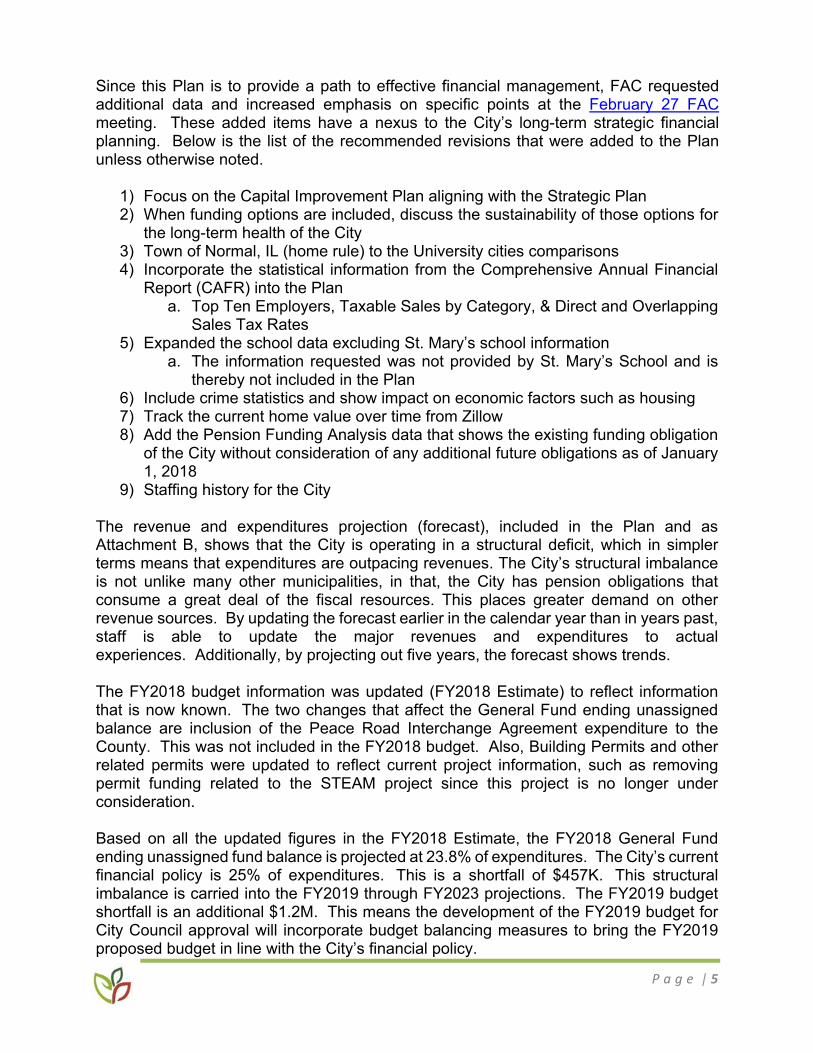
P a g e | 5
Since this Plan is to provide a path to effective financial management, FAC requested additional data and increased emphasis on specific points at the February 27 FAC meeting. These added items have a nexus to the City’s long-term strategic financial planning. Below is the list of the recommended revisions that were added to the Plan unless otherwise noted.
1) Focus on the Capital Improvement Plan aligning with the Strategic Plan 2) When funding options are included, discuss the sustainability of those options for
the long-term health of the City 3) Town of Normal, IL (home rule) to the University cities comparisons 4) Incorporate the statistical information from the Comprehensive Annual Financial
Report (CAFR) into the Plan a. Top Ten Employers, Taxable Sales by Category, & Direct and Overlapping
Sales Tax Rates 5) Expanded the school data excluding St. Mary’s school information
a. The information requested was not provided by St. Mary’s School and is thereby not included in the Plan
6) Include crime statistics and show impact on economic factors such as housing 7) Track the current home value over time from Zillow 8) Add the Pension Funding Analysis data that shows the existing funding obligation
of the City without consideration of any additional future obligations as of January 1, 2018
9) Staffing history for the City The revenue and expenditures projection (forecast), included in the Plan and as Attachment B, shows that the City is operating in a structural deficit, which in simpler terms means that expenditures are outpacing revenues. The City’s structural imbalance is not unlike many other municipalities, in that, the City has pension obligations that consume a great deal of the fiscal resources. This places greater demand on other revenue sources. By updating the forecast earlier in the calendar year than in years past, staff is able to update the major revenues and expenditures to actual experiences. Additionally, by projecting out five years, the forecast shows trends. The FY2018 budget information was updated (FY2018 Estimate) to reflect information that is now known. The two changes that affect the General Fund ending unassigned balance are inclusion of the Peace Road Interchange Agreement expenditure to the County. This was not included in the FY2018 budget. Also, Building Permits and other related permits were updated to reflect current project information, such as removing permit funding related to the STEAM project since this project is no longer under consideration. Based on all the updated figures in the FY2018 Estimate, the FY2018 General Fund ending unassigned fund balance is projected at 23.8% of expenditures. The City’s current financial policy is 25% of expenditures. This is a shortfall of $457K. This structural imbalance is carried into the FY2019 through FY2023 projections. The FY2019 budget shortfall is an additional $1.2M. This means the development of the FY2019 budget for City Council approval will incorporate budget balancing measures to bring the FY2019 proposed budget in line with the City’s financial policy.
P a g e | 6
Since FAC recommended revising the City’s fund balance policy with the FY2019 budget, the forecast includes the variance in each year to this potential policy as well as to the current policy. The City’s unassigned General Fund balance will be maintained to provide the municipality with sufficient working capital and a margin of safety to address emergencies without borrowing. Currently, the Fund Balance Policy (01-02) sets the General Fund unassigned fund balance minimum at 25% of annual expenditures. The FAC’s recommended calculation change to the General Fund unassigned fund balance policy is to calculate the minimum fund balance amount to be 30% of expenditures less property tax revenue. The recommended calculation is intended to maintain the current policy that the unassigned fund balance provide the City with sufficient working capital and a margin of safety to address emergencies without borrowing. However, by removing the property tax funded expenditures, the City Council can make important pension decisions without sacrificing other services through additional reductions or adding new or increased non-property tax revenues to fund the 25% unassigned fund balance requirement that is in the current calculation. Fiscal Year 2019 Budget Strategy Based on the outcome of the forecast, the recommended budget strategy is to prepare the FY2019 Proposed budget to meet the General Fund unassigned fund balance policy. This requires $1.68 million in budget balancing measures from the current FY2018 Estimated Year-End to reach the recommended General Fund unassigned fund balance policy of 30% of expenditures less property tax revenue. During July and part of August, staff enter the baseline FY2019 budget information and identify budget balancing measures for Council consideration. The process of identifying expenditure reductions will be service-focused, in that, the service reduction impact should be explained first, then the associated expenditures (staff, materials, equipment, etc.) will be evaluated as part of that reduction. The City’s revenues have been outlined with the potential impact of a rate increase as part of the Streets and Fleet section of the Plan and a portion of those revenues could be considered as part of the General Fund budget balancing. Another review of the existing revenues and expenditures will be conducted, and potential revisions incorporated into the forecast to determine the positive or negative impact on the budget gap. City Council will receive budget balancing information in the upcoming budget workshops in August and September for review. Once Council recommendation is received on the measures, these will then be incorporated into the FY2019 Proposed budget for release in October or November. III. Recommendation: Staff is recommending City Council review the Plan for any potential revisions to the overall document. Also, staff is seeking Council support of the FY2019 budget strategy. Attachments –
A) Five-Year Financial Plan 2019-2023 B) Five-Year Financial Forecast 2018
2019‐2023
Five Year Financial Plan
Attachment A

Introduction .................................................................................................................................................. 7
Purpose of Financial Planning ................................................................................................................... 7
Tool for Decision‐Making .......................................................................................................................... 8
Long‐Term Financial Plan .......................................................................................................................... 8
Elements of the Plan ................................................................................................................................. 9
Economic Position ....................................................................................................................................... 13
DeKalb’s Strengths .................................................................................................................................. 13
Population ............................................................................................................................................... 14
Northern Illinois University ..................................................................................................................... 17
Property Values and Taxes ...................................................................................................................... 18
National Retail and Commercial Real Estate .......................................................................................... 21
Bond Rating and Debt Obligations .......................................................................................................... 23
DeKalb Community Unit School District Data ......................................................................................... 26
DeKalb Crime Data .................................................................................................................................. 27
Benchmarking DeKalb to Comparable Communities .................................................................................. 30
Comparable Communities ...................................................................................................................... 30
Benchmarking Data ................................................................................................................................. 32
Population and Per Capita Income ......................................................................................................... 32
Full‐Time Equivalent Employees ............................................................................................................. 33
General Fund Expenditures ..................................................................................................................... 35
General Fund Revenues .......................................................................................................................... 36
Home Rule Sales Tax ............................................................................................................................... 41
Property Taxes and Assessed Valuation ................................................................................................. 42
Pensions .................................................................................................................................................. 61
Table of Contents
Revenue and Expenditure Projections ........................................................................................................ 72
Revenue and Expenditure Forecast ........................................................................................................ 72
Revenues ................................................................................................................................................. 83
Expenditures ........................................................................................................................................... 86
Personnel Costs ....................................................................................................................................... 88
Outsourcing of Services ...................................................................................................................... 89
Salaries ................................................................................................................................................ 90
Bargaining Units .................................................................................................................................. 91
Wellness .............................................................................................................................................. 92
Retiree Insurance ................................................................................................................................ 92
Health Insurance Plan Design ............................................................................................................. 94
Streets and Fleet Analysis – Preliminary Asset Management Plan ............................................................. 98
Fleet Inventory ........................................................................................................................................ 98
Fleet Condition Assessment .................................................................................................................. 101
Level of Service ..................................................................................................................................... 104
Replacement Cost ................................................................................................................................. 105
Street Inventory .................................................................................................................................... 107
Pavement Condition Assessment ......................................................................................................... 107
Level of Service ..................................................................................................................................... 110
Pavement Management Plan ................................................................................................................ 111
Alternative Funding Policy Considerations ............................................................................................... 116
Intergovernmental Agreements – Revenue Sharing ............................................................................ 116
DeKalb Market Square Agreements and the Peace Road Interchange ............................................ 116
Peace Road Interchange Improvements ........................................................................................... 118
DeKalb County Home Agreement ..................................................................................................... 122
Sycamore Boundary Agreement ....................................................................................................... 125
General Fund Stabilization – Property Tax Levy ................................................................................... 126
Streets and Fleet Funding ..................................................................................................................... 127
Streets and Fleet Conclusions ............................................................................................................... 128
Alternative Funding Policy Conclusions ................................................................................................ 128
Introduction
Introduction
Purpose of Financial Planning Tool for Decision Making Long‐Term Financial Plan Elements of the Plan
7
Introduction
The impact of the most recent recession and following slow growth recovery has built a structural imbalance for the City of DeKalb. A structural imbalance is where expenditure growth outpaces revenue growth. In the recent three years, the State of Illinois’ inability to pass a budget until the Fiscal Year 2019‐2020 budget has had additional direct and indirect impact on the City of DeKalb. The City’s budget has been impacted by declining and delayed revenue streams. It has also had an impact on the City’s latest bond rating by Moody’s. The two sectors hit hardest by the State’s lack of annual budgets include higher education and social services. The City’s largest employer Northern Illinois University has seen their funding drastically cut and revenue decreased which has had a domino effect on enrollment. Decreased social service agency funding has negatively impacted DeKalb residents who financially are the group that can least afford the reduction. All of these realities factor into the City’s ability to provide service to DeKalb residents and businesses, both short‐term and long‐term. In order to address the issues relating to the City, an important strategy in funding City operations is ensuring a diversified revenue base and creating stronger, more reliable revenue streams. One of the key components of that revenue base is a strong tax base and increasing the overall Equalized Assessed Valuation (EAV). The City has a number of projects that are in the works to assist in increasing the overall EAV and create stronger revenue streams.
Purpose of Financial Planning
The Government Finance Officers Association (GFOA) outlines a number of Best Practices. According to their list of Best Practices and one relating to long‐term planning is the Establishment of Strategic Plans. GFOA identifies the following.
Strategic planning is a comprehensive and systematic management tool designed to help organizations assess the current environment, anticipate and respond appropriately to changes in the environment, envision the future, increase effectiveness, develop commitment to the organizations mission and achieve consensus on strategies and objectives for achieving that mission.
GFOA further recommends that, “all governmental entities use some form of strategic planning to provide a long‐term perspective for service delivery and budgeting, thus establishing logical links between authorized spending and broad organizational goals.” In 2015, the City undertook a strategic planning process that would set direction for City policy, budgeting and program development for the next 10 years. An extensive community engagement effort was conducted in order to capture the opinions and ideas about the future of DeKalb from people who live, work and/or learn in the City. In February of 2016, the City Council adopted the DeKalb 2025 Strategic Plan that provided an outline of priorities for a 10‐year horizon.
8
GFOA’s Best Practice on Long‐Term Financial Planning states: Many governments have a comprehensive long‐term financial planning process because it stimulates discussion and engenders a long‐term perspective for decision makers. It can be used as a tool to prevent financial challenges; it stimulates long‐term and strategic thinking; it can give consensus on long‐term financial direction; and it is useful for communications with internal and external stakeholders.
In past annual budget documents, the City has included a Five‐Year Financial Forecast for the General Fund. It included assumptions required to understand the City’s financial position in future years beyond the information contained in the main portions of the annual operating budget for the General Fund. The Forecast is updated annually as part of the budget process.
The development of the City’s inaugural Five Year Financial Plan in 2018 was an extension of the continued and progressive path of effective financial management. The Five‐Year Financial Plan is a process and strategy for long‐term strategic financial planning that includes economic position analysis, benchmarking to comparable communities, revenue and expenditure analysis, capital planning and alternative policy considerations. The Plan will allow the City to address the individual or compounded effects of various policy choices and to demonstrate their impact on the City’s financial future.
This information enables City Council and the community to discuss policy decisions with greater awareness of their long‐term financial implications. Through this process and strategy, the City seeks to achieve the balance of fiscal strength, accountability and results that the community values.
Tool for Decision‐Making
To achieve results that the community values in a constrained economic environment, resources must be strategically aligned to reflect community values. This process of alignment cannot be completed in only a single budget cycle. This need for multi‐year alignment is addressed through long‐term planning. The Five‐Year Financial Plan does not include specific decisions on how to bring the City’s five‐year revenues and expenditures in balance. It presents the causes of particular issues and provides an opportunity for examining various policy options while facilitating a community dialogue about those choices.
Long‐Term Financial Plan
As outlined, long‐term financial planning is a best management practice recommended by the GFOA. The planning process combines financial forecasting with strategy planning. It is a collaborative process that considers future scenarios and helps governments navigate challenges. Long‐term financial planning works best as part of an overall strategic plan. GFOA states:
9
Financial forecasting is the process of projecting revenues and expenditures over a long‐term period, using assumptions about economic conditions, future spending scenarios, and other salient variables. Long‐term financial planning is the process of aligning financial capacity with long‐term service objectives. Financial planning uses forecasts to provide insight into future financial capacity so that strategies can be developed to achieve long‐term sustainability in light of the government's service objectives and financial challenges.
According to GFOA, “a long‐term financial plan should include these steps:
1. Mobilization Phase. The mobilization phase prepares the organization for long‐term planning by creating consensus on what the purpose and results of the planning process should be.
2. Analysis Phase. The analysis phase is designed to produce information that supports planning and strategizing. The analysis phase includes the projections and financial analysis commonly associated with long‐term financial planning.
3. Decision Phase. After the analysis phase is completed, the government must decide how
to use the information provided. Key to decision phase is a highly participative process that involves elected officials, staff, and the public. The decision phase also includes a culminating event where the stakeholders can assess the planning process to evaluate whether the purposes for the plan described in the mobilization phase were fulfilled and where a sense of closure and accomplishment can be generated. Finally, the decision phase should address the processes for executing the plan to ensure tangible results are realized.
4. Execution Phase. After the plan is officially adopted, strategies must be put into action
(e.g. funding required in achieving goals). The execution phase is where the strategies become operational through the budget, financial performance measures, and action plans. Regular monitoring should be part of this phase.”
Elements of the Plan The elements of the Five‐Year Financial Plan include:
1. Summary of DeKalb’s current economic position 2. Benchmarking DeKalb to comparable communities 3. Revenue and expenditure projections 4. Streets and Fleet Preliminary Asset Management Analysis 5. Alternative funding policy considerations
As part of the summary on DeKalb’s current economic position, DeKalb’s economic strengths are summarized. Information is provided regarding DeKalb’s population, education
10
attainment, housing and land use. This section also describes Northern Illinois University and its general impact on the community’s workforce. A commentary is also provided on retail and commercial real estate. Information is provided describing DeKalb’s 2017 downgraded bond rating and debt obligations. In benchmarking DeKalb to comparable communities, 13 comparable communities and five university communities were analyzed. The Town of Normal was added as the fifth university community in this 2018 update. Information was gathered from the Comprehensive Annual Financial Reports for data points of 2066, 2011 and 2016. This section compares population, per capita personal income, full time employees, employees per 1,000 population, General Fund expenditures, General Fund expenditures per capita, General Fund revenues and General Fund revenues per capita. General Fund revenues is further summarized by category – sales tax, income tax and utility tax. This section provides each communities’ information for property taxes levied, tax rates, assessed valuation and assessed valuation categories between 2006 and 2016. The last part of the benchmarking section contains comparable information for pension contributions, funding rate and unfunded liability for each community between 2006 and 2016. Summaries are provided for each detailed chart and table. The Revenues and Expenditures Forecast section includes historical fund balances, revenues and expenditures and forecasts. Each forecast contains a summary of the impact on fund balance and property tax rate. This section contains additional information describing the cost centers with significant effect on expenditures such as personnel costs, employee salaries, union contracts, health insurance and retiree health insurance. The Streets and Fleet Preliminary Asset Management Plan is outlined. For streets and fleet, this section includes detailed summaries of asset inventory and condition assessment, level of service evaluation, asset management strategy and financial strategy. Alternative Funding Policy Considerations sections includes detailed history of intergovernmental agreements between the City of DeKalb and DeKalb County and also between the City of DeKalb and the City of Sycamore. The current and projected impact of each agreement is provided. This section includes funding scenarios for streets and fleet. A forecast and policy consideration for General Fund stabilization is also provided.
11
Economic Position
12
Economic Position
DeKalb’s Strengths Population Northern Illinois University Property Values and Taxes National Retail and Commercial Real Estate Bond Rating and Debt Obligations
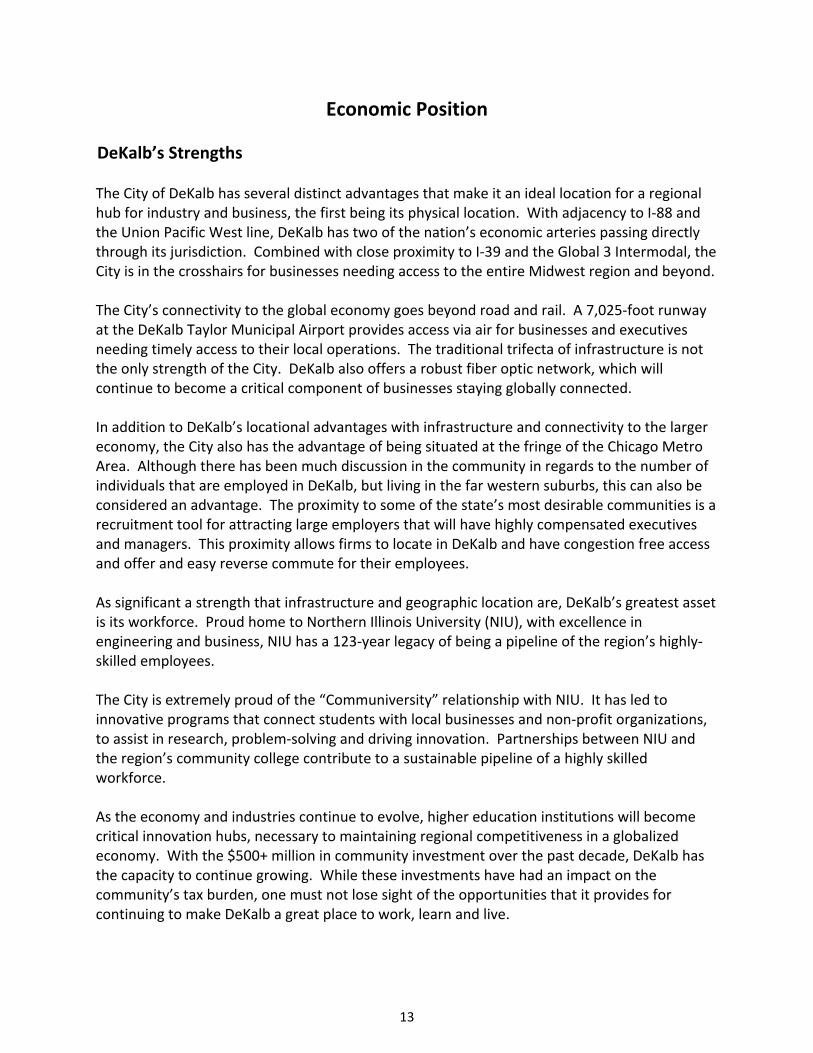
13
Economic Position
DeKalb’s Strengths The City of DeKalb has several distinct advantages that make it an ideal location for a regional hub for industry and business, the first being its physical location. With adjacency to I‐88 and the Union Pacific West line, DeKalb has two of the nation’s economic arteries passing directly through its jurisdiction. Combined with close proximity to I‐39 and the Global 3 Intermodal, the City is in the crosshairs for businesses needing access to the entire Midwest region and beyond. The City’s connectivity to the global economy goes beyond road and rail. A 7,025‐foot runway at the DeKalb Taylor Municipal Airport provides access via air for businesses and executives needing timely access to their local operations. The traditional trifecta of infrastructure is not the only strength of the City. DeKalb also offers a robust fiber optic network, which will continue to become a critical component of businesses staying globally connected. In addition to DeKalb’s locational advantages with infrastructure and connectivity to the larger economy, the City also has the advantage of being situated at the fringe of the Chicago Metro Area. Although there has been much discussion in the community in regards to the number of individuals that are employed in DeKalb, but living in the far western suburbs, this can also be considered an advantage. The proximity to some of the state’s most desirable communities is a recruitment tool for attracting large employers that will have highly compensated executives and managers. This proximity allows firms to locate in DeKalb and have congestion free access and offer and easy reverse commute for their employees. As significant a strength that infrastructure and geographic location are, DeKalb’s greatest asset is its workforce. Proud home to Northern Illinois University (NIU), with excellence in engineering and business, NIU has a 123‐year legacy of being a pipeline of the region’s highly‐skilled employees. The City is extremely proud of the “Communiversity” relationship with NIU. It has led to innovative programs that connect students with local businesses and non‐profit organizations, to assist in research, problem‐solving and driving innovation. Partnerships between NIU and the region’s community college contribute to a sustainable pipeline of a highly skilled workforce. As the economy and industries continue to evolve, higher education institutions will become critical innovation hubs, necessary to maintaining regional competitiveness in a globalized economy. With the $500+ million in community investment over the past decade, DeKalb has the capacity to continue growing. While these investments have had an impact on the community’s tax burden, one must not lose sight of the opportunities that it provides for continuing to make DeKalb a great place to work, learn and live.
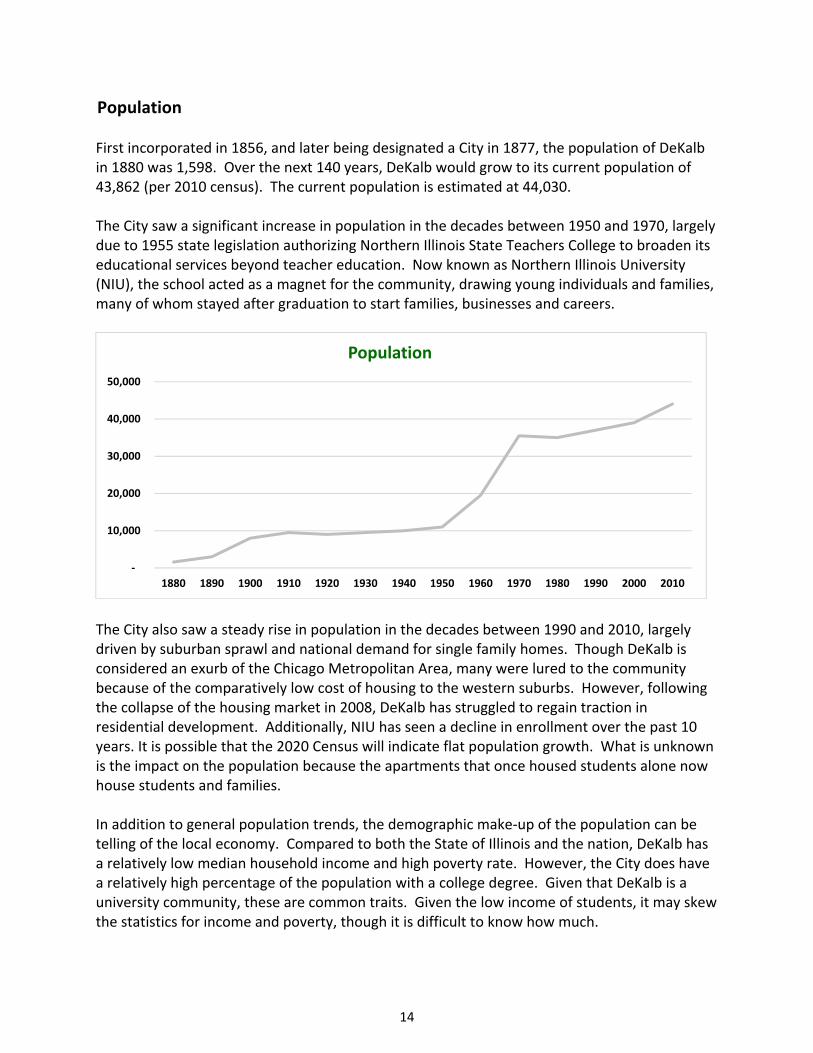
14
Population First incorporated in 1856, and later being designated a City in 1877, the population of DeKalb in 1880 was 1,598. Over the next 140 years, DeKalb would grow to its current population of 43,862 (per 2010 census). The current population is estimated at 44,030. The City saw a significant increase in population in the decades between 1950 and 1970, largely due to 1955 state legislation authorizing Northern Illinois State Teachers College to broaden its educational services beyond teacher education. Now known as Northern Illinois University (NIU), the school acted as a magnet for the community, drawing young individuals and families, many of whom stayed after graduation to start families, businesses and careers.
The City also saw a steady rise in population in the decades between 1990 and 2010, largely driven by suburban sprawl and national demand for single family homes. Though DeKalb is considered an exurb of the Chicago Metropolitan Area, many were lured to the community because of the comparatively low cost of housing to the western suburbs. However, following the collapse of the housing market in 2008, DeKalb has struggled to regain traction in residential development. Additionally, NIU has seen a decline in enrollment over the past 10 years. It is possible that the 2020 Census will indicate flat population growth. What is unknown is the impact on the population because the apartments that once housed students alone now house students and families. In addition to general population trends, the demographic make‐up of the population can be telling of the local economy. Compared to both the State of Illinois and the nation, DeKalb has a relatively low median household income and high poverty rate. However, the City does have a relatively high percentage of the population with a college degree. Given that DeKalb is a university community, these are common traits. Given the low income of students, it may skew the statistics for income and poverty, though it is difficult to know how much.
‐
10,000
20,000
30,000
40,000
50,000
1880 1890 1900 1910 1920 1930 1940 1950 1960 1970 1980 1990 2000 2010
Population
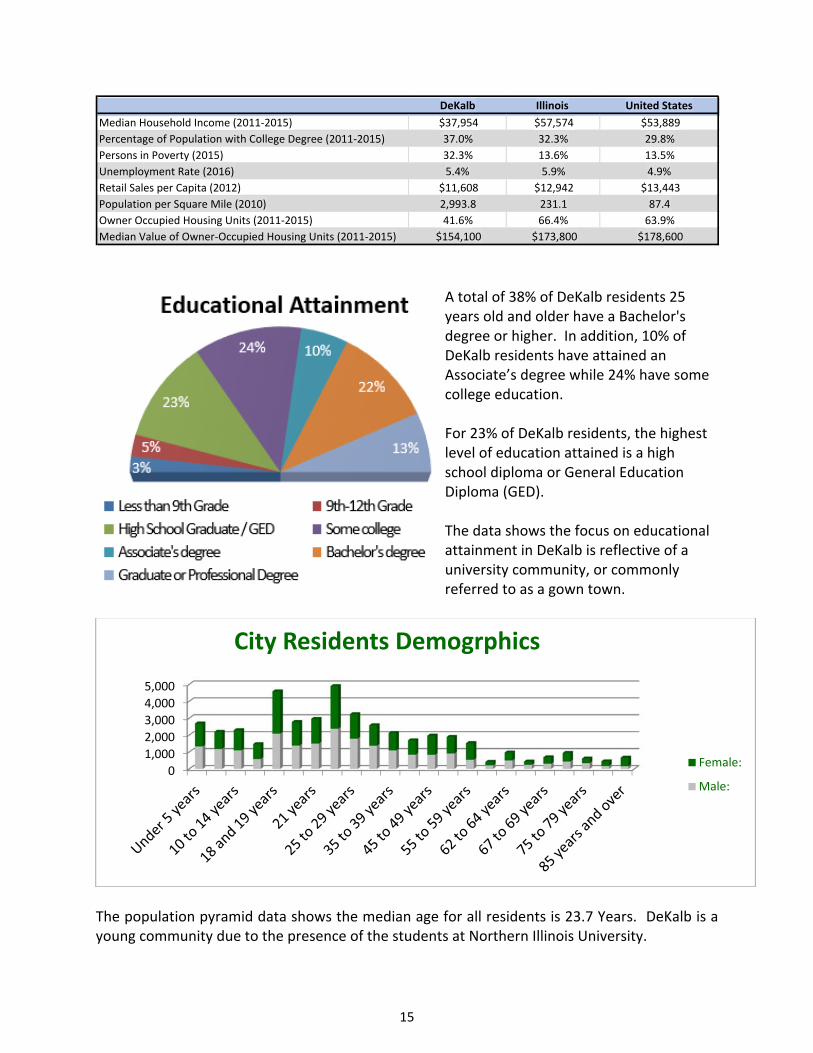
15
A total of 38% of DeKalb residents 25 years old and older have a Bachelor's degree or higher. In addition, 10% of DeKalb residents have attained an Associate’s degree while 24% have some college education. For 23% of DeKalb residents, the highest level of education attained is a high school diploma or General Education Diploma (GED). The data shows the focus on educational attainment in DeKalb is reflective of a university community, or commonly referred to as a gown town.
The population pyramid data shows the median age for all residents is 23.7 Years. DeKalb is a young community due to the presence of the students at Northern Illinois University.
0
1,000
2,000
3,000
4,000
5,000
City Residents Demogrphics
Female:
Male:
DeKalb Illinois United States
Median Household Income (2011‐2015) $37,954 $57,574 $53,889 Percentage of Population with College Degree (2011‐2015) 37.0% 32.3% 29.8% Persons in Poverty (2015) 32.3% 13.6% 13.5% Unemployment Rate (2016) 5.4% 5.9% 4.9%
Retail Sales per Capita (2012) $11,608 $12,942 $13,443 Population per Square Mile (2010) 2,993.8 231.1 87.4 Owner Occupied Housing Units (2011‐2015) 41.6% 66.4% 63.9% Median Value of Owner‐Occupied Housing Units (2011‐2015) $154,100 $173,800 $178,600
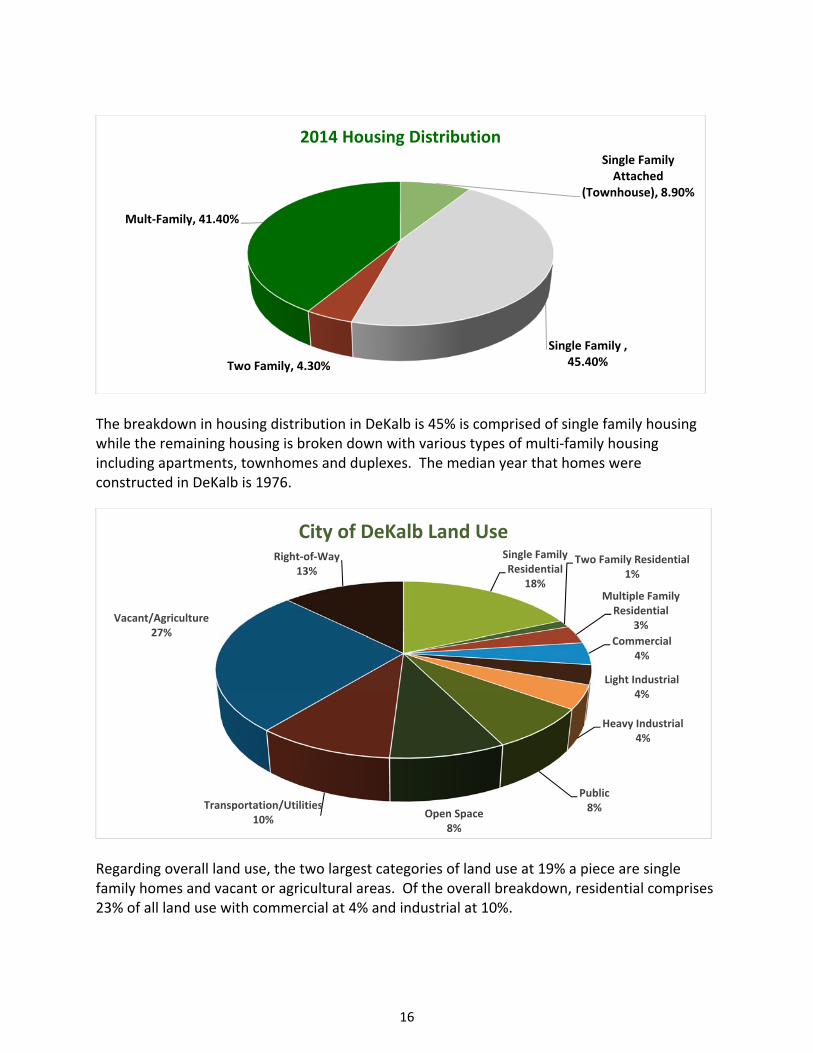
16
The breakdown in housing distribution in DeKalb is 45% is comprised of single family housing while the remaining housing is broken down with various types of multi‐family housing including apartments, townhomes and duplexes. The median year that homes were constructed in DeKalb is 1976.
Regarding overall land use, the two largest categories of land use at 19% a piece are single family homes and vacant or agricultural areas. Of the overall breakdown, residential comprises 23% of all land use with commercial at 4% and industrial at 10%.
Single Family Attached
(Townhouse), 8.90%
Single Family , 45.40%Two Family, 4.30%
Mult‐Family, 41.40%
2014 Housing Distribution
Single Family Residential
18%
Two Family Residential1%
Multiple Family Residential
3%
Commercial4%
Light Industrial4%
Heavy Industrial4%
Public8%Open Space
8%
Transportation/Utilities10%
Vacant/Agriculture27%
Right‐of‐Way13%
City of DeKalb Land Use
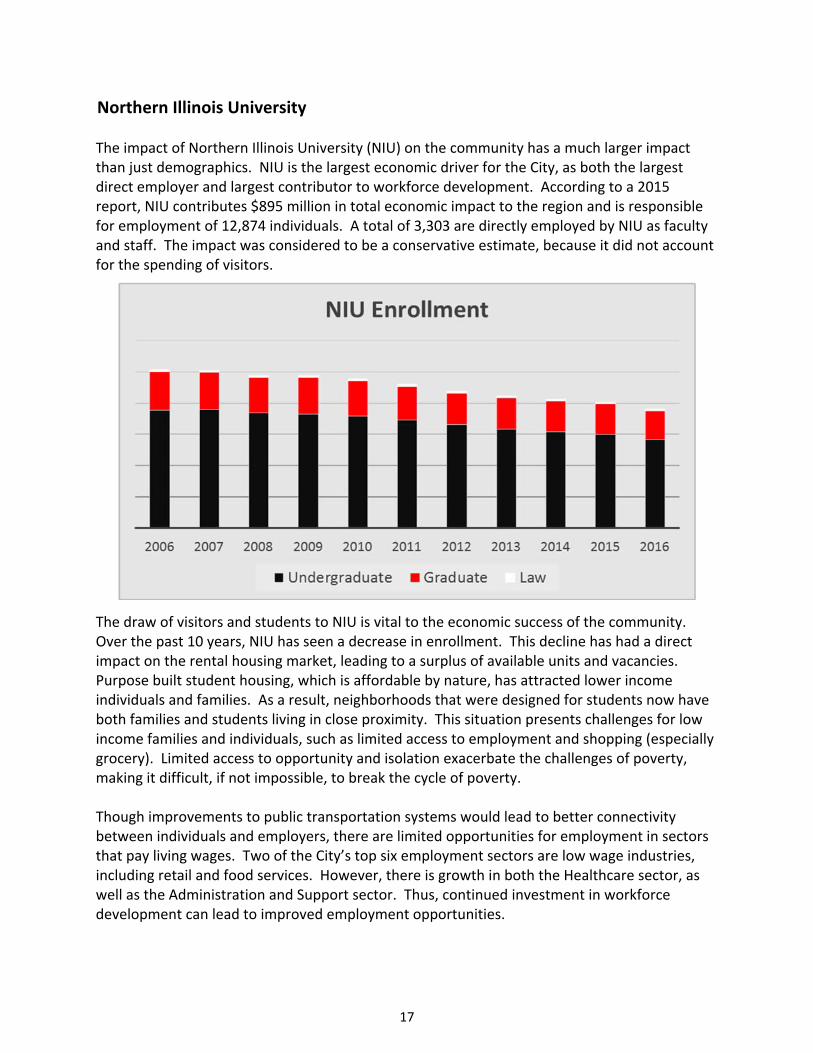
17
Northern Illinois University The impact of Northern Illinois University (NIU) on the community has a much larger impact than just demographics. NIU is the largest economic driver for the City, as both the largest direct employer and largest contributor to workforce development. According to a 2015 report, NIU contributes $895 million in total economic impact to the region and is responsible for employment of 12,874 individuals. A total of 3,303 are directly employed by NIU as faculty and staff. The impact was considered to be a conservative estimate, because it did not account for the spending of visitors.
The draw of visitors and students to NIU is vital to the economic success of the community. Over the past 10 years, NIU has seen a decrease in enrollment. This decline has had a direct impact on the rental housing market, leading to a surplus of available units and vacancies. Purpose built student housing, which is affordable by nature, has attracted lower income individuals and families. As a result, neighborhoods that were designed for students now have both families and students living in close proximity. This situation presents challenges for low income families and individuals, such as limited access to employment and shopping (especially grocery). Limited access to opportunity and isolation exacerbate the challenges of poverty, making it difficult, if not impossible, to break the cycle of poverty. Though improvements to public transportation systems would lead to better connectivity between individuals and employers, there are limited opportunities for employment in sectors that pay living wages. Two of the City’s top six employment sectors are low wage industries, including retail and food services. However, there is growth in both the Healthcare sector, as well as the Administration and Support sector. Thus, continued investment in workforce development can lead to improved employment opportunities.
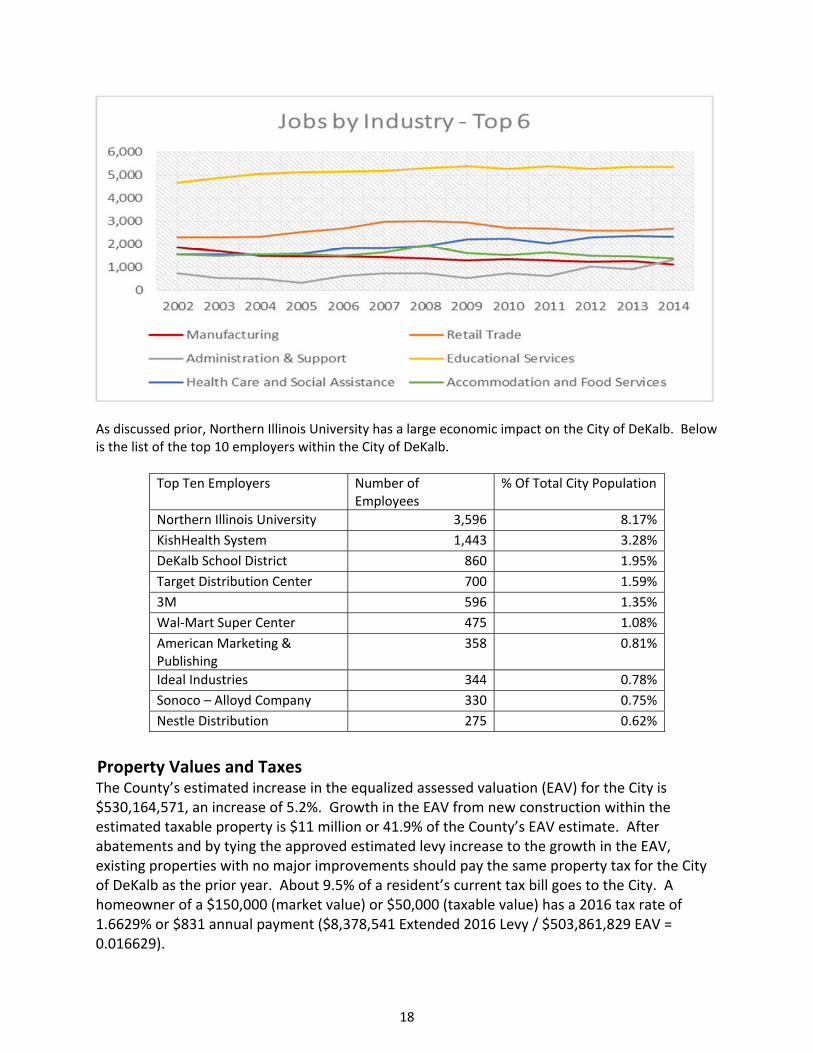
18
As discussed prior, Northern Illinois University has a large economic impact on the City of DeKalb. Below is the list of the top 10 employers within the City of DeKalb.
Top Ten Employers Number of Employees
% Of Total City Population
Northern Illinois University 3,596 8.17%
KishHealth System 1,443 3.28%
DeKalb School District 860 1.95%
Target Distribution Center 700 1.59%
3M 596 1.35%
Wal‐Mart Super Center 475 1.08%
American Marketing & Publishing
358 0.81%
Ideal Industries 344 0.78%
Sonoco – Alloyd Company 330 0.75%
Nestle Distribution 275 0.62%
Property Values and Taxes The County’s estimated increase in the equalized assessed valuation (EAV) for the City is $530,164,571, an increase of 5.2%. Growth in the EAV from new construction within the estimated taxable property is $11 million or 41.9% of the County’s EAV estimate. After abatements and by tying the approved estimated levy increase to the growth in the EAV, existing properties with no major improvements should pay the same property tax for the City of DeKalb as the prior year. About 9.5% of a resident’s current tax bill goes to the City. A homeowner of a $150,000 (market value) or $50,000 (taxable value) has a 2016 tax rate of 1.6629% or $831 annual payment ($8,378,541 Extended 2016 Levy / $503,861,829 EAV = 0.016629).
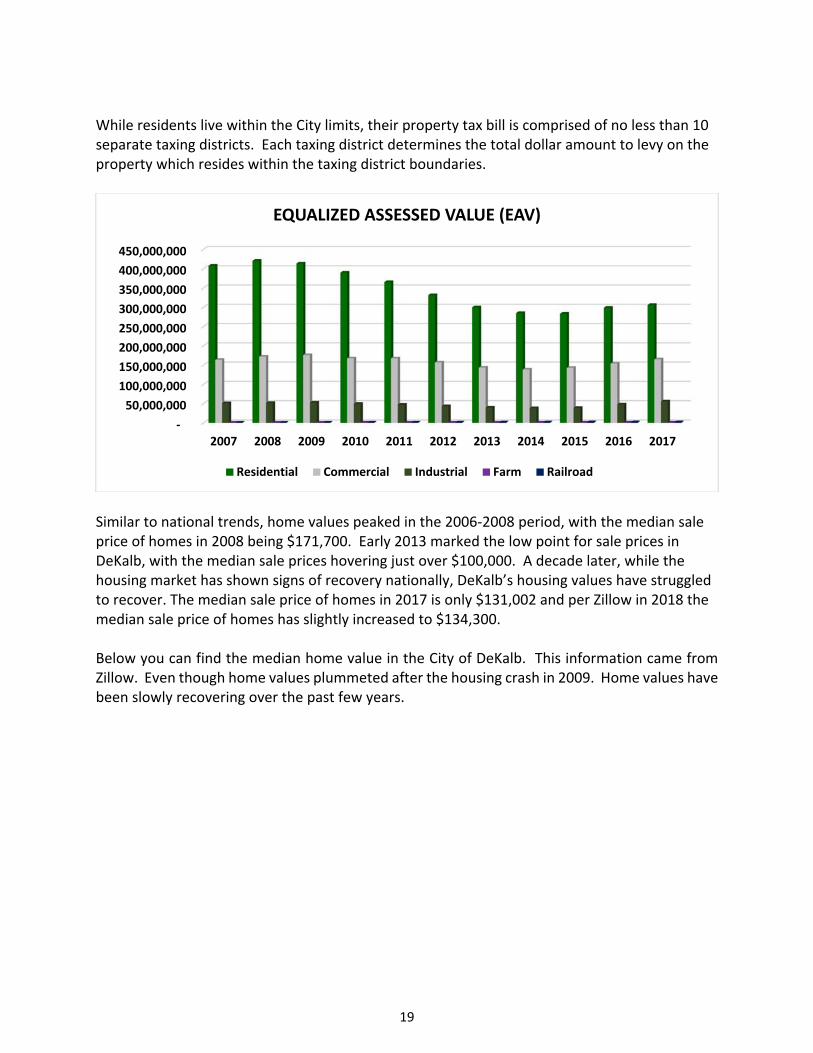
19
While residents live within the City limits, their property tax bill is comprised of no less than 10 separate taxing districts. Each taxing district determines the total dollar amount to levy on the property which resides within the taxing district boundaries.
Similar to national trends, home values peaked in the 2006‐2008 period, with the median sale price of homes in 2008 being $171,700. Early 2013 marked the low point for sale prices in DeKalb, with the median sale prices hovering just over $100,000. A decade later, while the housing market has shown signs of recovery nationally, DeKalb’s housing values have struggled to recover. The median sale price of homes in 2017 is only $131,002 and per Zillow in 2018 the median sale price of homes has slightly increased to $134,300. Below you can find the median home value in the City of DeKalb. This information came from Zillow. Even though home values plummeted after the housing crash in 2009. Home values have been slowly recovering over the past few years.
‐
50,000,000
100,000,000
150,000,000
200,000,000
250,000,000
300,000,000
350,000,000
400,000,000
450,000,000
2007 2008 2009 2010 2011 2012 2013 2014 2015 2016 2017
EQUALIZED ASSESSED VALUE (EAV)
Residential Commercial Industrial Farm Railroad
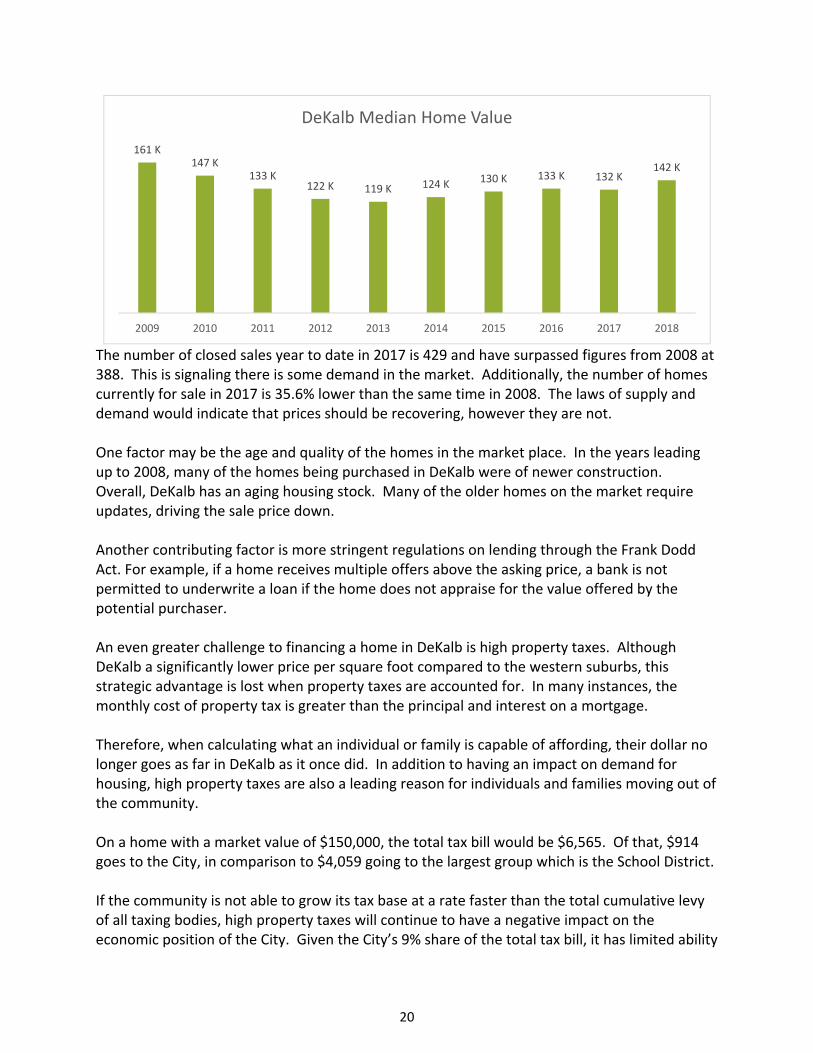
20
The number of closed sales year to date in 2017 is 429 and have surpassed figures from 2008 at 388. This is signaling there is some demand in the market. Additionally, the number of homes currently for sale in 2017 is 35.6% lower than the same time in 2008. The laws of supply and demand would indicate that prices should be recovering, however they are not. One factor may be the age and quality of the homes in the market place. In the years leading up to 2008, many of the homes being purchased in DeKalb were of newer construction. Overall, DeKalb has an aging housing stock. Many of the older homes on the market require updates, driving the sale price down. Another contributing factor is more stringent regulations on lending through the Frank Dodd Act. For example, if a home receives multiple offers above the asking price, a bank is not permitted to underwrite a loan if the home does not appraise for the value offered by the potential purchaser. An even greater challenge to financing a home in DeKalb is high property taxes. Although DeKalb a significantly lower price per square foot compared to the western suburbs, this strategic advantage is lost when property taxes are accounted for. In many instances, the monthly cost of property tax is greater than the principal and interest on a mortgage. Therefore, when calculating what an individual or family is capable of affording, their dollar no longer goes as far in DeKalb as it once did. In addition to having an impact on demand for housing, high property taxes are also a leading reason for individuals and families moving out of the community. On a home with a market value of $150,000, the total tax bill would be $6,565. Of that, $914 goes to the City, in comparison to $4,059 going to the largest group which is the School District. If the community is not able to grow its tax base at a rate faster than the total cumulative levy of all taxing bodies, high property taxes will continue to have a negative impact on the economic position of the City. Given the City’s 9% share of the total tax bill, it has limited ability
161 K147 K
133 K122 K 119 K 124 K 130 K 133 K 132 K
142 K
2009 2010 2011 2012 2013 2014 2015 2016 2017 2018
DeKalb Median Home Value
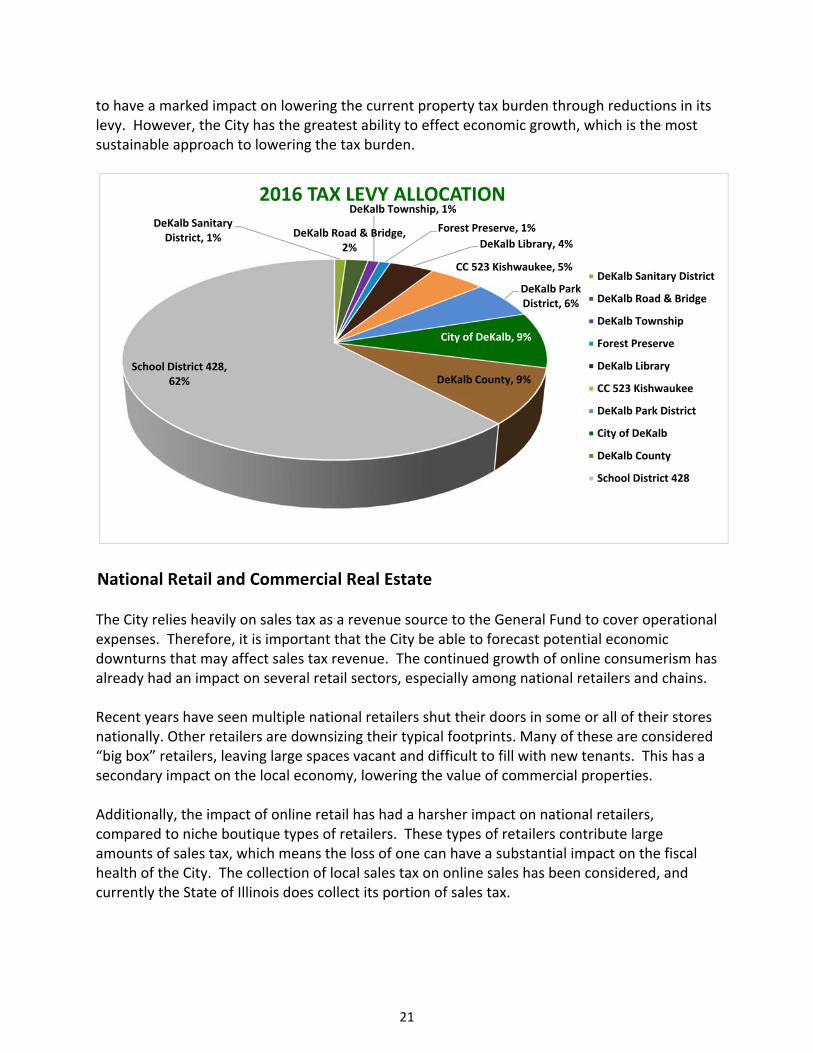
21
to have a marked impact on lowering the current property tax burden through reductions in its levy. However, the City has the greatest ability to effect economic growth, which is the most sustainable approach to lowering the tax burden.
National Retail and Commercial Real Estate The City relies heavily on sales tax as a revenue source to the General Fund to cover operational expenses. Therefore, it is important that the City be able to forecast potential economic downturns that may affect sales tax revenue. The continued growth of online consumerism has already had an impact on several retail sectors, especially among national retailers and chains. Recent years have seen multiple national retailers shut their doors in some or all of their stores nationally. Other retailers are downsizing their typical footprints. Many of these are considered “big box” retailers, leaving large spaces vacant and difficult to fill with new tenants. This has a secondary impact on the local economy, lowering the value of commercial properties. Additionally, the impact of online retail has had a harsher impact on national retailers, compared to niche boutique types of retailers. These types of retailers contribute large amounts of sales tax, which means the loss of one can have a substantial impact on the fiscal health of the City. The collection of local sales tax on online sales has been considered, and currently the State of Illinois does collect its portion of sales tax.
DeKalb Sanitary District, 1% DeKalb Road & Bridge,
2%
DeKalb Township, 1%
Forest Preserve, 1%
DeKalb Library, 4%
CC 523 Kishwaukee, 5%
DeKalb Park District, 6%
City of DeKalb, 9%
DeKalb County, 9%School District 428,
62%
2016 TAX LEVY ALLOCATION
DeKalb Sanitary District
DeKalb Road & Bridge
DeKalb Township
Forest Preserve
DeKalb Library
CC 523 Kishwaukee
DeKalb Park District
City of DeKalb
DeKalb County
School District 428
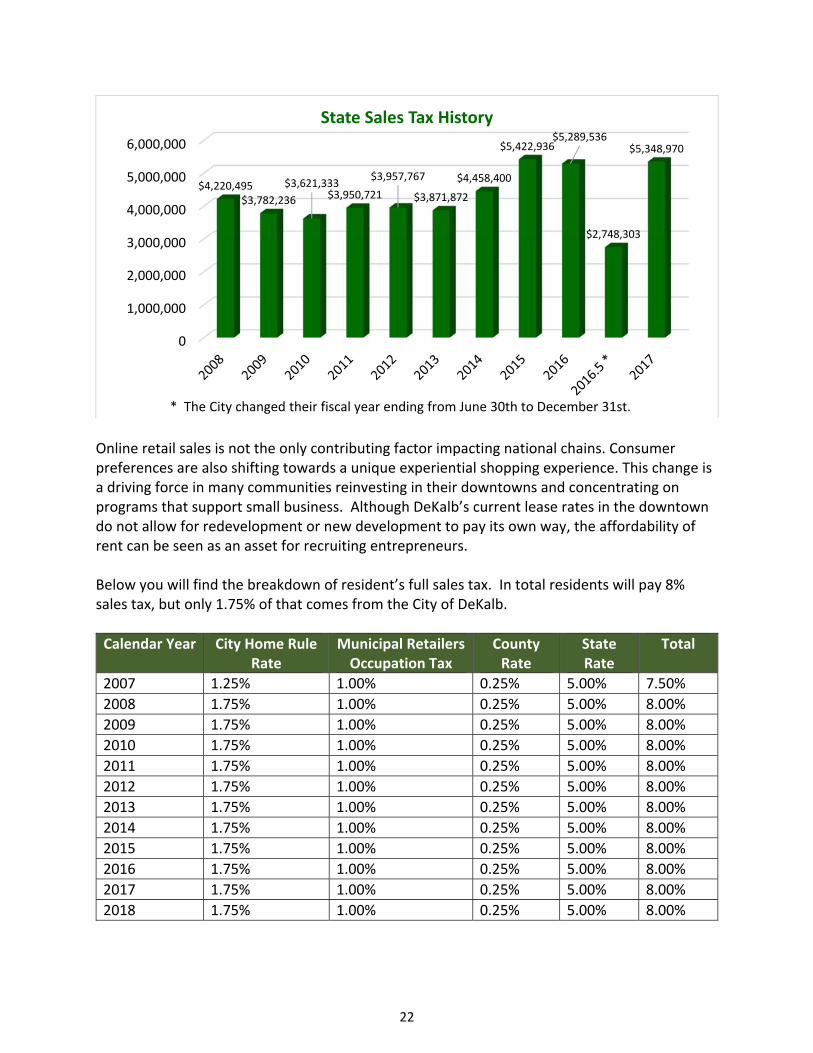
22
Online retail sales is not the only contributing factor impacting national chains. Consumer preferences are also shifting towards a unique experiential shopping experience. This change is a driving force in many communities reinvesting in their downtowns and concentrating on programs that support small business. Although DeKalb’s current lease rates in the downtown do not allow for redevelopment or new development to pay its own way, the affordability of rent can be seen as an asset for recruiting entrepreneurs. Below you will find the breakdown of resident’s full sales tax. In total residents will pay 8% sales tax, but only 1.75% of that comes from the City of DeKalb.
Calendar Year City Home Rule Rate
Municipal Retailers Occupation Tax
County Rate
State Rate
Total
2007 1.25% 1.00% 0.25% 5.00% 7.50%
2008 1.75% 1.00% 0.25% 5.00% 8.00%
2009 1.75% 1.00% 0.25% 5.00% 8.00%
2010 1.75% 1.00% 0.25% 5.00% 8.00%
2011 1.75% 1.00% 0.25% 5.00% 8.00%
2012 1.75% 1.00% 0.25% 5.00% 8.00%
2013 1.75% 1.00% 0.25% 5.00% 8.00%
2014 1.75% 1.00% 0.25% 5.00% 8.00%
2015 1.75% 1.00% 0.25% 5.00% 8.00%
2016 1.75% 1.00% 0.25% 5.00% 8.00%
2017 1.75% 1.00% 0.25% 5.00% 8.00%
2018 1.75% 1.00% 0.25% 5.00% 8.00%
0
1,000,000
2,000,000
3,000,000
4,000,000
5,000,000
6,000,000
$4,220,495$3,782,236
$3,621,333$3,950,721
$3,957,767
$3,871,872
$4,458,400
$5,422,936$5,289,536
$2,748,303
$5,348,970
State Sales Tax History
* The City changed their fiscal year ending from June 30th to December 31st.
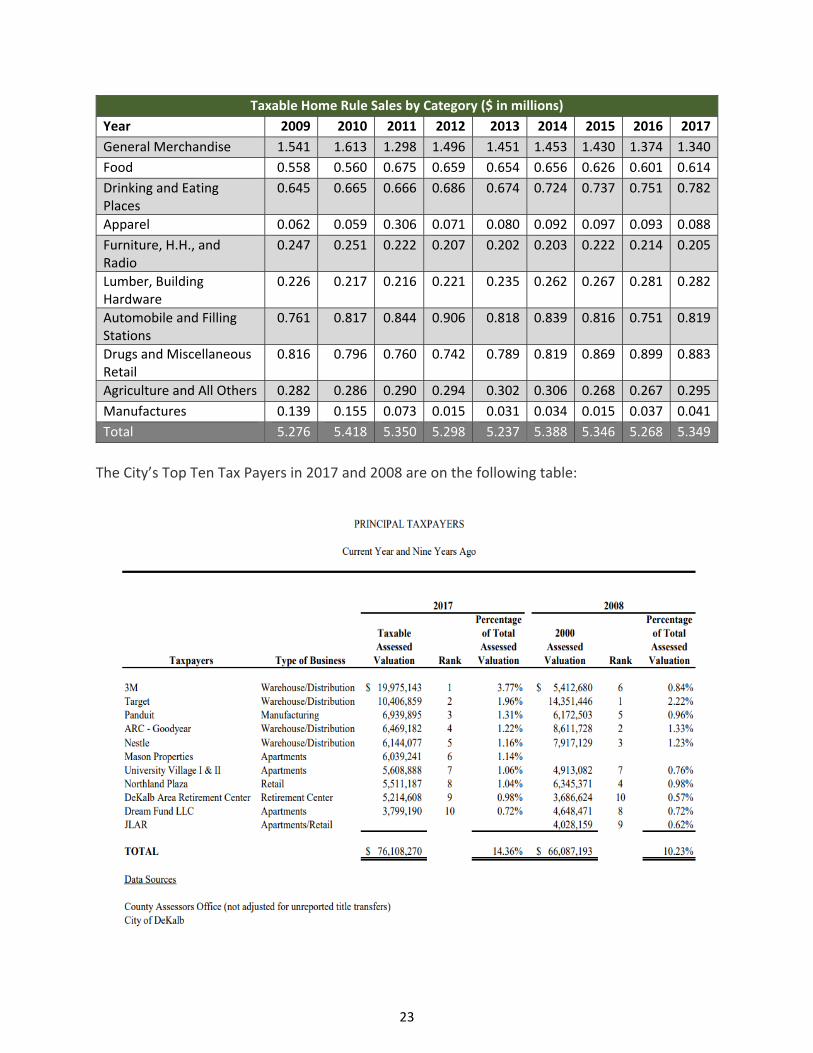
23
Taxable Home Rule Sales by Category ($ in millions)
Year 2009 2010 2011 2012 2013 2014 2015 2016 2017
General Merchandise 1.541 1.613 1.298 1.496 1.451 1.453 1.430 1.374 1.340
Food 0.558 0.560 0.675 0.659 0.654 0.656 0.626 0.601 0.614
Drinking and Eating Places
0.645 0.665 0.666 0.686 0.674 0.724 0.737 0.751 0.782
Apparel 0.062 0.059 0.306 0.071 0.080 0.092 0.097 0.093 0.088
Furniture, H.H., and Radio
0.247 0.251 0.222 0.207 0.202 0.203 0.222 0.214 0.205
Lumber, Building Hardware
0.226 0.217 0.216 0.221 0.235 0.262 0.267 0.281 0.282
Automobile and Filling Stations
0.761 0.817 0.844 0.906 0.818 0.839 0.816 0.751 0.819
Drugs and Miscellaneous Retail
0.816 0.796 0.760 0.742 0.789 0.819 0.869 0.899 0.883
Agriculture and All Others 0.282 0.286 0.290 0.294 0.302 0.306 0.268 0.267 0.295
Manufactures 0.139 0.155 0.073 0.015 0.031 0.034 0.015 0.037 0.041
Total 5.276 5.418 5.350 5.298 5.237 5.388 5.346 5.268 5.349
The City’s Top Ten Tax Payers in 2017 and 2008 are on the following table:
24
Bond Rating and Debt Obligations Moody’s Investors Service downgraded the City’s $32 million General Obligation (GO) bonds to ‘A1’ from ‘Aa3’on May 24, 2017. Moody’s noted in its Report:
The city’s leverage related to debt and pension liabilities has increased substantially in recent years, and is expected to remain elevated. The direct debt burden and the overall debt burden…..are above state and national medians.
Moody’s also identified “Increases in leverage related to the city’s debt or pension burden” as one of the factors that could lead to a downgrade. Moody’s further stated:
Certain rating factors are outside of the City’s control – Local economy and size of local tax base – Institutional presence of Northern Illinois University, whose debt was
downgraded to ‘Ba2’ (below investment grade) by Moody’s on June 9, 2017
Rating factors that are within the City’s control that are addressed in the
FMP – Pension Burdens – Financial Operations and General Fund Reserves
The credit strengths include: Institutional presence of Northern Illinois University Home‐rule with considerable revenue raising flexibility
The credit challenges are: Sizable and growing pension burden Exposure of main local economic institution to the State of Illinois (Baa2 negative)
The following factors that could lead to a downgrade include: Deterioration in the socio‐economic profile or tax base valuation Declines in the City’s reserves or liquidity Increases in leverage related to the City’s debt or pension burden
The City of DeKalb is a home‐rule community and has no legal debt limit set by the Illinois General Assembly. The City monitors the overlapping debt of all taxing districts and is sensitive to the burden debt places on the taxpayer. In FY 2017, the City’s ratio of General Obligation Bonded Debt to EAV was 4.68%.
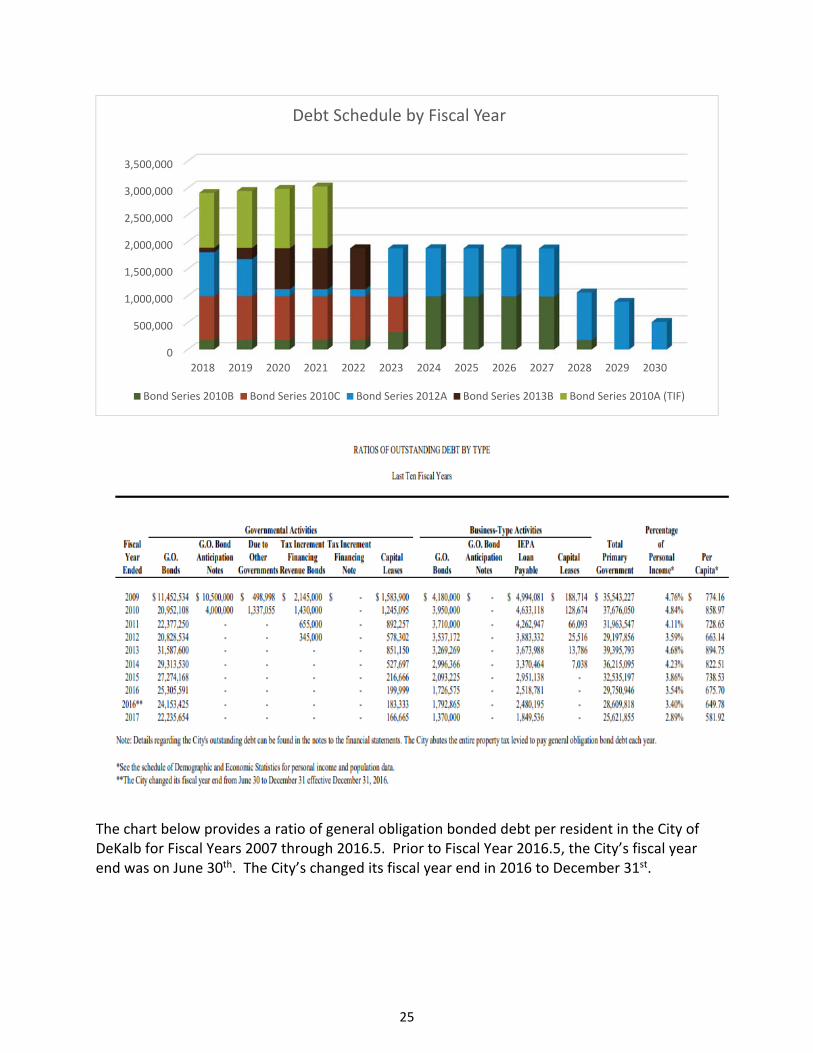
25
The chart below provides a ratio of general obligation bonded debt per resident in the City of DeKalb for Fiscal Years 2007 through 2016.5. Prior to Fiscal Year 2016.5, the City’s fiscal year end was on June 30th. The City’s changed its fiscal year end in 2016 to December 31st.
0
500,000
1,000,000
1,500,000
2,000,000
2,500,000
3,000,000
3,500,000
2018 2019 2020 2021 2022 2023 2024 2025 2026 2027 2028 2029 2030
Debt Schedule by Fiscal Year
Bond Series 2010B Bond Series 2010C Bond Series 2012A Bond Series 2013B Bond Series 2010A (TIF)
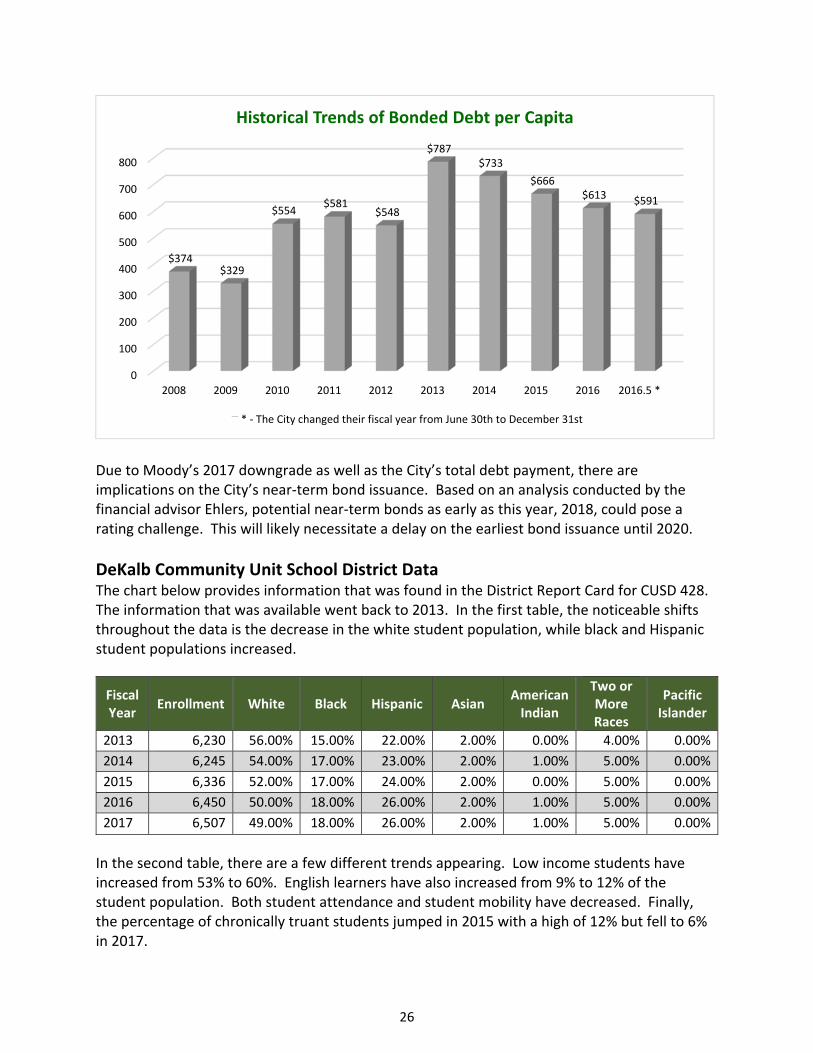
26
Due to Moody’s 2017 downgrade as well as the City’s total debt payment, there are implications on the City’s near‐term bond issuance. Based on an analysis conducted by the financial advisor Ehlers, potential near‐term bonds as early as this year, 2018, could pose a rating challenge. This will likely necessitate a delay on the earliest bond issuance until 2020.
DeKalb Community Unit School District Data The chart below provides information that was found in the District Report Card for CUSD 428. The information that was available went back to 2013. In the first table, the noticeable shifts throughout the data is the decrease in the white student population, while black and Hispanic student populations increased.
Fiscal Year
Enrollment White Black Hispanic Asian American Indian
Two or More Races
Pacific Islander
2013 6,230 56.00% 15.00% 22.00% 2.00% 0.00% 4.00% 0.00%
2014 6,245 54.00% 17.00% 23.00% 2.00% 1.00% 5.00% 0.00%
2015 6,336 52.00% 17.00% 24.00% 2.00% 0.00% 5.00% 0.00%
2016 6,450 50.00% 18.00% 26.00% 2.00% 1.00% 5.00% 0.00%
2017 6,507 49.00% 18.00% 26.00% 2.00% 1.00% 5.00% 0.00%
In the second table, there are a few different trends appearing. Low income students have increased from 53% to 60%. English learners have also increased from 9% to 12% of the student population. Both student attendance and student mobility have decreased. Finally, the percentage of chronically truant students jumped in 2015 with a high of 12% but fell to 6% in 2017.
0
100
200
300
400
500
600
700
800
2008 2009 2010 2011 2012 2013 2014 2015 2016 2016.5 *
$374 $329
$554 $581
$548
$787 $733
$666 $613 $591
Historical Trends of Bonded Debt per Capita
* ‐ The City changed their fiscal year from June 30th to December 31st
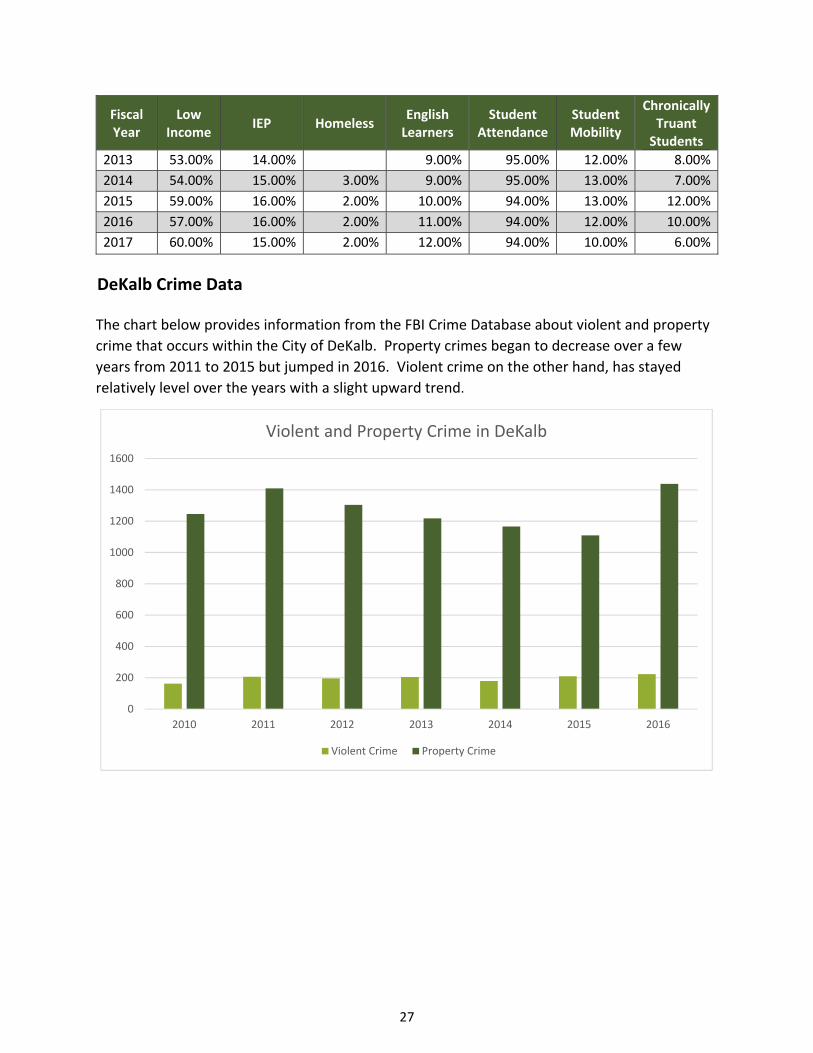
27
Fiscal Year
Low Income
IEP Homeless English Learners
Student Attendance
Student Mobility
Chronically Truant Students
2013 53.00% 14.00% 9.00% 95.00% 12.00% 8.00%
2014 54.00% 15.00% 3.00% 9.00% 95.00% 13.00% 7.00%
2015 59.00% 16.00% 2.00% 10.00% 94.00% 13.00% 12.00%
2016 57.00% 16.00% 2.00% 11.00% 94.00% 12.00% 10.00%
2017 60.00% 15.00% 2.00% 12.00% 94.00% 10.00% 6.00%
DeKalb Crime Data The chart below provides information from the FBI Crime Database about violent and property
crime that occurs within the City of DeKalb. Property crimes began to decrease over a few
years from 2011 to 2015 but jumped in 2016. Violent crime on the other hand, has stayed
relatively level over the years with a slight upward trend.
0
200
400
600
800
1000
1200
1400
1600
2010 2011 2012 2013 2014 2015 2016
Violent and Property Crime in DeKalb
Violent Crime Property Crime
28
Benchmarking
29
Comparable Communities Benchmarking Data Population and Per Capita Income Full‐Time Equivalent Employees General Fund Expenditures General Fund Revenues Home Rule Sale Tax Property Taxes and Assessed Valuation Pensions
Benchmarking
30
Benchmarking DeKalb to Comparable Communities
Comparable Communities In 2015, the City contracted with Sikich, a regional accounting, auditing and consulting firm, to complete a comprehensive Pay and Compensation Study. In order to identify comparable local government employers, Sikich used an empirically based, weighted variable model applied to communities that met the following criteria: Communities located within 40‐mile radius of DeKalb (due to the potential labor pool) Communities with a population plus or minus 50% of DeKalb’s population (between
22,015 and 66,045) Contiguous local government employers that provide a similar breadth of services to
those of DeKalb (Sycamore) Communities that provide municipal fire services
The empirical model used for the study employed a sliding scale of weighted variable that correspond to the measure community’s relative similarity to the City of DeKalb for the particular variable being measured. Eleven variables were assigned weighed value of 15, 10 or 5 points where proportional points were applied based a sliding scale of relativity to DeKalb. Based on a multivariate weighted model, Sikich determined 13 comparable cities or villages were sufficiently similar. The Carpentersville was the most comparable, while Sycamore and St. Charles were the least comparable.
Scoring Rubric for Empirical Development of Comparable Communities
Criterion Source Variable Weighting Max Point Value
1. Municipal Fire Department
Office of the Illinois State Fire Marshal (OSFM) httg://webapps.sfm.illinois.gov/FireDeptSearch/
Yes/No
2. Home Rule Status Illinois Municipal League Website http://imlrma.org/page.cfm?key=2
5 pts.
3. Colleges or
Universities Community Webpages
5 pts.
4. Population Illinois State Comptroller Local Government Warehouse FY 2013
15 pts.
5. Distance from DeKalb
http://www.distance‐cities.co/ 10 pts.
6. Number of Full‐ Time Employees
Illinois State Comptroller Local Government Warehouse FY 2013
15 pts.
7. General Fund Total Expenditures
Illinois State Comptroller Local Government Warehouse FY 2013
10 pts.
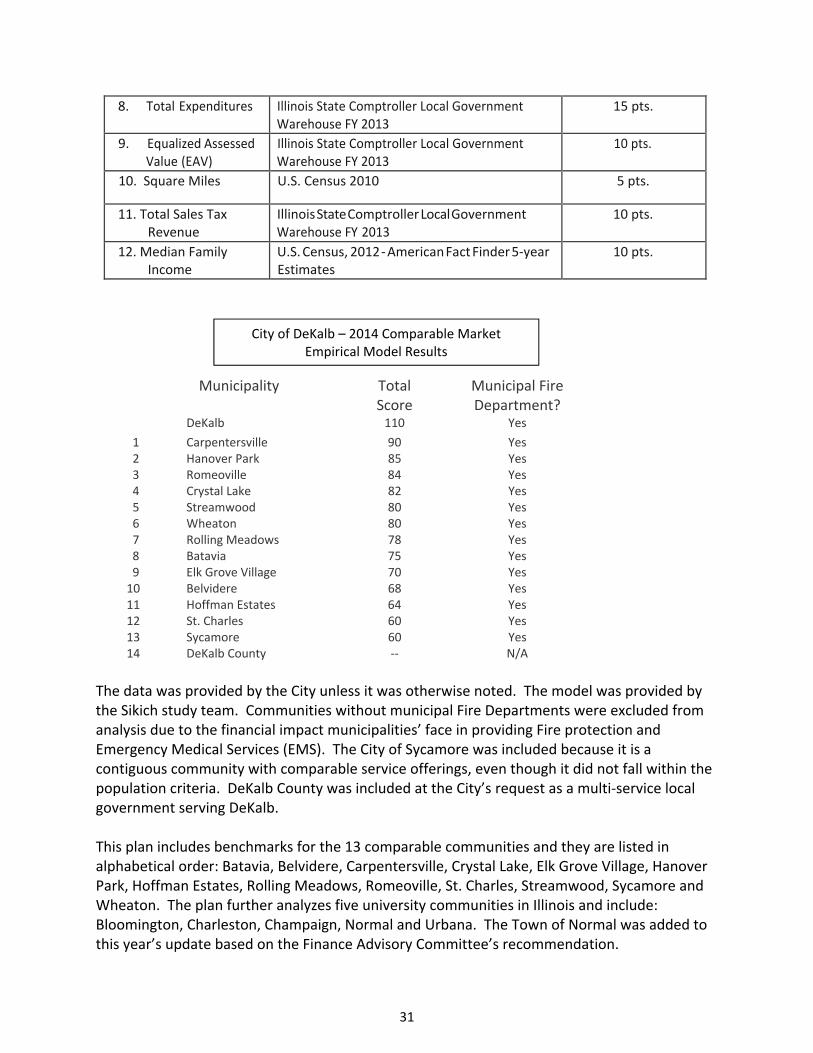
31
8. Total Expenditures Illinois State Comptroller Local Government Warehouse FY 2013
15 pts.
9. Equalized Assessed Value (EAV)
Illinois State Comptroller Local Government Warehouse FY 2013
10 pts.
10. Square Miles U.S. Census 2010 5 pts.
11. Total Sales Tax Revenue
Illinois State Comptroller Local Government Warehouse FY 2013
10 pts.
12. Median Family Income
U.S. Census, 2012 ‐ American Fact Finder 5‐year Estimates
10 pts.
Municipality Total Score
Municipal Fire Department?
DeKalb 110 Yes
1 Carpentersville 90 Yes 2 Hanover Park 85 Yes 3 Romeoville 84 Yes 4 Crystal Lake 82 Yes 5 Streamwood 80 Yes 6 Wheaton 80 Yes 7 Rolling Meadows 78 Yes 8 Batavia 75 Yes 9 Elk Grove Village 70 Yes 10 Belvidere 68 Yes 11 Hoffman Estates 64 Yes 12 St. Charles 60 Yes 13 Sycamore 60 Yes 14 DeKalb County ‐‐ N/A
The data was provided by the City unless it was otherwise noted. The model was provided by the Sikich study team. Communities without municipal Fire Departments were excluded from analysis due to the financial impact municipalities’ face in providing Fire protection and Emergency Medical Services (EMS). The City of Sycamore was included because it is a contiguous community with comparable service offerings, even though it did not fall within the population criteria. DeKalb County was included at the City’s request as a multi‐service local government serving DeKalb. This plan includes benchmarks for the 13 comparable communities and they are listed in alphabetical order: Batavia, Belvidere, Carpentersville, Crystal Lake, Elk Grove Village, Hanover Park, Hoffman Estates, Rolling Meadows, Romeoville, St. Charles, Streamwood, Sycamore and Wheaton. The plan further analyzes five university communities in Illinois and include: Bloomington, Charleston, Champaign, Normal and Urbana. The Town of Normal was added to this year’s update based on the Finance Advisory Committee’s recommendation.
City of DeKalb – 2014 Comparable Market Empirical Model Results
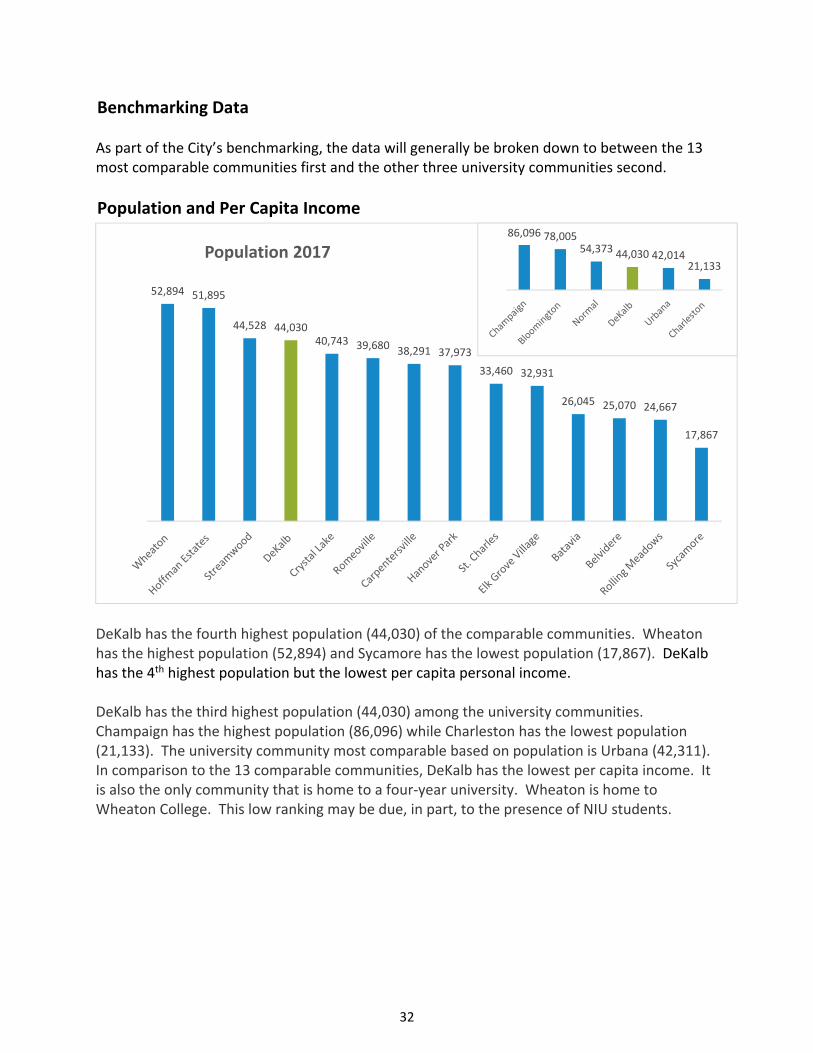
32
Benchmarking Data As part of the City’s benchmarking, the data will generally be broken down to between the 13 most comparable communities first and the other three university communities second.
Population and Per Capita Income
DeKalb has the fourth highest population (44,030) of the comparable communities. Wheaton has the highest population (52,894) and Sycamore has the lowest population (17,867). DeKalb has the 4th highest population but the lowest per capita personal income. DeKalb has the third highest population (44,030) among the university communities. Champaign has the highest population (86,096) while Charleston has the lowest population (21,133). The university community most comparable based on population is Urbana (42,311). In comparison to the 13 comparable communities, DeKalb has the lowest per capita income. It is also the only community that is home to a four‐year university. Wheaton is home to Wheaton College. This low ranking may be due, in part, to the presence of NIU students.
52,894 51,895
44,528 44,03040,743 39,680 38,291 37,973
33,460 32,931
26,045 25,070 24,667
17,867
Population 2017 86,096 78,005
54,373 44,030 42,01421,133
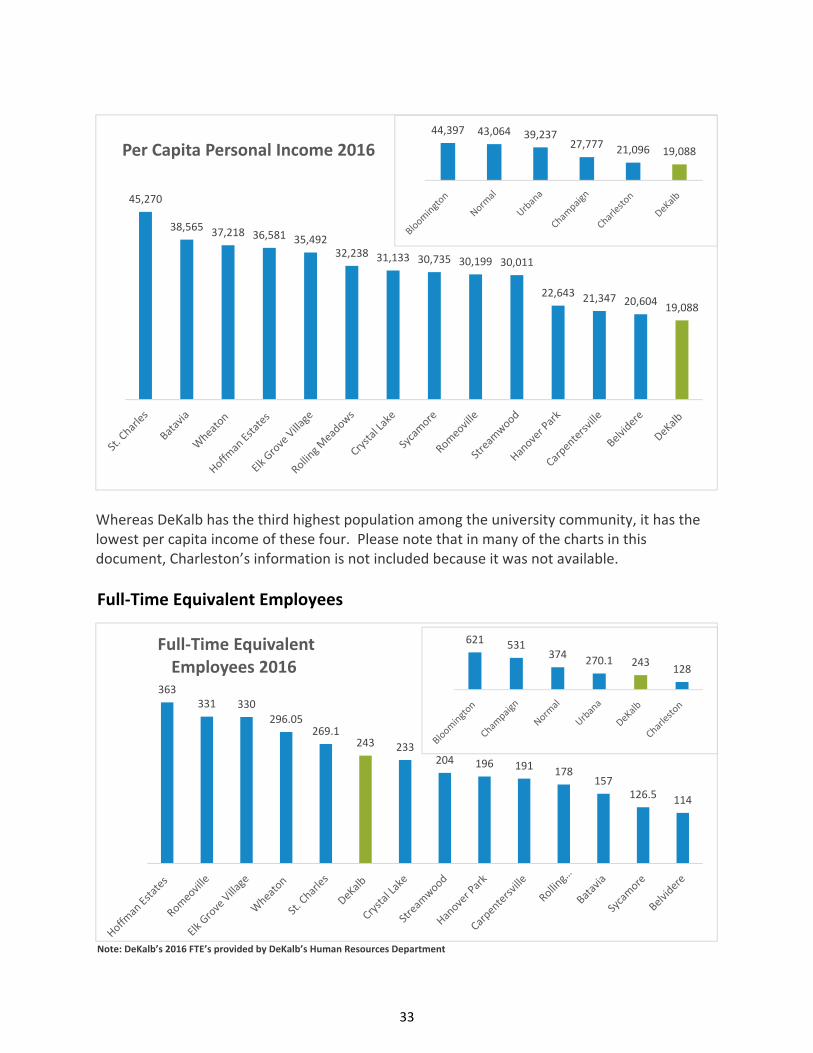
33
Whereas DeKalb has the third highest population among the university community, it has the lowest per capita income of these four. Please note that in many of the charts in this document, Charleston’s information is not included because it was not available.
Full‐Time Equivalent Employees
Note: DeKalb’s 2016 FTE’s provided by DeKalb’s Human Resources Department
45,270
38,565 37,218 36,581 35,49232,238 31,133 30,735 30,199 30,011
22,643 21,347 20,60419,088
Per Capita Personal Income 201644,397 43,064 39,237
27,777 21,096 19,088
363331 330
296.05269.1
243 233204 196 191 178
157126.5 114
Full‐Time Equivalent Employees 2016
621 531374
270.1 243128
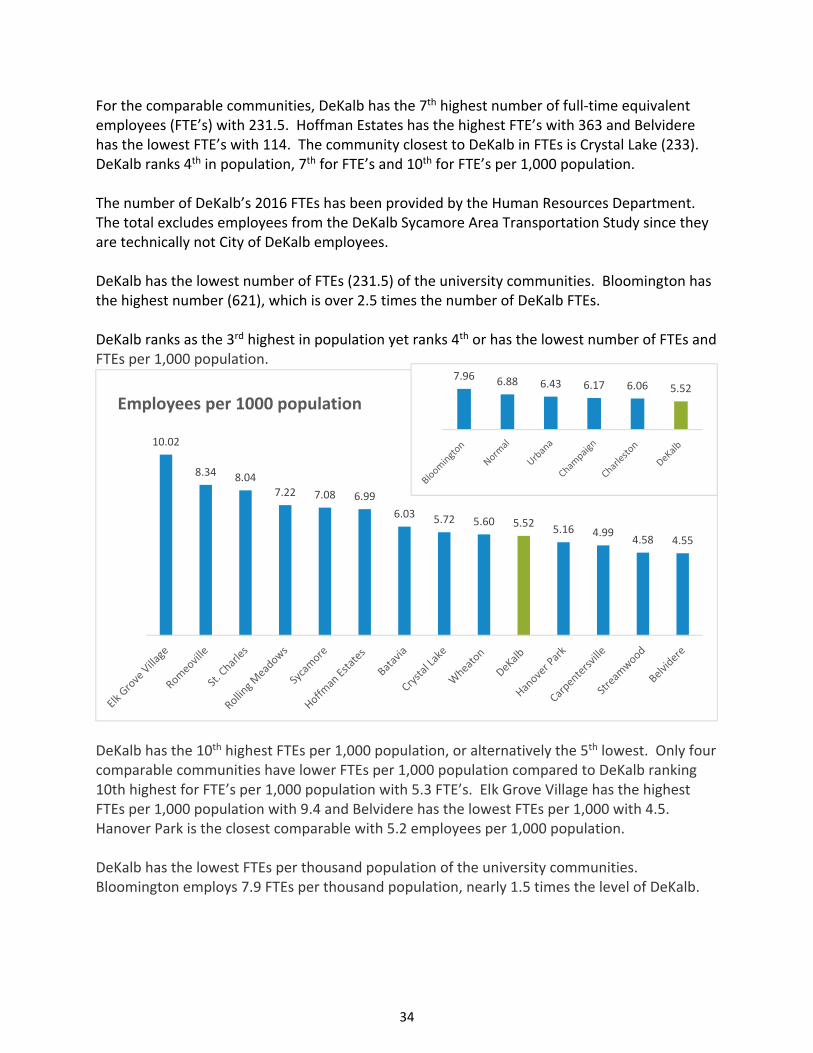
34
For the comparable communities, DeKalb has the 7th highest number of full‐time equivalent employees (FTE’s) with 231.5. Hoffman Estates has the highest FTE’s with 363 and Belvidere has the lowest FTE’s with 114. The community closest to DeKalb in FTEs is Crystal Lake (233). DeKalb ranks 4th in population, 7th for FTE’s and 10th for FTE’s per 1,000 population. The number of DeKalb’s 2016 FTEs has been provided by the Human Resources Department. The total excludes employees from the DeKalb Sycamore Area Transportation Study since they are technically not City of DeKalb employees. DeKalb has the lowest number of FTEs (231.5) of the university communities. Bloomington has the highest number (621), which is over 2.5 times the number of DeKalb FTEs. DeKalb ranks as the 3rd highest in population yet ranks 4th or has the lowest number of FTEs and FTEs per 1,000 population.
DeKalb has the 10th highest FTEs per 1,000 population, or alternatively the 5th lowest. Only four comparable communities have lower FTEs per 1,000 population compared to DeKalb ranking 10th highest for FTE’s per 1,000 population with 5.3 FTE’s. Elk Grove Village has the highest FTEs per 1,000 population with 9.4 and Belvidere has the lowest FTEs per 1,000 with 4.5. Hanover Park is the closest comparable with 5.2 employees per 1,000 population. DeKalb has the lowest FTEs per thousand population of the university communities. Bloomington employs 7.9 FTEs per thousand population, nearly 1.5 times the level of DeKalb.
10.02
8.34 8.047.22 7.08 6.99
6.03 5.72 5.60 5.525.16 4.99
4.58 4.55
Employees per 1000 population
7.96 6.88 6.43 6.17 6.06 5.52
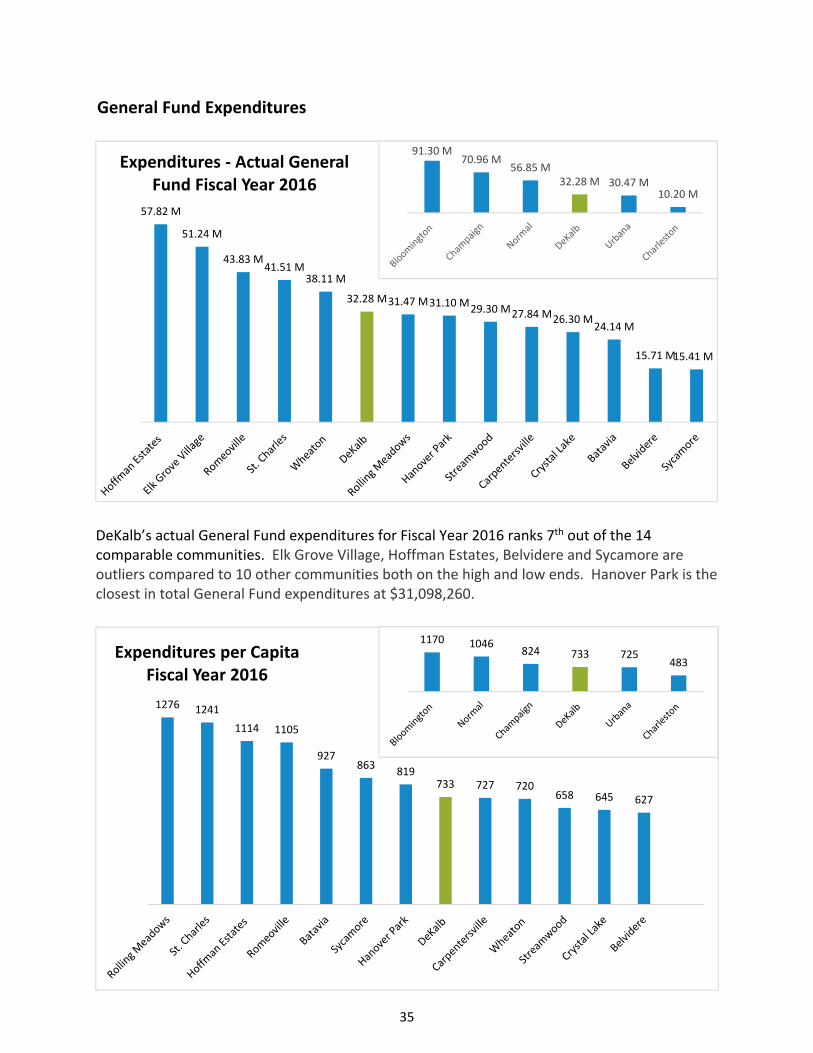
35
General Fund Expenditures
DeKalb’s actual General Fund expenditures for Fiscal Year 2016 ranks 7th out of the 14 comparable communities. Elk Grove Village, Hoffman Estates, Belvidere and Sycamore are outliers compared to 10 other communities both on the high and low ends. Hanover Park is the closest in total General Fund expenditures at $31,098,260.
57.82 M
51.24 M
43.83 M41.51 M
38.11 M
32.28 M31.47 M31.10 M29.30 M27.84 M26.30 M
24.14 M
15.71 M15.41 M
Expenditures ‐ Actual General Fund Fiscal Year 2016
91.30 M70.96 M
56.85 M32.28 M 30.47 M
10.20 M
1276 1241
1114 1105
927863
819733 727 720
658 645 627
Expenditures per Capita Fiscal Year 2016
1170 1046824 733 725
483
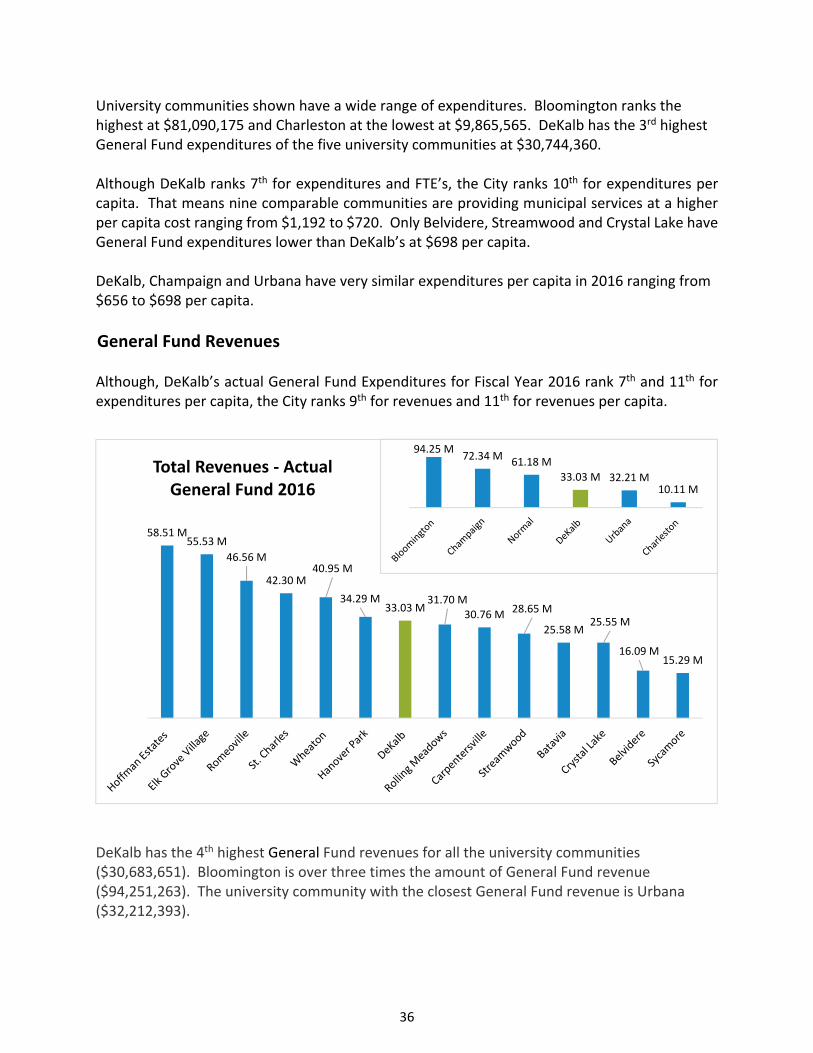
36
University communities shown have a wide range of expenditures. Bloomington ranks the highest at $81,090,175 and Charleston at the lowest at $9,865,565. DeKalb has the 3rd highest General Fund expenditures of the five university communities at $30,744,360. Although DeKalb ranks 7th for expenditures and FTE’s, the City ranks 10th for expenditures per capita. That means nine comparable communities are providing municipal services at a higher per capita cost ranging from $1,192 to $720. Only Belvidere, Streamwood and Crystal Lake have General Fund expenditures lower than DeKalb’s at $698 per capita. DeKalb, Champaign and Urbana have very similar expenditures per capita in 2016 ranging from $656 to $698 per capita.
General Fund Revenues Although, DeKalb’s actual General Fund Expenditures for Fiscal Year 2016 rank 7th and 11th for expenditures per capita, the City ranks 9th for revenues and 11th for revenues per capita.
DeKalb has the 4th highest General Fund revenues for all the university communities ($30,683,651). Bloomington is over three times the amount of General Fund revenue ($94,251,263). The university community with the closest General Fund revenue is Urbana ($32,212,393).
58.51 M55.53 M
46.56 M
42.30 M40.95 M
34.29 M33.03 M
31.70 M30.76 M 28.65 M
25.58 M25.55 M
16.09 M15.29 M
Total Revenues ‐ Actual General Fund 2016
94.25 M72.34 M 61.18 M
33.03 M 32.21 M10.11 M
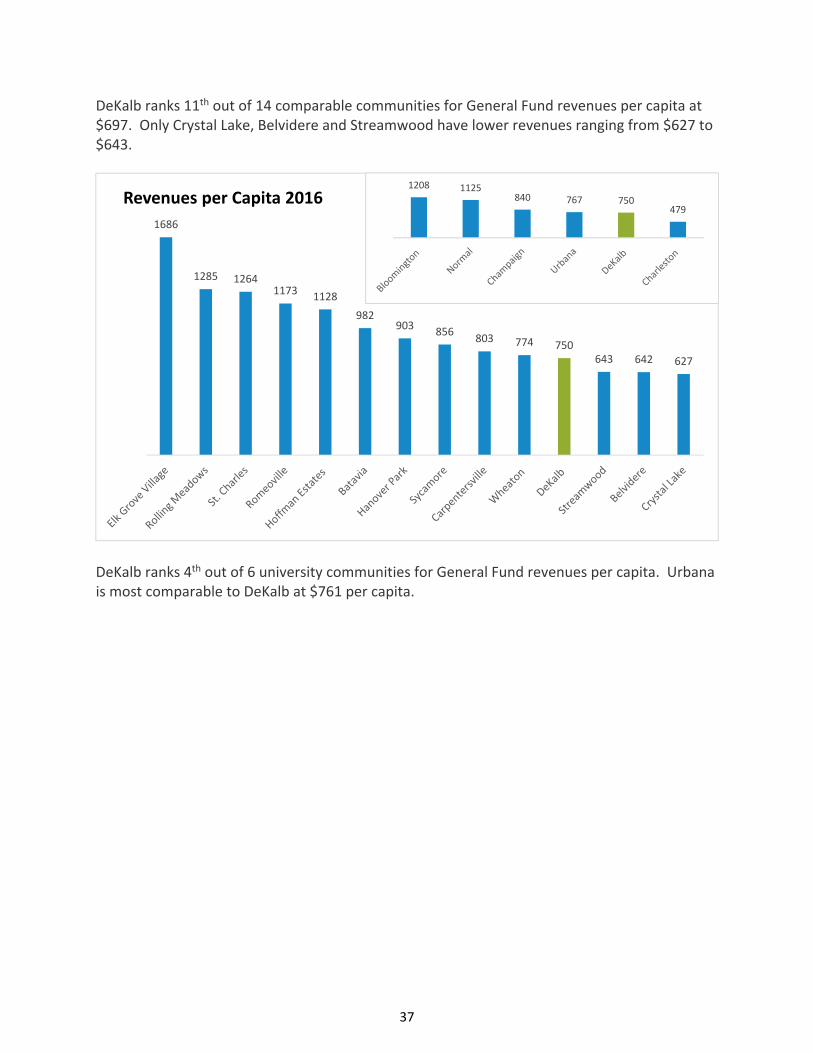
37
DeKalb ranks 11th out of 14 comparable communities for General Fund revenues per capita at $697. Only Crystal Lake, Belvidere and Streamwood have lower revenues ranging from $627 to $643.
DeKalb ranks 4th out of 6 university communities for General Fund revenues per capita. Urbana is most comparable to DeKalb at $761 per capita.
1686
1285 12641173 1128
982903
856803 774 750
643 642 627
Revenues per Capita 2016 1208 1125
840 767 750479
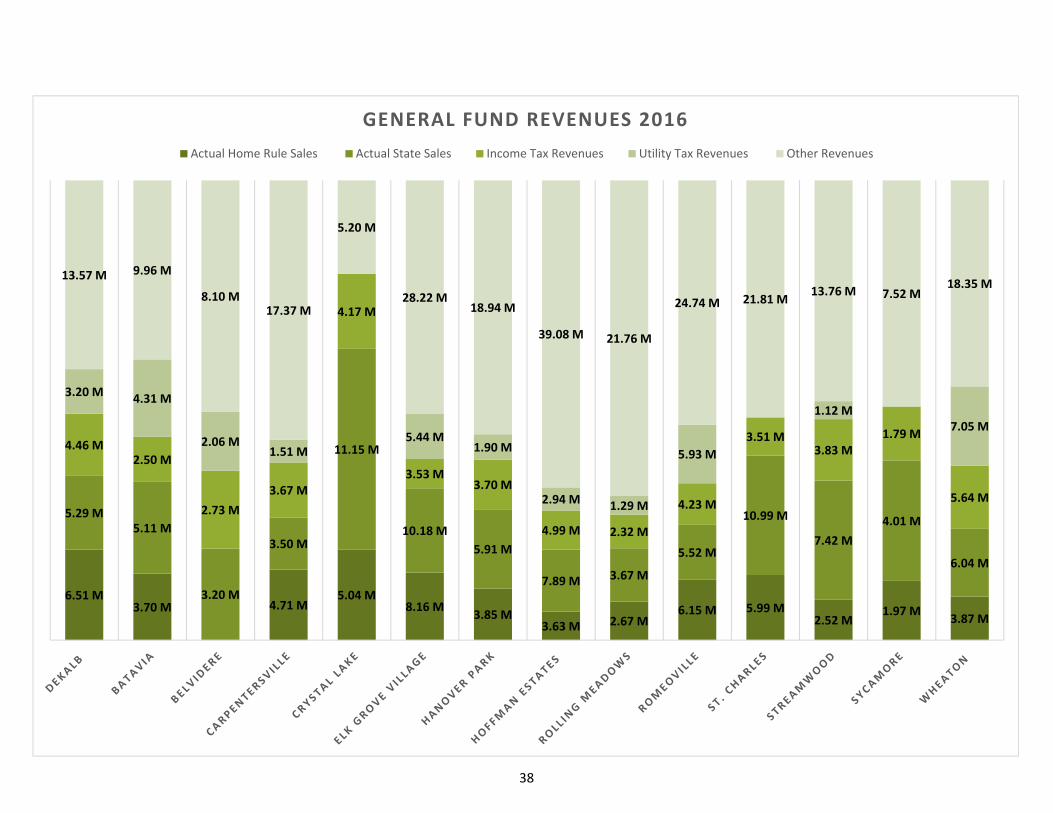
38
7
6.51 M3.70 M 4.71 M
5.04 M8.16 M
3.85 M3.63 M 2.67 M
6.15 M 5.99 M2.52 M
1.97 M3.87 M
5.29 M5.11 M
3.20 M
3.50 M
11.15 M
10.18 M
5.91 M
7.89 M 3.67 M
5.52 M
10.99 M
7.42 M
4.01 M
6.04 M
4.46 M2.50 M
2.73 M
3.67 M
4.17 M
3.53 M3.70 M
4.99 M 2.32 M
4.23 M
3.51 M3.83 M
1.79 M
5.64 M
3.20 M4.31 M
2.06 M1.51 M
5.44 M1.90 M
2.94 M 1.29 M
5.93 M
1.12 M7.05 M
13.57 M 9.96 M
8.10 M17.37 M
5.20 M
28.22 M18.94 M
39.08 M 21.76 M
24.74 M 21.81 M13.76 M 7.52 M
18.35 M
GENERAL FUND REVENUES 2016
Actual Home Rule Sales Actual State Sales Income Tax Revenues Utility Tax Revenues Other Revenues
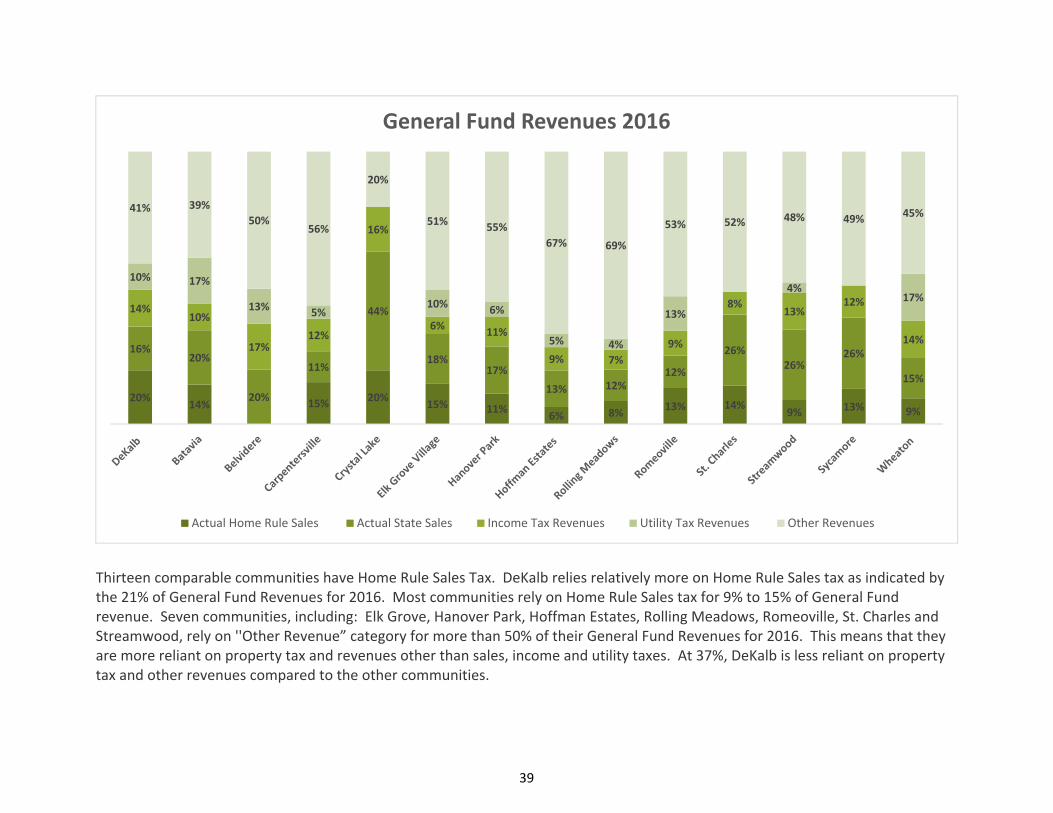
39
Thirteen comparable communities have Home Rule Sales Tax. DeKalb relies relatively more on Home Rule Sales tax as indicated by the 21% of General Fund Revenues for 2016. Most communities rely on Home Rule Sales tax for 9% to 15% of General Fund revenue. Seven communities, including: Elk Grove, Hanover Park, Hoffman Estates, Rolling Meadows, Romeoville, St. Charles and Streamwood, rely on ''Other Revenue” category for more than 50% of their General Fund Revenues for 2016. This means that they are more reliant on property tax and revenues other than sales, income and utility taxes. At 37%, DeKalb is less reliant on property tax and other revenues compared to the other communities.
20%14% 15% 20%
15% 11%6% 8%
13% 14%9% 13% 9%
16%20%
20%
11%
44%
18%17%
13% 12%12%
26%26%
26%
15%
14%10%
17%12%
16%
6%11%
9% 7%
9%
8%13%
12%
14%
10% 17%
13% 5%10%
6%
5% 4%
13%
4%17%
41% 39%
50%56%
20%
51% 55%
67% 69%
53% 52% 48% 49% 45%
General Fund Revenues 2016
Actual Home Rule Sales Actual State Sales Income Tax Revenues Utility Tax Revenues Other Revenues
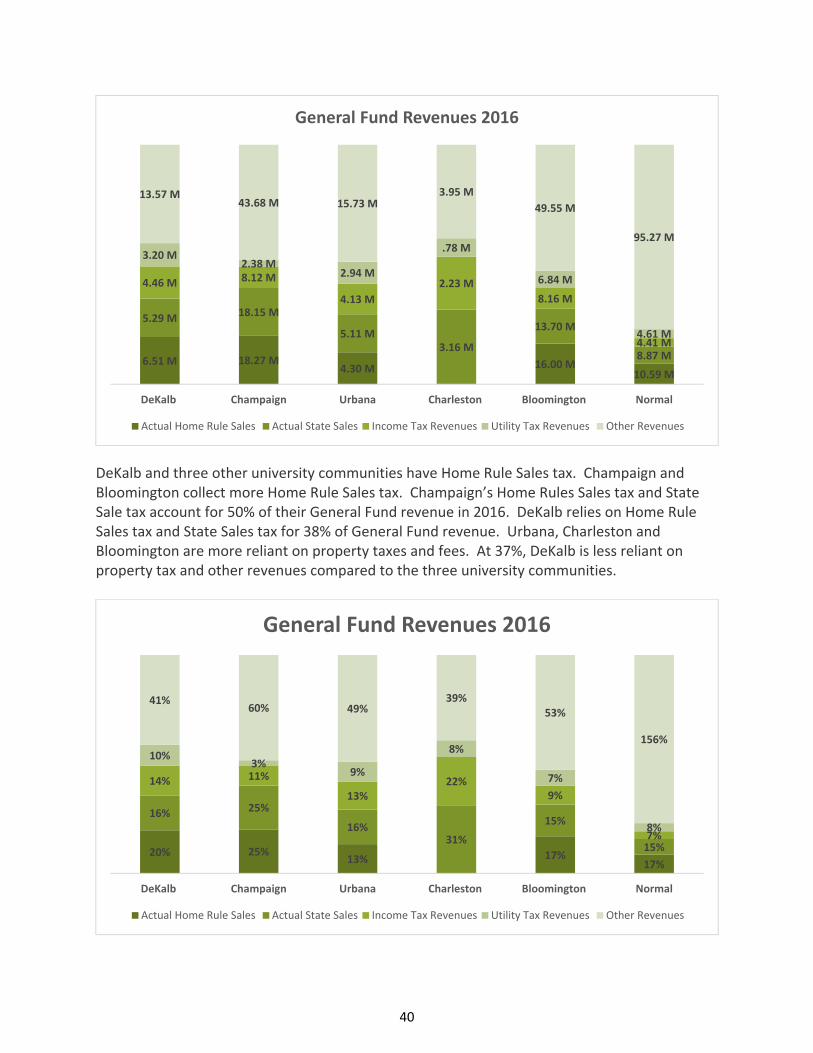
40
DeKalb and three other university communities have Home Rule Sales tax. Champaign and Bloomington collect more Home Rule Sales tax. Champaign’s Home Rules Sales tax and State Sale tax account for 50% of their General Fund revenue in 2016. DeKalb relies on Home Rule Sales tax and State Sales tax for 38% of General Fund revenue. Urbana, Charleston and Bloomington are more reliant on property taxes and fees. At 37%, DeKalb is less reliant on property tax and other revenues compared to the three university communities.
6.51 M 18.27 M4.30 M 16.00 M
10.59 M
5.29 M 18.15 M
5.11 M3.16 M
13.70 M
8.87 M
4.46 M 8.12 M
4.13 M
2.23 M
8.16 M
4.41 M
3.20 M2.38 M
2.94 M
.78 M
6.84 M
4.61 M
13.57 M43.68 M 15.73 M
3.95 M
49.55 M
95.27 M
DeKalb Champaign Urbana Charleston Bloomington Normal
General Fund Revenues 2016
Actual Home Rule Sales Actual State Sales Income Tax Revenues Utility Tax Revenues Other Revenues
20% 25%13% 17%
17%
16% 25%
16%31%
15%
15%
14% 11%
13%22%
9%
7%
10%3%
9%
8%
7%
8%
41%60% 49%
39%53%
156%
DeKalb Champaign Urbana Charleston Bloomington Normal
General Fund Revenues 2016
Actual Home Rule Sales Actual State Sales Income Tax Revenues Utility Tax Revenues Other Revenues
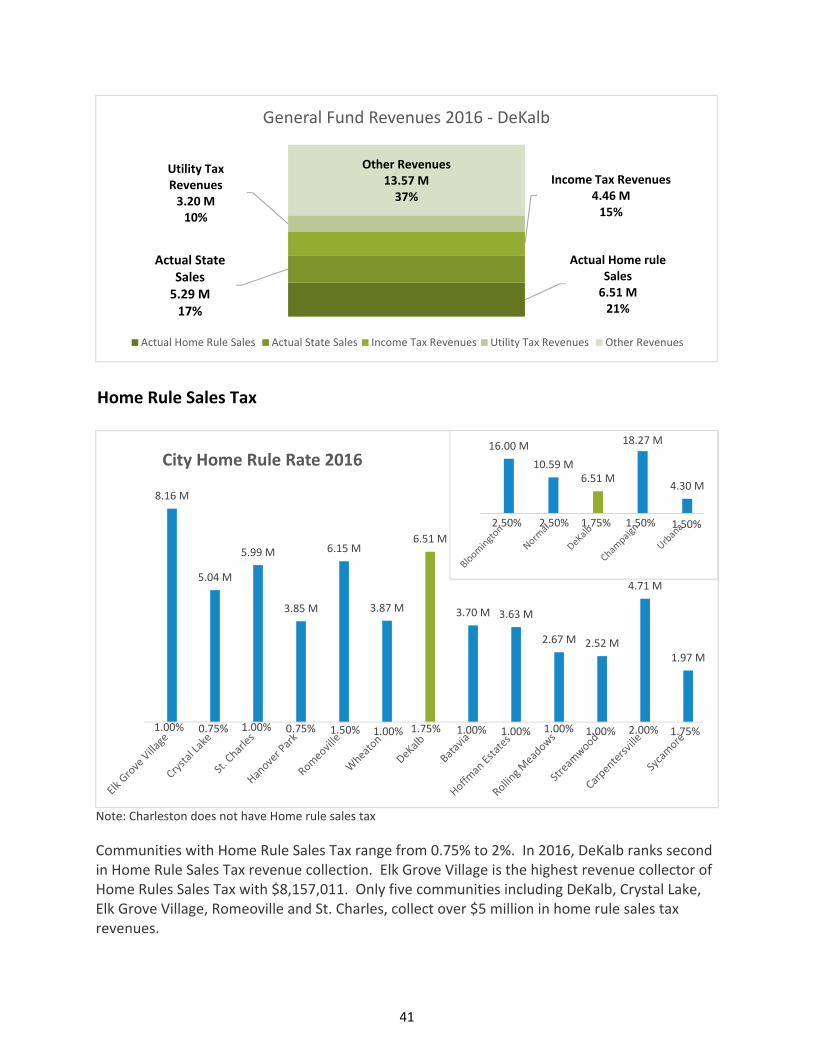
41
Home Rule Sales Tax
Note: Charleston does not have Home rule sales tax
Communities with Home Rule Sales Tax range from 0.75% to 2%. In 2016, DeKalb ranks second in Home Rule Sales Tax revenue collection. Elk Grove Village is the highest revenue collector of Home Rules Sales Tax with $8,157,011. Only five communities including DeKalb, Crystal Lake, Elk Grove Village, Romeoville and St. Charles, collect over $5 million in home rule sales tax revenues.
Actual Home rule Sales6.51 M21%
Actual State Sales5.29 M17%
Income Tax Revenues4.46 M15%
Utility Tax Revenues3.20 M10%
Other Revenues 13.57 M37%
General Fund Revenues 2016 ‐ DeKalb
Actual Home Rule Sales Actual State Sales Income Tax Revenues Utility Tax Revenues Other Revenues
1.00% 0.75% 1.00% 0.75% 1.50% 1.00% 1.75% 1.00% 1.00% 1.00% 1.00% 2.00% 1.75%
8.16 M
5.04 M
5.99 M
3.85 M
6.15 M
3.87 M
6.51 M
3.70 M 3.63 M
2.67 M 2.52 M
4.71 M
1.97 M
City Home Rule Rate 2016
2.50% 2.50% 1.75% 1.50% 1.50%
16.00 M
10.59 M6.51 M
18.27 M
4.30 M
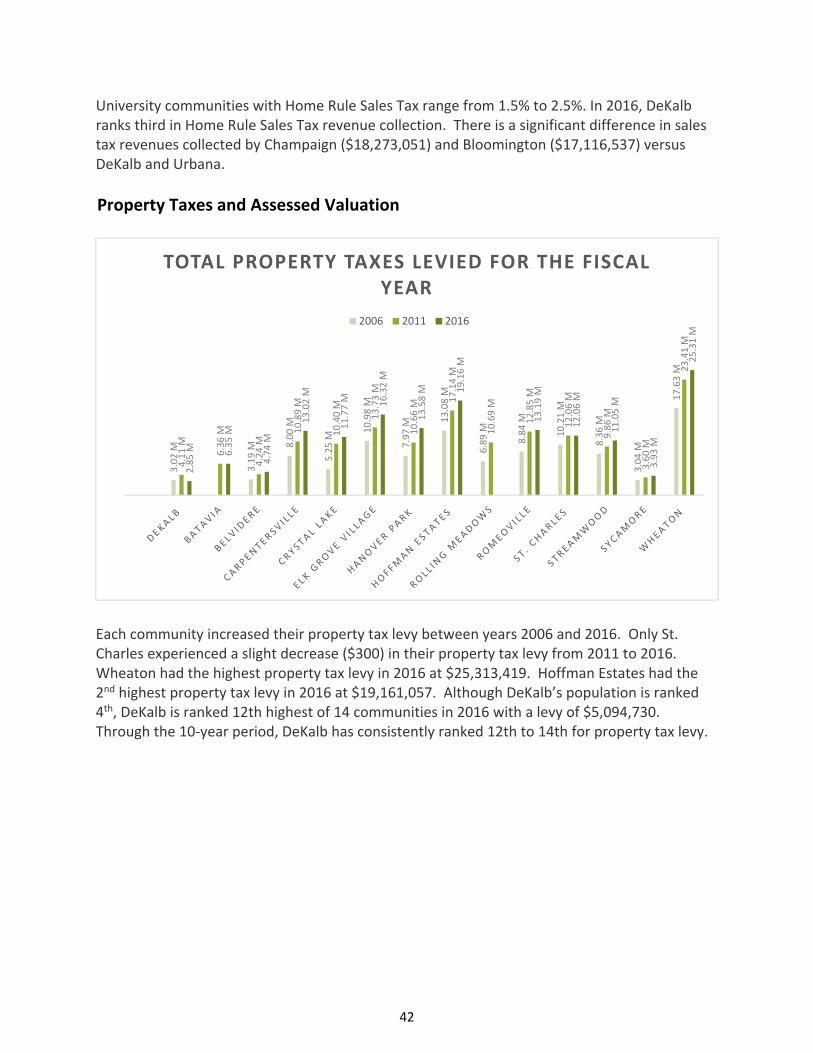
42
University communities with Home Rule Sales Tax range from 1.5% to 2.5%. In 2016, DeKalb ranks third in Home Rule Sales Tax revenue collection. There is a significant difference in sales tax revenues collected by Champaign ($18,273,051) and Bloomington ($17,116,537) versus DeKalb and Urbana.
Property Taxes and Assessed Valuation
Each community increased their property tax levy between years 2006 and 2016. Only St. Charles experienced a slight decrease ($300) in their property tax levy from 2011 to 2016. Wheaton had the highest property tax levy in 2016 at $25,313,419. Hoffman Estates had the 2nd highest property tax levy in 2016 at $19,161,057. Although DeKalb’s population is ranked 4th, DeKalb is ranked 12th highest of 14 communities in 2016 with a levy of $5,094,730. Through the 10‐year period, DeKalb has consistently ranked 12th to 14th for property tax levy.
3.02 M
3.19 M 8
.00 M
5.25 M
10.98 M
7.97 M
13.08 M
6.89 M
8.84 M
10.21 M
8.36 M
3.04 M
17.63 M
4.11 M
6.36 M
4.24 M
10.89 M
10.40 M
13.73 M
10.66 M
17.14 M
10.69 M
12.85 M
12.06 M
9.86 M
3.60 M
23.41 M
2.85 M 6.35 M
4.74 M
13.02 M
11.77 M 16.32 M
13.58 M 19.16 M
13.19 M
12.06 M
11.05 M
3.93 M
25.31 M
TOTAL PROPERTY TAXES LEVIED FOR THE FISCAL YEAR
2006 2011 2016
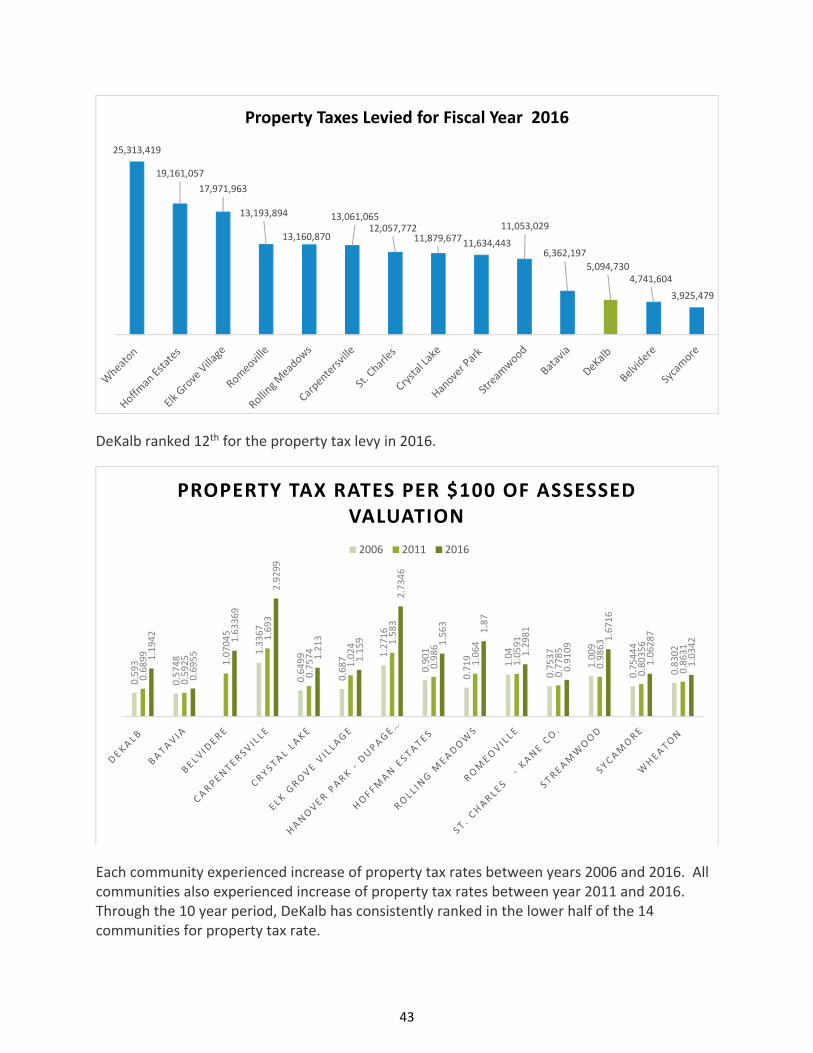
43
DeKalb ranked 12th for the property tax levy in 2016.
Each community experienced increase of property tax rates between years 2006 and 2016. All communities also experienced increase of property tax rates between year 2011 and 2016. Through the 10 year period, DeKalb has consistently ranked in the lower half of the 14 communities for property tax rate.
25,313,419
19,161,057
17,971,963
13,193,894
13,160,870
13,061,06512,057,772
11,879,67711,634,443
11,053,029
6,362,197
5,094,7304,741,604
3,925,479
Property Taxes Levied for Fiscal Year 20160.593
0.5748
1.3367
0.6499
0.687 1.2716
0.901
0.719
1.04
0.7537
1.009
0.75444
0.8302
0.6899
0.5925 1.07045 1.693
0.7574
1.024 1.583
0.986
1.064
1.0591
0.7785
0.9863
0.80356
0.8631
1.1942
0.6955
1.63369
2.9299
1.213
1.159
2.7346
1.563
1.87
1.2981
0.9109
1.6716
1.06287
1.0342
PROPERTY TAX RATES PER $100 OF ASSESSED VALUATION
2006 2011 2016
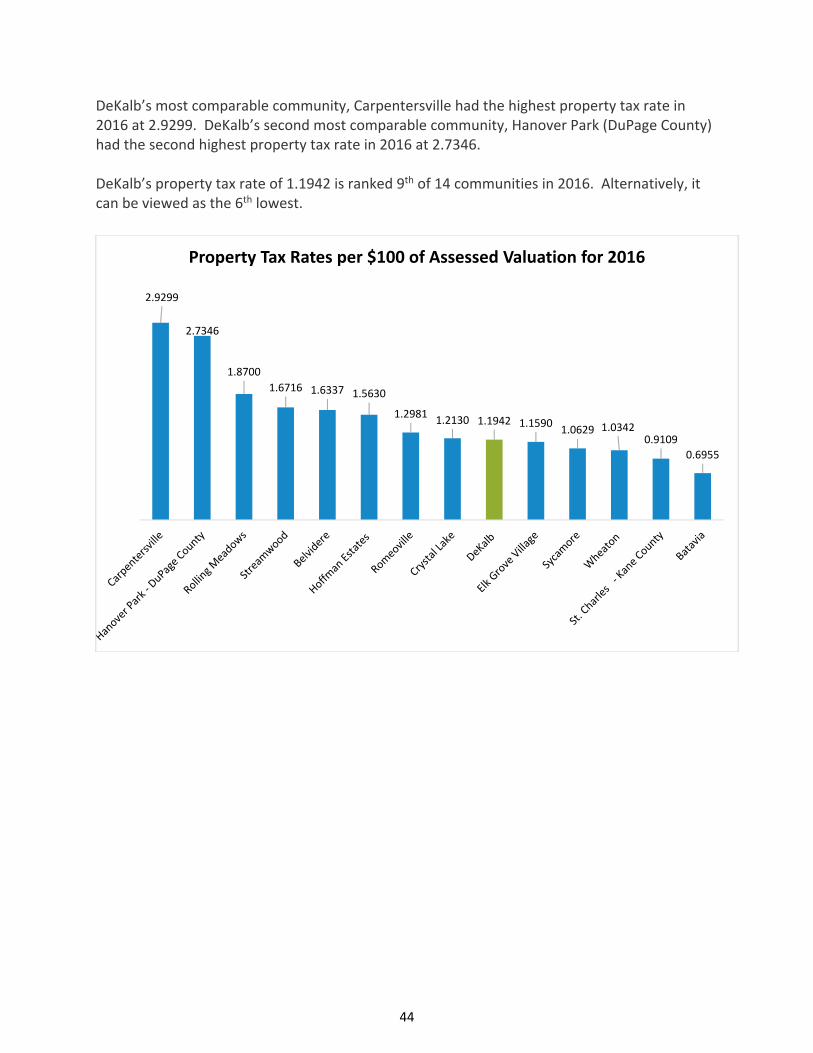
44
DeKalb’s most comparable community, Carpentersville had the highest property tax rate in 2016 at 2.9299. DeKalb’s second most comparable community, Hanover Park (DuPage County) had the second highest property tax rate in 2016 at 2.7346. DeKalb’s property tax rate of 1.1942 is ranked 9th of 14 communities in 2016. Alternatively, it can be viewed as the 6th lowest.
2.9299
2.7346
1.8700
1.6716 1.6337 1.5630
1.29811.2130 1.1942 1.1590
1.0629 1.03420.9109
0.6955
Property Tax Rates per $100 of Assessed Valuation for 2016
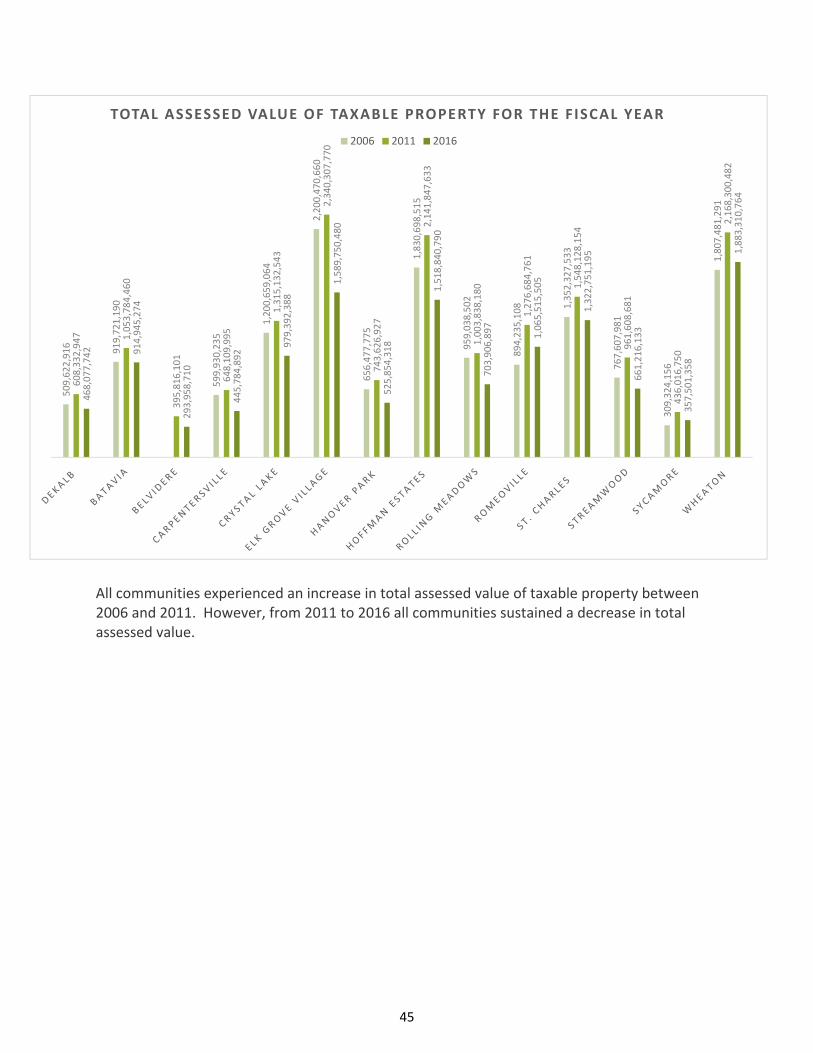
45
All communities experienced an increase in total assessed value of taxable property between 2006 and 2011. However, from 2011 to 2016 all communities sustained a decrease in total assessed value.
509,622,916
919,721,190
599,930,235
1,200,659,064
2,200,470,660
656,477,775
1,830,698,515
959,038,502
894,235,108 1,352,327,533
767,607,981
309,324,156
1,807,481,291
608,332,947 1,053,784,460
395,816,101
648,109,995
1,315,132,543
2,340,307,770
743,626,927
2,141,847,633
1,003,838,180
1,276,684,761
1,548,128,154
961,608,681
436,016,750
2,168,300,482
468,077,742 914,945,274
293,958,710
445,784,892
979,392,388
1,589,750,480
525,854,318
1,518,840,790
703,906,897
1,065,515,505
1,322,751,195
661,216,133
357,501,358
1,883,310,764
TOTAL ASSESSED VALUE OF TAXABLE PROPERTY FOR THE FISCAL YEAR
2006 2011 2016
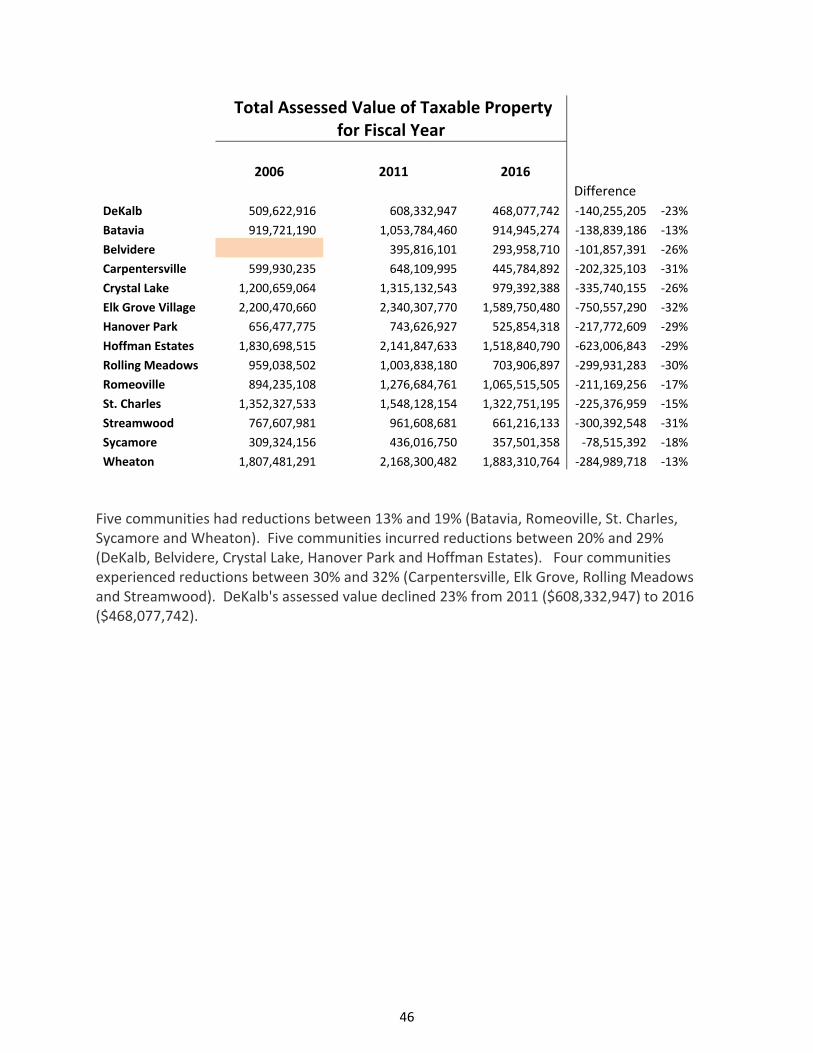
46
Total Assessed Value of Taxable Property for Fiscal Year
2006 2011 2016
Difference DeKalb 509,622,916 608,332,947 468,077,742 ‐140,255,205 ‐23%
Batavia 919,721,190 1,053,784,460 914,945,274 ‐138,839,186 ‐13%
Belvidere 395,816,101 293,958,710 ‐101,857,391 ‐26%
Carpentersville 599,930,235 648,109,995 445,784,892 ‐202,325,103 ‐31%
Crystal Lake 1,200,659,064 1,315,132,543 979,392,388 ‐335,740,155 ‐26%
Elk Grove Village 2,200,470,660 2,340,307,770 1,589,750,480 ‐750,557,290 ‐32%
Hanover Park 656,477,775 743,626,927 525,854,318 ‐217,772,609 ‐29%
Hoffman Estates 1,830,698,515 2,141,847,633 1,518,840,790 ‐623,006,843 ‐29%
Rolling Meadows 959,038,502 1,003,838,180 703,906,897 ‐299,931,283 ‐30%
Romeoville 894,235,108 1,276,684,761 1,065,515,505 ‐211,169,256 ‐17%
St. Charles 1,352,327,533 1,548,128,154 1,322,751,195 ‐225,376,959 ‐15%
Streamwood 767,607,981 961,608,681 661,216,133 ‐300,392,548 ‐31%
Sycamore 309,324,156 436,016,750 357,501,358 ‐78,515,392 ‐18%
Wheaton 1,807,481,291 2,168,300,482 1,883,310,764 ‐284,989,718 ‐13%
Five communities had reductions between 13% and 19% (Batavia, Romeoville, St. Charles, Sycamore and Wheaton). Five communities incurred reductions between 20% and 29% (DeKalb, Belvidere, Crystal Lake, Hanover Park and Hoffman Estates). Four communities experienced reductions between 30% and 32% (Carpentersville, Elk Grove, Rolling Meadows and Streamwood). DeKalb's assessed value declined 23% from 2011 ($608,332,947) to 2016 ($468,077,742).
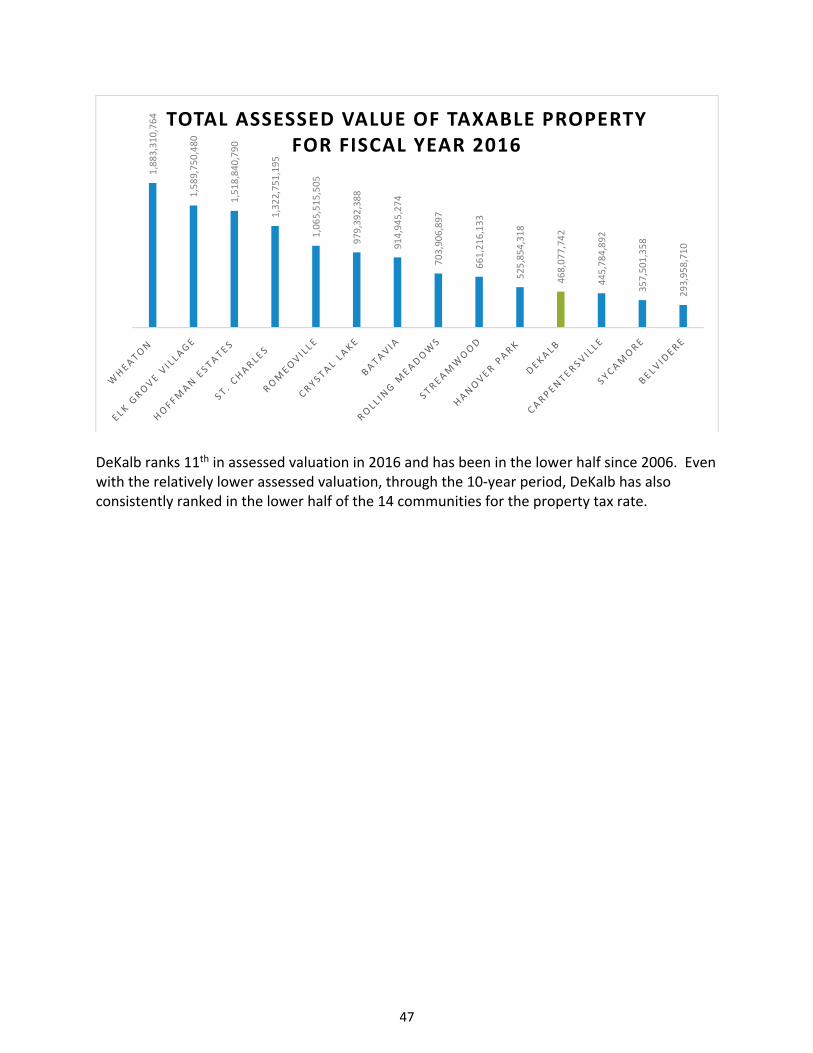
47
DeKalb ranks 11th in assessed valuation in 2016 and has been in the lower half since 2006. Even with the relatively lower assessed valuation, through the 10‐year period, DeKalb has also consistently ranked in the lower half of the 14 communities for the property tax rate.
1,883,310,764
1,589,750,480
1,518,840,790
1,322,751,195
1,065,515,505
979,392,388
914,945,274
703,906,897
661,216,133
525,854,318
468,077,742
445,784,892
357,501,358
293,958,710
TOTAL ASSESSED VALUE OF TAXABLE PROPERTY FOR FISCAL YEAR 2016
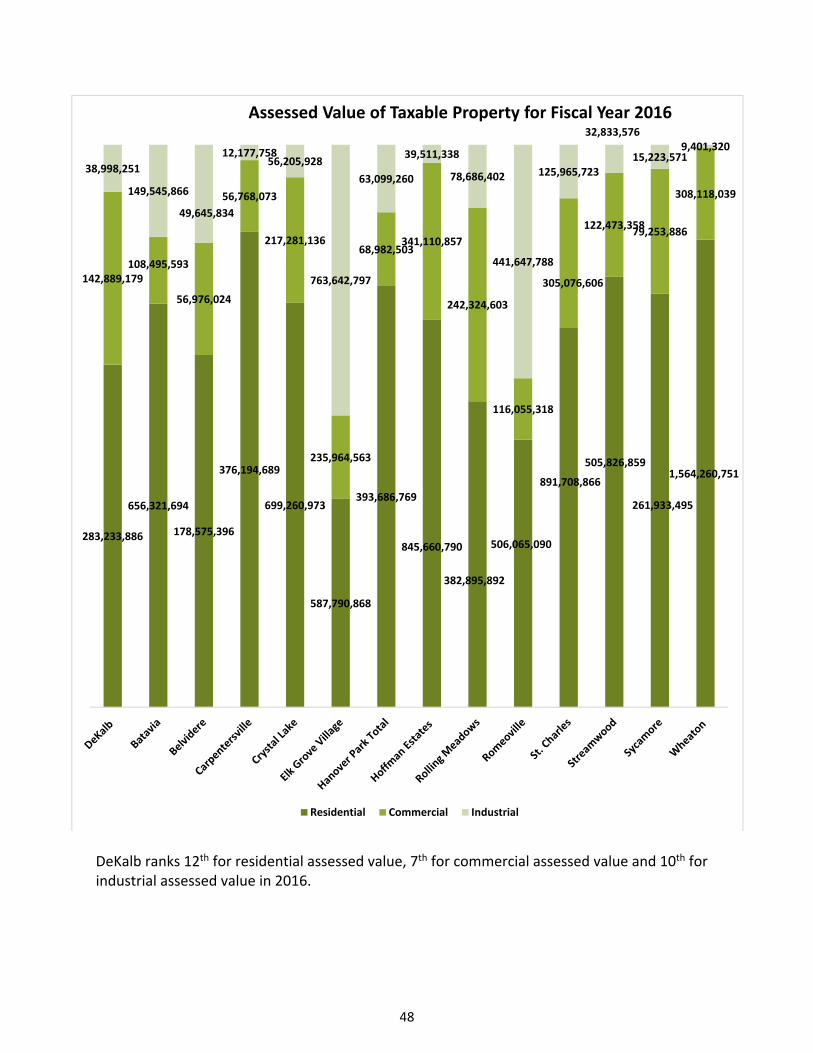
48
DeKalb ranks 12th for residential assessed value, 7th for commercial assessed value and 10th for industrial assessed value in 2016.
283,233,886
656,321,694
178,575,396
376,194,689
699,260,973
587,790,868
393,686,769
845,660,790
382,895,892
506,065,090
891,708,866
505,826,859
261,933,495
1,564,260,751
142,889,179108,495,593
56,976,024
56,768,073
217,281,136
235,964,563
68,982,503341,110,857
242,324,603
116,055,318
305,076,606
122,473,35879,253,886
308,118,039
38,998,251
149,545,866
49,645,834
12,177,75856,205,928
763,642,797
63,099,260
39,511,338
78,686,402
441,647,788
125,965,723
32,833,576
15,223,5719,401,320
Assessed Value of Taxable Property for Fiscal Year 2016
Residential Commercial Industrial
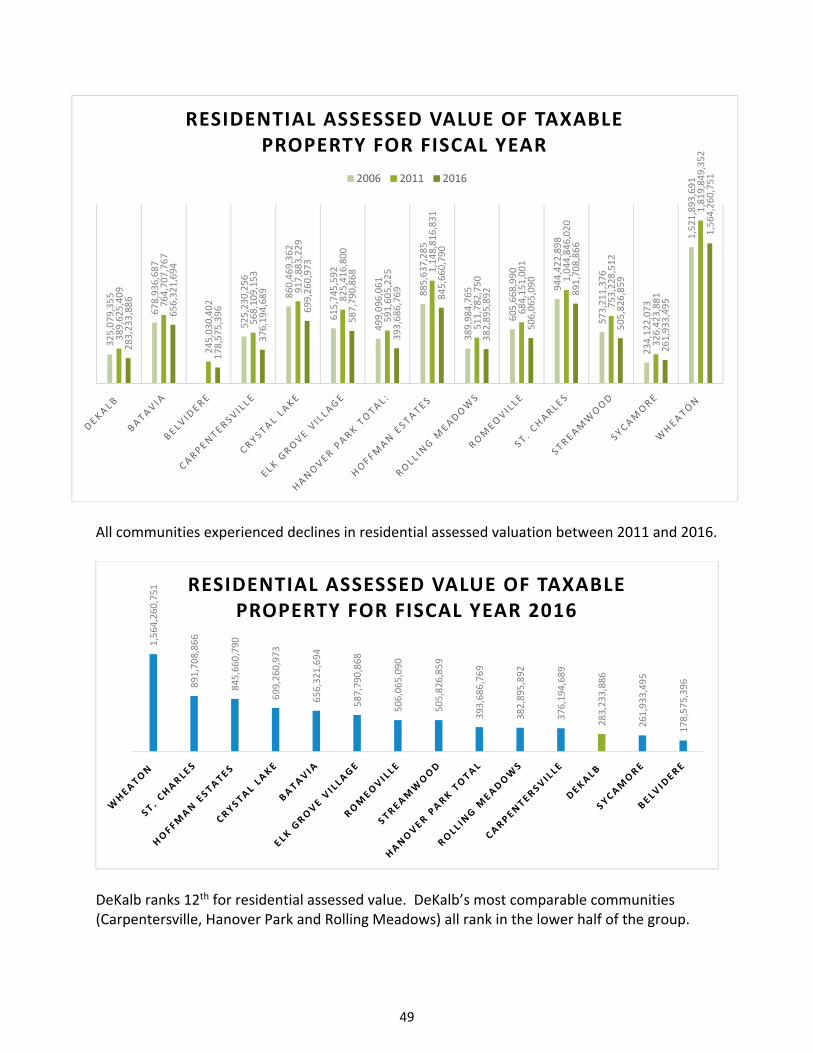
49
All communities experienced declines in residential assessed valuation between 2011 and 2016.
DeKalb ranks 12th for residential assessed value. DeKalb’s most comparable communities (Carpentersville, Hanover Park and Rolling Meadows) all rank in the lower half of the group.
325,079,355
678,936,687
525,230,256
860,469,362
615,745,592
499,096,061
885,637,285
389,984,765
605,668,990
944,422,898
573,211,376
234,122,073
1,521,893,691
389,625,409
764,707,767
245,030,402
568,109,153
917,883,229
825,416,800
591,605,225 1,148,816,831
511,782,750
684,151,001
1,044,846,020
753,228,512
326,423,881
1,819,849,352
283,233,886
656,321,694
178,575,396
376,194,689
699,260,973
587,790,868
393,686,769
845,660,790
382,895,892
506,065,090
891,708,866
505,826,859
261,933,495
1,564,260,751
RESIDENTIAL ASSESSED VALUE OF TAXABLE PROPERTY FOR FISCAL YEAR
2006 2011 2016
1,564,260,751
891,708,866
845,660,790
699,260,973
656,321,694
587,790,868
506,065,090
505,826,859
393,686,769
382,895,892
376,194,689
283,233,886
261,933,495
178,575,396
RESIDENTIAL ASSESSED VALUE OF TAXABLE PROPERTY FOR FISCAL YEAR 2016
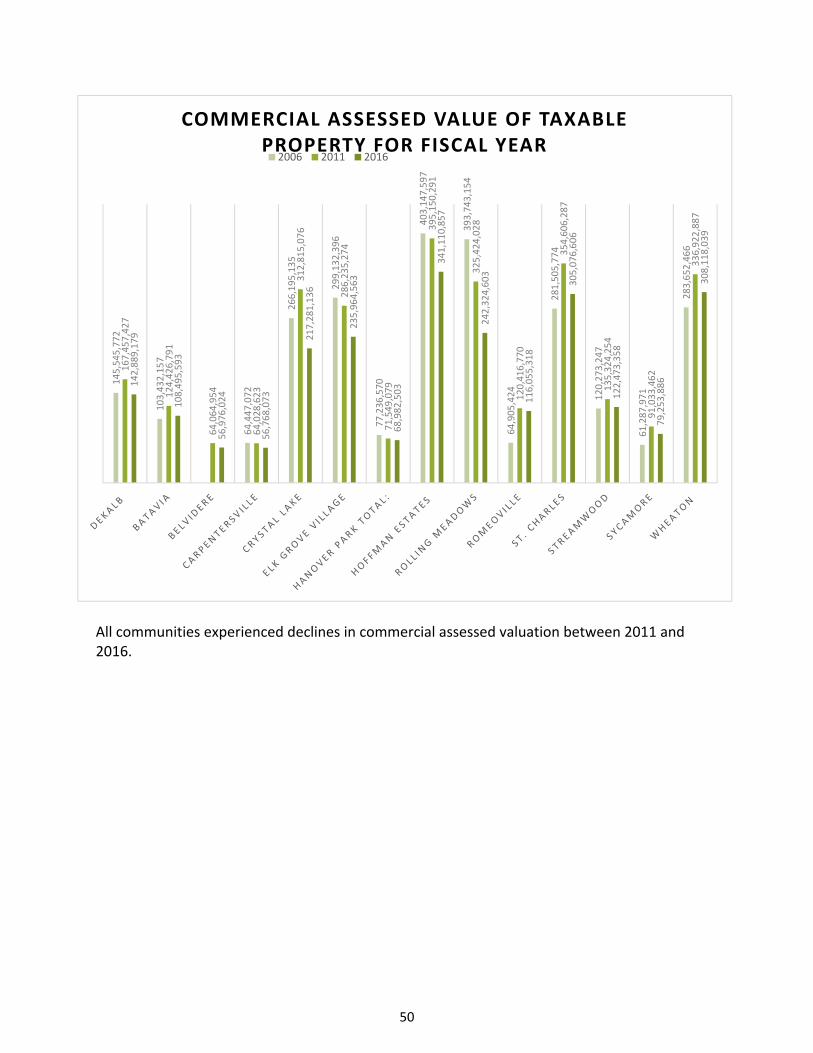
50
All communities experienced declines in commercial assessed valuation between 2011 and 2016.
145,545,772
103,432,157
64,447,072
266,195,135
299,132,396
77,236,570
403,147,597
393,743,154
64,905,424
281,505,774
120,273,247
61,287,971
283,652,466
167,457,427
124,426,791
64,064,954
64,028,623
312,815,076
286,235,274
71,549,079
395,150,291
325,424,028
120,416,770
354,606,287
135,324,254
91,033,462
336,922,887
142,889,179
108,495,593
56,976,024
56,768,073
217,281,136
235,964,563
68,982,503
341,110,857
242,324,603
116,055,318
305,076,606
122,473,358
79,253,886
308,118,039
COMMERCIAL ASSESSED VALUE OF TAXABLE PROPERTY FOR FISCAL YEAR
2006 2011 2016
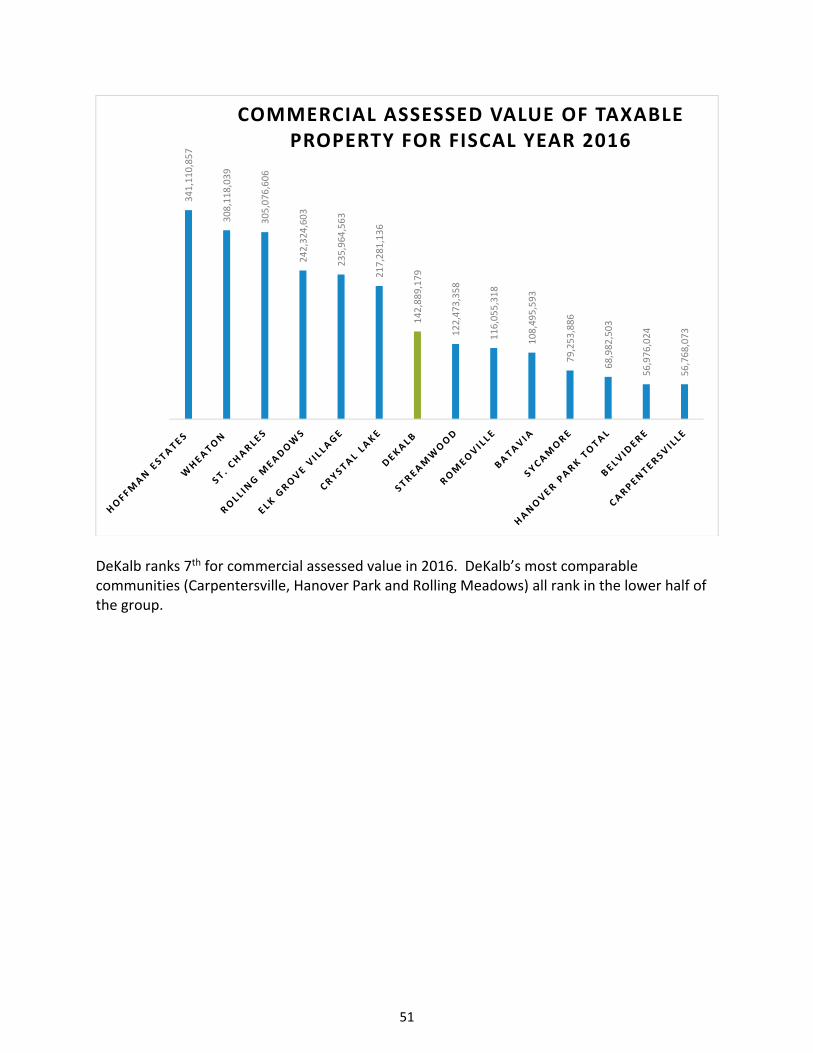
51
DeKalb ranks 7th for commercial assessed value in 2016. DeKalb’s most comparable communities (Carpentersville, Hanover Park and Rolling Meadows) all rank in the lower half of the group.
341,110,857
308,118,039
305,076,606
242,324,603
235,964,563
217,281,136
142,889,179
122,473,358
116,055,318
108,495,593
79,253,886
68,982,503
56,976,024
56,768,073
COMMERCIAL ASSESSED VALUE OF TAXABLE PROPERTY FOR FISCAL YEAR 2016
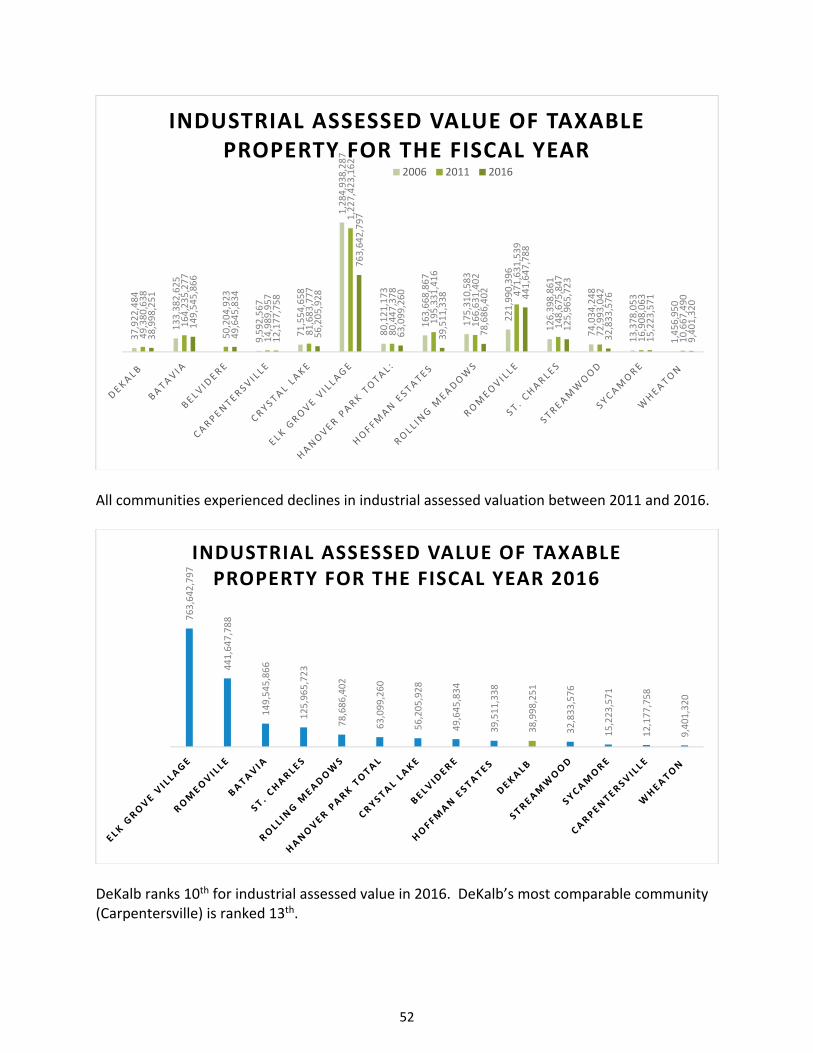
52
All communities experienced declines in industrial assessed valuation between 2011 and 2016.
DeKalb ranks 10th for industrial assessed value in 2016. DeKalb’s most comparable community (Carpentersville) is ranked 13th.
37,922,484
133,382,625
9,592,567
71,554,658
1,284,938,287
80,121,173
163,668,867
175,310,583
221,990,396
126,398,861
74,034,248
13,378,053
1,456,950
49,380,638
164,235,277
50,204,923
14,989,957
81,683,777
1,227,423,162
80,447,378
195,331,416
166,631,402
471,631,539
148,675,847
72,993,042
16,908,063
10,667,490
38,998,251
149,545,866
49,645,834
12,177,758
56,205,928
763,642,797
63,099,260
39,511,338
78,686,402
441,647,788
125,965,723
32,833,576
15,223,571
9,401,320
INDUSTRIAL ASSESSED VALUE OF TAXABLE PROPERTY FOR THE FISCAL YEAR
2006 2011 2016
763,642,797
441,647,788
149,545,866
125,965,723
78,686,402
63,099,260
56,205,928
49,645,834
39,511,338
38,998,251
32,833,576
15,223,571
12,177,758
9,401,320
INDUSTRIAL ASSESSED VALUE OF TAXABLE PROPERTY FOR THE FISCAL YEAR 2016
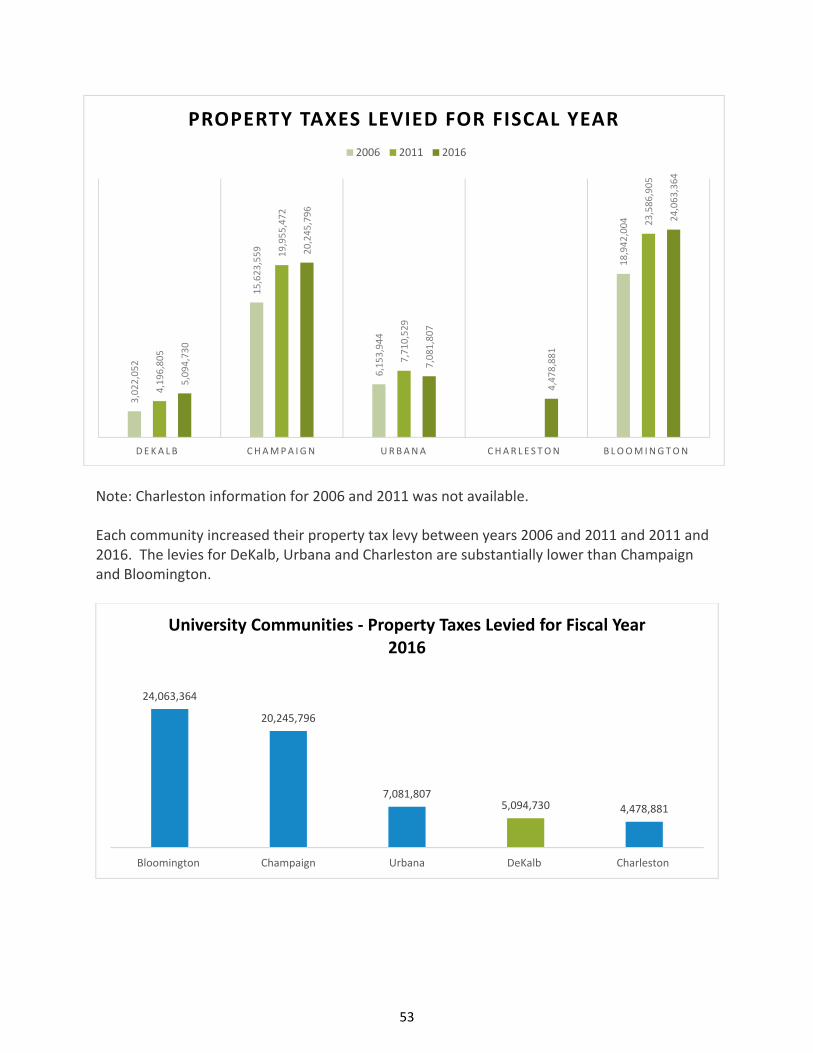
53
Note: Charleston information for 2006 and 2011 was not available. Each community increased their property tax levy between years 2006 and 2011 and 2011 and 2016. The levies for DeKalb, Urbana and Charleston are substantially lower than Champaign and Bloomington.
3,022,052
15,623,559
6,153,944
18,942,004
4,196,805
19,955,472
7,710,529
23,586,905
5,094,730
20,245,796
7,081,807
4,478,881
24,063,364
D E KA LB CHAMPA IGN URBANA CHAR L E S TON B LOOM INGTON
PROPERTY TAXES LEVIED FOR FISCAL YEAR
2006 2011 2016
24,063,364
20,245,796
7,081,8075,094,730 4,478,881
Bloomington Champaign Urbana DeKalb Charleston
University Communities ‐ Property Taxes Levied for Fiscal Year 2016
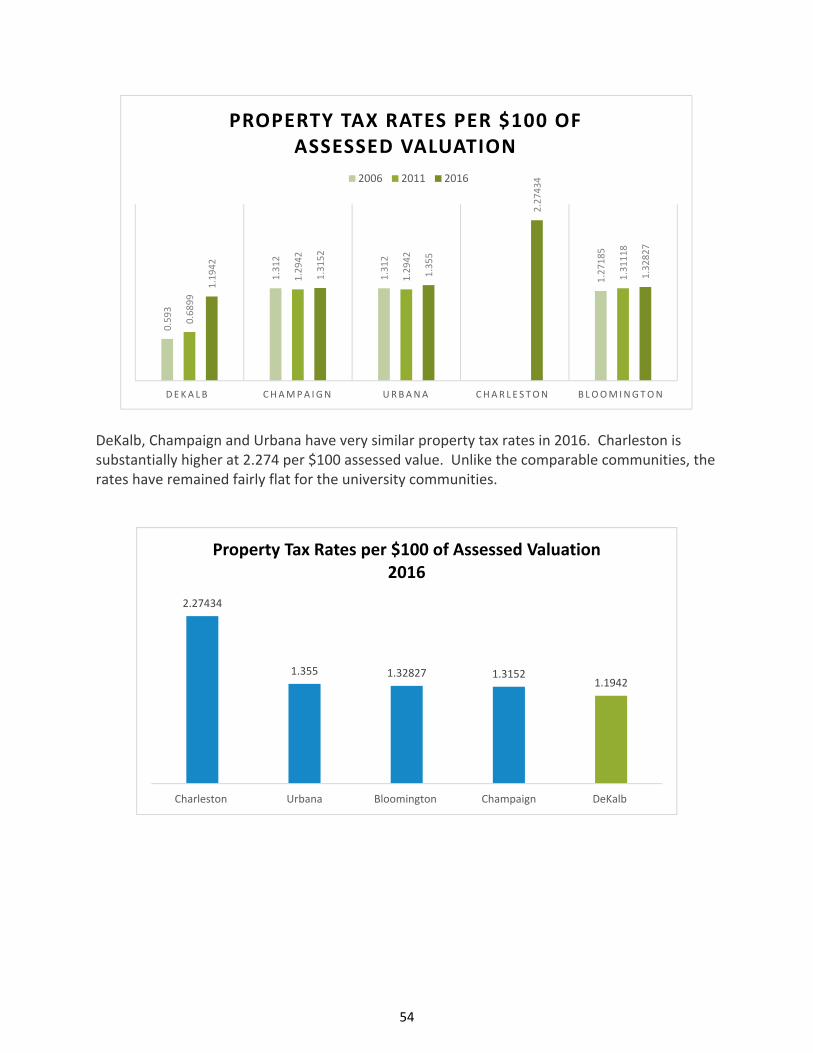
54
DeKalb, Champaign and Urbana have very similar property tax rates in 2016. Charleston is substantially higher at 2.274 per $100 assessed value. Unlike the comparable communities, the rates have remained fairly flat for the university communities.
0.593
1.312
1.312
1.27185
0.6899
1.2942
1.2942
1.31118
1.1942
1.3152
1.355
2.27434
1.32827
D E KA LB CHAMPA IGN URBANA CHAR L E S TON B LOOM INGTON
PROPERTY TAX RATES PER $100 OF ASSESSED VALUATION
2006 2011 2016
2.27434
1.355 1.32827 1.31521.1942
Charleston Urbana Bloomington Champaign DeKalb
Property Tax Rates per $100 of Assessed Valuation 2016
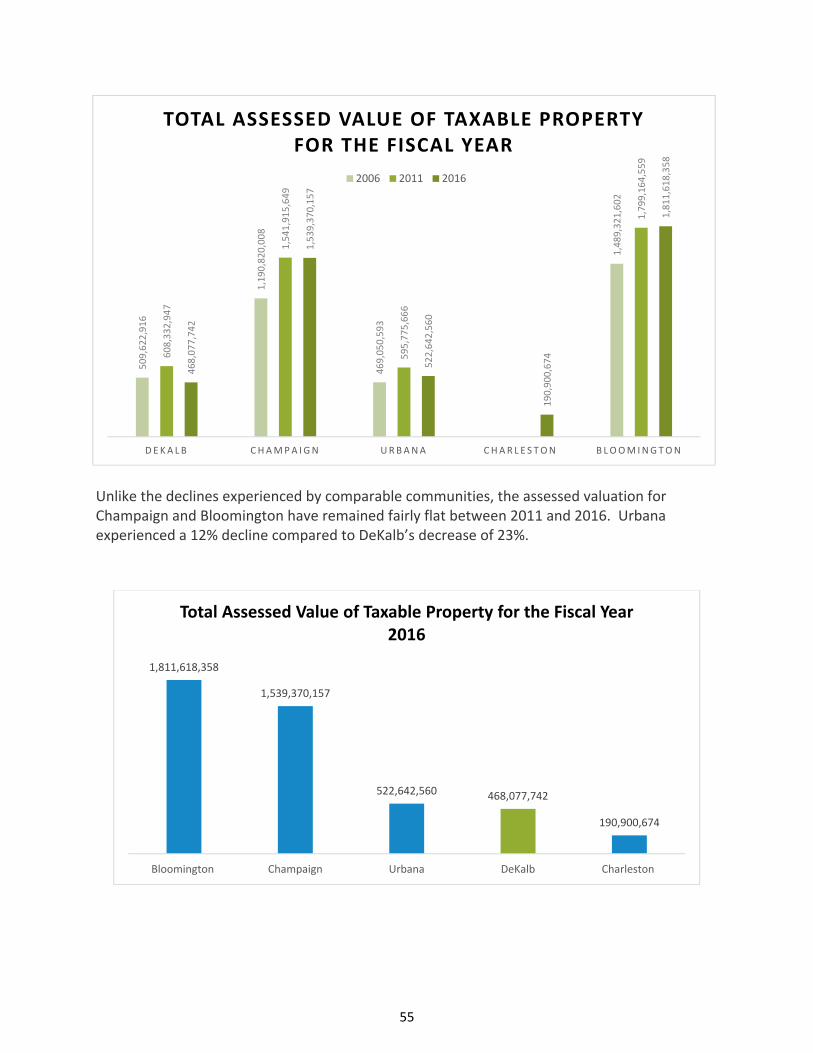
55
Unlike the declines experienced by comparable communities, the assessed valuation for Champaign and Bloomington have remained fairly flat between 2011 and 2016. Urbana experienced a 12% decline compared to DeKalb’s decrease of 23%.
509,622,916
1,190,820,008
469,050,593
1,489,321,602
608,332,947
1,541,915,649
595,775,666
1,799,164,559
468,077,742
1,539,370,157
522,642,560
190,900,674
1,811,618,358
D E KA LB CHAMPA IGN URBANA CHAR L E S TON B LOOM INGTON
TOTAL ASSESSED VALUE OF TAXABLE PROPERTY FOR THE FISCAL YEAR
2006 2011 2016
1,811,618,358
1,539,370,157
522,642,560 468,077,742
190,900,674
Bloomington Champaign Urbana DeKalb Charleston
Total Assessed Value of Taxable Property for the Fiscal Year 2016
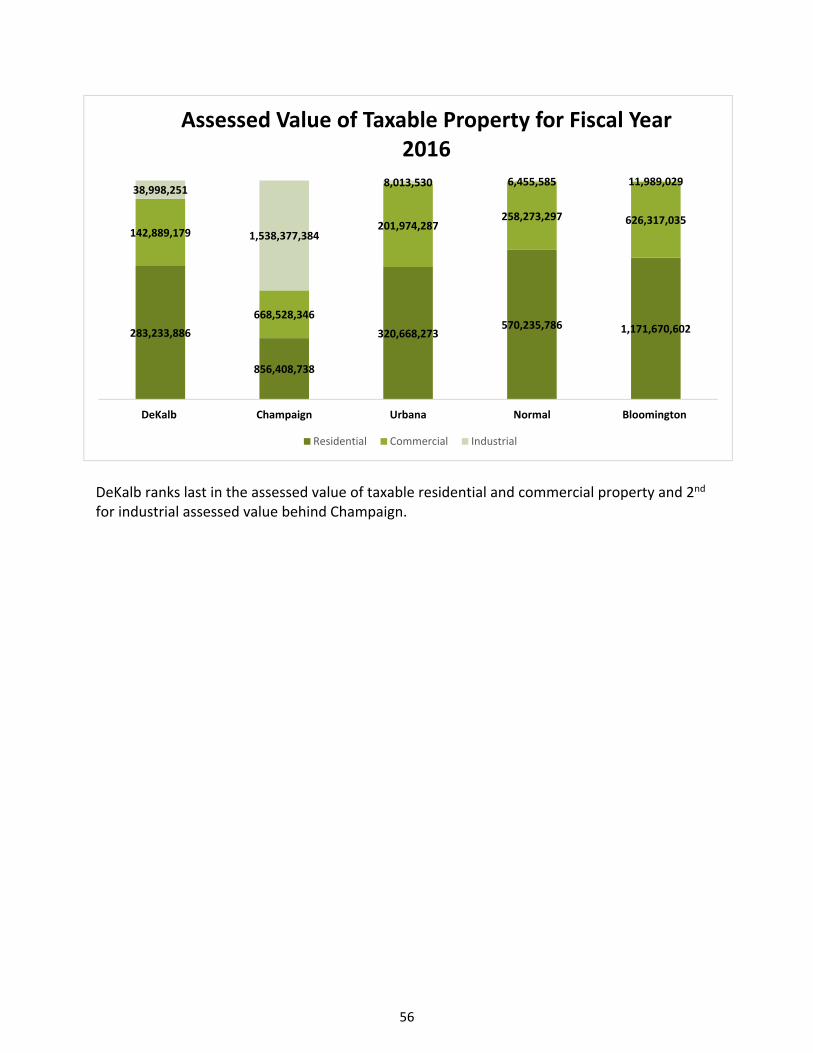
56
DeKalb ranks last in the assessed value of taxable residential and commercial property and 2nd for industrial assessed value behind Champaign.
283,233,886
856,408,738
320,668,273570,235,786 1,171,670,602
142,889,179
668,528,346
201,974,287258,273,297 626,317,035
38,998,251
1,538,377,384
8,013,530 6,455,585 11,989,029
DeKalb Champaign Urbana Normal Bloomington
Assessed Value of Taxable Property for Fiscal Year 2016
Residential Commercial Industrial
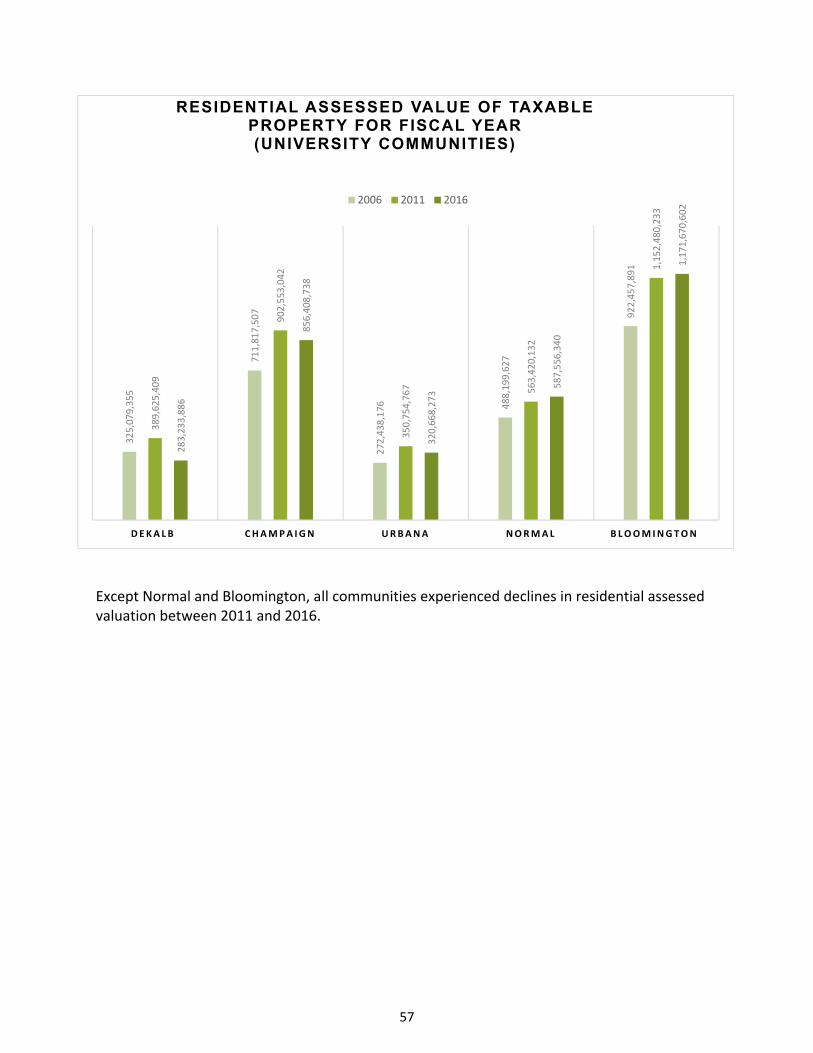
57
Except Normal and Bloomington, all communities experienced declines in residential assessed valuation between 2011 and 2016.
325,079,355
711,817,507
272,438,176 488,199,627
922,457,891
389,625,409
902,553,042
350,754,767 563,420,132
1,152,480,233
283,233,886
856,408,738
320,668,273
587,556,340
1,171,670,602
DEKA LB CHAMPA IGN URBANA NORMAL B LOOMINGTON
RESIDENTIAL ASSESSED VALUE OF TAXABLE PROPERTY FOR FISCAL YEAR (UNIVERSITY COMMUNITIES)
2006 2011 2016
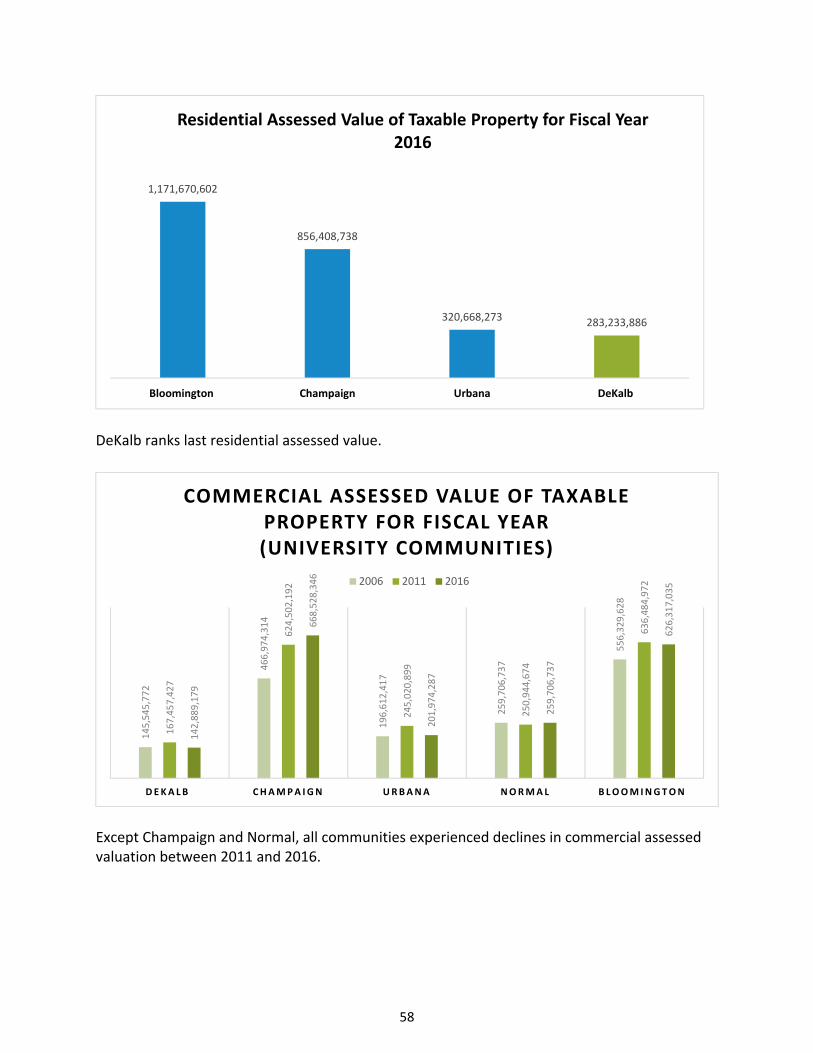
58
DeKalb ranks last residential assessed value.
Except Champaign and Normal, all communities experienced declines in commercial assessed valuation between 2011 and 2016.
1,171,670,602
856,408,738
320,668,273 283,233,886
Bloomington Champaign Urbana DeKalb
Residential Assessed Value of Taxable Property for Fiscal Year 2016
145,545,772
466,974,314
196,612,417
259,706,737
556,329,628
167,457,427
624,502,192
245,020,899
250,944,674
636,484,972
142,889,179
668,528,346
201,974,287
259,706,737
626,317,035
DEKA LB CHAMPA IGN URBANA NORMAL B LOOMINGTON
COMMERCIAL ASSESSED VALUE OF TAXABLE PROPERTY FOR FISCAL YEAR(UNIVERSITY COMMUNITIES)
2006 2011 2016
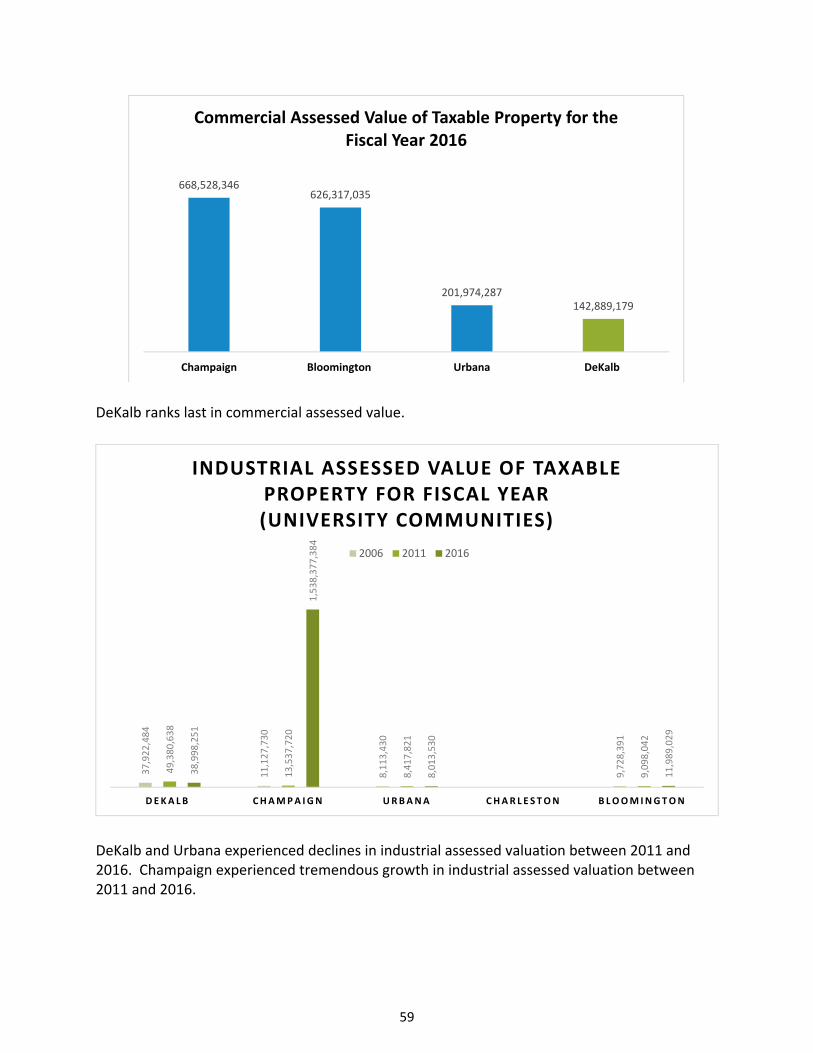
59
DeKalb ranks last in commercial assessed value.
DeKalb and Urbana experienced declines in industrial assessed valuation between 2011 and 2016. Champaign experienced tremendous growth in industrial assessed valuation between 2011 and 2016.
668,528,346626,317,035
201,974,287142,889,179
Champaign Bloomington Urbana DeKalb
Commercial Assessed Value of Taxable Property for the Fiscal Year 2016
37,922,484
11,127,730
8,113,430
9,728,391
49,380,638
13,537,720
8,417,821
9,098,042
38,998,251
1,538,377,384
8,013,530
11,989,029
DEKA LB CHAMPA IGN URBANA CHAR L E S TON B LOOMINGTON
INDUSTRIAL ASSESSED VALUE OF TAXABLE PROPERTY FOR FISCAL YEAR (UNIVERSITY COMMUNITIES)
2006 2011 2016
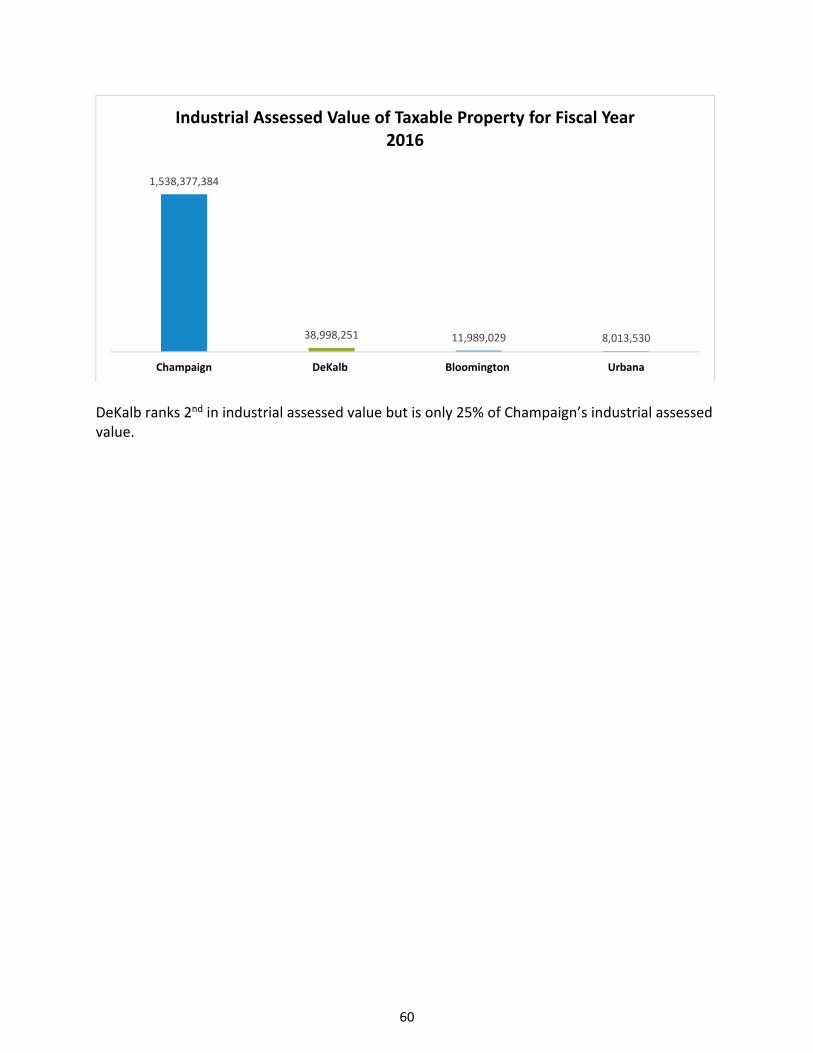
60
DeKalb ranks 2nd in industrial assessed value but is only 25% of Champaign’s industrial assessed value.
1,538,377,384
38,998,251 11,989,029 8,013,530
Champaign DeKalb Bloomington Urbana
Industrial Assessed Value of Taxable Property for Fiscal Year 2016
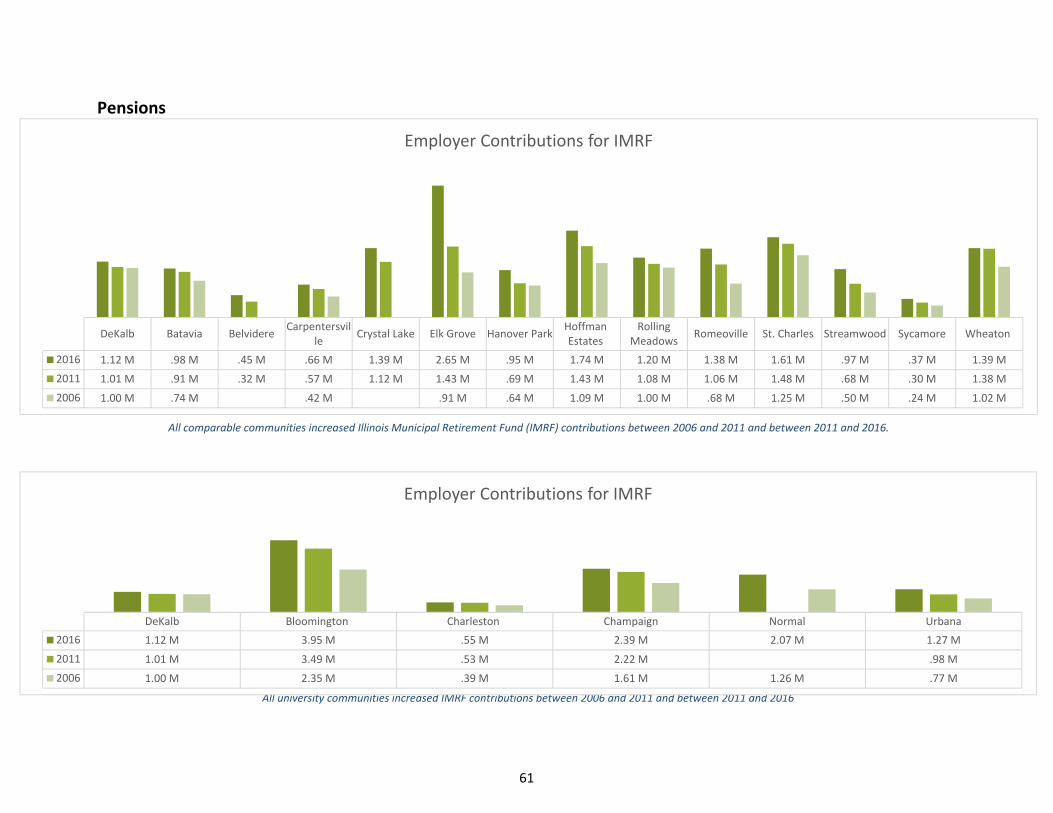
61
Pensions
DeKalb Batavia BelvidereCarpentersvil
leCrystal Lake Elk Grove Hanover Park
HoffmanEstates
RollingMeadows
Romeoville St. Charles Streamwood Sycamore Wheaton
2016 1.12 M .98 M .45 M .66 M 1.39 M 2.65 M .95 M 1.74 M 1.20 M 1.38 M 1.61 M .97 M .37 M 1.39 M
2011 1.01 M .91 M .32 M .57 M 1.12 M 1.43 M .69 M 1.43 M 1.08 M 1.06 M 1.48 M .68 M .30 M 1.38 M
2006 1.00 M .74 M .42 M .91 M .64 M 1.09 M 1.00 M .68 M 1.25 M .50 M .24 M 1.02 M
Employer Contributions for IMRF
All comparable communities increased Illinois Municipal Retirement Fund (IMRF) contributions between 2006 and 2011 and between 2011 and 2016.
All university communities increased IMRF contributions between 2006 and 2011 and between 2011 and 2016
DeKalb Bloomington Charleston Champaign Normal Urbana
2016 1.12 M 3.95 M .55 M 2.39 M 2.07 M 1.27 M
2011 1.01 M 3.49 M .53 M 2.22 M .98 M
2006 1.00 M 2.35 M .39 M 1.61 M 1.26 M .77 M
Employer Contributions for IMRF
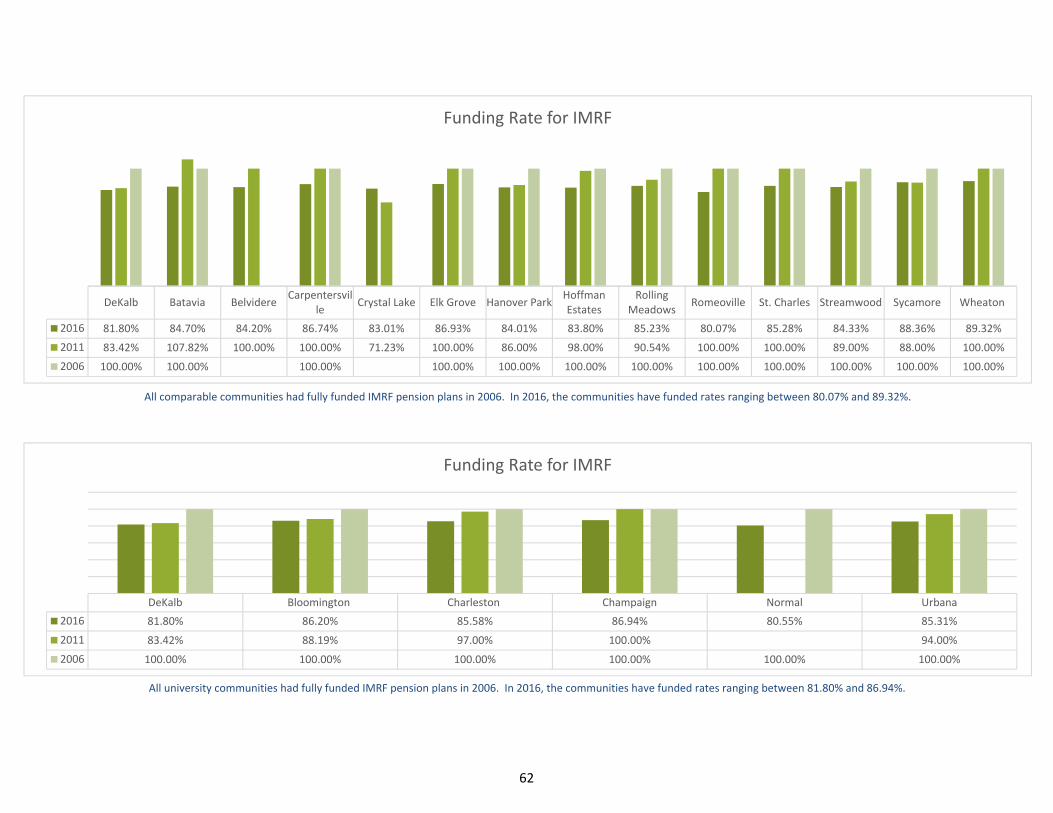
62
DeKalb Batavia BelvidereCarpentersvil
leCrystal Lake Elk Grove Hanover Park
HoffmanEstates
RollingMeadows
Romeoville St. Charles Streamwood Sycamore Wheaton
2016 81.80% 84.70% 84.20% 86.74% 83.01% 86.93% 84.01% 83.80% 85.23% 80.07% 85.28% 84.33% 88.36% 89.32%
2011 83.42% 107.82% 100.00% 100.00% 71.23% 100.00% 86.00% 98.00% 90.54% 100.00% 100.00% 89.00% 88.00% 100.00%
2006 100.00% 100.00% 100.00% 100.00% 100.00% 100.00% 100.00% 100.00% 100.00% 100.00% 100.00% 100.00%
Funding Rate for IMRF
DeKalb Bloomington Charleston Champaign Normal Urbana
2016 81.80% 86.20% 85.58% 86.94% 80.55% 85.31%
2011 83.42% 88.19% 97.00% 100.00% 94.00%
2006 100.00% 100.00% 100.00% 100.00% 100.00% 100.00%
Funding Rate for IMRF
All comparable communities had fully funded IMRF pension plans in 2006. In 2016, the communities have funded rates ranging between 80.07% and 89.32%.
All university communities had fully funded IMRF pension plans in 2006. In 2016, the communities have funded rates ranging between 81.80% and 86.94%.
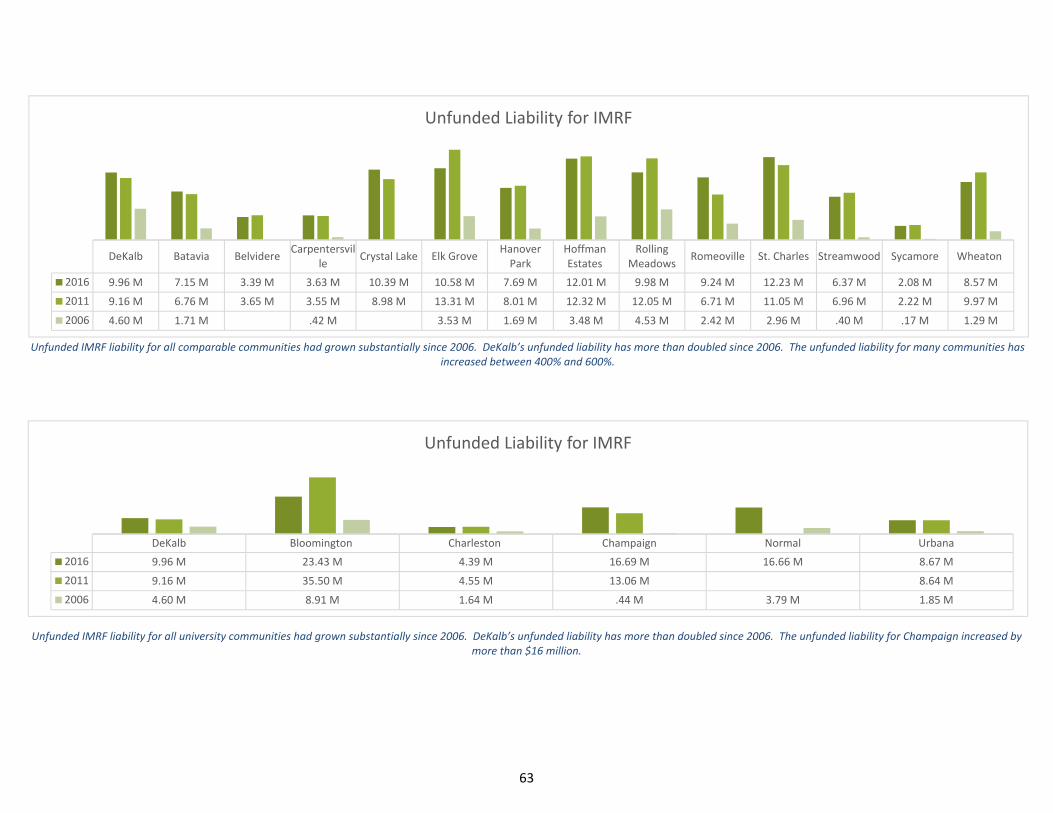
63
DeKalb Batavia BelvidereCarpentersvil
leCrystal Lake Elk Grove
HanoverPark
HoffmanEstates
RollingMeadows
Romeoville St. Charles Streamwood Sycamore Wheaton
2016 9.96 M 7.15 M 3.39 M 3.63 M 10.39 M 10.58 M 7.69 M 12.01 M 9.98 M 9.24 M 12.23 M 6.37 M 2.08 M 8.57 M
2011 9.16 M 6.76 M 3.65 M 3.55 M 8.98 M 13.31 M 8.01 M 12.32 M 12.05 M 6.71 M 11.05 M 6.96 M 2.22 M 9.97 M
2006 4.60 M 1.71 M .42 M 3.53 M 1.69 M 3.48 M 4.53 M 2.42 M 2.96 M .40 M .17 M 1.29 M
Unfunded Liability for IMRF
DeKalb Bloomington Charleston Champaign Normal Urbana
2016 9.96 M 23.43 M 4.39 M 16.69 M 16.66 M 8.67 M
2011 9.16 M 35.50 M 4.55 M 13.06 M 8.64 M
2006 4.60 M 8.91 M 1.64 M .44 M 3.79 M 1.85 M
Unfunded Liability for IMRF
Unfunded IMRF liability for all comparable communities had grown substantially since 2006. DeKalb’s unfunded liability has more than doubled since 2006. The unfunded liability for many communities has increased between 400% and 600%.
Unfunded IMRF liability for all university communities had grown substantially since 2006. DeKalb’s unfunded liability has more than doubled since 2006. The unfunded liability for Champaign increased by more than $16 million.
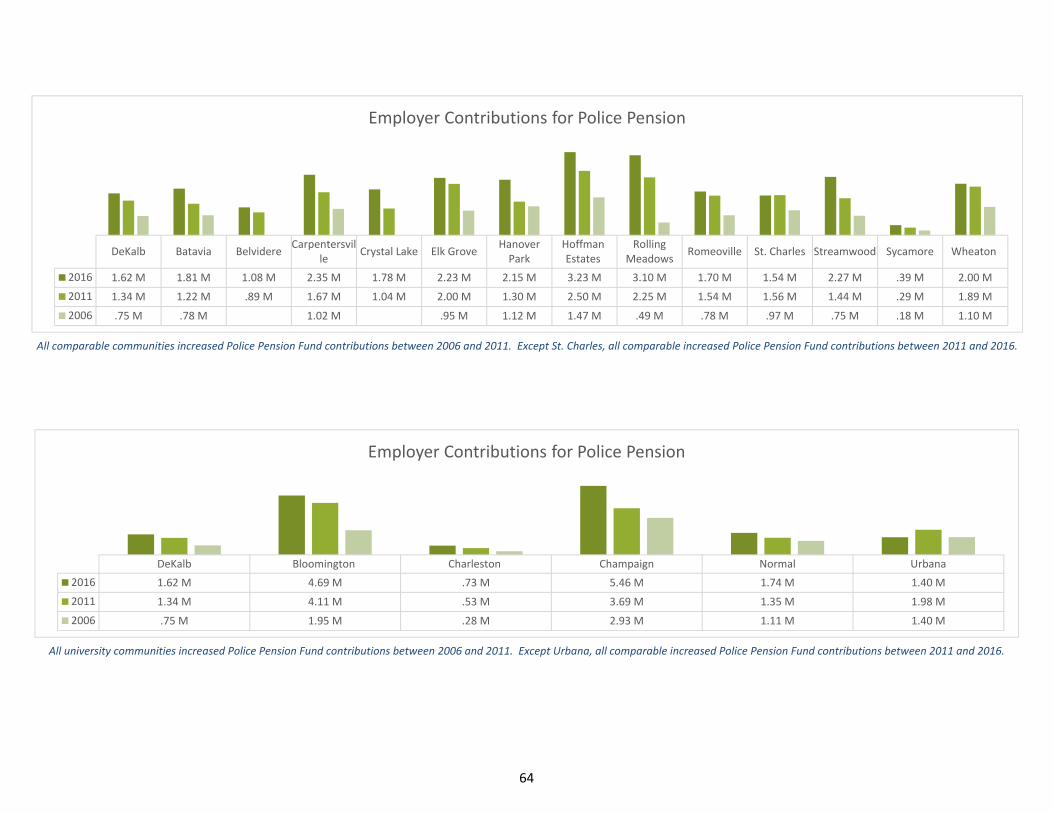
64
DeKalb Bloomington Charleston Champaign Normal Urbana
2016 1.62 M 4.69 M .73 M 5.46 M 1.74 M 1.40 M
2011 1.34 M 4.11 M .53 M 3.69 M 1.35 M 1.98 M
2006 .75 M 1.95 M .28 M 2.93 M 1.11 M 1.40 M
Employer Contributions for Police Pension
DeKalb Batavia BelvidereCarpentersvil
leCrystal Lake Elk Grove
HanoverPark
HoffmanEstates
RollingMeadows
Romeoville St. Charles Streamwood Sycamore Wheaton
2016 1.62 M 1.81 M 1.08 M 2.35 M 1.78 M 2.23 M 2.15 M 3.23 M 3.10 M 1.70 M 1.54 M 2.27 M .39 M 2.00 M
2011 1.34 M 1.22 M .89 M 1.67 M 1.04 M 2.00 M 1.30 M 2.50 M 2.25 M 1.54 M 1.56 M 1.44 M .29 M 1.89 M
2006 .75 M .78 M 1.02 M .95 M 1.12 M 1.47 M .49 M .78 M .97 M .75 M .18 M 1.10 M
Employer Contributions for Police Pension
All comparable communities increased Police Pension Fund contributions between 2006 and 2011. Except St. Charles, all comparable increased Police Pension Fund contributions between 2011 and 2016.
All university communities increased Police Pension Fund contributions between 2006 and 2011. Except Urbana, all comparable increased Police Pension Fund contributions between 2011 and 2016.
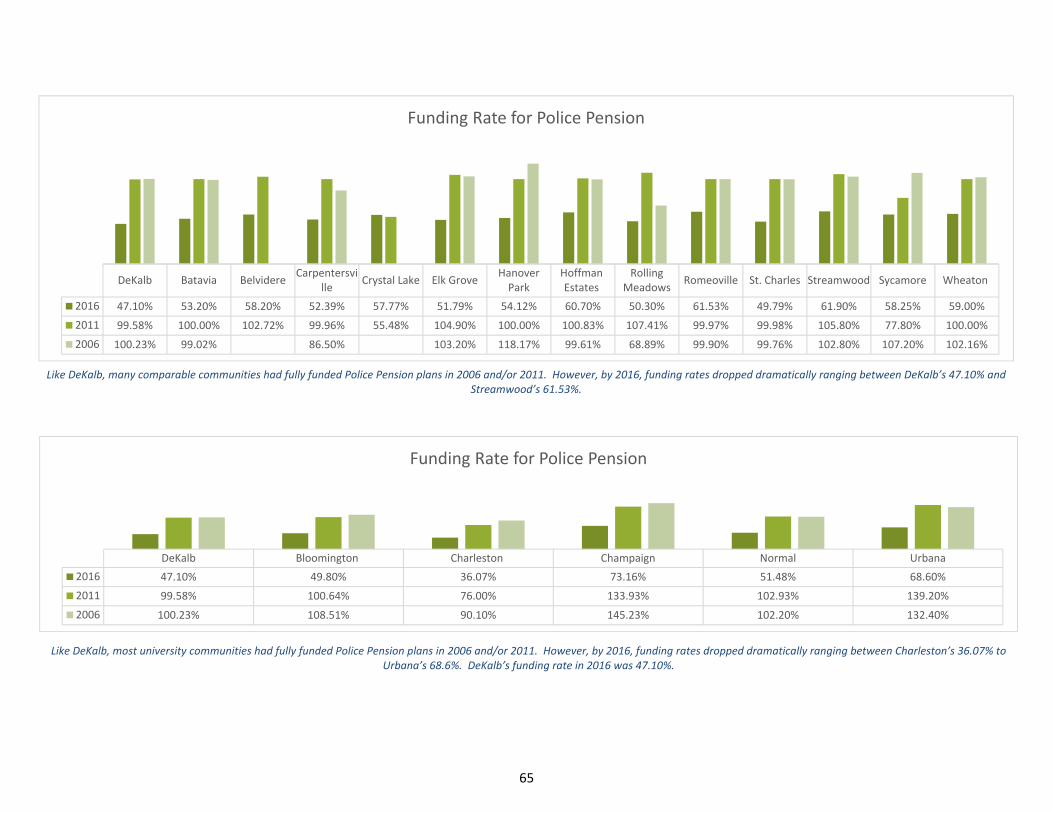
65
DeKalb Bloomington Charleston Champaign Normal Urbana
2016 47.10% 49.80% 36.07% 73.16% 51.48% 68.60%
2011 99.58% 100.64% 76.00% 133.93% 102.93% 139.20%
2006 100.23% 108.51% 90.10% 145.23% 102.20% 132.40%
Funding Rate for Police Pension
DeKalb Batavia BelvidereCarpentersvi
lleCrystal Lake Elk Grove
HanoverPark
HoffmanEstates
RollingMeadows
Romeoville St. Charles Streamwood Sycamore Wheaton
2016 47.10% 53.20% 58.20% 52.39% 57.77% 51.79% 54.12% 60.70% 50.30% 61.53% 49.79% 61.90% 58.25% 59.00%
2011 99.58% 100.00% 102.72% 99.96% 55.48% 104.90% 100.00% 100.83% 107.41% 99.97% 99.98% 105.80% 77.80% 100.00%
2006 100.23% 99.02% 86.50% 103.20% 118.17% 99.61% 68.89% 99.90% 99.76% 102.80% 107.20% 102.16%
Funding Rate for Police Pension
Like DeKalb, many comparable communities had fully funded Police Pension plans in 2006 and/or 2011. However, by 2016, funding rates dropped dramatically ranging between DeKalb’s 47.10% and Streamwood’s 61.53%.
Like DeKalb, most university communities had fully funded Police Pension plans in 2006 and/or 2011. However, by 2016, funding rates dropped dramatically ranging between Charleston’s 36.07% to Urbana’s 68.6%. DeKalb’s funding rate in 2016 was 47.10%.
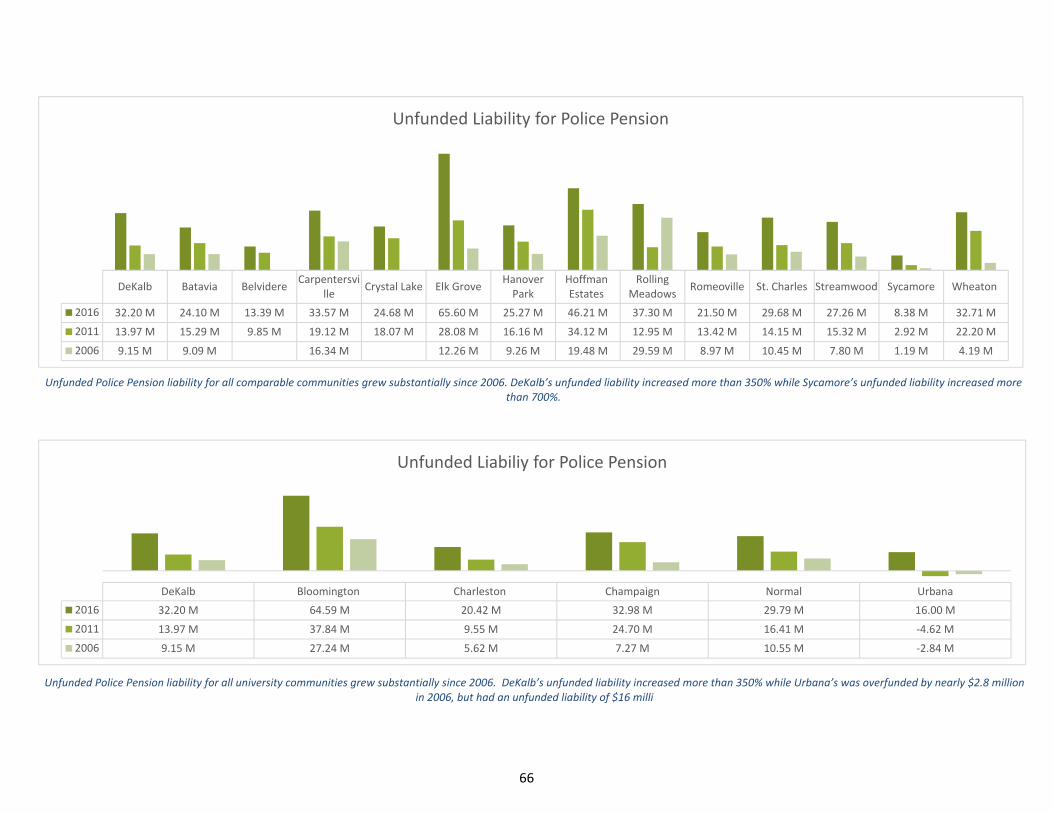
66
DeKalb Batavia BelvidereCarpentersvi
lleCrystal Lake Elk Grove
HanoverPark
HoffmanEstates
RollingMeadows
Romeoville St. Charles Streamwood Sycamore Wheaton
2016 32.20 M 24.10 M 13.39 M 33.57 M 24.68 M 65.60 M 25.27 M 46.21 M 37.30 M 21.50 M 29.68 M 27.26 M 8.38 M 32.71 M
2011 13.97 M 15.29 M 9.85 M 19.12 M 18.07 M 28.08 M 16.16 M 34.12 M 12.95 M 13.42 M 14.15 M 15.32 M 2.92 M 22.20 M
2006 9.15 M 9.09 M 16.34 M 12.26 M 9.26 M 19.48 M 29.59 M 8.97 M 10.45 M 7.80 M 1.19 M 4.19 M
Unfunded Liability for Police Pension
Unfunded Police Pension liability for all comparable communities grew substantially since 2006. DeKalb’s unfunded liability increased more than 350% while Sycamore’s unfunded liability increased more than 700%.
Unfunded Police Pension liability for all university communities grew substantially since 2006. DeKalb’s unfunded liability increased more than 350% while Urbana’s was overfunded by nearly $2.8 million in 2006, but had an unfunded liability of $16 milli
DeKalb Bloomington Charleston Champaign Normal Urbana
2016 32.20 M 64.59 M 20.42 M 32.98 M 29.79 M 16.00 M
2011 13.97 M 37.84 M 9.55 M 24.70 M 16.41 M ‐4.62 M
2006 9.15 M 27.24 M 5.62 M 7.27 M 10.55 M ‐2.84 M
Unfunded Liabiliy for Police Pension
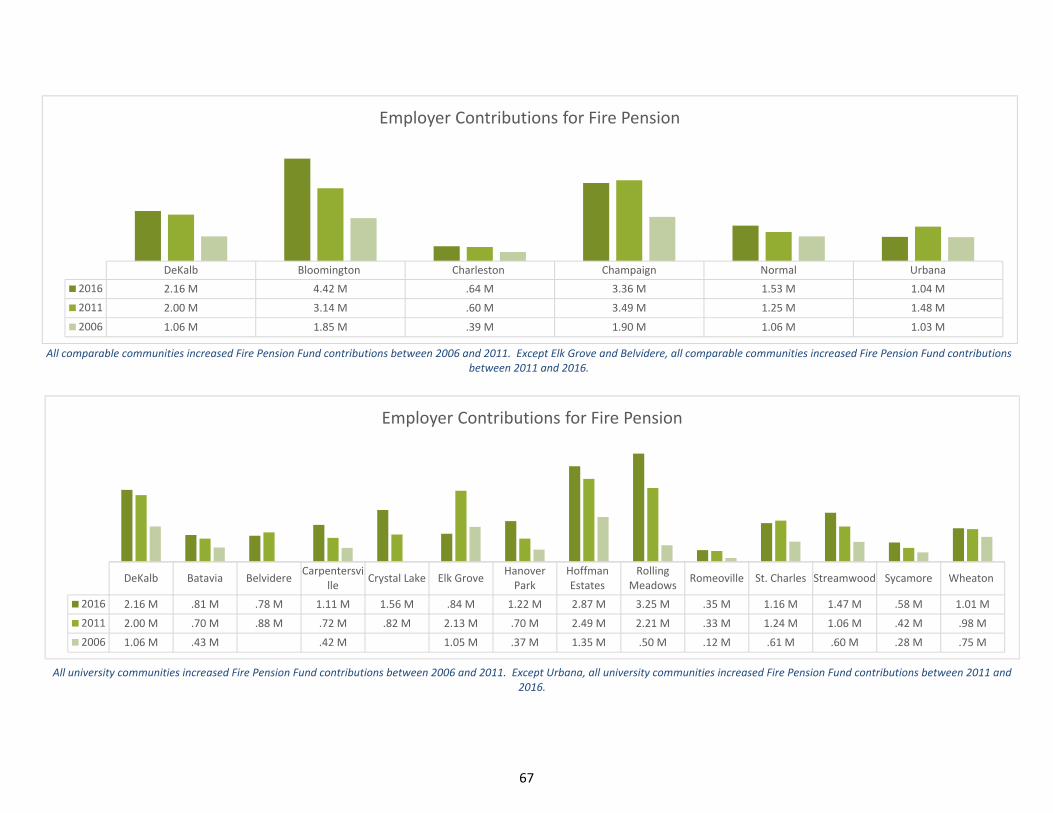
67
DeKalb Bloomington Charleston Champaign Normal Urbana
2016 2.16 M 4.42 M .64 M 3.36 M 1.53 M 1.04 M
2011 2.00 M 3.14 M .60 M 3.49 M 1.25 M 1.48 M
2006 1.06 M 1.85 M .39 M 1.90 M 1.06 M 1.03 M
Employer Contributions for Fire Pension
DeKalb Batavia BelvidereCarpentersvi
lleCrystal Lake Elk Grove
HanoverPark
HoffmanEstates
RollingMeadows
Romeoville St. Charles Streamwood Sycamore Wheaton
2016 2.16 M .81 M .78 M 1.11 M 1.56 M .84 M 1.22 M 2.87 M 3.25 M .35 M 1.16 M 1.47 M .58 M 1.01 M
2011 2.00 M .70 M .88 M .72 M .82 M 2.13 M .70 M 2.49 M 2.21 M .33 M 1.24 M 1.06 M .42 M .98 M
2006 1.06 M .43 M .42 M 1.05 M .37 M 1.35 M .50 M .12 M .61 M .60 M .28 M .75 M
Employer Contributions for Fire Pension
All comparable communities increased Fire Pension Fund contributions between 2006 and 2011. Except Elk Grove and Belvidere, all comparable communities increased Fire Pension Fund contributions between 2011 and 2016.
All university communities increased Fire Pension Fund contributions between 2006 and 2011. Except Urbana, all university communities increased Fire Pension Fund contributions between 2011 and 2016.
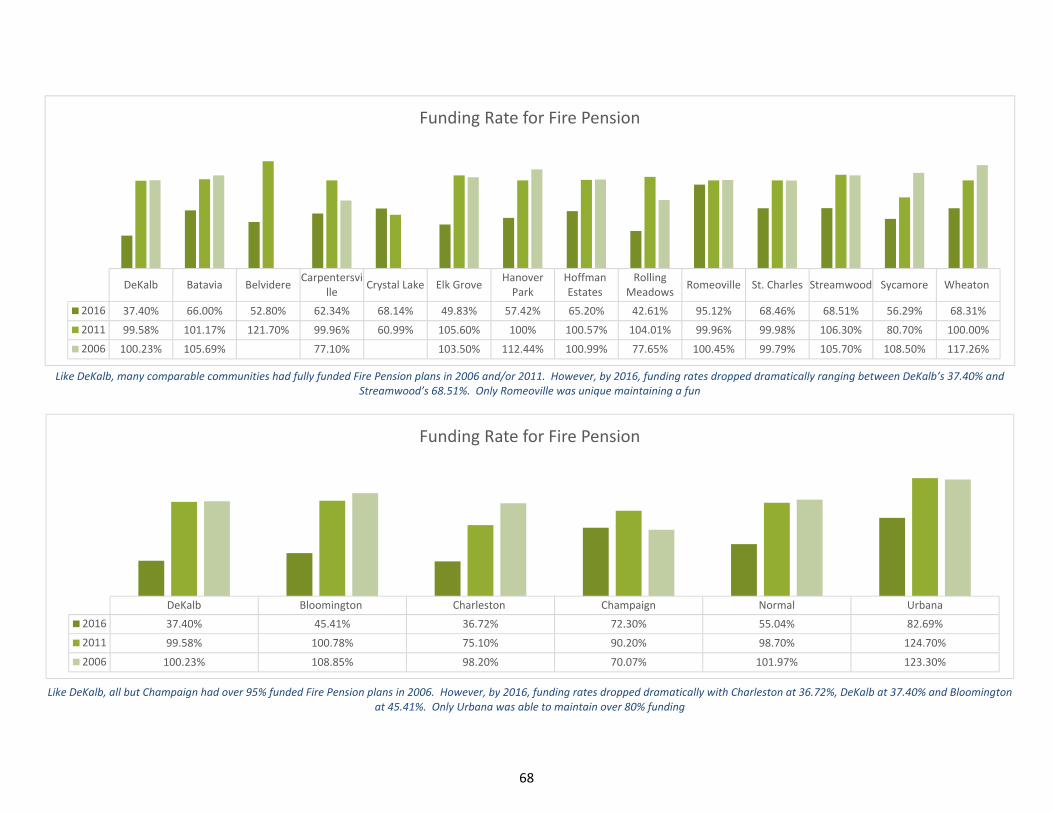
68
DeKalb Batavia BelvidereCarpentersvi
lleCrystal Lake Elk Grove
HanoverPark
HoffmanEstates
RollingMeadows
Romeoville St. Charles Streamwood Sycamore Wheaton
2016 37.40% 66.00% 52.80% 62.34% 68.14% 49.83% 57.42% 65.20% 42.61% 95.12% 68.46% 68.51% 56.29% 68.31%
2011 99.58% 101.17% 121.70% 99.96% 60.99% 105.60% 100% 100.57% 104.01% 99.96% 99.98% 106.30% 80.70% 100.00%
2006 100.23% 105.69% 77.10% 103.50% 112.44% 100.99% 77.65% 100.45% 99.79% 105.70% 108.50% 117.26%
Funding Rate for Fire Pension
DeKalb Bloomington Charleston Champaign Normal Urbana
2016 37.40% 45.41% 36.72% 72.30% 55.04% 82.69%
2011 99.58% 100.78% 75.10% 90.20% 98.70% 124.70%
2006 100.23% 108.85% 98.20% 70.07% 101.97% 123.30%
Funding Rate for Fire Pension
Like DeKalb, many comparable communities had fully funded Fire Pension plans in 2006 and/or 2011. However, by 2016, funding rates dropped dramatically ranging between DeKalb’s 37.40% and Streamwood’s 68.51%. Only Romeoville was unique maintaining a fun
Like DeKalb, all but Champaign had over 95% funded Fire Pension plans in 2006. However, by 2016, funding rates dropped dramatically with Charleston at 36.72%, DeKalb at 37.40% and Bloomington at 45.41%. Only Urbana was able to maintain over 80% funding
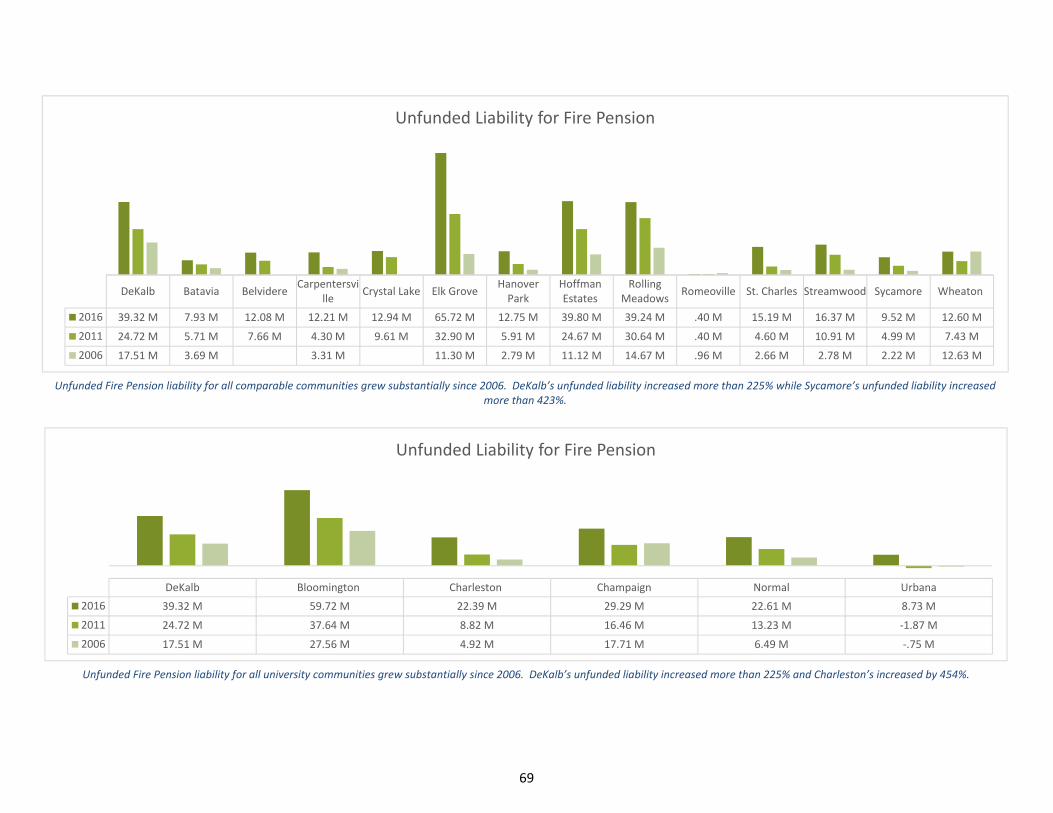
69
DeKalb Batavia BelvidereCarpentersvi
lleCrystal Lake Elk Grove
HanoverPark
HoffmanEstates
RollingMeadows
Romeoville St. Charles Streamwood Sycamore Wheaton
2016 39.32 M 7.93 M 12.08 M 12.21 M 12.94 M 65.72 M 12.75 M 39.80 M 39.24 M .40 M 15.19 M 16.37 M 9.52 M 12.60 M
2011 24.72 M 5.71 M 7.66 M 4.30 M 9.61 M 32.90 M 5.91 M 24.67 M 30.64 M .40 M 4.60 M 10.91 M 4.99 M 7.43 M
2006 17.51 M 3.69 M 3.31 M 11.30 M 2.79 M 11.12 M 14.67 M .96 M 2.66 M 2.78 M 2.22 M 12.63 M
Unfunded Liability for Fire Pension
DeKalb Bloomington Charleston Champaign Normal Urbana
2016 39.32 M 59.72 M 22.39 M 29.29 M 22.61 M 8.73 M
2011 24.72 M 37.64 M 8.82 M 16.46 M 13.23 M ‐1.87 M
2006 17.51 M 27.56 M 4.92 M 17.71 M 6.49 M ‐.75 M
Unfunded Liability for Fire Pension
Unfunded Fire Pension liability for all comparable communities grew substantially since 2006. DeKalb’s unfunded liability increased more than 225% while Sycamore’s unfunded liability increased more than 423%.
Unfunded Fire Pension liability for all university communities grew substantially since 2006. DeKalb’s unfunded liability increased more than 225% and Charleston’s increased by 454%.
70
Revenue and Expenditure Projections
71
Revenue and Expenditure Forecast Revenues Expenditures Personnel Costs
Outsourcing of Service Salaries Bargaining Units Wellness Retiree Insurance Health Insurance Plan Design
Revenue and Expenditure Projections
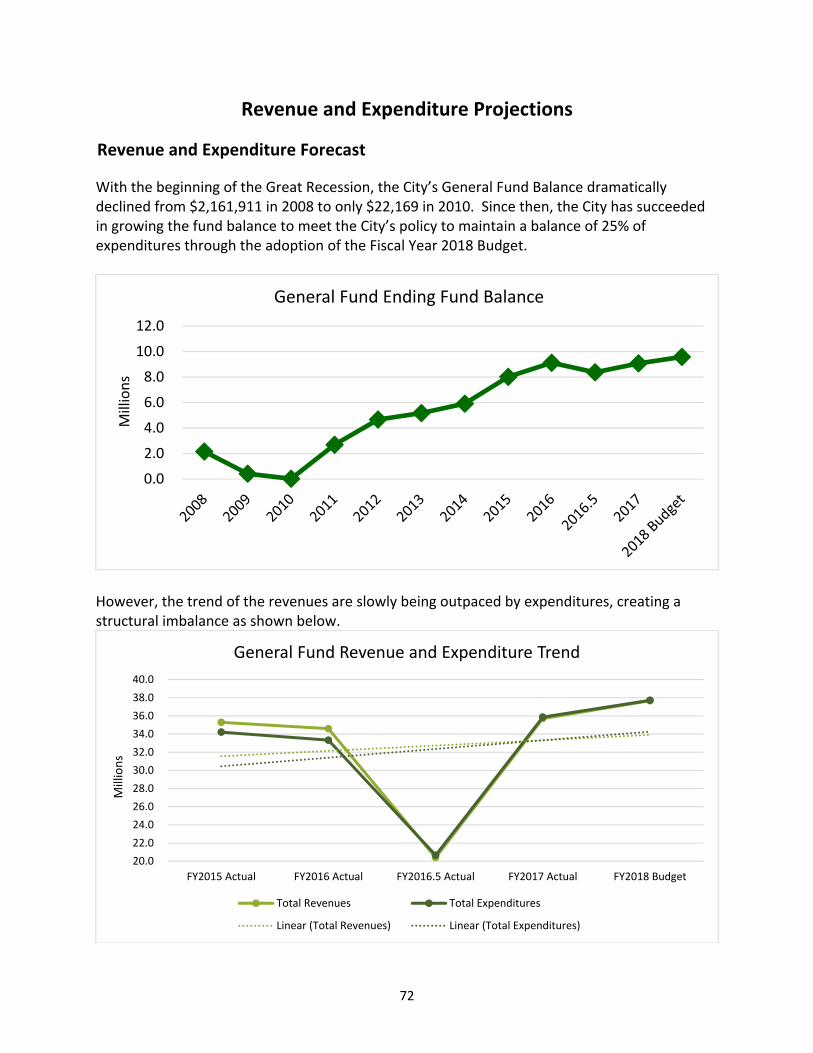
72
Revenue and Expenditure Projections
Revenue and Expenditure Forecast
With the beginning of the Great Recession, the City’s General Fund Balance dramatically declined from $2,161,911 in 2008 to only $22,169 in 2010. Since then, the City has succeeded in growing the fund balance to meet the City’s policy to maintain a balance of 25% of expenditures through the adoption of the Fiscal Year 2018 Budget.
However, the trend of the revenues are slowly being outpaced by expenditures, creating a structural imbalance as shown below.
0.0
2.0
4.0
6.0
8.0
10.0
12.0
Millions
General Fund Ending Fund Balance
20.0
22.0
24.0
26.0
28.0
30.0
32.0
34.0
36.0
38.0
40.0
FY2015 Actual FY2016 Actual FY2016.5 Actual FY2017 Actual FY2018 Budget
Millions
General Fund Revenue and Expenditure Trend
Total Revenues Total Expenditures
Linear (Total Revenues) Linear (Total Expenditures)
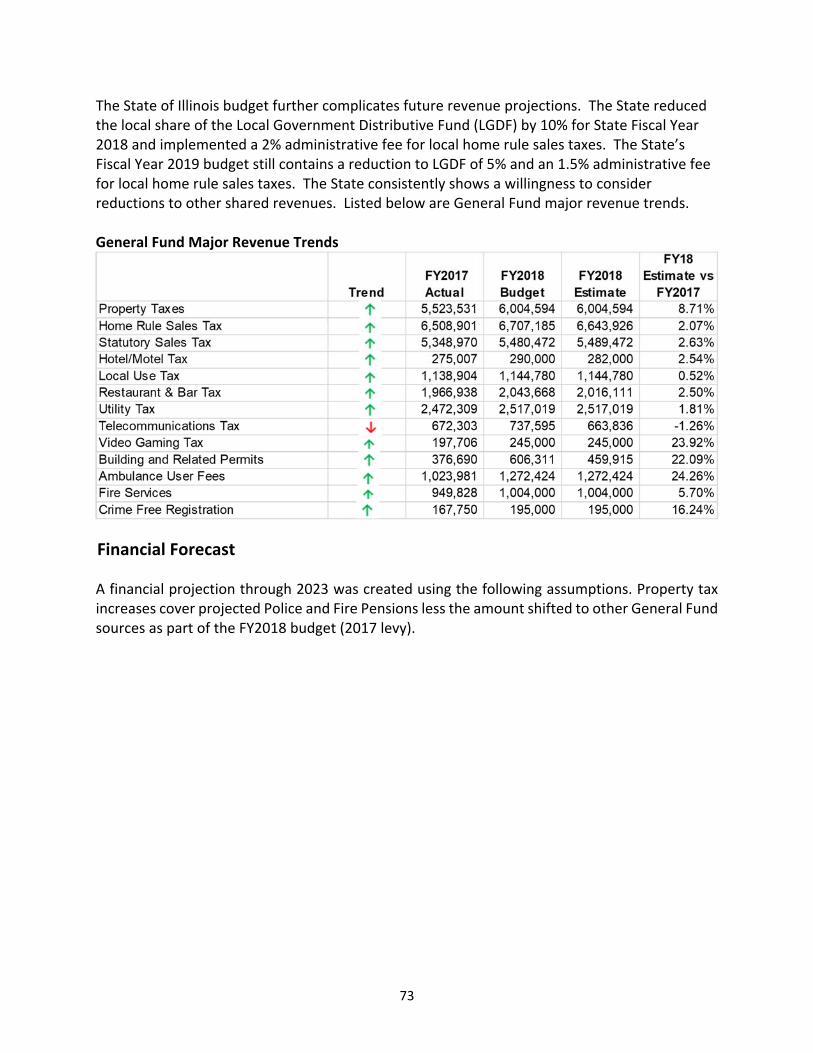
73
The State of Illinois budget further complicates future revenue projections. The State reduced the local share of the Local Government Distributive Fund (LGDF) by 10% for State Fiscal Year 2018 and implemented a 2% administrative fee for local home rule sales taxes. The State’s Fiscal Year 2019 budget still contains a reduction to LGDF of 5% and an 1.5% administrative fee for local home rule sales taxes. The State consistently shows a willingness to consider reductions to other shared revenues. Listed below are General Fund major revenue trends. General Fund Major Revenue Trends
Financial Forecast A financial projection through 2023 was created using the following assumptions. Property tax increases cover projected Police and Fire Pensions less the amount shifted to other General Fund sources as part of the FY2018 budget (2017 levy).
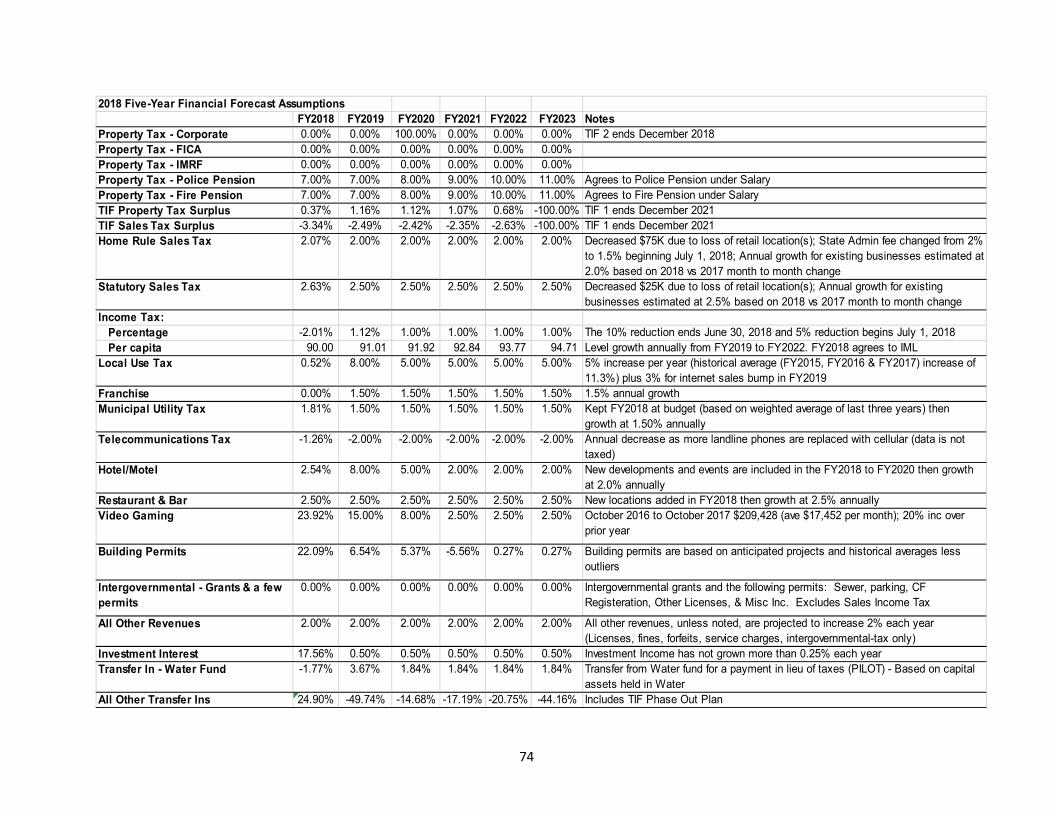
74
2018 Five-Year Financial Forecast AssumptionsFY2018 FY2019 FY2020 FY2021 FY2022 FY2023 Notes
Property Tax - Corporate 0.00% 0.00% 100.00% 0.00% 0.00% 0.00% TIF 2 ends December 2018Property Tax - FICA 0.00% 0.00% 0.00% 0.00% 0.00% 0.00%Property Tax - IMRF 0.00% 0.00% 0.00% 0.00% 0.00% 0.00%Property Tax - Police Pension 7.00% 7.00% 8.00% 9.00% 10.00% 11.00% Agrees to Police Pension under SalaryProperty Tax - Fire Pension 7.00% 7.00% 8.00% 9.00% 10.00% 11.00% Agrees to Fire Pension under SalaryTIF Property Tax Surplus 0.37% 1.16% 1.12% 1.07% 0.68% -100.00% TIF 1 ends December 2021TIF Sales Tax Surplus -3.34% -2.49% -2.42% -2.35% -2.63% -100.00% TIF 1 ends December 2021Home Rule Sales Tax 2.07% 2.00% 2.00% 2.00% 2.00% 2.00% Decreased $75K due to loss of retail location(s); State Admin fee changed from 2%
to 1.5% beginning July 1, 2018; Annual growth for existing businesses estimated at 2.0% based on 2018 vs 2017 month to month change
Statutory Sales Tax 2.63% 2.50% 2.50% 2.50% 2.50% 2.50% Decreased $25K due to loss of retail location(s); Annual growth for existing businesses estimated at 2.5% based on 2018 vs 2017 month to month change
Income Tax:Percentage -2.01% 1.12% 1.00% 1.00% 1.00% 1.00% The 10% reduction ends June 30, 2018 and 5% reduction begins July 1, 2018Per capita 90.00 91.01 91.92 92.84 93.77 94.71 Level growth annually from FY2019 to FY2022. FY2018 agrees to IML
Local Use Tax 0.52% 8.00% 5.00% 5.00% 5.00% 5.00% 5% increase per year (historical average (FY2015, FY2016 & FY2017) increase of 11.3%) plus 3% for internet sales bump in FY2019
Franchise 0.00% 1.50% 1.50% 1.50% 1.50% 1.50% 1.5% annual growthMunicipal Utility Tax 1.81% 1.50% 1.50% 1.50% 1.50% 1.50% Kept FY2018 at budget (based on weighted average of last three years) then
growth at 1.50% annuallyTelecommunications Tax -1.26% -2.00% -2.00% -2.00% -2.00% -2.00% Annual decrease as more landline phones are replaced with cellular (data is not
taxed)Hotel/Motel 2.54% 8.00% 5.00% 2.00% 2.00% 2.00% New developments and events are included in the FY2018 to FY2020 then growth
at 2.0% annually Restaurant & Bar 2.50% 2.50% 2.50% 2.50% 2.50% 2.50% New locations added in FY2018 then growth at 2.5% annually Video Gaming 23.92% 15.00% 8.00% 2.50% 2.50% 2.50% October 2016 to October 2017 $209,428 (ave $17,452 per month); 20% inc over
prior year
Building Permits 22.09% 6.54% 5.37% -5.56% 0.27% 0.27% Building permits are based on anticipated projects and historical averages less outliers
Intergovernmental - Grants & a few permits
0.00% 0.00% 0.00% 0.00% 0.00% 0.00% Intergovernmental grants and the following permits: Sewer, parking, CF Registeration, Other Licenses, & Misc Inc. Excludes Sales Income Tax
All Other Revenues 2.00% 2.00% 2.00% 2.00% 2.00% 2.00% All other revenues, unless noted, are projected to increase 2% each year (Licenses, fines, forfeits, service charges, intergovernmental-tax only)
Investment Interest 17.56% 0.50% 0.50% 0.50% 0.50% 0.50% Investment Income has not grown more than 0.25% each yearTransfer In - Water Fund -1.77% 3.67% 1.84% 1.84% 1.84% 1.84% Transfer from Water fund for a payment in lieu of taxes (PILOT) - Based on capital
assets held in Water All Other Transfer Ins 24.90% -49.74% -14.68% -17.19% -20.75% -44.16% Includes TIF Phase Out Plan
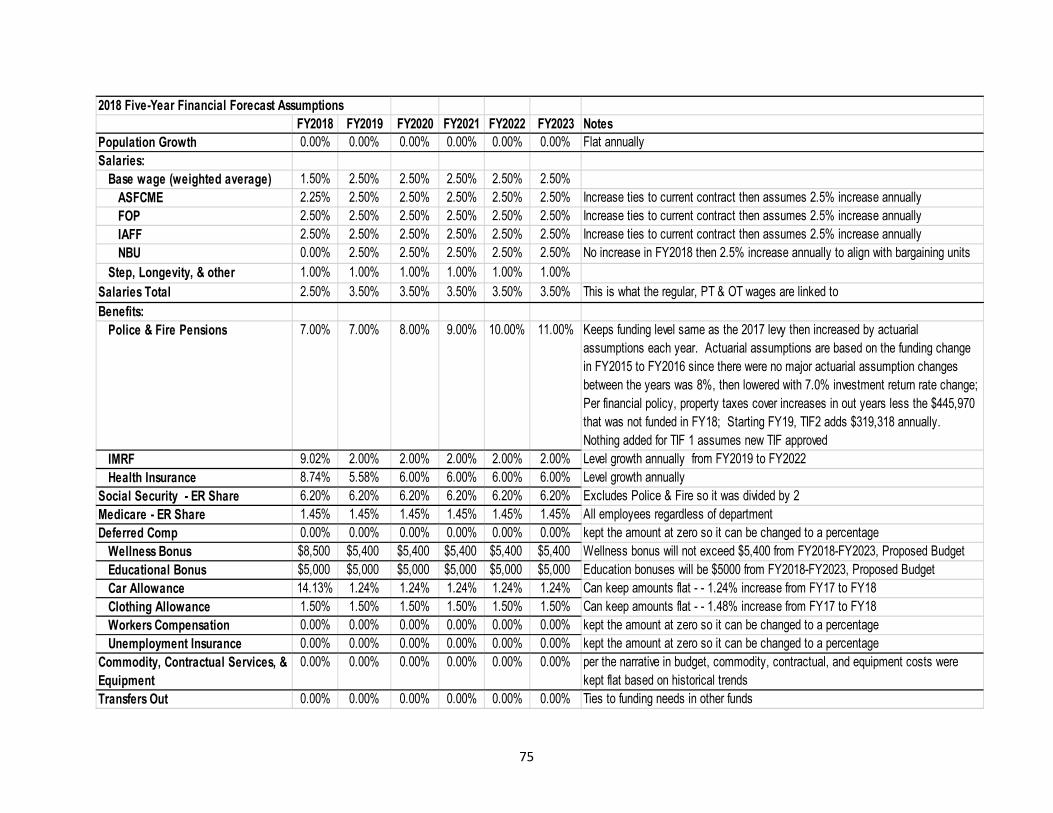
75
2018 Five-Year Financial Forecast AssumptionsFY2018 FY2019 FY2020 FY2021 FY2022 FY2023 Notes
Population Growth 0.00% 0.00% 0.00% 0.00% 0.00% 0.00% Flat annuallySalaries:
Base wage (weighted average) 1.50% 2.50% 2.50% 2.50% 2.50% 2.50%ASFCME 2.25% 2.50% 2.50% 2.50% 2.50% 2.50% Increase ties to current contract then assumes 2.5% increase annuallyFOP 2.50% 2.50% 2.50% 2.50% 2.50% 2.50% Increase ties to current contract then assumes 2.5% increase annuallyIAFF 2.50% 2.50% 2.50% 2.50% 2.50% 2.50% Increase ties to current contract then assumes 2.5% increase annuallyNBU 0.00% 2.50% 2.50% 2.50% 2.50% 2.50% No increase in FY2018 then 2.5% increase annually to align with bargaining units
Step, Longevity, & other 1.00% 1.00% 1.00% 1.00% 1.00% 1.00%
Salaries Total 2.50% 3.50% 3.50% 3.50% 3.50% 3.50% This is what the regular, PT & OT wages are linked to
Benefits:Police & Fire Pensions 7.00% 7.00% 8.00% 9.00% 10.00% 11.00% Keeps funding level same as the 2017 levy then increased by actuarial
assumptions each year. Actuarial assumptions are based on the funding change in FY2015 to FY2016 since there were no major actuarial assumption changes between the years was 8%, then lowered with 7.0% investment return rate change; Per financial policy, property taxes cover increases in out years less the $445,970 that was not funded in FY18; Starting FY19, TIF2 adds $319,318 annually. Nothing added for TIF 1 assumes new TIF approved
IMRF 9.02% 2.00% 2.00% 2.00% 2.00% 2.00% Level growth annually from FY2019 to FY2022Health Insurance 8.74% 5.58% 6.00% 6.00% 6.00% 6.00% Level growth annually
Social Security - ER Share 6.20% 6.20% 6.20% 6.20% 6.20% 6.20% Excludes Police & Fire so it was divided by 2Medicare - ER Share 1.45% 1.45% 1.45% 1.45% 1.45% 1.45% All employees regardless of departmentDeferred Comp 0.00% 0.00% 0.00% 0.00% 0.00% 0.00% kept the amount at zero so it can be changed to a percentage
Wellness Bonus $8,500 $5,400 $5,400 $5,400 $5,400 $5,400 Wellness bonus will not exceed $5,400 from FY2018-FY2023, Proposed BudgetEducational Bonus $5,000 $5,000 $5,000 $5,000 $5,000 $5,000 Education bonuses will be $5000 from FY2018-FY2023, Proposed BudgetCar Allowance 14.13% 1.24% 1.24% 1.24% 1.24% 1.24% Can keep amounts flat - - 1.24% increase from FY17 to FY18Clothing Allowance 1.50% 1.50% 1.50% 1.50% 1.50% 1.50% Can keep amounts flat - - 1.48% increase from FY17 to FY18Workers Compensation 0.00% 0.00% 0.00% 0.00% 0.00% 0.00% kept the amount at zero so it can be changed to a percentageUnemployment Insurance 0.00% 0.00% 0.00% 0.00% 0.00% 0.00% kept the amount at zero so it can be changed to a percentage
Commodity, Contractual Services, & Equipment
0.00% 0.00% 0.00% 0.00% 0.00% 0.00% per the narrative in budget, commodity, contractual, and equipment costs were kept flat based on historical trends
Transfers Out 0.00% 0.00% 0.00% 0.00% 0.00% 0.00% Ties to funding needs in other funds
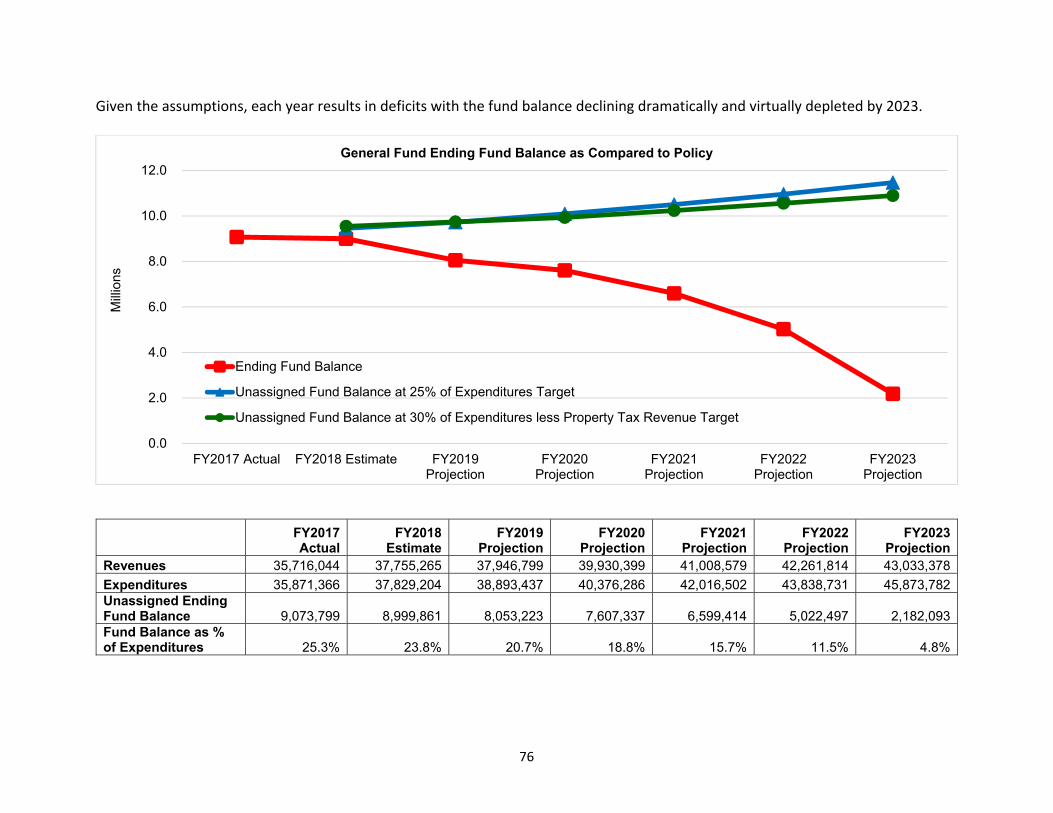
76
Given the assumptions, each year results in deficits with the fund balance declining dramatically and virtually depleted by 2023.
0.0
2.0
4.0
6.0
8.0
10.0
12.0
FY2017 Actual FY2018 Estimate FY2019Projection
FY2020Projection
FY2021Projection
FY2022Projection
FY2023Projection
Mill
ions
General Fund Ending Fund Balance as Compared to Policy
Ending Fund Balance
Unassigned Fund Balance at 25% of Expenditures Target
Unassigned Fund Balance at 30% of Expenditures less Property Tax Revenue Target
FY2017 Actual
FY2018 Estimate
FY2019 Projection
FY2020 Projection
FY2021 Projection
FY2022 Projection
FY2023 Projection
Revenues 35,716,044 37,755,265 37,946,799 39,930,399 41,008,579 42,261,814 43,033,378
Expenditures 35,871,366 37,829,204 38,893,437 40,376,286 42,016,502 43,838,731 45,873,782 Unassigned Ending Fund Balance 9,073,799 8,999,861 8,053,223 7,607,337 6,599,414 5,022,497 2,182,093 Fund Balance as % of Expenditures 25.3% 23.8% 20.7% 18.8% 15.7% 11.5% 4.8%
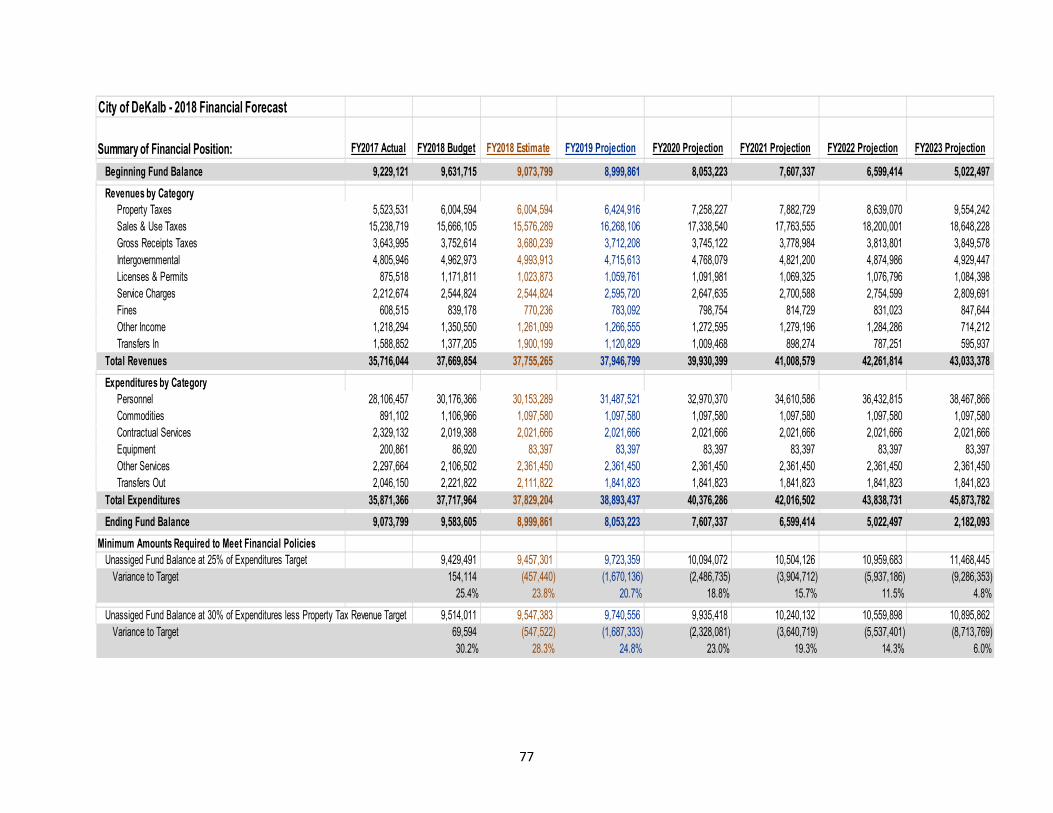
77
City of DeKalb - 2018 Financial Forecast
Summary of Financial Position: FY2017 Actual FY2018 Budget FY2018 Estimate FY2019 Projection FY2020 Projection FY2021 Projection FY2022 Projection FY2023 Projection
Beginning Fund Balance 9,229,121 9,631,715 9,073,799 8,999,861 8,053,223 7,607,337 6,599,414 5,022,497
Revenues by CategoryProperty Taxes 5,523,531 6,004,594 6,004,594 6,424,916 7,258,227 7,882,729 8,639,070 9,554,242Sales & Use Taxes 15,238,719 15,666,105 15,576,289 16,268,106 17,338,540 17,763,555 18,200,001 18,648,228Gross Receipts Taxes 3,643,995 3,752,614 3,680,239 3,712,208 3,745,122 3,778,984 3,813,801 3,849,578Intergovernmental 4,805,946 4,962,973 4,993,913 4,715,613 4,768,079 4,821,200 4,874,986 4,929,447Licenses & Permits 875,518 1,171,811 1,023,873 1,059,761 1,091,981 1,069,325 1,076,796 1,084,398Service Charges 2,212,674 2,544,824 2,544,824 2,595,720 2,647,635 2,700,588 2,754,599 2,809,691Fines 608,515 839,178 770,236 783,092 798,754 814,729 831,023 847,644Other Income 1,218,294 1,350,550 1,261,099 1,266,555 1,272,595 1,279,196 1,284,286 714,212Transfers In 1,588,852 1,377,205 1,900,199 1,120,829 1,009,468 898,274 787,251 595,937
Total Revenues 35,716,044 37,669,854 37,755,265 37,946,799 39,930,399 41,008,579 42,261,814 43,033,378
Expenditures by CategoryPersonnel 28,106,457 30,176,366 30,153,289 31,487,521 32,970,370 34,610,586 36,432,815 38,467,866Commodities 891,102 1,106,966 1,097,580 1,097,580 1,097,580 1,097,580 1,097,580 1,097,580Contractual Services 2,329,132 2,019,388 2,021,666 2,021,666 2,021,666 2,021,666 2,021,666 2,021,666Equipment 200,861 86,920 83,397 83,397 83,397 83,397 83,397 83,397Other Services 2,297,664 2,106,502 2,361,450 2,361,450 2,361,450 2,361,450 2,361,450 2,361,450Transfers Out 2,046,150 2,221,822 2,111,822 1,841,823 1,841,823 1,841,823 1,841,823 1,841,823
Total Expenditures 35,871,366 37,717,964 37,829,204 38,893,437 40,376,286 42,016,502 43,838,731 45,873,782
Ending Fund Balance 9,073,799 9,583,605 8,999,861 8,053,223 7,607,337 6,599,414 5,022,497 2,182,093
Minimum Amounts Required to Meet Financial PoliciesUnassiged Fund Balance at 25% of Expenditures Target 9,429,491 9,457,301 9,723,359 10,094,072 10,504,126 10,959,683 11,468,445
Variance to Target 154,114 (457,440) (1,670,136) (2,486,735) (3,904,712) (5,937,186) (9,286,353) 25.4% 23.8% 20.7% 18.8% 15.7% 11.5% 4.8%
Unassiged Fund Balance at 30% of Expenditures less Property Tax Revenue Target 9,514,011 9,547,383 9,740,556 9,935,418 10,240,132 10,559,898 10,895,862 Variance to Target 69,594 (547,522) (1,687,333) (2,328,081) (3,640,719) (5,537,401) (8,713,769)
30.2% 28.3% 24.8% 23.0% 19.3% 14.3% 6.0%
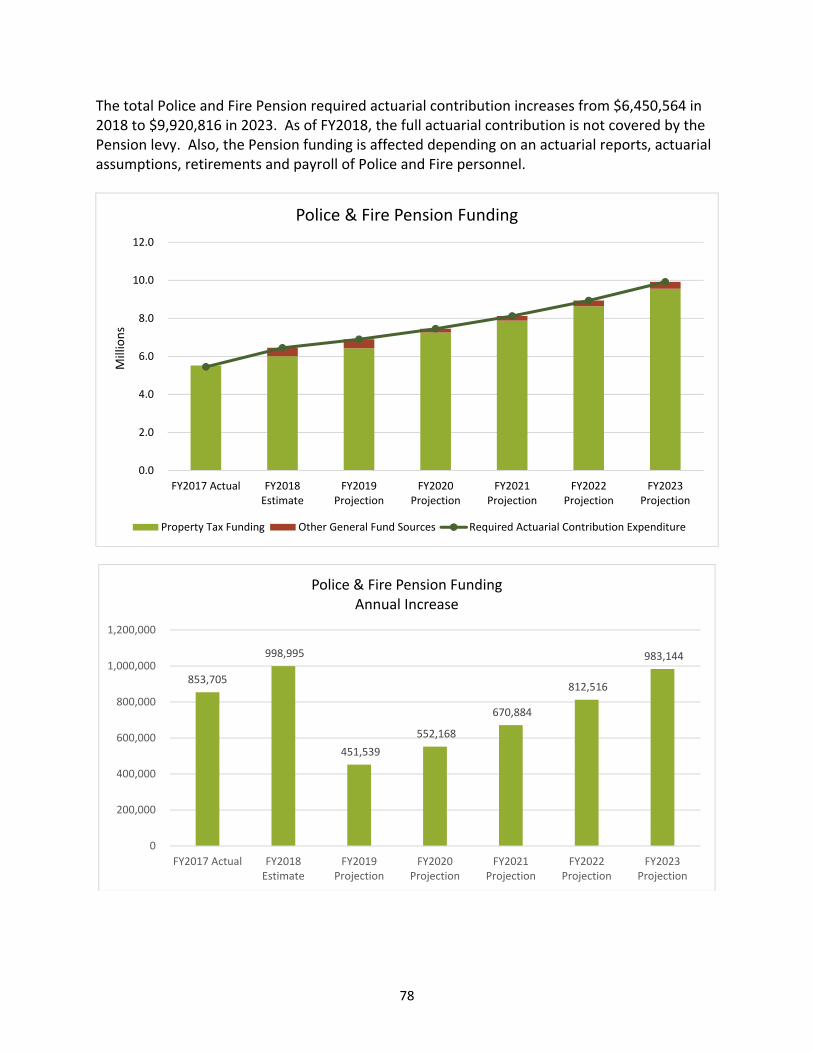
78
The total Police and Fire Pension required actuarial contribution increases from $6,450,564 in 2018 to $9,920,816 in 2023. As of FY2018, the full actuarial contribution is not covered by the Pension levy. Also, the Pension funding is affected depending on an actuarial reports, actuarial assumptions, retirements and payroll of Police and Fire personnel.
0.0
2.0
4.0
6.0
8.0
10.0
12.0
FY2017 Actual FY2018Estimate
FY2019Projection
FY2020Projection
FY2021Projection
FY2022Projection
FY2023Projection
Millions
Police & Fire Pension Funding
Property Tax Funding Other General Fund Sources Required Actuarial Contribution Expenditure
853,705
998,995
451,539
552,168
670,884
812,516
983,144
0
200,000
400,000
600,000
800,000
1,000,000
1,200,000
FY2017 Actual FY2018Estimate
FY2019Projection
FY2020Projection
FY2021Projection
FY2022Projection
FY2023Projection
Police & Fire Pension FundingAnnual Increase
79
The City’s actuary, Foster and Foster, created two illustrations, one for Fire and one for Police Pension funds, that would show the existing funding obligation of the City without consideration of any additional future obligations as of January 1, 2018. These illustrations show that there is still a significant pension obligation to the City of $57 million over a 30‐year period to pay off the liabilities that have been accrued as of January 1, 2018. Methodology and Assumptions
1) Year 0 will match the 1/1/2017 Valuation Results. Assuming no consideration of additional future liability as of 1/1/2018, no differences occur until Year 1.
2) This assumes that the full 2017 contribution will be contributed to the fund.
3) This also assumes that all contributions will be made in full each year.
4) It is assumed that all actuarial assumptions come true. The methods and assumptions are identical to those disclosed in the 1/1/2017 actuarial valuations. This includes an interest rate of 7.50%, payroll growth of 4.50% and payment period as of 1/1/2017 of 24 years on the unfunded liability.
5) Experience between the two illustrations, Fire and Police Pension Funds, are assumed to
be identical. In reality, it is possible that the pension funds would experience retirements at different points in time. For example, a short‐term retirement, not currently considered in the illustrations, would have an impact on the calculation, likely resulting in a loss (i.e., slightly higher contributions that are illustrated, which would reduce the savings).
6) The administrative expenses are assumed to grow with inflation at 2.50%. These expenses
are adjusted downward to reflect the assumption of no additional future obligations.
7) Under the ongoing plan calculations, normal cost is assumed to be the same percentage of payroll over the entire period.
8) Payroll is expected to grow with the assumption of 4.50%. Again, this amount could be
lower if payroll increases over the 30‐year period are lower than 4.50% per year. If that were true, the difference in the savings would be lower since normal cost would be decrease for the 30‐year period.
Outcome ‐ The below illustrations show the impact on the respective pension funds without any additional future obligations as of January 1, 2018. While there are some savings from doing so, the illustrations show that the obligation to pay off past accruals remains for some time into the future. Running the impact out over 30‐years and discounting the resulting savings back to January 1, 2018 using the valuation interest rate of 7.50%, the estimated savings over the 30‐year period are as follows:
80
Fire Pension Fund = $25.1 million
Police Pension Fund = $18.9 million However, there is still a significant contribution that needs to be realized over this period to pay off the liabilities that have been accrued to date. As of January 1, 2018, it is estimated that the City would still owe the following unfunded liability amounts on the pension funds, assuming no additional future obligations. These are the unfunded amounts for benefits that have been accrued as of January 1, 2018:
Fire Pension Fund = $29.8 million Police Pension Fund = $27.2 million
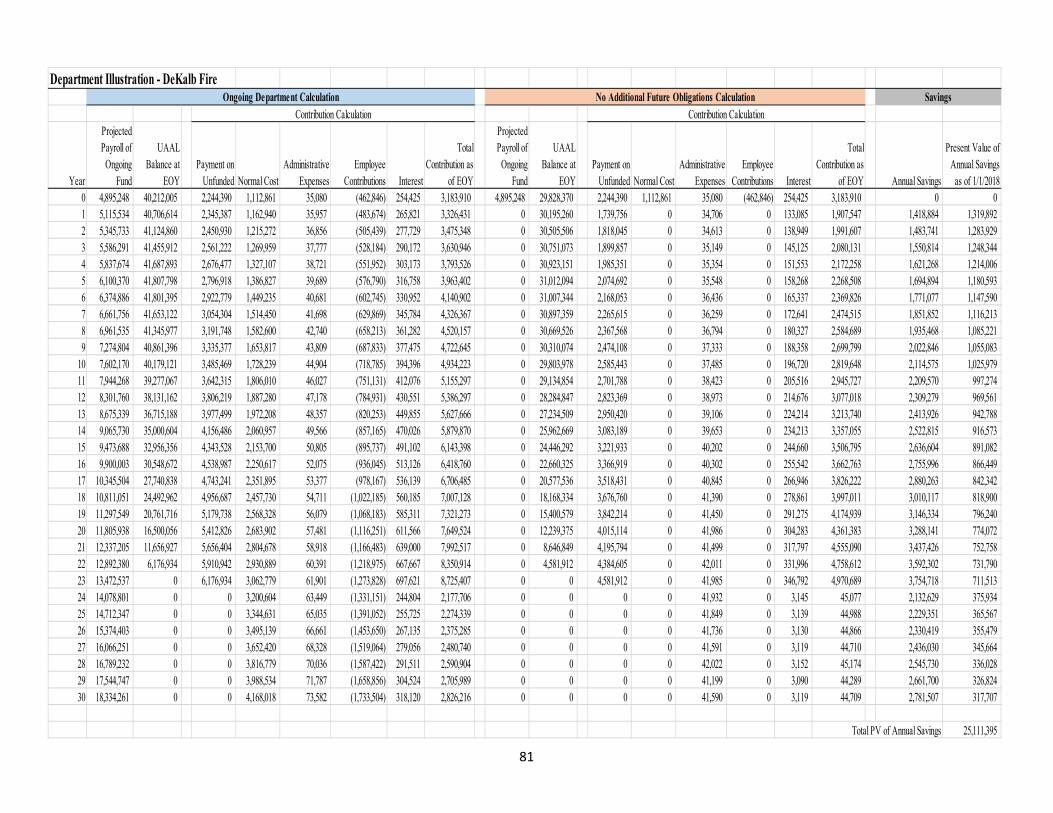
81
Department Illustration - DeKalb Fire
Year
Projected Payroll of
Ongoing Fund
UAAL Balance at
EOYPayment on
Unfunded Normal CostAdministrative
ExpensesEmployee
Contributions Interest
Total Contribution as
of EOY
Projected Payroll of
Ongoing Fund
UAAL Balance at
EOYPayment on
Unfunded Normal CostAdministrative
ExpensesEmployee
Contributions Interest
Total Contribution as
of EOY Annual Savings
Present Value of Annual Savings
as of 1/1/20180 4,895,248 40,212,005 2,244,390 1,112,861 35,080 (462,846) 254,425 3,183,910 4,895,248 29,828,370 2,244,390 1,112,861 35,080 (462,846) 254,425 3,183,910 0 01 5,115,534 40,706,614 2,345,387 1,162,940 35,957 (483,674) 265,821 3,326,431 0 30,195,260 1,739,756 0 34,706 0 133,085 1,907,547 1,418,884 1,319,8922 5,345,733 41,124,860 2,450,930 1,215,272 36,856 (505,439) 277,729 3,475,348 0 30,505,506 1,818,045 0 34,613 0 138,949 1,991,607 1,483,741 1,283,9293 5,586,291 41,455,912 2,561,222 1,269,959 37,777 (528,184) 290,172 3,630,946 0 30,751,073 1,899,857 0 35,149 0 145,125 2,080,131 1,550,814 1,248,3444 5,837,674 41,687,893 2,676,477 1,327,107 38,721 (551,952) 303,173 3,793,526 0 30,923,151 1,985,351 0 35,354 0 151,553 2,172,258 1,621,268 1,214,0065 6,100,370 41,807,798 2,796,918 1,386,827 39,689 (576,790) 316,758 3,963,402 0 31,012,094 2,074,692 0 35,548 0 158,268 2,268,508 1,694,894 1,180,5936 6,374,886 41,801,395 2,922,779 1,449,235 40,681 (602,745) 330,952 4,140,902 0 31,007,344 2,168,053 0 36,436 0 165,337 2,369,826 1,771,077 1,147,5907 6,661,756 41,653,122 3,054,304 1,514,450 41,698 (629,869) 345,784 4,326,367 0 30,897,359 2,265,615 0 36,259 0 172,641 2,474,515 1,851,852 1,116,2138 6,961,535 41,345,977 3,191,748 1,582,600 42,740 (658,213) 361,282 4,520,157 0 30,669,526 2,367,568 0 36,794 0 180,327 2,584,689 1,935,468 1,085,2219 7,274,804 40,861,396 3,335,377 1,653,817 43,809 (687,833) 377,475 4,722,645 0 30,310,074 2,474,108 0 37,333 0 188,358 2,699,799 2,022,846 1,055,083
10 7,602,170 40,179,121 3,485,469 1,728,239 44,904 (718,785) 394,396 4,934,223 0 29,803,978 2,585,443 0 37,485 0 196,720 2,819,648 2,114,575 1,025,97911 7,944,268 39,277,067 3,642,315 1,806,010 46,027 (751,131) 412,076 5,155,297 0 29,134,854 2,701,788 0 38,423 0 205,516 2,945,727 2,209,570 997,27412 8,301,760 38,131,162 3,806,219 1,887,280 47,178 (784,931) 430,551 5,386,297 0 28,284,847 2,823,369 0 38,973 0 214,676 3,077,018 2,309,279 969,56113 8,675,339 36,715,188 3,977,499 1,972,208 48,357 (820,253) 449,855 5,627,666 0 27,234,509 2,950,420 0 39,106 0 224,214 3,213,740 2,413,926 942,78814 9,065,730 35,000,604 4,156,486 2,060,957 49,566 (857,165) 470,026 5,879,870 0 25,962,669 3,083,189 0 39,653 0 234,213 3,357,055 2,522,815 916,57315 9,473,688 32,956,356 4,343,528 2,153,700 50,805 (895,737) 491,102 6,143,398 0 24,446,292 3,221,933 0 40,202 0 244,660 3,506,795 2,636,604 891,08216 9,900,003 30,548,672 4,538,987 2,250,617 52,075 (936,045) 513,126 6,418,760 0 22,660,325 3,366,919 0 40,302 0 255,542 3,662,763 2,755,996 866,44917 10,345,504 27,740,838 4,743,241 2,351,895 53,377 (978,167) 536,139 6,706,485 0 20,577,536 3,518,431 0 40,845 0 266,946 3,826,222 2,880,263 842,34218 10,811,051 24,492,962 4,956,687 2,457,730 54,711 (1,022,185) 560,185 7,007,128 0 18,168,334 3,676,760 0 41,390 0 278,861 3,997,011 3,010,117 818,90019 11,297,549 20,761,716 5,179,738 2,568,328 56,079 (1,068,183) 585,311 7,321,273 0 15,400,579 3,842,214 0 41,450 0 291,275 4,174,939 3,146,334 796,24020 11,805,938 16,500,056 5,412,826 2,683,902 57,481 (1,116,251) 611,566 7,649,524 0 12,239,375 4,015,114 0 41,986 0 304,283 4,361,383 3,288,141 774,07221 12,337,205 11,656,927 5,656,404 2,804,678 58,918 (1,166,483) 639,000 7,992,517 0 8,646,849 4,195,794 0 41,499 0 317,797 4,555,090 3,437,426 752,75822 12,892,380 6,176,934 5,910,942 2,930,889 60,391 (1,218,975) 667,667 8,350,914 0 4,581,912 4,384,605 0 42,011 0 331,996 4,758,612 3,592,302 731,79023 13,472,537 0 6,176,934 3,062,779 61,901 (1,273,828) 697,621 8,725,407 0 0 4,581,912 0 41,985 0 346,792 4,970,689 3,754,718 711,51324 14,078,801 0 0 3,200,604 63,449 (1,331,151) 244,804 2,177,706 0 0 0 0 41,932 0 3,145 45,077 2,132,629 375,93425 14,712,347 0 0 3,344,631 65,035 (1,391,052) 255,725 2,274,339 0 0 0 0 41,849 0 3,139 44,988 2,229,351 365,56726 15,374,403 0 0 3,495,139 66,661 (1,453,650) 267,135 2,375,285 0 0 0 0 41,736 0 3,130 44,866 2,330,419 355,47927 16,066,251 0 0 3,652,420 68,328 (1,519,064) 279,056 2,480,740 0 0 0 0 41,591 0 3,119 44,710 2,436,030 345,66428 16,789,232 0 0 3,816,779 70,036 (1,587,422) 291,511 2,590,904 0 0 0 0 42,022 0 3,152 45,174 2,545,730 336,02829 17,544,747 0 0 3,988,534 71,787 (1,658,856) 304,524 2,705,989 0 0 0 0 41,199 0 3,090 44,289 2,661,700 326,82430 18,334,261 0 0 4,168,018 73,582 (1,733,504) 318,120 2,826,216 0 0 0 0 41,590 0 3,119 44,709 2,781,507 317,707
Total PV of Annual Savings 25,111,395
Contribution CalculationOngoing Department Calculation No Additional Future Obligations Calculation
Contribution CalculationSavings
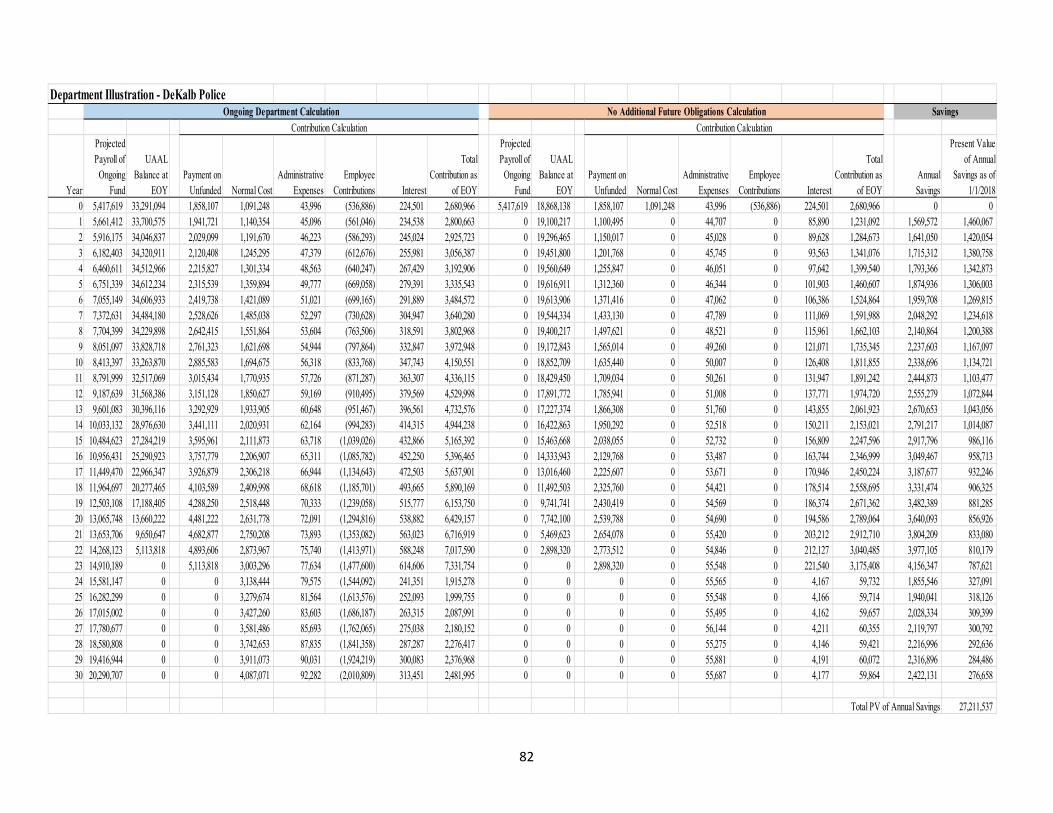
82
Department Illustration - DeKalb Police
Year
Projected Payroll of
Ongoing Fund
UAAL Balance at
EOYPayment on
Unfunded Normal CostAdministrative
ExpensesEmployee
Contributions Interest
Total Contribution as
of EOY
Projected Payroll of
Ongoing Fund
UAAL Balance at
EOYPayment on
Unfunded Normal CostAdministrative
ExpensesEmployee
Contributions Interest
Total Contribution as
of EOYAnnual Savings
Present Value of Annual
Savings as of 1/1/2018
0 5,417,619 33,291,094 1,858,107 1,091,248 43,996 (536,886) 224,501 2,680,966 5,417,619 18,868,138 1,858,107 1,091,248 43,996 (536,886) 224,501 2,680,966 0 01 5,661,412 33,700,575 1,941,721 1,140,354 45,096 (561,046) 234,538 2,800,663 0 19,100,217 1,100,495 0 44,707 0 85,890 1,231,092 1,569,572 1,460,0672 5,916,175 34,046,837 2,029,099 1,191,670 46,223 (586,293) 245,024 2,925,723 0 19,296,465 1,150,017 0 45,028 0 89,628 1,284,673 1,641,050 1,420,0543 6,182,403 34,320,911 2,120,408 1,245,295 47,379 (612,676) 255,981 3,056,387 0 19,451,800 1,201,768 0 45,745 0 93,563 1,341,076 1,715,312 1,380,7584 6,460,611 34,512,966 2,215,827 1,301,334 48,563 (640,247) 267,429 3,192,906 0 19,560,649 1,255,847 0 46,051 0 97,642 1,399,540 1,793,366 1,342,8735 6,751,339 34,612,234 2,315,539 1,359,894 49,777 (669,058) 279,391 3,335,543 0 19,616,911 1,312,360 0 46,344 0 101,903 1,460,607 1,874,936 1,306,0036 7,055,149 34,606,933 2,419,738 1,421,089 51,021 (699,165) 291,889 3,484,572 0 19,613,906 1,371,416 0 47,062 0 106,386 1,524,864 1,959,708 1,269,8157 7,372,631 34,484,180 2,528,626 1,485,038 52,297 (730,628) 304,947 3,640,280 0 19,544,334 1,433,130 0 47,789 0 111,069 1,591,988 2,048,292 1,234,6188 7,704,399 34,229,898 2,642,415 1,551,864 53,604 (763,506) 318,591 3,802,968 0 19,400,217 1,497,621 0 48,521 0 115,961 1,662,103 2,140,864 1,200,3889 8,051,097 33,828,718 2,761,323 1,621,698 54,944 (797,864) 332,847 3,972,948 0 19,172,843 1,565,014 0 49,260 0 121,071 1,735,345 2,237,603 1,167,097
10 8,413,397 33,263,870 2,885,583 1,694,675 56,318 (833,768) 347,743 4,150,551 0 18,852,709 1,635,440 0 50,007 0 126,408 1,811,855 2,338,696 1,134,72111 8,791,999 32,517,069 3,015,434 1,770,935 57,726 (871,287) 363,307 4,336,115 0 18,429,450 1,709,034 0 50,261 0 131,947 1,891,242 2,444,873 1,103,47712 9,187,639 31,568,386 3,151,128 1,850,627 59,169 (910,495) 379,569 4,529,998 0 17,891,772 1,785,941 0 51,008 0 137,771 1,974,720 2,555,279 1,072,84413 9,601,083 30,396,116 3,292,929 1,933,905 60,648 (951,467) 396,561 4,732,576 0 17,227,374 1,866,308 0 51,760 0 143,855 2,061,923 2,670,653 1,043,05614 10,033,132 28,976,630 3,441,111 2,020,931 62,164 (994,283) 414,315 4,944,238 0 16,422,863 1,950,292 0 52,518 0 150,211 2,153,021 2,791,217 1,014,08715 10,484,623 27,284,219 3,595,961 2,111,873 63,718 (1,039,026) 432,866 5,165,392 0 15,463,668 2,038,055 0 52,732 0 156,809 2,247,596 2,917,796 986,11616 10,956,431 25,290,923 3,757,779 2,206,907 65,311 (1,085,782) 452,250 5,396,465 0 14,333,943 2,129,768 0 53,487 0 163,744 2,346,999 3,049,467 958,71317 11,449,470 22,966,347 3,926,879 2,306,218 66,944 (1,134,643) 472,503 5,637,901 0 13,016,460 2,225,607 0 53,671 0 170,946 2,450,224 3,187,677 932,24618 11,964,697 20,277,465 4,103,589 2,409,998 68,618 (1,185,701) 493,665 5,890,169 0 11,492,503 2,325,760 0 54,421 0 178,514 2,558,695 3,331,474 906,32519 12,503,108 17,188,405 4,288,250 2,518,448 70,333 (1,239,058) 515,777 6,153,750 0 9,741,741 2,430,419 0 54,569 0 186,374 2,671,362 3,482,389 881,28520 13,065,748 13,660,222 4,481,222 2,631,778 72,091 (1,294,816) 538,882 6,429,157 0 7,742,100 2,539,788 0 54,690 0 194,586 2,789,064 3,640,093 856,92621 13,653,706 9,650,647 4,682,877 2,750,208 73,893 (1,353,082) 563,023 6,716,919 0 5,469,623 2,654,078 0 55,420 0 203,212 2,912,710 3,804,209 833,08022 14,268,123 5,113,818 4,893,606 2,873,967 75,740 (1,413,971) 588,248 7,017,590 0 2,898,320 2,773,512 0 54,846 0 212,127 3,040,485 3,977,105 810,17923 14,910,189 0 5,113,818 3,003,296 77,634 (1,477,600) 614,606 7,331,754 0 0 2,898,320 0 55,548 0 221,540 3,175,408 4,156,347 787,62124 15,581,147 0 0 3,138,444 79,575 (1,544,092) 241,351 1,915,278 0 0 0 0 55,565 0 4,167 59,732 1,855,546 327,09125 16,282,299 0 0 3,279,674 81,564 (1,613,576) 252,093 1,999,755 0 0 0 0 55,548 0 4,166 59,714 1,940,041 318,12626 17,015,002 0 0 3,427,260 83,603 (1,686,187) 263,315 2,087,991 0 0 0 0 55,495 0 4,162 59,657 2,028,334 309,39927 17,780,677 0 0 3,581,486 85,693 (1,762,065) 275,038 2,180,152 0 0 0 0 56,144 0 4,211 60,355 2,119,797 300,79228 18,580,808 0 0 3,742,653 87,835 (1,841,358) 287,287 2,276,417 0 0 0 0 55,275 0 4,146 59,421 2,216,996 292,63629 19,416,944 0 0 3,911,073 90,031 (1,924,219) 300,083 2,376,968 0 0 0 0 55,881 0 4,191 60,072 2,316,896 284,48630 20,290,707 0 0 4,087,071 92,282 (2,010,809) 313,451 2,481,995 0 0 0 0 55,687 0 4,177 59,864 2,422,131 276,658
Total PV of Annual Savings 27,211,537
Contribution CalculationOngoing Department Calculation No Additional Future Obligations Calculation
Contribution CalculationSavings
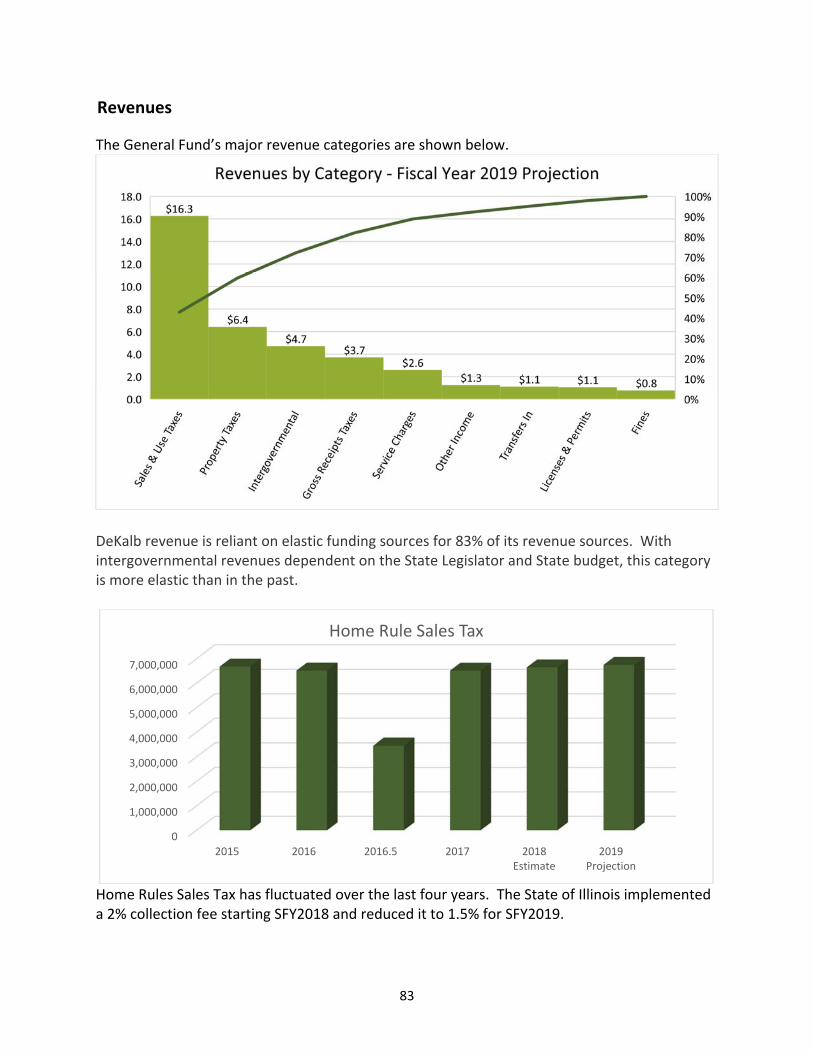
83
Revenues
The General Fund’s major revenue categories are shown below.
DeKalb revenue is reliant on elastic funding sources for 83% of its revenue sources. With intergovernmental revenues dependent on the State Legislator and State budget, this category is more elastic than in the past.
Home Rules Sales Tax has fluctuated over the last four years. The State of Illinois implemented a 2% collection fee starting SFY2018 and reduced it to 1.5% for SFY2019.
0
1,000,000
2,000,000
3,000,000
4,000,000
5,000,000
6,000,000
7,000,000
2015 2016 2016.5 2017 2018Estimate
2019Projection
Home Rule Sales Tax
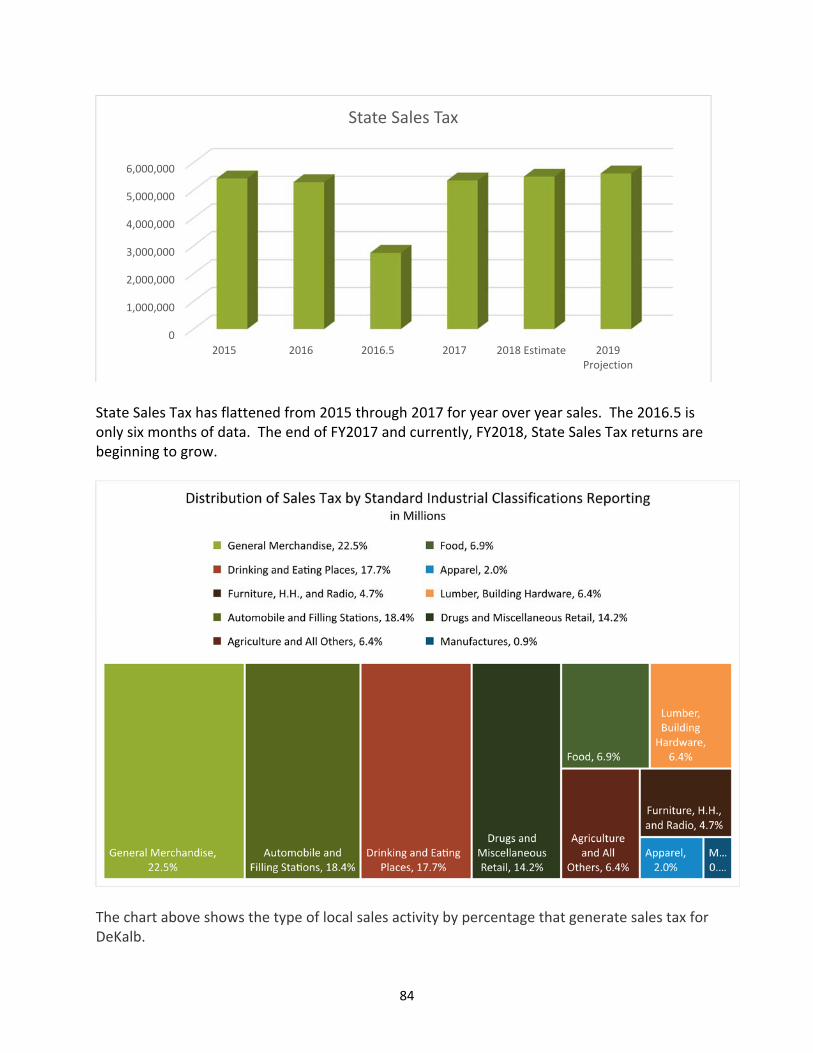
84
State Sales Tax has flattened from 2015 through 2017 for year over year sales. The 2016.5 is only six months of data. The end of FY2017 and currently, FY2018, State Sales Tax returns are beginning to grow.
The chart above shows the type of local sales activity by percentage that generate sales tax for DeKalb.
0
1,000,000
2,000,000
3,000,000
4,000,000
5,000,000
6,000,000
2015 2016 2016.5 2017 2018 Estimate 2019Projection
State Sales Tax
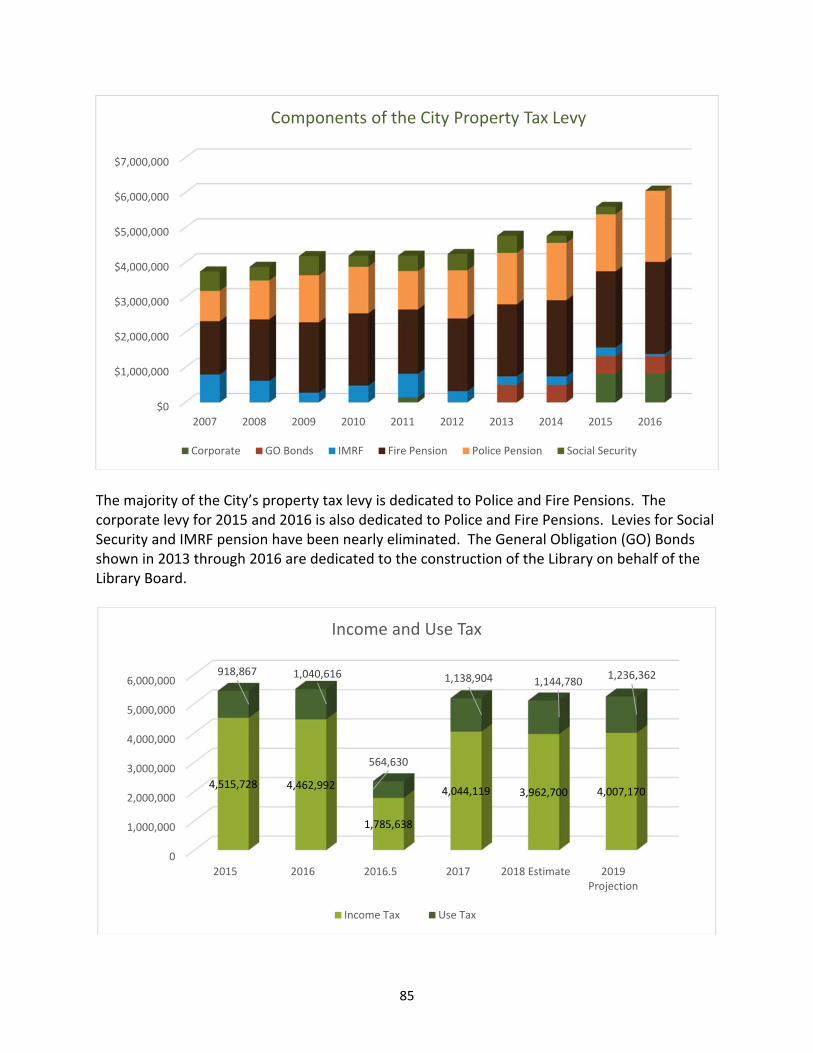
85
The majority of the City’s property tax levy is dedicated to Police and Fire Pensions. The corporate levy for 2015 and 2016 is also dedicated to Police and Fire Pensions. Levies for Social Security and IMRF pension have been nearly eliminated. The General Obligation (GO) Bonds shown in 2013 through 2016 are dedicated to the construction of the Library on behalf of the Library Board.
$0
$1,000,000
$2,000,000
$3,000,000
$4,000,000
$5,000,000
$6,000,000
$7,000,000
2007 2008 2009 2010 2011 2012 2013 2014 2015 2016
Components of the City Property Tax Levy
Corporate GO Bonds IMRF Fire Pension Police Pension Social Security
0
1,000,000
2,000,000
3,000,000
4,000,000
5,000,000
6,000,000
2015 2016 2016.5 2017 2018 Estimate 2019Projection
4,515,728 4,462,992
1,785,638
4,044,119 3,962,700 4,007,170
918,867 1,040,616
564,630
1,138,904 1,144,7801,236,362
Income and Use Tax
Income Tax Use Tax
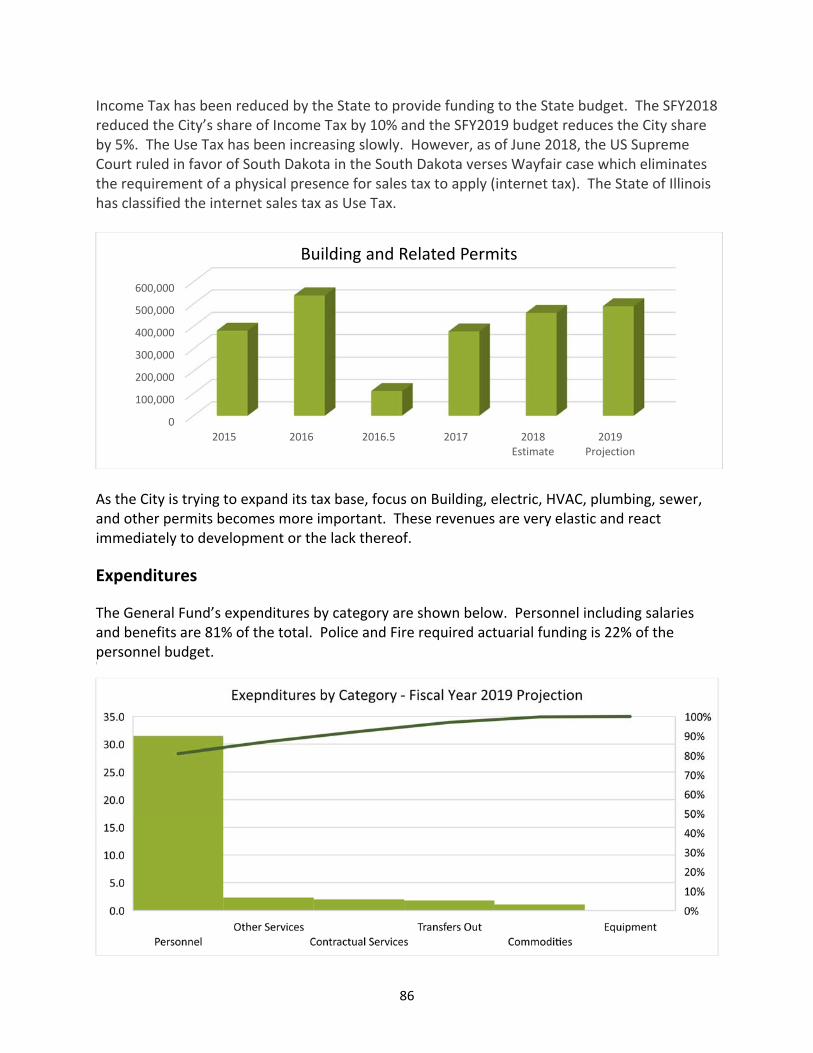
86
Income Tax has been reduced by the State to provide funding to the State budget. The SFY2018 reduced the City’s share of Income Tax by 10% and the SFY2019 budget reduces the City share by 5%. The Use Tax has been increasing slowly. However, as of June 2018, the US Supreme Court ruled in favor of South Dakota in the South Dakota verses Wayfair case which eliminates the requirement of a physical presence for sales tax to apply (internet tax). The State of Illinois has classified the internet sales tax as Use Tax.
As the City is trying to expand its tax base, focus on Building, electric, HVAC, plumbing, sewer, and other permits becomes more important. These revenues are very elastic and react immediately to development or the lack thereof.
Expenditures
The General Fund’s expenditures by category are shown below. Personnel including salaries and benefits are 81% of the total. Police and Fire required actuarial funding is 22% of the personnel budget. 2
0
100,000
200,000
300,000
400,000
500,000
600,000
2015 2016 2016.5 2017 2018Estimate
2019Projection
Building and Related Permits
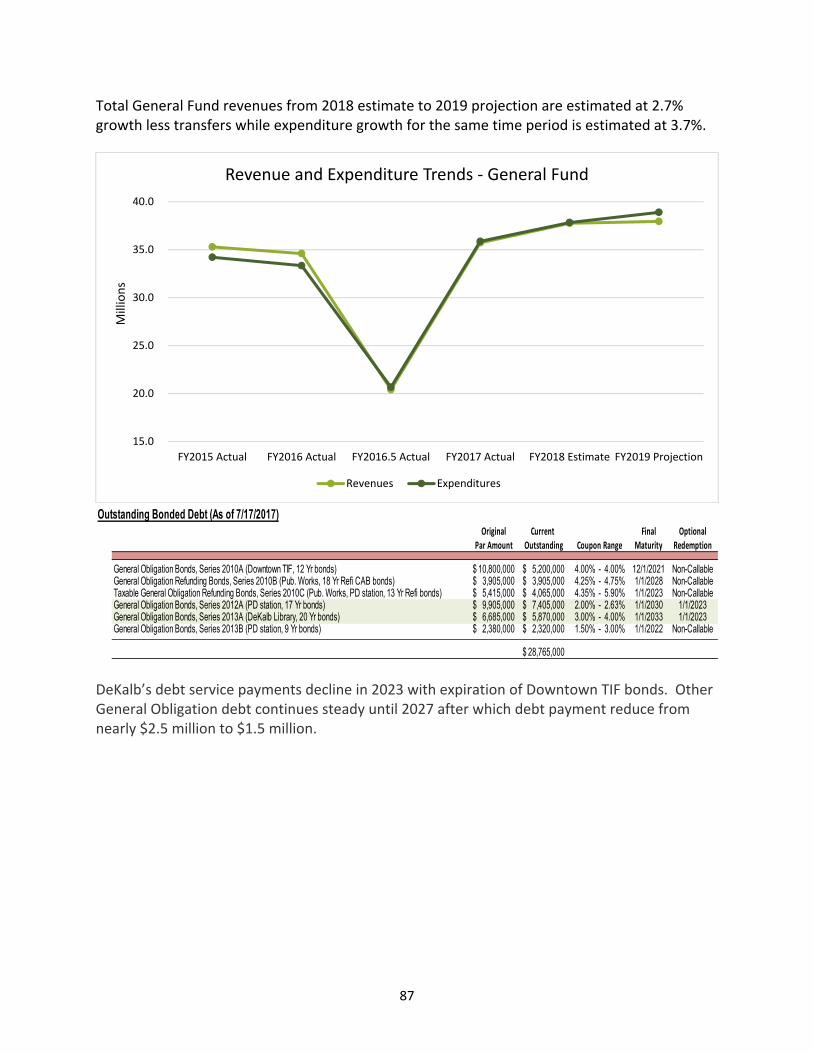
87
Total General Fund revenues from 2018 estimate to 2019 projection are estimated at 2.7% growth less transfers while expenditure growth for the same time period is estimated at 3.7%.
DeKalb’s debt service payments decline in 2023 with expiration of Downtown TIF bonds. Other General Obligation debt continues steady until 2027 after which debt payment reduce from nearly $2.5 million to $1.5 million.
15.0
20.0
25.0
30.0
35.0
40.0
FY2015 Actual FY2016 Actual FY2016.5 Actual FY2017 Actual FY2018 Estimate FY2019 Projection
Millions
Revenue and Expenditure Trends ‐ General Fund
Revenues Expenditures
Outstanding Bonded Debt (As of 7/17/2017)Original Current Final Optional
Par Amount Outstanding Maturity Redemption
General Obligation Bonds, Series 2010A (Downtown TIF, 12 Yr bonds) 10,800,000$ 5,200,000$ 4.00% - 4.00% 12/1/2021 Non-CallableGeneral Obligation Refunding Bonds, Series 2010B (Pub. Works, 18 Yr Refi CAB bonds) 3,905,000$ 3,905,000$ 4.25% - 4.75% 1/1/2028 Non-CallableTaxable General Obligation Refunding Bonds, Series 2010C (Pub. Works, PD station, 13 Yr Refi bonds) 5,415,000$ 4,065,000$ 4.35% - 5.90% 1/1/2023 Non-CallableGeneral Obligation Bonds, Series 2012A (PD station, 17 Yr bonds) 9,905,000$ 7,405,000$ 2.00% - 2.63% 1/1/2030 1/1/2023General Obligation Bonds, Series 2013A (DeKalb Library, 20 Yr bonds) 6,685,000$ 5,870,000$ 3.00% - 4.00% 1/1/2033 1/1/2023General Obligation Bonds, Series 2013B (PD station, 9 Yr bonds) 2,380,000$ 2,320,000$ 1.50% - 3.00% 1/1/2022 Non-Callable
28,765,000$
Coupon Range
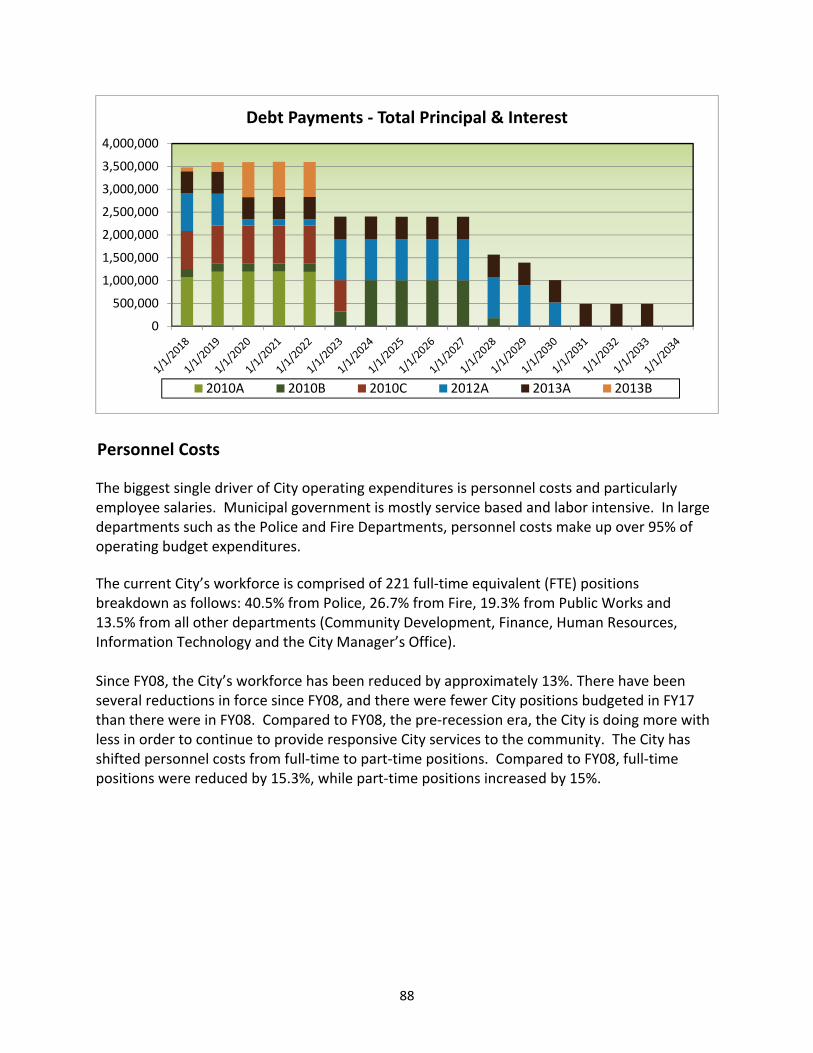
88
Personnel Costs
The biggest single driver of City operating expenditures is personnel costs and particularly employee salaries. Municipal government is mostly service based and labor intensive. In large departments such as the Police and Fire Departments, personnel costs make up over 95% of operating budget expenditures.
The current City’s workforce is comprised of 221 full‐time equivalent (FTE) positions breakdown as follows: 40.5% from Police, 26.7% from Fire, 19.3% from Public Works and 13.5% from all other departments (Community Development, Finance, Human Resources, Information Technology and the City Manager’s Office). Since FY08, the City’s workforce has been reduced by approximately 13%. There have been several reductions in force since FY08, and there were fewer City positions budgeted in FY17 than there were in FY08. Compared to FY08, the pre‐recession era, the City is doing more with less in order to continue to provide responsive City services to the community. The City has shifted personnel costs from full‐time to part‐time positions. Compared to FY08, full‐time positions were reduced by 15.3%, while part‐time positions increased by 15%.
0
500,000
1,000,000
1,500,000
2,000,000
2,500,000
3,000,000
3,500,000
4,000,000
Debt Payments ‐ Total Principal & Interest
2010A 2010B 2010C 2012A 2013A 2013B
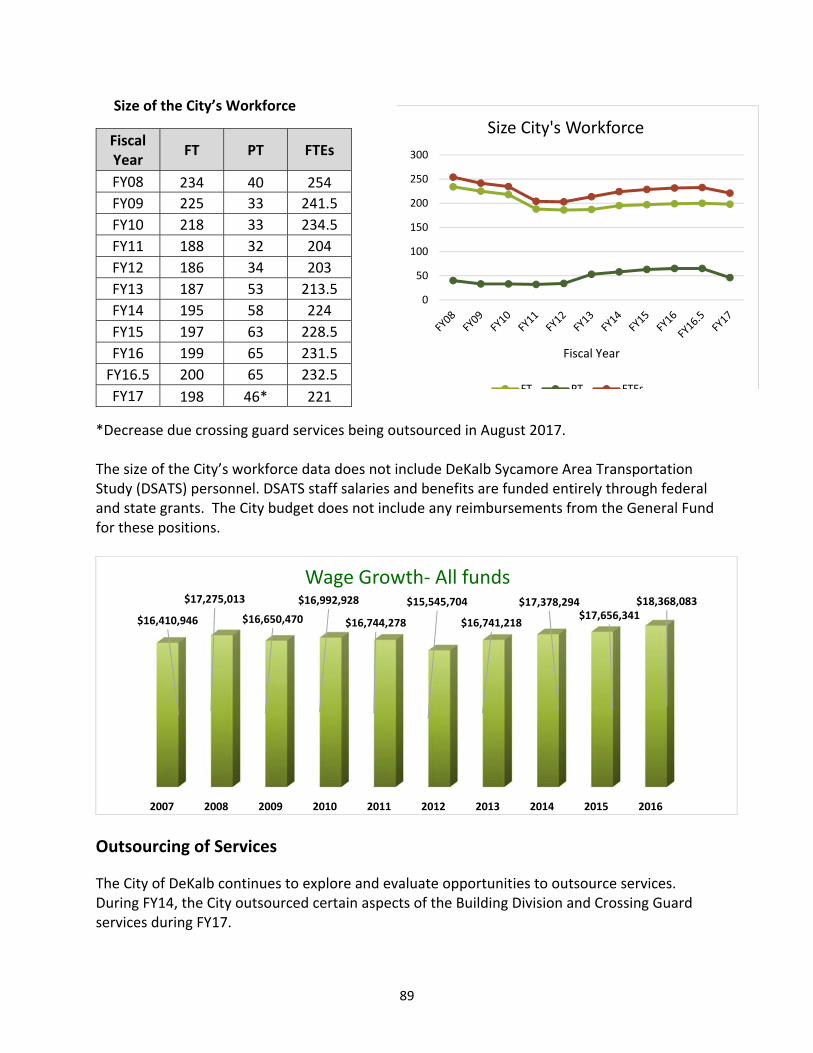
89
Size of the City’s Workforce
*Decrease due crossing guard services being outsourced in August 2017. The size of the City’s workforce data does not include DeKalb Sycamore Area Transportation Study (DSATS) personnel. DSATS staff salaries and benefits are funded entirely through federal and state grants. The City budget does not include any reimbursements from the General Fund for these positions.
Outsourcing of Services
The City of DeKalb continues to explore and evaluate opportunities to outsource services. During FY14, the City outsourced certain aspects of the Building Division and Crossing Guard services during FY17.
2007 2008 2009 2010 2011 2012 2013 2014 2015 2016
$16,410,946
$17,275,013
$16,650,470
$16,992,928
$16,744,278
$15,545,704
$16,741,218
$17,378,294$17,656,341
$18,368,083
Wage Growth‐ All funds
Fiscal Year
FT PT FTEs
FY08 234 40 254
FY09 225 33 241.5
FY10 218 33 234.5
FY11 188 32 204
FY12 186 34 203
FY13 187 53 213.5
FY14 195 58 224
FY15 197 63 228.5
FY16 199 65 231.5
FY16.5 200 65 232.5
FY17 198 46* 221
0
50
100
150
200
250
300
Fiscal Year
Size City's Workforce
FT PT FTEs
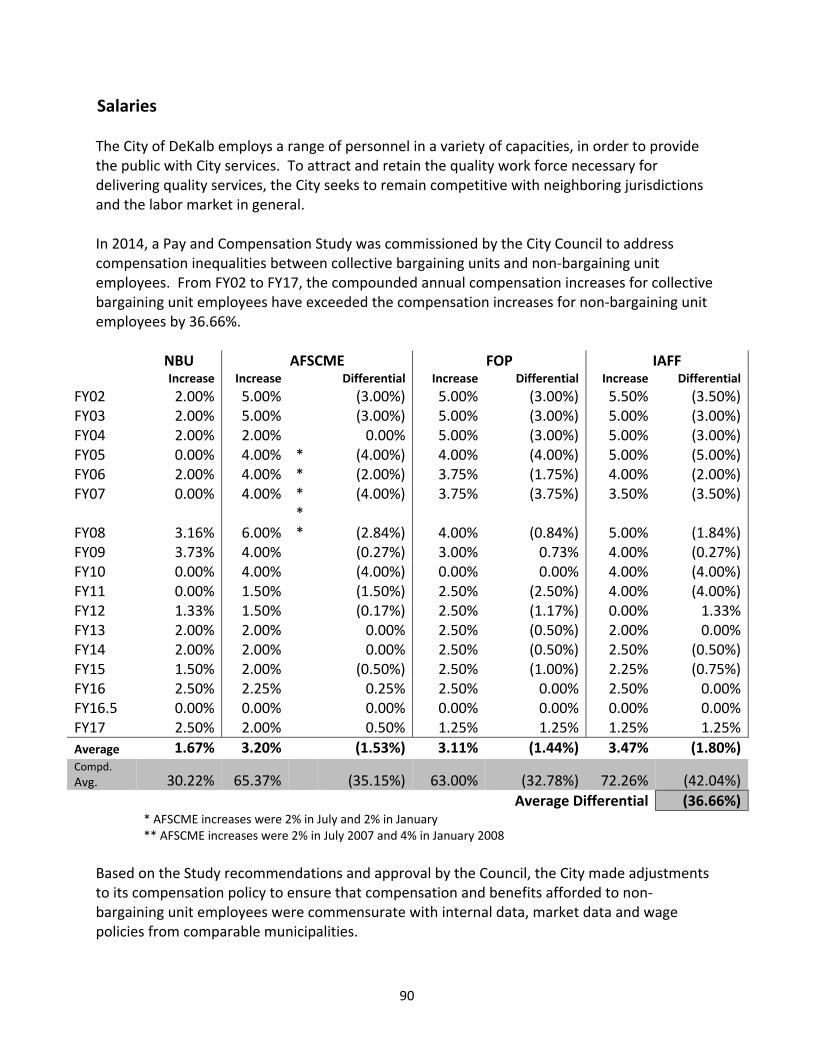
90
Salaries The City of DeKalb employs a range of personnel in a variety of capacities, in order to provide the public with City services. To attract and retain the quality work force necessary for delivering quality services, the City seeks to remain competitive with neighboring jurisdictions and the labor market in general. In 2014, a Pay and Compensation Study was commissioned by the City Council to address compensation inequalities between collective bargaining units and non‐bargaining unit employees. From FY02 to FY17, the compounded annual compensation increases for collective bargaining unit employees have exceeded the compensation increases for non‐bargaining unit employees by 36.66%.
NBU AFSCME FOP IAFF
Increase Increase Differential Increase Differential Increase Differential
FY02 2.00% 5.00% (3.00%) 5.00% (3.00%) 5.50% (3.50%) FY03 2.00% 5.00% (3.00%) 5.00% (3.00%) 5.00% (3.00%) FY04 2.00% 2.00% 0.00% 5.00% (3.00%) 5.00% (3.00%) FY05 0.00% 4.00% * (4.00%) 4.00% (4.00%) 5.00% (5.00%) FY06 2.00% 4.00% * (2.00%) 3.75% (1.75%) 4.00% (2.00%) FY07 0.00% 4.00% * (4.00%) 3.75% (3.75%) 3.50% (3.50%)
FY08 3.16% 6.00% ** (2.84%) 4.00% (0.84%) 5.00% (1.84%)
FY09 3.73% 4.00% (0.27%) 3.00% 0.73% 4.00% (0.27%) FY10 0.00% 4.00% (4.00%) 0.00% 0.00% 4.00% (4.00%) FY11 0.00% 1.50% (1.50%) 2.50% (2.50%) 4.00% (4.00%) FY12 1.33% 1.50% (0.17%) 2.50% (1.17%) 0.00% 1.33% FY13 2.00% 2.00% 0.00% 2.50% (0.50%) 2.00% 0.00% FY14 2.00% 2.00% 0.00% 2.50% (0.50%) 2.50% (0.50%) FY15 1.50% 2.00% (0.50%) 2.50% (1.00%) 2.25% (0.75%) FY16 2.50% 2.25% 0.25% 2.50% 0.00% 2.50% 0.00% FY16.5 0.00% 0.00% 0.00% 0.00% 0.00% 0.00% 0.00% FY17 2.50% 2.00% 0.50% 1.25% 1.25% 1.25% 1.25%
Average 1.67% 3.20% (1.53%) 3.11% (1.44%) 3.47% (1.80%) Compd. Avg. 30.22% 65.37% (35.15%) 63.00% (32.78%) 72.26% (42.04%)
Average Differential (36.66%) * AFSCME increases were 2% in July and 2% in January ** AFSCME increases were 2% in July 2007 and 4% in January 2008
Based on the Study recommendations and approval by the Council, the City made adjustments to its compensation policy to ensure that compensation and benefits afforded to non‐bargaining unit employees were commensurate with internal data, market data and wage policies from comparable municipalities.
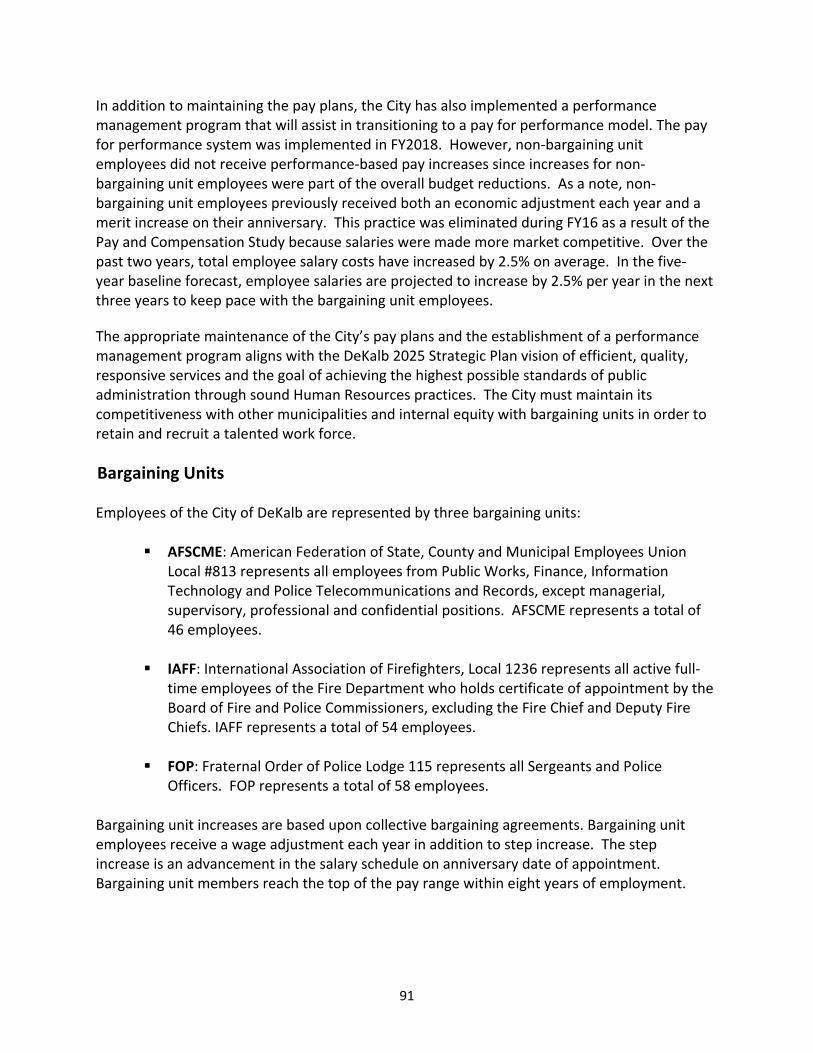
91
In addition to maintaining the pay plans, the City has also implemented a performance management program that will assist in transitioning to a pay for performance model. The pay for performance system was implemented in FY2018. However, non‐bargaining unit employees did not receive performance‐based pay increases since increases for non‐bargaining unit employees were part of the overall budget reductions. As a note, non‐bargaining unit employees previously received both an economic adjustment each year and a merit increase on their anniversary. This practice was eliminated during FY16 as a result of the Pay and Compensation Study because salaries were made more market competitive. Over the past two years, total employee salary costs have increased by 2.5% on average. In the five‐year baseline forecast, employee salaries are projected to increase by 2.5% per year in the next three years to keep pace with the bargaining unit employees.
The appropriate maintenance of the City’s pay plans and the establishment of a performance management program aligns with the DeKalb 2025 Strategic Plan vision of efficient, quality, responsive services and the goal of achieving the highest possible standards of public administration through sound Human Resources practices. The City must maintain its competitiveness with other municipalities and internal equity with bargaining units in order to retain and recruit a talented work force.
Bargaining Units
Employees of the City of DeKalb are represented by three bargaining units: AFSCME: American Federation of State, County and Municipal Employees Union
Local #813 represents all employees from Public Works, Finance, Information Technology and Police Telecommunications and Records, except managerial, supervisory, professional and confidential positions. AFSCME represents a total of 46 employees.
IAFF: International Association of Firefighters, Local 1236 represents all active full‐
time employees of the Fire Department who holds certificate of appointment by the Board of Fire and Police Commissioners, excluding the Fire Chief and Deputy Fire Chiefs. IAFF represents a total of 54 employees.
FOP: Fraternal Order of Police Lodge 115 represents all Sergeants and Police
Officers. FOP represents a total of 58 employees.
Bargaining unit increases are based upon collective bargaining agreements. Bargaining unit employees receive a wage adjustment each year in addition to step increase. The step increase is an advancement in the salary schedule on anniversary date of appointment. Bargaining unit members reach the top of the pay range within eight years of employment.
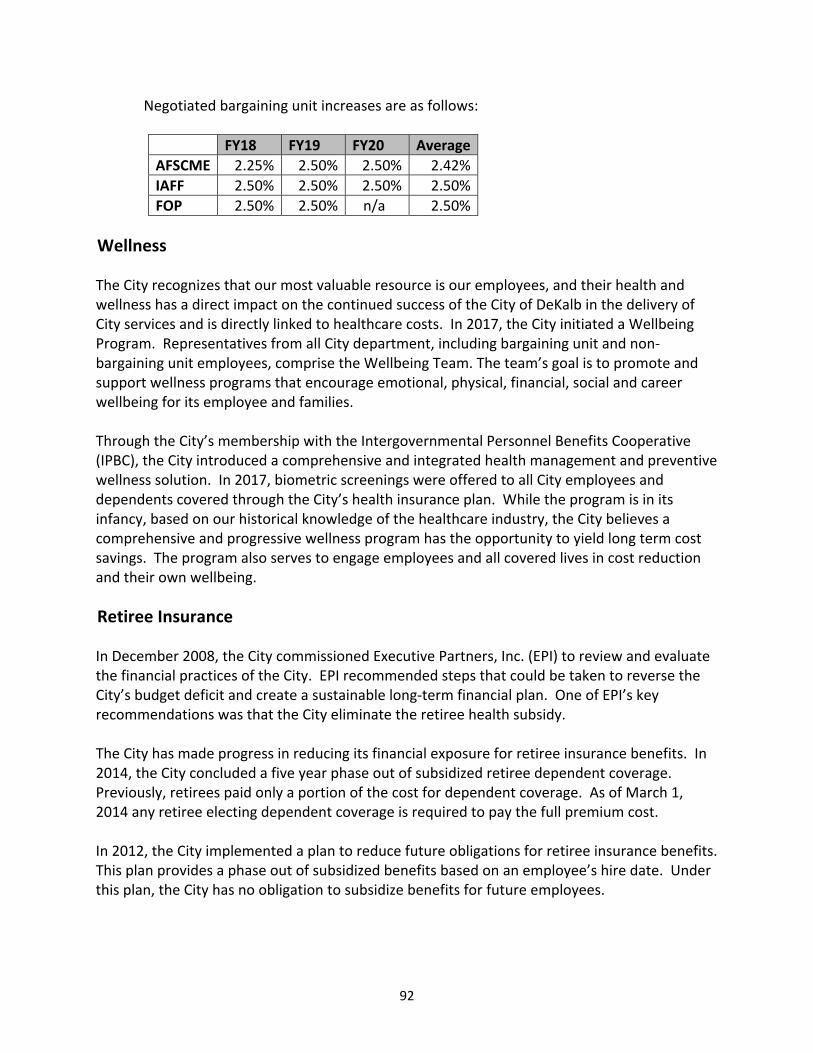
92
Negotiated bargaining unit increases are as follows:
FY18 FY19 FY20 Average
AFSCME 2.25% 2.50% 2.50% 2.42%
IAFF 2.50% 2.50% 2.50% 2.50%
FOP 2.50% 2.50% n/a 2.50%
Wellness The City recognizes that our most valuable resource is our employees, and their health and wellness has a direct impact on the continued success of the City of DeKalb in the delivery of City services and is directly linked to healthcare costs. In 2017, the City initiated a Wellbeing Program. Representatives from all City department, including bargaining unit and non‐bargaining unit employees, comprise the Wellbeing Team. The team’s goal is to promote and support wellness programs that encourage emotional, physical, financial, social and career wellbeing for its employee and families. Through the City’s membership with the Intergovernmental Personnel Benefits Cooperative (IPBC), the City introduced a comprehensive and integrated health management and preventive wellness solution. In 2017, biometric screenings were offered to all City employees and dependents covered through the City’s health insurance plan. While the program is in its infancy, based on our historical knowledge of the healthcare industry, the City believes a comprehensive and progressive wellness program has the opportunity to yield long term cost savings. The program also serves to engage employees and all covered lives in cost reduction and their own wellbeing.
Retiree Insurance In December 2008, the City commissioned Executive Partners, Inc. (EPI) to review and evaluate the financial practices of the City. EPI recommended steps that could be taken to reverse the City’s budget deficit and create a sustainable long‐term financial plan. One of EPI’s key recommendations was that the City eliminate the retiree health subsidy. The City has made progress in reducing its financial exposure for retiree insurance benefits. In 2014, the City concluded a five year phase out of subsidized retiree dependent coverage. Previously, retirees paid only a portion of the cost for dependent coverage. As of March 1, 2014 any retiree electing dependent coverage is required to pay the full premium cost. In 2012, the City implemented a plan to reduce future obligations for retiree insurance benefits. This plan provides a phase out of subsidized benefits based on an employee’s hire date. Under this plan, the City has no obligation to subsidize benefits for future employees.
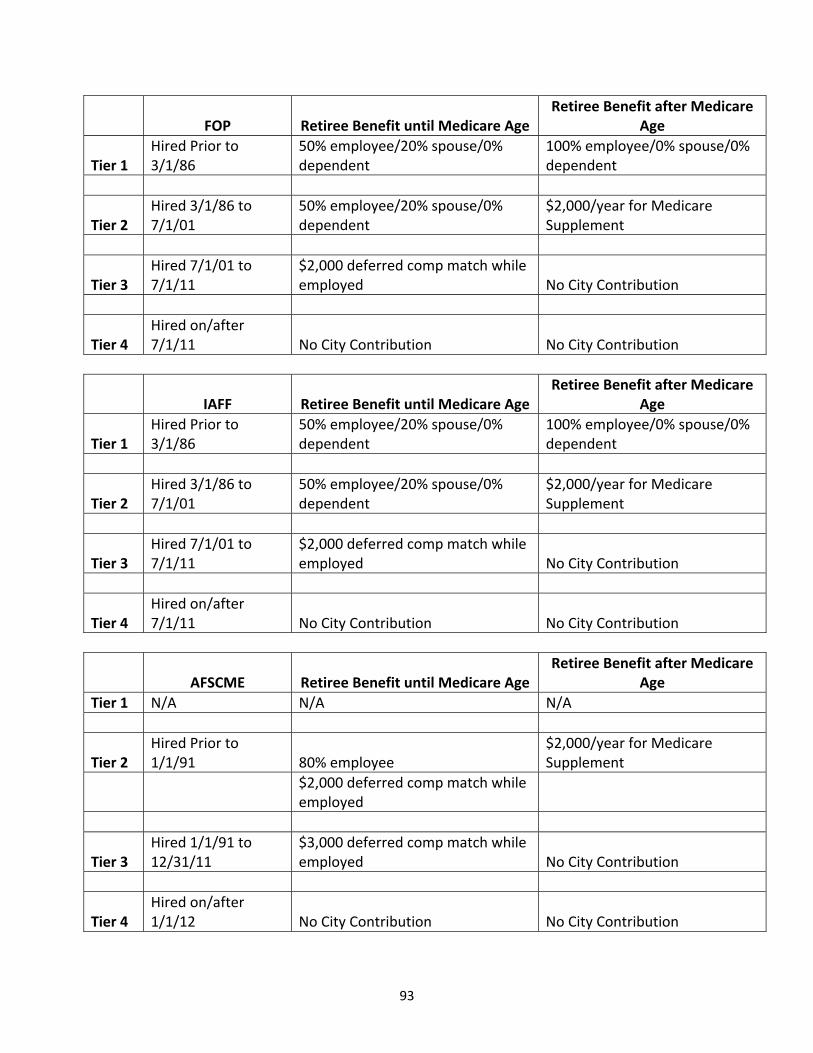
93
FOP Retiree Benefit until Medicare Age Retiree Benefit after Medicare
Age
Tier 1 Hired Prior to 3/1/86
50% employee/20% spouse/0% dependent
100% employee/0% spouse/0% dependent
Tier 2 Hired 3/1/86 to 7/1/01
50% employee/20% spouse/0% dependent
$2,000/year for Medicare Supplement
Tier 3 Hired 7/1/01 to 7/1/11
$2,000 deferred comp match while employed No City Contribution
Tier 4 Hired on/after 7/1/11 No City Contribution No City Contribution
IAFF Retiree Benefit until Medicare Age Retiree Benefit after Medicare
Age
Tier 1 Hired Prior to 3/1/86
50% employee/20% spouse/0% dependent
100% employee/0% spouse/0% dependent
Tier 2 Hired 3/1/86 to 7/1/01
50% employee/20% spouse/0% dependent
$2,000/year for Medicare Supplement
Tier 3 Hired 7/1/01 to 7/1/11
$2,000 deferred comp match while employed No City Contribution
Tier 4 Hired on/after 7/1/11 No City Contribution No City Contribution
AFSCME Retiree Benefit until Medicare Age Retiree Benefit after Medicare
Age
Tier 1 N/A N/A N/A
Tier 2 Hired Prior to 1/1/91 80% employee
$2,000/year for Medicare Supplement
$2,000 deferred comp match while employed
Tier 3 Hired 1/1/91 to 12/31/11
$3,000 deferred comp match while employed No City Contribution
Tier 4 Hired on/after 1/1/12 No City Contribution No City Contribution
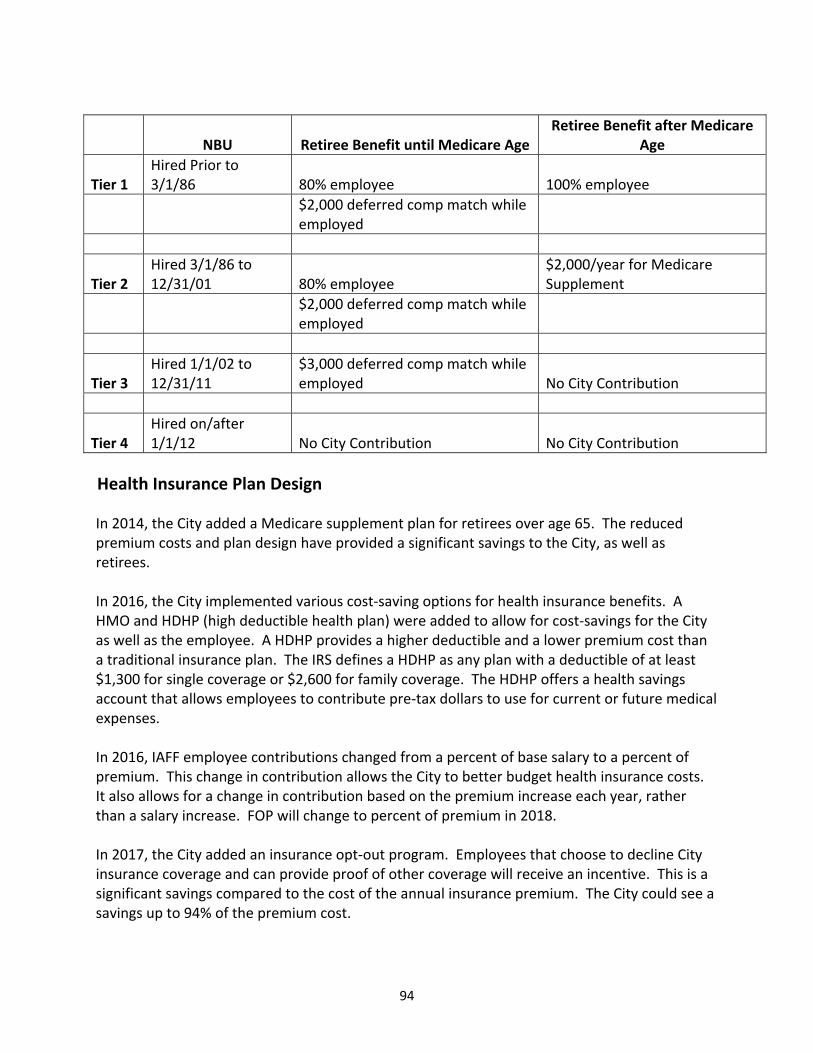
94
NBU Retiree Benefit until Medicare Age Retiree Benefit after Medicare
Age
Tier 1 Hired Prior to 3/1/86 80% employee 100% employee
$2,000 deferred comp match while employed
Tier 2 Hired 3/1/86 to 12/31/01 80% employee
$2,000/year for Medicare Supplement
$2,000 deferred comp match while employed
Tier 3 Hired 1/1/02 to 12/31/11
$3,000 deferred comp match while employed No City Contribution
Tier 4 Hired on/after 1/1/12 No City Contribution No City Contribution
Health Insurance Plan Design In 2014, the City added a Medicare supplement plan for retirees over age 65. The reduced premium costs and plan design have provided a significant savings to the City, as well as retirees. In 2016, the City implemented various cost‐saving options for health insurance benefits. A HMO and HDHP (high deductible health plan) were added to allow for cost‐savings for the City as well as the employee. A HDHP provides a higher deductible and a lower premium cost than a traditional insurance plan. The IRS defines a HDHP as any plan with a deductible of at least $1,300 for single coverage or $2,600 for family coverage. The HDHP offers a health savings account that allows employees to contribute pre‐tax dollars to use for current or future medical expenses. In 2016, IAFF employee contributions changed from a percent of base salary to a percent of premium. This change in contribution allows the City to better budget health insurance costs. It also allows for a change in contribution based on the premium increase each year, rather than a salary increase. FOP will change to percent of premium in 2018. In 2017, the City added an insurance opt‐out program. Employees that choose to decline City insurance coverage and can provide proof of other coverage will receive an incentive. This is a significant savings compared to the cost of the annual insurance premium. The City could see a savings up to 94% of the premium cost.
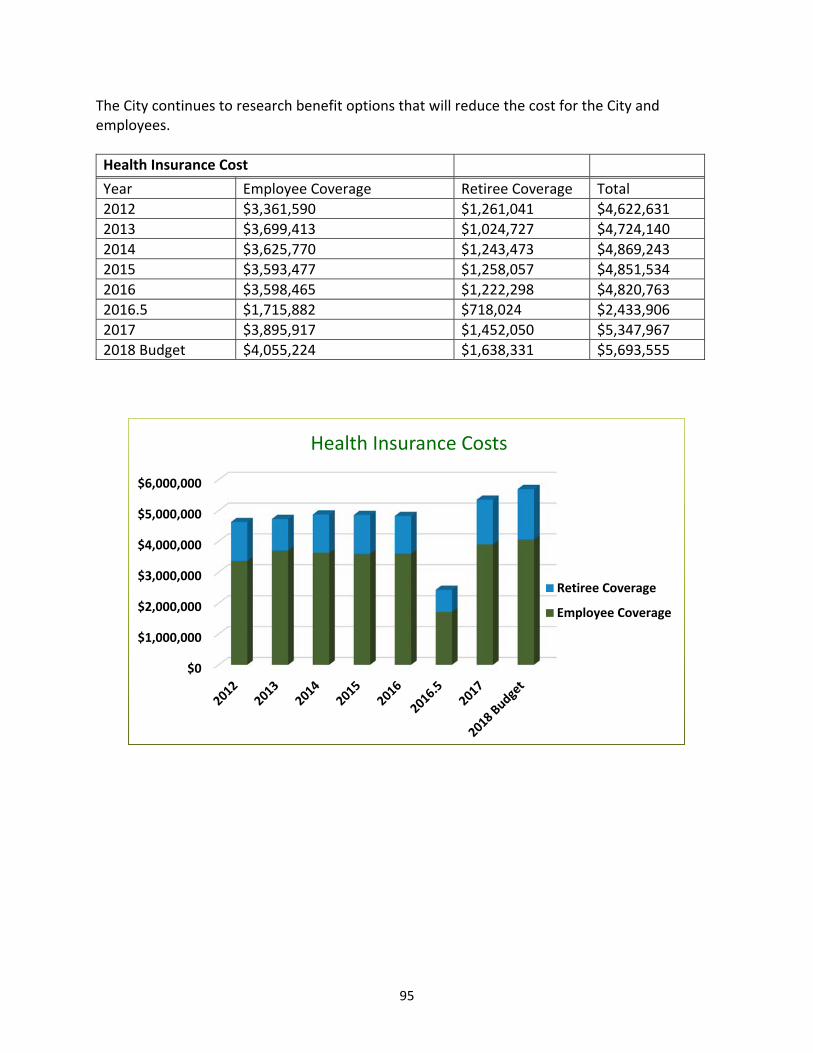
95
The City continues to research benefit options that will reduce the cost for the City and employees.
Health Insurance Cost
Year Employee Coverage Retiree Coverage Total
2012 $3,361,590 $1,261,041 $4,622,631
2013 $3,699,413 $1,024,727 $4,724,140
2014 $3,625,770 $1,243,473 $4,869,243
2015 $3,593,477 $1,258,057 $4,851,534
2016 $3,598,465 $1,222,298 $4,820,763
2016.5 $1,715,882 $718,024 $2,433,906
2017 $3,895,917 $1,452,050 $5,347,967
2018 Budget $4,055,224 $1,638,331 $5,693,555
$0
$1,000,000
$2,000,000
$3,000,000
$4,000,000
$5,000,000
$6,000,000
Health Insurance Costs
Retiree Coverage
Employee Coverage
96
Streets and Fleet Analysis
97
Streets and Fleet Analysis
Fleet Inventory Fleet Condition Assessment Level of Service Replacement Cost Street Inventory Pavement Condition Assessment Level of Service Pavement Management Plan
98
Streets and Fleet Analysis – Preliminary Asset Management Plan In 2017, the Public Works and Finance Departments, along with consultants from Engineering Enterprises, Inc. (EEI) and Ehlers, Inc. (Ehlers), developed a preliminary Asset Management Plan (AMP) for Streets and Fleet. EEI was engaged to perform the street portion of the plan. EEI has performed similar evaluations for other municipalities using the same software used by the City. The preliminary, high‐level AMP examines the City’s needs for maintaining streets and replacing fleet over the next 10 years. The AMP also presents options for dedicated revenue sources to fund the improvements including local gas tax, vehicle stickers, trash hauler fees and sales tax with resident rebate. Staff and the consultants presented the preliminary plan at the Special Committee of the Whole on August 31, 2017. The preliminary AMP is a first draft of ideas for addressing the deterioration of the City’s streets and fleet. It incorporates input from residents received during two public outreach meetings, even though only eight residents attended these meetings. As a background, Asset Management (AM) is a set of coordinated activities designed to optimize the benefits derived from an asset. At its core, AM is about effectively managing City‐owned assets over the long‐term. The AMP sets forth ideas and principles to manage municipal infrastructure in a financially sustainable manner that meets the needs and expectations of residents. The preliminary AMP consists of four primary elements:
1. Asset Inventory and Condition Assessment 2. Expected Level of Service 3. Asset Management Strategy 4. Financial Strategy
The asset inventory and condition assessment define the asset in terms of type, age, value, maintenance and other key characteristics. The expected level of service defines the performance goals of the asset. Together, the condition assessment and expected level of service are used to determine the financial resources required to meet expectations. The financial strategy lays out the funding plan for investing in the asset at the level required to meet the level of service objectives.
Fleet Inventory The Public Works Department maintains a fleet database that includes the following information for all City vehicles:
Equipment ID Chassis Description Asset Type Purchase Price
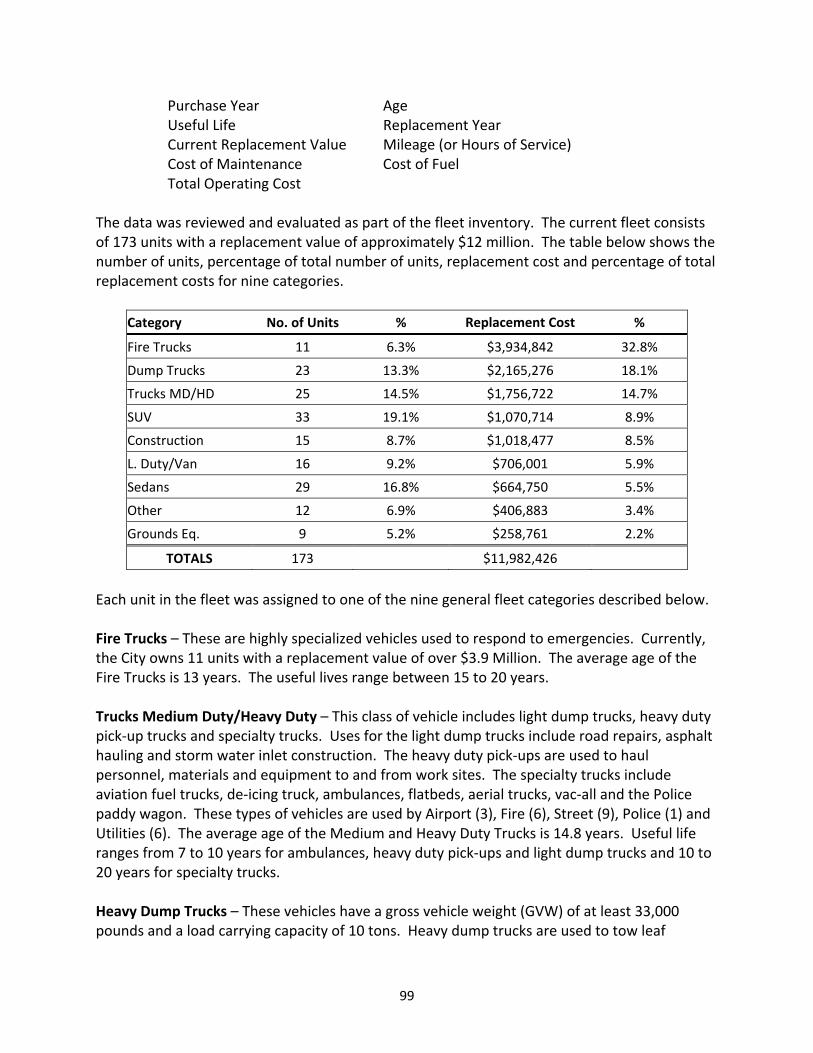
99
Purchase Year Age Useful Life Replacement Year Current Replacement Value Mileage (or Hours of Service) Cost of Maintenance Cost of Fuel Total Operating Cost
The data was reviewed and evaluated as part of the fleet inventory. The current fleet consists of 173 units with a replacement value of approximately $12 million. The table below shows the number of units, percentage of total number of units, replacement cost and percentage of total replacement costs for nine categories.
Category No. of Units % Replacement Cost %
Fire Trucks 11 6.3% $3,934,842 32.8%
Dump Trucks 23 13.3% $2,165,276 18.1%
Trucks MD/HD 25 14.5% $1,756,722 14.7%
SUV 33 19.1% $1,070,714 8.9%
Construction 15 8.7% $1,018,477 8.5%
L. Duty/Van 16 9.2% $706,001 5.9%
Sedans 29 16.8% $664,750 5.5%
Other 12 6.9% $406,883 3.4%
Grounds Eq. 9 5.2% $258,761 2.2%
TOTALS 173 $11,982,426
Each unit in the fleet was assigned to one of the nine general fleet categories described below. Fire Trucks – These are highly specialized vehicles used to respond to emergencies. Currently, the City owns 11 units with a replacement value of over $3.9 Million. The average age of the Fire Trucks is 13 years. The useful lives range between 15 to 20 years. Trucks Medium Duty/Heavy Duty – This class of vehicle includes light dump trucks, heavy duty pick‐up trucks and specialty trucks. Uses for the light dump trucks include road repairs, asphalt hauling and storm water inlet construction. The heavy duty pick‐ups are used to haul personnel, materials and equipment to and from work sites. The specialty trucks include aviation fuel trucks, de‐icing truck, ambulances, flatbeds, aerial trucks, vac‐all and the Police paddy wagon. These types of vehicles are used by Airport (3), Fire (6), Street (9), Police (1) and Utilities (6). The average age of the Medium and Heavy Duty Trucks is 14.8 years. Useful life ranges from 7 to 10 years for ambulances, heavy duty pick‐ups and light dump trucks and 10 to 20 years for specialty trucks. Heavy Dump Trucks – These vehicles have a gross vehicle weight (GVW) of at least 33,000 pounds and a load carrying capacity of 10 tons. Heavy dump trucks are used to tow leaf
100
vacuums and leaf boxes during the fall season, large loads of rock salt during the winter and heavy loads and tow equipment trailers throughout the year. The exposure to salt causes the frame and other steel parts of these dump trucks to deteriorate faster than normal vehicles. The Utility Division has one heavy dump truck and the Airport has three older (more than 20 years old) heavy dump trucks. The Street Division requires at least 16 heavy dump trucks during the fall and winter for leaf and snow plowing/salting. Currently, the Street Division has 19 units on hand, two of which are 20 years old. The average age of the Street Division Heavy Dump Trucks is 12.6 years. The useful life of a heavy dump truck is 10 years. Construction – These units are mobile on‐road and off‐road equipment that is used to dig, load and carry large loads over short distances. The inventory includes tractors, backhoes, loaders, graders, vibratory rollers and excavators. These type of vehicles are used by Street (11) and Utilities (4). The average age of the construction equipment is 16.5 years. The useful life of this equipment is generally from 10 to 15 years. SUV – These four wheel drive sports utility vehicles are larger than, and provide more passenger room and better off road performance than traditional sedans or pick‐up trucks. Because of their size, SUVs are highly visible and provide the operator with better visibility than sedans. These type of vehicles are used in the City Hall pool (3), IT (1), CD (1), Airport (2), DSATS (1), Fire (8), Street (5), Police (7) and Utilities (3). Six of the vehicles used by the Police Department are used for patrol cars. The average age of SUVs is 11.6 years. The useful lives for this class of vehicle is generally 10 years. Light Duty Trucks/Vans – This class of vehicle may be equipped with either two or four wheel drive and may have an extended cab capable of carrying a crew of five personnel along with light hand equipment or materials. These type of vehicles are used by Airport (2), Fire (1), Street (7), Police (2) and Utilities (4). The average age of these vehicles is 12.6 years. The typical useful life of this class of vehicle is 10 years. Sedans – This class of vehicle is used as almost exclusively by the Police Department. Currently, 26 of the 29 sedans are used by the Police Department. One is assigned to the Airport as a courtesy car and two are assigned to Community Development. The vehicles are used by detectives, commanders, school resources officers and for the resident officer program. Three of these vehicles are used as patrol cars. The older sedans are reassigned to the Community Development Department. The average age of these vehicles is 6.4 years. The typical useful life of this class of vehicle is eight to 10 years and four years for patrol cars. Other – These units include specialized equipment including two Harley Davidson motorcycles, two street sweepers, three forklifts, floor cleaner, scissor lift and a line laser truck used for roadway striping. These units are used by Airport (1), Street (6), Police (4) and Utilities (2). The average age of these vehicles is 11.4 years. The typical useful life of this class is seven to 15 years. Grounds Equipment – The equipment of this class includes tractors, motorized mowing
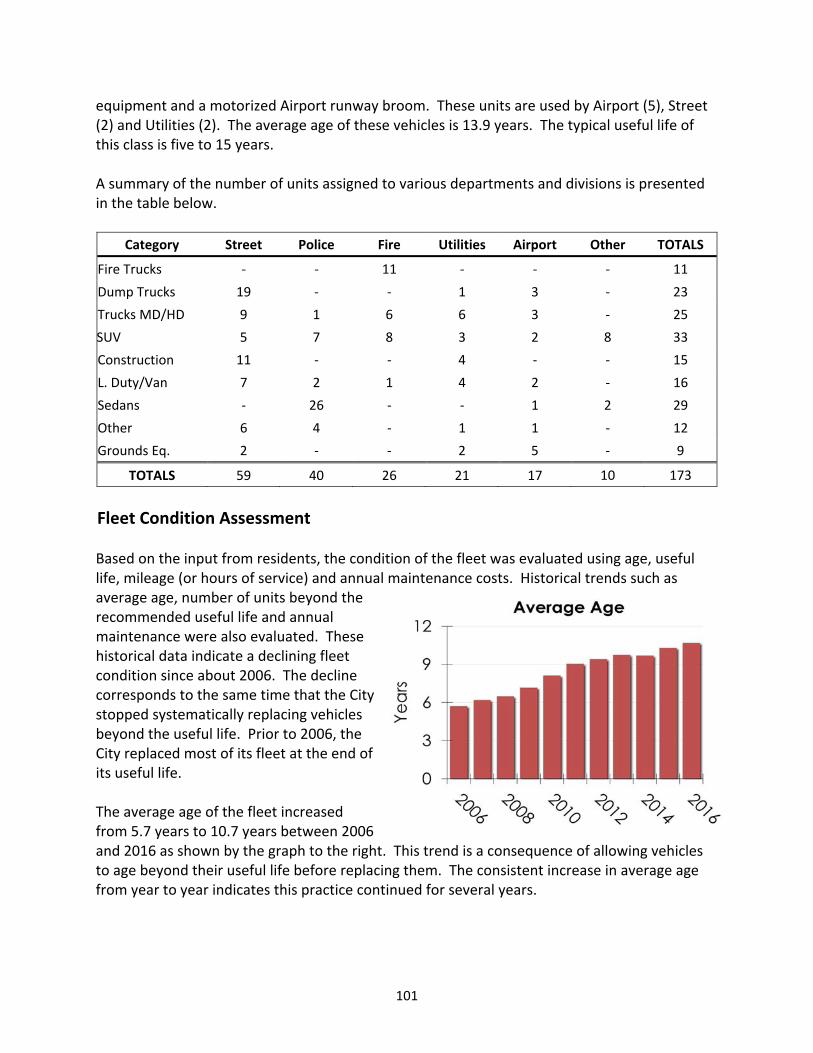
101
equipment and a motorized Airport runway broom. These units are used by Airport (5), Street (2) and Utilities (2). The average age of these vehicles is 13.9 years. The typical useful life of this class is five to 15 years. A summary of the number of units assigned to various departments and divisions is presented in the table below.
Fleet Condition Assessment Based on the input from residents, the condition of the fleet was evaluated using age, useful life, mileage (or hours of service) and annual maintenance costs. Historical trends such as average age, number of units beyond the recommended useful life and annual maintenance were also evaluated. These historical data indicate a declining fleet condition since about 2006. The decline corresponds to the same time that the City stopped systematically replacing vehicles beyond the useful life. Prior to 2006, the City replaced most of its fleet at the end of its useful life. The average age of the fleet increased from 5.7 years to 10.7 years between 2006 and 2016 as shown by the graph to the right. This trend is a consequence of allowing vehicles to age beyond their useful life before replacing them. The consistent increase in average age from year to year indicates this practice continued for several years.
Category Street Police Fire Utilities Airport Other TOTALS
Fire Trucks ‐ ‐ 11 ‐ ‐ ‐ 11
Dump Trucks 19 ‐ ‐ 1 3 ‐ 23
Trucks MD/HD 9 1 6 6 3 ‐ 25
SUV 5 7 8 3 2 8 33
Construction 11 ‐ ‐ 4 ‐ ‐ 15
L. Duty/Van 7 2 1 4 2 ‐ 16
Sedans ‐ 26 ‐ ‐ 1 2 29
Other 6 4 ‐ 1 1 ‐ 12
Grounds Eq. 2 ‐ ‐ 2 5 ‐ 9
TOTALS 59 40 26 21 17 10 173
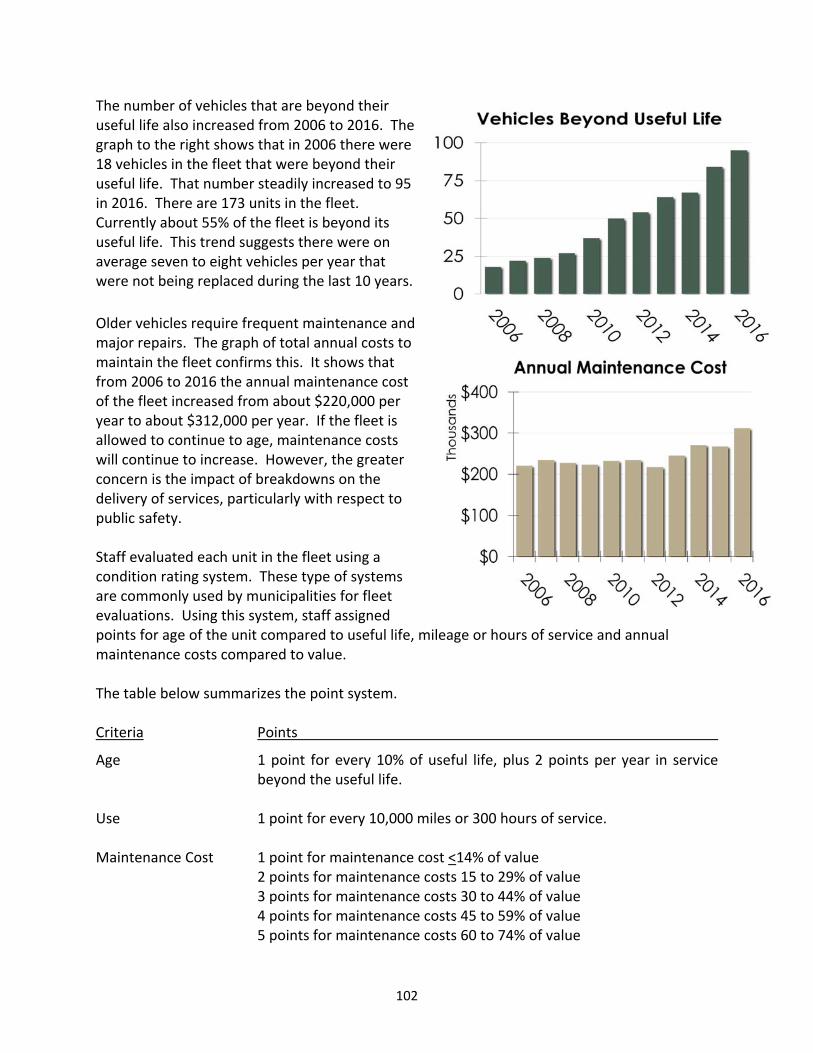
102
The number of vehicles that are beyond their useful life also increased from 2006 to 2016. The graph to the right shows that in 2006 there were 18 vehicles in the fleet that were beyond their useful life. That number steadily increased to 95 in 2016. There are 173 units in the fleet. Currently about 55% of the fleet is beyond its useful life. This trend suggests there were on average seven to eight vehicles per year that were not being replaced during the last 10 years.
Older vehicles require frequent maintenance and major repairs. The graph of total annual costs to maintain the fleet confirms this. It shows that from 2006 to 2016 the annual maintenance cost of the fleet increased from about $220,000 per year to about $312,000 per year. If the fleet is allowed to continue to age, maintenance costs will continue to increase. However, the greater concern is the impact of breakdowns on the delivery of services, particularly with respect to public safety. Staff evaluated each unit in the fleet using a condition rating system. These type of systems are commonly used by municipalities for fleet evaluations. Using this system, staff assigned points for age of the unit compared to useful life, mileage or hours of service and annual maintenance costs compared to value. The table below summarizes the point system. Criteria Points
Age 1 point for every 10% of useful life, plus 2 points per year in service beyond the useful life. Use 1 point for every 10,000 miles or 300 hours of service. Maintenance Cost 1 point for maintenance cost <14% of value 2 points for maintenance costs 15 to 29% of value 3 points for maintenance costs 30 to 44% of value 4 points for maintenance costs 45 to 59% of value 5 points for maintenance costs 60 to 74% of value
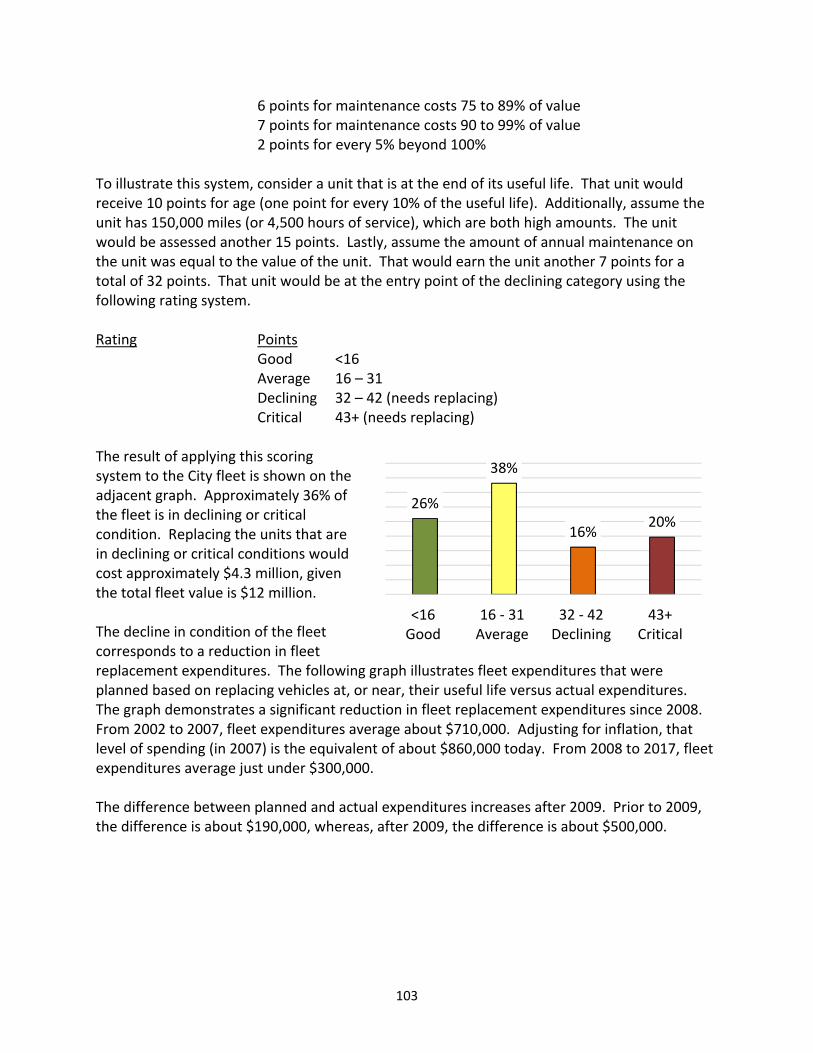
103
6 points for maintenance costs 75 to 89% of value 7 points for maintenance costs 90 to 99% of value 2 points for every 5% beyond 100% To illustrate this system, consider a unit that is at the end of its useful life. That unit would receive 10 points for age (one point for every 10% of the useful life). Additionally, assume the unit has 150,000 miles (or 4,500 hours of service), which are both high amounts. The unit would be assessed another 15 points. Lastly, assume the amount of annual maintenance on the unit was equal to the value of the unit. That would earn the unit another 7 points for a total of 32 points. That unit would be at the entry point of the declining category using the following rating system. Rating Points Good <16 Average 16 – 31 Declining 32 – 42 (needs replacing) Critical 43+ (needs replacing) The result of applying this scoring system to the City fleet is shown on the adjacent graph. Approximately 36% of the fleet is in declining or critical condition. Replacing the units that are in declining or critical conditions would cost approximately $4.3 million, given the total fleet value is $12 million.
The decline in condition of the fleet corresponds to a reduction in fleet replacement expenditures. The following graph illustrates fleet expenditures that were planned based on replacing vehicles at, or near, their useful life versus actual expenditures. The graph demonstrates a significant reduction in fleet replacement expenditures since 2008. From 2002 to 2007, fleet expenditures average about $710,000. Adjusting for inflation, that level of spending (in 2007) is the equivalent of about $860,000 today. From 2008 to 2017, fleet expenditures average just under $300,000. The difference between planned and actual expenditures increases after 2009. Prior to 2009, the difference is about $190,000, whereas, after 2009, the difference is about $500,000.
20%16%
38%
26%
43+Critical
32 ‐ 42Declining
16 ‐ 31Average
<16Good
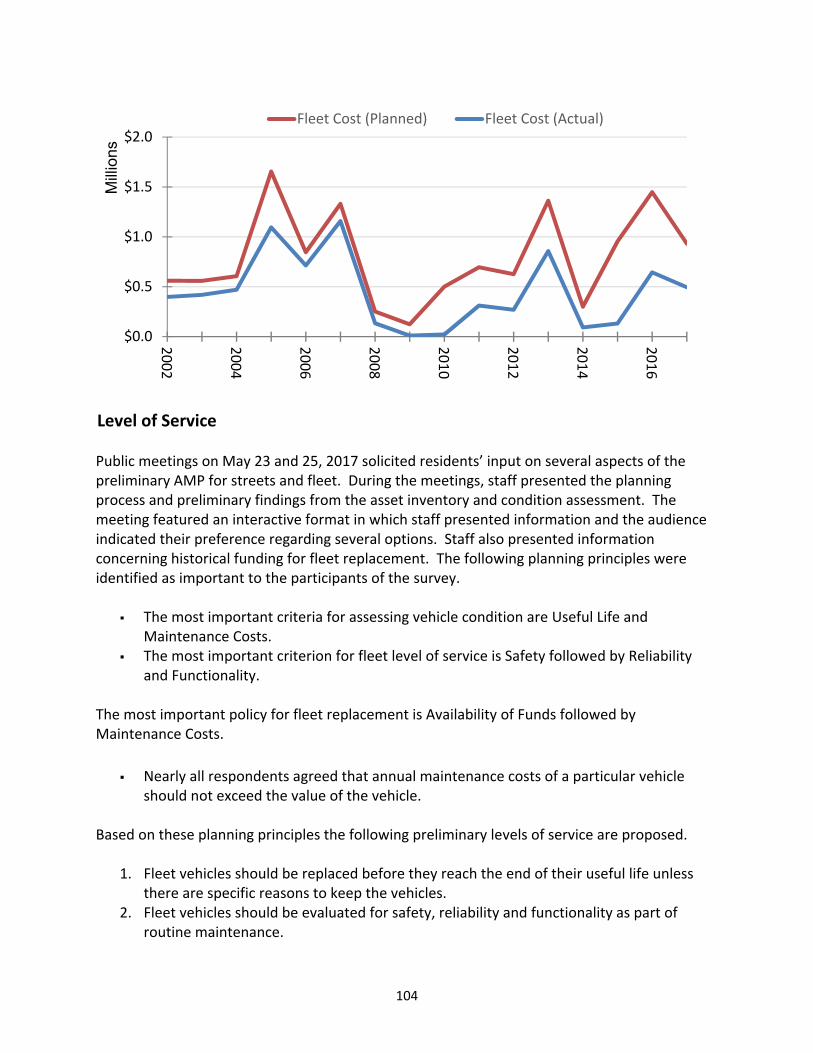
104
Level of Service Public meetings on May 23 and 25, 2017 solicited residents’ input on several aspects of the preliminary AMP for streets and fleet. During the meetings, staff presented the planning process and preliminary findings from the asset inventory and condition assessment. The meeting featured an interactive format in which staff presented information and the audience indicated their preference regarding several options. Staff also presented information concerning historical funding for fleet replacement. The following planning principles were identified as important to the participants of the survey.
The most important criteria for assessing vehicle condition are Useful Life and Maintenance Costs.
The most important criterion for fleet level of service is Safety followed by Reliability and Functionality.
The most important policy for fleet replacement is Availability of Funds followed by Maintenance Costs. Nearly all respondents agreed that annual maintenance costs of a particular vehicle
should not exceed the value of the vehicle. Based on these planning principles the following preliminary levels of service are proposed.
1. Fleet vehicles should be replaced before they reach the end of their useful life unless there are specific reasons to keep the vehicles.
2. Fleet vehicles should be evaluated for safety, reliability and functionality as part of routine maintenance.
$0.0
$0.5
$1.0
$1.5
$2.0
2002
2004
2006
2008
2010
2012
2014
2016
Mill
ions
Fleet Cost (Planned) Fleet Cost (Actual)
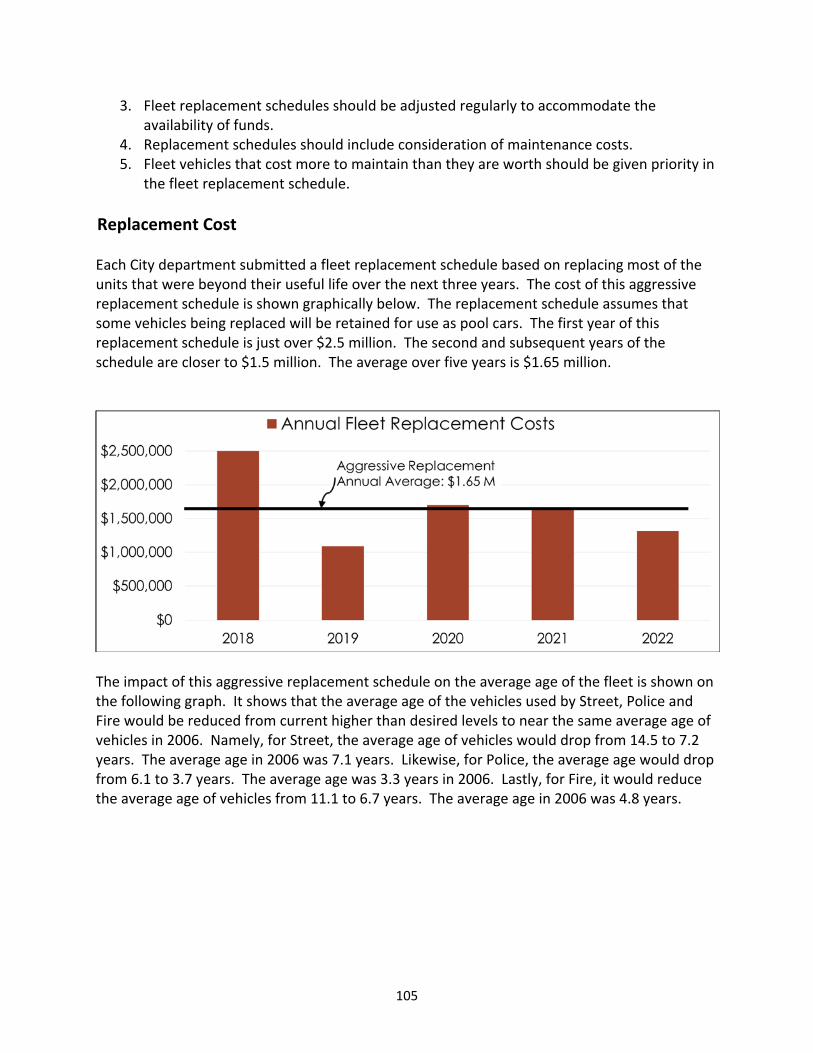
105
3. Fleet replacement schedules should be adjusted regularly to accommodate the availability of funds.
4. Replacement schedules should include consideration of maintenance costs. 5. Fleet vehicles that cost more to maintain than they are worth should be given priority in
the fleet replacement schedule.
Replacement Cost Each City department submitted a fleet replacement schedule based on replacing most of the units that were beyond their useful life over the next three years. The cost of this aggressive replacement schedule is shown graphically below. The replacement schedule assumes that some vehicles being replaced will be retained for use as pool cars. The first year of this replacement schedule is just over $2.5 million. The second and subsequent years of the schedule are closer to $1.5 million. The average over five years is $1.65 million.
The impact of this aggressive replacement schedule on the average age of the fleet is shown on the following graph. It shows that the average age of the vehicles used by Street, Police and Fire would be reduced from current higher than desired levels to near the same average age of vehicles in 2006. Namely, for Street, the average age of vehicles would drop from 14.5 to 7.2 years. The average age in 2006 was 7.1 years. Likewise, for Police, the average age would drop from 6.1 to 3.7 years. The average age was 3.3 years in 2006. Lastly, for Fire, it would reduce the average age of vehicles from 11.1 to 6.7 years. The average age in 2006 was 4.8 years.
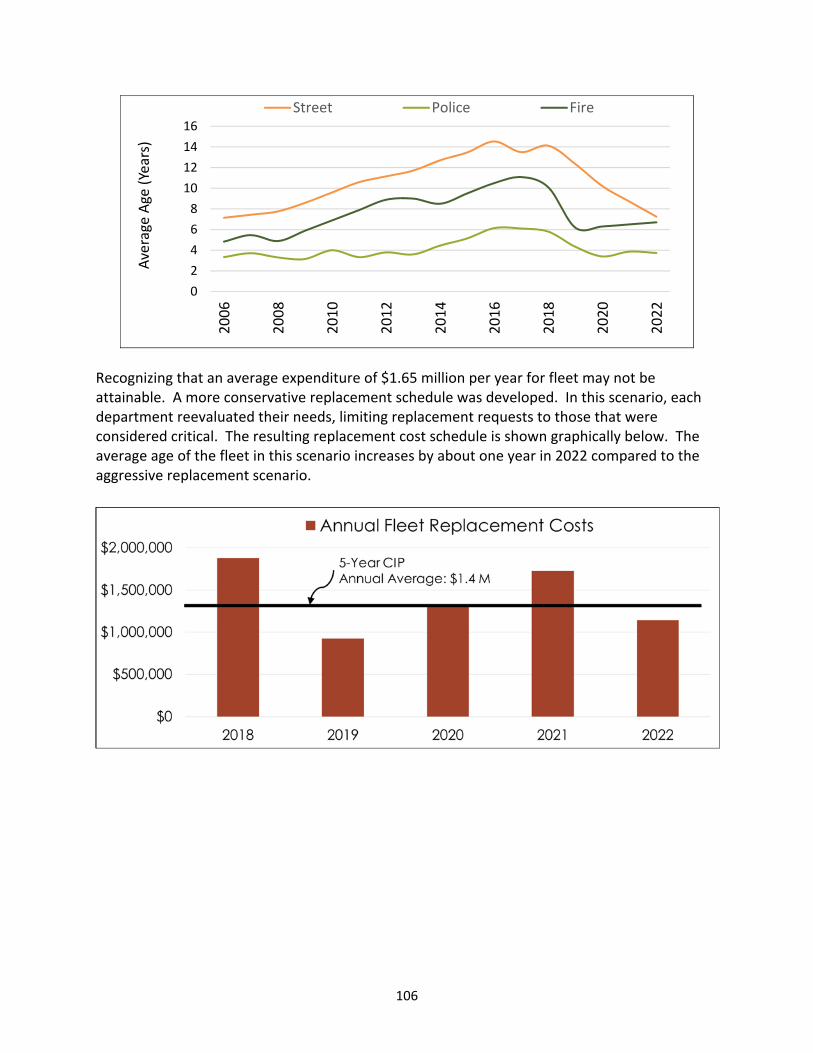
106
Recognizing that an average expenditure of $1.65 million per year for fleet may not be attainable. A more conservative replacement schedule was developed. In this scenario, each department reevaluated their needs, limiting replacement requests to those that were considered critical. The resulting replacement cost schedule is shown graphically below. The average age of the fleet in this scenario increases by about one year in 2022 compared to the aggressive replacement scenario.
0
2
4
6
8
10
12
14
16
2006
2008
2010
2012
2014
2016
2018
2020
2022
Average Age (Years)
Street Police Fire
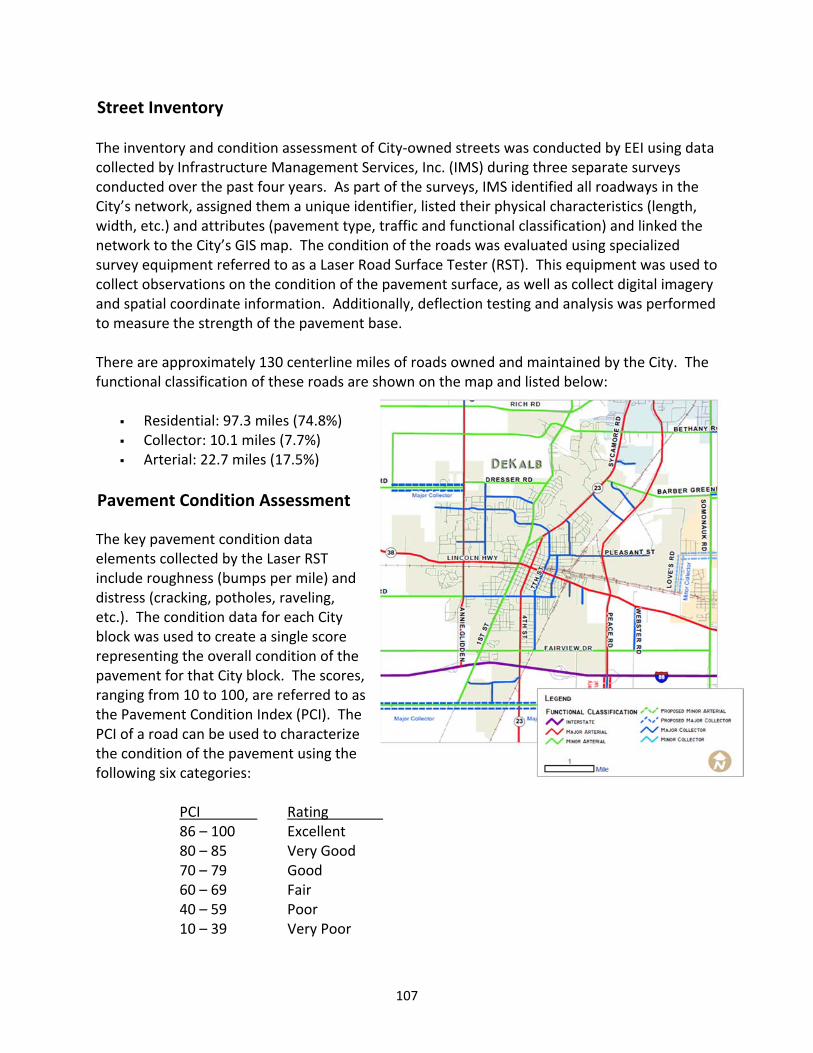
107
Street Inventory The inventory and condition assessment of City‐owned streets was conducted by EEI using data collected by Infrastructure Management Services, Inc. (IMS) during three separate surveys conducted over the past four years. As part of the surveys, IMS identified all roadways in the City’s network, assigned them a unique identifier, listed their physical characteristics (length, width, etc.) and attributes (pavement type, traffic and functional classification) and linked the network to the City’s GIS map. The condition of the roads was evaluated using specialized survey equipment referred to as a Laser Road Surface Tester (RST). This equipment was used to collect observations on the condition of the pavement surface, as well as collect digital imagery and spatial coordinate information. Additionally, deflection testing and analysis was performed to measure the strength of the pavement base. There are approximately 130 centerline miles of roads owned and maintained by the City. The functional classification of these roads are shown on the map and listed below:
Residential: 97.3 miles (74.8%) Collector: 10.1 miles (7.7%) Arterial: 22.7 miles (17.5%)
Pavement Condition Assessment
The key pavement condition data elements collected by the Laser RST include roughness (bumps per mile) and distress (cracking, potholes, raveling, etc.). The condition data for each City block was used to create a single score representing the overall condition of the pavement for that City block. The scores, ranging from 10 to 100, are referred to as the Pavement Condition Index (PCI). The PCI of a road can be used to characterize the condition of the pavement using the following six categories: PCI Rating 86 – 100 Excellent 80 – 85 Very Good 70 – 79 Good 60 – 69 Fair
40 – 59 Poor 10 – 39 Very Poor

108
The following pictures and descriptions of road surface, remaining life and maintenance activities are representative of several qualitative rating categories.
Very Good to Excellent (PCI 80 – 100) Near perfect condition. Very minor defects may be present. Comfortable to drive. The remaining life is 15 to 25 years. Little to no maintenance required when new. Requires routine maintenance such as crack and joint sealing.
Good (PCI 70‐79) Structurally sound. Cracking and other minor distresses are present. Road still feels smooth to drive. The remaining life is 12 to 18 years. Routine maintenance such as patching and crack sealing with surface treatments. Fair (60‐69) Structural damage may be present. Cracking and other minor distresses are extensive. Road may feel rough. The remaining life is 8 to 15 years. Heavier surface treatments and thin overlays. Localized panel replacements.
Poor (PCI 40 – 59) Structural damage is extensive. The road is very rough. The remaining life is 5 to 10 years. Heavy surface‐based inlays or overlays with localized repairs. Moderate to extensive panel replacements.
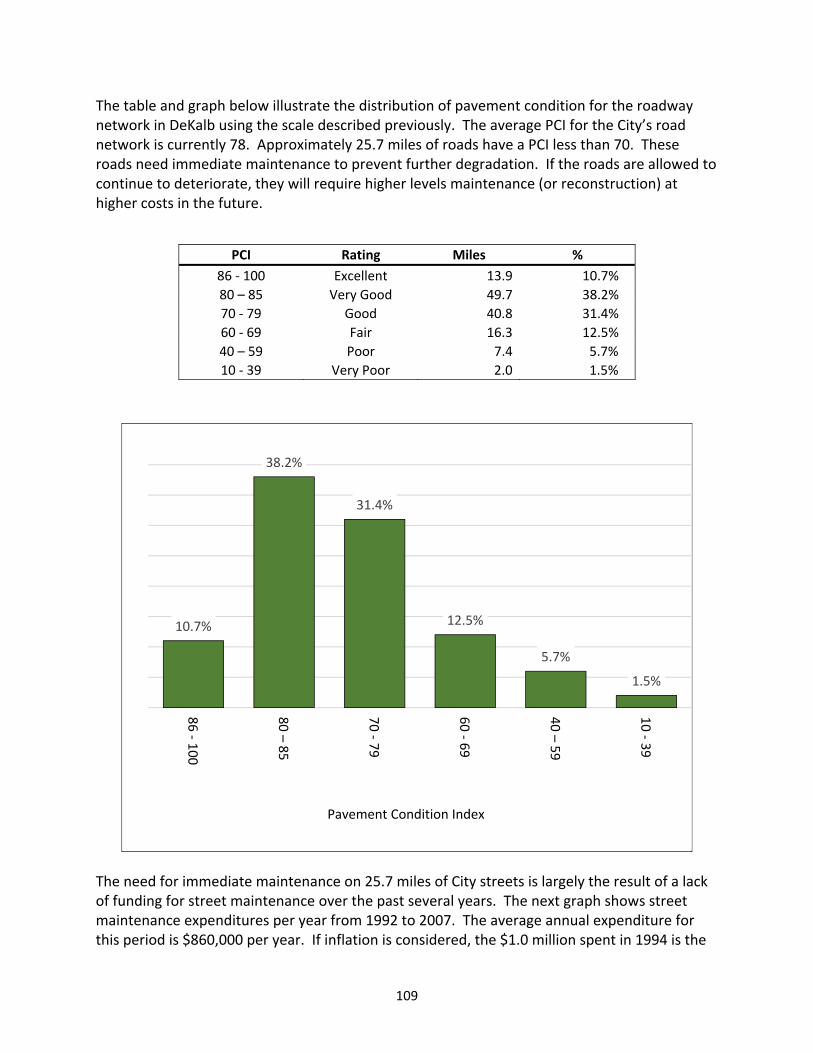
109
The table and graph below illustrate the distribution of pavement condition for the roadway network in DeKalb using the scale described previously. The average PCI for the City’s road network is currently 78. Approximately 25.7 miles of roads have a PCI less than 70. These roads need immediate maintenance to prevent further degradation. If the roads are allowed to continue to deteriorate, they will require higher levels maintenance (or reconstruction) at higher costs in the future.
The need for immediate maintenance on 25.7 miles of City streets is largely the result of a lack of funding for street maintenance over the past several years. The next graph shows street maintenance expenditures per year from 1992 to 2007. The average annual expenditure for this period is $860,000 per year. If inflation is considered, the $1.0 million spent in 1994 is the
10.7%
38.2%
31.4%
12.5%
5.7%
1.5%
86 ‐ 1
00
80 –85
70 ‐ 7
9
60 ‐ 6
9
40 –59
10 ‐ 3
9
Pavement Condition Index
PCI Rating Miles %
86 ‐ 100 Excellent 13.9 10.7%
80 – 85 Very Good 49.7 38.2%
70 ‐ 79 Good 40.8 31.4%
60 ‐ 69 Fair 16.3 12.5%
40 – 59 Poor 7.4 5.7%
10 ‐ 39 Very Poor 2.0 1.5%
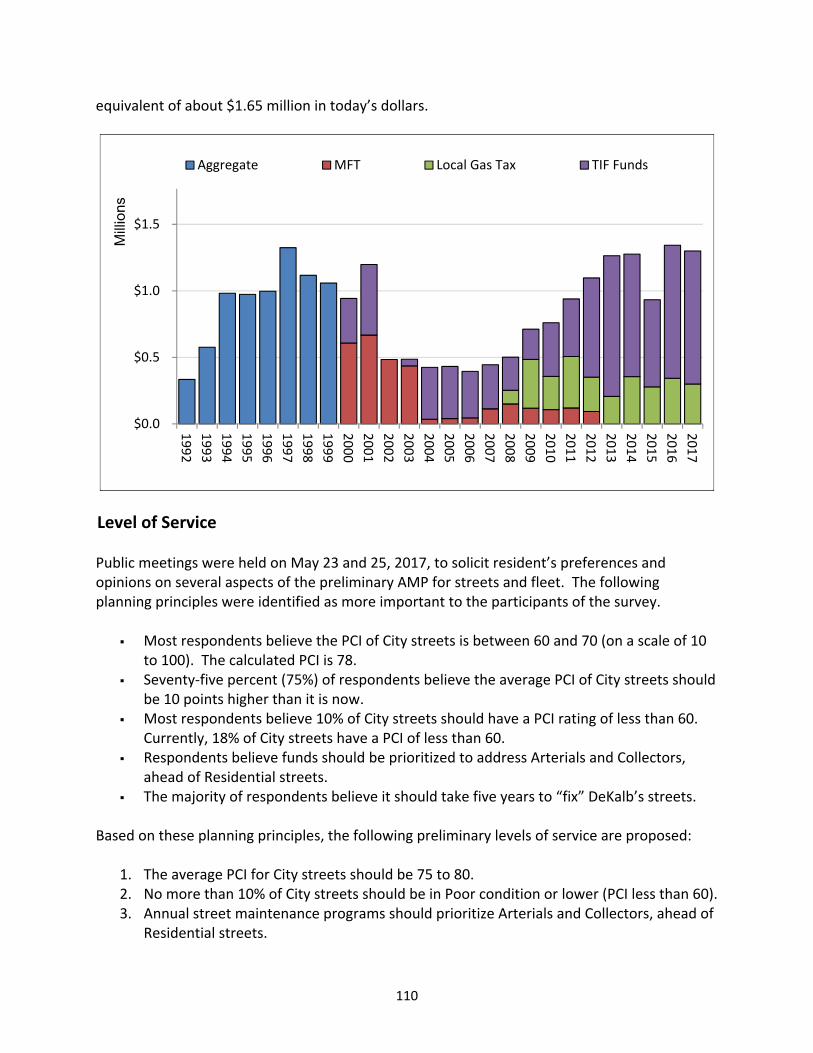
110
equivalent of about $1.65 million in today’s dollars.
Level of Service Public meetings were held on May 23 and 25, 2017, to solicit resident’s preferences and opinions on several aspects of the preliminary AMP for streets and fleet. The following planning principles were identified as more important to the participants of the survey.
Most respondents believe the PCI of City streets is between 60 and 70 (on a scale of 10 to 100). The calculated PCI is 78.
Seventy‐five percent (75%) of respondents believe the average PCI of City streets should be 10 points higher than it is now.
Most respondents believe 10% of City streets should have a PCI rating of less than 60. Currently, 18% of City streets have a PCI of less than 60.
Respondents believe funds should be prioritized to address Arterials and Collectors, ahead of Residential streets.
The majority of respondents believe it should take five years to “fix” DeKalb’s streets. Based on these planning principles, the following preliminary levels of service are proposed:
1. The average PCI for City streets should be 75 to 80. 2. No more than 10% of City streets should be in Poor condition or lower (PCI less than 60). 3. Annual street maintenance programs should prioritize Arterials and Collectors, ahead of
Residential streets.
$0.0
$0.5
$1.0
$1.5
$2.0
1992
1993
1994
1995
1996
1997
1998
1999
2000
2001
2002
2003
2004
2005
2006
2007
2008
2009
2010
2011
2012
2013
2014
2015
2016
2017
Mill
ions
Aggregate MFT Local Gas Tax TIF Funds
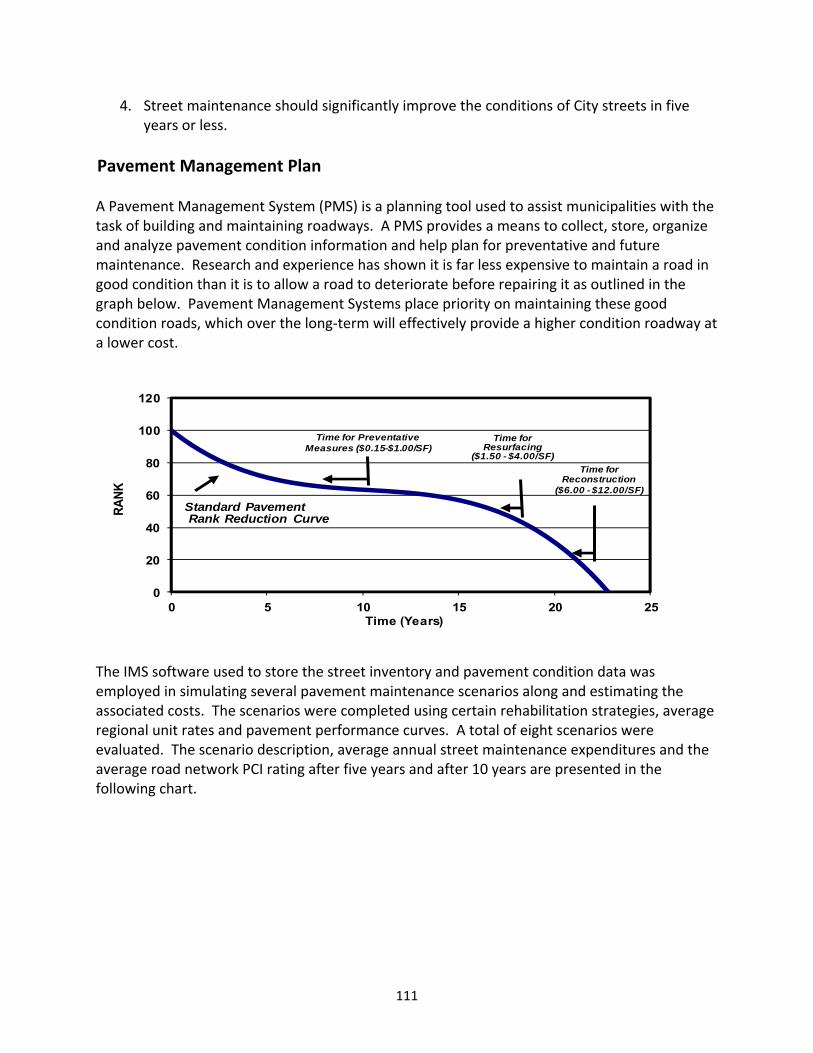
111
4. Street maintenance should significantly improve the conditions of City streets in five years or less.
Pavement Management Plan
A Pavement Management System (PMS) is a planning tool used to assist municipalities with the task of building and maintaining roadways. A PMS provides a means to collect, store, organize and analyze pavement condition information and help plan for preventative and future maintenance. Research and experience has shown it is far less expensive to maintain a road in good condition than it is to allow a road to deteriorate before repairing it as outlined in the graph below. Pavement Management Systems place priority on maintaining these good condition roads, which over the long‐term will effectively provide a higher condition roadway at a lower cost.
The IMS software used to store the street inventory and pavement condition data was employed in simulating several pavement maintenance scenarios along and estimating the associated costs. The scenarios were completed using certain rehabilitation strategies, average regional unit rates and pavement performance curves. A total of eight scenarios were evaluated. The scenario description, average annual street maintenance expenditures and the average road network PCI rating after five years and after 10 years are presented in the following chart.
0
20
40
60
80
100
120
0 5 10 15 20 25
RA
NK
Time (Years)
Standard Pavement Rank Reduction Curve
Time for Preventative Measures ($0.15-$1.00/SF)
Time for Resurfacing
($1.50 - $4.00/SF)
Time for Reconstruction
($6.00 - $12.00/SF)
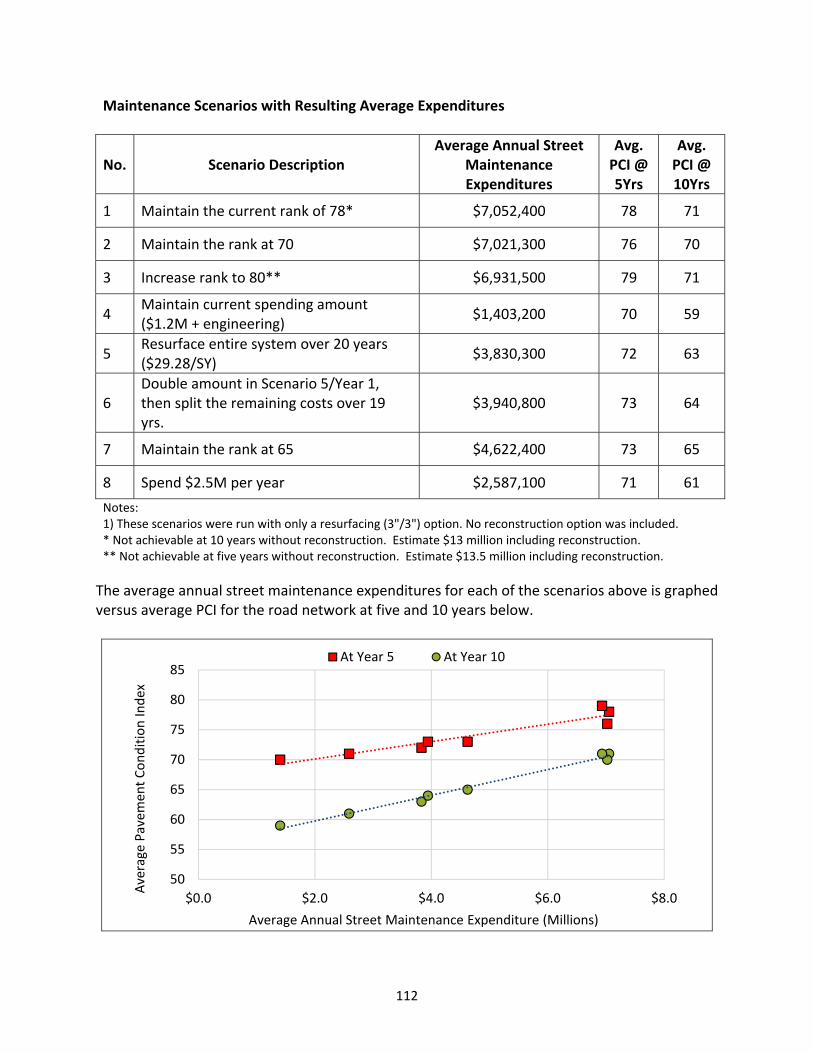
112
Maintenance Scenarios with Resulting Average Expenditures
No. Scenario Description Average Annual Street
Maintenance Expenditures
Avg. PCI @ 5Yrs
Avg. PCI @ 10Yrs
1 Maintain the current rank of 78* $7,052,400 78 71
2 Maintain the rank at 70 $7,021,300 76 70
3 Increase rank to 80** $6,931,500 79 71
4 Maintain current spending amount ($1.2M + engineering)
$1,403,200 70 59
5 Resurface entire system over 20 years ($29.28/SY)
$3,830,300 72 63
6 Double amount in Scenario 5/Year 1, then split the remaining costs over 19 yrs.
$3,940,800 73 64
7 Maintain the rank at 65 $4,622,400 73 65
8 Spend $2.5M per year $2,587,100 71 61
Notes: 1) These scenarios were run with only a resurfacing (3"/3") option. No reconstruction option was included. * Not achievable at 10 years without reconstruction. Estimate $13 million including reconstruction. ** Not achievable at five years without reconstruction. Estimate $13.5 million including reconstruction.
The average annual street maintenance expenditures for each of the scenarios above is graphed versus average PCI for the road network at five and 10 years below.
50
55
60
65
70
75
80
85
$0.0 $2.0 $4.0 $6.0 $8.0
Average Pavem
ent Condition In
dex
Average Annual Street Maintenance Expenditure (Millions)
At Year 5 At Year 10
113
The red squares represent the average PCI at the end of five years given the corresponding average street maintenance expenditures of a particular scenario. The red dashed line shows the best‐fit linear trend. Similarly, the blue circles represent the average PCI at the end of 10 years given the corresponding average street maintenance expenditures of a particular scenario. The blue dashed line shows the best‐fit linear trend. The scenarios that meet resident’s level of service expectations after five years include scenarios 1, 2 and 3. These scenarios require over $7 million dollars of expenditures on street maintenance per year. Given the current maintenance program is only $1.3 million, it may not be reasonable to expect such a large increase in annual expenditures to be possible. Therefore, a more conservative scenario has been selected for inclusion in the preliminary financial management plan. Scenario 5, with an average annual expenditure of approximately $3.8 million, is included in the preliminary financial management plan. This scenario keeps the average PCI for City streets above 70 for the next five years. It represents a significant increase in current street maintenance expenditures and would produce noticeable improvements throughout the City.
114
Alternative Funding
115
Alternative Funding
Intergovernmental Agreements – Revenue Sharing DeKalb Market Square Agreements Peace Road Interchange Improvements DeKalb County Home Agreement Sycamore Boundary Agreement
General Fund Stabilization – Property Tax Levy Streets and Fleet Funding Streets and Fleet Conclusions Alternative Funding Policy Conclusions
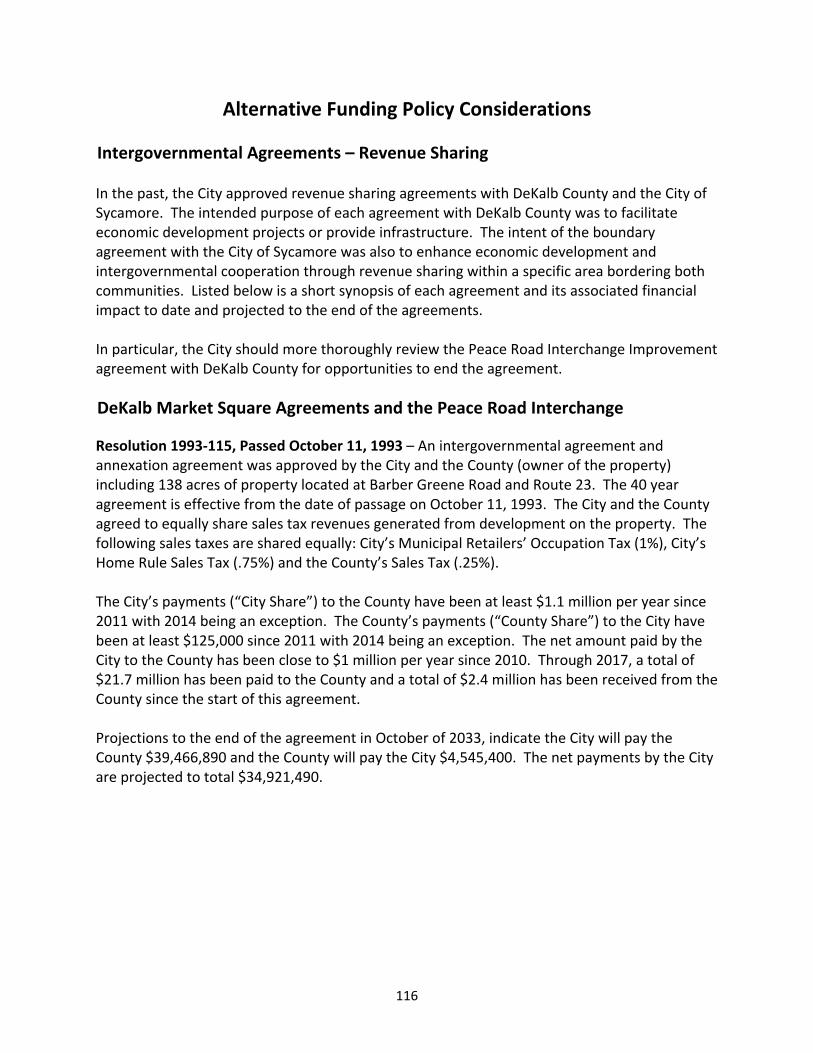
116
Alternative Funding Policy Considerations
Intergovernmental Agreements – Revenue Sharing In the past, the City approved revenue sharing agreements with DeKalb County and the City of Sycamore. The intended purpose of each agreement with DeKalb County was to facilitate economic development projects or provide infrastructure. The intent of the boundary agreement with the City of Sycamore was also to enhance economic development and intergovernmental cooperation through revenue sharing within a specific area bordering both communities. Listed below is a short synopsis of each agreement and its associated financial impact to date and projected to the end of the agreements. In particular, the City should more thoroughly review the Peace Road Interchange Improvement agreement with DeKalb County for opportunities to end the agreement.
DeKalb Market Square Agreements and the Peace Road Interchange
Resolution 1993‐115, Passed October 11, 1993 – An intergovernmental agreement and annexation agreement was approved by the City and the County (owner of the property) including 138 acres of property located at Barber Greene Road and Route 23. The 40 year agreement is effective from the date of passage on October 11, 1993. The City and the County agreed to equally share sales tax revenues generated from development on the property. The following sales taxes are shared equally: City’s Municipal Retailers’ Occupation Tax (1%), City’s Home Rule Sales Tax (.75%) and the County’s Sales Tax (.25%). The City’s payments (“City Share”) to the County have been at least $1.1 million per year since 2011 with 2014 being an exception. The County’s payments (“County Share”) to the City have been at least $125,000 since 2011 with 2014 being an exception. The net amount paid by the City to the County has been close to $1 million per year since 2010. Through 2017, a total of $21.7 million has been paid to the County and a total of $2.4 million has been received from the County since the start of this agreement. Projections to the end of the agreement in October of 2033, indicate the City will pay the County $39,466,890 and the County will pay the City $4,545,400. The net payments by the City are projected to total $34,921,490.
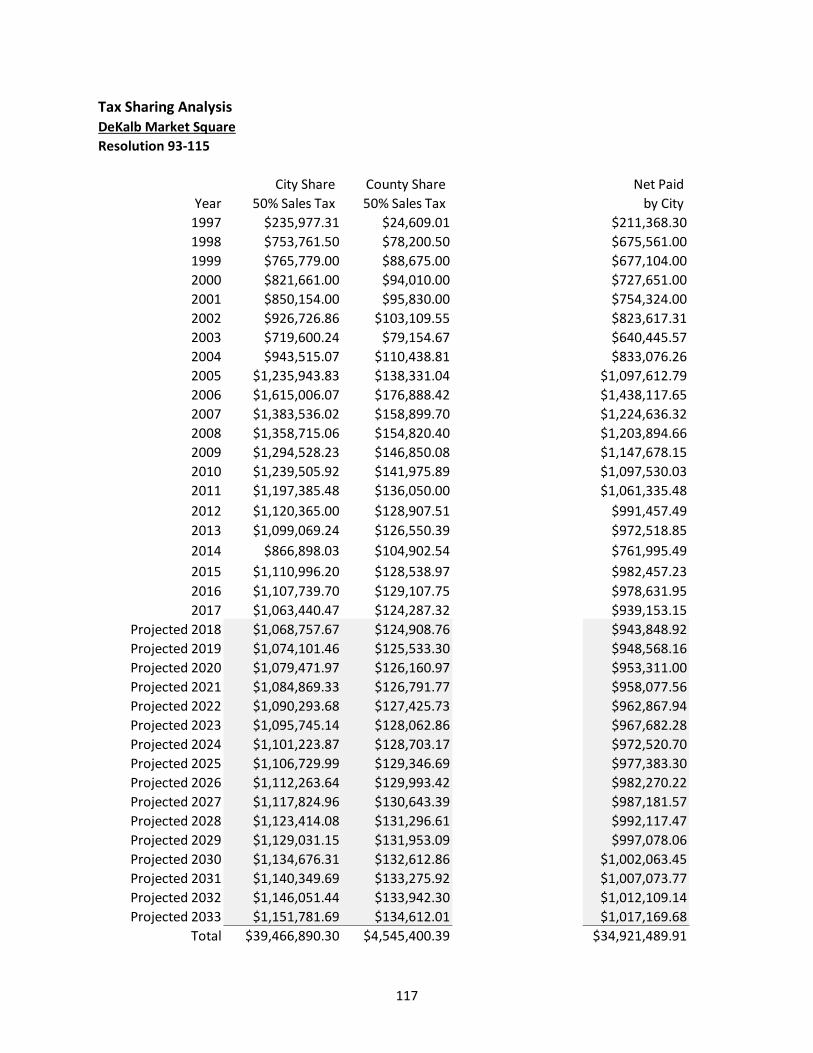
117
Tax Sharing AnalysisDeKalb Market Square
Resolution 93‐115
City Share County Share Net Paid
Year 50% Sales Tax 50% Sales Tax by City
1997 $235,977.31 $24,609.01 $211,368.30
1998 $753,761.50 $78,200.50 $675,561.00
1999 $765,779.00 $88,675.00 $677,104.00
2000 $821,661.00 $94,010.00 $727,651.00
2001 $850,154.00 $95,830.00 $754,324.00
2002 $926,726.86 $103,109.55 $823,617.31
2003 $719,600.24 $79,154.67 $640,445.57
2004 $943,515.07 $110,438.81 $833,076.26
2005 $1,235,943.83 $138,331.04 $1,097,612.79
2006 $1,615,006.07 $176,888.42 $1,438,117.65
2007 $1,383,536.02 $158,899.70 $1,224,636.32
2008 $1,358,715.06 $154,820.40 $1,203,894.66
2009 $1,294,528.23 $146,850.08 $1,147,678.15
2010 $1,239,505.92 $141,975.89 $1,097,530.03
2011 $1,197,385.48 $136,050.00 $1,061,335.48
2012 $1,120,365.00 $128,907.51 $991,457.49
2013 $1,099,069.24 $126,550.39 $972,518.85
2014 $866,898.03 $104,902.54 $761,995.49
2015 $1,110,996.20 $128,538.97 $982,457.23
2016 $1,107,739.70 $129,107.75 $978,631.95
2017 $1,063,440.47 $124,287.32 $939,153.15
Projected 2018 $1,068,757.67 $124,908.76 $943,848.92
Projected 2019 $1,074,101.46 $125,533.30 $948,568.16
Projected 2020 $1,079,471.97 $126,160.97 $953,311.00
Projected 2021 $1,084,869.33 $126,791.77 $958,077.56
Projected 2022 $1,090,293.68 $127,425.73 $962,867.94
Projected 2023 $1,095,745.14 $128,062.86 $967,682.28
Projected 2024 $1,101,223.87 $128,703.17 $972,520.70
Projected 2025 $1,106,729.99 $129,346.69 $977,383.30
Projected 2026 $1,112,263.64 $129,993.42 $982,270.22
Projected 2027 $1,117,824.96 $130,643.39 $987,181.57
Projected 2028 $1,123,414.08 $131,296.61 $992,117.47
Projected 2029 $1,129,031.15 $131,953.09 $997,078.06
Projected 2030 $1,134,676.31 $132,612.86 $1,002,063.45
Projected 2031 $1,140,349.69 $133,275.92 $1,007,073.77
Projected 2032 $1,146,051.44 $133,942.30 $1,012,109.14
Projected 2033 $1,151,781.69 $134,612.01 $1,017,169.68
Total $39,466,890.30 $4,545,400.39 $34,921,489.91

118
Resolution 1996‐001, Passed January 8, 1996 – An addendum to the original 1993 Intergovernmental Agreement. Walmart is listed as a “known” store to develop on the property. The City and the County agreed to each expend $500,000 toward public improvements. Resolution 2002‐095, Passed October 14, 2002 – A second amendment to the original 1993 Intergovernmental Agreement. The amendment is limited to Lot #12 of DeKalb Market Square (Kohl’s). The City and the County agreed to jointly fund and share equally in the cost of infrastructure improvements up to a total of $1,550,000 to be paid in cash or in the form of sales tax rebates of one‐half of City/County sales tax receipts for a period of up to eight years following the opening of the store. The last payment to Kohl’s was on September 27, 2013 for the period of December 2012 through February 2013. The total paid to Kohl’s was $609,301.16.
Peace Road Interchange Improvements Peace Road Interchange ‐ Resolution 2004‐031, Passed May 24, 2004 – A second intergovernmental agreement with DeKalb County was passed to share the City’s Home Rule Sales Tax generated at the DeKalb Market Square property. The City’s payments cover costs associated with the Illinois Toll Highway Authority installing Peace Road Interchange Improvements. In December 1997, the City entered into an agreement with the Illinois Toll Highway Authority agreeing to pay them in excess of $2,300,000 by June 2004. The County agreed to participate in repayment of the City’s debt. However, the City would provide additional City Home Rule Sales Tax revenues to the County. The City increased the City’s Home Rule Sales Tax from .75% to 1.25%. The City and County equally share the additional .50% City Home Rule Sales Tax. The agreement has a clause stipulating in the event the City repeals the 0.50% sales tax increase, every payment made to the County from the City would be applied to the principal balance due to the County. Thus, each payment made reduces the principal dollar for dollar.
Resolution 02-95COMPLETED in 2013
City Share
Year 50% Sales Tax
2004 $21,187.87
2005 $64,016.04
2006 $71,979.01
2007 $75,603.30
2008 $72,393.37
2009 $67,552.96
2010 $66,058.59
2011 $64,521.24
2012 $55,369.67
2013 $50,619.11
Total $609,301.16
$0.00
$10,000.00
$20,000.00
$30,000.00
$40,000.00
$50,000.00
$60,000.00
$70,000.00
$80,000.00
City Share
Kohl's Res. 02‐95
2004 2005 2006 2007 2008 2009 2010 2011 2012 2013
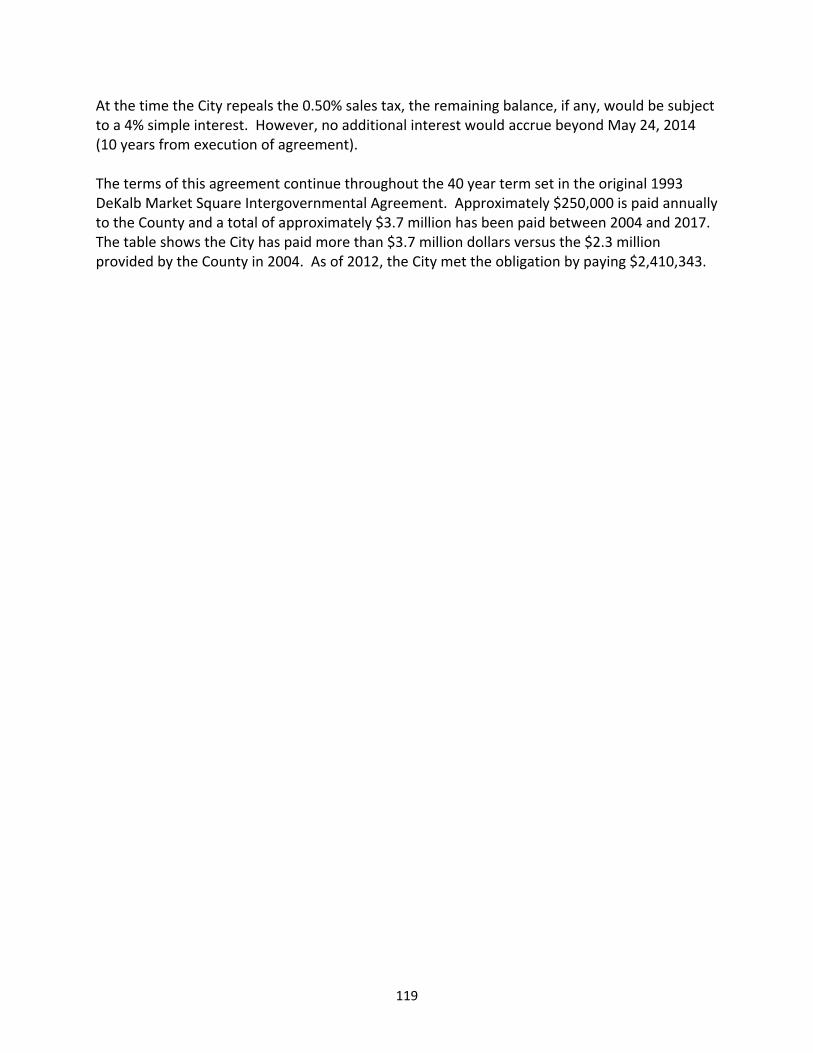
119
At the time the City repeals the 0.50% sales tax, the remaining balance, if any, would be subject to a 4% simple interest. However, no additional interest would accrue beyond May 24, 2014 (10 years from execution of agreement). The terms of this agreement continue throughout the 40 year term set in the original 1993 DeKalb Market Square Intergovernmental Agreement. Approximately $250,000 is paid annually to the County and a total of approximately $3.7 million has been paid between 2004 and 2017. The table shows the City has paid more than $3.7 million dollars versus the $2.3 million provided by the County in 2004. As of 2012, the City met the obligation by paying $2,410,343.
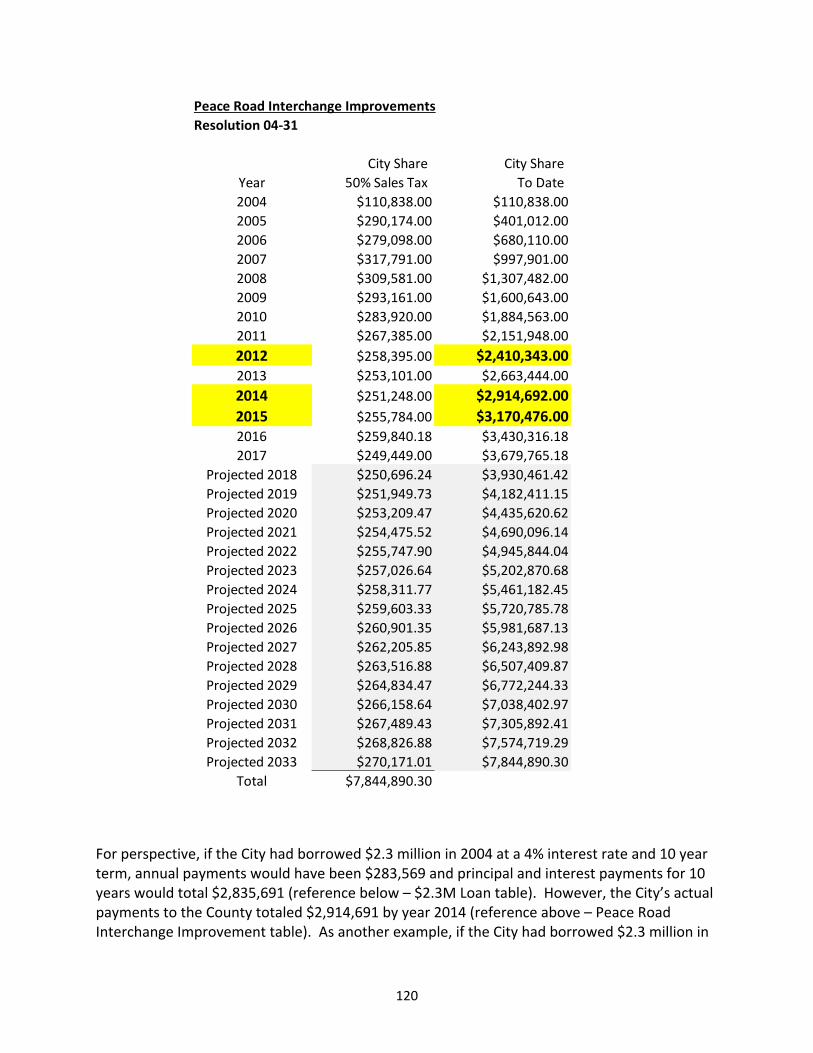
120
For perspective, if the City had borrowed $2.3 million in 2004 at a 4% interest rate and 10 year term, annual payments would have been $283,569 and principal and interest payments for 10 years would total $2,835,691 (reference below – $2.3M Loan table). However, the City’s actual payments to the County totaled $2,914,691 by year 2014 (reference above – Peace Road Interchange Improvement table). As another example, if the City had borrowed $2.3 million in
Peace Road Interchange Improvements
Resolution 04‐31
City Share City Share
Year 50% Sales Tax To Date
2004 $110,838.00 $110,838.00
2005 $290,174.00 $401,012.00
2006 $279,098.00 $680,110.00
2007 $317,791.00 $997,901.00
2008 $309,581.00 $1,307,482.00
2009 $293,161.00 $1,600,643.00
2010 $283,920.00 $1,884,563.00
2011 $267,385.00 $2,151,948.00
2012 $258,395.00 $2,410,343.002013 $253,101.00 $2,663,444.00
2014 $251,248.00 $2,914,692.00
2015 $255,784.00 $3,170,476.002016 $259,840.18 $3,430,316.18
2017 $249,449.00 $3,679,765.18
Projected 2018 $250,696.24 $3,930,461.42
Projected 2019 $251,949.73 $4,182,411.15
Projected 2020 $253,209.47 $4,435,620.62
Projected 2021 $254,475.52 $4,690,096.14
Projected 2022 $255,747.90 $4,945,844.04
Projected 2023 $257,026.64 $5,202,870.68
Projected 2024 $258,311.77 $5,461,182.45
Projected 2025 $259,603.33 $5,720,785.78
Projected 2026 $260,901.35 $5,981,687.13
Projected 2027 $262,205.85 $6,243,892.98
Projected 2028 $263,516.88 $6,507,409.87
Projected 2029 $264,834.47 $6,772,244.33
Projected 2030 $266,158.64 $7,038,402.97
Projected 2031 $267,489.43 $7,305,892.41
Projected 2032 $268,826.88 $7,574,719.29
Projected 2033 $270,171.01 $7,844,890.30
Total $7,844,890.30
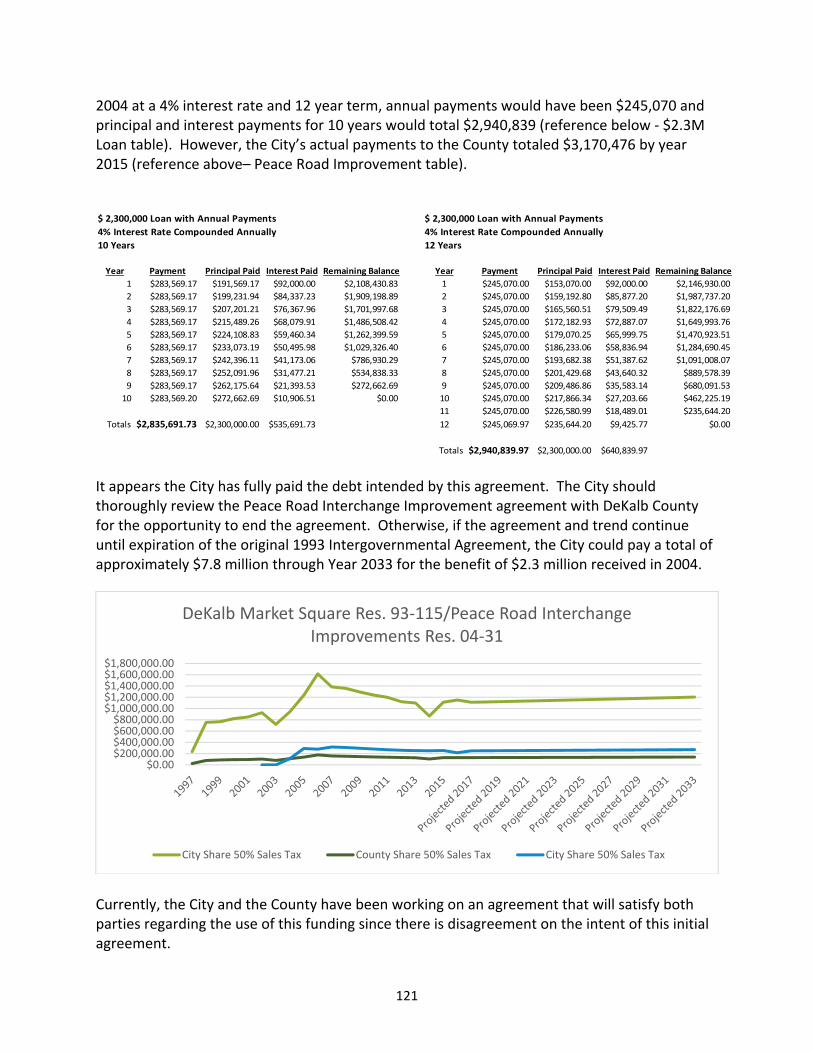
121
2004 at a 4% interest rate and 12 year term, annual payments would have been $245,070 and principal and interest payments for 10 years would total $2,940,839 (reference below ‐ $2.3M Loan table). However, the City’s actual payments to the County totaled $3,170,476 by year 2015 (reference above– Peace Road Improvement table).
It appears the City has fully paid the debt intended by this agreement. The City should thoroughly review the Peace Road Interchange Improvement agreement with DeKalb County for the opportunity to end the agreement. Otherwise, if the agreement and trend continue until expiration of the original 1993 Intergovernmental Agreement, the City could pay a total of approximately $7.8 million through Year 2033 for the benefit of $2.3 million received in 2004.
Currently, the City and the County have been working on an agreement that will satisfy both parties regarding the use of this funding since there is disagreement on the intent of this initial agreement.
$ 2,300,000 Loan with Annual Payments $ 2,300,000 Loan with Annual Payments
4% Interest Rate Compounded Annually 4% Interest Rate Compounded Annually
10 Years 12 Years
Year Payment Principal Paid Interest Paid Remaining Balance Year Payment Principal Paid Interest Paid Remaining Balance
1 $283,569.17 $191,569.17 $92,000.00 $2,108,430.83 1 $245,070.00 $153,070.00 $92,000.00 $2,146,930.00
2 $283,569.17 $199,231.94 $84,337.23 $1,909,198.89 2 $245,070.00 $159,192.80 $85,877.20 $1,987,737.20
3 $283,569.17 $207,201.21 $76,367.96 $1,701,997.68 3 $245,070.00 $165,560.51 $79,509.49 $1,822,176.69
4 $283,569.17 $215,489.26 $68,079.91 $1,486,508.42 4 $245,070.00 $172,182.93 $72,887.07 $1,649,993.76
5 $283,569.17 $224,108.83 $59,460.34 $1,262,399.59 5 $245,070.00 $179,070.25 $65,999.75 $1,470,923.51
6 $283,569.17 $233,073.19 $50,495.98 $1,029,326.40 6 $245,070.00 $186,233.06 $58,836.94 $1,284,690.45
7 $283,569.17 $242,396.11 $41,173.06 $786,930.29 7 $245,070.00 $193,682.38 $51,387.62 $1,091,008.07
8 $283,569.17 $252,091.96 $31,477.21 $534,838.33 8 $245,070.00 $201,429.68 $43,640.32 $889,578.39
9 $283,569.17 $262,175.64 $21,393.53 $272,662.69 9 $245,070.00 $209,486.86 $35,583.14 $680,091.53
10 $283,569.20 $272,662.69 $10,906.51 $0.00 10 $245,070.00 $217,866.34 $27,203.66 $462,225.19
11 $245,070.00 $226,580.99 $18,489.01 $235,644.20
Totals $2,835,691.73 $2,300,000.00 $535,691.73 12 $245,069.97 $235,644.20 $9,425.77 $0.00
Totals $2,940,839.97 $2,300,000.00 $640,839.97
$0.00$200,000.00$400,000.00$600,000.00$800,000.00
$1,000,000.00$1,200,000.00$1,400,000.00$1,600,000.00$1,800,000.00
DeKalb Market Square Res. 93‐115/Peace Road Interchange Improvements Res. 04‐31
City Share 50% Sales Tax County Share 50% Sales Tax City Share 50% Sales Tax
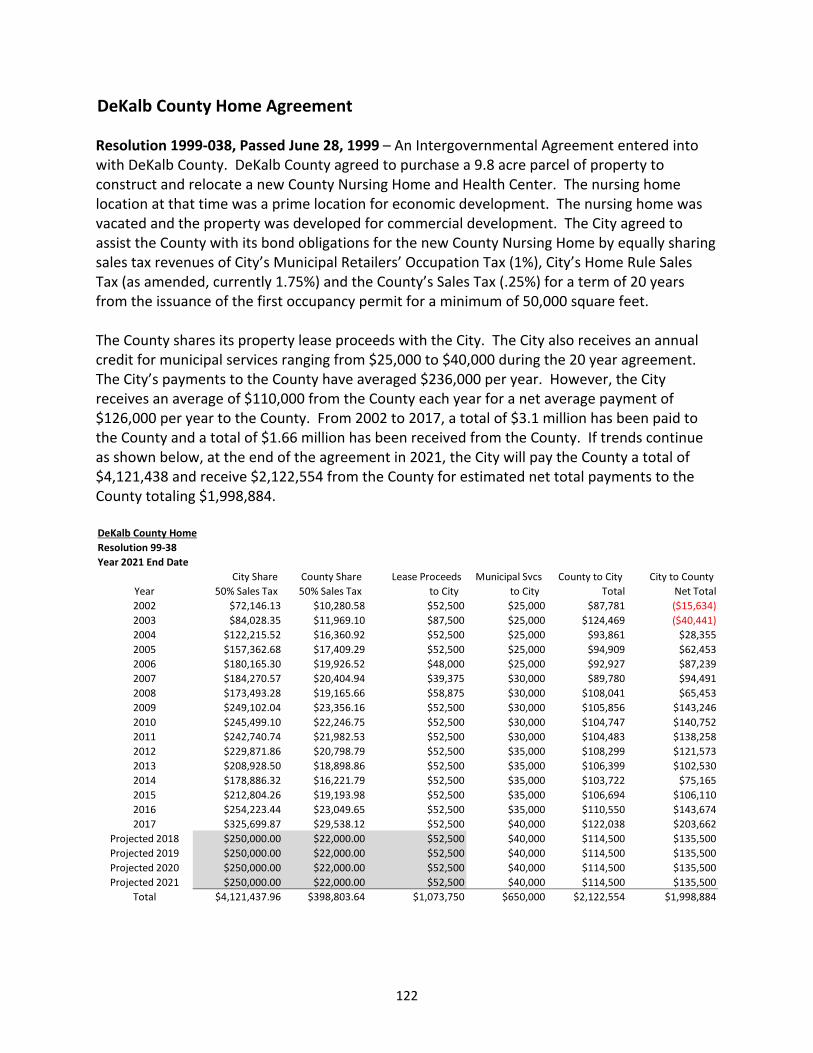
122
DeKalb County Home Agreement Resolution 1999‐038, Passed June 28, 1999 – An Intergovernmental Agreement entered into with DeKalb County. DeKalb County agreed to purchase a 9.8 acre parcel of property to construct and relocate a new County Nursing Home and Health Center. The nursing home location at that time was a prime location for economic development. The nursing home was vacated and the property was developed for commercial development. The City agreed to assist the County with its bond obligations for the new County Nursing Home by equally sharing sales tax revenues of City’s Municipal Retailers’ Occupation Tax (1%), City’s Home Rule Sales Tax (as amended, currently 1.75%) and the County’s Sales Tax (.25%) for a term of 20 years from the issuance of the first occupancy permit for a minimum of 50,000 square feet. The County shares its property lease proceeds with the City. The City also receives an annual credit for municipal services ranging from $25,000 to $40,000 during the 20 year agreement. The City’s payments to the County have averaged $236,000 per year. However, the City receives an average of $110,000 from the County each year for a net average payment of $126,000 per year to the County. From 2002 to 2017, a total of $3.1 million has been paid to the County and a total of $1.66 million has been received from the County. If trends continue as shown below, at the end of the agreement in 2021, the City will pay the County a total of $4,121,438 and receive $2,122,554 from the County for estimated net total payments to the County totaling $1,998,884.
DeKalb County Home
Resolution 99‐38
Year 2021 End Date
City Share County Share Lease Proceeds Municipal Svcs County to City City to County
Year 50% Sales Tax 50% Sales Tax to City to City Total Net Total
2002 $72,146.13 $10,280.58 $52,500 $25,000 $87,781 ($15,634)
2003 $84,028.35 $11,969.10 $87,500 $25,000 $124,469 ($40,441)
2004 $122,215.52 $16,360.92 $52,500 $25,000 $93,861 $28,355
2005 $157,362.68 $17,409.29 $52,500 $25,000 $94,909 $62,453
2006 $180,165.30 $19,926.52 $48,000 $25,000 $92,927 $87,239
2007 $184,270.57 $20,404.94 $39,375 $30,000 $89,780 $94,491
2008 $173,493.28 $19,165.66 $58,875 $30,000 $108,041 $65,453
2009 $249,102.04 $23,356.16 $52,500 $30,000 $105,856 $143,246
2010 $245,499.10 $22,246.75 $52,500 $30,000 $104,747 $140,752
2011 $242,740.74 $21,982.53 $52,500 $30,000 $104,483 $138,258
2012 $229,871.86 $20,798.79 $52,500 $35,000 $108,299 $121,573
2013 $208,928.50 $18,898.86 $52,500 $35,000 $106,399 $102,530
2014 $178,886.32 $16,221.79 $52,500 $35,000 $103,722 $75,165
2015 $212,804.26 $19,193.98 $52,500 $35,000 $106,694 $106,110
2016 $254,223.44 $23,049.65 $52,500 $35,000 $110,550 $143,674
2017 $325,699.87 $29,538.12 $52,500 $40,000 $122,038 $203,662
Projected 2018 $250,000.00 $22,000.00 $52,500 $40,000 $114,500 $135,500
Projected 2019 $250,000.00 $22,000.00 $52,500 $40,000 $114,500 $135,500
Projected 2020 $250,000.00 $22,000.00 $52,500 $40,000 $114,500 $135,500
Projected 2021 $250,000.00 $22,000.00 $52,500 $40,000 $114,500 $135,500
Total $4,121,437.96 $398,803.64 $1,073,750 $650,000 $2,122,554 $1,998,884
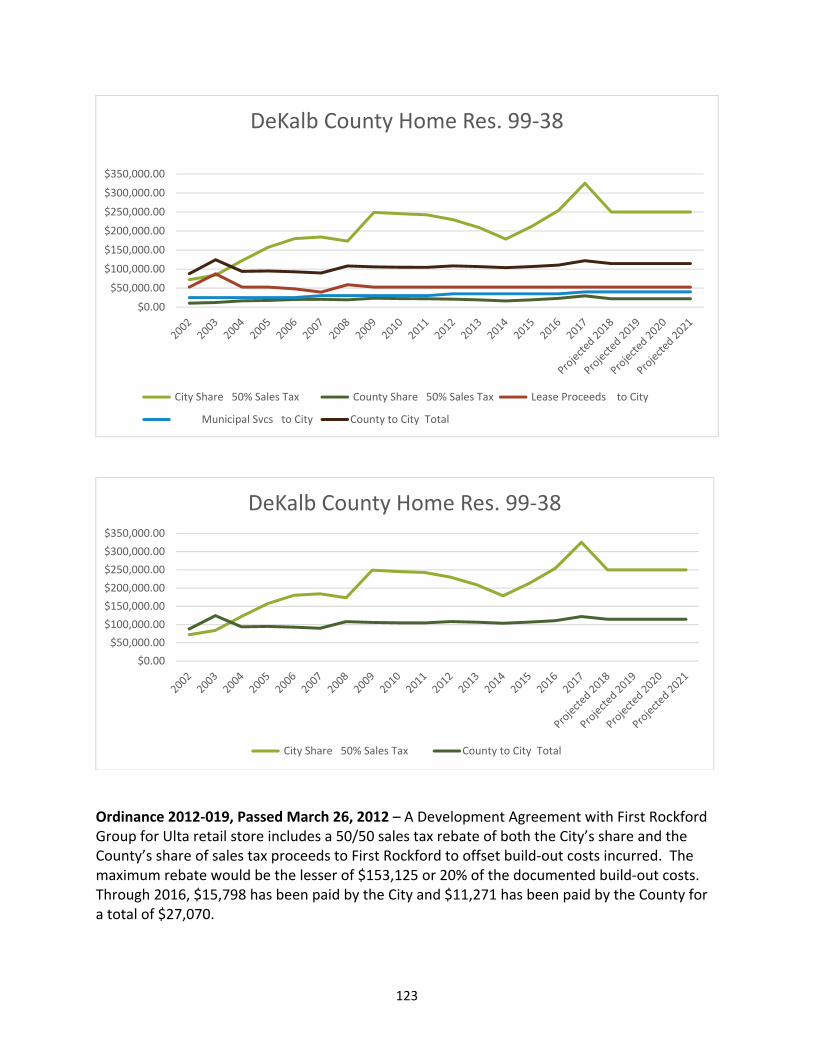
123
Ordinance 2012‐019, Passed March 26, 2012 – A Development Agreement with First Rockford Group for Ulta retail store includes a 50/50 sales tax rebate of both the City’s share and the County’s share of sales tax proceeds to First Rockford to offset build‐out costs incurred. The maximum rebate would be the lesser of $153,125 or 20% of the documented build‐out costs. Through 2016, $15,798 has been paid by the City and $11,271 has been paid by the County for a total of $27,070.
$0.00
$50,000.00
$100,000.00
$150,000.00
$200,000.00
$250,000.00
$300,000.00
$350,000.00
DeKalb County Home Res. 99‐38
City Share 50% Sales Tax County Share 50% Sales Tax Lease Proceeds to City
Municipal Svcs to City County to City Total
$0.00
$50,000.00
$100,000.00
$150,000.00
$200,000.00
$250,000.00
$300,000.00
$350,000.00
DeKalb County Home Res. 99‐38
City Share 50% Sales Tax County to City Total
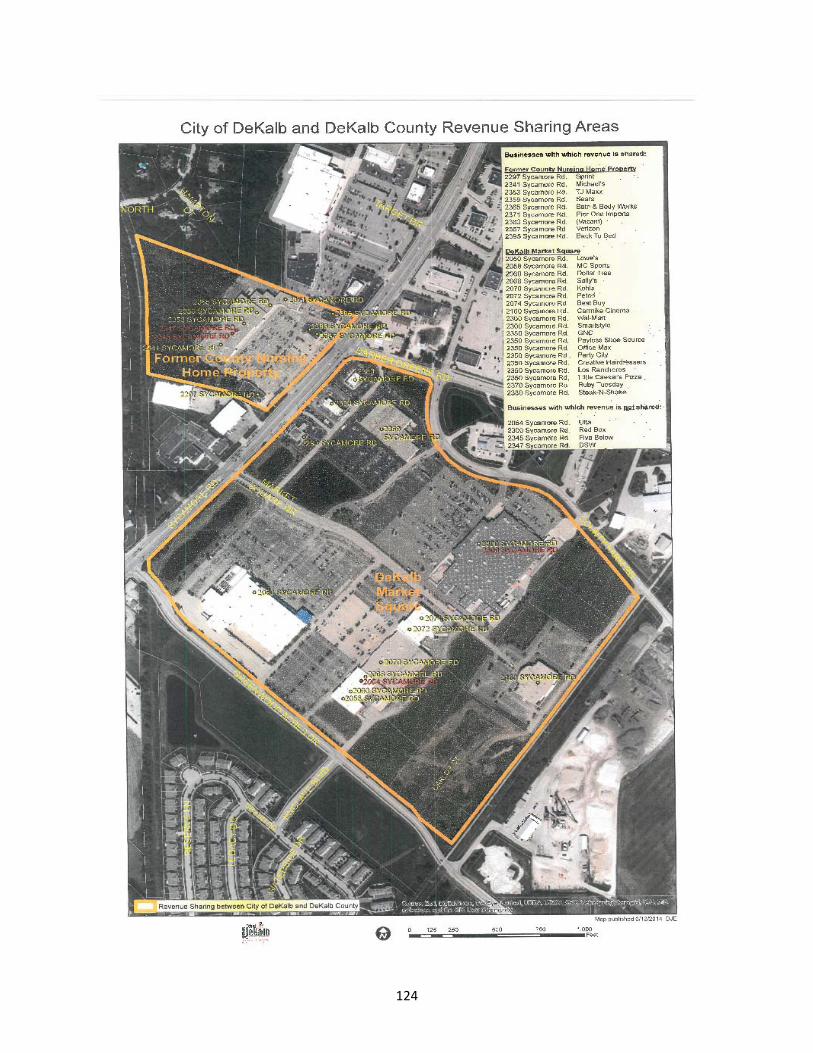
124
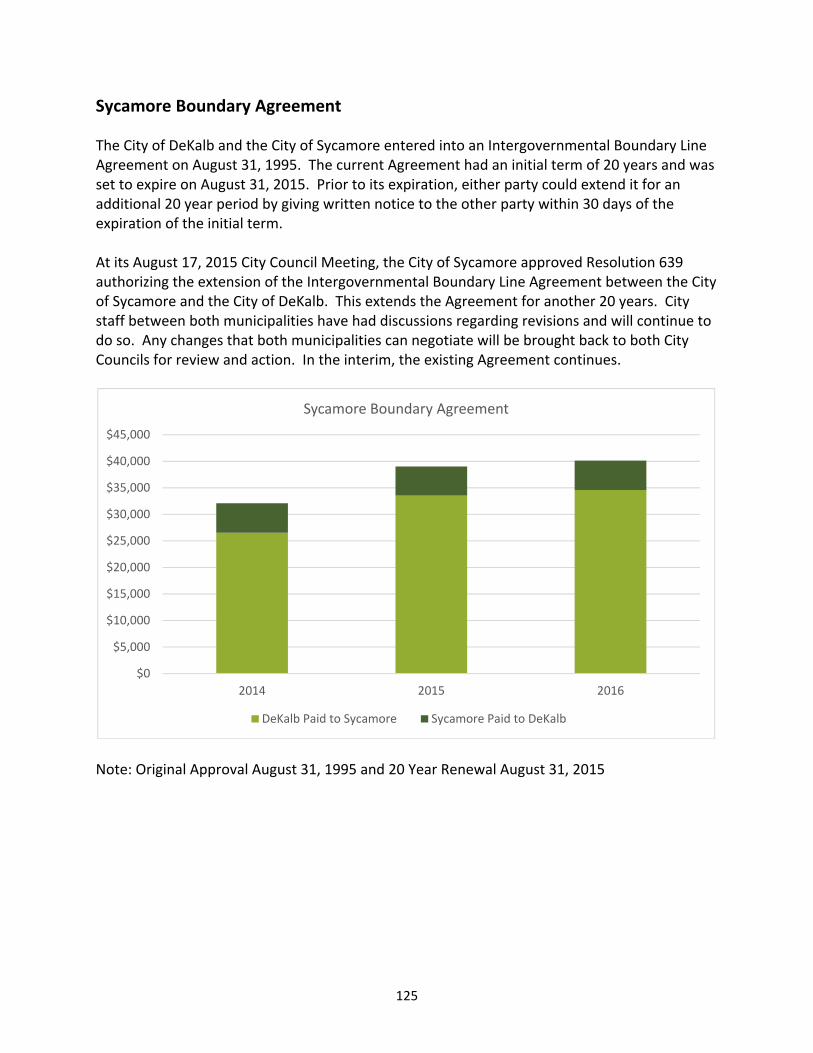
125
Sycamore Boundary Agreement The City of DeKalb and the City of Sycamore entered into an Intergovernmental Boundary Line Agreement on August 31, 1995. The current Agreement had an initial term of 20 years and was set to expire on August 31, 2015. Prior to its expiration, either party could extend it for an additional 20 year period by giving written notice to the other party within 30 days of the expiration of the initial term. At its August 17, 2015 City Council Meeting, the City of Sycamore approved Resolution 639 authorizing the extension of the Intergovernmental Boundary Line Agreement between the City of Sycamore and the City of DeKalb. This extends the Agreement for another 20 years. City staff between both municipalities have had discussions regarding revisions and will continue to do so. Any changes that both municipalities can negotiate will be brought back to both City Councils for review and action. In the interim, the existing Agreement continues.
Note: Original Approval August 31, 1995 and 20 Year Renewal August 31, 2015
$0
$5,000
$10,000
$15,000
$20,000
$25,000
$30,000
$35,000
$40,000
$45,000
2014 2015 2016
Sycamore Boundary Agreement
DeKalb Paid to Sycamore Sycamore Paid to DeKalb
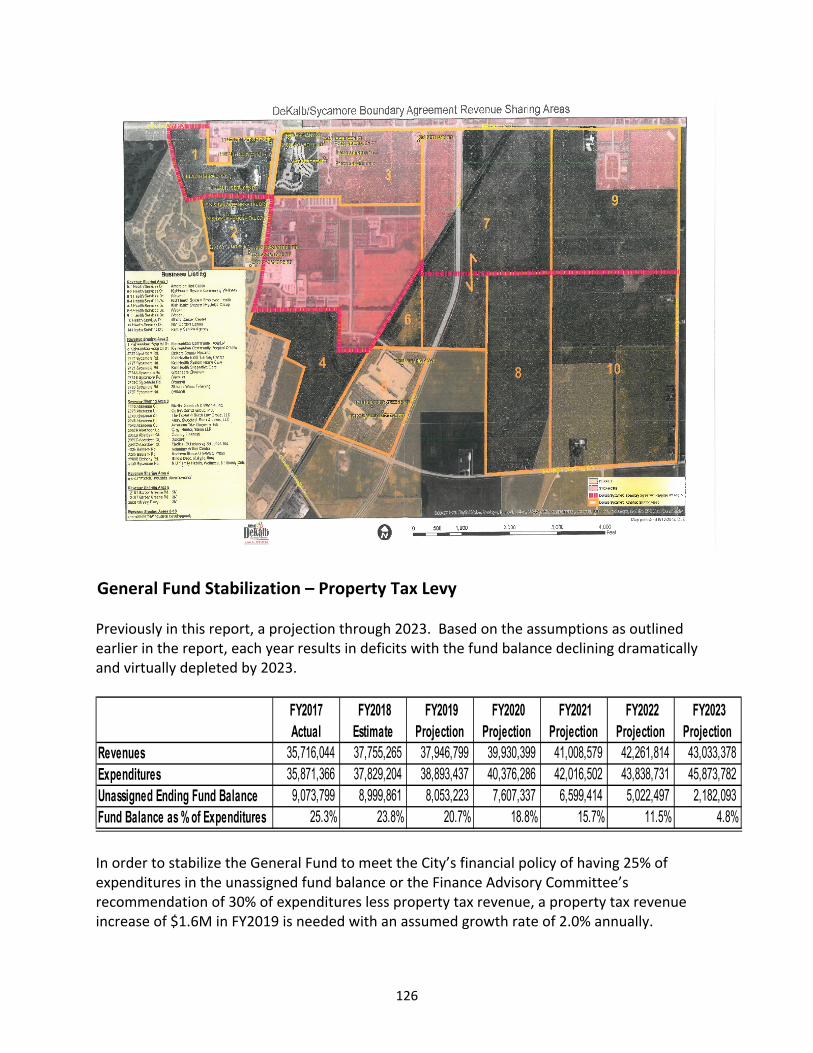
126
General Fund Stabilization – Property Tax Levy Previously in this report, a projection through 2023. Based on the assumptions as outlined earlier in the report, each year results in deficits with the fund balance declining dramatically and virtually depleted by 2023.
In order to stabilize the General Fund to meet the City’s financial policy of having 25% of expenditures in the unassigned fund balance or the Finance Advisory Committee’s recommendation of 30% of expenditures less property tax revenue, a property tax revenue increase of $1.6M in FY2019 is needed with an assumed growth rate of 2.0% annually.
FY2017 Actual
FY2018 Estimate
FY2019 Projection
FY2020 Projection
FY2021 Projection
FY2022 Projection
FY2023 Projection
Revenues 35,716,044 37,755,265 37,946,799 39,930,399 41,008,579 42,261,814 43,033,378Expenditures 35,871,366 37,829,204 38,893,437 40,376,286 42,016,502 43,838,731 45,873,782 Unassigned Ending Fund Balance 9,073,799 8,999,861 8,053,223 7,607,337 6,599,414 5,022,497 2,182,093 Fund Balance as % of Expenditures 25.3% 23.8% 20.7% 18.8% 15.7% 11.5% 4.8%
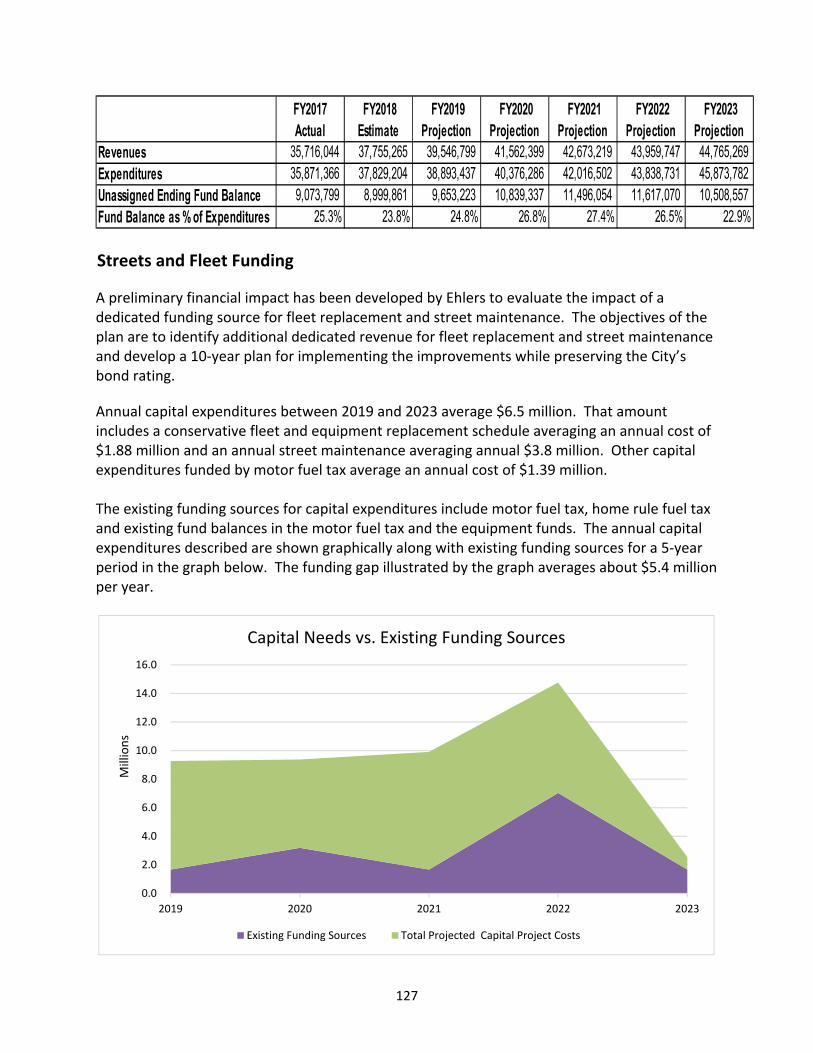
127
Streets and Fleet Funding
A preliminary financial impact has been developed by Ehlers to evaluate the impact of a dedicated funding source for fleet replacement and street maintenance. The objectives of the plan are to identify additional dedicated revenue for fleet replacement and street maintenance and develop a 10‐year plan for implementing the improvements while preserving the City’s bond rating.
Annual capital expenditures between 2019 and 2023 average $6.5 million. That amount includes a conservative fleet and equipment replacement schedule averaging an annual cost of $1.88 million and an annual street maintenance averaging annual $3.8 million. Other capital expenditures funded by motor fuel tax average an annual cost of $1.39 million.
The existing funding sources for capital expenditures include motor fuel tax, home rule fuel tax and existing fund balances in the motor fuel tax and the equipment funds. The annual capital expenditures described are shown graphically along with existing funding sources for a 5‐year period in the graph below. The funding gap illustrated by the graph averages about $5.4 million per year.
FY2017 Actual
FY2018 Estimate
FY2019 Projection
FY2020 Projection
FY2021 Projection
FY2022 Projection
FY2023 Projection
Revenues 35,716,044 37,755,265 39,546,799 41,562,399 42,673,219 43,959,747 44,765,269Expenditures 35,871,366 37,829,204 38,893,437 40,376,286 42,016,502 43,838,731 45,873,782 Unassigned Ending Fund Balance 9,073,799 8,999,861 9,653,223 10,839,337 11,496,054 11,617,070 10,508,557 Fund Balance as % of Expenditures 25.3% 23.8% 24.8% 26.8% 27.4% 26.5% 22.9%
0.0
2.0
4.0
6.0
8.0
10.0
12.0
14.0
16.0
2019 2020 2021 2022 2023
Millions
Capital Needs vs. Existing Funding Sources
Existing Funding Sources Total Projected Capital Project Costs
128
Streets and Fleet Conclusions
The level of funding for fleet replacement over the past 10 years has not been sufficient to sustain the overall condition of this asset. Vehicle replacement has averaged about $300,000 per year since 2006. That level is about $500,000 per year less than the amount needed to sustain the overall fleet condition of 2006. Currently, the fleet backlog is about $4.3 million. The fleet condition of 2006 can be attained in about five years with an investment of about $1.65 million per year. The funding for street maintenance has averaged $860,000 per year over the past 25 years. The current funding level is $1.3 million and the average PCI of City streets is 78. Continuing to invest $1.3 million in street maintenance will result in the average PCI dropping to 70 in five years and 59 in 10 years. Based on the scenarios evaluated using the PMS, it would cost about $13 million per year to maintain a PCI of 78. The scenario used in the financial model includes about $3.8 million per year in street maintenance. This would result in the average PCI dropping from 78 to 72 in five years and to 63 in 10 years. The list of revenue sources provides updated revenue information. 1) Home Rule Sales Tax ‐ This revenue is derived from the consumption of goods and services. Items that are not subject to this tax include groceries, medicine, and licensed personal property (e.g., automobiles). Currently one of the City’s three largest source of revenue in the General Fund.
a. Current tax rate is 1.75%. • Sycamore’s current tax rate is 1.75%. • Comparable cities tax rate is between 1.75% and 2.75%, however 50% of
comparable cities do not have a County Sales Tax. b. Residents and non‐residents are subject to this tax. c. Revenue can be volatile and will fluctuate with the economy.
Potential impact of a tax rate increase: Positive effect:
• An increase of 0.25% could results in an additional $3.0 million of revenue. • A small increase is unlikely to impact purchasing behavior, as DeKalb has retail stores
that are unavailable elsewhere in the immediate area. Negative effect:
• The City’s finances could become more volatile since this revenue is tied to the overall economic health of the City.
• Being the largest source of revenue for the General fund, the City’s overall tax structure would be less diverse which is contrary to an objective of the City’s Financial Policies
• The City would have a higher sales tax rate than surrounding communities. • As online sales increase, it is anticipated brick and mortar sales will decline.
129
2) Restaurant, Bar and Packaged Liquor Tax ‐ This tax is imposed upon prepared food items and alcoholic beverages available for immediate consumption, as well as purchase of alcoholic liquor from retailers.
a. Current tax rate is 2.00%. • Sycamore’s current tax rate is 2.00%. • Comparable cities Food and Beverage Tax range between 1.00% and 3.00%.
b. Residents and non‐residents are subject to this tax. c. This tax could be raised by various amounts in accordance with Council’s objectives.
Potential impact of a tax rate increase: Positive effect:
• An increase of 0.50% could results in an additional $480,000 of revenue. • Would meet several criteria established in the City’s Financial Policies for
consideration of new revenues; these include: i. Would diversify the City’s revenues, because at present this tax makes up only
5.30% of all City revenues. ii. Tax has outgrown the Consumer Price Index (Inflation) by an average of 3.00%
since its inception. iii. Tax meets several criteria for fairness; these reasons include:
a. Visitors to the community (who use the City’s services) would pay the tax, as well as residents;
b. Most people could avoid paying the tax if they desire to do so by not eating out; and
c. Tax payments increase in accordance with taxpayers’ income to a greater extent than other taxes.
• A small increase is unlikely to affect people’s purchasing behaviors, as a large portion of the restaurants and bars in the area are in DeKalb.
Negative effect: • Much of the increased revenues would result from a limited number of consumer preferences (eating and drinking away from home), which some residents consider unfair.
• In the past, some restaurant owners have objected to increasing this tax, stating that they were “singled out”, especially if they thought the increased revenues would not directly benefit them.
• A small increase is likely to affect people’s purchasing behaviors, resulting in residents traveling to Sycamore.
3) Hotel/Motel Tax ‐ This tax is imposed on hotel and motel room receipts. The hotel/motel tax rate is allocated as follows: 6.00% to the General Operating Fund; 1.00% to the Debt Service Fund.
a. Current tax rate is 7.00%. b. Currently, 7 hotels/motels remit tax to the City. c. Mainly non‐residents pay the tax. d. Stable revenue source with slight fluctuations due to the economy
130
e. The State levies a 6.00% Hotel/Motel Tax. Potential impact of a tax rate increase: Positive effect:
• An increase of 1.00% could results in an additional $84,000 of revenue. • The tax burden is mainly on non‐residents.
Negative effect: • The City would have a higher tax rate than surrounding communities.
4) Electric Utility Tax ‐ Tax imposed upon the privilege of using or consuming electricity. Sycamore currently does not have an electricity utility tax. Breakdown as follows:
• For the first 2,000 kilowatt‐hours used or consumed in a month; 0.61 cents per kilowatt‐hour; • For the next 48,000 kilowatt‐hours used or consumed in a month; 0.40 cents per kilowatt‐hour; • For the next 50,000 kilowatt‐hours used or consumed in a month; 0.36 cents per kilowatt‐hour; • for the next 400,000 kilowatt‐hours used or consumed in a month; 0.35 cents per kilowatt‐hour; • For the next 500,000 kilowatt‐hours used or consumed in a month; 0.34 cents per kilowatt‐hour; • For the next 2,000,000 kilowatt‐hours used or consumed in a month; 0.32 cents per kilowatt‐hour; • For the next 2,000,000 kilowatt‐hours used or consumed in a month; 0.315 cents per kilowatt‐hour; (10‐28) • For the next 5,000,000 kilowatt‐hours used or consumed in a month; 0.31 cents per kilowatt‐hour; • For the next 10,000,000 kilowatt‐hours used or consumed in a month; 0.305 cents per kilowatt‐hour; and (10‐28) • For all electricity used or consumed in excess of 20,000,000 kilowatt‐hours in a month; 0.300 cents per kilowatt‐hour
Potential impact of a tax rate increase: Positive effect:
Tax can be raised in small incremental amounts to match desired revenue goal. Negative effect:
Utility taxes are among the more regressive of the City’s taxes because they tax items that are less discretionary than many other taxes such as prepared food and beverages services, and some general merchandise
5) Gas Utility Tax ‐ Tax imposed on the privilege of using or consuming natural gas at 4 cents ($0.04) per therm
a. Sycamore currently does not have a gas utility tax. b. Other comparable cities tax rate is: Elk Grove Village 1.00%, Wheaton 3.00%,
131
Streamwood 3.25%, Carpentersville 4.50% and Hoffman Estates 5.00%. c. Council could increase these taxes up to 5.00%. d. Tax applies to residents, except for taxes passed on to visitors indirectly.
Potential impact of a tax rate increase: Positive effect:
• A 0.25% increase could result in an additional $240,000 of revenue, while an increasing the rate to 5.00% could raise an additional $2.1 million. • Tax can be raised in small incremental amounts to match desired revenue goal.
Negative effect: • Utility taxes are among the more regressive of the City’s taxes because they tax items that are less discretionary than many other taxes such as prepared food and beverages services, and some general merchandise.
6) Video Gaming Terminal Fee ‐ This is an annual fee imposed on business for each video gaming terminals located in the establishment.
a. The City currently has an initial application fee of $500 per video gaming terminal (maximum 5). Annual renewal fee for video gaming license is $250.00 per video gaming terminal. b. Sycamore’s current fee is $100 per terminal. c. Comparable cities average fee ranges from $25 ‐ $1,000 per terminal. d. Business with video gaming terminals are subject to this fee. e. Currently there are 82 video gaming terminals in the City. f. 16 belonging to not‐for‐profit entitles or charitable organizations with renewal fees of $25 per machine, per year
Potential impact of a tax rate increase: Positive effect:
• Adding this tax at $100 per terminal could raise an estimated $24,400. • Fee is relatively discretionary, so business can avoid them to some extent. • This tax would diversify the City’s revenues. • Tax can be raised in small incremental amounts to match desired revenue goal.
Negative effect: • Businesses would have an additional workload to pay the tax. • Could discourage businesses from having video gaming terminals.
7) Local Motor Fuel Tax ‐ Current local tax in 5 ½ cents per gallon with 1 ½ cents dedicated to the Airport. This was increase 2 cents per gallon effective March 1, 2018 for street funding.
a. Generates approximately $990,000 per year. b. At this time, bulk fuel sales are not taxed.
Potential impact of a rate increase: Positive effect:
• Drivers will pay for street maintenance
132
• Each ½ cent per gallon increase will generate $180,000 per year Negative effect:
• Revenue does not increase over time. • Tax increase
Alternative Funding Policy Conclusions Streets and Fleet Funding
The 2017 downgrade of the City’s bond rating will impact the ability to issue bonds for capital improvement prior to 2020. The City could implement the capital improvement program as a pay‐as‐you‐go program in 2019 with an issuance of bonds in 2020 or later. General Fund Stabilization – Property Tax Levy
Given projections, each year results in deficits with the fund balance declining dramatically and virtually depleted by 2022. A Corporate Property tax of $1.6 million would bring the fund balance in line with the City’s current financial policy and the Finance Advisory Committee’s recommended financial policy threshold. The increase would need to begin in FY2019 and increased annually by 2%.
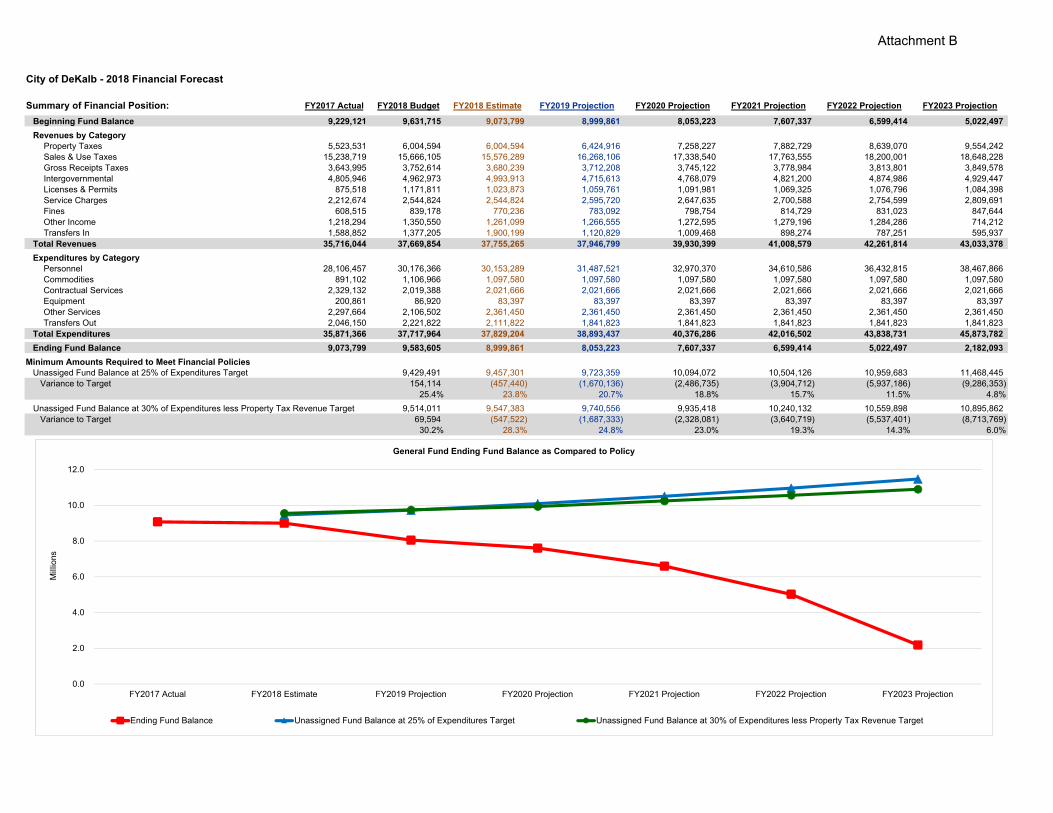
City of DeKalb - 2018 Financial Forecast
Summary of Financial Position: FY2017 Actual FY2018 Budget FY2018 Estimate FY2019 Projection FY2020 Projection FY2021 Projection FY2022 Projection FY2023 Projection
Beginning Fund Balance 9,229,121 9,631,715 9,073,799 8,999,861 8,053,223 7,607,337 6,599,414 5,022,497
Revenues by CategoryProperty Taxes 5,523,531 6,004,594 6,004,594 6,424,916 7,258,227 7,882,729 8,639,070 9,554,242Sales & Use Taxes 15,238,719 15,666,105 15,576,289 16,268,106 17,338,540 17,763,555 18,200,001 18,648,228Gross Receipts Taxes 3,643,995 3,752,614 3,680,239 3,712,208 3,745,122 3,778,984 3,813,801 3,849,578Intergovernmental 4,805,946 4,962,973 4,993,913 4,715,613 4,768,079 4,821,200 4,874,986 4,929,447Licenses & Permits 875,518 1,171,811 1,023,873 1,059,761 1,091,981 1,069,325 1,076,796 1,084,398Service Charges 2,212,674 2,544,824 2,544,824 2,595,720 2,647,635 2,700,588 2,754,599 2,809,691Fines 608,515 839,178 770,236 783,092 798,754 814,729 831,023 847,644Other Income 1,218,294 1,350,550 1,261,099 1,266,555 1,272,595 1,279,196 1,284,286 714,212Transfers In 1,588,852 1,377,205 1,900,199 1,120,829 1,009,468 898,274 787,251 595,937
Total Revenues 35,716,044 37,669,854 37,755,265 37,946,799 39,930,399 41,008,579 42,261,814 43,033,378
Expenditures by CategoryPersonnel 28,106,457 30,176,366 30,153,289 31,487,521 32,970,370 34,610,586 36,432,815 38,467,866Commodities 891,102 1,106,966 1,097,580 1,097,580 1,097,580 1,097,580 1,097,580 1,097,580Contractual Services 2,329,132 2,019,388 2,021,666 2,021,666 2,021,666 2,021,666 2,021,666 2,021,666Equipment 200,861 86,920 83,397 83,397 83,397 83,397 83,397 83,397Other Services 2,297,664 2,106,502 2,361,450 2,361,450 2,361,450 2,361,450 2,361,450 2,361,450Transfers Out 2,046,150 2,221,822 2,111,822 1,841,823 1,841,823 1,841,823 1,841,823 1,841,823
Total Expenditures 35,871,366 37,717,964 37,829,204 38,893,437 40,376,286 42,016,502 43,838,731 45,873,782
Ending Fund Balance 9,073,799 9,583,605 8,999,861 8,053,223 7,607,337 6,599,414 5,022,497 2,182,093
Minimum Amounts Required to Meet Financial PoliciesUnassiged Fund Balance at 25% of Expenditures Target 9,429,491 9,457,301 9,723,359 10,094,072 10,504,126 10,959,683 11,468,445
Variance to Target 154,114 (457,440) (1,670,136) (2,486,735) (3,904,712) (5,937,186) (9,286,353) 25.4% 23.8% 20.7% 18.8% 15.7% 11.5% 4.8%
Unassiged Fund Balance at 30% of Expenditures less Property Tax Revenue Target 9,514,011 9,547,383 9,740,556 9,935,418 10,240,132 10,559,898 10,895,862 Variance to Target 69,594 (547,522) (1,687,333) (2,328,081) (3,640,719) (5,537,401) (8,713,769)
30.2% 28.3% 24.8% 23.0% 19.3% 14.3% 6.0%
0.0
2.0
4.0
6.0
8.0
10.0
12.0
FY2017 Actual FY2018 Estimate FY2019 Projection FY2020 Projection FY2021 Projection FY2022 Projection FY2023 Projection
Mill
ions
General Fund Ending Fund Balance as Compared to Policy
Ending Fund Balance Unassigned Fund Balance at 25% of Expenditures Target Unassigned Fund Balance at 30% of Expenditures less Property Tax Revenue Target
Attachment B
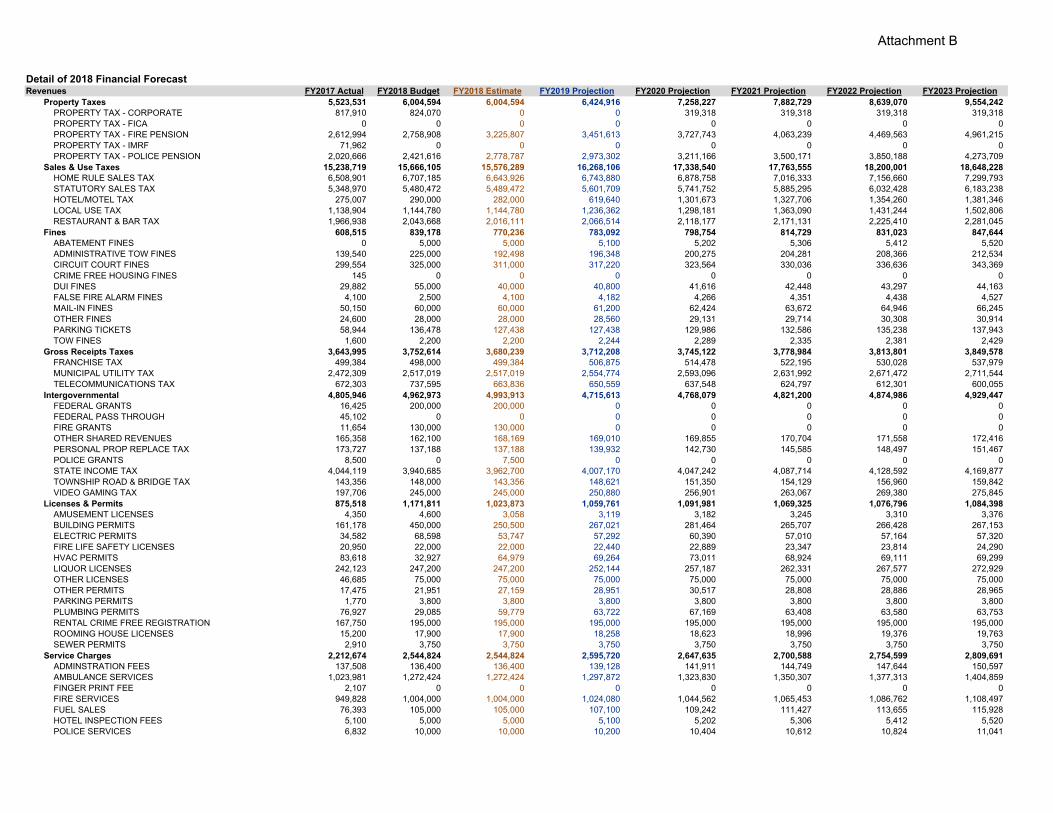
Detail of 2018 Financial ForecastRevenues FY2017 Actual FY2018 Budget FY2018 Estimate FY2019 Projection FY2020 Projection FY2021 Projection FY2022 Projection FY2023 Projection
Property Taxes 5,523,531 6,004,594 6,004,594 6,424,916 7,258,227 7,882,729 8,639,070 9,554,242PROPERTY TAX - CORPORATE 817,910 824,070 0 0 319,318 319,318 319,318 319,318PROPERTY TAX - FICA 0 0 0 0 0 0 0 0PROPERTY TAX - FIRE PENSION 2,612,994 2,758,908 3,225,807 3,451,613 3,727,743 4,063,239 4,469,563 4,961,215PROPERTY TAX - IMRF 71,962 0 0 0 0 0 0 0PROPERTY TAX - POLICE PENSION 2,020,666 2,421,616 2,778,787 2,973,302 3,211,166 3,500,171 3,850,188 4,273,709
Sales & Use Taxes 15,238,719 15,666,105 15,576,289 16,268,106 17,338,540 17,763,555 18,200,001 18,648,228HOME RULE SALES TAX 6,508,901 6,707,185 6,643,926 6,743,880 6,878,758 7,016,333 7,156,660 7,299,793STATUTORY SALES TAX 5,348,970 5,480,472 5,489,472 5,601,709 5,741,752 5,885,295 6,032,428 6,183,238HOTEL/MOTEL TAX 275,007 290,000 282,000 619,640 1,301,673 1,327,706 1,354,260 1,381,346LOCAL USE TAX 1,138,904 1,144,780 1,144,780 1,236,362 1,298,181 1,363,090 1,431,244 1,502,806RESTAURANT & BAR TAX 1,966,938 2,043,668 2,016,111 2,066,514 2,118,177 2,171,131 2,225,410 2,281,045
Fines 608,515 839,178 770,236 783,092 798,754 814,729 831,023 847,644ABATEMENT FINES 0 5,000 5,000 5,100 5,202 5,306 5,412 5,520ADMINISTRATIVE TOW FINES 139,540 225,000 192,498 196,348 200,275 204,281 208,366 212,534CIRCUIT COURT FINES 299,554 325,000 311,000 317,220 323,564 330,036 336,636 343,369CRIME FREE HOUSING FINES 145 0 0 0 0 0 0 0DUI FINES 29,882 55,000 40,000 40,800 41,616 42,448 43,297 44,163FALSE FIRE ALARM FINES 4,100 2,500 4,100 4,182 4,266 4,351 4,438 4,527MAIL-IN FINES 50,150 60,000 60,000 61,200 62,424 63,672 64,946 66,245OTHER FINES 24,600 28,000 28,000 28,560 29,131 29,714 30,308 30,914PARKING TICKETS 58,944 136,478 127,438 127,438 129,986 132,586 135,238 137,943TOW FINES 1,600 2,200 2,200 2,244 2,289 2,335 2,381 2,429
Gross Receipts Taxes 3,643,995 3,752,614 3,680,239 3,712,208 3,745,122 3,778,984 3,813,801 3,849,578FRANCHISE TAX 499,384 498,000 499,384 506,875 514,478 522,195 530,028 537,979MUNICIPAL UTILITY TAX 2,472,309 2,517,019 2,517,019 2,554,774 2,593,096 2,631,992 2,671,472 2,711,544TELECOMMUNICATIONS TAX 672,303 737,595 663,836 650,559 637,548 624,797 612,301 600,055
Intergovernmental 4,805,946 4,962,973 4,993,913 4,715,613 4,768,079 4,821,200 4,874,986 4,929,447FEDERAL GRANTS 16,425 200,000 200,000 0 0 0 0 0FEDERAL PASS THROUGH 45,102 0 0 0 0 0 0 0FIRE GRANTS 11,654 130,000 130,000 0 0 0 0 0OTHER SHARED REVENUES 165,358 162,100 168,169 169,010 169,855 170,704 171,558 172,416PERSONAL PROP REPLACE TAX 173,727 137,188 137,188 139,932 142,730 145,585 148,497 151,467POLICE GRANTS 8,500 0 7,500 0 0 0 0 0STATE INCOME TAX 4,044,119 3,940,685 3,962,700 4,007,170 4,047,242 4,087,714 4,128,592 4,169,877TOWNSHIP ROAD & BRIDGE TAX 143,356 148,000 143,356 148,621 151,350 154,129 156,960 159,842VIDEO GAMING TAX 197,706 245,000 245,000 250,880 256,901 263,067 269,380 275,845
Licenses & Permits 875,518 1,171,811 1,023,873 1,059,761 1,091,981 1,069,325 1,076,796 1,084,398AMUSEMENT LICENSES 4,350 4,600 3,058 3,119 3,182 3,245 3,310 3,376BUILDING PERMITS 161,178 450,000 250,500 267,021 281,464 265,707 266,428 267,153ELECTRIC PERMITS 34,582 68,598 53,747 57,292 60,390 57,010 57,164 57,320FIRE LIFE SAFETY LICENSES 20,950 22,000 22,000 22,440 22,889 23,347 23,814 24,290HVAC PERMITS 83,618 32,927 64,979 69,264 73,011 68,924 69,111 69,299LIQUOR LICENSES 242,123 247,200 247,200 252,144 257,187 262,331 267,577 272,929OTHER LICENSES 46,685 75,000 75,000 75,000 75,000 75,000 75,000 75,000OTHER PERMITS 17,475 21,951 27,159 28,951 30,517 28,808 28,886 28,965PARKING PERMITS 1,770 3,800 3,800 3,800 3,800 3,800 3,800 3,800PLUMBING PERMITS 76,927 29,085 59,779 63,722 67,169 63,408 63,580 63,753RENTAL CRIME FREE REGISTRATION 167,750 195,000 195,000 195,000 195,000 195,000 195,000 195,000ROOMING HOUSE LICENSES 15,200 17,900 17,900 18,258 18,623 18,996 19,376 19,763SEWER PERMITS 2,910 3,750 3,750 3,750 3,750 3,750 3,750 3,750
Service Charges 2,212,674 2,544,824 2,544,824 2,595,720 2,647,635 2,700,588 2,754,599 2,809,691ADMINSTRATION FEES 137,508 136,400 136,400 139,128 141,911 144,749 147,644 150,597AMBULANCE SERVICES 1,023,981 1,272,424 1,272,424 1,297,872 1,323,830 1,350,307 1,377,313 1,404,859FINGER PRINT FEE 2,107 0 0 0 0 0 0 0FIRE SERVICES 949,828 1,004,000 1,004,000 1,024,080 1,044,562 1,065,453 1,086,762 1,108,497FUEL SALES 76,393 105,000 105,000 107,100 109,242 111,427 113,655 115,928HOTEL INSPECTION FEES 5,100 5,000 5,000 5,100 5,202 5,306 5,412 5,520POLICE SERVICES 6,832 10,000 10,000 10,200 10,404 10,612 10,824 11,041
Attachment B
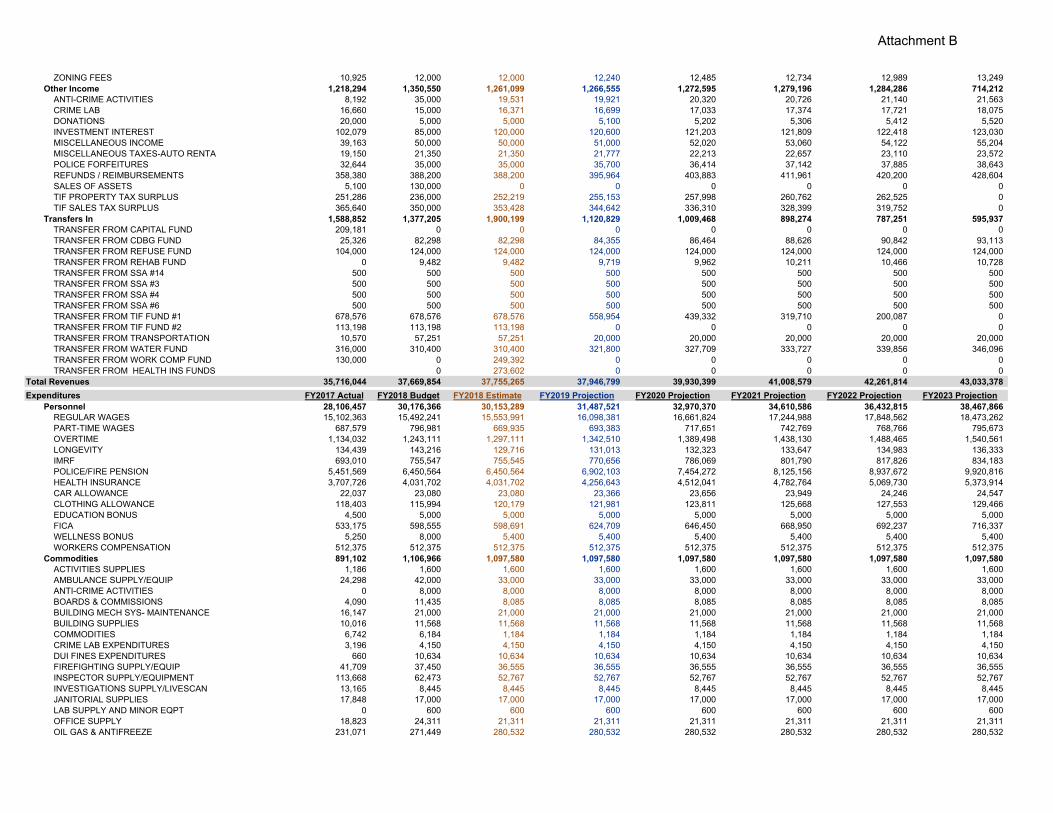
ZONING FEES 10,925 12,000 12,000 12,240 12,485 12,734 12,989 13,249Other Income 1,218,294 1,350,550 1,261,099 1,266,555 1,272,595 1,279,196 1,284,286 714,212
ANTI-CRIME ACTIVITIES 8,192 35,000 19,531 19,921 20,320 20,726 21,140 21,563CRIME LAB 16,660 15,000 16,371 16,699 17,033 17,374 17,721 18,075DONATIONS 20,000 5,000 5,000 5,100 5,202 5,306 5,412 5,520INVESTMENT INTEREST 102,079 85,000 120,000 120,600 121,203 121,809 122,418 123,030MISCELLANEOUS INCOME 39,163 50,000 50,000 51,000 52,020 53,060 54,122 55,204MISCELLANEOUS TAXES-AUTO RENTA 19,150 21,350 21,350 21,777 22,213 22,657 23,110 23,572POLICE FORFEITURES 32,644 35,000 35,000 35,700 36,414 37,142 37,885 38,643REFUNDS / REIMBURSEMENTS 358,380 388,200 388,200 395,964 403,883 411,961 420,200 428,604SALES OF ASSETS 5,100 130,000 0 0 0 0 0 0TIF PROPERTY TAX SURPLUS 251,286 236,000 252,219 255,153 257,998 260,762 262,525 0TIF SALES TAX SURPLUS 365,640 350,000 353,428 344,642 336,310 328,399 319,752 0
Transfers In 1,588,852 1,377,205 1,900,199 1,120,829 1,009,468 898,274 787,251 595,937TRANSFER FROM CAPITAL FUND 209,181 0 0 0 0 0 0 0TRANSFER FROM CDBG FUND 25,326 82,298 82,298 84,355 86,464 88,626 90,842 93,113TRANSFER FROM REFUSE FUND 104,000 124,000 124,000 124,000 124,000 124,000 124,000 124,000TRANSFER FROM REHAB FUND 0 9,482 9,482 9,719 9,962 10,211 10,466 10,728TRANSFER FROM SSA #14 500 500 500 500 500 500 500 500TRANSFER FROM SSA #3 500 500 500 500 500 500 500 500TRANSFER FROM SSA #4 500 500 500 500 500 500 500 500TRANSFER FROM SSA #6 500 500 500 500 500 500 500 500TRANSFER FROM TIF FUND #1 678,576 678,576 678,576 558,954 439,332 319,710 200,087 0TRANSFER FROM TIF FUND #2 113,198 113,198 113,198 0 0 0 0 0TRANSFER FROM TRANSPORTATION 10,570 57,251 57,251 20,000 20,000 20,000 20,000 20,000TRANSFER FROM WATER FUND 316,000 310,400 310,400 321,800 327,709 333,727 339,856 346,096TRANSFER FROM WORK COMP FUND 130,000 0 249,392 0 0 0 0 0TRANSFER FROM HEALTH INS FUNDS 0 273,602 0 0 0 0 0
Total Revenues 35,716,044 37,669,854 37,755,265 37,946,799 39,930,399 41,008,579 42,261,814 43,033,378
Expenditures FY2017 Actual FY2018 Budget FY2018 Estimate FY2019 Projection FY2020 Projection FY2021 Projection FY2022 Projection FY2023 ProjectionPersonnel 28,106,457 30,176,366 30,153,289 31,487,521 32,970,370 34,610,586 36,432,815 38,467,866
REGULAR WAGES 15,102,363 15,492,241 15,553,991 16,098,381 16,661,824 17,244,988 17,848,562 18,473,262PART-TIME WAGES 687,579 796,981 669,935 693,383 717,651 742,769 768,766 795,673OVERTIME 1,134,032 1,243,111 1,297,111 1,342,510 1,389,498 1,438,130 1,488,465 1,540,561LONGEVITY 134,439 143,216 129,716 131,013 132,323 133,647 134,983 136,333IMRF 693,010 755,547 755,545 770,656 786,069 801,790 817,826 834,183POLICE/FIRE PENSION 5,451,569 6,450,564 6,450,564 6,902,103 7,454,272 8,125,156 8,937,672 9,920,816HEALTH INSURANCE 3,707,726 4,031,702 4,031,702 4,256,643 4,512,041 4,782,764 5,069,730 5,373,914CAR ALLOWANCE 22,037 23,080 23,080 23,366 23,656 23,949 24,246 24,547CLOTHING ALLOWANCE 118,403 115,994 120,179 121,981 123,811 125,668 127,553 129,466EDUCATION BONUS 4,500 5,000 5,000 5,000 5,000 5,000 5,000 5,000FICA 533,175 598,555 598,691 624,709 646,450 668,950 692,237 716,337WELLNESS BONUS 5,250 8,000 5,400 5,400 5,400 5,400 5,400 5,400WORKERS COMPENSATION 512,375 512,375 512,375 512,375 512,375 512,375 512,375 512,375
Commodities 891,102 1,106,966 1,097,580 1,097,580 1,097,580 1,097,580 1,097,580 1,097,580ACTIVITIES SUPPLIES 1,186 1,600 1,600 1,600 1,600 1,600 1,600 1,600AMBULANCE SUPPLY/EQUIP 24,298 42,000 33,000 33,000 33,000 33,000 33,000 33,000ANTI-CRIME ACTIVITIES 0 8,000 8,000 8,000 8,000 8,000 8,000 8,000BOARDS & COMMISSIONS 4,090 11,435 8,085 8,085 8,085 8,085 8,085 8,085BUILDING MECH SYS- MAINTENANCE 16,147 21,000 21,000 21,000 21,000 21,000 21,000 21,000BUILDING SUPPLIES 10,016 11,568 11,568 11,568 11,568 11,568 11,568 11,568COMMODITIES 6,742 6,184 1,184 1,184 1,184 1,184 1,184 1,184CRIME LAB EXPENDITURES 3,196 4,150 4,150 4,150 4,150 4,150 4,150 4,150DUI FINES EXPENDITURES 660 10,634 10,634 10,634 10,634 10,634 10,634 10,634FIREFIGHTING SUPPLY/EQUIP 41,709 37,450 36,555 36,555 36,555 36,555 36,555 36,555INSPECTOR SUPPLY/EQUIPMENT 113,668 62,473 52,767 52,767 52,767 52,767 52,767 52,767INVESTIGATIONS SUPPLY/LIVESCAN 13,165 8,445 8,445 8,445 8,445 8,445 8,445 8,445JANITORIAL SUPPLIES 17,848 17,000 17,000 17,000 17,000 17,000 17,000 17,000LAB SUPPLY AND MINOR EQPT 0 600 600 600 600 600 600 600OFFICE SUPPLY 18,823 24,311 21,311 21,311 21,311 21,311 21,311 21,311OIL GAS & ANTIFREEZE 231,071 271,449 280,532 280,532 280,532 280,532 280,532 280,532
Attachment B
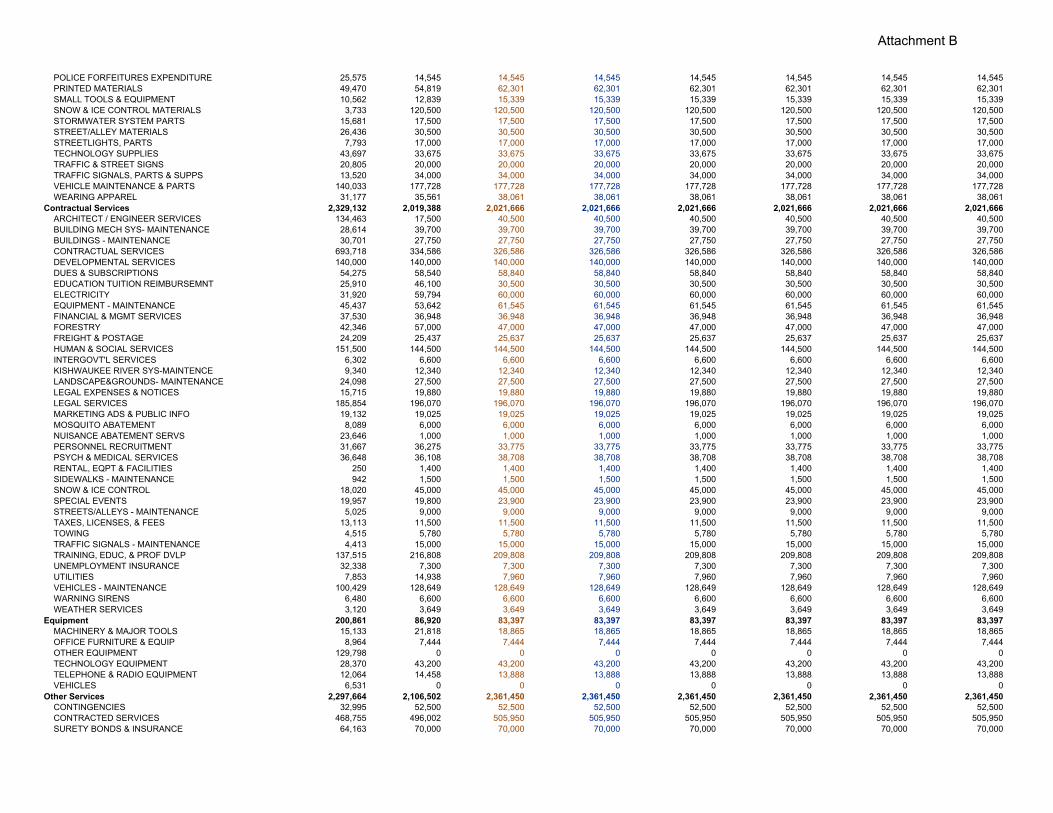
POLICE FORFEITURES EXPENDITURE 25,575 14,545 14,545 14,545 14,545 14,545 14,545 14,545PRINTED MATERIALS 49,470 54,819 62,301 62,301 62,301 62,301 62,301 62,301SMALL TOOLS & EQUIPMENT 10,562 12,839 15,339 15,339 15,339 15,339 15,339 15,339SNOW & ICE CONTROL MATERIALS 3,733 120,500 120,500 120,500 120,500 120,500 120,500 120,500STORMWATER SYSTEM PARTS 15,681 17,500 17,500 17,500 17,500 17,500 17,500 17,500STREET/ALLEY MATERIALS 26,436 30,500 30,500 30,500 30,500 30,500 30,500 30,500STREETLIGHTS, PARTS 7,793 17,000 17,000 17,000 17,000 17,000 17,000 17,000TECHNOLOGY SUPPLIES 43,697 33,675 33,675 33,675 33,675 33,675 33,675 33,675TRAFFIC & STREET SIGNS 20,805 20,000 20,000 20,000 20,000 20,000 20,000 20,000TRAFFIC SIGNALS, PARTS & SUPPS 13,520 34,000 34,000 34,000 34,000 34,000 34,000 34,000VEHICLE MAINTENANCE & PARTS 140,033 177,728 177,728 177,728 177,728 177,728 177,728 177,728WEARING APPAREL 31,177 35,561 38,061 38,061 38,061 38,061 38,061 38,061
Contractual Services 2,329,132 2,019,388 2,021,666 2,021,666 2,021,666 2,021,666 2,021,666 2,021,666ARCHITECT / ENGINEER SERVICES 134,463 17,500 40,500 40,500 40,500 40,500 40,500 40,500BUILDING MECH SYS- MAINTENANCE 28,614 39,700 39,700 39,700 39,700 39,700 39,700 39,700BUILDINGS - MAINTENANCE 30,701 27,750 27,750 27,750 27,750 27,750 27,750 27,750CONTRACTUAL SERVICES 693,718 334,586 326,586 326,586 326,586 326,586 326,586 326,586DEVELOPMENTAL SERVICES 140,000 140,000 140,000 140,000 140,000 140,000 140,000 140,000DUES & SUBSCRIPTIONS 54,275 58,540 58,840 58,840 58,840 58,840 58,840 58,840EDUCATION TUITION REIMBURSEMNT 25,910 46,100 30,500 30,500 30,500 30,500 30,500 30,500ELECTRICITY 31,920 59,794 60,000 60,000 60,000 60,000 60,000 60,000EQUIPMENT - MAINTENANCE 45,437 53,642 61,545 61,545 61,545 61,545 61,545 61,545FINANCIAL & MGMT SERVICES 37,530 36,948 36,948 36,948 36,948 36,948 36,948 36,948FORESTRY 42,346 57,000 47,000 47,000 47,000 47,000 47,000 47,000FREIGHT & POSTAGE 24,209 25,437 25,637 25,637 25,637 25,637 25,637 25,637HUMAN & SOCIAL SERVICES 151,500 144,500 144,500 144,500 144,500 144,500 144,500 144,500INTERGOVT'L SERVICES 6,302 6,600 6,600 6,600 6,600 6,600 6,600 6,600KISHWAUKEE RIVER SYS-MAINTENCE 9,340 12,340 12,340 12,340 12,340 12,340 12,340 12,340LANDSCAPE&GROUNDS- MAINTENANCE 24,098 27,500 27,500 27,500 27,500 27,500 27,500 27,500LEGAL EXPENSES & NOTICES 15,715 19,880 19,880 19,880 19,880 19,880 19,880 19,880LEGAL SERVICES 185,854 196,070 196,070 196,070 196,070 196,070 196,070 196,070MARKETING ADS & PUBLIC INFO 19,132 19,025 19,025 19,025 19,025 19,025 19,025 19,025MOSQUITO ABATEMENT 8,089 6,000 6,000 6,000 6,000 6,000 6,000 6,000NUISANCE ABATEMENT SERVS 23,646 1,000 1,000 1,000 1,000 1,000 1,000 1,000PERSONNEL RECRUITMENT 31,667 36,275 33,775 33,775 33,775 33,775 33,775 33,775PSYCH & MEDICAL SERVICES 36,648 36,108 38,708 38,708 38,708 38,708 38,708 38,708RENTAL, EQPT & FACILITIES 250 1,400 1,400 1,400 1,400 1,400 1,400 1,400SIDEWALKS - MAINTENANCE 942 1,500 1,500 1,500 1,500 1,500 1,500 1,500SNOW & ICE CONTROL 18,020 45,000 45,000 45,000 45,000 45,000 45,000 45,000SPECIAL EVENTS 19,957 19,800 23,900 23,900 23,900 23,900 23,900 23,900STREETS/ALLEYS - MAINTENANCE 5,025 9,000 9,000 9,000 9,000 9,000 9,000 9,000TAXES, LICENSES, & FEES 13,113 11,500 11,500 11,500 11,500 11,500 11,500 11,500TOWING 4,515 5,780 5,780 5,780 5,780 5,780 5,780 5,780TRAFFIC SIGNALS - MAINTENANCE 4,413 15,000 15,000 15,000 15,000 15,000 15,000 15,000TRAINING, EDUC, & PROF DVLP 137,515 216,808 209,808 209,808 209,808 209,808 209,808 209,808UNEMPLOYMENT INSURANCE 32,338 7,300 7,300 7,300 7,300 7,300 7,300 7,300UTILITIES 7,853 14,938 7,960 7,960 7,960 7,960 7,960 7,960VEHICLES - MAINTENANCE 100,429 128,649 128,649 128,649 128,649 128,649 128,649 128,649WARNING SIRENS 6,480 6,600 6,600 6,600 6,600 6,600 6,600 6,600WEATHER SERVICES 3,120 3,649 3,649 3,649 3,649 3,649 3,649 3,649
Equipment 200,861 86,920 83,397 83,397 83,397 83,397 83,397 83,397MACHINERY & MAJOR TOOLS 15,133 21,818 18,865 18,865 18,865 18,865 18,865 18,865OFFICE FURNITURE & EQUIP 8,964 7,444 7,444 7,444 7,444 7,444 7,444 7,444OTHER EQUIPMENT 129,798 0 0 0 0 0 0 0TECHNOLOGY EQUIPMENT 28,370 43,200 43,200 43,200 43,200 43,200 43,200 43,200TELEPHONE & RADIO EQUIPMENT 12,064 14,458 13,888 13,888 13,888 13,888 13,888 13,888VEHICLES 6,531 0 0 0 0 0 0 0
Other Services 2,297,664 2,106,502 2,361,450 2,361,450 2,361,450 2,361,450 2,361,450 2,361,450CONTINGENCIES 32,995 52,500 52,500 52,500 52,500 52,500 52,500 52,500CONTRACTED SERVICES 468,755 496,002 505,950 505,950 505,950 505,950 505,950 505,950SURETY BONDS & INSURANCE 64,163 70,000 70,000 70,000 70,000 70,000 70,000 70,000
Attachment B
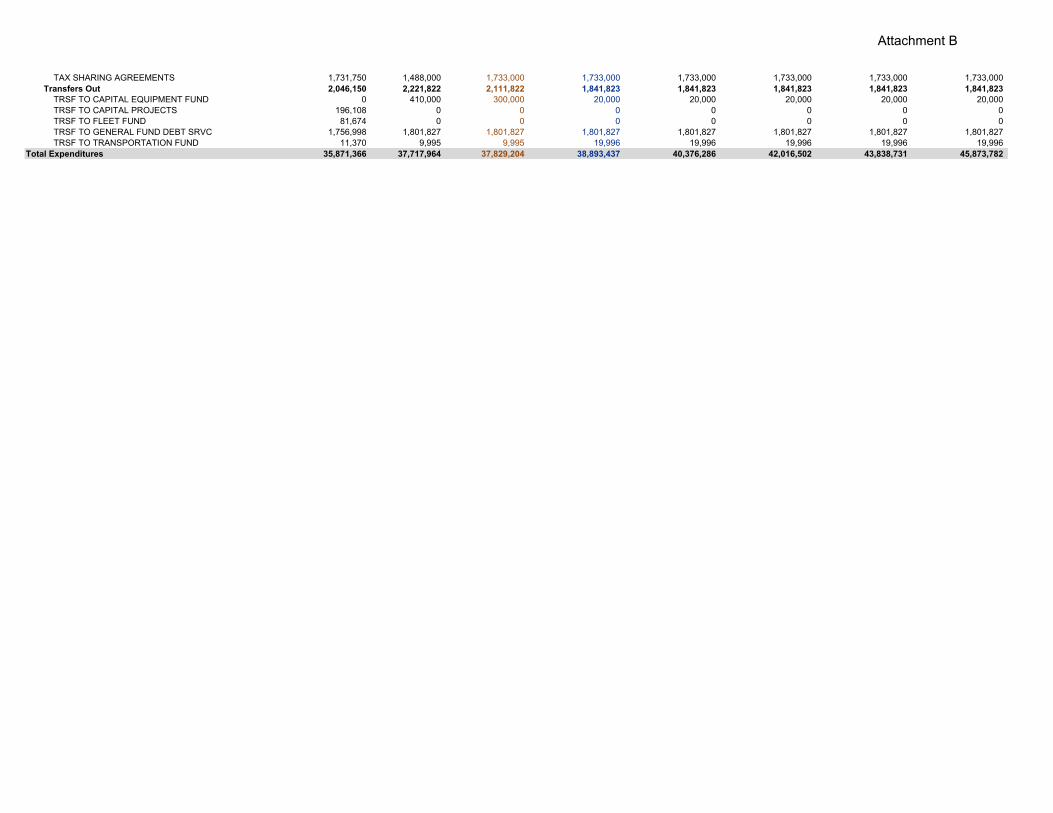
TAX SHARING AGREEMENTS 1,731,750 1,488,000 1,733,000 1,733,000 1,733,000 1,733,000 1,733,000 1,733,000Transfers Out 2,046,150 2,221,822 2,111,822 1,841,823 1,841,823 1,841,823 1,841,823 1,841,823
TRSF TO CAPITAL EQUIPMENT FUND 0 410,000 300,000 20,000 20,000 20,000 20,000 20,000TRSF TO CAPITAL PROJECTS 196,108 0 0 0 0 0 0 0TRSF TO FLEET FUND 81,674 0 0 0 0 0 0 0TRSF TO GENERAL FUND DEBT SRVC 1,756,998 1,801,827 1,801,827 1,801,827 1,801,827 1,801,827 1,801,827 1,801,827TRSF TO TRANSPORTATION FUND 11,370 9,995 9,995 19,996 19,996 19,996 19,996 19,996
Total Expenditures 35,871,366 37,717,964 37,829,204 38,893,437 40,376,286 42,016,502 43,838,731 45,873,782
Attachment B