Embed Size (px)
Citation preview
The Design and Development of Guidelines for Interactive Course Organizers
Wejdan Ahmed Almunive
Dissertation Submitted to The Faculty of the Virginia Polytechnic Institute and State University
In Partial Fulfillment of the Requirements for The Degree Of
Doctor of Philosophy
In
Curriculum and Instruction
Barbara B. Lockee (Chair)
Kenneth Potter
Mark Bond
Alicia Johnson
March 25, 2020
Blacksburg, Virginia
Keywords: interactive course organizers, course syllabi, design and development research,
instructional message design, visual literacy, interactivity
The Design and Development of Guidelines for Interactive Course Organizers
Wejdan Ahmed Almunive
Abstract
An Interactive Course Organizer (ICO) is an artifact that contains text and visual
representation of a traditional course syllabus, it integrates visual elements, such as timelines,
drawings, charts, graphs, maps, or pictures to show the sequencing and organization of major
course topics while offering the user an actively controlled progression of the amount of course
information covered. The goal of this research was to develop a theoretically- and empirically-
grounded guidelines to design and develop of ICOs. It is anticipated that these guidelines can
assist course developers and instructional designers in designing ICOs. This study employed a
design and developmental research methodology with four phases: analysis, design, development
and validation. Findings from literature review investigations in course syllabi, instructional
message design, visual literacy, and interactivity theories and research as well as expert review
informed the building of the guidelines.
The Design and Development of Guidelines for Interactive Course Organizers
Wejdan Ahmed Almunive
General Audience Abstract
Interactive Course Organizer (ICO) is a tool that acts as a course syllabus. It combines
both text and visual representation of a traditional course syllabus, and integrates visual
elements, such as timelines, drawings, charts, graphs, maps, or pictures to help learners visually
see the interrelationships between different parts of the course and how they all fit together. Its
purpose is to provide visuals to assist learners in seeing the course and how it is organized “big
picture”. And by adding the interactivity feature, learners will navigate, access, and view the
course content. It is a course framework to help students understand what it is they will be
learning in the course. This research aimed to develop a theoretically- and empirically- grounded
guidelines to design and develop of ICOs. It is anticipated that these guidelines can assist course
developers and instructional designers in designing ICOs. This study employed a design and
developmental research methodology with four phases: analysis, design, development and
validation. Findings from literature review investigations in course syllabi, instructional message
design, visual literacy, and interactivity theories and research as well as expert review informed
the building of the guidelines.

IV
Dedication
To my family, thanks for all of your support, love, and encouragement, which has helped
me to succeed and never give up.

V
Acknowledgements
I would like to thank those who supported me as I worked toward my PhD degree
throughout my five years at Virginia Tech. I could not have completed my PhD degree without
the help and support of these people.
First, I would like to express my sincere thanks to my advisor, Dr. Barbara Lockee, for
her continuous understanding, support, and guidance. I was very fortunate to be one of her
advisees. I also would like to thank my committee members, Dr. Ken R. Potter, Dr. Aaron Bond,
and Dr. Alicia Johnson, for their thoughtful and insightful comments and guidance.
I would like to thank the expert reviewers for this study, Dr. Rune Pettersson, Dr. MJ
Bishop, Dr. Susan G. Magliaro, and Dr. Jung Lee. Their feedback provided meaning and
relevance to my study.
Finally, my family and friends deserve great thanks for their endless love, understanding,
and support.
Thanks to all of you!
VI
Table of Contents
Dedication ......................................................................................................................... IV
Acknowledgements ............................................................................................................ V
Table of Contents .............................................................................................................. VI
List of Figures .................................................................................................................... X
List of Tables ..................................................................................................................... XI
Chapter 1: Introduction ....................................................................................................... 1
Background for the Study .........................................................................................................1
Need for the Study ......................................................................................................................3
Research Problem .......................................................................................................................4
Purpose of the Study ..................................................................................................................5
Chapter 2: Literature Review .............................................................................................. 8
Introduction ......................................................................................................................... 8
ICOs - Definition, Purpose, and Components .........................................................................9
ICO Definition .........................................................................................................................9
ICO Purpose .............................................................................................................................9
Course syllabus ..................................................................................................................................9
Visual organizers ..............................................................................................................................10
Interactivity and learner control .......................................................................................................10
ICO Components ....................................................................................................................11
Text components ..............................................................................................................................11
Visual components ...........................................................................................................................12
Learning Theories Related to the Use of ICO .......................................................................15
VII
Theories related to the use of text and visuals .......................................................................16
Information processing theory .........................................................................................................16
Dual coding theory ...........................................................................................................................17
Cognitive load theory .......................................................................................................................18
Theories related to the use of visual organizers .....................................................................21
Meaningful learning theory ..............................................................................................................21
Theories related to the use of interactivity and learner control ..............................................25
Cognitive theory of Multimedia learning .........................................................................................25
Evidence-Based Studies to Support the Use of ICO ..............................................................26
The use of course syllabus .....................................................................................................26
The use of visual organization ...............................................................................................27
The use of interactivity and learner control ...........................................................................29
Discussion ..................................................................................................................................30
Chapter 3: Research Methodology .................................................................................... 33
Introduction ....................................................................................................................... 33
Purpose of the Study ................................................................................................................33
Research Questions ..................................................................................................................34
Research Design: ......................................................................................................................34
Study Procedure .......................................................................................................................36
Phase One - Analysis Phase ...................................................................................................37
Phase Two - Design Phase .....................................................................................................38
Phase Three – Development Phase ........................................................................................39
Phase Four – Validation Phase ...............................................................................................40
Characteristics of Expert Reviewers ......................................................................................40
Instrumentation ........................................................................................................................40
VIII
Data sources ..............................................................................................................................41
Data Analysis ............................................................................................................................42
Chapter 4: The Design and Development of the Guidelines ............................................ 43
Introduction ....................................................................................................................... 43
Study Procedure ................................................................................................................ 43
Analysis Phase ...........................................................................................................................43
Graphics for learning Model. .................................................................................................51
Design Phase ..........................................................................................................................56
Development Phase ................................................................................................................60
Validation Phase ....................................................................................................................72
Chapter 5: Expert Reviews Feedback ............................................................................... 73
Introduction ....................................................................................................................... 73
Overall Expert Perspectives ....................................................................................................75
Expert Reviews Recommendations .................................................................................. 75
The Application of ICOs ........................................................................................................76
Overall Design of the Guidelines ...........................................................................................80
Analysis Phase .......................................................................................................................81
Design Phase ..........................................................................................................................82
Development Phase ................................................................................................................83
The Application of the Guidelines .........................................................................................85
Summary ...................................................................................................................................86
Chapter 6: Discussion ....................................................................................................... 89
Introduction ....................................................................................................................... 89
IX
Study Review .............................................................................................................................89
Study Limitations .....................................................................................................................90
Study Contributions .................................................................................................................92
Theoretical Implications ........................................................................................................93
Practical Implication ..............................................................................................................95
Recommendations for Future Research .................................................................................96
References ........................................................................................................................ 98
Appendices ..................................................................................................................... 113
Appendix A Screenshots of Each Section of ICO .......................................................... 113
Appendix B IRB Approval .............................................................................................. 118
Appendix C Expert Review Request .............................................................................. 119
Appendix D Reminder Email .......................................................................................... 121
Appendix E Consent Form .............................................................................................. 122
Appendix F Evaluation Rubric ....................................................................................... 125
Appendix G List Of Changes Made To The Revised Version Of The Guidelines .......... 133
Appendix H Revised Guidelines for Interactive Course Organizers (ICOs) .................. 134
X
List of Figures
Figure 1: An example of concept map. ......................................................................................... 22
Figure 2: An example of graphic organizer. ................................................................................. 23
Figure 3: Screenshot of the template. ........................................................................................... 59
Figure 4: Screenshot of the ICO embedded in an LMS. ............................................................... 59
XI
List of Tables
Table 1: Graphic Types to Use for Varied Goals ........................................................................... 12
Table 2: Common Methods Employed in Design and Development Research ............................ 35
Table 3: Summary of Research Design Process ........................................................................... 37
Table 4: Higher Education Institutional Websites Analyzed for Syllabus Requirements ............. 47
Table 5: A Framework for A Course Syllabus .............................................................................. 48
Table 6: Following the Visual Model to Plan ICOs ...................................................................... 53
Table 7: A List of Different Data Visualization Websites ............................................................. 57
Table 8: Guidelines to Analyze the Context for ICO. ................................................................... 61
Table 9: Guidelines for Designing ICOs. ...................................................................................... 64
Table 10: Guidelines to Develop Interactive Visuals for ICOs. .................................................... 68
1
Chapter 1: Introduction
Background for the Study
In an online course, there are a number of processes and guidelines learners will need to
follow throughout the course. The organization and structure of the course plays an essential and
significant role in guiding the students through the course materials. An Interactive Course
Organizer (ICO) is an artifact that contains text and visual representation of a traditional course
syllabus, it integrates visual elements, such as timelines, drawings, charts, graphs, maps, or
pictures to show the sequencing and organization of major course topics while offering the user
an actively controlled progression of the amount of course information covered. In other words,
ICOs are interactive in the sense that students have control over what information and interactive
features they can view and use to acquire more detailed information. The purpose of an ICO is to
provide visuals to assist learners in seeing the course and how it is organized “big picture,”
instead of just showing learners a linear format as presented in a text-only syllabus, and to
clearly articulate the connections between course content.
An ICO enables learners to visually see the interrelationships between different parts of
the course and how they all fit together. It describes the course topics, learning objectives, course
materials, assignment, schedule, learners support services, assignments, tests, etc. ICO provides
learners with prior knowledge and helps them organize their thoughts and ideas to prepare for a
course. It offers learners an educationally rich portal to course materials that forms the basis of
an online or face-to-face course exploration. By adding the interactivity feature, learners will
navigate, access, and view the course content. It is a course framework to help students
understand what it is they will be learning in the course.
2
Commonly, course syllabi can be loaded with certain subject terminology that is either
vague or insignificant to learners in the beginning of a class (Nilson, 2007). For learners, looking
at the course content and placing the pieces together will help them understand the
interrelationship between course content and the nature of the subject. Learners' first encounter
with the discipline and course may be confusing or overwhelming. Therefore, the syllabus is an
outline that describe students’ roles and responsibilities that both professors and students share in
the class (Grunert, 1997). An ICO is a visual form of a syllabus which provides learners with an
overview of the course and offers them interactive content, enabling them to take part in its
information expansion.
The structure of ICOs is very similar to that of concept maps (Novak & Gowin, 1984),
advance organizers (Ausubel, 1968), and graphic organizers (Hawk, 1986) which are generally
used by instructors to help students organize information presented or read (DiCecco & Gleason,
2002; Kim, et al. 2004). An ICO is a tool that is presented prior to the course to be learned, and
then branched out to show how main ideas can be broken down into specific topics. It helps
students recognize the course they are beginning to learn is not totally new and provides visual
explanations to show course concepts. Hyerle (1996) emphasized that visual tools can be used to
encourage learners to connect and organize information and detect interrelationships between
them. ICOs are designed to illustrate how the course content is incorporated together, which is
usually unclear to some learners particularly those entering a new discipline.
When it comes to using text and visuals, theories of learning — specifically those that
build on cognitive sciences and knowledge acquisition — expand our knowledge of how to
develop instructional materials that improve learning and performance. Information processing
theory examines the roles of memory structures of the human brain: sensory, short-term, and
3
long-term memory; how they perform; and how information is processed through these systems
and then stored in the brain (Driscoll, 2004). This theory offers a perspective of memory
structures that have an essential impact on both dual coding theory and cognitive load theory in
learning. According to these theories, ICO can help in holding and maintaining students’
attention, minimizing cognitive load, and supporting information retention. Thus, ICOs are
promising learning tools that can be adapted to an online learning setting to enhance students’
reception, retention, and retrieval of information (Driscoll, 2004; Paivio, 1986; Sweller et al.,
1998).
In online courses, interactivity is reached by allowing the learner to make decisions using
digital devices specific actions that control the progression of the course (Clark & Mayer, 2016).
In an ICO, the feature of interactivity is implemented by navigational features, such as timelines,
drawings, charts, graphs, maps, or pictures and links that allow learners to select a topic and its
details. Clark and Mayer (2016) stated that “We also know that learners prefer learner control,
and in many e-learning environments, they can easily drop out if not satisfied” (p. 322). In an
ICO, the learner will have the opportunity to control and view course topics, such as: instructor
and course information, learning objectives, assignments, tests, schedule, school policies, as well
as different support services offered to the learner. From an instructor’s perspective this creation
(ICO) can be used for an extended period of time as long as it serves its purpose.
Need for the Study
The growth of online learning has revolutionized education and provided easy access to
learning for multitudes of learners. The increase of online education enrollment is continually
rising in the higher education programs. A report by Allen and colleagues (2018) tracking online
education in the United States showed that “distance education enrollments increased for the

4
fourteenth straight year, growing faster than they have for the past several years” (p. 3). In the
fall of 2016, more than one in four students were taking a minimum of one online course, which
is a total of 6.3 million students (Allen et al., 2018). According to Allen and colleagues (2018),
31.6% of students enrolled in online courses with 14.9% in online courses only, and 16.7% in
both online and face- to- face courses.
Course Management Systems (CMS) or Learning Management Systems (LMS) are key
components of online and face-to-face courses. They can be described as web-based systems,
typically password-protected, where electronic materials (documents, files, web links) can be
distributed, and where learners can participate in online lectures and discussions. With Internet
access and a login, those systems can be accessed from anywhere at any time. LMS and CMS are
commonly used in educational environments to deliver course information, as well as to facilitate
fulfillment of coursework (McAvinia, 2016). According to Dahlstrom and colleagues (2014),
currently, almost all educational institutions use learning management systems.
Research Problem
With this continuously growing use of LMS, research has shown that in some cases LMS
are not used to fulfil their full potential; the purpose of the systems over the years has changed
and they now act primarily as content management systems (Dias & Diniz, 2014). Azmi and
Singh (2015) stressed that nowadays, LMS are mainly being used as a document distribution
system for course materials. The challenge that exists with online learning is not in rebuilding the
learning process but rather designing new approaches by utilizing the new tools available to us
(Ehlers, 2009). This raises the question of how the design of another layer to the system can
make the learning experience more fulfilling. There is a need to improve the use of LMS to adapt
to the current innovation and improvement in presenting course materials. One of the many ways
5
to expand the utilization of LMS is to present the students with a solid basic structure of the
course as well as to guide and direct them through the course materials, so they can see how each
of the topics are related to each other. Also, it increases the interaction between the students and
the course materials in the system itself.
Furthermore, Oblinger and Hawkins (2006) stressed that “Online instruction is more than
a series of readings posted to a website; it requires deliberate instructional design that hinges on
linking learning objectives to specific learning activities and measurable outcomes” (p.15). It is
essential that instructors provide a framework for teaching an online course — the course
syllabus can be considered this framework. For learners, the course syllabus provides them with
clear directions and expectations for the coursework (McKeachie, 1978; 1999). Yet, according to
Eberly and colleagues (2001), “Despite the importance of a syllabus, the structures and formats
of written syllabi tend to be handed down from one generation to the next, rarely considered as
part of curriculum redesign” (p. 56). Likewise, Merrill (2020) stressed: “a first-class syllabus can
help promote effective, efficient and engaging learning, but traditional syllabi too often fail to
attain this purpose”. Thus, designing an inclusive syllabus can offer a sound framework for the
course, as well as guidance for learners, and there are steps that can be followed in crafting an
efficient course syllabus. This is where new inventive learning approaches with a focus on an
interactive, visually pleasant course syllabus can be explored.
Purpose of the Study
With the increased number of software programs and websites dedicated to easy visual
design, it is necessary to explore new ways to achieve the simplicity and efficiency of visually
pleasing and professional syllabi. An effective ICO (i.e., a course syllabus) can, however, be
developed through design choices and the reduction of elements that distract from the message—
6
skills that are not inherent for many instructors. Developing an ICO easily can be overwhelming
for instructors, hence there is a need for theoretically grounded guidelines to create ICOs that can
be utilized by instructors that fit their design level. Moreover, it will give learners a view of the
course's "big picture " and serve as a road map that defines the content and context of learning in
online courses.
The purpose of this design and development study is to develop theoretical guidelines that
can help educators in creating ICOs. The aim of the guidelines is to assist in designing ICOs,
considering their capability to help students visualize the course “big picture,” and to clearly
articulate the connections between course content, as well as serve as road maps that define the
content and context of learning in courses. The guidelines are designed and developed with a
theoretically grounded foundation from several cognitive information processing theories.
Furthermore, the guidelines will assist in crafting ICO content, integrating both text and visuals
while they support each other, and minimizing cognitive load.
With the utilization of the design and development research method, the guidelines
produced an approach that can be generalized and that aims to improve the syllabus design
process (Richey & Klein, 2007). The guideline were validated by experts in the field, and their
recommendations were used to revise the guidelines. The guidelines can add to the literature on
syllabus design, instructional message design and visual literacy. As such, this set of theoretical
guidelines can assist in developing not only ICOs but also other visual instructional materials.
Design and development research applies various methods to link practice, research, and theory
to solve an educational problem (Richey, Klein and Nelson, 2004). Consequently, the proposed
developmental research study applied design principles from instructional message design and
visual literacy to ICOs. An evaluation rubric was provided to expert reviewers to collect their

7
feedback. Built on the findings and recommendations from the expert reviewers, the guidelines
were revised based on those findings and recommendations. This set of theoretical guidelines can
assist in developing not only ICOs, but also other visual materials.
8
Chapter 2: Literature Review
Introduction
This research study aims to design, develop, and validate a set of guidelines to create
Interactive Course Organizers (ICOs). With the growing number of software programs and
websites that are used to build professional and simply designed visuals, such as infographics,
presentations, and print templates, it is essential to explore new ways to reach the simplicity and
efficiency of a visually pleasing and professional syllabus. When developing an efficient ICO
(i.e., a course syllabus), many skills are required, such as the amount of text that needs to be
included, how text and visuals come together, how they are integrated, design choices, and the
removal of elements that distract from the message. Most of these skills are not inherent for
many instructors and creating ICOs can easily be overwhelming for them; hence, there is a need
for theoretically grounded guidelines to create ICOs that can be used by instructors that match
their design levels. Besides, from the students’ point of view, ICOs are their first exposure to the
course, and they serve as road maps that outline the content and context of learning in courses.
Assuming the potential of ICOs for learning, the following questions will be answered:
• What comprises an overview of ICOs, including their definition, identifying their
purpose, and the components built into them?
• How — according to several learning theories — can ICOs help in supporting
cognitive functions in learning?
• What evidence-based studies exist to support this type of visual presentation?
9
ICOs - Definition, Purpose, and Components
ICO Definition
An ICO is an artifact that contains text and visual representation of a traditional course
syllabus. It integrates visual elements, such as timelines, drawings, charts, graphs, maps, or
pictures to show the organization of major course topics while offering the users an actively
controlled progression of the amount of course information covered. In other words, ICOs are
interactive in the sense that students have control over what information they can view and what
interactive features they can use to acquire more detailed information.
ICO Purpose
The purpose of an ICO is to provide visuals to assist learners in seeing the course “big
picture,” and how it is organized, instead of just showing learners a linear format as presented in
a text-only syllabus, and to articulate the connections between course content. An ICO adds more
features to a traditional syllabus, making it more visually organized and interactive. It is built on
the fundamental principle of a traditional course syllabus, visual organization of advance
organizers, graphic organizers, and concept maps, as well as the interactivity and learner control
over the amount of viewed information.
Course syllabus
Parks & Harris (2002) stressed that a course syllabus can serve as a contract between
faculty members and learners, permanent record, as well as a learning tool. Syllabi are contracts
that offer and detail course rules and policies (Habanek, 2005). On the other hand, syllabi are
learning tools to prepare for the coursework, monitoring learners’ progress, and explanations for
how the course fits with real-life experiences (Parks & Harris, 2002). More than half of the
students refer to the course syllabus at least once a week during a course period (Smith &
10
Razzouk, 1993). Thus, a syllabus plays an important role in attracting learners’ attention toward
the course. The purpose of developing a course syllabus is to provide the context and a summary
of the course, as well as to describe the expectations instructors have for their students.
According to Littlefield (1999), a well-designed syllabus also sets the course agenda, acts as a
planning tool for faculty, and serves as a contract between the faculty members and learners.
Visual organizers
Thinking can take various forms and visual organizers can support different ways of
thinking about a subject (Clarke, 1990). Visual organizers have been used by educators to clarify
the objectives and the thought processes to create meaningful learning (Clarke, 1990; Jones,
Pierce, & Hunter, 1989). In the literature, visual organizers have been referred to by several
terms, including; advance organizers (Ausubel, 1968), concept maps (Novak & Gowin, 1984),
and graphic organizers (Hawk, 1986). An advance organizer is a method that links previous and
existing information using new information to support the learning and retention of that new
material (Ausubel, 1968). A concept map is another form of graphic organizer that connects
relationships among concepts using labeled nodes (Novak & Gowin, 1984). Similar to that,
graphic organizers intended to work as advance organizers, to activate learners’ prior knowledge
and illustrating its relationship with new (Hawk, 1986). While they have various names and
different purposes, their main goal is to provide learners with a ‘visual map’ to assist them in
organizing complex knowledge by linking new and unfamiliar information to their own prior
knowledge to create meaningful, useful, and accessible learning.
Interactivity and learner control
Interactive learning environments give learners the opportunity to control the presentation
of information and its content (Scheiter & Gerjets, 2007). In the literature on computer-based
11
instruction, the two terms interactivity and learner control are used interchangeably. According to
Scheiter and Gerjets (2007), the term interactivity is often used in the literature to describe the
flexibility of single representations (e.g., animation), and learner control is based on the learner’s
ability to modify several presentations of the information and have several techniques to interact
with them (i.e., sequencing, content selection). Even though these terms have different
connotative meaning, interactivity by definition involves how much control learners have over
the display of information. Consistent with Merrill (1975), learners should be given control over
the sequence of instructional material, so they can discover how to learn as they make
instructional decisions, which can give learners the ability to acquire strategies for learning in
different situations.
ICO Components
Text components
Several studies have addressed the components of a syllabus. There are four primary
roles for the course syllabus: (1) to provide the learner with a course map, (2) to form a contract
between the learner and the faculty member, (3) a communication tool connecting the learner
with the faculty member, and (3) to distribute the faculty members’ plan for the course (Matejka
& Kurke, 1994). As stated by Davis (1993), to achieve these purposes, he suggests incorporating
the following components into the course syllabus: (a) course information, for example year and
semester, course number, course time and date; (b) the name of the course instructor and his/her
contact information, such as phone number, email, office hours and location; and (c) the course
prerequisites from the university catalog. Moreover, Davis (1993) proposes 11 elements that
should be incorporated in the course syllabus they are as follow: (1) rationale for the sequence of
topics, (2) format for class presentations and activities, (3) materials students need for the class,
12
(4) all student assignments and requirements, (5) how work will be graded and its weight, (6)
student responsibilities and the reason(s) for course policies, (7) how students with special needs
may arrange to receive appropriate accommodations, (8) the course calendar, including specific
opportunities for student feedback and other important dates, (9) time commitments that
successful students are likely to make, (10) additional sources students can use to supplement
required sources, and (11) a section where students introduce themselves for other students in the
class.
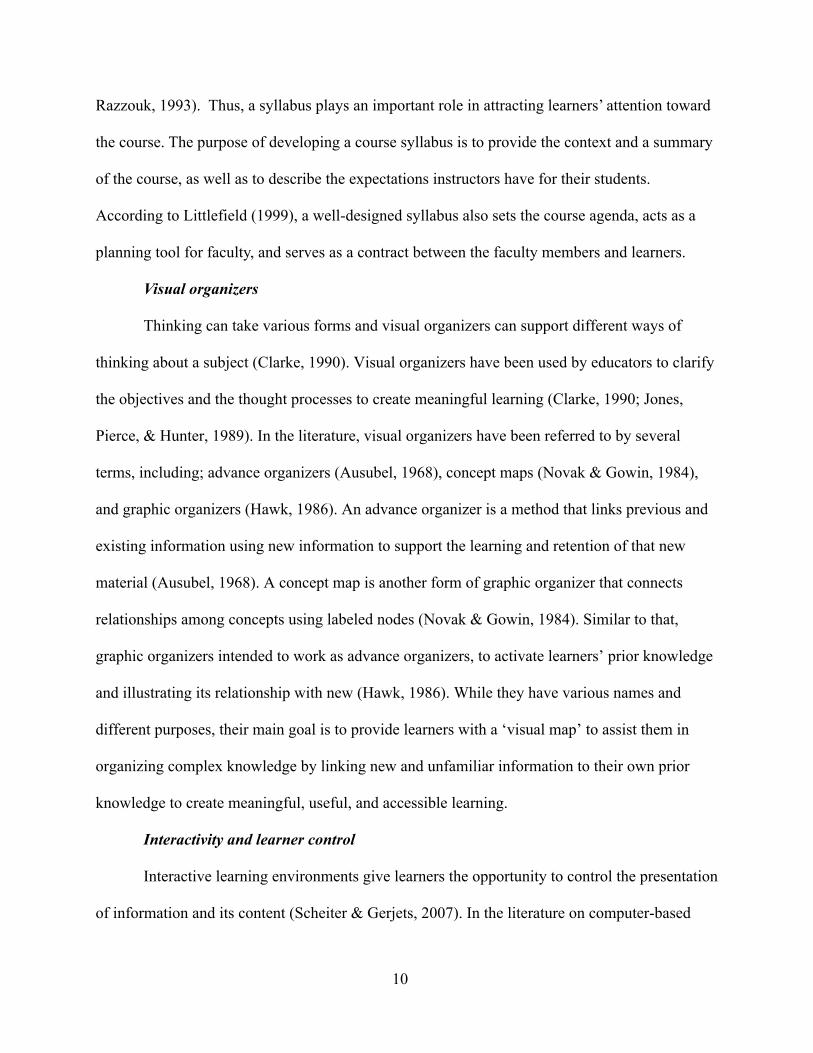
Visual components
When it comes to visual components built into an ICO, visuals can be pictures,
illustrations, graphs, and icons in the ICO design. Using accurate visuals to represent the
instructional message is essential to many aspects of learning. Table 1 provides different graphic
types to use for varied instructional goals (Table 1 - for better clarity, a picture, for example, is
added).
Table 1: Graphic Types to Use for Varied Goals
Table 1 Graphic Types to Use for Varied Goals
Instructional Purpose Graphic Types Example
Describe specific objects
• Photograph 3-D graphic • Illustration • Clip art (particularly in
diagrams and as game elements) (Malamed, 2015; Meirelles,2013; Black et al., 2017).
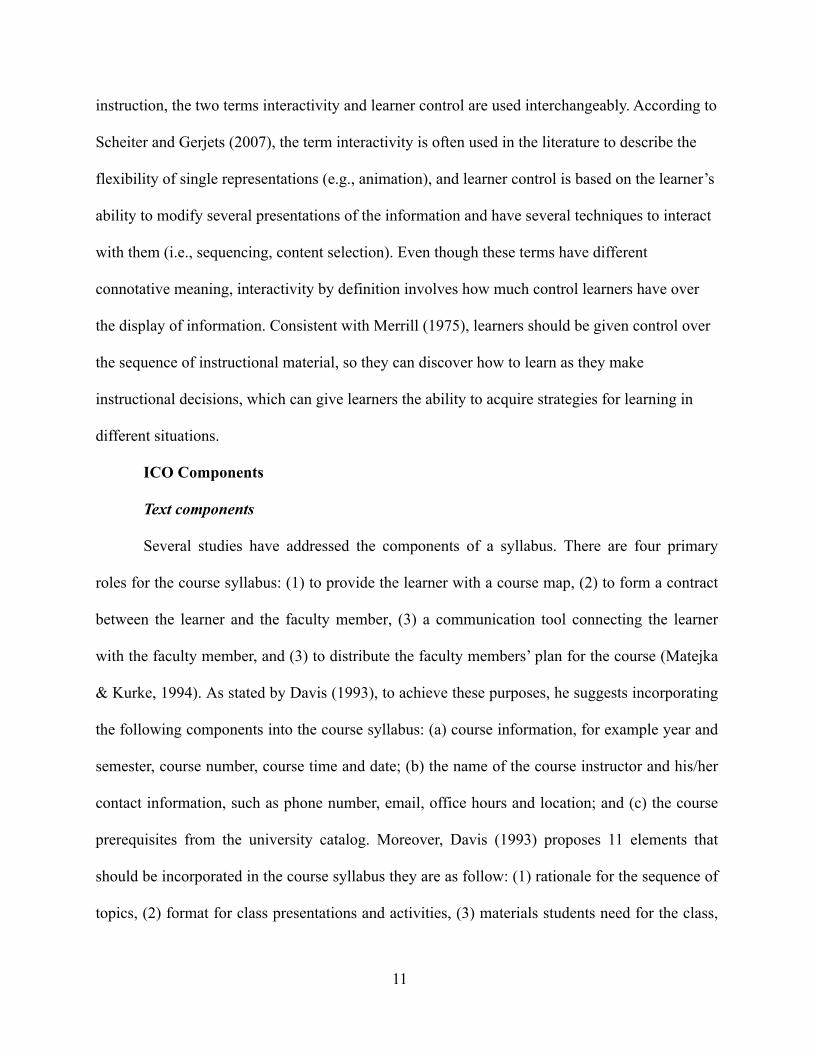
13
Tell a story or provide a scenario
• Sequence of photographs Sequence of illustrations
• Timeline (Malamed, 2015; Meirelles,2013; Black et al., 2017).
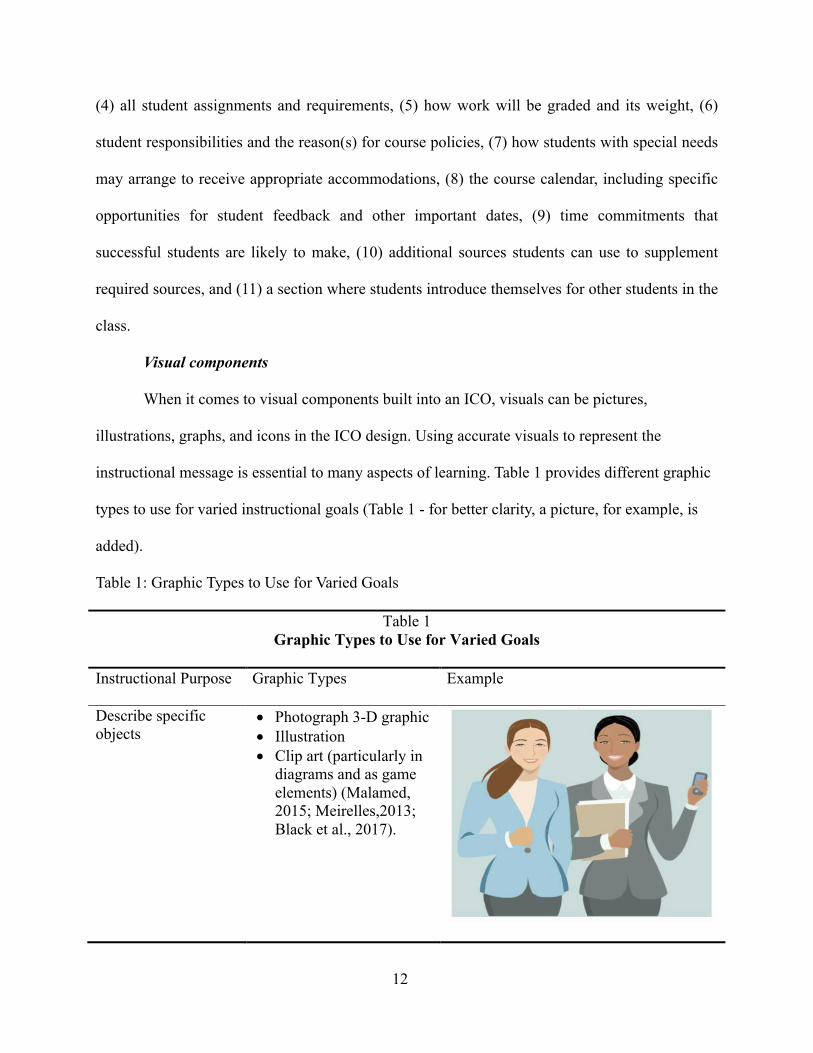
Persuade an audience • Sequence of photos or illustrations to tell a story
• Photographs that evoke emotions
• Visualization of statistics and data (Malamed, 2015; Meirelles,2013; Black et al., 2017).
Explain unfamiliar or complex concepts and theories
• Visual metaphor • Diagram showing
connections (Malamed, 2015; Meirelles,2013; Black et al., 2017).
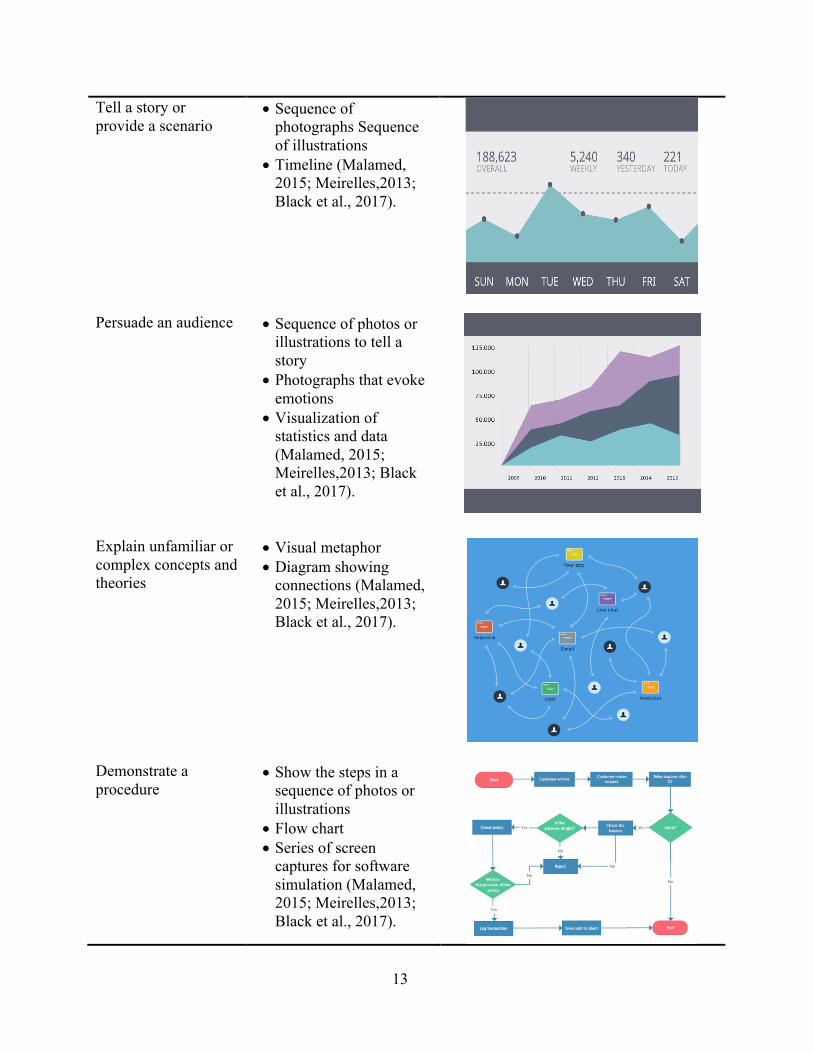
Demonstrate a procedure
• Show the steps in a sequence of photos or illustrations
• Flow chart • Series of screen
captures for software simulation (Malamed, 2015; Meirelles,2013; Black et al., 2017).
14
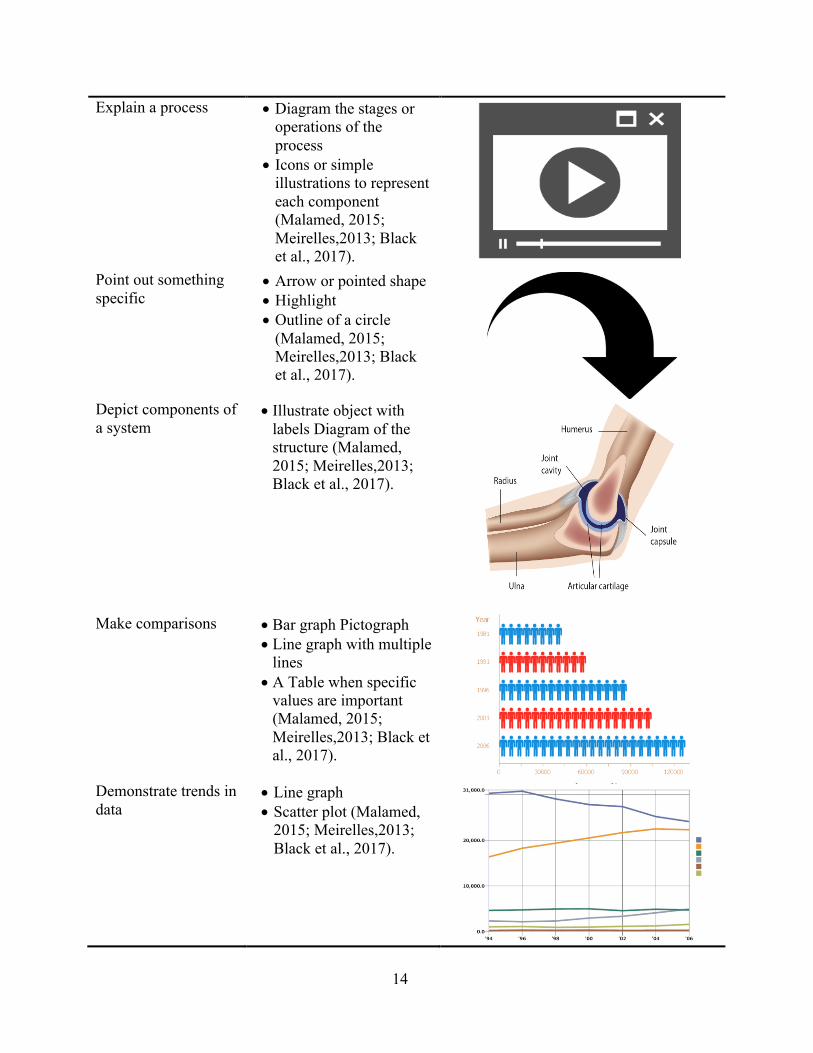
Explain a process • Diagram the stages or operations of the process
• Icons or simple illustrations to represent each component (Malamed, 2015; Meirelles,2013; Black et al., 2017).
Point out something specific
• Arrow or pointed shape • Highlight • Outline of a circle
(Malamed, 2015; Meirelles,2013; Black et al., 2017).
Depict components of a system
• Illustrate object with labels Diagram of the structure (Malamed, 2015; Meirelles,2013; Black et al., 2017).
Make comparisons • Bar graph Pictograph • Line graph with multiple
lines • A Table when specific
values are important (Malamed, 2015; Meirelles,2013; Black et al., 2017).
Demonstrate trends in data
• Line graph • Scatter plot (Malamed,
2015; Meirelles,2013; Black et al., 2017).
15
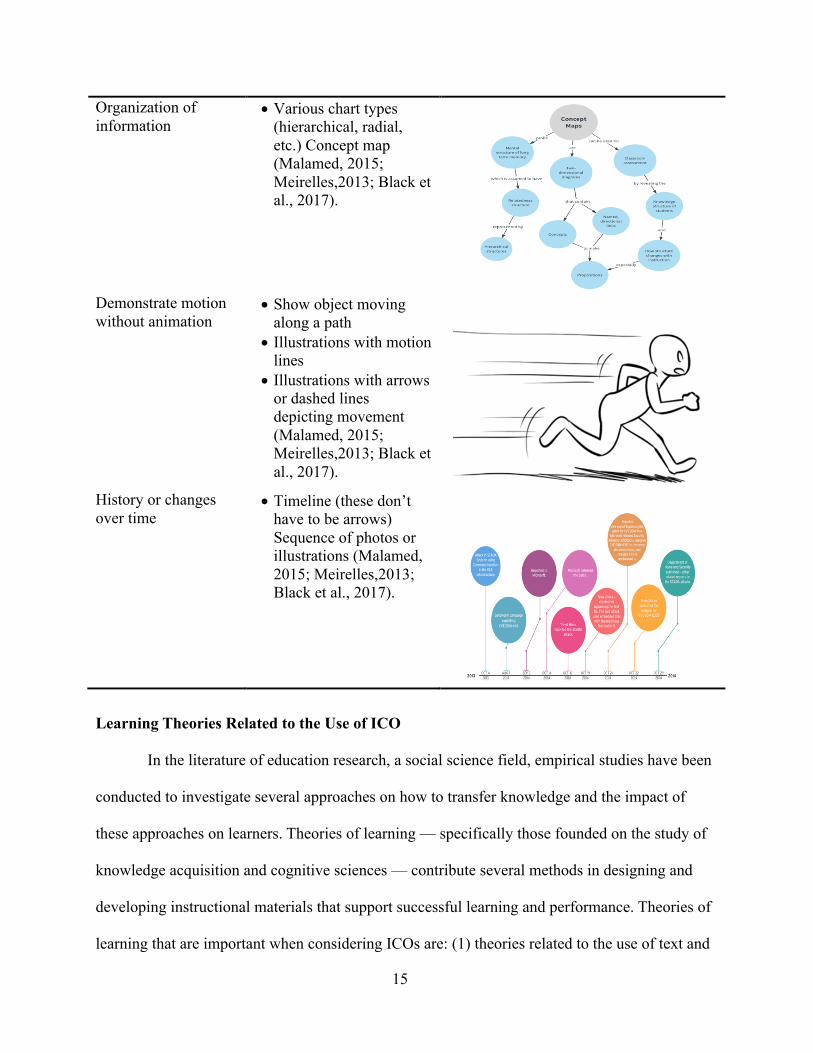
Organization of information
• Various chart types (hierarchical, radial, etc.) Concept map (Malamed, 2015; Meirelles,2013; Black et al., 2017).
Demonstrate motion without animation
• Show object moving along a path
• Illustrations with motion lines
• Illustrations with arrows or dashed lines depicting movement (Malamed, 2015; Meirelles,2013; Black et al., 2017).
History or changes over time
• Timeline (these don’t have to be arrows) Sequence of photos or illustrations (Malamed, 2015; Meirelles,2013; Black et al., 2017).
Learning Theories Related to the Use of ICO
In the literature of education research, a social science field, empirical studies have been
conducted to investigate several approaches on how to transfer knowledge and the impact of
these approaches on learners. Theories of learning — specifically those founded on the study of
knowledge acquisition and cognitive sciences — contribute several methods in designing and
developing instructional materials that support successful learning and performance. Theories of
learning that are important when considering ICOs are: (1) theories related to the use of text and
16
visuals, (2) theories related to the use of visual organizers, and (3) theories related to the use of
interactivity and learner control.
Theories related to the use of text and visuals
Information processing theory offers an examination of the memory structures which add
to our knowledge of the implication of both cognitive load theory and dual coding theory. This
section will present how each of these theories assumed that using text and visuals can help in
holding and maintaining students’ attention, minimize cognitive load, and support information
retention (Pettersson, 2002; Driscoll, 2004; Paivio, 1986; Sweller et al., 1998).
Information processing theory
According to this theory, the human brain has three memory structures: short-term,
working, and long-term memory (Pettersson, 2002). When exposed to new information, it is
processed through these systems and then stored in the brain (Driscoll, 2004). Short-term
memory, also known as sensory memory, is linked with each of our five senses; it stores
information for up to one second until it is transferred to the working memory (Pettersson, 2002).
Vision is considered our most powerful sense (Avgerinou & Ericson, 1997); thus, visuals are
great tools for learning tasks that involve memorizing (Pettersson, 2002). According to Ware
(2013), the visual sensory memory or the iconic memory (vision) is the snapshot that the brain
holds for a brief period of time after looking at an object. Usually, it can be stored for less than a
second, except if it is examined and connected to something that is previously stored in the brain.
Visuals have the ability to continually draw from nonvisual information stored in the long-term
memory (Ware, 2013).
After processing the information in the sensory memory, it is delivered to the working
memory. Only limited information can be held in the working memory due to the activation of
17
the concepts from the long term memory to comprehend the incoming information (Driscoll,
2004). The working memory then calls upon long term memory to understand its meaning.
Lastly, the information is retained in the long-term memory after the experience, and can be
saved for a long period of time. When processing new information, humans can draw upon this
previous information (Lankow, Ritchie, & Crooks, 2012). Long term memory receives
information, recalls certain features of the information, and then retrieves the information as
needed (Driscoll, 2004). In the long term memory, information is divided into two processing
systems: episodic and semantic memory. The episodic memory is where images and scenes we
have experienced can be recalled, as well as the thoughts related to those experiences. The
semantic memory gives us the ability to recall information that is not connected to a specific
context or experience, and it could be considered the storage of common knowledge (Pettersson,
2002). It should be noted that knowledge in memory is stored as mental schemas, which are
developed based on information provided by life experiences. Mental schema provides slots of
packets of new knowledge to be placed in the memory (Driscoll, 2004).
Learning focuses on the interaction between short-term and long-term memory components.
It occurs through the transformation of relevant information from the short-term to the long-term
memory, then the retrieval of that information during a task performance. The primary concern
of instructional designers is the function of the working memory. Despite the delivery medium,
relevant information should gain learners’ attention, be held in working memory, and ideally be
in a form that is readily incorporated into long-term memory.
Dual coding theory
This theory enhances the general information processing theory. Paivio (1986)
recognized two different cognitive subsystems: one that processes nonverbal information, for
18
example pictures, and one that processes verbal and auditory languages. According to Paivio
(1983), a memory of a picture is superior to a memory of a word; it is called the “picture
superiority effect.” Paivio’s dual coding theory of the picture superiority effect assumes that
pictures are encoded through two routers, the image subsystem and the verbal subsystem to
support memory. The theory describes how people learn concepts more easily by viewing
pictures than by reading text alone. For more explanation, if a learner is presented with a picture
of a dog and the word “dog,” he or she can store the stimulus to the concept “dog.” To retrieve
the stimulus, the learner can recall the word or the picture separately, or together simultaneously.
When recalling the word, the picture of the dog is saved and can be retrieved at a later time.
Processing information in two different systems can increase the chance of recalling that
information. According to dual coding theory, text and pictures are assumed to be processed
separately by the image and verbal subsystems, and their combination is likely to facilitate the
recall of information (Paivio, 1986).
Cognitive load theory
This theory recognizes the memory structures of the information processing theory,
however, its main focus is the working memory limitations. Cognitive load is the amount of
mental effort required from the human cognitive system to performing a certain task (Sweller,
1988). As stated by Sweller and colleagues (1998), cognitive load is divided to three categories:
intrinsic, extraneous, and germane load. When comes to controlling the cognitive load, intrinsic
cognitive load can be controlled through the educational content type and the learner knowledge
of the content, extraneous and germane cognitive load are controlled by the layout and
organization of the educational material. For more explanation, the intrinsic cognitive load (ICL)
is associated with the content of material not the instructional design of this material, and it hard
19
to reduce compared other types of cognitive load (Madrid et al., 2009). ICL can be controlled by
the materials interactivity, and it is influenced very slightly by instructional design alone
(Brusilovsky, 2004; Lo et al., 2004).
Extraneous cognitive load (ECL) is influenced by elements such as instructional strategies
and instructional message design of the materials (Sweller et al., 1998). When creating
instructional materials, ECL can be reduced by integrating and relating both textual and visual
elements to avoid unnecessary cognitive processes (Cierniak et al., 2009). When talking about
ECL, it is important to mention the cognitive theory of multimedia learning (Mayer, 2005) that
identifies several cognitive processes learners face when constructing mental representation of
their learning experiences. The theory provides several principles for reducing cognitive
processes related to ECL. According, to this theory, engaging in three cognitive processes:
selection of related text for verbal processing, selection of related visual for visual processing,
and then unifying both text and visuals into a clear verbal model and visual model, combining
related components of the verbal and visual models can increase active learning (Mayer, 1997).
One of the six principles of multimedia learning theory is relevant for the use of text and visuals.
The principle called "spatial contiguity principle", which states that “people learn more deeply
from a multimedia message when corresponding words and pictures are presented near rather
than far from each other on the page or screen” (Mayer, 2005, p. 183).
Lastly, germane cognitive load (GCL) which is beneficial to learning and can be
produced by an appropriate instructional design of the educational material (Cierniak et al.,
2009). As claimed by several studies on CLT (Cierniak et al., 2009; Madrid et al., 2009; Sweller
et al., 1998), GCL have a positive and beneficial effect on learning, while both ICL and ECL
have a negative impact on learning. GCL is circuitously influenced by manipulating ECL and is
20
directly linked to schema formation (Sweller et al., 1998). The perception of GCL is that by
using appropriate instructional design strategies learners can be motivated to process information
and construct schemas to be store in the long-term memory (Kolfschoten et al., 2010). To
promoting GCL, strategies such as chunking and sequencing the content, presenting relations
between the content, and creating a rich multimedia learning experience can help learners
understand new information (Fallahkhair, Pemberton, & Griffiths, 2005; Liu, Liao, & Pratt,
2009). Here, it is important to reference metacognition strategies which occurs when learners
participate in a high order of thinking that includes active control over the cognitive processes
involved in learning.
Metacognition: Metacognition is related to the planning, monitoring, evaluating and restoring
performance (Kirsh, 2005). It deals with learners’ awareness about their own thinking and
knowledge of how to acquire information, how to interpret a complex text, and how to use this
knowledge to support memory (Driscoll, 2004). Metacognitive skills depend on the learner, the
materials to be learned, and the strategy used to learn these materials. Therefore, the organization
and arrangement of the learning materials should offer the learner specific directions and
guidance to learn the task on hand. When talking about metacognition, it is important to
reference the idea of affordance which was first introduced by J.J. Gibson (Gibson, 1966,1979).
According to Gibson, the artifacts in our environment hold functional attributes (referred to as
affordances), people can understand, comprehend, and perceive those affordances. When a
learner is interacting with instructional materials that present several types of cue structures, such
as visual cues, the affordances for the use of the materials are revealed.
21
Theories related to the use of visual organizers
Meaningful learning theory
As has been explained at the beginning of this chapter, visual organizers have been
mentioned in the literature by various names. Some of these include advance organizer (Ausubel,
1968) which is a visual presentation in the form of a narrative or outline to use before the
instruction to bridge between what learners know and the instruction on hand. They are used as
a strategy to link and connect old information with new information to support the learning and
recalling of the new information (Ausubel, 1968). Numerous criticisms have been raised in
inconsistency of Ausubel's definition of advance organizer and how it considered to be unclear
and ambiguous (Hartley & Davis, 1976). The definition provided by Ausubel for advance
organizer is logical rather than operational. It explains abstractly what advance organizer is but
does not specify how it is to be developed (Clarke & Bean, 1982).
Another name used to describe visual organizers in the literature is the concept map
(Novak & Gowin, 1984). A concept map is another form of graphic organizer that connects
relationships among concepts using labeled nodes (Novak & Gowin, 1984). What put concept
maps apart from other visual organizer techniques, is their very specific rules. According to
Novak (1998), to increase the operationalization of advance organizers, there are two principles
to extend the effectiveness of advance organizers. The first principle is that in a concept map
information is categorized and identified beginning with the general ideas at the top then
secondary ideas are below. The second principle is that the ideas are connected with arrows and
the arrows are labeled to explain the type of the relationship.
22
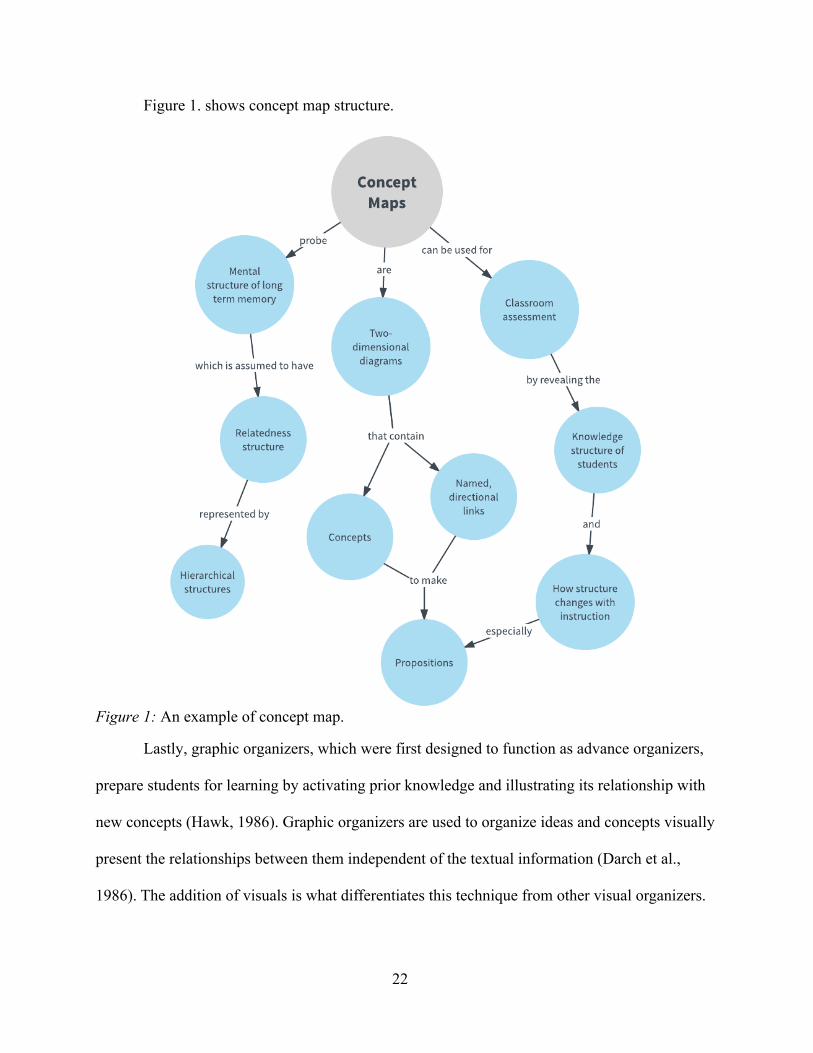
Figure 1. shows concept map structure.
Figure 1: An example of concept map.
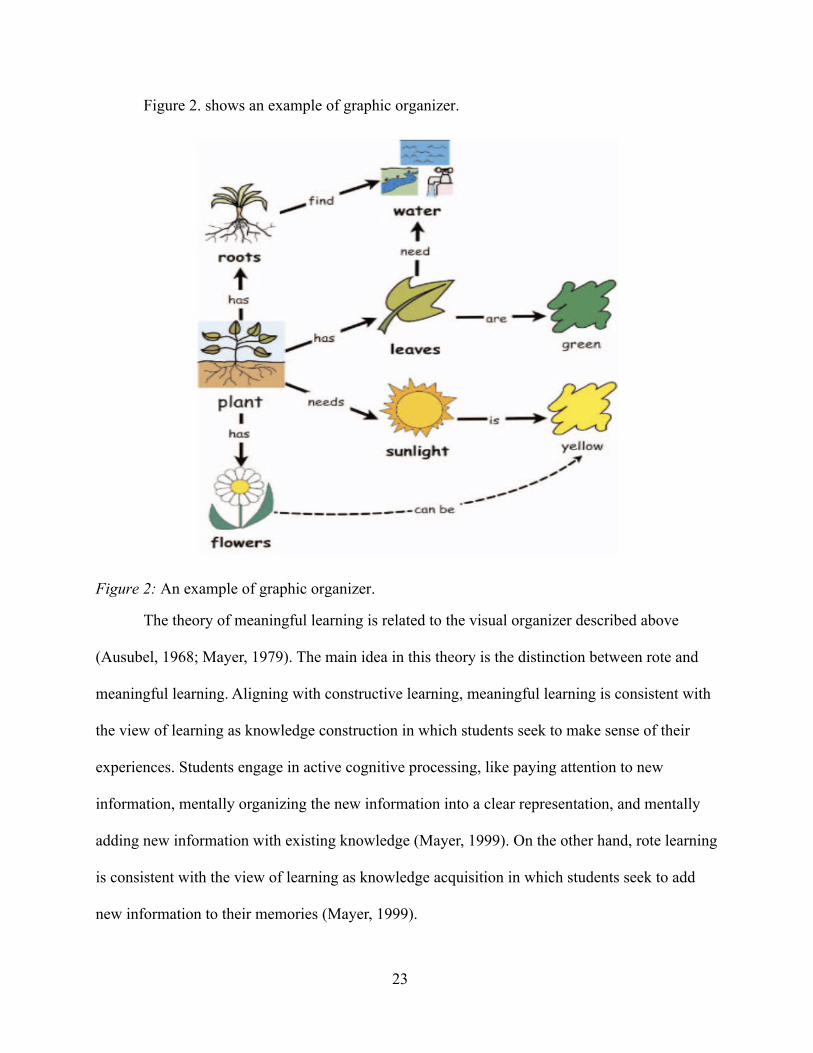
Lastly, graphic organizers, which were first designed to function as advance organizers,
prepare students for learning by activating prior knowledge and illustrating its relationship with
new concepts (Hawk, 1986). Graphic organizers are used to organize ideas and concepts visually
present the relationships between them independent of the textual information (Darch et al.,
1986). The addition of visuals is what differentiates this technique from other visual organizers.
23
Figure 2. shows an example of graphic organizer.
Figure 2: An example of graphic organizer.
The theory of meaningful learning is related to the visual organizer described above
(Ausubel, 1968; Mayer, 1979). The main idea in this theory is the distinction between rote and
meaningful learning. Aligning with constructive learning, meaningful learning is consistent with
the view of learning as knowledge construction in which students seek to make sense of their
experiences. Students engage in active cognitive processing, like paying attention to new
information, mentally organizing the new information into a clear representation, and mentally
adding new information with existing knowledge (Mayer, 1999). On the other hand, rote learning
is consistent with the view of learning as knowledge acquisition in which students seek to add
new information to their memories (Mayer, 1999).
24
Meaningful learning emphasizes the importance of determining students’ prior
knowledge in order to build upon their understanding (Ausubel, 1968). According to this theory,
learning process happens when new concepts are connected to existing ones in conceptual
structure of learner (Kowata et al., 2010). Therefore, new concepts are learned essentially when
connected to the learner’s conceptual structure in a more logical way. Ausubel stressed that when
the learner is presented with the details of a lesson in a way that the details are incorporated into
one another in a relational way, the students were expected to learn more (Ausubel, 1962, 1963).
Novak (1998) added that meaningful learning occurs when the following three conditions are
present:
1. Prior knowledge: learners are required to identify some information that connects to
the information on hand; their prior knowledge have to suit the new presented knowledge.
2. Meaningful material: information to be learned is appropriate to the learners, contains
interesting topics, and appropriately organized.
3. The learner must choose to learn meaningfully: learners decide to interact with the new
information and connect it to an existing knowledge they learned from a different experience.
Novak (1998), also emphasized the process of meaningful learning, and how new
information can be linked to existing concepts in the cognitive structure. Meaningful learning
results when the learner chooses to relate new information to ideas the learner already knows
(Novak, 1998, p. 19). Thus, students who know more to begin with learn more at the end of a
course; this is due to having a stronger start that made them better able to make sense of the
things they were taught. Visual organizers are used to support more meaningful learning and
assist in encoding and retention of new material by making abstract concepts more concrete and
connecting new information with learners’ prior knowledge (Ausubel, 1968; Mayer, 1979)
25
Theories related to the use of interactivity and learner control
Cognitive theory of Multimedia learning
As has been mentioned at the beginning of this chapter, the terms interactivity and learner
control are used interchangeably in the literature on computer-based instruction. The phrase
interactivity is most often used to describe the flexibility of any illustration (e.g., animation), and
learner control is centered on the learner’s capability to modify some representations and have
multiple interactions with these representations (i.e., sequencing, selection of content) (Scheiter
& Gerjets, 2007). Thus, interactivity by definition indicates that the learners have control over
the presentation of information. One of the most prominent theories in the field and the one
related to interactivity and learner control is Richard Mayer's theory of multimedia learning.
According to Mayer (2004), “Multimedia learning involves learning from words and pictures
and includes learning from textbooks that contain text and illustrations, computer-based lessons
that contain animation and narration, and face-to-face slide presentations that contain graphics
and spoken words.”
Mayer's theory of multimedia learning (Mayer, 2009) has provided a range of principles,
one of which is learner-centered approach, which would also connect to the learner control
principle. This principle is all about allowing learners to have control over the information
presented to them and independently chosen information. Moreno and Mayer (2007) proposed
three aspects of interactivity, which are: pacing (controlling speed of information presentation),
manipulating (controlling aspects of information presentation), and navigating (selecting
information sources). According to Scheiter (2014), “Giving learners control over their
instruction by allowing them to pace, sequence, and select information aids learning if learners
possess high levels of prior knowledge and if they receive additional instructional support to
26
orient themselves in the learning environment and to self-regulate their learning” (p. 487). The
Learner Control Principle can be extremely effective with students as it allows them to be more
selective over what they need to learn and their particular preferred focus. Learners “can adapt
the instruction to their goals, needs, and preferences, thereby creating individualized instruction”
(Scheiter, 2014, p. 495).
Evidence-Based Studies to Support the Use of ICO
After explaining how ICOs can support cognitive functions according to several learning
theories, it is important to understand what kind of research has been conducted to support this
type of presentation.
The use of course syllabus
Course syllabi play central role in guiding the learning process in higher education
institutions; thus, they play a significant role in improving the quality of institutions’ education.
Course syllabus can offer details of what will be covered in the course, what students are/would
be expected to do, and how learning outcomes are/will be measured and are often examined as
part of accreditation reviews by professional organizations (Parkes & Harris, 2002). According to
Hess and Whittington (2003), “It is important and fundamental that educators provide a
framework for the course they will be teaching. Most often that framework is provided to the
students through a course syllabus.” From the learners’ point of view, course syllabus offers
security when comes to the direction of the course and what is and expected from to succeed in
that course (McKeachie, 1978, 1999).
Course syllabus main purpose is to offer the context and summary of a course and
explain learners’ expectations to complete the course. As stated by Habanek (2005), course
syllabi are contracts between the instructor and the learners, they include course topics, learning
27
objectives, grading policies, and institute policies. Additionally, they are learning tools to prepare
learners for course assignments, monitor learners’ growth, and explain how the course fits with
real life experiences. Course syllabi serve three main purposes: as a contract between the
instructor and the student that outlines the expectations of both regarding course requirements
including assignments, as a permanent record of what was taught, and as a learning tool (Parkes
& Harris, 2002). Smith and Razzouk (1993) stated that students tend to view course syllabi on a
weekly basis, which implies the important role they play in attracting learners’ attention toward
the course.
Looking at course syllabi from the instructors’ side, they assist in developing and
organizing their vision for the course (Appleby, 1999). Course syllabi are documents that guide
the learning process and an important part of the course building and evaluation. They can
function as a planning tool for faculty members to organizes students' work during the course,
and can help in the planning and achievement of the course goals. To sum up, course syllabi are
shown to benefit the essential role of the instructors’ courses, which is supporting and promoting
interactive, effective, and purposeful learning (Hess & Whittington, 2013).
The use of visual organization
All advance organizers (Ausubel, 1968), concept maps (Novak & Gowin, 1984), and
graphic organizers (Hawk, 1986) are deeply rooted in the meaningful learning theory. The
obvious purpose of these visual organizers is to connect high order information and low order
information and show the relationship between the two to the learners (Armbruster & Anderson,
1981). Compared to text-only format, the benefit of this visual format is that it visually presents
the high-level organizational structure of information, pinpointing the main concepts and
identifying their interrelationships (Meyer, 1975,1977,1980). Moreover, these visual organizers
28
intend to facilitate learning and recalling of new material to support meaningful learning by
transferring abstract concepts to concrete concepts and connecting new information with old
existing information (Ausubel, 1968; Mayer, 1979).
Evidently the most commonly examined learning measure in the literature of visual
organizers is information comprehension. The majority of those studies reported that visual
organizers, specifically graphic organizers, are used to improve comprehension. Furthermore,
various meta-analyses studies sustained these comprehension improvements (Ciullo, 2013;
Dexter & Hughes, 2011; Dexter, Park, & Hughes, 2011; Moore & Readence, 1984). In these
studies, researchers detected a minor, however, consistent effects on knowledge comprehension.
Moreover, the findings also show a gain in vocabulary knowledge. For example, Moore and
Readence’s (1984) meta-analysis proposes that gains in vocabulary knowledge after the use of
graphic organizer could be greater than gains in comprehension. Likewise, a meta-analysis by
Dexter and Hughes (2011) and Dexter and colleagues’ (2011) reported a moderate to high effect
in vocabulary knowledge after the use of graphic organizers.
A new area of research is the presentation of information in visual organizer using of
digital technology-based approaches. They can be used by both learners and instructors. Digital-
based graphic organizers allow learners to design and control visual representations of
information and provide different ways to display that information (Cañas & Novak, 2010).
When learners use graphic organizers to build more abstract comparisons, evaluations, and
conclusions, it allows them to play an active role in their learning. On the other hand, graphic
organizers allow instructors to present and clarify relationships between content and sub-content
and show how it is related to other content areas. A meta-analysis by Ciullo’s (2013) examined
the use of digital-based graphic organizers by students with learning disabilities, the study found
29
a high effect in social studies measures and moderate effects in reading, writing, and information
comprehension.
Lastly, after exploring visual organizers’ literature and research that used them in a
similar fashion as ICO will be used. Robinson and Schraw (1994) stated that visual organizers
can facilitate learners' understanding of conceptual "big picture" patterns than linear
presentations. When starting a new course, a student may have low to no prior knowledge of the
course content. Lambiotte and Dansereau (1992) suggested that by introducing visual organizers
learners with low prior knowledge of the content can benefit more than those with high prior
knowledge. Moreover, Mayer (1979) assumed that the specific macrostructure signaled by a map
might guide the knowledge construction of less knowledgeable learners. Additionally, as stated
by Shaw and colleagues (2012), “An overview effect suggests that GOs (Graphic organizers) are
most beneficial when they can activate learners' prior knowledge or schema before text is
presented.”
The use of interactivity and learner control
Learner control is the level to which learners are given control over several instructional
features during a lesson (Reeves, 1993). For more explanation, a course with a high degree of
learner control may allow learners to select what content in the lesson they want to view. Merrill
(1975) recommended given the learner control over the sequence of instructional material.
Through learner control, learners can be freed to explore how to learn new content by make
instructional choices and experience, the results of those choices offer them the ability to develop
strategies for learning in different conditions. Additional, Merrill (1983) Component Display
Theory and Reigeluth and Stein (1983) Elaboration Theory suggested that learner control can
positively influence the effectiveness and efficiency of learning.
30
Interactive features, such as learner control over the pace and content may influence the
learner’s motivation. Several motivation design models such as ARCS (Keller, 1983) and
MUSIC (Jones, 2009) suggested using learner control to motivate learners. Keller (1979) has
established that when students are given some control over aspects of their learning, they are
more likely to have positive feelings towards the content. Moreover, Jones (2009) stressed that
“instructors should design their courses to empower students. Empowerment refers to the amount
of perceived control that students have over their learning.” (Jones, 2009). In an experiment
conducted by Chen and Catrambone (2014), they found that learners were more motivated and
engaged in the learning process when using interactivity, which can also help them produce
meaningful learning.
As stated by Patterson (2000) learner control supports a deeper processing of the
information presented, due to its ability to influence learners to examine the information then
choose what information can assist them in achieve their learning goals. Additionally, the
multiple ways learners can access the information provide them with the opportunity to identify
the relationships between different information and incorporate them with their prior knowledge
(Scheiter & Gerjets, 2007). According to Jonassen and Grabinger (1990), learner control is
expected to increase learners’ engagement with the information and aid them in building their
own understanding of it instead of being passive receivers of the information.
Discussion
This literature review defined ICO as objects that include both text and visual
representation of a traditional course syllabus. They combine visual elements, such as timelines,
drawings, charts, graphs, maps, or pictures and links to show the outline and organization of
main course topics while presenting the learners with an active control over the amount of course
31
information covered. ICO give learners control over what information they can view and the
ability to acquire more detailed information as needed. Following that, many learning theories
connected to ICO were explored: (1) theories related to the use of text and visuals, (2) theories
related to the use of visual organizers, and (3) theories related to the use of interactivity and
learner control. Lastly, evidence-based studies were presented to support this type of
presentation.
After reviewing the literature, the development of a learning tool, such as ICO, can guide
the learners through any course. ICO serve as a map to navigate any online or face-to-face course
and ease the process of familiarization with a new course. From the learners’ point of view, it is
their first glance at the course and/or instructor and, often, it is the learners’ first encounter with
the discipline. An ICO function as a course syllabus and learners may spend a great deal of time
going back and forth to this artifact during the semester on a weekly basis. Looking at an ICO at
the beginning can give them the chance to see how the content is related to each other and can
open their eyes to the ending gain of the course. To add, ICO is the first impression learners have
of the instructor and course content, and it can help in setting the tone of the course. In ICOs, the
visual organization of information display features can assist learners in make wise decisions
about the use of their time in a course.
From the instructors’ point of view, considering ICO as a course guide to present course
material in clear and rich way is the first steps in creating a creative classroom learning
environment. Furthermore, as presented in the literature in the use of text and visuals and visual
organizers, the proper use of headers, visuals, and layout strategies can enhance syllabi and make
them more attractive and user-friendly. With the additions of interactivity and learner control,
learners can realize that they are actively participating in the learning process instead of being

32
passive recipients of information (Littlefield, 1999a). ICO can present the learners with an active
relationship with the material, which may increase their engagement and motivation in the
learning process (Khalifa & Lam, 2002). ICO can explain course expectations clearly and
pleasantly to encourage and motivate learners with the anticipation of positive learners’
outcomes.
33
Chapter 3: Research Methodology
Introduction
This design and development study aims to create a set of theoretically grounded
guidelines which can assist in crafting ICO. These guidelines were created using a design and
development research approach. To design, develop, and validate this set of theoretically
grounded guidelines, a series of steps was followed. These steps are: (1) Analysis phase,
conducting a literature review to identify the component of ICO and a specific theoretical
foundation for developing the guidelines; (2) Design phase, building the first draft of the ICO (3)
Development phase, developing the guidelines and a rubric to evaluate them; and (4) Validation
phase, reporting the guidelines validation procedure, revise the guidelines based on expert
reviewers’ feedback, and report the results.
Purpose of the Study
The purpose of this design and development study is to develop theoretical guidelines
that can help educators in creating ICO. The aim of the guidelines is to assist in designing ICO,
considering their capability to provide visual to help students see the “big picture” of how a
course is organized, clearly articulate the connections between course content, and serve as road
maps that define the content and context of learning in a courses. The guidelines are designed
and developed with a theoretically grounded foundation from several cognitive information
processing theories. Furthermore, the guidelines assist in crafting ICO content, integrating both
text and visuals while they support each other, and minimizing cognitive load.
34
Research Questions
1. What are the components of an effective Interactive Course Organizer?
2. What considerations should be made to design Interactive Course Organizers?
3. How can Interactive Course Organizer guidelines be designed to ensure practical
application?
Research Design:
This is a design and developmental research, which is a research that is directly attached to
instructional development. According to Richey and Klein (2007), design and developmental
research is:
The systematic study of design, development, and evaluation processes with the aim of
establishing an empirical basis for the creation of instructional and non-instructional
products and tools and new or enhanced models that govern their development. (p. 1)
As explained by Richey and Klein (2007) design and development research can be
classified into two categories product and tool research (formerly referred to as Type I research)
and model research (formerly referred to as Type II research). There are different research
methods that can be used for each type of design and development research if it is a product and
tool research or model research. Richey and Klein (2007) provided a more details and
descriptions in the common methods employed in design and development research shown in the
table below (Table 2).
35
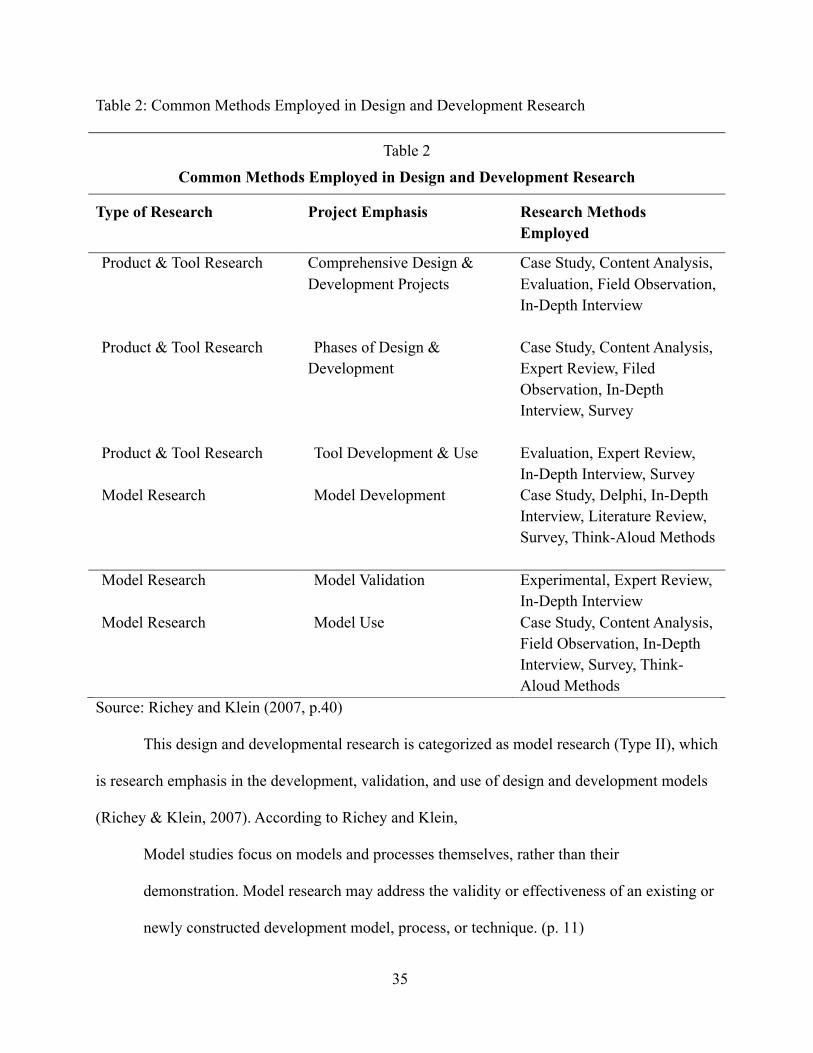
Table 2: Common Methods Employed in Design and Development Research
Table 2
Common Methods Employed in Design and Development Research
Type of Research Project Emphasis Research Methods Employed
Product & Tool Research Comprehensive Design & Development Projects
Case Study, Content Analysis, Evaluation, Field Observation, In-Depth Interview
Product & Tool Research Phases of Design & Development
Case Study, Content Analysis, Expert Review, Filed Observation, In-Depth Interview, Survey
Product & Tool Research Tool Development & Use Evaluation, Expert Review, In-Depth Interview, Survey
Model Research Model Development Case Study, Delphi, In-Depth Interview, Literature Review, Survey, Think-Aloud Methods
Model Research Model Validation Experimental, Expert Review, In-Depth Interview
Model Research Model Use Case Study, Content Analysis, Field Observation, In-Depth Interview, Survey, Think-Aloud Methods
Source: Richey and Klein (2007, p.40)
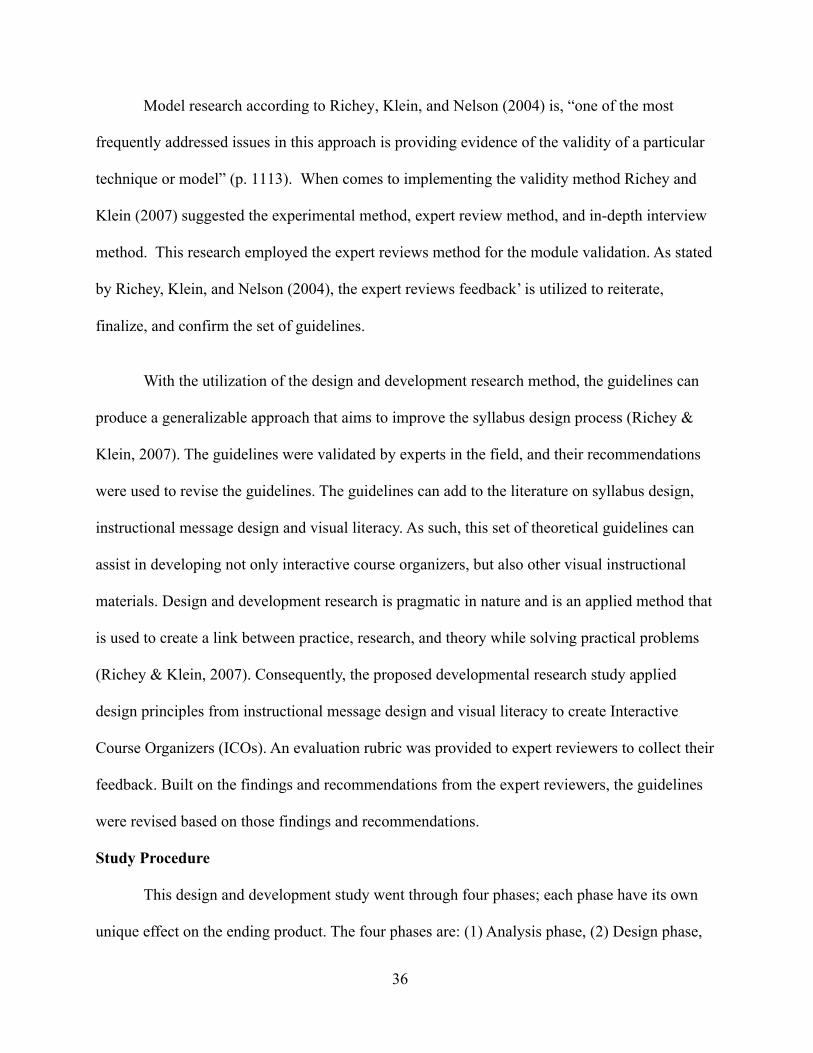
This design and developmental research is categorized as model research (Type II), which
is research emphasis in the development, validation, and use of design and development models
(Richey & Klein, 2007). According to Richey and Klein,
Model studies focus on models and processes themselves, rather than their
demonstration. Model research may address the validity or effectiveness of an existing or
newly constructed development model, process, or technique. (p. 11)
36
Model research according to Richey, Klein, and Nelson (2004) is, “one of the most
frequently addressed issues in this approach is providing evidence of the validity of a particular
technique or model” (p. 1113). When comes to implementing the validity method Richey and
Klein (2007) suggested the experimental method, expert review method, and in-depth interview
method. This research employed the expert reviews method for the module validation. As stated
by Richey, Klein, and Nelson (2004), the expert reviews feedback’ is utilized to reiterate,
finalize, and confirm the set of guidelines.
With the utilization of the design and development research method, the guidelines can
produce a generalizable approach that aims to improve the syllabus design process (Richey &
Klein, 2007). The guidelines were validated by experts in the field, and their recommendations
were used to revise the guidelines. The guidelines can add to the literature on syllabus design,
instructional message design and visual literacy. As such, this set of theoretical guidelines can
assist in developing not only interactive course organizers, but also other visual instructional
materials. Design and development research is pragmatic in nature and is an applied method that
is used to create a link between practice, research, and theory while solving practical problems
(Richey & Klein, 2007). Consequently, the proposed developmental research study applied
design principles from instructional message design and visual literacy to create Interactive
Course Organizers (ICOs). An evaluation rubric was provided to expert reviewers to collect their
feedback. Built on the findings and recommendations from the expert reviewers, the guidelines
were revised based on those findings and recommendations.
Study Procedure
This design and development study went through four phases; each phase have its own
unique effect on the ending product. The four phases are: (1) Analysis phase, (2) Design phase,
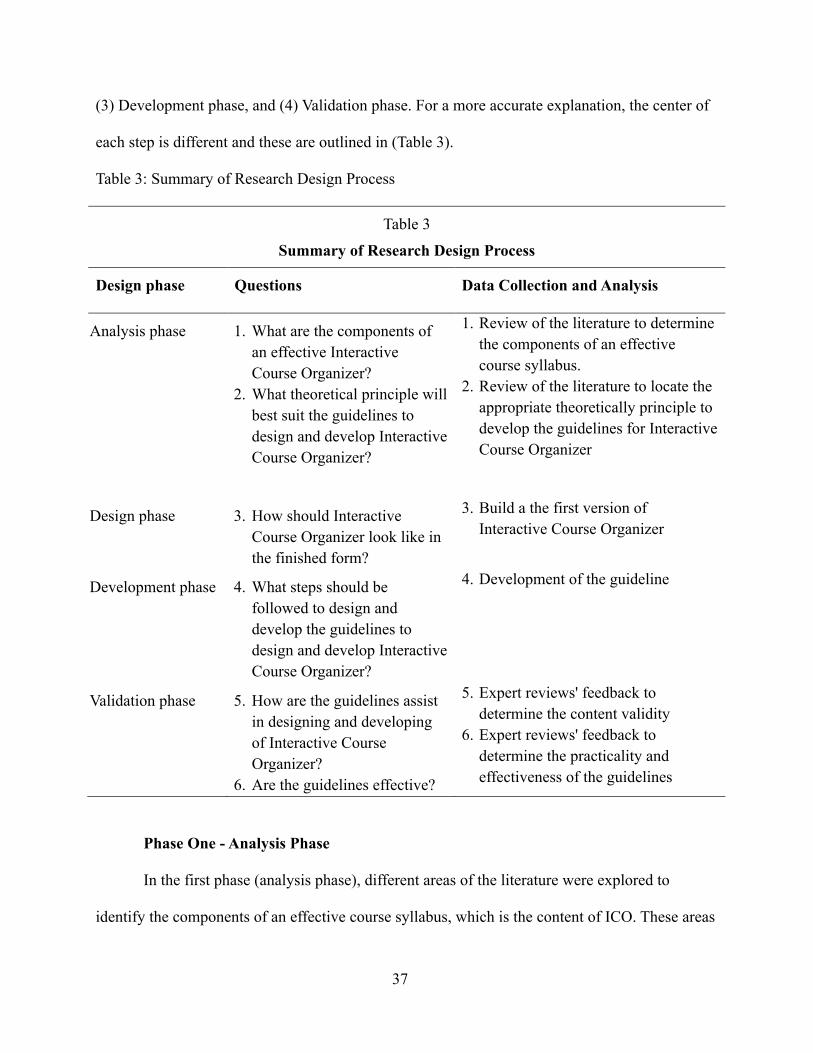
37
(3) Development phase, and (4) Validation phase. For a more accurate explanation, the center of
each step is different and these are outlined in (Table 3).
Table 3: Summary of Research Design Process
Table 3
Summary of Research Design Process
Design phase Questions Data Collection and Analysis
Analysis phase 1. What are the components of an effective Interactive Course Organizer?
2. What theoretical principle will best suit the guidelines to design and develop Interactive Course Organizer?
1. Review of the literature to determine the components of an effective course syllabus.
2. Review of the literature to locate the appropriate theoretically principle to develop the guidelines for Interactive Course Organizer
Design phase 3. How should Interactive Course Organizer look like in the finished form?
3. Build a the first version of Interactive Course Organizer
Development phase 4. What steps should be followed to design and develop the guidelines to design and develop Interactive Course Organizer?
4. Development of the guideline
Validation phase 5. How are the guidelines assist in designing and developing of Interactive Course Organizer?
6. Are the guidelines effective?
5. Expert reviews' feedback to determine the content validity
6. Expert reviews' feedback to determine the practicality and effectiveness of the guidelines
Phase One - Analysis Phase
In the first phase (analysis phase), different areas of the literature were explored to
identify the components of an effective course syllabus, which is the content of ICO. These areas
38
covered the course syllabus literature to identify the main component of ICO, so they function as
course guide, visual organizer literature to justify the visual organization, and the best way to
incorporate interactivity and learner control was explored too. Also, another literature review
was conducted to locate the specific theoretical foundation for developing the guidelines. Then, a
set of evidences to justify the proposed theoretical foundation was provided. For more
explanation, the analysis phase is all about conducting a thorough analysis of the available
literature to identify the highly developed and theoretically rooted principles in the literature of
designing and developing visual instructional materials. Many areas of instructional message
design and visual literacy was explored to identify the best principles to be used in building these
guidelines. Since ICOs are new and inventive tools that have not been developed yet, in this case
Richey and Klein (2007) suggested, “The researcher must still identify literature that is relevant
to the foundational theory of the project, even though the link may be indirect”. After the
components of ICO are identified and the set of principles are located there is a need to justify
the use of these components and principles, which was done by supporting them with empirical
studies to ensure they are appropriate to use, and how the can be aligned with the purposed used
of the new learning tool in this study.
Phase Two - Design Phase
In the second phase (design phase), the actual ICO was built since it has been mentioned
in the analysis phase ICO is a new learning tool that has not been developed yet. To develop an
actual ICO a sample of effective course syllabus was identified and was converted into an ICO.
To ease the process of the conversion, the identified principles are used in each step of the
production. First, the content of the course syllabus was broken down into a different component,
and the importance of each component are categorized and classified. Second, looking at each
39
category to determent the best way to visually present the categorized component. Then, utilizing
the located principles to develop the ICO.
After the ICO was developed it was uploaded to Canvas, which is a course management
system to see how it will be function and operationalize. The design phase is utilized to describe
the process of embedding the components and the theoretical principles to ICO. This includes
application of theoretical knowledge to the development of the ICO. The aim of the design phase
was to identify factors which would contribute in a successful implementation of the ICO. As
been stressed by Nunamaker and colleagues (1990), It is essential for researchers to include any
environmental factors that may affect the tool meeting its objectives.
Phase Three – Development Phase
In the third phase (development phase), the process of developing the guidelines begins
and the theoretical foundation was applied to the set of guidelines and a description of the
guidelines are completed. As stated by Richey and Seels (1994), “Development is the process of
translating the design specifications into physical form” (p. 35). In this phase, starting the
selection of any existing resources, adapting, editing, and then adjusting these resources to fit the
set of guidelines to aid the guidelines’ development and creation process. In some cases, the need
for designing new resources may occur depending on what best suits the purpose of these
guidelines. After developing a description of the guidelines’ completed form, a prototype of the
guidelines was ready to be validated. To ensure that the guidelines are appropriately validated, an
evaluation rubric was developed too, to confirm which theoretical principle each guideline
followed and aligned with it. Following this step was sending the guidelines to the expert
reviewers with the sample of ICO developed in phase two and a rubric for their feedback,
suggestions, and comments so it can be utilized in validating the guidelines.
40
Phase Four – Validation Phase
In the last and final phase (validation phase), the data gathered from the expert reviewers
were reported, incorporated, and included to revise the guidelines based on their feedback. This
phase evaluates the effectiveness and efficiency of the guidelines. The phase of revision and
evaluation involves looking at the feedbacks, suggestions, and recommendations from the expert
reviewers. From this set of data collection, improvements to the final guidelines’ form were
made, and the final version of the guidelines to design and develop ICOs are presented in the
study.
Characteristics of Expert Reviewers
To provide appropriate and effective feedback, the expert reviewers who reviewed and
validated the guidelines for ICOs needs to have specific characteristics. First, they were
identified based on their expertise in instructional message design, visual literacy, effective
development of visual instructional materials (online or printed), and syllabus design. Second,
they have a solid knowledge base in learning theories related to the use of text and visuals. After
the expert reviewers were identified, obtaining the approval from the Institutional Review Board
(IRB) was the next step. The expert reviewers were asked to participate in the study via an email
that explained and clarified the study’s purpose and how their participation will be beneficial to
the validation of these guidelines.
Instrumentation
A website was created that includes an expert reviewers package with different materials
to go over before validating the guidelines. The website contains five pages; (1) information
about the study, (2) example of an Interactive Course Organizer (ICO), (3) guidelines to design
and develop ICOs, (4) consent form, (5) an evaluation rubric to provide their feedback. The
41
evaluation rubric was developed electronically using Google Form, the first page of the rubric is
the consent form. Then the rubric was organized into 6 sections and they are as follows: sections
1 asked about the application of ICOs, with questions that address their use by the target users
and if they achieved their goals with effectiveness, efficiency and satisfaction. Sections 2
includes questions concerning the overall design and organization of the guidelines and questions
about the simplicity as well as stability of the guidelines. Sections 3 to 5 contain question for
each phase in the design and development process; the analysis, design, and development phase
of the ICOs. In the last section, section 6 covers the application of the guidelines with questions
about their implement by educators, the intended user audience. Each section includes a
paragraph explaining and clarify the purpose and rational for the section. To get appropriate and
effective feedback, quantitative and qualitative data was gathered. Each section had a five-point
agree-disagree scale (strongly agree to strongly disagree) for the quantitative data collection, and
an open-ended question asking for comments and suggestions for the quantitative data collection.
Data sources
The literature was the main source of data to develop this set of guidelines. The study
involved an examination of literature in different areas to determine the components of an
effective course syllabus and instructional message design and visual literacy to locate what
principles exist for designing ICOs. Therefore, three important areas were considered when
designing these guidelines: course syllabus literature to identify the main component of ICOs, so
they function as course guide, visual organizer literature to justify the visual organization, and
the best way to incorporate interactivity and learner control will be explored.
The second source of data to develop this set of guidelines is the expert reviewers’
feedback, suggestions, and recommendations. As mentioned in the instrumentations section, both
42
quantitative and qualitative data were gathered. Therefore, the feedback and recommendations
from expert reviewers were analyzed and incorporated in the final guidelines form.
Data Analysis
After the quantitative and qualitative data collection from the expert reviewers, centered
on the guidelines created and a rubric, the collected data were carefully analyzed to determine
the effectiveness and validity of the guidelines designed for Interactive Course Organizers
(ICOs), the feedback, suggestions, and recommendations from the expert reviewers were
considered and included in the final version of the guidelines.
43
Chapter 4: The Design and Development of the Guidelines
Introduction
This chapter describes the design and development process that lead to building the
guidelines for creating an Interactive Course Organizers ICO. As mentioned in the previous
chapter, this design and developmental research is categorized as model research (Type II). This
study followed four phases, and each phase had a result that contributes to the final product. The
four phases are the (1) analysis phase, (2) design phase, (3) development phase, and (4)
validation phase. In the analysis phase, a literature review was conducted to identify the standard
components of a course syllabus, and utilized and transform these into the components of an
ICO. To aid this transformation, another literature investigation was completed to locate specific
theoretical principles to design and develop the guidelines that can assist in building an ICO. In
the second phase (design phase), the results gathered and collected from the analysis phase was
used to create the first version of the ICO. The development phase covers a description of the
completed guidelines form and a rubric developed to verify how each of the theoretical
principles aligned with the guideline. Finally, the validation phase includes the feedback from
expert reviewers to determine the content validity and practicality, and the effectiveness of the
guidelines. The following chapter focuses on the procedures and the methods used to design and
develop this site of guidelines.
Study Procedure
Analysis Phase
During this phase of the study, an analysis of literature review was conducted and data
was collected to determine the components of a practical course syllabus, as well as identify the
theoretical principle used to design and develop the ICO guidelines. After a thorough
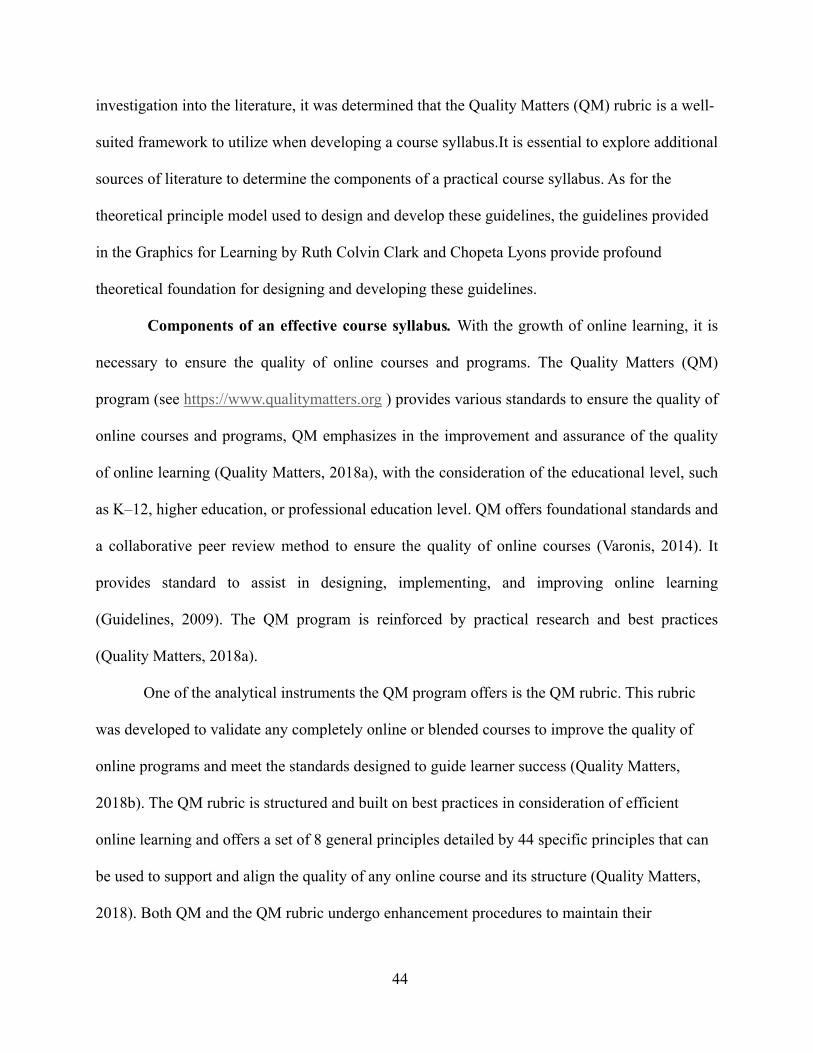
44
investigation into the literature, it was determined that the Quality Matters (QM) rubric is a well-
suited framework to utilize when developing a course syllabus.It is essential to explore additional
sources of literature to determine the components of a practical course syllabus. As for the
theoretical principle model used to design and develop these guidelines, the guidelines provided
in the Graphics for Learning by Ruth Colvin Clark and Chopeta Lyons provide profound
theoretical foundation for designing and developing these guidelines.
Components of an effective course syllabus. With the growth of online learning, it is
necessary to ensure the quality of online courses and programs. The Quality Matters (QM)
program (see https://www.qualitymatters.org ) provides various standards to ensure the quality of
online courses and programs, QM emphasizes in the improvement and assurance of the quality
of online learning (Quality Matters, 2018a), with the consideration of the educational level, such
as K–12, higher education, or professional education level. QM offers foundational standards and
a collaborative peer review method to ensure the quality of online courses (Varonis, 2014). It
provides standard to assist in designing, implementing, and improving online learning
(Guidelines, 2009). The QM program is reinforced by practical research and best practices
(Quality Matters, 2018a).
One of the analytical instruments the QM program offers is the QM rubric. This rubric
was developed to validate any completely online or blended courses to improve the quality of
online programs and meet the standards designed to guide learner success (Quality Matters,
2018b). The QM rubric is structured and built on best practices in consideration of efficient
online learning and offers a set of 8 general principles detailed by 44 specific principles that can
be used to support and align the quality of any online course and its structure (Quality Matters,
2018). Both QM and the QM rubric undergo enhancement procedures to maintain their
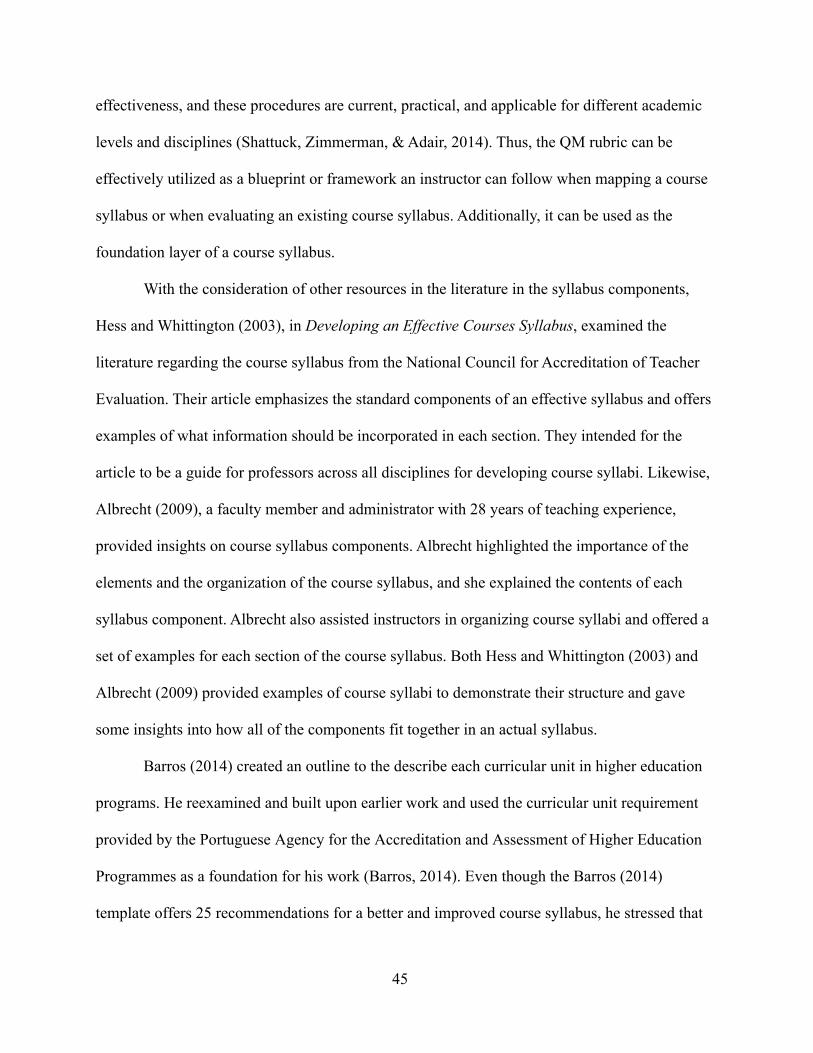
45
effectiveness, and these procedures are current, practical, and applicable for different academic
levels and disciplines (Shattuck, Zimmerman, & Adair, 2014). Thus, the QM rubric can be
effectively utilized as a blueprint or framework an instructor can follow when mapping a course
syllabus or when evaluating an existing course syllabus. Additionally, it can be used as the
foundation layer of a course syllabus.
With the consideration of other resources in the literature in the syllabus components,
Hess and Whittington (2003), in Developing an Effective Courses Syllabus, examined the
literature regarding the course syllabus from the National Council for Accreditation of Teacher
Evaluation. Their article emphasizes the standard components of an effective syllabus and offers
examples of what information should be incorporated in each section. They intended for the
article to be a guide for professors across all disciplines for developing course syllabi. Likewise,
Albrecht (2009), a faculty member and administrator with 28 years of teaching experience,
provided insights on course syllabus components. Albrecht highlighted the importance of the
elements and the organization of the course syllabus, and she explained the contents of each
syllabus component. Albrecht also assisted instructors in organizing course syllabi and offered a
set of examples for each section of the course syllabus. Both Hess and Whittington (2003) and
Albrecht (2009) provided examples of course syllabi to demonstrate their structure and gave
some insights into how all of the components fit together in an actual syllabus.
Barros (2014) created an outline to the describe each curricular unit in higher education
programs. He reexamined and built upon earlier work and used the curricular unit requirement
provided by the Portuguese Agency for the Accreditation and Assessment of Higher Education
Programmes as a foundation for his work (Barros, 2014). Even though the Barros (2014)
template offers 25 recommendations for a better and improved course syllabus, he stressed that
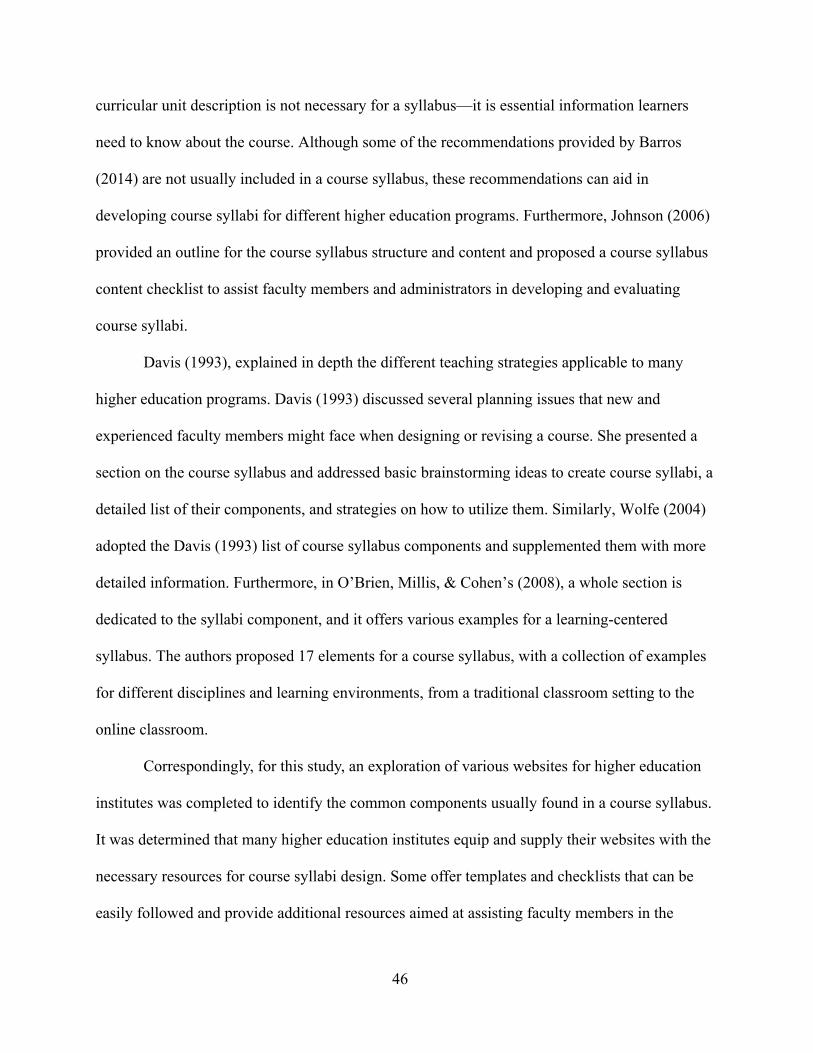
46
curricular unit description is not necessary for a syllabus—it is essential information learners
need to know about the course. Although some of the recommendations provided by Barros
(2014) are not usually included in a course syllabus, these recommendations can aid in
developing course syllabi for different higher education programs. Furthermore, Johnson (2006)
provided an outline for the course syllabus structure and content and proposed a course syllabus
content checklist to assist faculty members and administrators in developing and evaluating
course syllabi.
Davis (1993), explained in depth the different teaching strategies applicable to many
higher education programs. Davis (1993) discussed several planning issues that new and
experienced faculty members might face when designing or revising a course. She presented a
section on the course syllabus and addressed basic brainstorming ideas to create course syllabi, a
detailed list of their components, and strategies on how to utilize them. Similarly, Wolfe (2004)
adopted the Davis (1993) list of course syllabus components and supplemented them with more
detailed information. Furthermore, in O’Brien, Millis, & Cohen’s (2008), a whole section is
dedicated to the syllabi component, and it offers various examples for a learning-centered
syllabus. The authors proposed 17 elements for a course syllabus, with a collection of examples
for different disciplines and learning environments, from a traditional classroom setting to the
online classroom.
Correspondingly, for this study, an exploration of various websites for higher education
institutes was completed to identify the common components usually found in a course syllabus.
It was determined that many higher education institutes equip and supply their websites with the
necessary resources for course syllabi design. Some offer templates and checklists that can be
easily followed and provide additional resources aimed at assisting faculty members in the
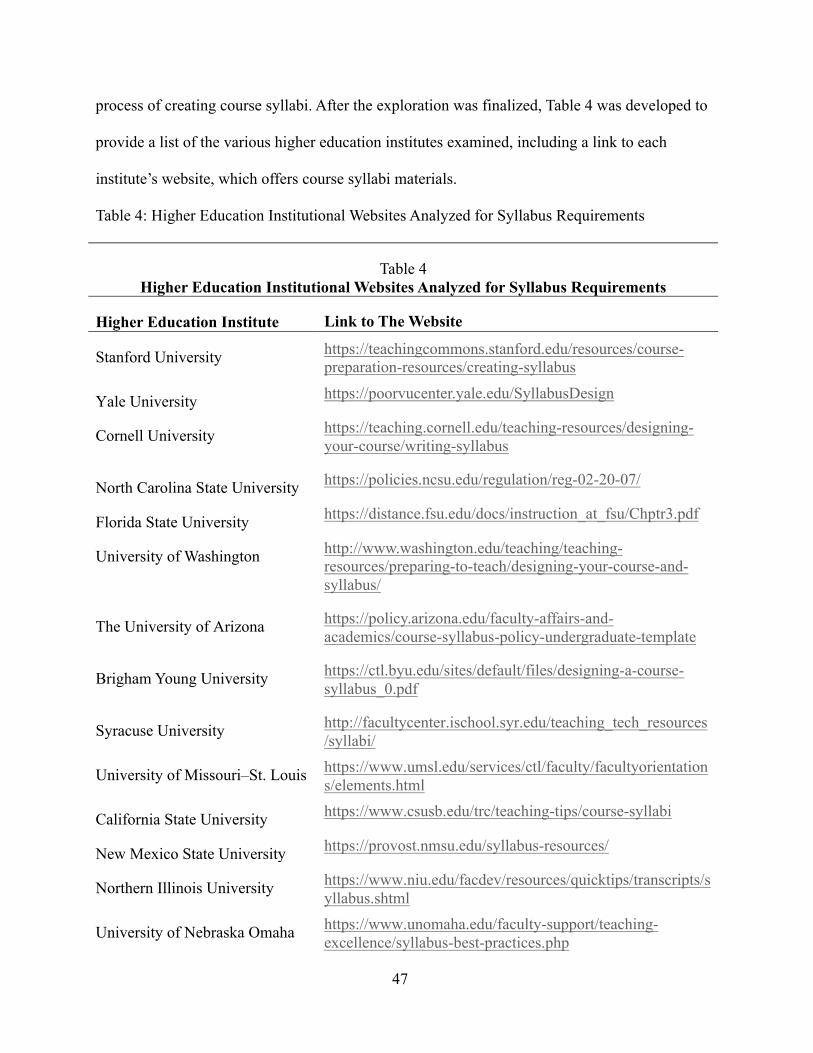
47
process of creating course syllabi. After the exploration was finalized, Table 4 was developed to
provide a list of the various higher education institutes examined, including a link to each
institute’s website, which offers course syllabi materials.
Table 4: Higher Education Institutional Websites Analyzed for Syllabus Requirements
Table 4 Higher Education Institutional Websites Analyzed for Syllabus Requirements
Higher Education Institute Link to The Website
Stanford University
https://teachingcommons.stanford.edu/resources/course-preparation-resources/creating-syllabus
Yale University
https://poorvucenter.yale.edu/SyllabusDesign
Cornell University
https://teaching.cornell.edu/teaching-resources/designing-your-course/writing-syllabus
North Carolina State University
https://policies.ncsu.edu/regulation/reg-02-20-07/
Florida State University
https://distance.fsu.edu/docs/instruction_at_fsu/Chptr3.pdf
University of Washington
http://www.washington.edu/teaching/teaching-resources/preparing-to-teach/designing-your-course-and-syllabus/
The University of Arizona
https://policy.arizona.edu/faculty-affairs-and-academics/course-syllabus-policy-undergraduate-template
Brigham Young University
https://ctl.byu.edu/sites/default/files/designing-a-course-syllabus_0.pdf
Syracuse University
http://facultycenter.ischool.syr.edu/teaching_tech_resources/syllabi/
University of Missouri–St. Louis
https://www.umsl.edu/services/ctl/faculty/facultyorientations/elements.html
California State University
https://www.csusb.edu/trc/teaching-tips/course-syllabi
New Mexico State University
https://provost.nmsu.edu/syllabus-resources/
Northern Illinois University
https://www.niu.edu/facdev/resources/quicktips/transcripts/syllabus.shtml
University of Nebraska Omaha
https://www.unomaha.edu/faculty-support/teaching-excellence/syllabus-best-practices.php
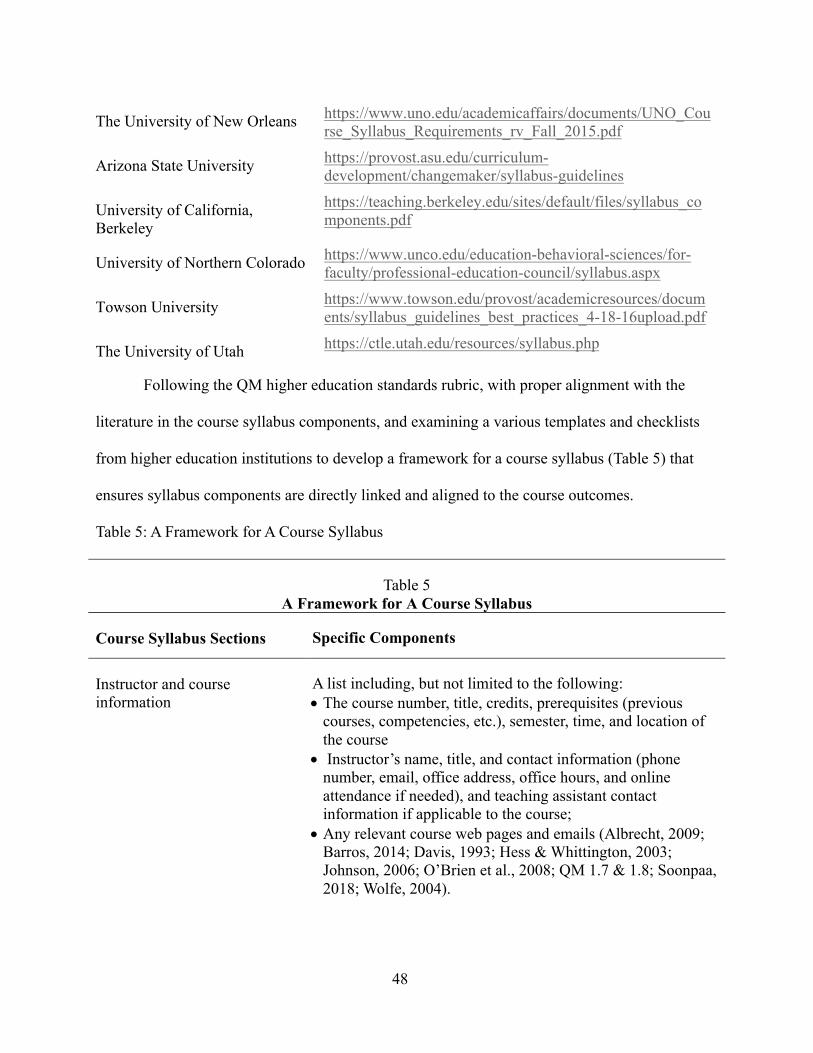
48
The University of New Orleans
https://www.uno.edu/academicaffairs/documents/UNO_Course_Syllabus_Requirements_rv_Fall_2015.pdf
Arizona State University
https://provost.asu.edu/curriculum-development/changemaker/syllabus-guidelines
University of California, Berkeley
https://teaching.berkeley.edu/sites/default/files/syllabus_components.pdf
University of Northern Colorado
https://www.unco.edu/education-behavioral-sciences/for-faculty/professional-education-council/syllabus.aspx
Towson University
https://www.towson.edu/provost/academicresources/documents/syllabus_guidelines_best_practices_4-18-16upload.pdf
The University of Utah
https://ctle.utah.edu/resources/syllabus.php
Following the QM higher education standards rubric, with proper alignment with the
literature in the course syllabus components, and examining a various templates and checklists
from higher education institutions to develop a framework for a course syllabus (Table 5) that
ensures syllabus components are directly linked and aligned to the course outcomes.
Table 5: A Framework for A Course Syllabus
Table 5 A Framework for A Course Syllabus
Course Syllabus Sections Specific Components
Instructor and course information
A list including, but not limited to the following: • The course number, title, credits, prerequisites (previous
courses, competencies, etc.), semester, time, and location of the course
• Instructor’s name, title, and contact information (phone number, email, office address, office hours, and online attendance if needed), and teaching assistant contact information if applicable to the course;
• Any relevant course web pages and emails (Albrecht, 2009; Barros, 2014; Davis, 1993; Hess & Whittington, 2003; Johnson, 2006; O’Brien et al., 2008; QM 1.7 & 1.8; Soonpaa, 2018; Wolfe, 2004).
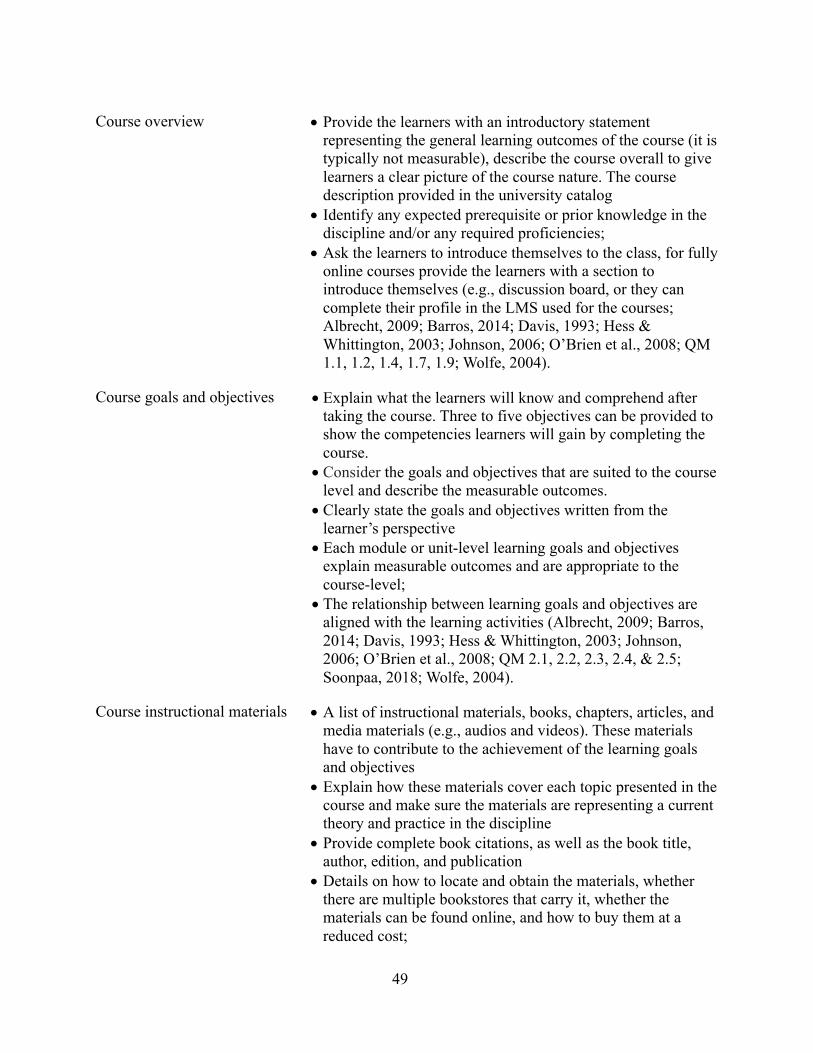
49
Course overview
• Provide the learners with an introductory statement representing the general learning outcomes of the course (it is typically not measurable), describe the course overall to give learners a clear picture of the course nature. The course description provided in the university catalog
• Identify any expected prerequisite or prior knowledge in the discipline and/or any required proficiencies;
• Ask the learners to introduce themselves to the class, for fully online courses provide the learners with a section to introduce themselves (e.g., discussion board, or they can complete their profile in the LMS used for the courses; Albrecht, 2009; Barros, 2014; Davis, 1993; Hess & Whittington, 2003; Johnson, 2006; O’Brien et al., 2008; QM 1.1, 1.2, 1.4, 1.7, 1.9; Wolfe, 2004).
Course goals and objectives
• Explain what the learners will know and comprehend after taking the course. Three to five objectives can be provided to show the competencies learners will gain by completing the course.
• Consider the goals and objectives that are suited to the course level and describe the measurable outcomes.
• Clearly state the goals and objectives written from the learner’s perspective
• Each module or unit-level learning goals and objectives explain measurable outcomes and are appropriate to the course-level;
• The relationship between learning goals and objectives are aligned with the learning activities (Albrecht, 2009; Barros, 2014; Davis, 1993; Hess & Whittington, 2003; Johnson, 2006; O’Brien et al., 2008; QM 2.1, 2.2, 2.3, 2.4, & 2.5; Soonpaa, 2018; Wolfe, 2004).
Course instructional materials
• A list of instructional materials, books, chapters, articles, and media materials (e.g., audios and videos). These materials have to contribute to the achievement of the learning goals and objectives
• Explain how these materials cover each topic presented in the course and make sure the materials are representing a current theory and practice in the discipline
• Provide complete book citations, as well as the book title, author, edition, and publication
• Details on how to locate and obtain the materials, whether there are multiple bookstores that carry it, whether the materials can be found online, and how to buy them at a reduced cost;
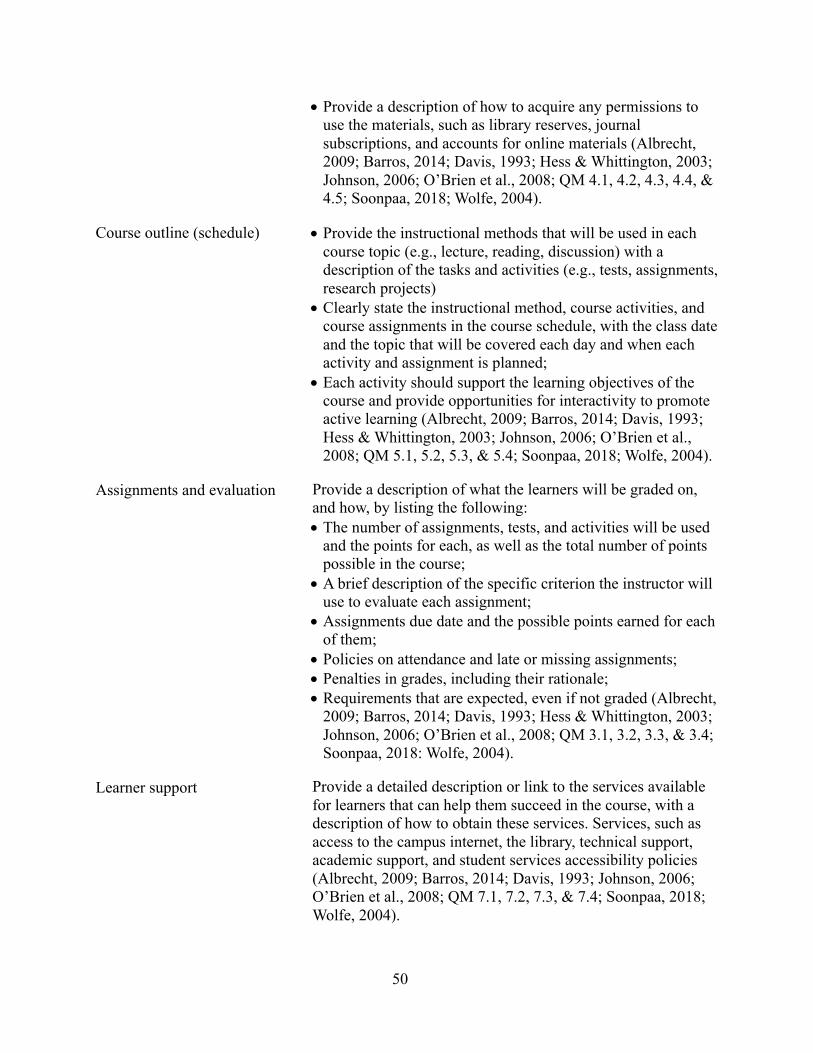
50
• Provide a description of how to acquire any permissions to use the materials, such as library reserves, journal subscriptions, and accounts for online materials (Albrecht, 2009; Barros, 2014; Davis, 1993; Hess & Whittington, 2003; Johnson, 2006; O’Brien et al., 2008; QM 4.1, 4.2, 4.3, 4.4, & 4.5; Soonpaa, 2018; Wolfe, 2004).
Course outline (schedule)
• Provide the instructional methods that will be used in each course topic (e.g., lecture, reading, discussion) with a description of the tasks and activities (e.g., tests, assignments, research projects)
• Clearly state the instructional method, course activities, and course assignments in the course schedule, with the class date and the topic that will be covered each day and when each activity and assignment is planned;
• Each activity should support the learning objectives of the course and provide opportunities for interactivity to promote active learning (Albrecht, 2009; Barros, 2014; Davis, 1993; Hess & Whittington, 2003; Johnson, 2006; O’Brien et al., 2008; QM 5.1, 5.2, 5.3, & 5.4; Soonpaa, 2018; Wolfe, 2004).
Assignments and evaluation Provide a description of what the learners will be graded on, and how, by listing the following: • The number of assignments, tests, and activities will be used
and the points for each, as well as the total number of points possible in the course;
• A brief description of the specific criterion the instructor will use to evaluate each assignment;
• Assignments due date and the possible points earned for each of them;
• Policies on attendance and late or missing assignments; • Penalties in grades, including their rationale; • Requirements that are expected, even if not graded (Albrecht,
2009; Barros, 2014; Davis, 1993; Hess & Whittington, 2003; Johnson, 2006; O’Brien et al., 2008; QM 3.1, 3.2, 3.3, & 3.4; Soonpaa, 2018: Wolfe, 2004).
Learner support Provide a detailed description or link to the services available for learners that can help them succeed in the course, with a description of how to obtain these services. Services, such as access to the campus internet, the library, technical support, academic support, and student services accessibility policies (Albrecht, 2009; Barros, 2014; Davis, 1993; Johnson, 2006; O’Brien et al., 2008; QM 7.1, 7.2, 7.3, & 7.4; Soonpaa, 2018; Wolfe, 2004).
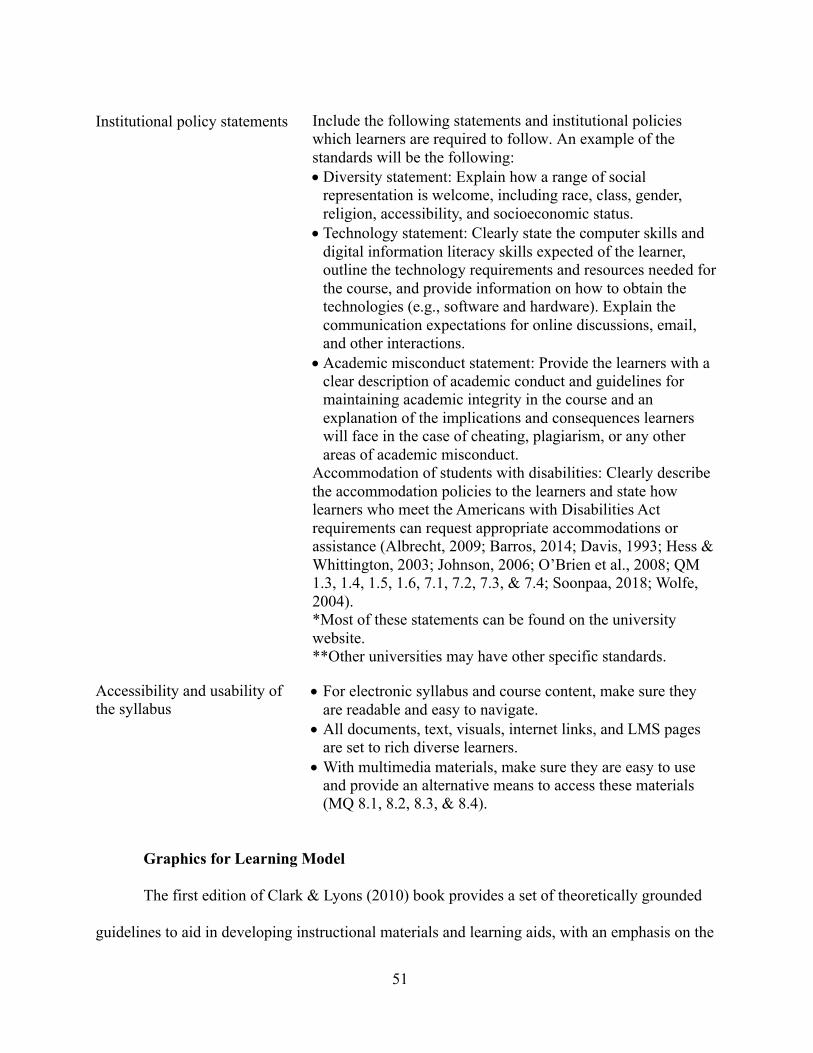
51
Institutional policy statements Include the following statements and institutional policies which learners are required to follow. An example of the standards will be the following: • Diversity statement: Explain how a range of social
representation is welcome, including race, class, gender, religion, accessibility, and socioeconomic status.
• Technology statement: Clearly state the computer skills and digital information literacy skills expected of the learner, outline the technology requirements and resources needed for the course, and provide information on how to obtain the technologies (e.g., software and hardware). Explain the communication expectations for online discussions, email, and other interactions.
• Academic misconduct statement: Provide the learners with a clear description of academic conduct and guidelines for maintaining academic integrity in the course and an explanation of the implications and consequences learners will face in the case of cheating, plagiarism, or any other areas of academic misconduct.
Accommodation of students with disabilities: Clearly describe the accommodation policies to the learners and state how learners who meet the Americans with Disabilities Act requirements can request appropriate accommodations or assistance (Albrecht, 2009; Barros, 2014; Davis, 1993; Hess & Whittington, 2003; Johnson, 2006; O’Brien et al., 2008; QM 1.3, 1.4, 1.5, 1.6, 7.1, 7.2, 7.3, & 7.4; Soonpaa, 2018; Wolfe, 2004). *Most of these statements can be found on the university website. **Other universities may have other specific standards.
Accessibility and usability of the syllabus
• For electronic syllabus and course content, make sure they
are readable and easy to navigate. • All documents, text, visuals, internet links, and LMS pages
are set to rich diverse learners. • With multimedia materials, make sure they are easy to use
and provide an alternative means to access these materials (MQ 8.1, 8.2, 8.3, & 8.4).
Graphics for Learning Model
The first edition of Clark & Lyons (2010) book provides a set of theoretically grounded
guidelines to aid in developing instructional materials and learning aids, with an emphasis on the
52
selection and design of effective visuals to support the instructional content (Hofmann, 2005).
The second edition of the book followed the same principles by adding additional methods and
used more current research in designing effective visuals for printed and online instructional
content (Clark & Lyons, 2010). According to Clark and Lyons (2010), what sets this book apart
from others in the field is how it presents “evidence-based, theoretically grounded, practically
relevant, clearly presented, and current guidelines” (p. xvi). The guidelines in this book are
constructed from two essential resources, research evidence in using visuals and a systematic
design process. The guidelines in the book utilize research in visuals and how they best support
learning processes to aid in making significant decisions about them. A visual design process is
then used to help develop the visual with a systematic approach (Clark & Lyons, 2010).
Clark and Lyons (2010) provided a visual design model for planning graphics
systematically. The model was utilized to design and develop ICOs efficiently. The model
assisted in ensuring the ICOs are designed and developed to support instructional needs. The
model contains five phases: defining the goals, determining the context, designing the visual
approach, identifying the communication function needed to match content types, and applying
the principles of psychological instructional events. As stated by Clark and Lyons (2010), “when
designing the treatment, along with assessing audience, delivery, and production issues,
designers need to also consider the goal, the instructional strategy, and multimedia principles” (p.
34). Following this systematic approach, Table 6 below shows how the phases of the visual
model have been utilized to plan ICOs and ensure they best aid their instructional needs.
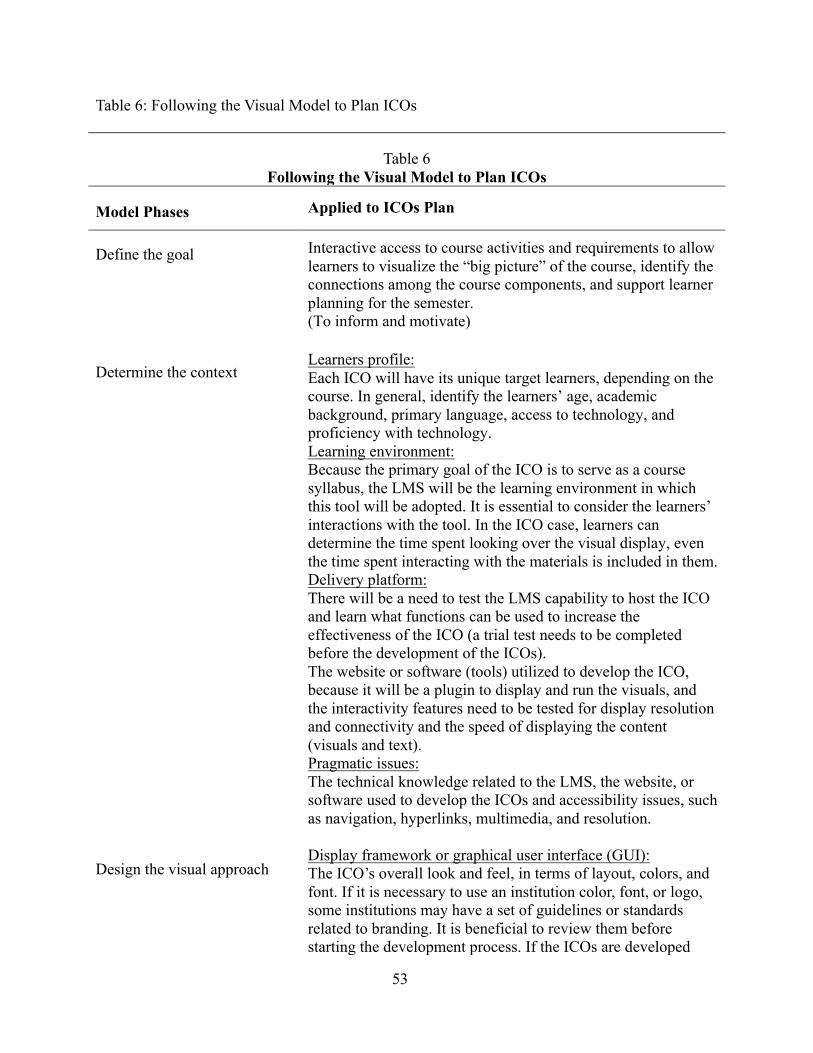
53
Table 6: Following the Visual Model to Plan ICOs
Table 6 Following the Visual Model to Plan ICOs
Model Phases
Applied to ICOs Plan
Define the goal
Interactive access to course activities and requirements to allow learners to visualize the “big picture” of the course, identify the connections among the course components, and support learner planning for the semester. (To inform and motivate)
Determine the context
Learners profile: Each ICO will have its unique target learners, depending on the course. In general, identify the learners’ age, academic background, primary language, access to technology, and proficiency with technology. Learning environment: Because the primary goal of the ICO is to serve as a course syllabus, the LMS will be the learning environment in which this tool will be adopted. It is essential to consider the learners’ interactions with the tool. In the ICO case, learners can determine the time spent looking over the visual display, even the time spent interacting with the materials is included in them. Delivery platform: There will be a need to test the LMS capability to host the ICO and learn what functions can be used to increase the effectiveness of the ICO (a trial test needs to be completed before the development of the ICOs). The website or software (tools) utilized to develop the ICO, because it will be a plugin to display and run the visuals, and the interactivity features need to be tested for display resolution and connectivity and the speed of displaying the content (visuals and text). Pragmatic issues: The technical knowledge related to the LMS, the website, or software used to develop the ICOs and accessibility issues, such as navigation, hyperlinks, multimedia, and resolution.
Design the visual approach
Display framework or graphical user interface (GUI): The ICO’s overall look and feel, in terms of layout, colors, and font. If it is necessary to use an institution color, font, or logo, some institutions may have a set of guidelines or standards related to branding. It is beneficial to review them before starting the development process. If the ICOs are developed
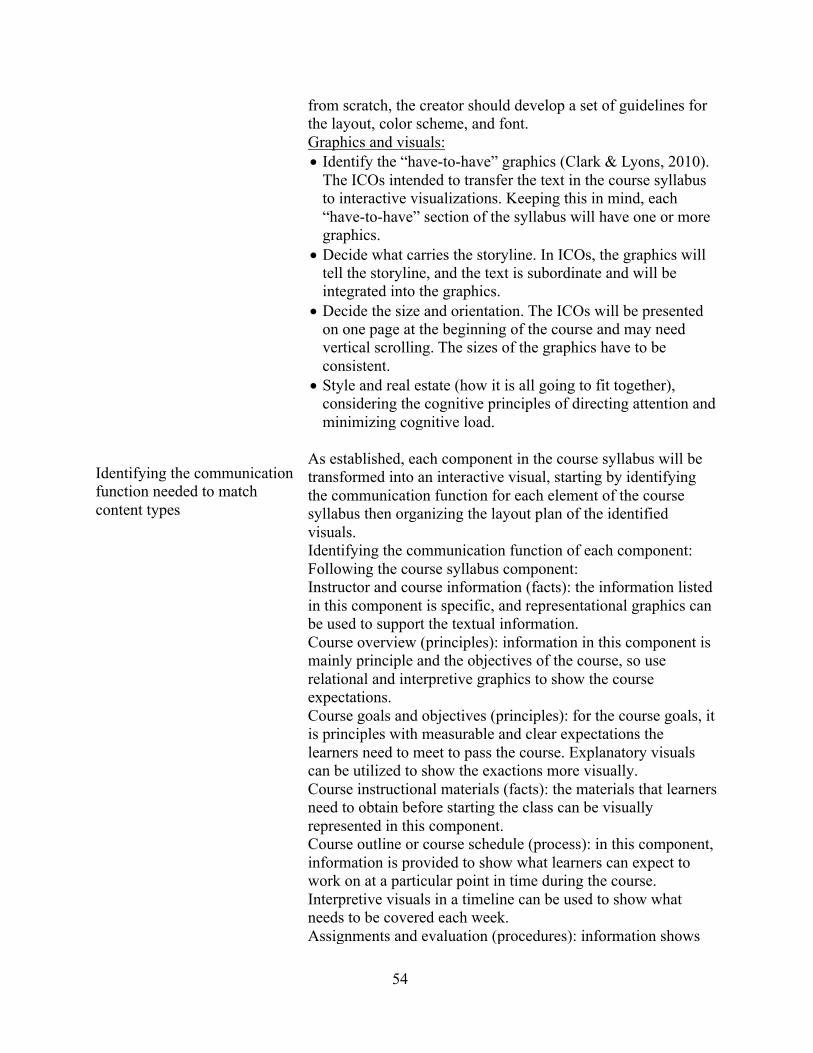
54
from scratch, the creator should develop a set of guidelines for the layout, color scheme, and font. Graphics and visuals: • Identify the “have-to-have” graphics (Clark & Lyons, 2010).
The ICOs intended to transfer the text in the course syllabus to interactive visualizations. Keeping this in mind, each “have-to-have” section of the syllabus will have one or more graphics.
• Decide what carries the storyline. In ICOs, the graphics will tell the storyline, and the text is subordinate and will be integrated into the graphics.
• Decide the size and orientation. The ICOs will be presented on one page at the beginning of the course and may need vertical scrolling. The sizes of the graphics have to be consistent.
• Style and real estate (how it is all going to fit together), considering the cognitive principles of directing attention and minimizing cognitive load.
Identifying the communication function needed to match content types
As established, each component in the course syllabus will be transformed into an interactive visual, starting by identifying the communication function for each element of the course syllabus then organizing the layout plan of the identified visuals. Identifying the communication function of each component: Following the course syllabus component: Instructor and course information (facts): the information listed in this component is specific, and representational graphics can be used to support the textual information. Course overview (principles): information in this component is mainly principle and the objectives of the course, so use relational and interpretive graphics to show the course expectations. Course goals and objectives (principles): for the course goals, it is principles with measurable and clear expectations the learners need to meet to pass the course. Explanatory visuals can be utilized to show the exactions more visually. Course instructional materials (facts): the materials that learners need to obtain before starting the class can be visually represented in this component. Course outline or course schedule (process): in this component, information is provided to show what learners can expect to work on at a particular point in time during the course. Interpretive visuals in a timeline can be used to show what needs to be covered each week. Assignments and evaluation (procedures): information shows
55
learners what and how they will be evaluated and graded on each assignment, test, and so on. Using a visual representation of each assignment, the learner will be graded, and it will give them an idea of what they are supposed to do in the class and how it is going to affect their overall grade. Learner support (facts): the information in this component is provided to list the other services available for the learners. Having a visual representation of each service will help them look at the other resources available to them and may aid them in completing the class. Institutional policy statements (principles): information in the component is principles, but the institutional policies learner is expected to comply. Utilizing representational graphics will support the learners in associating visuals with each statement or policy. Layout plan of the visuals Having the content of the ICO organized, following the course syllabus components, will make the organization of the ICO layout plan easier. The ICO will have the same order and structure of a course syllabus in terms of the organization, and the content will be minimized in text and supported with interactive visuals. Using a visualization website creates a (comprehensive) sample of the ICO to show the estimated finished ICO in regard to the medium used, form, size, and the arrangement of the element (often no textual or visual content); however, it has to show the exact way the elements will be incorporated together. In this stage, it is more about the text font, colors, and the placement of the visuals and the layout. The emphasis here is on the final look of the product, not the textual content and the information. The ICO sample can start with identifying the primary sections, which are the components of the course syllabus, then the textual and visual content of each major section, and, finally, adding an interactivity feature and any other unique feature to the text and visual.
Apply principles of psychological instructional events
The two main principles of psychological stress in an ICO are the attention and cognitive load principles and the principles of the motivational visual. Thus, the following guidelines provided by Clark and Lyons (2010) will be considered when designing and developing an ICO:
• Use signals to focus the attention of the learners. • Utilize color and contrast to focus the attention of the
learners. • Employ color to improve job performance.
56
• Place the text close to the visual it describes (contiguity principle).
• Avoid distracting visuals. • Utilize dynamic visuals that display the work context. • Leverage social presence through learning agents. • Use relevant trigger visuals to catch the initial interest. • Minimize graphics used solely as eye candy. • Utilize style and real estate (Clark & Lyons, 2010) (how it is
all going to fit together), considering the cognitive principles of directing attention and minimizing cognitive load.
Design Phase
In this phase, the question “How should the Interactive Course Organizer look in finished
form?” was answered by developing the first version of the ICO. While building and
constructing this version, each step of this process was documented. Therefore, the results of this
documentation process was employed to the design and development of the ICO guidelines. To
create this version, the components in (Table 6) was utilized as a sample syllabus because it
contents all section present in course syllabi; next, a sample of the ICOs was developed.
According to Clark and Lyons (2010), a sample or a comprehensive is an estimated finished
product in the medium used, form, size, and the arrangement of the element (often no textual or
visual content); however, they have to show the exact way the elements will be incorporated
together. In this stage, it is about the text font, colors, the placement of the visuals, and the
layout. The emphasis is on the final look of the product, not the textual content and the
information.
To construct this version, a data visualization website was used. Because many websites
serve this purpose, an exploration of different data visualizations websites was concluded to
choose a website that will best attend to ICOs objectives. Most of these websites provide their
users with a platform to create and share digital charts, infographics, and maps through a free or
paid subscription. Moreover, these products can be published, embedded, or shared on different
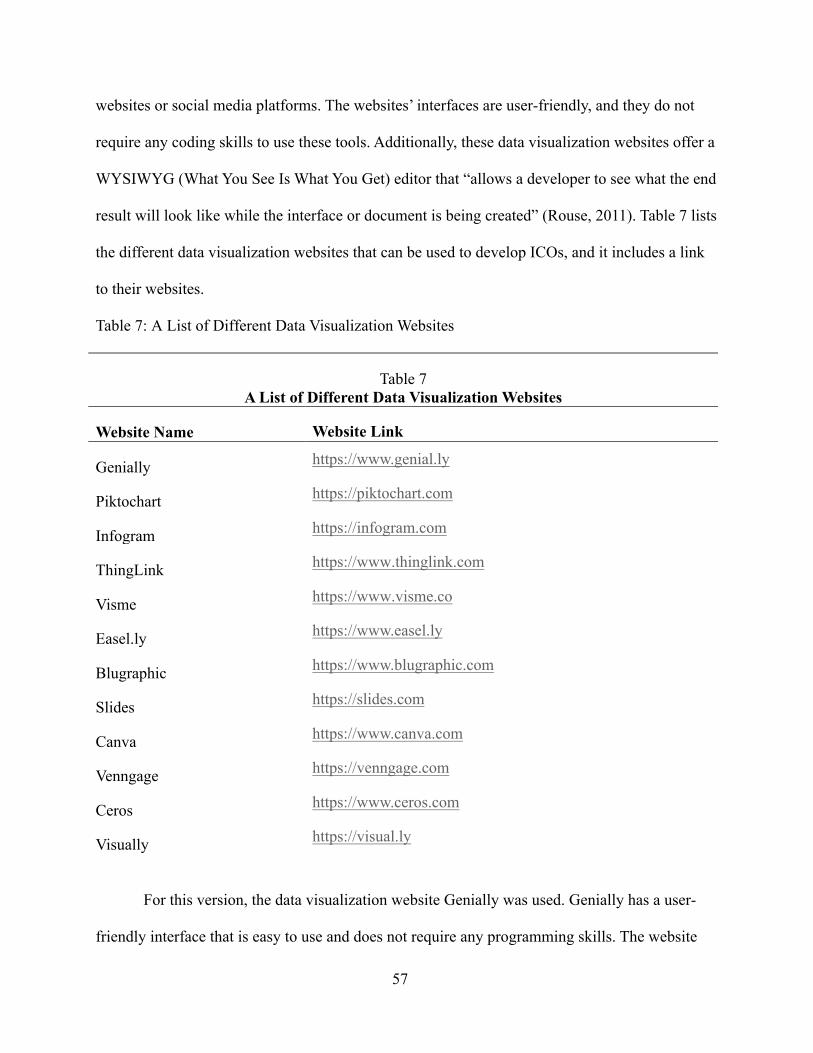
57
websites or social media platforms. The websites’ interfaces are user-friendly, and they do not
require any coding skills to use these tools. Additionally, these data visualization websites offer a
WYSIWYG (What You See Is What You Get) editor that “allows a developer to see what the end
result will look like while the interface or document is being created” (Rouse, 2011). Table 7 lists
the different data visualization websites that can be used to develop ICOs, and it includes a link
to their websites.
Table 7: A List of Different Data Visualization Websites
Table 7 A List of Different Data Visualization Websites
Website Name Website Link
Genially
https://www.genial.ly
Piktochart
https://piktochart.com
Infogram
https://infogram.com
ThingLink
https://www.thinglink.com
Visme
https://www.visme.co
Easel.ly
https://www.easel.ly
Blugraphic
https://www.blugraphic.com
Slides
https://slides.com
Canva
https://www.canva.com
Venngage
https://venngage.com
Ceros
https://www.ceros.com
Visually
https://visual.ly
For this version, the data visualization website Genially was used. Genially has a user-
friendly interface that is easy to use and does not require any programming skills. The website
58
allows its users to develop visually interactive content, such as presentations, reports,
infographics, and video presentations. Moreover, it offers educational resources, including
games, interactive images, illustrations, icons, figures, and maps. What sets this website apart
from others is its highly interactive and animated characteristics, which give a new layer to the
content, one that is more visual and less saturated. Furthermore, the Genially website offers
several sharing options; the projects can be presented live, embed into a website, uploaded to
social media, sent via email, or downloaded as a pdf or jpg to print or in HTML to view without
the Internet.
In an online display, particularly highly interactive content, Clark and Lyons (2010)
discussed building the “look and feel.” Designing visual content typically goes through static
phases, which is the look phase, a demonstration where each element is placed in a template,
then a prototype, which shows the functions and features of the final product, “the feel.”
Therefore, to begin the process of developing the first version of the ICO, the earliest focus
should be on the static phases, with “the look” concentrating on the size and measurements of the
ICO and how it has to be exact or as close as possible to the final product. Figure 3 shows a shot
of the size of the ICO embedded on an LMS page.
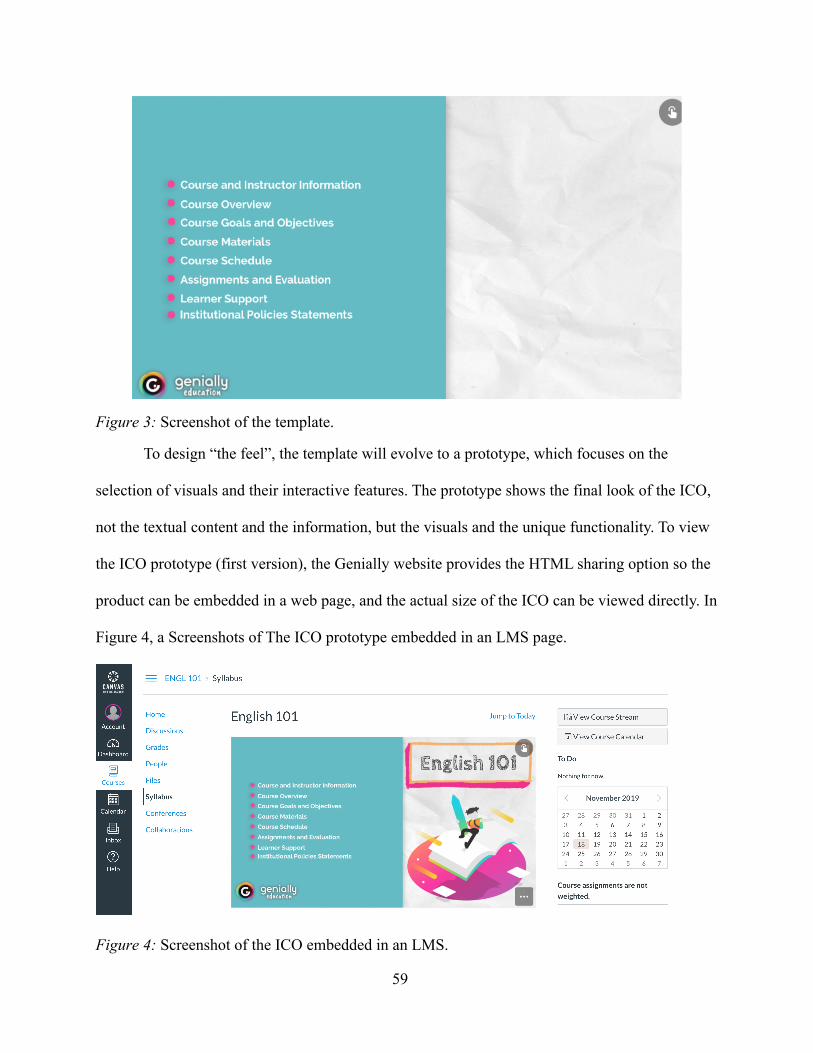
59
Figure 3: Screenshot of the template.
To design “the feel”, the template will evolve to a prototype, which focuses on the
selection of visuals and their interactive features. The prototype shows the final look of the ICO,
not the textual content and the information, but the visuals and the unique functionality. To view
the ICO prototype (first version), the Genially website provides the HTML sharing option so the
product can be embedded in a web page, and the actual size of the ICO can be viewed directly. In
Figure 4, a Screenshots of The ICO prototype embedded in an LMS page.
Figure 4: Screenshot of the ICO embedded in an LMS.
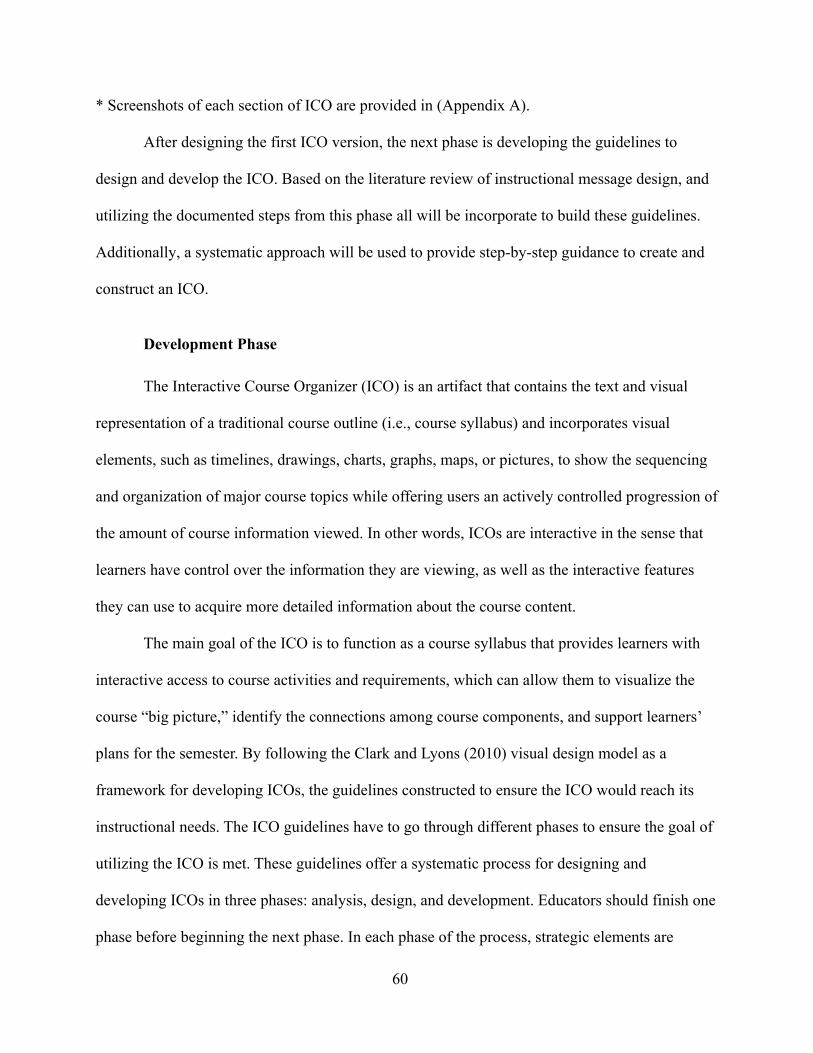
60
* Screenshots of each section of ICO are provided in (Appendix A).
After designing the first ICO version, the next phase is developing the guidelines to
design and develop the ICO. Based on the literature review of instructional message design, and
utilizing the documented steps from this phase all will be incorporate to build these guidelines.
Additionally, a systematic approach will be used to provide step-by-step guidance to create and
construct an ICO.
Development Phase
The Interactive Course Organizer (ICO) is an artifact that contains the text and visual
representation of a traditional course outline (i.e., course syllabus) and incorporates visual
elements, such as timelines, drawings, charts, graphs, maps, or pictures, to show the sequencing
and organization of major course topics while offering users an actively controlled progression of
the amount of course information viewed. In other words, ICOs are interactive in the sense that
learners have control over the information they are viewing, as well as the interactive features
they can use to acquire more detailed information about the course content.
The main goal of the ICO is to function as a course syllabus that provides learners with
interactive access to course activities and requirements, which can allow them to visualize the
course “big picture,” identify the connections among course components, and support learners’
plans for the semester. By following the Clark and Lyons (2010) visual design model as a
framework for developing ICOs, the guidelines constructed to ensure the ICO would reach its
instructional needs. The ICO guidelines have to go through different phases to ensure the goal of
utilizing the ICO is met. These guidelines offer a systematic process for designing and
developing ICOs in three phases: analysis, design, and development. Educators should finish one
phase before beginning the next phase. In each phase of the process, strategic elements are
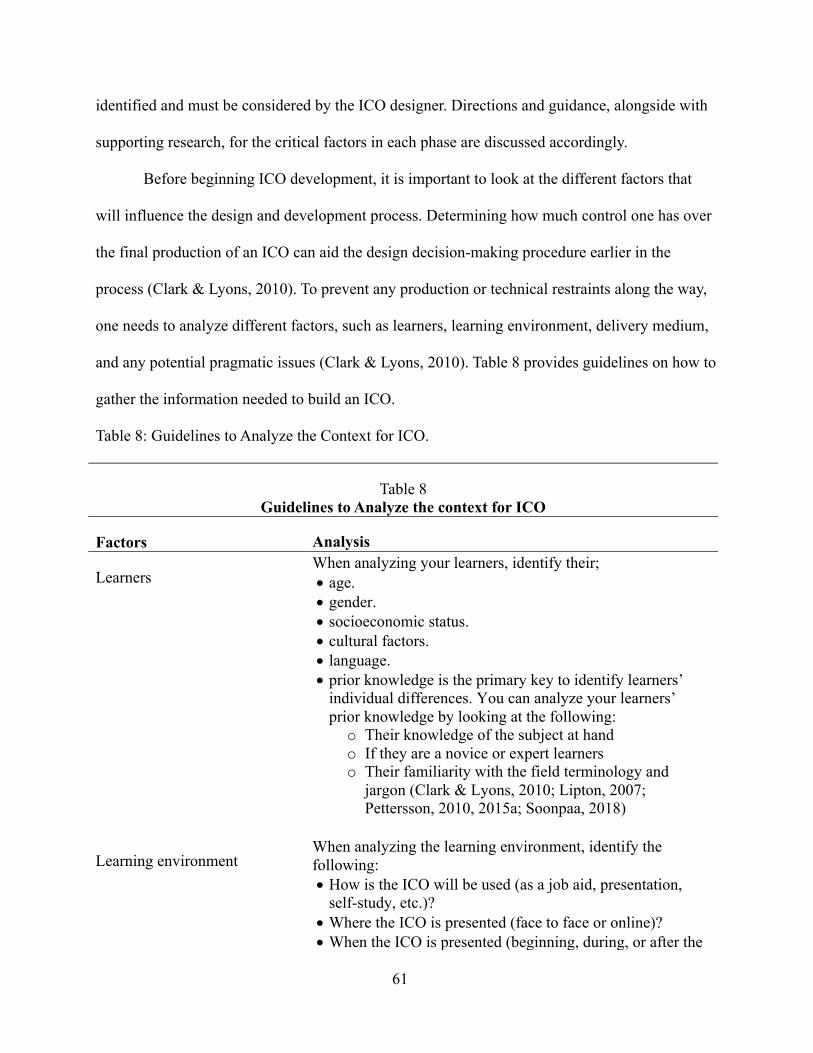
61
identified and must be considered by the ICO designer. Directions and guidance, alongside with
supporting research, for the critical factors in each phase are discussed accordingly.
Before beginning ICO development, it is important to look at the different factors that
will influence the design and development process. Determining how much control one has over
the final production of an ICO can aid the design decision-making procedure earlier in the
process (Clark & Lyons, 2010). To prevent any production or technical restraints along the way,
one needs to analyze different factors, such as learners, learning environment, delivery medium,
and any potential pragmatic issues (Clark & Lyons, 2010). Table 8 provides guidelines on how to
gather the information needed to build an ICO.
Table 8: Guidelines to Analyze the Context for ICO.
Table 8 Guidelines to Analyze the context for ICO
Factors Analysis
Learners
When analyzing your learners, identify their; • age. • gender. • socioeconomic status. • cultural factors. • language. • prior knowledge is the primary key to identify learners’
individual differences. You can analyze your learners’ prior knowledge by looking at the following: o Their knowledge of the subject at hand o If they are a novice or expert learners o Their familiarity with the field terminology and
jargon (Clark & Lyons, 2010; Lipton, 2007; Pettersson, 2010, 2015a; Soonpaa, 2018)
Learning environment
When analyzing the learning environment, identify the following: • How is the ICO will be used (as a job aid, presentation,
self-study, etc.)? • Where the ICO is presented (face to face or online)? • When the ICO is presented (beginning, during, or after the
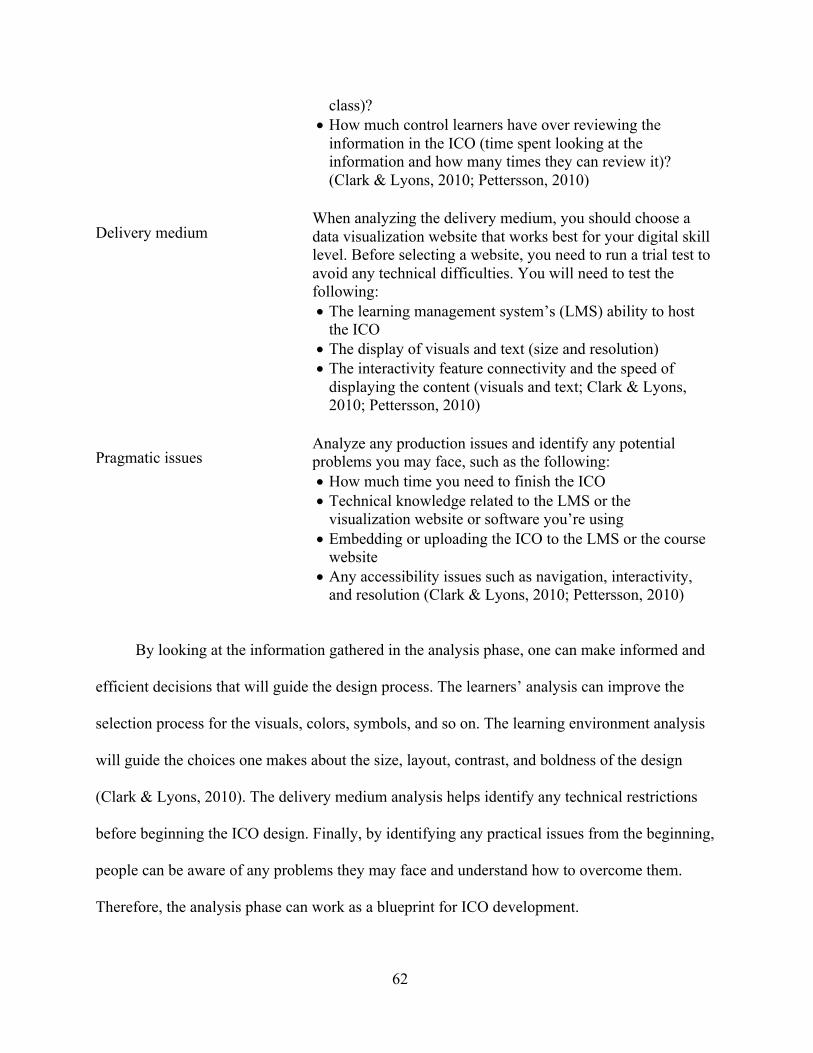
62
class)? • How much control learners have over reviewing the
information in the ICO (time spent looking at the information and how many times they can review it)? (Clark & Lyons, 2010; Pettersson, 2010)
Delivery medium
When analyzing the delivery medium, you should choose a data visualization website that works best for your digital skill level. Before selecting a website, you need to run a trial test to avoid any technical difficulties. You will need to test the following: • The learning management system’s (LMS) ability to host
the ICO • The display of visuals and text (size and resolution) • The interactivity feature connectivity and the speed of
displaying the content (visuals and text; Clark & Lyons, 2010; Pettersson, 2010)
Pragmatic issues
Analyze any production issues and identify any potential problems you may face, such as the following: • How much time you need to finish the ICO • Technical knowledge related to the LMS or the
visualization website or software you’re using • Embedding or uploading the ICO to the LMS or the course
website • Any accessibility issues such as navigation, interactivity,
and resolution (Clark & Lyons, 2010; Pettersson, 2010)
By looking at the information gathered in the analysis phase, one can make informed and
efficient decisions that will guide the design process. The learners’ analysis can improve the
selection process for the visuals, colors, symbols, and so on. The learning environment analysis
will guide the choices one makes about the size, layout, contrast, and boldness of the design
(Clark & Lyons, 2010). The delivery medium analysis helps identify any technical restrictions
before beginning the ICO design. Finally, by identifying any practical issues from the beginning,
people can be aware of any problems they may face and understand how to overcome them.
Therefore, the analysis phase can work as a blueprint for ICO development.
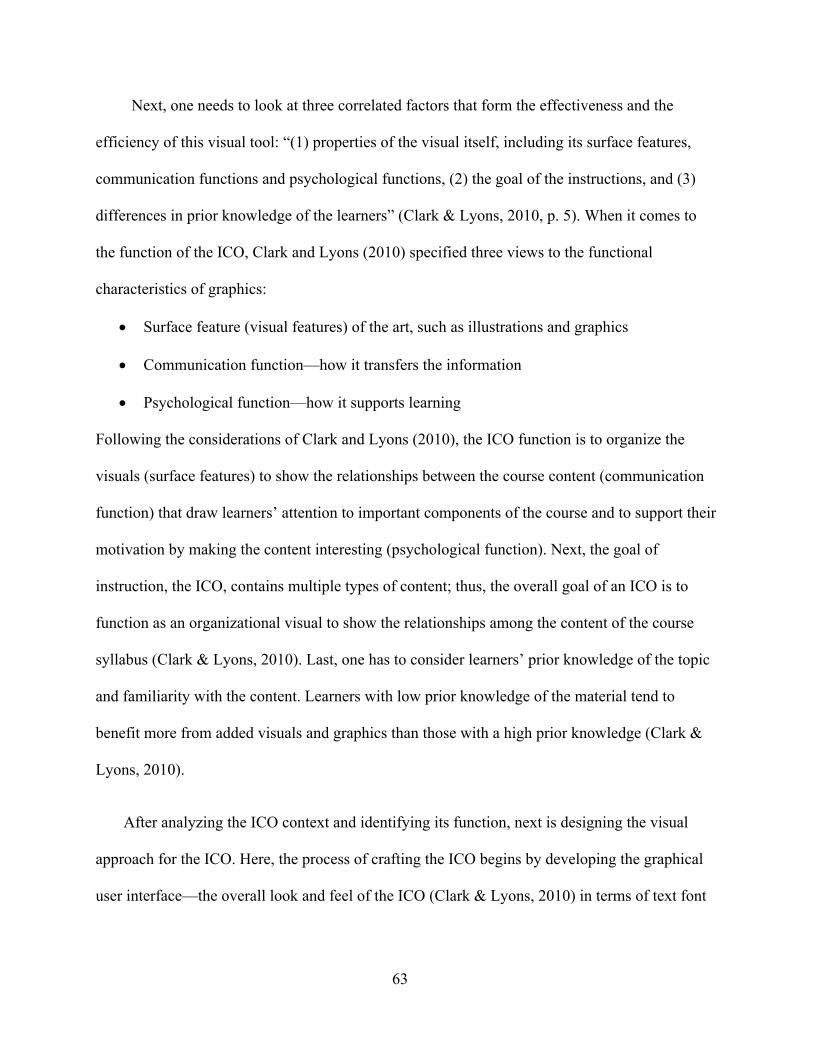
63
Next, one needs to look at three correlated factors that form the effectiveness and the
efficiency of this visual tool: “(1) properties of the visual itself, including its surface features,
communication functions and psychological functions, (2) the goal of the instructions, and (3)
differences in prior knowledge of the learners” (Clark & Lyons, 2010, p. 5). When it comes to
the function of the ICO, Clark and Lyons (2010) specified three views to the functional
characteristics of graphics:
• Surface feature (visual features) of the art, such as illustrations and graphics
• Communication function—how it transfers the information
• Psychological function—how it supports learning
Following the considerations of Clark and Lyons (2010), the ICO function is to organize the
visuals (surface features) to show the relationships between the course content (communication
function) that draw learners’ attention to important components of the course and to support their
motivation by making the content interesting (psychological function). Next, the goal of
instruction, the ICO, contains multiple types of content; thus, the overall goal of an ICO is to
function as an organizational visual to show the relationships among the content of the course
syllabus (Clark & Lyons, 2010). Last, one has to consider learners’ prior knowledge of the topic
and familiarity with the content. Learners with low prior knowledge of the material tend to
benefit more from added visuals and graphics than those with a high prior knowledge (Clark &
Lyons, 2010).
After analyzing the ICO context and identifying its function, next is designing the visual
approach for the ICO. Here, the process of crafting the ICO begins by developing the graphical
user interface—the overall look and feel of the ICO (Clark & Lyons, 2010) in terms of text font
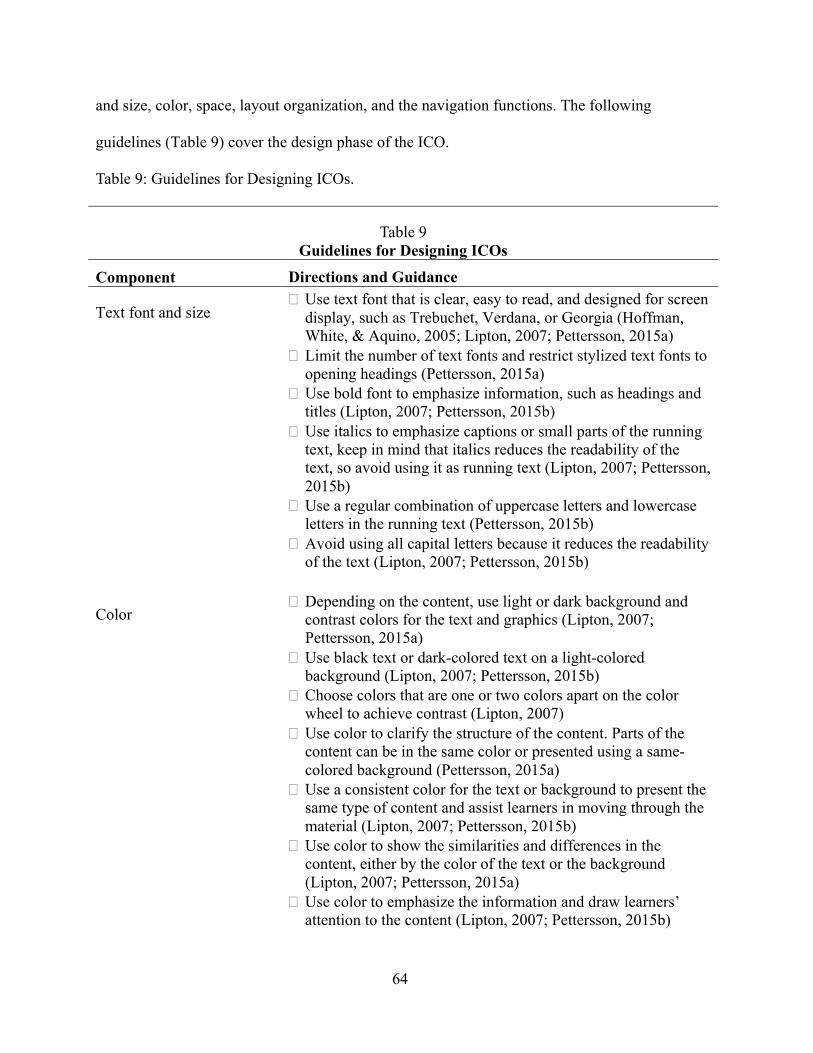
64
and size, color, space, layout organization, and the navigation functions. The following
guidelines (Table 9) cover the design phase of the ICO.
Table 9: Guidelines for Designing ICOs.
Table 9 Guidelines for Designing ICOs
Component
Directions and Guidance
Text font and size
� Use text font that is clear, easy to read, and designed for screen display, such as Trebuchet, Verdana, or Georgia (Hoffman, White, & Aquino, 2005; Lipton, 2007; Pettersson, 2015a)
� Limit the number of text fonts and restrict stylized text fonts to opening headings (Pettersson, 2015a)
� Use bold font to emphasize information, such as headings and titles (Lipton, 2007; Pettersson, 2015b)
� Use italics to emphasize captions or small parts of the running text, keep in mind that italics reduces the readability of the text, so avoid using it as running text (Lipton, 2007; Pettersson, 2015b)
� Use a regular combination of uppercase letters and lowercase letters in the running text (Pettersson, 2015b)
� Avoid using all capital letters because it reduces the readability of the text (Lipton, 2007; Pettersson, 2015b)
Color
� Depending on the content, use light or dark background and
contrast colors for the text and graphics (Lipton, 2007; Pettersson, 2015a)
� Use black text or dark-colored text on a light-colored background (Lipton, 2007; Pettersson, 2015b)
� Choose colors that are one or two colors apart on the color wheel to achieve contrast (Lipton, 2007)
� Use color to clarify the structure of the content. Parts of the content can be in the same color or presented using a same-colored background (Pettersson, 2015a)
� Use a consistent color for the text or background to present the same type of content and assist learners in moving through the material (Lipton, 2007; Pettersson, 2015b)
� Use color to show the similarities and differences in the content, either by the color of the text or the background (Lipton, 2007; Pettersson, 2015a)
� Use color to emphasize the information and draw learners’ attention to the content (Lipton, 2007; Pettersson, 2015b)
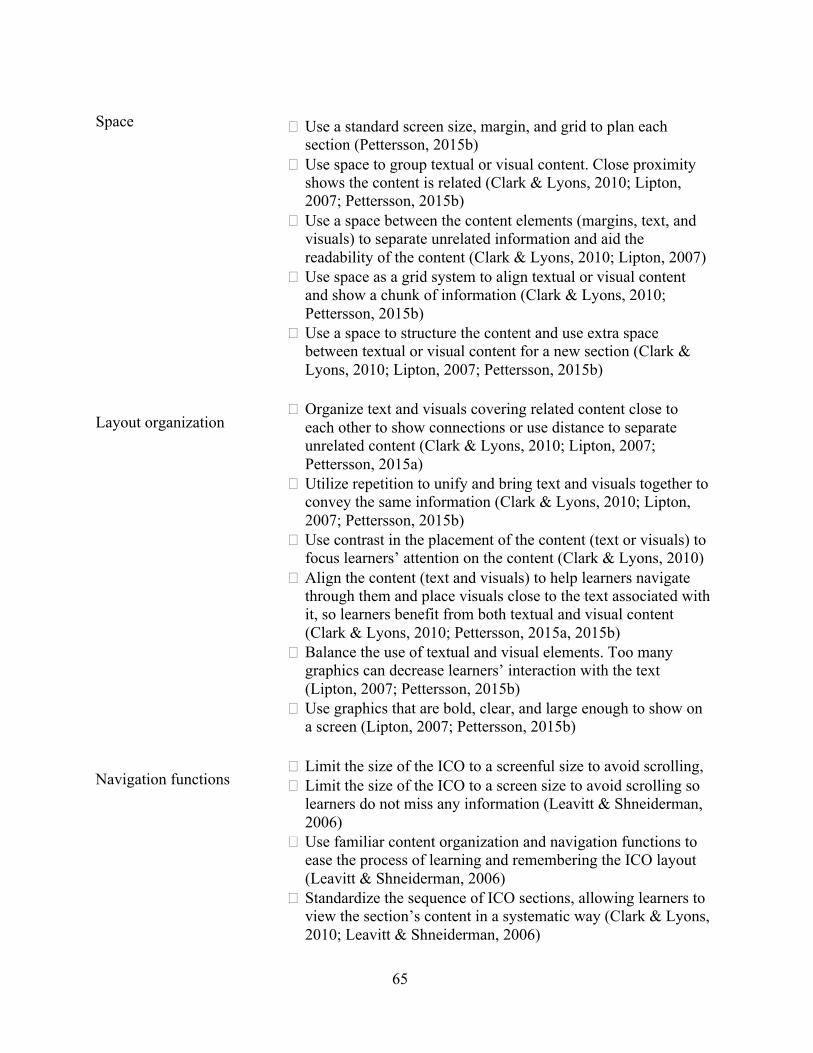
65
Space
� Use a standard screen size, margin, and grid to plan each
section (Pettersson, 2015b) � Use space to group textual or visual content. Close proximity
shows the content is related (Clark & Lyons, 2010; Lipton, 2007; Pettersson, 2015b)
� Use a space between the content elements (margins, text, and visuals) to separate unrelated information and aid the readability of the content (Clark & Lyons, 2010; Lipton, 2007)
� Use space as a grid system to align textual or visual content and show a chunk of information (Clark & Lyons, 2010; Pettersson, 2015b)
� Use a space to structure the content and use extra space between textual or visual content for a new section (Clark & Lyons, 2010; Lipton, 2007; Pettersson, 2015b)
Layout organization
� Organize text and visuals covering related content close to
each other to show connections or use distance to separate unrelated content (Clark & Lyons, 2010; Lipton, 2007; Pettersson, 2015a)
� Utilize repetition to unify and bring text and visuals together to convey the same information (Clark & Lyons, 2010; Lipton, 2007; Pettersson, 2015b)
� Use contrast in the placement of the content (text or visuals) to focus learners’ attention on the content (Clark & Lyons, 2010)
� Align the content (text and visuals) to help learners navigate through them and place visuals close to the text associated with it, so learners benefit from both textual and visual content (Clark & Lyons, 2010; Pettersson, 2015a, 2015b)
� Balance the use of textual and visual elements. Too many graphics can decrease learners’ interaction with the text (Lipton, 2007; Pettersson, 2015b)
� Use graphics that are bold, clear, and large enough to show on a screen (Lipton, 2007; Pettersson, 2015b)
Navigation functions
� Limit the size of the ICO to a screenful size to avoid scrolling, � Limit the size of the ICO to a screen size to avoid scrolling so
learners do not miss any information (Leavitt & Shneiderman, 2006)
� Use familiar content organization and navigation functions to ease the process of learning and remembering the ICO layout (Leavitt & Shneiderman, 2006)
� Standardize the sequence of ICO sections, allowing learners to view the section’s content in a systematic way (Clark & Lyons, 2010; Leavitt & Shneiderman, 2006)
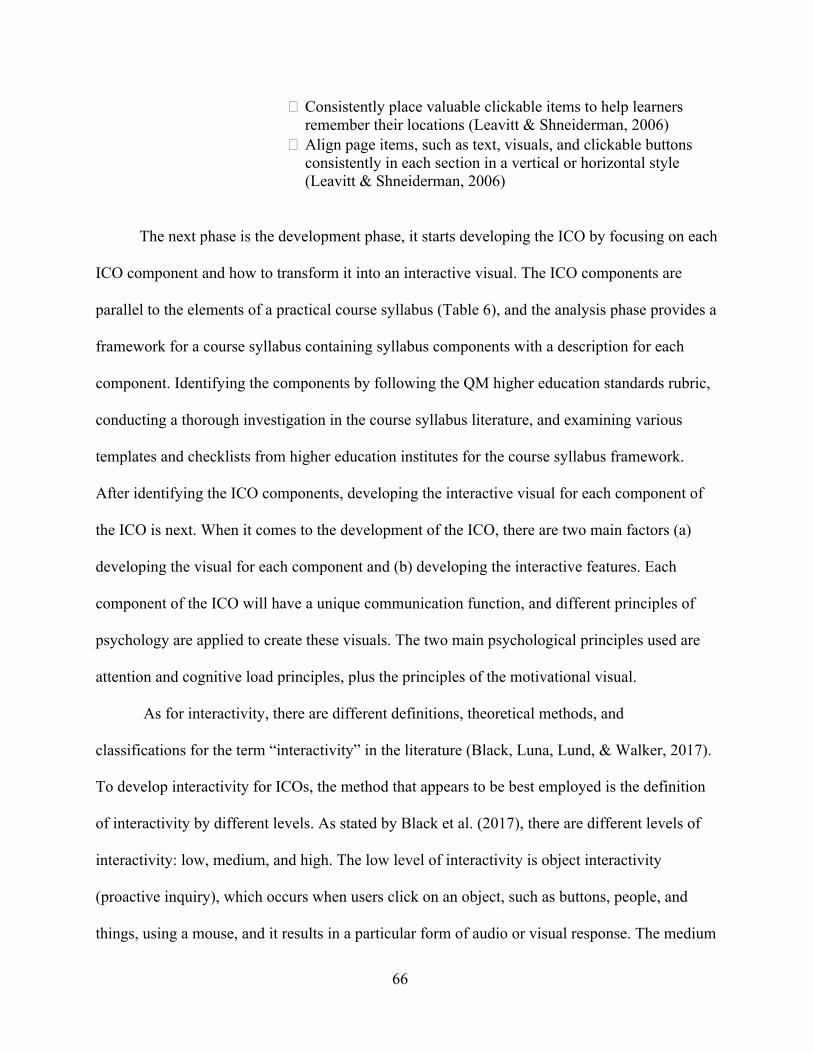
66
� Consistently place valuable clickable items to help learners remember their locations (Leavitt & Shneiderman, 2006)
� Align page items, such as text, visuals, and clickable buttons consistently in each section in a vertical or horizontal style (Leavitt & Shneiderman, 2006)
The next phase is the development phase, it starts developing the ICO by focusing on each
ICO component and how to transform it into an interactive visual. The ICO components are
parallel to the elements of a practical course syllabus (Table 6), and the analysis phase provides a
framework for a course syllabus containing syllabus components with a description for each
component. Identifying the components by following the QM higher education standards rubric,
conducting a thorough investigation in the course syllabus literature, and examining various
templates and checklists from higher education institutes for the course syllabus framework.
After identifying the ICO components, developing the interactive visual for each component of
the ICO is next. When it comes to the development of the ICO, there are two main factors (a)
developing the visual for each component and (b) developing the interactive features. Each
component of the ICO will have a unique communication function, and different principles of
psychology are applied to create these visuals. The two main psychological principles used are
attention and cognitive load principles, plus the principles of the motivational visual.
As for interactivity, there are different definitions, theoretical methods, and
classifications for the term “interactivity” in the literature (Black, Luna, Lund, & Walker, 2017).
To develop interactivity for ICOs, the method that appears to be best employed is the definition
of interactivity by different levels. As stated by Black et al. (2017), there are different levels of
interactivity: low, medium, and high. The low level of interactivity is object interactivity
(proactive inquiry), which occurs when users click on an object, such as buttons, people, and
things, using a mouse, and it results in a particular form of audio or visual response. The medium
67
level of interactivity involves hierarchical and hyperlinked interactivity (reactive navigation),
which provides users with access to predefined options they can navigate and choose. Last, the
high level of interactivity refers to virtual interactivity, which offers users a real-world
experience through a computer-generated interactive environment that responds to users’
movements and actions (as cited in Black et al., 2017). Using this consideration, ICOs have three
different levels of interactivity: low (proactive inquiry), medium (reactive navigation), and high.
The low level offered gives the learner options using clickable buttons to view and navigate
through the ICO content. The medium level is presented by providing learners with visuals, such
as charts, graphics, and timelines, with predefined objects they can select from the content and a
high level to give the user the option to choose how to view and navigate the information. Table
10 offers directions and guidance on how to develop the interactive visual for ICOs.
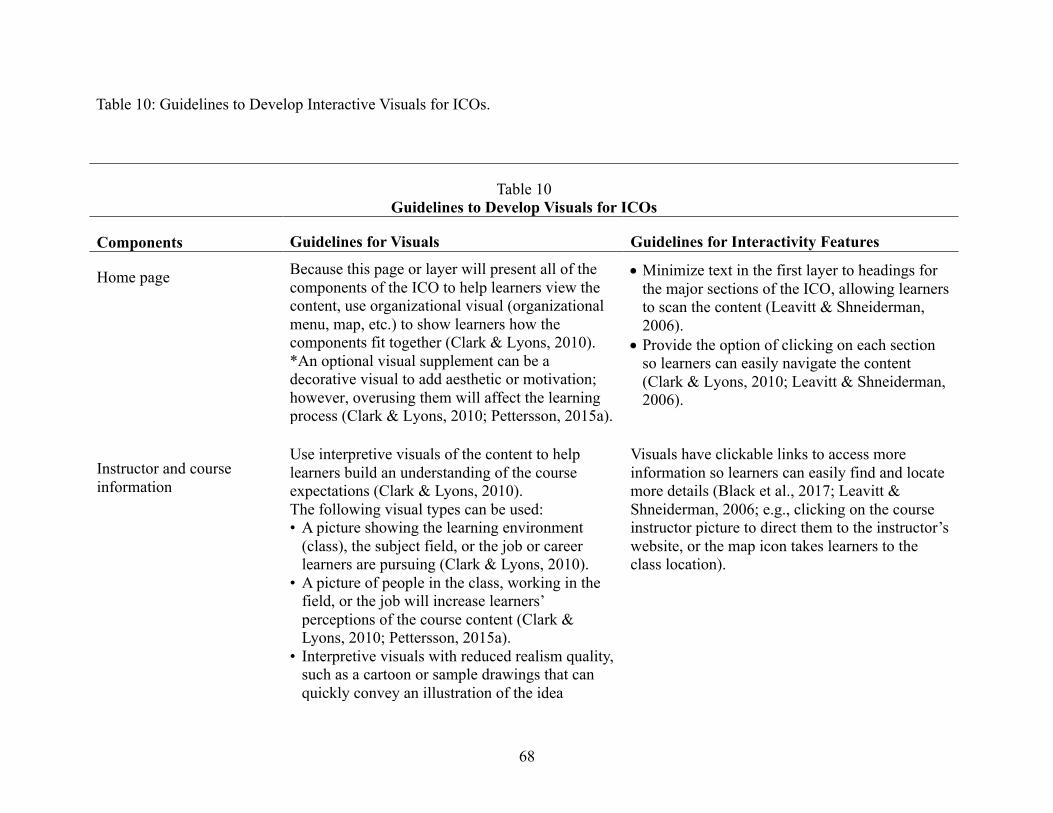
68
Table 10: Guidelines to Develop Interactive Visuals for ICOs.
Table 10 Guidelines to Develop Visuals for ICOs
Components Guidelines for Visuals
Guidelines for Interactivity Features
Home page
Because this page or layer will present all of the components of the ICO to help learners view the content, use organizational visual (organizational menu, map, etc.) to show learners how the components fit together (Clark & Lyons, 2010). *An optional visual supplement can be a decorative visual to add aesthetic or motivation; however, overusing them will affect the learning process (Clark & Lyons, 2010; Pettersson, 2015a).
• Minimize text in the first layer to headings for the major sections of the ICO, allowing learners to scan the content (Leavitt & Shneiderman, 2006).
• Provide the option of clicking on each section so learners can easily navigate the content (Clark & Lyons, 2010; Leavitt & Shneiderman, 2006).
Instructor and course information
Use interpretive visuals of the content to help learners build an understanding of the course expectations (Clark & Lyons, 2010). The following visual types can be used: • A picture showing the learning environment
(class), the subject field, or the job or career learners are pursuing (Clark & Lyons, 2010).
• A picture of people in the class, working in the field, or the job will increase learners’ perceptions of the course content (Clark & Lyons, 2010; Pettersson, 2015a).
• Interpretive visuals with reduced realism quality, such as a cartoon or sample drawings that can quickly convey an illustration of the idea
Visuals have clickable links to access more information so learners can easily find and locate more details (Black et al., 2017; Leavitt & Shneiderman, 2006; e.g., clicking on the course instructor picture to direct them to the instructor’s website, or the map icon takes learners to the class location).
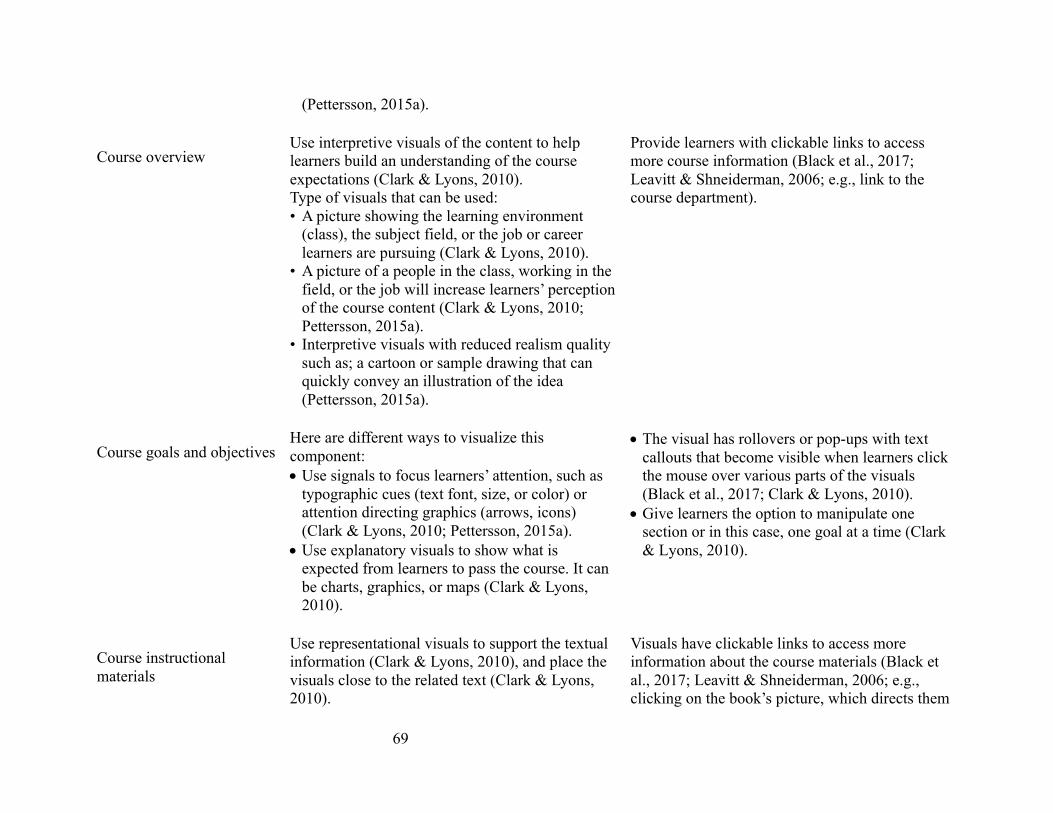
69
(Pettersson, 2015a).
Course overview
Use interpretive visuals of the content to help learners build an understanding of the course expectations (Clark & Lyons, 2010). Type of visuals that can be used: • A picture showing the learning environment
(class), the subject field, or the job or career learners are pursuing (Clark & Lyons, 2010).
• A picture of a people in the class, working in the field, or the job will increase learners’ perception of the course content (Clark & Lyons, 2010; Pettersson, 2015a).
• Interpretive visuals with reduced realism quality such as; a cartoon or sample drawing that can quickly convey an illustration of the idea (Pettersson, 2015a).
Provide learners with clickable links to access more course information (Black et al., 2017; Leavitt & Shneiderman, 2006; e.g., link to the course department).
Course goals and objectives
Here are different ways to visualize this component: • Use signals to focus learners’ attention, such as
typographic cues (text font, size, or color) or attention directing graphics (arrows, icons) (Clark & Lyons, 2010; Pettersson, 2015a).
• Use explanatory visuals to show what is expected from learners to pass the course. It can be charts, graphics, or maps (Clark & Lyons, 2010).
• The visual has rollovers or pop-ups with text callouts that become visible when learners click the mouse over various parts of the visuals (Black et al., 2017; Clark & Lyons, 2010).
• Give learners the option to manipulate one section or in this case, one goal at a time (Clark & Lyons, 2010).
Course instructional materials
Use representational visuals to support the textual information (Clark & Lyons, 2010), and place the visuals close to the related text (Clark & Lyons, 2010).
Visuals have clickable links to access more information about the course materials (Black et al., 2017; Leavitt & Shneiderman, 2006; e.g., clicking on the book’s picture, which directs them
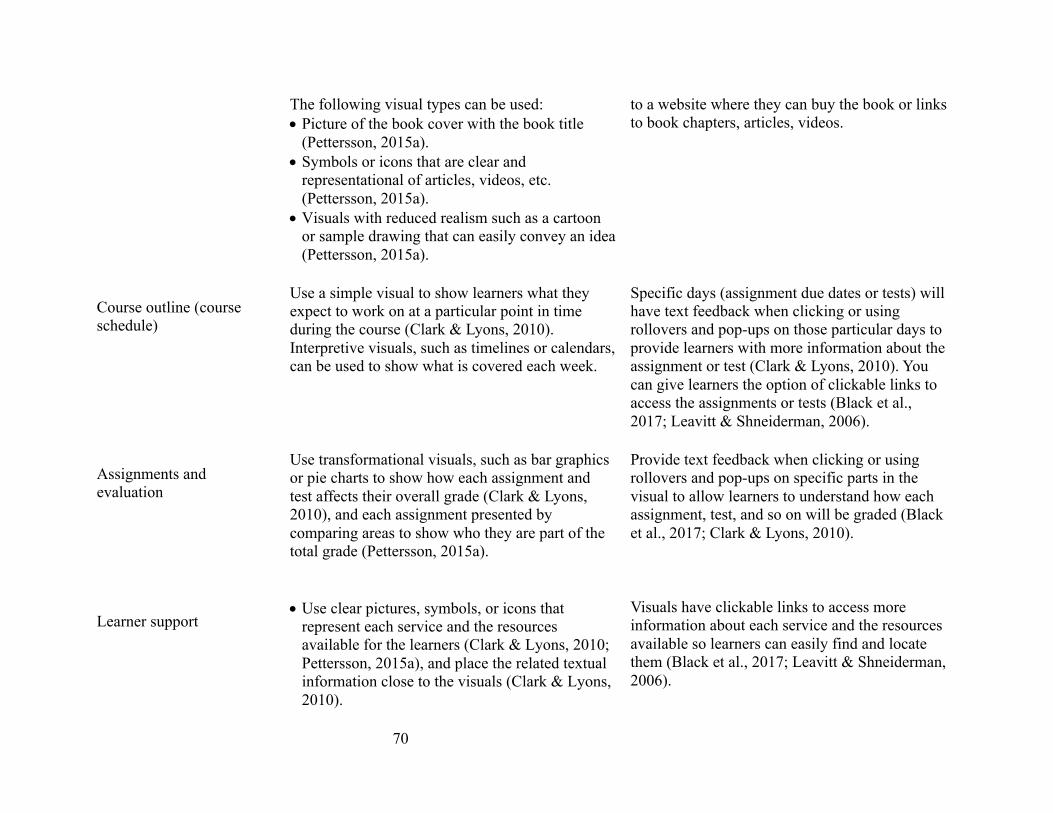
70
The following visual types can be used: • Picture of the book cover with the book title
(Pettersson, 2015a). • Symbols or icons that are clear and
representational of articles, videos, etc. (Pettersson, 2015a).
• Visuals with reduced realism such as a cartoon or sample drawing that can easily convey an idea (Pettersson, 2015a).
to a website where they can buy the book or links to book chapters, articles, videos.
Course outline (course schedule)
Use a simple visual to show learners what they expect to work on at a particular point in time during the course (Clark & Lyons, 2010). Interpretive visuals, such as timelines or calendars, can be used to show what is covered each week.
Specific days (assignment due dates or tests) will have text feedback when clicking or using rollovers and pop-ups on those particular days to provide learners with more information about the assignment or test (Clark & Lyons, 2010). You can give learners the option of clickable links to access the assignments or tests (Black et al., 2017; Leavitt & Shneiderman, 2006).
Assignments and evaluation
Use transformational visuals, such as bar graphics or pie charts to show how each assignment and test affects their overall grade (Clark & Lyons, 2010), and each assignment presented by comparing areas to show who they are part of the total grade (Pettersson, 2015a).
Provide text feedback when clicking or using rollovers and pop-ups on specific parts in the visual to allow learners to understand how each assignment, test, and so on will be graded (Black et al., 2017; Clark & Lyons, 2010).
Learner support
• Use clear pictures, symbols, or icons that represent each service and the resources available for the learners (Clark & Lyons, 2010; Pettersson, 2015a), and place the related textual information close to the visuals (Clark & Lyons, 2010).
Visuals have clickable links to access more information about each service and the resources available so learners can easily find and locate them (Black et al., 2017; Leavitt & Shneiderman, 2006).
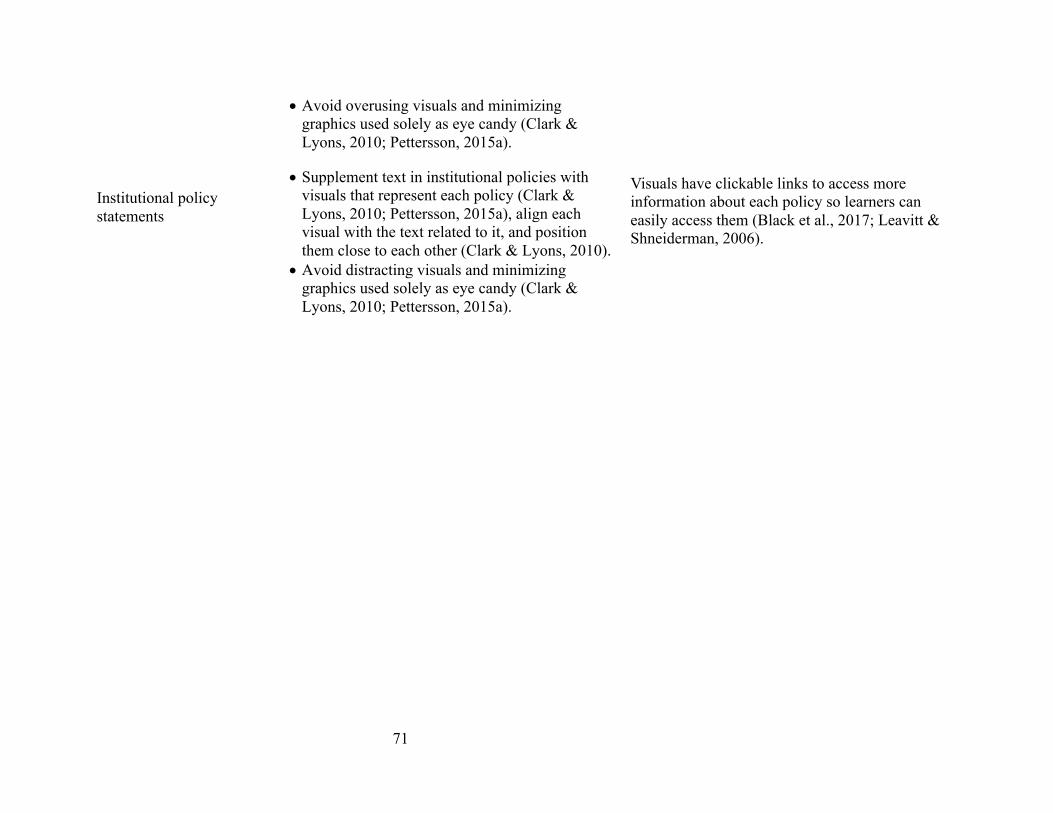
71
• Avoid overusing visuals and minimizing graphics used solely as eye candy (Clark & Lyons, 2010; Pettersson, 2015a).
Institutional policy statements
• Supplement text in institutional policies with visuals that represent each policy (Clark & Lyons, 2010; Pettersson, 2015a), align each visual with the text related to it, and position them close to each other (Clark & Lyons, 2010).
• Avoid distracting visuals and minimizing graphics used solely as eye candy (Clark & Lyons, 2010; Pettersson, 2015a).
Visuals have clickable links to access more information about each policy so learners can easily access them (Black et al., 2017; Leavitt & Shneiderman, 2006).
72
Validation Phase
In this phase, the question, “How did the guidelines assist in the design and development
of the ICO?” will be answered and the guidelines will be completed. Using the data collected
from the feedback of expert reviews and analyzing this data, the results will conclude the content
validity and the practicality and effectiveness of the guidelines. A discussion of the results of the
expert feedback, followed by their recommendations, then the revisions made to the original
draft of the guidelines is presented in the following chapter.
73
Chapter 5: Expert Reviews Feedback
Introduction
To validate the guidelines for the Interactive Course Organizers (ICOs), expert reviewers
were recruited to review and provide their views and evaluation of the guidelines. After
obtaining approval from the Institutional Review Board (IRB) at Virginia Tech (Appendix B),
experts in the field of instructional design, instructional message design, visual literacy, and
teaching and learning were sent a recruitment email (Appendix C). Once the expert reviewers
agreed to participate in the research, they received an email with a link to a website with the
review material, including: (1) information about the study, (2) an example of an ICO (Appendix
A), (3) guidelines to design and develop ICOs, (4) consent form (Appendix E), and (5) an
evaluation rubric (Appendix F) to complete a review and offer their feedback via an online rubric
created in Google Form. The expert reviewers were given a period of approximately 2 hours over
a two-week review period. A reminder email (Appendix D) was sent to the expert reviewers after
the first week.
Four expert reviewers participated in the validation of the guidelines. They were as
follows:
• Dr. Rune Pettersson is an expert in visual literacy, information design, and visual
communication. Dr. Pettersson is a former information design professor at Mälardalen
University, a past president and past vice president of the International Visual Literacy
Association (IVLA), and vice president of the International Institute for Information Design.
His work centers around the study of the presentation of visual messages in learning
environments and blending both text and visuals to investigate who the design factor can
74
assist in interpreting those visual messages. He has published 206 papers and 65 books in
this area.
• Dr. MJ Bishop with an experience in message design, she is an author of several books in
this area. Additionally, she is an expert in various instructional media and delivery systems
to improve learning. She is the inaugural director of the University System of Maryland’s
(USM) Center for Academic Innovation. The USM Center carries out research on best
practices and publishes its findings. Dr. Bishop is an author of several national and
international articles on innovative academic practices. Currently, Dr. Bishop serves as an
editor of the Association for Educational Communications and Technology (AECT) research
handbook.
• Dr. Susan G. Magliaro, emerita professor of Educational Psychology in the School of
Education at Virginia Tech, is an expert in teaching and learning and instructional design.
She has collaborated with many school systems on topics such as instructional design,
teacher training, and aligning curriculum, instruction, and assessment. Dr. Magliaro is an
author of four books, more than 50 book chapters, and peer-reviewed journal articles.
• Dr. Jung Lee, an expert in instructional technology and visual literacy, is a professor of
Instructional Technology at the Richard Stockton College of New Jersey. She served on the
Board of Directors for the International Visual Literacy Association (IVLA).
In the following discussion of the results, comments and feedbacks collected from the
expert reviewers are presented anonymously. As such, the input they provided is not connected to
individual reviewers by name. For this purpose, each of the expert reviewers is given a number
(i.e., Reviewer One, Reviewer Two, etc.) to maintain their anonymity regarding specific
comments.
75
Overall Expert Perspectives
In general, the results of the expert review’ feedback showed that the guidelines could
support the design and development of ICOs and they are described in sufficient detail to meet
their purpose and intended use. Expert Three stated, “The key thing is that your guidelines match
the needs and motivation of your audience. Your guidelines are very detailed.” In regards to the
guidelines assisting learners in making connections and linking different course content through
the use of textual and visual components, Expert Two opined that, “I do think the guidelines
recommended will help students see the ‘big picture’ for the course.” Although the proposed
guidelines for ICOs were generally evaluated as meeting their intended use, experts offered a
range of feedback and recommendations for improvement. Opportunities for improving the
guidelines are discussed in the next section, including more detailed input for each phase of the
guidelines.
Expert Reviews Recommendations
Comments and feedback collected from the expert reviewers were analyzed and
examined to improve the guidelines. To help the process go efficiently, each section of the rubric
used to evaluate the guidelines will be addressed individually, the rubric sections were as
followed; the application of ICOs, overall design of the guidelines, analysis phase, design phase,
development phase, as well as the application of the guidelines. For each section of the
evaluation rubric, recommendations from the expert reviewers will be described, followed by
how those recommendations were applied to revise and improve the final draft of the guidelines.
All individual question in each section will be cited and presented in the results (i.e., question
one, question two, etc.) to look at the questions refer to the evaluation rubric (Appendix G).
76
Focusing on each section separately can ensure that all recommended revisions collected for the
expert reviewers are considered and reflected in terms of shaping the guidelines’ final form.
The Application of ICOs
Expert reviewers were provided with an example of an ICO to examine their function and
application. This section focused on the application of ICOs starting by the first question, which
asked the expert to determine if the guidelines will be used by the target users to achieve its
goals. ICOs were targeted for use by instructors. One expert agreed that ICOs could be created
by educators, two offered a neutral response, and one disagreed. Expert reviewers provided
several related comments and suggestions. Expert Two stated, “I worry about the extent to which
most faculty members (particularly the ones who really need to do this!) will be able to apply the
instructional design principles recommended in the guidelines without a lot of scaffolding and a
tool that will make much of this "plug-and-play." Would be nice if the LMS had a function that
helped educators develop ICOs easily and within the guidelines you have suggested.” Similar to
that, Expert Three said, “While the idea and application of ICOs makes some sense, the
investment in the design and development by a single faculty member is unlikely. There would
need to be a very easy, efficient electronic template for this to work. There is also the scaling up
of general knowledge about the elements of the template. So, my question focuses on return on
investment...”
Both suggestions centered around having a platform that is easy to use by educators, such
as a template or added features to the LMS. While the purpose of this research study was to
simplify the process of making design choices and the reduction of elements that distract from
the message—skills that not many educators have. As stated by Clark and Lyons (2010), “The
use and interpretation of graphics is a more neglected skill” (p. 3). The guidelines did not provide
77
examples of tools or websites that can be utilized to develop ICOs. Therefore, in the revised
version of the guidelines a list of different data visualization websites has been added with links
to those websites.
Another critical piece mentioned by the reviewers was the return on investment for
developing an ICO. From the learners’ standpoint, in addition to the use of ICOs to navigate the
course content, it is hoped that they can also enhance learner engagement and motivation for the
learning process. An ICO is intended to create a learning environment that is welcoming and that
builds excitement and anticipation for the course. From an educator’s standpoint, an ICO can act
as a visually pleasing course syllabus, and depending on course content, it could be used for an
extended period of time, as long as it serves its purpose.
Questions two in this section was the question of what constraints may affect the
development of ICOs by educators. The question provided four different factors, allowing expert
reviewers to specify as many factors as they think applicable as part of their answers rather than
just one factor, with the option of adding more. The choices were time (ICOs take time to
develop), digital skills (skills required to make basic use of computer applications, websites, and
other online platforms), openness (staying open minded and willing to try new things), and
patience (the developing process can be slow going). As expected, several factors may affect the
development of the ICO. All experts indicated that both time and digital skills were the main
factors; the next was patience, chosen by three experts, then openness scored one choice; in
addition, Expert Three added personal and professional satisfaction, student feedback, and access
to the internet. Expert Two stated, “I generally think faculty are eager to do what they can to help
their students learn.”
78
Next, expert reviewers responded to question three, evaluating how textual and visual
components in an ICO may assist learners in organizing and making connections between course
content. All expert reviewers either agreed or strongly agreed with that statement, with Expert
One saying: “I like the “dynamic and interactive feeling” when you present a “numbered list” of
items in this way.” Then added, “I like that an image of the required text “pops up.”” Expert Two
pointed out the importance of aligning course goals and content and how they should reinforce
one another by stating, “I wonder the extent to which we really need also to be focusing on the
even bigger picture of curricular coherence? How does this course fit into my larger program of
study? What are the larger, "career ready" skills I'm acquiring?” The guidelines offered a
framework for a course syllabus, with different sections and specific components for each
section. On the subject of curricular coherence, this hinges on how well written are the course
goals and objectives and how the content supports them, which is not within the scope of these
guidelines.
Expert Three raised the concern of the need for instructional designers to assist in
developing the ICO. The reviewer specified, “Here is where a faculty member would need an
instructional designer or someone with knowledge of visual literacy, advance organizers, etc. to
help with the design of an ICO.” This concern was emphasized in several comments and
suggestions throughout the expert reviewers’ responses to the evaluation rubric, which begs the
question of whether the guidelines would be better suited to, and more useful for, instructional
designers and course developers.
Question four addressed content interactivity, all experts agreed that an ICO is interactive
and it allows learners to navigate, access, and view the course content. Correspondingly, in
question five, expert reviewers were asked to evaluate if ICO provides innovative improvements
79
in terms of presenting course materials, they either strongly agreeing or agreeing while one
reviewer selected “neutral.” Notwithstanding, the question of ROI was raised again here, with
Expert Three offering, “I think that ICOs align with current expectations for information
delivery. But this is an empirical question. For me, that would be the next step in determining
ROI.” This concern was mentioned earlier; however, return on investment can be determined
after the implementation of the ICO developed using the proposed guidelines.
Regarding question six, the ICO’s ability to attract learners’ attention and motivate them
to work through course content, two expert reviewers agreed with the statement and two selected
“neutral.” Expert Three stated, “Again, this matches current expectations, and current reliance on
electronic devices.” Expert Two touched on the novelty effect, she stated, “There might be an
initial novelty effect, but I’m not sure how long that will last.” The novelty effect is mostly
related to computer-assisted learning and is explained as the increased level of engagement
and/or performance when learners are presented with a new learning experience such as a new
technology (Tsay, Kofinas, Trivedi, & Yang, 2019). In the case of the ICO, this effect can be
significant because the tool’s goal is to inform and motivate learners, and the novelty effect can
be tested after its implementation.
As for additional suggestions from expert reviewers to improve the application of ICOs,
Expert Three emphasized the need for faculty support, stressing, “If these types of electronic
templates are not currently available, the development of one would be helpful. It seems that
CMS might have this as an element to make it align with the current platforms that universities
are using. I do think that faculty support should be offered, not only technical support - but also
support related to how people learn.” Having said that, it is possible that the guidelines are more
befitting for course developers and instructional designers, or with the assistance of one.
80
Expert Two suggested that the development of the ICO, especially the sections related to
course syllabus design, can be expanded to the whole degree program. She stated, “I realize this
is beyond the scope of your current work, but I'm envisioning a much larger mapping of a
student's progress through a degree program, with the course forming one stop along the
pathway. That would be a huge contribution to the work happening around alternative
credentialing, the comprehensive learner record, etc. out of organizations like Concentric Sky
and the Lumina Foundation. Are there ways you can begin to anticipate the need for creating the
infrastructure for more curricular coherence in what you're doing here?”
Overall Design of the Guidelines
In this section of the evaluation rubric, expert reviewers were asked to provide their
comments and feedback on the overall design and organization of the guidelines, as well as their
simplicity and stability. Two expert reviewers agreed, one strongly agreed, and one disagreed
that the guidelines described in sufficient detail the ICO’s purpose and intended use (question
one). Expert Two, who disagreed, said “I guess my response to this really depends on who the
audience for the guidelines are. I think they get too detailed for faculty, but probably provide the
right level of detail for instructional designers.” This was echoed by Expert Three: “I’m not sure
that the general faculty member, say in engineering, architecture, or natural resources, will
engage with all 16 pages.”
In question two, expert reviewers were asked about the clarity and sufficiency of the
directions and guidance provided in the guidelines, two expert reviewers strongly agreed with,
one selected “neutral”, and one disagreed with the statement expressing, “I like that you've
walked the user through the Analysis, Design, and Development phases, but I don't believe most
faculty will know how to move from Analysis to Design. The guidelines make a lot of
81
assumptions about the non-IDer's ability to take the information from the front-end analysis to
organize the visuals in a way that shows relationships in the course content, motivate learners,
and the like.”
The next question, question three, requested an evaluation of the organization and
formatting of the guidelines, and if they are well designed to sustenance their purpose and use.
Expert reviewers’ responses ranged from “strongly agree” to “disagree.” Expert Two stated: “I
think detail is lacking if this is intended for non-IDers.” Then Expert Three suggested, “I think a
shorter checklist will be more useful for the general faculty member.” These comments indicate
that the guidelines are possibly too elaborate for faculty members, and perhaps are best suited for
instructional designers and course developers, which is a theme that been identified throughout
the expert reviewers’ responses.
In the additional suggestion section to improve the overall design of the guidelines,
Expert Four suggested, “adding visuals in the guidelines”. This recommendation was considered
and visual examples were added to the final revised version of the guidelines.
Analysis Phase
This section contains questions to evaluation the analysis phase in the guidelines. When
expert reviewers were asked if the key factors discussed in the analysis phase were appropriate
and applicable in question one, their responses ranged from “strongly agree” to “neutral.”. Expert
Three stated, “While the content is good (from an ID perspective), how can you convey it for
someone who is not an ID'er. For example, when you talk about prior knowledge, you just may
want to talk about HOW to assess it. Maybe you need additional section that has tools for the
faculty member? How could they do a pre-test?” As for question two in the clarity and
82
sufficiently of the table (Guidelines to Analyze the context for ICO), the expert reviewers’
responses also ranged from “strongly agree” to “natural.”
Question three asked whether or not the analysis phase reflects relevant research, along
with important practices in the design of educational visual materials. Two expert reviewers
agreed and two offered a neutral response. Expert Two who selected neutral responses, noted: “I
don't believe there's any discussion here of whether learners will be using mobile devices.”
Expert Three, the other reviewer who chose “neutral,” stated, “Actually, it's difficult to talk about
the design of visual materials with no visuals.” Lastly, expert reviewers offered additional
suggestions to improve the analysis phase of the guidelines. Expert Two noted “I guess what's
missing for me here is a discussion of the ramifications of the findings for each. What difference
does it make if the learners are older, adult learners? What difference does it make if the learning
environment is online or F2F?” Furthermore, Expert Three recommended: “I’m thinking you
need visuals, job aids, actual tools.” In the revised version of the guidelines adjustments were
made to describe how each factor of the analysis will influence the design phase.
Design Phase
Questions in this section were about the design phase, expert reviewers were asked to
give their feedback on the components of that phase. In question one, Expert reviewers were
requested to evaluate the applicability of this phase, three expert reviewers agreed and one
disagreed that the guidelines are appropriate and sufficient. Expert Two, who disagreed, noted:
“I’m struggling with the extent to which these design phases spill over into the design of the
course itself. What you've provided in the table are just interface design guidelines, but those
can't really exist independently of the larger instructional design.” Expert Three said, “The
information is good - but you still need visuals to help the faculty member actually understand
83
what you want or what is needed. You need to show examples and non-examples. Each of the
components readily lends itself to visual examples.”
In question two, expert reviewers were asked to evaluate the table (Guidelines to Design
the ICO) and if the guidelines for each component were clear and sufficient, three expert
reviewers agreed and one selected “neutral.” Expert Two asked: “Any considerations about
accessibility?” When expert reviewers were asked if the design phase reflects relevant research
along with important practices in the design of educational visual materials in question three, all
agreed with the statement. Expert Two pointed out: “Agree, but missing any discussion of the
potential for auditory elements.”, while Expert Three noted: “But you need visuals.”
The expert reviewers offered additional suggestions to improve the design phase, with
Expert Two mentioning: “No guidance is provided here about how to take the findings from the
analysis and apply it to the design.” Expert Three added: “The information is excellent—but it’s
the presentation that needs to be done differently.” All suggestions were taken into account, and
the guidelines were revised to reflect each recommendation.
Development Phase
In regards to evaluating the development phase, and after expert reviewers examined the
course syllabus framework, in question one they been asked to provide their feedback on the
appropriateness and sufficiency of the framework, with their responses ranging from “strongly
agree” to “neutral.” Expert Two said: “I agree, but this all seems pretty "standard" to me... how is
this different based on having completed the front-end analysis?” additional guidance and
direction were added to the analysis phase in how the data collected in the phase can be used to
impact the design and development phase. Expert Three noted “I'm now wondering if you need
an elaborated matrix presentation that actually tells folks why they need to do each of the steps,
84
then have a visual example... So you would have the course syllabus sections, specific
components, rationale, then example... That said, then you've just created a more complex
document. The larger and more complex it gets, the less likely you'll get the general faculty
member to want to do this.” In response to this feedback, the course syllabus framework was
enhanced by adding rationales for each section of the course syllabus followed by examples.
Question two asked about the clarity and appropriateness of each of the components in
the course syllabus framework table, one expert reviewer strongly agreed and three agreed that
the components were applicable to the course syllabus design. Expert Three said: “For the most
part, you have all of the components that need to be there. I'm a little concerned about the
evaluation components. What happens if the instructor doesn't use a point system? There's
really no background on assessment and, if there is one place that general faculty truly violate
educational research principles, it's evaluation. Also, I see where you cite university policies.
I'm not sure faculty will even worry about some of those details.” This concern was addressed in
the final draft of the guidelines by given rationale and examples for the sections of the course
syllabus framework.
Question three asked the expert reviewers whether the framework for the course syllabus
reflected relevant research in components of an effective course syllabus, their responses differed
from “strongly agree” to “neutral.” Expert Two commented: “I'm not well read in this area, but
this is typically what we're asked to include.” In question four, about the sufficiently of the
development phase, the experts’ answers also varied from “strongly agree” to “disagree.” Expert
Two mentioned: “It's not clear to me how the guidelines will lead the average faculty member to
do anything different than what he/she is currently doing.” Responding to question five, a
variation was seen in the responses of the clarity of the guidelines for developing visuals for
85
ICOs, with one expert strongly agreeing, one agreeing, and two selecting “neutral” for the
statement. Expert Two suggested: “I think providing some concrete examples here would help,”
while Expert Three noted: “The content is there—but you need visuals, examples/non-
examples.”
In the topic of designing interactive visual materials, in question six, the expert reviewers
were asked to evaluate if the guidelines reflected relevant research as well as practical practices
in the field; their responses ranged from “strongly agree” to “neutral.” Expert Two said: “I think
you've covered the scope of what's possible in an ICO, but not provided much *design* support.”
On the additional suggestion to improve the development phase of the guidelines, Expert Two
suggested: “You might consider providing specific examples from 3-4 clusters of content areas
(STEM, humanities, social sciences, etc.).” Expert Three added “Similar to what was noted
above. You have a wealth of information in these guidelines, but I'm not sure that they are
accessible to the general course designer (a.k.a., faculty member). Remember that they are hired
because they are experts in their discipline, not pedagogy or design or evaluation...”
The Application of the Guidelines
Lastly, in this section expert reviewers assessed the overall application of the guidelines,
their effectiveness, and their ability to assist educators in the design and development of ICOs. In
question one about the likelihood of the use of the guidelines by educators, expert answers varied
from “strongly agree” to “disagree.” Expert Two stressed: “I think that, in order for these
guidelines to have an impact in their current form, it would require support from an IDer.” Expert
Three commented: “While the content is there, the examples to truly give them guidance in
design need to be added.” In connection with the above, question two asked whether or not the
guidelines were reasonable to be implement by educators and the intended user, expert
86
reviewers’ response differed from “agree” to “disagree.” Expert One commented: “In my
experience many educators are conservative,” Expert Three noted: “The information is dense and
complex. You need to simplify it.”
In question three, expert reviewers were asked to provide additional recommendations to
improve the application of the guidelines. Expert Two suggested, “While I understand your
motivation, I've come to recognize over the last few years that our expectations that we can make
faculty into instructional designers is probably unrealistic and, maybe, a bit unfair. Better for us
to ask faculty to stay focused on their day-to-day interactions with students and support their
understandings of how to use data to make formative and summative adjustments to their course
and leave this kind of design activity to the development of tools that support their efforts. My
suggestion would be to make the audience for these guidelines IDers at higher education
institutions and/or tool developers.” Expert Three added, “If you are trying to help educators
design more accessible tools for their learners - remember that educators are learners, too. And,
in terms of higher education, their focus on teaching is split between other expectations (e.g.,
research, outreach, campus expectations, etc.).” Reflecting these recommendations, even though
the guidelines intended audience were educators, the guidelines’ audience changed to course
developers and instructional designers.
Summary
After considering all recommendations from expert reviewers some adjustments and
revisions were made to the final version of the guidelines. In the application of ICO section,
comments were made about the platform that supports the presentation of the ICO. Although the
proposed guidelines were aimed at facilitating and easing the design process of an ICO for
average educators, the guidelines fall short in identifying examples of tools or websites that can
87
be used to develop ICOs. Thus, in the revised version of the guidelines, a list of various data
visualization websites was added with links. Moreover, several of these data visualization
websites have features that can be used to embed the product (ICO) in an LMS, which will
maximize LMS use and aid in achieving their full potential. Another theme identified from the
expert reviewers’ comments and feedback was that the guidelines were too elaborate and
complex for a typical faculty member; therefore, the target audience of the guidelines shifted
from average educators such as faculty members to course developers and instructional
designers. In addition, discussions were had about ROI and the novelty effect aspect of the
guidelines; both observations can be examined after the implementation of the guidelines.
In the overall design section of the evaluation rubric, one expert reviewer suggested the
use of visuals in the guidelines, which is another theme that has been identified throughout the
expert reviewers’ responses. Thus, modifications were made to the final revised version of the
guidelines by supplementing them with varies visuals examples. In the analysis phase, there was
a need to rationalize the ramification of analyzing each factor in the phase and how to utilize the
data to aid the design process; therefore, additional guidance and direction information were
added to improve and enhance the analysis phase.
As regards the design phase, concerns were evident about how this phase extends to the
course design, specifically the ICO; reflecting on this recommendation, modifications were made
to clarify the information in the design phase by adding examples of how it is presented in an
ICO. Additionally, guidance and directions on integrating auditory elements and accessibility to
an ICO were further added to the guidelines. In the development phase, adjustments were made
to clarify the information and provided more design support, which was enhanced by adding
examples. Finally, a link to an example of ICO was included in the final draft. In Appendix G, a

88
table that includes all changes that were made to the final version of the guidelines based on the
suggestions provided by the expert reviewers, and Appendix H presents the revised guidelines
for interactive course organizers (ICOs).
89
Chapter 6: Discussion
Introduction
This chapter provides a brief overview of the research study, and presents the limitations
faced while conducting the study. Following, a discussion of the study contributions in term of
theoretical implications as well as practical implication. Lastly, the chapter offers
recommendations for future research and practice.
Study Review
In recent years, online education has transformed higher education learning by offering
various online programs and classes that are accessible to learners anywhere and at any time.
Reports show that 6.3 million learners took a minimum of one online course in the year of 2016,
a total 31.6%, and the trend toward growth in online enrollments has increased, despite a decline
in overall higher education enrollments (Allen et al., 2018). One of the main influences that has
played a significant role in online education is the adoption of Learning Management Systems
(LMS) or Course Management Systems (CMS). Those systems function as a delivery and
distribution medium for course materials such as course syllabi, documents, files, assignments,
quizzes, and discussions. Currently, these systems are utilized by the majority educational
institutions around the world (Dahlstrom et al., 2014). With this expansion of the use of LMSs in
both online and face to face courses, there is a need to design new and innovative methods to
present course materials to learners, rather than utilize LMSs as a distribution system for course
materials (Azmi & Singh, 2015). To maximize the use of these systems, there is a need to
identify new strategies and methods to make the learning experience more fulfilling.
One of the essential elements of any course is the course syllabus, where all course
information is found, such as instructor information, course units, and the course evaluation.
90
Because of the significance of the course syllabus in presenting the course agenda to learners, it
can function as a framework for the course. (Littlefield, 1999). Merrill (2020) emphasize that: “A
first-class syllabus can help promote effective, efficient and engaging learning, but traditional
syllabi too often fail to attain this purpose”. This raises the question of how to construct the
course syllabus in a more interactive, visually pleasing approach could help learners comprehend
the course organization, making it more useful and engaging. ICOs can support this kind of
approach to a more helpful and interactive course syllabus design, they can offer a sound
framework for the course, as well as guidance for learners.
This study employed a design and development research methodology with four phases:
(1) the analysis phase, (2) the design phase, (3) the development phase, and (4) the validation
phase (Richey & Klein, 2007). In the analysis phase, a literature review was conducted to
identify the standard components of a course syllabus and transform these into the components
of an ICO. To support this transformation, another literature examination was done to locate
specific theoretical principles to design and develop the guidelines that assisted in building an
ICO. In the second phase (design phase), the results collected from the analysis phase were
applied to craft the first version of the ICO. In the development phase, the development of the
guidelines was completed, as well as an evaluation rubric to validate how each of the theoretical
principles supported each proposed guideline. Lastly, the validation phase included the feedback
and recommendations from five expert reviewers to determine the validity and the prospective
effectiveness of the guidelines.
Study Limitations
This study faced two major limitations, the time and the recruitment of expert reviewers.
The time limitation was related to the timeline intended to complete this study, the time
91
anticipated to develop the guidelines was insufficiently limited. Like any type of research,
especially design and development research, the development of the guidelines should have a
carefully planned timeline, from the analysis phase, to the design phase, then the development
phase, and later the validation phase. In this study, the analysis phase included two different
literature analyses, examining the course syllabus components and the theoretical principles to
develop the guidelines for ICOs. In the design phase, the first version of ICO was created. The
development phase was the developing of the guideline and the evaluation rubric. Lastly, the
validation phase to determine the content validity and effectiveness of the guidelines by
collecting expert reviews' feedback, then revise the guidelines according to those feedbacks.
As a consequence, completion of the study took twice as long as forecasted, and
ultimately some of the phases were rushed. For example, the development of the version of the
ICO should have had more carefully selected visual representations for the content. Moreover, in
the validation phase the limited time led to not considering any follow-up interviews with the
experts, who may have offered more insights into the strengths and weaknesses of the original
guidelines. Thus it is essential for future studies, particularly those similar to this one, that
researchers allow more time to complete all phases.
The second limitation was having access to the expert reviewers. Finding direct access to
expert reviewers was a difficult process. First, most experts in the field of visual literacy or
message design were either retired or extremely busy. Second, after identifying the expert
reviewers there was a need to obtain access to their contact information since recruitment was
via email. The experts’ emails were found online, either through universities websites they
affiliated with, or research papers and articles they published. However, there was a lack of
response from some expert which could be due to not receiving the recruitment email or the
92
email addresses were not correct. For example, more than 10 experts were sent the expert review
request email and most of them did not respond. Other expert reviewers responded that they did
not have time to evaluate the guidelines, especially because it was a hectic time of the year, being
December and the holidays. Furthermore, originally there were five experts who agreed to
participate in the research; however, one expert was not able serve as an expert reviewer due to
health reasons.
For future design and development research studies that incorporate a validation phase,
researchers should plan to have at least 10–15 expert reviewers they might be able to contact,
bearing in mind that not all expert reviewer would be able to participate in the evaluation of the
work.
Study Contributions
According to Richey and Klein (2007), design and development research is aimed at
contributing to the instructional design and development knowledge base. This study produced a
set of guidelines to assist in designing ICOs that will help students visualize course content and
its organization and recognize the connections between different content. These guidelines were
designed and developed based on a theoretically-grounded foundation, as well as prior research
in message design and visual literacy. The guidelines were built using several cognitive
information processing theories, and they incorporated both text and visuals to help attract and
maintain learners’ attention, minimize cognitive load, and support information retention (Paivio,
1986; Pettersson, 2002; Sweller et al., 1998). In this study, all information and data collected and
assembled to develop these guidelines has both theoretical and practical implications.
93
Theoretical Implications
ICOs are an innovative tools aimed at offering a visual aid to help learners grasp the
course’s “big picture” and how it is structured, specifically the course syllabus, through the use
of both text and visuals and supported by several interactive features. As has been explored in the
literature review, an ICO is built on the fundamental principles of a traditional course syllabus
and visual organization of advance organizers, graphic organizers, and concept maps as well as
interactivity and learner control.
The first theoretical contribution of this research study is to add to the literature on
effective components of a course syllabus, given that the latter can operate as a contract between
the course instructor and learners, a permanent record, and a learning tool (Parkes & Harris,
2002). A course syllabus offers learners directions and expectations for the course (McKeachie,
1978, 1999), as well as being a planning tool for educators (Littlefield, 1999). Regarding the
development of syllabi, different educational institutions offer a variety of templates and
checklists to assist in this process (Gannon, 2018). Although in the literature a number of articles
from several disciplines consider common syllabus components, empirical studies of syllabus
components were not evident in the literature. This research study provided a foundational
knowledge of the components of an effective course syllabus by utilizing the Quality Matters
QM higher education standards rubric (Quality Matters, 2018), different literature on the course
syllabus components, and an exploration of various templates and checklists from higher
education institutions. Future researchers can extend and expand this foundation and are
encouraged to investigate other useful approaches to creating effective course syllabi.
The second theoretical contribution of this research study is to expand the literature on
operationalizing cognitive information processing theories in support of the design of learning
94
solutions like the ICO. The study adapted and applied principles from the visual design model by
Clark and Lyons (2010); the model provided theoretically-grounded and evidence-based
principles to assist in developing instructional materials for both printed and online content. This
adaptation offers additional evidence of the quality and usefulness of the visual design model
principles that have developed from different learning theories on the use of both text and visuals
to create instructional content. In fact, each of the principles used in developing these guidelines
united empirical and current research that can help in designing not only ICOs but also other
online or printed visual materials.
Furthermore, this research study contributes to the literature on instructional message
design and visual literacy. Instructional message design “comprises analysis, planning,
presentation and understanding of messages their content, language and form” (Pettersson, 2002,
p. 1). The guidelines produced in this study were organized in a systemic way from an analysis
phase, to a design phase, then development phase. Each phase considers different factors that
influence the design of a message, and how to use text and visuals to deliver better conditions for
learning (Pettersson, 2009).
Another theoretical contribution is to the field of content interactivity and learner control,
in that this research study also produced a set of guidelines for creating interactive instructional
content. In the development phase of the guidelines, guidance and direction concerning
interactive content was provided. Interactive content can provide a more engaging learning
environment and offer meaningful learning to students (Chen & Catrambone, 2014). Interactive
content can be more effective in online courses because it offers additional support to learners by
allowing them to sequence and choose the amount of information they can view and absorb at
any time (Merrill, 1983). With the increasing number of online technologies, even free web-
95
based examples, and the various features that are available in LMSs (ATD Research,
2019a,2019b), future researchers can benefit from the guidelines developed for interactivity and
can add to and expand their uses.
Practical Implication
From an instructional design standpoint, the essence of the field is that it is a practical
and interdisciplinary arena focused on solving an educational problem. As in any design and
development research, the aim of this study was to minimize the gap between theory and practice
(Richey et al., 2011). The guidelines developed in this study were designed for a specific
practical use by educators such as faculty members, teachers, and instructors. Though these
guidelines may have been intended to assist in developing ICOs, they can be utilized jointly to
develop ICOs, or each section can be used separately to create course syllabi, visual instructional
materials, or interactive instructional materials.
Any course, either online or face to face, at any educational level—K–12 or university
level—and in any field, must have a syllabus. ICOs can explain learners’ expectations in a course
in a clear and pleasant manner and anticipate positive learners’ outcomes. The guidelines for
developing and designing ICOs were created to guide educators in developing new approaches to
improve the course syllabus design process. As stated by Littlefield (1999), a well-designed
syllabus also sets the course agenda, acts as a planning tool for faculty, and serves as a contract
between the instructor and students. The framework for effective syllabus produced in this study
provides the different sections essential for an effective syllabus, with a detailed explanation and
examples for each component. Effective syllabus can support learner needs in terms of the
pathway and expectations for courses, and educators can employ the guidelines exclusively to
guide them in creating their syllabus and it can be used as a planning tool for their course.
96
Furthermore, the guidelines for designing ICOs can be used to build any visual
instructional materials because they set out several components that must be considered when
designing visual materials, with directions and guidance on how to organize both text and
visuals. ICOs combine visual elements, such as timelines, drawings, charts, graphs, maps, or
pictures to show the outline and organization of main course topics. Looking at an ICO at the
beginning can give learners the chance to see how the content is related to each other and will
open their eyes to the ending gain of the course. Likewise, the guidelines can be used to develop
interactive content, they can enhance learner engagement and motivation in the course through
adding interactive features to an otherwise static presentation of information. ICO can present the
learners with an active relationship with the material, while allowing them to have an active
control over the amount of course information covered.
Though the guidelines developed in this study are intended to guide the design process,
they can also be used as an evaluation tool or checklist. As has been stated, the guidelines can be
used separately or as a list of items required or components to be considered when creating
course syllabi, visual instructional materials, or interactive instructional materials.
Recommendations for Future Research
As a result of the expert review process, the guidelines have been revised and improved
to be more applicable for course developers and instructional designers with limited knowledge
in learning theory, instructional message design, and visual literacy. Like any other design and
development research studies, the next step is the implementation of the guidelines to assess their
effectiveness and efficiency. Further examination and testing of the guidelines can enhance their
application and utilization. Some of the expert reviewers suggested testing the return on
investment after using ICOs. Also, the novelty effect and how long it will last after using an ICO.

97
Both aspects can be considered for exploration and testing when implementing the guidelines.
Another expert reviewer proposed expanding the use of the guidelines as a map for entire degree
programs. The guidelines can be a start for designing and developing more coherence
curriculums.
98
References
Albrecht, M. L. (2009). Getting Started: Writing the Course Syllabus. Hort Technology, 19(2),
240–246. doi: 10.21273/hortsci.19.2.240
Allen, I. E., Seaman, J., & Seaman, J. E. (2018). Grade increase: Tracking distance education in
the United States. Babson Park, MA: Babson Survey Research Group. Retrieved from
http://onlinelearningsurvey.com/reports/gradeincrease.pdf
Allen, I. E., & Seaman, J. (2017). Digital learning compass: Distance education enrollment
report 2017. Retrieved from
https://onlinelearningsurvey.com/reports/digtiallearningcompassenrollment2017.pdf
Appleby, D. C. (1999). How to improve your teaching with the course syllabus? In B. Perlman,
L. I. McCann, & S. H. McGadden (Eds.), Lessons learned: Practical advice for the
teaching of psychology (pp. 19-24). ed. Washington, DC: American Psychological
Society.
Armbruster, B. B., & Anderson, T. H. (1981). Content area textbooks (Reading Ed. Rep. No. 23).
Urbana: University of Illinois, Center for the Study of Reading.
ATD Research. (2019a, November 26). Is the LMS Dead? Learning Management Technology in
Today’s Organizations. Retrieved February 25, 2020, from https://www.td.org/research-
reports/is-the-lms-dead
ATD Research. (2019b, December 20). 2019 State of the Industry. Retrieved February 25, 2020,
from https://www.td.org/research-reports/2019-state-of-the-industry
Ausubel, D. P. (1960). The use of advance organizers in the learning and retention of meaningful
verbal material. Journal of Educational Psychology, 51(5), 267-272. doi:
10.1037/h0046669
99
Ausubel, D. P. (1962). A subsumption theory of meaningful verbal learning and retention. The
Journal of General Psychology, 66 (2), 213-224.
Ausubel, D. P. (1968). Educational psychology: A cognitive view. New York: Rinehart &
Winston.
Ausubel, D.P. (1963). Cognitive structure and the facilitation of meaningful verbal learning.
Avgerinou, M., & Ericson, J. (1997). A review of the concept of visual literacy. British Journal of
Educational Technology, 28, 280–291. doi:10.1111/1467-8535.00035
Azmi, M. A., & Singh, D. (2015). Schoolcube: Gamification for learning management system
through Microsoft SharePoint. International Journal of Computer Games Technology,1-
5. doi:10.1155/2015/589180
Baecker, D. 1998. Uncovering the rhetoric of the syllabus. College Teaching 46 (2), 58-62.
Barros, J. P. (2014). On the description of individual course units for programme assessment and
better syllabuses. International Journal of Engineering Pedagogy, 4(5), 28–33.
https://doiorg.ezproxy.lib.vt.edu/10.3991/ijep.v4i5.353
Black, A., Luna, P., Lund, O., & Walker, S. (2017). Information design (1st). Retrieved from
https://doi-org.ezproxy.lib.vt.edu/10.4324/9781315585680
Brusilovsky, P. (2004). Adaptive navigation support: From adaptive hypermedia to the adaptive
web and beyond. Psychnology, 2(1), 7–23.
Buller, J. L. (2010). The essential college professor: A practical guide to an academic career.
San Francisco, CA: Jossey-Bass.
Cañas, A. J., & Novak, J. D. (2010). The theory underlying concept maps and how to construct
and use them. Práxis Educativa, 5(1), 9-29.
100
Chen, B. (2014). Advance Organizer. In K. Thompson and B. Chen (Eds.), Teaching Online
Pedagogical Repository. Orlando, FL: University of Central Florida Center for
Distributed Learning. Retrieved from
https://topr.online.ucf.edu/index.php?title=Advance_Organizer&oldid=3589
Chen, D. W., & Catrambone, R. (2014). Effects of multimedia interactivity on spatial task
learning outcomes. In Proceedings of the Human Factors and Ergonomics Society
Annual Meeting 58(1), 1356-1360 Retrieved from
http://www.psychology.gatech.edu/probsolvelab/pubs/CubeHFES2014.pdf
Cierniak, G., Scheiter, K., & Gerjets, P. (2009). Explaining the split-attention effect: Is the
reduction of extraneous cognitive load accompanied by an increase in germane cognitive
load? Computers in Human Behavior, 25(2), 315–324.
Ciullo, S. & Reutebuch, C. (2013). Computer-Based graphic organizers for students with
learning disabilities: a systematic review of literature. Learning Disabilities Research &
Practice, 28(4), 196-210.
Clark, C. H., & Bean, T. W. (1982). Improving advance organizers research: Persistent problems
and future directions. Reading World, 22, 2-10.
Clark, R. C., & Lyons, C. (2010). Graphics for learning: proven guidelines for planning,
designing, and evaluating visuals in training materials. Retrieved from
https://ebookcentral-proquest-com.ezproxy.lib.vt.edu
Clark, R. C., & Mayer, R. E. (2016). E-learning and the science of instruction: Proven guidelines
for consumers and designers of multimedia learning (4th ed.). Hoboken: Wiley.
Clarke, J.H. (1990). Patterns of thinking: Integrating learning skills with content teaching.
Boston: Allyn & Bacon.
101
Dahlstrom, E., Brooks, D. C., & Bichsel, J. (2014). The current ecosystem of learning
management systems in higher education: Student, faculty, and IT perspectives. Research
report. Louisville, CO: ECAR. Retrieved December 23, 2017 from
https://net.educause.edu/ir/library/pdf/ers1414.pdf
Darch, C. B., Carnie, D. W., & Kameenui, E. J. (1986). The role of graphic organizers and social
structure in content area instruction. Journal of Reading Behavior, 18 (4), 275-295.
Davis, B. G. (1993). Designing or revising a course. In Tools for teaching (pp. 3-20). San
Francisco, CA: Jossey-Bass.
Dexter, D. D. & Hughes, C. A. (2011). Graphic organizers and students with learning disabilities:
A meta-analysis. Learning Disability Quarterly, 34, 51–72.
Dexter, D. D., Park, Y. J., & Hughes, C. A. (2011). A meta-analytic review of graphic organizers
and science instruction for adolescents with learning disabilities: Implications for the
intermediate and secondary science classroom. Learning Disabilities Research &
Practice, 26, 204–213.
DiCecco, V. M., & Gleason, M. M. (2002). Using graphic organizers to attain relational
knowledge from expository text. Journal of Learning Disabilities, 35(4), 306-320.
doi:10.1177/002248716301400220
Driscoll, M. (2004). Psychology of learning for instruction (3rd ed.). Boston, MA: Pearson
Eberly, M. B., Newton, S. E., Wiggins, R. A. (2001). The syllabus as a tool for student-centered
learning. The Journal of General Education, 50 (1), 56, 71-72.
Ehlers, U. D. (2009). Web 2.0 - e-learning 2.0 - quality 2.0? quality for new learning cultures.
Quality Assurance in Education, 17(3), 296-314. doi:10.1108/09684880910970687
102
Fallahkhair, S., Pemberton, L., & Griffiths, R. (2005). Dual device user interface design for
ubiquitous language learning: Mobile phone and interactive television (iTV). In
Proceedings of the 2005 IEEE International Workshop on Wireless and Mobile
Technologies in Education (pp. 85–92). Tokushima, Japan: IEEE Computer Society
Press.
Felker, D. B. (1981). Guidelines for document designers. Washington, D.C. : American Institutes
for Research. Retrieved from
http://search.ebscohost.com/login.aspx?direct=true&db=cat07058a&AN=vtp.991303&sit
e=eds-live&scope=site
Gannon, K. (2018). How to create a syllabus: Advice guide. Retrieved from
https://www.chronicle.com/interactives/advice-syllabus Accessed on January 30, 2020.
Gibson, James J. (1966). The senses considered as perceptual systems. Boston: Houghton
Mifflin.
Gibson, James J. (1979). The Ecological Approach to Visual Perception. Boston: Publisher?
Global Industry Analysts, Inc. (2019). Learning - Market Analysis, Trends, and Forecasts.
Retrieved from https://www.strategyr.com/market-report-e-learning-forecasts-global-
industry-analysts-inc.asp.
Grunert, J. (1997). The course syllabus: A learning-centered approach. Anker Publishing
Company, Inc.
Guidelines from the Quality Matters Rubric. (2009). Distance Education Report, 13(19), 5-7.
Habanek, D.V. (2005). An examination of the integrity of the syllabus. College Teaching, 53, 62-
65.
103
Hartley, J., & Davies, I. K. (1976). Pre-instructional strategies: The role of pretest, behavioral
objectives, overviews and advance organizers. Review of Educational Research, 46(2),
239-265.
Hawk, P. (1986). Using graphic organizers to increase achievement in middle school life science.
Science Education, 70, 81-87.
Hess, J. L., & Whittington, M. S. (2003). Developing an Effective Course Syllabus. NACTA
Journal, 57(3), 67–71. Retrieved from
http://login.ezproxy.lib.vt.edu/login?url=http://search.ebscohost.com/login.aspx?direct=tr
ue&db=ehh&AN=93664258&site=eds-live&scope=site
Hoffman, B., White, A., & Aquino, N. (2005). Screen Text Readability – Ease, Accuracy, And
Speed of Some Common Computer Typefaces. In R. E. Griffin, B. D. Cowden, M.
Avgerinou (Eds.) 2006. Imagery and Artistry Animating the Mind ́s Eye: Selected
Readings of the International Visual Literacy Association. International Visual Literacy
Association.
Hofmann, P. L. (2005). Graphics for Learning: Proven Guidelines for Planning, Designing, and
Evaluating Visuals in Training Materials. IEEE Transactions on Professional
Communication, (2), 234. Retrieved from
http://login.ezproxy.lib.vt.edu/login?url=http://search.ebscohost.com/login.aspx?direct=tr
ue&db=edsgao&AN=edsgcl.141604676&site=eds-live&scope=site.
Hyerle, D. (1996). Visual tools for constructing knowledge. Alexandria, VA: Association for
Supervision and Curriculum Development.
Johnson C. (2006). Best practices in syllabus writing: contents of a learner-centered syllabus.
Journal of Chiropractic Education (Association of Chiropractic Colleges), 20(2), 139–
104
144. Retrieved from
http://login.ezproxy.lib.vt.edu/login?url=http://search.ebscohost.com/login.aspx?direct=tr
ue&db=c8h&AN=106262016&site=eds-live&scope=site
Jonassen, D. H., & Grabinger, R. S. (1990). Problems and issues in designing
hypertext/hypermedia for learning. In D.H. Jonassen & H. Mandl (Eds), Designing
Hypermedia for Learning. 3-25, Berlin Heidelberg: Springer Verlag.
Jones, B. D. (2009). Motivating students to engage in learning: The MU- SIC Model of
Academic Motivation. International Journal of Teaching and Learning in Higher
Education, 21(2), 272-285.
Jones, B.F., Pierce, J., & Hunter, B. (1989). Teaching students to construct graphic
representations. Educational Leadership, 46(4), 21-25. Journal of Teacher Education.
June 1963 14: 217-222.
Keller, J. M. (1979). Motivation and instructional design: A theoretical perspective. Journal of
Instructional Development, 2(4), 26-34.
Keller, J. M. (1983). Motivational design of instruction. In C. M. Reigeluth (Ed.), Instructional
design theories and models: An overview of their current studies (pp. 383–434).
Hillsdale, NJ: Erlbaum.
Khalifa, M. & Lam, R. (2002). Web-Based Learning: Effects on Learning Process and Outcome.
IEEE Transactions on Education, 45 (4), 350-356.
Kim, A., Vaughn, S., Wanzek, J., & Wei, S. (2004). Graphic organizers and their effects on the
reading comprehension of students with LD: A synthesis of research. Journal of Learning
Disabilities, 37(2), 105-118.
105
Kolfschoten, G., Lukosch, S., Verbraeck, A., Valentin, E., & Vreede, G.J.D. (2010). Cognitive
learning efficiency through the use of design patterns in teaching. Computers &
Education, 54(3), 652–660.
Kowata, J. H., Cury, D. & Boeres, M. C. S. (2010). Concept maps core elements candidate
recognition from text. In Proceedings of the Fourth International Conference on concept
mapping (pp. 120–127), Viña del Mar, Chile.
Lambiotte, J. G., & Dansereau, D. F. (1992). Effects of knowledge maps and prior knowledge on
recall of science lecture content. Journal of Experimental Education,60, 189-201.
Lankow, J., Ritchie, J., & Crooks, R. (2012). Infographics: The power of visual storytelling.
Hoboken, N.J: John Wiley & Sons, Inc.
Leavitt, M. O., & Shneiderman, B. (2006). Research-based web design & usability guidelines.
Washington, D.C.: U.S. Dept. of Health and Human Services.
Lipton, R. (2007). The practical guide to information design. Hoboken, NJ: Wiley.
Littlefield, V. M. (1999a). My syllabus? it's fine. Why do you ask? Or the syllabus: A tool for
improving teaching and learning. Paper presented at the Society for Teaching and
Learning in Higher Education, Calgary, Canada.
Liu, S.H., Liao, H.L., & Pratt, J.A. (2009). Impact of media richness and flow on e-learning
technology acceptance. Computers & Education, 52(3), 599–607.
Lo, J., Wang, H., & Yeh, S. (2004). Effects of confidence scores and remedial instruction on
prepositions learning in adaptive hypermedia. Computers & Education, 42(1), 45–63.
Madrid, R.I., Oostendorp, H.V., & Melguizo, M.C.P. (2009). The effects of the number of links
and navigation support on cognitive load and learning with hypertext: The mediating role
of reading order. Computers in Human Behavior, 25(1), 66–75.
106
Malamed, C. (2015). Visual design solutions: Principles and creative inspiration for learning
professionals (1st ed.). Hoboken: Wiley.
Matejka, K., & Kurke, L. B. (1994). Designing a great syllabus. College Teaching, 42 (3), 115-
117.
Mayer, R. E. (1979). Can advance organizers influence meaningful learning? Review of
Educational Research, 49, 371-383.
Mayer, R. E. (2001). Multimedia learning. New York: Cambridge University Press.
Mayer, R. E. (2004). Should there be a three-strikes rule against pure discovery learning?
American Psychologist, 59, 14–19.
Mayer, R. E. (2005). Principles for reducing extraneous processing in multimedia learning:
Coherence, signaling, redundancy, spatial contiguity, and temporal contiguity principles.
In R. Mayer (Ed.), The Cambridge handbook of multimedia learning (pp. 183-200). New
York: Cambridge University Press.
Mayer, R. E. (2009). Multimedia learning (2nd ed.). New York: Cambridge University Press.
doi:10.1017/CBO9780511811678
Mayer, R. E., & Sims, V. K. (1994). For whom is a picture worth a thousand words? Extensions
of a dual-coding theory of multimedia learning. Journal of Educational Psychology, 86,
389–401.
Mayer, R.E. (1999). The promise of educational psychology. Upper Saddle River, NJ: Prentice
Hall.
McAvinia, C. (2016). Online learning and its users: lessons for higher education. Retrieved
from https://ebookcentral.proquest.com
107
McKeachie, W J. (1978). Teaching tips: A guidebook for the beginning college teacher (7th ed.).
Lexington, MA: D.C. Heath and Company.
McKeachie, W J. (1999). Teaching tips: Strategies, research, and theory for college and
university teachers (10th ed.). Boston: Houghton Mifflin.
Meirelles, I. (2013). Design for Information : An Introduction to the Histories, Theories, and
Best Practices Behind Effective Information Visualizations. Rockport Publishers.
Merrill, M.D. (1975). Learner control: Beyond aptitude-treatment interactions. AV
Communications Review, 23, 217–226.
Merrill, M.D. (1983). Component display theory. In C. M. Reigeluth (Ed.), Instructional Design
Theories and Models: An Overview of Their Current Status. Hillsdale: Erlbaum
Associates.
Merrill, M. D. (2020). A Syllabus Review Check-List to Promote Problem-Centered Instruction.
TechTrends: Linking Research & Practice to Improve Learning, 64(1), 105–123.
https://doi-org.ezproxy.lib.vt.edu/10.1007/s11528-019-00411-4
Meyer, B. J. F. (1975). Identification of the structure of prose and its implications for the study of
reading and memory. Journal of Reading Behavior, 7, 7-47.
Meyer, B. J. F. (1977). The structure of prose: Effects on learning and memory and implications
for educational practice. In R. C. Anderson, R. Spiro, & W. E. Montague (Eds.),
Schooling and the acquisition of knowledge. Hillsdale, NJ: Erlbaum.
Meyer, B. J. F. (1980). Organizational patterns in prose and their use in reading. In M. L. Kamil
& A. J. Moe (Eds.), Reading research: Studies and applications. Clemson, SC: National
Reading
108
Moore, D. W. & Readence, J. E. (1984). A quantitative and qualitative review of graphic
organizer research. Journal of Educational Research, 78(1), 11–17.
Moreno, R. & Mayer, R.E. (2007). Interactive multimodal learning environments. Educational
Psychology Review, 19, 309-326.
Nilson, L.B. (2007). The graphic syllabus and the outcomes map: communicating your course
(1st Ed.). San Francisco, CA: Jossey-Bass.
Novak, J. D., & Gowin, D. B. (1984). Learning how to learn. New York: Cambridge University
Press.
Novak, J.D. (1998), Learning, Creating, and Using Knowledge: Concept Maps as Facilitative
Tools in Schools and Corporations, Mahwah, NJ: Lawrence Erlbaum Associates.
Nunamaker Jr, J. F., Chen, M., & Purdin, T. D. (1990). Systems development in information
systems research. Journal of Management Information Systems, 7(3), 89-106.
O’Brien, J. G., Millis, B. J., & Cohen, M. G. (2008). The course syllabus: A learning-centered
approach. San Francisco, CA: Jossey-Bass.
Oblinger, D., & Hawkins, B. (2006). The myth about online course development, Educause
Review, January/February, 14-15.
Paivio, A. (1983). The empirical case for dual coding. In J.C. Yuille (Ed.), Imagery, memory and
cognition. Hillsdale, NJ: Lawrence Erlbaum Associates.
Paivio, A. (1986). Mental representations. New York: Oxford University Press.
Parks, J., & Harris, M.B. (2002). The purpose of a syllabus. College Teaching, 50, 55-61.
Patterson, N. G. (2000). Hypertext and the changing roles of readers. English Journal, 90, 74-80.
Pettersson, R. (2002). Information design: An introduction. Amsterdam: John Benjamins
Publishing Company. doi:10.1075/ddcs.3
109
Pettersson, R. (2010). Information Design-Principles and Guidelines. Journal of Visual Literacy,
29(2), 167. Retrieved from
http://search.ebscohost.com.ezproxy.lib.vt.edu/login.aspx?direct=true&db=edo&AN=566
76117&site=eds-live&scope=site
Pettersson, R. (2015a). It Depends. Tullinge, Sweden: Institute for Infology. Retrieved from
http://www.iiid.net/PublicLibrary/ Pettersson-Rune-ID-It-Depends.pdf.
Pettersson, R. (2015b). Information Design 4: Graphic design. Tullinge, Sweden: Institute for
Infology.
Quality Matters. (2018a). About us: Quality Matters. Retrieved from
https://www.qualitymatters.org/about
Quality Matters. (2018b). QM resources & standards. Retrieved from
https://www.qualitymatters.org/qa-resources/rubric-standards
Reeves, T. (1993). Pseudoscience in computer-based instruction: The case of learner control
research. Journal of Computer-Based Instruction, 20(2), 39–46.
Reigeluth, C.M. and Stein, F.S. (1983). The elaboration theory of instruction. In C.M.
Richards, S. L. (20030. The interactive syllabus: A resource-based, constructivist approach to
learning. The Technology Source, July/August.
http://www.technologysource.org/article/interactive_syllabus/
Richey, R. C., & Nelson, W. (1996). Developmental research. In D. Jonassen (Ed.), Handbook
of research for educational communications and technology (pp. 1213–1245). New
York, NY: Simon & Schuster.
Richey, R. C., & Seels, B. (1994). Defining a Field: A Case Study of the Development of the
1994 Definition of Instructional Technology. Educational media and technology
110
Richey, R., & Klein, J. (2007). Design and development research: methods, strategies, and
issues. Mahwah, NJ: Erlbaum.
Richey, R., Klein, J., & Nelson, W.A. (2004). Developmental research: Studies of instructional
design and development. In D.H. Jonassen (Ed.), Handbook of research for educational
communications and technology: A project of the association for educational
communications and technology (2nd ed., pp. 1099–1130). Hillsdale, NJ: Erlbaum.
Robinson, D. H., & Schraw, G. (1994). Computational efficiency through visual argument: Do
graphic organizers communicate relations in text too effectively? Contemporary
Educational Psychology, 19, 399-115.
Rouse, M. (2011, March). What is WYSIWYG (what you see is what you get)? - Definition from
WhatIs.com. Retrieved March 23, 2019, from:
https://whatis.techtarget.com/definition/WYSIWYG-what-you-see-is-what-you-get
Scheiter, K. (2014). The learner control principle in multimedia learning. In R. Mayer (Ed.), The
Cambridge handbook of multimedia learning (Cambridge Handbooks in Psychology, pp.
487-512). Cambridge: Cambridge University Press.
doi:10.1017/CBO9781139547369.025
Scheiter, K., & Gerjets, P. (2007). Learner control in hypermedia environments. Educational
Psychology Review, 19(3), 285-307. doi:10.1007/s10648-007-9046-3
Shattuck, K., Zimmerman, W. A., & Adair, D. (2014). Continuous improvement of the QM
rubric and review processes: Scholarship of integration and application. Internet
Learning, 3(1), 25-34.
111
Shaw, S., Nihalani, P., Mayrath, M., & Robinson, D. H. (2012). Graphic organizers or graphic
overviews? presentation order effects with computer-based text. Educational Technology
Research and Development, 60(5), 807-820. 10.1007/s11423-012-9257-2
Smith, M. E, & Razzouk, N. Y. (1993). Improving classroom communication: The case of the
course syllabus. Journal of Education for Business, 68 (4), 215-21.
Sofia Balula Dias, & José Alves Diniz. (2014). Towards an Enhanced Learning Management
System for Blended Learning in Higher Education Incorporating Distinct Learners'
Profiles. Journal of Educational Technology & Society, 17(1), 307-319. Retrieved from
http://www.jstor.org/stable/jeductechsoci.17.1.307
Soonpaa, N. J. (2018). The Ins and Outcomes of Writing an Effective Syllabus. Journal of Legal
Education, (3), 833. Retrieved from
http://search.ebscohost.com/login.aspx?direct=true&db=edsggo&AN=edsgcl.556443110
&site=eds-live&scope=site
Sweller, J. (1988). Cognitive load during problem solving: Effects on learning. Cognitive
Science, 12, 257-285. doi:10.1207/s15516709cog1202_4
Sweller, J., van Merrie ̈nboer, J. J. G., & Paas, F. (1998). Cognitive architecture and instructional
design. Educational Psychology Review, 10, 251–296.
Tsay, C. H. H., Kofinas, A. K., Trivedi, S. K., & Yang, Y. (2019). Overcoming the novelty effect
in online gamified learning systems: An empirical evaluation of student engagement and
performance. Journal of Computer Assisted Learning. doi: 10.1111/jcal.12385
Vandergrift, L. (2007). Recent development in second and foreign language listening
comprehension research. Language Teaching, 40(3), 191–210. doi:
10.1017/S0261444807004338
112
Varonis, E. M. (2014). Most courses are not born digital: An overview of the Quality Matters
peer review process for online course design. Campus - Wide Information Systems, 1(4),
217-229. doi:10.1108/CWIS-09-2013-0053
Ware, C. (2013). Information visualization: Perception for design (3rd ed.). Waltham, MA:
Morgan Kaufmann.
Wolfe, K. (2004). Course materials-- syllabus and textbooks. Journal of Teaching in Travel &
Tourism, 4(4), 55–60. Retrieved from https://doi-
org.ezproxy.lib.vt.edu/10.1300/J172v04n04•05
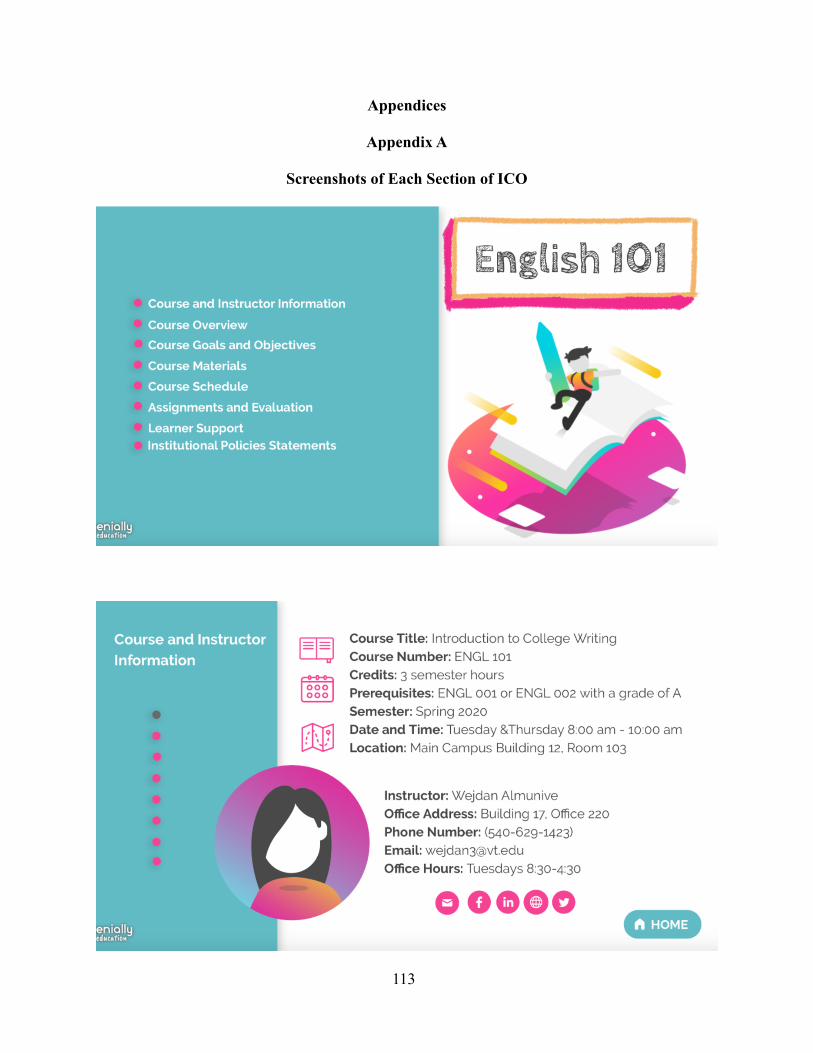
113
Appendices
Appendix A
Screenshots of Each Section of ICO
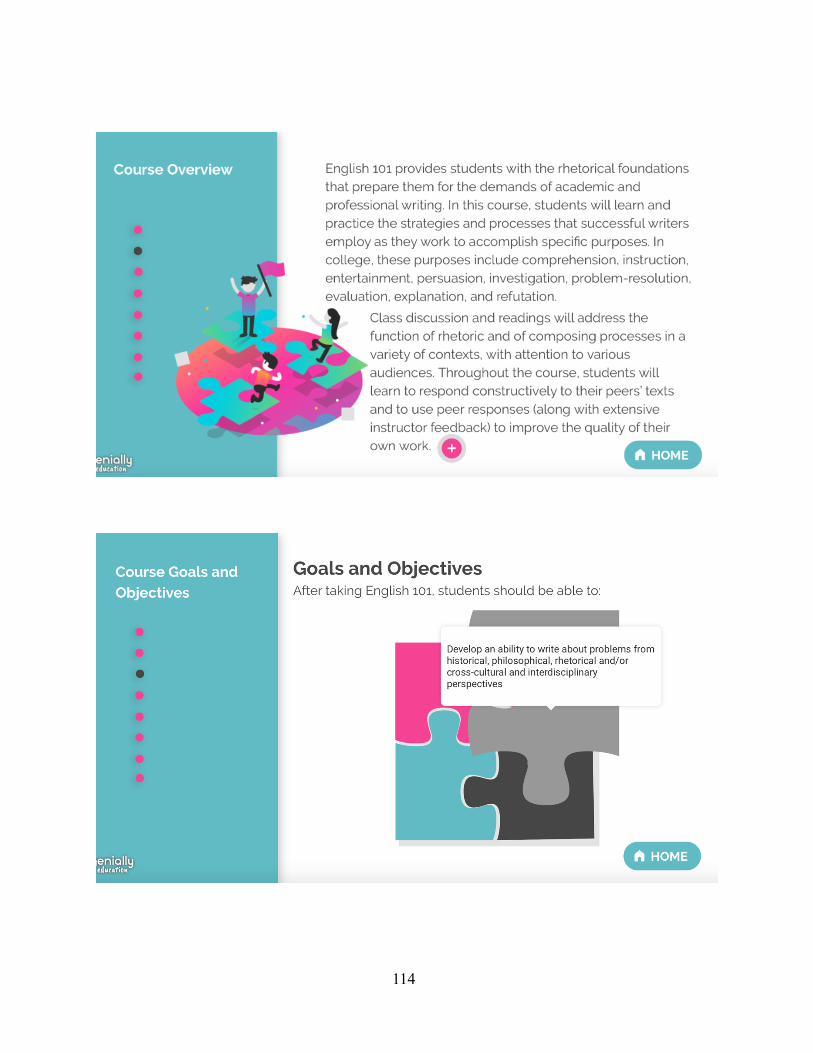
114
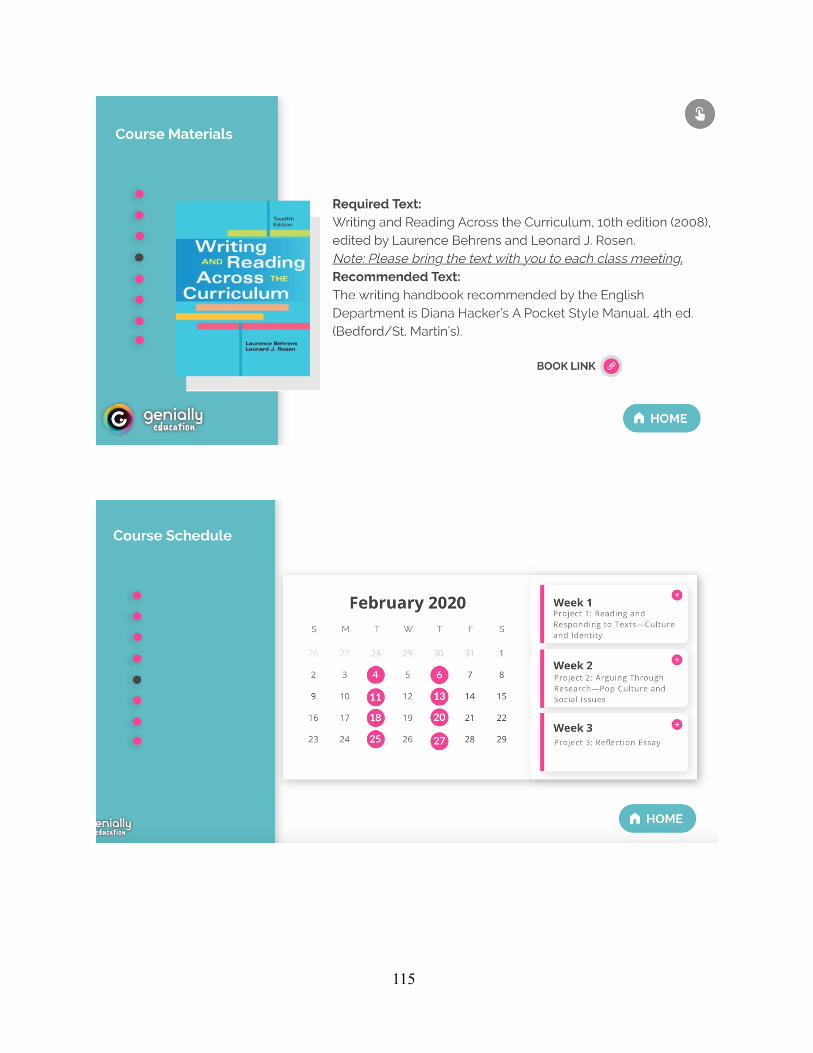
115
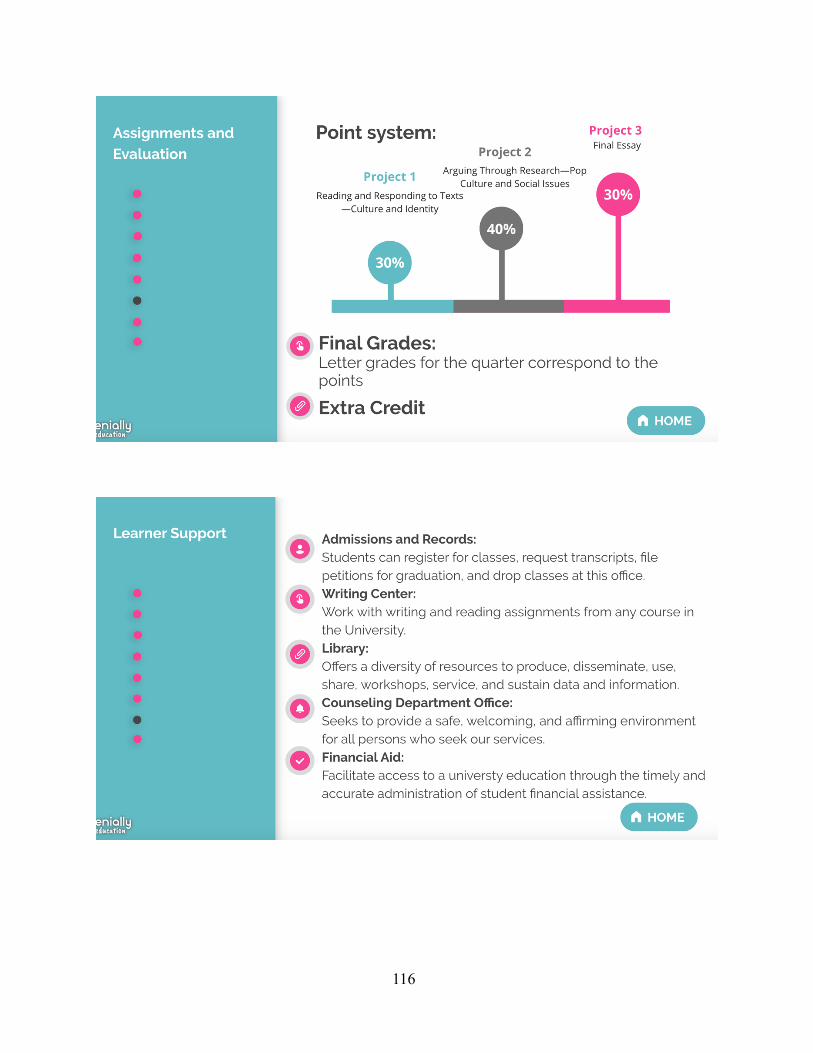
116
117
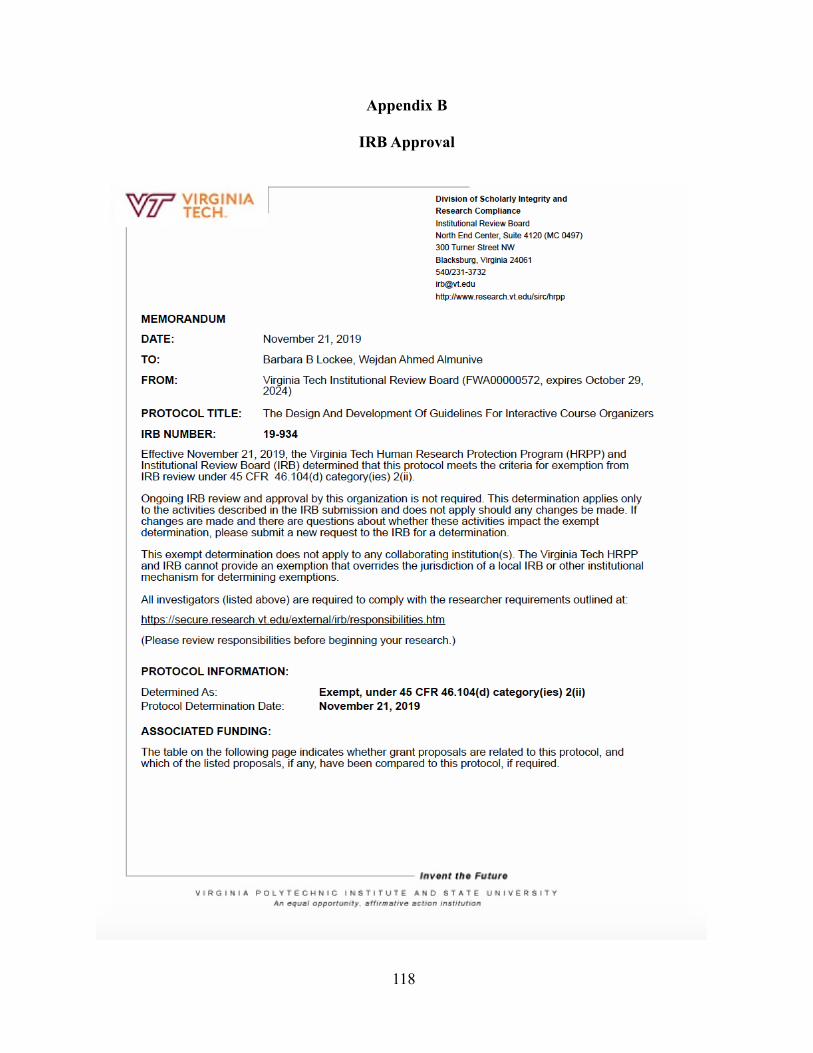
118
Appendix B
IRB Approval
119
Appendix C
Expert Review Request
Dear Professor ____________
My name is Wejdan Almunive, and I am a Doctoral Candidate in the Instructional Design and
Technology program at Virginia Tech. As a recognized expert in instructional message design,
visual literacy, and effective development of visual instructional materials I would like to invite
you to evaluate a guideline that I am designing and developing as part of my dissertation work
under the supervision of my advisor Dr. Barbara B. Lockee ([email protected]). Your
participation in this study is voluntary.
The purpose of my research study is to develop theoretical guidelines that can assist
educators in creating Interactive Course Organizers (ICOs), Institutional Review Board (IRB) at
Virginia Tech number 19-934. The aim of the guidelines is to aid in designing ICOs, considering
their capability to help students visualize the course “big picture”, how a course is organized,
clearly articulate the connections between course content, and serve as road maps that define the
content and context of learning in online courses. The guidelines are designed and developed
with a theoretically grounded foundation from several cognitive information processing theories.
This study is categorized as model research (Type II) development research, and it includes four
phases: (1) Analysis phase, (2) Design phase, (3) Development phase, and (4) Validation phase.
The validation stage requires that the guidelines be formatively evaluated by experts for
recommendations for improvement.
Should you elect to act as an expert reviewer, you will be provided with a link to the expert
reviews package website. The website will contain five pages; (1) information about the study,
(2) example of an Interactive Course Organizer (ICO), (3) guidelines to design and develop
120
ICOs, (4) consent form, (5) an evaluation rubric. You will have two weeks to complete a review
and provide your feedback via the evaluation rubric. I estimate that your participation would take
approximately 2 hours of your time over a two-week review period, beginning with receiving the
materials.
Your expertise will help me to improve the guidelines before its dissemination as a practical
tool for designing ICOs. I hope that you are able to participate! If you have any questions, please
do not hesitate to contact me.
Thank you in advance for your valuable time and expertise.
Sincerely,
Wejdan Almunive
Ph.D. Candidate, Instructional Design & Technology
121
Appendix D
Reminder Email
Dear Professor ____________
Recently, I contacted you to request your participation as an expert reviewer of Guidelines
for Interactive Course Organizers (see below for original email). If you have completed the
expert review, I want to thank you for your time and participation.
If you have not completed the expert review yet and are interested in doing so, I eagerly
await your input! Please complete the review by Date***
Sincerely,
Wejdan Almunive
Ph.D. Candidate, Instructional Design & Technology
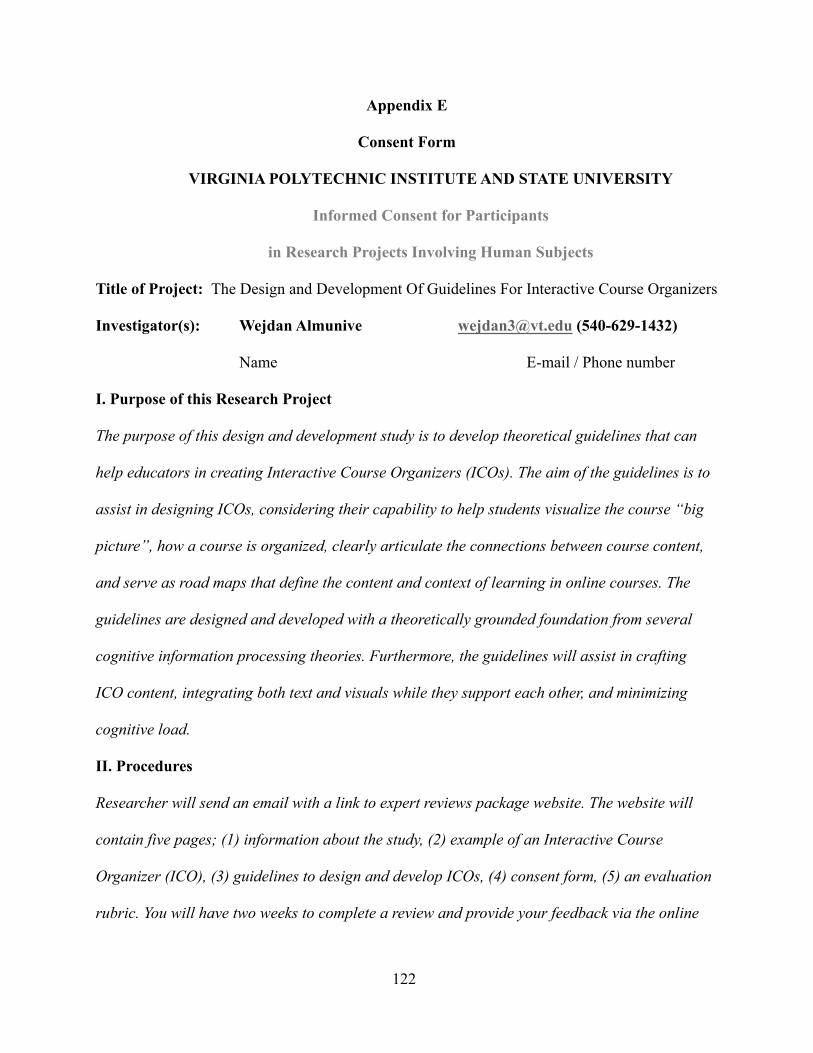
122
Appendix E
Consent Form
VIRGINIA POLYTECHNIC INSTITUTE AND STATE UNIVERSITY
Informed Consent for Participants
in Research Projects Involving Human Subjects
Title of Project: The Design and Development Of Guidelines For Interactive Course Organizers Investigator(s): Wejdan Almunive [email protected] (540-629-1432)
Name E-mail / Phone number
I. Purpose of this Research Project
The purpose of this design and development study is to develop theoretical guidelines that can
help educators in creating Interactive Course Organizers (ICOs). The aim of the guidelines is to
assist in designing ICOs, considering their capability to help students visualize the course “big
picture”, how a course is organized, clearly articulate the connections between course content,
and serve as road maps that define the content and context of learning in online courses. The
guidelines are designed and developed with a theoretically grounded foundation from several
cognitive information processing theories. Furthermore, the guidelines will assist in crafting
ICO content, integrating both text and visuals while they support each other, and minimizing
cognitive load.
II. Procedures
Researcher will send an email with a link to expert reviews package website. The website will
contain five pages; (1) information about the study, (2) example of an Interactive Course
Organizer (ICO), (3) guidelines to design and develop ICOs, (4) consent form, (5) an evaluation
rubric. You will have two weeks to complete a review and provide your feedback via the online
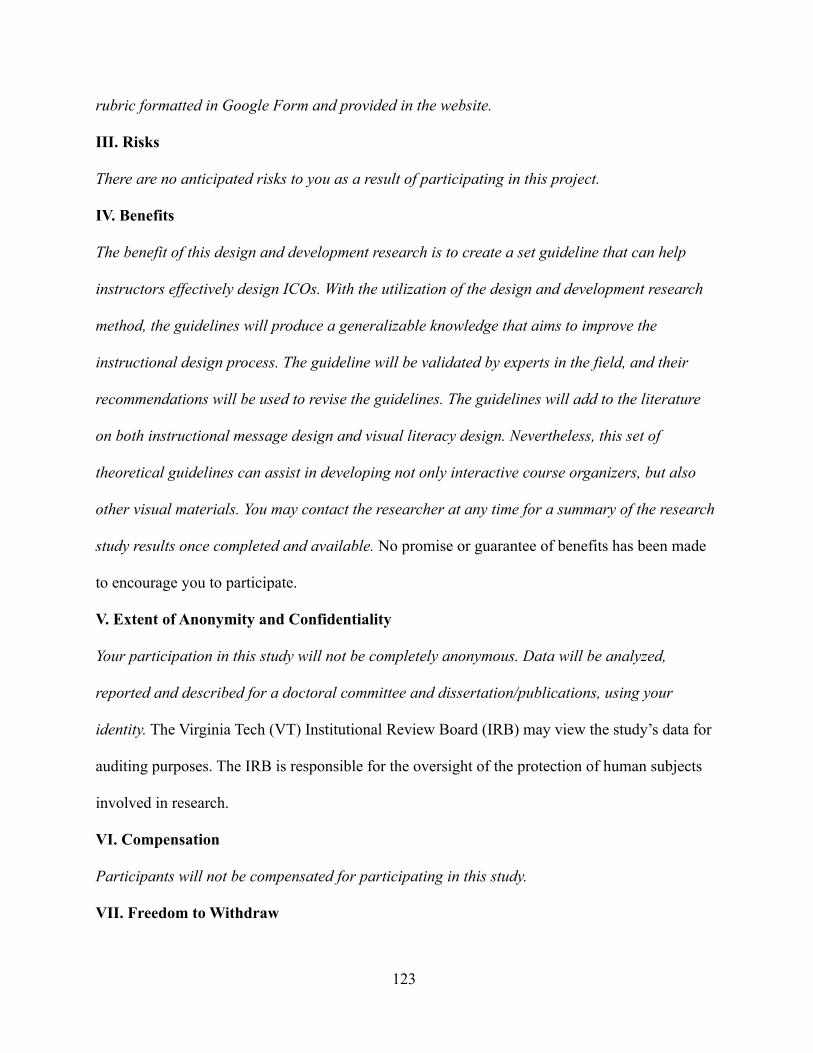
123
rubric formatted in Google Form and provided in the website.
III. Risks
There are no anticipated risks to you as a result of participating in this project.
IV. Benefits
The benefit of this design and development research is to create a set guideline that can help
instructors effectively design ICOs. With the utilization of the design and development research
method, the guidelines will produce a generalizable knowledge that aims to improve the
instructional design process. The guideline will be validated by experts in the field, and their
recommendations will be used to revise the guidelines. The guidelines will add to the literature
on both instructional message design and visual literacy design. Nevertheless, this set of
theoretical guidelines can assist in developing not only interactive course organizers, but also
other visual materials. You may contact the researcher at any time for a summary of the research
study results once completed and available. No promise or guarantee of benefits has been made
to encourage you to participate.
V. Extent of Anonymity and Confidentiality
Your participation in this study will not be completely anonymous. Data will be analyzed,
reported and described for a doctoral committee and dissertation/publications, using your
identity. The Virginia Tech (VT) Institutional Review Board (IRB) may view the study’s data for
auditing purposes. The IRB is responsible for the oversight of the protection of human subjects
involved in research.
VI. Compensation
Participants will not be compensated for participating in this study.
VII. Freedom to Withdraw
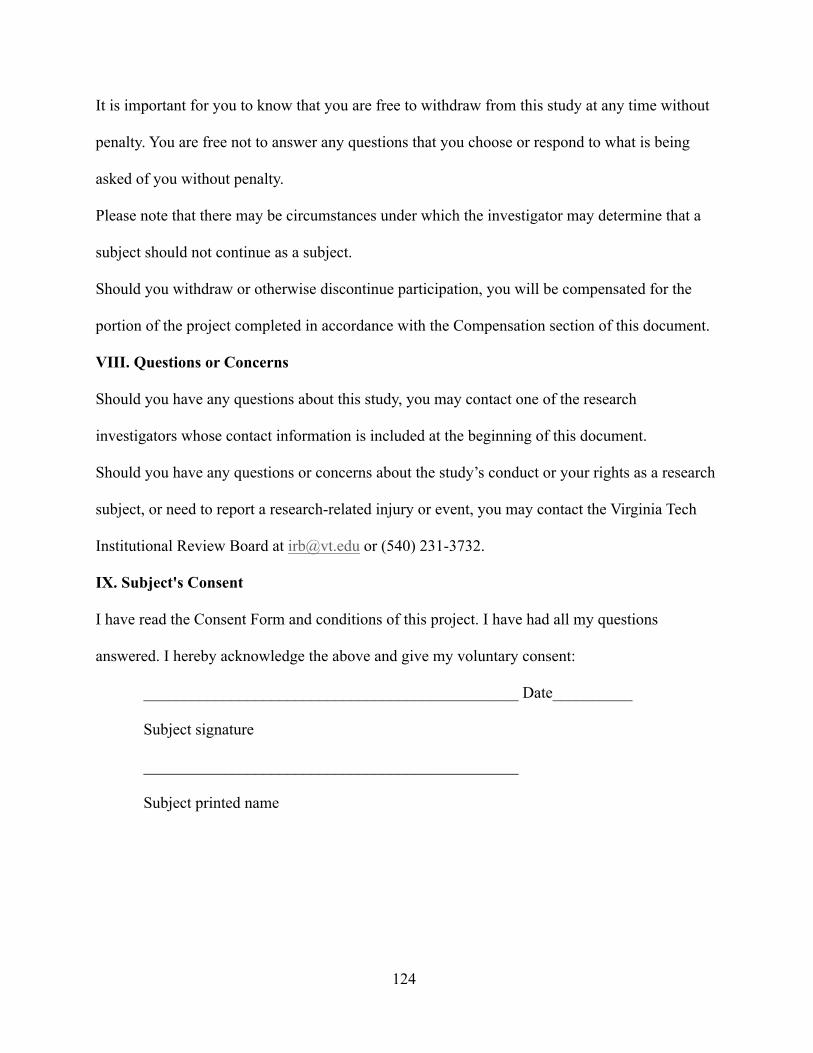
124
It is important for you to know that you are free to withdraw from this study at any time without
penalty. You are free not to answer any questions that you choose or respond to what is being
asked of you without penalty.
Please note that there may be circumstances under which the investigator may determine that a
subject should not continue as a subject.
Should you withdraw or otherwise discontinue participation, you will be compensated for the
portion of the project completed in accordance with the Compensation section of this document.
VIII. Questions or Concerns
Should you have any questions about this study, you may contact one of the research
investigators whose contact information is included at the beginning of this document.
Should you have any questions or concerns about the study’s conduct or your rights as a research
subject, or need to report a research-related injury or event, you may contact the Virginia Tech
Institutional Review Board at [email protected] or (540) 231-3732.
IX. Subject's Consent
I have read the Consent Form and conditions of this project. I have had all my questions
answered. I hereby acknowledge the above and give my voluntary consent:
_______________________________________________ Date__________
Subject signature
_______________________________________________
Subject printed name
125
Appendix F
Evaluation Rubric
I. Purpose of this Research Project The purpose of this design and development study is to develop theoretical guidelines that can help educators in creating Interactive Course Organizers (ICOs). The aim of the guidelines is to assist in designing ICOs, considering their capability to help students visualize the course “big picture”, how a course is organized, clearly articulate the connections between course content, and serve as road maps that define the content and context of learning in online courses. The guidelines are designed and developed with a theoretically grounded foundation from several cognitive information processing theories. Furthermore, the guidelines will assist in crafting ICO content, integrating both text and visuals while they support each other, and minimizing cognitive load. II. Procedures Researcher will send an email with a link to expert review packet website. The website will contain five pages; (1) information about the study, (2) example of an Interactive Course Organizer (ICO), (3) guidelines to design and develop ICOs, (4) consent form, (5) an evaluation rubric. You will have two weeks to complete a review and provide your feedback via the online rubric formatted in Google Form and provided in the website. III. Risks There are no anticipated risks to you as a result of participating in this project. IV. Benefits The benefit of this design and development research is to create a set guideline that can help instructors effectively design ICOs. With the utilization of the design and development research method, the guidelines will produce a generalizable knowledge that aims to improve the instructional design process. The guideline will be validated by experts in the field, and their recommendations will be used to revise the guidelines. The guidelines will add to the literature on both instructional message design and visual literacy design. Nevertheless, this set of theoretical guidelines can assist in developing not only interactive course organizers, but also other visual materials. You may contact the researcher at any time for a summary of the research study results once completed and available. No promise or guarantee of benefits has been made to encourage you to participate. V. Extent of Anonymity and Confidentiality Your participation in this study will not be completely anonymous. Data will be analyzed, reported and described for a doctoral committee and dissertation/publications, using your identity. The Virginia Tech (VT) Institutional Review Board (IRB) may view the study’s data for auditing purposes. The IRB is responsible for the oversight of the protection of human subjects involved in research.
126
VI. Compensation Participants will not be compensated for participating in this study. VII. Freedom to Withdraw It is important for you to know that you are free to withdraw from this study at any time without penalty. You are free not to answer any questions that you choose or respond to what is being asked of you without penalty. Please note that there may be circumstances under which the investigator may determine that a subject should not continue as a subject. Should you withdraw or otherwise discontinue participation, you will be compensated for the portion of the project completed in accordance with the Compensation section of this document. VIII. Questions or Concerns Should you have any questions about this study, you may contact one of the research investigators whose contact information is included at the beginning of this document. Should you have any questions or concerns about the study’s conduct or your rights as a research subject, or need to report a research-related injury or event, you may contact the Virginia Tech Institutional Review Board at [email protected] or (540) 231-3732. IX. Subject's Consent I have read the Consent Form and conditions of this project. I have had all my questions answered. I hereby acknowledge the above and give my voluntary consent. * Required Email address * Name: * Informed Consent * Check all that apply. I have read the Consent Form and conditions of this project. I have had all my questions answered. I hereby acknowledge the above and give my voluntary consent.
Section 1: The Application of ICOs This section contains questions about the application of ICOs and will it be used by the target users to achieve its goals with effectiveness, efficiency and satisfaction. Please leave any comments you have regarding the application of ICOs. In particular, if you responded Disagree or Strongly Disagree to any item, please offer specific recommendations for improvement. Q1: Educators will most likely develop ICOs * Mark only one oval.
Strongly disagree Disagree Neutral Agree Strongly agree
Comments and suggestions:
127
Q2: Which of the following constraints may affect the development of ICOs: * Check all that apply.
Time (ICOs take time to develop) Digital skills (skills required to make basic use of computer applications, websites,
and other online platforms) Openness (keeping an open-minded and willing to try new things) Patience (the developing process can be slow going) Other: Comments and suggestions:
Q3: In ICOs textual and visual components assist learners in making connection and organize the course content. * Mark only one oval.
Strongly disagree Disagree Neutral Agree Strongly agree Comments and suggestions: Q4: ICOs are interactive and they allow learners to navigate, access and view the course
content. Mark only one oval. Strongly disagree Disagree Neutral Agree Strongly agree Comments and suggestions: Q5: ICOs provide innovation improvement in presenting course materials * Mark only
one oval. Strongly disagree Disagree Neutral Agree Strongly agree Comments and suggestions: Q6: ICOs will attract learners’ attention and motivate them to go through course content
* Mark only one oval. Strongly disagree Disagree Neutral
128
Agree Strongly Agree Comments and suggestions: Q7: Please provide additional suggestion to improve the application of ICOs * Skip to question 16. Section 2: Overall Design of The Guidelines
This section contains questions about the overall design and organization of the guidelines and
questions about the simplicity as well as stability of the guidelines. Please leave any comments you have regarding the overall design of the guidelines. In particular, if you responded Disagree or Strongly Disagree to any item, please offer specific recommendations for improvement.
Q1:The guidelines describes in sufficient detail its purpose and intended use. * Mark only
one oval. Strongly disagree Disagree Neutral Agree Strongly agree Comments and suggestions: Q2: The directions and guidance for using the guidelines is clear and sufficient. * Mark
only one oval. Strongly disagree Disagree Neutral Agree Strongly agree Comments and suggestions: Q3: The organization and format of the guidelines are well designed to support its
purpose and use. * Mark only one oval. Strongly disagree Disagree Neutral Agree Strongly agree Comments and suggestions:
129
Q4: Please provide additional suggestion to improve the overall design of the guidelines *
Section 3: Analysis Phase This section contains questions about the guidelines for the analysis phase. Please leave any
comments you have regarding the analysis phase of the guidelines. In particular, if you responded Disagree or Strongly Disagree to any item, please offer specific recommendations for improvement.
Q1: The key factors in the analysis phase are appropriate and sufficient * Mark only one
oval. Strongly disagree Disagree Neutral Agree Strongly agree Comments and suggestion: Q2: In the table(Guidelines to Analyze the context for ICO), the guidelines for each
factor are clear and sufficient * Mark only one oval. Strongly disagree Disagree Neutral Agree Strongly agree Comments and suggestions: Q3: The analysis phase reflects relevant research as well as important practices in the
design of educational visual materials * Mark only one oval. Strongly disagree Disagree Neutral Agree Strongly agree Comments and suggestions: Q4: Please provide additional suggestion to improve the analysis phase of the guidelines
* Section 4: Design Phase This section contains questions about the guidelines for the design phase. Please leave any
comments you have regarding the analysis phase of the guidelines. In particular, if you responded Disagree or Strongly Disagree to any item, please offer specific recommendations for improvement.
130
Q1: The components in the design phase are appropriate and sufficient * Mark only one oval.
Strongly disagree Disagree Neutral Agree Strongly agree Comments and suggestion: Q2: In the table (Guidelines to Design the ICO), the guidelines for each component are
clear and sufficient * Mark only one oval. Strongly disagree Disagree Neutral Agree Strongly agree Comments and suggestions: Q3: The design phase reflects relevant research as well as important practices in the
design of educational visual materials * Mark only one oval. Strongly disagree Disagree Neutral Agree Strongly agree Comments and suggestions: Q4: Please provide additional suggestion to improve the design phase of the guidelines
* Section 5: Development Phase This section contains questions about the guidelines for the development phase. Please leave
any comments you have regarding the analysis phase of the guidelines. In particular, if you responded Disagree or Strongly Disagree to any item, please offer specific recommendations for improvement.
Q1: The framework for course syllabus are appropriate and sufficient * Mark only one
oval. Strongly disagree Disagree Neutral Agree Strongly agree
131
Comments and suggestion: Q2: In the table (Framework for A Course Syllabus), the specific components for each
course syllabus component are clear and sufficient * Mark only one oval. Strongly disagree Disagree Neutral Agree Strongly agree Mark only one oval. Option 1 Comments and suggestion: Q3: The framework for course syllabus reflects relevant research in components of an
effective course syllabus * Mark only one oval. Strongly disagree Disagree Neutral Agree Strongly Agree Comments and suggestions: Q4: The components in the development phase are appropriate and sufficient * Mark
only one oval. Strongly disagree Disagree Neutral Agree Strongly agree Comments and suggestions: Q5: In the table (Guidelines to Develop Visuals for ICOs), the guidelines for each
component are clear and sufficient * Mark only one oval. Strongly disagree Disagree Neutral Agree Strongly agree Comments and suggestions:
132
Q6: The development phase reflects relevant research as well as important practices in the design of interactive visual materials * Mark only one oval.
Strongly disagree Disagree Neutral Agree Strongly agree Comments and suggestions: Q7: Please provide additional suggestion to improve the development phase of the
guidelines * Section 6: The Application of The Guidelines
This section contains questions about the application of the guidelines. Please leave any
comments you have regarding the analysis phase of the guidelines. In particular, if you responded Disagree or Strongly Disagree to any item, please offer specific recommendations for improvement.
Q1: Overall, the guidelines, when used by educators, will likely be effective in helping to
design and develop ICOs * Mark only one oval. Strongly disagree Disagree Neutral Agree Strongly agree Comments and suggestion: Q2: The guidelines will be reasonable to implement by educators, the intended user
audience. * Mark only one oval. Strongly disagree Disagree Neutral Agree Strongly agree Comments and suggestion: Q3: What additional recommendations do you have to improve this guidelines? *
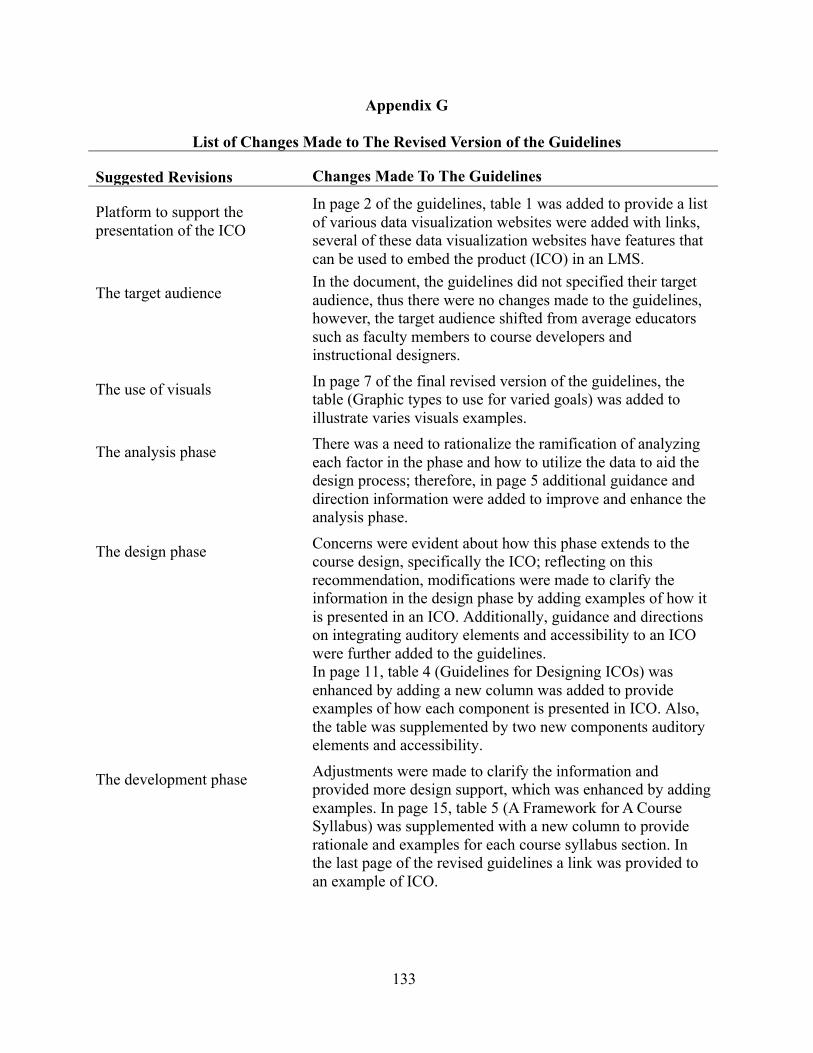
133
Appendix G
List of Changes Made to The Revised Version of the Guidelines
Suggested Revisions Changes Made To The Guidelines
Platform to support the presentation of the ICO
In page 2 of the guidelines, table 1 was added to provide a list of various data visualization websites were added with links, several of these data visualization websites have features that can be used to embed the product (ICO) in an LMS.
The target audience
In the document, the guidelines did not specified their target audience, thus there were no changes made to the guidelines, however, the target audience shifted from average educators such as faculty members to course developers and instructional designers.
The use of visuals
In page 7 of the final revised version of the guidelines, the table (Graphic types to use for varied goals) was added to illustrate varies visuals examples.
The analysis phase
There was a need to rationalize the ramification of analyzing each factor in the phase and how to utilize the data to aid the design process; therefore, in page 5 additional guidance and direction information were added to improve and enhance the analysis phase.
The design phase
Concerns were evident about how this phase extends to the course design, specifically the ICO; reflecting on this recommendation, modifications were made to clarify the information in the design phase by adding examples of how it is presented in an ICO. Additionally, guidance and directions on integrating auditory elements and accessibility to an ICO were further added to the guidelines. In page 11, table 4 (Guidelines for Designing ICOs) was enhanced by adding a new column was added to provide examples of how each component is presented in ICO. Also, the table was supplemented by two new components auditory elements and accessibility.
The development phase
Adjustments were made to clarify the information and provided more design support, which was enhanced by adding examples. In page 15, table 5 (A Framework for A Course Syllabus) was supplemented with a new column to provide rationale and examples for each course syllabus section. In the last page of the revised guidelines a link was provided to an example of ICO.
134
Appendix H
Revised Guidelines for Interactive Course Organizers (ICOs)
Guidelines for Interactive Course Organizers (ICOs) A Design and Development
Research
___
By Wejdan Almunive
INTRODUCTION
The Interactive Course Organizer (ICO) is an artifact that contains the text and visual
representation of a traditional course outline (i.e., course syllabus) and incorporates visual
elements, such as timelines, drawings, charts, graphs, maps, or pictures, to show the sequencing
and organization of major course topics while offering users an actively controlled progression of
the amount of course information viewed. In other words, ICOs are interactive in the sense that
learners have control over the information they are viewing, as well as the interactive features
they can use to acquire more detailed information about the course content.
The main goal of the ICO is to function as a course syllabus that provides learners with
interactive access to course activities and requirements, which will allow them to visualize the
course “big picture,” identify the connections among course components, and support learners’
plans for the semester. By following the Clark and Lyons (2010) visual design model as a
framework for developing ICOs, we constructed the guidelines to ensure the ICO would reach its
instructional needs. The ICO guidelines have to go through different phases to ensure the goal of
utilizing the ICO is met. These guidelines offer a systematic process for designing and
developing ICOs in three phases: analysis, design, and development. Educators should finish one
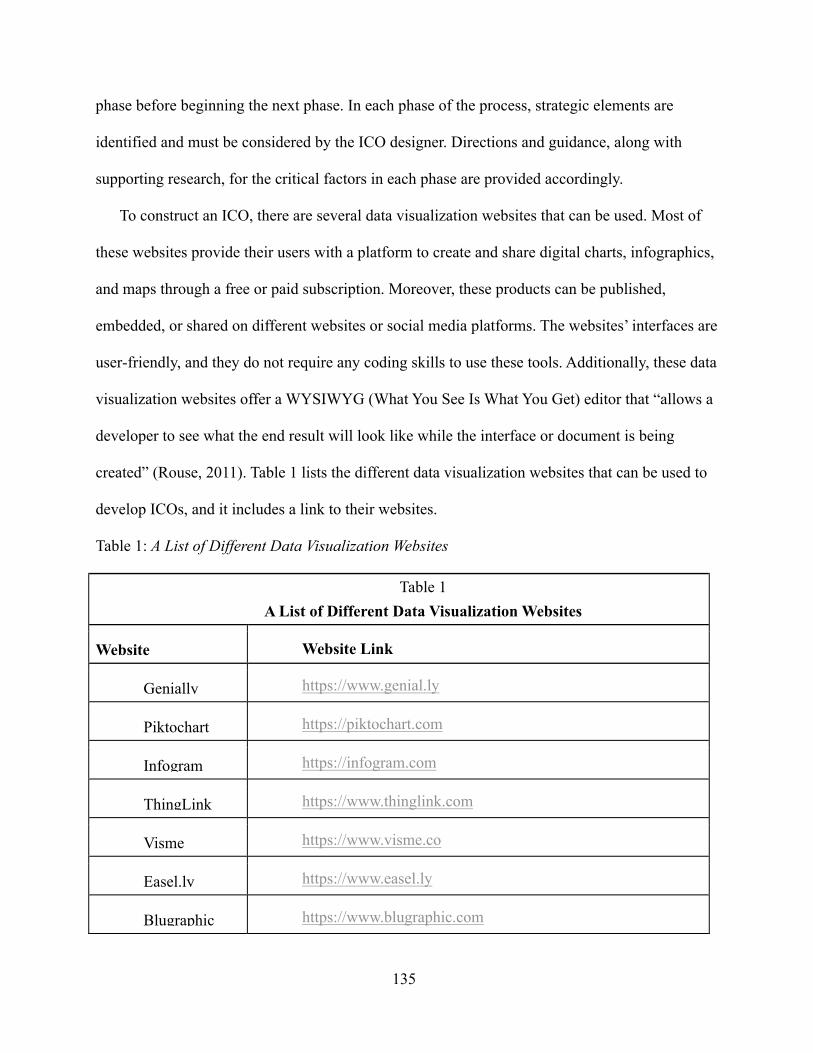
135
phase before beginning the next phase. In each phase of the process, strategic elements are
identified and must be considered by the ICO designer. Directions and guidance, along with
supporting research, for the critical factors in each phase are provided accordingly.
To construct an ICO, there are several data visualization websites that can be used. Most of
these websites provide their users with a platform to create and share digital charts, infographics,
and maps through a free or paid subscription. Moreover, these products can be published,
embedded, or shared on different websites or social media platforms. The websites’ interfaces are
user-friendly, and they do not require any coding skills to use these tools. Additionally, these data
visualization websites offer a WYSIWYG (What You See Is What You Get) editor that “allows a
developer to see what the end result will look like while the interface or document is being
created” (Rouse, 2011). Table 1 lists the different data visualization websites that can be used to
develop ICOs, and it includes a link to their websites.
Table 1: A List of Different Data Visualization Websites
Table 1
A List of Different Data Visualization Websites Website
Website Link
Genially
https://www.genial.ly
Piktochart
https://piktochart.com
Infogram
https://infogram.com
ThingLink
https://www.thinglink.com
Visme
https://www.visme.co
Easel.ly
https://www.easel.ly
Blugraphic
https://www.blugraphic.com
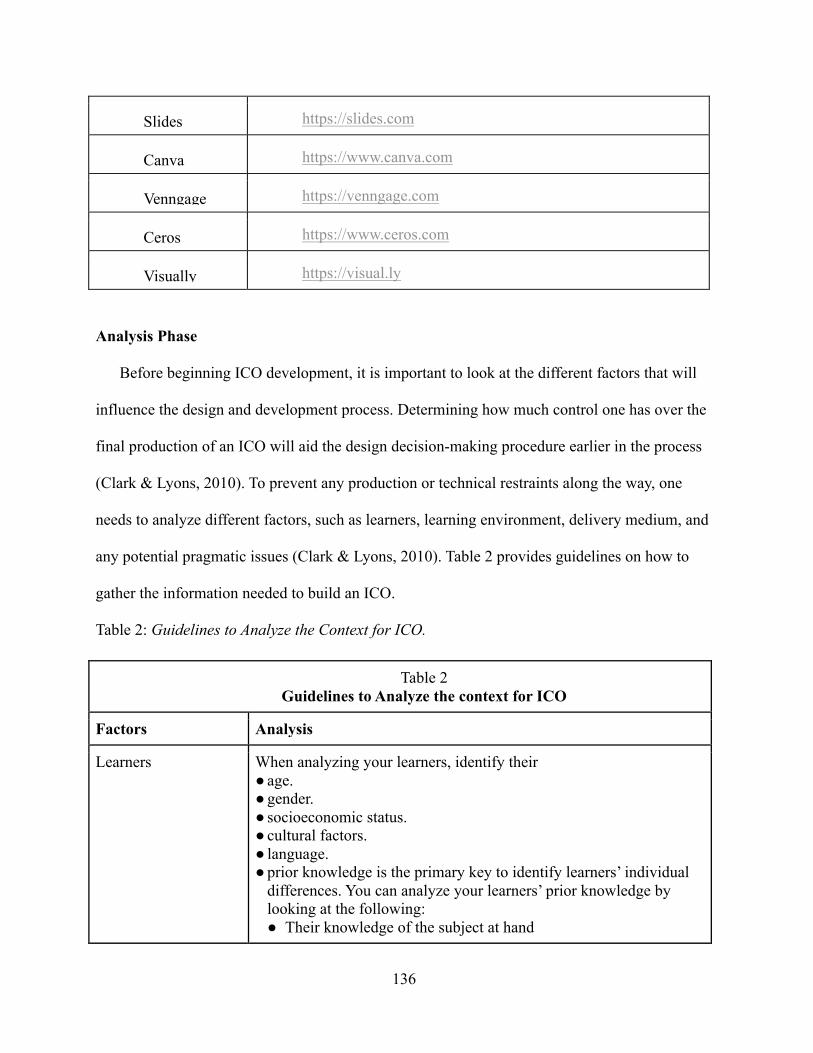
136
Slides
https://slides.com
Canva
https://www.canva.com
Venngage
https://venngage.com
Ceros
https://www.ceros.com
Visually
https://visual.ly
Analysis Phase
Before beginning ICO development, it is important to look at the different factors that will
influence the design and development process. Determining how much control one has over the
final production of an ICO will aid the design decision-making procedure earlier in the process
(Clark & Lyons, 2010). To prevent any production or technical restraints along the way, one
needs to analyze different factors, such as learners, learning environment, delivery medium, and
any potential pragmatic issues (Clark & Lyons, 2010). Table 2 provides guidelines on how to
gather the information needed to build an ICO.
Table 2: Guidelines to Analyze the Context for ICO.
Table 2 Guidelines to Analyze the context for ICO
Factors Analysis
Learners When analyzing your learners, identify their ● age. ● gender. ● socioeconomic status. ● cultural factors. ● language. ● prior knowledge is the primary key to identify learners’ individual
differences. You can analyze your learners’ prior knowledge by looking at the following: ● Their knowledge of the subject at hand
137
● If they are a novice or expert learners ● Their familiarity with the field terminology and jargon (Clark &
Lyons, 2010; Lipton, 2007; Pettersson, 2010, 2015a; Soonpaa, 2018)
Learning environment When analyzing the learning environment, identify the following: ● How will the ICO be used (as a job aid, presentation, self-study,
etc.)? ● Where the ICO is presented (face to face or online)? ● When the ICO is presented (beginning, during, or after the class)? ● How much control learners have over reviewing the information in
the ICO (time spent looking at the information and how many times they can review it)? (Clark & Lyons, 2010; Pettersson, 2010)
Delivery medium When analyzing the delivery medium, you should choose a data visualization website that works best for your digital skill level. Before selecting a website.You will need to test the following: ● The Learning Management System’s (LMS) ability to host the ICO ● The display of visuals and text (size and resolution) ● The interactivity feature connectivity and the speed of displaying
the content (visuals and text; Clark & Lyons, 2010; Pettersson, 2010)
Pragmatic issues Analyze any production issues and identify any potential problems you may face, such as the following: ● How much time you need to finish the ICO ● Technical knowledge related to the LMS or the visualization
website or software you’re using ● Embedding or uploading the ICO to the LMS or the course website ● Any accessibility issues such as navigation, interactivity, and
resolution (Clark & Lyons, 2010; Pettersson, 2010)
By looking at the information gathered in the analysis phase, one can make informed and
efficient decisions that will guide the design process. The learners’ analysis will improve the
selection process for the visuals, colors, symbols, and so on. Identify certain characteristics about
you learners for example their cultural background can be critical. Understanding the culture
your learners come from will provide some insights on the colors choosing process, color can be
interpreted differently cultures. Using the color red as an example, in Asian cultures red can
mean good luck and prosperity and in Western cultures can mean alarm and warnings (Clark &
138
Lyons, 2010). The learning environment analysis will guide the choices one makes about the
size, layout, contrast, and boldness of the design (Clark & Lyons, 2010). For example, if the
content is presented in an online course (E-learning environment) make sure that you are using a
graphic format the can be clearly displayed in a computer screen, if you are considering the use
of mobile devices check the graphic display too. The delivery medium analysis helps identify
any technical restrictions before beginning the ICO design. Using an LMS as a delivery
medium, you need to look at how the website or software (tools) will plug into the LMS to
display and run the visuals, and the interactivity features need to be tested for display resolution
and connectivity and the speed of displaying the content. Finally, by identifying any practical
issues from the beginning, people will be aware of any problems they may face and understand
how to overcome them. Therefore, the analysis phase can work as a blueprint for ICO
development.
Design Phase
By looking at the information gathered in the analysis phase, one can make informed and
efficient decisions that will guide the design process. In the design phase, one needs to look at
three correlated factors that form the effectiveness and the efficiency of this visual tool: “(1)
properties of the visual itself, including its surface features, communication functions and
psychological functions, (2) the goal of the instructions, and (3) differences in prior knowledge
of the learners” (Clark & Lyons, 2010, p. 5). When it comes to the function of the ICO, Clark
and Lyons (2010) specified three views to the functional characteristics of graphics:
● Surface feature (visual features) of the art, such as illustrations and graphics ● Communication function—how it transfers the information ● Psychological function—how it supports learning
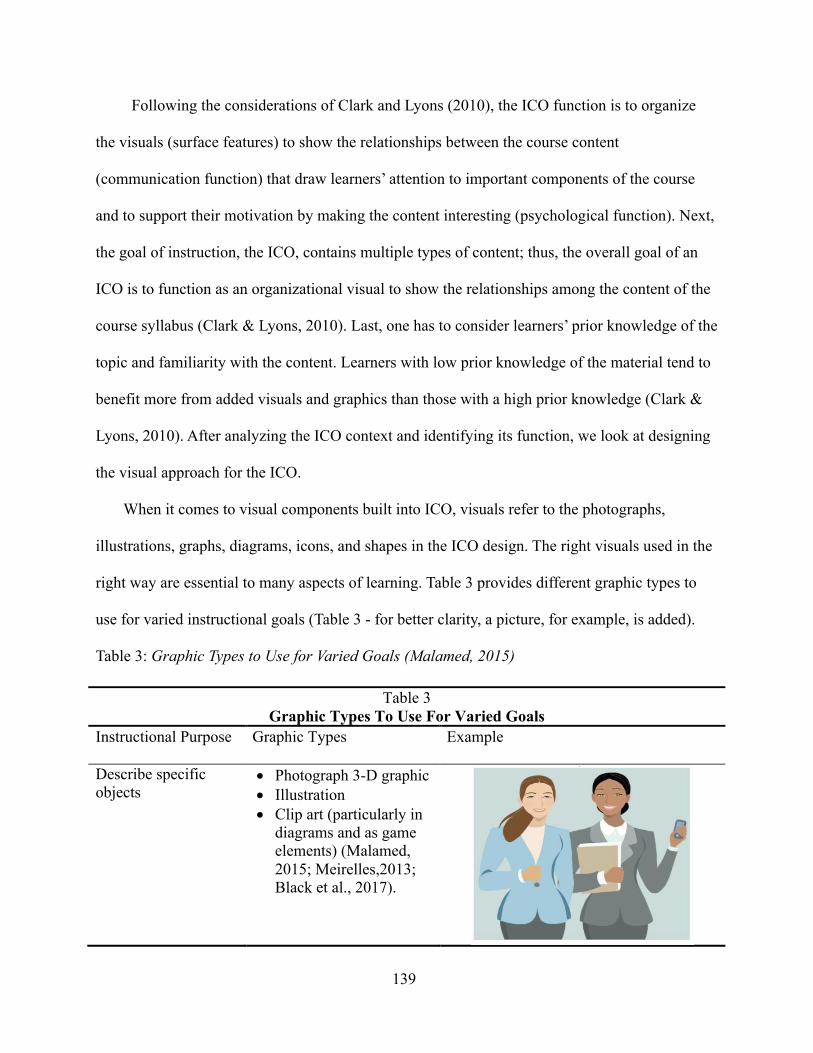
139
Following the considerations of Clark and Lyons (2010), the ICO function is to organize
the visuals (surface features) to show the relationships between the course content
(communication function) that draw learners’ attention to important components of the course
and to support their motivation by making the content interesting (psychological function). Next,
the goal of instruction, the ICO, contains multiple types of content; thus, the overall goal of an
ICO is to function as an organizational visual to show the relationships among the content of the
course syllabus (Clark & Lyons, 2010). Last, one has to consider learners’ prior knowledge of the
topic and familiarity with the content. Learners with low prior knowledge of the material tend to
benefit more from added visuals and graphics than those with a high prior knowledge (Clark &
Lyons, 2010). After analyzing the ICO context and identifying its function, we look at designing
the visual approach for the ICO.
When it comes to visual components built into ICO, visuals refer to the photographs,
illustrations, graphs, diagrams, icons, and shapes in the ICO design. The right visuals used in the
right way are essential to many aspects of learning. Table 3 provides different graphic types to
use for varied instructional goals (Table 3 - for better clarity, a picture, for example, is added).
Table 3: Graphic Types to Use for Varied Goals (Malamed, 2015)
Table 3 Graphic Types To Use For Varied Goals
Instructional Purpose Graphic Types Example
Describe specific objects
• Photograph 3-D graphic • Illustration • Clip art (particularly in
diagrams and as game elements) (Malamed, 2015; Meirelles,2013; Black et al., 2017).

140
Tell a story or provide a scenario
• Sequence of
photographs Sequence of illustrations
• Timeline (Malamed, 2015; Meirelles,2013; Black et al., 2017).
Persuade an audience • Sequence of photos or illustrations to tell a story
• Photographs that evoke emotions
• Visualization of statistics and data (Malamed, 2015; Meirelles,2013; Black et al., 2017).
Explain unfamiliar or complex concepts and theories
• Visual metaphor • Diagram showing
connections (Malamed, 2015; Meirelles,2013; Black et al., 2017).
Demonstrate a procedure
• Show the steps in a sequence of photos or illustrations
• Flow chart • Series of screen
captures for software simulation (Malamed, 2015; Meirelles,2013; Black et al., 2017).

141
Explain a process • Diagram the stages or operations of the process
• Icons or simple illustrations to represent each component (Malamed, 2015; Meirelles,2013; Black et al., 2017).
Point out something specific
• Arrow or pointed shape • Highlight • Outline of a circle
(Malamed, 2015; Meirelles,2013; Black et al., 2017).
Depict components of a system
• Illustrate object with labels Diagram of the structure (Malamed, 2015; Meirelles,2013; Black et al., 2017).
Make comparisons • Bar graph Pictograph • Line graph with multiple
lines • A Table when specific
values are important (Malamed, 2015; Meirelles,2013; Black et al., 2017).
Demonstrate trends in data
• Line graph • Scatter plot (Malamed,
2015; Meirelles,2013; Black et al., 2017).
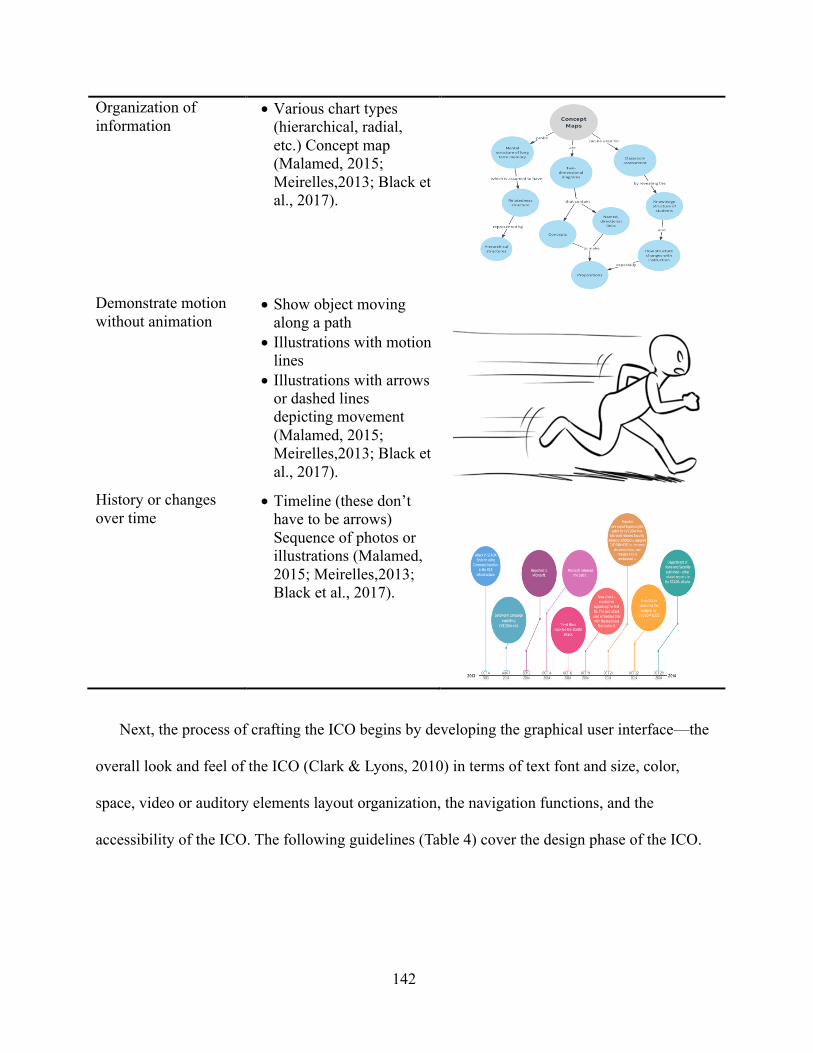
142
Organization of information
• Various chart types (hierarchical, radial, etc.) Concept map (Malamed, 2015; Meirelles,2013; Black et al., 2017).
Demonstrate motion without animation
• Show object moving along a path
• Illustrations with motion lines
• Illustrations with arrows or dashed lines depicting movement (Malamed, 2015; Meirelles,2013; Black et al., 2017).
History or changes over time
• Timeline (these don’t have to be arrows) Sequence of photos or illustrations (Malamed, 2015; Meirelles,2013; Black et al., 2017).
Next, the process of crafting the ICO begins by developing the graphical user interface—the
overall look and feel of the ICO (Clark & Lyons, 2010) in terms of text font and size, color,
space, video or auditory elements layout organization, the navigation functions, and the
accessibility of the ICO. The following guidelines (Table 4) cover the design phase of the ICO.
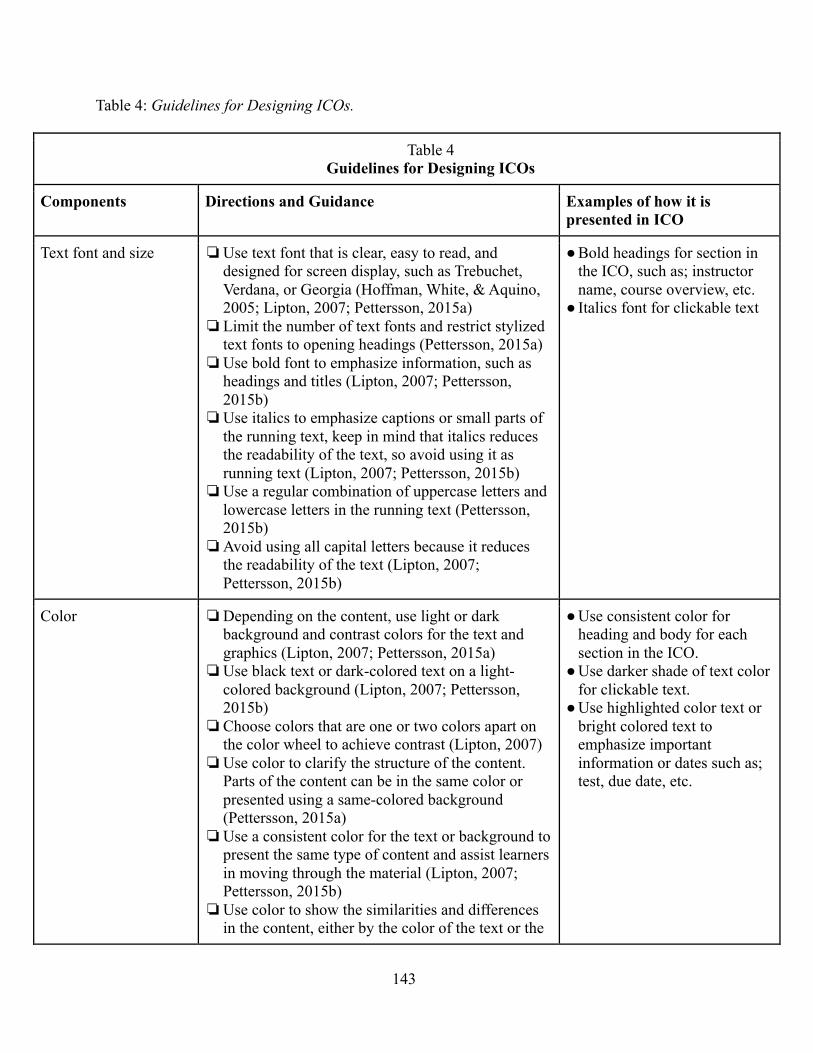
143
Table 4: Guidelines for Designing ICOs.
Table 4 Guidelines for Designing ICOs
Components Directions and Guidance Examples of how it is presented in ICO
Text font and size ❏ Use text font that is clear, easy to read, and designed for screen display, such as Trebuchet, Verdana, or Georgia (Hoffman, White, & Aquino, 2005; Lipton, 2007; Pettersson, 2015a)
❏ Limit the number of text fonts and restrict stylized text fonts to opening headings (Pettersson, 2015a)
❏ Use bold font to emphasize information, such as headings and titles (Lipton, 2007; Pettersson, 2015b)
❏ Use italics to emphasize captions or small parts of the running text, keep in mind that italics reduces the readability of the text, so avoid using it as running text (Lipton, 2007; Pettersson, 2015b)
❏ Use a regular combination of uppercase letters and lowercase letters in the running text (Pettersson, 2015b)
❏ Avoid using all capital letters because it reduces the readability of the text (Lipton, 2007; Pettersson, 2015b)
● Bold headings for section in the ICO, such as; instructor name, course overview, etc. ● Italics font for clickable text
Color ❏ Depending on the content, use light or dark background and contrast colors for the text and graphics (Lipton, 2007; Pettersson, 2015a)
❏ Use black text or dark-colored text on a light-colored background (Lipton, 2007; Pettersson, 2015b)
❏ Choose colors that are one or two colors apart on the color wheel to achieve contrast (Lipton, 2007)
❏ Use color to clarify the structure of the content. Parts of the content can be in the same color or presented using a same-colored background (Pettersson, 2015a)
❏ Use a consistent color for the text or background to present the same type of content and assist learners in moving through the material (Lipton, 2007; Pettersson, 2015b)
❏ Use color to show the similarities and differences in the content, either by the color of the text or the
● Use consistent color for heading and body for each section in the ICO. ● Use darker shade of text color
for clickable text. ● Use highlighted color text or
bright colored text to emphasize important information or dates such as; test, due date, etc.
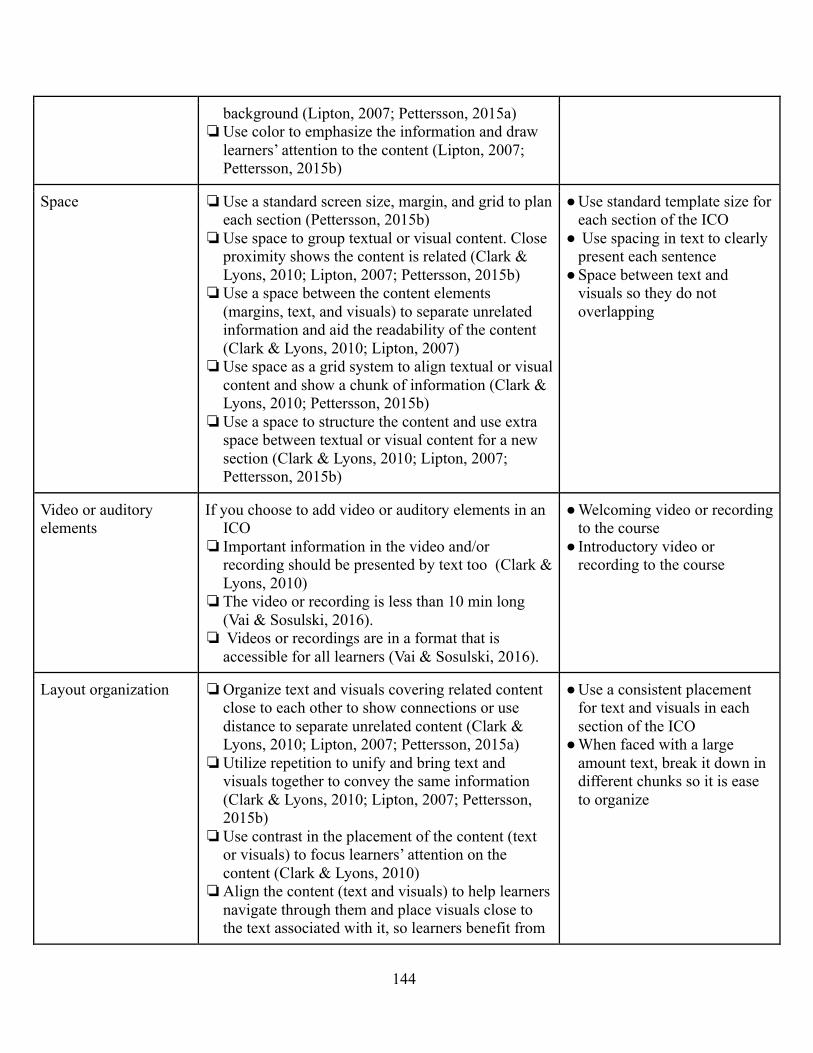
144
background (Lipton, 2007; Pettersson, 2015a) ❏ Use color to emphasize the information and draw
learners’ attention to the content (Lipton, 2007; Pettersson, 2015b)
Space ❏ Use a standard screen size, margin, and grid to plan each section (Pettersson, 2015b)
❏ Use space to group textual or visual content. Close proximity shows the content is related (Clark & Lyons, 2010; Lipton, 2007; Pettersson, 2015b)
❏ Use a space between the content elements (margins, text, and visuals) to separate unrelated information and aid the readability of the content (Clark & Lyons, 2010; Lipton, 2007)
❏ Use space as a grid system to align textual or visual content and show a chunk of information (Clark & Lyons, 2010; Pettersson, 2015b)
❏ Use a space to structure the content and use extra space between textual or visual content for a new section (Clark & Lyons, 2010; Lipton, 2007; Pettersson, 2015b)
● Use standard template size for each section of the ICO ● Use spacing in text to clearly
present each sentence ● Space between text and
visuals so they do not overlapping
Video or auditory elements
If you choose to add video or auditory elements in an ICO
❏ Important information in the video and/or recording should be presented by text too (Clark & Lyons, 2010)
❏ The video or recording is less than 10 min long (Vai & Sosulski, 2016).
❏ Videos or recordings are in a format that is accessible for all learners (Vai & Sosulski, 2016).
● Welcoming video or recording to the course ● Introductory video or
recording to the course
Layout organization ❏ Organize text and visuals covering related content close to each other to show connections or use distance to separate unrelated content (Clark & Lyons, 2010; Lipton, 2007; Pettersson, 2015a)
❏ Utilize repetition to unify and bring text and visuals together to convey the same information (Clark & Lyons, 2010; Lipton, 2007; Pettersson, 2015b)
❏ Use contrast in the placement of the content (text or visuals) to focus learners’ attention on the content (Clark & Lyons, 2010)
❏ Align the content (text and visuals) to help learners navigate through them and place visuals close to the text associated with it, so learners benefit from
● Use a consistent placement for text and visuals in each section of the ICO ● When faced with a large
amount text, break it down in different chunks so it is ease to organize
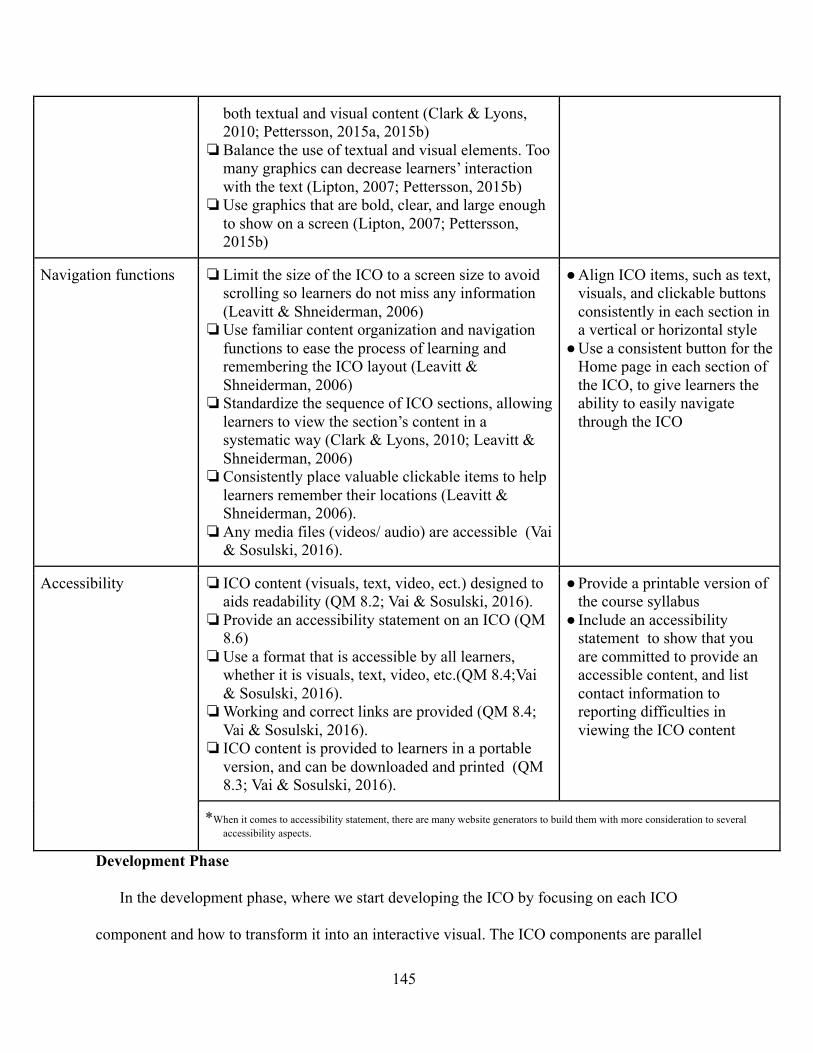
145
both textual and visual content (Clark & Lyons, 2010; Pettersson, 2015a, 2015b)
❏ Balance the use of textual and visual elements. Too many graphics can decrease learners’ interaction with the text (Lipton, 2007; Pettersson, 2015b)
❏ Use graphics that are bold, clear, and large enough to show on a screen (Lipton, 2007; Pettersson, 2015b)
Navigation functions ❏ Limit the size of the ICO to a screen size to avoid scrolling so learners do not miss any information (Leavitt & Shneiderman, 2006)
❏ Use familiar content organization and navigation functions to ease the process of learning and remembering the ICO layout (Leavitt & Shneiderman, 2006)
❏ Standardize the sequence of ICO sections, allowing learners to view the section’s content in a systematic way (Clark & Lyons, 2010; Leavitt & Shneiderman, 2006)
❏ Consistently place valuable clickable items to help learners remember their locations (Leavitt & Shneiderman, 2006).
❏ Any media files (videos/ audio) are accessible (Vai & Sosulski, 2016).
● Align ICO items, such as text, visuals, and clickable buttons consistently in each section in a vertical or horizontal style ● Use a consistent button for the
Home page in each section of the ICO, to give learners the ability to easily navigate through the ICO
Accessibility ❏ ICO content (visuals, text, video, ect.) designed to aids readability (QM 8.2; Vai & Sosulski, 2016).
❏ Provide an accessibility statement on an ICO (QM 8.6)
❏ Use a format that is accessible by all learners, whether it is visuals, text, video, etc.(QM 8.4;Vai & Sosulski, 2016).
❏ Working and correct links are provided (QM 8.4; Vai & Sosulski, 2016).
❏ ICO content is provided to learners in a portable version, and can be downloaded and printed (QM 8.3; Vai & Sosulski, 2016).
● Provide a printable version of the course syllabus ● Include an accessibility
statement to show that you are committed to provide an accessible content, and list contact information to reporting difficulties in viewing the ICO content
*When it comes to accessibility statement, there are many website generators to build them with more consideration to several accessibility aspects.
Development Phase
In the development phase, where we start developing the ICO by focusing on each ICO
component and how to transform it into an interactive visual. The ICO components are parallel
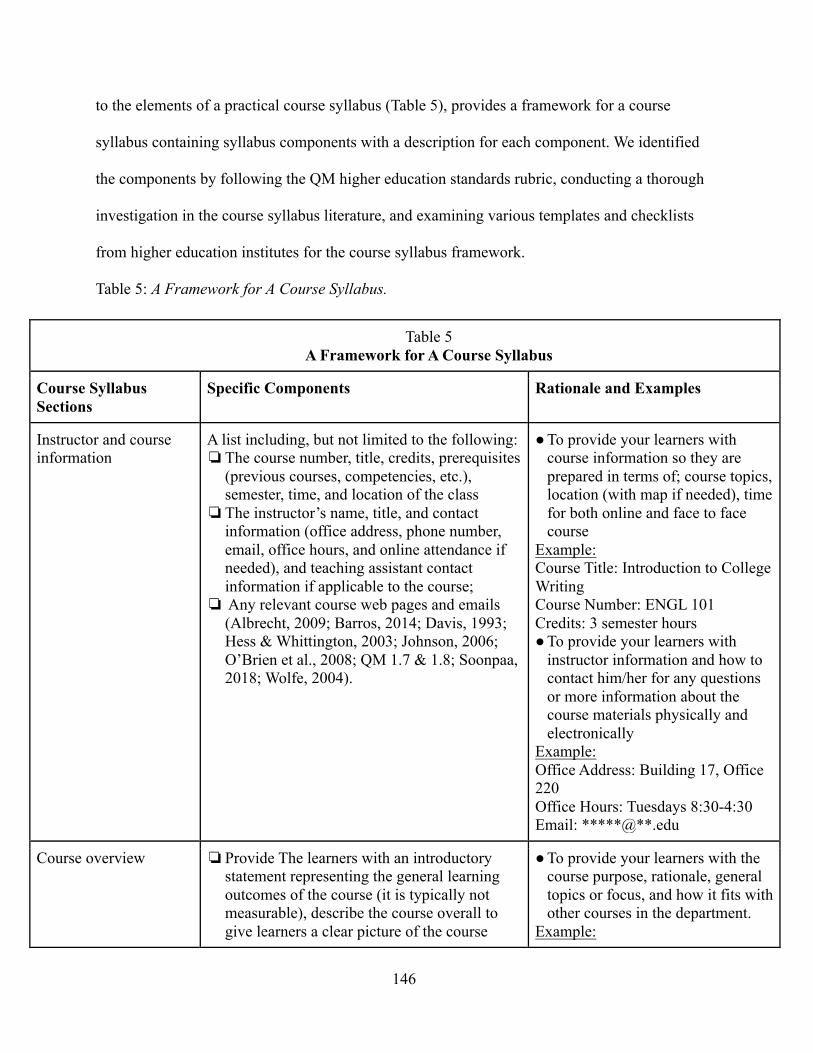
146
to the elements of a practical course syllabus (Table 5), provides a framework for a course
syllabus containing syllabus components with a description for each component. We identified
the components by following the QM higher education standards rubric, conducting a thorough
investigation in the course syllabus literature, and examining various templates and checklists
from higher education institutes for the course syllabus framework.
Table 5: A Framework for A Course Syllabus.
Table 5 A Framework for A Course Syllabus
Course Syllabus Sections
Specific Components Rationale and Examples
Instructor and course information
A list including, but not limited to the following: ❏ The course number, title, credits, prerequisites
(previous courses, competencies, etc.), semester, time, and location of the class
❏ The instructor’s name, title, and contact information (office address, phone number, email, office hours, and online attendance if needed), and teaching assistant contact information if applicable to the course;
❏ Any relevant course web pages and emails (Albrecht, 2009; Barros, 2014; Davis, 1993; Hess & Whittington, 2003; Johnson, 2006; O’Brien et al., 2008; QM 1.7 & 1.8; Soonpaa, 2018; Wolfe, 2004).
● To provide your learners with course information so they are prepared in terms of; course topics, location (with map if needed), time for both online and face to face course
Example: Course Title: Introduction to College Writing Course Number: ENGL 101 Credits: 3 semester hours ● To provide your learners with
instructor information and how to contact him/her for any questions or more information about the course materials physically and electronically
Example: Office Address: Building 17, Office 220 Office Hours: Tuesdays 8:30-4:30 Email: *****@**.edu
Course overview ❏ Provide The learners with an introductory statement representing the general learning outcomes of the course (it is typically not measurable), describe the course overall to give learners a clear picture of the course
● To provide your learners with the course purpose, rationale, general topics or focus, and how it fits with other courses in the department.
Example:
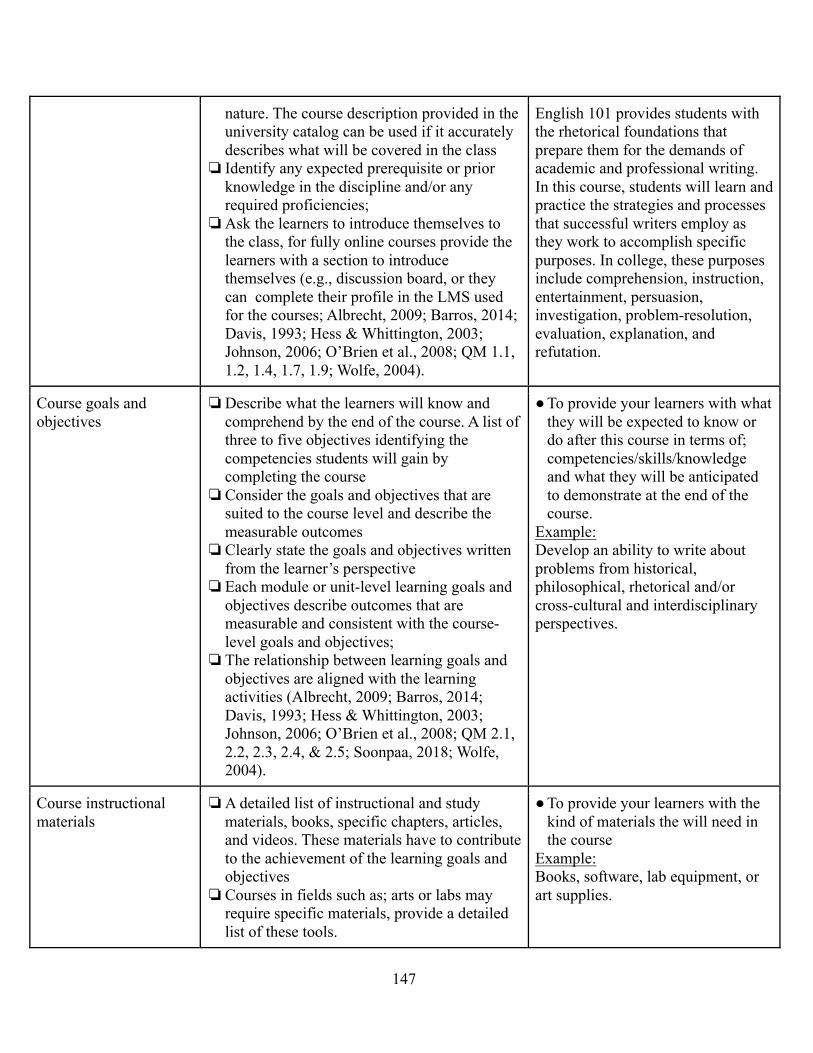
147
nature. The course description provided in the university catalog can be used if it accurately describes what will be covered in the class
❏ Identify any expected prerequisite or prior knowledge in the discipline and/or any required proficiencies;
❏ Ask the learners to introduce themselves to the class, for fully online courses provide the learners with a section to introduce themselves (e.g., discussion board, or they can complete their profile in the LMS used for the courses; Albrecht, 2009; Barros, 2014; Davis, 1993; Hess & Whittington, 2003; Johnson, 2006; O’Brien et al., 2008; QM 1.1, 1.2, 1.4, 1.7, 1.9; Wolfe, 2004).
English 101 provides students with the rhetorical foundations that prepare them for the demands of academic and professional writing. In this course, students will learn and practice the strategies and processes that successful writers employ as they work to accomplish specific purposes. In college, these purposes include comprehension, instruction, entertainment, persuasion, investigation, problem-resolution, evaluation, explanation, and refutation.
Course goals and objectives
❏ Describe what the learners will know and comprehend by the end of the course. A list of three to five objectives identifying the competencies students will gain by completing the course
❏ Consider the goals and objectives that are suited to the course level and describe the measurable outcomes
❏ Clearly state the goals and objectives written from the learner’s perspective
❏ Each module or unit-level learning goals and objectives describe outcomes that are measurable and consistent with the course-level goals and objectives;
❏ The relationship between learning goals and objectives are aligned with the learning activities (Albrecht, 2009; Barros, 2014; Davis, 1993; Hess & Whittington, 2003; Johnson, 2006; O’Brien et al., 2008; QM 2.1, 2.2, 2.3, 2.4, & 2.5; Soonpaa, 2018; Wolfe, 2004).
● To provide your learners with what they will be expected to know or do after this course in terms of; competencies/skills/knowledge and what they will be anticipated to demonstrate at the end of the course.
Example: Develop an ability to write about problems from historical, philosophical, rhetorical and/or cross-cultural and interdisciplinary perspectives.
Course instructional materials
❏ A detailed list of instructional and study materials, books, specific chapters, articles, and videos. These materials have to contribute to the achievement of the learning goals and objectives
❏ Courses in fields such as; arts or labs may require specific materials, provide a detailed list of these tools.
● To provide your learners with the kind of materials the will need in the course
Example: Books, software, lab equipment, or art supplies.
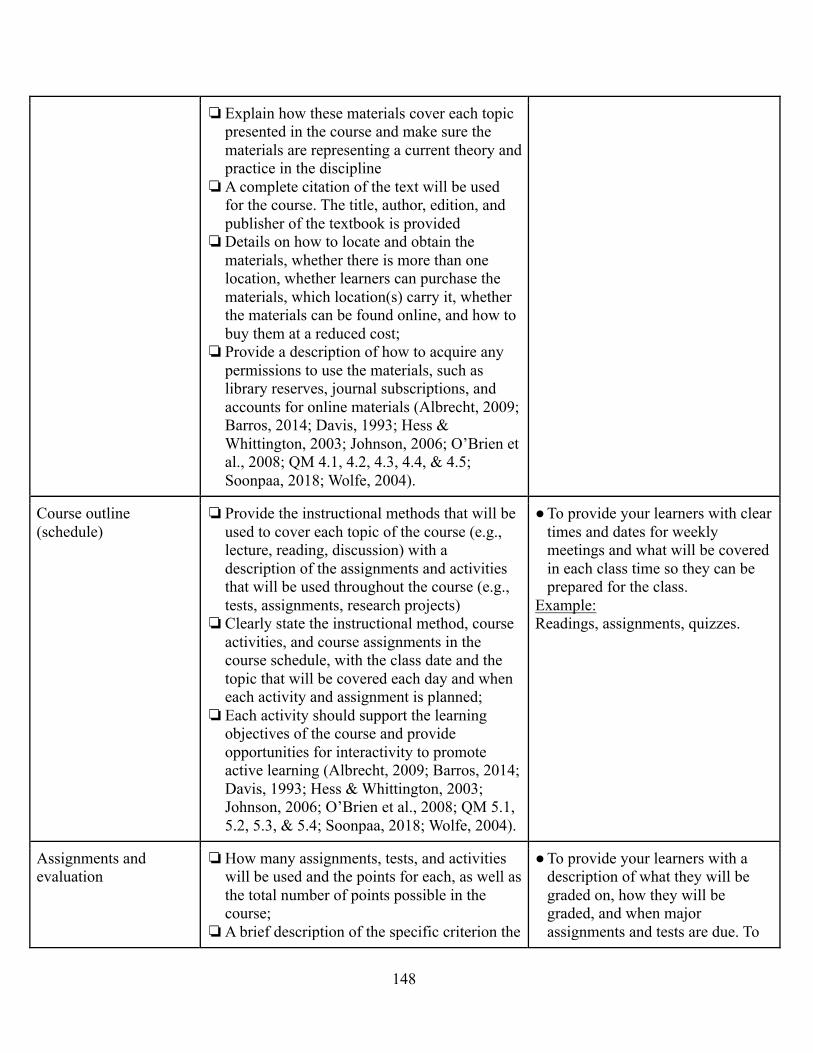
148
❏ Explain how these materials cover each topic presented in the course and make sure the materials are representing a current theory and practice in the discipline
❏ A complete citation of the text will be used for the course. The title, author, edition, and publisher of the textbook is provided
❏ Details on how to locate and obtain the materials, whether there is more than one location, whether learners can purchase the materials, which location(s) carry it, whether the materials can be found online, and how to buy them at a reduced cost;
❏ Provide a description of how to acquire any permissions to use the materials, such as library reserves, journal subscriptions, and accounts for online materials (Albrecht, 2009; Barros, 2014; Davis, 1993; Hess & Whittington, 2003; Johnson, 2006; O’Brien et al., 2008; QM 4.1, 4.2, 4.3, 4.4, & 4.5; Soonpaa, 2018; Wolfe, 2004).
Course outline (schedule)
❏ Provide the instructional methods that will be used to cover each topic of the course (e.g., lecture, reading, discussion) with a description of the assignments and activities that will be used throughout the course (e.g., tests, assignments, research projects)
❏ Clearly state the instructional method, course activities, and course assignments in the course schedule, with the class date and the topic that will be covered each day and when each activity and assignment is planned;
❏ Each activity should support the learning objectives of the course and provide opportunities for interactivity to promote active learning (Albrecht, 2009; Barros, 2014; Davis, 1993; Hess & Whittington, 2003; Johnson, 2006; O’Brien et al., 2008; QM 5.1, 5.2, 5.3, & 5.4; Soonpaa, 2018; Wolfe, 2004).
● To provide your learners with clear times and dates for weekly meetings and what will be covered in each class time so they can be prepared for the class.
Example: Readings, assignments, quizzes.
Assignments and evaluation
❏ How many assignments, tests, and activities will be used and the points for each, as well as the total number of points possible in the course;
❏ A brief description of the specific criterion the
● To provide your learners with a description of what they will be graded on, how they will be graded, and when major assignments and tests are due. To
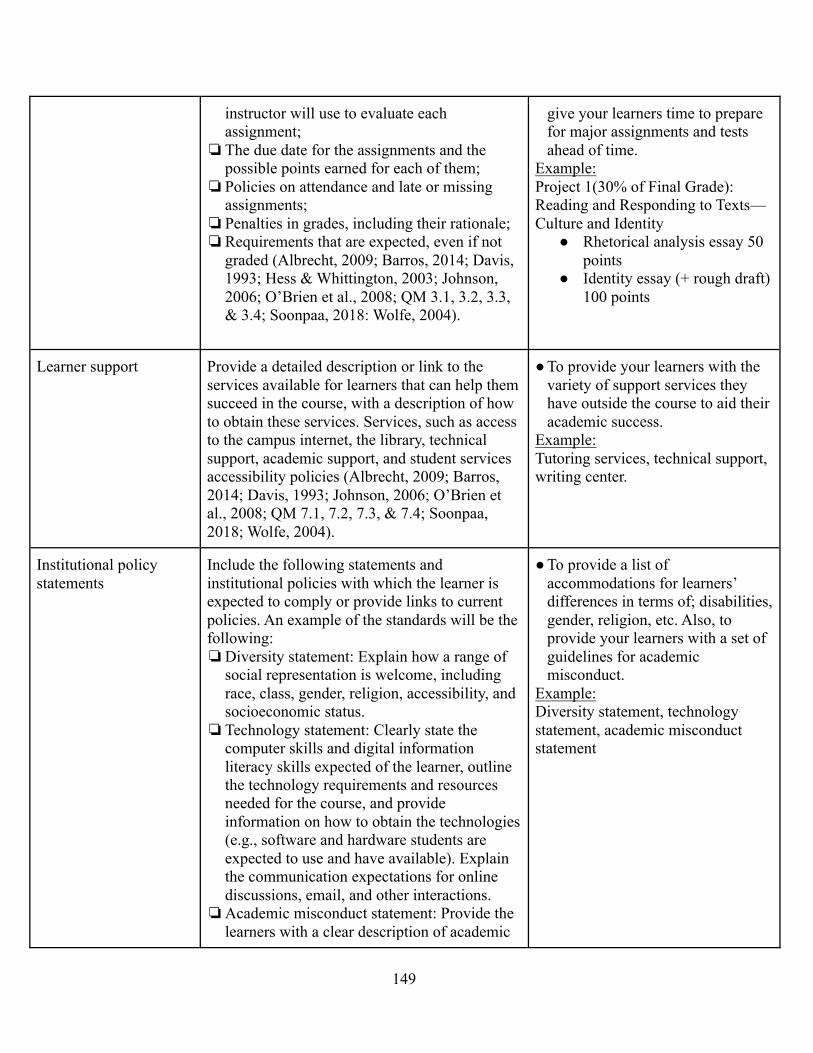
149
instructor will use to evaluate each assignment;
❏ The due date for the assignments and the possible points earned for each of them;
❏ Policies on attendance and late or missing assignments;
❏ Penalties in grades, including their rationale; ❏ Requirements that are expected, even if not
graded (Albrecht, 2009; Barros, 2014; Davis, 1993; Hess & Whittington, 2003; Johnson, 2006; O’Brien et al., 2008; QM 3.1, 3.2, 3.3, & 3.4; Soonpaa, 2018: Wolfe, 2004).
give your learners time to prepare for major assignments and tests ahead of time.
Example: Project 1(30% of Final Grade): Reading and Responding to Texts—Culture and Identity ● Rhetorical analysis essay 50
points ● Identity essay (+ rough draft)
100 points
Learner support Provide a detailed description or link to the services available for learners that can help them succeed in the course, with a description of how to obtain these services. Services, such as access to the campus internet, the library, technical support, academic support, and student services accessibility policies (Albrecht, 2009; Barros, 2014; Davis, 1993; Johnson, 2006; O’Brien et al., 2008; QM 7.1, 7.2, 7.3, & 7.4; Soonpaa, 2018; Wolfe, 2004).
● To provide your learners with the variety of support services they have outside the course to aid their academic success.
Example: Tutoring services, technical support, writing center.
Institutional policy statements
Include the following statements and institutional policies with which the learner is expected to comply or provide links to current policies. An example of the standards will be the following: ❏ Diversity statement: Explain how a range of
social representation is welcome, including race, class, gender, religion, accessibility, and socioeconomic status.
❏ Technology statement: Clearly state the computer skills and digital information literacy skills expected of the learner, outline the technology requirements and resources needed for the course, and provide information on how to obtain the technologies (e.g., software and hardware students are expected to use and have available). Explain the communication expectations for online discussions, email, and other interactions.
❏ Academic misconduct statement: Provide the learners with a clear description of academic
● To provide a list of accommodations for learners’ differences in terms of; disabilities, gender, religion, etc. Also, to provide your learners with a set of guidelines for academic misconduct.
Example: Diversity statement, technology statement, academic misconduct statement
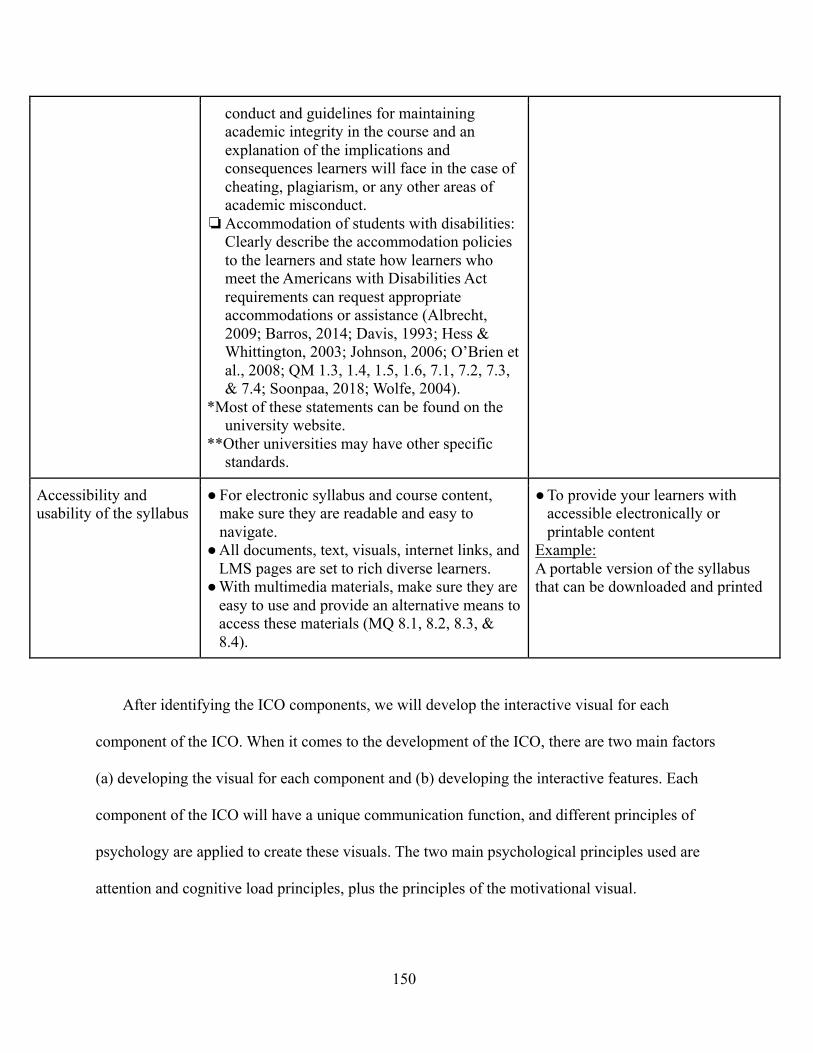
150
conduct and guidelines for maintaining academic integrity in the course and an explanation of the implications and consequences learners will face in the case of cheating, plagiarism, or any other areas of academic misconduct.
❏ Accommodation of students with disabilities: Clearly describe the accommodation policies to the learners and state how learners who meet the Americans with Disabilities Act requirements can request appropriate accommodations or assistance (Albrecht, 2009; Barros, 2014; Davis, 1993; Hess & Whittington, 2003; Johnson, 2006; O’Brien et al., 2008; QM 1.3, 1.4, 1.5, 1.6, 7.1, 7.2, 7.3, & 7.4; Soonpaa, 2018; Wolfe, 2004).
*Most of these statements can be found on the university website.
**Other universities may have other specific standards.
Accessibility and usability of the syllabus
● For electronic syllabus and course content, make sure they are readable and easy to navigate.
● All documents, text, visuals, internet links, and LMS pages are set to rich diverse learners. ● With multimedia materials, make sure they are
easy to use and provide an alternative means to access these materials (MQ 8.1, 8.2, 8.3, & 8.4).
● To provide your learners with accessible electronically or printable content
Example: A portable version of the syllabus that can be downloaded and printed
After identifying the ICO components, we will develop the interactive visual for each
component of the ICO. When it comes to the development of the ICO, there are two main factors
(a) developing the visual for each component and (b) developing the interactive features. Each
component of the ICO will have a unique communication function, and different principles of
psychology are applied to create these visuals. The two main psychological principles used are
attention and cognitive load principles, plus the principles of the motivational visual.
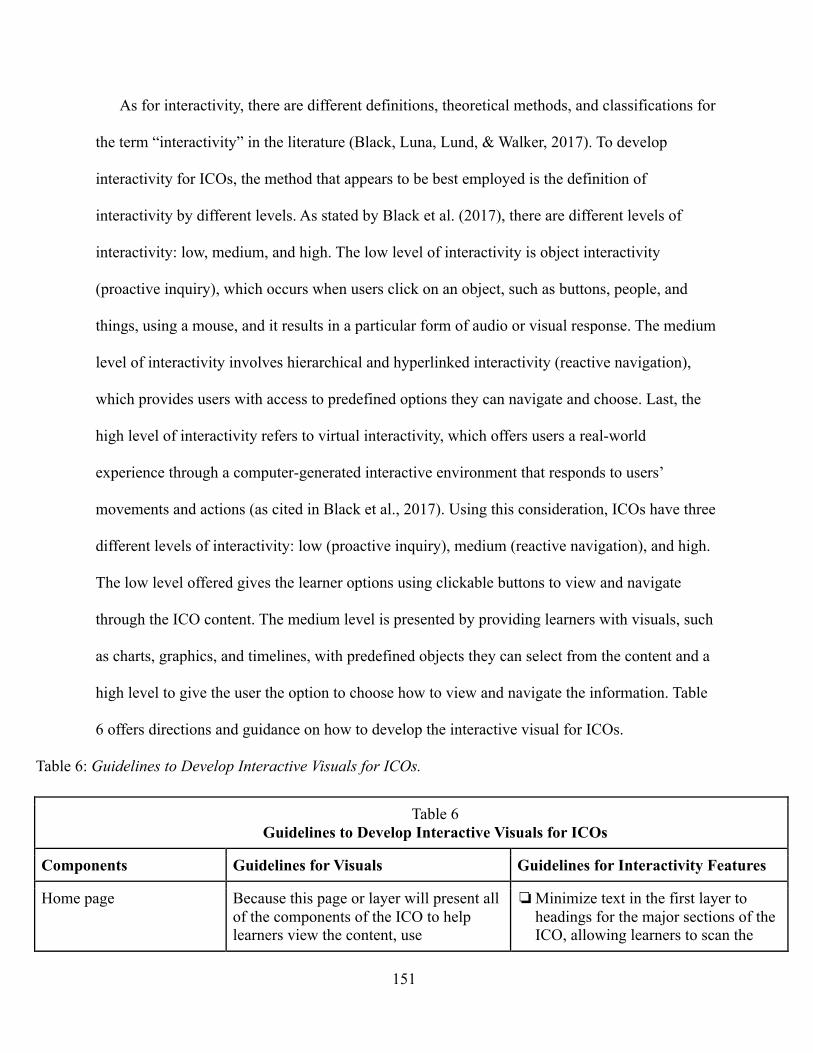
151
As for interactivity, there are different definitions, theoretical methods, and classifications for
the term “interactivity” in the literature (Black, Luna, Lund, & Walker, 2017). To develop
interactivity for ICOs, the method that appears to be best employed is the definition of
interactivity by different levels. As stated by Black et al. (2017), there are different levels of
interactivity: low, medium, and high. The low level of interactivity is object interactivity
(proactive inquiry), which occurs when users click on an object, such as buttons, people, and
things, using a mouse, and it results in a particular form of audio or visual response. The medium
level of interactivity involves hierarchical and hyperlinked interactivity (reactive navigation),
which provides users with access to predefined options they can navigate and choose. Last, the
high level of interactivity refers to virtual interactivity, which offers users a real-world
experience through a computer-generated interactive environment that responds to users’
movements and actions (as cited in Black et al., 2017). Using this consideration, ICOs have three
different levels of interactivity: low (proactive inquiry), medium (reactive navigation), and high.
The low level offered gives the learner options using clickable buttons to view and navigate
through the ICO content. The medium level is presented by providing learners with visuals, such
as charts, graphics, and timelines, with predefined objects they can select from the content and a
high level to give the user the option to choose how to view and navigate the information. Table
6 offers directions and guidance on how to develop the interactive visual for ICOs.
Table 6: Guidelines to Develop Interactive Visuals for ICOs.
Table 6 Guidelines to Develop Interactive Visuals for ICOs
Components Guidelines for Visuals Guidelines for Interactivity Features
Home page
Because this page or layer will present all of the components of the ICO to help learners view the content, use
❏ Minimize text in the first layer to headings for the major sections of the ICO, allowing learners to scan the
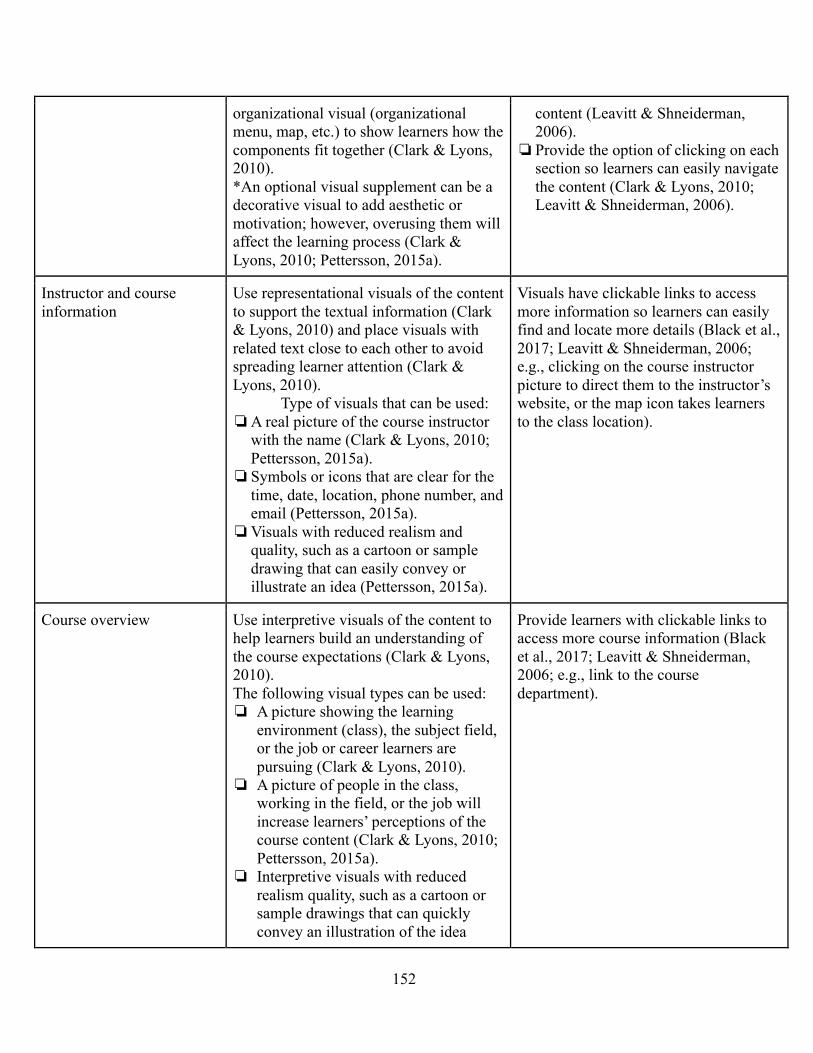
152
organizational visual (organizational menu, map, etc.) to show learners how the components fit together (Clark & Lyons, 2010). *An optional visual supplement can be a decorative visual to add aesthetic or motivation; however, overusing them will affect the learning process (Clark & Lyons, 2010; Pettersson, 2015a).
content (Leavitt & Shneiderman, 2006).
❏ Provide the option of clicking on each section so learners can easily navigate the content (Clark & Lyons, 2010; Leavitt & Shneiderman, 2006).
Instructor and course information
Use representational visuals of the content to support the textual information (Clark & Lyons, 2010) and place visuals with related text close to each other to avoid spreading learner attention (Clark & Lyons, 2010).
Type of visuals that can be used: ❏ A real picture of the course instructor
with the name (Clark & Lyons, 2010; Pettersson, 2015a).
❏ Symbols or icons that are clear for the time, date, location, phone number, and email (Pettersson, 2015a).
❏ Visuals with reduced realism and quality, such as a cartoon or sample drawing that can easily convey or illustrate an idea (Pettersson, 2015a).
Visuals have clickable links to access more information so learners can easily find and locate more details (Black et al., 2017; Leavitt & Shneiderman, 2006; e.g., clicking on the course instructor picture to direct them to the instructor’s website, or the map icon takes learners to the class location).
Course overview Use interpretive visuals of the content to help learners build an understanding of the course expectations (Clark & Lyons, 2010). The following visual types can be used: ❏ A picture showing the learning
environment (class), the subject field, or the job or career learners are pursuing (Clark & Lyons, 2010).
❏ A picture of people in the class, working in the field, or the job will increase learners’ perceptions of the course content (Clark & Lyons, 2010; Pettersson, 2015a).
❏ Interpretive visuals with reduced realism quality, such as a cartoon or sample drawings that can quickly convey an illustration of the idea
Provide learners with clickable links to access more course information (Black et al., 2017; Leavitt & Shneiderman, 2006; e.g., link to the course department).
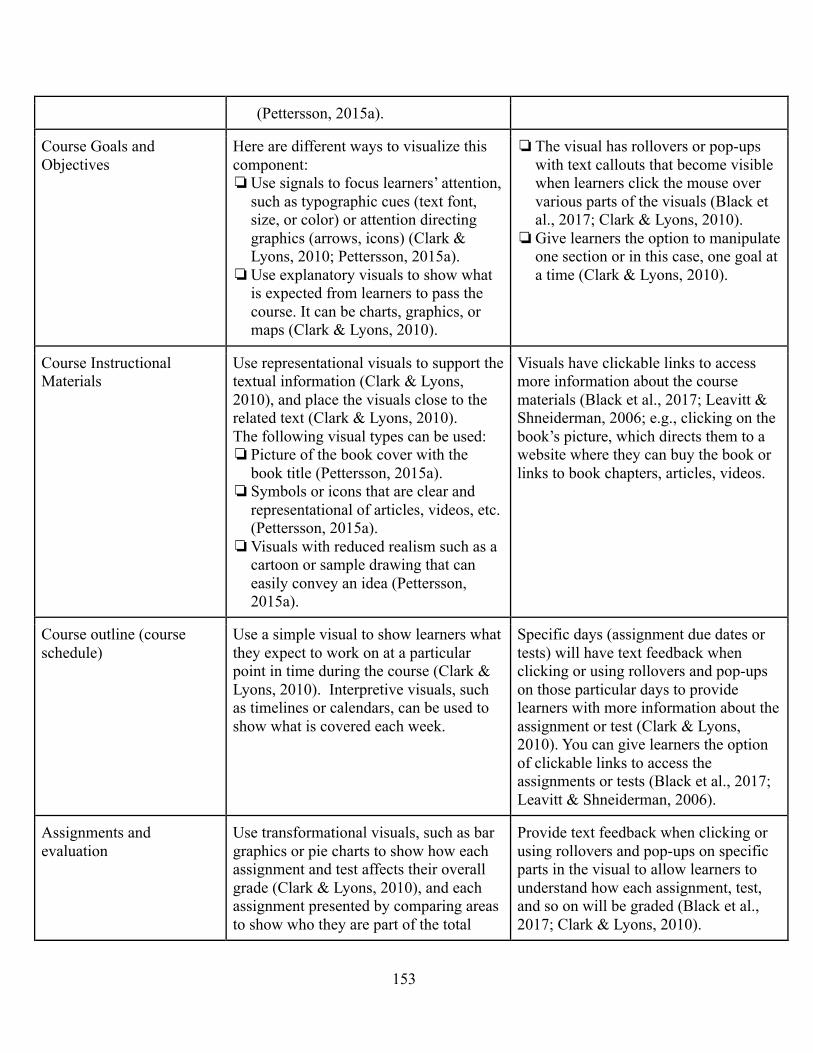
153
(Pettersson, 2015a).
Course Goals and Objectives
Here are different ways to visualize this component: ❏ Use signals to focus learners’ attention,
such as typographic cues (text font, size, or color) or attention directing graphics (arrows, icons) (Clark & Lyons, 2010; Pettersson, 2015a).
❏ Use explanatory visuals to show what is expected from learners to pass the course. It can be charts, graphics, or maps (Clark & Lyons, 2010).
❏ The visual has rollovers or pop-ups with text callouts that become visible when learners click the mouse over various parts of the visuals (Black et al., 2017; Clark & Lyons, 2010).
❏ Give learners the option to manipulate one section or in this case, one goal at a time (Clark & Lyons, 2010).
Course Instructional Materials
Use representational visuals to support the textual information (Clark & Lyons, 2010), and place the visuals close to the related text (Clark & Lyons, 2010). The following visual types can be used: ❏ Picture of the book cover with the
book title (Pettersson, 2015a). ❏ Symbols or icons that are clear and
representational of articles, videos, etc. (Pettersson, 2015a).
❏ Visuals with reduced realism such as a cartoon or sample drawing that can easily convey an idea (Pettersson, 2015a).
Visuals have clickable links to access more information about the course materials (Black et al., 2017; Leavitt & Shneiderman, 2006; e.g., clicking on the book’s picture, which directs them to a website where they can buy the book or links to book chapters, articles, videos.
Course outline (course schedule)
Use a simple visual to show learners what they expect to work on at a particular point in time during the course (Clark & Lyons, 2010). Interpretive visuals, such as timelines or calendars, can be used to show what is covered each week.
Specific days (assignment due dates or tests) will have text feedback when clicking or using rollovers and pop-ups on those particular days to provide learners with more information about the assignment or test (Clark & Lyons, 2010). You can give learners the option of clickable links to access the assignments or tests (Black et al., 2017; Leavitt & Shneiderman, 2006).
Assignments and evaluation
Use transformational visuals, such as bar graphics or pie charts to show how each assignment and test affects their overall grade (Clark & Lyons, 2010), and each assignment presented by comparing areas to show who they are part of the total
Provide text feedback when clicking or using rollovers and pop-ups on specific parts in the visual to allow learners to understand how each assignment, test, and so on will be graded (Black et al., 2017; Clark & Lyons, 2010).
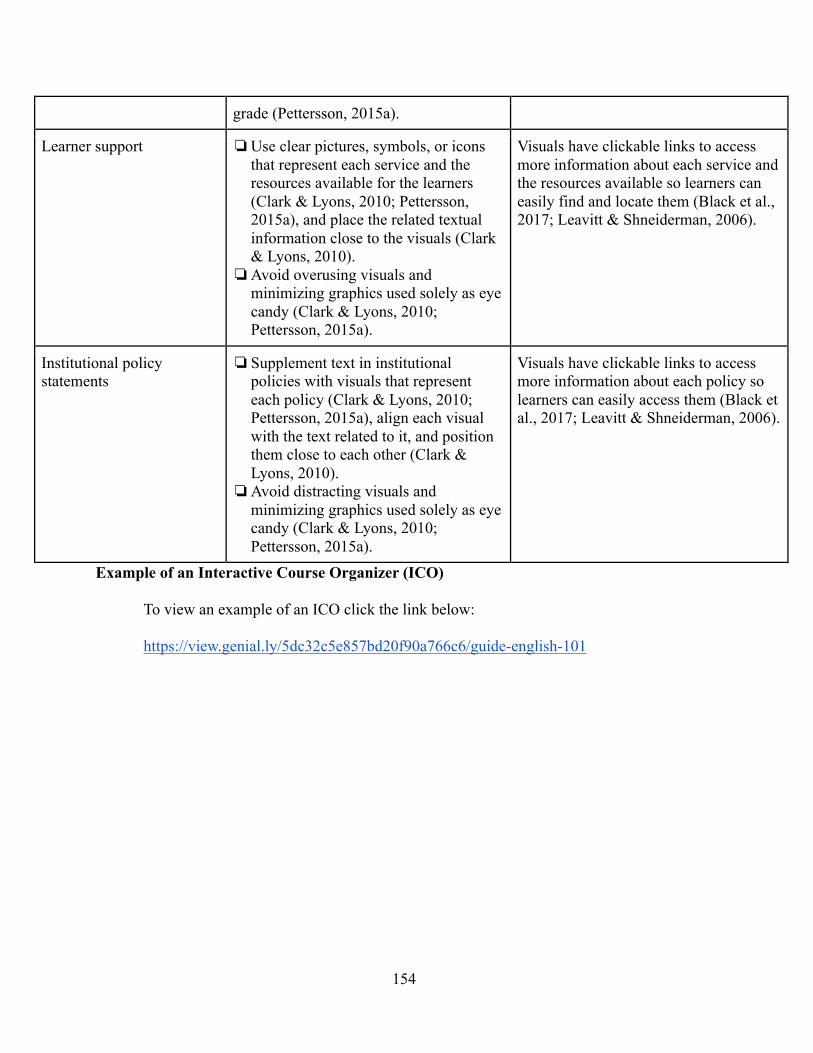
154
grade (Pettersson, 2015a).
Learner support ❏ Use clear pictures, symbols, or icons that represent each service and the resources available for the learners (Clark & Lyons, 2010; Pettersson, 2015a), and place the related textual information close to the visuals (Clark & Lyons, 2010).
❏ Avoid overusing visuals and minimizing graphics used solely as eye candy (Clark & Lyons, 2010; Pettersson, 2015a).
Visuals have clickable links to access more information about each service and the resources available so learners can easily find and locate them (Black et al., 2017; Leavitt & Shneiderman, 2006).
Institutional policy statements
❏ Supplement text in institutional policies with visuals that represent each policy (Clark & Lyons, 2010; Pettersson, 2015a), align each visual with the text related to it, and position them close to each other (Clark & Lyons, 2010).
❏ Avoid distracting visuals and minimizing graphics used solely as eye candy (Clark & Lyons, 2010; Pettersson, 2015a).
Visuals have clickable links to access more information about each policy so learners can easily access them (Black et al., 2017; Leavitt & Shneiderman, 2006).
Example of an Interactive Course Organizer (ICO)
To view an example of an ICO click the link below:
https://view.genial.ly/5dc32c5e857bd20f90a766c6/guide-english-101


