Embed Size (px)
Citation preview
An Analysis of a Trickle-Bed Bioreactor:Carbon Disulfide Removal
Ricardo Lobo, Sergio Revah, Tomas Viveros-Garcıa
Departamento de Ingenierıa de Procesos e Hidraulica, UniversidadAutonoma Metropolitana-Iztapalapa, Av. Michoacan y Purısima s/n,Iztapalapa, D.F. CP 09340, Mexico; telephone: +52 5 724-4648; fax: +52 5724-4900; e-mail: [email protected]
Received 9 April 1998; accepted 25 September 1998
Abstract: An analysis of the local processes occurring ina trickle-bed bioreactor (TBB) with a first-order bioreac-tion shows that the identification of the TBB operatingregime requires knowledge of the substrate concentra-tion in the liquid phase. If the substrate liquid concentra-tion is close to 0, the rate-controlling step is mass transferat the gas–liquid interface; when it is close to the value inequilibrium with the gas phase, the controlling step is thephenomena occurring in the biofilm. CS2 removal ratedata obtained in a TBB with a Thiobacilii consortia bio-film are analyzed to obtain the mass transfer and kineticparameters, and to show that the bioreactor operates ina regime mainly controlled by mass transfer. A TBBmodel with two experimentally determined parametersis developed and used to show how the bioreactor sizedepends on the rate-limiting step, the absorption factor,the substrate fractional conversion, and on the gas andliquid contact pattern. Under certain conditions, the TBBsize is independent of the flowing phases’ contact pat-tern. The model effectively describes substrate gas andliquid concentration data for mass transfer and biodeg-radation rate controlled processes. © 1999 John Wiley &Sons, Inc. Biotechnol Bioeng 63: 98–109, 1999.Keywords: trickle-bed bioreactor; carbon disulfide re-moval; rate controlling step; model
INTRODUCTION
Desulfurization of gas streams is important from the stand-point of pollution prevention, health, safety, and corrosion.Several biological gas desulfurization processes have beenproposed and show potential for treating dilute sulfide-containing streams (Jensen and Webb, 1995). One such pro-cess simultaneously removes H2S and CS2 from air streams(Morales et al., 1992; Revah et al., 1995; US Patent5,236,677, 1993; Mexican Patent 178497, 1995). There arethree commercial-size plants operating with this process inMonterrey, NL, Mexico and one in Tonawanda, NY, USA.The process is based on a TBB with aThiobacilii consortiabiofilm supported on a structured packing. The reactionsthat are believed to occur in the system are (Smith andKelly, 1988):
CS2 + H2O → COS + H2S; COS + H2O → CO2 + H2S;
H2S + ½O2 → S° + H2OS° + H2O + 3/2 O2 → H2SO4
Trickle-bed bioreactors appear to be suited for treating airstreams containing diverse volatile compounds and thus,reliable models are needed for TBB analysis and scale-up.Trickle-bed bioreactors modeling reports are scarce, but thearticles of Diks and Ottengraf (1991a), and Heckmat andVortmeyer (1994) are representative of the state of the art.These authors model first- and zero-order bioreactions in-side the biofilm using a biocatalytical effectiveness factorapproach for flat-plate geometry. Diks and Ottengraf(1991a) use the following assumptions: (1) a batch-determined zero-order intrinsic kinetic parameter holds forthe biofilm; (2) biomass concentration in the biofilm is con-stant; (3) liquid-biofilm mass transfer resistance is negli-gible; (4) the bioreaction is not oxygen-limited; (5) gas–liquid mass transfer may be represented by an overall volu-metric gas-based coefficient; (6) the gas and the liquid are inplug flow; and (7) the TBB operates at steady state. Heck-mat and Vortmeyer (1994) use somewhat similar assump-tions, although they also analyze a first-order bioreactionand discuss scale-up based on their model. The above as-sumptions reflect the complexity of the phenomena occur-ring in the TBB and indicate the restrictions that must beaccepted to obtain a working model. The models are solvedestimating several parameters and fitting other ones to gas-phase data. Ockeloen et al. (1996) develop an extension toDiks and Ottengraf’s model to include Monod kinetics, butuse a large number of parameters which are estimated andassumed to be typical of TBBs. No comparison with data ispresented. Hartmans and Tramper (1991) follow anotherapproach, modeling their TBB as a series of ideal continu-ous-stirred tank reactors and calculate their number and sizeto give the desired conversion. Good agreement with data isalso shown. In another report, CS2 removal is analyzed byLobo et al. (1996), comparing a pseudo-homogeneous witha heterogeneous model based on gas- and liquid-residencetimes. They find that both models effectively fit gas-phasesubstrate axial concentration data.
In general, the models seem to effectively reproduce sub-strate gas-phase data. However, all models require the es-timation and/or fitting of several parameters. Heckmat and
Correspondence to:Tomas Viveros-Garcı´aContract grant sponsor: Grupo Cydsa
© 1999 John Wiley & Sons, Inc. CCC 0006-3592/99/010098-12
Vortmeyer (1994) recognize that the estimation of the pa-rameters needed to describe the diffusion and bioreactionprocesses inside biofilms is highly uncertain. Additionally,the rate controlling step of the removal process is not deter-mined by experiment in the TBB experimental reportsknown to the authors, except for the work of Diks andOttengraf (1991b). Therefore, significance of the data andits use for model validation is uncertain.
In view of the above, two issues will be addressed in thisarticle. First, as the size of any TBB depends on the rate-controlling step of the removal process, a simple criterion isdeveloped to identify it in a given experimental TBB, thusmaking data interpretation unambiguous. In addition, wewill show how the overall resistance of the removal processmay be uncoupled to obtain its governing parameters. Sec-ond, a simplified heterogeneous TBB model that uses onlytwo parameters obtained from experiment is developed andtested against both substrate gas- and liquid-concentrationdata. Further, it will be also shown that under certain con-ditions the size of a TBB is the same whether it is operatedcounter- or cocurrently. The analysis will be limited to asubstrate first-order bioreaction without oxygen limitation.
MATERIALS AND METHODS
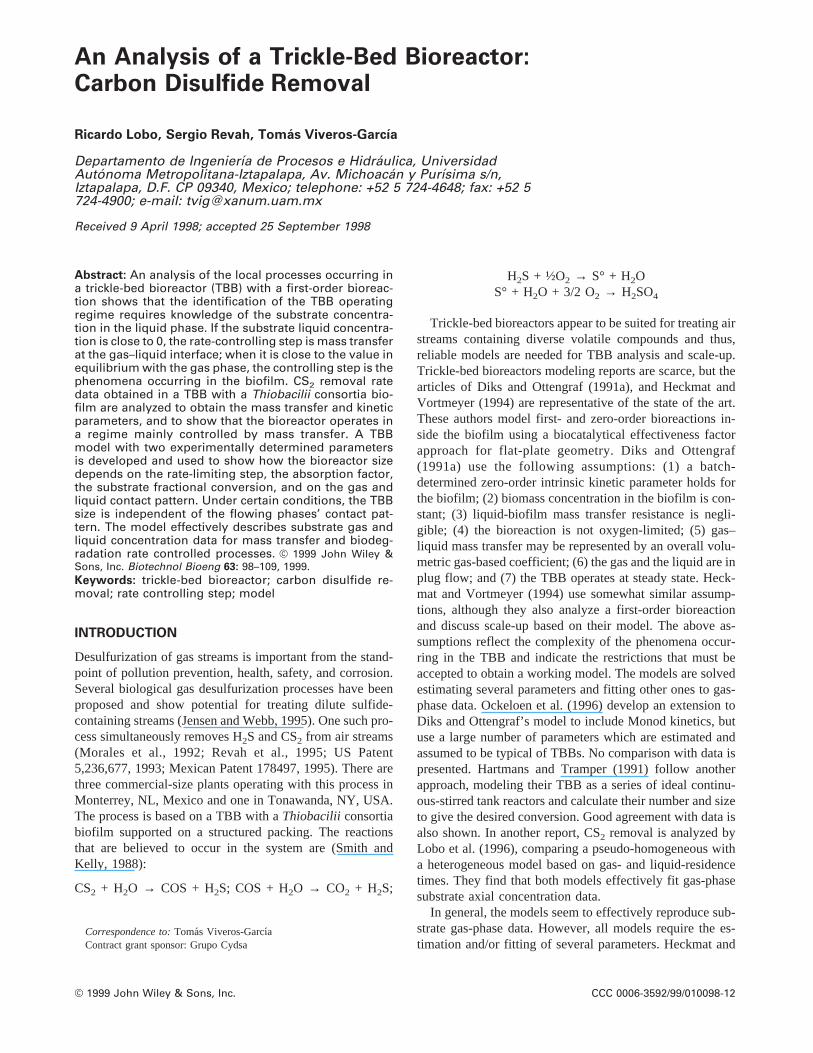
The experimental TBB (Fig. 1) used for the present analysishas undergone extensive testing over a period of more than5 years. It consists of a 0.29 m ID by 2.5 m-long acrylic tubepacked with 0.08 m3 of Plasdek 12060 structured PVCpacking (Munters Corporation, Fort Myers, FL). The pack-ing consists of corrugated sheets of triangular wave-likeflutes 0.028 m wide; adjacent sheets are joined as mirrorimages of each other; the corrugations make a 60° anglewith respect to the horizontal plane. The packing specificarea is 223 m2/m3 and its void fraction is 0.95. The TBBpacked length is 1.13 m. AThiobacilii consortia biofilm issupported on the packing surface.
The TBB is operated countercurrently. Air with CS2 isfed at the TBB bottom—water with nutrients at the top. Thelower part of the TBB serves as a holding tank, from whichthe liquid is recirculated to the top. The recirculating liquidpH is controlled through NaOH additions and the sulfatecontent by periodic bleeding and fresh culture medium ad-dition to the holding tank. The TBB has gas- and liquid-sampling ports located at 0, 25, 50, 75, and 100% of its totallength measured from the top, and another at the holding-tank exit. All experiments are performed at 78 kPa, roomtemperature (around 298 K), and at optimized conditions ofpH and liquid-flow rate. Fractional liquid hold-up is mea-sured by the drainage method, allowing the liquid to drainfor 15 min after suspending the liquid feed. Other TBBconstruction details, operating procedures, analytical tech-niques, and materials are described elsewhere (Revah et al.,1995; Trinidad R. 1996. M.Ch.E. Thesis, Universidad Au-tonoma Metropolitana-Iztapalapa, Mexico City).
THEORY
Local Processes Analysis for a First-OrderBioreaction: The Use of theQuasi-Stationary Approximation
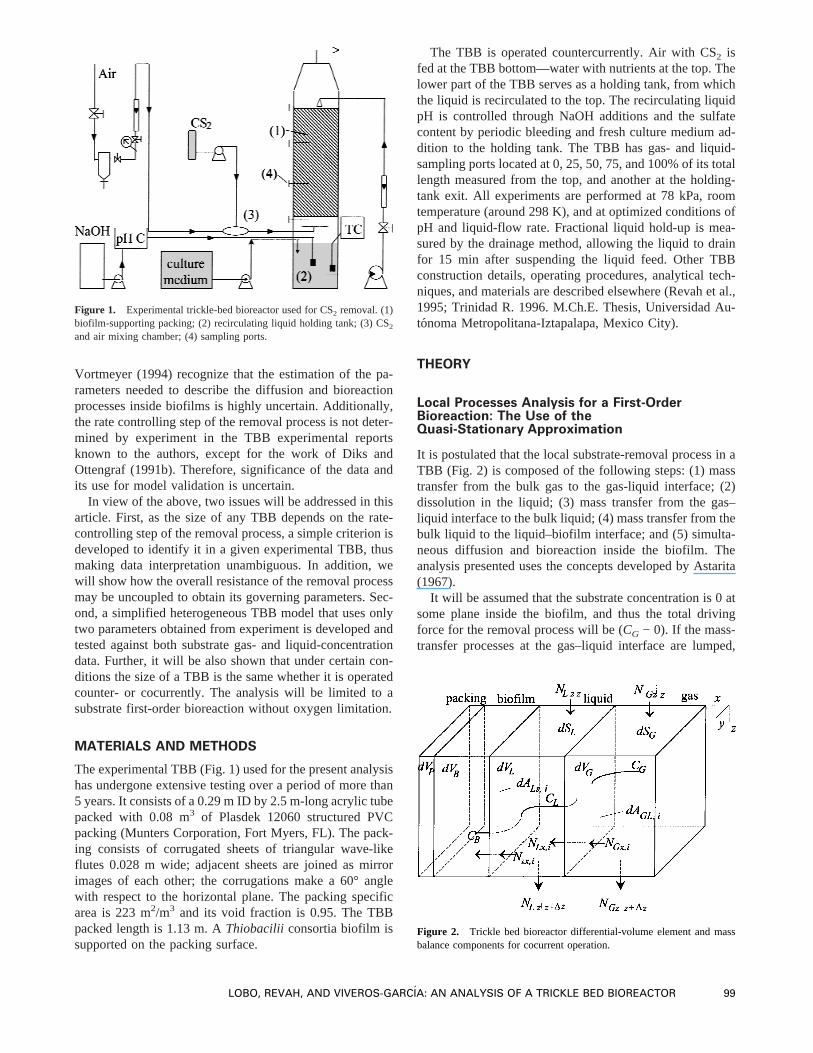
It is postulated that the local substrate-removal process in aTBB (Fig. 2) is composed of the following steps: (1) masstransfer from the bulk gas to the gas-liquid interface; (2)dissolution in the liquid; (3) mass transfer from the gas–liquid interface to the bulk liquid; (4) mass transfer from thebulk liquid to the liquid–biofilm interface; and (5) simulta-neous diffusion and bioreaction inside the biofilm. Theanalysis presented uses the concepts developed by Astarita(1967).
It will be assumed that the substrate concentration is 0 atsome plane inside the biofilm, and thus the total drivingforce for the removal process will be (CG − 0). If the mass-transfer processes at the gas–liquid interface are lumped,
Figure 1. Experimental trickle-bed bioreactor used for CS2 removal. (1)biofilm-supporting packing; (2) recirculating liquid holding tank; (3) CS2
and air mixing chamber; (4) sampling ports.
Figure 2. Trickle bed bioreactor differential-volume element and massbalance components for cocurrent operation.
LOBO, REVAH, AND VIVEROS-GARCIA: AN ANALYSIS OF A TRICKLE BED BIOREACTOR 99
their driving force will be [(CG /m) − CL]. The simultaneousdiffusion and bioreaction processes inside the biofilm maybe lumped by an effectiveness factorh. Further, if the bulkliquid-biofilm mass transfer step (4) is lumped with thediffusion-bioreaction step (5), the driving force for theselumped steps would be (CL − 0). The lumping of steps (4)and (5) will hereby be referred to as the biofilm phenomena.
In reference to Figure 2 and assuming that the quasi-steady-state approximation is valid, the substrate absorptionflux may be expressed by:
Nabs= NGx,i = kG ~CG − CGi! = NLx,i = kL (CLi − CL) (1)
Assuming equilibrium at the gas–liquid interface (CGi 4mCLi), substituting this relation in Eq. (1), eliminating in-terfacial concentrations, and rearrangement lead to the fol-lowing local absorption flux expression:
Nabs= kLhL SCG
m− CLD (2)
where
hL =1
1 + kL/mkG=
1/kL
1/kL + 1/mkG(3)
represents a gas–liquid mass transfer-effectiveness factor,and it has the meaning of the fraction of the total gas- andliquid-mass transfer resistance which corresponds to the liquid.
Considering that liquid–biofilm substrate transfer is con-sumed by a first-order bioreaction inside the biofilm,
Nsx,i = ks~CL − Cs! =kBh
aBCs = kCs (4)
wherekB is the rate constant for the bioreaction,h is theeffectiveness factor for the bioreaction, andaB is the exter-nal surface per unit volume of biofilm, i.e., the biofilmthickness, which is considered constant. The symbolk hasbeen introduced to group in the last three parameters andhas the meaning of a pseudo-superficial kinetic constant.Then, eliminatingCs from Eq. (4),
Nsx,i 4 khsCL (5)
where
hs =1
1 + kBh/ksaB=
1
1 + k/ks=
1/k
1/k + 1/ks(6)
is an effectiveness factor that lumps the liquid-biofilm masstransfer and the diffusion-bioreaction process inside the bio-film. This parameter has the meaning of the fraction of thetotal biofilm phenomena resistance that corresponds to thebioreaction.
Under the quasi-stationary approximation the substratemass balance in the liquid phase per unit volume of liquid is
Nabs
d AGL,i
dVL= kLhLaL SCG
m− CLD = kshsasCL = Nsx,i
d ALs,i
dVL(7)
From this equation:
CL = h0 SCG
m D (8)
where
h0 =1
1 + ~khsas/kLhLaL!=
1/khsas
1/khsas + 1/kLhLaL=
1
P(9)
is a global effectiveness factor for all the local processesoccurring in the bioreactor differential volume. The globaleffectiveness factor has the meaning of the fraction of thetotal resistance of the removal process that corresponds tobiofilm phenomena. Substituting Eqs. (8) and (9) in Eq. (2)and rearranging:
Nabs
kLhL~CG/m!= 1 − h0 =
1
1 + ~kLhLaL/khsas!(10)
The left-hand side of Eq. (10) is the ratio of the localsubstrate absorption rate [driving force4 (CG /m) − CL] tothe maximum possible absorption rate [maximum drivingforce4 (CG /m) − 0]. This equation has two asymptotes, thefirst one being
kLhLaL
khsas→ 0 ⇒
Nabs
kLhLCG/m→ 1; h0 → 0 (11)
In these conditions the biofilm phenomena are much fasterthan those occurring at the gas–liquid interface, the latterprocesses control the rate of substrate removal, and the en-tire driving force is used in the absorption process. There-fore,
CL ≈ 0 (12)
The substrate absorption flux is then given by
Nabs 4 kLhLCG /m (13)
and theobservablerate of substrate removal per unit ofbioreactor volume is
(−r)obs 4 NabsaV 4 kLhLaVCG /m (14)
This asymptotic behavior is called the gas–liquid masstransfer regime.
The second asymptote of Eq. (10) occurs when
kLhLaL
khsas→ ` ⇒
Nabs
kLhLCG/m→ 0; h0 → 1 (15)
This signifies that in these conditions the gas–liquid masstransfer is much faster than the biofilm phenomena, and thatthe latter controls the substrate removal rate. In this case, theoverall driving force is used to transfer the solute from thebulk liquid to the biofilm surface and for the diffusion-bioreaction process. Consequently, the substrate concentra-tion in the liquid is close to its equilibrium value with thegas phase,
CL ≈ CG /m (16)
Then, the substrate absorption flux is
100 BIOTECHNOLOGY AND BIOENGINEERING, VOL. 63, NO. 1, APRIL 5, 1999
Nabs 4 khs(as/aL)(CG /m) (17)
and its observable removal rate per unit of bioreactor vol-ume is
~−r!obs= NabsaV = khs~aVas/aL!~CG/m! =khsas«LCG/m (18)
HereaV 4 «LaL, where«L is the fractional liquid hold-up.In this case, (−r)obs is proportional to the specific biofilmsurface area per unit of bioreactor volumeas«L. For a first-order bioreaction the observed removal rate is also propor-tional to the substrate concentration in the gas phase, as inthe gas–liquid mass transfer regime [Eq. (14)]. Thus, a lin-ear behavior of (−r)obswith respect to substrate gas concen-tration in a given experimental TBB study does not neces-sarily mean that the observation refers to biofilm phenom-ena. It may be noted that only under the assumption ofaL 4as the rate (−r)obs becomes independent of the fractionalliquid hold-up,
(−r)obs 4 NabsaV 4 khsaVCG/m (19)
Eq. (10) describes the transition between the two asymp-totic regimes, but it is then necessary to separate the ob-served global process resistance to obtain meaningful ex-perimental data. Unfortunately, much of the publishedremoval-rate data has been obtained without prior identifi-cation of the operating regime. It should also be pointed outthat, although the above analysis assumed a first-order bio-reaction, when a TBB operates in either of the asymptoticregimes, the corresponding value of the substrate concen-tration in the liquid is independent of any particular kinetics.
The lumping of the liquid-biofilm mass transfer step withthe biodegradation process inside the biofilm deserves com-ment. It has been proven (Petersen, 1965) that fluid–solidmass transfer limitations may be expected only when thereare strong diffusional effects in the solid. Because it is notpossible to know the extent of the diffusional limitationsinside the biofilm with a typical experimental TBB, thelumping considers two possibilities: (1) if the liquid–biofilmmass transfer resistance is important, it is taken into accountin the magnitude ofkhsas; (2) if it is not important, simplyhs 4 1, khsas 4 kBhas/aB, and the group of parametersrefers to the diffusion-bioreaction process inside the bio-film. In the latter case,as/aB has the meaning of volume ofbiofilm per unit volume of liquid.
A Trickle-Bed Bioreactor Model
In TBBs, physical factors add to the complexity of the bio-chemical phenomena occurring in the biofilm. Most experi-mental TBB studies lack the characterization of some of thephysical factors and thus, data may be expressing the lump-ing of several variables. An acceptable model must considerthe main phenomenological effects and make explicit theassumptions on which it is based. Development of models isnot necessarily in the direction of greater complexity or anincreasing number of parameters. Improvement may be di-
rected toward simplification and the reduction of the num-ber of adjustable constants (Aris, 1994).
The model to be developed here seeks to characterizeTBB behavior with parameters obtained only from experi-ment. The model is steady-state, one-species, one-dimensional, and heterogeneous. It contains equations de-scribing the behavior of the gas, liquid, and biofilm phases.An one-dimensional model is justified if uniform-flow dis-tribution and isothermal conditions are assumed.
Referring to Figure 2, considering both countercurrentand cocurrent flow, and assuming no gas-biofilm substratetransfer, the substrate mass balance indVG is
7(NGz|z − NGz|z+Dz)dSG − NGx,i dAGL,i 4 0 (20)
In the following, when the signs7 and ± appear, it shouldbe understood that the upper sign refers to countercurrentoperation, and the lower one to cocurrent operation. Forboth types of operationz 4 0 will be located at the liquidinlet. AssuminguG, aG, and«G as constants, it is possible toobtain the plug-flow gas equation.
5uG
dCG
dz− kGaG~CG − CG,i! = 0 (21)
Because the liquid carries suspended microorganisms,biodegradation also occurs in the liquid phase. However,due to the usually small suspended biomass concentration,this biodegradation may be neglected (Diks and Ottengraf,1991a). In the case where the liquid-phase biodegradation issubstantial, it may be accounted for by attributing it to thebiofilm. This means overestimating somewhat the biofilmactivity, but keeps the model manageable without loosingthe essential process features. Thus, the substrate mass bal-ance indVL is (see Fig. 2):
(NLz|z − NLz|z+Dz)dSL + NLx,idAGL,i − Nsx,i dALs,i 4 0 (22)
If uL, aL, as, and «L are taken as constants and completebiofilm wetting is assumed, the plug-flow liquid equation is
−uL
dCL
dz+ kLaL~CLi − CL! − ksas~CL − Cs! = 0 (23)
The substrate mass balance in the biofilm may be writtenin terms of a volumetric bioreaction rate as follows:
Nsx,idALs,i − hRBsdVB 4 0 (24)
The measurement or estimation of the parameters needed toevaluate the effectiveness factor is highly uncertain, as wasdiscussed by Heckmat and Vortmeyer (1994). Also, de Beeret al. (1994) measured considerable velocity fields insideheterogeneous biofilms, therefore questions arise as towhether mass transport inside them occurs only by Fickean-type diffusion. It is possible to state a number of assump-tions regarding the processes occurring inside the biofilm,but for overall TBB modeling purposes, available data doesnot permit a clear differentiation of even simplified phe-nomena. Additionally, in view of the uncertainties intro-duced by the lack of physical characterization of experi-
LOBO, REVAH, AND VIVEROS-GARCIA: AN ANALYSIS OF A TRICKLE BED BIOREACTOR 101
mental TBB systems, detailed biofilm modeling is unnec-essary. With the limitations stated above, Eq. (24) may bewritten as
Nsx,i =hRBs
aB(25)
Considering a first-order bioreaction with no oxygen limi-tation, the biofilm equation (25) reduces to
ks~CL − Cs! =kBh
aBCs = kCs (26)
Substitution of the biofilm equation (26) in the liquid equa-tion (23), elimination of interfacial concentrations in Eqs.(21) and (23) by means of Eqs. (3) and (6), and rearrange-ment yield:
uG
dCG
dz= 5kLhLaG SCG
m− CLD (27)
uL
dCL
dz= kLhLaL SCG
m− CLD − kLhLaL PCL (28)
whereP is defined by Eq. (9). Eqs. (27) and (28) are subjectto the conditions:
CG(z 4 Z) 4 CGZ countercurrent operation (29)
CG(z 4 0) 4 CG0 cocurrent operation (30)
CL(z 4 0) 4 CL(z 4 Z) liquid recirculation (31)
Model Eqs. (27) to (31) may be rendered dimensionlessin terms of liquid mass transfer units. The height of a trans-fer unit, and dimensionless concentrations are defined by
h =uL,sup
kLhLaV; g =
CG
CGmax; l =
mCL
CGmax(32)
where CGmax 4 CGZ for countercurrent operation andCGmax 4 CG0 for cocurrent. Substitution of the above defi-nitions in Eqs. (27) and (28) and rearrangement lead to
dg
dN= 5S QL
mQGD~g − l! = 5Q~g − l! (33)
dl
dN= g − Pl (34)
In these equations,N is the number of mass transfer unitsdefined asN 4 z/hand thusdN 4 dz/h, Qis the absorptionfactor, andP is the inverse of the global effectiveness factordefined by Eq. (9). The dimensionless boundary conditionsare
g~N = NT! = gNT= 1; countercurrent (35)
g~N = 0! = g0 = 1; cocurrent (36)
l~N = 0! = l0 = l~N = NT! = lNT; liquid recirculation (37)
NT is the total number of mass transfer units in the TBBdefined asNT 4 Z/h, whereZ is the total TBB height.
Bioreactor Model Solution and Simplifications
Equations (33) and (34) may be combined to produce asingle second-order differential equation in terms of thedimensionless substrate liquid concentration:
l9 + (P 7 Q)l8 7 Q(P − 1)l 4 0 (38)
subject to the conditions:
l0 4 lNT(39)
l80 4 g0 − Pl0 (40)
This last condition is obtained from Eq. (34). The roots ofthe characteristic equation of Eq. (38) are:
r1 = −P 7 Q
2+ FSP 7 Q
2 D2
5 Q~P − 1!G1/2
(41)
r2 = −P 7 Q
2− FSP 7 Q
2 D2
5 Q~P − 1!G1/2
(42)
Substrate axial-concentration profiles may be obtained fromthe solution of Eq. (38):
g
gmax=
~P + r1!exp~r1N! − rexp~P + r2!exp~r2N!
~P + r1! − rexp~P + r2!(43)
l
gmax=
exp~r1N! − rexp exp~r2N!
~P + r1! − rexp~P + r2!(44)
where
rexp =1 − exp~r1NT!
1 − exp~r2NT!(45)
andgmax is gNTfor countercurrent operation andg0 for co-
current. Once an exit gas concentration is fixed, Eq. (43)allows the calculation ofNT (or the TBB height). The cal-culation ofNT may be simplified considering that for manyTBBs of practical interest,P > Q; then, the rootr2 willalways be negative. Also, it may be expected that a TBBrequires a considerable packing height and thusNT > 1.Then, the term exp(r2NT) → 0. This approximation permitsthe use of Eq. (43) to obtain:
NT = −1
r1lnFP + r1
r1 − r2~1 − X!51 −
P + r2
r1 − r2G (46)
where the substrate fractional conversionX has been intro-duced
1 − X = S g0
gNTD51
; X , 1 (47)
It is now convenient to examine under which conditionsthe quasi-stationary approximation is valid. Using the sameassumptions leading to Eq. (46), a relation between the sub-strate dimensionless gas and liquid concentrations may beobtained from Eqs. (43) and (44) by eliminating the termexp(r2NT):
102 BIOTECHNOLOGY AND BIOENGINEERING, VOL. 63, NO. 1, APRIL 5, 1999
l
g=
1
P + r1(48)
This result contrasts with the one obtained from the quasi-stationary approximation that is indicated in Eq. (8). If thisequation is put in dimensionless form:
S l
gDq−s app.=
1
P= h0 (49)
Thus, from the last two equations, the quasi-stationary ap-proximation is valid whenP >> r1.
Many cases of practical interest involve substrates withlow solubility and thus, it is very likely thatQ << 1. On theother hand, by definition,P > 1. These values ofQ andPmake it possible to approximate the roots given by Eqs. (41)and (42) by:
r1 = 5Q~P − 1!
P(50)
r2 = −P (51)
The substitution of Eqs. (50) and (51) in (46) leads to thefollowing expression for the total number of transfer units:
NT 4P
Q~P − 1!lnS 1
1 − XD; X , 1 (52)
This result shows that under the restrictions imposed and forthe same conversion, the height of a TBB is the same wheth-er the operation is countercurrent or cocurrent. Diks andOttengraff (1991a, 1991b) report that their experimentaldata and the predictions of their model are independent ofthe contacting pattern of the flowing phases. They attributethis behavior to the effect of the recirculating liquid whichsmoothes the axial liquid concentration profiles. However,if the present model is solved with the equilibrium boundarycondition l(N 4 NT) 4 1 instead of that expressing theliquid recirculation [Eq. (39)] and the same assumptions aremade, Eq. (52) is still obtained. Therefore, the lack of sen-sitivity of TBB height with respect to gas- and liquid-contacting pattern may not be attributed to liquid recircula-
tion, but to particular combinations of the valuesP andQ,as will be discussed later.
RESULTS AND DISCUSSION
Data Analysis
For the purpose of testing the quality of a model, experi-ments should be directed to obtain the values of the param-eters which characterize the processes assumed by themodel to occur. Consequently, this section aims to deter-mine the values of the parameters governing gas–liquidmass transfer and biofilm phenomena. Also, it is necessaryto identify the substrate removal rate-controlling step fromsubstrate removal rate data. In what follows, this is illus-trated for a TBB used for CS2 removal.
Data obtained in the TBB and utilized to determine theobserved rate constant, calculated conversion, and calcu-latedP parameter are shown in Table I. In addition, data inTable II will be used for model validation. A value of thepartition coefficientm 4 0.7 was taken from Elliot (1989)for a salt solution of similar ionic strength as the solutionused in the recirculating liquid.
The analysis is based on a gas-phase pseudo-homogeneous model of the experimental TBB, with plugflow and an observed first-order removal rate. In the presentcase the operation is countercurrent, so the liquid enters atz 4 0 and the gas atz 4 Z. The substrate differential massbalance is:
uG
dCG
dz= ~−r!obs= kobsCG (53)
CG~z = Z! = CGZ (54)
where (−r)obs is the experimentally observed substrate re-moval rate. The intersticial gas velocityuG is related to thesubstrate inlet loadFGZ /Vr by
uG =~FGZ/Vr!Z
«GCGZ(55)
Table I. Data used to obtain the observed rate constant«Gkobs and to validate the TBB model.
FGZ/Vr 4 72 g/m3h; CGZ 4 0.480 g/m3
QG 4 12 m3/h; QL 4 0.6 m3/hFGZ/Vr 4 108 g/m3h; CGZ 4 0.480 g/m3
QG 4 18 m3/h; QL 4 0.6 m3/h
z /Z,Fraction
totallength
CG
g/m3CL
g/m3 P =CG
mCL X
z/Z,Fraction
totallength
CG
g/m3CL
g/m3 P =CG
mCL X
0.0 0.023 d, nqa >>1 0.952 0.0 0.071 d, nqa >>1 0.8530.25 0.049 d, nqa >>1 0.898 0.25 0.108 0.045 3.4 0.7760.50 0.089 d, nqa >>1 0.815 0.50 0.216 0.048 6.4 0.5480.75 0.132 0.065 2.9 0.725 0.75 0.321 0.073 6.3 0.3311.00 0.480 0.055 12.5 0 1.00 0.480 0.103 6.7 0
Holdingtank
d, nqa Holdingtank
d, nqa
aDetectable, not quantifiable.
LOBO, REVAH, AND VIVEROS-GARCIA: AN ANALYSIS OF A TRICKLE BED BIOREACTOR 103
Integration of Eq. (53) yields
X = 1 −CG
CGZ= 1 − expF−
«GkobsCGZ
FGZ/VrS1 −
z
ZDG (56)
where X is the substrate fractional conversion. The term«Gkobsmay be obtained by an integral analysis (Levenspiel,1968) of inlet–outlet concentration measurements evaluat-ing the conversion at the gas outlet:
−ln~1 − X|z=0! = «Gkobs
CGZ
FGZ/Vr; X , 1 (57)
The overall removal process resistance is reflected in theterm «Gkobs, in which the resistances to gas–liquid masstransfer and to biofilm phenomena are lumped. If it is notpossible to ensure that the TBB operates in the biofilmphenomena controlling regime [Eq. (16)], or in the gas-liquid mass transfer regime [Eq. (12)], the overall removalprocess resistance must be uncoupled applying the quasi-stationary approximation:
«GkobsCGdVr = kLhL~CG/m − CL!dAGL,i = ks~CL − Cs)dALs,i
= kCsdALs,i (58)
and
1
kas=
«L
m«Gkobs−
1
kLhLaL−
1
ksas(59)
The fractional liquid hold-up,«L, may be estimated or ex-perimentally determined. Ifksas cannot be properly esti-mated, it may be lumped with the diffusion-bioreaction pro-cess inside the biofilm
1
kas+
1
ksas=
1
khsas=
«L
m«Gkobs−
1
kLhLaL(60)
From Eqs. (8) and (9):
CL =CG/m
1 +~khsas/kLhLaL!=
CG/m
P(61)
The two groups of unknown parameterskhsas andkLhLaL
may be obtained by combining Eqs. (60) and (61). It is now
evident that the measurement of substrate gasand liquidconcentrations are necessary to uncouple the overall processresistance and to determine the operating regime of the ex-perimental TBB.
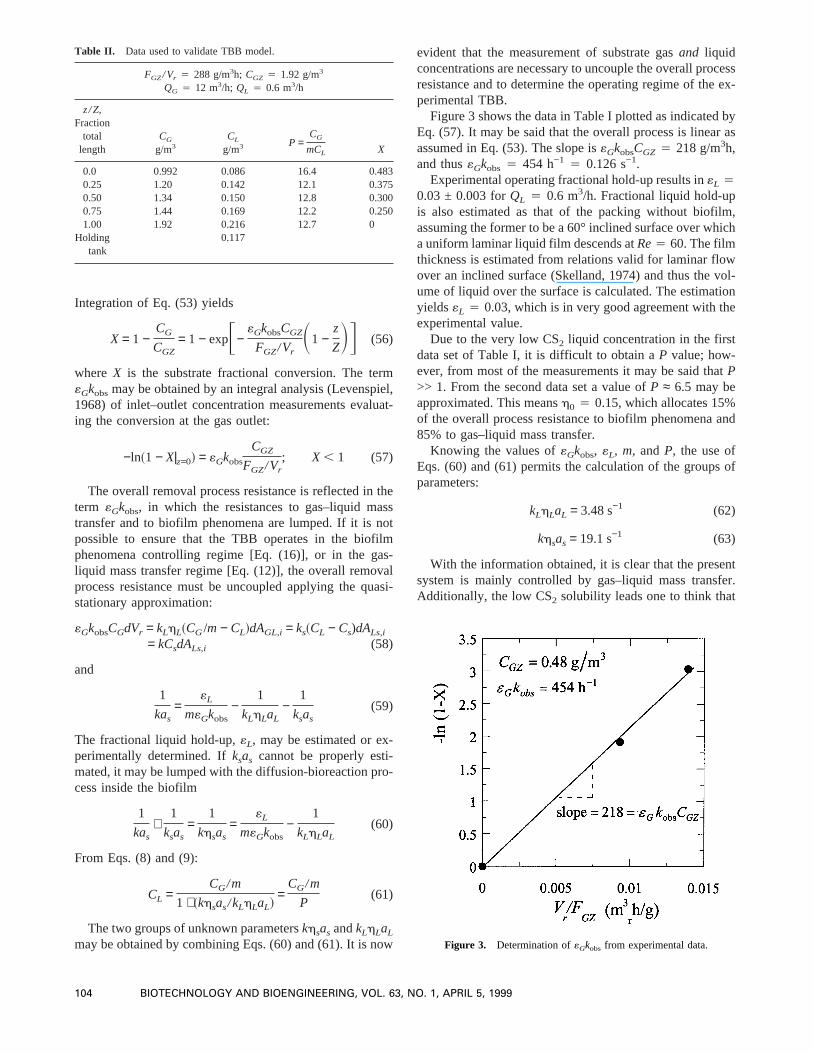
Figure 3 shows the data in Table I plotted as indicated byEq. (57). It may be said that the overall process is linear asassumed in Eq. (53). The slope is«GkobsCGZ 4 218 g/m3h,and thus«Gkobs 4 454 h−1 4 0.126 s−1.
Experimental operating fractional hold-up results in«L 40.03 ± 0.003 forQL 4 0.6 m3/h. Fractional liquid hold-upis also estimated as that of the packing without biofilm,assuming the former to be a 60° inclined surface over whicha uniform laminar liquid film descends atRe4 60. The filmthickness is estimated from relations valid for laminar flowover an inclined surface (Skelland, 1974) and thus the vol-ume of liquid over the surface is calculated. The estimationyields«L 4 0.03, which is in very good agreement with theexperimental value.
Due to the very low CS2 liquid concentration in the firstdata set of Table I, it is difficult to obtain aP value; how-ever, from most of the measurements it may be said thatP>> 1. From the second data set a value ofP ≈ 6.5 may beapproximated. This meansh0 4 0.15, which allocates 15%of the overall process resistance to biofilm phenomena and85% to gas–liquid mass transfer.
Knowing the values of«Gkobs, «L, m, and P, the use ofEqs. (60) and (61) permits the calculation of the groups ofparameters:
kLhLaL = 3.48 s−1 (62)
khsas = 19.1 s−1 (63)
With the information obtained, it is clear that the presentsystem is mainly controlled by gas–liquid mass transfer.Additionally, the low CS2 solubility leads one to think that
Table II. Data used to validate TBB model.
FGZ/Vr 4 288 g/m3h; CGZ 4 1.92 g/m3
QG 4 12 m3/h; QL 4 0.6 m3/h
z /Z,Fraction
totallength
CG
g/m3CL
g/m3 P =CG
mCL X
0.0 0.992 0.086 16.4 0.4830.25 1.20 0.142 12.1 0.3750.50 1.34 0.150 12.8 0.3000.75 1.44 0.169 12.2 0.2501.00 1.92 0.216 12.7 0
Holdingtank
0.117
Figure 3. Determination of«Gkobs from experimental data.
104 BIOTECHNOLOGY AND BIOENGINEERING, VOL. 63, NO. 1, APRIL 5, 1999
the gas-phase resistance may be negligible (hL → 1) andthat main resistance is located in the liquid phase. On theother hand, it was also possible to obtain the magnitude ofthe biofilm phenomena rate constant.
The analysis may also be applied to a biofilm phenomenarate-controlled process. It is possible to estimate the rateconstant for the biodegradation process by estimating theliquid–biofilm mass transfer coefficient and the effective-ness factor for the bioreaction. The estimation of the latteradditionally needs the estimation of the biofilm thicknessand the substrate effective diffusivity. These estimates, al-though commonly used as detailed in current literature, areuncertain and may mask the true nature of the processes.Instead, the approach used in the present analysis avoidsseveral sources of uncertainty at the cost of distributed in-formation. In the authors’ view, this is the best that can bedone with the information obtained in a typical experimen-tal TBB.
Local Processes
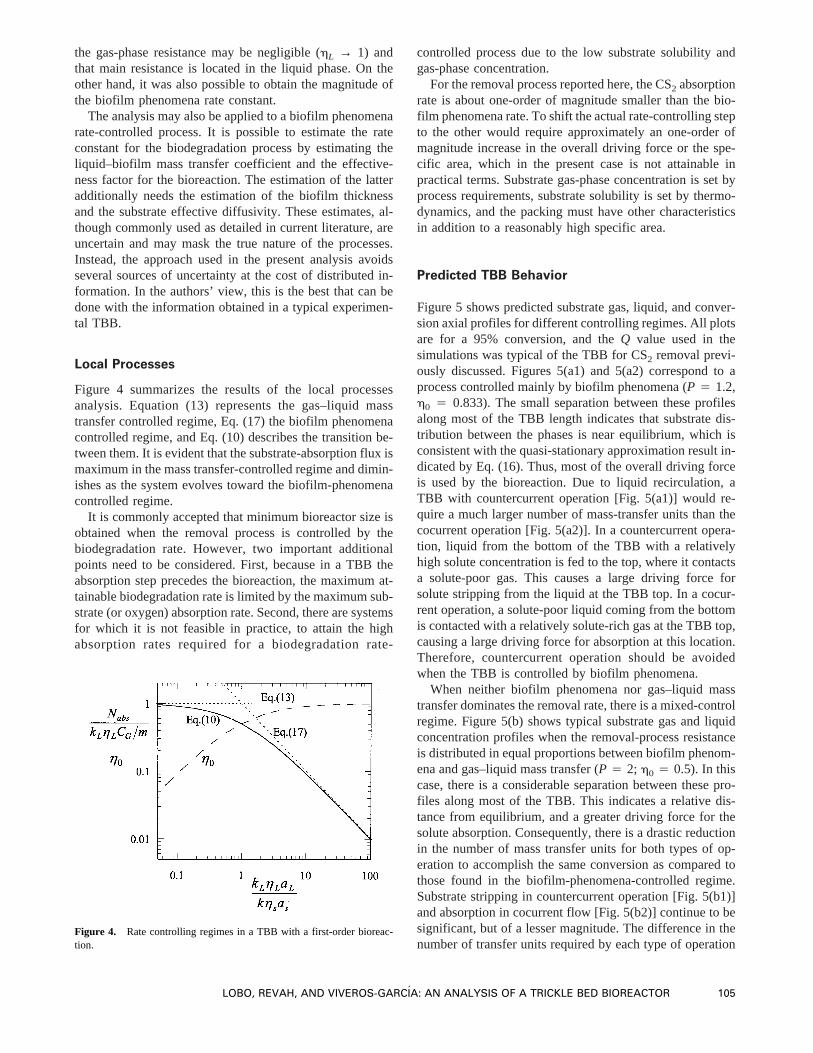
Figure 4 summarizes the results of the local processesanalysis. Equation (13) represents the gas–liquid masstransfer controlled regime, Eq. (17) the biofilm phenomenacontrolled regime, and Eq. (10) describes the transition be-tween them. It is evident that the substrate-absorption flux ismaximum in the mass transfer-controlled regime and dimin-ishes as the system evolves toward the biofilm-phenomenacontrolled regime.
It is commonly accepted that minimum bioreactor size isobtained when the removal process is controlled by thebiodegradation rate. However, two important additionalpoints need to be considered. First, because in a TBB theabsorption step precedes the bioreaction, the maximum at-tainable biodegradation rate is limited by the maximum sub-strate (or oxygen) absorption rate. Second, there are systemsfor which it is not feasible in practice, to attain the highabsorption rates required for a biodegradation rate-
controlled process due to the low substrate solubility andgas-phase concentration.
For the removal process reported here, the CS2 absorptionrate is about one-order of magnitude smaller than the bio-film phenomena rate. To shift the actual rate-controlling stepto the other would require approximately an one-order ofmagnitude increase in the overall driving force or the spe-cific area, which in the present case is not attainable inpractical terms. Substrate gas-phase concentration is set byprocess requirements, substrate solubility is set by thermo-dynamics, and the packing must have other characteristicsin addition to a reasonably high specific area.
Predicted TBB Behavior
Figure 5 shows predicted substrate gas, liquid, and conver-sion axial profiles for different controlling regimes. All plotsare for a 95% conversion, and theQ value used in thesimulations was typical of the TBB for CS2 removal previ-ously discussed. Figures 5(a1) and 5(a2) correspond to aprocess controlled mainly by biofilm phenomena (P 4 1.2,h0 4 0.833). The small separation between these profilesalong most of the TBB length indicates that substrate dis-tribution between the phases is near equilibrium, which isconsistent with the quasi-stationary approximation result in-dicated by Eq. (16). Thus, most of the overall driving forceis used by the bioreaction. Due to liquid recirculation, aTBB with countercurrent operation [Fig. 5(a1)] would re-quire a much larger number of mass-transfer units than thecocurrent operation [Fig. 5(a2)]. In a countercurrent opera-tion, liquid from the bottom of the TBB with a relativelyhigh solute concentration is fed to the top, where it contactsa solute-poor gas. This causes a large driving force forsolute stripping from the liquid at the TBB top. In a cocur-rent operation, a solute-poor liquid coming from the bottomis contacted with a relatively solute-rich gas at the TBB top,causing a large driving force for absorption at this location.Therefore, countercurrent operation should be avoidedwhen the TBB is controlled by biofilm phenomena.
When neither biofilm phenomena nor gas–liquid masstransfer dominates the removal rate, there is a mixed-controlregime. Figure 5(b) shows typical substrate gas and liquidconcentration profiles when the removal-process resistanceis distributed in equal proportions between biofilm phenom-ena and gas–liquid mass transfer (P 4 2; h0 4 0.5). In thiscase, there is a considerable separation between these pro-files along most of the TBB. This indicates a relative dis-tance from equilibrium, and a greater driving force for thesolute absorption. Consequently, there is a drastic reductionin the number of mass transfer units for both types of op-eration to accomplish the same conversion as compared tothose found in the biofilm-phenomena-controlled regime.Substrate stripping in countercurrent operation [Fig. 5(b1)]and absorption in cocurrent flow [Fig. 5(b2)] continue to besignificant, but of a lesser magnitude. The difference in thenumber of transfer units required by each type of operation
Figure 4. Rate controlling regimes in a TBB with a first-order bioreac-tion.
LOBO, REVAH, AND VIVEROS-GARCIA: AN ANALYSIS OF A TRICKLE BED BIOREACTOR 105
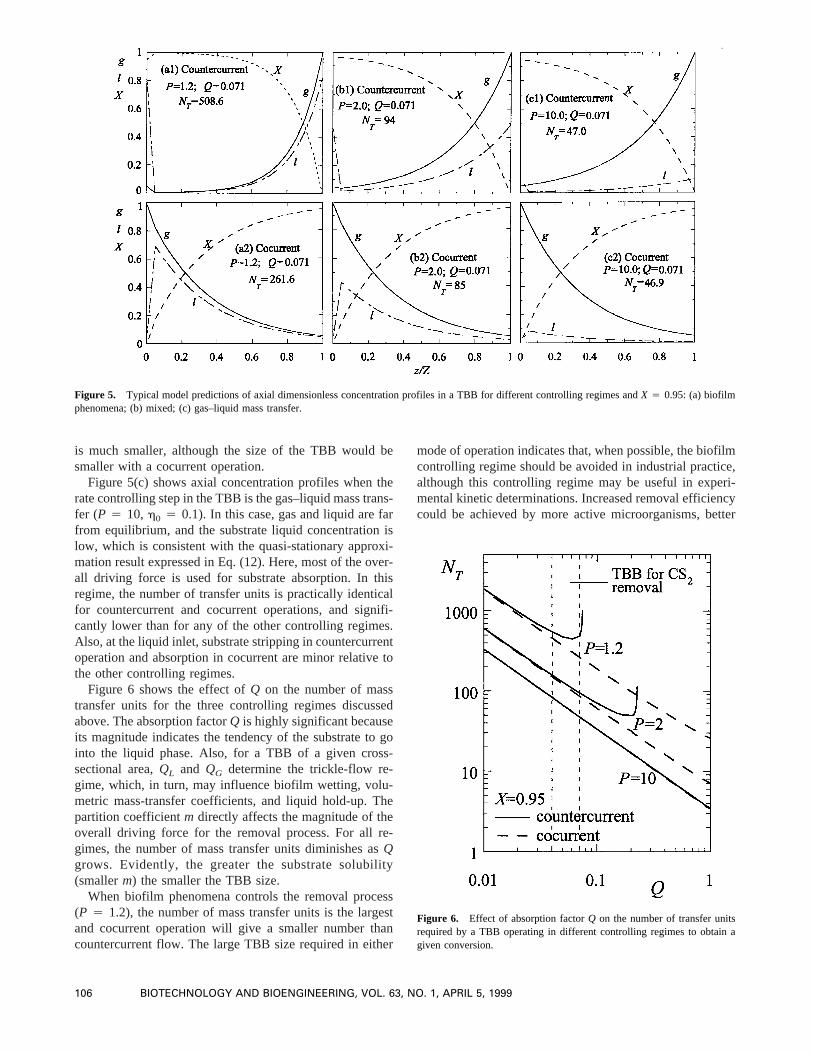
is much smaller, although the size of the TBB would besmaller with a cocurrent operation.
Figure 5(c) shows axial concentration profiles when therate controlling step in the TBB is the gas–liquid mass trans-fer (P 4 10, h0 4 0.1). In this case, gas and liquid are farfrom equilibrium, and the substrate liquid concentration islow, which is consistent with the quasi-stationary approxi-mation result expressed in Eq. (12). Here, most of the over-all driving force is used for substrate absorption. In thisregime, the number of transfer units is practically identicalfor countercurrent and cocurrent operations, and signifi-cantly lower than for any of the other controlling regimes.Also, at the liquid inlet, substrate stripping in countercurrentoperation and absorption in cocurrent are minor relative tothe other controlling regimes.
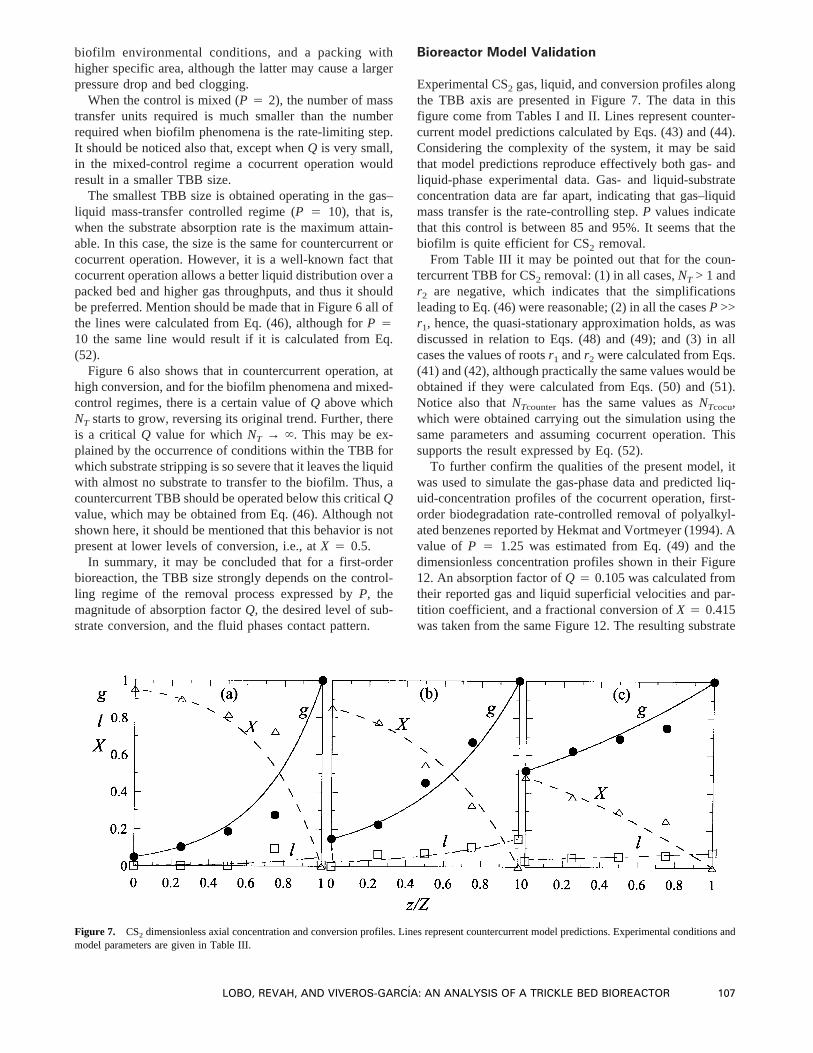
Figure 6 shows the effect ofQ on the number of masstransfer units for the three controlling regimes discussedabove. The absorption factorQ is highly significant becauseits magnitude indicates the tendency of the substrate to gointo the liquid phase. Also, for a TBB of a given cross-sectional area,QL and QG determine the trickle-flow re-gime, which, in turn, may influence biofilm wetting, volu-metric mass-transfer coefficients, and liquid hold-up. Thepartition coefficientm directly affects the magnitude of theoverall driving force for the removal process. For all re-gimes, the number of mass transfer units diminishes asQgrows. Evidently, the greater the substrate solubility(smallerm) the smaller the TBB size.
When biofilm phenomena controls the removal process(P 4 1.2), the number of mass transfer units is the largestand cocurrent operation will give a smaller number thancountercurrent flow. The large TBB size required in either
mode of operation indicates that, when possible, the biofilmcontrolling regime should be avoided in industrial practice,although this controlling regime may be useful in experi-mental kinetic determinations. Increased removal efficiencycould be achieved by more active microorganisms, better
Figure 6. Effect of absorption factorQ on the number of transfer unitsrequired by a TBB operating in different controlling regimes to obtain agiven conversion.
Figure 5. Typical model predictions of axial dimensionless concentration profiles in a TBB for different controlling regimes andX 4 0.95: (a) biofilmphenomena; (b) mixed; (c) gas–liquid mass transfer.
106 BIOTECHNOLOGY AND BIOENGINEERING, VOL. 63, NO. 1, APRIL 5, 1999
biofilm environmental conditions, and a packing withhigher specific area, although the latter may cause a largerpressure drop and bed clogging.
When the control is mixed (P 4 2), the number of masstransfer units required is much smaller than the numberrequired when biofilm phenomena is the rate-limiting step.It should be noticed also that, except whenQ is very small,in the mixed-control regime a cocurrent operation wouldresult in a smaller TBB size.
The smallest TBB size is obtained operating in the gas–liquid mass-transfer controlled regime (P 4 10), that is,when the substrate absorption rate is the maximum attain-able. In this case, the size is the same for countercurrent orcocurrent operation. However, it is a well-known fact thatcocurrent operation allows a better liquid distribution over apacked bed and higher gas throughputs, and thus it shouldbe preferred. Mention should be made that in Figure 6 all ofthe lines were calculated from Eq. (46), although forP 410 the same line would result if it is calculated from Eq.(52).
Figure 6 also shows that in countercurrent operation, athigh conversion, and for the biofilm phenomena and mixed-control regimes, there is a certain value ofQ above whichNT starts to grow, reversing its original trend. Further, thereis a critical Q value for whichNT → `. This may be ex-plained by the occurrence of conditions within the TBB forwhich substrate stripping is so severe that it leaves the liquidwith almost no substrate to transfer to the biofilm. Thus, acountercurrent TBB should be operated below this criticalQvalue, which may be obtained from Eq. (46). Although notshown here, it should be mentioned that this behavior is notpresent at lower levels of conversion, i.e., atX 4 0.5.
In summary, it may be concluded that for a first-orderbioreaction, the TBB size strongly depends on the control-ling regime of the removal process expressed byP, themagnitude of absorption factorQ, the desired level of sub-strate conversion, and the fluid phases contact pattern.
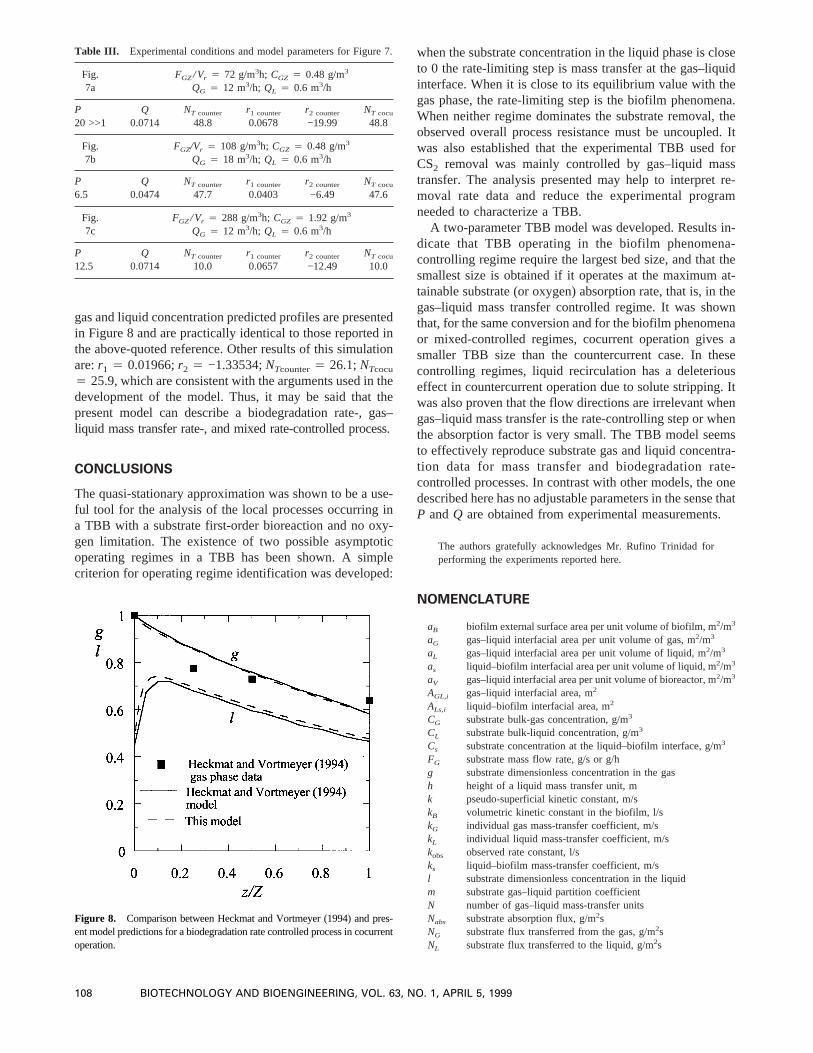
Bioreactor Model Validation
Experimental CS2 gas, liquid, and conversion profiles alongthe TBB axis are presented in Figure 7. The data in thisfigure come from Tables I and II. Lines represent counter-current model predictions calculated by Eqs. (43) and (44).Considering the complexity of the system, it may be saidthat model predictions reproduce effectively both gas- andliquid-phase experimental data. Gas- and liquid-substrateconcentration data are far apart, indicating that gas–liquidmass transfer is the rate-controlling step.P values indicatethat this control is between 85 and 95%. It seems that thebiofilm is quite efficient for CS2 removal.
From Table III it may be pointed out that for the coun-tercurrent TBB for CS2 removal: (1) in all cases,NT > 1 andr2 are negative, which indicates that the simplificationsleading to Eq. (46) were reasonable; (2) in all the casesP >>r1, hence, the quasi-stationary approximation holds, as wasdiscussed in relation to Eqs. (48) and (49); and (3) in allcases the values of rootsr1 andr2 were calculated from Eqs.(41) and (42), although practically the same values would beobtained if they were calculated from Eqs. (50) and (51).Notice also thatNTcounter has the same values asNTcocu,which were obtained carrying out the simulation using thesame parameters and assuming cocurrent operation. Thissupports the result expressed by Eq. (52).
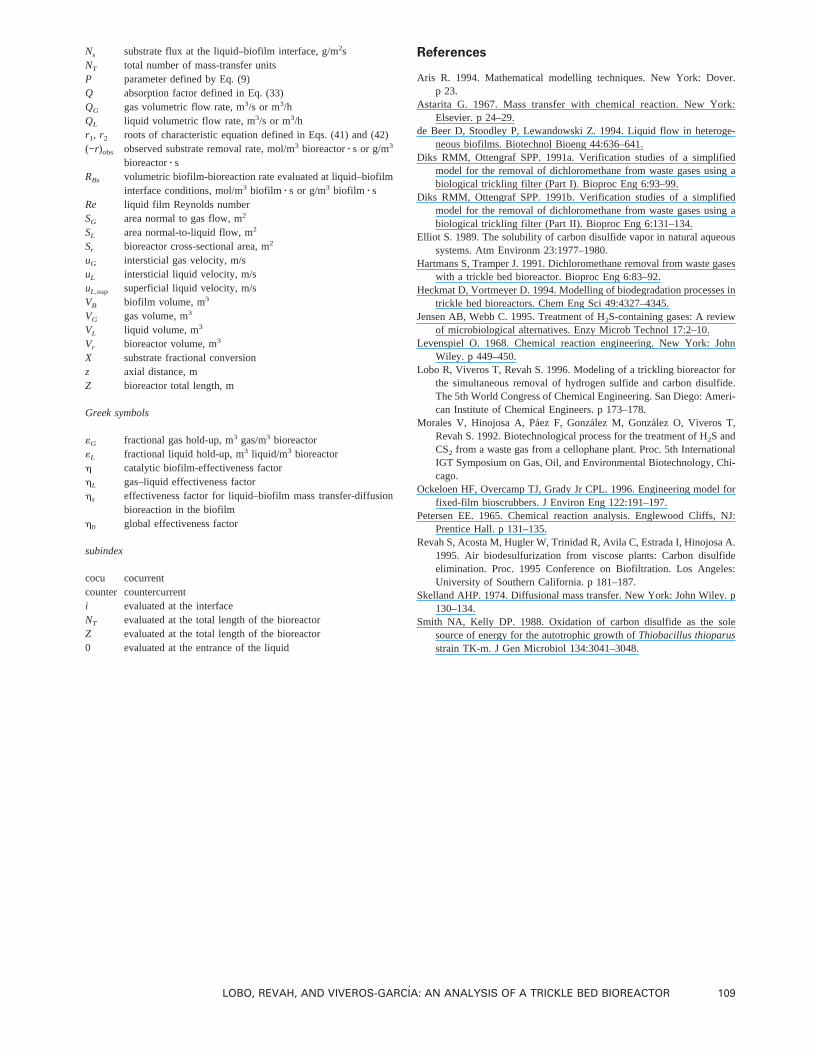
To further confirm the qualities of the present model, itwas used to simulate the gas-phase data and predicted liq-uid-concentration profiles of the cocurrent operation, first-order biodegradation rate-controlled removal of polyalkyl-ated benzenes reported by Hekmat and Vortmeyer (1994). Avalue of P 4 1.25 was estimated from Eq. (49) and thedimensionless concentration profiles shown in their Figure12. An absorption factor ofQ 4 0.105 was calculated fromtheir reported gas and liquid superficial velocities and par-tition coefficient, and a fractional conversion ofX 4 0.415was taken from the same Figure 12. The resulting substrate
Figure 7. CS2 dimensionless axial concentration and conversion profiles. Lines represent countercurrent model predictions. Experimental conditions andmodel parameters are given in Table III.
LOBO, REVAH, AND VIVEROS-GARCIA: AN ANALYSIS OF A TRICKLE BED BIOREACTOR 107
gas and liquid concentration predicted profiles are presentedin Figure 8 and are practically identical to those reported inthe above-quoted reference. Other results of this simulationare:r1 4 0.01966;r2 4 −1.33534;NTcounter4 26.1;NTcocu
4 25.9, which are consistent with the arguments used in thedevelopment of the model. Thus, it may be said that thepresent model can describe a biodegradation rate-, gas–liquid mass transfer rate-, and mixed rate-controlled process.
CONCLUSIONS
The quasi-stationary approximation was shown to be a use-ful tool for the analysis of the local processes occurring ina TBB with a substrate first-order bioreaction and no oxy-gen limitation. The existence of two possible asymptoticoperating regimes in a TBB has been shown. A simplecriterion for operating regime identification was developed:
when the substrate concentration in the liquid phase is closeto 0 the rate-limiting step is mass transfer at the gas–liquidinterface. When it is close to its equilibrium value with thegas phase, the rate-limiting step is the biofilm phenomena.When neither regime dominates the substrate removal, theobserved overall process resistance must be uncoupled. Itwas also established that the experimental TBB used forCS2 removal was mainly controlled by gas–liquid masstransfer. The analysis presented may help to interpret re-moval rate data and reduce the experimental programneeded to characterize a TBB.
A two-parameter TBB model was developed. Results in-dicate that TBB operating in the biofilm phenomena-controlling regime require the largest bed size, and that thesmallest size is obtained if it operates at the maximum at-tainable substrate (or oxygen) absorption rate, that is, in thegas–liquid mass transfer controlled regime. It was shownthat, for the same conversion and for the biofilm phenomenaor mixed-controlled regimes, cocurrent operation gives asmaller TBB size than the countercurrent case. In thesecontrolling regimes, liquid recirculation has a deleteriouseffect in countercurrent operation due to solute stripping. Itwas also proven that the flow directions are irrelevant whengas–liquid mass transfer is the rate-controlling step or whenthe absorption factor is very small. The TBB model seemsto effectively reproduce substrate gas and liquid concentra-tion data for mass transfer and biodegradation rate-controlled processes. In contrast with other models, the onedescribed here has no adjustable parameters in the sense thatP andQ are obtained from experimental measurements.
The authors gratefully acknowledges Mr. Rufino Trinidad forperforming the experiments reported here.
NOMENCLATURE
aB biofilm external surface area per unit volume of biofilm, m2/m3
aG gas–liquid interfacial area per unit volume of gas, m2/m3
aL gas–liquid interfacial area per unit volume of liquid, m2/m3
as liquid–biofilm interfacial area per unit volume of liquid, m2/m3
aV gas–liquid interfacial area per unit volume of bioreactor, m2/m3
AGL,i gas–liquid interfacial area, m2
ALs,i liquid–biofilm interfacial area, m2
CG substrate bulk-gas concentration, g/m3
CL substrate bulk-liquid concentration, g/m3
Cs substrate concentration at the liquid–biofilm interface, g/m3
FG substrate mass flow rate, g/s or g/hg substrate dimensionless concentration in the gash height of a liquid mass transfer unit, mk pseudo-superficial kinetic constant, m/skB volumetric kinetic constant in the biofilm, l/skG individual gas mass-transfer coefficient, m/skL individual liquid mass-transfer coefficient, m/skobs observed rate constant, l/sks liquid–biofilm mass-transfer coefficient, m/sl substrate dimensionless concentration in the liquidm substrate gas–liquid partition coefficientN number of gas–liquid mass-transfer unitsNabs substrate absorption flux, g/m2sNG substrate flux transferred from the gas, g/m2sNL substrate flux transferred to the liquid, g/m2s
Table III. Experimental conditions and model parameters for Figure 7.
Fig.7a
FGZ/Vr 4 72 g/m3h; CGZ 4 0.48 g/m3
QG 4 12 m3/h; QL 4 0.6 m3/h
P Q NT counter r1 counter r2 counter NT cocu
20 >>1 0.0714 48.8 0.0678 −19.99 48.8
Fig.7b
FGZ/Vr 4 108 g/m3h; CGZ 4 0.48 g/m3
QG 4 18 m3/h; QL 4 0.6 m3/h
P Q NT counter r1 counter r2 counter NT cocu
6.5 0.0474 47.7 0.0403 −6.49 47.6
Fig.7c
FGZ/Vr 4 288 g/m3h; CGZ 4 1.92 g/m3
QG 4 12 m3/h; QL 4 0.6 m3/h
P Q NT counter r1 counter r2 counter NT cocu
12.5 0.0714 10.0 0.0657 −12.49 10.0
Figure 8. Comparison between Heckmat and Vortmeyer (1994) and pres-ent model predictions for a biodegradation rate controlled process in cocurrentoperation.
108 BIOTECHNOLOGY AND BIOENGINEERING, VOL. 63, NO. 1, APRIL 5, 1999
Ns substrate flux at the liquid–biofilm interface, g/m2sNT total number of mass-transfer unitsP parameter defined by Eq. (9)Q absorption factor defined in Eq. (33)QG gas volumetric flow rate, m3/s or m3/hQL liquid volumetric flow rate, m3/s or m3/hr1, r2 roots of characteristic equation defined in Eqs. (41) and (42)(−r)obs observed substrate removal rate, mol/m3 bioreactorz s or g/m3
bioreactorz sRBs volumetric biofilm-bioreaction rate evaluated at liquid–biofilm
interface conditions, mol/m3 biofilm z s or g/m3 biofilm z sRe liquid film Reynolds numberSG area normal to gas flow, m2
SL area normal-to-liquid flow, m2
Sr bioreactor cross-sectional area, m2
uG intersticial gas velocity, m/suL intersticial liquid velocity, m/suL,sup superficial liquid velocity, m/sVB biofilm volume, m3
VG gas volume, m3
VL liquid volume, m3
Vr bioreactor volume, m3
X substrate fractional conversionz axial distance, mZ bioreactor total length, m
Greek symbols
«G fractional gas hold-up, m3 gas/m3 bioreactor«L fractional liquid hold-up, m3 liquid/m3 bioreactorh catalytic biofilm-effectiveness factorhL gas–liquid effectiveness factorhs effectiveness factor for liquid–biofilm mass transfer-diffusion
bioreaction in the biofilmh0 global effectiveness factor
subindex
cocu cocurrentcounter countercurrenti evaluated at the interfaceNT evaluated at the total length of the bioreactorZ evaluated at the total length of the bioreactor0 evaluated at the entrance of the liquid
References
Aris R. 1994. Mathematical modelling techniques. New York: Dover.p 23.
Astarita G. 1967. Mass transfer with chemical reaction. New York:Elsevier. p 24–29.
de Beer D, Stoodley P, Lewandowski Z. 1994. Liquid flow in heteroge-neous biofilms. Biotechnol Bioeng 44:636–641.
Diks RMM, Ottengraf SPP. 1991a. Verification studies of a simplifiedmodel for the removal of dichloromethane from waste gases using abiological trickling filter (Part I). Bioproc Eng 6:93–99.
Diks RMM, Ottengraf SPP. 1991b. Verification studies of a simplifiedmodel for the removal of dichloromethane from waste gases using abiological trickling filter (Part II). Bioproc Eng 6:131–134.
Elliot S. 1989. The solubility of carbon disulfide vapor in natural aqueoussystems. Atm Environm 23:1977–1980.
Hartmans S, Tramper J. 1991. Dichloromethane removal from waste gaseswith a trickle bed bioreactor. Bioproc Eng 6:83–92.
Heckmat D, Vortmeyer D. 1994. Modelling of biodegradation processes intrickle bed bioreactors. Chem Eng Sci 49:4327–4345.
Jensen AB, Webb C. 1995. Treatment of H2S-containing gases: A reviewof microbiological alternatives. Enzy Microb Technol 17:2–10.
Levenspiel O. 1968. Chemical reaction engineering. New York: JohnWiley. p 449–450.
Lobo R, Viveros T, Revah S. 1996. Modeling of a trickling bioreactor forthe simultaneous removal of hydrogen sulfide and carbon disulfide.The 5th World Congress of Chemical Engineering. San Diego: Ameri-can Institute of Chemical Engineers. p 173–178.
Morales V, Hinojosa A, Pa´ez F, Gonza´lez M, Gonza´lez O, Viveros T,Revah S. 1992. Biotechnological process for the treatment of H2S andCS2 from a waste gas from a cellophane plant. Proc. 5th InternationalIGT Symposium on Gas, Oil, and Environmental Biotechnology, Chi-cago.
Ockeloen HF, Overcamp TJ, Grady Jr CPL. 1996. Engineering model forfixed-film bioscrubbers. J Environ Eng 122:191–197.
Petersen EE. 1965. Chemical reaction analysis. Englewood Cliffs, NJ:Prentice Hall. p 131–135.
Revah S, Acosta M, Hugler W, Trinidad R, Avila C, Estrada I, Hinojosa A.1995. Air biodesulfurization from viscose plants: Carbon disulfideelimination. Proc. 1995 Conference on Biofiltration. Los Angeles:University of Southern California. p 181–187.
Skelland AHP. 1974. Diffusional mass transfer. New York: John Wiley. p130–134.
Smith NA, Kelly DP. 1988. Oxidation of carbon disulfide as the solesource of energy for the autotrophic growth ofThiobacillus thioparusstrain TK-m. J Gen Microbiol 134:3041–3048.
LOBO, REVAH, AND VIVEROS-GARCIA: AN ANALYSIS OF A TRICKLE BED BIOREACTOR 109


