Embed Size (px)
Citation preview

lable at ScienceDirect
Journal of Structural Geology 31 (2009) 842–852
Contents lists avai
Journal of Structural Geology
journal homepage: www.elsevier .com/locate/ jsg
An approach to folding kinematics from the analysis of folded oblique surfacesq
N.C. Bobillo-Ares a, F. Bastida b, J. Aller b,*, R.J. Lisle c
a Departamento de Matematicas, Universidad de Oviedo, 33007 Oviedo, Spainb Departamento de Geologıa, Universidad de Oviedo, Jesus Arias de Velasco s/n, 33005 Oviedo, Spainc School of Earth and Ocean Sciences, Cardiff University, Cardiff CF10 3YE, UK
a r t i c l e i n f o
Article history:Received 6 June 2008Received in revised form19 March 2009Accepted 10 June 2009Available online 18 June 2009
Keywords:Folding kinematicsOblique surfacesStrainComputer modelling
q The program code (‘‘FoldModelerObliSurf’’) can bpage: http://www.geol.uniovi.es/Investigacion/OFAG/F
* Corresponding author. Tel.: þ34 98 510 3119; faxE-mail address: [email protected] (J. Aller).
0191-8141/$ – see front matter � 2009 Elsevier Ltd.doi:10.1016/j.jsg.2009.06.006
a b s t r a c t
Two-dimensional analysis of folded surfaces oblique to the mechanical layering can shed light on thekinematic mechanisms that operated during the development of folds. A new version of the program‘FoldModeler’, developed in the MATHEMATICA� environment, is used to obtain the deformed configurationof an initial pattern of oblique surfaces deformed by any combination of the most common kinematicfolding mechanisms: flexural flow, tangential longitudinal strain, with or without area change andheterogeneous simple shear. The layer can also undergo any form of homogeneous strain at any momentof the folding process. The outputs of the program provide complete information about the straindistribution in the folded layer that includes graphs of the angle between the oblique surfaces asa function of the inclination of the layering through the fold. These graphs can be very useful todiscriminate between the mechanisms that operate in the development of natural folds, and they havebeen obtained and discussed for the most common combinations of strain patterns. The program isapplied to obtain theoretical folds that give a good fit of some natural examples of folded obliquesurfaces.
� 2009 Elsevier Ltd. All rights reserved.
1. Introduction
Folds are structures consisting of a curvature of a set ofgeological surfaces. In some instances we observe two sets ofmutually oblique surfaces affected by folding. Examples of this arefound in folded angular unconformities, in folded strata showingcross bedding and in cases where bedding is obliquely cut by sets ofcleavage surfaces formed in an earlier folding event. Commonly, theangle between the two sets (obliquity angle) was approximatelyconstant before folding over a distance greater than fold size, butgeological experience shows that after folding this angle changesby varying amounts due to the heterogeneous strain associatedwith folding. The measurements of the obliquity angle in a fold canbe plotted graphically as a function of the bedding inclination. Theform of this function obviously depends on the folding strainpattern, i.e., on the kinematic folding mechanism.
The analysis of folding of oblique surfaces in rocks serves twomain purposes: a) to contribute to the knowledge of strain patternsin folded layers; and b) to decipher the orientation of the oblique
e found in the following weboldteam.html.
: þ34 98 510 3103.
All rights reserved.
surfaces in the configuration prior to folding. The former aim can beachieved in cylindrical folds by analysis of the two-dimensionalstrain on the profile of the folded layers; however, the achievementof the latter aim requires a three-dimensional analysis of the strain,so that the obliquity angles must be considered as dihedral angles.
The study of folded oblique surfaces has received little attention,and only a few papers have considered this subject (Ramsay, 1961,1963, 1967, pp. 491–417; Whitten, 1966, pp. 522–532; Coward,1973; Williams, 1979; Ramsay and Huber, 1987, pp. 476–477 and484–489; Ramsay and Lisle, 2000, pp. 968–972). Ramsay (1961,1967) obtained curves of the obliquity angle versus inclination forfolds formed by several mechanisms (flexural slip – or flexural flow,flattening and heterogeneous simple shear through the layers).Ramsay and Lisle (2000) made a computer program (DIHEDAN-GLE.BAS) that gives the modification of the dihedral angle betweentwo planar features as a result of a heterogeneous strain field. Withthis program the above authors modelled the variation of thedihedral angle as a result of folding by heterogeneous simple shearor heterogeneous simple shear plus flattening.
The present paper is concerned with the application of theanalysis of oblique surfaces to the study of folding kinematics. Wedevelop a generalised two-dimensional method to obtain theo-retical curves that show the variation of the obliquity angle againstbedding inclination for a general folding process in which severalbuckling mechanisms and other types of strain can be involved. The

Fig. 1. Sign convention for the obliquity angle d and the inclination a.
N.C. Bobillo-Ares et al. / Journal of Structural Geology 31 (2009) 842–852 843
theoretical analysis is incorporated in a new version of the program‘FoldModeler’ (Bobillo-Ares et al., 2004), which allows the model-ling of folds by any simultaneous or successive superposition offlexural flow, tangential longitudinal strain with or without areachange, heterogeneous simple shear parallel to the axial trace andany type of homogeneous strain. The program allows the pattern ofobliquity angle variation to be determined for folds with differentlayer geometries (from similar to class 1A; Ramsay, 1967, pp 365–367), surface geometries (from chevron to circular), attitudes (fromupright to recumbent) and asymmetries. ‘FoldModeler’ also calcu-lates a parameter (k) that gives a measure of the quality of the fitbetween the theoretical curves obtained by the program and thenatural data. The parameter k is the root mean square error (RMSE)obtained from the vertical distances between the points corre-sponding to measurements on the natural fold and the theoreticalcurve (the coefficient increases with the misfit). Natural points outof the interval of definition of the theoretical curve are notconsidered in the calculation of k.
After the development of the theoretical basis, patterns ofobliquity angle variation versus inclination are characterised forseveral kinematic folding mechanisms (forward problem). Finally,a few natural examples of folded oblique surfaces are analysed. Bycomparison of these with theoretically modelled folds conclusionsabout their folding kinematics are drawn (inverse problem).
2. Modelling folded oblique surfaces
To model folding by different kinematic mechanisms theprogram ‘FoldModeler’, developed in the MATHEMATICA� environ-ment, starts from the initial configuration of a layer profile formedby a grid of squares or rectangles. The nodes of the grid are thendisplaced according to the transformation relations of the mecha-nisms involved in folding, and the layer shape and strain state areobtained. In the modelling, it is necessary to initially define the‘‘guideline’’, a longitudinal reference line located inside the layerthat enables the monitoring of folding. In our models, this line hasbeen initially placed in the middle of the layer. The shape of theguideline is defined by a single mathematical function for the twolimbs, and the functions used in this paper are conic sections (Alleret al., 2004). The part of a conic section used to represent the foldguideline is defined by its eccentricity e (0� e< 1, ellipse; e¼ 1,parabola; e> 1, hyperbola), and the aspect ratio h of the fold forsymmetrical folds (h is the ratio between the height yf and thewidth xf of a fold limb). In asymmetric folds, the aspect ratioconsidered is defined for the right limb. The left limb aspect ratio isautomatically obtained by the program from the conic eccentricityand the length of the limb. Modelling of folds is achieved bysuccessive or simultaneous superposition of folding steps. Eachfolding step is defined by the mechanism applied, the incrementthat it produces in terms of the aspect ratio h of the right limb, andthe change that it produces in the eccentricity of the guideline, orby the deformation gradient matrix in the case of a homogeneousstrain step. Simultaneous superposition of several mechanisms canbe modelled by applying many times in a single run of the programa sequence of folding steps of the involved mechanisms with verysmall increments in the aspect ratio and shape of the guideline or inthe matrix elements that define the homogeneous strain.
To model folding of oblique surfaces, a set of traces with specificinclination is drawn on the initial grid. Each trace is divided intoseveral segments by the intersection points with the lines of thegrid, and the position of these points in the initial configuration iscalculated by ‘FoldModeler’. Once the deformed configuration ofthe initial squares is obtained applying the transformation relationsof the involved mechanisms, the images of the intersection pointson the sides of each deformed quadrilateral are determined by
maintaining the proportionality relationships of the segmentsdefined by these points on the corresponding side. Joining theimages of the different segments of a trace, we obtain the image ofthe oblique trace. Since the strain is heterogeneous, the accuracy ofthis method obviously increases as the size of the squares of thegrid decreases. Finally, the obliquity angle d is determined and itsvariation as a function of the layer inclination a is graphicallyrepresented. The way to measure these angles and the signconvention for them is shown in Fig. 1.
3. Folding of oblique surfaces by different foldingkinematic mechanisms
To facilitate the analysis of folding of oblique surfaces, curves ofthe variation with inclination (a) of the obliquity angle (d) havebeen generated with ‘FoldModeler’ for different kinematic mech-anisms or superposition of them. In general, for a specific mecha-nism, the geometry of the curves depends on the geometry of thefolded surfaces, the initial ratio between the thickness and length ofthe layer, the initial dip (d0) of the oblique surfaces, assumedconstant, and the aspect ratio (h) of the fold. If the oblique surfaceshave been generated by the superposition of several mechanisms,the geometry of the curve also depends on the relative amount ofeach mechanism. There are countless possibilities to model foldedoblique surfaces, and in the following text we only show d–a curvesrepresentative of the main kinematic folding mechanisms. Thesecurves allow the main properties of the folding of oblique surfacesfor these mechanisms to be inferred (forward problem) and can bealso used for obtaining a first indication of the mechanisms thathave operated in the development of a specific natural fold withoblique surfaces, whose d–a curve has been obtained frommeasurements in the field or photographs (reverse problem). Arefinement of the analysis must be made using ‘FoldModeler’, as itwill be described below. The theoretically modelled folds consist ofa half wavelength and the thickness/length ratio of the initial layerhas been set as 1/30. With exception of the folds formed by pureflexural flow, the geometry of the folded surfaces is parabolic.Likewise, with exception of the folds formed by pure flexural flowand by heterogeneous simple shear, the initial obliquity angle (d0)has been set to 30�. One characteristic is that oblique surfaces withopposite signs of the initial obliquity angle (d0 and �d0) havedifferent curves, although closely related. So if a point (a, d) belongsto a curve with initial dip d0, the point (�a, 180� d) belongs to thecurve with initial dip �d0 and vice versa. The dominant curvaturesof the two curves generally have opposite sign.
3.1. Flexural flow
In this mechanism the strain at a point on the folding layerdepends essentially on the inclination at this point with respect to

N.C. Bobillo-Ares et al. / Journal of Structural Geology 31 (2009) 842–852844
a fixed point without strain (pin point) that is taken as the pointwhose inclination is zero. This point is generally chosen to be at thehinge point of the folded layer. The strain is independent of thecurvature, thickness/length ratio of the layer and fold aspect ratio.Consequently, the d–a curves are the same for the bottom and the topof the folded layer. A complete analysis of the variation of the dihedralangle between two surfaces for folding by this mechanism was madeby Ramsay (1967, pp. 492–498 and Fig. 9–18). Here we present analternative approach to this problem using ‘FoldModeler’. A layerwith a set of oblique surfaces folded by this mechanism is shown inFig. 2a. In this case the guideline is a semi-ellipse that provides aninclination range from �90� to 90� in the construction of the d–a curves. A complete set of curves of oblique surfaces for intervals of10� of initial obliquity angle (d0) folded by flexural flow are shown inFig. 3. From this figure we can draw the following conclusions:
- The curves describe decreasing functions.- Since there is no strain in the hinge point, the initial obliquity
angle d0 is not modified in this point and the ordinate at theorigin of each curve allows the d0 value to be inferred.
3.2. Tangential longitudinal strain
Tangential longitudinal strain involves the existence of a neutralsurface whose points have no finite strain (neutral points). A layerwith a set of oblique surfaces folded by this mechanism is shown inFig. 2b. Two types of tangential longitudinal strain have beendistinguished: parallel and equiareal tangential longitudinal strain(Bobillo-Ares et al., 2006). The former involves area change and
Fig. 2. Folded layers with oblique surfaces obtained with ‘FoldModeler’ for folding by differstrain (ETLS). (c) Flexural flow (FF) plus flattening (FLAT) (RF is the ratio between major andthe function that describes the displacements of the heterogeneous simple shear is the sameangle is of 30� .
constant orthogonal thickness (parallel fold); the latter involves noarea change through the fold and produces a thickening of the innerarc part and a thinning of the outer arc part (Ramsay, 1967, pp. 397–403; Bobillo-Ares et al., 2000).
Several pairs of curves, one for the outer arc and other for theinner arc, corresponding to layers folded by parallel tangentiallongitudinal strain with different aspect ratios h are shown inFig. 4a. These curves show the following features:
- The d–a curves are symmetric with respect to the Y-axis.- The obliquity angle d increases with respect to d0 in the inner
arc of the folded layer and decreases in the outer arc. All curveshave a turning point at the hinge point; this is a maximum inthe inner arc and a minimum on the outer arc.
- The maximum value of the inner arc curves increases as theaspect ratio increases and the outer arc minimum valuedecreases as this ratio increases.
- Along the neutral line the initial obliquity angle d0 does notchange with folding. Similarly, this angle barely changes inparts of the layer with high inclinations, where the curvature ofthe layer is very low. In these zones, the corresponding d valuegives approximately the initial value d0.
Folds modelled by tangential longitudinal strain with the sameaspect ratio show that the extreme values of d in the curves deviatefrom the initial d0 value as the layer thickness/length ratioincreases; that is, an increase in this ratio has a similar effect that anincrease of the aspect ratio.
Representative d–a curves for folding by equiareal tangentiallongitudinal strain (Fig. 4b) exhibit similar properties to the
ent kinematic mechanisms. (a) Flexural flow (FF). (b) Equiareal tangential longitudinalminor axes of the strain ellipse due to the flattening). (d) Heterogeneous simple shear;that defines the shape of the guideline (parabola, e¼ 1). In all cases the initial obliquity

Fig. 3. d–a curves for folding by flexural flow with several initial obliquity angles (numbers on the curves).
N.C. Bobillo-Ares et al. / Journal of Structural Geology 31 (2009) 842–852 845
curves of folding by parallel tangential longitudinal strain. Theonly characteristic difference is that the curves of the inner arc inthe equiareal mechanism can be asymmetric, so that themaximum point appears for a s 0. This asymmetry is moreapparent as the fold aspect ratio or the thickness/length of thelayer increases, and it is due to the high curvature gradient in thehinge zone that produces an appreciable deviation of the longaxes of the strain ellipse from the normal to the layer boundary(Bobillo-Ares et al., 2000).
3.3. Flexural flow or tangential longitudinal strain plus flattening
Flattening of parallel folds has been a mechanism commonlyconsidered to explain the development of class 1C folds or
Fig. 4. d–a curves for folding by parallel (a) and equiareal (b) tangential longitudinal strain wand length of the layer of 1/30 and parabolic neutral line (NL). Curves above the neutral linouter arc (OA). The initial obliquity angle is of 30� .
subsimilar folds (Ramsay, 1962, 1967; Mukhopadhyay, 1965;Hudleston, 1973). In this section, flattening of folds previouslyformed by buckling mechanisms (flexural flow or tangentiallongitudinal strain) will be considered.
Oblique surfaces folded by flexural flow plus flattening wereanalysed by Ramsay (1967, pp. 498–500, Fig. 9–19), who showedseveral representative d–a curves. A layer with a set of obliquesurfaces folded by this combination of mechanisms flexural flowplus flattening is shown in Fig. 2c, and a set of d–a curves is shownin Fig. 5a. The aspect ratio of the fold by flexural flow is h¼ 1, andthe amount of flattening is given on the curves by the value ofRF ¼
ffiffiffiffiffiffiffiffiffiffiffiffil1=l2
p, where l1 and l2 are the principal quadratic elonga-
tions due to the flattening. The curves show that as the flatteningamount increases a more definite turning point more appears. This
ith different aspect ratio (numbers on the curves), an initial ratio between the thicknesse correspond to the inner arc (IA) and curves below the neutral line correspond to the
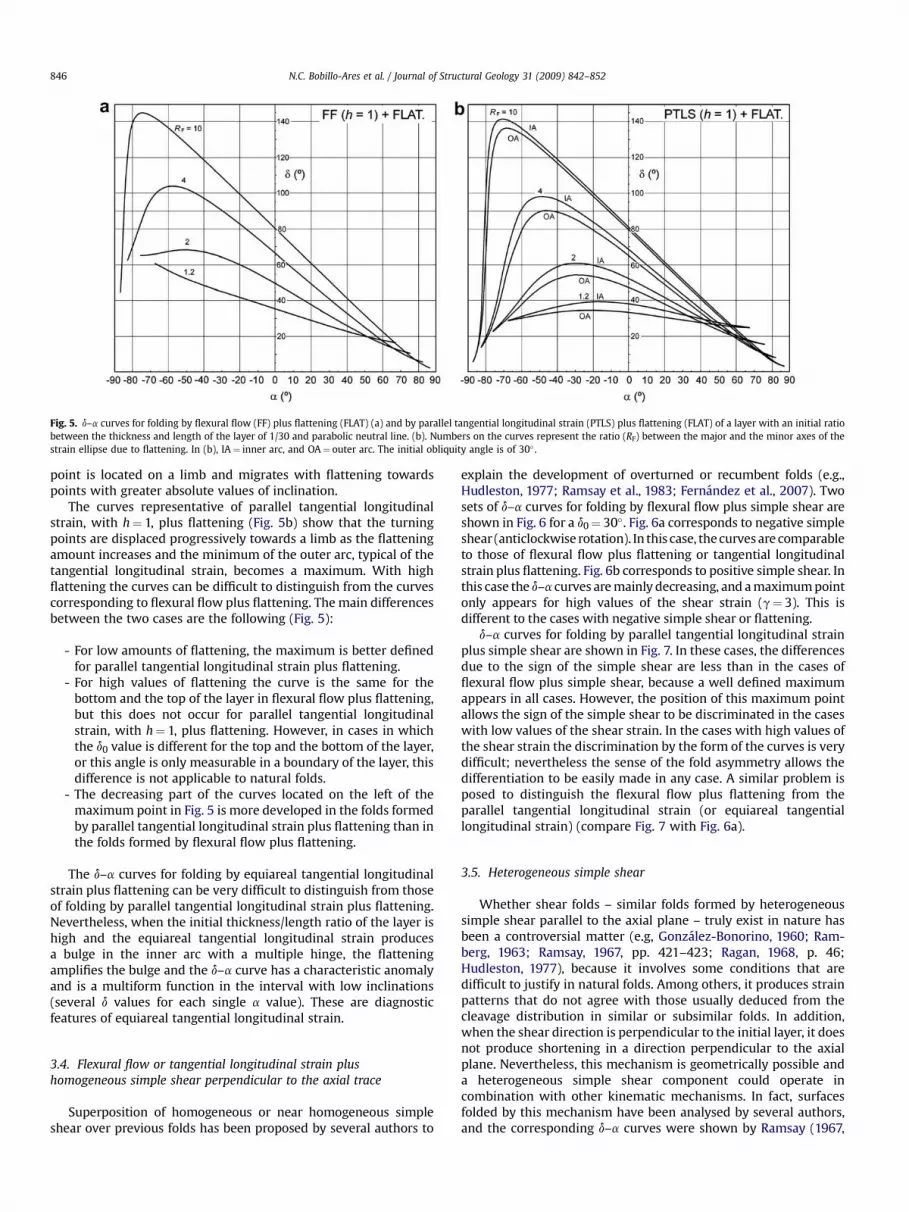
Fig. 5. d–a curves for folding by flexural flow (FF) plus flattening (FLAT) (a) and by parallel tangential longitudinal strain (PTLS) plus flattening (FLAT) of a layer with an initial ratiobetween the thickness and length of the layer of 1/30 and parabolic neutral line. (b). Numbers on the curves represent the ratio (RF) between the major and the minor axes of thestrain ellipse due to flattening. In (b), IA¼ inner arc, and OA¼ outer arc. The initial obliquity angle is of 30� .
N.C. Bobillo-Ares et al. / Journal of Structural Geology 31 (2009) 842–852846
point is located on a limb and migrates with flattening towardspoints with greater absolute values of inclination.
The curves representative of parallel tangential longitudinalstrain, with h¼ 1, plus flattening (Fig. 5b) show that the turningpoints are displaced progressively towards a limb as the flatteningamount increases and the minimum of the outer arc, typical of thetangential longitudinal strain, becomes a maximum. With highflattening the curves can be difficult to distinguish from the curvescorresponding to flexural flow plus flattening. The main differencesbetween the two cases are the following (Fig. 5):
- For low amounts of flattening, the maximum is better definedfor parallel tangential longitudinal strain plus flattening.
- For high values of flattening the curve is the same for thebottom and the top of the layer in flexural flow plus flattening,but this does not occur for parallel tangential longitudinalstrain, with h¼ 1, plus flattening. However, in cases in whichthe d0 value is different for the top and the bottom of the layer,or this angle is only measurable in a boundary of the layer, thisdifference is not applicable to natural folds.
- The decreasing part of the curves located on the left of themaximum point in Fig. 5 is more developed in the folds formedby parallel tangential longitudinal strain plus flattening than inthe folds formed by flexural flow plus flattening.
The d–a curves for folding by equiareal tangential longitudinalstrain plus flattening can be very difficult to distinguish from thoseof folding by parallel tangential longitudinal strain plus flattening.Nevertheless, when the initial thickness/length ratio of the layer ishigh and the equiareal tangential longitudinal strain producesa bulge in the inner arc with a multiple hinge, the flatteningamplifies the bulge and the d–a curve has a characteristic anomalyand is a multiform function in the interval with low inclinations(several d values for each single a value). These are diagnosticfeatures of equiareal tangential longitudinal strain.
3.4. Flexural flow or tangential longitudinal strain plushomogeneous simple shear perpendicular to the axial trace
Superposition of homogeneous or near homogeneous simpleshear over previous folds has been proposed by several authors to
explain the development of overturned or recumbent folds (e.g.,Hudleston, 1977; Ramsay et al., 1983; Fernandez et al., 2007). Twosets of d–a curves for folding by flexural flow plus simple shear areshown in Fig. 6 for a d0¼ 30�. Fig. 6a corresponds to negative simpleshear (anticlockwise rotation). In this case, the curves are comparableto those of flexural flow plus flattening or tangential longitudinalstrain plus flattening. Fig. 6b corresponds to positive simple shear. Inthis case the d–a curves are mainly decreasing, and a maximum pointonly appears for high values of the shear strain (g¼ 3). This isdifferent to the cases with negative simple shear or flattening.
d–a curves for folding by parallel tangential longitudinal strainplus simple shear are shown in Fig. 7. In these cases, the differencesdue to the sign of the simple shear are less than in the cases offlexural flow plus simple shear, because a well defined maximumappears in all cases. However, the position of this maximum pointallows the sign of the simple shear to be discriminated in the caseswith low values of the shear strain. In the cases with high values ofthe shear strain the discrimination by the form of the curves is verydifficult; nevertheless the sense of the fold asymmetry allows thedifferentiation to be easily made in any case. A similar problem isposed to distinguish the flexural flow plus flattening from theparallel tangential longitudinal strain (or equiareal tangentiallongitudinal strain) (compare Fig. 7 with Fig. 6a).
3.5. Heterogeneous simple shear
Whether shear folds – similar folds formed by heterogeneoussimple shear parallel to the axial plane – truly exist in nature hasbeen a controversial matter (e.g, Gonzalez-Bonorino, 1960; Ram-berg, 1963; Ramsay, 1967, pp. 421–423; Ragan, 1968, p. 46;Hudleston, 1977), because it involves some conditions that aredifficult to justify in natural folds. Among others, it produces strainpatterns that do not agree with those usually deduced from thecleavage distribution in similar or subsimilar folds. In addition,when the shear direction is perpendicular to the initial layer, it doesnot produce shortening in a direction perpendicular to the axialplane. Nevertheless, this mechanism is geometrically possible anda heterogeneous simple shear component could operate incombination with other kinematic mechanisms. In fact, surfacesfolded by this mechanism have been analysed by several authors,and the corresponding d–a curves were shown by Ramsay (1967,

Fig. 6. d–a curves for folding by flexural flow (FF) and homogeneous simple shear (SS) perpendicular to the axial trace. (a) The rotation sense is anticlockwise (SS< 0). (b) Therotation sense is clockwise (SS> 0). Numbers on the curves represent the shear strain (g). The initial obliquity angle is of 30� .
N.C. Bobillo-Ares et al. / Journal of Structural Geology 31 (2009) 842–852 847
Fig. 9–30), Williams (1979, Fig. 5c) and Ramsay and Lisle (2000,Fig. 36–71). Hence, this mechanism has been included in theprogram ‘FoldModeler’ and considered in the analysis of obliquesurfaces. In any case, the comparison of the theoretical resultsproduced for this mechanism with the characteristics of naturalfolds can provide good arguments to know if heterogeneous simpleshear is a mechanism that operates in natural folds.
A layer with a set of oblique surfaces folded by heterogeneoussimple shear is shown in Fig. 2d. As with the mechanism of flexuralflow, in heterogeneous simple shear the obliquity angle d is inde-pendent of the curvature, thickness/length ratio of the layer andfold aspect ratio. Fig. 8a shows a set of d–a curves of folds modelledby heterogeneous simple shear with different values of the initialobliquity angle d0. Except the curve with d0¼ 90�, which corre-sponds to the straight line d¼ 90� a, the curves have a turningpoint (maximum when d0< 90� and minimum when d0> 90�),
Fig. 7. d–a curves for folding by parallel tangential longitudinal strain (PTLS) and homogenbetween the thickness and length of the layer of 1/30 and parabolic neutral line. (a) The se(SS< 0). (b) The sense of the displacements is opposite to the dip direction of the oblique surangle is of 30� .
whose corresponding inclination value depends on the d0 value.These curves are difficult to distinguish from those obtained forflexural flow or tangential longitudinal strain plus flattening. Apeculiar characteristic of these curves is that they pass through thepoints (�90, 0) and (90, 0). This can be a distinctive feature, but onlywhen high inclinations appear in the fold. As in flexural flow, whenthe initial obliquity angle d0 has the same value for the top and thebottom of the layer, the curve is the same for the two layerboundaries; this feature can help to distinguish heterogeneoussimple shear from other mechanisms.
3.6. Heterogeneous simple shear parallel to the axialplane plus flattening
This mechanism has been proposed by several authors (Ramsay,1967, pp. 421–436; Hudleston, 1977; Ramsay and Lisle, 2000, p. 824
eous simple shear (SS) perpendicular to the axial trace of a layer with an initial rationse of the displacements is the same of the initial dip direction of the oblique surfacesfaces (SS> 0). Numbers on the curves represent the shear strain (g). The initial obliquity

Fig. 8. (a) d–a curves for folding by heterogeneous simple shear (HSS) with several initial obliquity angles (numbers on the curves). (b) d–a curves for folding by heterogeneoussimple shear (HSS) plus flattening (FLAT); numbers on the curves represent the ratio (RF) between the major and the minor axes of the strain ellipse due to flattening; the initialobliquity angle is of 30� .
N.C. Bobillo-Ares et al. / Journal of Structural Geology 31 (2009) 842–852848
and 826–831) to explain the development of similar folds. Theseauthors obtained d–a curves for oblique surfaces folded by thissuperposition of strain patterns (Ramsay, 1967, Fig. 9–31; andRamsay and Lisle, 2000, Fig. 36.71). The inclusion of flatteningeliminates some of the problems of the heterogeneous simple shearmechanism, since flattening gives rise to shortening perpendicularto the axial plane and produces strain patterns compatible with thecleavage distribution observed in natural folds. An interestingaspect is that, in this type of superposition, the application order ofthe mechanisms does not influence the form of the d–a curvealthough it influences the geometry of the final fold, i.e., thesuperposition is commutative for the curves but not for the folds(Appendix A). As a consequence of this, the curves corresponding tothis combination of mechanisms (Fig. 8b) are indistinguishablefrom those obtained in a single episode of heterogeneous simpleshear, since the d–a curve of a fold formed by a component offlattening and another of heterogeneous simple shear can be alsoobtained by heterogeneous simple shear on a layer with a differentinitial dip d0 that incorporates the effect of the flattening compo-nent on the initial layer.
4. Application to the analysis of natural folds
When the curves that describe the d vs. a variation are availablefor a natural fold, the graphs obtained in the previous section can beused to gain some insight into the folding mechanisms involved inthe development of the fold. On the other hand, ‘FoldModeler’ can beused in this case to find by a trial-and-error method a particularcombination of mechanisms that gives the best fit to all thegeometrical features of the natural fold. Two natural examples havebeen selected to explore the potentials of this method. The first ofthem corresponds to a slightly asymmetric anticline developed ina unit of Cambrian sandstone and shale of the Westasturian-Leonesezone near Cudillero (Asturias, Spain). The sandstone layers A and Bpictured in Fig. 9a show a folded pattern of cross bedding that hasbeen sketched in black in Fig. 9b. Points in the graphics of Fig. 9c andd indicate the variation of the obliquity angle d along the folded layerfor the top of layers A and B respectively. Note that as ‘FoldModeler’
only models synforms and has a particular convention to measureangles (shown in Fig. 9b), the left part of the layer is represented inthe right part of the diagram and vice versa. A good fit to thegeometrical features of these folds can be been obtained with thefollowing modelling parameters: Layer A: Guideline eccentricity¼ 0(circular arc) and a superposition of a first folding increment oftangential longitudinal strain without area change (Dh¼ 0.28measured in the right limb) and a second event of flexural flow(Dh¼ 0.56 measured in the right limb). The d–a curve for this fold isrepresented in green in Fig. 9c, in which curves for pure tangentiallongitudinal strain with area change and flexural flow are also dis-played to allow comparison. Good fits can be also obtained if theapplication order of the two mechanisms is reversed, but the relativeintensity of the flexural flow episode must be increased. Tangentiallongitudinal strain preceding flexural flow is suggested by theanalysis of other folds in the area (Toimil and Fernandez, 2007).Layer B: Guideline eccentricity¼ 0.6 (ellipse arc) and a single foldingepisode of flexural flow (h¼ 1 in the right limb). The initial obliquityangle (d0) is 160� for the two layers, though a better fit for the left-most part of layer B (rightmost part of the diagram of Fig. 9d) isobtained with d0¼154�. The ‘FoldModeler’ output with thedeformed grids of quadrilaterals (green) and the deformed traces(red) is shown in Fig. 9b superposed on the sketch of the natural fold.
The analysis of folded oblique surfaces using ‘FoldModeler’ hasbeen also applied to a minor fold developed in a psammite layernear Rhoscolyn Head (Holy Island, North Wales) during a seconddeformation event that modified and distorted a previous hecto-metric anticline and gave rise to minor folds and crenulationcleavage S2 (Cosgrove, 1980; Lisle, 1988; Treagus et al., 2002).Oblique surfaces analysed in this case are S1 surfaces folded intoa minor D2 synform. Fig. 10a shows the studied fold with a super-posed sketch of bedding (blue lines), folded S1 surfaces (red lines)and the reference frame used for the measure of angles. Fig. 10b andd allows comparison between the obliquity angles measured on thephotograph (points) and those obtained for the theoretical foldshown on Fig. 10c (green lines). The theoretical fold was obtainedwith ‘FoldModeler’, applying to a horizontal layer a foldingsequence with guideline eccentricity¼ 1.2 (hyperbola arc) and

Fig. 9. (a) Anticline developed in Cambrian sandstone and shale of the Westasturian-Leonese zone near Cudillero (Asturias, Spain) showing a folded pattern of cross bedding.(b) Sketch of the natural folded oblique surfaces (in black) with the theoretical fold obtained with ‘FoldModeler’ superposed (layer boundaries and grid in green and oblique surfacesin red); the sign convention is shown. (c) and (d) Variation of the obliquity angle d along the folded layer for the top of layers A and B respectively. Points correspond to natural data;the green curve is the best fit obtained for layer A (RMSE parameter k¼ 5.9); red curves correspond to a mechanism of pure tangential longitudinal strain without area change(k¼ 7.05 for layer A and 7.3 for layer B); blue curves correspond to a pure flexural flow mechanism (k¼ 6.54 for layer A and 4.36 for layer B with d0¼160� , the curve correspondingto d0¼ 154� has been constructed to fit the points with a between 60 and 80�).
N.C. Bobillo-Ares et al. / Journal of Structural Geology 31 (2009) 842–852 849
involving three folding steps: i) Tangential longitudinal strainwithout area change (Dh¼ 0.2), ii) Flexural flow (Dh¼ 0.3), and iii)Homogeneous flattening perpendicular to the axial plane withffiffiffiffiffiffiffiffiffiffiffiffi
l1=l2p
¼ 3:24: The initial obliquity angle (d0) was 30�. Curvescorresponding to pure tangential longitudinal strain plus homo-geneous flattening and pure flexural flow plus homogeneous flat-tening are also shown in Fig. 10b and d to allow comparison. Thedifferent attitude of the natural and the theoretical fold (Fig. 10aand c) is probably due to the formation of the former in a seconddeformation event on a layer dipping as a result of the first defor-mation, whereas the theoretical fold was modelled from a hori-zontal layer. The fit obtained suggests that the deformationsequence of the theoretical fold can be considered as a firstapproach to the one which operated in the natural fold, thoughsome mechanisms that cannot be introduced in the ‘FoldModeler’analysis cannot be discarded. This is the case of a possible role ofactive folding during the last stage that gave rise to the synformdrawn by S1 in the left limb of the fold analysed. The thinning of thelayer towards the left can be interpreted as a feature previous tofolding that can be tentatively attributed to pinch and swellstructures developed in the limb of a D1 fold due to flatteningassociated with this deformation phase. ‘FoldModeler’ cannotproduce folds from a layer with variable thickness and hence theprecise form of the folded layer could not be reproduced in themodel. Theoretical folds that reproduce the thinning observed in
the psammite layer and give a reasonably good fit to the d variationthroughout the fold can be obtained applying simple shear defor-mation to the model, but they do not agree with the deformationsequence of the area nor with the geometries of other foldsobserved in the outcrop (Lisle, 1988; Treagus et al., 2002).
5. Conclusions
Analysis of folded oblique surfaces can provide an interestingcontribution to the discrimination of kinematic mechanisms thatoperated during folding. The program ‘FoldModeler’ allowsmodelling oblique surfaces folded by any successive or simulta-neous superposition of the main kinematic folding mechanismsand facilitates a general method to make this analysis on the foldprofiles. The graphical representation of the obliquity angle d asa function of the inclination a (d–a curve) is the tool used to carryout the discrimination. ‘FoldModeler’ allows obtaining a lot of d–a curves in a short interval of time.
The discrimination between the two basic mechanisms ofbuckling (flexural flow and tangential longitudinal) is simple whensuperposed homogeneous strain did not operate. The d–a curves offolds formed by flexural flow are monotonously decreasing and,when the initial obliquity angle d0 is the same for the top and bottomof the layer, the d–a curve is also the same for the two layerboundaries. On the other hand, the d–a curves of folds formed by

Fig. 10. (a) Minor fold developed in a psammite layer near Rhoscolyn Head (Holy Island, North Wales) with a superposed sketch of bedding (blue lines), folded S1 surfaces (red lines)and the reference frame used for the measure of angles. (b) and (d) Variation of the obliquity angle d along the folded layer for the inner arc and the outer arc respectively; pointscorrespond to natural data; green curves correspond to the theoretical best fit obtained (k¼ 7.33 for the inner arc and 9.54 for the outer arc); blue curves correspond to pure flexuralflow plus flattening (k¼ 9.12 for the inner arc and 18.79 for the outer arc); red curves correspond to the pure tangential longitudinal strain without area change plus flattening(k¼ 13.57 for the inner arc and 12.67 for the outer arc). (c) Theoretical fold obtained with ‘FoldModeler’ to fit the natural fold.
N.C. Bobillo-Ares et al. / Journal of Structural Geology 31 (2009) 842–852850
tangential longitudinal strain are in general symmetrical witha turning point at the hinge point (a¼ 0). These curves are differentfor the two layer boundaries and the turning point is a maximum inthe inner arc and a minimum on the outer arc. An exception appearsfor equiareal tangential longitudinal strain, in which the maximumof the curve can appear slightly outside the point with a¼ 0 and thecurve can be somewhat asymmetric when the thickness/length ratioof the initial layer or the aspect ratio of the fold is high.
The superposition of a flattening or a homogeneous simpleshear parallel to the axial trace on folds previously formed byflexural flow or tangential longitudinal strain gives rise to changesin the form of the d–a curves. If low homogeneous strain is involvedin the superposition, these curves can allow the discrimination ofthe kinematic mechanisms involved in the folding by inspectionabout the existence of a maximum point and its location when itexists. When high homogeneous strain is superposed on previousfolds, a convergence in the form of the curves is produced, so thatthese present a prominent maximum point in the high inclinationpart of a limb. In these cases, the discrimination of the kinematicmechanisms involved in the folding is difficult. An exception is the
case of flexural flow plus homogeneous simple shear with a sheardirection opposite to the initial dip of the oblique surfaces. In thiscase, a maximum point only appears for very high levels of strainand near to an end of the curve.
The d–a curves corresponding to folds formed by heterogeneoussimple shear are comparable to those for folds modified by flat-tening or homogeneous simple shear, although the initial obliquityangles are very different for these curves. When shear folds areflattened, their curves are very difficult to distinguish from thosecorresponding to other types of flattened or sheared folds.
When shear folds are combined with an irrotational homoge-neous strain with the maximum elongation direction perpendicularto the original layer, the order of application of the kinematicmechanisms influences the geometry of the folded layer but not theform of the d–a curve.
The use of standard sets of curves corresponding to differenttypes of strain patterns can be a valuable method to obtain a firstindication about the kinematic mechanisms that operated ina specific natural fold, mainly when other geological informationabout the structure is available. However, the search for a specific
N.C. Bobillo-Ares et al. / Journal of Structural Geology 31 (2009) 842–852 851
d–a curve that precisely fits the points (a, d) measured from thenatural fold can provide a more exact determination of the mech-anisms involved. This can be made by trial-and-error using theprogram ‘FoldModeler’.
Acknowledgements
The present work was supported by Spanish CGL-2006-06401-BTE project funded by Ministerio de Educacion y Ciencia and FondoEuropeo de Desarrollo Regional (FEDER). We are grateful to P.J.Hudleston and R.J. Twiss for many valuable suggestions thatnotably improved the manuscript.
Appendix A. Commutativity of the superposition ofheterogeneous simple shear and flattening for the functionalrelation between d and a
Let h be the deformation gradient, U and u the vectors indicatingthe layer inclination before and after folding, and V and v thevectors indicating the trace direction of the oblique surface beforeand after the folding (Fig. A1). We have that
u ¼ hU; v ¼ hV (A1)
The angles searched are determined by the following geomet-rical relationships:
cos d ¼ u,vjujjvj; tan a ¼ u,bj
u,bi; (A2)
where bi and bj are the unit vectors of the orthonormal basise ¼ ðbi;bjÞ (Fig. A1).
Specifically, we will determine these angles in two cases: 1)heterogeneous simple shear plus flattening, and 2) flattening plusheterogeneous simple shear. In the two cases the matrices of theobjects will be referred to the basis e. These matrices will be namedby a subscript e; for example, he and ve are the matrices of h and v inthat basis.
Case 1 heterogeneous simple shear plus flatteningThe equations of the total transformation are:
x ¼ AXy ¼ Baf ðX=aÞ þ BY
�; (A3)
where f(X/a) is the equation of the conic that represents theguideline and a the scale factor of this curve. We obtain directly thefollowing matrices:
hð1Þe ¼�
A 0Bf 0ðX=aÞ B
�; Ue ¼
�10
�; Ve ¼
�cos d0sin d0
�; (A4)
where f 0ðX=aÞ is the derivative of f at the value X/a. Then, the vectoruð1Þe is given by:
Fig. 1A. Vectors used to define the directions of the layer boundary and the obliquesurface in the initial (a) and the final (b) configurations. bi and bj are the unit vectors ofthe reference orthonormal basis.
uð1Þe ¼ hð1Þe Ue ¼A
Bf 0ðX=aÞ ; and tan að1Þ ¼ BA
f 0ðX=aÞ:
� �(A5)
With this equation for tan a(1) we can write hð1Þe and uð1Þe in thefollowing form:
hð1Þe ¼�
A 0A tan að1Þ B
�uð1Þe ¼
�A
A tan að1Þ
�(A6)
The vector vð1Þe is calculated using the hð1Þe value given in (A6)andthe Ve value given in (A3), i.e.,
vð1Þe ¼ hð1Þe Ve ¼�
A cos d0A tan að1Þcos d0 þ B sin d0
�(A7)
Case 2 flattening plus heterogeneous simple shearIn this case, the equations of the total transformation are:
x ¼ AXy ¼ Aaf ðX=aÞ þ BY
�: (A8)
Comparing equations (A8) with those (A3) we observe that bothare different and then, the folds formed in the cases 1) and 2) maybe different.
The matrix of the deformation gradient is
hð2Þe ¼�
A 0Af 0ðX=aÞ B
�; (A9)
and therefore,
uð2Þe ¼ hð2Þe Ue ¼�
AAf 0ðX=aÞ
�; and tan að2Þ ¼ f 0ðX=aÞ:
(A10)
Introducing this value of tan a(2) in the previous matrix hð2Þe , wehave:
hð2Þe ¼�
A 0A tan að2Þ B
�and uð2Þe ¼
�A
A tan að2Þ
�; (A11)
and finally
vð2Þe ¼ hð2Þe Ve ¼�
A cos d0A tan að2Þcos d0 þ B sin d0
�: (A12)
As we can see in (A2), the calculation of d is made in terms of uand v. On the other hand, the form of the matrices uð1Þe and vð1Þe interms of tan a(1) [eq. (A6 and A7)] is the same than those of uð2Þe andvð2Þe in terms of tan a(2) [eq (A11) and (A12)]. Hence, although thefolded layers are different in the two cases, the relations betweend and a are identical.
References
Aller, J., Bastida, F., Toimil, N.C., Bobillo-Ares, N.C., 2004. The use of conic sections forthe geometrical analysis of folded surface profiles. Tectonophysics 379,239–254.
Bobillo-Ares, N.C., Aller, J., Bastida, F., Lisle, R.J., Toimil, N.C., 2006. The problem ofarea change in tangential longitudinal strain folding. Journal of StructuralGeology 28, 1835–1848.
Bobillo-Ares, N.C., Bastida, F., Aller, J., 2000. On tangential longitudinal strainfolding. Tectonophysics 319, 53–68.
Bobillo-Ares, N.C., Toimil, N.C., Aller, J., Bastida, F., 2004. ‘FoldModeler’: a tool for thegeometrical and kinematic analysis of folds. Computers & Geosciences 30,147–159.
Cosgrove, J.W., 1980. The tectonic implications of small scale structures in the MonaComplex of Holy Isle, North Wales. Journal of Structural Geology 2, 383–396.
Coward, M.P., 1973. The structure and origin of areas anomalously of low-intensityfinite deformation in the basement gneiss complex of the Outer Hebrides.Tectonophysics, 117–140.

N.C. Bobillo-Ares et al. / Journal of Structural Geology 31 (2009) 842–852852
Fernandez, F.J., Aller, J., Bastida, F., 2007. Kinematics of a kilometric recumbent fold:the Courel syncline (Iberian massif, NW Spain). Journal of Structural Geology29, 1650–1664.
Gonzalez-Bonorino, F., 1960. The mechanical factor in the formation of schistosity.In: 21st International Geological Congress, Copenhagen, Pt. 18, pp. 303–316.
Hudleston, P.J., 1973. The analysis and interpretation of minor folds developed inthe Moine rocks of Monar, Scotland. Tectonophysics 17, 89–132.
Hudleston, P.J., 1977. Similar folds, recumbent folds, and gravity tectonics in ice androcks. Journal of Geology 85, 113–122.
Lisle, R.J., 1988. Anomalous vergence patterns on the Rhoscolyn Anticline, Anglesey:implications for structural analysis of refolded regions. Geological Journal 23,211–220.
Mukhopadhyay, D., 1965. Effects of compression on concentric folds and mecha-nism of similar folding. Journal of the Geological Society of India 6, 27–41.
Ragan, D.M., 1968. Structural Geology. An Introduction to Geometrical Techniques.John Wiley & Sons, New York.
Ramberg, H., 1963. Strain distribution and geometry of folds. Bulletin of theGeological Institution of the University of Upsala 42, 1–20.
Ramsay, J.G., 1961. The effects of folding on the orientation of sedimentationstructures. Journal of Geology 69, 84–100.
Ramsay, J.G., 1962. The geometry and mechanics of formation of ‘‘similar’’ typefolds. Journal of Geology 70, 309–327.
Ramsay, J.G., 1963. The folding of angular unconformable sequences. Journal ofGeology 71, 297–400.
Ramsay, J.G.,1967.FoldingandFracturingofRocks.Mc-GrawHill BookCompany,NewYork.Ramsay, J.G., Huber, M.I., 1987. Modern Structural Geology. In: Folds and Fractures,
vol. 2. Academic Press, London.Ramsay, J.G., Lisle, R.J., 2000. Modern Structural Geology. In: Applications of
Continuum Mechanics in Structural Geology, vol. 3. Academic Press, London.Ramsay, J.G., Casey, M., Kligfield, R., 1983. Role of shear in development of the
Helvetic fold-thrust belt of Switzerland. Geology 11, 439–442.Toimil, N.C., Fernandez, F.J., 2007. Kinematic analysis of symmetrical natural folds
developed in competent layers. Journal of Structural Geology 29, 467–480.Treagus, S.H., Treagus, J.E., Droop, G.T.R., 2002. Superposed deformations and their
hybrid effects: the Rhoscolyn Anticline unravelled. Journal of the GeologicalSociety, London 159, 117–136.
Whitten, E.H.T., 1966. Structural Geology of Folded Rocks. Rand McNally &Company, Chicago.
Williams, P.F., 1979. The development of asymmetrical folds in a cross-laminatedsiltstone. Journal of Structural Geology 1, 19–30.


![Ergative as Perfective Oblique (2014) [Invited Talk, Goettingen]](https://img.pdfslide.net/doc/110x75/6322c3f064690856e1094fc7/ergative-as-perfective-oblique-2014-invited-talk-goettingen.jpg)


