Embed Size (px)
Citation preview

A
qpt((Bwtacwt©
K
1
3iasi�ahmm
0d
Available online at www.sciencedirect.com
Journal of Pharmaceutical and Biomedical Analysis 46 (2008) 771–779
An improved and fully validated LC–MS/MS method for the simultaneousquantification of simvastatin and simvastatin acid in human plasma
Constantinos Apostolou, Constantinos Kousoulos, Yannis Dotsikas, Georgios-Stefanos Soumelas,Filomila Kolocouri, Afroditi Ziaka, Yannis L. Loukas ∗
Laboratory of Pharmaceutical Analysis and Bioequivalence Services (GLP Compliant), Department of Pharmaceutical Chemistry,School of Pharmacy, University of Athens, Panepistimioupoli Zografou GR 157 71, Athens, Greece
Received 16 June 2007; accepted 2 December 2007Available online 8 December 2007
bstract
A fully automated high-throughput liquid chromatography/tandem mass spectrometry (LC–MS/MS) method was developed for the simultaneousuantification of simvastatin (SV) and simvastatin acid (SVA) in human plasma. Plasma samples were treated by acetonitrile (ACN) addition forrotein precipitation (PP) and subsequent two-step liquid–liquid extraction (LLE) in 96-deepwell plates, using methyl t-butyl ether (MTBE) ashe organic solvent. ACN addition step was proven to enhance method sensitivity, as well as producing cleaner samples for injection. LovastatinLV) and lovastatin acid (LVA) were used as internal standards (IS) for SV and SVA quantification respectively. A relatively small plasma volume300 �L) was employed and all procedure liquid transfer steps were performed automatically, by the use of robotic liquid handling workstations.oth electrospray (ESI) and atmospheric pressure chemical ionization (APCI) sources were applied and compared for LC–MS/MS sample analysis,ith ESI proven to be more sensitive for the specific analytes. Polarity switch (from negative to positive ionization mode) was performed during
he same analytical run, so as for the simultaneous SV and SVA determination to be possible. The method had a short sample preparation time,
s well as a chromatographic run time of just 1.9 min, the shortest so far reported for SV determination. It was validated and fulfilled all presetriteria for sensitivity, specificity, linearity (0.100–40.0 ng/mL), inter- and intra-accuracy and precision for both molecules. The proposed methodas applied to the rapid and reliable simultaneous determination of SV and SVA in a bioequivalence study, after per os administration of a SVablet (80 mg).2008 Elsevier B.V. All rights reserved.
ction
pspaprcda
eywords: Simvastatin; Bioequivalence; 96-Well; Electrospray; Two-step extra
. Introduction
Simvastatin is one of the major representatives of 3-hydroxy--methyl-glutaril coenzyme A (HMG-CoA) reductase (HMGR)nhibitors, also known as “statins”. Simvastatin is administereds a cholesterol-lowering agent in order to control the in vivoynthesis of cholesterol and treat hypercholesterolemia [1]. SVs known to be rapidly hydrolyzed in vivo to its corresponding-hydroxy acid (SVA). Low concentrations of both SV and SVAre found in systemic circulation because of the high first-pass
epatic extraction [2,3]. Therefore, highly sensitive analyticalethods are needed in order to determine both SV and its activeetabolite SVA in body fluids.∗ Corresponding author. Tel.: +30 210 7274224; fax: +30 210 7274224.E-mail address: [email protected] (Y.L. Loukas).
ntspdat
731-7085/$ – see front matter © 2008 Elsevier B.V. All rights reserved.oi:10.1016/j.jpba.2007.12.001
; Polarity switch
Several analytical methods for SV determination in humanlasma have been reported, including gas chromatography–masspectrometric (GC–MS) [4,5] and liquid chromatographic cou-led to UV detector [6,7]. However, GC–MS methods includenalyte derivitization with a generally complicated samplereparation procedure. On the other hand, LC/UV methods arearely sensitive enough to determine very low SV and SVA con-entration levels. LC–MS methods are usually employed to SVetermination in biological fluids, as they are sensitive, specificnd simple. An LC–MS method has been reported for determi-ation of SV without taking SVA into account [8], while severalandem mass spectrometric methods have been proposed forimultaneous determination of SV and SVA employing solid
hase extraction (SPE) [9], liquid–solid extraction [10] andirect injection [11]. Some of the previous methods did not havesuitable concentration range for pharmacokinetic studies. Inwo other publications it was proven that automation along with

7 ical a
LS
oLaAtbbaiovwS1sfnpaq
ab(
2
2
cftRaCffbwtk
2
(aeams1E
rfn2a9aweph(ApdcTpastoaa(aca
2
iaw(i(TTf
2
tut2mvta
72 C. Apostolou et al. / Journal of Pharmaceut
LE resulted in lower interconversion rates between SV andVA [12,13].
In the present study we report the development and validationf a fully automated high throughput 96-well format based LLEC–MS/MS method for the simultaneous determination of SVnd SVA in human plasma. The method involved a PP step, byCN, followed by a two-step LLE with MTBE. The combina-
ion of PP and two-step extraction LLE has never been employedefore for SV analysis in human plasma and it was proven toe very effective, in terms of method sensitivity increase for allnalytes and matrix interferences reduction. Preparation of cal-bration standards and quality control samples (QCs), transferf study samples, addition of IS, addition of the organic sol-ent, as well as supernatant organic layer transfer after LLEere performed automatically using robotic workstations. BothV and SVA were determined in the same analytical run of.9 min, the shortest so far reported, by employing a polaritywitch within the run. This specific protocol could be appliedor LV/LVA determination as well, with SV/SVA being the inter-al standards. Furthermore, this general approach for samplereparation can be suggested for employment in other bioan-lytical protocols that require both ionization modes and lowuantitation limits.
The current method enabled the automated high throughputnd reliable simultaneous determination of SV and SVA in aioequivalence study after per os administration of a SV tablet80 mg) to 43 healthy volunteers.
. Experimental
.1. Chemicals and reagents
Simvastatin ammonium salt and simvastatin acid were pur-hased from Biocon (Bangalore, India). Lovastatin was obtainedrom Sigma–Aldrich (Chemilab, Athens, Greece) while lovas-atin hydroxy acid ammonium salt was obtained from Synfineesearch (Ontario, Canada). Acetonitrile (HPLC grade) andmmonium acetate (analysis grade) were purchased fromhemilab (Athens, Greece). MeOH (HPLC grade) was obtained
rom Neohimiki (Athens, Greece) while MTBE (HPLC grade)rom Techline (Athens, Greece). All aqueous solutions anduffers were prepared using de-ionized and doubly distilledater (Resistivity > 18 M�) from a Millipore Milli-Q Plus Sys-
em (Malva, Athens, Greece). Pooled human control plasma wasindly donated from Ippokrateio hospital (Athens, Greece).
.2. Instrumentation
A PerkinElmer Multiprobe II HT-EX workstationPerkinElmer, Downers Grove, IL, USA) equipped withn 8-tip robotic arm and controlled by WinPrep Software wasmployed for all liquid transfers, including buffer, IS addition,s well as plasma samples transferring from 2 mL eppendorf
icrofuge tubes (Lab Supplies, Athens, Greece) into 2.2 mLquare 96-deepwell plates (Sigma–Aldrich, Athens, Greece).000 �L conductive disposable tip-boxes were purchased from&K Scientific Products (Cambell, CA, USA). A tipchute,
imS4
nd Biomedical Analysis 46 (2008) 771–779
eagent troughs and a tip flush/wash station were purchasedrom PerkinElmer. ACN and MTBE addition as well as super-atant organic layer transferring after extraction into a new.2 mL 96-deepwell plates and reconstitution of the samplesfter evaporation were performed employing a Tomtec Quadra6 model 320 robotic liquid handling system equipped with96-tip pipetting head (Bidservice, NJ, USA). Evaporationas performed into a Zymark TurboVap 96-well format plate
vaporator (Malva, Athens, Greece) by nitrogen application,roduced by an Agilent Nitrogen Generator (Duratec, Hocken-eim, Germany), that receives air from a SF4 Air CompressorAtlas Copco, Athens, Greece). An Eppendorf 5810 R (Bacakos,thens, Greece) centrifuge that could accommodate 96-welllates as well as Eppendorf microfuge tubes was also utilizeduring sample preparation. Eppendorf deepwell mats forovering the 96-well plates were obtained from Sigma–Aldrich.wo 96-well plate vortex-mixers (MS1 Minishaker) wereurchased from Metrolab (Athens, Greece). The CTC PALutosampler (Hellamco, Athens, Greece) could accommodateix 96-deepwell plates stored before analysis at a fixed tempera-ure inside the autosampler drawers. The HPLC system includedne Agilent 1100 series binary pump, a degasser as well ascolumn oven/cooler (Hellamco, Athens, Greece). Finally,PE Sciex API 3000 triple quadrupole mass spectrometer
Biosolutions, Athens, Greece) interfaced with the HPLC vian electrospray ionization (ESI) or an atmospheric pressurehemical ionization (APCI) source was used for the massnalysis and detection, operating under Analyst 1.4.2 software.
.3. Chromatographic conditions
An isocratic HPLC elution mobile phase was used, consist-ng of 82% acetonitrile and 18% ammonium acetate 5 mM (v/v),djusted to pH 4.5 with acetic acid. A flow rate of 0.7 mL/minas used for sample analysis on a YMC ODS-A (C18)
Schermbeck, Germany) analytical column (50 mm × 4.0 mm.d.). The column was maintained at ambient temperature∼23 ◦C), while the autosampler temperature was set at 10 ◦C.he pressure of the system during the analysis was ∼600 psi.he injection volume was 60 �L and the total run time was set
or 1.9 min.
.4. Mass spectrometric conditions
A PE Sciex API 3000 triple quadrupole mass spectrome-er interfaced with the HPLC via a turbo ionspray source wassed for the mass analysis and detection. The tuning parame-ers were optimized for SV, SVA and LV, LVA by infusing a00 ng/mL standard solution containing all four compounds inobile phase at 30 �L/min, via an external syringe pump (Har-
ard 11 plus) directly connected to the mass spectrometer. Theurbo ionspray source temperature was optimized at 425 ◦C. Thenalytes were detected by monitoring the precursor → product
on transition using multiple reaction monitoring (MRM) scanode. The MRM was performed at m/z 435.3 → 319.0 forVA, 421.1 → 319.0 for LVA and 419.1 → 199.3 for SV,05.4 → 199.3 for LV. The current MS method consisted of

ical a
tmafst5(tdtavt
2s
(({((t2pq(S(t6p(sdas
o(wIrc0e/Mdt
2
i
cssstiaLAsrs
ticiiciwp
2
taptttaaefaTtrffr9a3rli9apm
C. Apostolou et al. / Journal of Pharmaceut
wo periods combining both negative and positive ionizationode. Specifically, the mass spectrometer operated in the neg-
tive detection mode for 1.21 min with a dwell time of 150 msollowed by a period of 0.69 min in the positive mode with theame dwell time. The curtain gas was set at 9 (arbitrary units),he declustering potential (DP) at −56 V for SVA and LVA, and6 V for SV and LV. The nebulizer gas (GS1) was set at 12arbitrary units) during period 1, and at 9 during period 2 whilehe turbo ionspray gas (GS2) at 7 L/min. The collision-inducedissociation (CID) gas setting was optimized at 12 and 9 (arbi-rary units) for periods 1 and 2 respectively, the collision energyt −24 V, for SVA and LVA while for SV and LV the parameteralues were 19 and 17 V respectively. Data was acquired usinghe Analyst 1.4.2 software.
.5. Standards and quality control/method validationamples preparation
Stock solutions of SV and SVA {100 �g/mL both (SS1) andSS′
1)} were prepared in ACN. LV stock solution {100 �g/mLIS1)} was also prepared in ACN, while LVA stock solution50 �g/mL (IS′
1)} was prepared in a mixture of ACN/H2O75:25, v/v). A mixed SV and SVA stock solution {2 �g/mLSS2)} was prepared by diluting each of the initial stock solu-ions by ACN. Working solutions of 800, 400, 200, 100, 40.0,0.0, 10.0, 4.00 and 2.00 ng/mL for both SV and SVA wererepared by diluting SS2 with ACN/ H2O 50/50 (v/v). Twouality control/method validation (QC/MV) stock solutions100 �g/mL each) were prepared from separate weighing ofV and SVA, as well as a quality control/method validationQC/MV) mixed diluted stock solution (2 �g/mL each). Dilu-ions were used to prepare four levels of QC working solutions,00, 60.0, 6.00 and 2.00 ng/mL. All working solutions wererepared in 2 mL eppendorf tubes. A mixed, diluted IS solution1 �g/mL each, IS2) was prepared daily by diluting the IS stockolutions in MeOH. SV and SVA stock solutions, as well as theiluted stock solutions were stored at −75 ◦C. LV and LVA (IS1nd IS2) stock solutions were stored at 4 ◦C, while all workingolutions were stored at −30 ◦C.
Nine calibration standards were prepared by spiking 100 �Lf each working solution to 1900 �L of blank human plasma20 times dilution). A blank sample (matrix sample processedithout IS), a zero sample (matrix sample processed with
S) completed the calibration curve covering the expectedange of concentrations to be quantified. Final standard con-entrations were 40.0, 20.0, 10.0, 5.00, 2.00, 1.00, 0.500,.200, and 0.100 ng/mL. The following concentration lev-ls of QC/MV samples were prepared: MVL (0.100 ngmL), MV1/QC1 (0.300 ng/mL), MV2/QC2 (3.00 ng/mL) and
V3/QC3 (30.0 ng/mL). Standards were prepared in bulk andispensed in 2.0 mL aliquots into properly labeled eppendorfubes and stored at −30 ◦C.
.6. Protein precipitation and two-step LLE procedure
Two evaluation tests were performed so as to assess themportance of ACN PP step, as well as the two-step LLE pro-
wopo
nd Biomedical Analysis 46 (2008) 771–779 773
edure followed in the current method. Initially, two separateample preparation procedures both of them including a two-tep LLE were conducted, while only one of them involved a PPtep. Matrix effects, as well as peak areas, were compared so aso evaluate the influence of the PP step in extracts cleanness andn method sensitivity, too. A second test was performed to evalu-te the importance of the two-step LLE procedure versus singleLE. Two sets of plasma samples were treated with 150 �L ofCN prior to LLE with the same MTBE volume. In the one
et of samples a second step of LLE was performed. Peak areasesulting from the two procedures were compared, so as for theensitivity increase to be assessed.
Both evaluation tests were performed in three concentra-ion levels for both SV and SVA (0.300, 3.00 and 30.0 ng/mL)n triplicate. Matrix effect profiles investigation for the wholehromatographic run time was performed by the post-columnnfusion protocol [14,15]. Briefly, blank sample extracts werenjected into the LC–MS/MS system by the simultaneous post-olumn infusion of a mixture of all analytes and IS at 10 ng/mLn mobile phase via the Harvard syringe pump. The flow rateas set at 30 �L/min while the syringe pump was connected inarallel via a PEEK tee.
.7. Sample preparation
All plasma samples were stored at −30 ◦C, thawed at roomemperature, vortex mixed and centrifuged at 3500 rpm for 5 mint 4 ◦C prior to analysis. Eppendorf tubes were decapped andlaced in 24-position microfuge racks on the deck of the Mul-iprobe, along with 2.2 mL 96-deepwell plates and two reagentroughs containing buffer reagent and IS solution. Multiproberansferred 50 �L of ammonium acetate buffer 100 mM adjustedt pH 4.5 as well as 50 �L of IS2 solution into the appropri-te wells of a 96-well plate with fixed tips. Then, 300 �L ofach of the calibration, QC and subject samples were trans-erred from the eppendorf tubes into the appropriate wells of96-well plate employing 1000 �L disposable conductive tips.he 96-well plates were removed from the Multiprobe and vor-
ex mixed for 5 min. Next, 150 �L of ACN were added from aeservoir on the Tomtec into all 96-wells of each plate, so asor PP to take place and once again plates were vortex mixedor 5 min. Then, 1100 �L of MTBE were transferred from aeservoir on the Tomtec containing the organic solvent into all6-wells of each plate and the plates after being covered withmat, were vortex mixed for 20 min, centrifuged for 15 min, at500 rpm and 4 ◦C and then frozen for 10 min at −30 ◦C. Afteremoving the mats carefully 900 �L of the supernatant organicayer, in 3 aliquots of 300 �L, were transferred from the orig-nal sample plates, into the respective positions of new 2.2 mL6-deepwell plates. Next, a second extraction was performed bydding another 1000 �L of MTBE to the plates containing thelasma samples by Tomtec and the same procedure of vortexixing and centrifugation was followed as before. The plates
ere then frozen for 30 min at −30 ◦C and another 900 �L ofrganic solvent were transferred from the plates to the same newlates used for organic extracts placement before. A total volumef about 1800 �L was placed at each well of the new 96-well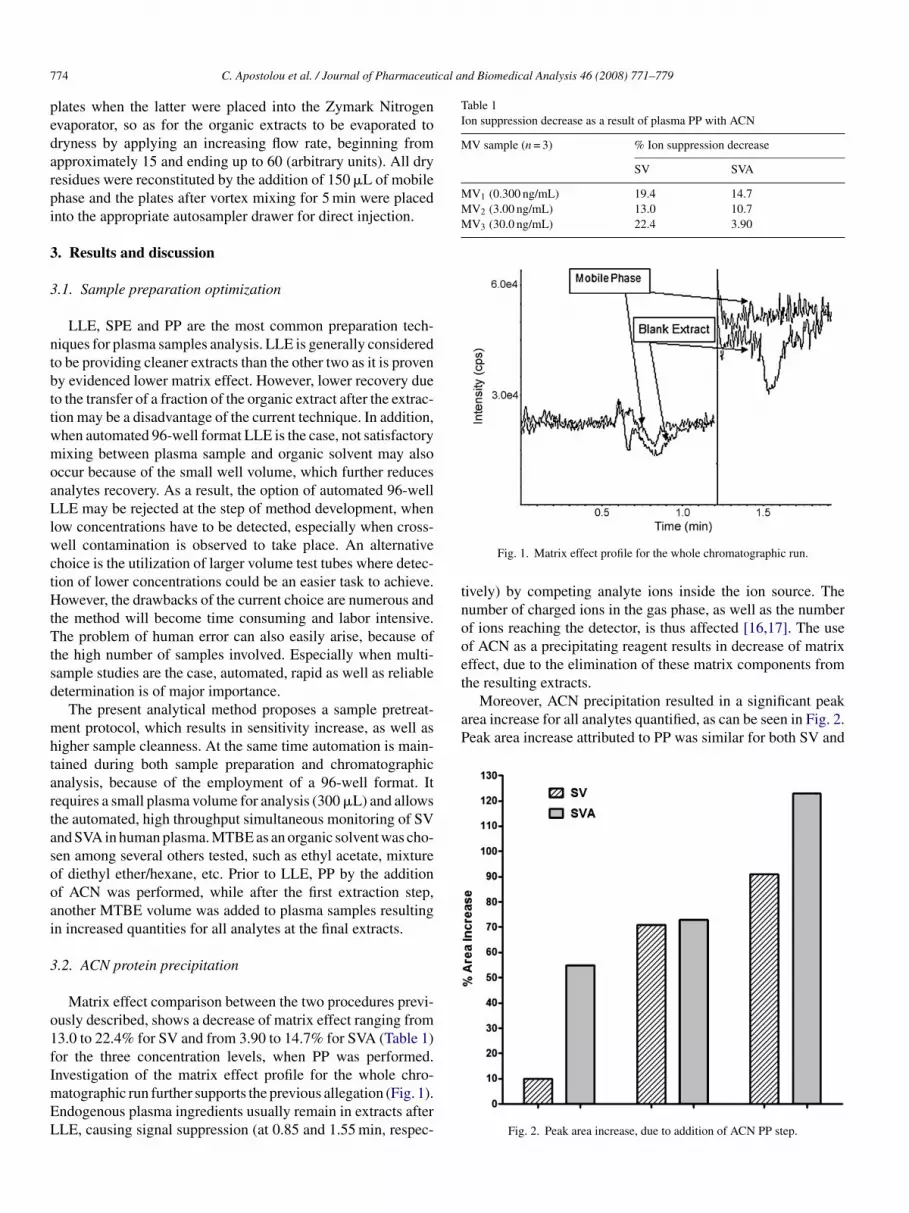
7 ical and Biomedical Analysis 46 (2008) 771–779
pedarpi
3
3
ntbttwmoaLlwctHtTtsd
mhtartasooai
3
o1fImEL
Table 1Ion suppression decrease as a result of plasma PP with ACN
MV sample (n = 3) % Ion suppression decrease
SV SVA
MV1 (0.300 ng/mL) 19.4 14.7MV2 (3.00 ng/mL) 13.0 10.7MV3 (30.0 ng/mL) 22.4 3.90
tnooethe resulting extracts.
Moreover, ACN precipitation resulted in a significant peakarea increase for all analytes quantified, as can be seen in Fig. 2.Peak area increase attributed to PP was similar for both SV and
74 C. Apostolou et al. / Journal of Pharmaceut
lates when the latter were placed into the Zymark Nitrogenvaporator, so as for the organic extracts to be evaporated toryness by applying an increasing flow rate, beginning frompproximately 15 and ending up to 60 (arbitrary units). All dryesidues were reconstituted by the addition of 150 �L of mobilehase and the plates after vortex mixing for 5 min were placednto the appropriate autosampler drawer for direct injection.
. Results and discussion
.1. Sample preparation optimization
LLE, SPE and PP are the most common preparation tech-iques for plasma samples analysis. LLE is generally consideredo be providing cleaner extracts than the other two as it is proveny evidenced lower matrix effect. However, lower recovery dueo the transfer of a fraction of the organic extract after the extrac-ion may be a disadvantage of the current technique. In addition,hen automated 96-well format LLE is the case, not satisfactoryixing between plasma sample and organic solvent may also
ccur because of the small well volume, which further reducesnalytes recovery. As a result, the option of automated 96-wellLE may be rejected at the step of method development, when
ow concentrations have to be detected, especially when cross-ell contamination is observed to take place. An alternative
hoice is the utilization of larger volume test tubes where detec-ion of lower concentrations could be an easier task to achieve.owever, the drawbacks of the current choice are numerous and
he method will become time consuming and labor intensive.he problem of human error can also easily arise, because of
he high number of samples involved. Especially when multi-ample studies are the case, automated, rapid as well as reliableetermination is of major importance.
The present analytical method proposes a sample pretreat-ent protocol, which results in sensitivity increase, as well as
igher sample cleanness. At the same time automation is main-ained during both sample preparation and chromatographicnalysis, because of the employment of a 96-well format. Itequires a small plasma volume for analysis (300 �L) and allowshe automated, high throughput simultaneous monitoring of SVnd SVA in human plasma. MTBE as an organic solvent was cho-en among several others tested, such as ethyl acetate, mixturef diethyl ether/hexane, etc. Prior to LLE, PP by the additionf ACN was performed, while after the first extraction step,nother MTBE volume was added to plasma samples resultingn increased quantities for all analytes at the final extracts.
.2. ACN protein precipitation
Matrix effect comparison between the two procedures previ-usly described, shows a decrease of matrix effect ranging from3.0 to 22.4% for SV and from 3.90 to 14.7% for SVA (Table 1)or the three concentration levels, when PP was performed.
nvestigation of the matrix effect profile for the whole chro-atographic run further supports the previous allegation (Fig. 1).ndogenous plasma ingredients usually remain in extracts afterLE, causing signal suppression (at 0.85 and 1.55 min, respec-Fig. 1. Matrix effect profile for the whole chromatographic run.
ively) by competing analyte ions inside the ion source. Theumber of charged ions in the gas phase, as well as the numberf ions reaching the detector, is thus affected [16,17]. The usef ACN as a precipitating reagent results in decrease of matrixffect, due to the elimination of these matrix components from
Fig. 2. Peak area increase, due to addition of ACN PP step.

ical a
SiipmsfiAattrpM
rmwrIft
3
wtooai9cos
F
3
ttrotwntcbgpt9yrorp
ttppfsrwsa
C. Apostolou et al. / Journal of Pharmaceut
VA, increasing for higher concentration samples and reach-ng as much as 91% for SV and 123% for SVA. This increasen sensitivity is primarily due to analytes displacement fromlasma proteins and thus facilitating the contact between analyteolecules with the organic solvent. In conclusion, ion suppres-
ion decrease, due to lower matrix components concentration innal extracts, is accounted for the sensitivity increase. SeveralCN volumes (120, 150, 200, 250 �L) were tested in order tochieve the highest peak area, with 150 �L volume providingo be the best. In addition, the specific ACN volume eliminatedhe irregular emulsion observed after organic extracts evapo-ation, when MTBE is employed for LLE of analytes fromlasma. Effective mixing of ACN with MTBE was achieved asTBE/ACN ratio remained > 3 for both extraction steps [18].PP reagent is often used as a dilution solvent for IS, so as to
educe the number of reagent additions. However, in the presentethod ACN addition was preferred to take place as an extra stepithin the sample preparation procedure after IS addition. The
eason for this choice lies at the very precipitating nature of ACN.S addition prior to protein precipitation ensures a more satis-ying binding of IS molecules with plasma proteins, simulatinghe binding of proteins with analytes in real human plasma.
.3. Two-step extraction
Plasma samples at three concentration levels were treatedith 150 �L of ACN in triplicate in two parallel procedures: in
he first one a single LLE step took place, while in the secondne, an additional LLE step was performed with MTBE being therganic extraction solvent. SV and SVA peak areas increased inll three concentration levels, as can be seen in Fig. 3. Peak areancrease was similar for both analytes and varied from 44.0 to
5.6% for SV and from 45.6 to 92.9% for SVA for the three con-entration levels. The phenomenon of more effective extractionf the analytes from plasma after adding the second extractiontep is mainly responsible for the increase in peak areas.ig. 3. Peak area increase due to two-step LLE as opposed to single LLE.
scidip
mapwaosa3
3
dr[f
nd Biomedical Analysis 46 (2008) 771–779 775
.4. Automation and high throughput of procedure
The employment of a 96-well format was the most impor-ant step to achieve a high degree of automation. All liquidransfers including (i) working and standards preparation, (ii)eagents and plasma addition, (iii) organic solvent addition, (iv)rganic extracts transfer and (v) evaporated extracts reconstitu-ion were performed by the use of two robotic liquid handlingorkstations, Multiprobe and Tomtec. Moreover, the simulta-eous evaporation of 192 samples (2 plates) further reducedhe sample preparation time. As a result, 2000 plasma samplesould be analyzed in only 5 days, with chromatographic analysiseing the most time-consuming step, despite the short chromato-raphic run time of the method. In addition, automation of therocedure reduced the human agent involvement, minimizinghis way the possibility of human error. Therefore, the automated6-well format is extremely important when multi samples anal-ses are the case. On the contrary, the use of 96-well plates couldesult in deficient method sensitivity, especially when low limitsf quantitation are involved, due to volume limitations. For thiseason, test tubes are some times preferred instead of 96-welllates.
The current method enabled the increase of method sensi-ivity, while maintaining at the same time the 96-well formathat significantly reduced sample preparation time. Despite theerformance of the two subsequent LLE steps, the overall sam-le preparation time is estimated to be half of the respectiveor the same plasma and organic solvent volumes in a onetep LLE procedure in test tubes (2 instead of 4 h for prepa-ation of 96 samples). The approach of ACN PP combinedith the two-step LLE was proven to result in both cleaner
amples and significantly increased method sensitivity for SVnd SVA. This sample preparation approach could generallyerve as a model in method development, when low analyteoncentrations are to be quantified and procedure automations desired as well. It could also be applied to LV and LVAetermination, with SV and SVA being the ISs, since areancrease was also noticed in LV and LVA chromatographiceaks.
As for the chromatographic profile of the method, it was opti-ized among several columns (CN, C18, C8), buffers (formic
cid, ammonium acetate), as well as organic solvent/buffer pro-ortions tested. Retention times for SVA, LVA, SV and LVere about 0.98, 0.86, 1.61 and 1.39 min respectively, withtotal run time of 1.9 min (Figs. 4 and 5). To the best of
ur knowledge, this is the shortest chromatographic run timeo far reported for SV and SVA simultaneous quantification,llowing the chromatographic analysis of 96 samples in onlyh.
.5. ESI–APCI comparison
Both ESI and APCI sources were utilized for SV and SVA
etermination during method development phase. APCI waseported to have similar sensitivity to ESI for the current analytes9]. However, ESI was proven to be significantly more sensitiveor both SV and SVA, compared to APCI. Fig. 6 displays the Q1
776 C. Apostolou et al. / Journal of Pharmaceutical and Biomedical Analysis 46 (2008) 771–779
Fs
sieIfiwL
sg
Fp
ig. 4. Representative MRM SVA–LVA chromatogram obtained from a MVL
ample.
cans for SV and LV with both ion sources. Parent SV and LVons as well as main ion peaks appear in both ion spectra. How-ver, ESI sensitivity for the specific analytes was 3fold higher.ncreased ESI as opposed to APCI sensitivity was further con-rmed by daughter ions intensity optimization procedure. ESIas proven to be equally more sensitive than APCI for SVA and
VA determination as well.As far as ESI source optimization is concerned, several factorsuch as collision energy (CE), declustering potential, collisionas, curtain gas, ion source temperature and others were opti-
ig. 5. Representative MRM SV–LV chromatogram obtained from a MVL sam-le.
mwttecS
Fig. 6. SV–LV Q1 scans with ESI and APCI sources.
ized so as to maximize method sensitivity. CE optimizationas proven to be the critical step for both signal maximiza-
ion, as well as daughter ions selection. Figs. 7 and 8 displayhe dependence of the three principal daughter ions intensity for
ach analyte, from CE value. The current optimization step wasritical for the selection of the final MRM transitions for SV andVA.Fig. 7. ESI collision energy optimization for main SV daughter ions.

C. Apostolou et al. / Journal of Pharmaceutical a
3
oFit2dawiosfdc
fiTre9c(
root(sSwdv
emrsfttomf
wiilc
3
epsapum
TA
S
S
Fig. 8. ESI collision energy optimization for main SVA daughter ions.
.6. Standard curve and method validation
The method was proven to be highly sensitive with a limitf quantification (LOQ) of 0.100 ng/mL for both SV and SVA.ull validation of the current analytical method was performed
n our laboratory, according to US Food and Drug Administra-ion (FDA) bioanalytical method validaton guidance (CDER,001) [19]. A calibration curve, containing 9 non-zero stan-ards ranging from 0.100 to 40.0 ng/mL for each analyte (SVnd SVA) was prepared for each analytical run. This rangeas suitable for a pharmacokinetic study after per os admin-
stration of a 40 or 80 mg tablet of SV. Peak area ratiosf SV and SVA to the respective IS were used for regres-ion analysis. The calculated concentrations were determinedrom linear regression using 1/x2 weighting. Individual stan-ard curve data from 5 analytical runs met all of the presetriteria.
The absence of chromatographic interferences was certi-ed by the analysis of a zero and a blank plasma samples.he mean regression coefficient (R-squared) for the five
uns was 0.99994 for SV and 0.9996 for SVA, average lin-
ar slope was 3.47 × 10⁻³ (Sa = 1.00 × 10⁻⁵) for SV and.48 × 10−3 (Sa = 6.70 × 10⁻⁵) for SVA, while average inter-ept was 1.44 × 10⁻³ (Sb = 1.50 × 10⁻⁴) and 3.76 × 10⁻³Sb = 1.04 × 10⁻³) for SV and SVA, respectively.
pawp
able 2NOVA results for lack of fit
Degrees of freedom Sum of squares
VError 40 4.73 × 10⁻⁵
Lack of fit 7 1.43 × 10⁻⁶
Pure error 33 4.59 × 10⁻⁵
VAError 43 2.91 × 10⁻⁴
Lack of fit 7 1.68 × 10⁻⁶
Pure error 36 2.90 × 10⁻⁴
nd Biomedical Analysis 46 (2008) 771–779 777
However, before applying a statistical hypothesis test to theegression line coefficients it is essential to check whether “lackf fit” exists. This test is based on the analysis of the variancef the residuals from the regression line [20,21]. The ANOVAable (Table 2) divides the total variability of the residuals in yy = ax + b) into two pieces: (i) a pure error piece, which mea-ures the variability between replicate values of y at the same x.ince the variability among these replicates has nothing to doith the fitted model, it is a “pure” estimate of the noise in theata; (ii) a lack-of-fit piece, which estimates groups of replicatesariation from the fitted line.
The table also shows the results of an F test comparing thestimated lack of fit to pure error through F ratio = lack-of-fitean square/pure error mean square. These mean squares values
esult from dividing the sum of squares due to lack of fit and theum of squares due to pure error by the corresponding degrees ofreedom. Of primary interest is the P-value associated with theest. Small values of P (<0.05) indicate significant lack of fit athe 5% significance level. From P values listed in the table, it isbvious that there is no significant lack of fit and that the currentethod was capable of producing satisfactory concentration data
or SV and SVA standard samples.As far as accuracy and precision are concerned, all values
ere within the acceptable range. Data for accuracy and bothntra and inter run precision (expressed as CV %) are presentedn Table 3. Extraction recovery was examined at 3 concentrationevels for SV and SVA and was estimated to be >85% in allases.
.7. Stability data
As part of the method validation, data were also generated tonsure that SV and SVA were stable at distinct timing and tem-erature conditions, as well as the stability of the analytes in thetock and working solutions. Also, interconversion between SVnd SVA was evaluated for the current protocol. Plasma sam-les containing two concentration levels of SV and SVA weresed for the stability experiments, low-medium (Sl) 1 ng/mL andedium-high (Sh) 10 ng/mL.Initially, in order to assess autosampler stability, three sam-
les of each of the two concentration levels (Sl and Sh) remainedt autosampler temperature (10 ◦C) for 30 h, a period of timehich was 6 h longer than the respective required for the com-letion of the analysis of a 4-plates batch. Another set of samples
Mean square F ratio Probability level
1.18 × 10⁻⁶
2.04 × 10⁻⁷ 0.15 0.991.39 × 10−6
6.78 × 10⁻⁶
2.40 × 10⁻⁷ 0.030 1.008.05 × 10−6

778 C. Apostolou et al. / Journal of Pharmaceutical and Biomedical Analysis 46 (2008) 771–779
Table 3Intra- and inter-assay accuracy and precision results
MV sample % Intra-run accuracya % Inter-run accuracyb Intra-run precisionc (%CV) Inter-run precisionb (%CV)
SV SVA SV SVA SV SVA SV SVA
MVL (0.100 ng/mL) 105 91.8 103 98.1 16 14 3.3 15MV1 (0.300 ng/mL) 95.1 105 104 10 10 13 11 2.6MV2 (3.00 ng/mL) 105 104 102 101.8 7.9 5.4 3.7 5.5MV3 (30.0 ng/mL) 112 109 103 104.4 4.6 4.4 5.1 5.7
a (n = 5), expressed as 100 × (mean calculated concentration)/(nominal concentration).
aat
dbtcf2
sttwltsbbdtp
tpcamcmpctIaloritctp
FS
sscl
3
stbcarioS
4
b Values obtained from all 5 runs (n = 30).c (n = 5).
t the two concentration levels was freshly prepared. Mean vari-nce % between the results for the two sets of samples was lesshan 2.5 for both analytes.
To evaluate freeze/thaw stability, a freeze/thaw cycle wasefined as the storage of Sl and Sh samples at −30 ◦C followedy thawing at room temperature. Samples were analyzed afterhe fourth cycle, along with fresh reference samples of the sameoncentration. The results (back-calculated concentrations) ofour freeze-thaw cycles as well as fresh ones varied less than%, from their nominal values.
Short-term stability was assessed by the following procedure:ix aliquots of Sl and Sh were prepared and maintained at roomemperature for 1 h, period of time which exceeds the normalime that samples remain at room temperature, before analysis,ithout the addition of ammonium acetate buffer. To evaluate
ong-term stability, aliquots of the two sample-types were ini-ially frozen at −30 ◦C for 90 days, thawed and analyzed. Bothhort and long term stability proved that the mean variation waselow 10% (data not shown). Stock and working solutions sta-ility (stored at 4 ◦C) was estimated by comparing fresh and oldilutions in mobile phase. The results (data not shown) provedhat all working and stock solution remained stable for the timeeriod being stored.
Finally, interconversion between SV and SVA is known to beaking place by hydrolysis of SV and lactonization of SVA. Thishenomenon may cause increased variance in accuracy and pre-ision of the method and depends by several parameters suchs temperature, pH, storage condition and sample extractionethod. As Yang et al. reported, buffer pH highly influences the
urrent interconversion procedure, with pH 4.5 being the opti-al value for minimum interconversion rate [12]. The specific
H is applied to both sample preparation and chromatographiconditions. After thawing and being vortexed, samples wereransferred to plate wells were buffer reagent was already placed.nterconversion rate between SV and SVA was investigated byllowing two sets of samples in triplicate and with the sameow-medium and medium-high concentration levels as in previ-us stability tests, to remain at room temperature for 1 and 3 hespectively, after thawing and before being mixed with buffernside plate wells. The current samples were as well divided in
wo more sets, one of which contained SV only while the otherontained SVA only. All samples described above, along withhe equivalent fresh ones were treated according to the methodrotocol developed. Automated LLE is known to be the lessLip
ig. 9. Mean plasma concentration–time curves from 43 subjects for SV andVA.
usceptible to interconversion between SV and SVA among allample preparation techniques [13]. In the current method, inter-onversion of SV to SVA as well as SVA to SV was found to beess than 0.5 % for both concentration levels.
.8. Application to a pharmacokinetic study
The present method was applied to the analysis of plasmaamples obtained from 43 healthy volunteers after the adminis-ration of a single dose of 80 mg tablet containing SV, as part of aioequivalence study. The study was harmonized with the ethi-al principles that have their origins in the declaration of helsinkind it was in accordance with the good clinical practice (GLP)equirements. The concentration—time profile of SV and SVAn these volunteers displayed in Fig. 9, indicates the suitabilityf the proposed method for pharmacokinetic studies of SV andVA in human plasma.
. Conclusions
We have presented a highly automated 96-well PP two-stepLE, LC–MS/MS method for the quantification of SV and SVA
n human plasma. The current method is advantageous com-ared to the existed ones in terms of sensitivity, extract cleanness

ical a
apawrmptTasTmphs
R
[
[
[
[
[
[
[
[[
[19] Guidance for Industry: Bioanalytical Method Validation, US Department
C. Apostolou et al. / Journal of Pharmaceut
nd matrix effect minimization, due to the employment of arotein precipitation and a two-step LLE. The employment of96-well format combined with two liquid-handling roboticorkstations simplified and minimized the time of sample prepa-
ation, automating the whole procedure. Moreover, the currentethod includes the shortest chromatographic runtime so far
roposed for SV and SVA quantification, as well as a rela-ively small volume of human plasma (300 �L) for analysis.he method was proven to be highly sensitive, accurate, precisend specific and was applied to a bioequivalence study (∼2000amples), which was completed in a very short period of time.he current sample preparation protocol could serve as a modelethod development for the analysis of low concentration sam-
les, when at the same time automation and high throughout areighly important, such as bioequivalence or other multi-sampletudies.
eferences
[1] W.F. Hoffman, A.W. Alberts, P.S. Anderson, R.L. Smith, A.K. Willard, J.Med. Chem. 29 (1986) 849–852.
[2] S. Vickers, C.A. Duncan, I.W. Chen, A. Rosegay, D.E. Duggan, DrugMetab. Dispos. 18 (1990) 138–145.
[3] S. Vickers, C.A. Duncan, K.P. Vyas, P.H. Kari, B. Arison, S.R. Prakash,H.G. Ramjit, S.M. Pitzenberger, G. Stokker, D.E. Duggan, Drug Metab.Dispos. 18 (1990) 476–483.
[4] T. Takano, S. Abe, S. Hata, Biomed. Environ. Mass Spectrom. 19 (1990)577–586.
[[
nd Biomedical Analysis 46 (2008) 771–779 779
[5] M.J. Morris, J.D. Gilbert, J.Y.K. Hsieh, B.K. Matuszewski, H.G.Ramjit, W.F. Bayne, Biomed. Environ. Mass Spectrom. 22 (1993) 1–8.
[6] L. Wang, M. Asgharnjard, J. Pharm. Biomed. Anal. 21 (2000) 1243–1248.[7] G. Carlucci, P. Mazzeo, L. Biordi, M. Bologna, J. Pharm. Biomed. Anal.
10 (1992) 693–697.[8] H. Yang, Y. Feng, Y. Luan, J. Chromatogr. B 785 (2003) 369–375.[9] B. Barrett, J. Huclova, V. Borek-Dohalsky, B. Nemec, I. Jelinek, J. Pharm.
Biomed. Anal. 41 (2006) 517–526.10] J.J. Zhao, I.H. Xie, A.Y. Yang, B.R. Roadcap, J.D. Rogers, J. Mass Spec-
trom. 35 (2000) 1133–1143.11] M. Jemal, Z. Ouyang, M.L. Powell, J. Pharm. Biomed. Anal. 23 (2000)
323–340.12] A.Y. Yang, L. Sun, D.G. Musson, J.J. Zhao, J. Pharm. Biomed. Anal. 38
(2005) 521–527.13] N. Zhang, A. Yang, J.D. Rogers, J.J. Zhao, J. Pharm. Biomed. Anal. 34
(2004) 175–187.14] F.L. Sauvage, J.M. Gaulier, G. Lachatre, P. Marquet, Ther. Drug Monit. 28
(2006) 123–130.15] C. Apostolou, Y. Dotsikas, C. Kousoulos, Y.L. Loukas, J. Chromatogr. B
848 (2007) 239–244.16] R. Bonfiglio, R.C. King, T.V. Olah, K. Merkle, Rapid Commun. Mass
Spectrom. 13 (1999) 1175–1185.17] T.M. Annesley, Clin. Chem. 49 (2003) 1041–1044.18] C. Kousoulos, G. Tsatsou, C. Apostolou, Y. Dotsikas, Y.L. Loukas, Anal.
Bioanal. Chem. 384 (2006) 199–207.
of Health and Human Services, Food and Drug Administration, Center forDrug Evaluation and Research (CDER), Rockville, MD, 2001.
20] A. Martınez, J. Riu, F.X. Rius, Chemom. Intell. Lab. Syst. 54 (2000) 61–73.21] M. Analla, Agric. Syst. 57 (1998) 115–119.


