Embed Size (px)
Citation preview

An Integrative Model of the Cardiac Ventricular Myocyte IncorporatingLocal Control of Ca2� Release
Joseph L. Greenstein and Raimond L. WinslowDepartment of Biomedical Engineering and The Whitaker Biomedical Engineering Institute, Center for Computational Medicine andBiology, The Johns Hopkins University School of Medicine and Whiting School of Engineering, Baltimore, Maryland 21205 USA
ABSTRACT The local control theory of excitation-contraction (EC) coupling in cardiac muscle asserts that L-type Ca2�
current tightly controls Ca2� release from the sarcoplasmic reticulum (SR) via local interaction of closely apposed L-typeCa2� channels (LCCs) and ryanodine receptors (RyRs). These local interactions give rise to smoothly graded Ca2�-induced Ca2� release (CICR), which exhibits high gain. In this study we present a biophysically detailed model of the normalcanine ventricular myocyte that conforms to local control theory. The model formulation incorporates details of microscopicEC coupling properties in the form of Ca2� release units (CaRUs) in which individual sarcolemmal LCCs interact in astochastic manner with nearby RyRs in localized regions where junctional SR membrane and transverse-tubular membraneare in close proximity. The CaRUs are embedded within and interact with the global systems of the myocyte describing ionicand membrane pump/exchanger currents, SR Ca2� uptake, and time-varying cytosolic ion concentrations to form a modelof the cardiac action potential (AP). The model can reproduce both the detailed properties of EC coupling, such as variablegain and graded SR Ca2� release, and whole-cell phenomena, such as modulation of AP duration by SR Ca2� release.Simulations indicate that the local control paradigm predicts stable APs when the L-type Ca2� current is adjusted in accordwith the balance between voltage- and Ca2�-dependent inactivation processes as measured experimentally, a scenariowhere common pool models become unstable. The local control myocyte model provides a means for studying theinterrelationship between microscopic and macroscopic behaviors in a manner that would not be possible in experiments.
INTRODUCTION
Understanding of the mechanisms by which Ca2� influx viavoltage-gated L-type Ca2� channels (LCCs) triggers Ca2�
release from the junctional sarcoplasmic reticulum (SR) hasadvanced tremendously with the development of experi-mental techniques for simultaneous measurement of LCCcurrents and Ca2� transients (Wier et al., 1994; Cannell etal., 1987; Nabauer et al., 1989), and detection of local Ca2�
transients (Cannell et al., 1984; Lopez-Lopez et al., 1994,1995; Cheng et al., 1995). This has given rise to the localcontrol theory of excitation-contraction (EC) coupling(Stern, 1992; Bers, 1993; Wier et al., 1994; Sham, 1997),which asserts that opening of an individual LCC located inthe transverse (T) tubular membrane triggers Ca2� releasefrom a small cluster of SR Ca2� release channels known asryanodine receptors (RyRs) located in the closely apposedjunctional SR membrane (Fabiato, 1985; Cheng et al., 1993;Cannell et al., 1995; Santana et al., 1996, Sham et al., 1995;Collier et al., 1999; Wang et al., 2001). Tight regulation ofthis Ca2�-induced Ca2� release (CICR) is made possible bythe fact that LCCs and RyRs are sensitive to local ratherthan global Ca2� levels. The local control theory also as-serts that graded control of SR Ca2� release, in which Ca2�
release from junctional SR is a smooth, increasing functionof Ca2� influx, is achieved by statistical recruitment of
elementary SR Ca2� release events by trigger Ca2� enteringvia single LCCs (Stern, 1992; Beuckelmann and Wier,1988; Wier and Balke, 1999). In addition to triggering SRCa2� release, increases of local Ca2� promote Ca2�-depen-dent inactivation of LCCs (Peterson et al., 1999; Bers andPerez-Reyes, 1999). Because L-type Ca2� current (ICaL)plays a primary role in determining action potential (AP)shape and duration, local control theory therefore impliesthat the microscopic properties of Ca2� release are likely tocontribute to macroscopic electrophysiological responses ofthe cardiac myocyte.
Several computational models have been developed toinvestigate properties of local Ca2� release at the level ofthe cardiac dyad (Rice et al., 1999; Stern et al., 1999;Langer and Peskoff, 1996; Cannell and Soeller, 1997;Soeller and Cannell, 1997). Each of these model formula-tions incorporates 1) one or a few LCCs; 2) a cluster ofRyRs; 3) the dyadic volume in which the events of CICRoccur; and 4) anionic binding sites, which buffer Ca2�. Insome of these models, detailed descriptions of diffusion andCa2� binding in the dyadic cleft are used to demonstrate theeffects of geometry, LCC, and RyR properties and organi-zation, and surface charge on the spatiotemporal profile ofCa2� within the dyad, and hence on the efficiency of CICR(Langer and Peskoff, 1996; Cannell and Soeller, 1997;Soeller and Cannell, 1997). Stern et al. (1999) have simu-lated CICR stochastically using numerous RyR schemes todemonstrate conditions necessary for stability of EC cou-pling, and have suggested a possible role for allostericinteractions between RyRs. The functional release unitmodel of Rice et al. (1999) has demonstrated that local
Submitted December 14, 2001, and accepted for publication July 26, 2002.
Address reprint requests to Raimond L. Winslow, Clark Hall, Room 201B,3400 N. Charles St., Baltimore, MD 21218. Tel.: 410-516-5417; Fax:410-516-5294; E-mail: [email protected].
© 2002 by the Biophysical Society
0006-3495/02/12/2918/28 $2.00
2918 Biophysical Journal Volume 83 December 2002 2918–2945

control of CICR (i.e., graded SR release and high ECcoupling gain) can be obtained without including com-putationally intensive descriptions of Ca2� gradientswithin the dyadic space. Isolated EC coupling modelssuch as these, however, cannot elucidate the nature of theinteraction between local events of CICR and integrativecellular behavior.
Existing models of the cardiac ventricular myocyte do notincorporate mechanisms of local control of SR Ca2� release(Winslow et al., 1999; Jafri et al., 1998; Luo and Rudy,1994; Priebe and Beuckelmann, 1998; Pandit et al., 2001;Noble et al., 1998; Fox et al., 2002). Rather, in these modelsall Ca2� influx through sarcolemmal LCCs and Ca2� re-lease flux through RyRs is directed into a common Ca2�
compartment. As defined by Stern (1992), a “commonpool” model is one in which trigger Ca2� reaches the SR viathe same cytosolic Ca2� pool into which SR Ca2� is re-leased, where activation of the SR release mechanism iscontrolled by Ca2� concentration in this cytosolic pool. Theresult of this physical arrangement is that once RyR Ca2�
release is initiated, the resulting increase of Ca2� concen-tration in the common pool stimulates regenerative, all-or-none rather than graded Ca2� release (Stern, 1992). This“latch up” of Ca2� release can be avoided, and graded SRrelease can be achieved in a model of EC coupling byformulating Ca2� release flux as an explicit function ofsarcolemmal Ca2� influx (Priebe and Beuckelmann, 1998;Luo and Rudy, 1994; Faber and Rudy, 2000; Fox et al.,2002). Models of this type are not common pool modelsbased on the definition given by Stern (1992), and do notsuffer an inability to stably exhibit both high gain andgraded SR Ca2� release. These phenomenological formula-tions, however, lack mechanistic descriptions of the pro-cesses that are the underlying basis of CICR. Both commonpool models and models with phenomenological Ca2� re-lease mechanisms are therefore inadequate for the study ofhow detailed microscopic features of EC coupling have animpact on macroscopic electrophysiological properties ofthe myocyte, such as the whole-cell Ca2� transient and APmorphology.
In this study, we develop a comprehensive model of theventricular myocyte based on the theory of local control ofSR Ca2� release. This is accomplished by updating andextending the canine ventricular myocyte model of Win-slow et al. (1999) to include a population of dyadic Ca2�
release units. Local interactions of individual sarcolemmalLCCs with nearby RyRs in the JSR membrane are simulatedstochastically, with these local simulations embeddedwithin the numerical integration of the differential equationsdescribing ionic and membrane pump/exchanger currents,SR Ca2� cycling, and time-varying cytosolic ion concen-trations. We demonstrate that this model faithfully repro-duces experimentally observed features of LCC voltage-and Ca2�-dependent gating (Linz and Meyer, 1998; Sipidoet al., 1995; Hobai and O’Rourke, 2001; Sham et al., 1995;
Sham, 1997; Rose et al., 1992; Herzig et al., 1993), micro-scopic EC coupling (Wier et al., 1994; Sham et al., 1998;Song et al., 2001), and macroscopic whole-cell AP andCa2� cycling properties (O’Rourke et al., 1999). Simula-tions demonstrate that local control is an essential propertyfor stability of APs when the LCC inactivation processdepends more strongly on local Ca2� than on membranepotential, a scenario that is supported by experiments (Linzand Meyer, 1998; Peterson et al., 1999, 2000), but whichcannot be implemented successfully using a common poolmodel where the inherent positive feedback of rising Ca2�
levels on RyR activation is intact. Modeling supports thehypothesis that the robust bidirectional interaction betweenCa2� dynamics and membrane potential in the local controlenvironment plays a central role in establishing the integra-tive electrophysiological properties of the cardiac myocyte.Preliminary results from this study were presented previ-ously in abstract form (Greenstein and Winslow, 2001a,2001b).
METHODS
The Ca2� release unit model
We seek to define a model of local control of SR Ca2� release that capturesfundamental properties such as graded release, while at the same time iscomputationally tractable such that it may be incorporated into an integra-tive model of the ventricular myocyte. Models describing diffusion of Ca2�
within the dyadic space, detailed dyad geometry, and surface charge effects(Cannell and Soeller, 1997; Soeller and Cannell, 1997; Langer and Peskoff,1996) are too computationally demanding for this application. As a com-promise between structural and biophysical detail versus tractability, a“minimal model” of local control of Ca2� release, referred to as the Ca2�
release unit (CaRU) model, is implemented. A full mathematical descrip-tion of the stochastic state models, dynamical equations, parameters, andinitial conditions defining the myocyte model are given in Appendix I.
Fig. 1 A shows a schematic of the CaRU model based in part on theprevious model of Rice et al. (1999). The CaRU model is intended tomimic the properties of Ca2� sparks in the T-tubule/SR (T-SR) junction.Ca2� sparks are elementary SR Ca2� release events arising from a clusterof RyRs (Cheng et al., 1993). Fig. 1 B shows a cross-section of the modelT-SR cleft, which is divided into four individual dyadic subspace com-partments arranged on a 2 � 2 grid. Each subspace (SS) compartmentcontains a single LCC and 5 RyRs in its JSR and sarcolemmal membranes,respectively. All 20 RyRs in the CaRU (5 RyRs/SS � 4 SSs/CaRU � 20RyRs/CaRU) communicate with a single local JSR volume. The 5:1RyR/LCC stoichiometry is chosen to be consistent with recent estimatesindicating that a single LCC typically triggers the opening of four to sixRyRs (Wang et al., 2001). Each subspace is treated as a single compart-ment in which Ca2� concentration is uniform; however, Ca2� may diffusepassively to neighboring subspaces within the same CaRU. The rate ofCa2� transfer between two adjacent subspace compartments is assumed tobe 10-fold slower than that from subspace to cytosol. This yields aninter-subspace transfer rate (riss) of 20 ms�1, which corresponds to adiffusion coefficient of �3.3 � 10�6 cm2 s�1 when the assumed height ofthe model subspace is 12 nm. This value is similar to estimates for Ca2�
diffusion in the presence of RyR “feet” structures in the restrictive dyadicsubspace volume (Soeller and Cannell, 1997). The division of the CaRUinto four subunits allows for the possibility that an LCC may trigger Ca2�
release in adjacent subspaces (i.e., RyR recruitment) under conditionswhere unitary LCC currents are large. The existence of communication
Local Control Myocyte Model 2919
Biophysical Journal 83(6) 2918–2945

among adjacent subspace volumes is supported by the findings that Ca2�
release sites can be coherent over distances larger than that occupied by asingle release site (Parker et al., 1996), and that the mean amplitude ofCa2� spikes, local SR Ca2� release events that consist of one or a few Ca2�
sparks (Song et al., 1998), exhibits a bell-shaped voltage dependence,indicating synchronization of multiple Ca2� release events within a T-SRjunction (Song et al., 2001). The choice of four subunits allows forsemi-quantitative description of dyadic Ca2� diffusion while retainingminimal model complexity.
One of the bases for local control of SR Ca2� release is the structuralseparation of T-SR clefts at the ends of sarcomeres (i.e., RyR clusters arephysically separated) (Franzini-Armstrong et al., 1999). Each CaRU istherefore simulated independently in accord with this observation. Uponactivation of RyRs, subspace Ca2� concentration will become elevated.This Ca2� will freely diffuse to either adjacent subspace compartments(Jiss) or into the cytosol (Jxfer) along its concentration gradient. The local
JSR compartment is refilled via passive diffusion of Ca2� from the net-work SR (NSR) compartment (Jtr).
The model for the L-type Ca2� channel is identical in structure to themode-switching model developed previously by Jafri et al. (1998). Thefollowing modifications have been made to model parameters: 1) voltage-dependence of forward and reverse activation transition rates (� and �,respectively) have been adjusted based on recent measurements of ICaL
obtained in canine midmyocardial cells (Hobai and O’Rourke, 2001); 2)voltage-independent transition rates into open states f and f� have beenadjusted to yield peak open probability in the range of 5–15% in responseto a maximally activating voltage clamp stimulus (Rose et al., 1992; Herziget al., 1993; Handrock et al., 1998); 3) transition rates between the normalgating mode (Mode Normal) and the Ca2�-inactivation mode (Mode Ca) �and � are adjusted to enhance Ca2�-dependent inactivation, while thevoltage-dependent steady-state inactivation function (y�) is modified tohave an asymptotic value of 0.6 for large positive membrane potentials.The latter is based on the observation that there is a small sustainedcomponent of Ca2� current in response to voltage clamp stimuli in canineventricular cells (Kaab et al., 1996; Tseng et al., 1987), and that Ca2�-dependent inactivation dominates the ICaL inactivation process while volt-age-dependent inactivation is relatively weak and incomplete (Linz andMeyer, 1998; Hadley and Hume, 1987; Peterson et al., 1999, 2000); 4)permeation through the LCC is described by the Goldman-Hodgkin-Katzcurrent equation as originally presented by Luo and Rudy (Luo and Rudy,1994) where Ca2� concentration at the inner mouth of the channel isassumed to be equivalent to Ca2� concentration of the adjacent subspace,rather than assuming it is constant (Jafri et al., 1998; Rice et al., 1999); 5)LCC permeability (PCaL) is adjusted to a value of 9.13 � 10�13 cm3 s�1,which yields a single channel slope conductance of 8.2 pS and a unitarycurrent of ��0.12 pA at 0 mV (see Fig. 2 G) (Rose et al., 1992; Yue andMarban, 1990).
Whole-cell Ca2� current can be described as a function of the totalnumber of channels (NLCC), the single channel current magnitude (i), theopen probability (po), and the fraction of channels that are available foractivation (factive, i.e., in a phosphorylated mode), where ICaL � NLCC �i � po � factive (Handrock et al., 1998). Under conditions where factive
remains constant, ICaL � Nactive � i � po, where Nactive � NLCC � factive
is constant. As described above, single channel parameters are based onexperimentally obtained constraints on both i and po. Nactive is thereforechosen such that the amplitude of the ensemble current summed over allLCCs corresponds to whole-cell measurements in canine myocytes (Hobaiand O’Rourke, 2001). This approach yields a value of 50,000 for Nactive,which agrees with experimental estimates of LCC density (Rose et al.,1992; McDonald et al., 1986), and which corresponds to 12,500 CaRUs(NCaRU). The process of slow cycling between active and inactive states isnot included in this model; rather only active LCCs are simulated.
Each RyR channel is represented by the model developed by Keizer andSmith (1998) and later modified by Rice et al. (1999). This model wasoriginally designed to describe the property of RyR adaptation, a slowspontaneous decrease in open probability that has been observed to occurafter activation by a step increase in Ca2� when measured in singlechannels reconstituted in lipid bilayers (Gyorke and Fill, 1993). A channelin the adapted state can be reactivated by an additional increase in Ca2�.In contrast, the findings of Sham et al. (1998) suggest that RyR inactivationinto an absolute refractory state occurs in vivo during EC coupling. It isdifficult to incorporate single channel RyR data obtained in vitro intomodels of EC coupling due to the lack of quantitative information regard-ing in vivo regulation by accessory proteins and other ligands. Therefore,our approach has been to constrain RyR model parameters based onexperimentally obtained properties of EC coupling (Song et al., 2001; Wieret al., 1994), without an explicit attempt to retain the property of adapta-tion. The Ca2� dependence of the RyR model state transition rates havebeen adjusted based on the assumption that four Ca2� ions must bind to thechannel before it can enter the open state (Zahradnikova et al., 1999).
Ca2� buffering in each CaRU is implemented as described previously(Rice et al., 1999) using the rapid buffer approximation (Wagner and
FIGURE 1 Schematic representation of the Ca2� release unit model(CaRU). (A) Trigger Ca2� influx through the LCCs enters into the T-SRcleft (dyadic space). The rise in local Ca2� level promotes the opening ofRyRs and ClChs. The excess local Ca2� passively diffuses out of the cleftinto the cytosol, and JSR Ca2� is refilled via passive diffusion from theNSR. (B) The T-SR cleft (shown in cross-section) is composed of fourdyadic subspace volumes, arranged on a 2 � 2 grid, each containing 1LCC, 1 ClCh, and 5 RyRs. Ca2� in any subspace may diffuse to aneighboring subspace (Jiss) or to the cytosol (Jxfer). Jiss,i,j,l represents Ca2�
flux from the jth subspace to the lth subspace within the ith CaRU.Similarly, Jxfer,i,j represents Ca2� flux from the jth subspace to the cytosolfrom the ith CaRU (see Appendix I).
2920 Greenstein and Winslow
Biophysical Journal 83(6) 2918–2945

Keizer, 1994). It is assumed that Ca2� is buffered in the subspace by thephospholipid anion groups on both the SR and sarcolemmal membranes,and that these buffers are immobile (Smith et al., 1998). Buffering param-eters for JSR Ca2� are based on measures of Ca2�-calsequestrin binding(Shannon et al., 2000).
The Ca2�-dependent transient outward chloride (Cl�) current (Ito2) isincluded as part of the CaRU. Experimental evidence indicates that theCa2� binding affinity of this Cl� channel (ClCh) is low (Kd,ClCh � 150�M) relative to normal cytosolic Ca2� concentrations (Collier et al., 1996),and that Ito2 is abolished in the presence of caffeine and exhibits rate-dependent properties that correlate with those of SR Ca2� load (Zygmunt,1994), suggesting that ClChs are activated by subspace Ca2�. Estimates ofClCh density are in the range of 3–4 �m�2 (Collier et al., 1996), a valuesimilar to the density of active LCCs (2–5 �m�2) (Rose et al., 1992;McDonald et al., 1986). Each CaRU therefore includes an equal number ofClChs as LCCs, i.e., one Cl� channel per subspace (Fig. 1 B). Ito2 ismodeled as a voltage- and time-independent ligand-gated channel, using asimple two-state, closed-open model (see Fig. 12 C), based on the gatingand permeation properties of the unitary current as measured by Collier etal. (1996). For simplicity, intracellular Cl� concentration is assumed to beconstant.
Whole myocyte model
Definitions for global state variables (e.g., K� currents, cytosolic Ca2�
concentration) of the local control myocyte model are based on those of theWinslow et al. (1999) canine ventricular cell model with the followingmodifications: 1) the voltage-dependent Ca2�-independent transient out-ward potassium (K�) current (Ito1) is modeled as described by Greensteinet al. (2000); 2) the rapid delayed rectifier K� current (IKr) is modeled asdescribed by Mazhari et al. (2001); 3) the SR Ca2� ATPase (SERCA2apump) has been updated based on the model and parameter set of Shannonet al. (2000), which accounts for both a forward and a backward Ca2�
pump flux; and 4) some membrane currents and ionic fluxes are scaled topreserve cytosolic ionic concentrations and AP shape (see Appendix I).
A detailed description of the local control simulation algorithm is givenin Appendix II. Within the whole-cell simulation, the time progression ofstates within each CaRU is calculated individually. The simulation of eachCaRU requires both numerical integration of local (subspace and JSR)Ca2� balance equations and Monte Carlo simulation of channel gating(LCC, RyR, and ClCh). The state of each channel is described by a set ofdiscrete valued random variables that evolve in time as described byMarkov processes. Time steps for CaRU simulations are adaptive and arechosen to be sufficiently small based on channel transition rates. The CaRUsimulations occur within the (larger) time step used for the numericalintegration of global state variables (e.g., Vm). The majority of computa-tional time is spent in stochastic simulation of the large number of inde-pendent CaRUs. This simulation is therefore highly parallelizable, and isimplemented on an SGI Power Challenge symmetric multiprocessing com-puter configured with 12 R10,000 processors and 1 Gbyte memory.
As a result of the embedded Monte Carlo simulation, all state variables(e.g., Vm) and ionic currents/fluxes (e.g., ICaL) will contain a component ofstochastic noise (e.g., Fig. 3 A). These fluctuations introduce a degree ofvariability to simulation output. Therefore, where appropriate, simulationdata are presented as mean � SE, where the specified value for n refers tothe number of simulation runs.
RESULTS
L-type Ca2� current
Because local control of Ca2� release is the central featureof the myocyte model presented here, it is necessary toverify that the newly parametrized L-type Ca2� channel
model behavior is consistent with experimental data forboth single LCCs and whole-cell currents. Fig. 2 demon-strates single LCC properties of the model under normalphysiological conditions (i.e., with EC coupling intact and 2mM extracellular Ca2�). Sample LCC unitary currents inresponse to 200-ms membrane depolarizations to test po-tentials of �20 mV and 0 mV from a holding potential of�100 mV are shown in Fig. 2, A and B, respectively. At testpulses �0 mV, 200-ms sweeps with no LCC openingsseldom occur because 1) no silent mode behavior (Herzig etal., 1993; Handrock et al., 1998) is implemented in thismodel; 2) voltage-dependent inactivation is relatively slowand incomplete with respect to activation kinetics; and 3)the likelihood that Ca2�-mediated inactivation occurs isvery low before the first opening of an LCC. Multipleopenings within the same record are common because thesteady-state inactivation probability of LCCs at depolarizedpotentials is substantially less than unity in canine myocytes(i.e., inactivation is incomplete) (Kaab et al., 1996; Tseng etal., 1987; Rose et al., 1992). Fig. 2, C and D show open timehistograms and Fig. 2, E and F show cumulative firstlatency distributions, determined at test potentials of �20mV and 0 mV, respectively, based on a random sampling of500 LCCs. Open time histograms are well-described by asingle exponential (�open � 0.481 ms and 0.492 ms at �20mV and 0 mV, respectively), indicating that mean open timedoes not vary with test potential. Open durations, and firstlatency distributions are consistent with previous measure-ments after accounting for differences in experimental con-ditions (e.g., temperature) (Herzig et al., 1993; Handrock etal., 1998; Schroder et al., 1998; Rose et al., 1992). Thefraction of sweeps exhibiting no openings is lower in themodel than found in experiments due to the exclusion ofLCC silent mode behavior in the model (Handrock et al.,1998). The sharpening of the first latency distribution atdepolarized potentials indicates that channel openings be-come less temporally dispersed with increasing depolariza-tion, in agreement with experimental findings (see Fig. 5 ofRose et al., 1992). Fig. 2 G shows unitary currents as afunction of membrane potential. Single channel slope con-ductance, as measured in the range between �80 mV and�20 mV, is 8.2 pS and agrees with measurements made innear physiological solutions (6.9–9.1 pS, see Fig. 3 B ofRose et al., 1992, and Fig. 4 B of Yue and Marban, 1990).
The summation of all unitary Ca2� currents within themyocyte, such as those shown in Fig. 2, A and B, yieldsmacroscopic ICaL. Simulated whole-cell currents elicited bya family of depolarizing voltage steps from �30 mV to 40mV in 10-mV increments are shown in Fig. 3 A. Currentsactivate rapidly (6 ms) and decay over �100 ms. In Fig.3 B, peak ICaL amplitude is plotted as function of testpotential (where data points represent the mean of five runsat each potential). Maximum inward Ca2� current is pro-duced at a test potential of 10 mV (n � 5). The bell-shapedpeak current profile is in close agreement with peak currents
Local Control Myocyte Model 2921
Biophysical Journal 83(6) 2918–2945
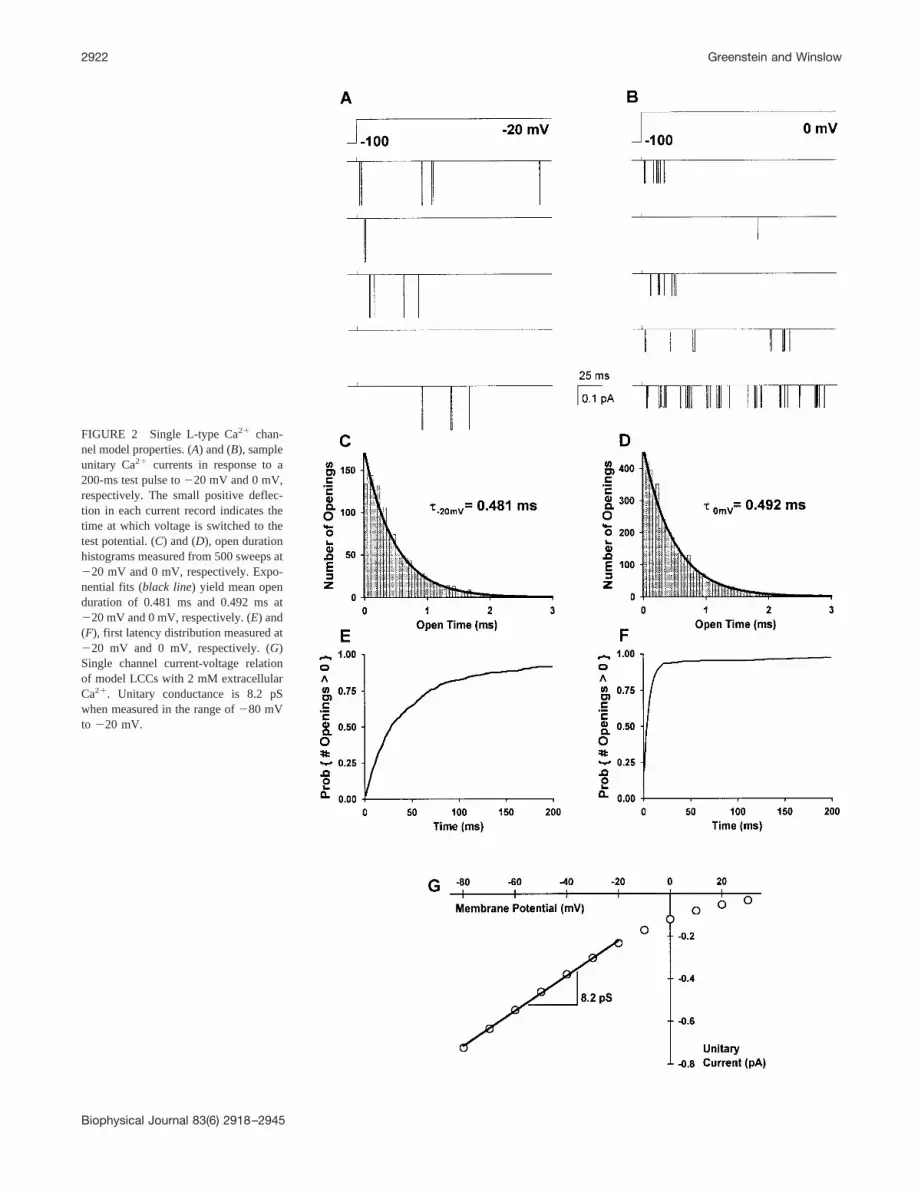
FIGURE 2 Single L-type Ca2� chan-nel model properties. (A) and (B), sampleunitary Ca2� currents in response to a200-ms test pulse to �20 mV and 0 mV,respectively. The small positive deflec-tion in each current record indicates thetime at which voltage is switched to thetest potential. (C) and (D), open durationhistograms measured from 500 sweeps at�20 mV and 0 mV, respectively. Expo-nential fits (black line) yield mean openduration of 0.481 ms and 0.492 ms at�20 mV and 0 mV, respectively. (E) and(F), first latency distribution measured at�20 mV and 0 mV, respectively. (G)Single channel current-voltage relationof model LCCs with 2 mM extracellularCa2�. Unitary conductance is 8.2 pSwhen measured in the range of �80 mVto �20 mV.
2922 Greenstein and Winslow
Biophysical Journal 83(6) 2918–2945

measured in canine (compare to Fig. 1 E of Hobai andO’Rourke, 2001) (Kaab et al., 1996; O’Rourke et al., 1999),guinea pig (Rose et al., 1992), and human (He et al., 2001)ventricular myocytes. Fig. 3 C demonstrates the underlyingprocesses that govern the time course of ICaL during thevoltage clamp to 0 mV. The quantities shown are LCC openprobability (po, black solid line), the probability of occu-pancy of Mode Normal (Prob{Norm} � 1 � Prob{Ca2�-mediated inactivation has occurred}, gray solid line), andthe fraction of channels available for voltage-dependentinactivation (y � 1 � Prob{voltage-dependent inactivationhas occurred}, dashed line). LCC po reaches a peak value of�0.1, consistent with studies that indicate that peak po withCa2� as the charge carrier (Rose et al., 1992) and time-averaged po with Ba2� as the charge carrier (minimizingCa2�-mediated inactivation) (Herzig et al., 1993; Handrock
et al., 1998) is in the range of 0.05–0.15. A comparison ofthe time progression of Prob{Norm} and y clearly demon-strates that at 0 mV, Ca2�-mediated inactivation of ICaL
develops more rapidly and progresses more completely thanvoltage-dependent inactivation, in agreement with recentexperiments (Linz and Meyer, 1998; Sipido et al., 1995;Hadley and Hume, 1987; Peterson et al., 1999, 2000). Inaddition, Ca2�-mediated inactivation is partially relieved inthe latter portion of the pulse (Fig. 3 C), indicative ofdecaying local Ca2� levels.
The feedback of local Ca2� signals on LCC gating plays animportant role in the determination of properties of both CICRand APs, and is a key feature of the local control myocytemodel, which is explored in more detail below. Steady-stateinactivation properties of ICaL are measured using a double-pulse protocol where membrane potential is first stepped from
FIGURE 3 Properties of macroscopic ICaL. (A) Simulated whole-cell currents as a function of time in response to a family of depolarizing voltage stepsfrom �30 mV to 40 mV in 10 mV increments. (B) Mean peak current-voltage relation based on five simulations at each potential (i.e., n � 5). (C) LCCopen probability (black solid line), probability of occupancy of Mode Normal (Prob{Norm}, gray solid line), and probability that voltage-dependentinactivation has not occurred (y, dashed line) in response to a voltage clamp to 0 mV. (D) Steady-state inactivation curve obtained using a double-pulseprotocol (see text) with (filled circles) and without (open circles) Ca2� as the charge carrier.
Local Control Myocyte Model 2923
Biophysical Journal 83(6) 2918–2945

�100 mV to various pre-pulse potentials for 400 ms and thento a 0-mV test potential. Peak currents, normalized by currentobtained in the absence of a pre-pulse, are shown as a functionof the pre-pulse potential in Fig. 3 D. Simulations were per-formed under normal conditions (filled circles) and with sub-space Ca2� clamped to diastolic levels to mimic an alternativecharge carrier such as Ba2� that would not significantly pro-mote Ca2�-mediated inactivation (open circles). Under normalconditions, the ICaL steady-state inactivation curve isU-shaped. Disabling of Ca2�-mediated inactivation yields aninactivation curve that decreases monotonically with depolar-ization. Inactivation is incomplete, and asymptotically ap-proaches �50% for highly depolarized pre-pulses. These fea-tures agree well with inactivation curves obtainedexperimentally in native myocytes (compare to Fig. 10 ofHadley and Hume, 1987, Fig. 1 E of Linz and Meyer, 1998,and Fig. 7 B of Li et al., 1999). Ca2�-mediated inactivationmakes a dominant contribution to the total inactivation of ICaL
in the range of potentials of �10 mV to �30 mV, consistentwith the range of potentials where LCC Ca2� influx is maxi-mal (Fig. 3 B). In addition, this is within the range of plateaupotentials where inactivation would normally occur during anAP. The U-shape is therefore a consequence of the variation inlocal Ca2� transients that arise due to the voltage dependenceof LCC Ca2� influx, and the subsequent graded CICR.
Excitation-contraction coupling
Fig. 4, A and B, demonstrate the most elementary modelrelease event, as triggered by a single LCC. A typical
response to a 200-ms 0 mV voltage clamp pulse is shown.Ca2� flux through an LCC (gray line) and the net SR Ca2�
release flux through the five adjacent RyRs (black line) areshown in Fig. 4 A. At the onset of the voltage pulse, theLCC first opens after �5 ms, and then exhibits only oneadditional opening. Local JSR release flux is triggered bythe first LCC opening and lasts �20 ms, far longer than theLCC open duration. The amplitude of the release flux varieswith the number of open RyRs and the local Ca2� gradientacross the JSR membrane. Individual RyR channel gatingevents can be discerned as step-like changes in local JSRrelease flux (Fig. 4 A, arrow 1), while changes due to thetime varying local Ca2� gradient across the RyRs (i.e.,effects of JSR depletion) occur more gradually over time(Fig. 4 A, arrow 2). Mean RyR open time varies from �7ms, when subspace Ca2� is high early in the voltage clamppulse to 1 ms after the subspace Ca2� has subsided laterin the pulse (data not shown), similar to values reportedpreviously (Rice et al., 1999; Lukyanenko et al., 1996). Fig.4 B shows the corresponding dyadic subspace Ca2� concen-tration, which reaches a peak value of �40 �M. The smallamplitude deflections in subspace Ca2� level that continueto occur following termination of the transient are the resultof inter-subspace Ca2� diffusion (Jiss), and are indicative oftrigger events (LCC openings) occurring in neighboringsubspace compartments within the CaRU.
A local Ca2� spike (a localized Ca2� release event withina single T-SR junction) is modeled by a single CaRU in Fig.4, C and D, for the same voltage clamp stimulus. Total Ca2�
influx through the set of four LCCs (gray line) and the net
FIGURE 4 Sample results for asingle CaRU in response to a 200-msvoltage clamp to 0 mV. (A) Ca2� fluxthrough a single LCC (gray line) andthrough the set of five RyRs (blackline) within a single dyadic subspacecompartment. Arrows 1 and 2 high-light changes in SR Ca2� release fluxdue to changes in the number of openRyRs and due to the changing localCa2� gradient arising from JSR Ca2�
depletion, respectively. (B) SubspaceCa2� concentration associated withthe events of panel A. (C) Ca2� fluxthrough the set of four LCCs (grayline) and the set of 20 RyRs (blackline) within a single CaRU. (D).Mean subspace Ca2� concentrationin the four subspace compartmentsassociated with the events in theCaRU described in panel C.
2924 Greenstein and Winslow
Biophysical Journal 83(6) 2918–2945

SR Ca2� release flux through the set of 20 RyRs (black line)are shown in Fig. 4 C. LCC Ca2� influx rises to a levelconsistent with two open channels within a short timefollowing the initiation of the pulse, indicating some degreeof temporal synchronization in the onset of trigger Ca2�
influx at 0 mV. Net JSR Ca2� release flux follows a similartime course to that observed in an individual subspace. Thespatial average of Ca2� concentration in the four subspacecompartments of the CaRU is intended to represent a Ca2�
spike (Fig. 4 D). The peak amplitude of this signal is lessthan that seen in a single subspace (Fig. 4 B) due to tem-poral dispersion of Ca2� release events. The Ca2� spikeduration is �25 ms (at half-maximal amplitude), similar tothat measured in myocytes using confocal imaging tech-niques (20–50 ms) (Cheng et al., 1993; Song et al., 2001;Sham et al., 1998).
Whole cell Ca2� signals, which can be explained as thespatial and temporal summation of local elementary Ca2�
release events, are shown in Fig. 5. Total LCC Ca2� influx(gray line) and RyR Ca2� release flux (black line) in re-sponse to a 0 mV voltage clamp are plotted as a function oftime in Fig. 5 A. EC coupling gain, measured as the ratio ofpeak RyR Ca2� flux to peak LCC Ca2� flux, is �12 at 0mV. Although peak Ca2� flux through both RyRs andLCCs occurs within a few milliseconds following the onsetof the voltage pulse, there is a relatively small sustainedcomponent of flux that lasts throughout the duration of thevoltage clamp, indicative of a small number of releaseevents associated with LCC reopenings and/or late open-ings. Fig. 5 B demonstrates mean subspace free Ca2� con-centration (solid line) averaged over all CaRUs, and bulkcytosolic Ca2� concentration (dashed line). The peak am-plitude of mean subspace Ca2� concentration is �18 �M,substantially greater than the cytosolic Ca2� level, whichpeaks at 1 �M. The mean subspace Ca2� concentration is,however, less than that observed for individual simulatedCa2� release events due to temporal dispersion in the oc-currence of Ca2� release events, and because Ca2� releasefails to occur in some CaRUs. On average, the local Ca2�
transient displays fast kinetics. It rises and decays within�70 ms at 0 mV, while the cytosolic Ca2� transient lasts200 ms. The late sustained Ca2� fluxes shown in Fig.5 A give rise to a similar sustained component of the sub-space Ca2� signal, which lasts for the duration of thevoltage clamp pulse. Fig. 5 C shows corresponding freeCa2� levels in the JSR (solid black line, average over allJSR volume compartments) and NSR (solid gray line), andtotal SR Ca2� load (dashed line), which includes both freeand buffer-bound Ca2� in all SR compartments. JSR andNSR Ca2� pools are at similar levels at all times during thepulse, indicative of the fast Ca2� diffusion rate betweenthese compartments (�tr � 3 ms). Preceding the pulse, SRfree Ca2� concentration is �730 �M, which corresponds tototal SR Ca2� content of �118 �mol L-cytosol�1, in agree-ment with measurements of SR load in canine myocytes
(Hobai and O’Rourke, 2001). Upon CICR, total SR Ca2� isreduced to �80 �mol L-cytosol�1, resulting in �32% de-crease in total SR Ca2� content. Similar values of fractionalSR Ca2� release have been obtained in experiments(�35%) (Bassani et al., 1995; DelBridge et al., 1996).
FIGURE 5 Whole-cell Ca2� fluxes and concentrations in response to a200-ms voltage clamp to 0 mV. (A) Ca2� fluxes through the entirepopulation of LCCs (gray line) and the entire population of RyRs (blackline) are shown as a function of time. For consistency, fluxes are reportedin units of mmol L-cytosol�1 s�1 (B) Average subspace Ca2� transient(black line, left axis) and bulk cytosolic Ca2� transient (dashed line, rightaxis). (C) Free Ca2� concentration in the NSR (gray solid line, left axis),mean free JSR Ca2� concentration (averaged over all CaRUs, black solidline, left axis), and total SR Ca2� concentration (includes both free andbound Ca2� in the NSR and JSR, dashed line, right axis).
Local Control Myocyte Model 2925
Biophysical Journal 83(6) 2918–2945

Recently, Song et al. (2001) examined voltage-dependentrecruitment and amplitude of Ca2� spikes. Under controlconditions, they found a bell-shaped voltage dependence forthe likelihood of Ca2� spike occurrence and a shallowerbell-shaped dependence for the amplitude of Ca2� spikes.These data demonstrated that the gradation of SR Ca2�
release is predominantly attributable to graded recruitmentof T-SR junctions, with a smaller contribution due to vari-ations in the amplitude of local Ca2� release flux. Fig. 6demonstrates the ability of the local control myocyte modelto reproduce these findings. Fig. 6 A shows the fraction ofCaRUs that fire at least one Ca2� spike during a 200-msdepolarizing test pulse as a function of test pulse potential.Ca2� spikes are detected by monitoring the mean subspaceCa2� concentration within each CaRU, and are consideredto have occurred if Ca2� concentration rises above a thresh-old value of 4 �M for a time greater than 5 ms. Valuesreported in Fig. 6 were determined by analyzing a minimumof 250 CaRUs at each potential (n � 250). Under controlconditions (filled circles), the model voltage dependence ofthe probability of firing a Ca2� spike is bell-shaped andsaturates at �1.0 in the range of �20 mV to �20 mV,indicating that it is extremely rare for SR release not tooccur in this voltage range. The same simulations wereperformed using an altered version of the model in whichthere is a single dyadic subspace per unit (total number ofLCCs, RyRs, and subspace compartments per myocyte be-ing conserved) and therefore lacks inter-subspace diffusion(open circles). These results represent the probability ofelementary release events within the model, and peak at�0.9 in the range of �10 mV to �10 mV. In either case, thebell-shaped voltage dependence indicates that gradation of
SR Ca2� release arises, in part, from voltage-dependentrecruitment of T-SR junction (i.e., CaRU) activation. If it isassumed that the results for the modified model are similarto the properties of a single subunit within a control CaRUand that CaRU activation (i.e., a Ca2� spike) occurs as longas at least one elementary release event occurs within aCaRU, then the probability of CaRU activation in the pres-ence of LCC silent mode behavior can be estimated. Theestimate assumes that only 40% of LCCs are active at anygiven time (factive � 0.4) (Handrock et al., 1998) and pro-duces peak fractional T-SR activation similar to experi-ments (Song et al., 2001), as shown in Fig. 6 A (triangles).Fig. 6 B shows the model voltage dependence of local Ca2�
spike amplitude (as CaRU Ca2� release flux) averaged overall CaRUs for the same two simulations. For the controlcase (closed circles), Ca2� spike amplitude has a shallowbell-shaped voltage dependence and peaks at �170 nmolL-cytosol�1 s�1 in the range of �10 mV to �10 mV. Therise in mean Ca2� spike amplitude in the central voltagerange occurs as a result of enhanced synchronization of RyRrelease events within CaRUs contributing to gradation ofSR Ca2� release, and agrees well with the experiments ofSong et al. (2001). In the modified model lacking inter-subspace Ca2� diffusion (open circles), subspace Ca2� re-lease flux is smaller at all potentials. This is the casebecause these signals represent SR Ca2� release flux from aset of five RyRs, whereas the control simulations representflux from all 20 RyRs in the CaRU. More interestinghowever, is that the shape of the voltage dependence of theCa2� transient amplitude in the absence of inter-subspacecoupling is inverted compared to the control simulations. Inthe absence of inter-subspace coupling, synchronization
FIGURE 6 Microscopic properties of model Ca2� spikes. (A) The fraction of CaRUs that fire a Ca2� spike as a function of voltage under controlconditions is shown (filled circles). For the modified model lacking intersubspace diffusion, the fraction of subspaces that exhibit a Ca2� release event isshown (open circles). The fraction of CaRUs that fire a Ca2� spike in the presence of LCC slow cycling between active and silent modes is estimated (seetext, triangles), n � 250 simulations at each potential. (B) Ca2� spike amplitude as a function of voltage clamp potential under control conditions (filledcircles) and for the modified model lacking intersubspace diffusion (open circles).
2926 Greenstein and Winslow
Biophysical Journal 83(6) 2918–2945

within a single unit is not possible because only a singleCa2� release event occurs. There is therefore no enhance-ment of local Ca2� release signals in the central range ofpotentials. The depressed release at central voltages in themodified model is due to a reduction in the Ca2� gradientacross the SR membrane as a result of SR depletion. In thecentral voltage range, where SR release is maximal (Fig.6 A, open circles), reduction in global SR Ca2� load overthe duration of the pulse will lead to a reduction in Ca2�
transient amplitude for events that occur late within thepulse (data not shown). In the control case, this effect ismasked by the enhancement of Ca2� spike amplitude thatoccurs within the same range of potentials due to synchro-nization of release events within CaRUs.
While Fig. 6 shows results regarding voltage-dependentgradation of SR Ca2� release at the level of the CaRU, Fig.7 demonstrates the macroscopic properties of SR Ca2�
release. Previous experimental studies (Wier et al., 1994;Santana et al., 1996; Janczewski et al., 1995; Cannell et al.,1995) and mathematical models (Stern, 1992; Stern et al.,1999) have shown that there can be significant differencesbetween the voltage dependence of LCC Ca2� influx (FLCC)and RyR Ca2� release flux (FRyR) even though SR Ca2�
release is controlled by Ca2� entry via ICaL. These dif-ferences underlie the phenomenon of “variable” EC cou-pling gain. We use the definition of gain given by Wier etal. (1994) as the ratio FRyR(max)/FLCC(max). Fig. 7 A showsthe voltage dependence of FLCC(max) (filled circles) andFRyR(max) (open circles) obtained using the same voltageprotocols as in Fig. 3 B. In Fig. 7 B, the peak fluxes of Fig.7 A have been normalized based on their respective max-ima. Although both FLCC(max) and FRyR(max) are bell-shapedfunctions of membrane potential, they do not share identicalvoltage dependence. Maximal LCC Ca2� influx occurs at10 mV, whereas maximal RyR Ca2� release flux occurs at0 mV. EC coupling gain as defined above is plotted as afunction of voltage in Fig. 7 C (triangles), and is monoton-ically decreasing with increasing membrane potential. Thesimilarity in shape of the EC coupling gain curve and theunitary LCC current-voltage relation (dashed line, scaledfor comparison) suggests that EC coupling gain may bemore closely related to unitary LCC current, rather thanmacroscopic ICaL. The simulated data of Fig. 7 agrees wellwith experimentally obtained measurements of whole-cellCa2� fluxes (Wier et al., 1994; Santana et al., 1996; Song etal., 2001; Cannell et al., 1995; Janczewski et al., 1995). Thevalue of riss (inter-subspace Ca2� transfer rate) was chosento match the model gain function with experiments and tobe consistent with estimates of Ca2� diffusion within thedyad (Soeller and Cannell, 1997). The role of inter-subspacecoupling on gain is demonstrated in Fig. 7 C, by comparisonof control simulations (triangles) to those in the absence ofinter-subspace coupling (i.e., riss � 0, squares). With inter-subspace coupling intact, EC coupling gain is greater at allpotentials, but the increase in gain is most dramatic at more
negative potentials. In this negative voltage range LCC po issubmaximal, leading to sparse LCC openings. However,
FIGURE 7 Voltage dependence of macroscopic LCC Ca2� influx, SRCa2� release, and EC coupling gain. (A) Mean peak Ca2� flux amplitudes,FLCC(max) (filled circles) and FRyR(max) (open circles) as a function ofmembrane voltage, n � 5 simulations at each voltage. (B) Peak Ca2�
fluxes (data of panel A) normalized by their respective maxima. (C) ECcoupling gain as a function of membrane potential defined as FRyR(max)/FLCC(max) under control conditions (triangles) and in the absence of inter-subspace coupling within the CaRUs (squares), as well as L-type unitarycurrent (dashed line, scaled to match the gain function at �40 mV).
Local Control Myocyte Model 2927
Biophysical Journal 83(6) 2918–2945

unitary current magnitude is relatively high, such that theopening of an LCC efficiently triggers adjacent RyRs. Anincreased riss value allows the rise in local Ca2� due to thetriggering action a single LCC to recruit and activate RyRsin adjacent subspace compartments within the same T-SRjunction (where the LCCs have not opened, as openings aresparse), effectively raising the functional RyR/LCC ratio.The net effect of inter-subspace coupling is to increase themagnitude and slope of the gain function preferentially inthe negative voltage range. The local control myocytemodel predicts that Ca2� diffusion in the T-SR junction(across the subspace compartments) is an important mech-anism underlying the rate at which gain decreases withincreasing voltage. Previous models of EC coupling havesimilarly achieved a steeply decreasing gain function withhigh amplitude at negative potentials by incorporating de-tails of spatial Ca2� gradients in the dyadic space (Stern etal., 1999).
One defining difference between a macroscopic modeland a local control model of EC coupling is that it would beimpossible for a macroscopic model to exhibit differentvalues of gain for macroscopic L-type Ca2� currents of thesame amplitude (Stern, 1992). Wier et al. (1994) haveexplicitly demonstrated that Ca2� currents of similar shapeand amplitude can evoke very different responses of SRCa2� release. The local control myocyte model can repro-duce the findings of this experiment, as shown in Fig. 8. Fig.8, A and B show FLCC, and Fig. 8, C and D show FRyR inresponse to 200-ms depolarizing pulses to �20 mV and�50 mV, respectively. Although the amplitude and timecourse of macroscopic LCC Ca2� influx is similar for thetwo test pulses, the SR Ca2� release is triggered effectivelyin response to the �20 mV pulse (where gain is high), butonly minimal Ca2� release occurs at �50 mV (where gainis low). In addition, upon repolarization to �100 mV from�50 mV, the brief Ca2� tail current triggers substantial SRCa2� release (Fig. 8 D).
Action potentials
Fig. 9 demonstrates the ability of the model to reconstructaction potentials and Ca2� transients of normal canine mid-myocardial ventricular myocytes. In Fig. 9 A, a normal 1-Hzsteady-state AP is shown. AP properties are similar to thosemeasured in experiments (O’Rourke et al., 1999), withaction potential duration (APD) of �300 ms. Fig 9 B showscytosolic (black line) and mean subspace (gray line) Ca2�
transients. While the cytosolic Ca2� transient peaks at�0.75 �M, and lasts longer than the duration of the AP,Ca2� in the subspace reaches �11 �M on average, andequilibrates to near-cytosolic levels rapidly, within �100–150 ms. Fig. 9 C demonstrates the two model currents thatcommunicate directly with the local subspaces within theCaRUs, ICaL (black line) and Ito2 (gray line). ICaL peaks at�4.7 pA pF�1 and has a sustained component of �0.7 pA
pF�1, which lasts for nearly the entire duration of the AP.Ito2 peaks at �0.6 pA pF�1 and also displays a minimalsustained current component. The sustained current appearsbecause subspace Ca2� remains moderately elevated onaverage throughout the AP due to LCC reopenings, andbecause Ito2 does not inactivate.
While macroscopic ICaL shown in Fig. 9 C has a similarshape as that of the common pool Winslow et al. (1999)canine myocyte model, the underlying LCC inactivationprocess in the local control model has been altered todepend more strongly on local Ca2� than on membranepotential. This adjustment is based on experimental findingsobtained from both isolated myocytes (Linz and Meyer,1998; Sipido et al., 1995) and recombinant channels ex-pressed in HEK 293 cells (Peterson et al., 1999, 2000),which show that LCC voltage-dependent inactivation isslow and incomplete while Ca2�-mediated inactivation isstrong and dominates the inactivation process (see also Fig.3 D). Strong Ca2�-dependent inactivation (in the absence ofstrong voltage-dependent inactivation) is a key mechanismin determining how graded SR Ca2� release influences APproperties and whole-cell Ca2� dynamics. Fig. 10 demon-strates the differences in ICaL inactivation properties be-
FIGURE 8 Variable EC coupling gain. (A) and (B), whole-cell LCCCa2� influx (FLCC) in response to voltage clamp stimuli of �20 mV and�50 mV, respectively. (C) and (D), whole-cell SR Ca2� release flux(FRyR) in response to voltage clamp stimuli of �20 mV and �50 mV,respectively. Note that while FLCC is similar in response to each of the twovoltage clamp stimuli, the magnitude of FRyR is very different, indicatingthat EC coupling gain is not determined by properties of macroscopic ICaL.In addition, note that the large, but brief, tail of Ca2� influx that occursfollowing repolarization from �50 mV triggers substantial SR Ca2� re-lease flux.
2928 Greenstein and Winslow
Biophysical Journal 83(6) 2918–2945

tween the Winslow et al. (1999) common pool model andthe local control myocyte model, and their consequences.
Fig. 10, A and B, show steady-state APs (solid line),Prob{Norm} (dashed line), and y (dotted line), for the
FIGURE 9 The action potential, Ca2� transients, and membrane currents. Signals shown are in response to a 1-Hz pulse train, with responses shown insteady state. (A) Membrane potential as a function of time simulated using the local control myocyte model under normal conditions. (B) Cytosolic (blackline, left axis) and mean subspace (gray line, right axis) Ca2� concentrations corresponding to the AP simulated in panel A. (C) L-type Ca2� current (ICaL,black line) and the Ca2�-dependent transient outward Cl� current (Ito2, gray line) corresponding to the AP simulated in panel A.
FIGURE 10 Inactivation properties of ICaL in common pool and local control models of the action potential. (A) and (B), membrane potential (solid line,left axis), Prob{Norm} (dashed line, right axis), and y (dotted line, right axis) for the Winslow et al. (1999) common pool myocyte model and the localcontrol myocyte model, respectively. Prob{Norm} and y are the model quantities indicating the time progression of the Ca2�- and voltage-dependentinactivation processes of ICaL (see text for details). (C) Membrane potential as a function of time for a 10-s simulation of a modified version of the Winslowet al. (1999) model with ICaL parametrized with strongly Ca2�-dependent and weakly voltage-dependent inactivation (similar to that of the local controlmodel). (D) Membrane potential (solid line, left axis), Prob{Norm} (dashed line, right axis), and y (dotted line, right axis) for the local control myocytemodel where SR Ca2� load has been reduced to 33% of its normal level.
Local Control Myocyte Model 2929
Biophysical Journal 83(6) 2918–2945

common pool and local control models, respectively.Prob{Norm} and y are the model quantities indicating thetime progression of the Ca2�- and voltage-dependent inac-tivation processes, respectively, as previously described inFig. 3 C. During the plateau of the AP, �70% of LCCsbecome unavailable due to voltage-dependent inactivationwhile �60% become unavailable due to Ca2�-dependentinactivation in the common pool model (Fig. 10 A). Thebalance between voltage- and Ca2�-dependent inactivationprocesses in the Winslow et al. (1999) common pool modelare therefore in contrast to experimental findings. Theguinea pig models of Jafri et al. (1998) and Luo and Rudy(1994) also exhibit very strong voltage-dependent inactiva-tion of ICaL and relatively weak Ca2�-mediated inactivation(data not shown, see Winslow et al., 2001). The roles ofthese processes are reversed (as they should be) in the localcontrol myocyte model, with only �35% of LCCs suc-cumbing to voltage-dependent inactivation, while �75%are shut down by Ca2�-dependent inactivation (Fig. 10 B,compare to Fig. 11 of Linz and Meyer, 1998). Understand-ing the fundamental differences in the CICR processes inthe common pool versus the local control models providesthe reason why the balance between each of the inactivationprocesses is incorrectly assigned in the common poolmodel. In a model where the release of SR Ca2� is con-trolled by sensing Ca2� levels in the same pool into whichSR Ca2� is released, Ca2� release will be an all-or-noneresponse (Stern, 1992). If Ca2�-dependent inactivation ofLCCs were the dominant inactivation process in this type ofmodel, then it follows that ICaL inactivation would alsoexhibit all-or-none behavior, switching on in response to SRCa2� release. The single regenerative SR release eventwould rapidly and strongly promote Ca2�-dependent inac-tivation of ICaL, and would therefore destabilize the plateauphase of the AP. An attempt at simulating APs using theWinslow et al. (1999) model modified to have stronglyCa2�-dependent and weakly voltage-dependent inactivationof ICaL (with equations governing y identical to that of thelocal control model) is illustrated in Fig. 10 C. APs alternatebetween those with short duration (�150–250 ms) andthose with very long duration (1000 ms) with unstableoscillatory plateau potentials. The alternans indicate thepresence of a bifurcation in the AP profile as a function ofJSR Ca2� load. Short-duration APs occur when the all-or-none SR Ca2� release event strongly inactivates ICaL, andhence terminates the AP. SR Ca2� load will be graduallydiminished following successive short APs due to the im-balance between cellular Ca2� influx (via LCCs) and Ca2�
efflux (via Na�/Ca2� exchangers and sarcolemmal Ca2�
pumps). When the SR becomes sufficiently depleted, theweak SR Ca2� release flux produces only slight inactivationof ICaL. In addition, the population of RyRs fails to ade-quately inactivate/adapt, leading to additional spontaneousrelease events and a long-lasting unstable oscillatory pla-teau. This unstable behavior occurs over a wide range of
LCC inactivation parameters as long as voltage-dependentinactivation of ICaL is relatively slow and incomplete (datanot shown). Strong voltage-dependent inactivation of ICaL,although contrary to experimental observations, is thereforenecessary to enforce stability of those common pool modelsthat incorporate the regenerative SR release mechanisms ofCICR. As seen in Fig. 10 B, the local control myocytemodel does not suffer from the consequences of all-or-none SR Ca2� release (at the whole-cell level) and there-fore successfully generates stable APs with LCCs whoseinactivation process is dominated by local Ca2�-medi-ated inactivation.
Altered EC coupling in both human (Lindner et al., 1998)and canine (Hobai and O’Rourke, 2001) heart failure isassociated with decreased SR Ca2� content. Both modeling(Winslow et al., 1999) and experimental studies (Ahmmedet al., 2000; O’Rourke et al., 1999) support the idea thataltered Ca2� handling plays a key role in heart failure-associated AP prolongation. Fig. 10 D shows an AP (solidline), Prob{Norm} (dashed line), and y (dotted line) for thelocal control model under conditions where SR Ca2� loadhas been reduced to 33% of its normal level. This is anon-steady-state simulation in which the pre-stimulus initialcondition for SR Ca2� load (in NSR and all JSR compart-ments) has been reduced three-fold from control withoutany alteration in model parameters, thereby isolating theimpact of depressed SR Ca2� load on the AP. The voltage-dependent inactivation mechanism proceeds in a mannersimilar to that of the control case (dotted line). However,under conditions of reduced SR Ca2� release, Ca2�-medi-ated inactivation of ICaL occurs at a far slower rate and to alesser extent (dashed line) than in the control case (compareto Fig. 10 B). The resulting increased magnitude of the latesustained component of ICaL (not shown) maintains theplateau and dramatically prolongs the AP (solid line). Thissupports the hypothesis that in heart failure, alterations inCa2� handling proteins that decrease SR Ca2� load andreduce the amplitude of local Ca2� transients may contrib-ute substantially to prolongation of APD by reducing Ca2�-mediated inactivation of the L-type current.
In a previous study (Greenstein et al., 2000), we exam-ined the role of Ito1 in shaping AP morphology and durationusing the common pool canine myocyte model (Winslow etal., 1999). These simulations predicted that reduction of Ito1
density from normal levels leads to modest shortening ofAPD. The reduction in Ito1 reduces the depth of the phase 1AP notch, reducing the driving force for, and hence the peaklevel of, ICaL. Because this study was performed in a modeldisplaying all-or-none rather than graded SR Ca2� releaseproperties, the altered ICaL had no ability to modulate FRyR.In Fig. 11 the role of Ito1 is revisited, with particular atten-tion to how an alteration of AP shape influences EC cou-pling. Under normal 1-Hz steady-state conditions (solidblack line) the AP has a duration of �315 ms (Fig. 11 A),peak ICaL is �4.8 pA pF�1 (Fig. 11 B), peak FRyR is �0.8
2930 Greenstein and Winslow
Biophysical Journal 83(6) 2918–2945

mmol L-cytosol�1 s�1 (Fig. 11 C), and peak cytosolic Ca2�
concentration is �0.8 �M (Fig. 11 D). (Note that slightdifferences in control simulations in Fig. 11 compared toFig. 9 arise due to stochastic noise inherent in the model.)The density of Ito1 was then reduced by 67%, an amountsimilar to that observed in failing canine myocytes (Kaab etal., 1996), and simulations were repeated using normalinitial conditions to demonstrate the role of graded SR Ca2�
release under conditions of identical SR Ca2� load. Thephase 1 notch of the AP becomes less pronounced, and APDis shortened modestly to �255 ms (Fig. 11 A, gray line).The corresponding peak ICaL is reduced by 40% to �2.9 pApF�1 (Fig. 11 B). The property of graded SR Ca2� releaseis evident by observing FRyR (Fig. 11 C, gray line). Thereduction in trigger Ca2� reduces peak SR Ca2� release fluxby nearly 50% under conditions where SR load is un-changed. The resulting cytosolic Ca2� transient is conse-quently reduced to �0.65 �M (Fig. 11 D). Although this isa good demonstration of the effects of graded release duringthe AP, a sudden decrease in Ito1 is not a physiologicallyrelevant event. Upon pacing to steady state with a 67%
reduction of Ito1 (dotted line), both graded SR Ca2� releaseand the new steady-state SR Ca2� load affect Ca2� cyclingproperties. The shortening of the APs results in a decreasedsteady-state SR Ca2� load compared to control (data notshown), which in turn leads to a further decrease in SR Ca2�
release, reducing the amplitude of the cytosolic Ca2� tran-sient to �0.6 �M, 25% less than control (Fig. 11 D). Themodel therefore predicts that reduction in Ito1, similar to thatobserved in heart failure (Kaab et al., 1996), may contributeto reduced force generation. This model prediction has beenverified by recent experiments showing that slowed phase 1repolarization during the AP reduces temporal synchronyand recruitment of Ca2� release events, in conjunction witha reduced amplitude of ICaL (Sah et al., 2002).
DISCUSSION
In this study we present a biophysically detailed model ofthe normal canine ventricular myocyte that conforms to thetheory of local control of EC coupling in cardiac muscle.
FIGURE 11 Role of Ito1 on theevents of EC coupling. (A) Mem-brane potential, (B) L-type Ca2� cur-rent (ICaL), (C) SR Ca2� release flux(FRyR), and (D) cytosolic Ca2� con-centration as a function of time.Each of the signals is shown undernormal 1-Hz steady-state conditions(solid black line), with 67% reduc-tion in Ito1 density using the normalinitial conditions (gray line), andwith 67% reduction in Ito1 densityunder 1-Hz steady-state conditions(see text for details). The alteredshape of the AP resulting from re-duction in Ito1 reduces trigger influxCa2� via LCCs leading to decreasedSR Ca2� release flux, and thereforea depressed cytosolic Ca2� transient.
Local Control Myocyte Model 2931
Biophysical Journal 83(6) 2918–2945

Local control theory asserts that L-type Ca2� current tightlycontrols SR Ca2� release because elementary, independentSR Ca2� release events occur in response to highly local-ized Ca2� transients, which are produced by the opening ofsingle L-type Ca2� channels in the vicinity of a smallcluster of RyRs (Stern, 1992; Bers, 1993; Wier et al., 1994;Sham et al., 1995). Tight regulation of CICR is madepossible by the fact that LCCs and RyRs are sensitive tolocal submembrane Ca2�, rather than global Ca2� levels,allowing for graded control of Ca2� release while maintain-ing high EC coupling gain (Fabiato, 1985; Beuckelmannand Wier, 1988; Sham, 1997). To capture these properties oflocal control, our myocyte model incorporates EC couplingin the form of Ca2� release units in which individual sar-colemmal L-type Ca2� channels interact in a stochasticmanner with nearby RyRs in localized regions where junc-tional SR membrane and T-tubular membrane are in closeproximity. The CaRUs are embedded within and interactwith the global systems of the myocyte describing ionic andmembrane pump/exchanger currents, SR Ca2� uptake, andtime-varying cytosolic ion concentrations. The results dem-onstrate that a single comprehensive model of the cardiacmyocyte can reproduce both detailed properties of ECcoupling predicted by local control theory, such as vari-able gain and graded SR Ca2� release, while at the sametime reproducing whole-cell phenomena, such as modu-lation of AP duration by SR Ca2� release. The ability ofthis model to encompass mechanisms of both micro-scopic and macroscopic phenomena afford it the uniqueability to provide insight into the integrative properties ofthe myocyte that arise from the interaction among thesesubcellular processes.
The main goal of this study was to develop a myocytemodel incorporating mechanistic descriptions of the pro-cesses that underlie local control of SR Ca2� release. Thisrequires the simulation of a large number of individualstochastically gating channels, which poses a substantialcomputational task. To maintain tractability, the CaRU wasdesigned as a “minimal model,” including biophysicallydetailed descriptions of individual LCCs and RyRs (Jafri etal., 1998; Rice et al., 1999; Keizer and Smith, 1998). EachCaRU contains four subspace compartments in which ele-mentary Ca2� release events may occur, allowing for pas-sive flow of Ca2� to neighboring subspaces providing forthe possibility that an initial release event may trigger anadditional release event in the neighboring cluster of RyRs(Parker et al., 1996; Song et al., 2001). This geometryallows the summation of release events within a CaRU toserve as a minimal model of a Ca2� spike while reproducingfundamental properties of EC coupling measured at thewhole cell level, such as graded Ca2� release. It is importantto note, however, that the individual release events withinthe CaRU are not intended to reproduce the detailed spa-tiotemporal properties of experimentally observed Ca2�
sparks (Fig. 4 A) (Cheng et al., 1993). Such a model would
require explicit descriptions of dyadic subspace geometry,Ca2� diffusion, and surface charge effects. Models account-ing for these features have been developed for a singleisolated dyad (Cannell and Soeller, 1997; Soeller and Can-nell, 1997; Langer and Peskoff, 1996), but would be toocomputationally demanding for this application.
Stern et al. (1999) have demonstrated that a number ofRyR models, with rate constants determined from measure-ments in lipid bilayers (Zahradnikova and Zahradnik, 1996;Keizer and Levine, 1996; Schiefer et al., 1995) exhibit localinstability (failure of SR release termination following ac-tivation) or global instability (spontaneous activation bybackground Ca2�) when simulated in a local control envi-ronment. Furthermore, they have shown that stability oflocal control requires that RyRs exhibit strong inactivationand cooperative activation by more than one Ca2� ion, andhave suggested that such properties may arise from alloste-ric interactions between neighboring RyRs. The RyR modelformulation presented in this study, which is based on thatof Keizer and Smith (1998), exhibits both strong inactiva-tion/adaptation properties consistent with rates observed inthe presence of Mg2� (Valdivia et al., 1995), and requirescooperative binding of four Ca2� ions in order to open.Although there is mounting evidence that RyR gatingproperties are influenced by physical coupling of neigh-boring RyRs (Marx et al., 2001), the results of this studysuggest that the stability of local control of SR Ca2�
release can be achieved without accounting for suchinteractions explicitly.
The local control myocyte model description requires thatICaL be computed based on the ensemble behavior of indi-vidually simulated LCCs. This requires that both singlechannel properties (e.g., unitary conductance, open andclosed time distributions) and whole-cell current properties(e.g., peak current-voltage relation, steady-state inactiva-tion) are incorporated into the model, unlike typical mac-roscopic model formulations that need only describe whole-cell properties. Figs. 2 and 3 demonstrate that the LCCmodel reproduces both single channel (Herzig et al., 1993;Handrock et al., 1998; Schroder et al., 1998; Rose et al.,1992; Yue and Marban, 1990) and whole-cell (Hobai andO’Rourke, 2001; Kaab et al., 1996; O’Rourke et al., 1999;Rose et al., 1992; He et al., 2001; Linz and Meyer, 1998;Sipido et al., 1995; Sham, 1997; Hadley and Hume, 1987;Peterson et al., 1999; Li et al., 1999) current propertiesrather well. A model based prediction of �50,000 wasobtained for Nactive, the number of active (phosphorylated)LCCs in a cardiac myocyte, which agrees well with exper-imental estimates (Rose et al., 1992; McDonald et al.,1986). In keeping with the approach of a “minimal model,”only active LCCs were simulated and the process of slowcycling between active and silent modes of behavior (Her-zig et al., 1993) was not included in the model.
The ICaL steady-state inactivation curve (Fig. 3 D) dem-onstrates how whole-cell properties emerge from mechanis-
2932 Greenstein and Winslow
Biophysical Journal 83(6) 2918–2945

tic descriptions of underlying processes. The model steady-state inactivation curve is U-shaped under normalconditions, but monotonically decreases and is incompletewith increasing membrane potential when Ca2� is not thecharge carrier, which agrees well with experiments (Hadleyand Hume, 1987; Linz and Meyer, 1998; Li et al., 1999).Some previous models of ICaL have been able to reproducethe phenomena of U-shaped inactivation by incorporatingthis property directly into the equations describing inacti-vation (Jafri et al., 1998; Sun et al., 2000). In the localcontrol myocyte model, however, the U-shaped inactivationcurve emerges as a consequence of local Ca2�-mediatedevents. The magnitude of the local Ca2� transient is gradedas a function of LCC Ca2� influx, which is maximal in thecentral range of potentials of �10 mV to �30 mV (Fig.3 B). The local rise in Ca2� induces Ca2�-mediated inacti-vation of ICaL, which makes a dominant contribution to thetotal inactivation of ICaL when local Ca2� levels are raised(e.g., Fig. 3 C). The U-shape therefore emerges as a reflec-tion of the bell-shaped voltage dependence of LCC Ca2�
influx.By summing over all of the local events that occur in the
CaRUs, model simulations are able to faithfully reproducedetails regarding the relationship between whole-cell ICaL
and whole-cell SR Ca2� release. In response to a depolar-izing voltage clamp pulse, the whole-cell SR Ca2� releaseflux peaks soon after depolarization and then decays to asmall maintained component in a similar manner to signalsmeasured experimentally (Wier et al., 1994). The smallamplitude maintained release is supported by the slow/sustained component of ICaL and turns off following repo-larization to the resting potential (Fig. 5 A). Control of SRCa2� release by ICaL has been demonstrated experimentallyby showing that SR Ca2� release can be turned off bytermination of Ca2� current (Wier et al., 1994; Cannell etal., 1987; Cleemann and Morad, 1991). Although the SRCa2� release flux in response to a short-duration pulse hasnot been shown explicitly in this study, the model doesexhibit this behavior. The exemplar Ca2� spike shown inFig. 4 C occurred �25 ms following the onset of the depo-larizing voltage clamp pulse, and clearly would not havebeen triggered if the pulse was truncated to 25 ms.Additional evidence for control of SR Ca2� release by ICaL
has been demonstrated by the ability of ICaL tail currents,occurring upon repolarization to the rest potential followinga depolarized voltage clamp, to trigger a release event (Wieret al., 1994; Sham et al., 1998). The local control modelreadily reproduces this response (Fig. 8, B and D). Uponmembrane depolarization, the model demonstrates that themean dyadic subspace Ca2� concentration reaches levelsthat are 20-fold greater than in the cytosol (Fig. 5 B),consistent with both experimental and theoretical predic-tions that submembrane Ca2� can reach concentrations thatare much higher than in the cytosol (Sham, 1997; Stern,1992; Langer and Peskoff, 1996; Soeller and Cannell, 1997;
Jafri et al., 1998; Cheng et al., 1993; Wang et al., 2001;Song et al., 2001). It has been noted recently that thecommon pool model of Winslow et al. (1999) has a limita-tion in that the SR is almost two-thirds depleted upon asingle stimulus (Michailova and McCulloch, 2001). Thelocal control model of this study demonstrates both frac-tional SR release (�32%) and total pre-release SR Ca2�
content (�118 �mol L-cytosol�1) consistent with experi-mental studies (Bassani et al., 1995; DelBridge et al., 1996;Hobai and O’Rourke, 2001).
The key experimental observation that has suggested theprocess of CICR is locally controlled is that while bothFRyR(max) and FLCC(max) exhibit a bell-shaped dependenceon membrane potential, the relationships are not the same(Wier et al., 1994; Santana et al., 1996; Cannell et al., 1995;Janczewski et al., 1995; Wier and Balke, 1999). At negativepotentials, single channel currents are large, but macro-scopic current is relatively small due to the fact that LCCopenings are infrequent. This implies that LCC openings aresparsely dispersed throughout the membrane. As a result,ICaL in this potential range is more effective at triggering SRCa2� release than at positive potentials, where single chan-nel openings are far more frequent but unitary currentmagnitude is smaller. This behavior reveals itself in themodel in the form of a shift in the voltage dependence ofFRyR(max) vs. FLCC(max) (Fig. 7 B) and in the form of gradedSR Ca2� release with variable EC coupling gain that de-creases with increasing membrane potential (Fig. 7 C) sim-ilar to curves obtained experimentally (Wier et al., 1994;Santana et al., 1996; Cannell et al., 1995; Janczewski et al.,1995) and theoretically (Stern, 1992; Stern et al., 1999).Gain decreases with increasing depolarization due to thedecrease in local triggering efficiency that occurs as unitarycurrent magnitude decreases. Experimentally measured ECcoupling gain functions typically display a steeper slope atnegative potentials compared to positive potentials (Wier etal., 1994; Song et al., 2001). Simulations using the localcontrol myocyte model show that coupling among neigh-boring subspace compartments within the CaRUs is neces-sary to generate responses with relatively very high gain atthe most negative potentials (Fig. 7 C, triangles). At nega-tive voltages, where the unitary current magnitude is rela-tively high, the Ca2� influx from the opening of a singleLCC is sufficient to trigger SR release from RyRs thatreside in the same dyadic subspace compartment, as well asfrom RyRs in adjacent subspace compartments, but withinthe same T-SR junction (i.e., the same CaRU). The numberof RyRs that may sense trigger Ca2� from a particular LCCis effectively increased with increasing unitary LCC cur-rent, increasing the slope of the gain function at negativepotentials. The simulated EC coupling gain function, how-ever, falls somewhat short of the values measures experi-mentally at negative voltages (e.g., at �30 mV: model gain,�28; Wier et al., 1994, 40; Song et al., 2001, �42). Thisdiscrepancy in slope of the gain function at negative poten-
Local Control Myocyte Model 2933
Biophysical Journal 83(6) 2918–2945

tials results from the “minimal model” assumption that asingle LCC can trigger activity of no more than 20 RyRs(i.e., only the RyRs within a single CaRU) regardless of thestrength of inter-subspace coupling. As described above, thechoice of only four subunits per CaRU was necessary toretain minimal model complexity in the description of localCa2� diffusion. Model EC coupling gain at negative volt-ages would be increased in line with experimental data if thedyad of each CaRU were expanded from our minimalrepresentation to include a greater number of LCC-RyRfunctional groupings (�100 RyRs per dyad) as has beenobserved in structural studies (Franzini-Armstrong et al.,1999).
The fact that SR Ca2� release is graded is a property thatemerges from considering the mechanistic details of localinteractions between LCCs and RyRs. Our myocyte modelis not the first to exhibit SR Ca2� release that is graded.Previous myocyte models (Luo and Rudy, 1994; Faber andRudy, 2000; Fox et al., 2002), however, achieved the gradedSR release phenomenologically by formulating SR Ca2�
release flux as a direct function of sarcolemmal Ca2� influxrather than a function of Ca2� concentration at the site ofthe RyRs. Even though these formulations are capable ofgenerating graded CICR, a formulation of SR Ca2� releasethat depends only upon macroscopic Ca2� influx cannotreproduce an EC coupling gain function that decreasesmonotonically with increasing membrane potential (Fig.7 C).
Many cardiac Ca2� cycling proteins that play a role in ECcoupling, including LCCs (Herzig et al., 1993; Handrock etal., 1998) and RyRs (Marx et al., 2000), are known targetproteins of the �-adrenergic receptor (�-AR)-adenylyl cy-clase-cAMP-protein kinase A signaling pathway. An in-crease in �-adrenergic stimulation, such as that which oc-curs during heart failure (Handrock et al., 1998; Marx et al.,2000), tends to increase channel availability or promotefaster kinetics. The microscopic mechanisms underlying�-AR-mediated modulation of EC coupling are not wellunderstood. Recent experiments suggest that improved syn-chronization of SR Ca2� release both within and amongT-SR junctions, and hence increased cardiac inotropy, oc-curs as a result of increased �-adrenergic stimulation (Songet al., 2001). In this study, it has been demonstrated thatbaseline model Ca2� spike statistics, both within and amongCaRUs, agree well with those measured in experiments(Fig. 6) (Song et al., 2001). Additional experiments havedemonstrated that heart failure-related alterations in LCCproperties might not be apparent in whole-cell ICaL mea-surements. Single LCCs from failing human ventricularmyocytes exhibit increased availability and open probabilitycompared to nonfailing myocytes, while whole-cell currentmeasurements do not reveal a change in ICaL current den-sity, suggesting that the number of functional channels mustbe reduced in failing myocytes (Schroder et al., 1998). Infailing canine myocytes, the number of LCCs has been
found to be reduced as well via measurement of intramem-brane charge movement, where whole-cell currents wereagain found to be unchanged (He et al., 2001). In failinghearts, RyRs have been found to be hyperphosphorylated,leading to dissociation of FKBP12.6 regulatory subunits,which results in both increased Ca2� sensitivity for activa-tion and elevated channel open probability (Marx et al.,2000). Macroscopically defined myocyte models do notaccount for single channel properties, and are not useful ininterpreting these findings. The local control myocytemodel, however, provides a means to study detailed mech-anisms of �-AR-mediated and/or heart failure-related alter-ations in LCC, RyR, and Ca2� spike properties, and the rolesuch alterations would have on both microscopic EC cou-pling and whole-cell behavior.
It is widely accepted that ICaL inactivates via both volt-age-dependent and Ca2�-mediated processes. Recent exper-iments have elucidated mechanistic details of the Ca2�-mediated inactivation process, indicating that calmodulin istethered to the LCC and acts as a critical Ca2� sensor, andthat targeted mutations that prevent calmodulin binding tothe LCC (Zuhlke et al., 1999) or prevent Ca2� binding tocalmodulin (Peterson et al., 1999, 2000), dramatically re-duce the degree of ICaL inactivation observed during adepolarizing voltage clamp pulse. It has also been shownthat Ca2�-mediated inactivation plays a dominant role inICaL inactivation under AP clamp protocols (Linz andMeyer, 1998) and under voltage clamp protocols where SRCa2� load is varied (Sipido et al., 1995; Sham, 1997).Although experimental evidence indicates that the Ca2�-mediated inactivation process is dominant and the voltage-dependent process is far slower, mathematical models ofICaL have consistently been formulated with strong voltage-dependent inactivation and relatively weaker Ca2�-medi-ated inactivation (Winslow et al., 1999; Jafri et al., 1998;Luo and Rudy, 1994; Pandit et al., 2001). The local controlmyocyte model presented in this study displays strongCa2�-mediated LCC inactivation properties consistent withexperimental findings (Figs. 3 D and 10 B). Moreover, Fig.10 demonstrates that the all-or-none SR Ca2� release prop-erty of common pool models (with explicit descriptions ofCICR mechanisms) precludes stability of simulated APswhen the balance between Ca2�-mediated and voltage-de-pendent inactivation of ICaL is adjusted to be consistent withexperimental findings. This points to a critical flaw of thesecommon pool model formulations for Ca2� cycling withinthe cardiac myocyte. In a number of animal models of heartfailure, EC, coupling processes have been found to bedefective (Lindner et al., 1998; Hobai and O’Rourke, 2001;Ahmmed et al., 2000; Marx et al., 2000; Schroder et al.,1998; He et al., 2001; Gomez et al., 1997; O’Rourke et al.,1999). A clear and quantitative understanding of Ca2� cy-cling and the microscopic details of CICR are critical to theelucidation of heart failure-related alterations in EC cou-pling. It may be difficult to interpret altered EC coupling
2934 Greenstein and Winslow
Biophysical Journal 83(6) 2918–2945

processes in the context of a common pool model due to theinherent instability of ICaL in that environment. The localcontrol myocyte model, however, displays robust graded SRCa2� release and strong Ca2�-mediated inactivation of ICaL,processes that are central to properties of CICR. As anexample, the model demonstrates that depressed SR Ca2�
content similar to that measured in heart failure (Lindner etal., 1998; Hobai and O’Rourke, 2001) leads to dramatic APprolongation by relieving the strong Ca2�-mediated inacti-vation of LCCs (Fig. 10 D). In addition, the coupling ofquantitative descriptions of microscopic events of CICR tothe macroscopic processes within the myocyte reveals howthe integration of these cellular processes gives rise tophenomena that may be difficult to predict or understandwithout interpretation in the context of a quantitative model(Fig. 11).
The local control myocyte model provides a means forstudying the interrelationship between microscopic and
macroscopic behaviors in a manner that would not be pos-sible in experiments. It is likely that the role of localstochastic interactions in determining macroscopic proper-ties applies to physiological systems other than CICR incardiac myocytes. In a model of phage �-infection (Arkin etal., 1998), molecular level fluctuations in the rates of geneexpression can arise due to stochastic local actions of reg-ulatory proteins. These fluctuations lead to highly erratictime patterns of protein production in individual cells,which determine the phenotypic outcome for the phage �lysis-lysogeny decision circuit. Recordings from rat hip-pocampal neurons have demonstrated the existence of apreassembled macromolecular signaling complex, whichassociates the �-AR with the L-type Ca2� channel (Davareet al., 2001). The complex also contains a G-protein, anadenylyl cyclase, protein kinase A, and a phosphatase. Thephysical association of the molecular components of thesesignaling pathway elements suggests that the chain of sig-naling events from receptor-ligand binding to phosphoryla-tion of the LCC will be determined by interactions betweena small number of molecular entities within their localenvironment. Modeling studies of systems such as thesemay benefit from an approach, such as the one presented in
TABLE 1 Physical constants and cell geometry parameters
Parameter Definition Value
F Faraday constant 96.5 C mmol�1
T Absolute temperature 310 KR Universal gas constant 8.314 J mol�1 K�1
CSA Cell surface area capacitance 153.4 pFVcyto Cytosolic volume 25.84 pLVNSR NSR volume 1.113 pLVJSR JSR volume (single compartment) 22.26 � 10�6 pLVSS SS volume (single compartment) 0.203 � 10�6 pLNCaRU Number of Ca2� release units 12,500
TABLE 2 Standard ionic concentrations
Parameter Definition Value (mM)
[K�]o Extracellular K� concentration 4.0[Na�]o Extracellular Na� concentration 138.0[Ca2�]o Extracellular Ca2� concentration 2.0[Cl�]o Extracellular Cl� concentration 150.0[Cl�]cyto Intracellular Cl� concentration 20.0
TABLE 3 L-type Ca2� channel and Ca2�-dependent Cl� channel parameters
Parameter Definition Value
f LCC transition rate into open state 0.85 ms�1
g LCC transition rate out of open state 2.0 ms�1
f� LCC transition rate into open state for Mode Ca 0.005 ms�1
g� LCC transition rate out of open state for Mode Ca 7.0 ms�1
a LCC mode transition parameter 2.0b LCC mode transition parameter 1.9356�o LCC mode transition parameter 0.44 mM�1 ms�1
� LCC mode transition parameter 0.02158 ms�1
PCaL L-type Ca2� channel permeability to Ca2� (unitary) 9.13 � 10�13 cm3 s�1
Kd,ClCh Dissociation constant of ClCh for Ca2� 0.1502 mMkf,ClCh ClCh transition rate into open state (kb,ClCh/Kd,ClCh) 13.3156 mM�1 ms�1
kb,ClCh ClCh transition rate out of open state 2.0 ms�1
Pto2 Ca2�-dependent Cl� channel permeability to Cl� (unitary) 2.65 � 10�15 cm3 s�1
TABLE 4 Ryanodine receptor parameters
Parameter Definition Value
k12 Rate constant: state 1 to state 2 877.5 mM�2 ms�1
k21 Rate constant: state 2 to state 1 250.0 ms�1
k23 Rate constant: state 2 to state 3 2.358 � 108 mM�2 ms�1
k32 Rate constant: state 3 to state 2 9.6 ms�1
k34 Rate constant: state 3 to state 4 1.415 � 106 mM�2 ms�1
k43 Rate constant: state 4 to state 3 13.65 ms�1
k45 Rate constant: state 4 to state 5 0.07 ms�1
k54 Rate constant: state 5 to state 4 93.385 mM�2 ms�1
k56 Rate constant: state 5 to state 6 1.887 � 107 mM�2 ms�1
k65 Rate constant: state 6 to state 5 30.0 ms�1
k25 Rate constant: state 2 to state 5 2.358 � 106 mM�2 ms�1
k52 Rate constant: state 5 to state 2 0.001235 ms�1
rRyR Rate of Ca2� flux through anopen RyR
3.92 ms�1
Local Control Myocyte Model 2935
Biophysical Journal 83(6) 2918–2945

this study, which combines stochastic and deterministicmethods to maintain detailed descriptions of local molecularinteractions. Furthermore, the need for implementing localmolecular interactions poses a unique challenge to the sci-entific community. More mathematically efficient ways ofdescribing local phenomena are necessary to build modelsthat can be used to rapidly explore hypotheses and/or can beincorporated into larger-scale multicellular tissue or wholeorgan models.
APPENDIX I
Local ionic fluxes
Each Ca2� release unit (CaRU) contains a single JSR compartment andfour dyadic subspace compartments, which are arranged on a 2 � 2 grid(Fig. 1). Between each subspace and the JSR compartment there are fiveRyRs, and between each subspace and the T-tubule lumen there is one LCCand one ClCh. All model parameter values are given in Tables 1–7.
The JSR volume of the ith CaRU is refilled via passive Ca2� influx
from the NSR:
Jtr,i rtr��Ca2� NSR �Ca2� JSR,i� (1)
where rtr is the transfer rate of Ca2� from the NSR to a JSR compartment;[Ca2�]NSR is the NSR Ca2� concentration; and [Ca2�]JSR,i is the JSR Ca2�
concentration in the ith CaRU. Total Ca2� flux from NSR into all CaRUJSR compartments is
Jtr NCaRU
Ns�i�1
Ns
Jtr,i (2)
where NCaRU is the number of CaRUs included in the full model and Ns isthe number of CaRUs actually simulated (see Appendix II for descriptionof NCaRU vs. Ns). Diffusive Ca2� flux between the jth and the lth contig-uous subspaces within the ith CaRU is defined by
Jiss,i,j,l riss��Ca2� SS,i,j �Ca2� SS,i,l� (3)
where riss is the inter-subspace Ca2� transfer rate and [Ca2�]SS,i,j is thesubspace Ca2� concentration in the jth subspace of the ith CaRU. Everysubspace compartment has two neighbors into which or from which Ca2�
may flow (Fig. 1 B). Similarly, Ca2� diffusion out of the jth subspace ofthe ith CaRU into the cytosol is calculated as
Jxfer,i,j rxfer��Ca2� SS,i,j �Ca2� cyto� (4)
where rxfer is the rate of Ca2� transfer from a single subspace compartmentto the cytosol and [Ca2�]cyto is the cytosolic Ca2� concentration. The totalCa2� flux entering the cytosol from all CaRUs is
Jxfer NCaRU
Ns�i�1
Ns �j�1
4
Jxfer,i,j (5)
The Markov state model for the L-type Ca2� channel is the mode-switching model developed previously by Jafri et al. (1998) and is shownin Fig. 12 A. Briefly, the upper row of states comprises Mode Normal,while the lower row of states comprises Mode Ca, the Ca2�-mediatedinactivation mode. States labeled O and OCa (states 6 and 12) are conduct-ing states. Elevation of local Ca2� level promotes transition into Mode Ca,in which transitions to the open state are extremely rare. The rate constantsare defined individually for each LCC by the parameter values given inTable 3 and
TABLE 5 Ca2� flux and buffering parameters
Parameter Definition Value
rxfer Rate of Ca2� flux between SS and cytosol 200.0 ms�1
rtr Rate of Ca2� flux between NSR and JSR 0.333 ms�1
riss Intersubspace Ca2� flux rate 20.0 ms�1
[BSR]T Total subspace SR membrane siteconcentration
47.0 �M
KBSR Ca2�-half-saturation constant for BSR 0.87 �M[BSL]T Total subspace sarcolemma site
concentration1124.0 �M
KBSL Ca2�-half-saturation constant for BSL 8.7 �M[CSQN]T Total JSR calsequestrin concentration 13.5 mMKCSQN Ca2�-half-saturation constant for
calsequestrin0.63 mM
[CMDN]T Total cytosolic calmodulin concentration 50.0 �MKCMDN Ca2�-half-saturation constant for
calmodulin2.38 �M
TABLE 6 Ionic current and flux formulations from previous studies
Current/Flux Reference New Parameter Values
Fast Na� current (INa) Winslow et al., 1999 No changeRapid delayed rectifier K� current (IKr) Mazhari et al., 2001 GKr � 0.024 mS �F�1
Slow delayed rectifier K� current (IKs) Winslow et al., 1999 No changeTransient outward K� current (Ito1) Greenstein et al., 2000 GKv4.3 � 0.1389 mS �F�1
PKv1.4 � 1.989 � 10�7 cm s�1
Time-independent K� current (IK1) Winslow et al., 1999 GK1 � 3.0 mS �F�1
Plateau K� current (IKp) Winslow et al., 1999 GKp � 0.002659 mS �F�1
Na�/Ca2� exchanger current (INaCa) Winslow et al., 1999 kNaCa � 0.27 pA pF�1
Na�/K� pump current (INaK) Winslow et al., 1999 INaK,max � 0.901 pA pF�1
Sarcolemmal Ca2� pump current (Ip(Ca)) Winslow et al., 1999 Ip(Ca),max � 0.03 pA pF�1
Km,p(Ca) � 0.0005 mMCa2� background current (ICa,b) Winslow et al., 1999 GCa,b � 0.0002536 mS �F�1
Na� background current (INa,b) Winslow et al., 1999 GNa,b � 0.00264 mS �F�1
Ca2� binding to troponin (Jtrpn) Winslow et al., 1999 No changeSR Ca2� pump (SERCA2a pump, Jup) Shannon et al., 2000 Vmaxf � Vmaxr � 209.6 �M s�1
(Ca2� flux between cytosol and NSR) k � 0 (leak term omitted)
2936 Greenstein and Winslow
Biophysical Journal 83(6) 2918–2945

� 2.0e0.012(Vm�35) (6)
� 0.0882e�0.05(Vm�35) (7)
�� a� (8)
�� �/b (9)
� �o�Ca2� SS (10)
where Vm is membrane potential in units of mV; �, �, ��, ��, and � are inunits of ms�1; and [Ca2�]SS is the Ca2� concentration in the dyadicsubspace adjacent to the inner pore of the channel. Voltage-dependentinactivation of an LCC, indicated by the value of yi,j, is modeled by thesimple two-state gating scheme shown in Fig. 12 B, with rates determinedby
y� 0.4/�1 � e(Vm�12.5)/5� � 0.6 (11)
�y 340/�1 � e(Vm�30)/12� � 60 (12)
kb,y y�/�y (13)
kb,y �1 y��/�y (14)
with �y given in ms, and ki,y and kb,y given in ms�1. The current passingthrough the jth LCC of the ith CaRU can then be written as
ILCC,i,j isopen(LCCi,j, yi,j)PCaL
�4VmF2
RT
�Ca2� SS,i,j e2VmF/RT 0.341�Ca2� o
e2VmF/RT 1
(15)
where isopen(LCCi,j, yi,j) indicates when the jth channel of the ith CaRU isopen and takes on the value of 1 when it occupies state O or OCa, and isnot voltage-inactivated (i.e., LCCi,j is in state 6 or 12 and yij is in state 1),and takes on the value of 0 otherwise; PCaL is the permeability of a singleLCC; F is Faraday’s constant; R is the universal gas constant; T is absolutetemperature; [Ca2�]SS,i,j is the subspace Ca2� concentration adjacent to thejth channel of the ith CaRU; and [Ca2�]o is extracellular Ca2� concentra-tion. Whole-cell ICaL, normalized by whole-cell capacitance, is equal to thesummation of unitary Ca2� currents over all LCCs
ICaL 1
CSA
NCaRU
Ns�i�1
Ns �j�1
4
ILCC,i,j (16)
where CSA is the capacitance of the cell’s surface area and it has beenassumed that specific membrane capacity is 1 �F cm�2.
The Ca2�-dependent Cl� channel (ClCh) is modeled as a voltage- andtime-independent ligand-gated channel, using a simple two-state model asshown in Fig. 12 C. Although detailed Ca2�-dependent kinetics have notbeen experimentally measured for this channel, model rates have beenchosen to be sufficiently fast (�2 ms�1) to track kinetics of local Ca2�
transients, and to be consistent with the experimentally estimated Kd valuefor Ca2� binding of �150 �M (Collier et al., 1996). Unitary C1� currentthrough the jth ClCh of the ith CaRU is described as
IClCh,i,j isopen�ClChi,j�Pto2
�VmF2
RT
�Cl� cyto e�VmF/RT �Cl� o
e�VmF/RT 1(17)
where isopen(ClChi,j) indicates when the jth channel of the ith CaRU isopen and Pto2 is the permeability of a single ClCh. ClCh permeability is
adjusted to match unitary C1� currents measured in canine ventricularmyocytes (Collier et al., 1996). Because other Cl� transport mechanismsare not included in the model, it was assumed that intracellular/subspaceCl� concentration remains constant. Whole-cell Ito2, normalized by cell
TABLE 7 State variable initial conditions
VariableInitial Value
(Voltage Clamp)*Initial Value
(AP)†
Vm �100.0 mV �91.3258 mVm (INa) 1.21087 � 10�4 5.33837 � 10�4
h (INa) 0.999484 0.996345j (INa) 0.999480 0.997315[Na�]cyto 10.0 mM 10.0 mM[K�]cyto 133.24 mM 131.84 mM[Ca2�]cyto 1.11074 � 10�4 mM 1.45273 � 10�4 mM[Ca2�]NSR 0.728737 mM 0.908882 mM[LTRPNCa] 7.02394 � 10�3 mM 8.98282 � 10�3 mM[HTRPNCa] 0.136915 mM 0.137617 mMxKs (IKs) 0.104829 � 10�3 0.204717 � 10�3
C1 (IKr) 0.990 0.999503C2 (IKr) 0.008 0.413720 � 10�3
C3 (IKr) 0.002 0.727568 � 10�4
O (IKr) 0.0 0.873984 � 10�5
I (IKr) 0.0 0.136159 � 10�5
C0 (IKv4.3) 0.968277 0.953060C1 (IKv4.3) 0.0133601 0.0253906C2 (IKv4.3) 0.691875 � 10�4 0.253848 � 10�3
C3 (IKv4.3) 0.159092 � 10�6 0.112796 � 10�5
O (IKv4.3) 0.0 0.187950 � 10�8
CI0 (IKv4.3) 0.0153235 0.0151370CI1 (IKv4.3) 0.00271424 0.00517622CI2 (IKv4.3) 0.243515 � 10�3 0.896600 � 10�3
CI3 (IKv4.3) 0.115007 � 10�4 0.817569 � 10�4
OI (IKv4.3) 0.163239 � 10�6 0.224032 � 10�5
C0 (IKv1.4) 0.824239 0.722328C1 (IKv1.4) 0.0522865 0.101971C2 (IKv1.4) 0.00124396 0.00539932C3 (IKv1.4) 0.131359 � 10�4 0.127081 � 10�3
O (IKv1.4) 0.522383 � 10�7 0.182742 � 10�5
CI0 (IKv1.4) 0.118010 0.152769CI1 (IKv1.4) 0.00334011 0.00962328CI2 (IKv1.4) 0.684631 � 10�3 0.00439043CI3 (IKv1.4) 0.136717 � 10�3 0.00195348OI (IKv1.4) 0.451249 � 10�4 0.00143629[Ca2�]JSR,i 0.728921 mM (100%) 0.908408 mM (100%)[Ca2�]SS,i,j 0.111074 � 10�3
mM (100%)0.145370 � 10�3 mM
(100%)LCCi,j state 1 (100%) states 1, 2, 7 (95.8%, 3.8%,
0.4%)yi,j state 1 (100%) states 0, 1 (94.25%, 5.75%)ClChi,j state 0 (100%) states 0, 1 (99.8%, 0.2%)RyRi,j,k state 1 (100%) states 1, 5–6 (60.9%, 39.1%)
For global state variable definitions, see text and references given in Table6. For CaRU-compartment and CaRU-random state variable definitions,the initial distribution is given in parentheses for each state respectively.*Initial values for voltage clamp simulations (Figs. 2–8) correspond to thestate of the system after holding at �100 mV for �3 s following a train of200-ms voltage clamp pulses to 0 mV applied at 1 Hz (to load SR withCa2�).†Initial values for APs (Figs. 9–11) are obtained at 1 Hz following 10 beats(i.e., at steady state).
Local Control Myocyte Model 2937
Biophysical Journal 83(6) 2918–2945

surface area, is equal to the summation of unitary Cl� currents over allClChs
Ito2 1
CSA
NCaRU
Ns�i�1
Ns �j�1
4
IClCh,i,j (18)
Each RyR channel is represented by the Markov state model developedby Keizer and Smith (1998) and later modified by Rice et al. (1999). Fig.13 A shows the baseline RyR model structure. States 3 and 4 correspond toopen states in the baseline model. Under conditions of elevated subspaceCa2�, rapid equilibrium approximations are applied to pairs of states whenthe transition rates between the pair are �200-fold faster than the ratesexiting the pair (Keizer and Smith, 1998). Fig. 13, B and C show the five-and four-state equivalent models used and the [Ca2�]SS ranges in whichthese reduced order models are considered to be valid. The RyR modelrepresentations are dynamically switched among the six, five, and four-state representations during the simulation as local Ca2� levels vary. Tofurther reduce computation time, RyR Ca2�-dependent transition rates arebounded below a maximal value corresponding to the rates that occur at asubspace Ca2� level of 50 �M to prevent extremely fast and unrealistictransition rates at high local Ca2� levels (Rice et al., 1999). This bound wasnot applied to rate k12 because it is significantly slower than the otherCa2�-dependent rates, and the constraint of microscopic reversibility doesnot apply to k12 because it is not within a closed loop of states.
The RyR Ca2� release flux in the jth subspace of the ith CaRU iscomputed as
Jrel,i,j �k�1
5
is open(RyRi,j,k)rRyR��Ca2� JSR,i �Ca2� SS,i,j�
(19)
where is open(RyRi,j,k) takes on the value of 1 when the kth RyR in the jthsubspace of the ith CaRU is open(RyRi,j,k is in state 3, 4, or 3–4) and takeson the value of 0 otherwise; rRyR is the transfer rate of Ca2� through anopen RyR; [Ca2�]SS,i,j is the subspace Ca2� concentration in the jthsubspace of the ith CaRU; and [Ca2�]JSR,i is the JSR Ca2� concentrationin the ith CaRU. Jrel, the whole-cell SR release flux, can be calculated by
applying Eq. 16 to Jrel,i,j. This is necessary only when calculating featuressuch as EC coupling gain.
Local Ca2� balance
The Ca2� balance equation for the JSR in the ith CaRU is
d�Ca2� JSR,i
dt �JSR,i �Jtr,i
VSS
VJSR�j�1
4
Jrel,i,j� (20)
where
�JSR,i �1 ��CSQN]T KCSQN
�KCSQN � �Ca2� JSR,i�2��1
(21)
is an implementation of the rapid buffering approximation as previouslydescribed by Rice et al. (1999). Calsequestrin concentration and Ca2�
binding affinity ([CSQN]T and KCSQN) are based on recent measurements(Shannon et al., 2000). Similarly, Ca2� balance in the 1st, 2nd, 3rd, and 4thsubspaces of the ith CaRU are respectively described by
d�Ca2� SS,i,1
dt
�SS,i,1�JLCC,i,1 � Jrel,i,1 Jxfer,i,1 � Jiss,i,2,1 � Jiss,i,4,1�
(22)
d�Ca2� SS,i,2
dt
�SS,i,2�JLCC,i,2 � Jrel,i,2 Jxfer,i,2 � Jiss,i,3,2 � Jiss,i,1,2�
(23)
FIGURE 12 State diagrams for the LCC and theClCh channel Markov models. (A) State model of themode switching and voltage activation processes of theLCC channel model. The states in the upper row en-compass Mode Normal and the states in the lower rowencompass Mode Ca. Open states are labeled O andOCa (states 6 and 12). Depolarization promotes transi-tions from left to right toward the open states. Elevationof Ca2� in the adjacent subspace promotes transitionsinto Mode Ca, where transitions into OCa are rare (formore details see Jafri et al., 1998, and Rice et al.,1999). (B) State model for voltage-dependent inactiva-tion of an LCC. Depolarization promotes transitionsfrom the available state (y) to the unavailable state(1�y). See Eqs. 6–16 and Table 3 for equations andparameters describing LCC state transitions. (C) Statemodel for the ClCh (Ito2). Elevation of Ca2� in theadjacent subspace promotes transitions from the closedstate into the open state. See Eqs. 17–18 and Table 3for equations and parameters describing ClCh statetransitions.
2938 Greenstein and Winslow
Biophysical Journal 83(6) 2918–2945

FIGURE 13 State diagrams for the RyR Markov models. (A) Baseline RyR model where states 1 and 2 are the resting states, states 3 and 4 are the open states,and states 5 and 6 are the refractory states. It is assumed that each Ca2�-dependent transition is associated with the binding of two Ca2� ions, therefore requiringthat four Ca2� ions bind to reach the open state. This model is implemented when subspace Ca2� concentration is 0.115 �M. See Table 4 for values of the rateconstants. (B) Approximation of the model in panel A where it has been assumed that states 5 and 6 are in rapid equilibrium, and are therefore merged into a singlestate. This model is implemented when subspace Ca2� concentration is in the range of 0.115–36.85 �M. (C) Approximation of the model in panel B whereit has been assumed that states 3 and 4 are in rapid equilibrium. This model is implemented when subspace Ca2� concentration is 36.85 �M.
Local Control Myocyte Model 2939
Biophysical Journal 83(6) 2918–2945

d�Ca2� SS,i,3
dt
�SS,i,3�JLCC,i,3 � Jrel,i,3 Jxfer,i,3 � Jiss,i,4,3 � Jiss,i,2,3�
(24)
d�Ca2� SS,i,4
dt �SS,i,4�JLCC,i,4 � Jrel,i,4 Jxfer,i,4 � Jiss,i,1,4
� Jiss,i,3,4� (25)
where
JLCC,i,j ILCC,j,i
2FVSS(26)
and
�SS,i,j �1 ��BSR T KBSR
�KBSR � �Ca2� SS,i,j�2
��BSL]TKBSL
�KBSL � �Ca2� SS,i,j�2��1
(27)
describes rapid equilibrium between Ca2� and membrane-bound Ca2�
buffers (Rice et al., 1999).
Global ionic fluxes
All of the global currents and ionic fluxes that are incorporated into thelocal control myocyte model have been described fully in previous work.Table 6 provides references for previously published mathematical modeldescriptions and parameters, and any parameters that differ in the presentimplementation from the referenced version of the model are provided.
Global ionic flux balance and membrane potential
Intracellular concentrations of Na�, K�, NSR Ca2�, and cytosolic Ca2�
are described respectively by
d�Na� i
dt
CSA
VcytoF�INa � INa,b � 3INaCa � 3INaK� (28)
d�K� i
dt
CSA
VcytoF�IKr � IKs � Ito1 � IKl � IKp 2INaK�
(29)
d�Ca2� NSR
dt
Vcyto
VNSRJup
VJSR
VNSRJtr (30)
d�Ca2� cyto
dt �cyto � CSA
2VcytoF�ICa,b � Ip(Ca) 2INaCa�
�VSS
VcytoJxfer Jup Jtrpn� (31)
where
�cyto �1 ��CMDN T KCMDN
�KCMDN � �Ca2� cyto�2��1
(32)
describes Ca2� buffering by calmodulin (Winslow et al., 1999).
The membrane potential is calculated as
dVm
dt �INa � ICaL � IKr � IKs � Ito1 � IKl � IKp
� Ito2 � INaK � INaCa � Ip(Ca) � ICa,b � INa,b� (33)
where all currents are expressed in units of pA pF�1.
APPENDIX II
Local control myocyte simulation algorithm
Each model state variable (SV) is a member of one of the following threegroups: 1) global, 2) CaRU-compartment, or 3) CaRU-random. The JSR-NSR, subspace-cytosol, and subspace-sarcolemmal borders define theboundaries of a CaRU. Global SVs represent quantities external to theCaRU boundaries, including membrane potential (Vm), cytosolic ion con-centrations (Ca2�, K�, and Na�), and NSR Ca2� concentration. In addi-tion, Hodgkin-Huxley-type gating variables (e.g., m, h, and j for INa) andMarkov model states (e.g., C1, C2, C3, I, and O for IKr) associated withcurrents that exist entirely outside of the CaRUs are global. The CaRU-compartment SVs are Ca2� concentrations in the JSR and in each SS ofevery CaRU, and are thus local states. CaRU-random SVs take on the valueof the occupied states in single channel Monte Carlo simulations (LCC,RyR, and ClCh), and are therefore also local states. Each group of SVsrequires its own simulation sub-algorithm. First, each of these sub-algo-rithms is described, and then we show how they interact to form thecomplete simulation of the local control model.
Let global SVs be denoted by the vector x(t). Let CaRU-compartmentSVs and CaRU-random SVs within the ith CaRU be denoted by the vectorsyi (t) and zi(t), respectively. NCaRU is the number of CaRUs in the myocyteand Ns is the number of CaRUs actually simulated. The difference in NCaRU
and Ns arises from a useful approximation described below.The coupled system of differential equations for the global SVs is
represented by
x f x�t, x, y1, . . . , yNs, z1, . . . , zNs� (34)
where fx denotes the function defining the velocity field (time derivative)of x. Note that the right-hand side of Eq. 34 depends upon SVs from allthree groups. Integration of global SVs is performed with the Runge-Kutta-Merson fourth-order adaptive step method (RK4M) (Kubicek and Marek,1983). The RK4M advances the global state vector in time from x(t) tox(t � hx), where hx denotes a global time step, by subdividing hx intoEuler-type intermediate steps (sub-steps). Fig. 14 shows the relationshipamong different time steps used throughout the simulation algorithm.Equations 35 through 39 compose a single RK4M time step for this systemand make use of the compact notation f x([txyz]n) � f x (tn, xn, y1
n, . . . ,yNsn ,
z1n, . . . ,zNs
n ):
vn�1/3 xn �hx
n
3f x��txyz]n� (35)
vn�1/3 xn �hx
n
3 �f x��txyz]n� � f x��tvyz]n�1/3�
2 � (36)
vn�1/2 xn �hx
n
2 �f x��txyz]n� � 3f x��tvyz]n�1/3�
4 � (37)
2940 Greenstein and Winslow
Biophysical Journal 83(6) 2918–2945

vn�1 xn
� hxn�f x��txyz]n� 3f x��tvyz])n�1/3� � 4f x��tvyz]n�1/2�
2 �(38)
vn�1 xn
� hxn�f x��txyz]n� � 4f x��tvyz]n�1/2� � fx��tvyz])n�1
6 �(39)
FIGURE 14 Time-stepping scheme for the local control myocyte simulation algorithm. The global state vector is advanced in time from tn to tn�1 overthe global time step hx
n, where n is an index to global time steps (i.e., hxn is the nth global time step). Each global time step is divided into RK4M substeps,
which are themselves divided into local time steps. CaRU-compartment and CaRU-random state vectors are simulated along local time steps, which aredetermined independently within each CaRU. The local time step in the ith CaRU between times ti
m and tim � 1 is denoted hyz,i
m , where m is an index to localtime steps. The index Mi refers to the last local time step in the ith CaRU within the bounds of the encompassing global time step, and Ns is the numberof CaRUs included in the Monte Carlo simulation.
Local Control Myocyte Model 2941
Biophysical Journal 83(6) 2918–2945

where tn�1/p � tn � hxn/p, p � 3, 2, 1 denote intermediate times within the
nth global time step hxn. Similarly, we have made use of the notation
un�1/p � u(tn � hxn/p), where u denotes any state vector. Equation 39 yields
the fourth-order estimate of the solution, xn�1 � vn�1. The solution isaccepted if the embedded truncation error estimate
E �vn�1 vn�1�/5 (40)
is less than the tolerance ( ) for each global SV, otherwise Eqs. 35–39 arereevaluated with a smaller hx
n determined by
hx,newn 0.85hx,old
n � /�E��0.2 (41)
Equation 41 is also used to increase the global time step if the solution overthe previous step has been accepted. The errors for each SV are normalizedto ensure that each is equally weighted in the truncation error calculation.Global step size is normally limited by the time-rate-of-change of theglobal SVs, but is not limited by fast dynamics within CaRUs. An impor-tant feature of this procedure is that every equation evaluation (of Eqs.35–39) yields an estimated solution at the intermediate time step (i.e., eachv is an estimate of x, e.g., xn�1/2 � vn�1/2). We make use of this propertywhen calculating fluxes that cross CaRU boundaries (see below). Theleft-hand sides of Eqs. 36 and 39 are denoted with a caret symbol (i.e., v)to indicate that these are refinements of the estimates obtained in theimmediately preceding equation (at the same time point).
The simulation of a CaRU does not require knowledge of events occurringin any other CaRU within the span of a single global time step (i.e., CaRUs areindependent on the interval [t, t � hx]), which allows for parallelization of thispart of the algorithm. The solution of both CaRU-compartment and CaRU-random SVs within the ith CaRU is advanced in increments of the local timestep, hyz,i. The coupled system of differential equations for the CaRU-com-partment SVs of the ith CaRU is represented by
yi f y�t, x, yi, zi� (42)
where f y denotes the function defining the velocity field of yi (for any i).Integration of CaRU-compartment SVs is performed with the second-ordertrapezoidal method. The trapezoidal method is chosen because it provideshigher-order accuracy than the Euler method without the need to furthersubdivide the local time step. The solution is advanced in time as follows:
wim�1 yi
m � hyz,im f y�ti
m, xim, yi
m, zim� (43)
yim�1 yi
m
� hyz,im �f y�ti
m, xim, yi
m, zim� � f y�ti
m�1, xim�1, wi
m�1, zim�
2 �(44)
where yim � yi(ti
m), yim�1 � yi(ti
m � hyz,im ), and hyz,i
m is the mth local time stepwithin the ith CaRU. Note that while t and x are global, the notation ti
m andxi
m are used locally because local time steps are not synchronized acrossCaRUs, i.e., hyz,i
m � hyz,jm , which implies ti
m � tjm and xi
m � xjm. The counter
variable m restarts at the beginning of each RK4M substep (see Fig. 14).The CaRU-random SV vector, zi
m, is not updated to zim�1 within Eq. 44,
rather zim is assumed to remain constant during the local time step, and is
updated immediately after the CaRU-compartment SVs have been updatedto yi
m�1 (see below for more details). Within Eqs. 43 and 44, xim is
calculated by linearly interpolating from values previously calculated at thebeginning and ending time of the current RK4M substep (Fig. 14). Forexample, if tn�1/3 ti
m tn�1/2, then xim is interpolated using the current
estimates of the interval endpoints xn�1/3 � vn�1/3 and xn�1/2 � vn�1/2.A Monte Carlo simulation is run to update zi
m to zim�1 over the local
time step hyz,im in the ith CaRU. It is assumed that CaRU-compartment SVs
remain constant over the duration of a single local time step. Let j � 1, 2,3, . . . index the group of CaRU-random variables for the ith CaRU (i.e.,
each j is an index to a particular channel or Markov process). Let ri,jk , k �
1, 2, 3, . . . denote the transition rate for the jth channel in the ith CaRUfrom its currently occupied state into state k. Also, let �i,j � �k ri,j
k . Thenthe probability that the jth channel made a state transition within the timestep hyz,i
m is
pi,j � �i,jhyz,im (45)
and the probability that no transition occurred is therefore 1 � �i,jhyz,im .
Then, by conditioning on whether a change of state has occurred, theprobability that the jth channel entered state k within the time step hyz,i
m is
pi,jk � ��i,jhyz,i
m ��ri,jk /�i,j� hyz,i
m ri,jk (46)
For each j, a standard uniform random variable is generated and is used todetermine into which state the process transits, if a transition occurs, basedon Eqs. 45 and 46. This process is completed for each i (each CaRU), andthe newly occupied states are recorded as zi
m�1.The local time step hyz,i
m is determined based on two criteria: 1) to ensurethat the approximate relation of Eq. 45 is valid, and 2) to ensure that dynamicsof Ca2� within the CaRUs (CaRU-compartments SVs) are adequately cap-tured. The first criterion is satisfied by imposing the condition
hyz,im �
tol
maxj
��i,j�(47)
With tol � 0.05, hyz,im is no greater than 5% of the expected waiting time
until the next transition of the channel with the fastest exit rate. Becausepi,j � 1 � exp(��i,jhyz,i
m ) � �i,jhyz,im , the maximum transition probability is
pi,j � 1 � exp(�tol) � 0.04877 � tol � 0.05. A bound on the error in pi,j
due to the approximation of Eq. 45 is therefore 0.00133. The secondcriterion is satisfied by imposing the constraint: if Ca2� concentration inany subspace compartment of the ith CaRU is 1.5 �M, then hyz,i
m � 5 �s,else hyz,i
m � 10 �s. In addition to these criteria, local time steps areoccasionally shortened to synchronize with the encompassing global timestep, hx
n.Using the algorithmic components described above, the local control
myocyte simulation advances the solution from the states defined by x(t),y1(t), . . . , yNs
(t), z1(t), . . . , zNs(t) to x(t � hx
n), y1(t � hxn), . . . , yNs
(t � hxn),
z1(t � hxn), . . . , zNs
(t � hxn), respectively, in the following manner:
1. Choose hxn (initial guess or based on E of previous RK4M step, Eq. 40).
2. Calculate vn�1/3 (Eq. 35).3. Loop over each i:
a) While tim tn�1/3 do:
i. Choose hyz,im (Eq. 47 and other bounds).
ii. Calculate xim and xi
m�1 (interpolate between xn and vn�1/3).iii. Calculate yi
m�1 (Eqs. 43–44).iv. Calculate zi
m�1 (Eqs. 45–46 and uniform random variables).v. Set m � m � 1.
End While;b) Set yn�1/3 � yi
m�1; Set zn�1/3 � zim�1.
End Loop over i;4. Calculate vn�1/3 (Eq. 36) and vn�1/2 (Eq. 37).5. Repeat procedure as described in step 3 on the interval [tn�1/3, tn�1/2].6. Calculate vn�1 (Eq. 38).7. Repeat procedure as described in step 3 on the interval [tn�1/2, tn�1].8. Calculate vn�1 (Eq. 39).9. If E (Eq. 40) is acceptable, then
a) xn�1 � vn�1 (update global SVs).b) Set n � n � 1.c) Set new global time step hx
n�1 (Eq. 41).d) Goto step 1 (to continue)
Elsea) revise hx
n, (Eq. 41).b) Goto step 1 (to repeat).
2942 Greenstein and Winslow
Biophysical Journal 83(6) 2918–2945

The loops performed over all CaRUs (i’s) can be parallelized (steps 3, 5,and 7). Sensible reductions in the number of necessary calculation can bemade during many of these steps. For example, in step 3.a.ii of the CaRUsimulation, the only global SVs that need be interpolated are NSR andcytosolic Ca2� concentrations, and Vm.
Equations 45 and 46 give probabilities that a transition has occurredsometime during the local time step, hyz,i
m . It is always assumed that thestate transition occurs exactly at time ti
m � hyz,im (i.e., zi
m is updated to zim�1
after Eq. 44 is evaluated). Discretizing the Markov process in this mannerintroduces an additional source of approximation error. The expectedwaiting time, denoted E[Ti,j], until the jth channel in the ith CaRU exits itscurrent state is 1/�i,j. When the process is discretized, the waiting timefollows a geometric distribution, such that
E[Ti,j] �k�1
�
khyz,im �1 pi,j�
k�1pi,j hyz,i
m
pi,j(48)
In general, Eq. 48 would not yield an expected waiting time of exactly1/�i,j. However, if the approximate expression for pi,j defined by Eq. 45 andused in this algorithm is substituted into Eq. 48, the desired result isobtained, i.e., E[Ti,j] � 1/�i,j.
When the subspace Ca2� level is high, the local time step for a CaRUis limited mainly by the fast transition rates of the RyRs. Computationaltime is reduced by about an order of magnitude by making use of the rapidequilibrium approximation for pairs of states when the transition ratesbetween the pair are relatively fast compared to the rates exiting the pair(Keizer and Smith, 1998). The six-state RyR models are converted tolower-order (five- or four-state) models dynamically under conditions ofhigh local Ca2� when the approximation is valid. In addition, sometransition rates are bounded with a maximum value (in a manner thatmaintains microscopic reversibility) to prevent extremely fast and unreal-istic transition rates at high local Ca2� levels (Rice et al., 1999). Fordetails, see the RyR model description in Appendix I.
An additional reduction in computation time can be achieved by sim-ulating only a subset of CaRUs. Every evaluation of f x (Eq. 34) requiresthat ICaL, Jtr, Jxfer, and Ito2 are calculated by summing over all of therespective unitary currents/fluxes in each CaRU (see Eqs. 2, 5, 16, and 18).Simulation of only a subset of the full population of CaRUs dramaticallyreduces simulation time. A reduction of Ns will increase the stochasticgating noise in macroscopic ICaL, and hence in Vm and most global SVs.However, the level of noise in these signals remains acceptably low forvalues of Ns NCaRU, making this a very useful and time-saving approx-imation. During the application of 1-Hz current stimuli, one second ofmodel simulation time requires �40 min of run time when implemented inparallel on 10 SGI Power Challenge R10,000 processors with only 10% ofthe total population of CaRUs included in the Monte Carlo simulation (i.e.,NCaRU � 12,500 and Ns � 1250). Most simulations presented in this studywere performed with 20% of the CaRUs included in the Monte Carlosimulation. At this approximation level, repeated runs showed minimalvariation (e.g., error bars in Figs. 3 B and 7 A). L-type Ca2� currents shownin Fig. 3 A were simulated without using this approximation (i.e., 100% ofthe CaRUs were simulated), and therefore, the noise in these signals isrepresentative of channel gating noise for the entire population of LCCs.
Uniform random variables are obtained using the Numerical Recipesfunction ran2 (Press et al., 1992). This generator has a period 2 � 1018
with added safeguards designed to eliminate possible serial correlations inthe sequence of uniform deviates. An independent sequence is generatedfor each simulated channel and each sequence is initialized by generatingseeds with the Numerical Recipes function ran1 (Press et al., 1992). Atthe beginning of each global time step, all random sequence seeds arestored. If a global time step is rejected in step 9 of the simulation algorithm,the random sequence seeds are reset to the stored values before repeatingthat step (with a smaller step size) to ensure that the trajectory of the MonteCarlo simulation is not artificially influenced or altered by the decision toaccept or reject global time steps based on truncation error (Eq. 40).
The validity of the simulation algorithm was tested by applying acombined voltage- and Ca2� -clamp protocol. From a �100 mV holdingpotential, voltage is stepped to 0 mV for 50 ms, and then returned to theholding potential. Concurrently, Ca2� in all subspace compartments isclamped at 0.1 mM, stepped to 20 mM for 50 ms, and then returned to 0.1mM. RyR and LCC open probability determined using the local controlmodel algorithm are nearly the same as those obtained by solving theassociated set of ordinary differential equations for this protocol, withslight deviations due only to the presence of gating noise in the localcontrol simulation (data not shown). An additional test is performed toensure Ca2� flux between individual CaRUs and the whole cell arecorrectly handled. Total cell Ca2� (in all compartments, including both freeand bound Ca2�) is calculated at each point in time by: 1) summing overall cellular compartments, and 2) tracking incremental changes in totalCa2� based on set sarcolemmal Ca2� flux. These values differ by 0.05%after a 10-s simulation of APs paced at 1 Hz (data not shown).
This work was supported by National Institutes of Health Grants RO1HL60133 and P50 HL52307, and by the Whitaker Foundation.
REFERENCES
Ahmmed, G. U., P. H. Dong, G. Song, N. A. Ball, Y. Xu, R. A. Walsh, andN. Chiamvimonvat. 2000. Changes in Ca2� cycling proteins underliecardiac action potential prolongation in a pressure-overloaded guinea pigmodel with cardiac hypertrophy and failure. Circ. Res. 86:558–570.
Arkin, A., J. Ross, and H. H. McAdams. 1998. Stochastic kinetic analysisof developmental pathway bifurcation in phage �-infected Escherichiacoli cells. Genetics. 149:1633–1648.
Bassani, J. W., W. Yuan, and D. M. Bers. 1995. Fractional SR Ca releaseis regulated by trigger Ca and SR Ca content in cardiac myocytes.Am. J. Physiol. Cell Physiol. 268:C1313–C1319.
Bers, D. M. 1993. Excitation Contraction Coupling and Cardiac ContractileForce. Kluwer Academic Press, Boston.
Bers, D. M., and E. Perez-Reyes. 1999. Ca channels in cardiac myocytes:structure and function in Ca influx and intracellular Ca release. Cardio-vasc Res. 42:339–360.
Beuckelmann, D. J., and W. G. Wier. 1988. Mechanism of release ofcalcium from sarcoplasmic reticulum of guinea-pig cardiac cells.J. Physiol. (Lond). 405:233–255.
Cannell, M., J. Berlin, and W. Lederer. 1987. Effect of membrane potentialchanges on the calcium transient in single rat cardiac muscle cells.Science. 283:1419–1423.
Cannell, M., H. Cheng, and W. Lederer. 1984. Spatial non-uniformities in[Ca2�]i during excitation-contraction coupling in cardiac myocytes.Biophys J. 67:1942–1956.
Cannell, M. B., H. Cheng, and W. J. Lederer. 1995. The control of calciumrelease in heart muscle. Science. 268:1045–1049.
Cannell, M. B., and C. Soeller. 1997. Numerical analysis of ryanodinereceptor activation by L-type channel activity in the cardiac muscle diad.Biophys J. 73:112–122.
Cheng, H., M. Fill, H. Valdivia, and W. J. Lederer. 1995. Models of Ca2�
release channel adaptation. Science. 267:2009–2010.
Cheng, H., W. J. Lederer, and M. B. Cannell. 1993. Calcium sparks:elementary events underlying excitation-contraction coupling in heartmuscle. Science. 262:740–744.
Cleemann, L., and M. Morad. 1991. Role of the Ca2� channel in cardiacexcitation-contraction coupling in the rat: evidence from Ca2� transientsand contraction. J. Physiol. 432:283–312.
Collier, M., P. Levesque, J. Kenyon, and J. Hume. 1996. Unitary Cl�
channels activated by cytoplasmic Ca2� in canine ventricular myocytes.Circ. Res. 78:936–944.
Collier, M. L., A. P. Thomas, and J. R. Berlin. 1999. Relationship betweenL-type Ca2� current and unitary sarcoplasmic reticulum Ca2� releaseevents in rat ventricular myocytes. J. Physiol. (Lond.). 516:117–128.
Local Control Myocyte Model 2943
Biophysical Journal 83(6) 2918–2945

Davare, M. A., V. Avdonin, D. D. Hall, E. M. Peden, A. Burette, R. J.Weinberg, M. C. Horne, T. Hoshi, and J. W. Hell. 2001. A beta 2adrenergic receptor signaling complex assembled with the Ca2� channelCav1.2. Science. 293:98–101.
DelBridge, L. M., J. W. Bassani, and D. M. Bers. 1996. Steady-state twitchCa2� fluxes and cytosolic Ca2� buffering in rabbit ventricular myocytes.Am. J. Physiol. Cell Physiol. 270:C192–C199.
Faber, G. M., and Y. Rudy. 2000. Action potential and contractilitychanges in [Na�]i overloaded cardiac myocytes: a simulation study.Biophys. J. 78:2392–2404.
Fabiato, A. 1985. Time and calcium dependence of activation and inacti-vation of calcium-induced release of calcium from the sarcoplasmicreticulum of a skinned canine cardiac Purkinje cell. J. Gen. Physiol.85:247–289.
Fox, J. J., J. L. McHarg, and R. F. Gilmour, Jr. 2002. Ionic mechanism ofelectrical alternans. Am. J. Physiol. Heart Circ. Physiol. 282:H516–H530.
Franzini-Armstrong, C., F. Protasi, and V. Ramesh. 1999. Shape, size, anddistribution of Ca2� release units and couplons in skeletal and cardiacmuscles. Biophys. J. 77:1528–1539.
Gomez, A. M., H. H. Valdivia, H. Cheng, M. R. Lederer, L. F. Santana,M. B. Cannell, S. A. McCune, R. A. Altschuld, and W. J. Lederer. 1997.Defective excitation-contraction coupling in experimental cardiac hy-pertrophy and heart failure. Science. 276:800–806.
Greenstein, J. L., and R. L. Winslow. 2001a. Probing the role of excitation-contraction coupling properties on the ventricular action potential. Ann.Biomed. Eng. 29:S-51.
Greenstein, J. L., and R. L. Winslow. 2001b. Integration of a stochasticmodel of local calcium control with a simulation of the cardiac ventric-ular action potential. Biophys. J. 80:593a. (Abstr.).
Greenstein, J. L., R. Wu, S. Po, G. F. Tomaselli, and R. L. Winslow. 2000.Role of the calcium-independent transient outward current Ito1 in shap-ing action potential morphology and duration. Circ Res. 87:1026–1033.
Gyorke, S., and M. Fill. 1993. Ryanodine receptor adaptation: controlmechanism of Ca2�-induced Ca2� release in heart. Science. 260:807–809.
Hadley, R. W., and J. R. Hume. 1987. An intrinsic potential-dependentinactivation mechanism associated with calcium channels in guinea-pigmyocytes. J. Physiol. 389:205–222.
Handrock, R., F. Schroder, S. Hirt, A. Haverich, C. Mittmann, and S.Herzig. 1998. Single-channel properties of L-type calcium channelsfrom failing human ventricle. Cardiovasc. Res. 37:445–455.
He, J.-Q., M. Conklin, J. Foell, M. Wolff, R. Haworth, R. Coronado, andT. Kamp. 2001. Reduction in density of transverse tubules and L-typeCa2� channels in canine tachycardia-induced heart failure. Cardiovasc.Res. 49:298–307.
Herzig, S., P. Patil, J. Neumann, C.-M. Staschen, and D. Yue. 1993.Mechanisms of �-adrenergic stimulation of cardiac Ca2� channels re-vealed by discrete-time Markov analysis of slow gating. Biophys. J.65:1599–1612.
Hobai, I. A., and B. O’Rourke. 2001. Decreased sarcoplasmic reticulumcalcium content is responsible for defective excitation-contraction cou-pling in canine heart failure. Circulation. 103:1577–1584.
Jafri, S., J. J. Rice, and R. L. Winslow. 1998. Cardiac Ca2� dynamics: theroles of ryanodine receptor adaptation and sarcoplasmic reticulum load.Biophys. J. 74:1149–1168.
Janczewski, A. M., H. A. Spurgeon, M. D. Stern, and E. G. Lakatta. 1995.Effects of sarcoplasmic reticulum Ca2� load on the gain function ofCa2� release by Ca2� current in cardiac cells. Am. J. Physiol. HeartCirc. Physiol. 268:H916–H9120.
Kaab, S., H. B. Nuss, N. Chiamvimonvat, B. O’Rourke, P. H. Pak, D. A.Kass, E. Marban, and G. F. Tomaselli. 1996. Ionic mechanism of actionpotential prolongation in ventricular myocytes from dogs with pacing-induced heart failure. Circ. Res. 78:262–273.
Keizer, J., and L. Levine. 1996. Ryanodine receptor adaptation and Ca2�-induced Ca2� release-dependent Ca2� oscillations. Biophys. J. 71:3477–3487.
Keizer, J., and G. D. Smith. 1998. Spark-to-wave transition: saltatorytransmission of calcium waves in cardiac myocytes. Biophys. Chem.72:87–100.
Kubicek, M., and M. Marek. 1983. Computational Methods in BifurcationTheory and Dissipative Structures. Springer-Verlag, New York.
Langer, G. A., and A. Peskoff. 1996. Calcium concentration and movementin the diadic cleft space of the cardiac ventricular cell. Biophys. J.70:1169–1182.
Li, G.-R., B. Yang, J. Feng, R. F. Bosch, M. Carrier, and S. Nattel. 1999.Transmembrane ICa contributes to rate-dependent changes of actionpotentials in human ventricular myocytes. Am. J. Physiol. Heart Circ.Physiol. 276:H98–H106.
Lindner, M., E. Erdmann, and D. J. Beuckelmann. 1998. Calcium contentof the sarcoplasmic reticulum in isolated ventricular myocytes frompatients with terminal heart failure. J. Mol. Cell Cardiol. 30:743–749.
Linz, K. W., and R. Meyer. 1998. Control of L-type calcium current duringthe action potential of guinea-pig ventricular myocytes. J. Physiol.(Lond.). 513:425–442.
Lopez-Lopez, J. R., P. S. Shacklock, C. W. Balke, and W. G. Wier. 1994.Local stochastic release of Ca2� in voltage-clamped rat heart cells:visualization with confocal microscopy. J. Physiol. (Lond.). 480:21–29.
Lopez-Lopez, J. R., P. S. Shacklock, C. W. Balke, and W. G. Wier. 1995.Local calcium transients triggered by single L-type calcium channelcurrents in cardiac cells. Science. 268:1042–1045.
Lukyanenko, V., I. Gyorke, and S. Gyorke. 1996. Regulation of calciumrelease by calcium inside the sarcoplasmic reticulum in ventricularmyocytes. Pflugers Arch. 432:1047–1054.
Luo, C. H., and Y. Rudy. 1994. A dynamic model of the cardiac ventricularaction potential. I. Simulations of ionic currents and concentrationchanges. Circ. Res. 74:1071–1096.
Marx, S. O., J. Gaburjakova, M. Gaburjakova, C. Henrikson, K. Ondrias,and A. R. Marks. 2001. Coupled gating between cardiac calcium releasechannels (ryanodine receptors). Circ. Res. 88:1151–1158.
Marx, S. O., S. Reiken, Y. Hisamatsu, T. Jayaraman, D. Burkhoff, N.Rosemblit, and A. R. Marks. 2000. PKA phosphorylation dissociatesFKBP12.6 from the calcium release channel (ryanodine receptor): de-fective regulation in failing hearts. Cell. 101:365–376.
Mazhari, R., J. L. Greenstein, R. L. Winslow, E. Marban, and H. B. Nuss.2001. Molecular interactions between two long-QT syndrome geneproducts, HERG and KCNE2, rationalized by in vitro and in silicoanalysis. Circ. Res. 89:33–38.
McDonald, T. F., A. Cavalie, W. Trautwein, and D. Pelzer. 1986. Voltage-dependent properties of macroscopic and elementary calcium channelcurrents in guniea pig ventricular myocytes. Pflugers Arch. 406:437–448.
Michailova, A., and A. McCulloch. 2001. Model study of ATP and ADPbuffering, transport of Ca2� and Mg2�, and regulation of ion pumps inventricular myocyte. Biophys. J. 81:614–629.
Nabauer, M., G. Callewaert, L. Cleeman, and M. Morad. 1989. Regulationof calcium release is gated by calcium current, not gating charge, incardiac myocytes. Science. 244:800–803.
Noble, D., A. Varghese, P. Kohl, and P. Noble. 1998. Improved guinea-pigventricular cell model incorporating a diadic space, Ikr and Iks, andlength- and tension-dependent processes. Can. J. Cardiol. 14:123–134.
O’Rourke, B., D. A. Kass, G. F. Tomaselli, S. Kaab, R. Tunin, and E.Marban. 1999. Mechanisms of altered excitation-contraction coupling incanine tachycardia-induced heart failure. I. Experimental studies. Circ.Res. 84:562–570.
Pandit, S. V., R. B. Clark, W. R. Giles, and S. S. Demir. 2001. Amathematical model of action potential heterogeneity in adult rat leftventricular myocytes. Biophys J. 81:3029–3051.
Parker, I., W. J. Zang, and W. G. Wier. 1996. Ca2� sparks involvingmultiple Ca2� release sites along Z-lines in rat heart cells. J. Physiol.(Lond.). 497:31–38.
Peterson, B., C. DeMaria, J. Adelman, and D. Yue. 1999. Calmodulin is theCa2� sensor for Ca2�-dependent inactivation of L-type calcium chan-nels. Neuron. 22:549–558.
2944 Greenstein and Winslow
Biophysical Journal 83(6) 2918–2945

Peterson, B. Z., J. S. Lee, J. G. Mulle, Y. Wang, M. de Leon, and D. T.Yue. 2000. Critical determinants of Ca2�-dependent inactivation withinan EF-hand motif of L-type Ca2� channels. Biophys. J. 78:1906–1920.
Press, W. H., S. A. Teukolsky, W. T. Vetterling, and B. P. Flannery. 1992.Numerical Recipes. Cambridge University Press, Cambridge.
Priebe, L., and D. J. Beuckelmann. 1998. Simulation study of cellularelectric properties in heart failure. Circ. Res. 82:1206–1223.
Rice, J. J., M. S. Jafri, and R. L. Winslow. 1999. Modeling gain andgradedness of Ca2� release in the functional unit of the cardiac diadicspace. Biophys. J. 77:1871–1884.
Rose, W. C., C. W. Balke, W. G. Wier, and E. Marban. 1992. Macroscopicand unitary properties of physiological ion flux through L-type Ca2�
channels in guinea-pig heart cells. J. Physiol. (Lond.). 456:267–284.
Sah, R., R. J. Ramirez, and P. H. Backx. 2002. Modulation of Ca2� releasein cardiac myocytes by changes in repolarization rate. Role of phase-1action potential repolarization in excitation-contraction coupling. Circ.Res. 90:165–173.
Santana, L. F., H. Cheng, A. M. Gomez, M. B. Cannell, and W. J. Lederer.1996. Relation between the sarcolemmal Ca2� current and Ca2� sparksand local control theories for cardiac excitation-contraction coupling.Circ. Res. 78:166–171.
Schiefer, A., G. Meissner, and G. Isenberg. 1995. Ca2� activation andCa2� inactivation of canine reconstituted cardiac sarcoplasmic reticulumCa2�-release channels. J. Physiol. (Lond.). 489:337–348.
Schroder, F., R. Handrock, D. J. Beuckelmann, S. Hirt, R. Hullin, L.Priebe, R. H. Schwinger, J. Weil, and S. Herzig. 1998. Increasedavailability and open probability of single L-type calcium channels fromfailing compared with nonfailing human ventricle. Circulation. 98:969–976.
Sham, J. S. K. 1997. Ca2� release-induced inactivation of Ca2� current inrat ventricular myocytes: evidence for local Ca2� signaling. J. Physiol.500:285–295.
Sham, J. S. K., L. Cleeman, and M. Morad. 1995. Functional coupling ofCa2� channels and ryanodine receptors in cardiac myocytes. Proc. Natl.Acad. Sci. USA. 92:121–125.
Sham, J., L.-S. Song, Y. Chien, L.-H. Deng, M. D. Stern, E. G. Lakatta, andH. Cheng. 1998. Termination of Ca2� release by a local inactivation ofryanodine receptors in cardiac myocytes. Proc. Natl. Acad. Sci. USA.95:15096–15101.
Shannon, T. R., K. S. Ginsburg, and D. M. Bers. 2000. Reverse mode ofthe sarcoplasmic reticulum calcium pump and load-dependent cytosoliccalcium decline in voltage-clamped cardiac ventricular myocytes. Bio-phys. J. 78:322–333.
Sipido, K., G. Callewaert, and E. Carmeliet. 1995. Inhibition and rapidrecovery of Ca2� during Ca2� release from sarcoplasmic reticulum inguinea pig ventricular myocytes. Circ. Res. 76:102–109.
Smith, G. D., J. E. Keizer, M. D. Stern, W. J. Lederer, and H. Cheng. 1998.A simple numerical model of calcium spark formation and detection incardiac myocytes. Biophys. J. 75:15–32.
Soeller, C., and M. B. Cannell. 1997. Numerical simulation of localcalcium movements during L-type calcium channel gating in the cardiacdiad. Bipphys. J. 73:97–111.
Song, L., J. Sham, M. Stern, E. Lakatta, and H. Cheng. 1998. Directmeasurement of SR release flux by tracking “Ca2� spikes” in rat cardiacmyocytes. J. Physiol. 512:677–691.
Song, L.-S., S.-Q. Wang, R.-P. Xiao, H. Spurgeon, E. G. Lakatta, and H.Cheng. 2001. �-adrenergic stimulation synchronizes intracellular Ca2�
release during excitation-contraction coupling in cardiac myocytes. Circ.Res. 88:794–801.
Stern, M. D. 1992. Theory of excitation-contraction coupling in cardiacmuscle. Biophys. J. 63:497–517.
Stern, M. D., L. S. Song, H. Cheng, J. S. Sham, H. T. Yang, K. R. Boheler,and E. Rios. 1999. Local control models of cardiac excitation-contraction coupling. A possible role for allosteric interactions betweenryanodine receptors. J. Gen. Physiol. 113:469–489.
Sun, L., J.-S. Fan, J. W. Clark, and P. T. Palade. 2000. A model of theL-type Ca2� channel in rat ventricular myocytes: ion selectivity andinactivation mechanisms. J. Physiol. (Lond.). 529:139–158.
Tseng, G.-N., R. B. Robinson, and B. F. Hoffman. 1987. Passive propertiesand membrane currents of canine ventricular myocytes. J. Gen. Physiol.90:671–701.
Valdivia, H. H., J. H. Kaplan, G. C. Ellis-Davies, and W. J. Lederer. 1995.Rapid adaptation of cardiac ryanodine receptors: modulation by Mg2�
and phosphorylation. Science. 267:1997–2000.Wagner, J., and J. Keizer. 1994. Effects of rapid buffers on Ca2� diffusion
and Ca2� oscillations. Biophys. J. 67:447–456.Wang, S. Q., L. S. Song, E. G. Lakatta, and H. Cheng. 2001. Ca2�
signaling between single L-type Ca2� channels and ryanodine receptorsin heart cells. Nature. 410:592–596.
Wier, W. G., and C. W. Balke. 1999. Ca2� release mechanisms, Ca2�
sparks, and local control of excitation-contraction coupling in normalheart muscle. Circ. Res. 85:770–776.
Wier, W. G., T. M. Egan, J. R. Lopez-Lopez, and C. W. Balke. 1994. Localcontrol of excitation-contraction coupling in rat heart cells. J. Physiol.474:463–471.
Winslow, R. L., J. L. Greenstein, G. F. Tomaselli, and B. O’Rourke. 2001.Computational models of the failing myocyte: relating altered geneexpression to cellular function. Phil. Trans. R. Soc. Lond. A. 359:1187–1200.
Winslow, R. L., J. J. Rice, M. S. Jafri, E. Marban, and B. O’Rourke. 1999.Mechanisms of altered excitation-contraction coupling in canine tachy-cardia-induced heart failure. II. Model studies. Circ. Res. 84:571–586.
Yue, D. T., and E. Marban. 1990. Permeation in the dihydropyridine-sensitive calcium channel. Multi-ion occupancy but no anomalous mole-fraction effect between Ba2� and Ca2�. J. Gen. Physiol. 95:911–939.
Zahradnikova, A., and I. Zahradnik. 1996. A minimal gating model for thecardiac calcium release channel. Biophys. J. 71:2996–3012.
Zahradnikova, A., I. Zahradnik, I. Gyorke, and S. Gyorke, 1999. Rapidactivation of the cardiac ryanodine receptor by submillisecond calciumstimuli. J. Gen. Physiol. 114:787–798.
Zuhlke, R., G. Pitt, K. Deisseroth, R. Tsien, and H. Reuter. 1999. Calmod-ulin supports both inactivation and facilitation of L-type calcium chan-nels. Nature. 399:159–162.
Zygmunt, A. C. 1994. Intracellular calcium activates a chloride current incanine ventricular myocytes. Am. J. Physiol. Heart Circ. Physiol. 267:H1984–H1995.
Local Control Myocyte Model 2945
Biophysical Journal 83(6) 2918–2945


