Embed Size (px)
Citation preview
Supervisors: ir. L.M. Verhoeven dr. ir. J. A. van Oijen prof. dr. L.P.H. de Goey Eindhoven University of Technology Department of Mechanical Engineering Division of Thermo Fluids Engineering
Section of Combustion Technology
Analysis and operability optimization of
an updraft gasifier unit
Arthur Okuga
II
Abstract.
As a result of environmental and policy considerations as well as dwindling oil resources, there is increasing interest in using renewable energy sources. Biomass gasification is seen as an important technology component for expanding the use of biomass. The gas from biomass gasifiers contains quantities of particulates, tars, and other constituents that may exceed the specified limits that hinder their safe usage in applications where tar free clean gas is required such as in automobile engines. As a result a lot of research is being carried out in gas cleaning systems. The market potential for the use of small scale gasification systems for residential heating, heat applications and small scale power generation is vast because of the prospects for competitive production. A small scale updraft gasifier system has been installed in the Biomass laboratory at the Technical University of Eindhoven for experimental purposes in order to further develop the technology.
The installation consists of is a 20 kW updraft gasifier, a partial oxidizer and a flare. In
the gasifier, beech wood chips with an average size of 10 x 10 x 2 mm are broken down
by the use of heat in an oxygen-deficient environment to produce a combustible gas. The
heat for gasification is generated through combustion of part of the feed material on the
grate of the reactor. Tars formed during thermal degradation of biomass can be partially
oxidized in a partial oxidator to reduce the tar content in the gas to acceptable levels.
After tar partial oxidation, the combustible gases are flared in a flame tube and exhausted
to the atmosphere as carbon dioxide and water. The flare and gasifier are currently not functioning as required. This project aims at making the updraft gasifier and flare system operable for experimental purposes. The problems with the gasifier include difficulty in starting up and inability to measure the temperatures of the process zones in the reactor. The first problem is solved by modifying the burner and correctly setting the flow rate of air/methane mixture. Also, fire lighter that has a lower ignition than biomass is used to homogeneously ignite the biomass particles on the grate. The second problem is solved by protecting the thermocouples with steel shrouds that protrude into the reactor at different axial positions. The problems with the flare include pilot flame detection and clogging of the methane outlet holes of the pilot flame. In order to prevent tar from clogging the methane holes, steel tubes were used to introduce methane into the flare at an angle that is approximately horizontal so that flow of tar by gravity into them is non existent. Previously, the methane outlet holes were drilled vertically and any tar condensing in the flare would flow downwards into them. The problem of pilot flame detection was solved by installing the ionization electrode such that its tip is within the region of flame at all times. This choice was based on the principles of ionization flame detection. The flare was tested with air and nitrogen replacing producer gas after design changes were made. The tests involved changing the flow settings for methane and air of the pilot as well as nitrogen and air .The essence of the tests was to find out if the pilot flame would not be extinguished at the maximum flow settings of nitrogen and air. These results proved satisfactory for the artificial producer gas because the flame detection device (ionization pen) was able to detect a flame under the maximum air and nitrogen flow conditions.
III
The flare was also tested with real producer gas. The test showed that tar tends to introduce problems with ionization flame detection after approximately 20 minutes of operation. Tar particularly insulates the ionization pen thus preventing it from functioning. Gasification experiments were carried out at 70 l/min and 80 l/min of gasification air flow. Wood chips were consumed at a rate of 2.25 kg/hr and 4.5 kg/hr respectively. A steady state model was developed for the gasifier and implemented with polymath to simulate the operation of the installation. The model was used to predict the temperature profiles in the reactor as well as concentration profiles for air flow rates of 70, 80 and 90 l/min. The measured temperature profiles of the reactor for the different gasification agent flow were taken after 50 minutes of operation. At this time, the gasifier was considered to be in pseudo steady state. The model over predicts the production of hydrogen and under predicts carbon monoxide. The model also predicts that lower tar content in the producer gas is achieved by using lower air flow rates. The model requires the further improvement by removal of some of the limiting assumptions.
IV
Contents 1 Introduction........................................................................................................... 1
1.1 Overview of the current setup..................................................................... 1 1.1.1 Current gasifier setup...................................................................... 2 1.1.1 The current flare setup .................................................................... 3
1.2 Research objectives..................................................................................... 4 1.3 Report layout............................................................................................... 6
2 Literature review .................................................................................................. 7 2.1 Biomass energy conversion processes ........................................................ 7 2.2 Updraft gasification .................................................................................... 9
2.2.1 Drying ........................................................................................... 10 2.2.2 Devolatilization............................................................................. 10 2.2.3 Gasification (reduction) ................................................................ 11 2.2.4 Combustion................................................................................... 11
2.3 Factors affecting gasification.................................................................... 12
3 The Flare.............................................................................................................. 14 3.1 Overview of the Flare ............................................................................... 14
3.1.1 General description of the flare..................................................... 15 3.1.2 The pilot flame.............................................................................. 16
3.2 Design changes made to flare unit ............................................................ 18 3.2.1 Methane nozzles............................................................................ 19 3.2.2 Secondary, tertiary and quaternary air .......................................... 20 3.2.3 Location of ionization pen ............................................................ 21 3.2.4 Location of the infrared detector................................................... 21
3.3 Gas flow velocities.................................................................................... 22 3.4 Performance testing of flare...................................................................... 24
4 The Gasifier ......................................................................................................... 28 4.1 Problems with the previous gasifier setup ................................................ 28 4.2 Description of the gasifier......................................................................... 29 4.3 Changes made to the gasifier .................................................................... 31
4.3.1 Changes made to the Bunsen burner............................................. 31 4.3.2 Spark gap ...................................................................................... 33 4.3.3 Changes made to the pressure and temperature measurement devices33
4.4 Experimental test procedure ..................................................................... 35 4.4.1 Loading the reactor and start up.................................................... 35 4.4.2 Results and discussion .................................................................. 36
5 Modelling ............................................................................................................. 41 5.1 Updraft gasifier model .............................................................................. 41 5.2 Governing equations ................................................................................. 41 5.3 Reaction chemistry.................................................................................... 43
5.3.1 Reaction components considered in the model............................. 43 5.3.2 Chemical reactions........................................................................ 43
5.4 Boundary conditions ................................................................................. 51 5.5 Numerical method..................................................................................... 52 5.6 Validation.................................................................................................. 52
V
5.7 Cases studied............................................................................................. 53 5.7.1 Results........................................................................................... 53
Chapter 6 ......................................................................................................................... 60 6 Conclusions and recommendations................................................................... 60
6.1 Conclusions............................................................................................... 60 6.2 Recommendations..................................................................................... 61
Bibliography .................................................................................................................... 62 Appendix A...................................................................................................................... 65
A.1 Downdraft gasification.............................................................................. 65 A.2 Cross draft gasification ............................................................................. 66
Appendix B ...................................................................................................................... 67 B.1 Controls and operating procedure............................................................. 67 B.2 Adiabatic flame temperature of methane/air mix (Pilot flame) ................ 69
Appendix C...................................................................................................................... 72 C.1 Operation of the gasifier ........................................................................... 72
Appendix D...................................................................................................................... 77 D.1 Model assumptions ................................................................................... 77
VI
Nomenclature
bedε Bed porosity
particleε , Particle porosity
S Cross sectional area of the reactor [m2]
jM Molar mass of species j [kg/mol]
F Mass flow [kg/s]
ijv Stoichiometric coefficient of species j in reaction i
ir Reaction rate of reaction i [kmol/m3s or kg/ m3s]
pjC Specific heat capacity of species j [kJ/kg K]
RiH∆ Enthalpy of reaction i [kJ/kg]
T Temperature [K] z axial distance [m]
pν t Particle volume [m3].
Ap Particle surface area [m2] Vp Particle density number [1/m] ρ Density of the gas mixture [kg/m3] Ugas Superficial velocity [m/s] dp Diameter of particle [m]
gas
µ Dynamic viscosity [kg/ms]
R Universal gas constant [kJ/kg K] Cj Concentration of species j [kmol/m3] Dgas Gas diffusivity [m2/s] km Mass transfer coefficient [m/s] Re Reynolds number Sc Schmidt number xi Mole fraction P Pressure [Kg/m2] NU Nusselt number i R1 to R10
j CO,CO2,H2,H20,CH4,N2,O2,tar,char or wood
1
Chapter 1
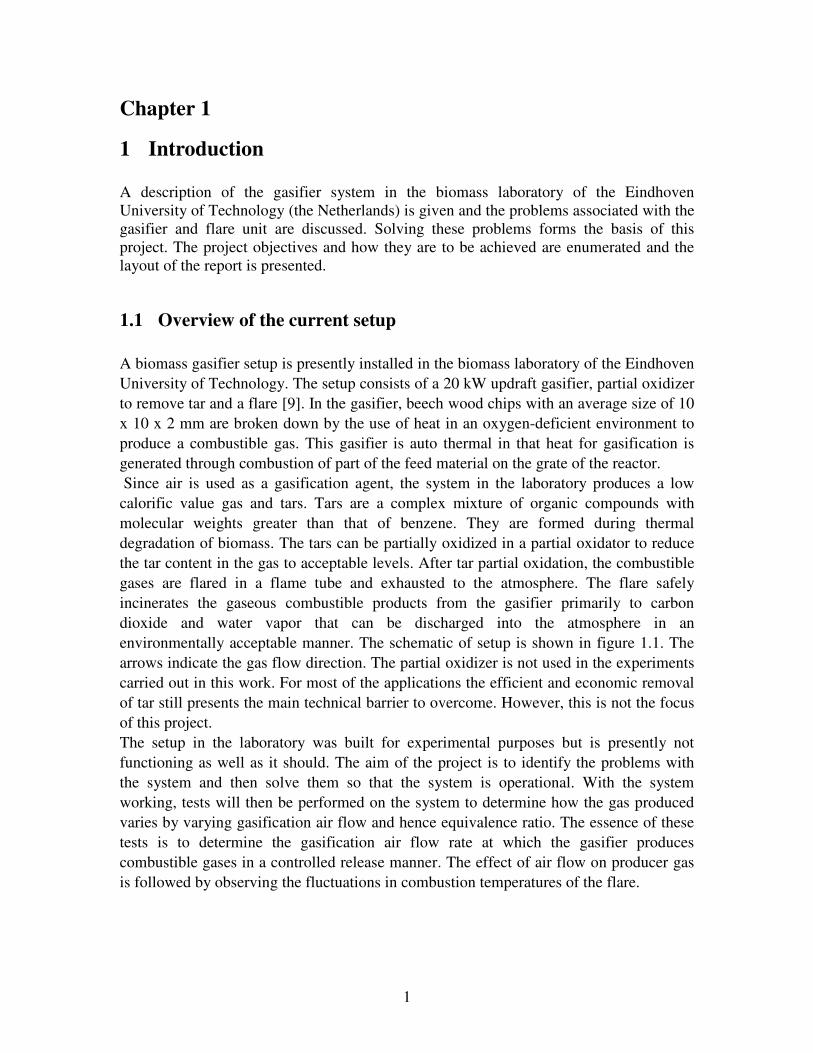
1 Introduction A description of the gasifier system in the biomass laboratory of the Eindhoven University of Technology (the Netherlands) is given and the problems associated with the gasifier and flare unit are discussed. Solving these problems forms the basis of this project. The project objectives and how they are to be achieved are enumerated and the layout of the report is presented.
1.1 Overview of the current setup
A biomass gasifier setup is presently installed in the biomass laboratory of the Eindhoven
University of Technology. The setup consists of a 20 kW updraft gasifier, partial oxidizer
to remove tar and a flare [9]. In the gasifier, beech wood chips with an average size of 10
x 10 x 2 mm are broken down by the use of heat in an oxygen-deficient environment to
produce a combustible gas. This gasifier is auto thermal in that heat for gasification is
generated through combustion of part of the feed material on the grate of the reactor.
Since air is used as a gasification agent, the system in the laboratory produces a low
calorific value gas and tars. Tars are a complex mixture of organic compounds with
molecular weights greater than that of benzene. They are formed during thermal
degradation of biomass. The tars can be partially oxidized in a partial oxidator to reduce
the tar content in the gas to acceptable levels. After tar partial oxidation, the combustible
gases are flared in a flame tube and exhausted to the atmosphere. The flare safely
incinerates the gaseous combustible products from the gasifier primarily to carbon
dioxide and water vapor that can be discharged into the atmosphere in an
environmentally acceptable manner. The schematic of setup is shown in figure 1.1. The
arrows indicate the gas flow direction. The partial oxidizer is not used in the experiments
carried out in this work. For most of the applications the efficient and economic removal
of tar still presents the main technical barrier to overcome. However, this is not the focus
of this project.
The setup in the laboratory was built for experimental purposes but is presently not
functioning as well as it should. The aim of the project is to identify the problems with
the system and then solve them so that the system is operational. With the system
working, tests will then be performed on the system to determine how the gas produced
varies by varying gasification air flow and hence equivalence ratio. The essence of these
tests is to determine the gasification air flow rate at which the gasifier produces
combustible gases in a controlled release manner. The effect of air flow on producer gas
is followed by observing the fluctuations in combustion temperatures of the flare.

2
Figure 1.1: Schematic of the setup
1.1.1 Current gasifier setup
The biomass reactor in the laboratory is a batch operated cylindrical reactor made of steel, which is heat resistant. The cylinder has an internal diameter of 0.192 m and the thickness of the steel material used in the construction is 0.027 m. The height of the reactor is 1.5 m and can accommodate a maximum of 15 kg of wood chips when fully loaded. Feeding is from the top of the reactor through a blind flange that can be unbolted and bolted back onto a T-piece on the gasifier after loading operations. A diagrammatic representation of the reactor is shown in the following figure.
Figure 1.2: Gasifier dimensions
Insulation of the gasifier is accomplished by means of an AES (alkaline earth silicate)
wool layer of 0.05 m thickness and has been determined to be sufficient to prevent
substantial heat losses [9]. Initial ignition of the gasifier is by means of a Bunsen burner
situated at the bottom of the gasifier. An ash container with a height of 0.2 m is located at
3
the bottom of the reactor (figure 1.2). In addition, a grate consisting of a 5 mm thick
perforated steel plate of 35% porosity holds the wood chips above the ash container and
serves to disperse the air for gasification uniformly over the bed. Gasification air enters
the gasifier through four inlet holes that terminate into the Bunsen burner. The reactor is
pressure controlled with a maximum operating pressure of 0.7 bars above atmospheric
pressure. For measuring temperature, K-type thermocouples, which are located
longitudinally on the reactor walls at various positions, are used.
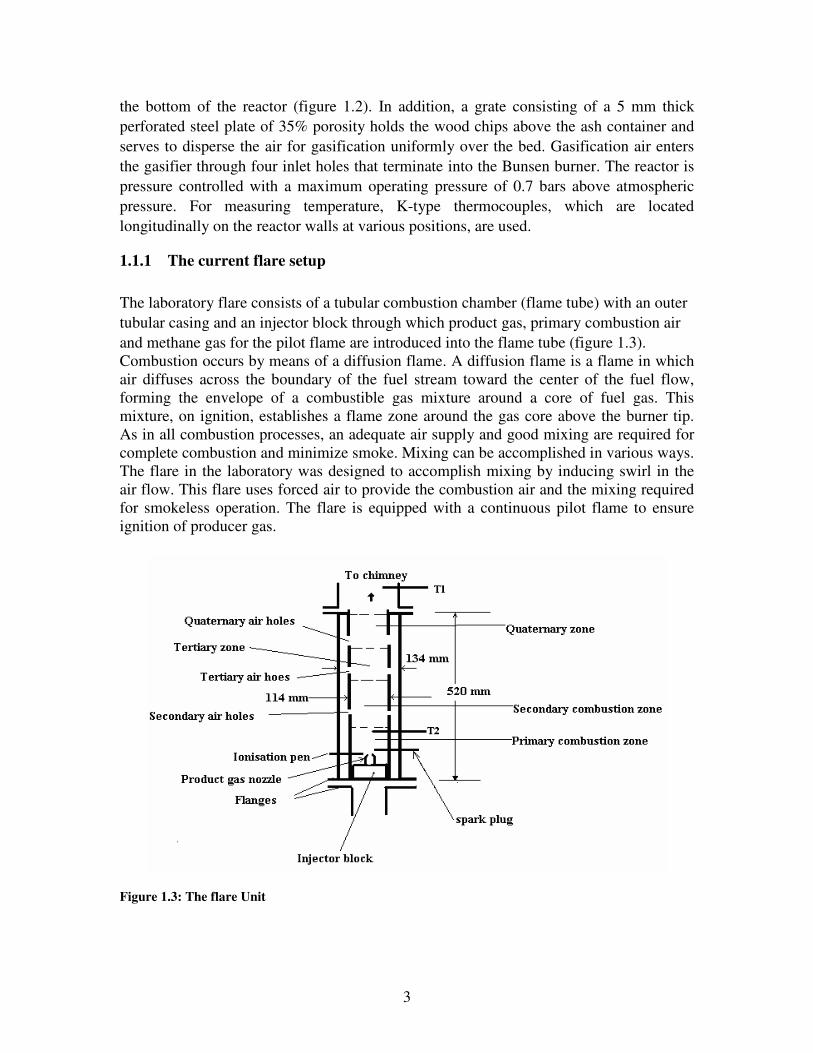
1.1.1 The current flare setup
The laboratory flare consists of a tubular combustion chamber (flame tube) with an outer
tubular casing and an injector block through which product gas, primary combustion air
and methane gas for the pilot flame are introduced into the flame tube (figure 1.3). Combustion occurs by means of a diffusion flame. A diffusion flame is a flame in which air diffuses across the boundary of the fuel stream toward the center of the fuel flow, forming the envelope of a combustible gas mixture around a core of fuel gas. This mixture, on ignition, establishes a flame zone around the gas core above the burner tip. As in all combustion processes, an adequate air supply and good mixing are required for complete combustion and minimize smoke. Mixing can be accomplished in various ways. The flare in the laboratory was designed to accomplish mixing by inducing swirl in the air flow. This flare uses forced air to provide the combustion air and the mixing required for smokeless operation. The flare is equipped with a continuous pilot flame to ensure ignition of producer gas.
Figure 1.3: The flare Unit
4
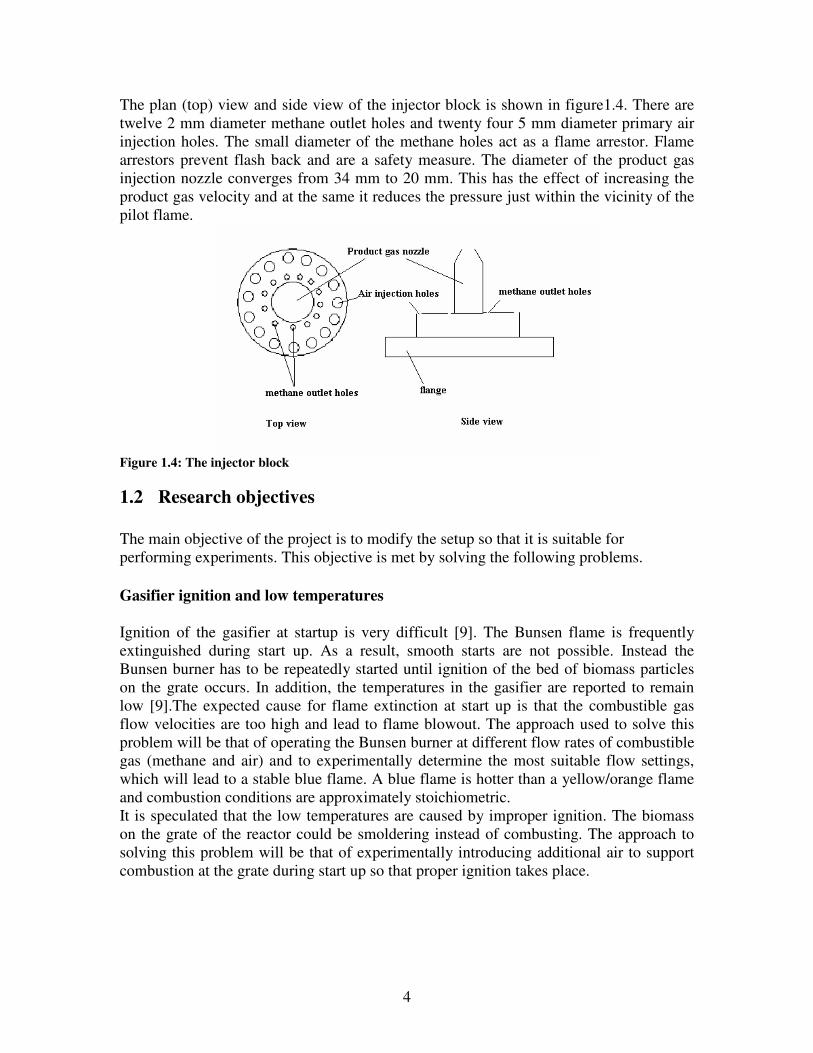
The plan (top) view and side view of the injector block is shown in figure1.4. There are twelve 2 mm diameter methane outlet holes and twenty four 5 mm diameter primary air injection holes. The small diameter of the methane holes act as a flame arrestor. Flame arrestors prevent flash back and are a safety measure. The diameter of the product gas injection nozzle converges from 34 mm to 20 mm. This has the effect of increasing the product gas velocity and at the same it reduces the pressure just within the vicinity of the pilot flame.
Figure 1.4: The injector block
1.2 Research objectives
The main objective of the project is to modify the setup so that it is suitable for performing experiments. This objective is met by solving the following problems.
Gasifier ignition and low temperatures
Ignition of the gasifier at startup is very difficult [9]. The Bunsen flame is frequently extinguished during start up. As a result, smooth starts are not possible. Instead the Bunsen burner has to be repeatedly started until ignition of the bed of biomass particles on the grate occurs. In addition, the temperatures in the gasifier are reported to remain low [9].The expected cause for flame extinction at start up is that the combustible gas flow velocities are too high and lead to flame blowout. The approach used to solve this problem will be that of operating the Bunsen burner at different flow rates of combustible gas (methane and air) and to experimentally determine the most suitable flow settings, which will lead to a stable blue flame. A blue flame is hotter than a yellow/orange flame and combustion conditions are approximately stoichiometric. It is speculated that the low temperatures are caused by improper ignition. The biomass on the grate of the reactor could be smoldering instead of combusting. The approach to solving this problem will be that of experimentally introducing additional air to support combustion at the grate during start up so that proper ignition takes place.
5
Gasifier thermocouples
The thermocouples are installed on the walls of the gasifier. Because of this, temperature measurements of the different zones inside the gasifier are not possible. The approach used is to relocate the thermocouples from the gasifier walls to inside the gasifier.
Flare Unit
The problems with the previous flare design are outlined below. Firstly, the flame detector (ionization pen) does not function properly and this causes unnecessary shut down of the flare triggered by the control system and this is undesirable during gasification experiments. Secondly, the position of the pilot flames is close the walls of the flame tube. At this position, it is not easy for the pilot flame to ignite the product gas which has its nozzle in the centre of the injector block. Thirdly, tar which condenses in the flare blocks the methane holes and stops the flow of methane. This is especially true at start up when the flare has not yet reached temperatures above the tar condensation temperature. The approach used to overcome these situations will be to alter the flame geometry by repositioning the methane outlets to a position close to the product gas nozzle. The ionization electrode will be placed at a location such that the principles of ionization flame detection are made use of. Also, the secondary, tertiary and quaternary air will be introduced tangentially at the circumference of the flame tube to reinforce the swirl imposed by the primary air flow. Other objectives will be to answer the questions listed below after ensuring that the setup is functional.
1) What are the reactor temperature profiles for different equivalence ratios and what can be deduced from these profiles? How can they be explained by using the process chemistry taking place in the gasifier? The temperature profiles are data logged using lab view software and a comparison between the profiles at the different gasification air flow rates is made.
2) What are the specific gasification rates? This is calculated from the mass of the batch of wood chips divided by the time for completion of gasification and the cross sectional area of the reactor. This gives an indication of how fast the solids are being converted into gases. The research objectives are to analyze and provide solutions to the gasifier and flare problems that prevent the system from operating reliably. Additionally, the gasifier is modeled so predictions can be made for reactor temperature profiles and gas compositions at different gasification agent flow.
6
1.3 Report layout
This report is structured as follows: Chapter 2 is an in depth discussion of updraft fixed bed gasification technology in order to gain a greater grasp and understanding of the different processes taking place in the updraft fixed bed reactor because the reactor in the Biomass laboratory was designed as an updraft unit. The processes taking place in the reactor are used to explain the trend of the combustion temperatures achieved in the flare because they are closely coupled. In addition, the literature serves as a reference to know what the operating temperatures expected in the gasifier in the laboratory should be during gasification. Also, a decision is made regarding the suitability of the use of the experimental beech wood chips as a fuel for the updraft unit. It also examines the suitability of the gases from the updraft unit for the flaring application (burners) based on the properties of the producer gas from the unit. In chapter 3, the correct methane/air mixture settings for the pilot flame of the flare are discussed. After this, the design changes made to the flame tube, methane nozzles and ionization electrode are presented. The flammability limits of producer gas are determined in order to correctly set the primary air necessary for producer gas combustion. The chapter ends with tests conducted on the modified flare using air and nitrogen as artificial producer gas to find out how the pilot flame responds to extreme conditions of flow within the limits of the system. The essence of the tests was to determine whether the pilot flame would be blown out. The choice of nitrogen and air was strictly for safety purposes. With the flare operating as desired, experiments with real producer gas could then be performed. These experiments are carried out after making changes to the gasifier. Chapter 4 addresses the problems with the gasifier. First, detailed descriptions of the problems with the setup are discussed. Next, the changes made to the gasifier in order to solve the existing problems are presented. Results of gasification experiments with a fixed mass of biomass and varying gasification air flow rates are discussed. Chapter 5 describes a one dimensional model of the gasifier in the steady state so that prediction of the producer gas concentrations and temperature profiles for different gasification agent flow rates is possible. The measured temperature at different axial positions along the gasifier are taken after 50 minutes of operation and compared with the predictions to judge the accuracy of the model. In chapter 6, conclusions are drawn about the whole system and recommendations about areas that need improvement are made.
7
Chapter 2
2 Literature review This chapter provides a biomass overview and the methods available for converting it into energy. Thereafter, review of the basic characteristics of updraft fixed-bed gasification equipment used for biomass gasification is studied in order to gain in depth knowledge of the processes taking place in the reactor. These processes are used to explain the characteristics of gases produced by examining the combustion temperatures attained in the flare in chapter 3. Also explained is the amount of air necessary to gasify wood. The updraft equipment settings for air flow should be within this range in order to produce gas with the reactor. The chapter also studies the suitability of the experimental wood chips used in the experiments conducted.
2.1 Biomass energy conversion processes
Biomass is the solar energy stored in chemical form in plant and animal materials and is among the most precious and versatile resources on earth. It provides not only food but also energy, building materials, paper, fabrics, medicines and chemicals. Today, biomass fuels can be utilized for tasks ranging from heating to fuelling automobiles. In this respect, biomass is considered the renewable energy source with the highest potential to contribute to the energy needs of modern society for both the developed and developing economies world-wide because the prospects for production at competitive costs are vast [1, 2, 3, 4]. It is therefore important that the setbacks in the technologies for conversion of biomass into energy are improved upon. In considering the methods for extracting the energy, it is possible to order them by the processes that are discussed in the following:
Biological processing
This includes processes such as anaerobic digestion and fermentation which, lead to a useful gaseous or liquid fuel. Anaerobic digestion, like pyrolysis, occurs in the absence of air; but in this case the decomposition is caused by bacterial action rather than high temperatures. It is a process which takes place in almost any biological material that is decomposing and is favored by warm, wet and of course, airless conditions. In this case the resulting gas is a mixture consisting mainly of methane and carbon dioxide usually referred to as biogas.
Thermochemical processing to upgrade the bio-fuel
Processes in this category include pyrolysis, gasification and liquefaction. In thermochemical processing, the equivalence ratio Φ is an important parameter and is given by
8
tricstoichiomeoxygen
fuel
oxygen
fuel
m
m
m
m
=Φ
(1.1)
Where mfuel is the mass of fuel and moxygen is the mass of oxygen. The stoichiometric oxygen to fuel ratio is the theoretical amount of oxygen needed to completely combust the fuel. Based on the equivalence ratio, different types of thermal processes of biomass fuels are characterized as follows [6]. I) Pyrolysis: 0≤ Φ ≤ 0.2 II) Combustion: Φ ≥ 0.4 III) Gasification: 0.2≤Φ≤ 0.40
(I) Pyrolysis
Conventional pyrolysis involves heating the original material in a reactor vessel in the absence of air, typically at 300 - 500 °C, until the volatile matter has been released from the biomass. The residue is char - more commonly known as charcoal - a fuel which has about twice the energy density of the original and burns at a much higher temperature. If no attempt is made to collect the volatile matter, the charcoal is obtained at the cost of about two-thirds of the original energy content. With more sophisticated pyrolysis techniques, the volatiles can be collected, and careful choice of the temperature at which the process takes place allows control of their composition. The liquid product has potential as fuel oil, but is contaminated with acids and must be treated before use. Pyrolysis can also be carried out in the presence of a small quantity of oxygen, water or hydrogen.
(II) Direct combustion of biomass
This process involves oxidation of biomass. Combustion of wood can be divided into four phases with increasing temperature described as follows: In the initial stage water inside the wood evaporates as temperature increases. In the second stage, the volatile content is freed from the wood. It is vital that these gases should burn and not just disappear up the chimney. In the third stage, the gases emitted are mixed with air and burn at a high temperature. The proportions of mixing should be adequate for combustion to take place and a flame should be present to ignite the combustible gas mixture. In the fourth stage, after gases have been expelled, the remaining wood (mostly carbon in the form of char) burns and ash is left as a residue in the end. The parameters necessary for effective burning are: high enough temperatures, enough air, and long enough residence time for complete combustion
9
(III) Gasification
Biomass gasification is a complex combination of pyrolysis and oxidation reactions of biomass in the condensed and vapor phases [7]. Evans and Milne identified reaction regimes and characterized the gaseous constituents present and the nature of the major vapor and solid-phase reactions. Under typical gasification conditions, oxygen levels are restricted to less than 40% of that required for complete combustion, and CO and H2 are the major products [7]. The stoichiometric air requirement for complete combustion of wood is normally approximately 6.3 kg of air per kilogram of wood. Thus air/fuel ratio for complete combustion is 6.3.At an air density of 1.25 kg/m3, the volume of air needed for combustion is 5 m3 per kilogram of wood [6, 7, 11, and 12]. In order to gasify wood, the amount of air needed for gasification is within the ranges 1.25 m3 to 2 m3 per kg of wood. These volumes of air correspond to equivalence ratios between 0.25 and 0.4 respectively. In a sense, gasification is a form of incomplete combustion. Heat from the burning solid fuel creates gases which are unable to burn completely because of the insufficient amounts of oxygen from the available supply of air. All solid biomass fuels are composed primarily of carbon with varying amounts of hydrogen, oxygen, and impurities, such as sulfur, ash, and moisture. Thus, the aim of gasification is the almost complete transformation of these constituents into gaseous form so that only the ashes and inert materials remain. The setup in the biomass laboratory at the Eindhoven University of Technology makes use of the gasification technique to convert biomass into producer gas. Gasification is therefore the main topic in the rest of the report.
2.2 Updraft gasification
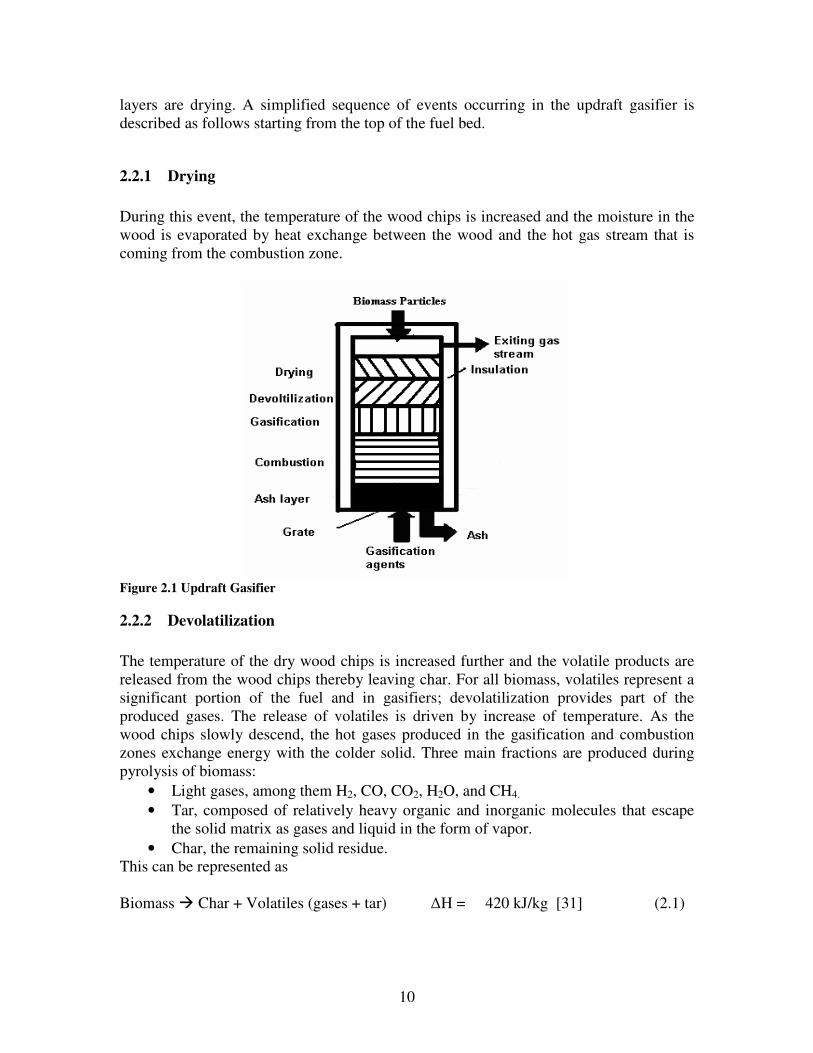
A gasification reactor provides a method to provide gas-solid reactions in which a gas stream passes through a bed of particles. If the particles remain fixed in their positions, the equipment is called a fixed-bed reactor. In fact, the particles are usually allowed to move without detaching from each other and therefore the process is better classified as moving bed. The particles will not detach from each other if the gasification agent velocity is less than the fluidization velocity. Fixed bed gasification can be of updraft, downdraft or cross draft type. Since there is an interaction of air or oxygen and biomass in the gasifier, they are classified according to the way air or oxygen is introduced to the system. Here, only updraft gasification is discussed because this is the basis of the design of the reactor in the Biomass laboratory. For comparison purposes, the other two are discussed in appendix A. Figure 2.1 shows a schematic view of a possible gasifier configuration using this technique [10, 12, 13 and 14]. The particles of biomass, for instance wood chips are fed at the top of the reactor and slowly move to the bottom where the residual ash is withdrawn. The combustion and gasification agents normally air is injected through the distributor at the bottom. In their downward movement, the biomass particles undergo the following main processes: drying, devolatilization, gasification, and combustion. During the conversion in a gasifier, there is no sharp delimitation between these regions. For instance, a descending particle may be going through devolatilization in its outer layers while inner
10
layers are drying. A simplified sequence of events occurring in the updraft gasifier is described as follows starting from the top of the fuel bed.
2.2.1 Drying
During this event, the temperature of the wood chips is increased and the moisture in the wood is evaporated by heat exchange between the wood and the hot gas stream that is coming from the combustion zone.
Figure 2.1 Updraft Gasifier
2.2.2 Devolatilization
The temperature of the dry wood chips is increased further and the volatile products are released from the wood chips thereby leaving char. For all biomass, volatiles represent a significant portion of the fuel and in gasifiers; devolatilization provides part of the produced gases. The release of volatiles is driven by increase of temperature. As the wood chips slowly descend, the hot gases produced in the gasification and combustion zones exchange energy with the colder solid. Three main fractions are produced during pyrolysis of biomass:
• Light gases, among them H2, CO, CO2, H2O, and CH4.
• Tar, composed of relatively heavy organic and inorganic molecules that escape the solid matrix as gases and liquid in the form of vapor.
• Char, the remaining solid residue. This can be represented as Biomass � Char + Volatiles (gases + tar) ∆H = 420 kJ/kg [31] (2.1)
11
2.2.3 Gasification (reduction)
After drying and devolatilization, the char enters the gasification zone where carbon reacts with steam, carbon dioxide, and hydrogen. Endothermic reactions in this section produce carbon monoxide and hydrogen. The slightly exothermic reaction of hydrogen with carbon produces methane. The carbon monoxide produced also reacts with water to produce hydrogen and carbon dioxide in the water gas shift reaction. Differentiation between the gasification zone and combustion zone is based on the presence or absence of oxygen. The reactions that take place in this region of the gasifier can be represented by: C + CO2 � 2 CO ∆H = 164.9 MJ/kmol (2.2) C + H2O � H2 + CO ∆H = 131 MJ/kmol (2.3) C + 2 H2 � CH4 ∆H = - 75 MJ/kmol (2.4) CO + H2O � CO2 + H2 ∆H = - 42 MJ/kmol (2.5)
2.2.4 Combustion
The remaining char is burned, using oxygen from air in the feed gas and leaving an ash residue according to 2 C + O2 � 2 CO ∆H = - 221 MJ/kmol (2.6) 2 CO + O2 � 2 CO2 ∆H = - 283.0 MJ/ kmol (2.7)
From the point of view of energy generation and consumption, if taken as irreversible, the combination of exothermic reactions 2.6 and 2.7 involves an energy input of 394 MJ/kmol of carbon (calculated at 298 K) and is mainly responsible for the energy requirements of the process. This energy is used to promote and sustain the gasification and pyrolysis reactions, which are mostly endothermic. In typical updraft gasifiers the following processes take place at temperatures indicated in table 1.1[32].
Table 2.1 Process temperatures
1. Drying >423 K
2. Pyrolysis 423-973 K
3. Reduction 1073-1373 K
4. Combustion 973-1773K
The gas exiting from the top of the reactor consists of products of drying, devolatilization and gasification processes. It contains a significant amount of tar and moisture and is at low temperatures between 473 K and 623 K because of the high heat exchange between the solid and gas phases. Updraft gasifiers are useful for producing gases to be burned at temperatures of above 473 K. At higher temperatures, the tars do not condense and can easily be burnt in combustors (e.g. burners for cooking). The high tar level makes them difficult to clean
12
for other applications where clean gas is required for example in internal combustion engines. The major advantages of this type of gasifier are its simplicity in design, high degree of controllability, high charcoal burn-out and internal heat exchange leading to low gas exit temperatures and high gasification efficiencies because of the high heat exchange [33]. Also, because of the internal heat exchange the fuel is dried in the top of the gasifier and therefore fuels with high moisture content (up to 50 % wb) [32] can be used. Furthermore this type of gasifier can even process relatively small sized fuel particles and accepts some size variation in the fuel feedstock [32, 33]. Major drawbacks are the high amounts of tar and pyrolysis products, because the pyrolysis gas does not pass through the combustion zone of the reactor. This is of minor importance if the gas is used for direct heat applications, in which the tars are simply burnt when above condensation temperature.
2.3 Factors affecting gasification
Studies have shown [17, 21, and 24] that there are several factors influencing the gasification of wood. These include the following:
Energy content of Fuel
Fuel with high energy content provides easier combustion to sustain the endothermic gasification reactions because they can burn at higher temperatures. Beech wood chips have an energy content of approximately 20 MJ/kg. This is typical for most biomass sources and has been proved to be easy to gasify.
Fuel Moisture content
Since moisture is in effect water, a non-burnable component in the biomass, it is important that the water content be kept to a minimum. All water in the feed stock must be vaporized in the drying phase before combustion otherwise there will be difficulty in sustaining combustion because the heat released will be used to evaporate moisture. Wood with low moisture content can therefore be more readily gasified than that with high moisture. Wood with high moisture content should be dried first before it can be used as fuel for the gasifier. The beech wood chips used in the experiments have been factory dried to a moisture content of 10% prior to packaging. This makes it suitable as a fuel for the gasifier .Updraft gasifiers are also capable of operating with fuels that have moisture contents of up to 50% [32].
Size Distribution of the Fuel
Fuel should be of a form that will not lead to bridging within the reactor. Bridging occurs when unscreened fuels do not flow freely axially downwards in the gasifier. Therefore particle size is an important parameter in biomass gasification because it determines the bed porosity and thus the fluid-dynamic characteristics of the bed. On the other hand, fine grained fuels lead to substantial pressure drops in fixed bed reactors. The experimental
13
wood chips are approximately 10 x 10 x 2 mm and regular in shape. This size is not fine grained when compared to the micron scale and thus no substantial pressure drops occur in the reactor.
Temperature of the Reactor
There is a need to properly insulate the reactor so that heat losses are reduced. If heat losses are higher than the heat requirement of the endothermic reactions, the gasification reactions will not occur [13, 14].The reactor in the laboratory has been insulated with 50 mm of alkaline earth silicate to keep heat losses minimal. This thickness has been determined in [9].
14
Chapter 3
3 The Flare This chapter is organized as follows. After this introduction, section 3.1 provides a description of the modified flare. The pilot flame and the rationale for the methane and air flow settings of the flare controls for sustaining the flame are described. In section 3.2, the design changes to the flare unit are discussed .Section 3.3 is a calculation of product gas, methane and air flow velocities that can be expected in the flare for real operating conditions and how they impact on flame stability. Section 3.4 describes tests carried out on the flare to determine stability of the pilot flame by varying the flow rates of air, nitrogen and methane to the system.
3.1 Overview of the Flare
Flares are commonly used to safely combust flammable gases. Flares can accommodate fluctuations in flow rate and heating value of the gases to be flared. Because of these attributes, a flare was designed to oxidize the producer gas which is produced by the gasifier in the laboratory before being discharged to the atmosphere as carbon dioxide and water [9]. The flare is operated with a flame present at all times. The presence of a flare pilot flame is monitored to ensure that a flame is present at all times for safety reasons. Gas is transported through piping from the gasifier to the flare and burned. Completeness of combustion in a flare is governed by flame temperature, residence time in the combustion zone, turbulent mixing of the components to complete the oxidation reaction, and available oxygen for free radical formation. In order that tars do not condense in the piping on their way to the flare, the pipes are heated using tracer heaters. Combustion is complete if the flammable gases are converted to carbon dioxide and water. Incomplete combustion results in some of the gaseous compounds being unaltered or converted to other compounds such as soot and carbon monoxide. The flaring process can produce some undesirable by-products including smoke and an additional source of ignition where not desired. However, proper design minimizes these. The problems with the previous flare design are outlined below.
� The flame detectors (ionization pen and infrared flame detector) do not function
as desired and this causes unnecessary shut down to be triggered. � Tar has a tendency of clogging the methane outlet holes and thereby leading to
stoppage of methane flow for the pilot flame. The pilot flame then becomes extinct.
� The methane outlet holes are far from the product gas nozzle and this results in difficulty of product gas ignition by the pilot flame because radicals that play an important role in combustion have a very short life span and are far from the nozzle of the product gas.
� The introduction of secondary, tertiary and quaternary air has a tendency to cause flame stability problems. In particular flame blow out.
15
These problems lead to the inability to operate the flare reliably during gasification operations.
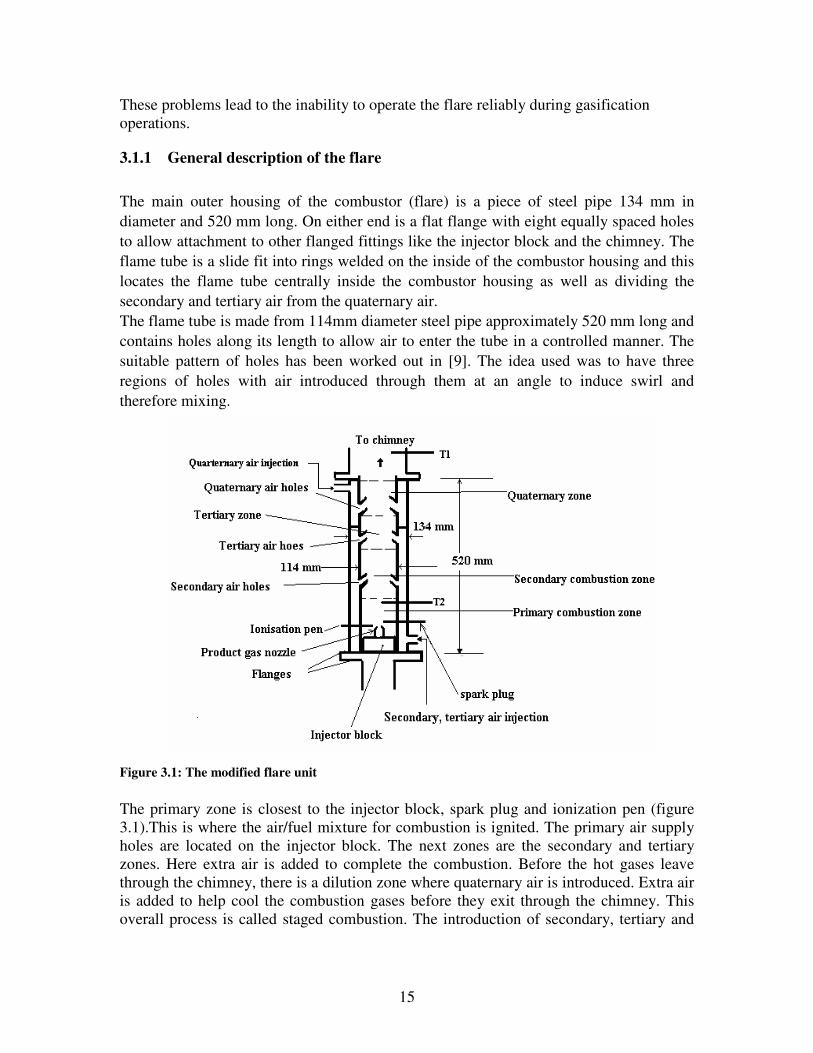
3.1.1 General description of the flare
The main outer housing of the combustor (flare) is a piece of steel pipe 134 mm in
diameter and 520 mm long. On either end is a flat flange with eight equally spaced holes
to allow attachment to other flanged fittings like the injector block and the chimney. The
flame tube is a slide fit into rings welded on the inside of the combustor housing and this
locates the flame tube centrally inside the combustor housing as well as dividing the
secondary and tertiary air from the quaternary air.
The flame tube is made from 114mm diameter steel pipe approximately 520 mm long and
contains holes along its length to allow air to enter the tube in a controlled manner. The
suitable pattern of holes has been worked out in [9]. The idea used was to have three
regions of holes with air introduced through them at an angle to induce swirl and
therefore mixing.
Figure 3.1: The modified flare unit
The primary zone is closest to the injector block, spark plug and ionization pen (figure 3.1).This is where the air/fuel mixture for combustion is ignited. The primary air supply holes are located on the injector block. The next zones are the secondary and tertiary zones. Here extra air is added to complete the combustion. Before the hot gases leave through the chimney, there is a dilution zone where quaternary air is introduced. Extra air is added to help cool the combustion gases before they exit through the chimney. This overall process is called staged combustion. The introduction of secondary, tertiary and
16
quaternary air is controlled by the set point temperature of the two thermocouples in the flare. At the bottom end of the combustor housing is a flange where the injector block is attached. In the center of the injector block a 20 mm diameter nozzle is used to feed producer gas into the flame tube. The primary air openings are located on the rim of the base of the injector block on a circle of 100 mm diameter (figure 1.4). When the whole unit is assembled, their positions are close to the walls of the flame tube. These air holes impart swirl on the air flow because they are drilled at an angle of 45 degree in the circumferential direction. A spark plug and an ionization pen attached to the combustor housing terminate in the flame tube close to the product gas nozzle. They are used for ignition and flame detection purposes. The feed openings for methane are positioned around the product gas nozzle. Twelve 2 mm internal diameter tubes are screwed into these feed openings and rise to the level of the product gas nozzle (figure 3.2). The spark plug gap is opened up to approximately 3 mm. This means that the gap between the earth electrode and the high voltage electrode is 3 mm wide. This gap has been determined experimentally to give a thick blue spark that can reliably ignite the combustible mixture. Reliability was tested by igniting methane/air mixtures with different flammability limits several times and each time, ignition was achieved in less than 5 seconds. For other spark gap settings, longer ignition times were required possibly because the spark was not hot enough or was being quenched by the cool combustible mixture.
3.1.2 The pilot flame
The function of the pilot flame in the flare is to ignite the product gas that flows from the gasifier into the flame tube. This requires the continuous presence of a pilot flame. Reliable ignition of product gas is obtained by a pilot burner designed for stability and positioned around the outer circumference of the product gas nozzle. To ensure that the pilot is continuously lit during operation, a flame detection device is incorporated into the system to monitor this. The pilot burner is ignited by an ignition source system, which is designed for both manual and automatic actuation [9].Manual actuation occurs at start up by the operator using the start up mode of the flare. The spark is maintained for 10 seconds. This time has been judged sufficient for the established flame to be detected by the detector. Automatic actuation occurs during operation. If the pilot flame goes out during operation then a spark attempts to reignite the mixture. The spark is maintained for 10 seconds. Methane and air are used as flammable mixture for the pilot flame. Ignition is achieved by a high voltage electric spark. If after 10 seconds no flame has been established, the system is shut down. Because of the importance of the pilot flame, it is necessary to ensure that the pilot flame is stable if the flare is to operate correctly. This means that the mixture of air/methane should be within the flammability limits and well mixed.
17
Flammability limits of methane/air mixtures
The flammability limits are defined as the mixture composition limits by volume (maximum and minimum) of an air-fuel mixture that will burn indefinitely at given conditions of temperature and pressure without further ignition. When flammability limits are narrow, the interior of the flame may have insufficient air for the mixture to burn. Fuels, such as hydrogen, with wide limits of flammability (4 to 74.2%) are therefore easier to combust than those with narrow limits. The maximum amount of air required to oxidize methane in a given methane/air mixture is usually termed as the lower flammability limit. This mixture is lean if compared with stoichiometric conditions. On the other hand, the upper flammability limit is the minimum amount of oxygen required to oxidize methane in a methane/air mixture. This mixture will be rich. If the methane/air mixture is out of these limits, then ignition may not be possible. It can also be possible that momentary ignition is achieved but combustion cannot be sustained because the flame soon becomes extinct. The other major factors affecting combustion in the flare are product gas flammability, auto-ignition temperature and heating value and flame zone mixing. The flammability limits of the flared gases influence ignition stability and flame extinction.
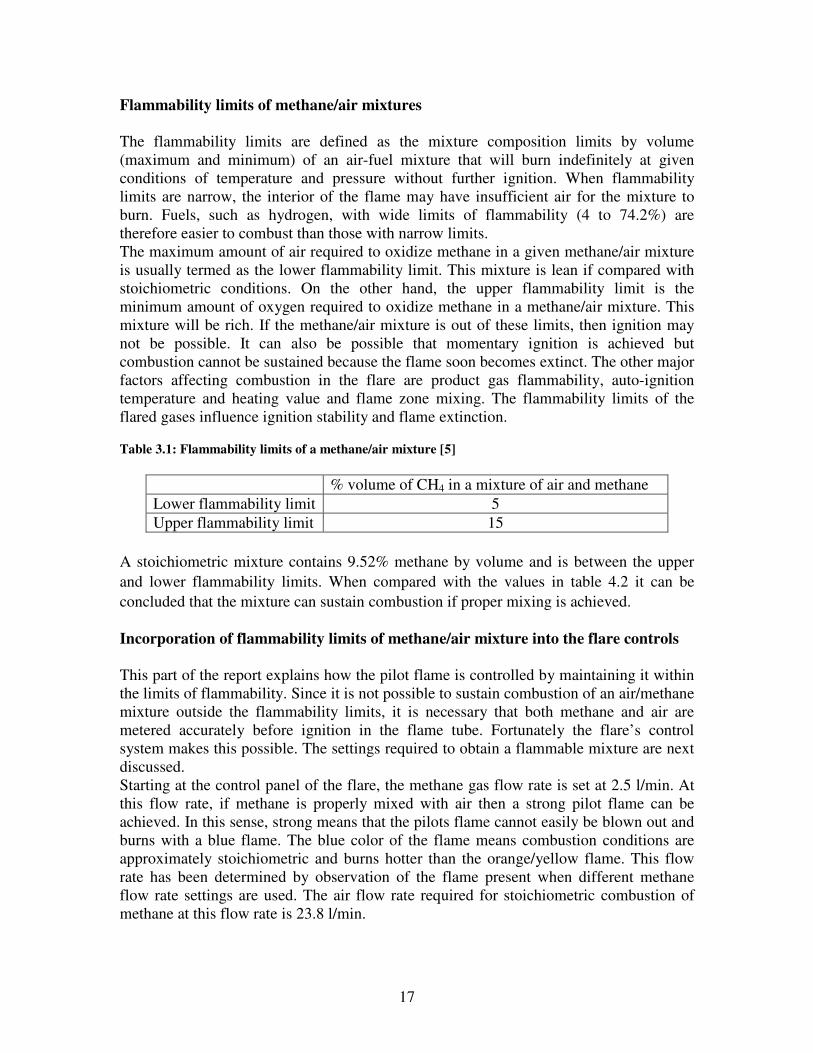
Table 3.1: Flammability limits of a methane/air mixture [5]
% volume of CH4 in a mixture of air and methane
Lower flammability limit 5
Upper flammability limit 15
A stoichiometric mixture contains 9.52% methane by volume and is between the upper
and lower flammability limits. When compared with the values in table 4.2 it can be
concluded that the mixture can sustain combustion if proper mixing is achieved.
Incorporation of flammability limits of methane/air mixture into the flare controls
This part of the report explains how the pilot flame is controlled by maintaining it within the limits of flammability. Since it is not possible to sustain combustion of an air/methane mixture outside the flammability limits, it is necessary that both methane and air are metered accurately before ignition in the flame tube. Fortunately the flare’s control system makes this possible. The settings required to obtain a flammable mixture are next discussed. Starting at the control panel of the flare, the methane gas flow rate is set at 2.5 l/min. At this flow rate, if methane is properly mixed with air then a strong pilot flame can be achieved. In this sense, strong means that the pilots flame cannot easily be blown out and burns with a blue flame. The blue color of the flame means combustion conditions are approximately stoichiometric and burns hotter than the orange/yellow flame. This flow rate has been determined by observation of the flame present when different methane flow rate settings are used. The air flow rate required for stoichiometric combustion of methane at this flow rate is 23.8 l/min.
18
Using the flow setting of 2.5 l/min for methane and taking the lower flammability limit, the air flow rate required in order to achieve a flammable mixture will be 47.5 l/min. Similarly for the upper flammability limit, the required air flow is 14.16 l/min. However, the interest will be on lower flammability limits to ensure that more than stoichiometric air is supplied. This is necessary so that there is more than sufficient air to completely mix with the methane. The flame color under these conditions is still blue Varying the flow rates of both methane and air are possible. For example the methane flow rate can be varied from 0 l/min to a maximum of 3.8 l/min by simply changing the settings on the touch screen panel. There is a minimum methane flow rate for operation without burn lock or instability. Burn lock means that the flare will shut down because of the inability to establish a pilot flame and instability is when the pilot flame flickers. The minimum methane gas flow setting at which an unstable pilot flame is achieved was determined experimentally at 1 l/min. This flame was easily blown out when more air (required for product gas combustion) was introduced. Flow settings of 2.5 l/min and above thus proved more reliable. The controls allow a multiplication factor for the air flow rate to be set based on the methane flow rate. The implication of this is that should the methane flow rate settings be changed to a different value, then the required air flow rate will be simultaneously changed according to the multiplication factor. The multiplication factor has been set based on the lower flammability limit. That is to say an air: methane ratio of 19:1. If air is let to diffuse naturally, the process is slow. To speed up the mixing of methane and air, swirl is introduced in the air flow. This swirl imparts itself on the flame. Once the proper amount of air and methane is available, the reaction is self sustaining by auto ignition of the unreacted fuel by the already combusted fuel which will have reached the auto ignition temperature of methane (540 ºC).The initial ignition is accomplished by the use of a high voltage spark of approximately 10,000 volts.
Flammability limits of producer gas
In this section, an estimate of the flammability limits of producer gas from an updraft gasifier is made. This estimate is made so that the primary air for product gas can be set correctly on the control panel. Producer gas is assumed to have the composition given in table B.1 (appendix B) [9].The flammability limits of the mixture are calculated based on the limits of the individual gas components. The lower and upper flammability limits of producer gas are between 13.1 % and 80 %.An estimate of this is shown in table B.2.The air requirement for the designed product gas flow of 2.4(10-3) m3/s is between 6(10-4) and 1.6(10-2) m3/s .The primary air for the product gas combustion is set to the maximum limit allowable by the mass flow controllers. This value is set at 90 l/min or 1.5(10-3) m3/s and is between the limits for the air requirement
3.2 Design changes made to flare unit
The flare design is influenced by several factors, including the availability of space, the characteristics of the flare gas (namely composition, quantity, and pressure) and occupational and safety concerns. For safety reasons, the flare in the laboratory was designed as an enclosed flare to protect lab personnel from harmful gases. The emphasis
19
of this section is to discuss the design changes to an already designed flare that was not functioning as required.
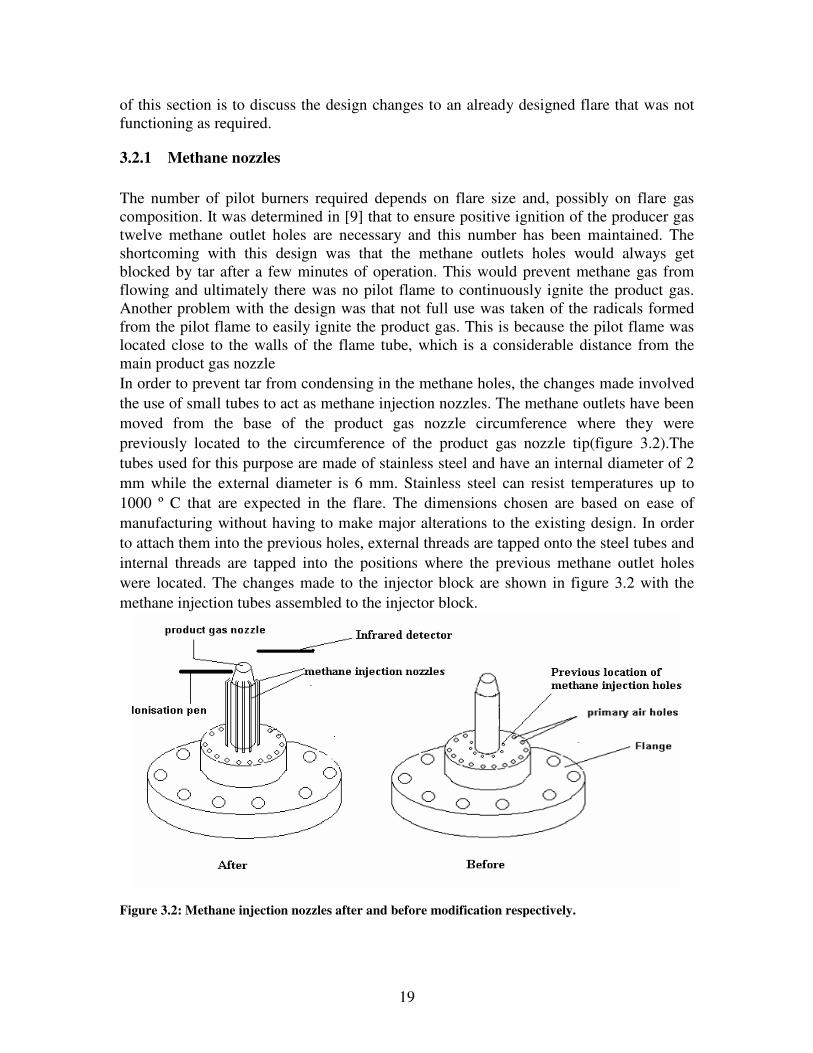
3.2.1 Methane nozzles
The number of pilot burners required depends on flare size and, possibly on flare gas composition. It was determined in [9] that to ensure positive ignition of the producer gas twelve methane outlet holes are necessary and this number has been maintained. The shortcoming with this design was that the methane outlets holes would always get blocked by tar after a few minutes of operation. This would prevent methane gas from flowing and ultimately there was no pilot flame to continuously ignite the product gas. Another problem with the design was that not full use was taken of the radicals formed from the pilot flame to easily ignite the product gas. This is because the pilot flame was located close to the walls of the flame tube, which is a considerable distance from the main product gas nozzle
In order to prevent tar from condensing in the methane holes, the changes made involved
the use of small tubes to act as methane injection nozzles. The methane outlets have been
moved from the base of the product gas nozzle circumference where they were
previously located to the circumference of the product gas nozzle tip(figure 3.2).The
tubes used for this purpose are made of stainless steel and have an internal diameter of 2
mm while the external diameter is 6 mm. Stainless steel can resist temperatures up to
1000 º C that are expected in the flare. The dimensions chosen are based on ease of
manufacturing without having to make major alterations to the existing design. In order
to attach them into the previous holes, external threads are tapped onto the steel tubes and
internal threads are tapped into the positions where the previous methane outlet holes
were located. The changes made to the injector block are shown in figure 3.2 with the
methane injection tubes assembled to the injector block.
Figure 3.2: Methane injection nozzles after and before modification respectively.
20
These 2 mm internal diameter steel tubes are screwed directly into the injector block at the positions where the methane outlet holes were situated. The tips of the methane nozzles are bent toward the product gas nozzle (figure 3.2). This way, the flames from the twelve methane nozzles are directed towards the product gas nozzle and with the air swirl imposed by the primary air holes; an upward rotating motion is imparted to the 12 flames. They then combine to form one flame which is centered on the product gas nozzle. If the primary air flow for the pilot and product gas is set to a value less than 70 l/min, the combined flame rotates upwards towards the chimney. Above 70 l/min of primary air flow, the flame becomes 12 separate flames rotating around the product gas nozzle tip. This is because the swirl speed increases with increasing air flow. In either case, the product gas will be in a state of continuous ignition from the pilot flame because of proximity of the pilot flame(s). Tar does not find its way into the methane injection nozzles because they (methane nozzles) are at an angle approximately horizontal to the product gas nozzle. This minimizes the flow of tar by gravity into them.
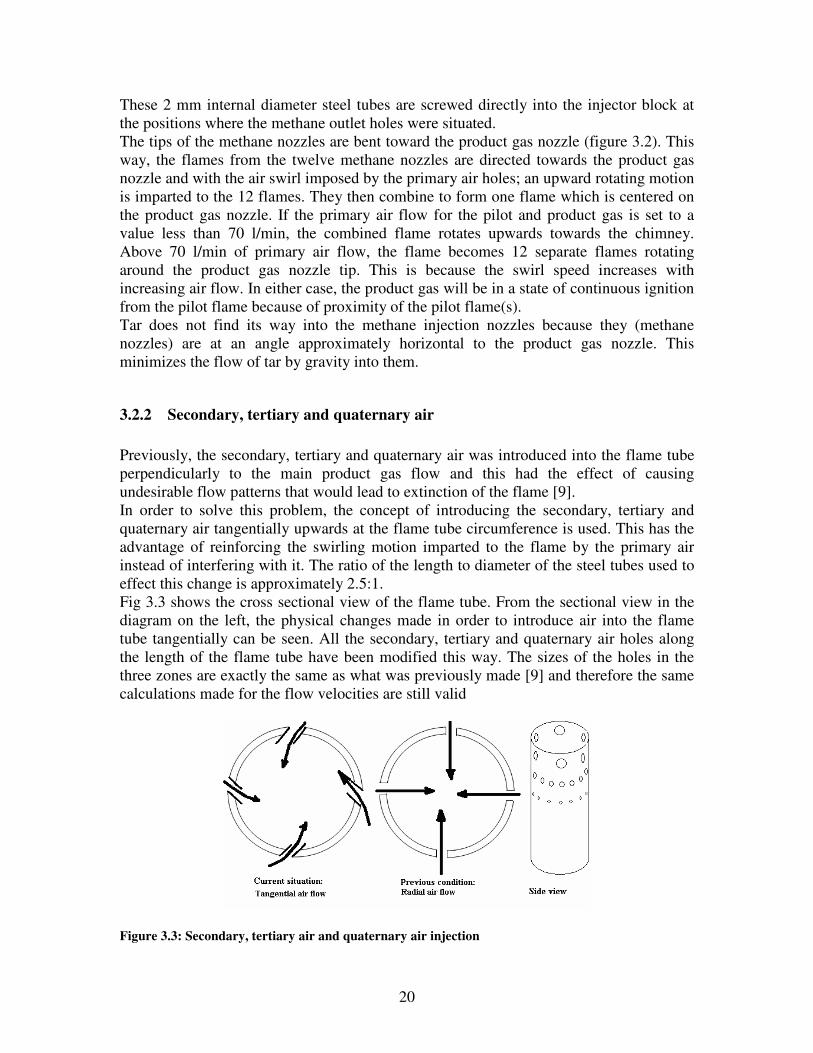
3.2.2 Secondary, tertiary and quaternary air
Previously, the secondary, tertiary and quaternary air was introduced into the flame tube perpendicularly to the main product gas flow and this had the effect of causing undesirable flow patterns that would lead to extinction of the flame [9]. In order to solve this problem, the concept of introducing the secondary, tertiary and quaternary air tangentially upwards at the flame tube circumference is used. This has the advantage of reinforcing the swirling motion imparted to the flame by the primary air instead of interfering with it. The ratio of the length to diameter of the steel tubes used to effect this change is approximately 2.5:1. Fig 3.3 shows the cross sectional view of the flame tube. From the sectional view in the diagram on the left, the physical changes made in order to introduce air into the flame tube tangentially can be seen. All the secondary, tertiary and quaternary air holes along the length of the flame tube have been modified this way. The sizes of the holes in the three zones are exactly the same as what was previously made [9] and therefore the same calculations made for the flow velocities are still valid
Figure 3.3: Secondary, tertiary air and quaternary air injection
21
3.2.3 Location of ionization pen
Sensing of the pilot flame is necessary for safety purposes and to ensure that a pilot flame is always present when the flare is ‘on’. The two sensors used in the flare are the infrared detector and the ionization pen.
The ionization pen is a sensor that is used to detect the presence of a flame in the flare. A
brief description of its operating principle is discussed as follows: An ion is a charged
atom that has either gained an electron to become negatively charged (anion) or has lost
an electron to become positively charged (cation). The energy released during a
combustion process will cause electrons to be knocked loose from an atom, resulting in a
positively charged particle and a free electron [28, 30].Since the electrons are so much
lighter than the ions, the electrons travel much faster and move away from the burner
outlet toward the tip of the flame much more quickly than the heavier ions. This leaves a
greater concentration of positively charged ions in the area near the burner outlet than
free electrons. If two electrodes with a small gap between them are placed in or near the
flame and a voltage is applied to the electrodes, a current will flow between the
electrodes using the ions and the electrons as charge carriers. A current will flow between
the electrodes when a flame is present [28, 30].
Using this as the guiding principle, the position for the ionization pen is chosen.
The ionization pen is situated in such a way that its tip is located within the flame at all
times (see figure 3.2) and this position is just to the side of the product gas nozzle.
Because non-premixed flames do not propagate, the pilot flame is at a fixed position
close to the tips of the methane gas injection nozzles. This is the area within which the tip
of the ionization pen is located. The body of the injection block is the earth electrode. The
other electrode to which an AC voltage is applied is the central electrode. The central
electrode of the ionization pen is isolated from touching the earth electrode by a ceramic
housing.
3.2.4 Location of the infrared detector
The infrared detector is a sensor that picks up infrared radiation and converts it into a
current. The presence or absence of a current is the basis for flame detection in the flare.
Previously, the infrared detector was located in the stark at the top of the flame tube.
In this position, the infrared detector was not able to sense the heat given off by the flame
in the primary combustion zone. It would only detect a flame when secondary, tertiary
and quaternary air started to flow. This was due to the fact that this air convects heat with
it that in effect actuates the infrared sensor. Despite this, the infrared sensor would always
flicker ‘on’ and ‘off’ [9]. This therefore meant that its operation was not a reliable means
to determine the presence of a flame. This behavior was attributed to the position of the
sensor not being ideal for flame detection. The infrared detector was therefore
repositioned.
The new position of the detector is such that it is pointing towards the flame in the
primary combustion zone. (Figure 3.2)This is the position where the pilot flame is
22
established. In essence, the infrared detector detects the heat from the pilot flame instead
of the heat from the products of combustion as was previously the case. The optical
sensor of the infrared detector can withstand temperatures of up to 600 º C and is
therefore positioned on the housing of the flame tube. The housing of the optical sensor is
made to face the flame in such a way that primary combustion air provides cooling to it
before it mixes with the product gas and methane. This detection is thought to be more
reliable for determination of the presence or absence of a flame.
3.3 Gas flow velocities
The velocities of combustible gases in the flame tube are estimated in this section of the
report. Very high flow velocities will inevitably lead to flame blow out and this is to be
avoided for safe operation of the flare.
Methane gas velocity
As stated earlier on, methane is used as a fuel for the pilot flame. It is necessary to know its flow velocities so that a good idea of when flame blow out is imminent. The criteria used here is the Reynolds number. Laminar and turbulent flows can lead to stable pilot flames. Transitory flow causes disturbances and can lead to pilot flame extinction. The methane gas velocity at the injection nozzles is obtained from the continuity equation,
AV=φ (3.1)
With A being the cross sectional area of the methane outlet holes, V is the gas velocity
andφ is the volumetric flow rate.
Taking a flow rate of 2.5 l/min, the velocity of methane gas is calculated to be 1.1 m/s.
The density of methane is 0.72 kg/m3 and its viscosity is 1.12x10⁻⁵ Pas at 298 K [29]. So
the Reynolds number is calculated to be 142 and this indicates that the flow can be
described as laminar. Therefore transitional disturbances are not to be expected. In pipe
flows, the transition Reynolds number typically is 2200. By design, the velocity in many flares is very low; therefore, most of the flame structure is developed through buoyant forces as a result of combustion [31].
Primary air necessary for combustion of product gas
The product gas leaves the gasifier hot, dirty (with tar) and moist and does not undergo cleaning, cooling and drying before combustion in the flare. Wood derived producer gas from the updraft gasifier is comprised of the components and proportions shown in B.1 in appendix B. The primary air for stoichiometric combustion is estimated based on the stoichiometric requirements of the individual components. Tar though combustible, has been excluded here for simplicity of the approximation.
23
The stoichiometric equations for combustion of these gases are given by: H2 + O2 + 3.76 N2 � 2 H2O + 3.76 N2 (3.2) 2 CO + O2 + 3.76 N2 � 2 CO2 + 3.76 N2 (3.3) CH4 + 2 (O2 + 3.76 N2) � CO2 + 2 H2O + 7.52 N2 (3.4)
The air fuel ratios for complete combustion of these gases are determined and shown in
the following table.
Table 3.2: Air/ fuel ratios
Component Air: Fuel
H2 4.76: 1
CO 2.38:1
CH4 9.52:1
The product gas flow rate can be used to determine the amount of primary air necessary
for combustion from the above ratios.
The highest product gas flow rate occurs when the gasifier operates at its designed power
of 20 kW. At this power, the product gas flow has been calculated to be 2.9 g/s and
product gas velocity is 2 m/s through a pipeline of 39.5 mm diameter [9].At the product
gas nozzle outlet where the diameter constricts to 20 mm, the velocity of product gas will
be 7.8 m/s. This value is calculated by applying the continuity equation to the two pipe
diameters. Reynolds number for this flow is 9750. The Re is based on the assumption that
product gas has a density of 1.25 kg/m3 and a viscosity of 2.0x10⁻⁵ Pas at 300 º C. This
flow is turbulent and it is postulated that it will enhance mixing with air .The product gas
flow rate is calculated to be 2.4x10⁻³ m3/s.
The flow rates of the individual components and the stoichiometric air flow rate required
by each gaseous species are shown in table B.3 in appendix B. These values are
computed based on the compositions in table B.1 in appendix B.
The primary air flow required for complete combustion of product gas is 3.47x10⁻³ m3/s
and is simply a summation of the air flow rates in table B.3.
The total primary airflow is therefore (that required for the pilot flame + that required for
product gas) 4.26x10⁻³ m3/s. This is if primary air for methane oxidation is based on the
previous calculation of 47.5 l/min.
The primary air velocity through the 5mm air holes on the injector block is thus 9 m/s.
The Reynolds number for this flow is 3031.This is described as turbulent
In practice this flow is in considered to be transitional. The overall effect of imparting the
Reynolds number for methane flow, primary air flow and product gas flow is postulated
to give a desirable result of turbulent chaotic flow. This causes proper mixing of
combustible gas and air for complete combustion to take place and implies turbulent non-
premixed combustion occurs. However, observation of this is difficult because the flare is
not made of quartz so looking through it is not possible. The ionization pen is therefore
used to judge the stability of the flame.
24
In experiments using air and nitrogen to simulate product gas, the ionization flame
detector showed that the flame was stable even at the maximum flow limits of the setup.
There was no flicker in the ionization pen signal and the flameout condition did not
occur.
3.4 Performance testing of flare
The following part of the report describes a number of tests that were carried out on the
flare after making the changes described in the previous sections. The tests were carried
out to find out how the flare responds to extreme conditions of flow within the limits of
the setup.
Testing procedure
The tests were designed to experimentally establish the stability limits of the pilot flame
under a range operating conditions. Stability here is defined as the ability of the pilot
flame not to be extinguished under operating conditions. The blow out condition is
sensed when the ionization pen does not detect a flame and triggers the shut down mode.
Data of three tests are reported. These three tests were the ones that had the highest
product gas flows and were postulated to be likely to cause flame blow out. Low product
gas flow conditions ideally cannot cause blow out.
The tests were carried out by simulating product gas using nitrogen and air by
introducing them (air and nitrogen) through the injector nozzle of the flare. The reasons
for using nitrogen and air were mainly for safety. Their flow rates can easily be set to
high values that can be used to simulate high product gas flows. Also, air and nitrogen
have no calorific value. Because they are non combustible, a flame cannot be established
from them that would interact with the pilot flame due to their presence. This can be
taken as the extreme condition with no producer gas being formed in the gasifier at the
end of the gasification runs. Varying artificial product gas flow rates were used and these
are based on the maximum flow settings of the system. The methane and primary air flow
rate for pilot flame combustion were also varied.
The three tests reported here had the following gas flow rates as shown in table 3.3.The
maximum designed product gas flow of the gasifier is 2.4(10-4) m3/s.This is
approximately 144 l/min. The temperature inside the flare was measured by two
thermocouples positioned 250mm apart along the length of the flame tube (figure 3.1).
T1 is the thermocouple reading at the top of the flame tube and T2 the bottom reading.
Thermocouple T2 is at a height of 210 mm above the base of the flame tube.
25
Table 3.3: Gas flow rate settings
Test 1 Test 2 Test 3
Product gas (Nitrogen and air) 160 l/min 230 l/min 160 l/min
Ratio of product gas(nitrogen and air)
to real expected product gas flow
1.11:1 1.6:1 1.11:1
Methane 2.5 l/min 3.0 l/min 3.0 l/min
Primary air 80 l/min 145 l/min 130 l/min
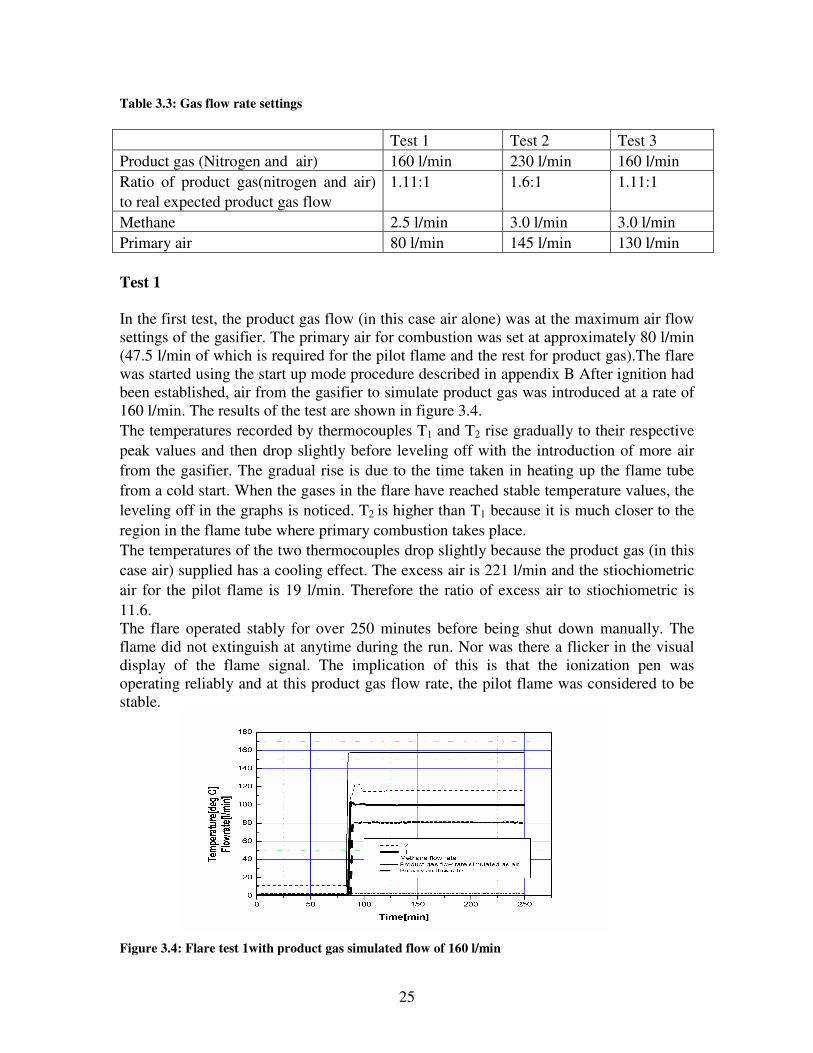
Test 1
In the first test, the product gas flow (in this case air alone) was at the maximum air flow settings of the gasifier. The primary air for combustion was set at approximately 80 l/min (47.5 l/min of which is required for the pilot flame and the rest for product gas).The flare was started using the start up mode procedure described in appendix B After ignition had been established, air from the gasifier to simulate product gas was introduced at a rate of 160 l/min. The results of the test are shown in figure 3.4.
The temperatures recorded by thermocouples T1 and T2 rise gradually to their respective
peak values and then drop slightly before leveling off with the introduction of more air
from the gasifier. The gradual rise is due to the time taken in heating up the flame tube
from a cold start. When the gases in the flare have reached stable temperature values, the
leveling off in the graphs is noticed. T2 is higher than T1 because it is much closer to the
region in the flame tube where primary combustion takes place.
The temperatures of the two thermocouples drop slightly because the product gas (in this
case air) supplied has a cooling effect. The excess air is 221 l/min and the stiochiometric
air for the pilot flame is 19 l/min. Therefore the ratio of excess air to stiochiometric is
11.6. The flare operated stably for over 250 minutes before being shut down manually. The flame did not extinguish at anytime during the run. Nor was there a flicker in the visual display of the flame signal. The implication of this is that the ionization pen was operating reliably and at this product gas flow rate, the pilot flame was considered to be stable.
Figure 3.4: Flare test 1with product gas simulated flow of 160 l/min
26
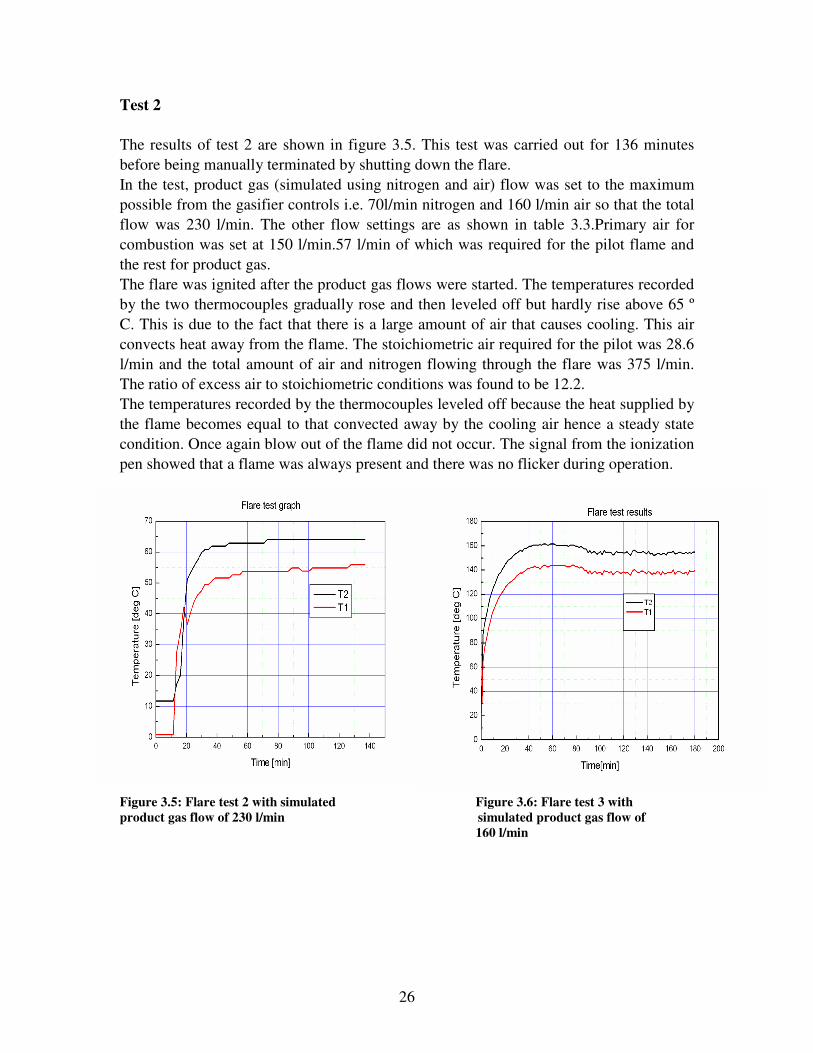
Test 2
The results of test 2 are shown in figure 3.5. This test was carried out for 136 minutes
before being manually terminated by shutting down the flare.
In the test, product gas (simulated using nitrogen and air) flow was set to the maximum
possible from the gasifier controls i.e. 70l/min nitrogen and 160 l/min air so that the total
flow was 230 l/min. The other flow settings are as shown in table 3.3.Primary air for
combustion was set at 150 l/min.57 l/min of which was required for the pilot flame and
the rest for product gas.
The flare was ignited after the product gas flows were started. The temperatures recorded
by the two thermocouples gradually rose and then leveled off but hardly rise above 65 º
C. This is due to the fact that there is a large amount of air that causes cooling. This air
convects heat away from the flame. The stoichiometric air required for the pilot was 28.6
l/min and the total amount of air and nitrogen flowing through the flare was 375 l/min.
The ratio of excess air to stoichiometric conditions was found to be 12.2.
The temperatures recorded by the thermocouples leveled off because the heat supplied by
the flame becomes equal to that convected away by the cooling air hence a steady state
condition. Once again blow out of the flame did not occur. The signal from the ionization
pen showed that a flame was always present and there was no flicker during operation.
Figure 3.5: Flare test 2 with simulated Figure 3.6: Flare test 3 with
product gas flow of 230 l/min simulated product gas flow of
160 l/min
27
Test 3
This test was carried out with air as product gas from the gasifier at a flow rate of 160
l/min. The methane flow rate settings were at 3.0 l/min and primary air at 130 l/min.
Air flow from the gasifier was first started and then the flare was later ignited. The results
of this test are shown in figure 3.6.
The temperatures recorded by thermocouples T1 and T2 rise steeply to between 140 and
160 º C at start up within a few minutes. After that the temperatures then level off.
When compared with test 1, there has been a 0.5 l/min increase in the methane flow rate.
This accounts for the higher temperatures compared to those in test 1. In particular, the
temperatures are approximately 20 º C higher. The flame was stable and did not
extinguish during the run and this was the objective of this test.
Conclusion and recommendation
The design changes made to the methane holes, the position of the ionization pen and the secondary tertiary and quaternary air holes show that the stability of the pilot flame was good at the fairly high flow rates simulated by the use of nitrogen and air to act as product gas during the tests. This meant that there was no heating value in the product gas but still the pilot flame was sustained. No blow out was observed and the flame detection system (ionization pen) was working as required. In addition to this, ignition during start up would take approximately five seconds. However, in a test with real product gas, the ionization pen failed to detect a flame after 20 minutes of operation. This was attributed to the following: There was a considerable amount of tar in product gas and this had the tendency to clog the electrode of the ionization pen. The tar acts as insulation on the surface of the ionization electrode and this prevented it from detecting the presence of a flame. In addition, the infra red flame detector ceased to function when the temperatures in the flare rose to approximately 1000 ºC. The maximum sensor temperature of the infrared detector is limited to 600 ºC. It is probable that the sensitivity of the sensing element was adversely affected by the prolonged exposure to temperatures above its operating limit. A replacement with a higher temperature range may solve this problem. In order to overcome these short falls, it is recommended that an additional flame sensor be used. The most probable alternative is a thermocouple that is inserted in the flame. Clogging by tar does not affect the operating principle of a thermocouple.
28
Chapter 4
4 The Gasifier A gasifier is a device in which biomass is transformed into combustible gases in processes distinctly and controllably separate in time and location from the eventual combustion of the gases. This chapter of the report describes the gasifier set up in the biomass laboratory at the Technology University of Eindhoven and the problems with the unit. The design changes made to it in order to rectify the problems are then described. Thereafter, a description of the gasification tests carried out with biomass is given and the results of the test are presented. Recommendations and conclusions then follow.
4.1 Problems with the previous gasifier setup
The biomass laboratory has an updraft gasifier. The issues that need to be addressed are outlined below.
� Measurement of process temperatures in the reaction zones of the reactor is not possible. The previous design allows for temperatures of the reactor walls to be measured using thermocouples. As a result of this, it is difficult to tell when the gasifier is ‘on’ [9] because the ‘on’ state is determined by the temperature setting of a thermocouple located at the top of the gasifier is used to detect the gasifier ‘on’ condition. This occurs when a temperature of 200 ° C is measured. This temperature setting can be changed using the control panel. The thermocouples will be installed in a steel shroud to protect them from breaking during loading and they will be installed in the bed of the reactor at predetermined positions along the reactor axis for measurement of the reactor bed temperatures.
� Ignition of wood chips on the grate at start up is not easy. An additional fuel source like fire lighter that has a lower ignition temperature than biomass will also be used to improve the homogeneous ignition and combustion of the bottom layer of biomass at start up. In addition to the use of fire lighter, air flow is divided into that required for the ignition burner and that required for wood combustion at start up. After start up all the air supplied is consumed by the combustion of wood on the grate when the burner is switched off.
� The flame of the startup burner cannot be kept burning when starting up. Very
frequently it is extinguished. As a result, smooth starts are not possible. Instead,
the Bunsen burner has to be repeatedly ignited until ignition of the bed of
biomass particles on the grate finally occurs. It (the burner) can only stay lit when
the temperatures in the ash chamber reach approximately 600 ° C [9] because the
reactor will have reached a temperature where most of the heat from the flame is
29
not used to heat up bulk of the reactor. At this temperature, quenching of the
flame does not occur. It may be possible that the combustible gas flow velocities
are too high and lead to flame blowout.
It can also be that the combustible gas (methane and air) flow settings may not be
correct and all the air supplied during start up is consumed by Bunsen burner and
none or little is left for wood combustion on the grate. The approach used to solve
this problem will be that of operating the Bunsen burner at different flow rates of
combustible gas (methane and air) and experimentally determining the most
suitable flow settings for methane and air which will lead to a stable blue flame
which is the result of a hotter and more complete combustion reaction.
� The over pressure transducer behaves erratically. It unnecessarily triggers over
pressure alarms even when the sensor is supposedly at atmospheric pressure when removed and left in the open. The first approach is to replace the sensor and also clean the tube attaching it to the gasifier such that there are no blockages.
� The previous product gas measurement device is a rotameter. However, its draw
back is that it gets clogged with tar. In one test using air and nitrogen at the maximum flow settings to simulate product gas flow, it was found that the float appeared to be too heavy for the flowing gases to lift. The float would only be lifted in order to allow gas to flow through intermittently after sufficient pressure had been built up in the pipelines of the system. In this respect, continuous flow measurements were not possible. It was proposed to use a vortex flow meter but the cost of one unit proved to be prohibitive.
The next section describes the gasifier in detail and what has been done in an attempt to solve these problems.
4.2 Description of the gasifier
The reactor is a 20 kW updraft gasifier. The basis for the choice of this power is presented in [9] and includes among others relatively long operating times when fully loaded with biomass and the simple cylindrical design of the reactor. Figure 4.1 is a diagrammatic representation of the system after modifications were made. The dimensions of the reactor can be found in chapter 1 and in [9]. The cylindrical portion of the gasifier unit is simply a storage bin for wood chips. The chamber has to be refueled for each gasification operation. The system is not designed with a continuous feeding mechanism.
Gasifier variable parameters
The updraft gasifier is a multivariable component, having four controllable inputs (biomass, nitrogen, methane and air) and three controlled outputs (pressure, temperature and gas quality).There is a high degree of cross coupling between these inputs and outputs.
30
The controllable inputs are: � Amount of biomass loaded into the reactor (kg) � Air volumetric flow (l/min) � Nitrogen volumetric flow (l/min) - used mainly for extinction of the gasifier. � Methane flow (l/min) - for initial ignition of the bed at start up.
Depending on whether the gasifier is operating in start up mode, shut down mode or gasifier ‘on’ mode, the gas stream can be either of the following:
� A mixture of air and methane � Only air � Only nitrogen
The controlled outputs which fully depend on the controllable inputs are: � Product gas calorific value � Reactor pressure � Reactor temperature
Raw material for the gasifier A large variety of biomass types have been studied as raw materials for thermochemical
processes to produce gaseous fuels. The wood fuel used in this gasifier is beech wood chips. The wood chips are purchased, already prepared and no further preparation is necessary before being fed into the reactor. Of course it is possible to use other biomass types as well for instance charcoal or wood pellets as long as the particle size is not so small so as to cause a substantial pressure drop or restrict the flow of the gasification agent in the reactor.
The ash chamber
The ash chamber is a pipe section of 0.17 m external diameter and 0.2 m long (figure 4.1). When assembled onto the gasifier, the top of the ash chamber is covered by a grate made of stainless steel plate 5 mm thick. The grate has a porosity of 35% with 5 mm diameter holes. The grate is located at the bottom of the gasifier, just upstream of the ash chamber. The grate has perforations to distribute air uniformly across the bed of wood chips. The grate holds the wood chips in place above the Bunsen burner which is situated in the ash chamber. The ash chamber fits in between a pipe section of diameter 0.192 m internal diameter. One end of this pipe is welded to a flange that can is bolted on to the blind flange and the other end has a flange that can be bolted onto the gasifier. The blind flange contains the fittings where gasification air and nitrogen can be introduced into the gasifier. In addition, electrical fittings like the ignition electrode and ionization electrode are attached to it. Also attached is flanged pipe that joins it to the pipe that vents to the atmosphere in the event that the pressure in the gasifier becomes too high (set point 1.7 bars).
The Bunsen burner and ignition system
A Bunsen burner is used for heating the wood chips on the grate at start up. This is because it contains some arrangement for mixing fuel and oxidant in the appropriate proportions such that they are within the flammability limits. The device safely burns a
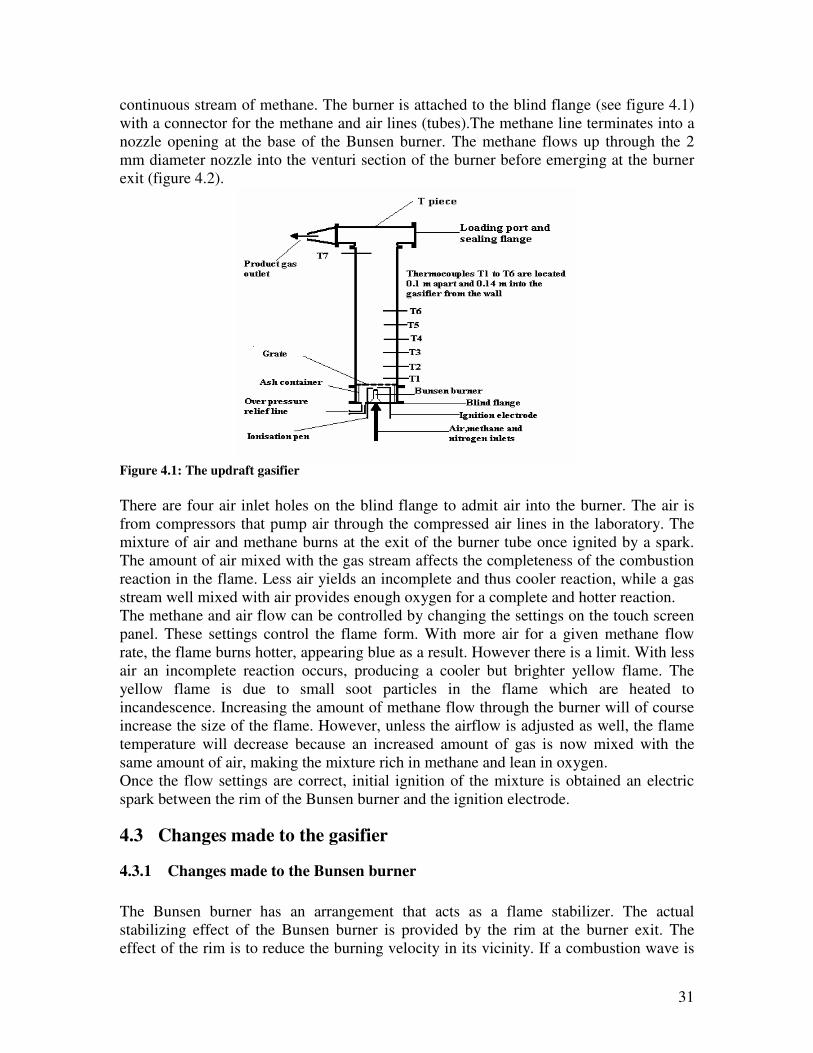
31
continuous stream of methane. The burner is attached to the blind flange (see figure 4.1) with a connector for the methane and air lines (tubes).The methane line terminates into a nozzle opening at the base of the Bunsen burner. The methane flows up through the 2 mm diameter nozzle into the venturi section of the burner before emerging at the burner exit (figure 4.2).
Figure 4.1: The updraft gasifier
There are four air inlet holes on the blind flange to admit air into the burner. The air is from compressors that pump air through the compressed air lines in the laboratory. The mixture of air and methane burns at the exit of the burner tube once ignited by a spark. The amount of air mixed with the gas stream affects the completeness of the combustion reaction in the flame. Less air yields an incomplete and thus cooler reaction, while a gas stream well mixed with air provides enough oxygen for a complete and hotter reaction. The methane and air flow can be controlled by changing the settings on the touch screen panel. These settings control the flame form. With more air for a given methane flow rate, the flame burns hotter, appearing blue as a result. However there is a limit. With less air an incomplete reaction occurs, producing a cooler but brighter yellow flame. The yellow flame is due to small soot particles in the flame which are heated to incandescence. Increasing the amount of methane flow through the burner will of course increase the size of the flame. However, unless the airflow is adjusted as well, the flame temperature will decrease because an increased amount of gas is now mixed with the same amount of air, making the mixture rich in methane and lean in oxygen. Once the flow settings are correct, initial ignition of the mixture is obtained an electric spark between the rim of the Bunsen burner and the ignition electrode.
4.3 Changes made to the gasifier
4.3.1 Changes made to the Bunsen burner
The Bunsen burner has an arrangement that acts as a flame stabilizer. The actual stabilizing effect of the Bunsen burner is provided by the rim at the burner exit. The effect of the rim is to reduce the burning velocity in its vicinity. If a combustion wave is
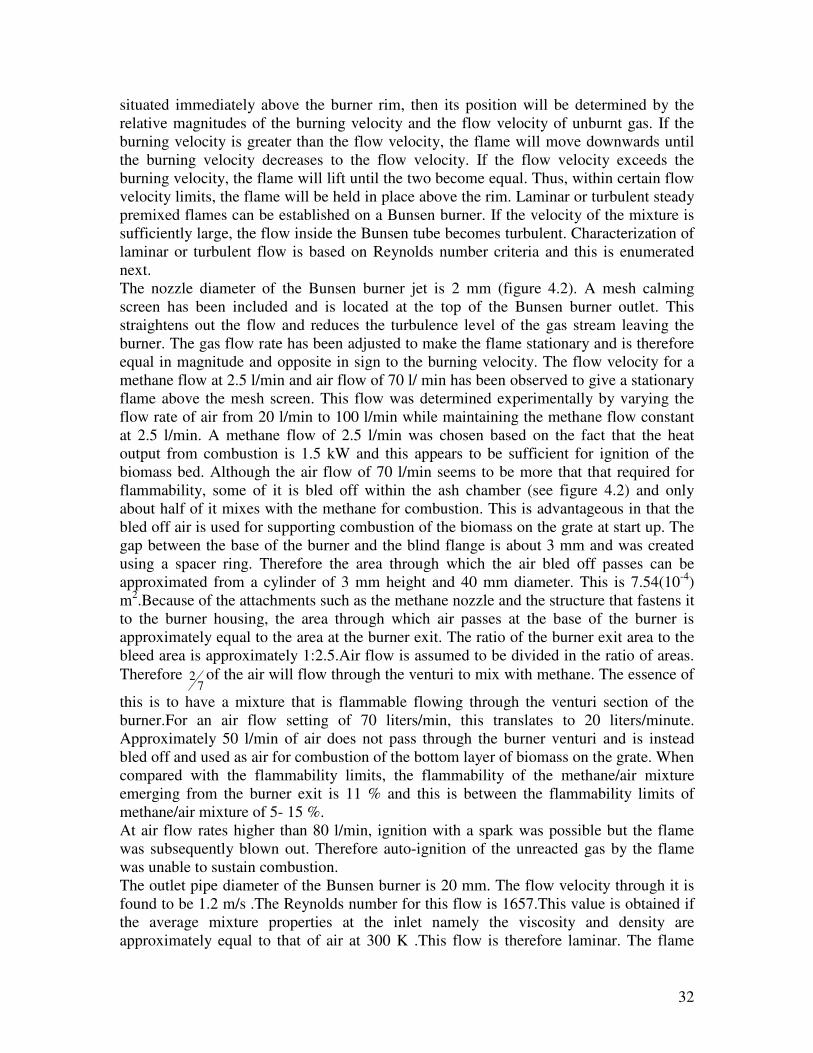
32
situated immediately above the burner rim, then its position will be determined by the relative magnitudes of the burning velocity and the flow velocity of unburnt gas. If the burning velocity is greater than the flow velocity, the flame will move downwards until the burning velocity decreases to the flow velocity. If the flow velocity exceeds the burning velocity, the flame will lift until the two become equal. Thus, within certain flow velocity limits, the flame will be held in place above the rim. Laminar or turbulent steady premixed flames can be established on a Bunsen burner. If the velocity of the mixture is sufficiently large, the flow inside the Bunsen tube becomes turbulent. Characterization of laminar or turbulent flow is based on Reynolds number criteria and this is enumerated next. The nozzle diameter of the Bunsen burner jet is 2 mm (figure 4.2). A mesh calming screen has been included and is located at the top of the Bunsen burner outlet. This straightens out the flow and reduces the turbulence level of the gas stream leaving the burner. The gas flow rate has been adjusted to make the flame stationary and is therefore equal in magnitude and opposite in sign to the burning velocity. The flow velocity for a methane flow at 2.5 l/min and air flow of 70 l/ min has been observed to give a stationary flame above the mesh screen. This flow was determined experimentally by varying the flow rate of air from 20 l/min to 100 l/min while maintaining the methane flow constant at 2.5 l/min. A methane flow of 2.5 l/min was chosen based on the fact that the heat output from combustion is 1.5 kW and this appears to be sufficient for ignition of the biomass bed. Although the air flow of 70 l/min seems to be more that that required for flammability, some of it is bled off within the ash chamber (see figure 4.2) and only about half of it mixes with the methane for combustion. This is advantageous in that the bled off air is used for supporting combustion of the biomass on the grate at start up. The gap between the base of the burner and the blind flange is about 3 mm and was created using a spacer ring. Therefore the area through which the air bled off passes can be approximated from a cylinder of 3 mm height and 40 mm diameter. This is 7.54(10-4) m2.Because of the attachments such as the methane nozzle and the structure that fastens it to the burner housing, the area through which air passes at the base of the burner is approximately equal to the area at the burner exit. The ratio of the burner exit area to the bleed area is approximately 1:2.5.Air flow is assumed to be divided in the ratio of areas.
Therefore 7
2 of the air will flow through the venturi to mix with methane. The essence of
this is to have a mixture that is flammable flowing through the venturi section of the burner.For an air flow setting of 70 liters/min, this translates to 20 liters/minute. Approximately 50 l/min of air does not pass through the burner venturi and is instead bled off and used as air for combustion of the bottom layer of biomass on the grate. When compared with the flammability limits, the flammability of the methane/air mixture emerging from the burner exit is 11 % and this is between the flammability limits of methane/air mixture of 5- 15 %. At air flow rates higher than 80 l/min, ignition with a spark was possible but the flame was subsequently blown out. Therefore auto-ignition of the unreacted gas by the flame was unable to sustain combustion. The outlet pipe diameter of the Bunsen burner is 20 mm. The flow velocity through it is found to be 1.2 m/s .The Reynolds number for this flow is 1657.This value is obtained if the average mixture properties at the inlet namely the viscosity and density are approximately equal to that of air at 300 K .This flow is therefore laminar. The flame
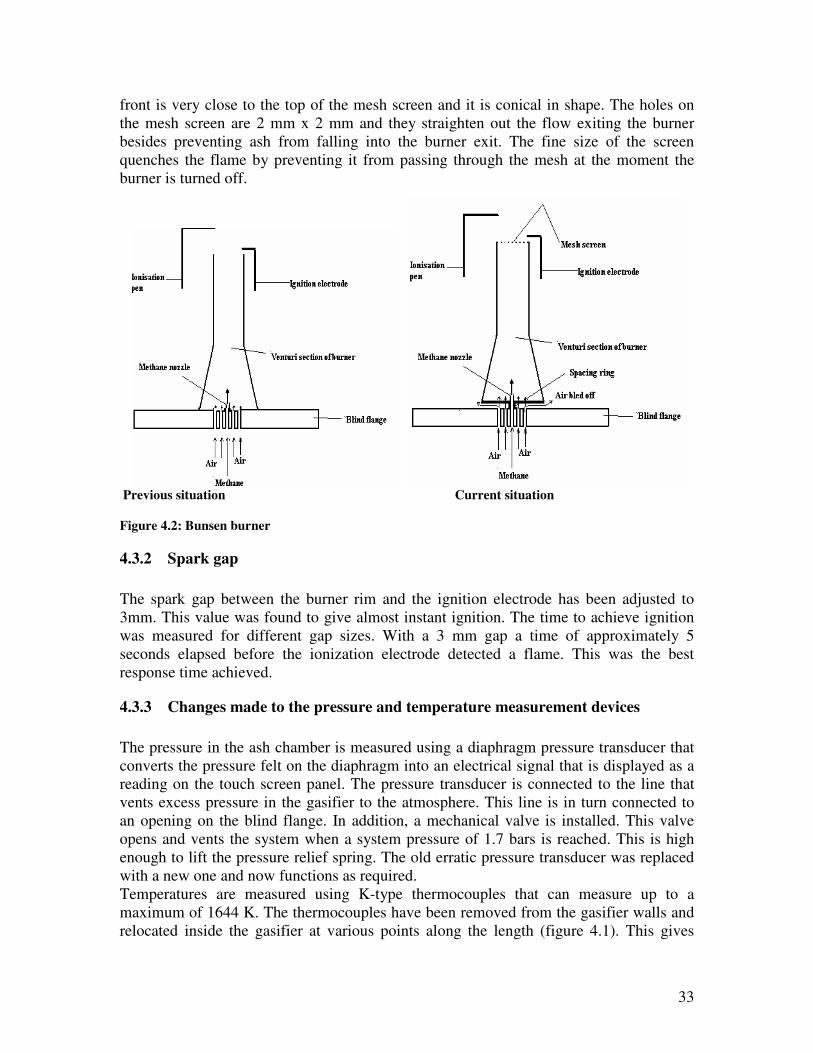
33
front is very close to the top of the mesh screen and it is conical in shape. The holes on the mesh screen are 2 mm x 2 mm and they straighten out the flow exiting the burner besides preventing ash from falling into the burner exit. The fine size of the screen quenches the flame by preventing it from passing through the mesh at the moment the burner is turned off.
Previous situation Current situation
Figure 4.2: Bunsen burner
4.3.2 Spark gap
The spark gap between the burner rim and the ignition electrode has been adjusted to 3mm. This value was found to give almost instant ignition. The time to achieve ignition was measured for different gap sizes. With a 3 mm gap a time of approximately 5 seconds elapsed before the ionization electrode detected a flame. This was the best response time achieved.
4.3.3 Changes made to the pressure and temperature measurement devices
The pressure in the ash chamber is measured using a diaphragm pressure transducer that converts the pressure felt on the diaphragm into an electrical signal that is displayed as a reading on the touch screen panel. The pressure transducer is connected to the line that vents excess pressure in the gasifier to the atmosphere. This line is in turn connected to an opening on the blind flange. In addition, a mechanical valve is installed. This valve opens and vents the system when a system pressure of 1.7 bars is reached. This is high enough to lift the pressure relief spring. The old erratic pressure transducer was replaced with a new one and now functions as required. Temperatures are measured using K-type thermocouples that can measure up to a maximum of 1644 K. The thermocouples have been removed from the gasifier walls and relocated inside the gasifier at various points along the length (figure 4.1). This gives
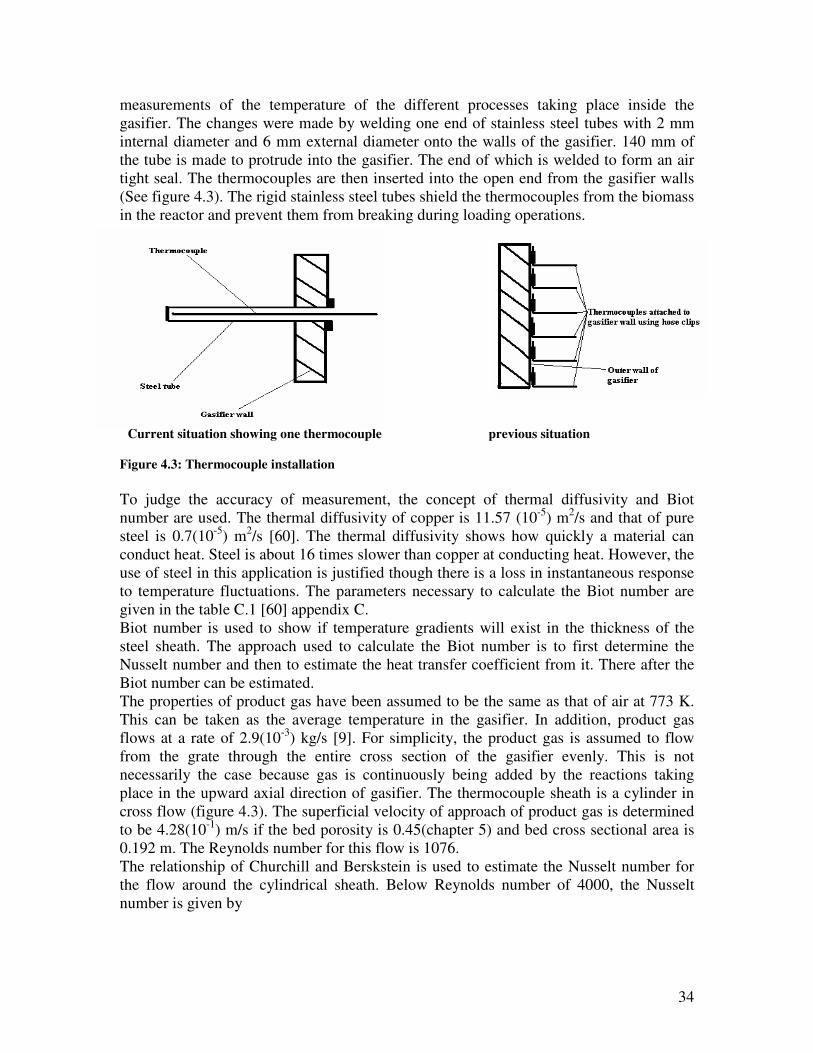
34
measurements of the temperature of the different processes taking place inside the gasifier. The changes were made by welding one end of stainless steel tubes with 2 mm internal diameter and 6 mm external diameter onto the walls of the gasifier. 140 mm of the tube is made to protrude into the gasifier. The end of which is welded to form an air tight seal. The thermocouples are then inserted into the open end from the gasifier walls (See figure 4.3). The rigid stainless steel tubes shield the thermocouples from the biomass in the reactor and prevent them from breaking during loading operations. Current situation showing one thermocouple previous situation
Figure 4.3: Thermocouple installation
To judge the accuracy of measurement, the concept of thermal diffusivity and Biot number are used. The thermal diffusivity of copper is 11.57 (10-5) m2/s and that of pure steel is 0.7(10-5) m2/s [60]. The thermal diffusivity shows how quickly a material can conduct heat. Steel is about 16 times slower than copper at conducting heat. However, the use of steel in this application is justified though there is a loss in instantaneous response to temperature fluctuations. The parameters necessary to calculate the Biot number are given in the table C.1 [60] appendix C. Biot number is used to show if temperature gradients will exist in the thickness of the steel sheath. The approach used to calculate the Biot number is to first determine the Nusselt number and then to estimate the heat transfer coefficient from it. There after the Biot number can be estimated. The properties of product gas have been assumed to be the same as that of air at 773 K. This can be taken as the average temperature in the gasifier. In addition, product gas flows at a rate of 2.9(10-3) kg/s [9]. For simplicity, the product gas is assumed to flow from the grate through the entire cross section of the gasifier evenly. This is not necessarily the case because gas is continuously being added by the reactions taking place in the upward axial direction of gasifier. The thermocouple sheath is a cylinder in cross flow (figure 4.3). The superficial velocity of approach of product gas is determined to be 4.28(10-1) m/s if the bed porosity is 0.45(chapter 5) and bed cross sectional area is 0.192 m. The Reynolds number for this flow is 1076. The relationship of Churchill and Berskstein is used to estimate the Nusselt number for the flow around the cylindrical sheath. Below Reynolds number of 4000, the Nusselt number is given by
35
25.067.0
33.05.0
Pr
4.01
PrRe62.03.0
+
+=NU (4.1)
From this equation, the Nusselt number for flow across the cylinder is found to be 16.3. The heat transfer coefficient from the product gas to the steel is calculated from
gasproductk
hDNU
= (4.2)
And the Biot number finally from
steelk
hDBi = (4.3)
The value of NU determined is 163 [W/m2K].Knowing that the external diameter of the steel sheath is 6 mm. Biot number is calculated to be 0.034 from equation 4.3.If the Biot number << 1, the temperature of the body is almost constant within the body at any time [60].This shows that no temperature gradients will exist between the thermocouple and the steel sheath. It can therefore be said that the temperatures measured by the thermocouples will be close to those of the processes taking place in the gasifier. Additionally, the steel sheath averages the temperature measurements because it forces the temperatures along the length of the sheath to approach due to conduction.
4.4 Experimental test procedure
Three experiments were conducted by varying the amount of air supplied for gasification. The main essence of the experiments was to test the Bunsen burner and to also determine the profiles of temperature in the reactor as well as flare temperatures for different air flows. The air flow affects the air fuel ratio. The amount biomass used was 7.5 kg for each of the tests. When this amount of wood chips was fed into the reactor, it occupied roughly half the height of the reactor. The flow rate of the oxidation agent (air) was varied as follows: 70, 80 and 90 l/min. These correspond to equivalence ratios of 0.21, 0.23 and 0.25 respectively and they are chosen because they are within the range of equivalence ratios for gasification. The experiments are performed using single feeding of the biomass in the reactor (batch experiments), thus the duration of the gasification was limited. Each experiment was conducted until the biomass was completely consumed except one experiment where the reactor had to be shut down before completion of gasification due to flare failure.
4.4.1 Loading the reactor and start up
Prior to loading the reactor with wood chips, the tracer heater had to be switched on for about 12 hours to heat up the pipe line to the flare. This ensured that the liquid products
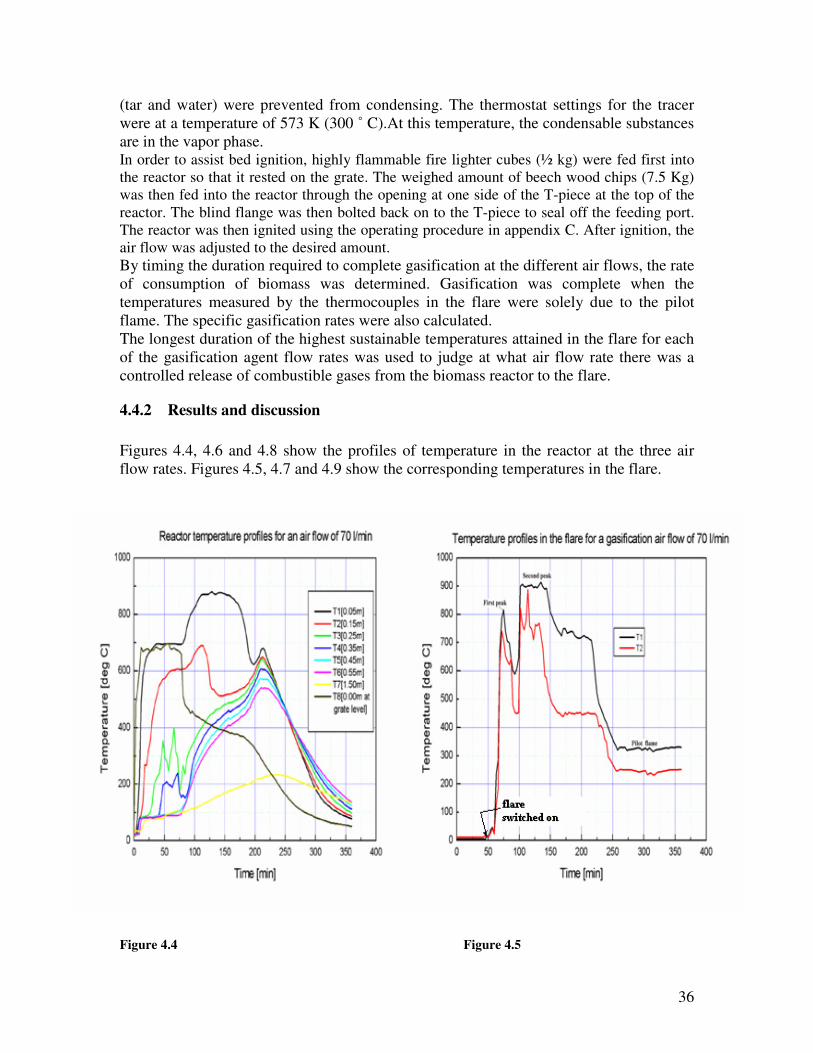
36
(tar and water) were prevented from condensing. The thermostat settings for the tracer were at a temperature of 573 K (300 ˚ C).At this temperature, the condensable substances are in the vapor phase. In order to assist bed ignition, highly flammable fire lighter cubes (½ kg) were fed first into the reactor so that it rested on the grate. The weighed amount of beech wood chips (7.5 Kg) was then fed into the reactor through the opening at one side of the T-piece at the top of the reactor. The blind flange was then bolted back on to the T-piece to seal off the feeding port. The reactor was then ignited using the operating procedure in appendix C. After ignition, the air flow was adjusted to the desired amount. By timing the duration required to complete gasification at the different air flows, the rate of consumption of biomass was determined. Gasification was complete when the temperatures measured by the thermocouples in the flare were solely due to the pilot flame. The specific gasification rates were also calculated. The longest duration of the highest sustainable temperatures attained in the flare for each of the gasification agent flow rates was used to judge at what air flow rate there was a controlled release of combustible gases from the biomass reactor to the flare.
4.4.2 Results and discussion
Figures 4.4, 4.6 and 4.8 show the profiles of temperature in the reactor at the three air flow rates. Figures 4.5, 4.7 and 4.9 show the corresponding temperatures in the flare.
Figure 4.4 Figure 4.5
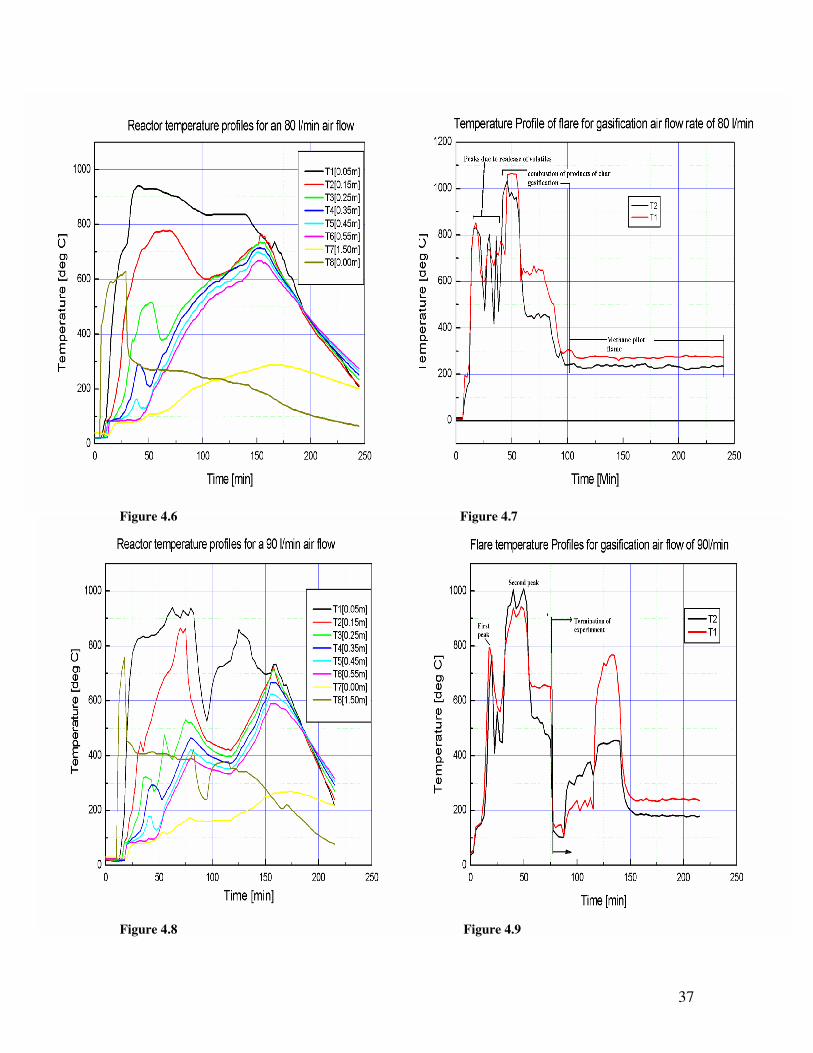
37
Figure 4.6 Figure 4.7
Figure 4.8 Figure 4.9
38
The gasifier temperature profiles
From figures .4, 4.6 and 4.8, it is evident that after ignition, the temperatures rise from the grate upwards in the reactor to the top with time. The gradual rise in temperature is because some of the heat released is expended in heating up the metal parts of the reactor. In particular, the temperature recorded by thermocouple T1 at the bottom of the reactor increases with air flow rate but there is a threshold. At an air flow rate of 70 l/min, the maximum temperature at the grate is approximately 850 º C and at 80 l/min a temperature of 940 º C is attained. This is attributed to the higher air flow rate that makes more oxygen available for the combustion reaction. The maximum temperature for an air flow of 90 l/min was slightly less (930 º C). This is a result of the air being introduced into the reactor cooling the combustion zone despite the greater content of air flow which would mean more oxygen available per unit of time. After the initial temperature rise, the temperatures shown by thermocouples T2 –T6 start to drop before rising again. The drop occurs because heat produced in the combustion zone is being used by pyrolysis and drying reactions to convert the wood chips in the reactor into char. These reactions are favored by higher temperatures. It is also possible that at the moment the Bunsen burner is switched off, hot products of methane combustion stop to flow and the cool gasification air introduced in the reactor initially cools the bed The pyrolysis front rises from the region just above the grate (position of T2) upwards in the reactor (position T6). After all the biomass has been pyrolysed and dried, char is left. The rise in temperatures occurs because char burn out starts to take place at the lower layers of the bed where air is available together with char gasification reactions in the upper layers of the fuel bed that rapidly reduce the amount of char in the reactor. It should be noted that as the mass of char in the reactor reduces, still the same amount of air for gasification is supplied and in effect, the reactions in the reactor will tend towards combustion and the temperatures measured by thermocouples T1-T6 will approximately become equal. When the last amount of char has been combusted, the temperatures in the reactor start to fall because no more heat is being added to the reactor. The reactor then cools down to room temperature by losses to the surrounding as well as by convective transport by the air supplied to the gasifier for gasification. It can be deduced from the figures that for higher air flow rates, char is consumed faster and the batch run occurs for a shorter duration due to the availability of more air to support combustion. The consumption of wood for air flow rates of 70 and 80 l/min are 2.25 kg/hr and 4.5 kg/hr and this translates to a mass flux of 1.3 kg/m2s and 2.6 kg/m2s respectively. The area is based on the reactor cross section and the time used in the calculation is based on the time at which the flare temperatures are those due to the pilot flame only. The consumption rate for an air flow of 90 l/min is not calculated basing on the fact that the reaction was not run to completion at an air flow of 90 l/min.
The flare The general trends of events that occur in the flare are discussed together with the differences
evidenced in the three cases. T1 measures the temperature in the primary combustion zone and T2 that in the quaternary zone close to the stark. The temperatures measured by T1
39
are higher that that of T2 because T1 is within the primary combustion region. Temperature T2 can only be higher than T1 if the primary air supplied by combustion is less than stoichiometric and the secondary tertiary and quaternary air are then used to complete combustion as is the case in staged combustion. This is clearly the case in figure 4.9 at the second peak. However, T2 starts to drop when the air becomes excess and causes flame cooling of the products of combustion. The initial rise in temperature to about 800 º C (first peak) (figures 4.5, 4.7 and 4.9) in the
flare can be attributed to the combustion of the volatiles that are released from the gasifier. The rates at which the volatiles (hemicellulose, lignin and cellulose) and water vapor are released from the solid fuel are not uniform. This causes the combustion temperature
around the first peak to oscillate. The release rates are dependent on the prevailing thermal conditions in the gasifier. The temperature in the flare is lower in the first peak than that of the second peak because the released combustibles contain moisture which is a non combustible component in the producer gas. The temperature in the flare then drops as all the volatiles in the wood chips are driven off and less of it is available for combustion.
After the first peak, there is a second peak temperature of approximately 950-1050 º C. This can be attributed to the combustion of gases releases by char gasification reactions (Boudouard reaction and water gas reaction). The temperatures are higher than in the first
peak because the combustible gases (mainly hydrogen and carbon monoxide) do not contain moisture and have a higher heating value than the volatiles. It may also be that they are released at a faster rate than the release of volatiles. The temperatures start to drop as the release rate of combustible gases from the gasifier decrease because char gets consumed in the reactor. The reactor ceases to release combustible gases when all the char has been consumed and all that is left is ash. When no more gases are released from the reactor, the temperature measured by the thermocouples in the flare is mainly due to the pilot flame. The differences in the profiles in the three cases arise because of different gasification agent flow rates. The higher air flow rates of gasification agent lead to higher release rates of combustible gases because convective heat transfer in the reactor is enhanced. The processes taking place in the reactor therefore occur faster and the duration of the gasification run is shorter. The faster release rate leads to higher temperature peaks in the flare (figure 4.7 and 4.9) because more gas is available for combustion within short time duration. The gasification test at air flow of 90 l/min was terminated before completion of the test due to flare failure but was again run up to completion with different gasification agent flow rate therefore only part of the data is at an air flow rate of 90 l/min (figure 4.9). The slowest release rate and therefore most controlled release was for a gasification agent flow of 70 l/min. Flare temperatures between 600- 900 º C were maintained for duration of time close to 200 min.
Conclusions
The problems with the difficulty in starting up the updraft gasifier in the biomass laboratory have been addressed. Changes were made to the Bunsen burner by bleeding off some of the air used for initial start up. From the tests carried out, the gasifier was ignited easily. The easy ignition was enhanced by the use of highly flammable fire lighter cubes.

40
The measurement of temperature profiles in the reactor has been made possible by the installation of the thermocouples into the fuel bed instead of the walls where they were previously located. The consumption of wood for air flow rates of 70 and 80 l/min are 2.25 kg/hr and 4.5 kg/hr.
41
Chapter 5
5 Modelling In this chapter, an attempt is made to model the processes taking place inside the updraft gasifier so that the compositions of combustible gases released from wood chip gasification can be predicted. The model is divided into transport and chemistry equations. The equations are numerically solved simultaneously to yield the solution for the profiles of gas composition and temperature along the reactor. The results are then compared with experimental data to show the accuracy of the model.
5.1 Updraft gasifier model
In this equipment, adjacent particles maintain the same contact as found in a fixed bed of solids, and the solid particles slowly travel downwards through the equipment as they are dried, pyrolysed, reduced and combusted respectively. The gasifier is modeled in one dimension with species concentration and temperatures varying in the axial z-direction. The model is based on the models of Diblasi [31] and Hobbs [13]. The gasifier is imagined to be consisting of two streams (gas and solid) which flow countercurrent to each other. These streams exchange heat and mass through their common interface. It is assumed that each phase flows through the reactor in a plug flow regime where no back mixing of gases occurs [33]. A simplified scheme of the model is shown in figure D.1 (appendix D).
5.2 Governing equations
The equations used for modeling the gasifier are the continuity and energy equations. Of course there will be momentum transfer between gas molecules but the assumption that the gas is inviscid makes this to be neglected. In the moving-bed gasifier there is no considerable variation in pressure throughout the equipment because the biomass particles are of considerable size and not pulverized. In addition, concentration and temperature profiles are not severely affected by relatively small pressure variations. In view of this, isobaric operation can be assumed and the momentum equation can be discarded from the system of equations to be solved. The necessary equations are presented at the end of the section. The assumptions used in arriving at these equations can be found in appendix D.
Species conservation
This is mass balance for each chemical species and is described by equation 5.1 [45]. The first approximation is to neglect the diffusion term. This is justifiable because in moving bed gasifiers the main convective terms, given by the left side of 1.1, are much greater than the diffusion terms. In addition, the diffusivities of solid components are really negligible. The continuity equations for chemical species require the description of the
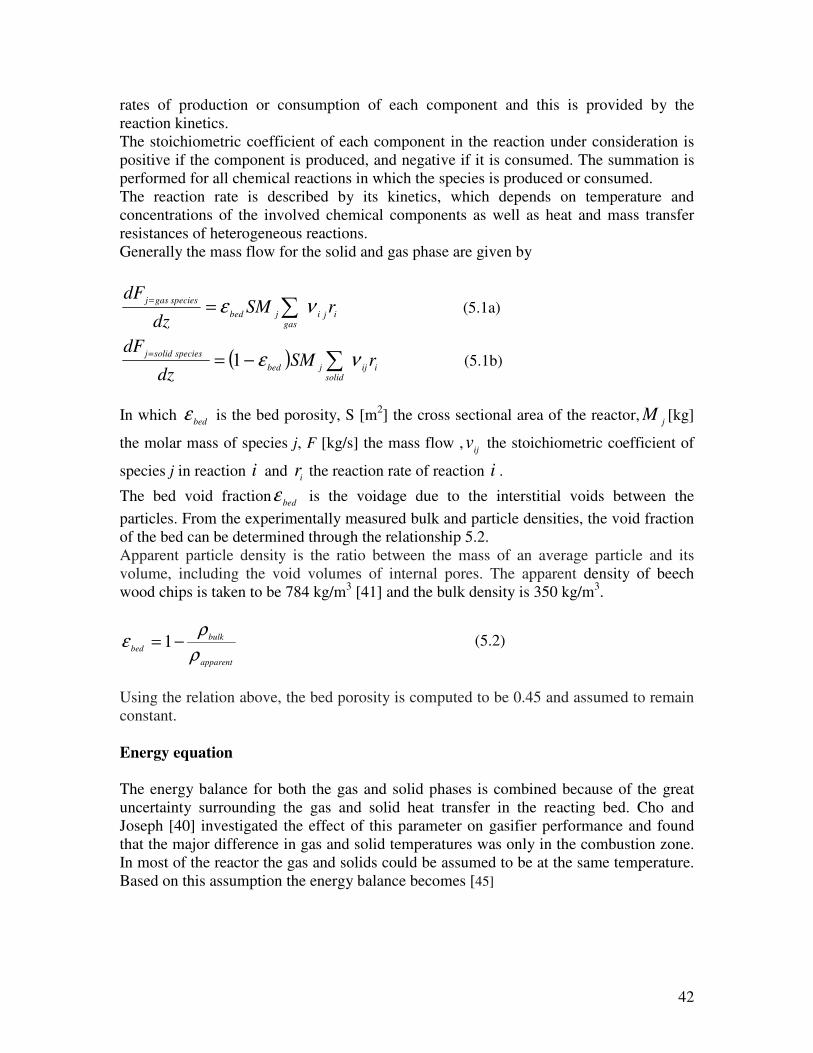
42
rates of production or consumption of each component and this is provided by the reaction kinetics. The stoichiometric coefficient of each component in the reaction under consideration is positive if the component is produced, and negative if it is consumed. The summation is performed for all chemical reactions in which the species is produced or consumed. The reaction rate is described by its kinetics, which depends on temperature and concentrations of the involved chemical components as well as heat and mass transfer resistances of heterogeneous reactions. Generally the mass flow for the solid and gas phase are given by
ijigas
jbed
speciesgasjrSM
dz
dFνε ∑=
= (5.1a)
( )iij
solidjbed
speciessolidjrSM
dz
dFνε ∑−=
=1
(5.1b)
In which bed
ε is the bed porosity, S [m2] the cross sectional area of the reactor,j
M [kg]
the molar mass of species j, F [kg/s] the mass flow ,ij
v the stoichiometric coefficient of
species j in reaction i and i
r the reaction rate of reaction i .
The bed void fractionbed
ε is the voidage due to the interstitial voids between the
particles. From the experimentally measured bulk and particle densities, the void fraction of the bed can be determined through the relationship 5.2. Apparent particle density is the ratio between the mass of an average particle and its volume, including the void volumes of internal pores. The apparent density of beech wood chips is taken to be 784 kg/m3 [41] and the bulk density is 350 kg/m3.
1apparent
bulk
bedρ
ρε −= (5.2)
Using the relation above, the bed porosity is computed to be 0.45 and assumed to remain constant.
Energy equation
The energy balance for both the gas and solid phases is combined because of the great uncertainty surrounding the gas and solid heat transfer in the reacting bed. Cho and Joseph [40] investigated the effect of this parameter on gasifier performance and found that the major difference in gas and solid temperatures was only in the combustion zone. In most of the reactor the gas and solids could be assumed to be at the same temperature. Based on this assumption the energy balance becomes [45]
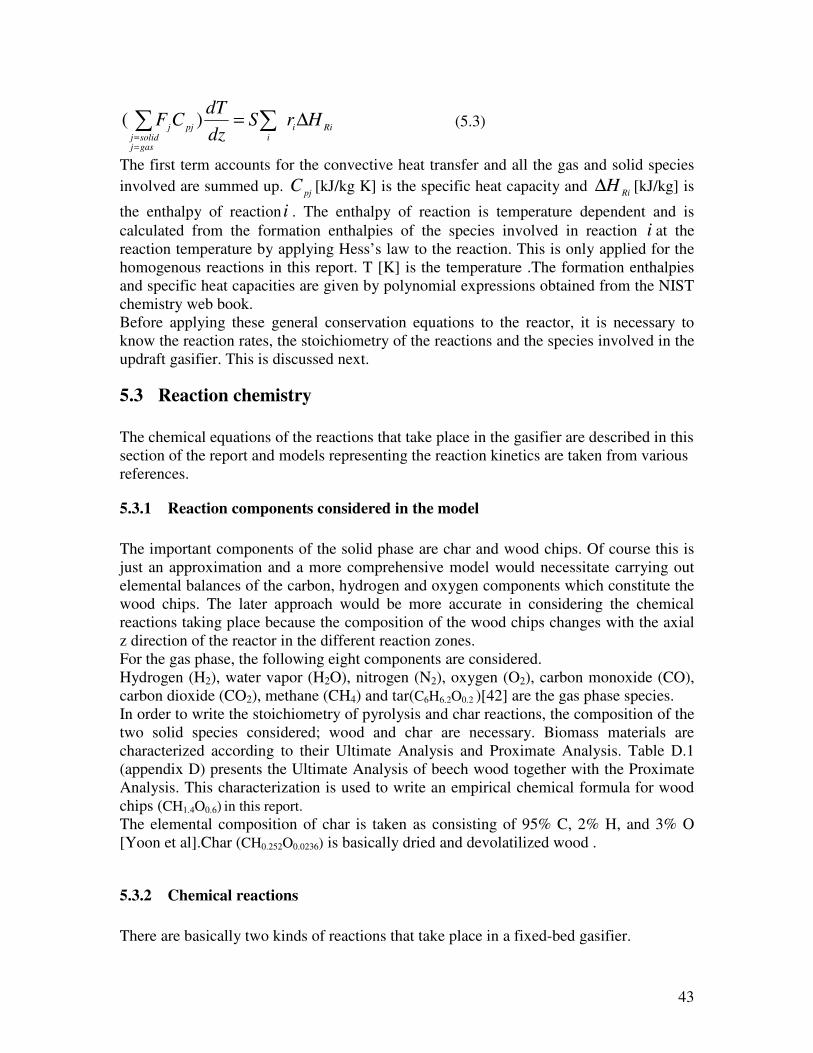
43
Riii
pj
gasjsolidj
jHrS
dz
dTCF ∆= ∑∑
==
)( (5.3)
The first term accounts for the convective heat transfer and all the gas and solid species
involved are summed up. pj
C [kJ/kg K] is the specific heat capacity and Ri
H∆ [kJ/kg] is
the enthalpy of reaction i . The enthalpy of reaction is temperature dependent and is
calculated from the formation enthalpies of the species involved in reaction i at the reaction temperature by applying Hess’s law to the reaction. This is only applied for the homogenous reactions in this report. T [K] is the temperature .The formation enthalpies and specific heat capacities are given by polynomial expressions obtained from the NIST chemistry web book. Before applying these general conservation equations to the reactor, it is necessary to know the reaction rates, the stoichiometry of the reactions and the species involved in the updraft gasifier. This is discussed next.
5.3 Reaction chemistry
The chemical equations of the reactions that take place in the gasifier are described in this section of the report and models representing the reaction kinetics are taken from various references.
5.3.1 Reaction components considered in the model
The important components of the solid phase are char and wood chips. Of course this is just an approximation and a more comprehensive model would necessitate carrying out elemental balances of the carbon, hydrogen and oxygen components which constitute the wood chips. The later approach would be more accurate in considering the chemical reactions taking place because the composition of the wood chips changes with the axial z direction of the reactor in the different reaction zones. For the gas phase, the following eight components are considered. Hydrogen (H2), water vapor (H2O), nitrogen (N2), oxygen (O2), carbon monoxide (CO), carbon dioxide (CO2), methane (CH4) and tar(C6H6.2O0.2 )[42] are the gas phase species. In order to write the stoichiometry of pyrolysis and char reactions, the composition of the two solid species considered; wood and char are necessary. Biomass materials are characterized according to their Ultimate Analysis and Proximate Analysis. Table D.1 (appendix D) presents the Ultimate Analysis of beech wood together with the Proximate Analysis. This characterization is used to write an empirical chemical formula for wood chips (CH1.4O0.6) in this report. The elemental composition of char is taken as consisting of 95% C, 2% H, and 3% O [Yoon et al].Char (CH0.252O0.0236) is basically dried and devolatilized wood .
5.3.2 Chemical reactions
There are basically two kinds of reactions that take place in a fixed-bed gasifier.
44
� Homogeneous, or gas-gas, reactions � Heterogeneous, or gas-solid, reactions
For each kind of reaction (homogeneous or heterogeneous), the rate of production or consumption of a given component can be described by the set of equations. The approach used here will be to describe all the heterogeneous reactions together with their kinetic models and then the homogeneous reactions with their model equations will be described next.
Heterogeneous reactions
Heterogeneous reactions involve two distinct phases, and hence mass transfer processes play an important role. For example if a gas reactant is near a solid particle, which is the other reactant, in order to meet the solid reactant the gas molecules have to travel though the gas within the particle pores and possibly the ash layer of spent material around the unreacted solid. Depending on the rates of reaction, the rate might be controlled or limited by the speed of that mass transfer.
The heterogeneous reactions that take place in the updraft reactor are the following:
(1) Char combustion
The oxidation of char is one of the most important chemical reactions taking place inside a gasifier, providing practically all the thermal energy needed for the endothermic reactions. Air supplied to the gasifier reacts with the combustible substances present in char, resulting in the formation of CO and H2O. CO is oxidized in the presence of O2 to CO2 in the gas phase. Subsequently CO2 and H2O undergo reduction upon contact with the char produced from pyrolysis. This char oxidation reaction is: CH0.252O0.0236 (char) + 0.5512 O2 + 2.073 N2 �CO + 0.126 H2O + 2.073 N2 (R1)
250001
−=∆R
H kJ/kg from [31]
Char conversion is assumed to follow a shrinking core behavior, where all reactions take place at the surface of a shrinking char core and with an ash layer building up outside the char. However, in this approach ash build up is assumed to be minimal because wood contains little ash content (table D.1) The surface area of the shrinking char core is that of the remaining mass of char and approaches zero as the mass of char goes to zero. The reaction rate which has been investigated by Hobbs [50] is give by
skmol/m/1/1
3
1
2
1
Rm
opp
Rkk
CVAr
+= (5.4)
In which Ap is the particle surface area [m2], Vp is the particle density number [1/m3] and
2oC [kmol/m3] is the concentration of oxygen
PparticlepV νε /)1( −= (5.5)
45
Where p
ν is the particle volume [m3].The parameter m
k [m/s] is the mass transfer
coefficient. The parameter value for the intrinsic kinetics constant 1R
k [ms-1] is obtained
from [53]
19294
exp1067.5 9
1
−=
Txk
R (5.6)
The mass transfer coefficient km is given by
bed
gas
m
Uk
ε
-0.667575.0 ScRe06.2 −
= (5.7)
Reynolds number depends on the density ρ [kg/m3] of the gas, the superficial velocity
Ugas [m/s], diameter of particles dp [m] in the bed and the dynamic viscosity gas
µ [kg/ms]
of the gas and is given by [45].
d
Rep
gas
gasU
µ
ρ= (5.8)
Schmidt number is a ratio of momentum transport to mass transport. This dimensionless group of fluid transport plays a prominent role in a gasifier where competing transport processes occur. It is represented by
Scρ
µ
gas
gas
D= (5.9)
Where Dgas [m
2/s] is the gas diffusivity. Diffusivity depends on the temperature, pressure, nature of the involved gases, and their concentrations. For low concentration of one diffusing gas, the dependence on concentration can be neglected [55].In cases normally found in combustion and gasification, the problem is complex because a particular gas diffuses through a mixture of gases. An example of this can be found in the heterogeneous reactions where a gas component diffuses through the gas boundary layer covering the particle before diffusing into the pores in the particle. The following correlation is [55] to compute the average diffusivities of these gases.
( )P
TD
gas
75.1
510677.8 −= (5.10)
Where P is the gas pressure in Pascals and T is the gas temperature in K. The gas viscosity varies with temperature according to [56].
46
mskgT
xgas
/300
1098.1
3/2
5
= −µ (5.11)
The density of the gas is calculated from the ideal gas law
RT
PMgas
gas=ρ (5.12)
Biomass particles are porous with the bulk of the particle volume being empty due to tunnels that crisscross its interior. The porosity demonstrates the importance of pores and their structures on the rate of heterogeneous or gas-solid reactions. The porosity can be calculated using two different definitions of density: • Apparent particle density is the ratio between the mass of an average particle and its volume, including the void volumes of internal pores. The apparent density of beech wood chips is taken as 784 kg/m3. • Real density, which is the ratio between the mass of an average particle and its volume, excluding the volumes occupied by internal pores is assumed to be 1400 kg/m3 for wood.
1real
apparent
particleρ
ρε −= (5.12)
Using the relation above, the porosity of wood chips is computed as 0.44.
(2) Pyrolysis reaction rate (wood chip decomposition) The pyrolysis reaction is given by reaction CH1.4O0.6 (dry and ash free) � vchar CH0.252O0.0236 (char) + {v1 H2 + v2H2O + v3 CO + v4 CO2 +
v5 CH4} (gases) + v6C6H6.2O0.2 (tar) 4202
=∆R
H kJ/kg from [31] (R2)
The release of many individual gas species does not occur in a single stage during devolatilization [24, 38, and 44]. Some of them present several peaks of escaping rates. Solomon [44] actually uses the functional group model to predict accurately the rates of release during devolatilization. However, for ease of calculations, volatiles will be released in the proportions shown in the table D.2 [41] (appendix D).This makes it easy to write the stoichiometry of heterogeneous pyrolysis reactions. A one-step global reaction is considered for wood devolatilization, where the fractions of gas, tar, and char [52] produced are assigned as in table D.2. Kinetic constant [s-1] for primary pyrolysis is given by Roberts and Clough [51].The pyrolysis reaction rate is given by
skg/m 75549
exp10516.1 33
2 woodT
r ρ
−•= (5.13)
47
Bryden& Ragland [42] define tar as a single component having the formula C6H6.2O0.2 and this definition has been adopted here. Tar is actually a complex mixture of organic and inorganic components in vapor and liquid phases [9, 42].Despite this, it is included in the gas phase because this brings convenience and simplicity as the inclusion of another physical phase (liquid) is avoided
(3) Heterogeneous char –water reaction
This reaction is given by CH0.252O0.0236 (char) + 0.978 H2O � 1.0394 H2 + CO (R3)
64003
=∆R
H kJ/kg [31]
The reaction rate 3
r and the intrinsic kinetics constant 3R
K [m/s] are given by Hobbs [50]
and Gronenveld [53] respectively.
skmol/m/1/1
3
3
3
2
Rm
OHpp
kk
CVAr
+= (5.13)
−•=
Tsmk
R
22220exp]/[10492.7 4
3 (5.14)
WhereOH
C2
[kmol/m3] is the concentration of water.
(4) Heterogeneous char-carbon dioxide This reaction is given by CH0.252O0.0236 (char) + CO2 � 2CO + 0.0236 H2O + 0.02284 H2 (R4)
93004
=∆R
H kJ/kg [31]
To account for the simultaneous effects of the different resistances (diffusion through the gas film, surrounding the particle and intrinsic chemical kinetics), an effective reaction rate is used. The reaction rate and the intrinsic kinetics constant is given by
skmol/m/1/1
3
4
4
2
Rm
copp
kk
CVAr
+= (5.15)
•=
Tk
R
22220exp1092.7 4
4 (5.16)
(5) Heterogeneous methanation reaction
The reaction is given by. CH0.252O0.0236 (char) + 2.253 H2 � CH4 + 0.252 H2O (R5)
72005
−=∆R
H kJ/kg [31]
48
Like in the previous heterogeneous reactions, the reaction rate and intrinsic rate constants can be calculated using the following equations.
skmol/m/1/1
3
5
5
2
Rm
Hpp
kk
CVAr
+= (5.17)
−=
22220exp]/[2.79
5T
smkR
(5.18)
Homogeneous reactions
(1) Water gas shift reaction
This reaction is represented by. CO + H2O � CO2 + H2 (6)
The sources of water vapor associated with this reaction are from, pyrolysis and the incoming air fed at the bottom of the grate. The heating value of hydrogen is higher than that of carbon monoxide. Therefore, the reduction of water vapor by carbon monoxide to produce hydrogen is a highly desirable reaction. This slightly exothermic reaction results in an increase in the ratio of hydrogen to carbon monoxide in the gas. Its reaction rate has been investigated by Parent, J.D [47] and is of the form
)( 22
266
wgs
Hco
OHcok
CCCCkr −= kmol/m3s (5.19)
Where r6 is the reaction rate in kmol/m3 s and C is the concentration in kmol/m3 The water gas shift constant is given
)3958
exp(0265.0T
kwgs
−= [dimensionless] (5.20)
The kinetics reaction constant k9 is of the Arrhenius form [Biba] [48]
sT
k31-3
6mkmol
1510exp1078.2
•= (5.21)
Because of difficulty in obtaining literature of reaction rates with equilibrium incorporated in them, only the water gas shift reaction is considered as an equilibrium reaction. The rest are taken as occurring only in the forward direction.
(2) Carbonmonoxide combustion reaction This reaction is given by the work of Yetter et al [49]
49
2 CO + O2 � 2 CO2 (R7)
sCCCT
smkmolxrOHOco
35.025.0125.275.017
7kmol/m
34740exp][103.1
22
= −−− (5.22)
(3) Hydrogen combustion reaction
The reaction rate for this reaction has been experimentally determined by Vilienskii who gives the overall representation for kinetics of hydrogen combustion as [46] 2 H2 + O2 � 2 H2O (R8)
sCCTT
sKmkmolxrOH
35.115.15.4113
8kmol/m
3430exp][10159.5
22
−−−−
= (5.23)
(4) Methane combustion reaction rate
The reaction rate for reaction r9 is modeled as in [46].It is a first-order with respect to the combustible gas (in this case methane). CH4 + 2 O2 � CO2 + 2H2O (R9)
3113114
9kmol/m
15700exp[10552.3
24 OCHCCT
TKsmkmolxr −−−
−= (5.24)
(5) Tar decomposition
The tars undergo secondary cracking in the void spaces of the bed. This has been described by a one-step global reaction with Arrhenius rate. Secondary gases are produced.
C6H6.2O0.2 (tar) � v7 CO + v8 CO2 + v9 CH4 421
−=∆R
H kJ/kg (R10)
Their coefficients have been assigned values shown in table C.3 [52] (appendix IV). The reaction rate is given by [52, 54].
skg/m 12919
exp][1028.4 316
10 tarT
sxr ρ
−= − (5.25)
3.4 Transport equations
In this section, the conservation equations (5.1.a and 5.1b) for mass and energy are applied to the gas and solid phases for the different reaction components .This results in the following equations:
50
Mass flow of wood (F-kg/s)
2woodS)M--(1 r
dz
dFwood ε= (5.26)
Mass flow of char
)(SMS)1(1543char2
rrrrrdz
dFchar +++−−−= ε
(5.27) Mass flow of oxygen
(5.28)
Mass flow of carbon monoxide
)09500750(M)(SM)2(SM102CO31CO67CO
r.r.Srr-rr-dz
dFCO
++++= εε (5.29)
Mass flow of hydrogen
2453H68H0010)02284.0253.2S(1.039M)2(SM
222
2 r.SMrrrrr-dz
dFH
Hεε +++++=
(5.30) Mass flow of carbon dioxide
)05701302(SM)S(M102976CO4CO 22
2 r.r.rrr-rdz
dFCO
+++++= ε (5.31)
Mass flow methane
)03800150(S)(SM)S(M1029CH5CH 444
4 r.r.Mr-rdz
dFCH
CH++= εε (5.32)
Mass flow of water vapor
(5.33) )250 2225200236097801260(SM39865431OH2
2 r.rr-rr.r.r.-r.dz
dFOH
+++++= ε
Mass flow of tar
)190(S102
-rr.Mdz
dFtar
Tar ε= (5.34)
Mass flow of nitrogen
02 =dz
dFN (5.35)
The term on the right accounts for the net heat of reaction due to reactions R1 to R10.
( )
)
(S
)(
22443311
10105577668899
+++∆
+++++−=
+
RRRR
RRRRRRpsolidpgasgas
∆Hr∆Hr∆HrHr
∆Hr∆Hr∆Hr∆Hr∆Hr∆Hr
dz
dTCFCFsolid
(5.36)
)2(SM)550S(M987O1O 22
2 r--rr-r.-dz
dFO
ε=
51
5.4 Boundary conditions
Temperature at the base of the gasifier (z=0) and at the top of the reactor
Usually, the temperature and the mass flow of each component in the gas stream which is injected at the base (z=0) of the gasifier, are known. However, because of the assumption that the gas and solid streams are in thermal equilibrium, one temperature for the solid and gas stream will be estimated. The gas (air) enters at 298 K and is rapidly heated to solid temperature. Heat exchange between the wood chips and air due to convection will let the temperatures approach (equalize).Therefore, as a reasonable first approximation the temperature at the base of the gasifier is assumed to be 1200 K. However, this temperature is varied until the exit temperature is attained at the top of the reactor. The reason for imposing a temperature at the top of the gasifier is that it is not certain how ignition of the bed can be initiated at the base of the gasifier using the model. The temperature at the top of the bed must be equal to the solid feeding temperature. Because there is no continuous feed in the reactor in the laboratory, a temperature when steady temperature profiles have been reached in the reactor is assumed. This temperature is chosen as 473 K at the top of the reactor. This is the boundary condition for the reactor temperature. The major inaccuracy with this assumption is that the biomass in a batch reactor is continuously being depleted by the combustion, gasification, pyrolysis and drying processes. The temperature at the top of the reactor will continuously rise until all the biomass has been consumed. The combustion rate of char at the bottom of the gasifier is assumed to be equal to the rate at which wood chips would be fed into the reactor if it were a continuously fed reactor otherwise there would be accumulation of wood chips in the reactor. To obtain the gasifier power of 20 kW, the conversion rate of wood chips is 1.1(10-3) kg/s [9].This is taken as the feed rate of wood chips.
Table 5.1: Boundary conditions:
Z=0 Z=0.6
Mass flow(kg/s)
Mole fraction Mass flow(kg/s)
Mole fraction
O2 3.38(10-4) to 6.43(10-4)
0.21
N2 1.34(10-3) to 2.41(10-3)
0.79
CH4 0 0
CO2 0 0
CO 0 0
Tar 0 0
H2 0 0
Char 0 0 0
Wood 0 0 -1.1(10-3)
H2O 0 0
T 1150 to 1200 K 0 473 K
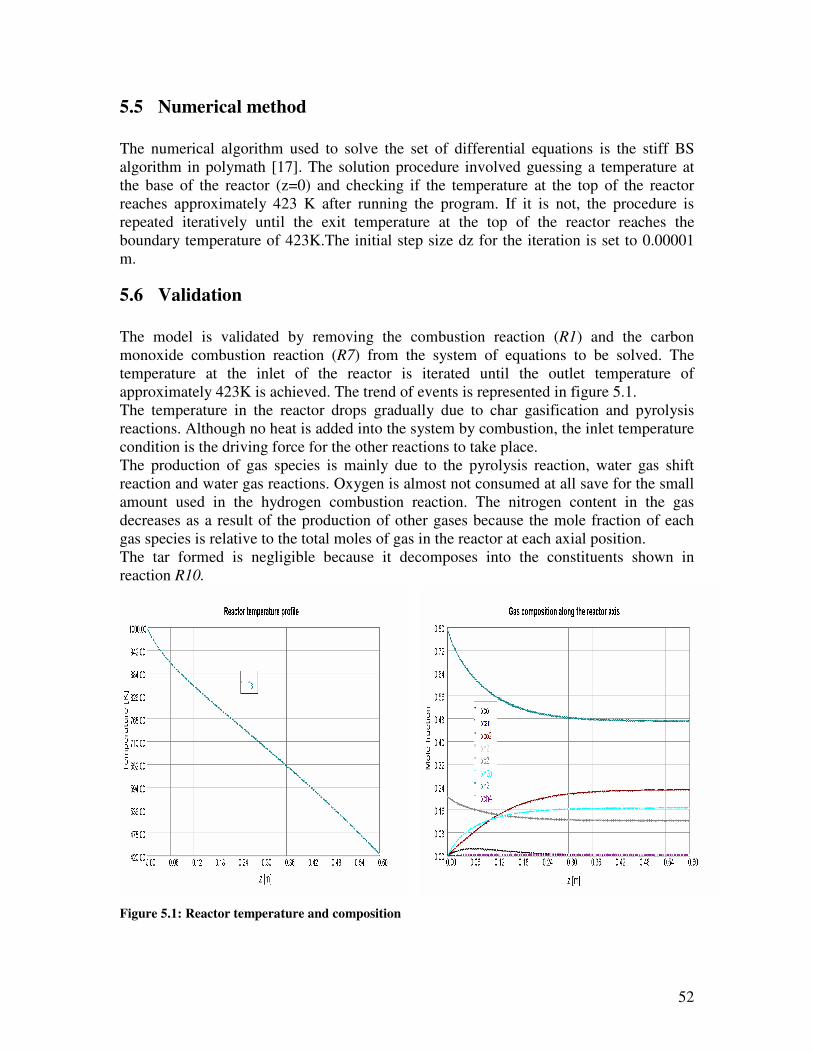
52
5.5 Numerical method
The numerical algorithm used to solve the set of differential equations is the stiff BS algorithm in polymath [17]. The solution procedure involved guessing a temperature at the base of the reactor (z=0) and checking if the temperature at the top of the reactor reaches approximately 423 K after running the program. If it is not, the procedure is repeated iteratively until the exit temperature at the top of the reactor reaches the boundary temperature of 423K.The initial step size dz for the iteration is set to 0.00001 m.
5.6 Validation
The model is validated by removing the combustion reaction (R1) and the carbon monoxide combustion reaction (R7) from the system of equations to be solved. The temperature at the inlet of the reactor is iterated until the outlet temperature of approximately 423K is achieved. The trend of events is represented in figure 5.1. The temperature in the reactor drops gradually due to char gasification and pyrolysis reactions. Although no heat is added into the system by combustion, the inlet temperature condition is the driving force for the other reactions to take place. The production of gas species is mainly due to the pyrolysis reaction, water gas shift reaction and water gas reactions. Oxygen is almost not consumed at all save for the small amount used in the hydrogen combustion reaction. The nitrogen content in the gas decreases as a result of the production of other gases because the mole fraction of each gas species is relative to the total moles of gas in the reactor at each axial position. The tar formed is negligible because it decomposes into the constituents shown in reaction R10.
Figure 5.1: Reactor temperature and composition
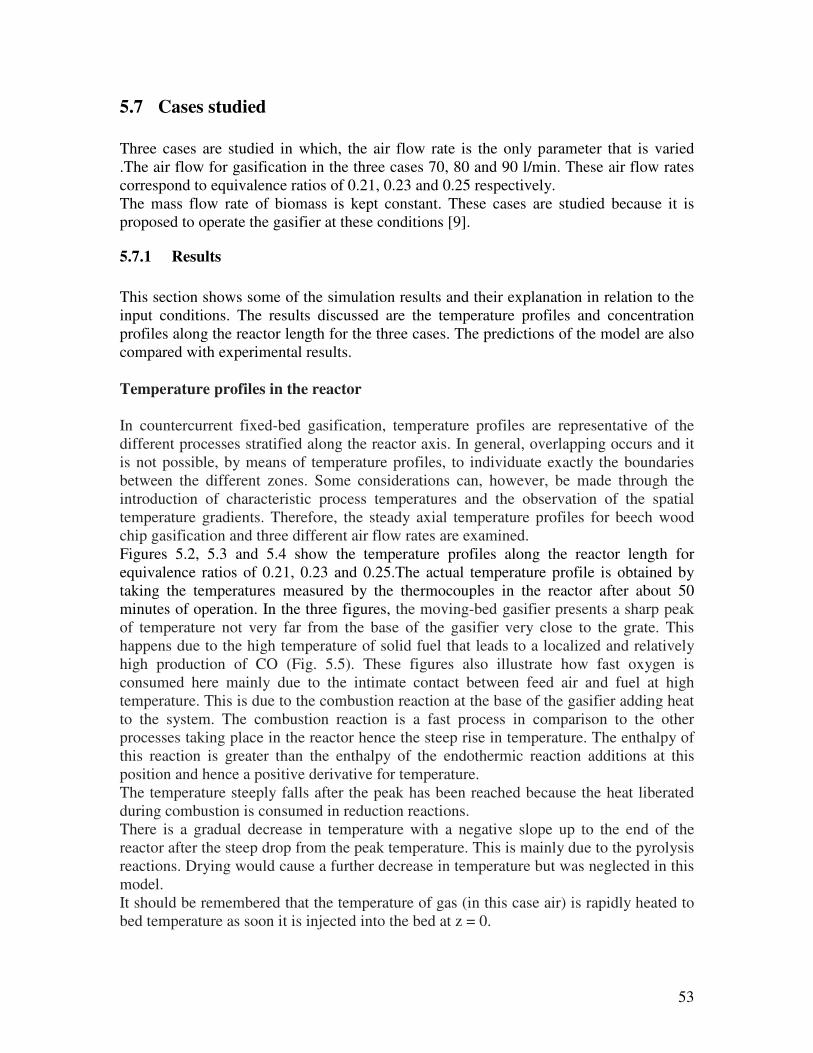
53
5.7 Cases studied
Three cases are studied in which, the air flow rate is the only parameter that is varied .The air flow for gasification in the three cases 70, 80 and 90 l/min. These air flow rates correspond to equivalence ratios of 0.21, 0.23 and 0.25 respectively. The mass flow rate of biomass is kept constant. These cases are studied because it is proposed to operate the gasifier at these conditions [9].
5.7.1 Results
This section shows some of the simulation results and their explanation in relation to the
input conditions. The results discussed are the temperature profiles and concentration profiles along the reactor length for the three cases. The predictions of the model are also compared with experimental results.
Temperature profiles in the reactor
In countercurrent fixed-bed gasification, temperature profiles are representative of the different processes stratified along the reactor axis. In general, overlapping occurs and it is not possible, by means of temperature profiles, to individuate exactly the boundaries between the different zones. Some considerations can, however, be made through the introduction of characteristic process temperatures and the observation of the spatial temperature gradients. Therefore, the steady axial temperature profiles for beech wood chip gasification and three different air flow rates are examined. Figures 5.2, 5.3 and 5.4 show the temperature profiles along the reactor length for equivalence ratios of 0.21, 0.23 and 0.25.The actual temperature profile is obtained by taking the temperatures measured by the thermocouples in the reactor after about 50 minutes of operation. In the three figures, the moving-bed gasifier presents a sharp peak of temperature not very far from the base of the gasifier very close to the grate. This happens due to the high temperature of solid fuel that leads to a localized and relatively high production of CO (Fig. 5.5). These figures also illustrate how fast oxygen is consumed here mainly due to the intimate contact between feed air and fuel at high temperature. This is due to the combustion reaction at the base of the gasifier adding heat to the system. The combustion reaction is a fast process in comparison to the other processes taking place in the reactor hence the steep rise in temperature. The enthalpy of this reaction is greater than the enthalpy of the endothermic reaction additions at this position and hence a positive derivative for temperature. The temperature steeply falls after the peak has been reached because the heat liberated during combustion is consumed in reduction reactions. There is a gradual decrease in temperature with a negative slope up to the end of the reactor after the steep drop from the peak temperature. This is mainly due to the pyrolysis reactions. Drying would cause a further decrease in temperature but was neglected in this model. It should be remembered that the temperature of gas (in this case air) is rapidly heated to bed temperature as soon it is injected into the bed at z = 0.
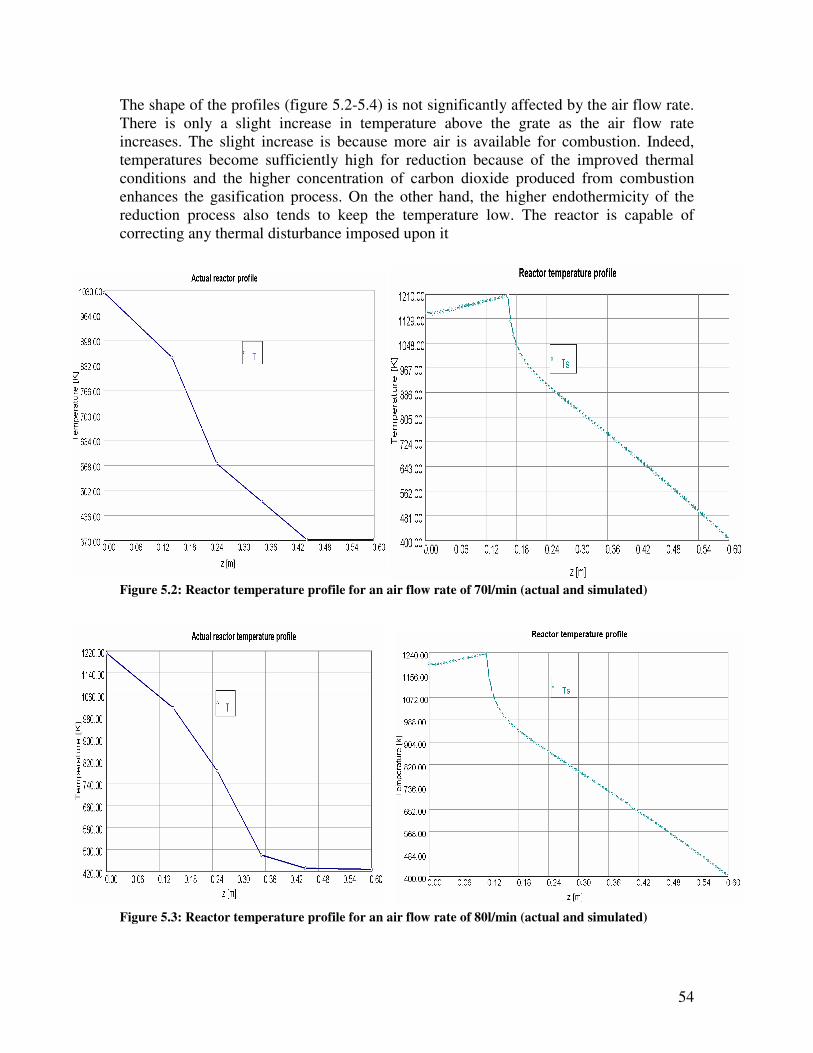
54
The shape of the profiles (figure 5.2-5.4) is not significantly affected by the air flow rate. There is only a slight increase in temperature above the grate as the air flow rate increases. The slight increase is because more air is available for combustion. Indeed, temperatures become sufficiently high for reduction because of the improved thermal conditions and the higher concentration of carbon dioxide produced from combustion enhances the gasification process. On the other hand, the higher endothermicity of the reduction process also tends to keep the temperature low. The reactor is capable of correcting any thermal disturbance imposed upon it
Figure 5.2: Reactor temperature profile for an air flow rate of 70l/min (actual and simulated) Figure 5.3: Reactor temperature profile for an air flow rate of 80l/min (actual and simulated)
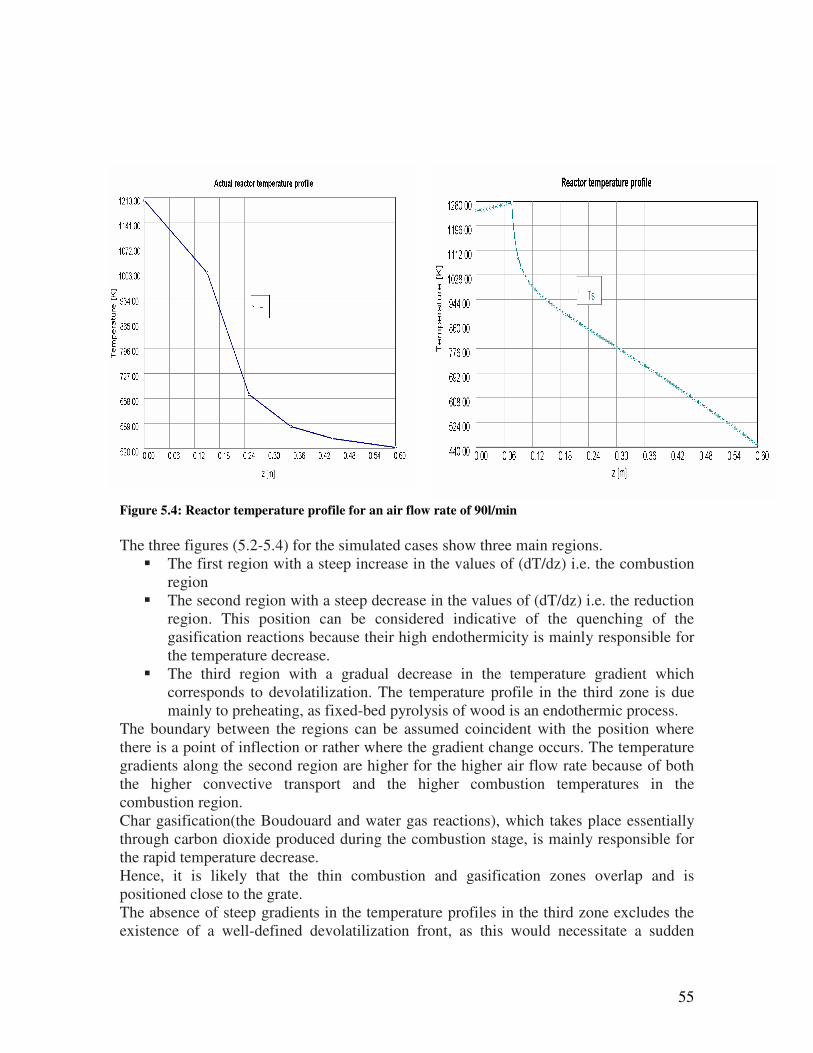
55
Figure 5.4: Reactor temperature profile for an air flow rate of 90l/min
The three figures (5.2-5.4) for the simulated cases show three main regions.
� The first region with a steep increase in the values of (dT/dz) i.e. the combustion region
� The second region with a steep decrease in the values of (dT/dz) i.e. the reduction region. This position can be considered indicative of the quenching of the gasification reactions because their high endothermicity is mainly responsible for the temperature decrease.
� The third region with a gradual decrease in the temperature gradient which corresponds to devolatilization. The temperature profile in the third zone is due mainly to preheating, as fixed-bed pyrolysis of wood is an endothermic process.
The boundary between the regions can be assumed coincident with the position where there is a point of inflection or rather where the gradient change occurs. The temperature gradients along the second region are higher for the higher air flow rate because of both the higher convective transport and the higher combustion temperatures in the combustion region. Char gasification(the Boudouard and water gas reactions), which takes place essentially through carbon dioxide produced during the combustion stage, is mainly responsible for the rapid temperature decrease. Hence, it is likely that the thin combustion and gasification zones overlap and is positioned close to the grate. The absence of steep gradients in the temperature profiles in the third zone excludes the existence of a well-defined devolatilization front, as this would necessitate a sudden
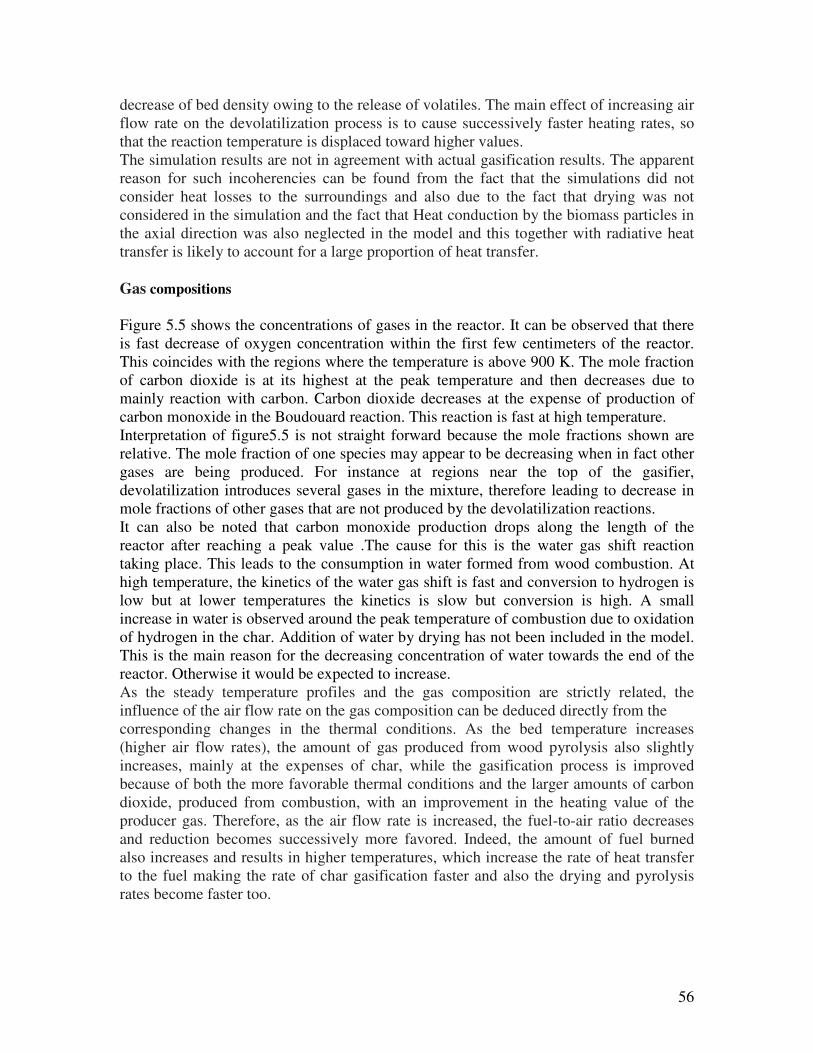
56
decrease of bed density owing to the release of volatiles. The main effect of increasing air flow rate on the devolatilization process is to cause successively faster heating rates, so that the reaction temperature is displaced toward higher values. The simulation results are not in agreement with actual gasification results. The apparent reason for such incoherencies can be found from the fact that the simulations did not consider heat losses to the surroundings and also due to the fact that drying was not considered in the simulation and the fact that Heat conduction by the biomass particles in the axial direction was also neglected in the model and this together with radiative heat transfer is likely to account for a large proportion of heat transfer.
Gas compositions
Figure 5.5 shows the concentrations of gases in the reactor. It can be observed that there is fast decrease of oxygen concentration within the first few centimeters of the reactor. This coincides with the regions where the temperature is above 900 K. The mole fraction of carbon dioxide is at its highest at the peak temperature and then decreases due to mainly reaction with carbon. Carbon dioxide decreases at the expense of production of carbon monoxide in the Boudouard reaction. This reaction is fast at high temperature. Interpretation of figure5.5 is not straight forward because the mole fractions shown are relative. The mole fraction of one species may appear to be decreasing when in fact other gases are being produced. For instance at regions near the top of the gasifier, devolatilization introduces several gases in the mixture, therefore leading to decrease in mole fractions of other gases that are not produced by the devolatilization reactions. It can also be noted that carbon monoxide production drops along the length of the reactor after reaching a peak value .The cause for this is the water gas shift reaction taking place. This leads to the consumption in water formed from wood combustion. At high temperature, the kinetics of the water gas shift is fast and conversion to hydrogen is low but at lower temperatures the kinetics is slow but conversion is high. A small increase in water is observed around the peak temperature of combustion due to oxidation of hydrogen in the char. Addition of water by drying has not been included in the model. This is the main reason for the decreasing concentration of water towards the end of the reactor. Otherwise it would be expected to increase. As the steady temperature profiles and the gas composition are strictly related, the influence of the air flow rate on the gas composition can be deduced directly from the corresponding changes in the thermal conditions. As the bed temperature increases (higher air flow rates), the amount of gas produced from wood pyrolysis also slightly increases, mainly at the expenses of char, while the gasification process is improved because of both the more favorable thermal conditions and the larger amounts of carbon dioxide, produced from combustion, with an improvement in the heating value of the producer gas. Therefore, as the air flow rate is increased, the fuel-to-air ratio decreases and reduction becomes successively more favored. Indeed, the amount of fuel burned also increases and results in higher temperatures, which increase the rate of heat transfer to the fuel making the rate of char gasification faster and also the drying and pyrolysis rates become faster too.
57
Figure 5.5: concentration profiles in the reactor for an air flow of 70 l/min
It can also be seen (table 5.2) that, the amount of condensable vapors increase with the air flow rate, i.e., with the reaction temperature, because the amount of both water and organic compounds (tars) increases. The surge in tar appears after the combustion zone and this is because of the devolatilization of the wood above this zone. From there tar is not cracked into smaller fractions because of the absence of temperatures high enough to cause this happen. By reducing the air flow rate from 90 l/min to 70 l/min, the tar content in the product gas is reduced. This is probably because of the increased residence time in the reactor. From figure 5.5 , it is evident that oxygen consumption takes place only along a very thin region, usually less than 0.1 m thick. Thus, this region corresponds only to the first part of the of the bed and is characterized by maximum temperatures between 1150 and 1300 K, which for beech wood do not give rise to ash-related sintering problems. The sharp decrease in water concentration is due to consumption to produce hydrogen, but mainly because of dilution with air that contains about 79% nitrogen by volume at the injection point into the bed. Very little methane is produced both by carbon and hydrogen reaction as well as by devolatilization of wood but mostly from the latter process.
Comparison with actual results
Some results from simulation and comparisons against real operational data are illustrated below. The data presented here is taken from [9] for a run at a gasification at an air flow rate of 90 l/min. In any case, the actual operation of the reactor is in a transient state because there is no continuous feed of wood chips. However, for purposes of comparison, the reactor is assumed to have reached steady state conditions after a one hour of operation. This is done so that important aspects of updraft gasification can be commented upon
58
Simulation 1 was carried out at a gasification agent flow of 70 l/min, simulation 2 at 80 l/min and simulation 3 was carried out at a flow rate of 90 l/min. However, experimental data of gas compositions for comparing simulation 1 and 2 is not available and comparisons are only for simulation 3.Table 5.2 shows the real and simulated gas compositions. The compositions from the simulation are end gas compositions at the reactor exit.
Table 5.2: comparison of real and simulated results
Component Mol %
Real operation Simulation 1 Simulation 2 Simulation 3
H2 7 18.7 15.9 18.5
CO 25 15.8 17.8 19.1
CH4 3 0.75 0.11 0.87
CO2 10 12.8 11.6 8.2
O2 1 0 0 0
N2 45 42.5 43.8 41.7
Tar Not estimated 8.9 9.6 11.2
H2O Not estimated 0.33 0.3 0.16
The reproductions showed substantial deviations between real and simulated results. Deviations in Hydrogen is 62% higher and that in carbon monoxide content is 23% lower %.Carbondioxide content is 18% lower than actual whereas nitrogen is 7.3% lower than actual. The reason for such incoherencies can be found from the fact that the simulations did not consider heat losses to the surroundings and also due to the fact that drying was not considered in the simulation. Another possible source of error is the consideration of fixed distribution of products from pyrolysis in the model. In reality, the products of pyrolysis are emitted at different rates [24]. The stoichiometric coefficients in equations for pyrolysis therefore change along the reactor axis. Perhaps the major source of deviation is that a batch operated reactor does not attain steady state. As seen from table 5.2, tar should be avoided in the exiting gas. This goal can be reached by use of deep beds with fuel feeding far from its top in order to ensure enough residence time for tar cracking, before it reaches the freeboard of the reactor (the part of the reactor with no biomass). It can also be achieved by using lower gasification agent (air) flow rates. This ensures that the gases produced have longer residence times in the reactor due to lower superficial velocity. At a flow rate of 70 l/min which has an equivalence ratio of 0.21, the residence time in the reactor is longer and this accounts for the less percentage of tar formed than at 90 l/min.
Conclusion
A steady-state model of a countercurrent, updraft, biomass gasifier has been developed and compared with the results of real operating data. Mass and energy balances, along with kinetic and thermodynamic equations, were used in the derivation of the steady state plug flow simulation model for the updraft gasifier. The gasifier was modeled using a set of reactions involving combustion, reduction and pyrolysis.
59
The experimental data for comparison with model results was obtained from a 20 kW beech wood chip gasifier. There is some deviation between the results from the model and experimental data. Due to the high coupling between energy and mass balances, there is very high dependence between reaction rates and temperatures. Only reasonable evaluations of temperature profiles would lead to reasonable predictions of gas compositions. The results from the model are not in complete agreement with actual data because of the limiting assumptions made and have been discussed. The gasifier produces a high percentage of carbon monoxide relative to other gases and the deviations observed were as high as 62% for hydrogen the most important gas desired by the gasification process. Even though the accuracy of the model is limited, some useful insights that can be deduced are explained from the general trend of events. The impact of increasing air flow is as follows: Increasing the air velocity while maintaining a specified amount of biomass fed into the reactor results in a higher burning rate as the oxygen penetrates further into the bed. This consumes char at a greater rate, increasing the overall temperature of the bed, which increases the rate of heat transfer to the fuel. This in turn increases the drying and pyrolysis and gasification rate of the fuel. From this discussion it is obvious that there is a relatively broad range of gasification air velocity that can be used to obtain a desired product gas composition. Less tar production in the product stream can also be achieved by operating the reactor at air flow rates that allow for a longer residence time for the products of pyrolysis in the reactor.
60
Chapter 6
6 Conclusions and recommendations
6.1 Conclusions
Biomass gasification requires an air flow of between 1.25 m3 and 2m3 per kg of wood. This corresponds to equivalence ratios between 0.25 and 0.4. Above this equivalence ratio, combustion takes place instead of gasification. The use of equivalence ratios within these limits in the batch operated reactor in the Biomass laboratory necessitates the use of a programmable logic control algorithm that can continuously vary the gasification air flow based on the amount of biomass left in the reactor. This is because equivalence ratio changes as biomass is consumed in the reactor. The gas produced from the reactor has a relatively high content of tar and moisture when compared with a downdraft unit because the products of pyrolysis and drying are added to those of reduction as they flow upwards toward the reactor outlet. The experimental beech wood chips of dimension 10 x 10 x 2 mm and 10 % moisture content are suitable for updraft gasification. The size of the particles is not of micron scale so as to cause restriction to flow of gasification air and fairly regular so as not to cause bridging in the reactor. The design changes made to the methane nozzles, position of the ionization pen and tangential introduction of secondary, tertiary and quaternary into the flame tube showed during tests using artificial producer gas (air and nitrogen) that the pilot flame was stable. This is because it did not extinguish and was able to be detected by the ionization electrode. However, tests with real product gas caused the ionization flame detection system to fail after 20 minutes of operation from start up during gasification tests. This was caused by gradual build up of tar on the ionization electrode. This had the effect of unnecessarily triggering the shut down mode of the flare. This was solved partially by installing a manual test mode to run the flare without the flame detection system. Also, the infrared detection device ceased to function when its maximum operating temperature of 600 º C was exceeded for an extended period of time at 1000 º C. The sensitivity of the sensing element could have been compromised in the process. The problem of tar clogging the methane injection nozzles in the flare does not occur anymore. This was observed by opening up the flare and observing the methane holes which appeared to be unclogged after a test run. The air bleed modifications to the Bunsen burner, the correct settings of the methane/air flow rates and the use of fire lighter solved the problem of difficulty in starting up the gasifier. Temperature measurements of the processes taking place in the gasifier are also now possible due to relocation of the thermocouples to the inside of the reactor. Gasification experiments carried out consumed wood at a rate of 2.25 kg/hr and 4.5 kg/hr for air flow rates of 70 l/min and 80 l/min. The higher the air flow for gasification, the faster the consumption of wood in the reactor and the flammable gases are in effect released at a faster rate. This attribute can be used to adjust the power output of the reactor at the expense of a shorter gasification run time.
61
Mass, energy and kinetics of chemical processes taking place in the reactor were used to model the updraft gasifier in order to determine the gas compositions expected at the flow rates at which gasification experiments were carried out. Deviations exist between the experimental and actual measured data because of the limiting assumptions made in the model. The temperatures measured are lower than the simulation temperatures. The major limitation is the steady state approximation. As such, the model was only applicable when biomass in the reactor had not decreased so much below the level to which it was filled in the reactor. At such levels, the reactor can be said to act like a continuously fed reactor where the level of biomass is kept constant and the reactor considered being in pseudo steady state. Even though the model accuracy is limited, the useful insights that can be drawn are that increasing the air velocity while maintaining a specified amount of biomass fed into the reactor results in a higher burning rate. This consumes char at a greater rate, increasing the overall temperature of the bed, which increases the rate of heat transfer to the fuel. This in turn increases the drying and pyrolysis and gasification rate of the fuel. Also, less tar production in the product stream can also be achieved by operating the reactor at low air flow rates that allow for a longer residence time for the products of pyrolysis in the reactor.
6.2 Recommendations
The problem of flame detection still remains a bottleneck to the entire functioning of the setup. It is recommended that a thermocouple be used for flame detection in addition to the ionization pen and infrared detector. Alternatively, the gasifier could be changed to a downdraft unit so that tars are cracked before leaving the gasifier. With a smaller amount tar in the producer gas, it is likely that the ionization electrode will not get contaminated and hence continuously detects the presence of a flame. The other areas of improvements are in the pipeline leading to the flare. There are a number of 90 degree bends; they can be a source for pressure drops and tar accumulation. If possible, these should be reduced. Also a flow meter needs to be installed so that the flow rate of combustible gases can be measured.
Bibliography [1] European Commission (1997) Communication from the commission: Energy for the
future: Renewable Energy Sources-White Paper for a Community Strategy and Action
Plan. COM (97) 599, Final of 26.11.97, Brussels [2] International Energy Agency (2000) World Energy Outlook 2000.IEA, Paris [3] Sorensen B.; Renewable Energy, Academic Press London
[4]WEA, World Energy Assessment; Energy and the challenge of sustainability, UNDP, New York,2000,http://www.undp.org/seed/eap/activities/wea/drafts-frame.html/
[4] Brunland, Our Common Future, Oxford University Press. [5] Combustion Handbook, Vol 1, North American Mfg. Co., Cleveland, OH, Third
Edition, 1986 [6] T.Reed, R.Desrosiers; the Equivalence Ratio: The Key to Understanding
Pyrolysis, Combustion and Gasification of Fuels, Encyclopedia of Biomass Thermal Conversion
[7] Evans, R.J.; Milne, T.A. 1987.Molecular Characterization of the Pyrolysis of
Biomass Fundamentals, Energy & Fuels 1 (2), pp.123–138) [8] Kaupp, A., and Goss, J. R., Technical and Economical Problems in the Gasification
of Rice hulls. Physical and Chemical properties, Energy in Agriculture, 1, 201, 1981-1983
[9] Dorus van der Hoeven, Partial product gas combustion for tar Reduction. TU/e 2007 [10] R.J.M.Bastians, J.A Oijen, M.J Prins, Energy from Biomass.2005 [11] M. R. Purvis, S. O. Santos, Biomass Combustion Study Pack.2005 [12]Daey, Ouwens, Renewable energy sources 2005 [13] Hobbs, M.L., Radulovic, P.T., Smoot, L.D. (1993), Combustion and gasification of
coals in fixed-beds. Energy Combustion Science [14] Salo, K., Jartunen, M., Asplund, D. (December 1–3, 1980), Production of Fuel with
Gasification of Peat in Fixed Bed, Peat as an Energy Alternative Arlington, Virginia [15] Jeng-Chyan .M.Lin, Combination of a Biomass Fired Updraft Gasifier and a
Sterling Engine for Power Production Journal of Energy Resources Technology -- March 2007 Volume 129, Issue 1
[16] T.B Reed and A .Das.Handbook of biomass downdraft gasifier engine systems, The Biomass Energy foundation Press, Colorado, O.K. [17] Michael B.Cutlip and Mordechai Shacham, Polymath Manual. www.plolymath-software.com [18] Kaupp, A., and Goss, J. R., State of the Art for small Scale (to 50 kW) Gas
Producer-Engine Systems, Final Report, U.S.D.A., Forest Service, March 1981 [19] Juliano, B. O. (ed) (1985), Rice Chemistry and Technology The American
Association of Cereal Chemist, Inc. St.Paul, Minnesota, USA. [20] J.Warnatz, U.Maas, R.Dibble, Combustion. Physical and chemical fundamentals,
modeling and simulation, Experiments, Pollutant formation
[21] Kimber, G.M., Gray, M.D. (1967). Rapid devolatilization of small coal particles [22] Bridgewater, A.V., Peacocke, G.V.C. (2000). Fast pyrolysis processes for biomass,
Renewable and Sustainable Energy Reviews 4
63
[23] Shapatina, E.A., Kalyuzhnyi, V.A., Chukhanov, Z.F. (1961), Technological
utilization of fuel for energy 1-Thermal treatments of fuels, 1960. [24] Raveendran, K., Ganesh, A., Khilar, K.C. (1996). Pyrolysis characteristics of
biomass and biomass components, Fuel 75(8).
[25] Antunes, F.J.A., Figueiredo, J.L. (1999). Pyrolysis kinetics of lignocellolosic
materials—three independent reaction model, Fuel. [26] Combustion Properties of Commercial Fuel Gases, www.intellishare-env.com [27] Irvin Glassman, Combustion [28] http://www.wipo.int/pctdb/fr/ia.jsp [29] http://webbook.nist.gov/chemistry/ [30] http://www.durag.com/html/heg/heglit.html [31] Colomba Di Blasi .Modeling Wood Gasification in a Countercurrent Fixed-Bed
Reactor. Wiley InterScience. [32] Beenackers, A. A. C. M., Biomass gasification in moving beds, a review of
European technologies, Renewable .Energy, 16 [33] Michael L. Hobbs, Predrag T. Radulovic, and L. Douglas Smoot, Modeling Fixed-
Bed Coal Gasifiers
[34] Guillermo Rein, Computational Model of Forward and Opposed Smoldering
Combustion with Improved Chemical Kinetics [35] Di Blasi C. Heat momentum and mass transport through a shrinking biomass
particle exposed to thermal radiation. Chem. Engineering 1996; [36] Froment GF, Bischoff KB. Chemical reactor analysis and design New York: Wiley;
1979 [37] Merrick D. Mathematical models of the thermal decomposition of coal: Specific
heats and heats of reactions. Fuel 1983. [38] Konfopanos CA, Papayannakos N, Maschio G, Lucchesi A. Modelling of the
pyrolysis of biomass particles. Studies on kinetics, thermal and heat transfer effects. Can J Chemical Engineering 1991.
[39] Phillip G. Kosky and Joachim K. Floess, Global Model of Countercurrent Coal
Gasifiers
[40] Y. S. Cho and B. Joseph, Heterogeneous Model for Mowing-Bed Coal Gasification
Reactors Chemical Engineering Department, Washington University, St. Louis, Missouri
[41] K. W. Ragland, D. J. Aerts Properties of Wood for Combustion Analysis Department of Mechanical Engineering, University of Wisconsin-Madison, Madison, Wisconsin 53706, USA
[42] Bryden, K. M., & Ragland, K. (1996), Numerical modeling of a deep, fixed-bed
combustor. Energy & Fuels [43] Amundson, N. R., Arri, L. E., AIChE J., 24, 87 (1978), Solid-fluid interactions in
fixed and moving beds. Eng. Chem. 1956a, [44] Solomon, P. R., D. G. Hamblen, R. M. Carangelo, M. A. Serio, and G. Y.
Deshpande, General Model of Coal Devolatilization, Energy and Fuels(1988). [45] R.Bird, E.Stewart, N.lightfoot. Transport Phenomena. John Wiley and sons, Inc. [46] Vilienskii, Hezmalian, D.M. (1978), Dynamics of the Combustion of Pulverized Fuel
(Dinamika Gorenia Prilevidnovo Topliva). Moscow: Energia.
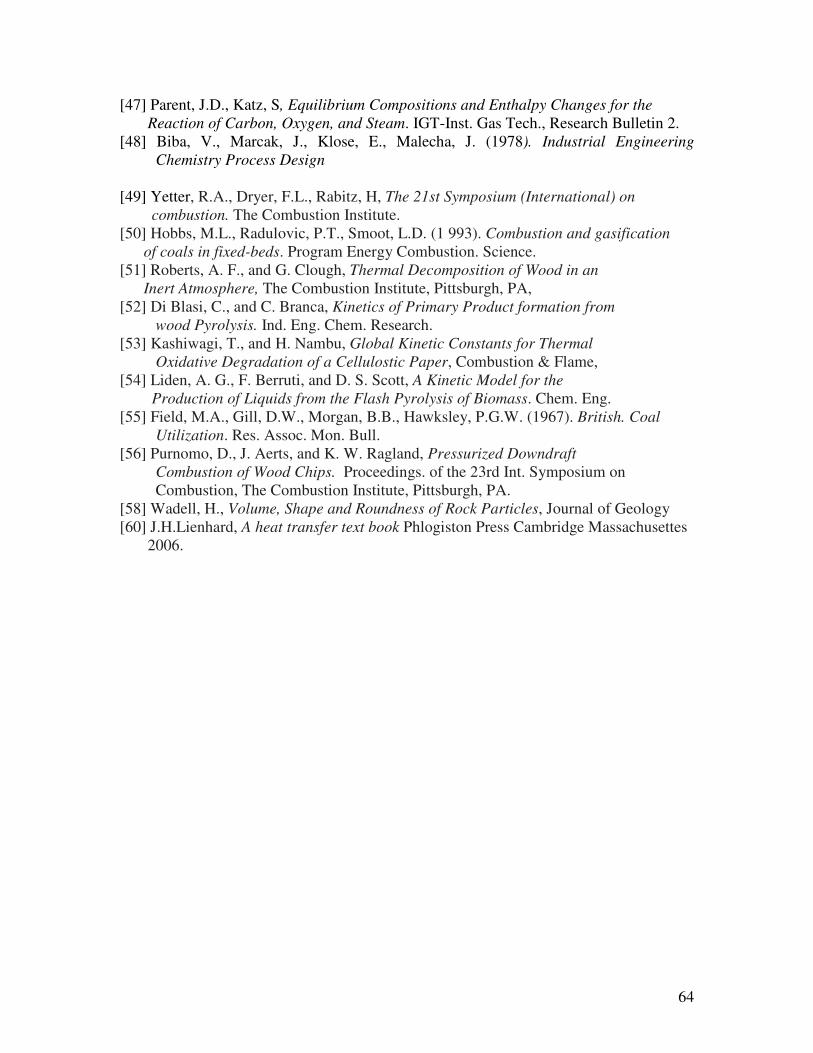
64
[47] Parent, J.D., Katz, S, Equilibrium Compositions and Enthalpy Changes for the
Reaction of Carbon, Oxygen, and Steam. IGT-Inst. Gas Tech., Research Bulletin 2. [48] Biba, V., Marcak, J., Klose, E., Malecha, J. (1978). Industrial Engineering
Chemistry Process Design
[49] Yetter, R.A., Dryer, F.L., Rabitz, H, The 21st Symposium (International) on
combustion. The Combustion Institute. [50] Hobbs, M.L., Radulovic, P.T., Smoot, L.D. (1 993). Combustion and gasification
of coals in fixed-beds. Program Energy Combustion. Science. [51] Roberts, A. F., and G. Clough, Thermal Decomposition of Wood in an
Inert Atmosphere, The Combustion Institute, Pittsburgh, PA, [52] Di Blasi, C., and C. Branca, Kinetics of Primary Product formation from
wood Pyrolysis. Ind. Eng. Chem. Research. [53] Kashiwagi, T., and H. Nambu, Global Kinetic Constants for Thermal
Oxidative Degradation of a Cellulostic Paper, Combustion & Flame, [54] Liden, A. G., F. Berruti, and D. S. Scott, A Kinetic Model for the
Production of Liquids from the Flash Pyrolysis of Biomass. Chem. Eng. [55] Field, M.A., Gill, D.W., Morgan, B.B., Hawksley, P.G.W. (1967). British. Coal
Utilization. Res. Assoc. Mon. Bull. [56] Purnomo, D., J. Aerts, and K. W. Ragland, Pressurized Downdraft
Combustion of Wood Chips. Proceedings. of the 23rd Int. Symposium on Combustion, The Combustion Institute, Pittsburgh, PA.
[58] Wadell, H., Volume, Shape and Roundness of Rock Particles, Journal of Geology [60] J.H.Lienhard, A heat transfer text book Phlogiston Press Cambridge Massachusettes 2006.
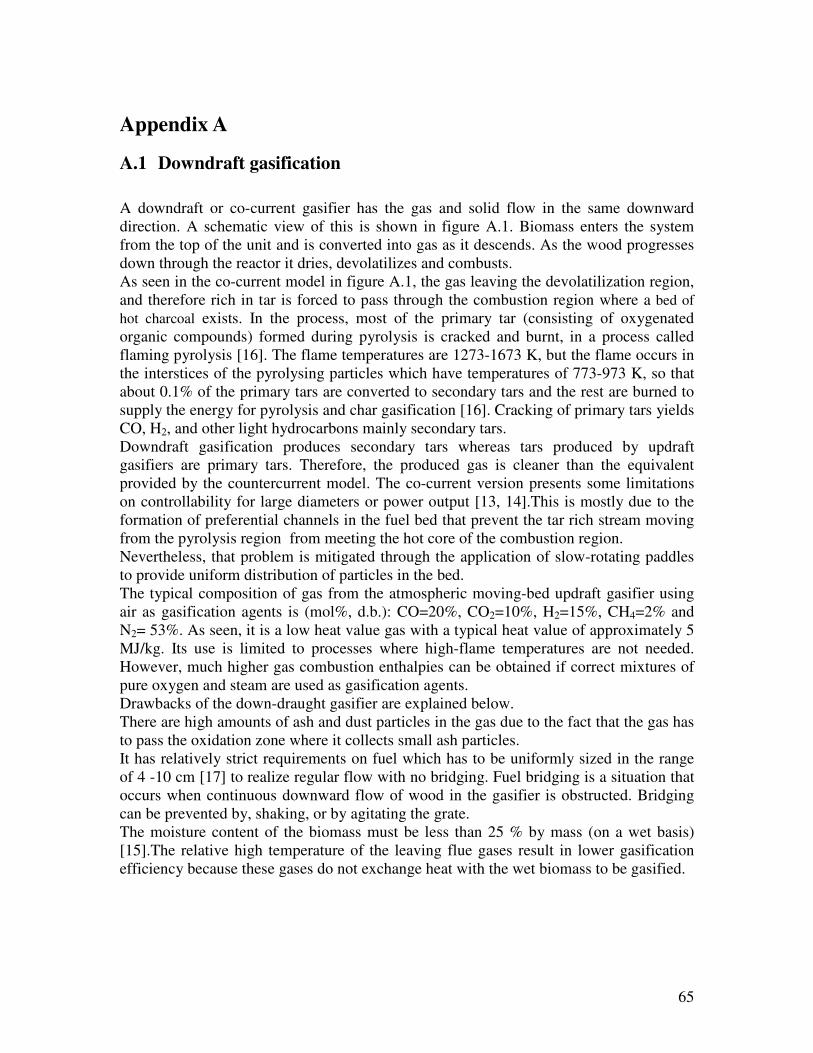
65
Appendix A
A.1 Downdraft gasification
A downdraft or co-current gasifier has the gas and solid flow in the same downward direction. A schematic view of this is shown in figure A.1. Biomass enters the system from the top of the unit and is converted into gas as it descends. As the wood progresses down through the reactor it dries, devolatilizes and combusts. As seen in the co-current model in figure A.1, the gas leaving the devolatilization region, and therefore rich in tar is forced to pass through the combustion region where a bed of
hot charcoal exists. In the process, most of the primary tar (consisting of oxygenated organic compounds) formed during pyrolysis is cracked and burnt, in a process called flaming pyrolysis [16]. The flame temperatures are 1273-1673 K, but the flame occurs in the interstices of the pyrolysing particles which have temperatures of 773-973 K, so that about 0.1% of the primary tars are converted to secondary tars and the rest are burned to supply the energy for pyrolysis and char gasification [16]. Cracking of primary tars yields CO, H2, and other light hydrocarbons mainly secondary tars. Downdraft gasification produces secondary tars whereas tars produced by updraft gasifiers are primary tars. Therefore, the produced gas is cleaner than the equivalent provided by the countercurrent model. The co-current version presents some limitations on controllability for large diameters or power output [13, 14].This is mostly due to the formation of preferential channels in the fuel bed that prevent the tar rich stream moving from the pyrolysis region from meeting the hot core of the combustion region. Nevertheless, that problem is mitigated through the application of slow-rotating paddles to provide uniform distribution of particles in the bed. The typical composition of gas from the atmospheric moving-bed updraft gasifier using air as gasification agents is (mol%, d.b.): CO=20%, CO2=10%, H2=15%, CH4=2% and N2= 53%. As seen, it is a low heat value gas with a typical heat value of approximately 5 MJ/kg. Its use is limited to processes where high-flame temperatures are not needed. However, much higher gas combustion enthalpies can be obtained if correct mixtures of pure oxygen and steam are used as gasification agents. Drawbacks of the down-draught gasifier are explained below. There are high amounts of ash and dust particles in the gas due to the fact that the gas has to pass the oxidation zone where it collects small ash particles. It has relatively strict requirements on fuel which has to be uniformly sized in the range of 4 -10 cm [17] to realize regular flow with no bridging. Fuel bridging is a situation that occurs when continuous downward flow of wood in the gasifier is obstructed. Bridging can be prevented by, shaking, or by agitating the grate. The moisture content of the biomass must be less than 25 % by mass (on a wet basis) [15].The relative high temperature of the leaving flue gases result in lower gasification efficiency because these gases do not exchange heat with the wet biomass to be gasified.
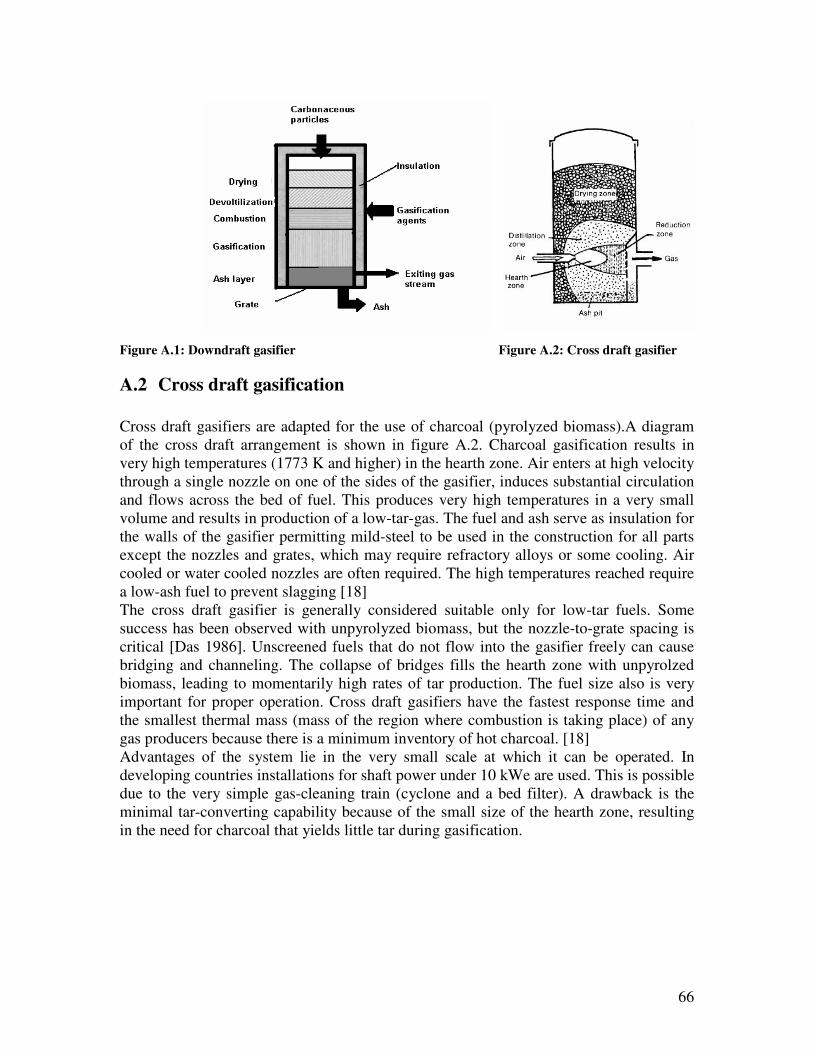
66
Figure A.1: Downdraft gasifier Figure A.2: Cross draft gasifier
A.2 Cross draft gasification
Cross draft gasifiers are adapted for the use of charcoal (pyrolyzed biomass).A diagram of the cross draft arrangement is shown in figure A.2. Charcoal gasification results in very high temperatures (1773 K and higher) in the hearth zone. Air enters at high velocity through a single nozzle on one of the sides of the gasifier, induces substantial circulation and flows across the bed of fuel. This produces very high temperatures in a very small volume and results in production of a low-tar-gas. The fuel and ash serve as insulation for the walls of the gasifier permitting mild-steel to be used in the construction for all parts except the nozzles and grates, which may require refractory alloys or some cooling. Air cooled or water cooled nozzles are often required. The high temperatures reached require a low-ash fuel to prevent slagging [18] The cross draft gasifier is generally considered suitable only for low-tar fuels. Some success has been observed with unpyrolyzed biomass, but the nozzle-to-grate spacing is critical [Das 1986]. Unscreened fuels that do not flow into the gasifier freely can cause bridging and channeling. The collapse of bridges fills the hearth zone with unpyrolzed biomass, leading to momentarily high rates of tar production. The fuel size also is very important for proper operation. Cross draft gasifiers have the fastest response time and the smallest thermal mass (mass of the region where combustion is taking place) of any gas producers because there is a minimum inventory of hot charcoal. [18] Advantages of the system lie in the very small scale at which it can be operated. In developing countries installations for shaft power under 10 kWe are used. This is possible due to the very simple gas-cleaning train (cyclone and a bed filter). A drawback is the minimal tar-converting capability because of the small size of the hearth zone, resulting in the need for charcoal that yields little tar during gasification.
67
Appendix B
B.1 Controls and operating procedure
An in depth review of the instrumentation and controls of the flare can be found in [9]. The flare control system can be operated completely automated or semi-automated. The semi-automatic mode of operation has recently been added. The semi-automatic mode of operation is the ‘test mode’ where all the automatic controls are by passed except the auxiliary air flows. The components of the flare system which are controlled automatically include the secondary, tertiary and quaternary air. This air flow is not displayed in l/min but rather in percentages in the lab view software on the data logging computer. These air flows are actuated when the thermocouple situated just above the primary combustion zone records a temperature of 900 º C and that further above it records a temperature of 500 º C. This introduces cooling air into the flare. The main three automatic modes of operation will be discussed in the following paragraphs.
The flare has three modes of operation namely the start up mode, flare on mode and shut
down mode.
Start up mode
In order to start the flare, the main valves on the feed lines that supply methane and air
are opened by the operator. The feed line pressures are then checked by the Control
system of the flare and their readings are shown on the touch screen control panel. If the
pressure of methane and air are above the lower limit of the preset pressure, then pressing
the ‘ start’ button on the touch screen will cause the flare to be purged with air first.
Purging of the system is done to ensure safety. This expels any combustible gases that
may be present in the flare and can constitute an explosion hazard. After purging, primary
air and methane gas will start to flow into the flare when their fast shut off valves are
opened. Finally, an electric spark maintained for duration of 10 seconds will ignite the
mixture. Having achieved ignition, the flare will go into flare ‘on’ mode. If the flame
detectors do not sense a flame after this duration, the flare goes into shut down mode. In
this mode, air is used to purge the flame tube for 10 minutes to ensure no combustible gas
is left.
Flare on mode
In the flare on mode, the flare basically operates automatically with no need for external
intervention from anyone. External intervention in this case means an operator changing
the settings on the touch screen panel for example primary air and methane flow rates.
Cooling air is introduced automatically into the flare based on the temperature settings of
the thermocouples in the flame tube.
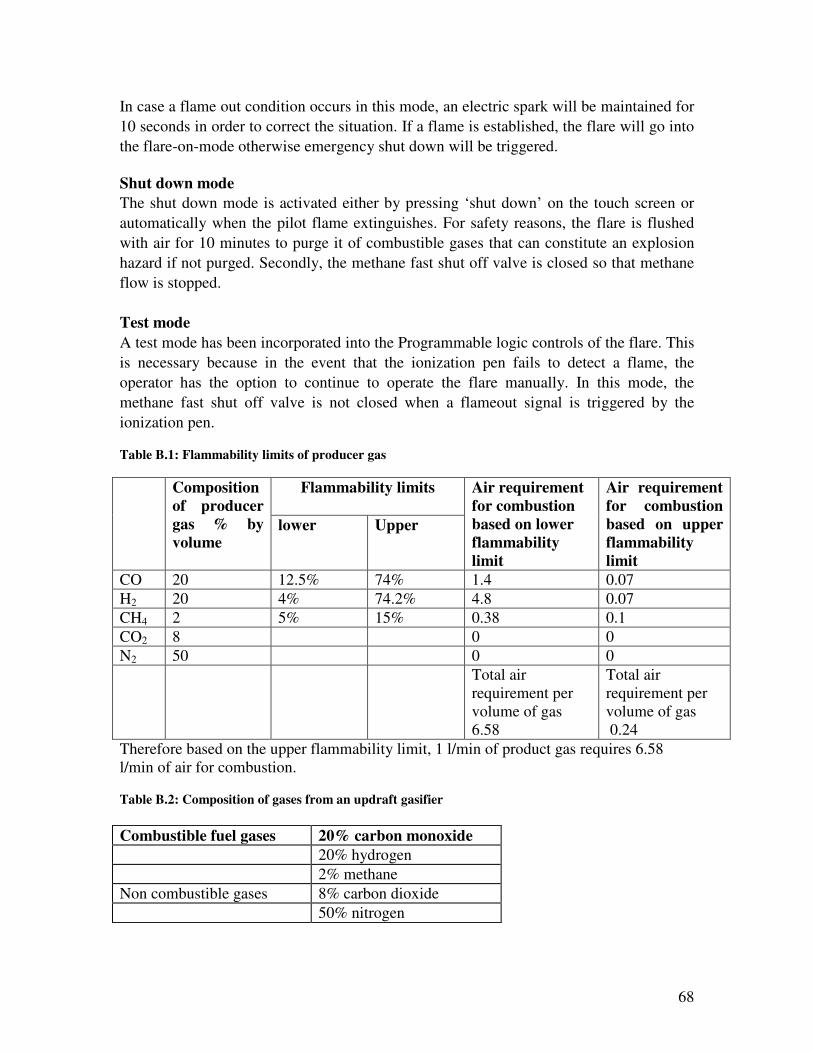
68
In case a flame out condition occurs in this mode, an electric spark will be maintained for
10 seconds in order to correct the situation. If a flame is established, the flare will go into
the flare-on-mode otherwise emergency shut down will be triggered.
Shut down mode
The shut down mode is activated either by pressing ‘shut down’ on the touch screen or
automatically when the pilot flame extinguishes. For safety reasons, the flare is flushed
with air for 10 minutes to purge it of combustible gases that can constitute an explosion
hazard if not purged. Secondly, the methane fast shut off valve is closed so that methane
flow is stopped.
Test mode
A test mode has been incorporated into the Programmable logic controls of the flare. This
is necessary because in the event that the ionization pen fails to detect a flame, the
operator has the option to continue to operate the flare manually. In this mode, the
methane fast shut off valve is not closed when a flameout signal is triggered by the
ionization pen.
Table B.1: Flammability limits of producer gas
Flammability limits
Composition
of producer
gas % by
volume lower Upper
Air requirement
for combustion
based on lower
flammability
limit
Air requirement
for combustion
based on upper
flammability
limit
CO 20 12.5% 74% 1.4 0.07
H2 20 4% 74.2% 4.8 0.07
CH4 2 5% 15% 0.38 0.1
CO2 8 0 0
N2 50 0 0
Total air requirement per volume of gas 6.58
Total air requirement per volume of gas 0.24
Therefore based on the upper flammability limit, 1 l/min of product gas requires 6.58 l/min of air for combustion.
Table B.2: Composition of gases from an updraft gasifier
Combustible fuel gases 20% carbon monoxide
20% hydrogen
2% methane
Non combustible gases 8% carbon dioxide
50% nitrogen
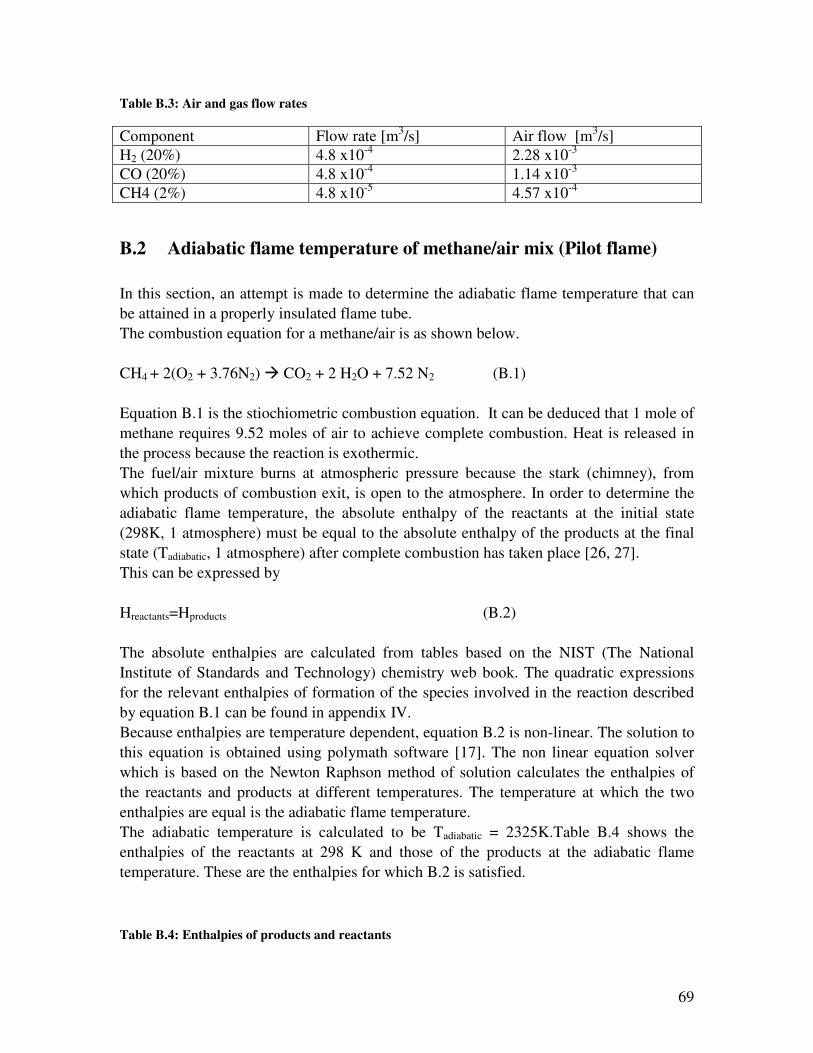
69
Table B.3: Air and gas flow rates
Component Flow rate [m3/s] Air flow [m3/s]
H2 (20%) 4.8 x10⁻⁴ 2.28 x10⁻³
CO (20%) 4.8 x10⁻⁴ 1.14 x10⁻³
CH4 (2%) 4.8 x10⁻⁵ 4.57 x10⁻⁴
B.2 Adiabatic flame temperature of methane/air mix (Pilot flame)
In this section, an attempt is made to determine the adiabatic flame temperature that can
be attained in a properly insulated flame tube.
The combustion equation for a methane/air is as shown below.
CH4 + 2(O2 + 3.76N2) � CO2 + 2 H2O + 7.52 N2 (B.1)
Equation B.1 is the stiochiometric combustion equation. It can be deduced that 1 mole of
methane requires 9.52 moles of air to achieve complete combustion. Heat is released in
the process because the reaction is exothermic.
The fuel/air mixture burns at atmospheric pressure because the stark (chimney), from
which products of combustion exit, is open to the atmosphere. In order to determine the
adiabatic flame temperature, the absolute enthalpy of the reactants at the initial state
(298K, 1 atmosphere) must be equal to the absolute enthalpy of the products at the final
state (Tadiabatic, 1 atmosphere) after complete combustion has taken place [26, 27].
This can be expressed by
Hreactants=Hproducts (B.2)
The absolute enthalpies are calculated from tables based on the NIST (The National
Institute of Standards and Technology) chemistry web book. The quadratic expressions
for the relevant enthalpies of formation of the species involved in the reaction described
by equation B.1 can be found in appendix IV.
Because enthalpies are temperature dependent, equation B.2 is non-linear. The solution to
this equation is obtained using polymath software [17]. The non linear equation solver
which is based on the Newton Raphson method of solution calculates the enthalpies of
the reactants and products at different temperatures. The temperature at which the two
enthalpies are equal is the adiabatic flame temperature.
The adiabatic temperature is calculated to be Tadiabatic = 2325K.Table B.4 shows the
enthalpies of the reactants at 298 K and those of the products at the adiabatic flame
temperature. These are the enthalpies for which B.2 is satisfied.
Table B.4: Enthalpies of products and reactants
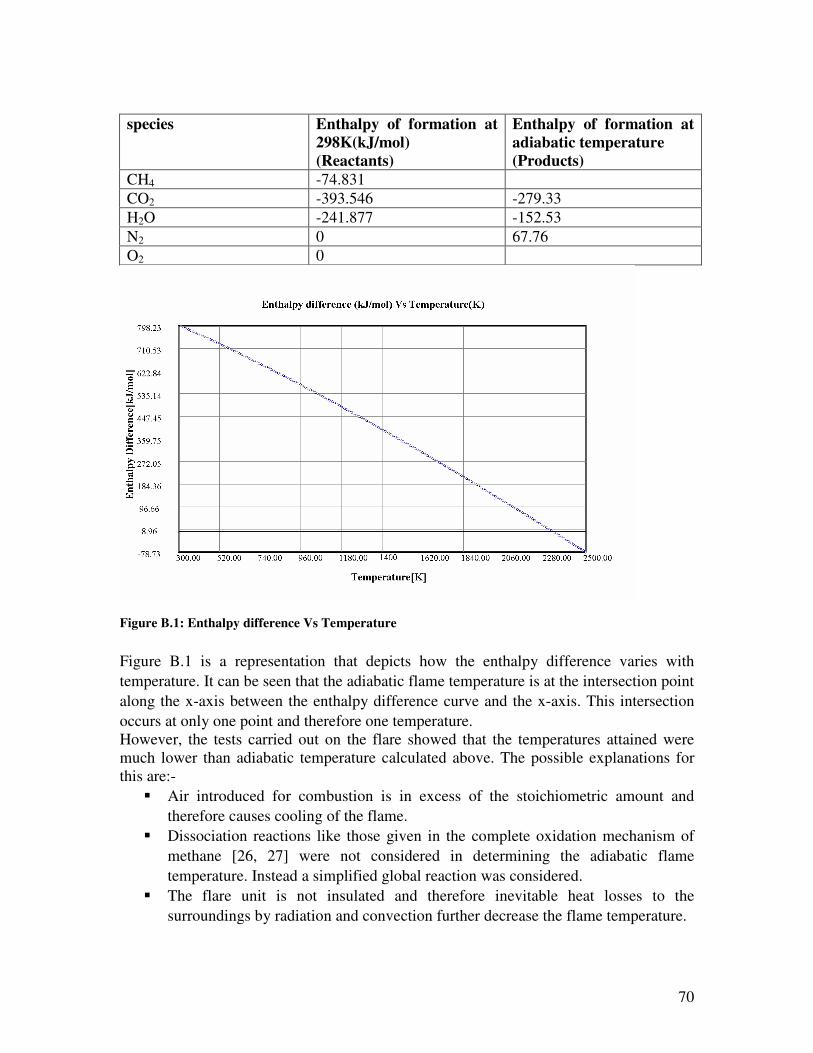
70
species Enthalpy of formation at
298K(kJ/mol)
(Reactants)
Enthalpy of formation at
adiabatic temperature
(Products)
CH4 -74.831
CO2 -393.546 -279.33
H2O -241.877 -152.53
N2 0 67.76
O2 0
Figure B.1: Enthalpy difference Vs Temperature
Figure B.1 is a representation that depicts how the enthalpy difference varies with
temperature. It can be seen that the adiabatic flame temperature is at the intersection point
along the x-axis between the enthalpy difference curve and the x-axis. This intersection
occurs at only one point and therefore one temperature. However, the tests carried out on the flare showed that the temperatures attained were much lower than adiabatic temperature calculated above. The possible explanations for this are:-
� Air introduced for combustion is in excess of the stoichiometric amount and
therefore causes cooling of the flame.
� Dissociation reactions like those given in the complete oxidation mechanism of
methane [26, 27] were not considered in determining the adiabatic flame
temperature. Instead a simplified global reaction was considered.
� The flare unit is not insulated and therefore inevitable heat losses to the
surroundings by radiation and convection further decrease the flame temperature.

71
The thermocouples that record temperature are not necessarily always in the fame. They may therefore be recording the temperatures of the gas formed after combustion has taken place.
72
Appendix C
C.1 Operation of the gasifier
This section describes how an operator can use the gasifier for gasification experiments.
Instrumentation and controls
Instrumentation and control systems for the gasifier are critical to the successful operation. As many individual systems are involved, the controls are distributed type using multi-loop PLC’s networked to a central computer based system. The instrumentation monitors the conditions under which the basic processes in the gasifier. The gasifier control system allows the user to choose the mode in which to operate the gasifier. There are basically two methods of operating the gasifier which can be selected from the touch screen control panel. These are manually or automatically. The algorithms used for operating automatically are programmed into the PLC (programmable logic controls) controls of the gasifier. During automatic operation, start up, shut down and flushing are performed automatically depending on the conditions prevailing in the gasifier. Manual operation requires decisions and inputs made by the operator. The next section describes the modes of operation.
Test mode of operation
The test mode is a form of manual mode of operation. This is enabled by selecting the test mode button on the touch screen panel. The user has access to control of the input flow settings. These include air, nitrogen and methane flow. The flow ranges are as follows:
� Methane flow can be varied from 0 to 5 liters/min depending on the amount of heat required at start up.
� Air flow can be varied from 0 to 160 liters/min depending on what amount of air is required for stable operation of the Bunsen burner. Stability is defined as the ability of the Bunsen flame not to extinguish during operation. Extinction is detected using an ionization pen. When the ionization pen does not detect an ionization current, then extinction is said to have occurred.
� Nitrogen flow rate can be varied from 0 to 100 liters/min. Nitrogen is typically used to extinguish the bed because it is an inert gas that does not support combustion.
The upper limits for these settings have been programmed into the PLC software that is used in the control system. These limits are based on the maximum possible allowable design flow of the mass flow controllers. In order to operate the gasifier in test mode, the procedure described below is used. After loading the beech wood chips into the gasifier and the loading port has been sealed, the spark gap and position of the ionization electrode are checked to ensure that they are correct. The spark gap should be approximately 3 mm. This gap gives a spark that can reliably ignite the methane/air mixture from the Bunsen burner within 3 seconds of
73
pressing the ‘start’ button on the touch screen panel. After a delay time of 10 seconds, the ionization pen will be triggered to give a no flame signal if no ionization current is detected. This time is therefore more than ample for the ionization pen to sense a flame if present. The ionization pen tip is just located about 5 to10 mm above the mesh screen (see figure 5.2). If the electrode settings described above are correct, the ash chamber is then placed onto the blind flange such that it is located centrally on it. The flange is then bolted onto the flange of the pipe that attaches it to the gasifier (figure 5.1). After the system has been sealed, the unit is tested for air tightness to ensure that there are no leaks at any of the flanged joints. Gaskets are used between any two joints flanged joints. The air tightness test involves setting the air and nitrogen flow through the gasifier at the maximum possible (260 liters/min) and closing the product gas valve of the line leading to the flare. Each of the joints are then observed for possible leakages by listening for any hissing sound as the pressure in the system builds. Where necessary, corrective measures are taken .This involves tightening the joints. This is done by tightening any two diagonal bolts on the flange one after the other. This way, the flanges will be joined evenly i.e. the surfaces will be flash and flat against the gasket. When the unit is air tight, the over pressure valve will signal an over pressure condition on the control panel. The user next has to open the product gas valve and start the gasifier but before this, the flare is first started. Starting up the flare is described in chapter 4. At start up, the air and methane flow buttons on the touch screen are depressed. When it they are in the ‘on’ state, they will be illuminated green. The next step is to depress the ‘settings’ button. When this button is depressed, a screen similar to that of a calculator emerges and from this screen the user can input the required air flow rate for methane combustion. This flow rate has been determined experimentally to be equal to between 50 and 70 liters/min for a methane flow of 2.5 liters/min. With this done, the solenoid valve and mass flow controller that control air will open and air will begin to flow through the system at the preset rate. Next, the methane gas flow is set to 2.5 liters/min and after a while, methane gas will start to flow when the solenoid valve and mass flow controller that control its flow has been opened. The high voltage current will begin to flow in the spark electrode at the moment the start button is depressed. This button is depressed immediately methane starts to flow. This start up procedure is a safety measure so that large concentrations of combustible mixture do not accumulate in the ash chamber. These mixtures can constitute an explosion hazard and hence the need to avoid such instances. Once ignition is achieved, thermocouple temperatures in the region just above the grate will begin to rise. When the temperature of the thermocouple just above the grate reads above 973 K (500 deg C), methane flow has to be set to zero on the control panel and air flow is set to the amount desired for gasification by the user. The time required for this temperature to be attained is approximately 10 minutes. The gasifier then operates until all the wood chips have been converted to gas. This can be evidenced when the thermocouple temperature readings of the gasifier start to drop. The temperatures in the flare will be between than 400- 1100 º C as long as gas is being produced from the gasifier. At the end of the gasification process, the temperature readings of the flare will drop to about 250-300 º C. This is temperature is due to the pilot flame in the flare.
74
Automatic operation
There are basically three operating modes when the gasifier is to be controlled automatically by the logic maps programmed into the programmable logic software. Control is by monitoring the settings and conditions prevailing in the gasifier and decisions are implemented based on these. The modes include the start up mode, shut down mode and flush mode. The settings can be changed by the user using the touch screen panel by invoking the settings menu and altering them before going into the automatic operation. Automatic operation is activated by disabling the test mode of operation. This is done by depressing the test mode button so that the system goes into automatic mode if it was initially in the test mode. The operating modes are described here in detail.
Flush mode
In this mode, the gasifier is flushed with inert gas. This mode is activated by depressing the flush button. If for any reason the gasifier needs to be purged, then this mode is chosen and the gasifier is flushed with nitrogen at a rate of 30 liters/min. the nitrogen mass flow controller and solenoid valve are opened during this process. The flush mode proceeds for a time of 6 minutes. Six minutes is chosen on the basis that it is ample to expel combustible gases from the system and associated pipelines. It is generally used for safety and it is desirable to flush the system before start up.
Start up mode
This is the first step in initiation of gasification. During start up mode, the system is first checked for correct pressures in the feed lines and over pressure line. If these are correct, ignition of the bed will proceed after depressing the start button. The fast shut off valve (solenoid valve) and mass flow controller that control air flow to the gasifier are first opened. Air then flows at the preset rate of 70 l/min. Next, the fast shut off valve and mass flow controller for methane are opened and methane will start to flow at the preset rate of 2.5 l/min. These settings were determined experimentally to give a stable blue pilot flame capable of igniting the bed. A spark is then used to ignite the combustible mixture that is exiting from the Bunsen burner. The spark is continuous for a duration of 10 seconds and is activated the moment methane starts to flow. This is done for safety reasons to avoid large volumes of combustible gas in the ash chamber. The ionization pen then detects the Bunsen flame when ionization current begins to flow from the ionization electrode through the flame to the body of the burner (earth electrode). Methane and air flow will continue to flow until the preset temperature of 473 K (200 ºdeg C) was reached and detected by the thermocouple T7 at the top of the gasifier. . This temperature is chosen on the basis that it is the expected exit temperature of product gas. At that temperature, the logic controls assume the gasifier is ‘on’ and the methane mass flow controller and fast shut off valves will close. The mass flow controller for air flow will then adjust the air flow to the preset value for gasification. This can be anywhere between 0 and 160 liters/min depending on what has been preset.
75
However, in gasification experiments, combustible gas was observed to be formed within the first three minutes during ignition. This was evident in the rise in temperature of the flare. Therefore the preset temperature of thermocouple T7 was changed to 373 K for the gasifier ‘on’ state to be sensed. If during start up mode, the ionization pen does not detect a flame, then the shut down mode is triggered. This mode is explained below.
Shut down mode
The purpose of this mode is to extinguish the biomass in the combustion zone of the gasifier. This is accomplished when the fast shut off valves and mass flow controllers for air and methane close. The mass flow controller and fast shut off valve for nitrogen are then opened and nitrogen will flow through the gasifier at the preset value of 50 /min. Other settings are possible by choosing the settings menu and changing them. The maximum can be set to 100 liters/min. This mode of operation continues until it is stopped by a manual reset from the operator. Activation of the shut down mode can be done by depressing the ‘shut down’ button on the touch screen panel. Alternatively, it can be activated automatically if any of the following conditions occur.
� The Bunsen flame extinguishes during ignition or any time before ignition is complete i.e. before Thermocouple T7 records a temperature of 373 K.
� The temperature at the top of the gasifier reaches the preset limit of 623 K (350 deg C). Of course this value can be changed by the user depending on the temperature sensitivity of downstream equipment. The current setting was chosen based on the maximum temperature that the product gas flow meter would withstand. However, the flow meter was removed due to clogging with tar.
� A system error such as pressure in the gasifier exceeding the preset value of 1.7 bars
This is a safety procedure designed for controlled shut down of the gasifier. Shut down is let to operate until the temperature readings of the thermocouples in the gasifier approach about 313 K. At this temperature, it is assumed that all the gasification reactions will have ceased to take place. The length of the duration during which cooling down from reaction temperatures to 313 K is long enough for the nitrogen to flush out any combustible gases in the gasifier and pipelines to prevent explosion hazards.
Safety considerations
To allow an emergency stop, an independent pipe supplies nitrogen to the reactor. If necessary, the air flow will be rapidly stopped and substituted by nitrogen. Since there is a moderate risk for leakage, the gasifier is placed inside a room with a suction system. There are carbon monoxide, hydrogen and nitrogen detectors in this room to monitor the levels of these gases
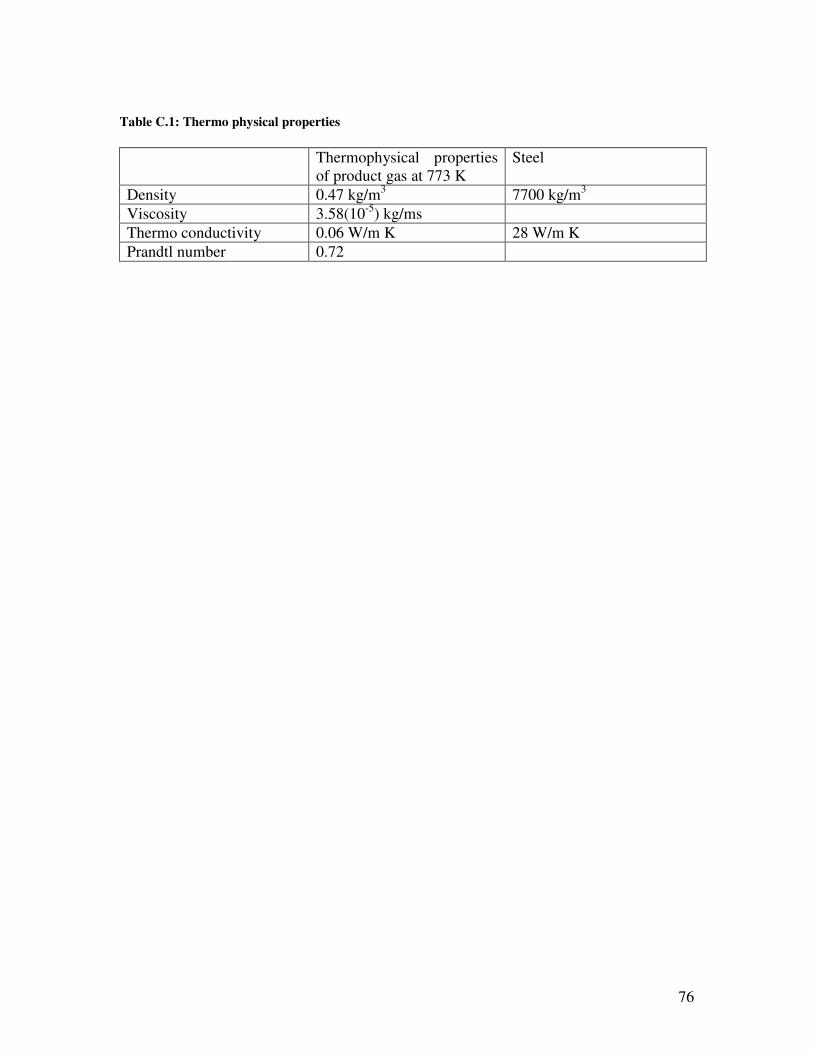
76
Table C.1: Thermo physical properties
Thermophysical properties of product gas at 773 K
Steel
Density 0.47 kg/m3 7700 kg/m3
Viscosity 3.58(10-5) kg/ms
Thermo conductivity 0.06 W/m K 28 W/m K
Prandtl number 0.72
77
Appendix D
D.1 Model assumptions
This section presents the assumptions that are used in simplifying the mathematical model of the updraft gasifier. The assumptions lead to the treatment of the gasifier in a one dimensional model
Steady state operation
This occurs during operations which do not include starting-up and shutting-down. These transient operations are excluded because they would necessitate the use of partial differential equations in the model and thereby increasing the complexity of the problem. In reality, because the reactor in the laboratory does not have continuous biomass feed, steady state is hadly achieved; however, a steady state approximation is used as a first attempt in modeling the gasifier.
Gas flow is upward in plug flow regime
There are no rotational velocity components at a given cross section of the reactor From the point of view of flow, this is a reasonable assumption for any fluid that percolates a bed of particles in a main axial direction. As the gas percolates the bed, it is forced to pass through small channels formed by the particles. No matter the flow regime (laminar or turbulent), the overall combination of these entire small streams behave like a plug flow for the gas phase [33, 34]. If the gas velocity could be assumed to evenly flow throughout the cross section of the bed, the temperature and concentration profiles could be modeled as flat profiles as well. Therefore, the rates of gas-solid reactions do not vary too much in the radial or horizontal direction. This last aspect would lead to an almost uniform consumption of the solid particles at a given cross section of the bed. In this way, it would be plausible to assume the particulate solid phase flowing in almost uniform downward motion. Thus, plug flow regime could be also assumed as a valid approximation for the overall movement of solid phase. Another factor that should be ensured to allow acceptable one-dimensional treatment is the relative large differences between the reactor cross-sectional diameter and the particle diameter. Consequently, negligible wall effects on flows and temperature profiles are assumed [36].
48004.0
192.0diameter Partical
diameterReactor ==
Temperature and concentration profiles do not vary in the radial direction in each
phase
The temperatures are different between the gas and the solid phase. Therefore, heat and mass transfers will be imposed between the two phases. It is obvious that, for instance, the difference of temperatures between the gas and solid phase at each height z of the bed would lead to a varying temperature profile within each phase.
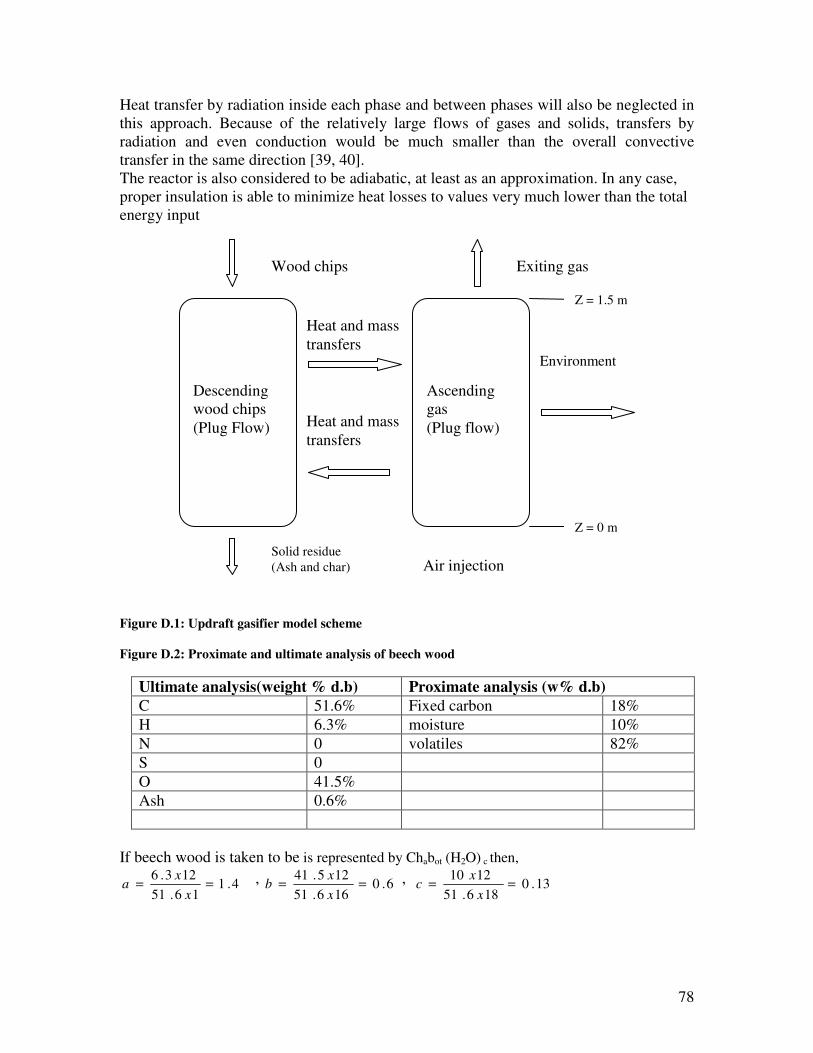
78
Heat transfer by radiation inside each phase and between phases will also be neglected in this approach. Because of the relatively large flows of gases and solids, transfers by radiation and even conduction would be much smaller than the overall convective transfer in the same direction [39, 40]. The reactor is also considered to be adiabatic, at least as an approximation. In any case, proper insulation is able to minimize heat losses to values very much lower than the total energy input
Figure D.1: Updraft gasifier model scheme
Figure D.2: Proximate and ultimate analysis of beech wood
Ultimate analysis(weight % d.b) Proximate analysis (w% d.b)
C 51.6% Fixed carbon 18%
H 6.3% moisture 10%
N 0 volatiles 82%
S 0
O 41.5%
Ash 0.6%
If beech wood is taken to be is represented by Chabot (H2O) c then,
4.116.51
123.6==
x
xa , 6.0
166.51
125.41==
x
xb , 13.0
186.51
1210==
x
xc
Environment
Heat and mass
transfers
Heat and mass
transfers
Descending wood chips
(Plug Flow)
Ascending gas
(Plug flow)
Exiting gas Wood chips
Solid residue
(Ash and char) Air injection
Z = 0 m
Z = 1.5 m
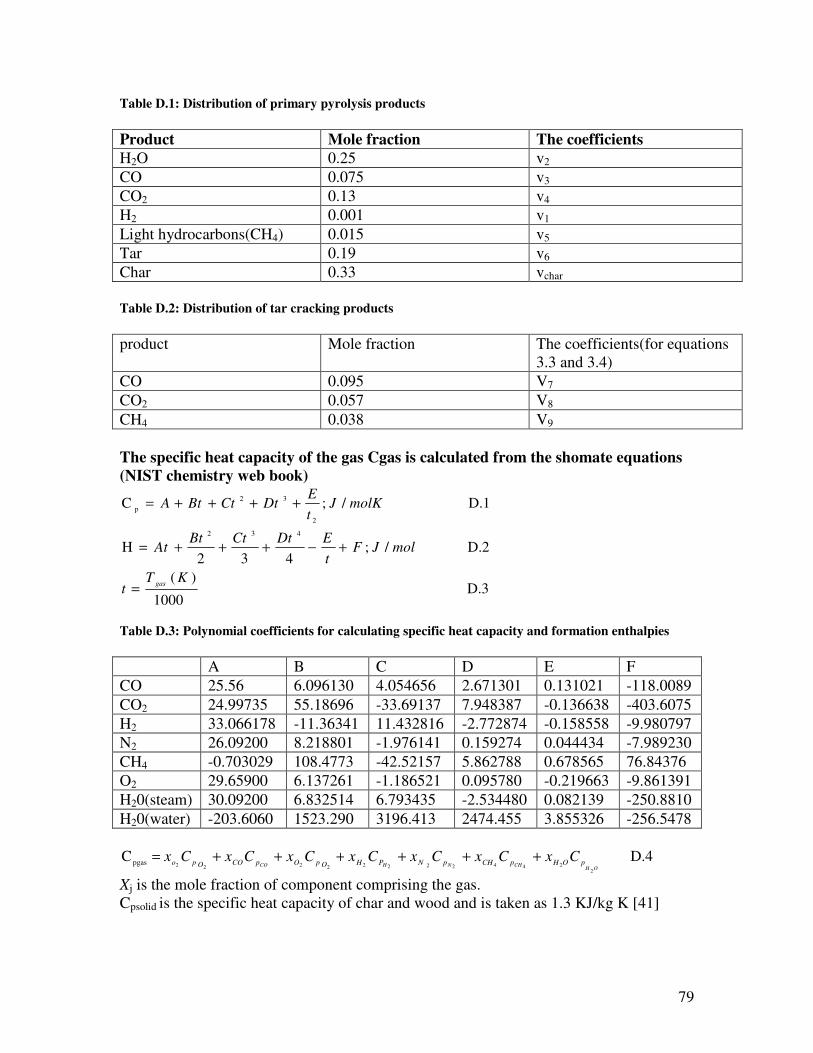
79
Table D.1: Distribution of primary pyrolysis products
Product Mole fraction The coefficients
H2O 0.25 v2
CO 0.075 v3
CO2 0.13 v4
H2 0.001 v1
Light hydrocarbons(CH4) 0.015 v5
Tar 0.19 v6
Char 0.33 vchar
Table D.2: Distribution of tar cracking products
product Mole fraction The coefficients(for equations 3.3 and 3.4)
CO 0.095 V7
CO2 0.057 V8
CH4 0.038 V9
The specific heat capacity of the gas Cgas is calculated from the shomate equations
(NIST chemistry web book)
D.3 1000
)(
D.2 /;432
H
D.1 /;C
432
2
32
p
KTt
molJFt
EDtCtBtAt
molKJt
EDtCtBtA
gas=
+−+++=
++++=
Table D.3: Polynomial coefficients for calculating specific heat capacity and formation enthalpies
A B C D E F
CO 25.56 6.096130 4.054656 2.671301 0.131021 -118.0089
CO2 24.99735 55.18696 -33.69137 7.948387 -0.136638 -403.6075
H2 33.066178 -11.36341 11.432816 -2.772874 -0.158558 -9.980797
N2 26.09200 8.218801 -1.976141 0.159274 0.044434 -7.989230
CH4 -0.703029 108.4773 -42.52157 5.862788 0.678565 76.84376
O2 29.65900 6.137261 -1.186521 0.095780 -0.219663 -9.861391
H20(steam) 30.09200 6.832514 6.793435 -2.534480 0.082139 -250.8810
H20(water) -203.6060 1523.290 3196.413 2474.455 3.855326 -256.5478
D.4 C
224422222222pgas
OHCHNHCO pOHpCHpNPHOpOpCOOpo
CxCxCxCxCxCxCx ++++++=
Xj is the mole fraction of component comprising the gas. Cpsolid is the specific heat capacity of char and wood and is taken as 1.3 KJ/kg K [41]
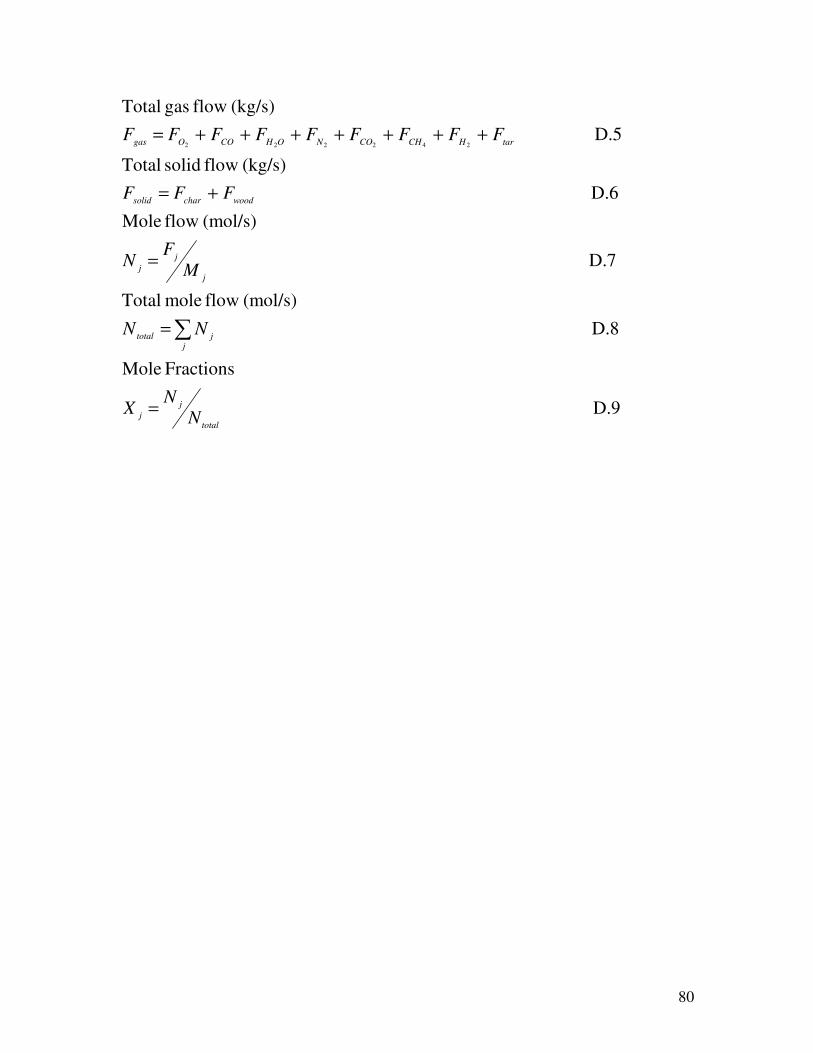
80
D.9
Fractions Mole
D.8
(mol/s) flow mole Total
D.7
(mol/s) flow Mole
D.6
(kg/s) flow solid Total
D.5
(kg/s) flow gas Total
242222
total
j
j
jjtotal
j
j
j
woodcharsolid
tarHCHCONOHCOOgas
N
NX
NN
M
FN
FFF
FFFFFFFFF
=
=
=
+=
+++++++=
∑