Embed Size (px)
Citation preview
Author's personal copy
Analysis of liquid water transport in cathode catalyst layerof PEM fuel cells
Prodip K. Das a,b, Xianguo Li a,*, Zhong-Sheng Liu b
a Department of Mechanical and Mechatronics Engineering, University of Waterloo, 200 University Avenue West, Waterloo, ON N2L 3G1,
Canadab Institute for Fuel Cell Innovation, National Research Council, Vancouver, BC V6T 1W5, Canada
a r t i c l e i n f o
Article history:
Received 7 August 2009
Accepted 23 December 2009
Available online 25 January 2010
Keywords:
Analytical formulation
Cathode catalyst layer
Liquid water transport
PEM fuel cell
Water flooding
a b s t r a c t
The performance of a polymer electrolyte membrane (PEM) fuel cell is significantly affected
by liquid water generated at the cathode catalyst layer (CCL) potentially causing water
flooding of cathode; while the ionic conductivity of PEM is directly proportional to its water
content. Therefore, it is essential to maintain a delicate water balance, which requires
a good understanding of the liquid water transport in the PEM fuel cells. In this study,
a one-dimensional analytical solution of liquid water transport across the CCL is derived
from the fundamental transport equations to investigate the water transport in the CCL of
a PEM fuel cell. The effect of CCL wettability on liquid water transport and the effect of
excessive liquid water, which is also known as ‘‘flooding’’, on reactant transport and cell
performance have also been investigated. It has been observed that the wetting charac-
teristic of a CCL plays significant role on the liquid water transport and cell performance.
Further, the liquid water saturation in a hydrophilic CCL can be significantly reduced by
increasing the surface wettability or lowering the contact angle. Based on a dimensionless
time constant analysis, it has been shown that the liquid water production from the phase
change process is negligible compared to the production from the electrochemical process.
ª 2010 Professor T. Nejat Veziroglu. Published by Elsevier Ltd. All rights reserved.
1. Introduction
Over the last decade, polymer electrolyte membrane (PEM)
fuel cells have drawn immense attention as high-efficiency
and low-emission power sources, particularly for portable and
automotive applications [1]. However, the performance and
cost of the PEM fuel cells need to be improved significantly in
order to be viable for commercial applications. Among the
several key factors that are hindering the PEM fuel cells to be
competitive with portable and automotive applications, water
management is most crucial [2–9]. The ionic conductivity of
PEM is significantly dependent on the membrane hydration.
Inadequate membrane hydration results in high electrical
resistance as well as the formation of dry and hot spots
leading to membrane failure. Conversely, the excessive
amount of liquid water in the cathode catalyst layer (CCL),
produced from the electrochemical reaction and due to elec-
tro-osmotic drag effect, could block the access of reactant gas
to the reaction site and lower cell performance. Hence, liquid
water is one of the key factors responsible for degradation of
electrolyte membrane as well as performance reduction.
Water transport in the CCL of a PEM fuel cell involves
several transport and physical processes: (a) electro-osmotic
transport of water from the membrane to the CCL, (b) back-
diffusion of water from the CCL to the membrane, (c)
condensation and evaporation of water, and (d) removal of
* Corresponding author. Tel.: þ1 519 888 4567x36843; fax: þ1 519 885 5862.E-mail addresses: [email protected] (P.K. Das), [email protected] (X. Li), [email protected] (Z.-S. Liu).
Avai lab le a t www.sc iencedi rec t .com
j ourna l homepage : www.e lsev ier . com/ loca te /he
i n t e r n a t i o n a l j o u r n a l o f h y d r o g e n e n e r g y 3 5 ( 2 0 1 0 ) 2 4 0 3 – 2 4 1 6
0360-3199/$ – see front matter ª 2010 Professor T. Nejat Veziroglu. Published by Elsevier Ltd. All rights reserved.doi:10.1016/j.ijhydene.2009.12.160
Author's personal copy
liquid water to the gas flow channel through the gas diffusion
layer (GDL). The electro-osmotic transport occurs due to the
proton transport. Proton migrations drag water along with it
from the anode side to the cathode side that can eventually
reduce the membrane hydration and block the active reaction
site in the CCL. Conversely, the back-diffusion represents the
water transport back to the membrane due to the concentra-
tion gradient. Since water is produced at the CCL and protons
are dragging liquid water from the anode side, the liquid water
concentration in the cathode side increases significantly
compared to the anode side during the operation of fuel cells.
This concentration difference causes diffusion of water from
the CCL to the membrane. Further, if the reactant gases are
fully humidified, water vapors in the gas mixture tend to
condense. Conversely, if the gases are partially hydrated,
liquid water will start to saturate the gas mixture through the
evaporation process. Furthermore, the liquid water can be
removed from the cathode GDL by the flow of reactant gas in
the gas flow channel that can eventually dry out the electrode,
hence the membrane, if the rate of water removal is too fast.
Clearly, the entire water transport process in a PEM fuel cell is
a complex phenomenon, hence it is essential to make a deli-
cate water balance for better and optimum fuel cell perfor-
mance, and prevent material degradation.
There are numerous theoretical and numerical studies
related to liquid water transport available in literature [2–4,10–
15], however, most of them addressed the liquid water
transport in the membrane or the GDL of a PEM fuel cell. These
studies also addressed the water flooding in the GDL and gas
flow channel, and none of the previous studies specifically
addressed the liquid water transport in the CCL of a PEM fuel
cell. Further, these studies were based on the assumption that
most of the liquid water produced at the GDL/CCL interface or
the catalyst layer is very thin. While the highest reaction rate
occurs at the membrane/CCL interface [16] and the CCL
thickness needs to be higher than 10 mm to obtain optimum
performance from a PEM fuel cell [17]. Therefore, the
approximation of a thin CCL or considering the CCL as an
interface seems to be insufficient to explore the overall liquid
water transport in a PEM fuel cell. Substantial amount of
experimental studies have also been conducted for the
flooding in PEM fuel cells to understand the fundamental
water transport processes [5–9,18–20]. Further, Pasaogullari
and Wang [21] developed an analytical model of liquid water
transport in the GDL of a PEM fuel cell. Although water
flooding in the CCL likely occurs prior to that in the flow
channel and GDL because of water is produced in the CCL
from the electrochemical reaction and is expelled from the
CCL to the flow channel through the GDL, the studies related
to the CCL flooding are still elusive.
The objective of this study is to investigate liquid water
transport in the CCL of a PEM fuel cell. In-situ measurement of
water flooding in the CCL is very difficult. Even if possible, for
instance, by using NMR Microscopy [22] and Neutron Radiog-
raphy [18,23], it can only yield a qualitative picture of liquid
water distribution in a PEM fuel cell. Therefore, our objective is
to provide a simple, easy to implement and quick estimate of
liquid water transport in the CCL of a PEM fuel cell. The liquid
water transport process has been dealt with analytically,
including electro-osmotic transport, back-diffusion, conden-
sation and evaporation of water, and removal of liquid water
through GDL. A simplified formulation has been developed
from the conservation of mass and momentum equations and
the one-dimensional (1D) analytical solutions of liquid water
profile have been derived for both hydrophilic and hydro-
phobic CCLs. Then the effect of catalyst layer wettability and
effect of CCL flooding on the performance of a PEM fuel cell
have been investigated.
2. The physical problem
In the present study, a typical PEM fuel cell is considered that
consists of a cathode and an anode electrode with a proton-
conducting membrane as the electrolyte that separates the
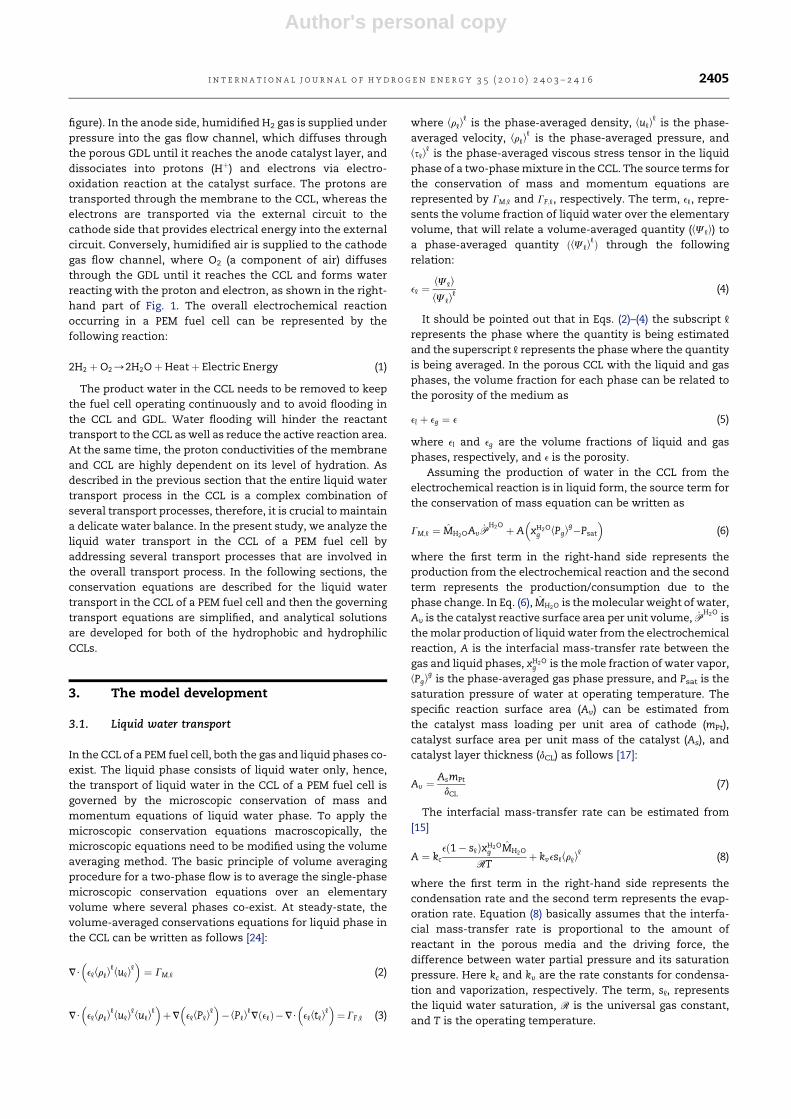
anode side and the cathode side. Fig. 1 shows a schematic of
a PEM fuel cell with key components (left figure) and
a cathode catalyst layer with the coordinate system (right
Fig. 1 – The schematic of a PEM fuel cell with key components (left) and a cathode catalyst layer with the coordinate system
(right).
i n t e r n a t i o n a l j o u r n a l o f h y d r o g e n e n e r g y 3 5 ( 2 0 1 0 ) 2 4 0 3 – 2 4 1 62404
Author's personal copy
figure). In the anode side, humidified H2 gas is supplied under
pressure into the gas flow channel, which diffuses through
the porous GDL until it reaches the anode catalyst layer, and
dissociates into protons (Hþ) and electrons via electro-
oxidation reaction at the catalyst surface. The protons are
transported through the membrane to the CCL, whereas the
electrons are transported via the external circuit to the
cathode side that provides electrical energy into the external
circuit. Conversely, humidified air is supplied to the cathode
gas flow channel, where O2 (a component of air) diffuses
through the GDL until it reaches the CCL and forms water
reacting with the proton and electron, as shown in the right-
hand part of Fig. 1. The overall electrochemical reaction
occurring in a PEM fuel cell can be represented by the
following reaction:
2H2 þO2/2H2OþHeatþ Electric Energy (1)
The product water in the CCL needs to be removed to keep
the fuel cell operating continuously and to avoid flooding in
the CCL and GDL. Water flooding will hinder the reactant
transport to the CCL as well as reduce the active reaction area.
At the same time, the proton conductivities of the membrane
and CCL are highly dependent on its level of hydration. As
described in the previous section that the entire liquid water
transport process in the CCL is a complex combination of
several transport processes, therefore, it is crucial to maintain
a delicate water balance. In the present study, we analyze the
liquid water transport in the CCL of a PEM fuel cell by
addressing several transport processes that are involved in
the overall transport process. In the following sections, the
conservation equations are described for the liquid water
transport in the CCL of a PEM fuel cell and then the governing
transport equations are simplified, and analytical solutions
are developed for both of the hydrophobic and hydrophilic
CCLs.
3. The model development
3.1. Liquid water transport
In the CCL of a PEM fuel cell, both the gas and liquid phases co-
exist. The liquid phase consists of liquid water only, hence,
the transport of liquid water in the CCL of a PEM fuel cell is
governed by the microscopic conservation of mass and
momentum equations of liquid water phase. To apply the
microscopic conservation equations macroscopically, the
microscopic equations need to be modified using the volume
averaging method. The basic principle of volume averaging
procedure for a two-phase flow is to average the single-phase
microscopic conservation equations over an elementary
volume where several phases co-exist. At steady-state, the
volume-averaged conservations equations for liquid phase in
the CCL can be written as follows [24]:
V$�
e[Cr[D[Cu[D
[�¼ GM;[ (2)
V$�
e[Cr[D[Cu[D
[Cu[D
[�þV
�e[CP[D
[�� CP[D
[Vðe[Þ�V$
�e[Ct[D
[�¼GF;[ (3)
where Cr[D[
is the phase-averaged density, Cu[D[
is the phase-
averaged velocity, Cr[D[
is the phase-averaged pressure, and
Cs[D[
is the phase-averaged viscous stress tensor in the liquid
phase of a two-phase mixture in the CCL. The source terms for
the conservation of mass and momentum equations are
represented by GM;[ and GF;[, respectively. The term, e[, repre-
sents the volume fraction of liquid water over the elementary
volume, that will relate a volume-averaged quantity (CJ[D) to
a phase-averaged quantity ðCJ[D[Þ through the following
relation:
e[ ¼CJ[D
CJ[D[ (4)
It should be pointed out that in Eqs. (2)–(4) the subscript [
represents the phase where the quantity is being estimated
and the superscript [ represents the phase where the quantity
is being averaged. In the porous CCL with the liquid and gas
phases, the volume fraction for each phase can be related to
the porosity of the medium as
el þ eg ¼ e (5)
where el and eg are the volume fractions of liquid and gas
phases, respectively, and e is the porosity.
Assuming the production of water in the CCL from the
electrochemical reaction is in liquid form, the source term for
the conservation of mass equation can be written as
GM;[ ¼ M̂H2OAv_P
H2O þA�
xH2Og CPgD
g�Psat
�(6)
where the first term in the right-hand side represents the
production from the electrochemical reaction and the second
term represents the production/consumption due to the
phase change. In Eq. (6), M̂H2O is the molecular weight of water,
Av is the catalyst reactive surface area per unit volume, _PH2O
is
the molar production of liquid water from the electrochemical
reaction, A is the interfacial mass-transfer rate between the
gas and liquid phases, xH2Og is the mole fraction of water vapor,
CPgD
gis the phase-averaged gas phase pressure, and Psat is the
saturation pressure of water at operating temperature. The
specific reaction surface area (Av) can be estimated from
the catalyst mass loading per unit area of cathode (mPt),
catalyst surface area per unit mass of the catalyst (As), and
catalyst layer thickness (dCL) as follows [17]:
Av ¼AsmPt
dCL(7)
The interfacial mass-transfer rate can be estimated from
[15]
A ¼ kc
eð1� s[ÞxH2Og M̂H2O
RTþ kves[Cr[D
[(8)
where the first term in the right-hand side represents the
condensation rate and the second term represents the evap-
oration rate. Equation (8) basically assumes that the interfa-
cial mass-transfer rate is proportional to the amount of
reactant in the porous media and the driving force, the
difference between water partial pressure and its saturation
pressure. Here kc and kv are the rate constants for condensa-
tion and vaporization, respectively. The term, s[, represents
the liquid water saturation, R is the universal gas constant,
and T is the operating temperature.
i n t e r n a t i o n a l j o u r n a l o f h y d r o g e n e n e r g y 3 5 ( 2 0 1 0 ) 2 4 0 3 – 2 4 1 6 2405
Author's personal copy
The source term for the conservation of momentum
equation in the CCL is:
GF;[ ¼ �e[m[
Kkr[
Cu[D[
(9)
where m[ is the liquid water viscosity, K is the permeability, and
kr[ denotes the relative permeability of the liquid phase in the
CCL. The phase relative permeability is the ratio of the intrinsic
permeability for the phase at a given saturation to the total
intrinsic permeability of a porous medium. Physically, the
relative permeability of a phase describes the extent to which
one phase is hindered by other in pore spaces, and hence can
be formulated as a function of liquid water volume fraction (i.e.
liquid water saturation). The simplest approach is to consider
the relative permeability as a linear function of saturation [25],
while the cubic relation is most widely used that can be rep-
resented by the following empirical correlation [26]:
kr[ ¼ s3[ (10)
where s[ is the liquid water saturation. Since the liquid phase
consists of liquid water only, the term s[ can be simply
referred to as liquid saturation. The relative permeability is
also a function of capillary pressure, Pc, which is the difference
between the gas and liquid phase pressures, i.e.,
Pc ¼ Pg � P[ (11)
For the two-phase flow in a porous CCL, the capillary pres-
sure can be modeled by the following empirical correlation
[27]:
Pc ¼ gcosqc
� e
K
�0:5Fðs[Þ (12)
where g is the surface tension between the gas and liquid
phases and qc is the contact angle. The term F(s[) is the Leverett
function that represents the dimensionless capillary pressure
as a function of liquid saturation. For the hydrophilic (qc < 90�)
and hydrophobic (qc > 90�) CCLs, the Leverett functions are
given by the following relations [21,27,28]:
Fðs[Þ ¼�
1:417ð1� s[Þ � 2:120ð1� s[Þ2þ1:263ð1� s[Þ3 if qc < 90+
1:417s[ � 2:120s2[ þ 1:263s3
[ if qc > 90+
(13)
In a hydrophilic medium, the wetting phase is the liquid
phase and in a hydrophobic medium, the wetting phase is the
gas phase. Hence, the Leverett functions are expressed by the
gas phase saturation, (1 � s[), and liquid phase saturation, s[,
respectively. Several other correlations are also available in
the literature that relate the liquid saturation in fuel cell to the
capillary pressure [29–31], while the Leverett function has
been widely used in fuel cell studies. In addition, Pasaogullari
and Wang [21] developed the analytical model for liquid water
transport in the GDL of a PEM cell using the Leverett function.
Hence for the liquid water transport in CCL, the Leverett
function is considered for consistency.
3.2. Electrochemical reaction rate
The electrochemical reaction occurring in the CCL of a PEM
fuel cell is the oxygen reduction reaction that can be repre-
sented by the following reaction:
O2 þ 4Hþ þ 4e�#2H2O (14)
The rate of reaction for the above-mentioned chemical
reaction in mol m�2 s�1 can be represented by the Butler–
Volmer equation as [1]
Rc;red ¼JO20
nF
�CO2 ;rs
CO2 ;ref
��exp
�naaFhc
RT
�� exp
�� nacFhc
RT
�(15)
where JO20 is the reference exchange current density for oxygen
reduction reaction, F is the Faraday’s constant
(96487 C mol�1), R is the universal gas constant
(8.315 J mol�1 K�1), CO2 ;rs and CO2 ;ref are the oxygen concen-
tration at the reaction site and reference oxygen concentra-
tion, respectively. The terms, aa and ac, are the apparent
transfer coefficients for the anodic and cathodic reactions,
respectively, n is the number of electrons transferred in the
electrochemical reaction, and hc represents the activation
overpotential, which is the driving force for the electro-
chemical reaction. The reference exchange current density,
JO20 , in A cm�2 for oxygen reduction corresponding to the low
Tafel slope (about�70 mV decade�1) at the Pt/Nafion interface
is correlated with the cell temperature based on the experi-
mental data of Parthasarathy et al. [32] with a confidence level
of 97.72% as
log10
JO20
�¼ 3:504� 4001:135
T(16)
where T is the temperature in Kelvin. Based on the electro-
chemical reaction and the rate of reaction given in Eqs. (14)
and (15), the molar production of liquid water in the CCL of
a PEM fuel cell, in unit of mol m�2 s�1, can be written as
_PH2O ¼ 2Rc;red (17)
3.3. One-dimensional liquid water transport
The liquid water transport inside the CCL of a PEM fuel cell is
mainly driven by the liquid pressure gradient according to the
Darcy’s law. Hence, the conservation of momentum equation
for the liquid phase can be simplified by neglecting the
convective and viscous terms for the steady-state case as
e[VCP[D[¼ �e[m[
Kkr[
Cu[D[
(18)
Substituting Eq. (11) in Eq. (18) yields
�VPc þ VCPgD
g¼ � m[
Kkr[
Cu[D[
(19)
The gas phase pressure can be considered constant
throughout the CCL and GDL of a PEM fuel cell, and is equal to
the gas phase pressure in the cathode flow channel [21].
Assuming a constant gas phase pressure and solving Eq. (19)
for Cu[D[
and substituting into Eq. (2) yields
V$
�Kkr[
m[
Cr[DdPc
ds[
Vs[
�¼ GM;[ (20)
Considering the one-dimensional transport of liquid water
in the through-plane direction of catalyst layer, Eq. (20)
reduces to an ordinary differential equation that can be solved
analytically with appropriate approximation and boundary
conditions.
i n t e r n a t i o n a l j o u r n a l o f h y d r o g e n e n e r g y 3 5 ( 2 0 1 0 ) 2 4 0 3 – 2 4 1 62406
Author's personal copy
Assuming the reactant gas is fully humidified, the evapo-
ration part from Eq. (8) can be neglected and hence, the right-
hand part of Eq. (20) reduces to
GM;[ ¼ M̂H2OAv_P
H2O þ kc
exH2Og M̂H2O
RT
�xH2O
g CPgD
g�Psat
�(21)
The molar production of liquid water, _PH2O
, is the function
of reaction rate and hence, oxygen concentration and acti-
vation overpotential. Later in Sections (3.5) and (3.6), we
describe how these quantities are evaluated in the CCL of
a PEM fuel cell.
After integrating Eq. (20) with respect to x yields
Kkr[
m[
Cr[DdPc
ds[
Vs[ ¼ xGM;[ þ C1 (22)
where C1 is the integration constant. The boundary condition
for Eq. (22) at the membrane/CCL interface can be written as�Kkr[
m[
Cr[DdPc
ds[
Vs[
�����x¼0
¼ 2a
�J
2FM̂H2O
�(23)
where a is the net drag coefficient, J is the current density, F is
the Faraday’s constant, and M̂H2O is the molar mass of water.
The net drag coefficient includes both electro-osmotic drag
and back-diffusion between the membrane and CCL. Hence,
the right-hand side term in Eq. (23) describes the overall water
transport through the membrane to the CCL [33,34]. The
coefficient, a, is positive when water transport by the electro-
osmotic drag is higher than the back-diffusion from the CCL to
the membrane, and will be negative when water transport by
the electro-osmotic process is lower than the back-diffusion
process. If water transport by the electro-osmotic drag is equal
to the back-diffusion, then one can assume that the net
transport of water across the membrane is zero. Using the
boundary condition given in Eq. (23), the first integration
constant is found as
C1 ¼ 2a
�J
2FM̂H2O
�(24)
The volume-averaged liquid water density, Cr[D, can be
written in terms of phase-averaged density as
Cr[D ¼ es[Cr[D[¼ es[r[ (25)
Hence, using the Leverett function, Eq. (22) simplifies in
terms of liquid saturation for a hydrophilic CCL (qc < 90�) as
s4[
� 0:966þ 3:338s[ � 3:789s2
[
�ds[
dx¼ xRw þ Rd (26)
and for a hydrophobic CCL (qc > 90�) as
s4[
1:417� 4:240s[ þ 3:789s2
[
�ds[
dx¼ xRw þ Rd (27)
The terms, Rw and Rd, are represented by the following
expressions:
Rw¼n[
eðeKÞ0:5gcosqc
"2M̂H2OAvRc;redþkc
exH2Og M̂H2O
RT
�xH2O
g CPgD
g�Psat
�#
(28)
Rd ¼n[
eðeKÞ0:5gcosqc
�aM̂H2OJ
F
�(29)
where n[ is the kinematic viscosity of liquid water. After
integrating Eqs. (26) and (27), the liquid saturation expressions
have been obtained for a hydrophilic CCL as
�0:541s7[ þ 0:556s6
[ � 0:193s5[ ¼ 0:5x2Rw þ xRd þ C21 (30)
and for a hydrophobic CCL as
�0:541s7[ þ 0:707s6
[ � 0:28s5[ ¼ 0:5x2Rw þ xRd þ C22 (31)
where C21 and C22 are the second integration constants that
are governed by the second boundary condition, which is the
liquid saturation at the GDL/CCL interface of a PEM fuel cell.
Once the liquid saturation at the GDL/CCL interface is known,
C21 and C22 can easily be calculated. In addition, the terms, Rw
and Rd, in the liquid saturation expressions are the functions
of reaction rate and current density, respectively. Hence, it is
possible to relate liquid saturation with the cathode activa-
tion overpotential that will eventually allow us to study the
effect of liquid saturation on the PEM fuel cell performance.
In the following subsections, the boundary condition at the
GDL/CCL interface is derived from the formulation proposed
by Pasaogullari and Wang [21], followed by the estimation of
oxygen concentration at the reaction site and activation
overpotential in the CCL of a PEM fuel cell that are based on
our earlier study [17].
3.4. Boundary condition for GDL/CCL interface
The boundary condition at the GDL/CCL interface can be
defined as
s[jx¼dCL¼ sb (32)
where sb is a known liquid saturation at the GDL/CCL inter-
face. To estimate sb, we employed the analytical formulation
developed by Pasaogullari and Wang [21] for the liquid water
transport in the GDL of a PEM fuel cell. Using the formulation
of Pasaogullari and Wang [21], the following expressions are
derived:
s4b
0:354�0:848sbþ0:613s2
b
�¼� J
2FM̂H2O
n[dGDL
ðeKÞ0:5gcosqc
for qc > 90+
(33)
s4b
�0:241þ0:668sb�0:613s2
b
�¼� J
2FM̂H2O
n[dGDL
ðeKÞ0:5gcosqc
forqc<90+
(34)
where dGDL is the GDL thickness.
It should be noted here, for simplicity, Pasaogullari and
Wang [21] assumed that no liquid saturation is present in the
gas flow channel. However, it is possible to consider a liquid
saturation in the flow channel; in such case, the formulation
of Pasaogullari and Wang [21] needs to be re-derived to obtain
the boundary value (sb) of liquid saturation. It has also been
assumed in Ref. [21] that the net transport of water across the
membrane is zero. Since the objective of this study is to use
the formulation given in Ref. [21] to obtain the boundary
condition at the GDL/CCL interface, no changes have been
made to the above-mentioned assumptions. The variations of
i n t e r n a t i o n a l j o u r n a l o f h y d r o g e n e n e r g y 3 5 ( 2 0 1 0 ) 2 4 0 3 – 2 4 1 6 2407
Author's personal copy
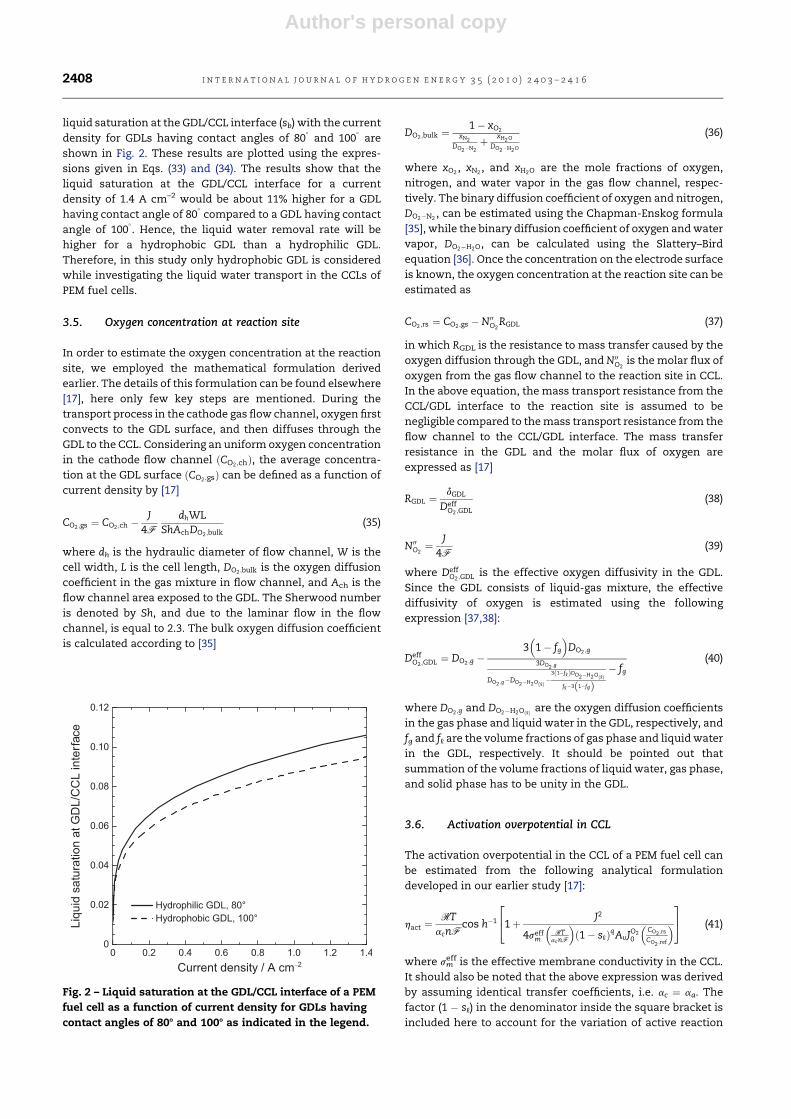
liquid saturation at the GDL/CCL interface (sb) with the current
density for GDLs having contact angles of 80�
and 100�
are
shown in Fig. 2. These results are plotted using the expres-
sions given in Eqs. (33) and (34). The results show that the
liquid saturation at the GDL/CCL interface for a current
density of 1.4 A cm–2 would be about 11% higher for a GDL
having contact angle of 80�
compared to a GDL having contact
angle of 100�. Hence, the liquid water removal rate will be
higher for a hydrophobic GDL than a hydrophilic GDL.
Therefore, in this study only hydrophobic GDL is considered
while investigating the liquid water transport in the CCLs of
PEM fuel cells.
3.5. Oxygen concentration at reaction site
In order to estimate the oxygen concentration at the reaction
site, we employed the mathematical formulation derived
earlier. The details of this formulation can be found elsewhere
[17], here only few key steps are mentioned. During the
transport process in the cathode gas flow channel, oxygen first
convects to the GDL surface, and then diffuses through the
GDL to the CCL. Considering an uniform oxygen concentration
in the cathode flow channel ðCO2 ;chÞ, the average concentra-
tion at the GDL surface ðCO2 ;gsÞ can be defined as a function of
current density by [17]
CO2 ;gs ¼ CO2 ;ch �J
4FdhWL
ShAchDO2 ;bulk(35)
where dh is the hydraulic diameter of flow channel, W is the
cell width, L is the cell length, DO2 ;bulk is the oxygen diffusion
coefficient in the gas mixture in flow channel, and Ach is the
flow channel area exposed to the GDL. The Sherwood number
is denoted by Sh, and due to the laminar flow in the flow
channel, is equal to 2.3. The bulk oxygen diffusion coefficient
is calculated according to [35]
DO2 ;bulk ¼1� xO2
xN2DO2�N2
þ xH2O
DO2�H2O
(36)
where xO2, xN2
, and xH2O are the mole fractions of oxygen,
nitrogen, and water vapor in the gas flow channel, respec-
tively. The binary diffusion coefficient of oxygen and nitrogen,
DO2�N2, can be estimated using the Chapman-Enskog formula
[35], while the binary diffusion coefficient of oxygen and water
vapor, DO2�H2O, can be calculated using the Slattery–Bird
equation [36]. Once the concentration on the electrode surface
is known, the oxygen concentration at the reaction site can be
estimated as
CO2 ;rs ¼ CO2 ;gs �N00O2RGDL (37)
in which RGDL is the resistance to mass transfer caused by the
oxygen diffusion through the GDL, and N00O2is the molar flux of
oxygen from the gas flow channel to the reaction site in CCL.
In the above equation, the mass transport resistance from the
CCL/GDL interface to the reaction site is assumed to be
negligible compared to the mass transport resistance from the
flow channel to the CCL/GDL interface. The mass transfer
resistance in the GDL and the molar flux of oxygen are
expressed as [17]
RGDL ¼dGDL
DeffO2 ;GDL
(38)
N00O2¼ J
4F(39)
where DeffO2 ;GDL is the effective oxygen diffusivity in the GDL.
Since the GDL consists of liquid-gas mixture, the effective
diffusivity of oxygen is estimated using the following
expression [37,38]:
DeffO2 ;GDL ¼ DO2 ;g �
3�
1� fg
�DO2 ;g
3DO2 ;g
DO2 ;g�DO2�H2Oð[Þ �
3ð1�f[ÞDO2�H2Oð[Þf[�3ð1�fgÞ
� fg
(40)
where DO2 ;g and DO2�H2Oð[Þ are the oxygen diffusion coefficients
in the gas phase and liquid water in the GDL, respectively, and
fg and f[ are the volume fractions of gas phase and liquid water
in the GDL, respectively. It should be pointed out that
summation of the volume fractions of liquid water, gas phase,
and solid phase has to be unity in the GDL.
3.6. Activation overpotential in CCL
The activation overpotential in the CCL of a PEM fuel cell can
be estimated from the following analytical formulation
developed in our earlier study [17]:
hact ¼RT
acnFcos h�1
241þ J2
4seffm
�RT
acnF
�ð1� s[ÞqAvJO2
0
�CO2 ;rs
CO2 ;ref
�35 (41)
where smeff is the effective membrane conductivity in the CCL.
It should also be noted that the above expression was derived
by assuming identical transfer coefficients, i.e. ac ¼ aa. The
factor (1 � s[) in the denominator inside the square bracket is
included here to account for the variation of active reaction
Fig. 2 – Liquid saturation at the GDL/CCL interface of a PEM
fuel cell as a function of current density for GDLs having
contact angles of 808 and 1008 as indicated in the legend.
i n t e r n a t i o n a l j o u r n a l o f h y d r o g e n e n e r g y 3 5 ( 2 0 1 0 ) 2 4 0 3 – 2 4 1 62408
Author's personal copy
area with liquid saturation, where q is the order for the active
area reduction due to the liquid saturation that is also known
as saturation exponent.
The effective membrane conductivity in the CCL is esti-
mated from the following expression [37,38]:
seffm ¼ sm �
31� fm
�sm
3� fm�
3fv
�sm �
3ð1�fmÞsm
3�fm
�2þ fv
(42)
in which sm is the membrane conductivity, fs, fm, fv are the
volume fractions of solid platinum/carbon (Pt/C) particles,
electrolyte membrane, and void space in the CCL, respec-
tively. Here, the fraction of void space is simply the CCL
porosity, while the volume fraction of membrane (usually
Nafion) in the CCL can be related through the Nafion content
%N (defined as the weight percentage of Nafion in the sum of
Nafion and solid Pt/C particles) by [16,17]
fm ¼%N
ð1�%NÞrm
mPt
%Pt$dCL(43)
where rm is the density of Nafion, %Pt is the mass percentage
of platinum in the combined total mass of Pt/C particles, mPt is
the Pt-loading, and dCL is the catalyst layer thickness. If the
catalyst layer surface area (ACL) and carbon weight (WC) are
known, %Pt can be calculated from the following relation:
%Pt ¼ mPtACL
mPtACL þWC(44)
The volume fraction of solid Pt/C in the CCL is related to %Pt,
catalyst layer thickness, and the densities of platinum and
carbon black (rPt and rC) as
fs ¼�
1rPt
þ 1�%Pt%Pt$rC
�mPt
dCL(45)
3.7. Dimensionless liquid water profile
Using the boundary condition at the GDL/CCL interface given
in the previous section, the expressions for liquid water
transport in the CCL become:
�0:541s7
[ � s7b
�þ 0:556
s6
[ � s6b
�� 0:193
s5
[ � s5b
�¼x2 � 1
�Rw þ ðx� 1ÞRd (46)
0:541s7
[ � s7b
�� 0:707
s6
[ � s6b
�þ 0:283
s5
[ � s5b
�¼x2 � 1
�Rw þ ðx� 1ÞRd (47)
where Eq. (46) is for the hydrophilic CCL and Eq. (47) is for the
hydrophobic CCL. Here sb is the liquid saturation at the GDL/
CCL interface that can be obtained from Eqs. (33) and (34) for
hydrophobic and hydrophilic CCLs, respectively, x is the
dimensionless distance along the catalyst layer thickness, Rw
is the dimensionless water production in the CCL from the
electrochemical reaction and condensation, and Rd is the
dimensionless net water transport from the membrane to
the CCL by the electro-osmotic drag and back-diffusion. The
dimensionless distance along the CCL thickness is defined as
x ¼ xdCL
(48)
where dCL is the catalyst layer thickness.
The dimensionless water production in the CCL from the
electrochemical reaction and condensation is defined by the
following expression:
Rw¼0:5m[d
2CL
eðeKÞ0:5gcosqc
"2M̂H2OAvRc;red
r[
þkc
exH2Og M̂H2O
r[RT
�xH2O
g CPgD
g�Psat
�#
¼CDThðEPTÞ�1þðPCTÞ�1
i¼P1þP2
(49)
where P1 and P2 are the dimensionless numbers that are
named as the ‘‘dimensionless time of first kind‘‘ and ‘‘dimensionless
time of second kind’’, respectively. The dimensionless time of
first kind represents the ratio between the capillary diffusion
time (CDT) to the electrochemical production time (EPT) and
the dimensionless time of second kind represents the ratio
between the capillary diffusion time to the phase change time
(PCT) at steady-state. Conversely, the term Rd is defined as
Rd ¼0:5m[d
2CL
eðeKÞ0:5gcosqc
�2aJM̂H2O
r[dCLF
�¼ P3 (50)
where P3 is the ‘‘dimensionless time of third kind’’, which
represents the ratio between the capillary diffusion time to
the time required for liquid water transport by the net electro-
osmotic drag and back-diffusion processes across the CCL.
These dimensionless time constants will provide insight
about how much liquid water would be accumulated in the
CCL and transported from the CCL to the gas flow channel
through the GDL. Since the capillary diffusion is the major
mode of water transport from the CCL to the GDL, the higher
the time constants are, the higher the liquid water accumu-
lation. Hence, the water saturation will also be higher in the
CCL for higher time constant values.
4. Results and discussion
In the following subsections, the results are presented for both
hydrophilic and hydrophobic CCLs that are estimated using
the analytical solutions of liquid water transport given in Eqs.
(46) and (47). The analytical expressions for the liquid water
distribution, however, require several physical and electro-
chemical parameters as well as liquid water saturation at the
GDL/CCL interface, oxygen concentration at the reaction site,
and cathode activation overpotential. The required physical
electrochemical parameters are listed in Table 2, while the
analytical expressions are already provided in previous
sections for liquid water saturation at the GDL/CCL interface,
oxygen concentration at the reaction site, and cathode acti-
vation overpotential, respectively. It is worthwhile to note
that the proposed analytical expressions for liquid water
distribution in the CCL do not involve any complicated
numerical modeling or solutions to several simultaneous
transport equations except the expressions given in Sections
(3.4)–(3.6).
4.1. Liquid saturation profile in cathode catalyst layer
The liquid saturation profiles obtained from the 1D analytical
solution of liquid water transport in the CCL of a PEM fuel cell
i n t e r n a t i o n a l j o u r n a l o f h y d r o g e n e n e r g y 3 5 ( 2 0 1 0 ) 2 4 0 3 – 2 4 1 6 2409
Author's personal copy
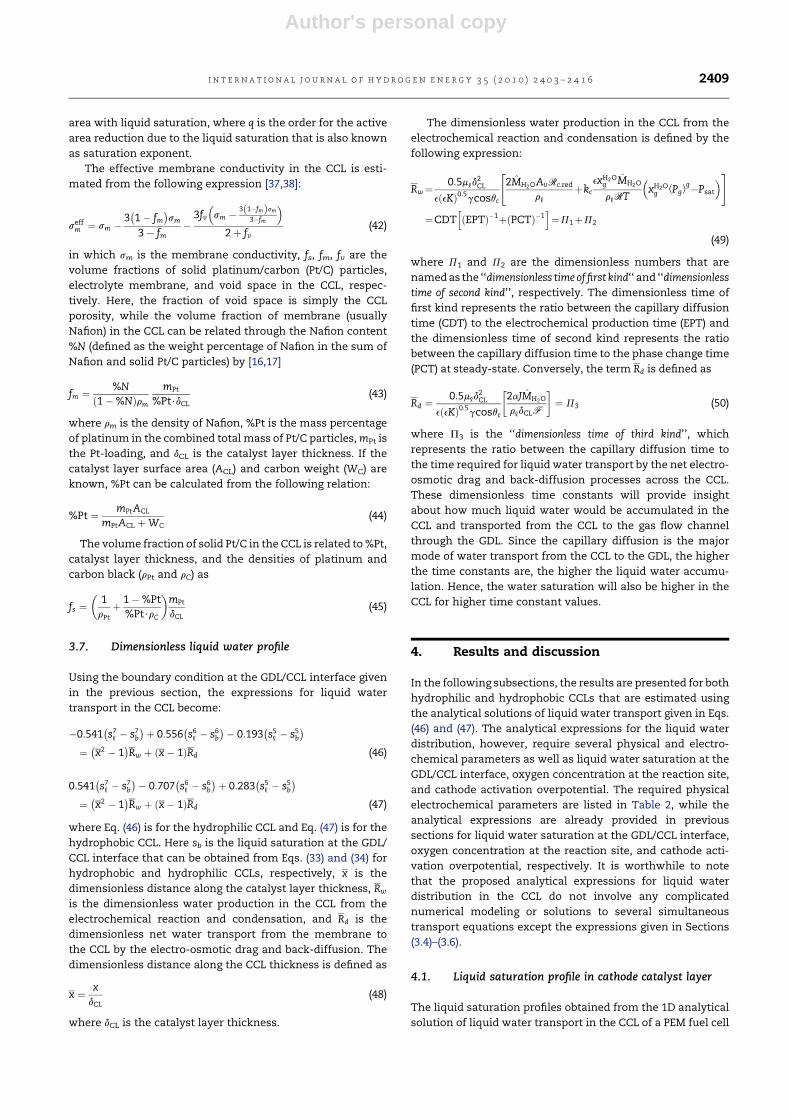
are shown in Fig. 3 for two different current densities as
indicated in the figure. Both hydrophobic and hydrophilic
cases are considered, where the solid lines represent the
profile in a CCL having contact angle of 80�
and the dashed
lines depict the profile for contact angle of 100�
for the case
when the electro-osmotic drag is significant than the back-
diffusion at the membrane/CCL interface. As observed from
Fig. 3, the hydrophilic CCL shows higher liquid saturation than
the hydrophobic CCL. It should be pointed out that for both
cases, the GDL is considered as hydrophobic with a contact
angle of 100�. The GDL properties are identical of Ref. [21] that
are listed in Table 1. In Fig. 3, the higher liquid saturation level
near the membrane/CCL interface for a hydrophilic CCL than
a hydrophobic CCL suggests slower liquid water transport
from the CCL to the GDL if the catalyst layer is hydrophilic.
This situation might be favorable for the proton transport in
the CCL. At the same time, the higher liquid saturation at the
membrane/CCL interface also implies that the higher level of
water transport from the membrane to the CCL that might
eventually dry out membrane. Further, the higher level of
liquid accumulation in the CCL, particularly in a hydrophilic
CCL, will require a better water management in the GDL.
4.2. Effect of surface wettability
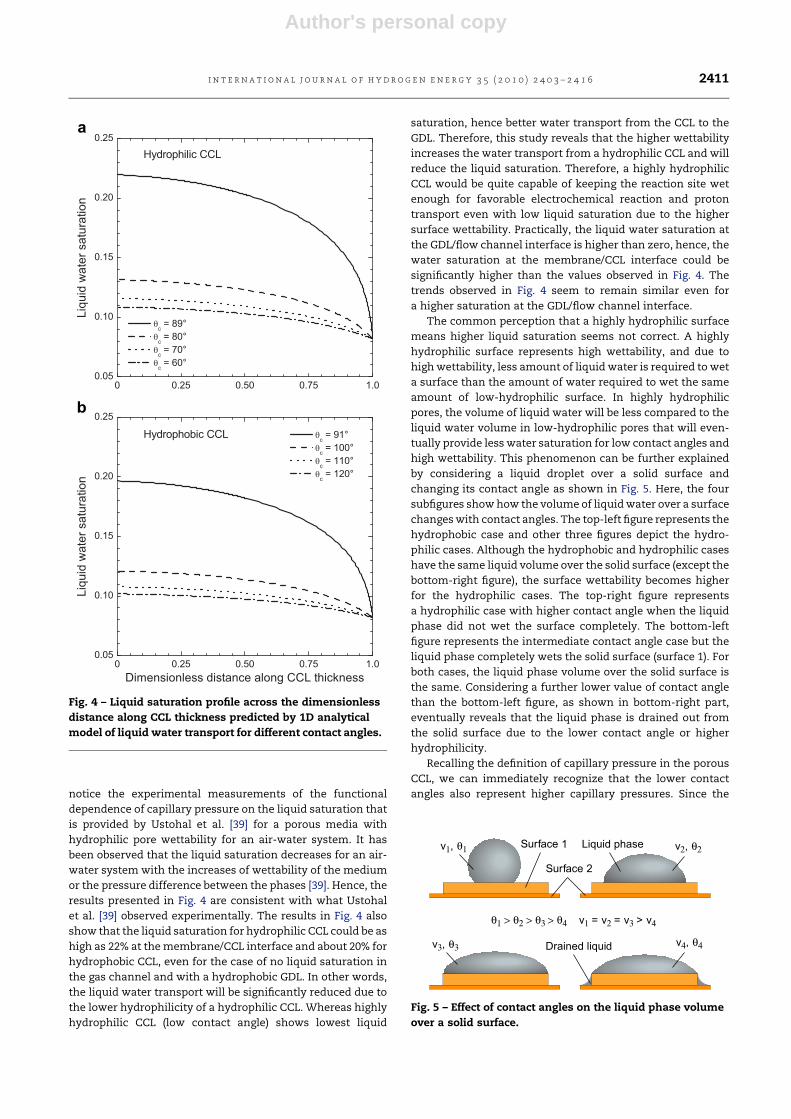
Fig. 4 depicts the effect of contact angle on the liquid water
distribution in the CCL for a current density of 0.8 A cm�2. All
the parameters are identical to those for Fig. 3, except the CCL
contact angles that are indicated in the legend. It is observed
that the contact angles have significant influence on the liquid
water distribution inside a fuel cell catalyst layer. In a hydro-
philic catalyst layer (qc < 90�) as shown in Fig. 4a, the CCL
having a contact angle of 89�
shows significantly higher liquid
saturation than the CCL having lower contact angle or higher
wettability. It is mainly due to the capillary pressure. Since the
capillary pressure drives the flow of liquid water in the CCL
and the capillary pressure reduces significantly with contact
angle, the hydrophilic CCL with high contact angle shows
higher liquid saturation. Conversely, in a hydrophobic catalyst
layer (qc > 90�) as shown in Fig. 4b, lower contact angle shows
a higher liquid saturation. As the hydrophobicity increases,
the liquid saturation in the catalyst layer decreases rapidly.
This result also implies that a hydrophobic catalyst layer
would enhance water transport from the catalyst layer,
whereas a catalyst layer has to be hydrophilic in nature for
better proton transport. Hence, a balance between the
hydrophlicity and hydrophobicity might be desirable for a PEM
fuel cell catalyst layer for better water transport as well as
higher cell performance.
The reason why a lower contact angle or highly hydrophilic
CCL (Fig. 4a) shows low liquid saturation can be justified if we
Table 1 – Electrochemical and transport properties usedin Ref. [21].
Description Value
Cell temperature (K) 353
Faraday constant (C mol�1) 96 487
Liquid water density (kg m�3) 971.8
Liquid water viscosity (Pa s) 3.56 � 10�4
Surface tension (N m�1) 0.0625
GDL porosity 0.5
GDL permeability (m2) 6.875 � 10�13
GDL thickness (m) 300 � 10�6
Table 2 – Parameters used in the model calculations.
Description Value Source
Gas pressure (atm) 3
Relative humidity (%) 100
Gas constant (J mol�1 K�1) 8.315
Cell width (mm) 70.7 [17]
Cell height (mm) 70.7 [17]
Flow channel width (mm) 1 [21]
Flow channel height (mm) 1 [21]
Liquid saturation in gas channel 0 [21]
Catalyst layer thickness (m) 20 � 10–6 [17]
Anodic and cathodic transfer
coefficients
0.5 [16]
Reference oxygen concentration
(mol m�3)
1.2 [16]
GDL contact angle (�) 100 [21]
Drag coefficient, a 0.25 [15]
Condensation rate constant (s�1) 100 [15]
Platinum loading (mg cm�2) 0.3 [17]
%Wt of Platinum 0.2 [17]
%Wt of Nafion 0.3 [17]
Catalyst surface area per unit
mass of catalyst (m2 gm�1)
112 [17]
Membrane conductivity (S m�1) 17 [15]
Platinum density (kg m�3) 21.5 � 103 [15]
Carbon density (kg m�3) 2.0 � 103 [15]
Nafion density (kg m�3) 1.9 � 103 [15]
Fig. 3 – Liquid saturation profile across the CCL of a PEM
fuel cell predicted by 1D analytical model for two different
current densities as indicated in the legend. The solid and
dashed lines represent liquid water profile for the CCL
having contact angles of 808 and 1008, respectively.
i n t e r n a t i o n a l j o u r n a l o f h y d r o g e n e n e r g y 3 5 ( 2 0 1 0 ) 2 4 0 3 – 2 4 1 62410
Author's personal copy
notice the experimental measurements of the functional
dependence of capillary pressure on the liquid saturation that
is provided by Ustohal et al. [39] for a porous media with
hydrophilic pore wettability for an air-water system. It has
been observed that the liquid saturation decreases for an air-
water system with the increases of wettability of the medium
or the pressure difference between the phases [39]. Hence, the
results presented in Fig. 4 are consistent with what Ustohal
et al. [39] observed experimentally. The results in Fig. 4 also
show that the liquid saturation for hydrophilic CCL could be as
high as 22% at the membrane/CCL interface and about 20% for
hydrophobic CCL, even for the case of no liquid saturation in
the gas channel and with a hydrophobic GDL. In other words,
the liquid water transport will be significantly reduced due to
the lower hydrophilicity of a hydrophilic CCL. Whereas highly
hydrophilic CCL (low contact angle) shows lowest liquid
saturation, hence better water transport from the CCL to the
GDL. Therefore, this study reveals that the higher wettability
increases the water transport from a hydrophilic CCL and will
reduce the liquid saturation. Therefore, a highly hydrophilic
CCL would be quite capable of keeping the reaction site wet
enough for favorable electrochemical reaction and proton
transport even with low liquid saturation due to the higher
surface wettability. Practically, the liquid water saturation at
the GDL/flow channel interface is higher than zero, hence, the
water saturation at the membrane/CCL interface could be
significantly higher than the values observed in Fig. 4. The
trends observed in Fig. 4 seem to remain similar even for
a higher saturation at the GDL/flow channel interface.
The common perception that a highly hydrophilic surface
means higher liquid saturation seems not correct. A highly
hydrophilic surface represents high wettability, and due to
high wettability, less amount of liquid water is required to wet
a surface than the amount of water required to wet the same
amount of low-hydrophilic surface. In highly hydrophilic
pores, the volume of liquid water will be less compared to the
liquid water volume in low-hydrophilic pores that will even-
tually provide less water saturation for low contact angles and
high wettability. This phenomenon can be further explained
by considering a liquid droplet over a solid surface and
changing its contact angle as shown in Fig. 5. Here, the four
subfigures show how the volume of liquid water over a surface
changes with contact angles. The top-left figure represents the
hydrophobic case and other three figures depict the hydro-
philic cases. Although the hydrophobic and hydrophilic cases
have the same liquid volume over the solid surface (except the
bottom-right figure), the surface wettability becomes higher
for the hydrophilic cases. The top-right figure represents
a hydrophilic case with higher contact angle when the liquid
phase did not wet the surface completely. The bottom-left
figure represents the intermediate contact angle case but the
liquid phase completely wets the solid surface (surface 1). For
both cases, the liquid phase volume over the solid surface is
the same. Considering a further lower value of contact angle
than the bottom-left figure, as shown in bottom-right part,
eventually reveals that the liquid phase is drained out from
the solid surface due to the lower contact angle or higher
hydrophilicity.
Recalling the definition of capillary pressure in the porous
CCL, we can immediately recognize that the lower contact
angles also represent higher capillary pressures. Since the
a
b
Fig. 4 – Liquid saturation profile across the dimensionless
distance along CCL thickness predicted by 1D analytical
model of liquid water transport for different contact angles.
3 θ3
θ1 > θ2 > θ3 > θ4 1 2 3 4
1 θ1 2 θ2
4 θ4
Fig. 5 – Effect of contact angles on the liquid phase volume
over a solid surface.
i n t e r n a t i o n a l j o u r n a l o f h y d r o g e n e n e r g y 3 5 ( 2 0 1 0 ) 2 4 0 3 – 2 4 1 6 2411
Author's personal copy
capillary pressure is the gas phase pressure minus the liquid
phase pressure for a hydrophilic medium, the liquid phase
pressure will decrease with the capillary pressures. Hence, the
gas phase will push away the liquid phase from a hydrophilic
pore, and eventually reduces the volume of liquid water over
the solid phase. Conversely, the reaction site needs to be well
hydrated for better electrochemical reaction that can even be
achieved with less liquid water if the surface wettability is
higher. A balance of liquid saturation and surface wettability
is desirable as the high liquid saturation may block pores that
will eventually hinder the oxygen transport to the reaction
site, while the low liquid saturation may cause dry out of the
reaction site and membrane that will hinder the proton
transport to the reaction site.
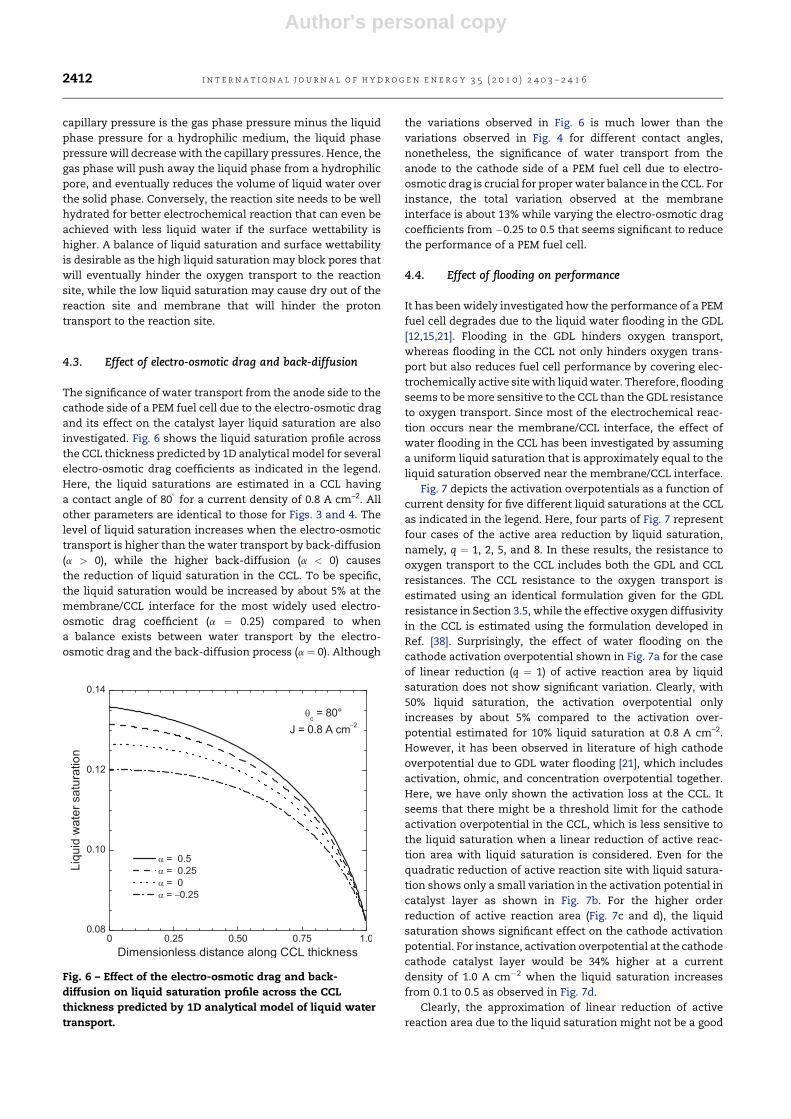
4.3. Effect of electro-osmotic drag and back-diffusion
The significance of water transport from the anode side to the
cathode side of a PEM fuel cell due to the electro-osmotic drag
and its effect on the catalyst layer liquid saturation are also
investigated. Fig. 6 shows the liquid saturation profile across
the CCL thickness predicted by 1D analytical model for several
electro-osmotic drag coefficients as indicated in the legend.
Here, the liquid saturations are estimated in a CCL having
a contact angle of 80�
for a current density of 0.8 A cm–2. All
other parameters are identical to those for Figs. 3 and 4. The
level of liquid saturation increases when the electro-osmotic
transport is higher than the water transport by back-diffusion
(a > 0), while the higher back-diffusion (a < 0) causes
the reduction of liquid saturation in the CCL. To be specific,
the liquid saturation would be increased by about 5% at the
membrane/CCL interface for the most widely used electro-
osmotic drag coefficient (a ¼ 0.25) compared to when
a balance exists between water transport by the electro-
osmotic drag and the back-diffusion process (a ¼ 0). Although
the variations observed in Fig. 6 is much lower than the
variations observed in Fig. 4 for different contact angles,
nonetheless, the significance of water transport from the
anode to the cathode side of a PEM fuel cell due to electro-
osmotic drag is crucial for proper water balance in the CCL. For
instance, the total variation observed at the membrane
interface is about 13% while varying the electro-osmotic drag
coefficients from �0.25 to 0.5 that seems significant to reduce
the performance of a PEM fuel cell.
4.4. Effect of flooding on performance
It has been widely investigated how the performance of a PEM
fuel cell degrades due to the liquid water flooding in the GDL
[12,15,21]. Flooding in the GDL hinders oxygen transport,
whereas flooding in the CCL not only hinders oxygen trans-
port but also reduces fuel cell performance by covering elec-
trochemically active site with liquid water. Therefore, flooding
seems to be more sensitive to the CCL than the GDL resistance
to oxygen transport. Since most of the electrochemical reac-
tion occurs near the membrane/CCL interface, the effect of
water flooding in the CCL has been investigated by assuming
a uniform liquid saturation that is approximately equal to the
liquid saturation observed near the membrane/CCL interface.
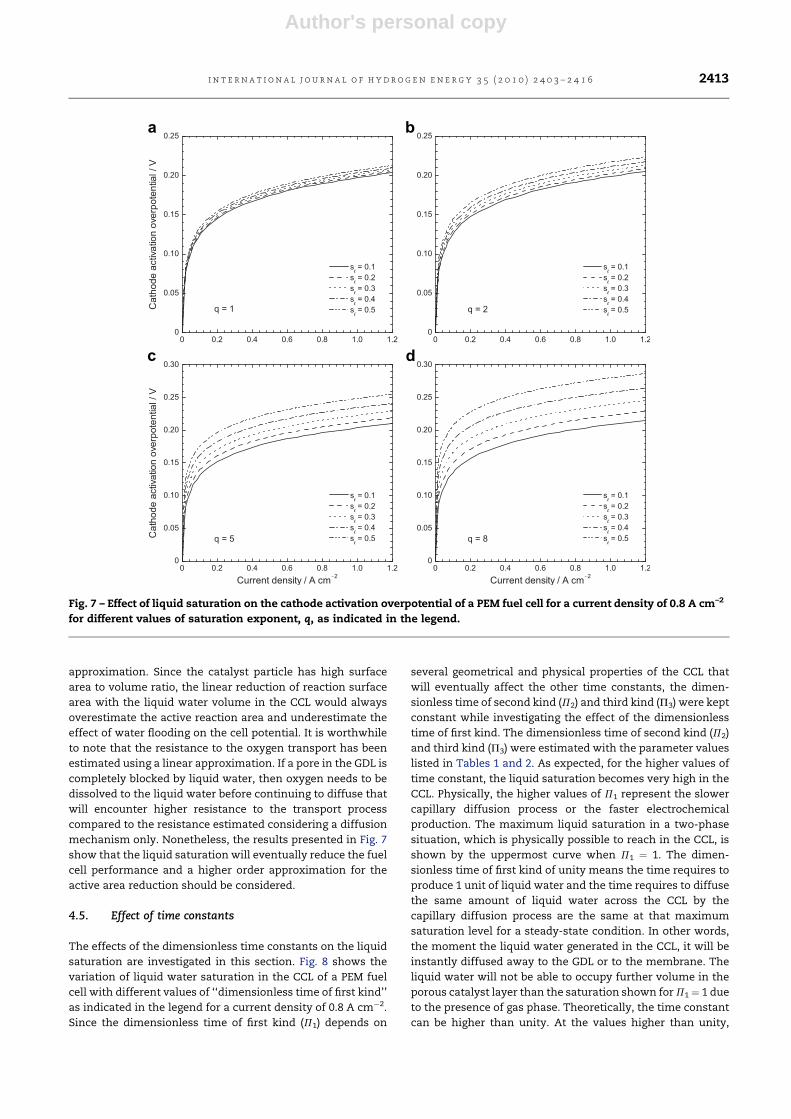
Fig. 7 depicts the activation overpotentials as a function of
current density for five different liquid saturations at the CCL
as indicated in the legend. Here, four parts of Fig. 7 represent
four cases of the active area reduction by liquid saturation,
namely, q ¼ 1, 2, 5, and 8. In these results, the resistance to
oxygen transport to the CCL includes both the GDL and CCL
resistances. The CCL resistance to the oxygen transport is
estimated using an identical formulation given for the GDL
resistance in Section 3.5, while the effective oxygen diffusivity
in the CCL is estimated using the formulation developed in
Ref. [38]. Surprisingly, the effect of water flooding on the
cathode activation overpotential shown in Fig. 7a for the case
of linear reduction (q ¼ 1) of active reaction area by liquid
saturation does not show significant variation. Clearly, with
50% liquid saturation, the activation overpotential only
increases by about 5% compared to the activation over-
potential estimated for 10% liquid saturation at 0.8 A cm–2.
However, it has been observed in literature of high cathode
overpotential due to GDL water flooding [21], which includes
activation, ohmic, and concentration overpotential together.
Here, we have only shown the activation loss at the CCL. It
seems that there might be a threshold limit for the cathode
activation overpotential in the CCL, which is less sensitive to
the liquid saturation when a linear reduction of active reac-
tion area with liquid saturation is considered. Even for the
quadratic reduction of active reaction site with liquid satura-
tion shows only a small variation in the activation potential in
catalyst layer as shown in Fig. 7b. For the higher order
reduction of active reaction area (Fig. 7c and d), the liquid
saturation shows significant effect on the cathode activation
potential. For instance, activation overpotential at the cathode
cathode catalyst layer would be 34% higher at a current
density of 1.0 A cm�2 when the liquid saturation increases
from 0.1 to 0.5 as observed in Fig. 7d.
Clearly, the approximation of linear reduction of active
reaction area due to the liquid saturation might not be a good
Fig. 6 – Effect of the electro-osmotic drag and back-
diffusion on liquid saturation profile across the CCL
thickness predicted by 1D analytical model of liquid water
transport.
i n t e r n a t i o n a l j o u r n a l o f h y d r o g e n e n e r g y 3 5 ( 2 0 1 0 ) 2 4 0 3 – 2 4 1 62412
Author's personal copy
approximation. Since the catalyst particle has high surface
area to volume ratio, the linear reduction of reaction surface
area with the liquid water volume in the CCL would always
overestimate the active reaction area and underestimate the
effect of water flooding on the cell potential. It is worthwhile
to note that the resistance to the oxygen transport has been
estimated using a linear approximation. If a pore in the GDL is
completely blocked by liquid water, then oxygen needs to be
dissolved to the liquid water before continuing to diffuse that
will encounter higher resistance to the transport process
compared to the resistance estimated considering a diffusion
mechanism only. Nonetheless, the results presented in Fig. 7
show that the liquid saturation will eventually reduce the fuel
cell performance and a higher order approximation for the
active area reduction should be considered.
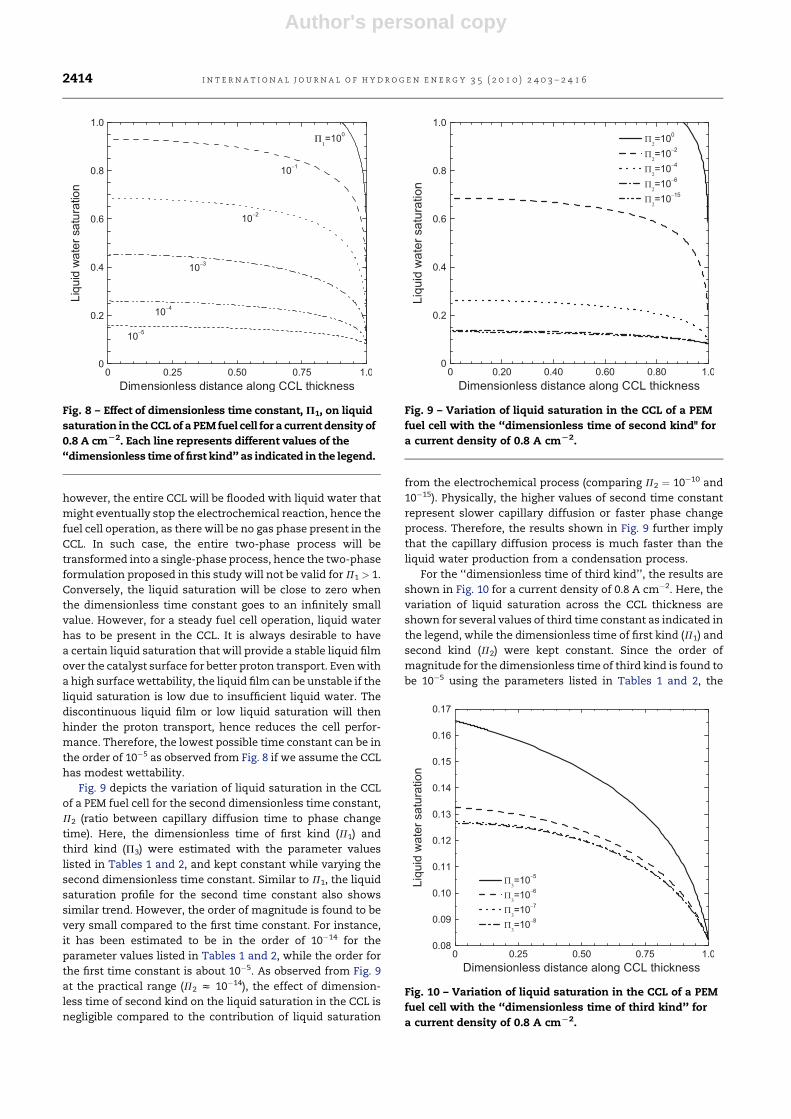
4.5. Effect of time constants
The effects of the dimensionless time constants on the liquid
saturation are investigated in this section. Fig. 8 shows the
variation of liquid water saturation in the CCL of a PEM fuel
cell with different values of ‘‘dimensionless time of first kind’’
as indicated in the legend for a current density of 0.8 A cm�2.
Since the dimensionless time of first kind (P1) depends on
several geometrical and physical properties of the CCL that
will eventually affect the other time constants, the dimen-
sionless time of second kind (P2) and third kind (P3) were kept
constant while investigating the effect of the dimensionless
time of first kind. The dimensionless time of second kind (P2)
and third kind (P3) were estimated with the parameter values
listed in Tables 1 and 2. As expected, for the higher values of
time constant, the liquid saturation becomes very high in the
CCL. Physically, the higher values of P1 represent the slower
capillary diffusion process or the faster electrochemical
production. The maximum liquid saturation in a two-phase
situation, which is physically possible to reach in the CCL, is
shown by the uppermost curve when P1 ¼ 1. The dimen-
sionless time of first kind of unity means the time requires to
produce 1 unit of liquid water and the time requires to diffuse
the same amount of liquid water across the CCL by the
capillary diffusion process are the same at that maximum
saturation level for a steady-state condition. In other words,
the moment the liquid water generated in the CCL, it will be
instantly diffused away to the GDL or to the membrane. The
liquid water will not be able to occupy further volume in the
porous catalyst layer than the saturation shown for P1¼ 1 due
to the presence of gas phase. Theoretically, the time constant
can be higher than unity. At the values higher than unity,
a b
c d
Fig. 7 – Effect of liquid saturation on the cathode activation overpotential of a PEM fuel cell for a current density of 0.8 A cm–2
for different values of saturation exponent, q, as indicated in the legend.
i n t e r n a t i o n a l j o u r n a l o f h y d r o g e n e n e r g y 3 5 ( 2 0 1 0 ) 2 4 0 3 – 2 4 1 6 2413
Author's personal copy
however, the entire CCL will be flooded with liquid water that
might eventually stop the electrochemical reaction, hence the
fuel cell operation, as there will be no gas phase present in the
CCL. In such case, the entire two-phase process will be
transformed into a single-phase process, hence the two-phase
formulation proposed in this study will not be valid for P1 > 1.
Conversely, the liquid saturation will be close to zero when
the dimensionless time constant goes to an infinitely small
value. However, for a steady fuel cell operation, liquid water
has to be present in the CCL. It is always desirable to have
a certain liquid saturation that will provide a stable liquid film
over the catalyst surface for better proton transport. Even with
a high surface wettability, the liquid film can be unstable if the
liquid saturation is low due to insufficient liquid water. The
discontinuous liquid film or low liquid saturation will then
hinder the proton transport, hence reduces the cell perfor-
mance. Therefore, the lowest possible time constant can be in
the order of 10�5 as observed from Fig. 8 if we assume the CCL
has modest wettability.
Fig. 9 depicts the variation of liquid saturation in the CCL
of a PEM fuel cell for the second dimensionless time constant,
P2 (ratio between capillary diffusion time to phase change
time). Here, the dimensionless time of first kind (P1) and
third kind (P3) were estimated with the parameter values
listed in Tables 1 and 2, and kept constant while varying the
second dimensionless time constant. Similar to P1, the liquid
saturation profile for the second time constant also shows
similar trend. However, the order of magnitude is found to be
very small compared to the first time constant. For instance,
it has been estimated to be in the order of 10�14 for the
parameter values listed in Tables 1 and 2, while the order for
the first time constant is about 10�5. As observed from Fig. 9
at the practical range (P2 z 10�14), the effect of dimension-
less time of second kind on the liquid saturation in the CCL is
negligible compared to the contribution of liquid saturation
from the electrochemical process (comparing P2 ¼ 10�10 and
10�15). Physically, the higher values of second time constant
represent slower capillary diffusion or faster phase change
process. Therefore, the results shown in Fig. 9 further imply
that the capillary diffusion process is much faster than the
liquid water production from a condensation process.
For the ‘‘dimensionless time of third kind’’, the results are
shown in Fig. 10 for a current density of 0.8 A cm�2. Here, the
variation of liquid saturation across the CCL thickness are
shown for several values of third time constant as indicated in
the legend, while the dimensionless time of first kind (P1) and
second kind (P2) were kept constant. Since the order of
magnitude for the dimensionless time of third kind is found to
be 10�5 using the parameters listed in Tables 1 and 2, the
Fig. 9 – Variation of liquid saturation in the CCL of a PEM
fuel cell with the ‘‘dimensionless time of second kind" for
a current density of 0.8 A cmL2.
Π1
−
−
−
−
−
Fig. 8 – Effect of dimensionless time constant, P1, on liquid
saturation in the CCL of a PEM fuel cell for a current density of
0.8 A cmL2. Each line represents different values of the
‘‘dimensionless time of first kind’’ as indicated in the legend.
Fig. 10 – Variation of liquid saturation in the CCL of a PEM
fuel cell with the ‘‘dimensionless time of third kind’’ for
a current density of 0.8 A cmL2.
i n t e r n a t i o n a l j o u r n a l o f h y d r o g e n e n e r g y 3 5 ( 2 0 1 0 ) 2 4 0 3 – 2 4 1 62414
Author's personal copy
result for the dimensionless time of third kind are presented
only for the values lower than or equal to 10�5. The liquid
saturation profiles across the CCL thickness are found to be
almost independent of the time constant for lower values of
P3. This is mainly due to the fact that the time requires for
water transport across the CCL by the capillary diffusion.
Physically, the higher values of third time constant represent
a slower capillary diffusion or a faster electro-osmotic drag
and back-diffusion process. Therefore, the time requires for
liquid water transport by the capillary diffusion is small
compared to the time requires for the electro-osmotic drag
and back-diffusion process at smaller P3. It should be pointed
out that for the practical range of third time constant, 10�5–
10�6, the effect of the third time constant on the liquid satu-
ration in CCL is significant. Hence, the electro-osmotic drag
and back-diffusion process should always be considered
during the water management for PEM fuel cells.
5. Conclusions
A simplified mathematical formulation of liquid water trans-
port in the CCL of a PEM fuel cell has been developed and the
one-dimensional analytical solutions have been provided for
both the hydrophilic and hydrophobic CCLs. It has been
observed that the wetting properties of a CCL control the
flooding behavior, and hydrophilic characteristic of CCL plays
significant role on the cell performance. Although a hydro-
phobic CCL has shown less liquid saturation compared to
a hydrophilic CCL at the similar hydrophobicities or hydro-
philicities, it seems possible to reduce liquid saturation by
increasing the surface wettability (i.e. lowering the contact
angle) of a hydrophilic CCL. At the same time, high surface
wettability of hydrophilic CCL would provide sufficient
surface wetting to enhance proton transport in the CCL. Based
on the analysis of the dimensionless time constants, it is
found that liquid water production from the phase change
process is almost negligible compared to liquid water
production from the electrochemical process. However, the
liquid water transport by the electro-osmotic drag and back-
diffusion from the membrane to the CCL has significant
contribution to the liquid accumulation, hence it cannot be
neglected. The effect of water flooding on the activation
overpotential is found to be less sensitive if a linear reduction
of active reaction area is assumed, whereas the higher order
reduction of active reaction area shows significant increase of
activation overpotential due to the liquid saturation. Hence,
the widely used linear approximation of the reduction of
active reaction site due to the liquid water saturation seems to
be an underestimation. The dimensionless time constants
defined in this study might be a useful tool in investigating
other flows in porous medium, such as ground water trans-
port, oil transport in oil sands, and membrane filtration.
Acknowledgments
The financial support of the Natural Sciences and Engineering
Research Council of Canada is gratefully acknowledged. P.K.D.
also thanks the National Research Council of Canada, the
Ontario Graduate Scholarship program, and the University of
Waterloo for postgraduate scholarships.
Nomenclature
A interfacial mass-transfer rate (kg m�3 s�1 Pa�1)
As catalyst surface area per unit mass of catalyst (m2 kg�1)
Av reactive surface area per unit volume (m�1)
C integration constant
CO2 oxygen concentration (mol m�3)
dh hydraulic diameter (m)
D diffusivity (m2 s–1)
f volume fraction
F Faraday’s constant (C mol�1)
J current density (A cm�2)
kc condensation rate constant (s�1)
kv evaporation rate constant (Pa�1 s�1)
krl relative permeability (m2)
M̂ molecular weight (kg mol�1)
P pressure (Pa)
Pc capillary pressure (Pa)
Psat saturation pressure (Pa)
R universal gas constant (J mol�1 K�1)
s saturation
T temperature (K)
u velocity (m s�1)
xH2O water mole fraction
xN2 nitrogen mole fraction
xO2 oxygen mole fraction
Greek letters
a drag coefficient
aa anodic transfer coefficient
ac cathodic transfer coefficient
g surface tension (N m�1)
G source term
d thickness (m)
e porosity
hc activation overpotential (V)
qc contact angle
m viscosity (Pa s)
n kinematic viscosity (m2 s�1)
r density (kg m�3)
s conductivity (S m�1)
Subscripts & superscripts
b boundary value
C carbon
CL catalyst layer
eff effective value
g gas phase
GDL gas diffusion layer
[ liquid phase
m membrane phase
Pt platinum
ref reference value
s solid phase
v void space
i n t e r n a t i o n a l j o u r n a l o f h y d r o g e n e n e r g y 3 5 ( 2 0 1 0 ) 2 4 0 3 – 2 4 1 6 2415
Author's personal copy
Abbreviations
CCL cathode catalyst layer
GDL gas diffusion layer
PEM polymer electrolyte membrane
r e f e r e n c e s
[1] Li X. Principles of fuel cells. New York: Taylor & Francis; 2006.[2] Bernardi D, Verbrugge M. Mathematical model of a gas-
diffusion electrode bonded to a polymer electrolyte. AIChE J1991;37:1151–63.
[3] Springer T, Zawodzinski T, Gottesfeld S. Polymer electrolytefuel cell model. J Electrochem Soc 1991;138:2334–42.
[4] Fuller T, Newman J. Water and thermal management insolid-polymer-electrolyte fuel cells. J Electrochem Soc 1993;140:1218–25.
[5] Yamada H, Hatanaka T, Murata H, Morimoto Y.Measurement of flooding in gas diffusion layers of polymerelectrolyte fuel cells with conventional flow field. JElectrochem Soc 2006;153:A1748–54.
[6] Ho Jung U, Uk Jeong S, Tae Park K, Mee Lee H, Chun K, WoongChoi D, et al. Improvement of water management in air-breathing and air-blowing PEMFC at low temperature usinghydrophilic silica nano-particles. Int J Hydrogen Energy 2007;32:4459–65.
[7] Liu X, Guo H, Ye F, Ma C. Flow dynamic characteristics inflow field of proton exchange membrane fuel cells. Int JHydrogen Energy 2008;33:1040–51.
[8] Owejan J, Gagliardo J, Sergi J, Kandlikar S, Trabold T. Watermanagement studies in PEM fuel cells, part I: fuel cell designand in situ water distributions. Int J Hydrogen Energy 2009;34:3436–44.
[9] Lu Z, Kandlikar S, Rath C, Grimm M, Domigan W, White A,et al. Water management studies in pem fuel cells, part II:ex-situ investigation of flow maldistribution, pressure dropand two-phase flow pattern in gas channels. Int J HydrogenEnergy 2009;34:3445–56.
[10] Janssen GJM. A phenomenological model of water transportin a proton exchange membrane fuel cell. J Electrochem Soc2001;148:A1313–23.
[11] You L, Liu H. A parametric study of the cathode catalyst layerof PEM fuel cells using a pseudo-homogeneous model. Int JHydrogen Energy 2001;26:991–9.
[12] Natarajan D, Nguyen T. Three-dimensional effects of liquidwater flooding in the cathode of a PEM fuel cell. J PowerSources 2003;115:66–80.
[13] Sahraoui M, Kharrat C, Halouani K. Two-dimensionalmodeling of electrochemical and transport phenomena inthe porous structures of a PEMFC. Int J Hydrogen Energy2009;34:3091–103.
[14] Pasaogullari U, Wang C. Two-phase modeling and floodingprediction of polymer electrolyte fuel cells. J Electrochem Soc2005;152:A380–90.
[15] Song D, Wang Q, Liu ZS, Huang C. Transient analysis for thecathode gas diffusion layer of PEM fuel cells. J Power Sources2006;159:928–42.
[16] Das PK, Li X, Liu ZS. A three-dimensional agglomerate modelfor the cathode catalyst layer in PEM fuel cells. J PowerSources 2008;179:186–99.
[17] Das PK, Li X, Liu ZS. Analytical approach to polymerelectrolyte membrane fuel cell performance andoptimization. J Electroanal Chem 2007;604:72–90.
[18] Trabold T, Owejan J, Jacobson D, Arif M, Huffman P. In situinvestigation of water transport in an operating PEM fuel cellusing neutron radiography: part 1 – experimental method
and serpentine flow field results. Int J Heat Mass Transf 2006;49:4712–20.
[19] Owejan J, Trabold T, Jacobson D, Arif M, Kandlikar S. Effectsof flow field and diffusion layer properties on wateraccumulation in a PEM fuel cell. Int J Hydrogen Energy 2007;32:4489–502.
[20] Ous T, Arcoumanis C. The formation of water droplets inan air-breathing PEMFC. Int J Hydrogen Energy 2009;34:3476–87.
[21] Pasaogullari U, Wang C. Liquid water transport in gasdiffusion layer of polymer electrolyte fuel cells. JElectrochem Soc 2004;151:A399–406.
[22] Feindel K, LaRocque L, Starke D, Bergens S, Wasylishen R. Insitu observations of water production and distribution in anoperating H2/O2 PEM fuel cell assembly using 1H NMRmicroscopy. J Am Chem Soc 2004;126:11436–7.
[23] Park J, Li X, Tran D, Abdel-Baset T, Hussey D, Jacobson D,et al. Neutron imaging investigation of liquid waterdistribution in and the performance of a PEM fuel cell. Int JHydrogen Energy 2008;33:3373–84.
[24] Neild D, Bejan A. Convection in porous media. New York:Springer; 1999.
[25] Berning T, Djilali N. A 3D, multiphase, multicomponentmodel of the cathode and anode of a PEM fuel cell. JElectrochem Soc 2003;150:A1589–98.
[26] Wang C. A fixed-grid numerical algorithm for two-phase flowand heat transfer in porous media. Numer Heat Transf Part B1997;32:85–105.
[27] Leverett M. Capillary behavior in porous solids. Trans AIME1941;142:152–69.
[28] Udell K. Heat transfer in porous media considering phasechange and capillarity - the heat pipe effect. Int J Heat MassTransf 1985;28:485–95.
[29] Natarajan D, Nguyen T. A two-dimensional, two-phase,multicomponent, transient model for the cathode ofa proton exchange membrane fuel cell using conventionalgas distributors. J Electrochem Soc 2001;148:A1324–35.
[30] Pisani L, Murgia G, Valentini M, D’Aguanno B. A workingmodel of polymer electrolyte fuel cells - comparisonsbetween theory and experiments. J Electrochem Soc 2002;149:A898–904.
[31] Weber A, Darling R, Newman J. Modeling two-phase behaviorin PEFCs. J Electrochem Soc 2004;151:A1715–27.
[32] Parthasarathy A, Srinivasan S, Appleby A, Martin C.Temperature-dependence of the electrode-kinetics of oxygenreduction at the platinum nafion interface-A microelectrodeinvestigation. J Electrochem Soc 1992;139:2530–7.
[33] Birgersson E, Noponen M, Vynnyckya M. Analysis of a two-phase non-isothermal model for a PEFC. J Electrochem Soc2005;152:A1021–34.
[34] Park Y, Caton J. An experimental investigation of electro-osmotic drag coefficients in a polymer electrolyte membranefuel cell. Int J Hydrogen Energy 2008;33:7513–20.
[35] Perry R, Green D. Perry’s chemical engineers’ handbook. NewYork: McGraw-Hill; 1997.
[36] Bird R, Stewart W, Lightfoot E. Transport phenomena. NewYork: John Wiley & Sons Inc.; 1960.
[37] Das PK, Li X, Liu ZS. Estimation of effective transportproperties for PEM fuel cells. In: Proceedings of the 4thInternational green energy Conference. Beijing, 2008. pp.164–174. Paper ID 68.
[38] Das PK, Li X, Liu ZS. Effective transport coefficients in PEMfuel cell catalyst and gas diffusion layers: beyond Bruggemanapproximation. Appl Energy, in press.
[39] Ustohal P, Stauffer F, Dracos T. Measurement andmodeling of hydraulic characteristics of unsaturatedporous media with mixed wettability. J Contam Hydrol1998;33:5–37.
i n t e r n a t i o n a l j o u r n a l o f h y d r o g e n e n e r g y 3 5 ( 2 0 1 0 ) 2 4 0 3 – 2 4 1 62416