Embed Size (px)
Citation preview

IEEE TRANSACTIONS ON INDUSTRIAL ELECTRONICS, VOL. 56, NO. 3, MARCH 2009 685
Minimum Fuel Consumption Strategyfor PEM Fuel Cells
Carlos Andrés Ramos-Paja, Student Member, IEEE, Carlos Bordons, Member, IEEE,Alfonso Romero, Member, IEEE, Roberto Giral, Member, IEEE, and Luis Martínez-Salamero, Member, IEEE
Abstract—This paper proposes a proton exchange membranefuel cell control strategy to produce the power requested by anelectrical load, minimizing the fuel consumption and also pro-viding a regulated dc bus voltage to the load. The power systemconsists of a hybrid fuel cell/capacitor topology, and the controlobjective is to follow the minimum fuel consumption points for agiven load power profile. This is done by controlling the air pumpvoltage and regulating the fuel cell current through a dc/dc switch-ing converter. Moreover, the design and control parameters of theoutput dc bus are discussed, and the calculations are adjusted to aBallard 1.2-kW Nexa power module. Finally, the control results,fuel consumption, and fuel cell protection against oxygen star-vation phenomenon are analyzed and experimentally validated,contrasting its performance with the Nexa power module internalcontrol system.
Index Terms—Efficiency, fuel optimal control, optimization,oxygen excess ratio control, power control, proton exchangemembrane (PEM) fuel cell.
I. INTRODUCTION
PROTON exchange membrane (PEM) fuel cells are cleanand efficient electrical power generation systems, which
are currently under intense research efforts, being particularlyuseful in portable applications, small-distributed generation,and vehicle propulsion. The most important advantages are itshigh efficiency, low operating temperature, high power density,solid electrolytes, relatively low corrosion, and fast start-upcompared with other generation systems and other fuel celltypes [1]. The PEM fuel cells consume hydrogen and oxygen toproduce electrical energy. The hydrogen is provided pressurizedto the anode; next, it arrives to the anode catalytic layer whereit is dissociated into electrons and protons. The last ones flowthrough an electrolytic membrane, which blocks the electrons,to the catalytic layer of the cathode. The electrons travelthrough an external circuit to the cathode, generating electriccurrent in this process. Simultaneously, oxygen flow is provided
Manuscript received February 28, 2008; revised September 23, 2008. Firstpublished October 31, 2008; current version published February 27, 2009. Thiswork was supported in part by the Spanish Ministerio de Educación y Cienciaunder Project ENE2005-06934 and in part by the FPI scholarship under GrantBES-2006-11637.
C. A. Ramos-Paja, A. Romero, R. Giral, and L. Martínez-Salamero are withthe Departamento d’Enginyeria Electrònica, Elèctrica i Automàtica, EscolaTècnica Superior d’Enginyeria, Universitat Rovira i Virgili de Tarragona, 43007Tarragona, Spain (e-mail: [email protected]).
C. Bordons is with the Departamento de Ingeniería de Sistemas y Auto-mática, Escuela Superior de Ingenieros, Universidad de Sevilla, 410092 Sevilla,Spain (e-mail: [email protected]).
Color versions of one or more of the figures in this paper are available onlineat http://ieeexplore.ieee.org.
Digital Object Identifier 10.1109/TIE.2008.2007993
to the cathode, arriving to its catalytic layer, where oxygen, pro-tons, and electrons react, producing water and heat in the sur-face of catalytic particles. The global reaction in the fuel cell [2]is described in
H2 +12
O2 → H2O + heat + electricity. (1)
The fuel cell operation requires different auxiliary systems,including physical devices and control strategies that ensure theappropriate and safe working conditions like stack temperature,anode–cathode pressure ratio, oxygen flow, anode purge, etc.One of the most commonly used fuel cell power systems inresearch tasks is the Ballard 1.2-kW Nexa power module inFig. 1(a), composed by a stack of 46 cells with membranes of110 cm2 and other auxiliary systems. The physical configura-tion of the fuel cell Nexa module is shown in Fig. 1(b), wherethe interaction between the stack, the air pump, the humidifier,the cooling system, the hydrogen supply, and the anode purgevalve is depicted. Moreover, the Nexa module has a controlboard, where strategies to regulate the anode–cathode pressureratio and the stack temperature and humidity to ensure safeoperation conditions are implemented. Similarly, the controlboard executes safe start-up, load connection, and shutdownsequences and allows command and monitoring proceduresin a PC through the Nexa module control interface. Finally,the control board has regulation strategies for the anode purgevalve and the air pump voltage that are intended to avoidundesired phenomena like flooding and oxygen starvation. Theflooding phenomenon occurs when the water generated andthe inert gases supplied with the hydrogen get stuck in theanode, producing a decrease in the stack voltage and power [3].The oxygen starvation phenomenon occurs when the oxygensupplied to the fuel cell is not enough to react in agreementwith the demand of stack current, causing degradation of thefuel cell and decrement of the output power, and requiring toshut down the fuel cell to stop it [4].
Fig. 1(b) shows an electrical power conditioning system thatinterfaces the fuel cell and an electrical load. This system is im-portant because it adapts the fuel cell electrical behavior to theload requirements, protects the fuel cell from load transients,and allows one to control the load voltage or the fuel cell powerrequested. Fuel cell-based systems generally use an additionalenergy source to supply the load power transients and reducethe fuel cell stress, being the common choices are batteries andcapacitors. In this way, Thounthong et al. [5] present a hybridpower source using fuel cells and supercapacitors, where thefuel cell is protected from load transients but without taking
0278-0046/$25.00 © 2009 IEEE

686 IEEE TRANSACTIONS ON INDUSTRIAL ELECTRONICS, VOL. 56, NO. 3, MARCH 2009
Fig. 1. Ballard 1.2-kW Nexa power module. (a) Nexa power module. (b) Nexapower module diagram.
into account the efficiency of the fuel cell control system or theprobability of undesired effects like flooding or oxygen starva-tion. This same approach was assumed by Jiang and Dougal [6],using batteries instead of supercapacitors. Vahidi et al. madedifferent considerations in [7], where this same hybrid topologyis used but focusing intensively in the fuel cell control andsimplifying the power conditioning and dc bus voltage control.Moreover, many studies of fuel cell power control [7]–[10] andsafety operation [3], [11], [12] are reported in the literature,which can be used to improve the fuel cell power managementand conditioning behavior in order to produce less losses andreduce the probability of undesired phenomena in fuel cells.
A previous work presented in [13] analyzed the possibilityof controlling the fuel cell following the stack maximum powerpoints, using a battery to supply the load power transientsand to fix the load voltage. The work presented in this paperevaluates fuel cell and output dc bus control approaches inorder to minimize the hydrogen flow required to supply therequested load power and, also, to allow the dc bus voltageregulation. In this way, a hybrid topology is considered, wherea capacitor supplies the load power transients. The controlstrategy allows a safe and efficient fuel cell control whileminimizing fuel consumption. The dc-bus design and controlstrategies are developed and adjusted to a 1.2-kW Nexa power
module, using a detailed physical model, and validated in a realprototype. Moreover, the fuel consumptions generated by theproposed strategy and by the Nexa internal control system inthe experimental system are compared. The physical model ispresented in Section II, and the analysis and characterization ofthe fuel cell maximum power points that allow a minimum fuelconsumption are described in Section III. The dc bus designand control parameters, and the fuel cell power managementstrategy are described in Section IV. The fuel consumptionand system efficiency obtained using a load power profilewith different transient frequencies are evaluated in Section V.Finally, the conclusions of this paper are given in Section VI.
II. FUEL CELL PHYSICAL MODEL
Different mathematical and physical models of fuel cellpower systems are reported in the literature, some of them beingcontrol oriented like the one proposed by Correa et al. in [2].However, that work does not describe physically the auxiliarysystem dynamics that affect the overall power generation, andtherefore, some important variables that allow the fuel-useefficiency analysis are difficult to estimate. In a different way,the nonlinear model proposed by Pukrushpan et al. [14], [15]describes the fuel cell stack and the auxiliary system dynamicswith control purposes but considers both operating temperatureinside the cells and reactive humidity controlled and thereforeconstant, which avoids the consideration of flooding phenom-ena. Other modeling approach considers detailed auxiliarysystem models like those presented in [16] but, again, con-sidering the stack temperature constant. This was reported byJemei et al. in the artificial neural network-based model pre-sented in [17], where the stack temperature is taken into accountto calculate the output voltage and power. However, this modelis expressed in terms of an output-to-control transfer function,and therefore, it is not possible to analyze internal variablesrequired in this paper.
The model used in this paper to analyze the power gener-ation and the hydrogen consumption considers the auxiliarysystem dynamics and power consumption, the stack humidityand temperature effects, the fluid dynamics, gas diffusion, andelectrochemical reactions inside the stack [18]. Moreover, themodel is tuned to the 1.2-kW fuel cell Nexa module describedin Section I, using experimental data and taking four operatingpoints to fit the polarization curve. The stack voltage is gov-erned by the following:
Vfc = x1 + x2
(Tst − T 0
st
)+ x3 (0.5 ln(pO2,ca) + ln(pH2))
−x4 (1 − exp(−j/x5)) − x6 · j − x7 · j(1+x8) (2)
whose parameters {xk, k = 1 . . . 8} are given by
x8 =(1 + p2
4i
)/(0.25 p4i) (3)
x7 =(p4v − p3v) + (p2v − p3v) ((p4i − p3i)/(p3i − p2i))
−p(1+x8)4i + p
(1+x8)3i ((p4i − p3i)/(p3i − p2i))
(4)
x6 =((p2v − p3v) − x7p
(1+x8)3i
)/(p3i − p2i) (5)

RAMOS-PAJA et al.: MINIMUM FUEL CONSUMPTION STRATEGY FOR PEM FUEL CELLS 687
x5 = (p2i − p1i)/4 (6)
x4 = p1v − p2v − x6p2i (7)
x3 = 2 p0O2,ca(ΔVfc/ΔpO2,ca) (8)
x2 = ΔVfc/ΔTst (9)
x1 = p1v − x3
(0.5 ln
(p0O2,ca
)+ ln
(p0H2
))(10)
while the current density j is defined by
j = Ist/Afc = Ist/(A0
fc(1 − α1m1,anch))
(11)
and the stack power is given by
Pfc = Vfc · Ist. (12)
Vfc, Ist, Pst, and Tst represent the fuel cell Nexa modulevoltage, current, power, and temperature, respectively. pO2,ca
and pH2 are the oxygen cathode and hydrogen anode pressures.Afc is the effective fuel cell area, which depends on the nominalfuel cell area A0
fc and a mass fraction of the liquid water presentin the anode α1m1,anch. This value is included to considerthe effect of the anode water accumulation on the voltage.{(pki, pkv), k = 1, . . . , 4} denotes the currents and voltages ofthe experimental operating points used to model the fuel cell,and also, p0
O2,ca, p0H2
, and T 0st define a nominal operating point
where ΔVfc/ΔTst, ΔVfc/ΔpO2,ca, and α1 are measured. Thestack current considered in the model is the requested by bothload and auxiliary systems, and therefore, the stack power cor-responds to the total system consumption. The thermal and fluiddynamics are also taken into account, and detailed descriptionand validation of this physical model can be found in [18].
In summary, this model describes the static and dynamicbehaviors of the stack and auxiliary systems of a 1.2-kWNexa fuel cell module, taking into account the physical andelectrochemical effects present in the overall system and alsoconsidering thermal and fluid dynamics effects. This last char-acteristic allows the analysis of the conditions of flooding andoxygen starvation and, therefore, the design and evaluation ofcontrol strategies that tackle these undesired phenomena.
III. FUEL CELL MAXIMUM POWER POINT
CHARACTERIZATION
Fuel cell output power depends on the stack current andair pump flow rate. The stack current is the result of the loadand auxiliary system currents, and therefore, a higher air pumpflow rate implies higher current demand. For constant-stack-current conditions, this power relationship has an optimal point,where the relation between the power generated by the stackand the one spent by the air pump is maximum. In thoseoperating points, the power delivered to the load (net power)is the maximum for the load current requested.
The oxygen flow WO2,reac and hydrogen flow WH2,reac thatreact to produce a certain stack current Ist are defined by(13) and (14), respectively [1], [18], where MO2 and MH2 arethe oxygen and hydrogen molar masses and F is the Faradayconstant. Moreover, it is important to remark that the watervapor flow Wv,gen generated in the electro-chemical reaction
is defined by (15), where Mv is the vapor molar mass. From(13)–(15), it is deduced that higher reagent flow is requiredat high currents, which carries nitrogen and other inert gases,and results under these conditions in a higher production ofwater vapor. These conditions increment the probability offlooding effects, being necessary to purge the anode to removethe condensed water that degrades the fuel cell voltage andpower. This procedure is performed by the Nexa control boardby opening the anode purge valve
WO2,reac =MO2
Ist
4F(13)
WH2,reac =MH2
Ist
2F(14)
Wv,gen =MvIst
2F. (15)
Autonomous fuel cell power generation systems like theNexa module have control systems that ensure a defined small-pressure difference between the anode and cathode in order toprevent membrane damages. This implies that the oxygen flowand stack current determine the hydrogen flow, and therefore,the oxygen flow is the main control variable. The control ofthe oxygen flow is critical because deficiency in the oxygenrequired to react according to the stack current requested gen-erates the oxygen starvation effect. The relation between theoxygen flow supplied by the air pump and the one reacted isdenominated oxygen excess ratio (λO2), and it is defined in [1]as follows:
λO2 =WO2,ca,in
WO2,reac(16)
where WO2,ca,in represents the oxygen flow supplied to thecathode by the air pump.
The oxygen excess ratio must be restricted to λO2 ≥ 1,because under this limit, the fuel cell suffers oxygen starvation.In [7] and [19], for a 75-kW fuel cell, the authors propose totrack λO2 = 2, because this value prevents oxygen starvationeffect and it is close to a high efficiency range. The analysisof different control strategies for λO2 is presented in [4], andthese control considerations for the Nexa power module usingthe same physical model selected in this paper are evaluatedin [20]. The analysis of common control objectives is shownin Fig. 2, where the behavior of the net power as a functionof λO2 in constant-stack-current curves is presented. Thesenet power curves describe the effective power delivered to theload, which is the electric power generated by the stack minusthe power required by the auxiliary systems. Moreover, Fig. 2shows the λO2 profiles generated by constant voltage, λO2 =3.29, and maximum power control strategies. The constantvoltage control is not safe because its profile is near the oxygenstarvation limit; the constant λO2 = 3.29 was chosen becauseit is the highest λO2 constant value that can be achieved beforethe air pump saturation and therefore is the farthest constantvalue from starvation limit. Finally, the maximum power profiledetermines the values of λO2 , where the relation between theenergy delivered to the load and the energy spent by the air

688 IEEE TRANSACTIONS ON INDUSTRIAL ELECTRONICS, VOL. 56, NO. 3, MARCH 2009
Fig. 2. Fuel cell Nexa power module λO2 profiles.
pump is maximum, and again, this profile is far from thestarvation limit.
In the maximum power points, the stack current requestedby the load and auxiliary systems is the minimum possible toproduce the particular stack power condition. For example, inFig. 2, it is observed that the maximum power point corre-sponding to a 610-W net power is {Ist = 17.5 A, λO2 = 4.35},but this net power can be also generated in other operatingpoints like {Ist = 19 A, λO2 = 1.8}. From this minimum stackcurrent condition of the maximum power points, and from thehydrogen flow requested in the electrochemical reaction (14), itis concluded that the maximum power points correspond to theminimum fuel consumption conditions to provide a particularnet power. This paper proposes to follow these maximum powerpoints in order to supply the power requested by the load withthe minimum fuel consumption, providing safety to the fuelcell and smooth behavior of λO2 . In this way, λO2 must beregulated, following the maximum power profile, and the fuelcell net current will be also controlled to avoid high-frequencytransients that produce fast changes in the oxygen excess ratioand the output power.
Fuel cell temperature changes cause stack voltage variations,modifying, in this way, the stack power at the maximum powerpoints. According to the stack voltage (2) of the model, thevoltage variation caused by changes in the stack temperatureis described by (17), and in a defined net current and a λO2
operating point, the net power variation is given by
ΔVfc,T =x2
(Tst − T 0
st
)(17)
ΔPnet,T = ΔVfc,T · Inet. (18)
In order to identify the net-current and λO2 optimal profilesfor minimum consumption, the maximum power points wereexperimentally obtained for constant temperatures. This wasperformed by heating the cooling fan input air to control thestack temperature, being limited up to net power operatingpoints where the stack does not require heating to achieve thedesired temperature. Fig. 3 shows the experimental maximumpower points with operating conditions at 31 ◦C, 35 ◦C, and44 ◦C. Using the net power deviation given in (18), the net
power of those maximum power points at 35 ◦C is calculated,and these conditions are used to identify the net-current andλO2 optimal profiles at 35 ◦C, shown in Fig. 3 (solid line).
From the identified net current and λO2 curves, the optimaloperating conditions are calculated to produce a required netpower at 35 ◦C. Equations (19) and (20) allow one to calculatethe optimal net current (Inet,op) and λO2,op to generate arequested net power Pnet,35 when Tst = 35 ◦C. The equationparameters are given in Table I
Inet,op =3∑
k=0
[ak · (Pnet,35)k
](19)
λO2,op =5∑
k=0
[bk · (Pnet,35)k
]. (20)
To obtain Inet,op and λO2,op at different stack temperatures,it is necessary to take into account the power deviation causedby the temperature. The required net power Pnet (21) can beexpressed as the power Pnet,35 generated with the same netcurrent and λO2 at 35 ◦C plus the power deviation caused bythe temperature difference
Pnet = Pnet,35 + ΔPnet,T . (21)
From (18), it is noted that the power deviation also dependson the net current. Replacing (18) in (21), the polynomialequation presented in (22) is obtained, whose solution describesthe Pnet,35 value used to calculate the optimal operating point{Inet,op, λO2,op} that produces the required net power at thegiven stack temperature
Pnet,35 + ΔVfc,T · Inet,op − Pnet = 0. (22)
Equation (22) is a third order polynomial equation with atleast one real solution. In cases where more than one realsolution exist, the selection criteria given in (23) are usedand also constrained to the power slew-rate restriction. Theexperimental voltage deviation parameters are given in
Pnet,35 > 0if Tst > T 0
st ⇒ Pnet,35 < Pnet
if Tst < T 0st ⇒ Pnet,35 > Pnet
⎫⎬⎭ (23)
T 0st = 35 ◦C, x2 =
{0.250, if Tst < 35 ◦C0.135, if Tst > 35 ◦C.
(24)
The procedure to obtain the optimal operating point for anyrequired power and stack temperature is as follows: calculatethe required net power Pnet,35 at 35 ◦C, solving (22), and next,calculate the optimal net-current and λO2 values using (19)and (20).
Finally, to allow a comparison with the internal controlsystem of the 1.2-kW Nexa power module, its experimentalnet-current and λO2 profiles at the same temperatures of themaximum power point profiles are also shown in Fig. 3. TheNexa internal control system describes nonoptimal λO2 valuesthat require higher net currents and, therefore, higher fuelconsumption.

RAMOS-PAJA et al.: MINIMUM FUEL CONSUMPTION STRATEGY FOR PEM FUEL CELLS 689
Fig. 3. Fuel cell Nexa power module current and λO2 optimal profiles for fuel consumption efficiency. (a) Net-current profile for maximum net power.(b) λO2 profile for maximum net power.
TABLE IInet,op AND λO2,op EQUATION PARAMETERS
IV. MINIMUM FUEL CONSUMPTION POINT TRACKING
TOPOLOGY AND ALGORITHM
Equations (19) and (22) define the reference of the fuel cellnet-current control, as a function of the power requested andstack temperature. Due to the effect of the current in the be-havior of λO2 , this net-current regulation is a feedforward con-trol system that allows fast responses to power transients andsmooth λO2 behavior. Similarly, (20) defines the reference ofthe λO2 feedback control system to achieve the same minimumconsumption condition. Moreover, a slew-rate power regulationis designed to minimize the transient effects in λO2 , and this isdone by the current slope constraint and the coupling with acapacitor that provides energy in high-frequency transients.
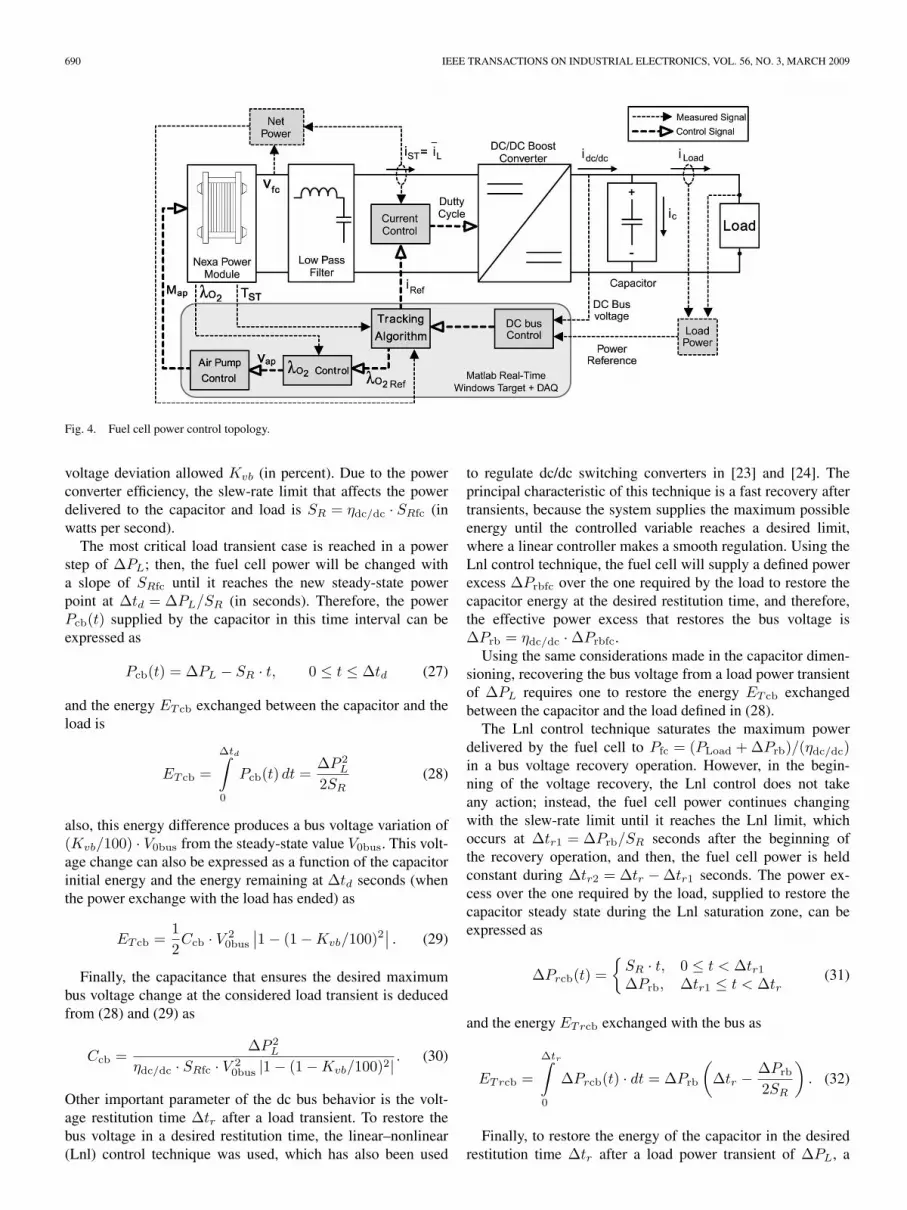
The regulation of the fuel cell current is performed byusing an input current controlled dc/dc switching converter, aswas previously proposed in [13]. Likewise, other authors haveproposed the same strategy with different objectives [5]–[7]. In[13], a battery was proposed as power transient filter, but inthis paper, a capacitor was selected due to its high-frequencycapabilities, easy state-of-charge estimation, and low serialresistance. The use of supercapacitors and fuel cells in hybridtopologies has been analyzed in [21] and [22], whose resultsare also valid for high capacitive–low serial resistance capacitorbanks. The topology used to control the power generated bythe fuel cell following the optimal λO2 and net-current profilesis shown in Fig. 4, where a boost dc/dc switching converteris controlled to define the fuel cell current and a capacitorsupplies the power transients. Moreover, the topology allowsone to control the capacitor voltage in order to provide aregulated dc bus. These controllers were implemented by using
the Matlab Real-Time Windows Target and a National Instru-ments data acquisition card to interface with the sensors andactuators.
A. DC Bus Design
In this paper, the fuel cell does not interact directly with theload; instead, the switching converter and the capacitor decou-ple the fuel cell and load currents. The net-current control of thefuel cell has two objectives: first, to follow the optimal profiledefined in (19) to support the λO2 regulation and, second, toconstrain the power slew rate of the fuel cell to allow smoothtransitions between the steady-state operating points in a loadpower transient and, therefore, to avoid the stack and air pumpstress.
In order to provide a regulated dc bus, the capacitor behavioris controlled in admissible voltage limits and power transientrestoring times. From Fig. 4, it is observed that the relationsbetween the switching converter, capacitor, and load currentsand powers are given by
idc/dc = icb + iLoad (25)
Pdc/dc = Pcb + PLoad (26)
where idc/dc and Pdc/dc correspond to the switching converter,icb and Pcb to the capacitor, and iLoad and PLoad to the load.Moreover, it is necessary to take into account the switchingconverter losses, which are represented by a power conversionefficiency of ηdc/dc, which is considered constant in all thepower range.
In a power transient, the capacitor initially supplies the powerto the load; then, the fuel cell operating point is moved to thenew steady-state, constraining its maximum power slope to thedefined slew-rate limit. If the load current has a high-frequencyripple, this one is supplied by the capacitor, and the fuel cellprovides the low-frequency components.
In order to dimension the capacitor, the following dc busparameters were defined: maximum load power transient con-sidered ΔPL (in watts), maximum fuel cell power slew rateadmissible SRfc (in watts per second), and maximum bus
690 IEEE TRANSACTIONS ON INDUSTRIAL ELECTRONICS, VOL. 56, NO. 3, MARCH 2009
Fig. 4. Fuel cell power control topology.
voltage deviation allowed Kvb (in percent). Due to the powerconverter efficiency, the slew-rate limit that affects the powerdelivered to the capacitor and load is SR = ηdc/dc · SRfc (inwatts per second).
The most critical load transient case is reached in a powerstep of ΔPL; then, the fuel cell power will be changed witha slope of SRfc until it reaches the new steady-state powerpoint at Δtd = ΔPL/SR (in seconds). Therefore, the powerPcb(t) supplied by the capacitor in this time interval can beexpressed as
Pcb(t) = ΔPL − SR · t, 0 ≤ t ≤ Δtd (27)
and the energy ET cb exchanged between the capacitor and theload is
ET cb =
Δtd∫0
Pcb(t) dt =ΔP 2
L
2SR(28)
also, this energy difference produces a bus voltage variation of(Kvb/100) · V0bus from the steady-state value V0bus. This volt-age change can also be expressed as a function of the capacitorinitial energy and the energy remaining at Δtd seconds (whenthe power exchange with the load has ended) as
ET cb =12Ccb · V 2
0bus
∣∣1 − (1 − Kvb/100)2∣∣ . (29)
Finally, the capacitance that ensures the desired maximumbus voltage change at the considered load transient is deducedfrom (28) and (29) as
Ccb =ΔP 2
L
ηdc/dc · SRfc · V 20bus |1 − (1 − Kvb/100)2| . (30)
Other important parameter of the dc bus behavior is the volt-age restitution time Δtr after a load transient. To restore thebus voltage in a desired restitution time, the linear–nonlinear(Lnl) control technique was used, which has also been used
to regulate dc/dc switching converters in [23] and [24]. Theprincipal characteristic of this technique is a fast recovery aftertransients, because the system supplies the maximum possibleenergy until the controlled variable reaches a desired limit,where a linear controller makes a smooth regulation. Using theLnl control technique, the fuel cell will supply a defined powerexcess ΔPrbfc over the one required by the load to restore thecapacitor energy at the desired restitution time, and therefore,the effective power excess that restores the bus voltage isΔPrb = ηdc/dc · ΔPrbfc.
Using the same considerations made in the capacitor dimen-sioning, recovering the bus voltage from a load power transientof ΔPL requires one to restore the energy ET cb exchangedbetween the capacitor and the load defined in (28).
The Lnl control technique saturates the maximum powerdelivered by the fuel cell to Pfc = (PLoad + ΔPrb)/(ηdc/dc)in a bus voltage recovery operation. However, in the begin-ning of the voltage recovery, the Lnl control does not takeany action; instead, the fuel cell power continues changingwith the slew-rate limit until it reaches the Lnl limit, whichoccurs at Δtr1 = ΔPrb/SR seconds after the beginning ofthe recovery operation, and then, the fuel cell power is heldconstant during Δtr2 = Δtr − Δtr1 seconds. The power ex-cess over the one required by the load, supplied to restore thecapacitor steady state during the Lnl saturation zone, can beexpressed as
ΔPrcb(t) ={
SR · t, 0 ≤ t < Δtr1ΔPrb, Δtr1 ≤ t < Δtr
(31)
and the energy ETrcb exchanged with the bus as
ETrcb =
Δtr∫0
ΔPrcb(t) · dt = ΔPrb
(Δtr −
ΔPrb
2SR
). (32)
Finally, to restore the energy of the capacitor in the desiredrestitution time Δtr after a load power transient of ΔPL, a

RAMOS-PAJA et al.: MINIMUM FUEL CONSUMPTION STRATEGY FOR PEM FUEL CELLS 691
power excess limit ΔPrbfc is required, obtained from (28) and(32) as
ΔPrbfc =SRfc
⎡⎣Δtr −
√Δt2r −
(ΔPL
ηdc/dc · SRfc
)2⎤⎦
Δtr ≥(
ΔPL
ηdc/dc · SRfc
)
ΔPrbfc ≤Δtr · SRfc (33)
where the constraints on Δtr and ΔPrbfc are achieved when thefuel cell power slew-rate limit is fulfilled.
The Lnl control technique allows a smooth regulation nearthe steady state by means of a linear control system, andtherefore, the Lnl saturation will affect the fuel cell powercontrol reference in high power transients. In power transientsthat require a fuel cell power below the defined limit, the linearcontrol defines the power reference, but again respecting thefuel cell power slew-rate limit.
The series resistance of the capacitor generates power lossesthat can be considerable, depending on its ohmic value and thebus voltage. For the previous ΔPL load transient, the capacitorcurrent is given in (34), and the energy dissipated in its serialresistance Rs is described by
icb(t) =ΔPL − SR · t
Vbus, 0 ≤ t ≤ Δtd (34)
Esr,cb =
Δtd∫0
i2cb(t) · Rs dt =Rs · ΔP 3
L
3ηdc/dc · SRfc · V 2bus
. (35)
The dissipation factor KE,RS, defined in (36), presents the
energy spent in Rs in comparison to the energy exchanged withthe capacitor
KRS=
Esr,cb
ET cb=
2Rs · ΔPL
3V 2bus
. (36)
The power consumption in Rs is reflected as an incrementin the restitution time Δtr, caused by the excess of energyrequired to restore the bus voltage. Assuming that the energydissipated in the restitution operation is approximately equalto the one dissipated in the transient supply, the excess ofenergy required is 2Esr,cb. From (28) and (32), the incrementin the restitution time Δtr,RS
, given in (37), and the relativeincrement factor KΔt,RS
, defined in (38), are calculated
Δtr,RS=
2Rs · ΔP 3L
3V 2bus · η2
dc/dc · ΔPrbfc · SRfc(37)
KΔt,RS=
Δtr,RS
Δtr=
4Rs · ΔP 3L
3V 2bus
(η2dc/dc · ΔP 2
rbfc + ΔP 2L
) . (38)
In this paper, a 48-V dc bus has been selected to illustratethe design and control process, due to its common use (i.e.,aerospace and telecom power systems). The dc-bus parametersare summarized in Table II.
TABLE IIDC-BUS PARAMETERS
The fuel cell power slew rate has been selected from theexperimental behavior of the Nexa power module, and themaximum power transient corresponds to 30% of the Nexapower module range. Moreover, the bus restitution time andfuel cell power excess have been designed to obtain an accept-able response time without an excessive excursion of the fuelcell power from its final steady state. The capacitor requiredin this application must support up to 50.4 V, and actually, asingle capacitor or supercapacitor that fulfills both voltage andcapacitance specifications does not exist; therefore, it is nec-essary to use a module constituted by commercially availablecapacitors. In this paper, the capacitor bank was implementedusing a parallel array of 7 Nippon Chemi-con U36D capacitorsof 0.27 F and 63 V, each one with a serial resistance of 4 mΩ.The capacitor-bank theoretical serial resistance is 571 μΩ,but the experimental value that considers also the connectorsand cables is Rs = 1.87 mΩ. From (36) and (38), and takinginto account the accepted variation of the bus voltage definedby Kvb, the energy dissipated in Rs is between 0.015% and0.018% of the energy exchanged with the load, and the incre-ment in the restitution time is between 0.027% and 0.033%.
Finally, a supercapacitor system with the same characteristicscan be implemented with commercially available devices, i.e.,using a serial array of 27 AN-series LS ultracapacitors of 50 Fand 2.7 V. Each one of these supercapacitors has a serialresistance Rs0 = 16 mΩ, which results in a total Rs = 432 mΩthat generates an energy dissipation between 3.40% and 4.16%of the energy exchanged with the load, and an increment inthe restitution time is between 6.30% and 7.70%. In terms ofresistive losses, for high voltage applications, it is more efficientto use high voltage capacitors in parallel instead of low voltagesupercapacitors in series.
B. Fuel Cell Power Control Algorithm
The fuel cell is controlled to supply the power demanded bythe load and required to regulate the dc bus. Moreover, the airpump voltage and dc/dc converter input current are regulatedto produce the demanded electric power while tracking theminimum fuel consumption points.
The fuel cell current is controlled to follow the profile definedin (19), which allows the fast tracking of the operating pointsthat produce the requested power with maximum efficiency.Moreover, the current is affected by the power slew-rate reg-ulation system, constraining the maximum current slope andtherefore reducing the λO2 control transients that deviate itfrom its optimal profile. The λO2 control has been designed

692 IEEE TRANSACTIONS ON INDUSTRIAL ELECTRONICS, VOL. 56, NO. 3, MARCH 2009
using a linearized model that depends on the fuel cell currentIst and air pump voltage Vap obtained in [20] and employedin (39). The linearization has been made around an operatingpoint of 15 A and 69.9% of the maximum air pump voltage
λO2(s) =[ 0.01218s2+0.01802s+0.7242
s3+3.45s2+7.324s+5.745−0.2659s−0.001432
s+0.005318
]T[Vap(s)Ist(s)
]. (39)
The controller developed to regulate λO2 has a feed-backcomponent designed to obtain a gain margin of 10 dB and aphase margin of 60◦. Moreover, the controller has a feedforwardcomponent that depends on the current, designed to obtainthe same gain margin. The transfer function that defines thebehavior of the air pump voltage to control λO2 in a desiredprofile is summarized in (40), where eλO2
(s) is the deviation ofλO2 from the desired value
Vap(s) =[158.1
1 + 0.44s
1 + 26s1.2
] [eλO2
(s)Ist(s)
]+ 40. (40)
The model described in (39) considers a controlled air pumpthat produces the desired air flow, and its control strategy corre-sponds to the Nexa regulation system for this device. In order toperform an experimental validation of the proposed λO2 controland minimum consumption strategies, an externally accessiblecontroller for the air pump has been developed. This controlleris designed to reproduce the closed loop behavior of the airpump controlled by the Nexa board, and following the identifiedNexa control strategy, the feedforward controller given in (41)has been implemented. The controller defines the air pumpmotor speed reference Map to obtain an air flow that is equal tothe one generated by the Nexa air pump controller at the samecontrol voltage Vap condition
Map(s) = 1.315s2 + 11.3s + 13
s2 + 16.7s + 25.5Vap(s). (41)
The designed λO2 and air pump controllers were used toevaluate the behavior of the fuel cell and dc bus systems inresponse to high-frequency load power transients. The changein the requested load power determines the reference of the fuelcell current controlled by the dc/dc converter and for the airpump voltage control system to follow the optimal profiles thatensure a minimum hydrogen consumption for the load profile.
The fuel cell power conditioning system developed is shownin Fig. 5, where the output bus 1.9-F capacitor bank, thecontrolled dc/dc converter, and the input filter are observed.The input filter is a low pass L–C network (L = 1.5 μH;C = 1000 μF) designed to filter the switching frequency com-ponents of the stack current. The 1.2-kW switching converterwas implemented using four 300-W boost dc/dc convertermodules in parallel, each one of them with a local sliding-modecurrent control and its references being regulated by an inputcurrent controller to obtain null steady-state error in the currentrequested to the fuel cell. The parameters of the convertersare L = 43 μH, Ci = 22 μF, and Co = 22 μF, where Ci andCo are the input and output capacitors, respectively. Finally,to constrain the stack current slew rate in the capacitor-bank
Fig. 5. Fuel cell power conditioning system.
start-up charge transient, a 10-Ω charge resistor was connectedin series with the fuel cell. When the capacitor bank reachesthe fuel cell voltage, this charge resistor is short-circuited byturning on a switch connected in parallel with it.
Fig. 6(a) shows the experimental behavior of the fuel cellcontrol system in response to a 300-W step-down load powertransient. The action of the 250-W/s slew-rate regulation systemand the bus restoring system that saturates the power excessover the one required by the load to the designed value isobserved. The corresponding λO2 optimal reference and experi-mentally controlled profiles for the fuel cell power delivered areshown in Fig. 6(b), where satisfactory performance and smoothtransitions are observed. Finally, Fig. 6(c) shows the measuredbus voltage profile, where the capacitor bank supplies the high-frequency transient and, therefore, its voltage is modified in theexpected deviation, and it is also restored by the bus controlsystem in the specified restitution time. Similarly, Fig. 6(d)–(f)shows the experimental behaviors of the fuel cell and dc buscontrol system in response to a 250-W step-up power transient.The expected performance of the control system and a satis-factory λO2 regulation in the tracking of the minimum fuelconsumption points are observed. Moreover, a small λO2 ripplecaused by the air flow system is noted.
V. FUEL CONSUMPTION AND EFFICIENCY ANALYSIS
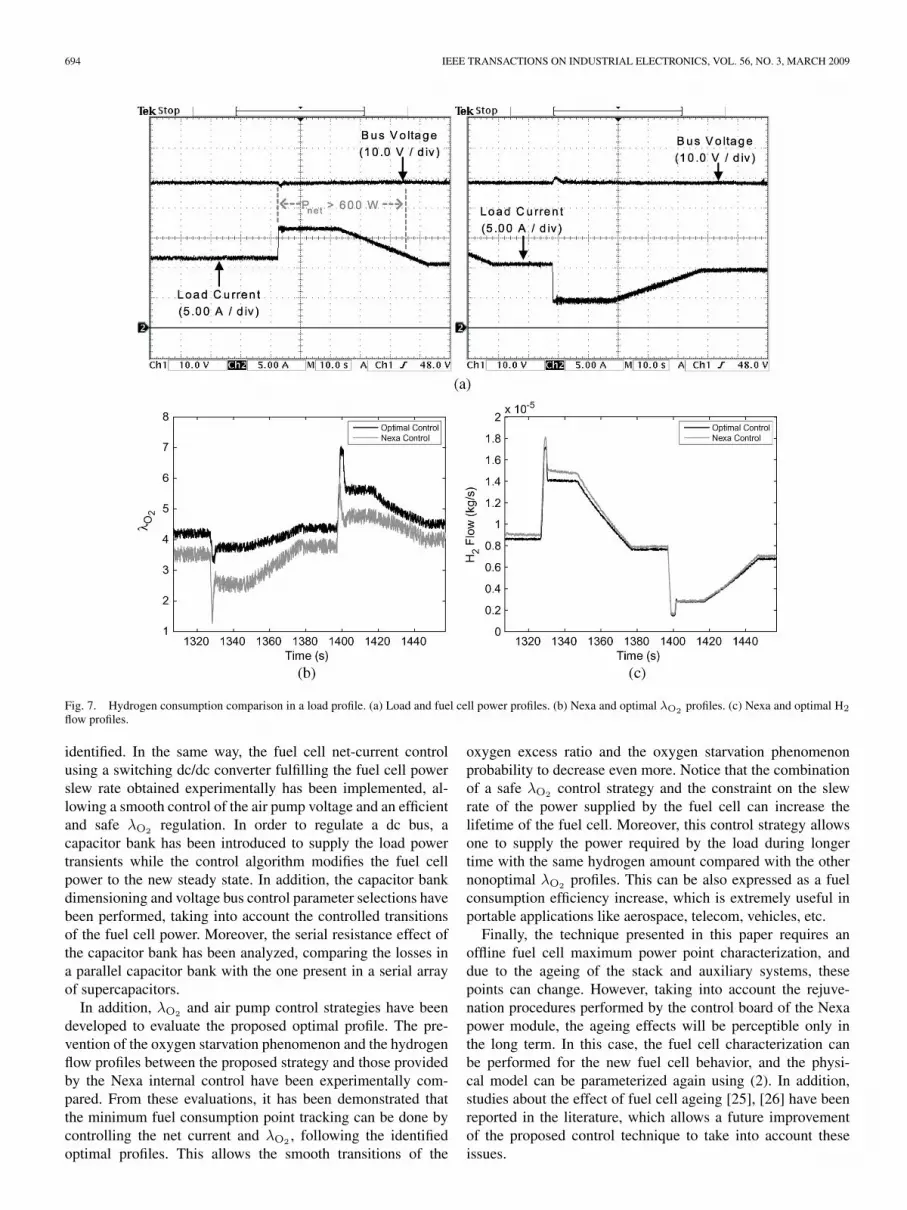
To analyze the fuel consumption efficiency of the fuel cellsystem with the proposed λO2 control profile, its hydrogen flowprofile was compared with the one generated by the internalcontrol system implemented in the Nexa control board. Thiswas performed by controlling an electronic load to obtain theload current profile shown in Fig. 7(a), which requests high- andlow-frequency transients while the bus control system regulatesthe load voltage. The capacitor bank provides the energy tothe load in the transients that do not fulfill the selected powerslew rate. In the same figure, the experimental behavior of thedc bus voltage is presented, which corroborates the expectedcapacitor-bank energy control and the constraint of its voltageto the maximum admissible deviation limits.

RAMOS-PAJA et al.: MINIMUM FUEL CONSUMPTION STRATEGY FOR PEM FUEL CELLS 693
Fig. 6. Fuel cell and dc bus control in load power transients. (a) Step-down power profiles. (b) Step-down λO2 profile. (c) Step-down bus voltage. (d) Step-uppower profiles. (e) Step-up λO2 profile. (f) Step-up bus voltage.
The defined load profile was applied to the fuel cell systemworking with both Nexa and optimal profile controllers. Thefuel cell net power profiles in both cases were the same dueto the decoupling performed by the dc/dc converter and itspower slope limitation. The experimental λO2 profiles per-formed by Nexa and optimal profile controllers are shown inFig. 7(b), where the last one performs an accurate tracking ofthe minimum consumption points. This was done because ofthe satisfactory performance of the λO2 and air pump controlsystems at the optimal profile. The λO2 profile generated by theNexa module internal control follows a similar behavior com-pared with the optimal profile but has significant differencesin the steady-state values. Moreover, the Nexa controlled pro-file presents lower regulation in load power transients, whichcould be dangerous for the fuel cell because this implies ahigh probability of entering in an oxygen starvation condition.Fig. 7(c) shows the experimental hydrogen flows generated byboth control strategies to supply the load power. A significantreduction of the hydrogen flow requested at high power usingthe optimal profile control instead of the Nexa internal controland, also, a small reduction at low power are observed. Thesebehaviors are in agreement with the corresponding λO2 profilesand the fuel cell power characterization shown in Fig. 3, where,at λO2 values far from the maximum power points, highercurrents are required to produce the desired net power and,therefore, higher hydrogen consumption.
Finally, considering a hydrogen cylinder of 240 g, the pre-sented load power profile in Fig. 7(a) could be supplied bythe electrical power generation system during 8 h, using theNexa internal control. Using the optimal profile control, this
load power profile can be supplied during an addition of18.7 min with the same hydrogen cylinder. This supply timeexcesses can be also expressed in terms of fuel-use efficiency,the optimal profile control being 3.87% more efficient than theNexa internal control in this particular case. The analysis showsa higher efficiency of the optimal profile control comparedwith the Nexa internal control for high power profiles. In thisway, in the high power component of the requested net powerprofile (Pnet ≥ 600 W), the optimal profile control is 4.43%more efficient than the Nexa internal control. Similarly, in thelow power component (Pnet < 600 W), the optimal profilecontrol is 2.89% more efficient than the other strategy. Finally,for a constant fuel cell net power of 885 W, the optimalprofile control is 5.2% more efficient than the Nexa internalcontrol.
With these results, the optimal profile control allows oneto supply the load for a longer time with the same hydrogenstorage than the other strategies which generate nonoptimalλO2 profiles. This implies an increment in the efficiency of theoverall electrical energy generation system based on fuel cells.Moreover, the developed control strategies protect the stack bydecreasing the probability of oxygen starvation.
VI. CONCLUSION
In this paper, a fuel cell maximum power point character-ization in function of the oxygen excess ratio λO2 and stacktemperature has been presented. Moreover, net-current and λO2
optimal profiles that produce lower losses to supply a desiredpower and prevent oxygen starvation phenomenon have been
694 IEEE TRANSACTIONS ON INDUSTRIAL ELECTRONICS, VOL. 56, NO. 3, MARCH 2009
Fig. 7. Hydrogen consumption comparison in a load profile. (a) Load and fuel cell power profiles. (b) Nexa and optimal λO2 profiles. (c) Nexa and optimal H2
flow profiles.
identified. In the same way, the fuel cell net-current controlusing a switching dc/dc converter fulfilling the fuel cell powerslew rate obtained experimentally has been implemented, al-lowing a smooth control of the air pump voltage and an efficientand safe λO2 regulation. In order to regulate a dc bus, acapacitor bank has been introduced to supply the load powertransients while the control algorithm modifies the fuel cellpower to the new steady state. In addition, the capacitor bankdimensioning and voltage bus control parameter selections havebeen performed, taking into account the controlled transitionsof the fuel cell power. Moreover, the serial resistance effect ofthe capacitor bank has been analyzed, comparing the losses ina parallel capacitor bank with the one present in a serial arrayof supercapacitors.
In addition, λO2 and air pump control strategies have beendeveloped to evaluate the proposed optimal profile. The pre-vention of the oxygen starvation phenomenon and the hydrogenflow profiles between the proposed strategy and those providedby the Nexa internal control have been experimentally com-pared. From these evaluations, it has been demonstrated thatthe minimum fuel consumption point tracking can be done bycontrolling the net current and λO2 , following the identifiedoptimal profiles. This allows the smooth transitions of the
oxygen excess ratio and the oxygen starvation phenomenonprobability to decrease even more. Notice that the combinationof a safe λO2 control strategy and the constraint on the slewrate of the power supplied by the fuel cell can increase thelifetime of the fuel cell. Moreover, this control strategy allowsone to supply the power required by the load during longertime with the same hydrogen amount compared with the othernonoptimal λO2 profiles. This can be also expressed as a fuelconsumption efficiency increase, which is extremely useful inportable applications like aerospace, telecom, vehicles, etc.
Finally, the technique presented in this paper requires anoffline fuel cell maximum power point characterization, anddue to the ageing of the stack and auxiliary systems, thesepoints can change. However, taking into account the rejuve-nation procedures performed by the control board of the Nexapower module, the ageing effects will be perceptible only inthe long term. In this case, the fuel cell characterization canbe performed for the new fuel cell behavior, and the physi-cal model can be parameterized again using (2). In addition,studies about the effect of fuel cell ageing [25], [26] have beenreported in the literature, which allows a future improvementof the proposed control technique to take into account theseissues.

RAMOS-PAJA et al.: MINIMUM FUEL CONSUMPTION STRATEGY FOR PEM FUEL CELLS 695
REFERENCES
[1] J. Pukrushpan, A. Stefanopoulou, and H. Peng, “Control of fuel cellbreathing,” IEEE Control Syst. Mag., vol. 24, no. 2, pp. 30–46, Apr. 2004.
[2] J. Correa, F. Farret, L. Canha, and M. Simoes, “An electrochemical-based fuel-cell model suitable for electrical engineering automation ap-proach,” IEEE Trans. Ind. Electron., vol. 51, no. 5, pp. 1103–1112,Oct. 2004.
[3] A. Hernandez, D. Hissel, and R. Outbib, “Fuel cell fault diagnosis: Astochastic approach,” in Proc. IEEE ISIE, 2006, vol. 6, pp. 1984–1989.
[4] C. Bordons, A. Arce, and A. del Real, “Constrained predictive controlstrategies for PEM fuel cells,” in Proc. Amer. Control Conf., 2006,pp. 2486–2491.
[5] P. Thounthong, S. Rael, and B. Davat, “Control strategy of fuel cell andsupercapacitors association for a distributed generation system,” IEEETrans. Ind. Electron., vol. 54, no. 6, pp. 3225–3233, Dec. 2007.
[6] Z. Jiang and R. Dougal, “A compact digitally controlled fuel cell/batteryhybrid power source,” IEEE Trans. Ind. Electron., vol. 53, no. 4, pp. 1094–1104, Jun. 2006.
[7] A. Vahidi, A. G. Stefanopoulou, and H. Peng, “Current management ina hybrid fuel cell power system: A model-predictive control approach,”IEEE Trans. Control Syst. Technol., vol. 14, no. 6, pp. 1047–1057,Nov. 2006.
[8] J. Pukrushpan, A. Stefanopoulou, and H. Peng, “Modeling and control forPEM fuel cell stack system,” in Proc. Amer. Control Conf., 2002, vol. 4,pp. 3117–3122.
[9] M. Hatti, “Neural network controller for PEM fuel cells,” in Proc. IEEEISIE, 2007, pp. 341–346.
[10] A. Giustiniani, G. Petrone, C. Pianese, M. Sorrentino, G. Spagnuolo,and M. Vitelli, “PEM fuel cells control by means of the perturband observe technique,” in Proc. 32nd Annu. IEEE IECON, 2006,pp. 4349–4354.
[11] B. Wahdame, D. Candusso, X. Francois, F. Harel, M.-C. Pera, D. Hissel,and J.-M. Kauffmann, “Dual response surface approach for the analysisof a fuel cell durability test,” in Proc. 32nd Annu. IEEE IECON, 2006,pp. 4337–4342.
[12] P. Coddet, M.-C. Pera, D. Candusso, and D. Hissel, “Study of protonexchange membrane fuel cell safety procedures in case of emergencyshutdown,” in Proc. IEEE ISIE, 2007, pp. 725–730.
[13] C. Ramos, A. Romero, R. Giral, and L. Martinez-Salamero, “Maximumpower point tracking strategy for fuel cell power systems,” in Proc. IEEEISIE, 2007, pp. 2613–2618.
[14] J. Pukrushpan, A. Stefanopoulou, and H. Peng, “Control-orientedmodeling and analysis for automotive fuel cell systems,” J. Dyn. Syst.Meas. Control, vol. 126, no. 1, pp. 14–25, Mar. 2004.
[15] J. T. Pukrushpan, A. G. Stefanopoulou, and H. Peng, Control of Fuel CellPower Systems. London, U.K.: Springer-Verlag, 2004.
[16] M. Tekin, D. Hissel, M.-C. Pera, and J. Kauffmann, “Energy-managementstrategy for embedded fuel-cell systems using fuzzy logic,” IEEE Trans.Ind. Electron., vol. 54, no. 1, pp. 595–603, Feb. 2007.
[17] S. Jemei, D. Hissel, M.-C. Pera, and J. Kauffmann, “A new model-ing approach of embedded fuel-cell power generators based on artificialneural network,” IEEE Trans. Ind. Electron., vol. 55, no. 1, pp. 437–447,Jan. 2008.
[18] A. J. del Real, A. Arce, and C. Bordons, “Development and experimentalvalidation of a PEM fuel cell dynamic model,” J. Power Sources, vol. 173,no. 1, pp. 310–324, Nov. 2007.
[19] K.-W. Suh and A. G. Stefanopoulou, “Performance limitations of air flowcontrol in power-autonomous fuel cell systems,” IEEE Trans. ControlSyst. Technol., vol. 15, no. 3, pp. 465–473, May 2007.
[20] A. Arce, D. Ramirez, A. del Real, and C. Bordons, “Constrained explicitpredictive control strategies for PEM fuel cell systems,” in Proc. 46thIEEE Conf. Decision Control, 2007, pp. 6088–6093.
[21] J. Moreno, M. Ortuzar, and J. Dixon, “Energy-management system for ahybrid electric vehicle, using ultracapacitors and neural networks,” IEEETrans. Ind. Electron., vol. 53, no. 2, pp. 614–623, Apr. 2006.
[22] M. Ortuzar, J. Moreno, and J. Dixon, “Ultracapacitor-based auxil-iary energy system for an electric vehicle: Implementation and eval-uation,” IEEE Trans. Ind. Electron., vol. 54, no. 4, pp. 2147–2156,Aug. 2007.
[23] J. Quintero, A. Barrado, M. Sanzand, C. Ragaand, and A. Lazaro, “Band-width and dynamic response decoupling in a multi-phase VRM by apply-ing linear–non-linear control,” in Proc. IEEE ISIE, 2007, pp. 3373–3378.
[24] A. Barrado, A. Lazaro, R. Vazquez, V. Salas, and E. Olias, “The fastresponse double buck DC–DC converter (FRDB): Operation and outputfilter influence,” IEEE Trans. Power Electron., vol. 20, no. 6, pp. 1261–1270, Nov. 2005.
[25] E. Laffly, M.-C. Pera, and D. Hissel, “Polymer electrolyte membrane fuelcell modelling and parameters estimation for ageing consideration,” inProc. IEEE ISIE, 2007, pp. 180–185.
[26] B. Wahdame, D. Candusso, X. Franois, F. Harel, M.-C. Pera, D. Hissel,and J.-M. Kauffmann, “Comparison between two PEM fuel cell durabilitytests performed at constant current and under solicitations linked to trans-port mission profile,” Int. J. Hydrogen Energy, vol. 32, no. 17, pp. 4523–4536, Dec. 2007.
Carlos Andrés Ramos-Paja (S’08) received (withhonors) the Ingeniera Electrónica and Master enIngeniería Automática degrees from the Universi-dad del Valle, Cali, Colombia, in 2002 and in2005, respectively. He is currently working towardthe Ph.D. degree in the Departamento d’EnginyeriaElectrònica, Elèctrica i Automàtica, Escola TècnicaSuperior d’Enginyeria, Universitat Rovira i Virgili deTarragona, Tarragona, Spain, where he is working inthe fields of fuel cell control and power electronics.
Carlos Bordons (M’98) received the Ph.D. degree inelectrical engineering from the University of Seville,Seville, Spain, in 1994.
He joined the Departamento de Ingeniería de Sis-temas y Automática, University of Seville, as anAssistant Professor, where he is currently a FullProfessor. He has worked on different projects incollaboration with industry in fields such as controlof steam generators in sugar factories, simulation andoptimization of oil pipeline networks, automation ofcopper furnaces, or modeling and control of fuel
cell systems. His recent work has focused on power management in hybridsystems, including fuel cells as power sources, as is the case of hybrid vehiclesand multigenerator electrical systems. He is the coauthor of the books ModelPredictive Control in the Process Industry and Model Predictive Control (firstand second editions) published by Springer-Verlag, London, U.K. He is theholder of two related patents. His current research interests include advancedprocess control, particularly model predictive control and its application to fuel-cell-based systems.
Dr. Bordons was elected as a member of the European Union ControlAssociation Council in 2007.
Alfonso Romero (S’97–M’02) received the Inge-niero de Telecomunicación and Ph.D. degrees fromthe Universitat Politècnica de Catalunya, Barcelona,Spain, in 1994 and 2001, respectively.
He is currently an Associate Professor with theDepartamento d’Enginyeria Electrònica, Elèctrica iAutomàtica, Escola Tècnica Superior d’Enginyeria,Universitat Rovira i Virgili de Tarragona, Tarragona,Spain, where he is working in the fields of instrumen-tation and power electronics.

696 IEEE TRANSACTIONS ON INDUSTRIAL ELECTRONICS, VOL. 56, NO. 3, MARCH 2009
Roberto Giral (S’94–M’02) received the IngenieroTécnico de Telecomunicación, Ingeniero de Teleco-municación, and Ph.D. (with honors) degrees fromthe Universitat Politècnica de Catalunya, Barcelona,Spain, in 1991, 1994, and 1999, respectively.
He is currently an Associate Professor with theDepartamento d’Enginyeria Electrònica, Elèctrica iAutomàtica, Escola Tècnica Superior d’Enginyeria,Universitat Rovira i Virgili de Tarragona, Tarragona,Spain, where he is working in the field of powerelectronics.
Luis Martínez-Salamero (S’77–M’85) received theIngeniería de Telecomunicaciones and Ph.D. de-grees from the Universitat Politécnica de Catalunya,Barcelona, Spain, in 1978 and 1984, respectively.
From 1978 to 1992, he taught circuit theory, ana-log electronics, and power processing at the EscuelaTécnica Superior de Ingenieros de Telecomunicaciónde Barcelona, Barcelona. During the academic year1992–1993, he was a Visiting Professor at the Centerfor Solid State Power Conditioning and Control,Deparment of Electrical Engineering, Duke Univer-
sity, Durham, NC. He is currently a Full Professor with the Departamentod’Enginyeria Electrònica, Elèctrica i Automàtica, Escola Tècnica Superiord’Enginyeria, Universitat Rovira i Virgili de Tarragona, Tarragona, Spain. Dur-ing the academic year 2003–2004, he was a Visiting scholar at the Laboratoired’Architecture et d’Analyse des Systémes, Centre National de la RechercheScientifique, Toulouse, France. He has published numerous papers in scientificjournals and conference proceedings, and he is the holder of a U.S. patenton electric energy distribution in vehicles by means of a bidirectional dc-to-dc switching converter. He is the Director of the Grupo de Automática yElectrónica Industrial, which is a research group on industrial electronicsand automatic control whose main research fields are power conditioning forvehicles, satellites, and renewable energy. His research interests are in thefields of structure and control of power conditioning systems for autonomoussystems.
Dr. Martínez-Salamero served as the President of the Joint Spanish Chapterof the IEEE Power Electronics and IEEE Industrial Electronics Societies during2005–2008. He was a Guest Editor of the IEEE TRANSACTIONS ON CIRCUITS
AND SYSTEMS “Special Issue on Simulation, Theory, and Design of Switched-Analog Networks (August 1997).” He was a Distinguished Lecturer of the IEEECircuits and Systems Society during 2001–2002.