Embed Size (px)
Citation preview
PADCO, INC.Planning and Development Collaborative International
ANALYSIS OF SURVEY RESULTSTO ESTIMATE EFFECTIVE DEMAND FOR HOUSING IN SZCZECIN
PREPARED FOR
THE UNITED STATES AGENCY FOR INTERNATIONAL DEVELOPMENTOFFICE OF HOUSING AND URBAN PROGRAMS
Contract No. EUR 0034-C-004029-00, RFS 40
BYREGINA ARMSTRONG
MARTHA SICKLES-GRABOWSKAMARIUSZ CZEPCZYNSKI
SEPTEMBER 1997
PADCO, Inc.1025 Thomas Jefferson St., NW, Suite 170, Washington DC 20007, USA
4.
2.
..,j.
Table of Contents
PREFACE
PART I: THE DEMAND FOR HOUSING IN SZCZECIN
1.0 Introduction
2.0 Survey of Housing Needs, Preferences & Ability to Pay
2.1 Housing Need
2.2. Housing Preferences
2.3 Household Ability to Pay
2.4 Nature of Demand: Effective Demand vs Non-Market Demand
2.5 Demand for Renovation
3.0 Extrapolation of Results to the Universe of Households in Szczecin
PART II: LOCAL HOUSING SUPPLY OPTIONS
1. Szczecin's Housing System - Overview
1.1 Housing Stock by Ownership
Existing Housing : Rental Housing
2.1 Communal Rental Unit Costs
2.2 Private Market Rental Housing
2.3 Cooperatives
2.4 Enterprise Housing
City Supported Programs for Housing and Community Improvement
3.1 Small Improvement Program
3.2 Our House Program
3.3 The Local Initiatives Program for Neighborhood and InfrastructureImprovements
New Development
4.1 Cooperative Housing
4.2 TBS: New Construction and Renovation
5. Funding and Financing Sources
5.1 Housing Allowances
- 3 -
5
8
8
9
9
11
13
21
22
24
31
31
32
34
34
36
36
37
37
37
39
41
41
43
45
47
47
5.2
5.3
5.4
Table of Contents
Contract Savings System
Mortgage Finance Products
Tax Benefits
50
51
51
PART III: AN EXAMINATION OF HOUSEHOLD INCOME IN SZCZECIN S3
1. Introduction and Objective 53
2. Household Income Findings from Habitat Survey 53
3. Method of Analysis 54
4. Tax Method 54
5. Economic Aggregates Method 56
ANNEX 1:Worksheets: Tax, population and employment data used to extrapolate incomes and 59verify the survey results.
ANNEX 2:Draft, Indicators to Monitor Housing Conditions and Progress in Attaining Housing 67Strategy Goals
- 4 -

PREFACE
Under the sponsorship of the Gmina Housing Partnership, funded by the United States Agencyfor International Development technical assistance in the area of housing was delivered to theCity of Szczecin over the past year and a half in two phases. During the first phase, assistancewas provided in the development and preparation of a housing policy and strategy documentwhich was approved by the City Council on December 2, 1996. Work during the second phasefocused on the development of an implementation plan for the housing policy \vith assistancebeing targeted to the following four programmatic areas.
(l) Assistance in the formation of a TBS and in project development.
(2) Development of strategies to monitor and improve management of the communalhousing stock.
(3) Technical assistance and training on public-private partnership strategies inhousing development, rehabilitation and revitalization.
(4) Assessment of the effective demand for housing and housing services andidentification of housing indicators.
The overall approach guiding this assistance was to assist the city officials and staff in carryingout organizational, program and project restructuring and development by providing both toolsdesigned to meet Szczecin's specific needs and best practice adapted to the local conditions.
The work was carried out in close cooperation with City staff by a team led by Martha SicklesGrabowska, PADCO resident advisor and Director ofUrbecon, Sp.zo.o. The team included localconsultants and consulting firms: Marcin Szpak of DS Consultants, Mariusz Czepczynski, Dr.Marek Majchrzak, Dr. Tomasz Zelawski, Jerzy Fiszer and Zofia Pindor of Habitat, SopotCenter for Social Research; and PADCO short term consultants: Regina Armstrong ofUrbanomics, as well as John Driscoll, Mona Serageldin and David Jones of the Harvard Unit forHousing and Urbanization (HUHU).
Vice President Piotr Mync was the City leader directly responsible for this program, withcoordination and cooperation provided by Szczecin City Board Member Janusz Szewczuk. Theinterdisciplinary nature of the work resulted in cooperation with 14 city departments and otherentities: the Renovation Team, Housing Department, Housing Policy Group, Bureau of CityDevelopment and Coordination, Architecture and Building Inspection Department, the UrbanPlanning Studio and the communal housing management companies. As the Szczecin TBSformed, its leadership became close counterparts. Staff and overall project coordination wascarried out by Aleksandra Piskorska who was recently replaced by Katarzyna StachowiakBongwa.
- 5 -

The fourth programatic area is addressed in this report. It is focused primarily on an assessmentof the effective demand for housing in Szczecin, and includes identification of housing indicatorswhich meet the monitoring needs of Polish cities.
Effective Demand for Housing
This project originated from review of the extensive assessment of local housing conditionsconducted by the Szczecin Housing Policy Group as background for the preparation of the city's
local housing policy. A glaring deficiency in their thorough research was a lack of information
on household income and housing expenditure, data which is essential to developing an effectivebousing policy and strategy. In the absence such data on local income, a three-phase etTortevolved to develop a baseline information on local income.
During the initial phase, local research firms, Habitat and the Sopot Social Research Center(SSRC), were commissioned to conduct a field survey of 1,000 families selected to berepresentative of the Szczecin city population. The survey instrument was designed with inputfrom the city and PADCO team. The initial survey results were analyzed and summarized byHabitat in a repOli officially published by the City as part of its housing policy analysis. I Thereader is referred to that document to obtain a more detailed explanation of the purpose of thesurvey, the methodology and a comprehensive summary of survey results. Training of SzczecinCity staff on the use of the data generated by the survey was also provided by Habitat in order toenable the staff to carry out additional analysis, as suggested by many participants engaged in thevarious segments of the local housing system.
The Habitat/SSRC report generated many questions, comments and requests for more extensiveanalysis. Addressing the issues of real effective demand and housing preference was the subjectof Phase 3.
The second phase of effort to develop local income data included the empirical examination oflocal household income based on administrative records of the Tax Offices and statistical datafrom the Statistical Offices to verify the the Habitat/SSRC survey findings. Part 3 of this reportcontains a summary of the analyses of these two alternative data sources - tax records andeconomic aggregates.
The initial first phase report on the Habitat/SSRC survey generated many questions, commentsand requests for more extensive analysis. Once the survey findings were positively verified inphase 2, a more in-depth third phase analysis was conducted to (a) examine supply side optionsand (b) tabulate further correlations in response to specific questions on effective demand andhousing preference posed by the city team. These results of this analysis are included found inParts 1 and 2 of this report.
"Opinions, Needs and Housing Preferences: Survey Results" (published informally by HabitatConsulting Office and City of Szczecin, May J997.
- 6 -
Housing Indicators
Throughout the program, emphasis was placed on the importance of identifying measures formonitoring key conditions in the housing sector and progress in attaining housing policy goals.One objective of this project was to create a data base of indicators to monitor both the localhousing system and the progress of housing strategy implementation. The indicator data base,included in Annex I to the present Report (Polish translation only), was developed inconjunction with the Housing Policy Group. It reflects existing data as well as some indicatorsfor which data must still be generated. Many of the indicators may be used to monitor goalattainment of the housing policy. This is very much a "work in progress" since the City ofSzczecin has not as yet developed an action plan for implementing its housing policy due torecent reorganization of housing functions. The new manager of the Housing Policy Group hasexpressed his commitment to implementing the indicator system and completing the strategy forhousing policy implementation.
- 7 -
PART I
THE DEMAND FOR HOUSING IN SZCZECIN
1.0 Introduction
In a market economy, effective housing demand reflects not only needs and preferences,but also ability to pay. Moreover, satisfaction can be an imperfect indicator of need. Need is bestdefined by measurement against acceptable standards of housing condition, such as householdoccupancy, housing size, and physical condition. Preferences are typically gauged by desiredchanges in housing condition, when comparing existing housing characteristics like buildingstock, type of ownership, interior quality and neighborhood location to new or other housingpreferences. While need and preference are an indication ofhousing demand. ability to pay is theultimate criteria of effective demand for housing. Ability to pay is largely determined by whetherhousing costs associated with housing preferences represent an affordable percentage ofhousehold income, and if households have access to requisite capital when opting for homeownership.
The Habitat/Sopot Social Research Center Survey of 998 households in Szczecin elicitedresponses to many, but not all, of these housing demand indicators. The questionnaire used forthe survey will be discussed with recommended improvements in a later section. However, as alarge, quite representative sample capturing nearly one percent of all residents, it provides thebasis for estimating effective demand for various types of housing, in relation to respondentincomes and housing expenditures, and for comparing household survey characteristics to theuniverse of households in Szczecin. This extrapolation of survey results to City residents as awhole will provide the gmina with quantified guidance as it develops policy options to meethousing demand in the future.
- 8 -
2.0 Survey of Housing Needs, Preferences & Ability to Pay
The following results are drawn from a household survey conducted in January 1997 byHabitat and the Sopot Social Research Center Survey.
2.1 Housing Need
2.1.1 Household Occupancy
Fully 1,175 households occupy the 998 surveyed dwellings, with 847 households livingalone and 328 households, or 27.9 percent, sharing housing units. In 67 of these cases, three ormore households share a single dwelling unit. Although the majority of shared housingoccupancies are with family relatives, "doubling-up" creates decidedly larger households and cancontribute to conditions of overcrowding. Single household dwellings average 2.98 persons perdwelling unit, while multiple household dwellings average 5.57 persons per unit.
Compared to an ideal occupancy standard of one household per housing unit, at 1.18households per unit recorded by the survey, an additional 177 dwellings would be needed forevery 1,000 units occupied. Without information on housing preference and income for eachhousehold sharing, it is not possible to determine the extent to which additional dwelling unitswould actually be required or each household's ability to pay. Clearly, an unknown proportion ofdoubling-up is voluntary and would continue even with adequate housing and financialresources.
2.1.2 Dwelling Size
The dwellings surveyed averaged 57.42 m2 in size, ranging from less than 45 m2 inprivate rentals and enterprise flats to more than 100 m2 in privately-owned single family houses.Typically, owner-occupied cooperative and communal flats are larger than rental counterparts,with, owned housing averaging 66.22 m2 in size and rental housing averaging 50.10 m2. Interms of rooms per housing unit, the average dwelling measured 2.6 rooms, with owneroccupied units containing 3.0 rooms on average, and renter units, 2.3 rooms. The surveyindicates that housing size is directly correlated with household income and the portion ofincome allocated to housing expenditures, rising with increases in either of these instances.
Relative to accepted spatial standards, and given the reported occupancy conditions, amajor portion of the housing units surveyed are considered to be overcrowded. Measured againsta norm of one person per room, the surveyed housing averages 1.3 persons per room, or 17.0 m2per capita, in comparison to the national average of 18.5 m2. Units occupied by one or twopersons are adequately sized, however, for the average household size in Szczecin of2.86persons/units, the number of occupants already exceed unit capacities as measured in rooms orin square meters. In households of more than five persons, overcrowding increases on average
- 9 -
from 2 to more than 5 persons per room depending upon total occupant size. Compared tomodest spatial standards of 25 m2 per capita, roughly midway between the Central Europeanaverage of 19.6 m2 and the Western European average of 32.3 1112 (reported by Building onProgress, Appendix A), the housing stock surveyed in Szczecin reflects deficiency of more than30 percent in spatial capacity for its present occupants.
Fully 530 of 998 surveyed dwellings, or 53.1 percent, do not meet the modest 25 m2 percapita standard for their existing occupants. Less overcrowding is evident among privately
owned single family and owner occupied communal housing, where less than one third of units
are overcrowded. More overcrowding occurs among renter occupants of privately O\vned,cooperative and communal housing, with more than 60 percent of households overcrowded.Survey results further indicate that satisfaction with current housing is strongly correlated withaverage unit size. Satisfied households average 1.1 persons per room while dissatisfiedhouseholds reported 1.7 persons per room.
2.1.3 Physical Condition
Among all types of dwelling units surveyed, only enterprise housing was fully furnishedwith all utilities, i.e., heat and hot water, drainage, electricity and gas, toilet and bath. In general,however, households deficient in each of these essential installations, were relatively few. Lessthan 5 percent of all households were without one or more basic utilities, except for bath andtoilet facilities in which 11.4% and 14.5% of households were deficient. After enterprisehousing, owner- and renter-occupied cooperative housing was the best furnished, with less than3% of these units lacking some bath and toilet installations. By contrast, owner-occupiedcommunal housing was considerably more deficient with 6% of units lacking toilet, 22%lacking bath facilities and 6% lacking sewage facilities as well. However, privately-ownedsingle family housing and renter-occupied communal housing accounted for the bulk of deficientunits. Single family housing in particular, lacks sewage and gas connections (30% and 12%),while renter occupied communal housing lacks hot water, bath and toilet facilities ( 19%,35%and 45% of units respectively). Communal housing also accounts for the overwhelming share ofcoal fired housing units reported by the survey, which collectively constitute 10.5 percent of alldwelling units.
The physical deficiencies in surveyed housing are significant only with respect tocommunal stock. Presumably, essential facilities will be added to private housing when fundsbecome available, but the condition of communal stock requires public action. Given spatialconstraints in these units, which average 51.5 m2 in size, their extent of overcrowding (15.2 m2per capita), the prevalence of coal fired furnaces for heating, and the absence of hot water, bathand toilet facilities, there is clear evidence of the need for some rehabilitation of communalstructures. Yet the apparent superior physical condition of O1vner-occupied communal unitswould indicate that structures differ in quality and that more deficient units may be concentratedin select buildings. Deficiencies reported by the survey data suggest that three in every tenoccupants of communal stock are in need of improvements to their present housing.
- 10-
2.2. Housing Preferences
Roughly one in four respondents (27.7%) expressed a preference for new or otherhousing. Besides being strongly related to a dissatisfaction with their current housing condition,the desire to relocate was positively correlated with high rent and housing expenditures aspercent of household income, low Floor space per occupant, high levels of overcrowding andlocation in selected neighborhoods of the City. Indeed, when asked to rank various factors assignificant in impOliance to their choice of housing, three principle causative factors emerged.
• Price. Respondents desiring to relocate their housing rated price as the most significantfactor influencing this choice by a margin of 1.5: lover Floor space, the next significantfactor. Currently, these same households tend to spend a lower percentage of their nethousehold income than average on monthly housing expenditures. Forty-seven percent ofhouseholds desiring to relocate spend less than 20% of monthly income on housing costscompared to 30% spent on average by households having no preference for new or otherhousing. However, the actual level of housing expenditures (including utilities) persquare meter of usable space by respondents preferring to relocate, 4.9 PLN/m2, wasmarginally greater than the monthly average of 4.6 PLN/m2 for all households. Onenecessarily concludes that households preferring to relocate are cost conscious withrespect to housing value; though they appear to have the financial resources to affordmore housing. The desire to optimize the effective cost per square meter of usable spacemay be the driving factor in their choice.
• Floor space & Number of Rooms. Floor space is the second most significant factorinfluencing those households preferring new or other accommodations, followed closelyby the number of rooms. Both overcrowding and low space per occupant ratios are notedamong survey respondents as a whole. However, fully 75 percent of all householdswanting new or other housing were overcrowded, at more than one occupant per room,and 80 percent had fewer than 20 m2 per occupant. This compares to an overcrowdingrate of 45 percent among households not wanting to relocate, of which only 53 percentoccupied space at fewer than 20 m2 per occupant.
• Location. The third most significant factor in housing choice recorded by all householdswanting to relocate was the location of new or other housing within the City of Szczecin.Although location was only half as significant as price, it ranked closely behind Floorspace in importance. Viewed on a neighborhood basis, the greatest disparity in housingpreference was concentrated in four districts of Szczecin. Bukowo, in the north, and onthe right bank, Pionia-Smierdnica-Jezierzyce, Majowe-Kijewo, and WielgowoSlawociesze reported more than half of all surveyed households wanting new or otherhousing.
Assuming these threet factors to be the most significant attributes sought in new or otherhousing, the following housing options emerge in the demand profile emerging from the survey.
- 11 -
2.2.1 Housing Stock and Ownership
Among all' households wanting new or other housing, renters of units provided by privateindividuals and in communal stock are the most interested in changing their housing, whileoccupants of enterprise housing are the least interested. The housing type preferred byhouseholds desiring change is overwhelmingly a private home with 42% citing this option. Thiswas followed by ownershop of cooperative housing, preferred by 25% of the households andrental of communal housing, preferred by 19%. However, among renters residing in communal
stock the largest percentage preferred to upgrade \vithin communal housing, and with a lower
proportion preferring to own cooperative housing. In contrast, while renters of private unitsprefer primarily to own private homes, they are indifferent toward renting in either cooperative orcommunal housing.
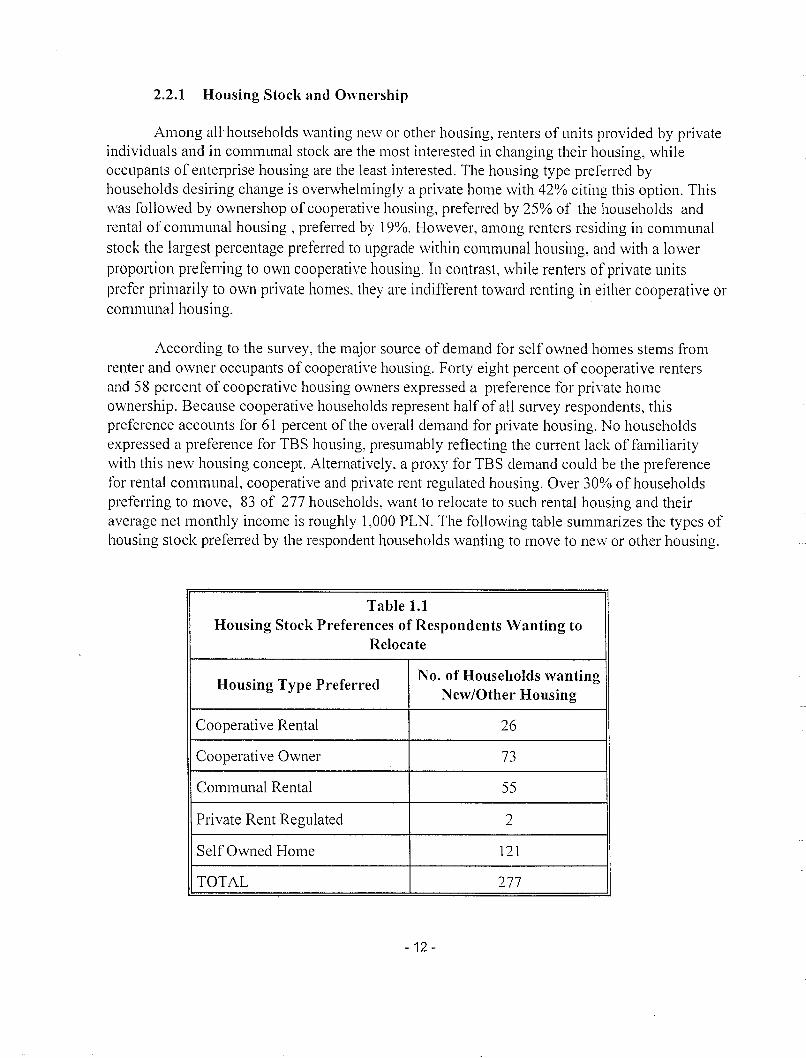
According to the survey, the major source of demand for self owned homes stems fromrenter and owner occupants of cooperative housing. Forty eight percent of cooperative rentersand 58 percent of cooperative housing owners expressed a preference for printe homeownership. Because cooperative households represent half of all survey respondents, thispreference accounts for 61 percent of the overall demand for private housing. No householdsexpressed a preference for TBS housing, presumably reflecting the current lack of familiaritywith this new housing concept. Alternatively, a proxy for TBS demand could be the preferencefor rental communal, cooperative and private rent regulated housing. Over 30% of householdspreferring to move, 83 of 277 households, want to relocate to such rental housing and theiraverage net monthly income is roughly 1,000 PLN. The following table summarizes the types ofhousing stock preferred by the respondent households wanting to move to new or other housing.
Table 1.1Housing Stock Preferences of Respondents Wanting to
Relocate
Housing Type PreferredNo. of Households wanting
New/Other Housing
Cooperative Rental 26
Cooperative Owner 73
Communal Rental 55
Private Rent Regulated 2
Self Owned Home 121
TOTAL 277
- 12 -
2.2.2 Housing Type
Given the major emphasis placed on home ownership, it follows that a majority of therevealed preference for new or other housing should be for single family units. especiallydetached single family houses. Fully 52% of all respondents seeking to relocate want to occupysingle family housing, with three in every four preferring detached houses. and the remaining onequarter split one third for duplex houses and two thirds for attached or town houses. Multifamilyhousing is prefened by 38% of those seeking a change in housing, with virtually all respondents(93%) wanting small scale multifamily structures of one to four units. The remaining 10 percentof respondents prefer other forms of housing or express an indifference to the type of housing.
2.2.3 Housing Quality & Location
When asked why they prefer new or other housing, households desiring to relocate statefirst the need for larger living space (43% of such respondents), followed by the need for separatequarters to achieve independence from shared households (25%). Space needs are particularlyacute for those currently living at less than 20 m2 per capita: 85 percent of all householdswanting larger or separate quarters currently live with those space constraints. Much smallerpercentages, 9 and 6 percent respectively, cite the lack of physical installations or the desire for adifferent location as the primary reason for preferring change.
When these households were queried as to the optimum size preferred for new or otherhousing, or the number of rooms a new unit should have, most respondents cited more than 75m2 of usable area, with a mean value of84m2, and an average of3.5 rooms or one more roomthan currently. Questioned as to whether they would be interested in a renovated apartment ofhigh standard in an old downtown building. fully 61 percent of those seeking to relocateresponded in the affirmative. Other indications of preferred locations can be gleaned from therespondents' satisfaction with their current neighborhoods. The highest level of satisfaction wasrecorded for Glegokie-Pilchowo in the west followed by several right bank neighborhoods,Bukowe-Kleskowo, Zalom, and Podjuchy.
2.3 Household Ability to Pay
In a market economy, the ultimate determinant of effective demand for housing iswhether or not households preferring to relocate to new or other housing actually have thefinancial resources to afford the available housing. In Szczecin, the survey respondents wantingto move have a higher median income than average and a low~r monthly net housing expenditurethan average, including utility costs. Although this relationship suggests that the group as awhole has the potential to afford higher housing costs, and thus compete more effectively in themarket, not all households with such preferences are in a position to do so.
- 13 -
2.3.1 Household Income
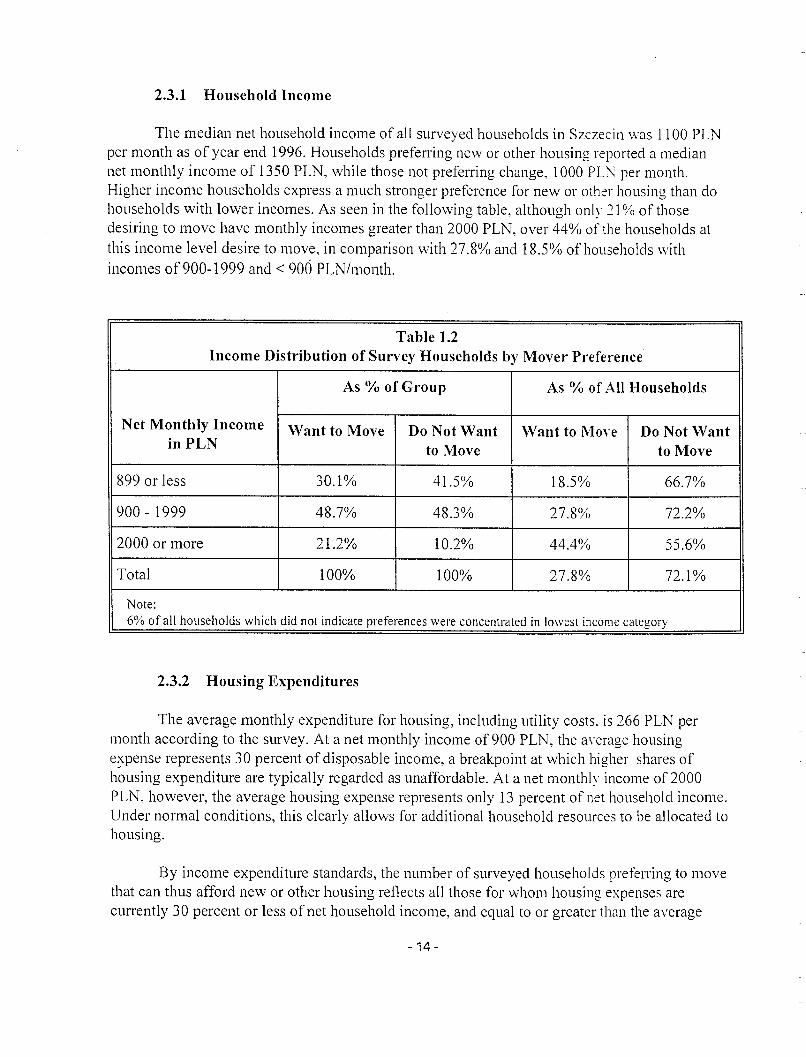
The median net household income of all surveyed households in Szczecin \vas 1100 PLNper month as of year end 1996. Households preferring new or other housing reported a mediannet monthly income of 1350 PLN, while those not preferring change, 1000 PL\: per month.Higher income households express a much stronger preference for new or other housing than dohouseholds with lower incomes. As seen in the following table, although only 21 % of thosedesiring to move have monthly incomes greater than 2000 PLN, over 44% of the households atthis income level desire to move, in comparison with 27.8% and 18.5% of households withincomes of 900-1999 and < 906 PLN/month.
Table 1.2Income Distribution of Survey Households by Mover Preference
As % of Group As % of All Households
Net Monthly Income Want to Move Do Not Want Want to MoYe Do Not WantinPLN to Move to Move
899 or less 30.1% 41.5% 18.5% 66.7%
900 - 1999 48.7% 48.3% 27.8% 72.2%
2000 or more 21.2% 10.2% 44.4% 55.6%
Total 100% 100% 27.8% 72.1%
Note:6% of all households which did not indicate preferences were concentrated in lowest income category
2.3.2 Housing Expenditures
The average monthly expenditure for housing, including utility costs, is 266 PLN permonth according to the survey. At a net monthly income of 900 PLN, the average housinge::cpense represents 30 percent of disposable income, a breakpoint at which higher shares ofhousing expenditure are typically regarded as unaffordable. At a net monthly income of2000PLN, however, the average housing expense represents only 13 percent of net household income.Under normal conditions, this clearly allows for additional household resources to be allocated tohousing.
By income expenditure standards, the number of surveyed households preferring to movethat can thus afford new or other housing reflects all those for whom housing expenses arecurrently 30 percent or less of net household income, and equal to or greater than the average
- 14 -
housing outlay. However, since the average housing outlay represents the existing pattern ofhousing stock and ownership, the average monthly expense of 266 PLN per unit is consideredlow by market standards. According to the survey, households owning single family dwellingsthe preferred form of housing - currently expend 361 PLN per month on housing costs, whilethose owning cooperative housing spend 266 PLN and those renting from private individuals paythe most, or 465 PLN per month. (It should be noted that monthly housing expenditures. asreported by the survey, coven'ent, electricity, garage and other payments. Although the survey isnot fully clear on this issue, these expenditures probably do not include housing loan repaymentsby owner occupants.)
In addition to the variation in effective housing costs by stock and ownership preference,differences exist in the quality of housing purchased by housing outlays. Although imperfect as ameasure, housing outlays per m2 of usable space (PLN/m2) are the best available surrogate forapproximating housing quality. According to survey data, monthly housing expenditures average4.64 PLN per m2 of all occupied space. At the highest priced end, households renting fromprivate individuals pay 11.86 PLN/m2, while those owning cooperative units pay 5.28 PLN/m2and communal units 3.91 PLN/m2 of usable area. Partly as a reflection of size, single familyowned houses are reported as the most cost effective, or 3.59 PLN/m2. Arrayed by housing size,larger units as a whole emerge as the most cost saving, with average outlays of2.74 PLN/m2 inunits of 100 m2 or more, while the smallest units (under 30 m2) are the least cost effective at7.00 PLN/m2.
Accounting for differences in housing cost and quality, yet keeping affordability at 30percent or less of net household income, the following tables divide the number of householdswanting new or other housing into those that can and cannot effectively demand housing giventheir current income characteristics. Three examples of preferred housing options are consideredin modeling alternative size and Gost conditions:
(1) new TBS or high quality communal rental housing of 50 m2 at 7.12 PLN/m2 (seeappendix for cost assumptions) which is roughly equivalent to owner operatingcosts of single family housing of 100 m2 at 3.6 PLN/m2 (without the monthlycapital costs ofloan repayment) for a range of operating costs from 356-360 PLNper month;
(2) small cooperative flat ownership housing of 50 m2 at 5.3 PLN/m2 for operatingcosts of 265 PLN per month, and;
(3) large cooperative flat ownership housing of 80 m2 at 5.3 PLN/m2 for operatingcosts of 424 PLN per month.
It should be noted that market prices will differ from survey reported housing costs for thesekinds of housing and that single family and cooperative owner costs do not reflect initial downpayments or owner capital invested in the property. It is also likely that reported operating costs
- 15 -
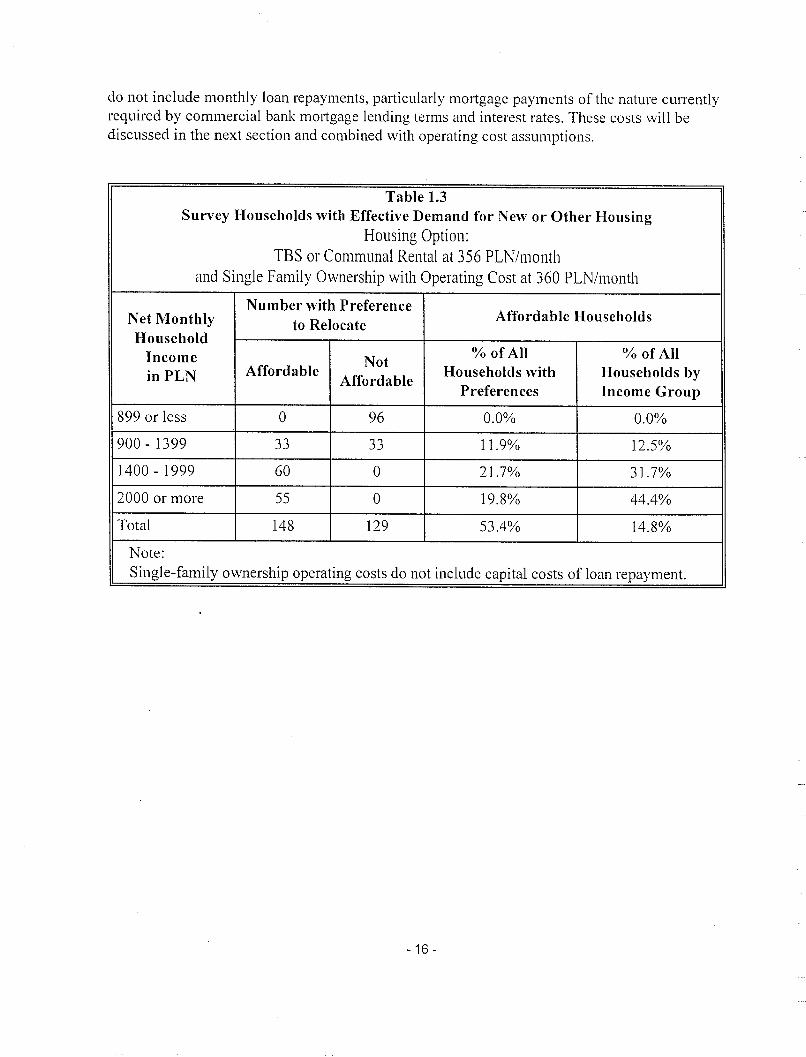
do not include monthly loan repayments, particularly mortgage payments of the nature currentlyrequired by commercial bank mortgage lending terms and interest rates. These costs will bediscussed in the next section and combined with operating cost assumptions.
Table 1.3Survey Households with Effective Demand for New or Other Housing
Housing Option:TBS or Communal Rental at 356 PLN/month
and Single Family Ownership with Operating Cost at 360 PLN/month
Number with PreferenceAffordable HouseholdsNet Monthly to Relocate
HouseholdIncome Not
% of All % of All
inPLN AffordableAffordable
Households with Households byPreferences Income Group
899 or less 0 96 0.0% 0.0%
900-1399.,., .,.,
11.9% 12.5%jj jj
1400 - 1999 60 0 21.7% 31.7%
2000 or more 55 0 19.8% 44.4%
Total 148 129 53.4% 14.8%
Note:Single-family ownership operating costs do not include capital costs of loan repayment.
- 16 -
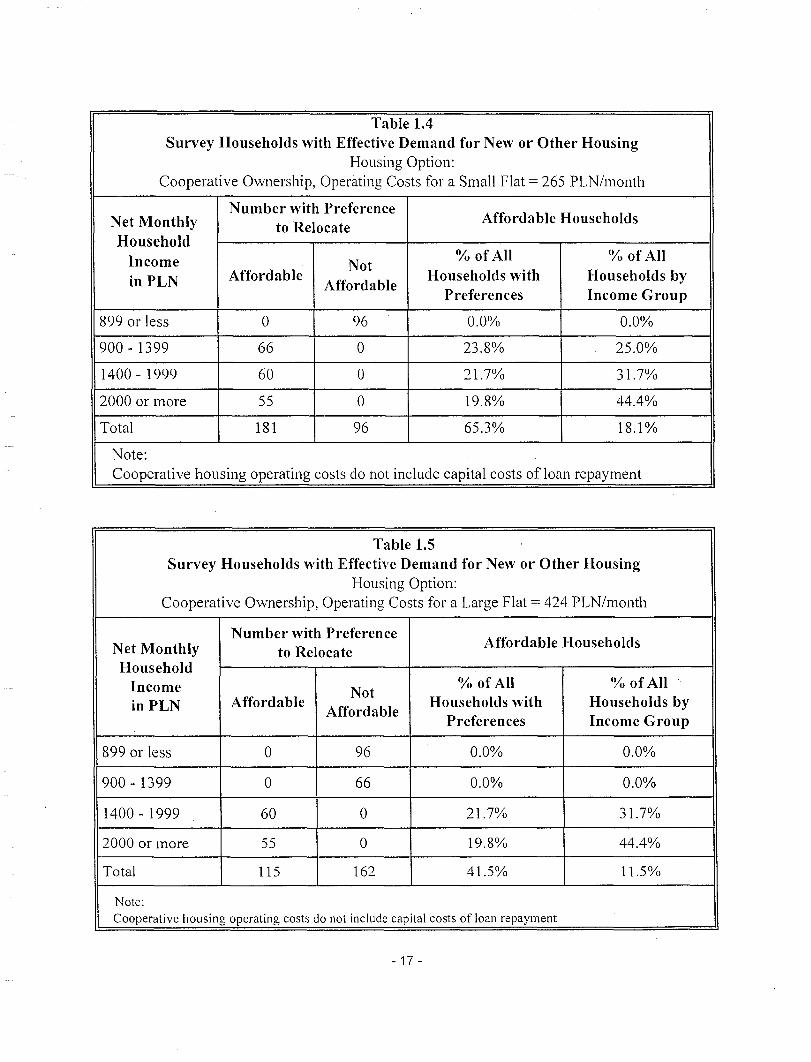
Table 1.4Survey Households with Effective Demand for New or Other Housing
Housing Option:Cooperative Ownership, Operating Costs for a Small Flat = 265 PLN/month
Number with PreferenceAffordable HouseholdsNet Monthly to Relocate
HouseholdIncome Not
% of All (Yo of All
in PLN AffordableAffordable
Households with Households byPreferences Income Group
899 or less 0 96 0.0% 0.0%
900 - 1399 66 0 23.8% 25.0%
1400 - 1999 60 0 21.7% 31.7%
2000 or more 55 0 19.8% 44.4%
Total 181 96 65.3% 18.1%
Note:Cooperative housing operating costs do not include capital costs of loan repayment
Table 1.5Survey Households with Effective Demand for New or Other Housing
Housing Option:Cooperative Ownership, Operating Costs for a Large Flat = 424 PLN/month
Number with PreferenceAffordable HouseholdsNet Monthly to Relocate
HouseholdIncome Not
% of All % of All
in PLN AffordableAffordable
Households with Households byPreferences Income Group
899 or less 0 96 0.0% 0.0%
900-1399 0 66 0.0% 0.0%
1400 - 1999 60 0 21.7% 31.7%
2000 or more 55 0 19.8% 44.4%
Total 115 162 41.5% 11.5%
Note:Cooperative housing operating costs do not include capital costs of loan repayment
- 17 -
As the tables show, once the market realities of cost and affordability ratios areintroduced to the decision-making process, the number of households with effective demand forhousing (i.e. those 'able to afford new or other housing) is substantially reduced from the numberof those with preferences to relocate:
• Under the TBS or communal rental scenario, with monthly housing expenditures of 356PLN, only 53.4% of households preferring new or other housing actually can afford theaverage flat of 50 m2. These 148 households are 14.8% all surveyed households.
• Under the single family home ownership scenario, viewed only from an operating costperspective, the same number of households with preferences for ne\\' or other housingcan afford operating costs on the average single family house of 100 m2 with averageexpenditures of 360 PLN per month.
• Under the small cooperative ownership scenario, a larger percentage of householdsdisplay effective demand, with 65% of households desiring to relocate and able to affordsmall cooperative flats.
• The percentage of households displaying effective demand is less for large cooperativeflats, with only 41.5% of households can afford the expenses associated \vith a large flat.
• As a share of all households surveyed (not only those desiring to relocate), only 18.1%and 11.5% would be able to afford the costs of small or large cooperative apartmentownership, considering only operating costs.
2.3.3 Housing Investment Resources
Cooperative or single family home ownership requires access to capital for an initialdown payment or development cost, followed by periodic repayments of principal and interest, iffinanced on a loan or credit basis. If purchased in full from own savings or assets, such as thesale of real estate, no additional costs of capital are incurred for home or flat o\vnership, otherthan the opportunity costs of foregone earnings from more profitable forms of investment.
When asked how much they would be willing to invest in their housing. fully 75.1 % or208 of277 surveyed households with preferences for new or other housing gave no response or"zero", while 69 households were willing to state a financial commitment. In aggregate, theycited resources of 920,744 PLN or 13,344 PLN on average. Additional potential sources offinancing, amounting to 482,949 PLN or 6,999 PLN on average, were identified by the 69households, drawn primarily from additional credit (35.6% of funds), and own or relatives'savings (43.0% of funds). Although respondents could have misinterpreted these surveyquestions, it appears probable that 69 households or one quarter of those with relocationpreferences expect to have financial resources of 20,343 PLN, on average per household, toapply to their housing investment.
- 18 -
In the following financing scenarios, the downpayment required under all housingoptions is greater than the average of 20,343 PLN reported as available financial resources. agreater level of capital commitment than the average of reported financial resources. Thisrequirement, however, was not taken as a limiting factor in estimating the number of householdsthat could afIOl'd to meet both operating and capital costs of home ownership on a monthly basis.The assumption is reasonable given the extent to which other sources of capital might bemobilized for a purchase, once the household qualifies for a housing loan,
Commercial banks in Szczecin currently offer housing mortgages with 20 to 40 percentcash down payment, financed at 23 to 25 percent interest annually over a 10 to 20 yearrepayment period. From a bank's perspective, the standard for housing affordability appears to be25 times the monthly gross household income. Borrowers can choose to repay 1 percent or moreof the loan and interest on a monthly basis, but the bank can require no more than 25 percent ofthe borrower's monthly gross income. Under these constraints, the median income householdpreferring new or other housing (annual net income of 16,200 PLN and gross income of 23,140PLN) could not afford a bank mortgage. Assuming a household with 20,000 PLN in financialresources for a cash down payment, a loan of 50,000 PLN financed at 25.13 percent over 15years would entail an initial monthly payment of 500 PLN for amortization, increasing yearlythereafter with inflation. Coupled with average monthly housing expenditures for operations, themedian income household would expend more than half of its net monthly income of 1,350 PLNon housing costs.
Only households with a net monthly income of 3,500 PLN or more (equivalent to a grossannual income of at least 60,000 PLN), an affordable housing price of 180,000 and financialresources to apply a significant down payment, could afford a large cooperative apartment (80m2 at 144,000 PLN) or a market rate single family house (l00 m2 at 180,000 PLN). However, ahousehold with a net monthly income of 2,400 PLN could easily afford a small cooperativeapartment (50 m2 at 90,000 PLN) if they commit to a 50 percent cash down payment. Undercurrent financing assumptions (25.13% and 15 years), with a 50 percent down payment in anyinstance, the large cooperative purchasers would face monthly amortization costs of 720 PLNand the single family home buyers 900 PLN., while the small cooperative buyers would pay 450PLN in monthly loan repayments. Adding in monthly operating costs of 424 PLN for a largecooperative apartment and 360 PLN for a single family house, an aggregate housing expenditureof 1,144 to 1,260 PLN would represent an affordable expense, i.e., roughly 30 percent or less ofnet monthly incomes of 3,500 PLN or more. For purchasers of small cooperative flats, thecombined operating and capital costs would be 715 PLN per month, or exactly 30 percent of netmonthly incomes of 2,400 PLN. With any allowable personal income tax deductions, theseshares would become even more affordable. Although recently reduced, tax benefits for newconstruction of housing are still quite liberal. Taken over 3 years as a pe~centage of constructioncosts deducted directly from taxes owed, the benefits could serve as a reimbursement for downpayments if short-term personal loans or bank credits can be obtained initially.
- 19 -
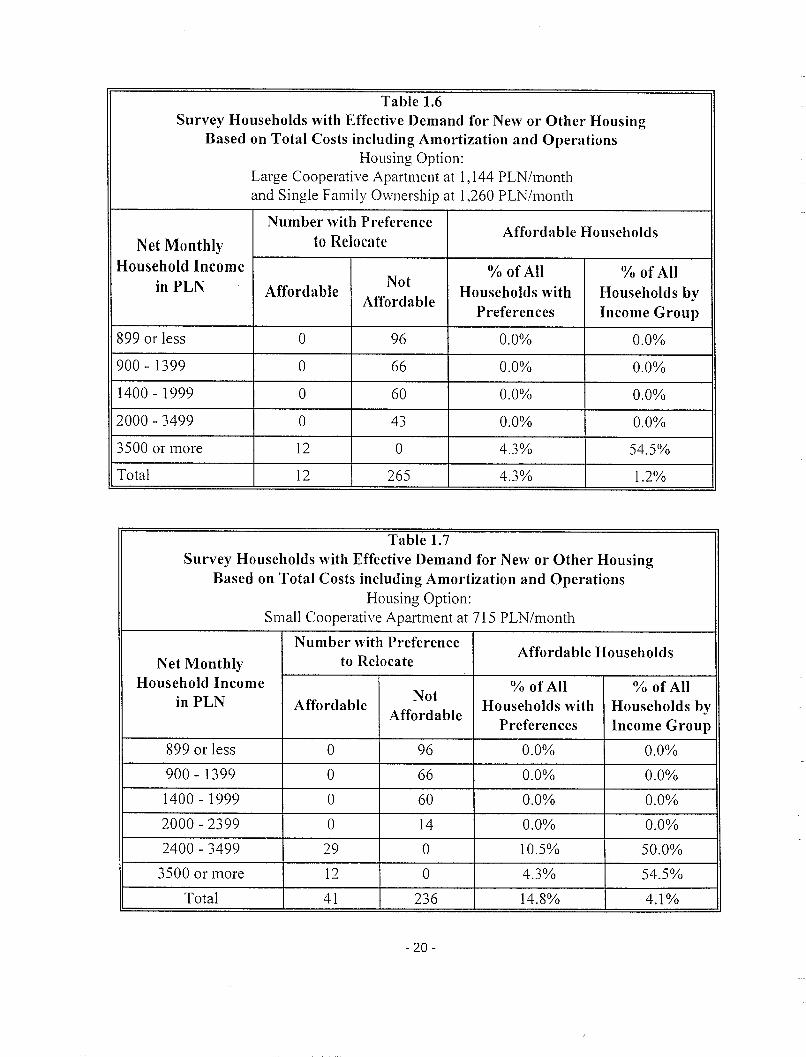
Table 1.6Survey Households with Effective Demand for New or Other Housing
Based on Total Costs including Amortization and OperationsHousing Option:
Large Cooperative Apartment at 1,144 PLN/monthand Single Family Ownership at 1,260 PLN/month
Number with PreferenceAffordable Households
Net Monthly to Relocate
Household Income % of All % of AllinPLN Affordable
NotHouseholds with Households by
AffordablePreferences Income Group
899 or less 0 96 0.0% 0.0%
900 - 1399 0 66 0.0% 0.0%
1400 - 1999 0 60 0.0% 0.0%
2000 - 3499 0 43 0.0% 0.0%
3500 or more 12 0 4.3% 54.5%
Total 12 265 4.3% 1.2%
Table 1.7Survey Households with Effective Demand for New or Other Housing
Based on Total Costs including Amortization and OperationsHousing Option:
Small Cooperative Apartment at 715 PLN/month
Number with PreferenceAffordable Households
Net Monthly to Relocate
Household Income % of All % of AllinPLN Affordable
NotHouseholds with Households by
AffordablePreferences Income Group
899 or less 0 96 0.0% 0.0%
900-1399 0 66 0.0% 0.0%
1400 - 1999 0 60 0.0% 0.0%
2000 - 2399 0 14 0.0% 0.0%
2400 - 3499 29 0 10.5% 50.0%
3500 or more 12 0 4.3% 54.5%
Total 41 236 14.8% 4.1%
- 20-
2.4 Nature of Demand: Effective Demand vs Non-Market Demand
Based upon the survey findings, a significant "need" exists for housing in Szczecin toovercome the existing housing deficit, comprised of inadequately housed families inovercrowded and substandard housing, and to address the current and future housing preferencesfor new or other units by existing residents. It should be noted that other housing demands willarise in the near term from the formation of future households through population aging, societallifestyle changes, and in-migration. As has been expressed previously, hOvve\'eL not all demandis effective -- i.e. supportable in the market. Public policy must thus address the issue ofallocating scarce resources to meet housing needs that are beyond the affordability of residents.
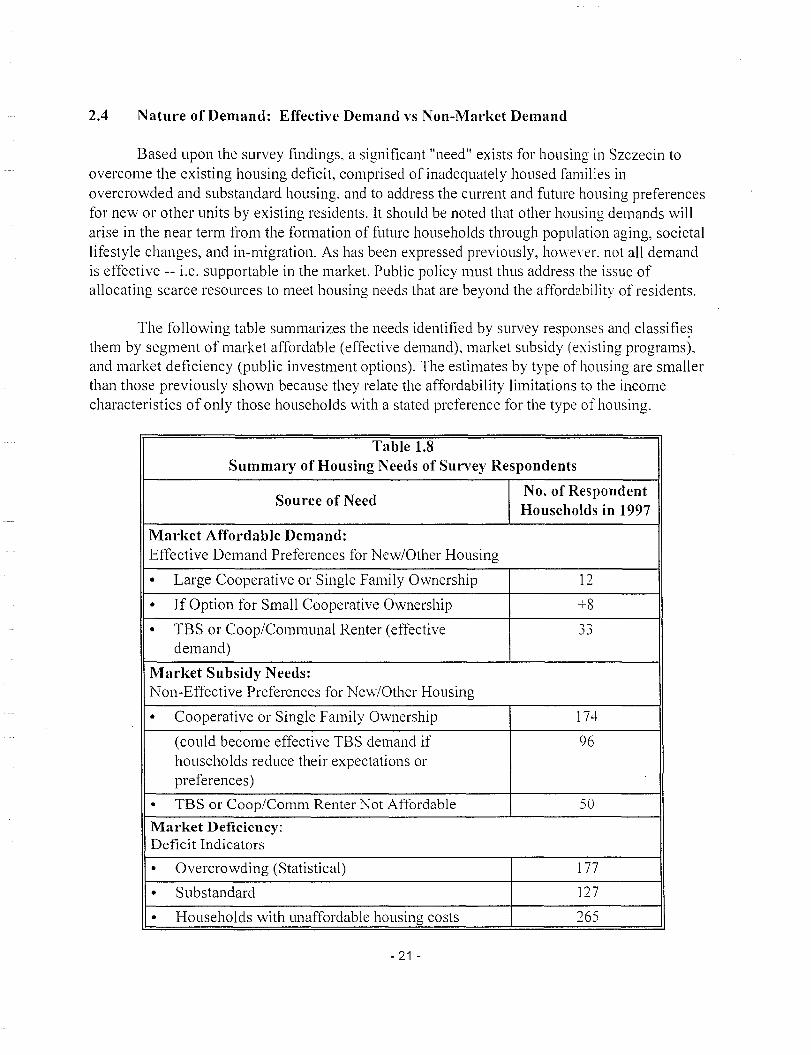
The following table summarizes the needs identified by survey responses and c1assifie~
them by segment of market affordable (effective demand), market subsidy (existing programs),and market deficiency (public investment options). The estimates by type of housing are smallerthan those previously shown because they relate the affordability limitations to the incomecharacteristics of only those households with a stated preference for the type of housing.
Table 1.8Summary of Housing Needs of Survey Respondents
Source of NeedNo. of RespondentHouseholds in 1997
Market Affordable Demand:Effective Demand Preferences for New/Other Housing
• Large Cooperative or Single Family Ownership 12
• If Option for Small Cooperative Ownership +8
• TBS or Coop/Communal Renter (effective..,..,.J.)
demand)
Market Subsidy Needs:Non-Effective Preferences for New/Other Housing
• Cooperative or Single Family Ownership 174
(could become effective TBS demand if 96households reduce their expectations orpreferences)
• TBS or Coop/Comm Renter Not Affordable 50
Market Deficiency:Deficit Indicators
• Overcrowding (Statistical) 177
• Substandard 127
• Households with unaffordable housing costs 265
- 21 -
Given prevailing home ownership financing costs and income requirements. only 12 of277 households expressing preference for new or other single family or cooperative housing canactually afford to buy a large cooperative apartment or a single family house at market prices.Currently developed at 1,800 PLN per square meter of floor space, an 80 m2 apartment wouldcost 144,000 PLN and a 100 m2 house 180,000 PLN. These costs limit effecti\'e demand to 4.3percent of all households with preferences, which is equivalent to 1.2 percent of all surveyedhouseholds. Excluded for lack of effective demand are 67 households preferring a cooperative
apartment or 115 households preferring a single family house. However, if households arewilling to purchase a smaller cooperative apartment of 50 m2 at 90,000 PLN, then another 8households preferring a cooperative apartment can be satisfied. Of the 174 households thatcannot afford to own, fully 96 have sufficient monthly income to rent a new but smaller TBS ortop quality communal unit at 356 PLN/month. Shown above as needing a market subsidy, thosehouseholds might be induced to downscale their preferences by a program that allows them toeventually purchase their unit.
Households with preferences for cooperative, communal or private rent regulated rentalsnumbered 83 in total. With an average net monthly household income of roughly 1,000 PLN, 33households would have adequate resources to rent a new TBS or communal unit, while 50households could not afford such housing without a subsidy. Thus collectively. among allhouseholds preferring new or other housing, 53 will be able to realize their preferences forowning or renting at asking prices, another 96 could acquire new housing if they changed theirpreferences from owning to renting, and 128 would not be able to relocate \vithout a housingsubsidy. At its maximum, effective demand comprises 53.8 percent of those \vith preferences fornew or other housing and 14.9 percent of all households surveyed.
In addition, over 500 households are deficient in housing from a statistical overcrowding,substandard physical condition, or housing affordability perspective. Much double-countingundoubtedly exists in this category of housing need and an unduplicated number cannot beaccurately determined from the survey data. Appropriate policy responses should includeprograms of renovation as well as new construction and housing rent subsidy.
2.5 Demand for Renovation
In addition to demand for new or other housing, a significant number of households, 313or nearly one in every three surveyed, expressed a need for housing renovation, Of these,however, only 200 households currently spend less than 30 percent oftheir net monthly incomeson housing expenditures and thus can probably afford to incur additional expenses forrenovation. Overall, they identified 666 improvements in their existing units, \vith the majority ofthese (513) required by households that prefer not to relocate. The need for housing renovationwas characteristic of all income groups, with the group average income of 1,261 PLN slightlyabove the all-household net monthly income average. Households with incomes over 2,000 PLNhad the highest incidence of expressed desire for renovation, or 38.7% of such households.
- 22 -
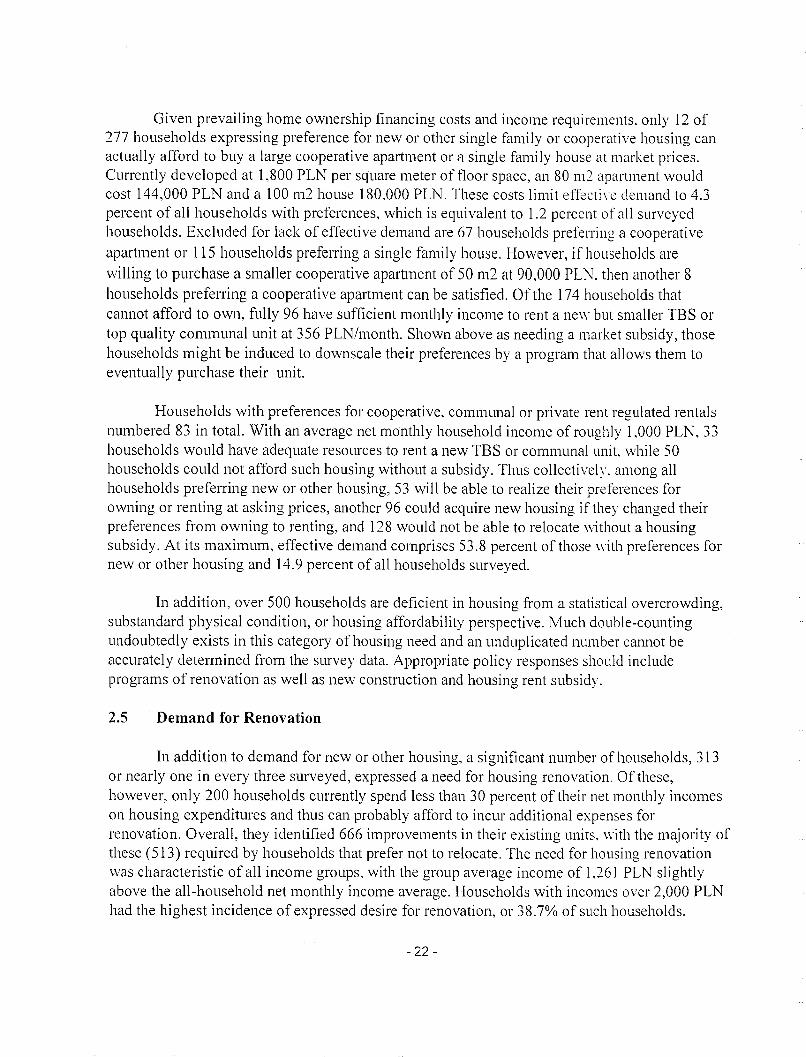
Renovations ranged from merely cosmetic to major capital improvements. While themajority were identified for the occupant's flat (88.2%), building capital improvements like roofand exterior wall repair were also cited by the respondents. Categorized by type of pi'ogram forwhich the identified projects would qualify, the following table summarizes the renovationneeds. Roughly one in every three projects would likely be eligible for public programs, OurHouse and Little Improvements. They entail expenditures for changing windows, insulating\valls, or changing radiators. Complex renovation of capital systems fall largely outside thepublic programs.
Table 1.9Renovation Projects Identified by Survey Respondents
Number of Projects
Type of Renovation Project by Households by Households
Totalthat Prefer to that Prefer
Move Not to Move
"Little Improvements" Program 22 2 20
"Our House" Program 210 51 159
Capital Improvements (self-managed) 207 48 159
Cosmetic Repairs (self-managed) 227 52 175
Total 666 153 513
Although survey respondents were not asked to identify the source of funds for housingrenovation, fully 204 households expressed a willingness to save for this purpose using aHousing Savings Fund. Of these households, 107 preferred to move, while the other 97 intendedto remain in their existing units. Although applicable to housing purchase, loans provided by aHousing Savings Fund are perhaps more suitable for renovation investments. Typically, acontractual savings program requires the depositor to make monthly payments over a three yearperiod, after which a multiple of savings and interest (1.5 times) will be lent at a low rate ofinterest repayment.
• Among all households expressing a willingness to participate in contractual savings, theaverage monthly savings intention was 194 PLN, or an annual deposit of2,238 PLN.With cumulative interest earnings, after a three year period such savings could qualify for
- 23-

a loan of more than 10,000 PLN.
• Among households intending to move, average annual savings intentions vvere greaterthan the average, at 3,000 PLN.
• Among households intending to remain in their existing units, average annual savingswere lower, at 1,660 PLN. Even for this group of households desiring to remain in theirunits and renovate, the average level of savings could generate over 8.000 PLN for capital
investment.
3.0 Extrapolation of Results to the Universe of Households in Szczecin
Survey results can be applied to the universe of households in Szczecin if the survey wasbased upon a representative sample of all inhabitants. Such determination can be made by avalidation of relevant survey findings with citywide indicators. Although the sample size waslarge, covering nearly one percent of all households (see following table), it does not conform inevery respect to the aggregate demographic indicators of Szczecin. It should be noted thataggregate indicator data, as provided by the Central Statistical Office of the Voivodship, is notalways as current as the survey data.
- 24-
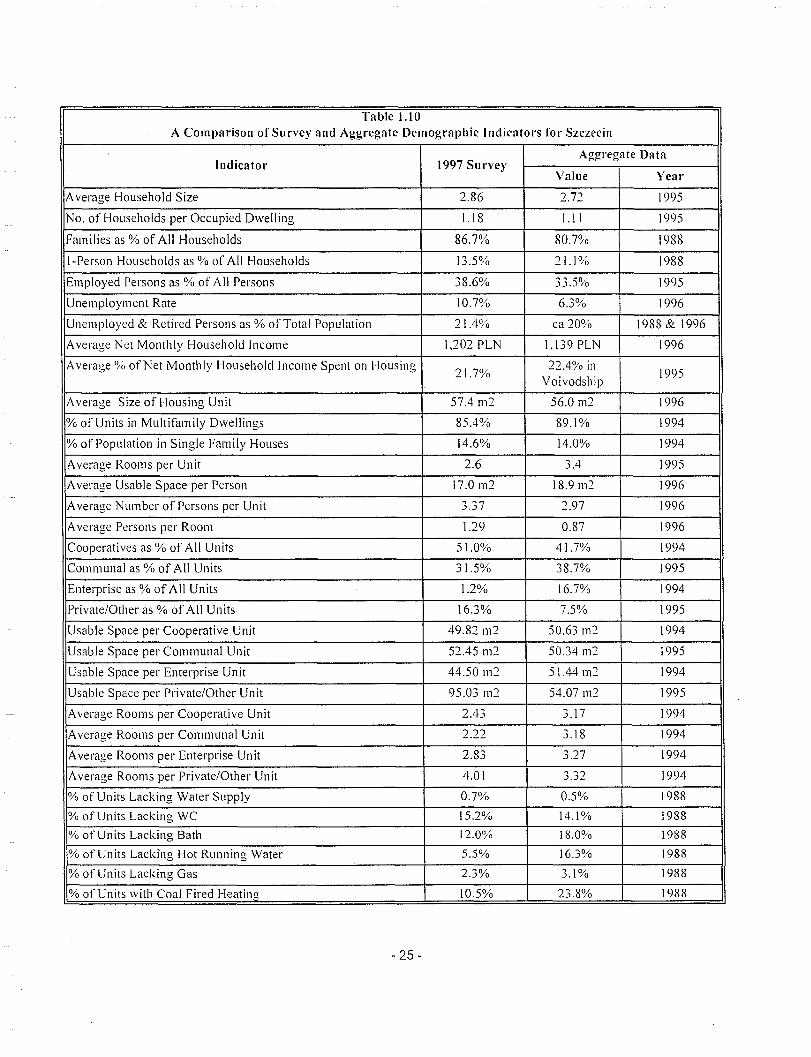
Table UOA Comparison of Survey and Aggregate Demographic Indicators for Szczecin
Indicator 1997 SurveyAggregate Data
Value Year
Average Household Size 2.86 2.72 1995
No. of Households per Occupied Dwelling 1.18 1.11 1995
Families as % of All Households 86.7% 80.7% 1988
I-Person Households as % of All Households 13.5% 21.1% 1988
Employed Persons as % of All Persons 38.6% 33.5% 1995
Unemployment Rate 10.7% 6.3% 1996
Unemployed & Retired Persons as % of Total Population 21.4% ca 20% 1988& 1996
Average Net Monthly Household Income 1,202 PLN 1,139PLN 1996
Average % of Net Monthly Household Income Spent on Housing21.7%
22.4% in1995
Voivodship
Average Size of Housing Unit 57.4 m2 56.0 m2 1996
% of Units in Multifamily Dwellings 85.4% 89.1% 1994
% of Population in Single Family Houses 14.6% 14.0% 1994
Average Rooms per Unit 2.6 3.4 1995
Average Usable Space per Person 17.0 m2 18.9 m2 1996
Average Number of Persons per Unit 3.37 2.97 1996
Average Persons per Room 1.29 0.87 1996
Cooperatives as % of All Units 51.0% 41.7% 1994
Communal as % of All Units 31.5% 38.7% 1995
Enterprise as % of All Units 1.2% 16.7% 1994
Private/Other as % of All Units 16.3% 7.5% 1995
Usable Space per Cooperative Unit 49.82 m2 50.63 m2 1994
Usable Space per Communal Unit 52.45 m2 50.34 m2 1995
Usable Space per Enterprise Unit 44.50 m2 51.44 m2 1994
Usable Space per Private/Other Unit 95.03 m2 54.07 m2 1995
Average Rooms per Cooperative Unit 2.43 3.17 1994
Average Rooms per Communal Unit 2.22 3.18 1994
Average Rooms per Enterprise Unit 2.83 3.27 1994
Average Rooms per Private/Other Unit 4.01 ~ ~7 1994.J ..J~
% of Units Lacking Water Supply 0.7% 0.5% 1988
% of Units Lacking WC 15.2% 14.1% 1988
% of Units Lacking Bath 12.0% 18.0% 1988
% of Units Lacking Hot Running Water 5.5% 16.3% 1988
% of Units Lacking Gas 2.3% 3.1% 1988
% of Units with Coal Fired Heating 10.5% 23.8% 1988
- 25 -

While discrepancies can be observed in all indicators, the variance in statistical values ofthe survey and aggregate indicators is significant only in a few instances. These significantdifferences can be summarized as follows:
• Too many cooperatives and single family homes were surveyed to the exclusion ofenterprise and communal housing. The privately owned housing, primarily single family,was considerably larger than all private stock in the city and the surveyed enterprisehousing was smaller. It also appears, from indicators not shown, that the quality of
communal housing surveyed vvas in poorer condition than average for citywide
communal stock, accounting for the higher shares of units without we installations.
• As a consequence of these housing type discrepancies, strong differences emerge inaverage household size and housing occupancy or independence (one household perhousing unit). Relative to the citywide average, too many families were surveyed and toofew I-person households were captured in the sampling. The coupling of primary andsecondary families in single family houses may be reflected in the high share ofemployed to resident population, which is also considerably higher for surveyedhouseholds. At the citywide level, overcrowding or double occupancy is less evident thanin the sample, reflecting the higher proportion of small households in adequately sizedunits. These differences in turn are reflected in differences in average floor space perperson.
• Lastly, the specification of rooms by survey respondents may not be an accurateexpression of their current housing conditions. While the size of housing units (in m2) isquite comparable between citywide aggregates and the survey sample, sharp differencesexist in the number of rooms per unit and the aggregate indicator of persons per room. Ona stock specific basis, survey respondents repOli considerably fewer rooms per unit forcooperative, enterprise and communal housing. but more per unit for private housing. Ona size of unit basis, (in m2), many of these differences disappear with the exception ofprivate housing. While the survey confirms a qualitative deficiency exists in housing, theextent of deficiency may be exaggerated by sampling distribution of stock and not by thelack of rooms overall.
Given the importance of the type of housing stock in accounting for disparities inhousehold independence, average floor space per occupant, and even the physical condition ofhousing, the extrapolation of survey findings to the universe of Szczecin households is bestperformed on a stock specific basis. Therefore, the following table represents the likelypreferences for new or other housing and the ability to pay under alternative housing costconditions for the city as a whole, segmented by existing housing stock occupied. Thisextrapolation was performed using the preference and income coefficients of survey respondentsstratified by type of stock and ownership.
- 26-
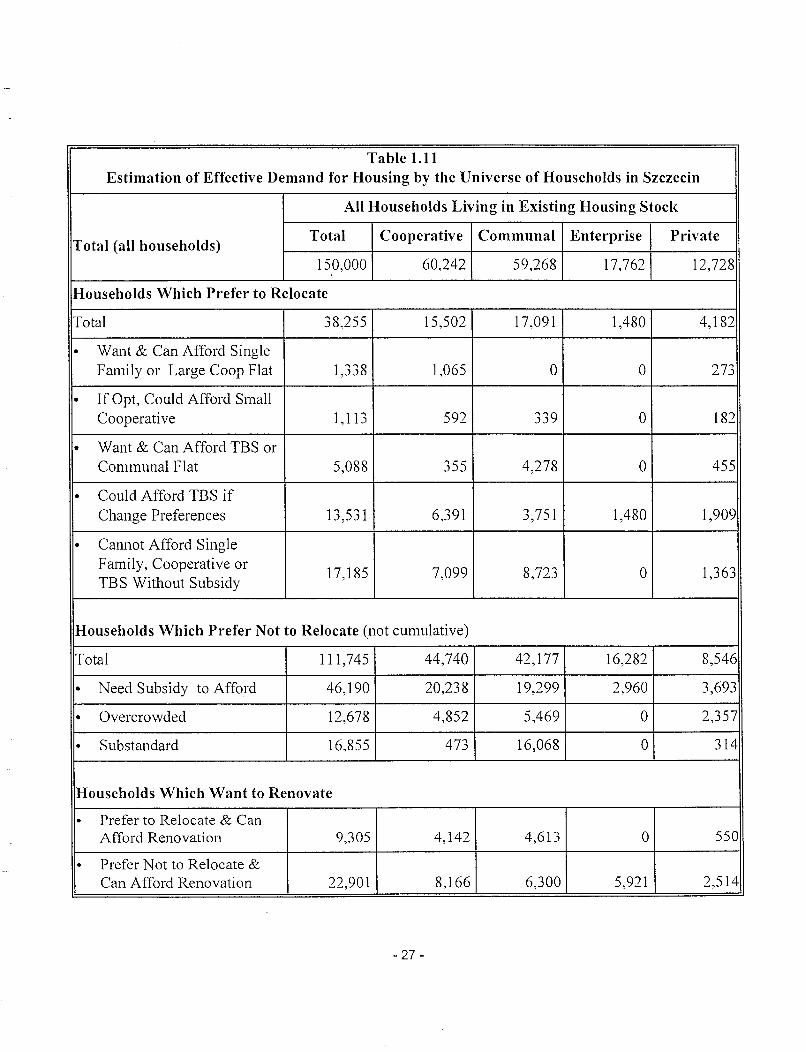
Table 1.11Estimation of Effective Demand for Housing by the Universe of Households in Szczecin
All Households Living in Existing Housing Stock
Total (all households)Total Cooperative Communal Enterprise Private
150,000 60,242 59,268 17,762 12,728
Households Which Prefer to Relocate
Total 38,255 15,502 17,091 1,480 4,182
• Want & Can Afford SingleFamily or Large Coop Flat 1,338 1,065 ° 0 273
• If Opt, Could Afford SmallCooperative 1,113 592 339 0 182
• Want & Can Afford TBS orCommunal Flat 5,088 355 4,278 ° 455
• Could Afford TBS ifChange Preferences 13,531 6,391 3,751 1,480 1,909
• Cannot Afford SingleFamily, Cooperative or
17,185 7,099 8,723 0 1,363TBS Without Subsidy
Households Which Prefer Not to Relocate (not cumulative)
Total 111,745 44,740 42,177 16,282 8,546
• Need Subsidy to Afford 46,190 20,238 19,299 2,960 3,693
• Overcrowded 12,678 4,852 5,469 0 2,357
• Substandard 16,855 473 16,068 0 314
Households Which Want to Renovate
• Prefer to Relocate & CanAfford Renovation 9,305 4,142 4,613 0 550
• Prefer Not to Relocate &Can Afford Renovation 22,901 8,166 6,300 5,921 2,514
- 27-
Among 150,000 households currently residing in Szczecin, an estimated 38,255households or 25.5 percent prefer to relocate to new or other housing. Of these. only an estimated1,338 households (3.5%) can afford their preferences for single family or large cooperativeapartment ownership, and an estimated 5,088 households (13.3%) want and can atford TBS orcommunal type rental units. Another 1,113 households (2.9%) wanting to own cooperativeapartments (with an average preference for 84 m2) could afford cooperative units of 50 m2, if
they were willing to opt for smaller units. The bulk of new owner occupants \',:ould be drawnfrom existing cooperative apartments (now either owner-occupied or rented), while the majorityof new renter occupants would be drawn from existing communal stock. The 7,539 combinedhouseholds that have the financial means to realize their housing preferences (perhaps modifiedpreferences) under market conditions account for only 5.0 percent of all households in Szczecin.
Of those households that prefer single family or cooperative housing. yet do not have thefinancial resources to afford even smaller cooperative units, fully 13,531 (35.4%) could relocateto new housing if they were willing to downscale their preferences from owning a house orapartment to renting a new TBS or communal flat. They comprise another 9.0 percent of allSzczecin households and are nearly equivalent in number to the statistical deficit of dependenthouseholds, now sharing housing units. While the inducement to move to a smaller rental flatmight be made more attractive by a future option to buy their housing, it is unlikely that all13,531 households would be willing to change their preferences. Assuming that half of thesehouseholds effectively demand TBS or communal stock, then coupled with those that can affordsingle family and cooperative housing, nearly 10 percent of the city's households could berehoused at current prices in new owner or rental housing. Under current conditions, however,an estimated 17,185 households preferring to relocate (44.9% of this group) will be unable toafford new or other housing, given current costs and their financial resources.
Of all Szczecin households, an estimated 111,745 (or 74.5%) prefer not to relocate to newor other housing, yet many of these households currently live under inadequate housingconditions. An estimated 46,190 households, primarily occupying cooperative and communalstock, spend more than 30 percent of their net monthly household income on housing expenses.Fully 12,678 households that prefer not to relocate currently live in shared d\\'elling units, intypically cooperative and communal stock, as doubled-up households. An estimated 16,855households occupy substandard flats, primarily in communal stock, as measured by the lack oftoilet facilities. While it is not possible to determine the unduplicated number of non-moverhouseholds that are inadequately housed. it is quite likely that at least half of all those who prefernot to relocate are living under problematic housing conditions.
Lastly, an estimated 32,206 citywide households want to undertake some form of housingrenovation and are likely able to afford additional housing expenditures, for example, as monthlysavings for a renovation loan. The bulk of these households currently occupy units in which theyexpect to remain, while roughly one in every three households wanting to renovate also prefer to
- 28 -

relocate to new or other housing. Housing renovation assistance for those that intend to remain intheir current housing and can afford to participate in renovation investments would represent asignificant step in alleviating the housing quality deficit of Szczecin.
- 29 -

PART II
LOCAL HOUSING SUPPLY OPTIONS
1. Szczecin's Housing System - Overview
With a vacancy rate close to zero, the current housing stock offers few options to thoseseeking new housing opportunities except in rare instances when an apartment is exchanged orvacated. The vacancy rate will increase as the ownership and tenure structure of the currenthousing stock continues to evolve and new housing opportunities arise on the market. However,as indicated above, new market rate housing opportunities are limited to a very small segment ofthe population. Most of the current housing stock built between World War II and 1989, washeavily subsidized. Of the 10,500 units built after 1990, a high portion of the cooperative unitsprobably received interest rate buy-outs by the state. Even with these capital subsidies or a lackof debt service to be paid, many residents are still unable to cover the maintenance and operatingcosts required for adequate management and repairs of their units. As effective demand for newhousing is explored, consideration must be given to those who are currently inadequately housed,living in substandard conditions or overextended in their housing costs.
Section 1 below outlines the current structure of Szczecin's housing stock, general rentsor operating expenses, and income characteristics of inhabitants. The still high percentage ofcommunal stock poses both threats and opportunities. Threats stem from its overall poorcondition, and require attention in the very near term. Opportunities arise from the centrallocation of much of the communal stock, which provides the city with a resource which couldleverage external financing and funding under careful planning and strategic management. Ther.esulting resources could be used to address local housing needs.
The City of Szczecin has a very pro-active housing policy. Extensive research precededthe drafting of the housing policy which guides the City in taking full advantage of currentfunding and financing sources available to support local housing strategies. The discussionpresented in this section draws upon the research conducted by the Housing Policy Group,however its scope is limited to briefly outlining supply side options available to Szczecin'sresidents.
- 31 -

Szczecin's policy of setting rents to recover costs is described below in Section 2:"Existing Rental Housing."
Recognizing the difficulty for apartment owners and tenants to assume responsibility torenovate building suffering from long term neglect, the City has created incentive and supportprograms for improvement of the communal and housing association stock. and a program tosLlpport locally defined infrastructure and small neighborhood project development. Theseprograms are briefly described in Section 3 below: "City Supported Programs for HOLlsing andCommunity Improvement."
Section 4, "New Development," describes new construction trends and products.
Section 5, "Funding and Financing Sources," provides a description of financing andfiscal tools for housing development and renovation and support.
1.1 Housing Stock by Ownership
As indicated in the table below, Szczecin's housing stock includes a higher percentage ofcommunal and cooperative housing when compared to the nation as a whole.
Table 2.1Ownership of Housing Stock
Survey Results and Statistical Data
Data from Urzad National Averages,Form of Ownership Statystyczny Szczecin Polish Cities over
Units PercentSurvey Results 100,000 Population
(GUS 1995)
Cooperatives56,700 42.1% 51.0% 34.4%
Communal or41,700 31% 31.6% 12.9%
Housing Association
Housing Association 10,200 7.6% 18.3% ,
Former Enterprise3,000 2.2%
Converted to Coop ,
1.2% 6.6%Former Enterprise
8,400 6.2%converted to Private
Privately owned 14,600 10.9% 12.7% 24.6%
Total 134,600 100% 96.5% 96.8%HOUSlllg Pohcy Group, 1997 (Some roundlllg errors and mlsslllg data repeated from source materials.)
- 32-
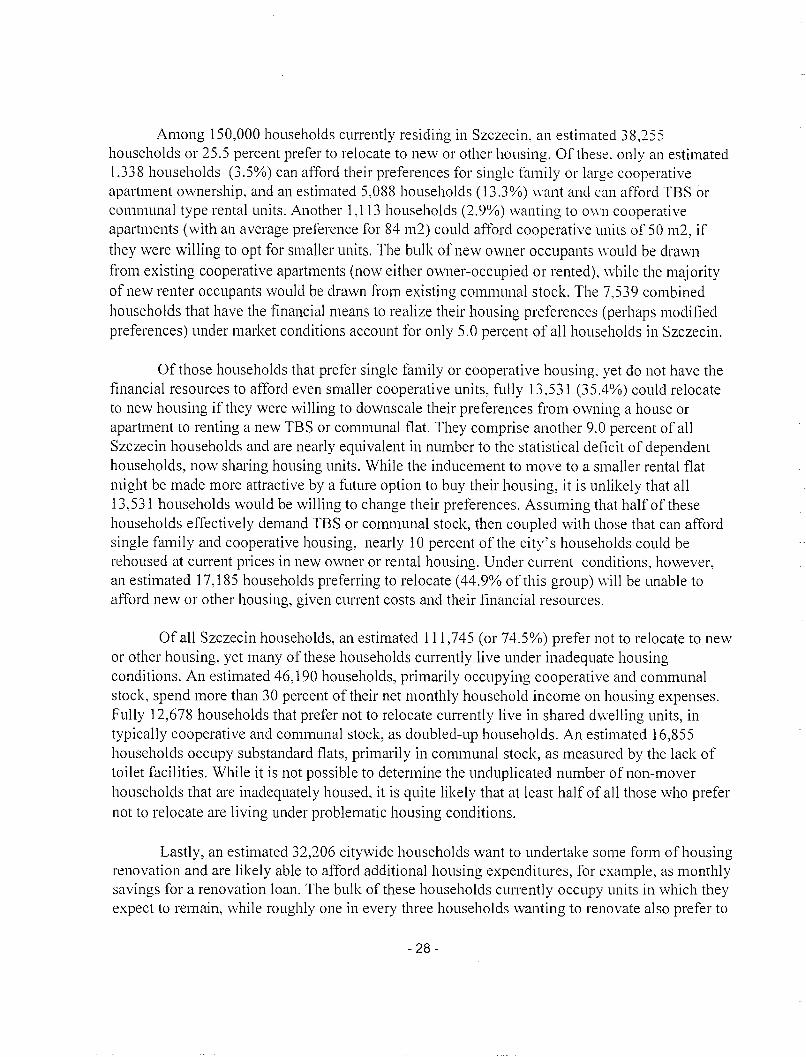
However, the communal housing is periodically being privatized to sitting tenants andnow to newly forming TBS.
Table 2.2Sales of Communal Housing Units to Tenants in Szczecin
Year No. of Units Usable Area Total Sales Price per Share of citySold to by m2 Amount m2/PLN revenues (%)
Tenants
1992 1,095 60,300 3,1 00,000 51.5 4.16
1993 1,177 65,974 5,112,569 77.5 4.97
1994 1,009 57,792 4,650,558 80.5 2.83
1995 1,694 87,053 6,869,815 78.9 3.09HOllSll1g Pollcy Ul1It, Szczecll1 1996
Residents were surveyed concerning their income and housing expenditure levels. Thefollowing two tables summarize the average incomes and average housing cost expenditures bytype of ownership and housing.
Table 2.3Income Ranges by Housing Ownership Type
Average Household IncomeForm of Ownership (Range)
in PLN/month
Communal901
Housing association or cooperative1,000 - 1,100
Single family, rental cooperative or1,200 - 1,500
private rental
Survey
- 33 -
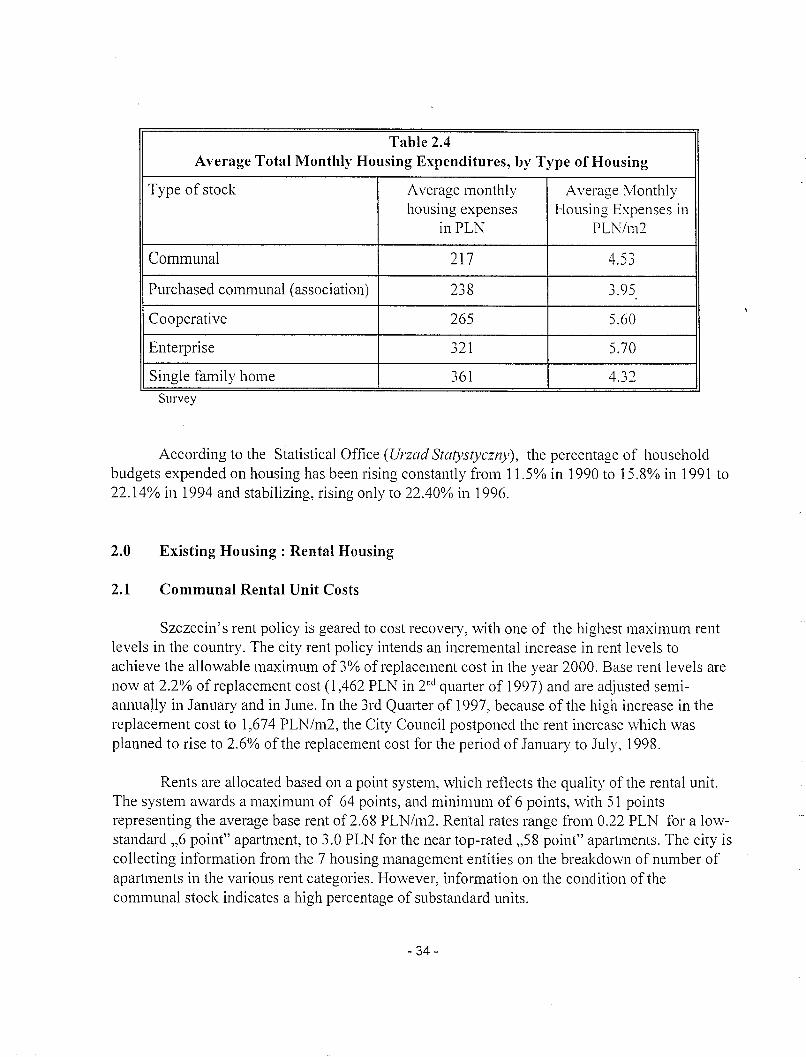
Table 2.4Average Total Monthly Housing Expenditures, by Type of Housing
Type of stock Average monthly Average Monthlyhousing expenses Housing Expenses in
inPLN PLN/m2
Communal 217 4.53
Purchased communal (association) 238 3.95
Cooperative 265 5.60
Enterprise 321 5.70
Single family home 361 4.32
Survey
According to the Statistical Office (Urzad Statystyczny) , the percentage of householdbudgets expended on housing has been rising constantly from 11.5% in 1990 to 15.8% in 1991 to22.14% in 1994 and stabilizing, rising only to 22.40% in 1996.
2.0 Existing Housing: Rental Housing
2.1 Communal Rental Unit Costs
Szczecin's rent policy is geared to cost recovery, with one of the highest maximum rentlevels in the country. The city rent policy intends an incremental increase in rent levels toachieve the allowable maximum of3% of replacement cost in the year 2000. Base rent levels arenow at 2.2% ofreplacement cost (l,462 PLN in 2nd quarter of 1997) and are adjusted semiannually in January and in June. In the 3rd Quarter of 1997, because of the high increase in thereplacement cost to 1,674 PLN/m2, the City Council postponed the rent increase which wasplanned to rise to 2.6% of the replacement cost for the period of January to July, 1998.
Rents are allocated based on a point system, which reflects the quality of the rental unit.The system awards a maximum of 64 points, and minimum of 6 points, with 51 pointsrepresenting the average base rent of 2.68 PLN/m2. Rental rates range from 0.22 PLN for a lowstandard ,,6 point" apartment, to 3.0 PLN for the near top-rated ,,58 point" apartments. The city iscollecting information from the 7 housing management entities on the breakdown of number ofapartments in the various rent categories. However, information on the condition of thecommunal stock indicates a high percentage of substandard units.
- 34-
In 1995 the Renovation Team characterized the condition of the communal units as:
• approximately 80% of the 42,000 communal units are found in pre-war buildings;
• 2% of communal buildings were constructed prior to 1880, of which:• 30% of units lack toilets• 37% of units lack bathrooms• 50% of units have coal-fueled heating systems.
Typically, substandard stock costs more to manage, thus the housing management entities withmore substandard stock will have less funding available for repairs, requiring greater subsidiesfrom the city.
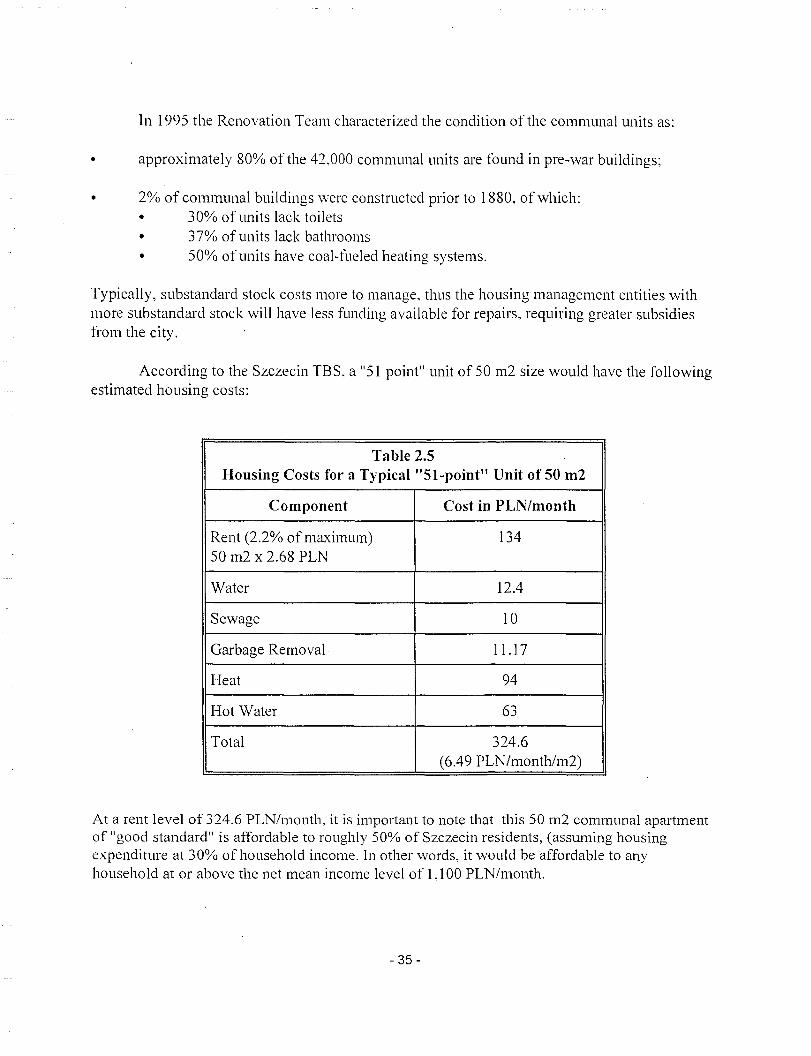
According to the Szczecin TBS, a "51 point" unit of 50 m2 size would have the followingestimated housing costs:
Table 2.5Housing Costs for a Typical" 51-point" Unit of 50 m2
Component Cost in PLN/month
Rent (2.2% of maximum) 13450 m2 x 2.68 PLN
Water 12.4
Sewage 10
Garbage Removal 11.17
Heat 94
Hot Water 63
Total 324.6(6.49 PLN/month/m2)
At a rent level of 324.6 PLN/month, it is important to note that this 50 m2 communal apartmentof "good standard" is affordable to roughly 50% of Szczecin residents, (assuming housingexpenditure at 30% of household income. In other words, it would be affordable to anyhousehold at or above the net mean income level of 1,100 PLN/month.
- 35-
2.2 Private Market Rental Housing
The private rental market in Szczecin is not large, with one local broker turning over 20to 30 apartments a week. Several brokers indicate that small apartments dominate the rentalmarket both in terms of supply and demand with larger apartments staying on the market longer.Neighborhoods commanding the highest rents are the center city and outlying areas surroundingthe city where there are high standard new units for rent. Renters pay the owner a rental fee andalso cover all apartment expenses, including the basic rental charge which usually ranges from
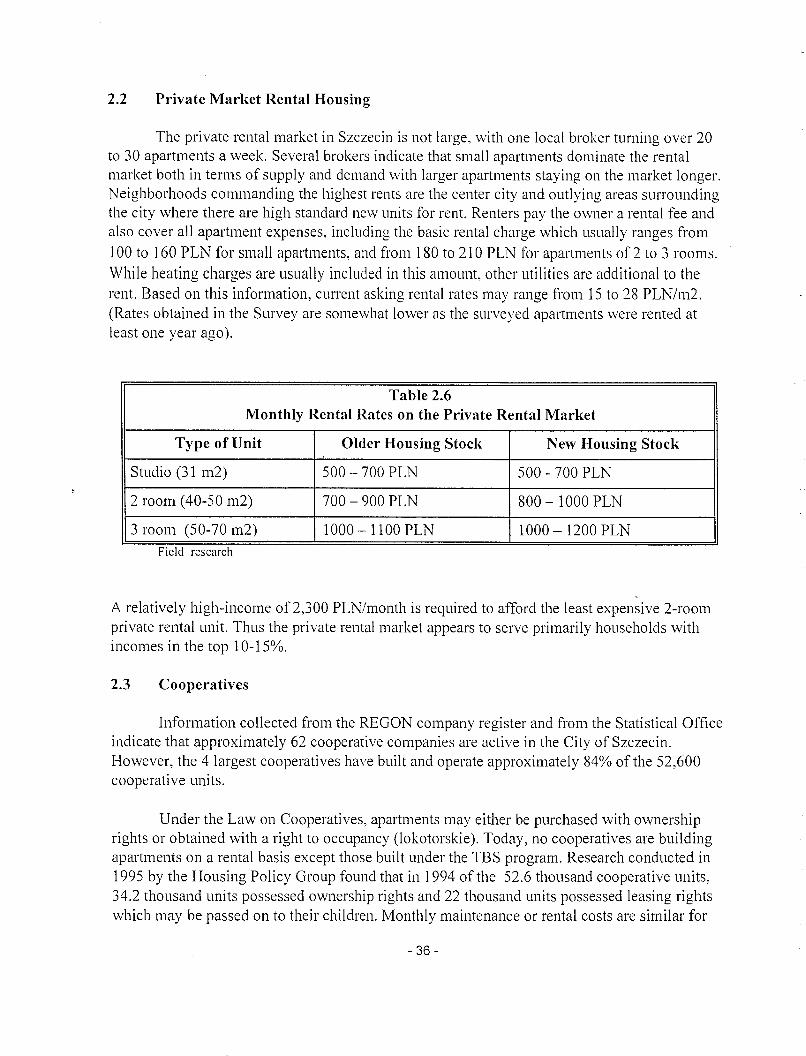
100 to 160 PLN for small apartments, and from 180 to 210 PLN for apartments of 2 to 3 rooms.While heating charges are usually included in this amount, other utilities are additional to therent. Based on this information, current asking rental rates may range from 15 to 28 PLN/m2.(Rates obtained in the Survey are somewhat lower as the surveyed apartments were rented atleast one year ago).
Table 2.6Monthly Rental Rates on the Private Rental Market
Type of Unit Older Housing Stock New Housing Stock
Studio (31 m2) 500 -700 PLN 500 -700 PLN
2 room (40-50 m2) 700-900 PLN 800 - 1000 PLN
3 room (50-70 m2) 1000 - 11 00 PLN 1000 - 1200 PLN
FIeld research
A relatively high-income of2,300 PLN/month is required to afford the least expensive 2-roomprivate rental unit. Thus the private rental market appears to serve primarily households withincomes in the top 10-15%.
2.3 Cooperatives
Information collected from the REGON company register and from the Statistical Officeindicate that approximately 62 cooperative companies are active in the City of Szczecin.However, the 4 largest cooperatives have built and operate approximately 84% of the 52,600cooperative units.
Under the Law on Cooperatives, apartments may either be purchased with ownershiprights or obtained with a right to occupancy (lokotorskie). Today, no cooperatives are buildingapartments on a rental basis except those built under the TBS program. Research conducted in1995 by the Housing Policy Group found that in 1994 of the 52.6 thousand cooperative units,34.2 thousand units possessed ownership rights and 22 thousand units possessed leasing rightswhich may be passed on to their children. Monthly maintenance or rental costs are similar for
- 36-
both ownership type within the same building. Changes in the Law on Cooperatives haveclaritied ownership rights and cooperative owners may rent their units for market prices.
2.4 Enterprise Housing
As described above, much of the housing built and managed by Szczecin companies hasbeen or is in the process of being transformed into communal stock, housing associations orcooperatives as allowed under the Act on Transforming Enterprise Housing. October 1994 .
3.0 City Supported Programs for Housing and Community Improvement
To address the deteriorated state and substandard conditions in the communal stock, thei:ity has created two rehabilitation assistance programs: "Small Improvement Program" and "OurHouse." These programs encourage tenants and owners in communal stock to upgrade both theirunits and buildings with co-tinancing from the city. A large proortion of tenants and owners areunable to pay either the higher rental rates attached to improved housing, or the higher cost ofmore substantial renovation. The City's renovation programs attempt to address some of theseissues by subsidizing renovation costs and postponing increases in maintenance payments orrents due to the improved conditions. An additional source of co-financing. but one which is littleused, is the contract savings system.
3.1 Small Improvement Program
The Small Improvement Program, an important part of the renovation strategy, providesgrants to tenants and owners (only for group investments) in communal or mixed ownershipstock to conduct specified repairs and types of moderate renovation. The program has been insuccessful operation since March 1994 under the administration of the Renovation Group andhas provided grants to 1,034 participants. The majority of grants (956 out of 1.034) were forconversion of coal powered heating systems to gas (739) or electric (217). The secondimprovement was the installation of toilets and bathrooms (71). In the later years of the program,there have been some jointly funded improvements in common areas such as installation ofbuilding intercoms or more extensive repairs of common areas. The total expenditure for theprogram over the past three years was 1,816,934 PLN which in turn has leveraged additionalinvestment of approximately 3,374,306 PLN for a total of 5, 191 ,240 new investment in housingrenovation.
- 37 -
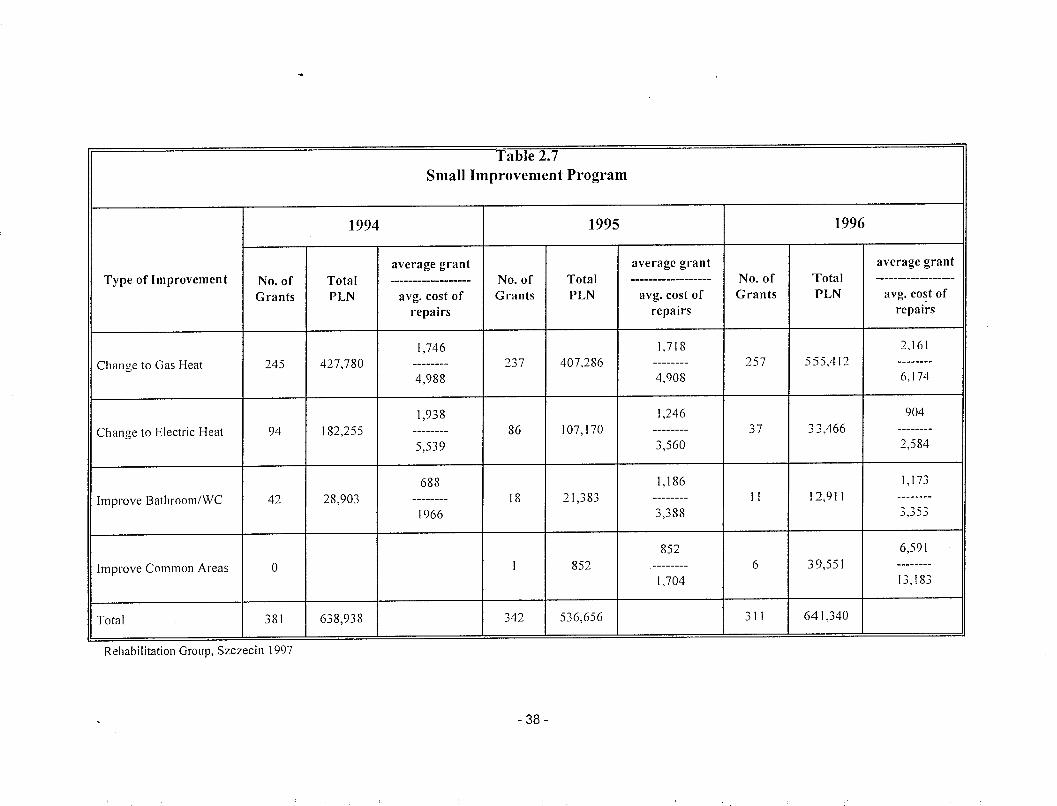
Table 2.7Small Improvement Program
1994 1995 1996
average grant average grant average grantType of Improvement No. of Total ------------------ No. of Total ------------------ No. of Total ------------------
Grants PLN avg. cost of Grants PLN avg. cost of Grants PLN avg. cost ofrepairs repairs repairs
1,746 1,718 2,161Change to Gas Heat 245 427,780 -------- 237 407,286 -------- 257 555,412 --------
4,988 4,908 6,174
1,938 1,246 904Change to Electric Heat 94 182,255 -------- 86 107,170 -------- 37 33,466 --------
5,539 3,560 2,584
688 1,186 1,173Improve Bathroom/WC 42 28,903 -------- 18 21,383 -------- 1I 12,911 --------
1966 3,388 3,353
852 6,591Improve Common Areas 0 1 852 -------- 6 39,551
I.704 13,183
Total 381 638,938 342 536,656 311 641,340
Rehabilitation Group, Szczecin 1997
- 38-
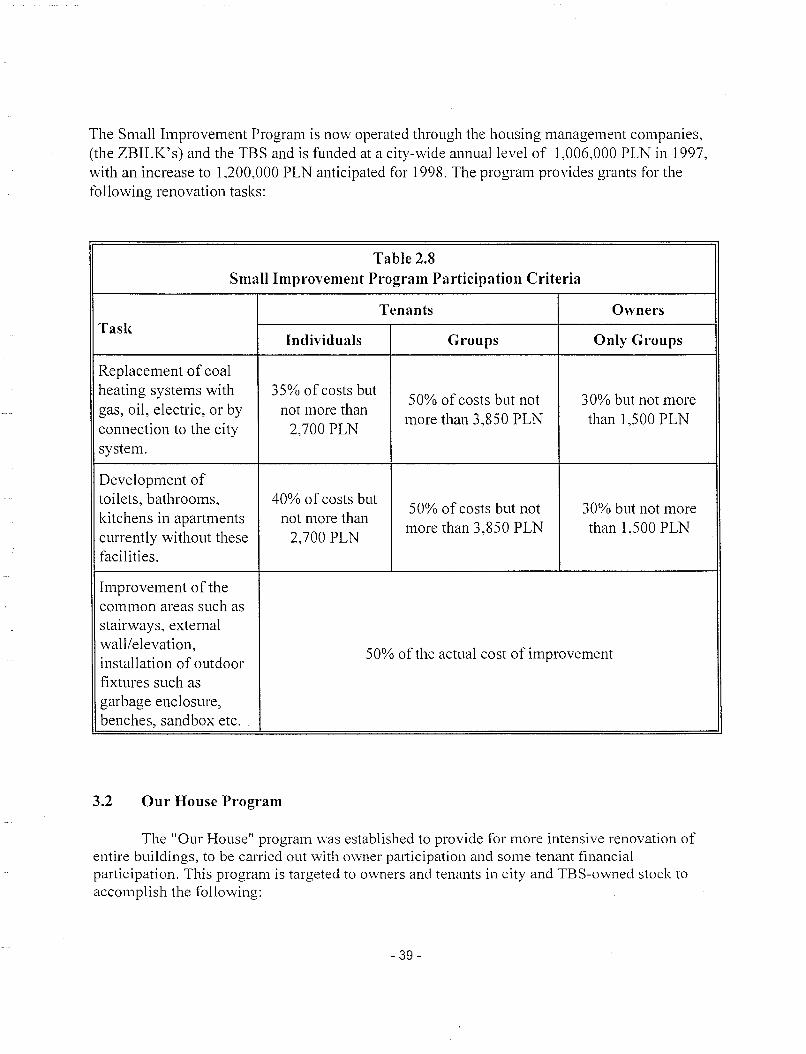
The Small Improvement Program is now operated through the housing management companies,(the ZBILK's) and the TBS and is funded at a city-wide annual level of 1,006,000 PLN in 1997,with an increase to 1,200,000 PLN anticipated for 1998. The program provides grants for thefollowing renovation tasks:
Table 2.8Small Improvement Program Participation Criteria
Tenants OwnersTask
Individuals Groups Only Groups
Replacement of coalheating systems with 35% of costs but
50% of costs but not 30% but not moregas, oil, electric, or by not more than
more than 3,850 PLN than 1,500 PLNconnection to the city 2,700 PLNsystem.
Development oftoilets, bathrooms, 40% of costs but
50% of costs but not 30% but not morekitchens in apartments not more than
more than 3,850 PLN than 1,500 PLNcurrently without these 2,700 PLNfacilities.
Improvement of thecommon areas such asstairways, externalwall/elevation,
50% of the actual cost of improvementinstallation of outdoorfixtures such asgarbage enclosure,benches, sandbox etc.
3.2 Our House Program
The "Our House" program was established to provide for more intensive renovation ofentire buildings, to be carried out with owner participation and some tenant financialparticipation. This program is targeted to owners and tenants in city and TBS-owned stock toaccomplish the following:
- 39-
• to create incentives for purchase of communal units by sitting tenants
• to improve housing conditions to create a housing management market through initiatingand financing training for future managers.
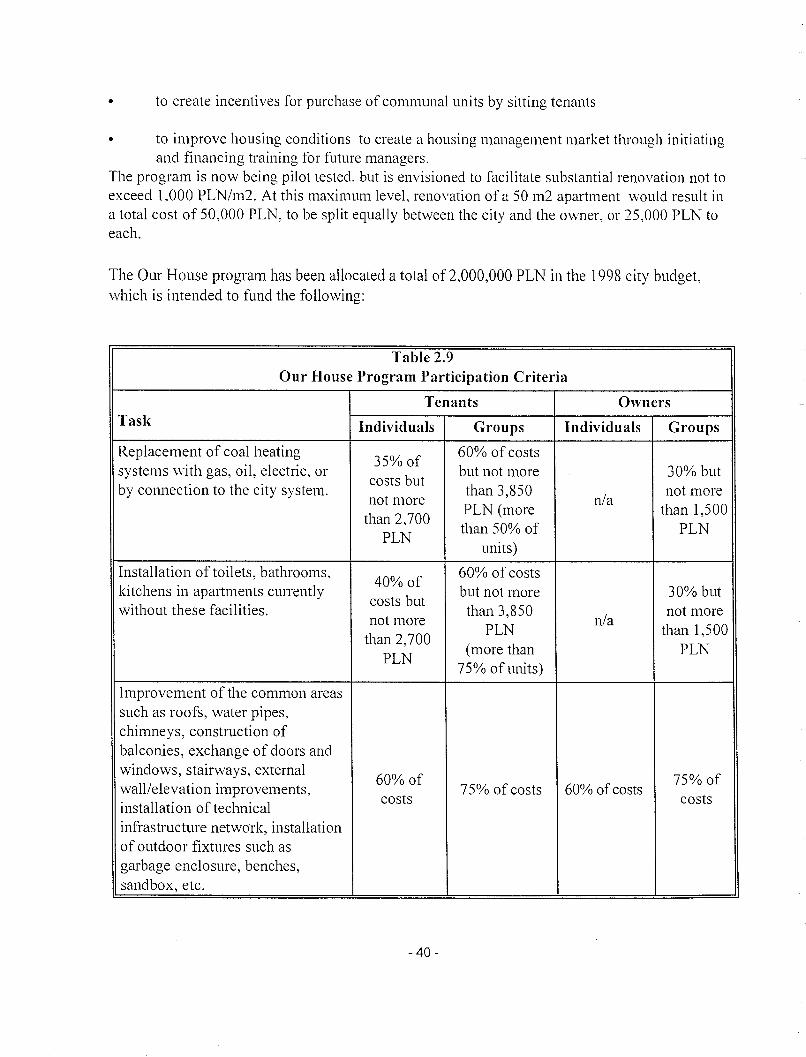
The program is now being pilot tested, but is envisioned to facilitate substantial renovation not toexceed 1,000 PLN/m2. At this maximum leveL renovation of a 50 m2 apartment would result ina total cost of 50,000 PLN, to be split equally between the city and the owner, or 25,000 PLN toeach.
The Our House program has been allocated a total of 2,000,000 PLN in the 1998 city budget,which is intended to fund the following:
Table 2.9Our House Program Participation Criteria
Tenants OwnersTask Individuals Groups Individuals Groups
Replacement of coal heating35% of
60% of costssystems with gas, oil, electric, or
costs butbut not more 30% but
by connection to the city system. than 3,850n/a
not morenot more
PLN (more than 1,500than 2,700
than 50% of PLNPLN
units)
Installation of toilets, bathrooms,40% of
60% of costskitchens in apartments currently
costs butbut not more 30% but
without these facilities. than 3,850n/a
not morenot more
PLN than 1,500than 2,700
(more than PLNPLN
75% of units)
Improvement of the common areassuch as roofs, water pipes,chimneys, construction ofbalconies, exchange of doors andwindows, stairways, external
60% of 75% ofwall/elevation improvements, 75% of costs 60% of costsinstallation of technical
costs costs
infrastructure network, installationof outdoor fixtures such asgarbage enclosure, benches,sandbox, etc.
- 40-

These two programs are creative attempts to provide incentives for owner and tenantparticipation in moderate and substantial housing stock improvement. For some of the city'shousing stock, these programs may provide a sufficient level of intervention or may be used tostem serious, immediate problems in anticipation of eventual capital renovation. The programsare most important in advancing the notion and that owners and tenants should invest in theirhousing and providing the mechanisms for them to do so. When combined with saving in thecontract savings system (described above) and with the use of tax deductions (described below),these two programs could make participation in renovation affordable to a greater percentage ofthe population. Currently the programs are modestly funded. With anticipated increase indemand, the city could develop mechanisms to recoup contributions to renovation costs byplacing liens on privately owned apartments to be payed at time of sale or to increasemaintenance fees by a percentage of renovation costs.
3.3 The Local Initiatives Program for Neighborhood and Infrastructure Improvements
In 1996, the City funded the Local Initiatives Program at a level of2,000,000 PLN toprovideincentives for neighborhood groups and individuals to support the development of infrastructure,school, playgrounds, sport fields, roads. parking, housing related objects, green areas and streetlights. The level of the city's participation ranges from 50 to 80% of the costs depending on thetask. Last year, all funds were allocated to 25 projects in 6 areas, as follows:
• 7 water and sewer supply• 6 local roads• 4 installations of electrical lines• 4 grants for project planning• 2 playgrounds• 2 schools.
In 1997,27 applications have already been received for new projects. The budget allocation for1998 has increased to 2.5 million PLN. This Local Initiatives Program is important in correctinginfrastructure deficiencies in lower rise neighborhoods with predominantly privately-ownedstock and to support the evolution of community-based neighborhood improvement efforts.
4.0 New Development
The use of cooperatives to develop new housing is declining somewhat, although rentalcooperatives are eligible to receive credit from the National Housing Fund (if conforming to theTBS criteria). Most new rental stock will be built by TBS and offered at moderately higher rentallevels than existing communal stock Some replacement housing for tenants relocated due torenovation is being built by TBS (with rents to be regulated by the city).
- 41 -
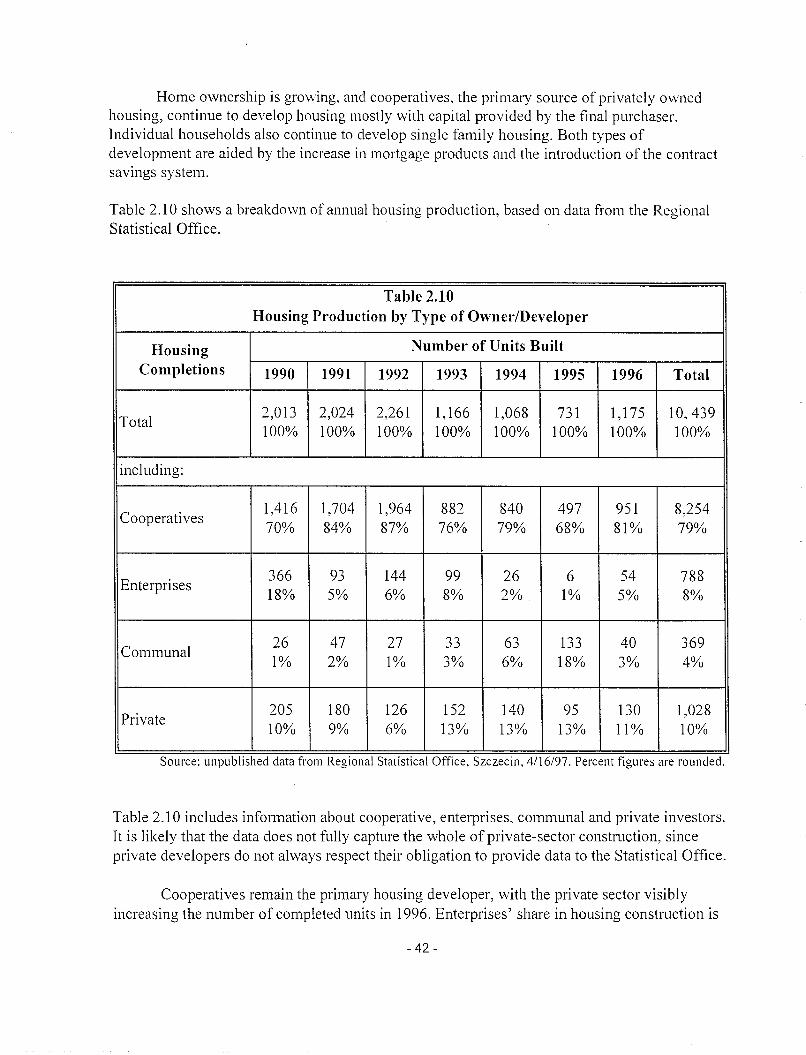
Home ownership is growing, and cooperatives, the primary source of privately ownedhousing, continue to develop housing mostly with capital provided by the final purchaser.Individual households also continue to develop single family housing. Both types ofdevelopment are aided by the increase in mortgage products and the introduction of the contractsavings system.
Table 2.10 shows a breakdown of annual housing production, based on data from the RegionalStatistical Office.
Source: unpublIshed data from RegIonal StatIstIcal Office, Szczecll1, 4/16/97. Percent figures are rounded.
Table 2.10Housing Production by Type of Owner/Developer
Housing Number of Units Built
Completions 1990 1991 1992 1993 1994 1995 1996 Total
Total2,013 2,024 2,261 1,166 1,068 731 1,175 10,439100% 100% 100% 100% 100% 100% 100% 100%
including:
Cooperatives1,416 1,704 1,964 882 840 497 951 8,25470% 84% 87% 76% 79% 68% 81% 79%
Enterprises366 93 144 99 26 6 54 78818% 5% 6% 8% 2% 1% 5% 8%
26 47 27,.,,.,
63 133 40 369Communal
.)j
1% 2% 1% 3% 6% 18% 3% 4%
Private205 180 126 152 140 95 130 1,02810% 9% 6% 13% 13% 13% 11% 10%
..
Table 2.10 includes information about cooperative, enterprises, communal and private investors.It is likely that the data does not fully capture the whole of private-sector construction, sinceprivate developers do not always respect their obligation to provide data to the Statistical Office.
Cooperatives remain the primary housing developer, with the private sector visiblyincreasing the number of completed units in 1996. Enterprises' share in housing construction is
- 42-
marginal and decreasing. The communal share in local housing construction has increased from1.3% in 1990 to 18.2% in 1995, decreasing to 4.6% in 1996. In total, from 1991-1997, 418 unitswere completed by communal investors, including 218 .attic adaptations and 200 newlyconstructed units.
4.1 Cooperative Housing
Field Survey on Development Trends: Development and Maintenance Rates
In June 1997, four housing cooperatives responded to questionnaires and interviewsintended to assess current housing development and maintenance costs. The cooperatives wereasked to profile projects developed in 1997 or currently in progress. Information from thissurvey of coops is presented in Table 2.11
- 43-
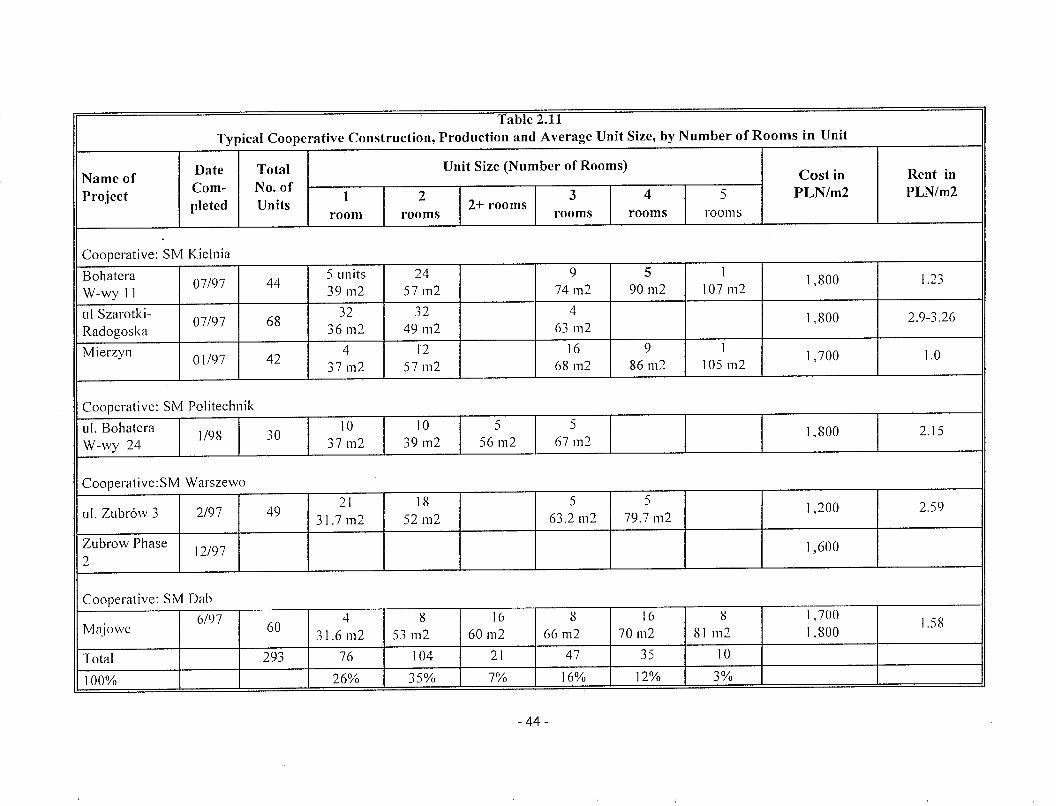
Table 2.11Typical Cooperative Construction, Production and Average Unit Size, by Number of Rooms in Unit
Name ofDate Total Unit Size (Number of Rooms)
Cost in Rent inProject
Com- No. of1 2 3 4 5 PLN/m2 PLN/m2
pleted Units 2+ roomsroom I"ooms rooms rooms rooms
Cooperative: SM Kielnia
Bohatera07/97 44
5 units 24 9 5 11,800 1.23
W-wy 11 39 m2 571112 74 1112 90 1112 107 1112
ul Szarotki-07/97 68
32 32 41,800 2.9-3.26
Radogoska 36 1112 491112 63 1112
Mierzyn01/97 42
4 12 16 9 I1,700 1.0
37 1112 57 1112 68 1112 86 1112 lOS m2
Cooperative: SM Politechnik
ul. Bohatera1/98 30
10 10 5 51,800 2.15
W-wy 24 37 1112 39 m2 56 1112 671112
Cooperative:SM Warszewo
ul. Zubrow 3 2/97 4921 18 5 5
1,200 2.5931.71112 52 m2 63.21112 79.71112
Zu brow Phase12/97 1,600
2
Cooperative: SM Dab
Majowe6N7
604 8 16 8 16 8 1.70U
1.583 I .6 1112 531112 601112 66 1112 701112 81 1112 1.800
Total 293 76 104 21 47 35 10
100% 26% 35% 7% 16% 12% 3%
- 44-
As indicated by Table 2.11, cooperatives building for the private market are developingapproximately 70% of their units at 60 m2 or less and more than 60% at 55 m2 or less to meetthe market demand for smaller or average sized units. Thus, despite the desire for larger units (85m2 and over) by survey respondents, examination of the actual market indicates the greatesteffective demand is for smaller units in the range of 1 to 3 units.
Cooperative projects developed today have typically been financed with the capital ofpurchasers who made an initial payment of 20 to 30% of the development cost, then paid theremainder in installments during construction, with the balance due on completion. However,Josef Karbowniczyn. President of Dab S.M., suggested a marked increase in use of m0l1gages forunit purchased from 1995 to 1996, in his estimation an increase ranging from 5% to 30%. Hefurther categorized his purchasers in three groups, and estimated the percentage of households ineach:
• 30% to 40% are families with apartments who are interested in improving their housingconditions, and usually opt for apartments of 80 m2 or larger.
• 20% to 30% are families purchasing units for their children or for tax benefits, usuallybuying smaller apartments to 50 m2.
• 30% are first-time home buyers who may have several housing savings books
4.2 TBS: New Construction and Renovation
STBS, the first TBS in Szczecin, was established in the process of restructuring the cityhousing management entities. Since then STBS has assumed management of 4,719 housingunits and 337 commercial units located in the city center. The City has also transferred to STBSthe ownership of two blocks located in the city center, for which renovation plans have beenprepared. These blocks include 626 housing and 15 commercial units. The City is nowdeveloping a second TBS by transforming another housing management entity.
Briefly, TBS are created to develop, rehabilitate and manage rental housing stockaffordable to middle-income families. Below are the most recent TBS income qualification limitsfor the Szczecin voivodship.
- 45-
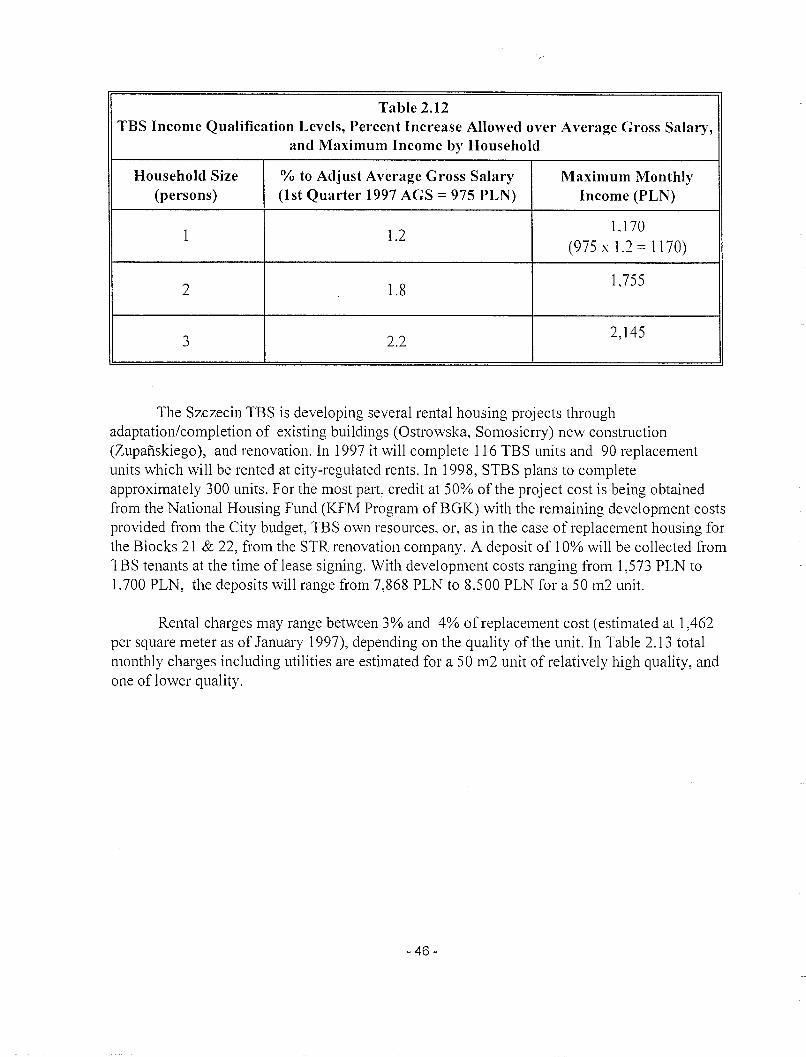
Table 2.12TBS Income Qualification Levels, Percent Increase Allowed over Average Gross Salary,
and Maximum Income by Household
Household Size % to Adjust Average Gross Salary Maximum Monthly(persons) (1st Quarter 1997 AGS = 975 PLN) Income (PLN)
1 1.21.170
(975 x 1.2 = 1170)
2 1.81.755
..,2.2
2,145..)
The Szczecin TBS is developing several rental housing projects throughadaptation/completion of existing buildings (Ostrowska, Somosierry) new construction(Zupanskiego), and renovation. In 1997 it will complete 116 TBS units and 90 replacementunits which will be rented at city-regulated rents. In 1998, STBS plans to completeapproximately 300 units. For the most part. credit at 50% of the project cost is being obtainedfrom the National Housing Fund (KFM Program ofBGK) with the remaining development costsprovided from the City budget, TBS own resources, or. as in the case of replacement housing forthe Blocks 21 & 22, from the STR renovation company. A deposit of 10% will be collected fromTBS tenants at the time oflease signing. With development costs ranging from 1,573 PLN to1.700 PLN, the deposits will range from 7,868 PLN to 8,500 PLN for a 50 m2 unit.
Rental charges may range between 3% and 4% of replacement cost (estimated at 1,462per square meter as of January 1997), depending on the quality of the unit. In Table 2.13 totalmonthly charges including utilities are estimated for a 50 m2 unit of relatively high quality, andone of lower quality.
- 46-
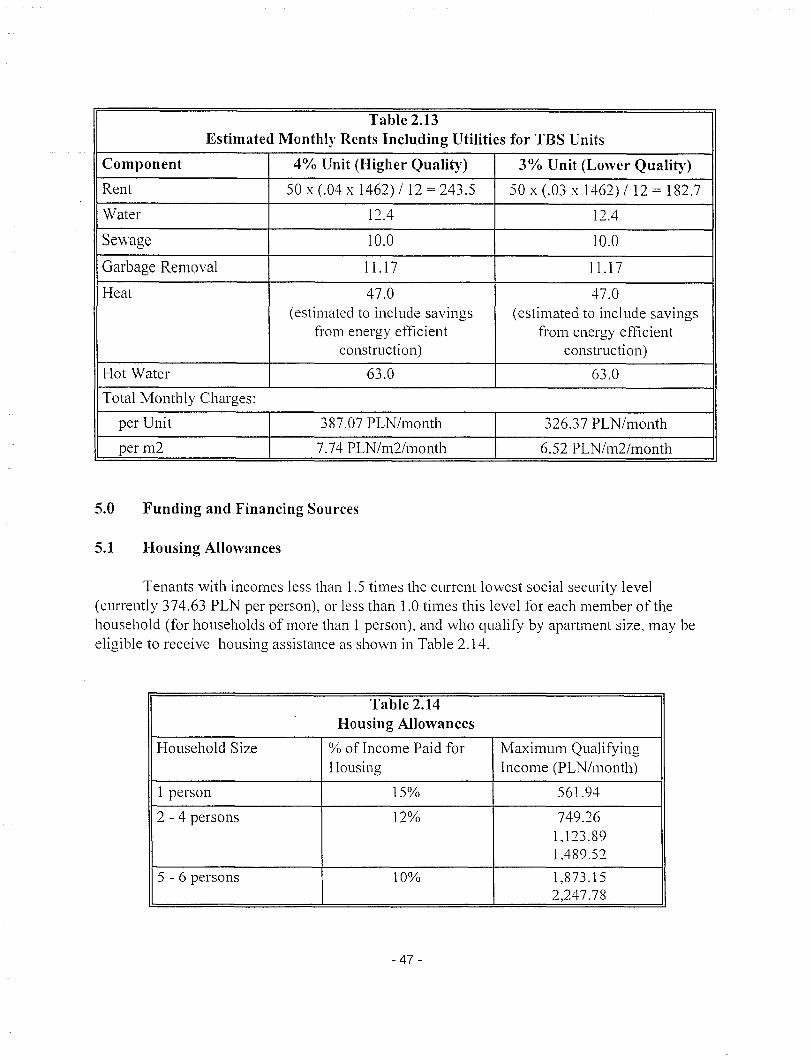
Table 2.13Estimated Monthly Rents Including Utilities for TBS Units
Component 4% Unit (Higher Quality) 3% Unit (Lower Quality)
Rent 50 x (.04 x 1462) 112 = 243.5 SOx(.03 x 1462)1 12= 182.7
Water 12.4 12.4
Sewage 10.0 10.0
Garbage Removal 11.17 11.17
Heat 47.0 47.0(estimated to include savings (estimated to include savings
from energy efficient from energy efficientconstruction) construction)
Hot Water 63.0 63.0
Total Monthly Charges:
per Unit 387.07 PLN/month 326.37 PLN/month
perm2 7.74 PLN/m2/month 6.52 PLN/m2/month
5.0 Funding and Financing Sources
5.1 Housing Allowances
Tenants with incomes less than 1.5 times the current lowest social security level(currently 374.63 PLN per person), or less than 1.0 times this level for each member of thehousehold (for households of more than 1 person), and who qualify by apartment size, may beeligible to receive housing assistance as shown in Table 2.14.
Table 2.14Housing Allowances
Household Size % of Income Paid for Maximum QualifyingHousing Income (PLN/month)
1 person 15% 561.94
2 - 4 persons 12% 749.261.123.891,489.52
5 - 6 persons 10% 1,873.152,247.78
- 47 -

The percentage of households receiving housing allowances in Szczecin is higher thannational rates for large cities. Of the 149,000 households in Szczecin, 10% or 14,858 receivedhousing allowances in 1996. This appears to be significantly higher than the rate of 4.8% insample cities researched in 1995 by the Housing Institute. It should be noted. however, thathousing allowance utilization is increasing countrywide as people become familiar with therelatively new program. Table 2.15 provides an overview of major characteristics of the 1996Housing Allowance Program in Szczecin.
- 48-
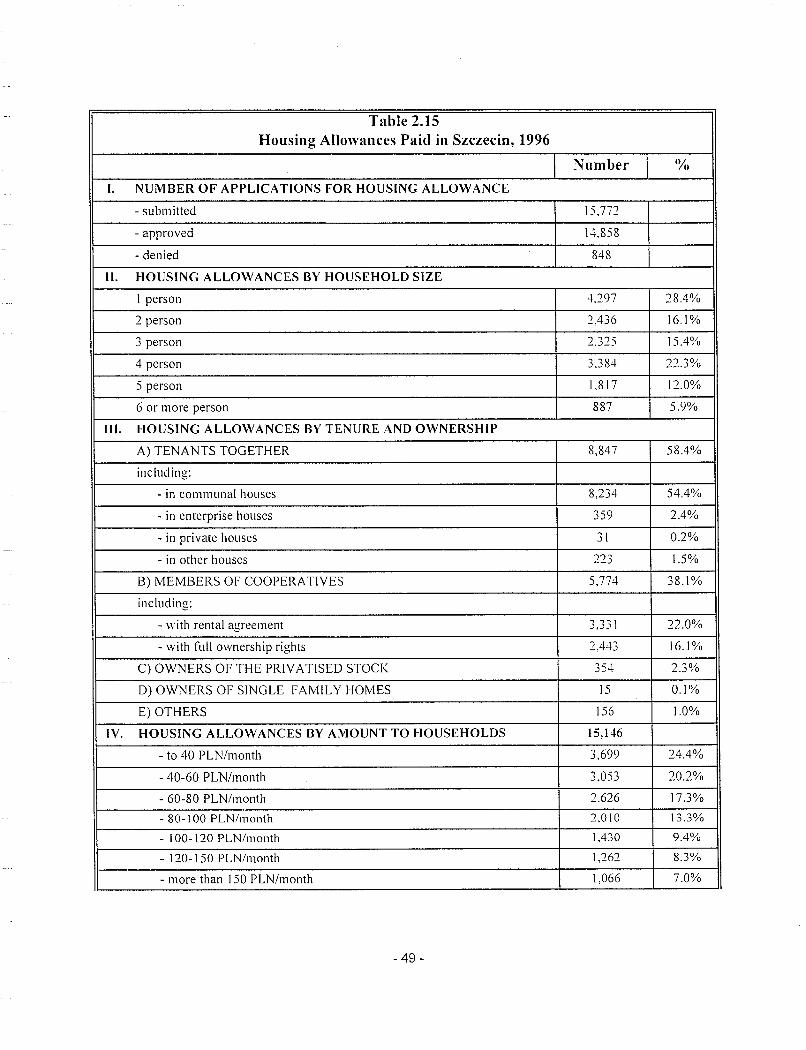
Table 2.15Housing Allowances Paid in Szczecin, 1996
Number (%
I. NUMBER OF APPLICATIONS FOR HOUSING ALLOWANCE
- submitted 15,772
- approved 14,858
- denied 848
II. HOUSING ALLOWANCES BY HOUSEHOLD SIZE
I person 4,297 28.4%
2 person 2,436 16.1%
3 person 2,325 15.4%
4 person 3,384 22.3%
5 person L8I7 12.0%
6 or more person 887 5.9%
III. HOUSING ALLOWANCES BY TENURE AND OWNERSHIP
A) TENANTS TOGETHER 8,847 58.4%
including:
- in communal houses 8,234 54.4%
- in enterprise houses 359 2.4%
- in private houses 31 0.2%
- in other houses ')')~ 1.5%~_.:J
B) MEMBERS OF COOPERATIVES 5,774 38.1%
including:
- with rental agreement 3,331 22.0%
- with full ownership rights 2,443 16.1%
C) OWNERS OF THE PRIVATISEO STOCK 354 2.3%
0) OWNERS OF SINGLE FAMILY HOMES 15 0.1%
E) OTHERS 156 1.0%
IV. HOUSING ALLOWANCES BY AMOUNT TO HOUSEHOLDS 15,146
- to 40 PLN/month 3,699 24.4%
- 40-60 PLN/month 3,053 20.2%
- 60-80 PLN/month 2,626 17.3%
- 80-100 PLN/month 2,010 13.3%
- 100-120 PLN/month 1,430 9.4%
- 120-150 PLN/month 1,262 8.3%
- more than 150 PLN/month 1,066 7.0%
- 49-
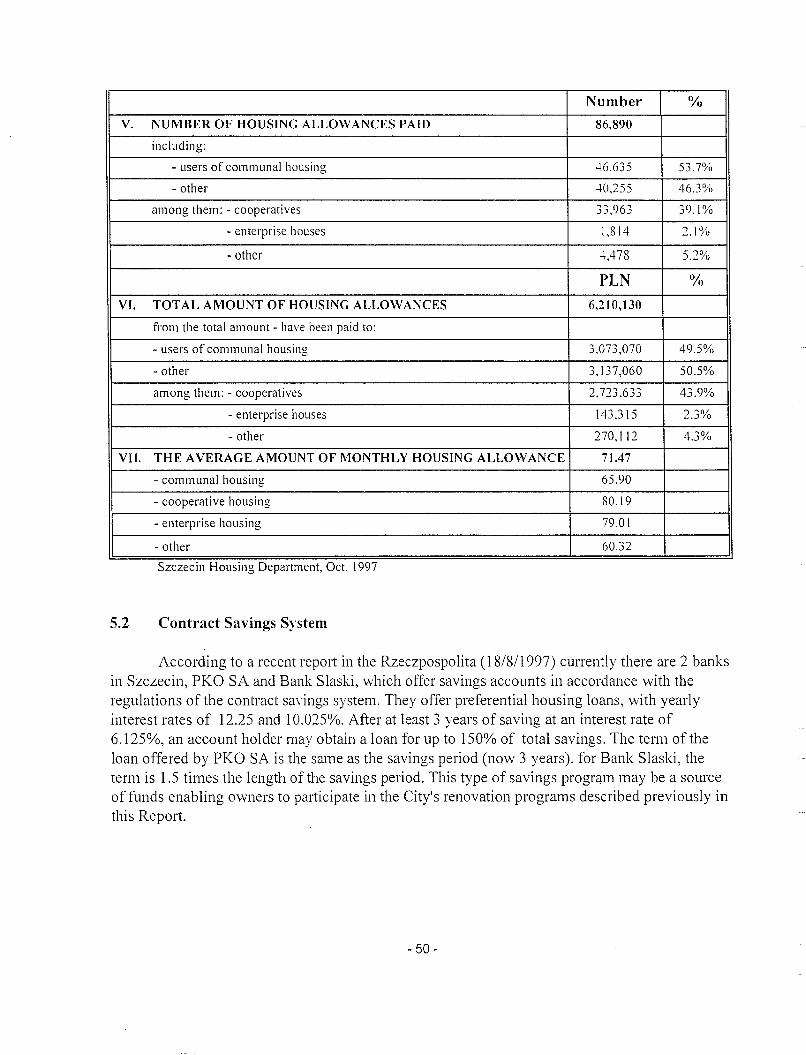
Number (10
V. NUMBER OF HOUSING ALLOWANCES PAID 86,890
including:
- users of communal hOLlsing ..\6.635 53.7%
- other ..\0,255 46.3%
among them: - cooperatives 33.963 39.1%
- enterprise houses 1,814 2.1%
- other ..\,478 5.2%
PLN (XI
VI. TOTAL AMOUNT OF HOUSING ALLOWANCES 6,210,130
from the total amount - have been paid to:
- users of communal housing 3,073,070 49.5%
- other 3,137,060 50.5%
among them: - cooperatives 2,723,633 43.9%
- enterprise houses 143,315 2.3%
- other 270,112 4.3%
VII. THE AVERAGE AMOUNT OF MONTHLY HOUSING ALLOWANCE 71.47
- communal housing 65.90
- cooperative housing 80.19
- enterprise housing 79.01
- other 60.32
Szczeclll Housll1g Department, Oct. 1997
5.2 Contract Savings System
According to a recent report in the Rzeczpospolita (18/8/1997) currently there are 2 banksin Szczecin, PKO SA and Bank Slaski, which offer savings accounts in accordance with theregulations of the contract savings system. They offer preferential housing loans, with yearlyinterest rates of 12.25 and 10.025%. After at least 3 years of saving at an interest rate of6.125%, an account holder may obtain a loan for up to 150% of total savings. The term of theloan offered by PKO SA is the same as the savings period (now 3 years). for Bank Slaski, theterm is 1.5 times the length of the savings period. This type of savings program may be a sourceof funds enabling owners to participate in the City's renovation programs described previously inthis Report.
- 50 -
5.3 Mortgage Finance Products
In the past year, several banks began offering mortgage products in the Szczecin area. Afew banks were contacted to learn of their products. Housing mortgage loans can be obtainedfor terms ranging from 10 to 20 years (Bank Gdafiski and PKO SA, respectively). The totalamount of the loan depends on the income level of the borrower and is usually equal to 20 to 25times monthly income. The interest rate is similar in all the banks, ranging between 25-26% peryear. Minimum required downpayments range from 20 to 40% of the total development cost.Better terms may be provided with a lower loan to value ratio. Often a minimal level of monthlyincome is required of the potential borrowers. For example Bank Gdanski requires minimumincome equal to 150% of national average gross per capita earnings for a single person, and200% of the national average for a t\vo-earner household. PBK offers dual indexed mortgagesunder the Mortgage Fund, and currently offers the most advantageolls terms (used in the aboveanalysis).
5.4 Tax Benefits
5.4.1 Housing Purchase
Tax benefits are available for hOllsing investments and are deducted from the amount oftaxes owed. The deduction can be taken over a period of three years. At present, 19 % thefollowing costs qualify as deductible investments:
• new construction (limited to 70 m2 at the indicated cost per m2 determined for housingsavings books);
• land purchase or long term lease (no more than 350 m2)
• down payment to a housing cooperative;
• expansion of an apartment
• adaptation of non-residential space.
At a typical construction cost of 1,462 PLN per square meter, the maximum allowable deductionwould be:
70 m2 x 1,462 = 102,340 x 0.19 = 18,620 over 3 years,or 6,206 PLN deduction per year.
- 51 -
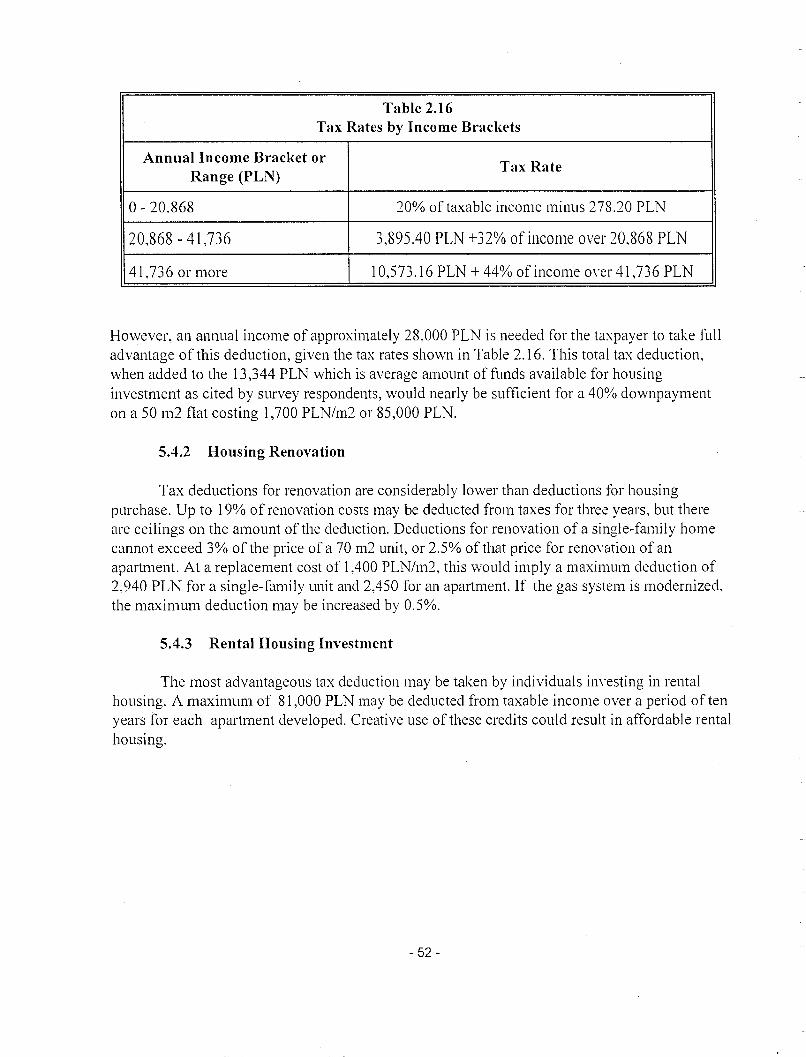
Table 2.16Tax Rates by Income Brackets
Annual Income Bracket orTax Rate
Range (PLN)
0-20,868 20% of taxable income minus 278.20 PLN
20,868 - 41,736 3,895.40 PLN +32% of income over 20,868 PLN
41,736 or more 10,573.16 PLN + 44% of income O\oer 41,736 PLN
However, an annual income of approximately 28,000 PLN is needed for the taxpayer to take fulladvantage of this deduction, given the tax rates shown in Table 2.16. This total tax deduction,when added to the 13,344 PLN which is average amount of funds available for housinginvestment as cited by survey respondents, would nearly be sufficient for a 40% downpaymenton a 50 m2 flat costing 1,700 PLN/m2 or 85,000 PLN.
5.4.2 Housing Renovation
Tax deductions for renovation are considerably lower than deductions for housingpurchase. Up to 19% ofrenovation costs may be deducted from taxes for three years, but thereare ceilings on the amount of the deduction. Deductions for renovation of a single-family homecannot exceed 3% of the price of a 70 m2 unit, or 2.5% of that price for renovation of anapartment. At a replacement cost of 1AOO PLN/m2, this would imply a maximum deduction of2,940 PLN for a single-family unit and 2,450 for an apartment. If the gas system is modernized,the maximum deduction may be increased by 0.5%.
5.4.3 Rental Housing Investment
The most advantageous tax deduction may be taken by individuals investing in rentalhousing. A maximum of 81,000 PLN may be deducted from taxable income over a period of tenyears for each apartment developed. Creative use of these credits could result in affordable rentalhousing.
- 52 -
PART III
AN EXAMINATION OF HOUSEHOLD INCOME IN SZCZECIN
1. Introduction and Objective
Part III of this Report contains the results of an empirical examination of householdincome in Szczecin, based on administrative records and statistical sources. It was undertaken forpurposes of evaluating the representative character of responses to the survey of 998 households(less than 1% of all households), conducted in January 1997 by Habitat. One objective of thesurvey \vas to ascertain housing preferences and other information pertinent to assessing theeffective demand for housing in Szczecin. The sample was randomly drawn within a sampleframe weighted by neighborhood population and housing types. Because it was not possible topre-select households by income level, the reported income characteristics of all respondentsbecame an important indicator of sampling validity. In addition, insofar as household income isthe major determinant of effective demand for housing, the accuracy of survey analysis andconclusions rested upon obtaining a reliable measure of aggregate household income.
Subsequently, it was determined that an independent examination of household incomeshould be conducted for purposes of corroborating or challenging the survey results. If astatistically significant difference was determined to exist, a recommendation would be made tore-weight the survey results so to give greater importance to lower or higher income respondentsin the sample's income distribution, and so to achieve a more accurate overall profile of allhouseholds in the City of Szczecin.
2. Household Income Findings from Habitat Survey
The Habitat survey reported an aggregate net monthly household income of 1,200,009PLN for 998 households, or an average annual net income of 14,429 PLN per household. AtetTective tax rates, net income is 70 percent of gross income, thus the average annual grosshousehold income of Szczecin would have been 20,613 PLN in 1996. Income was reported for\/','Ork, unemployment, pension and disability, though income was not reported by individualsource. Fully 735 households reported having adult workers, 138 households reported havingincome from unemployment compensation, and 412 from pension and disability sources.Households reported multiple sources of income.
- 53-
3. Method of Analysis
A two-pronged approach was designed to estimate and evaluate gross and net annualhousehold income of Szczecin inhabitants in 1996, independent of the Habitat survey findings.These approaches entailed:
(l) Tax Method -- an analysis of Personal Income Tax (PIT) filings for Fiscal District1 ofSzczecin Voivodship, which includes approximately one-third of the City of
Szczecin. Conducted on a limited geographic basis by extrapolating data availablefor 1993 - 1995 to the year 1996.
(2) Economic Aggregates Method -- an analysis of aggregate income generated fromemployment, unemployment compensation, pension and disability payments to allworkers and residents of the City of Szczecin. Utilized annual average data for theCity's economy in 1995 and 1996.
Data were provided by the Voivodship Tax Office and the Central Statistical Office(WUS) in response to requests by the City of Szczecin.
Annex 1 to the present report contains worksheets showing tax, population andemployment data used to extrapolate incomes and verify the survey results.
4. Tax Method
Fiscal District 1 is comprised of portions or all of three major districts in the City ofSzczecin and four outlying municipalities to the northwest. Based on WUS data and currentmunicipal population and household trends (see Annex 2), Fiscal District 1 is estimated tocontain 72,500 households in 1996, as follows:
• Srodmiescie District -- 30,400 households or 49 percent of resident population from all orpart of five neighborhoods;
• Polnoc District -- 17,800 households or 100 percent of resident population from all sevenneighborhoods;
• Zachod District -- 5,500 households or 13 percent of resident population from all or partsof five neighborhoods;
• Outside Szczecin -- 18,800 households or 100 percent of resident population in Dobrej,Kolbaskawa, NW Warpno and Police
In Fiscal District 1, for tax year 1995, Personal Income Tax (PIT) returns were filed by105,969 taxpayers with annual gross income or with retirement and disability pensions, and by
- 54-
employers or ZUS, using PIT forms 30, 31,32,33,34,40 and 40A, which vary by single or jointincome status, with or without deductions. In tax year 1994, PIT returns were filed by 102,271persons. Nearly another 3,000 persons filed using tax charts in each year (see attached tables).Compared to the number of resident households in each year, taxfilers per household rose from1.45 persons in 1994 to 1.50 persons per household in 1995. In 1996 it is estimated that 1.56taxfilers will exist per household, or collectively 113,092 PIT returns and tax chart filings inFiscal District I.
Based on the annual gross income reported by income class for all PIT taxfilers in 1994,and 1995, aggregate gross income (in current PLN not adjusted for inflation) rose from 607.9mPLN to 832.4 mPLN, exclusive of income reported by tax charts or deducted as the cost ofgetting to work. Average taxtller income correspondingly increased from 5,944 in 1994 to 7,855per annum in 1995 (see attached tables). This growth represents a gain of 32.2 percent comparedto an annual rate of inflation of 27.8 percent between 1994 and 1995. Assuming that real incomegrowth continued in a comparable relationship to inflation between 1995 and 1996, whichaveraged 19.9 percent, then average taxtiter income would have reached 9,739 in 1996 or 24percent above 1995. Adjusted for annual gross income of taxpayers reporting by tax chart and forthe deducted cost of getting to work, aggregate gross income would have been 1,132.8 mPLN inFiscal District 1 in 1996. For 72,500 resident households, average annual gross householdincome was thus 15,624 PLN in 1996.
Although taxpayer data is believed to be comprehensive in coverage for the geographicarea of households, it is unlikely that the data are complete in terms of annual income reporting.That is to say, taxpayers fail to report income earned in the "grey economy" -- these areeconomic activities for which other transaction data are unlikely to be available. Independentstudies of the informal sector or grey economy in Poland suggest that substantial "moonlighting"occurs. According to the Gdansk Institute for Market Economics, about 30 percent of Polishlabor has unregistered jobs. The National Labor Office estimates that about 50 percent of theunemployed actually moonlight, and that unreported wages and salaries account for threequarters of their incomes. According to the Central Statistical Office (GUS), moonlighting couldbe costing the budget as much as 17 to 18 percent of GOP in lost tax receipts and unlawfullyclaimed unemployment and welfare benefits. Using these estimates as guides, an assumption wasmade regarding a reasonable percentage of annual income not reported in Fiscal District for taxpurposes.
Assuming 25% of annual gross income is not reported for taxfiling purposes in FiscalDistrict 1, then the average annual gross household income was 19,530 PLN in 1996 (1.25 x15,624 = 19,530), and the net household income was 13,671 PLN. Compared to the Habitatsurvey results for net household income, which exceeded the net income measure derived by thetax method, a variance of 5.5 percent exists. This cannot be regarded as a statisticallvsignificant difference (see Chart I).
- 55-
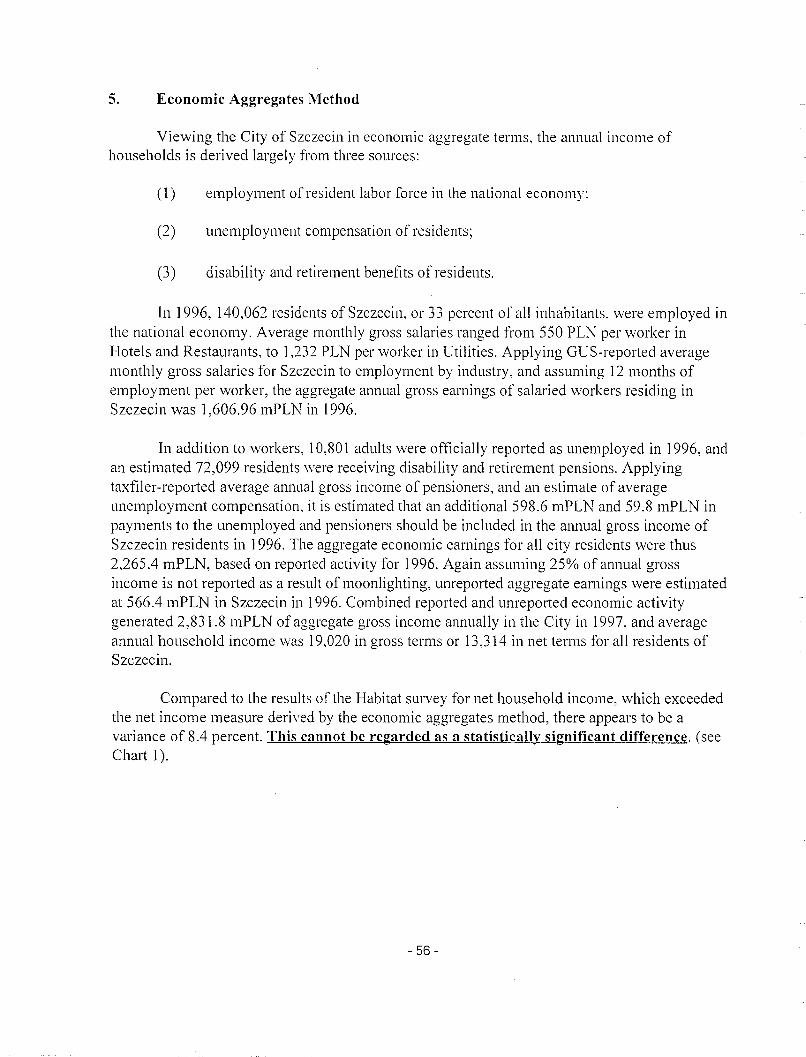
5. Economic Aggregates Method
Viewing the City of Szczecin in economic aggregate terms, the annual income ofhouseholds is derived largely from three sources:
(1) employment of resident labor force in the national economy:
(2) unemployment compensation of residents;
(3) disability and retirement benetlts of residents.
In 1996, 140,062 residents of Szczecin, or 33 percent of all inhabitants. were employed inthe national economy. Average monthly gross salaries ranged from 550 PLN per worker inHotels and Restaurants. to 1,232 PLN per worker in Utilities. Applying GUS-reported averagemonthly gross salaries for Szczecin to employment by industry, and assuming 12 months ofemployment per worker, the aggregate annual gross earnings of salaried workers residing inSzczecin was 1,606.96 mPLN in 1996.
In addition to workers, 10,801 adults were officially reported as unemployed in 1996, andan estimated 72,099 residents were receiving disability and retirement pensions. Applyingtaxfiler-reported average annual gross income of pensioners, and an estimate of averageunemployment compensation, it is estimated that an additional 598.6 mPLN and 59.8 mPLN inpayments to the unemployed and pensioners should be included in the annual gross income ofSzczecin residents in 1996. The aggregate economic earnings for all city residents were thus2,265.4 mPLN, based on reported activity for 1996. Again assuming 25% of annual grossincome is not reported as a result of moonlighting, unreported aggregate earnings were estimatedat 566.4 mPLN in Szczecin in 1996. Combined reported and unreported economic activitygenerated 2,831.8 mPLN of aggregate gross income annually in the City in 1997, and averageannual household income \-vas 19,020 in gross terms or 13,314 in net terms for all residents ofSzczecin.
Compared to the results of the Habitat survey for net household income, which exceededthe net income measure derived by the economic aggregates method, there appears to be avariance of 8.4 percent. This cannot be regarded as a statistically significant difference. (seeChart 1).
- 56-
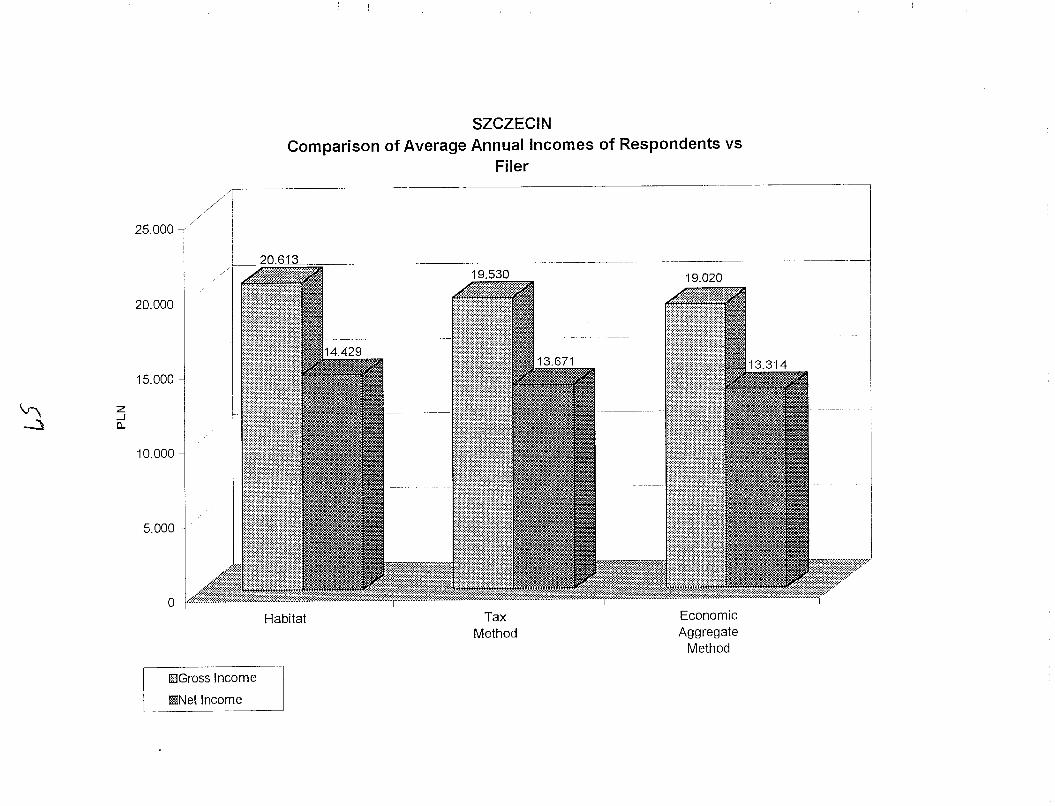
SZCZECINComparison of Average Annual Incomes of Respondents vs
Filer
25.000//
..J
19.020
5.000
o
20.000
10.000
15.000
Z...JC.
Iv\,-.:\
Habitat TaxMethod
EconomicAggregate
Method
lillGross Income
ImNet Income

ANNEX 1:
WorksheetsTax, population and employment data used to extrapolate incomes and verify the survey results.
- 59-
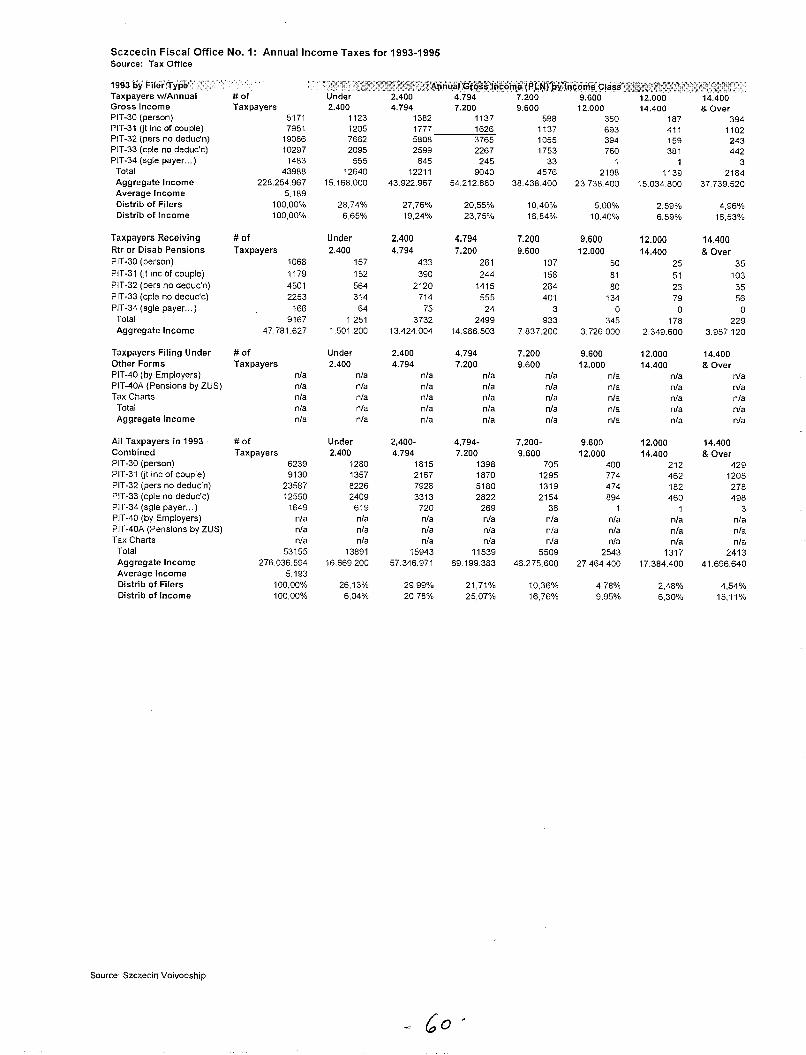
Sczcecin Fiscal Office No.1: Annual Income Taxes for 1993-1995Source: Tax Office
TaxpayersGross Income 2.400 4.794 7.200 9.600 12.000 14.400 & OverPIT-30 (person) 5171 1123 1382 1137 598 350 187 394PIT-31 (it inc of couple) 7951 1205 1777 1626 1137 693 411 1102PIT-32 (pers no deduc'n) 19086 7662 5808 3765 1055 394 159 243PIT-33 (cple no deduc'c) 10297 2095 2599 2267 1753 760 381 442PIT-34 (5gle payer... ) 1483 555 645 245 33 1 1 3
Total 43988 12640 12211 9040 4576 2198 1139 2184Aggregate Income 228.254.967 15.168.000 43.922.967 54.212.880 38.438.400 23.738.400 15034.800 37.739520Average Income 5.189Distrib of Filers 100.00% 28,74% 27,76% 20,55% 10.40% 5.00% 2,59% 4,96%Distrib of Income 100,00% 6,65% 19,24% 23,75% 16,84% 10,40% 6.59% 16,53%
Taxpayers Receiving # of Under 2.400 4.794 7.200 9.600 12.000 14.400Rtr or Disab Pensions Taxpayers 2.400 4.794 7.200 9.600 12.000 14.400 & OverPIT-30 (person) 1068 157 433 261 107 50 25 35PIT-31 (jt inc of couple) 1179 152 390 244 158 81 51 103PIT-32 (pers no deduc'n) 4501 564 2120 1415 264 80 23 35PIT-33 (cple no deduc'c) 2253 314 714 555 401 134 79 56PIT-34 (sgle payer... ) 166 64 75 24 3 0 0 0
Total 9167 1251 3732 2499 933 345 178 229Aggregate Income 47781.627 1.501.200 13.424004 14.986.503 7837.200 3.726000 2.349600 3.957.120
Taxpayers Filing Under # of Under 2.400 4.794 7.200 9.600 12.000 14.400Other Forms Taxpayers 2.400 4.794 7.200 9.600 12.000 14.400 & OverPIT-40 (by Employers) nfa nfa nfa nla nfa nla nla nfaPIT-40A (Pensions by ZUS) nfa nfa nla nla nfa nla nla nfaTax Charts nla nfa nla nla nfa nla nla nfa
Total nla nla nla nla nfa nla nla nfaAggregate Income nla nla nla nla nla nla nfa nfa
All Taxpayers in 1993 # of Under 2,400- 4,794- 7,200- 9.600 12.000 14.400Combined Taxpayers 2.400 4.794 7.200 9.600 12.000 14.400 & OverPIT-3D (person) 6239 1280 1815 1398 705 400 212 429PIT-31 (jt inc of couple) 9130 1357 2167 1870 1295 774 462 1205PIT-32 (pers no deduc'n) 23587 8226 7928 5180 1319 474 182 278PIT-33 (cple no deduc'c) 12550 2409 3313 2822 2154 894 460 498PIT-34 (sgle payer... ) 1649 619 720 269 36 1 1 3PIT-40 (by Employers) nla nla nla nfa nfa nla nfa nfaPIT-40A (Pensions by ZUS) nla nla nla nfa nla nla nfa nlaTax Charts nla nla nla nfa nfa nfa nfa nla
Total 53155 13891 15943 11539 5509 2543 1317 2413Aggregate Income 276.036.594 16.669200 57.346.971 69.199.383 46.275.600 27.464400 17.384.400 41.696.640Average Income 5.193Distrib of Filers 100,00% 26,13% 29,99% 21,71% 10,36% 4,78% 2,48% 4,54%Distrib of Income 100,00% 6,04% 20,78% 25,07% 16,76% 9,95% 6,30% 15,11%
Source: Szczecin Voivodship
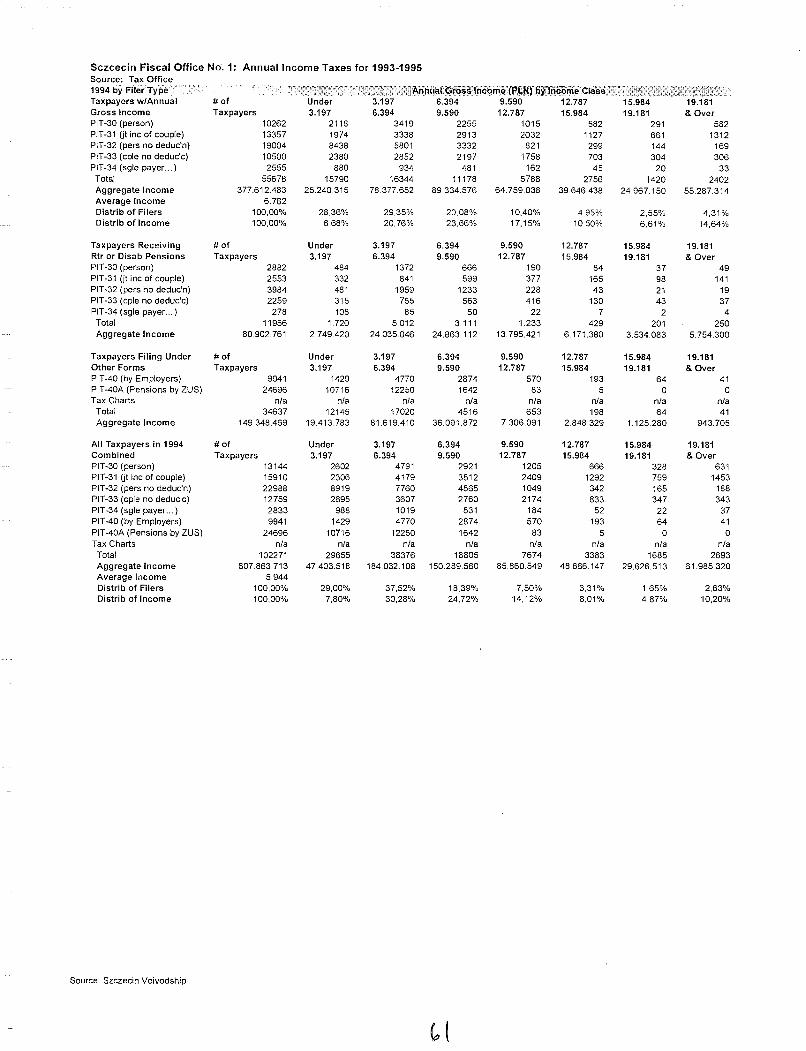
Sczcecin Fiscal Office No: 1: Annual Income Taxes for 1993-1995Source: Tax Office1994 by Filer TypeTaxpayers w/Annual # of 6.394Gross Income Taxpayers 3.197 6.394 9.590 12.787 15.984 19.181 & OverPIT-30 (person) 10262 2118 3419 2255 1015 582 291 582PIT-31 (jt inc of couple) 13357 1974 3338 2913 2032 1127 661 1312PIT-32 (pers no deduc'n) 19004 8438 5801 3332 821 299 144 169PIT-33 (cple no deduc'c) 10500 2380 2852 2197 1758 703 304 306PIT-34 (sgle payer... ) 2555 880 934 481 162 45 20 33
Total 55678 15790 16344 11178 5788 2756 1420 2402Aggregate Income 377.612.483 25.240315 78.377652 89.334.576 64.759.038 39646.438 24967.150 55.287.314Average Income 6.782Distrib of Filers 100.00% 28,36% 29,35% 20,08% 10,40% 4.95% 2.55% 4.31%Distrib of Income 100.00% 6,68% 20,76% 23.66% 17.15% 10.50% 6,61% 14,64%
Taxpayers Receiving # of Under 3.197 6.394 9.590 12.787 15.984 19.181Rtr or Disab Pensions Taxpayers 3.197 6.394 9.590 12.787 15.984 19.181 & OverPIT-30 (person) 2882 484 1372 666 190 84 37 49PIT-31 (it inc of couple) 2553 332 841 599 377 165 98 141PIT-32 (pers no deduc'n) 3984 481 1959 1233 228 43 21 19PIT-33 (cple no deduc'c) 2259 315 755 563 416 130 43 37PIT-34 (sgle payer... ) 278 108 85 50 22 7 2 4Total 11956 1.720 5012 3,111 1.233 429 201 250Aggregate Income 80902.761 2.749.420 24.035046 24.863,112 13.795.421 6,171,380 3,534.083 5,754.300
Taxpayers Filing Under # of Under 3.197 6.394 9.590 12.787 15.984 19.181Other Forms Taxpayers 3.197 6.394 9.590 12.787 15.984 19.181 & OverPIT-40 (by Employers) 9941 1429 4770 2874 570 193 64 41PIT-40A (Pensions by ZUS) 24696 10716 12250 1642 83 5 0 0Tax Charts nla nla nla nla nla nla nla nla
Total 34637 12145 17020 4516 653 198 64 41Aggregate Income 149348.469 19.413783 81.619.410 36.091.872 7306.091 2848329 1125280 943.705
All Taxpayers in 1994 # of Under 3.197 6.394 9.590 12.787 15.984 19.181Combined Taxpayers 3.197 6.394 9.590 12.787 15.984 19.181 & OverPIT-30 (person) 13144 2602 4791 2921 1205 666 328 631PIT-31 (it inc of couple) 15910 2306 4179 3512 2409 1292 759 1453PIT-32 (pers no deduc'n) 22988 8919 7760 4565 1049 342 165 188PIT-33 (cple no deduc'c) 12759 2695 3607 2760 2174 833 347 343PIT-34 (sgle payer... ) 2833 988 1019 531 184 52 22 37PIT-40 (by Employers) 9941 1429 4770 2874 570 193 64 41PIT-40A (Pensions by ZUS) 24696 10716 12250 1642 83 5 0 0Tax Charts nla nla nla nla nla nla nla nla
Total 102271 29655 38376 18805 7674 3383 1685 2693Aggregate Income 607863.713 47.403.518 184.032.108 150.289.560 85,860.549 48666,147 29.626,513 61.985.320Average Income 5,944Distrib of Filers 100,00% 29.00% 37,52% 18,39% 7,50% 3,31% 1,65% 2,63%Distrib of Income 100,00% 7,80% 30,28% 24.72% 14,12% 8,01% 4,87% 10,20%
Source: Szczecin Voivodship
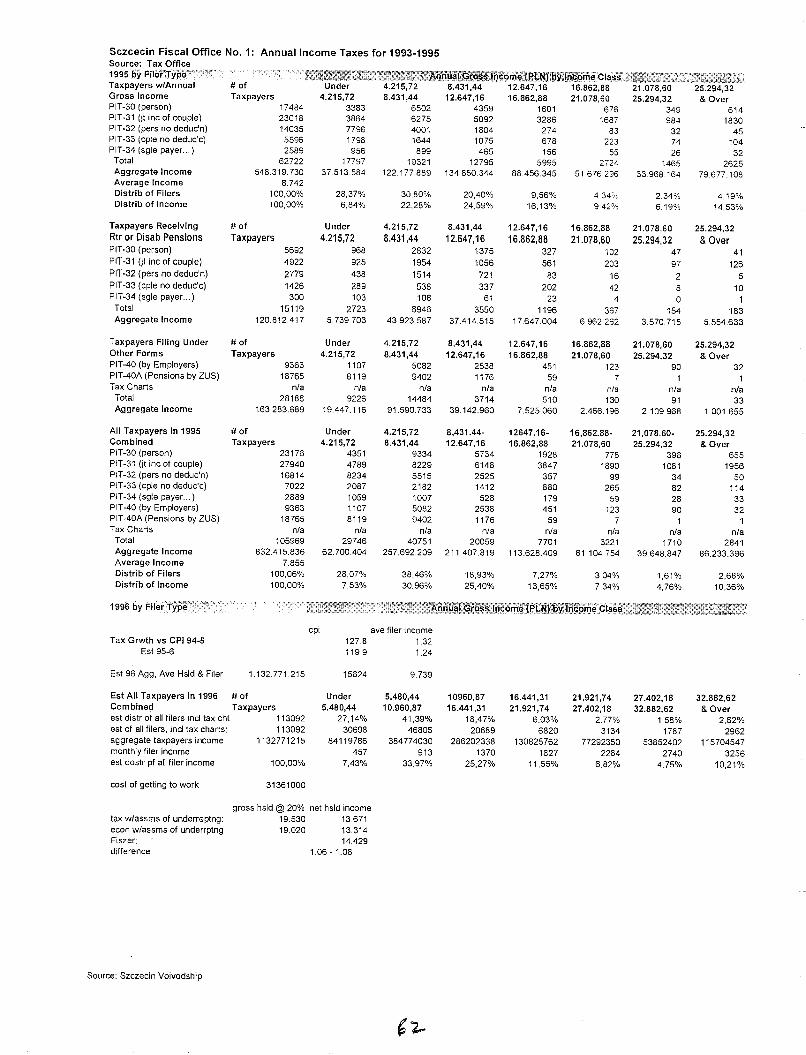
Sczcecin Fiscal Office No.1: Annual Income Taxes for 1993-1995Source: Tax Office19S5 by f'i1er;Typ~W
Taxpayers w/Annual # ofGross Income Taxpayers 4.215,72 8.431,44 12.647,16 16.862,88 21.078,60 25.294,32 & OverPIT-30 (person) 17484 3383 6502 4359 1601 676 349 614PIT-31 (jt inc of couple) 23018 3864 6275 5092 3286 1687 984 1830PIT-32 (pers no deduc'n) 14035 7796 4001 1804 274 83 32 45PIT-33 (cple no deduc'c) 5596 1798 1644 1075 678 223 74 104PIT-34 (sgle payer... ) 2589 956 899 465 156 55 26 32
Total 62722 17797 19321 12795 5995 2724 1465 2625Aggregate Income 548.319.730 37.513584 122177889 134850344 88456.345 51 676296 33.968.164 79677.108Average Income 8742Distrib of Filers 100,00% 28.37% 30,80% 20,40% 9.56% 4.34';, 2,34% 4,19%Distrib of Income 100,00% 6,84% 22,28% 24,59% 16,13% 942% 6,19% 14,53%
Taxpayers Receiving # of Under 4.215,72 8.431,44 12.647,16 16.862,88 21.078,60 25.294,32
Rtr or Oisab Pensions Taxpayers 4.215,72 8.431,44 12.647,16 16,862,88 21.078,60 25.294,32 & OverPIT-30 (person) 5692 968 2832 1375 327 102 47 41PIT-31 (jt inc of couple) 4922 925 1954 1056 561 203 97 126
PIT-32 (pers no deduc'n) 2779 438 1514 721 83 16 2 5PIT-33 (cple no deduc'c) 1426 289 538 337 202 42 8 10PIT-34 (sgle payer... ) 300 103 108 61 23 4 0 1
Total 15119 2723 6946 3550 1196 367 154 183Aggregate Income 120812417 5739703 43923.587 37.414.515 17.647.004 6.962262 3.570715 5.554.633
Taxpayers Filing Under # of Under 4.215,72 8.431,44 12.647,16 16.862,88 21.078,60 25,294,32Other Forms Taxpayers 4,215,72 8.431,44 12.647,16 16.862,88 21.078,60 25.294,32 & OverPIT-40 (by Employers) 9363 1107 5082 2538 451 123 90 32PIT-40A (Pensions by ZUS) 18765 8119 9402 1176 59 7 1 1Tax Charts n/a n/a n/a n/a n/a n/a n/a n/a
Total 28188 9226 14484 3714 510 130 91 33Aggregate Income 163.283.689 19447.116 91.590.733 39.142.960 7.525.060 2.466.196 2.109.968 1001.655
All Taxpayers in 1995 # of Under 4.215,72 8,431.44- 12647.16- 16,862.88- 21,078.60- 25.294,32Combined Taxpayers 4.215,72 8.431,44 12.647,16 16.862,88 21.078,60 25.294,32 &OverPIT-30 (person) 23176 4351 9334 5734 1928 778 396 655PIT-31 (jt inc of couple) 27940 4789 8229 6148 3847 1890 1081 1956PIT-32 (pers no deduc'n) 16814 8234 5515 2525 357 99 34 50PIT-33 (cple no deduc'c) 7022 2087 2182 1412 880 265 82 114PIT-34 (sgle payer... ) 2889 1059 1007 526 179 59 26 33PIT-40 (by Employers) 9363 1107 5082 2538 451 123 90 32PIT-40A (Pensions by ZUS) 18765 8119 9402 1176 59 7 1 1Tax Charts n/a n/a n/a n/a n/a n/a n/a n/a
Total 105969 29746 40751 20059 7701 3221 1710 2841Aggregate Income 832.415836 62.700.404 257.692.209 211.407.819 113.628.409 61104754 39.648.847 86.233.396Average Income 7.855Distrib of Filers 100,06% 28,07% 38,46% 18,93% 7,27% 304% 1,61% 2,68%Distrib of Income 100,00% 7,53% 30,96% 25,40% 13,65% 7,34% 4,76% 10,36%
1996 by
cpi ave filer incomeTax Grwth vs CPI 94-5 127,8 1,32
Est 95-6 119,9 1,24
Est 96 Agg, Ave Hsld & Filer 1.132771.215 15624 9.739
Est All Taxpayers in 1996 # of Under 5.480,44 10960,87 16.441,31 21,921,74 27.402,18 32.882,62Combined Taxpayers 5.480,44 10.960,87 16.441,31 21.921,74 27.402,18 32.882,62 & Overest distr of all filers incl tax cht 113092 27,14% 41,39% 18,47% 6,03% 2.77% 1,58% 2,62%est of all filers, incl tax charts: 113092 30698 46806 20889 6820 3134 1787 2962aggregate taxpayers income: 1132771215 84119786 384774030 286202338 130825762 77292350 53852402 115704547
monthly filer income 457 913 1370 1827 2284 2740 3256est dostr pf all filer income 100,00% 7,43% 33,97% 25,27% 11,55% 6.82% 4,75% 10,21%
cost of getting to work 31361000
gross hsld @ 20% net hsld incometax w/assms of underreptng: 19.530 13.671econ w/assms of underrptng: 19,020 13.314Fiszer: 14.429difference 1.06 -1.08
Source: Szczecin Voivodship
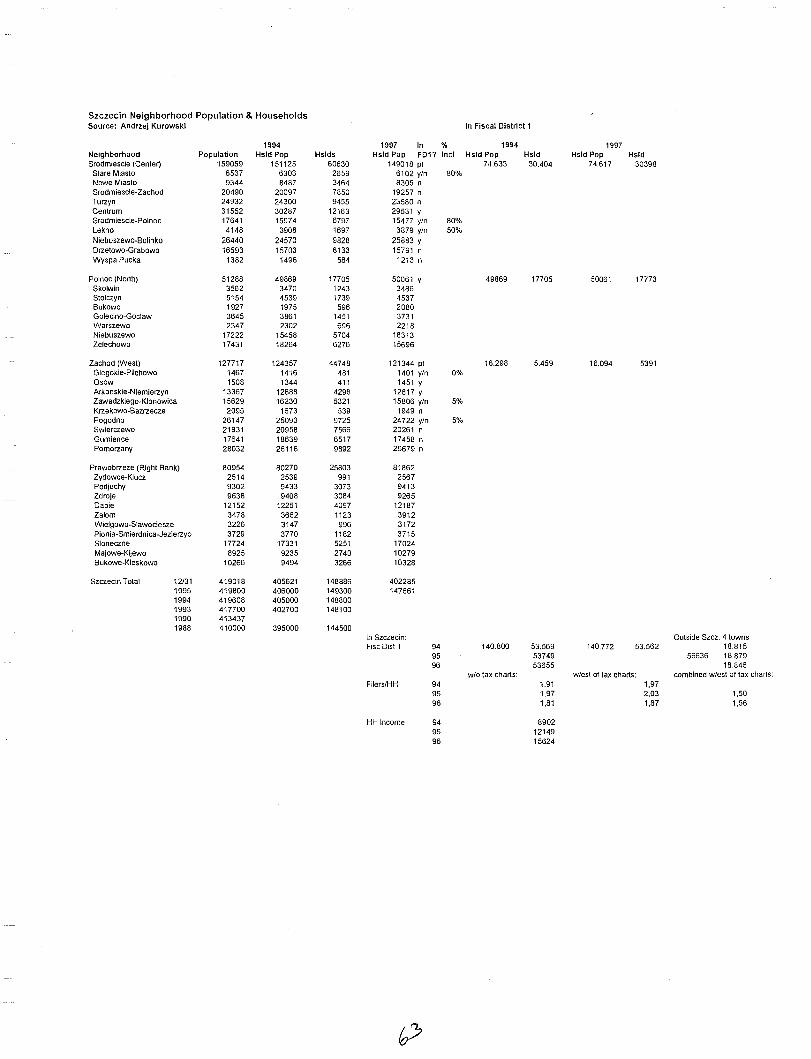
Szczecin Neighborhood Population & HouseholdsSource: Andrze] Kurowski In Fiscal District 1
1994 1997 In % 1994 1997Neighborhood Population Hsld Pop Hslds Hsld Pop FD1? Incl Hsld Pop Hsld Hsld Pop HsldSrodmlescie ICenter) 159059 151125 60630 149018 pI 74.633 30.404 74.617 30398
Stare Miasto 6537 6303 2659 6102 yin 80%Nowe Miasla 9344 8487 3464 8305 nSrodmiescie~Zachod 20490 20097 7850 19257 nTwzyn 24932 24300 9455 23580 nCentrum 31552 30287 12163 29531 ySrodmiescie~Polnoc 17641 15974 6797 15477 yin 80%Lekno 4148 3908 1697 3879 yin 50%Niebuszewo-Bolinko 26440 24570 9828 25883 yDrzetowo-Grabowo 16593 15703 6133 15791 nWyspa Pucka 1382 1496 584 1213 n
Polnoc (North) 51288 49869 17705 50061 y 49869 17705 50061 17773Skolwin 3562 3470 1243 3486Stolczyn 5154 4539 1739 4537BLlkowo 1927 1975 596 2080Golecino-Goclaw 3645 3861 1451 3731Warszewo 2347 2302 696 2218Niebuszewo 17222 15458 5704 18313Zelechowo 17431 18264 6276 15696
Zachod (WeSI) 127717 124357 44748 121344 pI 16.298 5.459 16.094 5391Glegokie-Pilchowo 1467 1416 481 1401 yin 0%Osow 1508 1344 411 1451 YArkonskie-Niemierzyn 13367 12888 4296 12617 YZawadzkiego-Klonowica 15629 16230 5321 15806 yin 5%Krzekowo-Bezrzecze 2095 1673 539 1949 nPogodno 26147 25093 9725 24722 yin 5%SwierczewQ 21831 20958 7566 20261 nGtlmience 17641 18639 6517 17458 nPomorzany 28032 26116 9892 25679 n
Prawobrzeze (Righi Bank) 80954 80270 25803 81862Zydowce-Klucz 2514 2539 991 2567Podjuchy 9302 9433 3073 9413Zdroje 9638 9408 3084 9265Dabie 12152 12251 4097 12187Zalom 3478 3662 1123 3912Wielgowo-Slawociesze 3226 3147 996 3172Pionia-Smierdnic8-Jezierzyc 3729 3770 1182 3715Sioneczne 17724 17331 5251 17024Majowe-Kijewo 8925 9235 2740 10279BLlkowe-KleskowQ 10266 9494 3266 10328
Szczecin Total 12/31 419018 405621 148886 4022851995 419800 406000 149300 1476611994 419608 405000 1488001993 417700 402700 1481001990 4134371988 410000 395000 144500
In Szczecin: Outside Szcz: 4 townsFisc Dist 1 94 140.800 53.569 140.772 53.562 18.815
95 53749 56636 18.87996 53655 18.846
w/o tax charts: wiest of lax charts: combined wiest of tax charts:Filers/HH 94 1,91 1,97
95 1,97 2,03 1,5096 1,81 1,87 1,56
HH Income 94 890295 1214996 15624
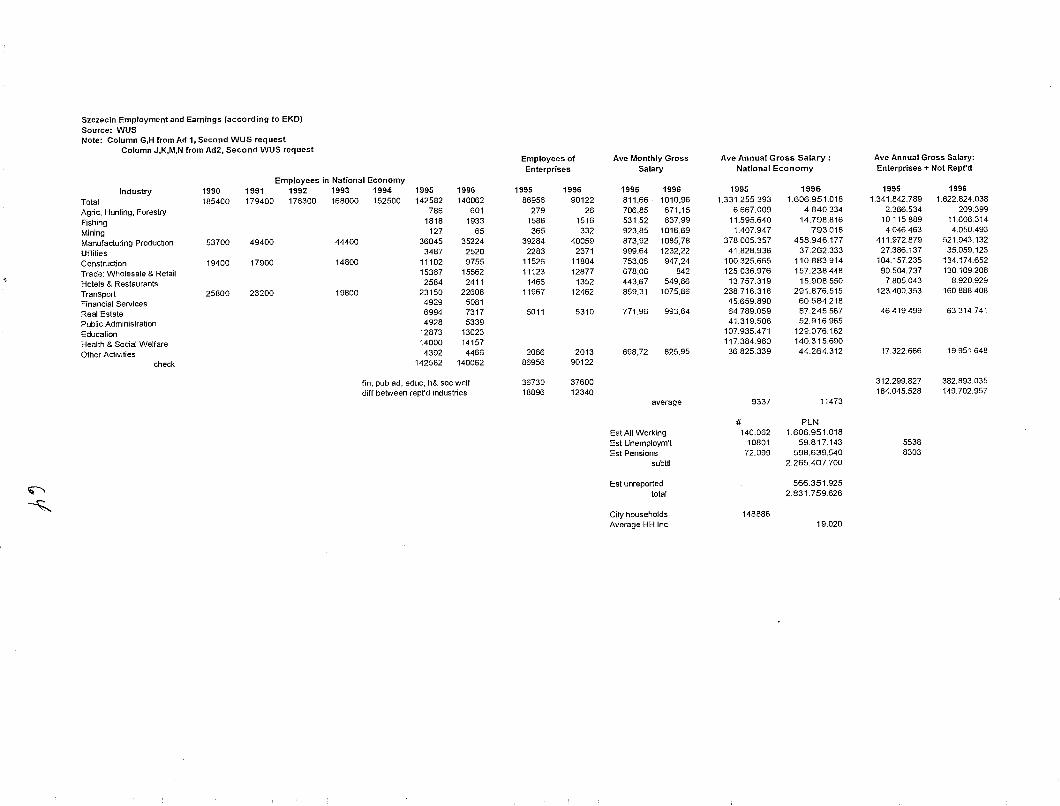
Szczecin Employment and Earnings (according to EKD)Source: WUSNote: Column G,H from Ad 1, Second WUS request
Column J,K,M,N from Ad2, Second WUS request
o~
IndustryTotalAgric, Hunting, ForestryFishingMiningManufacturing ProductionUtilitiesConstructionTrade: Wholesale & RetailHotels & RestaurantsTransportFinancial ServicesReal EstatePublic AdministrationEducationHealth & Social WelfareOther Activities
check
Employees in National Economy1990 1991 1992 1993 1994 1995 1996185400 179400 176300 168000 152500 142582 140062
786 6011818 1933
127 6553700 49400 44400 36045 35224
3487 252019400 17900 14800 11102 9755
15367 155622584 2411
25800 23200 19800 23150 226084929 50816994 73174928 5339
12873 1302314000 141574392 4466
142582 140062
fin, pub ad, educ, h& soc welfdiff between rept'd industries
Employees of Ave Monthly Gross Ave Annual Gross Salary : Ave Annual Gross Salary:Enterprises Salary National Economy Enterprises + Not Rept'd
1995 1996 1995 1996 1995 1996 1995 199686956 90122 811,66 1010,96 1.331.255.393 1.606951.018 1.341.842.789 1.622.824.038
279 26 706,85 671,15 6.667.009 4.840.334 2.366.534 209.3991586 1516 531,52 637,99 11.595.640 14.798.816 10.115.889 11.606.314365 332 923,85 1016,69 1.407.947 793.018 4.046.463 4.050.493
39284 40059 873,92 1085)8 378005.357 458.946.177 411.972.879 521.943.1322283 2371 999,64 1232,22 41.828.936 37.262.333 27.386.137 35.059.123
11526 11804 753,06 947,24 100.325.665 110.883.914 104.157.235 134.174.65211123 12877 678,06 842 125.036.976 157.238.448 90.504.737 130.109.208
1466 1352 443,67 549,86 13.757.319 15.908.550 7805.043 8.920.92911967 12462 859,31 1075,86 238.716.318 291.876.515 123.400.353 160.888.408
45.659.890 60584.2185011 5310 771.96 993.64 64.789.059 87.245.567 46.419.499 63.314.741
41.319.506 52.916.965107.935.471 129.076.162117.384.960 140315.690
2066 2013 698,72 825,95 36.825.339 44.264.312 17322.666 1995164886956 90122
36730 37600 312.299.827 382.893.03518896 12340 184.045.528 149702.957
average 9337 11473
# PLNEst All Working 140.062 1.606951.018Est Unemploym't 10801 59817.143 5538Est Pensions 72.099 598.639.540 8303
sublll 2.265.407.700
Est unreported 566.351.925total 2.831.759.626
City households 148886Average HH Inc 19020
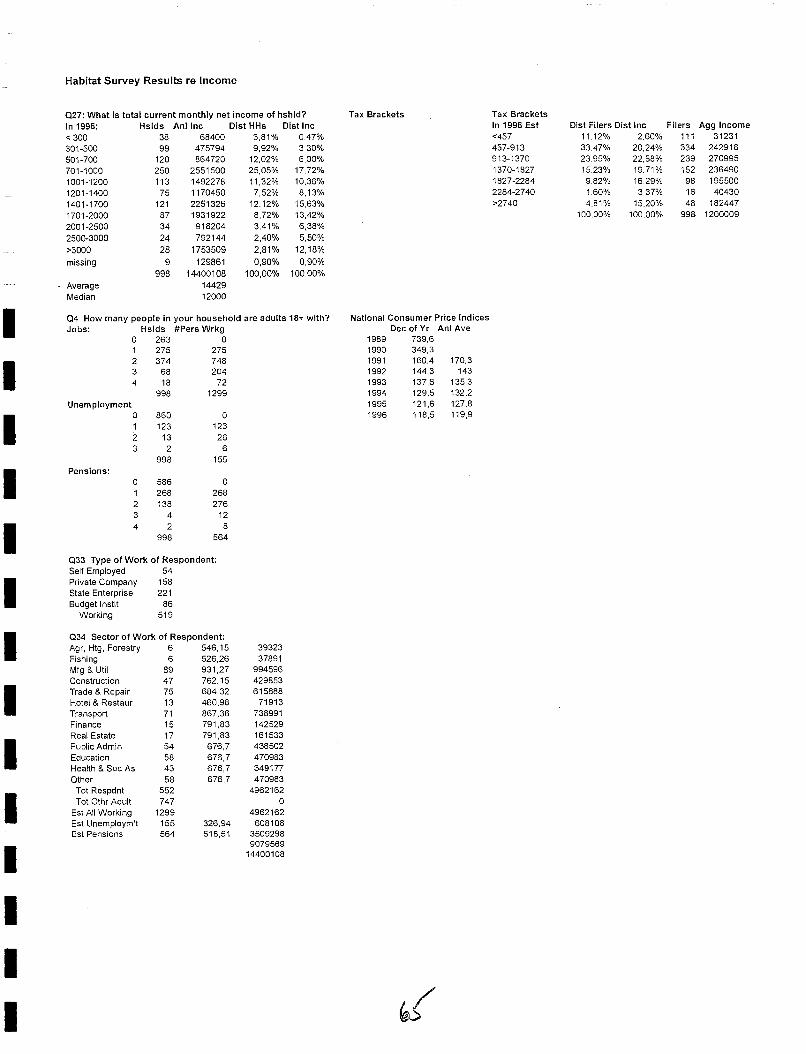
Habitat Survey Results re Income
Q27: What is total current monthly net income of hshld?
Q4 How many people in your household are adults 18+ with?Jobs: Hslds #Pers Wrkg
o 263 01 275 2752 374 7483 68 2044 18 72
998 1299Unemployment
0 860 01 123 1232 13 263 2 6
998 155Pensions:
0 586 01 268 2682 138 2763 4 124 2 8
998 564
Tax BracketsDist Filers Dist Inc Filers Agg Income
11.12% 2,60% 111 3123133,47% 20,24% 334 24291623 95% 22,58% 239 27099515.23% 19,71% 152 2364909.82% 16,29% 98 1955001.60% 3,37% 16 404304,81% 15,20% 48 182447
100,00% 100,00% 998 1200009
Tax BracketsIn 1996 Est<457457-913913-13701370-18271827-22842284-2740>2740
170,3143
135,3132,2127,8119,9
National Consumer Price IndicesDec of Yr Ani Ave
1989 739,61990 349,31991 160,41992 144,31993 137,61994 129,51995 121,61996 118,5
Dist Inc0,47%3,30%6,00%
17.72%10,36%8,13%
15,63%13,42%6,38%5,50%
12,18%0,90%
100,00%
Dist HHs3,81%9,92%
12,02%25,05%11,32%7,52%
12,12%8,72%3,41%2,40%2,81%0,90%
100,00%
Hslds Anllnc38 6840099 475794
120 864720250 2551500113 149227875 1170450
121 225132687 193192234 91820424 79214428 1753509
9 129861998 14400108
1442912000
AverageMedian
In 1996:< 300301-500501-700701-10001001-12001201-14001401-17001701-20002001-25002500-3000>3000missing
I
II
I
I
Q33 Type of Work of Respondent:Self Employed 54Private Company 158State Enterprise 221Budget Instit 86
Working 519
Q34 Sector of Work of Respondent:
IIIIII
Agr, Htg, ForestryFishingMfg & UtilConstructionTrade & RepairHotel & RestaurTransportFinanceReal EstatePublic AdminEducationHealth & Soc AsOtherTot RespdntTot Othr Adult
Est All WorkingEst Unemploym'tEst Pensions
66
8947751371151754584358
552747
1299155564
546,15526,26931,27762,15684,32460,98867,36791,83791,83
676,7676,7676,7676,7
326,94518,51
3932337891
994596429853615888
71913738991142529161533438502470983349177470983
4962162o
4962162608108
35092989079569
14400108
III
IIIIIII
ANNEX 2:
DraftIndicators to Monitor Housing Conditions and Progress in Attaining Housing Strategy Goals
- 67 -
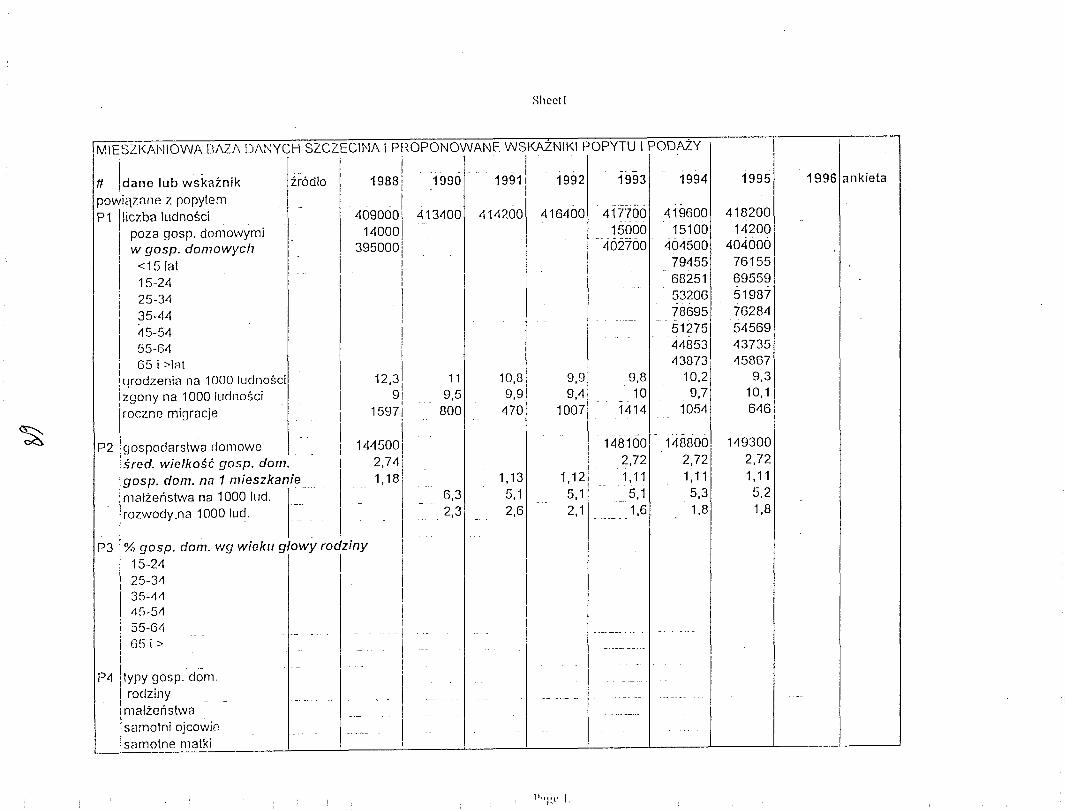
Sheet!
MIESZI<AI,I\OWI\ [\AZ/\ Dl\NYCH SZCZECINA I Pf~OPONOWANE WSKAZNIKI POPYTU \ PODAZY
1990
413'100
19961anl<ieta1995
1493002,721,115,21,8
41820014200
4040007615569559519877628454569'13735'15SG7
9,310,1646
1994
9,810
1414
1993
.-419600
15100404500
79455682515320678695512754485343873
10,29,7
105'11
148100 - 14880012,72 2,721,11 1,11
5,1 5,31,6 1,8
41770015000
402700
1992
10,8 9,99,9 9,4
'170 1007
1,13 1,125,1 5,12,6 2,1
-1-1991
41 '1200 I 416'100
6,32,3
119,5
800
I1988i
I4090001
140001. 3950001I !I !
1
IIII
123 1, I91
I
15971
I1445001I
2,741I
. _ 1,18
1 --
IIiIIIIi
II !
-_ .. - IIII
zr6dlo# Idane (ub wskaznil<pawiqzane z ropytemPi \liczba ludnosci
I poza gosp, domowymiI w gasp. domowychI
I, <15lat
15-24i 25-34I 35-44I .I 45-54I 55-64i 65 i >181I:qrodzeni8 na 1000 ludnosci!zgony na 1000 luclnosci
Iroczne migracje
P2 igosrodarstwa c!ol1loweisred. wielkosc gasp. dom.I
:gosp. dom. na 1 mieszkanieImalzenstwa na 1000 Iud. : __,rozwody.na 1000 Iud.!i I;
P3 !% gasp. dam. wg wieku g/owy rodziny
II 15-24 I I
25-31\
I35-1\1\'Ei-51\
i 55-64I 65 i>II
1:J4 !tyry gasp. dam.I roclziny1malzeristwa -
Isarnolni ojcowicsamatne matki
~
P"gl' 1
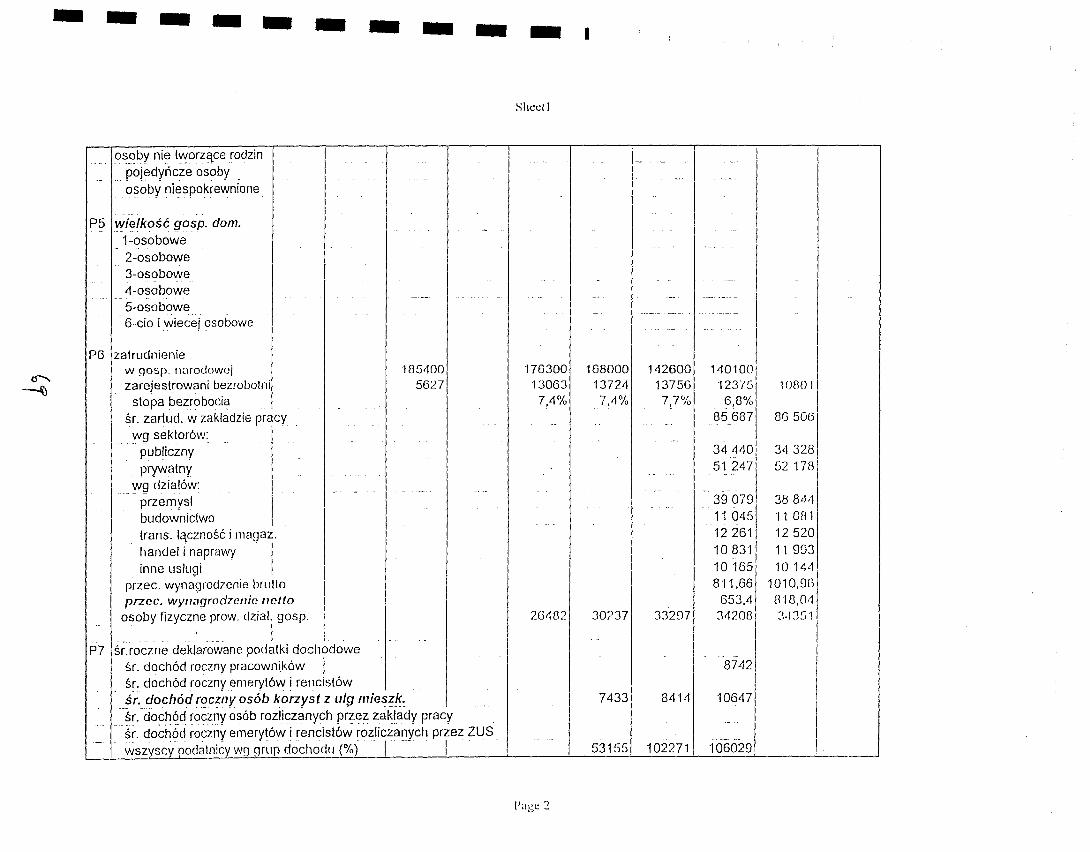
------ - -- -Shed!
I
~
-\)
osoby nie tworzqce rodzin I, .. - .._-.. ,.. -.-,.. .. - .. -. - - .. _. -.-- 1
. ... pojedync2:~ ()~~by , .. . .... .... Iasoby niespo~relJ\lnione ., -"
P5 wfeikosc gasp. dam. . I. 1-osobowe' - -, . I
2-osobowe3-osobowe_. _. - - - - -
4-osobowe.. , ...-- .. . .. ' -. ---- ..- I
~~~i~oib~:~ej osobowe --. -- . .,--- --- - .. --- IP6 zatrudnienie' , I - -.. 1
w g~sp. l1<:lrod:lWCj . 185400 176300 168000 142600 1401001zareJestrowanl bezrobotnl 5627 13063 13724 13756 12375 10801
slopa bezrobocia 7,4% 7,4% 7J% 6,8%sr. zartud. w zakladziepracy. _ 85.687 86 50fi I
wg seklor6w: I.. pLJbliczny - 34 440i 34 328
prywalny 51 2471 52 178wg dzial6w:
przemysl 39079, 388<1,1budow'niclwo .. , 11 0451 11 081trans. Iqcznosc i magaz. 122611 12 520~1andel i' n~prawy , I 10 ~311 11 993!nne uslugl 101G5' 10 1114 1
przec, wynagrodzenie brutto I 8 '11,G6 1010,%Ipace. wynilgrodzcnic I1cttO G53,tl BI8,O,1
.:S~bY fiZYCZnep~~w. clZia!.1 gosp. 26482 __3~237 33207 342081 :i·1JSI
P7 sr.roczne deklarowane podatki dochodowe Isr. doch6d roczny pracowni.k6w I 8742 i Isr. doch6d roczny emeryl6w i rencisl6w I I
. jf...r:!~ch6~ f9c!'ny oSb_b !wi-zyst Z uly mie~!~: 7433 841·1 106471 J' ..~r. do~h~d roczllY os6b rozliczanych przez zaklady pracy . . I
sr. doch6d roczny emeryl6w i rencisl6w rozliczanych przez ZUS I- 'wszyscy podatnicywg gr~IP dochodu {%} I --- . 1- " 53155 102271 1060291 I
Page :2
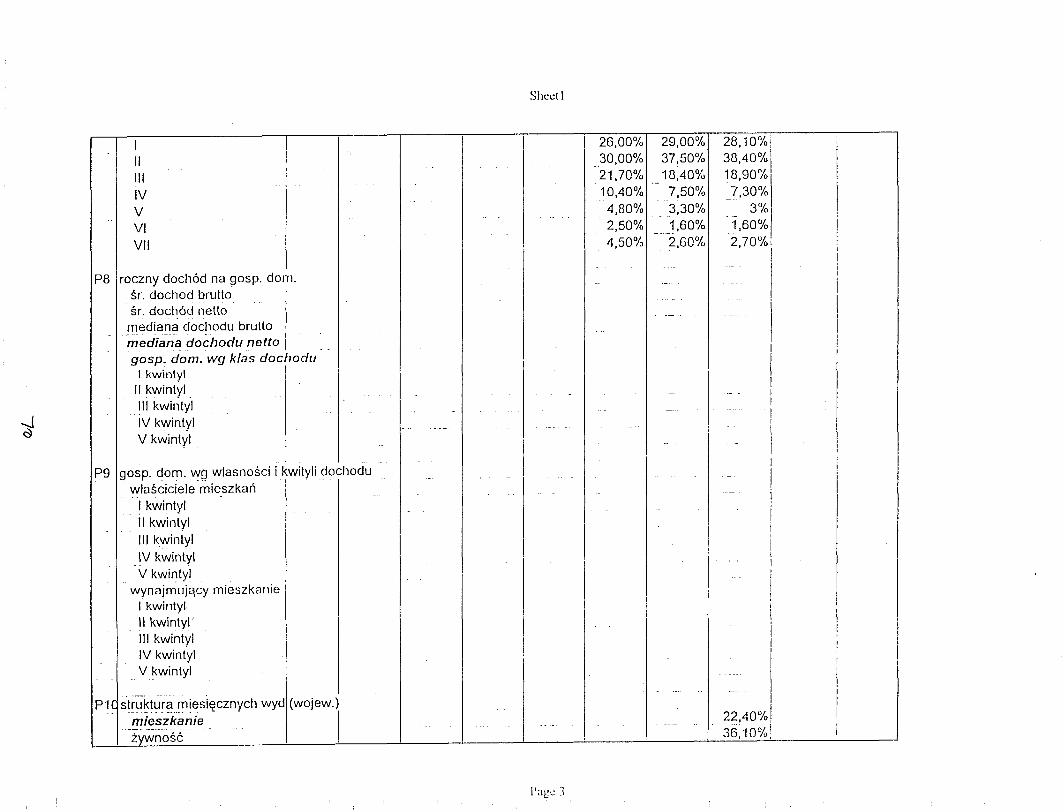
~
Shed!
I I I 26,00% 29,00% 28,10''101
II 30,00% 37,50% 0;,'--
38,40 01III 21,70% 18,40% 18,90%\--IV 10,40% 7,50% 7,30%
-- ..
V 4,80% _3,30% 3%'-
j,60%/VI 2,50% 1,60%
VII , 4,50% 2,GO% 2,70%!I - I
roczny doch6d na gasp. dorn..-._-
JP8 -- .- .
sr. dochod brutla ISf. doch6d netla
I--- -
mediana docl1adu brutla. . -- ... ._- ~ -mediana dochodu netto - -
Igasp: dam. wg klas dachadlJI kwinlyl
II kwintyl_ I... - _. ._- - I
_!" kwintyl I.. -.- - -- ..... _-- I
IV kwintyl - .. .-.._"I
.-
\V kwintyl I_. - . i I
I
P9 gasp. dam. ~g wlasnasci i kwityli dachadu I !-- -- -
wlasciciele mieszkan ._- .
_! kwintylII kwintyl
IIII kwintylIV kwintyl - .
V kwintyl
Iwynajmujqcy mieszkanieII kwintyl
II kwintyl' I IIII kwintyl
!I
IV kwintylI
V kwintylI
--- II
IPH
# ••••_ .. --- ••-- •
-.- .- - I Ist~~~tLfr~_m!esi~cznych wyd (wajew.)--
j22,40%! Imieszkanie
.. -_.- ----_.+- -- -.. ---- .. 0 I Izywnosc 36,1010; I
l)a~t.: :1
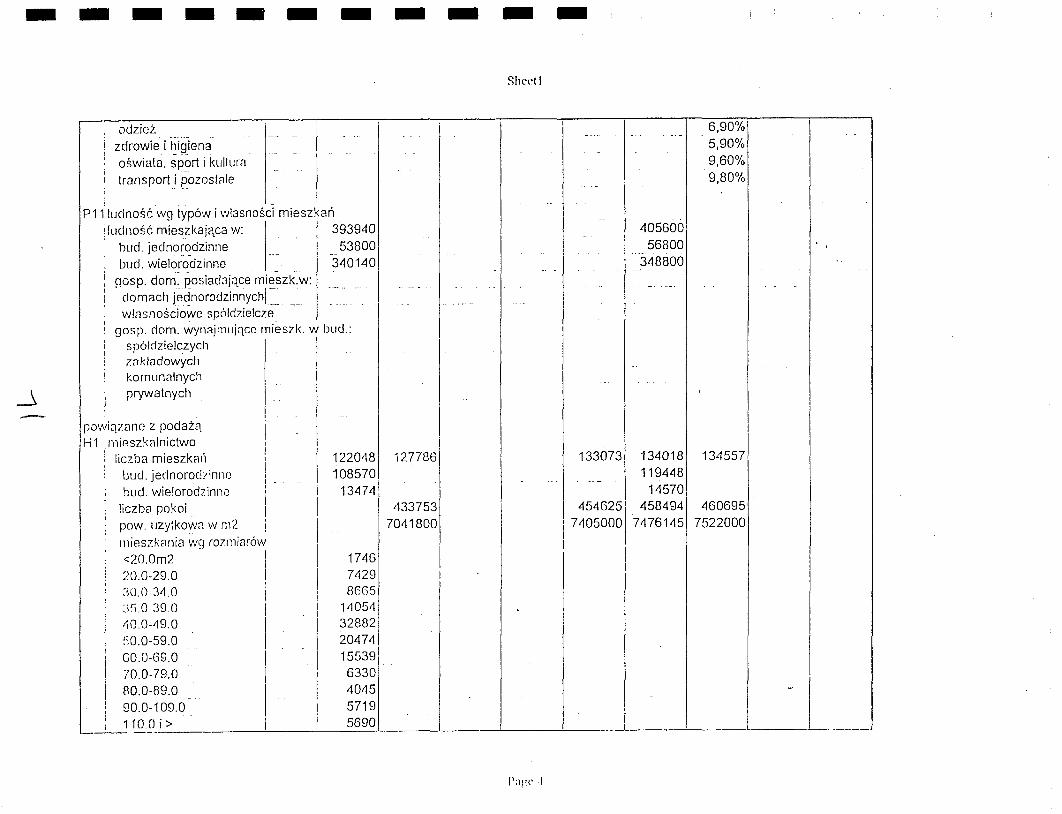
-----------Sheetl
174674298GG5
1'105'1
32882'1'2047tl15539'
6330tlOl\557195690 L__
6,90%5,90%9,60%9,80%
134557\
I460695
7522000
40560056800
3tl8800
134018119448
14570458494
7tl7611\5
133073
454625
i 71\05000II
!1220'181 127786108570
13474!I 433753
\701\1800
odzicl Izdrowie i higiena
oswiatn, sport i kliliura Itransporti pozos!<lle
- IP1 lurlnosc w9 typo'.", i wlasnosci mieszkan
ludnosc mieszkajqca w: j 393940
bud. jednor~dzinne __ I. 53800
bud. wielo!~dzinne. ... I 340140gasp. dom. posiadajetce mieszk.w:
domach je~norodzinnychl= ._ ' -- - ....
wlasnosc~o~e sp()ldzielcze.gasp. dam. wynCljmujqCe rnieszk. w bud.:
sp61dzielczych I7.<lk/3dowych I
! kornunalnych i!. pcywalnych I
powlqz3ne z podaz'l. IH1 :mip.szkalnictwo I
, I
: liczba mieszkclli I! bud. jeclnoroc!/inne I; hud. wielorodzinnc ii liczba pokoi II pow. lIzylkoW;1 W rn2 i I
rl1ieszkclllia wg rozmiar6w ,I
<20.0m2 !20.0-29.0 I I
' ': 30.0·3'1.0 I: Y1.0-39 0 I Ij IiO.0-'19.0 I Ii :~O.O-59.0
I GO.O-69.0 I Ii 70.0-79.0 .. I I'
i RO.0-89.0... I; 90.0-109.0 !
L-_i _~'!.Q.Q_ i > I!
-.-\
1'; I) ~ l' ·1
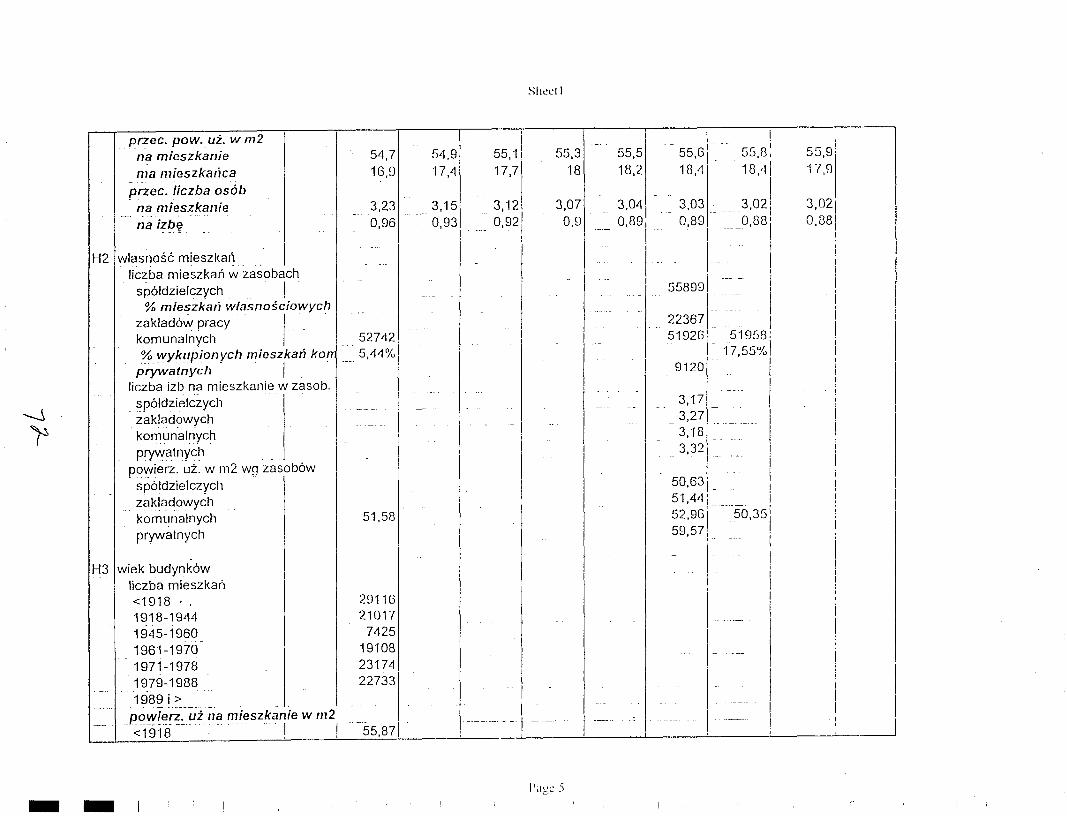
Sited I
'1/,9
3,020,88
i
;5S,9:
\,-- .-
55,61
-
18,'155,518,2
!55,S:18:11
I - I_ 3,04, 3,03! },02i
-- 0,89i 0,891
_._0,88 i
I 1- . i558991' -- I223671 ~.-- I51926! 51958;
1- 17,55%1_91201'" _. I
I
__ 3,17~ ~.=__ i- ~:~~ I .' -- ---- - I
3,32/ . !
5063' - I, I
51,4-1 i52,96 ·-·-··50,35,i
59,57 I
I
55,318
3,070,9
i55,1 !
17,71I3,12:
092 1. --- ' I
!
3,150,93
54,917,4
54,716,9
51,58
___ 3,230,96
przec. pow. LIZ. W m2na mieszkanierna mieszkarka
przee. liezba os6bna mieszkaniena i~1?rr
H2 Iwlasnosc mieszkari . ,liczba mieszkari w zasobach
sp61dzielczych ,% mieszkarj wlasnosciowych
zaklad6w pracy I_komunalnych I 527-12~ ,!"ykupionych mieSZ,kan kon1. 5,4-1%
prywatnychliczba izb na mieszkanie w zasob.. ~p6ldzielczych
zakladowychkomunalnychprywatnyc~
powierz. uz. w m2 wg zasob6wsp6ldzielczychzak!ad()wychkomunalnychprywatnych
--.j
~
II
-.--J
IiI
II-- ------ - I
-- !
I. 1-
,._-
I
II----..--- - -'1 ---
2911621017
7425191082317422733
--55,87! -
H3 Iwiek budynk6wliczba mieszkan<19181918-19441945-19601961-19701971-19781979-19881989 i >. _ •.. • __ •.••__ 0._. -"- ._..
powierz. liZ na mieszkanie w m2-.<.1918.-.-.---.. ' I -. I
- - I'age :)
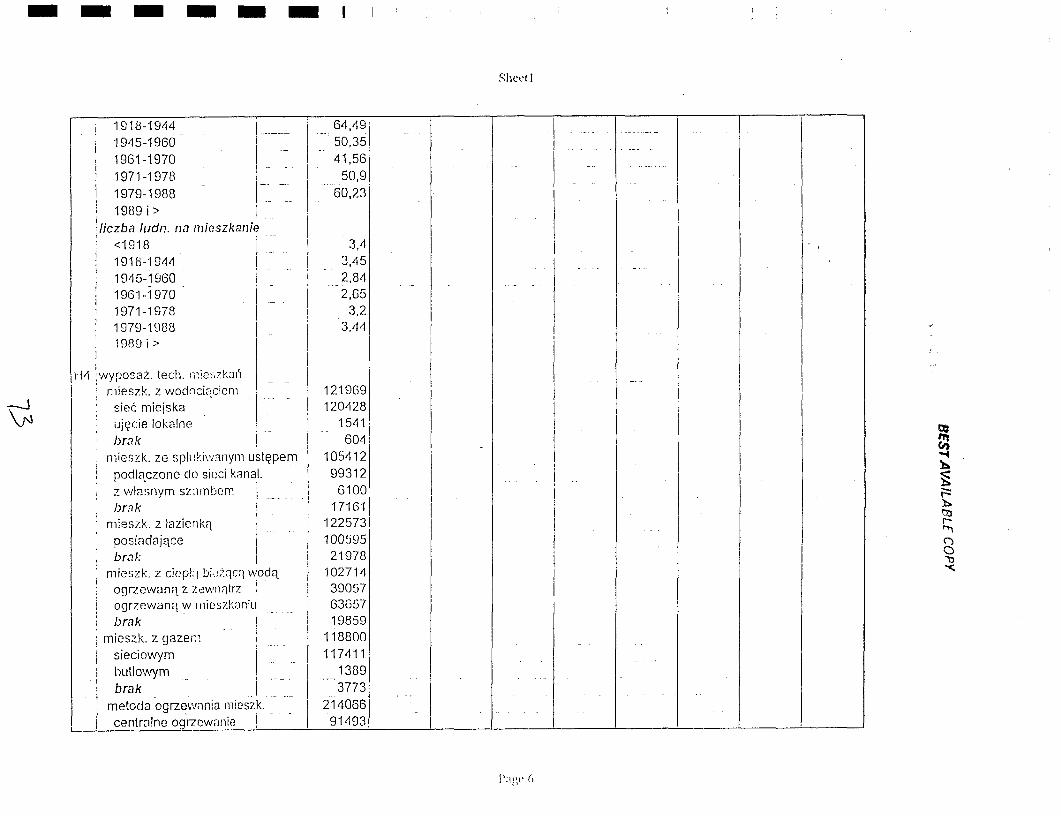
------ShCl'f I
~
1918-1944 I ~ 64,49, I
- .. _----- -- j -_.------- --
-19'15-1960 50,35 I---.- -- - ._. -
I 1961-1970 41,56
Ii -- -- .-.., 1971-1978 50,9I - _.0 __._,
I 1979-1988 60,23, -- --I 19E19 i >1-;liczba ludn. na micszkaniei --
<1918 3,4 ij -
191H-1944 3,45! - -
1945-1960 2,84- ----- - - - -
: 1961-1970 2,65I --: 1971-1978 3,2! 1979-1988 3,4tJ I !: 1SlS9 i > I!i
IH4 ;WYPOS3Z. tech. n:je~;!:k::111 -- - -- -I mieszk. z wodndqciem 1219G9
I
I--siec miejska 120428 Iujc;cie loknlne 1541
1I
bra,/{ 604: I I II
mieslk. ze spluki\'/3nym ust~pem 105412
II
I
i! podlqczone clo si()ci k;maL__ _. 99312z wbsnym snmbcm , 6100 Ii _. __
171611
I IIJrak I I i; !
mieszk. z lazieni\'l
I1225731 I
posindajqce I100595 i
brak I
I21978 I
! I Imieszk_ z ciep!;! b;..~;:rjC;l wodq 10271t!
II
ogrzewan'l z zewll'1lrZi
! 39057:ogrzewan'l w ll1icslf',aniu 63657 I- ... -
rbrak I 19859rnieszk. z gazem I 118800I --
sieciowym 117'111--
butlowym I 1389_.- --- .- .--- -
lJrak I 3773- .--
metoda ogrz~wani8 mieszk. I214066
- - --
cet"!tmlne ogrzcwllnie I 91493!
1':\1',l' (I
toZl......';b
§r:::httl(no,()a'tI...;
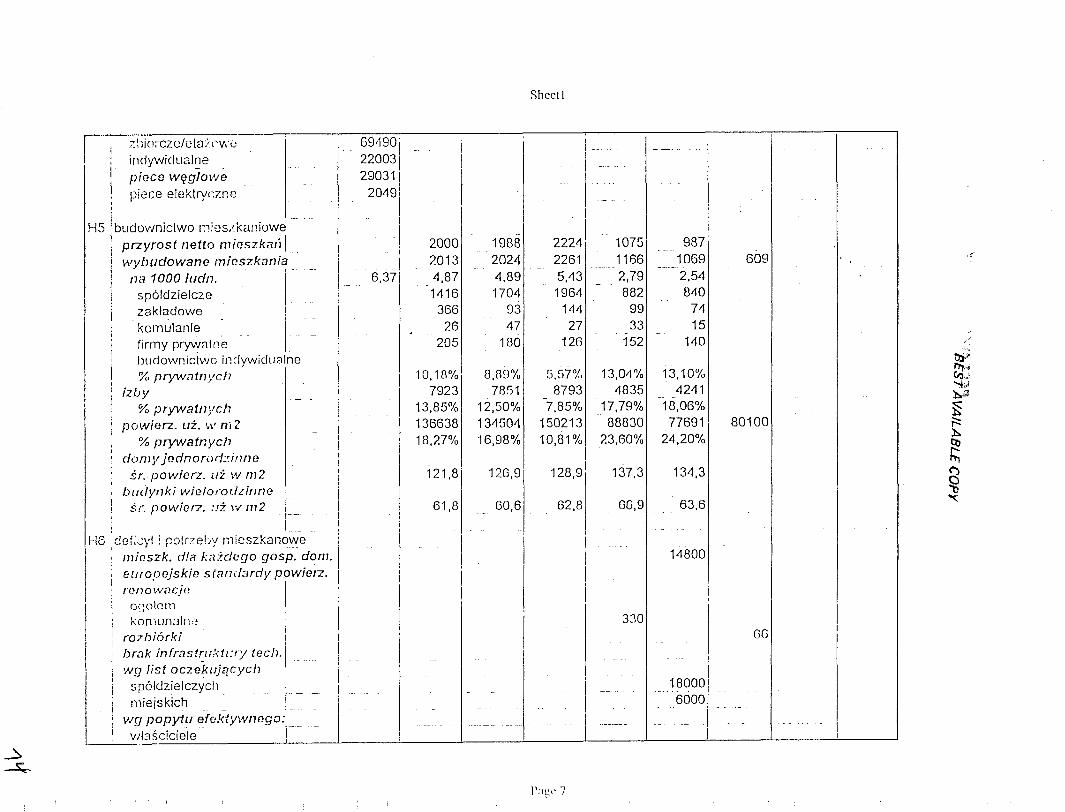
Sheetl
II1----- -
",.!j
l),f"F'!'J"{t,j;.;'"i;Jh J
§;::::h
~I'l,
~"<::
66
609
80100
63,6
98710692.54840
7415
140
134,3
14800
180006000
13,10%4241
18,06%77691
24,20%
330
6G,9
137,3
13,0/1%4835
17,79%88830
23,60%
1
2221\ II .- 1075
2261 11665,43 2,791961\ 882
144 9927 33
126 152
I --
5,sr;.,8793
7,85%15021310,81%
II
128,9\
62,8
1I
IIII
II
--- I -II
GO,6
198820244,891704
9347
180
126,9
8,89%7851
12,50%131\50416,98%
61,8
200020134,871416
36626
205
I121,8
10,18%17923
13,85%13663818,27%
6,37
1
_ 691901220031290311
20-19 1
I
,::: ~~iorcz01c ta):cw~! inoywiclllaine
\. P!~cn W??!o\:'1e, piece eleKtryl.lne,
H5 iblldowniclwo I~'ieszkaniowe--i przyrost netio mieszkatl!
wybudowane mieszkaniana 1000 Illdn. L-_ ._-
sp61dzielczezakladowekOlnlllanle
I firmy prYWcltner .
'I' bllcJownidwo inrfywiclualne% prywatnycll
: izlJy 'I
' % prywatnyc17i powinrz. uI. IN m 2 i
% prywatnyc/l I, ({omy jednorodzinne I
.i:.r. powierz. III W m2 Iblltlynki wielorotlzinne i
i sr. powierz. ;,z \v m2 __ I, I
IH6 'dek;yt ! patrze!Jy rnjcszkano~-e - Imio$zk. dla kaidcgo gasp. dom. IelJropejskie standardy powierz. I
1 • I
renownCjO: G\)olcl1l
I kon-,lln:1111:;: rozbi6rki
brak infr:lslru:-:tl:ry teell.i wg Jist oezekl1jq cychi sp6/c!zielczyctl. ,. __r miejskichI -'--- -; wg popytu efektywnego: __ _
l.__I_~J/3sciciele !~~
1';1!!l' 7
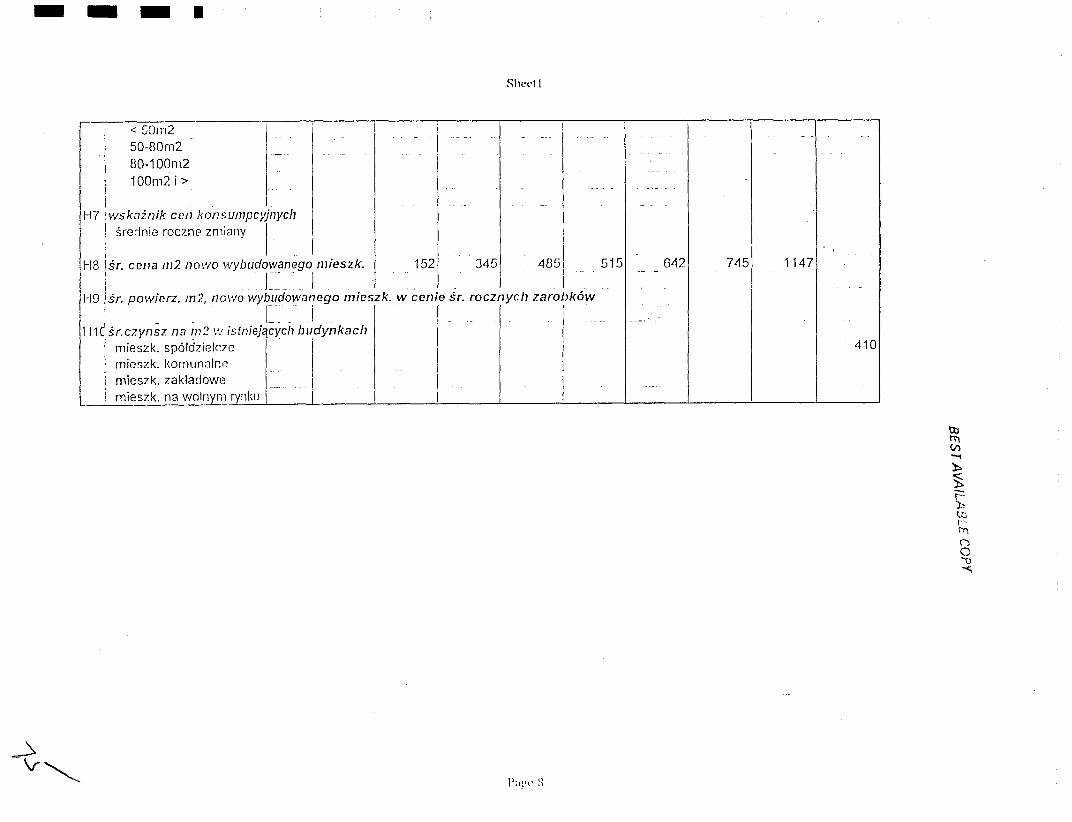
- - _.Sheet I
50-80m2SO-100m2100m2 i > 1-·- ... I
H7 Vlsktlinik ceo kon5umpcyjnycIJ II srcrlnic rocznc zmiany I i: I II -- .. I I
riB isr. cena m2 1l0WO WYb[Jdj=an~~olmieszk._ 1521 _ 345 -4851 ... 515
H9 Isr. powierz. m2, nowa wybudowanego mieszk. VI cenie sr. rocznycl1 zarohkow
H1Jsr.:7.ynSz n? n)~ \'/ istniej~~ycl) bl;dynkaCh I: lllleszk. spoldzleloc I Ij micszk. komun;llr.c _... I! lllieszk. zakladowe __. ! I; rnieszk. na wolnym ryl1l;u i IL .2.:...~..l___..l_ ..l_ _l_ _l_ ......!
~,
< 50m2-I
P:lgt' X
6tl2 7tl5 1147
410
lJ::l!i"\(I)-;
:t>.§~P!.Xl,~
rtj
()
o~-<i


