Embed Size (px)
Citation preview
Analysis of the Volt/VAr Control Scheme for Smart Distribution Feeders
Mahti Daliparthi, Marsela Jakub-Wood, Anjan Bose, and Anurag Srivastava The School of Electrical Engineering and Computer Science
Washington State University Pullman, WA
Abstract—With ongoing smart grid activities, there are a number of active demonstration projects in different parts of USA. In the northwest, an ongoing demonstration project is conducted by Avista Utilities to improve the reliability and efficiency of the distribution system. This project includes automated management of distribution system and bi-directional communication capabilities between the devices in the field and the control center. With the added communication capacity, the newly installed equipment coupled with the distribution automation system has the ability of enhanced monitoring and control as well as the potential to decrease the overall power demand. This research explores one aspect of the smart grid in distribution automation called the Volt-VAr Control (VVC) scheme. Voltage regulation over a distribution feeder serves the purpose of achieving a flat voltage profile and maintaining the permissible voltage (plus or minus 5% of rated voltage) at the end-use customer. VAr control allows power factor correction in near real time. To accurately predict the benefits and plan Volt/VAr control, an accurate representation of the load models is essential. The benefits of VVC include reduction of losses, maintenance costs, operating costs, voltage variation, and increase in the power delivery capacity of existing equipment. Resulting analysis of the VVC control shows demand savings of 2-3% for every 2.5% voltage drop.
I. INTRODUCTION Distribution utilities are under the increased pressure to
maintain quality of power delivered to the end use customer in this digital era where the demand is increasing day by day. Integration of renewable energy as an alternate generating source also requires enhanced control on the distribution system. Intelligent distribution automation techniques must be developed to achieve efficiency, reliability, and security for the power grid. Volt/VAr control (VVC) scheme [1] is one such concept that allows reducing voltages in permissible range along the feeder and allows power factor correction in near real-time to reduce peak power demand and minimize losses on the system. This also increases the efficiency and lifetime of equipment.
Voltage control can also lead to Conservation Voltage Reduction (CVR), defined as the reduction of energy consumption due to the reduction of feeder voltage. Studies of CVR in [2] and [3] have established that a 1% reduction in voltage leads to 1% reduction in the power demand. According to the ANSI standards, the range for voltages at the distribution transformer terminals must be within 114 and 126 volts [4]. CVR is accomplished by line drop compensation (LDC), where the tap settings of the voltage regulators are
automatically adjusted to maintain the end of line (EOL) voltage within specified voltage. CVR studies by Pacific Northwest National Laboratory have concluded that the behavior of the end-use loads must be accurately modeled to represent the effects of CVR on a feeder [2]. Load models are classified into two broad categories: static and dynamic. This paper focuses on static load models because in voltage reduction studies, it is sufficient to use only these models as the steady-state real and reactive powers are functions of bus voltages at a fixed frequency [5].
Near real-time power factor correction is achieved through the systematic switching of the switched capacitors on the feeders. This is the most effective way of meeting the load VAr requirements on the system. Fixed banks are installed to meet the minimum load requirements while switched banks are added or removed as the load increases or decreases [6]. With the added communication feature of the smart grid, the switched capacitor can now receive power factor information from the beginning of the feeder, broadening its power factor correction reach. Avista Utilities requires the end of line voltage at the primary side of the distribution transformer to be at 120V and power factor to be above 95% lagging.
Previous literature on VVC schemes concentrate only on developing an algorithm and proving the theory for prototypical feeders using typical load parameter values [7],[8],[9]. This paper uses actual field load data for every five-minute interval to quantify the benefits of VVC over a period of time for a given feeder. Different ways to improve the accuracy of the scheme have also been explored. Operation of switched capacitor banks to achieve greater energy benefits is analyzed. Load parameters using statistical approaches for an accurate representation of the loads on the distribution feeder have also been determined. These different techniques help to achieve a more accurate study of the benefits of the VVC scheme under different scenarios.
The rest of this paper is organized as follows: Section II describes the Smart Grid implementation plans in Pullman, WA. The detailed procedures for VVC scheme are explained in Section III. Section IV discusses the significant factors that affect VVC and some concluding remarks are given in Section V.
978-1-4673-2308-6/12/$31.00 ©2012 IEEE
II. PULLMAN DISTRIBUTION SY
Located in the Pacific Northwest, Pullmapart of the Smart Grid Demonstration projeDepartment of Energy and led by Avista Utigoal of this project is to achieve a flat voltasystem by voltage optimization. Over 13,0have been installed for every customer in Pthis project. Deployment of these meters Metering Infrastructure (AMI) makes powreadings readily available.
The town of Pullman is fed by thirteen feinstalled automated line switches, recloserswitched capacitor banks. Two feeders out feeders have been considered in this studyreferred as Pullman Feeder 1 (PF1) and P(PF2).
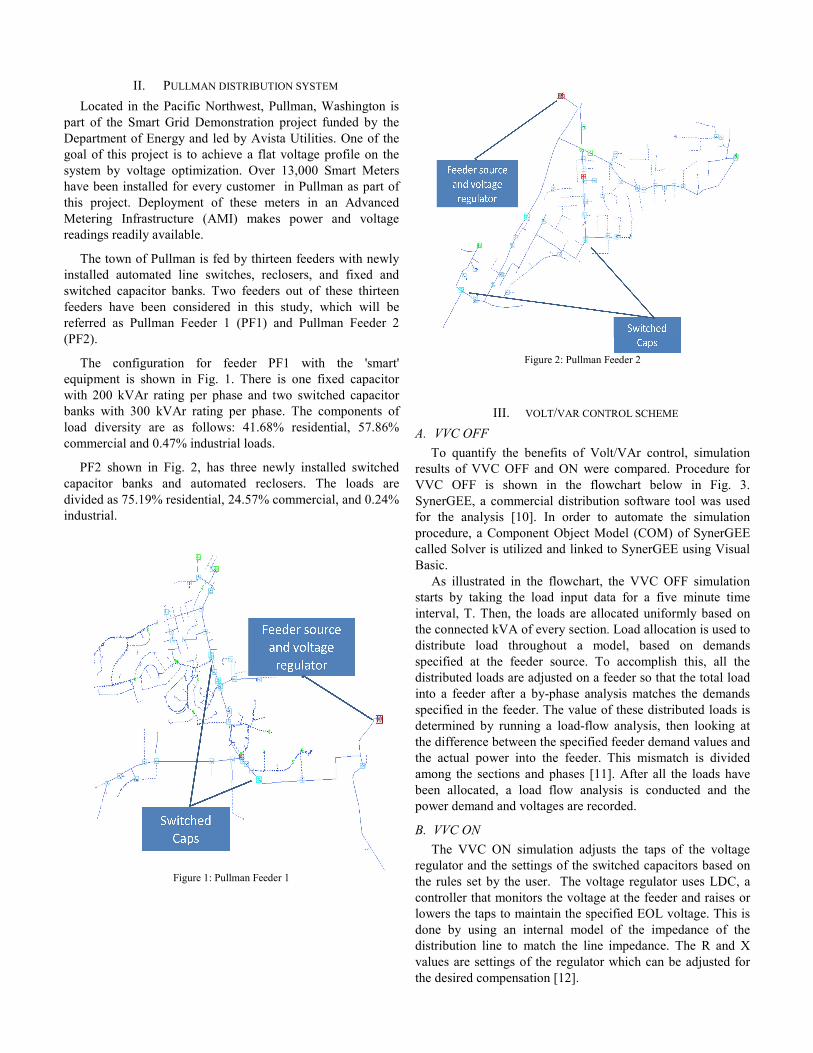
The configuration for feeder PF1 wequipment is shown in Fig. 1. There is onwith 200 kVAr rating per phase and two swbanks with 300 kVAr rating per phase. Thload diversity are as follows: 41.68% rescommercial and 0.47% industrial loads.
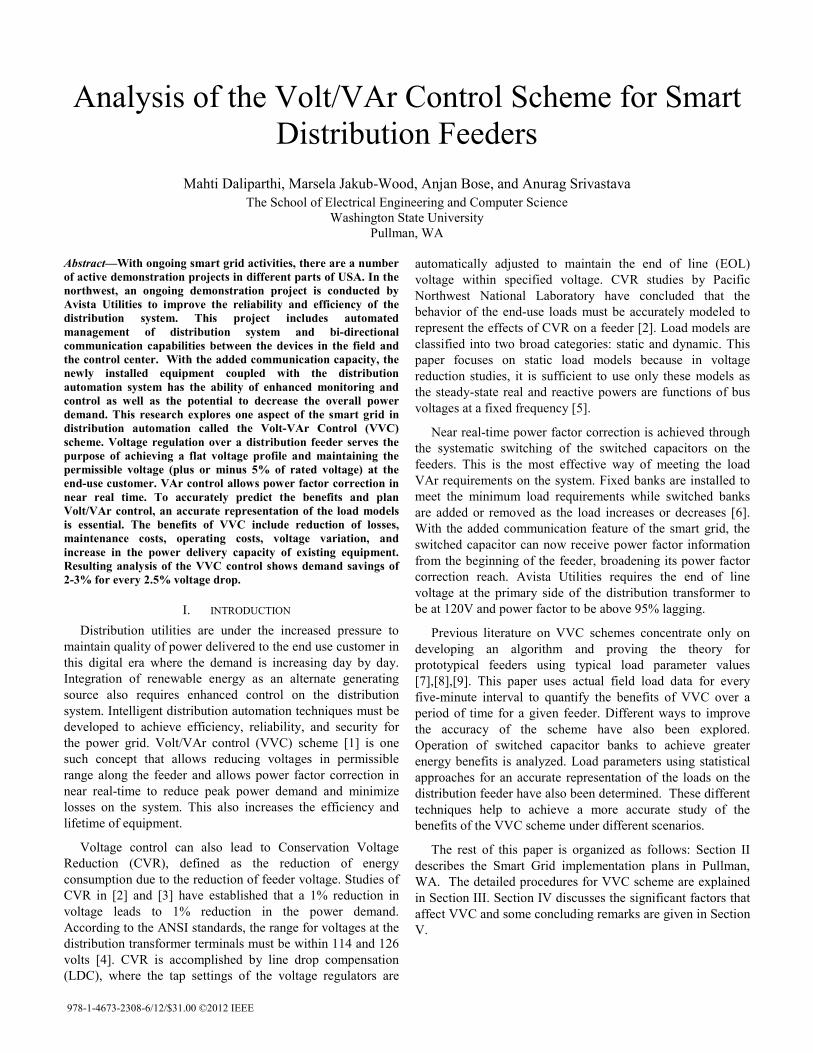
PF2 shown in Fig. 2, has three newly icapacitor banks and automated reclosers.divided as 75.19% residential, 24.57% commindustrial.
Figure 1: Pullman Feeder 1
YSTEM an, Washington is ect funded by the ilities. One of the age profile on the 000 Smart Meters Pullman as part of
in an Advanced wer and voltage
eeders with newly s, and fixed and of these thirteen
y, which will be Pullman Feeder 2
with the 'smart' ne fixed capacitor witched capacitor
he components of sidential, 57.86%
installed switched . The loads are
mercial, and 0.24%
Figure 2: Pullman F
III. VOLT/VAR CONT
A. VVC OFF To quantify the benefits of Vol
results of VVC OFF and ON wereVVC OFF is shown in the flowSynerGEE, a commercial distributiofor the analysis [10]. In order to procedure, a Component Object Mocalled Solver is utilized and linked tBasic.
As illustrated in the flowchart, starts by taking the load input datinterval, T. Then, the loads are allothe connected kVA of every section.distribute load throughout a mospecified at the feeder source. Todistributed loads are adjusted on a feinto a feeder after a by-phase analyspecified in the feeder. The value ofdetermined by running a load-flowthe difference between the specified the actual power into the feeder. Tamong the sections and phases [11]been allocated, a load flow analypower demand and voltages are reco
B. VVC ON The VVC ON simulation adjust
regulator and the settings of the swithe rules set by the user. The voltacontroller that monitors the voltage lowers the taps to maintain the specdone by using an internal model distribution line to match the line values are settings of the regulator the desired compensation [12].
Feeder 2
TROL SCHEME
lt/VAr control, simulation e compared. Procedure for wchart below in Fig. 3. on software tool was used
automate the simulation odel (COM) of SynerGEE to SynerGEE using Visual
the VVC OFF simulation ta for a five minute time ocated uniformly based on . Load allocation is used to
odel, based on demands o accomplish this, all the feeder so that the total load ysis matches the demands f these distributed loads is
w analysis, then looking at feeder demand values and
This mismatch is divided ]. After all the loads have
ysis is conducted and the orded.
ts the taps of the voltage itched capacitors based on age regulator uses LDC, a at the feeder and raises or
cified EOL voltage. This is of the impedance of the impedance. The R and X which can be adjusted for
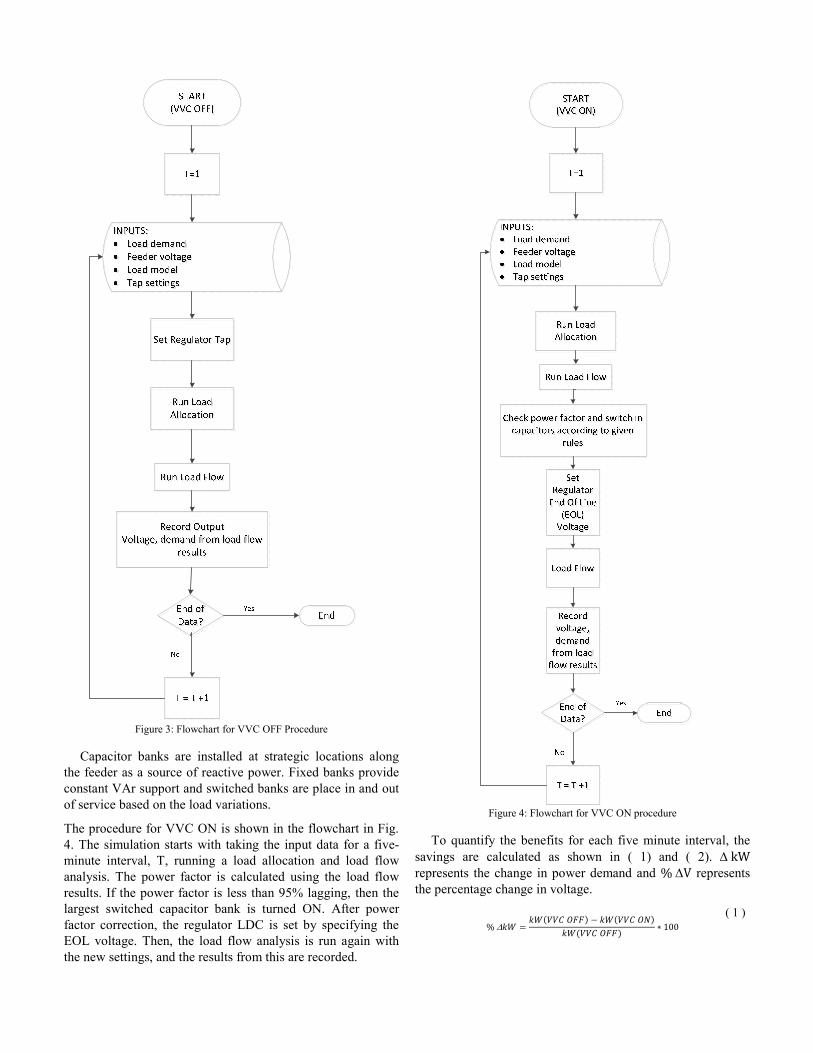
Figure 3: Flowchart for VVC OFF Procedure
Capacitor banks are installed at strategic locations along the feeder as a source of reactive power. Fixed banks provide constant VAr support and switched banks are place in and out of service based on the load variations.
The procedure for VVC ON is shown in the flowchart in Fig. 4. The simulation starts with taking the input data for a five-minute interval, T, running a load allocation and load flow analysis. The power factor is calculated using the load flow results. If the power factor is less than 95% lagging, then the largest switched capacitor bank is turned ON. After power factor correction, the regulator LDC is set by specifying the EOL voltage. Then, the load flow analysis is run again with the new settings, and the results from this are recorded.
Figure 4: Flowchart for VVC ON procedure
To quantify the benefits for each five minute interval, the savings are calculated as shown in ( 1) and ( 2). Δ kW represents the change in power demand and % ΔV represents the percentage change in voltage.
% Δ 100
( 1 )
% Δ 100 ( 2 )
After developing the basic algorithms, the challenges in
implementing these studies for practical purposes were analyzed. Load models have a direct correlation in estimating savings in power demand. Placement and control of capacitor banks also play an important role as explained in the following section.
IV. FACTORS AFFECTING VVC SCHEME A. Load Models
The types of loads on a feeder have a direct impact on the benefits of VVC. Static load models are widely represented by the ZIP model where the real and reactive powers are functions of voltage and the coefficients of that relationship are constant impedance (Z), constant current (I) and constant power (P):
S=S0 Z VV I VV PQ
(3)
where S is the actual apparent power, S0 is the apparent power at a reference voltage V0, and Z+I+PQ=1 [13].
It is important to note that the ZIP model is realistic only for V
V0 near unity and the coefficients can assume negative
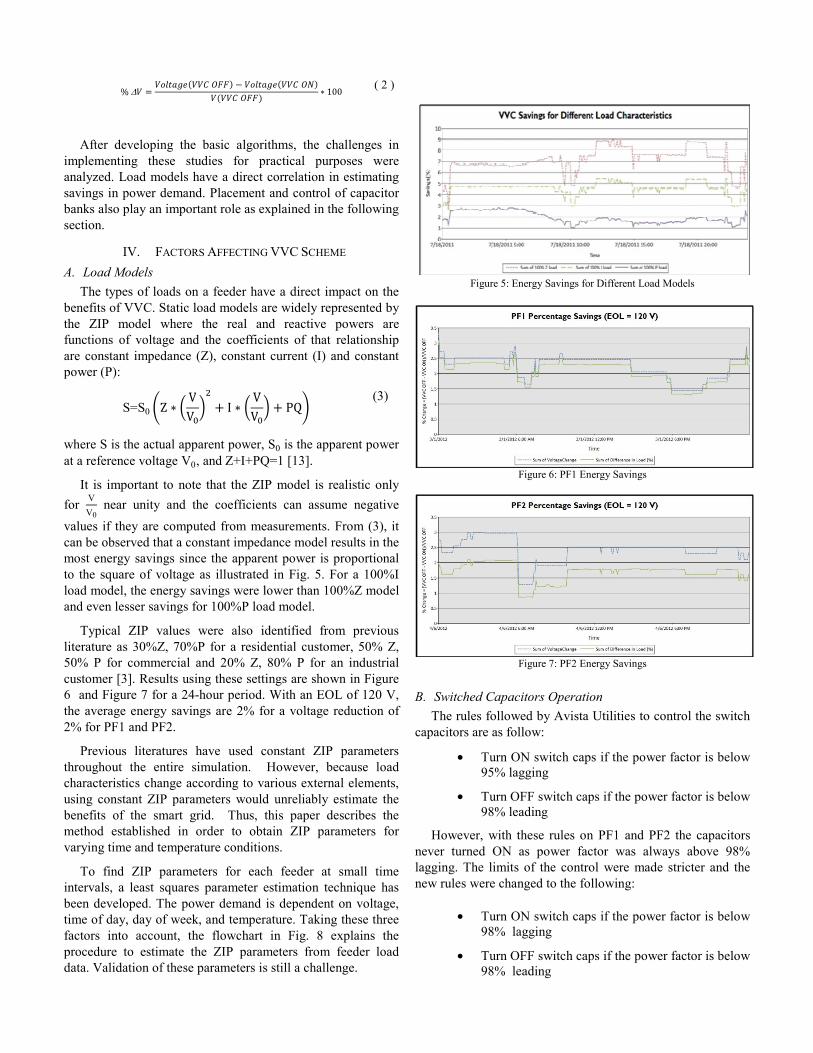
values if they are computed from measurements. From (3), it can be observed that a constant impedance model results in the most energy savings since the apparent power is proportional to the square of voltage as illustrated in Fig. 5. For a 100%I load model, the energy savings were lower than 100%Z model and even lesser savings for 100%P load model.
Typical ZIP values were also identified from previous literature as 30%Z, 70%P for a residential customer, 50% Z, 50% P for commercial and 20% Z, 80% P for an industrial customer [3]. Results using these settings are shown in Figure 6 and Figure 7 for a 24-hour period. With an EOL of 120 V, the average energy savings are 2% for a voltage reduction of 2% for PF1 and PF2.
Previous literatures have used constant ZIP parameters throughout the entire simulation. However, because load characteristics change according to various external elements, using constant ZIP parameters would unreliably estimate the benefits of the smart grid. Thus, this paper describes the method established in order to obtain ZIP parameters for varying time and temperature conditions.
To find ZIP parameters for each feeder at small time intervals, a least squares parameter estimation technique has been developed. The power demand is dependent on voltage, time of day, day of week, and temperature. Taking these three factors into account, the flowchart in Fig. 8 explains the procedure to estimate the ZIP parameters from feeder load data. Validation of these parameters is still a challenge.
Figure 5: Energy Savings for Different Load Models
Figure 6: PF1 Energy Savings
Figure 7: PF2 Energy Savings
B. Switched Capacitors Operation
The rules followed by Avista Utilities to control the switch capacitors are as follow:
• Turn ON switch caps if the power factor is below 95% lagging
• Turn OFF switch caps if the power factor is below 98% leading
However, with these rules on PF1 and PF2 the capacitors never turned ON as power factor was always above 98% lagging. The limits of the control were made stricter and the new rules were changed to the following:
• Turn ON switch caps if the power factor is below 98% lagging
• Turn OFF switch caps if the power factor is below 98% leading
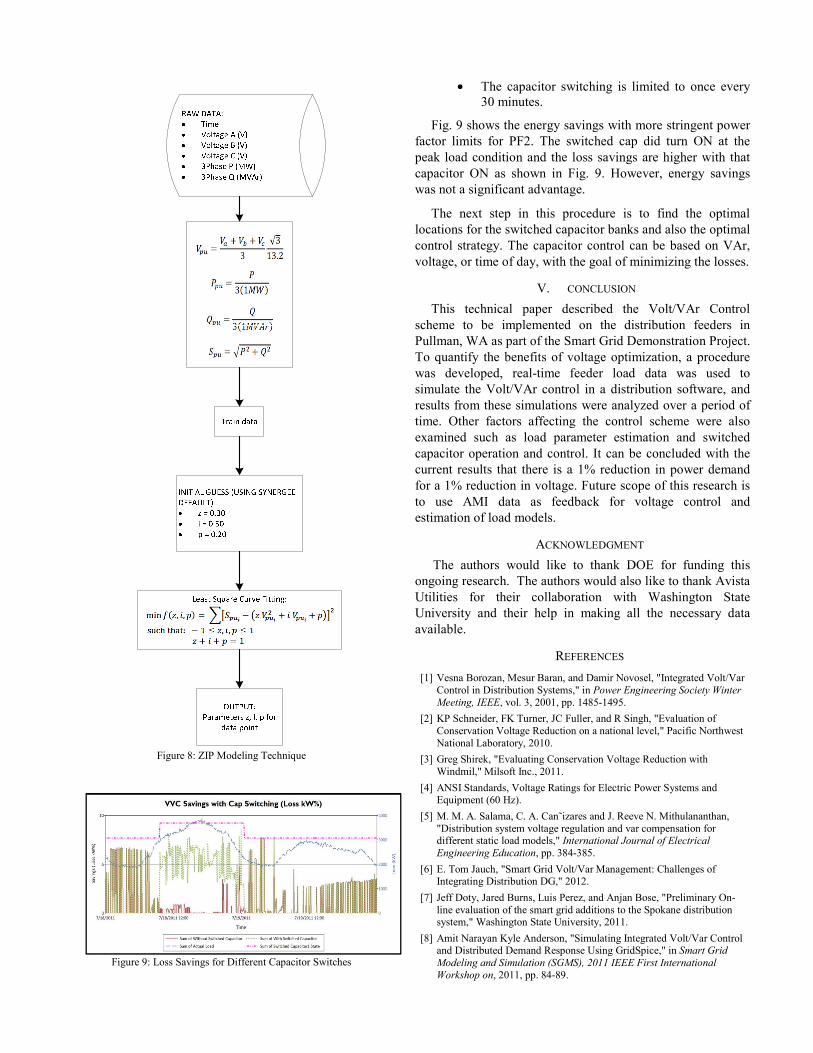
Figure 8: ZIP Modeling Technique
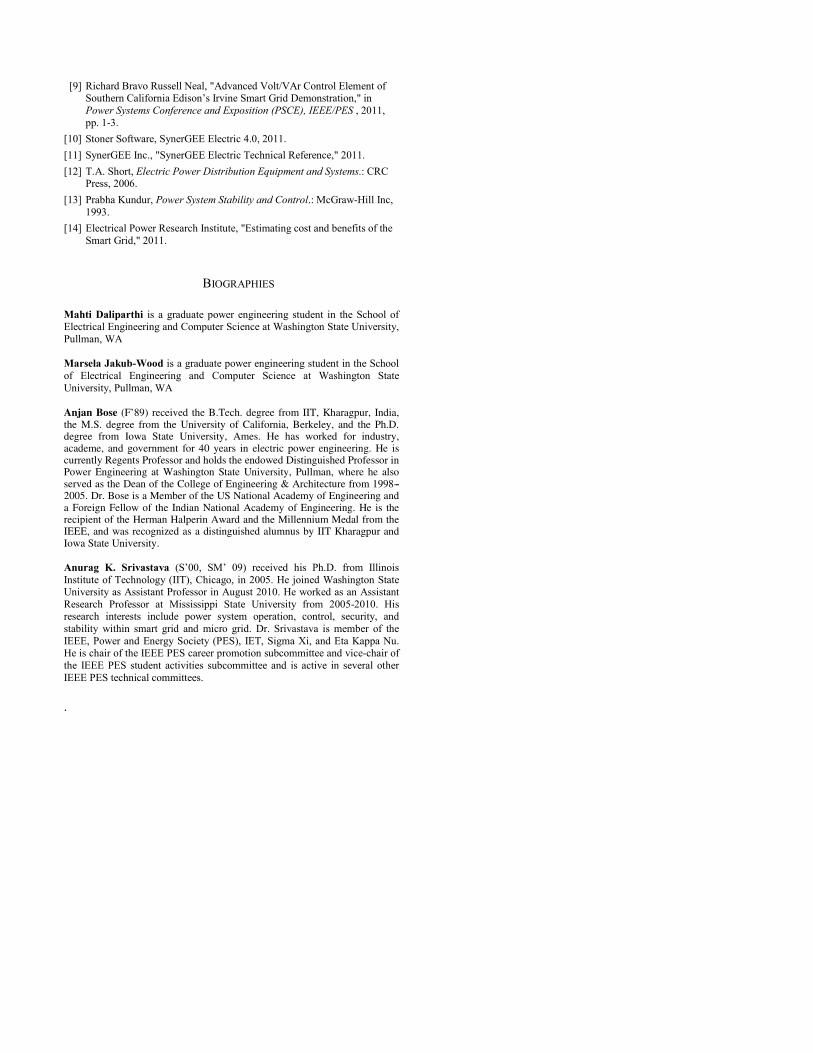
Figure 9: Loss Savings for Different Capacitor Switches
• The capacitor switching is limited to once every 30 minutes.
Fig. 9 shows the energy savings with more stringent power factor limits for PF2. The switched cap did turn ON at the peak load condition and the loss savings are higher with that capacitor ON as shown in Fig. 9. However, energy savings was not a significant advantage.
The next step in this procedure is to find the optimal locations for the switched capacitor banks and also the optimal control strategy. The capacitor control can be based on VAr, voltage, or time of day, with the goal of minimizing the losses.
V. CONCLUSION This technical paper described the Volt/VAr Control
scheme to be implemented on the distribution feeders in Pullman, WA as part of the Smart Grid Demonstration Project. To quantify the benefits of voltage optimization, a procedure was developed, real-time feeder load data was used to simulate the Volt/VAr control in a distribution software, and results from these simulations were analyzed over a period of time. Other factors affecting the control scheme were also examined such as load parameter estimation and switched capacitor operation and control. It can be concluded with the current results that there is a 1% reduction in power demand for a 1% reduction in voltage. Future scope of this research is to use AMI data as feedback for voltage control and estimation of load models.
ACKNOWLEDGMENT The authors would like to thank DOE for funding this
ongoing research. The authors would also like to thank Avista Utilities for their collaboration with Washington State University and their help in making all the necessary data available.
REFERENCES [1] Vesna Borozan, Mesur Baran, and Damir Novosel, "Integrated Volt/Var
Control in Distribution Systems," in Power Engineering Society Winter Meeting, IEEE, vol. 3, 2001, pp. 1485-1495.
[2] KP Schneider, FK Turner, JC Fuller, and R Singh, "Evaluation of Conservation Voltage Reduction on a national level," Pacific Northwest National Laboratory, 2010.
[3] Greg Shirek, "Evaluating Conservation Voltage Reduction with Windmil," Milsoft Inc., 2011.
[4] ANSI Standards, Voltage Ratings for Electric Power Systems and Equipment (60 Hz).
[5] M. M. A. Salama, C. A. Can˜izares and J. Reeve N. Mithulananthan, "Distribution system voltage regulation and var compensation for different static load models," International Journal of Electrical Engineering Education, pp. 384-385.
[6] E. Tom Jauch, "Smart Grid Volt/Var Management: Challenges of Integrating Distribution DG," 2012.
[7] Jeff Doty, Jared Burns, Luis Perez, and Anjan Bose, "Preliminary On-line evaluation of the smart grid additions to the Spokane distribution system," Washington State University, 2011.
[8] Amit Narayan Kyle Anderson, "Simulating Integrated Volt/Var Control and Distributed Demand Response Using GridSpice," in Smart Grid Modeling and Simulation (SGMS), 2011 IEEE First International Workshop on, 2011, pp. 84-89.
[9] Richard Bravo Russell Neal, "Advanced Volt/VAr Control Element of Southern California Edison’s Irvine Smart Grid Demonstration," in Power Systems Conference and Exposition (PSCE), IEEE/PES , 2011, pp. 1-3.
[10] Stoner Software, SynerGEE Electric 4.0, 2011. [11] SynerGEE Inc., "SynerGEE Electric Technical Reference," 2011. [12] T.A. Short, Electric Power Distribution Equipment and Systems.: CRC
Press, 2006. [13] Prabha Kundur, Power System Stability and Control.: McGraw-Hill Inc,
1993. [14] Electrical Power Research Institute, "Estimating cost and benefits of the
Smart Grid," 2011.
BIOGRAPHIES Mahti Daliparthi is a graduate power engineering student in the School of Electrical Engineering and Computer Science at Washington State University, Pullman, WA Marsela Jakub-Wood is a graduate power engineering student in the School of Electrical Engineering and Computer Science at Washington State University, Pullman, WA Anjan Bose (F’89) received the B.Tech. degree from IIT, Kharagpur, India, the M.S. degree from the University of California, Berkeley, and the Ph.D. degree from Iowa State University, Ames. He has worked for industry, academe, and government for 40 years in electric power engineering. He is currently Regents Professor and holds the endowed Distinguished Professor in Power Engineering at Washington State University, Pullman, where he also served as the Dean of the College of Engineering & Architecture from 1998---2005. Dr. Bose is a Member of the US National Academy of Engineering and a Foreign Fellow of the Indian National Academy of Engineering. He is the recipient of the Herman Halperin Award and the Millennium Medal from the IEEE, and was recognized as a distinguished alumnus by IIT Kharagpur and Iowa State University. Anurag K. Srivastava (S’00, SM’ 09) received his Ph.D. from Illinois Institute of Technology (IIT), Chicago, in 2005. He joined Washington State University as Assistant Professor in August 2010. He worked as an Assistant Research Professor at Mississippi State University from 2005-2010. His research interests include power system operation, control, security, and stability within smart grid and micro grid. Dr. Srivastava is member of the IEEE, Power and Energy Society (PES), IET, Sigma Xi, and Eta Kappa Nu. He is chair of the IEEE PES career promotion subcommittee and vice-chair of the IEEE PES student activities subcommittee and is active in several other IEEE PES technical committees. .


