Embed Size (px)
Citation preview
document.xlsx Historical_simulation / revised: 9 Mar 2006 © Dr J R Hicks page 1 (of 40)
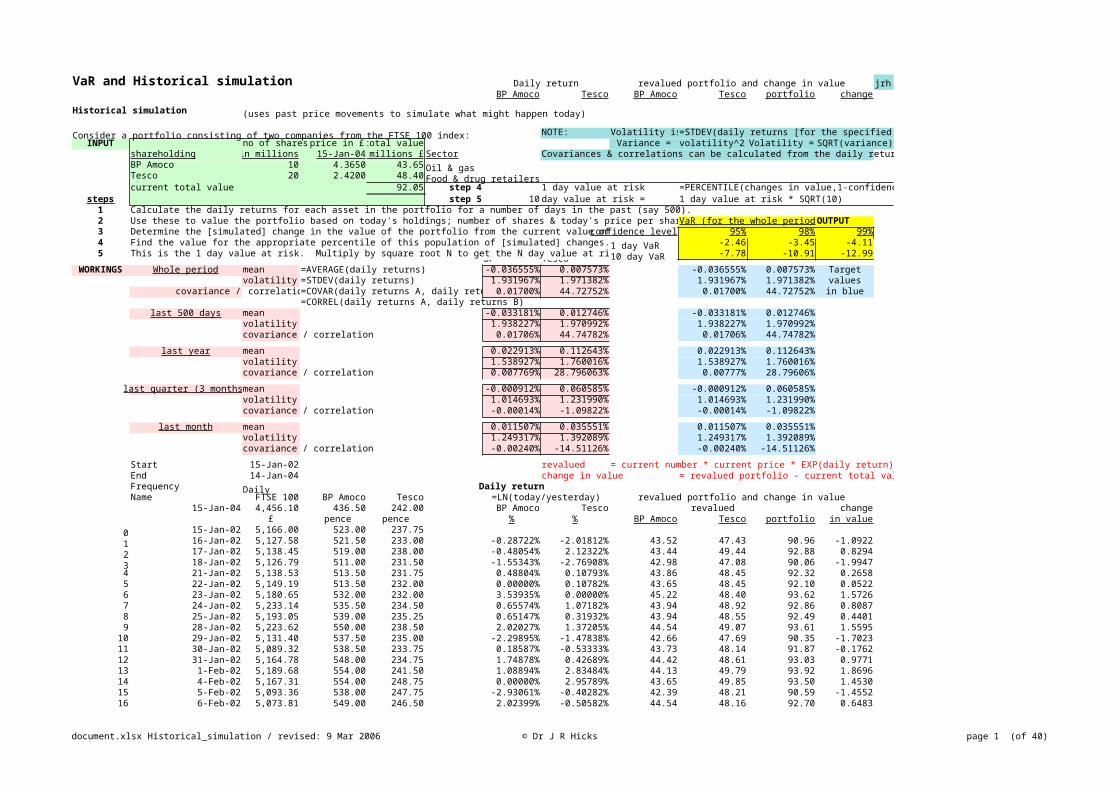
VaR and Historical simulation Daily return revalued portfolio and change in value jrhBP Amoco Tesco BP Amoco Tesco portfolio change
Historical simulation (uses past price movements to simulate what might happen today)
Consider a portfolio consisting of two companies from the FTSE 100 index: NOTE: Volatility is=STDEV(daily returns [for the specified period])INPUT no of shares price in £ total value Variance = volatility^2 Volatility = SQRT(variance)
shareholding in millions 15-Jan-04 millions £ Sector Covariances & correlations can be calculated from the daily returns.BP Amoco 10 4.3650 43.65 Oil & gasTesco 20 2.4200 48.40 Food & drug retailerscurrent total value 92.05 step 4 1 day value at risk =PERCENTILE(changes in value,1-confidence level)
steps step 5 10 day value at risk = 1 day value at risk * SQRT(10)1 Calculate the daily returns for each asset in the portfolio for a number of days in the past (say 500).2 Use these to value the portfolio based on today's holdings; number of shares & today's price per sharVaR (for the whole periodOUTPUT3 Determine the [simulated] change in the value of the portfolio from the current value ofconfidence level 95% 98% 99%4 Find the value for the appropriate percentile of this population of [simulated] changes.1 day VaR -2.46 -3.45 -4.115 This is the 1 day value at risk. Multiply by square root N to get the N day value at ri10 day VaR -7.78 -10.91 -12.99BP Tesco
WORKINGS Whole period mean =AVERAGE(daily returns) -0.036555% 0.007573% -0.036555% 0.007573% Targetvolatility =STDEV(daily returns) 1.931967% 1.971382% 1.931967% 1.971382% values
covariance / correlatio=COVAR(daily returns A, daily retu 0.01700% 44.72752% 0.01700% 44.72752% in blue=CORREL(daily returns A, daily returns B)
last 500 days mean -0.033181% 0.012746% -0.033181% 0.012746%volatility 1.938227% 1.970992% 1.938227% 1.970992%covariance / correlation 0.01706% 44.74782% 0.01706% 44.74782%
last year mean 0.022913% 0.112643% 0.022913% 0.112643%volatility 1.538927% 1.760016% 1.538927% 1.760016%covariance / correlation 0.007769% 28.796063% 0.00777% 28.79606%
last quarter (3 months)mean -0.000912% 0.060585% -0.000912% 0.060585%volatility 1.014693% 1.231990% 1.014693% 1.231990%covariance / correlation -0.00014% -1.09822% -0.00014% -1.09822%
last month mean 0.011507% 0.035551% 0.011507% 0.035551%volatility 1.249317% 1.392089% 1.249317% 1.392089%covariance / correlation -0.00240% -14.51126% -0.00240% -14.51126%
Start 15-Jan-02 revalued = current number * current price * EXP(daily return)End 14-Jan-04 change in value = revalued portfolio - current total valueFrequency Daily Daily returnName FTSE 100 BP Amoco Tesco =LN(today/yesterday) revalued portfolio and change in value
15-Jan-04 4,456.10 436.50 242.00 BP Amoco Tesco revalued change£ pence pence % % BP Amoco Tesco portfolio in value
0 15-Jan-02 5,166.00 523.00 237.751 16-Jan-02 5,127.58 521.50 233.00 -0.28722% -2.01812% 43.52 47.43 90.96 -1.09222 17-Jan-02 5,138.45 519.00 238.00 -0.48054% 2.12322% 43.44 49.44 92.88 0.82943 18-Jan-02 5,126.79 511.00 231.50 -1.55343% -2.76908% 42.98 47.08 90.06 -1.99474 21-Jan-02 5,138.53 513.50 231.75 0.48804% 0.10793% 43.86 48.45 92.32 0.26585 22-Jan-02 5,149.19 513.50 232.00 0.00000% 0.10782% 43.65 48.45 92.10 0.05226 23-Jan-02 5,180.65 532.00 232.00 3.53935% 0.00000% 45.22 48.40 93.62 1.57267 24-Jan-02 5,233.14 535.50 234.50 0.65574% 1.07182% 43.94 48.92 92.86 0.80878 25-Jan-02 5,193.05 539.00 235.25 0.65147% 0.31932% 43.94 48.55 92.49 0.44019 28-Jan-02 5,223.62 550.00 238.50 2.02027% 1.37205% 44.54 49.07 93.61 1.5595
10 29-Jan-02 5,131.40 537.50 235.00 -2.29895% -1.47838% 42.66 47.69 90.35 -1.702311 30-Jan-02 5,089.32 538.50 233.75 0.18587% -0.53333% 43.73 48.14 91.87 -0.176212 31-Jan-02 5,164.78 548.00 234.75 1.74878% 0.42689% 44.42 48.61 93.03 0.977113 1-Feb-02 5,189.68 554.00 241.50 1.08894% 2.83484% 44.13 49.79 93.92 1.869614 4-Feb-02 5,167.31 554.00 248.75 0.00000% 2.95789% 43.65 49.85 93.50 1.453015 5-Feb-02 5,093.36 538.00 247.75 -2.93061% -0.40282% 42.39 48.21 90.59 -1.455216 6-Feb-02 5,073.81 549.00 246.50 2.02399% -0.50582% 44.54 48.16 92.70 0.6483
document.xlsx Historical_simulation / revised: 9 Mar 2006 © Dr J R Hicks page 2 (of 40)
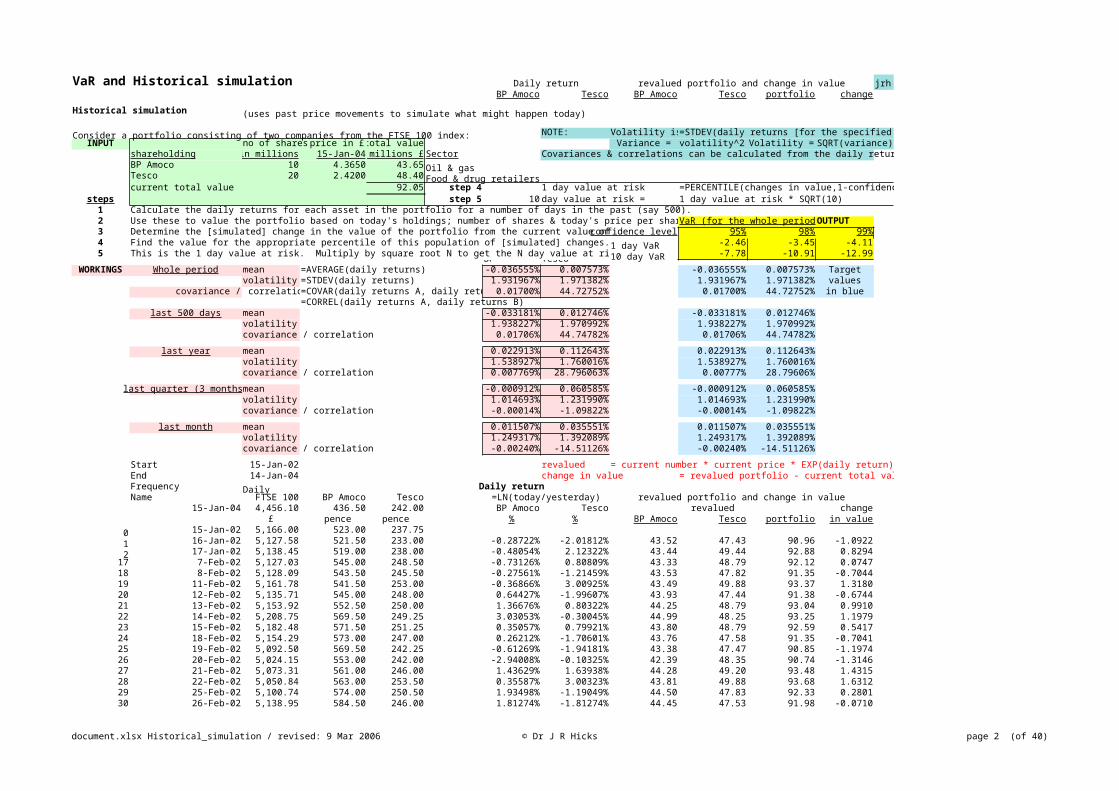
VaR and Historical simulation Daily return revalued portfolio and change in value jrhBP Amoco Tesco BP Amoco Tesco portfolio change
Historical simulation (uses past price movements to simulate what might happen today)
Consider a portfolio consisting of two companies from the FTSE 100 index: NOTE: Volatility is=STDEV(daily returns [for the specified period])INPUT no of shares price in £ total value Variance = volatility^2 Volatility = SQRT(variance)
shareholding in millions 15-Jan-04 millions £ Sector Covariances & correlations can be calculated from the daily returns.BP Amoco 10 4.3650 43.65 Oil & gasTesco 20 2.4200 48.40 Food & drug retailerscurrent total value 92.05 step 4 1 day value at risk =PERCENTILE(changes in value,1-confidence level)
steps step 5 10 day value at risk = 1 day value at risk * SQRT(10)1 Calculate the daily returns for each asset in the portfolio for a number of days in the past (say 500).2 Use these to value the portfolio based on today's holdings; number of shares & today's price per sharVaR (for the whole periodOUTPUT3 Determine the [simulated] change in the value of the portfolio from the current value ofconfidence level 95% 98% 99%4 Find the value for the appropriate percentile of this population of [simulated] changes.1 day VaR -2.46 -3.45 -4.115 This is the 1 day value at risk. Multiply by square root N to get the N day value at ri10 day VaR -7.78 -10.91 -12.99BP Tesco
WORKINGS Whole period mean =AVERAGE(daily returns) -0.036555% 0.007573% -0.036555% 0.007573% Targetvolatility =STDEV(daily returns) 1.931967% 1.971382% 1.931967% 1.971382% values
covariance / correlatio=COVAR(daily returns A, daily retu 0.01700% 44.72752% 0.01700% 44.72752% in blue=CORREL(daily returns A, daily returns B)
last 500 days mean -0.033181% 0.012746% -0.033181% 0.012746%volatility 1.938227% 1.970992% 1.938227% 1.970992%covariance / correlation 0.01706% 44.74782% 0.01706% 44.74782%
last year mean 0.022913% 0.112643% 0.022913% 0.112643%volatility 1.538927% 1.760016% 1.538927% 1.760016%covariance / correlation 0.007769% 28.796063% 0.00777% 28.79606%
last quarter (3 months)mean -0.000912% 0.060585% -0.000912% 0.060585%volatility 1.014693% 1.231990% 1.014693% 1.231990%covariance / correlation -0.00014% -1.09822% -0.00014% -1.09822%
last month mean 0.011507% 0.035551% 0.011507% 0.035551%volatility 1.249317% 1.392089% 1.249317% 1.392089%covariance / correlation -0.00240% -14.51126% -0.00240% -14.51126%
Start 15-Jan-02 revalued = current number * current price * EXP(daily return)End 14-Jan-04 change in value = revalued portfolio - current total valueFrequency Daily Daily returnName FTSE 100 BP Amoco Tesco =LN(today/yesterday) revalued portfolio and change in value
15-Jan-04 4,456.10 436.50 242.00 BP Amoco Tesco revalued change£ pence pence % % BP Amoco Tesco portfolio in value
0 15-Jan-02 5,166.00 523.00 237.751 16-Jan-02 5,127.58 521.50 233.00 -0.28722% -2.01812% 43.52 47.43 90.96 -1.09222 17-Jan-02 5,138.45 519.00 238.00 -0.48054% 2.12322% 43.44 49.44 92.88 0.8294
17 7-Feb-02 5,127.03 545.00 248.50 -0.73126% 0.80809% 43.33 48.79 92.12 0.074718 8-Feb-02 5,128.09 543.50 245.50 -0.27561% -1.21459% 43.53 47.82 91.35 -0.704419 11-Feb-02 5,161.78 541.50 253.00 -0.36866% 3.00925% 43.49 49.88 93.37 1.318020 12-Feb-02 5,135.71 545.00 248.00 0.64427% -1.99607% 43.93 47.44 91.38 -0.674421 13-Feb-02 5,153.92 552.50 250.00 1.36676% 0.80322% 44.25 48.79 93.04 0.991022 14-Feb-02 5,208.75 569.50 249.25 3.03053% -0.30045% 44.99 48.25 93.25 1.197923 15-Feb-02 5,182.48 571.50 251.25 0.35057% 0.79921% 43.80 48.79 92.59 0.541724 18-Feb-02 5,154.29 573.00 247.00 0.26212% -1.70601% 43.76 47.58 91.35 -0.704125 19-Feb-02 5,092.50 569.50 242.25 -0.61269% -1.94181% 43.38 47.47 90.85 -1.197426 20-Feb-02 5,024.15 553.00 242.00 -2.94008% -0.10325% 42.39 48.35 90.74 -1.314627 21-Feb-02 5,073.31 561.00 246.00 1.43629% 1.63938% 44.28 49.20 93.48 1.431528 22-Feb-02 5,050.84 563.00 253.50 0.35587% 3.00323% 43.81 49.88 93.68 1.631229 25-Feb-02 5,100.74 574.00 250.50 1.93498% -1.19049% 44.50 47.83 92.33 0.280130 26-Feb-02 5,138.95 584.50 246.00 1.81274% -1.81274% 44.45 47.53 91.98 -0.0710
document.xlsx Historical_simulation / revised: 9 Mar 2006 © Dr J R Hicks page 3 (of 40)
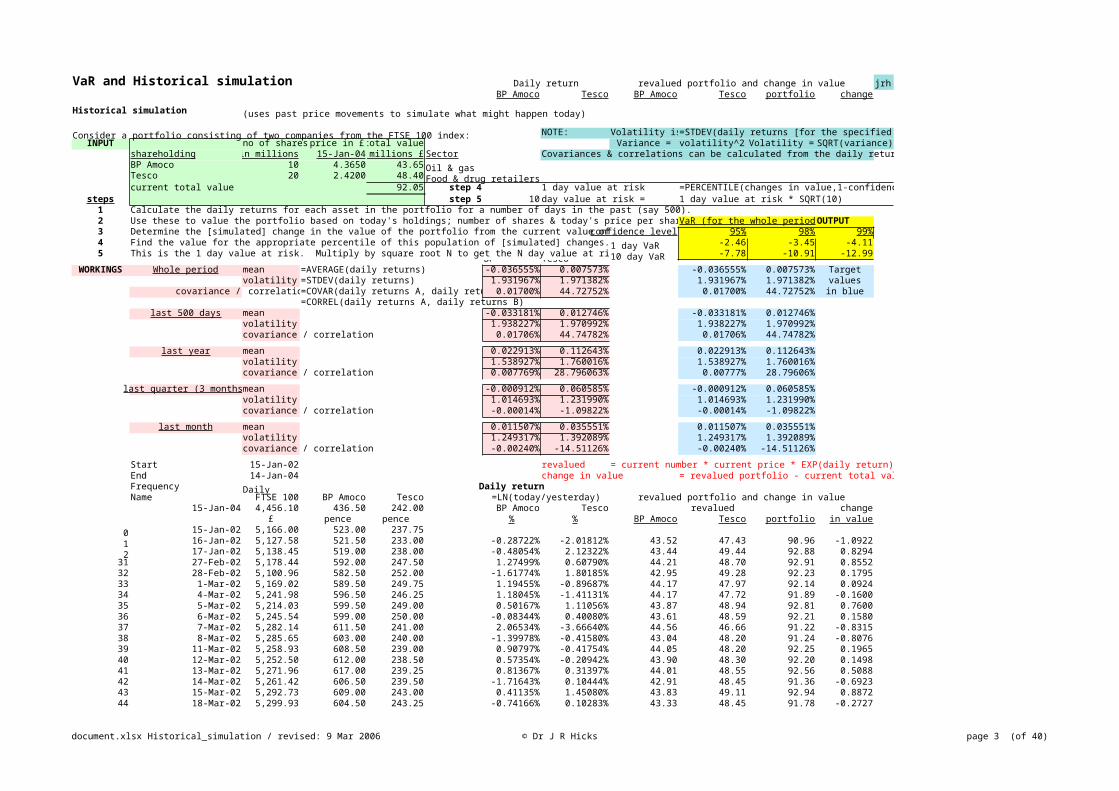
VaR and Historical simulation Daily return revalued portfolio and change in value jrhBP Amoco Tesco BP Amoco Tesco portfolio change
Historical simulation (uses past price movements to simulate what might happen today)
Consider a portfolio consisting of two companies from the FTSE 100 index: NOTE: Volatility is=STDEV(daily returns [for the specified period])INPUT no of shares price in £ total value Variance = volatility^2 Volatility = SQRT(variance)
shareholding in millions 15-Jan-04 millions £ Sector Covariances & correlations can be calculated from the daily returns.BP Amoco 10 4.3650 43.65 Oil & gasTesco 20 2.4200 48.40 Food & drug retailerscurrent total value 92.05 step 4 1 day value at risk =PERCENTILE(changes in value,1-confidence level)
steps step 5 10 day value at risk = 1 day value at risk * SQRT(10)1 Calculate the daily returns for each asset in the portfolio for a number of days in the past (say 500).2 Use these to value the portfolio based on today's holdings; number of shares & today's price per sharVaR (for the whole periodOUTPUT3 Determine the [simulated] change in the value of the portfolio from the current value ofconfidence level 95% 98% 99%4 Find the value for the appropriate percentile of this population of [simulated] changes.1 day VaR -2.46 -3.45 -4.115 This is the 1 day value at risk. Multiply by square root N to get the N day value at ri10 day VaR -7.78 -10.91 -12.99BP Tesco
WORKINGS Whole period mean =AVERAGE(daily returns) -0.036555% 0.007573% -0.036555% 0.007573% Targetvolatility =STDEV(daily returns) 1.931967% 1.971382% 1.931967% 1.971382% values
covariance / correlatio=COVAR(daily returns A, daily retu 0.01700% 44.72752% 0.01700% 44.72752% in blue=CORREL(daily returns A, daily returns B)
last 500 days mean -0.033181% 0.012746% -0.033181% 0.012746%volatility 1.938227% 1.970992% 1.938227% 1.970992%covariance / correlation 0.01706% 44.74782% 0.01706% 44.74782%
last year mean 0.022913% 0.112643% 0.022913% 0.112643%volatility 1.538927% 1.760016% 1.538927% 1.760016%covariance / correlation 0.007769% 28.796063% 0.00777% 28.79606%
last quarter (3 months)mean -0.000912% 0.060585% -0.000912% 0.060585%volatility 1.014693% 1.231990% 1.014693% 1.231990%covariance / correlation -0.00014% -1.09822% -0.00014% -1.09822%
last month mean 0.011507% 0.035551% 0.011507% 0.035551%volatility 1.249317% 1.392089% 1.249317% 1.392089%covariance / correlation -0.00240% -14.51126% -0.00240% -14.51126%
Start 15-Jan-02 revalued = current number * current price * EXP(daily return)End 14-Jan-04 change in value = revalued portfolio - current total valueFrequency Daily Daily returnName FTSE 100 BP Amoco Tesco =LN(today/yesterday) revalued portfolio and change in value
15-Jan-04 4,456.10 436.50 242.00 BP Amoco Tesco revalued change£ pence pence % % BP Amoco Tesco portfolio in value
0 15-Jan-02 5,166.00 523.00 237.751 16-Jan-02 5,127.58 521.50 233.00 -0.28722% -2.01812% 43.52 47.43 90.96 -1.09222 17-Jan-02 5,138.45 519.00 238.00 -0.48054% 2.12322% 43.44 49.44 92.88 0.8294
31 27-Feb-02 5,178.44 592.00 247.50 1.27499% 0.60790% 44.21 48.70 92.91 0.855232 28-Feb-02 5,100.96 582.50 252.00 -1.61774% 1.80185% 42.95 49.28 92.23 0.179533 1-Mar-02 5,169.02 589.50 249.75 1.19455% -0.89687% 44.17 47.97 92.14 0.092434 4-Mar-02 5,241.98 596.50 246.25 1.18045% -1.41131% 44.17 47.72 91.89 -0.160035 5-Mar-02 5,214.03 599.50 249.00 0.50167% 1.11056% 43.87 48.94 92.81 0.760036 6-Mar-02 5,245.54 599.00 250.00 -0.08344% 0.40080% 43.61 48.59 92.21 0.158037 7-Mar-02 5,282.14 611.50 241.00 2.06534% -3.66640% 44.56 46.66 91.22 -0.831538 8-Mar-02 5,285.65 603.00 240.00 -1.39978% -0.41580% 43.04 48.20 91.24 -0.807639 11-Mar-02 5,258.93 608.50 239.00 0.90797% -0.41754% 44.05 48.20 92.25 0.196540 12-Mar-02 5,252.50 612.00 238.50 0.57354% -0.20942% 43.90 48.30 92.20 0.149841 13-Mar-02 5,271.96 617.00 239.25 0.81367% 0.31397% 44.01 48.55 92.56 0.508842 14-Mar-02 5,261.42 606.50 239.50 -1.71643% 0.10444% 42.91 48.45 91.36 -0.692343 15-Mar-02 5,292.73 609.00 243.00 0.41135% 1.45080% 43.83 49.11 92.94 0.887244 18-Mar-02 5,299.93 604.50 243.25 -0.74166% 0.10283% 43.33 48.45 91.78 -0.2727

document.xlsx Historical_simulation / revised: 9 Mar 2006 © Dr J R Hicks page 4 (of 40)
VaR and Historical simulation Daily return revalued portfolio and change in value jrhBP Amoco Tesco BP Amoco Tesco portfolio change
Historical simulation (uses past price movements to simulate what might happen today)
Consider a portfolio consisting of two companies from the FTSE 100 index: NOTE: Volatility is=STDEV(daily returns [for the specified period])INPUT no of shares price in £ total value Variance = volatility^2 Volatility = SQRT(variance)
shareholding in millions 15-Jan-04 millions £ Sector Covariances & correlations can be calculated from the daily returns.BP Amoco 10 4.3650 43.65 Oil & gasTesco 20 2.4200 48.40 Food & drug retailerscurrent total value 92.05 step 4 1 day value at risk =PERCENTILE(changes in value,1-confidence level)
steps step 5 10 day value at risk = 1 day value at risk * SQRT(10)1 Calculate the daily returns for each asset in the portfolio for a number of days in the past (say 500).2 Use these to value the portfolio based on today's holdings; number of shares & today's price per sharVaR (for the whole periodOUTPUT3 Determine the [simulated] change in the value of the portfolio from the current value ofconfidence level 95% 98% 99%4 Find the value for the appropriate percentile of this population of [simulated] changes.1 day VaR -2.46 -3.45 -4.115 This is the 1 day value at risk. Multiply by square root N to get the N day value at ri10 day VaR -7.78 -10.91 -12.99BP Tesco
WORKINGS Whole period mean =AVERAGE(daily returns) -0.036555% 0.007573% -0.036555% 0.007573% Targetvolatility =STDEV(daily returns) 1.931967% 1.971382% 1.931967% 1.971382% values
covariance / correlatio=COVAR(daily returns A, daily retu 0.01700% 44.72752% 0.01700% 44.72752% in blue=CORREL(daily returns A, daily returns B)
last 500 days mean -0.033181% 0.012746% -0.033181% 0.012746%volatility 1.938227% 1.970992% 1.938227% 1.970992%covariance / correlation 0.01706% 44.74782% 0.01706% 44.74782%
last year mean 0.022913% 0.112643% 0.022913% 0.112643%volatility 1.538927% 1.760016% 1.538927% 1.760016%covariance / correlation 0.007769% 28.796063% 0.00777% 28.79606%
last quarter (3 months)mean -0.000912% 0.060585% -0.000912% 0.060585%volatility 1.014693% 1.231990% 1.014693% 1.231990%covariance / correlation -0.00014% -1.09822% -0.00014% -1.09822%
last month mean 0.011507% 0.035551% 0.011507% 0.035551%volatility 1.249317% 1.392089% 1.249317% 1.392089%covariance / correlation -0.00240% -14.51126% -0.00240% -14.51126%
Start 15-Jan-02 revalued = current number * current price * EXP(daily return)End 14-Jan-04 change in value = revalued portfolio - current total valueFrequency Daily Daily returnName FTSE 100 BP Amoco Tesco =LN(today/yesterday) revalued portfolio and change in value
15-Jan-04 4,456.10 436.50 242.00 BP Amoco Tesco revalued change£ pence pence % % BP Amoco Tesco portfolio in value
0 15-Jan-02 5,166.00 523.00 237.751 16-Jan-02 5,127.58 521.50 233.00 -0.28722% -2.01812% 43.52 47.43 90.96 -1.09222 17-Jan-02 5,138.45 519.00 238.00 -0.48054% 2.12322% 43.44 49.44 92.88 0.8294
45 19-Mar-02 5,316.07 614.00 241.25 1.55933% -0.82560% 44.34 48.00 92.34 0.288046 20-Mar-02 5,266.90 616.00 239.00 0.32520% -0.93702% 43.79 47.95 91.74 -0.309247 21-Mar-02 5,253.30 614.00 240.25 -0.32520% 0.52165% 43.51 48.65 92.16 0.111448 22-Mar-02 5,250.50 613.00 244.00 -0.16300% 1.54882% 43.58 49.16 92.73 0.684449 25-Mar-02 5,203.61 606.50 244.00 -1.06602% 0.00000% 43.19 48.40 91.59 -0.462850 26-Mar-02 5,195.46 609.00 242.25 0.41135% -0.71980% 43.83 48.05 91.88 -0.167251 27-Mar-02 5,214.70 612.50 239.00 0.57307% -1.35067% 43.90 47.75 91.65 -0.398552 28-Mar-02 5,271.76 625.00 241.00 2.02027% 0.83334% 44.54 48.81 93.35 1.295853 2-Apr-02 5,251.44 624.00 246.25 -0.16013% 2.15503% 43.58 49.45 93.03 0.984554 3-Apr-02 5,247.84 625.00 247.00 0.16013% 0.30411% 43.72 48.55 92.27 0.217455 4-Apr-02 5,209.46 610.00 247.75 -2.42927% 0.30318% 42.60 48.55 91.15 -0.900656 5-Apr-02 5,233.63 608.50 248.00 -0.24620% 0.10086% 43.54 48.45 91.99 -0.058557 8-Apr-02 5,178.55 608.50 249.25 0.00000% 0.50277% 43.65 48.64 92.29 0.244058 9-Apr-02 5,179.56 599.50 249.00 -1.49009% -0.10035% 43.00 48.35 91.36 -0.6941

document.xlsx Historical_simulation / revised: 9 Mar 2006 © Dr J R Hicks page 5 (of 40)
VaR and Historical simulation Daily return revalued portfolio and change in value jrhBP Amoco Tesco BP Amoco Tesco portfolio change
Historical simulation (uses past price movements to simulate what might happen today)
Consider a portfolio consisting of two companies from the FTSE 100 index: NOTE: Volatility is=STDEV(daily returns [for the specified period])INPUT no of shares price in £ total value Variance = volatility^2 Volatility = SQRT(variance)
shareholding in millions 15-Jan-04 millions £ Sector Covariances & correlations can be calculated from the daily returns.BP Amoco 10 4.3650 43.65 Oil & gasTesco 20 2.4200 48.40 Food & drug retailerscurrent total value 92.05 step 4 1 day value at risk =PERCENTILE(changes in value,1-confidence level)
steps step 5 10 day value at risk = 1 day value at risk * SQRT(10)1 Calculate the daily returns for each asset in the portfolio for a number of days in the past (say 500).2 Use these to value the portfolio based on today's holdings; number of shares & today's price per sharVaR (for the whole periodOUTPUT3 Determine the [simulated] change in the value of the portfolio from the current value ofconfidence level 95% 98% 99%4 Find the value for the appropriate percentile of this population of [simulated] changes.1 day VaR -2.46 -3.45 -4.115 This is the 1 day value at risk. Multiply by square root N to get the N day value at ri10 day VaR -7.78 -10.91 -12.99BP Tesco
WORKINGS Whole period mean =AVERAGE(daily returns) -0.036555% 0.007573% -0.036555% 0.007573% Targetvolatility =STDEV(daily returns) 1.931967% 1.971382% 1.931967% 1.971382% values
covariance / correlatio=COVAR(daily returns A, daily retu 0.01700% 44.72752% 0.01700% 44.72752% in blue=CORREL(daily returns A, daily returns B)
last 500 days mean -0.033181% 0.012746% -0.033181% 0.012746%volatility 1.938227% 1.970992% 1.938227% 1.970992%covariance / correlation 0.01706% 44.74782% 0.01706% 44.74782%
last year mean 0.022913% 0.112643% 0.022913% 0.112643%volatility 1.538927% 1.760016% 1.538927% 1.760016%covariance / correlation 0.007769% 28.796063% 0.00777% 28.79606%
last quarter (3 months)mean -0.000912% 0.060585% -0.000912% 0.060585%volatility 1.014693% 1.231990% 1.014693% 1.231990%covariance / correlation -0.00014% -1.09822% -0.00014% -1.09822%
last month mean 0.011507% 0.035551% 0.011507% 0.035551%volatility 1.249317% 1.392089% 1.249317% 1.392089%covariance / correlation -0.00240% -14.51126% -0.00240% -14.51126%
Start 15-Jan-02 revalued = current number * current price * EXP(daily return)End 14-Jan-04 change in value = revalued portfolio - current total valueFrequency Daily Daily returnName FTSE 100 BP Amoco Tesco =LN(today/yesterday) revalued portfolio and change in value
15-Jan-04 4,456.10 436.50 242.00 BP Amoco Tesco revalued change£ pence pence % % BP Amoco Tesco portfolio in value
0 15-Jan-02 5,166.00 523.00 237.751 16-Jan-02 5,127.58 521.50 233.00 -0.28722% -2.01812% 43.52 47.43 90.96 -1.09222 17-Jan-02 5,138.45 519.00 238.00 -0.48054% 2.12322% 43.44 49.44 92.88 0.8294
59 10-Apr-02 5,229.12 600.50 255.00 0.16667% 2.38106% 43.72 49.57 93.29 1.239160 11-Apr-02 5,137.43 590.00 259.50 -1.76401% 1.74932% 42.89 49.25 92.14 0.090961 12-Apr-02 5,161.02 584.00 263.50 -1.02216% 1.52967% 43.21 49.15 92.35 0.302262 15-Apr-02 5,201.44 596.00 259.00 2.03397% -1.72253% 44.55 47.57 92.12 0.070463 16-Apr-02 5,259.88 605.00 260.00 1.49878% 0.38536% 44.31 48.59 92.90 0.846064 17-Apr-02 5,263.88 598.00 258.00 -1.16377% -0.77220% 43.14 48.03 91.17 -0.877365 18-Apr-02 5,229.37 595.50 260.50 -0.41894% 0.96433% 43.47 48.87 92.34 0.286566 19-Apr-02 5,243.60 597.50 266.00 0.33529% 2.08934% 43.80 49.42 93.22 1.168567 22-Apr-02 5,221.47 597.50 266.25 0.00000% 0.09394% 43.65 48.45 92.10 0.045568 23-Apr-02 5,190.99 588.00 262.25 -1.60273% -1.51375% 42.96 47.67 90.63 -1.421269 24-Apr-02 5,218.17 577.50 263.00 -1.80185% 0.28558% 42.87 48.54 91.41 -0.641070 25-Apr-02 5,197.54 573.50 260.00 -0.69505% -1.14724% 43.35 47.85 91.20 -0.854471 26-Apr-02 5,159.01 565.00 262.75 -1.49322% 1.05214% 43.00 48.91 91.91 -0.135072 29-Apr-02 5,153.86 569.00 260.75 0.70547% -0.76409% 43.96 48.03 91.99 -0.0594

document.xlsx Historical_simulation / revised: 9 Mar 2006 © Dr J R Hicks page 6 (of 40)
VaR and Historical simulation Daily return revalued portfolio and change in value jrhBP Amoco Tesco BP Amoco Tesco portfolio change
Historical simulation (uses past price movements to simulate what might happen today)
Consider a portfolio consisting of two companies from the FTSE 100 index: NOTE: Volatility is=STDEV(daily returns [for the specified period])INPUT no of shares price in £ total value Variance = volatility^2 Volatility = SQRT(variance)
shareholding in millions 15-Jan-04 millions £ Sector Covariances & correlations can be calculated from the daily returns.BP Amoco 10 4.3650 43.65 Oil & gasTesco 20 2.4200 48.40 Food & drug retailerscurrent total value 92.05 step 4 1 day value at risk =PERCENTILE(changes in value,1-confidence level)
steps step 5 10 day value at risk = 1 day value at risk * SQRT(10)1 Calculate the daily returns for each asset in the portfolio for a number of days in the past (say 500).2 Use these to value the portfolio based on today's holdings; number of shares & today's price per sharVaR (for the whole periodOUTPUT3 Determine the [simulated] change in the value of the portfolio from the current value ofconfidence level 95% 98% 99%4 Find the value for the appropriate percentile of this population of [simulated] changes.1 day VaR -2.46 -3.45 -4.115 This is the 1 day value at risk. Multiply by square root N to get the N day value at ri10 day VaR -7.78 -10.91 -12.99BP Tesco
WORKINGS Whole period mean =AVERAGE(daily returns) -0.036555% 0.007573% -0.036555% 0.007573% Targetvolatility =STDEV(daily returns) 1.931967% 1.971382% 1.931967% 1.971382% values
covariance / correlatio=COVAR(daily returns A, daily retu 0.01700% 44.72752% 0.01700% 44.72752% in blue=CORREL(daily returns A, daily returns B)
last 500 days mean -0.033181% 0.012746% -0.033181% 0.012746%volatility 1.938227% 1.970992% 1.938227% 1.970992%covariance / correlation 0.01706% 44.74782% 0.01706% 44.74782%
last year mean 0.022913% 0.112643% 0.022913% 0.112643%volatility 1.538927% 1.760016% 1.538927% 1.760016%covariance / correlation 0.007769% 28.796063% 0.00777% 28.79606%
last quarter (3 months)mean -0.000912% 0.060585% -0.000912% 0.060585%volatility 1.014693% 1.231990% 1.014693% 1.231990%covariance / correlation -0.00014% -1.09822% -0.00014% -1.09822%
last month mean 0.011507% 0.035551% 0.011507% 0.035551%volatility 1.249317% 1.392089% 1.249317% 1.392089%covariance / correlation -0.00240% -14.51126% -0.00240% -14.51126%
Start 15-Jan-02 revalued = current number * current price * EXP(daily return)End 14-Jan-04 change in value = revalued portfolio - current total valueFrequency Daily Daily returnName FTSE 100 BP Amoco Tesco =LN(today/yesterday) revalued portfolio and change in value
15-Jan-04 4,456.10 436.50 242.00 BP Amoco Tesco revalued change£ pence pence % % BP Amoco Tesco portfolio in value
0 15-Jan-02 5,166.00 523.00 237.751 16-Jan-02 5,127.58 521.50 233.00 -0.28722% -2.01812% 43.52 47.43 90.96 -1.09222 17-Jan-02 5,138.45 519.00 238.00 -0.48054% 2.12322% 43.44 49.44 92.88 0.8294
73 30-Apr-02 5,165.58 585.50 263.00 2.85857% 0.85919% 44.92 48.82 93.73 1.683474 1-May-02 5,125.51 578.00 258.25 -1.28923% -1.82259% 43.09 47.53 90.62 -1.433375 2-May-02 5,174.06 577.50 258.75 -0.08654% 0.19342% 43.61 48.49 92.11 0.055976 3-May-02 5,203.05 594.00 262.00 2.81709% 1.24822% 44.90 49.01 93.91 1.855177 7-May-02 5,119.90 576.00 260.50 -3.07717% -0.57416% 42.33 48.12 90.45 -1.599878 8-May-02 5,209.10 583.00 262.00 1.20795% 0.57416% 44.18 48.68 92.86 0.809279 9-May-02 5,197.58 587.00 263.50 0.68376% 0.57089% 43.95 48.68 92.63 0.576680 10-May-02 5,171.24 585.00 263.00 -0.34130% -0.18993% 43.50 48.31 91.81 -0.240681 13-May-02 5,204.84 590.00 262.00 0.85107% -0.38095% 44.02 48.22 92.24 0.189082 14-May-02 5,239.47 606.00 260.75 2.67574% -0.47824% 44.83 48.17 93.00 0.952883 15-May-02 5,259.11 596.00 260.25 -1.66393% -0.19194% 42.93 48.31 91.24 -0.813184 16-May-02 5,248.53 596.00 260.75 0.00000% 0.19194% 43.65 48.49 92.14 0.093085 17-May-02 5,217.98 592.00 261.50 -0.67340% 0.28722% 43.36 48.54 91.90 -0.153786 20-May-02 5,208.10 589.50 259.75 -0.42319% -0.67147% 43.47 48.08 91.54 -0.5082

document.xlsx Historical_simulation / revised: 9 Mar 2006 © Dr J R Hicks page 7 (of 40)
VaR and Historical simulation Daily return revalued portfolio and change in value jrhBP Amoco Tesco BP Amoco Tesco portfolio change
Historical simulation (uses past price movements to simulate what might happen today)
Consider a portfolio consisting of two companies from the FTSE 100 index: NOTE: Volatility is=STDEV(daily returns [for the specified period])INPUT no of shares price in £ total value Variance = volatility^2 Volatility = SQRT(variance)
shareholding in millions 15-Jan-04 millions £ Sector Covariances & correlations can be calculated from the daily returns.BP Amoco 10 4.3650 43.65 Oil & gasTesco 20 2.4200 48.40 Food & drug retailerscurrent total value 92.05 step 4 1 day value at risk =PERCENTILE(changes in value,1-confidence level)
steps step 5 10 day value at risk = 1 day value at risk * SQRT(10)1 Calculate the daily returns for each asset in the portfolio for a number of days in the past (say 500).2 Use these to value the portfolio based on today's holdings; number of shares & today's price per sharVaR (for the whole periodOUTPUT3 Determine the [simulated] change in the value of the portfolio from the current value ofconfidence level 95% 98% 99%4 Find the value for the appropriate percentile of this population of [simulated] changes.1 day VaR -2.46 -3.45 -4.115 This is the 1 day value at risk. Multiply by square root N to get the N day value at ri10 day VaR -7.78 -10.91 -12.99BP Tesco
WORKINGS Whole period mean =AVERAGE(daily returns) -0.036555% 0.007573% -0.036555% 0.007573% Targetvolatility =STDEV(daily returns) 1.931967% 1.971382% 1.931967% 1.971382% values
covariance / correlatio=COVAR(daily returns A, daily retu 0.01700% 44.72752% 0.01700% 44.72752% in blue=CORREL(daily returns A, daily returns B)
last 500 days mean -0.033181% 0.012746% -0.033181% 0.012746%volatility 1.938227% 1.970992% 1.938227% 1.970992%covariance / correlation 0.01706% 44.74782% 0.01706% 44.74782%
last year mean 0.022913% 0.112643% 0.022913% 0.112643%volatility 1.538927% 1.760016% 1.538927% 1.760016%covariance / correlation 0.007769% 28.796063% 0.00777% 28.79606%
last quarter (3 months)mean -0.000912% 0.060585% -0.000912% 0.060585%volatility 1.014693% 1.231990% 1.014693% 1.231990%covariance / correlation -0.00014% -1.09822% -0.00014% -1.09822%
last month mean 0.011507% 0.035551% 0.011507% 0.035551%volatility 1.249317% 1.392089% 1.249317% 1.392089%covariance / correlation -0.00240% -14.51126% -0.00240% -14.51126%
Start 15-Jan-02 revalued = current number * current price * EXP(daily return)End 14-Jan-04 change in value = revalued portfolio - current total valueFrequency Daily Daily returnName FTSE 100 BP Amoco Tesco =LN(today/yesterday) revalued portfolio and change in value
15-Jan-04 4,456.10 436.50 242.00 BP Amoco Tesco revalued change£ pence pence % % BP Amoco Tesco portfolio in value
0 15-Jan-02 5,166.00 523.00 237.751 16-Jan-02 5,127.58 521.50 233.00 -0.28722% -2.01812% 43.52 47.43 90.96 -1.09222 17-Jan-02 5,138.45 519.00 238.00 -0.48054% 2.12322% 43.44 49.44 92.88 0.8294
87 21-May-02 5,197.21 596.00 258.25 1.09659% -0.57915% 44.13 48.12 92.25 0.201888 22-May-02 5,151.89 584.00 255.50 -2.03397% -1.07057% 42.77 47.88 90.66 -1.394389 23-May-02 5,175.31 584.00 258.75 0.00000% 1.26399% 43.65 49.02 92.67 0.615790 24-May-02 5,169.07 591.00 254.00 1.19150% -1.85281% 44.17 47.51 91.68 -0.365391 27-May-02 5,136.26 588.00 249.50 -0.50891% -1.78754% 43.43 47.54 90.97 -1.079192 28-May-02 5,074.22 573.50 246.25 -2.49690% -1.31116% 42.57 47.77 90.34 -1.706993 29-May-02 5,082.98 580.00 250.00 1.12702% 1.51136% 44.14 49.14 93.28 1.231894 30-May-02 5,040.75 576.50 251.00 -0.60528% 0.39920% 43.39 48.59 91.98 -0.069895 31-May-02 5,085.07 585.00 258.00 1.46365% 2.75066% 44.29 49.75 94.04 1.993496 5-Jun-02 4,989.15 565.00 252.50 -3.47861% -2.15483% 42.16 47.37 89.53 -2.524197 6-Jun-02 4,957.63 564.00 257.75 -0.17715% 2.05789% 43.57 49.41 92.98 0.929198 7-Jun-02 4,920.40 558.00 258.50 -1.06953% 0.29056% 43.19 48.54 91.73 -0.323599 10-Jun-02 4,928.21 555.50 255.25 -0.44904% -1.26522% 43.45 47.79 91.25 -0.8041
100 11-Jun-02 4,934.82 560.00 256.50 0.80682% 0.48852% 44.00 48.64 92.64 0.5906

document.xlsx Historical_simulation / revised: 9 Mar 2006 © Dr J R Hicks page 8 (of 40)
VaR and Historical simulation Daily return revalued portfolio and change in value jrhBP Amoco Tesco BP Amoco Tesco portfolio change
Historical simulation (uses past price movements to simulate what might happen today)
Consider a portfolio consisting of two companies from the FTSE 100 index: NOTE: Volatility is=STDEV(daily returns [for the specified period])INPUT no of shares price in £ total value Variance = volatility^2 Volatility = SQRT(variance)
shareholding in millions 15-Jan-04 millions £ Sector Covariances & correlations can be calculated from the daily returns.BP Amoco 10 4.3650 43.65 Oil & gasTesco 20 2.4200 48.40 Food & drug retailerscurrent total value 92.05 step 4 1 day value at risk =PERCENTILE(changes in value,1-confidence level)
steps step 5 10 day value at risk = 1 day value at risk * SQRT(10)1 Calculate the daily returns for each asset in the portfolio for a number of days in the past (say 500).2 Use these to value the portfolio based on today's holdings; number of shares & today's price per sharVaR (for the whole periodOUTPUT3 Determine the [simulated] change in the value of the portfolio from the current value ofconfidence level 95% 98% 99%4 Find the value for the appropriate percentile of this population of [simulated] changes.1 day VaR -2.46 -3.45 -4.115 This is the 1 day value at risk. Multiply by square root N to get the N day value at ri10 day VaR -7.78 -10.91 -12.99BP Tesco
WORKINGS Whole period mean =AVERAGE(daily returns) -0.036555% 0.007573% -0.036555% 0.007573% Targetvolatility =STDEV(daily returns) 1.931967% 1.971382% 1.931967% 1.971382% values
covariance / correlatio=COVAR(daily returns A, daily retu 0.01700% 44.72752% 0.01700% 44.72752% in blue=CORREL(daily returns A, daily returns B)
last 500 days mean -0.033181% 0.012746% -0.033181% 0.012746%volatility 1.938227% 1.970992% 1.938227% 1.970992%covariance / correlation 0.01706% 44.74782% 0.01706% 44.74782%
last year mean 0.022913% 0.112643% 0.022913% 0.112643%volatility 1.538927% 1.760016% 1.538927% 1.760016%covariance / correlation 0.007769% 28.796063% 0.00777% 28.79606%
last quarter (3 months)mean -0.000912% 0.060585% -0.000912% 0.060585%volatility 1.014693% 1.231990% 1.014693% 1.231990%covariance / correlation -0.00014% -1.09822% -0.00014% -1.09822%
last month mean 0.011507% 0.035551% 0.011507% 0.035551%volatility 1.249317% 1.392089% 1.249317% 1.392089%covariance / correlation -0.00240% -14.51126% -0.00240% -14.51126%
Start 15-Jan-02 revalued = current number * current price * EXP(daily return)End 14-Jan-04 change in value = revalued portfolio - current total valueFrequency Daily Daily returnName FTSE 100 BP Amoco Tesco =LN(today/yesterday) revalued portfolio and change in value
15-Jan-04 4,456.10 436.50 242.00 BP Amoco Tesco revalued change£ pence pence % % BP Amoco Tesco portfolio in value
0 15-Jan-02 5,166.00 523.00 237.751 16-Jan-02 5,127.58 521.50 233.00 -0.28722% -2.01812% 43.52 47.43 90.96 -1.09222 17-Jan-02 5,138.45 519.00 238.00 -0.48054% 2.12322% 43.44 49.44 92.88 0.8294
101 12-Jun-02 4,851.67 551.00 252.00 -1.62020% -1.76996% 42.95 47.55 90.50 -1.5506102 13-Jun-02 4,771.91 542.50 254.50 -1.55467% 0.98717% 42.98 48.88 91.86 -0.1932103 14-Jun-02 4,630.77 523.50 239.50 -3.56511% -6.07474% 42.12 45.55 87.67 -4.3814104 17-Jun-02 4,756.75 540.00 248.75 3.10321% 3.78950% 45.03 50.27 95.30 3.2451105 18-Jun-02 4,702.01 541.00 246.50 0.18501% -0.90864% 43.73 47.96 91.69 -0.3570106 19-Jun-02 4,652.43 538.00 245.00 -0.55607% -0.61038% 43.41 48.11 91.51 -0.5366107 20-Jun-02 4,580.34 538.50 241.25 0.09289% -1.54245% 43.69 47.66 91.35 -0.7002108 21-Jun-02 4,605.35 532.00 239.00 -1.21440% -0.93702% 43.12 47.95 91.07 -0.9783109 24-Jun-02 4,541.87 531.00 240.00 -0.18815% 0.41754% 43.57 48.60 92.17 0.1205110 25-Jun-02 4,630.96 545.50 241.25 2.69408% 0.51948% 44.84 48.65 93.49 1.4440111 26-Jun-02 4,531.01 534.50 238.00 -2.03711% -1.35631% 42.77 47.75 90.52 -1.5322112 27-Jun-02 4,540.65 535.00 238.50 0.09350% 0.20986% 43.69 48.50 92.19 0.1425113 28-Jun-02 4,656.36 551.00 238.50 2.94681% 0.00000% 44.96 48.40 93.36 1.3054114 1-Jul-02 4,685.76 559.50 243.50 1.53087% 2.07476% 44.32 49.41 93.74 1.6880

document.xlsx Historical_simulation / revised: 9 Mar 2006 © Dr J R Hicks page 9 (of 40)
VaR and Historical simulation Daily return revalued portfolio and change in value jrhBP Amoco Tesco BP Amoco Tesco portfolio change
Historical simulation (uses past price movements to simulate what might happen today)
Consider a portfolio consisting of two companies from the FTSE 100 index: NOTE: Volatility is=STDEV(daily returns [for the specified period])INPUT no of shares price in £ total value Variance = volatility^2 Volatility = SQRT(variance)
shareholding in millions 15-Jan-04 millions £ Sector Covariances & correlations can be calculated from the daily returns.BP Amoco 10 4.3650 43.65 Oil & gasTesco 20 2.4200 48.40 Food & drug retailerscurrent total value 92.05 step 4 1 day value at risk =PERCENTILE(changes in value,1-confidence level)
steps step 5 10 day value at risk = 1 day value at risk * SQRT(10)1 Calculate the daily returns for each asset in the portfolio for a number of days in the past (say 500).2 Use these to value the portfolio based on today's holdings; number of shares & today's price per sharVaR (for the whole periodOUTPUT3 Determine the [simulated] change in the value of the portfolio from the current value ofconfidence level 95% 98% 99%4 Find the value for the appropriate percentile of this population of [simulated] changes.1 day VaR -2.46 -3.45 -4.115 This is the 1 day value at risk. Multiply by square root N to get the N day value at ri10 day VaR -7.78 -10.91 -12.99BP Tesco
WORKINGS Whole period mean =AVERAGE(daily returns) -0.036555% 0.007573% -0.036555% 0.007573% Targetvolatility =STDEV(daily returns) 1.931967% 1.971382% 1.931967% 1.971382% values
covariance / correlatio=COVAR(daily returns A, daily retu 0.01700% 44.72752% 0.01700% 44.72752% in blue=CORREL(daily returns A, daily returns B)
last 500 days mean -0.033181% 0.012746% -0.033181% 0.012746%volatility 1.938227% 1.970992% 1.938227% 1.970992%covariance / correlation 0.01706% 44.74782% 0.01706% 44.74782%
last year mean 0.022913% 0.112643% 0.022913% 0.112643%volatility 1.538927% 1.760016% 1.538927% 1.760016%covariance / correlation 0.007769% 28.796063% 0.00777% 28.79606%
last quarter (3 months)mean -0.000912% 0.060585% -0.000912% 0.060585%volatility 1.014693% 1.231990% 1.014693% 1.231990%covariance / correlation -0.00014% -1.09822% -0.00014% -1.09822%
last month mean 0.011507% 0.035551% 0.011507% 0.035551%volatility 1.249317% 1.392089% 1.249317% 1.392089%covariance / correlation -0.00240% -14.51126% -0.00240% -14.51126%
Start 15-Jan-02 revalued = current number * current price * EXP(daily return)End 14-Jan-04 change in value = revalued portfolio - current total valueFrequency Daily Daily returnName FTSE 100 BP Amoco Tesco =LN(today/yesterday) revalued portfolio and change in value
15-Jan-04 4,456.10 436.50 242.00 BP Amoco Tesco revalued change£ pence pence % % BP Amoco Tesco portfolio in value
0 15-Jan-02 5,166.00 523.00 237.751 16-Jan-02 5,127.58 521.50 233.00 -0.28722% -2.01812% 43.52 47.43 90.96 -1.09222 17-Jan-02 5,138.45 519.00 238.00 -0.48054% 2.12322% 43.44 49.44 92.88 0.8294
115 2-Jul-02 4,546.77 543.50 240.00 -2.90138% -1.44780% 42.40 47.70 90.11 -1.9439116 3-Jul-02 4,392.55 532.50 234.25 -2.04468% -2.42500% 42.77 47.24 90.01 -2.0430117 4-Jul-02 4,471.19 537.00 240.00 0.84152% 2.42500% 44.02 49.59 93.61 1.5569118 5-Jul-02 4,615.65 555.00 246.50 3.29700% 2.67231% 45.11 49.71 94.82 2.7740119 8-Jul-02 4,601.29 554.00 250.00 -0.18034% 1.40989% 43.57 49.09 92.66 0.6086120 9-Jul-02 4,542.94 546.00 240.25 -1.45457% -3.97809% 43.02 46.51 89.53 -2.5179121 10-Jul-02 4,420.13 537.00 232.00 -1.66209% -3.49427% 42.93 46.74 89.67 -2.3815122 11-Jul-02 4,230.05 513.00 223.00 -4.57222% -3.95656% 41.70 46.52 88.22 -3.8284123 12-Jul-02 4,224.11 500.00 225.25 -2.56677% 1.00391% 42.54 48.89 91.43 -0.6178124 15-Jul-02 3,994.50 462.50 213.50 -7.79615% -5.35741% 40.38 45.88 86.25 -5.7985125 16-Jul-02 4,021.93 470.00 210.25 1.60861% -1.53395% 44.36 47.66 92.02 -0.0289126 17-Jul-02 4,190.63 489.00 215.00 3.96298% 2.23407% 45.41 49.49 94.91 2.8580127 18-Jul-02 4,297.30 495.00 220.00 1.21953% 2.29895% 44.19 49.53 93.71 1.6612128 19-Jul-02 4,098.32 464.50 216.50 -6.35962% -1.60370% 40.96 47.63 88.59 -3.4595

document.xlsx Historical_simulation / revised: 9 Mar 2006 © Dr J R Hicks page 10 (of 40)
VaR and Historical simulation Daily return revalued portfolio and change in value jrhBP Amoco Tesco BP Amoco Tesco portfolio change
Historical simulation (uses past price movements to simulate what might happen today)
Consider a portfolio consisting of two companies from the FTSE 100 index: NOTE: Volatility is=STDEV(daily returns [for the specified period])INPUT no of shares price in £ total value Variance = volatility^2 Volatility = SQRT(variance)
shareholding in millions 15-Jan-04 millions £ Sector Covariances & correlations can be calculated from the daily returns.BP Amoco 10 4.3650 43.65 Oil & gasTesco 20 2.4200 48.40 Food & drug retailerscurrent total value 92.05 step 4 1 day value at risk =PERCENTILE(changes in value,1-confidence level)
steps step 5 10 day value at risk = 1 day value at risk * SQRT(10)1 Calculate the daily returns for each asset in the portfolio for a number of days in the past (say 500).2 Use these to value the portfolio based on today's holdings; number of shares & today's price per sharVaR (for the whole periodOUTPUT3 Determine the [simulated] change in the value of the portfolio from the current value ofconfidence level 95% 98% 99%4 Find the value for the appropriate percentile of this population of [simulated] changes.1 day VaR -2.46 -3.45 -4.115 This is the 1 day value at risk. Multiply by square root N to get the N day value at ri10 day VaR -7.78 -10.91 -12.99BP Tesco
WORKINGS Whole period mean =AVERAGE(daily returns) -0.036555% 0.007573% -0.036555% 0.007573% Targetvolatility =STDEV(daily returns) 1.931967% 1.971382% 1.931967% 1.971382% values
covariance / correlatio=COVAR(daily returns A, daily retu 0.01700% 44.72752% 0.01700% 44.72752% in blue=CORREL(daily returns A, daily returns B)
last 500 days mean -0.033181% 0.012746% -0.033181% 0.012746%volatility 1.938227% 1.970992% 1.938227% 1.970992%covariance / correlation 0.01706% 44.74782% 0.01706% 44.74782%
last year mean 0.022913% 0.112643% 0.022913% 0.112643%volatility 1.538927% 1.760016% 1.538927% 1.760016%covariance / correlation 0.007769% 28.796063% 0.00777% 28.79606%
last quarter (3 months)mean -0.000912% 0.060585% -0.000912% 0.060585%volatility 1.014693% 1.231990% 1.014693% 1.231990%covariance / correlation -0.00014% -1.09822% -0.00014% -1.09822%
last month mean 0.011507% 0.035551% 0.011507% 0.035551%volatility 1.249317% 1.392089% 1.249317% 1.392089%covariance / correlation -0.00240% -14.51126% -0.00240% -14.51126%
Start 15-Jan-02 revalued = current number * current price * EXP(daily return)End 14-Jan-04 change in value = revalued portfolio - current total valueFrequency Daily Daily returnName FTSE 100 BP Amoco Tesco =LN(today/yesterday) revalued portfolio and change in value
15-Jan-04 4,456.10 436.50 242.00 BP Amoco Tesco revalued change£ pence pence % % BP Amoco Tesco portfolio in value
0 15-Jan-02 5,166.00 523.00 237.751 16-Jan-02 5,127.58 521.50 233.00 -0.28722% -2.01812% 43.52 47.43 90.96 -1.09222 17-Jan-02 5,138.45 519.00 238.00 -0.48054% 2.12322% 43.44 49.44 92.88 0.8294
129 22-Jul-02 3,895.50 428.00 199.00 -8.18384% -8.42857% 40.22 44.49 84.71 -7.3422130 23-Jul-02 3,857.99 428.50 197.50 0.11675% -0.75662% 43.70 48.04 91.74 -0.3138131 24-Jul-02 3,777.13 425.00 189.25 -0.82016% -4.26697% 43.29 46.38 89.67 -2.3783132 25-Jul-02 3,965.89 449.50 210.00 5.60467% 10.40386% 46.17 53.71 99.87 7.8230133 26-Jul-02 4,016.65 454.00 205.25 0.99613% -2.28788% 44.09 47.31 91.39 -0.6578134 29-Jul-02 4,202.70 479.50 215.50 5.46467% 4.87322% 46.10 50.82 96.92 4.8688135 30-Jul-02 4,180.92 482.00 217.75 0.52002% 1.03867% 43.88 48.91 92.78 0.7329136 31-Jul-02 4,246.21 497.00 218.75 3.06459% 0.45819% 45.01 48.62 93.63 1.5807137 1-Aug-02 4,044.52 473.00 208.75 -4.94946% -4.67922% 41.54 46.19 87.73 -4.3204138 2-Aug-02 4,075.55 475.00 216.00 0.42194% 3.41410% 43.83 50.08 93.92 1.8655139 5-Aug-02 3,996.41 473.50 207.00 -0.31629% -4.25596% 43.51 46.38 89.90 -2.1545140 6-Aug-02 4,131.03 494.00 211.75 4.23836% 2.26875% 45.54 49.51 95.05 3.0004141 7-Aug-02 4,094.43 494.00 211.00 0.00000% -0.35482% 43.65 48.23 91.88 -0.1714142 8-Aug-02 4,240.47 512.00 215.75 3.57891% 2.22622% 45.24 49.49 94.73 2.6801

document.xlsx Historical_simulation / revised: 9 Mar 2006 © Dr J R Hicks page 11 (of 40)
VaR and Historical simulation Daily return revalued portfolio and change in value jrhBP Amoco Tesco BP Amoco Tesco portfolio change
Historical simulation (uses past price movements to simulate what might happen today)
Consider a portfolio consisting of two companies from the FTSE 100 index: NOTE: Volatility is=STDEV(daily returns [for the specified period])INPUT no of shares price in £ total value Variance = volatility^2 Volatility = SQRT(variance)
shareholding in millions 15-Jan-04 millions £ Sector Covariances & correlations can be calculated from the daily returns.BP Amoco 10 4.3650 43.65 Oil & gasTesco 20 2.4200 48.40 Food & drug retailerscurrent total value 92.05 step 4 1 day value at risk =PERCENTILE(changes in value,1-confidence level)
steps step 5 10 day value at risk = 1 day value at risk * SQRT(10)1 Calculate the daily returns for each asset in the portfolio for a number of days in the past (say 500).2 Use these to value the portfolio based on today's holdings; number of shares & today's price per sharVaR (for the whole periodOUTPUT3 Determine the [simulated] change in the value of the portfolio from the current value ofconfidence level 95% 98% 99%4 Find the value for the appropriate percentile of this population of [simulated] changes.1 day VaR -2.46 -3.45 -4.115 This is the 1 day value at risk. Multiply by square root N to get the N day value at ri10 day VaR -7.78 -10.91 -12.99BP Tesco
WORKINGS Whole period mean =AVERAGE(daily returns) -0.036555% 0.007573% -0.036555% 0.007573% Targetvolatility =STDEV(daily returns) 1.931967% 1.971382% 1.931967% 1.971382% values
covariance / correlatio=COVAR(daily returns A, daily retu 0.01700% 44.72752% 0.01700% 44.72752% in blue=CORREL(daily returns A, daily returns B)
last 500 days mean -0.033181% 0.012746% -0.033181% 0.012746%volatility 1.938227% 1.970992% 1.938227% 1.970992%covariance / correlation 0.01706% 44.74782% 0.01706% 44.74782%
last year mean 0.022913% 0.112643% 0.022913% 0.112643%volatility 1.538927% 1.760016% 1.538927% 1.760016%covariance / correlation 0.007769% 28.796063% 0.00777% 28.79606%
last quarter (3 months)mean -0.000912% 0.060585% -0.000912% 0.060585%volatility 1.014693% 1.231990% 1.014693% 1.231990%covariance / correlation -0.00014% -1.09822% -0.00014% -1.09822%
last month mean 0.011507% 0.035551% 0.011507% 0.035551%volatility 1.249317% 1.392089% 1.249317% 1.392089%covariance / correlation -0.00240% -14.51126% -0.00240% -14.51126%
Start 15-Jan-02 revalued = current number * current price * EXP(daily return)End 14-Jan-04 change in value = revalued portfolio - current total valueFrequency Daily Daily returnName FTSE 100 BP Amoco Tesco =LN(today/yesterday) revalued portfolio and change in value
15-Jan-04 4,456.10 436.50 242.00 BP Amoco Tesco revalued change£ pence pence % % BP Amoco Tesco portfolio in value
0 15-Jan-02 5,166.00 523.00 237.751 16-Jan-02 5,127.58 521.50 233.00 -0.28722% -2.01812% 43.52 47.43 90.96 -1.09222 17-Jan-02 5,138.45 519.00 238.00 -0.48054% 2.12322% 43.44 49.44 92.88 0.8294
143 9-Aug-02 4,322.36 524.50 224.00 2.41208% 3.75257% 44.72 50.25 94.97 2.9164144 12-Aug-02 4,221.56 503.00 220.00 -4.18553% -1.80185% 41.86 47.54 89.40 -2.6536145 13-Aug-02 4,271.66 515.50 223.25 2.45471% 1.46647% 44.73 49.12 93.85 1.7997146 14-Aug-02 4,171.06 501.00 219.75 -2.85312% -1.58017% 42.42 47.64 90.06 -1.9866147 15-Aug-02 4,327.45 524.00 225.00 4.48856% 2.36099% 45.65 49.56 95.21 3.1602148 16-Aug-02 4,329.97 519.00 225.00 -0.95878% 0.00000% 43.23 48.40 91.63 -0.4165149 19-Aug-02 4,426.85 530.00 229.00 2.09731% 1.76216% 44.58 49.26 93.84 1.7856150 20-Aug-02 4,368.89 526.00 223.00 -0.75758% -2.65502% 43.32 47.13 90.45 -1.5976151 21-Aug-02 4,364.80 521.50 222.50 -0.85919% -0.22447% 43.28 48.29 91.57 -0.4820152 22-Aug-02 4,434.72 537.00 222.00 2.92888% -0.22497% 44.95 48.29 93.24 1.1886153 23-Aug-02 4,389.82 528.00 219.25 -1.69018% -1.24648% 42.92 47.80 90.72 -1.3311154 27-Aug-02 4,449.72 543.00 217.00 2.80130% -1.03153% 44.89 47.90 92.79 0.7434155 28-Aug-02 4,274.02 512.00 209.75 -5.87847% -3.39810% 41.16 46.78 87.94 -4.1090156 29-Aug-02 4,209.31 498.00 208.25 -2.77245% -0.71771% 42.46 48.05 90.51 -1.5397

document.xlsx Historical_simulation / revised: 9 Mar 2006 © Dr J R Hicks page 12 (of 40)
VaR and Historical simulation Daily return revalued portfolio and change in value jrhBP Amoco Tesco BP Amoco Tesco portfolio change
Historical simulation (uses past price movements to simulate what might happen today)
Consider a portfolio consisting of two companies from the FTSE 100 index: NOTE: Volatility is=STDEV(daily returns [for the specified period])INPUT no of shares price in £ total value Variance = volatility^2 Volatility = SQRT(variance)
shareholding in millions 15-Jan-04 millions £ Sector Covariances & correlations can be calculated from the daily returns.BP Amoco 10 4.3650 43.65 Oil & gasTesco 20 2.4200 48.40 Food & drug retailerscurrent total value 92.05 step 4 1 day value at risk =PERCENTILE(changes in value,1-confidence level)
steps step 5 10 day value at risk = 1 day value at risk * SQRT(10)1 Calculate the daily returns for each asset in the portfolio for a number of days in the past (say 500).2 Use these to value the portfolio based on today's holdings; number of shares & today's price per sharVaR (for the whole periodOUTPUT3 Determine the [simulated] change in the value of the portfolio from the current value ofconfidence level 95% 98% 99%4 Find the value for the appropriate percentile of this population of [simulated] changes.1 day VaR -2.46 -3.45 -4.115 This is the 1 day value at risk. Multiply by square root N to get the N day value at ri10 day VaR -7.78 -10.91 -12.99BP Tesco
WORKINGS Whole period mean =AVERAGE(daily returns) -0.036555% 0.007573% -0.036555% 0.007573% Targetvolatility =STDEV(daily returns) 1.931967% 1.971382% 1.931967% 1.971382% values
covariance / correlatio=COVAR(daily returns A, daily retu 0.01700% 44.72752% 0.01700% 44.72752% in blue=CORREL(daily returns A, daily returns B)
last 500 days mean -0.033181% 0.012746% -0.033181% 0.012746%volatility 1.938227% 1.970992% 1.938227% 1.970992%covariance / correlation 0.01706% 44.74782% 0.01706% 44.74782%
last year mean 0.022913% 0.112643% 0.022913% 0.112643%volatility 1.538927% 1.760016% 1.538927% 1.760016%covariance / correlation 0.007769% 28.796063% 0.00777% 28.79606%
last quarter (3 months)mean -0.000912% 0.060585% -0.000912% 0.060585%volatility 1.014693% 1.231990% 1.014693% 1.231990%covariance / correlation -0.00014% -1.09822% -0.00014% -1.09822%
last month mean 0.011507% 0.035551% 0.011507% 0.035551%volatility 1.249317% 1.392089% 1.249317% 1.392089%covariance / correlation -0.00240% -14.51126% -0.00240% -14.51126%
Start 15-Jan-02 revalued = current number * current price * EXP(daily return)End 14-Jan-04 change in value = revalued portfolio - current total valueFrequency Daily Daily returnName FTSE 100 BP Amoco Tesco =LN(today/yesterday) revalued portfolio and change in value
15-Jan-04 4,456.10 436.50 242.00 BP Amoco Tesco revalued change£ pence pence % % BP Amoco Tesco portfolio in value
0 15-Jan-02 5,166.00 523.00 237.751 16-Jan-02 5,127.58 521.50 233.00 -0.28722% -2.01812% 43.52 47.43 90.96 -1.09222 17-Jan-02 5,138.45 519.00 238.00 -0.48054% 2.12322% 43.44 49.44 92.88 0.8294
157 30-Aug-02 4,227.28 500.50 211.50 0.50075% 1.54857% 43.87 49.16 93.02 0.9745158 2-Sep-02 4,180.88 499.00 211.00 -0.30015% -0.23669% 43.52 48.29 91.80 -0.2452159 3-Sep-02 4,028.65 468.00 201.50 -6.41378% -4.60688% 40.94 46.22 87.16 -4.8909160 4-Sep-02 4,026.95 451.50 204.75 -3.58929% 1.60003% 42.11 49.18 91.29 -0.7583161 5-Sep-02 4,011.01 456.00 208.75 0.99174% 1.93476% 44.09 49.35 93.43 1.3806162 6-Sep-02 4,107.22 473.00 213.25 3.66026% 2.13278% 45.28 49.44 94.72 2.6707163 9-Sep-02 4,062.44 467.00 209.50 -1.27661% -1.77414% 43.10 47.55 90.65 -1.4048164 10-Sep-02 4,175.52 478.00 217.00 2.32815% 3.51736% 44.68 50.13 94.81 2.7609165 11-Sep-02 4,210.66 482.50 220.50 0.93702% 1.60003% 44.06 49.18 93.24 1.1916166 12-Sep-02 4,084.90 466.00 213.50 -3.47953% -3.22609% 42.16 46.86 89.02 -3.0292167 13-Sep-02 4,008.02 456.00 212.00 -2.16928% -0.70506% 42.71 48.06 90.77 -1.2767168 16-Sep-02 4,044.25 467.00 216.00 2.38364% 1.86921% 44.70 49.31 94.02 1.9662169 17-Sep-02 4,025.15 459.00 204.50 -1.72790% -5.47104% 42.90 45.82 88.73 -3.3246170 18-Sep-02 3,865.41 435.50 203.50 -5.25554% -0.49020% 41.42 48.16 89.58 -2.4715

document.xlsx Historical_simulation / revised: 9 Mar 2006 © Dr J R Hicks page 13 (of 40)
VaR and Historical simulation Daily return revalued portfolio and change in value jrhBP Amoco Tesco BP Amoco Tesco portfolio change
Historical simulation (uses past price movements to simulate what might happen today)
Consider a portfolio consisting of two companies from the FTSE 100 index: NOTE: Volatility is=STDEV(daily returns [for the specified period])INPUT no of shares price in £ total value Variance = volatility^2 Volatility = SQRT(variance)
shareholding in millions 15-Jan-04 millions £ Sector Covariances & correlations can be calculated from the daily returns.BP Amoco 10 4.3650 43.65 Oil & gasTesco 20 2.4200 48.40 Food & drug retailerscurrent total value 92.05 step 4 1 day value at risk =PERCENTILE(changes in value,1-confidence level)
steps step 5 10 day value at risk = 1 day value at risk * SQRT(10)1 Calculate the daily returns for each asset in the portfolio for a number of days in the past (say 500).2 Use these to value the portfolio based on today's holdings; number of shares & today's price per sharVaR (for the whole periodOUTPUT3 Determine the [simulated] change in the value of the portfolio from the current value ofconfidence level 95% 98% 99%4 Find the value for the appropriate percentile of this population of [simulated] changes.1 day VaR -2.46 -3.45 -4.115 This is the 1 day value at risk. Multiply by square root N to get the N day value at ri10 day VaR -7.78 -10.91 -12.99BP Tesco
WORKINGS Whole period mean =AVERAGE(daily returns) -0.036555% 0.007573% -0.036555% 0.007573% Targetvolatility =STDEV(daily returns) 1.931967% 1.971382% 1.931967% 1.971382% values
covariance / correlatio=COVAR(daily returns A, daily retu 0.01700% 44.72752% 0.01700% 44.72752% in blue=CORREL(daily returns A, daily returns B)
last 500 days mean -0.033181% 0.012746% -0.033181% 0.012746%volatility 1.938227% 1.970992% 1.938227% 1.970992%covariance / correlation 0.01706% 44.74782% 0.01706% 44.74782%
last year mean 0.022913% 0.112643% 0.022913% 0.112643%volatility 1.538927% 1.760016% 1.538927% 1.760016%covariance / correlation 0.007769% 28.796063% 0.00777% 28.79606%
last quarter (3 months)mean -0.000912% 0.060585% -0.000912% 0.060585%volatility 1.014693% 1.231990% 1.014693% 1.231990%covariance / correlation -0.00014% -1.09822% -0.00014% -1.09822%
last month mean 0.011507% 0.035551% 0.011507% 0.035551%volatility 1.249317% 1.392089% 1.249317% 1.392089%covariance / correlation -0.00240% -14.51126% -0.00240% -14.51126%
Start 15-Jan-02 revalued = current number * current price * EXP(daily return)End 14-Jan-04 change in value = revalued portfolio - current total valueFrequency Daily Daily returnName FTSE 100 BP Amoco Tesco =LN(today/yesterday) revalued portfolio and change in value
15-Jan-04 4,456.10 436.50 242.00 BP Amoco Tesco revalued change£ pence pence % % BP Amoco Tesco portfolio in value
0 15-Jan-02 5,166.00 523.00 237.751 16-Jan-02 5,127.58 521.50 233.00 -0.28722% -2.01812% 43.52 47.43 90.96 -1.09222 17-Jan-02 5,138.45 519.00 238.00 -0.48054% 2.12322% 43.44 49.44 92.88 0.8294
171 19-Sep-02 3,813.53 433.00 206.25 -0.57571% 1.34230% 43.40 49.05 92.45 0.4035172 20-Sep-02 3,860.10 437.00 216.25 0.91955% 4.73461% 44.05 50.75 94.80 2.7499173 23-Sep-02 3,739.37 432.50 204.00 -1.03509% -5.83152% 43.20 45.66 88.86 -3.1912174 24-Sep-02 3,671.13 424.50 195.50 -1.86703% -4.25596% 42.84 46.38 89.23 -2.8241175 25-Sep-02 3,696.25 418.00 199.00 -1.54306% 1.77444% 42.98 49.27 92.25 0.1981176 26-Sep-02 3,850.61 441.50 204.00 5.46966% 2.48152% 46.10 49.62 95.72 3.6701177 27-Sep-02 3,907.20 452.50 207.50 2.46097% 1.70113% 44.74 49.23 93.97 1.9179178 30-Sep-02 3,721.75 425.00 205.75 -6.26986% -0.84695% 41.00 47.99 88.99 -3.0610179 1-Oct-02 3,797.40 435.50 199.75 2.44056% -2.95953% 44.73 46.99 91.72 -0.3330180 2-Oct-02 3,905.25 442.50 205.50 1.59457% 2.83794% 44.35 49.79 94.14 2.0948181 3-Oct-02 3,880.34 431.50 202.00 -2.51730% -1.71783% 42.56 47.58 90.14 -1.9094182 4-Oct-02 3,813.77 425.50 203.50 -1.40026% 0.73983% 43.04 48.76 91.80 -0.2475183 7-Oct-02 3,780.93 424.00 198.00 -0.35315% -2.73990% 43.50 47.09 90.59 -1.4620184 8-Oct-02 3,730.47 412.00 193.50 -2.87101% -2.29895% 42.41 47.30 89.71 -2.3354

document.xlsx Historical_simulation / revised: 9 Mar 2006 © Dr J R Hicks page 14 (of 40)
VaR and Historical simulation Daily return revalued portfolio and change in value jrhBP Amoco Tesco BP Amoco Tesco portfolio change
Historical simulation (uses past price movements to simulate what might happen today)
Consider a portfolio consisting of two companies from the FTSE 100 index: NOTE: Volatility is=STDEV(daily returns [for the specified period])INPUT no of shares price in £ total value Variance = volatility^2 Volatility = SQRT(variance)
shareholding in millions 15-Jan-04 millions £ Sector Covariances & correlations can be calculated from the daily returns.BP Amoco 10 4.3650 43.65 Oil & gasTesco 20 2.4200 48.40 Food & drug retailerscurrent total value 92.05 step 4 1 day value at risk =PERCENTILE(changes in value,1-confidence level)
steps step 5 10 day value at risk = 1 day value at risk * SQRT(10)1 Calculate the daily returns for each asset in the portfolio for a number of days in the past (say 500).2 Use these to value the portfolio based on today's holdings; number of shares & today's price per sharVaR (for the whole periodOUTPUT3 Determine the [simulated] change in the value of the portfolio from the current value ofconfidence level 95% 98% 99%4 Find the value for the appropriate percentile of this population of [simulated] changes.1 day VaR -2.46 -3.45 -4.115 This is the 1 day value at risk. Multiply by square root N to get the N day value at ri10 day VaR -7.78 -10.91 -12.99BP Tesco
WORKINGS Whole period mean =AVERAGE(daily returns) -0.036555% 0.007573% -0.036555% 0.007573% Targetvolatility =STDEV(daily returns) 1.931967% 1.971382% 1.931967% 1.971382% values
covariance / correlatio=COVAR(daily returns A, daily retu 0.01700% 44.72752% 0.01700% 44.72752% in blue=CORREL(daily returns A, daily returns B)
last 500 days mean -0.033181% 0.012746% -0.033181% 0.012746%volatility 1.938227% 1.970992% 1.938227% 1.970992%covariance / correlation 0.01706% 44.74782% 0.01706% 44.74782%
last year mean 0.022913% 0.112643% 0.022913% 0.112643%volatility 1.538927% 1.760016% 1.538927% 1.760016%covariance / correlation 0.007769% 28.796063% 0.00777% 28.79606%
last quarter (3 months)mean -0.000912% 0.060585% -0.000912% 0.060585%volatility 1.014693% 1.231990% 1.014693% 1.231990%covariance / correlation -0.00014% -1.09822% -0.00014% -1.09822%
last month mean 0.011507% 0.035551% 0.011507% 0.035551%volatility 1.249317% 1.392089% 1.249317% 1.392089%covariance / correlation -0.00240% -14.51126% -0.00240% -14.51126%
Start 15-Jan-02 revalued = current number * current price * EXP(daily return)End 14-Jan-04 change in value = revalued portfolio - current total valueFrequency Daily Daily returnName FTSE 100 BP Amoco Tesco =LN(today/yesterday) revalued portfolio and change in value
15-Jan-04 4,456.10 436.50 242.00 BP Amoco Tesco revalued change£ pence pence % % BP Amoco Tesco portfolio in value
0 15-Jan-02 5,166.00 523.00 237.751 16-Jan-02 5,127.58 521.50 233.00 -0.28722% -2.01812% 43.52 47.43 90.96 -1.09222 17-Jan-02 5,138.45 519.00 238.00 -0.48054% 2.12322% 43.44 49.44 92.88 0.8294
185 9-Oct-02 3,742.40 407.00 193.00 -1.22102% -0.25873% 43.12 48.27 91.40 -0.6548186 10-Oct-02 3,777.28 412.00 194.25 1.22102% 0.64558% 44.19 48.71 92.90 0.8497187 11-Oct-02 3,953.38 427.50 207.00 3.69309% 6.35728% 45.29 51.58 96.87 4.8190188 14-Oct-02 3,931.64 423.00 199.00 -1.05821% -3.94140% 43.19 46.53 89.72 -2.3300189 15-Oct-02 4,130.33 448.00 206.00 5.74211% 3.45713% 46.23 50.10 96.33 4.2823190 16-Oct-02 4,057.71 445.00 204.25 -0.67190% -0.85314% 43.36 47.99 91.35 -0.7035191 17-Oct-02 4,170.68 456.00 205.50 2.44185% 0.61013% 44.73 48.70 93.43 1.3752192 18-Oct-02 4,130.54 458.50 199.75 0.54675% -2.83794% 43.89 47.05 90.94 -1.1149193 21-Oct-02 4,133.77 452.00 200.00 -1.42781% 0.12508% 43.03 48.46 91.49 -0.5582194 22-Oct-02 4,118.88 427.50 202.25 -5.57279% 1.11872% 41.28 48.94 90.23 -1.8215195 23-Oct-02 4,006.91 420.00 200.00 -1.76996% -1.11872% 42.88 47.86 90.75 -1.3042196 24-Oct-02 4,103.69 434.00 207.00 3.27898% 3.44014% 45.11 50.09 95.20 3.1490197 25-Oct-02 4,051.09 426.50 204.50 -1.74322% -1.21508% 42.90 47.82 90.71 -1.3389198 28-Oct-02 4,090.46 423.00 205.25 -0.82402% 0.36608% 43.29 48.58 91.87 -0.1807

document.xlsx Historical_simulation / revised: 9 Mar 2006 © Dr J R Hicks page 15 (of 40)
VaR and Historical simulation Daily return revalued portfolio and change in value jrhBP Amoco Tesco BP Amoco Tesco portfolio change
Historical simulation (uses past price movements to simulate what might happen today)
Consider a portfolio consisting of two companies from the FTSE 100 index: NOTE: Volatility is=STDEV(daily returns [for the specified period])INPUT no of shares price in £ total value Variance = volatility^2 Volatility = SQRT(variance)
shareholding in millions 15-Jan-04 millions £ Sector Covariances & correlations can be calculated from the daily returns.BP Amoco 10 4.3650 43.65 Oil & gasTesco 20 2.4200 48.40 Food & drug retailerscurrent total value 92.05 step 4 1 day value at risk =PERCENTILE(changes in value,1-confidence level)
steps step 5 10 day value at risk = 1 day value at risk * SQRT(10)1 Calculate the daily returns for each asset in the portfolio for a number of days in the past (say 500).2 Use these to value the portfolio based on today's holdings; number of shares & today's price per sharVaR (for the whole periodOUTPUT3 Determine the [simulated] change in the value of the portfolio from the current value ofconfidence level 95% 98% 99%4 Find the value for the appropriate percentile of this population of [simulated] changes.1 day VaR -2.46 -3.45 -4.115 This is the 1 day value at risk. Multiply by square root N to get the N day value at ri10 day VaR -7.78 -10.91 -12.99BP Tesco
WORKINGS Whole period mean =AVERAGE(daily returns) -0.036555% 0.007573% -0.036555% 0.007573% Targetvolatility =STDEV(daily returns) 1.931967% 1.971382% 1.931967% 1.971382% values
covariance / correlatio=COVAR(daily returns A, daily retu 0.01700% 44.72752% 0.01700% 44.72752% in blue=CORREL(daily returns A, daily returns B)
last 500 days mean -0.033181% 0.012746% -0.033181% 0.012746%volatility 1.938227% 1.970992% 1.938227% 1.970992%covariance / correlation 0.01706% 44.74782% 0.01706% 44.74782%
last year mean 0.022913% 0.112643% 0.022913% 0.112643%volatility 1.538927% 1.760016% 1.538927% 1.760016%covariance / correlation 0.007769% 28.796063% 0.00777% 28.79606%
last quarter (3 months)mean -0.000912% 0.060585% -0.000912% 0.060585%volatility 1.014693% 1.231990% 1.014693% 1.231990%covariance / correlation -0.00014% -1.09822% -0.00014% -1.09822%
last month mean 0.011507% 0.035551% 0.011507% 0.035551%volatility 1.249317% 1.392089% 1.249317% 1.392089%covariance / correlation -0.00240% -14.51126% -0.00240% -14.51126%
Start 15-Jan-02 revalued = current number * current price * EXP(daily return)End 14-Jan-04 change in value = revalued portfolio - current total valueFrequency Daily Daily returnName FTSE 100 BP Amoco Tesco =LN(today/yesterday) revalued portfolio and change in value
15-Jan-04 4,456.10 436.50 242.00 BP Amoco Tesco revalued change£ pence pence % % BP Amoco Tesco portfolio in value
0 15-Jan-02 5,166.00 523.00 237.751 16-Jan-02 5,127.58 521.50 233.00 -0.28722% -2.01812% 43.52 47.43 90.96 -1.09222 17-Jan-02 5,138.45 519.00 238.00 -0.48054% 2.12322% 43.44 49.44 92.88 0.8294
199 29-Oct-02 3,935.93 392.50 203.00 -7.48356% -1.10228% 40.50 47.87 88.37 -3.6779200 30-Oct-02 4,002.65 404.00 197.25 2.88783% -2.87340% 44.93 47.03 91.96 -0.0920201 31-Oct-02 4,039.66 410.00 198.25 1.47423% 0.50569% 44.30 48.65 92.94 0.8936202 1-Nov-02 3,996.98 418.00 197.00 1.93243% -0.63251% 44.50 48.09 92.60 0.5465203 4-Nov-02 4,141.46 411.50 203.50 -1.56724% 3.24623% 42.97 50.00 92.97 0.9182204 5-Nov-02 4,146.13 406.50 204.50 -1.22251% 0.49020% 43.12 48.64 91.76 -0.2925205 6-Nov-02 4,103.72 399.50 208.50 -1.73702% 1.93711% 42.90 49.35 92.25 0.1950206 7-Nov-02 4,081.26 396.50 204.75 -0.75377% -1.81493% 43.32 47.53 90.85 -1.1983207 8-Nov-02 4,034.58 403.00 201.00 1.62605% -1.84848% 44.37 47.51 91.88 -0.1709208 11-Nov-02 4,015.58 405.50 203.50 0.61843% 1.23611% 43.92 49.00 92.92 0.8728209 12-Nov-02 4,085.05 408.50 204.00 0.73710% 0.24540% 43.97 48.52 92.49 0.4419210 13-Nov-02 4,029.38 403.00 198.25 -1.35554% -2.85911% 43.06 47.04 90.10 -1.9519211 14-Nov-02 4,053.14 402.50 199.00 -0.12415% 0.37760% 43.60 48.58 92.18 0.1289212 15-Nov-02 4,091.62 410.00 200.50 1.84621% 0.75094% 44.46 48.76 93.23 1.1782

document.xlsx Historical_simulation / revised: 9 Mar 2006 © Dr J R Hicks page 16 (of 40)
VaR and Historical simulation Daily return revalued portfolio and change in value jrhBP Amoco Tesco BP Amoco Tesco portfolio change
Historical simulation (uses past price movements to simulate what might happen today)
Consider a portfolio consisting of two companies from the FTSE 100 index: NOTE: Volatility is=STDEV(daily returns [for the specified period])INPUT no of shares price in £ total value Variance = volatility^2 Volatility = SQRT(variance)
shareholding in millions 15-Jan-04 millions £ Sector Covariances & correlations can be calculated from the daily returns.BP Amoco 10 4.3650 43.65 Oil & gasTesco 20 2.4200 48.40 Food & drug retailerscurrent total value 92.05 step 4 1 day value at risk =PERCENTILE(changes in value,1-confidence level)
steps step 5 10 day value at risk = 1 day value at risk * SQRT(10)1 Calculate the daily returns for each asset in the portfolio for a number of days in the past (say 500).2 Use these to value the portfolio based on today's holdings; number of shares & today's price per sharVaR (for the whole periodOUTPUT3 Determine the [simulated] change in the value of the portfolio from the current value ofconfidence level 95% 98% 99%4 Find the value for the appropriate percentile of this population of [simulated] changes.1 day VaR -2.46 -3.45 -4.115 This is the 1 day value at risk. Multiply by square root N to get the N day value at ri10 day VaR -7.78 -10.91 -12.99BP Tesco
WORKINGS Whole period mean =AVERAGE(daily returns) -0.036555% 0.007573% -0.036555% 0.007573% Targetvolatility =STDEV(daily returns) 1.931967% 1.971382% 1.931967% 1.971382% values
covariance / correlatio=COVAR(daily returns A, daily retu 0.01700% 44.72752% 0.01700% 44.72752% in blue=CORREL(daily returns A, daily returns B)
last 500 days mean -0.033181% 0.012746% -0.033181% 0.012746%volatility 1.938227% 1.970992% 1.938227% 1.970992%covariance / correlation 0.01706% 44.74782% 0.01706% 44.74782%
last year mean 0.022913% 0.112643% 0.022913% 0.112643%volatility 1.538927% 1.760016% 1.538927% 1.760016%covariance / correlation 0.007769% 28.796063% 0.00777% 28.79606%
last quarter (3 months)mean -0.000912% 0.060585% -0.000912% 0.060585%volatility 1.014693% 1.231990% 1.014693% 1.231990%covariance / correlation -0.00014% -1.09822% -0.00014% -1.09822%
last month mean 0.011507% 0.035551% 0.011507% 0.035551%volatility 1.249317% 1.392089% 1.249317% 1.392089%covariance / correlation -0.00240% -14.51126% -0.00240% -14.51126%
Start 15-Jan-02 revalued = current number * current price * EXP(daily return)End 14-Jan-04 change in value = revalued portfolio - current total valueFrequency Daily Daily returnName FTSE 100 BP Amoco Tesco =LN(today/yesterday) revalued portfolio and change in value
15-Jan-04 4,456.10 436.50 242.00 BP Amoco Tesco revalued change£ pence pence % % BP Amoco Tesco portfolio in value
0 15-Jan-02 5,166.00 523.00 237.751 16-Jan-02 5,127.58 521.50 233.00 -0.28722% -2.01812% 43.52 47.43 90.96 -1.09222 17-Jan-02 5,138.45 519.00 238.00 -0.48054% 2.12322% 43.44 49.44 92.88 0.8294
213 18-Nov-02 4,115.99 413.50 200.00 0.85004% -0.24969% 44.02 48.28 92.30 0.2519214 19-Nov-02 4,096.51 418.50 200.50 1.20194% 0.24969% 44.18 48.52 92.70 0.6488215 20-Nov-02 4,094.86 407.00 200.25 -2.78637% -0.12477% 42.45 48.34 90.79 -1.2598216 21-Nov-02 4,190.00 412.00 201.75 1.22102% 0.74627% 44.19 48.76 92.95 0.8988217 22-Nov-02 4,175.23 404.00 196.00 -1.96085% -2.89146% 42.80 47.02 89.82 -2.2270218 25-Nov-02 4,122.21 402.50 194.50 -0.37198% -0.76825% 43.49 48.03 91.52 -0.5325219 26-Nov-02 4,070.96 400.00 194.50 -0.62305% 0.00000% 43.38 48.40 91.78 -0.2711220 27-Nov-02 4,144.19 417.00 200.50 4.16217% 3.03821% 45.51 49.89 95.40 3.3482221 28-Nov-02 4,185.40 423.00 203.50 1.42860% 1.48518% 44.28 49.12 93.40 1.3522222 29-Nov-02 4,169.41 418.50 203.00 -1.06953% -0.24600% 43.19 48.28 91.47 -0.5833223 2-Dec-02 4,154.27 412.50 202.50 -1.44407% -0.24661% 43.02 48.28 91.30 -0.7450224 3-Dec-02 4,075.39 415.50 198.50 0.72464% -1.99508% 43.97 47.44 91.41 -0.6386225 4-Dec-02 4,048.60 414.00 199.75 -0.36166% 0.62775% 43.49 48.70 92.20 0.1472226 5-Dec-02 4,032.42 418.00 197.25 0.96155% -1.25946% 44.07 47.79 91.87 -0.1840

document.xlsx Historical_simulation / revised: 9 Mar 2006 © Dr J R Hicks page 17 (of 40)
VaR and Historical simulation Daily return revalued portfolio and change in value jrhBP Amoco Tesco BP Amoco Tesco portfolio change
Historical simulation (uses past price movements to simulate what might happen today)
Consider a portfolio consisting of two companies from the FTSE 100 index: NOTE: Volatility is=STDEV(daily returns [for the specified period])INPUT no of shares price in £ total value Variance = volatility^2 Volatility = SQRT(variance)
shareholding in millions 15-Jan-04 millions £ Sector Covariances & correlations can be calculated from the daily returns.BP Amoco 10 4.3650 43.65 Oil & gasTesco 20 2.4200 48.40 Food & drug retailerscurrent total value 92.05 step 4 1 day value at risk =PERCENTILE(changes in value,1-confidence level)
steps step 5 10 day value at risk = 1 day value at risk * SQRT(10)1 Calculate the daily returns for each asset in the portfolio for a number of days in the past (say 500).2 Use these to value the portfolio based on today's holdings; number of shares & today's price per sharVaR (for the whole periodOUTPUT3 Determine the [simulated] change in the value of the portfolio from the current value ofconfidence level 95% 98% 99%4 Find the value for the appropriate percentile of this population of [simulated] changes.1 day VaR -2.46 -3.45 -4.115 This is the 1 day value at risk. Multiply by square root N to get the N day value at ri10 day VaR -7.78 -10.91 -12.99BP Tesco
WORKINGS Whole period mean =AVERAGE(daily returns) -0.036555% 0.007573% -0.036555% 0.007573% Targetvolatility =STDEV(daily returns) 1.931967% 1.971382% 1.931967% 1.971382% values
covariance / correlatio=COVAR(daily returns A, daily retu 0.01700% 44.72752% 0.01700% 44.72752% in blue=CORREL(daily returns A, daily returns B)
last 500 days mean -0.033181% 0.012746% -0.033181% 0.012746%volatility 1.938227% 1.970992% 1.938227% 1.970992%covariance / correlation 0.01706% 44.74782% 0.01706% 44.74782%
last year mean 0.022913% 0.112643% 0.022913% 0.112643%volatility 1.538927% 1.760016% 1.538927% 1.760016%covariance / correlation 0.007769% 28.796063% 0.00777% 28.79606%
last quarter (3 months)mean -0.000912% 0.060585% -0.000912% 0.060585%volatility 1.014693% 1.231990% 1.014693% 1.231990%covariance / correlation -0.00014% -1.09822% -0.00014% -1.09822%
last month mean 0.011507% 0.035551% 0.011507% 0.035551%volatility 1.249317% 1.392089% 1.249317% 1.392089%covariance / correlation -0.00240% -14.51126% -0.00240% -14.51126%
Start 15-Jan-02 revalued = current number * current price * EXP(daily return)End 14-Jan-04 change in value = revalued portfolio - current total valueFrequency Daily Daily returnName FTSE 100 BP Amoco Tesco =LN(today/yesterday) revalued portfolio and change in value
15-Jan-04 4,456.10 436.50 242.00 BP Amoco Tesco revalued change£ pence pence % % BP Amoco Tesco portfolio in value
0 15-Jan-02 5,166.00 523.00 237.751 16-Jan-02 5,127.58 521.50 233.00 -0.28722% -2.01812% 43.52 47.43 90.96 -1.09222 17-Jan-02 5,138.45 519.00 238.00 -0.48054% 2.12322% 43.44 49.44 92.88 0.8294
227 6-Dec-02 4,013.46 414.00 195.50 -0.96155% -0.89116% 43.23 47.97 91.20 -0.8471228 9-Dec-02 3,933.93 412.00 193.50 -0.48426% -1.02829% 43.44 47.90 91.34 -0.7060229 10-Dec-02 3,925.00 414.00 193.50 0.48426% 0.00000% 43.86 48.40 92.26 0.2119230 11-Dec-02 3,974.87 419.00 198.00 1.20049% 2.29895% 44.18 49.53 93.70 1.6528231 12-Dec-02 3,935.31 414.00 196.00 -1.20049% -1.01524% 43.13 47.91 91.04 -1.0098232 13-Dec-02 3,878.07 410.50 193.25 -0.84900% -1.41300% 43.28 47.72 91.00 -1.0481233 16-Dec-02 3,983.97 426.00 197.25 3.70634% 2.04873% 45.30 49.40 94.70 2.6500234 17-Dec-02 3,908.71 421.00 190.75 -1.18065% -3.35083% 43.14 46.81 89.94 -2.1073235 18-Dec-02 3,835.18 413.00 187.50 -1.91852% -1.71848% 42.82 47.58 90.40 -1.6541236 19-Dec-02 3,841.41 413.00 188.00 0.00000% 0.26631% 43.65 48.53 92.18 0.1291237 20-Dec-02 3,889.86 416.50 189.25 0.84389% 0.66269% 44.02 48.72 92.74 0.6917238 23-Dec-02 3,936.87 426.00 190.50 2.25529% 0.65833% 44.65 48.72 93.37 1.3153239 24-Dec-02 3,942.10 429.00 190.25 0.70176% -0.13132% 43.96 48.34 92.29 0.2439240 27-Dec-02 3,829.39 415.00 187.00 -3.31784% -1.72304% 42.23 47.57 89.80 -2.2513

document.xlsx Historical_simulation / revised: 9 Mar 2006 © Dr J R Hicks page 18 (of 40)
VaR and Historical simulation Daily return revalued portfolio and change in value jrhBP Amoco Tesco BP Amoco Tesco portfolio change
Historical simulation (uses past price movements to simulate what might happen today)
Consider a portfolio consisting of two companies from the FTSE 100 index: NOTE: Volatility is=STDEV(daily returns [for the specified period])INPUT no of shares price in £ total value Variance = volatility^2 Volatility = SQRT(variance)
shareholding in millions 15-Jan-04 millions £ Sector Covariances & correlations can be calculated from the daily returns.BP Amoco 10 4.3650 43.65 Oil & gasTesco 20 2.4200 48.40 Food & drug retailerscurrent total value 92.05 step 4 1 day value at risk =PERCENTILE(changes in value,1-confidence level)
steps step 5 10 day value at risk = 1 day value at risk * SQRT(10)1 Calculate the daily returns for each asset in the portfolio for a number of days in the past (say 500).2 Use these to value the portfolio based on today's holdings; number of shares & today's price per sharVaR (for the whole periodOUTPUT3 Determine the [simulated] change in the value of the portfolio from the current value ofconfidence level 95% 98% 99%4 Find the value for the appropriate percentile of this population of [simulated] changes.1 day VaR -2.46 -3.45 -4.115 This is the 1 day value at risk. Multiply by square root N to get the N day value at ri10 day VaR -7.78 -10.91 -12.99BP Tesco
WORKINGS Whole period mean =AVERAGE(daily returns) -0.036555% 0.007573% -0.036555% 0.007573% Targetvolatility =STDEV(daily returns) 1.931967% 1.971382% 1.931967% 1.971382% values
covariance / correlatio=COVAR(daily returns A, daily retu 0.01700% 44.72752% 0.01700% 44.72752% in blue=CORREL(daily returns A, daily returns B)
last 500 days mean -0.033181% 0.012746% -0.033181% 0.012746%volatility 1.938227% 1.970992% 1.938227% 1.970992%covariance / correlation 0.01706% 44.74782% 0.01706% 44.74782%
last year mean 0.022913% 0.112643% 0.022913% 0.112643%volatility 1.538927% 1.760016% 1.538927% 1.760016%covariance / correlation 0.007769% 28.796063% 0.00777% 28.79606%
last quarter (3 months)mean -0.000912% 0.060585% -0.000912% 0.060585%volatility 1.014693% 1.231990% 1.014693% 1.231990%covariance / correlation -0.00014% -1.09822% -0.00014% -1.09822%
last month mean 0.011507% 0.035551% 0.011507% 0.035551%volatility 1.249317% 1.392089% 1.249317% 1.392089%covariance / correlation -0.00240% -14.51126% -0.00240% -14.51126%
Start 15-Jan-02 revalued = current number * current price * EXP(daily return)End 14-Jan-04 change in value = revalued portfolio - current total valueFrequency Daily Daily returnName FTSE 100 BP Amoco Tesco =LN(today/yesterday) revalued portfolio and change in value
15-Jan-04 4,456.10 436.50 242.00 BP Amoco Tesco revalued change£ pence pence % % BP Amoco Tesco portfolio in value
0 15-Jan-02 5,166.00 523.00 237.751 16-Jan-02 5,127.58 521.50 233.00 -0.28722% -2.01812% 43.52 47.43 90.96 -1.09222 17-Jan-02 5,138.45 519.00 238.00 -0.48054% 2.12322% 43.44 49.44 92.88 0.8294
241 30-Dec-02 3,900.62 424.00 193.25 2.14549% 3.28761% 44.60 50.02 94.61 2.5643242 31-Dec-02 3,940.36 427.00 194.00 0.70506% 0.38735% 43.96 48.59 92.55 0.4967243 2-Jan-03 4,009.46 428.00 195.75 0.23392% 0.89802% 43.75 48.84 92.59 0.5388244 3-Jan-03 4,004.95 427.00 192.50 -0.23392% -1.67422% 43.55 47.60 91.14 -0.9056245 6-Jan-03 4,001.37 429.00 196.50 0.46729% 2.05663% 43.85 49.41 93.26 1.2102246 7-Jan-03 3,957.39 424.00 198.75 -1.17235% 1.13853% 43.14 48.95 92.10 0.0455247 8-Jan-03 3,924.82 418.50 201.00 -1.30566% 1.12572% 43.08 48.95 92.03 -0.0183248 9-Jan-03 3,933.98 420.25 192.75 0.41729% -4.19109% 43.83 46.41 90.25 -1.8040249 10-Jan-03 3,974.12 424.00 186.75 0.88837% -3.16232% 44.04 46.89 90.93 -1.1171250 13-Jan-03 3,948.27 416.00 183.00 -1.90482% -2.02847% 42.83 47.43 90.25 -1.7955251 14-Jan-03 3,945.59 410.50 185.75 -1.33093% 1.49155% 43.07 49.13 92.20 0.1502252 15-Jan-03 3,887.75 405.75 182.00 -1.16387% -2.03950% 43.14 47.42 90.57 -1.4822253 16-Jan-03 3,881.81 408.75 183.00 0.73665% 0.54795% 43.97 48.67 92.64 0.5887254 17-Jan-03 3,820.57 403.50 183.50 -1.29272% 0.27285% 43.09 48.53 91.62 -0.4284

document.xlsx Historical_simulation / revised: 9 Mar 2006 © Dr J R Hicks page 19 (of 40)
VaR and Historical simulation Daily return revalued portfolio and change in value jrhBP Amoco Tesco BP Amoco Tesco portfolio change
Historical simulation (uses past price movements to simulate what might happen today)
Consider a portfolio consisting of two companies from the FTSE 100 index: NOTE: Volatility is=STDEV(daily returns [for the specified period])INPUT no of shares price in £ total value Variance = volatility^2 Volatility = SQRT(variance)
shareholding in millions 15-Jan-04 millions £ Sector Covariances & correlations can be calculated from the daily returns.BP Amoco 10 4.3650 43.65 Oil & gasTesco 20 2.4200 48.40 Food & drug retailerscurrent total value 92.05 step 4 1 day value at risk =PERCENTILE(changes in value,1-confidence level)
steps step 5 10 day value at risk = 1 day value at risk * SQRT(10)1 Calculate the daily returns for each asset in the portfolio for a number of days in the past (say 500).2 Use these to value the portfolio based on today's holdings; number of shares & today's price per sharVaR (for the whole periodOUTPUT3 Determine the [simulated] change in the value of the portfolio from the current value ofconfidence level 95% 98% 99%4 Find the value for the appropriate percentile of this population of [simulated] changes.1 day VaR -2.46 -3.45 -4.115 This is the 1 day value at risk. Multiply by square root N to get the N day value at ri10 day VaR -7.78 -10.91 -12.99BP Tesco
WORKINGS Whole period mean =AVERAGE(daily returns) -0.036555% 0.007573% -0.036555% 0.007573% Targetvolatility =STDEV(daily returns) 1.931967% 1.971382% 1.931967% 1.971382% values
covariance / correlatio=COVAR(daily returns A, daily retu 0.01700% 44.72752% 0.01700% 44.72752% in blue=CORREL(daily returns A, daily returns B)
last 500 days mean -0.033181% 0.012746% -0.033181% 0.012746%volatility 1.938227% 1.970992% 1.938227% 1.970992%covariance / correlation 0.01706% 44.74782% 0.01706% 44.74782%
last year mean 0.022913% 0.112643% 0.022913% 0.112643%volatility 1.538927% 1.760016% 1.538927% 1.760016%covariance / correlation 0.007769% 28.796063% 0.00777% 28.79606%
last quarter (3 months)mean -0.000912% 0.060585% -0.000912% 0.060585%volatility 1.014693% 1.231990% 1.014693% 1.231990%covariance / correlation -0.00014% -1.09822% -0.00014% -1.09822%
last month mean 0.011507% 0.035551% 0.011507% 0.035551%volatility 1.249317% 1.392089% 1.249317% 1.392089%covariance / correlation -0.00240% -14.51126% -0.00240% -14.51126%
Start 15-Jan-02 revalued = current number * current price * EXP(daily return)End 14-Jan-04 change in value = revalued portfolio - current total valueFrequency Daily Daily returnName FTSE 100 BP Amoco Tesco =LN(today/yesterday) revalued portfolio and change in value
15-Jan-04 4,456.10 436.50 242.00 BP Amoco Tesco revalued change£ pence pence % % BP Amoco Tesco portfolio in value
0 15-Jan-02 5,166.00 523.00 237.751 16-Jan-02 5,127.58 521.50 233.00 -0.28722% -2.01812% 43.52 47.43 90.96 -1.09222 17-Jan-02 5,138.45 519.00 238.00 -0.48054% 2.12322% 43.44 49.44 92.88 0.8294
255 20-Jan-03 3,778.61 395.00 185.75 -2.12907% 1.21870% 42.73 48.99 91.72 -0.3261256 21-Jan-03 3,736.69 388.75 187.00 -1.59493% 0.67069% 42.96 48.73 91.69 -0.3650257 22-Jan-03 3,677.98 379.75 186.00 -2.34233% -0.53619% 42.64 48.14 90.78 -1.2694258 23-Jan-03 3,622.16 374.00 181.00 -1.52573% -2.72496% 42.99 47.10 90.09 -1.9620259 24-Jan-03 3,603.72 369.00 178.00 -1.34592% -1.67135% 43.07 47.60 90.66 -1.3858260 27-Jan-03 3,480.83 356.50 168.50 -3.44624% -5.48478% 42.17 45.82 87.99 -4.0618261 28-Jan-03 3,489.98 362.50 168.00 1.66902% -0.29718% 44.38 48.26 92.64 0.5910262 29-Jan-03 3,483.79 383.00 163.75 5.50105% -2.56231% 46.12 47.18 93.29 1.2441263 30-Jan-03 3,578.67 382.50 165.25 -0.13063% 0.91186% 43.59 48.84 92.44 0.3864264 31-Jan-03 3,567.41 382.00 165.50 -0.13080% 0.15117% 43.59 48.47 92.07 0.0162265 3-Feb-03 3,689.36 393.50 171.75 2.96605% 3.70687% 44.96 50.23 95.19 3.1419266 4-Feb-03 3,590.09 386.50 168.25 -1.79492% -2.05890% 42.87 47.41 90.29 -1.7628267 5-Feb-03 3,678.72 397.50 174.00 2.80631% 3.36043% 44.89 50.05 94.95 2.8964268 6-Feb-03 3,597.04 382.50 174.00 -3.84663% 0.00000% 42.00 48.40 90.40 -1.6472

document.xlsx Historical_simulation / revised: 9 Mar 2006 © Dr J R Hicks page 20 (of 40)
VaR and Historical simulation Daily return revalued portfolio and change in value jrhBP Amoco Tesco BP Amoco Tesco portfolio change
Historical simulation (uses past price movements to simulate what might happen today)
Consider a portfolio consisting of two companies from the FTSE 100 index: NOTE: Volatility is=STDEV(daily returns [for the specified period])INPUT no of shares price in £ total value Variance = volatility^2 Volatility = SQRT(variance)
shareholding in millions 15-Jan-04 millions £ Sector Covariances & correlations can be calculated from the daily returns.BP Amoco 10 4.3650 43.65 Oil & gasTesco 20 2.4200 48.40 Food & drug retailerscurrent total value 92.05 step 4 1 day value at risk =PERCENTILE(changes in value,1-confidence level)
steps step 5 10 day value at risk = 1 day value at risk * SQRT(10)1 Calculate the daily returns for each asset in the portfolio for a number of days in the past (say 500).2 Use these to value the portfolio based on today's holdings; number of shares & today's price per sharVaR (for the whole periodOUTPUT3 Determine the [simulated] change in the value of the portfolio from the current value ofconfidence level 95% 98% 99%4 Find the value for the appropriate percentile of this population of [simulated] changes.1 day VaR -2.46 -3.45 -4.115 This is the 1 day value at risk. Multiply by square root N to get the N day value at ri10 day VaR -7.78 -10.91 -12.99BP Tesco
WORKINGS Whole period mean =AVERAGE(daily returns) -0.036555% 0.007573% -0.036555% 0.007573% Targetvolatility =STDEV(daily returns) 1.931967% 1.971382% 1.931967% 1.971382% values
covariance / correlatio=COVAR(daily returns A, daily retu 0.01700% 44.72752% 0.01700% 44.72752% in blue=CORREL(daily returns A, daily returns B)
last 500 days mean -0.033181% 0.012746% -0.033181% 0.012746%volatility 1.938227% 1.970992% 1.938227% 1.970992%covariance / correlation 0.01706% 44.74782% 0.01706% 44.74782%
last year mean 0.022913% 0.112643% 0.022913% 0.112643%volatility 1.538927% 1.760016% 1.538927% 1.760016%covariance / correlation 0.007769% 28.796063% 0.00777% 28.79606%
last quarter (3 months)mean -0.000912% 0.060585% -0.000912% 0.060585%volatility 1.014693% 1.231990% 1.014693% 1.231990%covariance / correlation -0.00014% -1.09822% -0.00014% -1.09822%
last month mean 0.011507% 0.035551% 0.011507% 0.035551%volatility 1.249317% 1.392089% 1.249317% 1.392089%covariance / correlation -0.00240% -14.51126% -0.00240% -14.51126%
Start 15-Jan-02 revalued = current number * current price * EXP(daily return)End 14-Jan-04 change in value = revalued portfolio - current total valueFrequency Daily Daily returnName FTSE 100 BP Amoco Tesco =LN(today/yesterday) revalued portfolio and change in value
15-Jan-04 4,456.10 436.50 242.00 BP Amoco Tesco revalued change£ pence pence % % BP Amoco Tesco portfolio in value
0 15-Jan-02 5,166.00 523.00 237.751 16-Jan-02 5,127.58 521.50 233.00 -0.28722% -2.01812% 43.52 47.43 90.96 -1.09222 17-Jan-02 5,138.45 519.00 238.00 -0.48054% 2.12322% 43.44 49.44 92.88 0.8294
269 7-Feb-03 3,599.16 379.00 172.00 -0.91924% -1.15608% 43.25 47.84 91.09 -0.9557270 10-Feb-03 3,579.07 379.50 169.50 0.13184% -1.46415% 43.71 47.70 91.40 -0.6459271 11-Feb-03 3,669.21 393.50 173.50 3.62265% 2.33247% 45.26 49.54 94.80 2.7525272 12-Feb-03 3,616.12 385.00 170.50 -2.18377% -1.74423% 42.71 47.56 90.27 -1.7798273 13-Feb-03 3,610.82 381.00 170.00 -1.04440% -0.29369% 43.20 48.26 91.45 -0.5954274 14-Feb-03 3,611.90 388.00 168.50 1.82060% -0.88627% 44.45 47.97 92.42 0.3749275 17-Feb-03 3,692.37 395.50 171.75 1.91454% 1.91042% 44.49 49.33 93.83 1.7773276 18-Feb-03 3,729.54 404.00 168.75 2.12641% -1.76216% 44.59 47.55 92.14 0.0927277 19-Feb-03 3,658.30 393.25 163.00 -2.69693% -3.46681% 42.49 46.75 89.24 -2.8107278 20-Feb-03 3,687.25 400.50 166.00 1.82682% 1.82376% 44.45 49.29 93.75 1.6955279 21-Feb-03 3,727.11 413.50 168.00 3.19437% 1.19762% 45.07 48.98 94.05 2.0000280 24-Feb-03 3,701.84 416.50 164.00 0.72289% -2.40976% 43.97 47.25 91.21 -0.8357281 25-Feb-03 3,621.47 414.00 161.75 -0.60205% -1.38145% 43.39 47.74 91.12 -0.9260282 26-Feb-03 3,593.29 402.00 159.50 -2.94139% -1.40080% 42.38 47.73 90.11 -1.9385

document.xlsx Historical_simulation / revised: 9 Mar 2006 © Dr J R Hicks page 21 (of 40)
VaR and Historical simulation Daily return revalued portfolio and change in value jrhBP Amoco Tesco BP Amoco Tesco portfolio change
Historical simulation (uses past price movements to simulate what might happen today)
Consider a portfolio consisting of two companies from the FTSE 100 index: NOTE: Volatility is=STDEV(daily returns [for the specified period])INPUT no of shares price in £ total value Variance = volatility^2 Volatility = SQRT(variance)
shareholding in millions 15-Jan-04 millions £ Sector Covariances & correlations can be calculated from the daily returns.BP Amoco 10 4.3650 43.65 Oil & gasTesco 20 2.4200 48.40 Food & drug retailerscurrent total value 92.05 step 4 1 day value at risk =PERCENTILE(changes in value,1-confidence level)
steps step 5 10 day value at risk = 1 day value at risk * SQRT(10)1 Calculate the daily returns for each asset in the portfolio for a number of days in the past (say 500).2 Use these to value the portfolio based on today's holdings; number of shares & today's price per sharVaR (for the whole periodOUTPUT3 Determine the [simulated] change in the value of the portfolio from the current value ofconfidence level 95% 98% 99%4 Find the value for the appropriate percentile of this population of [simulated] changes.1 day VaR -2.46 -3.45 -4.115 This is the 1 day value at risk. Multiply by square root N to get the N day value at ri10 day VaR -7.78 -10.91 -12.99BP Tesco
WORKINGS Whole period mean =AVERAGE(daily returns) -0.036555% 0.007573% -0.036555% 0.007573% Targetvolatility =STDEV(daily returns) 1.931967% 1.971382% 1.931967% 1.971382% values
covariance / correlatio=COVAR(daily returns A, daily retu 0.01700% 44.72752% 0.01700% 44.72752% in blue=CORREL(daily returns A, daily returns B)
last 500 days mean -0.033181% 0.012746% -0.033181% 0.012746%volatility 1.938227% 1.970992% 1.938227% 1.970992%covariance / correlation 0.01706% 44.74782% 0.01706% 44.74782%
last year mean 0.022913% 0.112643% 0.022913% 0.112643%volatility 1.538927% 1.760016% 1.538927% 1.760016%covariance / correlation 0.007769% 28.796063% 0.00777% 28.79606%
last quarter (3 months)mean -0.000912% 0.060585% -0.000912% 0.060585%volatility 1.014693% 1.231990% 1.014693% 1.231990%covariance / correlation -0.00014% -1.09822% -0.00014% -1.09822%
last month mean 0.011507% 0.035551% 0.011507% 0.035551%volatility 1.249317% 1.392089% 1.249317% 1.392089%covariance / correlation -0.00240% -14.51126% -0.00240% -14.51126%
Start 15-Jan-02 revalued = current number * current price * EXP(daily return)End 14-Jan-04 change in value = revalued portfolio - current total valueFrequency Daily Daily returnName FTSE 100 BP Amoco Tesco =LN(today/yesterday) revalued portfolio and change in value
15-Jan-04 4,456.10 436.50 242.00 BP Amoco Tesco revalued change£ pence pence % % BP Amoco Tesco portfolio in value
0 15-Jan-02 5,166.00 523.00 237.751 16-Jan-02 5,127.58 521.50 233.00 -0.28722% -2.01812% 43.52 47.43 90.96 -1.09222 17-Jan-02 5,138.45 519.00 238.00 -0.48054% 2.12322% 43.44 49.44 92.88 0.8294
283 27-Feb-03 3,569.88 400.00 161.00 -0.49875% 0.93604% 43.43 48.86 92.29 0.2380284 28-Feb-03 3,655.58 400.00 162.00 0.00000% 0.61920% 43.65 48.70 92.35 0.3006285 3-Mar-03 3,684.67 408.00 162.50 1.98026% 0.30817% 44.52 48.55 93.07 1.0224286 4-Mar-03 3,625.34 408.00 159.00 0.00000% -2.17738% 43.65 47.36 91.01 -1.0425287 5-Mar-03 3,563.54 405.50 161.00 -0.61463% 1.25002% 43.38 49.01 92.39 0.3413288 6-Mar-03 3,555.42 404.50 160.50 -0.24691% -0.31104% 43.54 48.25 91.79 -0.2580289 7-Mar-03 3,491.59 395.25 163.50 -2.31333% 1.85190% 42.65 49.30 91.96 -0.0935290 10-Mar-03 3,436.05 392.00 160.50 -0.82566% -1.85190% 43.29 47.51 90.80 -1.2470291 11-Mar-03 3,452.73 395.25 165.00 0.82566% 2.76515% 44.01 49.76 93.77 1.7189292 12-Mar-03 3,287.04 371.00 163.00 -6.33164% -1.21953% 40.97 47.81 88.79 -3.2648293 13-Mar-03 3,486.90 391.50 172.00 5.37835% 5.37443% 46.06 51.07 97.13 5.0843294 14-Mar-03 3,601.83 400.25 173.50 2.21038% 0.86831% 44.63 48.82 93.45 1.3977295 17-Mar-03 3,722.27 415.00 171.50 3.61892% -1.15943% 45.26 47.84 93.10 1.0507296 18-Mar-03 3,747.28 412.50 177.50 -0.60423% 3.43873% 43.39 50.09 93.48 1.4303
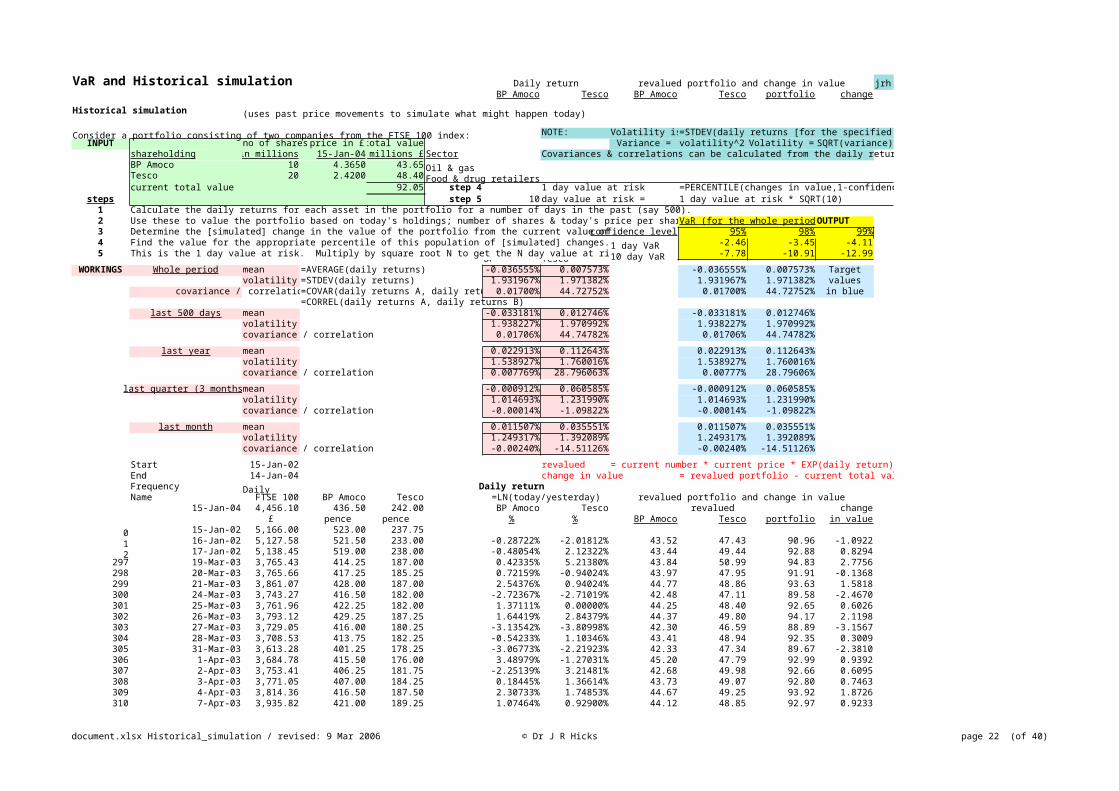
document.xlsx Historical_simulation / revised: 9 Mar 2006 © Dr J R Hicks page 22 (of 40)
VaR and Historical simulation Daily return revalued portfolio and change in value jrhBP Amoco Tesco BP Amoco Tesco portfolio change
Historical simulation (uses past price movements to simulate what might happen today)
Consider a portfolio consisting of two companies from the FTSE 100 index: NOTE: Volatility is=STDEV(daily returns [for the specified period])INPUT no of shares price in £ total value Variance = volatility^2 Volatility = SQRT(variance)
shareholding in millions 15-Jan-04 millions £ Sector Covariances & correlations can be calculated from the daily returns.BP Amoco 10 4.3650 43.65 Oil & gasTesco 20 2.4200 48.40 Food & drug retailerscurrent total value 92.05 step 4 1 day value at risk =PERCENTILE(changes in value,1-confidence level)
steps step 5 10 day value at risk = 1 day value at risk * SQRT(10)1 Calculate the daily returns for each asset in the portfolio for a number of days in the past (say 500).2 Use these to value the portfolio based on today's holdings; number of shares & today's price per sharVaR (for the whole periodOUTPUT3 Determine the [simulated] change in the value of the portfolio from the current value ofconfidence level 95% 98% 99%4 Find the value for the appropriate percentile of this population of [simulated] changes.1 day VaR -2.46 -3.45 -4.115 This is the 1 day value at risk. Multiply by square root N to get the N day value at ri10 day VaR -7.78 -10.91 -12.99BP Tesco
WORKINGS Whole period mean =AVERAGE(daily returns) -0.036555% 0.007573% -0.036555% 0.007573% Targetvolatility =STDEV(daily returns) 1.931967% 1.971382% 1.931967% 1.971382% values
covariance / correlatio=COVAR(daily returns A, daily retu 0.01700% 44.72752% 0.01700% 44.72752% in blue=CORREL(daily returns A, daily returns B)
last 500 days mean -0.033181% 0.012746% -0.033181% 0.012746%volatility 1.938227% 1.970992% 1.938227% 1.970992%covariance / correlation 0.01706% 44.74782% 0.01706% 44.74782%
last year mean 0.022913% 0.112643% 0.022913% 0.112643%volatility 1.538927% 1.760016% 1.538927% 1.760016%covariance / correlation 0.007769% 28.796063% 0.00777% 28.79606%
last quarter (3 months)mean -0.000912% 0.060585% -0.000912% 0.060585%volatility 1.014693% 1.231990% 1.014693% 1.231990%covariance / correlation -0.00014% -1.09822% -0.00014% -1.09822%
last month mean 0.011507% 0.035551% 0.011507% 0.035551%volatility 1.249317% 1.392089% 1.249317% 1.392089%covariance / correlation -0.00240% -14.51126% -0.00240% -14.51126%
Start 15-Jan-02 revalued = current number * current price * EXP(daily return)End 14-Jan-04 change in value = revalued portfolio - current total valueFrequency Daily Daily returnName FTSE 100 BP Amoco Tesco =LN(today/yesterday) revalued portfolio and change in value
15-Jan-04 4,456.10 436.50 242.00 BP Amoco Tesco revalued change£ pence pence % % BP Amoco Tesco portfolio in value
0 15-Jan-02 5,166.00 523.00 237.751 16-Jan-02 5,127.58 521.50 233.00 -0.28722% -2.01812% 43.52 47.43 90.96 -1.09222 17-Jan-02 5,138.45 519.00 238.00 -0.48054% 2.12322% 43.44 49.44 92.88 0.8294
297 19-Mar-03 3,765.43 414.25 187.00 0.42335% 5.21380% 43.84 50.99 94.83 2.7756298 20-Mar-03 3,765.66 417.25 185.25 0.72159% -0.94024% 43.97 47.95 91.91 -0.1368299 21-Mar-03 3,861.07 428.00 187.00 2.54376% 0.94024% 44.77 48.86 93.63 1.5818300 24-Mar-03 3,743.27 416.50 182.00 -2.72367% -2.71019% 42.48 47.11 89.58 -2.4670301 25-Mar-03 3,761.96 422.25 182.00 1.37111% 0.00000% 44.25 48.40 92.65 0.6026302 26-Mar-03 3,793.12 429.25 187.25 1.64419% 2.84379% 44.37 49.80 94.17 2.1198303 27-Mar-03 3,729.05 416.00 180.25 -3.13542% -3.80998% 42.30 46.59 88.89 -3.1567304 28-Mar-03 3,708.53 413.75 182.25 -0.54233% 1.10346% 43.41 48.94 92.35 0.3009305 31-Mar-03 3,613.28 401.25 178.25 -3.06773% -2.21923% 42.33 47.34 89.67 -2.3810306 1-Apr-03 3,684.78 415.50 176.00 3.48979% -1.27031% 45.20 47.79 92.99 0.9392307 2-Apr-03 3,753.41 406.25 181.75 -2.25139% 3.21481% 42.68 49.98 92.66 0.6095308 3-Apr-03 3,771.05 407.00 184.25 0.18445% 1.36614% 43.73 49.07 92.80 0.7463309 4-Apr-03 3,814.36 416.50 187.50 2.30733% 1.74853% 44.67 49.25 93.92 1.8726310 7-Apr-03 3,935.82 421.00 189.25 1.07464% 0.92900% 44.12 48.85 92.97 0.9233

document.xlsx Historical_simulation / revised: 9 Mar 2006 © Dr J R Hicks page 23 (of 40)
VaR and Historical simulation Daily return revalued portfolio and change in value jrhBP Amoco Tesco BP Amoco Tesco portfolio change
Historical simulation (uses past price movements to simulate what might happen today)
Consider a portfolio consisting of two companies from the FTSE 100 index: NOTE: Volatility is=STDEV(daily returns [for the specified period])INPUT no of shares price in £ total value Variance = volatility^2 Volatility = SQRT(variance)
shareholding in millions 15-Jan-04 millions £ Sector Covariances & correlations can be calculated from the daily returns.BP Amoco 10 4.3650 43.65 Oil & gasTesco 20 2.4200 48.40 Food & drug retailerscurrent total value 92.05 step 4 1 day value at risk =PERCENTILE(changes in value,1-confidence level)
steps step 5 10 day value at risk = 1 day value at risk * SQRT(10)1 Calculate the daily returns for each asset in the portfolio for a number of days in the past (say 500).2 Use these to value the portfolio based on today's holdings; number of shares & today's price per sharVaR (for the whole periodOUTPUT3 Determine the [simulated] change in the value of the portfolio from the current value ofconfidence level 95% 98% 99%4 Find the value for the appropriate percentile of this population of [simulated] changes.1 day VaR -2.46 -3.45 -4.115 This is the 1 day value at risk. Multiply by square root N to get the N day value at ri10 day VaR -7.78 -10.91 -12.99BP Tesco
WORKINGS Whole period mean =AVERAGE(daily returns) -0.036555% 0.007573% -0.036555% 0.007573% Targetvolatility =STDEV(daily returns) 1.931967% 1.971382% 1.931967% 1.971382% values
covariance / correlatio=COVAR(daily returns A, daily retu 0.01700% 44.72752% 0.01700% 44.72752% in blue=CORREL(daily returns A, daily returns B)
last 500 days mean -0.033181% 0.012746% -0.033181% 0.012746%volatility 1.938227% 1.970992% 1.938227% 1.970992%covariance / correlation 0.01706% 44.74782% 0.01706% 44.74782%
last year mean 0.022913% 0.112643% 0.022913% 0.112643%volatility 1.538927% 1.760016% 1.538927% 1.760016%covariance / correlation 0.007769% 28.796063% 0.00777% 28.79606%
last quarter (3 months)mean -0.000912% 0.060585% -0.000912% 0.060585%volatility 1.014693% 1.231990% 1.014693% 1.231990%covariance / correlation -0.00014% -1.09822% -0.00014% -1.09822%
last month mean 0.011507% 0.035551% 0.011507% 0.035551%volatility 1.249317% 1.392089% 1.249317% 1.392089%covariance / correlation -0.00240% -14.51126% -0.00240% -14.51126%
Start 15-Jan-02 revalued = current number * current price * EXP(daily return)End 14-Jan-04 change in value = revalued portfolio - current total valueFrequency Daily Daily returnName FTSE 100 BP Amoco Tesco =LN(today/yesterday) revalued portfolio and change in value
15-Jan-04 4,456.10 436.50 242.00 BP Amoco Tesco revalued change£ pence pence % % BP Amoco Tesco portfolio in value
0 15-Jan-02 5,166.00 523.00 237.751 16-Jan-02 5,127.58 521.50 233.00 -0.28722% -2.01812% 43.52 47.43 90.96 -1.09222 17-Jan-02 5,138.45 519.00 238.00 -0.48054% 2.12322% 43.44 49.44 92.88 0.8294
311 8-Apr-03 3,868.79 411.25 197.25 -2.34315% 4.14031% 42.64 50.45 93.09 1.0351312 9-Apr-03 3,861.42 411.75 199.50 0.12151% 1.13423% 43.70 48.95 92.66 0.6052313 10-Apr-03 3,803.27 405.75 195.75 -1.46792% -1.89759% 43.01 47.49 90.50 -1.5458314 11-Apr-03 3,808.08 404.75 198.75 -0.24676% 1.52094% 43.54 49.14 92.68 0.6342315 14-Apr-03 3,849.41 408.50 202.75 0.92223% 1.99259% 44.05 49.37 93.43 1.3785316 15-Apr-03 3,916.85 414.50 203.25 1.45811% 0.24631% 44.29 48.52 92.81 0.7605317 16-Apr-03 3,854.90 407.00 191.50 -1.82598% -5.95489% 42.86 45.60 88.46 -3.5878318 17-Apr-03 3,889.22 407.50 193.50 0.12277% 1.03897% 43.70 48.91 92.61 0.5591319 22-Apr-03 3,917.69 413.75 196.00 1.52210% 1.28371% 44.32 49.03 93.34 1.2948320 23-Apr-03 3,966.45 412.50 198.75 -0.30257% 1.39331% 43.52 49.08 92.60 0.5472321 24-Apr-03 3,899.03 406.00 190.00 -1.58830% -4.50237% 42.96 46.27 89.23 -2.8186322 25-Apr-03 3,870.20 395.00 194.00 -2.74674% 2.08341% 42.47 49.42 91.89 -0.1637323 28-Apr-03 3,940.25 403.00 194.00 2.00508% 0.00000% 44.53 48.40 92.93 0.8841324 29-Apr-03 3,927.82 399.75 196.00 -0.80972% 1.02565% 43.30 48.90 92.20 0.1470

document.xlsx Historical_simulation / revised: 9 Mar 2006 © Dr J R Hicks page 24 (of 40)
VaR and Historical simulation Daily return revalued portfolio and change in value jrhBP Amoco Tesco BP Amoco Tesco portfolio change
Historical simulation (uses past price movements to simulate what might happen today)
Consider a portfolio consisting of two companies from the FTSE 100 index: NOTE: Volatility is=STDEV(daily returns [for the specified period])INPUT no of shares price in £ total value Variance = volatility^2 Volatility = SQRT(variance)
shareholding in millions 15-Jan-04 millions £ Sector Covariances & correlations can be calculated from the daily returns.BP Amoco 10 4.3650 43.65 Oil & gasTesco 20 2.4200 48.40 Food & drug retailerscurrent total value 92.05 step 4 1 day value at risk =PERCENTILE(changes in value,1-confidence level)
steps step 5 10 day value at risk = 1 day value at risk * SQRT(10)1 Calculate the daily returns for each asset in the portfolio for a number of days in the past (say 500).2 Use these to value the portfolio based on today's holdings; number of shares & today's price per sharVaR (for the whole periodOUTPUT3 Determine the [simulated] change in the value of the portfolio from the current value ofconfidence level 95% 98% 99%4 Find the value for the appropriate percentile of this population of [simulated] changes.1 day VaR -2.46 -3.45 -4.115 This is the 1 day value at risk. Multiply by square root N to get the N day value at ri10 day VaR -7.78 -10.91 -12.99BP Tesco
WORKINGS Whole period mean =AVERAGE(daily returns) -0.036555% 0.007573% -0.036555% 0.007573% Targetvolatility =STDEV(daily returns) 1.931967% 1.971382% 1.931967% 1.971382% values
covariance / correlatio=COVAR(daily returns A, daily retu 0.01700% 44.72752% 0.01700% 44.72752% in blue=CORREL(daily returns A, daily returns B)
last 500 days mean -0.033181% 0.012746% -0.033181% 0.012746%volatility 1.938227% 1.970992% 1.938227% 1.970992%covariance / correlation 0.01706% 44.74782% 0.01706% 44.74782%
last year mean 0.022913% 0.112643% 0.022913% 0.112643%volatility 1.538927% 1.760016% 1.538927% 1.760016%covariance / correlation 0.007769% 28.796063% 0.00777% 28.79606%
last quarter (3 months)mean -0.000912% 0.060585% -0.000912% 0.060585%volatility 1.014693% 1.231990% 1.014693% 1.231990%covariance / correlation -0.00014% -1.09822% -0.00014% -1.09822%
last month mean 0.011507% 0.035551% 0.011507% 0.035551%volatility 1.249317% 1.392089% 1.249317% 1.392089%covariance / correlation -0.00240% -14.51126% -0.00240% -14.51126%
Start 15-Jan-02 revalued = current number * current price * EXP(daily return)End 14-Jan-04 change in value = revalued portfolio - current total valueFrequency Daily Daily returnName FTSE 100 BP Amoco Tesco =LN(today/yesterday) revalued portfolio and change in value
15-Jan-04 4,456.10 436.50 242.00 BP Amoco Tesco revalued change£ pence pence % % BP Amoco Tesco portfolio in value
0 15-Jan-02 5,166.00 523.00 237.751 16-Jan-02 5,127.58 521.50 233.00 -0.28722% -2.01812% 43.52 47.43 90.96 -1.09222 17-Jan-02 5,138.45 519.00 238.00 -0.48054% 2.12322% 43.44 49.44 92.88 0.8294
325 30-Apr-03 3,925.97 396.50 198.00 -0.81633% 1.01524% 43.30 48.89 92.19 0.1390326 1-May-03 3,880.13 395.00 194.00 -0.37903% -2.04089% 43.48 47.42 90.91 -1.1429327 2-May-03 3,952.59 405.25 198.00 2.56184% 2.04089% 44.78 49.40 94.18 2.1306328 6-May-03 4,006.39 410.75 203.25 1.34806% 2.61697% 44.24 49.68 93.93 1.8757329 7-May-03 3,992.90 413.50 198.00 0.66728% -2.61697% 43.94 47.15 91.09 -0.9579330 8-May-03 3,928.87 408.00 195.25 -1.33903% -1.39862% 43.07 47.73 90.80 -1.2528331 9-May-03 3,969.35 410.00 196.50 0.48900% 0.63816% 43.86 48.71 92.57 0.5238332 12-May-03 3,987.44 416.50 199.25 1.57293% 1.38979% 44.34 49.08 93.42 1.3694333 13-May-03 3,999.89 415.75 196.75 -0.18023% -1.26264% 43.57 47.79 91.36 -0.6859334 14-May-03 3,975.02 407.25 199.25 -2.06569% 1.26264% 42.76 49.01 91.77 -0.2774335 15-May-03 4,011.08 413.50 203.50 1.52303% 2.11057% 44.32 49.43 93.75 1.7023336 16-May-03 4,049.01 414.50 212.00 0.24155% 4.09203% 43.76 50.42 94.18 2.1272337 19-May-03 3,941.34 407.50 206.50 -1.70320% -2.62859% 42.91 47.14 90.06 -1.9928338 20-May-03 3,971.61 414.25 211.00 1.64287% 2.15577% 44.37 49.45 93.83 1.7778

document.xlsx Historical_simulation / revised: 9 Mar 2006 © Dr J R Hicks page 25 (of 40)
VaR and Historical simulation Daily return revalued portfolio and change in value jrhBP Amoco Tesco BP Amoco Tesco portfolio change
Historical simulation (uses past price movements to simulate what might happen today)
Consider a portfolio consisting of two companies from the FTSE 100 index: NOTE: Volatility is=STDEV(daily returns [for the specified period])INPUT no of shares price in £ total value Variance = volatility^2 Volatility = SQRT(variance)
shareholding in millions 15-Jan-04 millions £ Sector Covariances & correlations can be calculated from the daily returns.BP Amoco 10 4.3650 43.65 Oil & gasTesco 20 2.4200 48.40 Food & drug retailerscurrent total value 92.05 step 4 1 day value at risk =PERCENTILE(changes in value,1-confidence level)
steps step 5 10 day value at risk = 1 day value at risk * SQRT(10)1 Calculate the daily returns for each asset in the portfolio for a number of days in the past (say 500).2 Use these to value the portfolio based on today's holdings; number of shares & today's price per sharVaR (for the whole periodOUTPUT3 Determine the [simulated] change in the value of the portfolio from the current value ofconfidence level 95% 98% 99%4 Find the value for the appropriate percentile of this population of [simulated] changes.1 day VaR -2.46 -3.45 -4.115 This is the 1 day value at risk. Multiply by square root N to get the N day value at ri10 day VaR -7.78 -10.91 -12.99BP Tesco
WORKINGS Whole period mean =AVERAGE(daily returns) -0.036555% 0.007573% -0.036555% 0.007573% Targetvolatility =STDEV(daily returns) 1.931967% 1.971382% 1.931967% 1.971382% values
covariance / correlatio=COVAR(daily returns A, daily retu 0.01700% 44.72752% 0.01700% 44.72752% in blue=CORREL(daily returns A, daily returns B)
last 500 days mean -0.033181% 0.012746% -0.033181% 0.012746%volatility 1.938227% 1.970992% 1.938227% 1.970992%covariance / correlation 0.01706% 44.74782% 0.01706% 44.74782%
last year mean 0.022913% 0.112643% 0.022913% 0.112643%volatility 1.538927% 1.760016% 1.538927% 1.760016%covariance / correlation 0.007769% 28.796063% 0.00777% 28.79606%
last quarter (3 months)mean -0.000912% 0.060585% -0.000912% 0.060585%volatility 1.014693% 1.231990% 1.014693% 1.231990%covariance / correlation -0.00014% -1.09822% -0.00014% -1.09822%
last month mean 0.011507% 0.035551% 0.011507% 0.035551%volatility 1.249317% 1.392089% 1.249317% 1.392089%covariance / correlation -0.00240% -14.51126% -0.00240% -14.51126%
Start 15-Jan-02 revalued = current number * current price * EXP(daily return)End 14-Jan-04 change in value = revalued portfolio - current total valueFrequency Daily Daily returnName FTSE 100 BP Amoco Tesco =LN(today/yesterday) revalued portfolio and change in value
15-Jan-04 4,456.10 436.50 242.00 BP Amoco Tesco revalued change£ pence pence % % BP Amoco Tesco portfolio in value
0 15-Jan-02 5,166.00 523.00 237.751 16-Jan-02 5,127.58 521.50 233.00 -0.28722% -2.01812% 43.52 47.43 90.96 -1.09222 17-Jan-02 5,138.45 519.00 238.00 -0.48054% 2.12322% 43.44 49.44 92.88 0.8294
339 21-May-03 3,936.38 410.25 202.25 -0.97029% -4.23536% 43.23 46.39 89.62 -2.4286340 22-May-03 3,990.45 418.50 204.50 1.99102% 1.10634% 44.53 48.94 93.47 1.4162341 23-May-03 3,979.84 415.25 201.75 -0.77961% -1.35387% 43.31 47.75 91.06 -0.9898342 27-May-03 3,992.38 423.50 203.75 1.96728% 0.98644% 44.52 48.88 93.40 1.3470343 28-May-03 4,071.86 428.00 208.50 1.05697% 2.30453% 44.11 49.53 93.64 1.5922344 29-May-03 4,083.59 424.00 207.75 -0.93897% -0.36036% 43.24 48.23 91.47 -0.5820345 30-May-03 4,048.10 418.00 204.25 -1.42520% -1.69907% 43.03 47.58 90.62 -1.4331346 2-Jun-03 4,129.28 428.75 209.25 2.53926% 2.41850% 44.77 49.58 94.36 2.3074347 3-Jun-03 4,115.73 430.75 215.50 0.46539% 2.94312% 43.85 49.85 93.70 1.6493348 4-Jun-03 4,126.55 436.50 216.25 1.32605% 0.34742% 44.23 48.57 92.80 0.7511349 5-Jun-03 4,104.25 429.25 215.00 -1.67489% -0.57971% 42.93 48.12 91.05 -1.0048350 6-Jun-03 4,150.79 429.50 214.00 0.05822% -0.46620% 43.68 48.17 91.85 -0.1997351 9-Jun-03 4,129.09 429.00 212.00 -0.11648% -0.93897% 43.60 47.95 91.55 -0.5032352 10-Jun-03 4,113.01 432.25 211.25 0.75472% -0.35440% 43.98 48.23 92.21 0.1595

document.xlsx Historical_simulation / revised: 9 Mar 2006 © Dr J R Hicks page 26 (of 40)
VaR and Historical simulation Daily return revalued portfolio and change in value jrhBP Amoco Tesco BP Amoco Tesco portfolio change
Historical simulation (uses past price movements to simulate what might happen today)
Consider a portfolio consisting of two companies from the FTSE 100 index: NOTE: Volatility is=STDEV(daily returns [for the specified period])INPUT no of shares price in £ total value Variance = volatility^2 Volatility = SQRT(variance)
shareholding in millions 15-Jan-04 millions £ Sector Covariances & correlations can be calculated from the daily returns.BP Amoco 10 4.3650 43.65 Oil & gasTesco 20 2.4200 48.40 Food & drug retailerscurrent total value 92.05 step 4 1 day value at risk =PERCENTILE(changes in value,1-confidence level)
steps step 5 10 day value at risk = 1 day value at risk * SQRT(10)1 Calculate the daily returns for each asset in the portfolio for a number of days in the past (say 500).2 Use these to value the portfolio based on today's holdings; number of shares & today's price per sharVaR (for the whole periodOUTPUT3 Determine the [simulated] change in the value of the portfolio from the current value ofconfidence level 95% 98% 99%4 Find the value for the appropriate percentile of this population of [simulated] changes.1 day VaR -2.46 -3.45 -4.115 This is the 1 day value at risk. Multiply by square root N to get the N day value at ri10 day VaR -7.78 -10.91 -12.99BP Tesco
WORKINGS Whole period mean =AVERAGE(daily returns) -0.036555% 0.007573% -0.036555% 0.007573% Targetvolatility =STDEV(daily returns) 1.931967% 1.971382% 1.931967% 1.971382% values
covariance / correlatio=COVAR(daily returns A, daily retu 0.01700% 44.72752% 0.01700% 44.72752% in blue=CORREL(daily returns A, daily returns B)
last 500 days mean -0.033181% 0.012746% -0.033181% 0.012746%volatility 1.938227% 1.970992% 1.938227% 1.970992%covariance / correlation 0.01706% 44.74782% 0.01706% 44.74782%
last year mean 0.022913% 0.112643% 0.022913% 0.112643%volatility 1.538927% 1.760016% 1.538927% 1.760016%covariance / correlation 0.007769% 28.796063% 0.00777% 28.79606%
last quarter (3 months)mean -0.000912% 0.060585% -0.000912% 0.060585%volatility 1.014693% 1.231990% 1.014693% 1.231990%covariance / correlation -0.00014% -1.09822% -0.00014% -1.09822%
last month mean 0.011507% 0.035551% 0.011507% 0.035551%volatility 1.249317% 1.392089% 1.249317% 1.392089%covariance / correlation -0.00240% -14.51126% -0.00240% -14.51126%
Start 15-Jan-02 revalued = current number * current price * EXP(daily return)End 14-Jan-04 change in value = revalued portfolio - current total valueFrequency Daily Daily returnName FTSE 100 BP Amoco Tesco =LN(today/yesterday) revalued portfolio and change in value
15-Jan-04 4,456.10 436.50 242.00 BP Amoco Tesco revalued change£ pence pence % % BP Amoco Tesco portfolio in value
0 15-Jan-02 5,166.00 523.00 237.751 16-Jan-02 5,127.58 521.50 233.00 -0.28722% -2.01812% 43.52 47.43 90.96 -1.09222 17-Jan-02 5,138.45 519.00 238.00 -0.48054% 2.12322% 43.44 49.44 92.88 0.8294
353 11-Jun-03 4,150.15 439.00 212.00 1.54953% 0.35440% 44.33 48.57 92.90 0.8535354 12-Jun-03 4,161.26 446.00 205.00 1.58195% -3.35763% 44.35 46.80 91.15 -0.9021355 13-Jun-03 4,134.12 439.00 211.50 -1.58195% 3.12150% 42.96 49.93 92.90 0.8495356 16-Jun-03 4,152.90 438.00 210.50 -0.22805% -0.47393% 43.55 48.17 91.72 -0.3283357 17-Jun-03 4,190.36 433.25 217.00 -1.09040% 3.04117% 43.18 49.89 93.07 1.0212358 18-Jun-03 4,207.01 438.00 213.00 1.09040% -1.86052% 44.13 47.51 91.64 -0.4136359 19-Jun-03 4,131.46 429.25 208.00 -2.01794% -2.37541% 42.78 47.26 90.04 -2.0082360 20-Jun-03 4,160.14 434.00 210.00 1.10050% 0.95695% 44.13 48.87 93.00 0.9484361 23-Jun-03 4,087.89 431.25 209.00 -0.63566% -0.47733% 43.37 48.17 91.54 -0.5071362 24-Jun-03 4,060.93 427.50 211.50 -0.87337% 1.18907% 43.27 48.98 92.25 0.1994363 25-Jun-03 4,067.86 424.50 215.00 -0.70423% 1.64130% 43.34 49.20 92.54 0.4946364 26-Jun-03 4,041.67 420.50 217.25 -0.94675% 1.04107% 43.24 48.91 92.15 0.0952365 27-Jun-03 4,067.84 423.50 219.00 0.71090% 0.80230% 43.96 48.79 92.75 0.7013366 30-Jun-03 4,031.17 420.25 219.25 -0.77037% 0.11409% 43.32 48.46 91.77 -0.2797
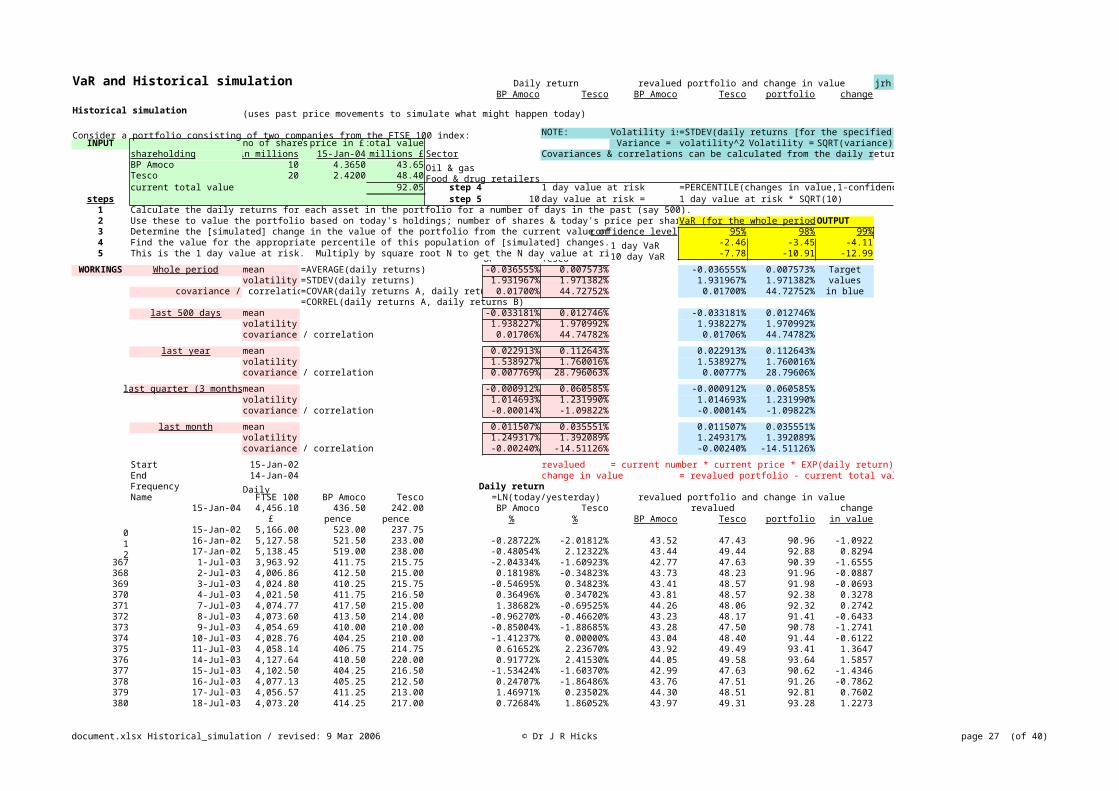
document.xlsx Historical_simulation / revised: 9 Mar 2006 © Dr J R Hicks page 27 (of 40)
VaR and Historical simulation Daily return revalued portfolio and change in value jrhBP Amoco Tesco BP Amoco Tesco portfolio change
Historical simulation (uses past price movements to simulate what might happen today)
Consider a portfolio consisting of two companies from the FTSE 100 index: NOTE: Volatility is=STDEV(daily returns [for the specified period])INPUT no of shares price in £ total value Variance = volatility^2 Volatility = SQRT(variance)
shareholding in millions 15-Jan-04 millions £ Sector Covariances & correlations can be calculated from the daily returns.BP Amoco 10 4.3650 43.65 Oil & gasTesco 20 2.4200 48.40 Food & drug retailerscurrent total value 92.05 step 4 1 day value at risk =PERCENTILE(changes in value,1-confidence level)
steps step 5 10 day value at risk = 1 day value at risk * SQRT(10)1 Calculate the daily returns for each asset in the portfolio for a number of days in the past (say 500).2 Use these to value the portfolio based on today's holdings; number of shares & today's price per sharVaR (for the whole periodOUTPUT3 Determine the [simulated] change in the value of the portfolio from the current value ofconfidence level 95% 98% 99%4 Find the value for the appropriate percentile of this population of [simulated] changes.1 day VaR -2.46 -3.45 -4.115 This is the 1 day value at risk. Multiply by square root N to get the N day value at ri10 day VaR -7.78 -10.91 -12.99BP Tesco
WORKINGS Whole period mean =AVERAGE(daily returns) -0.036555% 0.007573% -0.036555% 0.007573% Targetvolatility =STDEV(daily returns) 1.931967% 1.971382% 1.931967% 1.971382% values
covariance / correlatio=COVAR(daily returns A, daily retu 0.01700% 44.72752% 0.01700% 44.72752% in blue=CORREL(daily returns A, daily returns B)
last 500 days mean -0.033181% 0.012746% -0.033181% 0.012746%volatility 1.938227% 1.970992% 1.938227% 1.970992%covariance / correlation 0.01706% 44.74782% 0.01706% 44.74782%
last year mean 0.022913% 0.112643% 0.022913% 0.112643%volatility 1.538927% 1.760016% 1.538927% 1.760016%covariance / correlation 0.007769% 28.796063% 0.00777% 28.79606%
last quarter (3 months)mean -0.000912% 0.060585% -0.000912% 0.060585%volatility 1.014693% 1.231990% 1.014693% 1.231990%covariance / correlation -0.00014% -1.09822% -0.00014% -1.09822%
last month mean 0.011507% 0.035551% 0.011507% 0.035551%volatility 1.249317% 1.392089% 1.249317% 1.392089%covariance / correlation -0.00240% -14.51126% -0.00240% -14.51126%
Start 15-Jan-02 revalued = current number * current price * EXP(daily return)End 14-Jan-04 change in value = revalued portfolio - current total valueFrequency Daily Daily returnName FTSE 100 BP Amoco Tesco =LN(today/yesterday) revalued portfolio and change in value
15-Jan-04 4,456.10 436.50 242.00 BP Amoco Tesco revalued change£ pence pence % % BP Amoco Tesco portfolio in value
0 15-Jan-02 5,166.00 523.00 237.751 16-Jan-02 5,127.58 521.50 233.00 -0.28722% -2.01812% 43.52 47.43 90.96 -1.09222 17-Jan-02 5,138.45 519.00 238.00 -0.48054% 2.12322% 43.44 49.44 92.88 0.8294
367 1-Jul-03 3,963.92 411.75 215.75 -2.04334% -1.60923% 42.77 47.63 90.39 -1.6555368 2-Jul-03 4,006.86 412.50 215.00 0.18198% -0.34823% 43.73 48.23 91.96 -0.0887369 3-Jul-03 4,024.80 410.25 215.75 -0.54695% 0.34823% 43.41 48.57 91.98 -0.0693370 4-Jul-03 4,021.50 411.75 216.50 0.36496% 0.34702% 43.81 48.57 92.38 0.3278371 7-Jul-03 4,074.77 417.50 215.00 1.38682% -0.69525% 44.26 48.06 92.32 0.2742372 8-Jul-03 4,073.60 413.50 214.00 -0.96270% -0.46620% 43.23 48.17 91.41 -0.6433373 9-Jul-03 4,054.69 410.00 210.00 -0.85004% -1.88685% 43.28 47.50 90.78 -1.2741374 10-Jul-03 4,028.76 404.25 210.00 -1.41237% 0.00000% 43.04 48.40 91.44 -0.6122375 11-Jul-03 4,058.14 406.75 214.75 0.61652% 2.23670% 43.92 49.49 93.41 1.3647376 14-Jul-03 4,127.64 410.50 220.00 0.91772% 2.41530% 44.05 49.58 93.64 1.5857377 15-Jul-03 4,102.50 404.25 216.50 -1.53424% -1.60370% 42.99 47.63 90.62 -1.4346378 16-Jul-03 4,077.13 405.25 212.50 0.24707% -1.86486% 43.76 47.51 91.26 -0.7862379 17-Jul-03 4,056.57 411.25 213.00 1.46971% 0.23502% 44.30 48.51 92.81 0.7602380 18-Jul-03 4,073.20 414.25 217.00 0.72684% 1.86052% 43.97 49.31 93.28 1.2273

document.xlsx Historical_simulation / revised: 9 Mar 2006 © Dr J R Hicks page 28 (of 40)
VaR and Historical simulation Daily return revalued portfolio and change in value jrhBP Amoco Tesco BP Amoco Tesco portfolio change
Historical simulation (uses past price movements to simulate what might happen today)
Consider a portfolio consisting of two companies from the FTSE 100 index: NOTE: Volatility is=STDEV(daily returns [for the specified period])INPUT no of shares price in £ total value Variance = volatility^2 Volatility = SQRT(variance)
shareholding in millions 15-Jan-04 millions £ Sector Covariances & correlations can be calculated from the daily returns.BP Amoco 10 4.3650 43.65 Oil & gasTesco 20 2.4200 48.40 Food & drug retailerscurrent total value 92.05 step 4 1 day value at risk =PERCENTILE(changes in value,1-confidence level)
steps step 5 10 day value at risk = 1 day value at risk * SQRT(10)1 Calculate the daily returns for each asset in the portfolio for a number of days in the past (say 500).2 Use these to value the portfolio based on today's holdings; number of shares & today's price per sharVaR (for the whole periodOUTPUT3 Determine the [simulated] change in the value of the portfolio from the current value ofconfidence level 95% 98% 99%4 Find the value for the appropriate percentile of this population of [simulated] changes.1 day VaR -2.46 -3.45 -4.115 This is the 1 day value at risk. Multiply by square root N to get the N day value at ri10 day VaR -7.78 -10.91 -12.99BP Tesco
WORKINGS Whole period mean =AVERAGE(daily returns) -0.036555% 0.007573% -0.036555% 0.007573% Targetvolatility =STDEV(daily returns) 1.931967% 1.971382% 1.931967% 1.971382% values
covariance / correlatio=COVAR(daily returns A, daily retu 0.01700% 44.72752% 0.01700% 44.72752% in blue=CORREL(daily returns A, daily returns B)
last 500 days mean -0.033181% 0.012746% -0.033181% 0.012746%volatility 1.938227% 1.970992% 1.938227% 1.970992%covariance / correlation 0.01706% 44.74782% 0.01706% 44.74782%
last year mean 0.022913% 0.112643% 0.022913% 0.112643%volatility 1.538927% 1.760016% 1.538927% 1.760016%covariance / correlation 0.007769% 28.796063% 0.00777% 28.79606%
last quarter (3 months)mean -0.000912% 0.060585% -0.000912% 0.060585%volatility 1.014693% 1.231990% 1.014693% 1.231990%covariance / correlation -0.00014% -1.09822% -0.00014% -1.09822%
last month mean 0.011507% 0.035551% 0.011507% 0.035551%volatility 1.249317% 1.392089% 1.249317% 1.392089%covariance / correlation -0.00240% -14.51126% -0.00240% -14.51126%
Start 15-Jan-02 revalued = current number * current price * EXP(daily return)End 14-Jan-04 change in value = revalued portfolio - current total valueFrequency Daily Daily returnName FTSE 100 BP Amoco Tesco =LN(today/yesterday) revalued portfolio and change in value
15-Jan-04 4,456.10 436.50 242.00 BP Amoco Tesco revalued change£ pence pence % % BP Amoco Tesco portfolio in value
0 15-Jan-02 5,166.00 523.00 237.751 16-Jan-02 5,127.58 521.50 233.00 -0.28722% -2.01812% 43.52 47.43 90.96 -1.09222 17-Jan-02 5,138.45 519.00 238.00 -0.48054% 2.12322% 43.44 49.44 92.88 0.8294
381 21-Jul-03 4,044.28 415.00 216.00 0.18089% -0.46189% 43.73 48.18 91.91 -0.1440382 22-Jul-03 4,079.75 419.00 217.50 0.95924% 0.69204% 44.07 48.74 92.81 0.7568383 23-Jul-03 4,086.49 419.00 216.50 0.00000% -0.46083% 43.65 48.18 91.83 -0.2225384 24-Jul-03 4,149.60 423.00 226.75 0.95013% 4.62575% 44.07 50.69 94.76 2.7082385 25-Jul-03 4,131.18 416.00 218.00 -1.66869% -3.93530% 42.93 46.53 89.46 -2.5900386 28-Jul-03 4,148.82 422.75 219.25 1.60957% 0.57176% 44.36 48.68 93.04 0.9858387 29-Jul-03 4,137.01 419.50 217.00 -0.77175% -1.03153% 43.31 47.90 91.22 -0.8323388 30-Jul-03 4,141.17 422.75 217.00 0.77175% 0.00000% 43.99 48.40 92.39 0.3382389 31-Jul-03 4,157.02 426.00 215.25 0.76584% -0.80972% 43.99 48.01 92.00 -0.0548390 1-Aug-03 4,098.43 417.50 211.25 -2.01548% -1.87579% 42.78 47.50 90.28 -1.7704391 4-Aug-03 4,100.05 420.50 213.75 0.71599% 1.17648% 43.96 48.97 92.94 0.8864392 5-Aug-03 4,121.02 427.25 216.00 1.59248% 1.04713% 44.35 48.91 93.26 1.2102393 6-Aug-03 4,070.42 421.00 216.25 -1.47365% 0.11567% 43.01 48.46 91.47 -0.5825394 7-Aug-03 4,095.56 425.25 219.00 1.00444% 1.26366% 44.09 49.02 93.11 1.0561

document.xlsx Historical_simulation / revised: 9 Mar 2006 © Dr J R Hicks page 29 (of 40)
VaR and Historical simulation Daily return revalued portfolio and change in value jrhBP Amoco Tesco BP Amoco Tesco portfolio change
Historical simulation (uses past price movements to simulate what might happen today)
Consider a portfolio consisting of two companies from the FTSE 100 index: NOTE: Volatility is=STDEV(daily returns [for the specified period])INPUT no of shares price in £ total value Variance = volatility^2 Volatility = SQRT(variance)
shareholding in millions 15-Jan-04 millions £ Sector Covariances & correlations can be calculated from the daily returns.BP Amoco 10 4.3650 43.65 Oil & gasTesco 20 2.4200 48.40 Food & drug retailerscurrent total value 92.05 step 4 1 day value at risk =PERCENTILE(changes in value,1-confidence level)
steps step 5 10 day value at risk = 1 day value at risk * SQRT(10)1 Calculate the daily returns for each asset in the portfolio for a number of days in the past (say 500).2 Use these to value the portfolio based on today's holdings; number of shares & today's price per sharVaR (for the whole periodOUTPUT3 Determine the [simulated] change in the value of the portfolio from the current value ofconfidence level 95% 98% 99%4 Find the value for the appropriate percentile of this population of [simulated] changes.1 day VaR -2.46 -3.45 -4.115 This is the 1 day value at risk. Multiply by square root N to get the N day value at ri10 day VaR -7.78 -10.91 -12.99BP Tesco
WORKINGS Whole period mean =AVERAGE(daily returns) -0.036555% 0.007573% -0.036555% 0.007573% Targetvolatility =STDEV(daily returns) 1.931967% 1.971382% 1.931967% 1.971382% values
covariance / correlatio=COVAR(daily returns A, daily retu 0.01700% 44.72752% 0.01700% 44.72752% in blue=CORREL(daily returns A, daily returns B)
last 500 days mean -0.033181% 0.012746% -0.033181% 0.012746%volatility 1.938227% 1.970992% 1.938227% 1.970992%covariance / correlation 0.01706% 44.74782% 0.01706% 44.74782%
last year mean 0.022913% 0.112643% 0.022913% 0.112643%volatility 1.538927% 1.760016% 1.538927% 1.760016%covariance / correlation 0.007769% 28.796063% 0.00777% 28.79606%
last quarter (3 months)mean -0.000912% 0.060585% -0.000912% 0.060585%volatility 1.014693% 1.231990% 1.014693% 1.231990%covariance / correlation -0.00014% -1.09822% -0.00014% -1.09822%
last month mean 0.011507% 0.035551% 0.011507% 0.035551%volatility 1.249317% 1.392089% 1.249317% 1.392089%covariance / correlation -0.00240% -14.51126% -0.00240% -14.51126%
Start 15-Jan-02 revalued = current number * current price * EXP(daily return)End 14-Jan-04 change in value = revalued portfolio - current total valueFrequency Daily Daily returnName FTSE 100 BP Amoco Tesco =LN(today/yesterday) revalued portfolio and change in value
15-Jan-04 4,456.10 436.50 242.00 BP Amoco Tesco revalued change£ pence pence % % BP Amoco Tesco portfolio in value
0 15-Jan-02 5,166.00 523.00 237.751 16-Jan-02 5,127.58 521.50 233.00 -0.28722% -2.01812% 43.52 47.43 90.96 -1.09222 17-Jan-02 5,138.45 519.00 238.00 -0.48054% 2.12322% 43.44 49.44 92.88 0.8294
395 8-Aug-03 4,147.79 435.75 223.00 2.43915% 1.81000% 44.73 49.28 94.01 1.9618396 11-Aug-03 4,176.66 441.50 220.50 1.31093% -1.12741% 44.23 47.86 92.08 0.0334397 12-Aug-03 4,185.57 438.75 220.50 -0.62482% 0.00000% 43.38 48.40 91.78 -0.2719398 13-Aug-03 4,180.68 434.00 219.75 -1.08852% -0.34072% 43.18 48.24 91.41 -0.6372399 14-Aug-03 4,237.83 440.50 220.50 1.48659% 0.34072% 44.30 48.57 92.87 0.8189400 15-Aug-03 4,247.34 436.25 218.00 -0.96950% -1.14026% 43.23 47.85 91.08 -0.9699401 18-Aug-03 4,272.12 442.50 218.00 1.42250% 0.00000% 44.28 48.40 92.68 0.6254402 19-Aug-03 4,250.82 436.75 218.00 -1.30795% 0.00000% 43.08 48.40 91.48 -0.5672403 20-Aug-03 4,217.36 435.00 215.50 -0.40149% -1.15342% 43.48 47.84 91.32 -0.7299404 21-Aug-03 4,223.48 436.00 216.00 0.22962% 0.23175% 43.75 48.51 92.26 0.2126405 22-Aug-03 4,225.89 437.00 215.75 0.22910% -0.11581% 43.75 48.34 92.09 0.0441406 26-Aug-03 4,177.36 432.00 214.00 -1.15076% -0.81443% 43.15 48.01 91.16 -0.8920407 27-Aug-03 4,206.39 436.50 213.00 1.03628% -0.46838% 44.10 48.17 92.28 0.2285408 28-Aug-03 4,197.97 437.00 213.00 0.11448% 0.00000% 43.70 48.40 92.10 0.0500

document.xlsx Historical_simulation / revised: 9 Mar 2006 © Dr J R Hicks page 30 (of 40)
VaR and Historical simulation Daily return revalued portfolio and change in value jrhBP Amoco Tesco BP Amoco Tesco portfolio change
Historical simulation (uses past price movements to simulate what might happen today)
Consider a portfolio consisting of two companies from the FTSE 100 index: NOTE: Volatility is=STDEV(daily returns [for the specified period])INPUT no of shares price in £ total value Variance = volatility^2 Volatility = SQRT(variance)
shareholding in millions 15-Jan-04 millions £ Sector Covariances & correlations can be calculated from the daily returns.BP Amoco 10 4.3650 43.65 Oil & gasTesco 20 2.4200 48.40 Food & drug retailerscurrent total value 92.05 step 4 1 day value at risk =PERCENTILE(changes in value,1-confidence level)
steps step 5 10 day value at risk = 1 day value at risk * SQRT(10)1 Calculate the daily returns for each asset in the portfolio for a number of days in the past (say 500).2 Use these to value the portfolio based on today's holdings; number of shares & today's price per sharVaR (for the whole periodOUTPUT3 Determine the [simulated] change in the value of the portfolio from the current value ofconfidence level 95% 98% 99%4 Find the value for the appropriate percentile of this population of [simulated] changes.1 day VaR -2.46 -3.45 -4.115 This is the 1 day value at risk. Multiply by square root N to get the N day value at ri10 day VaR -7.78 -10.91 -12.99BP Tesco
WORKINGS Whole period mean =AVERAGE(daily returns) -0.036555% 0.007573% -0.036555% 0.007573% Targetvolatility =STDEV(daily returns) 1.931967% 1.971382% 1.931967% 1.971382% values
covariance / correlatio=COVAR(daily returns A, daily retu 0.01700% 44.72752% 0.01700% 44.72752% in blue=CORREL(daily returns A, daily returns B)
last 500 days mean -0.033181% 0.012746% -0.033181% 0.012746%volatility 1.938227% 1.970992% 1.938227% 1.970992%covariance / correlation 0.01706% 44.74782% 0.01706% 44.74782%
last year mean 0.022913% 0.112643% 0.022913% 0.112643%volatility 1.538927% 1.760016% 1.538927% 1.760016%covariance / correlation 0.007769% 28.796063% 0.00777% 28.79606%
last quarter (3 months)mean -0.000912% 0.060585% -0.000912% 0.060585%volatility 1.014693% 1.231990% 1.014693% 1.231990%covariance / correlation -0.00014% -1.09822% -0.00014% -1.09822%
last month mean 0.011507% 0.035551% 0.011507% 0.035551%volatility 1.249317% 1.392089% 1.249317% 1.392089%covariance / correlation -0.00240% -14.51126% -0.00240% -14.51126%
Start 15-Jan-02 revalued = current number * current price * EXP(daily return)End 14-Jan-04 change in value = revalued portfolio - current total valueFrequency Daily Daily returnName FTSE 100 BP Amoco Tesco =LN(today/yesterday) revalued portfolio and change in value
15-Jan-04 4,456.10 436.50 242.00 BP Amoco Tesco revalued change£ pence pence % % BP Amoco Tesco portfolio in value
0 15-Jan-02 5,166.00 523.00 237.751 16-Jan-02 5,127.58 521.50 233.00 -0.28722% -2.01812% 43.52 47.43 90.96 -1.09222 17-Jan-02 5,138.45 519.00 238.00 -0.48054% 2.12322% 43.44 49.44 92.88 0.8294
409 29-Aug-03 4,161.06 429.00 216.00 -1.84763% 1.39862% 42.85 49.08 91.93 -0.1174410 1-Sep-03 4,204.43 433.25 219.00 0.98580% 1.37933% 44.08 49.07 93.15 1.1047411 2-Sep-03 4,204.36 437.00 222.25 0.86183% 1.47311% 44.03 49.12 93.15 1.0961412 3-Sep-03 4,262.12 448.50 221.50 2.59755% -0.33803% 44.80 48.24 93.04 0.9854413 4-Sep-03 4,248.83 447.50 223.00 -0.22321% 0.67492% 43.55 48.73 92.28 0.2304414 5-Sep-03 4,257.20 441.50 223.75 -1.34985% 0.33576% 43.06 48.56 91.63 -0.4225415 8-Sep-03 4,292.09 449.50 225.50 1.79578% 0.77908% 44.44 48.78 93.22 1.1695416 9-Sep-03 4,263.91 442.50 224.00 -1.56954% -0.66741% 42.97 48.08 91.05 -1.0017417 10-Sep-03 4,252.08 441.00 224.50 -0.33956% 0.22297% 43.50 48.51 92.01 -0.0399418 11-Sep-03 4,242.19 443.00 224.50 0.45249% 0.00000% 43.85 48.40 92.25 0.1980419 12-Sep-03 4,237.81 438.75 224.50 -0.96400% 0.00000% 43.23 48.40 91.63 -0.4188420 15-Sep-03 4,260.92 436.00 228.50 -0.62875% 1.76605% 43.38 49.26 92.64 0.5888421 16-Sep-03 4,298.98 440.00 242.50 0.91325% 5.94655% 44.05 51.37 95.42 3.3659422 17-Sep-03 4,292.96 437.75 241.00 -0.51268% -0.62048% 43.43 48.10 91.53 -0.5226

document.xlsx Historical_simulation / revised: 9 Mar 2006 © Dr J R Hicks page 31 (of 40)
VaR and Historical simulation Daily return revalued portfolio and change in value jrhBP Amoco Tesco BP Amoco Tesco portfolio change
Historical simulation (uses past price movements to simulate what might happen today)
Consider a portfolio consisting of two companies from the FTSE 100 index: NOTE: Volatility is=STDEV(daily returns [for the specified period])INPUT no of shares price in £ total value Variance = volatility^2 Volatility = SQRT(variance)
shareholding in millions 15-Jan-04 millions £ Sector Covariances & correlations can be calculated from the daily returns.BP Amoco 10 4.3650 43.65 Oil & gasTesco 20 2.4200 48.40 Food & drug retailerscurrent total value 92.05 step 4 1 day value at risk =PERCENTILE(changes in value,1-confidence level)
steps step 5 10 day value at risk = 1 day value at risk * SQRT(10)1 Calculate the daily returns for each asset in the portfolio for a number of days in the past (say 500).2 Use these to value the portfolio based on today's holdings; number of shares & today's price per sharVaR (for the whole periodOUTPUT3 Determine the [simulated] change in the value of the portfolio from the current value ofconfidence level 95% 98% 99%4 Find the value for the appropriate percentile of this population of [simulated] changes.1 day VaR -2.46 -3.45 -4.115 This is the 1 day value at risk. Multiply by square root N to get the N day value at ri10 day VaR -7.78 -10.91 -12.99BP Tesco
WORKINGS Whole period mean =AVERAGE(daily returns) -0.036555% 0.007573% -0.036555% 0.007573% Targetvolatility =STDEV(daily returns) 1.931967% 1.971382% 1.931967% 1.971382% values
covariance / correlatio=COVAR(daily returns A, daily retu 0.01700% 44.72752% 0.01700% 44.72752% in blue=CORREL(daily returns A, daily returns B)
last 500 days mean -0.033181% 0.012746% -0.033181% 0.012746%volatility 1.938227% 1.970992% 1.938227% 1.970992%covariance / correlation 0.01706% 44.74782% 0.01706% 44.74782%
last year mean 0.022913% 0.112643% 0.022913% 0.112643%volatility 1.538927% 1.760016% 1.538927% 1.760016%covariance / correlation 0.007769% 28.796063% 0.00777% 28.79606%
last quarter (3 months)mean -0.000912% 0.060585% -0.000912% 0.060585%volatility 1.014693% 1.231990% 1.014693% 1.231990%covariance / correlation -0.00014% -1.09822% -0.00014% -1.09822%
last month mean 0.011507% 0.035551% 0.011507% 0.035551%volatility 1.249317% 1.392089% 1.249317% 1.392089%covariance / correlation -0.00240% -14.51126% -0.00240% -14.51126%
Start 15-Jan-02 revalued = current number * current price * EXP(daily return)End 14-Jan-04 change in value = revalued portfolio - current total valueFrequency Daily Daily returnName FTSE 100 BP Amoco Tesco =LN(today/yesterday) revalued portfolio and change in value
15-Jan-04 4,456.10 436.50 242.00 BP Amoco Tesco revalued change£ pence pence % % BP Amoco Tesco portfolio in value
0 15-Jan-02 5,166.00 523.00 237.751 16-Jan-02 5,127.58 521.50 233.00 -0.28722% -2.01812% 43.52 47.43 90.96 -1.09222 17-Jan-02 5,138.45 519.00 238.00 -0.48054% 2.12322% 43.44 49.44 92.88 0.8294
423 18-Sep-03 4,314.70 429.25 244.00 -1.96085% 1.23713% 42.80 49.00 91.80 -0.2451424 19-Sep-03 4,257.01 422.00 242.50 -1.70342% -0.61665% 42.91 48.10 91.02 -1.0348425 22-Sep-03 4,228.15 422.75 240.50 0.17757% -0.82816% 43.73 48.00 91.73 -0.3216426 23-Sep-03 4,221.71 419.00 243.25 -0.89101% 1.13696% 43.26 48.95 92.22 0.1662427 24-Sep-03 4,236.39 422.75 241.25 0.89101% -0.82560% 44.04 48.00 92.04 -0.0073428 25-Sep-03 4,202.18 426.25 235.00 0.82450% -2.62482% 44.01 47.15 91.16 -0.8925429 26-Sep-03 4,157.13 415.50 241.00 -2.55434% 2.52114% 42.55 49.64 92.18 0.1349430 29-Sep-03 4,142.72 415.00 239.50 -0.12041% -0.62435% 43.60 48.10 91.70 -0.3538431 30-Sep-03 4,091.31 413.00 241.00 -0.48309% 0.62435% 43.44 48.70 92.14 0.0928432 1-Oct-03 4,169.19 422.00 238.00 2.15577% -1.25263% 44.60 47.80 92.40 0.3487433 2-Oct-03 4,209.06 420.50 240.00 -0.35608% 0.83682% 43.49 48.81 92.30 0.2516434 3-Oct-03 4,274.04 428.75 242.50 1.94295% 1.03628% 44.51 48.90 93.41 1.3606435 6-Oct-03 4,270.10 432.25 241.00 0.81301% -0.62048% 44.01 48.10 92.11 0.0569436 7-Oct-03 4,271.96 432.25 244.50 0.00000% 1.44184% 43.65 49.10 92.75 0.7029

document.xlsx Historical_simulation / revised: 9 Mar 2006 © Dr J R Hicks page 32 (of 40)
VaR and Historical simulation Daily return revalued portfolio and change in value jrhBP Amoco Tesco BP Amoco Tesco portfolio change
Historical simulation (uses past price movements to simulate what might happen today)
Consider a portfolio consisting of two companies from the FTSE 100 index: NOTE: Volatility is=STDEV(daily returns [for the specified period])INPUT no of shares price in £ total value Variance = volatility^2 Volatility = SQRT(variance)
shareholding in millions 15-Jan-04 millions £ Sector Covariances & correlations can be calculated from the daily returns.BP Amoco 10 4.3650 43.65 Oil & gasTesco 20 2.4200 48.40 Food & drug retailerscurrent total value 92.05 step 4 1 day value at risk =PERCENTILE(changes in value,1-confidence level)
steps step 5 10 day value at risk = 1 day value at risk * SQRT(10)1 Calculate the daily returns for each asset in the portfolio for a number of days in the past (say 500).2 Use these to value the portfolio based on today's holdings; number of shares & today's price per sharVaR (for the whole periodOUTPUT3 Determine the [simulated] change in the value of the portfolio from the current value ofconfidence level 95% 98% 99%4 Find the value for the appropriate percentile of this population of [simulated] changes.1 day VaR -2.46 -3.45 -4.115 This is the 1 day value at risk. Multiply by square root N to get the N day value at ri10 day VaR -7.78 -10.91 -12.99BP Tesco
WORKINGS Whole period mean =AVERAGE(daily returns) -0.036555% 0.007573% -0.036555% 0.007573% Targetvolatility =STDEV(daily returns) 1.931967% 1.971382% 1.931967% 1.971382% values
covariance / correlatio=COVAR(daily returns A, daily retu 0.01700% 44.72752% 0.01700% 44.72752% in blue=CORREL(daily returns A, daily returns B)
last 500 days mean -0.033181% 0.012746% -0.033181% 0.012746%volatility 1.938227% 1.970992% 1.938227% 1.970992%covariance / correlation 0.01706% 44.74782% 0.01706% 44.74782%
last year mean 0.022913% 0.112643% 0.022913% 0.112643%volatility 1.538927% 1.760016% 1.538927% 1.760016%covariance / correlation 0.007769% 28.796063% 0.00777% 28.79606%
last quarter (3 months)mean -0.000912% 0.060585% -0.000912% 0.060585%volatility 1.014693% 1.231990% 1.014693% 1.231990%covariance / correlation -0.00014% -1.09822% -0.00014% -1.09822%
last month mean 0.011507% 0.035551% 0.011507% 0.035551%volatility 1.249317% 1.392089% 1.249317% 1.392089%covariance / correlation -0.00240% -14.51126% -0.00240% -14.51126%
Start 15-Jan-02 revalued = current number * current price * EXP(daily return)End 14-Jan-04 change in value = revalued portfolio - current total valueFrequency Daily Daily returnName FTSE 100 BP Amoco Tesco =LN(today/yesterday) revalued portfolio and change in value
15-Jan-04 4,456.10 436.50 242.00 BP Amoco Tesco revalued change£ pence pence % % BP Amoco Tesco portfolio in value
0 15-Jan-02 5,166.00 523.00 237.751 16-Jan-02 5,127.58 521.50 233.00 -0.28722% -2.01812% 43.52 47.43 90.96 -1.09222 17-Jan-02 5,138.45 519.00 238.00 -0.48054% 2.12322% 43.44 49.44 92.88 0.8294
437 8-Oct-03 4,268.59 430.50 241.50 -0.40568% -1.23458% 43.47 47.81 91.28 -0.7706438 9-Oct-03 4,313.88 435.00 242.75 1.03987% 0.51626% 44.11 48.65 92.76 0.7068439 10-Oct-03 4,311.02 433.75 238.50 -0.28777% -1.76628% 43.52 47.55 91.08 -0.9728440 13-Oct-03 4,362.34 441.75 238.75 1.82758% 0.10477% 44.46 48.45 92.91 0.8558441 14-Oct-03 4,334.09 435.25 237.75 -1.48235% -0.41973% 43.01 48.20 91.21 -0.8450442 15-Oct-03 4,368.82 432.75 235.50 -0.57604% -0.95088% 43.40 47.94 91.34 -0.7088443 16-Oct-03 4,339.68 426.50 234.75 -1.45478% -0.31898% 43.02 48.25 91.27 -0.7846444 17-Oct-03 4,343.97 426.25 239.25 -0.05863% 1.89879% 43.62 49.33 92.95 0.9022445 20-Oct-03 4,347.55 426.50 239.75 0.05863% 0.20877% 43.68 48.50 92.18 0.1268446 21-Oct-03 4,352.31 421.25 237.75 -1.23859% -0.83770% 43.11 48.00 91.11 -0.9411447 22-Oct-03 4,285.63 417.75 234.75 -0.83433% -1.26986% 43.29 47.79 91.08 -0.9734448 23-Oct-03 4,240.22 412.50 234.75 -1.26470% 0.00000% 43.10 48.40 91.50 -0.5486449 24-Oct-03 4,239.00 413.50 235.00 0.24213% 0.10644% 43.76 48.45 92.21 0.1574450 27-Oct-03 4,251.31 412.50 237.25 -0.24213% 0.95289% 43.54 48.86 92.41 0.3578

document.xlsx Historical_simulation / revised: 9 Mar 2006 © Dr J R Hicks page 33 (of 40)
VaR and Historical simulation Daily return revalued portfolio and change in value jrhBP Amoco Tesco BP Amoco Tesco portfolio change
Historical simulation (uses past price movements to simulate what might happen today)
Consider a portfolio consisting of two companies from the FTSE 100 index: NOTE: Volatility is=STDEV(daily returns [for the specified period])INPUT no of shares price in £ total value Variance = volatility^2 Volatility = SQRT(variance)
shareholding in millions 15-Jan-04 millions £ Sector Covariances & correlations can be calculated from the daily returns.BP Amoco 10 4.3650 43.65 Oil & gasTesco 20 2.4200 48.40 Food & drug retailerscurrent total value 92.05 step 4 1 day value at risk =PERCENTILE(changes in value,1-confidence level)
steps step 5 10 day value at risk = 1 day value at risk * SQRT(10)1 Calculate the daily returns for each asset in the portfolio for a number of days in the past (say 500).2 Use these to value the portfolio based on today's holdings; number of shares & today's price per sharVaR (for the whole periodOUTPUT3 Determine the [simulated] change in the value of the portfolio from the current value ofconfidence level 95% 98% 99%4 Find the value for the appropriate percentile of this population of [simulated] changes.1 day VaR -2.46 -3.45 -4.115 This is the 1 day value at risk. Multiply by square root N to get the N day value at ri10 day VaR -7.78 -10.91 -12.99BP Tesco
WORKINGS Whole period mean =AVERAGE(daily returns) -0.036555% 0.007573% -0.036555% 0.007573% Targetvolatility =STDEV(daily returns) 1.931967% 1.971382% 1.931967% 1.971382% values
covariance / correlatio=COVAR(daily returns A, daily retu 0.01700% 44.72752% 0.01700% 44.72752% in blue=CORREL(daily returns A, daily returns B)
last 500 days mean -0.033181% 0.012746% -0.033181% 0.012746%volatility 1.938227% 1.970992% 1.938227% 1.970992%covariance / correlation 0.01706% 44.74782% 0.01706% 44.74782%
last year mean 0.022913% 0.112643% 0.022913% 0.112643%volatility 1.538927% 1.760016% 1.538927% 1.760016%covariance / correlation 0.007769% 28.796063% 0.00777% 28.79606%
last quarter (3 months)mean -0.000912% 0.060585% -0.000912% 0.060585%volatility 1.014693% 1.231990% 1.014693% 1.231990%covariance / correlation -0.00014% -1.09822% -0.00014% -1.09822%
last month mean 0.011507% 0.035551% 0.011507% 0.035551%volatility 1.249317% 1.392089% 1.249317% 1.392089%covariance / correlation -0.00240% -14.51126% -0.00240% -14.51126%
Start 15-Jan-02 revalued = current number * current price * EXP(daily return)End 14-Jan-04 change in value = revalued portfolio - current total valueFrequency Daily Daily returnName FTSE 100 BP Amoco Tesco =LN(today/yesterday) revalued portfolio and change in value
15-Jan-04 4,456.10 436.50 242.00 BP Amoco Tesco revalued change£ pence pence % % BP Amoco Tesco portfolio in value
0 15-Jan-02 5,166.00 523.00 237.751 16-Jan-02 5,127.58 521.50 233.00 -0.28722% -2.01812% 43.52 47.43 90.96 -1.09222 17-Jan-02 5,138.45 519.00 238.00 -0.48054% 2.12322% 43.44 49.44 92.88 0.8294
451 28-Oct-03 4,272.93 408.50 236.50 -0.97443% -0.31662% 43.23 48.25 91.47 -0.5763452 29-Oct-03 4,265.65 407.25 237.25 -0.30647% 0.31662% 43.52 48.55 92.07 0.0199453 30-Oct-03 4,300.93 404.75 239.75 -0.61577% 1.04823% 43.38 48.91 92.29 0.2421454 31-Oct-03 4,287.59 409.00 236.25 1.04456% -1.47061% 44.11 47.69 91.80 -0.2482455 3-Nov-03 4,332.57 416.25 237.00 1.75709% 0.31696% 44.42 48.55 92.98 0.9274456 4-Nov-03 4,330.25 418.50 238.50 0.53908% 0.63092% 43.89 48.71 92.59 0.5423457 5-Nov-03 4,303.43 417.50 238.00 -0.23923% -0.20986% 43.55 48.30 91.84 -0.2058458 6-Nov-03 4,324.19 418.00 238.50 0.11969% 0.20986% 43.70 48.50 92.20 0.1540459 7-Nov-03 4,376.87 422.25 240.25 1.01161% 0.73107% 44.09 48.76 92.85 0.7989460 10-Nov-03 4,341.76 419.00 239.25 -0.77266% -0.41710% 43.31 48.20 91.51 -0.5374461 11-Nov-03 4,345.07 420.50 239.00 0.35736% -0.10455% 43.81 48.35 92.16 0.1057462 12-Nov-03 4,371.25 414.75 246.25 -1.37686% 2.98837% 43.05 49.87 92.92 0.8713463 13-Nov-03 4,373.04 413.25 243.00 -0.36232% -1.32858% 43.49 47.76 91.25 -0.7966464 14-Nov-03 4,396.99 419.25 246.50 1.44147% 1.43006% 44.28 49.10 93.38 1.3309
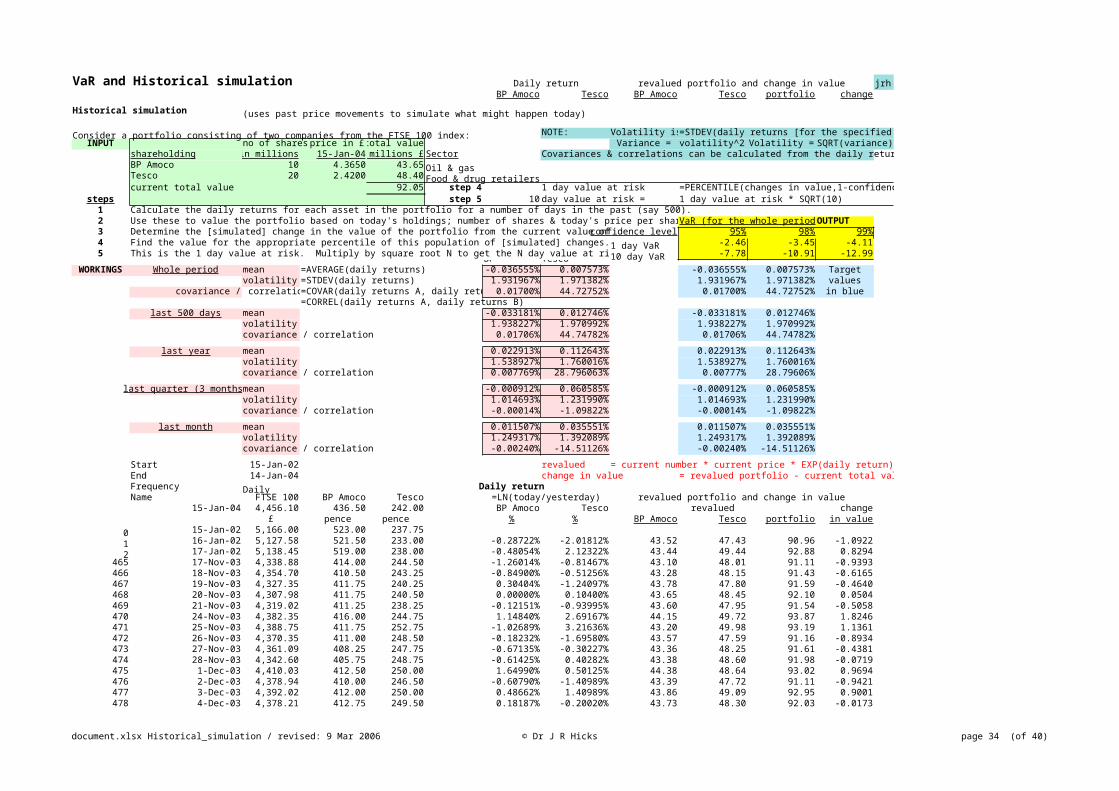
document.xlsx Historical_simulation / revised: 9 Mar 2006 © Dr J R Hicks page 34 (of 40)
VaR and Historical simulation Daily return revalued portfolio and change in value jrhBP Amoco Tesco BP Amoco Tesco portfolio change
Historical simulation (uses past price movements to simulate what might happen today)
Consider a portfolio consisting of two companies from the FTSE 100 index: NOTE: Volatility is=STDEV(daily returns [for the specified period])INPUT no of shares price in £ total value Variance = volatility^2 Volatility = SQRT(variance)
shareholding in millions 15-Jan-04 millions £ Sector Covariances & correlations can be calculated from the daily returns.BP Amoco 10 4.3650 43.65 Oil & gasTesco 20 2.4200 48.40 Food & drug retailerscurrent total value 92.05 step 4 1 day value at risk =PERCENTILE(changes in value,1-confidence level)
steps step 5 10 day value at risk = 1 day value at risk * SQRT(10)1 Calculate the daily returns for each asset in the portfolio for a number of days in the past (say 500).2 Use these to value the portfolio based on today's holdings; number of shares & today's price per sharVaR (for the whole periodOUTPUT3 Determine the [simulated] change in the value of the portfolio from the current value ofconfidence level 95% 98% 99%4 Find the value for the appropriate percentile of this population of [simulated] changes.1 day VaR -2.46 -3.45 -4.115 This is the 1 day value at risk. Multiply by square root N to get the N day value at ri10 day VaR -7.78 -10.91 -12.99BP Tesco
WORKINGS Whole period mean =AVERAGE(daily returns) -0.036555% 0.007573% -0.036555% 0.007573% Targetvolatility =STDEV(daily returns) 1.931967% 1.971382% 1.931967% 1.971382% values
covariance / correlatio=COVAR(daily returns A, daily retu 0.01700% 44.72752% 0.01700% 44.72752% in blue=CORREL(daily returns A, daily returns B)
last 500 days mean -0.033181% 0.012746% -0.033181% 0.012746%volatility 1.938227% 1.970992% 1.938227% 1.970992%covariance / correlation 0.01706% 44.74782% 0.01706% 44.74782%
last year mean 0.022913% 0.112643% 0.022913% 0.112643%volatility 1.538927% 1.760016% 1.538927% 1.760016%covariance / correlation 0.007769% 28.796063% 0.00777% 28.79606%
last quarter (3 months)mean -0.000912% 0.060585% -0.000912% 0.060585%volatility 1.014693% 1.231990% 1.014693% 1.231990%covariance / correlation -0.00014% -1.09822% -0.00014% -1.09822%
last month mean 0.011507% 0.035551% 0.011507% 0.035551%volatility 1.249317% 1.392089% 1.249317% 1.392089%covariance / correlation -0.00240% -14.51126% -0.00240% -14.51126%
Start 15-Jan-02 revalued = current number * current price * EXP(daily return)End 14-Jan-04 change in value = revalued portfolio - current total valueFrequency Daily Daily returnName FTSE 100 BP Amoco Tesco =LN(today/yesterday) revalued portfolio and change in value
15-Jan-04 4,456.10 436.50 242.00 BP Amoco Tesco revalued change£ pence pence % % BP Amoco Tesco portfolio in value
0 15-Jan-02 5,166.00 523.00 237.751 16-Jan-02 5,127.58 521.50 233.00 -0.28722% -2.01812% 43.52 47.43 90.96 -1.09222 17-Jan-02 5,138.45 519.00 238.00 -0.48054% 2.12322% 43.44 49.44 92.88 0.8294
465 17-Nov-03 4,338.88 414.00 244.50 -1.26014% -0.81467% 43.10 48.01 91.11 -0.9393466 18-Nov-03 4,354.70 410.50 243.25 -0.84900% -0.51256% 43.28 48.15 91.43 -0.6165467 19-Nov-03 4,327.35 411.75 240.25 0.30404% -1.24097% 43.78 47.80 91.59 -0.4640468 20-Nov-03 4,307.98 411.75 240.50 0.00000% 0.10400% 43.65 48.45 92.10 0.0504469 21-Nov-03 4,319.02 411.25 238.25 -0.12151% -0.93995% 43.60 47.95 91.54 -0.5058470 24-Nov-03 4,382.35 416.00 244.75 1.14840% 2.69167% 44.15 49.72 93.87 1.8246471 25-Nov-03 4,388.75 411.75 252.75 -1.02689% 3.21636% 43.20 49.98 93.19 1.1361472 26-Nov-03 4,370.35 411.00 248.50 -0.18232% -1.69580% 43.57 47.59 91.16 -0.8934473 27-Nov-03 4,361.09 408.25 247.75 -0.67135% -0.30227% 43.36 48.25 91.61 -0.4381474 28-Nov-03 4,342.60 405.75 248.75 -0.61425% 0.40282% 43.38 48.60 91.98 -0.0719475 1-Dec-03 4,410.03 412.50 250.00 1.64990% 0.50125% 44.38 48.64 93.02 0.9694476 2-Dec-03 4,378.94 410.00 246.50 -0.60790% -1.40989% 43.39 47.72 91.11 -0.9421477 3-Dec-03 4,392.02 412.00 250.00 0.48662% 1.40989% 43.86 49.09 92.95 0.9001478 4-Dec-03 4,378.21 412.75 249.50 0.18187% -0.20020% 43.73 48.30 92.03 -0.0173

document.xlsx Historical_simulation / revised: 9 Mar 2006 © Dr J R Hicks page 35 (of 40)
VaR and Historical simulation Daily return revalued portfolio and change in value jrhBP Amoco Tesco BP Amoco Tesco portfolio change
Historical simulation (uses past price movements to simulate what might happen today)
Consider a portfolio consisting of two companies from the FTSE 100 index: NOTE: Volatility is=STDEV(daily returns [for the specified period])INPUT no of shares price in £ total value Variance = volatility^2 Volatility = SQRT(variance)
shareholding in millions 15-Jan-04 millions £ Sector Covariances & correlations can be calculated from the daily returns.BP Amoco 10 4.3650 43.65 Oil & gasTesco 20 2.4200 48.40 Food & drug retailerscurrent total value 92.05 step 4 1 day value at risk =PERCENTILE(changes in value,1-confidence level)
steps step 5 10 day value at risk = 1 day value at risk * SQRT(10)1 Calculate the daily returns for each asset in the portfolio for a number of days in the past (say 500).2 Use these to value the portfolio based on today's holdings; number of shares & today's price per sharVaR (for the whole periodOUTPUT3 Determine the [simulated] change in the value of the portfolio from the current value ofconfidence level 95% 98% 99%4 Find the value for the appropriate percentile of this population of [simulated] changes.1 day VaR -2.46 -3.45 -4.115 This is the 1 day value at risk. Multiply by square root N to get the N day value at ri10 day VaR -7.78 -10.91 -12.99BP Tesco
WORKINGS Whole period mean =AVERAGE(daily returns) -0.036555% 0.007573% -0.036555% 0.007573% Targetvolatility =STDEV(daily returns) 1.931967% 1.971382% 1.931967% 1.971382% values
covariance / correlatio=COVAR(daily returns A, daily retu 0.01700% 44.72752% 0.01700% 44.72752% in blue=CORREL(daily returns A, daily returns B)
last 500 days mean -0.033181% 0.012746% -0.033181% 0.012746%volatility 1.938227% 1.970992% 1.938227% 1.970992%covariance / correlation 0.01706% 44.74782% 0.01706% 44.74782%
last year mean 0.022913% 0.112643% 0.022913% 0.112643%volatility 1.538927% 1.760016% 1.538927% 1.760016%covariance / correlation 0.007769% 28.796063% 0.00777% 28.79606%
last quarter (3 months)mean -0.000912% 0.060585% -0.000912% 0.060585%volatility 1.014693% 1.231990% 1.014693% 1.231990%covariance / correlation -0.00014% -1.09822% -0.00014% -1.09822%
last month mean 0.011507% 0.035551% 0.011507% 0.035551%volatility 1.249317% 1.392089% 1.249317% 1.392089%covariance / correlation -0.00240% -14.51126% -0.00240% -14.51126%
Start 15-Jan-02 revalued = current number * current price * EXP(daily return)End 14-Jan-04 change in value = revalued portfolio - current total valueFrequency Daily Daily returnName FTSE 100 BP Amoco Tesco =LN(today/yesterday) revalued portfolio and change in value
15-Jan-04 4,456.10 436.50 242.00 BP Amoco Tesco revalued change£ pence pence % % BP Amoco Tesco portfolio in value
0 15-Jan-02 5,166.00 523.00 237.751 16-Jan-02 5,127.58 521.50 233.00 -0.28722% -2.01812% 43.52 47.43 90.96 -1.09222 17-Jan-02 5,138.45 519.00 238.00 -0.48054% 2.12322% 43.44 49.44 92.88 0.8294
479 5-Dec-03 4,367.03 416.00 246.00 0.78432% -1.41274% 43.99 47.72 91.71 -0.3353480 8-Dec-03 4,359.84 419.00 244.25 0.71857% -0.71392% 43.96 48.06 92.02 -0.0295481 9-Dec-03 4,379.58 427.00 244.25 1.89131% 0.00000% 44.48 48.40 92.88 0.8334482 10-Dec-03 4,335.39 430.00 242.75 0.70012% -0.61602% 43.96 48.10 92.06 0.0094483 11-Dec-03 4,331.27 428.50 243.00 -0.34945% 0.10293% 43.50 48.45 91.95 -0.1024484 12-Dec-03 4,347.64 434.00 245.25 1.27538% 0.92167% 44.21 48.85 93.06 1.0084485 15-Dec-03 4,347.99 432.50 244.00 -0.34622% -0.51099% 43.50 48.15 91.65 -0.3976486 16-Dec-03 4,332.96 429.50 243.75 -0.69606% -0.10251% 43.35 48.35 91.70 -0.3524487 17-Dec-03 4,354.23 436.75 245.25 1.67392% 0.61350% 44.39 48.70 93.08 1.0347488 18-Dec-03 4,397.26 446.75 246.25 2.26382% 0.40692% 44.65 48.60 93.25 1.1968489 19-Dec-03 4,412.28 451.75 247.00 1.11298% 0.30411% 44.14 48.55 92.69 0.6359490 22-Dec-03 4,423.98 454.25 245.00 0.55188% -0.81301% 43.89 48.01 91.90 -0.1503491 23-Dec-03 4,440.87 448.50 249.50 -1.27390% 1.82007% 43.10 49.29 92.39 0.3364492 24-Dec-03 4,444.70 451.00 249.25 0.55587% -0.10025% 43.89 48.35 92.24 0.1948
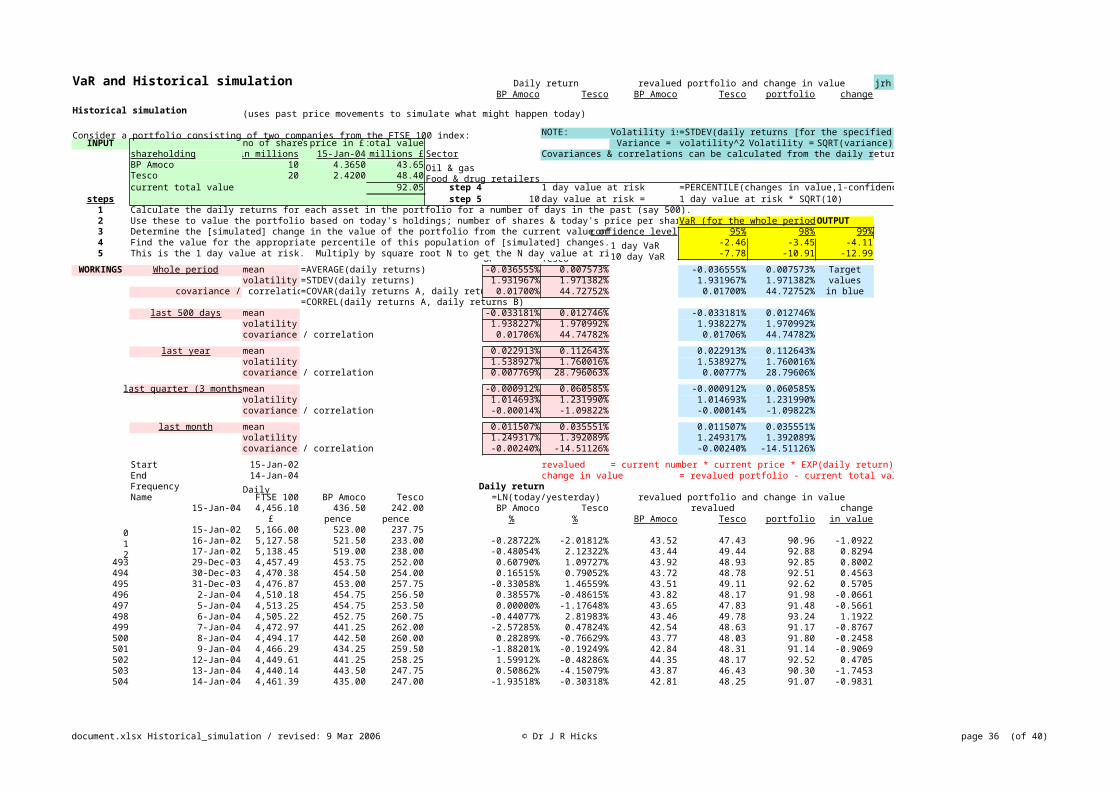
document.xlsx Historical_simulation / revised: 9 Mar 2006 © Dr J R Hicks page 36 (of 40)
VaR and Historical simulation Daily return revalued portfolio and change in value jrhBP Amoco Tesco BP Amoco Tesco portfolio change
Historical simulation (uses past price movements to simulate what might happen today)
Consider a portfolio consisting of two companies from the FTSE 100 index: NOTE: Volatility is=STDEV(daily returns [for the specified period])INPUT no of shares price in £ total value Variance = volatility^2 Volatility = SQRT(variance)
shareholding in millions 15-Jan-04 millions £ Sector Covariances & correlations can be calculated from the daily returns.BP Amoco 10 4.3650 43.65 Oil & gasTesco 20 2.4200 48.40 Food & drug retailerscurrent total value 92.05 step 4 1 day value at risk =PERCENTILE(changes in value,1-confidence level)
steps step 5 10 day value at risk = 1 day value at risk * SQRT(10)1 Calculate the daily returns for each asset in the portfolio for a number of days in the past (say 500).2 Use these to value the portfolio based on today's holdings; number of shares & today's price per sharVaR (for the whole periodOUTPUT3 Determine the [simulated] change in the value of the portfolio from the current value ofconfidence level 95% 98% 99%4 Find the value for the appropriate percentile of this population of [simulated] changes.1 day VaR -2.46 -3.45 -4.115 This is the 1 day value at risk. Multiply by square root N to get the N day value at ri10 day VaR -7.78 -10.91 -12.99BP Tesco
WORKINGS Whole period mean =AVERAGE(daily returns) -0.036555% 0.007573% -0.036555% 0.007573% Targetvolatility =STDEV(daily returns) 1.931967% 1.971382% 1.931967% 1.971382% values
covariance / correlatio=COVAR(daily returns A, daily retu 0.01700% 44.72752% 0.01700% 44.72752% in blue=CORREL(daily returns A, daily returns B)
last 500 days mean -0.033181% 0.012746% -0.033181% 0.012746%volatility 1.938227% 1.970992% 1.938227% 1.970992%covariance / correlation 0.01706% 44.74782% 0.01706% 44.74782%
last year mean 0.022913% 0.112643% 0.022913% 0.112643%volatility 1.538927% 1.760016% 1.538927% 1.760016%covariance / correlation 0.007769% 28.796063% 0.00777% 28.79606%
last quarter (3 months)mean -0.000912% 0.060585% -0.000912% 0.060585%volatility 1.014693% 1.231990% 1.014693% 1.231990%covariance / correlation -0.00014% -1.09822% -0.00014% -1.09822%
last month mean 0.011507% 0.035551% 0.011507% 0.035551%volatility 1.249317% 1.392089% 1.249317% 1.392089%covariance / correlation -0.00240% -14.51126% -0.00240% -14.51126%
Start 15-Jan-02 revalued = current number * current price * EXP(daily return)End 14-Jan-04 change in value = revalued portfolio - current total valueFrequency Daily Daily returnName FTSE 100 BP Amoco Tesco =LN(today/yesterday) revalued portfolio and change in value
15-Jan-04 4,456.10 436.50 242.00 BP Amoco Tesco revalued change£ pence pence % % BP Amoco Tesco portfolio in value
0 15-Jan-02 5,166.00 523.00 237.751 16-Jan-02 5,127.58 521.50 233.00 -0.28722% -2.01812% 43.52 47.43 90.96 -1.09222 17-Jan-02 5,138.45 519.00 238.00 -0.48054% 2.12322% 43.44 49.44 92.88 0.8294
493 29-Dec-03 4,457.49 453.75 252.00 0.60790% 1.09727% 43.92 48.93 92.85 0.8002494 30-Dec-03 4,470.38 454.50 254.00 0.16515% 0.79052% 43.72 48.78 92.51 0.4563495 31-Dec-03 4,476.87 453.00 257.75 -0.33058% 1.46559% 43.51 49.11 92.62 0.5705496 2-Jan-04 4,510.18 454.75 256.50 0.38557% -0.48615% 43.82 48.17 91.98 -0.0661497 5-Jan-04 4,513.25 454.75 253.50 0.00000% -1.17648% 43.65 47.83 91.48 -0.5661498 6-Jan-04 4,505.22 452.75 260.75 -0.44077% 2.81983% 43.46 49.78 93.24 1.1922499 7-Jan-04 4,472.97 441.25 262.00 -2.57285% 0.47824% 42.54 48.63 91.17 -0.8767500 8-Jan-04 4,494.17 442.50 260.00 0.28289% -0.76629% 43.77 48.03 91.80 -0.2458501 9-Jan-04 4,466.29 434.25 259.50 -1.88201% -0.19249% 42.84 48.31 91.14 -0.9069502 12-Jan-04 4,449.61 441.25 258.25 1.59912% -0.48286% 44.35 48.17 92.52 0.4705503 13-Jan-04 4,440.14 443.50 247.75 0.50862% -4.15079% 43.87 46.43 90.30 -1.7453504 14-Jan-04 4,461.39 435.00 247.00 -1.93518% -0.30318% 42.81 48.25 91.07 -0.9831
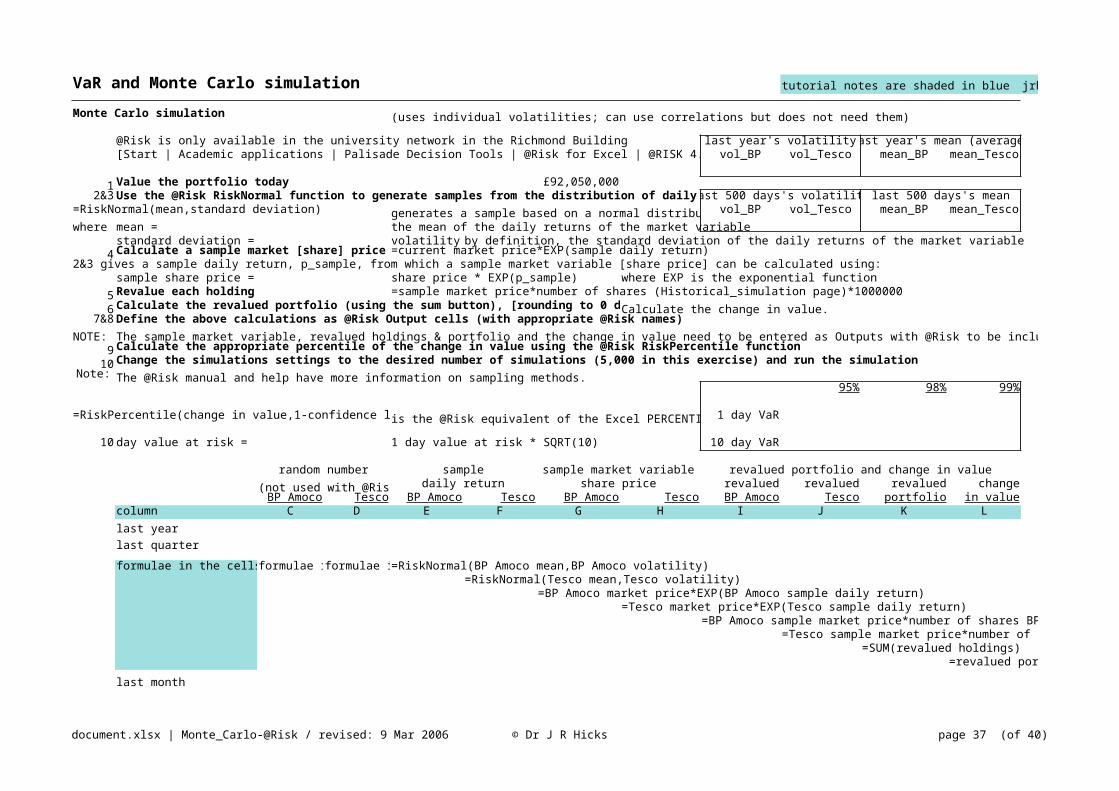
document.xlsx | Monte_Carlo-@Risk / revised: 9 Mar 2006 © Dr J R Hicks page 37 (of 40)
VaR and Monte Carlo simulation tutorial notes are shaded in blue jrh
Monte Carlo simulation (uses individual volatilities; can use correlations but does not need them)
@Risk is only available in the university network in the Richmond Building last year's volatilitylast year's mean (average)[Start | Academic applications | Palisade Decision Tools | @Risk for Excel | @RISK 4. vol_BP vol_Tesco mean_BP mean_Tesco
1 Value the portfolio today £92,050,0002&3 Use the @Risk RiskNormal function to generate samples from the distribution of daily last 500 days's volatilitylast 500 days's mean
=RiskNormal(mean,standard deviation) generates a sample based on a normal distribu vol_BP vol_Tesco mean_BP mean_Tescowhere mean = the mean of the daily returns of the market variable
standard deviation = volatility by definition, the standard deviation of the daily returns of the market variable4 Calculate a sample market [share] price =current market price*EXP(sample daily return)
2&3 gives a sample daily return, p_sample, from which a sample market variable [share price] can be calculated using:sample share price = share price * EXP(p_sample) where EXP is the exponential function
5 Revalue each holding =sample market price*number of shares (Historical_simulation page)*10000006 Calculate the revalued portfolio (using the sum button), [rounding to 0 dCalculate the change in value.
7&8 Define the above calculations as @Risk Output cells (with appropriate @Risk names)NOTE: The sample market variable, revalued holdings & portfolio and the change in value need to be entered as Outputs with @Risk to be inclu
9 Calculate the appropriate percentile of the change in value using the @Risk RiskPercentile function10 Change the simulations settings to the desired number of simulations (5,000 in this exercise) and run the simulation
Note: The @Risk manual and help have more information on sampling methods.95% 98% 99%
=RiskPercentile(change in value,1-confidence lis the @Risk equivalent of the Excel PERCENTI 1 day VaR
10 day value at risk = 1 day value at risk * SQRT(10) 10 day VaR
random number sample sample market variable revalued portfolio and change in value(not used with @Ris daily return share price revalued revalued revalued changeBP Amoco Tesco BP Amoco Tesco BP Amoco Tesco BP Amoco Tesco portfolio in value
column C D E F G H I J K Llast yearlast quarterformulae in the cellsformulae iformulae i=RiskNormal(BP Amoco mean,BP Amoco volatility)
=RiskNormal(Tesco mean,Tesco volatility)=BP Amoco market price*EXP(BP Amoco sample daily return)
=Tesco market price*EXP(Tesco sample daily return)=BP Amoco sample market price*number of shares BP Amoco*1000000
=Tesco sample market price*number of shares Tesco*1000000=SUM(revalued holdings)
=revalued portfolio-portfolio valuelast month
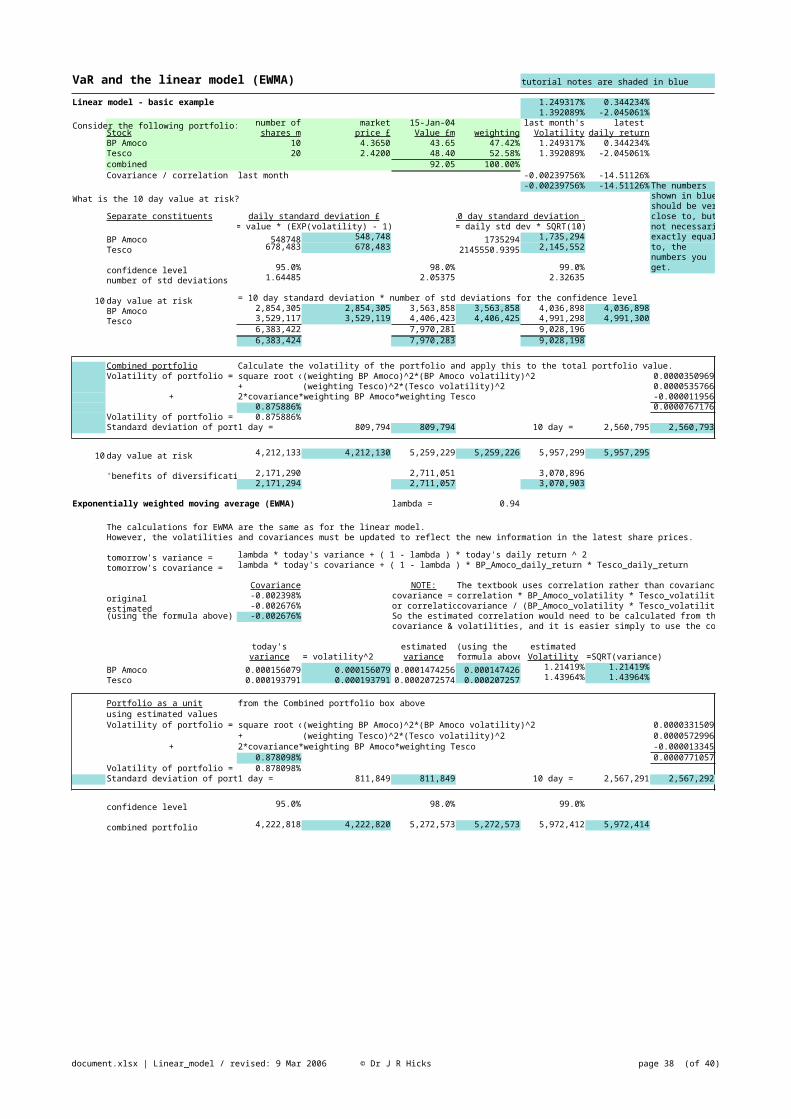
document.xlsx | Linear_model / revised: 9 Mar 2006 © Dr J R Hicks page 38 (of 40)
VaR and the linear model (EWMA) tutorial notes are shaded in blue
Linear model - basic example 1.249317% 0.344234%1.392089% -2.045061%
Consider the following portfolio: number of market 15-Jan-04 last month's latest Stock shares m price £ Value £m weighting Volatility daily returnBP Amoco 10 4.3650 43.65 47.42% 1.249317% 0.344234%Tesco 20 2.4200 48.40 52.58% 1.392089% -2.045061%combined 92.05 100.00%Covariance / correlation last month -0.00239756% -14.51126%
-0.00239756% -14.51126% The numbersWhat is the 10 day value at risk? shown in blue
should be verySeparate constituents daily standard deviation £ 10 day standard deviation £ close to, but
= value * (EXP(volatility) - 1) = daily std dev * SQRT(10) not necessarilyBP Amoco 548748 548,748 1735294 1,735,294 exactly equalTesco 678,483 678,483 2145550.9395 2,145,552 to, the
numbers you confidence level 95.0% 98.0% 99.0% get.number of std deviations 1.64485 2.05375 2.32635
10 day value at risk = 10 day standard deviation * number of std deviations for the confidence levelBP Amoco 2,854,305 2,854,305 3,563,858 3,563,858 4,036,898 4,036,898Tesco 3,529,117 3,529,119 4,406,423 4,406,425 4,991,298 4,991,300
6,383,422 7,970,281 9,028,1966,383,424 7,970,283 9,028,198
Combined portfolio Calculate the volatility of the portfolio and apply this to the total portfolio value.Volatility of portfolio = square root o(weighting BP Amoco)^2*(BP Amoco volatility)^2 0.0000350969
+ (weighting Tesco)^2*(Tesco volatility)^2 0.0000535766+ 2*covariance*weighting BP Amoco*weighting Tesco -0.000011956
0.875886% 0.0000767176Volatility of portfolio = 0.875886%Standard deviation of port1 day = 809,794 809,794 10 day = 2,560,795 2,560,793
10 day value at risk 4,212,133 4,212,130 5,259,229 5,259,226 5,957,299 5,957,295
'benefits of diversificati 2,171,290 2,711,051 3,070,8962,171,294 2,711,057 3,070,903
Exponentially weighted moving average (EWMA) lambda = 0.94
The calculations for EWMA are the same as for the linear model.However, the volatilities and covariances must be updated to reflect the new information in the latest share prices.
tomorrow's variance = lambda * today's variance + ( 1 - lambda ) * today's daily return ^ 2tomorrow's covariance = lambda * today's covariance + ( 1 - lambda ) * BP_Amoco_daily_return * Tesco_daily_return
Covariance NOTE: The textbook uses correlation rather than covariance.original -0.002398% covariance = correlation * BP_Amoco_volatility * Tesco_volatilityestimated -0.002676% or correlatiocovariance / (BP_Amoco_volatility * Tesco_volatility)(using the formula above) -0.002676% So the estimated correlation would need to be calculated from the estimated
covariance & volatilities, and it is easier simply to use the covariance directly.
today's estimated (using the estimatedvariance = volatility^2 variance formula above Volatility =SQRT(variance)
BP Amoco 0.000156079 0.000156079 0.0001474256 0.000147426 1.21419% 1.21419%Tesco 0.000193791 0.000193791 0.0002072574 0.000207257 1.43964% 1.43964%
Portfolio as a unit from the Combined portfolio box aboveusing estimated valuesVolatility of portfolio = square root o(weighting BP Amoco)^2*(BP Amoco volatility)^2 0.0000331509
+ (weighting Tesco)^2*(Tesco volatility)^2 0.0000572996+ 2*covariance*weighting BP Amoco*weighting Tesco -0.000013345
0.878098% 0.0000771057Volatility of portfolio = 0.878098%Standard deviation of port1 day = 811,849 811,849 10 day = 2,567,291 2,567,292
confidence level 95.0% 98.0% 99.0%
combined portfolio 4,222,818 4,222,820 5,272,573 5,272,573 5,972,412 5,972,414
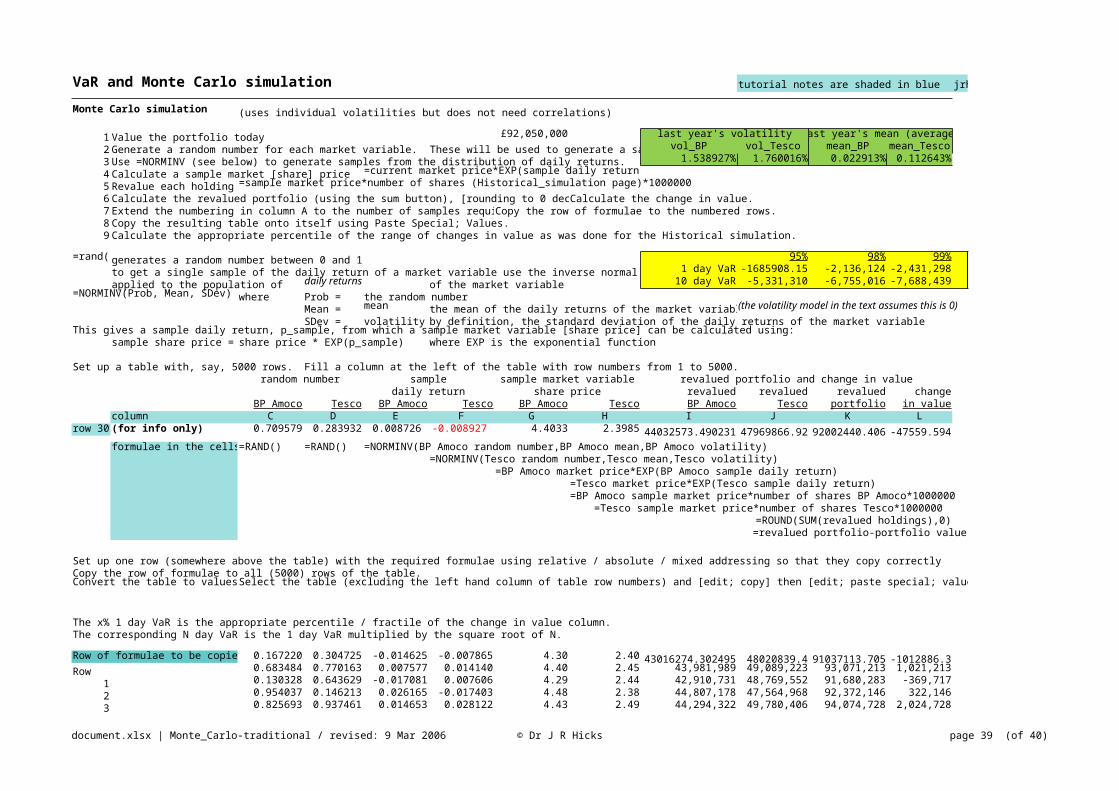
document.xlsx | Monte_Carlo-traditional / revised: 9 Mar 2006 © Dr J R Hicks page 39 (of 40)
VaR and Monte Carlo simulation tutorial notes are shaded in blue jrh
Monte Carlo simulation (uses individual volatilities but does not need correlations)
1 Value the portfolio today £92,050,000 last year's volatility last year's mean (average)2 Generate a random number for each market variable. These will be used to generate a sa vol_BP vol_Tesco mean_BP mean_Tesco3 Use =NORMINV (see below) to generate samples from the distribution of daily returns. 1.538927% 1.760016% 0.022913% 0.112643%4 Calculate a sample market [share] price =current market price*EXP(sample daily return)5 Revalue each holding =sample market price*number of shares (Historical_simulation page)*10000006 Calculate the revalued portfolio (using the sum button), [rounding to 0 decCalculate the change in value.7 Extend the numbering in column A to the number of samples requiCopy the row of formulae to the numbered rows.8 Copy the resulting table onto itself using Paste Special; Values.9 Calculate the appropriate percentile of the range of changes in value as was done for the Historical simulation.
=rand()generates a random number between 0 and 1 95% 98% 99%to get a single sample of the daily return of a market variable use the inverse normal 1 day VaR -1685908.15 -2,136,124 -2,431,298applied to the population of daily returns of the market variable 10 day VaR -5,331,310 -6,755,016 -7,688,439
=NORMINV(Prob, Mean, SDev) where Prob = the random numberMean = mean the mean of the daily returns of the market variabl(the volatility model in the text assumes this is 0)SDev = volatility by definition, the standard deviation of the daily returns of the market variable
This gives a sample daily return, p_sample, from which a sample market variable [share price] can be calculated using:sample share price = share price * EXP(p_sample) where EXP is the exponential function
Set up a table with, say, 5000 rows. Fill a column at the left of the table with row numbers from 1 to 5000.random number sample sample market variable revalued portfolio and change in value
daily return share price revalued revalued revalued changeBP Amoco Tesco BP Amoco Tesco BP Amoco Tesco BP Amoco Tesco portfolio in value
column C D E F G H I J K Lrow 30 (for info only) 0.709579 0.283932 0.008726 -0.008927 4.4033 2.3985 44032573.490231 47969866.92 92002440.406 -47559.594
formulae in the cells=RAND() =RAND() =NORMINV(BP Amoco random number,BP Amoco mean,BP Amoco volatility)=NORMINV(Tesco random number,Tesco mean,Tesco volatility)
=BP Amoco market price*EXP(BP Amoco sample daily return)=Tesco market price*EXP(Tesco sample daily return)=BP Amoco sample market price*number of shares BP Amoco*1000000
=Tesco sample market price*number of shares Tesco*1000000=ROUND(SUM(revalued holdings),0)=revalued portfolio-portfolio value
Set up one row (somewhere above the table) with the required formulae using relative / absolute / mixed addressing so that they copy correctlyCopy the row of formulae to all (5000) rows of the table.Convert the table to valuesSelect the table (excluding the left hand column of table row numbers) and [edit; copy] then [edit; paste special; values].
The x% 1 day VaR is the appropriate percentile / fractile of the change in value column.The corresponding N day VaR is the 1 day VaR multiplied by the square root of N.
Row of formulae to be copie 0.167220 0.304725 -0.014625 -0.007865 4.30 2.40 43016274.302495 48020839.4 91037113.705 -1012886.3Row 0.683484 0.770163 0.007577 0.014140 4.40 2.45 43,981,989 49,089,223 93,071,213 1,021,213
1 0.130328 0.643629 -0.017081 0.007606 4.29 2.44 42,910,731 48,769,552 91,680,283 -369,7172 0.954037 0.146213 0.026165 -0.017403 4.48 2.38 44,807,178 47,564,968 92,372,146 322,1463 0.825693 0.937461 0.014653 0.028122 4.43 2.49 44,294,322 49,780,406 94,074,728 2,024,728

BP_Amoco_10_day_sd =Linear_model!$F$17BP_Amoco_daily_return =Linear_model!$H$8BP_Amoco_daily_sd =Linear_model!$C$17BP_Amoco_market_price =Linear_model!$D$8BP_Amoco_number_of_shares =Linear_model!$C$8BP_Amoco_value =Linear_model!$E$8BP_Amoco_volatility =Linear_model!$G$8BP_Amoco_weighting =Linear_model!$F$8correlation =Linear_model!$H$11covariance =Linear_model!$G$11historical_portfolio_value =Historical_simulation!$H$11lambda =Linear_model!$F$44number_of_days =Linear_model!$A$23portfolio_10_day_sd =Linear_model!$H$36portfolio_daily_sd =Linear_model!$D$36portfolio_total_value =Linear_model!$E$10portfolio_value ='Monte_Carlo-@Risk'!$G$9portfolio_volatility =Linear_model!$C$35Tesco_10_day_sd =Linear_model!$F$18Tesco_daily_return =Linear_model!$H$9Tesco_daily_sd =Linear_model!$C$18Tesco_market_price =Linear_model!$D$9Tesco_number_of_shares =Linear_model!$C$9Tesco_value =Linear_model!$E$9Tesco_volatility =Linear_model!$G$9Tesco_weighting =Linear_model!$F$9
RiskAutoStopPercChange =1.5RiskExcelReportsGoInNewWorkbook =TRUERiskExcelReportsToGenerate =0RiskGenerateExcelReportsAtEndOfSimulation=FALSERiskRealTimeResults =FALSERiskReportGraphFormat =0RiskResultsUpdateFreq =100RiskShowRiskWindowAtEndOfSimulation =TRUERiskTemplateSheetName ="myTemplate"


