Embed Size (px)
Citation preview
LETTERdoi:10.1038/nature14249
Ancient proteins resolve the evolutionary history ofDarwin’s South American ungulatesFrido Welker1,2, Matthew J. Collins1, Jessica A. Thomas1, Marc Wadsley1, Selina Brace3, Enrico Cappellini4, Samuel T. Turvey5,Marcelo Reguero6, Javier N. Gelfo6, Alejandro Kramarz7, Joachim Burger8, Jane Thomas-Oates9, David A. Ashford10,Peter D. Ashton10, Keri Rowsell1, Duncan M. Porter11, Benedikt Kessler12, Roman Fischer12, Carsten Baessmann13,Stephanie Kaspar13, Jesper V. Olsen14, Patrick Kiley15, James A. Elliott15, Christian D. Kelstrup14, Victoria Mullin16,Michael Hofreiter1,17, Eske Willerslev4, Jean-Jacques Hublin2, Ludovic Orlando4, Ian Barnes3 & Ross D. E. MacPhee18
No large group of recently extinct placental mammals remains asevolutionarily cryptic as the approximately 280 genera grouped as‘South American native ungulates’. To Charles Darwin1,2, who firstcollected their remains, they included perhaps the ‘strangest animal[s]ever discovered’. Today, much like 180 years ago, it is no clearerwhether they had one origin or several, arose before or after theCretaceous/Palaeogene transition 66.2 million years ago3, or aremore likely to belong with the elephants and sirenians of superorderAfrotheria than with the euungulates (cattle, horses, and allies) ofsuperorder Laurasiatheria4–6. Morphology-based analyses have provedunconvincing because convergences are pervasive among unrelatedungulate-like placentals. Approaches using ancient DNA have alsobeen unsuccessful, probably because of rapid DNA degradationin semitropical and temperate deposits. Here we apply proteomicanalysis to screen bone samples of the Late Quaternary SouthAmerican native ungulate taxa Toxodon (Notoungulata) andMacrauchenia (Litopterna) for phylogenetically informative protein
sequences. For each ungulate, we obtain approximately 90% directsequence coverage of type I collagen a1- and a2-chains, representingapproximately 900 of 1,140 amino-acid residues for each subunit. Aphylogeny is estimated from an alignment of these fossil sequenceswith collagen (I) gene transcripts from available mammalian genomesor mass spectrometrically derived sequence data obtained for this study.The resulting consensus tree agrees well with recent higher-levelmammalian phylogenies7–9. Toxodon and Macrauchenia form amonophyletic group whose sister taxon is not Afrotheria or anyof its constituent clades as recently claimed5,6, but instead crownPerissodactyla (horses, tapirs, and rhinoceroses). These results areconsistent with the origin of at least some South American nativeungulates4,6 from ‘condylarths’, a paraphyletic assembly of archaicplacentals. With ongoing improvements in instrumentation andanalytical procedures, proteomics may produce a revolution insystematics such as that achieved by genomics, but with the possibilityof reaching much further back in time.
1BioArCh, University of York, York YO10 5DD, UK. 2Department of Human Evolution, Max Planck Institute for Evolutionary Anthropology, 04103 Leipzig, Germany. 3Department of Earth Sciences, NaturalHistory Museum, London SW7 5BD, UK. 4Centre for GeoGenetics, Natural History Museum of Denmark, University of Copenhagen, Øster Voldgade 5–7, 1350 Copenhagen K, Denmark. 5Institute of Zoology,Zoological Society of London, London NW1 4RY, UK. 6CONICET- Division Paleontologıa de Vertebrados, Museo de La Plata. Facultad de Ciencias Naturales y Museo de La Plata, Universidad Nacional de LaPlata. Paseo del Bosque s/n, B1900FWA, La Plata, Argentina. 7Seccion Paleontologıa de Vertebrados. Museo Argentino de Ciencias Naturales ‘‘Bernardino Rivadavia’’, 470 Angel Gallardo Av., C1405DJR,Buenos Aires, Argentina. 8Institute of Anthropology, Johannes Gutenberg-University, Anselm-Franz-von-Bentzel-Weg 7, D-55128 Mainz, Germany. 9Department of Chemistry, University of York, York YO105DD, UK. 10Bioscience Technology Facility, Department of Biology, University of York, York YO10 5DD, UK. 11Department of Biological Sciences, Virginia Polytechnic Institute and State University,Blacksburg, Virginia 24061, USA. 12Target Discovery Institute, Nuffield Department of Medicine, University of Oxford, Roosevelt Drive, Oxford OX3 7FZ, UK. 13Applications Development, Bruker DaltonikGmbH, 28359 Bremen, Germany. 14Novo Nordisk Foundation Center for Protein Research, Faculty of Health Sciences, University of Copenhagen, Blegdamsvej 3b, 2200 Copenhagen, Denmark.15Department of Materials Science and Metallurgy, University of Cambridge, Cambridge CB3 0FS, UK. 16Smurfit Institute of Genetics, Trinity College Dublin, Dublin 2, Ireland. 17Institute for Biochemistryand Biology, Karl-Liebknecht-Strasse 24–25, 14476 Potsdam OT Golm, Germany. 18Department of Mammalogy, American Museum of Natural History, New York, New York 10024, USA.
Darwin’s samplesSamples used in this studyMS/MS
Survival of 80-bp DNA fragments at 10 ka (%)
Dea
mid
ated
glu
tam
ines
(%)
Number of observed glutamines M. patachonica
T. platensisEquus sp.
Mylodon sp.
a
HMS Beag
le
0 100 200 300 4000
20
40
60
80
100
cb
0–0.
1
0.1–
0.2
0.2–
0.3
0.3–
0.4
4.1–
0.5
0.5–
0.6
0.6–
0.7
0.7–
0.8
0.8–
0.90.
9–1
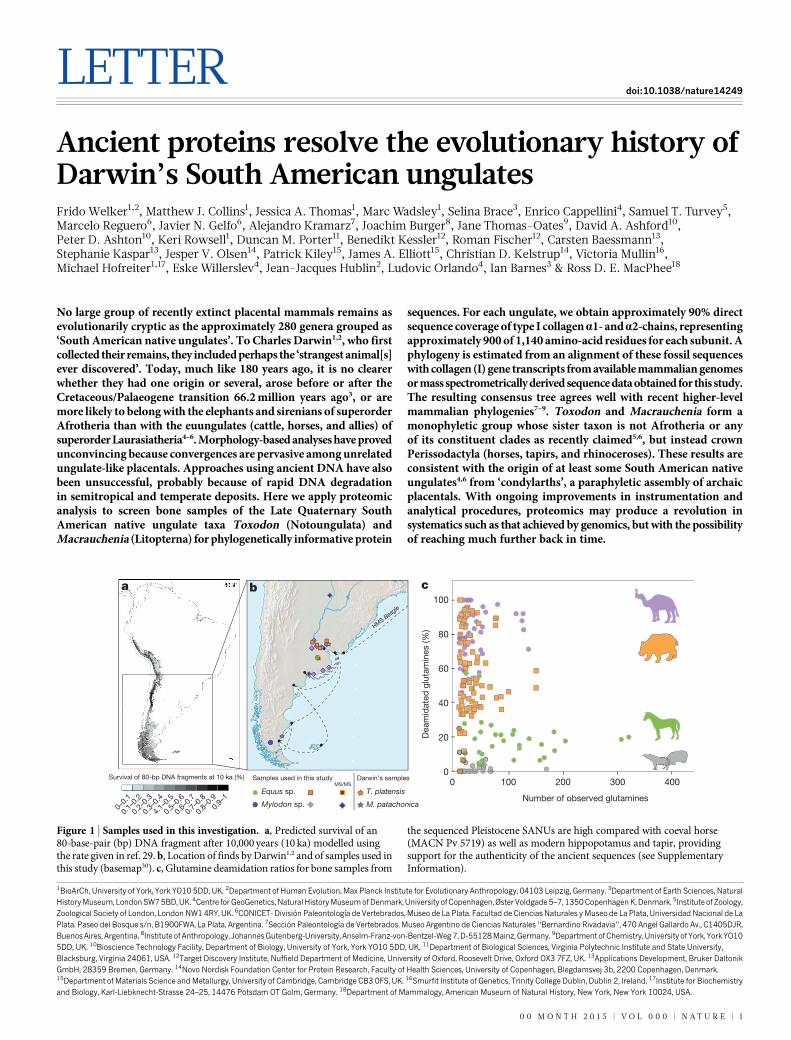
Figure 1 | Samples used in this investigation. a, Predicted survival of an80-base-pair (bp) DNA fragment after 10,000 years (10 ka) modelled usingthe rate given in ref. 29. b, Location of finds by Darwin1,2 and of samples used inthis study (basemap30). c, Glutamine deamidation ratios for bone samples from
the sequenced Pleistocene SANUs are high compared with coeval horse(MACN Pv 5719) as well as modern hippopotamus and tapir, providingsupport for the authenticity of the ancient sequences (see SupplementaryInformation).
0 0 M O N T H 2 0 1 5 | V O L 0 0 0 | N A T U R E | 1
South American native ungulates (SANUs) are conventionally orga-nized into five orders (Litopterna, Notoungulata, Astrapotheria, Xen-ungulata, and Pyrotheria) that are sometimes grouped together as aseparate placental superorder (Meridiungulata)10. They appear very earlyin the Palaeogene record and evolved thereafter along many divergentlines, as their abundant fossil record attests. Most lineages had becomeextinct by the end of the Miocene epoch, although a few species of lito-pterns and notoungulates persisted into the Late Pleistocene epoch.Despite continuing interest in their evolutionary history (for example
refs 5, 11–14), phylogenetic relationships of the major SANU clades toone another and to other placentals remain poorly understood (seeSupplementary Information). Although some recent investigations (forexample refs 4–6) have suggested that basal South American membersof Litopterna conclusively group with certain Holarctic condylarths,and are thus best placed in Euungulata (Laurasiatheria), several otherstudies claim to have identified potential synapomorphies linking var-ious SANU taxa with Afrotheria5,6,15,16. This latter view is broadly con-sistent with such indicators as prolonged late Mesozoic faunal exchange
0.02
1
0.96
1
1
1
1
0.58
0.97
0.77
0.99
1
1
1
0.79
0.56
1
0.56
1
1
0.56
1
1
1
1
0.99
1
1
1
0.98
0.96
0.96
1
1
1
0.94
1
0.99
1
0.53
1
1
1
1
1
0.99
1
1
1
0.99
1
0.86
1
1
0.99
1
1
1
0.99
1
0.64
1
1
1
0.64
0.89
1
1
1
0.84
0.96
1
1
1
Gallus gallus
Mylodon sp
Mus musculus
Ictidomys tridecemlineatus
Pan paniscus
Nomascus leucogenys
Dasypus novemcinctus
Microcebus murinus
Jaculus jaculus
Cyclopes didactylus
Pan troglodytes
Pongo abelii
Choloepus hoffmanni
Ornithorhynchus anatinus
Tupaia chinensis
Sarcophilus harrisii
Dipodomys ordii
Saimiri boliviensis
Pongo pygmaeus
Otolemur garnettii
Macaca mulatta
Monodelphis domestica
Homo sapiens
Macropus eugenii
Heterocephalus glaber
Myotis davidii
Chinchilla lanigera
Equus caballus
Eptesicus fuscus
Erinaceus europaeus
Myotis brandtii
Tapirus terrestris
Pteropus alecto
Ochotona princeps
Rattus norvegicus
Sorex araneus
Oryctolagus cuniculus
Mesocricetus auratus
Equus asinus
Myotis lucifugus
Ceratotherium simum
Condylura cristata
Cavia porcellus
Pteropus vampyrus
Octodon degus
Cricetulus griseus
Bubalus bubalis
Panthera tigris
Orcinus orca
Odobenus rosmarus
Toxodon sp
Canis lupus
Felis catus
Sus scrofa
Procavia capensis
Orycteropus afer
Bos primigenius
Ovis aries
Vicugna pacos
Tursiops truncatus
Hippopotamus amphibius
Physeter catodon
Camelus bactrianus
Mustela putorius
Macrauchenia sp
Pantholops hodgsonii
Leptonychotes weddellii
Echinops telfairi
Loxodonta africana
Mammut sp
Orycteropus afer
Elephantulus edwardii
Ailuropoda melanoleuca
Trichechus manatus
Chrysochloris asiatica
Mammuthus sp
Toxodon sp.
Tapirus terrestris
Equus caballus
Ceratotherium simum
Equus asinus
Equus sp. (Tapalqué)
1
1
1
1
1
1
Panperissodactyla
Equus sp. (Tapalqué)
Marsupialia
Afrotheria
Carnivora
Aves Monotremata
Artiodactyla
Perissodactyla
Chiroptera
Lipotyphla
Lagomorpha
Rodentia
Scandentia
Primates
Xenarthra
Macrauchenia sp.
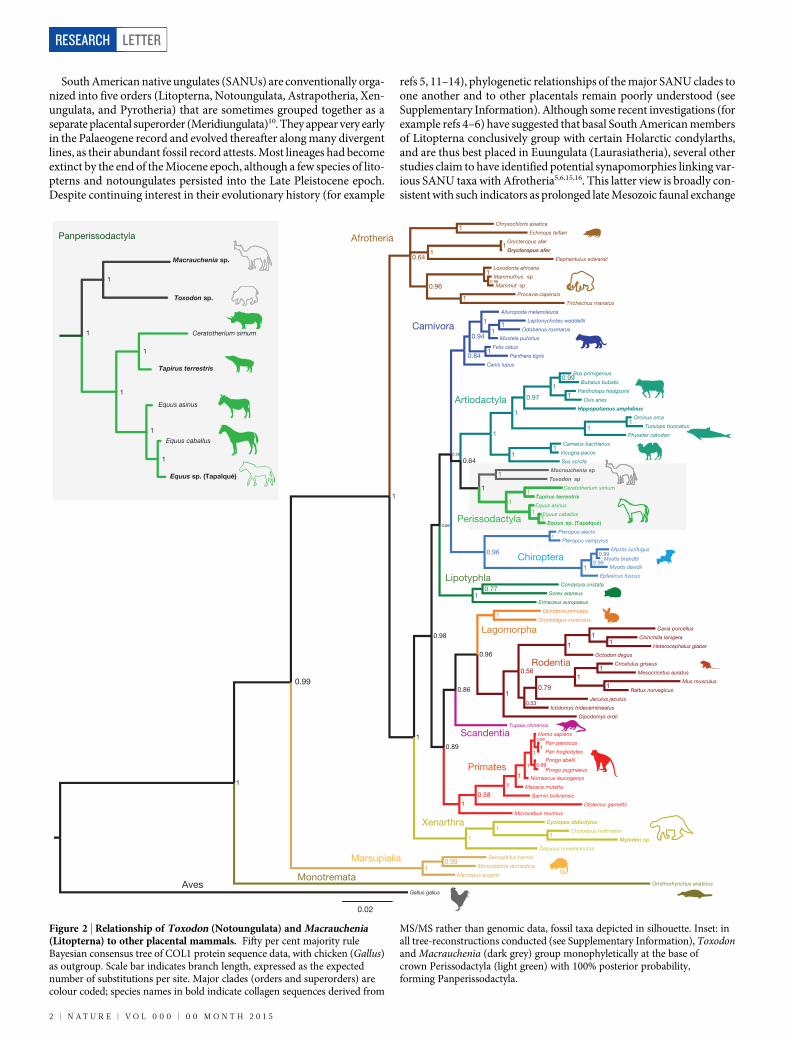
Figure 2 | Relationship of Toxodon (Notoungulata) and Macrauchenia(Litopterna) to other placental mammals. Fifty per cent majority ruleBayesian consensus tree of COL1 protein sequence data, with chicken (Gallus)as outgroup. Scale bar indicates branch length, expressed as the expectednumber of substitutions per site. Major clades (orders and superorders) arecolour coded; species names in bold indicate collagen sequences derived from
MS/MS rather than genomic data, fossil taxa depicted in silhouette. Inset: inall tree-reconstructions conducted (see Supplementary Information), Toxodonand Macrauchenia (dark grey) group monophyletically at the base ofcrown Perissodactyla (light green) with 100% posterior probability,forming Panperissodactyla.
RESEARCH LETTER
2 | N A T U R E | V O L 0 0 0 | 0 0 M O N T H 2 0 1 5
between Gondwanan landmasses17 and the possibility that Xenarthra(the other major endemic South American placental clade) is also relatedto Afrotheria7–9,18. However, most of the character evidence on whichthe SANU–Afrotheria sister-group hypothesis is based is in dispute19,20.In principle, a more definitive test of phylogenetic affinities could comefrom genomic data, but so far the application of ancient DNA tech-niques has been limited and DNA survival is predicted to be poor(Fig. 1a) (see Supplementary Information).
Type I collagen (COL1), a structural protein comprising two separatechains, COL1a1 and COL1a2 (coded by genes on separate chromo-somes), is known to provide useful systematic information (‘barcod-ing’)21, and can be recovered over significantly longer time spans thanDNA22. Most of the 48 samples of Toxodon sp. and Macrauchenia sp.we analysed for sequence information came from localities in BuenosAires province (Supplementary Information and Fig. 1b), especiallyfrom areas that experience subtropical to maritime–temperate climates23.Peptide mass fingerprinting (ZooMS) (Supplementary Information) ofCOL1 extracts24 revealed variable levels of collagen preservation in thesample set (see Supplementary Information and Extended Data Table 1).After screening, two samples each of Toxodon and Macrauchenia dis-playing excellent COL1 preservation (see Extended Data Fig. 1) wereselected for liquid chromatography–tandem mass spectrometry (LC–MS/MS) sequencing using a variety of LC–MS/MS platforms, and directradiocarbon dating (Supplementary Information and Extended DataTable 1).
Combining analyses from a total of eight MS/MS runs, we were ableto assemble near-complete COL1 sequences for Macrauchenia (89.4%)and Toxodon (91.0%), similar to levels of sequence coverage for modernsamples. Comparative analyses with fossil and modern samples suggestthat our SANU COL1 sequences are authentic: COL1 amino-acid se-quence variation is located in similar positions along both COL1 chainscompared with collagen sequences derived from genomic sources (Ex-tended Data Fig. 2) and deamidation ratios conform to expectations forPleistocene samples (Extended Data Fig. 3), a criticism of previous pre-Holocene collagen studies25. Independent manual de novo sequencingof product ion spectra for selected phylogenetically relevant peptideswas in full agreement with sequence assignments from database searches.Furthermore, 86.70% and 94.41% of the assembled species consensussequences for Macrauchenia and Toxodon, respectively, were coveredby a minimum of two independent product ion spectra, with individualpositions being covered by an average of 77.1 (for Macrauchenia) and103.9 (for Toxodon) product ion spectra (Extended Data Table 2).
Molecular evidence for the phylogenetic placement of the extinctSANUs Macrauchenia and Toxodon was previously unavailable. To ex-amine the phylogenetic position of these taxa, an alignment of 76 mam-malian COL1 sequences and one outgroup (Gallus) was constructedfrom available mammalian genomic COL1 sequences in GenBank, aswell as several MS/MS-derived protein sequences obtained for this study.A Bayesian phylogenetic tree was estimated from the data, with sepa-rate models of substitution applied to two partitions (COL1a1 andCOL1a2). The resulting consensus tree (Fig. 2) is based solely on pro-tein sequence data, but its topology corresponds closely to branchingrelationships in Placentalia recovered in recent molecular studies7–9.Furthermore, nodes poorly supported in this study (for example, thosewithin Laurasiatheria) involve the same series of phylogenetic relation-ships that have proved difficult to resolve in other studies5,7–9. To exam-ine how alternative topologies could affect the position of our targettaxa we ran additional Bayesian analyses, using constraints mirroringdiffering mammal phylogenies (Extended Data Fig. 4 and Supplemen-tary Information).
In all phylogenetic analyses performed with our data (including theuse of unconstrained parsimony and probabilistic tree reconstructionmethods), Macrauchenia and Toxodon formed a strongly supportedmonophyletic pair that grouped exclusively with Perissodactyla (as re-presented by extant Equus, Tapirus, and Ceratotherium). Neither showedany association with the clades conventionally contained in Afrotheria
(see Supplementary Information). In future, and with more evidence,it may be appropriate to include these SANUs within an augmented de-finition of Perissodactyla. At present, we prefer to recognize Litopternaand Notoungulata as part of a branch-based rankless taxon Pan-perissodactyla, uniting all taxa more closely related to crown Perisso-dactyla than to any other extant taxon of placentals (see SupplementaryInformation).
Despite poor resolution at the base of Laurasiatheria, the fact thatMacrauchenia and Toxodon were not recovered at a basal positionwithin Euungulata would imply that the initial split between Perisso-dactyla and Artiodactyla occurred earlier than the origin of the SANUclades. Since fossil evidence indicates that both litopterns and notoun-gulates were already present in South America by the Early Palaeoceneepoch4,26, this would suggest that the divergence events leading to themodern orders must have occurred at, if not before, the Cretaceous/Palaeogene boundary (Supplementary Information and Extended DataFig. 5).
These observations do not constitute a full molecular test of SANUmonophyly, as there is no proteomic evidence available for members ofthe remaining orders (Astrapotheria, Xenungulata, Pyrotheria). As faras it is now known, Xenungulata and Pyrotheria became extinct in theLate Palaeogene, but some members of Astrapotheria (sometimes con-sidered the sister group of Notoungulata27) persisted until the MiddleMiocene (16.0–11.6 million years ago (Ma) (ref. 28)). This is well be-yond the extrapolated estimate of less than 4.0 Ma for good collagensurvival in an optimal (cool) burial environment22, although the empir-ical limits on collagen survival under differing environmental conditionsare poorly understood at present (see Supplementary Information).
The results presented here establish that, in principle, the approxi-mately 2,100 residues (that is, one-fifth of the amino-acid residues ana-lysed in ref. 9) comprising bone COL1 in placental mammals aresufficiently variable to provide reliable systematic information. Of course,a phylogeny based on two genes may be sensitive to factors affectingphylogenetic resolution such as gene lineage sorting, missing taxa, ab-errant molecular rates, and selection acting on protein coding sequences.Despite this, the topology derived from the collagen sequences in thisstudy is in broad agreement with other mammalian trees, and supportsmonophyletic placement of two Late Quaternary SANUs with a highdegree of confidence. Reliable systematic information is an essentialfoundation for many other enquiries in evolutionary biology, includ-ing patterns of early Cenozoic mammalian divergence, radiation, ex-tinction, and palaeobiogeography. With further development, molecularsequencing of degradation-resistant proteins such as bone COL1 is sureto open new vistas in the study of vertebrate evolution.
Online Content Methods, along with any additional Extended Data display itemsandSourceData, are available in the online version of the paper; references uniqueto these sections appear only in the online paper.
Received 28 September 2014; accepted 22 January 2015.
Published online 18 March 2015.
1. Owen, R. in The Zoology of the Voyage of H.M.S. Beagle, under the Command ofCaptain Fitzroy, during the Years 1832 to 1836 (ed. Darwin, C.) Part I, Numbers I–IV(Smith Elder 1838–40).
2. Darwin, C. Journal of Researches into the Geology and Natural History of the VariousCountries Visited by H.M.S. Beagle: Under the Command of Captain FitzRoy, R.N. from1832 to 1836 (Henry Colburn, 1839).
3. Husson, D. et al. Astronomical calibration of the Maastrichtian (Late Cretaceous).Earth Planet. Sci. Lett. 305, 328–340 (2011).
4. De Muizon, C. & Cifelli, R. L. The ‘‘condylarths’’ (archaic Ungulata, Mammalia)from the early Palaeocene of Tiupampa (Bolivia): implications on theorigin of the South American ungulates. Geodiversitas 22, 1–150(2000).
5. Agnolin, F. L. & Chimento, N. R. Afrotherian affinities for endemic South American‘‘ungulates’’. Mamm. Biol. 76, 101–108 (2011).
6. O’Leary, M. A. et al. The placental mammal ancestor and the post-K-Pg radiation ofplacentals. Science 339, 662–667 (2013).
7. Dos Reis, M. et al. Phylogenomic datasets provide both precision and accuracy inestimating the timescale of placental mammal phylogeny. Proc. R. Soc. B 279,3491–3500 (2012).
LETTER RESEARCH
0 0 M O N T H 2 0 1 5 | V O L 0 0 0 | N A T U R E | 3
8. Song, S., Liu, L., Edwards, S. V. & Wu, S. Resolving conflict in eutherian mammalphylogeny using phylogenomics and the multispecies coalescent model. Proc.Natl Acad. Sci. USA 109, 14942–14947 (2012).
9. Meredith, R. W. et al. Impacts of the Cretaceous Terrestrial Revolution and KPgextinction on mammal diversification. Science 334, 521–524 (2011).
10. McKenna, M. C., Bell, S. K. & Simpson, G. G. Classification of Mammals above theSpecies Level (Columbia Univ. Press, 1997).
11. Simpson,G.G.Thebeginning of theageofmammals inSouthAmerica.Part2.Bull.Am. Mus. Nat. Hist. 137, 1–259 (1967).
12. Patterson, B. & Pascual, R. The fossil mammal fauna of South America. Q. Rev. Biol.43, 409–451 (1968).
13. Cifelli, R. L. inMammalPhylogeny (edsSzalay, F. S.,Novacek,M. J.&McKenna,M.C.)195–216 (Springer, 1993).
14. Horovitz, I. Eutherian mammal systematics and the origins of South Americanungulates as based on postcranial osteology. Bull. Carnegie Mus. Nat. Hist. 63–79(2004).
15. Asher,R. J.& Lehmann, T.Dental eruption inafrotherianmammals.BMC Biol. 6,14(2008).
16. Sanchez-Villagra, M. R., Narita, Y. & Kuratani, S. Thoracolumbar vertebral number:the first skeletal synapomorphy for afrotherian mammals. Syst. Biodivers. 5, 1–7(2007).
17. Van Bocxlaer, I., Roelants, K., Biju, S. D., Nagaraju, J. & Bossuyt, F. Late Cretaceousvicariance in Gondwanan amphibians. PLoS ONE 1, e74 (2006).
18. Murphy, W. J., Pringle, T. H., Crider, T. A., Springer, M. S. & Miller, W. Using genomicdata to unravel the root of the placental mammal phylogeny. Genome Res. 17,413–421 (2007).
19. Billet, G. & Martin, T. No evidence for an afrotherian-like delayed dental eruption inSouth American notoungulates. Naturwissenschaften 98, 509–517 (2011).
20. Kramarz, A. & Bond, M. Critical revision of the alleged delayed dental eruption inSouth American ‘‘ungulates’’. Mamm. Biol. 79, 170–175 (2014).
21. Van Doorn, N. L. in Encyclopedia of Global Archaeology 7998–8000 (Springer,2014).
22. Buckley, M. & Collins, M. J. Collagen survival and its use for species identification inHolocene-lower Pleistocene bone fragments from British archaeological andpaleontological sites. Antiqua 1, e1 (2011).
23. Hamza, V. M. & Vieira, F. P. in Climate Change - Geophysical Foundations andEcological Effects (edsBlanco, J.&Kheradmand,H.)Ch.6,113–136 (Intech, 2011).
24. Buckley, M., Collins, M., Thomas-Oates, J. & Wilson, J. C. Species identification byanalysis of bone collagen using matrix-assisted laser desorption/ionisation time-of-flight mass spectrometry. Rapid Commun. Mass Spectrom. 23, 3843–3854(2009).
25. Asara, J. M., Schweitzer, M. H., Freimark, L. M., Phillips, M. & Cantley, L. C. Proteinsequences from mastodon and Tyrannosaurus rex revealed by mass spectrometry.Science 316, 280–285 (2007).
26. Wilf, P., Ruben Cuneo, N., Escapa, I. H., Pol, D. & Woodburne, M. O. Splendid andseldom isolated: the paleobiogeography of Patagonia. Annu. Rev. Earth Planet. Sci.41, 561–603 (2013).
27. Van Valen, L. M. Paleocene dinosaurs or Cretaceous ungulates in South America?Evol. Monogr. 10, 1–79 (1988).
28. Vizcaino, M., Mikolajewicz, U., Jungclaus, J. & Schurgers, G. Climate modificationby future ice sheet changes and consequences for ice sheet mass balance. Clim.Dyn. 34, 301–324 (2010).
29. Allentoft, M. E. et al. The half-life of DNA in bone: measuring decay kinetics in 158dated fossils. Proc. R. Soc. B 279, 4724–4733 (2012).
30. US. Central Intelligence Agency. The World Factbook2013–14 (Central IntelligenceAgency, 2013).
Supplementary Information is available in the online version of the paper.
Acknowledgements We thank the Museo Argentino de Ciencias Naturales‘‘Bernardino Rivadavia’’, Buenos Aires (MACN), the Museo de La Plata (MLP), and theNatural History Museum of Denmark, Copenhagen (ZMK), for allowing us to samplefossil specimens in their collections for this project. The American Museum of NaturalHistory and the Copenhagen Zoo provided samples of extant mammals suitable forcollagen extraction. Mogens Andersen and Kristian Gregersen of ZMK providedinformation on specimens in their care. This work was partly supported by SYNTAXaward ‘‘Barcode of Death’’, European Research Council (ERC) Advanced Award CodeX,ERC Consolidator Award GeneFlow, SYNTHESYS FP7 grant agreement 226506,Engineering and Physical Sciences Research Council NE/G012237/1 and NationalScience Foundation OPP 1142052. J.T.-O. and D.A.A. are members of the York Centreof Excellence in Mass Spectrometry, created thanks to a major capital investmentthrough Science City York, supported by Yorkshire Forward with funds from theNorthern Way Initiative.
Author Contributions R.D.E.M., I.B., and M.J.C. conceived the project and coordinatedthe writing of the paper with F.W. and J.A.T., with all authors participating. J.N.G., A.K.,M.R., E.C., and R.D.E.M. collected fossil and extant mammal samples for proteinextraction. M.W., S.B., I.B., J.A.T., J.B., and M.H. conducted DNA analyses. F.W., M.W., P.A.,S.K., C.B., C.K., D.A., J.T.-O., R.F., B.K., P.K., J.A.E., E.C., L.O., and M.J.C. performed proteinanalyses and interpretation of results. J.A.T., I.B., F.W., and M.W. conducted thephylogenetic analyses and constructed trees. S.T.T., J.N.G., M.R., D.M.P., and R.D.E.M.provided the historical, systematic, and palaeontological framework for this study.J.-J.H., E.W., and J.S. provided technical information. Final editing and manuscriptpreparation was coordinated by M.J.C., R.D.E.M., and I.B.
Author Information Raw MS/MS and PEAKS search files have been deposited to theProteomeXchange with identifier PXD001411. Generated COL1 species consensussequences will be available in the UniProt Knowledgebase under the accessionnumbers C0HJN3–C0HJP8. Reprints and permissions information is available atwww.nature.com/reprints. The authors declare no competing financial interests.Readers are welcome to comment on the online version of the paper. Correspondenceand requests for materials should be addressed to I.B. ([email protected]),F.W. ([email protected]), M.J.C. ([email protected]), orR.D.E.M. ([email protected]).
RESEARCH LETTER
4 | N A T U R E | V O L 0 0 0 | 0 0 M O N T H 2 0 1 5
METHODSNo statistical methods were used to predetermine sample size.Zooarchaeology by MS screening. After zooarchaeology by MS (ZooMS) screen-ing of selected Macrauchenia (n 5 26) and Toxodon (n 5 22), four bone specimenswere selected for MS/MS analysis. Using a combination of enzymes, we were ableto obtain sequence coverage of around 90% for COL1 for both genera. Subsamplesof about 200 mg were taken from each bone or skin sample for COL1 extraction.Bone samples were demineralized in 0.6 M HCl for 8 days at 4 uC. The acid wasremoved and the samples were washed three times with ultrapure water then heatedat 70 uC in 0.6 M HCl for 48 h to gelatinize the COL1. Samples were then ultra-filtered using 30 kilodalton filters and washed through with ultrapure water. Half amillilitre from each sample retentate was taken to dryness overnight in a vacuumcentrifuge. One hundred microlitres of 50 mM ammonium bicarbonate solution(pH 8) was added to each sample. The samples were then digested with trypsin(0.5mgml21, for 16 h at 37 uC). After enzyme digestion, samples were acidified with2ml of 5% (volume %) trifluoroacetic acid (TFA). Samples were then concentratedusing C18 ZipTips: the ZipTips were prepared using a conditioning solution of50% acetonitrile, 49.9% water, 0.1% TFA; the tips were then washed with a washingsolution of 0.1% TFA; the sample was then transferred over the column ten times;the tips were then washed again using 0.1% TFA solution; finally the sample waseluted using the conditioning solution. For ZooMS analysis, 1 ml of each samplewas spotted in triplicate onto a ground steel plate with 1ml of CHCA matrix solu-tion (1% in 50% ACN/0.1% TFA (v/v/v)). MS analysis was on a Bruker ultraflexmatrix-assisted laser desorption/ionization–tandem time of flight (MALDI–TOF/TOF) mass spectrometer over the m/z range 800–4,000 (Extended Data Fig. 1).Screening revealed large differences in COL1 spectral quality between samples. Of46 SANU samples, only five (3 out of 20 from Toxodon, 2 out of 25 from Macrau-chenia) yielded good ZooMS spectra. One of the three Toxodon samples (ZMK 22/1889) produced a few strong MS/MS spectra and only four samples (two each fromMacrauchenia and Toxodon) were used in the main study.MS/MS sequence analysis. Selected collagen extracts from pooled trypsin (0.4mgml21,16 h, 37 uC) and elastase digests (0.8mgml21, 16 h, 37 uC) of two specimens of eachSANU sample were analysed on both Thermo Scientific Orbitrap and BrukermaXis HD LC–MS/MS platforms. Additionally, Orbitrap and maXis HD instru-ments were also used for sequencing collagen from modern aardvark (Orycteropusafer), silky anteater (Cyclopes didactylus), hippopotamus (Hippopotamus amphi-bius), and South American tapir (Tapirus terrestris), as well as Pleistocene Mylodondarwinii and Equus sp. samples from South America.Hybrid Quadrupole-Orbitrap. Sample separation was performed on an Ultimate3000 RSLCnano LC system (Thermo Scientific). Peptides were first trapped on aPepmapm-pre-column (0.5 cm 3 300mm; Thermo Scientific) and separated on anEASY Spray PepMap UHPLC column (50 cm3 75mm, 2mm particles, 40 uC; ThermoScientific) with a 60 min multi-step acetonitrile gradient ranging from 2% to 35%mobile phase B (mobile phase A: 0.1% formic acid/5% dimethylsulfoxide (DMSO)in water; mobile phase B: 0.1% formic acid/5% DMSO in acetonitrile) at a flow rateof 250 nl min21. Mass spectra were acquired on a Q Exactive Hybrid Quadrupole-Orbitrap mass spectrometer at a resolution of 70,000 at m/z 200 using an ion targetof 3 3 106 and maximal injection time of 100 ms between m/z 380 and 1,800. Pro-duct ion spectra of up to 15 precursor masses at a signal threshold of 4.7 3 104 countsand a dynamic exclusion for 27 s were acquired at a resolution of 17,500 using an iontarget of 105 and a maximal injection time of 128 ms. Precursor masses were iso-lated with an isolation window of 1.6 Da and fragmented with 28% normalizedcollision energy.Bruker maXis HD. Sample separation was performed on an Ultimate 3000RSLCnano LC system (Thermo Scientific). Peptides were first trapped on a Pep-map pre-column (2 cm 3 100mm; Thermo Scientific) and separated on a PepMapUHPLC column (50 cm3 75mm, 2mm particles; Thermo Scientific) with a 120 minmulti-step acetonitrile gradient ranging from 5 to 35% mobile phase B (mobile phaseA: 0.1% formic acid in water; mobile phase B: 0.1% formic acid in acetonitrile) at aflow rate of 400 nl min21. A CaptiveSpray nanoBooster source (Bruker Daltonik),with acetonitrile as a dopant, was used to interface the LC system to the maXis HDUHR-Q-TOF system (Bruker Daltonik). Source parameters were set to 3 l min21
dry gas and 150 uC dry heater; nitrogen ‘flow’ setting for the nanoBooster was setto 0.2 bar. Mass spectra were acquired in the m/z range 150–2,000 at a spectralacquisition rate of 2 Hz. Precursors were fragmented with a fixed cycle time of 4 susing a dynamic method adapting spectra rates between 2 and 10 Hz based onprecursor intensities. Dynamic exclusion was set to 0.4 min combined with recon-sideration of an excluded precursor for fragmentation if its intensity rose by a fac-tor of 3.Collagen type I sequence assembly. Product ion data from the maXis HD andOrbitrap platforms were analysed in three stages. Initially MASCOT (Matrix Science)was used to search against the UniColl database, a database of non-redundant
synthetic collagen peptides, to generate a list of ranked peptides for each spectrum.Sequences derived from this exercise were added to a local database of genomicand published collagen sequences and common laboratory contaminants, and theoriginal data were then re-analysed by PEAKS31 using this new database (for anexample of PEAKS output see Extended Data Fig. 1b–d).
As an independent check, a limited number of the product ion spectra of pep-tides (previously assigned by PEAKS) were also manually de novo interpreted (byJ.T.-O.) without prior knowledge of the assignment, in all cases with full agreementbetween the two approaches.Generation of, and searching against, Unicoll. Publicly available COL1a1 andCOL1a2 sequences were concatenated and aligned using Mafft32 with subsequentmanual alignment of misaligned sites using Bioedit and Geneious version 4.6 (ref. 33).A custom Python script was used to digest the COL1 with trypsin in silico. For eachtryptic fragment, all variable amino-acid positions across the aligned sequences wererecorded. A new sequence was created for every permutation of these variable sites.These sequences were concatenated and stored in FASTA format with a headerindicating the position in the original alignment. The result was a database witheach entry a concatenation of sequences representing every permutation of observedmutations for that particular tryptic fragment. One tryptic fragment of the sequence(COL1a2 positions 870–905) was too variable to include without exceeding avail-able memory. Only the original observed variants were included for this part of thesequence. Using this strategy, it was possible to generate the equivalent of morethan 10200 alternative collagen ‘sequences’ (cf. 1082, which is the upper estimate ofthe number of atoms in the universe).
MS/MS data files were merged and submitted to Mascot with enzyme set toTrypsin/P; variable modifications for deamidated (NQ), LysRHyl (K), oxidation(M), and ProRHyp (P); peptide mass tolerance 610 ppm; and fragment mass tol-erance 60.07 Da. The structure of sequence entries in Unicoll meant that it couldnot accommodate missed cleavages. Select summaries containing matched peptideswith a Mascot score greater than 30 were exported into Microsoft Excel for eachanalysis. Peptides were identified by picking the highest scoring hits for each trypticfragment, if the score exceeded 40; whereas for matches with scores between 30 and40, the spectra were inspected manually to choose the best hit among the possibil-ities given by the search engine.Searching data using PEAKS. Product ion spectra were searched using PEAKSsoftware against a database comprising genomic COL1 sequences plus fossil con-sensus sequences, composed of UniColl peptide hits, with missing and low coverageregions filled with conserved mammalian COL1 sequences (see Phylogenetic re-construction section below). Additionally, common laboratory contaminants wereincluded in database searches. Full PEAKS searches (Peptide de novo, PEAKS DB,PEAKS PTM, and SPIDER) were performed with peptide mass tolerance 610 ppmand fragment mass tolerance 60.07 Da, in addition to respective platform and en-zyme details. Searches were performed allowing for deamidated (NQ), LysRHyl(K), oxidation (M), and ProRHyp (P). False discovery rate was put at 0.5% andpeptide scores were only accepted with 210log10(P value) scores of at least 30 andaverage local confidence (%) at least 50. Where there was ambiguity in interpreta-tion of the spectra, peptides were selected on the basis of knowledge of sequenceconstraints, post-translational modifications, and fragmentation patterns.Reference sequence authentication. To check the quality of our MS/MS COL1sequences, we sampled a modern and a fossil sample for which we had independ-ent genomic data, specifically (1) a modern aardvark sample (Orycteropus afer)and (2) a fossil equid bone from a geological formation rich in SANU fossils withtheir respective genome sequences. The fossil sample had similar collagen yieldsand ZooMS profile to the SANU samples used for MS/MS sequencing (Pleistocenehorse, Tapalque, South America; Fig. 1b) (MS/MS sequence analysis, above). Ourmodern aardvark MS/MS sequence was identical to that of the protein product in-ferred from the released genomic sequence. For the Pleistocene Equus sp. sequence,two amino-acid substitutions were detected (T.L, COL1a1; H.D, COL1a2), sim-ilar to the maximum number of differences observed in a recent study comparingEquus genomes with the Equus ferus caballus reference genome34.De novo sequence authentication. The absence of corresponding genomic dataprevented similar comparisons with MS/MS-derived sequences for the SANU species.Instead we assessed amino-acid substitution locations along COL1a1 and COL1a2chains both in our (and previously published35) and in fossil COL1 sequences withgenomic data, using the COL1a1 and COL1a2 sequence of the Tasmanian devil(Sarcophilus harrisii) as an outgroup to eutherian mammals. Carboxy- (C-) andamino- (N-)terminal telopeptides were removed as they were rarely observed fromfossil samples. COL1 position numbers are given as a continuous count with COL1a1and COL1a2 concatenated, with COL1a1 ranging from position 1 to position 1014,and COL1a2 ranging from 1015 to 2028.
We found that the location of amino-acid variation along the COL1a1 andCOL1a2 chains was similar among the different COL1 sequences obtained fromgenomic sources (Extended Data Fig. 2). We identified several regions, mainly
LETTER RESEARCH
located in COL1a1, that appeared to lack sequence variation among the four majormammalian superorders. This could be a result of the functional importance ofsome of these regions during COL1 fibril formation, a1 and a2 chain binding, andCOL1 hydroxylation36–38. Additionally, we observed a substitution rate in COL1a2roughly twice that observed in COL1a1.
Comparing COL1 sequences derived from MS/MS data in this and an earlierstudy35 with genomic data for laurasiatheres revealed good correspondence in thelocation of substitutions along the COL1a1 and COL1a2 chains between our resultsand genomic data (Extended Data Fig. 2). The MS/MS data in ref. 35 for laura-siatheres were derived from a single species (Manis tetradactyla). Sequence vari-ation from those data compared with genomic data were similar, although we notedthat several regions displaying high rates of amino-acid substitution were missingfrom the Manis consensus sequence provided (notably around positions 726–756,991–1089, 1306–1364, 1423–1443 and 1899–1977).
Reference 35 provided two xenarthran and five afrotherian COL1 sequencesobtained using mass spectrometric sequencing. Regions with high substitutioncomplexity were missing from the consensus sequences provided, for Afrotheria(1024–1089, 1588–1599, 1740–1754) and Xenarthra (1024–1089, 1207–1234,1348–1364, 1588–1638, 1771–1806, 1921–1947). The absence of such regions pro-hibited the inclusion of these sequences in our phylogenetic tree-building, as themajority of informative positions were missing from the sequences provided. Forsubstitution locations, our data suggest structural and/or functional organizationof these, and their frequency, in specific regions of both chains.
We criticized claims of authentic collagen sequences retrieved from a Tyranno-saurus rex sample39 based in part on the low levels of reported deamidation40, andmore recently have demonstrated an increase in glutamine deamidation in archae-ological rather than modern collagen, which correlated with thermal age (ExtendedData Fig. 3 and ref. 41); similar levels have been reported for Pleistocene mammothsand equids34.
Deamidation ratios observed for glutamine here are consistent with ancient col-lagen of equivalent thermal age (Extended Data Fig. 1). The lowest levels of Gln toGlu deamidation are observed in modern samples from hippopotamus (1.8% 6 3.2)and tapir (5.7% 6 10.9) bone. The highest levels of Gln deamidation occur in theradiocarbon samples from dead Macrauchenia (Glu 5 82.8% 6 14.3). The Toxodonsamples are less deamidated (Glu 5 59.2% 6 24.5), which is consistent with a LatePleistocene date (12,000 years ago). However, by contrast, the Pleistocene equid ismuch better preserved (Glu 5 18.9% 6 18.4), despite the fact that it cannot be muchyounger than Toxodon (Fig. 1c).DNA extraction and sequencing. Approximately 250 mg of the three sampleswith the highest number of peaks in the mass spectra from each species (see Zoo-archaeology by MS screening, above) were used for DNA extraction. DNA extrac-tion was performed as in the method described in ref. 42. PCR primers were designedto target Perissodactyla- and Laurasiatheria-specific regions of the cytb, COX1, 16S,and 12S genes using mitochondrial DNA sequences downloaded from the NationalCenter for Biotechnology Information (NCBI) (Supplementary Table 1). Primerdesign used the program Primer3. PCR was performed for 60 cycles and sampleswere visualized on 2.5% agarose gel. Products were successfully amplified fromseveral samples whereas PCR controls showed no amplification products. BLASTsearches of the sequences obtained revealed no homology to any previously derivedsequence for several of the products, whereas sequences from two Macraucheniasamples showed high similarity (98% and 99%, respectively) to domestic pig se-quences, a common contaminant in ancient DNA analyses43. A Pleistocene horsebone from the same depositional context as some of the SANU specimens yieldeda sequence 98% identical to modern horse (Equus caballus), suggesting that thefailure to amplify putative SANU DNA sequences by PCR was not because of tech-nical problems, but because of a lack of endogenous DNA in the samples investigated.DNA next-generation sequencing approach. After failing to amplify endogen-ous DNA through Sanger sequencing of targeted PCR products, we applied a non-targeted, next-generation sequencing (NGS) shotgun approach in a further attemptto identify whether endogenous DNA could be obtained. Based on the collagensequencing results, Macrauchenia sample 12-1641 (metapodial) was selected as themost likely candidate for NGS analyses. DNA extractions of Macrauchenia sample12-1641 followed protocols described in ref. 44 and were performed in the ded-icated ancient-DNA laboratory at Royal Holloway, University of London, UK. Thelibrary was constructed in a dedicated laboratory for ancient DNA (Johannes Gu-tenberg University, Mainz, Germany) using a modified version of the protocol inref. 45. Modifications were as follows: the initial DNA fragmentation step was notrequired, and all clean-up steps used MinElute PCR purification kits. For the blunt-end repair step, Buffer Tango and ATP were replaced with 0.1 mg ml21 BSA and13 T4DNA ligase buffer. The proceeding clean-up step was replaced by an inac-tivation step, heating to 75 uC for 10 min. For the adaptor ligation step, 0.5 mM ATPreplaced the T4 DNA Ligase buffer. The index PCR step followed a further pro-tocol46 using AmpliTaq Gold DNA polymerase and the addition of 0.4 mg ml21
BSA. The index PCR was set for 20 cycles with three PCR reactions conducted perlibrary. The indexed library was sequenced on an Illumina HiSeq platform (Mainz)using a single lane, paired-end read, sequencing run.Bioinformatics methods and conclusion. Paired-end reads were quality trimmed(q 5 10) with cut-adapt47 and then sequences were simultaneously adaptor trimmedand the paired reads joined together with Seq-Prep (available from https://github.com/jstjohn/SeqPrep). Reads shorter than 17 base pairs were discarded. In the ab-sence of any close phylogenetic relative (required for the accurate genomic map-ping of reads), processed reads were de novo assembled into contigs using clc_denovo_assembler (available in CLC Assembly Cell version 4.2), with contigs shorterthan 70 base pairs discarded. Two approaches were then used to investigate thedata for mammalian genomic sequences (which had proved successful for otherancient DNA NGS samples).
To examine whether there were any mammalian DNA sequences suitable forphylogenetic analysis in our data set, first, contigs were blasted using blastn to a localnucleotide database, downloaded from NCBI. Custom perl scripts (available onrequest) were used to assign taxonomic and gene information to BLAST hits. Theseresults were searched for standard orthologous mitochondrial and nuclear phylo-genetic sequences. Each of the potential hits blasting to mammalian sequences wasinspected; however, all were assignable to bacterial elements, and no blast hit couldbe attributed to mammalian genes.
Second, two separate BLAST databases were generated: one from the contigs anda second from the processed reads, using the makeblastdb command in BLAST.These databases could then be queried with mammalian (including perissodactyl)mitochondrial and nuclear phylogenetic sequences of interest using blastn. Neitherof these searches returned any matching contigs. Thus, the NGS data set yieldednothing of use for phylogenetic analysis, and gave no indication that any Macra-uchenia DNA had persisted in the sample.Phylogenetic reconstruction. Before the advent of DNA-based molecular phylo-geny, variations in protein structure and sequence had been used to explore evo-lutionary relationships48,49. The comparative data set for this paper was built usingconsensus amino-acid sequences for COL1a1 and COL1a2 generated by MS/MSanalysis for the target taxa Toxodon and Macrauchenia as well as representatives ofall extant major mammalian clades. Leucine (L) and isoleucine (I) were convertedinto isoleucines as these are isobaric and low-energy MS/MS sequencing is not cap-able of discriminating between them. Partition Finder50 was used to select the best-fitpartitioning scheme from the amino-acid data. This was identified as two separatepartitions, for Col1a1 and Col1a2. Bayesian phylogenies were generated usingMrBayes version 3.2.1 (ref. 51) with the amino-acid model estimated from thedata (to allow model jumping between fixed-rate amino-acid models, the prior forthe amino-acid model was set as prset aamodellpr 5 mixed). The proportion ofinvariant sites, and the distribution of rates across sites (approximating to a gammadistribution), were also estimated from the data. Two chains were run for 5 milliongenerations (sampled every 500), with convergence between chains assessed inTracer version 1.6 (ref. 52). All effective sample sizes of parameters were greater than100. After burn-in was removed, a majority rule consensus tree was constructed,using the sumt command in MrBayes, from the trees sampled in the posteriordistribution.
To test for the robustness of the results of the Bayesian analysis under other me-thods of tree reconstruction, we also conducted maximum likelihood and max-imum parsimony analyses. We performed parsimony analyses running PAUP*version 4.0b10 (ref. 53), using the heuristic search option with a random taxonaddition sequence (1,000 repetitions) and TBR branch swapping, and rooting thetree along the branch leading to Aves. A maximum likelihood phylogeny was esti-mated in RAxML version 7.0.4 (ref. 54). A Dayhoff model of protein sequence evo-lution with gamma-distributed variation in rates across sites (corresponding to thePROTGAMMADAYHOFFF model in RAxML) was applied to each partition.Twenty separate maximum likelihood analyses were performed (using the ‘2fd’ command in RAxML), and the tree with the highest likelihood was chosen fromthis set.Molecular clock analysis. Fossil-calibrated phylogenies were constructed in BEASTversion 1.7 (ref. 55) with the Dayhoff amino-acid model (chosen under the MrBayesmixed model) together with the proportion of invariant sites and the distributionof rates across sites (approximating a gamma distribution) applied to each parti-tion. Analyses were run under a strict clock (estimated from the data), with the Yulemodel of speciation, for 10 million generations (sampled every 1,000 generations).Clock and tree parameters were linked across partitions. Prior distributions on theroot and 33 other nodes were applied based on an interpretation of the mammalianfossil record (see Supplementary Table 3)7,56. The clock rate prior was set as an un-informative uniform distribution (upper 5 10100, lower 5 10212). All other priorswere left as the default values in BEAUti57. Full details of all prior distributions fordivergence times are presented in Supplementary Table 3. As in the case of theMrBayes analysis, convergence and effective sampling were assessed using Tracer
RESEARCH LETTER
1.7. A maximum clade credibility tree was constructed using TreeAnnotator (avail-able with BEAST) from the trees sampled in the posterior distribution.
31. Ma, B. et al. PEAKS: powerful software for peptide de novo sequencing by tandemmass spectrometry. Rapid Commun. Mass Spectrom. 17, 2337–2342 (2003).
32. Katoh, K. & Standley, D. M. MAFFT multiple sequence alignment software version7: improvements in performance and usability. Mol. Biol. Evol. 30, 772–780(2013).
33. Drummond, A. J. et al. Geneious v4.7. (Geneious, 2010).34. Orlando, L. et al. Recalibrating Equus evolution using the genome sequence of an
early Middle Pleistocene horse. Nature 499, 74–78 (2013).35. Buckley, M. A molecular phylogeny of Plesiorycteropus reassigns the extinct
mammalian order ‘Bibymalagasia’. PLoS ONE 8, e59614 (2013).36. Terajima, M. et al. Glycosylation and cross-linking in bone type I collagen. J. Biol.
Chem. http://dx.doi.org/10.1074/jbc.M113.528513 (2014).37. Hudson, D. M., Weis, M. & Eyre, D. R. Insights on the evolution of prolyl
3-hydroxylation sites from comparative analysis of chicken and Xenopus fibrillarcollagens. PLoS ONE 6, e19336 (2011).
38. Hudson, D. M., Werther, R., Weis, M., Wu, J.-J. & Eyre, D. R. Evolutionary origins ofC-terminal (GPP)n 3-hydroxyproline formation in vertebrate tendon collagen.PLoS ONE 9, e93467 (2014).
39. Schweitzer, M. H. et al. Analyses of soft tissue from Tyrannosaurus rex suggest thepresence of protein. Science 316, 277–280 (2007).
40. Buckley, M. et al. Comment on ‘‘Protein sequences from mastodon andTyrannosaurus rex revealed by mass spectrometry’’. Science 319, 33 (2008).
41. Van Doorn, N. L., Wilson, J., Hollund, H., Soressi, M. & Collins, M. J. Site-specificdeamidation of glutamine: a new marker of bone collagen deterioration. RapidCommun. Mass Spectrom. 26, 2319–2327 (2012).
42. Rohland, N. & Hofreiter, M. Comparison and optimization of ancient DNAextraction. Biotechniques 42, 343–352 (2007).
43. Leonard, J. A. et al. Animal DNA in PCR reagents plagues ancient DNA research.J. Archaeol. Sci. 34, 1361–1366 (2007).
44. Brace, S. et al. Population history of the Hispaniolan hutia Plagiodontia aedium(Rodentia: Capromyidae): testing the model of ancient differentiation on ageotectonically complex Caribbean island. Mol. Ecol. 21, 2239–2253 (2012).
45. Meyer, M. & Kircher, M. Illumina sequencing library preparation for highlymultiplexed target captureand sequencing.ColdSpringHarb.Protoc.2010, http://dx.doi.org/10.1101/pdb.prot5448 (2010).
46. Dabney, J. & Meyer, M. Length and GC-biases during sequencing libraryamplification: a comparison of various polymerase-buffer systems with ancientand modern DNA sequencing libraries. Biotechniques 52, 87–94 (2012).
47. Martin, M. Cutadapt removes adapter sequences from high-throughputsequencing reads. EMBnet.journal 17, 10–12 (2011).
48. Zuckerkandl, E., Jones, R. T. & Pauling, L. A comparison of animal hemoglobins bytryptic peptide pattern analysis. Proc. Natl Acad. Sci. USA 46, 1349–1360 (1960).
49. Sarich, V. M. & Wilson, A. C. Rates of albumin evolution in primates. Proc. Natl Acad.Sci. USA 58, 142–148 (1967).
50. Lanfear, R., Calcott, B., Ho, S. Y. W. & Guindon, S. Partitionfinder: combinedselection of partitioning schemes and substitution models for phylogeneticanalyses. Mol. Biol. Evol. 29, 1695–1701 (2012).
51. Ronquist, F. et al. MrBayes 3.2: efficient Bayesian phylogenetic inference andmodel choice across a large model space. Syst. Biol. 61, 539–542 (2012).
52. Rambaut, A., Drummond, A. J. & Suchard, M. Tracer v.1. 6. (2013).53. Swofford, D. L. PAUP*. Phylogenetic Analysis Using Parsimony (*and Other
Methods) v.4.0b10 (Sinauer Associates, 2003).54. Stamatakis, A. RAxML version 8: a tool for phylogenetic analysis and post-analysis
of large phylogenies. Bioinformatics 30, 1312–1313 (2014).55. Drummond, A. J., Suchard,M.A., Xie,D.&Rambaut, A. Bayesianphylogeneticswith
BEAUti and the BEAST 1.7. Mol. Biol. Evol. 29, 1969–1973 (2012).56. Benton, M. J., Donoghue, P. C. J. & Asher, R. J. in The Timetree of Life (eds Hedges,
B. S. & Kumar, S.) 35–86 (Oxford Univ. Press, 2009).57. Rambaut, A. & Drummond, A. BEAUTi v.1. 4.2. Bayesian evolutionary analysis
utility (2007).58. Humphrey, W., Dalke, A. & Schulten, K. VMD – Visual Molecular Dynamics. J. Mol.
Graph. 14, 33–38 (1996).
LETTER RESEARCH
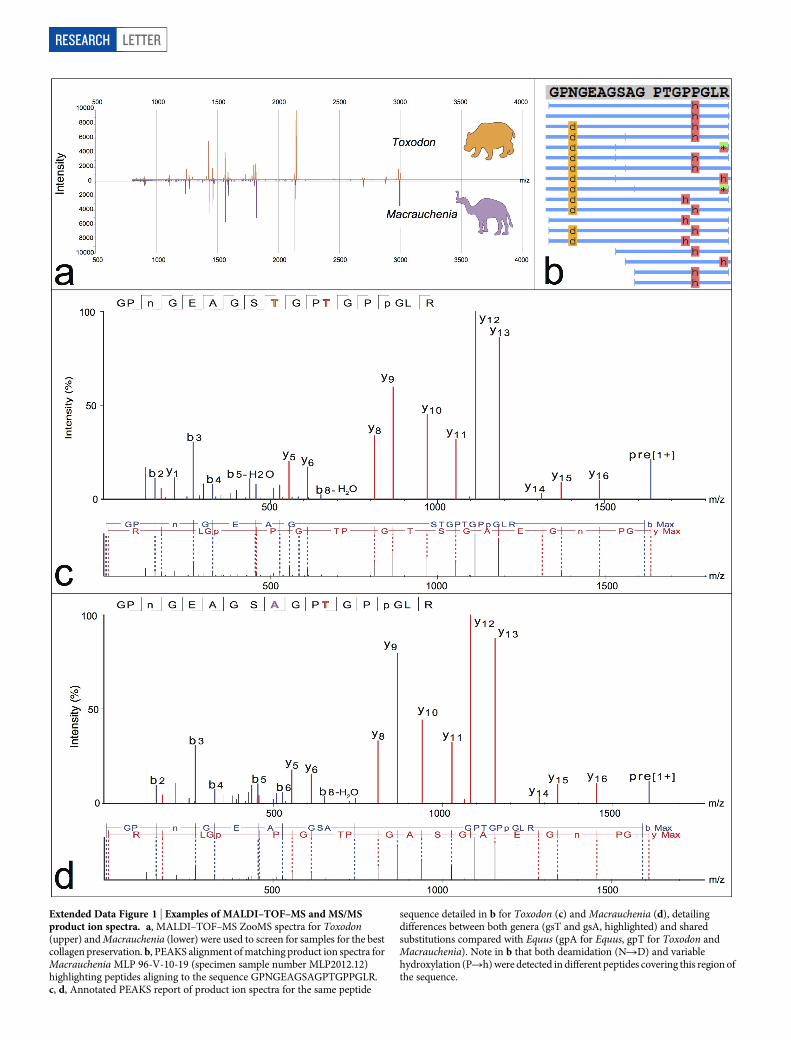
Extended Data Figure 1 | Examples of MALDI–TOF–MS and MS/MSproduct ion spectra. a, MALDI–TOF–MS ZooMS spectra for Toxodon(upper) and Macrauchenia (lower) were used to screen for samples for the bestcollagen preservation. b, PEAKS alignment of matching product ion spectra forMacrauchenia MLP 96-V-10-19 (specimen sample number MLP2012.12)highlighting peptides aligning to the sequence GPNGEAGSAGPTGPPGLR.c, d, Annotated PEAKS report of product ion spectra for the same peptide
sequence detailed in b for Toxodon (c) and Macrauchenia (d), detailingdifferences between both genera (gsT and gsA, highlighted) and sharedsubstitutions compared with Equus (gpA for Equus, gpT for Toxodon andMacrauchenia). Note in b that both deamidation (NRD) and variablehydroxylation (PRh) were detected in different peptides covering this region ofthe sequence.
RESEARCH LETTER
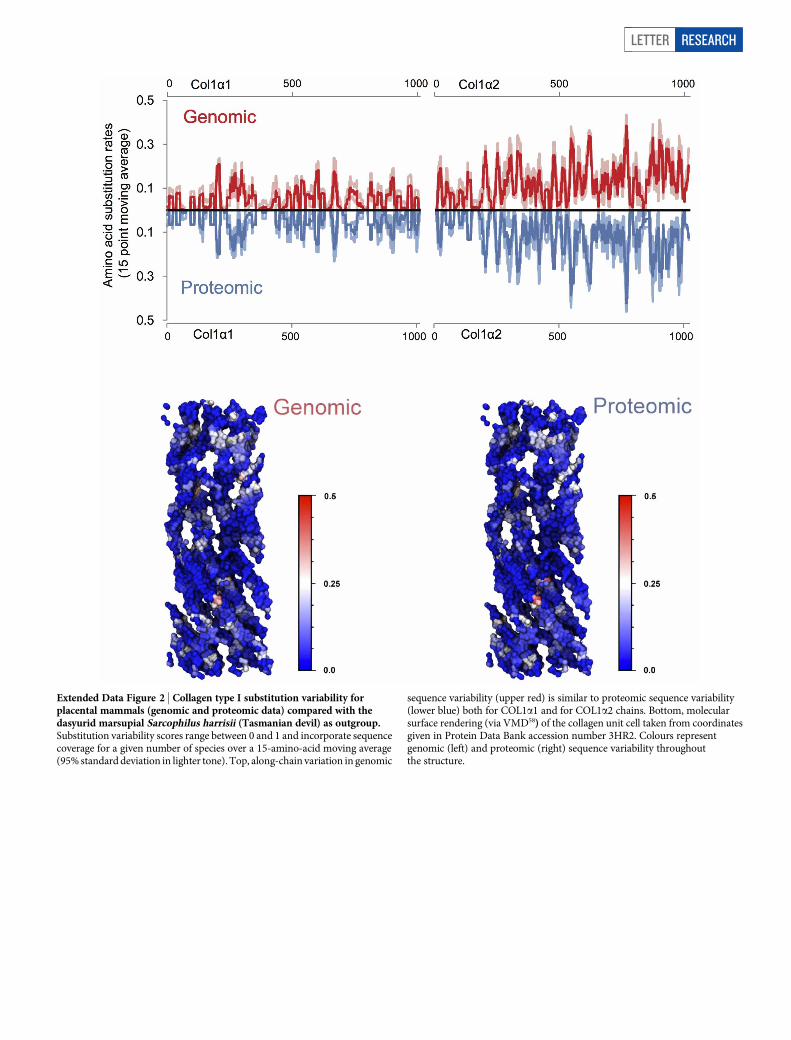
Extended Data Figure 2 | Collagen type I substitution variability forplacental mammals (genomic and proteomic data) compared with thedasyurid marsupial Sarcophilus harrisii (Tasmanian devil) as outgroup.Substitution variability scores range between 0 and 1 and incorporate sequencecoverage for a given number of species over a 15-amino-acid moving average(95% standard deviation in lighter tone). Top, along-chain variation in genomic
sequence variability (upper red) is similar to proteomic sequence variability(lower blue) both for COL1a1 and for COL1a2 chains. Bottom, molecularsurface rendering (via VMD58) of the collagen unit cell taken from coordinatesgiven in Protein Data Bank accession number 3HR2. Colours representgenomic (left) and proteomic (right) sequence variability throughoutthe structure.
LETTER RESEARCH
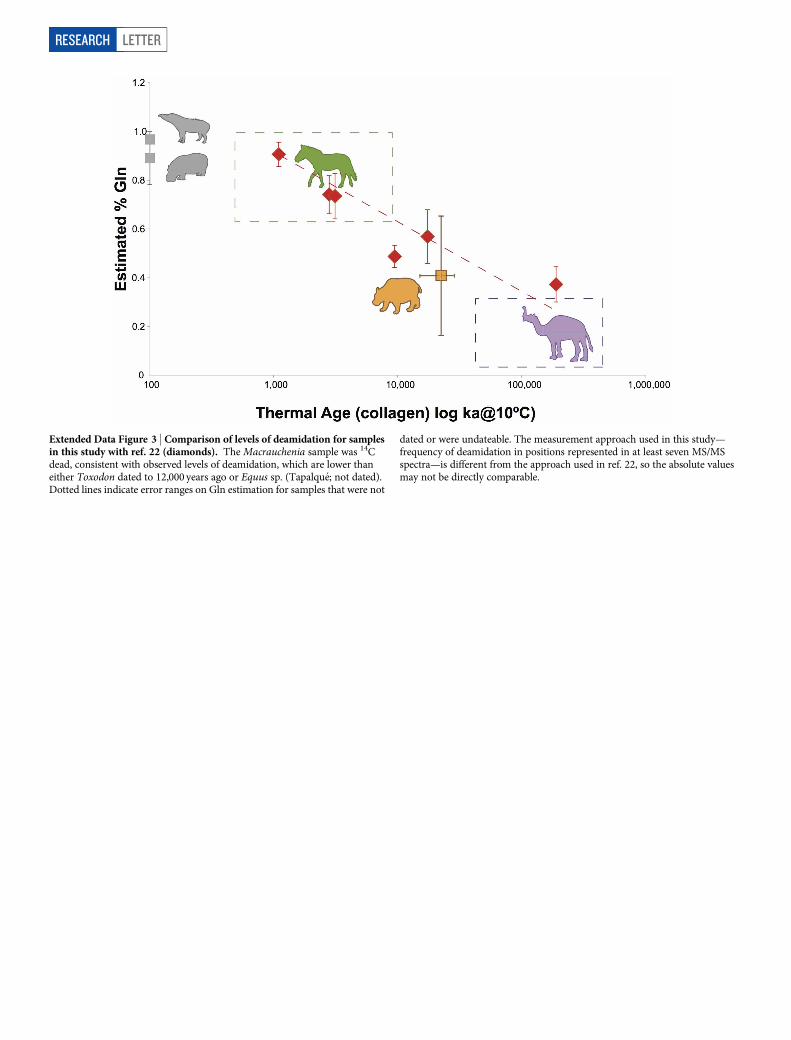
Extended Data Figure 3 | Comparison of levels of deamidation for samplesin this study with ref. 22 (diamonds). The Macrauchenia sample was 14Cdead, consistent with observed levels of deamidation, which are lower thaneither Toxodon dated to 12,000 years ago or Equus sp. (Tapalque; not dated).Dotted lines indicate error ranges on Gln estimation for samples that were not
dated or were undateable. The measurement approach used in this study—frequency of deamidation in positions represented in at least seven MS/MSspectra—is different from the approach used in ref. 22, so the absolute valuesmay not be directly comparable.
RESEARCH LETTER
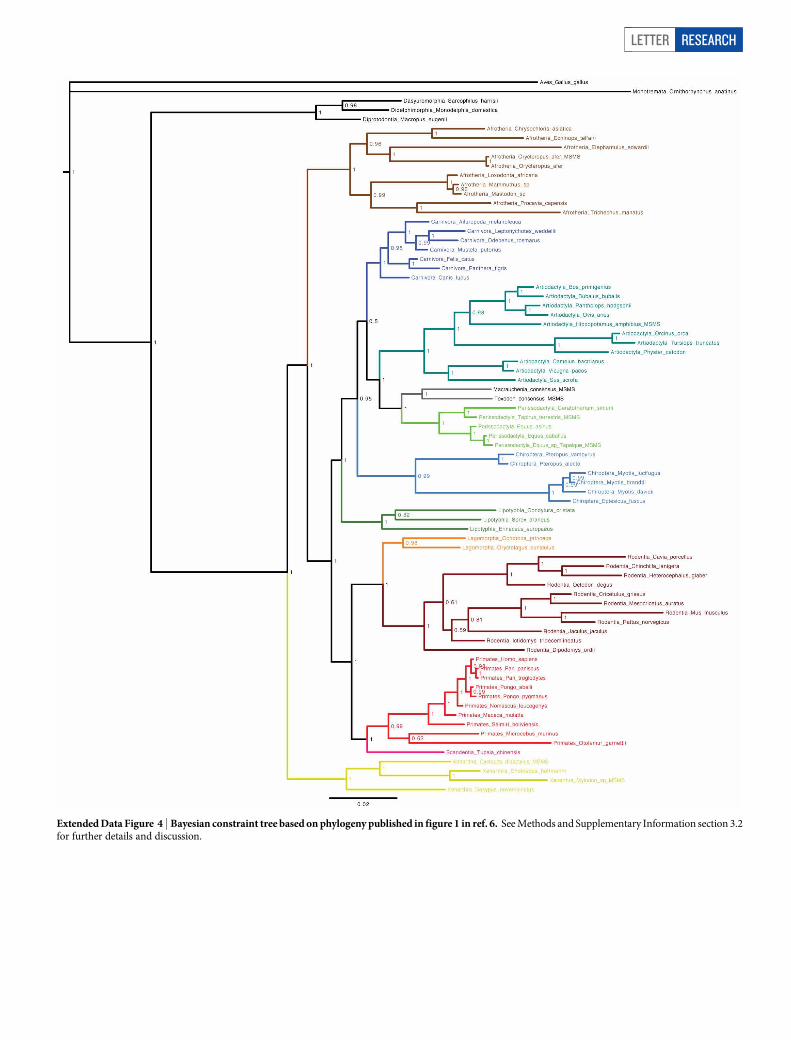
Extended Data Figure 4 | Bayesian constraint tree based on phylogeny published in figure 1 in ref. 6. See Methods and Supplementary Information section 3.2for further details and discussion.
LETTER RESEARCH
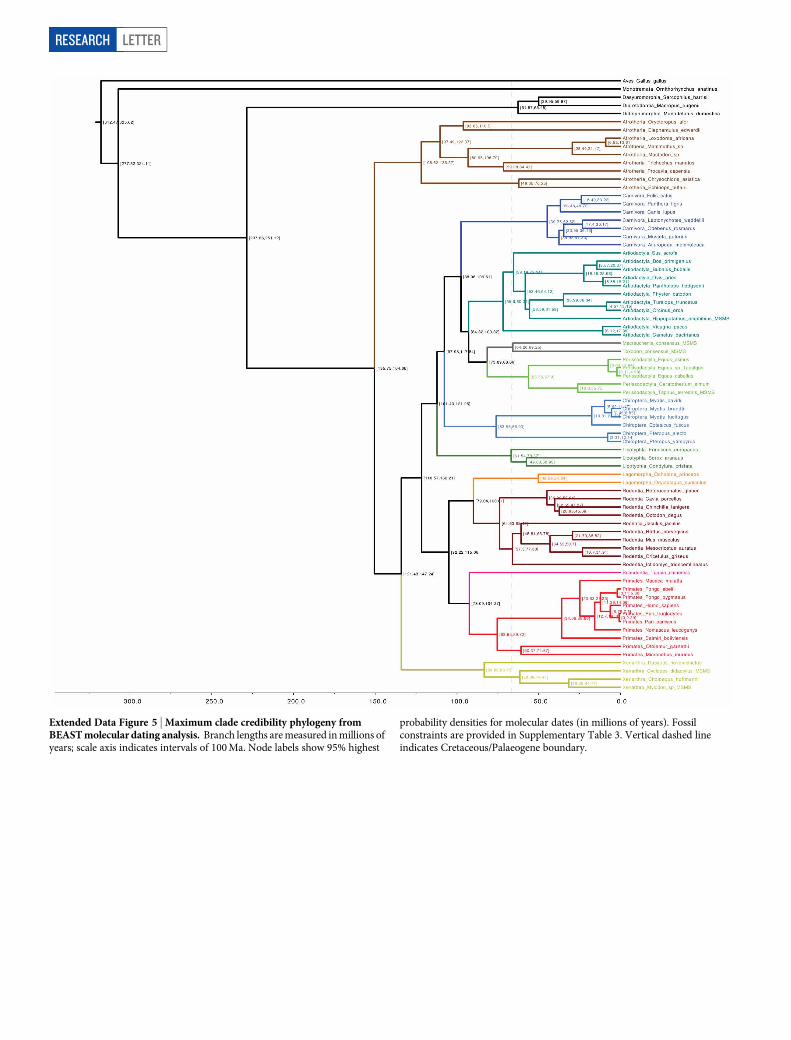
Extended Data Figure 5 | Maximum clade credibility phylogeny fromBEAST molecular dating analysis. Branch lengths are measured in millions ofyears; scale axis indicates intervals of 100 Ma. Node labels show 95% highest
probability densities for molecular dates (in millions of years). Fossilconstraints are provided in Supplementary Table 3. Vertical dashed lineindicates Cretaceous/Palaeogene boundary.
RESEARCH LETTER
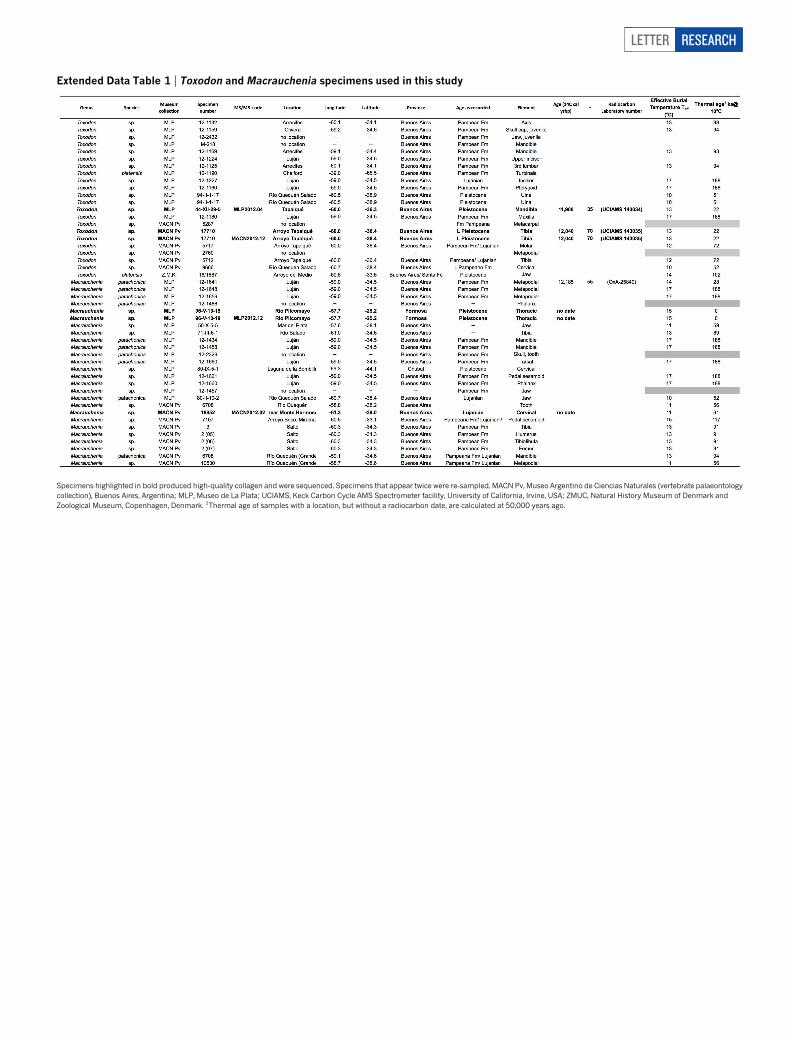
Extended Data Table 1 | Toxodon and Macrauchenia specimens used in this study
Specimens highlighted in bold produced high-quality collagen and were sequenced. Specimens that appear twice were re-sampled. MACN Pv, Museo Argentino de Ciencias Naturales (vertebrate palaeontologycollection), Buenos Aires, Argentina; MLP, Museo de La Plata; UCIAMS, Keck Carbon Cycle AMS Spectrometer facility, University of California, Irvine, USA; ZMUC, Natural History Museum of Denmark andZoological Museum, Copenhagen, Denmark. 1Thermal age of samples with a location, but without a radiocarbon date, are calculated at 50,000 years ago.
LETTER RESEARCH
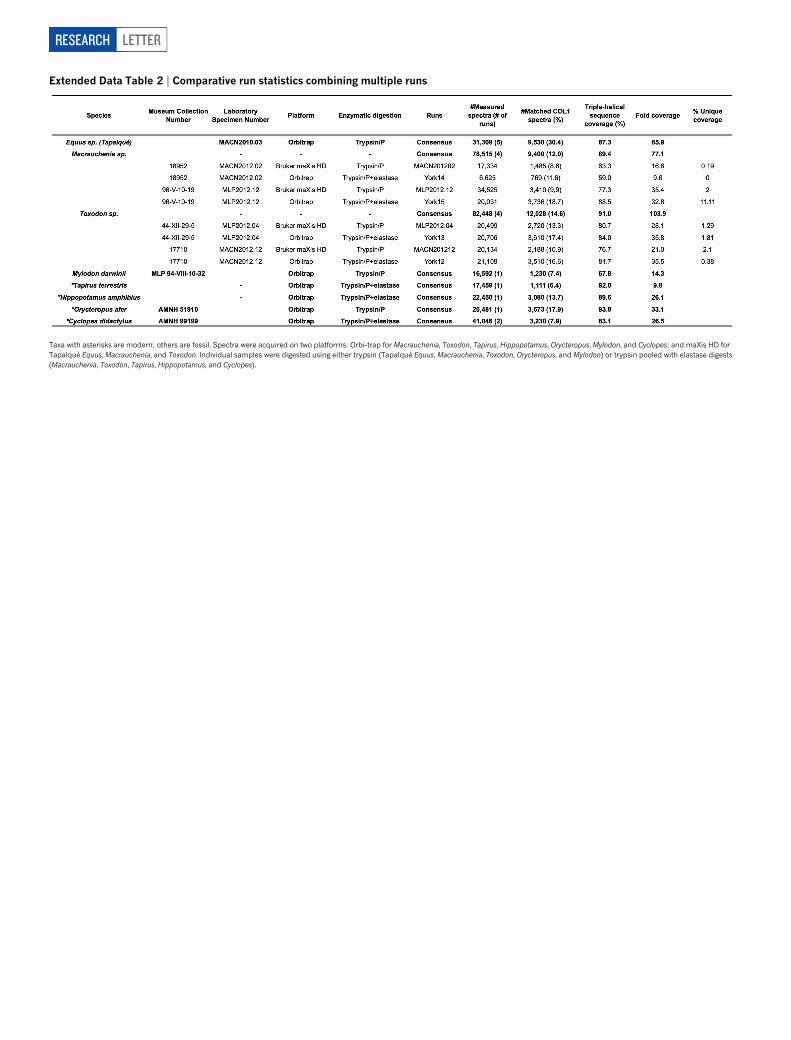
Extended Data Table 2 | Comparative run statistics combining multiple runs
Taxa with asterisks are modern; others are fossil. Spectra were acquired on two platforms: Orbi-trap for Macrauchenia, Toxodon, Tapirus, Hippopotamus, Orycteropus, Mylodon, and Cyclopes; and maXis HD forTapalque Equus, Macrauchenia, and Toxodon. Individual samples were digested using either trypsin (Tapalque Equus, Macrauchenia, Toxodon, Orycteropus, and Mylodon) or trypsin pooled with elastase digests(Macrauchenia, Toxodon, Tapirus, Hippopotamus, and Cyclopes).
RESEARCH LETTER


