Embed Size (px)
Citation preview

DOCUMENT RESUME
ED 269 394 SP 027 575
AUTHOR Mabry, Rodney H.; And OthersTITLE Fringe Benefits Available to Public School Teachers
in the Southeast. Research Report. Occasional Papersin Educational Policy Analysis.
INSTITUTION Southeastern Regional Council for EducationalImprovement, Research Triangle Park, N.C.
SPONS AGENCY National Inst. of Education (ED), Washington, DC.PUB DATE Nov 85NOTE 217p.; For executive summary, see SP 027 576.PUB TYPE Reports - Descriptive (141)
EDRS PRICEDESCRIPTORS
MF01/PC09 Plus Postage.*Fringe Benefits; *Leisure Time; Teacher Recruitment;*Teacher Salaries; *Teaching (Occupation); TeachingExperience
ABSTRACTThis project measured and evaluated the fringe
benefit element of the teacher compensation package available in the12 Southeastern Regional Council member states: Alabama, Arkansas,Florida, Georgia, Kentucky, Louisiana, Mississippi, North Carolina,South Carolina, Tennessee, Virginia, and West Virgina. Data werecollected by contacting members of the Council representing eachstate, and by questionnaires submitted to section head; in the statedepartments of education. Section one of this report presents anoverview of the project. The second section contains a specificdiscussion of the major fringe benefits available. Benefits aredescribed by state, and a tabular summary is given. Section threecontains a discussion of the theoretical basis for determining thevalue to teachers of summertime leisure. The question of whethersummertime leisure is a benefit or a constraint to teachers isconsidered. Section four presents tables of classroom teachercompensation by experience and level. The final section contains asummary of available fringe benefits and policy recommendations, aswell as suggestions for future research. A list of references isincluded. (JD)
***********************************************************************Reproductions supplied by EDRS are the best that can be made
from the original document.***********************************************************************

.w
OCCASIONAL PAPERSIN
EDUCATIONAL POLICY ANALYSIS
FRINGE BENEFITS AVAILABLE TO PUBLICSCHOOL TEACHERS IN THE SOUTHEAST
R.B.M. RESEARCH, INC.
Project Director and PrincipalInvestigator
Rodney H. Mabry
"PERMISSION TO REPRODUCE THISMATERIAL HAS BEEN GRANTED BY
gifi.ale...,
TO THE EDUCATIONAL RESOURCESINFORMATION CENTER (ERIC)"
fO Southeastern Regional Council for Educational ImprovementN11
P.O. Box 12746 200 Park Suite 204 Research Mangle Park North Carolina 27709 (919) 549/8216
4Z)
°I..n
U S DEPARTMENT OF EDUCATION0.tice 0 Educational Research and Improvemen
EDUCATIONAL RESOURCES INFORMATIONCENTER (ERIC)
o Oils document has been reproduced asreceived from the person or organizationoriginating it
C Minor changes have been made to improvereproduction duality
Points of view of opinions stated in this document do not necessarily represent officialOERI position or policy
o4,

This activity was supported in whole or in part by the NationalInstitute of Education, U. S. Department of Education. The contents do notnecessarily reflect the position or policies of the U. S. Department ofEducation or the Southeastern Regional Council for Educational Improvementmember states' Departments of Education or their Chief State SchoolOfficers.
I
I
I
I
I
I
I
I
I
I
I

RESEARCH REPORT
FRINGE BENEFITS AVAILABLE TO PUBLICSCHOOL TEACHERS IN THE SOUTHEAST
R.B.M. RESEARCH, INC.
Project Director and Principal
Investigator
Rodney H. Mabry
Co-InvestigatorsCotton M. Lindsay
Michael T. MaloneyBarbara H. Mabry
November 1985
Prepared for theSoutheastern Regional Council for Educational Improvement
200 Park Offices, Suite 204, Post Office Box 12746Research Triangle Park, North Carolina 27709
919/549-8216
4

TABLE OF CONTENTS
FOREWORD iii
SECTION
I. INTRODUCTION1
Purpose and Scope 2
Project Timeframe and Data Collection 4
Remainder of this Report 5
II. FRINGE BENEFITS FOR CLASSROOM TEACHERS IN THE SOUTHEAST 7
Alabama 11
Arkansas 17
Florida 23Georgia 32Kentucky 40Louisiana 43Mississippi 54North Carolina 60South Carolina 68Tennessee 75Virginia 82West Virginia 91Table 1, Summary of Available Fringe Benefits, by State 97
III. VALUING SUMMER LEISURE OF TEACHERS 100
Constrained Labor Supply and Wage Rates 102
Teachers as a Representative Subset of the General Population 111
Wage Compensation for Short Work Schedules 113
The Labor Supply Equation 114
Estimates of Labor Supply 116Table 2: Labor Supply, U.S. Workers Reporting Full Time Work 117
Do Constrained Hours Increase Wages? 119Table 3: Wages of u.S. Public School Teachers: Effects of
Work Schedules 121
Estimates of the Effect of Constrained Supply 122Summary 125
IV. CLASSROOM TEACHER COMPENSATION: SALARIES AND FRINGE BENEFITS . . . 131
Definitions/Calculation Methods for Fringe Benefits in Tables4-A through 6
Tables 4-A through 4-J: Salary and Fringe Benefit Values E.^:ludingValue of Summer Leisure for Teachers Classified by Education/Experience Levels, by State
Tables 5-A through 5-J: Total Compensation Including EstimatedValues of Summer Leisure for Teachers Classified by Education/Experience Levels, by State
Jt)
133
138
148

Table 6: Mean Values for Total Compensation, Fringe Benefits,and Typical Salaries across all Educational and ExperienceLevels, by State and for the Southeastern Region, 1984-85. 158
Highlights from Tables of Fringe Benefits and Salaries 165
Teacher Fringe Benefits Compared to Other Industries 168
Table 7: Fringe Benefits by Industry Type for 1983 and forTeach-!rs in the Southeastern Region for 1984-85 170
V. CONCLUSIONS 173
Summary of Fringe Benefits Available to Classroom Teachers. . . 174
Summary of Results and Methods of Valuing Summer Leisure. . . . 177Values of Classroom Teacher Fringe Benefits, Typical Salary,
Total Compensation, and Comparison to Other Industries. . 180
Policy Recommendations 181
Suggestions for Future Research 185
REFERENCES 188
I
I
1
I
I
I
p
I
I
1
I

FOREWORD
This project was begun in January of 1985 under the auspices of
the Southeastern Regional Council for Educational Improvement which
provided a grant through ROM Research, Incorporated, to the project
team. We began the project with no preconceived scientific notions,
though we were aware of the popular opinions that teachers are probably
underpaid and are not likely to have fringe benefits available to them
that are comparable to those found in private industry. These notions
were not borne out by the evidence gathered nor was either entirely
disproved. Here, we simply caution the reader to try to understand
the entire report, and not to lift specific comments or results from
only a page or a small portion of the report. Further, we were careful
to provide our resulting data in detailed form, so that readers might
make their own judgments rather than rely entirely on our interpretations
and conclusions. For example, fringe benefit values are given with
and without our estimates of the value of summer leisure included.
Finally, keep in mind that data grows old quickly. Salaries and fringe
benefits provided to teachers are changing rapidly each year and are
considerably higher now than in 1984-85, the year for which data were
collected. However, the work presented provides a solid snapshot of
teacher fringe benefit conditions in the Southeast last year by state
and in comparison with other industries.
Data were collected by contacting members of the Council
representing each state and then by sending questionnaires to designated
people, usually section heads in the various state departments of
education. We appreciate their responsiveness and wish to acknowledge

iv
their helpfulness here. The primary respondents in each state were
the following:
Alabama
Erskine Murray, Assistant Superintendent
Arkansas
B. L. Kincl, Coordinator for General Finance
Florida
Dianne A. Cothran, Associate for State-Federal RelationsG. Lavan Dukes, Administrator, Education Information Services
Georgia
Werner Rogers, Associate State Superintendent
Kentucky
Rebecca Brown, Associate Superintendent for Research andPlanning
Lynn Fluegge, Director, Unit for Research
Louisiana
Jerald Joe Hinton, Assistant Superintendent for Research andDevelopment
Mississippi
Thomas Saterfiel, Deputy Director, State Department of EducationN. F. Smith, Director, Bureau of Administration and Finance
North CarolinaReeves McGlohon, Associate State SuperintendentWilliam Pilegge, Assistant ControllerAudrey Wagoner, Personnel AnalystJane Worsham, Management Consultant
South Carolina
Robert R. Hill, Deputy Superintendent for Administration andPlanning
JoAnn Kerrey, Chief Supervisor, Management Information Section
Tennessee
James M. Kelly, Assistant Commissioner for General EducationJanice Cunningham, Chief of Benefits and Counseling, Tennessee
Consolidated Retirement System
Virginia
William H. Cochran, Deputy SuperintendentM.E. Cale, Associate Superintendent for Financial and
Administrative ServiceJames M. Patton, Director, Teacher Education and Certification

V
West VirginiaJames S. Gladwell, Assistant State SuperintendentClaude Smith, Coordinator, School Finance
We also wish to acknowledge the more than forty-five respondents
to our local district survey. These were selected district superin-
tendents in each state and their staff members. Though too numerous
to name inaividually here, we appreciate their generous cooperation
just the same.
Thanks go to co-investigators on the project: C.M. Lindsay and
M.T. Maloney, who did most of the theoretical and empirical work on
valuing summer leisure, and B.H. Mabry, who assisted with the data
collection, generation of ideas and writing throughout the project.
Several students at Clemson University worked diligently on the
project and deserve recognition. These are Kimberly Tripp (who wrote
the rough drafts for most of the state-by-state descriptions of fringe
be-3fits), Peggy James, and Sarah Rockwell.
We also wish to acknowledge the cooperation of the National Educa-
tion Association, and especially Mr. Barry Robinson of that organization
who offered his full assistance in collecting initial data and thought-
fully considering the early questions.
Finally, special thanks go to Ronald Bird, former Research Director
for SRCEI, who encouraged and guided us in the early stages of the
project; to Charles J. Law, Jr., Executive Director of SRCEI, who has
guided us to the conclusion of the project; and to Linda Brady, who
has spent many patient hours at odd times preparing the manuscript.
Rodney H. MabryProject DirectorOctober 20, 1985
9

I. INTRODUCTION
The ability to attract and retain highly qualified public school
teachers is an important concern of citizens, state and local government
officials, and professional educators at this time. As a result of
the feminist revolution and heavy inflation in the 1970s, which together
wened almost all occupations to women and also attracted them to a
variety of nontraditional, but higher paying positions, public school
systems can no longer automatically count on having an adequate supply
of highly qualified teachers.
Hence, urgent goals of school system administrators and others
at the current time are to (1) retain the quality teachers already
in the system, (2) upgrade the skills of less-qualified teachers in
the system, or available to it, and (3) increase the pool of highly-qual-
ified new teachers. Attainment of these goals may require significantly
higher compensation packages for teachers. Retention of quality teachers
already in the system may require more competitive salaries and working
conditions. Upgrading skills of those who need it is a "negative"
attribute of their current jobs and may also require higher compensation.
Higher entrance requirements and curriculum requirements for education
majors in colleges may require the prospect of more competitive compen-
sation, if education programs are to be successful in attracting the
desired students. Furthermore, recent trends towards longer school
days and longer academic school years (to increase the quantity and
quality of public school educational output) have certainly increased
the need for higher total teacher compensation.
Most state and local school officials, as well as legislators
and taxpayers, recognize the possible need for more ccmpensation for
10

2
teachers and have begun to take action. The difficulty is that little
is known at this time of the exact teacher compensation package--salary,
fringe benefits, and working conditions--that is currently in place
or the
above.
package that is needed to accomplish the consensus goals noted
Purpose and Scope
The purpose of this project is to measure and evaluate the fringe
benefit element of the teacher compensation package available in the
twelve Southeastern Regional Council member states. These states are
Alabama, Arkansas, Florida, Georgia, Kentucky, Louisiana, Mississippi,
North Carolina, South Carolina, Tennessee, Virginia, and West Virginia.
The major focus of the study is narrowed to fringe benefits for two
reasons: cirst, the least attention has been given to this element
of total teacher compensation; second, fringe benefits have become
a very important part of total compensation in most industries, a fact
that will remain as long as fringe benefits are not taxed as ordinary
income by governments. The value of fringe benefits amounted to about
one third of total payroll dollars fo7 all industries in the United
States in 1983 [U.S. Chamber of Commerce, 1984, pp. 29-30. Therefore,
it is important that as much as possible is learned about fringe benefits
for teachers so that full consideration of this element of total teacher
compensation can be given when the adequacy of teacher pay is questioned
and when additional pay for teachers is proposed.
Very little published information is currently available regarding
fringe benefits for public school teachers. The best source for data
on fringe benefits is the annual survey published by the U.S. Chamber
11

3
of Commerce. This publication has good data from a large survey and
reports specific dollar amounts in a meaningful way. The major drawback
here, however, is that there is no specific category foe teachers.
The "miscellaneous nonmanufacturing industries" group includes "research,
engineeritg, education, government agencies, construction, etc." [U.S.
Chamber of Commerce, 1984, p. 30]. This is hardly useful to teachers
and education institutions, though the data for specific manufacturing,
mining, and service industries is helpful for comparison purposes.
Data collected and published by the National Education Association
is useful for pupil counts, number of teachers, estimated average
salaries by region and state, and the like, but very little data is
available on fringe benefits, except retirement. The Educational
Research Service in Virginia puts out an annual compensation report
that includes fringe benefits for teachers. The fringe benefits section
is somewhat unsatisfactory for our purposes because most of the data
is presented in percentage form with the raw data and actual dollar
amounts conoeied. In addition, there is no comparative analysis made
in the report, though percentile data by state and by region are
presented.
Hence, to understand how education officials in the Southeast
can meet their goals partly through the total compensation package,
it is necessary to know exactly what that package currently is for
public school teachers so that some insight into what it should be
in a competitive labor market can be developed.
12

4
The specific objectives of this research are to:
(1) Identify the fringe benefits provided schoolteachers in the twelve Southeastern RegionalCouncil member states,
(2) Calculate the approximate dollar value ofeach of the major fringe benefits and presentas individual and total annual wage equivalents,
(3) Identify the extent to which fringe benefits varyby type and amount within the region,
(4) Examine carefully, theoretically and empirically,the question of whether free time in the summersis a benefit or detriment to teachers, and attemptto place a value on this leisure time,
(5) Compare teacher fringe benefits and total compensationin the Southeast with other occupations in industriesnationwide, and
(6) Make policy recommendations concerning fringe benefitsas a part of teacher compensation packages in the Sow:l-east.
Project Timeframe and Data Coliection
In January of 1985 all of the members of the Steering Committee
of the Southeastern Regional Council for Educational Improvement were
contacted and certain basic information, as well as their overall cooper-
ation, was solicited. Responses to general questions in our initial
letter and to a detailed questionnaire regarding statewide retirement
systems, salary schedules, and leave provisions were received during
the months of February and March. In late March and early April,
appropriate personnel in each of the state departments of education,
representing the twelve member states, were asked to identify local
districts that would be cooperative with the project and that would
represent a stratified sample of districts along the low-to-high
13

5
continuum of total compensation and, particularly, fringe benefits.
A questionnaire was sent to these local districts requesting information
on salaries, salary supplements, and various local and state fringe
benefits for the 1984-85 school year. Some 42 responses to the
questionnaire from local districts, along with booklets, personnel
handbooks, benefit pamphlets, and the like, were received throughout
April, May, June, and July. Information derived from published sources,
as well as from our own collection procedures involving local school
officials, provides the basis for the fringe benefit portion of this
report. The data for the empirical estimation of the value of summer
leisure available to teachers came from the Bureau of ' Census' Current
Population Survey tapes.
Remainder Jf this Report
Section II contains a specific discussion of the major fringe
benefits available to public school teachers in the Southeast. Benefits
are described by state and a tabular summary is given. Section III
contains an important discussion of the theoretical basis for deter-
mining the value to teachers of summertime leisure. The question of
whether summertime leisure is a benefit to teachers or should be
considered a constraint (or cost) is answered theoretically, and
estimates of the value of that leisure are reported. Section IV presents
tables of classroom teacher compensation by experience and education
level for each state. These tables show the typical contribution to
salary by both states and local districts, as well as the value of
state and locally offered fringe benefits. Also in this section, teacher
fringe benefits are compared with those available in other industries.

6
Finally, Section V concludes the report and contains a summary of
available fringe benefits and policy recommendations for possible future
action by either teachers or state departments of education, as well
as suggestions for future research.
15

7
II. FRINGE BENEFITS FOR CLASSROOM TEACHERS IN THE SOUTHEAST
Fringe benefits can be either broadly or narrowly defined. At
the broad end of the spectrum, these benefits to workers are said to
include any indirect (non-salary) form of worker compensation. In
1953, a pioneering writer, C.W. Sargent, devised five categories of
fringe benefits which contain a wide-ranging total of fifty "employee
benefits" that may seem somewhat extreme to some readers [Macaulay,
1959, pp. 185-186]. The first category of fringe benefits listed by
Sargent is for time not worked, which includes vacations, holidays,
lunch periods, sick and maternity leaves, jury duty time, voting time,
and more. The second category, monetary awards and prizes for special
activities and performance, includes anniversary awards, attendance
bonuses, plant neatness bonuses, suggestion-plan awards, quality bonuses,
and safety prizes. The third category is bonuses, contributions, and
profit-sharing in which the employee renders no direct, regular, or
special service. These simply include current profit-sharing payments,
stock plan contributions, Christmas-year-end bonuses, lay-off allowances,
college scholarship awards for employees' children, and educational
subsidies. The fourth category includes items intended to provide
employee security such as Social Security payments, workers' compensation
payments, and unemployment compensation payments. The last category,
"Practices and Services That Benefit Employees Primarily," includes
the following items: credit union facilities, food service costs or
losses, employee discounts on merchandise, recreational facilities,
house financing subsidies, vacation, and health and hospitalization
facilities provided at low cost.

8
The U.S. Chamber of Commerce currently lists fringe benefits
available to employees under five major headings [U.S. Chamber of
Commerce, 1984, p. 8]. The first is for the employer share of
legally-required payments for such benefit programs as social security,
unemployment compensation, workers' compensation, and railroad
retirement. In the second group are the employer's share of the cost
of pensions, insurance, and other agreed-upon benefits. In this
category, in addit'on to the expected pension and health and life
.insurance benefits, are short-term disability payments, salary
continuation payments for long-term disability, dental insurance,
discounts on goods and services, employee meals, and miscellaneous
payments such as v!sion care, prescription drugs, termi.tation pay,
and moving expenses, among others. The third category, called paid
rest periods, is comprised of lunch periods, wash-up time, travel time,
clothes change time, and get-ready time. The fourth category is for
payments for longer time periods during which no work is performed:
vacations and payments in lieu of vacations, holidays, sick leave,
payments during state or National Guard duty, jury duty, witness
appearances, voting pay allowance, and payments for time loss due to
death in family, or other personal reasons. The fifth and final category
is simply for other items such as profit-sharing payments, contributions
to employee thrift plans, Christmas or other special bonuses, service
awards, suggestion awards, etc., employee education expenditures, specia'
wage payments ordered by courts or payments to union stewards, and
so on.

9
Fringe benefits can also be defined somewhat narrowly to include
only actual monetary payments by employers on behalf of employees which
would include only the amounts paid by employers for such benefits
as social security, private pensions, and health and life insurance
premiums. This definition would exclude what some people term "working
conditions" rather than fringe benefits, i e I items such as a:r
conditioning in the workplace and short rest periods.
It is not necessary to debate heavily what constitutes a fringe
benefit for public school teachers. What the employer is after is
output. Such things as a fifteen minute morning break are certainly
important to the employer if they increase output and important to
the employee as a form of compensation to be bargained for either
:adividually or collectively.
The major fringe benefits we found available to teachers in the
Southeast that are the primary focus of this study are the following:
1) social security2) retirement
3) medical and hospitalization insurance4) life insurance5) leave benefits
sick
personalvacatiohmaternitysabbatical
6) unemployment compensation insurance7) worker's compensation insurance8) other fringe benfits9) summer leisure
These are the primary fringe benefits tnat are available in most
states, but, more importantly, are of considerable size in terms of
cost to education systems and value to teachers. Included with "other
fringe benefits" are those that are less widely offered or are of lesser
18
10
individual value. Examples are reimbursement for required and/or
discretionary educational expenses, payments to teachers for unused
sick and personal leave, either in cash or as credit towards retirement,
and many others.
Now we turn to the descriptions, by state, of fringe benefits
available to public school teachers in the Southeast. All categories
of fringe benefits listed above are discussed in turn, except summer
leisure which is the topic of Section III.
19
11
Teacher Fringe Benefit Descriptions by State
Alabama
Alabama allots state funds to districts prHarTly on a per teacher
basis and varies the amount depending on the certification classification
of each teacher. The only teacher classifications and the amounts
funded for 1984-85 are: bachelor's degree, $17,711; master's degree,
$20,342; and master's degree plus one or more years beyond, $21,726.
There is no experience criterion for allocating funds, but local
districts may establish more detailed salary schedules.
Major State Fringe Benefits
Social Security and Retirement: Public school teachers in Alabama
have mandatory social security coverage. Employer contributions to
this system are currently 7.05% of the teachers' actual annual pay
up to $39,600. In addition, all Alabama putlic school teachers are
required to be members of the state retirement system which provides
benefits for retirement, early retirement, disability, and death.
Teacher contributions amount to 5% of their annual salary while the
state contributes 9.75%.
Retirement with maxL um benefits may begin at age 60 provided
the member has ten (10) years of creditable service. A member may
also retire and receive maximum benefits after thirty (30) years of
service, regardless of age. A member who reaches age 70 is required
to retire and begin receiving benefits. These benefits are calculated
by multiplying average final salary by years of service and multiplying
that product by 2.0125%, which yields the .,aximum annual amount. Average
final salary is the average of the th;ee highest salaries within the
last ten service years.
20

12
Benefits from thc state retirement system are not sdbject to state
or local income taxes, but are subject to federal income taxes after
benefits equal to contributions are received. There are several optional
benefit plans that a teacher may select which pay to beneficiaries;
however, selection of an option will cause a reduction in monthly
benefits.
If a retiree returns to full time public school service, retirement
benefits will be suspended until the member again retires. In order
to earn additional credit, the member must return to full-time service
for at least two years. After two years the member must make a
contribution to the retirement system equal to the amount (plus interest)
he or she would have contributed if withdrawal from service had never
occurred. A retiree may return to state employment and receive maximum
benefits if employment is not full-time and if earnings are not more
than social security yearly earnings., The retiree's benefit will not
be affected at all by employment with any private industry or private
school system or public school system outside Alabama.
The retirement account accumulates interest at the rate o= 4%
per annum, a portion of which will be refunded upon withdrawal ;,om
service. The greater the number of years of accumulated service, the
greater the portion of accumulated interest refunded.
Teachers receive one year of retirement credit for each full 180-day
school year completed. Alabama public school teachers are e'igible
to purchase credit for out-of-state service provided they have
accumulated at least ten years of Alabama service. Each year of external
service purchased will cost 14.75% of the teacher's current annual
2j

13
salary. This 14.75% is the current state contribution ,rate (9.75%)
plus the 5% member contribution. Up to five years of service credit
may be purchased by the teacher. Military service credit may also
be purchased for up to four years, at a cost of 4% of the average
teacher's salary in Alabama during each year of service claimed plus
8% interest compounded annually from the last date of service to the
date of payment.
A teacher is eligible for disability retirement if he or she has
credit for at least ten years of service when the disability occurred.
To dttermine disability benefits the same formula is used as that for
the retirement benefit, except that a 3% reduction factor is used for
every year the member is under age 60 or for each year of service under
30 years. A reduction of 25% is the maximum, with the member receiving
the larger of the two calculations. If a member resumes full-time
service before age 50, he is required to become a member of the
retirement system again; if the retired member is older than 50, he
must work full-time for two years before requesting membership. If
a disabled retiree accepts part-time employment, the member's salary
will be limited to the difference between the annual disability benefit
and average final salary regardless of employer.
Medical and Hospitalization: Public school teachers are eligible
for medical and hospital insurance under the Alabama Public Education
Employees' Health Insurance Plan. The cost of the basic, individual
health plan is shared by the teacher and the state, with the state
providing $420 per year per teacher. Additional coverage and coverage
of dependents are available at extra cost to'the teacher. This optional
22

14
coverage includes special plans For cancer, hospital indemnity, and
dental coverage. Upon retirement, a teacher may still receive coverage
with the state paying all the cost of basic coverage.
The state does not pay for dental care for public school teachers.
However, though teachers may elect to receive dental coverage through
the state health insurance plan, they must pay all costs. Alabama
does not offer any separate or specific benefits for vision or auditory
care to its teachers.
Life Insurance: Alabama does not provide public school teachers
with any state-paid life insurance benefits.
Leave Benefits: Sick leave for public school teachers accrues
on the basis of one day per month and may accumulate up to 150 days.
This accumulated sick leave may be used as credit towards years of
service at retirement. The state of Alabama allows up to two days
of personal leave per year at full pay. These are in addition to sick
leave.
Sick leave must be used for maternity leave and there is no
provision for paternity leave. No vacation leave or sabbatical leave
is provided by the state.
Unemployment Benefits: The state of Alabama covers its teachers
with an unemployment compensation program which provides a reduced
but continuing income if the teacher becomes unemployed due to funding
changes or reorganization. The cost to the state for this plan varies
depending on local usage.
Workers' Compensation: Alabama does not provide funding for a
workers' compensation plan, though local districts may finance such
programs.

15
Other State Fringe Benefits: Another benefit provided by Alabama
is the Public Employees' Individual Retirement Account Fund (PEIRAF),
created by the Alabama legislature, toward which public employees may
make voluntary contributions. These contributions are termed deductible
voluntary employee contributions (DEC's) and are comparable to an IRA.
State Fringe Costs: Teachers are required to take classes in
order to maintain proper certification. The state provides no funding
for such classes, causing the total cost to fall on the teacher unless
local districts intervene.
Typical Local Fringe Benefits
Fringe benefits for public school teachers such as social security,
retirement, and health insurance coverage in addition to certain leave
benefits and unemployment compensation are provided by the state of
Alabama. Local systems also supply various benefits in addition to
these. These "extras" are described below. Three different school
districts -- a low paying, medium paying, and high paying district
-were surveyed in order to get an idea of typical local benefits for
which teachers are eligible.
Retirement: No extra retirement benefits are provided by the
local districts surveyed.
Health and Hospitalization: No extra medical benefits are provided
by the sample local districts in Alabama.
Life Insurance: Only one district provides life insurance benefits
for teae,ers. The standard policy is $5,000.00 per teacher and the
annual cost to the district per teacher for such a po,icy is $17.88.
Leave Benefits: Alabama public school teachers are allowed 150
days of accumulated sick leave. The high paying school district allows
21

16
teachers to receive payment annually for any unused sick leave in excess
of 150 days. The system pays the teacher $33.50 for each day accrued
over the 150 day state limit. Alabama allows teachers two days of
personal leave but local districts have the authority to offer more,
if they choose to do so. Two of the three districts questioned do
provide additional days, ranging from 3 to 5, while the third district
requires teachers to pay for substitutes for any personal leave over
2 days. The rate for a substitute is $20.50 per day in this county.
The high paying district also provides teachers with professional
leave with pay, which can be used to attend professional meetings and
educational workshops.
Unemployment Compensation: This state-provided benefit is not
augmented at the local level.
Worker's Compensation: The three Alabama school districts surveyed
all provide worker's compensation programs. The average annual cost
to the district per teacher is 27t per thousand dollars of each teacher's
salary.
Miscellaneous Local Fringe Benefits: The high paying school system
provides teachers with liability insurance coverage of $10,000.00.
It also reimburses teachers for fees for workshops that satisfy
recertification requirements and also for those that are purely
discretionary.
25

17
Arkansas
Arkansas has a locally oriented public school system in which
the state contributes the majority of funds on a formula basis. For
a sample of districts, the state's contribution averages 77% of local
school system total expenditures while local districts contribute the
remaining 23%. The only exception to this is the retirment system
cost to the employer which is paid entirely by the state. Her.,e, though
costs for almost all fringe benefits and salaries appear to fall on
localities, we have allocated the burden of these costs according to
the 77% - 23% sp::t.
Major State Fringe Benefits
Social Security and Retirement: Public school teachers in the
state of Arkansas are required to be members of the social security
system. The cost of this system is shared by the local systems (using
the state's money and their own) and the teacher. Employer and teacher
costs each equal 7.05% of teacher salaries.
The state of Arkansas has, for its public school teachers, a
mandatory retirement plan called the Arkansas Teacher's Retirement
System (TRS) to which the state pays all employer contributions by
appropriation. This system provides benefits for service retirement,
disability retirement, early retirement, and death and survivor benefits.
The cost to teachers for the retirement system is 6% of their
actual annual salaries. Annually required employer contributions by
the state are recomputed every year on an actuarial basis to keep the
system sound and are not credited to the teacher's account until he
26

18
or she retires. Teachers in Arkansas may retire and receive full
benefits if they are at least 60 years old with 10 or more years of
service credit, or if they have 30 years service credit regardless
of age. Members may retire early at a reduced benefit if they have
25 or more years of service credit and are not yet 60 years of age.
A teacher becomes vested in this retirement system after acquiring
ten years of service and may, upon termination of service, choose to
withdraw contributions from the system or to receive a deferred
retirement. If the member chooses a deferred plan he or she leaves
all contributions in the account and receives a benefit once the
retirement age of 60 is reached (or age 55, if at least 25 years of
service credit exists).
The retirement benefit amount is calculated based on average annual
salary and number of years of service. The final average annual salary
is calculated by averaging the highest five years of covered salary.
The benefit is then paid on the basis of the product of years of service,
final average annual salary, and 1.59 percent, subject to a benefit
floor of $1,800 per year.
There are several optional plans from which the teacher may choose.
Selection of an option may pay benefits to a spouse or other beneficiary,
but will lower the monthly benefit amount as a result.
Teachers receive one year of service credit for every full school
year (at least 120 days) that they teach. They may also receive credit
for fractional years.
If a member is vested in the Arkansas TRS, up to ten years of
out-of-state service credit may be purchased. The cost of such credit
will depend on the employee's salary at the time of purchase. Credit
also may be purchased for overseas and military service.
2'7

19
Retirees may return to full or part time employment in positions
covered by the TRS; however, retirees are subject to the social security
earnings limitation. The teachers retirement limitation increases
with the social security limitation. If the retiree exceeds the TRS
limitations, benefits cease until employment ceases, at which time
he or she will again receive benefits.
If the Consumer Price Index (CPI) has increased 3% or more during
the previous year, all teachers who have been retired for at least
one year will receive a 3% increase in their benefits. If the CPI
increase was less than 3%, then benefits will be adjusted by the actual
smaller amount.
As mentioned above, teachers are eligible to receive disability
benefits only after they become vested members of the TRS. In order
to qualify for this retirement, a teacher must become totally and
permanently disabled.
Health and Hospitalization: The cost of basic health and medical
insurance coverage for teachers is shared. The employee contributes
$13.36 per month and the employer contributes $35.00 per month per
teacher for such a policy.
No dental care or coverage for vision and auditory care is available
in the state-wide plan. No provision for long term disability is
available from the state.
Life Insurance: A statewide life insurance program is available
to Arkansas public school teachers through their local districts.
The cost is 80 per teacher (or $9.60 annually) for a $5,000 term life
28

20
policy. This policy will pay to a designated beneficiary for accidental
death and dismemberment as well.
Leave Benefits
Sick Leave: Teachers in Arkansas are allowed one day of sick
leave per month and may accumulate at least 45 days of sick leave time;
however, local districts may set their own limits. Any personal leave
time is determined by local districts; there is no state mandated minimum
number of days. Maternity leave counts against sick leave. There is
no state provision for separate maternity or paternity leave. Arkansas
also makes no provision for sabbatical leave. If any school systems
do have such a program, it is locally determined.
Unemployme,- Compensation: The state of Arkansas has an
unemployment compensation pool to which local systems contribute a
total of 1/4 of 1% of actual teachers' salaries.
Workers' Compensation: Local systems provide funds for workers'
compensation based on employer gross payroll for the year. Total gross
payroll is multiplied by .00093 to obtain the proper district
contribution.
Other State Fringe Benefits: The state will provide, to qualified
teachers, loans that pay for tuition, books, and supplies for required
coursework. Teachers have 36 months in which to repay the interest-
free loans.
Typical Local Fringe Benefits
While the state of Arkansas does provide money for fringe benefits
for public school teachers, local systems share these costs. Extra
non-state-mandated benefits are discussed below as local fringe benefits,
29

21
though funds used to pay for these benefits come from the common pool
of both state and locally generated monies. Three districts--low,
medium and high paying--were surveyed to determine their benefit
policies.
Retirement: No surveyed districts provide extra retirement benefits
beyond the state plan.
Health and Hospitalization: No surveyed districts provide extra
medical retirement benefits beyond the state plan.
Life Insurance: Two of the three districts pay for life insurance
for teachers. The high paying district provides a $30,000.00 term
life policy that costs the district $75.60 per teacher annually. The
middle paying district offers a $10,000.00 policy for which the cost
to the district is about $30.00 per teacher annually.
Leave Benefits: The state of Arkansas allows unused sick leave
to accrue up to a limit of 45 days. The high paying county allows
teachers to accumulate up to 60 days. Teachers in the other two
districts are paid for any leave days that they cannot accumulate over
45.
Local districts alone determine the number of personal leave days
to allow teachers. The high paying district allows two days per year
while the other two districts allow one, but the high paying district
charges personal leave against sick leave. Another district does not
charge used personal leave against sick leave, but requires that the
teactu_r pay the cost of a substitute ($35.00).
Unemployment and Workers' Compensation: All three districts offer
workers' and unemployment compensation programs. The table below shows
the different costs to each district.
30

22
Amount for Amount forDistrict Workers' Compensation Unemployment Compensation
High .00093 x teacher's salary .0025 x teacher's salary
Middle .003 x teacher's salary based on actual annual claims
Low $16.00 per year per teacher $127.00 per year per teacher
Miscellaneous Fringe Benefits: One county in Arkansas reimburses
teachers for college courses satisfying recertification requirements
and for workshops that satisfy recertification requirements, but will
not reimburse teachers for discretionary courses or workshops. Another
county provides teachers with some of the fees for workshops that satisfy
recertification requirements or are taken for purely discretionary
reasons.

23
Florida
There is no state salary schedule in Florida. The state funds
all local systems on the basis of full time equivalent stuaents at
rates adjusted for type of program (K-3, high school, vocational, etc.),
cost-of-living differences, sparsity of student population, and more.
Localities pay employer costs for social security, health care, and
the like with a combined pool of state funds (allocated per student)
and self-generated funds. For non-federal positions or programs, the
state allocates funds sufficient to pay an average of 65 percent of
total local expenditures.
Major State Fringe Benefits
Social Security and Retirement: Florida public school teachers
are required to participate in the federal social security program.
The amounts contributed by the state of Florida and by public school
teachers are equal and each is 7.05t of =rtml annual s .ml.nry.
Membership in the Florida Retirement System (FRS) is mandatory
for all public school teachers in this state. This plan provides
benefits for service retirement, early retirement, disability retirement,
and survivorship. Local systems have the authority to offer employees,
in addition to FRS, supplemental retirement plans to which membership
is optional. Many districts do offer such plans.
Contributions toward the FRS are made solely by the state of
Florida. Teachers have not contributed any part of their monthly
salaries for the state retirement system since 1925. The amount
contributed by the state for each teacher is 12.24% of actual annual
earnings.
Members of the FRS may retire at full formula amounts, if they
are age 62 with) 10 or more years of service credit, or if they have
32

24
30 years of credit renardless of age. Almost any type of creditable
service, including military service, may be purchased and counted toward
the 30 year requirement. To purchase credit for out-of-state service,
teachers pay the actuarial cost of the out-of-state service to the
FRS. Members of the FRS become vested in the system after complet;ng
10 years of service. After such time, teachers are eligible for
retirement but the benefit will be reduced by 5% for each year that
the member is under age 62 if the member has less than 30 years service
credit.
To determine the annual retirement benefit, a formula is used
that considers total years of creditable service, age at retirement,
and average final compensation. The average final compensation is
determined by averaging the teacher's five highest years of covered
salary. The maximum annual benefit is the product of years of service,
average final compensation, and two percent. As mentioned above, this
benefit will be reduced if the member retires early. There are also
several optional plans from which the employee may choose. By selection
of an option, monthly benefits amounts will be reduced.
If public school teachers in Florida become completely and
permanently disabled, they are eligible through the FRS to receive
disability benefits. There are two types of disability: In-line-of-duty
and regular disability. For in-line-of-duty disability, teachers will
receive a benefit calculated just like regular retirement which is
not to be less than 42% of average final compensation. Teachers become
eligible for regular disability if they have completed at least five
years of service as of July 1, 1985. If not, the teacher must have
33

25
10 years of creditable service to qualify for regular disability
retirement. If a teacher does qualify for this type of retirement,
he or she will receive a benefit calculated just as for regular
retirement or 25% of average final compensation, whichever is greater.
If the member, upon becoming totally disabled, is already eligible
for regular retirement, then the benefit will just be that for regular
retirement and the 25% minimum does not apply.
Cost of living adjustments in retirement benefits are made each
July 1. These changes reflect those of the cost-of-living index up
to three percent per year.
Upon retirement, teachers may seek other employment in a position
not covered by the FRS and still receive all retirement benefits.
A retiree may not seek employment in any position covered by the FRS
for one year after he or she retires or benefits will be suspended.
Further, reemployment in any FRS covered position is limited to $4,000
in earnings annually, or benefits will be suspended. If the retiree
is age 65 or over, there are no re,trictions or limitations on any
reemployment.
Health and Hospitalization: The state does not provide a basic
health and hospitalization plan for teachers. This is left to local
districts.
Life Insurance: Florida provides no life insurance coverage for
public school teachers.
Leave Benefits:
Sick Leave: Teachers in Florida are allowed one day of sick leave
per month and these leave days are allowed to accumulate from year
34

26
to year without limit. Teachers are not required to pay the cost of
a substitute when on sick leave. Though teachers are also allowed
up to six days of personal leave by the state, this leave is charged
against sick leave so that the total of leave days granted for
accumulation is still one per month. Local districts are allowed to
have policies that exceed these minimums.
Whether or not teachers may receive maternity or paternity leave
is up to individual districts. This is also true of sabbatical leaves;
there is no state policy.
Unemployment Benefits: Florida does not bear the costs of teacher
unemployment programs. Local districts reimburse the state annually
for actual use.
Workers' Compensation: Local districts are entirely responsible
for the cost of any workers' compensation plans they have in force.
Typical Local Fringe Benefits
The state of Florida provides local school districts with some
fringe benefits for public school teachers and requires others. Other
benefits for teachers are supplied by the local systems themselves.
Three Florida school districts were surveyed in order to obtain
information concerning the extra benefits they provide for teachers.
Retirement: The high paying school district provides a locally
funded and administered early retirement plan. This plan is provided
in addition to the plan by the Florida Retirement System (FRS). Members
of the FRS are eligible for this early retirement plan if:

27
1) They are at least 55;
2) they have between 25 and 28 years of service credit;
3) they have already retired under the FRS plan.
What this plan does, basically, is eliminate the penalty for retir-
ing early by paying the retiree tee difference between the FRS early
retirement benefit and what would have been received had the member
not retired early. The middle paying district also provides this early
retirement benefit for teachers but does not guarantee funding beyond
the current fiscal year. The cost to the high paying district for
this benefit is .2845% of teachers' annual salaries. There is no infor-
mation concerning the cost to the average district for this plan.
The cost for coverage varies from system to system with some districts
providing insurance at no cost to the teacher while other districts
provide coverage at a cost to the teacher. The cost to the district
for health care coverage for teachers also varies from $720 in one
Florida county to $2,000 in another.
Of the three districts evaluated, only one provided i s employees
with dental and vision care coverage. Other districts may have had
such care available but the extra cost of such rests with the teacher,
not the local system.
Life Insurance: Just as ..:!" kealth and medical insurance, local
systems do offer life insurance at various costs both to the teacher
and to the district. In one county, the cost to the district per teacher
per year is $108 for a policy equal to the teacher's salary rounded
to the next $1,000. The teacher makes no contribution for basic life
36

28
insurance plans in this county. Another county offers a $10,000 policy
which is lumped together with health insurance and was previously
mentioned. The third county offers its teachers life insurance at
a cost of $40.32 per year for the district and no cost to the teacher
for a $10,000 policy. Added benefit life insurance plans are available
to teachers for which they bear all costs.
One county allows teachers up to one year of maternity leave without
pay and this leave is not charged against sick leave. In another county,
school teachers can receive medical leave at any time, without pay,
based on a doctor's statement. Maternity leave is included in this.
Maternity leave may come from sick leave or the individual may request
medical leave. A third county which was evaluated had no maternity
leave policy, and instead, missed days must come from accumulated sick
leave.
Sabbatical Leave: nn,- of the count!es which vie surveyed funds
a sabbatical leave program for teachers. For this type of leave, the
teacher will receive one-half salary for one year. The teacher may
also continue to be a part of the group insurance plan and time spent
on sabbatical leave may be purchased and credited toward retirement.
Workers' Compensation: Local systems provide programs for workers'
compensation. Local districts contribute to these programs; the amount
of contribution varies. The costs of these plans vary from county
to county from .29% of salaries (about $55) on the low side to a high
of $112.
Unemployment Compensation: The cost of this program, like the
cost of the workers' compensation program, varies by district. In
37

29
one county surveyed, this cost is $400.00. Other systems reimburse
the state for actual expenses incurred by the state for its teachers
using the program.
Miscellaneous Local Fringe Benefits: Teachers in all three local
Florida districts surveyed are eligible to receive credit for unused
sick leave. The following is the scale used in one district at
retirement or termination to reimburse teachers for unused accumulated
sick leave.
1-3 years = 35% cf last daily salary rate x # of days
3-6 years = 40% of last daily salary rate x # of days
6-9 years = 45% of last daily salary rate x # of days
10-12 years = 50% of last daily salary rate x # of days
13+ years = 100% of last daily salary rate x # of days
Another district reimburses teachers annually for unused sick
leave that year at the rate of 80% of their current daily salary rate
if they used no more than three sick/personal days that fiscal year
and if they currently have a minimum of 21 accumulated unused sick
leave days. The third district simply pays teachers for 50% of their
accumulated sick leave days at retirement or termination at their current
full daily salary rate.
Only one county within the state of Florida offers an extended
leave policy without pay, as well as hardship/dire emergency leave,
for teachers as an added fringe benefit.

30
The state of Florida generally does not reimburse teachers for
costs of college courses taken to satisfy recertification requirements.
Local districts are authorized to provide the funds for classes and
most do so.
The high and low paying districts, and in some cases the average
paying district, provide teachers with reimbursement for college courses
taken in order to maintain certification. Money for discretionary
college courses is provided by the low paying district and also by
the high paying district (if these courses apply toward a master's
degree). The low and, in some cases, the average paying districts
provide fees for workshops satisfying recertification requirements.
Fees for discretionary workshops are also provided by the low paying
district.
The high paying district provides its employees with the option
to participate in the Variety of Individual Selections Trust Account
(VISTA) program. The local school board contributes $300.00 per month
toward this program for each eligible employee. The account earns
interest which can be used to provide other benefits.
There are two types of VISTA benefits -- Account A benefits and
Account B benefits. The board pays A benefits and the teacher pays
B benefits through payroll deductions. VISTA Account B benefits selected
are tax-free. Participants in the VISTA program select Account A
oenefits and Account B benefits that best fit their needs and situations.
Some benefits available under option A include:
1) Income Protection;
2) Life Insurance;
3) Accident Insurance;
39

31
4) Legal;
5) Physical Examinations and Diagnostic Plan; and
6) Dependent Group Medical.
Account B benefits include:
1) Account A Plans, minus Dependent Life Insurance;
2) Dependent Group Medical, Dental, and Vision
Premiums;
3) Reimbursement Account for Uncovered Medical
Expenses;
4) Day Care Expenses Reimbursement; and
5) Hospital Income Maintenance.

32
Georgia
The state of Georgia provides its school systems with the majority
of funds for salaries and fringe benefits paid to public school teachers.
Local districts supplement this compensation by supplying additional
funds for salaries and for established state fringe benefit plans and
by providing funds for additional fringe benefits provided at the local
level.
Major State Fringe Benefits
Social Security: Social security coverage is optional for Georgia's
public school districts. Only a minority of school districts in Georgia
have opted out of the social security system. In those cases, such
as the DeKalb County schcol system, alternative supplementary retirement
and disability insurance plans have been set up in which employees
are encouraged to invest. The DeKalb County Board of Education, for
example, allocates to its Alternative Plan an amount of money that
is slightly less than the amount that would have been paid to social
security. The employee is "strongly encouraged" to invest the money
the employee would have paid in social security taxes in this, or any
other, alternative tax sheltered annuity plan. This plan provides
benefits similar to those of social security: basic life insurance
and survivor benefits, long-term disability insurance purchased with
part of the contributions, and a tax-sheltered annuity that is set
up for each member with the remaining contributions. What is exciting
about this plan is that the employee's contribution to it is entirely
voluntary and whatever they choose to invest in addition to the amount
invested by the district for them in the Alternative Plan will be fully
available to them or their estate rather than being dependent on social
security rules in force at the time of retirement. 41

33
Retirement: The Georgia system requires all public school teachers
to belong to the Teachers' Retirement System as a condition of
employment. This retirement system provides benefits for retirement,
early retirement, and disability. With respect to cost, teachers
contribute 6.5% of their annual salaries to the retirement system;
though 6.0% is actually for retirement and 0.5% is to pay for a life
insurance plan. The state contributes to the retirement system, on
behalf of each teacher. 13.23% of each teacher's annual earnings.
Further, retirement benefits received from the Teachers' Retirement
System are not subject to state income taxes in Georgia. After the
retired member has received monthly benefits equal to the amount
contributed during active membership, benefits are then subject to
federal income tax. Of course, this usually occurs after one and one
half to two years of retirement.
Teachers may receive full retirement benefits after they reach
62 years of age or complete 30 years of service, regardless of age.
A teacher who is at least 60 years old may take early retirement with
less than 30 years of service. Benefits are reduced in this case by
one-fourth of one percent for each month the member is under age 62.
Finally, if a teacher becomes permanently disabled and has at
least 9} years of creditable service, he or she may apply for disability
retirement. Retirement benefit amounts are based on a period of highest
average salary and length of service. Highest average monthly salary
is determined by averaging the monthly pay fo- the highest 24 consecutive
calendar months of salary. This average salary is then multiplied
by 2%, and then by the number of years of creditable service. The
42

34
resulting product is the monthly retirement benefit under the maximum
plan of retirement. For teachers retiriny early, benefits will be
reduced as noted earlier. Optional retirement plans may be selected
to pay the spouse's beneficiaries or have other special features.
These optional plans may reduce the monthly benefit but may alter,
either upward or downward, the net present value of the total retirement
benefit at the time of retirement. A member who has at least 9 months
of service during a fiscal year receives credit for one full year of
service. The Teachers' Retirement System account stays active if the
teacher is an active contributing member at least one year out of any
five consecutive years. After teaching for six years in Georgia, a
teacher may establish up to ten years of out of state service. The
cost to the teacher to obtain credit for this service is 8% of the
annual salary earned in the other state plus accrued interest if the
teacher was ever a member of the Teachers' Retirement System of Georgia
prior to April 1, 1966. If membership began after April 1, 1966, the
cost is the total applicable member and employer contributions plus
accrued interest. Credit for teaching in private schools, colleges,
interdenominational schools, foreign sCiools, and military service
schools, cannot be established through the Teachers' Retirement System
in Georgia. The retirement system in Georgia includes a disability
section. Disability payments are fairly easy tL determine since they
are calculated using the percent of salary formula just as regular
retirement benefits are calculated, except that there is no age
requirement for disability retirement.
Health and Hospitalization Benefits: The medical and hospital
costs of public school teachers in Georgia are covered under the state's
43-1

35
health insurance program. This program i called the Georgia Health
Benefit Plan (or HBP). The HBP, a self insured plan, is managed by
the Georgia State Merit System. The state shares the cost with
individual teachers under a standard plan. However, teachers must
pay the full cost of any additional coverage if they choose a higher-op-
tion plan. Under the standard plan, the state contributes 3.9% of
teachers' salaries towards the total cost of the plan, and teachers
pay a flat amount of approximately $12 per month. If a teacher retires
and is to receive retirement benefits that are sufficient to pay the
rates approved by the State Personnel Board, his or her current level
of health insurance coverage can be continued with deducted payments
toward the HBP. If a teacher retires, but is not eligible for retirement
benefits, he or she can still receive health insurance through the
HBP only if he or she has at least 20 years of service. Besides standard
health and hospital insurance, Georgia does not carry any type of
specialized care insurance with its basic health plan. There are no
separate or specific benefits for vision or auditory care or for
long-term disability. Benefits of this type are sometimes available
at the local district level.
Life Int.urance: The state of Georgia does not contribute any
funds towards life insurance policies for classroom teachers. However,
local districts may provide such coverage. Teachers do receive a life
insurance plan but they pay its full cost and are forced to do so through
a contribution of one-half of one percent of their annual salaries
to the state Retirement System.
44

36
Leave Benefits: Public school teachers in Georgia accrue sick
leave on the basis of one and one-fourth days for each month of active
service, or 121 days for their regular, 10-month school year. Unused
sick leave may be carried over from year to year, and can accomulate
to a maximum of 45 days. Some local school districts allow school
teachers to accumulate more than 45 sick leave days, but then they
mi' t come up with the funds to pay teachers when they use their excess
accumulated sick leave days. Accumulated ,ick leave days are transfer-
able across school districts in the state.
The state allows public school teachers 3 days for personal leave,
though use of these days counts against sick leave accumulation. There
is no provision by the state for maternity leave. Sick leave must
be used for absence due to maternity, and such absence requires a physi-
cian's statement of disability. No paternity leave is specifically
recognized by the state, nor is there a state program for sabbatical
leave.
Unemployment Benefits: The state of Georgia makes no contribution
to unemployment compensation for public school teachers. Local
districts, however, can provide this funding.
Workers' Compensation: Teachers in Georgia are covered under
e workers' compensation plan for work-related injuries that is entirely
paid for by local districts.
Other State Fringe Benefits: No additional state fringe benefits,
other than the major ones noted above, are offered.
State Fringe Costs: Public school teachers in the state of Georgia
are required to renew their teaching certificates every five years.
45
I
I
I
I
I
I
I
1
I
I

37
To do so, teachers must have ten hours of college credit. As of now,
there is no funding provided by the state for these college or continuing
education courses. Beginning in fiscal year 1987, Georgia will provide
funds for teachers' tuition for such courses. For the present, however,
tuition, travel, books, and time costs for required continuing education
are quite significant, and represent, in effect, a net reduction in
pay.
Typical Local Fringe Benefits
The state of Georgia provides its teachers with fringe benefits
such as social security (or a comparable plan), retirement, leave time
and worker's compensation. Local districts supplement this state compen-
sation by supplying additional funds for existing plans and by providing
funds for additional fringe benefits. Three districts from this state
were surveyed in order to obtain information from representative high,
medium, and low paying school systems. Benefits offered by each district
are described below.
Social Security and Rctirement: Membership in the social security
program is not mandatory for public school teachers and some local
districts have set up alternative coverage plans in which employees
are urged to invest. The high paying district has set up such a plan
which is a tax sheltered annuity. The board pays an amount equal to
6.1% of gross salary (in lieu of social security payments).
For local districts with social security plans, the local system
contributes 7.05% of the total salary to this program. Local systems
also contribute toward retirement, 12.71% of the local portion
46

38
of teachers' salaries In Georgia, the state pays part of e teacher's
salary and most local systems provide a salary supplement. The typical
local salary supplement is $1,535 and the typical total salary is
$20,993; therefore contributions by locp' systems toward social security
and/or state retirement plans are $ ,480 and $195 respectively (per
teacher per year).
Health and Life Insurance: The high paying district offers its
teachers both health and life insurance plans. The health coverage
for this system provides a dental assistance plan and specified disease
insurance. This benefit costs the system $82.20 per teacher annually.
The life insurance benefit costs the local district about $11.00 per
teacher annually. The basic life insurance plan for teachers with
no dependents is a policy equal to double the annual salary not to
exceed $50,000. This district, in addition to providing its own health
and life insurance programs, also pays the teacher's cost of the basic
state health plan. The annual cost to the district for such is $163.20
per teacher.
The average district does make available an accident plan and
a cancer plan, but the teacher is required to pay the entire cost.
In the low paying district, the local system pays the teacher's
portion of the cost of the basic state health plan. The amount ofJJ
this benefit (annually) is $163.20 per teacher. In addition, this
district provides a $10,000 life insurance policy which costs the system
$13 per teacher per year.
Leave Benefits: Though each district surveyed allows the same
number of sick leave days (14 per month which equals the state minimum),

39
they vary with respect to accumulation limit. The high paying district
allows 120 days of sick leave to accumulate, the average system allows
80, and the low paying allows accrual of 45 days.
Regarding maternity leave, all systems charge this against sick
leave. The high paying district allows 30 maternity leave days, the
average district allows 6 weeks, and the low paying district allows
45 days.
Only the high paying system provides a sabbatical leave benefit.
Teachers who qualify for this type of leave will receive one-half salary
for one year.
Unemployment and Workers' Compensation: All three districts survey-
ed offer worker's and unemployment compensation programs. The costs
to the districts for these plans vary; the following table shows the
amouflt that each district pays annually.
District Workers' Compensation Unemployment Compensation
High paying $28.50 per teacher $12.00 per teacher
Average paying .08% of gross salary .1% of gross salary
Low paying $20.00 per teacher $15.00 per teacher

40
Kentucctl
Kentucky's system is a "minimum foundation" program supplemented
by locally generated funds. The basic foundation amounts allocated
to local districts by the state include scheduled minimum salary amounts
for teachers (based on education and experience levels) and other school
personnel, as well as monies for current expenses ($4,320 per classroom
unit in 1984-85), for capital outlay ($1,800 per classroom unit), and
student transportation. A state-wide salary schedule is in place which
is augmented by local supplements.
Major State Fringe Benefits
Social Security and Retirement: Public school teachers in Kentucky
make no contributions toward nor do they receive any benefits from
social security. Teachers are required to be members of the Kentucky
Teachers' Retirement System (TRS). This system provides benefits for
retirement, early retirement, disability retirement, death and survivor
benefits, and medical insurance for retirees.
Teacher contributions for retirement are 9.6% of their annual
salaries. The state's contribution is equal to the contribution of
all of the members plus an annual overmatch of 3.25% of total member
salaries. Retirement annuities are exempt from any Kentucky income
tax but are subject to federal taxes upon retirement. All retirees
are covered by a $2,500 death benefit.
The minimum age required for full retirement benefits is 60;
however, a member with 30 years of Kentucky service may retire with
full benefits regardless of age. Members with at least five years
of Kentucky service (at least two of these years must have been after

41
July 1, 1941) may retire at age 55, but the benefit is reduced 5% for
each year the member is less than 60 or by the number of years the
service is less than 30, whichever number is smaller. Out-of-state
or military credit cannot be used as credit for the five years.
Out-of-state service may be used as credit for members who are retiring
with 30 years of service; up to 8 years of out-of-state service may
be used and 6 additional years of military service. Such members must
contribute 7.84% of the final average salary for each year of out-ofstrte
service used to make up the 30 years. Members who are under the age
of 55 may retire with as little as 27 years of service but their benefits
are reduced 10% for each year the service is less than 30 years.
To calculate benefits received under the basic retirement plan
of Kentucky, the following steps are taken:
1. The number of years service between July 1, 1941
and June 30, 1983 is totaled, multiplied by the
average of the five highest salary years during
any period of service, and this product is
multiplied by 2%.
2. Service for 1983-1984 should be multiplied by the
5-year-average-salary and then by 2.5%.
3. Any service after July 1, 1984 should be totaled
and multiplied by the 5-year-average-salary and
then by 2.5%.
4. The sum of these three calculations is the maximum
annual benefit.
50
42
There are a number of optional plans that may be selected that pay
to spouses or beneficiaries or have other features. Selection of such
options will reduce the etiree's yearly annuity amount because of
the additional benefits.
To qualify for disability benefits, a member must have at least
5 years of Kentucky service credit (the last year of this service being
just prior to retirement) and be less than 60 years of age. Some members
over 60 may qualify for benefits under special conditions. Disability
retirees may receive one year of disability retirement for each 4 years
of Kentucky service. Each member automatically receives at least 5
years of credit if he or she meets disability requirements. The monthly
benefit is calculated by multiplying their 5 year average salary (calcu-
lation of this is shown above) by 60% and then dividing by 12.
The basic benefit to a surviving spouse is $180 per month; if
the surviving spouse's income is less than $500 per month, the benefit
will be $200 per month. If a member of the TRS dies after a minimum
of 10 years service, the surviving spouse may receive a benefit equal
to the benefit that would have been paid to the deceased member when
eligibility conditions were met. The surviving spouse would begin
receiving these benefits when the age of the deceased member would
have met retirement requirements. The monthly payments will continue
until the spouse dies or remarries. Dependent children under age 18
qualify for survivor's benefits regardless of income or marital status
of the surviving spouse. After reaching age 18, chiloren may still
be eligible for benefits if they are full-time students in a "recognized
educational program." If a student becomes classified as part-time,
51
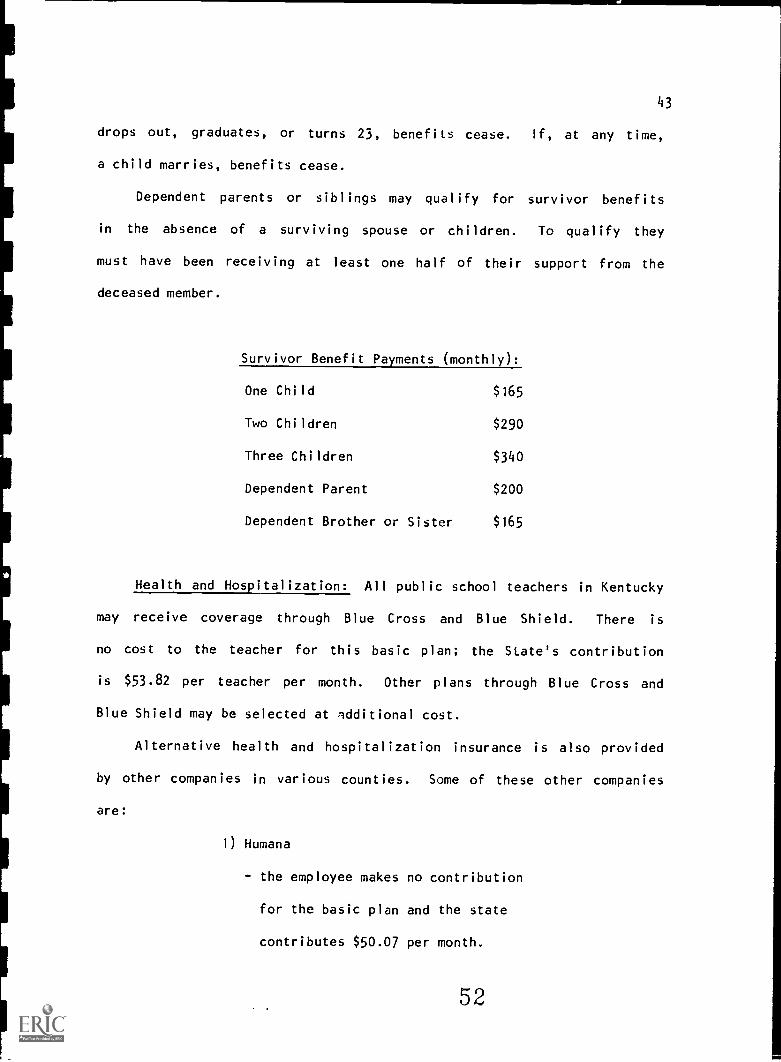
43
drops out, graduates, or turns 23, benefits cease. If, at any time,
a child marries, benefits cease.
Dependent parents or siblings may qualify for survivor benefits
in the absence of a surviving spouse or children. To qualify they
must have been receiving at least one half of their support from the
deceased member.
Survivor Benefit Payments (monthly):
One Child $165
Two Children $290
Three Children $340
Dependent Parent $200
Dependent Brother or Sister $165
Health and Hospitalization: All public school teachers in Kentucky
may receive coverage through Blue Cross and Blue Shield. There is
no cost to the teacher for this basic plan; the State's contribution
is $53.82 per teacher per month. Other plans through Blue Cross and
Blue Shield may be selected at additional cost.
Alternative health and hospitalization insurance is also provided
by other companies in various counties. Some of these other companies
are:
1) Humana
the employee makes no contribution
for the basic plan and the state
contributes $50.07 per month.
52

44
2) Health America
- the teacher pays $8.85 for the basic
plan and the state pays $53.82.
3) HMO Kentucky, Inc. (Blue Cross/Blue Shield Plan
2000)
- the states' contribution is $52.55 and the employee
contributes nothing for the basic plan.
4) Independence Health Plan of Kentucky
- state contributes $53.82 and the employee
contributes $5.83 for the basic health plan.
Through each of these additional firms, expanded coverage may
be obtained at full cost to the teacher. There is no provision for
dental, vision, or auditory care in the basic plan provided by the
state.
Life Insurance: The state of Kentucky provides its teachers with
a $3,000 life insurance policy. The cost to the state is 63 per month
or $7.56 per year for each teacher.
Leave Benefits: Teachers may earn up to 10 days of sick leave
per year and sick leave days can accumulate from year to year with
no limit. The teacher may be compensated, upon retirement, for each
unused sick leave day. Each district is also able to provide up to
3 personal leave days (at full pay) per year for teachers.
Maternity leave must come out of accumulated sick leave and there
is no provision for paternity leave. Kentucky also offers no sabbatical
leave program.
53

45
Unemployment/Workers' Compensation: The state of Kertucky makes
no contribution to an unemployment compensation program for teachers.
Teachers are eligible for workers' compensation but the funding for
this is provided by local districts.
Other State Fringe Benefits: One other fringe benefit to which
teachers in Kentucky are entitled is the ability to use accumulated,
unused sick leave for credit toward retirement. The amount of compensa-
tion for which the teacher is eligible is based on a percentage, not
to exceed 30%, of the teacher's daily salary rate calculated from his
or her last year of salary. This amount is paid by the local district,
not the state, and will then be incorporated into the member's final
year of service salary.
Some teachers may receive benefits for college tuition through
math and science scholarship programs. Teachers in Kentucky are required
to earn master's degrees within a certain period of time; therefore
these scholarships may help provide them with some of the funds necessary
to pay for this additional education.
State Fringe Costs: As stated above, public school teachers
are required to eventually earn master's degrees. If they do not receive
funds through math and science scholarship programs, the teachers must
pay for necessary college courses themselves.
Typical Local Fringe Benefits
Public school teachers in the state of Kentucky receive fringe
benefits provided by local school districts in addition to those avail-
able from the state. Locally provided benefits are described below
54

46
for representative high paying, average, and low paying Kentucky school
districts.
Retirement: None of the local districts surveyed supplemented
the state retirement system even though teachers in Kentucky are not
covered by social security.
Health and Life Insurance: The high paying Kentucky district
provides teachers with a cancer insurance plan at an annual cost of
$18.00 per teacher to the district. In addition to this plan, the
high paying district also provides life insurance for teachers. The
basic policy amount is $13,500 and costs the district $28.00 per teacher
per year. Life insurance is also offered by the average paying district
to its teachers. The policy amount is equal to the salary of the teacher
rounded to the next highest thousand, not to exceed $70,000 and not
to be less than $5,000. Upon reaching age 65, a teacher's policy is
reduced by 5% each year. At age 70, the amount is reduced by a ma;'mum
of $5,000. The present cost of this benefit to the local system is
$3.36 for every thousand dollars of teachers' salaries annually, or
from about $55.00 to $95.00 per teacher per year.
Leave Benefits: Teachers in the high and average districts receive
payment, upon retirement, for any unused accumulated sick leave at
the rate of 30% of the teacher's last annual salary. The low paying
district also pays for accumulated sick leave, but at the rate of 10%.
Unemployment and Workers' Compensation: All three districts provide
both workers' compensation and unemployment compensation programs.
The cost of these plans to local districts varies. The table below
summarizes these districts and their respective plans.
50r--
I
I
I
I
1
I

47
Annual Cost of Annual Cost ofDistrict Workers' Compensation Unemployment Compensation
High $35 per teacher $60 per teacher
Average $30 per teacher $60 per teacher
Low $29 per teacher $193.42 per teacher
Miscellaneous Local Frin e Benefits: Only the low paying district
indicated that it sometimes provides reimbursement of fees for workshops
that are purely discretionary.
56

48
LouisianJ
Louisiana's education system is state-oriented, with significant
flexibility incorporated in it for local deviation from state rules
when this favors teachers. The state's salary system is linked to
a state minimum salary schedule that is rrequently heavily supplemented
by local districts, resulting 'n wide salary differentials across
districts.
Major State Fringe Benefits
Social Security and Retirement: Forty-six of the school systems
in the state of Louisiana have completely withdrawn from the social
security system, while the remaining twenty systems !-,ove not. Only
some of the non-teaching staff in the latter systems are covered by
social security. Public school teachers do not contribute toward,
nor do they receive benefits from, social security regardless of whether
or not their particular school has fully withdrawn from the system.
Instead, Louisiana teachers become members of the Teachers' Retirement
System, if they are under the age of 60, from which they receive their
retirement benefits. This system provides benefits for retirement,
early retirement, and disability retirement.
Louisiana teachers contribute 7% of annual earnings and the state
contributes another 93% toward this retirement fund. Teachers may
retire and receive maximum benefits if they are at least 60 years of
age with 10 years of service, or if they have 20 years of service
regardless of age. Retirement is compulsory when a member reaches
age 70.
Any member who has at least 10 years of accumulated service may
choose either to withdraw contributions from the system or leave contri-
57

49
butions in the system and receive defined benefits upon reaching 60
based on the number of credited years at the time of service withdrawal.
Retirement benefits are calculated on the basis of 2% times the
years of creditable service (including any unused sick leave time)
times the average salary of the 36 highest consecutive months, plus
$300. Some members may be eligible for a 21% formula (calculated in
the same way as the 2% formula) if:
(a) the member is at least 55 and has credit for
25 years of service; or
(b) the member has credit for at least 30 years of
service regardless of age; or
(c) the member is at least 65 years of age and has
credit for at least 20 years of service.
The above conditions are exclusive of any unused sick leave or military
service.
A number of options are available for teachers, but selection
of any of these will reduce the benefit amount. These optional plans
provide payment to spouses or beneficiaries or have other special
features.
The Teachers' Retirement System of Louisiana provides disability
payments for total and permanent disability at any age, after a teacher
has served five years. If the teacher is eligible for the 2i% retire-
ment benefit mentioned above, he or she will receive a disability
allowance calculated by this 2+% retirement formula. However, if not
eligible for the 2+% formula, benefits are equal to 1.:le lesser of (1)
75% of the amount that the teacher could have received, had he or she
been able to teach until the age of 60, or (2) 50% of the average final
compensation. 58

50
If the disabled retiree has dependent children or a disabled spouse,
he or she receives an additional benefit of 50% of his or her disability
benefit, though the total cannot exceed 75% of the average final compen-
sation. If a teacher on disability dies, reaches age 60, or returns
to active membership for at least three years, he or she will receive
one year of service credit for each year of disability for the purpose
of calculating regular retirement benefits for the member or the member's
survivors.
Health and Hospitalization: The state of Louisiana appropriates
an amount equal to approximately 4% of teachers' salaries for health
and hospitalization coverage. The state, however, authorizes local
school boards to "make contracts for group medical, surgical, and
hospital benefits and services with any insurance company...legally
authorized to do business in this state...[and] may agree to pay part
or all of the premiums...for any such contracts out of any funds
appropriated For the purpose and included in the budgets of school
boards." Therefore, the amount paid for health insurance by the state
and by the teacher varies widely from district to district.
Any provisions for dental, vision and auditory, and long-term
disability are up to the local system.
Life Insurance: Local systems are authorized by the state of
Louisiana to establish their own ccntracts with legally authorized
insurance companies for life insurance policies. There is a death
benefit equal to one year of salary provided by the Teachers' Retire-
ment System; further, if a disabled teac er dies before age 60 and
is still receiving disability benefits, any eligible survivors will
then receive these benefits.
59

51
Leave Benefits: Public school teachers in Louisiana are allowed
10 days absence per school year with full pay. Sick leave is allowed
to accumulate without limit and up to 25 days of unused sick leave
can be paid for at retirement or death. Remaining unused sick leave
can be used as service credit in calculating retirement benefits.
Two days of personal leave are allowed per year with full pay,
but these are charged against sick leave. School boards are given
the authority to grant maternity leave to school teachers for a "reason-
able" amount of time before and after childbirth, though these days
are also charged against sick leave. There is no provision for paternity
leave.
Teachers in Louisiana are eligible for a very generous sabbatical
leave program that allows for professional or cultural improvement
or for rest and recuperation. A two-semester sabbatical may be taken
just following any 12 or more consecutive semesters of service, or
for a semester following any 6-12 semesters of service.
Teachers on sabbatical leave for professional or cultural improve-
ment must:
(1) pursue a program of study and earn at least 10undergraduate or six graduate credit hours or bea full time student at an institution of higherlearning; or
(2) pursue a program of independent study or research; or
(3) engage in travel that is of definite educational value.
Teachers on sabbatical leave will receive (a) 50% of the minimum
salary given to a beginning teacher with a bachelor's degree in that
school system, or (b) the difference between the salary he or she would
60

52
have received if in active service and the amount of money that would
be paid a substitute to fill in during this sabbatical leave. As an
example, a teacher who would earn $20,000 the next school year in a
district that pays substitutes $40 per day would be paid $12,800, which
is the difference between $20,000 and the product of $40 and 180 days.
Local school boards may pay additional compensation to teachers for
sabbatical leaves.
Teachers on sabbatical leave are eligible for any regular salary
increases. Also, persons on sabbatical leave still continue
contributions to the retirement fund and this leave time counts as
active service as far as this fund is concerned.
Unemployment Benefits: The state provides funding for unemployment
compensation programs. The amount of money provided depends on local
usage, i.e., the amount will vary from district to district.
Workers' Compensation: The maximum compensation for injuries
occurring after September 1, 1977 is 66 2/3% of the average weekly
wage paid in all employment subject to the Louisiana Employment Security
Law, and the minimum compensation is 20%.
Other State Fringe BenefiLb: Up to 25 days of unused sick leave
can be paid at retirement or death. This is only a state authorization;
local districts must u3e their own funds if they choose to offer this
benefit to their teachers.
Typical Local Fringe Benefits
The state of Louisiana provides its public school teachers with
many benefits such as those for retirement, leave time, workers' and
unemployment compensation, and health and life insurance. Actually,

53
the state provides the money for health and life insurance.
Establishment of types of plans is up to each local district. Three
Louisiana school districts--a high, middle, and low paying--were surveyed
in order to ascertain the types and the monetary value of benefits
available to teachers.
Retirement: No local districts surveyed added any retirement
benefits to those already available from the state.
Health and Hospitalization: No local districts surveyed added
any medical benefits to those already available from the state.
Life Insurance: No local districts surveyed added any life
insurance benefits to those already available from the state.
Leave Benefits: Upon retirement, the high paying district pays
teachers for any accumulated sick leave, up to 25 days. The other
two districts offer no reimbursement for accrued leave days. The average
district only allows an accumulation of 25 sick leave days, the state
minimum, and the other two districts have no limits.
The high and low paying districts allow teachers to stay on mater-
nity leave until the teacher is released from the doctor's care. The
average district allows a maximum of 25 days of leave. In all cases,
maternity leave is deducted from sick leave.
All three districts allow two days of personal leave per teacher
yearly. The high and average districts charge personal leave against
sick leave; the low paying district does not. The low paying district
simply requires teachers on personal leave to pay the cost of a substi-
tute which, in this county, is $20.00 per day.
Unemployment and Workers' Compensation: These programs are state
funded.
62

54
Mississippi
The primary and secondary educational system in Mississippi is
a traditional mixed system. The state allocates minimum foundation
funds and sets a minimum salary schedule that is often supplemented
by local districts. The state and local districts share payment of
the employer portion of retirement contributions. Sick leave is mandated
by the state, but paid for by iocal districts. The school year 1984-85,
for which data is reported here, represents a low point for Mississipi.
It should be noted that salary schedules and fringe benefits were
increased significantly for the 1985-8b academic year.
Major State Fringe Benefits
Social Security and Retirement: All Mississippi public school
teachers are required to be covered by the federal social security
program as well as the Mississippi Retirement System, which is mandatory
for all teachers under the age of 60. This system provides benefits
for retirement, early retirement, disability, and a death benefit.
The teacher, state, and local district share the costs of the
two mandatory retirement systems. Teachers pay 7.05% and 6.0% of their
salary, respectively, toward the social security and state retirement
programs. The state allots funds to school districts to pay the employer
portion of social st.zurity, 7.05%. The employer contribution for state
retirement is a total of 8.75%, 7.25% from the state and 1.50% from
the district.
Full benefits are received if teachers retire at age 65 or if
they have credit for 30 years of service, regardless of age. If a
teacher reaches age 60 and has at least 10 years of service credit,
63

55
he or _'-,e may also retire, but at a reduced benefit. A teacher becomes
vested in the system after ten years of service and, upon leaving ccvered
employment without 30 years of service or without reaching age 60 for
early retirement, may decide to withdraw teacher contributions and
accumulated interest or defer the retirement benefit to begin at age
60.
Retirement benefits in Mississippi are calculated using three
factors: (1) member's age; (2) years of service credit; and (3) maximum
annual salary (based on the average of the five highest consecutive
years of earnings). The member receives a benefit of 1 5/8% of the
average compensation for each year of service less than or equal to
20 years, 1 3/4% of aveige compensation for service years exceeding
20 but less than or equal to 30, and 2% of average compensation for
each year of service greater than 30 years. This benefit is reduced
at the rate of 3% for each year the member is under 65, unless he or
she has 30 years service credit. There will also be a reduction in
benefits if the teacher selects an optional plan. These optional plans
will pay to spouses, benefic!aries, or have other special features.
After retirement, a teacher may resume employment for a period
of not more than 120 days or earn 25% of average salary and still receive
all retirement benefits to which the teacher normally would be entitled.
If the teacher returns to full time or regular employment, benefits
will cease until the employee again retires. While employed for the
second time, contributions to the retirement system would resume and
these contributions would be used to recalculate a monthly benefit
after retirement.
64

56
Since 1984, retiring members of the Mississippi Retirement System
receive cost of living adjustments equal to the annual percentage change
in the Consumer Price Index up to 2i%.
A teacher receives one year of service credit for each 10 months
of service (177 days average). Service credit for military service
may be obtained up to a maximum of 4 years. Out-of-state service credit
may be purchased, provided the teacher has at least 5 years of
Mississippi service credit upon retirement. Up to two years credit
for every 10 years of Mississippi public school service may be purchased
for any professional leave time.
Teachers are eligible for disability retirement if they become
permanently and totally disabled and have at least 10 years of service
credit. These payments are calculated just as are benefits for service
retirement.
Health and Hospitalization: The State of Mississippi has a state-
wide health plan, but does not directly pay any portior of the cost
of this program for teachers. They do encourage local districts to
pay for health benefits for teachers by offering to give any district
$175 per teacher for any supportive, non-insurance expenditure purpose,
if the district will spend $250 per certified teacher for group health..._..
and/or life insurance. The law is quite specific, saying "It is the
intent of the Legislature that no state funds shall be used for the
purchase of such group health and/or life insurance."
Life Insurance: The cost of participation in the state life insur-
ance plan is entirely borne by teachers or local districts, not the
state.
6 5

57
Leave Benefits: Teachers in Mississippi must be allowed seven
days of sick leave per year by law and may accumulate up to 30 days.
Local districts may allow more days per year and/or more days accumula-
tion.
Two days of personal leave are also allowed by the state and are not
charged against sick leave. A form of extended sick leave is available
for ten days after accumulated sick leave has been exhausted. For
those ten days, only the established district substitute rate may be
deducted from teachers' pay. Thereafter, full pay may be withheld
for continued absence. No special provision for maternity or paternity
leave is provided by the state, and there is no provision for sabbatical
leave.
Unemployment Benefits: The state of Mississippi does not provide
unemployment benefits for teachers; however, some local districts do
provide such funds.
Worker's Compensation: Mississippi does not contribute to a
worker's compensation program but, as with unemployment benefits, local
districts may contribute to such pools.
Other State Fringe Benefits: Teachers are allowed to receive
retirement service credit for any unused sick leave up to 77 days.
State Fringe Costs: Teachers are required by the state of Mississ-
ippi to receive six semester hours of college credit every five years
to continue their employment, i.e., maintain their certification.
The State has no program to pay or subsidize these required expenses.
66

58
Typical Local Fringe Benefits
Three local Mississippi school districts--a high paying, middle
paying, and a low paying district--were surveyed in order to determire
what separate benefits, if any, they provided for their public school
teachers. Those benefits are described below.
Retirement: The local systems all contribute 1.5% of annual
salaries to the state retirement plan for each teacher.
Unemployment and Workers' Compensation: The high paying Mississ
district has an unemployment compensation plan, but no workers' compensa-
tion. Unemployment compensation and workers' compensation programs
are both provided by the middle paying district. The cost of each
is $32.00 and 2% of annual salary for workers' compensation and unem-
ployment compensation, respectively. The low paying district offered
neither of these benefits.
Health, Hospitalization, and Life Insurance: The state of Mississ-
ippi provides each listrict that spends at least $250 of its own money
for health and life insurance for teachers an additional $175.00 for
use in other areas. None of this state money is to be used for insurance
purchases. However, none of the districts included in this survey
reported providing any extra health and or life insurance for teachers.
Leave Benefits: The high paying district adds two more sick days
plus one unused personal leave day to the state minimum of seven, making
a total of ten days. Any unused portion of these ten days may be
accumulated without limit.
The middle paying district allows nine days of sick leave and
teachers may accumulate up to 40 unused days. Teachers are allowed
one personal leave day per year and may accumulate up to three days.

59
Seven days of sick leave are allowed teachers in the low paving
district which is equal to the state minimum. They may accumulate
up to 30 days, and they also receive two days of personal leave per
year.
Miscellaneous Fringe Benefits
Teachers in the high paying district are reimbursed for science
and math courses that satisfy recertification requirements.
Teachers in one of the other districts are eligible for "free
hours" at a university in Mississippi through a program in which univer-
sity students observe classes in county schools. By participat;ng
in this program, the district receives an allotment of free hours.
Though insurance benefits are employee paid, the high paying
district has at least established a payroll deduction procedure which
enables contributions to be made on a tax-sheltered basis.

60
Nob-th Carolina
North Carolina's is a very state-oriented school system. The
minimum salary schedule, with funds supplied by the state, is significant
and only slightly augmented by most local districts. Further, locally
provided fringe benefits are relatively minor.
Major State Fringe Benefits
Social Security and Retirement: All public school teachers in
North Carolina are required to be members of the federal social security
system. The state pays the employer matching portion of the contribution
which is 7.05% of teacher salaries. Teachers in North Carolina are
also required to become members of the Teacher's Retirement System
(TRS). This system provides benefits for retirement, early retirement,
benefits for total and permanent disabilities, and survivor benefits.
Retirement benefits are not subject to North Carolina state income
taxes. However, contributions made after July 1, 1982 are subject
to federal income tax. leachers contribute 7.1% of their monthly salary
to the retirement system while the state contributes 11.07%. Teachers
may retire and receive full benefits if they are at least 65 years
of age or have credit for at least 30 years of service regardless of
age. Teachers are eligible for early retirement at a reduced benefit
if they have reached age 50 and have 20 years of service or if they
have reached age 60 and have 5 years of service. The following table
shows early retirement benefit percentages:
69

61
Age atEarly Retirement
Percent of MaximumBenefit Received
50 42%51 45%52 48%53 51%54 55%55 59%56 63%57 68%58 73%59 79%60 85%61 88%62 91%63 94%64 97%
The percentage of benefit received drops by 3% per year as a penalty
for each year between the ages of 60 to 65 that a teacher takes early
retirement. From age 57-59, the penalty is set at 6%; from age 55-56,
the penalty rate is 5%; from age 52-54, the penalty decreases to 4%1
and from ages 50 to 52, the penalty rate becomes 3%.
After five years of service, the teacher is vested in the system.
A teacher may, at any time or age after becoming vested, leave the
system and will receive benefits based on average final salary and
years of public school service. The benefits will begin after the
vested member reaches 60; they may also begin at a reduced benefit
if the member is at least 50 and has 20 or more years service credit.
if the teacher leaves the system before becoming vested, he or she
will only receive a refund of contributions plus accrued interest.
Retirement Benefit Amount: The retirement benefit amount is based
on highest average salary and years of service credit earned. To deter-
mine the highest average salary, the salaries of the four consecutive
70

62
highest salary years are averaged; this is then multiplied by 1.57%
and then by years of service credit to get annual total benefit. As
mentioned above, this benefit will be reduced by early retirement.
Selection of an optional plan will also cause a decrease in benefits.
These optional plans provide benefits that pay to spouses or other
survivors or have other special features.
A retired teacher may return to employment by the state on a tempor-
ary or part-time status and still receive all retirement benefits.
However, if a teacher returns to full employment, benefits will cease
after six months and the teacher will again become a contributing member
of the retirement system. Upon second retirement, benefits will resume
and be increased due to the additional contribution.
Teachers receive one year of retirement credit for each 180 day
school year completed.
A teacher may receive credit for &ctive duty military service
at no cost if, at the time of enlistment, he or she is a public school
teacher. The teacher receives such credit at no cost if he or she
returns to teaching within two years after military service discharge
or if he or she, at some time, completes ten years of public school
service subsequent to leaving the military.
Credit for out-of-state service may be purchased after a member
has accrued 10 years of North Carolina public school service. The
teacher is allowed to purchase one year of out-of-state service for
every two years of North Carolina service, up to a maximum of ten years.
Teachers may receive disability retirement benefits if they become
totally and permanently disabled and have at least five years of North
71

63
Carolina service credit. Benefits for disability retirement are deter-
mined in the same way that regular retirement benefits are computed.
Health and Hospitalization: Electronic Data Systems Federal Corpor-
ation administers a group plan for public school teachers in North
Carolina that covers hospital and medical expenses. The state provides
all contributions for the basic coverage under this health plan. The
contribution by the state is approximately $577 per year per teacher.
The state plan makes no provision for dental, vision, or auditory care.
Long-term disability insurance is provided by the Teachers' Retire-
ment System and provides up to 60% of a disabled teacher's monthly
salary up to a maximum of $1,000 per month. In order to qualify, the
teacher must have credit for one year of service. Ninety-one days
after the disability occurs, the teacher is eligible to begin receiving
benefits.
Life Insurance: Though North Carolina has no separate life insur-
ance program, teachers are covered (after one year of service) under
the Teacher's Retirement System by a death benefit. The beneficiary
will receive, upon the death of the teacher, a benefit equal to the
deceased employee's previous twelve month's salary, up to a maximum
of $20,000.
Leave Benefits: North Carolina public school teachers have a
very generous total leave package. With regard to sick leave, teachers
accrue one day per month of active service. Sick leave may be
accumulated without limit. Teachers are also provided with a 20 day
extended sick leave period for personal illness. This leave can only
be used if all accumulated sick leave has been exhausted. The teacher
72

64
will receive, during this time, his or her regular pay minus the cost
of a substitute. These sick days are not allowed to accrue.
Teachers receive 2 days of personal leave per year and, though
personal leave days taken are not charged against sick leave, teachers
are required to pay the cost of a substitute for these days. Teachers
are allowed to accumulate up to 5 days of personal leave.
Sick leave must be used for maternity leave in North Carolina.
However, any public school employee, male or female, may be granted
up to one full year of leave (without pay) upon the birth or adoption
of a child.
Though North Carolina makes no provision for sabbatical leave,
teachers do earn vacation leave each year, a very unusual benefit for
regular classroom teachers. The amount of vacation leave earned per
month increases as years of service increase. The following is the
vacation leave schedule for teachers:
Days of Vacation
Years of Service Leave Per Year
Less than 2 years
2 but less than 5 years
5 but less than 10 years
10 but less than 15 years
15 but less than 20 years
20 or more years
10
111
14
Teachers may accumulate vacation leave and may accumulate a maximum
of 30 days of vacation time. The importance of this leave and the
fact that teachers are encouraged to take annual leave each year are
indicated in this excerpt from the North Carolina Administrative Code:
73
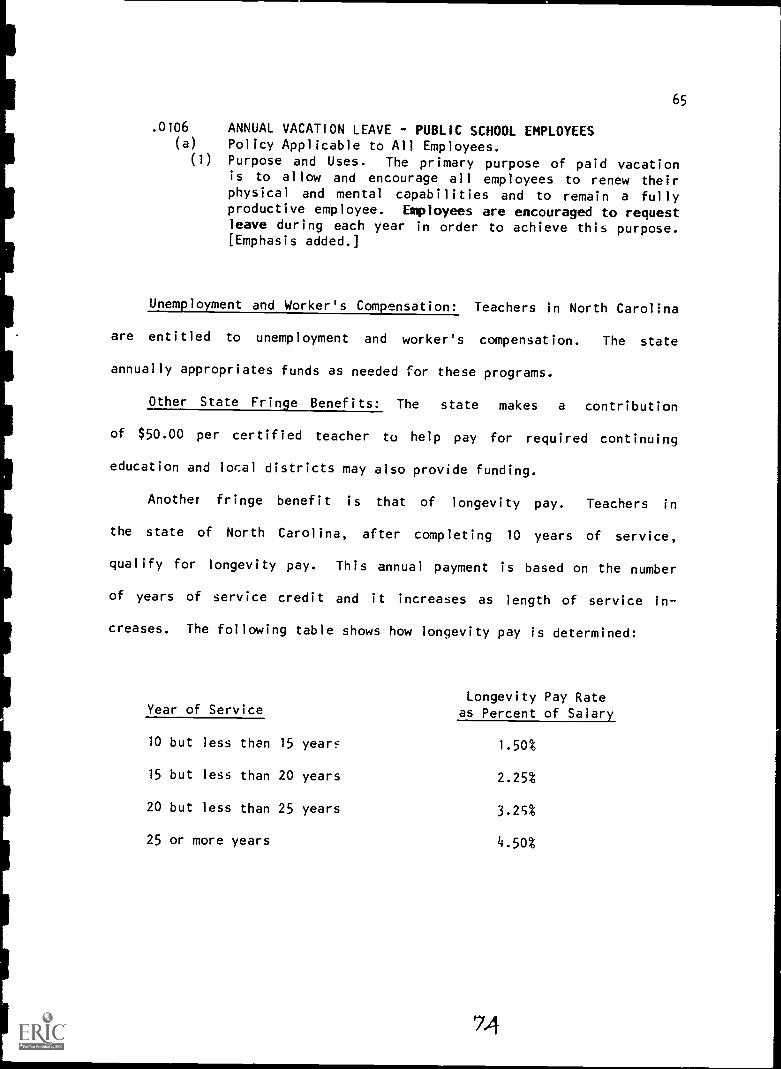
65
.0106 ANNUAL VACATION LEAVE - PUBLIC SCHOOL EMPLOYEES(a) Policy Applicable to All Employees.
(1) Purpose and Uses. The primary purpose of paid vacationis to allow and encourage all employees to renew theirphysical and mental capabilities and to remain a fullyproductive employee. Employees are encouraged to requestleave during each year in order to achieve this purpose.[Emphasis added.]
Unemployment and Worker's Compensation: Teachers in North Carolina
are entitled to unemployment and worker's compensation. The state
annually appropriates funds as needed for these programs.
Other State Fringe Benefits: The state makes a contribution
of $50.00 per certified teacher to help pay for required continuing
education and local districts may also provide funding.
Another fringe benefit is that of longevity pay. Teachers in
the state of North Carolina, after completing 10 years of service,
qualify for longevity pay. This annual payment is based on the number
of years of service credit and it increases as length of service in-
creases. The following table shows how longevity pay is determined:
Year of Service
10 but less than 15 years
15 but less than 20 years
20 but less than 25 years
25 or more years
Longevity Pay Rateas Percent of Salary
1.50%
2.25%
3.25%
4.50%

66
Typical Local Fringe Benefits
Most of the fringe benefits for public school teachers in North
Carolina are paid for by the state. State-provided benefits include
retirement, social security, basic health insurance, leave benefits,
and unemployment/workers' compensation. Local school systems may supply
teachers with additional benefits which vary across districts. Three
local districts were again selected, one each from the low, medium,
and high paying groups of districts in North Carolina, to obtain
information about locally provided benefits.
Retirement: The state of North Carolina provides teachers with
a retirement plan. No district surveyed offers any extra retiremet
benefits at this time, though one district had an attractive supplemental
program that was discontinued after 1971.
Health and Life Insurance: Dental insurance is available for
teachers in the high paying district. The cost to the local system
for this coverage is $8.84 per teacher monthly. The district represent-
ing the middle group in North Carolina pays the teacher's share of
the cost of the basic state health plan. The monthly cost to this
district for this benefit is $48.05 per teacher.
The high paying district pays for term life insurance for teachers
in the amount of i of the employee's annual salary. The cost for this
life insurance is $26.30 per teacher annually.
Leave Benefits: No extra leave benefits are provided by the local
districts surveyed.
Unemployment and Workers' Compensation: The state reimburses
local districts for any annual expenditure for either workers' compensa-
'75

67
tion or unemployment compensation. There are no added benefits of
this type among the local North Carolina districts surveyed.
Miscellaneous Local Fringe Benefits: If funds are available,
the high paying district provides teachers with funding for courses
and workshops that satisfy recertification requirements.
The middle paying district offers free workshops for employees.
The funds for these workshops come from local staff development monies.

68
South Carolina
The compensation system in South Carolina is a typical, mixed
state and local system in which the state provides the majority of
salary and fringe benefits for classroom teachers, with local districts
supplementing state compensation. A description of these local
supplements will be given at the end of this section.
Major State Fringe Benefits
Social Security and Retirement: All public school teachers in
South Carolina must be covered by the federal social security program.
Teacher contributions for 1985 are 7.05 percent of salary (on the first
$39,500 of salary) and the state pays an equal amount.
Enrollment in the South Carolina Retirement System is mandatory
for all public school teachers in the state and is available for city,
county, and other local employees. It provides a complete schedule
of benefits for retirement, early retirement, and disability protection
to complement social security. It further provides the equivalent
of life insurance benefits.
Teacher contributions for retirement are the sum of four percent
of the first $4,800 of salary and six percent of the remaining annual
earnings. The state contributes seven percent of annual earnings.
The state also contributes another three-tenths of a percent of annual
earnings to provide a death benefit discussed below under life insurance.
Teacher contributions are not subject to federal tax until retirement
or unless withdrawn from the system, but these contribution are not
tax deferred with respect to state and local income taxes.
7'7

69
Retirement benefits at full formula amounts may begin when a teacher
either reaches age 65 or completes 30 years of service (regardless
of age). Early retirement may begin at age 60 if the teacher does
not have thirty years service, and the retirement amount will be reduced
by five percent for each year the teacher is under age 65. After five
years of service, the teacher is vested in the system and, upon leaving
covered employment without 30 years of service or without reacing
age 60 for early retirement, may elect to withdraw teacher contributions
with accumulated interest or defer the retirement allowance to begin
at age 60.
The retirement benefit amount is based on a period of highest
average salary and length of service. Highest average salary is the
average of the three highest consecutive fiscal year earnings on which
contributions to the retirement system were made. The first $4,800
of the highest average salary is multiplied by 1.25% and the remainder
is multiplied by 1.65%. The sum of these two products is then multiplied
by the number of years and fraction thereof by early retirement (as
noted above), and/or by selection of a number of early retirement benefit
plans that pay to spouses, other beneficiaries, or have other special
features. Otherwise, the amount determined above is paid to the retired
teacher for life. There is no earnings limit after retirement to
continue receiving benefits if the retired teacher works for a private
employer or a public employer not covered by the South Carolina
retirement system. If the retired teacher returns to covered employment,
benefits cease for the fiscal year as soon as $7,000 is earned.
78
,1

70
If the Consumer Price Index (CPI) increases by three percent or
more from one December to the next December, then retirement benefits
are increased four percent at the beginning of that fiscal year. If
the CPI increase is less than three percent, the increase in retirement
benefits for the fiscal year will be equal to the actual percentage
increase in the CPI. It should be noted that the South Carolina General
Assembly frequently appropriates funds for retirement benefit increases
from the General Fund, apart from partial cost of living adjustment.
(For example, in November of 1984 an additional two percent increase
in benefits was granted to South Carolina retirees.)
Teachers receive one year of retirement credit for each full 190-day
school year completed. Service credit for teaching in public school
systems in other states may be purchased for ten percent of the teacher's
current salary as long as contributions to the other systems have been
withdrawn. Credit for federal service may also be purchased under
the same conditions. Credit for private school service cannot be pur-
chased, but credit for substitute teaching in South Carolina public
schools may be purchased for four percent of the teacher's current
salary with the state providing a matching amount.
Teachers who are vested in the retirement system (five years of
service) and become permanently and totally disabled will begin to
receive a disability benefit amount for life. The benefit amount is
calculated as retirement benefits above, where the highest average
salary is the average of the highest three consecutive years of salary
and length of service includes the years the teacher would have worked
had the teacher continued to work to age 65. Disability payments con-
tinue even if the disability payments are less than the amount earned

71
prior to the disability. If total earnings are equal to or greater
than prior earnings, the disability benefit ceases.
Health and Hospitalization: Public school teachers are covered
for medical and hospital costs under the state's Health Insurance
Program. The current carrier is Blue Cross and Blue Shield of South
Carolina. The state provides the individual teacher a standard or
basic plan at no cost to the teacher. The cost to the state of this
standard policy is $61.46 per month or $737.52 annually. Expanded
coverage beyond the standard plan is available to the teacher as well
as coverage for dependents at full cost to the teacher.
Teachers who retire may continue their health plan coverage with
the state continuing to pay all (or its portion of) expanded coverage
if the teacher retires with 20 years of service. Teachers who terminate
for other reasons but are eligible for retirement benefits and have
at least 10 years of service can continue health coverage with state-
funded benefits. Termination with 5 to 10 years service allows the
teacher to continue health coverage in the plan at full cost to the
teacher. Teachers who terminate with less than 5 years of service
cannot continue coverage.
In February of 1985, dental care was added as a separate component
of the health insurance package available to teachers. Again, the
state pays the full cost of the individual teacher's coverage, with
dependent benefits at full cost to the teacher. The cost to the state
for the individual teacher's coverage is $9.15 per month or $109.80
annually.
so
public school teachers are guaranteed a maximum disability benefit
for vision or auditory care to its teachers.
of 62.5 percent of their current salary under long term disability,
not to exceed $800 per month. The state pays the entire cost of this
policy for all teachers paid by the state. The cost to the state is
each teacher with a death benefit to a designated beneficiary equal
Other optional group life insurance programs are available for teachers
$.70 per month or $8.40 annually. In addition, the state provides
from a job-related injury). The state pays the entire cost of this
at full cost to the teacher.
active service or twelve days for nine months of active service. Unused
Accrued sick leave is transferable across school districts in the state.
to one year's salary, after one year of service (unless the death results
sick leave on the basis of one and one-fourth days for each month of
sick leave may be accumulated from year to year up to 90 days, provided
No separate personal leave days are provided by the state, nor is there
insurance in the amount of $2.55 per month or $30.60 annually.
any special provision for maternity or paternity leave. Maternity
into the retirement system which invests the funds and pays the benefits.
that such accumulation does not violate the teacher's contract with
the local school district that has more liberal sick leave provisions.
life insurance by paying .3 percent of the teacher's salary each year
leave is charged against sick leave.
South Carolina does not offer any separate or specific benefits
Life Insurance: The state provides a simple $3,000 life insurance
Leave Benefits: Public school teachers in South Carolina accrue
In addition to the retirement disability benefits described above,
81
72

73
Finally, no sabbatical leave i; provided by the state.
Unemployment Benefits: Teachers in South Carolina are covered
under an unemployment compensation program which provides some continua-
tion of salary should a teacher become involuntarily unemployed. The
cost to the state for each teacher is .4 percent of each teacher's
salary annually.
Workers' Compensation: Teachers in South Carolina are covered
under a workers' compensation plan for work related injuries. The
state's cost per teacher is again about .4 percent of annual salary.
Other State Fringe Benefits: The primary minor fringe benefit
in South Carolina is new for 1984-85. The state will now reimburse
teachers for courses taken which count toward recertification if the
teachers are located in a rural area or teach in a field where there
is a critical need for teachers.
Typical Local Fringe Benefits
Almost all fringe benefits for South Carolina public school teachers
are paid for by state contributions. Judging by the three districts- -
a high paying, a middle paying, and a low paying district--surveyed
in order to determine the nature of local benefits, there appear to
be few benefits provided at the local district level.
Retirement: No local districts surveyed in South Carolina offered
any additional retirement benefits.
Health and Hospitalization: No local districts surveyed in South
Carolina offered any additional medical benefit.
Life Insurance: The low paying district provides a life insurance
policy to each employee (term life) in the amount of $1,000.00. The
annual cost to the district for this benefit is $4.20 per teacher.
82

74
Leave Benefits: Two districts allow teachers three personal days
annually, but these are charged against sick leave when used. The
low paying district allows teachers one day of personal leave which
is also charged against sick leave.
Unemployment and Workers' Compensation: All three districts have
workers' and unemployment compensation plans, but the state speci:ically
allocates funds to local districts to be used for these programs.
Miscellaneous Fringe Benefits: Sometimes teachers in the middle
paying district are reimbursed for fees for recertification workshops
and discretionary workshops. Teachers in the high paying district
get partial reimbursement for courses taken toward advanced degrees.
Reimbursement in this case comes through a local foundation that helps
schools in that district.
I
I
1

75
Tennessee
The state of Tennessee allocates money to local school districts
based on "service delivered" or a certain amount for each pupil plus
different amounts for vocational education and handicapped programs.
Major State Frine_penfits
Social Security and Retirement: Teachers in the state of Tennessee
are required to contribute 7.05% of their annual salaries to social
security. The state contributes the employer matching portion.
Public school teachers in Tennessee are also required to become
members of the Tennessee Consolidated Retirement System (TCRS). This
system provides teachers with benefits for service retirement, early
retirement, disability retirement, and survivorship. Teachers' contribu-
tions to the TCRS are 5% of annual salary and the state's contribution
is 15.03% of annual salary.
Full service retirement benefits are available for 30 years of
service or after a vested member reaches age 60. Members become vested
in the system after 10 years of service and are eligible for early
retirement if they are at least 55 but less than 60, or if they have
25 years of service credit but have not yet reached 55. if the member
chooses to retire early, the benefit will be reduced by 0.4% for each
month by which the teacher's early retirement comes before full service
retirement.
A full year of credit toward retirement is received for every
school year a teacher completes. A member may receive credit toward
the TCRS for prior military service if he or she qualifies; he or she
may also recieve credit for prior school service after making the requir-
ed contributions plus interest.
84

76
Upon retirement, a teacher may use any accumulated sick leave
as credit toward the TCRS. A minimum of one month of credit will be
given for every 20 days of unused sick leave the teacher possesses.
To determine a retiree's monthly benefit, three factors are used:
the member's average final compensation (AFC), years of creditable
service, and the social security integration level (SSIL). The member's
benefit is not to exceed 75% of the member's AFC. To determine the
AFC, the member's Five highest consecutive salaries are averaged.
The SSIV is an average of social security wage bases and is $13,800
for 1985. To find the annual maximum benefit, 1.5% is multiplied by
years of creditable service and AFC. Then, an amount is added if the
AFC exceeds SSIL. The added amount is equal to .25% times the difference
between AFC and SS:L. The idea here is that social security retirement
payments, relative to current or final earnings, are weighted towards
lower income earners. Hence, this formula is intended to offset that
advantage of lower income earners by slightly boosting state teacher
retirement benefits based on earnings above the average social security
maximum wage bases over the past. The attempt is to help "integrate"
the two retirement plans so that about the same percentage of final
income is replaced at retirement, whether a teacher has been a lower
or higher earner In the system.
If a member becomes permanently and totally disabled before reach-
ing retirement age, he or she can receive disability retirement. The
disability may be either physical or mental and must be medically certi-
fied. The member must also have had at least five years of service
credit to be eligible. The retiree will receive a monthly benefit
equal to 90% of the retirement benefit that the member would normally
85

77
have received. The number of additional year of credit the member
would have received had he or she been able to work until age 60 may
be added to the teachet's creditable years if service credit is less
than 20 years. However, unless the member's service credit at the
time of disability retirement is greater than 20 years, this total
shall not exceed 20 years.
If a teacher becomes totally and permanently disabled as the result
of an accident or violence against him or her while in the performance
of duty, he or she is eligible for accidental disability. The benefit
for such retirement 50% of the AFC, or 33.3% of the AFC if the member
also receives a social security disability benefit. Upon retirement,
the benefit is reduced to 1/3 of the AFC.
After a teacher has been retired for at least one year, he or
she is eligible for a retirement allowance adjustment based on any
change in the Consumer Price Index. Retirees will receive any increase
or decrease in monthly benefit in accordance with the CPI up to a 3%
change either way.
Health and Hospitalization Insurance: As of now there is no state
health insurance plan but Tennessee will provide coverage beginning
January, 1986. Local systems and teachers fund any current health
benefits.
Leave Benefits: The state allows a minimum of one day of sick
leave per month and local districts may provide teachers with more
leave days. Sick leave days are allowed to accumulate without limit
from year to year. Teachers are allowed two days per year for personal
leave but local districts may provide teachers with more. Teachers
on personal leave do not have to pay for a substitute and leave days
are not charged against sick leave.

78
Tennessee makes no special p-ovisions for maternity, paternity,
or sabbatical leave.
Unemployment Compensation: This benefit is provided locally,
not by the state.
Workers' Compensation: As with unemployment compensation, workers'
compensation is not provided by the state.
Other State Fringe Benefits: As mentioned above, money for college
coursework may be provided by the state. Another fringe benefit is
the ability to use any accumulated sick leave for credit toward retire-
ment. Teachers receive one month of rc-Lirement credit for every 20
days of unused sick leave.
Typical Local Fringe Benefits
Funds for teachers' fringe benefits are provided by the state
of Tennessee for local school districts based on service delivered
in the form of a certain amount for erch pupil. The state also provides
funds for vocational education and handicapped programs for county
schools. Described below are the typical benefits provided by three
local school systems that represent the high paying, middle paying,
and low paying groups of school districts in Tennessee.
Retirement: None of the districts surveyed offered any extra
retirement benefits.
Health and Hospitalization: All three districts surveyed provide
health and hospitalization insurance for their teachers. The high
paying district offers 100% coverage of the usual and customary expenses
for hospitalization and phy3ician, as well as coverage for mental health
problems and catastrophic illness. This policy has a $250,000 maximum
87

79
and a $100 deductible on major medical expenses only. For this type
of coverage, the high paying district pays abcut $250 per teacher
annually.
The district from the middle group receives medical coverage through
Blue Cross. and Blue Shield. This coun.y pays $708.60 per teacher for
each 10 month period for basic, individual coverage. Only $200 per
year is spent by the representative low paying district on each teacher
for health coverage.
Of the three districts included in the survey, only the high paying
district offers life insurance to its employees. The cost to the
district is $27.50 per teacher per year for a $25,000 term life benefit.
Leave Benefits: Tennessee allows one day of sick leave per month
but local districts may increase this amount if they choose to do so.
Only the high paying Tennessee district takes advantage of this
authority, allowing 1.25 days of sick leave per month. The high payin:
district also allows up to one year of maternity leave (without pay)
and provides for a possible extension. The representative middle
district allows teachers to use any or all of their sicK leave as
maternity leave, while the district in the low paying group allows
only 30 days of maternity leave to be charged against sick leave.
Unemployment and Workers' Compensation: The representative high
paying district in Tennessee offers teachers both an unemployment compen-
sation and a workers' compensation -ogram. Apprcximately $31 per
teacher is spent annually for workt,s' compensation by :his district
and about $17.50 per teacher for unemployment compensation.

80
The middle district provides a workers' compensation pool for
teachers. The cost annually for this program is $48.00 per t cher.
Teachers in this district also receive unemployment compensat.,n that
costs the iocal system annually the actual amount that teachers in
that district receive in any given year.
The low paying district offers no workers' compensation plan but
does indicate it spends about $63.00 annually per teacher on unemployment
compensation.
Tennessee allows teachers a minimum of two days for personal leave
and the average and low paying districts allow only this minimum amount.
However, the high paying district allows seven personal leave days;
three personal, two religious, and two for the death of a close friend
or distant relative. In no district are personal leave days charged
against sick leave nor are teachers required to pay the cost of a substi-
tute while on personal leave.
Se)batical leave is provided by the high and middle paying
districts. The high paying district allows sabbatical leave to eligible
teachers and guarantees their position plus a two step advancement
on the salary index. Three teachers were on full sabbatical leave
in 1984-85. The middle district allows twc days per year of
non-cumulative sabbatical leave, or what might be better termed
"professional leave" in this case.
Miscellaneous Loce,i Fringe Benefits: The high paying district
reimburses teachers for college courses and workshops that have to
be taken in order to meet recertification requirements. In addition,
teachers also receive funds for college courses taken at the discretion
of the teacher, but not for discretionary workshops. This district
89

81
also provides paid professional leave to attend professional meetings
on a case-by-case basis. Expenses may be full or partially reimbursed,
as well.

82
Virginia
Virginia's is a state-funded, but locally-oriented system. A
set amount per pupil, '$1,605 in 1984-85, is allocated to support 54
teachers per one thousFA pupils. Higher salaries for these "state
authorized" teachers or full salaries for extra teachers mus'. come
from local funds. The state appropriates specific amounts in lump
sum for local districts to pay various fringe benefits for authorized
teachers.
Major State Fringe Benefits
Social Security and Retirement: Public school teachers in Virginia
are members of the federal social security system. Teacher contributions
toward this system are 7.05% of salary with the state providing the
funds for an equal amount to be paid by localities for the 54 teachers
per thousand pupils. The local districts must pay all fringe benefits
for any extra teachers they hire.
All state employees are also required, as a condition of employment,
tc become members of the Virginia Supplemental Retirement System (VSRS).
This system provides benefits for full retirement as well as for early
retirement, disability retirement, life insurance coverage, and survivor-
ship.
Employee contributions to the system are 5% of annual salary.
Employer contributions are based on the total payroll and the rate,
adjusted every two years, is 11.15 percent for 1984-85.
Members with at least 30 years of service credit may retire upon
reaching age 60 at full formula amounts. Members who are age 65 or
older may retire and receive full benefits regardless of amount of
91

83
service credit. Teachers may also retire early, with a reduction in
benefits, if they are at least 55 and have 5 or more years of service
credit. To determine this reduction, the number of months between
the member's regular retirement date and the date he or she would be
eligible for early retirement is calculated. A reduction of one-half
percent is applied for every month up to and including the sixtieth
month. If the member's "early retirement months" exceed 60, a reduction
of four-tenths of one percent is applied to these aodIt;onal months.
Members of the VSRS become vested sfter 5 years of service. After
becoming vested, a member may apply for early retirement, disability
retirement, may leave the system and withdraw contributions, or may
elect to begin receiving benefits at age 55.
Teachers in Virginia hired on or after April 1, 1980 are covered
under the "rule of 90." According to this rule, teachers may retire
with full benefits if they are at least 55 years of age, have at least
30 years of service credit and, when added, the years of age and service
are greater than or equal to 90. Once a teacher reaches age 70, retire-
ment is mandatory.
The retirement benefit amount is based on average final compensa-
tion, years of service, and age. Average final compensation (AFC)
is the average cf the three highest salary years, If the AFC is greater
than or equal to $13,200 (the usual case), then the maximum retirement
benefit is equal to the product of years of service, a factor of 1.65
percent, and AFC less $1,200. In other words, maximum annual benefits
= years of service x .0165 x (AFC-$1,200).
92

84
A teacher may obtain employment after retirement and still receive
benefit's from the VSRS, but only if the place of employment does not
provide employee retirement coverage through the VSRS.
Retirees do receive increases in benefits due to increases in
the cost of living after two years of retirement, and yearly thereafter.
This increase is based on the consumer price index (CPI). The retiree
will receive the full amount of the first 3 percent increase in the
CPI and one-half of any increase from 3 to 7 percent.
Teachers receive one year of service credit for every school year
they work, and members may purchase credit for out-of-state service
and military service. The cost of such service credit to the teacher
is 15 percent of either their current salary, average creditable compen-
sation, or the salary as of the last date in service, whichever is
the highest.
If a vested member of the VSRS becomes mentally or physically
disabled and this disability is likely to be permanent, he or she is
eligible for disability retirement provided he or she is under the
age of 65. Benefits for disability retirement are calculated just
as are the basic benefits for service retirement.
If a Virginia public school teacher dies before retirement, the
designated beneficiary can receive an actuarial benefit or contributions
plus interest if the member is 55 and vested in the system, is age
60 regardless of amount of service, or has at least 30 years of service
credit regardless of age.
Health and Hospitalization: No state medical plan is offered
by Virginia.
93
85
Life Insurance: Besides death benefits available through the
retirement system, Virginia offers a strong, mandatory group life insur-
ance plan. The state appropriates specific funds to pay the employer
portion of this shared-cost plan. The primary benefits are (1) life
insurance at two times salary, (2) double thiseAmount for accidental
death, and (3) dismemberment insurance. The cost to teachers is $7.20
annually per thousand dollars of insurance.
Leave Benefits: The state requires that teachers have gat least
one day per month of sick leave. Most leave policies are left to local
districts and are noted below.
Unemployment and Workers' Compensation: These benefits are not
state responsibilities.
Other State Friue Benefits: Virginia public school teachers
are required to take certain courses in order to maintain certification.
The state of Virginia does not normally provide teachers with the funds
for such courses; however, it does offer Mathematics/Science
Scholarships/Loans to college students at or beyond the junior level.
Eligible students may receive up to $2,000 scholarship/loan money that
is forgiveable by teaching for a certain period of time. This is the
only kind of funding provided by the state, but local districts dc
often provide money for certification costs.
Typical Local Fringe Benefits
Because the Virginia education system is so locally oriented,
as opposed to the state orientation of many systems, such as those
in North Carolina and Louisiana, six local districts were studied rather
I 94
.41.110011M001=1

86
than the usual three. The sample was stratified, containing two high
paying districts, two in the middle, and two relatively low paying
districts.
Retirement: Two of the six districts surveyed reported that they
paid the teacher's share of contributions toward the retirement system
which amounts to 5 percent of the teacher's annual salary. This, of
Jurse, is a major local benefit. In addition to coverage by the VSRS,
all teachers within one of the school districts are automatically members
of a generous local retirement system. The district pays two percent
of salaries for this retirement prcgram; teachers themselves make no
contributions to this system.
This retirement system provides full additional benefits for retire-
ment at age 60 with 30 or more years of service credit, retirement
at age 62 with 5 or more years of service credit, and disability
retirement with 10 or more years of service credit. Also provided
are survivorship benefits as well as reduced benefits for early retire-
ment at age 55. Members'are vested in this system after 5 years.
Another county provides public school teachers with an early retire-
ment plan if the employee has 15 years of service credit, 20 years
of coverage under the VSRS, and is between 55 and 65 years of age.
The amount of this beneift is equal to 20% of the final salary, and
teachers may receive this benefit for up to seven years.
A suburban county offers a retirement plan for educational employees
that provides benefits, in addition to those provided by VSRS and social
security, for disability retirement, service retirement, early retire-
ment, and survivorship. These benefits become available when the

87
teacher reaches age 55 and has 25 or more years of service credit or
when the teacher reaches age 65 with 5 or more years of service.
The formula for calculating full service benefits is as follows:
Average Salary for3 highest years x 2% x
Years of ServiceService = Benefit
After age 65,the above benefit is reduced using the following formula.
Avg. salary for
[years 1.
Years of Service5 highest $1,200 x 1.65% x Service = Benefit
Credit for out-of-state and military service may be purchased. Vesting
in this system occurs after five years of service. A vested member,
if he or she becomes permanently and totally disabled, is eligible
for disability retirement. The member will be eligible to receive
credit for the number of service years he or she would have received
had he or she retired normally.
Medical and Health Insurance: Though the state does not provide
health insurance for teachers, local districts do provide such coverage.
One suburban county
through four separate companies, with each emphasizing different plans
with varying total costs. The portion paid by the local district for
individual coverage is constant at about $72 per month in e3ch case
or $864 annually. 'amity coverage can be purchased at additional cost
to both the the employer and employee. Higher option plans may also
be purchased at extra cost to the teacher.
In another Virginia aunty, a single plan through Blue Cross and
Blue Shield coverage for teachers is available. The annual cost to
the teacher for basic coverage is $266.61, per year, and the cost to
the local district ;s about $660 per year.
provides its employees medical insurance coverage
96

88
Health insurance coverage in another county is provided for by
Blue Cross and Blue Shield along with two other companies. The cost
to the teacher for an individual, basic health plan is $61.80 per
year,and the cost to the local system is $1173.72 per year per teacher.
Higher option plans may be chosen by the teacher for which the local
district pays none of the extra cost.
No district provided any employer-paid coverage for dental, vision,
or auditory care.
Two of the six Virginia counties studied have long term disability
insurance plans that provide teachers with benefits if they become
totally disabled due to sickness or accident. Benefits may be received
after 90 days of total disability, in one case, arJ 30 days in the
other. The benefit under both plans is in the amount of two-thirds
of the basic monthly salary, subject to a $3,000 maximum and minus
any benefits that may be received from other sources such as workers'
compensation, retirement plans, and social security. Benefits may
be received until the teacher reaches age 65.
In the two school districts having disability plans, about one
third of the cost of long-term disability premiums is paid by the dis-
tricts, which amounts to about $101.87 per year per teacher.
Life Insurance: As noted above, the state of Virginia provides
its public school teachers with mandatory, share-cost life insurance
coverage in an amount equal to twice the annual salary. No district
has a y extra life insurance plan.
Leave Benefits: Five school districts allow teachers one day
of sick leave per month, the state required minimum. These days accrue
97

89
from year to year with no limit in three districts and with limits
of 120 days and 190 days in two districts. The sixth district allows
its teachers 12 days of sick leave per year with no limit on accrual.
All counties, except one, allow teachers to "sell" any unused
leave back to the district. Two of the districts pay $10 per day of
one pays 10% of the daily salary for each unusedunused sick leave,
sick day, and two other districts pay half of the daily rate for each
day of unused sick leave.
Three of the six districts surveyed allow three days of personal
leave per year, while the other three districts allow two days. These
days are not charged against sick leave and teachers are not required
to pay a substitute when on personal leave.
In four of the surveyed counties, there was no local provision
for maternity leave. Any time off due to pregnancy comes directly
from sick leave days. The two remaining counties also require maternity
leave days to come from sick leave; however, they allow time off for
either parent without pay for an extended period of time. Other dis-
tricts may also provide the same benefit. However, if they do, no
mention was made in any information provided.
Two of the local districts provide sabbatical leave programs for
their teachers. This benefit amounts to i of the annual salary for
a year of sabbatical leave.
Unemployment Compensation: There is a Virginia state plan for
unemployment compensation with the cost paid from local funds. The
districts indicated a range of annual costs of .01 percent of annual
salary (about $2.00) to $75.00 per year per teacher.
98

90
Workers' Compensation: Funding for workers' compensation varies
from district to district; typical contributions range from one percent
of salaries (or some $180) to $30 per teacher year.
Other Local Fringe Benefits: Four of the six districts provide
partial reimbursement for costs of courses taken tlr required
recertification purposes. Some pay a small amount; other districts
may pay up to $55 per semester hour. Several districts pay something
towards workshops, too. For example, one district allocates $150 per
teacher per year for such programs.
99
I
I
i

91
West Virginia
Funding of school districts in West Virginia is currently becoming
more state oriented. The state is trying to obtain an equalized teacher
alary schedule state-wide. Hence, the state pays counties different
amounts per teacher at the present time to get salaries in less affluent
districts up to a specified minimum level. If counties had been paying
a supplement, they cannot reduce it during this interim funding plan.
Otherwise, the funding system is a relatively traditional mixed-respon-
sibility system.
Major State Fringe Benefits
Social Security and Retirement: Public school teachers in West
Virginia are required to be covered by social security and the State
Teachers' Retirement System (STRS). Through membership in these programs
teachers receive benefits for retirement, early retirement, disabilitw,
death, and survivorship. Local districts may, in addition, offer
supplemental retirement plans.
Teacher contributions to the STRS are 6% of annual salaries.
The state, for the 1984-1985 school year, appropriated $39,670,000
to this program, or roughly 7% of salaries.
Members may retire and receive maximum benefits if they have 35
or more years of service credit regardless of age, at least 30 years
of service credit and are age 55 or older, or if they have at least
5 years of service credit and are at least 60 years of age. Teachers
may apply for early retirement if they have at least 30 years of service
credit but less than 35 and are less than 55 years old. The benefit
will then be reduced for each year the teacher is under 55. After
5 years of service the teacher is vested in the retirement system.
I

92
The retirement benefit amount is calculated by multiplying years
of service by 2% and then multiplying this figure by the final average
salary which is the average of the 5 highest years of service out of
the last 15. There are several optional retirement plans, the selection
of which will reduce the benefit, as will early retirement. Benefits
are not subject to West Virginia income tax but are subject to federal
income tax after total benefits equal the retiree's contributions.
Retired teachers may accept full time employment within thf system
but they forfeit their benefit for as long as they remain employed.
If the member later becomes unemployed, normal benefits will be resumed.
If a retired teacher accepts employment outside the system, there is
no loss of retirement benefits. Retired teachers are also eligible
in the fiscal year following the fiscal year in which they retire to
substitute in the public school system 100 days per year without loss
of retirement benefits.
For each 200 day term, teachers receive one year of service credit
toward retirement. Credit for teaching in public schools in other
states may be purchased, provided the member has at least two years
of West Virginia service credit for each year of out-of-state service
that is to be purchased. A maximum of 10 years of out-of-state service
credit may be purchased. In order to purchase credit for such service,
the member must contribute an amount equal to double his cont ibutions
made in his first year of West Virginia service plus 6% interest compoun-
ded annually from beginning of West Virginia service to the date the
out-of-state service is purchased. Members may receive credit for
military service if, at the time of service, a draft was in force.
1 oi

93
A major benefit is that this credit will be provided free if it is
less than one-fourth of a member's total service.
Disability benefits are available after the teacher has 10 years
of West Virginia service credit. Disability retirement may be provided
at any age if the member is totally disabled for six months and the
disability is permanent.
If a member dies before retirement, the survivor(s) usually receives
a refund of the member's contributions plus the state's contributions
plus interest. If the member had 25 years of service credit and was
at least 50 years of age at the time of death, the survivor is entitled
to a monthly benefit.
Health and Hospitalization: The state of West Virginia and other
agencies provide a comprehensive medical benefits program which is
state-funded. For the first year of coverage, the teacher must pay
the full policy amount of $25.20 per month for the basic plan. After
one year the state pays all of the cost, i.e., $25.20 per month per
teacher.
Upon retirement, a teacher may qualify for continuation of coverage
if he or she has earned a state pension benefit and was covered under
the Public Employees Insurance Program while actively employed. At
this time, retirees may also receive insurance credit for any unused
sick lease they may have accumulated. The retiree will receive one
free month of single medical insurance coverage for every two days
of unused sick leave credit.
No dental, vision, or auditory care coverage is available under
the state health plan.
102

94
Life Insurance: Public school teachers under the age of 65 are
provided with $10,000 of life insurance coverage along with $10,000
of accidental death and dismemberment coverage at no cost to the teacher
after the first year of employment. After age 65, the policy is reduced
to $6,500.
Leave Benefits: Teachers are allowed 1.5 days of sick leave for
every 20 working days which may be accumulated from year to year without
limit. Four days of personal lea e are allowed by the state per year,
but these are charged against sick leave. No maternity leave days
(or paternity leave) at full pay are provided; any time missed due
to maternity must come out of sick leave. Though no paid sabbatical
leave is provided by the state, teachers may take sabbatical leave
withovt pay.
Unemployment Benefits: me state of West Virginia contributes
to unemployment compensation programs, giving each school district
3.7% of their salary allocation.
Workers' Compensation: Teachers in West Virginia are eligible
for workers' compensation that is state funded. Each district receives
.94% of its salary allocation to use for this benefit.
Other State Fringe Benefits: Teachers are allowed to use any
accumulated sick leave for credit toward health insurance. Upon retire-
ment, teachers receive one month of single coverage free for every
two days of accumulated sick leave, or one month of family insurance
coverage free for every three days of unused leave.
Typical Local Fringe Benefits
The state of West Virginia provides public school teachers with
numerous benefits such as social security, retirement plans, health
103

I
95
insurance, life insurance, leave time and workers'/unemployment compensa-
tion. Three school districts from this state were selected as represent-
ative high, middle, and low paying systems and were surveyed in order
to determine what local benefits are available for teachers.
Retirement: The school district representing the middle group
offers a supplemental retirement plan in addition to the plan offered
by the state. Through this plan, retirees receive $20.00 per month
for life. The annual cost to the local district for this plan is $70.00
per teacher and the cost to the teacher is $100.00.
Health and Hospitalization: Two of the three districts included
in this survey provide teachers with additional medical insurance pol-
icies. The district representing the high paying group offers dental
and optical coverage, the annual cost of which is $375 per teacher.
The health insurance coverage provided by the middle paying district
is in the form of dental care. Providing this benefit costs the local
district $258 per teacher per year.
Life Insurance: None of the surveyed districts offer additional
district-paid life insurance.
Leave Benefits: No special leave benefits beyond the state mini-
mums are offered by the surveyed local districts.
Unemployment and Workers' Compensation: All of the three districts
provide workers' /unemployment compensation programs for teachers, for
which they receive funds from the state.
Summary of Available Fringe Benefits, by State
The following tables summarize various elements of fringe benefits
available to public school teachers in the twelve southeastern states
104

96
included in the study. It focuses on state-paid (directly or indirectly)
benefits. This results in some apparent bias in the table against
the states which let local districts set their own benefit policies.
For this reason, care should be taken in making quick comparisohs among
states based on items noted in the table. Rather, this information
should be taken as a starting point and the actual practice of local
districts in particular states must be determined before any final
conclusions are drawn regarding relative availability of benefits across
states.
Still, though many districts with sufficient wealth in almost
all states far surpass state benefit minimums, the majority (or at
least a large number) of districts in each state only provide the minimum
required benefits in such categories as leave time, health insurance,
retirement, and the like.
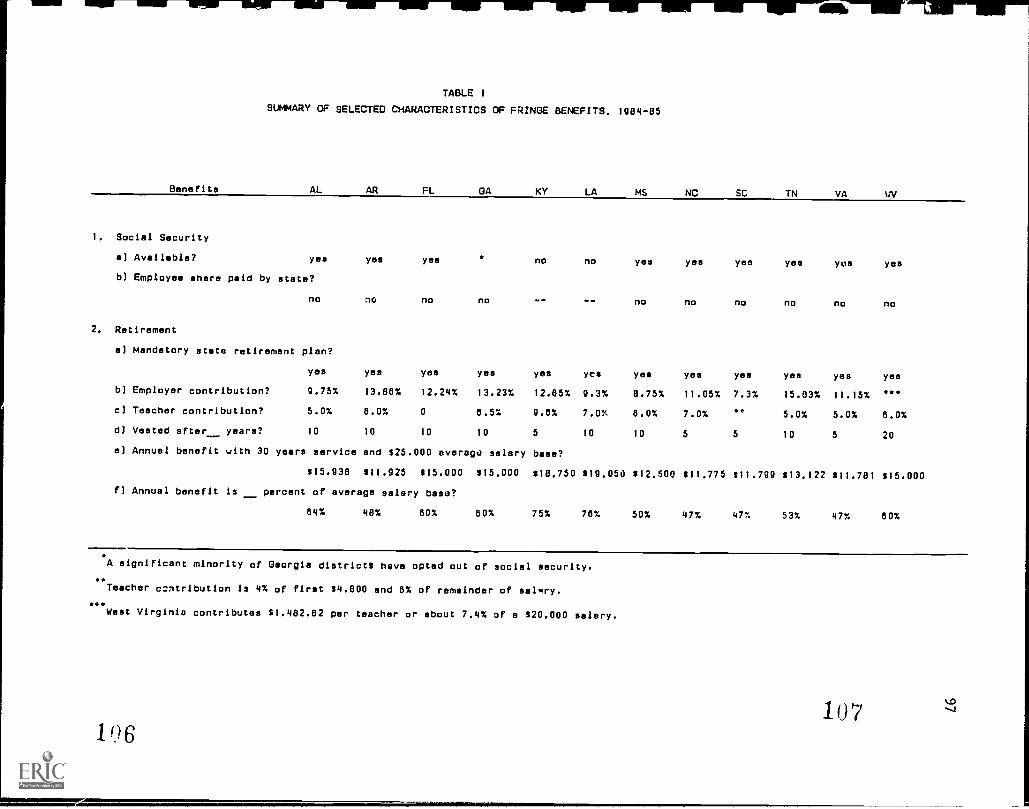
Benefits
TABLE 1
SUMMARY OF SELECTED CHARACTERISTICS OF FRINGE BENEFITS. 1584-85
AL AR FL OA KY LA MS NC SC TN VA WV
1. Social Security
a) Available? yes yes yes
b) Employee share paid by state?
no no yes yes yea yes yus yes
no no no no no no no no no no
2. Retirement
a) Mandatory state retirement plan?
yes yes yes yes yes yes yes yes yes yes yes yes
b) Employer contribution? 9.75% 13.80% 12.24% 13.23% 12.85% 9.3% 8.75% 11.05% 7.3% 15.03% 11.15% ".c) Teacher contribution? 5.0% 8.0% 0 6.5% 5.6% 7.0V 0.0% 7.0% . 5.0% 5.0% 8.0%
d) Vested after years? 10 10 10 10 5 10 10 5 5 10 5 20
e) Annual benefit with 30 years service and 525.000 average salary base?
$15.938 $11.925
f) Annual benefit is percent of average salary
$15.000
base?
$15.000 18.750 $19.050 12.500 $11.775 511.799 513.122 $11.781 s15.000
84% 48% 80% 00% 75% 76% 50% 47% 47% 53% 47% 80%
A significant minority of Georgia districts have opted out of social security.
ccntribution is 4% of first $4,800 and 0% of remainder of salary....
West Virginia contributes 51.482.82 per teacher or about 7,4% of a 520.000 salary.
107106

TABLE. I (Continued)
Benefit AL AR FL OA KY LA MS NC SC TN VA WV
3. Health and Hospitalization Insurance
al Basic. individual health plan available at state level?
... .yes yes yea yes no yes yes no yes
b) Annual cost to employer (state or local) per teacher for basic plan (dollar amount or percent of salary)?
$420 $420 3.g% $045 1,...-- $577 $738 1302
c) Centel care included at no cost (or partial cost) to teacher?
no no no no no yes no
d) Vision cnd/or hearing care included at no cost (or partial cost) to teacher?
no no no no no no no
4. Life Insurance
a) Basic life insurance plan through private carrier available from state at no cost tt. teacher?
no yea no yes no no yeu no yes
b) Face amount?
$5.000 $3.000 ". $3.000 .. $10.000
c) Is there an additional one-year-of-salary (or some other multiple) death b,,nefit paid by :state?
yea no no no yes no yes yes yes no
2xSalary
d) Annual cost to state or local district per teacher(dollar amount or percent of salary)?
.00905% ? .003% S.
Florida is a locally oriented system with good overall financial support from the state (about 85% of total local costs). Specific benefits
are left to local districts.
The Kentucky Retirement lystem provides $2.000 of paid up life insurance and monthly benefits to survivors of active members who dia.
Health and life insurance are locally provided in Louisiana. but the state provides lump-sum funding to districts of about 4.0% of salaries.
Tennessee is locally orient-A with respect to benefits. State formula funding enables local districts to provide health and life insurance.
In addition, the retirement system does have several in-service death benefits that ere equivalent to many thousands of dollars of life insurance.
109

Benefit
TABLE 1 (Continued)
AL AR FL OA KY LA MS NC SC TN VA WV5. Leave Benefits
a) Number of sick leave days allowed BY STATE assuming nine-month contract?
0 9 9 111; 10 10 7 9 12 9 9 131/2
b) Sick leave days accumulation limit?
150 45 no 45 no no 30 no 00 no no limitlimit limit limit limit limit
c) Number of personal leave days NOT charged to sick leave?
2 0 0 0 3 0 2 2 0 2 0
must pay
substitute
d) Is an eitended tick leave period available (a) without pay or (b) with cost of substitute only deducted?
no no no no no yes(a) yes(b) yes(b) no no ..,no
e) Number of maternity leave days NOT charged to sick leave?
0 0 0 0 0 0 0 0 0 0
f) Is paternity leave allowed?
no no no no no no no
g) Is there a true, paid (partially or wholly) sabbatical leave program available?
no no 0.1,no
no no no no no yes no no no no ...,ns
h) Is there a true, paid vacation leave program available to nine or ten-month contract teachers?
no no no no no no no yes no no no
10 to 21
days
Any teacher, male or female, in North Carolina may take up to one full year of leave without pay for the birth or adoption of a child..1.
Virginia sets a minimum sick leave standard of at least one day per month, but allows local districts to set all other leave policiesas well as add to the sick leave minimum.
D1/44
110

100
III. Valuing Summer Leisure of Teachers
In the previous section, several standard fringe benefits were
identified and their availability in southeastern states discussed.
Before the monetary value of the full fringe benefit package can be
I
estimated and reported in the following section, consideration must
be given to summer leisure available to teachers on standard contracts
for periods less than a full year in length. In this section, the
question of whether summer leisure is a benefit or an unhappy
circumstance of educational employment is investigated. The result
is that the constraint on teacher labor supply restricts choices and,
therefore, requires that a compensation premium be paid to teachers
operating in a relatively competitive labor market. However, it is
shown that the leisure time actually available to teachers is not without
value and that this leisure is also part of the total compensation
available to teachers. Finally, estimates of the average value of
the constraint premium are made, yielding some very interesting
implications for teacher salaries and school finance.
Schools are operated for most primary and secondary students for
only about nine months of each year. This traditional schedule may
exist to allow continuing education .for teachers, plant maintenance,
students to take advantage of non-school opportunities such as work,
camps, and the like, remediation, or perhaps it is the result of
precedent set when our economy was primarily agrarian and students
were needed on the farm from planting until harvest. Whatever the
reason, the short school year means that those employed to teach students
cannot be productively employed in this activity for a significant
112

101
part of the year. How to treat teachers' free time in the summer is
a question that ia both controversial and of considerable importance
for policy. On the one hand, it is argued that this work schedule
gives teachers a distinct advantage. Many have school-age children
themselves, and this work schedule permits them to be home when their
children are not being supervised in school. This argument is circular,
of course, because if schools were operated year round, then supervision
of children in the summer would be done by the schools. Teachers who
are parents would not be handicapped by year round work schedules.
There may, nevertheless, be a group of people who wish to supply less
than the standard forty-eight to fifty weeks of work per year. If
this is true, then this work schedule with its two or three month break
may be regarded as an advantage.
On the other hand, teacher groups have argued that this "abnormal"
work schedule imposes a hardship on teachers, that most teachers prefer
to wc-k longer than they are employed to teach each year. Indeed,
in one survey of Alabama teachers [Cotter and Hardee, 1984], it is
reported that 55 percent of primary and secondary teachers contacted
in that state have worked in second jobs at some point in their careers
to supplement their incomes. Fifty-one percent of this group had done
so during the previous year. If, in fact, most teachers are constrained
to work less than they would otherwise, we must regard this work schedule
as a disadvantage to teachers rather than a benefit. Moreover, as
we show below, this implies that, whatever the advantages of operating
schools for a partial year, this is not achieved costlessly. Teachers
in competitive labor markets would have to be paid a premium wage rate
113

102
to be induced to accept this disadvantage. Therefore, the costs of
instruction per unit could, where this is true, be lowered by lengthening
the school year to accommodate the wishes of teachers to obtain higher
total incomes by working longer each year.
Our results below show that teachers as a group, when compared
to a similarly constructed sample of full time workers in the population
at large, work significantly fewer weeks per year. These results further
suggest that teachers would be willing to accept a wage rate 9.9 percent
lower, if they were permitted to work extra weeks per year. Since
most educational physical plants are unused in summers, the reduction
in cost per unit (i.e., cost per student taught per day) from expanding
the teacher work schedule could be substantial.
Constrained Labor Supply and Wage Rates
We begin by introducing a well-developed model [Lindsay, 1971]
of occupational choice in which both wages and weeks worked are
endogenous. That is, workers supply themselves to occupations on the
basis of wage rates, then choose the amount of work to supply in that
occupation. Initially, we assume that workers are free to set their
own schedules and hours. This assumption is relaxed later or replaced
with the actual restricted work schedule faced by most teachers. Wages
vary because of the different educational and training requirements
for alternative occupations, and this wage rate variation produces
variation in the hours chosen. Since we also assume that workers are
identical, however, all choose the same schedule in each occupation.
114

103
Figure 1 depicts a wealth-hours space over which combinations
are ordered by a utility function for which the marginal rate pf
substitution of leisure for wealth is ne-,,tive. This simply means
that leisure time and wealth are substitutes, that the typical person
is willing to give up some amount of wealth to get more leisure, and
vice versa. Realistically, there are several margins of adjustment
for such a choice between leisure time and wealth. Workers choose
the length of day, week, number of holidays, and the number of weeks
they work per year. For simplicity in presentation, these are all
compressed into a single dimension, labor.
We also assume for the purposes of exposition that the interest
rate is zero, so that earnings over the lifetime may be aggregated
without the complication of discounting. The qualitative results of
the model are unaffected by this assumption, and empirical work reported
below is estimated in semilog form to incorporate standard human capital
discounting consideration.
It is easily shown that the amount of labor supplied is influenced
by the wage rate and the amount of nonwage income (initial wealth,
savings, and income o. other family members) available to the worker.
In Figure 1, for a base level worker with no training and nonwage wealth
of W1, the opportunity set of wealth and labor supplied is given by
OS1. The slope of this opportunity set is, of course, the wage rate.
The worker will choose combination t along this opportunity set.
Combination t represents the highest level of satisfaction the base
worker can attain, given the set of opportunities available to him.
An equally paid worker with more nonwage wealth, e.g., W2, however,
115

104
FIGURE 1
116

105
will choose combination h along parallel opportunity set 0S2 providing
less labor and more leisure, if leisure is a normal or desirable good.
Investment in training and education requires the expenditure
of household resources either directly in the form of tuition and other
out of pocket expenses or indirectly in the form of foregone earnings.
This reduction in wealth must be compensated for through the receipt
of a higher wage rate. For example, a reduction in nonwage wealth
from WI to W3 with no wage increase would nrovide combination b, at
best, which is less preferred than any en OSi. Only if wages rise
in this more highly trained occupation to the level indicated by the
slope of 0S4 does a combination such as k become available which is
equally attractive to combination t obtained without the training.
Note, however, that workers who invest in this training will h1 'h earn
higher wages and supply more labor. The theory has two implications:
labor supply is negatively related to nonwage income an0 positively
related to the amount of education and other human capital possessed,
which command a higher wage rate in the market.
School teachers, as we have noted, generally may not be responsible
for the work schedules they follow. In other words, they usually are
not free to select any combination of labor and earnings associated
with the wage rates they receive. Under such circumstances, it is
possible that school boards must premium er unit of work t
attract qualified workers into this occupation over and above the amount
that workers with their training and ualifications mi h t receive in
other occupations where workers are not constrained to work less than
117

106
they desire. It is possible that school teacher opportunity sets are
discontinuous, and that teachers find themselves on a corner and must
be compensated for this inconvenience.
This can be seen in Figure 2. Opportunity set OS1 represents
the unconstrained combinations available to workers with a given amount
of human capital and nonwage wealth. The opportunity set for workers
without this level of training has been deleted in the interest of
clarity. Combination p is preferred at this wage rate involving the
supply of Lp hours of labor. Assume, however, that teachers are
constrained to work no more than the actual amount, La. At the wage
rate paid to other unconstrained workers and represented in OS1, teachers
would obtain only the inferior combination g, resulting in wealth level
Wg instead of W. Competition among employers will not permit teachers
to be exploited in this way, however. As long as other employment
is available offering combination p, no worker will choose to become
a teacher. In order to make this occupation attractive to potential
teachers, the wage rate must rise until a combination is available
that is the equivalent of combination p. That can only occur if the
wage rate rises to the slope of 052 permitting workers who supply no
more than La hours of labor to obtain combination a, the actual
combination that occurs in the market and yields wealth level Wa.
A test of the presence of this work period constraint is the following
implication: Hourly rates for school teachers are predicted to be
higher than are wages for workers in occupations requiring the same
amount of human capital.
11.8
L.11.11.111....inglingROWIRIFFILMIIMMIONRWWWMPINIOMOk

FIGURE 2
Base Ctlealth.
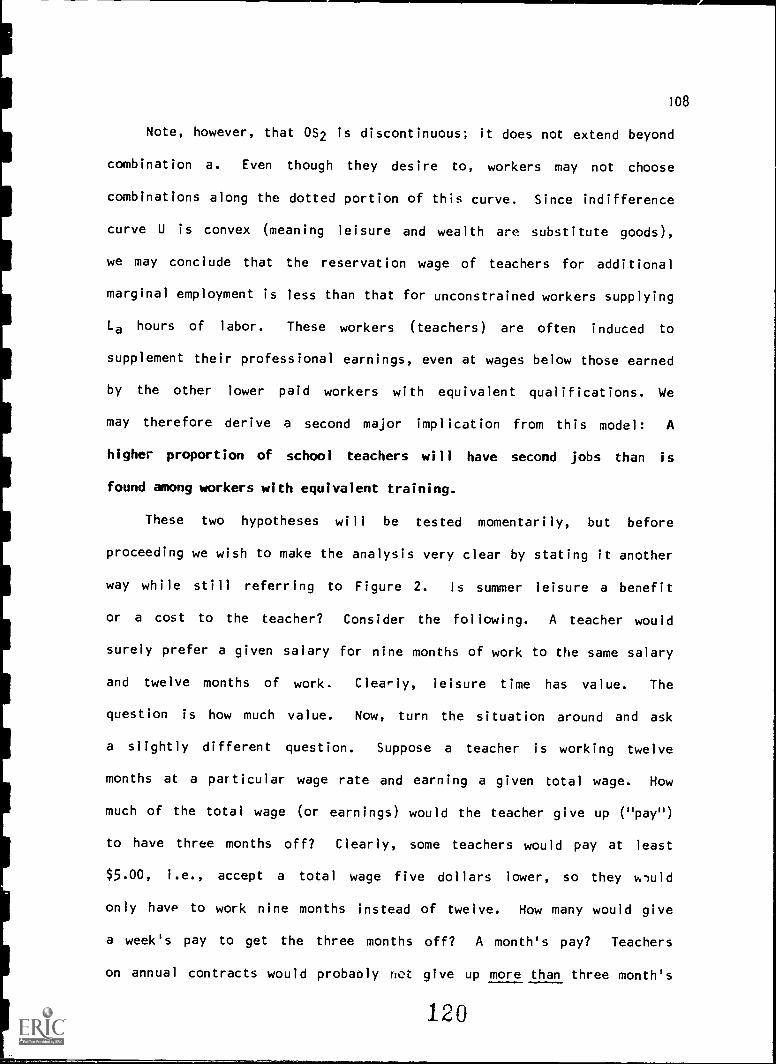
108
Note, however, that 0S2 is discontinuous; it does not extend beyond
combination a. Even though they desire to, workers may not choose
combinations along the dotted portion of this curve. Since indifference
curve U is convex (meaning leisure and wealth are substitute goods),
we may conclude that the reservation wage of teachers for additional
marginal employment is less than that for unconstrained workers supplying
La hours of labor. These workers (teachers) are often induced to
supplement their professional earnings, even at wages below those earned
by the other lower paid workers with equivalent qualifications. We
may therefore derive a second major implication from this model: A
higher proportion of school teachers will have second jobs than is
found among workers with equivalent training.
These two hypotheses will be tested momentarily, but before
proceeding we wish to make the analysis very clear by stating it another
way while still referring to Figure 2. Is summer leisure a benefit
or a cost to the teacher? Consider the following. A teacher would
surely prefer a given salary for nine months of work to the same salary
and twelve months of work. Clearly, leisure time has value. The
question is how much value. Now, turn the situation around and ask
a slightly different question. Suppose a teacher is working twelve
months at a particular wage rate and earning a given total wage. How
much of the total wage (or earnings) would the teacher give up ("pay")
to have three months off? Clearly, some teachers would pay at least
$5.00, i.e., accept a total wage five dollars lower, so they would
only have to work nine months instead of twelve. How many would give
a week's pay to get the three months off? A month's pay? Teachers
on annual contracts would probably not give up more than three month's
120
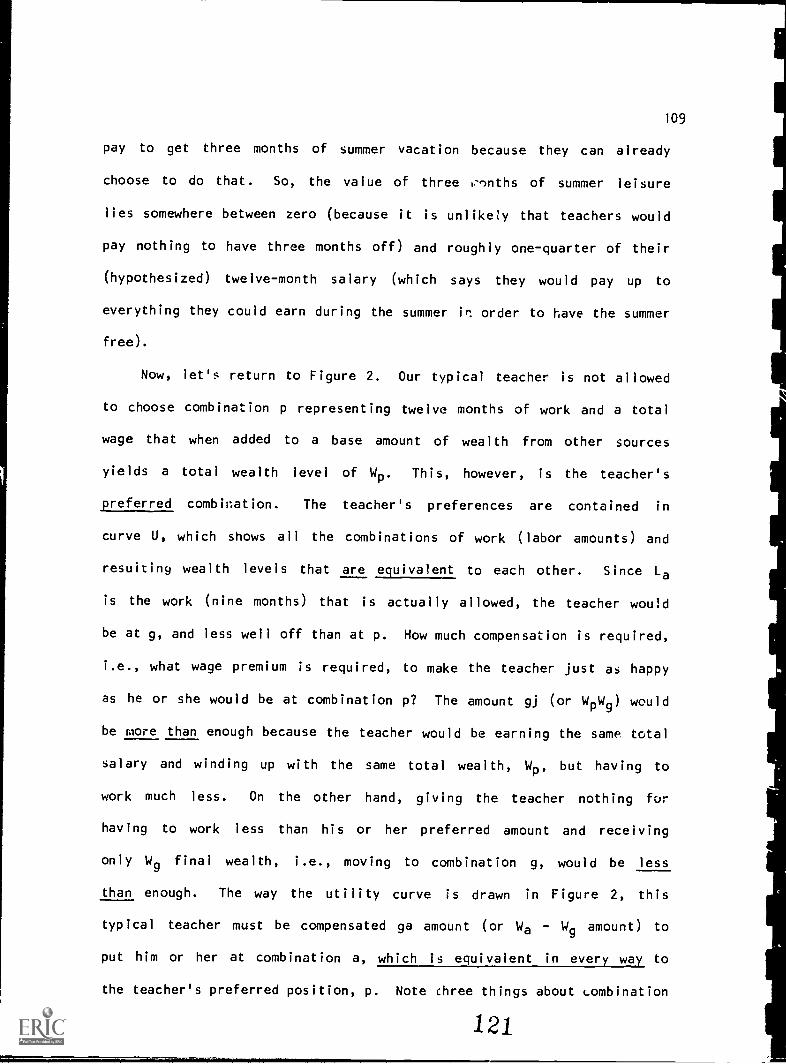
109
pay to get three months of summer vacation because they can already
choose to do that. So, the value of three conths of summer leisure
lies somewhere between zero (because it is unlikey that teachers would
pay nothing to have three months off) and roughly one-quarter of their
(hypothesized) twelve-month salary (which says they would pay up to
everything they could earn during the summer it order to have the summer
free).
Now, let's return to Figure 2. Our typical teacher is not allowed
to choose combination p representing twelve months of work and a total
wage that when added to a base amount of wealth from other sources
yields a total wealth level of W. This, however, is the teacher's
preferred combination. The teacher's preferences are contained in
curve U, which shows all the combinations of work (labor amounts) and
resulting wealth levels that are equivalent to each other. Since La
is the work (nine months) that is actually allowed, the teacher would
be at g, and less well off than at p. How much compensation is required,
i.e., what wage premium is required, to make the teacher just as happy
as he or she would be at combination p? The amount gj (or WpWg) would
be more than enough because the teacher would be earning the same total
salary and winding up with the same total wealth, Wp, but having to
work much less. On the other hand, giving the teacher nothing for
having to work less than his or her preferred amount and receiving
only Wg final wealth, i.e., moving to combination g, would be less
than enough. The way the utility curve is drawn in Figure 2, this
typical teacher must be compensated ga amount (or Wa - Wg amount) to
put him or her at combination a, which is equivalent in every way to
the teacher's preferred position, p. Note three things about combination
121

110
a: (1) it contains more total wage than is in combination g by ga
amount (the teacher is being compensated through a higher wage rate
to accept less work) and it contains more leisure than is in combination
p; (2) the full wage loss from being denied position p (full work)
and moving to g (nine months work a.. the old wage rate) is not made
up, and the difference between ga (the wage premium or the part that
is made up) and gj (the total wage loss) is the monetary value of the
extra leisure obtained; and (3) this is the actual combination that
occurs in the market, i.e., over the long run, compensation schedules
have changed so that teachers now in labor market equilibrium are
receiving a premium for accepting less than their preferred amount
of work.
Note further, that if the utility indifference curve were not
convex, but a straight line coinciding with OS1, then combination g
would be equivalent to the chosen combination p. This would mean the
lost salary (in g) was exactly offset by the extra leisure (also in
g). In other words, the value of the extra leisure from working only
nine months would be exactly equal to the income given up, and no premium
for having to work a shorter period would be necessary nor exist in
the market. On the other hand, if the utility curve were kinked or
otherwise a straight line from p over through j, then summer leisure
would have zero value to teachers and, in a competitive market, they
would have to be paid a premium equal to one-quarter of the twelve
months salary or, what is the same thing, one-third of the nine months
salary. Among other things, it is the existence of this premium we
wish to test in the remainder of this section, and, if it exists, we
wish to estimate its magnitude.
122

111
Teachers as a Representative Subset of the General Population
The two testable hypotheses discussed earlier -- the existence
of a wage rate premium for teachers due to constrained work schedules
and a disproportionately high number of moonlighting teachers -- are
implied only if school teachers are similar to the population of
non-teachers. It is quite possible that teachers as a group contain
a disproportionate number of workers who prefer to supply less labor.
Indeed, our theory suggests the presence of such a group. The preferred
amount of labor was shown above to vary at a given wage depending on
nonwage wealth. One group of workers who would be predic ed to p-efer
less work at a given wage rate is the one comprised of workers with
w, '-king spouses. It may be possible, therefore, that a disproportionate
number of school teachers have working spouses, and that they require
no wage premium in order to pursuade them to supply the chnrter workyeAr.
This situation may be as depicted in Figure 3. Workers with nonworking
spouses and single workers may be disproportionately represented id
non-teaching occupations supplying 11 units of labor, while
disproportionate numbers of workers with working spouses are congregated
in teaching. Because each group of workers is supplyiry the quantity
of labor that it chooses, neither commands a wage premium.
While possible, this argument, on its face, is not completely
convincing. It leaves unanswered the crucial question of why such
workers would choose teaching as the occupation in which to congregate.
That is, unless there are other good reasons to operate schools for
less than the full term, there is no reason for those wishing to supply
lower than normal levels of labor to congregate in disproportionate
1.23

0 L0 L1
124
Labor-

113
numbers in this occupation. It does suggest, however, that those with
working spouses as well as those with other nonwage wealth will accept
lower wages to teach.
Wage Compensation for Short Work Schedules
The procedure used to test the theory and to estimate the wage
premium paid to teachers for this constraint on their work schedules
is briefly outlined here. A detailed description of that procedure
will follow.
Census data on all full-time workers is used to predict the
schedules teachers would choose to work, based on worker and labor
market characteristics. (A discussion of the data is presented
immediately following this section.) That is, labor supply equations
are estimated, the parameters of which can be employed to predict the
number of hours and weeks chosen by workers with any particular set
of characteristics. The difference between the schedules actually
worked and those predicted to be chosen measures the extent to which
individual teachers are constrained.
Our theory predicts that wage rates are positively related to
this difference between desired and actual hours and weeks worked.
That is, the more severe the constraint on number of weeks teachers
are allowed to work, the greater will be the wage rate premium. The
second step of the procedure is, therefore, to observe the relationship
between the wage rate and this difference for teachers. We assembled
from the Census data a test group of primary and secondary public school
teachers. We then regressed the effective wage rates of these educators
125

114
on variables predicted to influence their pay including this work
schedule constraint variable. The results are largely supportive of
our theory. Teachers as a group work significantly fewer weeks per
year than they would choose to and are paid more per hour as a result.
The Labor Supply Equation
It is quite plausible that the constraint on labor supply operates
with the effect described on two margins. Both hours per week and
weeks per year may be affected. We have therefore tested for the effect
on both. The labor supply equation estimated has the following form:
WORK = b0 + b1 EDUCATION + b2 EDUCATION2 + b3 AGE + b4 AGE2
+ b5WIFE*KIDS + b6 NONWAGE INCOME + b7 SEX
+ bEi URBAN + b9 SMSA RANK*URBAN
The data employed were from the March and May 1977 Census of Population
Survey (CPS) tapes. Definitions of the variables and their modes of
construction, where applicable, are provided in the discussion of the
data at the end of this section. Here our discussion is limited to
the rationale for the inclusion of each variable as well as its
hypothesized sign.
WORK. In the hours equation, this variable is the number of hours
worked reported in the week prior to the survey. Some confusion is
apparent in responses to the question concerning weeks worked the
previous year in the survey. A large number of respondents interpreted
this question to concern the number of weeks employed, for approximately
60 percent answered this question with 52 weeks. For this reason,
it was necessary to construct a measure of weeks worked from other
data reported. This is described in the Data Appendix.
126

115
AGE, AGE2. It seems quite plausible that labor supply might vary
over the life cycle, holding other factors constant. During the early
years of a worker's career, many will have young children at home who
require more time for care and nurturing. During the autumn years,
on the other hand, workers look forward to retirement and may enter
this state gradually by slowly reducing the labor they supply to the
market. These thoughts suggest the possibility of a labor supply
function that rises over time in the early years of the career, reaches
a peak, and then declines. For this reason, we have included both
AGE and the square of this variable in these estimates.
EDUCATION, EDUCATION2. The theory suggests that labor supply
is positively related to level of education. Investment in education
raises productivity in work relative to leisure activities leading
those with more education to substitute income from work for household
production and leisure activities. A squared term is also included
to capture the possible higher order effects of education.
SEX. This variable is included to capture the effect of any
possible differential labor supply behavior due to the sex of the worker.
WIFE*KIDS. This variable allows the family status variable to
interact with the number of children under eighteen present in the
household. Children represent an additional household responsibility
that typically falls on the wife. This variable is included to measure
the impact of this responsibility on labor supply.
URBAN. This variable is included to capture the effect that the
work environment may have on the quantity supplied. To the extent
that workers in urban environments will typically face longer commutes,

116
we predict that some portion of this commuting time will be deducted
from both work and leisure. We therefore predict that workweeks supplied
by urban workers will be shorter. This variable is also included in
the workyear equation, although we predict no sign, a priori.
SMSA RANK*URBAN. This variable allows the size of the SMSA to
interact with the urban dummy variable. SMSAs are ranked by size from
1 to 61. As these ranks may be considered to proxy the lengths of
the commutes, an extension of the argument for the URBAN variable
suggests that labor supply will be related to rank with SMSAs.
Estimates of Labor Supply
Ordinary least squares regression estimates of the labor supply
equations are presented in TABLE 2. Although the R2s of these equations
are quite low, the F statistics indicate the equations taken as a whole
Pxplain cignific=nt am^nts of the v=riati^n in 1,,b^r
supplied. The weeks equation is troubled by the misreporting in the
dependent variable discussed above. We are encouraged, nevertheless,
by the similarity of these results and those in the hours equation.
The predicted effects are confirmed in each case in both.
The effect of education is to increase labor supplied in both
equations, as predicted by our theory. The relationship identified
is quadratic in both cases. The effect of education on weeks and hours
worked is positive and increasing with level of education throughout
the range of this variable among our teachers. Both AGE and its square
are significant, and the estimated shape conforms to our earlier
hypothesis. Labor supply in each equation rises at a decreasing rate
128
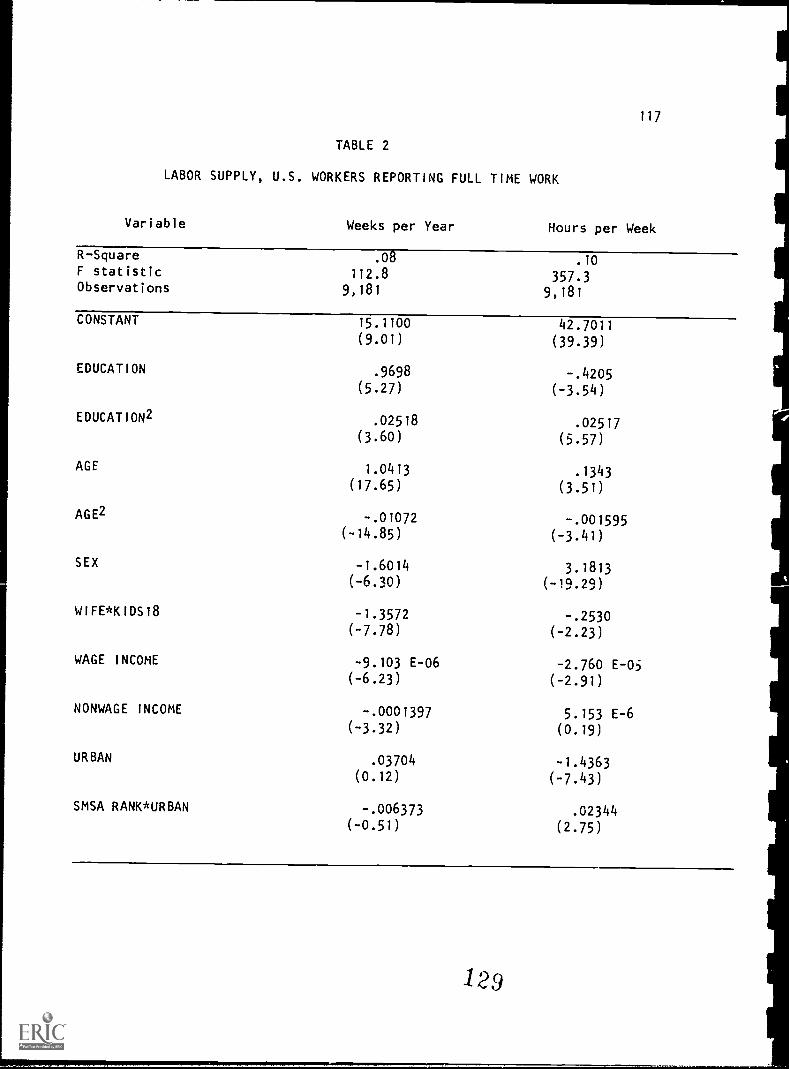
TABLE 2
LABOR SUPPLY, U.S. WORKERS REPORTING FULL TIME WORK
Variable
117
Weeks per Year Hours per Week
R-Square .08 .10F statistic 112.8 357.3Observations 9,181 9,181
CONSTANT 15.1100 42.7011(9.01) (39.39)
EDUCATION .9698 -.4205(5.27) (-3.54)
EDUCATION2
AGE
AGE2
SEX
.02518
(3.60).02517
(5.57)
1.0413 .1343(17.65) (3.51)
-.01072 -.001595(-14.85) (-3.41)
-1.6014 3.1813(-6.30) (- 19.29)
WIFE*KIDS18-1.3572 -.2530
WAGE INCOME
NONWAGE INCOME
URBAN
SMSA RANK*URBAN
(-7.78)
-9.103(-6.23)
E-06
(-2.23)
-2.760
(-2.91)E-05
-.0001397 5.153 E-6(-3.32) (0.19)
.03704 -1.4363(0.12) (-7.43)
-.006373 .02344(-0.51) (2.75)
1.29

118
to a peak (at 48 years in the weeks equation and at 42 years in the
hours equation) beyond which it falls. Being female and having children
in the home both reduce labor supply in both equations. Women workers
supply about 1.6 fewer weeks per year than statistically matched males
and about 3.2 fewer hours per week. Being a wife with children under
eighteen subtracts an additional 1.4 weeks per child and a quarter
of an hour per child from the typical work schedule.
The theory also predicts that other household income reduces labor
supply, and this implication is also supported by these results. The
effect of wage income of other household members is slght, reducing
labor supply by .009 weeks and .027 hours per $1,000, but significant
in both equations. Nonwage income reduces weeks supplied substantially
(.14 weeks per $1,000), but seems to have no effect on hours.
Finally, the labor market environment seems to have played a role
as well, Although our dummy variable Ue.BAN as well as the inte,oLioo
of this dummy with SMSA RANK has no effect on weeks worked, both
significantly affect hours per week. rlier we suggested that commuting
time would be subtracted from both leisure and hours worked per week,
and this result is strongly supported in the data. Workers in an SMSA
supply about 1.4 fewer hours per week. The interaction of SMSA
RANK*URBAN is also significant in the hours equation. We suggested
that size is related to commuting time, hence larger size implies less
labor supplied. As size is inversely related to rank, the positive
coefficient may be interpreted as indicating that higher rank (and
a longer commute) is assoc!ated with fewer hours supplied.
130

119
Do Constrained Hours Increase Wages?
A subsample of all public primary and secondary *ceachers was then
created from the original sample, and the residuals from both the hours
and the weeks equations were recovered. Our maintained hypothesis
holds that these residuals will be predominantly negative for teachers,
and that wages paid must increase at an increasing rate with the
magnitude of this difference between actual and desired labor supply.
The first of these hypotheses is confirmed, at least with respect
to weeks worked, by noting that the mean of this residual for teachers
is negative in the weeks equation. We denote the residual from the
weeks equation RWEEKS and the residual of the hours equation RHOURS.
The mean of RWEEKS is -1.00 and a t-test of the significance of the
different of this mean from zero yields a statistic of -3.93. Perhaps
surprisingly, the mean of RHOURS is positive and of borderline
significance. This suggests that teachers may compensate in part for
the constraint on the number of weeks they may work by working more
hours per week. This mean is 0.74 with a t-ratio of 1.83.
To test our second hypothesis, we regress the natual logarithm
of the wage rate on these residuals and other variables predicted to
influence the wage rate. The equation estimated here and reported
in Table 3 is
LNWAGE = Bo + B1 RHOURS + B2 RHOURS2 + B3 RWEEKS +
B4 RWEEKS2 + B5 EDUCATION + B6 EDUCATION2
+ B7 EXPERIENCE 4 B8 EXPERIENCE2 + B9 RACE
+ B10 SEX + B11 URBAN + B12 SMSA RANK*URBAN
+ STATE DUMMY VARIABLES
131
120
Although many of these variables also appear in the labor supply
equation, the justification for their inclusion here is in some cases
quite different and merits separate discussion.
SEX. It is often alleged that wages paid to women are less than
those paid to men because of discrimination. There are other
nondiscriminatory reasons why women might be expected to earn lower
wages than men, but this debate is beyond the scope of this research.
See several discussions of theories of nondiscriminatory wage
differentials by microeconomists [Gwartney and Stroup, 1973; Mincer
and Polachek, 1974; and Landes, 1977]. Nevertheless, the facts are
that regressions of the wage rate on sex typically find this an important
and highly significant determinant of variation in wages. This dummy
has a value of one if female and zero if male.
RACE. This variable has a value of one if the worker is a member
of a minority race. Otherwise it takes a value of zero. This is
included to identify effects such as those mentioned in connection
with SEX that may operate through the race of the worker.
EDUCATION, EDUCATION2. According to the theory presented above,
education is predicted to affect the wage rate as labor supply. The
square of the number of years of education completed is included, as
in the labor supply equation, to identify higher order effects.
EXPERIENCE, EXPERIENCE2. As pointed out in the Data Discussion
immediately following this section, this variable measures only years
not devoted to education, at best a irasure of years potentially in
the labor force. It fails to differentiate between experience in the
current job and experience in some unrelated occupation or even adult
132
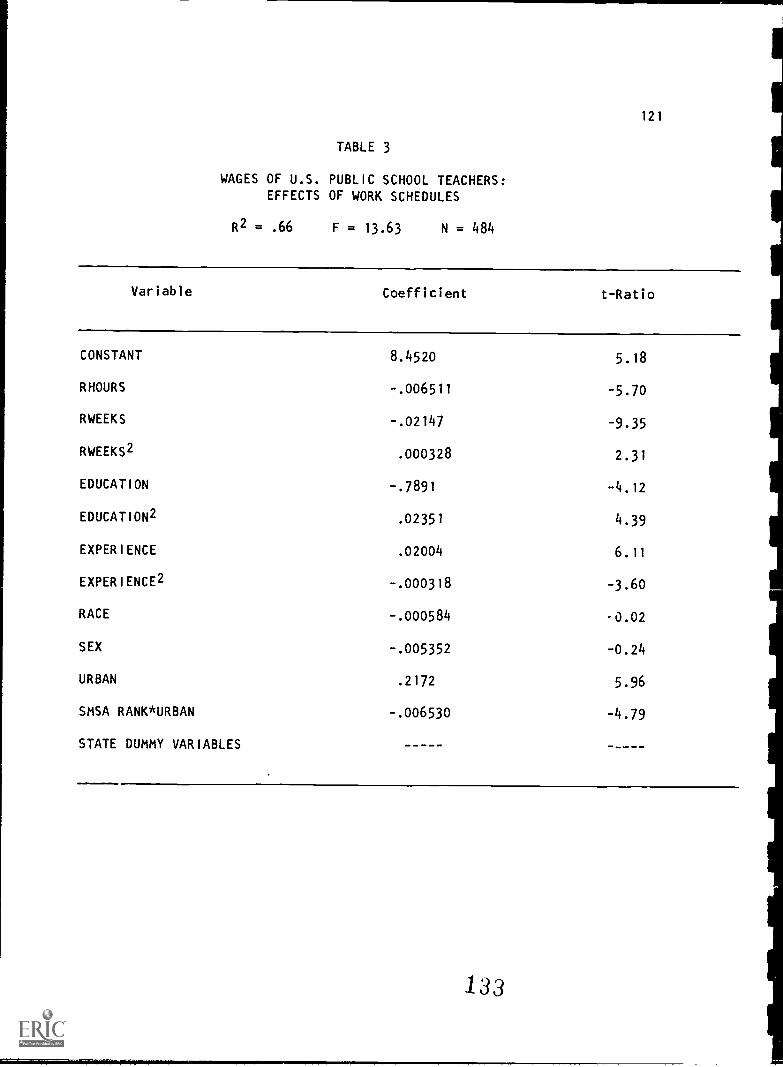
121
TABLE 3
WAGES OF U.S. PUBLIC SCHOOL TEACHERS:EFFECTS OF WORK SCHEDULES
R2 = .66 F = 13.63 N = 484
Variable Coefficient t-Ratio
CONSTANT 8.4520 5.18
RHOURS -.006511 -5.70
RWEEKS -.02147 -9.35
RWEEKS2 .000328 2.31
EDUCATION -.7891 -4.12
EDUCATION2 .02351 4.39
EXPERIENCE .02004 6.11
EXPERIENCE2 -.000318 -3.60
RACE -.000584 -0.02
SEX -.005352 -0.24
URBAN .2172 5.96
SMSA RANK*URBAN -.006530 -4.79
STATE DUMMY VARIABLES
133

122
years out of the labor force. This variable is nevertheless included
as a proxy of the worker's investment in on-the-job training (Mincer,
1974). Studies of the effect on the life-cycle wage rate of investment
in training that depreciates over time yield results that are consistent
with an upwardly convex curve over the life cycle [Porath, 1967).
For this reason, the square of years of experience is also included.
URBAN SMSA RANK*URBAN. URBAN is a dummy variable which takes
a value of one if the household lives in an SMSA and zero otherwise.
Wages are typically higher in cities, reflecting the higher costs of
living there. For the same reason, wages are higher in larger cities
than smaller ones. We therefore include the interaction of the URBAN
dummy with SMSA RANK. Recall that this rank is an inverse ordering
with size, so a negative coefficient is predicted for this variable.
STATE. Separate dummy variables are included for each state.
These are included to reflect differences in the cost of living and
other location specific effects that affect wage rates. Although we
do not report the coefficients on these dummies in Table 3, they enter
highly significantly as a group (F = 3.58), and, individually, several
are quite significant (27 have t-ratios greater than 2.00 in absolute
value).
Estimates of the Effect of Constrained Supply
Our general hypothesis holds that school teachers are constrained
by the abnormally low work schedules they must follow and must be
compensated with higher wage rates to induce them to supply labor to
134

123
this market. Before moving to a discussion of these effects, let us
briefly comment on the influence of the rer ining variables in the
wage rate equation. Education and experience both are significant
in the equation, and are significant in both their forms (as squared
val4es as well as unadjusted amounts). The coefficient of education
on the log of wages is widely interpreted to be the rate of return
earned on education. In our sample of teachers, this rate of return
is positive and rising at the mean value of education (17.7 years).
The estimated rate of return at this mean 4.3 percent.
Similarly, experience conforms to our hypothesis of an upwardly
convex curve over the working career of teachers. Teachers' wage rates
reach a maximum at 31.5 years of experience. Surprisingly, in view
of the frequency with which race and sex are found to have significant
wage effects in micro data sets such as these, these two variables
have very small and insignificant coefficients in this equation.
The performance of our variables of interest supports the hypothesis
that teachers are constrained by their work schedules. In both the
case of weeks per year and hours per week, school teachers reveal
themselves to be willing to accept a lower wage in order to work more.
That is, if given a choice, teachers would choose to work more, rather
than less, at the existing hourly wage rate. Thus, we can conclude
that the summer layoff imposed on teachers is a penalty rather than
a benefit, and that school district authorities are incurring higher
unit labor costs as a result.
This result is implied by the negative coefficients on both the
RWEEKS and RHOURS variables in the regression results. In particular,
based on the estimated coefficients, teachers would be willing to accept
135

124
up to a 9.9 percent reduction in their hourly wage rate in order to
be allowed to work 5 to 10 extra weeks per year. This clearly indicates
further that summer leisure has significant value since monthly wage
rates for teachers have not risen a full 33 1/3 percent so that when
applied to nine-month teacher salaries a "worthless" three month vacation
is fully offset.
Similarly, we estimate that teachers would be willing to take
a 3.25 percent cut in their hourly wage rate to be allowed to work
5 more hours per week. It is not reasonable to expect that school
districts could extract all of this surplus from teachers, but the
numbers do suggest that something like a 5-7 percent savings in salaries
could be accomplished by standard twelve month/forty hour per week
employment of school teachers.
Even though our estimates support the argument that school teachers
are constrained in their choice of the term of employment, they also
suggest that our estimating procedure is biased. The bias shows U)
in the fact that the estimated function relating the wage to residual
weeks worked does not reach a minimum where residual weeks are zero.
Similarly, the estimated relationship between RHOURS and the wage rate
is everywhere downward sloping. The theory says that at zero residual
work the wage effect should turn from downward to upward sloping.
This is an implication of the convex indifference curve shown in Figure
2 (p. 107). One interpretation of our empirical result is that, instead
of predicting workers' hours at p, our estimating procedure predicts
desired work somewhere to the left of its true value. In that sensr,
the wage contour we plot continues to fall beyond our estimate of zero
136

125
residual work. The causes of this bias are potentially several: meas-
urement error attributable to the survey nature of the data, a truncated
distribution of the dependent variable in the labor supply equations
due to the limit on the amount of time one can work, as well as omitted
and mi:.measured variables such as experience discussed above. All
or any of these effects are likely to bias our estimates of desired
work in the direction of understating residual work. An alternative
interpretation is that school teachers are not alone in facing a
constraint on the amount of work they are allowed to supply.
In all events, the fact remains that the relationship between
work and pay for school teachers is negative: teachers on average
are willing to work more for a lower pay rate in order to increase
their total annual compensation.
SUMMARY
In this section we have attempted to answer the following question:
Do teachers regard their present work schedules involving substantial
free time in the summers to be an advantage or a disadvantage? The
answer to this question clearly depends on the desired work schedules
of those employed in this occupation. On the one hand, it might be
argued that those workers who choose this occupation do so in order
to work fewer weeks per year. The alternative hypothesis treats workers
as similar in their labor supply objectives to others with the same
educational, age, and market characteristics. According to this view,
constraints on the work schedules of teachers are regarded as
disadvantageous, and wages must be adjusted to compensate for this
feature of that occupation.
137

126
We have chosen to model the latter hypothesis. Desired labor
supply both in weeks and hours per week is extrapolated for teachers
with varying characteristics from a sample of all full time workers.
A regression of wages on the deviation of actual from desired labor
supply tests the hypothesis that teachers are indeed compensated in
this manner. While the estimated results do not confirm that hypothesis
in all details, they suggest that work schedules are a binding constraint
on the labor supply of teachers. Wage rates decline monotonically
with the algebraic value of the deviation of desired from actual labor
supplied. This has an interpretation which is somewhat different from
either of the two hypotheses just offered. It suggests that teachers
are not like other workers, but differ in the opposite direction from
that suggested by the former hypothesis. The statistical results suggest
that teachers as a group wish to supply abnormally large amounts of
labor and are willing to accept lower wage rates for any increase in
their work schedules. This raises serious questions about how such
an unsuitable group of workers ever found its way into the teaching
profession, but we have no answer to those questions here. We can
only report what the data say, and these have spoken in a particularly
enigmatic way.
Clearly, this research has raised a number of important and yet
unresolved issues. The topic of work scheduling and its implications
for labor supply and the cost and productivity of our educational
resources has been the subject of almost no formal analysis to date.
The present study has only broken the surface of this subject, yet
it has unearthed some intriguing results. It suggests that substantial
138

127
savings in labor cost can be achieved by expanding the work schedules
of teachers. Clearly, these results need to be replicated with other
data and analyzed from additional vantage points. If substantiated,
however, serious attention must be given to altering the traditional
school calendar.
N
139

128
DATA DISCUSSION
In order to test the theory, we required data on workers from
both the 1977 March and May Census of Population Survey (CPS) tapes.
This year was chosen from the set 1971-1981 because it is arguably
the least affected by aggregate economic performance. CPS tapes report
the following variables that were of interest to us:
From the March 1977 Survey
WEEKS -- weeks worked over the last year
WAGES -- annual wages and earnings
FYTOT -- total family income
FYOUT -- family income from non-wage sources
NONWAGE INCOME -- family income minus individual earnings, wages,
and earnings
From the May 1977 Survey
SALARY -- average weekly salary
Included on Both 1977 Surveys
HOURS -- average hours worked each week
AGE -- age
SEX -- men = 0, women = 1
RACE -- whites = 0, black and others = 1
EDUCATION -- years of education completed
EXPERIENCE -- AGE minus EDUC minus 6
WIFE -- marital status reported as wife in family
SMSA RANK -- population rank of standard metropolitan statistical area
14 0

129
URBAN -- location of individual in a ranked SMSA = 1, non ranked
or rural = 0
STATE -- state of residence.
From the 160,799 observations, we chose those respondents who
were presently employed. Because this set contained many casual workers,
we further limited our sample to those who reported working more than
35 hours the previous week, who were employed more than 35 hours per
week the previous year, and who reported working more than 30 weeks
the previous year. This provided a sample of 39,036 observations.
However, a number of anomolies were discovered in the data that required
further restrictions on the sample.
Most important for the study at hand, we found that over half
of all people (teachers included) reported that their weeks of work
were 52. When we contacted the Department of Labor, we found out that
the interviewers do not prompt the respondents to clarify whether this
means weeks of employment or actual weeks worked. Hence, the sample
includes both types of answers. This is particularly troubling because,
for salaried people, the hourly wage must be computed. For this reason
we used the May CPS data source in connection with March. The May
survey reports average weekly earnings from which an hourly wage can
be computed without regard to the weeks variable. Moreover, the weeks
variable can be computed more accurately using the two data sources.
Thus, we adopted the following convention:
1) WEEKS = WAGES/SALARY
2) If WEEKS > 52 then hourly wage (HRWAGE) = WAGES/(HOURS-52)
3) If WEEKS > 52, then WEEKS = 52
141

130
As there is no respondent identifier on these tapes, it was
necessary to match individuals from tape to tape using a household
identifier and reported demographic information. The variables used
for this purpose included race, s x, veteran status, education, age,
relationship to head of househo'.1, marital status, and occupation.
This draws a coarser net than might be used, but, with degrees of freedom
in surplus, it assures that we only include truly tracked individuals.
By cross checking several categories, we did allow for birthdays,
marriages, divorces, and deaths between the surveys. Excluding all
nonmatches leaves a sample of over 9000 fulltime workers including
nearly five hundred public elementary and high school teachers.
142
I

131
IV. CLASSROOM TEACHER COMPENSATION: SALARIES AND FRINGE BENEFITS
Total teacher compensation is comprised of salary and fringe
benefits. In this section, we present the values of fringe benefits
available to teachers in the southeastern states along with typical
salaries paid. In all except the case of estimates of the %/Flue of
summer leisure, fringe benefits are valued at the cost to the employer.
All data are for the school year 1984-85. An attempt was made to keep
separate the state and local contributions to salary and the set of
fringe benefits provided to teachers. A word of caution is in order
here. We are least satisfied with our ability to make this separation
and, while we are confident of total salaries and total fringe benefits,
we urge special caution when interpreting or considering the breakdown
between state and local responsibility for expenditures. One should
use these particular figures only as a rough guide to the relative
separation of expenditure responsibility between state and local
districts. Many respondents (to the questionnaire and our telephone
calls) were quite unsure of whether the state paid certain benefits,
such as unemployment and workers' compensation, or whether the local
district paid them, with or without later reimbursement from the state.
Oftentimes, state and local funds are mixed into "a single pot," as
in Arkansas, before the spending process begins. Still, we believe
that the breakdown of expenditure responsibility between levels of
government is useful and the data are presented in the following tables
in a fashion that is as accurate as the data we could obtain.
We should also note that the variation of funding systems and
philosophies across states is great. Some states essentially pay teacher
143

132
salaries and certain fringe benefits directly, lake North Carolina;
others use extremely complicated per-pupil formulae. Some states,
like Tennessee, allocate funds by educational program or service
delivered (so much for remedial programs, transportation, etc.). Others
allocate a constant amount per teacher hired. Some state systems think
of the local districts as the primary providers of educational services
and simply assist them. Some try to equalize local resources and local
teacher salaries, while others encourage local districts to add
supplements of all kinds that cause teacher s-laries and benefits to
vary widely.
Salary and fringe benefit values excluding the value of summer
leisure are presented in Tables 4-A through 4-J. These tables differ
only according to teacher experience and educational level: Table
4-A is for the beginning teacher, Tables 4-B through 4-F are for
intermediate teachers with ten years of teacher experience and various
educational levels, and Tables 4-G through 4-J are for the experienced
teacher with twenty years of service and various levels of educational
attainment.
Tables 5-A through 5-J have exactly the same breakdown according
to teacher classifications as the first set of tables, but present
estimates of the minimum and maximum value of summer leisure, as well
as a mean value, and include this with the value of non-summer fringe
benefits to get "total fringe benefits with summer" and "total
compensation with summer."
Table 6 is a summary table (compressing the data from the preceding
sets of tables) showing the mean values for typical salaries, total
144
I
I
I
I
133
fringe benefits including sumner, and total compensation including
the mean value of summer leisure across all teacher classifications
by state and for the region as a whole.
Before these tables are presented, each of the main items contained
in them is explained below.
Definitions/Calculation Methods for Fringe Benefits in Tables 4 through 6
Typical State Contribution co Salary is column (1) in Tablg.s 4-A
through 4-J and represents our best estimate of actual salary dollars
supplied by the state. We again remind the reader of our earlier caution
concerning the difficulty of apportioning responsibility for teacher
salaries between the state government and local districts in some states.
Our calculation methodology differs by state. For example, Alabama
allots money to local districts for teacher salaries based on educational
level alone, $17,711 for a bachelor's degree regardless of experience,
$20,342 for a master's degree, anc $21,726 for a specialist's or doctoral
degree for the year 1984-85. These ire the appropriate figures that
appear for Alabama. Arkansas, however, supplies money to local districts
on a "minimum foundation" basis and sets no minimum salary schedules.
In this case, especially since local districts in Arkansas think in
terms of a shared pool for school expenses, we simply averaged for
the local districts surveyed the percentage of their total funds that
came from the state, which turned out to be 77%, and applied that factor
to the average of their three salaries paid to teachers in each
classification. Hence, the $11,883 state contribution by Arkansas
for beginning teachers (Table 4-A) is 77% of the average beginning
145

134
teacher salary in the three districts surveyed. The third method used
was to allocate as the state's share of salaries the amount shown on
a state mandated minim. salary schedule if we felt the state intended
to supply that amount of salary and allowed local districts to add
to it, but did not require the locality to make up a portion of the
minimum amount.
Typical Local Contributions to Salary is column (2) of Tables
4-A through 4-J. It is typical because it is an average of only three
representative local districts from the low, middle, and high segments
of the salary continuum. It is not a weighted average of salary
supplements paid in all districts or paid to all teachers. In all
cases, the local contribution is equal to the difference between the
average of the actual total salary paid in each of the three districts
surveyed and the state contribution to salary calculated earlier.
Typical Salary is column (3) of Tables 4-A through 4-J and for
each state is the sum of the contributions to salary by the state and
local districts found in columns (1) and (2). Remember, these are
typical salaries found in representative districts for each state and
will not match state average salaries, though the figures should be
quite similar.
State Paid Fringe Benefits are shown in column (4) of Tables 4-A
through 4-J. These are calculated on the basis of what they cost the
state per teacher directly or indirectly through appropriation or
reimbursement. The benefits include state paid employer portions of
social security, retirement, health insurance, disability insurance,
life insurance, unemployment and workers' compensation funds, and the
value of leave days calculated at the daily salary rate.

135
Locally Paid Fringe Benefits comprise column (5) of Tables 4-A
through 4-J and consist of the same general items as those noted just
above. These are also calculated ia the same manner.
Total Fringe Benefit Value is found in column (6) of Tables 4-A
through 4-J and is the sum of state paid and locally paid fringe
benefits, columns (4) and (5). This total does not include a value
for summer leisure.
Total Compensation is column (8) and is the sum of typical salary
(3) and total fringe benefit value (6). This is the total compensation
of teachers, exclusive of any value received from having free time
in summers.
Total Fringe Benefits without Summer is column (1) of Tables 5-A
through 5-J and is identical to column (6), Total Fringe Benefit Value,
in Tables 1 through 10.
Minimum Value of Summer Leisure is column (2) of Tables 5-A through
5-J. It follows the concept that free time in the summer is worth
something, as was indicated by the empirical tests in the last section.
The opportunity cost to teachers of summer leisure must be at least
the minimum wade'. Because teachers could choose to earn at that rate
and give up their free time, then it must be worth at least that amount
or more, if they accept the leisure. The specific amounts by state
are calculated as follows, yielding constant values for use throughout
the tables since, for the minimum, we assumed no variation in earning
power with respect to differences in salary related to educational
attainment or experience:
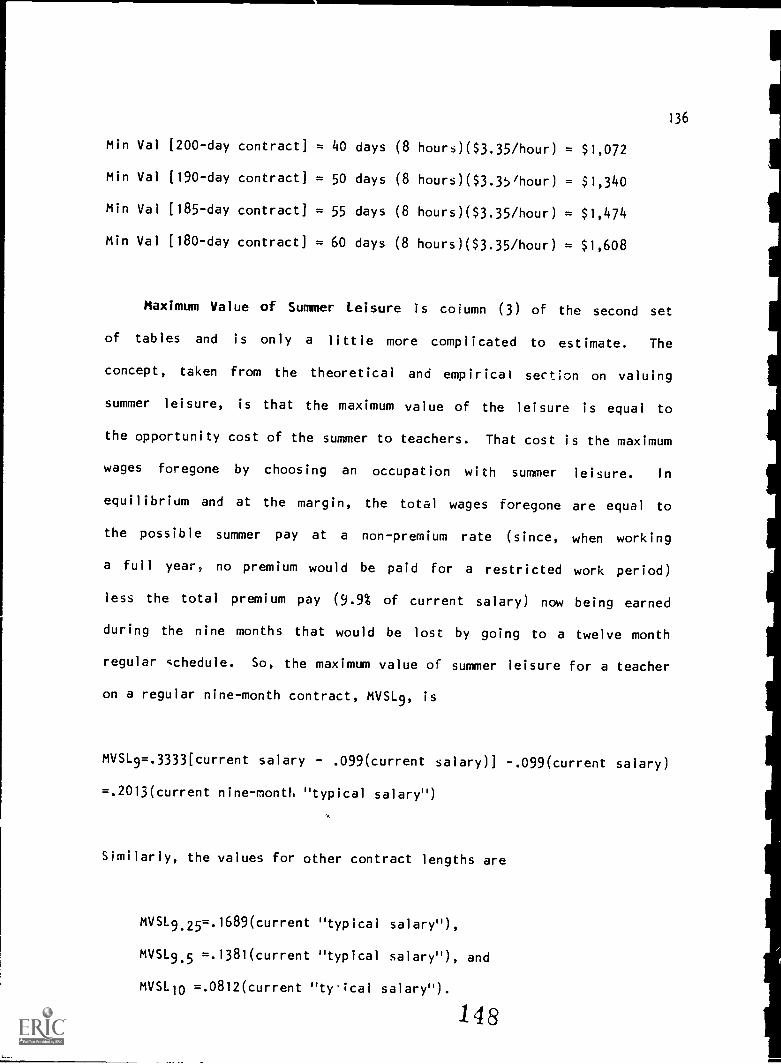
136
Min Val (200-day contract] = 40 days (8 hours)($3.35/hour) = $1,072
Min Val (190-day contract] = 50 days (8 hours)($3.35/hour) = $1,340
Min Val (185-day contract] = 55 days (8 hours)($3.35/hour) = $1,474
Min Val [180 -day contract] = 60 days (8 hours)($3.35/hour) = $1,608
Maximum Value of Summer Leisure is column (3) of the second set
of tables and is only a little more complicated to estimate. The
concept, taken from the theoretical and empirical section on valuing
summer leisure, is that the maximum value of the leisure is equal to
the opportunity cost of the summer to teachers. That cost is the maximum
wages foregone by choosing an occupation with summer leisure. In
equilibrium and at the margin, the total wages foregone are equal to
the possible summer pay at a non-premium rate (since, when working
a full year, no premium would be paid for a restricted work period)
less the total premium pay (9.9% of current salary) now being earned
during the nine months that would be lost by going to a twelve month
regular schedule. So, the maximum value of summer leisure for a teacher
on a regular nine-month contract, MVSL9, is
MVSL9=.3333[current salary - .099(current salary)] -.099(current salary)
=.2013(current nine-month "typical salary")
Similarly, the values for other contract lengths are
MVSL9.29=.1689(current "typical salary"),
MVSL9.9 =.1381(current "typical salary"), and
MVSL10 =.0812(current "ty-ical salary").
148

137
Mean Value of Sumer Leisure is column (4) of Tables 5-A through
5-J and is the average of the minimum and maximum values of summer
leisure to teachers presented in columns (2) and (3), respectively.
This is the value of summer leisure actually used in succeeding estimates
of total fringe benefits and total compensation that include the value
to teachers of time off in the summer.
Total Fringe Benefits Including Mean Value of Summer is column
(5) and is the sum by state of all other fringe benefits, column (1),
and the mean value of summer, column (4).
Total Compensation Including Summer is column (8) and is comprised
cf typical salary, column (7), and total fringe benefits including
the value of summer leisure, column (5). This is the figure that is
comparable to estimates of total compensation for private industry.
149

TABLE 4-A
SALARY AND FRINGE BENEFIT VALUES EXCLUDING VALUE OF SUMMER LEISURE
FOR TEACHERS WITH
BACHELOR'S DEGREE 0 ADDITIONAL HOURS AND ZERO YEARS EXPERIENCE
Typical Typical
State Local Steie State Total F.B.
Contri- Contri- State Locally Total Ronk by Total Renk by as T. of
bution to bution to Typical Paid Paid F.B. Total Compen- Total Com- Typical
State Salary Salary Salary F.B. F.B. Value F.B. Value cation pensation Salary
(1) (2) (3) (4) (5) (6) (7) (8) (9) (10)
AL 17.711 -1.915 15.796 3.927 121 4.048 10 19.844 7 25.6
AR 11.6G3 3.549 15.432 4.162 839 4.801 7 20.233 5 31.1
FL 9.601 5.169 14.770 3.556 1.914 5.470 2 20.240 4 37.0
OA 14.329 1.535 15.864 3.664 1.445 5.129 4 20.993 2 32.3
KY 14.170 423 14.593 3.315 663 3.976 11 18.571 11 27.3
LA 12.036 3.431 15.469 4.415 405 4.820 6 20.289 3 31.2
MS 11.475 596 11.975 2.286 688 2.974 12 14.949 12 24.8
NC 15.680 377 16.057 7.011 198 7.209 I 23.266 I 44.9
SC 14.172 664 14.856 4.075 75 4.150 9 19.006 10 27.9
TN 12.130 2.275 14.405 4.141 801 4.942 5 19.347 9 34.3
VA 6.949 7.636 14.785 2.460 2.774 5.234 3 20.019 6 35.4
WV 13.055 1.725 14.780 4.542 236 4.778 8 19.558 0 32.3
REGION 12.766 2.132 14.899 3.965 830 4.794 19.693 32.2
150

IMP MIMI 11111 OM MR
TABLE 4-8
SALARY AND FRINGE BENEFIT VALUES EXCLUDING VALUE OF SUMMER LEISURE
FOR TEACHERS WITH
BACHELOR'S DEGREE + 0 ADDITIONAL HOURS AND TEN YEARS EXPERIENCE
Typical Typical
State Local State State Total F.B.Contri- Contri- State Locally Total Rank by Total Rank by as % ofbution to bution to Typical Paid Paid F.B. Total Compen- Total Com- Typical
State Salary Salary Salary F.B. F.B. Value F.B. Value eation pansation Salary(1) (2) (3) (4) (5) (6) (7) (8) (9) (10)
AL 17.711 1.028 18.739 4.538 129 4.667 11 23.406 ;0 24.9
AR 13.701 4.092 17.793 4.706 703 5.409 a 23.202 11 30.4
FL 12.595 6.782 19.377 4.295 2.312 6.607 2 25.984 4 34.1
GA 17.059 2.640 19.699 4.446 1.856 6.302 4 26.001 3 32.0
KY 17.750 1.023 18.773 4.081 663 4.744 10 23.517 9 25.3
LA 15.283 3.815 19.098 5.704 4115 6.109 5 25.207 5 32.0
MS 14.225 884 15.109 2.872 754 3.626 12 18.735 12 24.0
NC 17.970 940 18.910 9.114 198 9.312 1 28.222 1 49.2
SC 17.998 779 18.777 4.917 75 4.992 9 23.769 a 26.6
TN 13.905 4.313 18.218 5.237 801 6.038 6 24.256 7 33.1
VA 9.272 10.455 19.727 3.086 3.480 6.566 3 26.293 2 33.3
WV 16.848 2.219 19.067 5.772 236 6.008 7 25.075 6 31.5
REGION 15.380 3.248 18.607 4.847 968 5.865 24.472 31.4
151

TABLE 4-C
SALARY AND FRINGE BENEFIT VALUES EXCLUDING VALUE OF SUMMER LEISURE
FOR TEACHERS WITH
BACHELOR'S DEGREE + 18 ADDITIONAL HOURS AND TEN YEARS EXPERIENCE
Typical Typical
State Local State State Total F.B.Contri- Contri- State Locally Total Rank by Total Rank by as X or
bution to bution to Typical Paid Paid F.B. Total Compsn- Total Com- TypicalState Salary Salary Salary F.B. F.B. Value F.B. Value cation pensation Salary
(1) (2) (31 (4) (5) (8) (7) (8) (9) (10)AL 17.711 1.107 18.918 4.55" 128 4.882 11 23.500 10 24.9
AR 13.681 4.148 19.027 4.780 710 5,470 8 23.497 11 30.3
FL 12.595 6,782 19.377 4.295 2.312 8.$07 3 25.984 4 34.1
GA 17.059 2.840 19.899 4.448 1.858 8.302 4 28.001 3 32.0
KY 17.750 1.188 18.938 4.111 883 4.774 10 23.712 9 25.2
LA 15.283 3.815 19.098 5.704 405 8.109 8 25.207 6 32.0
MS 14.225 884 15.109 2.872 754 3.626 12 18.735 12 24.0
NC 17.970 940 18.910 9.114 198 9.312 1 28.222 I 49.2
SC 18.707 796 19.503 5.074 75 5.149 9 24.552 7 26.4
TN 13.905 4.470 18.375 5.282 ' 801 6.083 7 24.458 e 33.1
VA 9.455 10.661 20.116 3.135 3.535 6.670 2 26.786 2 33.2
WV 17.495 2.264 19.759 5.971 236 6.207 5 25.966 5 31.4
REGION 15.503 2.308 18.811 4.943 973 5.918 24.727 31.3
152

TABLE 4-0
SALARY AND FRINGE BENEFIT VALUES EXCLUDING VALUE OF SUMMER LEISURE
FOR TEACHERS WITH
MASTERS IN EDUCATION DEGREE 0 ADDITIONAL HOURS AND TEN YEARS EXPERIENCE
Typi:.i Typical
State Local State State Total F.B.Contri- Contri- State Locally Total Rank by Total Rank by as X ofbutton to button to Typical Paid Paid F.B. Total Compen- Total Com- Typical
State Salary Salary Salary F,B. F.B. Value F.B. Value sation peneation Salary(11 (21 (31 (4) (51 (8) (71 (8) 191 (10)
AL 20.342 972 21.314 5,074 135 5,209 10 26.523 8 24.4
AR 14,446 4.315 18.761 4.931 710 5,841 e 24.402 11 30.1
FL 13,765 7,412 21.177 4,584 2.468 7.052 2 28.229 3 33.3
GA 19.515 2,619 22.134 5.027 2,024 7.051 3 29.185 2 31.9
KY 19.840 979 20.619 4.418 883 5.081 I. 25.700 10 24.6
LA 18.200 3.894 19.894 5.986 405 8.391 7 26.285 9 32.1
MS 15.275 1.050 16.325 3.095 780 3,878 12 20.203 12 24.0
NC 19.830 1,067 20.697 9,924 198 10.122 1 30.819 I 48.9
SC 20.479 841 21.320 5.463 75 5.538 9 26.858 6 28.0
TN 15.190 4.919 20.109 5,781 801 6.582 5 26.601 7 33.0
VA 9,944 11.213 21.157 3,287 3.884 6.951 4 28.108 4 33.0
WV 18.191 2.354 20,545 6.196 238 8,432 6 28.977 5 31.3
REGION 18.885 3,453 20,338 5.312 1,015 8.327 26.685 31.1
153
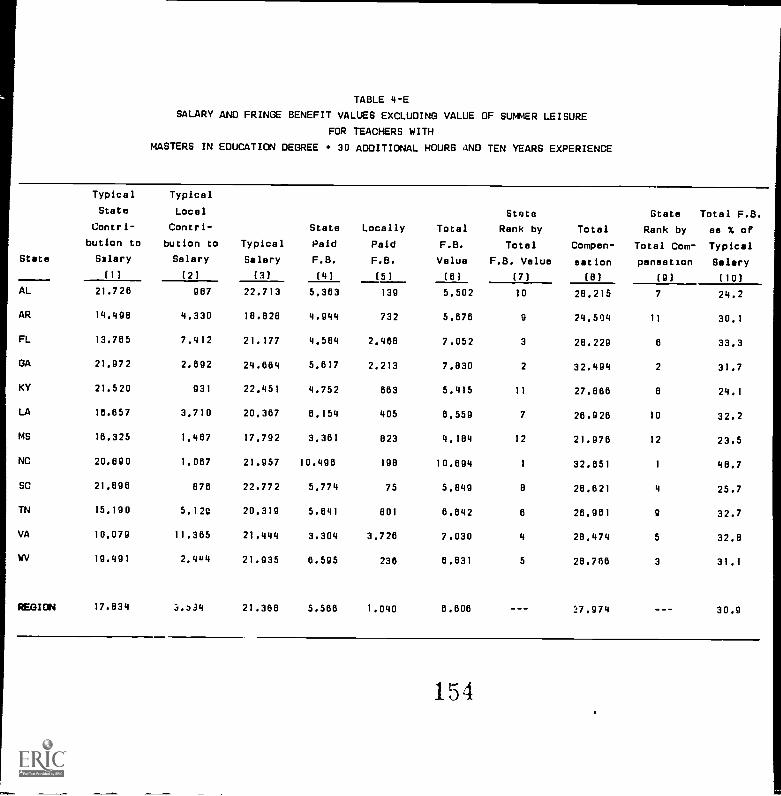
TABLE 4-E
SALARY AND FRINGE BENEFIT VALUES EXCLUDING VALUE OF SUMMER LEISURE
FOR TEACHERS WITH
MASTERS IN EDUCATION DEGREE 30 ADDITIONAL HOURS AND TEN YEARS EXPERIENCE
Typical Typical
State Local State State Total F.B.
Contri- Contri- State Locally Total Rank by Total Rank by as % ofbutton to bution to Typical Paid Paid F.B. Total Compen- Total Com- Typical
State Salary Salary Salary F.B. F.B. Value F.B. Value station pensation Salary(1) (2) (3) (4) (5) (6) (7) (8) (9) (10)
AL 21.726 987 22.713 5.363 139 5.502 10 28.215 7 24.2
AR 14.498 4,330 18.828 4.944 732 5.676 9 24.504 11 30.1
FL 13.765 7.412 21.177 4,584 2.468 7.052 3 28.229 6 33.3
GA 21.972 2.692 24.664 5.617 2.213 7.830 2 32.494 2 31.7
KY 21.520 931 22.451 4.752 663 5.415 11 27.866 8 24.1
LA 16.657 3.710 20.367 6.154 405 6.559 7 26.926 10 32.2
MS 16.325 1.467 17.792 3.361 823 4.184 12 21.976 12 23.5
NC 20.890 1,067 21.957 10.496 198 10.694 1 32.651 1 48.7
SC 21.890 876 22.772 5.774 75 5.849 8 28.621 4 25.7
TN 15.190 5.120 20,319 5.841 801 6.642 6 26.961 g 32.7
VA 10.079 11,365 21.444 3.304 3,726 7.030 4 28.474 5 32.8
WV 19.491 2.444 21.935 6.595 236 6.831 5 28.766 3 31.1
REGION 17.834 5.334 21.388 5.566 1.040 6.606 27.974 30.9
154

TABLE 4-F
SALARY AND FRINGE BENEFIT VALUES EXCLUDING VALUE OF SUMMER LEISURE
FDR TEACHERS WITH
DOCTORAL IN EDUCATION DEGREE AND TEN YEARS EXPERIENCE
Typical Typical
State Local State State Total F.B.Contri- Contri- State Locally Total Rank by Total Rank by as X ofbution to bution to Typical Paid Paid F.B. Total Compen- Total Cum- Typical
State Salary Salary Salary F.B. F.B. Value F.B. Value elation palliation Salary(1) (2) (3) (4) (5) (8) (7) (8) (ill (10)
AL 21.726 1.187 22.913 5.405 139 5.544 10 28.457 8 24.2
AR 14.935 4.481 19.346 5.075 747 5.822 4 25.218 11 30.0
FL 14.946 8.048 22.994 4.875 2.625 7.500 3 30.494 4 32.6
GA 24.428 2.783 27.211 6.209 2.404 8.613 2 35.824 1 31.7
KY 21.520 1.235 22.755 4.808 663 5.471 11 28.228 9 24.0
LA 17.576 3.450 21.028 6.384 405 6.794 7 27.820 10 32.3
MS 17.375 1.700 19.075 4.483 854 5.317 12 24.392 12 28.0
NC 22.180 1.087 23.227 11.072 ige 11.270 1 34.497 2 48.5
SC 24.730 217 24.947 8.253 75 6.328 8 31.275 3 25.3
TN 17.645 5.302 22.047 8.597 801 7.398 4 30.345 5 32.2
VA 10.2'4 11.517 21.731 3.340 3.788 7.108 5 28.837 7 33.0
WV 20.138 2.480 22.827 6.794 238 7.030 6 29.657 6 31.1
REGION 18.449 3.821 22.571 5.040 1.076 7.016 29.587 31.1
155

TABLE 4-0
SALARY AND FRINGE BENEFIT VALUES EXCLUDING VALUE OF SUMMER LEISURE
FOR TEACHERS WITH
BACHELOR DEGREE 18 ADDITIONAL HOURS AND TWENTY YEARS EXPERIENCE
Typical Typical
State Local Stato State Total F.B.Contri- Contri- State Locally Total Rank by Total Rank by as % ofbution to bution to Typical Paid Paid F.B. Total Compen- Total Com- Typical
State Salary Salary Salary F.B. F.B. Value F.B. Value Batton peneation Salary(1) (2) (3) (4) (5) (6) (7) (8) (9) (10)
AL 17.711 1.868 19.579 4.713 130 4.843 11 24.422 11 24.7
AR 14.821 4.427 19.248 5,041 743 5.784 8 25.032 9 30.0
FL 15.285 8.219 23.484 4.954 2.667 7.821 3 31.105 3 32.5
GA 19.106 2.969 22.075 4.966 2.066 7.032 4 28.107 4 31.9
KY 17.750 2.251 20.001 4.305 663 4.968 10 24.869 10 24.8
LA 15.283 5.709 20.992 6,376 405 6.781 5 27.773 6 32.3
MS 15.325 1.075 18.400 3.112 783 3.895 12 20.295 12 23.7
NC 21.530 1.310 22,840 '11.707 198 11.90: 1 34.745 1 52.1
SC 21,428 864 22.292 5.672 75 5.747 9 28.039 5 25.8
TN 14.810 5.251 20.061 5,767 801 6.568 7 28.629 7 32.7
VA 11.149 12.572 23,721 3.592 4.051 7.843 1 01.364 2 32.2
WV 18.646 2.399 21.045 6.340 238 6.578 8 27.621 8 31.2
REGION 13.902 4.076 20.978 5.546 1.0E8 6.614 27.592 31.5
156

vim mow 1111.0 1POIC VIM MOIR 111111 -iernill-111r,INT-INT111111-111
TABLE 4-H
SALARY AND FRINGE BENEFIT VALUES EXCLUDING VALUE OF SUMMER LEISURE
FOR TEACHERS WITH
MASTERS IN EDUCATION DEGREE 4. 0 ADDITIONAL HOURS AND TWENTY YEARS EXPERIENCE
Typical Typical
State Local State State Total F.B.Contri- Contri- State Locally Total Rank by Total Rank by as % of
button to bution to Typical Paid Paid F.B. Total Compen- Total Com- TypicalState Salary Salary Salary F.B. F.B. Value F.B. Value Elation penaation Salary
(I) (2) (3) (4) (5) (8) (7) (8) (9) (10)AL 20.342 1.733 22.075 5.230 137 5.387 10 27.442 9 24.3
AR 15.395 4.599 19.994 5.213 784 5.977 9 25.971 II 29.9
FL 18.435 0.049 24.484 5.243 2.023 0.068 3 32.550 4 32.9
GA 21.972 3.194 25.188 5.889 2.312 7.981 4 33,147 3 31,7
KY 19.640 2.207 21.847 4.842 863 5.305 11 27.152 10 24,3
LA 18.057 5.484 22.141 8,785 405 7.190 5 29.331 7 32,5
MS 17,075 1.317 18.392 3.484 825 4.309 12 22.701 12 23.4
NC 23.880 1.397 25.057 12.774 190 12.972 I 30.029 I 51.0
SC 23.455 915 24.370 8.117 75 8.192 0 30.582 5 25.4
TN 18.105 5.709 21.974 8,029 001 8.030 7 20.804 0 31.0
VA 12.105 13.740 25.925 3.871 4.386 8.237 2 34.182 2 31.8
WV 20.493 2.825 23.118 8.935 238 7.171 8 30.209 6 31.0
REGION 18.625 4.254 22.879 8.000 1.134 7.134 30.012 31.2
1 5 7

TABLE 4-I
SALARY AND FRINGE BENEFIT VALUES EXCLUDING VALUE OF SUMMER LEISURE
FOR TEACHERS WITH
MASTERS IN EDUCATION DEGREE + 30 ADDITIONAL HOURS AND TWENTY YEARS EXPERIENCE
Typical Typical
State Local State State Total F.B.
Contri- Contri- State Locally Total Rank by Total Rank by as % of
bution to bution to Typical PaAd Paid F.B. Total Compen- Total Com- TypicalState Salary Salary Salary F.B. F.B. Value F.B. Value cation pensation Salary
(1) (2) (3) (4) (5) (6) (7) (8) (9) (10)
AL 21.726 1.748 23.474 5.521 141 5.662 11 29.136 10 24.1
AR 15.446 4.614 20.060 5.228 766 5.994 9 26.054 II 29.9
FL 16.435 8.049 24.484 5.243 2.823 8.086 4 32.550 5 32.9
3A 24.838 3.260 28.098 6.356 2.527 8.883 2 38.981 2 31.6
KY 21.520 2.489 24.009 5.036 663 5.699 10 29.708 0 23.7
LA 17,728 5.354 23.082 7.119 405 7.524 8 30.606 7 32.6
MS 18.600 1.842 20.442 3.853 882 4.735 12 25.177 12 23.2
NC 24.920 1.397 26.317 13.382 198 13.580 I 39.897 1 51.6
SC 24.872 949 25.821 8.428 75 6.503 a 32.324 8 25.1
TN 16.185 6.103 22.238 6.409 801 7.210 7 29.498 9 32.3
VA 12.410 13.995 28.405 3.932 4.434 8.366 3 34.771 3 31.7
WV 22.944 2.850 25.794 7.703 23C 7.939 5 33.733 4 30.8
REGION 19.002 4.388 24.190 6.351 1.163 7.F13 31.703 30.0
158

TABLE 4-J
SALARY AND FRINGE BENEFIT VALUES EXCLUDING VALUE OF SUMMER LEISURE
FOR TEACHERS WITH
DOCTORAL DEGREE IN EDUCATION AND TWENTY YEARS EXPERIENCE
Typical Typical
State Local State State Total F.B.Contri- Contri- State Locally Total Rank by Total Rank by as % ofbution to bution to Typical Paid Paid F.B. Total Compen- Total Com- Typical
State Salary Salary Salary F.B. F.B. Value F.B. Value eation pensation Salary(1) (2) (3) (4) (5) (6) (7) (8) (9) (10)
AL 21.726 1.948 23.674 5.563 141 5.704 11 29.378 10 24.0
AR 15,901 4.750 20.651 5.364 782 6.146 9 26.797 12 29.8
FL 17,615 9.485 27.100 5.534 2.880 8.514 3 35.614 4 31.4
GA 27,703 3.357 31.060 7.045 2.740 9.785 2 40.845 2 31.5
KY 21.520 2.957 24.477 5.122 663 5.785 10 30.262 g 23.6
LA 18,471 5.301 23.772 7.364 405 7.769 7 31.541 e 32.7
MS 19.825 2.084 21.909 4.124 916 5.040 12 28.949 11 23.0
NC 26,180 1.387 27.587 13.984 198 14.192 1 41.779 1 51.4
SC 28,698 217 28.915 7.095 75 7.170 8 36.085 3 24.8
TN 18,635 6.600 25.235 7.254 801 8.055 5 33.290 6 31.9
VA 12.635 14.249 28.884 3.993 4.503 8.496 4 35.380 5 31.6
WV 23.591 2.895 26.488 7.901 236 8.137 5 34.623 7 30.7
REGION 21.042 4.603 25.1346 6.687 1.203 7.899 33.546 30.8
159

TABLE 5-A
TOTAL COMPENSATION INCLUDING ESTIMATED VALUES OF SUMMER LEISURE
FOR TEACHERS WITH
BACHELOR'S DEGREE 0 ADDITIONAL HOURS AND ZERO YEARS OF EXPERIENCE
State
Total
F.B.
Without
Summer
Minimum
Value of
Summer
Leisure
Maximum
Value of
Summer
Leisure
Mean
Value of
Summer
Leisure
Total F.B.
Including
Mean Value
of Summer
State
Rank by
Total
with Summer
Typical
Salary
Total
Compensation
Including
Summer
State Total F.B.
Rank by With Summer
Total Comp. as % of
Includ. Summer Typical Salary
(1) (2) (3) (4) (5) (6) (7) (8) (9) (10)
AL 4.048 1.608 3.180 2.394 6.442 9 15.796 22.238 7 40.8
AR 4.801 1.474 2.606 2.040 6.841 7 15.432 22.273 8 44.3
FL 5.470 1.608 2.973 2.291 7.761 2 14.770 22.531 4 52.5
GA 5.129 1.340 2.191 1.766 6.895 6 15.864 22.759 2 43.5
KY 3.978 1.474 2.465 1.970 5.948 10 14.593 20.541 11 40.8
LP 4.820 1.606 3.114 2.361 7.181 5 15.469 22.650 3 46.4
MS 2.974 1.608 2.411 2.010 4.984 12 11.975 16.e59 12 41.6
NC 7.209 1.608 3.232 2.420 9.629 t 16.057 25.886 1 60.0
SC 4.150 1.608 2.991 2.300 6.450 a 14.856 21.306 9 43.4
TN 4.942 1.608 2.900 2.254 7.196 4 14.405 21.801 8 50.0
VA 5.234 1.608 2.976 2.292 7.526 3 14.765 22.311 5 50.9
WV 4.778 1.072 1.200 1.136 5.914 11 14.780 20.694 10 40.0
REGION 4.795 1.519 2.687 2.103 6.897 14.899 21.796 46.3
160161

TABLE 5-8
TOTAL COMPENSATICN INCLUDING ESTIMATED VALUES OF SUMMER LEISURE
FOR TEACHERS WITH
BACHELOR'S DEGREE 0 ADDITIONAL HOURS AND TEN YEARS OF EXPERIENCE
State
Total
F.B.
Without
Summer
Minimum
Value of
Summer
Leisure
Maximum
Value of
Summer
Leisure
Mean
Value of
Summer
Leisure
Total F.B.
Including
Mean Value
of Summer
State
Rank by
Total F.B.
with Summer
Typica'
Salary
Total
Compensation
Including
Summer
State Total F.B.
Rank by With Summer
Total Comp. as X of
Includ. Summer Typical Salary
(1) (2) (3) (4) (5) (6) (7) (8) (9) (10)
AL 4.667 1.608 3.772 2.690 7.357 9 '39 26.096 8 39.3
AR 5.409 1.474 3.005 2.240 7.649 8 25.442 10 43.0
FL 6.607 1.608 :;.901 2.755 9.362 2 )2.377 28.739 3 48.3
OA 6.302 1.340 2.720 2.030 8.332 6 19.69e 28.031 4 42.3
KY 4.744 1.474 3.171 2.323 7.067 11 18.773 25.840 9 37.6
LA 6.109 1.608 3.844 2.726 8.835 4 19.098 27.933 12 46.3
MS 3.626 1.608 3.041 2.325 5.951 12 15.109 21.060 11 3.1.4
NC 9.312 1.808 3.807 2.708 12.020 1 18.910 30.930 1 63.6
SC 4.092 1.608 3.780 2.694 7.686 7 18.777 26.463 6 40.9
TN 6.038 1.608 3.667 2.637 8.676 5 18.218 26.894 5 47.6
VA 6.566 1.608 3.971 2.790 9.356 3 19.727 29.083 2 47.4
WV 6.008 1.072 1.548 1.310 7.318 10 19.067 26.385 7 38.4
REGION 5.865 1.519 3.352 2.436 8.301 18.607 26.908
163162
lD

TABLE 5-C
TOTAL COMPENSAtION INCLUDING ESTIMATED VALUES OF SUMMER LEISURE
FOR TEACHERS WITH
BACHELOR'S DEGREE + 18 ADDITIONAL HOURS AND TEN YEARS OF EXPERIENCE
State
Total
F.B.
Without
Summer
Minimum
Value of
Summer
Leisure
Maximum
Value of
Summar
Leisure
Mean
Value of
Summer
Leisure
Total F.B.
Including
Mean Value
of Summer
State
Rank by
Total F.B.
with Summer
Typical
Salary
Total
Compensation
Including
Summer
State Total F.B.
Rank by With Summer
Total Comp. as X of
Includ. Summer Typical Salary
(1) (2] (3] (4) (5] (6] (7] (8] (9] (10]
AL 4.882 1.608 3.788 2.698 7.380 10 18.818 26.198 10 39.2
AR 5.470 1.474 3.045 2.260 7.730 8 18.027 25.757 8 42.9
FL 6.607 1.608 3.901 2.755 9.362 3 19.377 28.739 3 48.3
GA 6.302 1.340 2.720 2.030 8.332 8 19.699 28.031 4 42.3
KY 4.774 1.474 3.187 2.331 7.105 11 18.938 26.043 II 37.7
LA 6.109 1.608 3.844 2.726 8.835 4 19.098 27.933 5 46.3
MS 3.826 1.608 3.041 2.325 5.951 12 15.109 21.060 12 39.4
NC 9.312 1.608 3.807 2.708 12.020 I 18.910 30.930 I Fi3.6
SC 5.149 1.608 3.926 2.767 7.918 7 19.503 27.419 7 40.6
TN 6.083 1.608 3.699 2.654 8.737 5 18.375 27.112 9 47.5
VA 6.670 1.608 4.089 2.839 9.509 2 20.116 29.725 2 47.3
WV 6.207 1.072 1.604 1.338 7.545 9 19.759 27.304 8 38.2
REGION 5.918 1.519 3.386 2.452 8.369 18.811 27.188 44.3
164O
165

TABLE 5-D
TOTAL COMPENSATION INCLUDING ESTIMATED VALUES OF SUMMER LEISURE
FOR TEACHERS WITH
MASTERS IN EDUCATION DEGREE 0 ADOITIONAL HOURS AND TEN YEARS OF EXPERIENCE
State
Total
F.B.
Without
Summer
Minimum
Value of
Summer
Leisure
Maximum
Value of
Summer
Leisure
Mean
Value of
Summer
Leisure
Total F.B.
Including
Mean Value
of Summer
State
Rank by
Total F.9.
wit's Summer
Typical
Salary
Total
Compensation
Including
Summer
State Total F.B.
Rank by With Summer
Total Comp. as 'X of
Includ. Summer Typical Salary(1) (2) (3) (4) (5) (6) (7) (8) (9) (10)
AL 5.209 1.606 4.291 2.950 6.159 8 21.314 29.473 7 38.3
AR 5,641 1.474 3.169 2.322 7.963 9 16.761 26.724 11 42.4
FL 7.052 1.808 4.263 2.936 9.988 2 21.177 31.165 3 47.2
GA 7.051 1.340 3.057 2.199 9.250 5 22.134 31.364 2 41.8
KY 5.081 1.474 3.483 2.479 7.560 11 20.619 26.179 10 36.7
LA 6.391 1.608 4.005 2.807 9.198 6 19.894 29.092 8 46.2
MS 3.878 1.608 3.286 2.447 6.325 12 16.325 22.650 12 38.7
NC 10.122 1.608 4.166 2.867 13.009 1 20.697 33.706 1 62.9
SC 5.536 1.608 4.292 2.950 8.488 7 21.320 29.806 5 39.8
TN 6.582 1.606 4.048 2.826 0.410 4 20.109 29.519 6 46.8
VA 6.951 1.608 4.259 2.934 9.885 3 21.157 31.042 4 46.7
WV 6.432 1.072 1.668 1.370 7.802 10 20.545 28.347 9 38.0
REGION 6.327 1.519 3.666 2.592 6.92P 20.338 29.257 43.8
166 167
V1

TABLE 5-E
TOTAL COMPENSATION INCLUDING ESTIMATED VALUES OF SUMMER LEISURE
FOR TEACHERS WITH
MASTERS IN EDUCATION DEGREE + 30 ADDITIONAL HOURS AND TEN YEARS OF EXPERIENCE
State
Total
F.B.
Without
Summer
Minimum
Value of
Summer
Leisure
Maximum
Value of
Summer
Leisure
Mean
Value of
Summer
Leisure
Total F.B.
Including
Mean Value
of Summer
State
Rank by
Total F.B.
with Summer
Typical
Salary
Total
Compensation
Including
Summer
State Total F.B.
Rank by With Summer
Total Comp. as % of
Includ. Summer Typical Salary
(1) (2) (3) (4) (5) (6) (7) (8) (9) (10)
AL 5.502 1.608 4.572 3.090 8.592 8 22.713 31.305 5 37.8
AR 5.876 1.474 3.180 2.327 8.003 11 18.828 26.831 11 42.5
FL 7.052 1.608 4.263 2.936 9.988 4 21.177 31.165 6 47.2
GA 7.830 1.340 3.406 2.373 10.203 2 24.664 34.867 2 41.4
KY 5.415 1.474 3.792 2.833 8.048 10 22.451 30.499 7 35.9
LA 6.559 1.608 4.100 2.854 9.413 6 20.367 29.780 10 46.2
MS 4.184 1.608 3.582 2.595 6.779 12 17.792 24.571 12 38.1
NC 10.694 1.608 4.420 3.014 13.708 1 21.957 35.685 1 62.4
SC 5.849 1.608 4.584 3.098 8.945 7 22.772 31.717 3 39.3
TN 6.842 1.808 4.090 2.849 9.491 5 20.319 29.810 9 46.7
VA 7.030 1.608 4.317 2.963 9.993 3 21.444 31.437 4 46.6
WV 6.831 1.072 1.781 1.427 8.258 9 21.935 30.193 8 37.6
REGION 8.806 1.519 3.841 2.800 9.285 21.368 30.654 43.5
I169
NWOMM UMMON OmWhdo mow,. ommum m.

TABLE 5-F
TOTAL COMPENSATION INCLUDING ESTIMATED VALUES OF SUMMER LEISURE
FOR TEACHERS WITH
DOCTORAL DEGREE AND TEN YEARS OF EXPERIENCE
State
Total
F.B.
Without
Summer
Minimum
Value of
Summer
Leisure
Maximum
Value of
Summer
Leisure
Mean
Value of
Summer
Leisure
Total F.B.
Including
Mean Value
of Summer
State
Rank by
Total F.B.
with Summer
Typical
Salary
Total
Compensation
Including
Summer
State Total F.B.
Rank by With Summer
Total Comp. as X of
Includ. Summer Typical Salary(I) (2) (3) (4) (5) (8) (7) (8) (9) (10)
AL 5.544 1.608 4.612 3.110 8.654 8 22.913 31.567 7 37.8
AR 5.822 1.474 3.276 2.375 8.197 10 19.396 27.593 11 42.3
FL 7.500 1.608 4.629 3.119 10.619 3 22.994 33.613 4 46.2
GA 8.613 1.340 3.758 2.549 11.162 2 27.211 38.373 I 41.0
KY 5.471 1.474 3,843 2.659 8.130 11 22.755 30.889 9 35.7
LA 6.794 1.808 4.233 2.921 9.715 6 21.028 30.741 10 46.2
MS 5.317 1.608 3.840 2.724 8.041 12 19.075 27.116 12 42.2
NC 11.270 1.608 4.676 3.142 14.412 1 23.227 37.839 2 62.0
SC 6.328 1.608 5.022 3.315 9.643 7 24.947 34.590 3 38.7
TN 7.398 1.608 4.619 3.114 10.512 4 22.947 33.459 5 45.8
VA 7.106 1.608 4.374 2.991 10.097 5 21.791 31.828 6 46.5
WV 7.030 1.072 1.837 1.455 8.485 9 22.827 31.112 8 37.5
nEGION 7.016 1.519 4.060 2.789 9.806 22.571 32.377 43.5
1'70 171
vi

TABLE 5-0
TOTAL COMPENSATION INCLUDING ESTIMATED VALUES OF SUMMER LEISURE
FOR TEACHERS WITH
BACHELOR'S DEGREE 18 ADDITIONAL HOURS AND TWENTY YEARS OF EXPERIENCE
State
Total
F.B.
Without
Summer
Minimum
Value of
Sumer
Leisure
Maximum
Value of
Summer
Leisure
Mean
Value of
Summer
Leisure
Total F.B.
Including
Mean Value
of Summer
State
Rank by
Total P.B.
with Summer
Typical
Salary
Total
Compensation
Including
Summer
State Total F.B.
Rank by With Summer
Total Comp. as X of
Includ. Summer Typical Salary
(1) (2) (3) (4) (5) (6) (7) (8) (9) (10)
AL 4.843 1.608 3.941 2.775 7.618 10 19,579 27.197 11 38.9
AR 5.784 1.474 3.251 2.363 8.147 8 19.248 27.395 9.5 42.3
FL 7.621 1.608 4.727 3.168 10.789 3 23.1:84 34.273 3 45.9
GA 7.032 1.340 3,049 2.195 9.227 6 22.075 31.302 4 41.0
KY 4.968 1.474 3.378 2.46 7.394 11 20.001 27.3g5 9.5 37.0
LA 6.781 1.608 4.220 2.917 9.098 4 20.992 30.890 6 46.2
MS 3.895 1.608 3.301 2.451.* 6.350 12 16.400 22.750 12 38.7
NC 11.905 1.608 4.598 3.103 15.008 I 22.840 37.848 I 65.7
SC 5.747 1.608 4.487 3.048 8.795 7 22.292 31.087 5 39.5
TN 0.568 1.608 4,038 2.823 9.391 5 20.061 29.452 7 46.8
VA 7.643 1.608 4.775 3.192 10.835 2 23.721 34.556 2 45.7
WV 6.576 1.072 1.709 1.391 7.987 9 21.045 29.012 8 37.9
REGION 6.614 1.519 3.760 2.654 9.268 20.978 30.247 44.2
172173

TABLE 5-H
TOTAL COMPENSATION INCLUDING ESTIMATED VALUES OF SUMMER LEISURE
FOR TEACHERS WITH
MASTERS DEGREE + 0 ADDITIONAL HOURS AND TWENTY YEARS OF EXPERIENCE
State
Total
F.B.
Without
Summer
Minimum
Value oF
Summer
Leisure
Maximum
Value oF
Summer
Leisure
Mean
Value of
Summer
Leisure
Total F.B.
Including
Mean Value
of Summer
State
Rank by
Total F.B.
with Summer
Typical
Salary
Total
Compensation
Including
Summer
State Total F.B.
Rank by With Summer
Total Comp. es X of'
Includ. Summer Typical Salary
i1) (2) (3) (4) (5) (8) (7) (8) (9) (10)
AL 5.367 1.608 4.444 3.026 8.383 10 22.075 30.468 9 38.0
AR 5.977 1.474 3.377 2.426 8.403 g 19.804 28.397 11 42.0
FL 8.066 1.608 4.928 3.269 11.335 3 24.484 35.819 3 46.3
GA 7.981 1.340 3.475 2.408 10.388 4 25.106 35.555 4 40.0
KY 5.305 1.474 3.680 2.582 7.887 11 21.847 28.734 10 36.1
LA 7.190 1.608 4.457 3.033 10.223 5 22.141 32.364 6 46.0
MS 4.308 1.608 3.702 2.655 6.864 12 18.392 25 356 12 38.0
NC 12.972 1.608 5.038 3.323 16.285 1 25.057 41.352 1 65.0
SC 6.192 1.608 4.906 3.257 9.440 7 24.370 33.819 5 38.0
TN 6.830 1.608 4.423 3.016 9.846 6 21.974 31.820 7 45.0
VA 8.237 1.608 5.218 3.414 11.651 2 25.925 37.576 2 45.0
WV 7.171 1.072 1.877 1.475 0.646 8 23.118 31.764 8 37.0
REGION 7.134 1.519 4.128 2.823 9.957 22.879 32.833 43.3
175 fz''
174

TABLE 5-I
TOTAL COMPENSATION INCLUDING ESTIMATED VALUES OF SUMMER LEISURE
FOR TEACHERS WITH
MASTERS DEGREE 30 ADDITIONAL HOURS AND TWENTY YEARS OF EXPERIENCE
State
Total
F.B.
Without
Summer
Minimum
Value of
Summer
Leisure
Maximum
Value of
Summer
Leisure
Mean
value of
Summer
Leisure
Total F.B.
Including
Mean Value
of Summer
State
Rank by
Total F.B.
with Summer
Typical
Salary
Total
Compensation
Including
Summer
State Total F.B.
Rank by With Summer
Total Comp. as % of
Includ. Summer Typical Salary
(1) (2) (3) (4) (5) (8) (7) (8) (9) (10)
AL 5.882 1.808 4.725 3.187 8,829 9 23.474 32.303 10 37.8
AR 5.994 1.474 3.388 2.431 8.425 11 20.060 28.485 11 42.0
FL 8.088 1.808 4.929 3,289 11.335 4 24.484 35.819 4 48.3
GA 8.883 1.340 3.880 2.610 11,493 3 28.098 39.591 2 40.9
KY 5.899 1.474 4.055 2.785 8.484 10 24.009 32.473 g 35.3
LA 7.524 1.808 4.848 3.127 10.851 5 23.082 33.733 7 48.1
MS 4.735 1.808 4.115 2.862 7.597 12 20.442 26.039 12 37.2
NC 13.580 1.808 5.298 3,453 17.033 1 28.317 43.350 1 84.7
SC 8.503 1.608 5.19d 3.403 9.908 7 25.821 35.727 5 38.4
TN 7.210 1.808 4,487 3.048 10.258 6 22.288 32.548 0 48.0
VA 8,388 1.808 5.315 3.482 11.828 2 26.405 38.233 3 44.8
WV 7.939 1.072 2.994 1,583 9.522 8 25.794 35.318 8 38.9
REGION 7.513 1.519 4.344 2.932 10.445 24.190 34.835 43.0
17617 '/

TABLE 5-J
TOTAL COMPENSATION INCLUDING ESTIMATED VALUES OF SUMMER LEISURE
FOR TEACHERS WITH
DOCTORAL DEGREE AND TWENTY YEARS OF EXPERIENCE
State
Total
F.B.
Without
Summer
Minimum
Value of
Summer
Leisure
Maximum
Value of
Summer
Leisure
Mean
Value of
Summer
Leisure
Total F.B.
Including
Mean Value
of Summer
Q.s.p
Rank by
Total F.B.
with Summe.
Typical
Salary
Total
Compensation
Including
Summer
State Total F.B.
Rank by With Summer
Total Comp. as X of
Includ. Summer Typical Salary(1) (2) (3) (4) (5) (6) (7) (8) (9) (10)
AL 5.704 1.608 4.766 3.187 8.891 9 23.874 32.585 10 37,6
AR 8.146 1.474 3.488 2.481 8.627 10 20.651 29.278 12 41.8
FL 8.514 1.606 5.455 3.532 12.045 3 27.100 39.148 4 44.4
GA 9.765 1.340 4.289 2.815 12.600 2 31.060 43.660 2 40.6
KY 5.785 1.474 4.134 2.804 8.589 11 24.477 33.086 9 35.1
LA 7.769 1.608 4.785 3.197 10.966 3 23.773 34.738 8 46.1
MS 5.040 1.608 4.410 3.009 8.049 12 21.909 29.958 11 36.7
NC 14.192 1.600 5.553 3.581 17.773 1 27.587 45.380 1 64.4
SC 7.170 1.608 5.821 3.715 10.885 7 28.915 39.800 3 37.8
TN e.055 1.808 5.080 3.344 11.399 5 25.235 36.634 6 45.1
,IA 8.496 1.608 5.412 3.510 12.006 4 26.884 38.890 5 44.7
WV 8.137 1.072 2.151 1.612 9.749 8 26.486 36.235 7 36.8
REGION 7.899 1.519 4.612 3.066 10.965 25.846 36.611 42.6
179
8

TABLE 6MEAN VALUES FOR TOTAL COMPENSATION, FRINGE BENEFITS AND TYPICAL SALARIES
ACROSS ALL EDUCATIONAL AND EXPERIENCE LEVELS BY STATEAND FOR THE SOUTHEASTERN REGION, 1984-85
ALABAMA ARKANSAS
Elements of Teacher Compensation
Mean ofAll Ed/Exp
Levels
(1)
Percent of Percent ofTotal Typical
Compensation Salary(2) (3)
Mean ofAll Ed/Exp
Levels
(1)
Percent ofTotal
Compensation(2)
Percent ofTypical
Salary
(3)
Total Compensation including Summer $28,942 100% 138% $26,818 100% 143%
Total F.B. Including Summer 8,032 28 38 7,999 30 43
Mean Value of Summer 2,909 10 14 2,327 9 12
State Paid F.B. 4,989 17 23 4,942 18 26
Locally Paid F.B. 134 1 1 730 3 5
Typical Salary 20,910 72 100 18,819 70 100
State Contribution toSalary 19,843 68 95 14,451 54 77
Local Contribution toSalary 1,067 4 5 4,328 16 23
1 S 0

TABLE 6 (Continued)MEAN VALUES FUR TOTAL COMPENSATION, FRINGE BENEFITS AND TYPICAL SALARIES
ACROSS ALL EDUCATIONAL AND EXPERIENCE LEVELS BY STATEAND FOR THE SOUTHEASTERN REGION, 1984-85
Elements of Teacher Compensation
FLORIDA GEORGIAMean of Percent of Percent of
Total TypicalCompensation Salary
All Ed/ExpLevels
Mean ofAll Ed/Exp
Levels
Percent of Percent ofTotal Typical
SalaryCompensation(1) (2) (3) (1) (2) (3)
Total Compensation Including Summer $32,100 l00% 147% $33,355 100% 1421
Total F.B. Including Summer 10,258 32 47 9,788 29 42
Mean Value of Summer 3,003 9 14 2,298 7 10
State Paid F.B. 4,716 15 21 5,347 16 23
Locally Paid F.B. 2,539 8 12 2,143 6 9
Typical Salary 21,842 68 100 23,567 71 100
State Contribution toSalary 14,302 45 65 20,798 62 88
Local Contribution toSalary 7,540 23 35 2,769 9 12
182 183

TABLE 6 (Continued)MEAN VALUES FOR TOTAL COMPENSATION, FRINGE BENEFITS AND TYPICAL SALARIES
ACROSS ALL EDUCATIONAL AND EXPERIENCE LEVELS BY STATEAND FOR THE SOUTHEASTERN REGION, 1984-85
KENTUCKY LOUISIANA
Elements of Teacher Compensation
Mean ofAll Ed/Exp
Levels
(1)
Percent of Percent ofTotal Typical
Compensation Salary(2) (3)
Mean ofAll Ed/Exp
Levels
(1)
Percent ofTotal
Compensation(2)
Percent ofTypicalSalary
(3)
Total Compensation Including Summer $28,465 100% 137% $29,966 100% 146%
Total F.B. Including Summer 7,619 27 37 9,472 32 46
Mean Value of Summer 2,457 9 12 2,867 10 14
State Paid F.B. 4,459 15 21 6,200 21 30
Locally Paid F.B. 663 3 4 405 2
Typical Saiary 20,846 73 100 20,494 68 100
State Contribution toSalary 19,278 68 92 16,118 54 79
Local Contribution toSalary 1,568 5 8 4,376 14 21
18418
0

TABLE 6 (Continued)MEAN VALUES FOR TOTAL COMPENSATION, FRINGE BENEFITS AND TYPICAL SALARIES
ACROSS ALL EDUCATIONAL AND EXPERIENCE LEVELS BY STATEAND FOR THE SOUTHEASTERN REGION, 1984-85
MISSISSIPPI NORTH CAROLINA
Elements of Teacher Compensation
Mean ofAll Ed/Exp
Levels
(1)
Percent ofTotal
Compensation(2)
Percent ofTypicalSalary
(3)
Mean ofAll Ed/Exp
Levels(1)
P-s!rcent of
Total
Compensation(2)
Percent ofTypicalSalary
(3)
Total Compensation Including Summer $23,952 100% 139% $36,247 100% 164%
Total F.B. Including Summer 6,699 28 39 14,091 39 64
Mean Value of Summer 2,541 11 15 3,034 8 14
State Paid F.B. 3,352 14 19 10,859 30 49
Locally Paid F.B. 806 3 5 198 1 1
Typical Salary 17,253 72 100 22,156 61 100
State Contribution toSalary 15,973 67 93 21,061 58 95
Local Contribution toSalary 1,280 5 7 1,095 3 5
186 187

TABLE 6 (Continued)MEAN VALUES FOR TOTAL COMPENSATION, FRINGE BENEFITS AND TYPICAL SALARIES
ACROSS ALL EDUCATIONAL AND EXPERIENCE LEVELS BY STATEAND FOR THE SOUTHEASTERN REGION, 1984-85
SOUTH CAROLINA TENNESSEE
Elements of Teacher Compensation
Mean ofAll Ed/Exp
Levels
(1)
Percent of
TotalCompensation
(2)
Percent ofTypical
Salary
(3)
Mean ofAll Ed/Exp
Levels
(1)
Percent of
Total
Compensation(2)
Percent ofTypical
Salary
(3)
Total Compensation Including Summer $31,173 100% 139% $29,885 100% 147%
Total F.B. Including Summer 8,816 28 39 9,492 32 47
Mean Value of Summer 3,055 10 14 2,857 10 14
State Paid F.B. 5,686 18 25 5,834 19 29
Locally Paid F.B. 75 0 0 801 3 4
Typical Salary 22,357 72 100 20,393 68 i00
State Contribution toSalary 21,644 70 97 15,378 51 75
Local Contribution toSalary 713 2 3 5,015 17 25
188189

TABLE 6 (Continued)MEAN VALUES FOR TOTAL COMPENSATION, FRINGE BENEFITS AND TYPICAL SALARIES
ACROSS ALL EDUCATIONAL AND EXPERIENCE LEVELS BY STATEAND FOR THE SOUTHEASTERN REGION, 1984-85
VIRGINIA WEST VIRGINIA
Elements of Teacher Compensation
Mean ofAll Ed/Exp
Levels
(1)
Percent ofTotal
Compensation(2)
Percent ofTypicalSalary
(3)
Mean ofAll Ed/Exp
Levels
(1)
Percent ofTotal
Compensation(2)
Percent ofTypicalSalary
(3)
Total Compensation Including Summer $32,458 100% 146% $29,637 100% 138%
Total F.B. Including Summer 10,268 32 46 8,121 27 38
Mean Value of Summer 3,039 9 14 1,410
State Paid F.B. 3,398 11 15 6,475 22 30
Locally Paid F.B. 3,831 12 17 236 1 1
Typical Salary 22,190 68 100 21,516 73 ioo
State Contribution toSalary 10,429 32 47 19,089 64 89
Local Contribution toSalary 11,761 36 53 2,427 9 11
191
190

TABLE 6 (Continued)MEAN VALUES FOR TOTAL COMPENSATION, FRINGE BENEFITS AND TYPICAL SALARIES
ACROSS ALL EDUCATIONALAND FOR
Elements of Teacher Compensation
AND EXPERIENCE LEVELS BY STATETHE SOUTHEASTERN REGION, 1984-85
SOUTHEASTERN REGION
MeanAll Ed/Exp
Levels
(1)
Percent ofTotal
Compensation(2)
Percent ofTypicalSalary
(3)
Total Compensation Including Summer $30,250 100% 144%
Total F.B. Including Summer 9,221 30 44
Mean Value of Summer 2,653 9 13
State Paid F.B. 5,521 18 26
Local:y Paid F.B. 1,047 3 5
Typical Salary 21,029 70 100
State Contribution toSalary 17,367 58 83
Local Contribution toSalary 3,662 12 17
192
11.1.011 M1E111E163E1 illb*Ims

165
Highlights from Tables of Fringe Benefits and Salaries
Tables 4-A through 4-J contain salary and fringe benefit valuations
for 1984-85 by state for each of ten teacher education/experience cate-
gories, excluding any ialue for summer leisure. The typical salary
received by beginning teachers in the local districts surveyed ranges
from a low of $11,975 in Mississippi to $16,057 in North Carolina,
averaging $14,899 for the southeastern region. At the other end of
the education/experience spectrum, teachers with a doctoral degree
and twenty years of experience receive a low of $21,909 in Mississippi
(83 percent more than the beginning teacher) and a high of $31,060
in Georgia (96 percent more than the beginning teacher in that state).
For the region, this most experienced teacher category averaged $25,646
or 72 percent more than the beginning teacher in the region.
The above suggests that teacher experience and educational level
significantly affect total salary. Table 4-B shows that teachers with
ten years of experience, but no more educational attainment than begin-
ning teachers, earn an average of $18,067 in the region or 25% more
for the extra ten years experience. Another comparison regarding exper-
ience is the 12 percent larger salary earned by teachers in the region
with twenty years experience relative to those with ten years, and
both having master's degrees (from Table 4-H, $22,879, and Table 4-D,
$20,338, respectively). The relative value of years of experience
increases much more slowly as higher levels of experience are reached.
Educational attainment raises salaries less rapidly than experience.
Teachers with ten years of experience and a bachelor's degree average
$18,607 in the region (Table 4-B). With a master's degree and still
193

166
ten years of experience, salary only rises to $20,338 (Table 4-0),
a 9 percent increase. Still with ten years experience, salary rises
to $22,571 with a doctoral degree (Table 4-F), an 11 percent increase
over the master's or 21 percent more than the bachelor's degree. The
results are similar for the range of education levels of teachers while
holding experience constant at twenty years: salary rises at a decreasing
rate and less rapidly than for increases in years of experience.
What is clear from the above is that classroom teachers typically
gain greater salary increases each year than is apparent in the news-
papers when yearly cost of living increases, whether automatic or appro-
priated each year, are considered along with available step increases
that include both additional experience and educational attainment.
While the annual overall salary increase for teachers is not overwhelm-
ingly large, and part of the increase must be earned by teachers through
extra learning effort off the job, the potential annual rate of increase
is important to keep in mind. For example, it is quite normal for
teachers to begin teaching with bachelor's degrees and to receive
master's degrees within the first ten years. (Some states require
a master's degree within that time frame to retain certification.)
For 1984-85, the difference in salary for the beginning teacher in
the region and one with ten years e:sperience and a master's degree
is $5,439, moving from $14,899 to $20,338. This is a compound annual
rate of growth of 3.2 percent. When coupled with annual appropriated
schedule increases that might average about 4.0 percent per year, the
average annual salary increase for teachers in their first ten years
in the Southeast is likely to be in the neighborhood of 7.2 percent.

I
I
I
1
I
I
I
I
I
167
It is interesting to note, however, that of that $5,439 typical
salary difference, the lion's share, or $3,708, is for the extra ten
years of experience (see Table 4-B) while the remaining $1,731 is for
the master's degree. This corroborates the point made above that exper-
ience tends to count much more than educational attainment.
Fringe benefits for beginning teachers (Table 4-A), excluding
the value of summer leisL:re, range from $2,974 to $7,209 and average
$4,794 for the region. As a percent of typical salary, these benefits
range from 24.8 percent to 44.9 percent and average 32.2 percent for
the twelve states examined. The figures for teachers with doctoral
degrees and twenty years of experience are higher in dollar terms,
but are much the same as a percent of salary. The range is from $5,040
to $14,192 with an average of $7,899 (Table 4-J). As a percent of
typical salary, the corresponding range is from 23.0 percent to 51.4
percent, averaging 30.8 percent.
It is worth noting here that North Carolina is at the top of the
scale in all fringe benefit measures. Excluding that state, fringe
benefits range from about 23 to 32 percent. North Carolina's fringe
benefits are much higher in value than those in other southeastern
states primarily because of two extra benefits, longevity pay and vaca-
tions. Vacations for regular teachers range from 10 da/s (with less
than two years of service) to 21.5 days (with twenty or more years
of service). Teachers in North Caroline also receive an annual longevity
payment based on years of service: from 1.5% of salary with 10 to 15
years of service up to 4.5% of salary with 25 or more years of service.

168
The mean value of summer leisure as calculated and reported in
Tables 5-A through 5-J averages $2,103 for beginning teachers in the
region and $3,066 for the top category of teachers. When this benefit
is added to other "normal" benefit values, the benefit package for
teachers is especially attractive. Total benefits for beginning teachers
as a percent of typical salary then range from 40.8 percent in Kentucky
to 60.0 percent in North Carolina, with a regional average of 46.3
percent.
At the end of Table 6, the mean values for typical salary, fringe
benefits, and total compensation are given for the southeastern region
for the mean of all teacher education/experience categories. The average
typical salary for 1984-85 is $21,029 for teachers in the region, and
the average value of non-summer fringe benefits is $6,568 which is
31 percent of salary. The mean value of summer leisure is another
$2,653 or 13 percent of total salary. Thus, total fringe benefits
on average in the region are valued at $9,221 or 44% of typical salary.
Teacher Fringe Benefits Compared to Other Industries
The latest hard data available on fringe benefits offered in other
industries is that contained in the latest report of an annual benefits
survey conducted by the U.S. Chamber of Commerce entitled Employee
Benefits 1983, published in late 1984. As reported in that survey
[U.S. Chamber of Commerce, 1984, p. 30], about $550 billion was spent
on fringe benefits in all industries in the U.S. for 1983. Benefits,
which are equal to more than one-third (36.6 percent in 1983) of payroll
dollars, are growing faster than either wages or inflation. For the
196
1
I
I
I

169
period 1973 to 1983, benefits rose 189 percent while wages rose 140
percent and prices 124 percent. Over that period, the annual compound
rate of growth in fringe benefits was a phenomenal 11.7 percent.
Table 7 below reports the dollar value of fringe benefits per
taployee for the nation by industry group for 1983 in column (1).
Column (2) shows these benefits as a percent of payroll or salary,
and column (3) reports these percentages for firms located in the
southeastern region. At the bottom of the table, our figures for
teachers in the Southeast for 1984-85 are shown for comparison.
The comparative results are mixed. The value of fringe benefits
given teachers in the Southeast, excluding the value of summer leisure,
is $6,568 which compares unfavorably with the national average of $7,582
for all industries. This is especially true considering the fact that
the industry data is for 1983 while our data is for the 1984-85 academic
year. This lag of at least one year in the industry data would make
the figure for 1984 be about $8,264, assuming a conservative growth
rate of 9 percent. On the other hand, the dollar figures are biased
in favor of teachers because the industry data is for a full year.
Taking three-quarters of the adjusted industry figure for 1984, we
would have a crudely comparable total fringe benefit amount for all
industries nationally on a nine-month basis of about $6,198, which
is less than what teachers receive in the Southeast with the value
of summer leisure excluded.
If we compare the full year figure for teaching, i.e., including
the mean value of summer leisure, of $9,221 with the full year figure
for all industries adjusted to 1984, $8,264, we find that teachers
197

170
TABLE 7
Fringe Benefits by Industry Type for 1983 and for Teachersin the Southeastern Region for 1984-85
Industry
Group
Annual FringeBenefits Per
EmployeeNationally
1983
(1)
Fringe SoutheasternBenefits Region's
as Percent of Fringe BenefitPayroll or as Percent ofSalary, Payroll or1983 Salary, 1983(2) (3)
Mean for All Industries $ 7,582 36.6% 33.9%Mean for Manufacturing 6,110 38.7 33.4
Food/Beverage/Tobacco 7,083 36.7 29.6Textiles 3,968 30.5 27.8Pulp/Paper/Lumber/Furniture 6,656 33.3 26.5Printing/Publishing 8,21b 37.6 33.3Chemicals 9,198 40.0 35.2Petroleum 12,122 40.7 36.4Rubber/Leather/Plastics 6,979 36.2 33.9Stone/Clay/Glass 8,112 37.9 NAPrimary Metals 10,422 47.1 38.4Fabricated Metal Products 7,776 39.8 34.2Machinery 9,296 40.4 38.4Electrical Machinery 7,406 36.6 30.0Transportation Equipment 9,794 40.9 36.4Instruments 7,457 37.4 34.8
Mean for Nonmanufacturing 7,163 34.9 34.3Public Utilities 10,142 40.0 39.0Department Stcres 3,721 31.8 25.9Wholesale/Retail Trade 4,956 29.0 28.2Banking/Finance 6,277 35.6 35.2Insurance 6,833 35.8 35.3Hospitals 5,728 31.8 29.9
Miscellaneous/Gov't/Education 7,511 32.8 30.7Mean for Southeastern Teachers
Without Summer, 1984-85 6,568 31.2 31.2Mean for Southeastern Teachers
With Summer, 1984-85 9,221 43.8 43.8

171
are typically still ahead of the average for all industries with respect
to the value of their fringe benefits.
On a percent of salary basis, teachers in the Southeast fare less
well. While fringe benefits nationally in all industries amounted
to 36.6 percent of payroll in 1983, benefits for teachers in the South-
east more than a year later amount to 31.2 percent of salary when the
value of summer leisure is excluded. However, this figure for teachers
in the Southeast rises to 43.8 percent when the estimated mean value
of summers is added, an amount that compares more than favorably with
other industries.
When compared to firms located in the Southeast where fringe bene-
fits are slightly less, or about 33.9 percent of payroll, either
comparable figure for teachers (31.2 percent without summer as a benefit
and 43.8 percent with summer leisure included) seems respectable at
worst and quite advantageous at bes,..
Average data for the nation or the Southeast may be somewhat mis-
leading. Though teachers' fringe benefits with summer leisure included
exceed, as a percent of salary, the comparable percentages given for
every industry groupino in Table 7, nationally as well as just for
firms in the Southeast, this is not the case when summer leisure is
i
ignored. In this case, fringe-benefits-to-pay percentages exceed those
for workers in only these industry groups: food/beverage/tobacco,
textiles, pulp/paper/furniture, electrical machinery, department store,
wholesale/retail trade, and hospital industries in the Southeast.
On the other hand, teachers' benefits (without summer) as a percent
of salary fall short of those for workers in the Southeast in all the
199

172
other industry groups, including printing/publishing, public utilities,
banking/finance, and insurance.
These averages also conceal important information within the region
regarding teacher benefits. Fringe benefits for teachers in particular
states vary significantly and some care should be taken when generalizing
across all states in the region. It is still true, however, that in
no state, when the value of summer leisure is included, does the fringe-
benefits-to-salary percentage for teachers fall short of the same figure
for either all industries nationally or the southeastern region.

173
V. CONCLUSION
This research has focused primarily on the fringe benefit element
of total compensation for teachers in the Southeast in order to develop
a more complete understanding of the teacher compensation picture.
This understanding Rill be necessary if school system administrators
are to meet their goals of (1) retaining quality teachers already in
the system, (2) upgrading the skills of less-qualified teachers in
the system, or available to it and (3) increasing the pool of highly
qualified new teachers. Increasing the supply of desirable teachers
will require increased compensation in the form of salary and/or fringe
benefits.
The fringe benefit element is a candidate for upgrading because
our tax laws do not include benefits in taxable income making them
the better bargain for employees and employers relative to salary in-
creases. Compared to a given salary gain, employees can receive through
appropriate fringe benefits the equivalent of more disposable income
for the same cost to the employer, or, from the employer's viewpoint,
the same equivalent amount of disposable income can be given through
fringe benefits for a lower total cost. Even though fringe benefits
for teachers compare favorably with those available on average in private
industry, it is critical that state and local governments use their
limited resources to upgrade teacher pay packages at least partly through
the fringe benefit element. This is important for two reasons. School
systems for a given cost can get more final equivalent income (utility)
into teachers' hands through fringe benefits. Second, fringe benefits
20.1

174
are often more highly visible than salary increases and appear more
competitive or up-to-date when inevitable comparisons with private
industry are made.
In the remainder of this section, the results noted in previous
sections of the report will be very briefly summarized and then policy
recommendations will be made, followed by suggestions for future research
in the area.
Summary of Fringe Benefits Available to Classroom Teachers
The major fringe benefits identified as available to teachers
in the Southeast are the following:
1) social security2) retirement3) medical and hospitalization insurance4) life insurance5) leave benefits
sick
personalvacationmaternitysabbatical
6) unemployment compensation insurance7) worker's compensation ins-.ance8) other fringe benefits9) summer leisure
Social Security. All but three states require participation by
classroom teachers in the federal social security program with the
employer contribution paid by the state or local district. Louisiana
and Kentucky teachers are not covered by social security and R signifi-
cant minority of local districts in Georgia (about one-third) have
chosen not to participate in the program.
Retirement. All twelve states in the region have mandatory state
retirement plans. The two best state plans are those in Louisiana
202

175
and Kentucky, which is to be expected since teachers in these states
are ineligible for social security. Maximum annual retirement benefits
after thirty years of service in Louisiana and Kentucky are about 75
percent of salary, compared with a range of from 47 percent to 64 percent
in the other ten states. Florida's retirement system is unique among
the state systems in that this is the only state of the twelve that
pays all system costs, not requiring any contributions from its teachers.
Medical and Hospitalization Insurance. In five of the twelve
southeastern states, medical and hospitalization insurance is left
to local districts with varying degrees of direct or indirect funding
flowing from state governments. These states are Florida, Louisiana,
Mississippi, Tennessee, and Virginia. The other seven states provide
state-wide health plans with annual costs to the states per teacher
varying From $302 to about $780.
It is in tnis fringe benefit area that we find the first deviation
from the range of benefits available to employees of private firms.
Large private firms began offering extra dental and other specialized
plans ei',.rlicr than state-wide school systems, which are certainly not
small industries. Of the more state-oriented systems in terms of health
plans, only South Carolina has a partially-state-paid dental plan,
for example, and this only became available in February of 1985. No
state has any vision or auditory insurance plans available, nor did
any districts that we surveyed. A few districts did offer subsidized
dental plans.
Life Insurance. The area of life insurance appears to be one
of the neglected fringe benefits for teachers. Very little lift isur-
203

176
ance is paid for by states or local districts on behalf of teachers.
Oftentimes the amounts are quite small, when it is available as a
benefit, ranging from $3,000 to $10,000. These have r,e unfortunate
ring of "burial policies." On the other hand, several states do offer
a one-year-of-salary (or some other multiple) benefit at death, sometimes
as a part of the retirement system's benefits. In some cases, it is
a tricky business to determine whether this is a paid benefit or not.
In Georgia, for example, five-tenths of one percentage point is added
to the teacher's contribution to the retirement system to pay for their
life insurance benefit. Virginia's sri3red-cost life insurance plan
is mandatory and represents the best plan in the group. Yhe primary
benefits are (1) life insurance at two times salary, (2) dou:le this
amount for accidental death, and (3) dismemberment insurance, with
the teacher's share of the cost at $7.20 per thousand dollars of insur-
ance.
Leave Benefits. All states set minimum sick leave policies ranging
from nine to thirteen and one-half days per nine-month contract year.
Several districts surveyed add one to three days to that minimum.
Accumulation of sick leave is allowed in all states from 45 days to
an unlimited amount. Only five states allow teachers to take personal
leave that is not charged against sick leave. These states are Alabama,
Kentucky, Mississippi, North Carolina, and Tennessee. Several of the
other states let local districts set their own personal leave policies.
Extended sick leave is not generally available as a specified
benefit, though most local districts probably allow teachers to return
to their jobs in the system, creating a defacto extended-leave-without-
204

177
pay policy. Louisiana, Mississippi, and North Carolina do have specific
extended leave policies.
In all states, except North Carolina, maternity leave is first
charged against sick leave. Procreation by teachers is not a subsidized
activity in the Southeast. North Carolina allows any teacher, male
or female, to take up to one full year of leave without pay for the
birth or adoption of a child. No paternity leave is recognized in
any of the other states.
Only Louisiana offers a true, employer-paid sabbatical leave policy
for its teachers. It is very generous in terms of pay and criteria
us-d to qualify for such a leave.
Only North Carolina offers true vacation leave for its teachers,
in addition to holidays, personal leave, and summer leisure. The length
ranges from ten to twenty-one days depending on years of service.
This is a tremendous benefit in North Carolina and coupled with generous
maternity and extended sick leave policies makes this state the clear
leader in leave benefits.
Summary of Results and Methods of Valuing Summer Leisure
In Section III the question is investigated of whether working
less than a full year is a benefit to teachers or a burden to bear.
Both views are certainly held by individual teachers and are not mutually
exclusive. Thy language used, however, needs to be made clear. The
teachers who say they wish to work in the summers are not really seeking
more work; they wish to have the opportunity to earn higher total
incomes. Thus, these people do not mean to say that having their summers
205

178
free is of -to value, but rather that they would value a proportionately
higher income more than they do the leisure time they now receive.
Other teachers, who say they like the benefit of summer leisure, simply
value the leisure more than the extra salary they would expect to receive
if they were able to work two or three more months. Therefore, summer
leisure does have value, to both groups, and Section III develops a
theoretical model for assessing the value of that leisure and reports
the results of some empirical tests.
The theory in Section III suggests that, though summer leisure
has value, restricting teachers to an arbitrarily sho7ter work schedule
ir, a competitive labor market (across industries) will require that
teachers be paid a premium for accepting this restriction on total
work time and, therefore, on total income. For 1977 data, it was found
that teachers receive a premium of about 9.9 percent of their salary
compared with all other workers of the same educational level and exper-
ience. In other words, teachers' hourly or daily wage rates are nearly
ten percent higher than in other occupations to compensate them for
accepting the restricted work schedule and resulting restricted income.
Of course, this is the figure for the average or typical teacher.
Some, who do not value summer leisure highly, are not satisfied with
this premiv- and want more or, rather, the opportunity to earn more
income by working longer. For others, who value their summer leisure
highly, this premium is far more than sufficient to induce them to
accept nine-month positions.
From this theory and the estimated premium for the average teacher,
a method for calculating the value of leisure for teachers is devised.

179
The value of the summer for a given teacher for whom leisure is a normal
good must lie between zero and a pro rata extension of the teacher's
current salary less the premium. The latter is true because the premium
would soon be lost in competitive markets if teachers were able to
work a full year. Within these constraints, we felt that the true
average value of summer leisure is represented by the opportunity cost
of income foregone by choosing not to work in the summers (giving up
at least the minimum wage) at a minimum and being unable to earn a
continuation of teachers' highest income possible (giving up other
occupations where a pro rata extension of teachers' current salaries
less the 9.9 percent premium could be earned) at a maximum. Hence,
throughout the remainder of the analysis, the value of summer leisure
is calLulated as the mean of these minimum and maximum amounts.
The major results of our investigation of the value of summer
leisure can be summarized as follows.
1) Summer leisure has positive value;
2) Teachers receive a 9.9 percent premium intheir current salaries as compensation for arestricted work schedule;
3) Teachers on average are willing to work moreweeks at a lower wage rate (by about 9.9 percent)in order to increase their total annual compensation;
4) Teachers on average are willing to work more hoursper week at a lower hourly wage rate (5 more hoursat about 3.25 percent less per hour) in order toincrease their total anrual compensation; and
5) Based on (3) and (4) above, school administratorscould open schools year round and lower perpupil education costs significantly, for a givennumber of per pupil instructional hours, andassuming mostly fixed physical plant costs, whileraising total annual teacher compensation.
207

180
Values of Classroom Teacher Fringe Benefits, Typical Salary,Total Compensation, and Comparison to Other Industries
Though typical salary amounts are reported in Section IV, the
focus of this section is on fringe benefits. Actual teacher annual
salaries are lower than those for some alternative occupations and
similar to others. Starting salaries, for example, in the region of
$14,899 are certainly comparable to 1984 starting salaries of $13,000
to $18,000 in the southeastern region for banking, especially given
the extra contract length required for these other salaries. However,
the $20,338 average salary with ten years experience and a master's
degree appears to be far off the mark, even for nine months.
Fringe benefits appear to be much better. These benefits, excluding
any value for summer, range across the southeastern states from 25
to 45 percent of typical salary for beginning teachers, and average
32.2 percent. For the most experienced teacher category (and still
excluding summer value), the range is from 23 percent to 51 percent,
averaging 30.8 percent. For all teacher education/experience categories
combined, the regional average for fringe benefits (without summer)
as a percent of salary is 31.2 percent. This is only slightly below
the national average for all workers of 36.6 percent and the southeastern
average of 33.9 percent.
Of course, when our modest estimates of the value of summer leisure
are included, fringe benefits for teachers in the Southeast as a percent
of salary far outstrip those available in other industries. Including
the mean value of summer leisure for the region raises the appropriate
figure to 43.8 percent.
208
1
I
1
1

181
Policy Recommendations
The suggestions that follow are based on the assumption that fully
qualified teachers are becoming more difficult to find in most areas,
for whatever reasons, and that positive action is required to increase
the quantity supplied of highly qualified teachers in given markets.
1. Increase salaries for the more experienced and educationallyqualified teachers. While it is not clear whether the averagestarting salary for nine months for teachers in the Southeast($14,899) is low relative to comparable occupations, it doesappear that salaries for the career teacher are low. PerhapsNorth Carolina's longevity pay system could serve as a model.
2. Use a cafeteria style or flexible fringe benefit plan.Teachers are individuals with very different needs. The moneyspent for their fringe benefits should be put in one lump
sum and then teachers should be allowed to "spend" these dollarson a variety of fringe benefits, from deferred compensationplans, retirement plans, life insurance, health andhospitalization insurance, sick leave, personal leave, andso on. The VISTA (Variety of Individual Selections TrustAccount) plan available in Dade County, Florida, is an excellentmodel, though it is far from being fully developed. Doingthis has several major advantages. First, teachers wouldbe confronted with a large dollar figure for their fringebenefits that would help them see just how much their full
salary or total compensation is. Second, the dollars whenused to purchase fringe benefits of greatest utility to
individual teachers would generate greater tota' satisfactionthan they do now. (Such problems as a teacher losing some
of his or her benefits entirely because he or she is alreadycovered for hospitalization under a spouse's plan could be
avoided.) Third, there would be major long run cost savingsfor employing school districts or states. Currently, whenan employer agrees to pay for a basic, individualhospitalization plan, that employer is locked into payingfuture cost increases which are generally unseen and quiteunappreciated by employees, whether teachers or not. But
if the employer is committed to providing, say, $3,000 for
a cafeteria style individual fringe benefit fund (IFBF), then
employer costs would not automatically escalate with risingmedical prices. Though there would be pressure for the employerto increase the size of the fund annually, this would be a
negotiable item and, further, the employer would get credit
209

182
for increasing the committed amount for fringe benefits ratherthan having the increase hidden as it is now. A flexibleIFBF concept would return control to states and districtsover the rate of increase in the cost of fringe benefits.(See Seitz and Gifford, 1982, pp. 17-20 for a full explanationof the concept.) This is one suggestion that is beneficialto all parties and can and should be implemented immediately.
3. Specific recommendations with respect to particular typesof fringe benefits include the following:
a. Retirement plans that have maximum annual benefitsof less than 60 percent of base salary should be reexaminedto see if an increase to this amount is cost efficient.Loss of more than 40 percent of salary at retirement isnot attractive. Will social security payments plusretirement system payments equal or exceed 75 percentof base salary? An excellent opportunity exists hereto stretch salary increase dollars. States could giveteachers a raise by "picking up" teachers' share ofretirement contributions. If this share is now, say,7 percent, then the equivalent raise in gross salary dollarsis 9.3 percent if teachers are in a marginal tax bracketof 25 percent. In other words, their disposable incomeor net pay, after the state picked up the 7 percentcurrently being paid into retirement by teachers, wouldrise by the same amount that it would if they were givena 9.3 percent raise.
b. Life insurance paid or subsidized by employers isoften quite low and offers an attractive opportunity toemployers to increase a fringe benefit at modest cost.Here, again, a cafeteria style plan would have aconsiderable advantage by allowing teachers to choosemore life insurance or less depending on their ownparticular situations.
c. Some personal leave days or vacation days should beavailable to teachers that are not charged against sickleave. More important than that, teachers should beencouraged (as they are in North Carolina) to take somedays off to refresh and rejuvenate themselves. We foundthat many districts treat teachers as industrial workers,which is not at all the image that should be projectedby school systems if they really wish to attract highlyqualified people. Some districts and states hand outpersonal days quite begrudgingly, saying, for example,that approval will not be granted to take personal dayson a Friday or Monday or any day preceeding or followinga holiday.
d. A true (funded) sabbatical leave policy should bein place, especially if it is desirable to have someteachers retrain themselves in science and mathematics.

183
This is difficult to do on a piece-meal, course-by-coursebasis. Further, teachers who are not completely retrainingstill need two or more opportunities during their careersto rebuild fully their human capital. Just as machineswear out and/or become obsolete with time, it is difficultfor teachers to maintain their store ,if knowledge (theirhuman capital) beyond ten years by simply working fulltime. Only Louisiana has a good sabbatical leave policyand, even in that state, it is not adequately funded.
e. In lieu of a good sabbatical program, teachers shouldbe paid to return to school in the summers to refreshand maintain their human capital. They are already paidin the form of salary increments that are directly relatedto education attainment. However, these increments werefound to be relatively small in some states. For example,in one state, teachers with a master's degree are paidonly a few hundred dollars more than teachers with a
bachelor's degree and the same experience. Further, mostteachers are incapable of concentrating properly (anddo not perform at the graduate level) under those rathertrying circumstances of taking night classes followinga full day of teaching.
4. Operate schools for a full year and give a significantproportion of teachers the opportunity to teach on an annualcontract. This recommendation fits in well with the currentpush to increase educational output. Remedial, gifted, andother special programs could be operated (at least partially)in the summer. Career teachers who want to teach a full yearcould be accommodated, while others could continue to optfor the shorter year. Teachers who work in the summer wouldaccept on average an extended contract at a salary equal toat least their current nine-month salary less 9.9 percentplus one-third of that adjusted figure. In other words, costsper pupil day wou'i fall, allowing schools to be operatedat lower unit cost.
5. Rethink the entire teacher career structure to allowopportunities for advancement. Most management theories suggestthat people are motivated by more than money, though, of course,income is still of major importance. As a rule, teachershave no opportunity for advancement, except perhaps to becomea principal, nor any externally recognized measures of success.While teachers are told they are professional, their careerladders are more similar to those of artists--doing the samework for thirty or more years with only an outside chanceof special recognition. For example. the accountant leavingcollege has several career tracks open to him and has somereasonable probability of becoming a partner in the firm and
211

184
earning an excellent income' as a result of special diligenceor brilliance. Faculty members in universities have at leastthree ranks through which they may pass and earn specialrecognition among peers and outsiders at each point. Perhaps;Tennessee's new Master Teacher plan will turn out to be a
good approach to this problem.
In sum, we recommend that administrators continue to look at
salaries, especially at the experienced levels, as the place to upgrade
in order to attract highly qualified young people into the teaching
profession; that total fringe benefit levels be maintained, though
not necessarily increased; that flexible cafeteria-style individual
fringe benefit funds be made available to teachers so that they can
select the proper mix of benefits for their own family situations and
so that systems can control fringe benefit costs whale achieving needed
visibility when they do increase monies committed to teacher fringe
benefits; that maximum retirement benefits, when added to social security
benefits, be at least equal to 75 percent of base salary which is the
amount available in the two non-social security states studied; that
additional life insurance be made available; that the number of personal
leave days be more generous and that teachers be encouraged to take
them; that full sabbatical leave programs be put in place to allow
teachers to regain and upgrade their human capital every ten years;
that teachers be paid to return to school in some summers in lieu of
a true sabbatical leave policy; that schools be operated for a full
year (or at least some of them) to take adyantage of unit labor cost
savings and to allow some teachers to receive higher total income (at
reduced wage rates) for the year; an0 that some thought be put into
devising a better career path for teachers that includes opportunities
212

185
to rise in rank or grade so that visible measures of career success
are made available to teachers.
Suggestions for Future Research
Our suggestions for future research in the area, given below,
come from several sources. Some are suggested by our results; some
by problems we ran into while trying to gather data and analyze it;
others are the result of our on-going literature search, and still
others are the suggestions from the many system and school administrators
we contacted during the course of the project.
1. A major longitudinal study of a reasonably laige sampleof college education majors should be undertaken. This wouldbe a relatively high-cost project that could yield very valuableresults over a five to ten year period. We constantly wrfaced with questions of fact in the current study the* 9
could not answer from the literature. How many beginningeducation majors switch to other majors in college? Whatother majors? Why? Are they the good students, poor studentsor a representative mixture? Of those who complete the degree,what percentage actually begins to teach? How many work secondjobs in the summer? How many are satisfied with their careers?How many leave the teaching field? Why? For what otheroccupations? Are they satisfied in those occupations? Arethese percentages any different from those who start out to
be engineers or social workers? We would envision a majorresearch group (private or university-related) beginning witha sample of two to three hundred education uajors from fouror five universities geographically dispersed and then trackingthem for as long as useful results are obtained.
2. A small study should be made of the mix of fringe benefitsthat would be selected by a sample of teachers if they weretold they had control of the actual fringe benefit dollarsbeing spent on them in their respective districts. Wouldthey choose to spend their $5,000 to $10,000 on more or fewerretirement benefits, more or less life insurance, more or
less personal leave, more or less tuition and book costs forcollege courses, a part-time aide in the classroom to keeprecords or work with certain reading groups, and so on? All
these options would first be priced at so much per unit (per
213

186
$1,000 of life insurance, per hour per aide, etc.) and teacherswould be asked to allocate their total amount of fringe benefitmoney across these categories. It might or might not be goodto show them first what the average use of the money is rightnow, with someone else making the decisions for them. Thisstudy might provide ev'dence of how far off the markadministrators currently are in providing particular fringebenefits and/or levels of fringe benefits.
3. A smaller stud focusin on the "fringe costs" of teachin ,such as buying classroom materials, taking courses to maintaincertification, and the like, balanced against the presentvalue of increased future earnings from higher levels ofeducational attainment and off-settin fringe benefits (suchas the availability of teachers' aides) needs to be undertaken.Are there (related or unrelated) benefits, like aides, thatoff-set having to spend for all those bulletin board materials?Do salary increments due to educational attainment fully payfor time spent in courses and workshops as well as tuition,books, and travel costs that are not currently reimbursed?In other words, is there a net cost to being a teacher thatshould be subtracted from salary or total compensation?
4. What effect on teacher retention rates does the burgeoningpaperwork problem have? Teachers spend literally hours eachweek keeping track of lunch money (regular cost, reduced,or free) with double entry ledger systems, and keeping trackof the progress of students. In South Carolina, keeping trackof scores of students on assessment exams is just the beginning.Teachers must record all of those results, and must recordhow much remedial time or other work is done with individualstudents to correct problems and bring them up to speed.Records are scrutinized by state education personnel. Districtrecords are also required on each student and these aredifferent from the State's. Then there are the local school'srecords. It is not at all unlikely for a teacher to spendthree hours per week on these records or 10% of his or her
available instructional time. Or is it? An analysis of thepaperwork explosion could be helpful in assessing the severityof the problem. Is paperwork a minor irritant or a majorflaw in the current system?
5 Final] , a stud of a articular art of the merit a
question--is there a measurable difference between studentpre -test and post-test performance that is significantly,if not wholly, attributable to teacher effectiveness--shouldbe made. Teachers will never be accepted as professionalsas long as they accept common salary schedules not based onperformance or output measures. They are currently paidstandard rates plus "input pay." The input pay is for moreeducational attainment, regardless of differences in output.At least some portion of annual teacher salary increases could
214

187
be based on output measures or performance. This would enhancethe attractiveness of the teaching profession to potential,high-quality entrants. The first objection we hear is thatmeasures of performance would be mostly subjective and poorlydone by principals. (Perhaps principals should take morepersonrel and business administration courses rather thanmore education courses.) However, this does not have to bethe case. In crudest form, some one or two percentagepoints of teacher pay increases could be tied to increasesin student performance (output) on statewide standardizedtests. Better yet, each teacher could participate in a"profit- sharing" or bonus plan, where if their students, onthe basis of a three-year moving average (so one year'saberration would be blended in with other normal years),increase their performance more than the average statewidefor that grade or subject area, then those teachers wouldget some predetermined share of the year-end allocated bonuspool. Some teachers object that tests do not measure everythingthat is produced, and that is correct, but they can measurethe most important element produced by schools: the betterability on the part of students each year to display knowledgeof facts and analytical ability. Those teachers whose studentsconsistently perform incrementally better (not better in totalsince performance levels are related to many non-school factors)should be rewarded. The same objections to merit pay madeby teachers could be made in private industry: that particularind:viduals might not (rarely do) have complete control overthe outcome or total performance for the company. But thosewhose divisions consistently do better than other divisions,or those whose sales gains are higher (per account in theterritory) than others get larger bonuses. The incentivesystem is set in motion. Such a system may be helpful ineducation.
We would envision a simulation study or demonstrationproject involving certain schools and their teachers or certaingrades where pre-test (from the end of last year or at beginningof the current year) and post-tests exist. A potential bonuspool (amount) that is realistic in terms of what a legislaturemight enact is determined and made known to teachers. Perhapsone-third of any actual salary increase monies might be placedin such a pool. Then a simulation of the results and likelybonuses to be paid teachers whose students' performance gainsare above average could be made. It would Pa valuable tofollow this simula'.ion through three years to see how resultsmight change when using individual annual performance dataversus using a moving average of performance gains. In anycase, such a demonstration project, if successful and withappropriately publicized results, might well turn the tideof teacher opinion towards moving to a profit-sharing(educational profit, in this case) bonus pay system. Excellentdiscussions of deferred profit-sharing plans and bonus paysystems exist in business literature (e.g., see Babson, 1974,PP. 139ff).
215

188
REFERENCES
Babson, S.M., Jr. (1974). Fringe Benefits--The Depreciation, Obso-lescence, and Transience of Man. New York: John Wiley 6 Sons.
Business Week. (1985). "Where the Jobs Will Be," Guide to Careers.Volume 3 (Spring/Summer), pp. 60-63.
Cotter, P.R. and B.B. Hardee. (1984). "Supplemental Employment amongAlabama Teachers," Occasional Papers in Educational Policy Analysis,No. 412. Research Triangle Park, NC: Southeastern Regional Councilfor Educational Improvement.
Council of State Governments. (1984). The Book of the States, 1984-85.Lexington, KY: The Council of State Governments.
Douty, H.M. (1930). The Wage Bargain and the Labor Market. Baltimore,MD: The Johns Hopkins University Press.
Educational Research Service. (1984). Fringe Benefits for Teachersin Public Schools, 1983-84. Part 3 of National Survey of FringeBenefits in Public Schools. Arlington, VA: Educational ResearchService.
Gwartney, J. and R. Stroup. (1973). "Measurement of Employment Discrim-ination According to Sex," Southern Economic Journal. Volume39 (April), pp. 575-587.
Landes, E.M. (1977). "Sex Differences in Wages and Employment: ATest of the Specific Capital Hypothesis," Economic Inquiry. Volume15 (October), pp. 523-538.
Lindsay, C.M. (1971). "Measuring Humor Capital Returns," Journalof Political Economy. Volume 79 (November/December), pp. 1195-
1215.
Macaulay, H.H. (1959). Fringe Benefits and Their Federal Tax Treat-ment. New York: Columbia University Press.
Mincer, J. (1974). Schooling, Experience and Earnings. New York:
National Bureau of Economic Research.
Mincer, J. and S. Polachek. (1974). "Family Investments in HumanCapital: Earnings of Women," Journal of Political Economy. Volume82 (March), pp. S76-5109.
Moore, G.A. (1976). The Effect of Collective Bargaining on Internal
Salary Structures in the Public Schools," Industrial and LaborRelations Review. Volume 29 (April), pp. 352-362.
216

189
National Education Association. (1978). Report of the NEA SpecialCommittee on Teacher Retirement. Washington, DC: National Edu-cation Association.
National Education Association. (1980). Highlights of the NEA Re-tirement Issues Forum,_ 1979. Washington, DC: National EducationAssociation.
National Education Association. (1981). A Review of Teacher Retire-ment Issues of the 1980's. Washington, DC: National EducationAssociation.
National Fdiication Association. (1981). Statistical Forecasting Pro-cedures Used in the Development of NEA's "Estimaces of SchoolStatistics". Washington, DC: National Education Association.
National Education Association. (1981). Summary of State RetirementLaws in Education. Washington, DC: National Education Association.
National Education Association. (1984). Estimates of School Statistics,1983-84. Washington, DC: National Education Association.
National Education Association. (1984). Rankings of the States, 1984.Washington, DC: National Education Association.
Porath, Y.B. (1967). "The Production of Human Capital and the LifeCycle of Earnings," Journal of Political Economy. Volume 75(August), pp. 352-365.
Seitz, C. and D.L. Gifford. (1982). Flexible Compensation: A ForwardLook. New York: American Management Association.
Triplett, J.E. (1983). The Measurement of Labor Cost. Studies inIncome and Wealth, No. 48, NER. Chicago: The University of ChicagoPress.
U.S. Bureau of Labor Statistics. (1977). BLS Measures of Compensation.Bulletin No. 1941. Washington, DC: USGPO.
U.S. Bureau of Labor Statistics. (1984). Employee Benefits in Medianand Large Firms, 1982. Washington, DC: USGPO.
U.S. Bureau of Labor Statistics. (1985). Employee Benefits in Mediumand Large Firms, 1983. Washington, DC: USGPO.
U.S. Chamber of Commerce. (1984). Employee Benefits 1983. Washing-ton, DC: U.S. Chamber of Commerce.
Wickenden, D. (1983). "Merit Pay Won't Work," New Republic. Volume189 (November 7th), pp. 12-15.
Wistert, F.M. (1959). Fringe Benefits. New York: Reinhold PublishingCorporation.


