Embed Size (px)
Citation preview
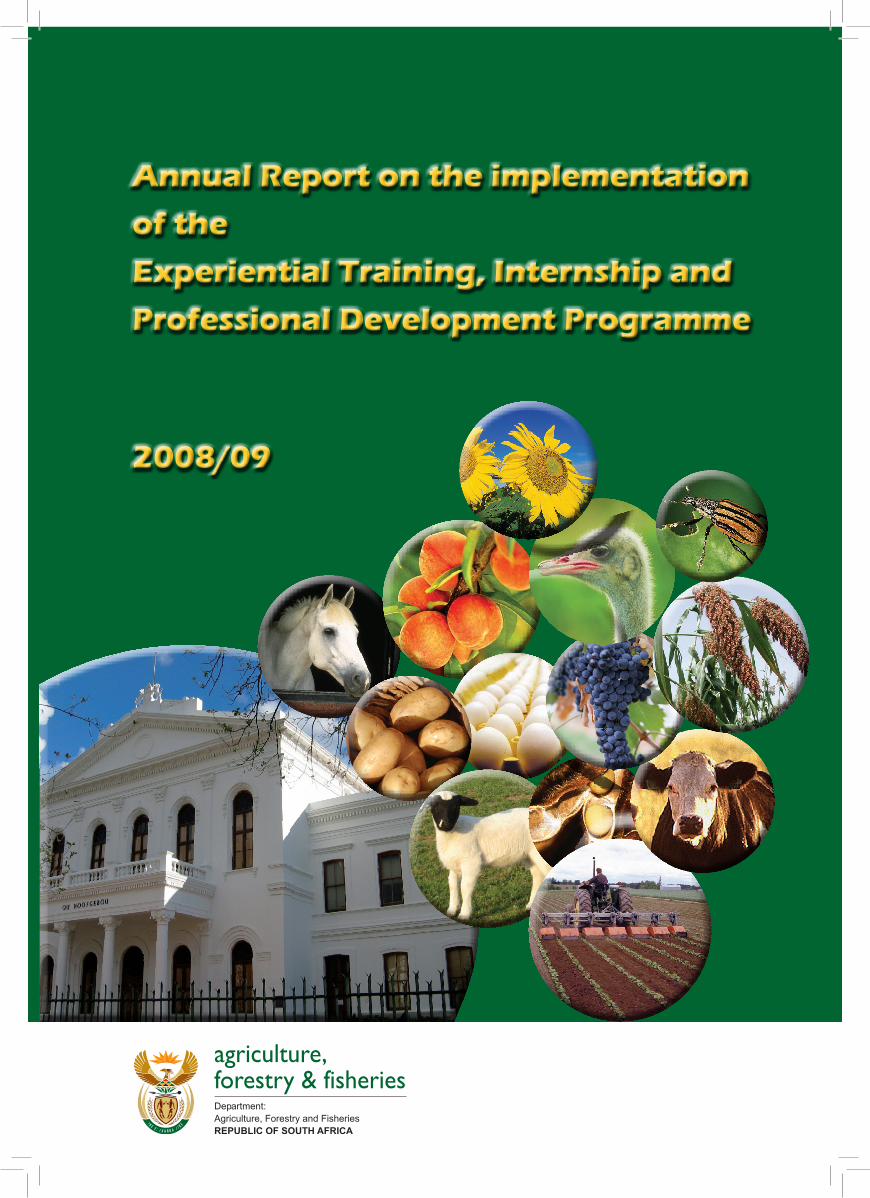
Annual Report on the implementation
of the
Experiential Training, Internship and
Professional Development Programme
2008/09
agriculture,forestry & fisheriesDepartment: Agriculture, Forestry and FisheriesREPUBLIC OF SOUTH AFRICA

DEPARTMENT OF AGRICULTURE, FORESTRY AND FISHERIES Directorate Education, Training and Extension Services
Annual Report on the implementation of the Experiential Training, Internship and Professional Development Programme
2008/09

2009
Compiled by the Directorate Education and Training
Design and layout by Directorate Agricultural Information Services
Printed and published by Department of Agriculture, Forestry and Fisheries Private Bag X144, Pretoria, 0001 South Africa
ISBN 978-1-86871-294-6
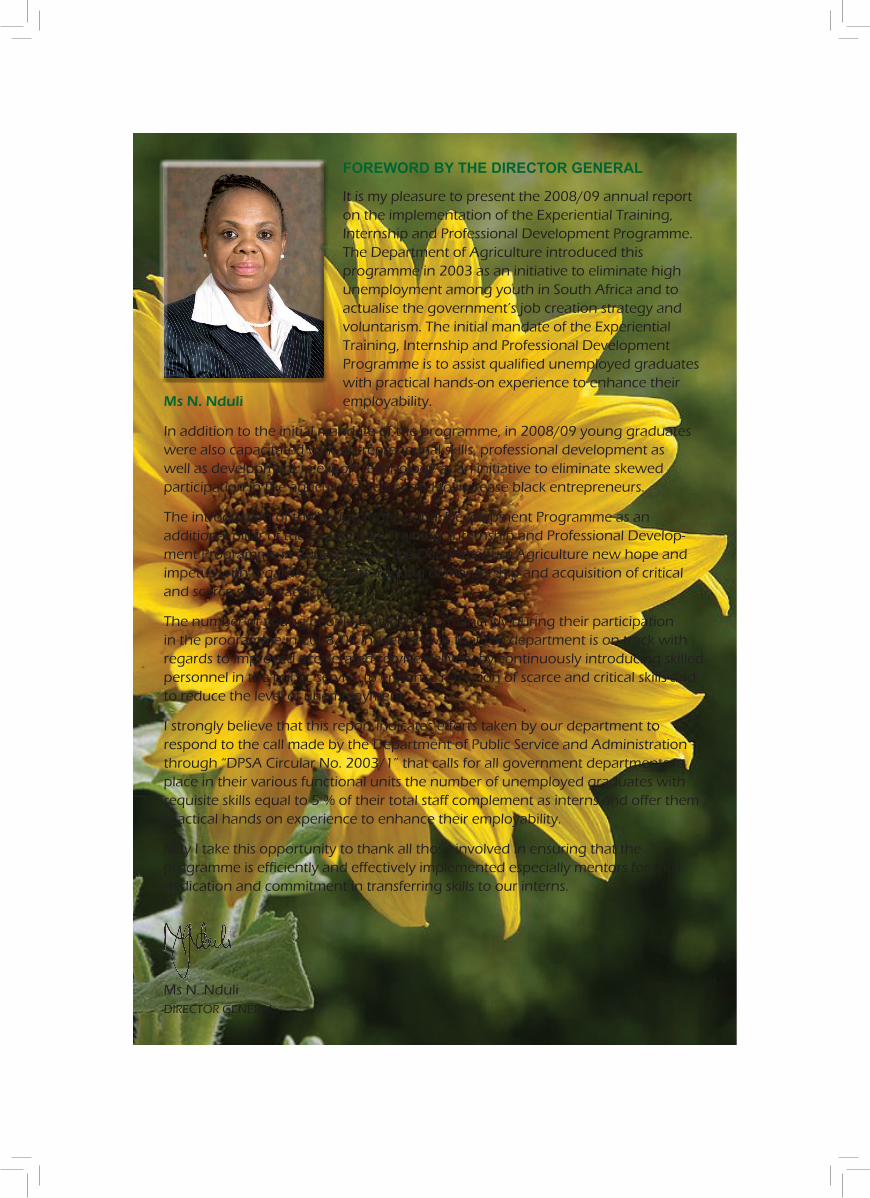
FOREWORD BY THE DIRECTOR GENERAL
It is my pleasure to present the 2008/09 annual report on the implementation of the Experiential Training, Internship and Professional Development Programme. The Department of Agriculture introduced this programme in 2003 as an initiative to eliminate high unemployment among youth in South Africa and to actualise the government’s job creation strategy and voluntarism. The initial mandate of the Experiential Training, Internship and Professional Development Programme is to assist qualified unemployed graduates with practical hands-on experience to enhance their employability.
In addition to the initial mandate of the programme, in 2008/09 young graduates were also capacitated with entrepreneurial skills, professional development as well as development in export technology as an initiative to eliminate skewed participation in the agricultural sector and to increase black entrepreneurs.
The introduction of the Young Professional Development Programme as an additional pillar of the Experiential Training, Internship and Professional Develop-ment Programme in 2008/09 gave the Department of Agriculture new hope and impetus with regards to the fast tracking of mentorship and acquisition of critical and scarce skills in agriculture.
The number of young people employed permanently during their participation in the programme in 2008/09 indeed shows that the department is on track with regards to improved accelerated service delivery by continuously introducing skilled personnel in the public service to enhance retention of scarce and critical skills and to reduce the level of unemployment.
I strongly believe that this report indicates efforts taken by our department to respond to the call made by the Department of Public Service and Administration through “DPSA Circular No. 2003/1” that calls for all government departments to place in their various functional units the number of unemployed graduates with requisite skills equal to 5 % of their total staff complement as interns and offer them practical hands on experience to enhance their employability.
May I take this opportunity to thank all those involved in ensuring that the programme is efficiently and effectively implemented especially mentors for their dedication and commitment in transferring skills to our interns.
Ms N. Nduli DIRECTOR GENERAL
Ms N. Nduli

— v —
CONTENTSList of tables ........................................................................................................................................................ vi
List of graphs ....................................................................................................................................................... vii
Definition of terms ................................................................................................................................................ vii
Acronyms ............................................................................................................................................................. vii
Executive summary ........................................................................................................................................... 1
1. Background and objectives ................................................................................................................... 11.1 Introduction and background .................................................................................................................... 11.2 Objectives of the Programme .................................................................................................................... 2
2. Recruitment and selection ..................................................................................................................... 22.1 Needs analysis .......................................................................................................................................... 22.2 Advertisement of internship vacancies ...................................................................................................... 22.3 Shortlisting and interviews ......................................................................................................................... 3
3. Preplacement interventions ................................................................................................................... 33.1 Training of mentors ................................................................................................................................... 3
4. Arrival programme of 2008/09 interns/trainees .................................................................................... 34.1 Arrival ....................................................................................................................................................... 34.2 Orientation and Induction Programme ...................................................................................................... 34.3 Capacity building programmes for trainees ............................................................................................... 4
5. Analytical reports of the implementation of various categories of the experiential training, internship and professional development ............................................................................. 4
5.1 Conventional ............................................................................................................................................. 45.2 Agriculture Industry Development Programme (AIDP) .............................................................................. 85.3 Young Professional Development Programme (PDP) ............................................................................... 12
6. Fields of studies and placement of young professionals for the 2008 academic year .................... 166.1 Fields of studies of young professionals for the 2008 academic year ....................................................... 166.2 Period of participation of young professionals in the programme ............................................................. 166.3 Placement of young professionals during the 2008 academic year .......................................................... 18
7. Summary of Profiles of all categories of the Experiential Training, Intersnhip and Professional Development Programme ................................................................................................ 18
8. Monitoring and evaluation ...................................................................................................................... 218.1 Monthly and quarterly progress reports ..................................................................................................... 218.2 Monthly claims and stipends ..................................................................................................................... 218.3 Monitoring visits ......................................................................................................................................... 228.4 Success indicators of the programme ....................................................................................................... 228.5 Analysis of exit interview forms ................................................................................................................. 278.6 Mid-term Review Conference .................................................................................................................... 28
9. Certification ceremony of the 2008/09 interns/trainees and mentors ................................................ 28
10. Summary of beneficiaries of the Programme since inception in 2003 to 2008 .................................. 29
11. State of expenditure ................................................................................................................................ 29
Annexure A .......................................................................................................................................................... 31
Annexure B .......................................................................................................................................................... 41
Annexure C .......................................................................................................................................................... 43
— vi —
LIST OF TABLESTABLE 1: Breakdown by race, gender and disability of “conventional” interns/trainees (n = 124) .................. 4
TABLE 2: Breakdown according to age of “conventional” interns/trainees (n = 124) ...................................... 5
TABLE 3: Breakdown according to placement of “conventional” interns/trainees (n = 124) ............................ 5
TABLE 4: Breakdown according to placements within functional units of “conventional” interns/trainees (n = 124) ........................................................................................................................ 6
TABLE 5: Breakdown according to provinces where “conventional” interns/trainees are coming from (n = 124) ................................................................................................................. 6
TABLE 6: Breakdown according to number of “conventional” interns/trainees per academic institution where they graduated (n = 124) ...................................................................................................... 6
TABLE 7: Breakdown according to municipalities or districts where “conventional” interns/trainees are coming from (n = 124) ..................................................................................................................... 7
TABLE 8: Breakdown of level of qualifications according to gender and race of “conventional” interns/trainees (n = 124) ................................................................................................................ 8
TABLE 9: Classification of Educational Study Matter (CESM) of “conventional” interns/trainees (n = 124) ... 8
TABLE 10: Breakdown by race and gender of AIDP interns/trainees (n = 24) .................................................. 9
TABLE 11: Breakdown according to age of AIDP interns/trainees (n = 24) ...................................................... 10
TABLE 12: Breakdown according to placement of AIDP interns/trainees (n = 24) ............................................ 10
TABLE 13: Breakdown according to number of AIDP interns/trainees per academic institution where they graduated (n = 24) .......................................................................................................................... 10
TABLE 14: Breakdown of level of qualifications according to gender and race of AIDP interns/trainees (n = 24) 11
TABLE 15: Classification of Educational Study Matter (CESM) of AIDP interns/trainees (n = 24) .................... 11
TABLE 16: Breakdown according to provinces where AIDP interns/trainees come from (n = 24) .................... 12
TABLE 17: Breakdown according to municipalities where AIDP interns/trainees come from (n = 24) .............. 12
TABLE 18: Breakdown by race, gender and disability of PDP interns/trainees (n = 25) ................................... 13
TABLE 19: Breakdown according to age of PDP interns/trainees (n = 25) ....................................................... 13
TABLE 20: Breakdown of level of qualifications according to gender and race of PDP interns/trainees (n = 25) 14
TABLE 21: A breakdown of PDP interns/trainees according to provinces they come from (n = 25) ................. 14
TABLE 22: Breakdown according to number of PDP interns/trainees per academic institution they graduated from (n = 25) .................................................................................................................. 14
TABLE 23: A breakdown of PDP interns/trainees according to Municipality where they come from (n = 25) .. 15
TABLE 24: Analysis of fields of studies of young professionals during the 2008 academic year according to race and gender (n = 18) ............................................................................................................ 16
TABLE 25: An analysis of the year of level of study for the young professionals (n = 18) ................................ 17
TABLE 26: Breakdown according to placement of young professionals (n = 25) ............................................. 18
TABLE 27: Breakdown by race, gender and disability of all interns/trainees (n = 173) ..................................... 18
TABLE 28: Breakdown according to age of all interns/trainees (n = 173) ......................................................... 19
TABLE 29: Breakdown according to provinces where all interns/trainees are coming from (n = 173) .............. 19
TABLE 30: Breakdown according to municipalities or districts where all interns/trainees are coming from (n = 173) ..................................................................................................................... 19
TABLE 31: Status of employment according to organisation (n = 68) ............................................................... 23
TABLE 32: Analysis of period of stay before securing employment (n = 68) .................................................... 24
TABLE 33: Analysis of levels of employment of trainees/interns (n = 68) ......................................................... 24
TABLE 34: An analysis of 2008 academic performance of young professionals (n = 18) ................................. 25
TABLE 35: An analysis of young professionals whose performance is satisfactory (n = 15) ............................ 26
TABLE 36: An analysis of young professionals whose performance is not satisfactory in 2008 (n = 3) ........... 27
— vii —
TABLE 37: An analysis of young professionals who completed their studies and graduated 2008 (n = 5) ...... 27
TABLE 38: An analysis of beneficiaries of the Experiential Training, Internship and Professional Development Programme from 2003–2008 (n = 763) .................................................................... 29
TABLE 39: State of expenditure ........................................................................................................................ 30
TABLE 40: Breakdown by race and gender of the Agri Export Technologist beneficiaries (n = 78) .................. 42
TABLE 41: Breakdown of the Agri Export Technologist beneficiaries according to age (n = 78) ..................... 42
TABLE 42: Employment status (n = 78) ............................................................................................................ 42
TABLE 43: Summary of beneficiaries of the implementation of the internship programme by provincial departments of agriculture (n = 774) ............................................................................................... 44
LIST OF GRAPHS
GRAPh 1: Analysis of status of resignation (n = 68) ........................................................................................ 23
GRAPh 2: Analysis of status of resignation by gender (n = 68) ....................................................................... 23
DEFINITION OF TERMSInternship: A structured workplace experience programme that is agreed to between the intern and the supervisor/
line manager who is delegated this responsibility by a department.
Intern: Also called a graduate intern, is a person who is contracted with a department to engage in an internship programme.
Trainee: Also called student intern, is a student who is currently studying towards a higher education qualification and must undertake work experience in order to fulfil the requirements of the qualification.
Mentor: A person who is trained and appointed to offer advice and her or his knowledge, wisdom, insight that is useful to the protégé’s professional and personal development.
Contract: A legitimate agreement between the department and the intern, describing the conditions of employment.
Youth: A person who is between the ages of 18 and 35 years.
ACRONYMSDoA Department of Agriculture
SA South Africa
SAQA South African Qualifications Authority
DPSA Department of Public Service and Administration
ETES Education, Training and Extension Services
CESM Classification of Education Study Matter
NGO nongovernmental organisation
PWD People with Disabilities
PDP Professional Development Programme
AIDP Agri Industry Development Programme
DEXCO Department of Agriculture Executive Committee
NQF National Qualification Framework
PoE Portfolio of Evidence
PPECB Perishable Products Export Control Board
USB-ED University of Stellenbosch Business School

— 1 —
EXECUTIVE SUMMARY
This annual report on the implementation of the Experiential Training, Internship and Profes-sional Development Programme covers the activities relating to the 2008/09 intake of interns/trainees. The report elaborates on the implementation procedures which include recruitment, selection, placement, monitoring and evaluation as well as the progress achieved against the expected outputs.
The report indicates that 173 interns/trainees participated in the programme during the 2008/09 financial year and were placed under various categories of the programme as follows: 124 (72,0 %) as conventional interns, 24 (14,0 %) as Agri Industry Development Programme interns and 25 (14,4 %) as Young Professional Development Programme interns. Of the 173 interns/trainees who participated in the programme, 101 (58,4 %) were females and 72 (41,6 %) were males. With regard to race, 169 (97,70 %) were Africans, 3 (1,74 %) were coloureds and 1 (0,56 %) was white and no Indians.
As part of monitoring the progress of interns and the overall evaluation of the programme, monthly progress reports of interns were received and analysed, site visits were conducted and the Mid Term Review conference was also held. Worth noting from this report is that from the 148 interns who were expected to secure employment, 68 (46,0 %) secured employment during their participation in the programme and 35 (51,5 %) were appointed by the Department of Agriculture (DoA). The report further indicates that 18 young professionals were registered for further studies in 2008 and the end of year performance of 15 (83,3 %)was satisfactory while for the other 3 (16,7 %) was not satisfactory.
The 3-year report on the implementation of the Export Technologist Programme of the Perishable Products Export Control Board as well as the 2008/09 implementation of the internship programme by provincial departments of agriculture are attached as annexures to this report. The DoA contributes an amount of R600 000,00 annually to the PPECB for the training of Black Export Technologists.
1. BACKGROUND AND OBJECTIVES
1.1 Introduction and background
The dawn of democracy in 1994 brought major political and economic changes in South Africa. This led to the restructuring of the public service and state-owned enterprises with the aim of improving effective service delivery. As a result, thousands of employees lost their jobs and some opted for severance packages in the process. As a measure to reduce unemployment among the youth, the government through the Department of Public Service and Administration issued “DPSA Circular No. 2003/1” that calls for all government departments to place in their various functional units the number of unemployed graduates with requisite skills equal to 5 % of their total staff complement as interns.
In response to the call, the DoA conceived the Experiential Training, Internship and Professional Development Programme in 2003 as an initiative to eliminate unemployment among the youth in South Africa. Since its inception in 2003, 763 young people participated and benefited from this programme. Of the 763 young people, 173 constituted the 2008/09 internship intake.
During these 5 years of implementation, the programme underwent rigorous restructuring and revitalisation in order to respond to new trends in the agricultural sector and economic value chain. In addition to its initial mandate of assisting qualified unemployed graduates with practical hands-on experience to enhance their employability, currently the programme also caters for entrepreneurial development, professional development as well as development in export technology.
— 2 —
The programme is viewed by the department as a youth development initiative and as such can only accommodate young people between the ages 18 and 35.
1.2 Objectives of the Programme
• Contribute to accelerated service delivery by government through the improved introduction of skilled personnel in the public service.
• Afford learners at tertiary institutions an opportunity of practical work experience as a requirement for them to obtain their qualifications.
• Enhance the employability of unemployed agricultural and other graduates.
• Develop the skills and capacity of previously disadvantaged people to direct commercial viable enterprises and engage effectively with the markets.
• Resolve the general shortage of qualified and skills people in the workforce by encouraging graduates to equip themselves with the necessary practical experience.
• Bridge the vacuum that exists between school and work by taking stock of skill gaps.
• Ensure the long-term sustainability of the agricultural sector in SA, by ensuring meaningful participation of black agricultural graduates.
• Actualise the government’s job creation strategy and voluntarism.
• Promote recruitment, development and retention of a sustainable cadre of scientists, technologists, technicians and other associated professionals and management support in the DoA.
• Provide the DoA with highly-skilled people and address the skill gaps within the agricultural sector.
• Promote linkages with external bodies and strengthen the capabilities of the workforce to contribute toward a prosperous agricultural sector.
2. RECRUITMENT AND SELECTION
2.1 Needs analysis
Each year a needs analysis survey is conducted to determine the number and requirements of interns/trainees each directorate or functional unit of the DoA or agribusiness can accom-modate. This year, a needs analysis questionnaire was sent to all directorates within the DoA as well as commodity organisations and agribusinesses. The information received was captured and analysed accordingly. Based on the information received on needs analysis questionnaires, a total of 173 internship opportunities were allocated to various categories of the programme as follows: 124 for the conventional interns, 24 to the Agriculture Industry Development Programme and 25 to the Professional Development Programme.
2.2 Advertisement of internship vacancies
From the needs analysis, an advert with internship opportunities for 2008/09 was compiled and flashed on 30 September 2007 in the 3 national newspapers, i.e. Sunday Times, City Press and Daily Sun as well as local print and electronic media. Invariably the advertisement specified the different areas in which interns/trainees were required based on information obtained from a needs analysis questionnaire. A total of 6 022 applications were received in response to the advert from all the provinces. The applications were screened, captured and sorted according to requirements indicated on the advert and preliminary schedules of shortlisted applicants were compiled.
— 3 —
2.3 Shortlisting and interviews
The preliminary schedules of shortlisted candidates together with the applications were forwarded to relevant directorates and agribusinesses for further shortlisting in November 2007. A brief guide of how to conduct shortlisting and interviews was also sent with the applications to ensure that directorates and agribusinesses execute the process within approved human resource prescripts. Interviews were conducted from December 2007 to January 2008 and the Directorate: Education, Training and Extension Services rendered secretariat services. All successful candidates were issued with letters of appointment to resume their training on 1 February 2008.
3. PREPLACEMENT INTERVENTIONS
3.1 Training of mentors
In preparation for the 2008/09 internship intake, a training programme on Mentorship and Couching was organised during September 2007 to equip the mentors with the necessary skills and knowledge to conduct one-on-one job training. Sixty two (62) mentors underwent the training which was conducted by accredited service providers; Mentornet and LEMARK respectively. The training programme is competency based, unit standard aligned and South African Qualifications Authority (SAQA) approved at National Qualification Framework (NQF) level 4.
4. ARRIVAL PROGRAMME OF 2008/09 INTERNS/TRAINEES
4.1 Arrival
Interns/trainees reported at the DoA premises on 1 February 2008. The first day was dedicated to administrative matters. Contracts were signed and all relevant documents such as certified copies of IDs, Z56 forms for electronic payments of stipend in their banking accounts and workplans from mentors were received. The contents of the forms were explained in order to give them a better understanding of the agreements entered into.
4.2 Orientation and Induction Programme
The orientation and induction session of the new intake was held at the DoA (Sefala conference centre) on the 12th of February 2008.The purpose of this session was to give new interns/trainees a broad overview of the programme and the expected outputs. Over and above this, it was also meant to lay a foundation for participants to come to a better understanding of the department, its values and the work ethics. The following aspects were covered during the session:
• Experiential Training, Internship and Professional Development Policy
• Code of conduct and dress code
• Effective usage of logbook (management toolkit)
• Procedures for monthly claims
• Monthly progress reports
• Monitoring visits
• Capacity building programmes for interns
• Telephone and internet policies.
— 4 —
4.3 Capacity building programmes for trainees
All conventional and AIDP interns/trainees attended a 4-day abridged accredited project management fundamentals course at NQF level 4 presented by Imsimbi Training at the Premier hotel from 14 April to 30 May 2008.
The objective of the course was to provide learners with a thorough knowledge of the project management model and project process groups. The course provided learners with the fundamental understanding of the project life-cycle, parties and documentation involved and the role played by the project management administrator throughout the life-cycle of the project. This was intended to enable interns/trainees to plan properly for effective service delivery.
All attendees were expected to submit Portfolios of Evidence (PoEs) as part of the practical assessment of the course. Out of the 142 interns who attended the training, 139 submitted their PoEs and 138 (99,3 %) were declared competent and only 1 (0,7 %) was declared incompetent.
5. ANALYTICAL REPORTS OF THE IMPLEMENTATION OF VARIOUS CATEGORIES OF THE EXPERIENTIAL TRAINING, INTERNSHIP AND PROFESSIONAL DEVELOPMENT
The programme catered for three major categories of interns/trainees in 2008/09:
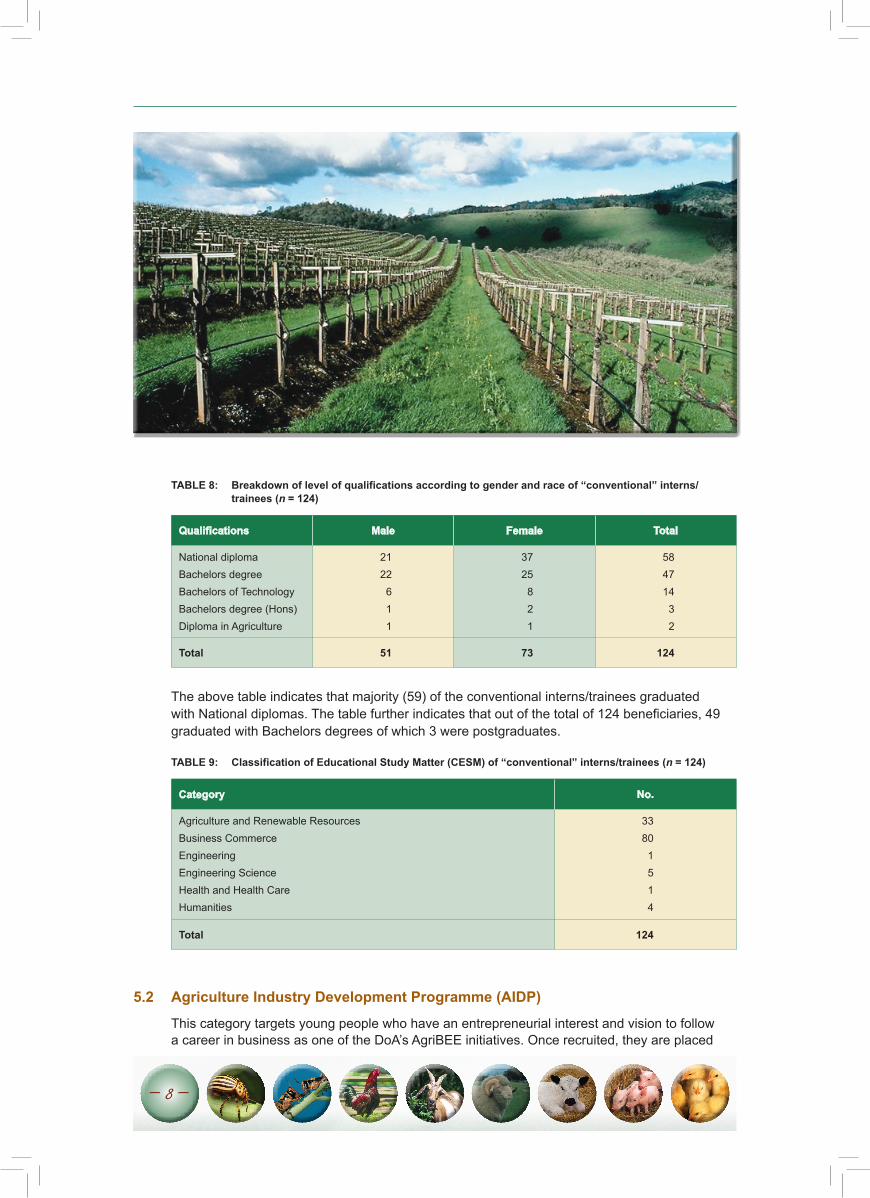
5.1 Conventional
This category targets young people who are completing their studies and need experiential training in order to obtain their qualifications as well as qualified unemployed graduates who need practical hands-on experience to enhance their chances of employability. Once recruited, they are placed with relevant functional units or directorates within the DoA for a period of 12 months for their training. A total of 124 interns/trainees were recruited and recommended for placement as conventional and constituted 72,0 % of the 2008/09 total intake. Out of these 124 conventional interns/trainees, 4 were doing experiential training.
The profiles of the 2008/09 conventional interns/trainees are presented in the following tables:
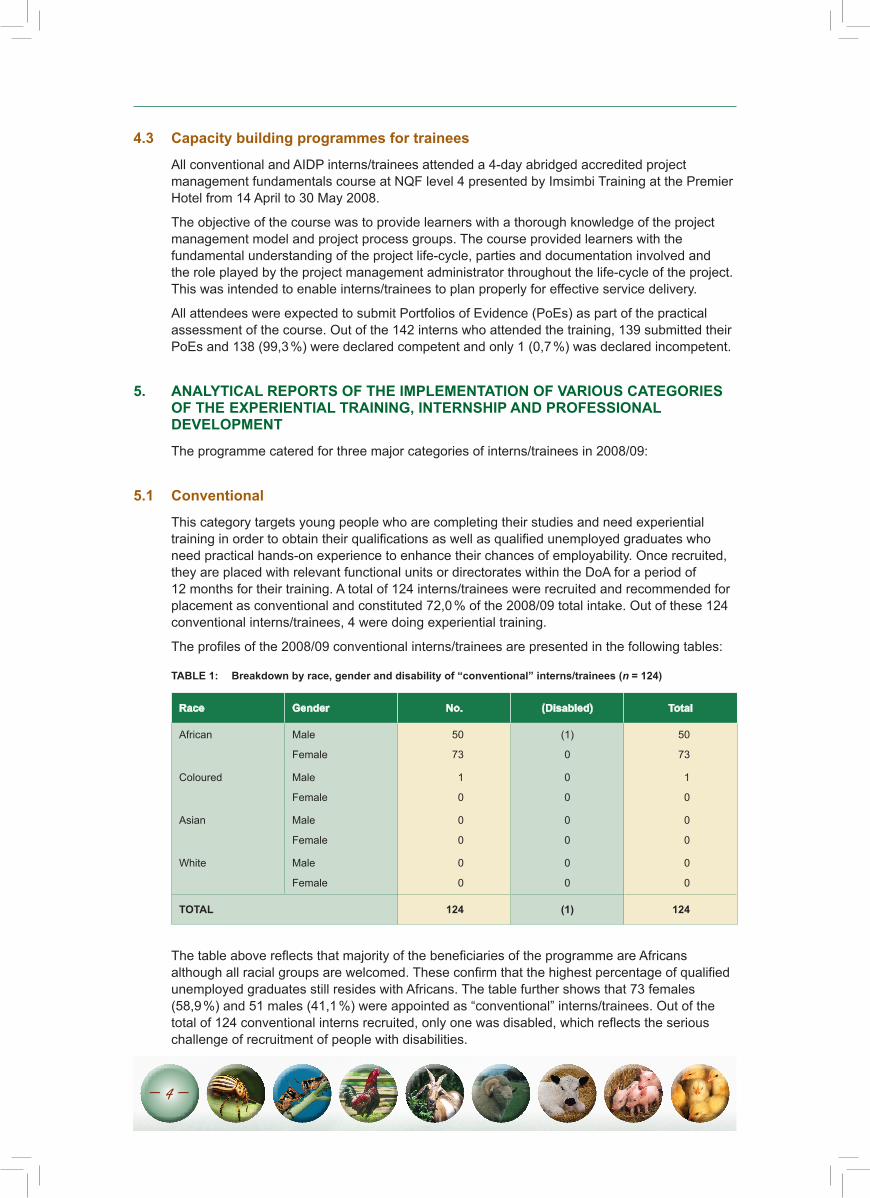
TABLE 1: Breakdown by race, gender and disability of “conventional” interns/trainees (n = 124)
Race Gender No. (Disabled) Total
African Male
Female
50
73
(1)
0
50
73
Coloured Male
Female
1
0
0
0
1
0
Asian Male
Female
0
0
0
0
0
0
White Male
Female
0
0
0
0
0
0
TOTAL 124 (1) 124
The table above reflects that majority of the beneficiaries of the programme are Africans although all racial groups are welcomed. These confirm that the highest percentage of qualified unemployed graduates still resides with Africans. The table further shows that 73 females (58,9 %) and 51 males (41,1 %) were appointed as “conventional” interns/trainees. Out of the total of 124 conventional interns recruited, only one was disabled, which reflects the serious challenge of recruitment of people with disabilities.
— 5 —
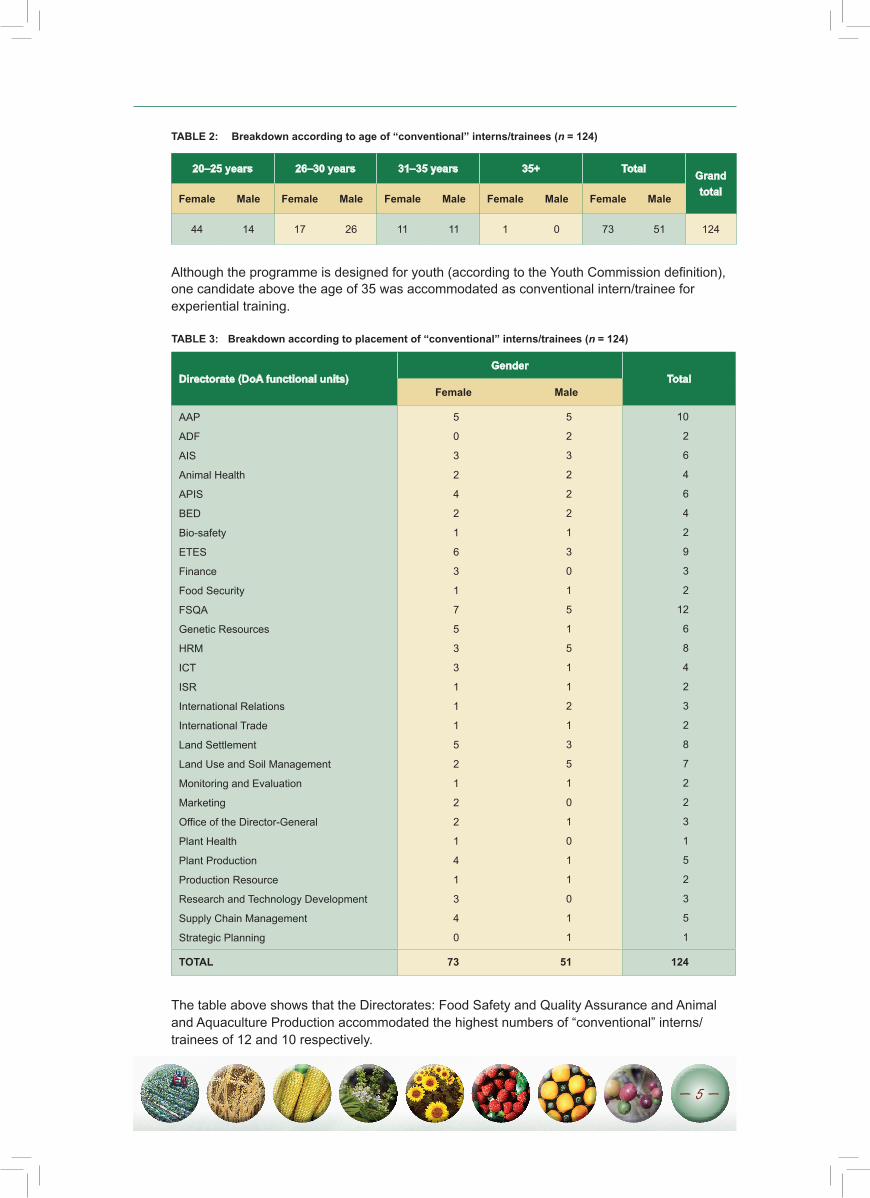
TABLE 2: Breakdown according to age of “conventional” interns/trainees (n = 124)
20–25 years 26–30 years 31–35 years 35+ Total Grand totalFemale Male Female Male Female Male Female Male Female Male
44 14 17 26 11 11 1 0 73 51 124
Although the programme is designed for youth (according to the Youth Commission definition), one candidate above the age of 35 was accommodated as conventional intern/trainee for experiential training.
TABLE 3: Breakdown according to placement of “conventional” interns/trainees (n = 124)
Directorate (DoA functional units)Gender
TotalFemale Male
AAP
ADF
AIS
Animal health
APIS
BED
Bio-safety
ETES
Finance
Food Security
FSQA
Genetic Resources
hRM
ICT
ISR
International Relations
International Trade
Land Settlement
Land Use and Soil Management
Monitoring and Evaluation
Marketing
Office of the Director-General
Plant health
Plant Production
Production Resource
Research and Technology Development
Supply Chain Management
Strategic Planning
5
0
3
2
4
2
1
6
3
1
7
5
3
3
1
1
1
5
2
1
2
2
1
4
1
3
4
0
5
2
3
2
2
2
1
3
0
1
5
1
5
1
1
2
1
3
5
1
0
1
0
1
1
0
1
1
10
2
6
4
6
4
2
9
3
2
12
6
8
4
2
3
2
8
7
2
2
3
1
5
2
3
5
1
TOTAL 73 51 124
The table above shows that the Directorates: Food Safety and Quality Assurance and Animal and Aquaculture Production accommodated the highest numbers of “conventional” interns/trainees of 12 and 10 respectively.
— 6 —
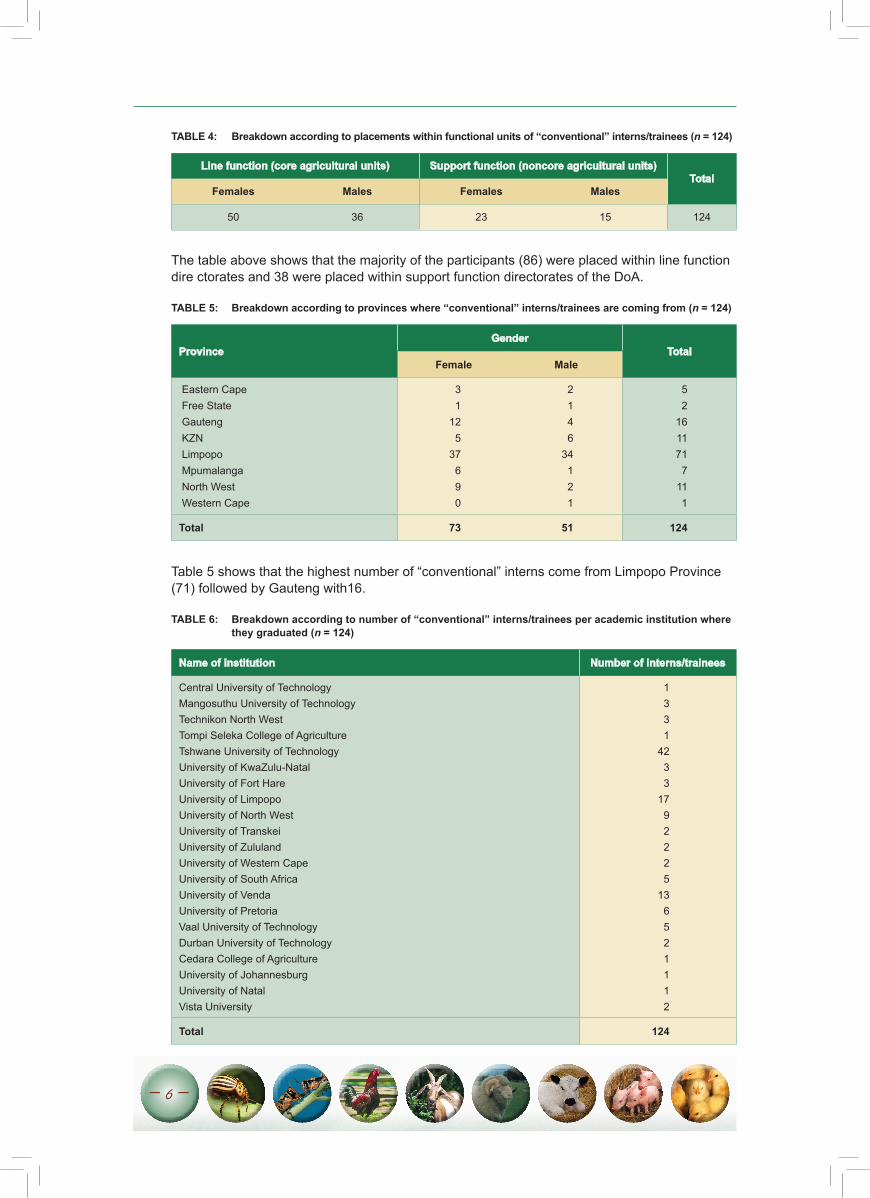
TABLE 4: Breakdown according to placements within functional units of “conventional” interns/trainees (n = 124)
Line function (core agricultural units) Support function (noncore agricultural units)Total
Females Males Females Males
50 36 23 15 124
The table above shows that the majority of the participants (86) were placed within line function dire ctorates and 38 were placed within support function directorates of the DoA.
TABLE 5: Breakdown according to provinces where “conventional” interns/trainees are coming from (n = 124)
ProvinceGender
TotalFemale Male
Eastern Cape Free State Gauteng KZN Limpopo Mpumalanga North West Western Cape
31
125
37690
2146
34121
52
1611717
111
Total 73 51 124
Table 5 shows that the highest number of “conventional” interns come from Limpopo Province (71) followed by Gauteng with16.
TABLE 6: Breakdown according to number of “conventional” interns/trainees per academic institution where they graduated (n = 124)
Name of institution Number of interns/trainees
Central University of TechnologyMangosuthu University of TechnologyTechnikon North WestTompi Seleka College of AgricultureTshwane University of TechnologyUniversity of KwaZulu-NatalUniversity of Fort hareUniversity of LimpopoUniversity of North WestUniversity of TranskeiUniversity of ZululandUniversity of Western CapeUniversity of South AfricaUniversity of VendaUniversity of PretoriaVaal University of TechnologyDurban University of TechnologyCedara College of AgricultureUniversity of JohannesburgUniversity of NatalVista University
1331
4233
1792225
136521112
Total 124
— 7 —
In terms of the academic institution where the beneficiaries of the programme graduated depicted by Table 6 on the previous page, Tshwane University of Technology has the highest number of 42 followed by University of Limpopo and University of Venda with 17 and 13 respectively.
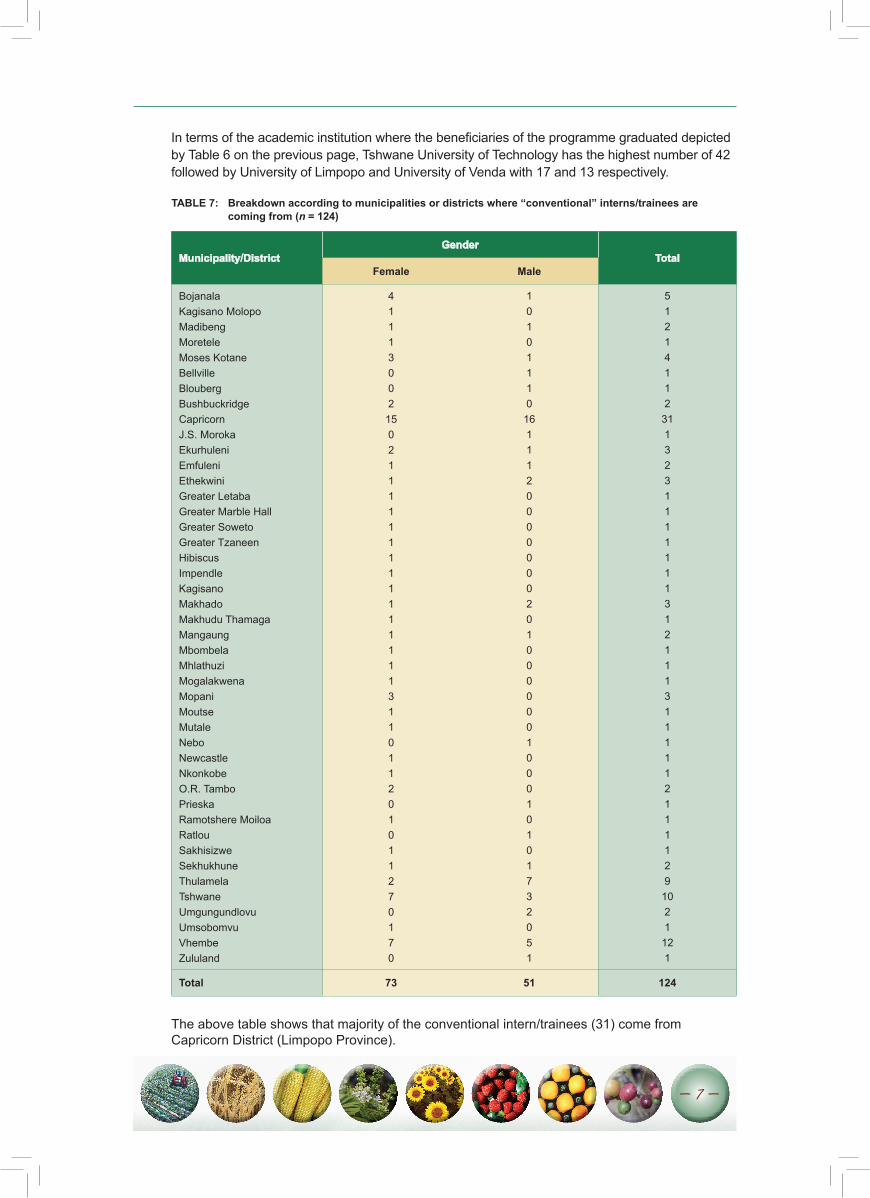
TABLE 7: Breakdown according to municipalities or districts where “conventional” interns/trainees are coming from (n = 124)
Municipality/DistrictGender
TotalFemale Male
BojanalaKagisano MolopoMadibengMoretele Moses KotaneBellvilleBloubergBushbuckridgeCapricornJ.S. MorokaEkurhuleniEmfuleniEthekwiniGreater LetabaGreater Marble hallGreater SowetoGreater TzaneenhibiscusImpendleKagisanoMakhadoMakhudu ThamagaMangaungMbombelaMhlathuziMogalakwenaMopaniMoutseMutaleNeboNewcastleNkonkobeO.R. TamboPrieskaRamotshere MoiloaRatlouSakhisizweSekhukhuneThulamelaTshwaneUmgungundlovuUmsobomvuVhembeZululand
411130021502111111111111111311011201011270170
101011101611120000000201000000100010101732051
51214112311323111111131211131111121111291021121
Total 73 51 124
The above table shows that majority of the conventional intern/trainees (31) come from Capricorn District (Limpopo Province).
— 8 —
TABLE 8: Breakdown of level of qualifications according to gender and race of “conventional” interns/trainees (n = 124)
Qualifications Male Female Total
National diplomaBachelors degreeBachelors of TechnologyBachelors degree (hons)Diploma in Agriculture
2122611
3725821
58471432
Total 51 73 124
The above table indicates that majority (59) of the conventional interns/trainees graduated with National diplomas. The table further indicates that out of the total of 124 beneficiaries, 49 graduated with Bachelors degrees of which 3 were postgraduates.
TABLE 9: Classification of Educational Study Matter (CESM) of “conventional” interns/trainees (n = 124)
Category No.
Agriculture and Renewable ResourcesBusiness CommerceEngineeringEngineering Sciencehealth and health Carehumanities
33801514
Total 124
5.2 Agriculture Industry Development Programme (AIDP)
This category targets young people who have an entrepreneurial interest and vision to follow a career in business as one of the DoA’s AgriBEE initiatives. Once recruited, they are placed
— 9 —
with relevant agribusinesses or industries for a period of 12 months for practical exposure and mentorship with regard to business related activities. A total of 24 interns/trainees were recruited and recommended for placement as AIDP interns and constituted 14,0 % of the 2008/09 total intake.
In addition to the project management training they attended as indicated under capacity development of interns above, the AIDP interns/trainees further attended an accredited and unit standard aligned Advanced Management Development course with the University of Stellenbosch Business School (USB-ED). The aim of the course is to equip the interns/trainees with the necessary leadership and entrepreneurial skills to enable them to be potential business men and women. The course is pitched at NQF level 7 and consists of the following modules:• Introduction to learning• Business directed action learning• Entrepreneurship and general management• Economics: A global perspective• Marketing• Labour issues and labour practice• Fundamentals of financial management• Managing people• Communication and presentation skills• Leadership and teamwork• Operations management• Safety, health and risk• Economics—sustainability in the agricultural industry.
All attendees were expected to submit an assignment per module as part of their assessment. In addition to assignments, the students were also expected to compile comprehensive business plans which they presented on the 29th of November 2008 to a committee comprising two representatives from the DoA and USB-ED respectively for correctness and viability. Out of the total 24 interns/trainees who attended the Advanced Management Development Course with the USB-ED School, 22 (91,7 %) completed all their assignments and were deemed competent whereas 2 (8,3 %) need to repeat two modules on their own during 2009 and successfully complete them to be regarded as competent.
The profiles of the 2008/09 AIDP interns/trainees are presented in the following tables:
TABLE 10: Breakdown by race and gender of AIDP interns/trainees (n = 24)
Race Gender No. Total
African MaleFemale
1311
1311
Coloured MaleFemale
00
00
Asian MaleFemale
00
00
White MaleFemale
00
00
Total 24 24
The table above reflects that all (24) of the beneficiaries of the programme are Africans and that there are no people with disabilities. The table further shows that 11 females (45,8 %) and 13 male (54,2 %) were appointed as AIDP interns/trainees.
— 10 —
TABLE 11: Breakdown according to age of AIDP interns/trainees (n = 24)
20–25 years 26–30 years 31–35 years 35+ Total Grand totalFemale Male Female Male Female Male Female Male Female Male
9 7 1 6 1 0 0 0 11 13 24
The table above indicates that the majorities (16) of the beneficiaries are between the age ranges of 20–25 and 7 between age categories of 26–30. Only 1 participant is above 30 years.
TABLE 12: Breakdown according to placement of AIDP interns/trainees (n = 24)
Agribusinesses/CompaniesGender
TotalFemale Male
ECI Africa
Citrus Academy
MADSED
MANSTRAT
MASDT
New Africa Skills Development
NWGASA
SENWES
TOES
2
1
2
2
1
0
0
2
1
1
1
2
3
1
1
2
2
0
3
2
4
5
2
1
2
4
1
Total 11 13 24
The table above indicates that MANSTRAT and MADSED hosted the majority of the AIDP interns of 5 and 4 respectively.
TABLE 13: Breakdown according to number of AIDP interns/trainees per academic institution where they graduated (n = 24)
Name of institution Number of interns/trainees
1. University of South Africa
2. University of North West
3. University of Pretoria
4. Fort-Cox College
5. Tshwane University of Technology
6. University of Cape Town
7. University of Fort hare
8. University of Free State
9. Cape Peninsula Technikon
10. Lowveld College of Agriculture
11. Durban University of Technology
12. Grootfontein College of Agriculture
13. Vaal Triangle Technikon
14. University of JhB
15. Walter Sisulu University
1
3
4
1
3
1
1
2
1
2
1
1
1
1
1
Total 24
— 11 —
In terms of the academic institution where the beneficiaries of the programme graduated, the University of Pretoria had the highest number of 4 (16,7 %) followed by University of North West and Tshwane University of Technology with 3 (12,5 %) each. University of Free State and Lowveld College of Agriculture followed with 2 (8,3 %) each. All the 10 remaining institutions accounted for 46,6 %.
TABLE 14: Breakdown of level of qualifications according to gender and race of AIDP interns/trainees (n = 24)
Qualifications Male Female Total
National diploma
Bachelors degree
Bachelors degree (hons)
Diploma in Agriculture
3
5
2
3
3
6
1
1
6
11
3
4
Total 13 11 24
The above table indicates that majority (11) of the interns/trainees were in possession of National Bachelors degrees followed by (6) with National diplomas. The table further shows that the majority (6) of the female were in possession of Bachelors degrees.
TABLE 15: Classification of Educational Study Matter (CESM) of AIDP interns/trainees (n = 24)
Category No.
Agriculture, Rural Development and Renewable Resources
Business and Commerce
humanities
12
7
5
Total 24
The results from the above table show that Agriculture, Rural Development and Renewable Resources constituted 50 % (12) of the CESM for 2008/9 AIDP interns/trainees. The next highest is the Business and Commerce with 29,2 % (7), followed by humanities at 20,8 % (5).
— 12 —
TABLE 16: Breakdown according to provinces where AIDP interns/trainees come from (n = 24)
ProvinceGender
TotalMale Female
GautengNorth WestLimpopoEastern CapeNorthern CapeMpumalangaFree StateKwaZulu-Natal
10241311
22212110
32453421
Total 13 11 24
The above table shows that the highest number of AIDP interns come from Eastern Cape Province (5) followed by Mpumalanga and Limpopo with (4) respectively.
TABLE 17: Breakdown according to municipalities where AIDP interns/trainees come from (n = 24)
MunicipalitiesGender
TotalMale Female
Amahlathi Vhembe Lesedi Frances Baard Nelson Mandela Thulamela Amathole Ditsobotla Sol Plaatjie T.S. Moroka Mangaung Aganang Mantsopa Mbombela Ethekwini Emalahleni Buffalo City Govan Mbeki Tlokwe Tshwane Mafikeng
100101100101111111010
021010011010010000111
121111111111121111121
Total 13 11 24
In terms of the municipalities where the AIDP interns come from, the table shows that they are evenly distributed among various municipalities.
5.3 Young Professional Development Programme (PDP)The Young Professional Development Programme was introduced by the DoA for the first time during this financial year 2008/09.It is a capacity building programme contributing to a relevant
— 13 —
and credible future agricultural scientific base for the agricultural sector. It was introduced to address the shortage of skilled agricultural professionals and technical staff which is one of the handicaps to agricultural development in South Africa. Through this programme, a pool of young scientists, engineers, technologists and technicians from the previously disadvantaged groups will be created.
This category targets young graduates in possession of requisite Bachelor’s degree such as B.Sc., B.Sc. Agric., B.Sc. Engineering, B.V.Sc. or postgraduate qualification in agriculture or natural science who would like to further their studies at honours, Masters and Ph.D. level in the area of research leading to innovation in the critically scarce skills in agriculture. Successful candidates are taken as interns, placed with the relevant research institution/industry and are attached to an experienced mentor/supervisor while furthering their studies and receive a monthly stipend. A total of 25 interns/trainees were recruited and recommended for placement as Young Professional Development Programme interns/trainees and constituted 14,4 % of the 2008/09 total intake.
During the recruitment process as outlined on page 2 (section 2) completing DoA bursary holders were given first preference to participate in the Young Professional Development Programme provided that they met admission requirements of the institution of higher learning in one of the scarce skills in agriculture and 9 of the 25 recruited were bursary holders. In an effort to address the shortage of skilled technicians and professionals at the Grootfontein Agricultural Development Institute, which is one of the DoA’s directorates, 7 of the 25 recruited young professionals were appointed on a 3-year contract and placed at the institution to carry out research projects of the institution.
The profiles of the 2008/09 PDP beneficiaries are presented in the following tables and graphs:
TABLE 18: Breakdown by race, gender and disability of PDP interns/trainees (n = 25)
Race Gender No. Disabled Total
African MaleFemale
715
00
715
Coloured MaleFemale
11
00
11
Asian MaleFemale
00
00
00
White MaleFemale
01
00
01
Total 25 0 25
The graph above shows that the majority of the young professionals came from the previously disadvantaged designated groups which is in line with the objectives of the programme. however, the major challenge is the recruitment of people with disabilities. Worth noting from the table above is the high number (17) of female beneficiaries.
TABLE 19: Breakdown according to age of PDP interns/trainees (n = 25)
20–25 years 26–30 years 31–35 years 35+ Total Grand totalFemale Male Female Male Female Male Female Male Female Male
7 2 4 5 6 1 0 0 17 8 25
The table above indicates that 9 beneficiaries are between the age ranges of 20–25 and 26–30 respectively and 7 are between age categories of 31–35.
— 14 —
TABLE 20: Breakdown of level of qualifications according to gender and race of PDP interns/trainees (n = 25)
Qualifications Male Female Total
National diplomaBachelors degreeBachelors of TechnologyBachelors degree (Masters)
0800
31211
32011
Total 8 17 25
The table above shows that out of the 25 recruited young professionals, 20 of them graduated with Bachelor of Science degrees in agriculture and 3 with National diplomas. The table further shows that those who graduated with Bachelor of Technology and Bachelors of Science (honours) degrees were one respectively.
TABLE 21: A breakdown of PDP interns/trainees according to provinces they come from (n = 25)
Provinces Total number
KwaZulu-NatalNorthern CapeEastern CapeFree StateMpumalangaNorth WestLimpopoGautengWestern Cape
204055522
Total 25
The table above shows that majority of the young professionals are coming from Mpumalanga, North West and Limpopo respectively.
TABLE 22: Breakdown according to number of PDP interns/trainees per academic institution they graduated from (n = 25)
Name of institution Number of interns/trainees
1. University of the Western Cape2. University of Free State3. University of Pretoria4. University of the North West5. University of Swaziland6. Tshwane University of Technology 7. University of Fort hare8. University of Limpopo9. University of Free State10. University of Stellenbosch11. Grootfontein College of Agriculture12. Cape Peninsula University of Technology
214411232311
Total 25
The table above shows the majority (4) of the young professionals graduated from the University of Pretoria and the North West respectively.
— 15 —
TABLE 23: A breakdown of PDP interns/trainees according to Municipality where they come from (n = 25)
Municipalities Total number
Moses KotaneBellvilleCity of JohannesburgNkobonkobeO.R.TamboLepelle NkumpiSteve TshweteRatlouRamotshereUmhlathuzeChris haniEthekwiniNkomaziGreater TzaneenDr J.S. MorokaGreater GiyaniThulamelaMsukaligwaThaba ChweuEkurhuleni
32112111111121111111
Total 25
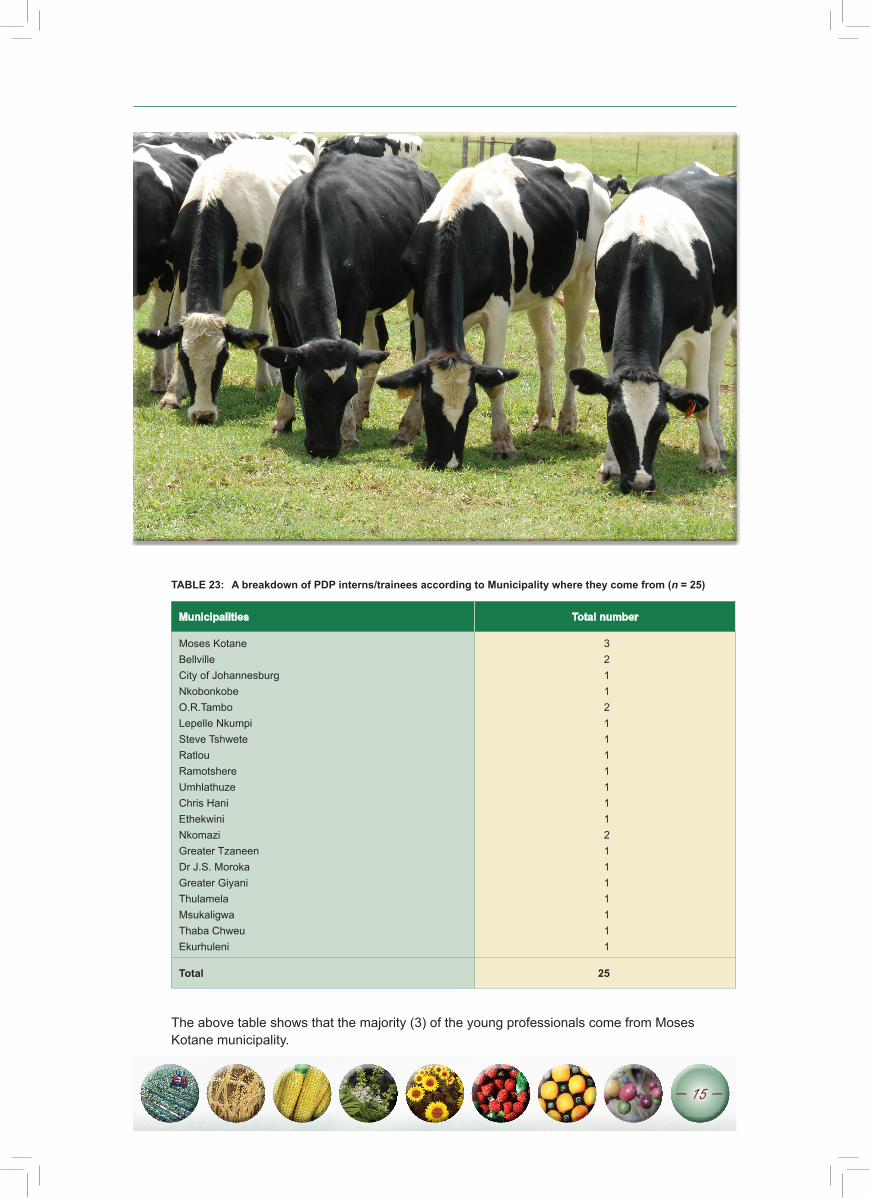
The above table shows that the majority (3) of the young professionals come from Moses Kotane municipality.
— 16 —
6. FIELDS OF STUDIES AND PLACEMENT OF YOUNG PROFESSIONALS FOR THE 2008 ACADEMIC YEAR
6.1 Fields of studies of young professionals for the 2008 academic year
One of the conditions set for participation in the Young Professional Development Programme, is to register for postgraduate studies in one of the identified scarce skills approved by the DoA while placed with the relevant industry or research institution for practical hands-on experience. Out of the total of 25 recruited young professionals; only 18 were registered for further studies. The 7 young professionals attached to Grootfontein Agricultural Development Institute were not registered for further studies during the 2008 academic year because they were appointed from 1st June 2008 and the academic institutions were closed for the 2008 academic year registration.
TABLE 24: Analysis of fields of studies of young professionals during the 2008 academic year according to race and gender (n = 18)
Field of study
Race Gender
TotalAfrican Coloured Indian White Male Female
(No.) (No.)
B.Sc. hons Agric. Economics 2 0 0 0 1 1 2
B.Sc. hons Agric. Extension 1 0 0 0 0 1 1
B.Sc. hons Agric. Economics and Viticulture 1 0 0 0 0 1 1
B.Sc. hons Ichthyology and Fisheries Science 1 0 0 0 1 0 1
B.Sc. hons Food Science 1 0 0 0 1 0 1
M.Sc. Agric Economics 2 0 0 0 0 2 2
M.Sc. Plant Biotechnology 0 1 0 0 1 0 1
M.Sc. Viticulture 0 0 0 1 0 1 1
M.Sc. Animal Science 1 0 0 0 0 1 1
M.Sc. Animal Production 1 0 0 0 0 1 1
M.Sc. horticulture 1 0 0 0 0 1 1
M.Sc. Veterinary Tropical Disease 1 0 0 0 0 1 1
B. Tech. Food Technology 2 0 0 0 0 2 2
M. Tech. Food Technology 0 1 0 0 0 1 1
Ph.D. Biotechnology 1 0 0 0 0 1 1
Total 15 2 0 1 4 14 18
The table above indicates the fields of studies which the young professionals are registered for in 2008. The table further indicates that of the 18 young professionals, 6 registered for B.Sc. (hons), 8 for M.Sc., 1 for B.Tech., M. Tech. and Ph.D. respectively.
6.2 Period of participation of young professionals in the programmeAll the recruited young professionals are requested to enter into an agreement with the DoA with the obligation to serve the department or its entities after completion of the programme and to complete their studies within the prescribed period. The prescribed period of participation is outlined below:• B. Tech. and honours degree: 2 years• Masters degree: 2 years• Ph.D: 3 years.
— 17 —
TABLE 25: An analysis of the year level of study for the young professionals (n = 18)
Fields of studiesYear of study
Total1 2 3
B. Tech.. Food Technology
B.Sc. hons Agric. Economics
B.Sc. hons Agric. Economics and Viticulture
B.Sc. hons Agric. Extension
B.Sc. hons Food Science
B.Sc. hons Ichthyology and Fisheries Science
M.Sc. Agric. Economics
M.Sc. Plant Biotechnology
M.Sc. Viticulture
M.Sc. Animal Science
M.Sc. Animal Production
M.Sc. horticulture
M.Sc. Veterinary Tropical Disease
M.Tech. Food Technology
Ph.D. Biotechnology
2
2
1
1
1
1
2
0
0
1
1
1
1
1
0
0
0
0
0
0
0
0
1
1
0
0
0
0
0
0
0
0
0
0
0
0
0
0
0
0
0
0
0
0
1
2
2
1
1
1
1
2
1
1
1
1
1
1
1
1
Total 15 2 1 18
The table above shows that the majority of the young professional were doing first year of their postgraduate studies.
— 18 —
6.3 Placement of young professionals during the 2008 academic year
It is a requirement for all young professionals to be placed with the relevant institution to be exposed to various research and technological methodologies in order to be equipped with hands-on practical experience of the agricultural research and technological environment. The table below indicates areas where the young professionals were placed to carry out research projects relevant to their fields of studies. Each young professional was allocated a mentor who worked together with the supervisor at the institution of higher learning regarding the academic progress of the student. The young professionals who were placed within the laboratories of the universities for the projects, their supervisors also served as their mentors.
TABLE 26: Breakdown according to placement of young professionals (n = 25)
Institution of higher learning/Research institution/industry
GenderTotal
Female Male
Grootfontein Agricultural Development InstituteAgricultural Research CouncilStellenbosch Fresh World ExportSurepure Cape Town DeucrispUniversity of PretoriaUniversity of the NorthUniversity of Fort hareCape Peninsula University of TechnologyUniversity of Free StateRhodes UniversityUniversity of the Western CapeUniversity of Stellenbosch
3211123110011
4000010001110
7211133111121
Total 17 8 25
The table above shows that the majority (7) of the young professional were placed at Grootfontein Agricultural Development Institute followed by the University of Pretoria and Limpopo with 3 young professionals respectively.
7. SUMMARY OF PROFILES OF ALL CATEGORIES OF THE EXPERIENTIAL TRAINING, INTERSNHIP AND PROFESSIONAL DEVELOPMENT PROGRAMME
The following tables summarise the profiles of all interns:
TABLE 27: Breakdown by race, gender and disability of all interns/trainees (n = 173)
Race Gender No. Disabled Total
African MaleFemale
7099
(1)0
7099
Coloured MaleFemale
21
00
21
Asian MaleFemale
00
00
00
White MaleFemale
01
00
01
TOTAL 173 (1) 173
— 19 —
Table 27 shows a comprehensive summary according to race and gender of all categories of interns. In the summary, the table shows that the majority of the participants are Africans. The table further indicates that females were 101 while males were 72.
TABLE 28: Breakdown according to age of all interns/trainees (n = 173)
20–25 years 26–30 years 31–35 years 35+ Total Grand totalFemale Male Female Male Female Male Female Male Female Male
60 23 22 37 18 12 1 0 101 72 173
The table above depicts the age ranges of all interns recruited during the 2008/09 financial year. In summary, out of the total intake of 173 interns/trainees, the majority (83) of them were within the age range of 20–25, 57 were between 26–30, 30 were between 31–35 while only one was above 35 years.
TABLE 29: Breakdown according to provinces where all interns/trainees are coming from (n = 173)
ProvinceGender
TotalMale Female
Eastern Cape
Free State
Gauteng
KwaZulu-Natal
Limpopo
Mpumalanga
North West
Western Cape
9
2
17
7
43
9
13
1
5
2
6
7
37
8
5
2
14
4
23
14
80
17
18
3
Total 101 72 173
The table above depicts the provinces where all interns are coming from. In summary, the majority (80) of the interns come from Limpopo Province.
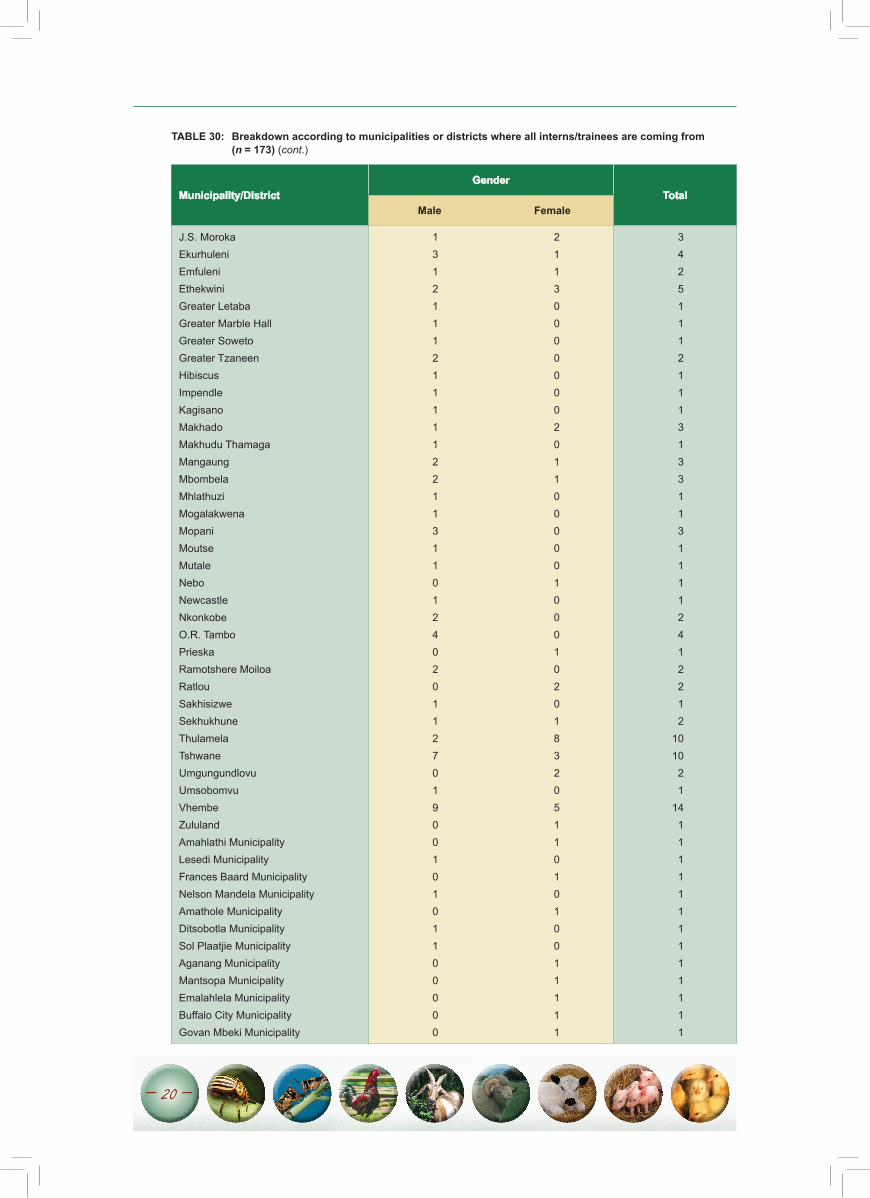
TABLE 30: Breakdown according to municipalities or districts where all interns/trainees are coming from (n = 173) (cont.)
Municipality/DistrictGender
TotalMale Female
Bojanala
Kagisano Molopo
Madibeng
Moretele
Moses Kotane
Bellville
Blouberg
Bushbuckridge
Capricorn
4
1
1
1
5
1
0
2
16
1
0
1
0
2
2
1
0
15
5
1
2
1
7
3
1
2
31
— 20 —
TABLE 30: Breakdown according to municipalities or districts where all interns/trainees are coming from (n = 173) (cont.)
Municipality/DistrictGender
TotalMale Female
J.S. MorokaEkurhuleniEmfuleniEthekwiniGreater LetabaGreater Marble hallGreater SowetoGreater TzaneenhibiscusImpendleKagisanoMakhadoMakhudu ThamagaMangaungMbombelaMhlathuziMogalakwenaMopaniMoutseMutaleNeboNewcastleNkonkobeO.R. TamboPrieskaRamotshere MoiloaRatlouSakhisizweSekhukhuneThulamelaTshwaneUmgungundlovuUmsobomvuVhembeZululandAmahlathi MunicipalityLesedi MunicipalityFrances Baard MunicipalityNelson Mandela MunicipalityAmathole MunicipalityDitsobotla Municipality Sol Plaatjie MunicipalityAganang MunicipalityMantsopa MunicipalityEmalahlela MunicipalityBuffalo City MunicipalityGovan Mbeki Municipality
13121112111112211311012402011270190010101100000
21130000000201100000100010201832051101010011111
34251112111313311311112412212
101021
141111111111111
— 21 —
TABLE 30: Breakdown according to municipalities or districts where all interns/trainees are coming from (n = 173) (cont.)
Municipality/DistrictGender
TotalMale Female
Tlokwe MunicipalityTshwane MunicipalityMafikeng MunicipalityGreater Giyane MunicipalityNkomazi MunicipalityThulamela MunicipalityMsukaligwa MunicipalityThaba ChweuCity of Johannesburg MunicipalityLepelle Nkumpi MunicipalitySteve Tshwete MunicipalityUmhlathuze MunicipalityChris hani Municipality
1110100111011
0101111000100
1211211111111
Total 101 72 173
The table above shows the municipalities where all interns are coming from. In summary, the majority (31) of the interns come from Capricorn district.
8. MONITORING AND EVALUATION
8.1 Monthly and quarterly progress reports
Monitoring and evaluation of the progress of interns/trainees is crucial and fundamental in the implementation of the programme. For conventional and AIDP interns, a day prior to the beginning of each month, the intern/trainee and the mentor agreed on the learning outcomes and key performance areas for the ensuing month and compiled a monthly workplan. Flowing from the workplan, the interns/trainees recorded all daily activities executed based on the roadmap provided by the workplan.
The compulsory weekly review meetings between mentor and intern/trainee were held to evaluate the progress of interns at that level. At the end of every month, all interns compiled their monthly progress reports based on activities executed during that particular month. Such reports were forwarded to the internship unit for evaluation and assessment. Many interns/trainees struggled to produce quality reports during the first 3 months of their participation in the programme. Through the interventions made during monitoring visits of the first quarter, the qualities of reports improved significantly.
With regard to the young professionals, quarterly progress reports signed by their supervisors/mentors were also received and analysed accordingly.
8.2 Monthly claims and stipends
All interns/trainees, except for the young professionals attached to Grootfontein Agricultural Development Institute, are classified as daily paid workers and they had to complete claim forms (time sheets) that indicated all the days they worked in a particular month. Mentors and
— 22 —
Senior Managers were tasked with the responsibility to manage this system at their respective workstations. A few days before the end of each month, reminders were sent to all interns/trainees, mentors and Senior Managers to advise them on how the time sheet should be completed. All completed claim forms, leave forms and progress reports were sent on a monthly basis to the Directorate: ETES for assessment before being forwarded to the Directorate: Finance for further processing. Monthly stipends of interns/trainees were increased from R167,60 to R185,20 per day from 1st of July 2008.The young professionals at Grootfontein Agricultural Development Institute were paid automatically every month end.
8.3 Monitoring visits
Monitoring visits constituted an important monitoring mechanism of the programme. Such visits were arranged between the mentors and interns/trainees and were conducted on a quarterly basis according to a planned schedule and when need arose. however, owing to limited human resources such schedules were not always adhered to. The purpose of the monitoring visits during the 1st quarter was to establish how the interns/trainees were settling at their workstations and to outline important administration aspects of the programme. Aspects encountered during the monitoring visits included insufficient office space, especially directorates located in Agriculture Place and lack of preparedness in most cases when interns are taken in.
Aspects dealt with during other monitoring visits included spot checks on logbooks, leave records and presentations of quarterly reports by interns/trainees. It was established during these visits that logbooks were satisfactorily utilised.
8.4 Success indicators of the programme
8.4.1 Conventional and Agriculture Industry Development Programme
For the Conventional and AIDP, the major success indicators of these categories of the intern-ship programme are the number of participants who secure employment or establish their own business during their training programme. These interns were expected to be very aggressive in their approach of looking for employment and business opportunities. Out of the total intake of 173, the conventional and AIDP interns were 148. By nature of their contracts, they were allowed to resign from the programme by serving 1 week’s notice once they have secured employment. Therefore monitoring resignations was an important tool to evaluate the impact of these categories of the programme and a comprehensive database to track resignations of these interns was established and updated continuously. The resignation database consisted of the following elements:• Personal details of the interns• Organisation or directorates where they are placed• Period of stay in the programme• Organisation where employment is secured• Position and salary level.
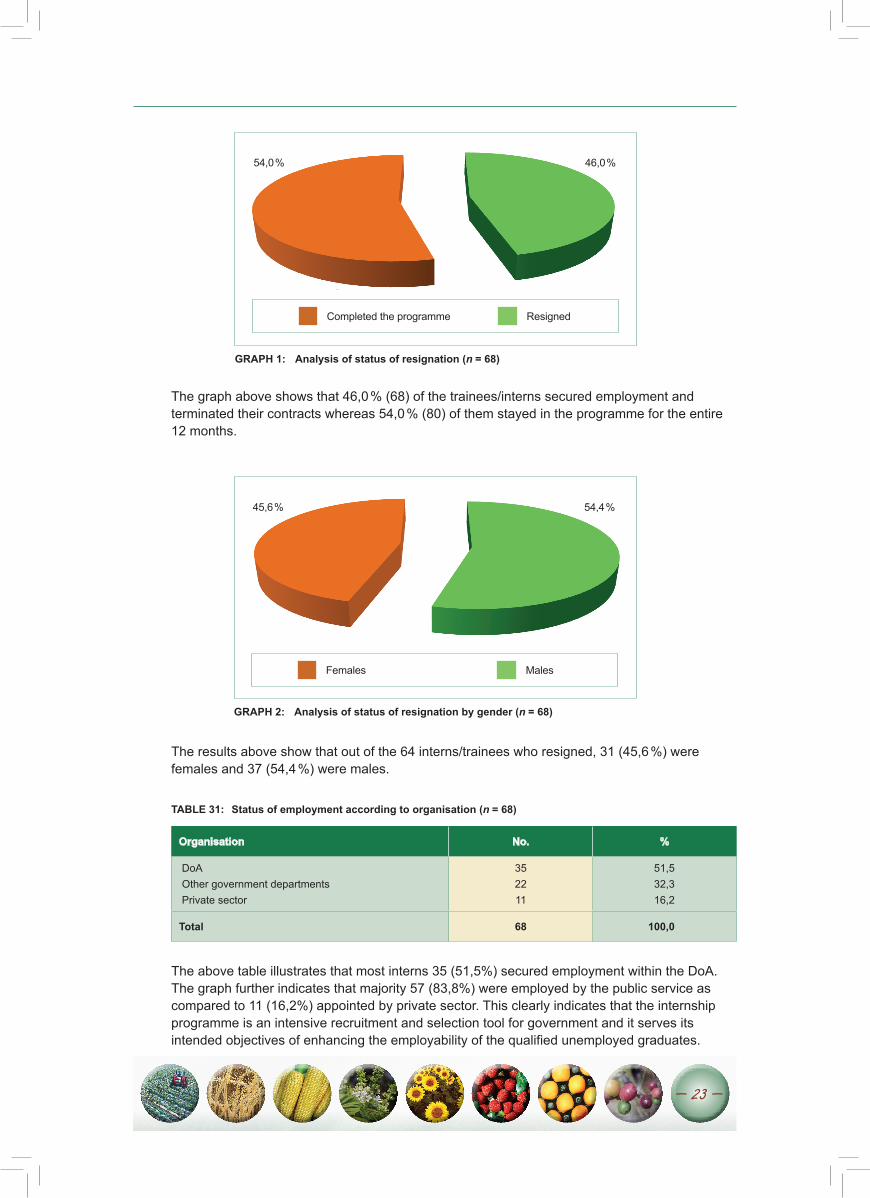
Out of the 148 interns who were expected to secure employment, 68 (46,0 %) secured employment and resigned from the programme while 80 (54,0 %) remained in the programme for the entire 12 months. The rate of employment of interns during the 2008/09 programme was lower as compared to 51 % (83 interns) who secured employment during 2007/08. This was because of the impact of the global recession in the economy that severely affected availability of jobs worldwide and South Africa was not an exception. The analysis of the status of resignations is outlined in the following graphs:
— 23 —
The results above show that out of the 64 interns/trainees who resigned, 31 (45,6 %) were females and 37 (54,4 %) were males.
TABLE 31: Status of employment according to organisation (n = 68)
Organisation No. %
DoA Other government departments Private sector
352211
51,532,316,2
Total 68 100,0
The above table illustrates that most interns 35 (51,5%) secured employment within the DoA. The graph further indicates that majority 57 (83,8%) were employed by the public service as compared to 11 (16,2%) appointed by private sector. This clearly indicates that the internship programme is an intensive recruitment and selection tool for government and it serves its intended objectives of enhancing the employability of the qualified unemployed graduates.
11
2
45,6 % 54,4 %
Females Males
GRAPH 2: Analysis of status of resignation by gender (n = 68)
11
2
54,0 % 46,0 %
Completed the programme Resigned
GRAPH 1: Analysis of status of resignation (n = 68)
The graph above shows that 46,0 % (68) of the trainees/interns secured employment and terminated their contracts whereas 54,0 % (80) of them stayed in the programme for the entire 12 months.
— 24 —
TABLE 32: Analysis of period of stay before securing employment (n = 68)
Period of participation Total
1–3 months4–6 months7–9 months9–12 months
04142030
Total 68
The table 13 above indicates that the majority of the interns/trainees 20 (44,1 %) of those who resigned, secured employment during the last 3 months of the programme (9–12).
TABLE 33: Analysis of levels of employment of trainees/interns (n = 68)
Salary level (SL) Number of interns/trainees
SL 10 SL 9 SL 8 SL 7 SL 6 SL 5 SL 4 SL 3
0502102511060405
Total 68
The table above indicates the levels at which trainees/interns secure employment. It is worth noting that 17 of them (25,0 %) were appointed at middle management level.
8.4.2 Young Professional Development Programme
The primary success indicator of this category of the internship programme is the number of participants who successfully complete their postgraduate studies and are absorbed in the mainstream of the economy in the agricultural sector. Out of the total intake of 25 young professionals, 18 of them were registered for postgraduate studies as depicted by Table 24 on page 16 and their performance is outlined in the following tables.
— 25 —
TABLE 34: An analysis of 2008 academic performance of young professionals (n = 18)
Field of studyNo.
satis factory
% No. un satis fac
tory
% Total
B. Tech. Food TechnologyB.Sc. hons Agric. EconomicsB.Sc. hons Agric. Economics and ViticultureB.Sc. hons Agric. ExtensionB.Sc. hons Food ScienceB.Sc. hons Ichthyology and Fisheries ScienceM.Sc. Agric. EconomicsM.Sc. Plant BiotechnologyM.Sc. ViticultureM.Sc. Animal ScienceM.Sc. Animal ProductionM.Sc. horticultureM.Sc. Veterinary Tropical DiseaseM.Tech. Food TechnologyPh.D. Biotechnology
111011211111111
5050
1000
100100100100100100100100100100100
110100000000000
50500
10000000000000
221111211111111
Total 15 83,3 3 16,7 18
The table above depicts the 2008 academic performance of 18 young professionals who are registered for further studies. The performance of 15 (83,3 %) young professionals is satisfactory while the one for 3 (16,7 %) is not satisfactory.
— 26 —
TABLE 35: An analysis of young professionals whose performance is satisfactory (n = 15)
Field of study
Race Gender
TotalAfrican Coloured Indian White Male Female
No. % No. % No. % No. % No. % No. %
B.Tech. Food Technology 1 100 0 0 0 0 0 0 0 0 1 100 1
B.Sc. hons Agric. Economics 1 100 0 0 0 0 0 0 0 0 1 100 1
B.Sc. hons Agric Economics and Viticulture 1 100 0 0 0 0 0 0 0 0 1 100 1
B.Sc. hons Agric. Extension 0 0 0 0 0 0 0 0 0 0 0 0 0
B.Sc. hons Food Science 1 100 0 0 0 0 0 0 1 100 0 0 1
B.Sc. hons Ichthyology and Fisheries Science 1 100 0 0 0 0 0 0 1 100 0 0 1
M.Sc. Agric. Economics 2 100 0 0 0 0 0 0 0 0 2 100 2
M.Sc. Plant Biotechnology 0 0 1 100 0 0 0 0 1 100 0 0 1
M.Sc. Viti- culture 0 0 0 0 0 0 1 100 0 0 1 100 1
M.Sc. Animal Science 1 100 0 0 0 0 0 0 0 0 1 100 1
M.Sc. Animal Production 1 100 0 0 0 0 0 0 0 0 1 100 1
M.Sc. horti- culture 1 100 0 0 0 0 0 0 0 0 1 100 1
M.Sc. Veterinary Tropical Disease 1 100 0 0 0 0 0 0 0 0 1 100 1
M.Tech. Food Technology 0 0 1 100 0 0 0 0 0 0 1 100 1
Ph.D. Bio - technology 1 100 0 0 0 0 0 0 0 0 1 100 1
Total 12 80,0 2 13,3 0 0 1 6,7 3 20,0 12 80,0 15
— 27 —
TABLE 36: An analysis of young professionals whose performance is not satisfactory in 2008 (n = 3)
Field of study
Race Gender
TotalAfrican Coloured Indian White Male Female
No. % No. % No. % No. % No. % No. %
B.Tech. Food Technology 1 100 0 0 0 0 0 0 0 0 1 100 1
B.Sc. hons Agric. Extension 1 100 0 0 0 0 0 0 0 0 1 100 1
B.Sc. hons Agric. Economics 1 100 0 0 0 0 0 0 1 100 0 0 1
Total 3 100 0 0 0 0 0 0 1 33,3 2 67,7 3
In terms of the data presented in the table above, the performance of 3 young professionals is unsatisfactory and they will be suspended from the programme in 2009.
TABLE 37: An analysis of young professionals who completed their studies and graduated 2008 (n = 5)
Field of study
Race Gender
TotalAfrican Coloured Indian White Male Female
No. % No. % No. % No. % No. % No. %
B.Sc. hons Agric. Economics 1 100 0 0 0 0 0 0 0 0 2 100 1
B.Sc. hons Agric. Economics and Viticulture 1 100 0 0 0 0 0 0 0 0 1 100 1
B.Sc. hons Food Science 1 100 0 0 0 0 0 0 1 100 0 0 1
B.Sc. hons Ichthyology and Fisheries Science 1 100 0 0 0 0 0 0 1 100 0 0 1
M.Sc. Veterinary Tropical Disease 1 100 0 0 0 0 0 0 0 0 1 100 1
Total 5 100 0 0 0 0 0 0 2 40 4 60 5
The above table shows that 5 of the young professionals completed their studies in the 2008 academic year. The intern who completed B.Sc. hons Agriculture and Viticulture was appointed by the Fresh Export Company in Stellenbosch responsible for logistics in LCL Grindrod (Tyger Valley area). All other young professionals will continue their studies through the DoA’s Young Professional Development Programme in 2009.
8.5 Analysis of exit interview forms
Upon resignation interns/trainees are required to complete an exit interview form as a tool to evaluate the effectiveness of the programme. The majority of interns/trainees reflected the following as benefits of the programme:
— 28 —
• Relevant exposure thus leading to securing employment.• Exposure to the workplace.• Boosted competence and confidence.• Access to resources, information and assistance for job searches and interviews.• Skills gained as follows:
– Project management knowledge – Presentation skills – Policy implementation – Report writing – Communication skills – Computer skills – Administration skills.
8.6 Midterm Review Conference
The Mid-term Review Conference to evaluate the effectiveness of the Experiential Training, Internship and Professional Development Programme was held at Kopanong hotel and Conference Centre from 27 to 29 August 2008. A detailed report of the conference is attached as Annexure A.
9. CERTIFICATION CEREMONY OF THE 2008/09 INTERNS/TRAINEES AND MENTORS
The certification ceremony of both the 2008/09 mentors and interns was held at the CSIR International Convention Centre on the 22nd of January 2009. The purpose of the event was to bid farewell to the interns and to congratulate those who have secured employment as well as to recognise and appreciate the mentors for their dedication and commitment in mentoring the interns. Guests who attended the ceremony included, amongst others, the following: Deputy Director-General: Agriculture Support Services (Ms V. Titi), Chief Director: Corporate Services (Mr I. Miti), Directors within the DoA, mentors, interns, agribusinesses, representatives from provincial departments of agriculture, Imsimbi Training and the University of Stellenbosch Business School.
The following certificates were awarded during the ceremony:• Certificates of services to the interns.• Certificates of recognition and appreciation to the mentors.• Certificates of appreciation to the agribusinesses for hosting AIDP interns.• Accredited certificate of competence to interns who successfully completed their Project
Management Training with Imsimbi Training.• Accredited certificate of competence to AIDP interns who successfully completed their Agri
Management Development course with the University of Stellenbosch Business School.
Speakers of the day included the following:• Mr J. Kgobokoe, Director: Education, Training and Extension Services gave a presentation
on the purpose of the event as well as the farewell message to interns on behalf of the Chief Director: Sector Services and Research.
• Ms V. Titi, Deputy Director-General: Agriculture Support Services delivered the keynote address. In her address, she urged the interns to remain focused in their endeavours in the struggle to become better people. She further thanked the mentors for their sacrifice pointing out that their hard work will not go down history unnoticed and that they have established a legacy that will never die.
— 29 —
• Mr P. Mathebula, Deputy Director: Sector Skills Development presented on the status of employment of the interns.
• Mr G. Mqambalala, (intern) who secured employment with the Directorate: International Trade delivered a speech on behalf of all interns and thanked the DoA for affording them the opportunity to participate in the internship programme.
• Ms S. Seeletse, (mentor) who spoke on behalf of other mentors thanked the interns for their cooperation during their training programme and further thanked her fellow mentors for their undivided attention, commitment and sacrifices in transferring skills to the interns.
• Prof. W. Law delivered a farewell message on behalf of the University of Stellenbosch Business School to the interns and presented Ms D. Mukhari (AIDP intern) with the Director’s award from the University of Stellenbosch Business School for being the best performer of the 2008 Agri Management Development course.
• Ms L. Bouwer; Director: human Resources Management rendered a vote of thanks item.
10. SUMMARY OF BENEFICIARIES OF THE PROGRAMME SINCE INCEPTION IN 2003 to 2008.
The table below summarises beneficiaries of the programme since its inception in 2003 to 2008 under various categories of the programme. According to the information presented, a total of 763 interns benefited from the programme with the highest number (173) of beneficiaries recorded during 2008/09 financial year. Out of 763 beneficiaries who participated in the programme, 326 secured employment during their participation in the programme
TABLE 38: An analysis of beneficiaries of the Experiential Training, Internship and Professional Development Programme from 2003–2008 (n = 763)
Y ear
Number of interns/trainees who secured employment during their participation in the Internship Programme
Conventional Agriculture Industry Development Programme
Young Professional Development Programme
Total parti
cipated
Total employed
No. participated
No. employed
No. participated
No. employed
Own businesses
No. participated
No. employed
2003/04
2004/05
2006/07
2007/08
2008/09
96
138
133
140
124
46
38
66
75
57
0
24
35
24
24
0
15
13
8
10
0
1
9
1
0
0
0
0
0
25
0
0
0
0
1
96
162
168
164
173
46
53
79
83
68
Total 631 282 107 46 11 25 1 763 329
The table above indicates that 2007/08 records the highest number of conventional beneficiaries as compared to other financial years.
11. STATE OF EXPENDITURE
Expenditure for the implementation of the programme during this financial year included venues for the Mid-term Review Conference, certification ceremony of both mentors and interns, printing of logbooks, files, advertisements, project management training, consultancy fees, printing of reports, framing of certificates, transport, accommodation as well as interns’/trainees’ monthly allowances. The total amount spent for the 2008/09 Experiential Training, Internship and Professional Development Programme is R8 564 279,12.
— 30 —
TABLE 39: State of expenditure
Item description Amount (R)
Personnel
Intern/trainee remuneration 5 681 000,00
Goods and services
StationeryAdvertisementsPrinting and publicationsConsultancy servicesTraining (Project Management)Training (Agri Management Development Programme)Venues, facilities and transport
210 000,00 135 528,67
51 882,98 92 200,49349 963,00775 000,00
1 168 703,98
Total 8 564 279,12
— 31 —
Annexure A
MIDTERM REVIEW CONFERENCE REPORT
1. BACKGROUND
1.1 Introduction
Each year in the middle of the cycle of the Experiential Training, Internship and Professional Development Programme, a mid-term review conference is hosted to review the overall pro-gramme for the purpose of improvements and alignment with the DoA’s strategic goals and the changing needs of the agricultural sector. One of the main aims of the 2008/09 event was to broaden the scope for the unemployed, to enlighten them on business and entrepreneurial and research opportunities. This 2008/09 conference was held at Kopanong hotel and Conference Centre (Benoni) from 27 to 29 August 2008.
2. OBJECTIVES OF THE MIDTERM REVIEW CONFERENCE
2.1 Measure both the outcome and the impact of the programme against its intended objectives.
2.2 Obtain feed-back from mentors on their experiences and suggestions, recommendations for further improvement of the programme.
2.3 Promote the harmonisation of the programme with key agricultural stakeholders’ similar programmes.
2.4 Share valuable information with the interns/trainees for personal development and advancement.
2.5 Infuse innovation in the programme through the sharing of ideas.
2.6 Establish needed networks.
2.7 Track progress on the implementation of resolutions adopted during the previous conferences.
3. MIDTERM REVIEW CONFERENCE PROCESS FLOW
The working theme of the conference was “EMPLOYMENT, ENTREPRENEURSHIP AND RESEARCH OPPORTUNITIES FOR THE YOUTH IN AGRICULTURE”. The theme sought to enhance the chances of employability among interns/trainees, increase entrepreneurs and capacity of research in the agricultural sector. The expected outcomes of the conference were:• Enriching presentations by the various role players, pertinent to the programme.• Feed-back on the implementation of resolutions adopted during the 2007/08 mid-term review
conference.• Empowered and motivated interns/trainees.• Recognition and incentivisation of the critical role played by mentors.• New resolutions to be adopted by all.• Delegates were also expected to formulate proposals and recommendations through the
commissions that were addressing the following thematic areas:
— 32 —
– Drivers to increase employability of interns. – Exit strategy/funding/exit packages for interns/trainees with entrepreneurial drive to start
their own businesses at the end of the Internship Programme. – how can the current initiatives in the implementation of the DoA’s Young Professional
Development Programme be improved to address the shortage of skills in the agricultural sector?
4. COMPOSITION OF THE DELEGATES
Two hundred and thirty eight (92 %) out of the expected 250 delegates attended the conference. The delegates comprised the following categories:• Mentors and interns from the DoA• Agribusinesses industries, research institutions and institutions of higher learning• Senior Managers from the DoA and CEOs from agribusinesses and commodity organisations
from the agricultural sector• Youth Cooperatives (Umsobomvu Youth Fund/National Youth Service)• Financial institutions• hRD Managers from national government departments and provincial departments of
agriculture• Principals of colleges of agriculture• Recruitment and selection agencies• CASP coordinators from the provinces• Municipal managers from nodal areas• Professional motivational speaker• Agricultural Research Council.
5. PROGRAMME OF THE CONFERENCE [PRESENTATIONS AND DISCUSSIONS]
The programme of the conference stretched over a 2½-day period comprising ten sessions. The registration of delegates took place on the afternoon of 26 August 2008. The morning of the first day, 27 August 2008, was devoted to welcome, setting the scene and presentation of progress reports by interns. The welcome speech was delivered by Mr P. Mathebula, Acting Deputy Director: Sector Skills Development.
5.1 Purpose of the conference
The Director: Education, Training and Extension Services, Mr M.J. Kgobokoe, gave an overview of the purpose of the conference as outlined in section 2 of this report. In his presentation, he also articulated the following objectives of the Experiential Training, Internship and Professional Development Programme:• Contribute to accelerated service delivery by government through the improved introduction
of skilled personnel in the public service.• Afford learners/students at institutions of higher learning an opportunity of practical work
experience as a requirement for them to obtain a qualification.• Enhance employability of unemployed agricultural and other graduates.• Develop skills and capacity of the historically disadvantaged youth to direct commercially
viable enterprises and engage effectively with the markets.• Resolve the general shortage of qualified people in the workforce by encouraging graduates
to equip themselves with the necessary practical experience.
— 33 —
• Bridge the gap that exists between school and work.• Actualise the government’s job creation initiatives.• Develop the business and entrepreneurial skills of youth in response to the AgriBEE.• Promote the development, recruitment and retention of a cadre of scientists, technicians,
technologists and other associated professionals.
5.2 Keynote address
The CEO of FOODBEV SETA, Mr R. Deonarain, delivered a keynote address. In his address, he outlined the role played by SETAs towards addressing the skills shortage in the agricultural sector through apprenticeships, learnerships and skills programmes. he highlighted workplace learning as a major challenge in the human Resources Development sector and the need for managers to meet with the employees regularly, to engage them in decision-making processes in order to increase the level of commitment in the workplace environment.
5.3 Alignment of the DoA’s internship programme to address the changing needs of the agricultural sector
The Chief Director: Sector Services, Mr M. Mankazana made a presentation on how the DoA’s internship is constantly restructured and revitalised to respond to the demands of the agricultural sector. he also articulated the strategic objectives of why the Young Professional Development Programme was introduced in 2008. he indicated the implications of the high food prices on various government key programmes such as ASGISA, CASP, LARP, extension recovery plan, etc. Worth noting from his presentation, was a call to generate a review report of the internship programme since its inception in 2003 to 2008 (5-year review report). The report will be presented during the Mid-Term Review Conference in 2009.
5.4 Presentation of the 2008/09 profiles of interns
The Director: Education, Training and Extension Services, Mr M.J. Kgobokoe, gave a detailed analysis of the interns’ profiles who participated in the programme. he articulated categories of interns catered for by various pillars of the programme as outlined in Section 1 (Background and Introduction) of this report. he further displayed how interns were distributed in each category of the programme according to gender, race, age, qualification, institutions where they graduated, provinces and municipalities where they come from, etc. Worth noting from his presentation was the high percentage of participation of females and Africans in the programme.
5.5 Presentation of progress reports made by interns
Two interns: Ms N. Tshabalala and Ms N. Galada, presented on the progress they registered since joining the programme. Ms N. Tshabalala, an intern from Directorate: Education, Training and Extension Services, presented on the progress she made from February to July 2008. In her presentation, she articulated her key performance areas, activities executed, challenges encountered, skills learned as well as training she still required. Ms N Galada; a Young Professional Development Programme, 3rd year enrolled Ph.D. Biotechnology intern from the University of the Western Cape, also gave an overview of the progress she registered since joining the programme. In her presentation, she highlighted activities she executed with regard to her research topic and dissertation. Flowing from the presentations made by these interns, it was evident that the programme was producing individuals ready to take up the challenges of the labour market.
— 34 —
5.6 Best practices for mentoring and coaching
The presentation on this topic was delivered by Ms M. Mohapi, a mentor from Directorate: International Relations. The scope of her presentation included the definition of the following concepts: Mentorship; Mentoring; Mentor; Mentee and Mentorship Programme. The following aspects which constituted the crux of her presentation were well articulated: reasons for mentoring people; what makes a good mentor and mentee; responsibilities of mentor and mentee; the outcomes of Mentorship Programme as well as challenges/obstacle of a mentor-ship relationship.
5.7 Business Development and Enterprise Finance
The Partnership Specialist from Umsombomvu Youth Fund, Mr D. van Vuuren, presented on business as well as support services that the youth can access at Umsombomvu Youth Fund and National Youth Service. In his presentation, he highlighted the following:
• Umsombomvu programmes These programmes include: Skills Development Programmes; Business Support; Access to Finance and Access to Opportunities.
• Products and services offeredProducts and services offered include the following: Information and Counselling; Business Development Services; JOBS Programme; Enterprise Finance; National Youth Service Supplier Development and Enterprise Education.
5.8 Effective internship for improved food security
Prof. M. Mbewe, Director: School of Agriculture from the University of the North West delivered a presentation with regard to this topic. In his presentation, he highlighted the following:
• Challenges of food insecurity:
– Increased urbanisation of rural communities.
– Fewer producers of agricultural products.
– Lack of proper productive land for those interested in agribusiness.
– Land reform that does not fully support beneficiaries of land restitution.
– Productive farms that become unproductive as a result of incomplete processes.
– Giving land to people with no interest in farming.
– Agricultural lands used for human settlement.
– high food prices.
– Unemployment.
• New ways of farming:
– Train students or interns on community agriculture/revival of home-based gardens.
– Discourage the farming of lawn grass instead of food.
– Encourage portable gardens/balcony gardens.
– Encourage farming with low maintenance animals such as African chickens, rabbits, and other protein sources.
– Involve the interns in community-project-based agriculture while others are in farm placements.
— 35 —
5.9 Success story of former DoA’s Agriculture Industry Development Programme
The last presenter of the late afternoon session on the 27th of August 2008 was Mr I. Letsoalo, a commercial farmer from Limpopo Province who presented a success story from being an intern under the AIDP in 2006 to become a farmer. In his presentation, he commended the DoA for affording him the opportunity to participate in the programme in 2006. Worth noting from his presentation were the challenges and obstacles that he encountered on his way to success and how the knowledge and skills acquired through his participation in the programme had assisted him to conquer these challenges.
5.10 Word of appreciation to the mentors and motivational talk
The activities of day one of the conference (27 August 2008) ended with the hosting of the gala dinner. During the gala event, the Chief Director: Sector Services, Mr M. Mankazana, conveyed a word of appreciation and recognition to the mentors for their sacrifice and commitment in mentoring the interns. he acknowledged the good work done by mentors in making the Experiential Training, Internship and Professional Development Programme a success. he further indicated that without the dedication and hard work from mentors, the programme could lie flat on the ground. he concluded that efforts should be taken to incentivise the mentors.
— 36 —
The last and key item during the gala dinner was a motivational talk delivered by Mr Vusi Thembekwayo. Mr Thembekwayo is a professional motivational speaker described as “The rockstar of public speaking” by John howard, former prime minister of Australia. he delivered a very powerful message to the interns emphasising the importance of planning for future, hard work, dedication and commitment. In his message, he also shared with the interns how he rose from humble beginning to own a business which has a turnover of almost half a billion rand per year.
5.11 AgriBEE assistance of youth towards agribusinesses ownership and shareholding
The morning session of day two (28 August 2008) of the conference was devoted to support packages from financial institutions/organisations which can assist interns with exit packages to set up small businesses at the end of the internship programme. Mr R. Abercrombie, Acting Director: Directorate Business Entrepreneurial Development, delivered a presentation on AgriBEE assistance of youth towards agribusinesses ownership and shareholding. In his presentation, he outlined the role of the directorate in ensuring that the youth are supported to become young entrepreneur as part of AgriBEE initiatives. he further made a commitment to engage the Directorate Business Entrepreneurial Development in assisting the 2008/09 AIDP interns with exit support packages.
5.12 Funding of youth projects and cooperatives
The presentation on this topic was delivered by Ms J. Mahlangu, Director: Agriculture Development Finance. In her presentation she highlighted the following on Mafisa:
• Mafisa (Microagricultural Financial Institutions of South Africa):
– Available to both individuals and groups.
– Gives maximum of R100 000 per person.
– For loans below R25 000 collateral is not a must.
– Only for agricultural production inputs.
– Interest rate 8 % compounded. – Repayment period ranges between 12 and 60 months. – Repayment tied to income cycle of the enterprise. – Available for the entire value chain.
• Eligibility criteria: – South Africans – Over 21 years old – In possession of valid South African ID – Must have access to land/processing facilities – historically disadvantaged groups – Display ability and willingness to pay – Gross nonfarm income not exceeding R20 000 per month.
• Required documents: – Fully completed application form – Certified copy of ID – Proof of address
— 37 —
– Proof of access to land/facilities – Proof of water rights where applicable.
5.13 Support packages for the youth from the Development Bank of Southern Africa (DBSA)
Mr R. Matsila, responsible for Agriculture and Rural Development from DBSA, outlined criteria for funding as follows:• The DBSA only funds projects with multiple stakeholders and beneficiaries.• Do not consider applications from individuals and small-scale/subsistence farming entities. • Facilitate co-funding with other financial institutions.
he further highlighted focus areas of the bank in agriculture which included the following: • Capacity building assistance for business plans and project development.• Off-site (bulk infrastructure) projects such as dams, irrigation infrastructure, etc.• On-site (fixed infrastructure) such as cooling and packaging infrastructure.• Movable agricultural assets/equipment.• Production input finance under exceptional cases.• Promotion of AgriBEE.
5.14 Good practice on how to find employment/job and interview techniques
Ms G. Scholtz, Manager: ITP SA human Resources holdings (PTY) LTD presented on this topic and highlighted the following:• Procedures on how to find a job.• Structuring of the curriculum vitae.• Tips and techniques for interviews.
In her presentation, she also gave the interns contact details of all the branches of the company across South Africa where they can list the curriculum vitae for job opportunities.
5.15 Current status of agricultural research among the youth in South Africa and possible solutions
This topic was presented by Dr M.S. Thaela-Chimuka from the Agricultural Research Council (ARC). In her presentation, she gave an overview of the critical shortage of researchers and technicians in the agricultural sector, the serious need for young graduates to further their studies in the areas of research as well as the role and mandate of the ARC, which includes innovative and creative agricultural research, technology development and transfer of technology in South Africa. She also highlighted the following capacity-building programmes from the ARC that can be accessed by young people:
• Experiential training – Assist students from tertiary institutions to complete their compulsory 1 year practical
training needed for them to be awarded their qualifications.
• Professional Development Programme – Assist graduates to further studies at postgraduate level while undergoing in-service
training under the leadership of a mentor where candidates are exposed to daily research activities and receive a monthly allowance during their participation in the programme.
— 38 —
5.16 The Department of Agriculture’s Young Professional Development Programme
Mr P. Mathebula, Deputy Director: Sector Skills Development, gave a comprehensive present-ation on this topic. In his presentation, he invited young people to participate in this programme in 2009 and highlighted the following:
• Aims of the Professional Development Programme – Capacity-building programme contributing to a relevant and credible future agricultural
scientific base for the agricultural sector. – Address the shortage of critical and scarce skills in agriculture. – Seeks to encourage further studies of South African graduates, particularly at
postgraduate level. – Address equity targets and ensure high level performance of the agriculture public sector. – Sustainable strategy for skills replacement. – Create a pool of young scientists from the previously disadvantaged groups.
• Application of the Professional Development Programme – Successful candidates will be registered for postgraduate, placed with relevant
industry/research institution for their practical hands-on experience, allocated a mentor and receive a monthly allowance during their participation in the programme. In his presentation, he also indicated the duration of participation in the programme, target group, entry requirements as well as the contractual obligation.
5.17 Building capacity through international training programmes
Ms L. Botsheleng, Deputy Director: Resources Mobilisation and International Study Opportunities gave a comprehensive overview of the international training programmes coordinated by the Department of Agriculture as part of capacity-building initiatives. In her presentation she indicated the following forms of capacity-building programmes:• Exchange programmes.• Undergraduate and postgraduate studies.• Industrial placements.• Short courses.• Conferences and seminars.
Worth noting from her presentation was the following prominent international training programme:• Land and Food Fellowship (United Kingdom): build capacity in Africans who have an interest
in agriculture, food, natural resource management and land reform.• COChRAN Fellowship (United States of America): part of the United States Department of
Agriculture and offers short-term opportunities ranging from 2 to 3 weeks, depending on the objectives of the programme.
• Young Professional Officers: South Africans at various levels are attached to the Food and Agriculture Organization (FAO) or other international bodies for exposure to aid delivery management and support systems for achieving food security and rural development.
6. COMMISSIONS PROCESS FLOW
The afternoon of the second day of the conference (28 August 2008) was devoted to commissions. Delegates participated in the breakaway sessions. The purpose of the commissions was to respond to the following thematic areas:
— 39 —
• Drivers to increase employability of interns.• Exit strategy/funding/exit packages for interns/trainees with entrepreneurial drive to start their
own businesses at the end of the Internship Programme.• how can the current initiatives in the implementation of the DoA’s Young Professional Develop-
ment Programme be improved to address the shortage of skills in the agricultural sector? • Each commission had a chairperson whose responsibility was to facilitate the activities of
the commission. The commission also had a rapporteur whose responsibility was to present the deliberations and recommendations of the commission during the plenary session on 29 August 2008.
6.1 Commission 1
Drivers to increase employability of interns.
Participants involved in this commission were expected to discuss drivers for successful implementation of the internship programme to yield maximum intended results. They were expected to focus on the following issues:• Bridging the gap between tertiary qualifications of interns with the real work environment.• Alternative methods of increasing participation of youth with disability and the role
government departments should play in absorbing people with disabilities to address the employment equity of people with disabilities (PWD).
• Initiatives to enhance employability of interns by host directorates during their participation in the programme.
• Strategies to involve the private sector in the employment of the interns.• Role of the mentors and Directorate: human Resources Management to enhance
employability of interns.
6.2 Commission 2
Exit strategy/funding/exit packages for interns/trainees with entrepreneurial drive to start their own businesses at the end of the Internship Programme.
The overall objective of this commission was to discuss various ways to assist interns/trainees to set up businesses at the end of the programme. This group was expected to focus on the following:• Qualities of a successful agribusiness venture.• Processes in starting an agribusiness venture (initiative, target market, funding).• Role of government in assisting youth ventures (land, funding, registration of venture,
international market, etc.).
6.3 Commission 3
how can the current initiatives in the implementation of the DoA’s Young Professional Develop-ment Programme be improved to address the shortage of skills in the agricultural sector?
Participants involved in this commission were expected to discuss various ways to improve the implementation of Young Professional Development Programme.
• Discuss and list various companies/industries/research stations or laboratories that can accommodate Masters and Ph.D. students to conduct research.
• Approaches to be employed to create a pool/database of very experienced mentors with Ph.D. to assist in guiding the research of the interns/students. (This must include retired personnel.)
— 40 —
• Mechanisms that can be used to identify companies/industries/research stations or laboratories with funded research projects without people to carry out such projects.
6.4 Broad areas of improvement and Conference Resolutions
The last day of the conference (29 August 2008) was devoted for report back from the dis-cussions of the various commissions and way forward from the conference. Flowing from the recommendations of the commissions, the Director: Education, Training and Extension Services, Mr M.J. Kgobokoe, consolidated the recommendations from the commissions into the following broad arrears of improvement:• Strengthening the selection criteria for the AIDP to ensure that the interns who participate in
the programme have what it takes for the world of business [Assessment Tool].• Strengthening the role of the Directorate: BED of the DoA to ensure the provision of start-up
capital for the AIDP beneficiaries, and to lead in the facilitation of more financial and other support services to the AIDP beneficiaries.
• Increase the participation of people with disability in the programme.
Lastly he presented the following Resolutions of the 2008 Conference which were adopted:
6.4.1 The Directorate: Business and Entrepreneurship Development of the DoA shall in 2009 introduce products and services including start-up capital for the beneficiaries of AIDP and shall lead in facilitating the provision of additional funding and other support services for these beneficiaries. Furthermore, the directorate shall participate directly in the generation of business plans by the AIDP beneficiaries for funding.
6.4.2 The Directorate: Education, Training and Extension Services shall transmit a clear message to the DoA’s Transformation Unit to develop a strategy on the employment and participation of people with disability in the department.
6.4.3 The Directorate: Education, Training and Extension Services shall engage the Subprogramme Corporate Services in coming up with ways of recognising and incentivising mentors, including possibilities of incorporating their roles in their performance contracts.
6.4.4 The Directorate: Education, Training and Extension Services shall establish a database of companies/industries/research organisations relevant to the DoA’s Professional Development Programme and facilitate the signing of a Memorandum of Understanding between the DoA and these companies for the provision of mentoring opportunities to the PDP beneficiaries.
6.4.5 The Directorate: Education, Training and Extension Services shall engage the Subprogramme Corporate Services to arrive at an agreement on the filling of vacant, funded technical posts through the Professional Development Programme.
7. VOTE OF THANKS
The Chief Director: Sector Services, Mr M. Mankazana thanked the organisers of the conference, all guests and presenters and everybody who contributed to make the 2008 Mid-term Review Conference a success.
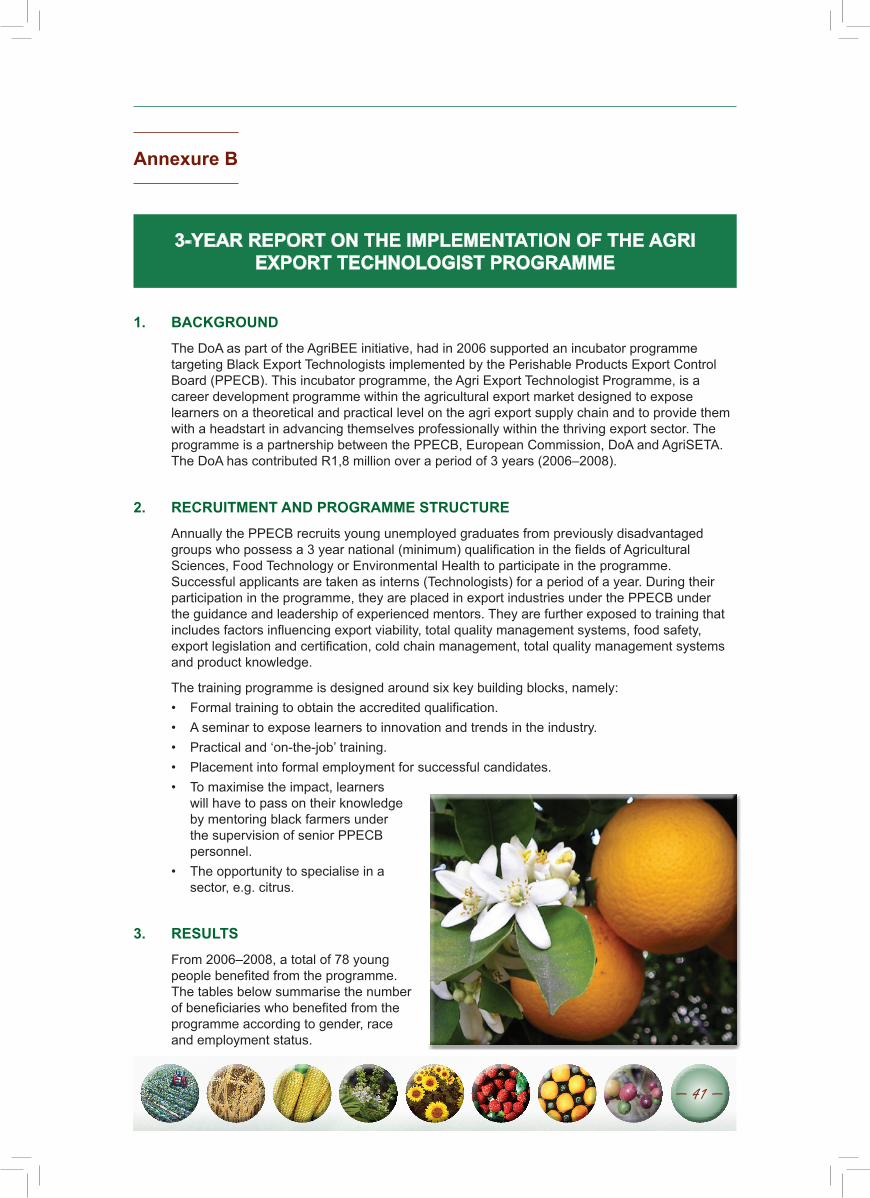
— 41 —
Annexure B
3YEAR REPORT ON THE IMPLEMENTATION OF THE AGRI EXPORT TECHNOLOGIST PROGRAMME
1. BACKGROUND
The DoA as part of the AgriBEE initiative, had in 2006 supported an incubator programme targeting Black Export Technologists implemented by the Perishable Products Export Control Board (PPECB). This incubator programme, the Agri Export Technologist Programme, is a career development programme within the agricultural export market designed to expose learners on a theoretical and practical level on the agri export supply chain and to provide them with a headstart in advancing themselves professionally within the thriving export sector. The programme is a partnership between the PPECB, European Commission, DoA and AgriSETA. The DoA has contributed R1,8 million over a period of 3 years (2006–2008).
2. RECRUITMENT AND PROGRAMME STRUCTURE
Annually the PPECB recruits young unemployed graduates from previously disadvantaged groups who possess a 3 year national (minimum) qualification in the fields of Agricultural Sciences, Food Technology or Environmental health to participate in the programme. Successful applicants are taken as interns (Technologists) for a period of a year. During their participation in the programme, they are placed in export industries under the PPECB under the guidance and leadership of experienced mentors. They are further exposed to training that includes factors influencing export viability, total quality management systems, food safety, export legislation and certification, cold chain management, total quality management systems and product knowledge.
The training programme is designed around six key building blocks, namely:• Formal training to obtain the accredited qualification.• A seminar to expose learners to innovation and trends in the industry.• Practical and ‘on-the-job’ training.• Placement into formal employment for successful candidates.• To maximise the impact, learners
will have to pass on their knowledge by mentoring black farmers under the supervision of senior PPECB personnel.
• The opportunity to specialise in a sector, e.g. citrus.
3. RESULTS
From 2006–2008, a total of 78 young people benefited from the programme. The tables below summarise the number of beneficiaries who benefited from the programme according to gender, race and employment status.
— 42 —
TABLE 40: Breakdown by race and gender of the Agri Export Technologist beneficiaries (n = 78)
Year TotalAfrican Coloured Indian White
DisabledFemales Males Females Males Females Males Females
2006 24 8 12 0 4 0 0 0 0
2008 30 15 10 0 4 1 0 0 0
2008/09 24 8 15 1 0 0 0 0 0
Grandtotal 78 31 37 1 8 1 0 0 0
The table above shows that the majority of the beneficiaries (68 out 78) are Africans, followed by Coloureds with 9 and 1 Indian.
In terms of gender breakdown 33 (42,3 %) of the beneficiaries are females and 45 (57,7 %) are males.
TABLE 41: Breakdown of the Agri Export Technologist beneficiaries according to age (n = 78)
Year20–25 years 26–30 years 31–35 years 35+
Female Male Female Male Female Male Female Male
2006 6 8 2 1 0 7 0 0
2008 12 12 4 2 0 0 0 0
2008/09 7 10 1 3 0 2 1 0
The table above shows that the majority of the beneficiaries 55 are within the 20–25 years age range, 13 within 26–30 years and only 1 (one) is above 35 years.
TABLE 42: Employment status (n = 78)
Year
Number of beneficiaries employed by the PPECB
Number of beneficiaries employed outside the PPECB
Total employed
Females Males Females Males Females Males
2006 5 10 3 6 8 16
2008 11 12 1 0 12 12
2008/09 2 2 0 0 2 2
Total 18 24 4 6 22 30
The table above shows that majority (42) of the beneficiaries is appointed by PPECB and 10 are appointed outside PPECB.
4. STRATEGIC FUTURE FOCUS OF THE PROGRAMME
The DoA will continue to contribute to the programme looking at other areas of human resources development and to be more involved in the recruitment, selection of candidates from 2009 onwards.
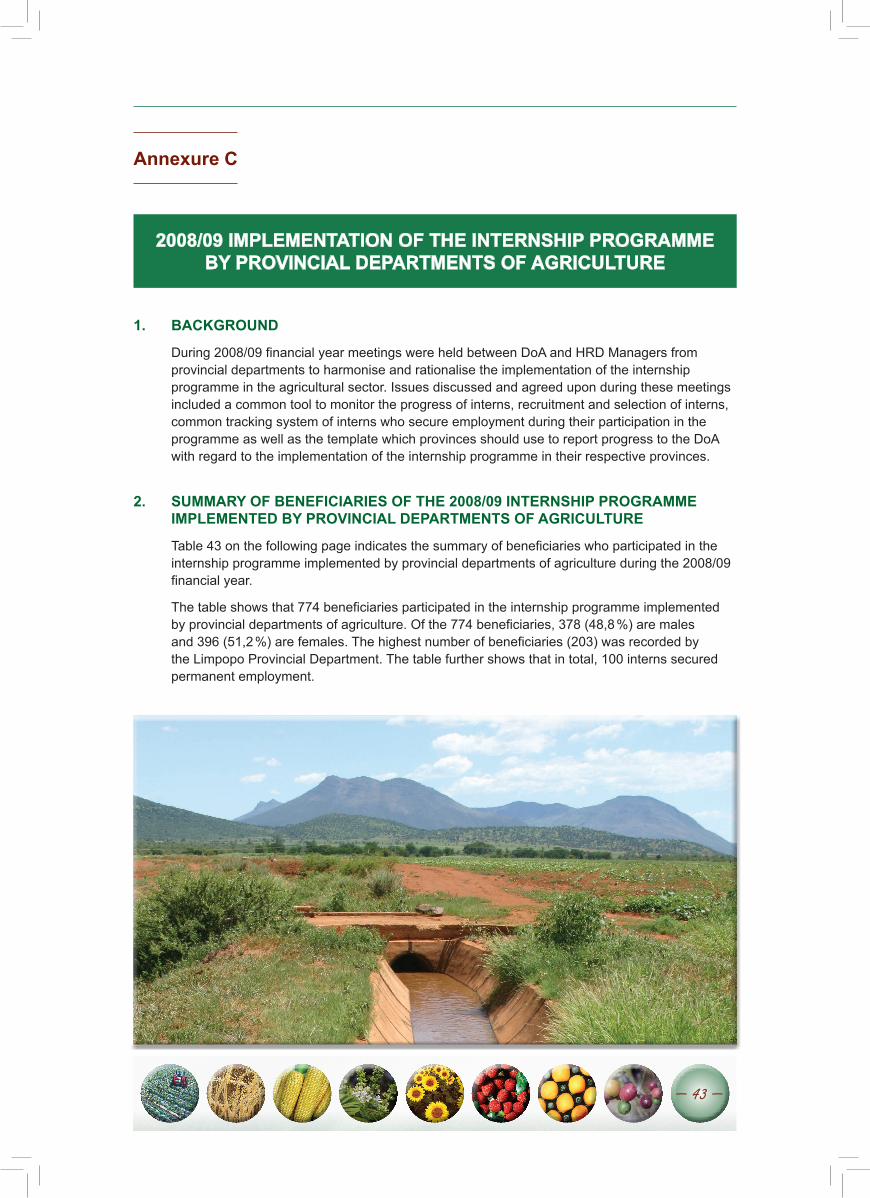
— 43 —
Annexure C
2008/09 IMPLEMENTATION OF THE INTERNSHIP PROGRAMME BY PROVINCIAL DEPARTMENTS OF AGRICULTURE
1. BACKGROUND
During 2008/09 financial year meetings were held between DoA and hRD Managers from provincial departments to harmonise and rationalise the implementation of the internship programme in the agricultural sector. Issues discussed and agreed upon during these meetings included a common tool to monitor the progress of interns, recruitment and selection of interns, common tracking system of interns who secure employment during their participation in the programme as well as the template which provinces should use to report progress to the DoA with regard to the implementation of the internship programme in their respective provinces.
2. SUMMARY OF BENEFICIARIES OF THE 2008/09 INTERNSHIP PROGRAMME IMPLEMENTED BY PROVINCIAL DEPARTMENTS OF AGRICULTURE
Table 43 on the following page indicates the summary of beneficiaries who participated in the internship programme implemented by provincial departments of agriculture during the 2008/09 financial year.
The table shows that 774 beneficiaries participated in the internship programme implemented by provincial departments of agriculture. Of the 774 beneficiaries, 378 (48,8 %) are males and 396 (51,2 %) are females. The highest number of beneficiaries (203) was recorded by the Limpopo Provincial Department. The table further shows that in total, 100 interns secured permanent employment.
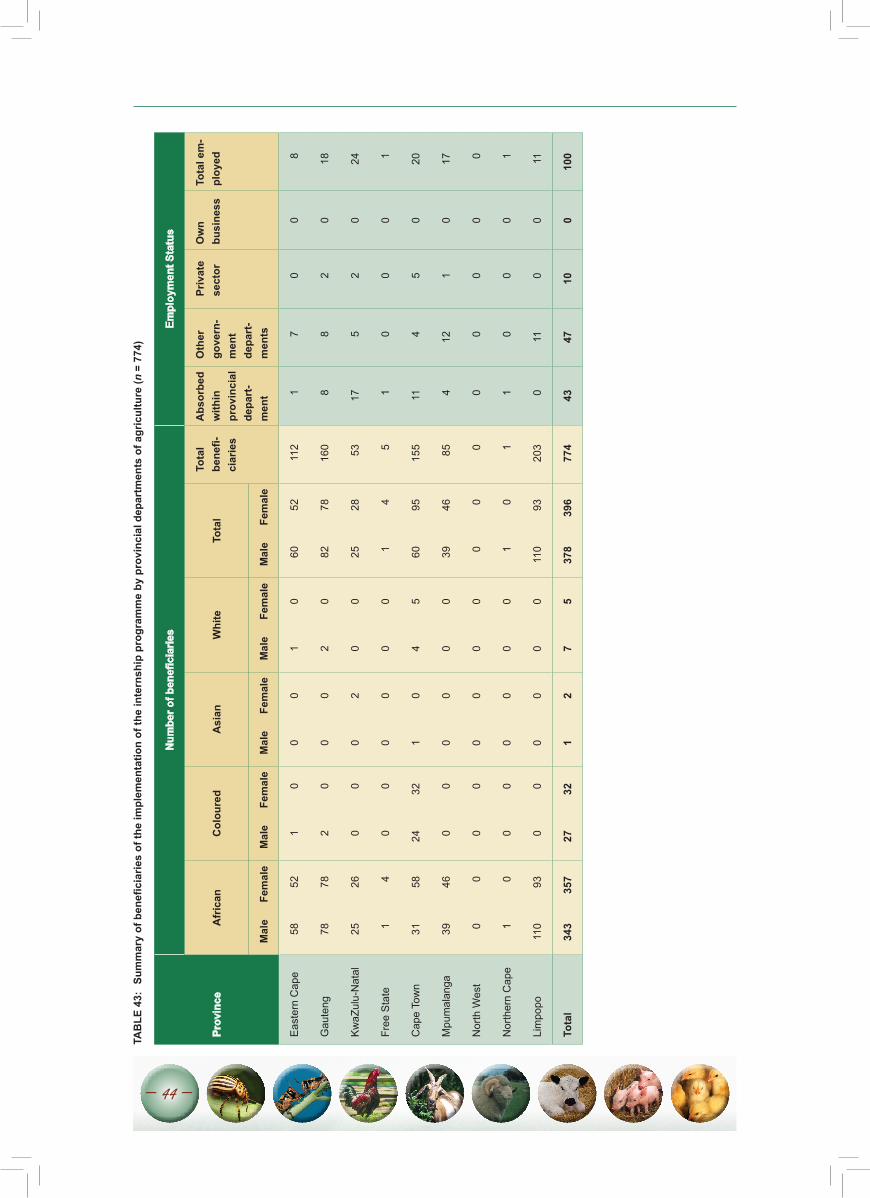
— 44 —
TAB
LE 4
3: S
umm
ary
of b
enef
icia
ries
of th
e im
plem
enta
tion
of th
e in
tern
ship
pro
gram
me
by p
rovi
ncia
l dep
artm
ents
of a
gric
ultu
re (n
= 7
74)
Prov
ince
Num
ber o
f ben
efic
iarie
sEm
ploy
men
t Sta
tus
Afr
ican
C
olou
red
Asi
anW
hite
Tota
lTo
tal
bene
fici
arie
s
Abs
orbe
d w
ithin
pr
ovin
cial
de
part
m
ent
Oth
er
gove
rn
men
t de
part
m
ents
Priv
ate
sect
or
Ow
n bu
sine
ss
Tota
l em
pl
oyed
Mal
eFe
mal
eM
ale
Fem
ale
Mal
eFe
mal
eM
ale
Fem
ale
Mal
eFe
mal
e
Eas
tern
Cap
e58
521
00
01
060
5211
21
70
08
Gau
teng
7878
20
00
20
8278
160
88
20
18
Kw
aZul
u-N
atal
2526
00
02
00
2528
5317
52
024
Free
Sta
te1
40
00
00
01
45
10
00
1
Cap
e To
wn
3158
2432
10
45
6095
155
114
50
20
Mpu
mal
anga
3946
00
00
00
3946
854
121
017
Nor
th W
est
00
00
00
00
00
00
00
00
Nor
ther
n C
ape
10
00
00
00
10
11
00
01
Lim
popo
110
930
00
00
011
093
203
011
00
11
Tota
l34
335
727
321
27
537
839
677
443
4710
010
0