Embed Size (px)
Citation preview

- 1 -
SUPPLEMENTAL INFORMATION
for
Ac magnetic susceptibility of a molecular magnet submonolayer
directly patterned onto a micro superconducting quantum
interference device
M. J. Martínez-Pérez,1, 2
E. Bellido,3 R. de Miguel,
4 J. Sesé,
4, 2 A. Lostao,
4, 5 C.
Gómez-Moreno,4, 6
D. Drung,7 T. Schurig,
7 D. Ruiz-Molina,
3, ∗ and F. Luis1, 2, †
1Instituto de Ciencia de Materiales de Aragón (ICMA),
CSIC-Universidad de Zaragoza, Pedro Cerbuna 12, E-50009 Zaragoza, Spain
2Dpto. de Física de la Materia Condensada, Universidad de Zaragoza, Pedro Cerbuna 12,
E-50009 Zaragoza, Spain
3Centro de Investigación en Nanociencia y Nanotecnología (CIN2, CSIC-ICN) Edifcio CM7,
Esfera UAB, Campus UAB, E-08193 Cerdanyola del Vallés, Spain
4Instituto de Nanociencia de Aragón. Universidad de Zaragoza Edifcio I+D. Campus Río
Ebro, E-50018 Zaragoza, Spain
5Fundación ARAID, Aragón, Spain
6Dpto. de Bioquímica, Universidad de Zaragoza, Pedro Cerbuna 12, E-50009 Zaragoza,
Spain
7Physikalisch-Technische Bundesanstalt (PTB) Abbestra_e 2-12, D-10587 Berlin, Germany
(Dated: June 14, 2011)

- 2 -
S1. Description of the SQUID
A commercial easy-to-use two-stage SQUID sensor from Magnicon[1]
was selected since it is
well suited to operate at mK temperatures with a broad bandwidth and sensitivities close to
the quantum limit. We profited from our ability of modifying superconducting circuits[2]
to
reroute some of the SQUIDs input wires to fabricate an integrated SQUID-susceptometer.
These sensors are installed inside the mixing chamber of a Leiden Cryogenics dilution
refrigerator providing a friendly tool capable of ac susceptibility measurements under
extreme conditions of frequencies (1 mHz – 1 MHz) and temperatures (T ≈ 13 mK). The
sensor chosen for this experiment consists of four one-turn primary coils connected in series
that create the exciting magnetic field and four one-turn pick-up coils connected in parallel
that couple the sample response directly to the front-end dc SQUID. No flux transformer is
needed since the pick-up coils are already part of the SQUID loop. The resulting signal is
amplified by a 16-SQUID series array and the whole system works in Flux Locked Loop
mode (FLL). Apart from a small background, the primary coils couple no net flux to the
SQUID due to their gradiometric design, unless a magnetic sample is placed onto one of
them. Such background signal can be easily compensated electronically or subtracted from
the sample signal. These coils are rectangular shaped with approximate dimensions 63 m ×
250 m. The pick-up coil wire cross dimensions are 9 m × 300 nm. The latter is covered
with a 250 nm-thick layer of SiO2, and finally the primary coil lies on top having a 5 m ×
500 nm cross area.
S2. Calculation and measurement of the coupling factor
The coupling factor is defined as P
Pcoupled
i
B
i
where coupled is the coupled magnetic flux
in the SQUID loop generated by a sample with magnetic moment i located at a particular
position with respect to the coils boundaries. his magnetic moment is induced by the
excitation magnetic field Bp, created by an electrical current, ip, circulating via the primary
coil.
The calculation was performed using finite element method software (COMSOL). First
i
coupled was calculated using the reciprocity theorem. This theorem states that calculating the

- 3 -
flux generated per unit of magnetic moment is equivalent to calculating the magnetic field,
generated at the location of the magnetic moment, per unit of current circulating through the
SQUID pick-up coil. Figure S1 shows the result, where a circular shaped pick-up coil was
used, having the same area as the real SQUID loop. The calculations take into account the
Meissner effect in the superconductor using appropriate boundary conditions in the magnetic
vector potential as already described.[3]
Figure S1. Finite element calculations of the magnetic field created by the pick-up coil with a driving
current of 500 A. The current circulating in the primary coil is forced to be zero.
Then P
P
i
Bis calculated using the same procedure (see Figure 1 in the manuscript), but taking
into account that a shielding current in the pick-up coil will appear due to the flux
conservation in the parallel gradiometer.
S3. Preparation and characterization of the CoO@apoferritin
CoO@apoferritin preparation. Horse spleen apoferritin (HsAFr) was purchased from
Sigma–Aldrich. The apo form is obtained after controlled acidic treatment of the commercial
sample to remove almost all the stored natural iron in the form of ferrihydrite. A few Fe3+
atoms anchored to internal nucleation centres are retained while maintaining intact a
quaternary structure of the protein with molecular weight (MW) of 481 kDa. Cobalt oxide

- 4 -
nanoparticles were synthesized following a previously reported method[4]
by introducing
rational modifications that allowed us to achieve different results in cobalt loading and even
composition of the nanoparticles. For these experiments, 500 mL of 100 mM pH 8.3 HEPES
buffer solution containing 0.5 mg·mL-1
HsAFr was prepared under argon atmosphere. The
solution was stirred and ammonium cobalt sulfate hexahydrate (Sigma-Aldrich) and sodium
sulphate were added to final concentrations of 3.0 and 37.5 mM respectively, followed by the
addition of hydrogen peroxide till a concentration of 1.5 mM. The solution was stirred for 20
minutes and then left at 50 ºC overnight. A pool of enriched 2 nm cobalt oxide nanoparticles
encapsulated ferritin was obtained. The syntheses did not generate any precipitate.
Transmission electron microscopy (TEM). The size and shape of the CoO nanoparticles
formed inside the cavity of the ferritin protein were studied by TEM experiments.
Measurements were performed using a Tecnai T20 thermo emission microscope at 200 kV.
Samples were prepared by diluting and sonicating the ferritin-based cobalt oxide
nanoparticles in water and deposited on a holey carbon 300 mesh copper grid (SPI Supplies)
by placing the grid over a droplet of diluted sample for 2 minutes. Excess liquid was removed
with a piece of “blotting paper” and the grid let to dry overnight.
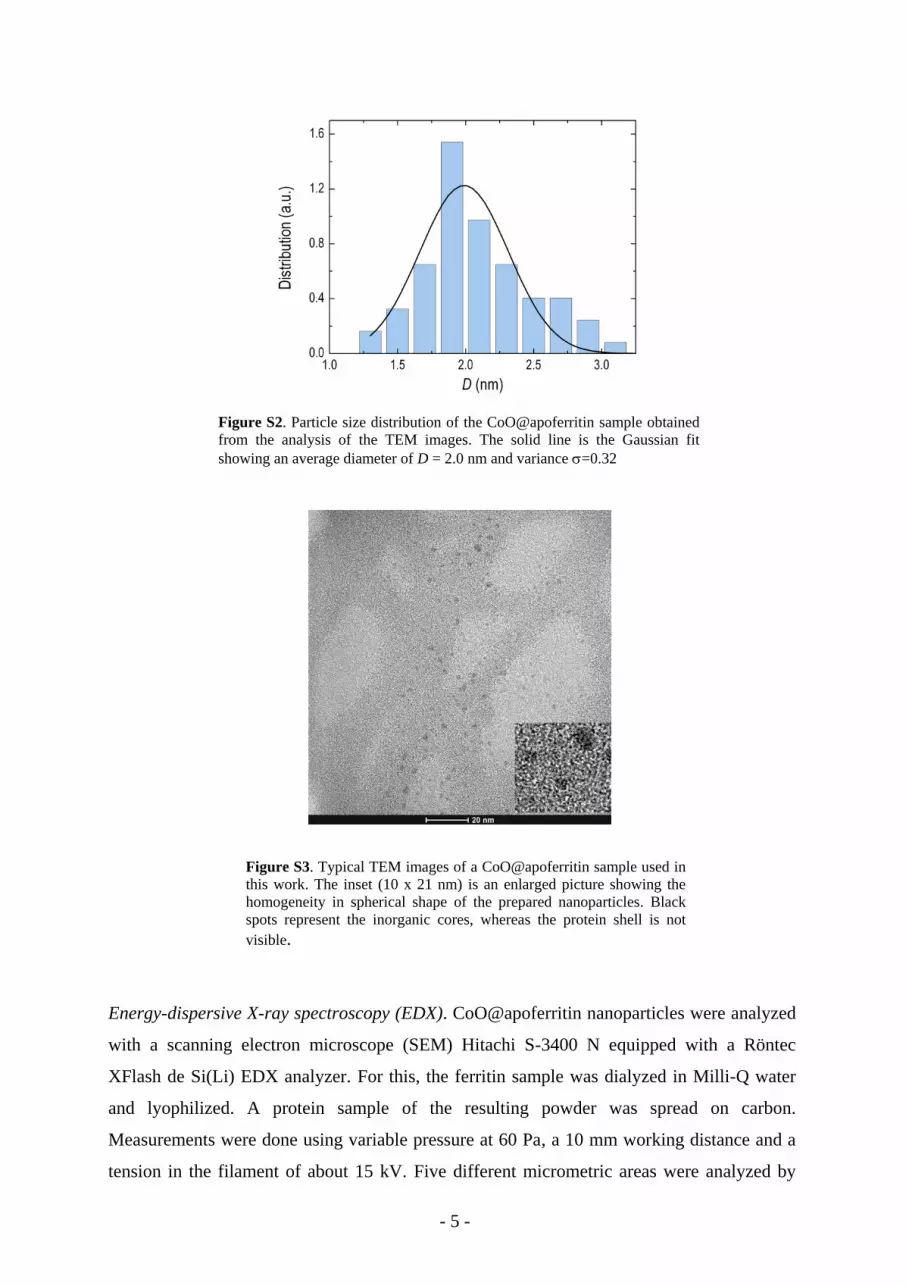
The particle size distribution of the sample was obtained after a thorough analysis of the
images obtained by TEM (Figure S2). The diameter of the nanoparticles ranges from 1.2 to
3.0 nm, with a maximum number of particles (peak of the Gaussian curve) near 2 nm.
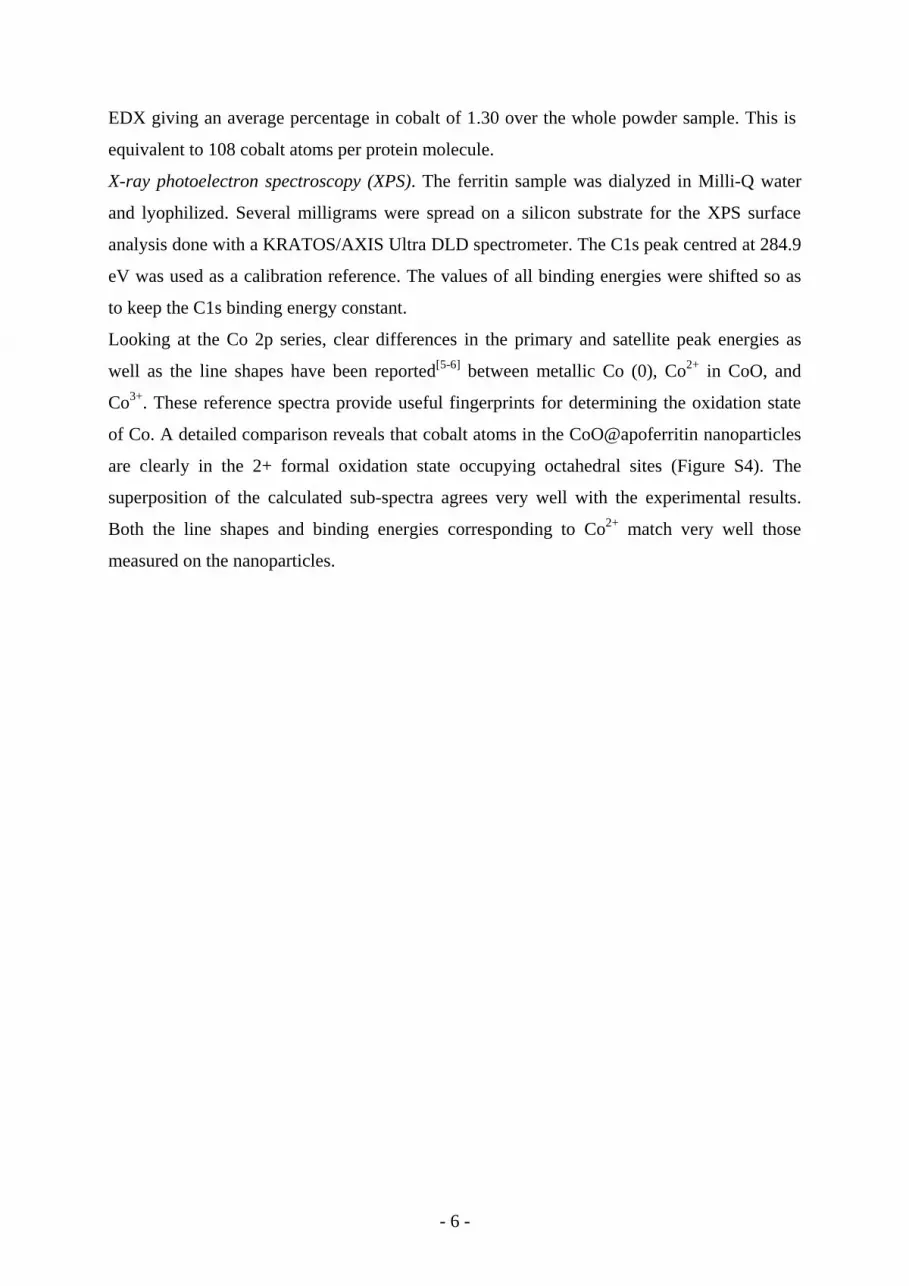
Moreover, as can be seen in Figure S3, most of CoO inside the nanoparticles is in the form of
a unique particle with spherical-like shape. However, in a very limited number of cases with
nanoparticle diameters over 3.0 nm, (not-shown in the figure) bean-shaped or several small
cores inside a single ferritin can be distinguished. This fact indicates that the in the case of
the larger nanoparticles the growth takes place from two or three different nucleation centres
placed on the inner cavity of the apoferritin.
- 5 -
Figure S2. Particle size distribution of the CoO@apoferritin sample obtained
from the analysis of the TEM images. The solid line is the Gaussian fit
showing an average diameter of D = 2.0 nm and variance =0.32
Figure S3. Typical TEM images of a CoO@apoferritin sample used in
this work. The inset (10 x 21 nm) is an enlarged picture showing the
homogeneity in spherical shape of the prepared nanoparticles. Black
spots represent the inorganic cores, whereas the protein shell is not
visible.
Energy-dispersive X-ray spectroscopy (EDX). CoO@apoferritin nanoparticles were analyzed
with a scanning electron microscope (SEM) Hitachi S-3400 N equipped with a Röntec
XFlash de Si(Li) EDX analyzer. For this, the ferritin sample was dialyzed in Milli-Q water
and lyophilized. A protein sample of the resulting powder was spread on carbon.
Measurements were done using variable pressure at 60 Pa, a 10 mm working distance and a
tension in the filament of about 15 kV. Five different micrometric areas were analyzed by
- 6 -
EDX giving an average percentage in cobalt of 1.30 over the whole powder sample. This is
equivalent to 108 cobalt atoms per protein molecule.
X-ray photoelectron spectroscopy (XPS). The ferritin sample was dialyzed in Milli-Q water
and lyophilized. Several milligrams were spread on a silicon substrate for the XPS surface
analysis done with a KRATOS/AXIS Ultra DLD spectrometer. The C1s peak centred at 284.9
eV was used as a calibration reference. The values of all binding energies were shifted so as
to keep the C1s binding energy constant.
Looking at the Co 2p series, clear differences in the primary and satellite peak energies as
well as the line shapes have been reported[5-6]
between metallic Co (0), Co2+
in CoO, and
Co3+
. These reference spectra provide useful fingerprints for determining the oxidation state
of Co. A detailed comparison reveals that cobalt atoms in the CoO@apoferritin nanoparticles
are clearly in the 2+ formal oxidation state occupying octahedral sites (Figure S4). The
superposition of the calculated sub-spectra agrees very well with the experimental results.
Both the line shapes and binding energies corresponding to Co2+
match very well those
measured on the nanoparticles.

- 7 -
Figure S4. High-resolution Co 2p core-level spectrum obtained by XPS. The
deconvolution into the different contributions corresponding to pure Co2+
asserts that the cobalt present in the NPs is in the Co 2+ state.
S4. Apoferritin stability
To study the stability of the deposited apoferritin proteins exposed to vacuum and low
temperature cycles fluorescence spectroscopy was used. Measurements were performed with
a Perkin Elmer LS55 spectrofluorometer at 20 ºC, using an excitation wavelength of 280 nm.
Initially, spectra of the bulk apoferritin in three different folding states in solution (native, a
semi-denaturated state where the subunits retain their tridimensional structure and a
completely unfolded state) were separately recorded to be used as models. Apoferritin was

- 8 -
unfolded to a semi folded and unfolded states with 0.01 M glycine hydrochloride buffer at pH
2.0 and 6 M guanidine hydrochloride at pH 1.9, respectively. The final spectra of the three
different folding states are shown in Figure S5. The native protein showed a maximum
emission at 323 nm, a smaller peak at 340 nm and a shoulder at 360 nm. In the semi-
denatured state, the maximum shifted towards 360 nm, but the smaller peak remained at 340
nm. The complete unfolding of the subunits further shifts the tryptophan emission to lower
energy, presenting a maximum at 360 nm, with a peak at 323 nm, related to the fluorescence
of tyrosyl residues, and a 340 nm shoulder.
Figure S5. Fluorescence emission spectra of 0.25 mg/mL HsAFr and their
subunits in 10 mM Tris-HCI buffer at pH 7.0. Excitation was at 280 nm. (Blue
line) bulk protein sample; (purple line) liquid protein sample obtain from dots
deposited by DPN; (black line) native apoferritin; (orange line) monomeric
subunits in 0.01 M glycine hydrochloride buffer at pH 2.0; (green line)
apoferritin subunits in 6 M guanidine hydrochloride at pH 1.9.
Afterwards, experiments were performed on apoferritin samples deposited on SiO2/Si and Nb
substrates, both as a bulk powder fixed with Apiezon grease or deposited from solution by
drop-casting (the small amount of material deposited by DPN is below the threshold
detection of our fluorescence experimental set-up). Such substrates were exposed to the same
temperature cycles and vacuum conditions as the samples used for the magnetic
measurements. However, due to experimental limitations that avoid direct in-situ
fluorescence studies, the samples were removed from the surface before their study by
extraction with water and posterior dilution in 10 mM Tris-HCl buffer at pH 7.0 down to a
final concentration of 0.25 mg/mL. In the case of the bulk sample the spectrum after removal

- 9 -
showed emission maxima at 340 nm and smaller peaks at 323 nm and 360 nm. The dip-
coated sample exhibited maximum emission at 340 nm, a smaller peak at 323 nm and a
shoulder at 360 nm. By comparison with the model spectra of the three folding states
previously described, it is rather difficult to unequivocally assign the folding status of the
complex quaternary protein structure in these samples. However, there is a clear tendency,
according to their emission spectra, which indicates that both samples contain a mixture of
states, where the protein is mostly folded or semi-folded.
S5. Experimental details of the methodology for direct writing
apoferritin/CoO@Apoferritin particles with DPN
Apoferritin and CoO@Apoferritin sample preparation. The molecular ink was prepared by
dissolving the lyophilized CoO@Apoferritin (concentration=55.2 mg·mL-1
) in a phosphate-
buffered saline (BupH PBS from Pierce) and glycerol (Sigma-Aldrich, ≥99.5 %, ACS grade)
solution (80/20%, respectively). The use of additives, such as glycerol, in the protein ink
solution is a well-known strategy because it significantly enhances the protein activity by
inhibiting dehydration. Furthermore, glycerol enhances the molecular ink viscosity, favouring
not only the tip coating but also the transference from the tip to the substrate.
Substrate preparation. Substrates used for contact angle measurements as well as for AFM
studies were obtained as follows. The SiO2/Si substrate was prepared by initially cutting the
Si wafers into 0.5 cm 0.5 cm pieces. Then, the substrate was washed in an ultrasonic bath
for 10 minutes progressively in acetonitrile, ethanol and Milli Q water, and dried by blowing
nitrogen gas. Nb substrates were washed following the same methodology. The SQUID
surface was cleaned by carefully washing it with ethanol and acetone, and dried by blowing
nitrogen gas before DPN deposition.
Dip-pen nanolithography setup. DPN experiments were performed with a commercial dip-pen
writer; NSCRIPTORTM
DPN®
System (NanoInk, Inc., USA). All DPN patterning experiments
were carried out under ambient conditions (~ 35% relative humidity, room temperature).
Commercial silicon nitride Type M Probe Arrays (NanoInk, Inc., USA) with a spring constant
of 0.5 N·m-1
were used for the patterning experiments. To coat the tip, a microfluidic ink
delivery chip-based system (Inkwell, NanoInk, Inc., USA) was used. The inkwells contained
several reservoirs filled with the desired Apoferritin/CoO@Apoferritin solution with a

- 10 -
micropipette. Afterwards the ink is transferred to a microwell through a microchannel, where
the tip is dipped and coated. The coating procedure first involved the addition of a few drops
of this ferritin solution into one of the reservoirs of the inkwell chip, and the AFM tip was
then coated by dipping it into the microwell that contained such solution.
Dip-pen nanolithography experiments. The experimental parameters used in this work have
already been successfully used for the deposition of ferritin proteins bearing different
inorganic nanoparticles onto a wide variety of surfaces.[7]
The ferritin deposition took place
by dispensing femptoliter volumes of the protein solution onto the specific regions of the pick
up coils. In all experiments, ferritin patterning was done at a constant humidity of 35% and
ambient temperature. The ferritin nanoarrays were generated by traversing the tip over the
surface in the form of the desired pattern, which is previously designed, as already described
in the text. The SQUID pick-up loop consists of two rectangular-shaped coils, each of them
with dimensions 50 × 200 m2. Such dimensions are larger than those of the piezo scanner
that controls the relative movement of the tip with respect to the sample (90 μm 90 μm).
Therefore, to overcome these limitations and cover the full perimeter of both coils, it is
necessary to induce, after each patterning writing, an x-y stage translation that relocates the
tip over different coil areas separated by more than 90 μm 90 μm. Such translation is
controlled by the software and optically controlled with the coupled camera, as can be seen in
Figure S6.
Figure S6. DPN camera images show the writing procedure followed by DPN in order to
deposit CoO@Apoferritin particles along the perimeter of the SQUID pick-up loop.

- 11 -
S6. Bulk magnetization measurements
The bulk magnetic response of the CoO@Apoferritin nanoparticles has been characterized
with a commercial MPMS magnetometer from Quantum Design over a few milligrams of the
sample fixed with Apiezon-N grease on a typical holder. Magnetic measurements down to
1.8 K confirmed the antiferromagnetic character of the nanoparticles. Antiferromagnetic bulk
materials exhibit no net (or negligible) magnetic moment since the magnetization of the two
sublattices cancels. However, a small net magnetic moment appears when the size of the
crystal is reduced as a consequence of poor crystallinity, surface disorder or spin canting. [11]
In the case of the CoO@Apoferritin nanoparticles the magnetic characterization enables us to
quantify this effect giving a net magnetic moment per particle of ~10 B. The magnetic
characterization down to mK temperatures (below 1.8 K) of the bulk material has been
performed by gluing a small quantity of the ferritin-Apiezon mixture (≈ 1 g) on the
microsusceptometer pick up coils and cooling it inside the mixing chamber of the dilution
refrigerator unit. The excitation magnetic field is produced by applying an input voltage
through a room temperature resistance (Rext=2 k) using the oscillator generator of a
commercial lock-in amplifier. The output voltage is then acquired as a function of frequency
using phase-sensitivity lock-in detection. The component in phase with the input voltage is
proportional to the real part of the samples susceptibility (’), whereas the out-of-phase
component is proportional to the imaginary part (’’). The resulting signal is transformed
into magnetic units by scaling it with measurements obtained in the commercial
magnetometer over a convenient temperature range where both measurements overlap.
The susceptibility data measured on the array and the bulk sample at a frequency of 21 Hz
are compared in Fig. S7a. The two have the same qualitative dependence on temperature
above 100 mK. However, below this temperature the susceptibility of the array shows a
maximum which, as shown in Fig. 3 of the manuscript, depends on frequency. The effect can
be ascribed to the better thermalization of the array with the Helium bath, on account of its
much larger contact area. The data of the bulk can be made equal to those of the array by
shifting them along the temperature axis (Fig. S7b). The temperature shift between the two
experiments, estimated in this way, is shown in Fig. S7c. There is a noticeable effect already
below 200 mK. This analysis suggests that nanopatterning molecular samples, with low
thermal conductivities, can provide a good method to investigate their magnetic properties
down to the neighbourhood of the absolute zero, when thermalization effects become a
crucial issue.

- 12 -
0.0
0.2
0.4
0.6
0.8
1.0
0.0
0.2
0.4
0.6
0.8
1.0
0.0 0.2 0.4 0.60
20
(c)
(b)
' (1
0-3
B/m
ole
cu
le A
m-1)
21 Hz(a)
Array
Bulk sample
T
(m
K)
Tbath
(K)
Figure S7. a) Direct comparison of the ac susceptibilities of the Co@apoferritin array deposited
by DPN (open dots) and of the bulk sample (solid line) measured at 21 Hz. b) The same data as
in a), but in this case the bulk data have been shifted in temperature to match those of the array.
c) Temperature shift between the bulk and array data.
REFERENCES
[1] D. Drung, C. Aßmann, J. Beyer, A. Kirste, M. Peters and F. Ruede, Th. Schurig, IEEE
Trans. Appl. Supercond. 17, 699-704 (2007).
[2] M. J. Martínez-Pérez, J. Sesé, R. Córdoba, F. Luis, D. Drung and T. Schurig, Supercond.
Sci. Technol. 22, 125020 (2009).
[3] J. Sesé, F. Lera, A. Camón and C. Rillo, IEEE Trans. Appl. Superconduct. 9, 58–62
(1999).
[4] K. Tsukamoto, M. Iwahori, M., Muraoka and I. Yamashita, Bull. Chem. Soc. Jpn. 78,
2075-2081 (2005).
[5] M. Hassel and H. J. Freund, Surf. Sci. 325, 163 (1995).

- 13 -
[6] S. A. Chambers, R. F. C. Farrow, S. Maat, M. F. Toney, L. Folks, J. G. Catalano, T. P.
Trainor and G. E. Brown, J. Magn. Magn. Mat. 246, 124-139 (2002).
[7] E. Bellido, R. de Miguel, J. Sesé, D. Ruiz-Molina, A. Lostao and D. Maspoch, Scanning
32, 35-41 (2010).
[8] E. Bellido, R. de Miguel, D. Ruiz-Molina, A. Lostao and D. Maspoch, Adv. Mater. 22,
352-355 (2010).
[9] A. K. Panwar, S. K. Barthwal and S. Ray, J. Adhesion Sci. Technol. 17, 1321-1329
(2003).
[10] L. Xu and M. Salmeron in Nano-Surface Chemistry: Studies of Wetting and Capillary
Phenomena at Nanometer Scale with Scanning Polarization Force Microscopy, M. Rosoff
editor (Marcel Dekker Inc., New York, 2001), chapter 6, pp. 243-288.
[11] L. Néel, C. R. Acad. Sci. 252, 4075-4080 (1961); ibid 253, 9-12 (1961); ibid 253, 1286-
1291 (1961).
![Erratum: “Strain-induced modulation of perpendicular magnetic anisotropy in Ta/CoFeB/MgO structures investigated by ferromagnetic resonance” [Appl. Phys. Lett. 106, 072402 (2015)]](https://img.pdfslide.net/doc/110x75/6337489a20d9c9602f0b39f6/erratum-strain-induced-modulation-of-perpendicular-magnetic-anisotropy-in-tacofebmgo.jpg)
![Exclusive ηc photo- and electroproduction at HERA as a possible probe of the odderon singularity in QCD [Phys. Lett. B 398 (1997) 400]](https://img.pdfslide.net/doc/110x75/633c90094893f7c991049292/exclusive-ic-photo-and-electroproduction-at-hera-as-a-possible-probe-of-the-odderon.jpg)
![Self-consistent description of Λ hypernuclei in the quark-meson coupling model [Phys. Lett. B 411 (1997) 9]](https://img.pdfslide.net/doc/110x75/6352ee2641bc6573100e4c31/self-consistent-description-of-l-hypernuclei-in-the-quark-meson-coupling-model.jpg)


